UNITED STATES
SECURITIES AND EXCHANGE COMMISSION
Washington, D.C. 20549
FORM N-CSR
CERTIFIED SHAREHOLDER REPORT OF REGISTERED MANAGEMENT INVESTMENT COMPANIES
Investment Company Act file number 811-04087
Manning & Napier Fund, Inc.
(Exact name of registrant as specified in charter)
290 Woodcliff Drive, Fairport, NY 14450
(Address of principal executive offices)(Zip Code)
Paul J. Battaglia 290 Woodcliff Drive, Fairport, NY 14450
(Name and address of agent for service)
Registrant’s telephone number, including area code: 585-325-6880
Date of fiscal year end: October 31
Date of reporting period: November 1, 2020 through October 31, 2021
Form N-CSR is to be used by management investment companies to file reports with the Commission not later than 10 days after the transmission to stockholders of any report that is required to be transmitted to stockholders under Rule 30e-1 under the Investment Company Act of 1940 (17 CFR 270.30e-1). The Commission may use the information provided on Form N-CSR in its regulatory, disclosure review, inspection, and policymaking roles.
A registrant is required to disclose the information specified by Form N-CSR, and the Commission will make this information public. A registrant is not required to respond to the collection of information contained in Form N-CSR unless the Form displays a currently valid Office of Management and Budget ("OMB") control number. Please direct comments concerning the accuracy of the information collection burden estimate and any suggestions for reducing the burden to Secretary, Securities and Exchange Commission, 450 Fifth Street, NW, Washington, DC 20549-0609. The OMB has reviewed this collection of information under the clearance requirements of 44 U.S.C. § 3507.
Explanatory Note
This amendment is being filed solely for the purposes of correcting two page headings within the Pro-Blend® Maximum Term Series section of the document. Those two page headings on pages 89 and 90 have now been corrected. No other information was changed from the original NCSR.
| Item 1(a): | Reports to Stockholders. |

www.manning-napier.com
Manning & Napier Fund, Inc.
| Equity Series |
Paper copies of the Series’ shareholder reports are no longer sent by mail, unless you specifically request them from the Series or from your financial intermediary, such as a broker-dealer or bank. Shareholder reports are available online. Each time a report is posted on the Series’ website you will be provided with a link to access the report online, either by mail (hard copy notice) or by email, if you have already signed up for electronic delivery of shareholder reports.
You may elect to receive all future shareholder reports in paper free of charge. If you invest through a financial intermediary, you can contact your financial intermediary to request that you continue to receive paper copies. If you invest directly with the Fund, you can inform the Fund that you wish to continue receiving paper copies by visiting www.manning-napier.com or calling 1-800-466-3863. Your election to receive reports in paper will apply to all funds held with your financial intermediary if you invest through a financial intermediary or all series of the Fund if you invest directly with the Fund.
Additionally, If you have not yet signed up for electronic delivery of shareholder reports and other Fund communications, you may do so by contacting your financial intermediary or, if you are a direct investor, by visiting www.manning-napier.com or calling 1-800-466-3863.

Independent Perspective | Real-World Solutions
A Note from Our CEO
Dear Shareholder,
The obstacles were many, but this year, in so many ways, is a story of triumphant resilience only serving to spotlight just how much more there is to do.
Over the past eighteen months, we’ve endured a recession, a bear market, and a pandemic. Our collective perseverance is now paying off.
We are today experiencing a remarkable economic boom, a historic market rally, and continued medical innovation, all of which have turned a challenging period into one of optimism and hope.
At the same time, political and societal polarization are heightened, social justice concerns have justifiably come to the fore, and the precarious state of our environment presents almost unimaginable challenges for government, business, and finance.
This certainly is a moment of great consequence.
The kind of moment that questions all the rules. Economic rules in how we add value for each other, as well as for ourselves. Social rules in how we interact with each other. Environmental rules that can balance the current needs of emerging economies with the requirements for everyone in the future. Workplace rules in how we get the job done.
Our lives are being redefined, and our society, planet, workplaces, and industry must confront the challenges of the upcoming decade.
Markets reflect us. They mirror our collective thoughts, feelings, expectations, and beliefs – these new life rules.
As we go through this period of change, it will be uncertain and uncomfortable. For those unaccustomed to change, for those reliant on ‘set it and forget it’, these may seem like daunting questions, but there is a better way.
Success in an era of change demands flexibility, adaptability, and a roll-up-your-sleeves willingness to do the work.
For over 50 years, independent thinking and tireless work have underpinned every decision we’ve made on behalf of our investors. We invest for the long-term, we do not speculate. We make active decisions, and we invest with discipline, patience, and confidence. This is the only way we know, to remain true to our values and our fiduciary duty to you, the investors in our mutual funds.
You demand more. At Manning & Napier, we demand more of ourselves. Upon reflection of the year, we’re proud to have continued to deliver more.
We wish you safety and good health, and we appreciate your confidence in our firm and our approach.
 | Sincerely,
Marc Mayer Chief Executive Officer |

Corporate Headquarters | 290 Woodcliff Drive | Fairport, NY 14450 | (585) 325-6880 phone | (800) 551-0224 toll free | www.manning-napier.com
1
Equity Series
Fund Commentary
(unaudited)
Investment Objective
To provide long-term growth of capital by investing primarily in common stocks. The Series may invest in large-, mid- and small-size companies within the US.
Performance Commentary
Broad US equity markets posted high double digit returns for the twelve-month period ending October 31, 2021. During the period, smaller-cap stocks generally outperformed larger-cap stocks, while growth and value stocks were roughly in line for large capitalization stocks and value notably outperformed growth in the small and mid-cap segments of the market. In terms of sectors, Energy and Financials experienced the highest returns while areas such as Utilities and Consumer Staples broadly lagged.
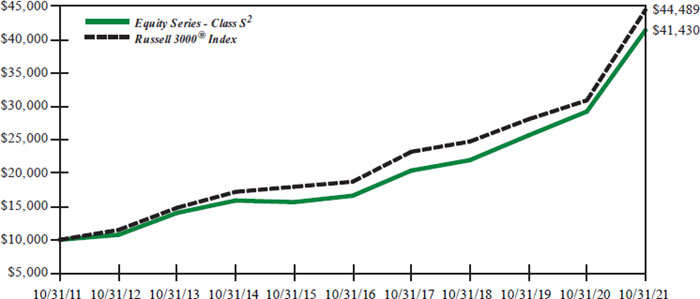
The Equity Series Class S delivered positive returns during the year but slightly underperformed the Russell 3000 Index, returning 41.7% and 43.9%, respectively.
Underperformance was primarily driven by stock selection, most notably within Health Care and Energy; however, an overweight to the Energy sector more than offset selection decisions in the sector. Within Health Care, Vertex Pharmaceuticals, a biotechnology company that engages in discovering, developing, manufacturing, and commercializing medicines for serious diseases, was among the largest detractors to relative returns following several trial failures. Additionally, an allocation to cash was a detractor as equities notably outperformed cash.
Alternatively, a lack of exposure to Utilities and an overweight to the Energy sector were the strongest contributors to relative returns. Taking a closer look at Energy, we initiated positions in several oil related companies in early 2020 as the market was experiencing Hurdle Rate conditions (i.e., the industry was experiencing a supply/demand imbalance). Since then, oil prices have rebounded significantly following the gradual reopening of key economies. While the fundamentals of the oil Hurdle Rate continue to track, the current wave of the COVID-19 delta variant and the recent UAE-Saudi conflict over OPEC production levels have weighed on investor sentiment. Furthermore, with oil prices rising, the risk of more supply coming back online and creating a supply/demand imbalance has risen. As a result, we’ve been gradually trimming exposure over the latter half of the fiscal year.
Looking ahead, our long-term outlook for growth remains challenged. Corporate debt levels are historically high, and while the consumer is relatively healthy all things considered, government borrowing remains elevated across the globe. Meanwhile, the demographic profiles of the major developed market economies are mixed at best. Aging demographics are reducing workforce growth, and economic growth in the process. As such, we believe today’s accelerated rate of economic growth is unsustainable, having been in part fueled by massive fiscal and monetary stimulus programs across the globe that are now beginning to recede. Overall, we expect the next step for global economic growth is more likely to be lower than higher from here.
Given today’s highly dynamic economic environment and building risks across financial markets, we believe investors should be particularly discerning. As always, we will continue to monitor the environment and remain opportunistic as we actively position client portfolios in what we believe are attractive long-term values.
Performance data quoted represents past performance and does not guarantee future results. The investment return and principal value of an investment will fluctuate, so that an investor’s shares, when redeemed, may be worth more or less than their original cost. Current performance may be higher or lower than that quoted; investors can obtain the most recent month-end performance at www.manning-napier.com or by calling (800) 466-3863.
Commentary prepared using data provided by FactSet. Analysis Manning & Napier. Commentary presented is relative to the Russell 3000® Index. Additional information and associated disclosures can be found on the Performance Update page of this report.
The data presented is for informational purposes only. It is not to be considered a specific stock recommendation.
All investments involve risks, including possible loss of principal. As with any stock fund, the value of your investment will fluctuate in response to stock market movements. Investing in the Series will also involve a number of other risks, including issuer-specific risk, small-cap/mid-cap risk, and interest rate risk.
2
Equity Series
Performance Update as of October 31, 2021
(unaudited)
AVERAGE ANNUAL TOTAL RETURNS AS OF OCTOBER 31, 2021 | |||
ONE YEAR1 | FIVE YEAR | TEN YEAR | |
| Equity Series - Class S2 | 41.71% | 20.05% | 15.27% |
| Equity Series - Class W2,3 | 43.17% | 20.70% | 15.58% |
| Russell 3000® Index4 | 43.90% | 18.91% | 16.10% |
The following graph compares the value of a $10,000 investment in the Equity Series - Class S for the ten years ended October 31, 2021 to the Russell 3000® Index.
1The returns shown are based on net asset values calculated for shareholder transactions and may differ from the returns shown in the financial highlights, which reflect adjustments made to the net asset values in accordance with accounting principles generally accepted in the United States of America.
2The Series’ performance does not reflect the deduction of taxes that a shareholder would pay on fund distributions or the redemption of shares. The Series’ performance is historical and may not be indicative of future results. The performance returns shown are inclusive of the net expense ratio of the Series. For the year ended October 31, 2021, this net expense ratio was 1.05% for Class S and 0.05% for Class W. The gross expense ratio, which does not account for any voluntary or contractual waivers currently in effect, was 1.29% for Class S and 1.04% for Class W for the year ended October 31, 2021.
3For periods through March 1, 2019 (the inception date of the Class W shares), performance for the Class W shares is based on the historical performance of the Class S shares. Because the Class W shares invest in the same portfolio of securities as the Class S shares, performance will be different only to the extent that the Class S shares have a higher expense ratio.
4The Russell 3000® Index is an unmanaged index that consists of 3,000 of the largest U.S. companies based on total market capitalization. The Index returns are based on a market capitalization-weighted average of relative price changes of the component stocks plus dividends whose reinvestments are compounded daily. The Index returns do not reflect any fees or expenses. Index returns provided by Bloomberg. Index data referenced herein is the property of London Stock Exchange Group plc and its group undertakings (“LSE Group”) and/or its third party suppliers and has been licensed for use by Manning & Napier. LSE Group and its third party suppliers accept no liability in connection with its use. Data provided is not a representation or warranty, express or implied, as to the ability of any index to accurately represent the asset class or market sector that it purports to represent and none of these parties shall have any liability for any errors, omissions, or interruptions of any index or the data included therein. For additional disclosure information, please see: https://go.manning-napier.com/benchmark-provisions.
3
Equity Series
Shareholder Expense Example
(unaudited)
As a shareholder of the Series, you incur ongoing costs, including management fees, shareholder service fees and other Series expenses. This example is intended to help you understand your ongoing costs (in dollars) of investing in the Series and to compare these costs with the ongoing costs of investing in other mutual funds.
The example is based on an investment of $1,000 invested in each class at the beginning of the period and held for the entire period (May 1, 2021 to October 31, 2021).
Actual Expenses
The Actual lines of the table below provide information about actual account values and actual expenses. You may use the information in these lines, together with the amount you invested, to estimate the expenses that you paid over the period. Simply divide your account value by $1,000 (for example, an $8,600 account value divided by $1,000 = 8.6), then multiply the result by the number in the Actual line for the Class in which you have invested under the heading entitled “Expenses Paid During Period” to estimate the expenses you paid on your account during this period.
Hypothetical Example for Comparison Purposes
The Hypothetical lines of each class in the table below provide information about hypothetical account values and hypothetical expenses based on the Class’ actual expense ratio and an assumed rate of return of 5% per year before expenses, which is not the Class’ actual return. The hypothetical account values and expenses may not be used to estimate the actual ending account balance or expenses you paid during the period. You may use this information to compare the ongoing costs of investing in a class of the Series and other funds. To do so, compare this 5% hypothetical example for the Class in which you have invested with the 5% hypothetical examples that appear in the shareholder reports of the other funds.
Please note that the expenses shown in the table are meant to highlight your ongoing costs only and do not reflect any transaction costs, such as sales charges (loads), redemption fees, or exchange fees that you may incur in other mutual funds. Therefore, the second line of the table is useful in comparing ongoing costs only, and will not help you determine the relative total costs of owning different funds.
BEGINNING ACCOUNT VALUE 5/1/21 | ENDING ACCOUNT VALUE 10/31/21 | EXPENSES PAID DURING PERIOD* 5/1/21 - 10/31/21 | ANNUALIZED EXPENSE RATIO | |
| Class S | ||||
| Actual | $1,000.00 | $1,091.60 | $5.54 | 1.05% |
Hypothetical (5% return before expenses) | $1,000.00 | $1,019.91 | $5.35 | 1.05% |
| Class W | ||||
| Actual | $1,000.00 | $1,097.10 | $0.26 | 0.05% |
Hypothetical (5% return before expenses) | $1,000.00 | $1,024.95 | $0.26 | 0.05% |
*Expenses are equal to each Class’ annualized expense ratio (for the six-month period), multiplied by the average account value over the period, multiplied by 184/365 (to reflect the one-half year period). Expenses are based on the most recent fiscal half year; therefore, the expense ratios stated above may differ from the expense ratios stated in the financial highlights, which are based on one-year data. The Class’ total return would have been lower had certain expenses not been waived or reimbursed during the period.
4
Equity Series
Portfolio Composition as of October 31, 2021
(unaudited)
| Sector Allocation1 |
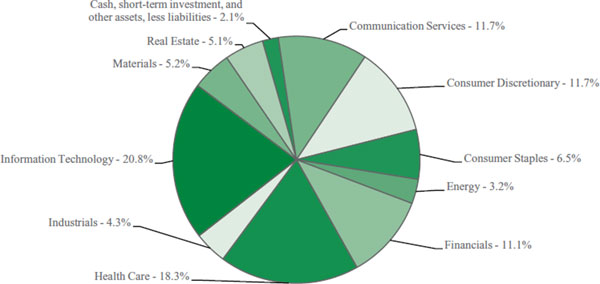
1As a percentage of net assets. |
5
Equity Series
Investment Portfolio - October 31, 2021
| SHARES | VALUE (NOTE 2) | |||||||
| COMMON STOCKS - 97.9% | ||||||||
| Communication Services - 11.7% | ||||||||
| Diversified Telecommunication Services - 1.1% | ||||||||
| Radius Global Infrastructure, Inc. - Class A* | 50,978 | $ | 883,449 | |||||
| Entertainment - 1.8% | ||||||||
| Electronic Arts, Inc. | 5,017 | 703,634 | ||||||
| The Walt Disney Co.* | 4,141 | 700,119 | ||||||
| 1,403,753 | ||||||||
| Interactive Media & Services - 7.2% | ||||||||
| Alphabet, Inc. - Class A* | 863 | 2,555,274 | ||||||
| Alphabet, Inc. - Class C* | 72 | 213,509 | ||||||
| Meta Platforms, Inc. - Class A* | 9,124 | 2,952,253 | ||||||
| 5,721,036 | ||||||||
| Media - 1.6% | ||||||||
| Charter Communications, Inc. - Class A* | 1,880 | 1,268,793 | ||||||
| Total Communication Services | 9,277,031 | |||||||
| Consumer Discretionary - 11.7% | ||||||||
| Hotels, Restaurants & Leisure - 2.5% | ||||||||
| Expedia Group, Inc. | 7,335 | 1,205,947 | ||||||
| Hyatt Hotels Corp. - Class A* | 9,563 | 814,768 | ||||||
| 2,020,715 | ||||||||
| Internet & Direct Marketing Retail - 4.0% | ||||||||
| Amazon.com, Inc.* | 945 | 3,186,946 | ||||||
| Multiline Retail - 3.3% | ||||||||
| Dollar General Corp. | 5,679 | 1,258,012 | ||||||
| Dollar Tree, Inc.* | 12,755 | 1,374,479 | ||||||
| 2,632,491 | ||||||||
| Specialty Retail - 0.8% | ||||||||
| AutoZone, Inc.* | 352 | 628,264 | ||||||
| Textiles, Apparel & Luxury Goods - 1.1% | ||||||||
| NIKE, Inc. - Class B. | 4,984 | 833,773 | ||||||
| Total Consumer Discretionary | 9,302,189 | |||||||
| Consumer Staples - 6.5% | ||||||||
| Beverages - 4.0% | ||||||||
| The Coca-Cola Co. | 25,015 | 1,410,096 | ||||||
| Constellation Brands, Inc. - Class A | 4,322 | 937,053 | ||||||
| PepsiCo, Inc. | 5,199 | 840,158 | ||||||
| 3,187,307 | ||||||||
| Food Products - 2.5% | ||||||||
| Mondelez International, Inc. - Class A | 31,680 | 1,924,243 | ||||||
| Total Consumer Staples | 5,111,550 | |||||||
| Energy - 3.2% | ||||||||
| Oil, Gas & Consumable Fuels - 3.2% | ||||||||
| ConocoPhillips. | 10,431 | 777,005 | ||||||
| Coterra Energy, Inc. | 26,650 | 568,178 | ||||||
| EQT Corp. | 38,613 | 768,785 | ||||||
| Exxon Mobil Corp. | 6,501 | 419,119 | ||||||
| Total Energy | 2,533,087 | |||||||
| SHARES | VALUE (NOTE 2) | |||||||
| COMMON STOCKS (continued) | ||||||||
| Financials - 11.1% | ||||||||
| Banks - 1.3% | ||||||||
| East West Bancorp, Inc. | 12,816 | $ | 1,018,616 | |||||
| Capital Markets - 7.8% | ||||||||
| BlackRock, Inc. | 882 | 832,132 | ||||||
| Cboe Global Markets, Inc. | 6,667 | 879,644 | ||||||
| Intercontinental Exchange, Inc. | 12,180 | 1,686,443 | ||||||
| Moody’s Corp. | 4,009 | 1,620,237 | ||||||
| S&P Global, Inc. | 2,410 | 1,142,725 | ||||||
| 6,161,181 | ||||||||
| Consumer Finance - 1.0% | ||||||||
| American Express Co. | 4,679 | 813,117 | ||||||
| Insurance - 1.0% | ||||||||
| W. R. Berkley Corp. | 9,775 | 778,090 | ||||||
| Total Financials | 8,771,004 | |||||||
| Health Care - 18.3% | ||||||||
| Biotechnology - 5.0% | ||||||||
| BioMarin Pharmaceutical, Inc.* | 12,958 | 1,026,663 | ||||||
| Seagen, Inc.* | 9,637 | 1,699,292 | ||||||
| Vertex Pharmaceuticals, Inc.* | 6,586 | 1,217,949 | ||||||
| 3,943,904 | ||||||||
| Health Care Equipment & Supplies - 4.4% | ||||||||
| Align Technology, Inc.* | 1,979 | 1,235,628 | ||||||
| Boston Scientific Corp.* | 14,735 | 635,521 | ||||||
| Heska Corp.* | 1,561 | 348,930 | ||||||
| IDEXX Laboratories, Inc.* | 1,163 | 774,721 | ||||||
| Intuitive Surgical, Inc.* | 1,254 | 452,857 | ||||||
| 3,447,657 | ||||||||
| Health Care Providers & Services - 4.5% | ||||||||
| Amedisys, Inc.* | 2,472 | 418,609 | ||||||
| Humana, Inc. | 3,314 | 1,534,912 | ||||||
| LHC Group, Inc.* | 2,666 | 358,817 | ||||||
| UnitedHealth Group, Inc. | 2,790 | 1,284,711 | ||||||
| 3,597,049 | ||||||||
| Life Sciences Tools & Services - 1.4% | ||||||||
| Thermo Fisher Scientific, Inc. | 1,805 | 1,142,691 | ||||||
| Pharmaceuticals - 3.0% | ||||||||
| Johnson & Johnson | 11,622 | 1,892,991 | ||||||
| Zoetis, Inc. | 2,160 | 466,992 | ||||||
| 2,359,983 | ||||||||
| Total Health Care | 14,491,284 | |||||||
| Industrials - 4.3% | ||||||||
| Commercial Services & Supplies - 0.8% | ||||||||
| Copart, Inc.* | 3,997 | 620,694 | ||||||
| Machinery - 1.1% | ||||||||
| Westinghouse Air Brake Technologies Corp. | 9,070 | 822,921 | ||||||
The accompanying notes are an integral part of the financial statements.
6
Equity Series
Investment Portfolio - October 31, 2021
| SHARES | VALUE (NOTE 2) | |||||||
| COMMON STOCKS (continued) | ||||||||
| Industrials (continued) | ||||||||
| Professional Services - 1.1% | ||||||||
| Insperity, Inc. | 7,121 | $ | 890,125 | |||||
| Road & Rail - 1.3% | ||||||||
| Norfolk Southern Corp. | 3,570 | 1,046,189 | ||||||
| Total Industrials | 3,379,929 | |||||||
| Information Technology - 20.8% | ||||||||
| Electronic Equipment, Instruments & Components - 0.5% | ||||||||
| CDW Corp. | 2,250 | 419,963 | ||||||
| IT Services - 6.5% | ||||||||
| Mastercard, Inc. - Class A | 6,055 | 2,031,574 | ||||||
| PayPal Holdings, Inc. | 5,169 | 1,202,258 | ||||||
| Snowflake, Inc. - Class A | 1,156 | 409,039 | ||||||
| Visa, Inc. - Class A | 7,080 | 1,499,331 | ||||||
| 5,142,202 | ||||||||
| Semiconductors & Semiconductor Equipment - 1.6% | ||||||||
| NVIDIA Corp. | 5,020 | 1,283,463 | ||||||
| Software - 12.2% | ||||||||
| Adobe, Inc.* | 1,259 | 818,803 | ||||||
| Anaplan, Inc. | 14,591 | 951,479 | ||||||
| Cadence Design Systems, Inc.* | 5,559 | 962,319 | ||||||
| Microsoft Corp. | 9,370 | 3,107,279 | ||||||
| Palo Alto Networks, Inc.* | 1,594 | 811,490 | ||||||
| salesforce.com, Inc.* | 4,559 | 1,366,287 | ||||||
| ServiceNow, Inc.* | 2,336 | 1,629,967 | ||||||
| 9,647,624 | ||||||||
| Total Information Technology | 16,493,252 | |||||||
| SHARES | VALUE (NOTE 2) | |||||||
| COMMON STOCKS (continued) | ||||||||
| Materials - 5.2% | ||||||||
| Chemicals - 2.0% | ||||||||
| FMC Corp. | 17,463 | $ | 1,589,307 | |||||
| Construction Materials - 1.6% | ||||||||
| Martin Marietta Materials, Inc. | 1,109 | 435,660 | ||||||
| Vulcan Materials Co. | 4,370 | 830,824 | ||||||
| 1,266,484 | ||||||||
| Containers & Packaging - 1.6% | ||||||||
| Graphic Packaging Holding Co. | 63,245 | 1,260,473 | ||||||
| Total Materials | 4,116,264 | |||||||
| Real Estate - 5.1% | ||||||||
| Equity Real Estate Investment Trusts (REITS) - 5.1% | ||||||||
| American Homes 4 Rent - Class A | 9,297 | 377,458 | ||||||
| American Tower Corp. | 3,910 | 1,102,503 | ||||||
| Equinix, Inc. | 698 | 584,275 | ||||||
| Invitation Homes, Inc. | 9,585 | 395,381 | ||||||
| SBA Communications Corp. | 4,606 | 1,590,590 | ||||||
| Total Real Estate | 4,050,207 | |||||||
| TOTAL COMMON STOCKS | ||||||||
| (Identified Cost $49,874,806) | 77,525,797 | |||||||
| SHORT-TERM INVESTMENT - 0.8% | ||||||||
| Dreyfus Government Cash Management, Institutional Shares, 0.03%1 | ||||||||
| (Identified Cost $651,260) | 651,260 | 651,260 | ||||||
| TOTAL INVESTMENTS - 98.7% | ||||||||
| (Identified Cost $50,526,066) | 78,177,057 | |||||||
| OTHER ASSETS, LESS LIABILITIES - 1.3% | 989,841 | |||||||
| NET ASSETS - 100% | $ | 79,166,898 | ||||||
*Non-income producing security.
1Rate shown is the current yield as of October 31, 2021.
The Global Industry Classification Standard (GICS) was developed by and is the exclusive property and a service mark of MSCI Inc. (MSCI) and Standard & Poor’s, a division of S&P Global Inc. (S&P), and is licensed for use by Manning & Napier when referencing GICS sectors. Neither MSCI, S&P, nor any third party involved in making or compiling the GICS or any GICS classifications makes any express or implied warranties or representations with respect to such standard or classification, nor shall any such party have any liability therefrom.
The accompanying notes are an integral part of the financial statements.
7
Equity Series
Statement of Assets and Liabilities
October 31, 2021
| ASSETS: | ||||
| Investments, at value (identified cost $50,526,066) (Note 2) | $ | 78,177,057 | ||
| Receivable for securities sold | 1,067,365 | |||
| Dividends receivable | 14,866 | |||
| Receivable for fund shares sold | 93 | |||
| Prepaid expenses | 11,446 | |||
| TOTAL ASSETS | 79,270,827 | |||
| LIABILITIES: | ||||
| Accrued management fees (Note 3) | 32,560 | |||
| Accrued shareholder services fees (Class S) (Note 3) | 16,311 | |||
| Accrued fund accounting and administration fees (Note 3) | 15,257 | |||
| Accrued transfer agent fees (Note 3) | 3,481 | |||
| Accrued Chief Compliance Officer service fees (Note 3) | 2,032 | |||
| Audit fees payable | 22,291 | |||
| Printing fees payable | 8,231 | |||
| Payable for fund shares repurchased | 1,052 | |||
| Other payables and accrued expenses | 2,714 | |||
| TOTAL LIABILITIES | 103,929 | |||
| TOTAL NET ASSETS | $ | 79,166,898 | ||
| NET ASSETS CONSIST OF: | ||||
| Capital stock | $ | 42,301 | ||
| Additional paid-in-capital | 40,334,567 | |||
| Total distributable earnings (loss) | 38,790,030 | |||
| TOTAL NET ASSETS | $ | 79,166,898 | ||
NET ASSET VALUE, OFFERING PRICE AND REDEMPTION PRICE PER SHARE - Class S | ||||
| ($78,687,199/4,204,633 shares) | $ | 18.71 | ||
| NET ASSET VALUE, OFFERING PRICE AND REDEMPTION PRICE PER SHARE - Class W | ||||
| ($479,699/25,421 shares) | $ | 18.87 | ||
The accompanying notes are an integral part of the financial statements.
8
Equity Series
Statement of Operations
For the Year Ended October 31, 2021
| INVESTMENT INCOME: | ||||
| Dividends | $ | 662,631 | ||
| Other Income | 4,633 | |||
| Total Investment Income | 667,264 | |||
| EXPENSES: | ||||
| Management fees (Note 3) | 554,044 | |||
| Shareholder services fees (Class S) (Note 3) | 183,573 | |||
| Fund accounting and administration fees (Note 3) | 46,260 | |||
| Directors’ fees (Note 3) | 8,572 | |||
| Chief Compliance Officer service fees (Note 3) | 6,096 | |||
| Custodian fees | 3,442 | |||
| Miscellaneous | 147,070 | |||
| Total Expenses | 949,057 | |||
| Less reduction of expenses (Note 3) | (177,828 | ) | ||
| Net Expenses | 771,229 | |||
| NET INVESTMENT LOSS | (103,965 | ) | ||
| REALIZED AND UNREALIZED GAIN (LOSS) ON INVESTMENTS: | ||||
| Net realized gain (loss) on investments | 12,646,377 | |||
| Net change in unrealized appreciation (depreciation) on investments | 12,101,122 | |||
| NET REALIZED AND UNREALIZED GAIN (LOSS) ON INVESTMENTS | 24,747,499 | |||
| NET INCREASE IN NET ASSETS RESULTING FROM OPERATIONS | $ | 24,643,534 |
The accompanying notes are an integral part of the financial statements.
9
Equity Series
Statements of Changes in Net Assets
FOR THE YEAR ENDED 10/31/21 | FOR THE YEAR ENDED 10/31/20 | |||||||
| INCREASE (DECREASE) IN NET ASSETS: | ||||||||
| OPERATIONS: | ||||||||
| Net investment income (loss) | $ | (103,965 | ) | $ | 28,312 | |||
| Net realized gain (loss) on investments | 12,646,377 | 5,039,992 | ||||||
| Net change in unrealized appreciation (depreciation) on investments | 12,101,122 | 2,979,452 | ||||||
| Net increase (decrease) from operations | 24,643,534 | 8,047,756 | ||||||
| DISTRIBUTIONS TO SHAREHOLDERS (Note 9): | ||||||||
| Class S | (5,290,998 | ) | (6,221,729 | ) | ||||
| Class W | (35,027 | ) | (33,999 | ) | ||||
| Total distributions to shareholders | (5,326,025 | ) | (6,255,728 | ) | ||||
| CAPITAL STOCK ISSUED AND REPURCHASED: | ||||||||
| Net increase (decrease) from capital share transactions (Note 5) | (297,832 | ) | (5,714,473 | ) | ||||
| Net increase (decrease) in net assets | 19,019,677 | (3,922,445 | ) | |||||
| NET ASSETS: | ||||||||
| Beginning of year | 60,147,221 | 64,069,666 | ||||||
| End of year | $ | 79,166,898 | $ | 60,147,221 | ||||
The accompanying notes are an integral part of the financial statements.
10
Equity Series
Financial Highlights - Class S*
| FOR THE YEAR ENDED | ||||||||||||||||||||
| 10/31/21 | 10/31/20 | 10/31/19 | 10/31/18 | 10/31/17 | ||||||||||||||||
Per share data (for a share outstanding throughout each year): | ||||||||||||||||||||
| Net asset value - Beginning of year | $14.32 | $13.89 | $14.28 | $14.27 | $12.20 | |||||||||||||||
| Income (loss) from investment operations: | ||||||||||||||||||||
| Net investment income (loss)1 | (0.02 | ) | 0.01 | 0.02 | (0.02 | ) | 0.01 | |||||||||||||
| Net realized and unrealized gain (loss) on investments | 5.67 | 1.81 | 1.86 | 1.07 | 2.63 | |||||||||||||||
| Total from investment operations | 5.65 | 1.82 | 1.88 | 1.05 | 2.64 | |||||||||||||||
| Less distributions to shareholders: | ||||||||||||||||||||
| From net investment income | (0.00 | )2 | (0.03 | ) | (0.01 | ) | — | — | ||||||||||||
| From net realized gain on investments | (1.26 | ) | (1.36 | ) | (2.26 | ) | (1.04 | ) | (0.57 | ) | ||||||||||
| Total distributions to shareholders | (1.26 | ) | (1.39 | ) | (2.27 | ) | (1.04 | ) | (0.57 | ) | ||||||||||
| Net asset value - End of year | $18.71 | $14.32 | $13.89 | $14.28 | $14.27 | |||||||||||||||
| Net assets - End of year (000’s omitted) | $78,687 | $59,789 | $63,701 | $69,562 | $83,355 | |||||||||||||||
| Total return3 | 41.71% | 14.00% | 4 | 16.88% | 7.67% | 22.68% | 5 | |||||||||||||
| Ratios (to average net assets)/Supplemental Data: | ||||||||||||||||||||
| Expenses** | 1.05% | 1.05% | 1.05% | 1.05% | 1.05% | |||||||||||||||
| Net investment income (loss) | (0.15% | ) | 0.04% | 0.12% | (0.17% | ) | 0.10% | |||||||||||||
| Series portfolio turnover | 35% | 49% | 48% | 45% | 71% | |||||||||||||||
| *Effective March 1, 2017, Class A shares of the Series have been designated as Class S shares. | ||||||||||||||||||||
**The investment advisor did not impose all or a portion of its management and/or other fees during the years, and may have paid a portion of the Series’ expenses. If these expenses had been incurred by the Class, the expense ratio (to average net assets) would have increased by the following amounts: | ||||||||||||||||||||
| 0.24% | 0.26% | 0.24% | 0.17% | 0.15% | ||||||||||||||||
1Calculated based on average shares outstanding during the years.
2Less than $(0.01).
3Represents aggregate total return for the years indicated, and assumes reinvestment of all distributions. Total return would have been lower had certain expenses not been waived or reimbursed during the years.
4Includes litigation proceeds. Excluding this amount, the Class’ total return is 13.76%.
5Includes litigation proceeds. Excluding this amount, the Class’ total return is 21.48%.
The accompanying notes are an integral part of the financial statements.
11
Equity Series
Financial Highlights - Class W
| FOR THE YEAR ENDED | FOR THE | |||||||||||
| PERIOD | ||||||||||||
| 3/1/191 TO | ||||||||||||
| 10/31/21 | 10/31/20 | 10/31/19 | ||||||||||
| Per share data (for a share outstanding throughout each period): | ||||||||||||
| Net asset value - Beginning of period | $14.42 | $13.98 | $12.53 | |||||||||
| Income from investment operations: | ||||||||||||
| Net investment income2 | 0.14 | 0.14 | 0.09 | |||||||||
| Net realized and unrealized gain (loss) on investments | 5.72 | 1.82 | 1.36 | |||||||||
| Total from investment operations | 5.86 | 1.96 | 1.45 | |||||||||
| Less distributions to shareholders: | ||||||||||||
| From net investment income | (0.15 | ) | (0.16 | ) | — | |||||||
| From net realized gain on investments | (1.26 | ) | (1.36 | ) | — | |||||||
| Total distributions to shareholders | (1.41 | ) | (1.52 | ) | — | |||||||
| Net asset value - End of period | $18.87 | $14.42 | $13.98 | |||||||||
| Net assets - End of period (000’s omitted) | $480 | $358 | $369 | |||||||||
| Total return3 | 43.17% | 15.15% | 4 | 11.57% | ||||||||
| Ratios (to average net assets)/Supplemental Data: | ||||||||||||
| Expenses* | 0.05% | 0.05% | 0.05% | 5 | ||||||||
| Net investment income | 0.85% | 1.03% | 1.04% | 5 | ||||||||
| Series portfolio turnover | 35% | 49% | 48% | |||||||||
| *The investment advisor did not impose all or a portion of its management and/or other fees during the periods, and may have paid a portion of the Series’ expenses. If these expenses had been incurred by the Class, the expense ratio (to average net assets) would have increased by the following amounts: | ||||||||||||
| 0.99% | 1.01% | 1.00% | 5 | |||||||||
1Commencement of operations.
2Calculated based on average shares outstanding during the periods.
3Represents aggregate total return for the periods indicated, and assumes reinvestment of all distributions. Total return would have been lower had certain expenses not been waived or reimbursed during the periods. Periods less than one year are not annualized.
4Includes litigation proceeds. Excluding this amount, the Class’ total return is 14.99%.
5Annualized.
The accompanying notes are an integral part of the financial statements.
12
Equity Series
Notes to Financial Statements
| 1. | Organization |
Equity Series (the “Series”) is a no-load diversified series of Manning & Napier Fund, Inc. (the “Fund”). The Fund is organized in Maryland and is registered under the Investment Company Act of 1940, as amended, as an open-end management investment company.
The Series’ investment objective is to provide long-term growth of capital.
The Series is authorized to issue two classes of shares (Class S and Class W). Each class of shares is substantially the same, except that Class S shares bear shareholder servicing fees.
The Fund’s Advisor is Manning & Napier Advisors, LLC (the “Advisor”). Shares of the Series are offered to investors, clients and employees of the Advisor and its affiliates. The total authorized capital stock of the Fund consists of 15 billion shares of common stock each having a par value of $0.01. As of October 31, 2021, 6.3 billion shares have been designated in total among 15 series, of which 200 million have been designated as Equity Series Class S common stock and 100 million have been designated as Equity Series Class W common stock.
| 2. | Significant Accounting Policies |
The following is a summary of significant accounting policies followed by the Series. The Series is an investment company and, accordingly, follows the investment company accounting and reporting guidance of the Financial Accounting Standards Board Accounting Standards Codification Topic 946 - Investment Companies, which is part of accounting principles generally accepted in the United States of America (“GAAP”).
Security Valuation
Portfolio securities, including domestic equities, listed on an exchange other than the NASDAQ Stock Market are valued at the latest quoted sales price of the exchange on which the security is primarily traded. Securities not traded on valuation date or securities not listed on an exchange are valued at the latest quoted bid price provided by the Fund’s pricing service. Securities listed on the NASDAQ Stock Market are valued in accordance with the NASDAQ Official Closing Price.
Short-term investments that mature in sixty days or less may be valued at amortized cost, which approximates fair value. Investments in open-end investment companies are valued at their net asset value per share on valuation date.
Volume and level of activity in established markets for an asset or liability are evaluated to determine whether recent transactions and quoted prices are determinative of fair value. Where there have been significant decreases in volume and level of activity, further analysis and adjustment may be necessary to estimate fair value. The Series measures fair value in these instances by the use of inputs and valuation techniques which may be based upon current market prices of securities that are comparable in coupon, rating, maturity and industry and/or expectation of future cash flows. As a result of trading in relatively thin markets and/or markets that experience significant volatility, the prices used by the Series to value these securities may differ from the value that would be realized if these securities were sold, and the differences could be material.
Securities for which representative valuations or prices are not available from the Series’ pricing service may be valued at fair value as determined in good faith by the Advisor under procedures approved by and under the general supervision and responsibility of the Fund’s Board of Directors (the “Board”). Due to the inherent uncertainty of valuations of such securities, the fair value may differ significantly from the values that would have been used had a ready market for such securities existed. If trading or events occurring after the close of the principal market in which securities are traded are expected to materially affect the value of those securities, then they may be valued at their fair value, taking this trading or these events into account.
Various inputs are used in determining the value of the Series’ assets or liabilities carried at fair value. These inputs are summarized in three broad levels. Level 1 includes quoted prices in active markets for identical assets and liabilities. Level 2 includes other significant observable inputs (including quoted prices for similar securities, interest rates, prepayment speeds, credit risk, etc.). Level 3 includes significant unobservable inputs (including the Series’ own assumptions in determining the fair value of investments). A financial instrument’s level within the fair value hierarchy is based on the lowest level of any input
13
Equity Series
Notes to Financial Statements (continued)
| 2. | Significant Accounting Policies (continued) |
Security Valuation (continued)
both individually and in aggregate that is significant to the fair value measurement. The inputs or methodology used for valuing securities are not necessarily an indication of the risk associated with investing in those securities.
The following is a summary of the valuation levels used for major security types as of October 31, 2021 in valuing the Series’ assets or liabilities carried at fair value:
| DESCRIPTION | TOTAL | LEVEL 1 | LEVEL 2 | LEVEL 3 | ||||||||||||
| Assets: | ||||||||||||||||
| Equity securities: | ||||||||||||||||
| Communication Services | $ | 9,277,031 | $ | 9,277,031 | $ | — | $ | — | ||||||||
| Consumer Discretionary | 9,302,189 | 9,302,189 | — | — | ||||||||||||
| Consumer Staples | 5,111,550 | 5,111,550 | — | — | ||||||||||||
| Energy | 2,533,087 | 2,533,087 | — | — | ||||||||||||
| Financials | 8,771,004 | 8,771,004 | — | — | ||||||||||||
| Health Care | 14,491,284 | 14,491,284 | — | — | ||||||||||||
| Industrials | 3,379,929 | 3,379,929 | — | — | ||||||||||||
| Information Technology | 16,493,252 | 16,493,252 | — | — | ||||||||||||
| Materials | 4,116,264 | 4,116,264 | — | — | ||||||||||||
| Real Estate | 4,050,207 | 4,050,207 | — | — | ||||||||||||
| Short-Term Investment | 651,260 | 651,260 | — | — | ||||||||||||
| Total assets | $ | 78,177,057 | $ | 78,177,057 | $ | — | $ | — | ||||||||
There were no Level 2 or Level 3 securities held by the Series as of October 31, 2020 or October 31, 2021.
Security Transactions, Investment Income and Expenses
Security transactions are accounted for on trade date. Dividend income is recorded on the ex-dividend date, except that if the ex-dividend date has passed, certain dividends from foreign securities are recorded as soon as the Series is informed of the ex-dividend date. Non-cash dividends, if any, are recorded at the fair value of the securities received. Interest income, including amortization of premium and accretion of discounts using the effective interest method, is earned from settlement date and accrued daily.
Expenses are recorded on an accrual basis. Most expenses of the Fund can be attributed to a specific series. Expenses which cannot be directly attributed are apportioned among the series in the Fund in such a manner as deemed equitable by the Fund’s Board, taking into consideration, among other things, the nature and type of expense.
The Series uses the identified cost method for determining realized gain or loss on investments for both financial statement and federal income tax reporting purposes.
Federal Taxes
The Series’ policy is to comply with the provisions of the Internal Revenue Code applicable to regulated investment companies. The Series is not subject to federal income tax or excise tax to the extent that the Series distributes to shareholders each year its taxable income, including any net realized gains on investments, in accordance with requirements of the Internal Revenue Code. Accordingly, no provision for federal income tax or excise tax has been made in the financial statements.
Management evaluates its tax positions to determine if the tax positions taken meet the minimum recognition threshold in connection with accounting for uncertainties in income tax positions taken or expected to be taken for the purposes of measuring and recognizing tax liabilities in the financial statements. Recognition of tax benefits of an uncertain tax position is required only when the position is “more likely than not” to be sustained assuming examination by taxing authorities. At October 31, 2021, the Series has recorded no liability for net unrecognized tax benefits relating to uncertain income tax positions taken or expected to be taken in future tax returns.
14
Equity Series
Notes to Financial Statements (continued)
| 2. | Significant Accounting Policies (continued) |
Federal Taxes (continued)
The Series files income tax returns in the U.S. federal jurisdiction, various states and foreign jurisdictions, as required. No income tax returns are currently under investigation. The statute of limitations on the Series’ tax returns remains open for the years ended October 31, 2018 through October 31, 2021. The Series is not aware of any tax positions for which it is reasonably possible that the total amounts of unrecognized tax benefits will significantly change in the next twelve months.
Foreign Taxes
Based on the Series’ understanding of the tax rules and rates related to income, gains and currency purchase/repatriation transactions for foreign jurisdictions in which it invests, the Series will provide for foreign taxes, and where appropriate, deferred foreign tax.
Distributions of Income and Gains
Distributions to shareholders of net investment income and net realized gains are made annually. An additional distribution may be necessary to avoid taxation of the Series. Distributions are recorded on the ex-dividend date.
Indemnifications
The Fund’s organizational documents provide former and current directors and officers with a limited indemnification against liabilities arising in connection with the performance of their duties to the Fund. In the normal course of business, the Fund may also enter into contracts that provide general indemnifications. The Fund’s maximum exposure under these arrangements is unknown as this would be dependent on future claims that may be made against the Fund. The risk of material loss from such claims is considered remote.
Other
The preparation of financial statements in conformity with GAAP requires management to make estimates and assumptions that affect the reported amounts of assets and liabilities and the disclosure of contingent assets and liabilities at the date of the financial statements and the reported amounts of income and expenses during the reporting period. Actual results could differ from those estimates.
| 3. | Transactions with Affiliates |
The Fund has an Investment Advisory Agreement (the “Agreement”) with the Advisor, for which the Series pays a fee, computed daily and payable monthly, at an annual rate of 0.75% of the Series’ average daily net assets.
Under the Agreement, personnel of the Advisor provide the Series with advice and assistance in the choice of investments and the execution of securities transactions, and otherwise maintain the Series’ organization. The Advisor also provides the Fund with necessary office space and fund administration and support services. The salaries of all officers of the Fund (except a percentage of the Fund’s Chief Compliance Officer’s salary, which is paid by the Fund), and of all Directors who are “affiliated persons” of the Fund, or of the Advisor, and all personnel of the Fund, or of the Advisor, performing services relating to research, statistical and investment activities, are paid by the Advisor. Each “non-affiliated” Director receives an annual stipend, which is allocated among all the active series of the Fund. In addition, these Directors also receive a fee per Board meeting attended plus a fee for each committee meeting attended and are reimbursed for travel and other out-of-pocket expenses incurred by them in connection with attending such meetings. The Fund also has an Audit Committee Chair, Governance & Nominating Committee Chair and Lead Independent Director who each receive an additional annual stipend for these roles.
The Class S shares of the Series are subject to a shareholder services fee in accordance with a shareholder services plan adopted by the Board. The shareholder services fee is intended to compensate financial intermediaries, including affiliates of the Fund, in connection with the provision of direct client service, personal services, maintenance of shareholder accounts and reporting services. For these services, Class S of the Series pay a fee, computed daily and payable monthly, at an annual rate of 0.25% of the average daily net assets of Class S shares. The Fund has a Shareholder Services Agreement with the Advisor, for which the Advisor receives the shareholder services fee as stated above.
15
Equity Series
Notes to Financial Statements (continued)
| 3. | Transactions with Affiliates (continued) |
The Advisor has contractually agreed to waive the management fee for the Class W shares. The full management fee will be waived under this agreement because Class W shares are only available to discretionary investment accounts and other accounts managed by the Advisor. These clients pay a management fee to the Advisor that is separate from the Series' expenses. In addition, pursuant to a separate expense limitation agreement, the Advisor has contractually agreed to limit its fees and reimburse expenses to the extent necessary so that the total direct annual fund operating expenses, exclusive of the shareholder services fee and waived Class W management fees (collectively, “excluded expenses”), to 0.80% of the average daily net assets of the Class S shares and 0.05% of the average daily net assets of the Class W shares. These contractual waivers are expected to continue indefinitely, and may not be amended or terminated by the Advisor without the approval of the Series’ Board of Directors. The Advisor may receive from a Class the difference between the Class’s total direct annual fund operating expenses, not including excluded expenses, and the Class’s contractual expense limit to recoup all or a portion of its prior fee waivers (other than Class W management fee waivers) or expense reimbursements made during the rolling three-year period preceding the recoupment if at any point the total direct annual fund operating expenses, not including excluded expenses, are below the contractual expense limit (a) at the time of the fee waiver and/or expense reimbursement and (b) at the time of the recoupment.
Pursuant to the advisory fee waiver, the Advisor waived $3,325 in management fees for Class W shares for the year ended October 31, 2021. In addition, pursuant to the separate expense limitation agreement, the Advisor waived or reimbursed expenses of $173,456 and $1,047 for Class S and Class W shares, respectively, for the year ended October 31, 2021. These amounts are included as a reduction of expenses on the Statement of Operations. For the year ended October 31, 2021, the Advisor did not recoup any expenses that have been previously waived or reimbursed.
As of October 31, 2021, the class specific waivers or reimbursements subject to possible future recoupment under the expense limitation agreement are as follows:
| CLASS | EXPIRING OCTOBER 31, | Total | ||
| 2022 | 2023 | 2024 | ||
| Class S | $108,913 | $158,100 | $173,456 | $440,469 |
| Class W | 612 | 872 | 1,047 | 2,531 |
Manning & Napier Investor Services, Inc., a registered broker-dealer affiliate of the Advisor, acts as distributor for the Fund’s shares. The services of Manning & Napier Investor Services, Inc. are provided at no additional cost to the Series.
Pursuant to a master services agreement dated February 13, 2020, the Fund pays the Advisor an annual fee related to fund accounting and administration of 0.0085% on the first $25 billion of average daily net assets; 0.0075% on the next $15 billion of average daily net assets; and 0.0065% of average daily net assets in excess of $40 billion; plus a base fee of $30,400 per series. Additionally, certain transaction and out-of-pocket expenses, including charges for reporting relating to the Fund’s compliance program, are charged. The Advisor has agreements with BNY Mellon Investment Servicing (U.S.) Inc. (“BNY”) under which BNY serves as sub-accountant services agent.
| 4. | Purchases and Sales of Securities |
For the year ended October 31, 2021, purchases and sales of securities, other than U.S. Government securities and short-term securities, were $24,660,180 and $30,601,450, respectively. There were no purchases or sales of U.S. Government securities.
16
Equity Series
Notes to Financial Statements (continued)
| 5. | Capital Stock Transactions |
Transactions in Class S and Class W shares of Equity Series were:
| CLASS S | FOR THE YEAR ENDED 10/31/21 | FOR THE YEAR ENDED 10/31/20 | ||||||||||||||
| SHARES | AMOUNT | SHARES | AMOUNT | |||||||||||||
| Sold | 265,725 | $ | 4,344,565 | 456,165 | $ | 5,779,151 | ||||||||||
| Reinvested | 342,989 | 5,141,405 | 461,351 | 6,066,767 | ||||||||||||
| Repurchased | (578,372 | ) | (9,788,118 | ) | (1,328,493 | ) | (17,536,295 | ) | ||||||||
| Total | 30,342 | $ | (302,148 | ) | (410,977 | ) | $ | (5,690,377 | ) | |||||||
| CLASS W | FOR THE YEAR ENDED 10/31/21 | FOR THE YEAR ENDED 10/31/20 | ||||||||||||||
| SHARES | AMOUNT | SHARES | AMOUNT | |||||||||||||
| Sold | — | $ | — | — | $ | — | ||||||||||
| Reinvested | 2,339 | 35,027 | 2,589 | 33,999 | ||||||||||||
| Repurchased | (1,765 | ) | (30,711 | ) | (4,135 | ) | (58,095 | ) | ||||||||
| Total | 574 | $ | 4,316 | (1,546 | ) | $ | (24,096 | ) | ||||||||
At October 31, 2021, the Advisor and its affiliates owned 14.1% of the Series.
| 6. | Line of Credit |
The Fund has entered into a 364-day, $25 million credit agreement (the “line of credit”) with Bank of New York Mellon. Each series of the Fund may borrow under the line of credit for temporary or emergency purposes, including funding shareholder redemptions and other short-term liquidity purposes. The Fund pays an annual fee on the unused commitment amount, payable quarterly, and is allocated among all the series of the Fund and included in miscellaneous expenses in the Statement of Operations for each series. The line of credit expires in September 2022 unless extended or renewed. During the year ended October 31, 2021, the Series did not borrow under the line of credit.
| 7. | Financial Instruments |
The Series may trade in instruments including written and purchased options, forward foreign currency exchange contracts and futures contracts and other derivatives in the normal course of investing activities to assist in managing exposure to various market risks. The Series may be subject to various elements of risk, which may involve, to a varying degree, elements of risk in excess of the amounts recognized for financial statement purposes. These risks include: the risk that changes in the value of a derivative may not correlate perfectly with the underlying asset, rate or index; counterparty credit risk related to over the counter derivative counterparties’ failure to perform under contract terms; liquidity risk related to the lack of a liquid market for these contracts allowing the fund to close out its position(s); and documentation risk relating to disagreement over contract terms. No such investments were held by the Series as of October 31, 2021.
| 8. | Foreign Securities |
Investing in securities of foreign companies and foreign governments involves special risks and considerations not typically associated with investing in securities of domestic companies and the U.S. Government. These risks include revaluation of currencies and future adverse political and economic developments. Moreover, securities of foreign companies and foreign governments and their markets may be less liquid and their prices more volatile than those of comparable domestic companies and the U.S. Government.
17
Equity Series
Notes to Financial Statements (continued)
| 9. | Federal Income Tax Information |
The amount and characterization of certain income and capital gains to be distributed are determined in accordance with federal income tax regulations, which may differ from GAAP. These differences are primarily due to differing book and tax treatments in the timing of the recognition of net investment income or gains and losses, including tax equalization and net operating loss/short term capital gain netting. The Series may periodically make reclassifications among its capital accounts to reflect income and gains available for distribution (or available capital loss carryovers) under income tax regulations, without impacting the Series’ net asset value. For the year ended October 31, 2021, amounts were reclassified within the capital accounts to increase Additional Paid in Capital by $595,797 and decrease Total Distributable Earnings by $595,797. Any such reclassifications are not reflected in the financial highlights.
The tax character of distributions paid were as follows:
| FOR THE YEAR ENDED 10/31/21 | FOR THE YEAR ENDED 10/31/20 | |||||||
| Ordinary income | $562,775 | $939,196 | ||||||
| Long-term capital gains | 4,763,250 | 5,316,532 | ||||||
At October 31, 2021, the identified cost of investments for federal income tax purposes, the resulting gross unrealized appreciation and depreciation, and the net unrealized appreciation were as follows:
| Cost for federal income tax purposes | $ | 50,773,176 | ||
| Unrealized appreciation | 27,851,343 | |||
| Unrealized depreciation | (447,462 | ) | ||
| Net unrealized appreciation | $ | 27,403,881 | ||
| Undistributed ordinary income | $ | 3,470,328 | ||
| Undistributed long-term capital gains | $ | 7,915,821 |
| 10. | Market Event |
In March 2020, the World Health Organization declared COVID-19 (a novel coronavirus) to be a pandemic. The situation is dynamic. Global financial markets have experienced and may continue to experience significant volatility resulting from the spread of COVID-19. The global economy, the economies of certain nations and individual issuers have been and may continue to be adversely affected by COVID-19, particularly in light of the interconnectivity between economies and financial markets, all of which may negatively impact the Series’ performance. In addition, COVID-19 and governmental responses to COVID-19 may negatively impact the capabilities of the Series’ service providers and disrupt the Series’ operations. Management of the Series will continue to monitor the impact of COVID-19.
18
Equity Series
Report of Independent Registered Public Accounting Firm
To the Board of Directors of Manning & Napier Fund, Inc. and Shareholders of Equity Series
Opinion on the Financial Statements
We have audited the accompanying statement of assets and liabilities, including the investment portfolio, of Equity Series (one of the series constituting Manning & Napier Fund, Inc., referred to hereafter as the “Fund”) as of October 31, 2021, the related statement of operations for the year ended October 31, 2021, the statement of changes in net assets for each of the two years in the period ended October 31, 2021, including the related notes, and the financial highlights for each of the periods indicated therein (collectively referred to as the “financial statements”). In our opinion, the financial statements present fairly, in all material respects, the financial position of the Fund as of October 31, 2021, the results of its operations for the year then ended, the changes in its net assets for each of the two years in the period ended October 31, 2021 and the financial highlights for each of the periods indicated therein in conformity with accounting principles generally accepted in the United States of America.
Basis for Opinion
These financial statements are the responsibility of the Fund’s management. Our responsibility is to express an opinion on the Fund’s financial statements based on our audits. We are a public accounting firm registered with the Public Company Accounting Oversight Board (United States) (PCAOB) and are required to be independent with respect to the Fund in accordance with the U.S. federal securities laws and the applicable rules and regulations of the Securities and Exchange Commission and the PCAOB.
We conducted our audits of these financial statements in accordance with the standards of the PCAOB. Those standards require that we plan and perform the audit to obtain reasonable assurance about whether the financial statements are free of material misstatement, whether due to error or fraud.
Our audits included performing procedures to assess the risks of material misstatement of the financial statements, whether due to error or fraud, and performing procedures that respond to those risks. Such procedures included examining, on a test basis, evidence regarding the amounts and disclosures in the financial statements. Our audits also included evaluating the accounting principles used and significant estimates made by management, as well as evaluating the overall presentation of the financial statements. Our procedures included confirmation of securities owned as of October 31, 2021 by correspondence with the custodian. We believe that our audits provide a reasonable basis for our opinion.

New York, New York
December 15, 2021
We have served as the auditor of one or more investment companies in Manning & Napier Mutual Funds since 1992.
19
Equity Series
Supplemental Tax Information
(unaudited)
All reportings are based on financial information available as of the date of this annual report and, accordingly, are subject to change.
For federal income tax purposes, the Series reports for the current fiscal year $546,815 or, if different, the maximum amount allowable under the tax law, as qualified dividend income.
For corporate shareholders, the percentage of investment income (dividend income plus short-term gains, if any) that qualifies for the dividends received deduction for the current fiscal year is 97.16%.
The Series designates $8,746,848 as Long-Term Capital Gain dividends pursuant to Section 852(b) of the Code for the fiscal year ended October 31, 2021.
20
Equity Series
Directors’ and Officers’ Information
(unaudited)
The Statement of Additional Information provides additional information about the Fund’s directors and officers and can be obtained without charge by calling 1-800-466-3863, at www.manning-napier.com, or on the EDGAR Database on the SEC Internet web site (http://www.sec.gov). The following chart shows certain information about the Fund’s directors and officers, including their principal occupations during the last five years. Unless specific dates are provided, the individuals have held the listed positions for longer than five years.
Interested Director and Officer
| Name: | Paul Battaglia* |
| Address: | 290 Woodcliff Drive Fairport, NY 14450 |
| Age: | 43 |
| Current Position(s) Held with Fund: | Principal Executive Officer, President, Chairman and Director |
| Term of Office1 & Length of Time Served: | Indefinite – Chairman and Director since November 2018 |
| Principal Occupation(s) During Past 5 Years: | Chief Financial Officer since 2018; Vice President of Finance (2016 – 2018); Director of Finance (2011 – 2016); Financial Analyst/Internal Auditor (2004- 2006) – Manning & Napier Advisors, LLC and affiliates Holds one or more of the following titles for various subsidiaries and affiliates: Chief Financial Officer |
| Number of Portfolios Overseen within Fund Complex: | 15 |
| Other Directorships Held Outside Fund Complex During Past 5 Years: | N/A |
Independent Directors
| Name: | Stephen B. Ashley |
| Address: | 290 Woodcliff Drive Fairport, NY 14450 |
| Age: | 81 |
| Current Position(s) Held with Fund: | Director, Audit Committee Member, Governance & Nominating Committee Member |
| Term of Office & Length of Time Served: | Indefinite – Since 1996 |
| Principal Occupation(s) During Past 5 Years: | Chairman and Director since 1997; Chief Executive Officer (1997-2019) - Ashley Companies (property management and investment) |
| Number of Portfolios Overseen within Fund Complex: | 15 |
| Other Directorships Held Outside Fund Complex During Past 5 Years: | Ashley Companies since 1997 |
| Name: | Paul A. Brooke |
| Address: | 290 Woodcliff Drive Fairport, NY 14450 |
| Age: | 75 |
| Current Position(s) Held with Fund: | Lead Independent Director, Audit Committee Member, Governance & Nominating Committee Chairman |
| Term of Office & Length of Time Served: | Indefinite – Director, Audit Committee Member, Governance & Nominating Committee Member since 2007; Lead Independent Director since 2017 |
| Principal Occupation(s) During Past 5 Years: | Managing Member since 1991 - PMSV Holdings LLC (investments); Managing Member (2010-2016) - Venbio (investments). |
| Number of Portfolios Overseen within Fund Complex: | 15 |
| Other Directorships Held Outside Fund Complex During Past 5 Years: | Incyte Corp. (biotech) (2000-2020); PureEarth (non-profit) since 2012; Cerus (biomedical) since 2016; Caelum BioSciences (biomedical) since 2018; Cheyne Capital International (investment)(2000-2017); |
21
Equity Series
Directors’ and Officers’ Information
(unaudited)
Independent Directors (continued)
| Name: | John Glazer |
| Address: | 290 Woodcliff Drive Fairport, NY 14450 |
| Age: | 56 |
| Current Position(s) Held with Fund: | Director, Audit Committee Member, Governance & Nominating Committee Member |
| Term of Office & Length of Time Served: | Indefinite – Director, Audit Committee Member, Governance & Nominating Committee Member since February 2021 |
| Principal Occupation(s) During Past 5 Years: | Chief Executive Officer since 2020 – Oikos Holdings LLC (Single-Family Office); Head of Corporate Development (2019-2020) – Caelum Biosciences (pharmaceutical development); Head of Private Investments (2015-2018) – AC Limited (Single-Family Office) |
| Number of Portfolios Overseen within Fund Complex: | 15 |
| Other Directorships Held Outside Fund Complex During Past 5 Years: | N/A |
| Name: | Margaret McLaughlin |
| Address: | 290 Woodcliff Drive Fairport, NY 14450 |
| Age: | 54 |
| Current Position(s) Held with Fund: | Director, Audit Committee Member, Governance & Nominating Committee Member |
| Term of Office & Length of Time Served: | Indefinite – Director, Audit Committee Member, Governance & Nominating Committee Member since February 2021 |
| Principal Occupation(s) During Past 5 Years: | Consultant since 2020 – Bates Group (consultants); Consultant (2019- 2020) – Madison Dearborn Partners (private equity); General Counsel/CCO (2011-2019) – Kramer Van Kirk Credit Strategies L.P./Mariana Systems LLC (Investment Adviser/SaaS Technology) |
| Number of Portfolios Overseen within Fund Complex: | 15 |
| Other Directorships Held Outside Fund Complex During Past 5 Years: | N/A |
| Name: | Russell O. Vernon |
| Address: | 290 Woodcliff Drive Fairport, NY 14450 |
| Age: | 63 |
| Current Position(s) Held with Fund: | Director, Audit Committee Member, Governance & Nominating Committee Chairman |
| Term of Office & Length of Time Served: | Indefinite – Director, Audit Committee Member, Governance & Nominating Committee Member since April 2020; Governance & Nominating Committee Chairman since November 2020 |
| Principal Occupation(s) During Past 5 Years: | Founder and General Partner (2009-2019) – BVM Capital Management (economic development) |
| Number of Portfolios Overseen within Fund Complex: | 15 |
| Other Directorships Held Outside Fund Complex During Past 5 Years: | Board Member, Vice Chairman and President since 2010 – Newburgh Armory Unity Center (military); Board Member and Executive Director since 2020 – National Purple Heart Honor Mission, Inc. (military); Board Member, Vice Chairman (2015-2020) – National Purple Heart Hall of Honor, Inc. (military) |
22
Equity Series
Directors’ and Officers’ Information
(unaudited)
Independent Directors (continued)
| Name: | Chester N. Watson |
| Address: | 290 Woodcliff Drive Fairport, NY 14450 |
| Age: | 71 |
| Current Position(s) Held with Fund: | Director, Audit Committee Chairman, Governance & Nominating Committee Member |
| Term of Office & Length of Time Served: | Indefinite – Director, Audit Committee Member, Governance & Nominating Committee Member Since 2012; Audit Committee Chairman since 2013 |
| Principal Occupation(s) During Past 5 Years: | General Auditor (2003-2011) - General Motors Company (auto manufacturer) |
| Number of Portfolios Overseen within Fund Complex: | 15 |
| Other Directorships Held Outside Fund Complex During Past 5 Years: | Rochester Institute of Technology (University) since 2005; Hudson Valley Center for Innovation, Inc. (New Business and Economic Development) since 2019; Town of Greenburgh, NY Planning Board (Municipal Government) (2015-2019); |
Officers:
| Name: | Elizabeth Craig |
| Address: | 290 Woodcliff Drive Fairport, NY 14450 |
| Age: | 34 |
| Current Position(s) Held with Fund: | Corporate Secretary |
| Term of Office1 & Length of Time Served: | Since 2016 |
| Principal Occupation(s) During Past 5 Years: | Director of Fund Administration since 2021; Fund Regulatory Administration Manager (2018-2021); Fund Administration Manager (2015-2018); Mutual Fund Compliance Specialist (2009-2015) - Manning & Napier Advisors, LLC; Assistant Corporate Secretary (2011-2016) - Manning & Napier Fund, Inc.; Corporate Secretary, Director since 2019– Manning & Napier Investor Services, Inc. |
| Name: | Samantha Larew |
| Address: | 290 Woodcliff Drive Fairport, NY 14450 |
| Age: | 41 |
| Current Position(s) Held with Fund: | Chief Compliance Officer and Anti-Money Laundering Compliance Officer |
| Term of Office1 & Length of Time Served: | Chief Compliance Officer since 2019; Anti-Money Laundering Compliance Officer since 2018 |
| Principal Occupation(s) During Past 5 Years: | Co-Director of Compliance since 2018; Compliance Communications Supervisor (2014-2018); Compliance Supervisor (2013-2014); Broker- Dealer Compliance Supervisor (2011-2013); Broker-Dealer Compliance Analyst (2010-2011) - Manning & Napier Advisors, LLC& Affiliates; Broker- Dealer Chief Compliance Officer since 2013; Broker-Dealer Assistant Corporate Secretary since 2011 – Manning & Napier Investor Services, Inc.; Compliance Analyst (2007-2009) – Wall Street Financial Group; Compliance Specialist (2003-2007) – Manning & Napier Advisors, LLC & Affiliates |
| Name: | Scott Morabito |
| Address: | 290 Woodcliff Drive Fairport, NY 14450 |
| Age: | 33 |
| Current Position(s) Held with Fund: | Vice President |
| Term of Office1 & Length of Time Served: | Vice President since 2019; Assistant Vice President (2017-2019) |
| Principal Occupation(s) During Past 5 Years: | Managing Director, Client Service and Business Operations since 2021; Managing Director of Operations (2019-2021); Director of Funds Group (2017-2019); Fund Product and Strategy Manager (2014-2017); Senior Product and Strategy Analyst (2013-2014); Product and Strategy Analyst (2011-2013) - Manning & Napier Advisors, LLC; President, Director since 2018 – Manning & Napier Investor Services, Inc.; President, Exeter Trust Company since 2021; |
23
Equity Series
Directors’ and Officers’ Information
(unaudited)
Officers: (continued)
| Name: | Troy Statczar |
| Address: | 290 Woodcliff Drive Fairport, NY 14450 |
| Age: | 50 |
| Current Position(s) Held with Fund: | Principal Financial Officer, Treasurer |
| Term of Office & Length of Time Served: | Principal Financial Officer and Treasurer since 2020 |
| Principal Occupation(s) During Past 5 Years: | Senior Director, Foreside Treasurer Services since 2020 - Foreside Financial Group; Director of Fund Administration (2017-2019) - Thornburg Investment Management, Inc.; Director of U.S. Operations (2008-2017) - Henderson Global Investors N.A., Inc. |
| Name: | Sarah Turner |
| Address: | 290 Woodcliff Drive Fairport, NY 14450 |
| Age: | 39 |
| Current Position(s) Held with Fund: | Chief Legal Officer; Assistant Corporate Secretary |
| Term of Office & Length of Time Served: | Since 2018 |
| Principal Occupation(s) During Past 5 Years: | Attorney since 2018 - Manning & Napier Advisors, LLC and affiliates; Counsel (2017-2018) – Harter Secrest and Emery LLP; Legal Counsel (2010-2017) – Manning & Napier Advisors, LLC and affiliates Holds one or more of the following titles for various affiliates: Corporate Secretary, General Counsel |
*Interested Director, within the meaning of the 1940 Act by reason of his positions with the Fund’s Advisor, Manning & Napier Advisors, LLC, and Distributor, Manning & Napier Investor Services, Inc.
1The term of office of all officers shall be one year and until their respective successors are chosen and qualified, or his or her earlier resignation or removal as provided in the Fund’s By-Laws.
24
{This page intentionally left blank}
25
Equity Series
Literature Requests
(unaudited)
Proxy Voting Policies and Procedures
A description of the policies and procedures that the Fund uses to determine how to vote proxies relating to portfolio securities is available, without charge, upon request:
| By phone | 1-800-466-3863 |
| On the Securities and Exchange Commission’s (SEC) web site | http://www.sec.gov |
Proxy Voting Record
Information regarding how the Fund voted proxies relating to portfolio securities during the most recent 12-month period ended June 30th is available, without charge, upon request:
| By phone | 1-800-466-3863 |
| On the SEC’s web site | http://www.sec.gov |
Quarterly Portfolio Holdings
The Series’ complete schedule of portfolio holdings for the 1st and 3rd quarters of each fiscal year are provided on Form N-PORT, and are available, without charge, upon request:
| By phone | 1-800-466-3863 |
| On the SEC’s web site | http://www.sec.gov |
Prospectus and Statement of Additional Information (SAI)
For more information about any of the Manning & Napier Fund, Inc. Series, you may obtain a prospectus and SAI at www.manning- napier.com or by calling 1-(800) 466-3863. Before investing, carefully consider the objectives, risks, charges and expenses of the investment and read the prospectus carefully as it contains this and other information about the investment company. In addition, this information can be found on the SEC’s web site, http://www.sec.gov.
Additional information available at www.manning-napier.com
| 1. Fund Holdings - Month-End |
| 2. Fund Holdings - Quarter-End |
| 3. Shareholder Report - Annual |
| 4. Shareholder Report - Semi-Annual |
The Fund also offers electronic notification or “e-delivery” when certain documents are available on-line to be downloaded or reviewed. Direct shareholders can elect to receive electronic notification when shareholder reports, prospectus updates, and/or statements are available. If you do not currently have on-line access to your account, you can establish access by going to www.manning-napier.com, click on “Login” in the top corner of the page, and follow the prompts to self-enroll. Once enrolled, you can set your electronic notification preferences by clicking on the Account Options tab located within the green toolbar and then select E-Delivery Option. Should you have any questions on either how to establish on-line access or how to update your account settings, please contact Investor Services at 1-800-466-3863.
The Manning & Napier Fund, Inc. is managed by Manning & Napier Advisors, LLC. Manning & Napier Investor Services, Inc., an affiliate of Manning & Napier Advisors, LLC, is the distributor of the Fund shares.
MNEQY-10/21-AR
26
| |
www.manning-napier.com |
Manning & Napier Fund, Inc.
Disciplined Value Series
Paper copies of the Series’ shareholder reports are no longer sent by mail, unless you specifically request them from the Series or from your financial intermediary, such as a broker-dealer or bank. Shareholder reports are available online. Each time a report is posted on the Series’ website you will be provided with a link to access the report online, either by mail (hard copy notice) or by email, if you have already signed up for electronic delivery of shareholder reports.
You may elect to receive all future shareholder reports in paper free of charge. If you invest through a financial intermediary, you can contact your financial intermediary to request that you continue to receive paper copies. If you invest directly with the Fund, you can inform the Fund that you wish to continue receiving paper copies by visiting www.manning-napier.com or calling 1-800-466-3863. Your election to receive reports in paper will apply to all funds held with your financial intermediary if you invest through a financial intermediary or all series of the Fund if you invest directly with the Fund.
Additionally, If you have not yet signed up for electronic delivery of shareholder reports and other Fund communications, you may do so by contacting your financial intermediary or, if you are a direct investor, by visiting www.manning-napier.com or calling 1-800-466-3863.
| | Independent Perspective | Real-World Solutions |
A Note from Our CEO
Dear Shareholder,
The obstacles were many, but this year, in so many ways, is a story of triumphant resilience only serving to spotlight just how much more there is to do.
Over the past eighteen months, we’ve endured a recession, a bear market, and a pandemic. Our collective perseverance is now paying off.
We are today experiencing a remarkable economic boom, a historic market rally, and continued medical innovation, all of which have turned a challenging period into one of optimism and hope.
At the same time, political and societal polarization are heightened, social justice concerns have justifiably come to the fore, and the precarious state of our environment presents almost unimaginable challenges for government, business, and finance.
This certainly is a moment of great consequence.
The kind of moment that questions all the rules. Economic rules in how we add value for each other, as well as for ourselves. Social rules in how we interact with each other. Environmental rules that can balance the current needs of emerging economies with the requirements for everyone in the future. Workplace rules in how we get the job done.
Our lives are being redefined, and our society, planet, workplaces, and industry must confront the challenges of the upcoming decade.
Markets reflect us. They mirror our collective thoughts, feelings, expectations, and beliefs – these new life rules.
As we go through this period of change, it will be uncertain and uncomfortable. For those unaccustomed to change, for those reliant on ‘set it and forget it’, these may seem like daunting questions, but there is a better way.
Success in an era of change demands flexibility, adaptability, and a roll-up-your-sleeves willingness to do the work.
For over 50 years, independent thinking and tireless work have underpinned every decision we’ve made on behalf of our investors. We invest for the long-term, we do not speculate. We make active decisions, and we invest with discipline, patience, and confidence. This is the only way we know, to remain true to our values and our fiduciary duty to you, the investors in our mutual funds.
You demand more. At Manning & Napier, we demand more of ourselves. Upon reflection of the year, we’re proud to have continued to deliver more.
We wish you safety and good health, and we appreciate your confidence in our firm and our approach.
| | Sincerely,
Marc Mayer Chief Executive Officer |
Corporate Headquarters | 290 Woodcliff Drive | Fairport, NY 14450 | (585) 325-6880 phone | (800) 551-0224 toll free | www.manning-napier.com
1
Disciplined Value Series
Fund Commentary
(unaudited)
Investment Objective
To provide competitive returns consistent with the broad equity market while also providing a level of capital protection during market downturns. The Series is designed to offer a diversified portfolio of dividend-paying US equity securities. Using a systematic process with a focus on mid- to large-capitalization US companies, securities are selected based on factors such as free cash flow generation and earnings power, minimum dividend yield, dividend sustainability, and financial health.
Performance Commentary
Broad US equity markets posted positive returns for the twelve-month period ending October 31, 2021. Large-cap stocks modestly trailed small- and mid-cap stocks, while from a style perspective growth and value stocks performed in line with one another.
The Disciplined Value Series Class S delivered positive returns during the year but underperformed the Russell 1000 Index, returning 37.2% and 43.8%, respectively. This return profile is consistent with the strategy’s history of providing a level of downside risk management during adverse equity market environments, while generating absolute returns that may not quite keep pace with the benchmark during especially strong equity markets.
From a factor perspective, the large- to mega-capitalization nature of the strategy weighed on relative returns as smaller capitalization stocks outperformed their larger counterparts within the large-capitalization value investment universe. The strategy’s focus on free cash flow generating, dividend paying stocks with sustainable dividend policies typically results in exposure to quality-oriented factors such as high return on equity (ROE) which offers a gauge of profit-generating efficiency. A characteristic of this year’s market behavior is that value leadership broadly has been led by lower-quality groups of stocks which weighed heavily on the strategy’s relative performance.
From a sector standpoint, an underweight allocation to Financials and Energy, the two best performing sectors, as well as a significant overweight to Consumer Staples, one of the worst performing sectors, weighed on relative returns over the trailing twelve-month period. Specific companies owned within the Industrials sector was a notable detractor as well. No exposure to Utilities and selection within the Information Technology and Materials sectors aided relative returns.
Within the Series, we pursue opportunities for shareholders through our disciplined screening process. Our goal is to generate stable income with the potential for capital growth. Importantly, this approach will continue to emphasize risk management as a critical component in managing the Series.
Performance data quoted represents past performance and does not guarantee future results. The investment return and principal value of an investment will fluctuate, so that an investor’s shares, when redeemed, may be worth more or less than their original cost. Current performance may be higher or lower than that quoted; investors can obtain the most recent month-end performance at www.manning-napier.com or by calling (800) 466-3863.
Commentary prepared using data provided by FactSet and Morningstar. Analysis Manning & Napier. Commentary presented is relative to the Russell 1000® Value Index. Additional information and associated disclosures can be found on the Performance Update page of this report.
The data presented is for informational purposes only. It is not to be considered a specific stock recommendation.
All investments involve risks, including possible loss of principal. As with any stock fund, the value of your investment will fluctuate in response to stock market movements. Investing in the Series will also involve a number of other risks, including issuer-specific risk and mid-cap risk. The Series invests primarily in dividend-paying equity securities, with a focus on mid- to large- cap companies. There is no assurance or guarantee that such companies will declare, continue to pay, or increase dividends. Stocks of mid-cap companies tend to be more volatile than those of large-cap companies, as mid-cap companies tend to be more susceptible to adverse business or economic events than larger, more established companies. In addition, because the Advisor manages the Series using a disciplined screening process, the Series is subject to the additional risk that the investment approach may not be successful. Further, the Advisor does not intend to make frequent changes to the Series’ portfolio in response to market movements.
Morningstar, Inc. is a global investment research firm providing data, information, and analysis of stocks and mutual funds. ©2021 Morningstar, Inc. All rights reserved. The information contained herein: (1) is proprietary to Morningstar and/or its content providers; (2) may not be copied, adapted or distributed; and (3) is not warranted to be accurate, complete or timely. Neither Morningstar nor its content providers are responsible for any damages or losses arising from any use of this information, except where such damages or losses cannot be limited or excluded by law in your jurisdiction. Past financial performance is no guarantee of future results.
2
Disciplined Value Series
Performance Update as of October 31, 2021
(unaudited)
AVERAGE ANNUAL TOTAL RETURNS AS OF OCTOBER 31, 2021 | |||
| ONE YEAR1 | FIVE YEAR | TEN YEAR | |
| Disciplined Value Series - Class I2 | 37.44% | 13.49% | 12.27% |
| Disciplined Value Series - Class S2,3 | 37.17% | 13.22% | 11.99% |
| Disciplined Value Series - Class W2,3 | 37.98% | 13.76% | 12.40% |
| Disciplined Value Series - Class Z2,3 | 37.61% | 13.56% | 12.31% |
| Russell 1000® Value Index4 | 43.76% | 12.39% | 12.85% |
The following graph compares the value of a $1,000,000 investment in the Disciplined Value Series - Class I for the ten years ended October 31, 2021 to the Russell 1000® Value Index.
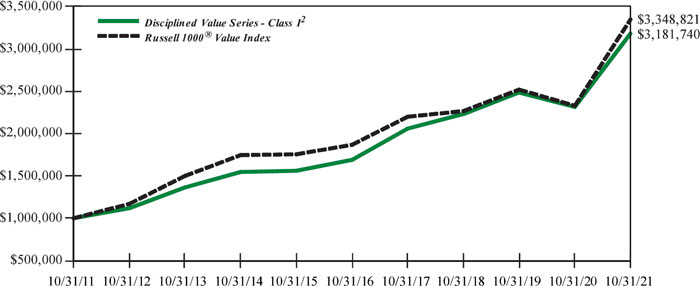
1The returns shown are based on net asset values calculated for shareholder transactions and may differ from the returns shown in the financial highlights, which reflect adjustments made to the net asset values in accordance with accounting principles generally accepted in the United States of America.
2The Series’ performance does not reflect the deduction of taxes that a shareholder would pay on fund distributions or the redemption of shares. The Series’ performance is historical and may not be indicative of future results. The performance returns shown are inclusive of the net expense ratio of the Series. For the year ended October 31, 2021, this net expense ratio was 0.72% for Class S, 0.54% for Class I, 0.11% for Class W and 0.41% for Class Z. The gross expense ratio, which does not account for any voluntary or contractual waivers currently in effect, was 0.72% for Class S, 0.54% for Class I, 0.41% for Class W and 0.41% for Class Z for the year ended October 31, 2021.
3For periods through the inception of Class S on September 21, 2018 the performance is hypothetical and is based on the historical performance of Class I shares adjusted for Class S shares’ charges and expenses. For periods through March, 1, 2019 (the inception date of the Class W and Class Z shares), performance for the Class W and Class Z shares is based on the historical performance of the Class I shares. Because the Class W and Class Z shares invest in the same portfolio of securities as the Class I shares, performance for the respective shares will be different only to the extent that the Class I shares have a higher expense ratio.
4The Russell 1000® Value Index is an unmanaged, market capitalization-weighted index consisting of those Russell 1000® Index companies with lower price-to-book ratios and lower forecasted growth values. The Index returns are based on a market capitalization-weighted average of relative price changes of the component stocks plus dividends whose reinvestments are compounded daily. The Index returns do not reflect any fees or expenses. Index returns provided by Bloomberg. Index data referenced herein is the property of London Stock Exchange Group plc and its group undertakings (“LSE Group”) and/or its third party suppliers and has been licensed for use by Manning & Napier. LSE Group and its third party suppliers accept no liability in connection with its use. Data provided is not a representation or warranty, express or implied, as to the ability of any index to accurately represent the asset class or market sector that it purports to represent and none of these parties shall have any liability for any errors, omissions, or interruptions of any index or the data included therein. For additional disclosure information, please see: https://go.manning-napier.com/benchmark-provisions.
3
Disciplined Value Series
Shareholder Expense Example
(unaudited)
As a shareholder of the Series, you incur ongoing costs, including management fees, shareholder service fees and other Series expenses. This example is intended to help you understand your ongoing costs (in dollars) of investing in the Series and to compare these costs with the ongoing costs of investing in other mutual funds.
The example is based on an investment of $1,000 invested in each class at the beginning of the period and held for the entire period (May 1, 2021 to October 31, 2021).
Actual Expenses
The Actual lines of the table below provide information about actual account values and actual expenses. You may use the information in these lines, together with the amount you invested, to estimate the expenses that you paid over the period. Simply divide your account value by $1,000 (for example, an $8,600 account value divided by $1,000 = 8.6), then multiply the result by the number in the Actual line for the Class in which you have invested under the heading entitled “Expenses Paid During Period” to estimate the expenses you paid on your account during this period.
Hypothetical Example for Comparison Purposes
The Hypothetical lines of each class in the table below provide information about hypothetical account values and hypothetical expenses based on the Class’ actual expense ratio and an assumed rate of return of 5% per year before expenses, which is not the Class’ actual return. The hypothetical account values and expenses may not be used to estimate the actual ending account balance or expenses you paid during the period. You may use this information to compare the ongoing costs of investing in a class of the Series and other funds. To do so, compare this 5% hypothetical example for the Class in which you have invested with the 5% hypothetical examples that appear in the shareholder reports of the other funds.
Please note that the expenses shown in the table are meant to highlight your ongoing costs only and do not reflect any transaction costs, such as sales charges (loads), redemption fees, or exchange fees that you may incur in other mutual funds. Therefore, the second line of the table is useful in comparing ongoing costs only, and will not help you determine the relative total costs of owning different funds.
BEGINNING 5/1/21 | ENDING 10/31/21 | EXPENSES PAID DURING PERIOD* | ANNUALIZED EXPENSE RATIO | |
| Class S | ||||
| Actual | $1,000.00 | $1,043.70 | $3.71 | 0.72% |
Hypothetical (5% return before expenses) | $1,000.00 | $1,021.58 | $3.67 | 0.72% |
| Class I | ||||
| Actual | $1,000.00 | $1,044.80 | $2.73 | 0.53% |
Hypothetical (5% return before expenses) | $1,000.00 | $1,022.53 | $2.70 | 0.53% |
| Class W | ||||
| Actual | $1,000.00 | $1,046.70 | $0.57 | 0.11% |
Hypothetical (5% return before expenses) | $1,000.00 | $1,024.65 | $0.56 | 0.11% |
| Class Z | ||||
| Actual | $1,000.00 | $1,045.70 | $2.11 | 0.41% |
Hypothetical (5% return before expenses) | $1,000.00 | $1,023.14 | $2.09 | 0.41% |
*Expenses are equal to each Class’ annualized expense ratio (for the six-month period), multiplied by the average account value over the period, multiplied by 184/365 (to reflect the one-half year period). Expenses are based on the most recent fiscal half year; therefore, the expense ratios stated above may differ from the expense ratios stated in the financial highlights, which are based on one-year data. The Class’ total return would have been lower had certain expenses not been waived or reimbursed during the period.
4
Disciplined Value Series
Portfolio Composition as of October 31, 2021
(unaudited)
| Sector Allocation1 |
1As a percentage of net assets. |
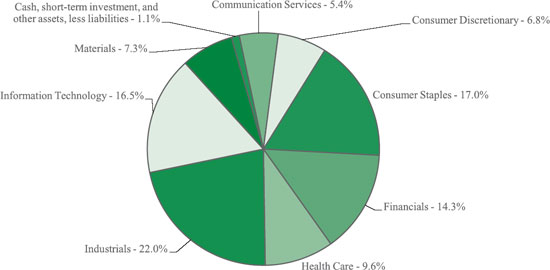
5
Disciplined Value Series
Investment Portfolio - October 31, 2021
| SHARES | VALUE (NOTE 2) | |||||||
| COMMON STOCKS - 98.9% | ||||||||
| Communication Services - 5.4% | ||||||||
| Diversified Telecommunication Services - 2.4% | ||||||||
| Verizon Communications, Inc. | 205,625 | $ | 10,896,069 | |||||
| Media - 3.0% | ||||||||
| Comcast Corp. - Class A | 229,876 | 11,822,522 | ||||||
| Omnicom Group, Inc. | 26,761 | 1,821,889 | ||||||
| 13,644,411 | ||||||||
| Total Communication Services | 24,540,480 | |||||||
| Consumer Discretionary - 6.8% | ||||||||
| Distributors - 0.5% | ||||||||
| Genuine Parts Co | 17,957 | 2,354,342 | ||||||
| Household Durables - 1.1% | ||||||||
| Garmin Ltd. | 20,663 | 2,967,207 | ||||||
| Whirlpool Corp. | 8,133 | 1,714,680 | ||||||
| 4,681,887 | ||||||||
| Specialty Retail - 5.2% | ||||||||
| Best Buy Co., Inc. | 28,745 | 3,513,789 | ||||||
| The Home Depot, Inc. | 49,064 | 18,239,051 | ||||||
| Williams-Sonoma, Inc. | 9,654 | 1,793,038 | ||||||
| 23,545,878 | ||||||||
| Total Consumer Discretionary | 30,582,107 | |||||||
| Consumer Staples - 17.0% | ||||||||
| Food & Staples Retailing - 4.3% | ||||||||
| The Kroger Co. | 77,626 | 3,106,593 | ||||||
| Walmart, Inc. | 108,253 | 16,175,163 | ||||||
| 19,281,756 | ||||||||
| Food Products - 6.8% | ||||||||
| Archer-Daniels-Midland Co. | 55,329 | 3,554,335 | ||||||
| Bunge Ltd. | 19,688 | 1,823,896 | ||||||
| Campbell Soup Co. | 37,571 | 1,500,962 | ||||||
| Conagra Brands, Inc. | 58,131 | 1,871,818 | ||||||
| General Mills, Inc. | 56,498 | 3,491,576 | ||||||
| The Hershey Co. | 20,237 | 3,548,558 | ||||||
| The J.M. Smucker Co. | 14,168 | 1,740,681 | ||||||
| The Kraft Heinz Co. | 102,452 | 3,677,002 | ||||||
| Mondelez International, Inc. - Class A | 102,168 | 6,205,684 | ||||||
| Tyson Foods, Inc. - Class A | 38,274 | 3,060,772 | ||||||
| 30,475,284 | ||||||||
| Household Products - 5.9% | ||||||||
| The Clorox Co. | 13,421 | 2,187,757 | ||||||
| Colgate-Palmolive Co. | 66,161 | 5,040,807 | ||||||
| Kimberly-Clark Corp. | 29,597 | 3,832,515 | ||||||
| The Procter & Gamble Co | 110,509 | 15,801,682 | ||||||
| 26,862,761 | ||||||||
| Total Consumer Staples | 76,619,801 | |||||||
| Financials - 14.3% | ||||||||
| Banks - 9.2% | ||||||||
| Citigroup, Inc. | 123,908 | 8,569,477 | ||||||
| Comerica, Inc. | 20,128 | 1,712,692 | ||||||
| SHARES | VALUE (NOTE 2) | |||||||
| COMMON STOCKS (continued) | ||||||||
| Financials (continued) | ||||||||
| Banks (continued) | ||||||||
| Fifth Third Bancorp | 75,754 | $ | 3,297,572 | |||||
| Huntington Bancshares, Inc. | 124,670 | 1,962,306 | ||||||
| JPMorgan Chase & Co. | 99,240 | 16,859,884 | ||||||
| Regions Financial Corp. | 112,789 | 2,670,843 | ||||||
| U.S. Bancorp. | 107,731 | 6,503,720 | ||||||
| 41,576,494 | ||||||||
| Insurance - 5.1% | ||||||||
| The Allstate Corp. | 29,504 | 3,648,760 | ||||||
| Chubb Ltd. | 34,427 | 6,726,347 | ||||||
| Cincinnati Financial Corp. | 20,166 | 2,448,959 | ||||||
| Everest Re Group Ltd. | 5,792 | 1,514,608 | ||||||
| Fidelity National Financial, Inc. | 39,350 | 1,885,259 | ||||||
| The Hartford Financial Services Group, Inc. | 40,083 | 2,923,253 | ||||||
| The Travelers Companies, Inc. | 23,805 | 3,829,748 | ||||||
| 22,976,934 | ||||||||
| Total Financials | 64,553,428 | |||||||
| Health Care - 9.6% | ||||||||
| Biotechnology - 1.3% | ||||||||
| Gilead Sciences, Inc. | 92,370 | 5,992,965 | ||||||
| Health Care Providers & Services - 0.5% | ||||||||
| Quest Diagnostics, Inc. | 16,155 | 2,371,231 | ||||||
| Pharmaceuticals - 7.8% | ||||||||
| Bristol-Myers Squibb Co. | 136,473 | 7,970,023 | ||||||
| Johnson & Johnson | 90,169 | 14,686,727 | ||||||
| Merck & Co., Inc. | 141,202 | 12,432,836 | ||||||
| 35,089,586 | ||||||||
| Total Health Care | 43,453,782 | |||||||
| Industrials - 22.0% | ||||||||
| Aerospace & Defense - 4.5% | ||||||||
| General Dynamics Corp. | 24,031 | 4,872,285 | ||||||
| L3Harris Technologies, Inc. | 18,509 | 4,267,065 | ||||||
| Lockheed Martin Corp. | 18,799 | 6,247,283 | ||||||
| Northrop Grumman Corp. | 13,581 | 4,851,405 | ||||||
| 20,238,038 | ||||||||
| Air Freight & Logistics - 0.4% | ||||||||
| C.H. Robinson Worldwide, Inc. | 17,790 | 1,725,452 | ||||||
| Building Products - 1.6% | ||||||||
| A. O. Smith Corp. | 22,272 | 1,627,415 | ||||||
| Johnson Controls International plc. | 76,246 | 5,594,169 | ||||||
| 7,221,584 | ||||||||
| Commercial Services & Supplies - 2.2% | ||||||||
| Republic Services, Inc. | 31,493 | 4,238,958 | ||||||
| Waste Management, Inc. | 35,434 | 5,677,590 | ||||||
| 9,916,548 | ||||||||
| Electrical Equipment - 2.7% | ||||||||
| Eaton Corp. plc. | 35,250 | 5,807,790 | ||||||
The accompanying notes are an integral part of the financial statements.
6
Disciplined Value Series
Investment Portfolio - October 31, 2021
| SHARES | VALUE (NOTE 2) | |||||||
| COMMON STOCKS (continued) | ||||||||
| Industrials (continued) | ||||||||
| Electrical Equipment (continued) | ||||||||
| Emerson Electric Co. | 52,584 | $ | 5,101,174 | |||||
| Hubbell, Inc. | 7,794 | 1,553,890 | ||||||
| 12,462,854 | ||||||||
| Industrial Conglomerates - 3.5% | ||||||||
| 3M Co. | 37,946 | 6,780,191 | ||||||
| Honeywell International, Inc. | 41,647 | 9,104,867 | ||||||
| 15,885,058 | ||||||||
| Machinery - 4.0% | ||||||||
| Caterpillar, Inc. | 36,864 | 7,520,625 | ||||||
| Cummins, Inc. | 14,873 | 3,567,140 | ||||||
| Illinois Tool Works, Inc. | 24,083 | 5,487,793 | ||||||
| Snap-on, Inc. | 7,204 | 1,464,069 | ||||||
| 18,039,627 | ||||||||
| Professional Services - 0.4% | ||||||||
| Booz Allen Hamilton Holding Corp. | 18,931 | 1,644,347 | ||||||
| Road & Rail - 2.1% | ||||||||
| Union Pacific Corp. | 39,347 | 9,498,366 | ||||||
| Trading Companies & Distributors - 0.6% | ||||||||
| W. W. Grainger, Inc. | 5,974 | 2,766,619 | ||||||
| Total Industrials | 99,398,493 | |||||||
| Information Technology - 16.5% | ||||||||
| Communications Equipment - 3.6% | ||||||||
| Cisco Systems, Inc. | 220,092 | 12,318,549 | ||||||
| Motorola Solutions, Inc. | 16,251 | 4,039,836 | ||||||
| 16,358,385 | ||||||||
| IT Services - 3.7% | ||||||||
| Automatic Data Processing, Inc. | 31,207 | 7,005,660 | ||||||
| Broadridge Financial Solutions, Inc. | 13,761 | 2,455,100 | ||||||
| International Business Machines Corp. | 56,722 | 7,095,922 | ||||||
| 16,556,682 | ||||||||
| Semiconductors & Semiconductor Equipment - 5.3% | ||||||||
| Analog Devices, Inc. | 29,730 | 5,157,858 | ||||||
| Intel Corp. | 202,189 | 9,907,261 | ||||||
| QUALCOMM, Inc. | 66,964 | 8,908,890 | ||||||
| 23,974,009 | ||||||||
| Software - 3.3% | ||||||||
| Oracle Corp. | 155,091 | 14,879,431 | ||||||
| Technology Hardware, Storage & Peripherals - 0.6% | ||||||||
| NetApp, Inc. | 27,976 | 2,498,257 | ||||||
| Total Information Technology | 74,266,764 | |||||||
| Materials - 7.3% | ||||||||
| Chemicals - 4.5% | ||||||||
| CF Industries Holdings, Inc. | 31,112 | 1,767,162 | ||||||
| Eastman Chemical Co. | 17,216 | 1,790,980 | ||||||
| FMC Corp. | 16,557 | 1,506,853 | ||||||
| International Flavors & Fragrances, Inc. | 24,203 | 3,568,732 | ||||||
| SHARES | VALUE (NOTE 2) | |||||||
| COMMON STOCKS (continued) | ||||||||
| Materials (continued) | ||||||||
| Chemicals (continued) | ||||||||
| Linde plc (United Kingdom) | 31,620 | $ | 10,093,104 | |||||
| RPM International, Inc. | 17,271 | 1,506,031 | ||||||
| 20,232,862 | ||||||||
| Containers & Packaging - 0.4% | ||||||||
| Packaging Corp. of America | 12,610 | 1,732,236 | ||||||
| Metals & Mining - 2.4% | ||||||||
| Newmont Corp. | 66,721 | 3,602,934 | ||||||
| Nucor Corp. | 36,728 | 4,100,681 | ||||||
| Reliance Steel & Aluminum Co. | 9,222 | 1,347,888 | ||||||
| Steel Dynamics, Inc. | 29,229 | 1,931,452 | ||||||
| 10,982,955 | ||||||||
| Total Materials | 32,948,053 | |||||||
| TOTAL COMMON STOCKS (Identified Cost $374,433,103) | 446,362,908 | |||||||
| SHORT-TERM INVESTMENT - 1.0% | ||||||||
| Dreyfus Government Cash Management, Institutional Shares, 0.03%1 | ||||||||
| (Identified Cost $4,472,275) | 4,472,275 | 4,472,275 | ||||||
| TOTAL INVESTMENTS - 99.9% (Identified Cost $378,905,378) | 450,835,183 | |||||||
| OTHER ASSETS, LESS LIABILITIES - 0.1% | 241,919 | |||||||
| NET ASSETS - 100% | $ | 451,077,102 | ||||||
The accompanying notes are an integral part of the financial statements.
7
Disciplined Value Series
Investment Portfolio - October 31, 2021
1Rate shown is the current yield as of October 31, 2021.
The Global Industry Classification Standard (GICS) was developed by and is the exclusive property and a service mark of MSCI Inc. (MSCI) and Standard & Poor’s, a division of S&P Global Inc. (S&P), and is licensed for use by Manning & Napier when referencing GICS sectors. Neither MSCI, S&P, nor any third party involved in making or compiling the GICS or any GICS classifications makes any express or implied warranties or representations with respect to such standard or classification, nor shall any such party have any liability therefrom.
The accompanying notes are an integral part of the financial statements.
8
Disciplined Value Series
Statement of Assets and Liabilities
October 31, 2021
| ASSETS: | ||||
| Investments, at value (identified cost $378,905,378) (Note 2) | $ | 450,835,183 | ||
| Dividends receivable | 668,836 | |||
| Receivable for fund shares sold | 81,259 | |||
| Foreign tax reclaims receivable | 1,220 | |||
| Prepaid expenses | 23,006 | |||
| TOTAL ASSETS | 451,609,504 | |||
| LIABILITIES: | ||||
| Accrued sub-transfer agent fees (Note 3) | 79,224 | |||
| Accrued management fees (Note 3) | 53,676 | |||
| Accrued fund accounting and administration fees (Note 3) | 30,898 | |||
| Accrued distribution and service (Rule 12b-1) fees (Class S) (Note 3) | 15,436 | |||
| Accrued Chief Compliance Officer service fees (Note 3) | 2,032 | |||
| Payable for fund shares repurchased | 283,717 | |||
| Accrued interest expense payable | 928 | |||
| Other payables and accrued expenses | 66,491 | |||
| TOTAL LIABILITIES | 532,402 | |||
| TOTAL NET ASSETS | $ | 451,077,102 | ||
| NET ASSETS CONSIST OF: | ||||
| Capital stock | $ | 483,431 | ||
| Additional paid-in-capital | 351,854,716 | |||
| Total distributable earnings (loss) | 98,738,955 | |||
| TOTAL NET ASSETS | $ | 451,077,102 | ||
| NET ASSET VALUE, OFFERING PRICE AND REDEMPTION PRICE PER SHARE - Class S | ||||
| ($72,925,123/7,951,812 shares) | $ | 9.17 | ||
| NET ASSET VALUE, OFFERING PRICE AND REDEMPTION PRICE PER SHARE - Class I | ||||
| ($109,844,516/11,350,840 shares) | $ | 9.68 | ||
| NET ASSET VALUE, OFFERING PRICE AND REDEMPTION PRICE PER SHARE - Class W | ||||
| ($244,196,565/26,549,463 shares) | $ | 9.20 | ||
| NET ASSET VALUE, OFFERING PRICE AND REDEMPTION PRICE PER SHARE - Class Z | ||||
| ($24,110,898/2,490,955 shares) | $ | 9.68 | ||
The accompanying notes are an integral part of the financial statements.
9
Disciplined Value Series
Statement of Operations
For the Year Ended October 31, 2021
| INVESTMENT INCOME: | ||||
| Dividends | $ | 11,079,976 | ||
| Other Income | 53,061 | |||
| Total Investment Income | 11,133,037 | |||
| EXPENSES: | ||||
| Management fees (Note 3) | 1,367,620 | |||
| Sub-transfer agent fees (Note 3) | 233,038 | |||
| Distribution and service (Rule 12b-1) fees (Class S) (Note 3) | 183,228 | |||
| Fund accounting and administration fees (Note 3) | 90,749 | |||
| Directors’ fees (Note 3) | 51,742 | |||
| Chief Compliance Officer service fees (Note 3) | 6,096 | |||
| Transfer agent fees | 116,098 | |||
| Custodian fees | 24,341 | |||
| Interest expense | 1,343 | |||
| Miscellaneous | 198,365 | |||
| Total Expenses | 2,272,620 | |||
| Less reduction of expenses (Note 3) | (655,729 | ) | ||
| Net Expenses | 1,616,891 | |||
| NET INVESTMENT INCOME | 9,516,146 | |||
| REALIZED AND UNREALIZED GAIN (LOSS) ON INVESTMENTS: | ||||
| Net realized gain (loss) on investments | 50,039,992 | |||
| Net change in unrealized appreciation (depreciation) on investments | 67,922,789 | |||
| NET REALIZED AND UNREALIZED GAIN (LOSS) ON INVESTMENTS | 117,962,781 | |||
| NET INCREASE IN NET ASSETS RESULTING FROM OPERATIONS | $ | 127,478,927 |
The accompanying notes are an integral part of the financial statements.
10
Disciplined Value Series
Statements of Changes in Net Assets
| FOR THE | FOR THE | |||||||
| YEAR ENDED | YEAR ENDED | |||||||
| 10/31/21 | 10/31/20 | |||||||
| INCREASE (DECREASE) IN NET ASSETS: | ||||||||
| OPERATIONS: | ||||||||
| Net investment income | $ | 9,516,146 | $ | 8,581,676 | ||||
| Net realized gain (loss) on investments | 50,039,992 | (22,422,146 | ) | |||||
| Net change in unrealized appreciation (depreciation) on investments | 67,922,789 | (13,056,997 | ) | |||||
| Net increase (decrease) from operations | 127,478,927 | (26,897,467 | ) | |||||
| DISTRIBUTIONS TO SHAREHOLDERS (Note 8): | ||||||||
| Class S | (1,023,993 | ) | (4,023,980 | ) | ||||
| Class I | (2,147,000 | ) | (6,604,992 | ) | ||||
| Class W | (4,365,225 | ) | (6,362,946 | ) | ||||
| Class Z | (329,345 | ) | (734,913 | ) | ||||
| Total distributions to shareholders | (7,865,563 | ) | (17,726,831 | ) | ||||
| CAPITAL STOCK ISSUED AND REPURCHASED: | ||||||||
| Net increase (decrease) from capital share transactions (Note 5) | 15,149,788 | 45,534,562 | ||||||
| Net increase (decrease) in net assets | 134,763,152 | 910,264 | ||||||
| NET ASSETS: | ||||||||
| Beginning of year | 316,313,950 | 315,403,686 | ||||||
| End of year | $ | 451,077,102 | $ | 316,313,950 | ||||
The accompanying notes are an integral part of the financial statements.
11
Disciplined Value Series
Financial Highlights - Class S
| FOR THE YEAR ENDED | ||||||||||||||||||||
| 10/31/21 | 10/31/20 | 10/31/19 | 10/31/18 | 10/31/17 | ||||||||||||||||
| Per share data (for a share outstanding throughout each year): | ||||||||||||||||||||
| Net asset value - Beginning of year | $6.78 | $7.67 | $8.77 | $11.42 | $10.16 | |||||||||||||||
| Income (loss) from investment operations: | ||||||||||||||||||||
| Net investment income1 | 0.15 | 0.16 | 0.16 | 0.16 | 0.20 | |||||||||||||||
| Net realized and unrealized gain (loss) on investments | 2.36 | (0.68 | ) | 0.54 | 0.72 | 1.89 | ||||||||||||||
| Total from investment operations | 2.51 | (0.52 | ) | 0.70 | 0.88 | 2.09 | ||||||||||||||
| Less distributions to shareholders: | ||||||||||||||||||||
| From net investment income | (0.12 | ) | (0.14 | ) | (0.19 | ) | (0.27 | ) | (0.33 | ) | ||||||||||
| From net realized gain on investments | — | (0.23 | ) | (1.61 | ) | (3.26 | ) | (0.50 | ) | |||||||||||
| Total distributions to shareholders | (0.12 | ) | (0.37 | ) | (1.80 | ) | (3.53 | ) | (0.83 | ) | ||||||||||
| Net asset value - End of year | $9.17 | $6.78 | $7.67 | $8.77 | $11.42 | |||||||||||||||
| Net assets - End of year (000’s omitted) | $72,925 | $64,205 | $83,332 | $72,088 | $30,940 | |||||||||||||||
| Total return2 | 37.17% | (7.09% | ) | 11.11% | 8.14% | 21.52% | ||||||||||||||
| Ratios (to average net assets)/Supplemental Data: | ||||||||||||||||||||
| Expenses* | 0.72% | 0.76% | 0.82% | 0.85% | 0.82% | |||||||||||||||
| Net investment income | 1.74% | 2.26% | 2.14% | 1.71% | 1.91% | |||||||||||||||
| Series portfolio turnover | 55% | 29% | 35% | 96% | 34% | |||||||||||||||
| *For certain years presented, the investment advisor did not impose all or a portion of its management and/or other fees, and in some years may have paid a portion of the Series’ expenses. If these expenses had been incurred by the Class, the expense ratio (to average net assets) would have increased by the following amounts: | ||||||||||||||||||||
| N/A | N/A | N/A | 0.04% | N/A | ||||||||||||||||
1Calculated based on average shares outstanding during the years.
2Represents aggregate total return for the years indicated, and assumes reinvestment of all distributions. Total return would have been lower had certain expenses not been waived or reimbursed during certain years.
The accompanying notes are an integral part of the financial statements.
12
Disciplined Value Series
Financial Highlights - Class I
| FOR THE YEAR ENDED | ||||||||||||||||||||
| 10/31/21 | 10/31/201 | 10/31/191 | 10/31/181 | 10/31/171 | ||||||||||||||||
| Per share data (for a share outstanding throughout each year): | ||||||||||||||||||||
| Net asset value - Beginning of year | $7.15 | $8.07 | $8.31 | $9.58 | $8.31 | |||||||||||||||
| Income (loss) from investment operations: | ||||||||||||||||||||
| Net investment income2 | 0.17 | 0.18 | 0.19 | 0.17 | 0.20 | |||||||||||||||
| Net realized and unrealized gain (loss) on investments | 2.49 | (0.71 | ) | 0.61 | 0.59 | 1.56 | ||||||||||||||
| Total from investment operations | 2.66 | (0.53 | ) | 0.80 | 0.76 | 1.76 | ||||||||||||||
| Less distributions to shareholders: | ||||||||||||||||||||
| From net investment income | (0.13 | ) | (0.16 | ) | (0.12 | ) | (0.17 | ) | (0.20 | ) | ||||||||||
| From net realized gain on investments | — | (0.23 | ) | (0.92 | ) | (1.86 | ) | (0.29 | ) | |||||||||||
| Total distributions to shareholders | (0.13 | ) | (0.39 | ) | (1.04 | ) | (2.03 | ) | (0.49 | ) | ||||||||||
| Net asset value - End of year | $9.68 | $7.15 | $8.07 | $8.31 | $9.58 | |||||||||||||||
| Net assets - End of year (000’s omitted) | $109,845 | $120,221 | $137,296 | $88,864 | $117,357 | |||||||||||||||
| Total return3 | 37.44% | (6.89% | ) | 11.44% | 8.35% | 21.86% | ||||||||||||||
| Ratios (to average net assets)/Supplemental Data: | ||||||||||||||||||||
| Expenses* | 0.54% | 0.55% | 0.58% | 0.60% | 0.57% | |||||||||||||||
| Net investment income | 1.93% | 2.45% | 2.38% | 2.05% | 2.24% | |||||||||||||||
| Series portfolio turnover | 55% | 29% | 35% | 96% | 34% | |||||||||||||||
| *For certain years presented, the investment advisor did not impose all or a portion of its management and/or other fees, and in some years may have paid a portion of the Series’ expenses. If these expenses had been incurred by the Class, the expense ratio (to average net assets) would have increased by the following amounts: | ||||||||||||||||||||
| N/A | N/A | N/A | 0.04% | N/A | ||||||||||||||||
1Per share amounts have been adjusted to reflect a 1.75-for-1 stock split effective after the close of business on December 5, 2019.
2Calculated based on average shares outstanding during the years.
3Represents aggregate total return for the years indicated, and assumes reinvestment of all distributions. Total return would have been lower had certain expenses not been waived or reimbursed during certain years.
The accompanying notes are an integral part of the financial statements.
13
Disciplined Value Series
Financial Highlights - Class W
| FOR THE YEAR ENDED | FOR THE | |||||||||||
| PERIOD | ||||||||||||
| 3/1/191 TO | ||||||||||||
| 10/31/21 | 10/31/20 | 10/31/19 | ||||||||||
| Per share data (for a share outstanding throughout each period): | ||||||||||||
| Net asset value - Beginning of period | $6.80 | $7.69 | $7.36 | |||||||||
| Income (loss) from investment operations: | ||||||||||||
| Net investment income2 | 0.20 | 0.20 | 0.13 | |||||||||
| Net realized and unrealized gain (loss) on investments | 2.37 | (0.68 | ) | 0.35 | ||||||||
| Total from investment operations | 2.57 | (0.48 | ) | 0.48 | ||||||||
| Less distributions to shareholders: | ||||||||||||
| From net investment income | (0.17 | ) | (0.18 | ) | (0.15 | ) | ||||||
| From net realized gain on investments | — | (0.23 | ) | — | ||||||||
| Total distributions to shareholders | (0.17 | ) | (0.41 | ) | (0.15 | ) | ||||||
| Net asset value - End of period | $9.20 | $6.80 | $7.69 | |||||||||
| Net assets - End of period (000’s omitted) | $244,197 | $116,106 | $76,322 | |||||||||
| Total return3 | 37.98% | (6.45% | ) | 6.58% | ||||||||
| Ratios (to average net assets)/Supplemental Data: | ||||||||||||
| Expenses* | 0.11% | 0.14% | 4 | 0.15% | 5 | |||||||
| Net investment income | 2.31% | 2.84% | 2.63% | 5 | ||||||||
| Series portfolio turnover | 55% | 29% | 35% | |||||||||
| *The investment advisor did not impose all or a portion of its management and/or other fees during the periods, and may have paid a portion of the Series’ expenses. If these expenses had been incurred by the Class, the expense ratio (to average net assets) would have increased by the following amounts: | ||||||||||||
| 0.30% | 0.30% | 0.32% | 5 | |||||||||
1Commencement of operations.
2Calculated based on average shares outstanding during the periods.
3Represents aggregate total return for the periods indicated, and assumes reinvestment of all distributions. Total return would have been lower had certain expenses not been waived or reimbursed during the periods. Periods less than one year are not annualized.
4Includes recoupment of past waived and/or reimbursed fees. Excluding this amount, the expense ratio (to average net assets) would have decreased by less than 0.01%.
5Annualized.
The accompanying notes are an integral part of the financial statements.
14
Disciplined Value Series
Financial Highlights - Class Z
| FOR THE YEAR ENDED | FOR THE | |||||||||||
| PERIOD | ||||||||||||
| 3/1/191 TO | ||||||||||||
| 10/31/21 | 10/31/202 | 10/31/192 | ||||||||||
| Per share data (for a share outstanding throughout each period): | ||||||||||||
| Net asset value - Beginning of period | $7.15 | $8.07 | $7.67 | |||||||||
| Income (loss) from investment operations: | ||||||||||||
| Net investment income3 | 0.19 | 0.19 | 0.12 | |||||||||
| Net realized and unrealized gain (loss) on investments | 2.48 | (0.72 | ) | 0.36 | ||||||||
| Total from investment operations | 2.67 | (0.53 | ) | 0.48 | ||||||||
| Less distributions to shareholders: | ||||||||||||
| From net investment income | (0.14 | ) | (0.16 | ) | (0.08 | ) | ||||||
| From net realized gain on investments | — | (0.23 | ) | — | ||||||||
| Total distributions to shareholders | (0.14 | ) | (0.39 | ) | (0.08 | ) | ||||||
| Net asset value - End of period | $9.68 | $7.15 | $8.07 | |||||||||
| Net assets - End of period (000’s omitted) | $24,111 | $15,781 | $18,454 | |||||||||
| Total return4 | 37.61% | (6.77% | ) | 6.31% | ||||||||
| Ratios (to average net assets)/Supplemental Data: | ||||||||||||
| Expenses* | 0.41% | 0.45% | 5 | 0.45% | 6 | |||||||
| Net investment income | 2.04% | 2.55% | 2.35% | 6 | ||||||||
| Series portfolio turnover | 55% | 29% | 35% | |||||||||
| *For certain periods presented, the investment advisor did not impose all or a portion of its management and/or other fees, and in some periods may have paid a portion of the Series’ expenses. If these expenses had been incurred by the Class, the expense ratio (to average net assets) would have increased by the following amounts: | ||||||||||||
| N/A | N/A | 0.02% | 6 | |||||||||
1Commencement of operations.
2Per share amounts have been adjusted to reflect a 1.75-for-1 stock split effective after the close of business on December 5, 2019.
3Calculated based on average shares outstanding during the periods.
4Represents aggregate total return for the periods indicated, and assumes reinvestment of all distributions. Total return would have been lower had certain expenses not been waived or reimbursed during certain periods. Periods less than one year are not annualized.
5Includes recoupment of past waived and/or reimbursed fees. Excluding this amount, the expense ratio (to average net assets) would have decreased by 0.01%.
6Annualized.
The accompanying notes are an integral part of the financial statements.
15
Disciplined Value Series
Notes to Financial Statements
| 1. | Organization |
Disciplined Value Series (the “Series”) is a no-load diversified series of Manning & Napier Fund, Inc. (the “Fund”). The Fund is organized in Maryland and is registered under the Investment Company Act of 1940, as amended, as an open-end management investment company.
The Series’ investment objective is to provide competitive returns consistent with the broad equity market while providing a level of capital protection during market downturns.
The Series is authorized to issue four classes of shares (Class S, I, W, and Z). Each class of shares is substantially the same, except that class-specific distribution and shareholder servicing expenses are borne by the specific class of shares to which they relate.
The Fund’s Advisor is Manning & Napier Advisors, LLC (the “Advisor”). Shares of the Series are offered to investors, clients and employees of the Advisor and its affiliates. The total authorized capital stock of the Fund consists of 15 billion shares of common stock each having a par value of $0.01. As of October 31, 2021, 6.3 billion shares have been designated in total among 15 series, of which 100 million have been designated as Disciplined Value Series Class I common stock, Disciplined Value Series Class S common stock, Disciplined Value Series Class W common stock, and Disciplined Value Series Class Z common stock.
| 2. | Significant Accounting Policies |
The following is a summary of significant accounting policies followed by the Series. The Series is an investment company and, accordingly, follows the investment company accounting and reporting guidance of the Financial Accounting Standards Board Accounting Standards Codification Topic 946 - Investment Companies, which is part of accounting principles generally accepted in the United States of America (“GAAP”).
Security Valuation
Portfolio securities, including domestic equities, foreign equities, warrants and options, listed on an exchange other than the NASDAQ Stock Market are valued at the latest quoted sales price of the exchange on which the security is primarily traded. Securities not traded on valuation date or securities not listed on an exchange are valued at the latest quoted bid price provided by the Fund’s pricing service. Securities listed on the NASDAQ Stock Market are valued in accordance with the NASDAQ Official Closing Price.
Short-term investments that mature in sixty days or less may be valued at amortized cost, which approximates fair value. Investments in open-end investment companies are valued at their net asset value per share on valuation date.
Volume and level of activity in established markets for an asset or liability are evaluated to determine whether recent transactions and quoted prices are determinative of fair value. Where there have been significant decreases in volume and level of activity, further analysis and adjustment may be necessary to estimate fair value. The Series measures fair value in these instances by the use of inputs and valuation techniques which may be based upon current market prices of securities that are comparable in coupon, rating, maturity and industry and/or expectation of future cash flows. As a result of trading in relatively thin markets and/or markets that experience significant volatility, the prices used by the Series to value these securities may differ from the value that would be realized if these securities were sold, and the differences could be material.
Securities for which representative valuations or prices are not available from the Series’ pricing service may be valued at fair value as determined in good faith by the Advisor under procedures approved by and under the general supervision and responsibility of the Fund’s Board of Directors (the “Board”). Due to the inherent uncertainty of valuations of such securities, the fair value may differ significantly from the values that would have been used had a ready market for such securities existed. If trading or events occurring after the close of the principal market in which securities are traded are expected to materially affect the value of those securities, then they may be valued at their fair value, taking this trading or these events into account.
Various inputs are used in determining the value of the Series’ assets or liabilities carried at fair value. These inputs are summarized in three broad levels. Level 1 includes quoted prices in active markets for identical assets and liabilities. Level 2
16
Disciplined Value Series
Notes to Financial Statements (continued)
| 2. | Significant Accounting Policies (continued) |
Security Valuation (continued)
includes other significant observable inputs (including quoted prices for similar securities, interest rates, prepayment speeds, credit risk, etc.). Level 3 includes significant unobservable inputs (including the Series’ own assumptions in determining the fair value of investments). A financial instrument’s level within the fair value hierarchy is based on the lowest level of any input both individually and in aggregate that is significant to the fair value measurement. The inputs or methodology used for valuing securities are not necessarily an indication of the risk associated with investing in those securities.
The following is a summary of the valuation levels used for major security types as of October 31, 2021 in valuing the Series’ assets or liabilities carried at fair value:
| DESCRIPTION | TOTAL | LEVEL 1 | LEVEL 2 | LEVEL 3 | ||||||||||||
| Assets: | ||||||||||||||||
| Equity securities: | ||||||||||||||||
| Communication Services | $ | 24,540,480 | $ | 24,540,480 | $ | — | $ | — | ||||||||
| Consumer Discretionary | 30,582,107 | 30,582,107 | — | — | ||||||||||||
| Consumer Staples | 76,619,801 | 76,619,801 | — | — | ||||||||||||
| Financials | 64,553,428 | 64,553,428 | — | — | ||||||||||||
| Health Care | 43,453,782 | 43,453,782 | — | — | ||||||||||||
| Industrials | 99,398,493 | 99,398,493 | — | — | ||||||||||||
| Information Technology | 74,266,764 | 74,266,764 | — | — | ||||||||||||
| Materials | 32,948,053 | 32,948,053 | — | — | ||||||||||||
| Short-Term Investment | 4,472,275 | 4,472,275 | — | — | ||||||||||||
| Total assets | $ | 450,835,183 | $ | 450,835,183 | $ | — | $ | — | ||||||||
There were no Level 2 or Level 3 securities held by the Series as of October 31, 2020 or October 31, 2021.
Security Transactions, Investment Income and Expenses
Security transactions are accounted for on trade date. Dividend income is recorded on the ex-dividend date, except that if the ex-dividend date has passed, certain dividends from foreign securities are recorded as soon as the Series is informed of the ex-dividend date. Non-cash dividends, if any, are recorded at the fair value of the securities received. Interest income, including amortization of premium and accretion of discounts using the effective interest method, is earned from settlement date and accrued daily.
Expenses are recorded on an accrual basis. Most expenses of the Fund can be attributed to a specific series. Expenses which cannot be directly attributed are apportioned among the series in the Fund in such a manner as deemed equitable by the Fund’s Board, taking into consideration, among other things, the nature and type of expense. Income, expenses (other than class specific expenses), and realized and unrealized gains and losses are prorated among the classes based on the relative net assets of each class. Class specific expenses are directly charged to that class.
The Series uses the identified cost method for determining realized gain or loss on investments for both financial statement and federal income tax reporting purposes.
Federal Taxes
The Series’ policy is to comply with the provisions of the Internal Revenue Code applicable to regulated investment companies. The Series is not subject to federal income tax or excise tax to the extent that the Series distributes to shareholders each year its taxable income, including any net realized gains on investments, in accordance with requirements of the Internal Revenue Code. Accordingly, no provision for federal income tax or excise tax has been made in the financial statements.
Management evaluates its tax positions to determine if the tax positions taken meet the minimum recognition threshold in connection with accounting for uncertainties in income tax positions taken or expected to be taken for the purposes of measuring and recognizing tax liabilities in the financial statements. Recognition of tax benefits of an uncertain tax position is required only
17
Disciplined Value Series
Notes to Financial Statements (continued)
| 2. | Significant Accounting Policies (continued) |
Federal Taxes (continued)
when the position is “more likely than not” to be sustained assuming examination by taxing authorities. At October 31, 2021, the Series has recorded no liability for net unrecognized tax benefits relating to uncertain income tax positions taken or expected to be taken in future tax returns.
The Series files income tax returns in the U.S. federal jurisdiction, various states and foreign jurisdictions, as required. No income tax returns are currently under investigation. The statute of limitations on the Series’ tax returns remains open for the years ended October 31, 2018 through October 31, 2021. The Series is not aware of any tax positions for which it is reasonably possible that the total amounts of unrecognized tax benefits will significantly change in the next twelve months.
Foreign Taxes
Based on the Series’ understanding of the tax rules and rates related to income, gains and currency purchase/repatriation transactions for foreign jurisdictions in which it invests, the Series will provide for foreign taxes, and where appropriate, deferred foreign tax.
Distributions of Income and Gains
Distributions to shareholders of net investment income and net realized gains are made annually. An additional distribution may be necessary to avoid taxation of the Series. Distributions are recorded on the ex-dividend date.
Indemnifications
The Fund’s organizational documents provide former and current directors and officers with a limited indemnification against liabilities arising in connection with the performance of their duties to the Fund. In the normal course of business, the Fund may also enter into contracts that provide general indemnifications. The Fund’s maximum exposure under these arrangements is unknown as this would be dependent on future claims that may be made against the Fund. The risk of material loss from such claims is considered remote.
Other
The preparation of financial statements in conformity with GAAP requires management to make estimates and assumptions that affect the reported amounts of assets and liabilities and the disclosure of contingent assets and liabilities at the date of the financial statements and the reported amounts of income and expenses during the reporting period. Actual results could differ from those estimates.
| 3. | Transactions with Affiliates |
The Fund has an Investment Advisory Agreement (the “Agreement”) with the Advisor, for which the Series pays a fee, computed daily and payable monthly, at an annual rate of 0.30% of the Series’ average daily net assets.
Under the Agreement, personnel of the Advisor provide the Series with advice and assistance in the choice of investments and the execution of securities transactions, and otherwise maintain the Series’ organization. The Advisor also provides the Fund with necessary office space and fund administration and support services. The salaries of all officers of the Fund (except a percentage of the Fund’s Chief Compliance Officer’s salary, which is paid by the Fund), and of all Directors who are “affiliated persons” of the Fund, or of the Advisor, and all personnel of the Fund, or of the Advisor, performing services relating to research, statistical and investment activities, are paid by the Advisor. Each “non-affiliated” Director receives an annual stipend, which is allocated among all the active series of the Fund. In addition, these Directors also receive a fee per Board meeting attended plus a fee for each committee meeting attended and are reimbursed for travel and other out-of-pocket expenses incurred by them in connection with attending such meetings. The Fund also has an Audit Committee Chair, Governance & Nominating Committee Chair and Lead Independent Director who each receive an additional annual stipend for these roles.
The Fund may enter into agreements with financial intermediaries pursuant to which the Fund may pay financial intermediaries for non-distribution related sub-transfer agency, administrative, sub-accounting, and other shareholder services in an amount not to exceed 0.15% of the average daily net assets of the Class S and Class I shares. Payments made pursuant to such agreements
18
Disciplined Value Series
Notes to Financial Statements (continued)
| 3. | Transactions with Affiliates (continued) |
are generally based on the current assets and/or number of accounts of the Series attributable to the financial intermediary. Any payments made pursuant to such agreements may be in addition to, rather than in lieu of, any Distribution and Shareholder Services Fee payable under the Rule 12b-1 plan of the Fund.
The Advisor has contractually agreed to waive the management fee for the Class W shares. The full management fee will be waived under this agreement because Class W shares are only available to discretionary investment accounts and other accounts managed by the Advisor. These clients pay a management fee to the Advisor that is separate from the Series' expenses. In addition, pursuant to a separate expense limitation agreement, the Advisor has contractually agreed to limit its fees and reimburse expenses to the extent necessary so that the total direct annual fund operating expenses, exclusive of the shareholder services fee and/or distribution and service (12b-1) fees and waived Class W management fees (collectively, “excluded expenses”), to 0.60% of the average daily net assets of the Class I and Class S shares, 0.45% of the average daily net assets of the Class Z shares, and 0.15% of the average daily net assets of the Class W shares. These contractual waivers are expected to continue indefinitely, and may not be amended or terminated by the Advisor without the approval of the Series’ Board of Directors. The Advisor may receive from a Class the difference between the Class’s total direct annual fund operating expenses, not including excluded expenses, and the Class’s contractual expense limit to recoup all or a portion of its prior fee waivers (other than Class W management fee waivers) or expense reimbursements made during the rolling three-year period preceding the recoupment if at any point the total direct annual fund operating expenses, not including excluded expenses, are below the contractual expense limit (a) at the time of the fee waiver and/or expense reimbursement and (b) at the time of the recoupment.
Pursuant to the advisory fee waiver, the Advisor waived $655,729 in management fees for Class W shares for the year ended October 31, 2021.
As of October 31, 2021, there are no expenses eligible to be recouped by the Advisor.
Manning & Napier Investor Services, Inc., a registered broker-dealer affiliate of the Advisor, acts as distributor for the Fund’s shares. The Series compensates the distributor for distributing and servicing the Series’ Class S shares pursuant to a distribution plan adopted under Rule 12b-1 of the 1940 Act, regardless of expenses actually incurred. Under the agreement, the Series pays distribution and service fees to the distributor at an annual rate of 0.25% of average daily net assets attributable to Class S shares. There are no distribution and service fees on the Class I, Class W or Class Z shares. The fees are accrued daily and paid monthly.
Pursuant to a master services agreement dated February 13, 2020, the Fund pays the Advisor an annual fee related to fund accounting and administration of 0.0085% on the first $25 billion of average daily net assets; 0.0075% on the next $15 billion of average daily net assets; and 0.0065% of average daily net assets in excess of $40 billion; plus a base fee of $30,400 per series. Additionally, certain transaction and out-of-pocket expenses, including charges for reporting relating to the Fund’s compliance program, are charged. The Advisor has agreements with BNY Mellon Investment Servicing (U.S.) Inc. (“BNY”) under which BNY serves as sub-accountant services agent.
| 4. | Purchases and Sales of Securities |
For the year ended October 31, 2021, purchases and sales of securities, other than U.S. Government securities and short-term securities, were $258,824,934 and $242,414,302, respectively. There were no purchases or sales of U.S. Government securities.
19
Disciplined Value Series
Notes to Financial Statements (continued)
| 5. | Capital Stock Transactions |
Transactions in Class S, Class I, Class W, and Class Z shares of Disciplined Value Series were:
| CLASS S | FOR THE YEAR ENDED | FOR THE YEAR ENDED | ||||||||||||||
| 10/31/21 | 10/31/20 | |||||||||||||||
| SHARES | AMOUNT | SHARES | AMOUNT | |||||||||||||
| Sold | 942,202 | $ | 7,928,247 | 2,185,798 | $ | 15,335,701 | ||||||||||
| Reinvested | 116,544 | 961,216 | 520,096 | 3,841,892 | ||||||||||||
| Repurchased | (2,570,637 | ) | (21,699,915 | ) | (4,104,449 | ) | (28,362,891 | ) | ||||||||
| Total | (1,511,891 | ) | $ | (12,810,452 | ) | (1,398,555 | ) | $ | (9,185,298 | ) | ||||||
| CLASS I | FOR THE YEAR ENDED | FOR THE YEAR ENDED | ||||||||||||||
| 10/31/21 | 10/31/20 | |||||||||||||||
| SHARES | AMOUNT | SHARES | AMOUNT | |||||||||||||
| Sold | 4,444,943 | $ | 39,546,365 | 6,855,394 | 1 | $ | 48,439,828 | |||||||||
| Reinvested | 223,309 | 1,948,391 | 810,028 | 1 | 6,258,066 | |||||||||||
| Repurchased | (10,124,275 | ) | (92,339,227 | ) | (7,878,944 | )1 | (56,327,596 | ) | ||||||||
| Total | (5,456,023 | ) | $ | (50,844,471 | ) | (213,522 | )1 | $ | (1,629,702 | ) | ||||||
| CLASS W | FOR THE YEAR ENDED | FOR THE YEAR ENDED | ||||||||||||||
| 10/31/21 | 10/31/20 | |||||||||||||||
| SHARES | AMOUNT | SHARES | AMOUNT | |||||||||||||
| Sold | 13,896,176 | $ | 113,166,084 | 8,913,190 | $ | 68,986,024 | ||||||||||
| Reinvested | 482,943 | 4,070,632 | 850,647 | 6,172,499 | ||||||||||||
| Repurchased | (4,906,776 | ) | (41,077,202 | ) | (2,615,296 | ) | (17,905,560 | ) | ||||||||
| Total | 9,472,343 | $ | 76,159,514 | 7,148,541 | $ | 57,252,963 | ||||||||||
| CLASS Z | FOR THE YEAR ENDED | FOR THE YEAR ENDED | ||||||||||||||
| 10/31/21 | 10/31/20 | |||||||||||||||
| SHARES | AMOUNT | SHARES | AMOUNT | |||||||||||||
| Sold | 528,456 | $ | 4,885,934 | 671,860 | 1 | $ | 5,033,822 | |||||||||
| Reinvested | 37,313 | 329,345 | 95,097 | 1 | 734,913 | |||||||||||
| Repurchased | (280,879 | ) | (2,570,082 | ) | (847,733 | )1 | (6,672,136 | ) | ||||||||
| Total | 284,890 | $ | 2,645,197 | (80,776 | )1 | $ | (903,401 | ) | ||||||||
1Effective after the close of business on December 5, 2019, the total outstanding shares of Class I and Z of the Disciplined Value Series split on a 1.75-for-1 basis. The impact of the stock split increased the number of shares outstanding by a factor of 1.75, while decreasing the NAV per share and market price per share by a factor of 1.75, resulting in no effect on fund net assets or on the total value of a shareholder’s investment.
At October 31, 2021, the Advisor and its affiliates owned 0.1% of the Series.
| 6. | Line of Credit |
The Fund has entered into a 364-day, $25 million credit agreement (the “line of credit”) with Bank of New York Mellon. Each series of the Fund may borrow under the line of credit for temporary or emergency purposes, including funding shareholder redemptions and other short-term liquidity purposes. The Fund pays an annual fee on the unused commitment amount, payable quarterly, and is allocated among all the series of the Fund and included in miscellaneous expenses in the Statement of Operations for each series. The line of credit expires in September 2022 unless extended or renewed. During the year ended October 31, 2021,
20
Disciplined Value Series
Notes to Financial Statements (continued)
| 6. | Line of Credit (continued) |
the Disciplined Value Series borrowed an average of $18,000,000 for 2 days at a weighted average interest rate of 1.34%. As of October 31, 2021, there was no borrowing outstanding.
| 7. | Financial Instruments |
The Series may trade in instruments including written and purchased options, forward foreign currency exchange contracts and futures contracts and other derivatives in the normal course of investing activities to assist in managing exposure to various market risks. The Series may be subject to various elements of risk, which may involve, to a varying degree, elements of risk in excess of the amounts recognized for financial statement purposes. These risks include: the risk that changes in the value of a derivative may not correlate perfectly with the underlying asset, rate or index; counterparty credit risk related to over the counter derivative counterparties’ failure to perform under contract terms; liquidity risk related to the lack of a liquid market for these contracts allowing the fund to close out its position(s); and documentation risk relating to disagreement over contract terms. No such investments were held by the Series as of October 31, 2021.
| 8. | Federal Income Tax Information |
The amount and characterization of certain income and capital gains to be distributed are determined in accordance with federal income tax regulations, which may differ from GAAP. These differences are primarily due to tax equalization. The Series may periodically make reclassifications among its capital accounts to reflect income and gains available for distribution (or available capital loss carryovers) under income tax regulations, without impacting the Series’ net asset value. For the year ended October 31, 2021, amounts were reclassified within the capital accounts to increase Additional Paid in Capital by $2,969,805 and decrease Total Distributable Earnings by $2,969,805. Any such reclassifications are not reflected in the financial highlights.
The tax character of distributions paid were as follows:
| FOR THE YEAR | FOR THE YEAR | |||||||
| ENDED 10/31/21 | ENDED 10/31/20 | |||||||
| Ordinary income | $7,865,563 | $9,212,400 | ||||||
| Long-term capital gains | — | 8,514,431 | ||||||
At October 31, 2021, the identified cost of investments for federal income tax purposes, the resulting gross unrealized appreciation and depreciation, and the net unrealized appreciation were as follows:
| Cost for federal income tax purposes | $380,272,804 | |||||||
| Unrealized appreciation | 77,656,103 | |||||||
| Unrealized depreciation | (7,093,724 | ) | ||||||
| Net unrealized appreciation | $70,562,379 | |||||||
| Undistributed ordinary income | $3,538,159 | |||||||
| Undistributed long-term capital gains | $24,638,416 |
For the year ended October 31, 2021, the capital loss carryover utilized was $20,858,336.
| 9. | Market Event |
In March 2020, the World Health Organization declared COVID-19 (a novel coronavirus) to be a pandemic. The situation is dynamic. Global financial markets have experienced and may continue to experience significant volatility resulting from the spread of COVID-19. The global economy, the economies of certain nations and individual issuers have been and may continue to be adversely affected by COVID-19, particularly in light of the interconnectivity between economies and financial markets, all of which may negatively impact the Series’ performance. In addition, COVID-19 and governmental responses to COVID-19 may negatively
21
Disciplined Value Series
Notes to Financial Statements (continued)
| 9. | Market Event (continued) |
impact the capabilities of the Series’ service providers and disrupt the Series’ operations. Management of the Series will continue to monitor the impact of COVID-19.
22
Disciplined Value Series
Report of Independent Registered Public Accounting Firm
To the Board of Directors of Manning & Napier Fund, Inc. and Shareholders of Disciplined Value Series
Opinion on the Financial Statements
We have audited the accompanying statement of assets and liabilities, including the investment portfolio, of Disciplined Value Series (one of the series constituting Manning & Napier Fund, Inc., referred to hereafter as the “Fund”) as of October 31, 2021, the related statement of operations for the year ended October 31, 2021, the statement of changes in net assets for each of the two years in the period ended October 31, 2021, including the related notes, and the financial highlights for each of the periods indicated therein (collectively referred to as the “financial statements”). In our opinion, the financial statements present fairly, in all material respects, the financial position of the Fund as of October 31, 2021, the results of its operations for the year then ended, the changes in its net assets for each of the two years in the period ended October 31, 2021 and the financial highlights for each of the periods indicated therein in conformity with accounting principles generally accepted in the United States of America.
Basis for Opinion
These financial statements are the responsibility of the Fund’s management. Our responsibility is to express an opinion on the Fund’s financial statements based on our audits. We are a public accounting firm registered with the Public Company Accounting Oversight Board (United States) (PCAOB) and are required to be independent with respect to the Fund in accordance with the U.S. federal securities laws and the applicable rules and regulations of the Securities and Exchange Commission and the PCAOB.
We conducted our audits of these financial statements in accordance with the standards of the PCAOB. Those standards require that we plan and perform the audit to obtain reasonable assurance about whether the financial statements are free of material misstatement, whether due to error or fraud.
Our audits included performing procedures to assess the risks of material misstatement of the financial statements, whether due to error or fraud, and performing procedures that respond to those risks. Such procedures included examining, on a test basis, evidence regarding the amounts and disclosures in the financial statements. Our audits also included evaluating the accounting principles used and significant estimates made by management, as well as evaluating the overall presentation of the financial statements. Our procedures included confirmation of securities owned as of October 31, 2021 by correspondence with the custodian. We believe that our audits provide a reasonable basis for our opinion.
New York, New York
December 15, 2021
We have served as the auditor of one or more investment companies in Manning & Napier Mutual Funds since 1992.
23
Disciplined Value Series
Supplemental Tax Information
(unaudited)
All reportings are based on financial information available as of the date of this annual report and, accordingly, are subject to change.
For federal income tax purposes, the Series reports for the current fiscal year $7,865,563 or, if different, the maximum amount allowable under the tax law, as qualified dividend income.
For corporate shareholders, the percentage of investment income (dividend income plus short-term gains, if any) that qualifies for the dividends received deduction for the current fiscal year is 100.00%.
The Series designates $28,597,065 as Long-Term Capital Gain dividends pursuant to Section 852(b) of the Code for the fiscal year ended October 31, 2021.
24
Disciplined Value Series
Directors’ and Officers’ Information
(unaudited)
The Statement of Additional Information provides additional information about the Fund’s directors and officers and can be obtained without charge by calling 1-800-466-3863, at www.manning-napier.com, or on the EDGAR Database on the SEC Internet web site (http://www.sec.gov). The following chart shows certain information about the Fund’s directors and officers, including their principal occupations during the last five years. Unless specific dates are provided, the individuals have held the listed positions for longer than five years.
Interested Director and Officer
| Name: | Paul Battaglia* | |
| Address: | 290 Woodcliff Drive | |
| Fairport, NY 14450 | ||
| Age: | 43 | |
| Current Position(s) Held with Fund: | Principal Executive Officer, President, Chairman and Director | |
| Term of Office1 & Length of Time Served: | Indefinite – Chairman and Director since November 2018 | |
| Principal Occupation(s) During Past 5 Years: | Chief Financial Officer since 2018; Vice President of Finance (2016 – 2018); Director of Finance (2011 – 2016); Financial Analyst/Internal Auditor (2004- 2006) – Manning & Napier Advisors, LLC and affiliates Holds one or more of the following titles for various subsidiaries and affiliates: Chief Financial Officer | |
| Number of Portfolios Overseen within Fund Complex: | 15 | |
| Other Directorships Held Outside Fund Complex During Past 5 Years: | N/A |
Independent Directors
| Name: | Stephen B. Ashley | |
| Address: | 290 Woodcliff Drive | |
| Fairport, NY 14450 | ||
| Age: | 81 | |
| Current Position(s) Held with Fund: | Director, Audit Committee Member, Governance & Nominating Committee Member | |
| Term of Office & Length of Time Served: | Indefinite – Since 1996 | |
| Principal Occupation(s) During Past 5 Years: | Chairman and Director since 1997; Chief Executive Officer (1997-2019) - Ashley Companies (property management and investment) | |
| Number of Portfolios Overseen within Fund Complex: | 15 | |
| Other Directorships Held Outside Fund Complex During Past 5 Years: | Ashley Companies since 1997 | |
| Name: | Paul A. Brooke | |
| Address: | 290 Woodcliff Drive | |
| Fairport, NY 14450 | ||
| Age: | 75 | |
| Current Position(s) Held with Fund: | Lead Independent Director, Audit Committee Member, Governance & Nominating Committee Chairman | |
| Term of Office & Length of Time Served: | Indefinite – Director, Audit Committee Member, Governance & Nominating Committee Member since 2007; Lead Independent Director since 2017 | |
| Principal Occupation(s) During Past 5 Years: | Managing Member since 1991 - PMSV Holdings LLC (investments); | |
| Managing Member (2010-2016) - Venbio (investments). | ||
| Number of Portfolios Overseen within Fund Complex: | 15 | |
| Other Directorships Held Outside Fund Complex During Past 5 Years: | Incyte Corp. (biotech) (2000-2020); PureEarth (non-profit) since 2012; Cerus (biomedical) since 2016; Caelum BioSciences (biomedical) since 2018; Cheyne Capital International (investment)(2000-2017); |
25
Disciplined Value Series
Directors’ and Officers’ Information
(unaudited)
Independent Directors (continued)
| Name: | John Glazer | |
| Address: | 290 Woodcliff Drive | |
| Fairport, NY 14450 | ||
| Age: | 56 | |
| Current Position(s) Held with Fund: | Director, Audit Committee Member, Governance & Nominating Committee Member | |
| Term of Office & Length of Time Served: | Indefinite – Director, Audit Committee Member, Governance & Nominating Committee Member since February 2021 | |
| Principal Occupation(s) During Past 5 Years: | Chief Executive Officer since 2020 – Oikos Holdings LLC (Single-Family Office); Head of Corporate Development (2019-2020) – Caelum Biosciences (pharmaceutical development); Head of Private Investments (2015-2018) – AC Limited (Single-Family Office) | |
| Number of Portfolios Overseen within Fund Complex: | 15 | |
| Other Directorships Held Outside Fund Complex During Past 5 Years: | N/A | |
| Name: | Margaret McLaughlin | |
| Address: | 290 Woodcliff Drive | |
| Fairport, NY 14450 | ||
| Age: | 54 | |
| Current Position(s) Held with Fund: | Director, Audit Committee Member, Governance & Nominating Committee Member | |
| Term of Office & Length of Time Served: | Indefinite – Director, Audit Committee Member, Governance & Nominating Committee Member since February 2021 | |
| Principal Occupation(s) During Past 5 Years: | Consultant since 2020 – Bates Group (consultants); Consultant (2019- 2020) – Madison Dearborn Partners (private equity); General Counsel/CCO (2011-2019) – Kramer Van Kirk Credit Strategies L.P./Mariana Systems LLC (Investment Adviser/SaaS Technology) | |
| Number of Portfolios Overseen within Fund Complex: | 15 | |
| Other Directorships Held Outside Fund Complex During Past 5 Years: | N/A | |
| Name: | Russell O. Vernon | |
| Address: | 290 Woodcliff Drive | |
| Fairport, NY 14450 | ||
| Age: | 63 | |
| Current Position(s) Held with Fund: | Director, Audit Committee Member, Governance & Nominating Committee Chairman | |
| Term of Office & Length of Time Served: | Indefinite – Director, Audit Committee Member, Governance & Nominating Committee Member since April 2020; Governance & Nominating Committee Chairman since November 2020 | |
| Principal Occupation(s) During Past 5 Years: | Founder and General Partner (2009-2019) – BVM Capital Management (economic development) | |
| Number of Portfolios Overseen within Fund Complex: | 15 | |
| Other Directorships Held Outside Fund Complex During Past 5 Years: | Board Member, Vice Chairman and President since 2010 – Newburgh Armory Unity Center (military); Board Member and Executive Director since 2020 – National Purple Heart Honor Mission, Inc. (military); Board Member, Vice Chairman (2015-2020) – National Purple Heart Hall of Honor, Inc. (military) |
26
Disciplined Value Series
Directors’ and Officers’ Information
(unaudited)
Independent Directors (continued)
| Name: | Chester N. Watson | |
| Address: | 290 Woodcliff Drive | |
| Fairport, NY 14450 | ||
| Age: | 71 | |
| Current Position(s) Held with Fund: | Director, Audit Committee Chairman, Governance & Nominating Committee Member | |
| Term of Office & Length of Time Served: | Indefinite – Director, Audit Committee Member, Governance & Nominating Committee Member Since 2012; Audit Committee Chairman since 2013 | |
| Principal Occupation(s) During Past 5 Years: | General Auditor (2003-2011) - General Motors Company (auto manufacturer) | |
| Number of Portfolios Overseen within Fund Complex: | 15 | |
| Other Directorships Held Outside Fund Complex During Past 5 Years: | Rochester Institute of Technology (University) since 2005; Hudson Valley Center for Innovation, Inc. (New Business and Economic Development) since 2019; Town of Greenburgh, NY Planning Board (Municipal Government) (2015-2019); | |
| Officers: | ||
| Name: | Elizabeth Craig | |
| Address: | 290 Woodcliff Drive | |
| Fairport, NY 14450 | ||
| Age: | 34 | |
| Current Position(s) Held with Fund: | Corporate Secretary | |
| Term of Office1 & Length of Time Served: | Since 2016 | |
| Principal Occupation(s) During Past 5 Years: | Director of Fund Administration since 2021; Fund Regulatory Administration Manager (2018-2021); Fund Administration Manager (2015-2018); Mutual Fund Compliance Specialist (2009-2015) - Manning & Napier Advisors, LLC; Assistant Corporate Secretary (2011-2016) - Manning & Napier Fund, Inc.; Corporate Secretary, Director since 2019– Manning & Napier Investor Services, Inc. | |
| Name: | Samantha Larew | |
| Address: | 290 Woodcliff Drive | |
| Fairport, NY 14450 | ||
| Age: | 41 | |
| Current Position(s) Held with Fund: | Chief Compliance Officer and Anti-Money Laundering Compliance Officer | |
| Term of Office1 & Length of Time Served: | Chief Compliance Officer since 2019; Anti-Money Laundering Compliance Officer since 2018 | |
| Principal Occupation(s) During Past 5 Years: | Co-Director of Compliance since 2018; Compliance Communications Supervisor (2014-2018); Compliance Supervisor (2013-2014); Broker- Dealer Compliance Supervisor (2011-2013); Broker-Dealer Compliance Analyst (2010-2011) -Manning & Napier Advisors, LLC& Affiliates; Broker- Dealer Chief Compliance Officer since 2013; Broker-Dealer Assistant Corporate Secretary since 2011 – Manning & Napier Investor Services, Inc.; Compliance Analyst (2007-2009) – Wall Street Financial Group; Compliance Specialist (2003-2007) – Manning & Napier Advisors, LLC & Affiliates | |
| Name: | Scott Morabito | |
| Address: | 290 Woodcliff Drive | |
| Fairport, NY 14450 | ||
| Age: | 33 | |
| Current Position(s) Held with Fund: | Vice President | |
| Term of Office1 & Length of Time Served: | Vice President since 2019; Assistant Vice President (2017-2019) | |
| Principal Occupation(s) During Past 5 Years: | Managing Director, Client Service and Business Operations since 2021; Managing Director of Operations (2019-2021); Director of Funds Group (2017-2019); Fund Product and Strategy Manager (2014-2017); Senior Product and Strategy Analyst (2013-2014); Product and Strategy Analyst (2011-2013) -Manning & Napier Advisors, LLC; President, Director since 2018 – Manning & Napier Investor Services, Inc.; President, Exeter Trust Company since 2021; |
27
Disciplined Value Series
Directors’ and Officers’ Information
(unaudited)
Officers: (continued)
| Name: | Troy Statczar | |
| Address: | 290 Woodcliff Drive | |
| Fairport, NY 14450 | ||
| Age: | 50 | |
| Current Position(s) Held with Fund: | Principal Financial Officer, Treasurer | |
| Term of Office & Length of Time Served: | Principal Financial Officer and Treasurer since 2020 | |
| Principal Occupation(s) During Past 5 Years: | Senior Director, Foreside Treasurer Services since 2020 - Foreside Financial Group; Director of Fund Administration (2017-2019) - Thornburg Investment Management, Inc.; Director of U.S. Operations (2008-2017) - Henderson Global Investors N.A., Inc. | |
| Name: | Sarah Turner | |
| Address: | 290 Woodcliff Drive | |
| Fairport, NY 14450 | ||
| Age: | 39 | |
| Current Position(s) Held with Fund: | Chief Legal Officer; Assistant Corporate Secretary | |
| Term of Office & Length of Time Served: | Since 2018 | |
| Principal Occupation(s) During Past 5 Years: | Attorney since 2018 - Manning & Napier Advisors, LLC and affiliates; Counsel (2017-2018) – Harter Secrest and Emery LLP; Legal Counsel (2010-2017) – Manning & Napier Advisors, LLC and affiliates Holds one or more of the following titles for various affiliates: Corporate Secretary, General Counsel |
*Interested Director, within the meaning of the 1940 Act by reason of his positions with the Fund’s Advisor, Manning & Napier Advisors, LLC, and Distributor, Manning & Napier Investor Services, Inc.
1The term of office of all officers shall be one year and until their respective successors are chosen and qualified, or his or her earlier resignation or removal as provided in the Fund’s By-Laws.
28
{This page intentionally left blank}
29
Disciplined Value Series
Literature Requests
(unaudited)
Proxy Voting Policies and Procedures
A description of the policies and procedures that the Fund uses to determine how to vote proxies relating to portfolio securities is available, without charge, upon request:
| By phone | 1-800-466-3863 |
| On the Securities and Exchange | |
| Commission’s (SEC) web site | http://www.sec.gov |
Proxy Voting Record
Information regarding how the Fund voted proxies relating to portfolio securities during the most recent 12-month period ended June 30th is available, without charge, upon request:
| By phone | 1-800-466-3863 |
| On the SEC’s web site | http://www.sec.gov |
Quarterly Portfolio Holdings
The Series’ complete schedule of portfolio holdings for the 1st and 3rd quarters of each fiscal year are provided on Form N-PORT, and are available, without charge, upon request:
| By phone | 1-800-466-3863 |
| On the SEC’s web site | http://www.sec.gov |
Prospectus and Statement of Additional Information (SAI)
For more information about any of the Manning & Napier Fund, Inc. Series, you may obtain a prospectus and SAI at www.manning-napier.com or by calling 1-(800) 466-3863. Before investing, carefully consider the objectives, risks, charges and expenses of the investment and read the prospectus carefully as it contains this and other information about the investment company. In addition, this information can be found on the SEC’s web site, http://www.sec.gov.
Additional information available at www.manning-napier.com
1. Fund Holdings - Month-End
2. Fund Holdings - Quarter-End
3. Shareholder Report - Annual
4. Shareholder Report - Semi-Annual
The Fund also offers electronic notification or “e-delivery” when certain documents are available on-line to be downloaded or reviewed. Direct shareholders can elect to receive electronic notification when shareholder reports, prospectus updates, and/or statements are available. If you do not currently have on-line access to your account, you can establish access by going to www.manning-napier.com, click on “Login” in the top corner of the page, and follow the prompts to self-enroll. Once enrolled, you can set your electronic notification preferences by clicking on the Account Options tab located within the green toolbar and then select E-Delivery Option. Should you have any questions on either how to establish on-line access or how to update your account settings, please contact Investor Services at 1-800-466-3863.
The Manning & Napier Fund, Inc. is managed by Manning & Napier Advisors, LLC. Manning & Napier Investor Services, Inc., an affiliate of Manning & Napier Advisors, LLC, is the distributor of the Fund shares.
MNDIV-10/21-AR
30
| |
www.manning-napier.com |
Manning & Napier Fund, Inc.
Overseas Series
Paper copies of the Series’ shareholder reports are no longer sent by mail, unless you specifically request them from the Series or from your financial intermediary, such as a broker-dealer or bank. Shareholder reports are available online. Each time a report is posted on the Series’ website you will be provided with a link to access the report online, either by mail (hard copy notice) or by email, if you have already signed up for electronic delivery of shareholder reports.
You may elect to receive all future shareholder reports in paper free of charge. If you invest through a financial intermediary, you can contact your financial intermediary to request that you continue to receive paper copies. If you invest directly with the Fund, you can inform the Fund that you wish to continue receiving paper copies by visiting www.manning-napier.com or calling 1-800-466-3863. Your election to receive reports in paper will apply to all funds held with your financial intermediary if you invest through a financial intermediary or all series of the Fund if you invest directly with the Fund.
Additionally, If you have not yet signed up for electronic delivery of shareholder reports and other Fund communications, you may do so by contacting your financial intermediary or, if you are a direct investor, by visiting www.manning-napier.com or calling 1-800-466-3863.
| | Independent Perspective | Real-World Solutions |
A Note from Our CEO
Dear Shareholder,
The obstacles were many, but this year, in so many ways, is a story of triumphant resilience only serving to spotlight just how much more there is to do.
Over the past eighteen months, we’ve endured a recession, a bear market, and a pandemic. Our collective perseverance is now paying off.
We are today experiencing a remarkable economic boom, a historic market rally, and continued medical innovation, all of which have turned a challenging period into one of optimism and hope.
At the same time, political and societal polarization are heightened, social justice concerns have justifiably come to the fore, and the precarious state of our environment presents almost unimaginable challenges for government, business, and finance.
This certainly is a moment of great consequence.
The kind of moment that questions all the rules. Economic rules in how we add value for each other, as well as for ourselves. Social rules in how we interact with each other. Environmental rules that can balance the current needs of emerging economies with the requirements for everyone in the future. Workplace rules in how we get the job done.
Our lives are being redefined, and our society, planet, workplaces, and industry must confront the challenges of the upcoming decade.
Markets reflect us. They mirror our collective thoughts, feelings, expectations, and beliefs – these new life rules.
As we go through this period of change, it will be uncertain and uncomfortable. For those unaccustomed to change, for those reliant on ‘set it and forget it’, these may seem like daunting questions, but there is a better way.
Success in an era of change demands flexibility, adaptability, and a roll-up-your-sleeves willingness to do the work.
For over 50 years, independent thinking and tireless work have underpinned every decision we’ve made on behalf of our investors. We invest for the long-term, we do not speculate. We make active decisions, and we invest with discipline, patience, and confidence. This is the only way we know, to remain true to our values and our fiduciary duty to you, the investors in our mutual funds.
You demand more. At Manning & Napier, we demand more of ourselves. Upon reflection of the year, we’re proud to have continued to deliver more.
We wish you safety and good health, and we appreciate your confidence in our firm and our approach.
| | Sincerely,
Marc Mayer Chief Executive Officer |
Corporate Headquarters | 290 Woodcliff Drive | Fairport, NY 14450 | (585) 325-6880 phone | (800) 551-0224 toll free | www.manning-napier.com
1
Overseas Series
Fund Commentary
(unaudited)
Investment Objective
To maximize long-term growth by investing principally in the common stocks of companies located around the world. The Series invests primarily in foreign companies, including those in developed and emerging markets.
Performance Commentary
Broad international equity markets posted high double digit returns for the twelve-month period ending October 31, 2021. During the period, smaller-cap stocks generally outperformed larger-cap stocks and value outperformed growth. In terms of sectors, Energy and Financials experienced the highest returns while areas such as Communication Services and Consumer Discretionary broadly lagged. On a regional basis, developed markets notably outperformed emerging markets.
The Overseas Series Class S delivered positive returns and outperformed the MSCI ACWI ex USA Index, returning 36.7% and 29.7%, respectively.
Outperformance was primarily driven by strong stock selection, notably within Energy and Communication Services. Taking a closer look at Energy, the Series benefitted from an overweight allocation to the sector, as well as stock selection. Notable contributors within Energy include Canadian company Cameco, the largest pure play uranium producer, and Tourmaline, the largest natural gas producer in Canada. Both positions were purchased under the Hurdle Rate strategy. Recently, we sold our remaining position in Tourmaline as we believe the current risk/reward tradeoff is no longer favorable. The natural gas macro also played a role in the sell, particularly in that the commodity price had a strong rally here and there is a risk that companies will continue to increase production and create a supply/demand imbalance. Within Communication Services, an overweight allocation to Southeast Asian internet company Sea Limited benefitted relative returns. Sea Limited continues to exhibit strong growth, driven by faster than expected growth in the eCommerce business, as well as durable growth in its gaming business. More recently, the payments business has begun to ramp up and investors are beginning to assign value to this growing revenue stream. Finally, the Series benefitted from an underweight allocation to emerging markets.
In terms of detractors, an underweight to and selection within Financials, including an underweight to the banking industry, were the largest detractors to relative returns. Additionally, an overweight allocation to Brazilian merchant acquirer Stone Company detracted from returns. Stone’s shares have been weak due to a large provision for credit losses within its working capital finance offering that is a result of a new registry of receivables system, launched by the Brazilian Central Bank, not working properly. While the size of the credit provision was unexpected, the core business of processing merchant payments continues to perform well.
Looking ahead, our long-term outlook for growth remains challenged. Corporate debt levels are historically high, and while the consumer is relatively healthy all things considered, government borrowing remains elevated across the globe. Meanwhile, the demographic profiles of the major developed market economies are mixed at best. Aging demographics are reducing workforce growth, and economic growth in the process. As such, we believe today’s accelerated rate of economic growth is unsustainable, having been in part fueled by massive fiscal and monetary stimulus programs across the globe that are now beginning to recede. Overall, we expect the next step for global economic growth is more likely to be lower than higher from here.
Given today’s highly dynamic economic environment and building risks across financial markets, we believe investors should be particularly discerning. As always, we will continue to monitor the environment and remain opportunistic as we actively position client portfolios in what we believe are attractive long-term values.
Performance data quoted represents past performance and does not guarantee future results. The investment return and principal value of an investment will fluctuate, so that an investor’s shares, when redeemed, may be worth more or less than their original cost. Current performance may be higher or lower than that quoted; investors can obtain the most recent month-end performance at www.manning-napier.com or by calling (800) 466-3863.
Commentary prepared using data provided by FactSet. Analysis Manning & Napier. Commentary presented is relative to the MSCI ACWI ex USA Index. Additional information and associated disclosures can be found on the Performance Update page of this report.
The data presented is for informational purposes only. It is not to be considered a specific stock recommendation.
All investments involve risks, including possible loss of principal. Funds whose investments are concentrated in foreign countries may be subject to fluctuating currency values, different accounting standards, and economic and political instability. The value of the Series may be affected by changes in exchange rates between foreign currencies and the U.S. dollar. Investments in emerging markets may be more volatile than investments in more developed markets.
2
Overseas Series
Performance Update as of October 31, 2021
(unaudited)
| AVERAGE ANNUAL TOTAL RETURNS AS OF OCTOBER 31, 2021 | |||
| ONE YEAR1 | FIVE YEAR | TEN YEAR | |
| Overseas Series - Class S2,3 | 36.72% | 13.51% | 8.12% |
| Overseas Series - Class I2 | 37.16% | 13.85% | 8.44% |
| Overseas Series - Class W2,4 | 38.13% | 14.28% | 8.64% |
| Overseas Series - Class Z2,5 | 37.31% | 13.94% | 8.48% |
| MSCI ACWI ex USA Index6 | 29.66% | 9.77% | 6.66% |
The following graph compares the value of a $1,000,000 investment in the Overseas Series - Class I for the ten years ended October 31, 2021 to the MSCI ACWI ex USA Index.
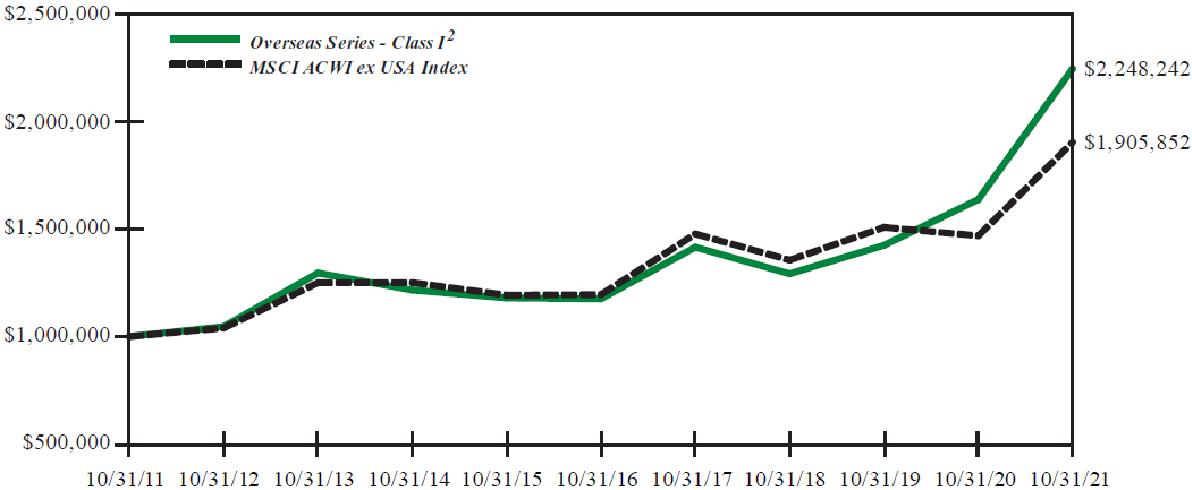
1The returns shown are based on net asset values calculated for shareholder transactions and may differ from the returns shown in the financial highlights, which reflect adjustments made to the net asset values in accordance with accounting principles generally accepted in the United States of America.
2The Series’ performance does not reflect the deduction of taxes that a shareholder would pay on fund distributions or the redemption of shares. The Series’ performance is historical and may not be indicative of future results. The performance returns shown are inclusive of the net expense ratio of the Series. For the year ended October 31, 2021, this net expense ratio was 1.05% for Class S, 0.75% for Class I, 0.05% for Class W and 0.65% for Class Z. The gross expense ratio, which does not account for any voluntary or contractual waivers currently in effect, was 1.08% for Class S, 0.75% for Class I, 0.69% for Class W and 0.69% for Class Z for the year ended October 31, 2021.
3For periods through September 21, 2018 (the inception date of the Class S shares), performance for the Class S shares is hypothetical and is based on the historical performance of the Class I shares adjusted for the Class S shares’ charges and expenses.
4For periods through March 1, 2019 (the inception date of the Class W shares), performance for the Class W shares is based on the historical performance of the Class I shares. Because the Class W shares invest in the same portfolio of securities as the Class I shares, performance will be different only to the extent that the Class I shares have a higher expense ratio.
5For periods through May 1, 2018 (the inception date of the Class Z shares), performance for the Class Z shares is based on the historical performance of the Class I shares. Because the Class Z shares invest in the same portfolio of securities as the Class I shares, performance will be different only to the extent that the Class I shares have a higher expense ratio.
3
Overseas Series
Performance Update as of October 31, 2021
(unaudited)
6The MSCI ACWI ex USA Index (ACWIxUS) is designed to measure large and mid-cap representation across 22 of 23 Developed Markets countries (excluding the U.S.) and 27 Emerging Markets countries. The Index returns do not reflect any fees or expenses. The Index is denominated in U.S. dollars. The returns are net of withholding taxes. They assume daily reinvestment of net dividends thus accounting for any applicable dividend taxation. Index returns provided by Bloomberg. Index data referenced herein is the property of MSCI, its affiliates (“MSCI”) and/or its third party suppliers and has been licensed for use by Manning & Napier. MSCI and its third party suppliers accept no liability in connection with its use. Data provided is not a representation or warranty, express or implied, as to the ability of any index to accurately represent the asset class or market sector that it purports to represent and none of these parties shall have any liability for any errors, omissions, or interruptions of any index or the data included therein. For additional disclosure information, please see: https://go.manning-napier.com/benchmark-provisions.
4
Overseas Series
Shareholder Expense Example
(unaudited)
As a shareholder of the Series, you incur ongoing costs, including management fees, shareholder service fees and other Series expenses. This example is intended to help you understand your ongoing costs (in dollars) of investing in the Series and to compare these costs with the ongoing costs of investing in other mutual funds.
The example is based on an investment of $1,000 invested in each class at the beginning of the period and held for the entire period (May 1, 2021 to October 31, 2021).
Actual Expenses
The Actual lines of the table below provide information about actual account values and actual expenses. You may use the information in these lines, together with the amount you invested, to estimate the expenses that you paid over the period. Simply divide your account value by $1,000 (for example, an $8,600 account value divided by $1,000 = 8.6), then multiply the result by the number in the Actual line for the Class in which you have invested under the heading entitled “Expenses Paid During Period” to estimate the expenses you paid on your account during this period.
Hypothetical Example for Comparison Purposes
The Hypothetical lines of each class in the table below provide information about hypothetical account values and hypothetical expenses based on the Class’ actual expense ratio and an assumed rate of return of 5% per year before expenses, which is not the Class’ actual return. The hypothetical account values and expenses may not be used to estimate the actual ending account balance or expenses you paid during the period. You may use this information to compare the ongoing costs of investing in a class of the Series and other funds. To do so, compare this 5% hypothetical example for the Class in which you have invested with the 5% hypothetical examples that appear in the shareholder reports of the other funds.
Please note that the expenses shown in the table are meant to highlight your ongoing costs only and do not reflect any transaction costs, such as sales charges (loads), redemption fees, or exchange fees that you may incur in other mutual funds. Therefore, the second line of the table is useful in comparing ongoing costs only, and will not help you determine the relative total costs of owning different funds.
BEGINNING 5/1/21 | ENDING ACCOUNT VALUE 10/31/21 | EXPENSES PAID DURING PERIOD* 5/1/21 - 10/31/21 | ANNUALIZED EXPENSE RATIO | |
| Class S | ||||
| Actual | $1,000.00 | $1,047.90 | $5.42 | 1.05% |
| Hypothetical (5% return before expenses) | $1,000.00 | $1,019.91 | $5.35 | 1.05% |
| Class I | ||||
| Actual | $1,000.00 | $1,049.60 | $3.87 | 0.75% |
| Hypothetical (5% return before expenses) | $1,000.00 | $1,021.42 | $3.82 | 0.75% |
| Class W | ||||
| Actual | $1,000.00 | $1,053.30 | $0.26 | 0.05% |
| Hypothetical (5% return before expenses) | $1,000.00 | $1,024.95 | $0.26 | 0.05% |
| Class Z | ||||
| Actual | $1,000.00 | $1,050.10 | $3.36 | 0.65% |
| Hypothetical (5% return before expenses) | $1,000.00 | $1,021.93 | $3.31 | 0.65% |
* Expenses are equal to each Class’ annualized expense ratio (for the six-month period), multiplied by the average account value over the period, multiplied by 184/365 (to reflect the one-half year period). Expenses are based on the most recent fiscal half year; therefore, the expense ratios stated above may differ from the expense ratios stated in the financial highlights, which are based on one-year data. The Class’ total return would have been lower had certain expenses not been waived or reimbursed during the period.
5
Overseas Series
Portfolio Composition as of October 31, 2021
(unaudited)
| Country Allocation1,2 |
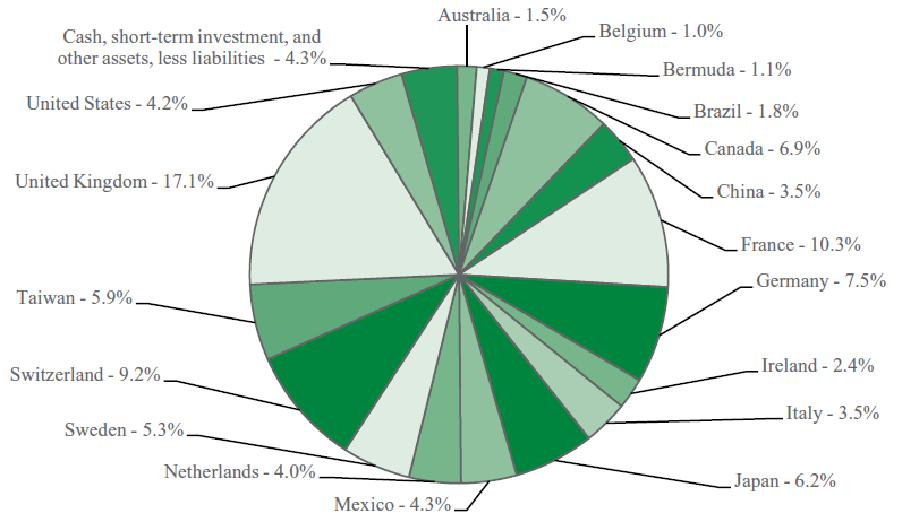 |
| 1As a percentage of net assets. |
| 2Allocations are based on country of risk. |
| Sector Allocation3 |
 |
| 3As a percentage of net assets. |
6
Overseas Series
Investment Portfolio - October 31, 2021
| SHARES | VALUE (NOTE 2) | |||||||
| COMMON STOCKS - 95.7% | ||||||||
| Communication Services - 8.6% | ||||||||
| Entertainment - 5.4% | ||||||||
| Sea Ltd. - ADR (Taiwan)* | 92,294 | $ | 31,709,450 | |||||
| Ubisoft Entertainment S.A. (France)* | 208,631 | 10,924,712 | ||||||
| 42,634,162 | ||||||||
| Interactive Media & Services - 1.9% | ||||||||
| Auto Trader Group plc (United Kingdom)1 | 1,859,245 | 15,413,953 | ||||||
| Media - 1.3% | ||||||||
| S4 Capital plc (United Kingdom)* | 1,037,511 | 10,303,697 | ||||||
| Total Communication Services | 68,351,812 | |||||||
| Consumer Discretionary - 10.5% | ||||||||
| Hotels, Restaurants & Leisure - 2.4% | ||||||||
| Accor S.A. (France)* | 346,566 | 12,402,362 | ||||||
| Restaurant Brands International, Inc. (Canada) | 112,360 | 6,364,070 | ||||||
| 18,766,432 | ||||||||
| Household Durables - 5.5% | ||||||||
| Nikon Corp. (Japan) | 1,434,400 | 15,815,350 | ||||||
| Sony Group Corp. (Japan) | 236,200 | 27,351,105 | ||||||
| 43,166,455 | ||||||||
| Textiles, Apparel & Luxury Goods - 2.6% | ||||||||
| adidas AG (Germany) | 34,061 | 11,148,218 | ||||||
| lululemon athletica, Inc. (United States)* | 20,988 | 9,780,618 | ||||||
| 20,928,836 | ||||||||
| Total Consumer Discretionary | 82,861,723 | |||||||
| Consumer Staples - 16.9% | ||||||||
| Beverages - 5.0% | ||||||||
| Anheuser-Busch InBev S.A./N.V. (Belgium) | 134,398 | 8,220,754 | ||||||
| Diageo plc (United Kingdom) | 408,175 | 20,307,396 | ||||||
| Heineken N.V. (Netherlands) | 101,690 | 11,255,978 | ||||||
| 39,784,128 | ||||||||
| Food Products - 6.4% | ||||||||
| Danone S.A. (France) | 216,130 | 14,088,607 | ||||||
| Kerry Group plc - Class A (Ireland) | 56,176 | 7,539,471 | ||||||
| Nestle S.A. (Switzerland) | 219,825 | 28,996,506 | ||||||
| 50,624,584 | ||||||||
| Household Products - 1.4% | ||||||||
| Kimberly-Clark de Mexico S.A.B. de C.V. - Class A (Mexico) | 7,027,500 | 11,107,191 | ||||||
| Personal Products - 4.1% | ||||||||
| Beiersdorf AG (Germany) | 101,562 | 10,799,436 | ||||||
| Unilever plc - ADR (United Kingdom) | 401,777 | 21,527,212 | ||||||
| 32,326,648 | ||||||||
| Total Consumer Staples | 133,842,551 | |||||||
| Energy - 7.1% | ||||||||
| Oil, Gas & Consumable Fuels - 7.1% | ||||||||
| BP plc - ADR (United Kingdom) | 298,736 | 8,600,609 | ||||||
| SHARES | VALUE (NOTE 2) | |||||||
| COMMON STOCKS (continued) | ||||||||
| Energy (continued) | ||||||||
| Oil, Gas & Consumable Fuels (continued) | ||||||||
| Cameco Corp. (Canada) | 1,244,206 | $ | 30,234,206 | |||||
| Royal Dutch Shell plc - Class B - ADR (Netherlands) | 194,841 | 8,931,511 | ||||||
| TotalEnergies SE - ADR (France) | 174,587 | 8,748,555 | ||||||
| Total Energy | 56,514,881 | |||||||
| Financials - 13.6% | ||||||||
| Banks - 4.6% | ||||||||
| The Bank of N.T. Butterfield & Son Ltd. (Bermuda) | 239,661 | 8,603,830 | ||||||
| FinecoBank Banca Fineco S.p.A. (Italy)* | 1,437,560 | 27,454,228 | ||||||
| 36,058,058 | ||||||||
| Capital Markets - 6.2% | ||||||||
| Allfunds Group plc (United Kingdom)* | 393,776 | 7,959,716 | ||||||
| Avanza Bank Holding AB (Sweden) | 247,272 | 9,830,467 | ||||||
| Deutsche Boerse AG (Germany) | 109,945 | 18,251,652 | ||||||
| Intermediate Capital Group plc (United Kingdom) | 444,257 | 13,325,475 | ||||||
| 49,367,310 | ||||||||
| Insurance - 2.8% | ||||||||
| Admiral Group plc (United Kingdom) | 554,046 | 21,764,129 | ||||||
| Total Financials | 107,189,497 | |||||||
| Health Care - 15.5% | ||||||||
| Health Care Equipment & Supplies - 10.6% | ||||||||
| Alcon, Inc. (Switzerland) | 295,192 | 24,607,205 | ||||||
| Getinge AB - Class B (Sweden) | 508,676 | 22,764,190 | ||||||
| Medtronic plc (United States) | 192,103 | 23,025,466 | ||||||
| Shandong Weigao Group Medical Polymer Co. Ltd. - Class H (China) | 7,908,000 | 13,469,943 | ||||||
| 83,866,804 | ||||||||
| Health Care Providers & Services - 0.5% | ||||||||
| Jinxin Fertility Group Ltd. (China)*1 | 2,516,000 | 3,548,628 | ||||||
| Pharmaceuticals - 4.4% | ||||||||
| Dechra Pharmaceuticals plc (United Kingdom) | 225,103 | 15,772,913 | ||||||
| Novartis AG - ADR (Switzerland) | 233,723 | 19,342,916 | ||||||
| 35,115,829 | ||||||||
| Total Health Care | 122,531,261 | |||||||
| Industrials - 10.9% | ||||||||
| Aerospace & Defense - 0.9% | ||||||||
| Airbus SE (France)* | 58,470 | 7,500,651 | ||||||
| Airlines - 2.1% | ||||||||
| Controladora Vuela Cia de Aviacion S.A.B. de C.V. - ADR (Mexico)* | 470,029 | 8,507,525 | ||||||
| Ryanair Holdings plc - ADR (Ireland)* | 70,116 | 7,958,867 | ||||||
| 16,466,392 | ||||||||
| Building Products - 1.2% | ||||||||
| Assa Abloy AB - Class B (Sweden) | 316,953 | 9,300,246 | ||||||
The accompanying notes are an integral part of the financial statements.
7
Overseas Series
Investment Portfolio - October 31, 2021
| SHARES | VALUE (NOTE 2) | |||||||
| COMMON STOCKS (continued) | ||||||||
| Industrials (continued) | ||||||||
| Commercial Services & Supplies - 1.5% | ||||||||
| Cleanaway Waste Management Ltd. (Australia) | 5,975,994 | $ | 12,153,723 | |||||
| Road & Rail - 2.3% | ||||||||
| Canadian National Railway Co. (Canada) | 136,778 | 18,179,164 | ||||||
| Trading Companies & Distributors - 1.0% | ||||||||
| Brenntag SE (Germany) | 81,346 | 7,739,124 | ||||||
| Transportation Infrastructure - 1.9% | ||||||||
| Grupo Aeroportuario del Centro Norte S.A.B. de C.V. (Mexico)* | 730,100 | 4,415,424 | ||||||
| Grupo Aeroportuario del Pacifico S.A.B.de C.V. - ADR (Mexico) | 39,007 | 4,925,804 | ||||||
| Grupo Aeroportuario del Sureste S.A.B.de C.V. - ADR (Mexico) | 26,925 | 5,429,426 | ||||||
| 14,770,654 | ||||||||
| Total Industrials | 86,109,954 | |||||||
| Information Technology - 10.3% | ||||||||
| Electronic Equipment, Instruments & Components - 2.2% | ||||||||
| Keyence Corp. (Japan) | 9,600 | 5,794,702 | ||||||
| Softwareone Holding AG (Germany) | 488,548 | 11,320,588 | ||||||
| 17,115,290 | ||||||||
| SHARES | VALUE (NOTE 2) | |||||||
| COMMON STOCKS (continued) | ||||||||
| Information Technology (continued) | ||||||||
| IT Services - 6.3% | ||||||||
| Adyen N.V. (Netherlands)*1 | 3,782 | $ | 11,411,468 | |||||
| Atos SE (France) | 178,976 | 9,337,665 | ||||||
| Keywords Studios plc (Ireland) | 91,845 | 3,564,696 | ||||||
| StoneCo Ltd. - Class A (Brazil)* | 425,556 | 14,409,326 | ||||||
| TravelSky Technology Ltd. - Class H (China) | 5,744,000 | 10,732,415 | ||||||
| 49,455,570 | ||||||||
| Semiconductors & Semiconductor Equipment - 1.8% | ||||||||
| Taiwan Semiconductor Manufacturing Co. Ltd. - ADR (Taiwan) | 128,587 | 14,620,342 | ||||||
| Total Information Technology | 81,191,202 | |||||||
| Materials - 2.3% | ||||||||
| Chemicals - 2.3% | ||||||||
| Air Liquide S.A. (France) | 110,945 | 18,523,138 | ||||||
| TOTAL COMMON STOCKS | ||||||||
| (Identified Cost $599,026,766) | 757,116,019 | |||||||
| SHORT-TERM INVESTMENT - 3.5% | ||||||||
| Dreyfus Government Cash Management, Institutional Shares, 0.03%2 (Identified Cost $28,035,032) | 28,035,032 | 28,035,032 | ||||||
| TOTAL INVESTMENTS - 99.2% | ||||||||
| (Identified Cost $627,061,798) | 785,151,051 | |||||||
| OTHER ASSETS, LESS LIABILITIES - 0.8% | 6,122,165 | |||||||
| NET ASSETS - 100% | $ | 791,273,216 | ||||||
ADR - American Depositary Receipt
*Non-income producing security.
1Security purchased or received in a transaction exempt from registration under the Securities Act of 1933, as amended (the “1933 Act”) and determined to be liquid under the Fund’s Liquidity Risk Management Program. The security may be resold pursuant to an exemption from registration under the 1933 Act, typically to qualified institutional buyers. The aggregate value of these securities at October 31, 2021 was $30,374,049, which represented 3.8% of the Series’ Net Assets.
2Rate shown is the current yield as of October 31, 2021.
The Series’ portfolio holds, as a percentage of net assets, greater than 10% in the following countries:
United Kingdom - 17.1% and France - 10.3%.
The Global Industry Classification Standard (GICS) was developed by and is the exclusive property and a service mark of MSCI Inc. (MSCI) and Standard & Poor’s, a division of S&P Global Inc. (S&P), and is licensed for use by Manning & Napier when referencing GICS sectors. Neither MSCI, S&P, nor any third party involved in making or compiling the GICS or any GICS classifications makes any express or implied warranties or representations with respect to such standard or classification, nor shall any such party have any liability therefrom.
The accompanying notes are an integral part of the financial statements.
8
Overseas Series
Statement of Assets and Liabilities
October 31, 2021
| ASSETS: | ||||
| Investments, at value (identified cost $627,061,798) (Note 2) | $ | 785,151,051 | ||
| Foreign currency, at value (identified cost $3,542,923) | 3,564,675 | |||
| Foreign tax reclaims receivable | 4,663,282 | |||
| Dividends receivable | 467,991 | |||
| Receivable for fund shares sold | 135,494 | |||
| Receivable for securities sold | 1,019 | |||
| Prepaid expenses | 33,984 | |||
| TOTAL ASSETS | 794,017,496 | |||
| LIABILITIES: | ||||
| Accrued management fees (Note 3) | 212,228 | |||
| Accrued sub-transfer agent fees (Note 3) | 128,401 | |||
| Accrued distribution and service (Rule 12b-1) fees (Class S) (Note 3) | 47,280 | |||
| Accrued fund accounting and administration fees (Note 3) | 42,543 | |||
| Accrued Chief Compliance Officer service fees (Note 3) | 2,032 | |||
| Payable for securities purchased | 1,743,731 | |||
| Payable for fund shares repurchased | 484,359 | |||
| Other payables and accrued expenses | 83,706 | |||
| TOTAL LIABILITIES | 2,744,280 | |||
| TOTAL NET ASSETS | $ | 791,273,216 | ||
| NET ASSETS CONSIST OF: | ||||
| Capital stock | $ | 211,736 | ||
| Additional paid-in-capital | 1,016,850,135 | |||
| Total distributable earnings (loss) | (225,788,655 | ) | ||
| TOTAL NET ASSETS | $ | 791,273,216 | ||
| NET ASSET VALUE, OFFERING PRICE AND REDEMPTION PRICE PER SHARE - Class S | ||||
| ($222,471,213/5,982,001 shares) | $ | 37.19 | ||
| NET ASSET VALUE, OFFERING PRICE AND REDEMPTION PRICE PER SHARE - Class I | ||||
| ($117,732,005/3,161,476 shares) | $ | 37.24 | ||
| NET ASSET VALUE, OFFERING PRICE AND REDEMPTION PRICE PER SHARE - Class W | ||||
| ($331,921,760/8,834,583 shares) | $ | 37.57 | ||
| NET ASSET VALUE, OFFERING PRICE AND REDEMPTION PRICE PER SHARE - Class Z | ||||
| ($119,148,238/3,195,576 shares) | $ | 37.29 | ||
The accompanying notes are an integral part of the financial statements.
9
Overseas Series
Statement of Operations
For the Year Ended October 31, 2021
| INVESTMENT INCOME: | ||||
| Dividends (net of foreign taxes withheld, $1,250,998) | $ | 11,611,259 | ||
| Other Income | 21,612 | |||
| Total Investment Income | 11,632,871 | |||
| EXPENSES: | ||||
| Management fees (Note 3) | 4,448,709 | |||
| Distribution and service (Rule 12b-1) fees (Class S) (Note 3) | 566,678 | |||
| Sub-transfer agent fees (Note 3) | 365,398 | |||
| Fund accounting and administration fees (Note 3) | 124,366 | |||
| Directors’ fees (Note 3) | 87,007 | |||
| Chief Compliance Officer service fees (Note 3) | 6,096 | |||
| Custodian fees | 98,940 | |||
| Recoupment of past waived and/or reimbursed fees | 5,183 | |||
| Miscellaneous | 372,142 | |||
| Total Expenses | 6,074,519 | |||
| Less reduction of expenses (Note 3) | (2,162,254 | ) | ||
| Net Expenses | 3,912,265 | |||
| NET INVESTMENT INCOME | 7,720,606 | |||
| REALIZED AND UNREALIZED GAIN (LOSS) ON INVESTMENTS AND FOREIGN CURRENCY: | ||||
| Net realized gain (loss) on- | ||||
| Investments | 85,748,767 | |||
| Foreign currency and translation of other assets and liabilities | 189,232 | |||
| 85,937,999 | ||||
| Net change in unrealized appreciation (depreciation) on- | ||||
| Investments | 124,428,220 | |||
| Foreign currency and translation of other assets and liabilities | (179,871 | ) | ||
| 124,248,349 | ||||
| NET REALIZED AND UNREALIZED GAIN (LOSS) ON INVESTMENTS AND FOREIGN CURRENCY | 210,186,348 | |||
| NET INCREASE IN NET ASSETS RESULTING FROM OPERATIONS | $ | 217,906,954 |
The accompanying notes are an integral part of the financial statements.
10
Overseas Series
Statements of Changes in Net Assets
| FOR THE YEAR ENDED 10/31/21 | FOR THE YEAR ENDED 10/31/20 | |||||||
| INCREASE (DECREASE) IN NET ASSETS: | ||||||||
| OPERATIONS: | ||||||||
| Net investment income | $ | 7,720,606 | $ | 7,306,396 | ||||
| Net realized gain (loss) on investments and foreign currency | 85,937,999 | 24,747,296 | ||||||
| Net change in unrealized appreciation (depreciation) on investments and foreign currency | 124,248,349 | 43,011,156 | ||||||
| Net increase (decrease) from operations | 217,906,954 | 75,064,848 | ||||||
| DISTRIBUTIONS TO SHAREHOLDERS (Note 9): | ||||||||
| Class S | (1,272,258 | ) | (2,602,504 | ) | ||||
| Class I | (729,781 | ) | (1,458,826 | ) | ||||
| Class W | (4,436,340 | ) | (5,369,336 | ) | ||||
| Class Z | (861,730 | ) | (895,797 | ) | ||||
| Total distributions to shareholders | (7,300,109 | ) | (10,326,463 | ) | ||||
| CAPITAL STOCK ISSUED AND REPURCHASED: | ||||||||
| Net increase (decrease) from capital share transactions (Note 5) | (2,282,508 | ) | 13,367,432 | |||||
| Net increase (decrease) in net assets | 208,324,337 | 78,105,817 | ||||||
| NET ASSETS: | ||||||||
| Beginning of year | 582,948,879 | 504,843,062 | ||||||
| End of year | $ | 791,273,216 | $ | 582,948,879 | ||||
The accompanying notes are an integral part of the financial statements.
11
Overseas Series
Financial Highlights - Class S
| FOR THE YEAR ENDED | FOR THE | |||||||||||||||
| PERIOD | ||||||||||||||||
| 9/21/181 TO | ||||||||||||||||
| 10/31/21 | 10/31/20 | 10/31/19 | 10/31/18 | |||||||||||||
| Per share data (for a share outstanding throughout each period): | ||||||||||||||||
| Net asset value - Beginning of period | $27.36 | $24.14 | $22.17 | $24.72 | ||||||||||||
| Income (loss) from investment operations: | ||||||||||||||||
| Net investment income2 | 0.18 | 0.19 | 0.35 | 0.01 | ||||||||||||
| Net realized and unrealized gain (loss) on investments | 9.83 | 3.34 | 3 | 1.81 | (2.56 | ) | ||||||||||
| Total from investment operations | 10.01 | 3.53 | 2.16 | (2.55 | ) | |||||||||||
| Less distributions to shareholders: | ||||||||||||||||
| From net investment income | (0.18 | ) | (0.31 | ) | (0.19 | ) | — | |||||||||
| Net asset value - End of period | $37.19 | $27.36 | $24.14 | $22.17 | ||||||||||||
| Net assets - End of period (000’s omitted) | $222,471 | $190,201 | $272,760 | $500,950 | ||||||||||||
| Total return4 | 36.72% | 14.70% | 3 | 9.88% | (10.32% | ) | ||||||||||
| Ratios (to average net assets)/Supplemental Data: | ||||||||||||||||
| Expenses* | 1.05% | 1.05% | 1.05% | 1.05% | 5 | |||||||||||
| Net investment income | 0.53% | 0.77% | 1.55% | 0.38% | 5 | |||||||||||
| Series portfolio turnover | 47% | 66% | 43% | 34% | ||||||||||||
| *The investment advisor did not impose all or a portion of its management and/or other fees during the periods, and may have paid a portion of the Series’ expenses. If these expenses had been incurred by the Class, the expense ratio (to average net assets) would have increased by the following amounts: | ||||||||||||||||
| 0.03% | 0.06% | 0.04% | 0.06% | 5 | ||||||||||||
1Commencement of operations.
2Calculated based on average shares outstanding during the periods.
3During the reporting period the Fund settled legal claims against an issuer of securities previously held by the Fund. As a result, the net realized and unrealized gain (loss) on investments per share includes proceeds received from the settlement. Without these proceeds the net realized and unrealized gain (loss) on investments per share would have been $2.39. Excluding the proceeds from the settlement, the total return would have been 10.21%.
4Represents aggregate total return for the periods indicated, and assumes reinvestment of all distributions. Total return would have been lower had certain expenses not been waived or reimbursed during the periods. Periods less than one year are not annualized.
5Annualized.
The accompanying notes are an integral part of the financial statements.
12
Overseas Series
Financial Highlights - Class I*
| FOR THE YEAR ENDED | ||||||||||||||||||||
| 10/31/21 | 10/31/20 | 10/31/19 | 10/31/18 | 10/31/17 | ||||||||||||||||
| Per share data (for a share outstanding throughout each year): | ||||||||||||||||||||
| Net asset value - Beginning of year | $27.39 | $24.22 | $22.18 | $24.73 | $20.88 | |||||||||||||||
| Income (loss) from investment operations: | ||||||||||||||||||||
| Net investment income1 | 0.28 | 0.27 | 0.42 | 0.41 | 0.26 | |||||||||||||||
| Net realized and unrealized gain (loss) on investments | 9.85 | 3.34 | 2 | 1.81 | (2.51 | ) | 3.94 | |||||||||||||
| Total from investment operations | 10.13 | 3.61 | 2.23 | (2.10 | ) | 4.20 | ||||||||||||||
| Less distributions to shareholders: | ||||||||||||||||||||
| From net investment income | (0.28 | ) | (0.44 | ) | (0.19 | ) | (0.45 | ) | (0.35 | ) | ||||||||||
| Net asset value - End of year | $37.24 | $27.39 | $24.22 | $22.18 | $24.73 | |||||||||||||||
| Net assets - End of year (000’s omitted) | $117,732 | $52,357 | $74,325 | $140,653 | $755,482 | |||||||||||||||
| Total return3 | 37.16% | 15.02% | 2 | 10.18% | (8.69% | ) | 20.49% | 4 | ||||||||||||
| Ratios (to average net assets)/Supplemental Data: | ||||||||||||||||||||
| Expenses** | 0.75% | 5 | 0.75% | 0.75% | 0.75% | 0.75% | ||||||||||||||
| Net investment income | 0.81% | 1.10% | 1.86% | 1.62% | 1.16% | |||||||||||||||
| Series portfolio turnover | 47% | 66% | 43% | 34% | 44% | |||||||||||||||
| *Effective March 1, 2017, Class A shares of the Series have been redesignated as Class I shares. | ||||||||||||||||||||
| **For certain years presented, the investment advisor did not impose all or a portion of its management and/or other fees, and in some years may have paid a portion of the Series’ expenses. If these expenses had been incurred by the Class, the expense ratio (to average net assets) would have increased by the following amounts: | ||||||||||||||||||||
| N/A | 0.04% | 0.05% | 0.02% | 0.02% | ||||||||||||||||
1Calculated based on average shares outstanding during the years.
2During the reporting period the Fund settled legal claims against an issuer of securities previously held by the Fund. As a result, the net realized and unrealized gain (loss) on investments per share includes proceeds received from the settlement. Without these proceeds the net realized and unrealized gain (loss) on investments per share would have been $2.60. Excluding the proceeds from the settlement, the total return would have been 10.57%.
3Represents aggregate total return for the years indicated, and assumes reinvestment of all distributions. Total return would have been lower had certain expenses not been waived or reimbursed during certain years.
4Includes litigation proceeds. Excluding this amount, the Class’ total return is 20.10%.
5Includes recoupment of past waived and/or reimbursed fees with no impact to the expense ratio.
The accompanying notes are an integral part of the financial statements.
13
Overseas Series
Financial Highlights - Class W
| FOR THE YEAR ENDED | FOR THE | |||||||||||
| PERIOD | ||||||||||||
| 3/1/191 TO | ||||||||||||
| 10/31/21 | 10/31/20 | 10/31/19 | ||||||||||
| Per share data (for a share outstanding throughout each period): | ||||||||||||
| Net asset value - Beginning of period | $27.59 | $24.31 | $22.95 | |||||||||
| Income from investment operations: | ||||||||||||
| Net investment income2 | 0.53 | 0.45 | 0.35 | |||||||||
| Net realized and unrealized gain (loss) on investments | 9.91 | 3.36 | 3 | 1.01 | ||||||||
| Total from investment operations | 10.44 | 3.81 | 1.36 | |||||||||
| Less distributions to shareholders: | ||||||||||||
| From net investment income | (0.46 | ) | (0.53 | ) | — | |||||||
| Net asset value - End of period | $37.57 | $27.59 | $24.31 | |||||||||
| Net assets - End of period (000’s omitted) | $331,922 | $267,777 | $107,192 | |||||||||
| Total return4 | 38.13% | 15.80% | 3 | 5.93% | ||||||||
| Ratios (to average net assets)/Supplemental Data: | ||||||||||||
| Expenses* | 0.05% | 0.05% | 0.05% | 5 | ||||||||
| Net investment income | 1.51% | 1.78% | 2.23% | 5 | ||||||||
| Series portfolio turnover | 47% | 66% | 43% | |||||||||
| *The investment advisor did not impose all or a portion of its management and/or other fees during the periods, and may have paid a portion of the Series’ expenses. If these expenses had been incurred by the Class, the expense ratio (to average net assets) would have increased by the following amounts: | ||||||||||||
| 0.64% | 0.66% | 0.67% | 5 | |||||||||
1Commencement of operations.
2Calculated based on average shares outstanding during the periods.
3During the reporting period the Fund settled legal claims against an issuer of securities previously held by the Fund. As a result, the net realized and unrealized gain (loss) on investments per share includes proceeds received from the settlement. Without these proceeds the net realized and unrealized gain (loss) on investments per share would have been $2.35. Excluding the proceeds from the settlement, the total return would have been 11.44%.
4Represents aggregate total return for the periods indicated, and assumes reinvestment of all distributions. Total return would have been lower had certain expenses not been waived or reimbursed during the periods. Periods less than one year are not annualized.
5Annualized.
The accompanying notes are an integral part of the financial statements.
14
Overseas Series
Financial Highlights - Class Z
| FOR THE YEAR ENDED | FOR THE | |||||||||||||||
| PERIOD | ||||||||||||||||
| 5/1/181 TO | ||||||||||||||||
| 10/31/21 | 10/31/20 | 10/31/19 | 10/31/18 | |||||||||||||
| Per share data (for a share outstanding throughout each period): | �� | |||||||||||||||
| Net asset value - Beginning of period | $27.41 | $24.24 | $22.19 | $24.85 | ||||||||||||
| Income (loss) from investment operations: | ||||||||||||||||
| Net investment income2 | 0.33 | 0.29 | 0.44 | 0.13 | ||||||||||||
| Net realized and unrealized gain (loss) on investments | 9.85 | 3.34 | 3 | 1.82 | (2.79 | ) | ||||||||||
| Total from investment operations | 10.18 | 3.63 | 2.26 | (2.66 | ) | |||||||||||
| Less distributions to shareholders: | ||||||||||||||||
| From net investment income | (0.30 | ) | (0.46 | ) | (0.21 | ) | — | |||||||||
| Net asset value - End of period | $37.29 | $27.41 | $24.24 | $22.19 | ||||||||||||
| Net assets - End of period (000’s omitted) | $119,148 | $72,614 | $50,566 | $104,538 | ||||||||||||
| Total return4 | 37.31% | 15.11% | 3 | 10.36% | (10.71% | ) | ||||||||||
| Ratios (to average net assets)/Supplemental Data: | ||||||||||||||||
| Expenses* | 0.65% | 0.65% | 0.65% | 0.65% | 5 | |||||||||||
| Net investment income | 0.94% | 1.14% | 1.95% | 1.04% | 5 | |||||||||||
| Series portfolio turnover | 47% | 66% | 43% | 34% | ||||||||||||
| *The investment advisor did not impose all or a portion of its management and/or other fees during the periods, and may have paid a portion of the Series’ expenses. If these expenses had been incurred by the Class, the expense ratio (to average net assets) would have increased by the following amounts: | ||||||||||||||||
| 0.04% | 0.06% | 0.07% | 0.09% | 5 | ||||||||||||
1Commencement of operations.
2Calculated based on average shares outstanding during the periods.
3During the reporting period the Fund settled legal claims against an issuer of securities previously held by the Fund. As a result, the net realized and unrealized gain (loss) on investments per share includes proceeds received from the settlement. Without these proceeds the net realized and unrealized gain (loss) on investments per share would have been $2.34. Excluding the proceeds from the settlement, the total return would have been 11.91%.
4Represents aggregate total return for the periods indicated, and assumes reinvestment of all distributions. Total return would have been lower had certain expenses not been waived or reimbursed during the periods. Periods less than one year are not annualized.
5Annualized.
The accompanying notes are an integral part of the financial statements.
15
Overseas Series
Notes to Financial Statements
| 1. | Organization |
Overseas Series (the “Series”) is a no-load diversified series of Manning & Napier Fund, Inc. (the “Fund”). The Fund is organized in Maryland and is registered under the Investment Company Act of 1940, as amended, as an open-end management investment company.
The Series’ investment objective is to provide long-term growth.
The Series is authorized to issue four classes of shares (Class I, S, W, and Z). Each class of shares is substantially the same, except that class-specific distribution and shareholder servicing expenses are borne by the specific class of shares to which they relate.
The Fund’s Advisor is Manning & Napier Advisors, LLC (the “Advisor”). Shares of the Series are offered to investors, clients and employees of the Advisor and its affiliates. The total authorized capital stock of the Fund consists of 15 billion shares of common stock each having a par value of $0.01. As of October 31, 2021, 6.3 billion shares have been designated in total among 15 series, of which 200 million have been designated as Overseas Series Class I common stock, 400 million have been designated as Overseas Series Class S common stock, 75 million have been designated as Overseas Series Class W common stock and 100 million have been designated as Overseas Series Class Z common stock.
| 2. | Significant Accounting Policies |
The following is a summary of significant accounting policies followed by the Series. The Series is an investment company and, accordingly, follows the investment company accounting and reporting guidance of the Financial Accounting Standards Board Accounting Standards Codification Topic 946 - Investment Companies, which is part of accounting principles generally accepted in the United States of America (“GAAP”).
Security Valuation
Portfolio securities, including domestic equities, foreign equities, warrants and options, listed on an exchange other than the NASDAQ Stock Market are valued at the latest quoted sales price of the exchange on which the security is primarily traded. Securities not traded on valuation date or securities not listed on an exchange are valued at the latest quoted bid price provided by the Fund’s pricing service. Securities listed on the NASDAQ Stock Market are valued in accordance with the NASDAQ Official Closing Price.
Short-term investments that mature in sixty days or less may be valued at amortized cost, which approximates fair value. Investments in open-end investment companies are valued at their net asset value per share on valuation date.
Volume and level of activity in established markets for an asset or liability are evaluated to determine whether recent transactions and quoted prices are determinative of fair value. Where there have been significant decreases in volume and level of activity, further analysis and adjustment may be necessary to estimate fair value. The Series measures fair value in these instances by the use of inputs and valuation techniques which may be based upon current market prices of securities that are comparable in coupon, rating, maturity and industry and/or expectation of future cash flows. As a result of trading in relatively thin markets and/or markets that experience significant volatility, the prices used by the Series to value these securities may differ from the value that would be realized if these securities were sold, and the differences could be material.
Securities for which representative valuations or prices are not available from the Series’ pricing service may be valued at fair value as determined in good faith by the Advisor under procedures approved by and under the general supervision and responsibility of the Fund’s Board of Directors (the “Board”). Due to the inherent uncertainty of valuations of such securities, the fair value may differ significantly from the values that would have been used had a ready market for such securities existed. If trading or events occurring after the close of the principal market in which securities are traded are expected to materially affect the value of those securities, then they may be valued at their fair value, taking this trading or these events into account. In accordance with the procedures approved by the Board, the values of certain securities trading outside the U.S. were adjusted following the close of local trading using a factor from a third party vendor. The third party vendor uses statistical analyses and quantitative models, which consider among other things subsequent movement and changes in the prices of indices, securities
16
Overseas Series
Notes to Financial Statements (continued)
| 2. | Significant Accounting Policies (continued) |
Security Valuation (continued)
and exchange rates in other markets, to determine the factors which are used to adjust local market prices. The value of securities used for net asset value calculation under these procedures may differ from published prices for the same securities. It is the Fund’s policy to classify each foreign equity security where a factor from a third party vendor is provided as a Level 2 security.
Various inputs are used in determining the value of the Series’ assets or liabilities carried at fair value. These inputs are summarized in three broad levels. Level 1 includes quoted prices in active markets for identical assets and liabilities. Level 2 includes other significant observable inputs (including quoted prices for similar securities, interest rates, prepayment speeds, credit risk, etc.). Level 3 includes significant unobservable inputs (including the Series’ own assumptions in determining the fair value of investments). A financial instrument’s level within the fair value hierarchy is based on the lowest level of any input both individually and in aggregate that is significant to the fair value measurement. The inputs or methodology used for valuing securities are not necessarily an indication of the risk associated with investing in those securities.
The following is a summary of the valuation levels used for major security types as of October 31, 2021 in valuing the Series’ assets or liabilities carried at fair value:
| DESCRIPTION | TOTAL | LEVEL 1 | LEVEL 2# | LEVEL 3 | ||||||||||||
| Assets: | ||||||||||||||||
| Equity securities: | ||||||||||||||||
| Communication Services | $ | 68,351,812 | $ | 31,709,450 | $ | 36,642,362 | $ | — | ||||||||
| Consumer Discretionary | 82,861,723 | 16,144,688 | 66,717,035 | — | ||||||||||||
| Consumer Staples | 133,842,551 | 32,634,403 | 101,208,148 | — | ||||||||||||
| Energy | 56,514,881 | 56,514,881 | — | — | ||||||||||||
| Financials | 107,189,497 | 8,603,830 | 98,585,667 | — | ||||||||||||
| Health Care | 122,531,261 | 66,975,587 | 55,555,674 | — | ||||||||||||
| Industrials | 86,109,954 | 49,416,210 | 36,693,744 | — | ||||||||||||
| Information Technology | 81,191,202 | 29,029,668 | 52,161,534 | — | ||||||||||||
| Materials | 18,523,138 | — | 18,523,138 | — | ||||||||||||
| Short-Term Investment | 28,035,032 | 28,035,032 | — | — | ||||||||||||
| Total assets | $ | 785,151,051 | $ | 319,063,749 | $ | 466,087,302 | $ | — | ||||||||
#Includes certain foreign equity securities for which a factor from a third party vendor was applied to determine the securities’ fair value following the close of local trading.
There were no Level 3 securities held by the Series as of October 31, 2020 or October 31, 2021.
Security Transactions, Investment Income and Expenses
Security transactions are accounted for on trade date. Dividend income is recorded on the ex-dividend date, except that if the ex-dividend date has passed, certain dividends from foreign securities are recorded as soon as the Series is informed of the ex-dividend date. Non-cash dividends, if any, are recorded at the fair value of the securities received. Interest income, including amortization of premium and accretion of discounts using the effective interest method, is earned from settlement date and accrued daily.
Expenses are recorded on an accrual basis. Most expenses of the Fund can be attributed to a specific series. Expenses which cannot be directly attributed are apportioned among the series in the Fund in such a manner as deemed equitable by the Fund’s Board, taking into consideration, among other things, the nature and type of expense.
The Series uses the identified cost method for determining realized gain or loss on investments for both financial statement and federal income tax reporting purposes.
17
Overseas Series
Notes to Financial Statements (continued)
| 2. | Significant Accounting Policies (continued) |
Foreign Currency Translation
The books and records of the Series are maintained in U.S. dollars. Foreign currencies, investments and other assets and liabilities are translated into U.S. dollars at the current exchange rates. Purchases and sales of investment securities and income and expenses are translated on the respective dates of such transactions. The Series does not isolate realized and unrealized gains and losses attributable to changes in the exchange rates from gains and losses that arise from changes in the fair value of investments. Such fluctuations are included with net realized and unrealized gain or loss on investments. Net realized foreign currency gains and losses represent foreign currency gains and losses between trade date and settlement date on securities transactions, gains and losses on disposition of foreign currencies and the difference between the amount of income and foreign withholding taxes recorded on the books of the Series and the amounts actually received or paid.
Federal Taxes
The Series’ policy is to comply with the provisions of the Internal Revenue Code applicable to regulated investment companies. The Series is not subject to federal income tax or excise tax to the extent that the Series distributes to shareholders each year its taxable income, including any net realized gains on investments, in accordance with requirements of the Internal Revenue Code. Accordingly, no provision for federal income tax or excise tax has been made in the financial statements.
Management evaluates its tax positions to determine if the tax positions taken meet the minimum recognition threshold in connection with accounting for uncertainties in income tax positions taken or expected to be taken for the purposes of measuring and recognizing tax liabilities in the financial statements. Recognition of tax benefits of an uncertain tax position is required only when the position is “more likely than not” to be sustained assuming examination by taxing authorities. At October 31, 2021, the Series has recorded no liability for net unrecognized tax benefits relating to uncertain income tax positions taken or expected to be taken in future tax returns.
The Series files income tax returns in the U.S. federal jurisdiction, various states and foreign jurisdictions, as required. No income tax returns are currently under investigation. The statute of limitations on the Series’ tax returns remains open for the years ended October 31, 2018 through October 31 2021 The Series is not aware of any tax positions for which it is reasonably possible that the total amounts of unrecognized tax benefits will significantly change in the next twelve months.
Foreign Taxes
Based on the Series’ understanding of the tax rules and rates related to income, gains and currency purchase/repatriation transactions for foreign jurisdictions in which it invests, the Series will provide for foreign taxes, and where appropriate, deferred foreign tax.
Distributions of Income and Gains
Distributions to shareholders of net investment income and net realized gains are made annually. An additional distribution may be necessary to avoid taxation of the Series. Distributions are recorded on the ex-dividend date.
Indemnifications
The Fund’s organizational documents provide former and current directors and officers with a limited indemnification against liabilities arising in connection with the performance of their duties to the Fund. In the normal course of business, the Fund may also enter into contracts that provide general indemnifications. The Fund’s maximum exposure under these arrangements is unknown as this would be dependent on future claims that may be made against the Fund. The risk of material loss from such claims is considered remote.
Other
The preparation of financial statements in conformity with GAAP requires management to make estimates and assumptions that affect the reported amounts of assets and liabilities and the disclosure of contingent assets and liabilities at the date of the financial statements and the reported amounts of income and expenses during the reporting period. Actual results could differ from those estimates.
18
Overseas Series
Notes to Financial Statements (continued)
| 3. | Transactions with Affiliates and Other Agreements |
The Fund has an Investment Advisory Agreement (the “Agreement”) with the Advisor, for which the Series pays a fee, computed daily and payable monthly, at an annual rate of 0.60% of the Series’ average daily net assets.
Under the Agreement, personnel of the Advisor provide the Series with advice and assistance in the choice of investments and the execution of securities transactions, and otherwise maintain the Series’ organization. The Advisor also provides the Fund with necessary office space and fund administration and support services. The salaries of all officers of the Fund (except a percentage of the Fund’s Chief Compliance Officer’s salary, which is paid by the Fund), and of all Directors who are “affiliated persons” of the Fund, or of the Advisor, and all personnel of the Fund, or of the Advisor, performing services relating to research, statistical and investment activities, are paid by the Advisor. Each “non-affiliated” Director receives an annual stipend, which is allocated among all the active series of the Fund. In addition, these Directors also receive a fee per Board meeting attended plus a fee for each committee meeting attended and are reimbursed for travel and other out-of-pocket expenses incurred by them in connection with attending such meetings. The Fund also has an Audit Committee Chair, Governance & Nominating Committee Chair and Lead Independent Director who each receive an additional annual stipend for these roles.
The Fund may enter into agreements with financial intermediaries pursuant to which the Fund may pay financial intermediaries for non-distribution related sub-transfer agency, administrative, sub-accounting, and other shareholder services in an annual amount not to exceed 0.15% of the average daily net assets of the Class I and Class S shares of the Series. Payments made pursuant to such agreements are generally based on the current assets and/or number of accounts of the Series attributable to the financial intermediary. Any payments made pursuant to such agreements may be in addition to, rather than in lieu of, any Distribution and Shareholder Services Fee payable under the Rule 12b-1 plan of the Fund.
The Advisor has contractually agreed to waive the management fee for the Class W shares. The full management fee will be waived under this agreement because Class W shares are only available to discretionary investment accounts and other accounts managed by the Advisor. These clients pay a management fee to the Advisor that is separate from the Series' expenses. In addition, pursuant to a separate expense limitation agreement, the Advisor has contractually agreed to limit its fees and reimburse expenses to the extent necessary so that the total direct annual fund operating expenses, exclusive of distribution and service (12b-1) fees and waived Class W management fees (collectively, “excluded expenses”), to 0.75% of the average daily net assets of the Class I shares, 0.80% of the average daily net assets of the Class S shares, 0.65% of the average daily net assets of the Class Z shares, and 0.05% of the average daily net assets of the Class W shares. These contractual waivers are expected to continue indefinitely, and may not be amended or terminated by the Advisor without the approval of the Series’ Board of Directors. The Advisor may receive from a Class the difference between the Class’s total direct annual fund operating expenses, not including excluded expenses, and the Class’s contractual expense limit to recoup all or a portion of its prior fee waivers (other than Class W management fee waivers) or expense reimbursements made during the rolling three-year period preceding the recoupment if at any point the total direct annual fund operating expenses, not including excluded expenses, are below the contractual expense limit(a) at the time of the fee waiver and/or expense reimbursement and (b) at the time of the recoupment.
Pursuant to the advisory fee waiver, the Advisor waived $1,905,415 in management fees for Class W shares for the year ended October 31, 2021. In addition, pursuant to the separate expense limitation agreement, the Advisor waived or reimbursed expenses of $75,098, $136,130, and $45,611 and for Class S, Class W, and Class Z shares, respectively, for the year ended October 31, 2021. These amounts are included as a reduction of expenses on the Statement of Operations.
For the year ended October 31, 2021, the Advisor recouped the following waivers and/or reimbursements previously recorded by the Series:
| CLASS | RECOUPED AMOUNT | |||
| Class I | $5,183 | |||
19
Overseas Series
Notes to Financial Statements (continued)
| 3. | Transactions with Affiliates and Other Agreements (continued) |
As of October 31, 2021, the class specific waivers or reimbursements subject to possible future recoupment under the expense limitation agreement are as follows:
| CLASS | EXPIRING OCTOBER 31, | |||||||||||
| 2022 | 2023 | 2024 | Total | |||||||||
| Class S | $115,448 | $119,905 | $75,098 | $310,451 | ||||||||
| Class I | 24,768 | 25,538 | — | 50,306 | ||||||||
| Class W | 45,443 | 161,408 | 136,130 | 342,981 | ||||||||
| Class Z | 25,315 | 33,168 | 45,611 | 104,094 | ||||||||
Manning & Napier Investor Services, Inc., a registered broker-dealer affiliate of the Advisor, acts as distributor for the Fund’s shares. The Series compensates the distributor for distributing and servicing the Series’ Class S shares pursuant to a distribution plan adopted under Rule 12b-1 of the 1940 Act, regardless of expenses actually incurred. Under the agreement, the Series pays distribution and service fees to the distributor at an annual rate of 0.25% of average daily net assets attributable to Class S shares. There are no distribution and service fees on the Class I, Class W or Class Z shares. The fees are accrued daily and paid monthly.
Pursuant to a master services agreement dated February 13, 2020, the Fund pays the Advisor an annual fee related to fund accounting and administration of 0.0085% on the first $25 billion of average daily net assets; 0.0075% on the next $15 billion of average daily net assets; and 0.0065% of average daily net assets in excess of $40 billion; plus a base fee of $30,400 per series. Additionally, certain transaction and out-of-pocket expenses, including charges for reporting relating to the Fund’s compliance program, are charged. The Advisor has agreements with BNY Mellon Investment Servicing (U.S.) Inc. (“BNY”) under which BNY serves as sub-accountant services agent.
| 4. | Purchases and Sales of Securities |
For the year ended October 31, 2021, purchases and sales of securities, other than U.S. Government securities and short-term securities, were $329,349,551 and $366,713,317, respectively. There were no purchases or sales of U.S. Government securities.
| 5. | Capital Stock Transactions |
Transactions in Class S, Class I, Class W and Class Z shares of Overseas Series were:
| CLASS S | FOR THE YEAR ENDED | FOR THE YEAR ENDED | ||||||||||||||
| 10/31/21 | 10/31/20 | |||||||||||||||
| SHARES | AMOUNT | SHARES | AMOUNT | |||||||||||||
| Sold | 203,183 | $ | 7,067,304 | 116,763 | $ | 2,889,142 | ||||||||||
| Reinvested | 38,267 | 1,220,718 | 95,968 | 2,480,784 | ||||||||||||
| Repurchased | (1,212,172 | ) | (42,632,734 | ) | (4,557,823 | ) | (111,752,746 | ) | ||||||||
| Total | (970,722 | ) | $ | (34,344,712 | ) | (4,345,092 | ) | $ | (106,382,820 | ) | ||||||
| CLASS I | FOR THE YEAR ENDED | FOR THE YEAR ENDED | ||||||||||||||
| 10/31/21 | 10/31/20 | |||||||||||||||
| SHARES | AMOUNT | SHARES | AMOUNT | |||||||||||||
| Sold | 1,642,817 | $ | 56,074,813 | * | 429,310 | $ | 10,653,421 | |||||||||
| Reinvested | 22,864 | 728,437 | 56,083 | 1,447,501 | ||||||||||||
| Repurchased | (415,731 | ) | (13,731,919 | ) | (1,642,269 | ) | (41,389,939 | ) | ||||||||
| Total | 1,249,950 | $ | 43,071,331 | (1,156,876 | ) | $ | (29,289,017 | ) | ||||||||
20
Overseas Series
Notes to Financial Statements (continued)
| 5. | Capital Stock Transactions (continued) |
| CLASS W | FOR THE YEAR ENDED | FOR THE YEAR ENDED | ||||||||||||||
| 10/31/21 | 10/31/20 | |||||||||||||||
| SHARES | AMOUNT | SHARES | AMOUNT | |||||||||||||
| Sold | 625,437 | $ | 21,735,662 | 6,597,679 | $ | 163,759,092 | ||||||||||
| Reinvested | 130,002 | 4,153,562 | 199,053 | 5,144,109 | ||||||||||||
| Repurchased | (1,625,314 | ) | (54,816,077 | ) | (1,501,706 | ) | (36,057,733 | ) | ||||||||
| Total | (869,875 | ) | $ | (28,926,853 | ) | 5,295,026 | $ | 132,845,468 | ||||||||
| CLASS Z | FOR THE YEAR ENDED | FOR THE YEAR ENDED | ||||||||||||||
| 10/31/21 | 10/31/20 | |||||||||||||||
| SHARES | AMOUNT | SHARES | AMOUNT | |||||||||||||
| Sold | 582,531 | $ | 19,364,606 | 692,891 | $ | 19,451,361 | ||||||||||
| Reinvested | 26,622 | 848,435 | 34,697 | 895,532 | ||||||||||||
| Repurchased | (62,475 | ) | (2,295,315 | ) | (164,998 | ) | (4,153,092 | ) | ||||||||
| Total | 546,678 | $ | 17,917,726 | 562,590 | $ | 16,193,801 | ||||||||||
*Includes subscriptions-in-kind of $22,669,944 from unaffiliated benefit plans that transferred their investments from a non- registered investment fund advised by the Advisor.
At October 31, 2021, the Advisor and its affiliates owned 0.8% of the Series.
| 6. | Line of Credit |
The Fund has entered into a 364-day, $25 million credit agreement (the “line of credit”) with Bank of New York Mellon. Each series of the Fund may borrow under the line of credit for temporary or emergency purposes, including funding shareholder redemptions and other short-term liquidity purposes. The Fund pays an annual fee on the unused commitment amount, payable quarterly, and is allocated among all the series of the Fund and included in miscellaneous expenses in the Statement of Operations for each series. The line of credit expires in September 2022 unless extended or renewed. During the year ended October 31, 2021, the Series did not borrow under the line of credit.
| 7. | Financial Instruments |
The Series may trade in instruments including written and purchased options, forward foreign currency exchange contracts and futures contracts and other derivatives in the normal course of investing activities to assist in managing exposure to various market risks. The Series may be subject to various elements of risk, which may involve, to a varying degree, elements of risk in excess of the amounts recognized for financial statement purposes. These risks include: the risk that changes in the value of a derivative may not correlate perfectly with the underlying asset, rate or index; counterparty credit risk related to over the counter derivative counterparties’ failure to perform under contract terms; liquidity risk related to the lack of a liquid market for these contracts allowing the fund to close out its position(s); and documentation risk relating to disagreement over contract terms. No such investments were held by the Series as of October 31, 2021.
| 8. | Foreign Securities |
Investing in securities of foreign companies and foreign governments involves special risks and considerations not typically associated with investing in securities of domestic companies and the U.S. Government. These risks include revaluation of currencies and future adverse political and economic developments. Moreover, securities of foreign companies and foreign governments and their markets may be less liquid and their prices more volatile than those of comparable domestic companies and the U.S. Government.
21
Overseas Series
Notes to Financial Statements (continued)
| 9. | Federal Income Tax Information |
The amount and characterization of certain income and capital gains to be distributed are determined in accordance with federal income tax regulations, which may differ from GAAP. These differences are primarily due to differing book and tax treatments in the timing of the recognition of net investment income or gains and losses, including foreign currency gains and losses, and passive foreign investment companies (PFICs). The Series may periodically make reclassifications among its capital accounts to reflect income and gains available for distribution (or available capital loss carryovers) under income tax regulations, without impacting the Series’ net asset value. Any such reclassifications are not reflected in the financial highlights.
The tax character of distributions paid were as follows:
| FOR THE YEAR ENDED 10/31/21 | FOR THE YEAR ENDED 10/31/20 | |||||||
| Ordinary income | $ | 7,300,109 | $ | 10,326,463 | ||||
At October 31, 2021, the identified cost of investments for federal income tax purposes, the resulting gross unrealized appreciation and depreciation, and the net unrealized appreciation were as follows:
| Cost for federal income tax purposes | $ | 638,265,684 | ||
| Unrealized appreciation | 176,413,405 | |||
| Unrealized depreciation | (29,528,038 | ) | ||
| Net unrealized appreciation | $ | 146,885,367 | ||
| Undistributed ordinary income | $ | 13,698,215 | ||
| Capital loss carryforward | $ | (386,498,932 | ) |
At October 31, 2021, the Series had net short-term capital loss carryforwards of $838,767 and net long-term capital loss carryforwards of $385,660,165, which may be carried forward indefinitely.
For the year ended October 31, 2021, the capital loss carryover utilized was $84,398,451.
| 10. | Market Event |
In March 2020, the World Health Organization declared COVID-19 (a novel coronavirus) to be a pandemic. The situation is dynamic. Global financial markets have experienced and may continue to experience significant volatility resulting from the spread of COVID-19. The global economy, the economies of certain nations and individual issuers have been and may continue to be adversely affected by COVID-19, particularly in light of the interconnectivity between economies and financial markets, all of which may negatively impact the Series’ performance. In addition, COVID-19 and governmental responses to COVID-19 may negatively impact the capabilities of the Series’ service providers and disrupt the Series’ operations. Management of the Series will continue to monitor the impact of COVID-19.
22
Overseas Series
Report of Independent Registered Public Accounting Firm
To the Board of Directors of Manning & Napier Fund, Inc. and Shareholders of Overseas Series
Opinion on the Financial Statements
We have audited the accompanying statement of assets and liabilities, including the investment portfolio, of Overseas Series (one of the series constituting Manning & Napier Fund, Inc., referred to hereafter as the “Fund”) as of October 31, 2021, the related statement of operations for the year ended October 31, 2021, the statement of changes in net assets for each of the two years in the period ended October 31, 2021, including the related notes, and the financial highlights for each of the periods indicated therein (collectively referred to as the “financial statements”). In our opinion, the financial statements present fairly, in all material respects, the financial position of the Fund as of October 31, 2021, the results of its operations for the year then ended, the changes in its net assets for each of the two years in the period ended October 31, 2021 and the financial highlights for each of the periods indicated therein in conformity with accounting principles generally accepted in the United States of America.
Basis for Opinion
These financial statements are the responsibility of the Fund’s management. Our responsibility is to express an opinion on the Fund’s financial statements based on our audits. We are a public accounting firm registered with the Public Company Accounting Oversight Board (United States) (PCAOB) and are required to be independent with respect to the Fund in accordance with the U.S. federal securities laws and the applicable rules and regulations of the Securities and Exchange Commission and the PCAOB.
We conducted our audits of these financial statements in accordance with the standards of the PCAOB. Those standards require that we plan and perform the audit to obtain reasonable assurance about whether the financial statements are free of material misstatement, whether due to error or fraud.
Our audits included performing procedures to assess the risks of material misstatement of the financial statements, whether due to error or fraud, and performing procedures that respond to those risks. Such procedures included examining, on a test basis, evidence regarding the amounts and disclosures in the financial statements. Our audits also included evaluating the accounting principles used and significant estimates made by management, as well as evaluating the overall presentation of the financial statements. Our procedures included confirmation of securities owned as of October 31, 2021 by correspondence with the custodian and brokers; when replies were not received from brokers, we performed other auditing procedures. We believe that our audits provide a reasonable basis for our opinion.
New York, New York
December 15, 2021
We have served as the auditor of one or more investment companies in Manning & Napier Mutual Funds since 1992.
23
Overseas Series
Supplemental Tax Information
(unaudited)
All reportings are based on financial information available as of the date of this annual report and, accordingly, are subject to change.
For federal income tax purposes, the Series reports for the current fiscal year $7,950,900 or, if different, the maximum amount allowable under the tax law, as qualified dividend income.
The Series has elected to pass through to its shareholders, foreign source income of $12,931,453 and foreign taxes paid of $995,303 for the year ended October 31, 2021.
24
Overseas Series
Directors’ and Officers’ Information
(unaudited)
The Statement of Additional Information provides additional information about the Fund’s directors and officers and can be obtained without charge by calling 1-800-466-3863, at www.manning-napier.com, or on the EDGAR Database on the SEC Internet web site (http://www.sec.gov). The following chart shows certain information about the Fund’s directors and officers, including their principal occupations during the last five years. Unless specific dates are provided, the individuals have held the listed positions for longer than five years.
Interested Director and Officer
| Name: | Paul Battaglia* | |
| Address: | 290 Woodcliff Drive Fairport, NY 14450 | |
| Age: | 43 | |
| Current Position(s) Held with Fund: | Principal Executive Officer, President, Chairman and Director | |
| Term of Office1 & Length of Time Served: | Indefinite – Chairman and Director since November 2018 | |
| Principal Occupation(s) During Past 5 Years: | Chief Financial Officer since 2018; Vice President of Finance (2016 – 2018); Director of Finance (2011 – 2016); Financial Analyst/Internal Auditor (2004- 2006) – Manning & Napier Advisors, LLC and affiliates Holds one or more of the following titles for various subsidiaries and affiliates: Chief Financial Officer | |
| Number of Portfolios Overseen within Fund Complex: | 15 | |
| Other Directorships Held Outside Fund Complex During Past 5 Years: | N/A |
Independent Directors
| Name: | Stephen B. Ashley | |
| Address: | 290 Woodcliff Drive Fairport, NY 14450 | |
| Age: | 81 | |
| Current Position(s) Held with Fund: | Director, Audit Committee Member, Governance & Nominating Committee Member | |
| Term of Office & Length of Time Served: | Indefinite – Since 1996 | |
| Principal Occupation(s) During Past 5 Years: | Chairman and Director since 1997; Chief Executive Officer (1997-2019) - Ashley Companies (property management and investment) | |
| Number of Portfolios Overseen within Fund Complex: | 15 | |
| Other Directorships Held Outside Fund Complex During Past 5 Years: | Ashley Companies since 1997 |
| Name: | Paul A. Brooke | |
| Address: | 290 Woodcliff Drive Fairport, NY 14450 | |
| Age: | 75 | |
| Current Position(s) Held with Fund: | Lead Independent Director, Audit Committee Member, Governance & Nominating Committee Chairman | |
| Term of Office & Length of Time Served: | Indefinite – Director, Audit Committee Member, Governance & Nominating Committee Member since 2007; Lead Independent Director since 2017 | |
| Principal Occupation(s) During Past 5 Years: | Managing Member since 1991 - PMSV Holdings LLC (investments); Managing Member (2010-2016) - Venbio (investments). | |
| Number of Portfolios Overseen within Fund Complex: | 15 | |
| Other Directorships Held Outside Fund Complex During Past 5 Years: | Incyte Corp. (biotech) (2000-2020); PureEarth (non-profit) since 2012; Cerus (biomedical) since 2016; Caelum BioSciences (biomedical) since 2018; Cheyne Capital International (investment)(2000-2017); |
25
Overseas Series
Directors’ and Officers’ Information
(unaudited)
Independent Directors (continued)
| Name: | John Glazer | |
| Address: | 290 Woodcliff Drive Fairport, NY 14450 | |
| Age: | 56 | |
| Current Position(s) Held with Fund: | Director, Audit Committee Member, Governance & Nominating Committee Member | |
| Term of Office & Length of Time Served: | Indefinite – Director, Audit Committee Member, Governance & Nominating Committee Member since February 2021 | |
| Principal Occupation(s) During Past 5 Years: | Chief Executive Officer since 2020 – Oikos Holdings LLC (Single-Family Office); Head of Corporate Development (2019-2020) – Caelum Biosciences (pharmaceutical development); Head of Private Investments (2015-2018) – AC Limited (Single-Family Office) | |
| Number of Portfolios Overseen within Fund Complex: | 15 | |
| Other Directorships Held Outside Fund Complex During Past 5 Years: | N/A |
| Name: | Margaret McLaughlin | |
| Address: | 290 Woodcliff Drive Fairport, NY 14450 | |
| Age: | 54 | |
| Current Position(s) Held with Fund: | Director, Audit Committee Member, Governance & Nominating Committee Member | |
| Term of Office & Length of Time Served: | Indefinite – Director, Audit Committee Member, Governance & Nominating Committee Member since February 2021 | |
| Principal Occupation(s) During Past 5 Years: | Consultant since 2020 – Bates Group (consultants); Consultant (2019- 2020) – Madison Dearborn Partners (private equity); General Counsel/CCO (2011-2019) – Kramer Van Kirk Credit Strategies L.P./Mariana Systems LLC (Investment Adviser/SaaS Technology) | |
| Number of Portfolios Overseen within Fund Complex: | 15 | |
| Other Directorships Held Outside Fund Complex During Past 5 Years: | N/A |
| Name: | Russell O. Vernon | |
| Address: | 290 Woodcliff Drive Fairport, NY 14450 | |
| Age: | 63 | |
| Current Position(s) Held with Fund: | Director, Audit Committee Member, Governance & Nominating Committee Chairman | |
| Term of Office & Length of Time Served: | Indefinite – Director, Audit Committee Member, Governance & Nominating Committee Member since April 2020; Governance & Nominating Committee Chairman since November 2020 | |
| Principal Occupation(s) During Past 5 Years: | Founder and General Partner (2009-2019) – BVM Capital Management (economic development) | |
| Number of Portfolios Overseen within Fund Complex: | 15 | |
| Other Directorships Held Outside Fund Complex During Past 5 Years: | Board Member, Vice Chairman and President since 2010 – Newburgh Armory Unity Center (military); Board Member and Executive Director since 2020 – National Purple Heart Honor Mission, Inc. (military); Board Member, Vice Chairman (2015-2020) – National Purple Heart Hall of Honor, Inc. (military) |
26
Overseas Series
Directors’ and Officers’ Information
(unaudited)
Independent Directors (continued)
| Name: | Chester N. Watson | |
| Address: | 290 Woodcliff Drive Fairport, NY 14450 | |
| Age: | 71 | |
| Current Position(s) Held with Fund: | Director, Audit Committee Chairman, Governance & Nominating Committee Member | |
| Term of Office & Length of Time Served: | Indefinite – Director, Audit Committee Member, Governance & Nominating Committee Member Since 2012; Audit Committee Chairman since 2013 | |
| Principal Occupation(s) During Past 5 Years: | General Auditor (2003-2011) - General Motors Company (auto manufacturer) | |
| Number of Portfolios Overseen within Fund Complex: | 15 | |
| Other Directorships Held Outside Fund Complex During Past 5 Years: | Rochester Institute of Technology (University) since 2005; Hudson Valley Center for Innovation, Inc. (New Business and Economic Development) since 2019; Town of Greenburgh, NY Planning Board (Municipal Government) (2015-2019); |
Officers:
| Name: | Elizabeth Craig | |
| Address: | 290 Woodcliff Drive Fairport, NY 14450 | |
| Age: | 34 | |
| Current Position(s) Held with Fund: | Corporate Secretary | |
| Term of Office1 & Length of Time Served: | Since 2016 | |
| Principal Occupation(s) During Past 5 Years: | Director of Fund Administration since 2021; Fund Regulatory Administration Manager (2018-2021); Fund Administration Manager (2015-2018); Mutual Fund Compliance Specialist (2009-2015) - Manning & Napier Advisors, LLC; Assistant Corporate Secretary (2011-2016) - Manning & Napier Fund, Inc.; Corporate Secretary, Director since 2019– Manning & Napier Investor Services, Inc. |
| Name: | Samantha Larew | |
| Address: | 290 Woodcliff Drive Fairport, NY 14450 | |
| Age: | 41 | |
| Current Position(s) Held with Fund: | Chief Compliance Officer and Anti-Money Laundering Compliance Officer | |
| Term of Office1 & Length of Time Served: | Chief Compliance Officer since 2019; Anti-Money Laundering Compliance Officer since 2018 | |
| Principal Occupation(s) During Past 5 Years: | Co-Director of Compliance since 2018; Compliance Communications Supervisor (2014-2018); Compliance Supervisor (2013-2014); Broker- Dealer Compliance Supervisor (2011-2013); Broker-Dealer Compliance Analyst (2010-2011) - Manning & Napier Advisors, LLC& Affiliates; Broker- Dealer Chief Compliance Officer since 2013; Broker-Dealer Assistant Corporate Secretary since 2011 – Manning & Napier Investor Services, Inc.; Compliance Analyst (2007-2009) – Wall Street Financial Group; Compliance Specialist (2003-2007) – Manning & Napier Advisors, LLC & Affiliates |
| Name: | Scott Morabito | |
| Address: | 290 Woodcliff Drive Fairport, NY 14450 | |
| Age: | 33 | |
| Current Position(s) Held with Fund: | Vice President | |
| Term of Office1 & Length of Time Served: | Vice President since 2019; Assistant Vice President (2017-2019) | |
| Principal Occupation(s) During Past 5 Years: | Managing Director, Client Service and Business Operations since 2021; Managing Director of Operations (2019-2021); Director of Funds Group (2017-2019); Fund Product and Strategy Manager (2014-2017); Senior Product and Strategy Analyst (2013-2014); Product and Strategy Analyst (2011-2013) - Manning & Napier Advisors, LLC; President, Director since 2018 – Manning & Napier Investor Services, Inc.; President, Exeter Trust Company since 2021; |
27
Overseas Series
Directors’ and Officers’ Information
(unaudited)
Officers: (continued)
| Name: | Troy Statczar | |
| Address: | 290 Woodcliff Drive Fairport, NY 14450 | |
| Age: | 50 | |
| Current Position(s) Held with Fund: | Principal Financial Officer, Treasurer | |
| Term of Office & Length of Time Served: | Principal Financial Officer and Treasurer since 2020 | |
| Principal Occupation(s) During Past 5 Years: | Senior Director, Foreside Treasurer Services since 2020 - Foreside Financial Group; Director of Fund Administration (2017-2019) - Thornburg Investment Management, Inc.; Director of U.S. Operations (2008-2017) - Henderson Global Investors N.A., Inc. |
| Name: | Sarah Turner | |
| Address: | 290 Woodcliff Drive Fairport, NY 14450 | |
| Age: | 39 | |
| Current Position(s) Held with Fund: | Chief Legal Officer; Assistant Corporate Secretary | |
| Term of Office & Length of Time Served: | Since 2018 | |
| Principal Occupation(s) During Past 5 Years: | Attorney since 2018 - Manning & Napier Advisors, LLC and affiliates; Counsel (2017-2018) – Harter Secrest and Emery LLP; Legal Counsel (2010-2017) – Manning & Napier Advisors, LLC and affiliates Holds one or more of the following titles for various affiliates: Corporate Secretary, General Counsel |
*Interested Director, within the meaning of the 1940 Act by reason of his positions with the Fund’s Advisor, Manning & Napier Advisors, LLC, and Distributor, Manning & Napier Investor Services, Inc.
1The term of office of all officers shall be one year and until their respective successors are chosen and qualified, or his or her earlier resignation or removal as provided in the Fund’s By-Laws.
28
{This page intentionally left blank}
29
Overseas Series
Literature Requests
(unaudited)
Proxy Voting Policies and Procedures
A description of the policies and procedures that the Fund uses to determine how to vote proxies relating to portfolio securities is available, without charge, upon request:
| By phone | 1-800-466-3863 |
| On the Securities and Exchange Commission’s (SEC) web site | http://www.sec.gov |
Proxy Voting Record
Information regarding how the Fund voted proxies relating to portfolio securities during the most recent 12-month period ended June 30th is available, without charge, upon request:
| By phone | 1-800-466-3863 |
| On the SEC’s web site | http://www.sec.gov |
Quarterly Portfolio Holdings
The Series’ complete schedule of portfolio holdings for the 1st and 3rd quarters of each fiscal year are provided on Form N-PORT, and are available, without charge, upon request:
| By phone | 1-800-466-3863 |
| On the SEC’s web site | http://www.sec.gov |
Prospectus and Statement of Additional Information (SAI)
For more information about any of the Manning & Napier Fund, Inc. Series, you may obtain a prospectus and SAI at www.manning- napier.com or by calling 1-(800) 466-3863. Before investing, carefully consider the objectives, risks, charges and expenses of the investment and read the prospectus carefully as it contains this and other information about the investment company. In addition, this information can be found on the SEC’s web site, http://www.sec.gov.
Additional information available at www.manning-napier.com
1. Fund Holdings - Month-End
2. Fund Holdings - Quarter-End
3. Shareholder Report - Annual
4. Shareholder Report - Semi-Annual
The Fund also offers electronic notification or “e-delivery” when certain documents are available on-line to be downloaded or reviewed. Direct shareholders can elect to receive electronic notification when shareholder reports, prospectus updates, and/or statements are available. If you do not currently have on-line access to your account, you can establish access by going to www.manning-napier.com, click on “Login” in the top corner of the page, and follow the prompts to self-enroll. Once enrolled, you can set your electronic notification preferences by clicking on the Account Options tab located within the green toolbar and then select E-Delivery Option. Should you have any questions on either how to establish on-line access or how to update your account settings, please contact Investor Services at 1-800-466-3863.
The Manning & Napier Fund, Inc. is managed by Manning & Napier Advisors, LLC. Manning & Napier Investor Services, Inc., an affiliate of Manning & Napier Advisors, LLC, is the distributor of the Fund shares.
MNOVS-10/21-AR
30
www.manning-napier.com
| Manning & Napier Fund, Inc. | |
| Pro-Blend® Conservative Term Series | |
| Pro-Blend® Moderate Term Series | |
| Pro-Blend® Extended Term Series | |
| Pro-Blend® Maximum Term Series |
Paper copies of the Series’ shareholder reports are no longer sent by mail, unless you specifically request them from the Series or from your financial intermediary, such as a broker-dealer or bank. Shareholder reports are available online. Each time a report is posted on the Series’ website you will be provided with a link to access the report online, either by mail (hard copy notice) or by email, if you have already signed up for electronic delivery of shareholder reports.
You may elect to receive all future shareholder reports in paper free of charge. If you invest through a financial intermediary, you can contact your financial intermediary to request that you continue to receive paper copies. If you invest directly with the Fund, you can inform the Fund that you wish to continue receiving paper copies by visiting www.manning-napier.com or calling 1-800-466-3863. Your election to receive reports in paper will apply to all funds held with your financial intermediary if you invest through a financial intermediary or all series of the Fund if you invest directly with the Fund.
Additionally, If you have not yet signed up for electronic delivery of shareholder reports and other Fund communications, you may do so by contacting your financial intermediary or, if you are a direct investor, by visiting www.manning-napier.com or calling 1-800-466-3863.
| | Independent Perspective | Real-World Solutions |
A Note from Our CEO
Dear Shareholder,
The obstacles were many, but this year, in so many ways, is a story of triumphant resilience only serving to spotlight just how much more there is to do.
Over the past eighteen months, we’ve endured a recession, a bear market, and a pandemic. Our collective perseverance is now paying off.
We are today experiencing a remarkable economic boom, a historic market rally, and continued medical innovation, all of which have turned a challenging period into one of optimism and hope.
At the same time, political and societal polarization are heightened, social justice concerns have justifiably come to the fore, and the precarious state of our environment presents almost unimaginable challenges for government, business, and finance.
This certainly is a moment of great consequence.
The kind of moment that questions all the rules. Economic rules in how we add value for each other, as well as for ourselves. Social rules in how we interact with each other. Environmental rules that can balance the current needs of emerging economies with the requirements for everyone in the future. Workplace rules in how we get the job done.
Our lives are being redefined, and our society, planet, workplaces, and industry must confront the challenges of the upcoming decade.
Markets reflect us. They mirror our collective thoughts, feelings, expectations, and beliefs – these new life rules.
As we go through this period of change, it will be uncertain and uncomfortable. For those unaccustomed to change, for those reliant on ‘set it and forget it’, these may seem like daunting questions, but there is a better way.
Success in an era of change demands flexibility, adaptability, and a roll-up-your-sleeves willingness to do the work.
For over 50 years, independent thinking and tireless work have underpinned every decision we’ve made on behalf of our investors. We invest for the long-term, we do not speculate. We make active decisions, and we invest with discipline, patience, and confidence. This is the only way we know, to remain true to our values and our fiduciary duty to you, the investors in our mutual funds.
You demand more. At Manning & Napier, we demand more of ourselves. Upon reflection of the year, we’re proud to have continued to deliver more.
We wish you safety and good health, and we appreciate your confidence in our firm and our approach.
| Sincerely,
Marc Mayer |
Corporate Headquarters | 290 Woodcliff Drive | Fairport, NY 14450 | (585) 325-6880 phone | (800) 551-0224 toll free | www.manning-napier.com
1
Fund Commentary
(unaudited)
Investment Objective
The Pro-Blend® Series are strategically allocated across stocks, bonds, and cash to balance growth, capital preservation, and income to fit a range of investor risk management priorities.
Performance Commentary
Global equity markets posted high double digit returns for the twelve-month period ending October 31, 2021 with US equities outpacing international markets, while fixed income markets experienced slightly negative returns. With respect to US equities, smaller-cap stocks generally outperformed larger-cap stocks, while growth and value stocks were roughly in line for large capitalization stocks and value notably outperformed growth in the small and mid-cap segments of the market. In terms of sectors, Energy and Financials experienced the highest returns while areas such as Utilities and Consumer Staples broadly lagged. On the fixed income side, treasury inflation protected securities and corporate bonds experienced the highest returns from a sector perspective, while shorter dated bonds were the highest returning segment of the market from a maturity perspective as a result of rising interest rates.
Each of the Pro-Blend Series Class S shares delivered positive returns over the period and outperformed their respective blended benchmarks.
Asset allocation positioning aided returns as the Series was generally overweight equities. Within equities, an overweight allocation to the Energy sector was the strongest contributor to relative returns for the period. As a reminder, we initiated positions in several oil related companies in early 2020 as the market was experiencing Hurdle Rate conditions (i.e., the industry was experiencing a supply/ demand imbalance). Since then, oil prices have rebounded significantly following the gradual reopening of key economies. While the fundamentals of the oil Hurdle Rate continue to track, the current wave of the COVID-19 delta variant and the recent UAE-Saudi conflict over OPEC production levels have weighed on investor sentiment. Furthermore, with oil prices rising, the risk of more supply coming back online and creating a supply/demand imbalance has risen. As a result, we’ve been gradually trimming exposure over the latter half of the fiscal year. With respect to fixed income, selection within corporate bonds, which includes a select allocation to high yield securities, contributed positively to relative returns.
In contrast, selection within the Health Care sector detracted from relative returns. Within the sector, Vertex Pharmaceuticals, a biotechnology company that engages in discovering, developing, manufacturing, and commercializing medicines for serious diseases, was among the largest detractors following several trial failures. Additionally, each of the Series was negatively impacted by a modest allocation to cash.
Looking ahead, our long-term outlook for growth remains challenged. Corporate debt levels are historically high, and while the consumer is relatively healthy all things considered, government borrowing remains elevated across the globe. Meanwhile, the demographic profiles of the major developed market economies are mixed at best. Aging demographics are reducing workforce growth, and economic growth in the process. As such, we believe today’s accelerated rate of economic growth is unsustainable, having been in part fueled by massive fiscal and monetary stimulus programs across the globe that are now beginning to recede. Overall, we expect the next step for global economic growth is more likely to be lower than higher from here.
Given today’s highly dynamic economic environment and building risks across financial markets, we believe investors should be particularly discerning. As always, we will continue to monitor the environment and remain opportunistic as we actively position client portfolios in what we believe are attractive long-term values.
Performance data quoted represents past performance and does not guarantee future results. The investment return and principal value of an investment will fluctuate, so that an investor’s shares, when redeemed, may be worth more or less than their original cost. Current performance may be higher or lower than that quoted; investors can obtain the most recent month-end performance at www.manning-napier.com or by calling (800) 466-3863.
Commentary prepared using data provided by FactSet. Analysis Manning & Napier. Commentary presented is relative to each Series’ respective blended benchmark. Additional information and associated disclosures can be found on the Performance Update pages contained in this report.
The data presented is for informational purposes only. It is not to be considered a specific stock recommendation.
All investments involve risks, including possible loss of principal. Because the fund invests in both stocks and bonds, the value of your investment will fluctuate in response to stock market movements and changes in interest rates. Investing in the fund will also involve a number of other risks, including issuer-specific risk, foreign investment risk, and small-cap/mid-cap risk. Investments in options and futures, like all derivatives, can be highly volatile and involve risks in addition to the risks of the underlying instrument on which the derivative is based, such as counterparty, correlation and liquidity risk. Also, the use of leverage increases exposure to the market and may magnify potential losses.
2
Performance Update as of October 31, 2021 - Pro-Blend® Conservative Term Series
(unaudited)
| AVERAGE ANNUAL TOTAL RETURNS AS OF OCTOBER 31, 2021 | |||
| ONE YEAR1 | FIVE YEAR | TEN YEAR | |
| Pro-Blend® Conservative Term Series - Class S2 | 10.99% | 6.62% | 5.50% |
| Pro-Blend® Conservative Term Series - Class I2 | 11.16% | 6.86% | 5.72% |
| Pro-Blend® Conservative Term Series - Class R2,3 | 10.81% | 6.37% | 5.23% |
| Pro-Blend® Conservative Term Series - Class L2,3 | 10.26% | 5.83% | 4.70% |
| Pro-Blend® Conservative Term Series - Class W2,4 | 11.84% | 7.06% | 5.72% |
| Bloomberg U.S. Intermediate Aggregate Bond Index5 | (0.64%) | 2.46% | 2.45% |
| Conservative Term Composite Benchmark6 | 10.43% | 6.76% | 5.89% |
The following graph compares the value of a $10,000 investment in the Pro-Blend® Conservative Term Series - Class S for the ten years ended October 31, 2021 to the Bloomberg U.S. Intermediate Aggregate Bond Index and Conservative Term Composite Benchmark.
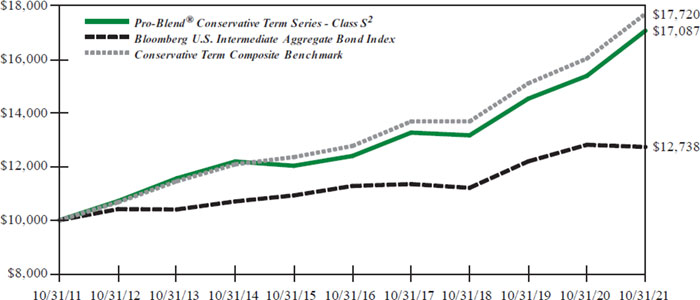
1The returns shown are based on net asset values calculated for shareholder transactions and may differ from the returns shown in the financial highlights, which reflect adjustments made to the net asset values in accordance with accounting principles generally accepted in the United States of America.
2The Series’ performance does not reflect the deduction of taxes that a shareholder would pay on fund distributions or the redemption of shares. The Series’ performance is historical and may not be indicative of future results. The performance returns shown are inclusive of the net expense ratio of the Series. For the year ended October 31, 2021, this net expense ratio was 0.87% for Class S, 0.62% for Class I, 1.05% for Class R, 1.58% for Class L and 0.10% for Class W. The gross expense ratio, which does not account for any voluntary or contractual waivers currently in effect, was 0.87% for Class S, 0.62% for Class I, 1.05% for Class R, 1.58% for Class L and 0.52% for Class W for the year ended October 31, 2021.
3For periods through the inception of Class L on January 4, 2010 and Class R on June 30, 2010, the performance is hypothetical and is based on the historical performance of the Class S shares adjusted for the respective class’ charges and expenses.
4For periods through April 1, 2019 (the inception date of the Class W shares), performance for the Class W shares is based on the historical performance of the Class S shares. Because the Class W shares invest in the same portfolio of securities as the Class S shares, performance will be different only to the extent that the Class S shares have a higher expense ratio.
5The Bloomberg U.S. Intermediate Aggregate Bond Index is an unmanaged, market-value weighted index of U.S. domestic investment-grade debt issues, including government, corporate, asset-backed and mortgage-backed securities, with maturities greater than one year but less than ten years. Index returns do not reflect any fees or expenses. Index returns provided by Interactive Data. Index data referenced herein is the property of Bloomberg Finance L.P. and its affiliates (“Bloomberg”), and/or its third party suppliers and has been licensed for use by Manning & Napier. Bloomberg and its third party suppliers accept no liability in connection with its use. Data provided is not a representation or warranty, express or implied, as to the ability of any index to accurately represent the asset class or market sector that it purports to represent and none of these parties shall have any liability for any errors, omissions, or interruptions of any index or the data included therein. For additional disclosure information, please see: https://go.manning-napier.com/benchmark-provisions.
3
Performance Update as of October 31, 2021 - Pro-Blend® Conservative Term Series (unaudited)
6The Conservative Term Composite Benchmark is a blend of the Russell 3000® Index (Russell 3000), MSCI ACWI ex USA Index (ACWIxUS), and Bloomberg U.S. Intermediate Aggregate Bond Index (BIAB) in the following weightings: 15% Russell 3000, 5% ACWIxUS, and 80% BIAB through 05/31/2012; and 22% Russell 3000, 8% ACWIxUS, and 70% BIAB beginning 06/01/2012. Russell 3000 is an unmanaged index that consists of 3,000 of the largest U.S. companies based on total market capitalization. Index returns are based on a market capitalization-weighted average of relative price changes of the component stocks plus dividends whose reinvestments are compounded daily. Index returns provided by Bloomberg. ACWIxUS is designed to measure large and mid-cap representation across 22 of 23 Developed Markets countries (excluding the U.S.) and 27 Emerging Markets countries. The Index is denominated in U.S. dollars. The Index returns are net of withholding taxes. They assume daily reinvestment of net dividends thus accounting for any applicable dividend taxation. Index returns provided by Bloomberg. BIAB is an unmanaged, market value-weighted index of U.S. domestic investment-grade debt issues, including government, corporate, asset-backed, and mortgage-backed securities with maturities of greater than one year but less than ten years. Index returns provided by Interactive Data. The returns of the indices do not reflect any fees or expenses. Returns provided are calculated monthly using a blended allocation. Because the fund’s asset allocation will vary over time, the composition of the fund’s portfolio may not match the composition of the Conservative Term Composite Benchmark. Index data referenced herein is the property of each index sponsor (London Stock Exchange Group plc and its group undertakings (Russell), MSCI, and Bloomberg), their affiliates (“Index Sponsors”) and/or their third party suppliers and has been licensed for use by Manning & Napier. The Index Sponsors and their third party suppliers accept no liability in connection with its use. Data provided is not a representation or warranty, express or implied, as to the ability of any index to accurately represent the asset class or market sector that it purports to represent and none of these parties shall have any liability for any errors, omissions, or interruptions of any index or the data included therein. For additional disclosure information, please see: https://go.manning-napier.com/ benchmark-provisions.
4
Shareholder Expense Example - Pro-Blend® Conservative Term Series
(unaudited)
As a shareholder of the Series, you incur ongoing costs, including management fees, shareholder service fees and other Series expenses. This example is intended to help you understand your ongoing costs (in dollars) of investing in the Series and to compare these costs with the ongoing costs of investing in other mutual funds.
The example is based on an investment of $1,000 invested in each class at the beginning of the period and held for the entire period (May 1, 2021 to October 31, 2021).
Actual Expenses
The Actual lines of the table below provide information about actual account values and actual expenses. You may use the information in these lines, together with the amount you invested, to estimate the expenses that you paid over the period. Simply divide your account value by $1,000 (for example, an $8,600 account value divided by $1,000 = 8.6), then multiply the result by the number in the Actual line for the Class in which you have invested under the heading entitled “Expenses Paid During Period” to estimate the expenses you paid on your account during this period.
Hypothetical Example for Comparison Purposes
The Hypothetical lines of each class in the table below provide information about hypothetical account values and hypothetical expenses based on the Class’ actual expense ratio and an assumed rate of return of 5% per year before expenses, which is not the Class’ actual return. The hypothetical account values and expenses may not be used to estimate the actual ending account balance or expenses you paid during the period. You may use this information to compare the ongoing costs of investing in a class of the Series and other funds. To do so, compare this 5% hypothetical example for the Class in which you have invested with the 5% hypothetical examples that appear in the shareholder reports of the other funds.
Please note that the expenses shown in the table are meant to highlight your ongoing costs only and do not reflect any transaction costs, such as sales charges (loads), redemption fees, or exchange fees that you may incur in other mutual funds. Therefore, the second line of the table is useful in comparing ongoing costs only, and will not help you determine the relative total costs of owning different funds.
| BEGINNING ACCOUNT VALUE 5/1/21 | ENDING ACCOUNT VALUE 10/31/21 | EXPENSES PAID DURING PERIOD* 5/1/21 - 10/31/21 | ANNUALIZED EXPENSE RATIO | |
| Class S | ||||
| Actual | $1,000.00 | $1,017.50 | $4.37 | 0.86% |
Hypothetical (5% return before expenses) | $1,000.00 | $1,020.87 | $4.38 | 0.86% |
| Class I | ||||
| Actual | $1,000.00 | $1,018.60 | $3.05 | 0.60% |
Hypothetical (5% return before expenses) | $1,000.00 | $1,022.18 | $3.06 | 0.60% |
| Class R | ||||
| Actual | $1,000.00 | $1,016.70 | $5.34 | 1.05% |
Hypothetical (5% return before expenses) | $1,000.00 | $1,019.91 | $5.35 | 1.05% |
| Class L | ||||
| Actual | $1,000.00 | $1,014.40 | $7.97 | 1.57% |
Hypothetical (5% return before expenses) | $1,000.00 | $1,017.29 | $7.98 | 1.57% |
| Class W | ||||
| Actual | $1,000.00 | $1,021.40 | $0.51 | 0.10% |
Hypothetical (5% return before expenses) | $1,000.00 | $1,024.70 | $0.51 | 0.10% |
5
Shareholder Expense Example - Pro-Blend® Conservative Term Series
(unaudited)
*Expenses are equal to each Class’ annualized expense ratio (for the six-month period), multiplied by the average account value over the period, multiplied by 184/365 (to reflect the one-half year period). Expenses are based on the most recent fiscal half year; therefore, the expense ratios stated above may differ from the expense ratios stated in the financial highlights, which are based on one-year data. The Class’ total return would have been lower had certain expenses not been waived or reimbursed during the period.
6
Portfolio Composition - Pro-Blend® Conservative Term Series - as of October 31, 2021
(unaudited)
| Asset Allocation1 |
1 As a percentage of net assets. 2 A U.S. Treasury Note is an intermediate long-term obligation of the U.S. Treasury issued with a maturity period between one and ten years. |
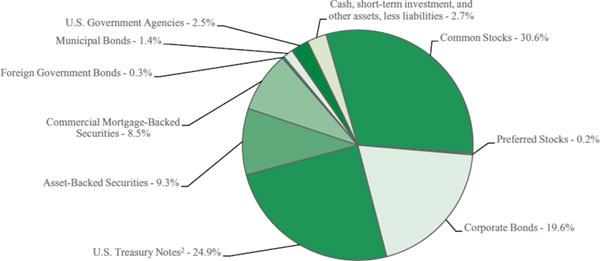
| Sector Allocation3 | |
| Industrials | 7.5% |
| Energy | 6.0% |
| Financials | 5.9% |
| Communication Services | 5.8% |
| Real Estate | 5.3% |
| Health Care | 5.1% |
| Information Technology | 4.7% |
| Consumer Discretionary | 4.1% |
| Consumer Staples | 3.4% |
| Materials | 2.9% |
| 3Including common stocks, preferred stocks and corporate bonds, as a percentage of total investments. |
| Top Five Stock Holdings4 | |
| Amazon.com, Inc. | 1.0% |
| Alphabet, Inc. - Class A | 1.0% |
| Johnson & Johnson | 0.9% |
| Meta Platforms, Inc. - Class A | 0.8% |
| Unilever plc - ADR (United Kingdom) | 0.7% |
| 4As a percentage of total investments. | |
| Top Five Bond Holdings5 | |
| U.S. Treasury Note, 2.50%, 5/15/2024 | 7.0% |
| U.S. Treasury Note, 2.125%, 5/15/2025 | 7.0% |
| U.S. Treasury Note, 1.75%, 5/15/2023 | 5.9% |
| U.S. Treasury Note, 1.625%, 5/15/2026 | 5.0% |
| Tencent Holdings Ltd. (China), 3.975%, 4/11/2029 | 1.3% |
| 5As a percentage of total investments. |
7
Investment Portfolio - October 31, 2021
| PRO-BLEND® CONSERVATIVE TERM SERIES | SHARES/ PRINCIPAL AMOUNT1 | VALUE (NOTE 2) | |||||
| COMMON STOCKS - 30.6% | |||||||
| Communication Services - 3.4% | |||||||
| Diversified Telecommunication Services - 0.3% | |||||||
| Radius Global Infrastructure, Inc. - Class A* | 15,206 | $ | 263,520 | ||||
| Verizon Communications, Inc. | 25,202 | 1,335,454 | |||||
| 1,598,974 | |||||||
| Entertainment - 0.8% | |||||||
| Electronic Arts, Inc. | 6,876 | 964,359 | |||||
| Sea Ltd. - ADR (Taiwan)* | 7,454 | 2,560,971 | |||||
| Ubisoft Entertainment S.A. - ADR (France)* | 70,640 | 736,775 | |||||
| 4,262,105 | |||||||
| Interactive Media & Services - 1.7% | |||||||
| Alphabet, Inc. - Class A* | 1,707 | 5,054,290 | |||||
| Meta Platforms, Inc. - Class A* | 12,977 | 4,198,968 | |||||
| 9,253,258 | |||||||
| Media - 0.6% | |||||||
| Charter Communications, Inc. - Class A* | 2,173 | 1,466,536 | |||||
| Comcast Corp. - Class A | 28,518 | 1,466,681 | |||||
| 2,933,217 | |||||||
| Total Communication Services | 18,047,554 | ||||||
| Consumer Discretionary - 2.9% | |||||||
Automobiles - 0.1% Honda Motor Co. Ltd. - ADR (Japan) | 20,511 | 606,715 | |||||
| Hotels, Restaurants & Leisure - 0.5% | |||||||
| Expedia Group, Inc.* | 9,946 | 1,635,222 | |||||
| Hyatt Hotels Corp. - Class A* | 12,179 | 1,037,651 | |||||
| 2,672,873 | |||||||
| Household Durables - 0.5% | |||||||
| Nikon Corp. (Japan) | 66,500 | 733,213 | |||||
| Sony Group Corp. - ADR (Japan) | 17,349 | 2,008,841 | |||||
| 2,742,054 | |||||||
Internet & Direct Marketing Retail - 1.0% Amazon.com, Inc.* | 1,533 | 5,169,935 | |||||
| Multiline Retail - 0.4% | |||||||
| Dollar General Corp. | 4,978 | 1,102,726 | |||||
| Dollar Tree, Inc.* | 8,810 | 949,366 | |||||
| 2,052,092 | |||||||
| Specialty Retail - 0.4% | |||||||
| The Home Depot, Inc. | 5,367 | 1,995,129 | |||||
| Total Consumer Discretionary | 15,238,798 | ||||||
| Consumer Staples - 3.4% | |||||||
| Beverages - 0.7% | |||||||
| The Coca-Cola Co. | 31,605 | 1,781,574 | |||||
| Diageo plc (United Kingdom) | 14,468 | 719,807 | |||||
| Heineken N.V. - ADR (Netherlands) | 18,013 | 1,003,865 | |||||
| 3,505,246 | |||||||
| SHARES/ PRINCIPAL AMOUNT1 | VALUE (NOTE 2) | ||||||
| COMMON STOCKS (continued) | |||||||
| Consumer Staples (continued) | |||||||
Food & Staples Retailing - 0.4% Walmart, Inc. | 13,388 | $ | 2,000,435 | ||||
| Food Products - 0.9% | |||||||
| The Kraft Heinz Co. | 12,232 | 439,006 | |||||
| Mondelez International, Inc. - Class A | 44,993 | 2,732,875 | |||||
| Nestle S.A. (Switzerland) | 12,345 | 1,628,395 | |||||
| 4,800,276 | |||||||
| Household Products - 0.6% | |||||||
| Colgate-Palmolive Co. | 9,230 | 703,233 | |||||
| Kimberly-Clark Corp. | 3,886 | 503,198 | |||||
| The Procter & Gamble Co. | 13,428 | 1,920,070 | |||||
| 3,126,501 | |||||||
| Personal Products - 0.7% | |||||||
| Unilever plc - ADR (United Kingdom) | 67,324 | 3,607,220 | |||||
| Tobacco - 0.1% | |||||||
| British American Tobacco plc - ADR (United Kingdom) | 19,577 | 683,629 | |||||
| Total Consumer Staples | 17,723,307 | ||||||
| Energy - 1.2% | |||||||
| Oil, Gas & Consumable Fuels - 1.2% | |||||||
| BP plc - ADR (United Kingdom) | 13,876 | 399,490 | |||||
| Cameco Corp. (Canada) | 51,774 | 1,258,108 | |||||
| ConocoPhillips | 16,551 | 1,232,884 | |||||
| EQT Corp.* | 53,559 | 1,066,360 | |||||
| Exxon Mobil Corp. | 13,295 | 857,129 | |||||
| Jonah Energy Parent LLC*2 | 2,353 | 147,062 | |||||
| Petroleo Brasileiro S.A. - ADR (Brazil) | 62,068 | 596,473 | |||||
| Royal Dutch Shell plc - Class B - ADR (Netherlands) | 6,344 | 290,809 | |||||
| Total Energies SE - ADR (France) | 8,505 | 426,186 | |||||
| Total Energy | 6,274,501 | ||||||
| Financials - 2.2% | |||||||
| Banks - 0.8% | |||||||
| Citigroup, Inc. | 16,067 | 1,111,194 | |||||
| JPMorgan Chase & Co. | 11,946 | 2,029,506 | |||||
| U.S. Bancorp | 15,720 | 949,016 | |||||
| 4,089,716 | |||||||
| Capital Markets - 1.0% | |||||||
| Intercontinental Exchange, Inc. | 17,007 | 2,354,789 | |||||
| Moody’s Corp. | 5,304 | 2,143,611 | |||||
| S&P Global, Inc. | 1,586 | 752,018 | |||||
| 5,250,418 | |||||||
| Insurance - 0.4% | |||||||
| Chubb Ltd. | 4,255 | 831,342 | |||||
| W. R. Berkley Corp. | 15,113 | 1,202,995 | |||||
| 2,034,337 | |||||||
| Total Financials | 11,374,471 | ||||||
The accompanying notes are an integral part of the financial statements.
8
Investment Portfolio - October 31, 2021
| PRO-BLEND® CONSERVATIVE TERM SERIES | SHARES/ PRINCIPAL AMOUNT1 | VALUE (NOTE 2) | |||||
| COMMON STOCKS (continued) | |||||||
Health Care - 4.6% Biotechnology - 1.3% | |||||||
| BioMarin Pharmaceutical, Inc.* | 22,539 | $ | 1,785,765 | ||||
| Gilead Sciences, Inc. | 11,550 | 749,364 | |||||
| Seagen, Inc.* | 12,278 | 2,164,980 | |||||
| Vertex Pharmaceuticals, Inc.* | 11,465 | 2,120,222 | |||||
| 6,820,331 | |||||||
| Health Care Equipment & Supplies - 0.9% | |||||||
| Alcon, Inc. (Switzerland) | 26,336 | 2,195,369 | |||||
| IDEXX Laboratories, Inc.* | 1,640 | 1,092,470 | |||||
| Koninklijke Philips N.V. (Netherlands) | 9,114 | 430,636 | |||||
| Medtronic plc | 8,327 | 998,074 | |||||
| 4,716,549 | |||||||
| Life Sciences Tools & Services - 0.2% | |||||||
| Thermo Fisher Scientific, Inc. | 1,672 | 1,058,493 | |||||
| Pharmaceuticals - 2.2% | |||||||
| Bristol-Myers Squibb Co. | 16,524 | 965,002 | |||||
| Johnson & Johnson | 27,590 | 4,493,859 | |||||
| Merck & Co., Inc. | 17,414 | 1,533,303 | |||||
| Novartis AG - ADR (Switzerland) | 35,282 | 2,919,938 | |||||
| Sanofi - ADR (France) | 18,142 | 914,901 | |||||
| Takeda Pharmaceutical Co. Ltd. - ADR (Japan) | 30,190 | 423,264 | |||||
| Zoetis, Inc. | 2,621 | 566,660 | |||||
| 11,816,927 | |||||||
| Total Health Care | 24,412,300 | ||||||
| Industrials - 3.2% | |||||||
| Aerospace & Defense - 0.4% | |||||||
| General Dynamics Corp. | 3,045 | 617,374 | |||||
| Lockheed Martin Corp. | �� | 2,251 | 748,052 | ||||
| Northrop Grumman Corp. | 1,427 | 509,753 | |||||
| 1,875,179 | |||||||
| Airlines - 0.2% | |||||||
| Ryanair Holdings plc - ADR (Ireland)* | 9,065 | 1,028,968 | |||||
| Building Products - 0.1% | |||||||
| Johnson Controls International plc. | 10,264 | 753,070 | |||||
| Commercial Services & Supplies - 0.3% | |||||||
| Copart, Inc.* | 6,714 | 1,042,617 | |||||
| Waste Management, Inc. | 5,035 | 806,758 | |||||
| 1,849,375 | |||||||
| Electrical Equipment - 0.3% | |||||||
| Eaton Corp. plc. | 5,030 | 828,743 | |||||
| Emerson Electric Co. | 7,789 | 755,611 | |||||
| 1,584,354 | |||||||
| Industrial Conglomerates - 0.4% | |||||||
| 3M Co. | 5,320 | 950,578 | |||||
| Honeywell International, Inc. | 6,295 | 1,376,213 | |||||
| 2,326,791 | |||||||
| SHARES/ PRINCIPAL AMOUNT1 | VALUE (NOTE 2) | ||||||
| COMMON STOCKS (continued) | |||||||
| Industrials (continued) | |||||||
| Machinery - 0.5% | |||||||
| Caterpillar, Inc. | 5,446 | $ | 1,111,039 | ||||
| Cummins, Inc. | 2,085 | 500,066 | |||||
| Illinois Tool Works, Inc. | 3,407 | 776,353 | |||||
| 2,387,458 | |||||||
| Professional Services - 0.2% | |||||||
| Insperity, Inc. | 8,697 | 1,087,125 | |||||
| Road & Rail - 0.8% | |||||||
| Canadian National Railway Co. (Canada) | 13,862 | 1,842,398 | |||||
| Norfolk Southern Corp. | 3,478 | 1,019,228 | |||||
| Union Pacific Corp. | 5,065 | 1,222,691 | |||||
| 4,084,317 | |||||||
| Total Industrials | 16,976,637 | ||||||
| Information Technology - 4.5% | |||||||
| Communications Equipment - 0.3% | |||||||
| Cisco Systems, Inc. | 31,256 | 1,749,398 | |||||
| IT Services - 1.7% | |||||||
| Automatic Data Processing, Inc. | 3,808 | 854,858 | |||||
| International Business Machines Corp. | 7,341 | 918,359 | |||||
| Mastercard, Inc. - Class A | 7,575 | 2,541,564 | |||||
| PayPal Holdings, Inc.* | 7,925 | 1,843,275 | |||||
| Switch, Inc. - Class A | 17,303 | 437,420 | |||||
| Visa, Inc. - Class A | 11,939 | 2,528,322 | |||||
| 9,123,798 | |||||||
| Semiconductors & Semiconductor Equipment - 0.9% | |||||||
| Analog Devices, Inc. | 3,888 | 674,529 | |||||
| Intel Corp. | 28,414 | 1,392,286 | |||||
| NVIDIA Corp. | 4,565 | 1,167,134 | |||||
| QUALCOMM, Inc. | 8,700 | 1,157,448 | |||||
| 4,391,397 | |||||||
| Software - 1.6% | |||||||
| Microsoft Corp. | 10,271 | 3,406,069 | |||||
| Oracle Corp. | 18,045 | 1,731,237 | |||||
| salesforce.com, Inc.* | 7,560 | 2,265,657 | |||||
| ServiceNow, Inc.* | 1,725 | 1,203,636 | |||||
| 8,606,599 | |||||||
| Total Information Technology | 23,871,192 | ||||||
| Materials - 2.2% | |||||||
| Chemicals - 0.9% | |||||||
| Air Liquide S.A. - ADR (France) | 43,987 | 1,470,046 | |||||
| FMC Corp. | 22,136 | 2,014,597 | |||||
| Linde plc (United Kingdom) | 3,907 | 1,247,114 | |||||
| 4,731,757 | |||||||
| Construction Materials - 0.1% | |||||||
| CRH plc - ADR (Ireland) | 10,726 | 514,204 | |||||
| Containers & Packaging - 0.4% | |||||||
| Graphic Packaging Holding Co. | 99,588 | 1,984,789 | |||||
The accompanying notes are an integral part of the financial statements.
9
Investment Portfolio - October 31, 2021
| PRO-BLEND® CONSERVATIVE TERM SERIES | SHARES/ PRINCIPAL AMOUNT1 | VALUE (NOTE 2) | |||||
| COMMON STOCKS (continued) | |||||||
| Materials (continued) | |||||||
| Metals & Mining - 0.8% | |||||||
| Agnico Eagle Mines Ltd. (Canada) | 13,446 | $ | 713,311 | ||||
| Barrick Gold Corp. (Canada) | 40,232 | 739,062 | |||||
| BHP Group plc - ADR (Australia) | 17,835 | 944,898 | |||||
| Newmont Corp. | 22,706 | 1,226,124 | |||||
| Rio Tinto plc - ADR (Australia) | 10,871 | 687,808 | |||||
| 4,311,203 | |||||||
| Total Materials | 11,541,953 | ||||||
| Real Estate - 3.0% | |||||||
| Equity Real Estate Investment Trusts (REITS) - 3.0% | |||||||
| Agree Realty Corp. | 1,561 | 110,925 | |||||
| American Campus Communities, Inc. | 4,551 | 244,480 | |||||
| American Homes 4 Rent - Class A | 8,520 | 345,912 | |||||
| American Tower Corp. | 5,440 | 1,533,917 | |||||
| Apple Hospitality REIT, Inc. | 15,532 | 244,008 | |||||
| AvalonBay Communities, Inc. | 1,026 | 242,834 | |||||
| Brandywine Realty Trust. | 9,649 | 127,849 | |||||
| Camden Property Trust. | 1,342 | 218,880 | |||||
| CareTrust REIT, Inc. | 4,829 | 100,202 | |||||
| Community Healthcare Trust, Inc. | 4,008 | 191,743 | |||||
| Cousins Properties, Inc. | 7,377 | 292,203 | |||||
| Digital Realty Trust, Inc. | 2,154 | 339,923 | |||||
| Douglas Emmett, Inc. | 3,449 | 112,713 | |||||
| Duke Realty Corp. | 6,801 | 382,488 | |||||
| Equinix, Inc. | 2,403 | 2,011,479 | |||||
| Equity LifeStyle Properties, Inc. | 3,691 | 311,926 | |||||
| Essex Property Trust, Inc. | 900 | 305,937 | |||||
| Extra Space Storage, Inc. | 1,400 | 276,318 | |||||
| Flagship Communities REIT | 8,307 | 165,891 | |||||
| Getty Realty Corp. | 4,149 | 133,266 | |||||
| Healthcare Trust of America, Inc. - Class A | 3,859 | 128,852 | |||||
| Healthpeak Properties, Inc. | 3,503 | 124,392 | |||||
| Hibernia REIT plc (Ireland) | 55,073 | 80,217 | |||||
| Innovative Industrial Properties, Inc. | 695 | 182,848 | |||||
| Invitation Homes, Inc. | 11,125 | 458,906 | |||||
| Kilroy Realty Corp. | 2,706 | 182,330 | |||||
| Lamar Advertising Co. - Class A | 841 | 95,201 | |||||
| Life Storage, Inc. | 1,435 | 192,017 | |||||
| Mid-America Apartment Communities, Inc. | 1,753 | 357,980 | |||||
| NexPoint Residential Trust, Inc. | 1,852 | 131,146 | |||||
| Prologis, Inc. | 8,380 | 1,214,765 | |||||
| Public Storage | 1,666 | 553,412 | |||||
| Realty Income Corp. | 1,031 | 73,644 | |||||
| Rexford Industrial Realty, Inc. | 4,936 | 331,699 | |||||
| SBA Communications Corp. | 8,061 | 2,783,705 | |||||
| Sun Communities, Inc. | 2,394 | 469,176 | |||||
| Terreno Realty Corp. | 2,014 | 147,284 | |||||
| UDR, Inc. | 5,129 | 284,813 | |||||
SHARES/ PRINCIPAL AMOUNT1 | VALUE (NOTE 2) | ||||||
| COMMON STOCKS (continued) | |||||||
| Real Estate (continued) | |||||||
| Equity Real Estate Investment Trusts (REITS) (continued) | |||||||
| Ventas, Inc. | 1,980 | $ | 105,673 | ||||
| Welltower, Inc. | 2,340 | 188,136 | |||||
| Total Real Estate | 15,779,090 | ||||||
TOTAL COMMON STOCKS (Identified Cost $122,937,896) | 161,239,803 | ||||||
| PREFERRED STOCKS - 0.2% | |||||||
Information Technology - 0.2% Software - 0.2% | |||||||
| Greenidge Generation Holdings, Inc., 8.50%, 10/31/2026 | 10,500 | 260,400 | |||||
| Synchronoss Technologies, Inc., 8.375%, 6/30/2026 | 21,100 | 510,198 | |||||
| 770,598 | |||||||
| Materials - 0.0%## | |||||||
| Metals & Mining - 0.0%## | |||||||
| Ramaco Resources, Inc., 9.00%, 7/30/2026 | 8,009 | 213,840 | |||||
TOTAL PREFERRED STOCKS (Identified Cost $991,919) | 984,438 | ||||||
| CORPORATE BONDS - 19.6% | |||||||
| Non-Convertible Corporate Bonds- 19.6% | |||||||
| Communication Services - 2.3% Diversified Telecommunication Services - 1.0% | |||||||
| Lumen Technologies, Inc., 7.50%, 4/1/2024 | 470,000 | 515,825 | |||||
| Verizon Communications, Inc., 4.272%, 1/15/2036 | 4,290,000 | 5,018,298 | |||||
| 5,534,123 | |||||||
| Interactive Media & Services - 1.3% | |||||||
| Tencent Holdings Ltd. (China), 3.975%, 4/11/20293 | 6,195,000 | 6,756,640 | |||||
| Total Communication Services | 12,290,763 | ||||||
| Consumer Discretionary - 1.2% | |||||||
| Automobiles - 0.1% | |||||||
| Ford Motor Co., 9.00%, 4/22/2025 | 445,000 | 535,112 | |||||
| Hotels, Restaurants & Leisure - 0.3% | |||||||
| Expedia Group, Inc., 3.25%, 2/15/2030 | 1,690,000 | 1,738,103 | |||||
| Household Durables - 0.1% | |||||||
| STL Holding Co. LLC, 7.50%, 2/15/20263 | 250,000 | 261,875 | |||||
The accompanying notes are an integral part of the financial statements.
10
Investment Portfolio - October 31, 2021
| PRO-BLEND® CONSERVATIVE TERM SERIES | SHARES/ PRINCIPAL AMOUNT1 | VALUE (NOTE 2) | |||||
| CORPORATE BONDS (continued) | |||||||
| Non-Convertible Corporate Bonds (continued) | |||||||
| Consumer Discretionary (continued) | |||||||
| Internet & Direct Marketing Retail - 0.7% | |||||||
| Alibaba Group Holding Ltd. (China), 4.00%, 12/6/2037 | 3,270,000 | $ | 3,543,979 | ||||
| Total Consumer Discretionary | 6,079,069 | ||||||
| Energy - 4.8% | |||||||
| Energy Equipment & Services - 0.1% | |||||||
| Tidewater, Inc., 8.50%, 11/16/2026 | 500,000 | 499,595 | |||||
| Oil, Gas & Consumable Fuels - 4.7% | |||||||
| BP Capital Markets America, Inc., 3.06%, 6/17/2041 | 4,470,000 | 4,506,293 | |||||
| Brooge Petroleum and Gas | |||||||
| Investment Co. FZE (United Arab Emirates), 8.50%, 9/24/20253 | 522,500 | 534,256 | |||||
| Cenovus Energy, Inc. (Canada),6.75%, 11/15/2039 | 3,900,000 | 5,339,059 | |||||
| Energy Transfer LP, 6.50%, 2/1/2042 | 4,170,000 | 5,428,057 | |||||
| Kinder Morgan Energy Partners LP,6.95%, 1/15/2038 | 3,330,000 | 4,691,132 | |||||
| Navigator Holdings Ltd., 8.00%, 9/10/20253 | 350,000 | 365,750 | |||||
| PetroTal Corp. (Peru), 12.00%, 2/16/20243 | 500,000 | 525,000 | |||||
| The Williams Companies, Inc., 2.60%, 3/15/2031 | 3,580,000 | 3,589,147 | |||||
| 24,978,694 | |||||||
| Total Energy | 25,478,289 | ||||||
| Financials - 3.7% | |||||||
| Banks - 2.2% | |||||||
| Bank of America Corp., 6.11%, 1/29/2037 | 2,090,000 | 2,823,852 | |||||
| Citigroup, Inc., 4.45%, 9/29/2027 | 3,020,000 | 3,387,682 | |||||
| JPMorgan Chase & Co., (U.S. Secured | |||||||
| Overnight Financing Rate + 2.515%),2.956%, 5/13/20314 | 4,090,000 | 4,224,518 | |||||
| Lloyds Bank plc (United Kingdom) (3mo. LIBOR US + 11.756%), 12.00%3,4,5 | 490,000 | 504,087 | |||||
| Popular, Inc. (Puerto Rico), 6.125%, 9/14/2023 | 485,000 | 517,841 | |||||
| 11,457,980 | |||||||
| Capital Markets - 0.7% | |||||||
| Blackstone Secured Lending Fund,2.75%, 9/16/2026 | 1,770,000 | 1,786,344 | |||||
| Owl Rock Technology Finance Corp.,3.75%, 6/17/20263 | 1,780,000 | 1,858,181 | |||||
| 3,644,525 | |||||||
| Consumer Finance - 0.3% | |||||||
| Navient Corp., 6.75%, 6/25/2025 | 485,000 | 533,776 | |||||
| SLM Corp., 5.125%, 4/5/2022 | 405,000 | 410,873 | |||||
SHARES/ PRINCIPAL AMOUNT1 | VALUE (NOTE 2) | ||||||
| CORPORATE BONDS (continued) | |||||||
| Non-Convertible Corporate Bonds (continued) | |||||||
| Financials (continued) | |||||||
| Consumer Finance (continued) | |||||||
| Synergy One Lending, Inc., 5.50%, 10/14/2026 | 550,000 | $ | 557,959 | ||||
| 1,502,608 | |||||||
| Diversified Financial Services - 0.4% | |||||||
| Blackstone Private Credit Fund,2.625%, 12/15/20263 | 1,780,000 | 1,749,531 | |||||
| FS Energy & Power Fund, 7.50%, 8/15/20233 | 510,000 | 530,400 | |||||
| 2,279,931 | |||||||
| Mortgage Real Estate Investment Trusts (REITS) - 0.1% | |||||||
| Arbor Realty Trust, Inc., 8.00%, 4/30/20233 | 160,000 | 168,220 | |||||
| MCREIF SubREIT LLC, 5.00% ,10/15/20266 | 525,000 | 525,410 | |||||
| 693,630 | |||||||
| Total Financials | 19,578,674 | ||||||
| Health Care - 0.5% | |||||||
| Health Care Providers & Services - 0.5%HCA, Inc., 4.125%, 6/15/2029 | 2,320,000 | 2,570,746 | |||||
| Industrials - 4.2% | |||||||
| Airlines - 0.9% | |||||||
| Alaska Airlines Pass-Through Trust, | |||||||
| Series 2020-1, Class B, 8.00%, 8/15/20253 | 248,104 | 279,826 | |||||
Southwest Airlines Co. 5.25%, 5/4/2025 | 810,000 | 908,191 | |||||
| 5.125%, 6/15/2027 | 2,530,000 | 2,919,733 | |||||
| United Airlines Pass-Through Trust, | |||||||
| Series 2019-2, Class B, 3.50%, 5/1/2028 | 492,683 | 486,593 | |||||
| United Airlines Pass-Through Trust, | |||||||
| Series 2018-1, Class B, 4.60%, 3/1/2026 | 94,656 | 96,664 | |||||
| 4,691,007 | |||||||
| Commercial Services & Supplies - 0.1% | |||||||
| Airswift Global AS (United Kingdom) (3 mo. LIBOR US + 8.500%), 8.623%, 5/12/20253,7 | 500,000 | 502,500 | |||||
| Industrial Conglomerates - 0.5% | |||||||
| General Electric Co., 6.875%, 1/10/2039 | 1,760,000 | 2,677,121 | |||||
| Marine - 0.2% | |||||||
| American Tanker, Inc. (Norway),7.75%, 7/2/2025 | 520,000 | 532,610 | |||||
| Seaspan Corp. (Hong Kong), 6.50%, 2/5/20243 | 500,000 | 527,500 | |||||
| 1,060,110 | |||||||
The accompanying notes are an integral part of the financial statements.
11
Investment Portfolio - October 31, 2021
| PRO-BLEND® CONSERVATIVE TERM SERIES | SHARES/ PRINCIPAL AMOUNT1 | VALUE (NOTE 2) | ||||||
| CORPORATE BONDS (continued) | ||||||||
| Non-Convertible Corporate Bonds (continued) | ||||||||
| Industrials (continued) | ||||||||
| Road & Rail - 0.3% | ||||||||
| BNSF Funding Trust I, (3 mo. LIBOR US + 2.350%), 6.613%, 12/15/20554 | 1,540,000 | $ | 1,754,137 | |||||
| Trading Companies & Distributors - 2.2% | ||||||||
| AerCap Ireland Capital DAC - AerCap Global Aviation Trust (Ireland), 3.00%, 10/29/2028 | 3,520,000 | 3,573,130 | ||||||
| Air Lease Corp., 3.625%, 4/1/2027 | 1,660,000 | 1,771,914 | ||||||
| Ashtead Capital, Inc. (United Kingdom), 4.00%, 5/1/20283 | 1,680,000 | 1,772,651 | ||||||
| Avolon Holdings Funding Ltd. | ||||||||
| (Ireland), 2.75%, 2/21/20283 | 4,510,000 | 4,465,948 | ||||||
| 11,583,643 | ||||||||
| Total Industrials | 22,268,518 | |||||||
| Materials - 0.7% | ||||||||
| Metals & Mining - 0.7% | ||||||||
| Copper Mountain Mining Corp. | ||||||||
| (Canada), 8.00%, 4/9/20263 | 490,000 | 510,825 | ||||||
| IAMGOLD Corp. (Burkina Faso), 5.75%, 10/15/20283 | 245,000 | 240,713 | ||||||
| Jervois Mining USA Ltd. (Australia), 12.50%, 7/20/20268 | 400,000 | 423,752 | ||||||
| Newcastle Coal Infrastructure Group | ||||||||
| Pty Ltd. (Australia), 4.40%, 9/29/20273 | 1,730,000 | 1,751,380 | ||||||
| Northwest Acquisitions ULC - Dominion Finco, Inc., 7.125%, 11/1/20229,10 | 880,000 | 88 | ||||||
| Tacora Resources, Inc. (Canada), 8.25%, 5/15/20263 | 505,000 | 506,262 | ||||||
| Total Materials | 3,433,020 | |||||||
| Real Estate - 2.2% | ||||||||
| Equity Real Estate Investment Trusts (REITS) - 2.2% | ||||||||
| American Tower Corp., 3.80%, 8/15/2029 | 4,560,000 | 5,013,483 | ||||||
| Crown Castle International Corp. | ||||||||
| 3.10%, 11/15/2029 | 4,830,000 | 5,051,560 | ||||||
| 3.30%, 7/1/2030 | 1,080,000 | 1,142,307 | ||||||
| IIP Operating Partnership LP, 5.50%, 5/25/2026 | 510,000 | 538,175 | ||||||
| 11,745,525 | ||||||||
| Real Estate Management & Development - 0.0%## | ||||||||
| Forestar Group, Inc., 3.85%, 5/15/20263 | 105,000 | 104,999 | ||||||
| Total Real Estate | 11,850,524 | |||||||
| TOTAL CORPORATE BONDS | ||||||||
| (Identified Cost $101,092,714) | 103,549,603 | |||||||
| SHARES/ PRINCIPAL AMOUNT1 | VALUE (NOTE 2) | |||||||
| U.S. TREASURY SECURITIES - 24.9% | ||||||||
| U.S. Treasury Notes - 24.9% | ||||||||
| U.S. Treasury Note | ||||||||
| 1.75%, 5/15/2023 | 30,645,000 | $ | 31,290,221 | |||||
| 2.50%, 5/15/2024 | 35,395,000 | 37,027,871 | ||||||
| 2.125%, 5/15/2025 | 35,165,000 | 36,627,919 | ||||||
| 1.625%, 5/15/2026 | 25,690,000 | 26,250,965 | ||||||
TOTAL U.S. TREASURY SECURITIES (Identified Cost $132,748,813) | 131,196,976 | |||||||
| ASSET-BACKED SECURITIES - 9.3% | ||||||||
| Aligned Data Centers Issuer LLC, Series 2021-1A, Class A2, 1.937%, 8/15/20463 | 2,350,000 | 2,338,888 | ||||||
| CF Hippolyta LLC | ||||||||
| Series 2020-1, Class A2, 1.99%, 7/15/20603 | 2,153,450 | 2,140,487 | ||||||
| Series 2020-1, Class B1, 2.28%, 7/15/20603 | 2,795,740 | 2,812,379 | ||||||
| Commonbond Student Loan Trust, | ||||||||
| Series 2019-AGS, Class A1, 2.54%, 1/25/20473 | 1,188,429 | 1,211,176 | ||||||
| Credit Acceptance Auto Loan Trust | ||||||||
| Series 2020-1A, Class B, 2.39%, 4/16/20293 | 1,150,000 | 1,171,067 | ||||||
| Series 2021-2A, Class A, 0.96%, 2/15/20303 | 2,200,000 | 2,194,450 | ||||||
| DataBank Issuer, Series 2021-2A, Class A2, 2.40%, 10/25/20513 | 1,630,000 | 1,629,775 | ||||||
| Hertz Vehicle Financing LLC, Series 2021-1A, Class A, 1.21%, 12/26/20253 | 2,000,000 | 1,989,253 | ||||||
| Home Partners of America Trust, Series 2019-1, Class A, 2.908%, 9/17/20393 | 2,696,784 | 2,730,728 | ||||||
| Invitation Homes Trust | ||||||||
| Series 2017-SFR2, Class A, (1 mo. LIBOR US + 0.850%), 0.936%, 12/17/20363,7 | 252,772 | 252,465 | ||||||
| Series 2017-SFR2, Class B, (1 mo. LIBOR US + 1.150%), 1.236%, 12/17/20363,7 | 211,244 | 211,414 | ||||||
| KREF Ltd., Series 2021-FL2, Class A, (1 mo. LIBOR US + 1.070%), 1.156%, 2/15/20393,7 | 1,450,000 | 1,450,192 | ||||||
| Navient Private Education Refi Loan Trust | ||||||||
| Series 2014-1, Class A3, (1 mo. LIBOR US + 0.510%), 0.599%, 6/25/20317 | 216,026 | 213,246 | ||||||
| Series 2019-EA, Class A2A, 2.64%, 5/15/20683 | 2,200,176 | 2,230,854 | ||||||
| Nelnet Student Loan Trust Series 2012-3A, Class A, (1 mo. LIBOR US + 0.700%), 0.789%, 2/25/20453,7 | 225,666 | 224,705 | ||||||
The accompanying notes are an integral part of the financial statements.
12
Investment Portfolio - October 31, 2021
| PRO-BLEND® CONSERVATIVE TERM SERIES | SHARES/ PRINCIPAL AMOUNT1 | VALUE (NOTE 2) | ||||||
| ASSET-BACKED SECURITIES (continued) | ||||||||
| Nelnet Student Loan Trust (continued) | ||||||||
| Series 2013-5A, Class A, (1 mo. LIBOR US + 0.630%), 0.719%, 1/25/20373,7 | 355,971 | $ | 356,901 | |||||
| Oxford Finance Funding LLC | ||||||||
| Series 2019-1A, Class A2, 4.459%, 2/15/20273 | 1,893,422 | 1,941,285 | ||||||
| Series 2020-1A, Class A2, 3.101%, 2/15/20283 | 505,000 | 513,543 | ||||||
| Progress Residential Trust | ||||||||
| Series 2019-SFR2, Class A, 3.147%, 5/17/20363 | 3,498,915 | 3,517,504 | ||||||
| Series 2019-SFR4, Class A, 2.687%, 10/17/20363 | 4,200,000 | 4,260,232 | ||||||
| SLM Student Loan Trust, Series 2005-7, Class A4, (3 mo. LIBOR US + 0.150%), 0.274%, 10/25/20297 | 173,131 | 172,384 | ||||||
| SMB Private Education Loan Trust Series 2016-B, Class A2A, 2.43%, 2/17/20323 | 2,269,847 | 2,310,311 | ||||||
| Series 2020-A, Class A2A, 2.23%, 9/15/20373 | 339,548 | 345,875 | ||||||
| SoFi Consumer Loan Program Trust, Series 2019-3, Class A, 2.90%, 5/25/20283 | 3,011 | 3,014 | ||||||
| SoFi Professional Loan Program LLC | ||||||||
| Series 2015-D, Class A2, 2.72%, 10/27/20363 | 26,195 | 26,331 | ||||||
| Series 2016-E, Class A2B, 2.49%, 1/25/20363 | 24,343 | 24,505 | ||||||
| Series 2017-F, Class A2FX, 2.84%, 1/25/20413 | 234,819 | 239,708 | ||||||
| Series 2020-A, Class A2FX, 2.54%, 5/15/20463 | 225,000 | 230,094 | ||||||
| Store Master Funding I-VII and XIV, Series 2019-1, Class A1, 2.82%, 11/20/20493 | 2,113,209 | 2,187,432 | ||||||
| Towd Point Mortgage Trust | ||||||||
| Series 2016-5, Class A1, 2.50%, 10/25/20563,11 | 654,772 | 661,688 | ||||||
| Series 2017-1, Class A1, 2.75%, 10/25/20563,11 | 768,974 | 778,636 | ||||||
| Series 2019-HY1, Class A1, (1 mo. LIBOR US + 1.000%), 1.089%, 10/25/20483,7 | 935,634 | 939,505 | ||||||
| Tricon American Homes Trust, Series 2017-SFR2, Class A, 2.928%, 1/17/20363 | 1,981,965 | 2,004,629 | ||||||
| Trinitas CLO XVII Ltd., Series 2021- 17A, Class B1, (Cayman Islands) (3 mo. LIBOR US + 1.700%), 1.813%, 10/20/20343,7 | 2,700,000 | 2,700,932 | ||||||
| TRP LLC, Series 2021-1, Class A, 2.07%, 6/19/20513 | 1,989,078 | 1,977,200 | ||||||
SHARES/ PRINCIPAL AMOUNT1 | VALUE (NOTE 2) | |||||||
| ASSET-BACKED SECURITIES (continued) | ||||||||
| VB-S1 Issuer LLC, Series 2020-1A, Class C2, 3.031%, 6/15/20503 | 1,200,000 | $ | 1,242,600 | |||||
TOTAL ASSET-BACKED SECURITIES (Identified Cost $48,873,999) | 49,235,388 | |||||||
| COMMERCIAL MORTGAGE-BACKED SECURITIES - 8.5% | ||||||||
| BWAY Mortgage Trust, Series 2015- 1740, Class A, 2.917%, 1/10/20353 | 4,633,000 | 4,684,256 | ||||||
| CIM Trust, Series 2019-INV1, Class A1, 4.00%, 2/25/20493,11 | 199,634 | 201,938 | ||||||
| Credit Suisse Mortgage Capital Trust | ||||||||
| Series 2013-IVR3, Class A1, 2.50%, 5/25/20433,11 | 385,357 | 385,896 | ||||||
| Series 2013-TH1, Class A1, 2.13%, 2/25/20433,11 | 238,459 | 240,539 | ||||||
| Fannie Mae REMICS | ||||||||
| Series 2018-31, Class KP, 3.50%, 7/25/2047 | 267,341 | 275,067 | ||||||
| Series 2021-69, Class WJ, 1.50%, 10/25/2050 | 1,350,252 | 1,341,691 | ||||||
| Fontainebleau Miami Beach Trust, Series 2019-FBLU, Class A, 3.144%, 12/10/20363. | 3,660,000 | 3,786,269 | ||||||
| Freddie Mac Multifamily Structured Pass-Through Certificates Series K017, Class X1 (IO), 1.459%, 12/25/202111 | 1,412,465 | 109 | ||||||
| Series K021, Class X1 (IO), 1.376%, 6/25/202211 | 13,439,546 | 39,422 | ||||||
| Series K030, Class X1 (IO), 0.148%, 4/25/202311 | 67,506,723 | 142,412 | ||||||
| Series K032, Class X1 (IO), 0.073%, 5/25/202311 | 42,624,299 | 61,141 | ||||||
| FREMF Mortgage Trust | ||||||||
| Series 2013-K28, Class X2A (IO), 0.10%, 6/25/20463 | 184,074,185 | 174,981 | ||||||
| Series 2014-K41, Class B, 3.833%, 11/25/20473,11 | 2,500,000 | 2,667,646 | ||||||
| Series 2015-K42, Class B, 3.850%, 1/25/20483,11 | 490,000 | 522,304 | ||||||
| Series 2015-K43, Class B, 3.732%, 2/25/20483,11 | 500,000 | 533,008 | ||||||
| Series 2015-K720, Class B, 3.390%, 7/25/20223,11 | 270,000 | 274,431 | ||||||
| GCT Commercial Mortgage Trust, Series 2021-GCT, Class A, (1 mo. LIBOR US + 0.800%), 0.89%, 2/15/20383,7 | 3,100,000 | 3,102,943 | ||||||
| GS Mortgage Securities Corp. | ||||||||
| Trust, Series 2019-70P, Class A, (1 mo. LIBOR US + 1.000%), 1.09%, 10/15/20363,7 | 2,985,000 | 2,979,342 | ||||||
The accompanying notes are an integral part of the financial statements.
13
Investment Portfolio - October 31, 2021
| PRO-BLEND® CONSERVATIVE TERM SERIES | SHARES/ PRINCIPAL AMOUNT1 | VALUE (NOTE 2) | ||||||
| COMMERCIAL MORTGAGE-BACKED SECURITIES (continued) | ||||||||
| GS Mortgage-Backed Securities Trust | ||||||||
| Series 2021-INV1, Class A9, (U.S. Secured Overnight Financing Rate 30 Day Average + 0.850%), 0.899%, 12/25/20513,7 | 1,692,328 | $ | 1,696,620 | |||||
Series 2021-PJ6, Class A8, 2.50%, 11/25/20513,11 | 1,475,675 | 1,502,999 | ||||||
| Series 2021-PJ9, Class A8, 2.50%, 2/26/20523,11 | 1,476,835 | 1,497,682 | ||||||
| Imperial Fund Mortgage Trust, Series 2021-NQM3, Class A1, 1.595%, 11/25/20563,11 | 1,625,000 | 1,620,287 | ||||||
| JP Morgan Mortgage Trust | ||||||||
| Series 2013-1, Class 1A2, 3.00%, 3/25/20433,11 | 181,978 | 183,626 | ||||||
| Series 2013-2, Class A2, 3.50%, 5/25/20433,11 | 168,710 | 170,646 | ||||||
| Series 2014-2, Class 1A1, 3.00%, 6/25/20293,11 | 433,397 | 439,834 | ||||||
| Series 2017-3, Class 1A3, 3.50%, 8/25/20473,11 | 54,904 | 55,336 | ||||||
| Series 2017-6, Class A3, 3.50%, 12/25/20483,11 | 169,608 | 171,106 | ||||||
| New Residential Mortgage Loan Trust | ||||||||
| Series 2014-3A, Class AFX3, 3.75%, 11/25/20543,11 | 458,674 | 483,016 | ||||||
| Series 2015-2A, Class A1, 3.75%, 8/25/20553,11 | 463,053 | 485,070 | ||||||
| Series 2016-4A, Class A1, 3.75%, 11/25/20563,11 | 690,098 | 733,739 | ||||||
| PMT Loan Trust, Series 2013-J1, Class A9, 3.50%, 9/25/20433,11 | 842,561 | 852,995 | ||||||
| Provident Funding Mortgage Trust | ||||||||
| Series 2021-2, Class A2A, 2.00%, 4/25/20513,11 | 1,805,590 | 1,813,349 | ||||||
| Series 2021-INV1, Class A1, 2.50%, 8/25/20513,11 | 2,717,300 | 2,758,589 | ||||||
| Sequoia Mortgage Trust | ||||||||
| Series 2013-2, Class A, 1.874%, 2/25/204311 | 239,216 | 239,095 | ||||||
| Series 2013-6, Class A2, 3.00%, 5/25/204311 | 1,760,194 | 1,767,581 | ||||||
| Series 2013-7, Class A2, 3.00%, 6/25/204311 | 247,031 | 248,360 | ||||||
| Series 2013-8, Class A1, 3.00%, 6/25/204311 | 299,526 | 301,934 | ||||||
| Series 2020-1, Class A1, 3.50%, 2/25/20503,11 | 98,693 | 100,605 | ||||||
| Starwood Retail Property Trust, Series 2014-STAR, Class A, (1 mo. LIBOR US + 1.470%), 1.560%, 11/15/20273,7 | 2,317,783 | 1,413,848 | ||||||
| Sutherland Commercial Mortgage Trust, Series 2019-SBC8, Class A, 2.86%, 4/25/20413,11 | 2,180,127 | 2,167,120 | ||||||
| Waikiki Beach Hotel Trust, Series 2019-WBM, Class A, (1 mo. LIBOR US + 1.050%), 1.14%, 12/15/20333,7 | 2,300,000 | 2,297,202 | ||||||
SHARES/ PRINCIPAL AMOUNT1 | VALUE (NOTE 2) | |||||||||
| COMMERCIAL MORTGAGE-BACKED SECURITIES (continued) | ||||||||||
| WinWater Mortgage Loan Trust, Series 2015-1, Class A1, 3.50%, 1/20/20453,11 | 156,168 | $ | 158,222 | |||||||
| TOTAL COMMERCIAL MORTGAGE-BACKED SECURITIES | ||||||||||
| (Identified Cost $45,770,438) | 44,572,256 | |||||||||
| FOREIGN GOVERNMENT BONDS - 0.3% | ||||||||||
| Canadian Government Bond | ||||||||||
| (Canada), 2.75%, 6/1/2022 | CAD | 327,000 | 267,726 | |||||||
| Mexican Government Bond | ||||||||||
| (Mexico), 6.50%, 6/9/2022 | MXN | 4,996,000 | 243,047 | |||||||
| (Mexico), 7.75%, 5/29/2031 | MXN | 908,000 | 44,789 | |||||||
| Mexico Government International Bond (Mexico), 4.125%, 1/21/2026 | 400,000 | 442,100 | ||||||||
| Republic of Italy Government International Bond (Italy), 2.375%, 10/17/2024 | 600,000 | 617,338 | ||||||||
| TOTAL FOREIGN GOVERNMENT BONDS | ||||||||||
| (Identified Cost $1,708,780) | 1,615,000 | |||||||||
| MUNICIPAL BONDS - 1.4% | ||||||||||
| Hawaii, Series GC, G.O. Bond, 2.682%, 10/1/2038 | 2,660,000 | 2,667,608 | ||||||||
| New York City Transitional Finance Authority, Future Tax Secured, Public Impt., Revenue Bond, 1.58%, 5/1/2024 | 950,000 | 967,119 | ||||||||
| South Carolina Public Service Authority, Series B, Revenue Bond, 1.852%, 12/1/2026 | 3,460,000 | 3,491,693 | ||||||||
TOTAL MUNICIPAL BONDS (Identified Cost $7,192,466) | 7,126,420 | |||||||||
| U.S. GOVERNMENT AGENCIES - 2.5% | ||||||||||
| Mortgage-Backed Securities - 2.5% | ||||||||||
| Fannie Mae | ||||||||||
| Pool #995329, UMBS, 5.50%, 12/1/2021 | 53 | 53 | ||||||||
| Pool #888815, UMBS, 4.50%, 11/1/2022 | 493 | 514 | ||||||||
| Pool #888810, UMBS, 5.50%, 11/1/2022 | 154 | 155 | ||||||||
| Pool #AA1563, UMBS, 4.50%, 2/1/2024 | 5,912 | 6,160 | ||||||||
| Pool #AC1557, UMBS, 4.50%, 9/1/2024 | 14,346 | 14,963 | ||||||||
| Pool #AD0462, UMBS, 5.50%, 10/1/2024 | 4,926 | 5,136 | ||||||||
The accompanying notes are an integral part of the financial statements.
14
Investment Portfolio - October 31, 2021
| PRO-BLEND® CONSERVATIVE TERM SERIES | SHARES/ PRINCIPAL AMOUNT1 | VALUE (NOTE 2) | ||||||
| U.S. GOVERNMENT AGENCIES (continued) | ||||||||
| Mortgage-Backed Securities (continued) | ||||||||
| Fannie Mae (continued) | ||||||||
| Pool #MA1834, UMBS, 4.50%, 2/1/2034 | 346,016 | $ | 379,659 | |||||
| Pool #MA1903, UMBS, 4.50%, 5/1/2034 | 433,821 | 476,014 | ||||||
| Pool #886904, UMBS, 6.50%, 9/1/2036 | 36,013 | 41,138 | ||||||
| Pool #933521, UMBS, 5.00%, 1/1/2038 | 7,134 | 8,161 | ||||||
| Pool #889260, UMBS, 5.00%, 4/1/2038 | 9,715 | 10,960 | ||||||
| Pool #889576, UMBS, 6.00%, 4/1/2038 | 218,080 | 257,732 | ||||||
| Pool #975840, UMBS, 5.00%, 5/1/2038 | 29,036 | 31,966 | ||||||
| Pool #995196, UMBS, 6.00%, 7/1/2038 | 293,248 | 346,552 | ||||||
| Pool #986458, UMBS, 6.00%, 8/1/2038 | 6,250 | 7,234 | ||||||
| Pool #987831, UMBS, 6.00%, 9/1/2038 | 9,170 | 10,291 | ||||||
| Pool #990897, UMBS, 6.00%, 9/1/2038 | 21,659 | 24,375 | ||||||
| Pool #AD0220, UMBS, 6.00%, 10/1/2038 | 38,766 | 45,812 | ||||||
| Pool #993920, UMBS, 6.00%, 11/1/2038 | 58,911 | 66,131 | ||||||
| Pool #257497, UMBS, 6.00%, 12/1/2038 | 11,017 | 12,970 | ||||||
| Pool #971022, UMBS, 5.00%, 1/1/2039 | 16,746 | 19,172 | ||||||
| Pool #AA1810, UMBS, 5.00%, 1/1/2039 | 43,923 | 50,273 | ||||||
| Pool #983686, UMBS, 5.00%, 2/1/2039 | 14,482 | 15,942 | ||||||
| Pool #AE0604, UMBS, 6.00%, 7/1/2039 | 256,411 | 303,003 | ||||||
| Pool #AA6788, UMBS, 6.00%, 8/1/2039 | 116,990 | 132,782 | ||||||
| Pool #AC0463, UMBS, 5.00%, 11/1/2039 | 24,781 | 28,360 | ||||||
| Pool #AC5111, UMBS, 5.00%, 11/1/2039 | 38,620 | 44,200 | ||||||
| Pool #MA0258, UMBS, 4.50%, 12/1/2039 | 418,128 | 465,769 | ||||||
| Pool #MA0259, UMBS, 5.00%, 12/1/2039 | 23,900 | 27,315 | ||||||
| Pool #AC8573, UMBS, 5.00%, 1/1/2040 | 34,400 | 39,239 | ||||||
| Pool #AL1595, UMBS, 6.00%, 1/1/2040 | 279,854 | 330,198 | ||||||
| Pool #AE0061, UMBS, 6.00%, 2/1/2040 | 114,292 | 135,077 | ||||||
| Pool #AL0152, UMBS, 6.00%, 6/1/2040 | 455,254 | 537,157 | ||||||
SHARES/ PRINCIPAL AMOUNT1 | VALUE (NOTE 2) | |||||||
| U.S. GOVERNMENT AGENCIES (continued) | ||||||||
| Mortgage-Backed Securities (continued) | ||||||||
| Fannie Mae (continued) | ||||||||
| Pool #MA4203, UMBS, 2.50%, 12/1/2040 | 3,405,243 | $ | 3,504,715 | |||||
| Pool #AI5172, UMBS, 4.00%, 8/1/2041 | 235,466 | 260,197 | ||||||
| Pool #AL1410, UMBS, 4.50%, 12/1/2041 | 489,574 | 546,964 | ||||||
| Pool #AB4300, UMBS, 3.50%, 1/1/2042 | 106,051 | 114,642 | ||||||
| Pool #AL7729, UMBS, 4.00%, 6/1/2043 | 249,576 | 273,378 | ||||||
| Pool #BC8677, UMBS, 4.00%, 5/1/2046 | 162,261 | 176,049 | ||||||
| Pool #BD6997, UMBS, 4.00%, 10/1/2046 | 332,948 | 362,730 | ||||||
| Pool #BE3812, UMBS, 4.00%, 12/1/2046 | 225,965 | 244,462 | ||||||
| Pool #BE7845, UMBS, 4.50%, 2/1/2047 | 180,003 | 196,068 | ||||||
| Pool #MA3184, UMBS, 4.50%, 11/1/2047 | 931,393 | 1,014,568 | ||||||
| Pool #AL8674, 5.659%, 1/1/2049 | 790,682 | 882,000 | ||||||
| Freddie Mac | ||||||||
| Pool #G12610, 6.00%, 3/1/2022 | 354 | 355 | ||||||
| Pool #G12655, 6.00%, 5/1/2022 | 292 | 293 | ||||||
| Pool #G13078, 6.00%, 3/1/2023 | 1,841 | 1,867 | ||||||
| Pool #C91746, 4.50%, 12/1/2033 | 59,025 | 64,637 | ||||||
| Pool #C91762, 4.50%, 5/1/2034 | 535,447 | 587,663 | ||||||
| Pool #G03926, 6.00%, 2/1/2038 | 187,452 | 221,589 | ||||||
| Pool #G05906, 6.00%, 4/1/2040 | 34,073 | 40,198 | ||||||
| Pool #G06789, 6.00%, 5/1/2040 | 160,331 | 189,221 | ||||||
| Pool #A92889, 4.50%, 7/1/2040 | 648,114 | 724,601 | ||||||
| Ginnie Mae, Pool #671161, 5.50%, 11/15/2037 | 26,943 | 30,226 | ||||||
| TOTAL U.S. GOVERNMENT AGENCIES | 13,310,886 | |||||||
| (Identified Cost $12,760,110) | ||||||||
| SHORT-TERM INVESTMENT - 2.5% | ||||||||
| Dreyfus Government Cash Management, Institutional Shares, 0.03%12 | ||||||||
| (Identified Cost $13,257,604) | 13,257,604 | 13,257,604 | ||||||
| TOTAL INVESTMENTS - 99.8% | ||||||||
| (Identified Cost $487,334,739) | 526,088,374 | |||||||
| OTHER ASSETS, LESS LIABILITIES - 0.2% | 1,308,537 | |||||||
| NET ASSETS - 100% | $ | 527,396,911 | ||||||
The accompanying notes are an integral part of the financial statements.
15
Investment Portfolio - October 31, 2021
ADR - American Depositary Receipt
CAD - Canadian Dollar
CLO - Collateralized Loan Obligation
G.O. Bond - General Obligation Bond
Impt. - Improvement
IO - Interest only
LIBOR - London Interbank Offered Rate
MXN - Mexican Peso
REMICS - Real Estate Mortgage Investment Conduits
UMBS - Uniform Mortgage-Backed Securities
*Non-income producing security.
## Less than 0.1%.
1Amount is stated in USD unless otherwise noted.
2Security has been valued using significant unobservable inputs.
3Security purchased or received in a transaction exempt from registration under the Securities Act of 1933, as amended (the “1933 Act”) and determined to be liquid under the Fund’s Liquidity Risk Management Program. The security may be resold pursuant to an exemption from registration under the 1933 Act, typically to qualified institutional buyers. The aggregate value of these securities at October 31, 2021 was $112,921,746, which represented 21.4% of the Series’ Net Assets.
4Variable rate security. Security may be issued at a fixed coupon rate, which converts to a variable rate at a specified date. Rate shown is the rate in effect as of October 31, 2021.
5Security is perpetual in nature and has no stated maturity date.
6Security purchased or received in a transaction exempt from registration under the Securities Act of 1933, as amended (the “1933 Act”) and determined to be illiquid under the Fund’s Liquidity Risk Management Program. The security may be resold pursuant to an exemption from registration under the 1933 Act, typically to qualified institutional buyers. The security was acquired on October 13, 2021 at a cost of $525,000. The value of the security at October 31, 2021 was $525,410, or 0.1% of the Series’ Net Assets.
7Floating rate security. Rate shown is the rate in effect as of October 31, 2021.
8Security purchased or received in a transaction exempt from registration under the Securities Act of 1933, as amended (the “1933 Act”) and determined to be illiquid under the Fund’s Liquidity Risk Management Program. The security may be resold pursuant to an exemption from registration under the 1933 Act, typically to qualified institutional buyers. The security was acquired on August 4, 2021 and August 6, 2021 at an aggregate cost of $425,000. The value of the security at October 31, 2021 was $423,752, or 0.1% of the Series’ Net Assets.
9Issuer filed for bankruptcy and/or is in default of interest payments.
10Security purchased or received in a transaction exempt from registration under the Securities Act of 1933, as amended (the “1933 Act”) and determined to be illiquid under the Fund’s Liquidity Risk Management Program. The security may be resold pursuant to an exemption from registration under the 1933 Act, typically to qualified institutional buyers. The security was acquired on October 10, 2017, September 6, 2018 and on dates between May 8, 2020 and May 13, 2020 at an aggregate cost of $212,263. The value of the security at October 31, 2021 was $88, or less than 0.1% of the Series’ Net Assets.
11Variable or floating rate security, the interest rate of which adjusts periodically based on changes in current interest rates and prepayments on the underlying pool of assets. Rate shown is the rate in effect as of October 31, 2021.
12Rate shown is the current yield as of October 31, 2021.
The Global Industry Classification Standard (GICS) was developed by and is the exclusive property and a service mark of MSCI Inc. (MSCI) and Standard & Poor’s, a division of S&P Global Inc. (S&P), and is licensed for use by Manning & Napier when referencing GICS sectors. Neither MSCI, S&P, nor any third party involved in making or compiling the GICS or any GICS classifications makes any express or implied warranties or representations with respect to such standard or classification, nor shall any such party have any liability therefrom.
The accompanying notes are an integral part of the financial statements.
16
Statement of Assets and Liabilities - Pro-Blend® Conservative Term Series
October 31, 2021
| ASSETS: | ||||
| Investments in securities, at value (identified cost $487,334,739) (Note 2) | $ | 526,088,374 | ||
| Foreign currency, at value (identified cost $49) | 49 | |||
| Interest receivable | 2,626,941 | |||
| Foreign tax reclaims receivable | 271,729 | |||
| Receivable for fund shares sold | 201,838 | |||
| Dividends receivable | 119,842 | |||
| Receivable for securities sold | 79,765 | |||
| Prepaid expenses | 25,789 | |||
| TOTAL ASSETS | 529,414,327 | |||
| LIABILITIES: | ||||
| Accrued management fees (Note 3) | 178,611 | |||
| Accrued sub-transfer agent fees (Note 3) | 155,285 | |||
| Accrued distribution and service (Rule 12b-1) fees (Class S) (Class R) (Class L) (Note 3) | 152,361 | |||
| Accrued fund accounting and administration fees (Note 3) | 45,409 | |||
| Accrued Chief Compliance Officer service fees (Note 3) | 2,032 | |||
| Directors' fees payable (Note 3) | 561 | |||
| Payable for securities purchased | 996,587 | |||
| Payable for fund shares repurchased | 384,963 | |||
| Other payables and accrued expenses | 101,607 | |||
| TOTAL LIABILITIES | 2,017,416 | |||
| TOTAL NET ASSETS | $ | 527,396,911 | ||
| NET ASSETS CONSIST OF: | ||||
| Capital stock | $ | 433,373 | ||
| Additional paid-in-capital | 458,971,068 | |||
| Total distributable earnings (loss) | 67,992,470 | |||
| TOTAL NET ASSETS | $ | 527,396,911 | ||
The accompanying notes are an integral part of the financial statements.
17
Statement of Assets and Liabilities - Pro-Blend® Conservative Term Series
October 31, 2021
NET ASSET VALUE, OFFERING PRICE AND REDEMPTION PRICE PER SHARE - Class S ($291,698,498/19,968,351 shares) | $ | 14.61 | |||
NET ASSET VALUE, OFFERING PRICE AND REDEMPTION PRICE PER SHARE - Class I ($115,216,345/11,127,255 shares) | $ | 10.35 | |||
NET ASSET VALUE, OFFERING PRICE AND REDEMPTION PRICE PER SHARE - Class R ($23,526,751/2,401,619 shares) | $ | 9.80 | |||
NET ASSET VALUE, OFFERING PRICE AND REDEMPTION PRICE PER SHARE - Class L ($94,970,660/9,704,476 shares) | $ | 9.79 | |||
NET ASSET VALUE, OFFERING PRICE AND REDEMPTION PRICE PER SHARE - Class W ($1,984,657/135,565 shares) | $ | 14.64 |
The accompanying notes are an integral part of the financial statements.
18
Statement of Operations - Pro-Blend® Conservative Term Series
For the Year Ended October 31, 2021
INVESTMENT INCOME:
| Interest | $ | 7,886,268 | ||
| Dividends (net of foreign taxes withheld, $65,746) | 2,721,242 | |||
| Other Income | 45,812 | |||
| Total Investment Income | 10,653,322 | |||
| EXPENSES: | ||||
| Management fees (Note 3) | 2,110,291 | |||
| Distribution and service (Rule 12b-1) fees (Class L) (Note 3) | 945,835 | |||
| Distribution and service (Rule 12b-1) fees (Class S) (Note 3) | 747,607 | |||
| Distribution and service (Rule 12b-1) fees (Class R) (Note 3) | 117,074 | |||
| Sub-transfer agent fees (Note 3) | 447,781 | |||
| Fund accounting and administration fees (Note 3) | 139,740 | |||
| Directors’ fees (Note 3) | 65,337 | |||
| Chief Compliance Officer service fees (Note 3) | 6,096 | |||
| Custodian fees | 33,842 | |||
| Miscellaneous | 411,691 | |||
| Total Expenses | 5,025,294 | |||
| Less reduction of expenses (Note 3) | (8,198 | ) | ||
| Net Expenses | 5,017,096 | |||
| NET INVESTMENT INCOME | 5,636,226 | |||
| REALIZED AND UNREALIZED GAIN (LOSS) ON INVESTMENTS AND FOREIGN CURRENCY: | ||||
| Net realized gain (loss) on- | ||||
| Investments in securities | 30,958,231 | |||
| Foreign currency and translation of other assets and liabilities | (6,307 | ) | ||
| 30,951,924 | ||||
| Net change in unrealized appreciation (depreciation) on- | ||||
| Investments in securities | 17,328,796 | |||
| Foreign currency and translation of other assets and liabilities | 4,289 | |||
| 17,333,085 | ||||
| NET REALIZED AND UNREALIZED GAIN (LOSS) ON INVESTMENTS AND FOREIGN CURRENCY | 48,285,009 | |||
| NET INCREASE IN NET ASSETS RESULTING FROM OPERATIONS | $ | 53,921,235 | ||
The accompanying notes are an integral part of the financial statements.
19
Statements of Changes in Net Assets - Pro-Blend® Conservative Term Series
FOR THE YEAR ENDED 10/31/21 | FOR THE YEAR ENDED 10/31/20 | |||||||
| INCREASE (DECREASE) IN NET ASSETS: | ||||||||
| OPERATIONS: | ||||||||
| Net investment income | $ | 5,636,226 | $ | 12,149,937 | ||||
| Net realized gain (loss) on investments and foreign currency | 30,951,924 | 76,597,288 | ||||||
| Net change in unrealized appreciation (depreciation) on investments and foreign currency | 17,333,085 | (33,352,187 | ) | |||||
| Net increase (decrease) from operations | 53,921,235 | 55,395,038 | ||||||
| DISTRIBUTIONS TO SHAREHOLDERS (Note 9): | ||||||||
| Class S | (27,201,997 | ) | (24,962,674 | ) | ||||
| Class I | (13,575,779 | ) | (10,898,861 | ) | ||||
| Class R | (2,959,670 | ) | (493,417 | ) | ||||
| Class L | (11,676,531 | ) | (4,422,053 | ) | ||||
| Class W | (186,001 | ) | (83,642 | ) | ||||
| Total distributions to shareholders | (55,599,978 | ) | (40,860,647 | ) | ||||
| CAPITAL STOCK ISSUED AND REPURCHASED: | ||||||||
| Net increase (decrease) from capital share transactions (Note 5) | 24,443,476 | (424,448,200 | ) | |||||
| Net increase (decrease) in net assets | 22,764,733 | (409,913,809 | ) | |||||
| NET ASSETS: | ||||||||
| Beginning of year | 504,632,178 | 914,545,987 | ||||||
| End of year | $ | 527,396,911 | $ | 504,632,178 | ||||
The accompanying notes are an integral part of the financial statements.
20
Financial Highlights - Pro-Blend® Conservative Term Series - Class S
| FOR THE YEAR ENDED | ||||||||||||||||||||
| 10/31/21 | 10/31/20 | 10/31/19 | 10/31/18 | 10/31/17 | ||||||||||||||||
Per share data (for a share outstanding throughout each year): | ||||||||||||||||||||
| Net asset value - Beginning of year | $14.47 | $14.23 | $13.39 | $14.10 | $13.36 | |||||||||||||||
Income (loss) from investment operations: Net investment income1 | 0.17 | 0.21 | 0.27 | 0.23 | 0.19 | |||||||||||||||
| Net realized and unrealized gain (loss) on investments | 1.34 | 0.592 | 1.07 | (0.33 | ) | 0.73 | ||||||||||||||
| Total from investment operations | 1.51 | 0.80 | 1.34 | (0.10 | ) | 0.92 | ||||||||||||||
| Less distributions to shareholders: | ||||||||||||||||||||
| From net investment income | (0.19 | ) | (0.21 | ) | (0.23 | ) | (0.18 | ) | (0.16 | ) | ||||||||||
| From net realized gain on investments | (1.18 | ) | (0.35 | ) | (0.27 | ) | (0.43 | ) | (0.02 | ) | ||||||||||
| Total distributions to shareholders | (1.37 | ) | (0.56 | ) | (0.50 | ) | (0.61 | ) | (0.18 | ) | ||||||||||
| Net asset value - End of year | $14.61 | $14.47 | $14.23 | $13.39 | $14.10 | |||||||||||||||
| Net assets - End of year (000’s omitted) | $291,698 | $294,276 | $609,145 | $596,934 | $627,523 | |||||||||||||||
| Total return3 | 10.99% | 5.86%2 | 10.40% | (0.75% | ) | 7.02% | ||||||||||||||
Ratios (to average net assets)/Supplemental Data: | ||||||||||||||||||||
| Expenses | 0.87% | 0.87% | 0.87% | 0.88% | 0.87% | |||||||||||||||
| Net investment income | 1.15% | 1.47% | 2.01% | 1.71% | 1.42% | |||||||||||||||
| Series portfolio turnover | 73% | 108% | 68% | 80% | 58% | |||||||||||||||
1Calculated based on average shares outstanding during the years.
2During the reporting period the Fund settled legal claims against an issuer of securities previously held by the Fund. As a result, the net realized and unrealized gain (loss) on investments per share includes proceeds received from the settlement. These proceeds impacted the net realized and unrealized gain (loss) on investments per share by less than $0.01. Excluding the proceeds from the settlement, the total return would have been 5.78%.
3Represents aggregate total return for the years indicated, and assumes reinvestment of all distributions.
The accompanying notes are an integral part of the financial statements.
21
Financial Highlights - Pro-Blend® Conservative Term Series - Class I
| FOR THE YEAR ENDED | |||||||||||||||
| 10/31/21 | 10/31/20 | 10/31/19 | 10/31/18 | 10/31/17 | |||||||||||
Per share data (for a share outstanding throughout each year): | |||||||||||||||
| Net asset value - Beginning of year | $10.68 | $10.65 | $10.15 | $10.85 | $10.33 | ||||||||||
| Income (loss) from investment operations: | |||||||||||||||
| Net investment income1 | 0.14 | 0.19 | 0.23 | 0.20 | 0.17 | ||||||||||
| Net realized and unrealized gain (loss) on investments | 0.97 | 0.442 | 0.80 | (0.26 | ) | 0.56 | |||||||||
| Total from investment operations | 1.11 | 0.63 | 1.03 | (0.06 | ) | 0.73 | |||||||||
| Less distributions to shareholders: | |||||||||||||||
| From net investment income | (0.26 | ) | (0.25 | ) | (0.26 | ) | (0.21 | ) | (0.19 | ) | |||||
| From net realized gain on investments | (1.18 | ) | (0.35 | ) | (0.27 | ) | (0.43 | ) | (0.02 | ) | |||||
| Total distributions to shareholders | (1.44 | ) | (0.60 | ) | (0.53 | ) | (0.64 | ) | (0.21 | ) | |||||
| Net asset value - End of year | $10.35 | $10.68 | $10.65 | $10.15 | $10.85 | ||||||||||
| Net assets - End of year (000’s omitted) | $115,216 | $99,139 | $207,346 | $192,157 | $213,824 | ||||||||||
| Total return3 | 11.16% | 6.27%2 | 10.69% | (0.62% | ) | 7.25% | |||||||||
Ratios (to average net assets)/Supplemental Data: | |||||||||||||||
| Expenses | 0.62% | 0.60% | 0.64% | 0.68% | 0.67% | ||||||||||
| Net investment income | 1.40% | 1.77% | 2.23% | 1.92% | 1.62% | ||||||||||
| Series portfolio turnover | 73% | 108% | 68% | 80% | 58% | ||||||||||
1Calculated based on average shares outstanding during the years.
2During the reporting period the Fund settled legal claims against an issuer of securities previously held by the Fund. As a result, the net realized and unrealized gain (loss) on investments per share includes proceeds received from the settlement. These proceeds impacted the net realized and unrealized gain (loss) on investments per share by less than $0.01. Excluding the proceeds from the settlement, the total return would have been 6.17%.
3Represents aggregate total return for the years indicated, and assumes reinvestment of all distributions.
The accompanying notes are an integral part of the financial statements.
22
Financial Highlights - Pro-Blend® Conservative Term Series - Class R
| FOR THE YEAR ENDED | |||||||||||||||
| 10/31/21 | 10/31/20 | 10/31/19 | 10/31/18 | 10/31/17 | |||||||||||
Per share data (for a share outstanding throughout each year): | |||||||||||||||
| Net asset value - Beginning of year | $10.18 | $10.19 | $9.73 | $10.42 | $9.92 | ||||||||||
| Income (loss) from investment operations: | |||||||||||||||
| Net investment income1 | 0.09 | 0.13 | 0.17 | 0.14 | 0.11 | ||||||||||
| Net realized and unrealized gain (loss) on investments | 0.94 | 0.422 | 0.77 | (0.24 | ) | 0.54 | |||||||||
| Total from investment operations | 1.03 | 0.55 | 0.94 | (0.10 | ) | 0.65 | |||||||||
| Less distributions to shareholders: | |||||||||||||||
| From net investment income | (0.23 | ) | (0.21 | ) | (0.21 | ) | (0.16 | ) | (0.13 | ) | |||||
| From net realized gain on investments | (1.18 | ) | (0.35 | ) | (0.27 | ) | (0.43 | ) | (0.02 | ) | |||||
| Total distributions to shareholders | (1.41 | ) | (0.56 | ) | (0.48 | ) | (0.59 | ) | (0.15 | ) | |||||
| Net asset value - End of year | $9.80 | $10.18 | $10.19 | $9.73 | $10.42 | ||||||||||
| Net assets - End of year (000’s omitted) | $23,527 | $22,539 | $8,850 | $10,886 | $13,672 | ||||||||||
| Total return3 | 10.81% | 5.69%2 | 10.12% | (1.08% | ) | 6.72% | |||||||||
Ratios (to average net assets)/Supplemental Data: | |||||||||||||||
| Expenses | 1.05% | 1.04% | 1.10% | 1.18% | 1.17% | ||||||||||
| Net investment income | 0.96% | 1.25% | 1.77% | 1.40% | 1.12% | ||||||||||
| Series portfolio turnover | 73% | 108% | 68% | 80% | 58% | ||||||||||
1Calculated based on average shares outstanding during the years.
2During the reporting period the Fund settled legal claims against an issuer of securities previously held by the Fund. As a result, the net realized and unrealized gain (loss) on investments per share includes proceeds received from the settlement. These proceeds impacted the net realized and unrealized gain (loss) on investments per share and total return by less than $0.01 and by less than 0.01%, respectively.
3Represents aggregate total return for the years indicated, and assumes reinvestment of all distributions.
The accompanying notes are an integral part of the financial statements.
23
Financial Highlights - Pro-Blend® Conservative Term Series - Class L*
| FOR THE YEAR ENDED | |||||||||||||||
| 10/31/21 | 10/31/20 | 10/31/19 | 10/31/18 | 10/31/17 | |||||||||||
Per share data (for a share outstanding throughout each year): | |||||||||||||||
| Net asset value - Beginning of year | $10.16 | $10.17 | $9.71 | $10.40 | $9.91 | ||||||||||
| Income (loss) from investment operations: | |||||||||||||||
| Net investment income1 | 0.04 | 0.08 | 0.13 | 0.09 | 0.06 | ||||||||||
| Net realized and unrealized gain (loss) on investments | 0.94 | 0.422 | 0.76 | (0.24 | ) | 0.54 | |||||||||
| Total from investment operations | 0.98 | 0.50 | 0.89 | (0.15 | ) | 0.60 | |||||||||
| Less distributions to shareholders: | |||||||||||||||
| From net investment income | (0.17 | ) | (0.16 | ) | (0.16 | ) | (0.11 | ) | (0.09 | ) | |||||
| From net realized gain on investments | (1.18 | ) | (0.35 | ) | (0.27 | ) | (0.43 | ) | (0.02 | ) | |||||
| Total distributions to shareholders | (1.35 | ) | (0.51 | ) | (0.43 | ) | (0.54 | ) | (0.11 | ) | |||||
| Net asset value - End of year | $9.79 | $10.16 | $10.17 | $9.71 | $10.40 | ||||||||||
| Net assets - End of year (000’s omitted) | $94,971 | $86,903 | $87,628 | $93,290 | $112,666 | ||||||||||
| Total return3 | 10.26% | 5.16%2 | 9.61% | (1.58% | ) | 6.13% | |||||||||
Ratios (to average net assets)/Supplemental Data: | |||||||||||||||
| Expenses | 1.58% | 1.55% | 1.59% | 1.68% | 1.67% | ||||||||||
| Net investment income | 0.44% | 0.79% | 1.29% | 0.91% | 0.62% | ||||||||||
| Series portfolio turnover | 73% | 108% | 68% | 80% | 58% | ||||||||||
*Effective March 1, 2019, Class R2 shares of the Series have been redesignated as Class L Shares.
1Calculated based on average shares outstanding during the years.
2During the reporting period the Fund settled legal claims against an issuer of securities previously held by the Fund. As a result, the net realized and unrealized gain (loss) on investments per share includes proceeds received from the settlement. These proceeds impacted the net realized and unrealized gain (loss) on investments per share and total return by less than $0.01 and by less than 0.01%, respectively.
3Represents aggregate total return for the years indicated, and assumes reinvestment of all distributions.
The accompanying notes are an integral part of the financial statements.
24
Financial Highlights - Pro-Blend® Conservative Term Series - Class W
| FOR THE YEAR ENDED | FOR THE PERIOD 4/1/191 TO | ||||||||
| 10/31/21 | 10/31/20 | 10/31/19 | |||||||
| Per share data (for a share outstanding throughout each period): | |||||||||
| Net asset value - Beginning of period | $14.52 | $14.28 | $13.62 | ||||||
| Income from investment operations: | |||||||||
| Net investment income2 | 0.28 | 0.32 | 0.23 | ||||||
| Net realized and unrealized gain (loss) on investments | 1.35 | 0.593 | 0.54 | ||||||
| Total from investment operations | 1.63 | 0.91 | 0.77 | ||||||
| Less distributions to shareholders: | |||||||||
| From net investment income | (0.33 | ) | (0.32 | ) | (0.11 | ) | |||
| From net realized gain on investments | (1.18 | ) | (0.35 | ) | (0.00 | )4 | |||
| Total distributions to shareholders | (1.51 | ) | (0.67 | ) | (0.11 | ) | |||
| Net asset value - End of period | $14.64 | $14.52 | $14.28 | ||||||
| Net assets - End of period (000’s omitted) | $1,985 | $1,775 | $1,577 | ||||||
| Total return5 | 11.84% | 6.66%3 | 5.71% | ||||||
| Ratios (to average net assets)/Supplemental Data: | |||||||||
| Expenses* | 0.10% | 0.09% | 0.08% | 6 | |||||
| Net investment income | 1.92% | 2.26% | 2.81% | 6 | |||||
| Series portfolio turnover | 73% | 108% | 68% | ||||||
*The investment advisor did not impose all or a portion of its management and/or other fees during the periods, and may have paid a portion of the Series’ expenses. If these expenses had been incurred by the Class, the expense ratio (to average net assets) would have increased by the following amounts:
| 0.42% | 0.40% | 0.40%6 |
1Commencement of operations.
2Calculated based on average shares outstanding during the periods.
3During the reporting period the Fund settled legal claims against an issuer of securities previously held by the Fund. As a result, the net realized and unrealized gain (loss) on investments per share includes proceeds received from the settlement. These proceeds impacted the net realized and unrealized gain (loss) on investments per share and total return by less than $0.01 and by less than 0.01%, respectively.
4Less than $(0.01).
5Represents aggregate total return for the periods indicated, and assumes reinvestment of all distributions. Total return would have been lower had certain expenses not been waived or reimbursed during the periods. Periods less than one year are not annualized.
6Annualized.
The accompanying notes are an integral part of the financial statements.
25
Performance Update as of October 31, 2021 - Pro-Blend® Moderate Term Series
(unaudited)
AVERAGE ANNUAL TOTAL RETURNS AS OF OCTOBER 31, 2021 | |||||||||
ONE | FIVE YEAR | TEN YEAR | |||||||
| Pro-Blend® Moderate Term Series - Class S2 | 15.78% | 8.58% | 6.92% | ||||||
| Pro-Blend® Moderate Term Series - Class I2 | 16.10% | 8.82% | 7.18% | ||||||
| Pro-Blend® Moderate Term Series - Class R2,3 | 15.62% | 8.31% | 6.66% | ||||||
| Pro-Blend® Moderate Term Series - Class L2,3 | 14.94% | 7.79% | 6.13% | ||||||
| Pro-Blend® Moderate Term Series - Class W2,4 | 16.98% | 9.13% | 7.19% | ||||||
| 30/10/30/30 Blended Index5 | 14.45% | 8.44% | 7.24% | ||||||
| Bloomberg U.S. Aggregate Bond Index6 | (0.48%) | 3.10% | 3.00% | ||||||
The following graph compares the value of a $10,000 investment in the Pro-Blend® Moderate Term Series - Class S for the ten years ended October 31, 2021 to the Bloomberg U.S. Aggregate Bond Index and the 30/10/30/30 Blended Index.
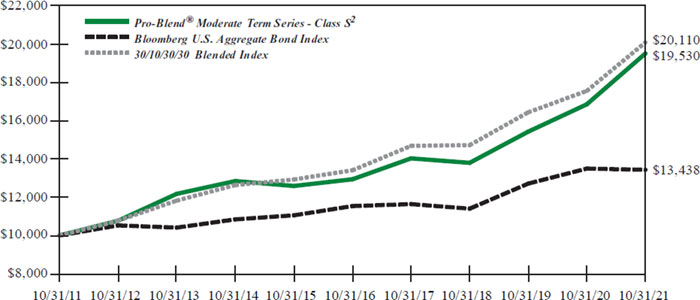
1The returns shown are based on net asset values calculated for shareholder transactions and may differ from the returns shown in the financial highlights, which reflect adjustments made to the net asset values in accordance with accounting principles generally accepted in the United States of America.
2The Series’ performance does not reflect the deduction of taxes that a shareholder would pay on fund distributions or the redemption of shares. The Series’ performance is historical and may not be indicative of future results. The performance returns shown are inclusive of the net expense ratio of the Series. For the year ended October 31, 2021, this net expense ratio was 1.05% for Class S, 0.84% for Class I, 1.26% for Class R, 1.77% for Class L and 0.10% for Class W. The gross expense ratio, which does not account for any voluntary or contractual waivers currently in effect, was 1.05% for Class S, 0.84% for Class I, 1.26% for Class R, 1.77% for Class L and 0.73% for Class W for the year ended October 31, 2021.
3For periods through the inception of Class L on January 4, 2010 and Class R on June 30, 2010, the performance is hypothetical and is based on the historical performance of the Class S shares adjusted for the respective class’ charges and expenses.
4For periods through April 1, 2019 (the inception date of the Class W shares), performance for the Class W shares is based on the historical performance of the Class S shares. Because the Class W shares invest in the same portfolio of securities as the Class S shares, performance will be different only to the extent that the Class S shares have a higher expense ratio.
26
Performance Update as of October 31, 2021 - Pro-Blend® Moderate Term Series
(unaudited)
5The 30/10/30/30 Blended Index is 30% Russell 3000® Index (Russell 3000), 10% MSCI ACWI ex USA Index (ACWIxUS), 30% Bloomberg U.S. Aggregate Bond Index (BAB), and 30% Bloomberg U.S. Intermediate Aggregate Bond Index (BIAB). Russell 3000 is an unmanaged index that consists of 3,000 of the largest U.S. companies based on total market capitalization. Index returns are based on a market capitalization-weighted average of relative price changes of the component stocks plus dividends whose reinvestments are compounded daily. Index returns provided by Bloomberg. ACWIxUS is designed to measure large and mid-cap representation across 22 of 23 Developed Markets countries (excluding the U.S.) and 27 Emerging Markets countries. The Index is denominated in U.S. dollars. The Index returns are net of withholding taxes. They assume daily reinvestment of net dividends thus accounting for any applicable dividend taxation. Index returns provided by Bloomberg. BAB is an unmanaged, market value-weighted index of U.S. domestic investment-grade debt issues, including government, corporate, asset-backed and mortgage-backed securities with maturities of one year or more. Index returns provided by Interactive Data. BIAB is an unmanaged, market value-weighted index of U.S. domestic investment-grade debt issues, including government, corporate, asset-backed, and mortgage-backed securities with maturities of greater than one year but less than ten years. Index returns provided by Interactive Data. The returns of the indices do not reflect any fees or expenses. Returns provided are calculated monthly using a blended allocation. Because the fund’s asset allocation will vary over time, the composition of the fund’s portfolio may not match the composition of the comparative Indices. Mid-month performance may not be available for all indices within the blended index. Where applicable, performance for those indices is included from the first of the month following the corresponding Fund’s inception date. Index data referenced herein is the property of each index sponsor (London Stock Exchange Group plc and its group undertakings (Russell), MSCI, and Bloomberg), their affiliates ("Index Sponsors") and/or their third party suppliers and has been licensed for use by Manning & Napier. The Index Sponsors and their third party suppliers accept no liability in connection with its use. Data provided is not a representation or warranty, express or implied, as to the ability of any index to accurately represent the asset class or market sector that it purports to represent and none of these parties shall have any liability for any errors, omissions, or interruptions of any index or the data included therein. For additional disclosure information, please see: https://go.manning-napier.com/benchmark-provisions.
6The Bloomberg U.S. Aggregate Bond Index is an unmanaged, market-value weighted index of U.S. domestic investment-grade debt issues, including government, corporate, asset-backed, and mortgage-backed securities, with maturities of one year or more. Index returns do not reflect any fees or expenses. Index returns provided by Interactive Data. Index data referenced herein is the property of Bloomberg Finance L.P. and its affiliates ("Bloomberg"), and/or its third party suppliers and has been licensed for use by Manning & Napier. Bloomberg and its third party suppliers accept no liability in connection with its use. Data provided is not a representation or warranty, express or implied, as to the ability of any index to accurately represent the asset class or market sector that it purports to represent and none of these parties shall have any liability for any errors, omissions, or interruptions of any index or the data included therein. For additional disclosure information, please see: https:// go.manning-napier.com/benchmark-provisions.
27
Shareholder Expense Example - Pro-Blend® Moderate Term Series
(unaudited)
As a shareholder of the Series, you incur ongoing costs, including management fees, shareholder service fees and other Series expenses. This example is intended to help you understand your ongoing costs (in dollars) of investing in the Series and to compare these costs with the ongoing costs of investing in other mutual funds.
The example is based on an investment of $1,000 invested in each class at the beginning of the period and held for the entire period (May 1, 2021 to October 31, 2021).
Actual Expenses
The Actual lines of the table below provide information about actual account values and actual expenses. You may use the information in these lines, together with the amount you invested, to estimate the expenses that you paid over the period. Simply divide your account value by $1,000 (for example, an $8,600 account value divided by $1,000 = 8.6), then multiply the result by the number in the Actual line for the Class in which you have invested under the heading entitled “Expenses Paid During Period” to estimate the expenses you paid on your account during this period.
Hypothetical Example for Comparison Purposes
The Hypothetical lines of each class in the table below provide information about hypothetical account values and hypothetical expenses based on the Class’ actual expense ratio and an assumed rate of return of 5% per year before expenses, which is not the Class’ actual return. The hypothetical account values and expenses may not be used to estimate the actual ending account balance or expenses you paid during the period. You may use this information to compare the ongoing costs of investing in a class of the Series and other funds. To do so, compare this 5% hypothetical example for the Class in which you have invested with the 5% hypothetical examples that appear in the shareholder reports of the other funds.
Please note that the expenses shown in the table are meant to highlight your ongoing costs only and do not reflect any transaction costs, such as sales charges (loads), redemption fees, or exchange fees that you may incur in other mutual funds. Therefore, the second line of the table is useful in comparing ongoing costs only, and will not help you determine the relative total costs of owning different funds.
| BEGINNING ACCOUNT VALUE 5/1/21 | ENDING ACCOUNT VALUE 10/31/21 | EXPENSES PAID | ANNUALIZED EXPENSE RATIO | |||||||||
| Class S | ||||||||||||
| Actual | $1,000.00 | $1,027.80 | $5.37 | 1.05% | ||||||||
Hypothetical (5% return before expenses) | $1,000.00 | $1,019.91 | $5.35 | 1.05% | ||||||||
| Class I | ||||||||||||
| Actual | $1,000.00 | $1,028.70 | $4.30 | 0.84% | ||||||||
Hypothetical (5% return before expenses) | $1,000.00 | $1,020.97 | $4.28 | 0.84% | ||||||||
| Class R | ||||||||||||
| Actual | $1,000.00 | $1,026.60 | $6.39 | 1.25% | ||||||||
Hypothetical (5% return before expenses) | $1,000.00 | $1,018.90 | $6.36 | 1.25% | ||||||||
| Class L | ||||||||||||
| Actual | $1,000.00 | $1,023.80 | $9.03 | 1.77% | ||||||||
Hypothetical (5% return before expenses) | $1,000.00 | $1,016.28 | $9.00 | 1.77% | ||||||||
| Class W | ||||||||||||
| Actual | $1,000.00 | $1,033.20 | $0.51 | 0.10% | ||||||||
Hypothetical (5% return before expenses) | $1,000.00 | $1,024.70 | $0.51 | 0.10% | ||||||||
28
Shareholder Expense Example - Pro-Blend® Moderate Term Series
(unaudited)
*Expenses are equal to each Class’ annualized expense ratio (for the six-month period), multiplied by the average account value over the period, multiplied by 184/365 (to reflect the one-half year period). Expenses are based on the most recent fiscal half year; therefore, the expense ratios stated above may differ from the expense ratios stated in the financial highlights, which are based on one-year data. The Class’ total return would have been lower had certain expenses not been waived or reimbursed during the period.
29
Portfolio Composition - Pro-Blend® Moderate Term Series - as of October 31, 2021
(unaudited)
Asset Allocation1 |
 |
1As a percentage of net assets. 2A U.S. Treasury Bond is a long-term obligation of the U.S. Treasury issued with a maturity period of more than ten years. 3A U.S. Treasury Note is an intermediate long-term obligation of the U.S. Treasury issued with a maturity period between one and ten years. |
Sector Allocation4 | |
| Communication Services | 8.1% |
| Health Care | 7.1% |
| Information Technology | 6.4% |
| Consumer Discretionary | 6.2% |
| Industrials | 6.1% |
| Financials | 6.1% |
| Real Estate | 5.9% |
| Energy | 5.7% |
| Consumer Staples | 4.4% |
| Materials | 3.8% |
4Including common stocks, preferred stocks and corporate bonds, as a percentage of total investments. | |
Top Ten Stock Holdings5 | |
| Amazon.com, Inc. | 2.0% |
| Alphabet, Inc. - Class A | 1.9% |
| Meta Platforms, Inc. - Class A | 1.8% |
| Microsoft Corp. | 1.3% |
| SBA Communications Corp. | 1.1% |
| Johnson & Johnson | 1.1% |
| Unilever plc - ADR (United Kingdom) | 1.1% |
| Visa, Inc. - Class A | 1.0% |
| Sea Ltd. - ADR (Taiwan) | 1.0% |
| Mastercard, Inc. - Class A | 1.0% |
5As a percentage of total investments. | |
30
Investment Portfolio - October 31, 2021
| PRO-BLEND® MODERATE TERM SERIES | SHARES/ PRINCIPAL AMOUNT1 | VALUE (NOTE 2) | ||||||
| COMMON STOCKS - 43.9% | ||||||||
| Communication Services - 6.2% | ||||||||
| Diversified Telecommunication Services - 0.1% | ||||||||
| Radius Global Infrastructure, Inc. - Class | ||||||||
| A* | 14,698 | $ | 254,717 | |||||
| Verizon Communications, Inc. | 2,966 | 157,168 | ||||||
| 411,885 | ||||||||
| Entertainment - 1.7% | ||||||||
| Electronic Arts, Inc. | 12,644 | 1,773,321 | ||||||
| Sea Ltd. - ADR (Taiwan)* | 14,724 | 5,058,725 | ||||||
| Ubisoft Entertainment S.A. - ADR | ||||||||
| (France)* | 138,571 | 1,445,295 | ||||||
| Ubisoft Entertainment S.A. (France)* | 3,629 | 190,028 | ||||||
| 8,467,369 | ||||||||
| Interactive Media & Services - 3.7% | ||||||||
| Alphabet, Inc. - Class A* | 3,323 | 9,839,137 | ||||||
| Auto Trader Group plc (United Kingdom)2 | 37,362 | 309,747 | ||||||
| Meta Platforms, Inc. - Class A* | 27,724 | 8,970,655 | ||||||
| 19,119,539 | ||||||||
| Media - 0.7% | ||||||||
| Charter Communications, Inc. - Class A* | 4,473 | 3,018,783 | ||||||
| Comcast Corp. - Class A | 3,257 | 167,508 | ||||||
| Omnicom Group, Inc. | 380 | 25,870 | ||||||
| S4 Capital plc (United Kingdom)* | 20,663 | 205,208 | ||||||
| 3,417,369 | ||||||||
| Total Communication Services | 31,416,162 | |||||||
| Consumer Discretionary - 5.2% | ||||||||
| Distributors - 0.0%## | ||||||||
| Genuine Parts Co. | 258 | 33,826 | ||||||
| Hotels, Restaurants & Leisure - 1.1% | ||||||||
| Accor S.A. (France)* | 6,964 | 249,217 | ||||||
| Expedia Group, Inc.* | 19,299 | 3,172,948 | ||||||
| Hyatt Hotels Corp. - Class A* | 23,825 | 2,029,890 | ||||||
| Restaurant Brands International, Inc. | ||||||||
| (Canada) | 2,711 | 153,551 | ||||||
| 5,605,606 | ||||||||
| Household Durables - 1.2% | ||||||||
| Garmin Ltd. | 302 | 43,367 | ||||||
| Nikon Corp. (Japan) | 158,400 | 1,746,481 | ||||||
| Sony Group Corp. - ADR (Japan) | 34,027 | 3,939,986 | ||||||
| Sony Group Corp. (Japan) | 3,900 | 451,606 | ||||||
| Whirlpool Corp. | 119 | 25,089 | ||||||
| 6,206,529 | ||||||||
| Internet & Direct Marketing Retail - 2.0% | ||||||||
| Amazon.com, Inc.* | 2,980 | 10,049,841 | ||||||
| Multiline Retail - 0.8% | ||||||||
| Dollar General Corp. | 9,538 | 2,112,858 | ||||||
| Dollar Tree, Inc.* | 17,064 | 1,838,817 | ||||||
| 3,951,675 | ||||||||
| SHARES/ PRINCIPAL AMOUNT1 | VALUE (NOTE 2) | |||||||
| COMMON STOCKS (continued) | ||||||||
| Consumer Discretionary (continued) | ||||||||
| Specialty Retail - 0.0%## | ||||||||
| Best Buy Co., Inc. | 405 | $ | 49,507 | |||||
| The Home Depot, Inc. | 700 | 260,218 | ||||||
| Williams-Sonoma, Inc. | 144 | 26,745 | ||||||
| 336,470 | ||||||||
| Textiles, Apparel & Luxury Goods - 0.1% | ||||||||
| adidas AG (Germany) | 684 | 223,875 | ||||||
| lululemon athletica, Inc. * | 424 | 197,588 | ||||||
| 421,463 | ||||||||
| Total Consumer Discretionary | 26,605,410 | |||||||
| Consumer Staples - 4.4% | ||||||||
| Beverages - 1.5% | ||||||||
| Anheuser-Busch InBev S.A./N.V. | ||||||||
| (Belgium) | 2,101 | 128,512 | ||||||
| The Coca-Cola Co. | 61,196 | 3,449,619 | ||||||
| Diageo plc (United Kingdom) | 35,973 | 1,789,718 | ||||||
| Heineken N.V. - ADR (Netherlands) | 34,865 | 1,943,026 | ||||||
| Heineken N.V. (Netherlands) | 1,939 | 214,626 | ||||||
| 7,525,501 | ||||||||
| Food & Staples Retailing - 0.0%## | ||||||||
| The Kroger Co. | 1,112 | 44,502 | ||||||
| Walmart, Inc. | 1,559 | 232,946 | ||||||
| 277,448 | ||||||||
| Food Products - 1.7% | ||||||||
| Archer-Daniels-Midland Co. | 790 | 50,750 | ||||||
| Bunge Ltd. | 280 | 25,939 | ||||||
| Campbell Soup Co. | 550 | 21,972 | ||||||
| Conagra Brands, Inc. | 830 | 26,726 | ||||||
| Danone S.A. (France) | 5,016 | 326,972 | ||||||
| General Mills, Inc. | 830 | 51,294 | ||||||
| The Hershey Co. | 292 | 51,202 | ||||||
| The J.M. Smucker Co. | 201 | 24,695 | ||||||
| Kerry Group plc - Class A (Ireland) | 1,141 | 153,135 | ||||||
| The Kraft Heinz Co. | 1,490 | 53,476 | ||||||
| Mondelez International, Inc. - Class A | 66,648 | 4,048,200 | ||||||
| Nestle S.A. (Switzerland) | 27,704 | 3,654,358 | ||||||
| Tyson Foods, Inc. - Class A | 539 | 43,104 | ||||||
| 8,531,823 | ||||||||
| Household Products - 0.1% | ||||||||
| The Clorox Co. | 193 | 31,461 | ||||||
| Colgate-Palmolive Co. | 943 | 71,847 | ||||||
| Kimberly-Clark Corp. | 438 | 56,717 | ||||||
| Kimberly-Clark de Mexico S.A.B. de C.V. | ||||||||
| - Class A (Mexico) | 141,300 | 223,329 | ||||||
| The Procter & Gamble Co. | 1,569 | 224,352 | ||||||
| 607,706 | ||||||||
| Personal Products - 1.1% | ||||||||
| Beiersdorf AG (Germany) | 2,045 | 217,452 | ||||||
The accompanying notes are an integral part of the financial statements.
31
Investment Portfolio - October 31, 2021
| PRO-BLEND® MODERATE TERM SERIES | SHARES/ PRINCIPAL AMOUNT1 | VALUE (NOTE 2) | ||||||
| COMMON STOCKS (continued) | ||||||||
| Consumer Staples (continued) | ||||||||
| Personal Products (continued) | ||||||||
| Unilever plc - ADR. (United Kingdom) | 99,902 | $ | 5,352,749 | |||||
| 5,570,201 | ||||||||
| Total Consumer Staples | 22,512,679 | |||||||
| Energy - 2.1% | ||||||||
| Oil, Gas & Consumable Fuels - 2.1% | ||||||||
| BP plc - ADR (United Kingdom) | 30,852 | 888,229 | ||||||
| Cameco Corp. (Canada) | 89,116 | 2,165,519 | ||||||
| ConocoPhillips | 25,554 | 1,903,518 | ||||||
| EQT Corp.* | 111,467 | 2,219,308 | ||||||
| Exxon Mobil Corp. | 25,569 | 1,648,433 | ||||||
| Jonah Energy Parent LLC*3 | 5,224 | 326,500 | ||||||
| Royal Dutch Shell plc - Class B - ADR | ||||||||
| (Netherlands) | 14,953 | 685,446 | ||||||
| TotalEnergies SE - ADR (France) | 20,886 | 1,046,597 | ||||||
| Total Energy | 10,883,550 | |||||||
| Financials - 3.1% | ||||||||
| Banks - 0.3% | ||||||||
| The Bank of N.T. Butterfield & Son Ltd. | ||||||||
| (Bermuda) | 3,887 | 139,543 | ||||||
| Citigroup, Inc. | 1,814 | 125,456 | ||||||
| Comerica, Inc. | 286 | 24,336 | ||||||
| Fifth Third BanCorp. | 1,070 | 46,577 | ||||||
| FinecoBank Banca Fineco S.p.A. (Italy)* | 32,215 | 615,235 | ||||||
| Huntington Bancshares, Inc. | 1,797 | 28,285 | ||||||
| JPMorgan Chase & Co. | 1,412 | 239,885 | ||||||
| Regions Financial Corp. | 1,642 | 38,883 | ||||||
| U.S. BanCorp. | 1,560 | 94,177 | ||||||
| Capital Markets - 2.2% | 1,352,377 | |||||||
| Allfunds Group plc (United Kingdom)* | 7,564 | 152,897 | ||||||
| Avanza Bank Holding AB (Sweden) | 3,832 | 152,344 | ||||||
| Deutsche Boerse AG (Germany) | 2,435 | 404,227 | ||||||
| Intercontinental Exchange, Inc. | 32,969 | 4,564,888 | ||||||
| Intermediate Capital Group plc (United | ||||||||
| Kingdom) | 7,839 | 235,130 | ||||||
| Moody's Corp. | 10,208 | 4,125,563 | ||||||
| S&P Global, Inc. | 3,085 | 1,462,784 | ||||||
| 11,097,833 | ||||||||
| Insurance - 0.6% | ||||||||
| Admiral Group plc (United Kingdom) | 12,060 | 473,743 | ||||||
| The Allstate Corp. | 413 | 51,076 | ||||||
| Chubb Ltd. | 487 | 95,150 | ||||||
| Cincinnati Financial Corp. | 279 | 33,882 | ||||||
| Everest Re Group Ltd. | 80 | 20,920 | ||||||
| Fidelity National Financial, Inc. | 562 | 26,925 | ||||||
| The Hartford Financial Services Group, | ||||||||
| Inc. | 575 | 41,935 | ||||||
| The Travelers Companies, Inc. | 338 | 54,377 | ||||||
| SHARES/ PRINCIPAL AMOUNT1 | VALUE (NOTE 2) | |||||||
| COMMON STOCKS (continued) | ||||||||
| Financials (continued) | ||||||||
| Insurance (continued) | ||||||||
| W. R. Berkley Corp. | 30,071 | $ | 2,393,652 | |||||
| 3,191,660 | ||||||||
| Total Financials | 15,641,870 | |||||||
| Health Care - 6.7% | ||||||||
| Biotechnology - 2.3% | ||||||||
| BioMarin Pharmaceutical, Inc.* | 42,797 | 3,390,806 | ||||||
| Gilead Sciences, Inc. | 1,287 | 83,501 | ||||||
| Seagen, Inc.* | 23,313 | 4,110,781 | ||||||
| Vertex Pharmaceuticals, Inc.* | 21,834 | 4,037,762 | ||||||
| 11,622,850 | ||||||||
| Health Care Equipment & Supplies - 1.9% | ||||||||
| Alcon, Inc. (Switzerland) | 57,032 | 4,754,188 | ||||||
| Getinge AB - Class B (Sweden) | 8,127 | 363,698 | ||||||
| IDEXX Laboratories, Inc.* | 2,811 | 1,872,520 | ||||||
| Medtronic plc. | 18,333 | 2,197,393 | ||||||
| Shandong Weigao Group Medical | ||||||||
| Polymer Co. Ltd. - Class H (China) | 128,000 | 218,026 | ||||||
| 9,405,825 | ||||||||
| Health Care Providers & Services - 0.0%## | ||||||||
| Jinxin Fertility Group Ltd. (China)*2 | 50,000 | 70,521 | ||||||
| Quest Diagnostics, Inc. | 238 | 34,934 | ||||||
| 105,455 | ||||||||
| Life Sciences Tools & Services - 0.4% | ||||||||
| Thermo Fisher Scientific, Inc. | 3,276 | 2,073,937 | ||||||
| Pharmaceuticals - 2.1% | ||||||||
| Bristol-Myers Squibb Co. | 1,923 | 112,303 | ||||||
| Dechra Pharmaceuticals plc (United | ||||||||
| Kingdom) | 4,079 | 285,815 | ||||||
| Johnson & Johnson | 34,337 | 5,592,811 | ||||||
| Merck & Co., Inc. | 2,061 | 181,471 | ||||||
| Novartis AG - ADR (Switzerland) | 44,752 | 3,703,675 | ||||||
| Organon & Co. | 206 | 7,570 | ||||||
| Zoetis, Inc. | 4,794 | 1,036,463 | ||||||
| 10,920,108 | ||||||||
| Total Health Care | 34,128,175 | |||||||
| Industrials - 2.8% | ||||||||
| Aerospace & Defense - 0.1% | ||||||||
| Airbus SE (France)* | 1,175 | 150,731 | ||||||
| General Dynamics Corp. | 344 | 69,746 | ||||||
| L3Harris Technologies, Inc. | 263 | 60,632 | ||||||
| Lockheed Martin Corp. | 266 | 88,397 | ||||||
| Northrop Grumman Corp. | 195 | 69,658 | ||||||
| 439,164 | ||||||||
| Air Freight & Logistics - 0.0%## | ||||||||
| C.H. Robinson Worldwide, Inc. | 258 | 25,023 | ||||||
The accompanying notes are an integral part of the financial statements.
32
Investment Portfolio - October 31, 2021
| PRO-BLEND® MODERATE TERM SERIES | SHARES/ PRINCIPAL AMOUNT1 | VALUE (NOTE 2) | ||||||
| COMMON STOCKS (continued) | ||||||||
| Industrials (continued) | ||||||||
| Airlines - 0.5% | ||||||||
| Controladora Vuela Cia de Aviacion | ||||||||
| S.A.B. de C.V. - ADR (Mexico)* | 9,005 | $ | 162,991 | |||||
| Ryanair Holdings plc - ADR (Ireland)* | 19,024 | 2,159,414 | ||||||
| 2,322,405 | ||||||||
| Building Products - 0.1% | ||||||||
| A. O. Smith Corp. | 321 | 23,455 | ||||||
| Assa Abloy AB - Class B (Sweden) | 6,356 | 186,502 | ||||||
| Johnson Controls International plc | 1,072 | 78,653 | ||||||
| 288,610 | ||||||||
| Commercial Services & Supplies - 0.5% | ||||||||
| Cleanaway Waste Management Ltd. | ||||||||
| (Australia) | 119,825 | 243,695 | ||||||
| Copart, Inc.* | 13,149 | 2,041,908 | ||||||
| Republic Services, Inc. | 451 | 60,705 | ||||||
| Waste Management, Inc. | 512 | 82,038 | ||||||
| 2,428,346 | ||||||||
| Electrical Equipment - 0.0%## | ||||||||
| Eaton Corp. plc. | 492 | 81,062 | ||||||
| Emerson Electric Co. | 754 | 73,145 | ||||||
| Hubbell, Inc. | 113 | 22,529 | ||||||
| 176,736 | ||||||||
| Industrial Conglomerates - 0.0%## | ||||||||
| 3M Co. | 535 | 95,594 | ||||||
| Honeywell International, Inc. | 589 | 128,767 | ||||||
| 224,361 | ||||||||
| Machinery - 0.1% | ||||||||
| Caterpillar, Inc. | 518 | 105,677 | ||||||
| Cummins, Inc. | 213 | 51,086 | ||||||
| Illinois Tool Works, Inc. | 343 | 78,160 | ||||||
| Snap-on, Inc. | 105 | 21,339 | ||||||
| 256,262 | ||||||||
| Professional Services - 0.4% | ||||||||
| Booz Allen Hamilton Holding Corp. | 272 | 23,626 | ||||||
| Insperity, Inc. | 17,055 | 2,131,875 | ||||||
| 2,155,501 | ||||||||
| Road & Rail - 1.0% | ||||||||
| Canadian National Railway Co. (Canada) | 24,086 | 3,201,270 | ||||||
| Norfolk Southern Corp. | 6,711 | 1,966,659 | ||||||
| Union Pacific Corp. | 565 | 136,391 | ||||||
| 5,304,320 | ||||||||
| Trading Companies & Distributors - 0.0%## | ||||||||
| Brenntag SE (Germany) | 1,651 | 157,074 | ||||||
| W. W. Grainger, Inc. | 85 | 39,364 | ||||||
| 196,438 | ||||||||
| SHARES/ PRINCIPAL AMOUNT1 | VALUE (NOTE 2) | |||||||
| COMMON STOCKS (continued) | ||||||||
| Industrials (continued) | ||||||||
| Transportation Infrastructure - 0.1% | ||||||||
| Grupo Aeroportuario del Centro Norte | ||||||||
| S.A.B. de C.V. (Mexico)* | 13,200 | $ | 79,830 | |||||
| Grupo Aeroportuario del Pacifico S.A.B. | ||||||||
| de C.V. - ADR (Mexico) | 850 | 107,338 | ||||||
| Grupo Aeroportuario del Sureste S.A.B. | ||||||||
| de C.V. - ADR (Mexico) | 544 | 109,697 | ||||||
| 296,865 | ||||||||
| Total Industrials | 14,114,031 | |||||||
| Information Technology - 6.3% | ||||||||
| Communications Equipment - 0.0%## | ||||||||
| Cisco Systems, Inc. | 3,148 | 176,194 | ||||||
| Motorola Solutions, Inc. | 245 | 60,904 | ||||||
| 237,098 | ||||||||
| Electronic Equipment, Instruments & Components | ||||||||
| -0.1% | ||||||||
| Keyence Corp. (Japan) | 200 | 120,723 | ||||||
| Softwareone Holding AG (Germany) | 9,927 | 230,028 | ||||||
| 350,751 | ||||||||
| IT Services - 3.0% | ||||||||
| Adyen N.V. (Netherlands)*2 | 78 | 235,350 | ||||||
| Atos SE (France) | 3,597 | 187,665 | ||||||
| Automatic Data Processing, Inc. | 441 | 99,000 | ||||||
| Broadridge Financial Solutions, Inc. | 195 | 34,790 | ||||||
| International Business Machines Corp. | 815 | 101,957 | ||||||
| Keywords Studios plc (Ireland) | 1,836 | 71,259 | ||||||
| Mastercard, Inc. - Class A | 14,592 | 4,895,908 | ||||||
| PayPal Holdings, Inc.* | 15,352 | 3,570,722 | ||||||
| StoneCo Ltd. - Class A (Brazil)* | 6,280 | 212,641 | ||||||
| Switch, Inc. - Class A | 16,698 | 422,125 | ||||||
| TravelSky Technology Ltd. - Class H | ||||||||
| (China) | 99,000 | 184,977 | ||||||
| Visa, Inc. - Class A | 24,612 | 5,212,083 | ||||||
| 15,228,477 | ||||||||
| Semiconductors & Semiconductor Equipment - 0.6% | ||||||||
| Analog Devices, Inc. | 429 | 74,427 | ||||||
| Intel Corp. | 2,867 | 140,483 | ||||||
| NVIDIA Corp. | 8,581 | 2,193,904 | ||||||
| QUALCOMM, Inc. | 961 | 127,852 | ||||||
| Taiwan Semiconductor Manufacturing | ||||||||
| Co. Ltd. - ADR (Taiwan) | 2,584 | 293,801 | ||||||
| 2,830,467 | ||||||||
| Software - 2.6% | ||||||||
| Microsoft Corp. | 19,179 | 6,360,140 | ||||||
| Oracle Corp. | 2,205 | 211,548 | ||||||
| salesforce.com, Inc.* | 14,827 | 4,443,503 | ||||||
| ServiceNow, Inc.* | 2,971 | 2,073,045 | ||||||
| 13,088,236 | ||||||||
The accompanying notes are an integral part of the financial statements.
33
Investment Portfolio - October 31, 2021
| PRO-BLEND® MODERATE TERM SERIES | SHARES/ PRINCIPAL AMOUNT1 | VALUE (NOTE 2) | ||||||
| COMMON STOCKS (continued) | ||||||||
| Information Technology (continued) | ||||||||
| Technology Hardware, Storage & Peripherals - 0.0%## | ||||||||
| NetApp, Inc. | 398 | $ | 35,541 | |||||
| Total Information Technology | 31,770,570 | |||||||
| Materials - 3.1% | ||||||||
| Chemicals - 1.4% | ||||||||
| Air Liquide S.A. - ADR (France) | 83,671 | 2,796,285 | ||||||
| Air Liquide S.A. (France) | 2,254 | 376,323 | ||||||
| CF Industries Holdings, Inc. | 451 | 25,617 | ||||||
| Eastman Chemical Co. | 245 | 25,487 | ||||||
| FMC Corp. | 43,353 | 3,945,557 | ||||||
| International Flavors & Fragrances, Inc. | 338 | 49,838 | ||||||
| Linde plc (United Kingdom) | 439 | 140,129 | ||||||
| RPM International, Inc. | 251 | 21,887 | ||||||
| 7,381,123 | ||||||||
| Containers & Packaging - 0.8% | ||||||||
| Graphic Packaging Holding Co. | 194,915 | 3,884,656 | ||||||
| Packaging Corp. of America | 180 | 24,727 | ||||||
| 3,909,383 | ||||||||
| Metals & Mining - 0.9% | ||||||||
| Agnico Eagle Mines Ltd. (Canada) | 26,313 | 1,395,905 | ||||||
| Barrick Gold Corp. (Canada) | 78,729 | 1,446,252 | ||||||
| Newmont Corp. | 30,623 | 1,653,642 | ||||||
| Nucor Corp. | 493 | 55,043 | ||||||
| Reliance Steel & Aluminum Co. | 132 | 19,293 | ||||||
| Steel Dynamics, Inc. | 407 | 26,894 | ||||||
| 4,597,029 | ||||||||
| Total Materials | 15,887,535 | |||||||
| Real Estate - 4.0% | ||||||||
| Equity Real Estate Investment Trusts (REITS) - 4.0% | ||||||||
| Agree Realty Corp. | 1,509 | 107,229 | ||||||
| American Campus Communities, Inc. | 4,398 | 236,260 | ||||||
| American Homes 4 Rent - Class A | 8,235 | 334,341 | ||||||
| American Tower Corp. | 9,555 | 2,694,223 | ||||||
| Apple Hospitality REIT, Inc. | 14,990 | 235,493 | ||||||
| AvalonBay Communities, Inc. | 991 | 234,550 | ||||||
| Brandywine Realty Trust | 9,326 | 123,569 | ||||||
| Camden Property Trust | 1,297 | 211,541 | ||||||
| CareTrust REIT, Inc. | 4,668 | 96,861 | ||||||
| Community Healthcare Trust, Inc. | 3,873 | 185,284 | ||||||
| Cousins Properties, Inc. | 7,130 | 282,419 | ||||||
| Digital Realty Trust, Inc. | 2,082 | 328,560 | ||||||
| Douglas Emmett, Inc. | 3,334 | 108,955 | ||||||
| Duke Realty Corp. | 6,574 | 369,722 | ||||||
| Equinix, Inc. | 3,370 | 2,820,926 | ||||||
| Equity LifeStyle Properties, Inc. | 3,568 | 301,532 | ||||||
| Essex Property Trust, Inc. | 870 | 295,739 | ||||||
| Extra Space Storage, Inc. | 1,353 | 267,042 | ||||||
| Flagship Communities REIT | 8,029 | 160,339 | ||||||
| SHARES/ PRINCIPAL AMOUNT1 | VALUE (NOTE 2) | |||||||
| COMMON STOCKS (continued) | ||||||||
| Real Estate (continued) | ||||||||
| Equity Real Estate Investment Trusts (REITS) (continued) | ||||||||
| Getty Realty Corp. | 4,010 | $ | 128,801 | |||||
| Healthcare Trust of America, Inc. - Class | ||||||||
| A | 3,730 | 124,545 | ||||||
| Healthpeak Properties, Inc. | 3,386 | 120,237 | ||||||
| Hibernia REIT plc (Ireland) | 53,230 | 77,533 | ||||||
| Innovative Industrial Properties, Inc. | 671 | 176,533 | ||||||
| Invitation Homes, Inc. | 10,753 | 443,561 | ||||||
| Kilroy Realty Corp. | 2,616 | 176,266 | ||||||
| Lamar Advertising Co. - Class A | 813 | 92,032 | ||||||
| Life Storage, Inc. | 1,387 | 185,594 | ||||||
| Mid-America Apartment Communities, | ||||||||
| Inc. | 1,695 | 346,136 | ||||||
| NexPoint Residential Trust, Inc. | 1,800 | 127,501 | ||||||
| Prologis, Inc. | 8,100 | 1,174,176 | ||||||
| Public Storage | 1,610 | 534,810 | ||||||
| Realty Income Corp. | 997 | 71,216 | ||||||
| Rexford Industrial Realty, Inc. | 4,771 | 320,611 | ||||||
| SBA Communications Corp. | 16,408 | 5,666,175 | ||||||
| Sun Communities, Inc. | 2,313 | 453,302 | ||||||
| Terreno Realty Corp. | 1,946 | 142,311 | ||||||
| UDR, Inc. | 4,958 | 275,318 | ||||||
| Ventas, Inc. | 1,911 | 101,990 | ||||||
| Welltower, Inc. | 2,287 | 183,875 | ||||||
| Total Real Estate | 20,317,108 | |||||||
| TOTAL COMMON STOCKS | ||||||||
| (Identified Cost $169,256,502) | 223,277,090 | |||||||
| PREFERRED STOCKS - 0.3% | ||||||||
| Information Technology - 0.2% | ||||||||
| Software - 0.2% | ||||||||
| Greenidge Generation Holdings, Inc., | ||||||||
| 8.50%, 10/31/2026 | 10,000 | 248,000 | ||||||
| Synchronoss Technologies, Inc., | ||||||||
| 8.375%, 6/30/2026 | 20,600 | 498,108 | ||||||
| 746,108 | ||||||||
| Materials - 0.1% | ||||||||
| Metals & Mining - 0.1% | ||||||||
| Ramaco Resources, Inc., 9.00%, | ||||||||
| 7/30/2026 | 20,500 | 547,350 | ||||||
| TOTAL PREFERRED STOCKS | ||||||||
| (Identified Cost $1,279,027) | 1,293,458 | |||||||
The accompanying notes are an integral part of the financial statements.
34
Investment Portfolio - October 31, 2021
| PRO-BLEND® MODERATE TERM SERIES | SHARES/ PRINCIPAL AMOUNT1 | VALUE (NOTE 2) | ||||||
| CORPORATE BONDS - 15.5% | ||||||||
| Non-Convertible Corporate Bonds- 15.5% | ||||||||
| Communication Services - 1.9% | ||||||||
| Diversified Telecommunication Services - 0.9% | ||||||||
| Lumen Technologies, Inc., 7.50%, | ||||||||
| 4/1/2024 | 460,000 | $ | 504,850 | |||||
| Verizon Communications, Inc., | ||||||||
| 4.272%, 1/15/2036 | 3,450,000 | 4,035,694 | ||||||
| 4,540,544 | ||||||||
| Interactive Media & Services - 1.0% | ||||||||
| Tencent Holdings Ltd. (China), 3.975%, | ||||||||
| 4/11/20292 | 4,920,000 | 5,366,048 | ||||||
| Total Communication Services | 9,906,592 | |||||||
| Consumer Discretionary - 0.9% | ||||||||
| Automobiles - 0.1% | ||||||||
| Ford Motor Co., 9.00%, 4/22/2025 | 425,000 | 511,062 | ||||||
| Hotels, Restaurants & Leisure - 0.3% | ||||||||
| Expedia Group, Inc., 3.25%, 2/15/2030 | 1,290,000 | 1,326,718 | ||||||
| Household Durables - 0.0%## | ||||||||
| STL Holding Co. LLC, 7.50%, | ||||||||
| 2/15/20262 | 195,000 | 204,262 | ||||||
| Internet & Direct Marketing Retail - 0.5% | ||||||||
| Alibaba Group Holding Ltd. (China), | ||||||||
| 4.00%, 12/6/2037 | 2,440,000 | 2,644,437 | ||||||
| Total Consumer Discretionary | 4,686,479 | |||||||
| Energy - 3.6% | ||||||||
| Energy Equipment & Services - 0.1% | ||||||||
| Tidewater, Inc., 8.50%, 11/16/2026 | 500,000 | 499,595 | ||||||
| Oil, Gas & Consumable Fuels - 3.5% | ||||||||
| BP Capital Markets America, Inc., | ||||||||
| 3.06%, 6/17/2041 | 3,340,000 | 3,367,118 | ||||||
| Brooge Petroleum and Gas | ||||||||
| Investment Co. FZE (United Arab | ||||||||
| Emirates), 8.50%, 9/24/20252 | 193,000 | 197,343 | ||||||
| Cenovus Energy, Inc. (Canada), | ||||||||
| 6.75%, 11/15/2039 | 3,020,000 | 4,134,348 | ||||||
| Energy Transfer LP, 6.50%, 2/1/2042 | 2,728,000 | 3,551,017 | ||||||
| Kinder Morgan Energy Partners LP, | ||||||||
| 6.95%, 1/15/2038 | 2,299,000 | 3,238,713 | ||||||
| Navigator Holdings Ltd., 8.00%, | ||||||||
| 9/10/20252. | 150,000 | 156,750 | ||||||
| PetroTal Corp. (Peru), 12.00%, | ||||||||
| 2/16/20242. | 500,000 | 525,000 | ||||||
| The Williams Companies, Inc., 2.60%, | ||||||||
| 3/15/2031 | 2,630,000 | 2,636,719 | ||||||
| 17,807,008 | ||||||||
| Total Energy | 18,306,603 | |||||||
| SHARES/ PRINCIPAL AMOUNT1 | VALUE (NOTE 2) | |||||||
| CORPORATE BONDS (continued) | ||||||||
| Non-Convertible Corporate Bonds (continued) | ||||||||
| Financials - 3.0% | ||||||||
| Banks - 1.8% | ||||||||
| Bank of America Corp., 6.11%, | ||||||||
| 1/29/2037 | 1,550,000 | $ | 2,094,244 | |||||
| Citigroup, Inc., 4.45%, 9/29/2027 | 2,135,000 | 2,394,934 | ||||||
| JPMorgan Chase & Co., (U.S. Secured | ||||||||
| Overnight Financing Rate + 2.515%), | ||||||||
| 2.956%, 5/13/20314 | 3,250,000 | 3,356,891 | ||||||
| Lloyds Bank plc (United Kingdom) (3 | ||||||||
| mo. LIBOR US + 11.756%), 12.00%2,4,5 | 480,000 | 493,800 | ||||||
| Popular, Inc. (Puerto Rico), 6.125%, | ||||||||
| 9/14/2023 | 470,000 | 501,826 | ||||||
| 8,841,695 | ||||||||
| Capital Markets - 0.5% | ||||||||
| Blackstone Secured Lending Fund, | ||||||||
| 2.75%, 9/16/2026 | 1,300,000 | 1,312,004 | ||||||
| Owl Rock Technology Finance Corp., | ||||||||
| 3.75%, 6/17/20262 | 1,290,000 | 1,346,660 | ||||||
| 2,658,664 | ||||||||
| Consumer Finance - 0.2% | ||||||||
| Navient Corp., 6.75%, 6/25/2025 | 475,000 | 522,771 | ||||||
| SLM Corp., 5.125%, 4/5/2022 | 125,000 | 126,812 | ||||||
| Synergy One Lending, Inc., 5.50%, | ||||||||
| 10/14/2026 | 525,000 | 532,597 | ||||||
| 1,182,180 | ||||||||
| Diversified Financial Services - 0.4% | ||||||||
| Blackstone Private Credit Fund, | ||||||||
| 2.625%, 12/15/20262 | 1,370,000 | 1,346,549 | ||||||
| FS Energy & Power Fund, 7.50%, | ||||||||
| 8/15/20232 | 495,000 | 514,800 | ||||||
| 1,861,349 | ||||||||
| Mortgage Real Estate Investment Trusts (REITS) - 0.1% | ||||||||
| Arbor Realty Trust, Inc., 8.00%, | ||||||||
| 4/30/20232. | 155,000 | 162,963 | ||||||
| MCREIF SubREIT LLC, 5.00%, | ||||||||
| 10/15/20266 | 500,000 | 500,390 | ||||||
| 663,353 | ||||||||
| Total Financials | 15,207,241 | |||||||
| Health Care - 0.3% | ||||||||
| Health Care Providers & Services - 0.3% | ||||||||
| HCA, Inc., 4.125%, 6/15/2029 | 1,617,000 | 1,791,765 | ||||||
| Industrials - 3.3% | ||||||||
| Airlines - 0.6% | ||||||||
| Alaska Airlines Pass-Through Trust, | ||||||||
| Series 2020-1, Class B, 8.00%, | ||||||||
| 8/15/20252 | 181,835 | 205,084 | ||||||
| Southwest Airlines Co., 5.25%, | ||||||||
| 5/4/2025 | 2,237,000 | 2,508,179 | ||||||
The accompanying notes are an integral part of the financial statements.
35
Investment Portfolio - October 31, 2021
| PRO-BLEND® MODERATE TERM SERIES | SHARES/ PRINCIPAL AMOUNT1 | VALUE (NOTE 2) | ||||||
| CORPORATE BONDS (continued) | ||||||||
| Non-Convertible Corporate Bonds (continued) | ||||||||
| Industrials (continued) | ||||||||
| Airlines (continued) | ||||||||
| United Airlines Pass-Through Trust, | ||||||||
| Series 2018-1, Class B, 4.60%, | ||||||||
| 3/1/2026 | 87,374 | $ | 89,229 | |||||
| United Airlines Pass-Through Trust, | ||||||||
| Series 2019-2, Class B, 3.50%, | ||||||||
| 5/1/2028 | 474,767 | 468,898 | ||||||
| 3,271,390 | ||||||||
| Commercial Services & Supplies - 0.1% | ||||||||
| Airswift Global AS (United Kingdom) (3 | ||||||||
| mo. LIBOR US + 8.500%), 8.623%, | ||||||||
| 5/12/20252,7 | 500,000 | 502,500 | ||||||
| Industrial Conglomerates - 0.4% | ||||||||
| General Electric Co., 6.875%, | ||||||||
| 1/10/2039 | 1,340,000 | 2,038,263 | ||||||
| Marine - 0.2% | ||||||||
| American Tanker, Inc. (Norway), | ||||||||
| 7.75%, 7/2/2025 | 505,000 | 517,246 | ||||||
| Seaspan Corp. (Hong Kong), 6.50%, | ||||||||
| 2/5/20242 | 500,000 | 527,500 | ||||||
| 1,044,746 | ||||||||
| Road & Rail - 0.3% | ||||||||
| BNSF Funding Trust I, (3 mo. LIBOR | ||||||||
| US + 2.350%), 6.613%, 12/15/20554 | 1,140,000 | 1,298,517 | ||||||
| Trading Companies & Distributors - 1.7% | ||||||||
| AerCap Ireland Capital DAC - AerCap | ||||||||
| Global Aviation Trust (Ireland), | ||||||||
| 3.00%, 10/29/2028 | 2,690,000 | 2,730,603 | ||||||
| Air Lease Corp., 3.625%, 4/1/2027 | 1,220,000 | 1,302,250 | ||||||
| Ashtead Capital, Inc. (United Kingdom), | ||||||||
| 4.00%, 5/1/20282 | 1,220,000 | 1,287,282 | ||||||
| Avolon Holdings Funding Ltd. | ||||||||
| (Ireland), 2.75%, 2/21/20282 | 3,440,000 | 3,406,399 | ||||||
| 8,726,534 | ||||||||
| Total Industrials | 16,881,950 | |||||||
| Materials - 0.6% | ||||||||
| Metals & Mining - 0.6% | ||||||||
| Copper Mountain Mining Corp. | ||||||||
| (Canada), 8.00%, 4/9/20262 | 490,000 | 510,825 | ||||||
| IAMGOLD Corp. (Burkina Faso), | ||||||||
| 5.75%, 10/15/20282 | 155,000 | 152,287 | ||||||
| Jervois Mining USA Ltd. (Australia), | ||||||||
| 12.50%, 7/20/20268 | 400,000 | 423,752 | ||||||
| Newcastle Coal Infrastructure Group | ||||||||
| Pty Ltd. (Australia), 4.40%, 9/29/20272 | 1,280,000 | 1,295,819 | ||||||
| Northwest Acquisitions ULC - | ||||||||
| Dominion Finco, Inc., 7.125%, | ||||||||
| 11/1/20229,10 | 497,000 | 50 | ||||||
| SHARES/ PRINCIPAL AMOUNT1 | VALUE (NOTE 2) | |||||||
| CORPORATE BONDS (continued) | ||||||||
| Non-Convertible Corporate Bonds (continued) | ||||||||
| Materials (continued) | ||||||||
| Metals & Mining (continued) | ||||||||
| Tacora Resources, Inc. (Canada), | ||||||||
| 8.25%, 5/15/20262 | 495,000 | $ | 496,237 | |||||
| Total Materials | 2,878,970 | |||||||
| Real Estate - 1.9% | ||||||||
| Equity Real Estate Investment Trusts (REITS) - 1.9% | ||||||||
| American Tower Corp., 3.80%, | ||||||||
| 8/15/2029 | 3,680,000 | 4,045,969 | ||||||
| Crown Castle International Corp., | ||||||||
| 3.10%, 11/15/2029 | 2,332,000 | 2,438,973 | ||||||
| IIP Operating Partnership LP, 5.50%, | ||||||||
| 5/25/2026 | 490,000 | 517,070 | ||||||
| SBA Tower Trust | ||||||||
| 1.884%, 1/15/20262 | 520,000 | 524,852 | ||||||
| 2.328%, 1/15/20282 | 1,800,000 | 1,831,553 | ||||||
| 9,358,417 | ||||||||
| Real Estate Management & Development - 0.0%## | ||||||||
| Forestar Group, Inc., 3.85%, | ||||||||
| 5/15/20262 | 100,000 | 99,999 | ||||||
| Total Real Estate | 9,458,416 | |||||||
| TOTAL CORPORATE BONDS | 79,118,016 | |||||||
| (Identified Cost $77,677,511) | ||||||||
| U.S. TREASURY SECURITIES - 20.6% | ||||||||
| U.S. Treasury Bonds - 1.0% | ||||||||
| U.S. Treasury Bond, 3.875%, | ||||||||
| 8/15/2040 | ||||||||
| (Identified Cost $5,283,433) | 3,800,000 | 4,977,852 | ||||||
| U.S. Treasury Notes - 19.6% | ||||||||
| U.S. Treasury Note | ||||||||
| 2.50%, 5/15/2024 | 24,370,000 | 25,494,257 | ||||||
| 2.125%, 5/15/2025 | 19,355,000 | 20,160,198 | ||||||
| 1.625%, 5/15/2026 | 33,285,000 | 34,011,809 | ||||||
| 2.375%, 5/15/2027 | 14,465,000 | 15,314,819 | ||||||
| 1.625%, 5/15/2031 | 4,935,000 | 4,972,012 | ||||||
| Total U.S. Treasury Notes | ||||||||
| (Identified Cost $101,394,144) | 99,953,095 | |||||||
| TOTAL U.S. TREASURY SECURITIES | 104,930,947 | |||||||
| (Identified Cost $106,677,577) | ||||||||
| ASSET-BACKED SECURITIES - 8.0% | ||||||||
| Aligned Data Centers Issuer LLC, | ||||||||
| Series 2021-1A, Class A2, 1.937%, | ||||||||
| 8/15/20462 | 1,800,000 | 1,791,489 | ||||||
| BRSP Ltd., Series 2021-FL1, Class A, | ||||||||
| (1 mo. LIBOR US + 1.150%), 1.230%, | ||||||||
| 8/19/20382,7 | 1,100,000 | 1,100,000 | ||||||
The accompanying notes are an integral part of the financial statements.
36
Investment Portfolio - October 31, 2021
| PRO-BLEND® MODERATE TERM SERIES | SHARES/ PRINCIPAL AMOUNT1 | VALUE (NOTE 2) | ||||||
| ASSET-BACKED SECURITIES (continued) | ||||||||
| CF Hippolyta LLC | ||||||||
| Series 2020-1, Class A1, 1.69%, 7/15/20602 | 955,211 | $ | 955,397 | |||||
| Series 2020-1, Class A2, 1.99%, 7/15/20602 | 832,851 | 827,838 | ||||||
| CLI Funding VIII LLC, Series 2021-1A, Class A, 1.64%, 2/18/20462 | 1,913,773 | 1,875,806 | ||||||
| Commonbond Student Loan Trust, Series 2019-AGS, Class A1, 2.54%, 1/25/20472 | 908,299 | 925,684 | ||||||
| Credit Acceptance Auto Loan Trust | ||||||||
| Series 2020-1A, Class A, 2.01%, 2/15/20292 | 1,583,000 | 1,602,052 | ||||||
| Series 2020-3A, Class A, 1.24%, 10/15/20292 | 2,230,000 | 2,239,883 | ||||||
| Series 2021-2A, Class A, 0.96%, 2/15/20302 | 1,800,000 | 1,795,459 | ||||||
| Goodgreen Trust, Series 2020-1A, Class A, 2.63%, 4/15/20552 | 1,350,973 | 1,357,668 | ||||||
| Hertz Vehicle Financing LLC, Series 2021-1A, Class A, 1.21%, 12/26/20252 | 1,600,000 | 1,591,403 | ||||||
| Invitation Homes Trust | ||||||||
| Series 2017-SFR2, Class A, (1 mo. LIBOR US + 0.850%), 0.936%, 12/17/20362,7 | 192,107 | 191,873 | ||||||
| Series 2017-SFR2, Class B, (1 mo. LIBOR US + 1.150%), 1.236%, 12/17/20362,7 | 159,942 | 160,071 | ||||||
| Navient Private Education Refi Loan Trust | ||||||||
| Series 2014-1, Class A3, (1 mo. LIBOR US + 0.510%), 0.599%, 6/25/20317 | 1,213,345 | 1,197,733 | ||||||
| Series 2020-1A, Class A1B, (1 mo. LIBOR US + 1.050%), 1.139%, 6/25/20692,7 | 1,836,754 | 1,885,580 | ||||||
| Series 2020-FA, Class A, 1.22%, 7/15/20692 | 887,319 | 886,279 | ||||||
| Nelnet Student Loan Trust | ||||||||
| Series 2012-3A, Class A, (1 mo. LIBOR US + 0.700%), 0.789%, 2/25/20452,7 | 307,113 | 305,805 | ||||||
| Series 2013-5A, Class A, (1 mo. LIBOR US + 0.630%), 0.719%, 1/25/20372,7 | 425,040 | 426,150 | ||||||
| Series 2014-5A, Class A, (1 mo. LIBOR US + 0.550%), 0.639%, 7/25/20462,7 | 1,610,602 | 1,604,224 | ||||||
| Series 2015-2A, Class A2, (1 mo. LIBOR US + 0.600%), 0.689%, 9/25/20472,7 | 601,310 | 600,155 | ||||||
| Oxford Finance Funding LLC | ||||||||
| Series 2019-1A, Class A2, 4.459%, 2/15/20272 | 49,286 | 50,532 | ||||||
| Series 2020-1A, Class A2, 3.101%, 2/15/20282 | 1,371,000 | 1,394,193 | ||||||
| SHARES/ PRINCIPAL AMOUNT1 | VALUE (NOTE 2) | |||||||
| ASSET-BACKED SECURITIES (continued) | ||||||||
| Progress Residential Trust, Series 2019-SFR2, Class A, 3.147%, 5/17/20362 | 1,593,840 | $ | 1,602,308 | |||||
| SLM Student Loan Trust, Series 2005-7, Class A4, (3 mo. LIBOR US + 0.150%), 0.274%, 10/25/20297 | 852,335 | 848,657 | ||||||
| SMB Private Education Loan Trust | ||||||||
| Series 2019-B, Class A2A, 2.84%, 6/15/20372 | 2,010,708 | 2,074,822 | ||||||
| Series 2020-A, Class A2A, 2.23%, 9/15/20372 | 1,876,503 | 1,911,468 | ||||||
| SoFi Consumer Loan Program LLC | ||||||||
| Series 2016-1, Class A, 3.26%, 8/25/20252 | 5,501 | 5,513 | ||||||
| Series 2019-3, Class A, 2.90%, 5/25/20282 | 280 | 280 | ||||||
| SoFi Professional Loan Program LLC | ||||||||
| Series 2016-E, Class A2B, 2.49%, 1/25/20362 | 37,383 | 37,632 | ||||||
| Series 2017-F, Class A2FX, 2.84%, 1/25/20412 | 153,143 | 156,332 | ||||||
| Series 2018-B, Class A2FX, 3.34%, 8/25/20472 | 597,698 | 611,446 | ||||||
| Series 2020-A, Class A2FX, 2.54%, 5/15/20462 | 1,126,000 | 1,151,494 | ||||||
| Towd Point Mortgage Trust | ||||||||
| Series 2016-5, Class A1, 2.50%, 10/25/20562,11 | 529,459 | 535,051 | ||||||
| Series 2017-1, Class A1, 2.75%, 10/25/20562,11 | 400,440 | 405,471 | ||||||
| Series 2019-HY1, Class A1, (1 mo. LIBOR US + 1.000%), 1.089%, 10/25/20482,7 | 491,395 | 493,428 | ||||||
| Tricon American Homes | ||||||||
| Series 2017-SFR2, Class A, 2.928%, 1/17/20362 | 1,473,147 | 1,489,993 | ||||||
| Series 2020-SFR1, Class A, 1.499%, 7/17/20382 | 57,903 | 57,481 | ||||||
| Trinitas CLO XVII Ltd., Series 2021-17A, Class B1, (Cayman Islands) (3 mo. LIBOR US + 1.700%), 1.813%, 10/20/20342,7 | 2,100,000 | 2,100,725 | ||||||
| TRP LLC, Series 2021-1, Class A, 2.07%, 6/19/20512 | 1,491,808 | 1,482,900 | ||||||
| Vantage Data Centers LLC, Series 2020-1A, Class A2, 1.645%, 9/15/20452 | 1,250,000 | 1,235,965 | ||||||
| TOTAL ASSET-BACKED SECURITIES | ||||||||
| (Identified Cost $40,804,575) | 40,966,240 | |||||||
| COMMERCIAL MORTGAGE-BACKED SECURITIES - 5.4% | ||||||||
| Brean Asset Backed Securities Trust, Series 2021-RM2, Class A, 1.75%, 10/25/20612,11 | 1,401,522 | 1,359,794 | ||||||
The accompanying notes are an integral part of the financial statements.
37
Investment Portfolio - October 31, 2021
| PRO-BLEND® MODERATE TERM SERIES | SHARES/ PRINCIPAL AMOUNT1 | VALUE (NOTE 2) | ||||||
| COMMERCIAL MORTGAGE-BACKED SECURITIES (continued) | ||||||||
| CIM Trust, Series 2019-INV1, Class A1, 4.00%, 2/25/20492,11 | 102,651 | $ | 103,836 | |||||
| Citigroup Mortgage Loan Trust, Inc., Series 2021-INV1, Class A3A, 2.50%, 5/25/20512,11 | 724,741 | 732,347 | ||||||
| Credit Suisse Mortgage Capital Trust | ||||||||
| Series 2013-7, Class A6, 3.50%, 8/25/20432,11 | 174,693 | 175,700 | ||||||
| Series 2013-IVR2, Class A2, 3.00%, 4/25/20432,11 | 438,399 | 444,458 | ||||||
| Series 2013-IVR3, Class A1, 2.50%, 5/25/20432,11 | 335,134 | 335,603 | ||||||
| Series 2013-TH1, Class A1, 2.13%, 2/25/20432,11 | 212,299 | 214,151 | ||||||
| Series 2014-IVR3, Class A1, 3.50%, 7/25/20442,11 | 87,574 | 88,820 | ||||||
| Fannie Mae REMICS | ||||||||
| Series 2018-31, Class KP, 3.50%, 7/25/2047 | 139,017 | 143,035 | ||||||
| Series 2021-69, Class WJ, 1.50%, 10/25/2050 | 1,053,494 | 1,046,814 | ||||||
| Fannie Mae-Aces, Series 2017-M15, Class A1, 2.959%, 9/25/202711 | 1,341,327 | 1,411,867 | ||||||
| Fontainebleau Miami Beach Trust, Series 2019-FBLU, Class A, 3.144%, 12/10/20362 | 1,541,000 | 1,594,164 | ||||||
| Freddie Mac Multifamily Structured Pass-Through Certificates | ||||||||
| Series K017, Class X1 (IO), 1.459%, 12/25/202111 | 1,510,860 | 117 | ||||||
| Series K021, Class X1 (IO), 1.376%, 6/25/202211 | 10,559,884 | 30,975 | ||||||
| Series K030, Class X1 (IO), 0.148%, 4/25/202311 | 54,716,553 | 115,430 | ||||||
| Series K032, Class X1 (IO), 0.073%, 5/25/202311 | 35,162,542 | 50,437 | ||||||
| FREMF Mortgage Trust | ||||||||
| Series 2013-K28, Class X2A (IO), 0.10%, 6/25/20462 | 139,754,939 | 132,851 | ||||||
| Series 2014-K37, Class B, 4.560%, 1/25/20472,11 | 1,977,000 | 2,114,364 | ||||||
| Series 2014-K41, Class B, 3.833%, 11/25/20472,11 | 48,000 | 51,219 | ||||||
| Government National Mortgage Association, Series 2017-54, Class AH, 2.60%, 12/16/2056 | 1,011,905 | 1,032,490 | ||||||
| GS Mortgage Securities Corp. Trust, Series 2019-70P, Class A, (1 mo. LIBOR US + 1.000%), 1.09%, 10/15/20362,7 | 1,342,000 | 1,339,456 | ||||||
| GS Mortgage-Backed Securities Trust | ||||||||
| Series 2021-INV1, Class A9, (U.S. Secured Overnight Financing Rate 30 Day Average + 0.850%), 0.899%, 12/25/20512,7 | 1,345,612 | 1,349,024 | ||||||
| Series 2021-PJ6, Class A8, 2.50%, 11/25/20512,11 | 1,115,168 | 1,135,817 | ||||||
| SHARES/ PRINCIPAL AMOUNT1 | VALUE (NOTE 2) | |||||||
| COMMERCIAL MORTGAGE-BACKED SECURITIES (continued) | ||||||||
| GS Mortgage-Backed Securities Trust (continued) | ||||||||
| Series 2021-PJ9, Class A8, 2.50%, 2/26/20522,11 | 1,132,240 | $ | 1,148,223 | |||||
| Imperial Fund Mortgage Trust, Series 2021-NQM3, Class A1, 1.595%, 11/25/20562,11 | 1,260,000 | 1,256,346 | ||||||
| JP Morgan Mortgage Trust | ||||||||
| Series 2013-1, Class 1A2, 3.00%, 3/25/20432,11 | 162,014 | 163,481 | ||||||
| Series 2013-2, Class A2, 3.50%, 5/25/20432,11 | 146,497 | 148,178 | ||||||
| Series 2014-2, Class 1A1, 3.00%, 6/25/20292,11 | 375,198 | 380,771 | ||||||
| Series 2017-2, Class A3, 3.50%, 5/25/20472,11 | 18,297 | 18,513 | ||||||
| New Residential Mortgage Loan Trust | ||||||||
| Series 2014-3A, Class AFX3, 3.75%, 11/25/20542,11 | 366,908 | 386,380 | ||||||
| Series 2015-2A, Class A1, 3.75%, 8/25/20552,11 | 434,042 | 454,680 | ||||||
| Series 2016-4A, Class A1, 3.75%, 11/25/20562,11 | 516,395 | 549,051 | ||||||
| PMT Loan Trust, Series 2013-J1, Class A9, 3.50%, 9/25/20432,11 | 385,238 | 390,009 | ||||||
| Provident Funding Mortgage Trust | ||||||||
| Series 2021-2, Class A2A, 2.00%, 4/25/20512,11 | 1,340,086 | 1,345,845 | ||||||
| Series 2021-INV1, Class A1, 2.50%, 8/25/20512,11 | 2,075,029 | 2,106,559 | ||||||
| Sequoia Mortgage Trust | ||||||||
| Series 2013-2, Class A, 1.874%, 2/25/204311 | 358,377 | 358,197 | ||||||
| Series 2013-6, Class A2, 3.00%, 5/25/204311 | 630,562 | 633,208 | ||||||
| Series 2013-7, Class A2, 3.00%, 6/25/204311 | 211,071 | 212,206 | ||||||
| Series 2013-8, Class A1, 3.00%, 6/25/204311 | 259,194 | 261,278 | ||||||
| Series 2017-6, Class A19, 3.50%, 9/25/20472,11 | 127,173 | 128,675 | ||||||
| Series 2020-1, Class A1, 3.50%, 2/25/20502,11 | 112,792 | 114,978 | ||||||
| Series 2020-1, Class A4, 3.50%, 2/25/20502,11 | 2,558 | 2,560 | ||||||
| Starwood Retail Property Trust, Series 2014-STAR, Class A, (1 mo. LIBOR US + 1.470%), 1.560%, 11/15/20272,7 | 1,910,953 | 1,165,681 | ||||||
| Sutherland Commercial Mortgage Trust, Series 2019-SBC8, Class A, 2.86%, 4/25/20412,11 | 203,274 | 202,061 | ||||||
| Waikiki Beach Hotel Trust, Series 2019-WBM, Class A, (1 mo. LIBOR US + 1.050%), 1.14%, 12/15/20332,7 | 1,204,000 | 1,202,535 | ||||||
The accompanying notes are an integral part of the financial statements.
38
Investment Portfolio - October 31, 2021
| PRO-BLEND® MODERATE TERM SERIES | SHARES/ PRINCIPAL AMOUNT1 | VALUE (NOTE 2) | ||||||
| COMMERCIAL MORTGAGE-BACKED SECURITIES (continued) | ||||||||
| WinWater Mortgage Loan Trust, Series 2015-1, Class A1, 3.50%, 1/20/20452,11 | 128,638 | $ | 130,330 | |||||
| TOTAL COMMERCIAL MORTGAGE-BACKED SECURITIES | ||||||||
| (Identified Cost $28,760,237) | 27,762,514 | |||||||
| FOREIGN GOVERNMENT BONDS - 0.3% | ||||||||
| Canadian Government Bond (Canada), 2.75%, 6/1/2022 | CAD | 433,000 | 354,511 | |||||
| Mexican Government Bond | ||||||||
| (Mexico), 6.50%, 6/9/2022 | MXN | 5,621,000 | 273,452 | |||||
| (Mexico), 7.75%, 5/29/2031 | MXN | 1,081,000 | 53,323 | |||||
| Mexico Government International Bond (Mexico), 4.125%, 1/21/2026 | 200,000 | 221,050 | ||||||
| Republic of Italy Government International Bond (Italy), 2.375%, 10/17/2024 | 380,000 | 390,981 | ||||||
| TOTAL FOREIGN GOVERNMENT BONDS | ||||||||
| (Identified Cost $1,446,712) | 1,293,317 | |||||||
| MUNICIPAL BONDS - 1.2% | ||||||||
| Clark County, Public Impt., Series A, G.O. Bond, 1.51%, 11/1/2028 | 2,530,000 | 2,476,693 | ||||||
| Hawaii, Series GC, G.O. Bond, 2.682%, 10/1/2038 | 1,835,000 | 1,840,248 | ||||||
| New York City Transitional Finance | ||||||||
| Authority, Future Tax Secured, Public Impt., Revenue Bond, 1.58%, 5/1/2024 | 685,000 | 697,344 | ||||||
| South Carolina Public Service Authority, Series B, Revenue Bond, 2.329%, 12/1/2028 | 955,000 | 975,083 | ||||||
| TOTAL MUNICIPAL BONDS | ||||||||
| (Identified Cost $6,090,016) | 5,989,368 | |||||||
| U.S. GOVERNMENT AGENCIES - 2.2% | ||||||||
| Mortgage-Backed Securities - 2.2% | ||||||||
| Fannie Mae | ||||||||
| Pool #995329, UMBS, 5.50%, 12/1/2021 | 62 | 62 | ||||||
| Pool #888810, UMBS, 5.50%, 11/1/2022 | 185 | 186 | ||||||
| Pool #AD0462, UMBS, 5.50%, 10/1/2024 | 4,599 | 4,795 | ||||||
| Pool #MA3463, UMBS, 4.00%, 9/1/2033 | 588,271 | 622,401 | ||||||
| Pool #MA1834, UMBS, 4.50%, 2/1/2034 | 334,113 | 366,599 | ||||||
| SHARES/ PRINCIPAL AMOUNT1 | VALUE (NOTE 2) | |||||||
| U.S. GOVERNMENT AGENCIES (continued) | ||||||||
| Mortgage-Backed Securities (continued) | ||||||||
| Fannie Mae (continued) | ||||||||
| Pool #MA1903, UMBS, 4.50%, 5/1/2034 | 326,050 | $ | 357,761 | |||||
| Pool #889576, UMBS, 6.00%, 4/1/2038 | 218,278 | 257,966 | ||||||
| Pool #MA3412, UMBS, 3.50%, 7/1/2038 | 440,168 | 467,341 | ||||||
| Pool #995196, UMBS, 6.00%, 7/1/2038 | 489,556 | 578,542 | ||||||
| Pool #AD0207, UMBS, 6.00%, 10/1/2038 | 83,174 | 98,295 | ||||||
| Pool #AD0220, UMBS, 6.00%, 10/1/2038 | 25,611 | 30,266 | ||||||
| Pool #MA0258, UMBS, 4.50%, 12/1/2039 | 404,155 | 450,205 | ||||||
| Pool #AL1595, UMBS, 6.00%, 1/1/2040 | 314,247 | 370,777 | ||||||
| Pool #AL0152, UMBS, 6.00%, 6/1/2040 | 455,667 | 537,644 | ||||||
| Pool #MA4203, UMBS, 2.50%, 12/1/2040 | 2,830,764 | 2,913,455 | ||||||
| Pool #AL7068, UMBS, 4.50%, 9/1/2042 | 131,203 | 146,426 | ||||||
| Pool #AX5234, UMBS, 4.50%, 11/1/2044 | 501,272 | 552,627 | ||||||
| Pool #BD1381, UMBS, 3.50%, 6/1/2046 | 72,843 | 77,726 | ||||||
| Pool #BE7845, UMBS, 4.50%, 2/1/2047 | 80,349 | 87,519 | ||||||
| Pool #AL8674, 5.659%, 1/1/2049 | 1,179,328 | 1,315,533 | ||||||
| Freddie Mac | ||||||||
| Pool #G12610, 6.00%, 3/1/2022 | 330 | 331 | ||||||
| Pool #G12655, 6.00%, 5/1/2022 | 273 | 274 | ||||||
| Pool #G12988, 6.00%, 1/1/2023 | 1,258 | 1,277 | ||||||
| Pool #G13078, 6.00%, 3/1/2023 | 1,717 | 1,741 | ||||||
| Pool #G13331, 5.50%, 10/1/2023 | 1,406 | 1,441 | ||||||
| Pool #C91762, 4.50%, 5/1/2034 | 410,079 | 450,070 | ||||||
| Pool #C91771, 4.50%, 6/1/2034 | 6,330 | 6,947 | ||||||
| Pool #C91780, 4.50%, 7/1/2034 | 10,014 | 10,991 | ||||||
| Pool #G03781, 6.00%, 1/1/2038 | 95,969 | 112,600 | ||||||
| Pool #G03926, 6.00%, 2/1/2038 | 120,686 | 142,664 | ||||||
| Pool #G05900, 6.00%, 3/1/2040 | 58,582 | 68,212 | ||||||
| Pool #G05906, 6.00%, 4/1/2040 | 79,206 | 93,442 | ||||||
| Pool #A92889, 4.50%, 7/1/2040 | 743,671 | 831,436 | ||||||
| Pool #G08772, 4.50%, 7/1/2047 | 90,270 | 98,369 | ||||||
| Pool #ZS4751, UMBS, 3.50%, 1/1/2048 | 175,659 | 186,628 | ||||||
| TOTAL U.S. GOVERNMENT AGENCIES | ||||||||
| (Identified Cost $10,873,940) | 11,242,549 | |||||||
The accompanying notes are an integral part of the financial statements.
39
Investment Portfolio - October 31, 2021
| PRO-BLEND® MODERATE TERM SERIES | SHARES/ PRINCIPAL AMOUNT1 | VALUE (NOTE 2) | ||||||
| SHORT-TERM INVESTMENT - 2.4% | ||||||||
| Dreyfus Government Cash Management, Institutional Shares, 0.03%12 | ||||||||
| (Identified Cost $12,150,030) | 12,150,030 | $ | 12,150,030 | |||||
| TOTAL INVESTMENTS - 99.8% | ||||||||
| (Identified Cost $455,016,127) | 508,023,529 | |||||||
| OTHER ASSETS, LESS LIABILITIES - 0.2% | 1,091,734 | |||||||
| NET ASSETS - 100% | $ | 509,115,263 | ||||||
ADR - American Depositary Receipt
CAD - Canadian Dollar
CLO - Collateralized Loan Obligation
G.O. Bond - General Obligation Bond
Impt. - Improvement
IO - Interest only
LIBOR - London Interbank Offered Rate
MXN - Mexican Peso
REMICS - Real Estate Mortgage Investment Conduits
UMBS - Uniform Mortgage-Backed Securities
*Non-income producing security.
## Less than 0.1%.
1Amount is stated in USD unless otherwise noted.
2Security purchased or received in a transaction exempt from registration under the Securities Act of 1933, as amended (the “1933 Act”) and determined to be liquid under the Fund’s Liquidity Risk Management Program. The security may be resold pursuant to an exemption from registration under the 1933 Act, typically to qualified institutional buyers. The aggregate value of these securities at October 31, 2021 was $83,156,440, which represented 16.3% of the Series’ Net Assets.
3Security has been valued using significant unobservable inputs.
4Variable rate security. Security may be issued at a fixed coupon rate, which converts to a variable rate at a specified date. Rate shown is the rate in effect as of October 31, 2021.
5Security is perpetual in nature and has no stated maturity date.
6Security purchased or received in a transaction exempt from registration under the Securities Act of 1933, as amended (the “1933 Act”) and determined to be illiquid under the Fund’s Liquidity Risk Management Program. The security may be resold pursuant to an exemption from registration under the 1933 Act, typically to qualified institutional buyers. The security was acquired on October 13, 2021 at a cost of $500,000. The value of the security at October 31, 2021 was $500,390, or 0.1% of the Series’ Net Assets.
7Floating rate security. Rate shown is the rate in effect as of October 31, 2021.
8Security purchased or received in a transaction exempt from registration under the Securities Act of 1933, as amended (the “1933 Act”) and determined to be illiquid under the Fund’s Liquidity Risk Management Program. The security may be resold pursuant to an exemption from registration under the 1933 Act, typically to qualified institutional buyers. The security was acquired on August 4, 2021 and August 6, 2021 at an aggregate cost of $425,000. The value of the security at October 31, 2021 was $423,752, or 0.1% of the Series’ Net Assets.
9Issuer filed for bankruptcy and/or is in default of interest payments.
10Security purchased or received in a transaction exempt from registration under the Securities Act of 1933, as amended (the “1933 Act”) and determined to be illiquid under the Fund’s Liquidity Risk Management Program. The security may be resold pursuant to an exemption from registration under the 1933 Act, typically to qualified institutional buyers. The security was acquired on October 10, 2017 and on dates between May 8, 2020 and September 18, 2020 at an aggregate cost of $89,149. The value of the security at October 31, 2021 was $50, or less than 0.1% of the Series’ Net Assets.
11Variable or floating rate security, the interest rate of which adjusts periodically based on changes in current interest rates and prepayments on the underlying pool of assets. Rate shown is the rate in effect as of October 31, 2021.
12Rate shown is the current yield as of October 31, 2021.
The Global Industry Classification Standard (GICS) was developed by and is the exclusive property and a service mark of MSCI Inc. (MSCI) and Standard & Poor’s, a division of S&P Global Inc. (S&P), and is licensed for use by Manning & Napier when referencing GICS sectors. Neither MSCI, S&P, nor any third party involved in making or compiling the GICS or any GICS classifications makes any express or implied warranties or representations with respect to such standard or classification, nor shall any such party have any liability therefrom.
The accompanying notes are an integral part of the financial statements.
40
Statement of Assets and Liabilities - Pro-Blend® Moderate Term Series
October 31, 2021
| ASSETS: | ||||
| Investments in securities, at value (identified cost $455,016,127) (Note 2) | $ | 508,023,529 | ||
| Interest receivable | 2,031,683 | |||
| Foreign tax reclaims receivable | 306,368 | |||
| Receivable for fund shares sold | 157,368 | |||
| Receivable for securities sold | 74,289 | |||
| Dividends receivable | 70,876 | |||
| Prepaid expenses | 25,593 | |||
| TOTAL ASSETS | 510,689,706 | |||
| LIABILITIES: | ||||
| Foreign currency overdraft, at value (identified cost $594) | 586 | |||
| Accrued management fees (Note 3) | 258,243 | |||
| Accrued distribution and service (Rule 12b-1) fees (Class S) (Class R) (Class L) (Note 3) | 155,151 | |||
| Accrued sub-transfer agent fees (Note 3) | 132,690 | |||
| Accrued fund accounting and administration fees (Note 3) | 44,143 | |||
| Accrued Chief Compliance Officer service fees (Note 3) | 2,032 | |||
| Directors' fees payable (Note 3) | 173 | |||
| Payable for securities purchased | 577,920 | |||
| Payable for fund shares repurchased | 309,357 | |||
| Other payables and accrued expenses | 94,148 | |||
| TOTAL LIABILITIES | 1,574,443 | |||
| TOTAL NET ASSETS | $ | 509,115,263 | ||
| NET ASSETS CONSIST OF: | ||||
| Capital stock | $ | 390,778 | ||
| Additional paid-in-capital | 418,777,513 | |||
| Total distributable earnings (loss) | 89,946,972 | |||
| TOTAL NET ASSETS | $ | 509,115,263 | ||
The accompanying notes are an integral part of the financial statements.
41
Statement of Assets and Liabilities - Pro-Blend® Moderate Term Series
October 31, 2021
| NET ASSET VALUE, OFFERING PRICE AND REDEMPTION PRICE PER SHARE - Class S | |||||
| ($244,965,189/15,421,255 shares) | $ | 15.88 | |||
| NET ASSET VALUE, OFFERING PRICE AND REDEMPTION PRICE PER SHARE - Class I | |||||
| ($127,247,950/11,554,442 shares) | $ | 11.01 | |||
| NET ASSET VALUE, OFFERING PRICE AND REDEMPTION PRICE PER SHARE - Class R | |||||
| ($28,120,663/2,382,869 shares) | $ | 11.80 | |||
| NET ASSET VALUE, OFFERING PRICE AND REDEMPTION PRICE PER SHARE - Class L | |||||
| ($108,543,772/9,704,484 shares) | $ | 11.18 | |||
| NET ASSET VALUE, OFFERING PRICE AND REDEMPTION PRICE PER SHARE - Class W | |||||
| ($237,689/14,868 shares) | $ | 15.99 |
The accompanying notes are an integral part of the financial statements.
42
Statement of Operations - Pro-Blend® Moderate Term Series
For the Year Ended October 31, 2021
| INVESTMENT INCOME: | ||||
| Interest (net of foreign taxes withheld, $150) | $ | 5,423,437 | ||
| Dividends (net of foreign taxes withheld, $121,722) | 2,807,501 | |||
| Other Income | 40,905 | |||
| Total Investment Income | 8,271,843 | |||
| EXPENSES: | ||||
| Management fees (Note 3) | 3,024,264 | |||
| Distribution and service (Rule 12b-1) fees (Class L) (Note 3) | 1,052,637 | |||
| Distribution and service (Rule 12b-1) fees (Class S) (Note 3) | 616,840 | |||
| Distribution and service (Rule 12b-1) fees (Class R) (Note 3) | 153,285 | |||
| Sub-transfer agent fees (Note 3) | 379,090 | |||
| Fund accounting and administration fees (Note 3) | 136,290 | |||
| Directors’ fees (Note 3) | 61,729 | |||
| Chief Compliance Officer service fees (Note 3) | 6,096 | |||
| Custodian fees | 40,706 | |||
| Recoupment of past waived and/or reimbursed fees | 2,857 | |||
| Miscellaneous | 397,885 | |||
| Total Expenses | 5,871,679 | |||
| Less reduction of expenses (Note 3) | (1,592 | ) | ||
| Net Expenses | 5,870,087 | |||
| NET INVESTMENT INCOME | 2,401,756 | |||
| REALIZED AND UNREALIZED GAIN (LOSS) ON INVESTMENTS AND FOREIGN CURRENCY: | ||||
| Net realized gain (loss) on- | ||||
| Investments in securities | 40,748,043 | |||
| Foreign currency and translation of other assets and liabilities | (1,596 | ) | ||
| 40,746,447 | ||||
| Net change in unrealized appreciation (depreciation) on- | ||||
| Investments in securities | 29,339,417 | |||
| Foreign currency and translation of other assets and liabilities | 381 | |||
| 29,339,798 | ||||
| NET REALIZED AND UNREALIZED GAIN (LOSS) ON INVESTMENTS AND FOREIGN CURRENCY | 70,086,245 | |||
| NET INCREASE IN NET ASSETS RESULTING FROM OPERATIONS | $ | 72,488,001 |
The accompanying notes are an integral part of the financial statements.
43
Statements of Changes in Net Assets - Pro-Blend® Moderate Term Series
| FOR THE YEAR ENDED 10/31/21 | FOR THE YEAR ENDED 10/31/20 | |||||||
| INCREASE (DECREASE) IN NET ASSETS: | ||||||||
| OPERATIONS: | ||||||||
| Net investment income | $ | 2,401,756 | $ | 3,586,777 | ||||
| Net realized gain (loss) on investments and foreign currency | 40,746,447 | 31,088,625 | ||||||
| Net change in unrealized appreciation (depreciation) on investments and foreign currency | 29,339,798 | (2,243,767 | ) | |||||
| Net increase (decrease) from operations | 72,488,001 | 32,431,635 | ||||||
| DISTRIBUTIONS TO SHAREHOLDERS (Note 9): | ||||||||
| Class S | (14,688,897 | ) | (8,280,136 | ) | ||||
| Class I | (9,739,740 | ) | (7,299,385 | ) | ||||
| Class R | (2,614,376 | ) | (423,388 | ) | ||||
| Class L | (7,813,969 | ) | (5,228,343 | ) | ||||
| Class W | (18,293 | ) | (14,111 | ) | ||||
| Total distributions to shareholders | (34,875,275 | ) | (21,245,363 | ) | ||||
| CAPITAL STOCK ISSUED AND REPURCHASED: | ||||||||
| Net increase (decrease) from capital share transactions (Note 5) | (3,097,475 | ) | 70,370,477 | |||||
| Net increase (decrease) in net assets | 34,515,251 | 81,556,749 | ||||||
| NET ASSETS: | ||||||||
| Beginning of year | 474,600,012 | 393,043,263 | ||||||
| End of year | $ | 509,115,263 | $ | 474,600,012 | ||||
The accompanying notes are an integral part of the financial statements.
44
Financial Highlights - Pro-Blend® Moderate Term Series - Class S
| FOR THE YEAR ENDED | ||||||||||||||||||||
| 10/31/21 | 10/31/20 | 10/31/19 | 10/31/18 | 10/31/17 | ||||||||||||||||
| Per share data (for a share outstanding throughout each year): | ||||||||||||||||||||
| Net asset value - Beginning of year | $14.57 | $13.96 | $13.13 | $14.17 | $13.37 | |||||||||||||||
| Income (loss) from investment operations: | ||||||||||||||||||||
| Net investment income1 | 0.09 | 0.14 | 0.20 | 0.17 | 0.13 | |||||||||||||||
| Net realized and unrealized gain (loss) on investments | 2.13 | 1.112 | 1.28 | (0.38 | ) | 0.97 | ||||||||||||||
| Total from investment operations | 2.22 | 1.25 | 1.48 | (0.21 | ) | 1.10 | ||||||||||||||
| Less distributions to shareholders: | ||||||||||||||||||||
| From net investment income | (0.07 | ) | (0.14 | ) | (0.17 | ) | (0.12 | ) | (0.10 | ) | ||||||||||
| From net realized gain on investments | (0.84 | ) | (0.50 | ) | (0.48 | ) | (0.71 | ) | (0.20 | ) | ||||||||||
| Total distributions to shareholders | (0.91 | ) | (0.64 | ) | (0.65 | ) | (0.83 | ) | (0.30 | ) | ||||||||||
| Net asset value - End of year | $15.88 | $14.57 | $13.96 | $13.13 | $14.17 | |||||||||||||||
| Net assets - End of year (000’s omitted) | $244,965 | $237,656 | $179,977 | $318,691 | $426,426 | |||||||||||||||
| Total return3 | 15.78% | 9.27% | 2 | 11.85% | (1.67% | ) | 8.46% | |||||||||||||
| Ratios (to average net assets)/Supplemental Data: | ||||||||||||||||||||
| Expenses* | 1.05% | 1.07% | 1.09% | 1.10% | 1.08% | |||||||||||||||
| Net investment income | 0.59% | 1.02% | 1.53% | 1.24% | 0.98% | |||||||||||||||
| Series portfolio turnover | 74% | 105% | 53% | 74% | 68% | |||||||||||||||
*For certain years presented, the investment advisor did not impose all or a portion of its management and/or other fees, and in some years may have paid a portion of the Series’ expenses. If these expenses had been incurred by the Class, the expense ratio (to average net assets) would have increased by the following amounts: | ||||||||||||||||||||
| N/A | N/A | 0.00% | 4 | N/A | N/A | |||||||||||||||
1Calculated based on average shares outstanding during the years.
2During the reporting period the Fund settled legal claims against an issuer of securities previously held by the Fund. As a result, the net realized and unrealized gain (loss) on investments per share includes proceeds received from the settlement. Without these proceeds the net realized and unrealized gain (loss) on investments per share would have been $1.10. Excluding the proceeds from the settlement, the total return would have been 9.12%.
3Represents aggregate total return for the years indicated, and assumes reinvestment of all distributions. Total return would have been lower had certain expenses not been waived or reimbursed during certain years.
4Less than 0.01%.
The accompanying notes are an integral part of the financial statements.
45
Financial Highlights - Pro-Blend® Moderate Term Series - Class I
| FOR THE YEAR ENDED | ||||||||||||||||||||
| 10/31/21 | 10/31/20 | 10/31/19 | 10/31/18 | 10/31/17 | ||||||||||||||||
| Per share data (for a share outstanding throughout each year): | ||||||||||||||||||||
| Net asset value - Beginning of year | $10.37 | $10.14 | $9.72 | $10.72 | $10.20 | |||||||||||||||
| Income (loss) from investment operations: | ||||||||||||||||||||
| Net investment income1 | 0.08 | 0.13 | 0.17 | 0.15 | 0.13 | |||||||||||||||
| Net realized and unrealized gain (loss) on investments | 1.51 | 0.782 | 0.93 | (0.29 | ) | 0.73 | ||||||||||||||
| Total from investment operations | 1.59 | 0.91 | 1.10 | (0.14 | ) | 0.86 | ||||||||||||||
| Less distributions to shareholders: | ||||||||||||||||||||
| From net investment income | (0.11 | ) | (0.18 | ) | (0.20 | ) | (0.15 | ) | (0.14 | ) | ||||||||||
| From net realized gain on investments | (0.84 | ) | (0.50 | ) | (0.48 | ) | (0.71 | ) | (0.20 | ) | ||||||||||
| Total distributions to shareholders | (0.95 | ) | (0.68 | ) | (0.68 | ) | (0.86 | ) | (0.34 | ) | ||||||||||
| Net asset value - End of year | $11.01 | $10.37 | $10.14 | $9.72 | $10.72 | |||||||||||||||
| Net assets - End of year (000’s omitted) | $127,248 | $108,333 | $111,637 | $125,647 | $140,706 | |||||||||||||||
| Total return3 | 16.10% | 9.37% | 2 | 12.20% | (1.49% | ) | 8.72% | |||||||||||||
| Ratios (to average net assets)/Supplemental Data: | ||||||||||||||||||||
| Expenses* | 0.84% | 0.85% | 0.85% | 0.85% | 0.83% | |||||||||||||||
| Net investment income | 0.79% | 1.26% | 1.76% | 1.50% | 1.24% | |||||||||||||||
| Series portfolio turnover | 74% | 105% | 53% | 74% | 68% | |||||||||||||||
*For certain years presented, the investment advisor did not impose all or a portion of its management and/or other fees, and in some years may have paid a portion of the Series’ expenses. If these expenses had been incurred by the Class, the expense ratio (to average net assets) would have increased by the following amounts: | ||||||||||||||||||||
| N/A | 0.01% | 0.02% | N/A | N/A | ||||||||||||||||
1Calculated based on average shares outstanding during the years.
2During the reporting period the Fund settled legal claims against an issuer of securities previously held by the Fund. As a result, the net realized and unrealized gain (loss) on investments per share includes proceeds received from the settlement. Without these proceeds the net realized and unrealized gain (loss) on investments per share would have been $0.77. Excluding the proceeds from the settlement, the total return would have been 9.27%.
3Represents aggregate total return for the years indicated, and assumes reinvestment of all distributions. Total return would have been lower had certain expenses not been waived or reimbursed during certain years.
The accompanying notes are an integral part of the financial statements.
46
Financial Highlights - Pro-Blend® Moderate Term Series - Class R
| FOR THE YEAR ENDED | ||||||||||||||||||||
| 10/31/21 | 10/31/20 | 10/31/19 | 10/31/18 | 10/31/17 | ||||||||||||||||
| Per share data (for a share outstanding throughout each year): | ||||||||||||||||||||
| Net asset value - Beginning of year | $11.06 | $10.76 | $10.25 | $11.25 | $10.68 | |||||||||||||||
| Income (loss) from investment operations: | ||||||||||||||||||||
| Net investment income1 | 0.04 | 0.07 | 0.13 | 0.11 | 0.08 | |||||||||||||||
| Net realized and unrealized gain (loss) on investments | 1.61 | 0.852 | 0.99 | (0.31 | ) | 0.77 | ||||||||||||||
| Total from investment operations | 1.65 | 0.92 | 1.12 | (0.20 | ) | 0.85 | ||||||||||||||
| Less distributions to shareholders: | ||||||||||||||||||||
| From net investment income | (0.07 | ) | (0.12 | ) | (0.13 | ) | (0.09 | ) | (0.08 | ) | ||||||||||
| From net realized gain on investments | (0.84 | ) | (0.50 | ) | (0.48 | ) | (0.71 | ) | (0.20 | ) | ||||||||||
| Total distributions to shareholders | (0.91 | ) | (0.62 | ) | (0.61 | ) | (0.80 | ) | (0.28 | ) | ||||||||||
| Net asset value - End of year | $11.80 | $11.06 | $10.76 | $10.25 | $11.25 | |||||||||||||||
| Net assets - End of year (000’s omitted) | $28,121 | $32,824 | $7,610 | $16,537 | $22,662 | |||||||||||||||
| Total return3 | 15.62% | 8.89% | 2 | 11.60% | (1.96% | ) | 8.21% | |||||||||||||
| Ratios (to average net assets)/Supplemental Data: | ||||||||||||||||||||
| Expenses* | 1.26% | 4 | 1.35% | 1.35% | 1.35% | 1.33% | ||||||||||||||
| Net investment income | 0.39% | 0.66% | 1.26% | 1.00% | 0.73% | |||||||||||||||
| Series portfolio turnover | 74% | 105% | 53% | 74% | 68% | |||||||||||||||
| *For certain years presented, the investment advisor did not impose all or a portion of its management and/or other fees, and in some years may have paid a portion of the Series’ expenses. If these expenses had been incurred by the Class, the expense ratio (to average net assets) would have increased by the following amounts: | ||||||||||||||||||||
| N/A | 0.01% | 0.03% | N/A | N/A | ||||||||||||||||
1Calculated based on average shares outstanding during the years.
2During the reporting period the Fund settled legal claims against an issuer of securities previously held by the Fund. As a result, the net realized and unrealized gain (loss) on investments per share includes proceeds received from the settlement. Without these proceeds the net realized and unrealized gain (loss) on investments per share would have been $0.84. These proceeds impacted the total return by less than 0.01%.
3Represents aggregate total return for the years indicated, and assumes reinvestment of all distributions. Total return would have been lower had certain expenses not been waived or reimbursed during certain years.
4Includes recoupment of past waived and/or reimbursed fees. Without recoupment the expense ratio would have been 1.25%.
The accompanying notes are an integral part of the financial statements.
47
Financial Highlights - Pro-Blend® Moderate Term Series - Class L*
| FOR THE YEAR ENDED | |||||||||||||||
| 10/31/21 | 10/31/20 | 10/31/19 | 10/31/18 | 10/31/17 | |||||||||||
| Per share data (for a share outstanding throughout each year): | |||||||||||||||
| Net asset value - Beginning of year | $10.53 | $10.28 | $9.84 | $10.83 | $10.29 | ||||||||||
| Income (loss) from investment operations: | |||||||||||||||
| Net investment income (loss)1 | (0.01 | ) | 0.03 | 0.08 | 0.05 | 0.02 | |||||||||
| Net realized and unrealized gain (loss) on investments | 1.52 | 0.80 | 2 | 0.95 | (0.29 | ) | 0.75 | ||||||||
| Total from investment operations | 1.51 | 0.83 | 1.03 | (0.24 | ) | 0.77 | |||||||||
| Less distributions to shareholders: | |||||||||||||||
| From net investment income | (0.02 | ) | (0.08 | ) | (0.11 | ) | (0.04 | ) | (0.03 | ) | |||||
| From net realized gain on investments | (0.84 | ) | (0.50 | ) | (0.48 | ) | (0.71 | ) | (0.20 | ) | |||||
| Total distributions to shareholders | (0.86 | ) | (0.58 | ) | (0.59 | ) | (0.75 | ) | (0.23 | ) | |||||
| Net asset value - End of year | $11.18 | $10.53 | $10.28 | $9.84 | $10.83 | ||||||||||
| Net assets - End of year (000’s omitted) | $108,544 | $95,532 | $93,687 | $98,571 | $116,724 | ||||||||||
| Total return3 | 14.94% | 8.43% | 2 | 11.10% | (2.42% | ) | 7.71% | ||||||||
| Ratios (to average net assets)/Supplemental Data: | |||||||||||||||
| Expenses** | 1.77% | 1.77% | 1.80% | 1.85% | 1.83% | ||||||||||
| Net investment income (loss) | (0.13% | ) | 0.33% | 0.81% | 0.50% | 0.23% | |||||||||
| Series portfolio turnover | 74% | 105% | 53% | 74% | 68% | ||||||||||
| *Effective March 1, 2019, Class R2 shares of the Series have been redesignated as Class L Shares. | |||||||||||||||
| **For certain years presented, the investment advisor did not impose all or a portion of its management and/or other fees, and in some years may have paid a portion of the Series’ expenses. If these expenses had been incurred by the Class, the expense ratio (to average net assets) would have increased by the following amounts: | |||||||||||||||
| N/A | N/A | 0.01 | % | N/A | N/A | ||||||||||
1Calculated based on average shares outstanding during the years.
2During the reporting period the Fund settled legal claims against an issuer of securities previously held by the Fund. As a result, the net realized and unrealized gain (loss) on investments per share includes proceeds received from the settlement. Without these proceeds the net realized and unrealized gain (loss) on investments per share would have been $0.79. Excluding the proceeds from the settlement, the total return would have been 8.32%.
3Represents aggregate total return for the years indicated, and assumes reinvestment of all distributions. Total return would have been lower had certain expenses not been waived or reimbursed during certain years.
The accompanying notes are an integral part of the financial statements.
48
Financial Highlights - Pro-Blend® Moderate Term Series - Class W
| FOR THE YEAR ENDED | ||||||||||||
| 10/31/21 | 10/31/20 | FOR THE PERIOD 4/1/191 TO 10/31/19 | ||||||||||
| Per share data (for a share outstanding throughout each period): | ||||||||||||
| Net asset value - Beginning of period | $14.65 | $14.00 | $13.27 | |||||||||
| Income from investment operations: | ||||||||||||
| Net investment income2 | 0.24 | 0.28 | 0.23 | |||||||||
| Net realized and unrealized gain (loss) on investments | 2.15 | 1.113 | 0.59 | |||||||||
| Total from investment operations | 2.39 | 1.39 | 0.82 | |||||||||
| Less distributions to shareholders: | ||||||||||||
| From net investment income | (0.21 | ) | (0.24 | ) | (0.09 | ) | ||||||
| From net realized gain on investments | (0.84 | ) | (0.50 | ) | 0.00 | 4 | ||||||
| Total distributions to shareholders | (1.05 | ) | (0.74 | ) | (0.09 | ) | ||||||
| Net asset value - End of period | $15.99 | $14.65 | $14.00 | |||||||||
| Net assets - End of period (000’s omitted) | $238 | $255 | $132 | |||||||||
| Total return5 | 16.98% | 10.31% | 3 | 6.25% | ||||||||
| Ratios (to average net assets)/Supplemental Data: | ||||||||||||
| Expenses* | 0.10% | 0.10% | 0.10% | 6 | ||||||||
| Net investment income | 1.54% | 2.00% | 3.15% | 6 | ||||||||
| Series portfolio turnover | 74% | 105% | 53% | |||||||||
| *The investment advisor did not impose all or a portion of its management and/or other fees during the periods, and may have paid a portion of the Series’ expenses. If these expenses had been incurred by the Class, the expense ratio (to average net assets) would have increased by the following amounts: | ||||||||||||
| 0.63% | 0.63% | 0.64% | 6 | |||||||||
1Commencement of operations.
2Calculated based on average shares outstanding during the periods.
3During the reporting period the Fund settled legal claims against an issuer of securities previously held by the Fund. As a result, the net realized and unrealized gain (loss) on investments per share includes proceeds received from the settlement. Without these proceeds the net realized and unrealized gain (loss) on investments per share would have been $1.10. Excluding the proceeds from the settlement, the total return would have been 10.16%.
4Less than $(0.01).
5Represents aggregate total return for the periods indicated, and assumes reinvestment of all distributions. Total return would have been lower had certain expenses not been waived or reimbursed during the periods. Periods less than one year are not annualized.
6Annualized.
The accompanying notes are an integral part of the financial statements.
49
Performance Update as of October 31, 2021 - Pro-Blend® Extended Term Series
(unaudited)
| AVERAGE ANNUAL TOTAL RETURNS | ||||||
| AS OF OCTOBER 31, 2021 | ||||||
| ONE | FIVE | TEN | ||||
| YEAR1 | YEAR | YEAR | ||||
| Pro-Blend® Extended Term Series - Class S2 | 21.19% | 10.73% | 8.65% | |||
| Pro-Blend® Extended Term Series - Class I2 | 21.48% | 10.98% | 8.91% | |||
| Pro-Blend® Extended Term Series - Class R2,3 | 20.86% | 10.44% | 8.37% | |||
| Pro-Blend® Extended Term Series - Class L2,3 | 20.38% | 9.90% | 7.84% | |||
| Pro-Blend® Extended Term Series - Class W2,4 | 22.27% | 11.26% | 8.91% | |||
| 40/15/45 Blended Index5 | 20.40% | 10.56% | 8.91% | |||
| Bloomberg U.S. Aggregate Bond Index6 | (0.48%) | 3.10% | 3.00% | |||
The following graph compares the value of a $10,000 investment in the Pro-Blend® Extended Term Series - Class S for the ten years ended October 31, 2021 to the Bloomberg U.S. Aggregate Bond Index and the 40/15/45 Blended Index.

1The returns shown are based on net asset values calculated for shareholder transactions and may differ from the returns shown in the financial highlights, which reflect adjustments made to the net asset values in accordance with accounting principles generally accepted in the United States of America.
2The Series’ performance does not reflect the deduction of taxes that a shareholder would pay on fund distributions or the redemption of shares. The Series’ performance is historical and may not be indicative of future results. The performance returns shown are inclusive of the net expense ratio of the Series. For the year ended October 31, 2021, this net expense ratio was 1.01% for Class S, 0.79% for Class I, 1.24% for Class R, 1.76% for Class L and 0.10% for Class W. The gross expense ratio, which does not account for any voluntary or contractual waivers currently in effect, was 1.01% for Class S, 0.79% for Class I, 1.24% for Class R, 1.76% for Class L and 0.72% for Class W for the year ended October 31, 2021.
3For periods through the inception of Class L on January 4, 2010 and Class R on June 30, 2010, the performance is hypothetical and is based on the historical performance of the Class S shares adjusted for the respective class’ charges and expenses.
4For periods through April 1, 2019 (the inception date of the Class W shares), performance for the Class W shares is based on the historical performance of the Class S shares. Because the Class W shares invest in the same portfolio of securities as the Class S shares, performance will be different only to the extent that the Class S shares have a higher expense ratio.
50
Performance Update as of October 31, 2021 - Pro-Blend® Extended Term Series
(unaudited)
5The 40/15/45 Blended Index is 40% Russell 3000® Index (Russell 3000), 15% MSCI ACWI ex USA Index (ACWIxUS), and 45% Bloomberg U.S. Aggregate Bond Index (BAB). Russell 3000 is an unmanaged index that consists of 3,000 of the largest U.S. companies based on total market capitalization. Index returns are based on a market capitalization weighted average of relative price changes of the component stocks plus dividends whose reinvestments are compounded daily. Index returns provided by Bloomberg. ACWIxUS is designed to measure large and mid-cap representation across 22 of 23 Developed Markets countries (excluding the U.S.) and 27 Emerging Markets countries. The Index is denominated in U.S. dollars. The Index returns are net of withholding taxes. They assume daily reinvestment of net dividends thus accounting for any applicable dividend taxation. Index returns provided by Bloomberg. Index returns provided by Bloomberg. BAB is an unmanaged, market value-weighted index of U.S. domestic investment-grade debt issues, including government, corporate, asset-backed and mortgage-backed securities with maturities of one year or more. Index returns provided by Interactive Data. The returns of the indices do not reflect any fees or expenses. Returns provided are calculated monthly using a blended allocation. Because the fund’s asset allocation will vary over time, the composition of the fund’s portfolio may not match the composition of the comparative Indices. Mid-month performance may not be available for all indices within the blended index. Where applicable, performance for those indices is included from the first of the month following the corresponding Fund’s inception date. Index data referenced herein is the property of each index sponsor (London Stock Exchange Group plc and its group undertakings (Russell), MSCI, and Bloomberg), their affiliates (“Index Sponsors”) and/or their third party suppliers and has been licensed for use by Manning & Napier. The Index Sponsors and their third party suppliers accept no liability in connection with its use. Data provided is not a representation or warranty, express or implied, as to the ability of any index to accurately represent the asset class or market sector that it purports to represent and none of these parties shall have any liability for any errors, omissions, or interruptions of any index or the data included therein. For additional disclosure information, please see: https://go.manning-napier.com/ benchmark-provisions.
6The Bloomberg U.S. Aggregate Bond Index is an unmanaged, market-value weighted index of U.S. domestic investment-grade debt issues, including government, corporate, asset-backed, and mortgage-backed securities, with maturities of one year or more. Index returns do not reflect any fees or expenses. Index returns provided by Interactive Data. Index data referenced herein is the property of Bloomberg Finance L.P. and its affiliates (“Bloomberg”), and/or its third party suppliers and has been licensed for use by Manning & Napier. Bloomberg and its third party suppliers accept no liability in connection with its use. Data provided is not a representation or warranty, express or implied, as to the ability of any index to accurately represent the asset class or market sector that it purports to represent and none of these parties shall have any liability for any errors, omissions, or interruptions of any index or the data included therein. For additional disclosure information, please see: https:// go.manning-napier.com/benchmark-provisions.
51
Shareholder Expense Example - Pro-Blend® Extended Term Series
(unaudited)
As a shareholder of the Series, you incur ongoing costs, including management fees, shareholder service fees and other Series expenses. This example is intended to help you understand your ongoing costs (in dollars) of investing in the Series and to compare these costs with the ongoing costs of investing in other mutual funds.
The example is based on an investment of $1,000 invested in each class at the beginning of the period and held for the entire period (May 1, 2021 to October 31, 2021).
Actual Expenses
The Actual lines of the table below provide information about actual account values and actual expenses. You may use the information in these lines, together with the amount you invested, to estimate the expenses that you paid over the period. Simply divide your account value by $1,000 (for example, an $8,600 account value divided by $1,000 = 8.6), then multiply the result by the number in the Actual line for the Class in which you have invested under the heading entitled “Expenses Paid During Period” to estimate the expenses you paid on your account during this period.
Hypothetical Example for Comparison Purposes
The Hypothetical lines of each class in the table below provide information about hypothetical account values and hypothetical expenses based on the Class’ actual expense ratio and an assumed rate of return of 5% per year before expenses, which is not the Class’ actual return. The hypothetical account values and expenses may not be used to estimate the actual ending account balance or expenses you paid during the period. You may use this information to compare the ongoing costs of investing in a class of the Series and other funds. To do so, compare this 5% hypothetical example for the Class in which you have invested with the 5% hypothetical examples that appear in the shareholder reports of the other funds.
Please note that the expenses shown in the table are meant to highlight your ongoing costs only and do not reflect any transaction costs, such as sales charges (loads), redemption fees, or exchange fees that you may incur in other mutual funds. Therefore, the second line of the table is useful in comparing ongoing costs only, and will not help you determine the relative total costs of owning different funds.
| BEGINNING | ENDING | EXPENSES PAID | ANNUALIZED | |||||
| ACCOUNT VALUE | ACCOUNT VALUE | DURING PERIOD* | EXPENSE | |||||
| 5/1/21 | 10/31/21 | 5/1/21 - 10/31/21 | RATIO | |||||
| Class S | ||||||||
| Actual | $1,000.00 | $1,039.50 | $5.19 | 1.01% | ||||
| Hypothetical | ||||||||
| (5% return before expenses) | $1,000.00 | $1,020.11 | $5.14 | 1.01% | ||||
| Class I | ||||||||
| Actual | $1,000.00 | $1,040.40 | $4.01 | 0.78% | ||||
| Hypothetical | ||||||||
| (5% return before expenses) | $1,000.00 | $1,021.27 | $3.97 | 0.78% | ||||
| Class R | ||||||||
| Actual | $1,000.00 | $1,038.40 | $6.37 | 1.24% | ||||
| Hypothetical | ||||||||
| (5% return before expenses) | $1,000.00 | $1,018.95 | $6.31 | 1.24% | ||||
| Class L | ||||||||
| Actual | $1,000.00 | $1,036.00 | $9.08 | 1.77% | ||||
| Hypothetical | ||||||||
| (5% return before expenses) | $1,000.00 | $1,016.28 | $9.00 | 1.77% | ||||
| Class W | ||||||||
| Actual | $1,000.00 | $1,044.20 | $0.52 | 0.10% | ||||
| Hypothetical | ||||||||
| (5% return before expenses) | $1,000.00 | $1,024.70 | $0.51 | 0.10% |
52
Shareholder Expense Example - Pro-Blend® Extended Term Series
(unaudited)
*Expenses are equal to each Class’ annualized expense ratio (for the six-month period), multiplied by the average account value over the period, multiplied by 184/365 (to reflect the one-half year period). Expenses are based on the most recent fiscal half year; therefore, the expense ratios stated above may differ from the expense ratios stated in the financial highlights, which are based on one-year data. The Class’ total return would have been lower had certain expenses not been waived or reimbursed during the period.
53
Portfolio Composition - Pro-Blend® Extended Term Series - as of October 31, 2021
(unaudited)
| Asset Allocation1 |
 |
1As a percentage of net assets. 2A U.S. Treasury Bond is a long-term obligation of the U.S. Treasury issued with a maturity period of more than ten years. 3A U.S. Treasury Note is an intermediate long-term obligation of the U.S. Treasury issued with a maturity period between one and ten years. |
| Sector Allocation4 | |
| Communication Services | 9.3% |
| Health Care | 9.1% |
| Information Technology | 8.9% |
| Consumer Discretionary | 7.5% |
| Industrials | 6.4% |
| Financials | 6.3% |
| Real Estate | 6.1% |
| Energy | 5.8% |
| Consumer Staples | 5.7% |
| Materials | 4.8% |
| 4Including common stocks, preferred stocks and corporate bonds, as a percentage of total investments. | |
| Top Ten Stock Holdings5 | |
| Amazon.com, Inc. | 2.6% |
| Alphabet, Inc. - Class A | 2.5% |
| Meta Platforms, Inc. - Class A | 1.9% |
| Microsoft Corp. | 1.9% |
| Sea Ltd. - ADR (Taiwan) | 1.5% |
| Johnson & Johnson | 1.5% |
| SBA Communications Corp. | 1.5% |
| Mastercard, Inc. - Class A | 1.4% |
| Visa, Inc. - Class A | 1.4% |
| Unilever plc - ADR (United Kingdom) | 1.3% |
| 5As a percentage of total investments. | |
54
Investment Portfolio - October 31, 2021
PRO-BLEND® EXTENDED TERM SERIES | SHARES/ PRINCIPAL AMOUNT1 | VALUE (NOTE 2) | ||||||
| COMMON STOCKS - 59.0% | ||||||||
| Communication Services - 8.0% | ||||||||
| Diversified Telecommunication Services - 0.1% | ||||||||
| Radius Global Infrastructure, Inc. - Class A* | 27,952 | $ | 484,408 | |||||
| Verizon Communications, Inc. | 5,607 | 297,115 | ||||||
| 781,523 | ||||||||
| Entertainment - 2.5% | ||||||||
| Electronic Arts, Inc. | 25,970 | 3,642,292 | ||||||
| Sea Ltd. - ADR (Taiwan)* | 32,666 | 11,223,058 | ||||||
| Ubisoft Entertainment S.A. - ADR (France)* | 262,051 | 2,733,192 | ||||||
| Ubisoft Entertainment S.A. (France)* | 6,783 | 355,184 | ||||||
| 17,953,726 | ||||||||
| Interactive Media & Services - 4.5% | ||||||||
| Alphabet, Inc. - Class A* | 6,171 | 18,271,837 | ||||||
| Auto Trader Group plc (United Kingdom)2 | 69,823 | 578,863 | ||||||
| Meta Platforms, Inc. - Class A* | 43,666 | 14,129,008 | ||||||
| 32,979,708 | ||||||||
| Media - 0.9% | ||||||||
| Charter Communications, Inc. - Class A* | 8,347 | 5,633,307 | ||||||
| Comcast Corp. - Class A | 6,156 | 316,603 | ||||||
| Omnicom Group, Inc. | 718 | 48,881 | ||||||
| S4 Capital plc (United Kingdom)* | 38,982 | 387,137 | ||||||
| 6,385,928 | ||||||||
| Total Communication Services | 58,100,885 | |||||||
| Consumer Discretionary - 6.9% | ||||||||
| Distributors - 0.0%## | ||||||||
| Genuine Parts Co. | 488 | 63,982 | ||||||
| Hotels, Restaurants & Leisure - 1.5% | ||||||||
| Accor S.A. (France)* | 13,015 | 465,760 | ||||||
| Expedia Group, Inc.* | 36,512 | 6,002,938 | ||||||
| Hyatt Hotels Corp. - Class A* | 44,758 | 3,813,382 | ||||||
| Restaurant Brands International, Inc. (Canada) | 4,829 | 273,514 | ||||||
| 10,555,594 | ||||||||
| Household Durables - 1.6% | ||||||||
| Garmin Ltd. | 560 | 80,416 | ||||||
| Nikon Corp. (Japan) | 291,800 | 3,217,317 | ||||||
| Sony Group Corp. - ADR (Japan) | 63,972 | 7,407,318 | ||||||
| Sony Group Corp. (Japan) | 9,000 | 1,042,167 | ||||||
| Whirlpool Corp. | 221 | 46,593 | ||||||
| 11,793,811 | ||||||||
| Internet & Direct Marketing Retail - 2.6% | ||||||||
| Amazon.com, Inc.* | 5,551 | 18,720,359 | ||||||
| Multiline Retail - 1.0% | ||||||||
| Dollar General Corp. | 17,974 | 3,981,600 | ||||||
| Dollar Tree, Inc.* | 30,975 | 3,337,866 | ||||||
| 7,319,466 | ||||||||
SHARES/ PRINCIPAL AMOUNT1 | VALUE (NOTE 2) | |||||||
| COMMON STOCKS (continued) | ||||||||
| Consumer Discretionary (continued) | ||||||||
| Specialty Retail - 0.1% | ||||||||
| Best Buy Co., Inc. | 765 | $ | 93,514 | |||||
| The Home Depot, Inc. | 1,356 | 504,079 | ||||||
| Williams-Sonoma, Inc. | 272 | 50,519 | ||||||
| 648,112 | ||||||||
| Textiles, Apparel & Luxury Goods - 0.1% | ||||||||
| adidas AG (Germany) | 1,279 | 418,619 | ||||||
| lululemon athletica, Inc. * | 797 | 371,410 | ||||||
| 790,029 | ||||||||
| Total Consumer Discretionary | 49,891,353 | |||||||
| Consumer Staples - 5.8% | ||||||||
| Beverages - 2.0% | ||||||||
| Anheuser-Busch InBev S.A./N.V. (Belgium) | 4,369 | 267,240 | ||||||
| The Coca-Cola Co. | 108,301 | 6,104,927 | ||||||
| Diageo plc (United Kingdom) | 74,884 | 3,725,605 | ||||||
| Heineken N.V. - ADR (Netherlands) | 70,815 | 3,946,520 | ||||||
| Heineken N.V. (Netherlands) | 3,633 | 402,134 | ||||||
| 14,446,426 | ||||||||
| Food & Staples Retailing - 0.1% | ||||||||
| The Kroger Co. | 2,103 | 84,162 | ||||||
| Walmart, Inc. | 2,948 | 440,490 | ||||||
| 524,652 | ||||||||
| Food Products - 2.2% | ||||||||
| Archer-Daniels-Midland Co. | 1,494 | 95,975 | ||||||
| Bunge Ltd. | 540 | 50,026 | ||||||
| Campbell Soup Co. | 1,039 | 41,508 | ||||||
| Conagra Brands, Inc. | 1,569 | 50,522 | ||||||
| Danone S.A. (France) | 9,053 | 590,127 | ||||||
| General Mills, Inc. | 1,569 | 96,964 | ||||||
| The Hershey Co. | 552 | 96,793 | ||||||
| The J.M. Smucker Co. | 379 | 46,564 | ||||||
| Kerry Group plc - Class A (Ireland) | 2,139 | 287,079 | ||||||
| The Kraft Heinz Co. | 2,816 | 101,066 | ||||||
| Mondelez International, Inc. - Class A | 122,237 | 7,424,675 | ||||||
| Nestle S.A. (Switzerland) | 51,941 | 6,851,393 | ||||||
| Tyson Foods, Inc. - Class A | 1,018 | 81,410 | ||||||
| 15,814,102 | ||||||||
| Household Products - 0.1% | ||||||||
| The Clorox Co. | 365 | 59,499 | ||||||
| Colgate-Palmolive Co. | 1,783 | 135,847 | ||||||
| Kimberly-Clark Corp. | 813 | 105,275 | ||||||
| Kimberly-Clark de Mexico S.A.B. de C.V. - Class A (Mexico) | 265,300 | 419,315 | ||||||
| The Procter & Gamble Co. | 2,967 | 424,251 | ||||||
| 1,144,187 | ||||||||
| Personal Products - 1.4% | ||||||||
| Beiersdorf AG (Germany) | 3,685 | 391,839 | ||||||
The accompanying notes are an integral part of the financial statements.
55
Investment Portfolio - October 31, 2021
PRO-BLEND® EXTENDED TERM SERIES | SHARES/ PRINCIPAL AMOUNT1 | VALUE (NOTE 2) | ||||||
| COMMON STOCKS (continued) | ||||||||
| Consumer Staples (continued) | ||||||||
| Personal Products (continued) | ||||||||
| Unilever plc - ADR (United Kingdom) | 181,061 | $ | 9,701,248 | |||||
| 10,093,087 | ||||||||
| Total Consumer Staples | 42,022,454 | |||||||
| Energy - 3.1% | ||||||||
| Oil, Gas & Consumable Fuels - 3.1% | ||||||||
| BP plc - ADR (United Kingdom) | 64,843 | 1,866,830 | ||||||
| Cameco Corp. (Canada) | 223,662 | 5,434,987 | ||||||
| ConocoPhillips | 61,613 | 4,589,552 | ||||||
| EQT Corp.* | 191,456 | 3,811,889 | ||||||
| Exxon Mobil Corp. | 48,118 | 3,102,168 | ||||||
| Jonah Energy Parent LLC*3 | 6,986 | 436,625 | ||||||
| Royal Dutch Shell plc - Class B - ADR (Netherlands) | 28,542 | 1,308,365 | ||||||
| Total Energies SE - ADR (France) | 38,380 | 1,923,222 | ||||||
| Total Energy | 22,473,638 | |||||||
| Financials - 4.1% | ||||||||
| Banks - 0.3% | ||||||||
| The Bank of N.T. Butterfield & Son Ltd. (Bermuda) | 8,583 | 308,130 | ||||||
| Citigroup, Inc. | 3,368 | 232,931 | ||||||
| Comerica, Inc. | 531 | 45,183 | ||||||
| Fifth Third Bancorp. | 2,065 | 89,889 | ||||||
| FinecoBank Banca Fineco S.p.A. (Italy)* | 52,076 | 994,537 | ||||||
| Huntington Bancshares, Inc. | 3,398 | 53,485 | ||||||
| JPMorgan Chase & Co. | 2,670 | 453,606 | ||||||
| Regions Financial Corp. | 3,049 | 72,200 | ||||||
| U.S. Bancorp. | 3,011 | 181,774 | ||||||
| 2,431,735 | ||||||||
| Capital Markets - 3.0% | ||||||||
| Allfunds Group plc (United Kingdom)* | 14,235 | 287,744 | ||||||
| Avanza Bank Holding AB (Sweden) | 9,416 | 374,339 | ||||||
| Deutsche Boerse AG (Germany) | 4,390 | 728,771 | ||||||
| Intercontinental Exchange, Inc. | 67,052 | 9,284,020 | ||||||
| Intermediate Capital Group plc (United Kingdom) | 14,713 | 441,316 | ||||||
| Moody’s Corp. | 19,057 | 7,701,887 | ||||||
| S&P Global, Inc. | 6,428 | 3,047,900 | ||||||
| 21,865,977 | ||||||||
| Insurance - 0.8% | ||||||||
| Admiral Group plc (United Kingdom) | 21,815 | 856,941 | ||||||
| The Allstate Corp. | 781 | 96,586 | ||||||
| Chubb Ltd. | 921 | 179,945 | ||||||
| Cincinnati Financial Corp. | 528 | 64,120 | ||||||
| Everest Re Group Ltd. | 152 | 39,748 | ||||||
| Fidelity National Financial, Inc. | 1,062 | 50,881 | ||||||
| The Hartford Financial Services Group, Inc. | 1,068 | 77,889 | ||||||
| The Travelers Companies, Inc. | 639 | 102,802 | ||||||
SHARES/ PRINCIPAL AMOUNT1 | VALUE (NOTE 2) | |||||||
| COMMON STOCKS (continued) | ||||||||
| Financials (continued) | ||||||||
| Insurance (continued) | ||||||||
| W. R. Berkley Corp. | 55,705 | $ | 4,434,118 | |||||
| 5,903,030 | ||||||||
| Total Financials | 30,200,742 | |||||||
| Health Care - 8.9% | ||||||||
| Biotechnology - 3.0% | ||||||||
| BioMarin Pharmaceutical, Inc.* | 79,532 | 6,301,320 | ||||||
| Gilead Sciences, Inc. | 2,434 | 157,918 | ||||||
| Seagen, Inc.* | 43,324 | 7,639,321 | ||||||
| Vertex Pharmaceuticals, Inc.* | 40,219 | 7,437,700 | ||||||
| 21,536,259 | ||||||||
| Health Care Equipment & Supplies - 2.5% | ||||||||
| Alcon, Inc. (Switzerland) | 107,082 | 8,926,355 | ||||||
| Getinge AB - Class B (Sweden) | 15,239 | 681,973 | ||||||
| IDEXX Laboratories, Inc.* | 6,455 | 4,299,934 | ||||||
| Medtronic plc | 34,357 | 4,118,030 | ||||||
| Shandong Weigao Group Medical | ||||||||
| Polymer Co. Ltd. - Class H (China) | 280,000 | 476,933 | ||||||
| 18,503,225 | ||||||||
| Health Care Providers & Services - 0.0%## | ||||||||
| Jinxin Fertility Group Ltd. (China)*2 | 96,000 | 135,401 | ||||||
| Quest Diagnostics, Inc. | 454 | 66,638 | ||||||
| 202,039 | ||||||||
| Life Sciences Tools & Services - 0.5% | ||||||||
| Thermo Fisher Scientific, Inc. | 6,306 | 3,992,140 | ||||||
| Pharmaceuticals - 2.9% | ||||||||
| Bristol-Myers Squibb Co. | 3,635 | 212,284 | ||||||
| Dechra Pharmaceuticals plc (United Kingdom) | 5,819 | 407,736 | ||||||
| Johnson & Johnson | 66,220 | 10,785,914 | ||||||
| Merck & Co., Inc. | 3,826 | 336,879 | ||||||
| Novartis AG - ADR (Switzerland) | 82,409 | 6,820,169 | ||||||
| Organon & Co. | 382 | 14,038 | ||||||
| Zoetis, Inc. | 10,135 | 2,191,187 | ||||||
| 20,768,207 | ||||||||
| Total HealthCare | 65,001,870 | |||||||
| Industrials - 3.9% | ||||||||
| Aerospace & Defense - 0.1% | ||||||||
| Airbus SE (France)* | 2,196 | 281,707 | ||||||
| General Dynamics Corp. | 650 | 131,788 | ||||||
| L3Harris Technologies, Inc. | 498 | 114,809 | ||||||
| Lockheed Martin Corp. | 503 | 167,157 | ||||||
| Northrop Grumman Corp. | 369 | 131,814 | ||||||
| 827,275 | ||||||||
| Air Freight & Logistics - 0.0%## | ||||||||
| C.H. Robinson Worldwide, Inc. | 499 | 48,398 | ||||||
The accompanying notes are an integral part of the financial statements.
56
Investment Portfolio - October 31, 2021
PRO-BLEND® EXTENDED TERM SERIES | SHARES/ PRINCIPAL AMOUNT1 | VALUE (NOTE 2) | ||||||
| COMMON STOCKS (continued) | ||||||||
| Industrials (continued) | ||||||||
| Airlines - 0.6% | ||||||||
| Controladora Vuela Cia de Aviacion S.A.B. de C.V. - ADR (Mexico)* | 16,895 | $ | 305,799 | |||||
| Ryanair Holdings plc - ADR (Ireland)* | 34,953 | 3,967,515 | ||||||
| 4,273,314 | ||||||||
| Building Products - 0.1% | ||||||||
| A. O. Smith Corp. | 607 | 44,354 | ||||||
| Assa Abloy AB - Class B (Sweden) | 11,872 | 348,356 | ||||||
| Johnson Controls International plc | 2,028 | 148,794 | ||||||
| 541,504 | ||||||||
| Commercial Services & Supplies - 0.6% | ||||||||
| Cleanaway Waste Management Ltd. (Australia) | 223,835 | 455,226 | ||||||
| Copart, Inc.* | 25,391 | 3,942,968 | ||||||
| Republic Services, Inc. | 852 | 114,679 | ||||||
| Waste Management, Inc. | 977 | 156,545 | ||||||
| 4,669,418 | ||||||||
| Electrical Equipment - 0.0%## | ||||||||
| Eaton Corp. plc | 930 | 153,227 | ||||||
| Emerson Electric Co. | 1,426 | 138,336 | ||||||
| Hubbell, Inc. | 216 | 43,064 | ||||||
| 334,627 | ||||||||
| Industrial Conglomerates - 0.1% | ||||||||
| 3M Co. | 1,011 | 180,646 | ||||||
| Honeywell International, Inc. | 1,113 | 243,324 | ||||||
| 423,970 | ||||||||
| Machinery - 0.1% | ||||||||
| Caterpillar, Inc. | 1,000 | 204,010 | ||||||
| Cummins, Inc. | 402 | 96,416 | ||||||
| Illinois Tool Works, Inc. | 649 | 147,888 | ||||||
| Snap-on, Inc. | 201 | 40,849 | ||||||
| 489,163 | ||||||||
| Professional Services - 0.6% | ||||||||
| Booz Allen Hamilton Holding Corp. | 514 | 44,646 | ||||||
| Insperity, Inc. | 32,822 | 4,102,750 | ||||||
| 4,147,396 | ||||||||
| Road & Rail - 1.6% | ||||||||
| Canadian National Railway Co. (Canada) | 55,003 | 7,310,449 | ||||||
| Norfolk Southern Corp. | 14,520 | 4,255,086 | ||||||
| Union Pacific Corp. | 1,069 | 258,056 | ||||||
| 11,823,591 | ||||||||
| Trading Companies & Distributors - 0.0%## | ||||||||
| Brenntag SE (Germany) | 3,093 | 294,263 | ||||||
| W. W. Grainger, Inc. | 163 | 75,487 | ||||||
| 369,750 | ||||||||
SHARES/ PRINCIPAL AMOUNT1 | VALUE (NOTE 2) | |||||||
| COMMON STOCKS (continued) | ||||||||
| Industrials (continued) | ||||||||
| Transportation Infrastructure - 0.1% | ||||||||
| Grupo Aeroportuario del Centro Norte S.A.B. de C.V. (Mexico)* | 24,300 | $ | 146,959 | |||||
| Grupo Aeroportuario del Pacifico S.A.B. de C.V. - ADR (Mexico) | 1,640 | 207,099 | ||||||
| Grupo Aeroportuario del Sureste S.A.B. de C.V. - ADR (Mexico) | 1,152 | 232,301 | ||||||
| 586,359 | ||||||||
| Total Industrials | 28,534,765 | |||||||
| Information Technology - 8.8% | ||||||||
| Communications Equipment - 0.1% | ||||||||
| Cisco Systems, Inc. | 5,948 | 332,910 | ||||||
| Motorola Solutions, Inc. | 456 | 113,357 | ||||||
| 446,267 | ||||||||
| Electronic Equipment, Instruments & Components - 0.1% | ||||||||
| Keyence Corp. (Japan) | 300 | 181,085 | ||||||
| Softwareone Holding AG (Germany) | 18,576 | 430,441 | ||||||
| 611,526 | ||||||||
| IT Services - 4.1% | ||||||||
| Adyen N.V. (Netherlands)*2 | 144 | 434,493 | ||||||
| Atos SE (France) | 6,721 | 350,653 | ||||||
| Automatic Data Processing, Inc. | 834 | 187,225 | ||||||
| Broadridge Financial Solutions, Inc. | 369 | 65,833 | ||||||
| International Business Machines Corp. | 1,541 | 192,779 | ||||||
| Keywords Studios plc (Ireland) | 3,437 | 133,397 | ||||||
| Mastercard, Inc. - Class A | 30,917 | 10,373,272 | ||||||
| PayPal Holdings, Inc.* | 27,980 | 6,507,868 | ||||||
| StoneCo Ltd. - Class A (Brazil)* | 11,751 | 397,889 | ||||||
| Switch, Inc. - Class A | 31,809 | 804,132 | ||||||
| TravelSky Technology Ltd. - Class H (China) | 336,000 | 627,801 | ||||||
| Visa, Inc. - Class A | 46,733 | 9,896,647 | ||||||
| 29,971,989 | ||||||||
| Semiconductors & Semiconductor Equipment - 0.8% | ||||||||
| Analog Devices, Inc. | 828 | 143,650 | ||||||
| Intel Corp. | 5,423 | 265,727 | ||||||
| NVIDIA Corp. | 17,192 | 4,395,479 | ||||||
| QUALCOMM, Inc. | 1,839 | 244,660 | ||||||
| Taiwan Semiconductor Manufacturing Co. Ltd. - ADR (Taiwan) | 4,828 | 548,943 | ||||||
| 5,598,459 | ||||||||
| Software - 3.7% | ||||||||
| Microsoft Corp. | 42,564 | 14,115,074 | ||||||
| Oracle Corp. | 4,167 | 399,782 | ||||||
| salesforce.com, Inc.* | 27,876 | 8,354,158 | ||||||
| ServiceNow, Inc.* | 6,050 | 4,221,448 | ||||||
| 27,090,462 | ||||||||
The accompanying notes are an integral part of the financial statements.
57
Investment Portfolio - October 31, 2021
PRO-BLEND® EXTENDED TERM SERIES | SHARES/ PRINCIPAL AMOUNT1 | VALUE (NOTE 2) | ||||||
| COMMON STOCKS (continued) | ||||||||
| Information Technology (continued) | ||||||||
| Technology Hardware, Storage & Peripherals - 0.0%## | ||||||||
| NetApp, Inc. | 770 | $ | 68,761 | |||||
| Total Information Technology | 63,787,464 | |||||||
| Materials - 4.2% | ||||||||
| Chemicals - 1.9% | ||||||||
| Air Liquide S.A. - ADR (France) | 157,197 | 5,253,524 | ||||||
| Air Liquide S.A. (France) | 4,218 | 704,228 | ||||||
| CF Industries Holdings, Inc. | 865 | 49,132 | ||||||
| Eastman Chemical Co. | 463 | 48,166 | ||||||
| FMC Corp. | 82,261 | 7,486,573 | ||||||
| International Flavors & Fragrances, Inc. | 638 | 94,073 | ||||||
| Linde plc (United Kingdom) | 830 | 264,936 | ||||||
| RPM International, Inc. | 475 | 41,420 | ||||||
| 13,942,052 | ||||||||
| Containers & Packaging - 1.1% | ||||||||
| Graphic Packaging Holding Co. | 409,656 | 8,164,444 | ||||||
| Packaging Corp. of America | 340 | 46,706 | ||||||
| 8,211,150 | ||||||||
| Metals & Mining - 1.2% | ||||||||
| Agnico Eagle Mines Ltd. (Canada) | 49,028 | 2,600,935 | ||||||
| Barrick Gold Corp. (Canada) | 146,690 | 2,694,695 | ||||||
| Newmont Corp. | 57,085 | 3,082,590 | ||||||
| Nucor Corp. | 932 | 104,058 | ||||||
| Reliance Steel & Aluminum Co. | 249 | 36,394 | ||||||
| Steel Dynamics, Inc. | 769 | 50,816 | ||||||
| 8,569,488 | ||||||||
| Total Materials | 30,722,690 | |||||||
| Real Estate - 5.3% | ||||||||
| Equity Real Estate Investment Trusts (REITS) - 5.3% | ||||||||
| Agree Realty Corp. | 2,870 | 203,942 | ||||||
| American Campus Communities, Inc. | 8,365 | 449,368 | ||||||
| American Homes 4 Rent - Class A | 15,661 | 635,837 | ||||||
| American Tower Corp. | 17,957 | 5,063,335 | ||||||
| Apple Hospitality REIT, Inc. | 28,554 | 448,583 | ||||||
| AvalonBay Communities, Inc. | 1,885 | 446,142 | ||||||
| Brandywine Realty Trust | 17,657 | 233,955 | ||||||
| Camden Property Trust | 2,467 | 402,368 | ||||||
| CareTrust REIT, Inc. | 8,877 | 184,198 | ||||||
| Community Healthcare Trust, Inc. | 7,366 | 352,389 | ||||||
| Cousins Properties, Inc. | 13,695 | 542,459 | ||||||
| Digital Realty Trust, Inc. | 3,960 | 624,928 | ||||||
| Douglas Emmett, Inc. | 6,340 | 207,191 | ||||||
| Duke Realty Corp. | 12,501 | 703,056 | ||||||
| Equinix, Inc. | 6,558 | 5,489,505 | ||||||
| Equity LifeStyle Properties, Inc. | 6,785 | 573,400 | ||||||
| Essex Property Trust, Inc. | 1,655 | 562,584 | ||||||
| Extra Space Storage, Inc. | 2,573 | 507,833 | ||||||
| Flagship Communities REIT | 15,269 | 304,922 | ||||||
SHARES/ PRINCIPAL AMOUNT1 | VALUE (NOTE 2) | |||||||
| COMMON STOCKS (continued) | ||||||||
| Real Estate (continued) | ||||||||
| Equity Real Estate Investment Trusts (REITS) (continued) | ||||||||
| Getty Realty Corp. | 7,626 | $ | 244,947 | |||||
| Healthcare Trust of America, Inc. - Class A | 7,155 | 238,906 | ||||||
| Healthpeak Properties, Inc. | 6,440 | 228,684 | ||||||
| Hibernia REIT plc (Ireland) | 100,776 | 146,786 | ||||||
| Innovative Industrial Properties, Inc. | 1,277 | 335,966 | ||||||
| Invitation Homes, Inc. | 20,449 | 843,521 | ||||||
| Kilroy Realty Corp. | 4,974 | 335,148 | ||||||
| Lamar Advertising Co. - Class A | 1,545 | 174,894 | ||||||
| Life Storage, Inc. | 2,638 | 352,991 | ||||||
| Mid-America Apartment Communities, Inc. | 3,223 | 658,169 | ||||||
| NexPoint Residential Trust, Inc. | 3,423 | 242,452 | ||||||
| Prologis, Inc. | 15,403 | 2,232,819 | ||||||
| Public Storage | 3,062 | 1,017,135 | ||||||
| Realty Income Corp. | 1,896 | 135,431 | ||||||
| Rexford Industrial Realty, Inc. | 9,074 | 609,773 | ||||||
| SBA Communications Corp. | 30,865 | 10,658,611 | ||||||
| Sun Communities, Inc. | 4,400 | 862,312 | ||||||
| Terreno Realty Corp. | 3,702 | 270,727 | ||||||
| UDR, Inc. | 9,428 | 523,537 | ||||||
| Ventas, Inc. | 3,577 | 190,905 | ||||||
| Welltower, Inc. | 4,282 | 344,273 | ||||||
| Total Real Estate | 38,583,982 | |||||||
| TOTAL COMMON STOCKS | ||||||||
| (Identified Cost $324,037,480) | 429,319,843 | |||||||
| PREFERRED STOCKS - 0.2% | ||||||||
| Information Technology - 0.1% | ||||||||
| Software - 0.1% | ||||||||
| Greenidge Generation Holdings, Inc., 8.50%, 10/31/2026 | 14,200 | 352,160 | ||||||
| Synchronoss Technologies, Inc., 8.375%, 6/30/2026 | 28,900 | 698,802 | ||||||
| 1,050,962 | ||||||||
| Materials - 0.1% | ||||||||
| Metals & Mining - 0.1% | ||||||||
| Ramaco Resources, Inc., 9.00%, 7/30/2026 | 28,800 | 768,960 | ||||||
| TOTAL PREFERRED STOCKS | ||||||||
| (Identified Cost $1,799,423) | 1,819,922 | |||||||
The accompanying notes are an integral part of the financial statements.
58
Investment Portfolio - October 31, 2021
PRO-BLEND® EXTENDED TERM SERIES | SHARES/ PRINCIPAL AMOUNT1 | VALUE (NOTE 2) | ||||||
| CORPORATE BONDS - 11.1% | ||||||||
| Non-Convertible Corporate Bonds- 11.1% | ||||||||
| Communication Services - 1.4% | ||||||||
| Diversified Telecommunication Services - 0.7% | ||||||||
| Lumen Technologies, Inc., 7.50%, 4/1/2024 | 640,000 | $ | 702,400 | |||||
| Verizon Communications, Inc., 4.272%, 1/15/2036 | 3,500,000 | 4,094,182 | ||||||
| 4,796,582 | ||||||||
| Interactive Media & Services - 0.7% | ||||||||
| Tencent Holdings Ltd. (China), 3.975%, 4/11/20292 | 4,990,000 | 5,442,395 | ||||||
| Total Communication Services | 10,238,977 | |||||||
| Consumer Discretionary - 0.7% | ||||||||
| Automobiles - 0.1% | ||||||||
| Ford Motor Co., 9.00%, 4/22/2025 | 600,000 | 721,500 | ||||||
| Hotels, Restaurants & Leisure - 0.2% | ||||||||
| Expedia Group, Inc., 3.25%, 2/15/2030 | 1,300,000 | 1,337,002 | ||||||
| Household Durables - 0.0%## | ||||||||
| STL Holding Co. LLC, 7.50%, 2/15/20262 | 260,000 | 272,350 | ||||||
| Internet & Direct Marketing Retail - 0.4% | ||||||||
| Alibaba Group Holding Ltd. (China), 4.00%, 12/6/2037 | 2,390,000 | 2,590,247 | ||||||
| Total Consumer Discretionary | 4,921,099 | |||||||
| Energy - 2.7% | ||||||||
| Energy Equipment & Services - 0.2% | ||||||||
| Kent Global plc (United Kingdom), 10.00%, 6/28/2026 | 400,000 | 399,092 | ||||||
| Petrofac Ltd. (United Kingdom), 9.75%, 11/15/20262 | 735,000 | 727,856 | ||||||
| Tidewater, Inc., 8.50%, 11/16/2026 | 700,000 | 699,433 | ||||||
| 1,826,381 | ||||||||
| Oil, Gas & Consumable Fuels - 2.5% | ||||||||
| BP Capital Markets America, Inc., 3.06%, 6/17/2041 | 3,280,000 | 3,306,631 | ||||||
| Brooge Petroleum and Gas Investment Co. FZE (United Arab Emirates), 8.50%, 9/24/20252 | 193,000 | 197,343 | ||||||
| Cenovus Energy, Inc. (Canada), 6.75%, 11/15/2039 | 3,040,000 | 4,161,728 | ||||||
| Energy Transfer LP, 6.50%, 2/1/2042 | 2,580,000 | 3,358,366 | ||||||
| Kinder Morgan Energy Partners LP, 6.95%, 1/15/2038 | 2,007,000 | 2,827,358 | ||||||
| Navigator Holdings Ltd., 8.00%, 9/10/20252 | 200,000 | 209,000 | ||||||
| PetroTal Corp. (Peru), 12.00%, 2/16/20242 | 695,000 | 729,750 | ||||||
| The Williams Companies, Inc., 2.60%, 3/15/2031 | 2,640,000 | 2,646,745 | ||||||
SHARES/ PRINCIPAL AMOUNT1 | VALUE (NOTE 2) | |||||||
| CORPORATE BONDS (continued) | ||||||||
| Non-Convertible Corporate Bonds (continued) | ||||||||
| Energy (continued) | ||||||||
| Oil, Gas & Consumable Fuels (continued) | ||||||||
| Welltec International ApS (Denmark), 8.25%, 10/15/20262 | 710,000 | $ | 727,913 | |||||
| 18,164,834 | ||||||||
| Total Energy | 19,991,215 | |||||||
| Financials - 2.2% | ||||||||
| Banks - 1.2% | ||||||||
| Bank of America Corp., 6.11%, 1/29/2037 | 1,530,000 | 2,067,222 | ||||||
| Citigroup, Inc., 4.45%, 9/29/2027 | 1,960,000 | 2,198,628 | ||||||
| JPMorgan Chase & Co., (U.S. Secured Overnight Financing Rate + 2.515%), 2.956%, 5/13/20314 | 3,290,000 | 3,398,206 | ||||||
| Lloyds Bank plc (United Kingdom) (3 mo. LIBOR US + 11.756%), 12.00%2,4,5 | 650,000 | 668,687 | ||||||
| Popular, Inc. (Puerto Rico), 6.125%, 9/14/2023 | 665,000 | 710,030 | ||||||
| 9,042,773 | ||||||||
| Capital Markets - 0.4% | ||||||||
| Blackstone Secured Lending Fund, 2.75%, 9/16/2026 | 1,300,000 | 1,312,004 | ||||||
| Owl Rock Technology Finance Corp., 3.75%, 6/17/20262 | 1,200,000 | 1,252,707 | ||||||
| 2,564,711 | ||||||||
| Consumer Finance - 0.2% | ||||||||
| Navient Corp., 6.75%, 6/25/2025 | 665,000 | 731,879 | ||||||
| Synergy One Lending, Inc., 5.50%, 10/14/2026 | 740,000 | 750,708 | ||||||
| 1,482,587 | ||||||||
| Diversified Financial Services - 0.3% | ||||||||
| Blackstone Private Credit Fund, 2.625%, 12/15/20262 | 1,375,000 | 1,351,463 | ||||||
| FS Energy & Power Fund, 7.50%, 8/15/20232 | 695,000 | 722,800 | ||||||
| 2,074,263 | ||||||||
| Mortgage Real Estate Investment Trusts (REITS) - 0.1% | ||||||||
| Arbor Realty Trust, Inc., 8.00%, 4/30/20232 | 215,000 | 226,046 | ||||||
| MCREIF SubREIT LLC, 5.00%, 10/15/20266 | 675,000 | 675,527 | ||||||
| 901,573 | ||||||||
| Total Financials | 16,065,907 | |||||||
| Health Care - 0.2% | ||||||||
| Health Care Providers & Services - 0.2% | ||||||||
| HCA, Inc., 4.125%, 6/15/2029 | 1,498,000 | 1,659,904 | ||||||
The accompanying notes are an integral part of the financial statements.
59
Investment Portfolio - October 31, 2021
PRO-BLEND® EXTENDED TERM | SHARES/ PRINCIPAL AMOUNT1 | VALUE (NOTE 2) | ||||||
| CORPORATE BONDS (continued) | ||||||||
| Non-Convertible Corporate Bonds (continued) | ||||||||
| Industrials - 2.5% | ||||||||
| Airlines - 0.5% | ||||||||
| Alaska Airlines Pass-Through Trust, Series 2020-1, Class B, 8.00%, 8/15/20252 | 250,529 | $ | 282,560 | |||||
| Southwest Airlines Co. | ||||||||
| 5.25%, 5/4/2025 | 2,027,000 | 2,272,722 | ||||||
| 5.125%, 6/15/2027 | 353,000 | 407,378 | ||||||
| United Airlines Pass-Through Trust, Series 2019-2, Class B, 3.50%, 5/1/2028 | 671,840 | 663,536 | ||||||
| United Airlines Pass-Through Trust, Series 2018-1, Class B, 4.60%, 3/1/2026 | 123,780 | 126,407 | ||||||
| 3,752,603 | ||||||||
| Commercial Services & Supplies - 0.1% | ||||||||
| Airswift Global AS (United Kingdom) (3 mo. LIBOR US + 8.500%), 8.623%, 5/12/20252,7 | 700,000 | 703,500 | ||||||
| Industrial Conglomerates - 0.3% | ||||||||
| General Electric Co., 6.875%, 1/10/2039 | 1,350,000 | 2,053,473 | ||||||
| Marine - 0.2% | ||||||||
| American Tanker, Inc. (Norway), 7.75%, 7/2/2025 | 715,000 | 732,339 | ||||||
| Seaspan Corp. (Hong Kong), 6.50%, 2/5/20242 | 700,000 | 738,500 | ||||||
| 1,470,839 | ||||||||
| Road & Rail - 0.2% | ||||||||
| BNSF Funding Trust I, (3 mo. LIBOR US + 2.350%), 6.613%, 12/15/20554 | 1,140,000 | 1,298,517 | ||||||
| Trading Companies & Distributors - 1.2% | ||||||||
| AerCap Ireland Capital DAC - AerCap Global Aviation Trust (Ireland), 3.00%, 10/29/2028 | 2,740,000 | 2,781,357 | ||||||
| Air Lease Corp., 3.625%, 4/1/2027 | 1,220,000 | 1,302,250 | ||||||
| Ashtead Capital, Inc. (United Kingdom), 4.00%, 5/1/20282 | 1,130,000 | 1,192,319 | ||||||
| Avolon Holdings Funding Ltd. (Ireland), 2.75%, 2/21/20282 | 3,510,000 | 3,475,715 | ||||||
| 8,751,641 | ||||||||
| Total Industrials | 18,030,573 | |||||||
| Materials - 0.5% | ||||||||
| Metals & Mining - 0.5% | ||||||||
| Copper Mountain Mining Corp. (Canada), 8.00%, 4/9/20262 | 686,000 | 715,155 | ||||||
| IAMGOLD Corp. (Burkina Faso), 5.75%, 10/15/20282 | 220,000 | 216,150 | ||||||
| Jervois Mining USA Ltd. (Australia), 12.50%, 7/20/20268 | 675,000 | 715,082 | ||||||
SHARES/ PRINCIPAL AMOUNT1 | VALUE (NOTE 2) | |||||||
| CORPORATE BONDS (continued) | ||||||||
| Non-Convertible Corporate Bonds (continued) | ||||||||
| Materials (continued) | ||||||||
| Metals & Mining (continued) | ||||||||
| Newcastle Coal Infrastructure Group Pty Ltd. (Australia), 4.40%, 9/29/20272 | 1,260,000 | $ | 1,275,571 | |||||
| Northwest Acquisitions ULC - Dominion Finco, Inc., 7.125%, 11/1/20229,10 | 653,000 | 65 | ||||||
| Tacora Resources, Inc. (Canada), 8.25%, 5/15/20262 | 695,000 | 696,738 | ||||||
| Total Materials | 3,618,761 | |||||||
| Real Estate - 0.9% | ||||||||
| Equity Real Estate Investment Trusts (REITS) - 0.9% | ||||||||
| American Tower Corp., 3.80%, 8/15/2029 | 3,730,000 | 4,100,941 | ||||||
| Crown Castle International Corp., 3.10%, 11/15/2029 | 1,306,000 | 1,365,908 | ||||||
| IIP Operating Partnership LP, 5.50%, 5/25/2026 | 700,000 | 738,671 | ||||||
| 6,205,520 | ||||||||
| Real Estate Management & Development - 0.0%## | ||||||||
| Forestar Group, Inc., 3.85%, 5/15/20262 | 40,000 | 40,000 | ||||||
| Total Real Estate | 6,245,520 | |||||||
| TOTAL CORPORATE BONDS | ||||||||
| (Identified Cost $79,456,855) | 80,771,956 | |||||||
| MUTUAL FUND - 0.6% | ||||||||
| iShares Broad USD Investment Grade Corporate Bond ETF | ||||||||
| (Identified Cost $4,311,577) | 70,193 | 4,227,724 | ||||||
| U.S. TREASURY SECURITIES - 14.7% | ||||||||
| U.S. Treasury Bonds - 3.0% | ||||||||
| U.S. Treasury Bond | ||||||||
| 3.875%, 8/15/2040 | 5,435,000 | 7,119,638 | ||||||
| 3.00%, 5/15/2047 | 12,310,000 | 14,944,628 | ||||||
| Total U.S. Treasury Bonds | ||||||||
| (Identified Cost $23,350,651) | 22,064,266 | |||||||
| U.S. Treasury Notes - 11.7% | ||||||||
| U.S. Treasury Note | ||||||||
| 2.125%, 5/15/2025 | 13,735,000 | 14,306,398 | ||||||
| 1.625%, 5/15/2026 | 14,635,000 | 14,954,569 | ||||||
| 2.375%, 5/15/2027 | 32,255,000 | 34,149,981 | ||||||
| 2.875%, 5/15/2028 | 13,010,000 | 14,206,818 | ||||||
The accompanying notes are an integral part of the financial statements.
60
Investment Portfolio - October 31, 2021
PRO-BLEND® EXTENDED TERM SERIES | SHARES/ PRINCIPAL AMOUNT1 | VALUE (NOTE 2) | ||||||
| U.S. TREASURY SECURITIES (continued) | ||||||||
| U.S. Treasury Notes (continued) | ||||||||
| U.S. Treasury Note (continued) | ||||||||
| 1.625%, 5/15/2031 | 6,945,000 | $ | 6,997,088 | |||||
| Total U.S. Treasury Notes | ||||||||
| (Identified Cost $85,986,051) | 84,614,854 | |||||||
| TOTAL U.S. TREASURY SECURITIES | ||||||||
| (Identified Cost $109,336,702) | 106,679,120 | |||||||
| ASSET-BACKED SECURITIES - 5.7% | ||||||||
| Aligned Data Centers Issuer LLC, | ||||||||
| Series 2021-1A, Class A2, 1.937%, 8/15/20462 | 1,800,000 | 1,791,489 | ||||||
| CF Hippolyta LLC | ||||||||
| Series 2020-1, Class A1, 1.69%, 7/15/20602 | 862,020 | 862,188 | ||||||
| Series 2020-1, Class A2, 1.99%, 7/15/20602 | 796,040 | 791,248 | ||||||
| CLI Funding VIII LLC, Series 2021-1A, Class A, 1.64%, 2/18/20462 | 1,820,418 | 1,784,303 | ||||||
| Commonbond Student Loan Trust, | ||||||||
| Series 2019-AGS, Class A1, 2.54%, 1/25/20472 | 887,926 | 904,921 | ||||||
| Credit Acceptance Auto Loan Trust | ||||||||
| Series 2020-1A, Class A, 2.01%, 2/15/20292 | 368,000 | 372,429 | ||||||
| Series 2021-2A, Class A, 0.96%, 2/15/20302 | 1,900,000 | 1,895,207 | ||||||
| Hertz Vehicle Financing LLC, Series 2021-1A, Class A, 1.21%, 12/26/20252 | 1,200,000 | 1,193,552 | ||||||
| Invitation Homes Trust | ||||||||
| Series 2017-SFR2, Class A, (1 mo. LIBOR US + 0.850%), 0.936%, 12/17/20362,7 | 198,352 | 198,111 | ||||||
| Series 2017-SFR2, Class B, (1 mo. LIBOR US + 1.150%), 1.236%, 12/17/20362,7 | 165,307 | 165,440 | ||||||
| KREF Ltd., Series 2021-FL2, Class A, (1 mo. LIBOR US + 1.070%), 1.156%, 2/15/20392,7 | 1,300,000 | 1,300,173 | ||||||
| Navient Private Education Refi Loan Trust | ||||||||
| Series 2014-1, Class A3, (1 mo. LIBOR US + 0.510%), 0.599%, 6/25/20317 | 267,032 | 263,596 | ||||||
| Series 2020-FA, Class A, 1.22%, 7/15/20692 | 864,450 | 863,437 | ||||||
| Nelnet Student Loan Trust | ||||||||
| Series 2012-3A, Class A, (1 mo. LIBOR US + 0.700%), 0.789%, 2/25/20452,7 | 277,802 | 276,620 | ||||||
| Series 2013-5A, Class A, (1 mo. LIBOR US + 0.630%), 0.719%, 1/25/20372,7 | 275,479 | 276,198 | ||||||
SHARES/ PRINCIPAL AMOUNT1 | VALUE (NOTE 2) | |||||||
| ASSET-BACKED SECURITIES (continued) | ||||||||
| Nelnet Student Loan Trust (continued) | ||||||||
| Series 2015-2A, Class A2, (1 mo. LIBOR US + 0.600%), 0.689%, 9/25/20472,7 | 2,404,446 | $ | 2,399,824 | |||||
| New Economy Assets Phase 1 Sponsor LLC, Series 2021-1, Class A1, 1.91%, 10/20/20612 | 2,275,000 | 2,233,754 | ||||||
| Octagon Investment Partners 18-R Ltd., Series 2018-18A, Class A1A, (Cayman Islands) (3 mo. LIBOR US + 0.960%), 1.082%, 4/16/20312,7 | 2,000,000 | 2,004,548 | ||||||
| Oxford Finance Funding LLC | ||||||||
| Series 2019-1A, Class A2, 4.459%, 2/15/20272 | 422,221 | 432,894 | ||||||
| Series 2020-1A, Class A2, 3.101%, 2/15/20282 | 1,323,000 | 1,345,381 | ||||||
| Progress Residential Trust | ||||||||
| Series 2019-SFR2, Class A, 3.147%, 5/17/20362 | 1,234,037 | 1,240,593 | ||||||
| Series 2019-SFR4, Class A, 2.687%, 10/17/20362 | 1,200,000 | 1,217,209 | ||||||
| Slam Ltd., Series 2021-1A, Class A, (Cayman Islands), 2.434%, 6/15/20462 | 1,762,560 | 1,745,428 | ||||||
| SMB Private Education Loan Trust | ||||||||
| Series 2019-B, Class A2A, 2.84%, 6/15/20372 | 1,930,279 | 1,991,829 | ||||||
| Series 2020-A, Class A2A, 2.23%, 9/15/20372 | 418,443 | 426,240 | ||||||
| Series 2020-B, Class A1A, 1.29%, 7/15/20532 | 1,336,147 | 1,328,231 | ||||||
| SoFi Consumer Loan Program Trust, | ||||||||
| Series 2019-3, Class A, 2.90%, 5/25/20282 | 1,481 | 1,483 | ||||||
| SoFi Professional Loan Program LLC | ||||||||
| Series 2017-F, Class A2FX, 2.84%, 1/25/20412 | 122,514 | 125,065 | ||||||
| Series 2018-B, Class A2FX, 3.34%, 8/25/20472 | 704,178 | 720,376 | ||||||
| Series 2020-A, Class A2FX, 2.54%, 5/15/20462 | 1,150,000 | 1,176,037 | ||||||
| Stack Infrastructure Issuer LLC, | ||||||||
| Series 2021-1A, Class A2, 1.877%, 3/26/20462 | 1,500,000 | 1,492,303 | ||||||
| Towd Point Mortgage Trust | ||||||||
| Series 2016-5, Class A1, 2.50%, 10/25/20562,11 | 426,307 | 430,810 | ||||||
| Series 2017-1, Class A1, 2.75%, 10/25/20562,11 | 501,887 | 508,193 | ||||||
| Series 2019-HY1, Class A1, (1 mo. LIBOR US + 1.000%), 1.089%, 10/25/20482,7 | 608,162 | 610,678 | ||||||
| Tricon American Homes | ||||||||
| Series 2017-SFR2, Class A, 2.928%, 1/17/20362 | 1,218,254 | 1,232,185 | ||||||
| Series 2020-SFR1, Class A, 1.499%, 7/17/20382 | 2,142,415 | 2,126,781 | ||||||
The accompanying notes are an integral part of the financial statements.
61
Investment Portfolio - October 31, 2021
| PRO-BLEND® EXTENDED TERM SERIES | SHARES/ PRINCIPAL AMOUNT1 | VALUE (NOTE 2) | ||||||
| ASSET-BACKED SECURITIES (continued) | ||||||||
| Trinitas CLO XVII Ltd., Series 2021-17A, Class B1, (Cayman Islands) (3 mo. LIBOR US + 1.700%), 1.813%, 10/20/20342,7 | 2,100,000 | $ | 2,100,724 | |||||
| Triton Container Finance VIII LLC, Series 2021-1A, Class A, 1.86%, 3/20/20462 | 1,758,271 | 1,730,102 | ||||||
| TOTAL ASSET-BACKED SECURITIES | ||||||||
| (Identified Cost $41,529,313) | 41,559,580 | |||||||
| COMMERCIAL MORTGAGE-BACKED SECURITIES - 4.2% | ||||||||
| Brean Asset Backed Securities Trust, Series 2021-RM2, Class A, 1.75%, 10/25/20612,11 | 1,401,522 | 1,359,794 | ||||||
| BWAY Mortgage Trust, Series 2015-1740, Class A, 2.917%, 1/10/20352 | 2,411,000 | 2,437,674 | ||||||
| CIM Trust, Series 2019-INV1, Class A1, 4.00%, 2/25/20492,11 | 97,845 | 98,974 | ||||||
| Citigroup Mortgage Loan Trust, Inc., Series 2021-INV1, Class A3A, 2.50%, 5/25/20512,11 | 966,321 | 976,462 | ||||||
| Credit Suisse Mortgage Capital Trust | ||||||||
| Series 2013-IVR3, Class A1, 2.50%, 5/25/20432,11 | 212,736 | 213,033 | ||||||
| Series 2013-TH1, Class A1, 2.13%, 2/25/20432,11 | 141,868 | 143,106 | ||||||
| Series 2014-IVR3, Class A1, 3.50%, 7/25/20442,11 | 86,799 | 88,034 | ||||||
| Fannie Mae REMICS | ||||||||
| Series 2018-31, Class KP, 3.50%, 7/25/2047 | 106,936 | 110,026 | ||||||
| Series 2021-69, Class WJ, 1.50%, 10/25/2050 | 1,045,580 | 1,038,951 | ||||||
| Fannie Mae-Aces, Series 2017-M15, Class A1, 2.959%, 9/25/202711 | 1,414,018 | 1,488,381 | ||||||
| Fontainebleau Miami Beach Trust, Series 2019-FBLU, Class A, 3.144%, 12/10/20362 | 1,571,000 | 1,625,199 | ||||||
| Freddie Mac Multifamily Structured Pass-Through Certificates | ||||||||
| Series K017, Class X1 (IO), 1.459%, 12/25/202111 | 3,729,773 | 288 | ||||||
| Series K021, Class X1 (IO), 1.376%, 6/25/202211 | 9,800,436 | 28,748 | ||||||
| Series K030, Class X1 (IO), 0.148%, 4/25/202311 | 39,357,851 | 83,029 | ||||||
| Series K032, Class X1 (IO), 0.073%, 5/25/202311 | 25,716,008 | 36,887 | ||||||
| FREMF Mortgage Trust | ||||||||
| Series 2013-K28, Class X2A (IO), 0.10%, 6/25/20462 | 71,669,200 | 68,129 | ||||||
| Series 2014-K41, Class B, 3.833%, 11/25/20472,11 | 1,731,000 | 1,847,078 | ||||||
| SHARES/ PRINCIPAL AMOUNT1 | VALUE (NOTE 2) | |||||||
| COMMERCIAL MORTGAGE-BACKED SECURITIES (continued) | ||||||||
| Government National Mortgage Association, Series 2017-54, Class AH, 2.60%, 12/16/2056 | 1,022,358 | $ | 1,043,155 | |||||
| GS Mortgage Securities Corp. Trust, Series 2019-70P, Class A, (1 mo. LIBOR US + 1.000%), 1.09%, 10/15/20362,7 | 1,589,000 | 1,585,988 | ||||||
| GS Mortgage-Backed Securities Trust | ||||||||
| Series 2021-INV1, Class A9, (U.S. Secured Overnight Financing Rate 30 Day Average + 0.850%), 0.899%, 12/25/20512,7 | 1,370,167 | 1,373,641 | ||||||
| Series 2021-PJ6, Class A8, 2.50%, 11/25/20512,11 | 1,100,748 | 1,121,130 | ||||||
| Series 2021-PJ9, Class A8, 2.50%, 2/26/20522,11 | 1,132,240 | 1,148,223 | ||||||
| Imperial Fund Mortgage Trust, Series 2021-NQM3, Class A1, 1.595%, 11/25/20562,11 | 1,290,000 | 1,286,259 | ||||||
| JP Morgan Mortgage Trust | ||||||||
| Series 2013-1, Class 1A2, 3.00%, 3/25/20432,11 | 108,266 | 109,246 | ||||||
| Series 2013-2, Class A2, 3.50%, 5/25/20432,11 | 93,213 | 94,282 | ||||||
| Series 2014-2, Class 1A1, 3.00%, 6/25/20292,11 | 297,894 | 302,319 | ||||||
| Series 2017-2, Class A3, 3.50%, 5/25/20472,11 | 157,586 | 159,450 | ||||||
| New Residential Mortgage Loan Trust | ||||||||
| Series 2014-3A, Class AFX3, 3.75%, 11/25/20542,11 | 263,199 | 277,168 | ||||||
| Series 2015-2A, Class A1, 3.75%, 8/25/20552,11 | 364,863 | 382,212 | ||||||
| Series 2016-4A, Class A1, 3.75%, 11/25/20562,11 | 421,128 | 447,759 | ||||||
| PMT Loan Trust, Series 2013-J1, Class A9, 3.50%, 9/25/20432,11 | 370,539 | 375,128 | ||||||
| Provident Funding Mortgage Trust | ||||||||
| Series 2021-2, Class A2A, 2.00%, 4/25/20512,11 | 1,316,576 | 1,322,234 | ||||||
| Series 2021-INV1, Class A1, 2.50%, 8/25/20512,11 | 2,075,029 | 2,106,559 | ||||||
| Sequoia Mortgage Trust | ||||||||
| Series 2013-2, Class A, 1.874%, 2/25/204311 | 160,243 | 160,162 | ||||||
| Series 2013-6, Class A2, 3.00%, 5/25/204311 | 694,124 | 697,037 | ||||||
| Series 2013-7, Class A2, 3.00%, 6/25/204311 | 141,496 | 142,257 | ||||||
| Series 2013-8, Class A1, 3.00%, 6/25/204311 | 166,831 | 168,173 | ||||||
| Series 2020-1, Class A4, 3.50%, 2/25/20502,11 | 21,918 | 21,935 | ||||||
| Starwood Retail Property Trust, Series 2014-STAR, Class A, (1 mo. LIBOR US + 1.470%), 1.560%, 11/15/20272,7 | 1,278,105 | 779,644 | ||||||
The accompanying notes are an integral part of the financial statements.
62
Investment Portfolio - October 31, 2021
| PRO-BLEND® EXTENDED TERM SERIES | SHARES/ PRINCIPAL AMOUNT1 | VALUE (NOTE 2) | ||||||
| COMMERCIAL MORTGAGE-BACKED SECURITIES (continued) | ||||||||
| Sutherland Commercial Mortgage Trust, Series 2019-SBC8, Class A, 2.86%, 4/25/20412,11 | 215,556 | $ | 214,270 | |||||
| Waikiki Beach Hotel Trust, Series 2019-WBM, Class A, (1 mo. LIBOR US + 1.050%), 1.14%, 12/15/20332,7 | 1,496,000 | 1,494,180 | ||||||
| Wells Fargo Commercial Mortgage Trust, Series 2021-SAVE, Class A, (1 mo. LIBOR US + 1.150%), 1.24%, 2/15/20402,7 | 1,818,044 | 1,820,360 | ||||||
| WinWater Mortgage Loan Trust, Series 2015-1, Class A1, 3.50%, 1/20/20452,11 | 72,900 | 73,859 | ||||||
| TOTAL COMMERCIAL MORTGAGE- BACKED SECURITIES | ||||||||
| (Identified Cost $30,811,805) | 30,350,423 | |||||||
| FOREIGN GOVERNMENT BONDS - 0.2% | ||||||||
| Canadian Government Bond | ||||||||
| (Canada), 2.75%, 6/1/2022 | CAD | 358,000 | 293,107 | |||||
| Mexican Government Bond | ||||||||
| (Mexico), 6.50%, 6/9/2022 | MXN | 5,057,000 | 246,014 | |||||
| (Mexico), 7.75%, 5/29/2031 | MXN | 972,000 | 47,946 | |||||
| Mexico Government International | ||||||||
| Bond (Mexico), 4.125%, 1/21/2026 | 200,000 | 221,050 | ||||||
| Republic of Italy Government International Bond (Italy), 2.375%, 10/17/2024 | 440,000 | 452,715 | ||||||
| TOTAL FOREIGN GOVERNMENT BONDS | ||||||||
| (Identified Cost $1,392,470) | 1,260,832 | |||||||
| MUNICIPAL BONDS - 0.7% | ||||||||
| Clark County, Public Impt., Series A, G.O. Bond, 1.51%, 11/1/2028 | 2,340,000 | 2,290,696 | ||||||
| Hawaii, Series GC, G.O. Bond, 2.682%, 10/1/2038 | 1,795,000 | 1,800,134 | ||||||
| New York City Transitional Finance Authority, Future Tax Secured, Public Impt., Revenue Bond, 1.58%, 5/1/2024 | 635,000 | 646,442 | ||||||
| South Carolina Public Service Authority, Series B, Revenue Bond, 2.329%, 12/1/2028 | 230,000 | 234,837 | ||||||
| TOTAL MUNICIPAL BONDS | ||||||||
| (Identified Cost $5,082,532) | 4,972,109 | |||||||
| SHARES/ PRINCIPAL AMOUNT1 | VALUE (NOTE 2) | |||||||
| U.S. GOVERNMENT AGENCIES - 1.6% | ||||||||
| Mortgage-Backed Securities - 1.6% | ||||||||
| Fannie Mae | ||||||||
| Pool #995329, UMBS, 5.50%, 12/1/2021 | 45 | $ | 45 | |||||
| Pool #888810, UMBS, 5.50%, 11/1/2022 | 127 | 128 | ||||||
| Pool #990895, UMBS, 5.50%, 10/1/2023 | 3,975 | 4,084 | ||||||
| Pool #AD0462, UMBS, 5.50%, 10/1/2024 | 3,352 | 3,495 | ||||||
| Pool #MA3463, UMBS, 4.00%, 9/1/2033 | 365,933 | 387,163 | ||||||
| Pool #MA1834, UMBS, 4.50%, 2/1/2034 | 397,544 | 436,198 | ||||||
| Pool #MA1903, UMBS, 4.50%, 5/1/2034 | 231,966 | 254,527 | ||||||
| Pool #889576, UMBS, 6.00%, 4/1/2038 | 145,477 | 171,928 | ||||||
| Pool #889579, UMBS, 6.00%, 5/1/2038 | 124,689 | 147,358 | ||||||
| Pool #MA3412, UMBS, 3.50%, 7/1/2038 | 440,168 | 467,341 | ||||||
| Pool #995196, UMBS, 6.00%, 7/1/2038 | 7,401 | 8,746 | ||||||
| Pool #AD0207, UMBS, 6.00%, 10/1/2038 | 395,933 | 467,913 | ||||||
| Pool #AD0220, UMBS, 6.00%, 10/1/2038 | 12,411 | 14,667 | ||||||
| Pool #MA0258, UMBS, 4.50%, 12/1/2039 | 257,659 | 287,017 | ||||||
| Pool #AL1595, UMBS, 6.00%, 1/1/2040 | 153,150 | 180,700 | ||||||
| Pool #AL0152, UMBS, 6.00%, 6/1/2040 | 303,691 | 358,327 | ||||||
| Pool #MA4203, UMBS, 2.50%, 12/1/2040 | 2,814,113 | 2,896,317 | ||||||
| Pool #AL0241, UMBS, 4.00%, 4/1/2041 | 413,952 | 456,070 | ||||||
| Pool #AI5172, UMBS, 4.00%, 8/1/2041 | 303,251 | 335,103 | ||||||
| Pool #AL1410, UMBS, 4.50%, 12/1/2041 | 517,289 | 577,929 | ||||||
| Pool #AL7729, UMBS, 4.00%, 6/1/2043 | 261,702 | 286,661 | ||||||
| Pool #AX5234, UMBS, 4.50%, 11/1/2044 | 293,781 | 323,878 | ||||||
| Pool #AS4103, UMBS, 4.50%, 12/1/2044 | 316,229 | 347,661 | ||||||
| Pool #BC6764, UMBS, 3.50%, 4/1/2046 | 180,323 | 193,308 | ||||||
| Pool #BD6997, UMBS, 4.00%, 10/1/2046 | 281,760 | 306,964 | ||||||
| Pool #BE7845, UMBS, 4.50%, 2/1/2047 | 135,002 | 147,051 | ||||||
| Pool #AL8674, 5.659%, 1/1/2049 | 1,006,978 | 1,123,277 | ||||||
| Freddie Mac | ||||||||
| Pool #G12610, 6.00%, 3/1/2022 | 241 | 241 | ||||||
The accompanying notes are an integral part of the financial statements.
63
Investment Portfolio - October 31, 2021
| PRO-BLEND® EXTENDED TERM SERIES | SHARES/ PRINCIPAL AMOUNT1 | VALUE (NOTE 2) | ||||||
| U.S. GOVERNMENT AGENCIES (continued) | ||||||||
| Mortgage-Backed Securities (continued) | ||||||||
| Freddie Mac (continued) | ||||||||
| Pool #G12655, 6.00%, 5/1/2022 | 199 | $ | 200 | |||||
| Pool #G12988, 6.00%, 1/1/2023 | 917 | 931 | ||||||
| Pool #G13078, 6.00%, 3/1/2023 | 1,252 | 1,270 | ||||||
| Pool #G13331, 5.50%, 10/1/2023 | 953 | 976 | ||||||
| Pool #C91762, 4.50%, 5/1/2034 | 275,212 | 302,051 | ||||||
| Pool #C91771, 4.50%, 6/1/2034 | 230,922 | 253,439 | ||||||
| Pool #C91780, 4.50%, 7/1/2034 | 361,142 | 396,366 | ||||||
| Pool #G03926, 6.00%, 2/1/2038 | 60,343 | 71,332 | ||||||
| Pool #G05906, 6.00%, 4/1/2040 | 73,113 | 86,254 | ||||||
| Pool #Q33778, 4.00%, 6/1/2045 | 408,553 | 450,642 | ||||||
| TOTAL U.S. GOVERNMENT AGENCIES | ||||||||
| (Identified Cost $11,389,928) | 11,747,558 | |||||||
| SHORT-TERM INVESTMENT - 1.9% | ||||||||
| Dreyfus Government Cash Management, Institutional Shares, 0.03%12 | ||||||||
| (Identified Cost $14,031,473) | 14,031,473 | 14,031,473 | ||||||
| TOTAL INVESTMENTS - 99.9% | ||||||||
| (Identified Cost $623,179,558) | 726,740,540 | |||||||
| OTHER ASSETS, LESS LIABILITIES - 0.1% | 577,845 | |||||||
| NET ASSETS - 100% | $ | 727,318,385 | ||||||
ADR - American Depositary Receipt
CAD - Canadian Dollar
CLO - Collateralized Loan Obligation
ETF - Exchange-Traded Fund
G.O. Bond - General Obligation Bond
Impt. - Improvement
IO - Interest only
LIBOR - London Interbank Offered Rate
MXN - Mexican Peso
REMICS - Real Estate Mortgage Investment Conduits
UMBS - Uniform Mortgage-Backed Securities
*Non-income producing security.
## Less than 0.1%.
1Amount is stated in USD unless otherwise noted.
2Security purchased or received in a transaction exempt from registration under the Securities Act of 1933, as amended (the “1933 Act”) and determined to be liquid under the Fund’s Liquidity Risk Management Program. The security may be resold pursuant to an exemption from registration under the 1933 Act, typically to qualified institutional buyers. The aggregate value of these securities at October 31, 2021 was $89,662,588, which represented 12.3% of the Series’ Net Assets.
3Security has been valued using significant unobservable inputs.
4Variable rate security. Security may be issued at a fixed coupon rate, which converts to a variable rate at a specified date. Rate shown is the rate in effect as of October 31, 2021.
5Security is perpetual in nature and has no stated maturity date.
6Security purchased or received in a transaction exempt from registration under the Securities Act of 1933, as amended (the “1933 Act”) and determined to be illiquid under the Fund’s Liquidity Risk Management Program. The security may be resold pursuant to an exemption from registration under the 1933 Act, typically to qualified institutional buyers. The security was acquired on October 13, 2021 at a cost of $675,000. The value of the security at October 31, 2021 was $675,527, or less than 0.1% of the Series’ Net Assets.
7Floating rate security. Rate shown is the rate in effect as of October 31, 2021.
The accompanying notes are an integral part of the financial statements.
64
Investment Portfolio - October 31, 2021
8Security purchased or received in a transaction exempt from registration under the Securities Act of 1933, as amended (the “1933 Act”) and determined to be illiquid under the Fund’s Liquidity Risk Management Program. The security may be resold pursuant to an exemption from registration under the 1933 Act, typically to qualified institutional buyers. The security was acquired on dates between August 4, 2021 and August 10, 2021 at an aggregate cost of $717,500. The value of the security at October 31, 2021 was $715,082, or less than 0.1% of the Series’ Net Assets.
9Issuer filed for bankruptcy and/or is in default of interest payments.
10Security purchased or received in a transaction exempt from registration under the Securities Act of 1933, as amended (the “1933 Act”) and determined to be illiquid under the Fund’s Liquidity Risk Management Program. The security may be resold pursuant to an exemption from registration under the 1933 Act, typically to qualified institutional buyers. The security was acquired on October 10, 2017 and on dates between May 8, 2020 and September 18, 2020 at an aggregate cost of $118,233. The value of the security at October 31, 2021 was $65, or less than 0.1% of the Series’ Net Assets.
11Variable or floating rate security, the interest rate of which adjusts periodically based on changes in current interest rates and prepayments on the underlying pool of assets. Rate shown is the rate in effect as of October 31, 2021.
12Rate shown is the current yield as of October 31, 2021.
The Global Industry Classification Standard (GICS) was developed by and is the exclusive property and a service mark of MSCI Inc. (MSCI) and Standard & Poor’s, a division of S&P Global Inc. (S&P), and is licensed for use by Manning & Napier when referencing GICS sectors. Neither MSCI, S&P, nor any third party involved in making or compiling the GICS or any GICS classifications makes any express or implied warranties or representations with respect to such standard or classification, nor shall any such party have any liability therefrom.
The accompanying notes are an integral part of the financial statements.
65
Statement of Assets and Liabilities - Pro-Blend® Extended Term Series
October 31, 2021
| ASSETS: | ||||
| Investments in securities, at value (identified cost $623,179,558) (Note 2) | $ | 726,740,540 | ||
| Interest receivable | 2,165,194 | |||
| Foreign tax reclaims receivable | 502,613 | |||
| Receivable for fund shares sold | 186,308 | |||
| Receivable for securities sold | 144,175 | |||
| Dividends receivable | 134,672 | |||
| Prepaid expenses | 28,050 | |||
| TOTAL ASSETS | 729,901,552 | |||
| LIABILITIES: | ||||
| Foreign currency overdraft, at value (identified cost $134) | 130 | |||
| Accrued management fees (Note 3) | 366,404 | |||
| Accrued distribution and service (Rule 12b-1) fees (Class S) (Class R) (Class L) (Note 3) | 195,723 | |||
| Accrued sub-transfer agent fees (Note 3) | 119,313 | |||
| Accrued fund accounting and administration fees (Note 3) | 49,894 | |||
| Accrued Chief Compliance Officer service fees (Note 3) | 2,032 | |||
| Directors' fees payable (Note 3) | 39 | |||
| Payable for securities purchased | 1,577,612 | |||
| Payable for fund shares repurchased | 145,620 | |||
| Other payables and accrued expenses | 126,400 | |||
| TOTAL LIABILITIES | 2,583,167 | |||
| TOTAL NET ASSETS | $ | 727,318,385 | ||
| NET ASSETS CONSIST OF: | ||||
| Capital stock | $ | 514,815 | ||
| Additional paid-in-capital | 571,016,993 | |||
| Total distributable earnings (loss) | 155,786,577 | |||
| TOTAL NET ASSETS | $ | 727,318,385 | ||
The accompanying notes are an integral part of the financial statements.
66
Statement of Assets and Liabilities - Pro-Blend® Extended Term Series
October 31, 2021
| NET ASSET VALUE, OFFERING PRICE AND REDEMPTION PRICE PER SHARE - Class S | ||||
| ($365,077,213/16,776,711 shares) | $ | 21.76 | ||
| NET ASSET VALUE, OFFERING PRICE AND REDEMPTION PRICE PER SHARE - Class I | ||||
| ($192,593,217/19,683,192 shares) | $ | 9.78 | ||
| NET ASSET VALUE, OFFERING PRICE AND REDEMPTION PRICE PER SHARE - Class R | ||||
| ($56,058,334/4,635,057 shares) | $ | 12.09 | ||
| NET ASSET VALUE, OFFERING PRICE AND REDEMPTION PRICE PER SHARE - Class L | ||||
| ($113,582,330/10,386,250 shares) | $ | 10.94 | ||
| NET ASSET VALUE, OFFERING PRICE AND REDEMPTION PRICE PER SHARE - Class W | ||||
| ($7,291/334 shares) | $ | 21.85 | 1 | |
1The net asset value of Class W Shares was calculated using unrounded net assets of $7,291.10 divided by the unrounded shares outstanding of 333.63.
The accompanying notes are an integral part of the financial statements.
67
Statement of Operations - Pro-Blend® Extended Term Series
For the Year Ended October 31, 2021
| INVESTMENT INCOME: | ||||
| Interest (net of foreign taxes withheld, $200) | $ | 5,686,586 | ||
| Dividends (net of foreign taxes withheld, $224,826) | 5,150,815 | |||
| Other Income | 53,130 | |||
| Total Investment Income | 10,890,531 | |||
| EXPENSES: | ||||
| Management fees (Note 3) | 4,223,579 | |||
| Distribution and service (Rule 12b-1) fees (Class L) (Note 3) | 1,115,818 | |||
| Distribution and service (Rule 12b-1) fees (Class S) (Note 3) | 904,924 | |||
| Distribution and service (Rule 12b-1) fees (Class R) (Note 3) | 279,892 | |||
| Sub-transfer agent fees (Note 3) | 339,497 | |||
| Fund accounting and administration fees (Note 3) | 153,198 | |||
| Directors’ fees (Note 3) | 85,190 | |||
| Chief Compliance Officer service fees (Note 3) | 6,096 | |||
| Custodian fees | 51,039 | |||
| Miscellaneous | 545,056 | |||
| Total Expenses | 7,704,289 | |||
| Less reduction of expenses (Note 3) | (43 | ) | ||
| Net Expenses | 7,704,246 | |||
| NET INVESTMENT INCOME | 3,186,285 | |||
| REALIZED AND UNREALIZED GAIN (LOSS) ON INVESTMENTS AND FOREIGN CURRENCY: | ||||
| Net realized gain (loss) on- | ||||
| Investments in securities | 59,355,859 | |||
| Foreign currency and translation of other assets and liabilities | (5,668 | ) | ||
| 59,350,191 | ||||
| Net change in unrealized appreciation (depreciation) on- | ||||
| Investments in securities | 68,713,246 | |||
| Foreign currency and translation of other assets and liabilities | 5,668 | |||
| 68,718,914 | ||||
| NET REALIZED AND UNREALIZED GAIN (LOSS) ON INVESTMENTS AND FOREIGN CURRENCY | 128,069,105 | |||
| NET INCREASE IN NET ASSETS RESULTING FROM OPERATIONS | $ | 131,255,390 |
The accompanying notes are an integral part of the financial statements.
68
Statements of Changes in Net Assets - Pro-Blend® Extended Term Series
| FOR THE YEAR ENDED 10/31/21 | FOR THE YEAR ENDED 10/31/20 | |||||||
| INCREASE (DECREASE) IN NET ASSETS: | ||||||||
| OPERATIONS: | ||||||||
| Net investment income | $ | 3,186,285 | $ | 3,940,299 | ||||
| Net realized gain (loss) on investments and foreign currency | 59,350,191 | 53,051,938 | ||||||
| Net change in unrealized appreciation (depreciation) on investments and foreign currency | 68,718,914 | (6,681,928 | ) | |||||
| Net increase (decrease) from operations | 131,255,390 | 50,310,309 | ||||||
| DISTRIBUTIONS TO SHAREHOLDERS (Note 9): | ||||||||
| Class S | (21,957,379 | ) | (11,710,120 | ) | ||||
| Class I | (20,900,222 | ) | (10,619,011 | ) | ||||
| Class R | (5,876,222 | ) | (437,348 | ) | ||||
| Class L | (11,934,028 | ) | (7,273,380 | ) | ||||
| Class W | (451 | ) | (279 | ) | ||||
| Total distributions to shareholders | (60,668,302 | ) | (30,040,138 | ) | ||||
| CAPITAL STOCK ISSUED AND REPURCHASED: | ||||||||
| Net increase (decrease) from capital share transactions (Note 5) | 19,291,832 | 115,919,304 | ||||||
| Net increase (decrease) in net assets | 89,878,920 | 136,189,475 | ||||||
| NET ASSETS: | ||||||||
| Beginning of year | 637,439,465 | 501,249,990 | ||||||
| End of year | $ | 727,318,385 | $ | 637,439,465 | ||||
The accompanying notes are an integral part of the financial statements.
69
Financial Highlights - Pro-Blend® Extended Term Series - Class S
| FOR THE YEAR ENDED | ||||||||||||||||||||
| 10/31/21 | 10/31/20 | 10/31/19 | 10/31/18 | 10/31/17 | ||||||||||||||||
| Per share data (for a share outstanding throughout each year): | ||||||||||||||||||||
| Net asset value - Beginning of year | $19.12 | $18.02 | $16.85 | $18.22 | $16.62 | |||||||||||||||
| Income (loss) from investment operations: | ||||||||||||||||||||
| Net investment income1 | 0.11 | 0.16 | 0.22 | 0.18 | 0.15 | |||||||||||||||
| Net realized and unrealized gain (loss) on investments | 3.80 | 1.72 | 2 | 1.87 | (0.43 | ) | 1.70 | |||||||||||||
| Total from investment operations | 3.91 | 1.88 | 2.09 | (0.25 | ) | 1.85 | ||||||||||||||
| Less distributions to shareholders: | ||||||||||||||||||||
| From net investment income | (0.06 | ) | (0.12 | ) | (0.15 | ) | (0.10 | ) | (0.09 | ) | ||||||||||
| From net realized gain on investments | (1.21 | ) | (0.66 | ) | (0.77 | ) | (1.02 | ) | (0.16 | ) | ||||||||||
| Total distributions to shareholders | (1.27 | ) | (0.78 | ) | (0.92 | ) | (1.12 | ) | (0.25 | ) | ||||||||||
| Net asset value - End of year | $21.76 | $19.12 | $18.02 | $16.85 | $18.22 | |||||||||||||||
| Net assets - End of year (000’s omitted) | $365,077 | $334,977 | $276,300 | $308,334 | $400,117 | |||||||||||||||
| Total return3 | 21.19% | 10.74% | 2 | 13.16% | (1.47% | ) | 11.26% | |||||||||||||
| Ratios (to average net assets)/Supplemental Data: | ||||||||||||||||||||
| Expenses* | 1.01% | 1.02% | 1.05% | 1.10% | 1.08% | |||||||||||||||
| Net investment income | 0.54% | 0.87% | 1.31% | 1.03% | 0.89% | |||||||||||||||
| Series portfolio turnover | 66% | 120% | 61% | 75% | 79% | |||||||||||||||
| *For certain years presented, the investment advisor did not impose all or a portion of its management and/or other fees, and in some years may have paid a portion of the Series’ expenses. If these expenses had been incurred by the Class, the expense ratio (to average net assets) would have increased by the following amounts: | ||||||||||||||||||||
| N/A | N/A | 0.01% | 0.01 | % | N/A | |||||||||||||||
1Calculated based on average shares outstanding during the years.
2During the reporting period the Fund settled legal claims against an issuer of securities previously held by the Fund. As a result, the net realized and unrealized gain (loss) on investments per share includes proceeds received from the settlement. Without these proceeds the net realized and unrealized gain (loss) on investments per share would have been $1.70. Excluding the proceeds from the settlement, the total return would have been 10.63%.
3Represents aggregate total return for the years indicated, and assumes reinvestment of all distributions. Total return would have been lower had certain expenses not been waived or reimbursed during certain years.
The accompanying notes are an integral part of the financial statements.
70
Financial Highlights - Pro-Blend® Extended Term Series - Class I
| FOR THE YEAR ENDED | ||||||||||||||||||||
| 10/31/21 | 10/31/20 | 10/31/19 | 10/31/18 | 10/31/17 | ||||||||||||||||
| Per share data (for a share outstanding throughout each year): | ||||||||||||||||||||
| Net asset value - Beginning of year. | $9.26 | $9.15 | $9.04 | $10.31 | $9.53 | |||||||||||||||
| Income (loss) from investment operations: | ||||||||||||||||||||
| Net investment income1 | 0.07 | 0.10 | 0.13 | 0.12 | 0.11 | |||||||||||||||
| Net realized and unrealized gain (loss) on investments | 1.77 | 0.84 | 2 | 0.95 | (0.22 | ) | 0.96 | |||||||||||||
| Total from investment operations | 1.84 | 0.94 | 1.08 | (0.10 | ) | 1.07 | ||||||||||||||
| Less distributions to shareholders: | ||||||||||||||||||||
| From net investment income | (0.11 | ) | (0.17 | ) | (0.20 | ) | (0.15 | ) | (0.13 | ) | ||||||||||
| From net realized gain on investments | (1.21 | ) | (0.66 | ) | (0.77 | ) | (1.02 | ) | (0.16 | ) | ||||||||||
| Total distributions to shareholders | (1.32 | ) | (0.83 | ) | (0.97 | ) | (1.17 | ) | (0.29 | ) | ||||||||||
| Net asset value - End of year | $9.78 | $9.26 | $9.15 | $9.04 | $10.31 | |||||||||||||||
| Net assets - End of year (000’s omitted) | $192,593 | $149,603 | $117,991 | $126,834 | $147,257 | |||||||||||||||
| Total return3 | 21.48% | 10.88% | 2 | 13.36% | (1.15% | ) | 11.56% | |||||||||||||
| Ratios (to average net assets)/Supplemental Data: | ||||||||||||||||||||
| Expenses* | 0.79% | 0.81% | 4 | 0.85% | 0.85% | 0.83% | ||||||||||||||
| Net investment income | 0.75% | 1.06% | 1.51% | 1.29% | 1.15% | |||||||||||||||
| Series portfolio turnover | 66% | 120% | 61% | 75% | 79% | |||||||||||||||
| *For certain years presented, the investment advisor did not impose all or a portion of its management and/or other fees, and in some years may have paid a portion of the Series’ expenses. If these expenses had been incurred by the Class, the expense ratio (to average net assets) would have increased by the following amounts: | ||||||||||||||||||||
| N/A | N/A | 0.01% | 0.01% | N/A | ||||||||||||||||
1Calculated based on average shares outstanding during the years.
2During the reporting period the Fund settled legal claims against an issuer of securities previously held by the Fund. As a result, the net realized and unrealized gain (loss) on investments per share includes proceeds received from the settlement. Without these proceeds the net realized and unrealized gain (loss) on investments per share would have been $0.83. These proceeds impacted the total return by less than 0.01%.
3Represents aggregate total return for the years indicated, and assumes reinvestment of all distributions. Total return would have been lower had certain expenses not been waived or reimbursed during certain years.
4Includes recoupment of past waived and/or reimbursed fees with no financial impact to the expense ratios.
The accompanying notes are an integral part of the financial statements.
71
Financial Highlights - Pro-Blend® Extended Term Series - Class R
| FOR THE YEAR ENDED | ||||||||||||||||||||
| 10/31/21 | 10/31/20 | 10/31/19 | 10/31/18 | 10/31/17 | ||||||||||||||||
| Per share data (for a share outstanding throughout each year): | ||||||||||||||||||||
| Net asset value - Beginning of year | $11.18 | $10.86 | $10.54 | $11.82 | $10.88 | |||||||||||||||
| Income (loss) from investment operations: | ||||||||||||||||||||
| Net investment income1 | 0.04 | 0.05 | 0.11 | 0.09 | 0.07 | |||||||||||||||
| Net realized and unrealized gain (loss) on investments | 2.15 | 1.04 | 2 | 1.11 | (0.26 | ) | 1.10 | |||||||||||||
| Total from investment operations | 2.19 | 1.09 | 1.22 | (0.17 | ) | 1.17 | ||||||||||||||
| Less distributions to shareholders: | ||||||||||||||||||||
| From net investment income | (0.07 | ) | (0.11 | ) | (0.13 | ) | (0.09 | ) | (0.07 | ) | ||||||||||
| From net realized gain on investments | (1.21 | ) | (0.66 | ) | (0.77 | ) | (1.02 | ) | (0.16 | ) | ||||||||||
| Total distributions to shareholders | (1.28 | ) | (0.77 | ) | (0.90 | ) | (1.11 | ) | (0.23 | ) | ||||||||||
| Net asset value - End of year | $12.09 | $11.18 | $10.86 | $10.54 | $11.82 | |||||||||||||||
| Net assets - End of year (000’s omitted) | $56,058 | $52,600 | $6,149 | $11,138 | $15,358 | |||||||||||||||
| Total return3 | 20.86% | 10.53% | 2 | 12.73% | (1.65% | ) | 10.97% | |||||||||||||
| Ratios (to average net assets)/Supplemental Data: | ||||||||||||||||||||
| Expenses* | 1.24% | 1.31% | 4 | 1.35% | (1.35% | ) | 1.33% | |||||||||||||
| Net investment income | 0.31% | 0.41% | 1.02% | 0.79% | 0.65% | |||||||||||||||
| Series portfolio turnover | 66% | 120% | 61% | 75% | 79% | |||||||||||||||
| *For certain years presented, the investment advisor did not impose all or a portion of its management and/or other fees, and in some years may have paid a portion of the Series’ expenses. If these expenses had been incurred by the Class, the expense ratio (to average net assets) would have increased by the following amounts: | ||||||||||||||||||||
| N/A | N/A | 0.02% | 0.01 | % | N/A | |||||||||||||||
1Calculated based on average shares outstanding during the years.
2During the reporting period the Fund settled legal claims against an issuer of securities previously held by the Fund. As a result, the net realized and unrealized gain (loss) on investments per share includes proceeds received from the settlement. Without these proceeds the net realized and unrealized gain (loss) on investments per share would have been $1.03. Excluding the proceeds from the settlement, the total return would have been 10.43%.
3Represents aggregate total return for the years indicated, and assumes reinvestment of all distributions. Total return would have been lower had certain expenses not been waived or reimbursed during certain years.
4Includes recoupment of past waived and/or reimbursed fees with no financial impact to the expense ratios.
The accompanying notes are an integral part of the financial statements.
72
Financial Highlights - Pro-Blend® Extended Term Series - Class L*
| FOR THE YEAR ENDED | ||||||||||||||||||||
| 10/31/21 | 10/31/20 | 10/31/19 | 10/31/18 | 10/31/17 | ||||||||||||||||
| Per share data (for a share outstanding throughout each year): | ||||||||||||||||||||
| Net asset value - Beginning of year | $10.21 | $10.00 | $9.78 | $11.05 | $10.19 | |||||||||||||||
| Income (loss) from investment operations: | ||||||||||||||||||||
| Net investment income (loss)1 | (0.02 | ) | 0.01 | 0.05 | 0.03 | 0.01 | ||||||||||||||
| Net realized and unrealized gain (loss) on investments | 1.97 | 0.93 | 2 | 1.04 | (0.24 | ) | 1.03 | |||||||||||||
| Total from investment operations | 1.95 | 0.94 | 1.09 | (0.21 | ) | 1.04 | ||||||||||||||
| Less distributions to shareholders: | ||||||||||||||||||||
| From net investment income | (0.01 | ) | (0.07 | ) | (0.10 | ) | (0.04 | ) | (0.02 | ) | ||||||||||
| From net realized gain on investments | (1.21 | ) | (0.66 | ) | (0.77 | ) | (1.02 | ) | (0.16 | ) | ||||||||||
| Total distributions to shareholders | (1.22 | ) | (0.73 | ) | (0.87 | ) | (1.06 | ) | (0.18 | ) | ||||||||||
| Net asset value - End of year | $10.94 | $10.21 | $10.00 | $9.78 | $11.05 | |||||||||||||||
| Net assets - End of year (000’s omitted) | $113,582 | $100,254 | $100,804 | $106,348 | $130,130 | |||||||||||||||
| Total return3 | 20.38% | 9.87% | 2 | 12.26% | (2.13% | ) | 10.42% | |||||||||||||
| Ratios (to average net assets)/Supplemental Data: | ||||||||||||||||||||
| Expenses** | 1.76% | 1.77% | 1.80% | 1.85% | 1.83% | |||||||||||||||
| Net investment income (loss) | (0.22% | ) | 0.13% | 0.57% | 0.28% | 0.14% | ||||||||||||||
| Series portfolio turnover | 66% | 120% | 61% | 75% | 79% | |||||||||||||||
| *Effective March 1, 2019, Class R2 shares of the Series have been redesignated as Class L shares | ||||||||||||||||||||
| **For certain years presented, the investment advisor did not impose all or a portion of its management and/or other fees, and in some years may have paid a portion of the Series’ expenses. If these expenses had been incurred by the Class, the expense ratio (to average net assets) would have increased by the following amounts: | ||||||||||||||||||||
| N/A | N/A | 0.00% | 4 | 0.01 | % | N/A | ||||||||||||||
1Calculated based on average shares outstanding during the years.
2During the reporting period the Fund settled legal claims against an issuer of securities previously held by the Fund. As a result, the net realized and unrealized gain (loss) on investments per share includes proceeds received from the settlement. Without these proceeds the net realized and unrealized gain (loss) on investments per share would have been $0.92. Excluding the proceeds from the settlement, the total return would have been 9.76%.
3Represents aggregate total return for the years indicated, and assumes reinvestment of all distributions. Total return would have been lower had certain expenses not been waived or reimbursed during certain years.
4Less than 0.01%.
The accompanying notes are an integral part of the financial statements.
73
Financial Highlights - Pro-Blend® Extended Term Series - Class W
| FOR THE YEAR ENDED | ||||||||||||
| 10/31/21 | 10/31/20 | FOR THE PERIOD 4/1/191 TO 10/31/19 | ||||||||||
| Per share data (for a share outstanding throughout each period): | ||||||||||||
| Net asset value - Beginning of period | $19.18 | $18.08 | $17.04 | |||||||||
| Income from investment operations: | ||||||||||||
| Net investment income2 | 0.30 | 0.33 | 0.23 | |||||||||
| Net realized and unrealized gain (loss) on investments | 3.82 | 1.71 | 3 | 0.90 | ||||||||
| Total from investment operations | 4.12 | 2.04 | 1.13 | |||||||||
| Less distributions to shareholders: | ||||||||||||
| From net investment income | (0.24 | ) | (0.28 | ) | (0.09 | ) | ||||||
| From net realized gain on investments | (1.21 | ) | (0.66 | ) | (0.00 | )4 | ||||||
| Total distributions to shareholders | (1.45 | ) | (0.94 | ) | (0.09 | ) | ||||||
| Net asset value - End of period | $21.85 | $19.18 | $18.08 | |||||||||
| Net assets - End of period (000’s omitted) | $7 | $6 | $5 | |||||||||
| Total return5 | 22.34% | 11.70% | 3 | 6.69% | ||||||||
| Ratios (to average net assets)/Supplemental Data: | ||||||||||||
| Expenses* | 0.10% | 0.10% | 0.10% | 6 | ||||||||
| Net investment income | 1.44% | 1.78% | 2.20% | 6 | ||||||||
| Series portfolio turnover | 66% | 120% | 61% | |||||||||
| *The investment advisor did not impose all or a portion of its management and/or other fees during the periods, and may have paid a portion of the Series’ expenses. If these expenses had been incurred by the Class, the expense ratio (to average net assets) would have increased by the following amounts: | ||||||||||||
| 0.62% | 0.62% | 0.62% | 6 | |||||||||
1Commencement of operations.
2Calculated based on average shares outstanding during the periods.
3During the reporting period the Fund settled legal claims against an issuer of securities previously held by the Fund. As a result, the net realized and unrealized gain (loss) on investments per share includes proceeds received from the settlement. Without these proceeds the net realized and unrealized gain (loss) on investments per share would have been $1.69. Excluding the proceeds from the settlement, the total return would have been 11.64%.
4Less than $(0.01).
5Represents aggregate total return for the periods indicated, and assumes reinvestment of all distributions. Total return would have been lower had certain expenses not been waived or reimbursed during the periods. Periods less than one year are not annualized.
6Annualized.
The accompanying notes are an integral part of the financial statements.
74
Performance Update as of October 31, 2021 - Pro-Blend® Maximum Term Series
(unaudited)
| AVERAGE ANNUAL TOTAL RETURNS AS OF OCTOBER 31, 2021 | ||||||
| ONE YEAR1 | FIVE YEAR | TEN YEAR | ||||
| Pro-Blend® Maximum Term Series - Class S2 | 35.82% | 16.03% | 12.30% | |||
| Pro-Blend® Maximum Term Series - Class I2 | 36.17% | 16.32% | 12.59% | |||
| Pro-Blend® Maximum Term Series - Class R2,3 | 35.60% | 15.76% | 12.04% | |||
| Pro-Blend® Maximum Term Series - Class L2,3 | 34.77% | 15.18% | 11.47% | |||
| Pro-Blend® Maximum Term Series - Class W2,4 | 37.19% | 16.63% | 12.59% | |||
| Russell 3000® Index5 | 43.90% | 18.91% | 16.10% | |||
| 65/20/15 Blended Index6 | 33.61% | 14.79% | 12.30% | |||
The following graph compares the value of a $10,000 investment in the Pro-Blend® Maximum Term Series - Class S for the ten years ended October 31, 2021 to the Russell 3000® Index and the 65/20/15 Blended Index.
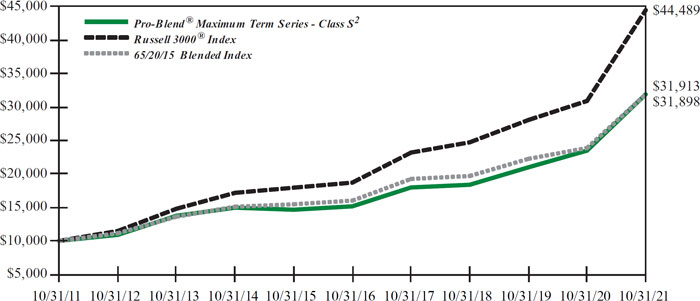
1The returns shown are based on net asset values calculated for shareholder transactions and may differ from the returns shown in the financial highlights, which reflect adjustments made to the net asset values in accordance with accounting principles generally accepted in the United States of America.
2The Series’ performance does not reflect the deduction of taxes that a shareholder would pay on fund distributions or the redemption of shares. The Series’ performance is historical and may not be indicative of future results. The performance returns shown are inclusive of the net expense ratio of the Series. For the year ended October 31, 2021, this net expense ratio was 1.10% for Class S, 0.85% for Class I, 1.29% for Class R, 1.82% for Class L and 0.10% for Class W. The gross expense ratio, which does not account for any voluntary or contractual waivers currently in effect, was 1.10% for Class S, 0.89% for Class I, 1.29% for Class R, 1.82% for Class L and 0.77% for Class W for the year ended October 31, 2021.
3For periods through the inception of Class L on January 4, 2010 and Class R on June 30, 2010, the performance is hypothetical and is based on the historical performance of the Class S shares adjusted for the respective class’ charges and expenses.
4For periods through April 1, 2019 (the inception date of the Class W shares), performance for the Class W shares is based on the historical performance of the Class S shares. Because the Class W shares invest in the same portfolio of securities as the Class S shares, performance will be different only to the extent that the Class S shares have a higher expense ratio.
5The Russell 3000® Index is an unmanaged index that consists of 3,000 of the largest U.S. companies based on total market capitalization. The Index returns are based on a market capitalization-weighted average of relative price changes of the component stocks plus dividends whose reinvestments are compounded daily. The Index returns do not reflect any fees or expenses. Index returns provided by Bloomberg. Index data referenced herein is the property of London Stock Exchange Group plc and its group undertakings (“LSE Group”) and/or its third party suppliers and has been licensed for use by Manning & Napier. LSE Group and its third party suppliers accept no liability in connection with its use. Data provided is not a representation or warranty, express or implied, as to the ability of any index to accurately represent the asset class or market sector that it purports to represent and none of these parties shall have any liability for any errors, omissions, or interruptions of any index or the data included therein. For additional disclosure information, please see: https://go.manning-napier.com/benchmark-provisions.
75
Performance Update as of October 31, 2021 - Pro-Blend® Maximum Term Series
(unaudited)
6The 65/20/15 Blended Index is 65% Russell 3000® Index (Russell 3000), 20% MSCI ACWI ex USA Index (ACWIxUS), and 15% Bloomberg U.S. Aggregate Bond Index (BAB). Russell 3000 is an unmanaged index that consists of 3,000 of the largest U.S. companies based on total market capitalization. The Index returns are based on a market capitalization-weighted average of relative price changes of the component stocks plus dividends whose reinvestments are compounded daily. Index returns provided by Bloomberg. ACWIxUS is designed to measure large and mid-cap representation across 22 of 23 Developed Markets countries (excluding the U.S.) and 27 Emerging Markets countries. The Index is denominated in U.S. dollars. The Index returns are net of withholding taxes. They assume daily reinvestment of net dividends thus accounting for any applicable dividend taxation. Index returns provided by Bloomberg. BAB is an unmanaged, market value-weighted index of U.S. domestic investment-grade debt issues, including government, corporate, asset-backed, and mortgage-backed securities with maturities of one year or more. Index returns provided by Interactive Data. The returns of the indices do not reflect any fees or expenses. Returns provided are calculated monthly using a blended allocation. Because the fund’s asset allocation will vary over time, the composition of the fund’s portfolio may not match the composition of the comparative Indices. Index data referenced herein is the property of each index sponsor (London Stock Exchange Group plc and its group undertakings (Russell), MSCI, and Bloomberg), their affiliates (“Index Sponsors”) and/ or their third party suppliers and has been licensed for use by Manning & Napier. The Index Sponsors and their third party suppliers accept no liability in connection with its use. Data provided is not a representation or warranty, express or implied, as to the ability of any index to accurately represent the asset class or market sector that it purports to represent and none of these parties shall have any liability for any errors, omissions, or interruptions of any index or the data included therein. For additional disclosure information, please see: https://go.manning-napier.com/benchmark-provisions.
76
Shareholder Expense Example - Pro-Blend® Maximum Term Series
(unaudited)
As a shareholder of the Series, you incur ongoing costs, including management fees, shareholder service fees and other Series expenses. This example is intended to help you understand your ongoing costs (in dollars) of investing in the Series and to compare these costs with the ongoing costs of investing in other mutual funds.
The example is based on an investment of $1,000 invested in each class at the beginning of the period and held for the entire period (May 1, 2021 to October 31, 2021).
Actual Expenses
The Actual lines of the table below provide information about actual account values and actual expenses. You may use the information in these lines, together with the amount you invested, to estimate the expenses that you paid over the period. Simply divide your account value by $1,000 (for example, an $8,600 account value divided by $1,000 = 8.6), then multiply the result by the number in the Actual line for the Class in which you have invested under the heading entitled “Expenses Paid During Period” to estimate the expenses you paid on your account during this period.
Hypothetical Example for Comparison Purposes
The Hypothetical lines of each class in the table below provide information about hypothetical account values and hypothetical expenses based on the Class’ actual expense ratio and an assumed rate of return of 5% per year before expenses, which is not the Class’ actual return. The hypothetical account values and expenses may not be used to estimate the actual ending account balance or expenses you paid during the period. You may use this information to compare the ongoing costs of investing in a class of the Series and other funds. To do so, compare this 5% hypothetical example for the Class in which you have invested with the 5% hypothetical examples that appear in the shareholder reports of the other funds.
Please note that the expenses shown in the table are meant to highlight your ongoing costs only and do not reflect any transaction costs, such as sales charges (loads), redemption fees, or exchange fees that you may incur in other mutual funds. Therefore, the second line of the table is useful in comparing ongoing costs only, and will not help you determine the relative total costs of owning different funds.
| BEGINNING ACCOUNT VALUE 5/1/21 | ENDING ACCOUNT VALUE 10/31/21 | EXPENSES PAID DURING PERIOD* 5/1/21 - 10/31/21 | ANNUALIZED EXPENSE RATIO | |||||
| Class S | ||||||||
| Actual | $1,000.00 | $1,072.60 | $5.75 | 1.10% | ||||
| Hypothetical (5% return before expenses) | $1,000.00 | $1,019.66 | $5.60 | 1.10% | ||||
| Class I | ||||||||
| Actual | $1,000.00 | $1,074.20 | $4.44 | 0.85% | ||||
| Hypothetical (5% return before expenses) | $1,000.00 | $1,020.92 | $4.33 | 0.85% | ||||
| Class R | ||||||||
| Actual | $1,000.00 | $1,071.90 | $6.74 | 1.29% | ||||
| Hypothetical (5% return before expenses) | $1,000.00 | $1,018.70 | $6.56 | 1.29% | ||||
| Class L | ||||||||
| Actual | $1,000.00 | $1,068.70 | $9.49 | 1.82% | ||||
| Hypothetical (5% return before expenses) | $1,000.00 | $1,016.03 | $9.25 | 1.82% | ||||
| Class W | ||||||||
| Actual | $1,000.00 | $1,078.30 | $0.52 | 0.10% | ||||
| Hypothetical (5% return before expenses) | $1,000.00 | $1,024.70 | $0.51 | 0.10% |
77
Shareholder Expense Example - Pro-Blend® Maximum Term Series
(unaudited)
*Expenses are equal to each Class’ annualized expense ratio (for the six-month period), multiplied by the average account value over the period, multiplied by 184/365 (to reflect the one-half year period). Expenses are based on the most recent fiscal half year; therefore, the expense ratios stated above may differ from the expense ratios stated in the financial highlights, which are based on one-year data. The Class’ total return would have been lower had certain expenses not been waived or reimbursed during the period.
78
Portfolio Composition - Pro-Blend® Maximum Term Series - as of October 31, 2021
(unaudited)
| Asset Allocation1 |
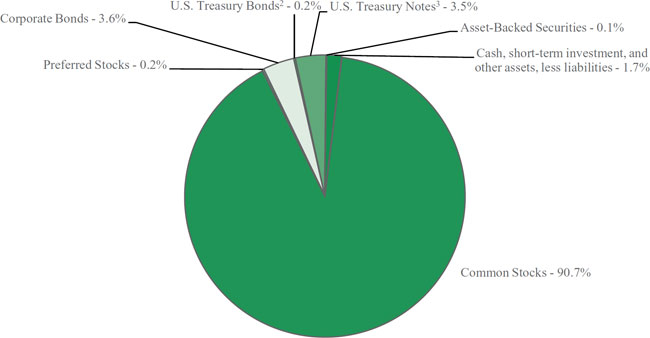 |
1As a percentage of net assets. 2A U.S. Treasury Bond is a long-term obligation of the U.S. Treasury issued with a maturity period of more than ten years. 3A U.S. Treasury Note is an intermediate long-term obligation of the U.S. Treasury issued with a maturity period between one and ten years. |
| Sector Allocation4 | |
| Information Technology | 14.4% |
| Health Care | 14.0% |
| Consumer Discretionary | 13.9% |
| Communication Services | 11.0% |
| Consumer Staples | 10.1% |
| Financials | 9.7% |
| Industrials | 7.8% |
| Energy | 4.9% |
| Real Estate | 4.8% |
| Materials | 3.9% |
| 4Including common stocks, preferred stocks and corporate bonds, as a percentage of total investments. | |
| Top Ten Stock Holdings5 | |
| Microsoft Corp. | 2.9% |
| Amazon.com, Inc. | 2.7% |
| Alphabet, Inc. - Class A | 2.5% |
| Meta Platforms, Inc. - Class A | 2.4% |
| Sea Ltd. - ADR (Taiwan) | 2.3% |
| ServiceNow, Inc. | 2.0% |
| Sony Group Corp. - ADR (Japan) | 2.0% |
| Medtronic plc | 1.8% |
| Johnson & Johnson | 1.7% |
| The Coca-Cola Co. | 1.6% |
| 5As a percentage of total investments. | |
79
Investment Portfolio - October 31, 2021
| PRO-BLEND® MAXIMUM TERM SERIES | SHARES/ PRINCIPAL AMOUNT1 | VALUE (NOTE 2) | ||||||
| COMMON STOCKS - 90.7% | ||||||||
| Communication Services - 10.6% | ||||||||
| Diversified Telecommunication Services - 0.1% | ||||||||
| Radius Global Infrastructure, Inc. - Class A* | 13,544 | $ | 234,717 | |||||
| Verizon Communications, Inc. | 5,721 | 303,156 | ||||||
| 537,873 | ||||||||
| Entertainment - 4.1% | ||||||||
| Electronic Arts, Inc. | 38,980 | 5,466,945 | ||||||
| Sea Ltd. - ADR (Taiwan)* | 38,260 | 13,144,988 | ||||||
| Ubisoft Entertainment S.A. - ADR (France)* | 183,716 | 1,916,158 | ||||||
| Ubisoft Entertainment S.A. (France)* | 5,429 | 284,283 | ||||||
| The Walt Disney Co.* | 13,947 | 2,358,020 | ||||||
| 23,170,394 | ||||||||
| Interactive Media & Services - 5.2% | ||||||||
| Alphabet, Inc. - Class A* | 4,757 | 14,085,097 | ||||||
| Alphabet, Inc. - Class C* | 474 | 1,405,604 | ||||||
| Auto Trader Group plc (United Kingdom)2 | 55,893 | 463,377 | ||||||
| Meta Platforms, Inc. - Class A* | 43,149 | 13,961,722 | ||||||
| 29,915,800 | ||||||||
| Media - 1.2% | ||||||||
| Charter Communications, Inc. - Class A*. | 8,973 | 6,055,788 | ||||||
| Comcast Corp. - Class A | 6,412 | 329,769 | ||||||
| Omnicom Group, Inc. | 736 | 50,107 | ||||||
| S4 Capital plc (United Kingdom)* | 31,367 | 311,511 | ||||||
| 6,747,175 | ||||||||
| Total Communication Services | 60,371,242 | |||||||
| Consumer Discretionary - 13.8% | ||||||||
| Distributors - 0.0%## | ||||||||
| Genuine Parts Co. | 497 | 65,161 | ||||||
| Hotels, Restaurants & Leisure - 2.6% | ||||||||
| Accor S.A. - ADR (France)* | 321,745 | 2,332,651 | ||||||
| Accor S.A. (France)* | 10,419 | 372,859 | ||||||
| Expedia Group, Inc.* | 46,102 | 7,579,630 | ||||||
| Hyatt Hotels Corp. - Class A* | 46,677 | 3,976,880 | ||||||
| Restaurant Brands International, Inc. (Canada) | 3,520 | 199,373 | ||||||
| 14,461,393 | ||||||||
| Household Durables - 2.6% | ||||||||
| Garmin Ltd. | 575 | 82,570 | ||||||
| Nikon Corp. (Japan) | 228,500 | 2,519,386 | ||||||
| Sony Group Corp. - ADR (Japan) | 99,257 | 11,492,968 | ||||||
| Sony Group Corp. (Japan) | 7,100 | 822,155 | ||||||
| Whirlpool Corp. | 228 | 48,069 | ||||||
| 14,965,148 | ||||||||
| Internet & Direct Marketing Retail - 2.7% | ||||||||
| Amazon.com, Inc.* | 4,556 | 15,364,791 | ||||||
| SHARES/ PRINCIPAL AMOUNT1 | VALUE (NOTE 2) | |||||||
| COMMON STOCKS (continued) | ||||||||
| Consumer Discretionary (continued) | ||||||||
| Multiline Retail - 2.6% | ||||||||
| Dollar General Corp. | 27,056 | $ | 5,993,445 | |||||
| Dollar Tree, Inc.* | 79,313 | 8,546,769 | ||||||
| 14,540,214 | ||||||||
| Specialty Retail - 0.6% | ||||||||
| AutoZone, Inc.* | 1,594 | 2,845,035 | ||||||
| Best Buy Co., Inc. | 768 | 93,880 | ||||||
| The Home Depot, Inc. | 1,375 | 511,143 | ||||||
| Williams-Sonoma, Inc. | 274 | 50,890 | ||||||
| 3,500,948 | ||||||||
| Textiles, Apparel & Luxury Goods - 2.7% | ||||||||
| adidas AG (Germany) | 7,524 | 2,462,617 | ||||||
| lululemon athletica, Inc. * | 14,560 | 6,785,106 | ||||||
| NIKE, Inc. - Class B | 37,836 | 6,329,584 | ||||||
| 15,577,307 | ||||||||
| Total Consumer Discretionary | 78,474,962 | |||||||
| Consumer Staples - 10.1% | ||||||||
| Beverages - 5.3% | ||||||||
| Anheuser-Busch InBev S.A./N.V. (Belgium) | 47,064 | 2,878,775 | ||||||
| The Coca-Cola Co. | 164,687 | 9,283,406 | ||||||
| Constellation Brands, Inc. - Class A | 22,941 | 4,973,838 | ||||||
| Diageo plc (United Kingdom) | 105,779 | 5,262,684 | ||||||
| Heineken N.V. - ADR (Netherlands) | 68,760 | 3,831,995 | ||||||
| Heineken N.V. (Netherlands) | 3,235 | 358,079 | ||||||
| PepsiCo, Inc. | 22,994 | 3,715,830 | ||||||
| 30,304,607 | ||||||||
| Food & Staples Retailing - 0.1% | ||||||||
| The Kroger Co. | 2,163 | 86,563 | ||||||
| Walmart, Inc. | 3,020 | 451,249 | ||||||
| 537,812 | ||||||||
| Food Products - 3.3% | ||||||||
| Archer-Daniels-Midland Co. | 1,536 | 98,673 | ||||||
| Bunge Ltd. | 538 | 49,840 | ||||||
| Campbell Soup Co. | 1,047 | 41,828 | ||||||
| Conagra Brands, Inc. | 1,625 | 52,325 | ||||||
| Danone S.A. (France) | 6,441 | 419,862 | ||||||
| General Mills, Inc. | 1,613 | 99,683 | ||||||
| The Hershey Co. | 580 | 101,703 | ||||||
| The J.M. Smucker Co. | 403 | 49,512 | ||||||
| Kerry Group plc - Class A (Ireland) | 1,683 | 225,878 | ||||||
| The Kraft Heinz Co. | 2,876 | 103,220 | ||||||
| Mondelez International, Inc. - Class A | 138,565 | 8,416,438 | ||||||
| Nestle S.A. (Switzerland) | 67,470 | 8,899,781 | ||||||
| Tyson Foods, Inc. - Class A | 1,040 | 83,169 | ||||||
| 18,641,912 | ||||||||
| Household Products - 0.2% | ||||||||
| The Clorox Co. | 372 | 60,640 | ||||||
The accompanying notes are an integral part of the financial statements.
80
Investment Portfolio - October 31, 2021
| PRO-BLEND® MAXIMUM TERM SERIES | SHARES/ PRINCIPAL AMOUNT1 | VALUE (NOTE 2) | ||||||
| COMMON STOCKS (continued) | ||||||||
| Consumer Staples (continued) | ||||||||
| Household Products (continued) | ||||||||
| Colgate-Palmolive Co. | 1,840 | $ | 140,189 | |||||
| Kimberly-Clark Corp. | 833 | 107,865 | ||||||
| Kimberly-Clark de Mexico S.A.B. de C.V.- Class A (Mexico) | 213,600 | 337,602 | ||||||
| The Procter & Gamble Co. | 3,113 | 445,128 | ||||||
| 1,091,424 | ||||||||
| Personal Products - 1.2% | ||||||||
| Beiersdorf AG (Germany) | 2,625 | 279,125 | ||||||
| Unilever plc - ADR (United Kingdom) | 128,011 | 6,858,830 | ||||||
| 7,137,955 | ||||||||
| Total Consumer Staples | 57,713,710 | |||||||
| Energy - 4.1% | ||||||||
| Oil, Gas & Consumable Fuels - 4.1% | ||||||||
| BP plc - ADR (United Kingdom) | 52,893 | 1,522,789 | ||||||
| Cameco Corp. (Canada) | 182,532 | 4,435,528 | ||||||
| ConocoPhillips | 43,382 | 3,231,525 | ||||||
| Coterra Energy, Inc. | 234,807 | 5,006,085 | ||||||
| EQT Corp.* | 199,925 | 3,980,507 | ||||||
| Exxon Mobil Corp. | 32,975 | 2,125,898 | ||||||
| Jonah Energy Parent LLC*3 | 2,449 | 153,063 | ||||||
| Royal Dutch Shell plc - Class B - ADR (Netherlands) | 30,580 | 1,401,787 | ||||||
| Total Energies SE - ADR (France) | 25,635 | 1,284,570 | ||||||
| Total Energy | 23,141,752 | |||||||
| Financials - 8.9% | ||||||||
| Banks - 1.1% | ||||||||
| The Bank of N.T. Butterfield & Son Ltd. (Bermuda) | 6,214 | 223,083 | ||||||
| Citigroup, Inc. | 3,414 | 236,112 | ||||||
| Comerica, Inc. | 539 | 45,864 | ||||||
| East West Bancorp, Inc. | 53,900 | 4,283,972 | ||||||
| Fifth Third Bancorp. | 1,984 | 86,364 | ||||||
| FinecoBank Banca Fineco S.p.A. (Italy)* | 47,010 | 897,787 | ||||||
| Huntington Bancshares, Inc. | 3,306 | 52,036 | ||||||
| JPMorgan Chase & Co. | 2,703 | 459,213 | ||||||
| Regions Financial Corp. | 3,018 | 71,466 | ||||||
| U.S. Bancorp | 2,981 | 179,963 | ||||||
| 6,535,860 | ||||||||
| Capital Markets - 6.1% | ||||||||
| Allfunds Group plc (United Kingdom)* | 11,565 | 233,773 | ||||||
| Avanza Bank Holding AB (Sweden) | 7,472 | 297,054 | ||||||
| BlackRock, Inc. | 7,217 | 6,808,951 | ||||||
| Cboe Global Markets, Inc. | 23,659 | 3,121,568 | ||||||
| Deutsche Boerse AG (Germany) | 23,745 | 3,941,839 | ||||||
| Intercontinental Exchange, Inc. | 41,673 | 5,770,044 | ||||||
| Intermediate Capital Group plc (United Kingdom) | 13,169 | 395,004 | ||||||
| Moody’s Corp. | 21,787 | 8,805,216 | ||||||
| SHARES/ PRINCIPAL AMOUNT1 | VALUE (NOTE 2) | |||||||
| COMMON STOCKS (continued) | ||||||||
| Financials (continued) | ||||||||
| Capital Markets (continued) | ||||||||
| S&P Global, Inc. | 11,366 | $ | 5,389,302 | |||||
| 34,762,751 | ||||||||
| Consumer Finance - 0.7% | ||||||||
| American Express Co. | 24,595 | 4,274,119 | ||||||
| Insurance - 1.0% | ||||||||
| Admiral Group plc (United Kingdom) | 15,097 | 593,043 | ||||||
| The Allstate Corp. | 817 | 101,038 | ||||||
| Chubb Ltd. | 925 | 180,727 | ||||||
| Cincinnati Financial Corp. | 544 | 66,063 | ||||||
| Everest Re Group Ltd. | 155 | 40,533 | ||||||
| Fidelity National Financial, Inc. | 1,078 | 51,647 | ||||||
| The Hartford Financial Services Group, Inc. | 1,062 | 77,452 | ||||||
| The Travelers Companies, Inc. | 658 | 105,859 | ||||||
| W. R. Berkley Corp. | 53,177 | 4,232,889 | ||||||
| 5,449,251 | ||||||||
| Total Financials | 51,021,981 | |||||||
| Health Care - 13.9% | ||||||||
| Biotechnology - 3.0% | ||||||||
| BioMarin Pharmaceutical, Inc.* | 63,756 | 5,051,388 | ||||||
| Gilead Sciences, Inc. | 2,512 | 162,979 | ||||||
| Seagen, Inc.* | 32,796 | 5,782,919 | ||||||
| Vertex Pharmaceuticals, Inc.* | 32,036 | 5,924,417 | ||||||
| 16,921,703 | ||||||||
| Health Care Equipment & Supplies - 5.5% | ||||||||
| Alcon, Inc. (Switzerland) | 43,154 | 3,597,317 | ||||||
| Align Technology, Inc.* | 9,783 | 6,108,212 | ||||||
| Boston Scientific Corp.* | 52,679 | 2,272,045 | ||||||
| Getinge AB - Class B (Sweden) | 15,318 | 685,509 | ||||||
| Heska Corp.* | 7,616 | 1,702,404 | ||||||
| IDEXX Laboratories, Inc.* | 6,006 | 4,000,837 | ||||||
| Intuitive Surgical, Inc.* | 5,922 | 2,138,612 | ||||||
| Medtronic plc | 84,437 | 10,120,619 | ||||||
| Shandong Weigao Group Medical Polymer Co. Ltd. - Class H (China) | 256,000 | 436,053 | ||||||
| 31,061,608 | ||||||||
| Health Care Providers & Services - 1.7% | ||||||||
| Amedisys, Inc.* | 12,542 | 2,123,862 | ||||||
| Humana, Inc. | 6,306 | 2,920,687 | ||||||
| Jinxin Fertility Group Ltd. (China)*2 | 76,000 | 107,192 | ||||||
| LHC Group, Inc.* | 13,524 | 1,820,195 | ||||||
| Quest Diagnostics, Inc. | 471 | 69,134 | ||||||
| UnitedHealth Group, Inc. | 6,193 | 2,851,691 | ||||||
| 9,892,761 | ||||||||
| Life Sciences Tools & Services - 0.8% | ||||||||
| Thermo Fisher Scientific, Inc. | 7,605 | 4,814,497 | ||||||
The accompanying notes are an integral part of the financial statements.
81
Investment Portfolio - October 31, 2021
| PRO-BLEND® MAXIMUM TERM SERIES | SHARES/ PRINCIPAL AMOUNT1 | VALUE (NOTE 2) | ||||||
| COMMON STOCKS (continued) | ||||||||
| Health Care (continued) | ||||||||
| Pharmaceuticals - 2.9% | ||||||||
| Bristol-Myers Squibb Co. | 3,795 | $ | 221,628 | |||||
| Dechra Pharmaceuticals plc (United Kingdom) | 6,833 | 478,787 | ||||||
| Johnson & Johnson | 57,870 | 9,425,865 | ||||||
| Merck & Co., Inc. | 4,022 | 354,137 | ||||||
| Novartis AG - ADR (Switzerland) | 47,495 | 3,930,686 | ||||||
| Zoetis, Inc. | 9,920 | 2,144,704 | ||||||
| 16,555,807 | ||||||||
| Total Health Care | 79,246,376 | |||||||
| Industrials - 7.0% | ||||||||
| Aerospace & Defense - 0.1% | ||||||||
| Airbus SE (France)* | 1,758 | 225,520 | ||||||
| General Dynamics Corp. | 657 | 133,207 | ||||||
| L3Harris Technologies, Inc. | 513 | 118,267 | ||||||
| Lockheed Martin Corp. | 521 | 173,139 | ||||||
| Northrop Grumman Corp. | 380 | 135,743 | ||||||
| 785,876 | ||||||||
| Air Freight & Logistics - 0.0%## | ||||||||
| C.H. Robinson Worldwide, Inc. | 497 | 48,204 | ||||||
| Airlines - 0.9% | ||||||||
| Controladora Vuela Cia de Aviacion S.A.B. de C.V. - ADR (Mexico)* | 13,633 | 246,757 | ||||||
| Ryanair Holdings plc - ADR (Ireland)* | 43,191 | 4,902,611 | ||||||
| 5,149,368 | ||||||||
| Building Products - 0.1% | ||||||||
| A. O. Smith Corp. | 633 | 46,253 | ||||||
| Assa Abloy AB - Class B (Sweden) | 9,529 | 279,606 | ||||||
| Johnson Controls International plc | 2,153 | 157,966 | ||||||
| 483,825 | ||||||||
| Commercial Services & Supplies - 0.6% | ||||||||
| Cleanaway Waste Management Ltd. | ||||||||
| (Australia) | 179,658 | 365,381 | ||||||
| Copart, Inc.* | 18,745 | 2,910,911 | ||||||
| Republic Services, Inc. | 888 | 119,525 | ||||||
| Waste Management, Inc. | 994 | 159,268 | ||||||
| 3,555,085 | ||||||||
| Electrical Equipment - 0.1% | ||||||||
| Eaton Corp. plc | 974 | 160,476 | ||||||
| Emerson Electric Co. | 1,473 | 142,896 | ||||||
| Hubbell, Inc. | 214 | 42,665 | ||||||
| 346,037 | ||||||||
| Industrial Conglomerates - 0.1% | ||||||||
| 3M Co. | 1,045 | 186,721 | ||||||
| Honeywell International, Inc. | 1,160 | 253,599 | ||||||
| 440,320 | ||||||||
| SHARES/ PRINCIPAL AMOUNT1 | VALUE (NOTE 2) | |||||||
| COMMON STOCKS (continued) | ||||||||
| Industrials (continued) | ||||||||
| Machinery - 0.8% | ||||||||
| Caterpillar, Inc. | 1,004 | $ | 204,826 | |||||
| Cummins, Inc. | 414 | 99,294 | ||||||
| Illinois Tool Works, Inc. | 663 | 151,078 | ||||||
| Snap-on, Inc. | 197 | 40,036 | ||||||
| Westinghouse Air Brake Technologies Corp. | 43,221 | 3,921,441 | ||||||
| 4,416,675 | ||||||||
| Professional Services - 0.8% | ||||||||
| Booz Allen Hamilton Holding Corp. | 536 | 46,557 | ||||||
| Insperity, Inc. | 37,411 | 4,676,375 | ||||||
| 4,722,932 | ||||||||
| Road & Rail - 2.2% | ||||||||
| Canadian National Railway Co. (Canada) | 61,018 | 8,109,902 | ||||||
| Norfolk Southern Corp. | 13,960 | 4,090,978 | ||||||
| Union Pacific Corp. | 1,118 | 269,885 | ||||||
| 12,470,765 | ||||||||
| Trading Companies & Distributors - 0.5% | ||||||||
| Brenntag SE (Germany) | 31,064 | 2,955,378 | ||||||
| W. W. Grainger, Inc. | 164 | 75,950 | ||||||
| 3,031,328 | ||||||||
| Transportation Infrastructure - 0.8% | ||||||||
| Grupo Aeroportuario del Centro Norte S.A.B. de C.V. - ADR (Mexico)* | 24,765 | 1,198,379 | ||||||
| Grupo Aeroportuario del Centro Norte S.A.B. de C.V. (Mexico)* | 19,400 | 117,325 | ||||||
| Grupo Aeroportuario del Pacifico S.A.B. de C.V. - ADR (Mexico) | 11,672 | 1,473,940 | ||||||
| Grupo Aeroportuario del Sureste S.A.B. de C.V. - ADR (Mexico) | 7,911 | 1,595,253 | ||||||
| 4,384,897 | ||||||||
| Total Industrials | 39,835,312 | |||||||
| Information Technology - 14.3% | ||||||||
| Communications Equipment - 0.1% | ||||||||
| Cisco Systems, Inc. | 6,216 | 347,909 | ||||||
| Motorola Solutions, Inc. | 467 | 116,092 | ||||||
| 464,001 | ||||||||
| Electronic Equipment, Instruments & Components - 0.5% | ||||||||
| CDW Corp | 13,269 | 2,476,659 | ||||||
| Keyence Corp. (Japan) | 300 | 181,084 | ||||||
| Softwareone Holding AG (Germany) | 14,631 | 339,028 | ||||||
| 2,996,771 | ||||||||
| IT Services - 4.6% | ||||||||
| Adyen N.V. (Netherlands)*2 | 114 | 343,973 | ||||||
| Atos SE (France) | 5,380 | 280,689 | ||||||
| Automatic Data Processing, Inc. | 849 | 190,592 | ||||||
| Broadridge Financial Solutions, Inc. | 378 | 67,439 | ||||||
The accompanying notes are an integral part of the financial statements.
82
Investment Portfolio - October 31, 2021
| PRO-BLEND® MAXIMUM TERM SERIES | SHARES/ PRINCIPAL AMOUNT1 | VALUE (NOTE 2) | ||||||
| COMMON STOCKS (continued) | ||||||||
| Information Technology (continued) | ||||||||
| IT Services (continued) | ||||||||
| International Business Machines Corp. | 1,566 | $ | 195,907 | |||||
| Keywords Studios plc (Ireland) | 2,756 | 106,966 | ||||||
| Mastercard, Inc. - Class A | 27,001 | 9,059,376 | ||||||
| PayPal Holdings, Inc.* | 33,389 | 7,765,947 | ||||||
| StoneCo Ltd. - Class A (Brazil)* | 9,429 | 319,266 | ||||||
| Switch, Inc. - Class A | 15,277 | 386,203 | ||||||
| TravelSky Technology Ltd. - Class H (China) | 271,000 | 506,352 | ||||||
| Visa, Inc. - Class A | 32,485 | 6,879,348 | ||||||
| 26,102,058 | ||||||||
| Semiconductors & Semiconductor Equipment - 1.3% | ||||||||
| Analog Devices, Inc. | 854 | 148,161 | ||||||
| Intel Corp. | 5,579 | 273,371 | ||||||
| NVIDIA Corp. | 24,978 | 6,386,125 | ||||||
| QUALCOMM, Inc. | 1,893 | 251,845 | ||||||
| Taiwan Semiconductor Manufacturing Co. Ltd. - ADR (Taiwan) | 3,866 | 439,564 | ||||||
| 7,499,066 | ||||||||
| Software - 7.8% | ||||||||
| Adobe, Inc.* | 4,871 | 3,167,904 | ||||||
| Microsoft Corp. | 49,067 | 16,271,599 | ||||||
| Oracle Corp. | 4,195 | 402,468 | ||||||
| Palo Alto Networks, Inc.* | 7,915 | 4,029,447 | ||||||
| salesforce.com, Inc.* | 30,334 | 9,090,796 | ||||||
| ServiceNow, Inc.* | 16,617 | 11,594,678 | ||||||
| 44,556,892 | ||||||||
| Technology Hardware, Storage & Peripherals - 0.0%## | ||||||||
| NetApp, Inc. | 779 | 69,565 | ||||||
| Total Information Technology | 81,688,353 | |||||||
| Materials - 3.5% | ||||||||
| Chemicals - 1.7% | ||||||||
| Air Liquide S.A. - ADR (France) | 106,806 | 3,569,456 | ||||||
| Air Liquide S.A. (France) | 3,322 | 554,634 | ||||||
| CF Industries Holdings, Inc. | 821 | 46,633 | ||||||
| Eastman Chemical Co. | 467 | 48,582 | ||||||
| FMC Corp. | 58,196 | 5,296,418 | ||||||
| International Flavors & Fragrances, Inc. | 668 | 98,497 | ||||||
| Linde plc (United Kingdom) | 850 | 271,320 | ||||||
| RPM International, Inc. | 480 | 41,856 | ||||||
| 9,927,396 | ||||||||
| Construction Materials - 1.0% | ||||||||
| Martin Marietta Materials, Inc. | 7,882 | 3,096,365 | ||||||
| Vulcan Materials Co. | 13,701 | 2,604,834 | ||||||
| 5,701,199 | ||||||||
| Containers & Packaging - 0.7% | ||||||||
| Graphic Packaging Holding Co. | 206,645 | 4,118,435 | ||||||
| SHARES/ PRINCIPAL AMOUNT1 | VALUE (NOTE 2) | |||||||
| COMMON STOCKS (continued) | ||||||||
| Materials (continued) | ||||||||
| Containers & Packaging (continued) | ||||||||
| Packaging Corp. of America | 345 | $ | 47,393 | |||||
| 4,165,828 | ||||||||
| Metals & Mining - 0.1% | ||||||||
| Newmont Corp. | 1,889 | 102,006 | ||||||
| Nucor Corp. | 986 | 110,087 | ||||||
| Reliance Steel & Aluminum Co. | 254 | 37,124 | ||||||
| Steel Dynamics, Inc. | 822 | 54,318 | ||||||
| 303,535 | ||||||||
| Total Materials | 20,097,958 | |||||||
| Real Estate - 4.5% | ||||||||
| Equity Real Estate Investment Trusts (REITS) - 4.5% | ||||||||
| Agree Realty Corp. | 1,384 | 98,347 | ||||||
| American Campus Communities, Inc. | 4,030 | 216,492 | ||||||
| American Homes 4 Rent - Class A | 7,545 | 306,327 | ||||||
| American Tower Corp. | 17,802 | 5,019,630 | ||||||
| Apple Hospitality REIT, Inc. | 13,714 | 215,447 | ||||||
| AvalonBay Communities, Inc. | 908 | 214,905 | ||||||
| Brandywine Realty Trust | 8,539 | 113,142 | ||||||
| Camden Property Trust | 1,188 | 193,763 | ||||||
| CareTrust REIT, Inc | 4,296 | 89,142 | ||||||
| Community Healthcare Trust, Inc. | 3,549 | 169,784 | ||||||
| Cousins Properties, Inc. | 6,482 | 256,752 | ||||||
| Digital Realty Trust, Inc. | 1,908 | 301,101 | ||||||
| Douglas Emmett, Inc. | 3,055 | 99,837 | ||||||
| Duke Realty Corp. | 6,023 | 338,734 | ||||||
| Equinix, Inc. | 4,942 | 4,136,800 | ||||||
| Equity LifeStyle Properties, Inc. | 3,269 | 276,263 | ||||||
| Essex Property Trust, Inc. | 797 | 270,924 | ||||||
| Extra Space Storage, Inc. | 1,245 | 245,726 | ||||||
| Flagship Communities REIT | 7,356 | 146,899 | ||||||
| Getty Realty Corp. | 3,674 | 118,009 | ||||||
| Healthcare Trust of America, Inc. - Class A | 3,411 | 113,893 | ||||||
| Healthpeak Properties, Inc. | 3,048 | 108,234 | ||||||
| Hibernia REIT plc (Ireland) | 48,250 | 70,279 | ||||||
| Innovative Industrial Properties, Inc. | 615 | 161,800 | ||||||
| Invitation Homes, Inc. | 9,852 | 406,395 | ||||||
| Kilroy Realty Corp. | 2,396 | 161,442 | ||||||
| Lamar Advertising Co. - Class A | 742 | 83,994 | ||||||
| Life Storage, Inc. | 1,271 | 170,073 | ||||||
| Mid-America Apartment Communities, Inc. | 1,553 | 317,138 | ||||||
| NexPoint Residential Trust, Inc. | 1,640 | 116,117 | ||||||
| Prologis, Inc. | 7,421 | 1,075,748 | ||||||
| Public Storage | 1,475 | 489,965 | ||||||
| Realty Income Corp. | 913 | 65,216 | ||||||
| Rexford Industrial Realty, Inc. | 4,371 | 293,731 | ||||||
| SBA Communications Corp. | 24,138 | 8,335,576 | ||||||
The accompanying notes are an integral part of the financial statements.
83
Investment Portfolio - October 31, 2021
| PRO-BLEND® MAXIMUM TERM SERIES | SHARES/ PRINCIPAL AMOUNT1 | VALUE (NOTE 2) | ||||||
| COMMON STOCKS (continued) | ||||||||
| Real Estate (continued) | ||||||||
| Equity Real Estate Investment Trusts (REITS) (continued) | ||||||||
| Sun Communities, Inc. | 2,120 | $ | 415,478 | |||||
| Terreno Realty Corp. | 1,783 | 130,391 | ||||||
| UDR, Inc. | 4,573 | 253,939 | ||||||
| Ventas, Inc. | 1,718 | 91,690 | ||||||
| Welltower, Inc. | 2,020 | 162,408 | ||||||
| Total Real Estate | 25,851,531 | |||||||
| TOTAL COMMON STOCKS | ||||||||
| (Identified Cost $357,196,501) | 517,443,177 | |||||||
| PREFERRED STOCKS - 0.2% | ||||||||
| Information Technology - 0.1% | ||||||||
| Software - 0.1% | ||||||||
| Greenidge Generation Holdings, Inc., 8.50%, 10/31/2026 | 5,500 | 136,400 | ||||||
| Synchronoss Technologies, Inc., 8.375%, 6/30/2026 | 11,200 | 270,816 | ||||||
| 407,216 | ||||||||
| Materials - 0.1% | ||||||||
| Metals & Mining - 0.1% | ||||||||
| Ramaco Resources, Inc., 9.00%, 7/30/2026 | 22,200 | 592,740 | ||||||
| TOTAL PREFERRED STOCKS | 999,956 | |||||||
| (Identified Cost $973,331) | ||||||||
| CORPORATE BONDS - 3.6% | ||||||||
| Non-Convertible Corporate Bonds- 3.6% | ||||||||
| Communication Services - 0.4% | ||||||||
| Diversified Telecommunication Services - 0.2% | ||||||||
| Lumen Technologies, Inc., 7.50%, 4/1/2024 | 240,000 | 263,400 | ||||||
| Verizon Communications, Inc., 4.272%, 1/15/2036 | 690,000 | 807,139 | ||||||
| 1,070,539 | ||||||||
| Interactive Media & Services - 0.2% | ||||||||
| Tencent Holdings Ltd. (China), 3.975%, 4/11/20292 | 990,000 | 1,079,753 | ||||||
| Total Communication Services | 2,150,292 | |||||||
| Consumer Discretionary - 0.2% | ||||||||
| Automobiles - 0.0%## | ||||||||
| Ford Motor Co., 9.00%, 4/22/2025 | 230,000 | 276,575 | ||||||
| Hotels, Restaurants & Leisure - 0.1% | ||||||||
| Expedia Group, Inc., 3.25%, 2/15/2030 | 270,000 | 277,685 | ||||||
| SHARES/ PRINCIPAL AMOUNT1 | VALUE (NOTE 2) | |||||||
| CORPORATE BONDS (continued) | ||||||||
| Non-Convertible Corporate Bonds (continued) | ||||||||
| Consumer Discretionary (continued) | ||||||||
| Internet & Direct Marketing Retail - 0.1% | ||||||||
| Alibaba Group Holding Ltd. (China), 4.00%, 12/6/2037 | 460,000 | $ | 498,541 | |||||
| Total Consumer Discretionary | 1,052,801 | |||||||
| Energy - 0.8% | ||||||||
| Energy Equipment & Services - 0.1% | ||||||||
| Kent Global plc (United Kingdom), 10.00%, 6/28/2026 | 280,000 | 279,364 | ||||||
| Tidewater, Inc., 8.50%, 11/16/2026 | 200,000 | 199,838 | ||||||
| 479,202 | ||||||||
| Oil, Gas & Consumable Fuels - 0.7% | ||||||||
| BP Capital Markets America, Inc., 3.06%, 6/17/2041 | 630,000 | 635,115 | ||||||
| Brooge Petroleum and Gas Investment Co. FZE (United Arab Emirates), 8.50%, 9/24/20252 | 193,000 | 197,343 | ||||||
| Cenovus Energy, Inc. (Canada), 6.75%, 11/15/2039 | 620,000 | 848,774 | ||||||
| Energy Transfer LP, 6.50%, 2/1/2042 | 542,000 | 705,517 | ||||||
| Kinder Morgan Energy Partners LP, 6.95%, 1/15/2038 | 414,000 | 583,222 | ||||||
| Navigator Holdings Ltd., 8.00%, 9/10/20252 | 150,000 | 156,750 | ||||||
| PetroTal Corp. (Peru), 12.00%, 2/16/20242 | 270,000 | 283,500 | ||||||
| Ping Petroleum UK Ltd. (Bermuda), 12.00%, 7/29/20244 | 285,000 | 282,150 | ||||||
| The Williams Companies, Inc., 2.60%, 3/15/2031 | 500,000 | 501,277 | ||||||
| 4,193,648 | ||||||||
| Total Energy | 4,672,850 | |||||||
| Financials - 0.8% | ||||||||
| Banks - 0.4% | ||||||||
| Bank of America Corp., 6.11%, 1/29/2037 | 290,000 | 391,826 | ||||||
| Citigroup, Inc., 4.45%, 9/29/2027 | 375,000 | 420,656 | ||||||
| JPMorgan Chase & Co., (U.S. Secured Overnight Financing Rate + 2.515%), 2.956%, 5/13/20315 | 650,000 | 671,378 | ||||||
| Lloyds Bank plc (United Kingdom) (3 mo. LIBOR US + 11.756%), 12.00%2,5,6 | 500,000 | 514,375 | ||||||
| Popular, Inc. (Puerto Rico), 6.125%, 9/14/2023 | 260,000 | 277,606 | ||||||
| 2,275,841 | ||||||||
| Capital Markets - 0.1% | ||||||||
| Blackstone Secured Lending Fund, 2.75%, 9/16/2026 | 240,000 | 242,216 | ||||||
The accompanying notes are an integral part of the financial statements.
84
Investment Portfolio - October 31, 2021
| PRO-BLEND® MAXIMUM TERM SERIES | SHARES/ PRINCIPAL AMOUNT1 | VALUE (NOTE 2) | ||||||
| CORPORATE BONDS (continued) | ||||||||
| Non-Convertible Corporate Bonds (continued) | ||||||||
| Financials (continued) | ||||||||
| Capital Markets (continued) | ||||||||
| Owl Rock Technology Finance Corp., 3.75%, 6/17/20262 | 240,000 | $ | 250,541 | |||||
| 492,757 | ||||||||
| Consumer Finance - 0.2% | ||||||||
| Navient Corp., 6.75%, 6/25/2025 | 510,000 | 561,291 | ||||||
| Synergy One Lending, Inc., 5.50%, 10/14/2026 | 285,000 | 289,124 | ||||||
| 850,415 | ||||||||
| Diversified Financial Services - 0.1% | ||||||||
| Blackstone Private Credit Fund, 2.625%, 12/15/20262 | 280,000 | 275,207 | ||||||
| FS Energy & Power Fund, 7.50%, 8/15/20232 | 540,000 | 561,600 | ||||||
| 836,807 | ||||||||
| Mortgage Real Estate Investment Trusts (REITS) - 0.0%## | ||||||||
| Arbor Realty Trust, Inc., 8.00%, 4/30/20232 | 80,000 | 84,110 | ||||||
| Total Financials | 4,539,930 | |||||||
| Health Care - 0.1% | ||||||||
| Health Care Providers & Services - 0.1% | ||||||||
| HCA, Inc., 4.125%, 6/15/2029 | 295,000 | 326,884 | ||||||
| Industrials - 0.8% | ||||||||
| Airlines - 0.2% | ||||||||
| Alaska Airlines Pass-Through Trust, Series 2020-1, Class B, 8.00%, 8/15/20252 | 88,897 | 100,263 | ||||||
| Southwest Airlines Co. | ||||||||
| 5.25%, 5/4/2025 | 16,000 | 17,940 | ||||||
| 5.125%, 6/15/2027 | 454,000 | 523,936 | ||||||
| United Airlines Pass-Through Trust, Series 2018-1, Class B, 4.60%, 3/1/2026 | 43,687 | 44,615 | ||||||
| United Airlines Pass-Through Trust, Series 2019-2, Class B, 3.50%, 5/1/2028 | 510,598 | 504,287 | ||||||
| 1,191,041 | ||||||||
| Commercial Services & Supplies - 0.1% | ||||||||
| Airswift Global AS (United Kingdom) (3 mo. LIBOR US + 8.500%), 8.623%, 5/12/20252,7 | 500,000 | 502,500 | ||||||
| Industrial Conglomerates - 0.1% | ||||||||
| General Electric Co., 6.875%, 1/10/2039 | 280,000 | 425,906 | ||||||
| Marine - 0.1% | ||||||||
| American Tanker, Inc. (Norway), 7.75%, 7/2/2025 | 275,000 | 281,669 | ||||||
| SHARES/ PRINCIPAL AMOUNT1 | VALUE (NOTE 2) | |||||||
| CORPORATE BONDS (continued) | ||||||||
| Non-Convertible Corporate Bonds (continued) | ||||||||
| Industrials (continued) | ||||||||
| Marine (continued) | ||||||||
| Seaspan Corp. (Hong Kong), 6.50%, 2/5/20242 | 200,000 | $ | 211,000 | |||||
| 492,669 | ||||||||
| Road & Rail - 0.0%## | ||||||||
| BNSF Funding Trust I, (3 mo. LIBOR US + 2.350%), 6.613%, 12/15/20555 | 210,000 | 239,200 | ||||||
| Trading Companies & Distributors - 0.3% | ||||||||
| AerCap Ireland Capital DAC - AerCap Global Aviation Trust (Ireland), 3.00%, 10/29/2028 | 570,000 | 578,604 | ||||||
| Air Lease Corp., 3.625%, 4/1/2027 | 230,000 | 245,506 | ||||||
| Ashtead Capital, Inc. (United Kingdom), 4.00%, 5/1/20282 | 230,000 | 242,684 | ||||||
| Avolon Holdings Funding Ltd. (Ireland), 2.75%, 2/21/20282 | 750,000 | 742,674 | ||||||
| 1,809,468 | ||||||||
| Total Industrials | 4,660,784 | |||||||
| Materials - 0.2% | ||||||||
| Metals & Mining - 0.2% | ||||||||
| Copper Mountain Mining Corp. (Canada), 8.00%, 4/9/20262 | 294,000 | 306,495 | ||||||
| IAMGOLD Corp. (Burkina Faso), 5.75%, 10/15/20282 | 80,000 | 78,600 | ||||||
| Jervois Mining USA Ltd. (Australia), 12.50%, 7/20/20268 | 400,000 | 423,752 | ||||||
| Newcastle Coal Infrastructure Group Pty Ltd. (Australia), 4.40%, 9/29/20272 | 250,000 | 253,090 | ||||||
| Northwest Acquisitions ULC - Dominion Finco, Inc., 7.125%, 11/1/20229,10 | 220,000 | 22 | ||||||
| Tacora Resources, Inc. (Canada), 8.25%, 5/15/20262 | 270,000 | 270,675 | ||||||
| Total Materials | 1,332,634 | |||||||
| Real Estate - 0.3% | ||||||||
| Equity Real Estate Investment Trusts (REITS) - 0.3% | ||||||||
| American Tower Corp., 3.80%, 8/15/2029 | 740,000 | 813,592 | ||||||
| Crown Castle International Corp., 3.10%, 11/15/2029 | 582,000 | 608,697 | ||||||
| IIP Operating Partnership LP, 5.50%, 5/25/2026 | 270,000 | 284,916 | ||||||
| 1,707,205 | ||||||||
The accompanying notes are an integral part of the financial statements.
85
Investment Portfolio - October 31, 2021
| PRO-BLEND® MAXIMUM TERM SERIES | SHARES/ PRINCIPAL AMOUNT1 | VALUE (NOTE 2) | ||||||
| CORPORATE BONDS (continued) | ||||||||
| Non-Convertible Corporate Bonds (continued) | ||||||||
| Real Estate (continued) | ||||||||
| Real Estate Management & Development - 0.0%## | ||||||||
| Forestar Group, Inc., 3.85%, 5/15/20262 | 55,000 | $ | 54,999 | |||||
| Total Real Estate | 1,762,204 | |||||||
| TOTAL CORPORATE BONDS | ||||||||
| (Identified Cost $20,378,532) | 20,498,379 | |||||||
| U.S. TREASURY SECURITIES - 3.7% | ||||||||
| U.S. Treasury Bonds - 0.2% | ||||||||
| U.S. Treasury Bond, 3.00%, 5/15/2047 (Identified Cost $1,446,377) | 1,185,000 | 1,438,618 | ||||||
| U.S. Treasury Notes - 3.5% | ||||||||
| U.S. Treasury Note | ||||||||
| 2.375%, 5/15/2027 | 16,025,000 | 16,966,469 | ||||||
| 1.625%, 5/15/2031 | 2,700,000 | 2,720,250 | ||||||
| Total U.S. Treasury Notes | ||||||||
| (Identified Cost $20,048,229) | 19,686,719 | |||||||
| TOTAL U.S. TREASURY SECURITIES | ||||||||
| (Identified Cost $21,494,606) | 21,125,337 | |||||||
| ASSET-BACKED SECURITIES - 0.1% | ||||||||
| Commonbond Student Loan Trust, Series 2019-AGS, Class A1, 2.54%, 1/25/20472 | 7,640 | 7,786 | ||||||
| Credit Acceptance Auto Loan Trust, Series 2020-1A, Class A, 2.01%, 2/15/20292 | 19,000 | 19,229 | ||||||
| Invitation Homes Trust | ||||||||
| Series 2017-SFR2, Class A, (1 mo. LIBOR US + 0.850%), 0.936%, 12/17/20362,7 | 2,082 | 2,079 | ||||||
| Series 2017-SFR2, Class B, (1 mo. LIBOR US + 1.150%), 1.236%, 12/17/20362,7 | 1,677 | 1,678 | ||||||
| Navient Student Loan Trust, Series 2014-1, Class A3, (1 mo. LIBOR US + 0.510%), 0.599%, 6/25/20317 | 13,802 | 13,624 | ||||||
| Nelnet Student Loan Trust | ||||||||
| Series 2012-3A, Class A, (1 mo. LIBOR US + 0.700%), 0.789%, 2/25/20452,7 | 14,266 | 14,205 | ||||||
| Series 2013-5A, Class A, (1 mo. LIBOR US + 0.630%), 0.719%, 1/25/20372,7 | 14,079 | 14,116 | ||||||
| Series 2015-2A, Class A2, (1 mo. LIBOR US + 0.600%), 0.689%, 9/25/20472,7 | 28,634 | 28,579 | ||||||
| Oxford Finance Funding LLC | ||||||||
| Series 2019-1A, Class A2, 4.459%, 2/15/20272 | 21,357 | 21,897 | ||||||
| SHARES/ PRINCIPAL AMOUNT1 | VALUE (NOTE 2) | |||||||
| ASSET-BACKED SECURITIES (continued) | ||||||||
| Oxford Finance Funding LLC (continued) | ||||||||
| Series 2020-1A, Class A2, 3.101%, 2/15/20282 | 16,000 | $ | 16,271 | |||||
| Progress Residential Trust, Series 2019-SFR2, Class A, 3.147%, 5/17/20362 | 16,850 | 16,940 | ||||||
| SMB Private Education Loan Trust, Series 2020-A, Class A2A, 2.23%, 9/15/20372 | 21,971 | 22,380 | ||||||
| SoFi Consumer Loan Program Trust, Series 2019-3, Class A, 2.90%, 5/25/20282 | 15 | 15 | ||||||
| SoFi Professional Loan Program Trust Series 2018-B, Class A2FX, 3.34%, 8/25/20472 | 9,041 | 9,249 | ||||||
| Series 2020-A, Class A2FX, 2.54%, 5/15/20462 | 14,000 | 14,317 | ||||||
| Towd Point Mortgage Trust Series 2016-5, Class A1, 2.50%, 10/25/20562,11 | 5,238 | 5,293 | ||||||
| Series 2017-1, Class A1, 2.75%, 10/25/20562,11 | 5,158 | 5,223 | ||||||
| Series 2019-HY1, Class A1, (1 mo. LIBOR US + 1.000%), 1.089%, 10/25/20482,7 | 6,362 | 6,389 | ||||||
| Tricon American Homes Series 2017-SFR2, Class A, 2.928%, 1/17/20362 | 12,599 | 12,744 | ||||||
| Series 2020-SFR1, Class A, 1.499%, 7/17/20382 | 25,957 | 25,767 | ||||||
| TOTAL ASSET-BACKED SECURITIES | ||||||||
| (Identified Cost $258,040) | 257,781 | |||||||
| COMMERCIAL MORTGAGE-BACKED SECURITIES - 0.0%## | ||||||||
| CIM Trust, Series 2019-INV1, Class A1, 4.00%, 2/25/20492,11 | 986 | 997 | ||||||
| Credit Suisse Mortgage Capital Trust Series 2013-IVR3, Class A1, 2.50%, 5/25/20432,11 | 2,527 | 2,530 | ||||||
| Series 2014-IVR3, Class A1, 3.50%, 7/25/20442,11 | 4,471 | 4,535 | ||||||
| Fannie Mae-Aces, Series 2017-M15, Class A1, 2.959%, 9/25/202711 | 14,538 | 15,303 | ||||||
| Fontainebleau Miami Beach Trust, Series 2019-FBLU, Class A, 3.144%, 12/10/20362 | 18,000 | 18,621 | ||||||
| Freddie Mac Multifamily Structured Pass-Through Certificates, Series K017, Class X1 (IO), 1.459%, 12/25/202111 | 45,936 | 3 | ||||||
| FREMF Mortgage Trust, Series 2014- K41, Class B, 3.833%, 11/25/20472,11 | 21,000 | 22,408 | ||||||
| Government National Mortgage Association, Series 2017-54, Class AH, 2.60%, 12/16/2056 | 11,448 | 11,681 | ||||||
The accompanying notes are an integral part of the financial statements.
86
Investment Portfolio - October 31, 2021
| PRO-BLEND® MAXIMUM TERM SERIES | SHARES/ PRINCIPAL AMOUNT | VALUE (NOTE 2) | |||||
| COMMERCIAL MORTGAGE-BACKED SECURITIES (continued) | |||||||
| GS Mortgage Securities Corp. Trust, Series 2019-70P, Class A, (1 mo. LIBOR US + 1.000%), 1.09%, 10/15/20362,7 | 19,000 | $ | 18,964 | ||||
| JP Morgan Mortgage Trust | |||||||
| Series 2013-2, Class A2, 3.50%, 5/25/20432,11 | 1,107 | 1,120 | |||||
| Series 2014-2, Class 1A1, 3.00%, 6/25/20292,11 | 3,538 | 3,590 | |||||
| Series 2017-2, Class A3, 3.50%, 5/25/20472,11 | 8,066 | 8,162 | |||||
| New Residential Mortgage Loan Trust | |||||||
| Series 2014-3A, Class AFX3, 3.75%, 11/25/20542,11 | 3,143 | 3,310 | |||||
| Series 2015-2A, Class A1, 3.75%, 8/25/20552,11 | 4,463 | 4,675 | |||||
| Series 2016-4A, Class A1, 3.75%, 11/25/20562,11 | 5,050 | 5,369 | |||||
| PMT Loan Trust, Series 2013-J1, Class A9, 3.50%, 9/25/20432,11 | 4,469 | 4,524 | |||||
| Sequoia Mortgage Trust | |||||||
| Series 2013-2, Class A, 1.874%, 2/25/204311 | 1,914 | 1,913 | |||||
| Series 2013-6, Class A2, 3.00%, 5/25/204311 | 5,064 | 5,085 | |||||
| Series 2013-8, Class A1, 3.00%, 6/25/204311 | 2,065 | 2,081 | |||||
| Series 2020-1, Class A4, 3.50%, 2/25/20502,11 | 1,109 | 1,110 | |||||
| Starwood Retail Property Trust, Series 2014-STAR, Class A, (1 mo. LIBOR US + 1.470%), 1.560%, 11/15/20272,7 | 15,954 | 9,732 | |||||
| Sutherland Commercial Mortgage Trust, Series 2019-SBC8, Class A,2.86%, 4/25/20412,11 | 11,054 | 10,988 | |||||
| Waikiki Beach Hotel Trust, Series 2019-WBM, Class A, (1 mo. LIBOR US + 1.050%), 1.14%, 12/15/20332,7 | 15,000 | 14,982 | |||||
| TOTAL COMMERCIAL MORTGAGE- BACKED SECURITIES | |||||||
| (Identified Cost $175,144) | 171,683 | ||||||
| MUNICIPAL BONDS - 0.0%## | |||||||
| New York City Transitional Finance Authority, Future Tax Secured, Public Impt., Revenue Bond, 1.58%, 5/1/2024 (Identified Cost $127,247) | 125,000 | 127,253 | |||||
| SHARES/ PRINCIPAL AMOUNT | VALUE (NOTE 2) | ||||||
| U.S. GOVERNMENT AGENCIES - 0.0%## | |||||||
| Mortgage-Backed Securities - 0.0%## | |||||||
| Fannie Mae | |||||||
| Pool #MA1834, UMBS, 4.50%, 2/1/2034 | 4,796 | $ | 5,262 | ||||
| Pool #AD0207, UMBS, 6.00%,10/1/2038 | 4,879 | 5,766 | |||||
| Pool #MA0258, UMBS, 4.50%, 12/1/2039 | 3,176 | 3,538 | |||||
| Pool #AL8674, 5.659%, 1/1/2049 | 12,360 | 13,787 | |||||
| Freddie Mac | |||||||
| Pool #C91762, 4.50%, 5/1/2034 | 3,443 | 3,778 | |||||
| Pool #C91771, 4.50%, 6/1/2034 | 2,837 | 3,114 | |||||
| Pool #C91780, 4.50%, 7/1/2034 | 4,381 | 4,809 | |||||
| TOTAL U.S. GOVERNMENT AGENCIES | |||||||
| (Identified Cost $40,598) | 40,054 | ||||||
| SHORT-TERM INVESTMENT - 1.7% | |||||||
| Dreyfus Government Cash Management, Institutional Shares, 0.03%12 | |||||||
| (Identified Cost $9,576,260) | 9,576,260 | 9,576,260 | |||||
| TOTAL INVESTMENTS - 100.0% | |||||||
| (Identified Cost $410,220,259) | 570,239,880 | ||||||
| OTHER ASSETS, LESS LIABILITIES - 0.0%## | 4,296 | ||||||
| NET ASSETS - 100% | $ | 570,244,176 | |||||
The accompanying notes are an integral part of the financial statements.
87
Investment Portfolio - October 31, 2021
ADR - American Depositary Receipt
Impt. - Improvement
IO - Interest only
LIBOR - London Interbank Offered Rate
UMBS - Uniform Mortgage-Backed Securities
*Non-income producing security.
## Less than 0.1%.
1Amount is stated in USD unless otherwise noted.
2Security purchased or received in a transaction exempt from registration under the Securities Act of 1933, as amended (the “1933 Act”) and determined to be liquid under the Fund’s Liquidity Risk Management Program. The security may be resold pursuant to an exemption from registration under the 1933 Act, typically to qualified institutional buyers. The aggregate value of these securities at October 31, 2021 was $7,460,475, which represented 1.3% of the Series’ Net Assets.
3Security has been valued using significant unobservable inputs.
4Security purchased or received in a transaction exempt from registration under the Securities Act of 1933, as amended (the “1933 Act”) and determined to be illiquid under the Fund’s Liquidity Risk Management Program. The security may be resold pursuant to an exemption from registration under the 1933 Act, typically to qualified institutional buyers. The security was acquired on September 15, 2021 at an aggregate cost of $284,288. The value of the security at October 31, 2021 was $282,150, or less than 0.1% of the Series’ Net Assets.
5Variable rate security. Security may be issued at a fixed coupon rate, which converts to a variable rate at a specified date. Rate shown is the rate in effect as of October 31, 2021.
6Security is perpetual in nature and has no stated maturity date.
7Floating rate security. Rate shown is the rate in effect as of October 31, 2021.
8Security purchased or received in a transaction exempt from registration under the Securities Act of 1933, as amended (the “1933 Act”) and determined to be illiquid under the Fund’s Liquidity Risk Management Program. The security may be resold pursuant to an exemption from registration under the 1933 Act, typically to qualified institutional buyers. The security was acquired on August 4, 2021 and August 6, 2021 at an aggregate cost of $425,000. The value of the security at October 31, 2021 was $423,752, or 0.1% of the Series’ Net Assets.
9Issuer filed for bankruptcy and/or is in default of interest payments.
10Security purchased or received in a transaction exempt from registration under the Securities Act of 1933, as amended (the “1933 Act”) and determined to be illiquid under the Fund’s Liquidity Risk Management Program. The security may be resold pursuant to an exemption from registration under the 1933 Act, typically to qualified institutional buyers. The security was acquired on October 10, 2017 and on dates between May 8, 2020 and September 18, 2020 at an aggregate cost of $44,437. The value of the security at October 31, 2021 was $22, or less than 0.1% of the Series’ Net Assets.
11Variable or floating rate security, the interest rate of which adjusts periodically based on changes in current interest rates and prepayments on the underlying pool of assets. Rate shown is the rate in effect as of October 31, 2021.
12Rate shown is the current yield as of October 31, 2021.
The Global Industry Classification Standard (GICS) was developed by and is the exclusive property and a service mark of MSCI Inc. (MSCI) and Standard & Poor’s, a division of S&P Global Inc. (S&P), and is licensed for use by Manning & Napier when referencing GICS sectors. Neither MSCI, S&P, nor any third party involved in making or compiling the GICS or any GICS classifications makes any express or implied warranties or representations with respect to such standard or classification, nor shall any such party have any liability therefrom.
The accompanying notes are an integral part of the financial statements
88
Statement of Assets and Liabilities - Pro-Blend® Maximum Term Series
October 31, 2021
| ASSETS: | ||||
| Investments in securities, at value (identified cost $410,220,259) (Note 2) | $ | 570,239,880 | ||
| Foreign tax reclaims receivable | 650,372 | |||
| Interest receivable | 496,944 | |||
| Receivable for fund shares sold | 133,262 | |||
| Dividends receivable | 131,092 | |||
| Receivable for securities sold | 70,630 | |||
| Prepaid expenses | 25,752 | |||
| TOTAL ASSETS | 571,747,932 | |||
| LIABILITIES: | ||||
| Foreign currency overdraft, at value (identified cost $1,107) | 1,096 | |||
| Accrued management fees (Note 3) | 284,280 | |||
| Accrued sub-transfer agent fees (Note 3) | 153,229 | |||
| Accrued distribution and service (Rule 12b-1) fees (Class S) (Class R) (Class L) (Note 3) | 144,241 | |||
| Accrued fund accounting and administration fees (Note 3) | 41,163 | |||
| Accrued Chief Compliance Officer service fees (Note 3) | 2,032 | |||
| Payable for fund shares repurchased | 463,239 | |||
| Payable for securities purchased | 292,841 | |||
| Other payables and accrued expenses | 121,635 | |||
| TOTAL LIABILITIES | 1,503,756 | |||
| TOTAL NET ASSETS | $ | 570,244,176 | ||
| NET ASSETS CONSIST OF | ||||
| Capital stock | $ | 296,962 | ||
| Additional paid-in-capital | 361,298,870 | |||
| Total distributable earnings (loss) | 208,648,344 | |||
| TOTAL NET ASSETS | $ | 570,244,176 | ||
The accompanying notes are an integral part of the financial statements.
89
Statement of Assets and Liabilities - Pro-Blend® Maximum Term Series
October 31, 2021
| NET ASSET VALUE, OFFERING PRICE AND REDEMPTION PRICE PER SHARE - Class S | ||||
| ($331,182,862/11,097,008 shares) | $ | 29.84 | ||
| NET ASSET VALUE, OFFERING PRICE AND REDEMPTION PRICE PER SHARE - Class I | ||||
| ($120,572,762/10,271,805 shares) | $ | 11.74 | ||
| NET ASSET VALUE, OFFERING PRICE AND REDEMPTION PRICE PER SHARE - Class R | ||||
| ($54,898,921/3,319,887 shares) | $ | 16.54 | ||
| NET ASSET VALUE, OFFERING PRICE AND REDEMPTION PRICE PER SHARE - Class L | ||||
| ($62,764,972/4,980,077 shares) | $ | 12.60 | ||
| NET ASSET VALUE, OFFERING PRICE AND REDEMPTION PRICE PER SHARE - Class W | ||||
| ($824,659/27,385 shares) | $ | 30.11 |
The accompanying notes are an integral part of the financial statements.
90
Statement of Operations - Pro-Blend® Maximum Term Series
For the Year Ended October 31, 2021
| INVESTMENT INCOME: | ||||
| Dividends (net of foreign taxes withheld, $194,920) | $ | 5,126,202 | ||
| Interest | 922,759 | |||
| Other Income | 29,387 | |||
| Total Investment Income | 6,078,348 | |||
| EXPENSES: | ||||
| Management fees (Note 3) | 3,136,674 | |||
| Distribution and service (Rule 12b-1) fees (Class S) (Note 3) | 776,639 | |||
| Distribution and service (Rule 12b-1) fees (Class L) (Note 3) | 605,933 | |||
| Distribution and service (Rule 12b-1) fees (Class R) (Note 3) | 263,796 | |||
| Sub-transfer agent fees (Note 3) | 414,154 | |||
| Fund accounting and administration fees (Note 3) | 126,970 | |||
| Directors’ fees (Note 3) | 60,553 | |||
| Chief Compliance Officer service fees (Note 3) | 6,096 | |||
| Transfer agent fees | 382,037 | |||
| Custodian fees | 42,978 | |||
| Miscellaneous | 258,038 | |||
| Total Expenses | 6,073,868 | |||
| Less reduction of expenses (Note 3) | (42,379 | ) | ||
| Net Expenses | 6,031,489 | |||
| NET INVESTMENT INCOME | 46,859 | |||
| REALIZED AND UNREALIZED GAIN (LOSS) ON INVESTMENTS AND FOREIGN CURRENCY: | ||||
| Net realized gain (loss) on- | ||||
| Investments | 55,673,019 | |||
| Foreign currency and translation of other assets and liabilities | (3,576 | ) | ||
| 55,669,443 | ||||
| Net change in unrealized appreciation (depreciation) on- | ||||
| Investments | 96,115,718 | |||
| Foreign currency and translation of other assets and liabilities | 653 | |||
| 96,116,371 | ||||
| NET REALIZED AND UNREALIZED GAIN (LOSS) ON INVESTMENTS AND FOREIGN CURRENCY | 151,785,814 | |||
| NET INCREASE IN NET ASSETS RESULTING FROM OPERATIONS | $ | 151,832,673 |
The accompanying notes are an integral part of the financial statements.
91
Statements of Changes in Net Assets - Pro-Blend® Maximum Term Series
| FOR THE YEAR ENDED 10/31/21 | FOR THE YEAR ENDED 10/31/20 | |||||||
| INCREASE (DECREASE) IN NET ASSETS: | ||||||||
| OPERATIONS: | ||||||||
| Net investment income | $ | 46,859 | $ | 719,850 | ||||
| Net realized gain (loss) on investments and foreign currency | 55,669,443 | 22,811,474 | ||||||
| Net change in unrealized appreciation (depreciation) on investments and foreign currency | 96,116,371 | 16,770,040 | ||||||
| Net increase (decrease) from operations | 151,832,673 | 40,301,364 | ||||||
| DISTRIBUTIONS TO SHAREHOLDERS (Note 9): | ||||||||
| Class S | (9,526,092 | ) | (11,447,811 | ) | ||||
| Class I. | (6,315,814 | ) | (9,843,357 | ) | ||||
| Class R | (2,873,640 | ) | (1,285,600 | ) | ||||
| Class L | (4,221,206 | ) | (5,583,198 | ) | ||||
| Class W | (27,673 | ) | (31,891 | ) | ||||
| Total distributions to shareholders | (22,964,425 | ) | (28,191,857 | ) | ||||
| CAPITAL STOCK ISSUED AND REPURCHASED: | ||||||||
| Net increase (decrease) from capital share transactions (Note 5) | 9,742,445 | 41,899,413 | ||||||
| Net increase (decrease) in net assets | 138,610,693 | 54,008,920 | ||||||
| NET ASSETS: | ||||||||
| Beginning of year | 431,633,483 | 377,624,563 | ||||||
| End of year | $ | 570,244,176 | $ | 431,633,483 | ||||
The accompanying notes are an integral part of the financial statements.
92
Financial Highlights - Pro-Blend® Maximum Term Series - Class S
| FOR THE YEAR ENDED | ||||||||||||||||||||
| 10/31/21 | 10/31/20 | 10/31/19 | 10/31/18 | 10/31/1 | ||||||||||||||||
| Per share data (for a share outstanding throughout each year): | ||||||||||||||||||||
| Net asset value - Beginning of year | $22.70 | $21.32 | $20.59 | $21.71 | $18.71 | |||||||||||||||
| Income from investment operations: | ||||||||||||||||||||
| Net investment income1 | 0.02 | 0.05 | 0.14 | 0.08 | 0.09 | |||||||||||||||
| Net realized and unrealized gain (loss) on investments | 7.95 | 2.40 | 2 | 2.44 | 0.42 | 3.32 | ||||||||||||||
| Total from investment operations | 7.97 | 2.45 | 2.58 | 0.50 | 3.41 | |||||||||||||||
| Less distributions to shareholders: | ||||||||||||||||||||
| From net investment income | — | (0.03 | ) | (0.08 | ) | (0.06 | ) | (0.04 | ) | |||||||||||
| From net realized gain on investments | (0.83 | ) | (1.04 | ) | (1.77 | ) | (1.56 | ) | (0.37 | ) | ||||||||||
| Total distributions to shareholders | (0.83 | ) | (1.07 | ) | (1.85 | ) | (1.62 | ) | (0.41 | ) | ||||||||||
| Net asset value - End of year | $29.84 | $22.70 | $21.32 | $20.59 | $21.71 | |||||||||||||||
| Net assets - End of year (000’s omitted) | $331,183 | $261,094 | $229,540 | $248,691 | $306,055 | |||||||||||||||
| Total return3 | 35.82% | 11.85% | 2 | 14.19% | 2.24% | 18.60% | ||||||||||||||
| Ratios (to average net assets)/Supplemental Data: | ||||||||||||||||||||
| Expenses* | 1.10% | 1.10% | 1.10 | 1.10% | 1.10% | |||||||||||||||
| Net investment income | 0.06% | 0.25% | 0.70 | 0.35% | 0.45% | |||||||||||||||
| Series portfolio turnover | 49% | 88% | 73 | 63% | 85% | |||||||||||||||
| *For certain years presented, the investment advisor did not impose all or a portion of its management and/or other fees, and in some years may have paid a portion of the Series’ expenses. If these expenses had been incurred by the Class, the expense ratio (to average net assets) would have increased by the following amounts: | ||||||||||||||||||||
| 0.00% | 4 | N/A | 0.01% | 0.03% | N/A | |||||||||||||||
1Calculated based on average shares outstanding during the years.
2During the reporting period the Fund settled legal claims against an issuer of securities previously held by the Fund. As a result, the net realized and unrealized gain (loss) on investments per share includes proceeds received from the settlement. Without these proceeds the net realized and unrealized gain (loss) on investments per share would have been $2.37. Excluding the proceeds from the settlement, the total return would have been 11.70%.
3Represents aggregate total return for the years indicated, and assumes reinvestment of all distributions. Total return would have been lower had certain expenses not been waived or reimbursed during certain years.
4Less than 0.01%.
The accompanying notes are an integral part of the financial statements.
93
Financial Highlights - Pro-Blend® Maximum Term Series - Class I
| FOR THE YEAR ENDED | ||||||||||||||||||||
| 10/31/21 | 10/31/20 | 10/31/19 | 10/31/18 | 10/31/17 | ||||||||||||||||
| Per share data (for a share outstanding throughout each year): | ||||||||||||||||||||
| Net asset value - Beginning of year | $9.38 | $9.44 | $10.22 | $11.60 | $10.19 | |||||||||||||||
| Income from investment operations: | ||||||||||||||||||||
| Net investment income1 | 0.03 | 0.05 | 0.09 | 0.07 | 0.08 | |||||||||||||||
| Net realized and unrealized gain (loss) on investments | 3.19 | 1.02 | 2 | 1.03 | 0.22 | 1.78 | ||||||||||||||
| Total from investment operations | 3.22 | 1.07 | 1.12 | 0.29 | 1.86 | |||||||||||||||
| Less distributions to shareholders: | ||||||||||||||||||||
| From net investment income | (0.03 | ) | (0.09 | ) | (0.13 | ) | (0.11 | ) | (0.08 | ) | ||||||||||
| From net realized gain on investments | (0.83 | ) | (1.04 | ) | (1.77 | ) | (1.56 | ) | (0.37 | ) | ||||||||||
| Total distributions to shareholders | (0.86 | ) | (1.13 | ) | (1.90 | ) | (1.67 | ) | (0.45 | ) | ||||||||||
| Net asset value - End of year | $11.74 | $9.38 | $9.44 | $10.22 | $11.60 | |||||||||||||||
| Net assets - End of year (000’s omitted) | $120,573 | $71,034 | $79,352 | $94,093 | $114,391 | |||||||||||||||
| Total return3 | 36.17% | 12.23% | 2 | 14.44% | 2.44% | 18.97% | ||||||||||||||
| Ratios (to average net assets)/Supplemental Data: | ||||||||||||||||||||
| Expenses* | 0.85% | 0.85% | 0.85% | 0.85% | 0.85% | |||||||||||||||
| Net investment income | 0.31% | 0.51% | 0.94% | 0.60% | 0.72% | |||||||||||||||
| Series portfolio turnover | 49% | 88% | 73% | 63% | 85% | |||||||||||||||
| *For certain years presented, the investment advisor did not impose all or a portion of its management and/or other fees, and in some years may have paid a portion of the Series’ expenses. If these expenses had been incurred by the Class, the expense ratio (to average net assets) would have increased by the following amounts: | ||||||||||||||||||||
| 0.04% | 0.04% | 0.05% | 0.03% | N/A | ||||||||||||||||
1Calculated based on average shares outstanding during the years.
2During the reporting period the Fund settled legal claims against an issuer of securities previously held by the Fund. As a result, the net realized and unrealized gain (loss) on investments per share includes proceeds received from the settlement. Without these proceeds the net realized and unrealized gain (loss) on investments per share would have been $1.01. Excluding the proceeds from the settlement, the total return would have been 12.11%.
3Represents aggregate total return for the years indicated, and assumes reinvestment of all distributions. Total return would have been lower had certain expenses not been waived or reimbursed during certain years.
The accompanying notes are an integral part of the financial statements.
94
Financial Highlights - Pro-Blend® Maximum Term Series - Class R
| FOR THE YEAR ENDED | ||||||||||||||||||||
| 10/31/21 | 10/31/20 | 10/31/19 | 10/31/18 | 10/31/17 | ||||||||||||||||
| Per share data (for a share outstanding throughout each year): | ||||||||||||||||||||
| Net asset value - Beginning of year | $12.93 | $12.61 | $12.98 | $14.28 | $12.48 | |||||||||||||||
| Income (loss) from investment operations: | ||||||||||||||||||||
| Net investment income (loss)1 | (0.02 | ) | (0.00 | )2 | 0.06 | 0.01 | 0.03 | |||||||||||||
| Net realized and unrealized gain (loss) on investments | 4.46 | 1.403 | 1.40 | 0.29 | 2.17 | |||||||||||||||
| Total from investment operations | 4.44 | 1.40 | 1.46 | 0.30 | 2.20 | |||||||||||||||
| Less distributions to shareholders: | ||||||||||||||||||||
| From net investment income | (0.00 | )2 | (0.04 | ) | (0.06 | ) | (0.04 | ) | (0.03 | ) | ||||||||||
| From net realized gain on investments | (0.83 | ) | (1.04 | ) | (1.77 | ) | (1.56 | ) | (0.37 | ) | ||||||||||
| Total distributions to shareholders | (0.83 | ) | (1.08 | ) | (1.83 | ) | (1.60 | ) | (0.40 | ) | ||||||||||
| Net asset value - End of year | $16.54 | $12.93 | $12.61 | $12.98 | $14.28 | |||||||||||||||
| Net assets - End of year (000’s omitted) | $54,899 | $46,036 | $13,767 | $13,841 | $17,404 | |||||||||||||||
| Total return4 | 35.60% | 11.69% | 3 | 13.84% | 1.99% | 18.21% | ||||||||||||||
| Ratios (to average net assets)/Supplemental Data: | ||||||||||||||||||||
| Expenses* | 1.29% | 1.30% | 1.34% | 1.35% | 1.35% | |||||||||||||||
| Net investment income (loss) | (0.12% | ) | (0.01% | ) | 0.46% | 0.11% | 0.22% | |||||||||||||
| Series portfolio turnover | 49% | 88% | 73% | 63% | 85% | |||||||||||||||
| *For certain years presented, the investment advisor did not impose all or a portion of its management and/or other fees, and in some years may have paid a portion of the Series’ expenses. If these expenses had been incurred by the Class, the expense ratio (to average net assets) would have increased by the following amounts: | ||||||||||||||||||||
| N/A | N/A | 0.00% | 5 | 0.03% | N/A | |||||||||||||||
1Calculated based on average shares outstanding during the years.
2Less than $(0.01).
3During the reporting period the Fund settled legal claims against an issuer of securities previously held by the Fund. As a result, the net realized and unrealized gain (loss) on investments per share includes proceeds received from the settlement. Without these proceeds the net realized and unrealized gain (loss) on investments per share would have been $1.39. Excluding the proceeds from the settlement, the total return would have been 11.60%.
4Represents aggregate total return for the years indicated, and assumes reinvestment of all distributions. Total return would have been lower had certain expenses not been waived or reimbursed during certain years.
5Less than 0.01%.
The accompanying notes are an integral part of the financial statements.
95
Financial Highlights - Pro-Blend® Maximum Term Series - Class L*
| FOR THE YEAR ENDED | ||||||||||||||||||||
| 10/31/21 | 10/31/20 | 10/31/19 | 10/31/18 | 10/31/17 | ||||||||||||||||
| Per share data (for a share outstanding throughout each year): | ||||||||||||||||||||
| Net asset value - Beginning of year | $10.08 | $10.08 | $10.76 | $12.13 | $10.68 | |||||||||||||||
| Income (loss) from investment operations: | ||||||||||||||||||||
| Net investment loss1 | (0.08 | ) | (0.04 | ) | 0.00 | 2 | (0.05 | ) | (0.03 | ) | ||||||||||
| Net realized and unrealized gain (loss) on investments | 3.43 | 1.09 | 3 | 1.12 | 0.24 | 1.86 | ||||||||||||||
| Total from investment operations | 3.35 | 1.05 | 1.12 | 0.19 | 1.83 | |||||||||||||||
| Less distributions to shareholders: | ||||||||||||||||||||
| From net investment income | — | (0.01 | ) | (0.03 | ) | — | (0.01 | ) | ||||||||||||
| From net realized gain on investments | (0.83 | ) | (1.04 | ) | (1.77 | ) | (1.56 | ) | (0.37 | ) | ||||||||||
| Total distributions to shareholders | (0.83 | ) | (1.05 | ) | (1.80 | ) | (1.56 | ) | (0.38 | ) | ||||||||||
| Net asset value - End of year | $12.60 | $10.08 | $10.08 | $10.76 | $12.13 | |||||||||||||||
| Net assets - End of year (000’s omitted) | $62,765 | $52,854 | $54,415 | $52,560 | $56,040 | |||||||||||||||
| Total return4 | 34.77% | 11.09% | 3 | 13.40% | 1.40% | 17.78% | ||||||||||||||
| Ratios (to average net assets)/Supplemental Data: | ||||||||||||||||||||
| Expenses** | 1.82% | 1.81% | 1.82% | 1.85% | 1.85% | |||||||||||||||
| Net investment (loss) | (0.65% | ) | (0.46% | ) | (0.03% | ) | (0.40% | ) | (0.31% | ) | ||||||||||
| Series portfolio turnover | 49% | 88% | 73% | 63% | 85% | |||||||||||||||
| *Effective March 1, 2019, Class R2 shares of the Series have been redesignated as Class L Shares. | ||||||||||||||||||||
| **For certain years presented, the investment advisor did not impose all or a portion of its management and/or other fees, and in some years may have paid a portion of the Series’ expenses. If these expenses had been incurred by the Class, the expense ratio (to average net assets) would have increased by the following amounts: | ||||||||||||||||||||
| N/A | N/A | 0.01% | 0.03% | N/A | ||||||||||||||||
1Calculated based on average shares outstanding during the years.
2Less than $0.01.
3During the reporting period the Fund settled legal claims against an issuer of securities previously held by the Fund. As a result, the net realized and unrealized gain (loss) on investments per share includes proceeds received from the settlement. Without these proceeds the net realized and unrealized gain (loss) on investments per share would have been $1.08. Excluding the proceeds from the settlement, the total return would have been 10.87%.
4Represents aggregate total return for the years indicated, and assumes reinvestment of all distributions. Total return would have been lower had certain expenses not been waived or reimbursed during certain years.
The accompanying notes are an integral part of the financial statements.
96
Financial Highlights - Pro-Blend® Maximum Term Series - Class W
| FOR THE YEAR ENDED | ||||||||||||
| 10/31/21 | 10/31/20 | FOR THE PERIOD 4/1/191 TO 10/31/19 | ||||||||||
| Per share data (for a share outstanding throughout each period): | ||||||||||||
| Net asset value - Beginning of period | $22.84 | $21.39 | $20.12 | |||||||||
| Income from investment operations: | ||||||||||||
| Net investment income2 | 0.29 | 0.27 | 0.12 | |||||||||
| Net realized and unrealized gain (loss) on investments | 8.01 | 2.41 | 3 | 1.24 | ||||||||
| Total from investment operations | 8.30 | 2.68 | 1.36 | |||||||||
| Less distributions to shareholders: | ||||||||||||
| From net investment income | (0.20 | ) | (0.19 | ) | (0.09 | ) | ||||||
| From net realized gain on investments | (0.83 | ) | (1.04 | ) | (0.00 | )4 | ||||||
| Total distributions to shareholders | (1.03 | ) | (1.23 | ) | (0.09 | ) | ||||||
| Net asset value - End of period | $30.11 | $22.84 | $21.39 | |||||||||
| Net assets - End of period (000’s omitted) | $825 | $615 | $551 | |||||||||
| Total return5 | 37.19% | 12.97% | 3 | 6.79% | ||||||||
| Ratios (to average net assets)/Supplemental Data: | ||||||||||||
| Expenses* | 0.10% | 0.10% | 0.10% | 6 | ||||||||
| Net investment income | 1.06% | 1.25% | 1.04% | 6 | ||||||||
| Series portfolio turnover | 49% | 88% | 73% | |||||||||
| *The investment advisor did not impose all or a portion of its management and/or other fees during the periods, and may have paid a portion of the Series’ expenses. If these expenses had been incurred by the Class, the expense ratio (to average net assets) would have increased by the following amounts: | ||||||||||||
| 0.67% | 0.66% | 0.65% | 6 | |||||||||
1Commencement of operations.
2Calculated based on average shares outstanding during the periods.
3During the reporting period the Fund settled legal claims against an issuer of securities previously held by the Fund. As a result, the net realized and unrealized gain (loss) on investments per share includes proceeds received from the settlement. Without these proceeds the net realized and unrealized gain (loss) on investments per share would have been $2.38. Excluding the proceeds from the settlement, the total return would have been 12.82%.
4Less than $(0.01).
5Represents aggregate total return for the periods indicated, and assumes reinvestment of all distributions. Total return would have been lower had certain expenses not been waived or reimbursed during the periods. Periods less than one year are not annualized.
6Annualized
The accompanying notes are an integral part of the financial statements.
97
Notes to Financial Statements
| 1. | Organization |
Pro-Blend® Conservative Term Series, Pro-Blend® Moderate Term Series, Pro-Blend® Extended Term Series and Pro-Blend® Maximum Term Series (each the “Series”) are no-load diversified series of Manning & Napier Fund, Inc. (the “Fund”). The Fund is organized in Maryland and is registered under the Investment Company Act of 1940 (the “1940 Act”), as amended, as an open-end management investment company.
The Series are asset allocation funds. Each invests in a combination of stocks, bonds and cash and is managed according to specific objectives. The objectives are as follows: Pro-Blend® Conservative Term Series - primary objective is preservation of capital; secondary objective is to provide income and long-term growth of capital. Pro-Blend® Moderate Term Series - equal emphasis on long-term growth of capital and preservation of capital. Pro-Blend® Extended Term Series - primary objective is long-term growth of capital; secondary objective is preservation of capital. Pro-Blend® Maximum Term Series - primary objective is long-term growth of capital.
Each Series is authorized to issue six classes of shares (Class S, I, R, L (formerly Class R2), W, and Z). Each class of shares is substantially the same, except that class-specific distribution and shareholder servicing expenses are borne by the specific class of shares to which they relate.
The Fund’s Advisor is Manning & Napier Advisors, LLC (the “Advisor”). Shares of each Series are offered to investors and employees of the Advisor and its affiliates. The total authorized capital stock of the Fund consists of 15 billion shares of common stock each having a par value of $0.01. As of October 31, 2021, 6.3 billion shares have been designated in total among 15 series, of which 162.5 million have been designated as Pro-Blend® Conservative Term Series Class S common stock, 75 million have been designated as Pro-Blend® Conservative Term Series Class I common stock, 125 million each have been designated as Class S common stock and Class I common stock for Pro-Blend® Moderate Term Series, 125 million each have been designated as Class S common stock for Pro-Blend® Extended Term Series and Pro-Blend® Maximum Term Series, 200 million each have been designated as Class I common stock for Pro-Blend® Extended Term Series and Pro-Blend® Maximum Term Series, 52.5 million have been designated in each of the Series as Class R common stock, 25 million have been designated in each of the Series as Class L (formerly Class R2) common stock, 100 million have been designated in each of the Series as Class W common stock and Class Z common stock. Class Z common stock is not currently offered for sale.
Reorganization of Target Income Series and Target 2015 Series into Pro-Blend® Conservative Term Series
On August 28, 2020, the shareholders of Target Income Series and Target 2015 Series approved the reorganization of Target Income Series and Target 2015 Series into Pro-Blend® Conservative Term Series, each a series of the Fund, pursuant to which Pro-Blend® Conservative Term Series acquired substantially all of the assets and assumed certain stated liabilities of Target Income Series and Target 2015 Series in exchange for an equal aggregate value of Pro-Blend® Conservative Term Series shares. For U.S. GAAP purposes, the transaction was treated as a merger. The merger took place after the close of business on September 25, 2020.
Each shareholder of Target Income Series’ and Target 2015 Series received shares of Pro-Blend® Conservative Term Series based on the class designation in the table below and an aggregate Net Asset Value of such shareholder’s Target Income Series and Target 2015 Series shares, as determined at the close of business on September 25, 2020.
98
Notes to Financial Statements (continued)
| 1. | Organization (continued) |
Reorganization of Target Income Series and Target 2015 Series into Pro-Blend® Conservative Term Series (continued)
The reorganization was accomplished by a tax-free exchange of shares of Pro-Blend® Conservative Term Series in the following amount and at the following conversion ratio:
| Series | Series’ Share Class | Shares Prior to Reorganization | Conversion Ratio | Pro-Blend® Conservative Term Series’ Share Class | Shares of Pro-Blend® Conservative Term Series | |||||||||||
| Target Income | Class I | 99,944 | 0.922993 | Class I | 92,247 | |||||||||||
| Target Income | Class K | 3,739,606 | 0.675857 | Class S | 2,527,439 | |||||||||||
| Target Income | Class R | 1,569,228 | 0.944552 | Class R | 1,482,217 | |||||||||||
| Target 2015 | Class I | 2,065 | 0.340678 | Class I | 704 | |||||||||||
| Target 2015 | Class K | 20,810 | 0.253416 | Class S | 5,273 | |||||||||||
Target Income Series’ and Target 2015 Series’ net assets and composition of net assets immediately prior to the reorganization, were as follows:
| Series | Net Assets | Paid-in Capital | Accumulated Earnings/(Loss) | |||||||
| Target Income | $ | 53,050,121 | $ | 52,900,260 | $ | 149,861 | ||||
| Target 2015 | 84,459 | 427,804 | (343,345 | ) | ||||||
For financial reporting purposes, assets received and shares issued by Pro-Blend® Conservative Term Series were recorded at fair value; however, the cost basis of the investments received from Target Income Series and Target 2015 Series were carried forward to align ongoing reporting of Pro-Blend® Conservative Term Series’ realized and unrealized gains and losses with amounts distributable to shareholders for tax purposes.
The aggregate net assets of Pro-Blend® Conservative Term Series immediately after the acquisition amounted to $866,427,919. Target Income Series’ and Target 2015 Series’ fair value and cost of investments prior to the reorganizations were as follows:
| Fair Value of Investments | Cost of Investments | ||||||
| Target Income | $ | 43,170,958 | $ | 40,777,643 | |||
| Target 2015 | 186,347 | 188,535 | |||||
The purpose of these transactions was to combine series managed by the Advisor with the same or substantially similar (but not identical) investment objectives, investment policies, strategies, risks and restrictions.
Assuming the acquisitions had been completed on November 1, 2019, the beginning of the annual reporting period of Pro-Blend® Conservative Term Series, the pro forma results of operations for the year ended October 31, 2020, are as follows:
| • | Net investment income: $13,941,777 |
| • | Net realized and change in unrealized gain/loss on investments: $49,483,570 |
| • | Net increase in the net assets resulting from operations: $63,425,347 |
Because the combined investment portfolios have been managed as a single integrated portfolio since the acquisition was completed, it is not practicable to separate the amounts of revenue and earnings of Target Income Series and Target 2015 Series that have been included in Pro-Blend® Conservative Term Series’ Statement of Changes in Net Assets since September 25, 2020.
99
Notes to Financial Statements (continued)
| 1. | Organization (continued) |
Reorganization of Target Income Series and Target 2015 Series into Pro-Blend® Conservative Term Series (continued)
Reorganization costs incurred by Pro-Blend® Conservative Term Series in connection with the reorganization were expensed by the Advisor.
Reorganization of Target 2020 Series and Target 2025 Series into Pro-Blend® Moderate Term Series
On August 28, 2020, the shareholders of Target 2020 Series and Target 2025 Series approved the reorganization of Target 2020 Series and Target 2025 Series into Pro-Blend® Moderate Term Series, each a series of the Fund, pursuant to which Pro-Blend® Moderate Term Series acquired substantially all of the assets and assumed certain stated liabilities of Target 2020 Series and Target 2025 Series in exchange for an equal aggregate value of Pro-Blend® Moderate Term Series shares. For U.S. GAAP purposes, the transaction was treated as a merger. The merger took place after the close of business on September 25, 2020.
Each shareholder of Target 2020 Series and Target 2025 Series received shares of Pro-Blend® Moderate Term Series based on the class designation in the table below and an aggregate Net Asset Value of such shareholder’s Target 2020 Series and Target 2025 Series shares, as determined at the close of business on September 25, 2020.
The reorganization was accomplished by a tax-free exchange of shares of Pro-Blend® Moderate Term Series in the following amount and at the following conversion ratio:
| Series | Series’ Share Class | Shares Prior to Reorganization | Conversion Ratio | Pro-Blend® Moderate Term Series’ Share Class | Shares of Pro-Blend® Moderate Term Series |
| Target 2020 | Class I | 701,580 | 0.906517 | Class I | 635,994 |
| Target 2020 | Class K | 1,897,737 | 0.640102 | Class S | 1,214,746 |
| Target 2020 | Class R | 993,072 | 0.827919 | Class R | 822,183 |
| Target 2025 | Class I | 131,765 | 1.015282 | Class I | 133,779 |
| Target 2025 | Class K | 2,498,924 | 0.722772 | Class S | 1,806,152 |
| Target 2025 | Class R | 1,781,614 | 0.953928 | Class R | 1,699,532 |
Target 2020 Series’ and Target 2025 Series’ net assets and composition of net assets immediately prior to the reorganization, were as follows:
| Series | Net Assets | Paid-in Capital | Accumulated Loss | |||||||
| Target 2020 | $ | 33,646,049 | $ | 34,023,092 | $ | (377,043 | ) | |||
| Target 2025 | 46,862,091 | 47,373,160 | (511,069 | ) | ||||||
For financial reporting purposes, assets received and shares issued by Pro-Blend® Moderate Term Series were recorded at fair value; however, the cost basis of the investments received from Target 2020 Series and Target 2025 Series were carried forward to align ongoing reporting of Pro-Blend® Moderate Term Series’ realized and unrealized gains and losses with amounts distributable to shareholders for tax purposes.
The aggregate net assets of Pro-Blend® Moderate Term Series immediately after the acquisition amounted to $486,547,461. Target 2020 Series’ and Target 2025 Series’ fair value and cost of investments prior to the reorganizations were as follows:
| Fair Value of Investments | Cost of Investments | ||||||
| Target 2020 | $ | 29,824,270 | $ | 30,201,005 | |||
| Target 2025 | 37,890,709 | 38,401,894 | |||||
100
Notes to Financial Statements (continued)
| 1. | Organization (continued) |
Reorganization of Target 2020 Series and Target 2025 Series into Pro-Blend® Moderate Term Series (continued)
The purpose of these transactions was to combine series managed by the Advisor with the same or substantially similar (but not identical) investment objectives, investment policies, strategies, risks and restrictions.
Assuming the acquisitions had been completed on November 1, 2019, the beginning of the annual reporting period of Pro-Blend® Moderate Term Series, the pro forma results of operations for the year ended October 31, 2020, are as follows:
| • | Net investment income: $5,746,651 |
| • | Net realized and change in unrealized gain/loss on investments: $40,414,108 |
| • | Net increase in the net assets resulting from operations: $46,160,759 |
Because the combined investment portfolios have been managed as a single integrated portfolio since the acquisition was completed, it is not practicable to separate the amounts of revenue and earnings of Target 2020 Series and Target 2025 Series that have been included in Pro-Blend® Moderate Term Series’ Statement of Changes in Net Assets since September 25, 2020.
Reorganization costs incurred by Pro-Blend® Moderate Term Series in connection with the reorganization were expensed by the Advisor.
Reorganization of Target 2030 Series, Target 2035 Series, and Target 2040 Series into Pro-Blend® Extended Term Series
On August 28, 2020, the shareholders of Target 2030 Series, Target 2035 Series, and Target 2040 Series approved the reorganization of Target 2030 Series, Target 2035 Series, and Target 2040 Series into Pro-Blend® Extended Term Series, each a series of the Fund, pursuant to which Pro-Blend® Extended Term Series acquired substantially all of the assets and assumed certain stated liabilities of Target 2030 Series, Target 2035 Series, and Target 2040 Series in exchange for an equal aggregate value of Pro-Blend® Extended Term Series shares. For U.S. GAAP purposes, the transaction was treated as a merger. The merger took place after the close of business on September 25, 2020.
Each shareholder of Target 2030 Series, Target 2035 Series, and Target 2040 Series received shares of Pro-Blend® Extended Term Series based on the class designation in the table below and an aggregate Net Asset Value of such shareholder’s Target 2030 Series, Target 2035 Series, and Target 2040 Series shares, as determined at the close of business on September 25, 2020.
The reorganization was accomplished by a tax-free exchange of shares of Pro-Blend® Extended Term Series in the following amount and at the following conversion ratio:
| Series | Series’ Share Class | Shares Prior to Reorganization | Conversion Ratio | Pro-Blend® Extended Term Series’ Share Class | Shares of Pro-Blend® Extended Term Series |
| Target 2030 | Class I | 683,163 | 0.990673 | Class I | 676,791 |
| Target 2030 | Class K | 2,958,407 | 0.472277 | Class S | 1,397,188 |
| Target 2030 | Class R | 2,220,941 | 0.796221 | Class R | 1,768,360 |
| Target 2035 | Class I | 42,171 | 1.171613 | Class I | 49,408 |
| Target 2035 | Class K | 1,568,264 | 0.561874 | Class S | 881,166 |
| Target 2035 | Class R | 1,490,889 | 0.963274 | Class R | 1,436,135 |
| Target 2040 | Class I | 314,449 | 0.983793 | Class I | 309,353 |
| Target 2040 | Class K | 1,437,549 | 0.469855 | Class S | 675,440 |
| Target 2040 | Class R | 1,648,333 | 0.792265 | Class R | 1,305,916 |
101
Notes to Financial Statements (continued)
| 1. | Organization (continued) |
Reorganization of Target 2030 Series, Target 2035 Series, and Target 2040 Series into Pro-Blend® Extended Term Series (continued)
Target 2030 Series’, Target 2035 Series’, and Target 2040 Series’ net assets and composition of net assets immediately prior to the reorganization, were as follows:
| Series | Net Assets | Paid-in Capital | Accumulated Loss | |||||||
| Target 2030 | $ | 53,310,876 | $ | 54,008,962 | $ | (698,086 | ) | |||
| Target 2035 | 33,714,875 | 34,122,259 | (407,384 | ) | ||||||
| Target 2040 | 30,701,845 | 31,151,529 | (449,684 | ) | ||||||
For financial reporting purposes, assets received and shares issued by Pro-Blend® Extended Term Series were recorded at fair value; however, the cost basis of the investments received from Target 2030 Series, Target 2035 Series, and Target 2040 Series were carried forward to align ongoing reporting of Pro-Blend® Extended Term Series’ realized and unrealized gains and losses with amounts distributable to shareholders for tax purposes.
The aggregate net assets of Pro-Blend® Extended Term Series immediately after the acquisition amounted to $656,855,289. Target 2030 Series’, Target 2035 Series’, and Target 2040 Series’ fair value and cost of investments prior to the reorganizations were as follows:
| Fair Value of Investments | Cost of Investments | ||||||
| Target 2030 | $ | 42,755,794 | $ | 43,453,020 | |||
| Target 2035 | 25,718,784 | 26,125,677 | |||||
| Target 2040 | 29,310,617 | 29,759,926 | |||||
The purpose of these transactions was to combine series managed by the Advisor with the same or substantially similar (but not identical) investment objectives, investment policies, strategies, risks and restrictions.
Assuming the acquisitions had been completed on November 1, 2019, the beginning of the annual reporting period of Pro-Blend® Extended Term Series, the pro forma results of operations for the year ended October 31, 2020, are as follows:
| • | Net investment income: $6,267,603 |
| • | Net realized and change in unrealized gain/loss on investments: $68,079,074 |
| • | Net increase in the net assets resulting from operations: $74,346,677 |
Because the combined investment portfolios have been managed as a single integrated portfolio since the acquisition was completed, it is not practicable to separate the amounts of revenue and earnings of Target 2030 Series, Target 2035 Series, and Target 2040 Series that have been included in Pro-Blend® Extended Term Series’ Statement of Changes in Net Assets since September 25, 2020.
Reorganization costs incurred by Pro-Blend® Extended Term Series in connection with the reorganization were expensed by the Advisor.
Reorganization of Target 2045 Series, Target 2050 Series, Target 2055 Series, and Target 2060 Series into Pro-Blend® Maximum Term Series
On August 28, 2020, the shareholders of Target 2045 Series, Target 2050 Series, Target 2055 Series, and Target 2060 Series approved the reorganization of Target 2045 Series, Target 2050 Series, Target 2055 Series, and Target 2060 Series into Pro-
102
Notes to Financial Statements (continued)
| 1. | Organization (continued) |
Reorganization of Target 2045 Series, Target 2050 Series, Target 2055 Series, and Target 2060 Series into Pro-Blend® Maximum Term Series (continued)
Blend® Maximum Term Series, each a series of the Fund, pursuant to which Pro-Blend® Maximum Term Series acquired substantially all of the assets and assumed certain stated liabilities of Target 2045 Series, Target 2050 Series, Target 2055 Series, and Target 2060 Series in exchange for an equal aggregate value of Pro-Blend® Maximum Term Series shares. For U.S. GAAP purposes, the transaction was treated as a merger. The merger took place after the close of business on September 25, 2020.
Each shareholder of Target 2045 Series, Target 2050 Series, Target 2055 Series, and Target 2060 Series received shares of Pro-Blend® Maximum Term Series based on the class designation in the table below and an aggregate Net Asset Value of such shareholder’s Target 2045 Series, Target 2050 Series, Target 2055 Series, and Target 2060 Series shares, as determined at the close of business on September 25, 2020.
The reorganization was accomplished by a tax-free exchange of shares of Pro-Blend® Maximum Term Series in the following amount and at the following conversion ratio:
| Series | Series’ Share Class | Shares Prior to Reorganization | Conversion Ratio | Pro-Blend® Maximum Term Series’ Share Class | Shares of Pro-Blend® Maximum Term Series |
| Target 2045 | Class I | 51,328 | 1.218507 | Class I | 62,543 |
| Target 2045 | Class K | 786,360 | 0.499557 | Class S | 392,832 |
| Target 2045 | Class R | 1,032,586 | 0.864756 | Class R | 892,935 |
| Target 2050 | Class I | 200,976 | 1.056067 | Class I | 212,244 |
| Target 2050 | Class K | 1,107,340 | 0.430039 | Class S | 476,199 |
| Target 2050 | Class R | 1,011,152 | 0.741395 | Class R | 749,663 |
| Target 2055 | Class I | 56,739 | 1.148538 | Class I | 65,167 |
| Target 2055 | Class K | 291,789 | 0.466648 | Class S | 136,163 |
| Target 2055 | Class R | 532,659 | 0.803125 | Class R | 427,792 |
| Target 2060 | Class I | 21,064 | 1.199727 | Class I | 25,271 |
| Target 2060 | Class K | 402,528 | 0.494538 | Class S | 199,065 |
| Target 2060 | Class R | 616,669 | 0.864139 | Class R | 532,888 |
Target 2045 Series’, Target 2050 Series’, Target 2055 Series’, and Target 2060 Series’ net assets and composition of net assets immediately prior to the reorganization, were as follows:
| Series | Net Assets | Paid-in Capital | Accumulated Loss | |||||||
| Target 2045 | $ | 21,357,008 | $ | 21,593,195 | $ | (236,187 | ) | |||
| Target 2050 | 22,820,861 | 23,133,111 | (312,250 | ) | ||||||
| Target 2055 | 9,368,203 | 9,477,375 | (109,172 | ) | ||||||
| Target 2060 | 11,816,298 | 11,954,381 | (138,083 | ) | ||||||
For financial reporting purposes, assets received and shares issued by Pro-Blend® Maximum Term Series were recorded at fair value; however, the cost basis of the investments received from of Target 2045 Series, Target 2050 Series, Target 2055 Series, and Target 2060 Series were carried forward to align ongoing reporting of Pro-Blend® Maximum Term Series’ realized and unrealized gains and losses with amounts distributable to shareholders for tax purposes.
103
Notes to Financial Statements (continued)
| 1. | Organization (continued) |
Reorganization of Target 2045 Series, Target 2050 Series, Target 2055 Series, and Target 2060 Series into Pro-Blend® Maximum Term Series (continued)
The aggregate net assets of Pro-Blend® Maximum Term Series immediately after the acquisition amounted to $449,307,143. Target 2045 Series’, Target 2050 Series’, Target 2055 Series’, and Target 2060 Series’ fair value and cost of investments prior to the reorganizations were as follows:
| Fair Value of Investments | Cost of Investments | ||||||
| Target 2045 | $ | 15,899,090 | $ | 16,135,031 | |||
| Target 2050 | 21,773,659 | 22,085,901 | |||||
| Target 2055 | 7,591,679 | 7,700,773 | |||||
| Target 2060 | 9,631,452 | 9,769,531 | |||||
The purpose of these transactions was to combine series managed by the Advisor with the same or substantially similar (but not identical) investment objectives, investment policies, strategies, risks and restrictions.
Assuming the acquisitions had been completed on November 1, 2019, the beginning of the annual reporting period of Pro-Blend® Maximum Term Series, the pro forma results of operations for the year ended October 31, 2020, are as follows:
| • | Net investment income: $1,383,227 |
| • | Net realized and change in unrealized gain/loss on investments: $51,479,938 |
| • | Net increase in the net assets resulting from operations: $52,863,165 |
Because the combined investment portfolios have been managed as a single integrated portfolio since the acquisition was completed, it is not practicable to separate the amounts of revenue and earnings of Target 2045 Series, Target 2050 Series, Target 2055 Series, and Target 2060 Series that have been included in Pro-Blend® Maximum Term Series’ Statement of Changes in Net Assets since September 25, 2020.
Reorganization costs incurred by Pro-Blend® Maximum Term Series in connection with the reorganization were expensed by the Advisor.
| 2. | Significant Accounting Policies |
The following is a summary of significant accounting policies followed by the Series. Each Series is an investment company and, accordingly, follows the investment company accounting and reporting guidance of the Financial Accounting Standards Board Accounting Standards Codification Topic 946 - Investment Companies, which is part of accounting principles generally accepted in the United States of America (“GAAP”).
Security Valuation
Portfolio securities, including domestic equities, foreign equities, warrants and options, listed on an exchange other than the NASDAQ Stock Market are valued at the latest quoted sales price of the exchange on which the security is primarily traded. Securities not traded on valuation date or securities not listed on an exchange are valued at the latest quoted bid price provided by the Fund’s pricing service. Securities listed on the NASDAQ Stock Market are valued in accordance with the NASDAQ Official Closing Price.
Debt securities, including government bonds, foreign bonds, asset-backed securities, structured notes, supranational obligations, sovereign bonds, corporate bonds and mortgage-backed securities will normally be valued on the basis of evaluated bid prices provided directly by an independent pricing service (the “Service”). The pricing services use multiple valuation techniques to determine fair value. In instances where sufficient market activity exists, the pricing services may utilize a market-based approach
104
Notes to Financial Statements (continued)
| 2. | Significant Accounting Policies (continued) |
Security Valuation (continued)
through which quotes from market makers are used to determine fair value. In instances where sufficient market activity may not exist or is limited, the pricing services also utilize proprietary valuation models which may consider market characteristics such as benchmark yield curves, option-adjusted spreads, credit spreads, estimated defaulted rates, coupon rates, anticipated timing of principal repayments, underlying collateral and other unique security features in order to estimate the relevant cash flows, which are then discounted to calculate the fair value. Certain investments in securities held by the Series may be valued on a basis of a price provided directly by a principal market maker. These prices may differ from the value that would have been used had a broader market for securities existed.
Municipal securities will normally be valued on the basis of market valuations provided by an independent pricing service. The Service utilizes the latest price quotations and a matrix system (which considers such factors as security prices of similar securities, yields, maturities and ratings). The Service has been approved by the Fund’s Board of Directors (the “Board”).
Short-term investments that mature in sixty days or less may be valued at amortized cost, which approximates fair value. Investments in open-end investment companies are valued at their net asset value per share on valuation date.
Volume and level of activity in established markets for an asset or liability are evaluated to determine whether recent transactions and quoted prices are determinative of fair value. Where there have been significant decreases in volume and level of activity, further analysis and adjustment may be necessary to estimate fair value. The Series measures fair value in these instances by the use of inputs and valuation techniques which may be based upon current market prices of securities that are comparable in coupon, rating, maturity and industry and/or expectation of future cash flows. As a result of trading in relatively thin markets and/or markets that experience significant volatility, the prices used by the Series to value these securities may differ from the value that would be realized if these securities were sold, and the differences could be material.
Securities for which representative valuations or prices are not available from the Series’ pricing service may be valued at fair value as determined in good faith by the Advisor under procedures approved by and under the general supervision and responsibility of the Board. Due to the inherent uncertainty of valuations of such securities, the fair value may differ significantly from the values that would have been used had a ready market for such securities existed. If trading or events occurring after the close of the principal market in which securities are traded are expected to materially affect the value of those securities, then they may be valued at their fair value, taking this trading or these events into account. In accordance with the procedures approved by the Board, the values of certain securities trading outside the U.S. were adjusted following the close of local trading using a factor from a third party vendor. The third party vendor uses statistical analyses and quantitative models, which consider among other things subsequent movement and changes in the prices of indices, securities and exchange rates in other markets, to determine the factors which are used to adjust local market prices. The value of securities used for net asset value calculation under these procedures may differ from published prices for the same securities. It is the Fund’s policy to classify each foreign equity security where a factor from a third party vendor is provided as a Level 2 security.
Various inputs are used in determining the value of the Series’ assets or liabilities carried at fair value. These inputs are summarized in three broad levels. Level 1 includes quoted prices in active markets for identical assets and liabilities. Level 2 includes other significant observable inputs (including quoted prices for similar securities, interest rates, prepayment speeds, credit risk, etc.). Level 3 includes significant unobservable inputs (including the Series’ own assumptions in determining the fair value of investments). A financial instrument’s level within the fair value hierarchy is based on the lowest level of any input both individually and in aggregate that is significant to the fair value measurement. The inputs or methodology used for valuing securities are not necessarily an indication of the risk associated with investing in those securities.
105
Notes to Financial Statements (continued)
| 2. | Significant Accounting Policies (continued) |
Security Valuation (continued)
The following is a summary of the valuation levels used for major security types as of October 31, 2021 in valuing the Series’ assets or liabilities carried at fair value:
| PRO-BLEND® CONSERVATIVE TERM SERIES | ||||||||||||||||
| DESCRIPTION | TOTAL | LEVEL 1 | LEVEL 2# | LEVEL 3 | ||||||||||||
| Assets: | ||||||||||||||||
| Equity securities: | ||||||||||||||||
| Communication Services | $ | 18,047,554 | $ | 18,047,554 | $ | — | $ | — | ||||||||
| Consumer Discretionary | 15,238,798 | 14,505,585 | 733,213 | — | ||||||||||||
| Consumer Staples | 17,723,307 | 15,375,105 | 2,348,202 | — | ||||||||||||
| Energy | 6,274,501 | 6,127,439 | — | 147,062 | ||||||||||||
| Financials | 11,374,471 | 11,374,471 | — | — | ||||||||||||
| Health Care | 24,412,300 | 24,412,300 | — | — | ||||||||||||
| Industrials | 16,976,637 | 16,976,637 | — | — | ||||||||||||
| Information Technology | 23,871,192 | 23,871,192 | — | — | ||||||||||||
| Materials | 11,541,953 | 11,541,953 | — | — | ||||||||||||
| Real Estate | 15,779,090 | 15,698,873 | 80,217 | — | ||||||||||||
| Preferred securities: | ||||||||||||||||
| Information Technology | 770,598 | 770,598 | — | — | ||||||||||||
| Materials | 213,840 | 213,840 | — | — | ||||||||||||
| Debt securities: | ||||||||||||||||
| U.S. Treasury and other U.S. | ||||||||||||||||
| Government agencies | 144,507,862 | — | 144,507,862 | — | ||||||||||||
| States and political subdivisions | ||||||||||||||||
| (municipals) | 7,126,420 | — | 7,126,420 | — | ||||||||||||
| Corporate debt: | ||||||||||||||||
| Communication Services | 12,290,763 | — | 12,290,763 | — | ||||||||||||
| Consumer Discretionary | 6,079,069 | — | 6,079,069 | — | ||||||||||||
| Energy | 25,478,289 | — | 25,478,289 | — | ||||||||||||
| Financials | 19,578,674 | — | 19,578,674 | — | ||||||||||||
| Health Care | 2,570,746 | — | 2,570,746 | — | ||||||||||||
| Industrials | 22,268,518 | — | 22,268,518 | — | ||||||||||||
| Materials | 3,433,020 | — | 3,433,020 | — | ||||||||||||
| Real Estate | 11,850,524 | — | 11,850,524 | — | ||||||||||||
| Asset-backed securities | 49,235,388 | — | 49,235,388 | — | ||||||||||||
| Commercial mortgage-backed | ||||||||||||||||
| securities | 44,572,256 | — | 44,572,256 | — | ||||||||||||
| Foreign government bonds | 1,615,000 | — | 1,615,000 | — | ||||||||||||
| Short-Term Investment | 13,257,604 | 13,257,604 | — | — | ||||||||||||
| Total assets | $ | 526,088,374 | $ | 172,173,151 | $ | 353,768,161 | $ | 147,062 | ||||||||
| PRO-BLEND® MODERATE TERM SERIES | ||||||||||||||||
| DESCRIPTION | TOTAL | LEVEL 1 | LEVEL 2# | LEVEL 3 | ||||||||||||
| Assets: | ||||||||||||||||
| Equity securities: | ||||||||||||||||
| Communication Services | $ | 31,416,162 | $ | 30,711,179 | $ | 704,983 | $ | — | ||||||||
| Consumer Discretionary | 26,605,410 | 23,934,231 | 2,671,179 | — | ||||||||||||
| Consumer Staples | 22,512,679 | 16,027,906 | 6,484,773 | — | ||||||||||||
| Energy | 10,883,550 | 10,557,050 | — | 326,500 | ||||||||||||
| Financials | 15,641,870 | 13,608,294 | 2,033,576 | — | ||||||||||||
| Health Care | 34,128,175 | 33,190,115 | 938,060 | — | ||||||||||||
| Industrials | 14,114,031 | 13,376,029 | 738,002 | — | ||||||||||||
106
Notes to Financial Statements (continued)
| 2. | Significant Accounting Policies (continued) |
Security Valuation (continued)
| PRO-BLEND® MODERATE TERM SERIES | ||||||||||||
| DESCRIPTION | TOTAL | LEVEL 1 | LEVEL 2# | LEVEL 3 | ||||||||
| Information Technology | $ | 31,770,570 | $ | 30,740,568 | $ | 1,030,002 | $ | — | ||||
| Materials | 15,887,535 | 15,511,212 | 376,323 | — | ||||||||
| Real Estate | 20,317,108 | 20,239,575 | 77,533 | — | ||||||||
| Preferred securities: | ||||||||||||
| Information Technology | 746,108 | 746,108 | — | — | ||||||||
| Materials | 547,350 | 547,350 | — | — | ||||||||
| Debt securities: | ||||||||||||
| U.S. Treasury and other U.S. Government agencies | 116,173,496 | — | 116,173,496 | — | ||||||||
| States and political subdivisions (municipals) | 5,989,368 | — | 5,989,368 | — | ||||||||
| Corporate debt: | ||||||||||||
| Communication Services | 9,906,592 | — | 9,906,592 | — | ||||||||
| Consumer Discretionary | 4,686,479 | — | 4,686,479 | — | ||||||||
| Energy | 18,306,603 | — | 18,306,603 | — | ||||||||
| Financials | 15,207,241 | — | 15,207,241 | — | ||||||||
| Health Care | 1,791,765 | — | 1,791,765 | — | ||||||||
| Industrials | 16,881,950 | — | 16,881,950 | — | ||||||||
| Materials | 2,878,970 | — | 2,878,970 | — | ||||||||
| Real Estate | 9,458,416 | — | 9,458,416 | — | ||||||||
| Asset-backed securities | 40,966,240 | — | 40,966,240 | — | ||||||||
| Commercial mortgage-backed securities | 27,762,514 | — | 27,762,514 | — | ||||||||
| Foreign government bonds | 1,293,317 | — | 1,293,317 | — | ||||||||
| Short-Term Investment | 12,150,030 | 12,150,030 | — | — | ||||||||
| Total assets | $ | 508,023,529 | $ | 221,339,647 | $ | 286,357,382 | $ | 326,500 | ||||
| PRO-BLEND® EXTENDED TERM SERIES | ||||||||||||
| DESCRIPTION | TOTAL | LEVEL 1 | LEVEL 2# | LEVEL 3 | ||||||||
| Assets: | ||||||||||||
| Equity securities: | ||||||||||||
| Communication Services | $ | 58,100,885 | $ | 56,779,701 | $ | 1,321,184 | $ | — | ||||
| Consumer Discretionary | 49,891,353 | 44,747,490 | 5,143,863 | — | ||||||||
| Consumer Staples | 42,022,454 | 29,507,037 | 12,515,417 | — | ||||||||
| Energy | 22,473,638 | 22,037,013 | — | 436,625 | ||||||||
| Financials | 30,200,742 | 26,517,094 | 3,683,648 | — | ||||||||
| Health Care | 65,001,870 | 63,299,827 | 1,702,043 | — | ||||||||
| Industrials | 28,534,765 | 27,155,213 | 1,379,552 | — | ||||||||
| Information Technology | 63,787,464 | 61,629,594 | 2,157,870 | — | ||||||||
| Materials | 30,722,690 | 30,018,462 | 704,228 | — | ||||||||
| Real Estate | 38,583,982 | 38,437,196 | 146,786 | — | ||||||||
| Preferred securities: | ||||||||||||
| Information Technology | 1,050,962 | 1,050,962 | — | — | ||||||||
| Materials | 768,960 | 768,960 | — | — | ||||||||
| Debt securities: | ||||||||||||
| U.S. Treasury and other U.S. Government agencies | 118,426,678 | — | 118,426,678 | — | ||||||||
| States and political subdivisions (municipals) | 4,972,109 | — | 4,972,109 | — | ||||||||
107
Notes to Financial Statements (continued)
| 2. | Significant Accounting Policies (continued) |
Security Valuation (continued)
| PRO-BLEND® EXTENDED TERM SERIES | |||||||||||||
| DESCRIPTION | TOTAL | LEVEL 1 | LEVEL 2# | LEVEL 3 | |||||||||
| Corporate debt: | |||||||||||||
| Communication Services | $ | 10,238,977 | $ | — | $ | 10,238,977 | $ | — | |||||
| Consumer Discretionary | 4,921,099 | — | 4,921,099 | — | |||||||||
| Energy | 19,991,215 | — | 19,991,215 | — | |||||||||
| Financials | 16,065,907 | — | 16,065,907 | — | |||||||||
| Health Care | 1,659,904 | — | 1,659,904 | — | |||||||||
| Industrials | 18,030,573 | — | 18,030,573 | — | |||||||||
| Materials | 3,618,761 | — | 3,618,761 | — | |||||||||
| Real Estate | 6,245,520 | — | 6,245,520 | — | |||||||||
| Asset-backed securities | 41,559,580 | — | 41,559,580 | — | |||||||||
| Commercial mortgage-backed securities | 30,350,423 | — | 30,350,423 | — | |||||||||
| Foreign government bonds | 1,260,832 | — | 1,260,832 | — | |||||||||
| Mutual fund | 4,227,724 | 4,227,724 | — | — | |||||||||
| Short-Term Investment | 14,031,473 | 14,031,473 | — | — | |||||||||
| Total assets | $ | 726,740,540 | $ | 420,207,746 | $ | 306,096,169 | $ | 436,625 | |||||
| PRO-BLEND® MAXIMUM TERM SERIES | |||||||||||||
| DESCRIPTION | TOTAL | LEVEL 1 | LEVEL 2# | LEVEL 3 | |||||||||
| Assets: | |||||||||||||
| Equity securities: | |||||||||||||
| Communication Services | $ | 60,371,242 | $ | 59,312,071 | $ | 1,059,171 | $ | — | |||||
| Consumer Discretionary | 78,474,962 | 72,297,945 | 6,177,017 | — | |||||||||
| Consumer Staples | 57,713,710 | 39,389,526 | 18,324,184 | — | |||||||||
| Energy | 23,141,752 | 22,988,689 | — | 153,063 | |||||||||
| Financials | 51,021,981 | 44,663,481 | 6,358,500 | — | |||||||||
| Health Care | 79,246,376 | 77,538,835 | 1,707,541 | — | |||||||||
| Industrials | 39,835,312 | 36,009,427 | 3,825,885 | — | |||||||||
| Information Technology | 81,688,353 | 79,930,261 | 1,758,092 | — | |||||||||
| Materials | 20,097,958 | 19,543,324 | 554,634 | — | |||||||||
| Real Estate | 25,851,531 | 25,781,252 | 70,279 | — | |||||||||
| Preferred securities: | |||||||||||||
| Information Technology | 407,216 | 407,216 | — | — | |||||||||
| Materials | 592,740 | 592,740 | — | — | |||||||||
| Debt securities: | |||||||||||||
| U.S. Treasury and other U.S. Government agencies | 21,165,391 | — | 21,165,391 | — | |||||||||
| States and political subdivisions (municipals) | 127,253 | — | 127,253 | — | |||||||||
| Corporate debt: | |||||||||||||
| Communication Services | 2,150,292 | — | 2,150,292 | — | |||||||||
| Consumer Discretionary | 1,052,801 | — | 1,052,801 | — | |||||||||
| Energy | 4,672,850 | — | 4,672,850 | — | |||||||||
| Financials | 4,539,930 | — | 4,539,930 | — | |||||||||
| Health Care | 326,884 | — | 326,884 | — | |||||||||
| Industrials | 4,660,784 | — | 4,660,784 | — | |||||||||
| Materials | 1,332,634 | — | 1,332,634 | — | |||||||||
| Real Estate | 1,762,204 | — | 1,762,204 | — | |||||||||
| Asset-backed securities | 257,781 | — | 257,781 | — | |||||||||
108
Notes to Financial Statements (continued)
| 2. | Significant Accounting Policies (continued) |
Security Valuation (continued)
| PRO-BLEND® MAXIMUM TERM SERIES | |||||||||||||
| DESCRIPTION | TOTAL | LEVEL 1 | LEVEL 2# | LEVEL 3 | |||||||||
| Commercial mortgage-backed securities | $ | 171,683 | $ | — | $ | 171,683 | $ | — | |||||
| Short-Term Investment | 9,576,260 | 9,576,260 | — | — | |||||||||
| Total assets | $ | 570,239,880 | $ | 488,031,027 | $ | 82,055,790 | $ | 153,063 | |||||
#Includes certain foreign equity securities for which a factor from a third party vendor was applied to determine the securities’ fair value following the close of local trading.
Other Market and Credit Risk
Certain debt securities, derivatives and other financial instruments utilize the London Interbank Offered Rate (“LIBOR”) as the reference or benchmark rate for variable interest rate calculations. In July 2017, the UK Financial Conduct Authority announced a desire to phase out the use of LIBOR by the end of 2021, suggesting that LIBOR may cease to be published after that time. Regulators and financial industry groups have begun planning for a transition to the use of a different benchmark, but there are obstacles and a lack of global consensus, and the process for amending existing contracts or instruments to transition away from LIBOR remains unclear. The transition process might lead to increased volatility and illiquidity in markets that currently rely on the LIBOR to determine interest rates, a reduction in the values of some LIBOR-based investments, and reduced effectiveness of certain hedging strategies, which may adversely affect a Series’ performance or net asset value. Since the usefulness of LIBOR as a benchmark could deteriorate during the transition period, these effects could occur prior to the end of 2021. In addition, the alternative reference or benchmark rate may be an ineffective substitute resulting in prolonged adverse market conditions for a Portfolio.
Security Transactions, Investment Income and Expenses
Security transactions are accounted for on trade date. Dividend income is recorded on the ex-dividend date, except that if the ex-dividend date has passed, certain dividends from foreign securities are recorded as soon as the Series is informed of the ex-dividend date. Non-cash dividends, if any, are recorded at the fair value of the securities received. Interest income, including amortization of premium and accretion of discounts using the effective interest method, is earned from settlement date and accrued daily.
Expenses are recorded on an accrual basis. Most expenses of the Fund can be attributed to a specific series. Expenses which cannot be directly attributed are apportioned among the series in the Fund in such a manner as deemed equitable by the Fund’s Board, taking into consideration, among other things, the nature and type of expense.
Income, expenses (other than class specific expenses), and realized and unrealized gains and losses are prorated among the classes based on the relative net assets of each class. Class specific expenses are directly charged to that Class.
The Series use the identified cost method for determining realized gain or loss on investments for both financial statement and federal income tax reporting purposes.
Foreign Currency Translation
The books and records of the Series are maintained in U.S. dollars. Foreign currencies, investments and other assets and liabilities are translated into U.S. dollars at the current exchange rates. Purchases and sales of investment securities and income and expenses are translated on the respective dates of such transactions. The Series do not isolate realized and unrealized gains and losses attributable to changes in the exchange rates from gains and losses that arise from changes in the fair value of investments. Such fluctuations are included with net realized and unrealized gain or loss on investments. Net realized foreign currency gains and losses represent foreign currency gains and losses between trade date and settlement date on securities transactions, gains and losses on disposition of foreign currencies and the difference between the amount of income and foreign withholding taxes recorded on the books of the Series and the amounts actually received or paid.
109
Notes to Financial Statements (continued)
| 2. | Significant Accounting Policies (continued) |
Option Contracts
The Series may write (sell) or buy call or put options on securities and other financial instruments. When a Series writes a call, the Series gives the purchaser the right to buy the underlying security from the Series at the price specified in the option contract (the “exercise price”) at any time during the option period. When a Series writes a put option, the Series gives the purchaser the right to sell to the Series the underlying security at the exercise price at any time during the option period. The Series will only write options on a “covered basis.” This means that the Series will own the underlying security when the Series writes a call or the Series will put aside cash, U.S. Government securities, or other liquid assets in an amount not less than the exercise price at all times the put option is outstanding.
When a Series writes an option, an amount equal to the premium received is reflected as a liability and is subsequently marked-to-market to reflect the current market value of the option. The Series, as a writer of an option, has no control over whether the underlying security or financial instrument may be sold (call) or purchased (put) and, as a result, bears the market risk of an unfavorable change in the price of the security or financial instrument underlying the written option. There is a risk that the Series may not be able to enter into a closing transaction because of an illiquid market.
Each Series may also purchase options in an attempt to hedge against fluctuations in the value of its portfolio and to protect against declines in the value of the securities. The premium paid by a Series for the purchase of an option is reflected as an investment and subsequently marked-to-market to reflect the current market value of the option. The risk associated with purchasing options is limited to the premium paid.
When a security is purchased or sold through an exercise of an option, the related premium paid (or received) is added to (or deducted from) the basis of the security acquired or deducted from (or added to) the proceeds of the security sold. When an option expires (or a Series enters into a closing transaction), the Series realizes a gain or loss on the option to the extent of the premium received or paid (or gain or loss to the extent the cost of the closing transaction exceeds the premium paid or received).
The measurement of the risks associated with option contracts is meaningful only when all related and offsetting transactions are considered. The counterparty for the Series’ written options contracts outstanding during the year ended October 31, 2021 is Pershing LLC, a BNY Mellon Company. No such investments were held by the Series on October 31, 2021.
Asset-Backed Securities
Each Series may invest in asset-backed securities. Asset-backed securities are generally issued as pass-through certificates or as debt instruments. Asset-backed securities issued as pass-through certificates represent undivided fractional ownership interests in an underlying pool of assets. Asset-backed securities issued as debt instruments, which are also known as collateralized obligations, are typically issued as the debt of a special purpose entity organized solely for the purpose of owning such assets and issuing such debt. Asset-backed securities are often backed by a pool of assets representing the obligations of a number of different parties. The yield characteristics of certain asset-backed securities may differ from traditional debt securities. One such major difference is that all or a principal part of the obligations may be prepaid at any time because the underlying assets (i.e. loans) may be prepaid at any time. As a result, a decrease in interest rates in the market may result in increases in the level of prepayments as borrowers, particularly mortgagors, refinance and repay their loans. An increased prepayment rate with respect to an asset-backed security will have the effect of shortening the maturity of the security. In addition, a Series may subsequently have to reinvest the proceeds at lower interest rates. If a Series has purchased such an asset-backed security at a premium, a faster than anticipated prepayment rate could result in a loss of principal to the extent of the premium paid.
Mortgage-Backed Securities
Each Series may invest in mortgage-backed securities (“MBS” or pass-through certificates) that represent an interest in a pool of specific underlying mortgage loans and entitle a Series to the periodic payments of principal and interest from those mortgages. MBS may be issued by government agencies or corporations, or private issuers. Most MBS issued by government agencies are guaranteed; however, the degree of protection differs based on the issuer. For MBS there are a number of important differences among the agencies and instrumentalities of the U.S. Government that issue mortgage-related securities and among the securities that they issue. For example, mortgage-related securities guaranteed by Ginnie Mae are guaranteed as to the timely
110
Notes to Financial Statements (continued)
| 2. | Significant Accounting Policies (continued) |
Mortgage-Backed Securities (continued)
payment of principal and interest by Ginnie Mae and such guarantee is backed by the full faith and credit of the United States. However, mortgage-related securities issued by Freddie Mac and Fannie Mae, including Freddie Mac and Fannie Mae guaranteed mortgage pass-through certificates, which are solely the obligations of Freddie Mac and Fannie Mae, are not backed by or entitled to the full faith and credit of the United States, but are supported by the right of the issuer to borrow from the U.S. Treasury. Non-agency mortgage-backed securities are securities issued by non-governmental issuers and have no direct or indirect government guarantees of payment and are subject to various risks. Non-agency mortgage loans are obligations of the borrowers thereunder only and are not typically insured or guaranteed by any other person or entity. The ability of a borrower to repay a loan is dependent upon the income or assets of the borrower. A number of factors, including a general economic downturn, acts of God, terrorism, social unrest and civil disturbances, may impair a borrower’s ability to repay its loans.
Inflation-Indexed Bonds
Each Series may invest in inflation-indexed bonds. Inflation-indexed bonds are fixed income securities whose principal value is periodically adjusted according to the rate of inflation. If the index measuring inflation rises or falls, the principal value of inflation-indexed bonds will be adjusted upward or downward, and consequently the interest payable on these securities (calculated with respect to a larger or smaller principal amount) will be increased or reduced, respectively. Any upward or downward adjustment in the principal amount of an inflation-indexed bond will be included as interest income in the Statements of Operations, even though investors do not receive their principal until maturity. Repayment of the original bond principal upon maturity (as adjusted for inflation) is guaranteed in the case of U.S. Treasury inflation-indexed bonds. For bonds that do not provide a similar guarantee, the adjusted principal value of the bond repaid at maturity may be less than the original principal.
Securities Purchased on a When-Issued Basis or Forward Commitment
Each Series may purchase securities on a when-issued basis or forward commitment. These transactions involve a commitment by the Series to purchase securities for a predetermined price with payment and delivery taking place beyond the customary settlement period. When such purchases are outstanding, the Series will designate liquid assets in an amount sufficient to meet the purchase price. When purchasing a security on a delayed delivery basis, the Series assumes the rights and risks of ownership of the security, including the risk of price and yield fluctuations, and take such fluctuations into account when determining their net asset value. The Series may sell the when-issued securities before they are delivered, which may result in a capital gain or loss.
In connection with their ability to purchase or sell securities on a forward commitment basis, the Series may enter into forward roll transactions principally using To Be Announced (TBA) securities. Forward roll transactions require the sale of securities for delivery in the current month, and a simultaneous agreement to repurchase substantially similar (same type, coupon and maturity) securities on a specified future date. Risks of entering into forward roll transactions include the potential inability of the counterparty to meet the terms of the agreement; the potential of the Series to receive inferior securities at redelivery as compared to the securities sold to the counterparty; counterparty credit risk; and the potential pay down speed variance between the mortgage-backed pools. During the roll period, the Series forgoes principal and interest paid on the securities. The Series accounts for such dollar rolls as purchases and sales. No such investments were held by the Series on October 31, 2021.
Interest Only Securities
The Series may invest in stripped mortgage-backed securities issued by the U.S. government, its agencies and instrumentalities. Stripped mortgage-backed securities are usually structured with two classes that receive different proportions of the interest and principal distributions on a pool of mortgage assets. In certain cases, one class will receive all of the interest (the interest-only or “IO” class), while the other class will receive all of the principal (the principal-only or “PO” class). The yield to maturity on IOs is sensitive to the rate of principal repayments (including prepayments) on the related underlying mortgage assets, and principal payments may have a material effect on yield to maturity. If the underlying mortgage assets experience greater than anticipated prepayments of principal, a Series may not fully recoup its initial investment in IOs.
Federal Taxes
Each Series’ policy is to comply with the provisions of the Internal Revenue Code applicable to regulated investment companies. The Series are not subject to federal income tax or excise tax to the extent that each Series distributes to shareholders each year
111
Notes to Financial Statements (continued)
| 2. | Significant Accounting Policies (continued) |
Federal Taxes (continued)
its taxable income, including any net realized gains on investments, in accordance with requirements of the Internal Revenue Code. Accordingly, no provision for federal income tax or excise tax has been made in the financial statements.
Management evaluates its tax positions to determine if the tax positions taken meet the minimum recognition threshold in connection with accounting for uncertainties in income tax positions taken or expected to be taken for the purposes of measuring and recognizing tax liabilities in the financial statements. Recognition of tax benefits of an uncertain tax position is required only when the position is “more likely than not” to be sustained assuming examination by taxing authorities. At October 31, 2021, the Series have recorded no liability for net unrecognized tax benefits relating to uncertain income tax positions taken or expected to be taken in future tax returns.
The Series file income tax returns in the U.S. federal jurisdiction, various states and foreign jurisdictions, as required. No income tax returns are currently under investigation. The statute of limitations on the Series’ tax returns remains open for the years ended October 31, 2018 through October 31, 2021. The Fund is not aware of any tax positions for which it is reasonably possible that the total amounts of unrecognized tax benefits will significantly change in the next twelve months.
Foreign Taxes
Based on the Series’ understanding of the tax rules and rates related to income, gains and currency purchase/repatriation transactions for foreign jurisdictions in which they invests, the Series will provide for foreign taxes, and where appropriate, deferred foreign tax.
Distributions of Income and Gains
Distributions to shareholders of net investment income are made semi-annually. Distributions of net realized gains are made annually. An additional distribution may be necessary to avoid taxation of a Series. Distributions are recorded on the ex-dividend date.
Indemnifications
The Fund’s organizational documents provide former and current directors and officers with a limited indemnification against liabilities arising in connection with the performance of their duties to the Fund. In the normal course of business, the Fund may also enter into contracts that provide general indemnifications. The Fund’s maximum exposure under these arrangements is unknown as this would be dependent on future claims that may be made against the Fund. The risk of material loss from such claims is considered remote.
Other
The preparation of financial statements in conformity with GAAP requires management to make estimates and assumptions that affect the reported amounts of assets and liabilities and the disclosure of contingent assets and liabilities at the date of the financial statements and the reported amounts of income and expenses during the reporting period. Actual results could differ from those estimates.
| 3. | Transactions with Affiliates |
The Fund has an Investment Advisory Agreement (the “Agreement”) with the Advisor, for which each Series pays a fee, computed daily and payable monthly, at an annual rate of 0.40% for Pro-Blend® Conservative Term Series and 0.60% for Pro- Blend® Moderate Term Series, Pro-Blend® Extended Term Series and Pro-Blend® Maximum Term Series, of the Series’ average daily net assets.
Under the Agreement, personnel of the Advisor provide the Series with advice and assistance in the choice of investments and the execution of securities transactions, and otherwise maintain the Series’ organization. The Advisor also provides the Fund with necessary office space and fund administration and support services. The salaries of all officers of the Fund (except a percentage of the Fund’s Chief Compliance Officer’s salary, which is paid by the Fund), and of all Directors who are “affiliated persons” of the Fund, or of the Advisor, and all personnel of the Fund, or of the Advisor, performing services relating to research, statistical and
112
Notes to Financial Statements (continued)
| 3. | Transactions with Affiliates (continued) |
investment activities, are paid by the Advisor. Each “non-affiliated” Director receives an annual stipend, which is allocated among all the active series of the Fund. In addition, these Directors also receive a fee per Board meeting attended plus a fee for each committee meeting attended and are reimbursed for travel and other out-of-pocket expenses incurred by them in connection with attending such meetings. The Fund also has an Audit Committee Chair, Governance & Nominating Committee Chair and Lead Independent Director who each receive an additional annual stipend for these roles.
The Fund may enter into agreements with financial intermediaries pursuant to which the Fund may pay financial intermediaries for non-distribution related sub-transfer agency, administrative, sub-accounting, and other shareholder services in an amount not to exceed 0.15% of the average daily net assets of the Class S, Class I, Class R and Class L shares. Payments made pursuant to such agreements are generally based on the current assets and/or number of accounts of the Series attributable to the financial intermediary. Any payments made pursuant to such agreements may be in addition to, rather than in lieu of, any Distribution and Shareholder Services Fee payable under the Rule 12b-1 plan of the Fund.
The Advisor has contractually agreed to waive the management fee for the Class W shares. The full management fee will be waived under this agreement because Class W shares are only available to discretionary investment accounts and other accounts managed by the Advisor. These clients pay a management fee to the Advisor that is separate from the Series’ expenses. In addition, pursuant to a separate expense limitation agreement, the Advisor has contractually agreed to limit its fees and reimburse expenses to the extent necessary so that the total direct annual fund operating expenses, exclusive of the shareholder services fee and/or distribution and service (12b-1) fees and waived Class W management fees (collectively, “excluded expenses”), at no more than the amounts presented in the following table, of average daily net assets each year.
| SERIES/CLASS | EXPENSE LIMIT | |
| Pro-Blend® Conservative Term Series Class S, I, R and L | 0.65% | |
| Pro-Blend® Conservative Term Series Class Z | 0.50% | |
| Pro-Blend® Conservative Term Series Class W | 0.10% | |
| Pro-Blend® Moderate Term Series Class S, I, R and L | 0.85% | |
| Pro-Blend® Moderate Term Series Class Z | 0.70% | |
| Pro-Blend® Moderate Term Series Class W | 0.10% | |
| Pro-Blend® Extended Term Series Class S, I, R and L | 0.85% | |
| Pro-Blend® Extended Term Series Class Z | 0.70% | |
| Pro-Blend® Extended Term Series Class W | 0.10% | |
| Pro-Blend® Maximum Term Series Class S, I, R and L | 0.85% | |
| Pro-Blend® Maximum Term Series Class Z | 0.70% | |
| Pro-Blend® Maximum Term Series Class W | 0.10% |
The contractual waivers are expected to continue indefinitely, and may not be amended or terminated by the Advisor without the approval of the Series’ Board of Directors. The Advisor’s agreement to limit each Class’s operating expenses is limited to direct operating expenses and, therefore, does not apply to acquired fund fees and expenses, which are indirect expenses incurred by the Series through its investments in other investment companies. The Advisor may receive from a Class the difference between the Class’s total direct annual fund operating expenses, not including excluded expenses, and the Class’s contractual expense limit to recoup all or a portion of its prior fee waivers (other than Class W management fee waivers) or expense reimbursements made during the rolling three-year period preceding the recoupment if at any point the total direct annual fund operating expenses, not including excluded expenses, are below the contractual expense limit (a) at the time of the fee waiver and/or expense reimbursement and (b) at the time of the recoupment.
Pursuant to the advisory fee waiver, the Advisor waived the following management fees for Class W shares for the year ended October 31, 2021. In addition, pursuant to the separate expense limitation agreement, the Advisor waived or reimbursed the
113
Notes to Financial Statements (continued)
| 3. | Transactions with Affiliates (continued) |
following expenses for Class S, Class I, Class R, Class L and Class W shares for the year ended October 31, 2021. These amounts are included as a reduction of expenses on the Statement of Operations:
| CLASS W | WAIVED | ||||||
| SERIES/CLASS | MANAGEMENT | OPERATING | |||||
| FEE WAIVER | EXPENSES | ||||||
| Pro-Blend® Conservative Term Series | $ 7,725 | $ 473 | |||||
| Pro-Blend® Moderate Term Series | 1,522 | 70 | |||||
| Pro-Blend® Extended Term Series | 42 | 1 | |||||
| Pro-Blend® Maximum Term Series | 4,549 | 37,830 | |||||
For the year ended October 31, 2021, the Advisor did not recoup any expenses from Pro-Blend® Conservative Term Series, Pro-Blend® Extended Term Series and Pro-Blend® Maximum Term Series that have been previously waived or reimbursed.
For the year ended October 31, 2021, the Advisor recouped the following waivers and/or reimbursements previously recorded by Pro-Blend® Moderate Term Series:
| SERIES/CLASS | RECOUPED AMOUNT | |||
| Pro-Blend® Moderate Term Series | ||||
| Class R | $ | 2,857 |
As of October 31, 2021, the class specific waivers or reimbursements subject to possible future recoupment under the expense limitation agreement are as follows:
| SERIES/CLASS | EXPIRING OCTOBER 31, | ||||||||||||
| 2022 | 2023 | 2024 | Total | ||||||||||
| Pro-Blend® Conservative Term Series | |||||||||||||
| Class W | $ | — | $ | — | $ | 473 | $ | 473 | |||||
| Pro-Blend® Moderate Term Series | |||||||||||||
| Class I | $ | 21,271 | $ | 10,501 | $ | — | $ | 31,772 | |||||
| Class W | 1 | 88 | 70 | 159 | |||||||||
| Pro-Blend® Extended Term Series | |||||||||||||
| Class W | $ | 1 | $ | 1 | $ | 1 | $ | 3 | |||||
| Pro-Blend® Maximum Term Series | |||||||||||||
| Class S | $ | — | $ | — | $ | 2,390 | $ | 2,390 | |||||
| Class I | 24,055 | 27,075 | 34,927 | 86,057 | |||||||||
| Class W | 16 | 351 | 513 | 880 | |||||||||
Manning & Napier Investor Services, Inc., a registered broker-dealer affiliate of the Advisor, acts as distributor for the Fund’s shares. Each Series compensates the distributor for distributing and servicing the Series’ Class L (formerly Class R2), Class R and Class S shares pursuant to a distribution plan adopted under Rule 12b-1 of the 1940 Act, regardless of expenses actually incurred. Under the agreement, each Series pays distribution and service fees to the distributor at an annual rate of 0.25% of average daily net assets attributable to Class S shares, 1.00% of average daily net assets attributable to Class L shares (formerly Class R2) and an annual rate of 0.50% of daily net assets attributable to Class R shares. There are no distribution and service fees on the Class I, Class W, and Class Z shares of each Series. The fees are accrued daily and paid monthly.
Pursuant to a master services agreement dated February 13, 2020, the Fund pays the Advisor an annual fee related to fund accounting and administration of 0.0085% on the first $25 billion of average daily net assets; 0.0075% on the next $15 billion of
114
Notes to Financial Statements (continued)
| 3. | Transactions with Affiliates (continued) |
average daily net assets; and 0.0065% of average daily net assets in excess of $40 billion; plus a base fee of $30,400 per series. Additionally, certain transaction and out-of-pocket expenses, including charges for reporting relating to the Fund’s compliance program, are charged. The Advisor has agreements with BNY Mellon Investment Servicing (U.S.) Inc. (“BNY”) under which BNY serves as sub-accountant services agent.
| 4. | Purchases and Sales of Securities |
For the year ended October 31, 2021, purchases and sales of securities, including paydowns and other than short-term securities, were as follows:
| SERIES | PURCHASES | SALES | ||||||
| OTHER ISSUERS | GOVERNMENT | OTHER ISSUERS | GOVERNMENT | |||||
| Pro-Blend® Conservative Term Series | $166,273,894 | $198,655,921 | $220,160,798 | $152,714,313 | ||||
| Pro-Blend® Moderate Term Series | 176,057,009 | 182,862,515 | 228,883,078 | 152,005,246 | ||||
| Pro-Blend® Extended Term Series | 271,202,310 | 177,137,463 | 318,281,865 | 156,560,911 | ||||
| Pro-Blend® Maximum Term Series | 185,378,897 | 64,779,612 | 209,129,204 | 54,767,033 |
| 5. | Capital Stock Transactions |
Transactions in Class S, Class I, Class R, Class L, and Class W shares were:
| PRO-BLEND® CONSERVATIVE TERM SERIES | ||||||||||||||||
| CLASS S | FOR THE YEAR ENDED | FOR THE YEAR ENDED | ||||||||||||||
| 10/31/21 | 10/31/20 | |||||||||||||||
| SHARES | AMOUNT | SHARES | AMOUNT | |||||||||||||
| Sold | 2,627,284 | $ | 37,719,035 | 12,298,072 | $ | 173,860,492 | ||||||||||
| Shares issued in reorganization1 | — | — | 2,532,712 | 36,926,877 | ||||||||||||
| Reinvested | 1,884,355 | 26,248,318 | 1,767,237 | 24,595,985 | ||||||||||||
| Repurchased | (4,881,589 | ) | (70,589,555 | ) | (39,070,434 | ) | (568,343,275 | ) | ||||||||
| Total | (369,950 | ) | $ | (6,622,202 | ) | (22,472,413 | ) | $ | (332,959,921 | ) | ||||||
| PRO-BLEND® CONSERVATIVE TERM SERIES | ||||||||||||||||
| CLASS I | FOR THE YEAR ENDED | FOR THE YEAR ENDED | ||||||||||||||
| 10/31/21 | 10/31/20 | |||||||||||||||
| SHARES | AMOUNT | SHARES | AMOUNT | |||||||||||||
| Sold | 3,359,581 | $ | 34,575,239 | 3,300,754 | $ | 34,554,453 | ||||||||||
| Shares issued in reorganization1 | — | — | 92,951 | 1,000,154 | ||||||||||||
| Reinvested | 1,325,920 | 13,111,952 | 1,041,590 | 10,691,803 | ||||||||||||
| Repurchased | (2,844,926 | ) | (29,211,438 | ) | (14,612,599 | ) | (151,140,703 | ) | ||||||||
| Total | 1,840,575 | $ | 18,475,753 | (10,177,304 | ) | $ | (104,894,293 | ) | ||||||||
115
Notes to Financial Statements (continued)
| 5. | Capital Stock Transactions (continued) |
| PRO-BLEND® CONSERVATIVE TERM SERIES | ||||||||||||||||
| CLASS R | FOR THE YEAR ENDED | FOR THE YEAR ENDED | ||||||||||||||
| 10/31/21 | 10/31/20 | |||||||||||||||
| SHARES | AMOUNT | SHARES | AMOUNT | |||||||||||||
| Sold | 415,855 | $ | 4,011,558 | 359,125 | $ | 3,716,453 | ||||||||||
| Shares issued in reorganization1 | — | — | 1,482,217 | 15,207,549 | ||||||||||||
| Reinvested | 315,745 | 2,959,418 | 50,234 | 493,417 | ||||||||||||
| Repurchased | (544,356 | ) | (5,382,646 | ) | (545,582 | ) | (5,574,834 | ) | ||||||||
| Total | 187,244 | $ | 1,588,330 | 1,345,994 | $ | 13,842,585 | ||||||||||
| PRO-BLEND® CONSERVATIVE TERM SERIES | ||||||||||||||||
| CLASS L | FOR THE YEAR ENDED | FOR THE YEAR ENDED | ||||||||||||||
| (FORMERLY CLASS R2) | 10/31/21 | 10/31/20 | ||||||||||||||
| SHARES | AMOUNT | SHARES | AMOUNT | |||||||||||||
| Sold | 1,434,206 | $ | 14,025,591 | 1,184,359 | $ | 11,726,742 | ||||||||||
| Reinvested | 1,240,526 | 11,631,401 | 447,586 | 4,397,960 | ||||||||||||
| Repurchased | (1,522,064 | ) | (14,841,387 | ) | (1,693,217 | ) | (16,734,018 | ) | ||||||||
| Total | 1,152,668 | $ | 10,815,605 | (61,272 | ) | $ | (609,316 | ) | ||||||||
| PRO-BLEND® CONSERVATIVE TERM SERIES | ||||||||||||||||
| CLASS W | FOR THE YEAR ENDED | FOR THE YEAR ENDED | ||||||||||||||
| 10/31/21 | 10/31/20 | |||||||||||||||
| SHARES | AMOUNT | SHARES | AMOUNT | |||||||||||||
| Sold | 69 | $ | 1,000 | 13,294 | $ | 189,177 | ||||||||||
| Reinvested | 13,353 | 186,001 | 5,999 | 83,642 | ||||||||||||
| Repurchased | (69 | ) | (1,011 | ) | (7,530 | ) | (100,074 | ) | ||||||||
| Total | 13,353 | $ | 185,990 | 11,763 | $ | 172,745 | ||||||||||
| PRO-BLEND® MODERATE TERM SERIES CLASS S | FOR THE YEAR ENDED | FOR THE YEAR ENDED | ||||||||||||||
| 10/31/21 | 10/31/20 | |||||||||||||||
| SHARES | AMOUNT | SHARES | AMOUNT | |||||||||||||
| Sold | 1,614,853 | $ | 24,843,390 | 3,089,925 | $ | 43,836,618 | ||||||||||
| Shares issued in reorganization1 | — | — | 3,020,898 | 44,346,890 | ||||||||||||
| Reinvested | 983,292 | 14,474,295 | 596,049 | 8,154,787 | ||||||||||||
| Repurchased | (3,493,124 | ) | (53,428,645 | ) | (3,279,163 | ) | (46,150,733 | ) | ||||||||
| Total | (894,979 | ) | $ | (14,110,960 | ) | 3,427,709 | $ | 50,187,562 | ||||||||
| PRO-BLEND® MODERATE TERM SERIES CLASS I | FOR THE YEAR ENDED | FOR THE YEAR ENDED | ||||||||||||||
| 10/31/21 | 10/31/20 | |||||||||||||||
| SHARES | AMOUNT | SHARES | AMOUNT | |||||||||||||
| Sold | 2,881,402 | $ | 30,823,306 | 2,832,509 | $ | 28,808,602 | ||||||||||
| Shares issued in reorganization1 | — | — | 769,773 | 8,044,128 | ||||||||||||
| Reinvested | 913,805 | 9,338,161 | 736,751 | 7,178,802 | ||||||||||||
| Repurchased | (2,684,479 | ) | (28,907,712 | ) | (4,907,808 | ) | (48,669,185 | ) | ||||||||
| Total | 1,110,728 | $ | 11,253,755 | (568,775 | ) | $ | (4,637,653 | ) | ||||||||
116
Notes to Financial Statements (continued)
| 5. | Capital Stock Transactions (continued) |
| PRO-BLEND® MODERATE TERM SERIES CLASS R | FOR THE YEAR ENDED | FOR THE YEAR ENDED | ||||||||||||||
| 10/31/21 | 10/31/20 | |||||||||||||||
| SHARES | AMOUNT | SHARES | AMOUNT | |||||||||||||
| Sold | 278,611 | $ | 3,178,088 | 157,609 | $ | 1,700,621 | ||||||||||
| Shares issued in reorganization1 | — | — | 2,521,715 | 28,117,122 | ||||||||||||
| Reinvested | 236,868 | 2,593,900 | 40,689 | 423,388 | ||||||||||||
| Repurchased | (1,100,118 | ) | (12,496,099 | ) | (459,556 | ) | (5,058,325 | ) | ||||||||
| Total | (584,639 | ) | $ | (6,724,111 | ) | 2,260,457 | $ | 25,182,806 | ||||||||
| PRO-BLEND® MODERATE TERM SERIES CLASS L | FOR THE YEAR ENDED | FOR THE YEAR ENDED | ||||||||||||||
| (FORMERLY CLASS R2) | 10/31/21 | 10/31/20 | ||||||||||||||
| SHARES | AMOUNT | SHARES | AMOUNT | |||||||||||||
| Sold | 849,296 | $ | 9,244,287 | 741,062 | $ | 7,587,028 | ||||||||||
| Reinvested | 747,653 | 7,775,591 | 524,246 | 5,199,415 | ||||||||||||
| Repurchased | (968,169 | ) | (10,495,927 | ) | (1,306,624 | ) | (13,261,633 | ) | ||||||||
| Total | 628,780 | $ | 6,523,951 | (41,316 | ) | $ | (475,190 | ) | ||||||||
| PRO-BLEND® MODERATE TERM SERIES CLASS W | FOR THE YEAR ENDED | FOR THE YEAR ENDED | ||||||||||||||
| 10/31/21 | 10/31/20 | |||||||||||||||
| SHARES | AMOUNT | SHARES | AMOUNT | |||||||||||||
| Sold | — | $ | — | 9,894 | $ | 140,015 | ||||||||||
| Reinvested | 1,004 | 14,788 | 711 | 9,708 | ||||||||||||
| Repurchased | (3,574 | ) | (54,898 | ) | (2,607 | ) | (36,771 | ) | ||||||||
| Total | (2,570 | ) | $ | (40,110 | ) | 7,998 | $ | 112,952 | ||||||||
| PRO-BLEND® EXTENDED TERM SERIES CLASS S | FOR THE YEAR ENDED | FOR THE YEAR ENDED | ||||||||||||||
| 10/31/21 | 10/31/20 | |||||||||||||||
| SHARES | AMOUNT | SHARES | AMOUNT | |||||||||||||
| Sold | 1,698,587 | $ | 35,117,336 | 2,144,012 | $ | 39,981,199 | ||||||||||
| Shares issued in reorganization1 | — | — | 2,953,794 | 57,067,186 | ||||||||||||
| Reinvested | 1,102,635 | 21,558,365 | 644,115 | 11,463,553 | ||||||||||||
| Repurchased | (3,547,645 | ) | (73,183,913 | ) | (3,548,426 | ) | (64,915,278 | ) | ||||||||
| Total | (746,423 | ) | $ | (16,508,212 | ) | 2,193,495 | $ | 43,596,660 | ||||||||
| PRO-BLEND® EXTENDED TERM SERIES CLASS I | FOR THE YEAR ENDED | FOR THE YEAR ENDED | ||||||||||||||
| 10/31/21 | 10/31/20 | |||||||||||||||
| SHARES | AMOUNT | SHARES | AMOUNT | |||||||||||||
| Sold | 4,349,025 | $ | 41,043,605 | 7,562,665 | $ | 65,944,754 | ||||||||||
| Shares issued in reorganization1 | — | — | 1,035,552 | 9,692,770 | ||||||||||||
| Reinvested | 2,279,040 | 20,094,037 | 1,210,746 | 10,477,274 | ||||||||||||
| Repurchased | (3,093,907 | ) | (29,381,299 | ) | (6,557,557 | ) | (58,029,737 | ) | ||||||||
| Total | 3,534,158 | $ | 31,756,343 | 3,251,406 | $ | 28,085,061 | ||||||||||
117
Notes to Financial Statements (continued)
| 5. | Capital Stock Transactions (continued) |
| PRO-BLEND® EXTENDED TERM SERIES CLASS R | FOR THE YEAR ENDED | FOR THE YEAR ENDED | ||||||||||||||
| 10/31/21 | 10/31/20 | |||||||||||||||
| SHARES | AMOUNT | SHARES | AMOUNT | |||||||||||||
| Sold | 469,896 | $ | 5,443,969 | 194,146 | $ | 2,208,470 | ||||||||||
| Shares issued in reorganization1 | — | — | 4,510,411 | 50,967,640 | ||||||||||||
| Reinvested | 538,530 | 5,866,204 | 41,833 | 436,591 | ||||||||||||
| Repurchased | (1,080,093 | ) | (12,492,188 | ) | (605,659 | ) | (6,952,937 | ) | ||||||||
| Total | (71,667 | ) | $ | (1,182,015 | ) | 4,140,731 | $ | 46,659,764 | ||||||||
| PRO-BLEND® EXTENDED TERM SERIES CLASS L | FOR THE YEAR ENDED | FOR THE YEAR ENDED | ||||||||||||||
| (FORMERLY CLASS R2) | 10/31/21 | 10/31/20 | ||||||||||||||
| SHARES | AMOUNT | SHARES | AMOUNT | |||||||||||||
| Sold | 764,366 | $ | 8,035,158 | 689,216 | $ | 6,798,861 | ||||||||||
| Reinvested | 1,205,350 | 11,896,801 | 758,441 | 7,245,993 | ||||||||||||
| Repurchased | (1,400,735 | ) | (14,706,694 | ) | (1,708,580 | ) | (16,467,314 | ) | ||||||||
| Total | 568,981 | $ | 5,225,265 | (260,923 | ) | $ | (2,422,460 | ) | ||||||||
| PRO-BLEND® EXTENDED TERM SERIES CLASS W | FOR THE YEAR ENDED | FOR THE YEAR ENDED | ||||||||||||||
| 10/31/21 | 10/31/20 | |||||||||||||||
| SHARES | AMOUNT | SHARES | AMOUNT | |||||||||||||
| Sold | — | $ | — | — | $ | — | ||||||||||
| Reinvested | 23 | 451 | 16 | 279 | ||||||||||||
| Repurchased | — | — | — | — | ||||||||||||
| Total | 23 | $ | 451 | 16 | $ | 279 | ||||||||||
| PRO-BLEND® MAXIMUM TERM SERIES CLASS S | FOR THE YEAR ENDED | FOR THE YEAR ENDED | ||||||||||||||
| 10/31/21 | 10/31/20 | |||||||||||||||
| SHARES | AMOUNT | SHARES | AMOUNT | |||||||||||||
| Sold | 1,488,799 | $ | 40,540,589 | 1,146,846 | $ | 24,659,490 | ||||||||||
| Shares issued in reorganization1 | — | — | 1,204,259 | 27,734,072 | ||||||||||||
| Reinvested | 376,615 | 9,396,547 | 528,558 | 11,258,420 | ||||||||||||
| Repurchased | (2,270,873 | ) | (61,653,091 | ) | (2,145,384 | ) | (46,108,609 | ) | ||||||||
| Total | (405,459 | ) | $ | (11,715,955 | ) | 734,279 | $ | 17,543,373 | ||||||||
| PRO-BLEND® MAXIMUM TERM SERIES CLASS I | FOR THE YEAR ENDED | FOR THE YEAR ENDED | ||||||||||||||
| 10/31/21 | 10/31/20 | |||||||||||||||
| SHARES | AMOUNT | SHARES | AMOUNT | |||||||||||||
| Sold | 4,264,238 | $ | 46,366,727 | 3,240,453 | $ | 28,793,291 | ||||||||||
| Shares issued in reorganization1 | — | — | 365,225 | 3,473,295 | ||||||||||||
| Reinvested | 603,579 | 5,928,030 | 1,080,109 | 9,517,742 | ||||||||||||
| Repurchased | (2,170,749 | ) | (23,530,321 | ) | (5,512,744 | ) | (48,230,214 | ) | ||||||||
| Total | 2,697,068 | $ | 28,764,436 | (826,957 | ) | $ | (6,445,886 | ) | ||||||||
118
Notes to Financial Statements (continued)
| 5. | Capital Stock Transactions (continued) |
| PRO-BLEND® MAXIMUM TERM SERIES CLASS R | FOR THE YEAR ENDED | FOR THE YEAR ENDED | ||||||||||||||
| 10/31/21 | 10/31/20 | |||||||||||||||
| SHARES | AMOUNT | SHARES | AMOUNT | |||||||||||||
| Sold | 334,577 | $ | 5,077,441 | 359,286 | $ | 4,509,309 | ||||||||||
| Shares issued in reorganization1 | — | — | 2,603,278 | 34,155,003 | ||||||||||||
| Reinvested | 207,381 | 2,872,226 | 105,321 | 1,280,754 | ||||||||||||
| Repurchased | (783,133 | ) | (11,803,883 | ) | (598,150 | ) | (7,800,737 | ) | ||||||||
| Total | (241,175 | ) | $ | (3,854,216 | ) | 2,469,735 | $ | 32,144,329 | ||||||||
| PRO-BLEND® MAXIMUM TERM SERIES CLASS L | FOR THE YEAR ENDED | FOR THE YEAR ENDED | ||||||||||||||
| (FORMERLY CLASS R2) | 10/31/21 | 10/31/20 | ||||||||||||||
| SHARES | AMOUNT | SHARES | AMOUNT | |||||||||||||
| Sold | 462,749 | $ | 5,341,385 | 816,309 | $ | 7,560,757 | ||||||||||
| Reinvested | 396,362 | 4,201,438 | 585,155 | 5,570,673 | ||||||||||||
| Repurchased | (1,125,123 | ) | (13,004,456 | ) | (1,554,323 | ) | (14,498,868 | ) | ||||||||
| Total | (266,012 | ) | $ | (3,461,633 | ) | (152,859 | ) | $ | (1,367,438 | ) | ||||||
| PRO-BLEND® MAXIMUM TERM SERIES CLASS W | FOR THE YEAR ENDED | FOR THE YEAR ENDED | ||||||||||||||
| 10/31/21 | 10/31/20 | |||||||||||||||
| SHARES | AMOUNT | SHARES | AMOUNT | |||||||||||||
| Sold | 2 | $ | 48 | — | $ | 86 | ||||||||||
| Reinvested | 1,094 | 27,673 | 1,494 | 31,891 | ||||||||||||
| Repurchased | (643 | ) | (17,908 | ) | (345 | ) | (6,942 | ) | ||||||||
| Total | 453 | $ | 9,813 | 1,149 | $ | 25,035 | ||||||||||
1See Note 1 regarding the reorganization.
At October 31, 2021, the Advisor and its affiliates owned less than 0.1% of each Series. Investment activities of these shareholders may have a material effect on the respective Series.
| 6. | Line of Credit |
The Fund has entered into a 364-day, $25 million credit agreement (the “line of credit”) with Bank of New York Mellon. Each series of the Fund may borrow under the line of credit for temporary or emergency purposes, including funding shareholder redemptions and other short-term liquidity purposes. The Fund pays an annual fee on the unused commitment amount, payable quarterly, and is allocated among all the series of the Fund and included in miscellaneous expenses in the Statement of Operations for each series. The line of credit expires in September 2022 unless extended or renewed. During the year ended October 31, 2021, none of the Series borrowed under the line of credit.
| 7. | Financial Instruments and Loan Assignments |
The Series may trade in instruments including written and purchased options, forward foreign currency exchange contracts and futures contracts and other derivatives in the normal course of investing activities to assist in managing exposure to various market risks. The Series may be subject to various elements of risk which may involve, to a varying degree, elements of risk in excess of the amounts recognized for financial statement purposes. These risks include: the risk that changes in the value of a derivative may not correlate perfectly with the underlying asset, rate or index; counterparty credit risk related to over the counter
119
Notes to Financial Statements (continued)
| 7. | Financial Instruments and Loan Assignments (continued) |
derivative counterparties’ failure to perform under contract terms; liquidity risk related to the lack of a liquid market for these contracts allowing the fund to close out its position(s); and documentation risk relating to disagreement over contract terms.
The Series may invest in a loan assignment of all or a portion of the loans. A Series has direct rights against the borrower on a loan when it purchases an assignment; however, the Series’ rights may be more limited than the lender from which it acquired the assignment and the Series may be able to enforce its rights only through an administrative agent. Loan assignments are vulnerable to market conditions and may become illiquid due to economic conditions or other events may reduce the demand for loan assignments and certain loan assignments which were liquid when purchased may become illiquid. At October 31, 2021, none of the Series held any loan assignments.
| 8. | Foreign Securities |
Investing in securities of foreign companies and foreign governments involves special risks and considerations not typically associated with investing in securities of domestic companies and the U.S. Government. These risks include revaluation of currencies and future adverse political and economic developments. Moreover, securities of foreign companies and foreign governments and their markets may be less liquid and their prices more volatile than those of comparable domestic companies and the U.S. Government.
| 9. | Federal Income Tax Information |
The amount and characterization of certain income and capital gains to be distributed are determined in accordance with federal income tax regulations, which may differ from GAAP. These differences are primarily due to differing book and tax treatments in the timing of the recognition on net investment income or gains and losses, including foreign currency gains and losses, losses deferred due to wash sales, investments in passive foreign investment companies (PFICs), the use of equalization and investments in real estate investment trusts. Each Series may periodically make reclassifications among its capital accounts to reflect income and gains available for distribution (or available capital loss carryovers) under income tax regulations, without impacting the Series’ net asset value. For the year ended October 31, 2021, amounts were reclassified within the capital accounts to increase Additional Paid in Capital by $2,399,037 and decrease Total Distributable Earnings (Loss) by $2,399,037 for Pro-Blend® Conservative Term Series, increase Additional Paid in Capital by $2,700,748 and decrease Total Distributable Earnings (Loss) by $2,700,748 for Pro-Blend® Moderate Term Series, increase Additional Paid in Capital by $3,175,977 and decrease Total Distributable Earnings (Loss) by $3,175,977 for Pro-Blend® Extended Term Series and increase Additional Paid in Capital by $4,131,799 and decrease Total Distributable Earnings (Loss) by $4,131,799 for Pro-Blend® Maximum Term Series. Any such reclassifications are not reflected in the financial highlights.
The tax character of distributions paid were as follows:
| PRO-BLEND® CONSERVATIVE TERM SERIES | PRO-BLEND® MODERATE TERM SERIES | ||||||||||||
| FOR THE YEAR ENDED 10/31/21 | FOR THE YEAR ENDED 10/31/20 | FOR THE YEAR ENDED 10/31/21 | FOR THE YEAR ENDED 10/31/20 | ||||||||||
| Ordinary income | $ | 39,150,066 | $ | 20,618,333 | $ | 16,739,550 | $ | 5,376,172 | |||||
| Long-term capital gains | 16,449,912 | 20,242,314 | 18,135,725 | 15,869,191 | |||||||||
| PRO-BLEND® EXTENDED TERM SERIES | PRO-BLEND® MAXIMUM TERM SERIES | ||||||||||||
| FOR THE YEAR ENDED 10/31/21 | FOR THE YEAR ENDED 10/31/20 | FOR THE YEAR ENDED 10/31/21 | FOR THE YEAR ENDED 10/31/20 | ||||||||||
| Ordinary income | $ | 26,352,090 | $ | 9,888,111 | $ | 1,754,535 | $ | 3,437,108 | |||||
| Long-term capital gains | 34,316,212 | 20,152,027 | 21,209,890 | 24,754,749 | |||||||||
120
Notes to Financial Statements (continued)
| 9. | Federal Income Tax Information (continued) |
At October 31, 2021, the identified cost of investments for federal income tax purposes, the resulting gross unrealized appreciation and depreciation, and the net unrealized appreciation were as follows:
| PRO-BLEND® CONSERVATIVE TERM SERIES | PRO-BLEND® MODERATE TERM SERIES | PRO-BLEND® EXTENDED TERM SERIES | PRO-BLEND® MAXIMUM TERM SERIES | |||||||||||||
| Cost for federal income tax purposes | $ | 487,668,447 | $ | 455,663,590 | $ | 624,423,602 | $ | 411,893,535 | ||||||||
| Unrealized appreciation | 45,861,819 | 60,127,767 | 113,673,368 | 164,915,294 | ||||||||||||
| Unrealized depreciation | (7,441,892 | ) | (7,767,828 | ) | (11,356,430 | ) | (6,568,949 | ) | ||||||||
| Net unrealized appreciation | $ | 38,419,927 | $ | 52,359,939 | $ | 102,316,938 | $ | 158,346,345 | ||||||||
| Undistributed ordinary income | $ | 14,722,269 | $ | 21,163,407 | $ | 34,261,720 | $ | 25,085,057 | ||||||||
| Undistributed long-term capital gains | $ | 15,212,515 | $ | 16,455,906 | $ | 19,205,037 | $ | 25,202,190 | ||||||||
| Capital loss carryforwards | $ | (339,734 | ) | — | — | — | ||||||||||
At October 31, 2021, Pro-Blend® Conservative Term Series had net short-term capital loss carryforwards of $ 20,936 and long-term capital loss carryforwards of $ 318,798, respectively, available, to the extent allowed by the Internal Revenue Code, to offset future net capital gain, if any, which may be carried forward indefinitely.
For the year ended October 31, 2021, the capital loss carryover utilized by Pro-Blend® Conservative Term Series was $752.
| 10. | Market Event |
In March 2020, the World Health Organization declared COVID-19 (a novel coronavirus) to be a pandemic. The situation is dynamic. Global financial markets have experienced and may continue to experience significant volatility resulting from the spread of COVID-19. The global economy, the economies of certain nations and individual issuers have been and may continue to be adversely affected by COVID-19, particularly in light of the interconnectivity between economies and financial markets, all of which may negatively impact the Series’ performance. In addition, COVID-19 and governmental responses to COVID-19 may negatively impact the capabilities of the Series’ service providers and disrupt the Series’ operations. Management of the Series will continue to monitor the impact of COVID-19.
121
Report of Independent Registered Public Accounting Firm
To the Board of Directors of Manning & Napier Fund, Inc. and Shareholders of Pro-Blend® Conservative Term Series, Pro-Blend® Moderate Term Series, Pro-Blend® Extended Term Series and Pro-Blend® Maximum Term Series
Opinions on the Financial Statements
We have audited the accompanying statements of assets and liabilities, including the investment portfolios, of Pro-Blend® Conservative Term Series, Pro-Blend® Moderate Term Series, Pro-Blend® Extended Term Series and Pro-Blend® Maximum Term Series (four of the series constituting Manning & Napier Fund, Inc., hereafter collectively referred to as the “Funds”) as of October 31, 2021, the related statements of operations for the year ended October 31, 2021, the statements of changes in net assets for each of the two years in the period ended October 31, 2021, including the related notes, and the financial highlights for each of the periods indicated therein (collectively referred to as the “financial statements”). In our opinion, the financial statements present fairly, in all material respects, the financial position of each of the Funds as of October 31, 2021, the results of each of their operations for the year then ended, the changes in each of their net assets for each of the two years in the period ended October 31, 2021 and each of the financial highlights for each of the periods indicated therein in conformity with accounting principles generally accepted in the United States of America.
Basis for Opinions
These financial statements are the responsibility of the Funds’ management. Our responsibility is to express an opinion on the Funds’ financial statements based on our audits. We are a public accounting firm registered with the Public Company Accounting Oversight Board (United States) (PCAOB) and are required to be independent with respect to the Funds in accordance with the U.S. federal securities laws and the applicable rules and regulations of the Securities and Exchange Commission and the PCAOB.
We conducted our audits of these financial statements in accordance with the standards of the PCAOB. Those standards require that we plan and perform the audit to obtain reasonable assurance about whether the financial statements are free of material misstatement, whether due to error or fraud.
Our audits included performing procedures to assess the risks of material misstatement of the financial statements, whether due to error or fraud, and performing procedures that respond to those risks. Such procedures included examining, on a test basis, evidence regarding the amounts and disclosures in the financial statements. Our audits also included evaluating the accounting principles used and significant estimates made by management, as well as evaluating the overall presentation of the financial statements. Our procedures included confirmation of securities owned as of October 31, 2021 by correspondence with the custodian and brokers; when replies were not received from brokers, we performed other auditing procedures. We believe that our audits provide a reasonable basis for our opinions.
New York, New York
December 15, 2021
We have served as the auditor of one or more investment companies in Manning & Napier Mutual Funds since 1992.
122
Supplemental Tax Information
(unaudited)
All reportings are based on financial information available as of the date of this annual report and, accordingly, are subject to change.
For federal income tax purposes, each of the Series reports for the current fiscal year the amount disclosed below or, if different, the maximum amount allowable under the tax law as qualified dividend income (“QDI”).
| Series | QDI | |||
| Pro-Blend® Conservative Term Series | $ | 3,940,303 | ||
| Pro-Blend® Moderate Term Series | 1,938,857 | |||
| Pro-Blend® Extended Term Series | 3,419,018 | |||
| Pro-Blend® Maximum Term Series | 1,581,937 |
For corporate shareholders, the percentage of investment income (dividend income plus short-term gain, if any) that qualifies for the dividends received deduction (DRD) for the current fiscal year is as follows:
| Series | DRD% | |||
| Pro-Blend® Conservative Term Series | 7.17 | % | ||
| Pro-Blend® Moderate Term Series | 6.43 | % | ||
| Pro-Blend® Extended Term Series | 7.14 | % | ||
| Pro-Blend® Maximum Term Series | 89.43 | % |
The Series designate Long-Term Capital Gain dividends pursuant to Section 852(b)(3) of the Code for the fiscal year ended October 31, 2021 as follows:
| Series | ||||
| Pro-Blend® Conservative Term Series | $ | 17,277,748 | ||
| Pro-Blend® Moderate Term Series | 18,519,167 | |||
| Pro-Blend® Extended Term Series | 21,374,989 | |||
| Pro-Blend® Maximum Term Series | 28,640,978 |
123
Directors’ and Officers’ Information
(unaudited)
The Statement of Additional Information provides additional information about the Fund’s directors and officers and can be obtained without charge by calling 1-800-466-3863, at www.manning-napier.com, or on the EDGAR Database on the SEC Internet web site (http://www.sec.gov). The following chart shows certain information about the Fund’s directors and officers, including their principal occupations during the last five years. Unless specific dates are provided, the individuals have held the listed positions for longer than five years.
Interested Director and Officer
| Name: | Paul Battaglia* | |
| Address: | 290 Woodcliff Drive Fairport, NY 14450 | |
| Age: | 43 | |
| Current Position(s) Held with Fund: | Principal Executive Officer, President, Chairman and Director | |
| Term of Office1 & Length of Time Served: | Indefinite – Chairman and Director since November 2018 | |
| Principal Occupation(s) During Past 5 Years: | Chief Financial Officer since 2018; Vice President of Finance (2016 – 2018); Director of Finance (2011 – 2016); Financial Analyst/Internal Auditor (2004-2006) – Manning & Napier Advisors, LLC and affiliates Holds one or more of the following titles for various subsidiaries and affiliates: Chief Financial Officer | |
| Number of Portfolios Overseen within Fund Complex: | 15 | |
| Other Directorships Held Outside Fund Complex During Past 5 Years: | N/A |
Independent Directors
| Name: | Stephen B. Ashley | |
| Address: | 290 Woodcliff Drive Fairport, NY 14450 | |
| Age: | 81 | |
| Current Position(s) Held with Fund: | Director, Audit Committee Member, Governance & Nominating Committee Member | |
| Term of Office & Length of Time Served: | Indefinite – Since 1996 | |
| Principal Occupation(s) During Past 5 Years: | Chairman and Director since 1997; Chief Executive Officer (1997-2019) - Ashley Companies (property management and investment) | |
| Number of Portfolios Overseen within Fund Complex: | 15 | |
| Other Directorships Held Outside Fund Complex During Past 5 Years: | Ashley Companies since 1997 | |
| Name: | Paul A. Brooke | |
| Address: | 290 Woodcliff Drive Fairport, NY 14450 | |
| Age: | 75 | |
| Current Position(s) Held with Fund: | Lead Independent Director, Audit Committee Member, Governance & Nominating Committee Chairman | |
| Term of Office & Length of Time Served: | Indefinite – Director, Audit Committee Member, Governance & Nominating Committee Member since 2007; Lead Independent Director since 2017 | |
| Principal Occupation(s) During Past 5 Years: | Managing Member since 1991 - PMSV Holdings LLC (investments); Managing Member (2010-2016) - Venbio (investments). | |
| Number of Portfolios Overseen within Fund Complex: | 15 | |
| Other Directorships Held Outside Fund Complex During Past 5 Years: | Incyte Corp. (biotech) (2000-2020); PureEarth (non-profit) since 2012; Cerus (biomedical) since 2016; Caelum BioSciences (biomedical) since 2018; Cheyne Capital International (investment)(2000-2017); |
124
Directors’ and Officers’ Information
(unaudited)
Independent Directors (continued)
| Name: | John Glazer | |
| Address: | 290 Woodcliff Drive Fairport, NY 14450 | |
| Age: | 56 | |
| Current Position(s) Held with Fund: | Director, Audit Committee Member, Governance & Nominating Committee Member | |
| Term of Office & Length of Time Served: | Indefinite – Director, Audit Committee Member, Governance & Nominating Committee Member since February 2021 | |
| Principal Occupation(s) During Past 5 Years: | Chief Executive Officer since 2020 – Oikos Holdings LLC (Single-Family Office); Head of Corporate Development (2019-2020) – Caelum Biosciences (pharmaceutical development); Head of Private Investments (2015-2018) – AC Limited (Single-Family Office) | |
| Number of Portfolios Overseen within Fund Complex: | 15 | |
| Other Directorships Held Outside Fund Complex During Past 5 Years: | N/A | |
| Name: | Margaret McLaughlin | |
| Address: | 290 Woodcliff Drive Fairport, NY 14450 | |
| Age: | 54 | |
| Current Position(s) Held with Fund: | Director, Audit Committee Member, Governance & Nominating Committee Member | |
| Term of Office & Length of Time Served: | Indefinite – Director, Audit Committee Member, Governance & Nominating Committee Member since February 2021 | |
| Principal Occupation(s) During Past 5 Years: | Consultant since 2020 – Bates Group (consultants); Consultant (2019-2020) – Madison Dearborn Partners (private equity); General Counsel/CCO (2011-2019) – Kramer Van Kirk Credit Strategies L.P./Mariana Systems LLC (Investment Adviser/SaaS Technology) | |
| Number of Portfolios Overseen within Fund Complex: | 15 | |
| Other Directorships Held Outside Fund Complex During Past 5 Years: | N/A | |
| Name: | Russell O. Vernon | |
| Address: | 290 Woodcliff Drive Fairport, NY 14450 | |
| Age: | 63 | |
| Current Position(s) Held with Fund: | Director, Audit Committee Member, Governance & Nominating Committee Chairman | |
| Term of Office & Length of Time Served: | Indefinite – Director, Audit Committee Member, Governance & Nominating Committee Member since April 2020; Governance & Nominating Committee Chairman since November 2020 | |
| Principal Occupation(s) During Past 5 Years: | Founder and General Partner (2009-2019) – BVM Capital Management (economic development) | |
| Number of Portfolios Overseen within Fund Complex: | 15 | |
| Other Directorships Held Outside Fund Complex During Past 5 Years: | Board Member, Vice Chairman and President since 2010 – Newburgh Armory Unity Center (military); Board Member and Executive Director since 2020 – National Purple Heart Honor Mission, Inc. (military); Board Member, Vice Chairman (2015-2020) – National Purple Heart Hall of Honor, Inc. (military) |
125
Directors’ and Officers’ Information
(unaudited)
Independent Directors (continued)
| Name: | Chester N. Watson | |
| Address: | 290 Woodcliff Drive Fairport, NY 14450 | |
| Age: | 71 | |
| Current Position(s) Held with Fund: | Director, Audit Committee Chairman, Governance & Nominating Committee Member | |
| Term of Office & Length of Time Served: | Indefinite – Director, Audit Committee Member, Governance & Nominating Committee Member Since 2012; Audit Committee Chairman since 2013 | |
| Principal Occupation(s) During Past 5 Years: | General Auditor (2003-2011) - General Motors Company (auto manufacturer) | |
| Number of Portfolios Overseen within Fund Complex: | 15 | |
| Other Directorships Held Outside Fund Complex During Past 5 Years: | Rochester Institute of Technology (University) since 2005; Hudson Valley Center for Innovation, Inc. (New Business and Economic Development) since 2019; Town of Greenburgh, NY Planning Board (Municipal Government) (2015-2019); |
Officers:
| Name: | Elizabeth Craig | |
| Address: | 290 Woodcliff Drive | |
| Fairport, NY 14450 | ||
| Age: | 34 | |
| Current Position(s) Held with Fund: | Corporate Secretary | |
| Term of Office1 & Length of Time Served: | Since 2016 | |
| Principal Occupation(s) During Past 5 Years: | Director of Fund Administration since 2021; Fund Regulatory Administration Manager (2018-2021); Fund Administration Manager (2015-2018); Mutual Fund Compliance Specialist (2009-2015) - Manning & Napier Advisors, LLC; Assistant Corporate Secretary (2011-2016) - Manning & Napier Fund, Inc.; Corporate Secretary, Director since 2019– Manning & Napier Investor Services, Inc. | |
| Name: | Samantha Larew | |
| Address: | 290 Woodcliff Drive Fairport, NY 14450 | |
| Age: | 41 | |
| Current Position(s) Held with Fund: | Chief Compliance Officer and Anti-Money Laundering Compliance Officer | |
| Term of Office1 & Length of Time Served: | Chief Compliance Officer since 2019; Anti-Money Laundering Compliance | |
| Officer since 2018 | ||
| Principal Occupation(s) During Past 5 Years: | Co-Director of Compliance since 2018; Compliance Communications Supervisor (2014-2018); Compliance Supervisor (2013-2014); Broker-Dealer Compliance Supervisor (2011-2013); Broker-Dealer Compliance Analyst (2010-2011) - Manning & Napier Advisors, LLC& Affiliates; Broker-Dealer Chief Compliance Officer since 2013; Broker-Dealer Assistant Corporate Secretary since 2011 – Manning & Napier Investor Services, Inc.; Compliance Analyst (2007-2009) – Wall Street Financial Group; Compliance Specialist (2003-2007) – Manning & Napier Advisors, LLC & Affiliates | |
| Name: | Scott Morabito | |
| Address: | 290 Woodcliff Drive Fairport, NY 14450 | |
| Age: | 33 | |
| Current Position(s) Held with Fund: | Vice President | |
| Term of Office1 & Length of Time Served: | Vice President since 2019; Assistant Vice President (2017-2019) | |
| Principal Occupation(s) During Past 5 Years: | Managing Director, Client Service and Business Operations since 2021; Managing Director of Operations (2019-2021); Director of Funds Group (2017-2019); Fund Product and Strategy Manager (2014-2017); Senior Product and Strategy Analyst (2013-2014); Product and Strategy Analyst (2011-2013) - Manning & Napier Advisors, LLC; President, Director since 2018 – Manning & Napier Investor Services, Inc.; President, Exeter Trust Company since 2021; |
126
Directors’ and Officers’ Information
(unaudited)
Officers: (continued)
| Name: | Troy Statczar | |
| Address: | 290 Woodcliff Drive | |
| Fairport, NY 14450 | ||
| Age: | 50 | |
| Current Position(s) Held with Fund: | Principal Financial Officer, Treasurer | |
| Term of Office & Length of Time Served: | Principal Financial Officer and Treasurer since 2020 | |
| Principal Occupation(s) During Past 5 Years: | Senior Director, Foreside Treasurer Services since 2020 - Foreside Financial Group; Director of Fund Administration (2017-2019) - Thornburg Investment Management, Inc.; Director of U.S. Operations (2008-2017) - Henderson Global Investors N.A., Inc. | |
| Name: | Sarah Turner | |
| Address: | 290 Woodcliff Drive Fairport, NY 14450 | |
| Age: | 39 | |
| Current Position(s) Held with Fund: | Chief Legal Officer; Assistant Corporate Secretary | |
| Term of Office & Length of Time Served: | Since 2018 | |
| Principal Occupation(s) During Past 5 Years: | Attorney since 2018 - Manning & Napier Advisors, LLC and affiliates; Counsel (2017-2018) – Harter Secrest and Emery LLP; Legal Counsel (2010-2017) – Manning & Napier Advisors, LLC and affiliates Holds one or more of the following titles for various affiliates: Corporate Secretary, General Counsel |
*Interested Director, within the meaning of the 1940 Act by reason of his positions with the Fund’s Advisor, Manning & Napier Advisors, LLC, and Distributor, Manning & Napier Investor Services, Inc.
1The term of office of all officers shall be one year and until their respective successors are chosen and qualified, or his or her earlier resignation or removal as provided in the Fund’s By-Laws.
127
{This page intentionally left blank}
128
{This page intentionally left blank}
129
Literature Requests
(unaudited)
Proxy Voting Policies and Procedures
A description of the policies and procedures that the Fund uses to determine how to vote proxies relating to portfolio securities is available, without charge, upon request:
| By phone | 1-800-466-3863 |
| On the Securities and Exchange Commission’s (SEC) web site | http://www.sec.gov |
Proxy Voting Record
Information regarding how the Fund voted proxies relating to portfolio securities during the most recent 12-month period ended June 30th is available, without charge, upon request:
| By phone | 1-800-466-3863 |
| On the SEC’s web site | http://www.sec.gov |
Quarterly Portfolio Holdings
The Series’ complete schedule of portfolio holdings for the 1st and 3rd quarters of each fiscal year are provided on Form N-PORT, and are available, without charge, upon request:
| By phone | 1-800-466-3863 |
| On the SEC’s web site | http://www.sec.gov |
Prospectus and Statement of Additional Information (SAI)
For more information about any of the Manning & Napier Fund, Inc. Series, you may obtain a prospectus and SAI at www.manning-napier.com or by calling 1-(800) 466-3863. Before investing, carefully consider the objectives, risks, charges and expenses of the investment and read the prospectus carefully as it contains this and other information about the investment company. In addition, this information can be found on the SEC’s web site, http://www.sec.gov.
Additional information available at www.manning-napier.com
| 1. | Fund Holdings - Month-End |
| 2. | Fund Holdings - Quarter-End |
| 3. | Shareholder Report - Annual |
| 4. | Shareholder Report - Semi-Annual |
The Fund also offers electronic notification or “e-delivery” when certain documents are available on-line to be downloaded or reviewed. Direct shareholders can elect to receive electronic notification when shareholder reports, prospectus updates, and/or statements are available. If you do not currently have on-line access to your account, you can establish access by going to www.manning-napier.com, click on “Login” in the top corner of the page, and follow the prompts to self-enroll. Once enrolled, you can set your electronic notification preferences by clicking on the Account Options tab located within the green toolbar and then select E-Delivery Option. Should you have any questions on either how to establish on-line access or how to update your account settings, please contact Investor Services at 1-800-466-3863.
The Manning & Napier Fund, Inc. is managed by Manning & Napier Advisors, LLC. Manning & Napier Investor Services, Inc., an affiliate of Manning & Napier Advisors, LLC, is the distributor of the Fund shares.
MNPRO-10/21-AR
130
www.manning-napier.com
Manning & Napier Fund, Inc.
Rainier International Discovery Series
Paper copies of the Series’ shareholder reports are no longer sent by mail, unless you specifically request them from the Series or from your financial intermediary, such as a broker-dealer or bank. Shareholder reports are available online. Each time a report is posted on the Series’ website you will be provided with a link to access the report online, either by mail (hard copy notice) or by email, if you have already signed up for electronic delivery of shareholder reports.
You may elect to receive all future shareholder reports in paper free of charge. If you invest through a financial intermediary, you can contact your financial intermediary to request that you continue to receive paper copies. If you invest directly with the Fund, you can inform the Fund that you wish to continue receiving paper copies by visiting www.manning-napier.com or calling 1-800-466-3863. Your election to receive reports in paper will apply to all funds held with your financial intermediary if you invest through a financial intermediary or all series of the Fund if you invest directly with the Fund.
Additionally, If you have not yet signed up for electronic delivery of shareholder reports and other Fund communications, you may do so by contacting your financial intermediary or, if you are a direct investor, by visiting www.manning-napier.com or calling 1-800-466-3863.
| | Independent Perspective l Real-World Solutions |
A Note from Our CEO
Dear Shareholder,
The obstacles were many, but this year, in so many ways, is a story of triumphant resilience only serving to spotlight just how much more there is to do.
Over the past eighteen months, we’ve endured a recession, a bear market, and a pandemic. Our collective perseverance is now paying off.
We are today experiencing a remarkable economic boom, a historic market rally, and continued medical innovation, all of which have turned a challenging period into one of optimism and hope.
At the same time, political and societal polarization are heightened, social justice concerns have justifiably come to the fore, and the precarious state of our environment presents almost unimaginable challenges for government, business, and finance.
This certainly is a moment of great consequence.
The kind of moment that questions all the rules. Economic rules in how we add value for each other, as well as for ourselves. Social rules in how we interact with each other. Environmental rules that can balance the current needs of emerging economies with the requirements for everyone in the future. Workplace rules in how we get the job done.
Our lives are being redefined, and our society, planet, workplaces, and industry must confront the challenges of the upcoming decade.
Markets reflect us. They mirror our collective thoughts, feelings, expectations, and beliefs – these new life rules.
As we go through this period of change, it will be uncertain and uncomfortable. For those unaccustomed to change, for those reliant on ‘set it and forget it’, these may seem like daunting questions, but there is a better way.
Success in an era of change demands flexibility, adaptability, and a roll-up-your-sleeves willingness to do the work.
For over 50 years, independent thinking and tireless work have underpinned every decision we’ve made on behalf of our investors. We invest for the long-term, we do not speculate. We make active decisions, and we invest with discipline, patience, and confidence. This is the only way we know, to remain true to our values and our fiduciary duty to you, the investors in our mutual funds.
You demand more. At Manning & Napier, we demand more of ourselves. Upon reflection of the year, we’re proud to have continued to deliver more.
We wish you safety and good health, and we appreciate your confidence in our firm and our approach.
| | Sincerely,
Marc Mayer
|
Corporate Headquarters | 290 Woodcliff Drive | Fairport, NY 14450 | (585) 325-6880 phone | (800) 551-0224 toll free | www.manning-napier.com
131
Rainier International Discovery Series
Fund Commentary
(unaudited)
Investment Objective
To seek long-term capital appreciation. The Series invests primarily in equity securities of foreign developed and emerging market companies that are small- to mid-sized at the time of purchase.
Performance Commentary
Broad international equity markets posted positive returns for the twelve-month period ending October 31, 2021, including small- and mid-cap stocks (on which the Series is focused) which outperformed their large cap counterparts. In a reversal from the prior year, value stocks outpaced growth stocks. On a regional basis, developed markets notably outperformed emerging markets.
The Rainier International Discovery Series Class S shares delivered significant positive returns and marginally trailed the MSCI ACWI ex USA Small Cap Index, returning 38.1% and 38.8% respectively.
Security selection broadly contributed positively to returns, while sector allocations detracted. Regional and country allocations, however, were positive. An overweight allocation to the Industrials sector was a positive, as well as selection within the Consumer Discretionary and Health Care sectors. Selection within Industrials and Financials, however, detracted from relative returns. Top individual contributors to performance during the period included MIPS (a Swedish company specializing in protective helmet technology), TFI International (a Canadian transport and logistics company), and Li Ning Company (a Chinese sportswear retailer).
Detractors from performance included Peptidream (a Japanese biopharma company specializing in non-standard peptide therapeutics) and flatexDEGIRO (a European online brokerage company based out of Germany). Peptidream was removed from the portfolio, and flatexDEGIRO remains.
The Series continues to maintain exposure to several important trends that we think will be crucial to global economic development moving forward, including automation, global digitization, remote connectivity, software as a service, healthcare innovation, and renewable energy. The portfolio remains underweight to emerging markets as greater macro risks continue to loom over many of those economies relative to the developed world, yet we continue to find attractive investment opportunities in innovative companies there on an individual basis.
Rainier’s international small-cap investment process and approach, as always, has been steady and disciplined throughout the year. The team is currently focused on positioning the Series through investment primarily in what they believe are strong, essential, and innovative businesses that have the potential to continue to lead the global economy for years to come. This is consistent with the team’s long-term philosophy over the past nine years of investing in companies with strong market positions, innovative leadership, and ability to deliver financial results to shareholders.
Performance data quoted represents past performance and does not guarantee future results. The investment return and principal value of an investment will fluctuate, so that an investor’s shares, when redeemed, may be worth more or less than their original cost. Current performance may be higher or lower than that quoted; investors can obtain the most recent month-end performance at www.manning-napier.com or by calling (800) 466-3863.
Commentary prepared using data provided by FactSet. Analysis Manning & Napier. Commentary presented is relative to the ACWIxUS Small Cap Index. Additional information and associated disclosures can be found on the Performance Update page of this report.
The data presented is for informational purposes only. It is not to be considered a specific stock recommendation.
All investments involve risks, including possible loss of principal. As with any stock fund, the value of your investment will fluctuate in response to stock market movements. Small- and medium-capitalization companies tend to have limited liquidity and greater price volatility than large-capitalization companies. Funds whose investments are concentrated in foreign and emerging market countries may be subject to fluctuating currency values, different accounting standards, and economic and political instability. The value of the Series may be affected by changes in exchange rates between foreign currencies and the U.S. dollar. Investments in emerging markets may be more volatile than investments in more developed markets. Additionally, the Series is subject to portfolio turnover risk as it may buy and sell investments frequently, which may result in higher expenses and an increase in realized capital gains and potential tax implications for shareholders.
132
Rainier International Discovery Series
Performance Update as of October 31, 2021
(unaudited)
| AVERAGE ANNUAL TOTAL RETURNS AS OF OCTOBER 31, 2021 | |||
| ONE YEAR1 | FIVE YEAR | SINCE INCEPTION2 | |
| Rainier International Discovery Series - Class S3,4 | 38.06% | 17.42% | 14.93% |
| Rainier International Discovery Series - Class I3,4 | 38.41% | 17.72% | 15.22% |
| Rainier International Discovery Series - Class W3,5 | 39.91% | 18.37% | 15.55% |
| Rainier International Discovery Series - Class Z3,4 | 38.61% | 17.86% | 15.29% |
| MSCI ACWI ex USA Small Cap Index6 | 38.83% | 11.21% | 6.38% |
The following graph compares the value of a $1,000,000 investment in the Rainier International Discovery Series - Class I from its inception2 (March 28, 2012) to present (October 31, 2021) to the MSCI ACWI ex USA Small Cap Index.
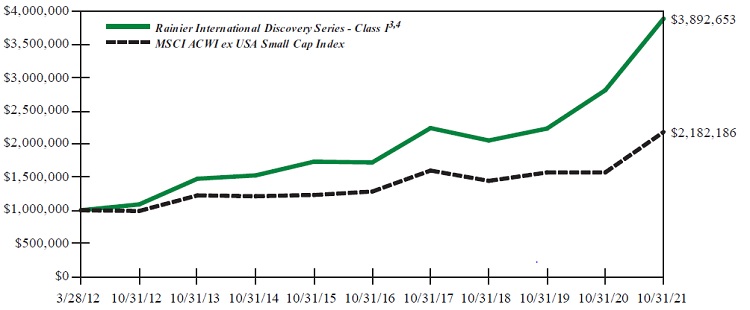
1The returns shown are based on net asset values calculated for shareholder transactions and may differ from the returns shown in the financial highlights, which reflect adjustments made to the net asset values in accordance with accounting principles generally accepted in the United States of America.
2Performance numbers for the Series and the MSCI ACWI ex USA Small Cap Index are calculated from March 28, 2012, the Class I inception date.
3The Series’ performance does not reflect the deduction of taxes that a shareholder would pay on fund distributions or the redemption of shares. The Series’ performance is historical and may not be indicative of future results. The performance returns shown are inclusive of the net expense ratio of the Series. For the year ended October 31, 2021, this net expense ratio was 1.40% for Class S, 1.13% for Class I, 0.10% for Class W and 1.00% for Class Z. The gross expense ratio, which does not account for any voluntary or contractual waivers currently in effect, was 1.40% for Class S, 1.13% for Class I, 1.03% for Class W and 1.03% for Class Z for the year ended October 31, 2021.
4The Rainier International Discovery Fund (Predecessor Fund), which was managed by Rainier Investment Management, LLC, was reorganized into the Manning & Napier Fund, Inc. Rainier International Discovery Series on August 21, 2017. For periods prior to August 21, 2017, performance for the Class I and Z Shares is based on the historical performance of the Predecessor Fund’s Institutional Shares, and will differ to the extent that the Predecessor Fund’s Institutional Shares had a higher expense ratio. For periods between November 30, 2012 and August 21, 2017, performance for Class S is based on the historical performance of the Predecessor Fund’s Class A Shares; performance prior to November 30, 2012 is based on the historical performance of the Predecessor Fund’s Institutional Shares and adjusted for the Predecessor Fund’s Class A Shares expenses. If the sales charges were reflected or if performance had been adjusted to reflect the Class S Shares’ expenses, the performance would have been different depending on total expenses incurred by the Predecessor Fund.
5For periods through March 1, 2019 (the inception date of the Class W shares), performance for the Class W shares is based on the historical performance of the Class I shares. Because the Class W shares invest in the same portfolio of securities as the Class I shares, performance will be different only to the extent that the Class I shares have a higher expense ratio.
133
Rainier International Discovery Series
Performance Update as of October 31, 2021
(unaudited)
6The MSCI ACWI ex USA Small Cap Index is designed to measure a small cap representation across 22 of 23 Developed Markets countries (excluding the U.S.) and 27 Emerging Markets countries. The Index returns do not reflect any fees or expenses. The Index is denominated in U.S. dollars. The Index returns are net of withholding taxes. They assume daily reinvestment of net dividends thus accounting for any applicable dividend taxation. Index returns provided by Bloomberg. Index data referenced herein is the property of MSCI, its affiliates ("MSCI") and/or its third party suppliers and has been licensed for use by Manning & Napier. MSCI and its third party suppliers accept no liability in connection with its use. Data provided is not a representation or warranty, express or implied, as to the ability of any index to accurately represent the asset class or market sector that it purports to represent and none of these parties shall have any liability for any errors, omissions, or interruptions of any index or the data included therein. For additional disclosure information, please see: https://go.manning-napier.com/benchmark-provisions.
134
Rainier International Discovery Series
Shareholder Expense Example
(unaudited)
As a shareholder of the Series, you incur ongoing costs, including management fees, shareholder service fees and other Series expenses. This example is intended to help you understand your ongoing costs (in dollars) of investing in the Series and to compare these costs with the ongoing costs of investing in other mutual funds.
The example is based on an investment of $1,000 invested in each class at the beginning of the period and held for the entire period (May 1, 2021 to October 31, 2021).
Actual Expenses
The Actual lines of the table below provide information about actual account values and actual expenses. You may use the information in these lines, together with the amount you invested, to estimate the expenses that you paid over the period. Simply divide your account value by $1,000 (for example, an $8,600 account value divided by $1,000 = 8.6), then multiply the result by the number in the Actual line for the Class in which you have invested under the heading entitled “Expenses Paid During Period” to estimate the expenses you paid on your account during this period.
Hypothetical Example for Comparison Purposes
The Hypothetical lines of each class in the table below provide information about hypothetical account values and hypothetical expenses based on the Class’ actual expense ratio and an assumed rate of return of 5% per year before expenses, which is not the Class’ actual return. The hypothetical account values and expenses may not be used to estimate the actual ending account balance or expenses you paid during the period. You may use this information to compare the ongoing costs of investing in a class of the Series and other funds. To do so, compare this 5% hypothetical example for the Class in which you have invested with the 5% hypothetical examples that appear in the shareholder reports of the other funds.
Please note that the expenses shown in the table are meant to highlight your ongoing costs only and do not reflect any transaction costs, such as sales charges (loads), redemption fees, or exchange fees that you may incur in other mutual funds. Therefore, the second line of the table is useful in comparing ongoing costs only, and will not help you determine the relative total costs of owning different funds.
| | BEGINNING ACCOUNT VALUE 5/1/21 | ENDING ACCOUNT VALUE 10/31/21 | EXPENSES PAID DURING PERIOD* 5/1/21 - 10/31/21 | ANNUALIZED EXPENSE RATIO |
| Class S | ||||
| Actual | $1,000.00 | $1,065.60 | $7.29 | 1.40% |
| Hypothetical (5% return before expenses) | $1,000.00 | $1,018.15 | $7.12 | 1.40% |
| Class I | ||||
| Actual | $1,000.00 | $1,067.20 | $5.94 | 1.14% |
| Hypothetical (5% return before expenses) | $1,000.00 | $1,019.46 | $5.80 | 1.14% |
| Class W | ||||
| Actual | $1,000.00 | $1,073.10 | $0.52 | 0.10% |
| Hypothetical (5% return before expenses) | $1,000.00 | $1,024.70 | $0.51 | 0.10% |
| Class Z | ||||
| Actual | $1,000.00 | $1,067.90 | $5.21 | 1.00% |
| Hypothetical (5% return before expenses) | $1,000.00 | $1,020.16 | $5.09 | 1.00% |
*Expenses are equal to each Class’ annualized expense ratio (for the six-month period), multiplied by the average account value over the period, multiplied by 184/365 (to reflect the one-half year period). Expenses are based on the most recent fiscal half year; therefore, the expense ratios stated above may differ from the expense ratios stated in the financial highlights, which are based on one-year data. The Class’ total return would have been lower had certain expenses not been waived or reimbursed during the period.
135
Rainier International Discovery Series
Portfolio Composition as of October 31, 2021
(unaudited)
| Country Allocation1,2 |
1As a percentage of net assets. 2Allocations are based on country of risk. 3Miscellaneous Ireland 0.5% Luxembourg 0.6% Mexico 0.5% |

| Sector Allocation4 |
4As a percentage of net assets. |
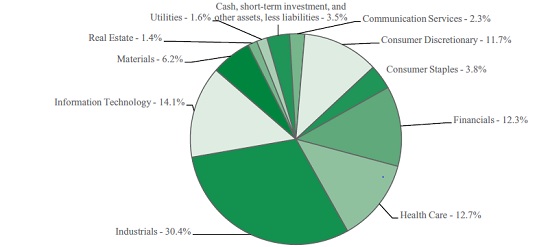
136
Rainier International Discovery Series
Investment Portfolio - October 31, 2021
| SHARES | VALUE (NOTE 2) | |||||||
| COMMON STOCKS - 96.5% | ||||||||
| Communication Services - 2.3% | ||||||||
| Diversified Telecommunication Services - 0.8% | ||||||||
| Internet Initiative Japan, Inc. (Japan) | 188,400 | $ | 6,591,797 | |||||
| Media - 1.5% | ||||||||
| Future plc (United Kingdom) | 253,095 | 12,210,121 | ||||||
| Total Communication Services | 18,801,918 | |||||||
| Consumer Discretionary - 11.7% | ||||||||
| Auto Components - 0.6% | ||||||||
| Linamar Corp. (Canada) | 99,176 | 5,454,840 | ||||||
| Hotels, Restaurants & Leisure - 1.9% | ||||||||
| Domino's Pizza Enterprises Ltd. | ||||||||
| (Australia) | 54,171 | 5,556,759 | ||||||
| The Indian Hotels Co. Ltd. (India) | 3,715,809 | 9,802,027 | ||||||
| 15,358,786 | ||||||||
| Household Durables - 1.5% | ||||||||
| Countryside Properties plc (United Kingdom)*1 | 887,933 | 5,715,750 | ||||||
| Dixon Technologies India Ltd. (India)1 | 103,760 | 6,930,262 | ||||||
| 12,646,012 | ||||||||
| Internet & Direct Marketing Retail - 0.4% | ||||||||
| BHG Group AB (Sweden)* | 269,633 | 3,109,096 | ||||||
| Leisure Products - 3.0% | ||||||||
| KMC Kuei Meng International, Inc. | ||||||||
| (Taiwan) | 679,000 | 4,947,126 | ||||||
| MIPS AB (Sweden)1 | 165,729 | 20,011,758 | ||||||
| 24,958,884 | ||||||||
| Multiline Retail - 0.4% | ||||||||
| B&M European Value Retail S.A. (United Kingdom) | 385,326 | 3,338,357 | ||||||
| Specialty Retail - 2.4% | ||||||||
| Musti Group OYJ (Finland) | 161,063 | 6,335,760 | ||||||
| Nextage Co. Ltd. (Japan) | 248,800 | 4,559,701 | ||||||
| Watches of Switzerland Group plc (United Kingdom)*1 | 548,746 | 8,520,745 | ||||||
| 19,416,206 | ||||||||
| Textiles, Apparel & Luxury Goods - 1.5% | ||||||||
| Li Ning Co. Ltd. (China) | 1,098,500 | 12,122,019 | ||||||
| Total Consumer Discretionary | 96,404,200 | |||||||
| Consumer Staples - 3.8% | ||||||||
| Beverages - 3.2% | ||||||||
| Royal Unibrew A/S (Denmark) | 153,732 | 19,097,420 | ||||||
| Varun Beverages Ltd. (India) | 614,572 | 6,981,567 | ||||||
| 26,078,987 | ||||||||
| Personal Products - 0.6% | ||||||||
| L'Occitane International S.A. | ||||||||
| (Luxembourg) | 1,372,500 | 4,909,028 | ||||||
| Total Consumer Staples | 30,988,015 | |||||||
| SHARES | VALUE (NOTE 2) | |||||||
| COMMON STOCKS (continued) | ||||||||
| Financials - 12.3% | ||||||||
| Banks - 6.6% | ||||||||
| Canadian Western Bank (Canada) | 497,305 | $ | 15,908,456 | |||||
| FinecoBank Banca Fineco S.p.A. (Italy)* | 670,656 | 12,808,051 | ||||||
| Ringkjoebing Landbobank A/S (Denmark) | 94,217 | 11,961,972 | ||||||
| Sydbank AS (Denmark) | 384,659 | 13,218,855 | ||||||
| 53,897,334 | ||||||||
| Capital Markets - 5.0% | ||||||||
| Avanza Bank Holding AB (Sweden) | 271,270 | 10,784,524 | ||||||
| Euronext N.V. (Netherlands)1 | 60,692 | 6,828,121 | ||||||
| flatexDEGIRO AG (Germany)* | 177,698 | 4,036,522 | ||||||
| Indian Energy Exchange Ltd. (India)1 | 484,672 | 4,594,091 | ||||||
| Intermediate Capital Group plc (United Kingdom) | 287,765 | 8,631,502 | ||||||
| MLP SE (Germany) | 674,040 | 6,490,655 | ||||||
| 41,365,415 | ||||||||
| Consumer Finance - 0.7% | ||||||||
| goeasy Ltd. (Canada) | 35,106 | 5,501,340 | ||||||
| Total Financials | 100,764,089 | |||||||
| Health Care - 12.7% | ||||||||
| Biotechnology - 0.7% | ||||||||
| Vitrolife AB (Sweden) | 86,077 | 5,602,147 | ||||||
| Health Care Equipment & Supplies - 5.4% | ||||||||
| Arjo AB - Class B (Sweden) | 1,333,238 | 18,181,710 | ||||||
| Asahi Intecc Co. Ltd. (Japan) | 247,800 | 6,531,850 | ||||||
| Revenio Group OYJ (Finland) | 93,408 | 6,163,548 | ||||||
| Surgical Science Sweden AB (Sweden)* | 70,232 | 2,089,459 | ||||||
| Vimian Group AB (Sweden)* | 464,611 | 5,125,977 | ||||||
| Xvivo Perfusion AB (Sweden)* | 150,039 | 5,957,534 | ||||||
| 44,050,078 | ||||||||
| Health Care Providers & Services - 0.7% | ||||||||
| Hygeia Healthcare Holdings Co. Ltd. | ||||||||
| (China)1 | 631,200 | 5,541,147 | ||||||
| Health Care Technology - 0.5% | ||||||||
| Pro Medicus Ltd. (Australia) | 115,710 | 4,672,769 | ||||||
| Life Sciences Tools & Services - 1.5% | ||||||||
| BICO Group AB (Sweden)* | 142,494 | 7,145,072 | ||||||
| Genovis AB (Sweden)* | 572,290 | 5,111,160 | ||||||
| 12,256,232 | ||||||||
| Pharmaceuticals - 3.9% | ||||||||
| ALK-Abello A/S (Denmark)* | 34,516 | 14,954,251 | ||||||
| Dechra Pharmaceuticals plc (United Kingdom) | 84,370 | 5,911,786 | ||||||
| Virbac S.A. (France) | 22,097 | 11,199,923 | ||||||
| 32,065,960 | ||||||||
| Total Health Care | 104,188,333 | |||||||
The accompanying notes are an integral part of the financial statements.
7
Rainier International Discovery Series
Investment Portfolio - October 31, 2021
| SHARES | VALUE (NOTE 2) | |||||||
| COMMON STOCKS (continued) | ||||||||
| Industrials - 30.4% | ||||||||
| Aerospace & Defense - 1.7% | ||||||||
| CAE, Inc. (Canada)* | 458,294 | $ | 13,897,684 | |||||
| Building Products - 1.1% | ||||||||
| Inwido AB (Sweden) | 506,935 | 9,294,039 | ||||||
| Commercial Services & Supplies - 0.8% | ||||||||
| Clipper Logistics plc (United Kingdom) | 619,503 | 6,082,866 | ||||||
| Electrical Equipment - 1.7% | ||||||||
| Alfen Beheer B.V. (Netherlands)*1 | 87,698 | 9,879,012 | ||||||
| Voltronic Power Technology Corp. | ||||||||
| (Taiwan) | 73,498 | 4,304,402 | ||||||
| 14,183,414 | ||||||||
| Machinery - 10.8% | ||||||||
| Aalberts N.V. (Netherlands) | 198,585 | 10,991,413 | ||||||
| Cargotec OYJ - Class B (Finland) | 134,816 | 6,981,376 | ||||||
| Daifuku Co. Ltd. (Japan) | 67,200 | 6,186,396 | ||||||
| Interpump Group S.p.A. (Italy) | 217,518 | 16,022,827 | ||||||
| Jungheinrich AG (Germany) | 134,300 | 6,810,697 | ||||||
| Nabtesco Corp. (Japan) | 154,100 | 5,001,097 | ||||||
| SFS Group AG (Switzerland) | 44,728 | 6,024,616 | ||||||
| Takeuchi Manufacturing Co. Ltd. (Japan) | 353,100 | 9,065,616 | ||||||
| THK Co. Ltd. (Japan) | 209,500 | 4,505,012 | ||||||
| Trelleborg AB - Class B (Sweden) | 158,363 | 3,624,555 | ||||||
| VAT Group AG (Switzerland)1 | 28,218 | 13,489,075 | ||||||
| 88,702,680 | ||||||||
| Professional Services - 5.9% | ||||||||
| ALS Ltd. (Australia) | 1,275,783 | 12,795,844 | ||||||
| en Japan, Inc. (Japan) | 159,700 | 6,341,991 | ||||||
| Nihon M&A Center Holdings, Inc. | ||||||||
| (Japan) | 364,000 | 11,176,401 | ||||||
| Teleperformance (France) | 43,431 | 18,141,650 | ||||||
| 48,455,886 | ||||||||
| Road & Rail - 3.3% | ||||||||
| Sixt SE (Germany)* | 69,016 | 11,899,207 | ||||||
| TFI International, Inc. (Canada) | 137,354 | 15,230,356 | ||||||
| 27,129,563 | ||||||||
| Trading Companies & Distributors - 4.6% | ||||||||
| Electrocomponents plc (United Kingdom) | 866,357 | 13,329,416 | ||||||
| Howden Joinery Group plc (United | ||||||||
| Kingdom) | 1,059,753 | 13,340,428 | ||||||
| IndiaMart InterMesh Ltd. (India)1 | 33,145 | 3,170,907 | ||||||
| Toromont Industries Ltd. (Canada) | 87,435 | 7,779,143 | ||||||
| 37,619,894 | ||||||||
| Transportation Infrastructure - 0.5% | ||||||||
| Grupo Aeroportuario del Sureste S.A.B. | ||||||||
| de C.V. - Class B (Mexico) | 196,432 | 3,968,045 | ||||||
| Total Industrials | 249,334,071 | |||||||
| SHARES | VALUE (NOTE 2) | |||||||
| COMMON STOCKS (continued) | ||||||||
| Information Technology - 14.1% | ||||||||
| Electronic Equipment, Instruments & Components - 2.1% | ||||||||
| Halma plc (United Kingdom) | 146,508 | $ | 5,941,381 | |||||
| Oxford Instruments plc (United Kingdom) | 198,735 | 6,252,904 | ||||||
| Sinbon Electronics Co. Ltd. (Taiwan) | 601,000 | 4,972,740 | ||||||
| 17,167,025 | ||||||||
| IT Services - 1.7% | ||||||||
| Keywords Studios plc (Ireland) | 118,983 | 4,617,977 | ||||||
| NHN KCP Corp. (South Korea)* | 77,004 | 3,778,265 | ||||||
| SHIFT, Inc. (Japan)* | 25,500 | 5,880,790 | ||||||
| 14,277,032 | ||||||||
| Semiconductors & Semiconductor Equipment - 6.6% | ||||||||
| ASPEED Technology, Inc. (Taiwan) | 92,000 | 9,228,906 | ||||||
| eMemory Technology, Inc. (Taiwan) | 110,000 | 9,137,206 | ||||||
| Koh Young Technology, Inc. (South Korea) | 340,382 | 5,378,705 | ||||||
| Melexis N.V. (Belgium) | 84,756 | 9,775,458 | ||||||
| Nordic Semiconductor ASA (Norway)* | 272,935 | 8,108,958 | ||||||
| SOITEC (France)* | 45,979 | 12,241,962 | ||||||
| 53,871,195 | ||||||||
| Software - 3.7% | ||||||||
| The Descartes Systems Group, Inc. | ||||||||
| (Canada)* | 80,361 | 6,562,772 | ||||||
| Fortnox AB (Sweden) | 95,015 | 6,726,725 | ||||||
| Netcompany Group A/S (Denmark)1 | 109,180 | 12,432,603 | ||||||
| QT Group OYJ (Finland)* | 28,685 | 4,641,033 | ||||||
| 30,363,133 | ||||||||
| Total Information Technology | 115,678,385 | |||||||
| Materials - 6.2% | ||||||||
| Chemicals - 2.7% | ||||||||
| Corbion N.V. (Netherlands) | 67,663 | 3,212,805 | ||||||
| Kaneka Corp. (Japan) | 216,100 | 8,287,202 | ||||||
| SK Materials Co. Ltd. (South Korea) | 11,446 | 3,747,004 | ||||||
| SKC Co. Ltd. (South Korea) | 42,549 | 6,541,571 | ||||||
| 21,788,582 | ||||||||
| Metals & Mining - 3.5% | ||||||||
| APL Apollo Tubes Ltd. (India)* | 550,968 | 5,904,165 | ||||||
| Lynas Rare Earths Ltd. (Australia)* | 1,615,440 | 9,011,737 | ||||||
| OZ Minerals Ltd. (Australia) | 364,275 | 6,929,186 | ||||||
| SSAB AB - Class B (Sweden)* | 1,433,291 | 7,163,817 | ||||||
| 29,008,905 | ||||||||
| Total Materials | 50,797,487 | |||||||
| Real Estate - 1.4% | ||||||||
| Real Estate Management & Development - 1.4% | ||||||||
| Katitas Co. Ltd. (Japan) | 307,400 | 11,224,331 | ||||||
The accompanying notes are an integral part of the financial statements.
8
Rainier International Discovery Series
Investment Portfolio - October 31, 2021
| SHARES | VALUE (NOTE 2) | |||||||
| COMMON STOCKS (continued) | ||||||||
| Utilities - 1.6% | ||||||||
| Independent Power and Renewable Electricity Producers - 1.6% | ||||||||
| ERG S.p.A. (Italy) | 249,471 | $ | 9,011,870 | |||||
| West Holdings Corp. (Japan) | 82,100 | 4,588,713 | ||||||
| Total Utilities | 13,600,583 | |||||||
| TOTAL COMMON STOCKS | ||||||||
| (Identified Cost $539,619,538) | 791,781,412 | |||||||
| SHARES | VALUE (NOTE 2) | |||||||
| SHORT-TERM INVESTMENT - 3.4% | ||||||||
| Dreyfus Government Cash Management, Institutional Shares, 0.03%2 | ||||||||
| (Identified Cost $27,845,839) | 27,845,839 | $ | 27,845,839 | |||||
| TOTAL INVESTMENTS - 99.9% | ||||||||
| (Identified Cost $567,465,377) | 819,627,251 | |||||||
| OTHER ASSETS, LESS LIABILITIES - 0.1% | 466,413 | |||||||
| NET ASSETS - 100% | $ | 820,093,664 | ||||||
*Non-income producing security.
1 Security purchased or received in a transaction exempt from registration under the Securities Act of 1933, as amended (the “1933 Act”) and determined to be liquid under the Fund’s Liquidity Risk Management Program. The security may be resold pursuant to an exemption from registration under the 1933 Act, typically to qualified institutional buyers. The aggregate value of these securities at October 31, 2021 was $97,113,471, which represented 11.8% of the Series’ Net Assets.
2Rate shown is the current yield as of October 31, 2021.
The Series’ portfolio holds, as a percentage of net assets, greater than 10% in the following countries:
Sweden - 13.4%, Japan - 11.0% and United Kingdom - 10.9%.
The Global Industry Classification Standard (GICS) was developed by and is the exclusive property and a service mark of MSCI Inc. (MSCI) and Standard & Poor’s, a division of S&P Global Inc. (S&P), and is licensed for use by Manning & Napier when referencing GICS sectors. Neither MSCI, S&P, nor any third party involved in making or compiling the GICS or any GICS classifications makes any express or implied warranties or representations with respect to such standard or classification, nor shall any such party have any liability therefrom.
The accompanying notes are an integral part of the financial statements.
9
Rainier International Discovery Series
Statement of Assets and Liabilities
October 31, 2021
| ASSETS: | ||||
| Investments, at value (identified cost $567,465,377) (Note 2) | $ | 819,627,251 | ||
| Foreign currency, at value (identified cost $970,791) | 969,056 | |||
| Receivable for fund shares sold | 735,640 | |||
| Foreign tax reclaims receivable | 581,251 | |||
| Receivable for securities sold | 476,265 | |||
| Dividends receivable | 365,506 | |||
| Prepaid expenses | 38,193 | |||
| TOTAL ASSETS | 822,793,162 | |||
| LIABILITIES: | ||||
| Accrued management fees (Note 3) | 576,615 | |||
| Accrued sub-transfer agent fees (Note 3) | 101,541 | |||
| Accrued fund accounting and administration fees (Note 3) | 61,785 | |||
| Accrued distribution and service (Rule 12b-1) fees (Class S) (Note 3) | 9,951 | |||
| Accrued Chief Compliance Officer service fees (Note 3) | 2,032 | |||
| Accrued foreign capital gains tax (Note 2) | 1,549,311 | |||
| Payable for fund shares repurchased | 270,114 | |||
| Other payables and accrued expenses | 128,149 | |||
| TOTAL LIABILITIES | 2,699,498 | |||
| TOTAL NET ASSETS | $ | 820,093,664 | ||
| NET ASSETS CONSIST OF: | ||||
| Capital stock | $ | 232,465 | ||
| Additional paid-in-capital | 487,714,153 | |||
| Total distributable earnings | 332,147,046 | |||
| TOTAL NET ASSETS | $ | 820,093,664 | ||
| NET ASSET VALUE, OFFERING PRICE AND REDEMPTION PRICE PER SHARE - Class S | ||||
| ($47,910,500/1,378,541 shares) | $ | 34.75 | ||
| NET ASSET VALUE, OFFERING PRICE AND REDEMPTION PRICE PER SHARE - Class I | ||||
| ($335,258,719/9,512,472 shares) | $ | 35.24 | ||
| NET ASSET VALUE, OFFERING PRICE AND REDEMPTION PRICE PER SHARE - Class W | ||||
| ($32,618,049/921,781 shares) | $ | 35.39 | ||
| NET ASSET VALUE, OFFERING PRICE AND REDEMPTION PRICE PER SHARE - Class Z | ||||
| ($404,306,396/11,433,686 shares) | ||||
| $ | 35.36 | |||
The accompanying notes are an integral part of the financial statements.
10
Rainier International Discovery Series
Statement of Operations
For the Year Ended October 31, 2021
| INVESTMENT INCOME: | ||||
| Dividends (net of foreign taxes withheld, $926,887) | $ | 6,857,911 | ||
| Other Income | 21,564 | |||
| Total Investment Income | 6,879,475 | |||
| EXPENSES: | ||||
| Management fees (Note 3) | 6,315,672 | |||
| Sub-transfer agent fees (Note 3) | 275,696 | |||
| Fund accounting and administration fees (Note 3) | 174,080 | |||
| Distribution and service (Rule 12b-1) fees (Class S) (Note 3) | 118,898 | |||
| Directors’ fees (Note 3) | 80,878 | |||
| Chief Compliance Officer service fees (Note 3) | 6,096 | |||
| Custodian fees | 238,258 | |||
| Recoupment of past waived and/or reimbursed fees | 51,120 | |||
| Miscellaneous | 412,100 | |||
| Total Expenses | 7,672,798 | |||
| Less reduction of expenses (Note 3) | (388,768 | ) | ||
| Net Expenses | 7,284,030 | |||
| NET INVESTMENT LOSS | (404,555 | ) | ||
| REALIZED AND UNREALIZED GAIN (LOSS) ON INVESTMENTS AND FOREIGN CURRENCY: | ||||
| Net realized gain (loss) on- Investments | 96,712,053 | |||
| Foreign currency and translation of other assets and liabilities | (284,736 | ) | ||
| 96,427,317 | ||||
| Net change in unrealized appreciation (depreciation) on- Investments (net of increase in accrued foreign capital gains tax of $1,447,024) | 112,014,763 | |||
| Foreign currency and translation of other assets and liabilities | (14,978 | ) | ||
| 111,999,785 | ||||
| NET REALIZED AND UNREALIZED GAIN (LOSS) ON INVESTMENTS AND FOREIGN CURRENCY | 208,427,102 | |||
| NET INCREASE IN NET ASSETS RESULTING FROM OPERATIONS | $ | 208,022,547 |
The accompanying notes are an integral part of the financial statements.
11
Rainier International Discovery Series
Statements of Changes in Net Assets
| FOR THE YEAR ENDED 10/31/21 | FOR THE YEAR ENDED 10/31/20 | |||||||
| INCREASE (DECREASE) IN NET ASSETS: | ||||||||
| OPERATIONS: | ||||||||
| Net investment (loss) | $ | (404,555 | ) | $ | (474,792 | ) | ||
| Net realized gain (loss) on investments and foreign currency | 96,427,317 | 45,150,643 | ||||||
| Net change in unrealized appreciation (depreciation) on investments and foreign currency | 111,999,785 | 61,667,226 | ||||||
| Net increase (decrease) from operations | 208,022,547 | 106,343,077 | ||||||
| DISTRIBUTIONS TO SHAREHOLDERS (Note 9): | ||||||||
| Class S | (736,874 | ) | – | |||||
| Class I | (3,609,202 | ) | (446,459 | ) | ||||
| Class W | (694,385 | ) | (188,339 | ) | ||||
| Class Z | (5,577,585 | ) | (909,875 | ) | ||||
| Total distributions to shareholders | (10,618,046 | ) | (1,544,673 | ) | ||||
| CAPITAL STOCK ISSUED AND REPURCHASED: | ||||||||
| Net increase (decrease) from capital share transactions (Note 5) | 103,148,664 | (34,488,974 | ) | |||||
| Net increase (decrease) in net assets | 300,553,165 | 70,309,430 | ||||||
| NET ASSETS: | ||||||||
| Beginning of year | 519,540,499 | 449,231,069 | ||||||
| End of year | $ | 820,093,664 | $ | 519,540,499 | ||||
The accompanying notes are an integral part of the financial statements.
12
Rainier International Discovery Series
Financial Highlights - Class S*1
| FOR THE YEAR ENDED | FOR THE | |||||||||||||||||
| 10/31/21 | 10/31/20 | 10/31/19 | 10/31/18 | PERIOD 4/1/17 to 10/31/17 | FOR THE YEAR ENDED 3/31/17 | |||||||||||||
| Per share data (for a share outstanding throughout each period): | ||||||||||||||||||
| Net asset value - Beginning of period | $25.62 | $20.41 | $18.83 | $20.61 | $16.44 | $15.93 | ||||||||||||
| Income (loss) from investment operations: | ||||||||||||||||||
| Net investment income (loss)2 | (0.13 | ) | (0.11 | ) | (0.07 | ) | (0.01 | ) | 0.02 | (0.02 | ) | |||||||
| Net realized and unrealized gain (loss) on investments | 9.77 | 5.32 | 1.67 | (1.77 | ) | 4.15 | 0.53 | |||||||||||
| Total from investment operations | 9.64 | 5.21 | 1.60 | (1.78 | ) | 4.17 | 0.51 | |||||||||||
| Less distributions to shareholders: | ||||||||||||||||||
| From net investment income | — | — | (0.02 | ) | — | — | — | |||||||||||
| From net realized gain on investments. | (0.51 | ) | — | — | — | — | — | |||||||||||
| Total distributions to shareholders | (0.51 | ) | — | (0.02 | ) | — | — | — | ||||||||||
| Net asset value - End of period | $34.75 | $25.62 | $20.41 | $18.83 | $20.61 | $16.44 | ||||||||||||
| Net assets - End of period (000’s omitted) | $47,911 | $36,577 | $39,387 | $193,071 | $120,399 | $78,260 | ||||||||||||
| Total return3 | 38.06% | 25.53% | 8.53% | (8.64% | ) | 25.36% | 3.14% | |||||||||||
| Ratios (to average net assets)/Supplemental Data: | ||||||||||||||||||
| Expenses** | 1.40% | 1.40% | 1.40% | 1.40% | 1.49% | 4,5 | 1.51% | 4 | ||||||||||
| Net investment income (loss) | (0.41% | ) | (0.48% | ) | (0.36% | ) | (0.05% | ) | 0.20% | 5 | (0.12% | ) | ||||||
| Series portfolio turnover | 76% | 91% | 102% | 73% | 46% | 123% | ||||||||||||
| *Effective March 1, 2019, Class K shares of the Series have been redesignated as Class S Shares. | ||||||||||||||||||
| **The investment advisor did not impose all or a portion of its management and/or other fees during the periods, and may have paid a portion of the Series’ expenses. If these expenses had been incurred by the Class, the expense ratio (to average net assets) would have increased by the following amounts: | ||||||||||||||||||
| 0.00% | 6 | 0.05% | 0.04% | 0.03% | 0.21% | 5 | 0.14% | |||||||||||
1Rainier International Discovery Fund (“the Predecessor Fund”) transferred its assets and liabilities to the Series at the close of business on August 21, 2017. Because the Series had no investment operations prior to the Reorganization, and based on the similarity of the Series to the Predecessor Fund, the Predecessor Fund is treated as the survivor for accounting and performance reporting purposes. Class S shares of the Series were formerly Class A shares of the Predecessor Fund.
2Calculated based on average shares outstanding during the periods.
3Represents aggregate total return for the periods indicated, and assumes reinvestment of all distributions. Total return would have been lower had certain expenses not been waived or reimbursed during the periods. Periods less than one year are not annualized.
4Expense ratio exceeds expense limitation due to recognition of expenses related to the Reorganization of the Fund. The majority of the expenses incurred by the Series in connection with the reorganization were paid by the Advisor. The Series paid certain expenses, including half of the cost of the proxy, such as printing and solicitation, and all of the legal fees incurred in connection to the reorganization.
5Annualized.
6Less than 0.01%.
The accompanying notes are an integral part of the financial statements.
13
Rainier International Discovery Series
Financial Highlights - Class I1
| FOR THE YEAR ENDED | FOR THE | |||||||||||||||||
| 10/31/21 | 10/31/20 | 10/31/19 | 10/31/18 | PERIOD 4/1/17 to 10/31/17 | FOR THE YEAR ENDED 3/31/17 | |||||||||||||
| Per share data (for a share outstanding throughout each period): | ||||||||||||||||||
| Net asset value - Beginning of period | $25.91 | $20.64 | $19.04 | $20.81 | $16.58 | $16.02 | ||||||||||||
| Income (loss) from investment operations: | ||||||||||||||||||
| Net investment income (loss)2 | (0.05 | ) | (0.05 | ) | 0.06 | 0.07 | 0.05 | 0.003 | ||||||||||
| Net realized and unrealized gain (loss) on investments | 9.89 | 5.38 | 1.61 | (1.81 | ) | 4.18 | 0.56 | |||||||||||
| Total from investment operations | 9.84 | 5.33 | 1.67 | (1.74 | ) | 4.23 | 0.56 | |||||||||||
| Less distributions to shareholders: | ||||||||||||||||||
| From net investment income | — | (0.06 | ) | (0.07 | ) | (0.03 | ) | — | — | |||||||||
| From net realized gain on investments | (0.51 | ) | — | — | — | — | — | |||||||||||
| Total distributions to shareholders | (0.51 | ) | (0.06 | ) | (0.07 | ) | (0.03 | ) | — | — | ||||||||
| Net asset value - End of period | $35.24 | $25.91 | $20.64 | $19.04 | $20.81 | $16.58 | ||||||||||||
| Net assets - End of period (000’s omitted) | $335,259 | $174,435 | $154,009 | $161,390 | $189,955 | $114,487 | ||||||||||||
| Total return4 | 38.41% | 25.88% | 8.81% | (8.38% | ) | 25.51% | 3.43% | |||||||||||
| Ratios (to average net assets)/Supplemental Data: | ||||||||||||||||||
| Expenses* | 1.13% | 5 | 1.15% | 1.14% | 1.12% | 1.24%6, | 7 | 1.26% | 6 | |||||||||
| Net investment income (loss) | (0.14% | ) | (0.22% | ) | 0.31% | 0.30% | 0.41% | 7 | 0.01% | |||||||||
| Series portfolio turnover | 76% | 91% | 102% | 73% | 46% | 123% | ||||||||||||
| *For certain periods presented, the investment advisor did not impose all or a portion of its management and/or other fees, and in some periods may have paid a portion of the Series’ expenses. If these expenses had been incurred by the Class, the expense ratio (to average net assets) would have increased by the following amounts: | ||||||||||||||||||
| N/A | 0.00% | 8 | 0.03% | N/A | 0.11% | 7 | 0.07% | |||||||||||
1Rainier International Discovery Fund (“the Predecessor Fund”) transferred its assets and liabilities to the Series at the close of business on August 21, 2017. Because the Series had no investment operations prior to the Reorganization, and based on the similarity of the Series to the Predecessor Fund, the Predecessor Fund is treated as the survivor for accounting and performance reporting purposes. Class I shares of the Series were formerly Institutional shares of the Predecessor Fund.
2Calculated based on average shares outstanding during the periods.
3Less than $0.01.
4Represents aggregate total return for the periods indicated, and assumes reinvestment of all distributions. Total return would have been lower had certain expenses not been waived or reimbursed during certain periods. Periods less than one year are not annualized.
5Includes recoupment of past waived and/or reimbursed fees. Without the recoupment the ratio would have been 1.11%.
6Expense ratio exceeds expense limitation due to recognition of expenses related to the Reorganization of the Fund. The majority of the expenses incurred by the Series in connection with the reorganization were paid by the Advisor. The Series paid certain expenses, including half of the cost of the proxy, such as printing and solicitation, and all of the legal fees incurred in connection to the reorganization.
7Annualized.
8Less than 0.01%.
The accompanying notes are an integral part of the financial statements.
14
Rainier International Discovery Series
Financial Highlights - Class W
| FOR THE YEAR ENDED | FOR THE | ||||||||
| 10/31/21 | 10/31/20 | PERIOD 3/1/191 TO 10/31/19 | |||||||
| Per share data (for a share outstanding throughout each period): | |||||||||
| Net asset value - Beginning of period | $25.93 | $20.59 | $19.34 | ||||||
| Income from investment operations: | |||||||||
| Net investment income2 | 0.28 | 0.19 | 0.22 | ||||||
| Net realized and unrealized gain (loss) on investments | 9.90 | 5.36 | 1.03 | ||||||
| Total from investment operations | 10.18 | 5.55 | 1.25 | ||||||
| Less distributions to shareholders: | |||||||||
| From net investment income | (0.21 | ) | (0.21 | ) | — | ||||
| From net realized gain on investments | (0.51 | ) | — | — | |||||
| Total distributions to shareholders | (0.72 | ) | (0.21 | ) | — | ||||
| Net asset value - End of period | $35.39 | $25.93 | $20.59 | ||||||
| Net assets - End of period (000’s omitted) | $32,618 | $24,962 | $18,095 | ||||||
| Total return3 | 39.91% | 27.17% | 6.46% | ||||||
| Ratios (to average net assets)/Supplemental Data: | |||||||||
| Expenses* | 0.10% | 0.10% | 0.10% | 4 | |||||
| Net investment income | 0.87% | 0.84% | 1.65% | 4 | |||||
| Series portfolio turnover | 76% | 91% | 102% | ||||||
| *The investment advisor did not impose all or a portion of its management and/or other fees during the periods, and may have paid a portion of the Series’ expenses. If these expenses had been incurred by the Class, the expense ratio (to average net assets) would have increased by the following amounts: | |||||||||
| 0.93% | 0.97% | 1.00% | 4 | ||||||
1Commencement of operations.
2Calculated based on average shares outstanding during the periods.
3Represents aggregate total return for the periods indicated, and assumes reinvestment of all distributions. Total return would have been lower had certain expenses not been waived or reimbursed during the periods. Periods less than one year are not annualized.
4Annualized.
The accompanying notes are an integral part of the financial statements.
15
Rainier International Discovery Series
Financial Highlights - Class Z*
| FOR THE YEAR ENDED | FOR THE | ||||||||||||||
| 10/31/21 | 10/31/20 | 10/31/19 | 10/31/18 | PERIOD 8/21/171 TO 10/31/17 | |||||||||||
| Per share data (for a share outstanding throughout each period): | |||||||||||||||
| Net asset value - Beginning of period | $25.96 | $20.67 | $19.06 | $20.82 | $19.40 | ||||||||||
| Income (loss) from investment operations: | |||||||||||||||
| Net investment income (loss)2 | (0.01 | ) | (0.01 | ) | 0.09 | 0.03 | 0.01 | ||||||||
| Net realized and unrealized gain (loss) on investments | 9.92 | 5.38 | 1.61 | (1.75 | ) | 1.41 | |||||||||
| Total from investment operations | 9.91 | 5.37 | 1.70 | (1.72 | ) | 1.42 | |||||||||
| Less distributions to shareholders: | |||||||||||||||
| From net investment income | (0.00 | )3 | (0.08 | ) | (0.09 | ) | (0.04 | ) | — | ||||||
| From net realized gain on investments | (0.51 | ) | — | — | — | — | |||||||||
| Total distributions to shareholders | (0.51 | ) | (0.08 | ) | (0.09 | ) | — | — | |||||||
| Net asset value - End of period | $35.36 | $25.96 | $20.67 | $19.06 | $20.82 | ||||||||||
| Net assets - End of period (000’s omitted) | $404,306 | $283,566 | $237,740 | $168,789 | $21 | ||||||||||
| Total return4 | 38.61% | 26.06% | 8.99% | (8.29% | ) | 7.32% | |||||||||
| Ratios (to average net assets)/Supplemental Data: | |||||||||||||||
| Expenses** | 1.00% | 1.00% | 1.00% | 1.00% | 1.00% | 5 | |||||||||
| Net investment income (loss) | (0.03% | ) | (0.05% | ) | 0.48% | 0.16% | 0.14% | 5 | |||||||
| Series portfolio turnover | 76% | 91% | 102% | 73% | 46% | ||||||||||
| *Effective August 21, 2018, Class R6 shares of the Series have been redesignated as Class Z shares. | |||||||||||||||
| **The investment advisor did not impose all or a portion of its management and/or other fees during the periods, and may have paid a portion of the Series’ expenses. If these expenses had been incurred by the Class, the expense ratio (to average net assets) would have increased by the following amounts: | |||||||||||||||
| 0.03% | 0.07% | 0.08% | 0.04% | 0.17% | 5 | ||||||||||
1Commencement of operations.
2Calculated based on average shares outstanding during the periods.
3Less than $(0.01).
4Represents aggregate total return for the periods indicated, and assumes reinvestment of all distributions. Total return would have been lower had certain expenses not been waived or reimbursed during the periods. Periods less than one year are not annualized.
5Annualized.
The accompanying notes are an integral part of the financial statements.
16
Rainier International Discovery Series
Notes to Financial Statements
| 1. | Organization |
Rainier International Discovery Series (the “Series”) is a no-load diversified series of Manning & Napier Fund, Inc. (the “Fund”). The Fund is organized in Maryland and is registered under the Investment Company Act of 1940, as amended, as an open-end management investment company.
The Series’ investment objective is to seek long-term capital appreciation.
The Series is authorized to issue four classes of shares (Class S, I, W and Z). Each class is substantially the same, except that class specific distribution and shareholder servicing expenses are borne by the specific class of shares to which they relate.
The Fund’s advisor is Manning & Napier Advisors, LLC (the “Advisor”). Shares of the Series are offered to investors, clients and employees of the Advisor and its affiliates. The total authorized capital stock of the Fund consists of 15 billion shares of common stock each having a par value of $0.01. As of October 31, 2021, 6.3 billion shares have been designated in total among 15 series, of which 100 million have been designated as Rainier International Discovery Series Class I common stock, Rainier International Discovery Series Class S (formerly Class K) common stock, Rainier International Discovery Series Class W common stock and Rainier International Discovery Series Class Z (formerly Class R6) common stock.
| 2. | Significant Accounting Policies |
The following is a summary of significant accounting policies followed by the Series. The Series is an investment company and, accordingly, follows the investment company accounting and reporting guidance of the Financial Accounting Standards Board Accounting Standards Codification Topic 946 - Investment Companies, which is part of accounting principles generally accepted in the United States of America (“GAAP”).
Security Valuation
Portfolio securities, including domestic equities, foreign equities, warrants and options, listed on an exchange other than the NASDAQ Stock Market are valued at the latest quoted sales price of the exchange on which the security is primarily traded. Securities not traded on valuation date or securities not listed on an exchange are valued at the latest quoted bid price provided by the Fund’s pricing service. Securities listed on the NASDAQ Stock Market are valued in accordance with the NASDAQ Official Closing Price.
Short-term investments that mature in sixty days or less may be valued at amortized cost, which approximates fair value. Investments in open-end investment companies are valued at their net asset value per share on valuation date.
Volume and level of activity in established markets for an asset or liability are evaluated to determine whether recent transactions and quoted prices are determinative of fair value. Where there have been significant decreases in volume and level of activity, further analysis and adjustment may be necessary to estimate fair value. The Series measures fair value in these instances by the use of inputs and valuation techniques which may be based upon current market prices of securities that are comparable in coupon, rating, maturity and industry and/or expectation of future cash flows. As a result of trading in relatively thin markets and/or markets that experience significant volatility, the prices used by the Series to value these securities may differ from the value that would be realized if these securities were sold, and the differences could be material.
Securities for which representative valuations or prices are not available from the Series’ pricing service may be valued at fair value as determined in good faith by the Advisor under procedures approved by and under the general supervision and responsibility of the Fund’s Board of Directors (the “Board”). Due to the inherent uncertainty of valuations of such securities, the fair value may differ significantly from the values that would have been used had a ready market for such securities existed. If trading or events occurring after the close of the principal market in which securities are traded are expected to materially affect the value of those securities, then they may be valued at their fair value, taking this trading or these events into account. In accordance with the procedures approved by the Board, the values of certain securities trading outside the U.S. were adjusted following the close of local trading using a factor from a third party vendor. The third party vendor uses statistical analyses and quantitative models, which consider among other things subsequent movement and changes in the prices of indices, securities and exchange rates in other markets, to determine the factors which are used to adjust local market prices. The value of securities
17
Rainier International Discovery Series
Notes to Financial Statements (continued)
| 2. | Significant Accounting Policies (continued) |
Security Valuation (continued)
used for net asset value calculation under these procedures may differ from published prices for the same securities. It is the Fund’s policy to classify each foreign equity security where a factor from a third party vendor is applied as a Level 2 security.
Various inputs are used in determining the value of the Series’ assets or liabilities carried at fair value. These inputs are summarized in three broad levels. Level 1 includes quoted prices in active markets for identical assets and liabilities. Level 2 includes other significant observable inputs (including quoted prices for similar securities, interest rates, prepayment speeds, credit risk, etc.). Level 3 includes significant unobservable inputs (including the Series’ own assumptions in determining the fair value of investments). A financial instrument’s level within the fair value hierarchy is based on the lowest level of any input both individually and in aggregate that is significant to the fair value measurement. The inputs or methodology used for valuing securities are not necessarily an indication of the risk associated with investing in those securities.
The following is a summary of the valuation levels used for major security types as of October 31, 2021 in valuing the Series’ assets or liabilities carried at fair value:
| DESCRIPTION | TOTAL | LEVEL 1 | LEVEL 2# | LEVEL 3 | |||||||||||
| Assets: | |||||||||||||||
| Equity securities: | |||||||||||||||
| Communication Services | $ | 18,801,918 | $ | — | $ | 18,801,918 | $ | — | |||||||
| Consumer Discretionary | 96,404,200 | 5,454,840 | 90,949,360 | — | |||||||||||
| Consumer Staples | 30,988,015 | — | 30,988,015 | — | |||||||||||
| Financials | 100,764,089 | 21,409,796 | 79,354,293 | — | |||||||||||
| Health Care | 104,188,333 | — | 104,188,333 | — | |||||||||||
| Industrials | 249,334,071 | 40,875,228 | 208,458,843 | — | |||||||||||
| Information Technology | 115,678,385 | 6,562,772 | 109,115,613 | — | |||||||||||
| Materials | 50,797,487 | — | 50,797,487 | — | |||||||||||
| Real Estate | 11,224,331 | — | 11,224,331 | — | |||||||||||
| Utilities | 13,600,583 | — | 13,600,583 | — | |||||||||||
| Short-Term Investment | 27,845,839 | 27,845,839 | — | — | |||||||||||
| Total assets | $ | 819,627,251 | $ | 102,148,475 | $ | 717,478,776 | $ | — | |||||||
#Includes certain foreign equity securities for which a factor from a third party vendor was applied to determine the securities’ fair value following the close of local trading.
There were no Level 3 securities held by the Series as of October 31, 2020 or October 31, 2021.
Security Transactions, Investment Income and Expenses
Security transactions are accounted for on trade date. Dividend income is recorded on the ex-dividend date, except that if the ex-dividend date has passed, certain dividends from foreign securities are recorded as soon as the Series is informed of the ex-dividend date. Non-cash dividends, if any, are recorded at the fair value of the securities received. Interest income, including amortization of premium and accretion of discounts using the effective interest method, is earned from settlement date and accrued daily.
Expenses are recorded on an accrual basis. Most expenses of the Fund can be attributed to a specific series. Expenses which cannot be directly attributed are apportioned among the series in the Fund in such a manner as deemed equitable by the Fund’s Board, taking into consideration, among other things, the nature and type of expense. Income, expenses (other than shareholder services fees), and realized and unrealized gains and losses are prorated among the classes based on the relative net assets of each class. Class specific expenses are directly charged to that class.
The Series uses the identified cost method for determining realized gain or loss on investments for both financial statement and federal income tax reporting purposes.
18
Rainier International Discovery Series
Notes to Financial Statements (continued)
| 2. | Significant Accounting Policies (continued) |
Foreign Currency Translation
The books and records of the Series are maintained in U.S. dollars. Foreign currencies, investments and other assets and liabilities are translated into U.S. dollars at the current exchange rates. Purchases and sales of investment securities and income and expenses are translated on the respective dates of such transactions. The Series does not isolate realized and unrealized gains and losses attributable to changes in the exchange rates from gains and losses that arise from changes in the fair value of investments. Such fluctuations are included with net realized and unrealized gain or loss on investments. Net realized foreign currency gains and losses represent foreign currency gains and losses between trade date and settlement date on securities transactions, gains and losses on disposition of foreign currencies and the difference between the amount of income and foreign withholding taxes recorded on the books of the Series and the amounts actually received or paid.
Federal Taxes
The Series’ policy is to comply with the provisions of the Internal Revenue Code applicable to regulated investment companies. The Series is not subject to federal income tax or excise tax to the extent that the Series distributes to shareholders each year its taxable income, including any net realized gains on investments, in accordance with requirements of the Internal Revenue Code. Accordingly, no provision for federal income tax or excise tax has been made in the financial statements.
Management evaluates its tax positions to determine if the tax positions taken meet the minimum recognition threshold in connection with accounting for uncertainties in income tax positions taken or expected to be taken for the purposes of measuring and recognizing tax liabilities in the financial statements. Recognition of tax benefits of an uncertain tax position is required only when the position is “more likely than not” to be sustained assuming examination by taxing authorities. At October 31, 2021, the Series has recorded no liability for net unrecognized tax benefits relating to uncertain income tax positions taken or expected to be taken in future tax returns.
The Series files income tax returns in the U.S. federal jurisdiction, various states and foreign jurisdictions, as required. No income tax returns are currently under investigation. The statute of limitations on the Series’ tax returns remains open for the years ended October 31, 2018 through October 31, 2021. The Series is not aware of any tax positions for which it is reasonably possible that the total amounts of unrecognized tax benefits will significantly change in the next twelve months.
Foreign Taxes
Based on the Series’ understanding of the tax rules and rates related to income, gains and currency purchase/repatriation transactions for foreign jurisdictions in which it invests, the Series will provide for foreign taxes, and where appropriate, deferred foreign tax. The Series is subject to a tax imposed on short term capital gains on securities of issuers domiciled in India. The Series records an estimated deferred tax liability for securities that have been held for less than a year at the end of the reporting period, assuming those positions were disposed of at the end of the period. This amount is reported in Accrued foreign capital gains tax in the accompanying Statement of Assets and Liabilities. Realized losses on the sale of securities of issuers domiciled in India can be carried forward for eight years to offset potential future short term realized capital gains.
Distributions of Income and Gains
Distributions to shareholders of net investment income and net realized gains are made annually. An additional distribution may be necessary to avoid taxation of the Series. Distributions are recorded on the ex-dividend date.
Indemnifications
The Fund’s organizational documents provide former and current directors and officers with a limited indemnification against liabilities arising in connection with the performance of their duties to the Fund. In the normal course of business, the Fund may also enter into contracts that provide general indemnifications. The Fund’s maximum exposure under these arrangements is unknown as this would be dependent on future claims that may be made against the Fund. The risk of material loss from such claims is considered remote.
19
Rainier International Discovery Series
Notes to Financial Statements (continued)
| 2. | Significant Accounting Policies (continued) |
Other
The preparation of financial statements in conformity with GAAP requires management to make estimates and assumptions that affect the reported amounts of assets and liabilities and the disclosure of contingent assets and liabilities at the date of the financial statements and the reported amounts of income and expenses during the reporting period. Actual results could differ from those estimates.
| 3. | Transactions with Affiliates |
The Fund has an Investment Advisory Agreement (the “Agreement”) with the Advisor, for which the Series pays a fee, computed daily and payable monthly, at an annual rate of 0.90% of the Series’ average daily net assets. The investment sub-advisor of the Series is Rainier Investment Management, LLC (“Rainier” or the “Sub-Advisor”). The Advisor pays the Sub-Advisor out of the fee received from the Series at an annual rate of 0.70% of the Series’ average daily net assets.
Under the Agreement, personnel of the Advisor maintain the Series' organization and select and oversee the Sub-Advisor, who provides the Series with advice and assistance in the choice of investments and the execution of securities transactions. The Advisor also provides the Fund with necessary office space and fund administration and support services. The salaries of all officers of the Fund (except a percentage of the Fund’s Chief Compliance Officer’s salary, which is paid by the Fund), and of all Directors who are “affiliated persons” of the Fund, or of the Advisor and/or Sub-Advisor, and all personnel of the Fund, or of the Advisor, performing services relating to research, statistical and investment activities, are paid by the Advisor and/or Sub-Advisor. Each “non-affiliated” Director receives an annual stipend, which is allocated among all the active series of the Fund. In addition, these Directors also receive a fee per Board meeting attended plus a fee for each committee meeting attended and are reimbursed for travel and other out-of-pocket expenses incurred by them in connection with attending such meetings. The Fund also has an Audit Committee Chair, Governance & Nominating Committee Chair and Lead Independent Director who each receive an additional annual stipend for these roles.
The Fund may enter into agreements with financial intermediaries pursuant to which the Fund may pay financial intermediaries for non-distribution related sub-transfer agency, administrative, sub-accounting, and other shareholder services in an amount not to exceed 0.15% of the average daily net assets of the Class S shares and Class I shares. Payments made pursuant to such agreements are generally based on the current assets and/or number of accounts of the Series attributable to the financial intermediary. Any payments made pursuant to such agreements may be in addition to, rather than in lieu of, any Distribution and Shareholder Services Fee payable under the Rule 12b-1 plan of the Fund.
The Advisor has contractually agreed to waive the management fee for the Class W shares. The full management fee will be waived under this agreement because Class W shares are only available to discretionary investment accounts and other accounts managed by the Advisor. These clients pay a management fee to the Advisor that is separate from the Series' expenses. In addition, pursuant to a separate expense limitation agreement, the Advisor has contractually agreed to limit its fees and reimburse expenses to the extent necessary so that the total direct annual fund operating expenses, exclusive of distribution and service (12b-1) fees and waived Class W management fees (collectively, “excluded expenses”), to 1.15% of the average daily net assets of the Class I and Class S shares, 1.00% of the average daily net assets of the Class Z shares, and 0.10% of the average daily net assets of the Class W shares. These contractual waivers are expected to continue indefinitely, and may not be amended or terminated by the Advisor without the approval of the Series’ Board of Directors. The Advisor may receive from a Class the difference between the Class’s total direct annual fund operating expenses, not including excluded expenses, and the Class’s contractual expense limit to recoup all or a portion of its prior fee waivers (other than Class W management fee waivers) or expense reimbursements made during the rolling three-year period preceding the recoupment if at any point the total direct annual fund operating expenses, not including excluded expenses, are below the contractual expense limit (a) at the time of the fee waiver and/or expense reimbursement and (b) at the time of the recoupment.
Pursuant to these agreements, the Advisor waived $271,414 in management fees for Class W shares for the year ended October 31, 2021. In addition, pursuant to the separate expense limitation agreement, the Advisor waived or reimbursed expenses of
20
Rainier International Discovery Series
Notes to Financial Statements (continued)
| 3. | Transactions with Affiliates (continued) |
$1,492, $9,014 and $106,848 for Class S, Class W, and Class Z shares, respectively, for the year ended October 31, 2021. These amounts are included as a reduction of expenses on the Statement of Operations.
As of October 31, 2021, the Advisor recouped the following waivers and/or reimbursements previously recorded by the Series:
| RECOUPED | |
| CLASS | AMOUNT |
| Class I | $51,120 |
As of October 31, 2021, the class specific waivers or reimbursements subject to possible future recoupment under the expense limitation agreement are as follows:
| CLASS | EXPIRES OCTOBER 31, | |||
| 2022 | 2023 | 2024 | Total | |
| Class S | $21,581 | $17,196 | $1,492 | $40,269 |
| Class W | 9,606 | 14,579 | 9,014 | 33,199 |
| Class Z | 149,233 | 172,344 | 106,848 | 428,425 |
Manning & Napier Investor Services, Inc., a registered broker-dealer affiliate of the Advisor, acts as distributor for the Fund’s shares. The Series compensates the distributor for distributing and servicing the Series’ Class S shares pursuant to a distribution plan adopted under Rule 12b-1 of the 1940 Act, regardless of expenses actually incurred. Under the agreement, the Series pays distribution and service fees to the distributor at an annual rate of 0.25% of average daily net assets attributable to Class S shares. There are no distribution and service fees on the Class I, Class W or Class Z shares. The fees are accrued daily and paid monthly.
Pursuant to a master services agreement dated February 13, 2020, the Fund pays the Advisor an annual fee related to fund accounting and administration of 0.0085% on the first $25 billion of average daily net assets; 0.0075% on the next $15 billion of average daily net assets; and 0.0065% of average daily net assets in excess of $40 billion; plus a base fee of $30,400 per series. Additionally, certain transaction and out-of-pocket expenses, including charges for reporting relating to the Fund’s compliance program, are charged. The Advisor has agreements with BNY Mellon Investment Servicing (U.S.) Inc. (“BNY”) under which BNY serves as sub-accountant services agent.
| 4. | Purchases and Sales of Securities |
For the year ended October 31, 2021, purchases and sales of securities, other than U.S. Government securities and short-term securities, were $589,930,828 and $507,339,719, respectively. There were no purchases or sales of U.S. Government securities.
| 5. | Capital Stock Transactions |
Transactions in Class S, Class I, Class W and Class Z shares of Rainier International Discovery Series were:
| CLASS S | FOR THE YEAR ENDED | FOR THE YEAR ENDED | ||||||||||||||
| 10/31/21 | 10/31/20 | |||||||||||||||
| SHARES | AMOUNT | SHARES | AMOUNT | |||||||||||||
| Sold | 513,423 | $ | 16,287,518 | 579,471 | $ | 12,599,423 | ||||||||||
| Reinvested | 25,327 | 724,601 | — | — | ||||||||||||
| Repurchased | (587,872 | ) | (19,324,511 | ) | (1,081,951 | ) | (22,724,547 | ) | ||||||||
| Total | (49,122 | ) | $ | (2,312,392 | ) | (502,480 | ) | $ | (10,125,124 | ) | ||||||
21
Rainier International Discovery Series
Notes to Financial Statements (continued)
| 5. | Capital Stock Transactions (continued) |
| CLASS I | FOR THE YEAR ENDED | FOR THE YEAR ENDED | ||||||||||||||
| 10/31/21 | 10/31/20 | |||||||||||||||
| SHARES | AMOUNT | SHARES | AMOUNT | |||||||||||||
| Sold | 4,318,178 | $ | 139,127,049 | 1,898,683 | $ | 43,505,520 | ||||||||||
| Reinvested | 114,986 | 3,327,704 | 18,082 | 394,018 | ||||||||||||
| Repurchased | (1,654,070 | ) | (52,684,277 | ) | (2,645,087 | ) | (56,494,016 | ) | ||||||||
| Total | 2,779,094 | $ | 89,770,476 | (728,322 | ) | $ | (12,594,478 | ) | ||||||||
| CLASS W | FOR THE YEAR ENDED | FOR THE YEAR ENDED | ||||||||||||||
| 10/31/21 | 10/31/20 | |||||||||||||||
| SHARES | AMOUNT | SHARES | AMOUNT | |||||||||||||
| Sold | 74,101 | $ | 2,364,133 | 209,873 | $ | 4,926,137 | ||||||||||
| Reinvested | 24,110 | 694,385 | 8,711 | 188,339 | ||||||||||||
| Repurchased | (139,012 | ) | (4,387,694 | ) | (134,887 | ) | (3,355,984 | ) | ||||||||
| Total | (40,801 | ) | $ | (1,329,176 | ) | 83,697 | $ | 1,758,492 | ||||||||
| CLASS Z | FOR THE YEAR ENDED | FOR THE YEAR ENDED | ||||||||||||||
| 10/31/21 | 10/31/20 | |||||||||||||||
| SHARES | AMOUNT | SHARES | AMOUNT | |||||||||||||
| Sold | 3,020,339 | $ | 97,161,014 | 2,892,412 | $ | 65,335,375 | ||||||||||
| Reinvested | 90,238 | 2,617,798 | 16,182 | 352,926 | ||||||||||||
| Repurchased | (2,601,137 | ) | (82,759,056 | ) | (3,485,927 | ) | (79,216,165 | ) | ||||||||
| Total | 509,440 | $ | 17,019,756 | (577,333 | ) | $ | (13,527,864 | ) | ||||||||
At October 31, 2021, one shareholder account owned 15.7% of the Series. In addition, the Advisor and its affiliates owned less than 0.1% of the Series. Investment activities of these shareholders may have a material effect on the Series.
| 6. | Line of Credit |
The Fund has entered into a 364-day, $25 million credit agreement (the “line of credit”) with Bank of New York Mellon. Each series of the Fund may borrow under the line of credit for temporary or emergency purposes, including funding shareholder redemptions and other short-term liquidity purposes. The Fund pays an annual fee on the unused commitment amount, payable quarterly, and is allocated among all the series of the Fund and included in miscellaneous expenses in the Statement of Operations for each series. The line of credit expires in September 2022 unless extended or renewed. During the year ended October 31, 2021, the Series did not borrow under the line of credit.
| 7. | Financial Instruments |
The Series may trade in instruments including futures contracts and other derivatives in the normal course of investing activities to assist in managing exposure to various market risks. The Series may be subject to various elements of risk, which may involve, to a varying degree, elements of risk in excess of the amounts recognized for financial statement purposes. These risks include: the risk that changes in the value of a derivative may not correlate perfectly with the underlying asset, rate or index; counterparty credit risk related to over the counter derivative counterparties’ failure to perform under contract terms; liquidity risk related to the lack of a liquid market for these contracts allowing the fund to close out its position(s); and documentation risk relating to disagreement over contract terms. No such investments were held by the Series as of October 31, 2021.
22
Rainier International Discovery Series
Notes to Financial Statements (continued)
| 8. | Foreign Securities |
Investing in securities of foreign companies and foreign governments involves special risks and considerations not typically associated with investing in securities of domestic companies and the U.S. Government. These risks include revaluation of currencies and future adverse political and economic developments. Moreover, securities of foreign companies and foreign governments and their markets may be less liquid and their prices more volatile than those of comparable domestic companies and the U.S. Government.
| 9. | Federal Income Tax Information |
The amount and characterization of certain income and capital gains to be distributed are determined in accordance with federal income tax regulations, which may differ from GAAP. These differences are primarily due to differing book and tax treatments in the timing and/or treatment of the recognition of net investment income or gains and losses, including foreign currency gains and losses, passive foreign investment companies (PFICs) and tax equalization. The Series may periodically make reclassifications among its capital accounts to reflect income and gains available for distribution (or available capital loss carryovers) under income tax regulations without impacting the Series’ net asset value. For the year ended October 31, 2021, amounts were reclassified within the capital accounts to increase Additional Paid in Capital by $8,940 856 and decrease Total Distributable Earnings by $8,940,856. Any such reclassifications are not reflected in the financial highlights.
The tax character of distributions paid were as follows:
| FOR THE YEAR | FOR THE YEAR | |
| ENDED 10/31/21 | ENDED 10/31/20 | |
| Ordinary income | $210,151 | $1,544,673 |
| Long-term capital gains | $10,407,895 | — |
At October 30, 2021, the identified cost of investments for federal income tax purposes, the resulting gross unrealized appreciation and depreciation, and the net unrealized appreciation were as follows:
| Cost for federal income tax purposes | $572,284,792 |
| Unrealized appreciation | 267,445,810 |
| Unrealized depreciation | (20,103,351) |
| Net unrealized appreciation | $247,342,459 |
| Undistributed ordinary income | $21,619,702 |
| Undistributed long-term capital gains | $64,737,752 |
| 10. | Market Event |
In March 2020, the World Health Organization declared COVID-19 (a novel coronavirus) to be a pandemic. The situation is dynamic. Global financial markets have experienced and may continue to experience significant volatility resulting from the spread of COVID-19. The global economy, the economies of certain nations and individual issuers have been and may continue to be adversely affected by COVID-19, particularly in light of the interconnectivity between economies and financial markets, all of which may negatively impact the Series’ performance. In addition, COVID-19 and governmental responses to COVID-19 may negatively impact the capabilities of the Series’ service providers and disrupt the Series’ operations. Management of the Series will continue to monitor the impact of COVID-19.
23
Rainier International Discovery Series
Report of Independent Registered Public Accounting Firm
To the Board of Directors of Manning & Napier Fund, Inc. and Shareholders of Rainier International Discovery Series
Opinion on the Financial Statements
We have audited the accompanying statement of assets and liabilities, including the investment portfolio, of Rainier International Discovery Series (one of the series constituting Manning & Napier Fund, Inc., referred to hereafter as the “Fund”) as of October 31, 2021, the related statement of operations for the year ended October 31, 2021, the statement of changes in net assets for each of the two years in the period ended October 31, 2021, including the related notes, and the financial highlights for each of the periods ended on or after October 31, 2017 (collectively referred to as the “financial statements”). In our opinion, the financial statements present fairly, in all material respects, the financial position of the Fund as of October 31, 2021, the results of its operations for the year then ended, the changes in its net assets for each of the two years in the period ended October 31, 2021 and the financial highlights for each of the periods ended on or after October 31, 2017 in conformity with accounting principles generally accepted in the United States of America.
The financial statements and financial highlights as of and for the year ended March 31, 2017 (not presented herein, other than the financial highlights) were audited by other auditors whose report dated May 22, 2017 expressed an unqualified opinion on those financial statements and financial highlights.
Basis for Opinion
These financial statements are the responsibility of the Fund’s management. Our responsibility is to express an opinion on the Fund’s financial statements based on our audits. We are a public accounting firm registered with the Public Company Accounting Oversight Board (United States) (PCAOB) and are required to be independent with respect to the Fund in accordance with the U.S. federal securities laws and the applicable rules and regulations of the Securities and Exchange Commission and the PCAOB.
We conducted our audits of these financial statements in accordance with the standards of the PCAOB. Those standards require that we plan and perform the audit to obtain reasonable assurance about whether the financial statements are free of material misstatement, whether due to error or fraud.
Our audits included performing procedures to assess the risks of material misstatement of the financial statements, whether due to error or fraud, and performing procedures that respond to those risks. Such procedures included examining, on a test basis, evidence regarding the amounts and disclosures in the financial statements. Our audits also included evaluating the accounting principles used and significant estimates made by management, as well as evaluating the overall presentation of the financial statements. Our procedures included confirmation of securities owned as of October 31, 2021 by correspondence with the custodian. We believe that our audits provide a reasonable basis for our opinion.
New York, New York
December 15, 2021
We have served as the auditor of one or more investment companies in Manning & Napier Mutual Funds since 1992.
24
Rainier International Discovery Series
Supplemental Tax Information
(unaudited)
All reportings are based on financial information available as of the date of this annual report and, accordingly, are subject to change.
For federal income tax purposes, the Series reports for the current fiscal year $449,340 or, if different, the maximum amount allowable under the tax law, as qualified dividend income.
The Series has elected to pass through to its shareholders, foreign source income of $7,603,003 and foreign taxes paid of $879,006 for the year ended October 31, 2021.
The Series designates $75,013,550 as Long-Term Capital Gain dividends pursuant to Section 852(b) of the Code for the fiscal year ended October 31, 2021.
25
Rainier International Discovery Series
Directors’ and Officers’ Information
(unaudited)
The Statement of Additional Information provides additional information about the Fund’s directors and officers and can be obtained without charge by calling 1-800-466-3863, at www.manning-napier.com, or on the EDGAR Database on the SEC Internet web site (http://www.sec.gov). The following chart shows certain information about the Fund’s directors and officers, including their principal occupations during the last five years. Unless specific dates are provided, the individuals have held the listed positions for longer than five years.
Interested Director and Officer
| Name: | Paul Battaglia* |
| Address: | 290 Woodcliff Drive |
| Fairport, NY 14450 | |
| Age: | 43 |
| Current Position(s) Held with Fund: | Principal Executive Officer, President, Chairman and Director |
| Term of Office1 & Length of Time Served: | Indefinite – Chairman and Director since November 2018 |
| Principal Occupation(s) During Past 5 Years: | Chief Financial Officer since 2018; Vice President of Finance (2016 – 2018); Director of Finance (2011 – 2016); Financial Analyst/Internal Auditor (2004-2006) – Manning & Napier Advisors, LLC and affiliates Holds one or more of the following titles for various subsidiaries and affiliates: Chief Financial Officer |
| Number of Portfolios Overseen within Fund Complex: | 15 |
| Other Directorships Held Outside Fund Complex During | N/A |
| Past 5 Years: |
Independent Directors
| Name: | Stephen B. Ashley |
| Address: | 290 Woodcliff Drive |
| Fairport, NY 14450 | |
| Age: | 81 |
| Current Position(s) Held with Fund: | Director, Audit Committee Member, Governance & Nominating Committee Member |
| Term of Office & Length of Time Served: | Indefinite – Since 1996 |
| Principal Occupation(s) During Past 5 Years: | Chairman and Director since 1997; Chief Executive Officer (1997-2019) - Ashley Companies (property management and investment) |
| Number of Portfolios Overseen within Fund Complex: | 15 |
| Other Directorships Held Outside Fund Complex During | Ashley Companies since 1997 |
| Past 5 Years: | |
| Name: | Paul A. Brooke |
| Address: | 290 Woodcliff Drive |
| Fairport, NY 14450 | |
| Age: | 75 |
| Current Position(s) Held with Fund: | Lead Independent Director, Audit Committee Member, Governance & Nominating Committee Chairman |
| Term of Office & Length of Time Served: | Indefinite – Director, Audit Committee Member, Governance & Nominating Committee Member since 2007; Lead Independent Director since 2017 |
| Principal Occupation(s) During Past 5 Years: | Managing Member since 1991 - PMSV Holdings LLC (investments); Managing Member (2010-2016) - Venbio (investments). |
| Number of Portfolios Overseen within Fund Complex: | 15 |
| Other Directorships Held Outside Fund Complex During Past 5 Years: | Incyte Corp. (biotech) (2000-2020); PureEarth (non-profit) since 2012; Cerus (biomedical) since 2016; Caelum BioSciences (biomedical) since 2018; Cheyne Capital International (investment)(2000-2017); |
26
Rainier International Discovery Series
Directors’ and Officers’ Information
(unaudited)
Independent Directors (continued)
| Name: | John Glazer |
| Address: | 290 Woodcliff Drive |
| Fairport, NY 14450 | |
| Age: | 56 |
| Current Position(s) Held with Fund: | Director, Audit Committee Member, Governance & Nominating Committee Member |
| Term of Office & Length of Time Served: | Indefinite – Director, Audit Committee Member, Governance & Nominating Committee Member since February 2021 |
| Principal Occupation(s) During Past 5 Years: | Chief Executive Officer since 2020 – Oikos Holdings LLC (Single-Family Office); Head of Corporate Development (2019-2020) – Caelum Biosciences (pharmaceutical development); Head of Private Investments (2015-2018) – AC Limited (Single-Family Office) |
| Number of Portfolios Overseen within Fund Complex: | 15 |
| Other Directorships Held Outside Fund Complex During | N/A |
| Past 5 Years: | |
| Name: | Margaret McLaughlin |
| Address: | 290 Woodcliff Drive |
| Fairport, NY 14450 | |
| Age: | 54 |
| Current Position(s) Held with Fund: | Director, Audit Committee Member, Governance & Nominating Committee Member |
| Term of Office & Length of Time Served: | Indefinite – Director, Audit Committee Member, Governance & Nominating Committee Member since February 2021 |
| Principal Occupation(s) During Past 5 Years: | Consultant since 2020 – Bates Group (consultants); Consultant (2019-2020) – Madison Dearborn Partners (private equity); General Counsel/CCO (2011-2019) – Kramer Van Kirk Credit Strategies L.P./Mariana Systems LLC (Investment Adviser/SaaS Technology) |
| Number of Portfolios Overseen within Fund Complex: | 15 |
| Other Directorships Held Outside Fund Complex During | N/A |
| Past 5 Years: | |
| Name: | Russell O. Vernon |
| Address: | 290 Woodcliff Drive |
| Fairport, NY 14450 | |
| Age: | 63 |
| Current Position(s) Held with Fund: | Director, Audit Committee Member, Governance & Nominating Committee Chairman |
| Term of Office & Length of Time Served: | Indefinite – Director, Audit Committee Member, Governance & Nominating Committee Member since April 2020; Governance & Nominating Committee Chairman since November 2020 |
| Principal Occupation(s) During Past 5 Years: | Founder and General Partner (2009-2019) – BVM Capital Management (economic development) |
| Number of Portfolios Overseen within Fund Complex: | 15 |
| Other Directorships Held Outside Fund Complex During Past 5 Years: | Board Member, Vice Chairman and President since 2010 – Newburgh Armory Unity Center (military); Board Member and Executive Director since 2020 – National Purple Heart Honor Mission, Inc. (military); Board Member, Vice Chairman (2015-2020) – National Purple Heart Hall of Honor, Inc. (military) |
27
Rainier International Discovery Series
Directors’ and Officers’ Information
(unaudited)
Independent Directors (continued)
| Name: | Chester N. Watson |
| Address: | 290 Woodcliff Drive |
| Fairport, NY 14450 | |
| Age: | 71 |
| Current Position(s) Held with Fund: | Director, Audit Committee Chairman, Governance & Nominating Committee Member |
| Term of Office & Length of Time Served: | Indefinite – Director, Audit Committee Member, Governance & Nominating Committee Member Since 2012; Audit Committee Chairman since 2013 |
| Principal Occupation(s) During Past 5 Years: | General Auditor (2003-2011) - General Motors Company (auto manufacturer) |
| Number of Portfolios Overseen within Fund Complex: | 15 |
| Other Directorships Held Outside Fund Complex | Rochester Institute of Technology (University) since 2005; Hudson |
| During Past 5 Years: | Valley Center for Innovation, Inc. (New Business and Economic Development) since 2019; Town of Greenburgh, NY Planning Board (Municipal Government) (2015-2019); |
Officers:
| Name: | Elizabeth Craig |
| Address: | 290 Woodcliff Drive |
| Fairport, NY 14450 | |
| Age: | 34 |
| Current Position(s) Held with Fund: | Corporate Secretary |
| Term of Office1 & Length of Time Served: | Since 2016 |
| Principal Occupation(s) During Past 5 Years: | Director of Fund Administration since 2021; Fund Regulatory Administration Manager (2018-2021); Fund Administration Manager (2015-2018); Mutual Fund Compliance Specialist (2009-2015) - Manning & Napier Advisors, LLC; Assistant Corporate Secretary (2011-2016) - Manning & Napier Fund, Inc.; Corporate Secretary, Director since 2019– Manning & Napier Investor Services, Inc. |
| Name: | Samantha Larew |
| Address: | 290 Woodcliff Drive |
| Fairport, NY 14450 | |
| Age: | 41 |
| Current Position(s) Held with Fund: | Chief Compliance Officer and Anti-Money Laundering Compliance Officer |
| Term of Office1 & Length of Time Served: | Chief Compliance Officer since 2019; Anti-Money Laundering Compliance Officer since 2018 |
| Principal Occupation(s) During Past 5 Years: | Co-Director of Compliance since 2018; Compliance Communications Supervisor (2014-2018); Compliance Supervisor (2013-2014); Broker-Dealer Compliance Supervisor (2011-2013); Broker-Dealer Compliance Analyst (2010-2011) - Manning & Napier Advisors, LLC& Affiliates; Broker-Dealer Chief Compliance Officer since 2013; Broker-Dealer Assistant Corporate Secretary since 2011 – Manning & Napier Investor Services, Inc.; Compliance Analyst (2007-2009) – Wall Street Financial Group; Compliance Specialist (2003-2007) – Manning & Napier Advisors, LLC & Affiliates |
| Name: | Scott Morabito |
| Address: | 290 Woodcliff Drive |
| Fairport, NY 14450 | |
| Age: | 33 |
| Current Position(s) Held with Fund: | Vice President |
| Term of Office1 & Length of Time Served: | Vice President since 2019; Assistant Vice President (2017-2019) |
| Principal Occupation(s) During Past 5 Years: | Managing Director, Client Service and Business Operations since 2021; Managing Director of Operations (2019-2021); Director of Funds Group (2017-2019); Fund Product and Strategy Manager (2014-2017); Senior Product and Strategy Analyst (2013-2014); Product and Strategy Analyst (2011-2013) - Manning & Napier Advisors, LLC; President, Director since 2018 – Manning & Napier Investor Services, Inc.; President, Exeter Trust Company since 2021; |
28
Rainier International Discovery Series
Directors’ and Officers’ Information
(unaudited)
Officers: (continued)
| Name: | Troy Statczar |
| Address: | 290 Woodcliff Drive |
| Fairport, NY 14450 | |
| Age: | 50 |
| Current Position(s) Held with Fund: | Principal Financial Officer, Treasurer |
| Term of Office & Length of Time Served: | Principal Financial Officer and Treasurer since 2020 |
| Principal Occupation(s) During Past 5 Years: | Senior Director, Foreside Treasurer Services since 2020 - Foreside Financial Group; Director of Fund Administration (2017-2019) - Thornburg Investment Management, Inc.; Director of U.S. Operations (2008-2017) – Henderson Global Investors N.A., Inc. |
| Name: | Sarah Turner |
| Address: | 290 Woodcliff Drive |
| Fairport, NY 14450 | |
| Age: | 39 |
| Current Position(s) Held with Fund: | Chief Legal Officer; Assistant Corporate Secretary |
| Term of Office & Length of Time Served: | Since 2018 |
| Principal Occupation(s) During Past 5 Years: | Attorney since 2018 - Manning & Napier Advisors, LLC and affiliates; Counsel (2017-2018) – Harter Secrest and Emery LLP; Legal Counsel (2010-2017) – Manning & Napier Advisors, LLC and affiliates Holds one or more of the following titles for various affiliates: Corporate Secretary, General Counsel |
*Interested Director, within the meaning of the 1940 Act by reason of his positions with the Fund’s Advisor, Manning & Napier Advisors, LLC, and Distributor, Manning & Napier Investor Services, Inc.
1The term of office of all officers shall be one year and until their respective successors are chosen and qualified, or his or her earlier resignation or removal as provided in the Fund’s By-Laws.
29
Rainier International Discovery Series
Literature Requests
(unaudited)
Proxy Voting Policies and Procedures
A description of the policies and procedures that the Fund uses to determine how to vote proxies relating to portfolio securities is available, without charge, upon request:
| By phone | 1-800-466-3863 |
| On the Securities and Exchange | |
| Commission’s (SEC) web site | http://www.sec.gov |
Proxy Voting Record
Information regarding how the Fund voted proxies relating to portfolio securities during the most recent 12-month period ended June 30th is available, without charge, upon request:
| By phone | 1-800-466-3863 |
| On the SEC’s web site | http://www.sec.gov |
Quarterly Portfolio Holdings
The Series’ complete schedule of portfolio holdings for the 1st and 3rd quarters of each fiscal year are provided on Form N-PORT, and are available, without charge, upon request:
| By phone | 1-800-466-3863 |
| On the SEC’s web site | http://www.sec.gov |
Prospectus and Statement of Additional Information (SAI)
For more information about any of the Manning & Napier Fund, Inc. Series, you may obtain a prospectus and SAI at www.manning-napier.com or by calling 1-(800) 466-3863. Before investing, carefully consider the objectives, risks, charges and expenses of the investment and read the prospectus carefully as it contains this and other information about the investment company. In addition, this information can be found on the SEC’s web site, http://www.sec.gov.
Additional information available at www.manning-napier.com
| 1. | Fund Holdings - Month-End |
| 2. | Fund Holdings - Quarter-End |
| 3. | Shareholder Report - Annual |
| 4. | Shareholder Report - Semi-Annual |
The Fund also offers electronic notification or “e-delivery” when certain documents are available on-line to be downloaded or reviewed. Direct shareholders can elect to receive electronic notification when shareholder reports, prospectus updates, and/or statements are available. If you do not currently have on-line access to your account, you can establish access by going to www.manning-napier.com, click on “Login” in the top corner of the page, and follow the prompts to self-enroll. Once enrolled, you can set your electronic notification preferences by clicking on the Account Options tab located within the green toolbar and then select E-Delivery Option. Should you have any questions on either how to establish on-line access or how to update your account settings, please contact Investor Services at 1-800-466-3863.
The Manning & Napier Fund, Inc. is managed by Manning & Napier Advisors, LLC. Manning & Napier Investor Services, Inc., an affiliate of Manning & Napier Advisors, LLC, is the distributor of the Fund shares.
MNIDS-10/21-AR
30
| (b) | Not applicable. |
ITEM 2: CODE OF ETHICS
| (a) | The registrant has adopted a code of ethics that applies to its principal executive officer, principal financial officer and principal accounting officer. A copy of the registrant's code of ethics is filed herewith as Exhibit 13(a)(1). |
| (b) | During the period covered by this report, no amendments were made to the provisions of the code of ethics adopted in 2(a) above. |
| (c) | During the period covered by this report, no implicit or explicit waivers to the provisions of the code of ethics adopted in 2(a) above were granted. |
| (d) | Not applicable to the registrant due to the response given in 2(c) above. |
ITEM 3: AUDIT COMMITTEE FINANCIAL EXPERT
All of the members of the Audit committee have been determined by the Registrant's Board of Directors to be Audit Committee Financial Experts as defined in this item. The current members of the Audit Committee are: Stephen B. Ashley, Paul A. Brooke, John M. Glazer, Russell O. Vernon, Margaret McLaughlin, and Chester N. Watson. All Audit Committee members are independent under applicable rules. This designation will not increase the designee's duties, obligations or liability as compared to their duties, obligations and liability as a member of the Audit Committee and of the Board.
Item 4: Principal Accountant Fees and Services
- Registrant may incorporate the following information by reference, if this information has been disclosed in the registrant’s definitive proxy statement or definitive information statement. The proxy statement or information statement must be filed no later than 120 days after the end of the fiscal year covered by the Annual Report.
Principal Accountant Fees and Services
Aggregate fees for professional services rendered for the Manning & Napier Fund, Inc. (Disciplined Value Series, Equity Series, Overseas Series, Pro-Blend® Conservative Term Series, Pro-Blend® Moderate Term Series, Pro-Blend® Extended Term Series, Pro-Blend® Maximum Term Series, Rainier International Discovery Series, Target Income Series, Target 2015 Series, Target 2020 Series, Target 2025 Series, Target 2030 Series, Target 2035 Series, Target 2040 series, Target 2045 Series, Target 2050 Series, Target 2055 Series, and Target 2060 Series collectively the “Fund”) by PricewaterhouseCoopers LLP (“PwC”) as of and for the years ended October 31, 2021 and 2020 were:
| 2021 | 2020 | |
| Audit Fees (a) | $ 344,212 | $ 356,712 |
| Audit Related Fees (b) | $ 0 | $ 0 |
| Tax Fees (c) | $ 154,223 | $346,558 |
| All Other Fees (d) | $ 0 | $ 0 |
| $ 498,435 | $ 703,269 |
| (a) | Audit Fees |
These fees relate to professional services rendered by PwC for the audit of the Fund’s annual financial statements or services normally provided by the accountant in connection with statutory and regulatory filing or engagements. These services include the audits of the financial statements of the Fund, issuance of consents, income tax provision procedures and assistance with review of documents filed with the SEC.
| (b) | Audit-Related Fees |
These fees relate to assurance and related services by PwC that are reasonably related to the performance of the audit of the Fund’s financial statements and are not reported under “Audit Fees” above.
| (c) | Tax Fees |
These fees relate to professional services rendered by PwC for tax compliance, tax advice, tax planning and shareholder reporting.
| (d) | All Other Fees |
These fees relate to products and services provided by PwC other than those reported above under “Audit Fees,” “Audit-Related Fees,” and “Tax Fees” above.
There were no amounts that were approved by the Audit Committee pursuant to the de minimus exception (Rule 2-01(c)(7) of Regulation S-X) for the fiscal years ended October 31, 2021 and 2020.
Non-Audit Services to the Fund’s Service Affiliates that were Pre-Approved by the Fund’s Audit Committee
The Fund’s Audit Committee is required to pre-approve non-audit services which meet both the following criteria:
| i) | Directly relate to the Fund’s operations and financial reporting; and |
| ii) | Rendered by PwC to the Fund’s advisor, Manning & Napier Advisors, LLC, and entities in a control relationship with the advisor (“service affiliate”) that provide ongoing services to the Fund. |
For purposes of disclosure, Manning & Napier Investor Services, Inc. is considered to be a service affiliate.
| 2021 | 2020 | |
| Audit Related Fees | $0 | $115,500 |
| Tax Fees | $0 | $0 |
| $0 | $115,500 |
There were no Audit Related fees for the year ended October 31, 2021. The Audit Related fees for the years ended October 31, 2020 were for work related to a fund liquidation and merger
There were no amounts that were approved by the Audit Committee pursuant to the de minimus exception (Rule 2-01(c)(7) of Regulation S-X) for the fiscal years ended October 31, 2021 and 2020.
Aggregate Fees
Aggregate fees billed to the Fund for non-audit services for 2021 and 2020 were $154,223 and $346,558, respectively. Aggregate fees billed to the Fund’s advisor and service affiliates for non-audit services were $0 and $115,000, respectively. These amounts include fees for non-audit services required to be pre-approved and fees for non-audit services that did not require pre-approval since they did not relate to the Fund’s operations and financial reporting.
The Fund’s Audit Committee has considered whether the provisions for non-audit services to the Fund’s advisor and service affiliates, which did not require pre-approval, are compatible with maintaining PwC’s independence.
Item 5:
Audit Committee of Listed registrants
Not applicable.
Item 6:
Investments
| (a) | See Investment Portfolios under Item 1 on this Form N-CSR. |
| (b) | Not applicable. |
Item 7:
Disclosure of Proxy Voting Policies and Procedures for Closed- End Management Investment Companies
Not applicable.
Item 8:
Portfolio Managers of Closed-End Management Investment Companies
Not applicable.
Item 9:
Purchases of Equity Securities by Closed-End Management Investment Company and Affiliated Purchasers
Not applicable.
Item 10:
Submission of Matters to a Vote of Security Holders
There have been no material changes to the procedure by which shareholders may recommend nominees to the registrant’s board of directors.
Item 11:
Controls and Procedures
(a) Based on their evaluation of the Funds’ disclosure controls and procedures, as of a date within 90 days of the filing date, the Funds’ Principal Executive Officer and Principal Financial Officer have concluded that the Funds’ disclosure controls and procedures are: (i) reasonably designed to ensure that information required to be disclosed in this report is appropriately communicated to the Funds’ officers to allow timely decisions regarding disclosures required in this report; (ii) reasonably designed to ensure that information required to be disclosed in this report is recorded, processed, summarized and reported in a timely manner; and (iii) are effective in achieving the goals described in (i) and (ii) above.
(b) During the period covered by this report, there have been no changes in the Funds’ internal control over financial reporting that the above officers believe to have materially affected, or to be reasonably likely to materially affect, the Funds’ internal control over financial reporting.
ITEM 12:
DISCLOSURE OF SECURITIES LENDING ACTIVITIES FOR CLOSED-END MANAGEMENT INVESTMENT COMPANIES.
Not applicable.
Item 13: Exhibits
| (a)(1) | Code of ethics that is subject to the disclosure of Item 2 above. |
| (a)(2) | Separate certifications for the Registrant’s principal executive officer and principal financial officer, as required by Section 302 of the Sarbanes-Oxley Act of 2002 and Rule 30a-2(a) under the Investment Company Act of 1940, are attached as EX-99.CERT. |
| (a)(2)(1) | Not applicable. |
| (a)(2)(2) | Not applicable. |
| (b) | A certification of the Registrant’s principal executive officer and principal financial officer, as required by 18 U.S.C Section 1350, as adopted pursuant to Section 906 of the Sarbanes-Oxley Act of 2002, and Rule 30a-2(b) under the Investment Company Act of 1940, is attached as EX-99.906CERT. The certification furnished pursuant to this paragraph is not deemed to be “filed” for purposes of Section 18 of the Securities Exchange Act of 1934, or otherwise subject to the liability of that section. Such certification is not deemed to be incorporated by reference into any filing under the Securities Act of 1933 or the Securities Exchange Act of 1934, except to the extent that the Registrant specifically incorporates them by reference. |
SIGNATURES
Pursuant to the requirements of the Securities Exchange Act of 1934 and the Investment Company Act of 1940, the registrant has duly caused this report to be signed on its behalf by the undersigned, thereunto duly authorized.
Manning & Napier Fund, Inc.
/s/ Paul J. Battaglia
Paul J. Battaglia
President & Principal Executive Officer of Manning & Napier Fund, Inc.
Date: 12/21/2021
Pursuant to the requirements of the Securities Exchange Act of 1934 and the Investment Company Act of 1940, this report has been signed below by the following persons on behalf of the registrant and in the capacities and on the dates indicated.
/s/ Paul J. Battaglia
Paul J. Battaglia
President & Principal Executive Officer of Manning & Napier Fund, Inc.
Date: 12/21/2021
/s/ Troy M. Statczar
Troy M. Statczar
Treasurer and Principal Financial Officer of Manning & Napier Fund, Inc.
Date: 12/21/2021