UNITED STATES
SECURITIES AND EXCHANGE COMMISSION
Washington, D.C. 20549
FORM N-CSR
CERTIFIED SHAREHOLDER REPORT OF REGISTERED MANAGEMENT INVESTMENT COMPANIES
Investment Company Act file number 811-04087
--------------------------------------------------
Manning & Napier Fund, Inc.
------------------------------------------------------------------------------------
(Exact name of registrant as specified in charter)
290 Woodcliff Drive, Fairport, NY 14450
------------------------------------------------------------------------------------
(Address of principal executive offices)(Zip Code)
Paul J. Battaglia, 290 Woodcliff Drive, Fairport, NY 14450
------------------------------------------------------------------------------------
(Name and address of agent for service)
Registrant’s telephone number, including area code: 585-325-6880
----------------------------------
Date of fiscal year end: December 31
------------------------------------------------------------
Date of reporting period: January 1, 2021 through December 31, 2021
Form N-CSR is to be used by management investment companies to file reports with the Commission not later than 10 days after the transmission to stockholders of any report that is required to be transmitted to stockholders under Rule 30e-1 under the Investment Company Act of 1940 (17 CFR 270.30e-1). The Commission may use the information provided on Form N-CSR in its regulatory, disclosure review, inspection, and policymaking roles.
A registrant is required to disclose the information specified by Form N-CSR, and the Commission will make this information public. A registrant is not required to respond to the collection of information contained in Form N-CSR unless the Form displays a currently valid Office of Management and Budget ("OMB") control number. Please direct comments concerning the accuracy of the information collection burden estimate and any suggestions for reducing the burden to Secretary, Securities and Exchange Commission, 450 Fifth Street, NW, Washington, DC 20549-0609. The OMB has reviewed this collection of information under the clearance requirements of 44 U.S.C. §3507.
Item 1(a): Reports to Stockholders

Manning & Napier Fund, Inc.
Real Estate Series
Paper copies of the Series’ shareholder reports are no longer sent by mail, unless you specifically request them from the Series or from your financial intermediary, such as a broker-dealer or bank. Shareholder reports are available online. Each time a report is posted on the Series’ website you will be provided with a link to access the report online, either by mail (hard copy notice) or by email, if you have already signed up for electronic delivery of shareholder reports.
You may elect to receive all future shareholder reports in paper free of charge. If you invest through a financial intermediary, you can contact your financial intermediary to request that you continue to receive paper copies. If you invest directly with the Fund, you can inform the Fund that you wish to continue receiving paper copies by visiting www.manning-napier.com or calling 1-800-466-3863. Your election to receive reports in paper will apply to all funds held with your financial intermediary if you invest through a financial intermediary or all series of the Fund if you invest directly with the Fund.
Additionally, If you have not yet signed up for electronic delivery of shareholder reports and other Fund communications, you may do so by contacting your financial intermediary or, if you are a direct investor, by visiting www.manning-napier.com or calling 1-800-466-3863.

Independent Perspective | Real-World Solutions
A Note from Our CEO
Dear Shareholder,
The obstacles were many, but this year, in so many ways, is a story of triumphant resilience only serving to spotlight just how much more there is to do.
Over the past two years, we’ve endured a recession, a bear market, and a pandemic. Our collective perseverance is now paying off.
We are today experiencing a remarkable economic boom, a historic market rally, and continued medical innovation, all of which have turned a challenging period into one of optimism and hope.
At the same time, political and societal polarization are heightened, social justice concerns have justifiably come to the fore, and the precarious state of our environment presents almost unimaginable challenges for government, business, and finance.
This certainly is a moment of great consequence.
The kind of moment that questions all the rules. Economic rules in how we add value for each other, as well as for ourselves. Social rules in how we interact with each other. Environmental rules that can balance the current needs of emerging economies with the requirements for everyone in the future. Workplace rules in how we get the job done.
Our lives are being redefined, and our society, planet, workplaces, and industry must confront the challenges of the upcoming decade.
Markets reflect us. They mirror our collective thoughts, feelings, expectations, and beliefs – these new life rules.
As we go through this period of change, it will be uncertain and uncomfortable. For those unaccustomed to change, for those reliant on ’set it and forget it’, these may seem like daunting questions, but there is a better way.
Success in an era of change demands flexibility, adaptability, and a roll-up-your-sleeves willingness to do the work.
For over 50 years, independent thinking and tireless work have underpinned every decision we’ve made on behalf of our investors. We invest for the long-term, we do not speculate. We make active decisions, and we invest with discipline, patience, and confidence. This is the only way we know, to remain true to our values and our fiduciary duty to you, the investors in our mutual funds.
You demand more. At Manning & Napier, we demand more of ourselves. Upon reflection of the year, we’re proud to have continued to deliver more.
We wish you safety and good health, and we appreciate your confidence in our firm and our approach.
 | Sincerely,
Marc Mayer Chief Executive Officer |

Corporate Headquarters | 290 Woodcliff Drive | Fairport, NY 14450 | (585) 325-6880 phone | (800) 551-0224 toll free | www.manning-napier.com
1
Real Estate Series
Fund Commentary
(unaudited)
Investment Objective
To provide high current income and long-term capital appreciation by investing principally in companies in the real estate industry. Under normal circumstances, at least 80% of the Series’ assets will be invested in securities of companies that are principally engaged in the US real estate industry.
Performance Commentary
Real estate markets delivered significantly positive returns during 2021 and led the broader U.S. equity market. Within the real estate market, positive performance was wide-spread across sub-industries, with virtually all market segments posting double-digit returns. Retail, Residential, and Industrial REITs were among the strongest performing sub-industries, while Office, Health Care, and Data Storage REITs lagged the broader market but were still meaningfully positive.
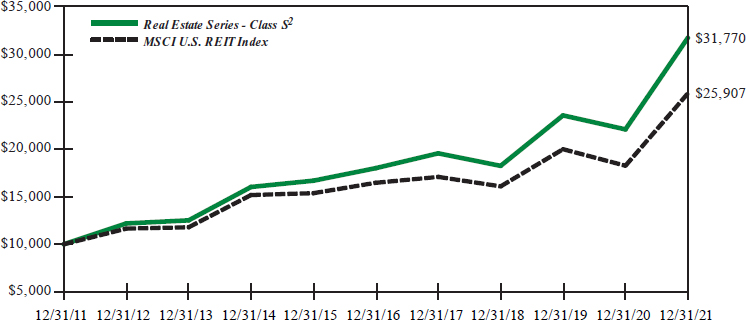
The Real Estate Series Class S shares posted strong returns for the year, and also outperformed its benchmark (i.e., the MSCI US REIT Index), returning 43.67% versus 41.71%, respectively. In aggregate, both industry allocations and security selection drove the Series’ outperformance. The largest contributors to relative outperformance during the year were stock selections within the Data Storage space and Apartment space, underweight allocations to Health Care, Office, Hospitality, Triple-Net Retail, and Gaming REITs, and overweight allocations to Industrial and Single-Family Housing REITs. The Series’ zero-weight allocations to Malls and Shopping Centers were the primary detractors from returns.
The portfolio currently favors Residential REITs, with the primary focus on Single-Family Housing and Manufactured Housing, as we expect the underbuilding of new houses relative to long-term household formation to result in excess demand and support pricing of residential rentals. The portfolio also has an overweight allocation to Industrials REITs compared to the benchmark because of the trend toward e-commerce (and associated warehousing/logistics needs) being accelerated and continuing, as well as an overweight allocation to Infrastructure companies (e.g. cell towers) which are expected to benefit from secular growth. The portfolio continued to maintain an overweight allocation to Data Storage REITs, which are key beneficiaries of the secular growth in cloud-hosted data across enterprises. Within traditional office REITs, we generally continue to prefer Sun Belt markets over coastal metropolitan markets due to the combination of strong job growth and manageable supply. The pandemic environment has strengthened this case as it has weakened demand for space in large metropolitan areas, which we expect to be persistent in certain respects. The portfolio has zero allocation to Mall and Shopping Center REITs, as we continue to have a long-term negative view of brick-and-mortar retail’s fundamental strength in an increasingly e-commerce-dominated world.
Performance for the Real Estate Series Class S shares is provided above. Performance for other shares classes will differ based on each class’ underlying expenses.
Performance data quoted represents past performance and does not guarantee future results. The investment return and principal value of an investment will fluctuate, so that an investor’s shares, when redeemed, may be worth more or less than their original cost. Current performance may be higher or lower than that quoted; investors can obtain the most recent month-end performance at www.manning-napier.com or by calling (800) 466-3863.
Additional information and associated disclosures can be found on the Performance Update page of this report.
All investments involve risks, including potential loss of principal. Funds whose investments are concentrated in a specific industry or sector may be subject to a higher degree of market risk than funds whose investments are diversified among a variety of sectors. The Real Estate Series is subject to risks associated with the direct ownership of real estate, including the potential for falling real estate prices and the possibility of being highly leveraged; an investment in the Series will be closely aligned with the performance of the real estate markets. Additionally, like all derivatives, investments in options can be highly volatile and involve risks in addition to the risks of the underlying instrument on which the derivative is based, such as counterparty, correlation and liquidity risk.
2
Real Estate Series
Performance Update as of December 31, 2021
(unaudited)
AVERAGE ANNUAL TOTAL RETURNS AS OF DECEMBER 31, 2021 | |||
ONE YEAR1 | FIVE YEAR | TEN YEAR | |
| Real Estate Series - Class S2 | 43.67% | 12.00% | 12.25% |
| Real Estate Series - Class I2,3 | 44.14% | 12.29% | 12.53% |
| Real Estate Series - Class W2,4 | 45.19% | 12.64% | 12.57% |
| Real Estate Series - Class Z2,4 | 44.36% | 12.27% | 12.39% |
| MSCI U.S. Real Estate Investment Trust (REIT) Index5 | 41.71% | 9.46% | 9.99% |
The following graph compares the value of a $10,000 investment in the Real Estate Series - Class S for the ten years ended December 31, 2021 to the MSCI U.S. REIT Index.
1The returns shown are based on net asset values calculated for shareholder transactions and may differ from the returns shown in the financial highlights, which reflect adjustments made to the net asset values in accordance with accounting principles generally accepted in the United States of America.
2The Series’ performance does not reflect the deduction of taxes that a shareholder would pay on fund distributions or the redemption of shares. The Series’ performance is historical and may not be indicative of future results. The performance returns shown are inclusive of the net expense ratio of the Series. For the year ended December 31, 2021, this net expense ratio was 1.10% for Class S, 0.84% for Class I, 0.10% for Class W and 0.70% for Class Z. The gross expense ratio, which does not account for any voluntary or contractual waivers currently in effect, was 1.11% for Class S, 0.84% for Class I, 0.71% for Class W and 0.71% for Class Z for the year ended December 31, 2021.
3For periods through August 1, 2012 (the inception date of the Class I shares), performance for Class I shares is based on the historical performance of the Class S shares. Because the Class I shares invest in the same portfolio of securities as Class S, performance will only be different to the extent that the Class S shares have a higher expense ratio.
4For periods through March 1, 2019 (the inception date of the Class W and Class Z shares), performance for the Class W and Class Z shares is based on the historical performance of the Class S shares. Because the Class W and Class Z shares invest in the same portfolio of securities as the Class S shares, performance will be different only to the extent that the Class S shares have a higher expense ratio.
5The MSCI U.S. Real Estate Investment Trust (REIT) Index is a free float-adjusted market capitalization index that is comprised of equity REITs that are classified in the Equity REITs Industry under the GICS® Real Estate sector. The MSCI U.S. REIT Index is a subset of the MSCI USA Investable Market Index (IMI) which captures large, mid, and small-cap securities. The Index returns do not reflect any fees or expenses. The Index is denominated in U.S. dollars. The Index returns are net of withholding taxes. They assume daily reinvestment of net dividends thus accounting for any applicable dividend taxation. Index returns provided by Bloomberg.Index data referenced herein is the property of MSCI, its affiliates (“MSCI”) and/or its third party suppliers and has been licensed for use by Manning & Napier. MSCI and its third party suppliers accept no liability in connection with its use. Data provided is not a representation or warranty, express or implied, as to the ability of any index to accurately represent the asset class or market sector that it purports to represent and none of these parties shall have any liability for any errors, omissions, or interruptions of any index or the data included therein. For additional disclosure information, please see: https://go.manning-napier.com/benchmark-provisions.
3
Real Estate Series
Shareholder Expense Example
(unaudited)
As a shareholder of the Series, you incur ongoing costs, including management fees, shareholder service fees and other Series expenses. This example is intended to help you understand your ongoing costs (in dollars) of investing in the Series and to compare these costs with the ongoing costs of investing in other mutual funds.
The example is based on an investment of $1,000 invested in each class at the beginning of the period and held for the entire period (July 1, 2021 to December 31, 2021).
Actual Expenses
The Actual lines of the table below provide information about actual account values and actual expenses. You may use the information in these lines, together with the amount you invested, to estimate the expenses that you paid over the period. Simply divide your account value by $1,000 (for example, an $8,600 account value divided by $1,000 = 8.6), then multiply the result by the number in the Actual line for the Class in which you have invested under the heading entitled “Expenses Paid During Period” to estimate the expenses you paid on your account during this period.
Hypothetical Example for Comparison Purposes
The Hypothetical lines of each class in the table below provide information about hypothetical account values and hypothetical expenses based on the Class’ actual expense ratio and an assumed rate of return of 5% per year before expenses, which is not the Class’ actual return. The hypothetical account values and expenses may not be used to estimate the actual ending account balance or expenses you paid during the period. You may use this information to compare the ongoing costs of investing in a class of the Series and other funds. To do so, compare this 5% hypothetical example for the Class in which you have invested with the 5% hypothetical examples that appear in the shareholder reports of the other funds.
Please note that the expenses shown in the table are meant to highlight your ongoing costs only and do not reflect any transaction costs, such as sales charges (loads), redemption fees, or exchange fees that you may incur in other mutual funds. Therefore, the second line of the table is useful in comparing ongoing costs only, and will not help you determine the relative total costs of owning different funds.
BEGINNING ACCOUNT VALUE 7/1/21 | ENDING ACCOUNT VALUE 12/31/21 | EXPENSES PAID DURING PERIOD* 7/1/21 - 12/31/21 | ANNUALIZED EXPENSE RATIO | |
| Class S | ||||
| Actual | $1,000.00 | $1,205.60 | $6.12 | 1.10% |
| Hypothetical | ||||
| (5% return before expenses) | $1,000.00 | $1,019.66 | $5.60 | 1.10% |
| Class I | ||||
| Actual | $1,000.00 | $1,207.60 | $4.67 | 0.84% |
| Hypothetical | ||||
| (5% return before expenses) | $1,000.00 | $1,020.97 | $4.28 | 0.84% |
| Class W | ||||
| Actual | $1,000.00 | $1,211.90 | $0.56 | 0.10% |
| Hypothetical | ||||
| (5% return before expenses) | $1,000.00 | $1,024.70 | $0.51 | 0.10% |
| Class Z | ||||
| Actual | $1,000.00 | $1,208.00 | $3.90 | 0.70% |
| Hypothetical | ||||
| (5% return before expenses) | $1,000.00 | $1,021.68 | $3.57 | 0.70% |
*Expenses are equal to each Class’ annualized expense ratio (for the six-month period), multiplied by the average account value over the period, multiplied by 184/365 (to reflect the one-half year period). Expenses are based on the most recent fiscal half year; therefore, the expense ratios stated above may differ from the expense ratios stated in the financial highlights, which are based on one-year data. The Class’ total return would have been lower had certain expenses not been waived or reimbursed during the period.
4
Real Estate Series
Portfolio Composition as of December 31, 2021
(unaudited)
Sector Allocation1 |
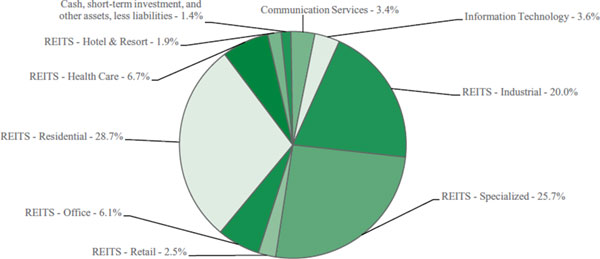 |
1As a percentage of net assets. |
Top Ten Stock Holdings2 | ||||
| Prologis, Inc. | 10.8% | Switch, Inc. - Class A | 3.6% | |
| Equinix, Inc. | 8.8% | Duke Realty Corp. | 3.2% | |
| Public Storage | 4.6% | SBA Communications Corp. | 3.1% | |
| Invitation Homes, Inc. | 3.9% | Digital Realty Trust, Inc. | 3.0% | |
| Sun Communities, Inc. | 3.9% | Rexford Industrial Realty, Inc. | 3.0% | |
2As a percentage of total investments. | ||||
5
Real Estate Series
Investment Portfolio - December 31, 2021
| SHARES | VALUE (NOTE 2) | |||||||
| COMMON STOCKS - 98.6% | ||||||||
| Communication Services - 3.4% | ||||||||
| Integrated Telecommunication Services - 3.4% | ||||||||
| Helios Towers plc (Tanzania)* | 1,701,244 | $ | 3,960,676 | |||||
| Radius Global Infrastructure, Inc. - Class A* | 565,224 | 9,100,107 | ||||||
| Total Communication Services | 13,060,783 | |||||||
| Information Technology - 3.6% | ||||||||
| Internet Services & Infrastructure - 3.6% | ||||||||
| Switch, Inc. - Class A | 488,666 | 13,995,394 | ||||||
| Real Estate - 91.6% | ||||||||
| REITS - Health Care - 6.7% | ||||||||
| CareTrust REIT, Inc. | 141,050 | 3,220,172 | ||||||
| Community Healthcare Trust, Inc. | 119,436 | 5,645,740 | ||||||
| Healthcare Trust of America, Inc. - Class A. | 113,264 | 3,781,885 | ||||||
| Healthpeak Properties, Inc. | 103,392 | 3,731,417 | ||||||
| Ventas, Inc. | 75,612 | 3,865,285 | ||||||
| Welltower, Inc. | 67,212 | 5,764,773 | ||||||
| 26,009,272 | ||||||||
| REITS - Hotel & Resort - 1.9% | ||||||||
| Apple Hospitality REIT, Inc. | 470,941 | 7,605,697 | ||||||
| REITS - Industrial - 20.0% | ||||||||
| Duke Realty Corp. | 191,388 | 12,562,708 | ||||||
| Innovative Industrial Properties, Inc. | 25,733 | 6,765,463 | ||||||
| Prologis, Inc. | 250,505 | 42,175,022 | ||||||
| Rexford Industrial Realty, Inc. | 143,020 | 11,600,352 | ||||||
| Terreno Realty Corp. | 61,184 | 5,218,384 | ||||||
| 78,321,929 | ||||||||
| REITS - Office - 6.1% | ||||||||
| Brandywine Realty Trust | 283,017 | 3,798,088 | ||||||
| Cousins Properties, Inc. | 215,934 | 8,697,822 | ||||||
| Douglas Emmett, Inc. | 103,351 | 3,462,258 | ||||||
| Hibernia REIT plc (Ireland) | 1,606,740 | 2,378,056 | ||||||
| Kilroy Realty Corp. | 80,507 | 5,350,495 | ||||||
| 23,686,719 | ||||||||
| REITS - Residential - 28.7% | ||||||||
| American Campus Communities, Inc. | 137,686 | 7,888,031 | ||||||
| American Homes 4 Rent - Class A | 256,695 | 11,194,469 | ||||||
| AvalonBay Communities, Inc. | 30,781 | 7,774,973 | ||||||
| Camden Property Trust | 39,937 | 7,135,943 | ||||||
| Equity LifeStyle Properties, Inc. | 109,992 | 9,641,899 | ||||||
| Essex Property Trust, Inc. | 24,381 | 8,587,720 | ||||||
| Flagship Communities REIT | 260,343 | 5,024,620 | ||||||
| Invitation Homes, Inc. | 336,556 | 15,259,449 | ||||||
| Mid-America Apartment Communities, Inc. | 44,938 | 10,310,575 | ||||||
| NexPoint Residential Trust, Inc. | 47,015 | 3,941,271 | ||||||
| Sun Communities, Inc. | 72,496 | 15,221,985 | ||||||
| UDR, Inc. | 169,169 | 10,148,448 | ||||||
| 112,129,383 | ||||||||
| SHARES | VALUE (NOTE 2) | |||||||
| COMMON STOCKS (continued) | ||||||||
| Real Estate (continued) | ||||||||
| REITS - Retail - 2.5% | ||||||||
| Agree Realty Corp. | 46,949 | $ | 3,350,281 | |||||
| Getty Realty Corp. | 124,960 | 4,009,966 | ||||||
| Realty Income Corp. | 31,669 | 2,267,184 | ||||||
| 9,627,431 | ||||||||
| REITS - Specialized - 25.7% | ||||||||
| American Tower Corp. | 21,771 | 6,368,018 | ||||||
| Digital Realty Trust, Inc. | 65,768 | 11,632,386 | ||||||
| Equinix, Inc. | 40,375 | 34,150,790 | ||||||
| Extra Space Storage, Inc. | 37,688 | 8,545,000 | ||||||
| Lamar Advertising Co. - Class A | 24,550 | 2,977,915 | ||||||
| Life Storage, Inc. | 43,906 | 6,725,521 | ||||||
| Public Storage | 47,432 | 17,766,130 | ||||||
| SBA Communications Corp. | 31,423 | 12,224,175 | ||||||
| 100,389,935 | ||||||||
| Total Real Estate | 357,770,366 | |||||||
| TOTAL COMMON STOCKS | ||||||||
| (Identified Cost $251,545,076) | 384,826,543 | |||||||
| SHORT-TERM INVESTMENT - 1.2% | ||||||||
| Dreyfus Government Cash Management, | ||||||||
| Institutional Shares, 0.03%1 | ||||||||
| (Identified Cost $4,859,391) | 4,859,391 | 4,859,391 | ||||||
| TOTAL INVESTMENTS - 99.8% | ||||||||
| (Identified Cost $256,404,467) | 389,685,934 | |||||||
| OTHER ASSETS, LESS LIABILITIES - 0.2% | 858,800 | |||||||
| NET ASSETS - 100% | $ | 390,544,734 | ||||||
REIT - Real Estate Investment Trust
The accompanying notes are an integral part of the financial statements.
6
Real Estate Series
Investment Portfolio - December 31, 2021
*Non-income producing security.
1Rate shown is the current yield as of December 31, 2021.
The Global Industry Classification Standard (GICS) was developed by and is the exclusive property and a service mark of MSCI Inc. (MSCI) and Standard & Poor’s, a division of S&P Global Inc. (S&P), and is licensed for use by Manning & Napier when referencing GICS sectors. Neither MSCI, S&P, nor any third party involved in making or compiling the GICS or any GICS classifications makes any express or implied warranties or representations with respect to such standard or classification, nor shall any such party have any liability therefrom.
The accompanying notes are an integral part of the financial statements.
7
Real Estate Series
Statement of Assets and Liabilities
December 31, 2021
ASSETS:
| Investments, at value (identified cost $256,404,467) (Note 2) | $ | 389,685,934 | ||
| Dividends receivable | 659,893 | |||
| Receivable for fund shares sold | 434,486 | |||
| Foreign tax reclaims receivable | 4,426 | |||
| Prepaid expenses | 20,842 | |||
| TOTAL ASSETS | 390,805,581 | |||
| LIABILITIES: | ||||
| Accrued sub-transfer agent fees (Note 3) | 59,052 | |||
| Accrued management fees (Note 3) | 43,061 | |||
| Accrued fund accounting and administration fees (Note 3) | 30,160 | |||
| Accrued distribution and service (Rule 12b-1) fees (Class S) (Note 3) | 9,829 | |||
| Accrued Chief Compliance Officer service fees (Note 3) | 1,531 | |||
| Payable for fund shares repurchased | 80,387 | |||
| Other payables and accrued expenses | 36,827 | |||
| TOTAL LIABILITIES | 260,847 | |||
| TOTAL NET ASSETS | $ | 390,544,734 | ||
| NET ASSETS CONSIST OF: | ||||
| Capital stock | $ | 236,904 | ||
| Additional paid-in-capital | 252,555,365 | |||
| Total distributable earnings (loss) | 137,752,465 | |||
| TOTAL NET ASSETS | ||||
| $ | 390,544,734 | |||
| NET ASSET VALUE, OFFERING PRICE AND REDEMPTION PRICE PER SHARE - Class S | ||||
| ($48,549,284/2,349,687 shares) | $ | 20.66 | ||
| NET ASSET VALUE, OFFERING PRICE AND REDEMPTION PRICE PER SHARE - Class I | ||||
| ($51,320,241/7,062,342 shares) | $ | 7.27 | ||
| NET ASSET VALUE, OFFERING PRICE AND REDEMPTION PRICE PER SHARE - Class W | ||||
| ($288,394,236/13,965,600 shares) | $ | 20.65 | ||
| NET ASSET VALUE, OFFERING PRICE AND REDEMPTION PRICE PER SHARE - Class Z | ||||
| ($2,280,973/312,804 shares) | $ | 7.29 | ||
The accompanying notes are an integral part of the financial statements.
8
Real Estate Series
Statement of Operations
For the Year Ended December 31, 2021
INVESTMENT INCOME:
| Dividends (net of foreign taxes withheld, $29,294) | $ | 5,723,873 | ||
| Other Income | 22,930 | |||
| Total Investment Income | 5,746,803 | |||
| EXPENSES: | ||||
| Management fees (Note 3) | 1,959,967 | |||
| Sub-transfer agent fees (Note 3) | 108,307 | |||
| Distribution and service (Rule 12b-1) fees (Class S) (Note 3) | 104,644 | |||
| Fund accounting and administration fees (Note 3) | 85,778 | |||
| Directors’ fees (Note 3) | 38,470 | |||
| Chief Compliance Officer service fees (Note 3) | 6,124 | |||
| Custodian fees | 13,913 | |||
| Recoupment of past waived and/or reimbursed fees | 2,357 | |||
| Miscellaneous | 222,742 | |||
| Total Expenses | 2,542,302 | |||
| Less reduction of expenses (Note 3) | (1,507,446 | ) | ||
| Net Expenses | 1,034,856 | |||
| NET INVESTMENT INCOME | 4,711,947 | |||
| REALIZED AND UNREALIZED GAIN (LOSS) ON INVESTMENTS AND FOREIGN CURRENCY: | ||||
| Net realized gain (loss) on- | ||||
| Investments | 26,118,909 | |||
| Foreign currency and translation of other assets and liabilities | 88 | |||
| 26,118,997 | ||||
| Net change in unrealized appreciation (depreciation) on- | ||||
| Investments | 91,602,234 | |||
| Foreign currency and translation of other assets and liabilities | (1,275 | ) | ||
| 91,600,959 | ||||
| NET REALIZED AND UNREALIZED GAIN (LOSS) ON INVESTMENTS AND FOREIGN CURRENCY | 117,719,956 | |||
| NET INCREASE IN NET ASSETS RESULTING FROM OPERATIONS | $ | 122,431,903 |
The accompanying notes are an integral part of the financial statements.
9
Real Estate Series
Statements of Changes in Net Assets
FOR THE YEAR ENDED 12/31/21 | FOR THE YEAR ENDED 12/31/20 | |||||||
| INCREASE (DECREASE) IN NET ASSETS: | ||||||||
| OPERATIONS: | ||||||||
| Net investment income | $ | 4,711,947 | $ | 4,815,586 | ||||
| Net realized gain (loss) on investments and foreign currency | 26,118,997 | (6,364,299 | ) | |||||
| Net change in unrealized appreciation (depreciation) on investments and foreign currency | 91,600,959 | (17,858,681 | ) | |||||
| Net increase (decrease) from operations | 122,431,903 | (19,407,394 | ) | |||||
| DISTRIBUTIONS TO SHAREHOLDERS (Note 10): | ||||||||
| Class S | (1,665,158 | ) | (827,914 | ) | ||||
| Class I | (4,881,125 | ) | (1,966,961 | ) | ||||
| Class W | (12,260,150 | ) | (6,148,808 | ) | ||||
| Class Z | (125,057 | ) | (33,883 | ) | ||||
| From return of capital (Class S) | – | (94,621 | ) | |||||
| From return of capital (Class I) | – | (262,791 | ) | |||||
| From return of capital (Class W) | – | (952,851 | ) | |||||
| From return of capital (Class Z) | – | (4,609 | ) | |||||
| Total distributions to shareholders | (18,931,490 | ) | (10,292,438 | ) | ||||
| CAPITAL STOCK ISSUED AND REPURCHASED: | ||||||||
| Net increase (decrease) from capital share transactions (Note 5) | 3,074,231 | 11,810,090 | ||||||
| Net increase (decrease) in net assets | 106,574,644 | (17,889,742 | ) | |||||
| NET ASSETS: | ||||||||
| Beginning of year | 283,970,090 | 301,859,832 | ||||||
| End of year | $ | 390,544,734 | $ | 283,970,090 | ||||
The accompanying notes are an integral part of the financial statements.
10
Real Estate Series
Financial Highlights - Class S
| FOR THE YEAR ENDED | |||||||||||||||
| 12/31/21 | 12/31/20 | 12/31/19 | 12/31/18 | 12/31/17 | |||||||||||
| Per share data (for a share outstanding throughout each year): | |||||||||||||||
| Net asset value - Beginning of year | $14.92 | $16.31 | $13.09 | $14.93 | $14.48 | ||||||||||
| Income (loss) from investment operations: | |||||||||||||||
| Net investment income1 | 0.12 | 0.12 | 2 | 0.15 | 0.26 | 0.24 | |||||||||
| Net realized and unrealized gain (loss) on investments | 6.35 | (1.15 | ) | 3.65 | (1.24 | ) | 1.02 | ||||||||
| Total from investment operations | 6.47 | (1.03 | ) | 3.80 | (0.98 | ) | 1.26 | ||||||||
| Less distributions to shareholders: | |||||||||||||||
| From net investment income | (0.10 | ) | (0.13 | ) | (0.16 | ) | (0.21 | ) | (0.25 | ) | |||||
| From net realized gain on investments | (0.63 | ) | (0.19 | ) | (0.42 | ) | (0.63 | ) | (0.56 | ) | |||||
| From return of capital | — | (0.04 | ) | — | (0.02 | ) | — | ||||||||
| Total distributions to shareholders | (0.73 | ) | (0.36 | ) | (0.58 | ) | (0.86 | ) | (0.81 | ) | |||||
| Net asset value - End of year | $20.66 | $14.92 | $16.31 | $13.09 | $14.93 | ||||||||||
| Net assets - End of year (000’s omitted) | $48,549 | $37,762 | $59,923 | $214,722 | $271,496 | ||||||||||
| Total return3 | 43.67% | (6.27% | ) | 29.14% | 4 | (6.73% | ) | 8.66% | |||||||
| Ratios (to average net assets)/Supplemental Data: | |||||||||||||||
| Expenses* | 1.10% | 1.10% | 1.11% | 1.11% | 1.10% | ||||||||||
| Net investment income | 0.66% | 0.81% | 2 | 1.02% | 1.82% | 1.58% | |||||||||
| Series portfolio turnover | 26% | 69% | 24% | 44% | 42% | ||||||||||
*For certain years presented, the investment advisor did not impose all or a portion of its management and/or other fees, and in some years may have paid a portion of the Series’ expenses. If these expenses had been incurred by the Class, the expense ratio (to average net assets) would have increased by the following amounts:
| 0.01% | 0.03% | 0.00% | 5 | N/A | 0.00% | 5 |
1Calculated based on average shares outstanding during the years.
2Includes special dividends from two of the Series’ securities. Excluding this amount, the net investment income per share would have been $0.11 and the net investment income ratio would have been 0.72%.
3Represents aggregate total return for the years indicated, and assumes reinvestment of all distributions. Total return would have been lower had certain expenses not been waived or reimbursed during certain years.
4Includes litigation proceeds. Excluding this amount, the Class’ total return is 29.06%.
5Less than 0.01%.
The accompanying notes are an integral part of the financial statements.
11
Real Estate Series
Financial Highlights - Class I
| FOR THE YEAR ENDED | |||||||||||||||
| 12/31/21 | 12/31/20 | 12/31/19 | 12/31/18 | 12/31/17 | |||||||||||
| Per share data (for a share outstanding throughout each year): | |||||||||||||||
| Net asset value - Beginning of year | $5.63 | $6.44 | $5.50 | $6.81 | $7.03 | ||||||||||
| Income (loss) from investment operations: | |||||||||||||||
| Net investment income1 | 0.06 | 0.06 | 2 | 0.11 | 0.14 | 0.14 | |||||||||
| Net realized and unrealized gain (loss) on investments | 2.38 | (0.45 | ) | 1.49 | (0.55 | ) | 0.49 | ||||||||
| Total from investment operations | 2.44 | (0.39 | ) | 1.60 | (0.41 | ) | 0.63 | ||||||||
| Less distributions to shareholders: | |||||||||||||||
| From net investment income | (0.17 | ) | (0.18 | ) | (0.24 | ) | (0.24 | ) | (0.29 | ) | |||||
| From net realized gain on investments | (0.63 | ) | (0.19 | ) | (0.42 | ) | (0.63 | ) | (0.56 | ) | |||||
| From return of capital | — | (0.05 | ) | — | (0.03 | ) | — | ||||||||
| Total distributions to shareholders | (0.80 | ) | (0.42 | ) | (0.66 | ) | (0.90 | ) | (0.85 | ) | |||||
| Net asset value - End of year | $7.27 | $5.63 | $6.44 | $5.50 | $6.81 | ||||||||||
| Net assets - End of year (000’s omitted) | $51,320 | $30,787 | $50,025 | $50,111 | $47,074 | ||||||||||
| Total return3 | 44.14% | (5.96% | ) | 29.31% | (6.41% | ) | 8.85% | ||||||||
| Ratios (to average net assets)/Supplemental Data: | |||||||||||||||
| Expenses* | 0.84% | 4 | 0.85% | 0.84% | 0.86% | 0.85% | |||||||||
| Net investment income | 0.92% | 1.02% | 2 | 1.62% | 2.12% | 1.95% | |||||||||
| Series portfolio turnover | 26% | 69% | 24% | 44% | 42% | ||||||||||
*For certain years presented, the investment advisor did not impose all or a portion of its management and/or other fees, and in some years may have paid a portion of the Series’ expenses. If these expenses had been incurred by the Class, the expense ratio (to average net assets) would have increased by the following amounts:
| N/A | 0.01% | N/A | N/A | 0.00% | 5 |
1Calculated based on average shares outstanding during the years.
2Includes special dividends from two of the Series’ securities. Excluding this amount, the net investment income per share would have been $0.05 and the net investment income ratio would have been 0.93%.
3Represents aggregate total return for the years indicated, and assumes reinvestment of all distributions. Total return would have been lower had certain expenses not been waived or reimbursed during certain years.
4Includes recoupment of past waived and/or reimbursed fees. Excluding this amount, the expense ratio (to average net assets) would have decreased by less than 0.01%.
5Less than 0.01%.
The accompanying notes are an integral part of the financial statements.
12
Real Estate Series
Financial Highlights - Class W
| FOR THE YEAR ENDED | FOR THE | ||||||||
| PERIOD | |||||||||
| 3/1/191 TO | |||||||||
| 12/31/21 | 12/31/20 | 12/31/19 | |||||||
| Per share data (for a share outstanding throughout each period): | |||||||||
| Net asset value - Beginning of period | $14.89 | $16.27 | $14.76 | ||||||
| Income (loss) from investment operations: | |||||||||
| Net investment income2 | 0.29 | 0.33 | 3 | 0.35 | |||||
| Net realized and unrealized gain (loss) on investments | 6.38 | (1.20 | ) | 1.91 | |||||
| Total from investment operations | 6.67 | (0.87 | ) | 2.26 | |||||
| Less distributions to shareholders: | |||||||||
| From net investment income | (0.29 | ) | (0.25 | ) | (0.33 | ) | |||
| From net realized gain on investments | (0.63 | ) | (0.19 | ) | (0.42 | ) | |||
| From return of capital | — | (0.07 | ) | — | |||||
| Total distributions to shareholders | (0.92 | ) | (0.51 | ) | (0.75 | ) | |||
| Net asset value - End of period | $20.65 | $14.89 | $16.27 | ||||||
| Net assets - End of period (000’s omitted) | $288,394 | $214,871 | $191,373 | ||||||
| Total return4 | 45.19% | (5.33% | ) | 15.43% | 5 | ||||
| Ratios (to average net assets)/Supplemental Data: | |||||||||
| Expenses* | 0.10% | 0.10% | 0.10% | 6 | |||||
| Net investment income | 1.66% | 2.27% | 3 | 2.58% | 6 | ||||
| Series portfolio turnover | 26% | 69% | 24% | ||||||
*The investment advisor did not impose all or a portion of its management and/or other fees during the periods, and may have paid a portion of the Series’ expenses. If these expenses had been incurred by the Class, the expense ratio (to average net assets) would have increased by the following amounts:
| 0.61% | 0.64% | 0.62% | 6 |
1Commencement of operations.
2Calculated based on average shares outstanding during the periods.
3Includes special dividends from two of the Series’ securities. Excluding this amount, the net investment income per share would have been $0.31 and the net investment income ratio would have been 2.14%.
4Represents aggregate total return for the periods indicated, and assumes reinvestment of all distributions. Total return would have been lower had certain expenses not been waived or reimbursed during the periods. Periods less than one year are not annualized.
5Includes litigation proceeds. Excluding this amount, the Class’ total return is 15.36%.
6Annualized.
The accompanying notes are an integral part of the financial statements.
13
Real Estate Series
Financial Highlights - Class Z
| FOR THE YEAR ENDED | FOR THE | ||||||||
| PERIOD | |||||||||
| 3/1/191 TO | |||||||||
| 12/31/21 | 12/31/20 | 12/31/19 | |||||||
| Per share data (for a share outstanding throughout each period): | |||||||||
| Net asset value - Beginning of period | $5.64 | $6.46 | $6.21 | ||||||
| Income (loss) from investment operations: | |||||||||
| Net investment income2 | 0.08 | 0.09 | 3 | 0.08 | |||||
| Net realized and unrealized gain (loss) on investments | 2.38 | (0.48 | ) | 0.84 | |||||
| Total from investment operations | 2.46 | (0.39 | ) | 0.92 | |||||
| Less distributions to shareholders: | |||||||||
| From net investment income | (0.18 | ) | (0.19 | ) | (0.25 | ) | |||
| From net realized gain on investments | (0.63 | ) | (0.19 | ) | (0.42 | ) | |||
| From return of capital | — | (0.05 | ) | — | |||||
| Total distributions to shareholders | (0.81 | ) | (0.43 | ) | (0.67 | ) | |||
| Net asset value - End of period | $7.29 | $5.64 | $6.46 | ||||||
| Net assets - End of period (000’s omitted) | $2,281 | $549 | $539 | ||||||
| Total return4 | 44.36% | (5.96% | ) | 14.98% | 5 | ||||
| Ratios (to average net assets)/Supplemental Data: | |||||||||
| Expenses* | 0.70% | 0.70% | 0.70% | 6 | |||||
| Net investment income | 1.15% | 1.51% | 3 | 1.42% | 6 | ||||
| Series portfolio turnover | 26% | 69% | 24% | ||||||
*The investment advisor did not impose all or a portion of its management and/or other fees during the periods, and may have paid a portion of the Series’ expenses. If these expenses had been incurred by the Class, the expense ratio (to average net assets) would have increased by the following amounts:
| 0.01% | 0.04% | 0.02% | 6 |
1Commencement of operations.
2Calculated based on average shares outstanding during the periods.
3Includes special dividends from two of the Series’ securities. Excluding this amount, the net investment income per share would have been $0.08 and the net investment income ratio would have been 1.39%.
4Represents aggregate total return for the periods indicated, and assumes reinvestment of all distributions. Total return would have been lower had certain expenses not been waived or reimbursed during the periods. Periods less than one year are not annualized.
5Includes litigation proceeds. Excluding this amount, the Class’ total return is 14.62%.
6Annualized.
The accompanying notes are an integral part of the financial statements.
14
Real Estate Series
Notes to Financial Statements
| 1. | Organization |
Real Estate Series (the “Series”) is a no-load diversified series of Manning & Napier Fund, Inc. (the “Fund”). The Fund is organized in Maryland and is registered under the Investment Company Act of 1940, as amended, as an open-end management investment company.
The Series’ investment objective is to provide high current income and long-term capital appreciation by investing principally in companies in the real estate industry.
The Fund’s advisor is Manning & Napier Advisors, LLC (the “Advisor”). Shares of the Series are offered to investors, clients and employees of the Advisor and its affiliates. The Series is authorized to issue four classes of shares (Class S, I, W, and Z). Each class of shares is substantially the same, except that class specific distribution and shareholder servicing expenses are borne by the specific class of shares to which they relate. The total authorized capital stock of the Fund consists of 15 billion shares of common stock each having a par value of $0.01. As of December 31, 2021, 6.3 billion shares have been designated in total among 15 series, of which 100 million have been designated as Real Estate Series Class I common stock, Real Estate Series Class S common stock and Real Estate Series Class Z common stock and 75 million have been designated as Real Estate Series Class W common stock.
| 2. | Significant Accounting Policies |
The following is a summary of significant accounting policies followed by the Series. The Series is an investment company and, accordingly, follows the investment company accounting and reporting guidance of the Financial Accounting Standards Board Accounting Standards Codification Topic 946 - Investment Companies, which is part of accounting principles generally accepted in the United States of America (“GAAP”).
Security Valuation
Portfolio securities, including domestic equities, foreign equities, warrants and options, listed on an exchange other than the NASDAQ Stock Market are valued at the latest quoted sales price of the exchange on which the security is primarily traded. Securities not traded on valuation date or securities not listed on an exchange are valued at the latest quoted bid price provided by the Fund’s pricing service. Securities listed on the NASDAQ Stock Market are valued in accordance with the NASDAQ Official Closing Price.
Short-term investments that mature in sixty days or less may be valued at amortized cost, which approximates fair value. Investments in open-end investment companies are valued at their net asset value per share on valuation date.
Volume and level of activity in established markets for an asset or liability are evaluated to determine whether recent transactions and quoted prices are determinative of fair value. Where there have been significant decreases in volume and level of activity, further analysis and adjustment may be necessary to estimate fair value. The Series measures fair value in these instances by the use of inputs and valuation techniques which may be based upon current market prices of securities that are comparable in coupon, rating, maturity and industry and/or expectation of future cash flows. As a result of trading in relatively thin markets and/or markets that experience significant volatility, the prices used by the Series to value these securities may differ from the value that would be realized if these securities were sold, and the differences could be material.
Securities for which representative valuations or prices are not available from the Series’ pricing service may be valued at fair value as determined in good faith by the Advisor under procedures approved by and under the general supervision and responsibility of the Fund’s Board of Directors (the “Board”). Due to the inherent uncertainty of valuations of such securities, the fair value may differ significantly from the values that would have been used had a ready market for such securities existed. If trading or events occurring after the close of the principal market in which securities are traded are expected to materially affect the value of those securities, then they may be valued at their fair value, taking this trading or these events into account. In accordance with the procedures approved by the Board, the values of certain securities trading outside the U.S. were adjusted following the close of local trading using a factor from a third party vendor. The third party vendor uses statistical analyses and quantitative models, which consider among other things subsequent movement and changes in the prices of indices, securities and exchange rates in other markets, to determine the factors which are used to adjust local market prices. The value of securities
15
Real Estate Series
Notes to Financial Statements (continued)
| 2. | Significant Accounting Policies (continued) |
Security Valuation (continued)
used for net asset value calculation under these procedures may differ from published prices for the same securities. It is the Fund’s policy to classify each foreign equity security where a factor from a third party vendor is provided as a Level 2 security.
Various inputs are used in determining the value of the Series’ assets or liabilities carried at fair value. These inputs are summarized in three broad levels. Level 1 includes quoted prices in active markets for identical assets and liabilities. Level 2 includes other significant observable inputs (including quoted prices for similar securities, interest rates, prepayment speeds, credit risk, etc.). Level 3 includes significant unobservable inputs (including the Series’ own assumptions in determining the fair value of investments). A financial instrument’s level within the fair value hierarchy is based on the lowest level of any input both individually and in aggregate that is significant to the fair value measurement. The inputs or methodology used for valuing securities are not necessarily an indication of the risk associated with investing in those securities.
The following is a summary of the valuation levels used for major security types as of December 31, 2021 in valuing the Series’ assets or liabilities carried at fair value:
| DESCRIPTION | TOTAL | LEVEL 1 | LEVEL 2# | LEVEL 3 | ||||||||||||
| Assets: | ||||||||||||||||
| Equity securities: | ||||||||||||||||
| Communication Services | $ | 13,060,783 | $ | 9,100,107 | $ | 3,960,676 | $ | — | ||||||||
| Information Technology | 13,995,394 | 13,995,394 | — | — | ||||||||||||
| Real Estate* | 357,770,366 | 355,392,310 | 2,378,056 | — | ||||||||||||
| Short-Term Investment | 4,859,391 | 4,859,391 | — | — | ||||||||||||
| Total assets | $ | 389,685,934 | $ | 383,347,202 | $ | 6,338,732 | $ | — | ||||||||
*Please refer to the Investment Portfolio for the industry classifications of these portfolio holdings.
#Includes certain foreign equity securities for which a factor from a third party vendor was applied to determine the securities’ fair value following the close of local trading.
There were no Level 3 securities held by the Series as of December 31, 2020 or December 31, 2021.
Security Transactions, Investment Income and Expenses
Security transactions are accounted for on trade date. Dividend income is recorded on the ex-dividend date, except that if the ex-dividend date has passed, certain dividends from foreign securities are recorded as soon as the Series is informed of the ex-dividend date. Non-cash dividends, if any, are recorded at the fair value of the securities received. Interest income, including amortization of premium and accretion of discounts using the effective interest method, is earned from settlement date and accrued daily.
Expenses are recorded on an accrual basis. Most expenses of the Fund can be attributed to a specific series. Expenses which cannot be directly attributed are apportioned among the series in the Fund in such a manner as deemed equitable by the Fund’s Board, taking into consideration, among other things, the nature and type of expense. Income, expenses (other than shareholder services fees), and realized and unrealized gains and losses are prorated among the classes based on the relative net assets of each class. Class specific expenses are directly charged to that Class.
The Fund records distributions received in excess of income from underlying investments as a reduction of cost of investments and/or realized gain. Such amounts are based on estimates if actual amounts are not available and actual amounts of income, realized gain and return of capital may differ from the estimated amounts. The Fund adjusts the estimated amounts of components of distributions (and consequently its net investment income) as necessary once the issuers provide information about the actual composition of the distributions.
The Series uses the identified cost method for determining realized gain or loss on investments for both financial statement and federal income tax reporting purposes.
16
Real Estate Series
Notes to Financial Statements (continued)
| 2. | Significant Accounting Policies (continued) |
Foreign Currency Translation
The books and records of the Series are maintained in U.S. dollars. Foreign currencies, investments and other assets and liabilities are translated into U.S. dollars at the current exchange rates. Purchases and sales of investment securities and income and expenses are translated on the respective dates of such transactions. The Series does not isolate realized and unrealized gains and losses attributable to changes in the exchange rates from gains and losses that arise from changes in the market value of investments. Such fluctuations are included with net realized and unrealized gain or loss on investments. Net realized foreign currency gains and losses represent foreign currency gains and losses between trade date and settlement date on securities transactions, gains and losses on disposition of foreign currencies and the difference between the amount of income and foreign withholding taxes recorded on the books of the Series and the amounts actually received or paid.
Federal Taxes
The Series’ policy is to comply with the provisions of the Internal Revenue Code applicable to regulated investment companies. The Series is not subject to federal income tax or excise tax to the extent that the Series distributes to shareholders each year its taxable income, including any net realized gains on investments, in accordance with requirements of the Internal Revenue Code. Accordingly, no provision for federal income tax or excise tax has been made in the financial statements.
Management evaluates its tax positions to determine if the tax positions taken meet the minimum recognition threshold in connection with accounting for uncertainties in income tax positions taken or expected to be taken for the purposes of measuring and recognizing tax liabilities in the financial statements. Recognition of tax benefits of an uncertain tax position is required only when the position is “more likely than not” to be sustained assuming examination by taxing authorities. At December 31, 2021, the Series has recorded no liability for net unrecognized tax benefits relating to uncertain income tax positions taken or expected to be taken in future tax returns.
The Series files income tax returns in the U.S. federal jurisdiction, various states and foreign jurisdictions, as required. No income tax returns are currently under investigation. The statute of limitations on the Series’ tax returns remains open for the years ended December 31, 2018 through December 31, 2021. The Series is not aware of any tax positions for which it is reasonably possible that the total amounts of unrecognized tax benefits will significantly change in the next twelve months.
Foreign Taxes
Based on the Series’ understanding of the tax rules and rates related to income, gains and currency purchase/repatriation transactions for foreign jurisdictions in which it invests, the Series will provide for foreign taxes, and where appropriate, deferred foreign tax.
Distributions of Income and Gains
Distributions to shareholders of net investment income and net realized gains are made annually. An additional distribution may be necessary to avoid taxation of the Series. Distributions are recorded on the ex-dividend date.
Indemnifications
The Fund’s organizational documents provide former and current directors and officers with a limited indemnification against liabilities arising in connection with the performance of their duties to the Fund. In the normal course of business, the Fund may also enter into contracts that provide general indemnifications. The Fund’s maximum exposure under these arrangements is unknown as this would be dependent on future claims that may be made against the Fund. The risk of material loss from such claims is considered remote.
Other
The preparation of financial statements in conformity with GAAP requires management to make estimates and assumptions that affect the reported amounts of assets and liabilities and the disclosure of contingent assets and liabilities at the date of the financial statements and the reported amounts of income and expenses during the reporting period. Actual results could differ from those estimates.
17
Real Estate Series
Notes to Financial Statements (continued)
| 3. | Transactions with Affiliates |
The Fund has an Investment Advisory Agreement (the “Agreement”) with the Advisor, for which the Series pays a fee, computed daily and payable monthly, at an annual rate of 0.60% of the Series’ average daily net assets.
Under the Agreement, personnel of the Advisor provide the Series with advice and assistance in the choice of investments and the execution of securities transactions, and otherwise maintain the Series’ organization. The Advisor also provides the Fund with necessary office space and fund administration and support services. The salaries of all officers of the Fund (except a percentage of the Fund’s Chief Compliance Officer’s salary, which is paid by the Fund), and of all Directors who are “affiliated persons” of the Fund, or of the Advisor, and all personnel of the Fund, or of the Advisor, performing services relating to research, statistical and investment activities, are paid by the Advisor. Each “non-affiliated” Director receives an annual stipend, which is allocated among all the active series of the Fund. In addition, these Directors also receive a fee per Board meeting attended plus a fee for each committee meeting attended and are reimbursed for travel and other out-of-pocket expenses incurred by them in connection with attending such meetings. The Fund also has an Audit Committee Chair, Governance & Nominating Committee Chair and Lead Independent Director, who each receive an additional annual stipend for these roles.
The Fund may enter into agreements with financial intermediaries pursuant to which the Fund may pay financial intermediaries for non-distribution related sub-transfer agency, administrative, sub-accounting, and other shareholder services in an annual amount not to exceed 0.15% of the average daily net assets of the Class I and Class S shares of the Series. Payments made pursuant to such agreements are generally based on the current assets and/or number of accounts of the Series attributable to the financial intermediary. Any payments made pursuant to such agreements may be in addition to, rather than in lieu of, any Distribution and Shareholder Services Fee payable under the Rule 12b-1 plan of the Fund. For the year ended December 31, 2021, the sub-transfer agency expenses incurred by Class S and Class I were $60,571 and $47,736, respectively.
Manning & Napier Investor Services, Inc., a registered broker-dealer affiliate of the Advisor, acts as distributor for the Fund’s shares. The Series compensates the distributor for distributing and servicing the Series’ Class S shares pursuant to a distribution plan adopted under Rule 12b-1 of the 1940 Act, regardless of expenses actually incurred. Under the agreement, the Series pays distribution and service fees to the distributor at an annual rate of 0.25% of average daily net assets attributable to Class S shares. There are no distribution and service fees on the Class I, Class W or Class Z shares. The fees are accrued daily and paid monthly.
Pursuant to a master services agreement dated February 13, 2020, as amended, the Fund pays the Advisor an annual fee related to fund accounting and administration of 0.0085% on the first $25 billion of average daily net assets; 0.0075% on the next $15 billion of average daily net assets; and 0.0065% of average daily net assets in excess of $40 billion; plus a base fee of $30,400 per series. Additionally, certain transaction and out-of-pocket expenses, including charges for reporting relating to the Fund’s compliance program, are charged. The Advisor has agreements with BNY Mellon Investment Servicing (U.S.) Inc. (“BNY”) under which BNY serves as sub-accountant services agent.
Pursuant to an advisory fee waiver agreement, the Advisor has contractually agreed to waive the management fee for the Class W shares. The full management fee will be waived under this agreement because Class W shares are only available to discretionary investment accounts and other accounts managed by the Advisor. These clients pay a management fee to the Advisor that is separate from the Fund’s expenses. In addition, pursuant to a separate expense limitation agreement, the Advisor has contractually agreed to limit its fees and reimburse expenses to the extent necessary so that the total direct annual fund operating expenses, exclusive of the shareholder services fee and/or distribution and service (12b-1) fees and waived Class W management fees (collectively, “excluded expenses”), do not exceed 0.85% of the average daily net assets of the Class S and Class I shares, 0.10% of the average daily net assets of the Class W shares, and 0.70% of the average daily net assets of the Class Z shares. These contractual waivers are expected to continue indefinitely, and may not be amended or terminated by the Advisor without the approval of the Series’ Board of Directors. The Advisor may receive from a Class the difference between the Class’s total direct annual fund operating expenses, not including excluded expenses, and the Class’s contractual expense limit to recoup all or a portion of its prior fee waivers (other than Class W management fee waivers) or expense reimbursements made during the rolling three-year period preceding the recoupment if at any point the total direct annual fund operating expenses, not including excluded expenses, are below the contractual expense limit (a) at the time of the fee waiver and/or expense reimbursement and (b) at the time of the recoupment.
18
Real Estate Series
Notes to Financial Statements (continued)
| 3. | Transactions with Affiliates (continued) |
Pursuant to the advisory fee waiver, the Advisor waived $1,474,038 in management fees for Class W for the year ended December 31, 2021. In addition, pursuant to the separate expense limitation agreement, the Advisor waived or reimbursed expenses of $2,956, $30,356 and $96 for Class S, Class W and Class Z, respectively, for the year ended December 31, 2021. These amounts are included as a reduction of expenses on the Statement of Operations.
As of December 31, 2021, the class specific waivers or reimbursements subject to possible future recoupment under the expense limitation agreement are as follows:
| CLASS | EXPIRING DECEMBER 31, | |||||||
| 2022 | 2023 | 2024 | Total | |||||
| Class S | $6,660 | $12,058 | $2,956 | $21,674 | ||||
| Class I | — | 5 | — | 5 | ||||
| Class W | 32,160 | 67,990 | 30,356 | 130,506 | ||||
| Class Z | 382 | 190 | 96 | 668 | ||||
For the year ended December 31, 2021, the Advisor recouped $2,357 that have been previously waived or reimbursed for Class I.
| 4. | Purchases and Sales of Securities |
For the year ended December 31, 2021, purchases and sales of securities, other than U.S. Government securities and short-term securities, were $84,649,398 and $98,317,902, respectively. There were no purchases or sales of U.S. Government securities.
| 5. | Capital Stock Transactions |
Transactions in Class S, Class I, Class W and Class Z shares of Real Estate Series were:
| CLASS S | FOR THE YEAR ENDED 12/31/21 | FOR THE YEAR ENDED 12/31/20 | ||||||||||||||
| SHARES | AMOUNT | SHARES | AMOUNT | |||||||||||||
| Sold | 366,265 | $ | 6,424,926 | 497,285 | $ | 7,097,568 | ||||||||||
| Reinvested | 82,953 | 1,621,736 | 60,668 | 894,249 | ||||||||||||
| Repurchased | (631,144 | ) | (10,881,761 | ) | (1,701,388 | ) | (23,099,433 | ) | ||||||||
| Total | (181,926 | ) | $ | (2,835,099 | ) | (1,143,435 | ) | $ | (15,107,616 | ) | ||||||
| CLASS I | FOR THE YEAR ENDED 12/31/21 | FOR THE YEAR ENDED 12/31/20 | ||||||||||||||
| SHARES | AMOUNT | SHARES | AMOUNT | |||||||||||||
| Sold | 2,388,550 | $ | 16,119,743 | 2,278,198 | $ | 13,092,128 | ||||||||||
| Reinvested | 631,336 | 4,337,281 | 355,681 | 1,977,588 | ||||||||||||
| Repurchased | (1,426,591 | ) | (9,257,738 | ) | (4,926,892 | ) | (26,342,003 | ) | ||||||||
| Total | 1,593,295 | $ | 11,199,286 | (2,293,013 | ) | $ | (11,272,287 | ) | ||||||||
19
Real Estate Series
Notes to Financial Statements (continued)
| 5. | Capital Stock Transactions (continued) |
| CLASS W | FOR THE YEAR ENDED 12/31/21 | FOR THE YEAR ENDED 12/31/20 | ||||||||||||||
| SHARES | AMOUNT | SHARES | AMOUNT | |||||||||||||
| Sold | 636,315 | $ | 11,124,927 | 4,172,038 | $ | 59,888,503 | ||||||||||
| Reinvested | 607,420 | 11,862,919 | 459,235 | 6,755,357 | ||||||||||||
| Repurchased | (1,705,540 | ) | (29,801,017 | ) | (1,966,099 | ) | (28,531,311 | ) | ||||||||
| Total | (461,805 | ) | $ | (6,813,171 | ) | 2,665,174 | $ | 38,112,549 | ||||||||
| CLASS Z | FOR THE YEAR ENDED 12/31/21 | FOR THE YEAR ENDED 12/31/20 | ||||||||||||||
| SHARES | AMOUNT | SHARES | AMOUNT | |||||||||||||
| Sold | 218,771 | $ | 1,551,103 | 21,301 | $ | 122,725 | ||||||||||
| Reinvested | 18,047 | 124,519 | 6,859 | 38,206 | ||||||||||||
| Repurchased | (21,422 | ) | (152,407 | ) | (14,322 | ) | (83,487 | ) | ||||||||
| Total | 215,396 | $ | 1,523,215 | 13,838 | $ | 77,444 | ||||||||||
Approximately 74% of the shares outstanding are fiduciary accounts where the Advisor has sole investment discretion.
| 6. | Line of Credit |
The Fund has entered into a 364-day, $25 million credit agreement (the “line of credit”) with Bank of New York Mellon. Each series of the Fund may borrow under the line of credit for temporary or emergency purposes, including funding shareholder redemptions and other short-term liquidity purposes. The Fund pays an annual fee on the unused commitment amount, payable quarterly, and is allocated among all the series of the Fund and included in miscellaneous expenses in the Statement of Operations for each series. The line of credit expires in September 2022 unless extended or renewed. During the year ended December 31, 2021, the Series did not borrow under the line of credit.
| 7. | Financial Instruments |
The Series may trade in instruments including written and purchased options, forward foreign currency exchange contracts and futures contracts and other derivatives in the normal course of investing activities to assist in managing exposure to various market risks. The Series may be subject to various elements of risk, which may involve, to a varying degree, elements of risk in excess of the amounts recognized for financial statement purposes. These risks include: the risk that changes in the value of a derivative may not correlate perfectly with the underlying asset, rate or index; counterparty credit risk related to over the counter derivative counterparties’ failure to perform under contract terms; liquidity risk related to the lack of a liquid market for these contracts allowing the fund to close out its position(s); and documentation risk relating to disagreement over contract terms. No such investments were held by the Series as of December 31, 2021.
| 8. | Foreign Securities |
Investing in securities of foreign companies and foreign governments involves special risks and considerations not typically associated with investing in securities of domestic companies and the U.S. Government. These risks include revaluation of currencies and future adverse political and economic developments. Moreover, securities of foreign companies and foreign governments and their markets may be less liquid and their prices more volatile than those of comparable domestic companies and the U.S. Government.
20
Real Estate Series
Notes to Financial Statements (continued)
| 9. | Real Estate Securities |
The Series may focus its investments in certain real estate related industries; hence, the Series may subject itself to a greater degree of risk than a series that is more diversified.
| 10. | Federal Income Tax Information |
The amount and characterization of certain income and capital gains to be distributed are determined in accordance with federal income tax regulations, which may differ from GAAP. These differences are primarily due to differing book and tax treatments in the timing and/or treatment of the recognition of net investment income or gains and losses, including foreign currency gains and losses, redesignation of distributions paid and tax equalization. The Series may periodically make reclassifications among its capital accounts to reflect income and gains available for distribution (or available capital loss carryovers) under income tax regulations without impacting the Series’ net asset value. For the year ended December 31, 2021, amounts were reclassified within the capital accounts to increase Additional Paid in Capital by $666,577 and decrease Total Distributable Earnings (Loss) by $666,557. Any such reclassifications are not reflected in the financial highlights.
The tax character of distributions paid were as follows:
| FOR THE YEAR | FOR THE YEAR | |||||||
| ENDED 12/31/21 | ENDED 12/31/20 | |||||||
| Ordinary income | $ | 4,712,706 | $ | 5,358,439 | ||||
| Long-term capital gains | $ | 14,218,784 | $ | 3,619,127 | ||||
| Return of capital | — | $ | 1,314,872 | |||||
At December 31, 2021, the tax basis of components of distributable earnings and the net unrealized appreciation based on the identified cost of investments for federal income tax purposes were as follows:
| Cost for federal income tax purposes | $ | 257,154,665 | ||
| Unrealized appreciation | 133,801,529 | |||
| Unrealized depreciation | (1,270,260 | ) | ||
| Net unrealized appreciation | $ | 132,531,269 | ||
| Undistributed long-term capital gains | $ | 5,221,495 |
For the year ended December 31, 2021, the capital loss carryover utilized was $5,903,036.
| 11. | Market Event |
In March 2020, the World Health Organization declared COVID-19 (a novel coronavirus) to be a pandemic. The situation is dynamic and a recent resurgence of COVID-19 has caused a continued time of uncertainty. Global financial markets have experienced and may continue to experience significant volatility resulting from the spread of COVID-19. The global economy, the economies of certain nations and individual issuers have been and may continue to be adversely affected by COVID-19, particularly in light of the interconnectivity between economies and financial markets, all of which may negatively impact the Series’ performance. Management of the Series will continue to monitor the impact of COVID-19 on investment performance, financial statements and the Series’ operations.
21
Real Estate Series
Report of Independent Registered Public Accounting Firm
To the Board of Directors of Manning & Napier Fund, Inc. and Shareholders of Real Estate Series
Opinion on the Financial Statements
We have audited the accompanying statement of assets and liabilities, including the investment portfolio, of Real Estate Series (one of the series constituting Manning & Napier Fund, Inc., referred to hereafter as the “Fund”) as of December 31, 2021, the related statement of operations for the year ended December 31, 2021, the statement of changes in net assets for each of the two years in the period ended December 31, 2021, including the related notes, and the financial highlights for each of the periods indicated therein (collectively referred to as the “financial statements”). In our opinion, the financial statements present fairly, in all material respects, the financial position of the Fund as of December 31, 2021, the results of its operations for the year then ended, the changes in its net assets for each of the two years in the period ended December 31, 2021 and the financial highlights for each of the periods indicated therein in conformity with accounting principles generally accepted in the United States of America.
Basis for Opinion
These financial statements are the responsibility of the Fund’s management. Our responsibility is to express an opinion on the Fund’s financial statements based on our audits. We are a public accounting firm registered with the Public Company Accounting Oversight Board (United States) (PCAOB) and are required to be independent with respect to the Fund in accordance with the U.S. federal securities laws and the applicable rules and regulations of the Securities and Exchange Commission and the PCAOB.
We conducted our audits of these financial statements in accordance with the standards of the PCAOB. Those standards require that we plan and perform the audit to obtain reasonable assurance about whether the financial statements are free of material misstatement, whether due to error or fraud.
Our audits included performing procedures to assess the risks of material misstatement of the financial statements, whether due to error or fraud, and performing procedures that respond to those risks. Such procedures included examining, on a test basis, evidence regarding the amounts and disclosures in the financial statements. Our audits also included evaluating the accounting principles used and significant estimates made by management, as well as evaluating the overall presentation of the financial statements. Our procedures included confirmation of securities owned as of December 31, 2021 by correspondence with the custodian. We believe that our audits provide a reasonable basis for our opinion.

New York, New York
February 18, 2022
We have served as the auditor of one or more investment companies in Manning & Napier Mutual Funds since 1992.
22
Real Estate Series
Supplemental Tax Information
(unaudited)
All reportings are based on financial information available as of the date of this annual report and, accordingly, are subject to change.
For federal income tax purposes, the Series reports for the current fiscal year $376,422 or, if different, the maximum amount allowable under the tax law, as qualified dividend income.
For corporate shareholders, the percentage of investment income (dividend income plus short-term gains, if any) that qualifies for the dividends received deduction for the current fiscal year is 2.18%.
The Series designates $4,523,226, or 92.01% of the dividends distributed as Section 199A dividends.
The Series designates $21,112,200 as Long-Term Capital Gain dividends pursuant to Section 852(b)(3) of the Internal Revenue Code for the fiscal year ended December 31, 2021.
23
Real Estate Series
Directors’ and Officers’ Information
(unaudited)
The Statement of Additional Information provides additional information about the Fund’s directors and officers and can be obtained without charge by calling 1-800-466-3863, at www.manning-napier.com, or on the EDGAR Database on the SEC Internet web site (http://www.sec.gov). The following chart shows certain information about the Fund’s directors and officers, including their principal occupations during the last five years. Unless specific dates are provided, the individuals have held the listed positions for longer than five years.
Interested Director and Officer
| Name: | Paul Battaglia* |
| Address: | 290 Woodcliff Drive |
| Fairport, NY 14450 | |
| Age: | 43 |
| Current Position(s) Held with Fund: | Principal Executive Officer, President, Chairman and Director |
| Term of Office1 & Length of Time Served: | Indefinite – Chairman and Director since November 2018 |
| Principal Occupation(s) During Past 5 Years: | Chief Financial Officer since 2018; Vice President of Finance (2016 – 2018); Director of Finance (2011 – 2016); Financial Analyst/Internal Auditor (2004- 2006) – Manning & Napier Advisors, LLC and affiliates Holds one or more of the following titles for various subsidiaries and affiliates: Chief Financial Officer |
| Number of Portfolios Overseen within Fund Complex: | 15 |
| Other Directorships Held Outside Fund Complex During Past 5 Years: | N/A |
Independent Directors
| Name: | Stephen B. Ashley |
| Address: | 290 Woodcliff Drive |
| Fairport, NY 14450 | |
| Age: | 81 |
| Current Position(s) Held with Fund: | Director, Audit Committee Member, Governance & Nominating Committee Member |
| Term of Office & Length of Time Served: | Indefinite – Since 1996 |
| Principal Occupation(s) During Past 5 Years: | Chairman and Director since 1997; Chief Executive Officer (1997-2019) - Ashley Companies (property management and investment) |
| Number of Portfolios Overseen within Fund Complex: | 15 |
| Other Directorships Held Outside Fund Complex During Past 5 Years: | Ashley Companies since 1997 |
| Name: | Paul A. Brooke |
| Address: | 290 Woodcliff Drive |
| Fairport, NY 14450 | |
| Age: | 76 |
| Current Position(s) Held with Fund: | Lead Independent Director, Audit Committee Member, Governance & Nominating Committee Member |
| Term of Office & Length of Time Served: | Indefinite – Director, Audit Committee Member, Governance & Nominating |
| Committee Member since 2007; Lead Independent Director since 2017 | |
| Principal Occupation(s) During Past 5 Years: | Managing Member since 1991 - PMSV Holdings LLC (investments); |
| Managing Member (2010-2016) - VenBio (investments). | |
| Number of Portfolios Overseen within Fund Complex: | 15 |
| Other Directorships Held Outside Fund Complex During Past 5 Years: | Incyte Corp. (biotech) (2000-2020); PureEarth (non-profit) since 2012; Cerus (biomedical) since 2016; Caelum BioSciences (biomedical) since 2018; Cheyne Capital International (investment)(2000-2017); |
24
Real Estate Series
Directors’ and Officers’ Information
(unaudited)
Independent Directors (continued)
| Name: | John Glazer |
| Address: | 290 Woodcliff Drive |
| Fairport, NY 14450 | |
| Age: | 56 |
| Current Position(s) Held with Fund: | Director, Audit Committee Member, Governance & Nominating Committee Member |
| Term of Office & Length of Time Served: | Indefinite – Director, Audit Committee Member, Governance & Nominating Committee Member since February 2021 |
| Principal Occupation(s) During Past 5 Years: | Chief Executive Officer since 2020 – Oikos Holdings LLC (Single-Family Office); Head of Corporate Development (2019-2020) – Caelum Biosciences (pharmaceutical development); Head of Private Investments (2015-2018) – AC Limited (Single-Family Office) |
| Number of Portfolios Overseen within Fund Complex: | 15 |
| Other Directorships Held Outside Fund Complex During Past 5 Years: | N/A |
| Name: | Margaret McLaughlin |
| Address: | 290 Woodcliff Drive |
| Fairport, NY 14450 | |
| Age: | 54 |
| Current Position(s) Held with Fund: | Director, Audit Committee Member, Governance & Nominating Committee Member |
| Term of Office & Length of Time Served: | Indefinite – Director, Audit Committee Member, Governance & Nominating Committee Member since February 2021 |
| Principal Occupation(s) During Past 5 Years: | Consultant since 2020 – Bates Group (consultants); Consultant (2019- 2020) – Madison Dearborn Partners (private equity); General Counsel/CCO (2011-2019) – Kramer Van Kirk Credit Strategies L.P./Mariana Systems LLC (Investment Adviser/SaaS Technology) |
| Number of Portfolios Overseen within Fund Complex: | 15 |
| Other Directorships Held Outside Fund Complex During Past 5 Years: | N/A |
| Name: | Russell O. Vernon |
| Address: | 290 Woodcliff Drive |
| Fairport, NY 14450 | |
| Age: | 64 |
| Current Position(s) Held with Fund: | Director, Audit Committee Member, Governance & Nominating Committee Chairman |
| Term of Office & Length of Time Served: | Indefinite – Director, Audit Committee Member, Governance & Nominating Committee Member since April 2020; Governance & Nominating Committee Chairman since November 2020 |
| Principal Occupation(s) During Past 5 Years: | Founder and General Partner (2009-2019) – BVM Capital Management (economic development) |
| Number of Portfolios Overseen within Fund Complex: | 15 |
| Other Directorships Held Outside Fund Complex During Past 5 Years: | Board Member, Vice Chairman and President since 2010 – Newburgh Armory Unity Center (military); Board Member and Executive Director since 2020 – National Purple Heart Honor Mission, Inc. (military); Board Member, Vice Chairman (2015-2020) – National Purple Heart Hall of Honor, Inc. (military) |
25
Real Estate Series
Directors’ and Officers’ Information
(unaudited)
Independent Directors (continued)
| Name: | Chester N. Watson |
| Address: | 290 Woodcliff Drive Fairport, NY 14450 |
| Age: | 71 |
| Current Position(s) Held with Fund: | Director, Audit Committee Chairman, Governance & Nominating Committee Member |
| Term of Office & Length of Time Served: | Indefinite – Director, Audit Committee Member, Governance & Nominating Committee Member Since 2012; Audit Committee Chairman since 2013 |
| Principal Occupation(s) During Past 5 Years: | General Auditor (2003-2011) - General Motors Company (auto manufacturer) |
| Number of Portfolios Overseen within Fund Complex: | 15 |
| Other Directorships Held Outside Fund Complex During Past 5 Years: | Rochester Institute of Technology (University) since 2005; Hudson Valley Center for Innovation, Inc. (New Business and Economic Development) since 2019; Town of Greenburgh, NY Planning Board (Municipal Government) (2015-2019); |
Officers:
| Name: | Elizabeth Craig |
| Address: | 290 Woodcliff Drive |
| Fairport, NY 14450 | |
| Age: | 34 |
| Current Position(s) Held with Fund: | Corporate Secretary |
| Term of Office1 & Length of Time Served: | Since 2016 |
| Principal Occupation(s) During Past 5 Years: | Director of Fund Administration since 2021; Fund Regulatory Administration Manager (2018-2021); Fund Administration Manager (2015-2018); Mutual Fund Compliance Specialist (2009-2015) - Manning & Napier Advisors, LLC; Assistant Corporate Secretary (2011-2016) - Manning & Napier Fund, Inc.; Corporate Secretary, Director since 2019 – Manning & Napier Investor Services, Inc. |
| Name: | Samantha Larew |
| Address: | 290 Woodcliff Drive |
| Fairport, NY 14450 | |
| Age: | 41 |
| Current Position(s) Held with Fund: | Chief Compliance Officer and Anti-Money Laundering Compliance Officer |
| Term of Office1 & Length of Time Served: | Chief Compliance Officer since 2019; Anti-Money Laundering Compliance Officer since 2018 |
| Principal Occupation(s) During Past 5 Years: | Co-Director of Compliance since 2018; Compliance Communications Supervisor (2014-2018); Compliance Supervisor (2013-2014); Broker- Dealer Compliance Supervisor (2011-2013); Broker-Dealer Compliance Analyst (2010-2011) - Manning & Napier Advisors, LLC& Affiliates; Broker- Dealer Chief Compliance Officer since 2013; Broker-Dealer Assistant Corporate Secretary since 2011 – Manning & Napier Investor Services, Inc.; Compliance Analyst (2007-2009) – Wall Street Financial Group; Compliance Specialist (2003-2007) – Manning & Napier Advisors, LLC & Affiliates |
| Name: | Scott Morabito |
| Address: | 290 Woodcliff Drive |
| Fairport, NY 14450 | |
| Age: | 34 |
| Current Position(s) Held with Fund: | Vice President |
| Term of Office1 & Length of Time Served: | Vice President since 2019; Assistant Vice President (2017-2019) |
| Principal Occupation(s) During Past 5 Years: | Managing Director, Client Service and Business Operations since 2021; Managing Director of Operations (2019-2021); Director of Funds Group (2017-2019); Fund Product and Strategy Manager (2014-2017); Senior Product and Strategy Analyst (2013-2014); Product and Strategy Analyst (2011-2013) - Manning & Napier Advisors, LLC; President, Director since 2018 – Manning & Napier Investor Services, Inc.; President, Exeter Trust Company since 2021; |
26
Real Estate Series
Directors’ and Officers’ Information
(unaudited)
Officers: (continued)
| Name: | Troy Statczar |
| Address: | 290 Woodcliff Drive |
| Fairport, NY 14450 | |
| Age: | 50 |
| Current Position(s) Held with Fund: | Principal Financial Officer, Treasurer |
| Term of Office1 & Length of Time Served: | Principal Financial Officer and Treasurer since 2020 |
| Principal Occupation(s) During Past 5 Years: | Senior Director, Foreside Treasurer Services since 2020 - Foreside Financial |
| Group; Director of Fund Administration (2017-2019) - Thornburg Investment | |
| Management, Inc.; Director of U.S. Operations (2008-2017) - Henderson | |
| Global Investors N.A., Inc. | |
| Name: | Sarah Turner |
| Address: | 290 Woodcliff Drive |
| Fairport, NY 14450 | |
| Age: | 39 |
| Current Position(s) Held with Fund: | Chief Legal Officer; Assistant Corporate Secretary |
| Term of Office1 & Length of Time Served: | Since 2018 |
| Principal Occupation(s) During Past 5 Years: | General Counsel since 2018 - Manning & Napier Advisors, LLC and |
| affiliates; Counsel (2017-2018) – Harter Secrest and Emery LLP; Legal/ | |
| Senior Counsel (2010-2017) – Manning & Napier Advisors, LLC and | |
| affiliates | |
| Holds one or more of the following titles for various affiliates: General | |
| Counsel | |
*Interested Director, within the meaning of the 1940 Act by reason of his positions with the Fund’s Advisor, Manning & Napier Advisors, LLC, and Distributor, Manning & Napier
Investor Services, Inc.
1The term of office of all officers shall be one year and until their respective successors are chosen and qualified, or his or her earlier resignation or removal as provided in the Fund’s By-Laws.
27
{This page intentionally left blank}
28
{This page intentionally left blank}
29
Real Estate Series
Literature Requests
(unaudited)
Proxy Voting Policies and Procedures
A description of the policies and procedures that the Fund uses to determine how to vote proxies relating to portfolio securities is available, without charge, upon request:
| By phone | 1-800-466-3863 |
| On the Securities and Exchange | |
| Commission’s (SEC) web site | http://www.sec.gov |
Proxy Voting Record
Information regarding how the Fund voted proxies relating to portfolio securities during the most recent 12-month period ended June 30th is available, without charge, upon request:
| By phone | 1-800-466-3863 |
| On the SEC’s web site | http://www.sec.gov |
Quarterly Portfolio Holdings
The Series’ complete schedule of portfolio holdings for the 1st and 3rd quarters of each fiscal year are provided on Form N-PORT, and are available, without charge, upon request:
| By phone | 1-800-466-3863 |
| On the SEC’s web site | http://www.sec.gov |
Prospectus and Statement of Additional Information (SAI)
For more information about any of the Manning & Napier Fund, Inc. Series, you may obtain a prospectus and SAI at www.manning-napier.com or by calling 1-(800) 466-3863. Before investing, carefully consider the objectives, risks, charges and expenses of the investment and read the prospectus carefully as it contains this and other information about the investment company. In addition, this information can be found on the SEC’s web site, http://www.sec.gov.
Additional information available at www.manning-napier.com
1. Fund Holdings - Month-End
2. Fund Holdings - Quarter-End
3. Shareholder Report - Annual
4. Shareholder Report - Semi-Annual
The Fund also offers electronic notification or “e-delivery” when certain documents are available on-line to be downloaded or reviewed. Direct shareholders can elect to receive electronic notification when shareholder reports, prospectus updates, and/or statements are available. If you do not currently have on-line access to your account, you can establish access by going to www.manning-napier.com, click on “Login” in the top corner of the page, and follow the prompts to self-enroll. Once enrolled, you can set your electronic notification preferences by clicking on the Account Options tab located within the green toolbar and then select E-Delivery Option. Should you have any questions on either how to establish on-line access or how to update your account settings, please contact Investor Services at 1-800-466-3863.
The Manning & Napier Fund, Inc. is managed by Manning & Napier Advisors, LLC. Manning & Napier Investor Services, Inc., an affiliate of Manning & Napier Advisors, LLC, is the distributor of the Fund shares.
MNRES-12/21-AR
30

Manning & Napier Fund, Inc.
Diversified Tax Exempt Series
Paper copies of the Series’ shareholder reports are no longer sent by mail, unless you specifically request them from the Series or from your financial intermediary, such as a broker-dealer or bank. Shareholder reports are available online. Each time a report is posted on the Series’ website you will be provided with a link to access the report online, either by mail (hard copy notice) or by email, if you have already signed up for electronic delivery of shareholder reports.
You may elect to receive all future shareholder reports in paper free of charge. If you invest through a financial intermediary, you can contact your financial intermediary to request that you continue to receive paper copies. If you invest directly with the Fund, you can inform the Fund that you wish to continue receiving paper copies by visiting www.manning-napier.com or calling 1-800-466-3863. Your election to receive reports in paper will apply to all funds held with your financial intermediary if you invest through a financial intermediary or all series of the Fund if you invest directly with the Fund.
Additionally, If you have not yet signed up for electronic delivery of shareholder reports and other Fund communications, you may do so by contacting your financial intermediary or, if you are a direct investor, by visiting www.manning-napier.com or calling 1-800-466-3863.
 | Independent Perspective | Real-World Solutions |
A Note from Our CEO
Dear Shareholder,
The obstacles were many, but this year, in so many ways, is a story of triumphant resilience only serving to spotlight just how much more there is to do.
Over the past two years, we’ve endured a recession, a bear market, and a pandemic. Our collective perseverance is now paying off.
We are today experiencing a remarkable economic boom, a historic market rally, and continued medical innovation, all of which have turned a challenging period into one of optimism and hope.
At the same time, political and societal polarization are heightened, social justice concerns have justifiably come to the fore, and the precarious state of our environment presents almost unimaginable challenges for government, business, and finance.
This certainly is a moment of great consequence.
The kind of moment that questions all the rules. Economic rules in how we add value for each other, as well as for ourselves. Social rules in how we interact with each other. Environmental rules that can balance the current needs of emerging economies with the requirements for everyone in the future. Workplace rules in how we get the job done.
Our lives are being redefined, and our society, planet, workplaces, and industry must confront the challenges of the upcoming decade.
Markets reflect us. They mirror our collective thoughts, feelings, expectations, and beliefs – these new life rules.
As we go through this period of change, it will be uncertain and uncomfortable. For those unaccustomed to change, for those reliant on ’set it and forget it’, these may seem like daunting questions, but there is a better way.
Success in an era of change demands flexibility, adaptability, and a roll-up-your-sleeves willingness to do the work.
For over 50 years, independent thinking and tireless work have underpinned every decision we’ve made on behalf of our investors. We invest for the long-term, we do not speculate. We make active decisions, and we invest with discipline, patience, and confidence. This is the only way we know, to remain true to our values and our fiduciary duty to you, the investors in our mutual funds.
You demand more. At Manning & Napier, we demand more of ourselves. Upon reflection of the year, we’re proud to have continued to deliver more.
We wish you safety and good health, and we appreciate your confidence in our firm and our approach.
 | Sincerely,
Marc Mayer Chief Executive Officer |

Corporate Headquarters | 290 Woodcliff Drive | Fairport, NY 14450 | (585) 325-6880 phone | (800) 551-0224 toll free | www.manning-napier.com
1
Diversified Tax Exempt Series
Fund Commentary
(unaudited)
Investment Objective
To provide as high a level of current income that is exempt from federal income taxes which the Advisor believes is consistent with the preservation of capital. The Series invests primarily in municipal bonds that provide income exempt from federal income tax.
Performance Commentary
Despite lingering inflation concerns, potential balance sheet reductions by the Federal Reserve, and looming interest rate hikes, the municipal bond market posted slightly positive returns for the year. Overall, municipal yields ended the year slightly higher with the largest increase occurring in the belly of the curve (i.e., securities in the 5 to 7-year maturity range generally saw the greatest increase in yields) and credit spreads tightened. The highest returning areas of the market included hospital and transportation bonds from a sector perspective, longer-dated issuances from a maturity perspective, and lower quality issuances when looking at it from a quality perspective.
The Diversified Tax Exempt Series Class A shares delivered positive absolute returns but underperformed on a relative basis, returning 0.16% during the year versus 0.59% for the benchmark (i.e., the Intercontinental Exchange (ICE) Bank of America (BofA) 1-12 Year Municipal Bond Index).
Underperformance primarily occurred during the first part of the year given the Series’ higher duration than the benchmark, coupled with an overweight allocation to longer-dated securities, as interest rates rose.
In terms of positioning, we continue to have a positive view of revenue bonds and, within general obligations (GOs), we have a relatively high-quality tilt as a result of our selectivity within the sector.
As the economic cycle moves forward, we are actively becoming more measured in our approach. Given tight credit spreads across much of the market and the prospect of interest rates rising off their post-pandemic lows, fixed income investors can generally expect a more challenging environment going forward.
Performance for the Diversified Tax Exempt Series Class A shares is provided above. Performance for other shares classes will differ based on each class’ underlying expenses.
Performance data quoted represents past performance and does not guarantee future results. The investment return and principal value of an investment will fluctuate, so that an investor’s shares, when redeemed, may be worth more or less than their original cost. Current performance may be higher or lower than that quoted; investors can obtain the most recent month-end performance at www.manning-napier.com or by calling (800) 466-3863.
Additional information and associated disclosures can be found on the Performance Update page of this report.
All investments involve risks, including possible loss of principal. There is an inverse relationship between bond prices and interest rates; as interest rates rise, bond prices (and therefore the value of bond funds) fall. Likewise, as interest rates fall, bond prices and the value of bond funds rise. The income earned by the Series may be subject to the Alternative Minimum Tax (AMT), depending on your tax situation.
2
Diversified Tax Exempt Series
Performance Update as of December 31, 2021
(unaudited)
| AVERAGE ANNUAL TOTAL RETURNS | |||
| AS OF DECEMBER 31, 2021 | |||
| ONE | FIVE | TEN | |
| YEAR1 | YEAR | YEAR | |
| Diversified Tax Exempt Series - Class A2 | 0.16% | 2.78% | 1.77% |
| Diversified Tax Exempt Series - Class W2,3 | 0.62% | 3.08% | 1.92% |
| Intercontinental Exchange (ICE) Bank of America (BofA) 1-12 Year Municipal Bond Index4 | 0.59% | 3.00% | 2.48% |
The following graph compares the value of a $10,000 investment in the Diversified Tax Exempt Series - Class A for the ten years ended December 31, 2021 to the Intercontinental Exchange (ICE) Bank of America (BofA) 1-12 Year Municipal Bond Index.
1The returns shown are based on net asset values calculated for shareholder transactions and may differ from the returns shown in the financial highlights, which reflect adjustments made to the net asset values in accordance with accounting principles generally accepted in the United States of America.
2The Series’ performance does not reflect the deduction of taxes that a shareholder would pay on fund distributions or the redemption of shares. The Series’ performance is historical and may not be indicative of future results. The performance returns shown are inclusive of the net expense ratio of the Series. For the year ended December 31, 2021, this net expense ratio was 0.67% for Class A and 0.17% for Class W. The gross expense ratio, which does not account for any voluntary or contractual waivers currently in effect, was 0.67% for Class A and 0.67% for Class W for the year ended December 31, 2021.
3For periods through March 1, 2019 (the inception date of the Class W shares), performance for the Class W shares is based on the historical performance of the Class A shares. Because the Class W shares invest in the same portfolio of securities as the Class A shares, performance will be different only to the extent that the Class A shares have a higher expense ratio.
4The Intercontinental Exchange (ICE) Bank of America (BofA) 1-12 Year Municipal Bond Index is a subset of the ICE BofA U.S. Municipal Securities Index. The Index includes all U.S. dollar denominated investment grade tax-exempt debt with a remaining term to final maturity greater than one year, but less than twelve years. Qualifying securities must have at least 18 months to final maturity at the time of issuance and a fixed coupon schedule. The Index returns do not reflect any fees or expenses.Index returns provided by ICE Intercontinental Exchange (ICE). Index data referenced herein is the property of ICE Data Indices, LLC, its affiliates (“ICE Data”) and/or its third party suppliers and has been licensed for use by Manning & Napier. ICE Data and its third party suppliers accept no liability in connection with its use. Data provided is not a representation or warranty, express or implied, as to the ability of any index to accurately represent the asset class or market sector that it purports to represent and none of these parties shall have any liability for any errors, omissions, or interruptions of any index or the data included therein. For additional disclosure information, please see: https://go.manning-napier.com/benchmark-provisions.
3
Diversified Tax Exempt Series
Shareholder Expense Example
(unaudited)
As a shareholder of the Series, you incur ongoing costs, including management fees, shareholder service fees and other Series expenses. This example is intended to help you understand your ongoing costs (in dollars) of investing in the Series and to compare these costs with the ongoing costs of investing in other mutual funds.
The example is based on an investment of $1,000 invested in each class at the beginning of the period and held for the entire period (July 1, 2021 to December 31, 2021).
Actual Expenses
The Actual lines of the table below provide information about actual account values and actual expenses. You may use the information in these lines, together with the amount you invested, to estimate the expenses that you paid over the period. Simply divide your account value by $1,000 (for example, an $8,600 account value divided by $1,000 = 8.6), then multiply the result by the number in the Actual line for the Class in which you have invested under the heading entitled “Expenses Paid During Period” to estimate the expenses you paid on your account during this period.
Hypothetical Example for Comparison Purposes
The Hypothetical lines of each class in the table below provide information about hypothetical account values and hypothetical expenses based on the Class’ actual expense ratio and an assumed rate of return of 5% per year before expenses, which is not the Class’ actual return. The hypothetical account values and expenses may not be used to estimate the actual ending account balance or expenses you paid during the period. You may use this information to compare the ongoing costs of investing in a class of the Series and other funds. To do so, compare this 5% hypothetical example for the Class in which you have invested with the 5% hypothetical examples that appear in the shareholder reports of the other funds.
Please note that the expenses shown in the table are meant to highlight your ongoing costs only and do not reflect any transaction costs, such as sales charges (loads), redemption fees, or exchange fees that you may incur in other mutual funds. Therefore, the second line of the table is useful in comparing ongoing costs only, and will not help you determine the relative total costs of owning different funds.
| BEGINNING | ENDING | EXPENSES PAID | ANNUALIZED | |
| ACCOUNT VALUE | ACCOUNT VALUE | DURING PERIOD* | EXPENSE | |
| 7/1/21 | 12/31/21 | 7/1/21 - 12/31/21 | RATIO | |
| Class A | ||||
| Actual | $1,000.00 | $997.70 | $3.37 | 0.67% |
| Hypothetical | ||||
| (5% return before expenses) | $1,000.00 | $1,021.83 | $3.41 | 0.67% |
| Class W | ||||
| Actual | $1,000.00 | $999.70 | $0.86 | 0.17% |
| Hypothetical | ||||
| (5% return before expenses) | $1,000.00 | $1,024.35 | $0.87 | 0.17% |
*Expenses are equal to each Class’ annualized expense ratio (for the six-month period), multiplied by the average account value over the period, multiplied by 184/365 (to reflect the one-half year period). Expenses are based on the most recent fiscal half year; therefore, the expense ratios stated above may differ from the expense ratios stated in the financial highlights, which are based on one-year data. The Class’ total return would have been lower had certain expenses not been waived or reimbursed during the period.
4
Diversified Tax Exempt Series
Portfolio Composition as of December 31, 2021
(unaudited)
| Sector Allocation1 | |
 | |
| 1As a percentage of net assets. | |
| Top Ten States2 | |||
| New York | 20.3% | Ohio | 4.6% |
| Texas | 9.4% | District of Columbia | 3.2% |
| Illinois | 8.1% | Arizona | 3.1% |
| Pennsylvania | 6.5% | New Jersey | 3.0% |
| Florida | 5.5% | Tennessee | 2.9% |
| 2As a percentage of total investments. | |||
5
Diversified Tax Exempt Series
Investment Portfolio - December 31, 2021
| PRINCIPAL | ||||||||
| AMOUNT1/ | VALUE | |||||||
| SHARES | (NOTE 2) | |||||||
| MUNICIPAL BONDS - 87.7% | ||||||||
| ALABAMA - 1.0% | ||||||||
| Cullman Utilities Board Water Division, Revenue Bond, AGM, 4.000%, 9/1/2025 | 1,000,000 | $ | 1,119,740 | |||||
| ALASKA - 2.1% | ||||||||
| Alaska Municipal Bond Bank Authority | ||||||||
| Electric Light & Power Impt., Revenue Bond, 5.000%, 12/1/2025 | 750,000 | 876,428 | ||||||
| Electric Light & Power Impt., Revenue Bond, 5.000%, 12/1/2030 | 875,000 | 1,146,154 | ||||||
| Public Impt., Prerefunded Balance, Series 2, Revenue Bond, 5.000%, 9/1/2022 | 365,000 | 367,752 | ||||||
| Public Impt., Unrefunded Balance, Series 2, Revenue Bond, 5.000%, 9/1/2022 | 135,000 | 136,023 | ||||||
| 2,526,357 | ||||||||
| ARIZONA - 3.1% | ||||||||
| Mesa | ||||||||
| Multiple Utility Impt., Revenue Bond, 5.000%, 7/1/2023 | 1,050,000 | 1,124,655 | ||||||
| Multiple Utility Impt., Revenue Bond, 5.000%, 7/1/2024 | 1,200,000 | 1,337,784 | ||||||
| Scottsdale, Water & Sewer, Revenue Bond, 5.250%, 7/1/2022 | 1,130,000 | 1,158,510 | ||||||
| 3,620,949 | ||||||||
| COLORADO - 1.0% | ||||||||
| E-470 Public Highway Authority, Senior Lien, Series A, Revenue Bond, 5.000%, 9/1/2026 | 1,000,000 | 1,195,750 | ||||||
| DISTRICT OF COLUMBIA - 3.1% | ||||||||
| District of Columbia | ||||||||
| Public Impt., Series A, G.O. Bond, 5.000%, 6/1/2022 | 1,385,000 | 1,412,506 | ||||||
| Public Impt., Series D, G.O. Bond, 5.000%, 6/1/2022 | 1,250,000 | 1,274,825 | ||||||
| District of Columbia Water & Sewer Authority, Series C, Revenue Bond, 5.000%, 10/1/2022 | 1,000,000 | 1,035,830 | ||||||
| 3,723,161 | ||||||||
| FLORIDA - 5.4% | ||||||||
| Central Florida Expressway Authority | ||||||||
| Senior Lien, Revenue Bond, 5.000%, 7/1/2024 | 500,000 | 556,880 | ||||||
| Senior Lien, Revenue Bond, 5.000%, 7/1/2027 | 500,000 | 613,800 | ||||||
| Senior Lien, Revenue Bond, 5.000%, 7/1/2038 | 530,000 | 639,896 | ||||||
| Florida State, Series B, G.O. Bond, 5.000%, 6/1/2024 | 930,000 | 1,034,104 | ||||||
| Florida State Department of Transportation Turnpike System, Series B, Revenue Bond, 2.500%, 7/1/2026 | 505,000 | 537,367 |
| PRINCIPAL | ||||||||
| AMOUNT1/ | VALUE | |||||||
| SHARES | (NOTE 2) | |||||||
| MUNICIPAL BONDS (continued) | ||||||||
| FLORIDA (continued) | ||||||||
| JEA Electric System, Series A, Revenue Bond, 5.000%, 10/1/2028 | 1,000,000 | $ | 1,256,280 | |||||
| Port St. Lucie Utility System, Water Utility Impt., Revenue Bond, NATL, 5.250%, 9/1/2023 | 500,000 | 540,705 | ||||||
| Tampa-Hillsborough County Expressway Authority, Highway Impt., Series A, Revenue Bond, BAM, 5.000%, 7/1/2028 | 1,000,000 | 1,250,360 | ||||||
| 6,429,392 | ||||||||
| HAWAII - 0.4% | ||||||||
| Hawaii, Series GJ, G.O. Bond, 1.033%, 8/1/2025 | 500,000 | 495,595 | ||||||
| ILLINOIS - 8.0% | ||||||||
| Aurora, Waterworks & Sewerage | ||||||||
| Series B, Revenue Bond, 3.000%,12/1/2022 | 500,000 | 512,490 | ||||||
| Series B, Revenue Bond, 3.000%, 12/1/2023 | 625,000 | 654,219 | ||||||
| Illinois Municipal Electric Agency | ||||||||
| Series A, Revenue Bond, 5.000%, 2/1/2025 | 2,000,000 | 2,265,220 | ||||||
| Series A, Revenue Bond, 5.000%, 2/1/2026 | 730,000 | 844,515 | ||||||
| Illinois State, Public Impt., Series A, G.O. Bond, 5.000%, 11/1/2024 | 1,800,000 | 2,017,728 | ||||||
| Illinois State Toll Highway Authority | ||||||||
| Highway Impt., Series B, Revenue Bond, 5.000%, 1/1/2038 | 1,050,000 | 1,234,485 | ||||||
| Series B, Revenue Bond, 5.000%, 1/1/2031 | 1,500,000 | 1,933,155 | ||||||
| 9,461,812 | ||||||||
| INDIANA - 1.0% | ||||||||
| South Bend Sewage Works, Revenue Bond, 3.000%, 12/1/2025 | 1,075,000 | 1,172,890 | ||||||
| IOWA - 2.3% | ||||||||
| Cedar Falls, Electric Utility, Revenue Bond, 5.000%, 12/1/2023 | 2,000,000 | 2,177,760 | ||||||
| Johnston, Public Impt., Series A, G.O. Bond, 5.000%, 6/1/2023 | 520,000 | 554,830 | ||||||
| 2,732,590 | ||||||||
| KENTUCKY - 1.3% | ||||||||
| Kentucky Municipal Power Agency, Series A, Revenue Bond, NATL, 5.000%, 9/1/2024 | 1,355,000 | 1,508,142 | ||||||
| LOUISIANA - 1.0% | ||||||||
| New Orleans | ||||||||
| Sewer Impt., Revenue Bond, 5.000%, 6/1/2023 | 300,000 | 319,698 | ||||||
| Sewer Impt., Series B, Revenue Bond, 5.000%, 6/1/2027 | 500,000 | 605,040 |
The accompanying notes are an integral part of the financial statements.
6
Diversified Tax Exempt Series
Investment Portfolio - December 31, 2021
PRINCIPAL | ||||||||
AMOUNT1/ | VALUE | |||||||
SHARES | (NOTE 2) | |||||||
| MUNICIPAL BONDS (continued) | ||||||||
| LOUISIANA (continued) | ||||||||
| Shreveport, Water & Sewer, Series B, Revenue Bond, AGM, 3.000%, 12/1/2022 | 300,000 | $ | 306,966 | |||||
| 1,231,704 | ||||||||
| MAINE - 0.6% | ||||||||
| Maine Turnpike Authority, Highway Impt., Revenue Bond, 5.000%, 7/1/2033 | 550,000 | 715,126 | ||||||
| MARYLAND - 0.6% | ||||||||
| Baltimore County, G.O. Bond, 5.000%, 3/1/2023 | 665,000 | 702,134 | ||||||
| MASSACHUSETTS - 0.4% | ||||||||
| Massachusetts, Series B, G.O. Bond, 5.000%, 7/1/2024 | 410,000 | 457,511 | ||||||
| MISSISSIPPI - 0.4% | ||||||||
| Mississippi, Series E, G.O. Bond, 1.122%, 10/1/2025 | 500,000 | 497,800 | ||||||
| MISSOURI - 2.1% | ||||||||
| Kansas City, Sanitary Sewer System, Sewer Impt., Series A, Revenue Bond, 4.000%, 1/1/2025 | 750,000 | 826,222 | ||||||
| Missouri Joint Municipal Electric Utility Commission, Prairie Street Project, Revenue Bond, 5.000%, 1/1/2027 | 1,410,000 | 1,696,456 | ||||||
| 2,522,678 | ||||||||
| NEBRASKA - 1.4% | ||||||||
| Nebraska Public Power District, Series B, Revenue Bond, 5.000%, 1/1/2030 | 640,000 | 829,408 | ||||||
| Omaha, Public Impt., Series A, G.O. Bond, 2.500%, 1/15/2023 | 760,000 | 778,012 | ||||||
| 1,607,420 | ||||||||
| NEW JERSEY - 2.9% | ||||||||
| New Jersey Economic Development Authority | ||||||||
| Revenue Bond, 5.000%, 6/15/2028 | 700,000 | 868,084 | ||||||
| School Impt., Revenue Bond, 5.000%, 6/15/2029 | 750,000 | 946,200 | ||||||
| New Jersey Transportation Trust Fund Authority, Transit Impt., Series AA, Revenue Bond, 5.000%, 6/15/2026 | 1,445,000 | 1,650,609 | ||||||
| 3,464,893 | ||||||||
| NEW MEXICO - 1.1% | ||||||||
| Albuquerque Bernalillo County Water Utility Authority, Water Utility Impt., Revenue Bond, 5.000%, 7/1/2022 | 1,250,000 | 1,279,812 | ||||||
| NEW YORK - 20.1% | ||||||||
| Metropolitan Transportation Authority, Transit Impt., Green Bond, Series C-1, Revenue Bond, 4.750%, 11/15/2045 | 2,000,000 | 2,396,240 |
PRINCIPAL | ||||||||
AMOUNT1/ | VALUE | |||||||
SHARES | (NOTE 2) | |||||||
| MUNICIPAL BONDS (continued) | ||||||||
| NEW YORK (continued) | ||||||||
| New York City | ||||||||
| Public Impt., Subseries F-3, G.O. Bond, 5.000%, 12/1/2024 | 825,000 | $ | 934,057 | |||||
| Series D, G.O. Bond, 1.216%, 8/1/2026 | 1,200,000 | 1,183,500 | ||||||
| Series J, G.O. Bond, 5.000%, 8/1/2023 | 950,000 | 1,020,680 | ||||||
| New York City Transitional Finance Authority, Building Aid, Prerefunded Balance, Series S-4A, Revenue Bond, 5.000%, 7/15/2023 | 645,000 | 691,950 | ||||||
| New York City Water & Sewer System, Series EE, Revenue Bond, 5.000%, 6/15/2040 | 3,500,000 | 4,292,855 | ||||||
| New York State Dormitory Authority | ||||||||
| Public Impt., Prerefunded Balance, Series C, Revenue Bond, 5.000%, 3/15/2023 | 2,000,000 | 2,114,920 | ||||||
| School Impt., Series E, Revenue Bond, AGM, 5.000%, 10/1/2025 | 860,000 | 928,680 | ||||||
| Series C, Revenue Bond, 0.887%, 3/15/2025 | 950,000 | 936,861 | ||||||
| Series C, Revenue Bond, 1.187%, 3/15/2026 | 1,110,000 | 1,094,627 | ||||||
| New York State Thruway Authority, Series B, Revenue Bond, 4.000%, 1/1/2038 | 2,390,000 | 2,799,359 | ||||||
| New York State Urban Development Corp., Highway Impt., Series C, Revenue Bond, 5.000%, 3/15/2024 | 765,000 | 808,819 | ||||||
| Port Authority of New York & New Jersey, Airport & Marina Impt., Consolidated Series 222, Revenue Bond, 5.000%, 7/15/2032 | 1,185,000 | 1,544,884 | ||||||
| Triborough Bridge & Tunnel Authority, Series A, Revenue Bond, 5.000%, 11/15/2023 | 2,805,000 | 2,981,939 | ||||||
| 23,729,371 | ||||||||
| NORTH CAROLINA - 1.9% | ||||||||
| Charlotte, Series A, G.O. Bond, 5.000%, 8/1/2022 | 615,000 | 632,202 | ||||||
| North Carolina Turnpike Authority, Highway Impt., Revenue Bond, 5.000%, 2/1/2024 | 1,500,000 | 1,634,865 | ||||||
| 2,267,067 | ||||||||
| OHIO - 4.6% | ||||||||
| Brecksville-Broadview Heights City School District, School Impt., Prerefunded Balance, G.O. Bond, 5.000%, 12/1/2048.. | 1,000,000 | 1,089,480 | ||||||
| Cincinnati, Public Impt., Series A, G.O. Bond, 5.000%, 12/1/2027. | 1,100,000 | 1,365,056 | ||||||
| Mason | ||||||||
| Recreational Facility Impt., Series A, G.O. Bond, 3.000%, 12/1/2023 | 595,000 | 625,732 |
The accompanying notes are an integral part of the financial statements.
7
Diversified Tax Exempt Series
Investment Portfolio - December 31, 2021
PRINCIPAL | ||||||||
AMOUNT1/ | VALUE | |||||||
SHARES | (NOTE 2) | |||||||
| MUNICIPAL BONDS (continued) | ||||||||
| OHIO (continued) | ||||||||
| Mason (continued) | ||||||||
| Recreational Facility Impt., Series B, G.O. Bond, 2.000%, 12/1/2023 | 680,000 | $ | 702,188 | |||||
| Middletown City School District, School Impt., Prerefunded Balance, G.O. Bond, 5.250%, 12/1/2040 | 1,000,000 | 1,046,260 | ||||||
| Toledo Water System, Water Utility Impt., Series A, Revenue Bond, 5.000%, 11/15/2022 | 610,000 | 610,818 | ||||||
| 5,439,534 | ||||||||
| OREGON - 1.2% | ||||||||
| Metro, Recreational Facility Impt., Series A, G.O. Bond, 5.000%, 6/1/2023 | 825,000 | 841,137 | ||||||
| Oregon State, Public Impt., Series K, G.O. Bond, 5.000%, 8/1/2023 | 575,000 | 617,682 | ||||||
| 1,458,819 | ||||||||
| PENNSYLVANIA - 6.4% | ||||||||
| Pennsylvania Turnpike Commission | ||||||||
| Highway Impt., Series A, Revenue Bond, 5.000%, 12/1/2029 | 750,000 | 964,448 | ||||||
| Highway Impt., Series A, Revenue Bond, 5.000%, 12/1/2030 | 850,000 | 1,089,742 | ||||||
| Highway Impt., Series A-1, Revenue Bond, 5.000%, 12/1/2023 | 1,200,000 | 1,306,656 | ||||||
| Series A-2, Revenue Bond, 5.000%, 6/1/2028.. | 590,000 | 695,215 | ||||||
| Philadelphia, Water & Wastewater, Water Utility Impt., Series A, Revenue Bond, 5.000%, 11/1/2040 | 2,450,000 | 3,152,341 | ||||||
| Pittsburgh Water & Sewer Authority, Series B, Revenue Bond, AGM, 5.000%, 9/1/2032 | 300,000 | 393,165 | ||||||
| 7,601,567 | ||||||||
| TENNESSEE - 2.9% | ||||||||
| Knoxville Electric System Revenue | ||||||||
| Series FF, Revenue Bond, 5.000%, 7/1/2023 | 800,000 | 818,648 | ||||||
| Series FF, Revenue Bond, 5.000%, 7/1/2025 | 705,000 | 721,250 | ||||||
| Metropolitan Government of Nashville & Davidson County, Water & Sewer, Series B, Revenue Bond, 1.031%, 7/1/2025 | 650,000 | 642,915 | ||||||
| Sullivan County, Correctional Facility Impt, G.O. Bond, 5.000%, 5/1/2027 | 1,000,000 | 1,220,910 | ||||||
| 3,403,723 | ||||||||
| TEXAS - 9.3% | ||||||||
| Austin Electric Utility, Series A, Revenue Bond, 5.000%, 11/15/2022 | 500,000 | 520,870 | ||||||
| Central Texas Turnpike System, Series C, Revenue Bond, 5.000%, 8/15/2027 | 1,470,000 | 1,639,667 | ||||||
| Harris County, Senior Lien, Toll Road Impt., Series B, Revenue Bond, 5.000%, 8/15/2023 | 600,000 | 645,888 |
PRINCIPAL | ||||||||
AMOUNT1/ | VALUE | |||||||
SHARES | (NOTE 2) | |||||||
| MUNICIPAL BONDS (continued) | ||||||||
| TEXAS (continued) | ||||||||
| North Texas Municipal Water District Water System, Series A, Revenue Bond, 5.000%, 9/1/2027 | 1,500,000 | $1,847,640 | ||||||
| North Texas Tollway Authority | ||||||||
| Series A, Revenue Bond, 5.000%, 1/1/2026 | 500,000 | 545,010 | ||||||
| Series A, Revenue Bond, 5.000%, 1/1/2027 | 2,000,000 | 2,339,160 | ||||||
| Series B, Revenue Bond, 5.000%, 1/1/2029 | 925,000 | 1,173,002 | ||||||
| San Antonio Electric & Gas, Revenue Bond, 5.000%, 2/1/2025 | 1,000,000 | 1,027,680 | ||||||
| Texas Municipal Gas Acquisition & Supply Corp. III | ||||||||
| Revenue Bond, 5.000%, 12/15/2026 | 200,000 | 237,338 | ||||||
| Revenue Bond, 5.000%, 12/15/2027 | 600,000 | 728,202 | ||||||
| Revenue Bond, 5.000%, 12/15/2028 | 250,000 | 309,510 | ||||||
| 11,013,967 | ||||||||
| WASHINGTON - 2.1% | ||||||||
| Washington State, Series R, G.O. Bond, 5.000%, 8/1/2027 | 2,000,000 | 2,464,300 | ||||||
| TOTAL MUNICIPAL BONDS | ||||||||
| (Identified Cost $101,924,103) | 103,843,804 | |||||||
| U.S. TREASURY SECURITIES - 5.9% | ||||||||
| U.S. Treasury Notes - 5.9% | ||||||||
| U.S. Treasury Note | ||||||||
| 1.50%, 12/15/2022 | 590,000 | 596,960 | ||||||
| 0.125%, 1/31/2023 | 605,000 | 602,920 | ||||||
| 0.125%, 2/28/2023 | 605,000 | 602,519 | ||||||
| 0.125%, 3/31/2023 | 605,000 | 602,235 | ||||||
| 0.25%, 4/15/2023 | 600,000 | 598,008 | ||||||
| 1.75%, 5/15/2023 | 590,000 | 599,749 | ||||||
| 0.25%, 6/15/2023 | 600,000 | 597,234 | ||||||
| 0.125%, 7/15/2023 | 605,000 | 600,675 | ||||||
| 2.50%, 8/15/2023 | 580,000 | 597,400 | ||||||
| 0.875%, 12/15/2024 | 500,000 | 500,664 | ||||||
| 1.625%, 12/31/2024 | 500,000 | 511,543 | ||||||
| 2.25%, 12/31/2024 | 500,000 | 518,926 | ||||||
| TOTAL U.S. TREASURY SECURITIES | ||||||||
| (Identified Cost $6,953,625) | 6,928,833 | |||||||
| SHORT-TERM INVESTMENT - 5.2% | ||||||||
| Dreyfus Government Cash Management, Institutional Shares, 0.03%2 | ||||||||
| (Identified Cost $6,212,918) | 6,212,918 | 6,212,918 | ||||||
| TOTAL INVESTMENTS - 98.8% | ||||||||
| (Identified Cost $115,090,646) | 116,985,555 | |||||||
| OTHER ASSETS, LESS LIABILITIES - 1.2% | 1,384,745 | |||||||
| NET ASSETS - 100.0% | $ | 118,370,300 |
The accompanying notes are an integral part of the financial statements.
8
Diversified Tax Exempt Series
Investment Portfolio - December 31, 2021
KEY:
G.O. Bond - General Obligation Bond
Impt. - Improvement
Scheduled principal and interest payments are guaranteed by:
AGM (Assurance Guaranty Municipal Corp.)
BAM (Build America Mutual Assurance Co.)
NATL (National Public Finance Guarantee Corp.)
The insurance does not guarantee the market value of the municipal bonds.
1Amount is stated in USD unless otherwise noted.
2Rate shown is the current yield as of December 31, 2021.
The accompanying notes are an integral part of the financial statements.
9
Diversified Tax Exempt Series
Statement of Assets and Liabilities
December 31, 2021
| ASSETS: | ||||
| Investments, at value (identified cost $115,090,646) (Note 2) | $ | 116,985,555 | ||
| Interest receivable | 1,176,869 | |||
| Receivable for fund shares sold | 241,632 | |||
| Dividends receivable | 140 | |||
| Prepaid expenses | 8,241 | |||
| 118,412,437 | ||||
| TOTAL ASSETS | ||||
LIABILITIES: | ||||
| Accrued fund accounting and administration fees (Note 3) | 22,296 | |||
| Accrued Chief Compliance Officer service fees (Note 3) | 1,531 | |||
| Accrued management fees (Note 3) | 1,082 | |||
| Audit fees payable | 7,502 | |||
| Accrued printing and postage fees payable | 3,912 | |||
| Other payables and accrued expenses | 5,814 | |||
| TOTAL LIABILITIES | 42,137 | |||
| TOTAL NET ASSETS | $ | 118,370,300 | ||
| NET ASSETS CONSIST OF: | ||||
| Capital stock | $ | 108,176 | ||
| Additional paid-in-capital | 114,998,518 | |||
| Total distributable earnings (loss) | 3,263,606 | |||
| TOTAL NET ASSETS | $ | 118,370,300 | ||
| NET ASSET VALUE, OFFERING PRICE AND REDEMPTION PRICE PER SHARE - Class A ($2,430,359/222,137 shares) | $ | 10.94 | ||
| NET ASSET VALUE, OFFERING PRICE AND REDEMPTION PRICE PER SHARE - Class W ($115,939,941/10,595,438 shares) | $ | 10.94 | ||
The accompanying notes are an integral part of the financial statements.
10
Diversified Tax Exempt Series
Statement of Operations
For the Year Ended December 31, 2021
| INVESTMENT INCOME: | ||||
| Interest | $ | 2,068,971 | ||
| Dividends | 1,154 | |||
| Other Income | 10,885 | |||
| Total Investment Income | 2,081,010 | |||
| EXPENSES: | ||||
| Management fees (Note 3) | 654,179 | |||
| Fund accounting and administration fees (Note 3) | 67,587 | |||
| Directors’ fees (Note 3) | 16,044 | |||
| Chief Compliance Officer service fees (Note 3) | 6,123 | |||
| Audit fees | 49,635 | |||
| Custodian fees | 5,712 | |||
| Miscellaneous | 79,925 | |||
| Total Expenses | 879,205 | |||
| Less reduction of expenses (Note 3) | (641,517 | ) | ||
| Net Expenses | 237,688 | |||
| NET INVESTMENT INCOME | 1,843,322 | |||
| REALIZED AND UNREALIZED GAIN (LOSS) ON INVESTMENTS: | ||||
| Net realized gain (loss) on investments | 8,714,790 | |||
| Net change in unrealized appreciation (depreciation) on investments | (9,903,740 | ) | ||
| NET REALIZED AND UNREALIZED GAIN (LOSS) ON INVESTMENTS | (1,188,950 | ) | ||
| NET INCREASE IN NET ASSETS RESULTING FROM OPERATIONS | $ | 654,372 |
The accompanying notes are an integral part of the financial statements.
11
Diversified Tax Exempt Series
Statements of Changes in Net Assets
| FOR THE | FOR THE | |||||||
| YEAR ENDED | YEAR ENDED | |||||||
| 12/31/21 | 12/31/20 | |||||||
| INCREASE (DECREASE) IN NET ASSETS: | ||||||||
| OPERATIONS: | ||||||||
| Net investment income | $ | 1,843,322 | $ | 4,311,399 | ||||
| Net realized gain (loss) on investments | 8,714,790 | 2,133,194 | ||||||
| Net change in unrealized appreciation (depreciation) on investments | (9,903,740 | ) | 6,077,786 | |||||
| Net increase (decrease) from operations | 654,372 | 12,522,379 | ||||||
| DISTRIBUTIONS TO SHAREHOLDERS (Note 8): | ||||||||
| Class A | (151,254 | ) | (46,521 | ) | ||||
| Class W | (7,220,650 | ) | (5,434,869 | ) | ||||
| Total distributions to shareholders | (7,371,904 | ) | (5,481,390 | ) | ||||
| CAPITAL STOCK ISSUED AND REPURCHASED: | ||||||||
| Net increase (decrease) from capital share transactions (Note 5) | (131,176,695 | ) | 55,493,327 | |||||
| Net increase (decrease) in net assets | (137,894,227 | ) | 62,534,316 | |||||
| NET ASSETS: | ||||||||
| Beginning of year | 256,264,527 | 193,730,211 | ||||||
| End of year | $ | 118,370,300 | $ | 256,264,527 | ||||
The accompanying notes are an integral part of the financial statements.
12
Diversified Tax Exempt Series
Financial Highlights - Class A
| FOR THE YEAR ENDED | |||||||||||||||
| 12/31/21 | 12/31/20 | 12/31/19 | 12/31/18 | 12/31/17 | |||||||||||
| Per share data (for a share outstanding throughout each year): | |||||||||||||||
| Net asset value - Beginning of year | $11.58 | $11.14 | $10.90 | $10.98 | $10.86 | ||||||||||
| Income from investment operations: | |||||||||||||||
| Net investment income1 | 0.10 | 0.15 | 0.17 | 0.15 | 0.13 | ||||||||||
| Net realized and unrealized gain (loss) on investments | (0.08 | ) | 0.48 | 0.39 | (0.08 | ) | 0.13 | ||||||||
| Total from investment operations | 0.02 | 0.63 | 0.56 | 0.07 | 0.26 | ||||||||||
| Less distributions to shareholders: | |||||||||||||||
| From net investment income | (0.09 | ) | (0.10 | ) | (0.20 | ) | (0.15 | ) | (0.14 | ) | |||||
| From net realized gain on investments | (0.57 | ) | (0.09 | ) | (0.12 | ) | — | — | |||||||
| Total distributions to shareholders | (0.66 | ) | (0.19 | ) | (0.32 | ) | (0.15 | ) | (0.14 | ) | |||||
| Net asset value - End of year. | $10.94 | $11.58 | $11.14 | $10.90 | $10.98 | ||||||||||
| Net assets - End of year (000’s omitted) | $2,430 | $2,324 | $4,394 | $297,814 | $278,329 | ||||||||||
| Total return2 | 0.16% | 5.73% | 5.10% | 0.65% | 2.37% | ||||||||||
| Ratios (to average net assets)/Supplemental Data: | |||||||||||||||
| Expenses | 0.67% | 0.61% | 0.58% | 0.59% | 0.58% | ||||||||||
| Net investment income | 0.91% | 1.35% | 1.62% | 1.42% | 1.22% | ||||||||||
| Series portfolio turnover | 23% | 41% | 29% | 12% | 4% | ||||||||||
1Calculated based on average shares outstanding during the years.
2Represents aggregate total return for the years indicated, and assumes reinvestment of all distributions.
The accompanying notes are an integral part of the financial statements.
13
Diversified Tax Exempt Series
Financial Highlights - Class W
| FOR THE YEAR ENDED | FOR THE | ||||||||
| PERIOD | |||||||||
| 3/1/191 TO | |||||||||
| 12/31/21 | 12/31/20 | 12/31/19 | |||||||
| Per share data (for a share outstanding throughout each period): | |||||||||
| Net asset value - Beginning of period | $11.59 | $11.15 | $11.01 | ||||||
| Income from investment operations: | |||||||||
| Net investment income2 | 0.16 | 0.21 | 0.20 | ||||||
| Net realized and unrealized gain (loss) on investments | (0.09 | ) | 0.48 | 0.31 | |||||
| Total from investment operations | 0.07 | 0.69 | 0.51 | ||||||
| Less distributions to shareholders: | |||||||||
| From net investment income | (0.15 | ) | (0.16 | ) | (0.25 | ) | |||
| From net realized gain on investments | (0.57 | ) | (0.09 | ) | (0.12 | ) | |||
| Total distributions to shareholders | (0.72 | ) | (0.25 | ) | (0.37 | ) | |||
| Net asset value - End of period | $10.94 | $11.59 | $11.15 | ||||||
| Net assets - End of period (000’s omitted) | $115,940 | $253,941 | $189,336 | ||||||
| Total return3 | 0.62% | 6.23% | 4.61% | ||||||
| Ratios (to average net assets)/Supplemental Data: | |||||||||
| Expenses* | 0.17% | 0.11% | 0.11% | 4 | |||||
| Net investment income | 1.42% | 1.79% | 2.14% | 4 | |||||
| Series portfolio turnover | 23% | 41% | 29% | ||||||
*The investment advisor did not impose all or a portion of its management and/or other fees during the periods, and may have paid a portion of the Series’ expenses. If these expenses had been incurred by the Class, the expense ratio (to average net assets) would have increased by the following amounts:
| 0.50% | 0.50% | 0.50% | 4 |
1Commencement of operations.
2Calculated based on average shares outstanding during the periods.
3Represents aggregate total return for the periods indicated, and assumes reinvestment of all distributions. Total return would have been lower had certain expenses not been waived or reimbursed during the periods. Periods less than one year are not annualized.
4Annualized.
The accompanying notes are an integral part of the financial statements.
14
Diversified Tax Exempt Series
Notes to Financial Statements
| 1. | Organization |
Diversified Tax Exempt Series (the “Series”) is a no-load diversified series of Manning & Napier Fund, Inc. (the “Fund”). The Fund is organized in Maryland and is registered under the Investment Company Act of 1940, as amended, as an open-end management investment company.
The Series’ investment objective is to provide as high a level of current income exempt from federal income tax as the Advisor believes is consistent with the preservation of capital.
The Series is authorized to issue two classes of shares (Class A and Class W). While each class of shares is substantially the same, each class has its own investment eligibility criteria and cost structure.
The Fund’s advisor is Manning & Napier Advisors, LLC (the “Advisor”). Shares of the Series are offered to investors, clients and employees of the Advisor and its affiliates. The total authorized capital stock of the Fund consists of 15 billion shares of common stock each having a par value of $0.01. As of December 31, 2021, 6.3 billion shares have been designated in total among 15 series, of which 100 million have been designated as Diversified Tax Exempt Series Class A common stock and 50 million have been designated as Diversified Tax Exempt Series Class W common stock.
| 2. | Significant Accounting Policies |
The following is a summary of significant accounting policies followed by the Series. The Series is an investment company and, accordingly, follows the investment company accounting and reporting guidance of the Financial Accounting Standards Board Accounting Standards Codification Topic 946 - Investment Companies, which is part of accounting principles generally accepted in the United States of America (“GAAP”).
Security Valuation
Municipal securities will normally be valued on the basis of market valuations provided by an independent pricing service (the “Service”). The Service utilizes the latest price quotations and a matrix system (which considers such factors as security prices of similar securities, yields, maturities and ratings). The Service has been approved by the Fund’s Board of Directors (the “Board”).
Short-term investments that mature in sixty days or less may be valued at amortized cost, which approximates fair value. Investments in open-end investment companies are valued at their net asset value per share on valuation date.
Volume and level of activity in established markets for an asset or liability are evaluated to determine whether recent transactions and quoted prices are determinative of fair value. Where there have been significant decreases in volume and level of activity, further analysis and adjustment may be necessary to estimate fair value. The Series measures fair value in these instances by the use of inputs and valuation techniques which may be based upon current market prices of securities that are comparable in coupon, rating, maturity and industry and/or expectation of future cash flows. As a result of trading in relatively thin markets and/or markets that experience significant volatility, the prices used by the Series to value these securities may differ from the value that would be realized if these securities were sold, and the differences could be material.
Securities for which representative valuations or prices are not available from the Series’ pricing service may be valued at fair value as determined in good faith by the Advisor under procedures approved by and under the general supervision and responsibility of the Board. Due to the inherent uncertainty of valuations of such securities, the fair value may differ significantly from the values that would have been used had a ready market for such securities existed. If trading or events occurring after the close of the principal market in which securities are traded are expected to materially affect the value of those securities, then they may be valued at their fair value, taking this trading or these events into account.
Various inputs are used in determining the value of the Series’ assets or liabilities carried at fair value. These inputs are summarized in three broad levels. Level 1 includes quoted prices in active markets for identical assets and liabilities. Level 2 includes other significant observable inputs (including quoted prices for similar securities, interest rates, prepayment speeds, credit risk, etc.). Level 3 includes significant unobservable inputs (including the Series’ own assumptions in determining the fair value of investments). A financial instrument’s level within the fair value hierarchy is based on the lowest level of any input
15
Diversified Tax Exempt Series
Notes to Financial Statements (continued)
| 2. | Significant Accounting Policies (continued) |
Security Valuation (continued)
both individually and in aggregate that is significant to the fair value measurement. The inputs or methodology used for valuing securities are not necessarily an indication of the risk associated with investing in those securities.
The following is a summary of the valuation levels used for major security types as of December 31, 2021 in valuing the Series’ assets or liabilities carried at fair value:
| DESCRIPTION | TOTAL | LEVEL 1 | LEVEL 2 | LEVEL 3 | |||||||||||
| Assets: | |||||||||||||||
| Debt securities: | |||||||||||||||
| Municipal Bonds | $ | 103,843,804 | $ | — | $ | 103,843,804 | $ | — | |||||||
| U.S. Treasury and other U.S. Government agencies | 6,928,833 | — | 6,928,833 | — | |||||||||||
| Short-Term Investment | 6,212,918 | 6,212,918 | — | — | |||||||||||
| Total assets | $ | 116,985,555 | $ | 6,212,918 | $ | 110,772,637 | $ | — | |||||||
There were no Level 3 securities held by the Series as of December 31, 2020 or December 31, 2021.
Security Transactions, Investment Income and Expenses
Security transactions are accounted for on trade date. Dividend income is recorded on the ex-dividend date, except that if the ex-dividend date has passed, certain dividends from foreign securities are recorded as soon as the Series is informed of the ex-dividend date. Non-cash dividends, if any, are recorded at the fair value of the securities received. Interest income, including amortization of premium and accretion of discounts using the effective interest method, is earned from settlement date and accrued daily.
Expenses are recorded on an accrual basis. Most expenses of the Fund can be attributed to a specific series. Expenses which cannot be directly attributed are apportioned among the series in the Fund in such a manner as deemed equitable by the Fund’s Board, taking into consideration, among other things, the nature and type of expense.
The Series uses the identified cost method for determining realized gain or loss on investments for both financial statement and federal income tax reporting purposes.
Federal Taxes
The Series’ policy is to comply with the provisions of the Internal Revenue Code applicable to regulated investment companies. The Series is not subject to federal income tax or excise tax to the extent that the Series distributes to shareholders each year its taxable income, including any net realized gains on investments, in accordance with requirements of the Internal Revenue Code. Accordingly, no provision for federal income tax or excise tax has been made in the financial statements.
Management evaluates its tax positions to determine if the tax positions taken meet the minimum recognition threshold in connection with accounting for uncertainties in income tax positions taken or expected to be taken for the purposes of measuring and recognizing tax liabilities in the financial statements. Recognition of tax benefits of an uncertain tax position is required only when the position is “more likely than not” to be sustained assuming examination by taxing authorities. At December 31, 2021, the Series has recorded no liability for net unrecognized tax benefits relating to uncertain income tax positions taken or expected to be taken in future tax returns.
The Series files income tax returns in the U.S. federal jurisdiction, various states and foreign jurisdictions, as required. No income tax returns are currently under investigation. The statute of limitations on the Series’ tax returns remains open for the years ended December 31, 2018 through December 31, 2021. The Series is not aware of any tax positions for which it is reasonably possible that the total amounts of unrecognized tax benefits will significantly change in the next twelve months.
16
Diversified Tax Exempt Series
Notes to Financial Statements (continued)
| 2. | Significant Accounting Policies (continued) |
Distributions of Income and Gains
Distributions to shareholders of net investment income are made quarterly. Distributions of net realized gains are made annually. An additional distribution may be necessary to avoid taxation of the Series. Distributions are recorded on the ex-dividend date.
Indemnifications
The Fund’s organizational documents provide former and current directors and officers with a limited indemnification against liabilities arising in connection with the performance of their duties to the Fund. In the normal course of business, the Fund may also enter into contracts that provide general indemnifications. The Fund’s maximum exposure under these arrangements is unknown as this would be dependent on future claims that may be made against the Fund. The risk of material loss from such claims is considered remote.
Other
The preparation of financial statements in conformity with GAAP requires management to make estimates and assumptions that affect the reported amounts of assets and liabilities and the disclosure of contingent assets and liabilities at the date of the financial statements and the reported amounts of income and expenses during the reporting period. Actual results could differ from those estimates.
| 3. | Transactions with Affiliates |
The Fund has an Investment Advisory Agreement (the “Agreement”) with the Advisor, for which the Series pays a fee, computed daily and payable monthly, at an annual rate of 0.50% of the Series’ average daily net assets.
Under the Agreement, personnel of the Advisor provide the Series with advice and assistance in the choice of investments and the execution of securities transactions, and otherwise maintain the Series’ organization. The Advisor also provides the Fund with necessary office space and fund administration and support services. The salaries of all officers of the Fund (except a percentage of the Fund’s Chief Compliance Officer’s salary, which is paid by the Fund), and of all Directors who are “affiliated persons” of the Fund, or of the Advisor, and all personnel of the Fund, or of the Advisor, performing services relating to research, statistical and investment activities, are paid by the Advisor. Each “non-affiliated” Director receives an annual stipend, which is allocated among all the active series of the Fund. In addition, these Directors also receive a fee per Board meeting attended plus a fee for each committee meeting attended and are reimbursed for travel and other out-of-pocket expenses incurred by them in connection with attending such meetings. The Fund also has an Audit Committee Chair, Governance & Nominating Committee Chair and Lead Independent Director, who each receive an additional annual stipend for these roles.
Manning & Napier Investor Services, Inc., a registered broker-dealer affiliate of the Advisor, acts as distributor for the Fund’s shares. The services of Manning & Napier Investor Services, Inc. are provided at no additional cost to the Series.
Pursuant to a master services agreement dated February 13, 2020, as amended, the Fund pays the Advisor an annual fee related to fund accounting and administration of 0.0085% on the first $25 billion of average daily net assets; 0.0075% on the next $15 billion of average daily net assets; and 0.0065% of average daily net assets in excess of $40 billion; plus a base fee of $30,400 per series. Additionally, certain transaction and out-of-pocket expenses, including charges for reporting relating to the Fund’s compliance program, are charged. The Advisor has agreements with BNY Mellon Investment Servicing (U.S.) Inc. (“BNY”) under which BNY serves as sub-accountant services agent.
Pursuant to an advisory fee waiver agreement, the Advisor has contractually agreed to waive the management fee for the Class W shares. The full management fee will be waived under this agreement because Class W shares are only available to discretionary investment accounts and other accounts managed by the Advisor. These clients pay a management fee to the Advisor that is separate from the Fund’s expenses. In addition, pursuant to a separate expense limitation agreement, the Advisor has contractually agreed to limit its fees and reimburse expenses to the extent necessary so that the total direct annual fund operating expenses, exclusive of the waived Class W management fees (collectively, “excluded expenses”), do not exceed 0.85% of the average daily net assets of the Class A shares and 0.35% of the average daily net assets of the Class W shares. These contractual waivers are expected to continue indefinitely, and may not be amended or terminated by the Advisor without the
17
Diversified Tax Exempt Series
Notes to Financial Statements (continued)
| 3. | Transactions with Affiliates (continued) |
approval of the Series’ Board of Directors. The Advisor may receive from a Class the difference between the Class’s total direct annual fund operating expenses, not including excluded expenses, and the Class’s contractual expense limit to recoup all or a portion of its prior fee waivers (other than Class W management fee waivers) or expense reimbursements made during the rolling three-year period preceding the recoupment if at any point the total direct annual fund operating expenses, not including excluded expenses, are below the contractual expense limit (a) at the time of the fee waiver and/or expense reimbursement and (b) at the time of the recoupment.
Pursuant to the advisory fee waiver, the Advisor waived $641,517 in management fees for Class W shares for the year ended December 31, 2021. This amount is included as a reduction of expenses on the Statement of Operations.
As of December 31, 2021, there are no expenses eligible to be recouped by the Advisor.
| 4. | Purchases and Sales of Securities |
For the year ended December 31, 2021, purchases and sales of securities, other than U.S. Government securities and short-term securities, were $23,727,593 and $163,529,188, respectively. Purchases of U.S. Government securities, other than short-term securities, were $6,961,565. There were no sales of U.S. Government securities.
| 5. | Capital Stock Transactions |
Transactions in shares of Class A and Class W of Diversified Tax Exempt Series were:
| CLASS A | FOR THE YEAR ENDED 12/31/21 | FOR THE YEAR ENDED 12/31/20 | ||||||||||||||
| SHARES | AMOUNT | SHARES | AMOUNT | |||||||||||||
| Sold | 121,144 | $ | 1,400,116 | 82,203 | $ | 893,427 | ||||||||||
| Reinvested | 13,707 | 150,949 | 3,999 | 45,891 | ||||||||||||
| Repurchased | (113,352 | ) | (1,298,287 | ) | (279,889 | ) | (3,192,964 | ) | ||||||||
| Total | 21,499 | $ | 252,778 | (193,687 | ) | $ | (2,253,646 | ) | ||||||||
| CLASS W | FOR THE YEAR ENDED 12/31/21 | FOR THE YEAR ENDED 12/31/20 | ||||||||||||||
| SHARES | AMOUNT | SHARES | AMOUNT | |||||||||||||
| Sold | 1,222,473 | $ | 14,076,424 | 10,351,481 | $ | 118,837,178 | ||||||||||
| Reinvested | 629,320 | 6,944,529 | 424,534 | 4,884,034 | ||||||||||||
| Repurchased | (13,167,815 | ) | (152,450,426 | ) | (5,850,618 | ) | (65,974,239 | ) | ||||||||
| Total | (11,316,022 | ) | $ | (131,429,473 | ) | 4,925,397 | $ | 57,746,973 | ||||||||
Over 90% of the shares outstanding are fiduciary accounts where the Advisor has sole investment discretion.
| 6. | Line of Credit |
The Fund has entered into a 364-day, $25 million credit agreement (the “line of credit”) with Bank of New York Mellon. Each series of the Fund may borrow under the line of credit for temporary or emergency purposes, including funding shareholder redemptions and other short-term liquidity purposes. The Fund pays an annual fee on the unused commitment amount, payable quarterly, and is allocated among all the series of the Fund and included in miscellaneous expenses in the Statement of Operations for each series. The line of credit expires in September 2022 unless extended or renewed. During the year ended December 31, 2021, the Series did not borrow under the line of credit.
18
Diversified Tax Exempt Series
Notes to Financial Statements (continued)
| 7. | Financial Instruments |
The Series may trade in instruments including written and purchased options, forward foreign currency exchange contracts and futures contracts and other derivatives in the normal course of investing activities to assist in managing exposure to various market risks. The Series may be subject to various elements of risk, which may involve, to a varying degree, elements of risk in excess of the amounts recognized for financial statement purposes. These risks include: the risk that changes in the value of a derivative may not correlate perfectly with the underlying asset, rate or index; counterparty credit risk related to over the counter derivative counterparties’ failure to perform under contract terms; liquidity risk related to the lack of a liquid market for these contracts allowing the fund to close out its position(s); and documentation risk relating to disagreement over contract terms. No such investments were held by the Series as of December 31, 2021.
| 8. | Federal Income Tax Information |
The amount and characterization of certain income and capital gains to be distributed are determined in accordance with federal income tax regulations, which may differ from GAAP. These differences are primarily due to differing book and tax treatments in the timing and/or treatment of the recognition of net investment income or gains and losses, including market discount on investments and tax equalization. The Series may periodically make reclassifications among its capital accounts to reflect income and gains available for distribution (or available capital loss carryovers) under income tax regulations, without impacting the Series’ net asset value. For the year ended December 31, 2021, amounts were reclassified within the capital accounts to increase Additional Paid in Capital by $3,036,731 and decrease Total Distributable Earnings (Loss) by $3,036,731. Any such reclassifications are not reflected in the financial highlights.
The tax character of distributions paid were as follows:
| FOR THE YEAR ENDED 12/31/21 | FOR THE YEAR ENDED 12/31/20 | |||||||
| Ordinary income | $ | 557,648 | $ | 1,270,851 | ||||
| Tax exempt income | $ | 1,548,715 | $ | 3,455,906 | ||||
| Long-term capital gains | $ | 5,265,541 | $ | 754,633 | ||||
At December 31, 2021, the tax basis of components of distributable earnings and the net unrealized appreciation based on the identified cost of investments for federal income tax purposes were as follows:
| Cost for federal income tax purposes | $ | 115,143,947 | ||||||
| Unrealized appreciation | 2,034,025 | |||||||
| Unrealized depreciation | (192,417 | ) | ||||||
| Net unrealized appreciation | $ | 1,841,608 | ||||||
| Undistributed tax exempt income | $ | 1,395,430 | ||||||
| Undistributed long-term capital gains | $ | 16,395 |
| 9. | Market Event |
In March 2020, the World Health Organization declared COVID-19 (a novel coronavirus) to be a pandemic. The situation is dynamic and a recent resurgence of COVID-19 has caused a continued time of uncertainty. Global financial markets have experienced and may continue to experience significant volatility resulting from the spread of COVID-19. The global economy, the economies of certain nations and individual issuers have been and may continue to be adversely affected by COVID-19, particularly in light of the interconnectivity between economies and financial markets, all of which may negatively impact the Series’ performance. Management of the Series will continue to monitor the impact of COVID-19 on investment performance, financial statements and the Series’ operations.
19
Diversified Tax Exempt Series
Report of Independent Registered Public Accounting Firm
To the Board of Directors of Manning & Napier Fund, Inc. and Shareholders of Diversified Tax Exempt Series
Opinion on the Financial Statements
We have audited the accompanying statement of assets and liabilities, including the investment portfolio, of Diversified Tax Exempt Series (one of the series constituting Manning & Napier Fund, Inc., referred to hereafter as the “Fund”) as of December 31, 2021, the related statement of operations for the year ended December 31, 2021, the statement of changes in net assets for each of the two years in the period ended December 31, 2021, including the related notes, and the financial highlights for each of the periods indicated therein (collectively referred to as the “financial statements”). In our opinion, the financial statements present fairly, in all material respects, the financial position of the Fund as of December 31, 2021, the results of its operations for the year then ended, the changes in its net assets for each of the two years in the period ended December 31, 2021 and the financial highlights for each of the periods indicated therein in conformity with accounting principles generally accepted in the United States of America.
Basis for Opinion
These financial statements are the responsibility of the Fund’s management. Our responsibility is to express an opinion on the Fund’s financial statements based on our audits. We are a public accounting firm registered with the Public Company Accounting Oversight Board (United States) (PCAOB) and are required to be independent with respect to the Fund in accordance with the U.S. federal securities laws and the applicable rules and regulations of the Securities and Exchange Commission and the PCAOB.
We conducted our audits of these financial statements in accordance with the standards of the PCAOB. Those standards require that we plan and perform the audit to obtain reasonable assurance about whether the financial statements are free of material misstatement, whether due to error or fraud.
Our audits included performing procedures to assess the risks of material misstatement of the financial statements, whether due to error or fraud, and performing procedures that respond to those risks. Such procedures included examining, on a test basis, evidence regarding the amounts and disclosures in the financial statements. Our audits also included evaluating the accounting principles used and significant estimates made by management, as well as evaluating the overall presentation of the financial statements. Our procedures included confirmation of securities owned as of December 31, 2021 by correspondence with the custodian. We believe that our audits provide a reasonable basis for our opinion.

New York, New York
February 18, 2022
We have served as the auditor of one or more investment companies in Manning & Napier Mutual Funds since 1992.
20
Diversified Tax Exempt Series
Supplemental Tax Information
(unaudited)
All reportings are based on financial information available as of the date of this annual report, and accordingly are subject to change.
The Series designates $7,874,817 as Long-Term Capital Gain dividends pursuant to Section 852(b)(3) of the Internal Revenue Code for the fiscal year ended December 31, 2021.
21
Diversified Tax Exempt Series
Directors’ and Officers’ Information
(unaudited)
The Statement of Additional Information provides additional information about the Fund’s directors and officers and can be obtained without charge by calling 1-800-466-3863, at www.manning-napier.com, or on the EDGAR Database on the SEC Internet web site (http://www.sec.gov). The following chart shows certain information about the Fund’s directors and officers, including their principal occupations during the last five years. Unless specific dates are provided, the individuals have held the listed positions for longer than five years.
Interested Director and Officer
| Name: | Paul Battaglia* |
| Address: | 290 Woodcliff Drive |
| Fairport, NY 14450 | |
| Age: | 43 |
| Current Position(s) Held with Fund: | Principal Executive Officer, President, Chairman and Director |
| Term of Office1 & Length of Time Served: | Indefinite – Chairman and Director since November 2018 |
| Principal Occupation(s) During Past 5 Years: | Chief Financial Officer since 2018; Vice President of Finance (2016 – 2018); |
| Director of Finance (2011 – 2016); Financial Analyst/Internal Auditor (2004-2006) – Manning & Napier Advisors, LLC and affiliates | |
| Holds one or more of the following titles for various subsidiaries and affiliates: Chief Financial Officer | |
| Number of Portfolios Overseen within Fund Complex: | 15 |
| Other Directorships Held Outside Fund Complex During Past 5 Years: | N/A |
Independent Directors
| Name: | Stephen B. Ashley |
| Address: | 290 Woodcliff Drive |
| Fairport, NY 14450 | |
| Age: | 81 |
| Current Position(s) Held with Fund: | Director, Audit Committee Member, Governance & Nominating Committee Member |
| Term of Office & Length of Time Served: | Indefinite – Since 1996 |
| Principal Occupation(s) During Past 5 Years: | Chairman and Director since 1997; Chief Executive Officer (1997-2019) - Ashley Companies (property management and investment) |
| Number of Portfolios Overseen within Fund Complex: | 15 |
| Other Directorships Held Outside Fund Complex During Past 5 Years: | Ashley Companies since 1997 |
| Name: | Paul A. Brooke |
| Address: | 290 Woodcliff Drive |
| Fairport, NY 14450 | |
| Age: | 76 |
| Current Position(s) Held with Fund: | Lead Independent Director, Audit Committee Member, Governance & Nominating Committee Member |
| Term of Office & Length of Time Served: | Indefinite – Director, Audit Committee Member, Governance & Nominating Committee Member since 2007; Lead Independent Director since 2017 |
| Principal Occupation(s) During Past 5 Years: | Managing Member since 1991 - PMSV Holdings LLC (investments); Managing Member (2010-2016) - VenBio (investments). |
| Number of Portfolios Overseen within Fund Complex: | 15 |
| Other Directorships Held Outside Fund Complex During Past 5 Years: | Incyte Corp. (biotech) (2000-2020); PureEarth (non-profit) since 2012; Cerus (biomedical) since 2016; Caelum BioSciences (biomedical) since 2018; Cheyne Capital International (investment)(2000-2017); |
22
Diversified Tax Exempt Series
Directors’ and Officers’ Information
(unaudited)
Independent Directors (continued)
| Name: | John Glazer |
| Address: | 290 Woodcliff Drive |
| Fairport, NY 14450 | |
| Age: | 56 |
| Current Position(s) Held with Fund: | Director, Audit Committee Member, Governance & Nominating Committee Member |
| Term of Office & Length of Time Served: | Indefinite – Director, Audit Committee Member, Governance & Nominating Committee Member since February 2021 |
| Principal Occupation(s) During Past 5 Years: | Chief Executive Officer since 2020 – Oikos Holdings LLC (Single-Family Office); Head of Corporate Development (2019-2020) – Caelum Biosciences (pharmaceutical development); Head of Private Investments (2015-2018) – AC Limited (Single-Family Office) |
| Number of Portfolios Overseen within Fund Complex: | 15 |
| Other Directorships Held Outside Fund Complex During Past 5 Years: | N/A |
| Name: | Margaret McLaughlin |
| Address: | 290 Woodcliff Drive |
| Fairport, NY 14450 | |
| Age: | 54 |
| Current Position(s) Held with Fund: | Director, Audit Committee Member, Governance & Nominating Committee Member |
| Term of Office & Length of Time Served: | Indefinite – Director, Audit Committee Member, Governance & Nominating Committee Member since February 2021 |
| Principal Occupation(s) During Past 5 Years: | Consultant since 2020 – Bates Group (consultants); Consultant (2019-2020) – Madison Dearborn Partners (private equity); General Counsel/CCO (2011-2019) – Kramer Van Kirk Credit Strategies L.P./Mariana Systems LLC (Investment Adviser/SaaS Technology) |
| Number of Portfolios Overseen within Fund Complex: | 15 |
| Other Directorships Held Outside Fund Complex During Past 5 Years: | N/A |
| Name: | Russell O. Vernon |
| Address: | 290 Woodcliff Drive |
| Fairport, NY 14450 | |
| Age: | 64 |
| Current Position(s) Held with Fund: | Director, Audit Committee Member, Governance & Nominating Committee Chairman |
| Term of Office & Length of Time Served: | Indefinite – Director, Audit Committee Member, Governance & Nominating Committee Member since April 2020; Governance & Nominating Committee Chairman since November 2020 |
| Principal Occupation(s) During Past 5 Years: | Founder and General Partner (2009-2019) – BVM Capital Management (economic development) |
| Number of Portfolios Overseen within Fund Complex: | 15 |
| Other Directorships Held Outside Fund Complex During Past 5 Years: | Board Member, Vice Chairman and President since 2010 – Newburgh Armory Unity Center (military); Board Member and Executive Director since 2020 – National Purple Heart Honor Mission, Inc. (military); Board Member, Vice Chairman (2015-2020) – National Purple Heart Hall of Honor, Inc. (military) |
23
Diversified Tax Exempt Series
Directors’ and Officers’ Information
(unaudited)
Independent Directors (continued)
| Name: | Chester N. Watson |
| Address: | 290 Woodcliff Drive |
| Fairport, NY 14450 | |
| Age: | 71 |
| Current Position(s) Held with Fund: | Director, Audit Committee Chairman, Governance & Nominating Committee Member |
| Term of Office & Length of Time Served: | Indefinite – Director, Audit Committee Member, Governance & Nominating Committee Member Since 2012; Audit Committee Chairman since 2013 |
| Principal Occupation(s) During Past 5 Years: | General Auditor (2003-2011) - General Motors Company (auto manufacturer) |
| Number of Portfolios Overseen within Fund Complex: | 15 |
Other Directorships Held Outside Fund Complex During Past 5 Years: | Rochester Institute of Technology (University) since 2005; Hudson Valley Center for Innovation, Inc. (New Business and Economic Development) since 2019; Town of Greenburgh, NY Planning Board (Municipal Government) (2015-2019); |
Officers: | |
| Name: | Elizabeth Craig |
| Address: | 290 Woodcliff Drive |
| Fairport, NY 14450 | |
| Age: | 34 |
| Current Position(s) Held with Fund: | Corporate Secretary |
| Term of Office1 & Length of Time Served: | Since 2016 |
| Principal Occupation(s) During Past 5 Years: | Director of Fund Administration since 2021; Fund Regulatory Administration Manager (2018-2021); Fund Administration Manager (2015-2018); Mutual Fund Compliance Specialist (2009-2015) - Manning & Napier Advisors, LLC; Assistant Corporate Secretary (2011-2016) - Manning & Napier Fund, Inc.; Corporate Secretary, Director since 2019– Manning & Napier Investor Services, Inc. |
| Name: | Samantha Larew |
| Address: | 290 Woodcliff Drive |
| Fairport, NY 14450 | |
| Age: | 41 |
| Current Position(s) Held with Fund: | Chief Compliance Officer and Anti-Money Laundering Compliance Officer |
| Term of Office1 & Length of Time Served: | Chief Compliance Officer since 2019; Anti-Money Laundering Compliance Officer since 2018 |
| Principal Occupation(s) During Past 5 Years: | Co-Director of Compliance since 2018; Compliance Communications Supervisor (2014-2018); Compliance Supervisor (2013-2014); Broker-Dealer Compliance Supervisor (2011-2013); Broker-Dealer Compliance Analyst (2010-2011) - Manning & Napier Advisors, LLC& Affiliates; Broker-Dealer Chief Compliance Officer since 2013; Broker-Dealer Assistant Corporate Secretary since 2011 – Manning & Napier Investor Services, Inc.; Compliance Analyst (2007-2009) – Wall Street Financial Group; Compliance Specialist (2003-2007) – Manning & Napier Advisors, LLC & Affiliates |
| Name: | Scott Morabito |
| Address: | 290 Woodcliff Drive |
| Fairport, NY 14450 | |
| Age: | 34 |
| Current Position(s) Held with Fund: | Vice President |
| Term of Office1 & Length of Time Served: | Vice President since 2019; Assistant Vice President (2017-2019) |
| Principal Occupation(s) During Past 5 Years: | Managing Director, Client Service and Business Operations since 2021; Managing Director of Operations (2019-2021); Director of Funds Group (2017-2019); Fund Product and Strategy Manager (2014-2017); Senior Product and Strategy Analyst (2013-2014); Product and Strategy Analyst (2011-2013) - Manning & Napier Advisors, LLC; President, Director since 2018 – Manning & Napier Investor Services, Inc.; President, Exeter Trust Company since 2021; |
24
Diversified Tax Exempt Series
Directors’ and Officers’ Information
(unaudited)
Officers: (continued)
| Name: | Troy Statczar |
| Address: | 290 Woodcliff Drive |
| Fairport, NY 14450 | |
| Age: | 50 |
| Current Position(s) Held with Fund: | Principal Financial Officer, Treasurer |
| Term of Office1 & Length of Time Served: | Principal Financial Officer and Treasurer since 2020 |
| Principal Occupation(s) During Past 5 Years: | Senior Director, Foreside Treasurer Services since 2020 - Foreside Financial Group; Director of Fund Administration (2017-2019) - Thornburg Investment Management, Inc.; Director of U.S. Operations (2008-2017) - Henderson Global Investors N.A., Inc. |
| Name: | Sarah Turner |
| Address: | 290 Woodcliff Drive |
| Fairport, NY 14450 | |
| Age: | 39 |
| Current Position(s) Held with Fund: | Chief Legal Officer; Assistant Corporate Secretary |
| Term of Office1 & Length of Time Served: | Since 2018 |
| Principal Occupation(s) During Past 5 Years: | General Counsel since 2018 - Manning & Napier Advisors, LLC and affiliates; Counsel (2017-2018) – Harter Secrest and Emery LLP; Legal/Senior Counsel (2010-2017) – Manning & Napier Advisors, LLC and affiliates Holds one or more of the following titles for various affiliates: General Counsel |
*Interested Director, within the meaning of the 1940 Act by reason of his positions with the Fund’s Advisor, Manning & Napier Advisors, LLC, and Distributor, Manning & Napier Investor Services, Inc.
1The term of office of all officers shall be one year and until their respective successors are chosen and qualified, or his or her earlier resignation or removal as provided in the Fund’s By-Laws.
25
Diversified Tax Exempt Series
Literature Requests
(unaudited)
Proxy Voting Policies and Procedures
A description of the policies and procedures that the Fund uses to determine how to vote proxies relating to portfolio securities is available, without charge, upon request:
| By phone | 1-800-466-3863 |
On the Securities and Exchange
| Commission’s (SEC) web site | http://www.sec.gov |
Proxy Voting Record
Information regarding how the Fund voted proxies relating to portfolio securities during the most recent 12-month period ended June 30th is available, without charge, upon request:
| By phone | 1-800-466-3863 |
| On the SEC’s web site | http://www.sec.gov |
Quarterly Portfolio Holdings
The Series’ complete schedule of portfolio holdings for the 1st and 3rd quarters of each fiscal year are provided on Form N-PORT, and are available, without charge, upon request:
| By phone | 1-800-466-3863 |
| On the SEC’s web site | http://www.sec.gov |
Prospectus and Statement of Additional Information (SAI)
For more information about any of the Manning & Napier Fund, Inc. Series, you may obtain a prospectus and SAI at www.manning-napier.com or by calling 1-(800) 466-3863. Before investing, carefully consider the objectives, risks, charges and expenses of the investment and read the prospectus carefully as it contains this and other information about the investment company. In addition, this information can be found on the SEC’s web site, http://www.sec.gov.
Additional information available at www.manning-napier.com
| 1. | Fund Holdings - Month-End |
| 2. | Fund Holdings - Quarter-End |
| 3. | Shareholder Report - Annual |
| 4. | Shareholder Report - Semi-Annual |
The Fund also offers electronic notification or “e-delivery” when certain documents are available on-line to be downloaded or reviewed. Direct shareholders can elect to receive electronic notification when shareholder reports, prospectus updates, and/or statements are available. If you do not currently have on-line access to your account, you can establish access by going to www.manning-napier.com, click on “Login” in the top corner of the page, and follow the prompts to self-enroll. Once enrolled, you can set your electronic notification preferences by clicking on the Account Options tab located within the green toolbar and then select E-Delivery Option. Should you have any questions on either how to establish on-line access or how to update your account settings, please contact Investor Services at 1-800-466-3863.
The Manning & Napier Fund, Inc. is managed by Manning & Napier Advisors, LLC. Manning & Napier Investor Services, Inc., an affiliate of Manning & Napier Advisors, LLC, is the distributor of the Fund shares.
MNDTE-12/21-AR
26

Manning & Napier Fund, Inc.
New York Tax Exempt Series
Paper copies of the Series’ shareholder reports are no longer sent by mail, unless you specifically request them from the Series or from your financial intermediary, such as a broker-dealer or bank. Shareholder reports are available online. Each time a report is posted on the Series’ website you will be provided with a link to access the report online, either by mail (hard copy notice) or by email, if you have already signed up for electronic delivery of shareholder reports.
You may elect to receive all future shareholder reports in paper free of charge. If you invest through a financial intermediary, you can contact your financial intermediary to request that you continue to receive paper copies. If you invest directly with the Fund, you can inform the Fund that you wish to continue receiving paper copies by visiting www.manning-napier.com or calling 1-800-466-3863. Your election to receive reports in paper will apply to all funds held with your financial intermediary if you invest through a financial intermediary or all series of the Fund if you invest directly with the Fund.
Additionally, If you have not yet signed up for electronic delivery of shareholder reports and other Fund communications, you may do so by contacting your financial intermediary or, if you are a direct investor, by visiting www.manning-napier.com or calling 1-800-466-3863.
 | Independent Perspective | Real-World Solutions |
A Note from Our CEO
Dear Shareholder,
The obstacles were many, but this year, in so many ways, is a story of triumphant resilience only serving to spotlight just how much more there is to do.
Over the past two years, we’ve endured a recession, a bear market, and a pandemic. Our collective perseverance is now paying off.
We are today experiencing a remarkable economic boom, a historic market rally, and continued medical innovation, all of which have turned a challenging period into one of optimism and hope.
At the same time, political and societal polarization are heightened, social justice concerns have justifiably come to the fore, and the precarious state of our environment presents almost unimaginable challenges for government, business, and finance.
This certainly is a moment of great consequence.
The kind of moment that questions all the rules. Economic rules in how we add value for each other, as well as for ourselves. Social rules in how we interact with each other. Environmental rules that can balance the current needs of emerging economies with the requirements for everyone in the future. Workplace rules in how we get the job done.
Our lives are being redefined, and our society, planet, workplaces, and industry must confront the challenges of the upcoming decade.
Markets reflect us. They mirror our collective thoughts, feelings, expectations, and beliefs – these new life rules.
As we go through this period of change, it will be uncertain and uncomfortable. For those unaccustomed to change, for those reliant on ’set it and forget it’, these may seem like daunting questions, but there is a better way.
Success in an era of change demands flexibility, adaptability, and a roll-up-your-sleeves willingness to do the work.
For over 50 years, independent thinking and tireless work have underpinned every decision we’ve made on behalf of our investors. We invest for the long-term, we do not speculate. We make active decisions, and we invest with discipline, patience, and confidence. This is the only way we know, to remain true to our values and our fiduciary duty to you, the investors in our mutual funds.
You demand more. At Manning & Napier, we demand more of ourselves. Upon reflection of the year, we’re proud to have continued to deliver more.
We wish you safety and good health, and we appreciate your confidence in our firm and our approach.
 | Sincerely,
Marc Mayer |

Corporate Headquarters | 290 Woodcliff Drive | Fairport, NY 14450 | (585) 325-6880 phone | (800) 551-0224 toll free | www.manning-napier.com
1
New York Tax Exempt Series
Fund Commentary
(unaudited)
Investment Objective
To provide as high a level of current income exempt from federal income tax and New York State personal income tax as the Advisor believes is consistent with the preservation of capital. The Series invests primarily in municipal bonds that provide income exempt from federal income tax and New York State personal income tax.
Performance Commentary
Despite lingering inflation concerns, potential balance sheet reductions by the Federal Reserve, and looming interest rate hikes, the municipal bond market posted slightly positive returns for the year. Overall, municipal yields ended the year slightly higher with the largest increase occurring in the belly of the curve (i.e., securities in the 5 to 7-year maturity range generally saw the greatest increase in yields) and credit spreads tightened. The highest returning areas of the market included hospital and transportation bonds from a sector perspective, longer-dated issuances from a maturity perspective, and lower quality issuances when looking at it from a quality perspective.
The New York Tax-Exempt Series Class A shares delivered positive absolute returns but underperformed on a relative basis, returning 0.24% during the year versus 0.59% for the benchmark (i.e., the Intercontinental Exchange (ICE) Bank of America (BofA) 1-12 Year Municipal Bond Index).
Underperformance primarily occurred during the first part of the year given the Series’ higher duration than the benchmark, coupled with an overweight allocation to longer-dated securities, as interest rates rose.
In terms of positioning, we continue to have a positive view of revenue bonds and, within general obligations (GOs), we have a relatively high-quality tilt as a result of our selectivity within the sector.
As the economic cycle moves forward, we are actively becoming more measured in our approach. Given tight credit spreads across much of the market and the prospect of interest rates rising off their post-pandemic lows, fixed income investors can generally expect a more challenging environment going forward.
Performance for the New York Tax Exempt Series Class A shares is provided above. Performance for other shares classes will differ based on each class’ underlying expenses.
Performance data quoted represents past performance and does not guarantee future results. The investment return and principal value of an investment will fluctuate, so that an investor’s shares, when redeemed, may be worth more or less than their original cost. Current performance may be higher or lower than that quoted; investors can obtain the most recent month-end performance at www.manning-napier.com or by calling (800) 466-3863.
Additional information and associated disclosures can be found on the Performance Update page of this report.
All investments involve risks, including possible loss of principal. There is an inverse relationship between bond prices and interest rates; as interest rates rise, bond prices (and therefore the value of bond funds) fall. Likewise, as interest rates fall, bond prices and the value of bond funds rise. The income earned by the Series may be subject to the Alternative Minimum Tax (AMT), depending on your tax situation.
2
New York Tax Exempt Series
Performance Update as of December 31, 2021
(unaudited)
| AVERAGE ANNUAL TOTAL RETURNS AS OF DECEMBER 31, 2021 | ||||||
| ONE YEAR1 | FIVE YEAR | TEN YEAR | ||||
| New York Tax Exempt Series - Class A2 | 0.24% | 2.51% | 1.61% | |||
| New York Tax Exempt Series - Class W2,3 | 0.80% | 2.83% | 1.77% | |||
| Intercontinental Exchange (ICE) Bank of America (BofA) 1-12 Year Municipal Bond Index4 | 0.59% | 3.00% | 2.48% | |||
The following graph compares the value of a $10,000 investment in the New York Tax Exempt Series - Class A for the ten years ended December 31, 2021 to the Intercontinental Exchange (ICE) Bank of America (BofA) 1-12 Year Municipal Bond Index.
1The returns shown are based on net asset values calculated for shareholder transactions and may differ from the returns shown in the financial highlights, which reflect adjustments made to the net asset values in accordance with accounting principles generally accepted in the United States of America.
2The Series’ performance does not reflect the deduction of taxes that a shareholder would pay on fund distributions or the redemption of shares. The Series’ performance is historical and may not be indicative of future results. The performance returns shown are inclusive of the net expense ratio of the Series. For the year ended December 31, 2021, this net expense ratio was 0.79% for Class A and 0.29% for Class W. The gross expense ratio, which does not account for any voluntary or contractual waivers currently in effect, was 0.79% for Class A and 0.79% for Class W for the year ended December 31, 2021.
3For periods through March 1, 2019 (the inception date of the Class W shares), performance for the Class W shares is based on the historical performance of the Class A shares. Because the Class W shares invest in the same portfolio of securities as the Class A shares, performance will be different only to the extent that the Class A shares have a higher expense ratio.
4The Intercontinental Exchange (ICE) Bank of America (BofA) 1-12 Year Municipal Bond Index is a subset of the ICE BofA U.S. Municipal Securities Index. The Index includes all U.S. dollar denominated investment grade tax-exempt debt with a remaining term to final maturity greater than one year, but less than twelve years. Qualifying securities must have at least 18 months to final maturity at the time of issuance and a fixed coupon schedule. The Index returns do not reflect any fees or expenses. Index returns provided by ICE Intercontinental Exchange (ICE). Index data referenced herein is the property of ICE Data Indices, LLC, its affiliates (“ICE Data”) and/or its third party suppliers and has been licensed for use by Manning & Napier. ICE Data and its third party suppliers accept no liability in connection with its use. Data provided is not a representation or warranty, express or implied, as to the ability of any index to accurately represent the asset class or market sector that it purports to represent and none of these parties shall have any liability for any errors, omissions, or interruptions of any index or the data included therein. For additional disclosure information, please see: https://go.manning-napier.com/benchmark-provisions.
3
New York Tax Exempt Series
Shareholder Expense Example
(unaudited)
As a shareholder of the Series, you incur ongoing costs, including management fees, shareholder service fees and other Series expenses. This example is intended to help you understand your ongoing costs (in dollars) of investing in the Series and to compare these costs with the ongoing costs of investing in other mutual funds.
The example is based on an investment of $1,000 invested in each class at the beginning of the period and held for the entire period (July 1, 2021 to December 31, 2021).
Actual Expenses
The Actual lines of the table below provide information about actual account values and actual expenses. You may use the information in these lines, together with the amount you invested, to estimate the expenses that you paid over the period. Simply divide your account value by $1,000 (for example, an $8,600 account value divided by $1,000 = 8.6), then multiply the result by the number in the Actual line for the Class in which you have invested under the heading entitled “Expenses Paid During Period” to estimate the expenses you paid on your account during this period.
Hypothetical Example for Comparison Purposes
The Hypothetical lines of each class in the table below provide information about hypothetical account values and hypothetical expenses based on the Class’ actual expense ratio and an assumed rate of return of 5% per year before expenses, which is not the Class’ actual return. The hypothetical account values and expenses may not be used to estimate the actual ending account balance or expenses you paid during the period. You may use this information to compare the ongoing costs of investing in a class of the Series and other funds. To do so, compare this 5% hypothetical example for the Class in which you have invested with the 5% hypothetical examples that appear in the shareholder reports of the other funds.
Please note that the expenses shown in the table are meant to highlight your ongoing costs only and do not reflect any transaction costs, such as sales charges (loads), redemption fees, or exchange fees that you may incur in other mutual funds. Therefore, the second line of the table is useful in comparing ongoing costs only, and will not help you determine the relative total costs of owning different funds.
| BEGINNING | ENDING | EXPENSES PAID | ANNUALIZED | |||||
| ACCOUNT VALUE | ACCOUNT VALUE | DURING PERIOD* | EXPENSE | |||||
| 7/1/21 | 12/31/21 | 7/1/21 - 12/31/21 | RATIO | |||||
| Class A | ||||||||
| Actual | $1,000.00 | $997.30 | $3.98 | 0.79% | ||||
| Hypothetical | ||||||||
| (5% return before expenses) | $1,000.00 | $1,021.22 | $4.02 | 0.79% | ||||
| Class W | ||||||||
| Actual | $1,000.00 | $1,001.10 | $1.46 | 0.29% | ||||
| Hypothetical | ||||||||
| (5% return before expenses) | $1,000.00 | $1,023.74 | $1.48 | 0.29% |
*Expenses are equal to each Class’ annualized expense ratio (for the six-month period), multiplied by the average account value over the period, multiplied by 184/365 (to reflect the one-half year period). Expenses are based on the most recent fiscal half year; therefore, the expense ratios stated above may differ from the expense ratios stated in the financial highlights, which are based on one-year data. The Class’ total return would have been lower had certain expenses not been waived or reimbursed during the period.
4
New York Tax Exempt Series
Portfolio Composition as of December 31, 2021
(unaudited)
| Sector Allocation1 |
 |
1As a percentage of net assets. 2A U.S. Treasury Note is an intermediate long-term obligation of the U.S. Treasury issued with a maturity period between one and ten years. |
5
New York Tax Exempt Series
Investment Portfolio - December 31, 2021
| PRINCIPAL AMOUNT1/ SHARES | VALUE (NOTE 2) | ||||||
| NEW YORK MUNICIPAL BONDS - 91.2% | |||||||
| Bath Central School District, G.O. | |||||||
| Bond, 4.000%, 6/15/2025 | 750,000 | $ | 842,123 | ||||
| Beacon City School District, G.O. | |||||||
| Bond, 2.000%, 6/15/2024 | 390,000 | 402,344 | |||||
| Briarcliff Manor, Public Impt., G.O. | |||||||
| Bond, 5.000%, 2/1/2023 | 400,000 | 420,552 | |||||
| Brighton Central School District | |||||||
| G.O. Bond, 2.125%, 6/15/2025 | 500,000 | 528,295 | |||||
| School Impt., G.O. Bond, 2.000%, | |||||||
| 6/15/2026 | 1,520,000 | 1,614,179 | |||||
| Brookhaven, Public Impt., Recreational | |||||||
| Facility Impt., G.O. Bond, 4.000%, | |||||||
| 3/15/2025 | 400,000 | 432,092 | |||||
| Brookhaven-Comsewogue Union Free | |||||||
| School District, School Impt., G.O. | |||||||
| Bond, 2.250%, 5/15/2024 | 500,000 | 519,620 | |||||
| Buffalo, Public Impt., Recreational | |||||||
| Facility Impt., Series A, G.O. Bond, | |||||||
| 5.000%, 4/1/2024 | 250,000 | 275,723 | |||||
| Buffalo Municipal Water Finance | |||||||
| Authority | |||||||
| Series A, Revenue Bond, 4.000%, | |||||||
| 7/1/2022 | 300,000 | 305,472 | |||||
| Series A, Revenue Bond, 5.000%, | |||||||
| 7/1/2023 | 300,000 | 320,256 | |||||
| Water Utility Impt., Series A, Revenue | |||||||
| Bond, AGM, 5.000%, 7/1/2039 | 250,000 | 293,323 | |||||
| Water Utility Impt., Series A, Revenue | |||||||
| Bond, AGM, 5.000%, 7/1/2043 | 600,000 | 699,384 | |||||
| Water Utility Impt., Series A, Revenue | |||||||
| Bond, AGM, 5.000%, 7/1/2048 | 250,000 | 289,627 | |||||
| Clarkstown, Public Impt., Series A, G.O. | |||||||
| Bond, 2.000%, 6/15/2026 | 535,000 | 564,527 | |||||
| Dutchess County, Series B, G.O. Bond, | |||||||
| 2.000%, 4/1/2027 | 1,000,000 | 1,068,480 | |||||
| Enlarged City School District of Troy, | |||||||
| G.O. Bond, BAM, 2.000%, 6/1/2026 | 500,000 | 526,565 | |||||
| Erie County | |||||||
| Public Impt., Series A, G.O. Bond, | |||||||
| 5.000%, 9/15/2026 | 300,000 | 360,831 | |||||
| Public Impt., Series A, G.O. Bond, | |||||||
| 5.000%, 9/15/2027 | 200,000 | 247,476 | |||||
| Erie County Fiscal Stability Authority, | |||||||
| Series D Revenue Bond, 5.000%, | |||||||
| 9/1/2038 | 1,000,000 | 1,217,530 | |||||
| Greece Central School District, G.O. | |||||||
| Bond, BAM, 2.500%, 6/15/2023 | 620,000 | 639,790 | |||||
| Kings Park Central School District, | |||||||
| School Impt., G.O. Bond, 2.000%, | |||||||
| 9/1/2024 | 415,000 | 432,306 | |||||
| Metropolitan Transportation Authority, | |||||||
| Transit Impt., Green Bond, Series C-1, | |||||||
| Revenue Bond, 4.750%, 11/15/2045 | 1,175,000 | 1,407,791 | |||||
| New York City | |||||||
| G.O. Bond, 5.000%, 8/1/2026 | 515,000 | 616,331 | |||||
| PRINCIPAL AMOUNT1/ SHARES | VALUE (NOTE 2) | ||||||
| NEW YORK MUNICIPAL BONDS (continued) | |||||||
| New York City (continued) | |||||||
| Public Impt., Series 2, G.O. Bond, | |||||||
| 3.375%, 3/1/2025 | 500,000 | $ | 532,275 | ||||
| Public Impt., Series D2, G.O. Bond, | |||||||
| 3.430%, 12/1/2024 | 500,000 | 531,995 | |||||
| Series D, G.O. Bond, 1.216%, | |||||||
| 8/1/2026 | 500,000 | 493,125 | |||||
| New York City Transitional Finance | |||||||
| Authority Building Aid | |||||||
| Prerefunded Balance, Revenue Bond, | |||||||
| 5.000%, 7/15/2023 | 390,000 | 417,827 | |||||
| Unrefunded Balance, Revenue Bond, | |||||||
| 5.000%, 7/15/2023 | 430,000 | 461,265 | |||||
| New York City Transitional Finance | |||||||
| Authority, Building Aid, Public Impt., | |||||||
| Series S-2, Revenue Bond, 5.000%, | |||||||
| 7/15/2023 | 2,000,000 | 2,145,420 | |||||
| New York City Transitional Finance | |||||||
| Authority, Future Tax Secured, | |||||||
| Series B, Revenue Bond, 5.000%, | |||||||
| 11/1/2024 | 3,000,000 | 3,119,160 | |||||
| New York City Water & Sewer | |||||||
| System, Water Utility Impt., Subseries | |||||||
| BB-1, Revenue Bond, 5.000%, | |||||||
| 6/15/2046 | 2,000,000 | 2,407,160 | |||||
| New York State, Highway Impt., Series | |||||||
| A, G.O. Bond, 5.000%, 3/15/2023 | 510,000 | 539,335 | |||||
| New York State Dormitory Authority | |||||||
| Highway Impt., Series A, Revenue | |||||||
| Bond, 5.000%, 3/15/2027 | 315,000 | 379,037 | |||||
| School Impt., Series A, Revenue | |||||||
| Bond, 5.000%, 3/15/2027 | 450,000 | 549,936 | |||||
| School Impt., Unrefunded Balance, | |||||||
| Series E, Revenue Bond, 5.000%, | |||||||
| 3/15/2026 | 760,000 | 901,717 | |||||
| Series C, Revenue Bond, 0.887%, | |||||||
| 3/15/2025 | 500,000 | 493,085 | |||||
| Unrefunded Balance, Series A, | |||||||
| Revenue Bond, 5.000%, 2/15/2030 | 1,500,000 | 1,810,650 | |||||
| New York State Environmental Facilities | |||||||
| Corp. | |||||||
| Water and Sewer, Series A, Revenue | |||||||
| Bond, 5.000%, 6/15/2025 | 300,000 | 320,625 | |||||
| Water Utility Impt., Series B, Revenue | |||||||
| Bond, 4.000%, 8/15/2046 | 2,000,000 | 2,233,000 | |||||
| New York State Thruway Authority, | |||||||
| Series B, Revenue Bond, 4.000%, | |||||||
| 1/1/2038 | 1,000,000 | 1,171,280 | |||||
| New York State Urban Development | |||||||
| Corp. | |||||||
| Economic Impt., Series A, Revenue | |||||||
| Bond, 5.000%, 3/15/2025 | 435,000 | 497,653 | |||||
| Series A, Revenue Bond, 5.000%, | |||||||
| 3/15/2027 | 1,875,000 | 2,214,825 | |||||
| North Colonie Central School District, | |||||||
| G.O. Bond, 2.000%, 7/15/2027 | 1,000,000 | 1,068,390 | |||||
The accompanying notes are an integral part of the financial statements.
6
New York Tax Exempt Series
Investment Portfolio - December 31, 2021
| PRINCIPAL AMOUNT1/ SHARES | VALUE (NOTE 2) | ||||||
| NEW YORK MUNICIPAL BONDS (continued) | |||||||
| North Rose-Wolcott Central School | |||||||
| District, G.O. Bond, AGM, 2.000%, | |||||||
| 6/15/2025 | 500,000 | $ | 522,830 | ||||
| Onondaga County, Public Impt., | |||||||
| Telecommunications Impt., G.O. Bond, | |||||||
| 5.000%, 5/15/2023 | 1,000,000 | 1,065,090 | |||||
| Orangetown, Series B, G.O. Bond, | |||||||
| 5.000%, 9/15/2026 | 355,000 | 424,615 | |||||
| Perinton | |||||||
| G.O. Bond, 4.000%, 12/15/2022 | 210,000 | 217,327 | |||||
| G.O. Bond, 4.000%, 12/15/2023 | 160,000 | 171,067 | |||||
| Port Authority of New York & New | |||||||
| Jersey, Consolidated Series 184, | |||||||
| Revenue Bond, 5.000%, 9/1/2025 | 1,000,000 | 1,121,770 | |||||
| Rochester, School Impt., Series A, G.O. | |||||||
| Bond, AMBAC, 5.000%, 8/15/2022 | 95,000 | 97,818 | |||||
| Sachem Central School District, G.O. | |||||||
| Bond, 5.000%, 10/15/2023 | 250,000 | 271,042 | |||||
| Schenectady, School Impt., G.O. Bond, | |||||||
| 2.000%, 12/15/2024 | 1,485,000 | 1,551,186 | |||||
| Smithtown | |||||||
| Public Impt., Recreational Facility | |||||||
| Impt., G.O. Bond, 2.000%, | |||||||
| 2/15/2022 | 675,000 | 676,444 | |||||
| Public Impt., Recreational Facility | |||||||
| Impt., G.O. Bond, 2.000%, | |||||||
| 2/15/2023 | 435,000 | 443,770 | |||||
| South Glens Falls Central School | |||||||
| District, Series A, G.O. Bond, 2.000%, | |||||||
| 7/15/2027 | 1,000,000 | 1,066,150 | |||||
| Sullivan County, Public Impt., G.O. | |||||||
| Bond, 3.000%, 11/15/2023 | 500,000 | 522,120 | |||||
| Triborough Bridge & Tunnel Authority | |||||||
| Highway Impt., Series A, Revenue | |||||||
| Bond, 5.000%, 11/15/2023 | 350,000 | 380,488 | |||||
| Highway Impt., Series A, Revenue | |||||||
| Bond, 4.000%, 11/15/2044 | 500,000 | 584,535 | |||||
| Series B, Revenue Bond, 5.000%, | |||||||
| 11/15/2029 | 360,000 | 437,872 | |||||
| Vestal Central School District, G.O. | |||||||
| Bond, 2.000%, 6/15/2025 | 685,000 | 718,914 | |||||
| Wappinger | |||||||
| Highway Impt., G.O. Bond, 2.000%, | |||||||
| 10/1/2027 | 310,000 | 330,603 | |||||
| Highway Impt., G.O. Bond, 2.000%, | |||||||
| 10/1/2028 | 320,000 | 341,849 | |||||
| Webster Central School District | |||||||
| School Impt., G.O. Bond, 2.125%, | |||||||
| 10/15/2025 | 320,000 | 338,909 | |||||
| School Impt., G.O. Bond, 2.250%, | |||||||
| 10/15/2026 | 330,000 | 354,443 | |||||
| TOTAL MUNICIPAL BONDS | |||||||
| (Identified Cost $46,773,931) | 47,951,219 |
| PRINCIPAL AMOUNT1/ SHARES | VALUE (NOTE 2) | ||||||
| U.S. TREASURY SECURITIES - 4.3% | |||||||
| U.S. Treasury Notes - 4.3% | |||||||
| U.S. Treasury Note | |||||||
| 1.50%, 12/15/2022 | 245,000 | $ | 247,890 | ||||
| 0.125%, 1/31/2023 | 250,000 | 249,141 | |||||
| 0.125%, 2/28/2023 | 250,000 | 248,974 | |||||
| 0.125%, 3/31/2023 | 250,000 | 248,857 | |||||
| 0.25%, 4/15/2023 | 250,000 | 249,170 | |||||
| 1.75%, 5/15/2023 | 245,000 | 249,048 | |||||
| 0.25%, 6/15/2023 | 250,000 | 248,848 | |||||
| 0.125%, 7/15/2023 | 250,000 | 248,213 | |||||
| 2.50%, 8/15/2023 | 240,000 | 247,200 | |||||
| TOTAL U.S. TREASURY SECURITIES | |||||||
| (Identified Cost $2,246,631) | 2,237,341 | ||||||
| SHORT-TERM INVESTMENT - 3.6% | |||||||
| Dreyfus Government Cash | |||||||
| Management, Institutional Shares, 0.03%2 | |||||||
| (Identified Cost $1,901,752) | 1,901,752 | 1,901,752 | |||||
| TOTAL INVESTMENTS - 99.1% | |||||||
| (Identified Cost $50,922,314) | 52,090,312 | ||||||
| OTHER ASSETS, LESS LIABILITIES - 0.9% | 463,142 | ||||||
| NET ASSETS - 100.0% | $ | 52,553,454 |
KEY:
G.O. Bond - General Obligation Bond
Impt. - Improvement
Scheduled principal and interest payments are guaranteed by:
AGM (Assurance Guaranty Municipal Corp.)
AMBAC (AMBAC Assurance Corp.)
BAM (Build America Mutual Assurance Co.)
The insurance does not guarantee the market value of the municipal bonds.
1Amount is stated in USD unless otherwise noted.
2Rate shown is the current yield as of December 31, 2021.
The accompanying notes are an integral part of the financial statements.
7
New York Tax Exempt Series
Statement of Assets and Liabilities
December 31, 2021
ASSETS:
| Investments, at value (identified cost $50,922,314) (Note 2) | $ | 52,090,312 | ||
| Interest receivable | 450,660 | |||
| Receivable for fund shares sold | 44,859 | |||
| Dividends receivable | 66 | |||
| Prepaid expenses | 2,328 | |||
| TOTAL ASSETS | 52,588,225 | |||
| LIABILITIES: | ||||
| Accrued fund accounting and administration fees (Note 3) | 18,235 | |||
| Accrued Chief Compliance Officer service fees (Note 3) | 1,531 | |||
| Accrued management fees (Note 3) | 819 | |||
| Audit fees payable | 7,053 | |||
| Accrued printing and postage fees payable | 3,151 | |||
| Other payables and accrued expenses | 3,982 | |||
| TOTAL LIABILITIES | 34,771 | |||
| TOTAL NET ASSETS | $ | 52,553,454 | ||
| NET ASSETS CONSIST OF: | ||||
| Capital stock | $ | 50,994 | ||
| Additional paid-in-capital | 50,720,649 | |||
| Total distributable earnings (loss) | 1,781,811 | |||
| TOTAL NET ASSETS | $ | 52,553,454 | ||
| NET ASSET VALUE, OFFERING PRICE AND REDEMPTION PRICE PER SHARE - Class A ($1,931,212/187,432 shares) | $ | 10.30 | ||
| NET ASSET VALUE, OFFERING PRICE AND REDEMPTION PRICE PER SHARE - Class W ($50,622,242/4,911,956 shares) | $ | 10.31 |
The accompanying notes are an integral part of the financial statements.
8
New York Tax Exempt Series
Statement of Operations
For the Year Ended December 31, 2021
INVESTMENT INCOME:
| Interest | $ | 994,364 | ||
| Dividends | 740 | |||
| Other Income | 4,781 | |||
| Total Investment Income | 999,885 | |||
| EXPENSES: | ||||
| Management fees (Note 3) | 280,286 | |||
| Fund accounting and administration fees (Note 3) | 54,510 | |||
| Directors’ fees (Note 3) | 6,936 | |||
| Chief Compliance Officer service fees (Note 3) | 6,124 | |||
| Audit fees | 48,337 | |||
| Custodian fees | 2,717 | |||
| Miscellaneous | 41,413 | |||
| Total Expenses | 440,323 | |||
| Less reduction of expenses (Note 3) | (271,083 | ) | ||
| Net Expenses | 169,240 | |||
| NET INVESTMENT INCOME | 830,645 | |||
| REALIZED AND UNREALIZED GAIN (LOSS) ON INVESTMENTS: | ||||
| Net realized gain (loss) on investments | 3,380,547 | |||
| Net change in unrealized appreciation (depreciation) on investments | (3,800,351 | ) | ||
| NET REALIZED AND UNREALIZED GAIN (LOSS) ON INVESTMENTS | (419,804 | ) | ||
| NET INCREASE IN NET ASSETS RESULTING FROM OPERATIONS | $ | 410,841 |
The accompanying notes are an integral part of the financial statements.
9
New York Tax Exempt Series
Statements of Changes in Net Assets
| FOR THE YEAR ENDED 12/31/21 | FOR THE YEAR ENDED 12/31/20 | |||||||
| INCREASE (DECREASE) IN NET ASSETS: | ||||||||
| OPERATIONS: | ||||||||
| Net investment income | $ | 830,645 | $ | 1,813,694 | ||||
| Net realized gain (loss) on investments | 3,380,547 | 563,820 | ||||||
| Net change in unrealized appreciation (depreciation) on investments | (3,800,351 | ) | 2,107,540 | |||||
| Net increase (decrease) from operations | 410,841 | 4,485,054 | ||||||
| DISTRIBUTIONS TO SHAREHOLDERS (Note 9): | ||||||||
| Class A | (98,977 | ) | (26,106 | ) | ||||
| Class W | (2,874,985 | ) | (2,011,775 | ) | ||||
| Total distributions to shareholders | (2,973,962 | ) | (2,037,881 | ) | ||||
| CAPITAL STOCK ISSUED AND REPURCHASED: | ||||||||
| Net increase (decrease) from capital share transactions (Note 5) | (52,921,093 | ) | 15,917,482 | |||||
| Net increase (decrease) in net assets | (55,484,214 | ) | 18,364,655 | |||||
| NET ASSETS: | ||||||||
| Beginning of year | 108,037,668 | 89,673,013 | ||||||
| End of year | $ | 52,553,454 | $ | 108,037,668 | ||||
The accompanying notes are an integral part of the financial statements.
10
New York Tax Exempt Series
Financial Highlights - Class A
| FOR THE YEAR ENDED | |||||||||||||||
| 12/31/21 | 12/31/20 | 12/31/19 | 12/31/18 | 12/31/17 | |||||||||||
| Per share data (for a share outstanding throughout each year): | |||||||||||||||
| Net asset value - Beginning of year | $10.83 | $10.49 | $10.34 | $10.43 | $10.31 | ||||||||||
| Income from investment operations: | |||||||||||||||
| Net investment income1 | 0.11 | 0.14 | 0.16 | 0.14 | 0.12 | ||||||||||
| Net realized and unrealized gain (loss) on investments | (0.08 | ) | 0.36 | 0.34 | (0.08 | ) | 0.11 | ||||||||
| Total from investment operations | 0.03 | 0.50 | 0.50 | 0.06 | 0.23 | ||||||||||
| Less distributions to shareholders: | |||||||||||||||
| From net investment income | (0.09 | ) | (0.10 | ) | (0.18 | ) | (0.15 | ) | (0.11 | ) | |||||
| From net realized gain on investments | (0.47 | ) | (0.06 | ) | (0.17 | ) | — | (0.00 | )2 | ||||||
| Total distributions to shareholders | (0.56 | ) | (0.16 | ) | (0.35 | ) | (0.15 | ) | (0.11 | ) | |||||
| Net asset value - End of year | $10.30 | $10.83 | $10.49 | $10.34 | $10.43 | ||||||||||
| Net assets - End of year (000’s omitted) | $1,931 | $1,797 | $1,952 | $138,694 | $154,018 | ||||||||||
| Total return3 | 0.24% | 4.73% | 4.86% | 0.54% | 2.27% | ||||||||||
| Ratios (to average net assets)/Supplemental Data: | |||||||||||||||
| Expenses | 0.79% | 0.67% | 0.63% | 0.62% | 0.60% | ||||||||||
| Net investment income | 0.99% | 1.29% | 1.56% | 1.39% | 1.12% | ||||||||||
| Series portfolio turnover | 31% | 35% | 24% | 21% | 9% | ||||||||||
1Calculated based on average shares outstanding during the years.
2Less than $0.01 per share.
3Represents aggregate total return for the periods indicated, and assumes reinvestment of all distributions.
The accompanying notes are an integral part of the financial statements.
11
New York Tax Exempt Series
Financial Highlights - Class W
| FOR THE YEAR ENDED | FOR THE | ||||||||
| PERIOD | |||||||||
| 3/1/191 TO | |||||||||
| 12/31/21 | 12/31/20 | 12/31/19 | |||||||
| Per share data (for a share outstanding throughout each period): | |||||||||
| Net asset value - Beginning of period | $10.84 | $10.49 | $10.45 | ||||||
| Income from investment operations: | |||||||||
| Net investment income2 | 0.16 | 0.19 | 0.19 | ||||||
| Net realized and unrealized gain (loss) on investments | (0.07 | ) | 0.37 | 0.25 | |||||
| Total from investment operations | 0.09 | 0.56 | 0.44 | ||||||
| Less distributions to shareholders: | |||||||||
| From net investment income | (0.15 | ) | (0.15 | ) | (0.23 | ) | |||
| From net realized gain on investments | (0.47 | ) | (0.06 | ) | (0.17 | ) | |||
| Total distributions to shareholders | (0.62 | ) | (0.21 | ) | (0.40 | ) | |||
| Net asset value - End of period | $10.31 | $10.84 | $10.49 | ||||||
| Net assets - End of period (000’s omitted) | $50,622 | $106,241 | $87,721 | ||||||
| Total return3 | 0.80% | 5.33% | 4.23% | ||||||
| Ratios (to average net assets)/Supplemental Data: | |||||||||
| Expenses* | 0.29% | 0.17% | 0.16% | 4 | |||||
| Net investment income | 1.50% | 1.77% | 2.09% | 4 | |||||
| Series portfolio turnover | 31% | 35% | 24% | ||||||
*The investment advisor did not impose all or a portion of its management and/or other fees during the periods, and may have paid a portion of the Series’ expenses. If these expenses had been incurred by the Class, the expense ratio (to average net assets) would have increased by the following amounts:
| 0.50% | 0.50% | 0.50%4 |
1Commencement of operations.
2Calculated based on average shares outstanding during the periods.
3Represents aggregate total return for the periods indicated, and assumes reinvestment of all distributions. Total return would have been lower had certain expenses not been waived or reimbursed during the periods. Periods less than one year are not annualized.
4Annualized.
The accompanying notes are an integral part of the financial statements.
12
New York Tax Exempt Series
Notes to Financial Statements
| 1. | Organization |
New York Tax Exempt Series (the “Series”) is a no-load diversified series of Manning & Napier Fund, Inc. (the “Fund”). The Fund is organized in Maryland and is registered under the Investment Company Act of 1940, as amended, as an open-end management investment company.
The Series’ investment objective is to provide as high a level of current income exempt from federal income tax and New York State personal income tax as the Advisor believes is consistent with the preservation of capital.
The Series is authorized to issue two classes of shares (Class A and Class W). While each class of shares is substantially the same, each class has its own investment eligibility criteria and cost structure.
The Fund’s advisor is Manning & Napier Advisors, LLC (the “Advisor”). Shares of the Series are offered to investors, clients and employees of the Advisor and its affiliates. The total authorized capital stock of the Fund consists of 15 billion shares of common stock each having a par value of $0.01. As of December 31, 2021, 6.3 billion shares have been designated in total among 15 series, of which 100 million have been designated as New York Tax Exempt Series Class A common stock and 50 million have been designated as New York Tax Exempt Series Class W common stock.
| 2. | Significant Accounting Policies |
The following is a summary of significant accounting policies followed by the Series. The Series is an investment company and, accordingly, follows the investment company accounting and reporting guidance of the Financial Accounting Standards Board Accounting Standards Codification Topic 946 - Investment Companies, which is part of accounting principles generally accepted in the United States of America (“GAAP”).
Security Valuation
Municipal securities will normally be valued on the basis of market valuations provided by an independent pricing service (the “Service”). The Service utilizes the latest price quotations and a matrix system (which considers such factors as security prices of similar securities, yields, maturities and ratings). The Service has been approved by the Fund’s Board of Directors (the “Board”).
Short-term investments that mature in sixty days or less may be valued at amortized cost, which approximates fair value. Investments in open-end investment companies are valued at their net asset value per share on valuation date.
Volume and level of activity in established markets for an asset or liability are evaluated to determine whether recent transactions and quoted prices are determinative of fair value. Where there have been significant decreases in volume and level of activity, further analysis and adjustment may be necessary to estimate fair value. The Series measures fair value in these instances by the use of inputs and valuation techniques which may be based upon current market prices of securities that are comparable in coupon, rating, maturity and industry and/or expectation of future cash flows. As a result of trading in relatively thin markets and/or markets that experience significant volatility, the prices used by the Series to value these securities may differ from the value that would be realized if these securities were sold, and the differences could be material.
Securities for which representative valuations or prices are not available from the Series’ pricing service may be valued at fair value as determined in good faith by the Advisor under procedures approved by and under the general supervision and responsibility of the Board. Due to the inherent uncertainty of valuations of such securities, the fair value may differ significantly from the values that would have been used had a ready market for such securities existed. If trading or events occurring after the close of the principal market in which securities are traded are expected to materially affect the value of those securities, then they may be valued at their fair value, taking this trading or these events into account.
Various inputs are used in determining the value of the Series’ assets or liabilities carried at fair value. These inputs are summarized in three broad levels. Level 1 includes quoted prices in active markets for identical assets and liabilities. Level 2 includes other significant observable inputs (including quoted prices for similar securities, interest rates, prepayment speeds, credit risk, etc.). Level 3 includes significant unobservable inputs (including the Series’ own assumptions in determining the fair value of investments). A financial instrument’s level within the fair value hierarchy is based on the lowest level of any input
13
New York Tax Exempt Series
Notes to Financial Statements (continued)
| 2. | Significant Accounting Policies (continued) |
Security Valuation (continued)
both individually and in aggregate that is significant to the fair value measurement. The inputs or methodology used for valuing securities are not necessarily an indication of the risk associated with investing in those securities.
The following is a summary of the valuation levels used for major security types as of December 31, 2021 in valuing the Series’ assets or liabilities carried at fair value:
| DESCRIPTION | TOTAL | LEVEL 1 | LEVEL 2 | LEVEL 3 | ||||||||||||
| Assets: | ||||||||||||||||
| Debt securities: | ||||||||||||||||
| New York Municipal Bonds | $ | 47,951,219 | $ | — | $ | 47,951,219 | $ | — | ||||||||
| U.S. Treasury and other U.S. | ||||||||||||||||
| Government agencies | 2,237,341 | — | 2,237,341 | — | ||||||||||||
| Short-Term Investment | 1,901,752 | 1,901,752 | — | — | ||||||||||||
| Total assets | $ | 52,090,312 | $ | 1,901,752 | $ | 50,188,560 | $ | — | ||||||||
There were no Level 3 securities held by the Series as of December 31, 2020 or December 31, 2021.
Security Transactions, Investment Income and Expenses
Security transactions are accounted for on trade date. Dividend income is recorded on the ex-dividend date, except that if the ex-dividend date has passed, certain dividends from foreign securities are recorded as soon as the Series is informed of the ex-dividend date. Non-cash dividends, if any, are recorded at the fair value of the securities received. Interest income, including amortization of premium and accretion of discounts using the effective interest method, is earned from settlement date and accrued daily.
Expenses are recorded on an accrual basis. Most expenses of the Fund can be attributed to a specific series. Expenses which cannot be directly attributed are apportioned among the series in the Fund in such a manner as deemed equitable by the Fund’s Board, taking into consideration, among other things, the nature and type of expense.
The Series uses the identified cost method for determining realized gain or loss on investments for both financial statement and federal income tax reporting purposes.
Federal Taxes
The Series’ policy is to comply with the provisions of the Internal Revenue Code applicable to regulated investment companies. The Series is not subject to federal income tax or excise tax to the extent that the Series distributes to shareholders each year its taxable income, including any net realized gains on investments, in accordance with requirements of the Internal Revenue Code. Accordingly, no provision for federal income tax or excise tax has been made in the financial statements.
Management evaluates its tax positions to determine if the tax positions taken meet the minimum recognition threshold in connection with accounting for uncertainties in income tax positions taken or expected to be taken for the purposes of measuring and recognizing tax liabilities in the financial statements. Recognition of tax benefits of an uncertain tax position is required only when the position is “more likely than not” to be sustained assuming examination by taxing authorities. At December 31, 2021, the Series has recorded no liability for net unrecognized tax benefits relating to uncertain income tax positions taken or expected to be taken in future tax returns.
The Series files income tax returns in the U.S. federal jurisdiction, various states and foreign jurisdictions, as required. No income tax returns are currently under investigation. The statute of limitations on the Series’ tax returns remains open for the years ended December 31, 2018 through December 31, 2021. The Series is not aware of any tax positions for which it is reasonably possible that the total amounts of unrecognized tax benefits will significantly change in the next twelve months.
14
New York Tax Exempt Series
Notes to Financial Statements (continued)
| 2. | Significant Accounting Policies (continued) |
Distributions of Income and Gains
Distributions to shareholders of net investment income are made quarterly. Distributions of net realized gains are made annually. An additional distribution may be necessary to avoid taxation of the Series. Distributions are recorded on the ex-dividend date.
Indemnifications
The Fund’s organizational documents provide former and current directors and officers with a limited indemnification against liabilities arising in connection with the performance of their duties to the Fund. In the normal course of business, the Fund may also enter into contracts that provide general indemnifications. The Fund’s maximum exposure under these arrangements is unknown as this would be dependent on future claims that may be made against the Fund. The risk of material loss from such claims is considered remote.
Other
The preparation of financial statements in conformity with GAAP requires management to make estimates and assumptions that affect the reported amounts of assets and liabilities and the disclosure of contingent assets and liabilities at the date of the financial statements and the reported amounts of income and expenses during the reporting period. Actual results could differ from those estimates.
| 3. | Transactions with Affiliates |
The Fund has an Investment Advisory Agreement (the “Agreement”) with the Advisor, for which the Series pays a fee, computed daily and payable monthly, at an annual rate of 0.50% of the Series’ average daily net assets.
Under the Agreement, personnel of the Advisor provide the Series with advice and assistance in the choice of investments and the execution of securities transactions, and otherwise maintain the Series’ organization. The Advisor also provides the Fund with necessary office space and fund administration and support services. The salaries of all officers of the Fund (except a percentage of the Fund’s Chief Compliance Officer’s salary, which is paid by the Fund), and of all Directors who are “affiliated persons” of the Fund, or of the Advisor, and all personnel of the Fund, or of the Advisor, performing services relating to research, statistical and investment activities, are paid by the Advisor. Each “non-affiliated” Director receives an annual stipend, which is allocated among all the active series of the Fund. In addition, these Directors also receive a fee per Board meeting attended plus a fee for each committee meeting attended and are reimbursed for travel and other out-of-pocket expenses incurred by them in connection with attending such meetings. The Fund also has an Audit Committee Chair, Governance & Nominating Committee Chair and Lead Independent Director, who each receive an additional annual stipend for these roles.
Manning & Napier Investor Services, Inc., a registered broker-dealer affiliate of the Advisor, acts as distributor for the Fund’s shares. The services of Manning & Napier Investor Services, Inc. are provided at no additional cost to the Series.
Pursuant to a master services agreement dated February 13, 2020 as amended, the Fund pays the Advisor an annual fee related to fund accounting and administration of 0.0085% on the first $25 billion of average daily net assets; 0.0075% on the next $15 billion of average daily net assets; and 0.0065% of average daily net assets in excess of $40 billion; plus a base fee of $30,400 per series. Additionally, certain transaction and out-of-pocket expenses, including charges for reporting relating to the Fund’s compliance program, are charged. The Advisor has agreements with BNY Mellon Investment Servicing (U.S.) Inc. (“BNY”) under which BNY serves as sub-accountant services agent.
Pursuant to an advisory fee waiver agreement, the Advisor has contractually agreed to waive the management fee for the Class W shares. The full management fee will be waived under this agreement because Class W shares are only available to discretionary investment accounts and other accounts managed by the Advisor. These clients pay a management fee to the Advisor that is separate from the Fund’s expenses. In addition, pursuant to a separate expense limitation agreement, the Advisor has contractually agreed to limit its fees and reimburse expenses to the extent necessary so that the total direct annual fund operating expenses, exclusive of the waived Class W management fees (collectively, “excluded expenses”), do not exceed 0.85% of the average daily net assets of the Class A shares and 0.35% of the average daily net assets of the Class W shares. These contractual waivers are expected to continue indefinitely, and may not be amended or terminated by the Advisor without the
15
New York Tax Exempt Series
Notes to Financial Statements (continued)
| 3. | Transactions with Affiliates (continued) |
approval of the Series’ Board of Directors. The Advisor may receive from a Class the difference between the Class’s total direct annual fund operating expenses, not including excluded expenses, and the Class’s contractual expense limit to recoup all or a portion of its prior fee waivers (other than Class W management fee waivers) or expense reimbursements made during the rolling three-year period preceding the recoupment if at any point the total direct annual fund operating expenses, not including excluded expenses, are below the contractual expense limit (a) at the time of the fee waiver and/or expense reimbursement and (b) at the time of the recoupment.
Pursuant to the advisory fee waiver, the Advisor waived $271,083 in management fees for Class W shares for the year ended December 31, 2021. This amount is included as a reduction of expenses on the Statement of Operations.
As of December 31, 2021, there are no expenses eligible to be recouped by the Advisor.
| 4. | Purchases and Sales of Securities |
For the year ended December 31, 2021, purchases and sales of securities, other than U.S. Government securities and short-term securities, were $14,645,521 and $67,871,675, respectively. Purchase of U.S. Government securities, other than short-term securities, were $2,249,737, respectively.
| 5. | Capital Stock Transactions |
Transactions in shares of Class A and Class W of New York Tax Exempt Series were:
| CLASS A | FOR THE YEAR ENDED | FOR THE YEAR ENDED | ||||||||||||||
| 12/31/21 | 12/31/20 | |||||||||||||||
| SHARES | AMOUNT | SHARES | AMOUNT | |||||||||||||
| Sold | 17,220 | $ | 185,742 | 5,832 | $ | 62,775 | ||||||||||
| Reinvested | 9,384 | 97,244 | 2,264 | 24,242 | ||||||||||||
| Repurchased | (5,153 | ) | (55,716 | ) | (28,204 | ) | (301,366 | ) | ||||||||
| Total | 21,451 | $ | 227,270 | (20,108 | ) | $ | (214,349 | ) | ||||||||
| CLASS W | FOR THE YEAR ENDED | FOR THE YEAR ENDED | ||||||||||||||
| 12/31/21 | 12/31/20 | |||||||||||||||
| SHARES | AMOUNT | SHARES | AMOUNT | |||||||||||||
| Sold | 512,584 | $ | 5,518,545 | 3,744,691 | $ | 40,315,465 | ||||||||||
| Reinvested | 268,406 | 2,789,603 | 178,564 | 1,913,476 | ||||||||||||
| Repurchased | (5,673,889 | ) | (61,456,511 | ) | (2,476,935 | ) | (26,097,110 | ) | ||||||||
| Total | (4,892,899 | ) | $ | (53,148,363 | ) | 1,446,320 | $ | 16,131,831 | ||||||||
Over 90% of the shares outstanding are fiduciary accounts where the Advisor has sole investment discretion.
| 6. | Line of Credit |
The Fund has entered into a 364-day, $25 million credit agreement (the “line of credit”) with Bank of New York Mellon. Each series of the Fund may borrow under the line of credit for temporary or emergency purposes, including funding shareholder redemptions and other short-term liquidity purposes. The Fund pays an annual fee on the unused commitment amount, payable quarterly, and is allocated among all the series of the Fund and included in miscellaneous expenses in the Statement of Operations for each series. The line of credit expires in September 2022 unless extended or renewed. During the year ended December 31, 2021, the Series did not borrow under the line of credit.
16
New York Tax Exempt Series
Notes to Financial Statements (continued)
| 7. | Financial Instruments |
The Series may trade in instruments including written and purchased options, forward foreign currency exchange contracts and futures contracts and other derivatives in the normal course of investing activities to assist in managing exposure to various market risks. The Series may be subject to various elements of risk, which may involve, to a varying degree, elements of risk in excess of the amounts recognized for financial statement purposes. These risks include: the risk that changes in the value of a derivative may not correlate perfectly with the underlying asset, rate or index; counterparty credit risk related to over the counter derivative counterparties’ failure to perform under contract terms; liquidity risk related to the lack of a liquid market for these contracts allowing the fund to close out its position(s); and documentation risk relating to disagreement over contract terms. No such investments were held by the Series as of December 31, 2021.
| 8. | Concentration of Credit |
The Series primarily invests in debt obligations issued by the State of New York and its political subdivisions, agencies and public authorities to obtain funds for various public purposes. The Series is more susceptible to factors adversely affecting issues of New York municipal securities than is a municipal bond fund that is not concentrated in these issues to the same extent.
| 9. | Federal Income Tax Information |
The amount and characterization of certain income and capital gains to be distributed are determined in accordance with federal income tax regulations, which may differ from GAAP. These differences are primarily due to differing book and tax treatments in the timing and/or treatment of the recognition of net investment income or gains and losses including market discount on investments and tax equialization. The Series may periodically make reclassifications among its capital accounts to reflect income and gains available for distribution (or available capital loss carryovers) under income tax regulations, without impacting the Series’ net asset value. For the year ended December 31, 2021, amounts were reclassified within the capital accounts to increase Additional Paid in Capital by $1,116,056 and decrease Total Distributable Earnings (Loss) by $1,116,056. Any such reclassifications are not reflected in the financial highlights.
The tax character of distributions paid were as follows:
| FOR THE YEAR ENDED 12/31/21 | FOR THE YEAR ENDED 12/31/20 | |||||||
| Ordinary income | $ | 257,981 | $ | 448,308 | ||||
| Tax exempt income | $ | 684,443 | $ | 1,457,001 | ||||
| Long-term capital gains | $ | 2,031,538 | $ | 132,572 | ||||
At December 31, 2021, the tax basis of components of distributable earnings and the net unrealized appreciation based on the identified cost of investments for federal income tax purposes were as follows:
| Cost for federal income tax purposes | $ | 50,932,618 | ||||||
| Unrealized appreciation | 1,232,635 | |||||||
| Unrealized depreciation | (74,941 | ) | ||||||
| Net unrealized appreciation | $ | 1,157,694 | ||||||
| Undistributed tax exempt income | $ | 624,120 |
17
New York Tax Exempt Series
Notes to Financial Statements (continued)
| 10. | Market Event |
In March 2020, the World Health Organization declared COVID-19 (a novel coronavirus) to be a pandemic. The situation is dynamic and a recent resurgence of COVID-19 has caused a continued time of uncertainty. Global financial markets have experienced and may continue to experience significant volatility resulting from the spread of COVID-19. The global economy, the economies of certain nations and individual issuers have been and may continue to be adversely affected by COVID-19, particularly in light of the interconnectivity between economies and financial markets, all of which may negatively impact the Series’ performance. Management of the Series will continue to monitor the impact of COVID-19 on investment performance, financial statements and the Series’ operations.
18
New York Tax Exempt Series
Report of Independent Registered Public Accounting Firm
To the Board of Directors of Manning & Napier Fund, Inc. and Shareholders of New York Tax Exempt Series
Opinion on the Financial Statements
We have audited the accompanying statement of assets and liabilities, including the investment portfolio, of New York Tax Exempt Series (one of the series constituting Manning & Napier Fund, Inc., referred to hereafter as the “Fund”) as of December 31, 2021, the related statement of operations for the year ended December 31, 2021, the statement of changes in net assets for each of the two years in the period ended December 31, 2021, including the related notes, and the financial highlights for each of the periods indicated therein (collectively referred to as the “financial statements”). In our opinion, the financial statements present fairly, in all material respects, the financial position of the Fund as of December 31, 2021, the results of its operations for the year then ended, the changes in its net assets for each of the two years in the period ended December 31, 2021 and the financial highlights for each of the periods indicated therein in conformity with accounting principles generally accepted in the United States of America.
Basis for Opinion
These financial statements are the responsibility of the Fund’s management. Our responsibility is to express an opinion on the Fund’s financial statements based on our audits. We are a public accounting firm registered with the Public Company Accounting Oversight Board (United States) (PCAOB) and are required to be independent with respect to the Fund in accordance with the U.S. federal securities laws and the applicable rules and regulations of the Securities and Exchange Commission and the PCAOB.
We conducted our audits of these financial statements in accordance with the standards of the PCAOB. Those standards require that we plan and perform the audit to obtain reasonable assurance about whether the financial statements are free of material misstatement, whether due to error or fraud.
Our audits included performing procedures to assess the risks of material misstatement of the financial statements, whether due to error or fraud, and performing procedures that respond to those risks. Such procedures included examining, on a test basis, evidence regarding the amounts and disclosures in the financial statements. Our audits also included evaluating the accounting principles used and significant estimates made by management, as well as evaluating the overall presentation of the financial statements. Our procedures included confirmation of securities owned as of December 31, 2021 by correspondence with the custodian. We believe that our audits provide a reasonable basis for our opinion.

New York, New York
February 18, 2022
We have served as the auditor of one or more investment companies in Manning & Napier Mutual Funds since 1992.
19
New York Tax Exempt Series
Supplemental Tax Information
(unaudited)
All reportings are based on financial information available as of the date of this annual report and, accordingly are subject to change.
The Series designates $3,164,301 as Long-Term Capital Gain dividends pursuant to Section 852(b)(3) of the Internal Revenue Code for the fiscal year ended December 31, 2021.
20
New York Tax Exempt Series
Directors’ and Officers’ Information
(unaudited)
The Statement of Additional Information provides additional information about the Fund’s directors and officers and can be obtained without charge by calling 1-800-466-3863, at www.manning-napier.com, or on the EDGAR Database on the SEC Internet web site (http://www.sec.gov). The following chart shows certain information about the Fund’s directors and officers, including their principal occupations during the last five years. Unless specific dates are provided, the individuals have held the listed positions for longer than five years.
Interested Director and Officer
| Name: | Paul Battaglia* | |
| Address: | 290 Woodcliff Drive | |
| Fairport, NY 14450 | ||
| Age: | 43 | |
| Current Position(s) Held with Fund: | Principal Executive Officer, President, Chairman and Director | |
| Term of Office1 & Length of Time Served: | Indefinite – Chairman and Director since November 2018 | |
| Principal Occupation(s) During Past 5 Years: | Chief Financial Officer since 2018; Vice President of Finance (2016 – 2018); | |
| Director of Finance (2011 – 2016); Financial Analyst/Internal Auditor (2004- | ||
| 2006) – Manning & Napier Advisors, LLC and affiliates | ||
| Holds one or more of the following titles for various subsidiaries and | ||
| affiliates: Chief Financial Officer | ||
| Number of Portfolios Overseen within Fund Complex: | 15 | |
| Other Directorships Held Outside Fund Complex During Past 5 Years: | N/A |
Independent Directors
| Name: | Stephen B. Ashley | |
| Address: | 290 Woodcliff Drive | |
| Fairport, NY 14450 | ||
| Age: | 81 | |
| Current Position(s) Held with Fund: | Director, Audit Committee Member, Governance & Nominating Committee | |
| Member | ||
| Term of Office & Length of Time Served: | Indefinite – Since 1996 | |
| Principal Occupation(s) During Past 5 Years: | Chairman and Director since 1997; Chief Executive Officer (1997-2019) - | |
| Ashley Companies (property management and investment) | ||
| Number of Portfolios Overseen within Fund Complex: | 15 | |
| Other Directorships Held Outside Fund Complex During Past 5 Years: | Ashley Companies since 1997 | |
| Name: | Paul A. Brooke | |
| Address: | 290 Woodcliff Drive | |
| Fairport, NY 14450 | ||
| Age: | 76 | |
| Current Position(s) Held with Fund: | Lead Independent Director, Audit Committee Member, Governance & | |
| Nominating Committee Member | ||
| Term of Office & Length of Time Served: | Indefinite – Director, Audit Committee Member, Governance & Nominating | |
| Committee Member since 2007; Lead Independent Director since 2017 | ||
| Principal Occupation(s) During Past 5 Years: | Managing Member since 1991 - PMSV Holdings LLC (investments); | |
| Managing Member (2010-2016) - VenBio (investments) | ||
| Number of Portfolios Overseen within Fund Complex: | 15 | |
| Other Directorships Held Outside Fund Complex During Past 5 Years: | Incyte Corp. (biotech) (2000-2020); PureEarth (non-profit) since 2012; Cerus (biomedical) since 2016; Caelum BioSciences (biomedical) since 2018; Cheyne Capital International (investment)(2000-2017); |
21
New York Tax Exempt Series
Directors’ and Officers’ Information
(unaudited)
Independent Directors (continued)
| Name: | John Glazer | |
| Address: | 290 Woodcliff Drive | |
| Fairport, NY 14450 | ||
| Age: | 56 | |
| Current Position(s) Held with Fund: | Director, Audit Committee Member, Governance & Nominating Committee | |
| Member | ||
| Term of Office & Length of Time Served: | Indefinite – Director, Audit Committee Member, Governance & Nominating | |
| Committee Member since February 2021 | ||
| Principal Occupation(s) During Past 5 Years: | Chief Executive Officer since 2020 – Oikos Holdings LLC (Single-Family | |
| Office); Head of Corporate Development (2019-2020) – Caelum Biosciences | ||
| (pharmaceutical development); Head of Private Investments (2015-2018) – | ||
| AC Limited (Single-Family Office) | ||
| Number of Portfolios Overseen within Fund Complex: | 15 | |
| Other Directorships Held Outside Fund Complex During Past 5 Years: | N/A | |
| Name: | Margaret McLaughlin | |
| Address: | 290 Woodcliff Drive | |
| Fairport, NY 14450 | ||
| Age: | 54 | |
| Current Position(s) Held with Fund: | Director, Audit Committee Member, Governance & Nominating Committee | |
| Member | ||
| Term of Office & Length of Time Served: | Indefinite – Director, Audit Committee Member, Governance & Nominating | |
| Committee Member since February 2021 | ||
| Principal Occupation(s) During Past 5 Years: | Consultant since 2020 – Bates Group (consultants); Consultant (2019- | |
| 2020) – Madison Dearborn Partners (private equity); General Counsel/CCO | ||
| (2011-2019) – Kramer Van Kirk Credit Strategies L.P./Mariana Systems LLC | ||
| (Investment Adviser/SaaS Technology) | ||
| Number of Portfolios Overseen within Fund Complex: | 15 | |
| Other Directorships Held Outside Fund Complex During Past 5 Years: | N/A | |
| Name: | Russell O. Vernon | |
| Address: | 290 Woodcliff Drive | |
| Fairport, NY 14450 | ||
| Age: | 64 | |
| Current Position(s) Held with Fund: | Director, Audit Committee Member, Governance & Nominating Committee | |
| Chairman | ||
| Term of Office & Length of Time Served: | Indefinite – Director, Audit Committee Member, Governance & Nominating | |
| Committee Member since April 2020; Governance & Nominating Committee | ||
| Chairman since November 2020 | ||
| Principal Occupation(s) During Past 5 Years: | Founder and General Partner (2009-2019) – BVM Capital Management | |
| (economic development) | ||
| Number of Portfolios Overseen within Fund Complex: | 15 | |
| Other Directorships Held Outside Fund Complex During Past 5 Years: | Board Member, Vice Chairman and President since 2010 – Newburgh Armory Unity Center (military); Board Member and Executive Director since 2020 – National Purple Heart Honor Mission, Inc. (military); Board Member, Vice Chairman (2015-2020) – National Purple Heart Hall of Honor, Inc. (military) | |
22
New York Tax Exempt Series
Directors’ and Officers’ Information
(unaudited)
Independent Directors (continued)
| Name: | Chester N. Watson | |
| Address: | 290 Woodcliff Drive | |
| Fairport, NY 14450 | ||
| Age: | 71 | |
| Current Position(s) Held with Fund: | Director, Audit Committee Chairman, Governance & Nominating Committee | |
| Member | ||
| Term of Office & Length of Time Served: | Indefinite – Director, Audit Committee Member, Governance & Nominating | |
| Committee Member Since 2012; Audit Committee Chairman since 2013 | ||
| Principal Occupation(s) During Past 5 Years: | General Auditor (2003-2011) - General Motors Company (auto manufacturer) | |
| Number of Portfolios Overseen within Fund Complex: | 15 | |
| Other Directorships Held Outside Fund Complex During Past 5 Years: | Rochester Institute of Technology (University) since 2005; Hudson Valley Center for Innovation, Inc. (New Business and Economic Development) since 2019; Town of Greenburgh, NY Planning Board (Municipal Government) (2015-2019); |
Officers:
| Name: | Elizabeth Craig | |
| Address: | 290 Woodcliff Drive | |
| Fairport, NY 14450 | ||
| Age: | 34 | |
| Current Position(s) Held with Fund: | Corporate Secretary | |
| Term of Office1 & Length of Time Served: | Since 2016 | |
| Principal Occupation(s) During Past 5 Years: | Director of Fund Administration since 2021; Fund Regulatory Administration | |
| Manager (2018-2021); Fund Administration Manager (2015-2018); Mutual | ||
| Fund Compliance Specialist (2009-2015) - Manning & Napier Advisors, | ||
| LLC; Assistant Corporate Secretary (2011-2016) - Manning & Napier Fund, | ||
| Inc.; Corporate Secretary, Director since 2019– Manning & Napier Investor | ||
| Services, Inc. | ||
| Name: | Samantha Larew | |
| Address: | 290 Woodcliff Drive | |
| Fairport, NY 14450 | ||
| Age: | 41 | |
| Current Position(s) Held with Fund: | Chief Compliance Officer and Anti-Money Laundering Compliance Officer | |
| Term of Office1 & Length of Time Served: | Chief Compliance Officer since 2019; Anti-Money Laundering Compliance | |
| Officer since 2018 | ||
| Principal Occupation(s) During Past 5 Years: | Co-Director of Compliance since 2018; Compliance Communications | |
| Supervisor (2014-2018); Compliance Supervisor (2013-2014); Broker- | ||
| Dealer Compliance Supervisor (2011-2013); Broker-Dealer Compliance | ||
| Analyst (2010-2011) - Manning & Napier Advisors, LLC& Affiliates; Broker- | ||
| Dealer Chief Compliance Officer since 2013; Broker-Dealer Assistant | ||
| Corporate Secretary since 2011 – Manning & Napier Investor Services, Inc.; | ||
| Compliance Analyst (2007-2009) – Wall Street Financial Group; Compliance | ||
| Specialist (2003-2007) – Manning & Napier Advisors, LLC & Affiliates | ||
| Name: | Scott Morabito | |
| Address: | 290 Woodcliff Drive | |
| Fairport, NY 14450 | ||
| Age: | 34 | |
| Current Position(s) Held with Fund: | Vice President | |
| Term of Office1 & Length of Time Served: | Vice President since 2019; Assistant Vice President (2017-2019) | |
| Principal Occupation(s) During Past 5 Years: | Managing Director, Client Service and Business Operations since 2021; | |
| Managing Director of Operations (2019-2021); Director of Funds Group | ||
| (2017-2019); Fund Product and Strategy Manager (2014-2017); Senior | ||
| Product and Strategy Analyst (2013-2014); Product and Strategy Analyst | ||
| (2011-2013) - Manning & Napier Advisors, LLC; President, Director since | ||
| 2018 – Manning & Napier Investor Services, Inc.; President, Exeter Trust | ||
| Company since 2021; | ||
23
New York Tax Exempt Series
Directors’ and Officers’ Information
(unaudited)
Officers: (continued)
| Name: | Troy Statczar | |
| Address: | 290 Woodcliff Drive | |
| Fairport, NY 14450 | ||
| Age: | 50 | |
| Current Position(s) Held with Fund: | Principal Financial Officer, Treasurer | |
| Term of Office1 & Length of Time Served: | Principal Financial Officer and Treasurer since 2020 | |
| Principal Occupation(s) During Past 5 Years: | Senior Director, Foreside Treasurer Services since 2020 - Foreside Financial | |
| Group; Director of Fund Administration (2017-2019) - Thornburg Investment | ||
| Management, Inc.; Director of U.S. Operations (2008-2017) - Henderson | ||
| Global Investors N.A., Inc. | ||
| Name: | Sarah Turner | |
| Address: | 290 Woodcliff Drive | |
| Fairport, NY 14450 | ||
| Age: | 39 | |
| Current Position(s) Held with Fund: | Chief Legal Officer; Assistant Corporate Secretary | |
| Term of Office1 & Length of Time Served: | Since 2018 | |
| Principal Occupation(s) During Past 5 Years: | General Counsel since 2018 - Manning & Napier Advisors, LLC and | |
| affiliates; Counsel (2017-2018) – Harter Secrest and Emery LLP; Legal/ | ||
| Senior Counsel (2010-2017) – Manning & Napier Advisors, LLC and affiliates | ||
| Holds one or more of the following titles for various affiliates: General Counsel | ||
*Interested Director, within the meaning of the 1940 Act by reason of his positions with the Fund’s Advisor, Manning & Napier Advisors, LLC, and Distributor, Manning & Napier Investor Services, Inc.
1The term of office of all officers shall be one year and until their respective successors are chosen and qualified, or his or her earlier resignation or removal as provided in the Fund’s By-Laws.
24
{This page intentionally left blank}
25
New York Tax Exempt Series
Literature Requests
(unaudited)
Proxy Voting Policies and Procedures
A description of the policies and procedures that the Fund uses to determine how to vote proxies relating to portfolio securities is available, without charge, upon request:
| By phone | 1-800-466-3863 |
| On the Securities and Exchange | |
| Commission’s (SEC) web site | http://www.sec.gov |
Proxy Voting Record
Information regarding how the Fund voted proxies relating to portfolio securities during the most recent 12-month period ended June 30th is available, without charge, upon request:
| By phone | 1-800-466-3863 |
| On the SEC’s web site | http://www.sec.gov |
Quarterly Portfolio Holdings
The Series’ complete schedule of portfolio holdings for the 1st and 3rd quarters of each fiscal year are provided on Form N-PORT, and are available, without charge, upon request:
| By phone | 1-800-466-3863 |
| On the SEC’s web site | http://www.sec.gov |
Prospectus and Statement of Additional Information (SAI)
For more information about any of the Manning & Napier Fund, Inc. Series, you may obtain a prospectus and SAI at www.manning-napier.com or by calling 1-(800) 466-3863. Before investing, carefully consider the objectives, risks, charges and expenses of the investment and read the prospectus carefully as it contains this and other information about the investment company. In addition, this information can be found on the SEC’s web site, http://www.sec.gov.
Additional information available at www.manning-napier.com
| 1. | Fund Holdings - Month-End |
| 2. | Fund Holdings - Quarter-End |
| 3. | Shareholder Report - Annual |
| 4. | Shareholder Report - Semi-Annual |
The Fund also offers electronic notification or “e-delivery” when certain documents are available on-line to be downloaded or reviewed. Direct shareholders can elect to receive electronic notification when shareholder reports, prospectus updates, and/or statements are available. If you do not currently have on-line access to your account, you can establish access by going to www.manning-napier.com, click on “Login” in the top corner of the page, and follow the prompts to self-enroll. Once enrolled, you can set your electronic notification preferences by clicking on the Account Options tab located within the green toolbar and then select E-Delivery Option. Should you have any questions on either how to establish on-line access or how to update your account settings, please contact Investor Services at 1-800-466-3863.
The Manning & Napier Fund, Inc. is managed by Manning & Napier Advisors, LLC. Manning & Napier Investor Services, Inc., an affiliate of Manning & Napier Advisors, LLC, is the distributor of the Fund shares.
MNNYT-12/21-AR
26

Manning & Napier Fund, Inc.
Core Bond Series
Paper copies of the Series’ shareholder reports are no longer sent by mail, unless you specifically request them from the Series or from your financial intermediary, such as a broker-dealer or bank. Shareholder reports are available online. Each time a report is posted on the Series’ website you will be provided with a link to access the report online, either by mail (hard copy notice) or by email, if you have already signed up for electronic delivery of shareholder reports.
You may elect to receive all future shareholder reports in paper free of charge. If you invest through a financial intermediary, you can contact your financial intermediary to request that you continue to receive paper copies. If you invest directly with the Fund, you can inform the Fund that you wish to continue receiving paper copies by visiting www.manning-napier.com or calling 1-800-466-3863. Your election to receive reports in paper will apply to all funds held with your financial intermediary if you invest through a financial intermediary or all series of the Fund if you invest directly with the Fund.
Additionally, If you have not yet signed up for electronic delivery of shareholder reports and other Fund communications, you may do so by contacting your financial intermediary or, if you are a direct investor, by visiting www.manning-napier.com or calling 1-800-466-3863.
| Independent Perspective | Real-World Solutions |

A Note from Our CEO
Dear Shareholder,
The obstacles were many, but this year, in so many ways, is a story of triumphant resilience only serving to spotlight just how much more there is to do.
Over the past two years, we’ve endured a recession, a bear market, and a pandemic. Our collective perseverance is now paying off.
We are today experiencing a remarkable economic boom, a historic market rally, and continued medical innovation, all of which have turned a challenging period into one of optimism and hope.
At the same time, political and societal polarization are heightened, social justice concerns have justifiably come to the fore, and the precarious state of our environment presents almost unimaginable challenges for government, business, and finance.
This certainly is a moment of great consequence.
The kind of moment that questions all the rules. Economic rules in how we add value for each other, as well as for ourselves. Social rules in how we interact with each other. Environmental rules that can balance the current needs of emerging economies with the requirements for everyone in the future. Workplace rules in how we get the job done.
Our lives are being redefined, and our society, planet, workplaces, and industry must confront the challenges of the upcoming decade.
Markets reflect us. They mirror our collective thoughts, feelings, expectations, and beliefs – these new life rules.
As we go through this period of change, it will be uncertain and uncomfortable. For those unaccustomed to change, for those reliant on ’set it and forget it’, these may seem like daunting questions, but there is a better way.
Success in an era of change demands flexibility, adaptability, and a roll-up-your-sleeves willingness to do the work.
For over 50 years, independent thinking and tireless work have underpinned every decision we’ve made on behalf of our investors. We invest for the long-term, we do not speculate. We make active decisions, and we invest with discipline, patience, and confidence. This is the only way we know, to remain true to our values and our fiduciary duty to you, the investors in our mutual funds.
You demand more. At Manning & Napier, we demand more of ourselves. Upon reflection of the year, we’re proud to have continued to deliver more.
We wish you safety and good health, and we appreciate your confidence in our firm and our approach.
 | Sincerely,
Marc Mayer Chief Executive Officer |

Corporate Headquarters | 290 Woodcliff Drive | Fairport, NY 14450 | (585) 325-6880 phone | (800) 551-0224 toll free | www.manning-napier.com
1
Core Bond Series
Fund Commentary
(unaudited)
Investment Objective
To provide long-term total return by investing primarily in fixed income securities. Under normal circumstances, at least 80% of the Series’ assets will be invested in investment-grade bonds and other financial instruments with economic characteristics similar to bonds. Holdings will consist of US dollar denominated securities. The Series is not subject to maturity or duration restrictions.
Performance Commentary
Fixed income markets, as measured by the Bloomberg US Aggregate Bond Index, posted negative returns for only the fourth calendar year on record as markets grappled with lingering inflation concerns, potential balance sheet reductions by the Federal Reserve, and looming interest rate hikes. Overall, interest rates generally ended the year higher than they started, the yield curve flattened, and, despite intra-year volatility, credit spreads ended roughly unchanged.
The Core Bond Series Class S shares experienced negative returns and modestly underperformed on a relative basis, returning -1.89% vs. -1.54% for the benchmark (i.e., the Bloomberg US Aggregate Bond Index).
Relative underperformance was primarily driven by yield curve positioning as the Series was overweight the belly of the curve (i.e., securities in the 5 to 7-year maturity range generally saw the greatest increase in yields) in a period where the yield curve flattened. Alternatively, the Series benefited from strong selection within corporate bonds, as well as a lower overall duration as interest rates rose.
As the economic cycle moves forward, we are actively becoming more measured in our approach. Given tight credit spreads across much of the bond market and the prospect of interest rates rising off their post-pandemic lows, fixed income investors can generally expect a more challenging environment going forward.
That stated, while the market continued to look expensive from a valuation perspective; we found select opportunities across various sectors. Specifically, we continued to find attractive opportunities in corporate credits, particularly within the Energy and Financials sectors, and, despite tightening valuations, in select BBB-rated issuances from a bottom-up perspective. Additionally, we continued to view asset-backed securities as relatively attractive and focused on securities with seniority in the capital structure that are backed by asset classes with high-quality fundamentals and lower credit risk (e.g., student loans, prime autos, etc.). Finally, we maintain a somewhat lower duration than the broad market as upward pressure on interest rates remains elevated.
Performance for the Core Bond Series Class S shares is provided above. Performance for other shares classes will differ based on each class’ underlying expenses.
Performance data quoted represents past performance and does not guarantee future results. The investment return and principal value of an investment will fluctuate, so that an investor’s shares, when redeemed, may be worth more or less than their original cost. Current performance may be higher or lower than that quoted; investors can obtain the most recent month-end performance at www.manning-napier.com or by calling (800) 466-3863.
Additional information and associated disclosures can be found on the Performance Update page of this report.
All investments involve risks, including possible loss of principal. There is an inverse relationship between bond prices and interest rates; as interest rates rise, bond prices (and therefore the value of bond funds) fall. Likewise, as interest rates fall, bond prices and the value of bond funds rise. Investments in derivatives can be highly volatile and involve risks in addition to the risks of the underlying instrument on which the derivative is based, such as counterparty, correlation and liquidity risk. Also, the use of leverage increases exposure to the market and may magnify potential losses.
2
Core Bond Series
Performance Update as of December 31, 2021
(unaudited)
| AVERAGE ANNUAL TOTAL RETURNS | |||
| AS OF DECEMBER 31, 2021 | |||
| ONE | FIVE | TEN | |
| YEAR1 | YEAR | YEAR | |
| Core Bond Series - Class S2 | (1.89%) | 3.33% | 3.19% |
| Core Bond Series - Class I2,3 | (1.65%) | 3.55% | 3.34% |
| Core Bond Series - Class W2,4 | (1.25%) | 3.70% | 3.37% |
| Core Bond Series - Class Z2,4 | (1.53%) | 3.54% | 3.29% |
| Bloomberg U.S. Aggregate Bond Index5 | (1.54%) | 3.57% | 2.90% |
The following graph compares the value of a $10,000 investment in the Core Bond Series - Class S for the ten years ended December 31, 2021 to the Bloomberg Barclays U.S. Aggregate Bond Index.
1The returns shown are based on net asset values calculated for shareholder transactions and may differ from the returns shown in the financial highlights, which reflect adjustments made to the net asset values in accordance with accounting principles generally accepted in the United States of America.
2The Series’ performance does not reflect the deduction of taxes that a shareholder would pay on fund distributions or the redemption of shares. The Series’ performance is historical and may not be indicative of future results. The performance returns shown are inclusive of the net expense ratio of the Series. For the year ended December 31, 2021, this net expense ratio was 0.65% for Class S, 0.45% for Class I, 0.05% for Class W and 0.30% for Class Z. The gross expense ratio, which does not account for any voluntary or contractual waivers currently in effect, was 0.65% for Class S, 0.47% for Class I, 0.35% for Class W and 0.35% for Class Z for the year ended December 31, 2021.
3For periods through August 3, 2015 (the inception date of the Class I shares), performance for the Class I shares is based on historical performance of the Class S shares. Because the Class I shares invest in the same portfolio of securities as Class S, performance will only be different to the extent that the Class S shares have a higher expense ratio.
4For periods through March 1, 2019 (the inception date of the Class W and Class Z shares), performance for the Class W and Class Z shares is based on the historical performance of the Class S shares. Because the Class W and Class Z shares invest in the same portfolio of securities as the Class S shares, performance will be different only to the extent that the Class S shares have a higher expense ratio.
5The Bloomberg U.S. Aggregate Bond Index is an unmanaged, market-value weighted index of U.S. domestic investment-grade debt issues, including government, corporate, asset-backed, and mortgage-backed securities, with maturities of one year or more. Index returns do not reflect any fees or expenses. Index returns provided by Interactive Data. Index data referenced herein is the property of Bloomberg Finance L.P. and its affiliates (“Bloomberg”), and/or its third party suppliers and has been licensed for use by Manning & Napier. Bloomberg and its third party suppliers accept no liability in connection with its use. Data provided is not a representation or warranty, express or implied, as to the ability of any index to accurately represent the asset class or market sector that it purports to represent and none of these parties shall have any liability for any errors, omissions, or interruptions of any index or the data included therein. For additional disclosure information, please see: https:// go.manning-napier.com/benchmark-provisions.
3
Core Bond Series
Shareholder Expense Example
(unaudited)
As a shareholder of the Series, you incur ongoing costs, including management fees, shareholder service fees and other Series expenses. This example is intended to help you understand your ongoing costs (in dollars) of investing in the Series and to compare these costs with the ongoing costs of investing in other mutual funds.
The example is based on an investment of $1,000 invested in each class at the beginning of the period and held for the entire period (July 1, 2021 to December 31, 2021).
Actual Expenses
The Actual lines of the table below provide information about actual account values and actual expenses. You may use the information in these lines, together with the amount you invested, to estimate the expenses that you paid over the period. Simply divide your account value by $1,000 (for example, an $8,600 account value divided by $1,000 = 8.6), then multiply the result by the number in the Actual line for the Class in which you have invested under the heading entitled “Expenses Paid During Period” to estimate the expenses you paid on your account during this period.
Hypothetical Example for Comparison Purposes
The Hypothetical lines of each class in the table below provide information about hypothetical account values and hypothetical expenses based on the Class’ actual expense ratio and an assumed rate of return of 5% per year before expenses, which is not the Class’ actual return. The hypothetical account values and expenses may not be used to estimate the actual ending account balance or expenses you paid during the period. You may use this information to compare the ongoing costs of investing in a class of the Series and other funds. To do so, compare this 5% hypothetical example for the Class in which you have invested with the 5% hypothetical examples that appear in the shareholder reports of the other funds.
Please note that the expenses shown in the table are meant to highlight your ongoing costs only and do not reflect any transaction costs, such as sales charges (loads), redemption fees, or exchange fees that you may incur in other mutual funds. Therefore, the second line of the table is useful in comparing ongoing costs only, and will not help you determine the relative total costs of owning different funds.
| BEGINNING | ENDING | EXPENSES PAID | ANNUALIZED | |
| ACCOUNT VALUE | ACCOUNT VALUE | DURING PERIOD* | EXPENSE | |
| 7/1/21 | 12/31/21 | 7/1/21 - 12/31/21 | RATIO | |
| Class S | ||||
| Actual | $1,000.00 | $994.90 | $3.37 | 0.67% |
| Hypothetical | ||||
| (5% return before expenses) | $1,000.00 | $1,021.83 | $3.41 | 0.67% |
| Class I | ||||
| Actual | $1,000.00 | $996.80 | $2.26 | 0.45% |
| Hypothetical | ||||
| (5% return before expenses) | $1,000.00 | $1,022.94 | $2.29 | 0.45% |
| Class W | ||||
| Actual | $1,000.00 | $999.10 | $0.25 | 0.05% |
| Hypothetical | ||||
| (5% return before expenses) | $1,000.00 | $1,024.95 | $0.26 | 0.05% |
| Class Z | ||||
| Actual | $1,000.00 | $996.60 | $1.51 | 0.30% |
| Hypothetical | ||||
| (5% return before expenses) | $1,000.00 | $1,023.69 | $1.53 | 0.30% |
*Expenses are equal to each Class’ annualized expense ratio (for the six-month period), multiplied by the average account value over the period, multiplied by 184/365 (to reflect the one-half year period). Expenses are based on the most recent fiscal half year; therefore, the expense ratios stated above may differ from the expense ratios stated in the financial highlights, which are based on one-year data. The Class’ total return would have been lower had certain expenses not been waived or reimbursed during the period.
4
Core Bond Series
Portfolio Composition as of December 31, 2021
(unaudited)
| Sector Allocation1 |
1As a percentage of net assets. 2A U.S. Treasury Bond is a long-term obligation of the U.S. Treasury issued with a maturity period of more than ten years. 3A U.S. Treasury Note is an intermediate long-term obligation of the U.S. Treasury issued with a maturity period between one and ten years. |
5
Core Bond Series
Investment Portfolio - December 31, 2021
| PRINCIPAL AMOUNT1/ SHARES1 | VALUE (NOTE 2) | |||||||
| CORPORATE BONDS - 23.9% | ||||||||
| Non-Convertible Corporate Bonds- 23.9% | ||||||||
| Communication Services - 3.4% | ||||||||
| Diversified Telecommunication Services - 1.5% | ||||||||
| Verizon Communications, Inc., 4.272%, 1/15/2036 | 4,810,000 | $ | 5,650,492 | |||||
| Interactive Media & Services - 1.9% | ||||||||
| Tencent Holdings Ltd. (China), 3.975%, 4/11/20292 | 6,550,000 | 7,128,165 | ||||||
| Total Communication Services | 12,778,657 | |||||||
| Consumer Discretionary - 1.5% | ||||||||
| Hotels, Restaurants & Leisure - 0.5% | ||||||||
| Expedia Group, Inc., 3.25%, 2/15/2030 | 1,850,000 | 1,889,725 | ||||||
| Internet & Direct Marketing Retail - 1.0% | ||||||||
| Alibaba Group Holding Ltd. (China), 4.00%, 12/6/2037 | 3,440,000 | 3,737,466 | ||||||
| Total Consumer Discretionary | 5,627,191 | |||||||
| Energy - 6.1% | ||||||||
| Oil, Gas & Consumable Fuels - 6.1% | ||||||||
| BP Capital Markets America, Inc., 3.06%, 6/17/2041 | 4,710,000 | 4,780,110 | ||||||
| Cenovus Energy, Inc. (Canada), 6.75%, 11/15/2039 | 4,200,000 | 5,711,575 | ||||||
| Energy Transfer LP, 6.50%, 2/1/2042 | 3,590,000 | 4,636,352 | ||||||
| Kinder Morgan Energy Partners LP, 6.95%, 1/15/2038 | 3,240,000 | 4,492,340 | ||||||
| The Williams Companies, Inc., 2.60%, 3/15/2031 | 3,650,000 | 3,629,276 | ||||||
| Total Energy | 23,249,653 | |||||||
| Financials - 4.3% | ||||||||
| Banks - 2.9% | ||||||||
| Bank of America Corp., 6.11%, 1/29/2037 | 2,195,000 | 2,958,581 | ||||||
| Citigroup, Inc., 4.45%, 9/29/2027 | 2,910,000 | 3,246,655 | ||||||
| JPMorgan Chase & Co., (U.S. Secured Overnight Financing Rate + 2.515%), 2.956%, 5/13/20313 | 4,530,000 | 4,695,023 | ||||||
| 10,900,259 | ||||||||
| Capital Markets - 0.9% | ||||||||
| Blackstone Secured Lending Fund, 2.75%, 9/16/2026 | 1,810,000 | 1,810,758 | ||||||
| Owl Rock Technology Finance Corp., 3.75%, 6/17/20262 | 1,680,000 | 1,731,390 | ||||||
| 3,542,148 | ||||||||
| Diversified Financial Services - 0.5% | ||||||||
| Blackstone Private Credit Fund, 2.625%, 12/15/20262 | 1,910,000 | 1,863,294 | ||||||
| Total Financials | 16,305,701 | |||||||
| PRINCIPAL AMOUNT1/ SHARES1 | VALUE (NOTE 2) | |||||||
| CORPORATE BONDS (continued) | ||||||||
| Non-Convertible Corporate Bonds (continued) | ||||||||
| Health Care - 0.6% | ||||||||
| Health Care Providers & Services - 0.6% | ||||||||
| HCA, Inc., 4.125%, 6/15/2029 | 2,220,000 | $ | 2,444,946 | |||||
| Industrials - 4.5% | ||||||||
| Airlines - 0.9% | ||||||||
| Southwest Airlines Co., 5.125%, 6/15/2027 | 2,970,000 | 3,397,468 | ||||||
| Road & Rail - 0.5% | ||||||||
| BNSF Funding Trust I, (3 mo. LIBOR US + 2.350%), 6.613%, 12/15/20553 | 1,570,000 | 1,740,737 | ||||||
| Trading Companies & Distributors - 3.1% | ||||||||
| AerCap Ireland Capital DAC - AerCap | ||||||||
| Global Aviation Trust (Ireland), 3.00%, 10/29/2028 | 3,770,000 | 3,826,568 | ||||||
| Air Lease Corp., 3.625%, 4/1/2027 | 1,700,000 | 1,784,168 | ||||||
| Ashtead Capital, Inc. (United Kingdom), 4.00%, 5/1/20282 | 1,580,000 | 1,651,846 | ||||||
| Avolon Holdings Funding Ltd. (Ireland), 2.75%, 2/21/20282 | 4,820,000 | 4,733,217 | ||||||
| 11,995,799 | ||||||||
| Total Industrials | 17,134,004 | |||||||
| Materials - 0.5% | ||||||||
| Metals & Mining - 0.5% | ||||||||
| Newcastle Coal Infrastructure Group Pty Ltd. (Australia), 4.40%, 9/29/20272 | 1,810,000 | 1,804,919 | ||||||
| Real Estate - 3.0% | ||||||||
| Equity Real Estate Investment Trusts (REITS) - 3.0% | ||||||||
| American Tower Corp., 3.80%, 8/15/2029 | 5,130,000 | 5,585,928 | ||||||
| Crown Castle International Corp., 3.10%, 11/15/2029 | 4,510,000 | 4,711,301 | ||||||
| SBA Tower Trust, 2.328%, 1/15/20282 | 1,300,000 | 1,327,017 | ||||||
| Total Real Estate | 11,624,246 | |||||||
| TOTAL CORPORATE BONDS (Identified Cost $89,735,661) | 90,969,317 | |||||||
| ASSET-BACKED SECURITIES - 19.1% | ||||||||
| AMSR Trust, Series 2020-SFR4, Class | ||||||||
| A, 1.355%, 11/17/20372 | 2,700,000 | 2,632,492 | ||||||
| Business Jet Securities LLC, Series | ||||||||
| 2021-1A, Class A, 2.162%, 4/15/20362 | 2,376,599 | 2,333,776 | ||||||
| CF Hippolyta LLC, | ||||||||
| Series 2020-1, Class A2, 1.99%, 7/15/20602 | 1,206,957 | 1,185,695 | ||||||
| Series 2020-1, Class B1, 2.28%, 7/15/20602 | 1,518,831 | 1,517,472 | ||||||
| Series 2021-1A, Class B1, 1.98%, 3/15/20612 | 1,697,529 | 1,672,532 | ||||||
The accompanying notes are an integral part of the financial statements.
6
Core Bond Series
Investment Portfolio - December 31, 2021
| PRINCIPAL AMOUNT1/ SHARES1 | VALUE (NOTE 2) | |||||||
| ASSET-BACKED SECURITIES (continued) | ||||||||
| CLI Funding VIII LLC, Series 2021-1A, Class A, 1.64%, 2/18/20462 | 3,209,083 | $ | 3,134,103 | |||||
| Commonbond Student Loan Trust, | ||||||||
| Series 2019-AGS, Class A1, 2.54%, 1/25/20472 | 585,676 | 593,991 | ||||||
| CoreVest American Finance Trust, Series 2020-3, Class A, 1.358%, 8/15/20532 | 1,135,823 | 1,105,405 | ||||||
| Credit Acceptance Auto Loan Trust, Series 2020-1A, Class A, 2.01%, 2/15/20292 | 500,000 | 503,949 | ||||||
| Series 2020-1A, Class B, 2.39%, 4/16/20292 | 600,000 | 607,923 | ||||||
| Series 2020-3A, Class A, 1.24%, 10/15/20292 | 4,500,000 | 4,500,310 | ||||||
| DataBank Issuer, Series 2021-1A, Class A2, 2.06%, 2/27/20512 | 2,400,000 | 2,353,471 | ||||||
| EDvestinU Private Education Loan Issue No. 3 LLC, Series 2021-A, Class A, 1.80%, 11/25/20452 | 1,345,733 | 1,324,051 | ||||||
| Flexential Issuer, Series 2021-1A, Class A2, 3.25%, 11/27/20512 | 2,825,000 | 2,830,028 | ||||||
| Ford Credit Auto Owner Trust, Series 2020-A, Class A4, 1.35%, 7/15/2025 | 1,750,000 | 1,763,713 | ||||||
| Goodgreen Trust, Series 2020-1A, Class A, 2.63%, 4/15/20552 | 1,908,902 | 1,905,005 | ||||||
| Hertz Vehicle Financing III LP, Series 2021-2A, Class B, 2.12%, 12/27/20272 | 1,800,000 | 1,782,855 | ||||||
| Home Partners of America Trust, Series 2019-1, Class A, 2.908%, 9/17/20392 | 871,448 | 895,324 | ||||||
| Navient Private Education Loan Trust, Series 2014-1, Class A3, (1 mo. LIBOR US + 0.510%), 0.613%, 6/25/20314 | 819,330 | 800,840 | ||||||
| Series 2015-BA, Class A3, (1 mo. LIBOR US + 1.450%), 1.560%, 7/16/20402,4 | 1,324,770 | 1,330,243 | ||||||
| Series 2019-EA, Class A2A, 2.64%, 5/15/20682 | 670,774 | 676,355 | ||||||
| Nelnet Student Loan Trust, Series 2013-5A, Class A, (1 mo. LIBOR US + 0.630%), 0.732%, 1/25/20372,4 | 973,619 | 975,265 | ||||||
| Series 2015-2A, Class A2, (1 mo. LIBOR US + 0.600%), 0.703%, 9/25/20472,4 | 2,551,641 | 2,538,373 | ||||||
| OCP CLO Ltd., Series 2020-8RA, Class | ||||||||
| A1, (Cayman Islands) (3 mo. LIBOR | ||||||||
| US + 1.220%), 1.342%, 1/17/20322,4 | 2,500,000 | 2,499,995 | ||||||
| Oxford Finance Funding LLC, | ||||||||
| Series 2019-1A, Class A2, 4.459%, 2/15/20272 | 806,590 | 822,424 | ||||||
| Series 2020-1A, Class A2, 3.101%, 2/15/20282 | 1,835,000 | 1,854,247 | ||||||
| PRINCIPAL AMOUNT1/ SHARES1 | VALUE (NOTE 2) | |||||||
| ASSET-BACKED SECURITIES (continued) | ||||||||
| PEAR LLC, Series 2021-1, Class | ||||||||
| A, 2.60%, 1/15/2034 (Acquired | ||||||||
| 11/16/2021, cost $3,665,000)5 | 3,665,000 | $ | 3,657,335 | |||||
| Progress Residential Trust, | ||||||||
| Series 2019-SFR2, Class A, 3.147%, 5/17/20362 | 901,229 | 906,530 | ||||||
| Series 2019-SFR4, Class A, 2.687%, 10/17/20362 | 800,000 | 810,300 | ||||||
| Series 2020-SFR2, Class A, 2.078%, 6/17/20372 | 1,000,000 | 1,003,695 | ||||||
| SMB Private Education Loan Trust, Series 2020-A, Class A2A, 2.23%, 9/15/20372 | 1,212,777 | 1,226,843 | ||||||
| SoFi Professional Loan Program LLC, | ||||||||
| Series 2016-E, Class A2B, 2.49%, 1/25/20362 | 66,011 | 66,290 | ||||||
| Series 2017-F, Class A2FX, 2.84%, 1/25/20412 | 1,421,714 | 1,446,283 | ||||||
| Series 2020-A, Class A2FX, 2.54%, 5/15/20462 | 812,137 | 826,669 | ||||||
| Series 2020-C, Class AFX, 1.95%, 2/15/20462 | 488,057 | 491,283 | ||||||
| Stack Infrastructure Issuer LLC, | ||||||||
| Series 2021-1A, Class A2, 1.877%, 3/26/20462 | 2,000,000 | 1,966,719 | ||||||
| TCI-Flatiron CLO Ltd., Series 2016- 1A, Class CR2, (Cayman Islands) (3 mo. LIBOR US + 2.200%), 2.322%, 1/17/20322,4 | 1,500,000 | 1,500,308 | ||||||
| Towd Point Mortgage Trust, | ||||||||
| Series 2016-5, Class A1, 2.50%, 10/25/20562,6 | 142,405 | 143,551 | ||||||
| Series 2017-1, Class A1, 2.75%, 10/25/20562,6 | 117,385 | 118,397 | ||||||
| Series 2019-HY1, Class A1, (1 mo. LIBOR US + 1.000%), 1.102%, 10/25/20482,4 | 159,192 | 159,830 | ||||||
| Toyota Auto Loan Extended Note Trust, Series 2020-1A, Class A, 1.35%, 5/25/20332 | 3,000,000 | 2,992,468 | ||||||
| Tricon American Homes, Series 2020- | ||||||||
| SFR1, Class B, 2.049%, 7/17/20382 | 1,300,000 | 1,277,944 | ||||||
| Trinitas CLO XVII Ltd., Series 2021- 17A, Class B1, (Cayman Islands) (3 mo. LIBOR US + 1.700%), 1.838%, 10/20/20342,4 | 2,900,000 | 2,883,021 | ||||||
| Triton Container Finance VIII LLC, | ||||||||
| Series 2021-1A, Class A, 1.86%, 3/20/20462 | 2,621,500 | 2,567,330 | ||||||
| Vantage Data Centers LLC, Series 2020-1A, Class A2, 1.645%, 9/15/20452 | 1,750,000 | 1,710,754 | ||||||
| VB-S1 Issuer LLC, | ||||||||
| Series 2020-1A, Class C2, 3.031%, 6/15/20502 | 375,000 | 385,273 | ||||||
The accompanying notes are an integral part of the financial statements.
7
Core Bond Series
Investment Portfolio - December 31, 2021
| PRINCIPAL AMOUNT1/ SHARES1 | VALUE (NOTE 2) | |||||||
| ASSET-BACKED SECURITIES (continued) | ||||||||
| VB-S1 Issuer LLC, (continued) | ||||||||
| Series 2020-2A, Class A, 2.636%, 9/15/20502 | 2,250,000 | $ | 2,263,612 | |||||
| TOTAL ASSET-BACKED SECURITIES (Identified Cost $72,811,326) | 72,544,272 | |||||||
| COMMERCIAL MORTGAGE-BACKED SECURITIES - 8.2% | ||||||||
| Brean Asset Backed Securities Trust, Series 2021-RM2, Class A, 1.75%, 10/25/20612,6 | 1,491,524 | 1,440,995 | ||||||
| CIM Trust, Series 2019-INV1, Class A1, 4.00%, 2/25/20492,6 | 37,010 | 37,328 | ||||||
| Citigroup Mortgage Loan Trust, Inc., Series 2021-INV1, Class A3A, 2.50%, 5/25/20512,6 | 944,628 | 946,252 | ||||||
| Credit Suisse Mortgage Capital Trust, Series 2013-6, Class 2A1, 3.50%, 8/25/20432,6 | 217,088 | 216,882 | ||||||
| Series 2013-IVR2, Class A2, 3.00%, 4/25/20432,6 | 243,868 | 245,614 | ||||||
| Series 2013-IVR3, Class A1, 2.50%, 5/25/20432,6 | 62,841 | 62,528 | ||||||
| Series 2013-TH1, Class A1, 2.13%, 2/25/20432,6 | 42,025 | 42,150 | ||||||
| Fannie Mae REMICS, | ||||||||
| Series 2018-31, Class KP, 3.50%, 7/25/2047 | 51,815 | 52,979 | ||||||
| Series 2021-69, Class WJ, 1.50%, 10/25/2050 | 1,381,180 | 1,369,284 | ||||||
| Fontainebleau Miami Beach Trust, Series 2019-FBLU, Class A, 3.144%, 12/10/20362 | 1,050,000 | 1,073,191 | ||||||
| Freddie Mac Multifamily Structured Pass-Through Certificates, Series K021, Class X1 (IO), 1.376%, 6/25/20226 | 8,095,264 | 6,333 | ||||||
| Series K030, Class X1 (IO), 0.146%, 4/25/20236 | 12,064,791 | 22,717 | ||||||
| Series K032, Class X1 (IO), 0.072%, 5/25/20236 | 7,203,819 | 9,485 | ||||||
| FREMF Mortgage Trust, Series 2015-K42, Class B, 3.849%, 1/25/20482,6 | 380,000 | 401,439 | ||||||
| Series 2015-K720, Class B, 3.390%, 7/25/20222,6 | 340,000 | 343,801 | ||||||
| Government National Mortgage Association, Series 2017-54, Class AH, 2.60%, 12/16/2056 | 183,460 | 186,198 | ||||||
| GS Mortgage-Backed Securities Corp. Trust, | ||||||||
| Series 2020-PJ3, Class A14, 3.00%, 10/25/20502,6 | 673,256 | 678,757 | ||||||
| PRINCIPAL AMOUNT1/ SHARES1 | VALUE (NOTE 2) | |||||||
| COMMERCIAL MORTGAGE-BACKED SECURITIES (continued) | ||||||||
| GS Mortgage-Backed Securities Corp. Trust, (continued) | ||||||||
| Series 2021-INV1, Class A9, (U.S. Secured Overnight Financing Rate | ||||||||
| 30 Day Average + 0.850%), 0.900%, 12/25/20512,4 | 1,823,435 | $ | 1,820,699 | |||||
| Series 2021-PJ6, Class A8, 2.50%, 11/25/20512,6 | 1,433,226 | 1,448,094 | ||||||
| Series 2021-PJ9, Class A8, 2.50%, 2/26/20522,6 | 1,431,388 | 1,446,172 | ||||||
| Imperial Fund Mortgage Trust, Series | ||||||||
| 2021-NQM3, Class A1, 1.595%, 11/25/20562,6 | 1,704,432 | 1,690,251 | ||||||
| JP Morgan Mortgage Trust, | ||||||||
| Series 2014-2, Class 1A1, 3.00%, 6/25/20292,6 | 64,269 | 64,840 | ||||||
| Series 2017-6, Class A3, 3.50%, 12/25/20482,6 | 32,931 | 33,195 | ||||||
| Morgan Stanley Capital I Trust, | ||||||||
| Series 2018-H3, Class A5, 4.177%, 7/15/2051 | 1,423,000 | 1,595,675 | ||||||
| New Residential Mortgage Loan Trust, | ||||||||
| Series 2014-1A, Class A, 3.75%, 1/25/20542,6 | 137,404 | 143,586 | ||||||
| Series 2014-3A, Class AFX3, 3.75%, 11/25/20542,6 | 64,701 | 67,601 | ||||||
| Series 2015-2A, Class A1, 3.75%, 8/25/20552,6 | 125,914 | 131,393 | ||||||
| Series 2016-4A, Class A1, 3.75%, 11/25/20562,6 | 116,894 | 123,298 | ||||||
| PMT Loan Trust, Series 2013-J1, Class A9, 3.50%, 9/25/20432,6 | 202,947 | 204,344 | ||||||
| Provident Funding Mortgage Trust, Series 2021-2, Class A2A, 2.00%, 4/25/20512,6 | 1,841,851 | 1,846,743 | ||||||
| Series 2021-INV1, Class A1, 2.50%, 8/25/20512,6 | 2,766,431 | 2,791,935 | ||||||
| RCKT Mortgage Trust, Series 2021-6, Class A1, 2.50%, 12/25/20512,6 | 1,800,000 | 1,789,734 | ||||||
| Sequoia Mortgage Trust, | ||||||||
| Series 2013-6, Class A2, 3.00%, 5/25/20436 | 581,581 | 580,562 | ||||||
| Series 2013-7, Class A2, 3.00%, 6/25/20436 | 41,852 | 41,837 | ||||||
| Series 2013-8, Class A1, 3.00%, 6/25/20436 | 104,922 | 105,359 | ||||||
| Series 2016-3, Class A10, 3.50%, 11/25/20462,6 | 26,290 | 26,265 | ||||||
| Series 2020-1, Class A4, 3.50%, 2/25/20502,6 | 13,648 | 13,642 | ||||||
| Sutherland Commercial Mortgage Trust, Series 2019-SBC8, Class A, 2.86%, 4/25/20412,6 | 612,695 | 605,448 | ||||||
| UBS Commercial Mortgage Trust, | ||||||||
| Series 2017-C7, Class A4, 3.679%, 12/15/2050 | 1,000,000 | 1,083,292 | ||||||
The accompanying notes are an integral part of the financial statements.
8
Core Bond Series
Investment Portfolio - December 31, 2021
| PRINCIPAL AMOUNT1/ SHARES1 | VALUE (NOTE 2) | |||||||
| COMMERCIAL MORTGAGE-BACKED SECURITIES (continued) | ||||||||
| Waikiki Beach Hotel Trust, Series | ||||||||
| 2019-WBM, Class A, (1 mo. LIBOR US + 1.050%), 1.16%, 12/15/20332,4 | 415,000 | $ | 414,282 | |||||
| Wells Fargo Commercial Mortgage | ||||||||
| Trust, Series 2015-C30, Class A4, 3.664%, 9/15/2058 | 3,000,000 | 3,197,720 | ||||||
| WFRBS Commercial Mortgage Trust, | ||||||||
| Series 2014-C19, Class A5, 4.101%, 3/15/2047 | 2,000,000 | 2,102,906 | ||||||
| WinWater Mortgage Loan Trust, | ||||||||
| Series 2015-1, Class A1, 3.50%, 1/20/20452,6 | 19,970 | 20,160 | ||||||
| Series 2015-2, Class A11, 3.50%, 2/20/20452,6 | 625,495 | 626,623 | ||||||
| TOTAL COMMERCIAL MORTGAGE-BACKED SECURITIES | 31,151,589 | |||||||
| (Identified Cost $31,375,856) | ||||||||
| MUNICIPAL BONDS - 1.3% | ||||||||
| Clark County, Public Impt., Series A, G.O. Bond, 1.15%, 11/1/2026 | 3,410,000 | 3,368,944 | ||||||
| Hawaii, Series GC, G.O. Bond, 2.682%, 10/1/2038 | 95,000 | 96,455 | ||||||
| New York City Transitional Finance Authority, Future Tax Secured, Public Impt., Revenue Bond, 1.58%, 5/1/2024 | 910,000 | 919,528 | ||||||
| South Carolina Public Service Authority, Series B, Revenue Bond, 2.329%, 12/1/2028 | 600,000 | 615,780 | ||||||
| TOTAL MUNICIPAL BONDS (Identified Cost $5,034,000) | 5,000,707 | |||||||
| U.S. TREASURY SECURITIES - 42.4% | ||||||||
| U.S. Treasury Bonds - 9.5% | ||||||||
| U.S. Treasury Bond | ||||||||
| 3.875%, 8/15/2040 | 10,135,000 | 13,394,827 | ||||||
| 2.50%, 2/15/2045 | 15,342,000 | 16,934,332 | ||||||
| 3.00%, 5/15/2047 | 4,642,000 | 5,655,987 | ||||||
| Total U.S. Treasury Bonds | ||||||||
| (Identified Cost $37,345,493) | 35,985,146 | |||||||
| U.S. Treasury Notes - 32.9% | ||||||||
| U.S. Treasury Note | ||||||||
| 2.125%, 5/15/2025 | 32,780,000 | 33,942,666 | ||||||
| 1.625%, 5/15/2026 | 31,007,000 | 31,543,566 | ||||||
| 2.375%, 5/15/2027 | 28,535,000 | 30,136,750 | ||||||
| 2.875%, 5/15/2028 | 27,155,000 | 29,608,497 | ||||||
| Total U.S. Treasury Notes | ||||||||
| (Identified Cost $127,744,796) | 125,231,479 | |||||||
| TOTAL U.S. TREASURY SECURITIES | ||||||||
| (Identified Cost $165,090,289) | 161,216,625 | |||||||
| PRINCIPAL AMOUNT1/ SHARES1 | VALUE (NOTE 2) | |||||||
| U.S. GOVERNMENT AGENCIES - 3.4% | ||||||||
| Mortgage-Backed Securities - 3.4% | ||||||||
| Fannie Mae | ||||||||
| Pool #888810, UMBS, 5.50%, 11/1/2022 | 58 | $ | 58 | |||||
| Pool #AD0462, UMBS, 5.50%, 10/1/2024 | 1,747 | 1,811 | ||||||
| Pool #MA3463, UMBS, 4.00%, 9/1/2033 | 145,022 | 152,368 | ||||||
| Pool #MA1834, UMBS, 4.50%, 2/1/2034 | 37,586 | 40,805 | ||||||
| Pool #FM1158, UMBS, 3.50%, 6/1/2034 | 481,722 | 509,402 | ||||||
| Pool #MA2587, UMBS, 3.50%, 4/1/2036 | 248,652 | 265,987 | ||||||
| Pool #MA3215, UMBS, 3.50%, 12/1/2037 | 798,420 | 850,410 | ||||||
| Pool #FM2568, UMBS, 3.00%, 5/1/2038 | 515,696 | 541,029 | ||||||
| Pool #995876, UMBS, 6.00%, 11/1/2038 | 71,681 | 83,145 | ||||||
| Pool #MA4203, UMBS, 2.50%, 12/1/2040 | 3,399,302 | 3,496,806 | ||||||
| Pool #AI5172, UMBS, 4.00%, 8/1/2041 | 50,951 | 55,942 | ||||||
| Pool #AH3858, UMBS, 4.50%, 8/1/2041 | 240,236 | 264,680 | ||||||
| Pool #AL7729, UMBS, 4.00%, 6/1/2043 | 59,215 | 64,458 | ||||||
| Pool #AX1685, UMBS, 3.50%, 11/1/2044 | 615,082 | 663,435 | ||||||
| Pool #AS4103, UMBS, 4.50%, 12/1/2044 | 143,470 | 156,281 | ||||||
| Pool #AY8604, UMBS, 3.50%, 4/1/2045 | 95,095 | 101,888 | ||||||
| Pool #BC6764, UMBS, 3.50%, 4/1/2046 | 33,728 | 36,066 | ||||||
| Pool #BC8677, UMBS, 4.00%, 5/1/2046 | 30,891 | 33,279 | ||||||
| Pool #BD1191, UMBS, 3.50%, 1/1/2047 | 218,798 | 233,219 | ||||||
| Pool #BE7845, UMBS, 4.50%, 2/1/2047 | 35,473 | 38,325 | ||||||
| Pool #MA3007, UMBS, 3.00%, 4/1/2047 | 851,530 | 893,019 | ||||||
| Pool #FM2232, UMBS, 4.00%, 6/1/2048 | 142,741 | 152,146 | ||||||
| Pool #AL8674, 5.658%, 1/1/2049 | 331,512 | 369,251 | ||||||
| Freddie Mac | ||||||||
| Pool #G12610, 6.00%, 3/1/2022 | 63 | 63 | ||||||
| Pool #G12655, 6.00%, 5/1/2022 | 33 | 33 | ||||||
| Pool #G12988, 6.00%, 1/1/2023 | 382 | 386 | ||||||
| Pool #G13078, 6.00%, 3/1/2023 | 541 | 547 | ||||||
| Pool #D98711, 4.50%, 7/1/2031 | 63,490 | 68,649 | ||||||
| Pool #C91746, 4.50%, 12/1/2033 | 48,542 | 52,717 | ||||||
| Pool #C91771, 4.50%, 6/1/2034 | 56,124 | 60,974 | ||||||
| Pool #C91780, 4.50%, 7/1/2034 | 73,383 | 79,726 | ||||||
The accompanying notes are an integral part of the financial statements.
9
Core Bond Series
Investment Portfolio - December 31, 2021
| PRINCIPAL AMOUNT1/ SHARES1 | VALUE (NOTE 2) | |||||||
| U.S. GOVERNMENT AGENCIES (continued) | ||||||||
| Mortgage-Backed Securities (continued) | ||||||||
| Freddie Mac (continued) | ||||||||
| Pool #QN0349, UMBS, 3.00%, | ||||||||
| 8/1/2034 | 446,509 | $ | 469,720 | |||||
| Pool #C91832, 3.50%, 6/1/2035 | 269,113 | 287,072 | ||||||
| Pool #G08268, 5.00%, 5/1/2038 | 335,589 | 380,823 | ||||||
| Pool #G05900, 6.00%, 3/1/2040 | 21,298 | 24,334 | ||||||
| Pool #A92889, 4.50%, 7/1/2040 | 143,674 | 158,937 | ||||||
| Pool #A93451, 4.50%, 8/1/2040 | 375,442 | 415,347 | ||||||
| Pool #G60513, 5.00%, 7/1/2041 | 354,854 | 402,076 | ||||||
| Pool #G60071, 4.50%, 7/1/2042 | 145,613 | 160,891 | ||||||
| Pool #Q17513, 3.50%, 4/1/2043 | 84,711 | 90,921 | ||||||
| Pool #Q37857, 4.00%, 12/1/2045 | 295,258 | 321,134 | ||||||
| PRINCIPAL AMOUNT1/ SHARES1 | VALUE (NOTE 2) | |||||||
| U.S. GOVERNMENT AGENCIES (continued) | ||||||||
| Mortgage-Backed Securities (continued) | ||||||||
| Freddie Mac (continued) | ||||||||
| Pool #G60855, 4.50%, 12/1/2045 | 128,793 | $ | 141,983 | |||||
| Pool #Q38388, 4.00%, 1/1/2046 | 383,699 | 417,266 | ||||||
| Pool #Q47544, 4.00%, 3/1/2047 | 277,981 | 300,685 | ||||||
| Pool #Q47130, 4.50%, 4/1/2047 | 26,015 | 27,855 | ||||||
| Pool #G08786, 4.50%, 10/1/2047 | 101,167 | 109,309 | ||||||
| TOTAL U.S. GOVERNMENT AGENCIES | 12,975,258 | |||||||
| (Identified Cost $12,720,305) | ||||||||
| SHORT-TERM INVESTMENT - 1.3% | ||||||||
| Dreyfus Government Cash Management, Institutional Shares, 0.03%7 | ||||||||
| (Identified Cost $4,828,454) | 4,828,454 | 4,828,454 | ||||||
| TOTAL INVESTMENTS - 99.6% (Identified Cost $381,595,891) | 378,686,222 | |||||||
| OTHER ASSETS, LESS LIABILITIES - 0.4% | 1,704,473 | |||||||
| NET ASSETS - 100% | $ | 380,390,695 | ||||||
CLO - Collateralized Loan Obligation
G.O. Bond - General Obligation Bond
Impt. - Improvement
IO - Interest only
LIBOR - London Interbank Offered Rate
No. - Number
REMICS - Real Estate Mortgage Investment Conduits
UMBS - Uniform Mortgage-Backed Securities
1Amount is stated in USD unless otherwise noted.
2Security purchased or received in a transaction exempt from registration under the Securities Act of 1933, as amended (the “1933 Act”) and determined to be liquid under the Fund’s Liquidity Risk Management Program. The security may be resold pursuant to an exemption from registration under the 1933 Act, typically to qualified institutional buyers. The aggregate value of these securities at December 31, 2021 was $107,359,474, which represented 28.2% of the Series’ Net Assets.
3Variable rate security. Security may be issued at a fixed coupon rate, which converts to a variable rate at a specified date. Rate shown is the rate in effect as of December 31, 2021.
4Floating rate security. Rate shown is the rate in effect as of December 31, 2021.
5Security purchased or received in a transaction exempt from registration under the Securities Act of 1933, as amended (the “1933 Act”) and determined to be illiquid under the Fund’s Liquidity Risk Management Program. The security may be resold pursuant to an exemption from registration under the 1933 Act, typically to qualified institutional buyers. The aggregate value of such securities at December 31, 2021 was $3,657,335, or 1.0% of the Series’ Net Assets.
6Variable or floating rate security, the interest rate of which adjusts periodically based on changes in current interest rates and prepayments on the underlying pool of assets. Rate shown is the rate in effect as of December 31, 2021.
7Rate shown is the current yield as of December 31, 2021.
The Global Industry Classification Standard (GICS) was developed by and is the exclusive property and a service mark of MSCI Inc. (MSCI) and Standard & Poor’s, a division of S&P Global Inc. (S&P), and is licensed for use by Manning & Napier when referencing GICS sectors. Neither MSCI, S&P, nor any third party involved in making or compiling the GICS or any GICS classifications makes any express or implied warranties or representations with respect to such standard or classification, nor shall any such party have any liability therefrom.
The accompanying notes are an integral part of the financial statements.
10
Core Bond Series
Statement of Assets and Liabilities
December 31, 2021
| ASSETS: | ||||
| Investments, at value (identified cost $381,595,891) (Note 2) | $ | 378,686,222 | ||
| Receivable from Advisor (Note 3) | 9,487 | |||
| Interest receivable | 1,737,274 | |||
| Receivable for fund shares sold | 8,064 | |||
| Dividends receivable | 112 | |||
| Prepaid expenses | 17,513 | |||
| TOTAL ASSETS | 380,458,672 | |||
| LIABILITIES: | ||||
| Accrued fund accounting and administration fees (Note 3) | 39,309 | |||
| Accrued sub-transfer agent fees (Note 3) | 5,775 | |||
| Accrued Chief Compliance Officer service fees (Note 3) | 1,531 | |||
| Accrued distribution and service (Rule 12b-1) fees (Class S) (Note 3) | 879 | |||
| Audit fees payable | 8,395 | |||
| Accrued printing and postage fees payable | 5,445 | |||
| Accrued custodian fees | 3,414 | |||
| Other payables and accrued expenses | 3,229 | |||
| TOTAL LIABILITIES | 67,977 | |||
| TOTAL NET ASSETS | $ | 380,390,695 | ||
| NET ASSETS CONSIST OF: | ||||
| Capital stock | $ | 354,363 | ||
| Additional paid-in-capital | 383,364,739 | |||
| Total distributable earnings (loss) | (3,328,407 | ) | ||
| TOTAL NET ASSETS | $ | 380,390,695 | ||
| NET ASSET VALUE, OFFERING PRICE AND REDEMPTION PRICE PER SHARE - Class S ($4,184,632/386,738 shares) | $ | 10.82 | ||
| NET ASSET VALUE, OFFERING PRICE AND REDEMPTION PRICE PER SHARE - Class I ($6,620,983/669,568 shares) | $ | 9.89 | ||
| NET ASSET VALUE, OFFERING PRICE AND REDEMPTION PRICE PER SHARE - Class W ($344,303,739/31,830,104 shares) | $ | 10.82 | ||
| NET ASSET VALUE, OFFERING PRICE AND REDEMPTION PRICE PER SHARE - Class Z ($25,281,341/2,549,894 shares) | $ | 9.91 | ||
The accompanying notes are an integral part of the financial statements.
11
Core Bond Series
Statement of Operations
For the Year Ended December 31, 2021
INVESTMENT INCOME:
| Interest | $ | 6,443,464 | ||
| Dividends | 32,889 | |||
| Other Income | 34,367 | |||
| Total Investment Income | 6,510,720 | |||
| EXPENSES: | ||||
| Management fees (Note 3) | 939,499 | |||
| Fund accounting and administration fees (Note 3) | 116,512 | |||
| Directors’ fees (Note 3) | 44,490 | |||
| Distribution and service (Rule 12b-1) fees (Class S) (Note 3) | 13,421 | |||
| Sub-transfer agent fees (Note 3) | 9,745 | |||
| Chief Compliance Officer service fees (Note 3) | 6,123 | |||
| Custodian fees | 20,750 | |||
| Miscellaneous | 187,128 | |||
| Total Expenses | 1,337,668 | |||
| Less reduction of expenses (Note 3) | (1,038,707) | |||
| Net Expenses | 298,961 | |||
| NET INVESTMENT INCOME | 6,211,759 | |||
| REALIZED AND UNREALIZED GAIN (LOSS) ON INVESTMENTS: | ||||
| Net realized gain (loss) on investments | 3,476,960 | |||
| Net change in unrealized appreciation (depreciation) on investments | (14,150,627) | |||
| NET REALIZED AND UNREALIZED GAIN (LOSS) ON INVESTMENTS | (10,673,667) | |||
| NET DECREASE IN NET ASSETS RESULTING FROM OPERATIONS | $ | (4,461,908) |
The accompanying notes are an integral part of the financial statements.
12
Core Bond Series
Statements of Changes in Net Assets
| FOR THE | FOR THE | |||||
| YEAR ENDED | YEAR ENDED | |||||
| 12/31/21 | 12/31/20 | |||||
| INCREASE (DECREASE) IN NET ASSETS: | ||||||
| OPERATIONS: | ||||||
| Net investment income | $ | 6,211,759 | $ | 5,486,744 | ||
| Net realized gain (loss) on investments | 3,476,960 | 13,271,334 | ||||
| Net change in unrealized appreciation (depreciation) on investments | (14,150,627) | 5,938,257 | ||||
| Net increase (decrease) from operations | (4,461,908) | 24,696,335 | ||||
| DISTRIBUTIONS TO SHAREHOLDERS (Note 9): | ||||||
| Class S | (103,827) | (273,050) | ||||
| Class I | (171,481) | (250,900) | ||||
| Class W | (9,639,144) | (16,916,170) | ||||
| Class Z | (640,465) | (1,079,320) | ||||
| Total distributions to shareholders | (10,554,917) | (18,519,440) | ||||
| CAPITAL STOCK ISSUED AND REPURCHASED: | ||||||
| Net increase (decrease) from capital share transactions (Note 5) | 43,705,280 | 134,963,968 | ||||
| Net increase (decrease) in net assets | 28,688,455 | 141,140,863 | ||||
| NET ASSETS: | ||||||
| Beginning of year | 351,702,240 | 210,561,377 | ||||
| End of year | $ | 380,390,695 | $ | 351,702,240 | ||
The accompanying notes are an integral part of the financial statements.
13
Core Bond Series
Financial Highlights - Class S
| FOR THE YEAR ENDED | |||||||||||||||
| 12/31/21 | 12/31/20 | 12/31/19 | 12/31/18 | 12/31/17 | |||||||||||
| Per share data (for a share outstanding throughout each year): | |||||||||||||||
| Net asset value - Beginning of year | $11.28 | $10.92 | $10.30 | $10.62 | $10.52 | ||||||||||
| Income (loss) from investment operations: | |||||||||||||||
| Net investment income1 | 0.12 | 0.16 | 0.23 | 0.24 | 0.20 | ||||||||||
| Net realized and unrealized gain (loss) on investments | (0.33 | ) | 0.78 | 0.61 | (0.32 | ) | 0.10 | ||||||||
| Total from investment operations | (0.21 | ) | 0.94 | 0.84 | (0.08 | ) | 0.30 | ||||||||
| Less distributions to shareholders: | |||||||||||||||
| From net investment income | (0.12 | ) | (0.16 | ) | (0.22 | ) | (0.24 | ) | (0.19 | ) | |||||
| From net realized gain on investments | (0.13 | ) | (0.42 | ) | — | — | (0.01 | ) | |||||||
| Total distributions to shareholders | (0.25 | ) | (0.58 | ) | (0.22 | ) | (0.24 | ) | (0.20 | ) | |||||
| Net asset value - End of year | $10.82 | $11.28 | $10.92 | $10.30 | $10.62 | ||||||||||
| Net assets - End of year (000’s omitted) | $4,185 | $5,760 | $2,382 | $101,314 | $119,137 | ||||||||||
| Total return2 | (1.89% | ) | 8.67% | 8.18% | (0.75% | ) | 2.91% | ||||||||
| Ratios (to average net assets)/Supplemental Data: | |||||||||||||||
| Expenses* | 0.65% | 0.64% | 0.69% | 0.70% | 0.70% | ||||||||||
| Net investment income | 1.07% | 1.38% | 2.27% | 2.35% | 1.86% | ||||||||||
| Series portfolio turnover | 69% | 110% | 66% | 78% | 48% | ||||||||||
*For certain years presented, the investment advisor did not impose all or a portion of its management and/or other fees, and in some years may have paid a portion of the Series’ expenses. If these expenses had been incurred by the Class, the expense ratio (to average net assets) would have increased by the following amounts:
N/A | N/A | 0.07 | % | 0.08 | % | 0.07 | % |
1Calculated based on average shares outstanding during the years.
2Represents aggregate total return for the years indicated, and assumes reinvestment of all distributions. Total return would have been lower had certain expenses not been waived or reimbursed during certain years.
The accompanying notes are an integral part of the financial statements.
14
Core Bond Series
Financial Highlights - Class I
| FOR THE YEAR ENDED | |||||||||||||||
| 12/31/21 | 12/31/20 | 12/31/19 | 12/31/18 | 12/31/17 | |||||||||||
| Per share data (for a share outstanding throughout each year): | |||||||||||||||
| Net asset value - Beginning of year | $10.33 | $10.04 | $9.52 | $9.84 | $9.77 | ||||||||||
| Income (loss) from investment operations: | |||||||||||||||
| Net investment income1 | 0.13 | 0.17 | 0.24 | 0.25 | 0.21 | ||||||||||
| Net realized and unrealized gain (loss) on investments | (0.30 | ) | 0.72 | 0.55 | (0.31 | ) | 0.09 | ||||||||
| Total from investment operations | (0.17 | ) | 0.89 | 0.79 | (0.06 | ) | 0.30 | ||||||||
| Less distributions to shareholders: | |||||||||||||||
| From net investment income | (0.14 | ) | (0.18 | ) | (0.27 | ) | (0.26 | ) | (0.22 | ) | |||||
| From net realized gain on investments | (0.13 | ) | (0.42 | ) | — | — | (0.01 | ) | |||||||
| Total distributions to shareholders | (0.27 | ) | (0.60 | ) | (0.27 | ) | (0.26 | ) | (0.23 | ) | |||||
| Net asset value - End of year | $9.89 | $10.33 | $10.04 | $9.52 | $9.84 | ||||||||||
| Net assets - End of year (000’s omitted) | $6,621 | $4,387 | $5,416 | $76,761 | $76,407 | ||||||||||
| Total return2 | (1.65% | ) | 8.93% | 8.38% | (0.53% | ) | 3.10% | ||||||||
| Ratios (to average net assets)/Supplemental Data: | |||||||||||||||
| Expenses* | 0.45% | 0.45% | 0.45% | 0.45% | 0.45% | ||||||||||
| Net investment income | 1.29% | 1.67% | 2.53% | 2.60% | 2.12% | ||||||||||
| Series portfolio turnover | 69% | 110% | 66% | 78% | 48% | ||||||||||
*The investment advisor did not impose all or a portion of its management and/or other fees during the years, and may have paid a portion of the Series’ expenses. If these expenses had been incurred by the Class, the expense ratio (to average net assets) would have increased by the following amounts:
| 0.02 | % | 0.01 | % | 0.06 | % | 0.08 | % | 0.07 | % |
1Calculated based on average shares outstanding during the years.
2Represents aggregate total return for the years indicated, and assumes reinvestment of all distributions. Total return would have been lower had certain expenses not been waived or reimbursed during the years.
The accompanying notes are an integral part of the financial statements.
15
Core Bond Series
Financial Highlights - Class W
| FOR THE YEAR ENDED | FOR THE | |||||||||||
| 12/31/21 | 12/31/20 | PERIOD 3/1/191 TO 12/31/19 | ||||||||||
| Per share data (for a share outstanding throughout each period): | ||||||||||||
| Net asset value - Beginning of period | $11.27 | $10.90 | $10.40 | |||||||||
| Income (loss) from investment operations: | ||||||||||||
| Net investment income2 | 0.19 | 0.22 | 0.26 | |||||||||
| Net realized and unrealized gain (loss) on investments | (0.33 | ) | 0.78 | 0.54 | ||||||||
| Total from investment operations | (0.14 | ) | 1.00 | 0.80 | ||||||||
| Less distributions to shareholders: | ||||||||||||
| From net investment income | (0.18 | ) | (0.21 | ) | (0.30 | ) | ||||||
| From net realized gain on investments | (0.13 | ) | (0.42 | ) | — | |||||||
| Total distributions to shareholders | (0.31 | ) | (0.63 | ) | (0.30 | ) | ||||||
| Net asset value - End of period | $10.82 | $11.27 | $10.90 | |||||||||
| Net assets - End of period (000’s omitted) | $344,304 | $321,288 | $192,391 | |||||||||
| Total return3 | (1.25% | ) | 9.31% | 7.74% | ||||||||
| Ratios (to average net assets)/Supplemental Data: | ||||||||||||
| Expenses* | 0.05% | 0.05% | 0.05% | 4 | ||||||||
| Net investment income | 1.68% | 1.97% | 2.87% | 4 | ||||||||
| Series portfolio turnover | 69% | 110% | 66% | |||||||||
*The investment advisor did not impose all or a portion of its management and/or other fees during the periods, and may have paid a portion of the Series’ expenses. If these expenses had been incurred by the Class, the expense ratio (to average net assets) would have increased by the following amounts:
| 0.30% | 0.32% | 0.34% | 4 |
1Commencement of operations.
2Calculated based on average shares outstanding during the periods.
3Represents aggregate total return for the periods indicated, and assumes reinvestment of all distributions. Total return would have been lower had certain expenses not been waived or reimbursed during the periods. Periods less than one year are not annualized.
4Annualized.
The accompanying notes are an integral part of the financial statements.
16
Core Bond Series
Financial Highlights - Class Z
| FOR THE YEAR ENDED | FOR THE | ||||||||
| 12/31/21 | 12/31/20 | PERIOD 3/1/191 TO 12/31/19 | |||||||
| Per share data (for a share outstanding throughout each period): | |||||||||
| Net asset value - Beginning of period | $10.35 | | $10.06 | | $9.62 | | |||
| Income (loss) from investment operations: | |||||||||
| Net investment income2 | 0.15 | 0.18 | 0.22 | ||||||
| Net realized and unrealized gain (loss) on investments | (0.31 | ) | 0.72 | 0.50 | |||||
| Total from investment operations | (0.16 | ) | 0.90 | 0.72 | |||||
| Less distributions to shareholders: | |||||||||
| From net investment income | (0.15 | ) | (0.19 | ) | (0.28 | ) | |||
| From net realized gain on investments | (0.13 | ) | (0.42 | ) | — | ||||
| Total distributions to shareholders | (0.28 | ) | (0.61 | ) | (0.28 | ) | |||
| Net asset value - End of period | $9.91 | $10.35 | $10.06 | ||||||
| Net assets - End of period (000’s omitted) | $25,281 | $20,266 | $10,372 | ||||||
| Total return3 | (1.53% | ) | 9.02% | 7.50% | |||||
| Ratios (to average net assets)/Supplemental Data: | |||||||||
| Expenses* | 0.30% | 0.30% | 0.30% | 4 | |||||
| Net investment income | 1.43% | 1.75% | 2.64% | 4 | |||||
| Series portfolio turnover | 69% | 110% | 66% | ||||||
*The investment advisor did not impose all or a portion of its management and/or other fees during the periods, and may have paid a portion of the Series’ expenses. If these expenses had been incurred by the Class, the expense ratio (to average net assets) would have increased by the following amounts:
| 0.05% | 0.07% | 0.09 | %4 |
1Commencement of operations.
2Calculated based on average shares outstanding during the periods.
3Represents aggregate total return for the periods indicated, and assumes reinvestment of all distributions. Total return would have been lower had certain expenses not been waived or reimbursed during the periods. Periods less than one year are not annualized.
4Annualized.
The accompanying notes are an integral part of the financial statements.
17
Core Bond Series
Notes to Financial Statements
| 1. | Organization |
Core Bond Series (the “Series”) is a no-load diversified series of Manning & Napier Fund, Inc. (the “Fund”). The Fund is organized in Maryland and is registered under the Investment Company Act of 1940, as amended, as an open-end management investment company.
The Series’ investment objective is to provide long-term total return by investing primarily in fixed income securities.
The Series is authorized to issue four classes of shares (Class S, I, W, and Z). Each class of shares is substantially the same, except that class specific distribution and shareholder servicing expenses are borne by the specific class of shares to which they relate.
The Fund’s advisor is Manning & Napier Advisors, LLC (the “Advisor”). Shares of the Series are offered to investors, clients and employees of the Advisor and its affiliates. The total authorized capital stock of the Fund consists of 15 billion shares of common stock each having a par value of $0.01. As of December 31, 2021, 6.3 billion shares have been designated in total among 15 series, of which 100 million have been designated as Core Bond Series Class I common stock, 125 million have been designated as Core Bond Series Class S common stock, 150 million have been designated as Core Bond Series Class W common stock and Core Bond Series Class Z common stock.
| 2. | Significant Accounting Policies |
The following is a summary of significant accounting policies followed by the Series. The Series is an investment company and, accordingly, follows the investment company accounting and reporting guidance of the Financial Accounting Standards Board Accounting Standards Codification Topic 946 - Investment Companies, which is part of accounting principles generally accepted in the United States of America (“GAAP”).
Security Valuation
Portfolio securities, including domestic equities, foreign equities, warrants and options, listed on an exchange other than the NASDAQ Stock Market are valued at the latest quoted sales price of the exchange on which the security is primarily traded. Securities not traded on valuation date or securities not listed on an exchange are valued at the latest quoted bid price provided by the Fund’s pricing service. Securities listed on the NASDAQ Stock Market are valued in accordance with the NASDAQ Official Closing Price.
Debt securities, including government bonds, foreign bonds, asset-backed securities, structured notes, supranational obligations, sovereign bonds, corporate bonds and mortgage-backed securities will normally be valued on the basis of evaluated bid prices provided directly by an independent pricing service (the “Service”). The pricing services use multiple valuation techniques to determine fair value. In instances where sufficient market activity exists, the pricing services may utilize a market-based approach through which quotes from market makers are used to determine fair value. In instances where sufficient market activity may not exist or is limited, the pricing services also utilize proprietary valuation models which may consider market characteristics such as benchmark yield curves, option-adjusted spreads, credit spreads, estimated default rates, coupon rates, anticipated timing of principal repayments, underlying collateral, and other unique security features in order to estimate the relevant cash flows, which are then discounted to calculate the fair value. Certain investments in securities held by the Series may be valued on a basis of a price provided directly by a principal market maker. These prices may differ from the value that would have been used had a broader market for securities existed.
Municipal securities will normally be valued on the basis of market valuations provided by the Service. The Service utilizes the latest price quotations and a matrix system (which considers such factors as security prices of similar securities, yields, maturities and ratings). The Service has been approved by the Fund’s Board of Directors (the “Board”).
Short-term investments that mature in sixty days or less may be valued at amortized cost, which approximates fair value. Investments in open-end investment companies are valued at their net asset value per share on valuation date.
18
Core Bond Series
Notes to Financial Statements (continued)
| 2. | Significant Accounting Policies (continued) |
Security Valuation (continued)
Volume and level of activity in established markets for an asset or liability are evaluated to determine whether recent transactions and quoted prices are determinative of fair value. Where there have been significant decreases in volume and level of activity, further analysis and adjustment may be necessary to estimate fair value. The Series measures fair value in these instances by the use of inputs and valuation techniques which may be based upon current market prices of securities that are comparable in coupon, rating, maturity and industry and/or expectation of future cash flows. As a result of trading in relatively thin markets and/or markets that experience significant volatility, the prices used by the Series to value these securities may differ from the value that would be realized if these securities were sold, and the differences could be material.
Securities for which representative valuations or prices are not available from the Series’ pricing service may be valued at fair value as determined in good faith by the Advisor under procedures approved by and under the general supervision and responsibility of the Fund’s Board of Directors (the “Board”). Due to the inherent uncertainty of valuations of such securities, the fair value may differ significantly from the values that would have been used had a ready market for such securities existed. If trading or events occurring after the close of the principal market in which securities are traded are expected to materially affect the value of those securities, then they may be valued at their fair value, taking this trading or these events into account.
Various inputs are used in determining the value of the Series’ assets or liabilities carried at fair value. These inputs are summarized in three broad levels. Level 1 includes quoted prices in active markets for identical assets and liabilities. Level 2 includes other significant observable inputs (including quoted prices for similar securities, interest rates, prepayment speeds, credit risk, etc.). Level 3 includes significant unobservable inputs (including the Series’ own assumptions in determining the fair value of investments). A financial instrument’s level within the fair value hierarchy is based on the lowest level of any input both individually and in aggregate that is significant to the fair value measurement. The inputs or methodology used for valuing securities are not necessarily an indication of the risk associated with investing in those securities.
The following is a summary of the valuation levels used for major security types as of December 31, 2021 in valuing the Series’ assets or liabilities carried at fair value:
| DESCRIPTION | TOTAL | LEVEL 1 | LEVEL 2 | LEVEL 3 | ||||||||||||
| Assets: | ||||||||||||||||
| Debt securities: | ||||||||||||||||
| U.S. Treasury and other U.S. Government agencies | $ | 174,191,883 | $ | — | $ | 174,191,883 | $ | — | ||||||||
| States and political subdivisions (municipals) | 5,000,707 | — | 5,000,707 | — | ||||||||||||
| Corporate debt: | ||||||||||||||||
| Communication Services | 12,778,657 | — | 12,778,657 | — | ||||||||||||
| Consumer Discretionary | 5,627,191 | — | 5,627,191 | — | ||||||||||||
| Energy | 23,249,653 | — | 23,249,653 | — | ||||||||||||
| Financials | 16,305,701 | — | 16,305,701 | — | ||||||||||||
| Health Care | 2,444,946 | — | 2,444,946 | — | ||||||||||||
| Industrials | 17,134,004 | — | 17,134,004 | — | ||||||||||||
| Materials | 1,804,919 | — | 1,804,919 | — | ||||||||||||
| Real Estate | 11,624,246 | — | 11,624,246 | — | ||||||||||||
| Asset-backed securities | 72,544,272 | — | 72,544,272 | — | ||||||||||||
| Commercial mortgage-backed securities | 31,151,589 | — | 31,151,589 | — | ||||||||||||
| Short-Term Investment | 4,828,454 | 4,828,454 | — | — | ||||||||||||
| Total assets | $ | 378,686,222 | $ | 4,828,454 | $ | 373,857,768 | $ | — | ||||||||
There were no Level 3 securities held by the Series as of December 31, 2020 or December 31, 2021.
19
Core Bond Series
Notes to Financial Statements (continued)
| 2. | Significant Accounting Policies (continued) |
LIBOR Transition Risk
The United Kingdom’s Financial Conduct Authority announced a phase out of the London Interbank Offered Rate (“LIBOR”). Although many LIBOR rates will cease to be published or no longer will be representative of the underlying market they seek to measure after December 31, 2021, a selection of widely used USD LIBOR rates will continue to be published through June 2023 in order to assist with the transition. The Series may be exposed to financial instruments tied to LIBOR to determine payment obligations, financing terms, hedging strategies or investment value. The transition process away from LIBOR might lead to increased volatility and illiquidity in markets for, and reduce the effectiveness of new hedges placed against, instruments whose terms currently include LIBOR. The ultimate effect of the LIBOR transition process on the Series is uncertain.
Security Transactions, Investment Income and Expenses
Security transactions are accounted for on trade date. Dividend income is recorded on the ex-dividend date, except that if the ex-dividend date has passed, certain dividends from foreign securities are recorded as soon as the Series is informed of the ex-dividend date. Non-cash dividends, if any, are recorded at the fair value of the securities received. Interest income, including amortization of premium and accretion of discounts using the effective interest method, is earned from settlement date and accrued daily.
Expenses are recorded on an accrual basis. Most expenses of the Fund can be attributed to a specific series. Expenses which cannot be directly attributed are apportioned among the series in the Fund in such a manner as deemed equitable by the Fund’s Board, taking into consideration, among other things, the nature and type of expense. Income, expenses (other than shareholder services fees), and realized and unrealized gains and losses are prorated among the classes based on the relative net assets of each class. Class specific expenses are directly charged to that Class.
The Series uses the identified cost method for determining realized gain or loss on investments for both financial statement and federal income tax reporting purposes.
Foreign Currency Translation
The books and records of the Series are maintained in U.S. dollars. Foreign currencies, investments and other assets and liabilities are translated into U.S. dollars at the current exchange rates. Purchases and sales of investment securities and income and expenses are translated on the respective dates of such transactions. The Series does not isolate realized and unrealized gains and losses attributable to changes in the exchange rates from gains and losses that arise from changes in the fair value of investments. Such fluctuations are included with net realized and unrealized gain or loss on investments. Net realized foreign currency gains and losses represent foreign currency gains and losses between trade date and settlement date on securities transactions, gains and losses on disposition of foreign currencies and the difference between the amount of income and foreign withholding taxes recorded on the books of the Series and the amounts actually received or paid.
Asset-Backed Securities
The Series may invest in asset-backed securities. Asset-backed securities are generally issued as pass-through certificates or as debt instruments. Asset-backed securities issued as pass-through certificates represent undivided fractional ownership interests in an underlying pool of assets. Asset-backed securities issued as debt instruments, which are also known as collateralized obligations, are typically issued as the debt of a special purpose entity organized solely for the purpose of owning such assets and issuing such debt. Asset-backed securities are often backed by a pool of assets representing the obligations of a number of different parties. The yield characteristics of certain asset-backed securities may differ from traditional debt securities. One such major difference is that all or a principal part of the obligations may be prepaid at any time because the underlying assets (i.e. loans) may be prepaid at any time. As a result, a decrease in interest rates in the market may result in increases in the level of prepayments as borrowers, particularly mortgagors, refinance and repay their loans. An increased prepayment rate with respect to an asset-backed security will have the effect of shortening the maturity of the security. In addition, the Series may subsequently have to reinvest the proceeds at lower interest rates. If the Series has purchased such an asset-backed security at a premium, a faster than anticipated prepayment rate could result in a loss of principal to the extent of the premium paid.
20
Core Bond Series
Notes to Financial Statements (continued)
| 2. | Significant Accounting Policies (continued) |
Mortgage-Backed Securities
The Series may invest in mortgage-backed securities (“MBS” or pass-through certificates) that represent an interest in a pool of specific underlying mortgage loans and entitle the Series to the periodic payments of principal and interest from those mortgages. MBS may be issued by government agencies or corporations, or private issuers. Most MBS issued by government agencies are guaranteed; however, the degree of protection differs based on the issuer. For MBS there are a number of important differences among the agencies and instrumentalities of the U.S. Government that issue mortgage-related securities and among the securities that they issue. For example, mortgage-related securities guaranteed by Ginnie Mae are guaranteed as to the timely payment of principal and interest by Ginnie Mae and such guarantee is backed by the full faith and credit of the United States. However, mortgage-related securities issued by Freddie Mac and Fannie Mae, including Freddie Mac and Fannie Mae guaranteed mortgage pass-through certificates, which are solely the obligations of Freddie Mac and Fannie Mae, are not backed by or entitled to the full faith and credit of the United States, but are supported by the right of the issuer to borrow from the U.S. Treasury. Non-agency mortgage-backed securities are securities issued by non-governmental issuers and have no direct or indirect government guarantees of payment and are subject to various risks. Non-agency mortgage loans are obligations of the borrowers thereunder only and are not typically insured or guaranteed by any other person or entity. The ability of a borrower to repay a loan is dependent upon the income or assets of the borrower. A number of factors, including a general economic downturn, acts of God, terrorism, social unrest and civil disturbances, may impair a borrower’s ability to repay its loans.
Inflation-Indexed Bonds
The Series may invest in inflation-indexed bonds. Inflation-indexed bonds are fixed income securities whose principal value is periodically adjusted according to the rate of inflation. If the index measuring inflation rises or falls, the principal value of inflation-indexed bonds will be adjusted upward or downward, and consequently the interest payable on these securities (calculated with respect to a larger or smaller principal amount) will be increased or reduced, respectively. Any upward or downward adjustment in the principal amount of an inflation-indexed bond will be included as interest income in the Statement of Operations, even though investors do not receive their principal until maturity. Repayment of the original bond principal upon maturity (as adjusted for inflation) is guaranteed in the case of U.S. Treasury inflation-indexed bonds. For bonds that do not provide a similar guarantee, the adjusted principal value of the bond repaid at maturity may be less than the original principal.
Securities Purchased on a When-Issued Basis or Forward Commitment
The Series may purchase securities on a when-issued basis or forward commitment. These transactions involve a commitment by the Series to purchase securities for a predetermined price with payment and delivery taking place beyond the customary settlement period. When such purchases are outstanding, the Series will designate liquid assets in an amount sufficient to meet the purchase price. When purchasing a security on a delayed delivery basis, the Series assumes the rights and risks of ownership of the security, including the risk of price and yield fluctuations, and takes such fluctuations into account when determining its net asset value. The Series may sell the when-issued securities before they are delivered, which may result in a capital gain or loss. No such investments were held by the Series on December 31, 2021.
In connection with its ability to purchase or sell securities on a forward commitment basis, the Series may enter into forward roll transactions principally using To Be Announced (TBA) securities. Forward roll transactions require the sale of securities for delivery in the current month, and a simultaneous agreement to repurchase substantially similar (same type, coupon and maturity) securities on a specified future date. Risks of entering into forward roll transactions include the potential inability of the counterparty to meet the terms of the agreement; the potential of the Series to receive inferior securities at redelivery as compared to the securities sold to the counterparty; counterparty credit risk; and the potential pay down speed variance between the mortgage-backed pools. During the roll period, the Series forgoes principal and interest paid on the securities. The Series accounts for such dollar rolls as purchases and sales. Information regarding securities purchased on a when-issued basis is included in the Series’ Investment Portfolio. No such investments were held by the Series on December 31, 2021.
Restricted Securities
Restricted securities are purchased in private placement transactions, are not registered under the Securities Act of 1933, as amended, and may have contractual restrictions on resale. Information regarding restricted securities is included at the end of the Series’ Investment Portfolio.
21
Core Bond Series
Notes to Financial Statements (continued)
| 2. | Significant Accounting Policies (continued) |
Federal Taxes
The Series’ policy is to comply with the provisions of the Internal Revenue Code applicable to regulated investment companies. The Series is not subject to federal income tax or excise tax to the extent that the Series distributes to shareholders each year its taxable income, including any net realized gains on investments, in accordance with requirements of the Internal Revenue Code. Accordingly, no provision for federal income tax or excise tax has been made in the financial statements.
Management evaluates its tax positions to determine if the tax positions taken meet the minimum recognition threshold in connection with accounting for uncertainties in income tax positions taken or expected to be taken for the purposes of measuring and recognizing tax liabilities in the financial statements. Recognition of tax benefits of an uncertain tax position is required only when the position is “more likely than not” to be sustained assuming examination by taxing authorities. At December 31, 2021, the Series has recorded no liability for net unrecognized tax benefits relating to uncertain income tax positions taken or expected to be taken in future tax returns.
The Series files income tax returns in the U.S. federal jurisdiction, various states and foreign jurisdictions, as required. No income tax returns are currently under investigation. The statute of limitations on the Series’ tax returns remains open for the years ended December 31, 2018 through December 31, 2021. The Series is not aware of any tax positions for which it is reasonably possible that the total amounts of unrecognized tax benefits will significantly change in the next twelve months.
Foreign Taxes
Based on the Series’ understanding of the tax rules and rates related to income, gains and currency purchase/repatriation transactions for foreign jurisdictions in which it invests, the Series will provide for foreign taxes, and where appropriate, deferred foreign tax.
Distributions of Income and Gains
Distributions to shareholders of net investment income are made quarterly. Distributions of net realized gains are made annually. An additional distribution may be necessary to avoid taxation of the Series. Distributions are recorded on the ex-dividend date.
Indemnifications
The Fund’s organizational documents provide former and current directors and officers with a limited indemnification against liabilities arising in connection with the performance of their duties to the Fund. In the normal course of business, the Fund may also enter into contracts that provide general indemnifications. The Fund’s maximum exposure under these arrangements is unknown as this would be dependent on future claims that may be made against the Fund. The risk of material loss from such claims is considered remote.
Other
The preparation of financial statements in conformity with GAAP requires management to make estimates and assumptions that affect the reported amounts of assets and liabilities and the disclosure of contingent assets and liabilities at the date of the financial statements and the reported amounts of income and expenses during the reporting period. Actual results could differ from those estimates.
| 3. | Transactions with Affiliates |
The Fund has an Investment Advisory Agreement (the “Agreement”) with the Advisor, for which the Series pays a fee, computed daily and payable monthly, at an annual rate of 0.25% of the Series’ average daily net assets.
Under the Agreement, personnel of the Advisor provide the Series with advice and assistance in the choice of investments and the execution of securities transactions, and otherwise maintain the Series’ organization. The Advisor also provides the Fund with necessary office space and fund administration and support services. The salaries of all officers of the Fund (except a percentage of the Fund’s Chief Compliance Officer’s salary, which is paid by the Fund), and of all Directors who are “affiliated persons” of the Fund, or of the Advisor, and all personnel of the Fund, or of the Advisor, performing services relating to research, statistical and investment activities, are paid by the Advisor. Each “non-affiliated” Director receives an annual stipend, which is allocated among
22
Core Bond Series
Notes to Financial Statements (continued)
| 3. | Transactions with Affiliates (continued) |
all the active series of the Fund. In addition, these Directors also receive a fee per Board meeting attended plus a fee for each committee meeting attended and are reimbursed for travel and other out-of-pocket expenses incurred by them in connection with attending such meetings. The Fund also has an Audit Committee Chair, Governance & Nominating Committee Chair and Lead Independent Director, who each receive an additional annual stipend for these roles.
The Fund may enter into agreements with financial intermediaries pursuant to which the Fund may pay financial intermediaries for non-distribution related sub-transfer agency, administrative, sub-accounting, and other shareholder services in an annual amount not to exceed 0.15% of the average daily net assets of the Class I and Class S shares of the Series. Payments made pursuant to such agreements are generally based on the current assets and/or number of accounts of the Series attributable to the financial intermediary. Any payments made pursuant to such agreements may be in addition to, rather than in lieu of, any Distribution and Shareholder Services Fee payable under the Rule 12b-1 plan of the Fund. For the year ended December 31, 2021, the sub-transfer agency expenses incurred by Class S and Class I were $2,838 and $6,907, respectively.
Manning & Napier Investor Services, Inc., a registered broker-dealer affiliate of the Advisor, acts as distributor for the Fund’s shares. The Series compensates the distributor for distributing and servicing the Series’ Class S shares pursuant to a distribution plan adopted under Rule 12b-1 of the 1940 Act, regardless of expenses actually incurred. Under the agreement, the Series pays distribution and service fees to the distributor at an annual rate of 0.25% of average daily net assets attributable to Class S shares. There are no distribution and service fees on the Class I, Class W or Class Z shares. The fees are accrued daily and paid monthly.
Pursuant to a master services agreement dated February 13, 2020, as amended, the Fund pays the Advisor an annual fee related to fund accounting and administration of 0.0085% on the first $25 billion of average daily net assets; 0.0075% on the next $15 billion of average daily net assets; and 0.0065% of average daily net assets in excess of $40 billion; plus a base fee of $30,400 per series. Additionally, certain transaction and out-of-pocket expenses, including charges for reporting relating to the Fund’s compliance program, are charged. The Advisor has agreements with BNY Mellon Investment Servicing (U.S.) Inc. (“BNY”) under which BNY serves as sub-accountant services agent.
Pursuant to an advisory fee waiver agreement, the Advisor has contractually agreed to waive the management fee for the Class W shares. The full management fee will be waived under this agreement because Class W shares are only available to discretionary investment accounts and other accounts managed by the Advisor. These clients pay a management fee to the Advisor that is separate from the Fund’s expenses. In addition, pursuant to a separate expense limitation agreement, the Advisor has contractually agreed to limit its fees and reimburse expenses to the extent necessary so that the total direct annual fund operating expenses, exclusive of the shareholder services fee and/or distribution and service (12b-1) fees and waived Class W management fees (collectively, “excluded expenses”), do not exceed 0.45% of the average daily net assets of the Class S and Class I shares, 0.05% of the average daily net assets of the Class W shares, and 0.30% of the average daily net assets of the Class Z shares. These contractual waivers are expected to continue indefinitely, and may not be amended or terminated by the Advisor without the approval of the Series’ Board of Directors. The Advisor may receive from a Class the difference between the Class’s total direct annual fund operating expenses, not including excluded expenses, and the Class’s contractual expense limit to recoup all or a portion of its prior fee waivers (other than Class W management fee waivers) or expense reimbursements made during the rolling three-year period preceding the recoupment if at any point the total direct annual fund operating expenses, not including excluded expenses, are below the contractual expense limit (a) at the time of the fee waiver and/or expense reimbursement and (b) at the time of the recoupment.
Pursuant to the advisory fee waiver, the Advisor waived $856,156 in management fees for Class W shares for the year ended December 31, 2021. In addition, pursuant to the separate expense limitation agreement, the Advisor waived or reimbursed expenses of $1,037, $170,505 and $11,009 for Class I, Class W and Class Z shares, respectively, for the year ended December 31, 2021. These amounts are included as a reduction of expenses on the Statement of Operations.
23
Core Bond Series
Notes to Financial Statements (continued)
| 3. | Transactions with Affiliates (continued) |
As of December 31, 2021, the class specific waivers or reimbursements subject to possible future recoupment under the expense limitation agreement are as follows:
| CLASS | EXPIRING DECEMBER 31, | |||||||||||||||
| 2022 | 2023 | 2024 | TOTAL | |||||||||||||
| Class I | $ | — | $ | 448 | $ | 1,037 | $ | 1,485 | ||||||||
| Class W | 136,322 | 171,244 | 170,505 | 478,071 | ||||||||||||
| Class Z | 17,743 | 10,229 | 11,009 | 38,981 | ||||||||||||
For the year ended December 31, 2021, the Advisor did not recoup any expenses that have been previously waived or reimbursed.
| 4. | Purchases and Sales of Securities |
For the year ended December 31, 2021, purchases and sales of securities, other than U.S. Government securities and short-term securities, were $115,931,588 and $105,916,561, respectively. Purchases and sales of U.S. Government securities, other than short-term securities, were $177,372,744 and $147,201,010, respectively.
| 5. | Capital Stock Transactions |
Transactions in Class S, Class I, Class W and Class Z shares of Core Bond Series were:
| CLASS S | FOR THE YEAR ENDED | FOR THE YEAR ENDED | ||||||||||||
| 12/31/21 | 12/31/20 | |||||||||||||
| SHARES | AMOUNT | SHARES | AMOUNT | |||||||||||
| Sold | 207,182 | $ | 2,288,163 | 577,999 | $ | 6,500,636 | ||||||||
| Reinvested | 9,348 | 102,072 | 23,896 | 269,234 | ||||||||||
| Repurchased | (340,592 | ) | (3,767,629 | ) | (309,325 | ) | (3,559,363 | ) | ||||||
| Total | (124,062 | ) | $ | (1,377,394 | ) | 292,570 | $ | 3,210,507 | ||||||
| CLASS I | FOR THE YEAR | FOR THE YEAR ENDED | ||||||||||||
| 12/31/21 | 12/31/20 | |||||||||||||
| SHARES | AMOUNT | SHARES | AMOUNT | |||||||||||
| Sold | 397,051 | $ | 4,026,057 | 275,463 | $ | 2,832,664 | ||||||||
| Reinvested | 16,449 | 163,961 | 22,732 | 234,637 | ||||||||||
| Repurchased | (168,610 | ) | (1,704,084 | ) | (412,865 | ) | (4,319,430 | ) | ||||||
| Total | 244,890 | $ | 2,485,934 | (114,670 | ) | $ | (1,252,129 | ) | ||||||
| CLASS W | FOR THE YEAR ENDED | FOR THE YEAR ENDED | ||||||||||||
| 12/31/21 | 12/31/20 | |||||||||||||
| SHARES | AMOUNT | SHARES | AMOUNT | |||||||||||
| Sold | 4,762,413 | $ | 52,744,658 | 19,775,065 | $ | 224,513,766 | ||||||||
| Reinvested | 839,927 | 9,165,523 | 1,451,618 | 16,338,440 | ||||||||||
| Repurchased | (2,285,988 | ) | (25,261,115 | ) | (10,370,089 | ) | (117,579,218 | ) | ||||||
| Total | 3,316,352 | $ | 36,649,066 | 10,856,594 | $ | 123,272,988 | ||||||||
24
Core Bond Series
Notes to Financial Statements (continued)
| 5. | Capital Stock Transactions (continued) |
| CLASS Z | FOR THE YEAR ENDED | FOR THE YEAR ENDED | ||||||||||||
| 12/31/21 | 12/31/20 | |||||||||||||
| SHARES | AMOUNT | SHARES | AMOUNT | |||||||||||
| Sold | 699,232 | $ | 7,061,796 | 823,153 | $ | 8,664,897 | ||||||||
| Reinvested | 64,083 | 640,465 | 104,383 | 1,079,320 | ||||||||||
| Repurchased | (171,107 | ) | (1,754,587 | ) | (1,096 | ) | (11,615 | ) | ||||||
| Total | 592,208 | $ | 5,947,674 | 926,440 | $ | 9,732,602 | ||||||||
Over 90% of the shares outstanding are fiduciary accounts where the Advisor has sole investment discretion.
| 6. | Line of Credit |
The Fund has entered into a 364-day, $25 million credit agreement (the “line of credit”) with Bank of New York Mellon. Each series of the Fund may borrow under the line of credit for temporary or emergency purposes, including funding shareholder redemptions and other short-term liquidity purposes. The Fund pays an annual fee on the unused commitment amount, payable quarterly, and is allocated among all the series of the Fund and included in miscellaneous expenses in the Statement of Operations for each series. The line of credit expires in September 2022 unless extended or renewed. During the year ended December 31, 2021, the Series did not borrow under the line of credit.
| 7. | Financial Instruments |
The Series may trade in instruments including written and purchased options, forward foreign currency exchange contracts and futures contracts and other derivatives in the normal course of investing activities to assist in managing exposure to various market risks. The Series may be subject to various elements of risk, which may involve, to a varying degree, elements of risk in excess of the amounts recognized for financial statement purposes. These risks include: the risk that changes in the value of a derivative may not correlate perfectly with the underlying asset, rate or index; counterparty credit risk related to over the counter derivative counterparties’ failure to perform under contract terms; liquidity risk related to the lack of a liquid market for these contracts allowing the fund to close out its position(s); and documentation risk relating to disagreement over contract terms. No such investments were held by the Series as of December 31, 2021.
| 8. | Foreign Securities |
Investing in securities of foreign companies and foreign governments involves special risks and considerations not typically associated with investing in securities of domestic companies and the U.S. Government. These risks include revaluation of currencies and future adverse political and economic developments. Moreover, securities of foreign companies and foreign governments and their markets may be less liquid and their prices more volatile than those of comparable domestic companies and the U.S. Government.
| 9. | Federal Income Tax Information |
The amount and characterization of certain income and capital gains to be distributed are determined in accordance with federal income tax regulations, which may differ from GAAP. These differences are primarily due to differing book and tax treatments in the timing and/or treatment of the recognition of net investment income or gains and losses including redesignation of distributions paid. The Series may periodically make reclassifications among its capital accounts to reflect income and gains available for distribution (or available capital loss carryovers) under income tax regulations, without impacting the Series’ net asset value. Any such reclassifications are not reflected in the financial highlights.
25
Core Bond Series
Notes to Financial Statements (continued)
| 9. | Federal Income Tax Information (continued) |
The tax character of distributions paid were as follows:
| FOR THE YEAR | FOR THE YEAR | |||||||
| ENDED 12/31/21 | ENDED 12/31/20 | |||||||
| Ordinary income | $7,941,545 | $10,657,577 | ||||||
| Long-term capital gains | $2,613,372 | $7,861,863 | ||||||
At December 31, 2021, the tax basis of components of distributable earnings and the net unrealized depreciation based on the identified cost of investments for federal income tax purposes were as follows:
| Cost for federal income tax purposes | $ | 381,975,709 | ||||||
| Unrealized appreciation | 2,729,184 | |||||||
| Unrealized depreciation | (6,018,671 | ) | ||||||
| Net unrealized depreciation | $ | (3,289,487 | ) | |||||
| Post October short-term deferred losses | $ | 30,725 |
| 10. | Market Event |
In March 2020, the World Health Organization declared COVID-19 (a novel coronavirus) to be a pandemic. The situation is dynamic and a recent resurgence of COVID-19 has caused a continued time of uncertainty. Global financial markets have experienced and may continue to experience significant volatility resulting from the spread of COVID-19. The global economy, the economies of certain nations and individual issuers have been and may continue to be adversely affected by COVID-19, particularly in light of the interconnectivity between economies and financial markets, all of which may negatively impact the Series’ performance. Management of the Series will continue to monitor the impact of COVID-19 on investment performance, financial statements and the Series’ operations.
26
Core Bond Series
Report of Independent Registered Public Accounting Firm
To the Board of Directors of Manning & Napier Fund, Inc. and Shareholders of Core Bond Series
Opinion on the Financial Statements
We have audited the accompanying statement of assets and liabilities, including the investment portfolio, of Core Bond Series (one of the series constituting Manning & Napier Fund, Inc., referred to hereafter as the “Fund”) as of December 31, 2021, the related statement of operations for the year ended December 31, 2021, the statement of changes in net assets for each of the two years in the period ended December 31, 2021, including the related notes, and the financial highlights for each of the periods indicated therein (collectively referred to as the “financial statements”). In our opinion, the financial statements present fairly, in all material respects, the financial position of the Fund as of December 31, 2021, the results of its operations for the year then ended, the changes in its net assets for each of the two years in the period ended December 31, 2021 and the financial highlights for each of the periods indicated therein in conformity with accounting principles generally accepted in the United States of America.
Basis for Opinion
These financial statements are the responsibility of the Fund’s management. Our responsibility is to express an opinion on the Fund’s financial statements based on our audits. We are a public accounting firm registered with the Public Company Accounting Oversight Board (United States) (PCAOB) and are required to be independent with respect to the Fund in accordance with the U.S. federal securities laws and the applicable rules and regulations of the Securities and Exchange Commission and the PCAOB.
We conducted our audits of these financial statements in accordance with the standards of the PCAOB. Those standards require that we plan and perform the audit to obtain reasonable assurance about whether the financial statements are free of material misstatement, whether due to error or fraud.
Our audits included performing procedures to assess the risks of material misstatement of the financial statements, whether due to error or fraud, and performing procedures that respond to those risks. Such procedures included examining, on a test basis, evidence regarding the amounts and disclosures in the financial statements. Our audits also included evaluating the accounting principles used and significant estimates made by management, as well as evaluating the overall presentation of the financial statements. Our procedures included confirmation of securities owned as of December 31, 2021 by correspondence with the custodian. We believe that our audits provide a reasonable basis for our opinion.

New York, New York
February 18, 2022
We have served as the auditor of one or more investment companies in Manning & Napier Mutual Funds since 1992.
27
Core Bond Series
Supplemental Tax Information
(unaudited)
All reportings are based on financial information available as of the date of this annual report and, accordingly, are subject to change.
The Series designates $2,744,041 as Long-Term Capital Gain dividends pursuant to Section 852(b)(3) of the Internal Revenue Code for the fiscal year ended December 31, 2021.
28
Core Bond Series
Directors’ and Officers’ Information
(unaudited)
The Statement of Additional Information provides additional information about the Fund’s directors and officers and can be obtained without charge by calling 1-800-466-3863, at www.manning-napier.com, or on the EDGAR Database on the SEC Internet web site (http://www.sec.gov). The following chart shows certain information about the Fund’s directors and officers, including their principal occupations during the last five years. Unless specific dates are provided, the individuals have held the listed positions for longer than five years.
Interested Director and Officer
| Name: | Paul Battaglia* |
| Address: | 290 Woodcliff Drive |
| Fairport, NY 14450 | |
| Age: | 43 |
| Current Position(s) Held with Fund: | Principal Executive Officer, President, Chairman and Director |
| Term of Office1 & Length of Time Served: | Indefinite – Chairman and Director since November 2018 |
| Principal Occupation(s) During Past 5 Years: | Chief Financial Officer since 2018; Vice President of Finance (2016 – 2018); Director of Finance (2011 – 2016); Financial Analyst/Internal Auditor (2004- 2006) – Manning & Napier Advisors, LLC and affiliates Holds one or more of the following titles for various subsidiaries and affiliates: Chief Financial Officer |
| Number of Portfolios Overseen within Fund Complex: | 15 |
| Other Directorships Held Outside Fund Complex During Past 5 Years: | N/A |
Independent Directors
| Name: | Stephen B. Ashley |
| Address: | 290 Woodcliff Drive |
| Fairport, NY 14450 | |
| Age: | 81 |
| Current Position(s) Held with Fund: | Director, Audit Committee Member, Governance & Nominating Committee Member |
| Term of Office & Length of Time Served: | Indefinite – Since 1996 |
| Principal Occupation(s) During Past 5 Years: | Chairman and Director since 1997; Chief Executive Officer (1997-2019) - Ashley Companies |
| (property management and investment) | |
| Number of Portfolios Overseen within Fund Complex: | 15 |
| Other Directorships Held Outside Fund Complex During Past 5 Years: | Ashley Companies since 1997 |
| Name: | Paul A. Brooke |
| Address: | 290 Woodcliff Drive |
| Fairport, NY 14450 | |
| Age: | 76 |
| Current Position(s) Held with Fund: | Lead Independent Director, Audit Committee Member, Governance & Nominating Committee Member |
| Term of Office & Length of Time Served: | Indefinite – Director, Audit Committee Member, Governance & Nominating Committee Member since 2007; Lead Independent Director since 2017 |
| Principal Occupation(s) During Past 5 Years: | Managing Member since 1991 - PMSV Holdings LLC (investments); Managing Member (2010-2016) - VenBio (investments). |
| Number of Portfolios Overseen within Fund Complex: | 15 |
| Other Directorships Held Outside Fund Complex During Past 5 Years: | Incyte Corp. (biotech) (2000-2020); PureEarth (non-profit) since 2012; Cerus (biomedical) since 2016; Caelum BioSciences (biomedical) since 2018; Cheyne Capital International (investment)(2000-2017); |
29
Core Bond Series
Directors’ and Officers’ Information
(unaudited)
Independent Directors (continued)
| Name: | John Glazer |
| Address: | 290 Woodcliff Drive |
| Fairport, NY 14450 | |
| Age: | 56 |
| Current Position(s) Held with Fund: | Director, Audit Committee Member, Governance & Nominating Committee Member |
| Term of Office & Length of Time Served: | Indefinite – Director, Audit Committee Member, Governance & Nominating Committee Member since February 2021 |
| Principal Occupation(s) During Past 5 Years: | Chief Executive Officer since 2020 – Oikos Holdings LLC (Single-Family Office); Head of Corporate Development (2019-2020) – Caelum Biosciences (pharmaceutical development); Head of Private Investments (2015-2018) – AC Limited (Single-Family Office) |
| Number of Portfolios Overseen within Fund Complex: | 15 |
| Other Directorships Held Outside Fund Complex During Past 5 Years: | N/A |
| Name: | Margaret McLaughlin |
| Address: | 290 Woodcliff Drive |
| Fairport, NY 14450 | |
| Age: | 54 |
| Current Position(s) Held with Fund: | Director, Audit Committee Member, Governance & Nominating Committee Member |
| Term of Office & Length of Time Served: | Indefinite – Director, Audit Committee Member, Governance & Nominating Committee Member since February 2021 |
| Principal Occupation(s) During Past 5 Years: | Consultant since 2020 – Bates Group (consultants); Consultant (2019- 2020) – Madison Dearborn Partners (private equity); General Counsel/CCO (2011-2019) – Kramer Van Kirk Credit Strategies L.P./Mariana Systems LLC (Investment Adviser/SaaS Technology) |
| Number of Portfolios Overseen within Fund Complex: | 15 |
| Other Directorships Held Outside Fund Complex During Past 5 Years: | N/A |
| Name: | Russell O. Vernon |
| Address: | 290 Woodcliff Drive |
| Fairport, NY 14450 | |
| Age: | 64 |
| Current Position(s) Held with Fund: | Director, Audit Committee Member, Governance & Nominating Committee Chairman |
| Term of Office & Length of Time Served: | Indefinite – Director, Audit Committee Member, Governance & Nominating Committee Member since April 2020; Governance & Nominating Committee Chairman since November 2020 |
| Principal Occupation(s) During Past 5 Years: | Founder and General Partner (2009-2019) – BVM Capital Management (economic development) |
| Number of Portfolios Overseen within Fund Complex: | 15 |
| Other Directorships Held Outside Fund Complex During Past 5 Years:
| Board Member, Vice Chairman and President since 2010 – Newburgh Armory Unity Center (military); Board Member and Executive Director since 2020 – National Purple Heart Honor Mission, Inc. (military); Board Member, Vice Chairman (2015-2020) – National Purple Heart Hall of Honor, Inc. (military) |
30
Core Bond Series
Directors’ and Officers’ Information
(unaudited)
| Independent Directors (continued) | |
| Name: | Chester N. Watson |
| Address: | 290 Woodcliff Drive |
| Fairport, NY 14450 | |
| Age: | 71 |
| Current Position(s) Held with Fund: | Director, Audit Committee Chairman, Governance & Nominating Committee Member |
| Term of Office & Length of Time Served: | Indefinite – Director, Audit Committee Member, Governance & Nominating Committee Member Since 2012; Audit Committee Chairman since 2013 |
| Principal Occupation(s) During Past 5 Years: | General Auditor (2003-2011) - General Motors Company (auto manufacturer) |
| Number of Portfolios Overseen within Fund Complex: | 15 |
Other Directorships Held Outside Fund Complex During Past 5 Years: | Rochester Institute of Technology (University) since 2005; Hudson Valley Center for Innovation, Inc. (New Business and Economic Development) since 2019; Town of Greenburgh, NY Planning Board (Municipal Government) (2015-2019); |
| Officers: | |
| Name: | Elizabeth Craig |
| Address: | 290 Woodcliff Drive |
| Fairport, NY 14450 | |
| Age: | 34 |
| Current Position(s) Held with Fund: | Corporate Secretary |
| Term of Office1 & Length of Time Served: | Since 2016 |
| Principal Occupation(s) During Past 5 Years: | Director of Fund Administration since 2021; Fund Regulatory Administration Manager (2018-2021); Fund Administration Manager (2015-2018); Mutual Fund Compliance Specialist (2009-2015) - Manning & Napier Advisors, LLC; Assistant Corporate Secretary (2011-2016) - Manning & Napier Fund, Inc.; Corporate Secretary, Director since 2019– Manning & Napier Investor Services, Inc. |
| Name: | Samantha Larew |
| Address: | 290 Woodcliff Drive |
| Fairport, NY 14450 | |
| Age: | 41 |
| Current Position(s) Held with Fund: | Chief Compliance Officer and Anti-Money Laundering Compliance Officer |
| Term of Office1 & Length of Time Served: | Chief Compliance Officer since 2019; Anti-Money Laundering Compliance Officer since 2018 |
| Principal Occupation(s) During Past 5 Years: | Co-Director of Compliance since 2018; Compliance Communications Supervisor (2014-2018); Compliance Supervisor (2013-2014); Broker- Dealer Compliance Supervisor (2011-2013); Broker-Dealer Compliance Analyst (2010-2011) - Manning & Napier Advisors, LLC& Affiliates; Broker- Dealer Chief Compliance Officer since 2013; Broker-Dealer Assistant Corporate Secretary since 2011 – Manning & Napier Investor Services, Inc.; Compliance Analyst (2007-2009) – Wall Street Financial Group; Compliance Specialist (2003-2007) – Manning & Napier Advisors, LLC & Affiliates |
| Name: | Scott Morabito |
| Address: | 290 Woodcliff Drive |
| Fairport, NY 14450 | |
| Age: | 34 |
| Current Position(s) Held with Fund: | Vice President |
| Term of Office1 & Length of Time Served: | Vice President since 2019; Assistant Vice President (2017-2019) |
| Principal Occupation(s) During Past 5 Years: | Managing Director, Client Service and Business Operations since 2021; Managing Director of Operations (2019-2021); Director of Funds Group (2017-2019); Fund Product and Strategy Manager (2014-2017); Senior Product and Strategy Analyst (2013-2014); Product and Strategy Analyst (2011-2013) - Manning & Napier Advisors, LLC; President, Director since 2018 – Manning & Napier Investor Services, Inc.; President, Exeter Trust Company since 2021; |
31
Core Bond Series
Directors’ and Officers’ Information
(unaudited)
Officers: (continued)
| Name: | Troy Statczar |
| Address: | 290 Woodcliff Drive |
| Fairport, NY 14450 | |
| Age: | 50 |
| Current Position(s) Held with Fund: | Principal Financial Officer, Treasurer |
| Term of Office1 & Length of Time Served: | Principal Financial Officer and Treasurer since 2020 |
| Principal Occupation(s) During Past 5 Years: | Senior Director, Foreside Treasurer Services since 2020 - Foreside Financial Group; Director of Fund Administration (2017-2019) - Thornburg Investment Management, Inc.; Director of U.S. Operations (2008-2017) - Henderson Global Investors N.A., Inc. |
| Name: | Sarah Turner |
| Address: | 290 Woodcliff Drive |
| Fairport, NY 14450 | |
| Age: | 39 |
| Current Position(s) Held with Fund: | Chief Legal Officer; Assistant Corporate Secretary |
| Term of Office1 & Length of Time Served: | Since 2018 |
| Principal Occupation(s) During Past 5 Years: | General Counsel since 2018 - Manning & Napier Advisors, LLC and affiliates; Counsel (2017-2018) – Harter Secrest and Emery LLP; Legal/ Senior Counsel (2010-2017) – Manning & Napier Advisors, LLC and affiliates |
| Holds one or more of the following titles for various affiliates: General Counsel | |
*Interested Director, within the meaning of the 1940 Act by reason of his positions with the Fund’s Advisor, Manning & Napier Advisors, LLC, and Distributor, Manning & Napier Investor Services, Inc.
1The term of office of all officers shall be one year and until their respective successors are chosen and qualified, or his or her earlier resignation or removal as provided in the Fund’s By-Laws.
32
{This page intentionally left blank}
33
Core Bond Series
Literature Requests
(unaudited)
Proxy Voting Policies and Procedures
A description of the policies and procedures that the Fund uses to determine how to vote proxies relating to portfolio securities is available, without charge, upon request:
| By phone | 1-800-466-3863 |
| On the Securities and Exchange | |
| Commission’s (SEC) web site | http://www.sec.gov |
Proxy Voting Record
Information regarding how the Fund voted proxies relating to portfolio securities during the most recent 12-month period ended June 30th is available, without charge, upon request:
| By phone | 1-800-466-3863 |
| On the SEC’s web site | http://www.sec.gov |
Quarterly Portfolio Holdings
The Series’ complete schedule of portfolio holdings for the 1st and 3rd quarters of each fiscal year are provided on Form N-PORT, and are available, without charge, upon request:
| By phone | 1-800-466-3863 |
| On the SEC’s web site | http://www.sec.gov |
Prospectus and Statement of Additional Information (SAI)
For more information about any of the Manning & Napier Fund, Inc. Series, you may obtain a prospectus and SAI at www.manning-napier.com or by calling 1-(800) 466-3863. Before investing, carefully consider the objectives, risks, charges and expenses of the investment and read the prospectus carefully as it contains this and other information about the investment company. In addition, this information can be found on the SEC’s web site, http://www.sec.gov.
Additional information available at www.manning-napier.com
| 1. | Fund Holdings - Month-End |
| 2. | Fund Holdings - Quarter-End |
| 3. | Shareholder Report - Annual |
| 4. | Shareholder Report - Semi-Annual |
The Fund also offers electronic notification or “e-delivery” when certain documents are available on-line to be downloaded or reviewed. Direct shareholders can elect to receive electronic notification when shareholder reports, prospectus updates, and/or statements are available. If you do not currently have on-line access to your account, you can establish access by going to www.manning-napier.com, click on “Login” in the top corner of the page, and follow the prompts to self-enroll. Once enrolled, you can set your electronic notification preferences by clicking on the Account Options tab located within the green toolbar and then select E-Delivery Option. Should you have any questions on either how to establish on-line access or how to update your account settings, please contact Investor Services at 1-800-466-3863.
The Manning & Napier Fund, Inc. is managed by Manning & Napier Advisors, LLC. Manning & Napier Investor Services, Inc., an affiliate of Manning & Napier Advisors, LLC, is the distributor of the Fund shares.
MNCOB-12/21-AR
34

Manning & Napier Fund, Inc.
Credit Series
Paper copies of the Series’ shareholder reports are no longer sent by mail, unless you specifically request them from the Series or from your financial intermediary, such as a broker-dealer or bank. Shareholder reports are available online. Each time a report is posted on the Series’ website you will be provided with a link to access the report online, either by mail (hard copy notice) or by email, if you have already signed up for electronic delivery of shareholder reports.
You may elect to receive all future shareholder reports in paper free of charge. If you invest through a financial intermediary, you can contact your financial intermediary to request that you continue to receive paper copies. If you invest directly with the Fund, you can inform the Fund that you wish to continue receiving paper copies by visiting www.manning-napier.com or calling 1-800-466-3863. Your election to receive reports in paper will apply to all funds held with your financial intermediary if you invest through a financial intermediary or all series of the Fund if you invest directly with the Fund. Additionally, If you have not yet signed up for electronic delivery of shareholder reports and other Fund communications, you may do so by contacting your financial intermediary or, if you are a direct investor, by visiting www.manning-napier.com or calling 1-800-466-3863.
| Independent Perspective | Real-World Solutions |

A Note from Our CEO
Dear Shareholder,
The obstacles were many, but this year, in so many ways, is a story of triumphant resilience only serving to spotlight just how much more there is to do.
Over the past two years, we’ve endured a recession, a bear market, and a pandemic. Our collective perseverance is now paying off.
We are today experiencing a remarkable economic boom, a historic market rally, and continued medical innovation, all of which have turned a challenging period into one of optimism and hope.
At the same time, political and societal polarization are heightened, social justice concerns have justifiably come to the fore, and the precarious state of our environment presents almost unimaginable challenges for government, business, and finance.
This certainly is a moment of great consequence.
The kind of moment that questions all the rules. Economic rules in how we add value for each other, as well as for ourselves. Social rules in how we interact with each other. Environmental rules that can balance the current needs of emerging economies with the requirements for everyone in the future. Workplace rules in how we get the job done.
Our lives are being redefined, and our society, planet, workplaces, and industry must confront the challenges of the upcoming decade.
Markets reflect us. They mirror our collective thoughts, feelings, expectations, and beliefs – these new life rules.
As we go through this period of change, it will be uncertain and uncomfortable. For those unaccustomed to change, for those reliant on ’set it and forget it’, these may seem like daunting questions, but there is a better way.
Success in an era of change demands flexibility, adaptability, and a roll-up-your-sleeves willingness to do the work.
For over 50 years, independent thinking and tireless work have underpinned every decision we’ve made on behalf of our investors. We invest for the long-term, we do not speculate. We make active decisions, and we invest with discipline, patience, and confidence. This is the only way we know, to remain true to our values and our fiduciary duty to you, the investors in our mutual funds.
You demand more. At Manning & Napier, we demand more of ourselves. Upon reflection of the year, we’re proud to have continued to deliver more.
We wish you safety and good health, and we appreciate your confidence in our firm and our approach.
 | Sincerely,
Marc Mayer Chief Executive Officer |

Corporate Headquarters | 290 Woodcliff Drive | Fairport, NY 14450 | (585) 325-6880 phone | (800) 551-0224 toll free | www.manning-napier.com
1
Credit Series
Fund Commentary
(unaudited)
Investment Objective
To provide long-term total return. Under normal circumstances, at least 80% of the Series’ assets will be invested in credit-related instruments and other financial instruments, principally derivative instruments and exchange-traded funds, with economic characteristics similar to credit-related instruments.
Performance Commentary
Fixed income markets, as measured by the Bloomberg US Aggregate Bond Index, posted negative returns for only the fourth calendar year on record as markets grappled with lingering inflation concerns, potential balance sheet reductions by the Federal Reserve, and looming interest rate hikes. Overall, interest rates generally ended the year higher than they started, the yield curve flattened, and, despite intra-year volatility, credit spreads ended roughly unchanged.
As a reminder, the Credit Series was created specifically to provide Manning & Napier’s separately managed multi-asset class clients with desired credit exposure (e.g., corporates, asset-backed, and commercial mortgage-backed securities).
The Series experienced slightly positive absolute returns for the year and outperformed on a relative basis, returning 0.02% versus -1.03% for its benchmark, the Bloomberg US Intermediate Credit Index. Outperformance was largely attributable to strong selection within corporates.
As the economic cycle moves forward, we are actively becoming more measured in our approach. Given tight credit spreads across much of the bond market and the prospect of interest rates rising off their post-pandemic lows, fixed income investors can generally expect a more challenging environment going forward.
That stated, while the market continued to look expensive from a valuation perspective; we found select opportunities across various sectors. Specifically, we continued to find attractive opportunities in corporate credits, particularly within the Energy and Financials sectors, and, despite tightening valuations, in select BBB-rated issuances from a bottom-up perspective. Additionally, we continued to view asset-backed securities as relatively attractive and focused on securities with seniority in the capital structure that are backed by asset classes with high-quality fundamentals and low credit risk (e.g., student loans, prime autos, etc.).
Performance for the Credit Series Class W shares is provided above.
Performance data quoted represents past performance and does not guarantee future results. The investment return and principal value of an investment will fluctuate, so that an investor’s shares, when redeemed, may be worth more or less than their original cost. Current performance may be higher or lower than that quoted; investors can obtain the most recent month-end performance at www.manning-napier.com or by calling (800) 466-3863.
Additional information and associated disclosures can be found on the Performance Update page of this report.
All investments involve risks, including possible loss of principal. There is an inverse relationship between bond prices and interest rates; as interest rates rise, bond prices (and therefore the value of bond funds) fall. Likewise, as interest rates fall, bond prices and the value of bond funds rise. Investments in derivatives can be highly volatile and involve risks in addition to the risks of the underlying instrument on which the derivative is based, such as counterparty, correlation and liquidity risk. Also, the use of leverage increases exposure to the market and may magnify potential losses.
2
Credit Series
Performance Update as of December 31, 2021
(unaudited)
| AVERAGE ANNUAL TOTAL RETURNS | ||
| AS OF DECEMBER 31, 2021 | ||
| ONE | TOTAL RETURN | |
| YEAR1 | SINCE INCEPTION1,2 | |
| Credit Series - Class W3 | 0.02% | 5.03% |
| Bloomberg U.S. Intermediate Government/Credit Bond Index4 | (1.03%) | 4.90% |
The following graph compares the value of a $10,000 investment in the Credit Series - Class W from its inception (April 14, 2020) to present (December 31, 2021) to the Bloomberg U.S. Intermediate Credit Index.
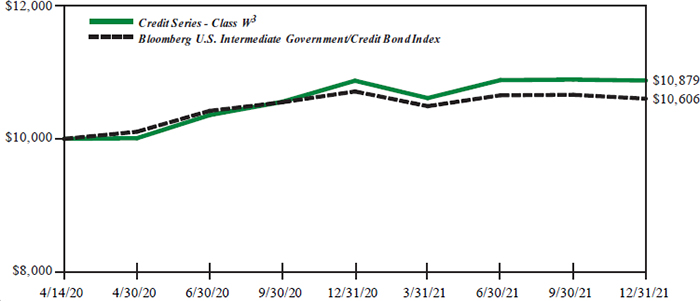
1The returns shown are based on net asset values calculated for shareholder transactions and may differ from the returns shown in the financial highlights, which reflect adjustments made to the net asset values in accordance with accounting principles generally accepted in the United States of America.
2Performance numbers are calculated from April 14, 2020, the Series’ inception date.
3The Series’ performance does not reflect the deduction of taxes that a shareholder would pay on fund distributions or the redemption of shares. The Series’ performance is historical and may not be indicative of future results. The performance returns shown are inclusive of the net expense ratio of the Series. For the period ended December 31, 2021, this annualized net expense ratio was 0.10% for Class W. The annualized gross expense ratio, which does not account for any voluntary or contractual waivers currently in effect, was 0.37% for Class W for the period ended December 31, 2021.
4The Bloomberg U.S. Intermediate Government/Credit Bond Index is a market value-weighted measure of over 3,000 investment-grade corporate and government securities with maturities greater than one year but less than ten years. The Index returns do not reflect any fees or expenses. Index returns provided by Interactive Data. Index data referenced herein is the property of Bloomberg Finance L.P. and its affiliates (“Bloomberg”), and/or its third party suppliers and has been licensed for use by Manning & Napier. Bloomberg and its third party suppliers accept no liability in connection with its use. Data provided is not a representation or warranty, express or implied, as to the ability of any index to accurately represent the asset class or market sector that it purports to represent and none of these parties shall have any liability for any errors, omissions, or interruptions of any index or the data included therein. For additional disclosure information, please see: https://go.manning-napier.com/ benchmark-provisions.
3
Credit Series
Shareholder Expense Example
(unaudited)
As a shareholder of the Series, you incur ongoing costs, including management fees, shareholder service fees and other Series expenses. This example is intended to help you understand your ongoing costs (in dollars) of investing in the Series and to compare these costs with the ongoing costs of investing in other mutual funds.
The example is based on an investment of $1,000 invested at the beginning of the period and held for the entire period (July 1, 2021 to December 31, 2021).
Actual Expenses
The Actual lines of the table below provide information about actual account values and actual expenses. You may use the information in this line, together with the amount you invested, to estimate the expenses that you paid over the period. Simply divide your account value by $1,000 (for example, an $8,600 account value divided by $1,000 = 8.6), then multiply the result by the number in the Actual line under the heading entitled “Expenses Paid During Period” to estimate the expenses you paid on your account during this period.
Hypothetical Example for Comparison Purposes
The Hypothetical line in the table below provides information about hypothetical account values and hypothetical expenses based on the Series’ actual expense ratio and an assumed rate of return of 5% per year before expenses, which is not the Series’ actual return. The hypothetical account values and expenses may not be used to estimate the actual ending account balance or expenses you paid during the period. You may use this information to compare the ongoing costs of investing in a class of the Series and other funds. To do so, compare this 5% hypothetical example for the class in which you have invested with the 5% hypothetical examples that appear in the shareholder reports of the other funds.
Please note that the expenses shown in the table are meant to highlight your ongoing costs only and do not reflect any transaction costs, such as sales charges (loads), redemption fees, or exchange fees that you may incur in other mutual funds. Therefore, the second line of the table is useful in comparing ongoing costs only, and will not help you determine the relative total costs of owning different funds.
| BEGINNING | ENDING | EXPENSES PAID | ANNUALIZED | |
| ACCOUNT VALUE | ACCOUNT VALUE | DURING PERIOD* | EXPENSE | |
| 7/1/21 | 12/31/21 | 7/1/21 - 12/31/21 | RATIO | |
| Class W | ||||
| Actual | $1,000.00 | $999.30 | $0.50 | 0.10% |
| Hypothetical | ||||
| (5% return before expenses) | $1,000.00 | $1,024.70 | $0.51 | 0.10% |
*Expenses are equal to each Series’ annualized expense ratio (for the six-month period), multiplied by the average account value over the period, multiplied by 184/365 (to reflect the one-half year period). Expenses are based on the most recent fiscal half year; therefore, the expense ratios stated above may differ from the expense ratios stated in the financial highlights, which are based on one-year data. The Series’ total return would have been lower had certain expenses not been waived or reimbursed during the period.
4
Credit Series
Portfolio Composition as of December 31, 2021
(unaudited)
| Sector Allocation1 |
1As a percentage of net assets. |
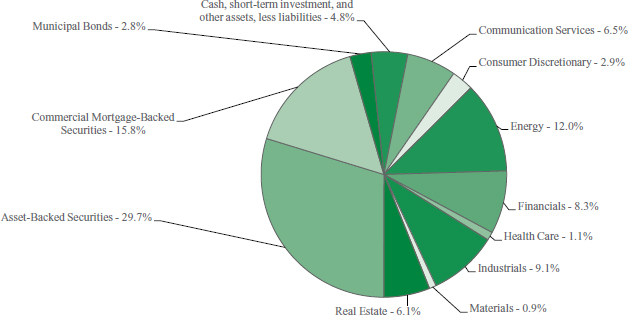
5
Credit Series
Investment Portfolio - December 31, 2021
| PRINCIPAL AMOUNT1/ SHARES1 | VALUE (NOTE 2) | |||||||
| CORPORATE BONDS - 46.9% | ||||||||
| Non-Convertible Corporate Bonds- 46.9% | ||||||||
| Communication Services - 6.5% | ||||||||
| Diversified Telecommunication Services - 2.9% | ||||||||
| Verizon Communications, Inc., 4.272%, 1/15/2036 | 5,140,000 | $ | 6,038,156 | |||||
| Interactive Media & Services - 3.6% | ||||||||
| Tencent Holdings Ltd. (China), 3.975%, 4/11/20292 | 6,770,000 | 7,367,584 | ||||||
| Total Communication Services | 13,405,740 | |||||||
| Consumer Discretionary - 2.9% | ||||||||
| Hotels, Restaurants & Leisure - 1.0% | ||||||||
| Expedia Group, Inc., 3.25%, 2/15/2030 | 1,970,000 | 2,012,301 | ||||||
| Internet & Direct Marketing Retail - 1.9% | ||||||||
| Alibaba Group Holding Ltd. (China), 4.00%, 12/6/2037 | 3,620,000 | 3,933,032 | ||||||
| Total Consumer Discretionary | 5,945,333 | |||||||
| Energy - 12.0% | ||||||||
| Oil, Gas & Consumable Fuels - 12.0% | ||||||||
| BP Capital Markets America, Inc., 3.06%, 6/17/2041 | 4,970,000 | 5,043,980 | ||||||
| Cenovus Energy, Inc. (Canada), 6.75%, 11/15/2039 | 4,480,000 | 6,092,347 | ||||||
| Energy Transfer LP, 6.50%, 2/1/2042 | 3,920,000 | 5,062,535 | ||||||
| Kinder Morgan Energy Partners LP, 6.95%, 1/15/2038 | 3,430,000 | 4,755,780 | ||||||
| The Williams Companies, Inc., 2.60%, 3/15/2031 | 3,810,000 | 3,788,367 | ||||||
| Total Energy | 24,743,009 | |||||||
| Financials - 8.3% | ||||||||
| Banks - 5.5% | ||||||||
| Bank of America Corp., 6.11%, 1/29/2037 | 2,320,000 | 3,127,066 | ||||||
| Citigroup, Inc., 4.45%, 9/29/2027 | 2,940,000 | 3,280,125 | ||||||
| JPMorgan Chase & Co., (U.S. Secured Overnight Financing Rate + 2.515%), 2.956%, 5/13/20313 | 4,840,000 | 5,016,316 | ||||||
| 11,423,507 | ||||||||
| Capital Markets - 1.8% | ||||||||
| Blackstone Secured Lending Fund, 2.75%, 9/16/2026 | 1,880,000 | 1,880,787 | ||||||
| Owl Rock Technology Finance Corp., 3.75%, 6/17/20262 | 1,890,000 | 1,947,813 | ||||||
| 3,828,600 | ||||||||
| Diversified Financial Services - 1.0% | ||||||||
| Blackstone Private Credit Fund, 2.625%, 12/15/20262 | 2,030,000 | 1,980,360 | ||||||
| Total Financials | 17,232,467 | |||||||
| PRINCIPAL AMOUNT1/ SHARES1 | VALUE (NOTE 2) | |||||||
| CORPORATE BONDS (continued) | ||||||||
| Non-Convertible Corporate Bonds (continued) | ||||||||
| Health Care - 1.1% | ||||||||
| Health Care Providers & Services - 1.1% | ||||||||
| HCA, Inc., 4.125%, 6/15/2029 | 2,080,000 | $ | 2,290,760 | |||||
| Industrials - 9.1% | ||||||||
| Airlines - 1.9% | ||||||||
| Southwest Airlines Co., 5.125%, 6/15/2027 | 3,490,000 | 3,992,311 | ||||||
| Road & Rail - 0.9% | ||||||||
| BNSF Funding Trust I, (3 mo. LIBOR US + 2.350%), 6.613%, 12/15/20553 | 1,640,000 | 1,818,350 | ||||||
| Trading Companies & Distributors - 6.3% | ||||||||
| AerCap Ireland Capital DAC - AerCap Global Aviation Trust (Ireland), 3.00%, 10/29/2028 | 4,100,000 | 4,161,520 | ||||||
| Air Lease Corp., 3.625%, 4/1/2027 | 1,760,000 | 1,847,138 | ||||||
| Ashtead Capital, Inc. (United Kingdom), 4.00%, 5/1/20282 | 1,780,000 | 1,860,940 | ||||||
| Avolon Holdings Funding Ltd. (Ireland), 2.75%, 2/21/20282 | 5,250,000 | 5,155,475 | ||||||
| 13,025,073 | ||||||||
| Total Industrials | 18,835,734 | |||||||
| Materials - 0.9% | ||||||||
| Metals & Mining - 0.9% | ||||||||
| Newcastle Coal Infrastructure Group Pty Ltd. (Australia), 4.40%, 9/29/20272 | 1,900,000 | 1,894,666 | ||||||
| Real Estate - 6.1% | ||||||||
| Equity Real Estate Investment Trusts (REITS) - 6.1% | ||||||||
| American Tower Corp., 3.80%, 8/15/2029 | 5,480,000 | 5,967,034 | ||||||
| Crown Castle International Corp., 3.10%, 11/15/2029 | 4,940,000 | 5,160,494 | ||||||
| SBA Tower Trust, 2.328%, 1/15/20282 | 1,400,000 | 1,429,096 | ||||||
| Total Real Estate | 12,556,624 | |||||||
| TOTAL CORPORATE BONDS | ||||||||
| (Identified Cost $95,710,368) | 96,904,333 | |||||||
| ASSET-BACKED SECURITIES - 29.7% | ||||||||
| AMSR Trust, Series 2020-SFR4, Class A, 1.355%, 11/17/20372 | 1,425,000 | 1,389,371 | ||||||
| BRSP Ltd., Series 2021-FL1, Class A, (1 mo. LIBOR US + 1.150%), 1.254%, 8/19/20382,4 | 1,400,000 | 1,394,959 | ||||||
| Business Jet Securities LLC, Series 2021-1A, Class A, 2.162%, 4/15/20362 | 1,289,431 | 1,266,197 | ||||||
| CF Hippolyta LLC, | ||||||||
| Series 2020-1, Class A2, 1.99%, 7/15/20602 | 680,615 | 668,625 | ||||||
The accompanying notes are an integral part of the financial statements.
6
Credit Series
Investment Portfolio - December 31, 2021
| PRINCIPAL AMOUNT1/ SHARES1 | VALUE (NOTE 2) | |||||||
| ASSET-BACKED SECURITIES (continued) | ||||||||
| CF Hippolyta LLC, (continued) | ||||||||
| Series 2020-1, Class B1, 2.28%, 7/15/20602 | 2,163,183 | $ | 2,161,248 | |||||
| Series 2021-1A, Class B1, 1.98%, 3/15/20612 | 916,280 | 902,787 | ||||||
| CLI Funding VIII LLC, Series 2021-1A, Class A, 1.64%, 2/18/20462 | 1,650,386 | 1,611,825 | ||||||
| Commonbond Student Loan Trust, Series 2020-AGS, Class A, 1.98%, 8/25/20502 | 924,072 | 923,223 | ||||||
| Credit Acceptance Auto Loan Trust, | ||||||||
| Series 2020-3A, Class A, 1.24%, 10/15/20292 | 1,600,000 | 1,600,110 | ||||||
| Series 2021-2A, Class A, 0.96%, 2/15/20302 | 800,000 | 795,216 | ||||||
| Series 2021-2A, Class C, 1.64%, 6/17/20302 | 1,000,000 | 986,592 | ||||||
| Series 2021-3A, Class B, 1.38%, 7/15/20302 | 1,300,000 | 1,284,393 | ||||||
| DataBank Issuer, Series 2021-2A, Class A2, 2.40%, 10/25/20512 | 900,000 | 900,056 | ||||||
| EDvestinU Private Education Loan Issue No. 3 LLC, Series 2021-A, Class A, 1.80%, 11/25/20452 | 756,975 | 744,778 | ||||||
| Flexential Issuer, Series 2021-1A, Class A2, 3.25%, 11/27/20512 | 1,525,000 | 1,527,714 | ||||||
| GoldentTree Loan Management U.S. CLO 1 Ltd., Series 2021-9A, Class A, (Cayman Islands) (3 mo. LIBOR US + 1.070%), 1.202%, 1/20/20332,4 | 2,000,000 | 1,999,406 | ||||||
| Goodgreen Trust, Series 2020-1A, Class A, 2.63%, 4/15/20552 | 1,033,988 | 1,031,878 | ||||||
| Hertz Vehicle Financing III LP, Series 2021-2A, Class B, 2.12%, 12/27/20272 | 950,000 | 940,951 | ||||||
| Hotwire Funding LLC, Series 2021-1, Class A2, 2.311%, 11/20/20512 | 1,470,000 | 1,458,746 | ||||||
| KREF Ltd., Series 2021-FL2, Class AS, (1 mo. LIBOR US + 1.300%), 1.409%, 2/15/20392,4 | 1,500,000 | 1,499,375 | ||||||
| Navient Private Education Refi Loan Trust, | ||||||||
| Series 2017-2A, Class A, (1 mo. LIBOR US + 1.050%), 1.153%, 12/27/20662,4 | 2,041,871 | 2,057,796 | ||||||
| Series 2020-DA, Class A, 1.69%, 5/15/20692 | 912,991 | 913,602 | ||||||
| Series 2021-A, Class A, 0.84%, 5/15/20692 | 599,922 | 592,400 | ||||||
| Nelnet Student Loan Trust, Series 2012-3A, Class A, (1 mo. LIBOR US + 0.700%), 0.802%, 2/25/20452,4 | 1,058,215 | 1,052,996 | ||||||
| Neuberger Berman Loan Advisers CLO 40 Ltd., | ||||||||
| Series 2021-40A, Class A, (Cayman Islands) (3 mo. LIBOR US + 1.060%), 1.182%, 4/16/20332,4 | 800,000 | 800,885 | ||||||
| PRINCIPAL AMOUNT1/ SHARES1 | VALUE (NOTE 2) | |||||||
| ASSET-BACKED SECURITIES (continued) | ||||||||
| Neuberger Berman Loan Advisers CLO 40 Ltd., (continued) | ||||||||
| Series 2021-40A, Class B, (Cayman Islands) (3 mo. LIBOR US + 1.400%), 1.522%, 4/16/20332,4 | 1,400,000 | $ | 1,387,153 | |||||
| Oxford Finance Funding LLC, Series 2019-1A, Class A2, 4.459%, 2/15/20272 | 1,229,090 | 1,253,217 | ||||||
| PEAR LLC, Series 2021-1, Class A, 2.60%, 1/15/2034 (Acquired 11/16/2021, cost $2,000,000)5 | 2,000,000 | 1,995,817 | ||||||
| PHEAA Student Loan Trust, Series 2016-1A, Class A, (1 mo. LIBOR US + 1.150%), 1.253%, 9/25/20652,4 | 731,973 | 744,774 | ||||||
| Progress Residential Trust, Series 2020-SFR2, Class A, 2.078%, 6/17/20372 | 500,000 | 501,848 | ||||||
| Slam Ltd., Series 2021-1A, Class A, (Cayman Islands), 2.434%, 6/15/20462 | 1,840,720 | 1,805,114 | ||||||
| SLM Student Loan Trust, | ||||||||
| Series 2011-2, Class A2, (1 mo. LIBOR US + 1.200%), 1.303%, 10/25/20344 | 863,911 | 868,280 | ||||||
| Series 2013-6, Class A3, (1 mo. LIBOR US + 0.650%), 0.753%, 6/25/20554 | 1,659,566 | 1,665,025 | ||||||
| SMB Private Education Loan Trust, | ||||||||
| Series 2015-B, Class A3, (1 mo. LIBOR US + 1.750%), 1.860%, 5/17/20322,4 | 1,830,000 | 1,847,156 | ||||||
| Series 2016-B, Class A2A, 2.43%, 2/17/20322 | 1,329,375 | 1,346,575 | ||||||
| Series 2017-B, Class A2A, 2.82%, 10/15/20352 | 285,098 | 290,512 | ||||||
| Series 2017-B, Class A2B, (1 mo. LIBOR US + 0.750%), 0.860%, 10/15/20352,4 | 1,291,205 | 1,294,968 | ||||||
| SoFi Professional Loan Program LLC, | ||||||||
| Series 2017-F, Class A2FX, 2.84%, 1/25/20412 | 906,474 | 922,139 | ||||||
| Series 2018-B, Class A2FX, 3.34%, 8/25/20472 | 244,121 | 248,350 | ||||||
| Stack Infrastructure Issuer LLC, Series 2021-1A, Class A2, 1.877%, 3/26/20462 | 1,050,000 | 1,032,528 | ||||||
| Store Master Funding I-VII, Series 2018-1A, Class A1, 3.96%, 10/20/20482 | 1,420,516 | 1,450,035 | ||||||
| Textainer Marine Containers VII Ltd., Series 2021-1A, Class A, (China), 1.68%, 2/20/20462 | 1,773,333 | 1,724,454 | ||||||
| Toyota Auto Loan Extended Note Trust, Series 2020-1A, Class A, 1.35%, 5/25/20332 | 2,500,000 | 2,493,723 | ||||||
| Tricon American Homes, | ||||||||
| Series 2017-SFR2, Class A, 2.928%, 1/17/20362 | 1,209,581 | 1,216,156 | ||||||
The accompanying notes are an integral part of the financial statements.
7
Credit Series
Investment Portfolio - December 31, 2021
| PRINCIPAL AMOUNT1/ SHARES1 | VALUE (NOTE 2) | |||||||
| ASSET-BACKED SECURITIES (continued) | ||||||||
| Tricon American Homes, (continued) | ||||||||
| Series 2020-SFR1, Class A, 1.499%, 7/17/20382 | 1,397,661 | $ | 1,373,735 | |||||
| Trinitas CLO XVII Ltd., Series 2021- 17A, Class B1, (Cayman Islands) (3 mo. LIBOR US + 1.700%), 1.838%, 10/20/20342,4 | 1,550,000 | 1,540,925 | ||||||
| Triton Container Finance VIII LLC, Series 2021-1A, Class A, 1.86%, 3/20/20462 | 1,380,969 | 1,352,433 | ||||||
| Vantage Data Centers LLC, Series 2020-1A, Class A2, 1.645%, 9/15/20452 | 1,750,000 | 1,710,754 | ||||||
| VB-S1 Issuer LLC, Series 2020-1A, Class C2, 3.031%, 6/15/20502 | 775,000 | 796,230 | ||||||
| TOTAL ASSET-BACKED SECURITIES | ||||||||
| (Identified Cost $61,472,417) | 61,367,030 | |||||||
| COMMERCIAL MORTGAGE-BACKED SECURITIES - 15.8% | ||||||||
| Brean Asset Backed Securities Trust, Series 2021-RM2, Class A, 1.75%, 10/25/20612,6 | 994,349 | 960,664 | ||||||
| Credit Suisse Mortgage Capital Trust, Series 2013-7, Class A6, 3.50%, 8/25/20432,6 | 312,840 | 314,413 | ||||||
| Fannie Mae REMICS, Series 2021-69, Class WJ, 1.50%, 10/25/2050 | 743,712 | 737,307 | ||||||
| Freddie Mac Multifamily Structured Pass-Through Certificates, | ||||||||
| Series K072, Class A2, 3.444%, 12/25/2027 | 1,000,000 | 1,102,857 | ||||||
| Series K106, Class X1 (IO), 1.354%, 1/25/20306 | 15,959,173 | 1,529,468 | ||||||
| FREMF Mortgage Trust, | ||||||||
| Series 2015-K43, Class B, 3.732%, 2/25/20482,6 | 400,000 | 422,598 | ||||||
| Series 2015-K720, Class B, 3.390%, 7/25/20222,6 | 2,500,000 | 2,527,949 | ||||||
| GCT Commercial Mortgage Trust, Series 2021-GCT, Class A, (1 mo. LIBOR US + 0.800%), 0.91%, 2/15/20382,4 | 1,900,000 | 1,897,719 | ||||||
| GS Mortgage Securities Corp. Trust, Series 2019-70P, Class A, (1 mo. LIBOR US + 1.000%), 1.11%, 10/15/20362,4 | 1,500,000 | 1,495,279 | ||||||
| GS Mortgage-Backed Securities Corp. Trust, | ||||||||
| Series 2020-PJ3, Class A14, 3.00%, 10/25/20502,6 | 336,628 | 339,379 | ||||||
| Series 2021-INV1, Class A6, 2.50%, 12/25/20512,6 | 993,584 | 1,003,917 | ||||||
| Series 2021-PJ6, Class A8, 2.50%, 11/25/20512,6 | 656,510 | 663,320 | ||||||
| PRINCIPAL AMOUNT1/ SHARES1 | VALUE (NOTE 2) | |||||||
| COMMERCIAL MORTGAGE-BACKED SECURITIES (continued) | ||||||||
| GS Mortgage-Backed Securities Corp. Trust, (continued) | ||||||||
| Series 2021-PJ9, Class A8, 2.50%, 2/26/20522,6 | 763,407 | $ | 771,292 | |||||
| Imperial Fund Mortgage Trust, Series 2021-NQM3, Class A1, 1.595%, 11/25/20562,6 | 926,108 | 918,402 | ||||||
| J.P. Morgan Chase Commercial Mortgage Securities Trust, Series 2019-ICON, Class A, 3.884%, 1/5/20342 | 2,000,000 | 2,057,193 | ||||||
| JPMDB Commercial Mortgage Securities Trust, Series 2017-C5, Class A5, 3.694%, 3/15/2050 | 1,496,000 | 1,614,010 | ||||||
| Morgan Stanley Bank of America Merrill Lynch Trust, Series 2014-C19, Class A4, 3.526%, 12/15/2047 | 965,361 | 1,013,331 | ||||||
| Morgan Stanley Capital I Trust, | ||||||||
| Series 2016-UB11, Class A4, 2.782%, 8/15/2049 | 500,000 | 519,119 | ||||||
| Series 2018-H3, Class A5, 4.177%, 7/15/2051 | 1,000,000 | 1,121,346 | ||||||
| Series 2020-CNP, Class A, 2.428%, 4/5/20422,6 | 1,000,000 | 1,005,310 | ||||||
| NewRez Warehouse Securitization Trust, Series 2021-1, Class A, (1 mo. LIBOR US + 0.750%), 0.852%, 5/25/20552,4 | 2,000,000 | 1,995,350 | ||||||
| Provident Funding Mortgage Trust, | ||||||||
| Series 2021-2, Class A2A, 2.00%, 4/25/20512,6 | 806,950 | 809,093 | ||||||
| Series 2021-INV1, Class A1, 2.50%, 8/25/20512,6 | 1,526,307 | 1,540,378 | ||||||
| RCKT Mortgage Trust, Series 2021-6, Class A1, 2.50%, 12/25/20512,6 | 950,000 | 944,582 | ||||||
| Sequoia Mortgage Trust, Series 2013- 5, Class A1, 2.50%, 5/25/20432,6 | 583,546 | 580,412 | ||||||
| UBS Commercial Mortgage Trust, Series 2017-C7, Class A4, 3.679%, 12/15/2050 | 1,000,000 | 1,083,292 | ||||||
| Wells Fargo Commercial Mortgage Trust, | ||||||||
| Series 2015-C30, Class A4, 3.664%, 9/15/2058 | 1,500,000 | 1,598,860 | ||||||
| Series 2015-NXS4, Class A4, 3.718%, 12/15/2048 | 1,000,000 | 1,071,685 | ||||||
| Series 2021-SAVE, Class A, (1 mo. LIBOR US + 1.150%), 1.26%, 2/15/20402,4 | 909,022 | 909,914 | ||||||
| TOTAL COMMERCIAL MORTGAGE- BACKED SECURITIES | ||||||||
| (Identified Cost $32,277,105) | 32,548,439 | |||||||
| MUNICIPAL BONDS - 2.8% | ||||||||
| Hawaii, Series GC, G.O. Bond, 2.632%, 10/1/2037 | 2,240,000 | 2,278,013 | ||||||
The accompanying notes are an integral part of the financial statements.
8
Credit Series
Investment Portfolio - December 31, 2021
| PRINCIPAL AMOUNT1/ SHARES1 | VALUE (NOTE 2) | |||||||
| MUNICIPAL BONDS (continued) | ||||||||
| New York City Transitional Finance Authority, Future Tax Secured, Public Impt., Revenue Bond, 1.58%, 5/1/2024 | 985,000 | $ | 995,313 | |||||
| South Carolina Public Service Authority, Series B, Revenue Bond, 2.329%, 12/1/2028 | 1,355,000 | 1,390,636 | ||||||
| Tampa-Hillsborough County Expressway Authority, Series B, Revenue Bond, BAM, 1.892%, 7/1/2029 | 1,000,000 | 995,410 | ||||||
| TOTAL MUNICIPAL BONDS | ||||||||
| (Identified Cost $5,685,808) | 5,659,372 | |||||||
| SHORT-TERM INVESTMENT - 4.3% | ||||||||
| Dreyfus Government Cash Management, Institutional Shares, 0.03%7 | ||||||||
| (Identified Cost $8,931,584) | 8,931,584 | 8,931,584 | ||||||
| TOTAL INVESTMENTS - 99.5% | ||||||||
| (Identified Cost $204,077,282) | 205,410,758 | |||||||
| OTHER ASSETS, LESS LIABILITIES - 0.5% | 1,066,365 | |||||||
| NET ASSETS - 100% | $ | 206,477,123 | ||||||
CLO - Collateralized Loan Obligation
G.O. Bond - General Obligation Bond
Impt. - Improvement
IO - Interest only
LIBOR - London Interbank Offered Rate
No. - Number
REMICS - Real Estate Mortgage Investment Conduits
Scheduled principal and interest payments are guaranteed by:
BAM (Build America Mutual Assurance Co.)
The insurance does not guarantee the market value of the municipal bonds.
1Amount is stated in USD unless otherwise noted.
2Security purchased or received in a transaction exempt from registration under the Securities Act of 1933, as amended (the “1933 Act”) and determined to be liquid under the Fund’s Liquidity Risk Management Program. The security may be resold pursuant to an exemption from registration under the 1933 Act, typically to qualified institutional buyers. The aggregate value of these securities at December 31, 2021 was $99,631,006, which represented 48.3% of the Series’ Net Assets.
3Variable rate security. Security may be issued at a fixed coupon rate, which converts to a variable rate at a specified date. Rate shown is the rate in effect as of December 31, 2021.
4Floating rate security. Rate shown is the rate in effect as of December 31, 2021.
5Security purchased or received in a transaction exempt from registration under the Securities Act of 1933, as amended (the “1933 Act”) and determined to be illiquid under the Fund’s Liquidity Risk Management Program. The security may be resold pursuant to an exemption from registration under the 1933 Act, typically to qualified institutional buyers. The aggregate value of such securities at December 31, 2021 was $1,995,817, or 1.0% of the Series’ Net Assets.
6Variable or floating rate security, the interest rate of which adjusts periodically based on changes in current interest rates and prepayments on the underlying pool of assets. Rate shown is the rate in effect as of December 31, 2021.
7Rate shown is the current yield as of December 31, 2021.
The accompanying notes are an integral part of the financial statements.
9
Credit Series
Investment Portfolio - December 31, 2021
The Global Industry Classification Standard (GICS) was developed by and is the exclusive property and a service mark of MSCI Inc. (MSCI) and Standard & Poor’s, a division of S&P Global Inc. (S&P), and is licensed for use by Manning & Napier when referencing GICS sectors. Neither MSCI, S&P, nor any third party involved in making or compiling the GICS or any GICS classifications makes any express or implied warranties or representations with respect to such standard or classification, nor shall any such party have any liability therefrom.
The accompanying notes are an integral part of the financial statements.
10
Credit Series
Statement of Assets and Liabilities
December 31, 2021
| ASSETS: | ||||
| Investments, at value (identified cost $204,077,282) (Note 2) | $ | 205,410,758 | ||
| Receivable from Advisor (Note 3) | 2,410 | |||
| Interest receivable | 1,096,490 | |||
| Receivable for fund shares sold | 8,273 | |||
| Dividends receivable | 191 | |||
| Prepaid expenses | 5,179 | |||
| TOTAL ASSETS | 206,523,301 | |||
| LIABILITIES: | ||||
| Accrued fund accounting and administration fees (Note 3) | 22,911 | |||
| Accrued Chief Compliance Officer service fees (Note 3) | 1,531 | |||
| Payable for fund shares repurchased | 8,634 | |||
| Audit fees payable | 7,706 | |||
| Accrued printing and postage fees payable | 3,908 | |||
| Other payables and accrued expenses | 1,488 | |||
| TOTAL LIABILITIES | 46,178 | |||
| TOTAL NET ASSETS | $ | 206,477,123 | ||
| NET ASSETS CONSIST OF: | ||||
| Capital stock | $ | 203,438 | ||
| Additional paid-in-capital | 204,808,681 | |||
| Total distributable earnings (loss) | 1,465,004 | |||
| TOTAL NET ASSETS | $ | 206,477,123 | ||
| NET ASSET VALUE, OFFERING PRICE AND REDEMPTION PRICE PER SHARE - Class W ($206,477,123/20,343,804 shares) | $ | 10.15 | ||
The accompanying notes are an integral part of the financial statements.
11
Credit Series
Statement of Operations
For the Year Ended December 31, 2021
| INVESTMENT INCOME: | ||||
| Interest (net of foreign taxes withheld, $6,316) | $ | 4,539,470 | ||
| Dividends | 81,905 | |||
| Other Income | 18,791 | |||
| Total Investment Income | 4,640,166 | |||
| EXPENSES: | ||||
| Management fees (Note 3) | 498,920 | |||
| Fund accounting and administration fees (Note 3) | 66,669 | |||
| Directors’ fees (Note 3) | 23,618 | |||
| Chief Compliance Officer service fees (Note 3) | 6,123 | |||
| Audit fees | 53,472 | |||
| Offering and Organizational expenses | 16,165 | |||
| Custodian fees | 9,942 | |||
| Miscellaneous | 57,593 | |||
| Total Expenses | 732,502 | |||
| Less reduction of expenses (Note 3) | (532,933 | ) | ||
| Net Expenses | 199,569 | |||
| NET INVESTMENT INCOME | 4,440,597 | |||
| REALIZED AND UNREALIZED GAIN (LOSS) ON INVESTMENTS: | ||||
| Net realized gain (loss) on investments | 3,919,220 | |||
| Net change in unrealized appreciation (depreciation) on investments | (8,155,311 | ) | ||
| NET REALIZED AND UNREALIZED GAIN (LOSS) ON INVESTMENTS | (4,236,091 | ) | ||
| NET INCREASE IN NET ASSETS RESULTING FROM OPERATIONS | $ | 204,506 |
The accompanying notes are an integral part of the financial statements.
12
Credit Series
Statements of Changes in Net Assets
| FOR THE | FOR THE PERIOD | |||||
| YEAR ENDED | 4/14/201 TO | |||||
| 12/31/21 | 12/31/20 | |||||
| INCREASE (DECREASE) IN NET ASSETS: | ||||||
| OPERATIONS: | ||||||
| Net investment income | $ | 4,440,597 | $ | 3,116,465 | ||
| Net realized gain (loss) on investments | 3,919,220 | 2,137,540 | ||||
| Net change in unrealized appreciation (depreciation) on investments | (8,155,311 | ) | 9,488,787 | |||
| Net increase (decrease) from operations | 204,506 | 14,742,792 | ||||
| DISTRIBUTIONS TO SHAREHOLDERS (Note 8): | ||||||
| Class W | (8,777,239 | ) | (4,705,055 | ) | ||
| CAPITAL STOCK ISSUED AND REPURCHASED: | ||||||
| Net increase (decrease) from capital share transactions (Note 5) | 22,923,299 | 182,088,820 | ||||
| Net increase (decrease) in net assets | 14,350,566 | 192,126,557 | ||||
| NET ASSETS: | ||||||
| Beginning of period | 192,126,557 | – | ||||
| End of period | $ | 206,477,123 | $ | 192,126,557 | ||
1Commencement of operations.
The accompanying notes are an integral part of the financial statements.
13
Credit Series
Financial Highlights - Class W
| FOR THE | FOR THE PERIOD | |||||
| YEAR ENDED | 4/14/201 TO | |||||
| 12/31/21 | 12/31/20 | |||||
| Per share data (for a share outstanding throughout each period): | ||||||
| Net asset value - Beginning of period | $ | 10.60 | $ | 10.00 | ||
| Income from investment operations: | ||||||
| Net investment income2 | 0.23 | 0.19 | ||||
| Net realized and unrealized gain (loss) on investments | (0.22 | ) | 0.68 | |||
| Total from investment operations | 0.01 | 0.87 | ||||
| Less distributions to shareholders: | ||||||
| From net investment income | (0.24 | ) | (0.18 | ) | ||
| From net realized gain on investments | (0.22 | ) | (0.09 | ) | ||
| Total distributions to shareholders | (0.46 | ) | (0.27 | ) | ||
| Net asset value - End of period | $ | 10.15 | $ | 10.60 | ||
| Net assets - End of period (000’s omitted) | $ | 206,477 | $ | 192,127 | ||
| Total return3 | 0.02% | 8.77% | ||||
| Ratios (to average net assets)/Supplemental Data: | ||||||
| Expenses* | 0.10% | 0.10%4 | ||||
| Net investment income | 2.23% | 2.52%4 | ||||
| Series portfolio turnover | 69% | 44% | ||||
| *The investment advisor did not impose all or a portion of its management and/or other fees during the periods, and may have paid a portion of the Series’ expenses. If these expenses had been incurred by the Class, the expense ratio (to average net assets) would have increased by the following amounts: | ||||||
| 0.27% | 0.33%4 | |||||
1Commencement of operations.
2Calculated based on average shares outstanding during the periods.
3Represents aggregate total return for the periods indicated, and assumes reinvestment of all distributions. Total return would have been lower had certain expenses not been waived or reimbursed during the periods. Periods less than one year are not annualized.
4Annualized.
The accompanying notes are an integral part of the financial statements.
14
Credit Series
Notes to Financial Statements
| 1. | Organization |
Credit Series (the “Series”) is a no-load non-diversified series of Manning & Napier Fund, Inc. (the “Fund”). The Fund is organized in Maryland and is registered under the Investment Company Act of 1940, as amended, as an open-end management investment company.
The Series’ investment objective is to provide long-term total return by investing primarily in fixed income securities.
The Fund’s advisor is Manning & Napier Advisors, LLC (the “Advisor”). Shares are only offered to discretionary investment accounts and other funds managed by the Advisor. The total authorized capital stock of the Fund consists of 15 billion shares of common stock each having a par value of $0.01. As of December 31, 2021, 6.3 billion shares have been designated in total among 15 series, of which 100 million have been designated as Credit Series Class W common stock.
| 2. | Significant Accounting Policies |
The following is a summary of significant accounting policies followed by the Series. The Series is an investment company and, accordingly, follows the investment company accounting and reporting guidance of the Financial Accounting Standards Board Accounting Standards Codification Topic 946 - Investment Companies, which is part of accounting principles generally accepted in the United States of America (“GAAP”).
Security Valuation
Portfolio securities, including domestic equities, foreign equities, warrants and options, listed on an exchange other than the NASDAQ Stock Market are valued at the latest quoted sales price of the exchange on which the security is primarily traded. Securities not traded on valuation date or securities not listed on an exchange are valued at the latest quoted bid price provided by the Fund’s pricing service. Securities listed on the NASDAQ Stock Market are valued in accordance with the NASDAQ Official Closing Price.
Debt securities, including government bonds, foreign bonds, asset-backed securities, structured notes, supranational obligations, sovereign bonds, corporate bonds and mortgage-backed securities will normally be valued on the basis of evaluated bid prices provided directly by an independent pricing service (the “Service”). The pricing services use multiple valuation techniques to determine fair value. In instances where sufficient market activity exists, the pricing services may utilize a market-based approach through which quotes from market makers are used to determine fair value. In instances where sufficient market activity may not exist or is limited, the pricing services also utilize proprietary valuation models which may consider market characteristics such as benchmark yield curves, option-adjusted spreads, credit spreads, estimated default rates, coupon rates, anticipated timing of principal repayments, underlying collateral, and other unique security features in order to estimate the relevant cash flows, which are then discounted to calculate the fair value. Certain investments in securities held by the Series may be valued on a basis of a price provided directly by a principal market maker. These prices may differ from the value that would have been used had a broader market for securities existed.
Municipal securities will normally be valued on the basis of market valuations provided by the Service. The Service utilizes the latest price quotations and a matrix system (which considers such factors as security prices of similar securities, yields, maturities and ratings). The Service has been approved by the Fund’s Board of Directors (the “Board”).
Short-term investments that mature in sixty days or less may be valued at amortized cost, which approximates fair value. Investments in open-end investment companies are valued at their net asset value per share on valuation date.
Volume and level of activity in established markets for an asset or liability are evaluated to determine whether recent transactions and quoted prices are determinative of fair value. Where there have been significant decreases in volume and level of activity, further analysis and adjustment may be necessary to estimate fair value. The Series measures fair value in these instances by the use of inputs and valuation techniques which may be based upon current market prices of securities that are comparable in coupon, rating, maturity and industry and/or expectation of future cash flows. As a result of trading in relatively thin markets and/or markets that experience significant volatility, the prices used by the Series to value these securities may differ from the value that would be realized if these securities were sold, and the differences could be material.
15
Credit Series
Notes to Financial Statements (continued)
| 2. | Significant Accounting Policies (continued) |
Security Valuation (continued)
Securities for which representative valuations or prices are not available from the Series’ pricing service may be valued at fair value as determined in good faith by the Advisor under procedures approved by and under the general supervision and responsibility of the Fund’s Board of Directors (the “Board”). Due to the inherent uncertainty of valuations of such securities, the fair value may differ significantly from the values that would have been used had a ready market for such securities existed. If trading or events occurring after the close of the principal market in which securities are traded are expected to materially affect the value of those securities, then they may be valued at their fair value, taking this trading or these events into account.
Various inputs are used in determining the value of the Series’ assets or liabilities carried at fair value. These inputs are summarized in three broad levels. Level 1 includes quoted prices in active markets for identical assets and liabilities. Level 2 includes other significant observable inputs (including quoted prices for similar securities, interest rates, prepayment speeds, credit risk, etc.). Level 3 includes significant unobservable inputs (including the Series’ own assumptions in determining the fair value of investments). A financial instrument’s level within the fair value hierarchy is based on the lowest level of any input both individually and in aggregate that is significant to the fair value measurement. The inputs or methodology used for valuing securities are not necessarily an indication of the risk associated with investing in those securities.
The following is a summary of the valuation levels used for major security types as of December 31, 2021 in valuing the Series’ assets or liabilities carried at fair value:
| DESCRIPTION | TOTAL | LEVEL 1 | LEVEL 2 | LEVEL 3 | ||||||||||||
| Assets: | ||||||||||||||||
| Debt securities: | ||||||||||||||||
| States and political subdivisions (municipals) | $ | 5,659,372 | $ | — | $ | 5,659,372 | $ | — | ||||||||
| Corporate debt: | ||||||||||||||||
| Communication Services | 13,405,740 | — | 13,405,740 | — | ||||||||||||
| Consumer Discretionary | 5,945,333 | — | 5,945,333 | — | ||||||||||||
| Energy | 24,743,009 | — | 24,743,009 | — | ||||||||||||
| Financials | 17,232,467 | — | 17,232,467 | — | ||||||||||||
| Health Care | 2,290,760 | — | 2,290,760 | — | ||||||||||||
| Industrials | 18,835,734 | — | 18,835,734 | — | ||||||||||||
| Materials | 1,894,666 | — | 1,894,666 | — | ||||||||||||
| Real Estate | 12,556,624 | — | 12,556,624 | — | ||||||||||||
| Asset-backed securities | 61,367,030 | — | 61,367,030 | — | ||||||||||||
| Commercial mortgage-backed securities | 32,548,439 | — | 32,548,439 | — | ||||||||||||
| Short-Term Investment | 8,931,584 | 8,931,584 | — | — | ||||||||||||
| Total assets | $ | 205,410,758 | $ | 8,931,584 | $ | 196,479,174 | $ | — | ||||||||
There were no Level 3 securities held by the Series as of December 31, 2020 or December 31, 2021.
LIBOR Transition Risk
The United Kingdom’s Financial Conduct Authority announced a phase out of the London Interbank Offered Rate (“LIBOR”). Although many LIBOR rates will cease to be published or no longer will be representative of the underlying market they seek to measure after December 31, 2021, a selection of widely used USD LIBOR rates will continue to be published through June 2023 in order to assist with the transition. The Series may be exposed to financial instruments tied to LIBOR to determine payment obligations, financing terms, hedging strategies or investment value. The transition process away from LIBOR might lead to increased volatility and illiquidity in markets for, and reduce the effectiveness of new hedges placed against, instruments whose terms currently include LIBOR. The ultimate effect of the LIBOR transition process on the Series is uncertain.
16
Credit Series
Notes to Financial Statements (continued)
| 2. | Significant Accounting Policies (continued) |
Security Transactions, Investment Income and Expenses
Security transactions are accounted for on trade date. Dividend income is recorded on the ex-dividend date, except that if the ex-dividend date has passed, certain dividends from foreign securities are recorded as soon as the Series is informed of the ex-dividend date. Non-cash dividends, if any, are recorded at the fair value of the securities received. Interest income, including amortization of premium and accretion of discounts using the effective interest method, is earned from settlement date and accrued daily.
Expenses are recorded on an accrual basis. Most expenses of the Fund can be attributed to a specific series. Expenses which cannot be directly attributed are apportioned among the series in the Fund in such a manner as deemed equitable by the Fund’s Board, taking into consideration, among other things, the nature and type of expense.
The Series uses the identified cost method for determining realized gain or loss on investments for both financial statement and federal income tax reporting purposes.
Organization and Offering Costs
Upon commencement of operations, organization costs associated with the establishment of the Series were expensed by the Series. Offering costs are amortized over a 12-month period beginning with the commencement of operations.
Foreign Currency Translation
The books and records of the Series are maintained in U.S. dollars. Foreign currencies, investments and other assets and liabilities are translated into U.S. dollars at the current exchange rates. Purchases and sales of investment securities and income and expenses are translated on the respective dates of such transactions. The Series does not isolate realized and unrealized gains and losses attributable to changes in the exchange rates from gains and losses that arise from changes in the fair value of investments. Such fluctuations are included with net realized and unrealized gain or loss on investments. Net realized foreign currency gains and losses represent foreign currency gains and losses between trade date and settlement date on securities transactions, gains and losses on disposition of foreign currencies and the difference between the amount of income and foreign withholding taxes recorded on the books of the Series and the amounts actually received or paid.
Asset-Backed Securities
The Series may invest in asset-backed securities. Asset-backed securities are generally issued as pass-through certificates or as debt instruments. Asset-backed securities issued as pass-through certificates represent undivided fractional ownership interests in an underlying pool of assets. Asset-backed securities issued as debt instruments, which are also known as collateralized obligations, are typically issued as the debt of a special purpose entity organized solely for the purpose of owning such assets and issuing such debt. Asset-backed securities are often backed by a pool of assets representing the obligations of a number of different parties. The yield characteristics of certain asset-backed securities may differ from traditional debt securities. One such major difference is that all or a principal part of the obligations may be prepaid at any time because the underlying assets (i.e. loans) may be prepaid at any time. As a result, a decrease in interest rates in the market may result in increases in the level of prepayments as borrowers, particularly mortgagors, refinance and repay their loans. An increased prepayment rate with respect to an asset-backed security will have the effect of shortening the maturity of the security. In addition, the Series may subsequently have to reinvest the proceeds at lower interest rates. If the Series has purchased such an asset-backed security at a premium, a faster than anticipated prepayment rate could result in a loss of principal to the extent of the premium paid.
Mortgage-Backed Securities
The Series may invest in mortgage-backed securities (“MBS” or pass-through certificates) that represent an interest in a pool of specific underlying mortgage loans and entitle the Series to the periodic payments of principal and interest from those mortgages. MBS may be issued by government agencies or corporations, or private issuers. Most MBS issued by government agencies are guaranteed; however, the degree of protection differs based on the issuer. For MBS there are a number of important differences among the agencies and instrumentalities of the U.S. Government that issue mortgage-related securities and among the securities that they issue. For example, mortgage-related securities guaranteed by Ginnie Mae are guaranteed as to the timely payment of principal and interest by Ginnie Mae and such guarantee is backed by the full faith and credit of the United States.
17
Credit Series
Notes to Financial Statements (continued)
| 2. | Significant Accounting Policies (continued) |
Mortgage-Backed Securities (continued)
However, mortgage-related securities issued by Freddie Mac and Fannie Mae, including Freddie Mac and Fannie Mae guaranteed mortgage pass-through certificates, which are solely the obligations of Freddie Mac and Fannie Mae, are not backed by or entitled to the full faith and credit of the United States, but are supported by the right of the issuer to borrow from the U.S. Treasury. Non-agency mortgage-backed securities are securities issued by non-governmental issuers and have no direct or indirect government guarantees of payment and are subject to various risks. Non-agency mortgage loans are obligations of the borrowers thereunder only and are not typically insured or guaranteed by any other person or entity. The ability of a borrower to repay a loan is dependent upon the income or assets of the borrower. A number of factors, including a general economic downturn, acts of God, terrorism, social unrest and civil disturbances, may impair a borrower’s ability to repay its loans.
Inflation-Indexed Bonds
The Series may invest in inflation-indexed bonds. Inflation-indexed bonds are fixed income securities whose principal value is periodically adjusted according to the rate of inflation. If the index measuring inflation rises or falls, the principal value of inflation-indexed bonds will be adjusted upward or downward, and consequently the interest payable on these securities (calculated with respect to a larger or smaller principal amount) will be increased or reduced, respectively. Any upward or downward adjustment in the principal amount of an inflation-indexed bond will be included as interest income in the Statement of Operations, even though investors do not receive their principal until maturity. Repayment of the original bond principal upon maturity (as adjusted for inflation) is guaranteed in the case of U.S. Treasury inflation-indexed bonds. For bonds that do not provide a similar guarantee, the adjusted principal value of the bond repaid at maturity may be less than the original principal.
Securities Purchased on a When-Issued Basis or Forward Commitment
The Series may purchase securities on a when-issued basis or forward commitment. These transactions involve a commitment by the Series to purchase securities for a predetermined price with payment and delivery taking place beyond the customary settlement period. When such purchases are outstanding, the Series will designate liquid assets in an amount sufficient to meet the purchase price. When purchasing a security on a delayed delivery basis, the Series assumes the rights and risks of ownership of the security, including the risk of price and yield fluctuations, and takes such fluctuations into account when determining its net asset value. The Series may sell the when-issued securities before they are delivered, which may result in a capital gain or loss. No such investments were held by the Series on December 31, 2021.
In connection with its ability to purchase or sell securities on a forward commitment basis, the Series may enter into forward roll transactions principally using To Be Announced (TBA) securities. Forward roll transactions require the sale of securities for delivery in the current month, and a simultaneous agreement to repurchase substantially similar (same type, coupon and maturity) securities on a specified future date. Risks of entering into forward roll transactions include the potential inability of the counterparty to meet the terms of the agreement; the potential of the Series to receive inferior securities at redelivery as compared to the securities sold to the counterparty; counterparty credit risk; and the potential pay down speed variance between the mortgage-backed pools. During the roll period, the Series forgoes principal and interest paid on the securities. The Series accounts for such dollar rolls as purchases and sales. Information regarding securities purchased on a when-issued basis is included in the Series’ Investment Portfolio. No such investments were held by the Series on December 31, 2021.
Restricted Securities
Restricted securities are purchased in private placement transactions, are not registered under the Securities Act of 1933, as amended, and may have contractual restrictions on resale. Information regarding restricted securities is included at the end of the Series’ Investment Portfolio.
Federal Taxes
The Series’ policy is to comply with the provisions of the Internal Revenue Code applicable to regulated investment companies. The Series is not subject to federal income tax or excise tax to the extent that the Series distributes to shareholders each year its taxable income, including any net realized gains on investments, in accordance with requirements of the Internal Revenue Code. Accordingly, no provision for federal income tax or excise tax has been made in the financial statements.
18
Credit Series
Notes to Financial Statements (continued)
| 2. | Significant Accounting Policies (continued) |
Federal Taxes (continued)
Management evaluates its tax positions to determine if the tax positions taken meet the minimum recognition threshold in connection with accounting for uncertainties in income tax positions taken or expected to be taken for the purposes of measuring and recognizing tax liabilities in the financial statements. Recognition of tax benefits of an uncertain tax position is required only when the position is “more likely than not” to be sustained assuming examination by taxing authorities. At December 31, 2021, the Series has recorded no liability for net unrecognized tax benefits relating to uncertain income tax positions taken or expected to be taken in future tax returns.
The Series files income tax returns in the U.S. federal jurisdiction, various states and foreign jurisdictions, as required. No income tax returns are currently under investigation. The statute of limitations on the Series’ tax returns remains open for the period ended December 31, 2020 and for the year ended December 31, 2021. The Series is not aware of any tax positions for which it is reasonably possible that the total amounts of unrecognized tax benefits will significantly change in the next twelve months.
Foreign Taxes
Based on the Series’ understanding of the tax rules and rates related to income, gains and currency purchase/repatriation transactions for foreign jurisdictions in which it invests, the Series will provide for foreign taxes, and where appropriate, deferred foreign tax.
Distributions of Income and Gains
Distributions to shareholders of net investment income are made quarterly. Distributions of net realized gains are made annually. An additional distribution may be necessary to avoid taxation of the Series. Distributions are recorded on the ex-dividend date.
Indemnifications
The Fund’s organizational documents provide former and current directors and officers with a limited indemnification against liabilities arising in connection with the performance of their duties to the Fund. In the normal course of business, the Fund may also enter into contracts that provide general indemnifications. The Fund’s maximum exposure under these arrangements is unknown as this would be dependent on future claims that may be made against the Fund. The risk of material loss from such claims is considered remote.
Other
The preparation of financial statements in conformity with GAAP requires management to make estimates and assumptions that affect the reported amounts of assets and liabilities and the disclosure of contingent assets and liabilities at the date of the financial statements and the reported amounts of income and expenses during the reporting period. Actual results could differ from those estimates.
| 3. | Transactions with Affiliates |
The Fund has an Investment Advisory Agreement (the “Agreement”) with the Advisor, for which the Series pays a fee, computed daily and payable monthly, at an annual rate of 0.25% of the Series’ average daily net assets.
Under the Agreement, personnel of the Advisor provide the Series with advice and assistance in the choice of investments and the execution of securities transactions, and otherwise maintain the Series’ organization. The Advisor also provides the Fund with necessary office space and fund administration and support services. The salaries of all officers of the Fund (except a percentage of the Fund’s Chief Compliance Officer’s salary, which is paid by the Fund), and of all Directors who are “affiliated persons” of the Fund, or of the Advisor, and all personnel of the Fund, or of the Advisor, performing services relating to research, statistical and investment activities, are paid by the Advisor. Each “non-affiliated” Director receives an annual stipend, which is allocated among all the active series of the Fund. In addition, these Directors also receive a fee per Board meeting attended plus a fee for each committee meeting attended and are reimbursed for travel and other out-of-pocket expenses incurred by them in connection with attending such meetings. The Fund also has an Audit Committee Chair, Governance & Nominating Committee Chair and Lead Independent Director who each receive an additional annual stipend for these roles.
19
Credit Series
Notes to Financial Statements (continued)
| 3. | Transactions with Affiliates (continued) |
Manning & Napier Investor Services, Inc., a registered broker-dealer affiliate of the Advisor, acts as distributor for the Fund’s shares. There are no distribution and service fees on the Class W shares.
Pursuant to a master services agreement dated February 13, 2020, as amended, the Fund pays the Advisor an annual fee related to fund accounting and administration of 0.0085% on the first $25 billion of average daily net assets; 0.0075% on the next $15 billion of average daily net assets; and 0.0065% of average daily net assets in excess of $40 billion; plus a base fee of $30,400 per series. Additionally, certain transaction and out-of-pocket expenses, including charges for reporting relating to the Fund’s compliance program, are charged. The Advisor has agreements with BNY Mellon Investment Servicing (U.S.) Inc. (“BNY”) under which BNY serves as sub-accountant services agent.
Pursuant to an advisory fee waiver agreement, the Advisor has contractually agreed to waive the management fee for the Class W shares. The full management fee will be waived under this agreement because Class W shares are only available to discretionary investment accounts and other accounts managed by the Advisor. These clients pay a management fee to the Advisor that is separate from the Fund’s expenses. In addition, pursuant to a separate expense limitation agreement, the Advisor has contractually agreed to limit its fees and reimburse expenses to the extent necessary so that the total direct annual fund operating expenses, exclusive of waived Class W management fees (collectively, “excluded expenses”), do not exceed 0.10% of the average daily net assets of the Class W shares. These contractual waivers are expected to continue indefinitely, and may not be amended or terminated by the Advisor without the approval of the Series’ Board of Directors. The Advisor may receive from a Class the difference between the Class’s total direct annual fund operating expenses, not including excluded expenses, and the Class’s contractual expense limit to recoup all or a portion of its prior fee waivers (other than Class W management fee waivers) or expense reimbursements made during the rolling three-year period preceding the recoupment if at any point the total direct annual fund operating expenses, not including excluded expenses, are below the contractual expense limit (a) at the time of the fee waiver and/or expense reimbursement and (b) at the time of the recoupment.
Pursuant to the advisory fee waiver, the Advisor waived $498,920 in management fees for Class W for the year ended December 31, 2021. In addition, pursuant to the separate expense limitation agreement, the Advisor waived or reimbursed expenses of $34,013 for Class W shares, respectively, for the year ended December 31, 2021. These amounts are included as a reduction of expenses on the Statement of Operations.
As of December 31, 2021, the class specific waivers or reimbursements subject to possible future recoupment under the expense limitation agreement are as follows:
| CLASS | EXPIRING DECEMBER 31, | ||||||||
| 2023 | 2024 | TOTAL | |||||||
| Class W | $ | 93,809 | $ | 34,013 | $ | 127,822 | |||
For the year ended December 31, 2021, the Advisor did not recoup any expenses that have been previously waived or reimbursed.
| 4. | Purchases and Sales of Securities |
For the year ended December 31, 2021, purchases and sales of securities, other than U.S. Government securities and short-term securities, were $132,593,585 and $115,973,134, respectively. Purchases and sales of U.S. Government securities, other than short-term securities, were $17,298,170 and $16,707,049, respectively.
20
Credit Series
Notes to Financial Statements (continued)
| 5. | Capital Stock Transactions |
Transactions in Class W shares of Credit Series were:
| CLASS W | FOR THE YEAR ENDED 12/31/21 | FOR THE PERIOD 4/14/20 (COMMENCEMENT OF OPERATIONS) TO 12/31/20 | ||||||||||||||
| SHARES | AMOUNT | SHARES | AMOUNT | |||||||||||||
| Sold | 3,674,022 | $ | 38,389,686 | 19,012,780 | $ | 191,266,907 | ||||||||||
| Reinvested | 828,766 | 8,498,088 | 434,202 | 4,557,331 | ||||||||||||
| Repurchased | (2,291,219 | ) | (23,964,475 | ) | (1,314,747 | ) | (13,735,418 | ) | ||||||||
| Total | 2,211,569 | $ | 22,923,299 | 18,132,235 | $ | 182,088,820 | ||||||||||
Over 90% of the shares outstanding are fiduciary accounts where the Advisor has sole investment discretion.
| 6. | Financial Instruments |
The Series may trade in instruments including written and purchased options, forward foreign currency exchange contracts and futures contracts and other derivatives in the normal course of investing activities to assist in managing exposure to various market risks. The Series may be subject to various elements of risk, which may involve, to a varying degree, elements of risk in excess of the amounts recognized for financial statement purposes. These risks include: the risk that changes in the value of a derivative may not correlate perfectly with the underlying asset, rate or index; counterparty credit risk related to over the counter derivative counterparties’ failure to perform under contract terms; liquidity risk related to the lack of a liquid market for these contracts allowing the fund to close out its position(s); and documentation risk relating to disagreement over contract terms. No such investments were held by the Series as of December 31, 2021.
| 7. | Foreign Securities |
Investing in securities of foreign companies and foreign governments involves special risks and considerations not typically associated with investing in securities of domestic companies and the U.S. Government. These risks include revaluation of currencies and future adverse political and economic developments. Moreover, securities of foreign companies and foreign governments and their markets may be less liquid and their prices more volatile than those of comparable domestic companies and the U.S. Government.
| 8. | Federal Income Tax Information |
The amount and characterization of certain income and capital gains to be distributed are determined in accordance with federal income tax regulations, which may differ from GAAP. These differences are primarily due to differing book and tax treatments in the timing and/or treatment of the recognition of net investment income or gains and losses and wash sales. The Series may periodically make reclassifications among its capital accounts to reflect income and gains available for distribution (or available capital loss carryovers) under income tax regulations, without impacting the Series’ net assets. Any such reclassifications are not reflected in the financial highlights.
21
Credit Series
Notes to Financial Statements (continued)
| 8. | Federal Income Tax Information (continued) |
The tax character of distributions paid were as follows:
| FOR THE PERIOD ENDED 12/31/21 | FOR THE PERIOD ENDED 12/31/20 | |||||||
| Ordinary income | $ | 6,724,292 | $ | 4,705,055 | ||||
| Long-term capital gains | $ | 2,052,947 | — | |||||
At December 31, 2021, the tax basis of components of distributable earnings and the net unrealized appreciation based on the identified cost of investments for federal income tax purposes were as follows:
| Cost for federal income tax purposes | $ | 204,148,350 | ||||||
| Unrealized appreciation | 2,932,475 | |||||||
| Unrealized depreciation | (1,670,067 | ) | ||||||
| Net unrealized appreciation | $ | 1,262,408 | ||||||
| Undistributed ordinary income | $ | 158,613 | ||||||
| Undistributed long-term capital gains | $ | 45,288 |
| 9. | Market Event |
In March 2020, the World Health Organization declared COVID-19 (a novel coronavirus) to be a pandemic. The situation is dynamic and a recent resurgence of COVID-19 has caused a continued time of uncertainty. Global financial markets have experienced and may continue to experience significant volatility resulting from the spread of COVID-19. The global economy, the economies of certain nations and individual issuers have been and may continue to be adversely affected by COVID-19, particularly in light of the interconnectivity between economies and financial markets, all of which may negatively impact the Series’ performance. Management of the Series will continue to monitor the impact of COVID-19 on investment performance, financial statements and the Series’ operations.
22
Credit Series
Report of Independent Registered Public Accounting Firm
To the Board of Directors of Manning & Napier Fund, Inc. and Shareholders of Credit Series
Opinion on the Financial Statements
We have audited the accompanying statement of assets and liabilities, including the investment portfolio, of Credit Series (one of the series constituting Manning & Napier Fund, Inc., referred to hereafter as the “Fund”) as of December 31, 2021, the related statement of operations for the year ended December 31, 2021, and the statement of changes in net assets and the financial highlights for the year ended December 31, 2021 and for the period April 14, 2020 (commencement of operations) through December 31, 2020, including the related notes (collectively referred to as the “financial statements”). In our opinion, the financial statements present fairly, in all material respects, the financial position of the Fund as of December 31, 2021, the results of its operations for the year ended December 31, 2021, and the changes in its net assets and the financial highlights for the year ended December 31, 2021 and for the period April 14, 2020 (commencement of operations) through December 31, 2020 in conformity with accounting principles generally accepted in the United States of America.
Basis for Opinion
These financial statements are the responsibility of the Fund’s management. Our responsibility is to express an opinion on the Fund’s financial statements based on our audits. We are a public accounting firm registered with the Public Company Accounting Oversight Board (United States) (PCAOB) and are required to be independent with respect to the Fund in accordance with the U.S. federal securities laws and the applicable rules and regulations of the Securities and Exchange Commission and the PCAOB.
We conducted our audits of these financial statements in accordance with the standards of the PCAOB. Those standards require that we plan and perform the audit to obtain reasonable assurance about whether the financial statements are free of material misstatement, whether due to error or fraud.
Our audits included performing procedures to assess the risks of material misstatement of the financial statements, whether due to error or fraud, and performing procedures that respond to those risks. Such procedures included examining, on a test basis, evidence regarding the amounts and disclosures in the financial statements. Our audits also included evaluating the accounting principles used and significant estimates made by management, as well as evaluating the overall presentation of the financial statements. Our procedures included confirmation of securities owned as of December 31, 2021 by correspondence with the custodian. We believe that our audits provide a reasonable basis for our opinion.

New York, New York
February 18, 2022
We have served as the auditor of one or more investment companies in Manning & Napier Mutual Funds since 1992.
23
Credit Series
Supplemental Tax Information
(unaudited)
All reportings are based on financial information available as of the date of this annual report and, accordingly, are subject to change.
The Series designates $2,098,235 as Long-Term Capital Gain dividends pursuant to Section 852(b)(3) of the Internal Revenue Code for the fiscal year ended December 31, 2021.
24
Credit Series
Directors’ and Officers’ Information
(unaudited)
The Statement of Additional Information provides additional information about the Fund’s directors and officers and can be obtained without charge by calling 1-800-466-3863, at www.manning-napier.com, or on the EDGAR Database on the SEC Internet web site (http://www.sec.gov). The following chart shows certain information about the Fund’s directors and officers, including their principal occupations during the last five years. Unless specific dates are provided, the individuals have held the listed positions for longer than five years.
Interested Director and Officer
| Name: | Paul Battaglia* |
| Address: | 290 Woodcliff Drive Fairport, NY 14450 |
| Age: | 43 |
| Current Position(s) Held with Fund: | Principal Executive Officer, President, Chairman and Director |
| Term of Office1 & Length of Time Served: | Indefinite – Chairman and Director since November 2018 |
| Principal Occupation(s) During Past 5 Years: | Chief Financial Officer since 2018; Vice President of Finance (2016 – 2018); Director of Finance (2011 – 2016); Financial Analyst/Internal Auditor (2004- 2006) – Manning & Napier Advisors, LLC and affiliates Holds one or more of the following titles for various subsidiaries and affiliates: Chief Financial Officer |
| Number of Portfolios Overseen within Fund Complex: | 15 |
| Other Directorships Held Outside Fund Complex During Past 5 Years: | N/A |
Independent Directors
| Name: | Stephen B. Ashley |
| Address: | 290 Woodcliff Drive Fairport, NY 14450 |
| Age: | 81 |
| Current Position(s) Held with Fund: | Director, Audit Committee Member, Governance & Nominating Committee Member |
| Term of Office & Length of Time Served: | Indefinite – Since 1996 |
| Principal Occupation(s) During Past 5 Years: | Chairman and Director since 1997; Chief Executive Officer (1997-2019) - Ashley Companies (property management and investment) |
| Number of Portfolios Overseen within Fund Complex: | 15 |
| Other Directorships Held Outside Fund Complex During Past 5 Years: | Ashley Companies since 1997 |
| Name: | Paul A. Brooke |
| Address: | 290 Woodcliff Drive Fairport, NY 14450 |
| Age: | 76 |
| Current Position(s) Held with Fund: | Lead Independent Director, Audit Committee Member, Governance & Nominating Committee Member |
| Term of Office & Length of Time Served: | Indefinite – Director, Audit Committee Member, Governance & Nominating Committee Member since 2007; Lead Independent Director since 2017 |
| Principal Occupation(s) During Past 5 Years: | Managing Member since 1991 - PMSV Holdings LLC (investments); Managing Member (2010-2016) - VenBio (investments). |
| Number of Portfolios Overseen within Fund Complex: | 15 |
| Other Directorships Held Outside Fund Complex During Past 5 Years: | Incyte Corp. (biotech) (2000-2020); PureEarth (non-profit) since 2012; Cerus (biomedical) since 2016; Caelum BioSciences (biomedical) since 2018; Cheyne Capital International (investment)(2000-2017); |
25
Credit Series
Directors’ and Officers’ Information
(unaudited)
Independent Directors (continued)
| Name: | John Glazer |
| Address: | 290 Woodcliff Drive Fairport, NY 14450 |
| Age: | 56 |
| Current Position(s) Held with Fund: | Director, Audit Committee Member, Governance & Nominating Committee Member |
| Term of Office & Length of Time Served: | Indefinite – Director, Audit Committee Member, Governance & Nominating Committee Member since February 2021 |
| Principal Occupation(s) During Past 5 Years: | Chief Executive Officer since 2020 – Oikos Holdings LLC (Single-Family Office); Head of Corporate Development (2019-2020) – Caelum Biosciences (pharmaceutical development); Head of Private Investments (2015-2018) – AC Limited (Single-Family Office) |
| Number of Portfolios Overseen within Fund Complex: | 15 |
| Other Directorships Held Outside Fund Complex During Past 5 Years: | N/A |
| Name: | Margaret McLaughlin |
| Address: | 290 Woodcliff Drive Fairport, NY 14450 |
| Age: | 54 |
| Current Position(s) Held with Fund: | Director, Audit Committee Member, Governance & Nominating Committee Member |
| Term of Office & Length of Time Served: | Indefinite – Director, Audit Committee Member, Governance & Nominating Committee Member since February 2021 |
| Principal Occupation(s) During Past 5 Years: | Consultant since 2020 – Bates Group (consultants); Consultant (2019- 2020) – Madison Dearborn Partners (private equity); General Counsel/CCO (2011-2019) – Kramer Van Kirk Credit Strategies L.P./Mariana Systems LLC (Investment Adviser/SaaS Technology) |
| Number of Portfolios Overseen within Fund Complex: | 15 |
| Other Directorships Held Outside Fund Complex During Past 5 Years: | N/A |
| Name: | Russell O. Vernon |
| Address: | 290 Woodcliff Drive Fairport, NY 14450 |
| Age: | 64 |
| Current Position(s) Held with Fund: | Director, Audit Committee Member, Governance & Nominating Committee Chairman |
| Term of Office & Length of Time Served: | Indefinite – Director, Audit Committee Member, Governance & Nominating Committee Member since April 2020; Governance & Nominating Committee Chairman since November 2020 |
| Principal Occupation(s) During Past 5 Years: | Founder and General Partner (2009-2019) – BVM Capital Management (economic development) |
| Number of Portfolios Overseen within Fund Complex: | 15 |
| Other Directorships Held Outside Fund Complex During Past 5 Years: | Board Member, Vice Chairman and President since 2010 – Newburgh Armory Unity Center (military); Board Member and Executive Director since 2020 – National Purple Heart Honor Mission, Inc. (military); Board Member, Vice Chairman (2015-2020) – National Purple Heart Hall of Honor, Inc. (military) |
26
Credit Series
Directors’ and Officers’ Information
(unaudited)
Independent Directors (continued)
| Name: | Chester N. Watson |
| Address: | 290 Woodcliff DriveFairport, NY 14450 |
| Age: | 71 |
| Current Position(s) Held with Fund: | Director, Audit Committee Chairman, Governance & Nominating Committee Member |
| Term of Office & Length of Time Served: | Indefinite – Director, Audit Committee Member, Governance & Nominating Committee Member Since 2012; Audit Committee Chairman since 2013 |
| Principal Occupation(s) During Past 5 Years: | General Auditor (2003-2011) - General Motors Company (auto manufacturer) |
| Number of Portfolios Overseen within Fund Complex: | 15 |
| Other Directorships Held Outside Fund Complex During Past 5 Years: | Rochester Institute of Technology (University) since 2005; Hudson Valley Center for Innovation, Inc. (New Business and Economic Development) since 2019; Town of Greenburgh, NY Planning Board (Municipal Government) (2015-2019); |
Officers:
| Name: | Elizabeth Craig |
| Address: | 290 Woodcliff Drive Fairport, NY 14450 |
| Age: | 34 |
| Current Position(s) Held with Fund: | Corporate Secretary |
| Term of Office1 & Length of Time Served: | Since 2016 |
| Principal Occupation(s) During Past 5 Years: | Director of Fund Administration since 2021; Fund Regulatory Administration Manager (2018-2021); Fund Administration Manager (2015-2018); Mutual Fund Compliance Specialist (2009-2015) - Manning & Napier Advisors, LLC; Assistant Corporate Secretary (2011-2016) - Manning & Napier Fund, Inc.; Corporate Secretary, Director since 2019– Manning & Napier Investor Services, Inc. |
| Name: | Samantha Larew |
| Address: | 290 Woodcliff Drive Fairport, NY 14450 |
| Age: | 41 |
| Current Position(s) Held with Fund: | Chief Compliance Officer and Anti-Money Laundering Compliance Officer |
| Term of Office1 & Length of Time Served: | Chief Compliance Officer since 2019; Anti-Money Laundering Compliance Officer since 2018 |
| Principal Occupation(s) During Past 5 Years: | Co-Director of Compliance since 2018; Compliance Communications Supervisor (2014-2018); Compliance Supervisor (2013-2014); Broker- Dealer Compliance Supervisor (2011-2013); Broker-Dealer Compliance Analyst (2010-2011) - Manning & Napier Advisors, LLC& Affiliates; Broker- Dealer Chief Compliance Officer since 2013; Broker-Dealer Assistant Corporate Secretary since 2011 – Manning & Napier Investor Services, Inc.; Compliance Analyst (2007-2009) – Wall Street Financial Group; Compliance Specialist (2003-2007) – Manning & Napier Advisors, LLC & Affiliates |
| Name: | Scott Morabito |
| Address: | 290 Woodcliff Drive Fairport, NY 14450 |
| Age: | 34 |
| Current Position(s) Held with Fund: | Vice President |
| Term of Office1 & Length of Time Served: | Vice President since 2019; Assistant Vice President (2017-2019) |
| Principal Occupation(s) During Past 5 Years: | Managing Director, Client Service and Business Operations since 2021; Managing Director of Operations (2019-2021); Director of Funds Group (2017-2019); Fund Product and Strategy Manager (2014-2017); Senior Product and Strategy Analyst (2013-2014); Product and Strategy Analyst (2011-2013) - Manning & Napier Advisors, LLC; President, Director since 2018 – Manning & Napier Investor Services, Inc.; President, Exeter Trust Company since 2021; |
27
Credit Series
Directors’ and Officers’ Information
(unaudited)
Officers: (continued)
| Name: | Troy Statczar |
| Address: | 290 Woodcliff Drive Fairport, NY 14450 |
| Age: | 50 |
| Current Position(s) Held with Fund: | Principal Financial Officer, Treasurer |
| Term of Office1 & Length of Time Served: | Principal Financial Officer and Treasurer since 2020 |
| Principal Occupation(s) During Past 5 Years: | Senior Director, Foreside Treasurer Services since 2020 - Foreside Financial Group; Director of Fund Administration (2017-2019) - Thornburg Investment Management, Inc.; Director of U.S. Operations (2008-2017) - Henderson Global Investors N.A., Inc. |
| Name: | Sarah Turner |
| Address: | 290 Woodcliff Drive Fairport, NY 14450 |
| Age: | 39 |
| Current Position(s) Held with Fund: | Chief Legal Officer; Assistant Corporate Secretary |
| Term of Office1 & Length of Time Served: | Since 2018 |
| Principal Occupation(s) During Past 5 Years: | General Counsel since 2018 - Manning & Napier Advisors, LLC and affiliates; Counsel (2017-2018) – Harter Secrest and Emery LLP; Legal/ Senior Counsel (2010-2017) – Manning & Napier Advisors, LLC and affiliates Holds one or more of the following titles for various affiliates: General Counsel |
*Interested Director, within the meaning of the 1940 Act by reason of his positions with the Fund’s Advisor, Manning & Napier Advisors, LLC, and Distributor, Manning & Napier Investor Services, Inc.
1The term of office of all officers shall be one year and until their respective successors are chosen and qualified, or his or her earlier resignation or removal as provided in the Fund’s By-Laws.
28
{This page intentionally left blank}
29
Credit Series
Literature Requests
(unaudited)
Proxy Voting Policies and Procedures
A description of the policies and procedures that the Fund uses to determine how to vote proxies relating to portfolio securities is available, without charge, upon request:
| By phone | 1-800-466-3863 |
| On the Securities and Exchange Commission’s (SEC) web site | http://www.sec.gov |
Proxy Voting Record
Information regarding how the Fund voted proxies relating to portfolio securities during the most recent 12-month period ended June 30th is available, without charge, upon request:
| By phone | 1-800-466-3863 |
| On the SEC’s web site | http://www.sec.gov |
Quarterly Portfolio Holdings
The Series’ complete schedule of portfolio holdings for the 1st and 3rd quarters of each fiscal year are provided on Form N-PORT, and are available, without charge, upon request:
| By phone | 1-800-466-3863 |
| On the SEC’s web site | http://www.sec.gov |
Prospectus and Statement of Additional Information (SAI)
For more information about any of the Manning & Napier Fund, Inc. Series, you may obtain a prospectus and SAI at www.manning-napier.com or by calling 1-(800) 466-3863. Before investing, carefully consider the objectives, risks, charges and expenses of the investment and read the prospectus carefully as it contains this and other information about the investment company. In addition, this information can be found on the SEC’s web site, http://www.sec.gov.
Additional information available at www.manning-napier.com
1. Fund Holdings - Month-End
2. Fund Holdings - Quarter-End
3. Shareholder Report - Annual
4. Shareholder Report - Semi-Annual
The Fund also offers electronic notification or “e-delivery” when certain documents are available on-line to be downloaded or reviewed. Direct shareholders can elect to receive electronic notification when shareholder reports, prospectus updates, and/or statements are available. If you do not currently have on-line access to your account, you can establish access by going to www.manning-napier.com, click on “Login” in the top corner of the page, and follow the prompts to self-enroll. Once enrolled, you can set your electronic notification preferences by clicking on the Account Options tab located within the green toolbar and then select E-Delivery Option. Should you have any questions on either how to establish on-line access or how to update your account settings, please contact Investor Services at 1-800-466-3863.
The Manning & Napier Fund, Inc. is managed by Manning & Napier Advisors, LLC. Manning & Napier Investor Services, Inc., an affiliate of Manning & Napier Advisors, LLC, is the distributor of the Fund shares.
MNCRE-12/21-AR
30

Manning & Napier Fund, Inc.
High Yield Bond Series
Paper copies of the Series’ shareholder reports are no longer sent by mail, unless you specifically request them from the Series or from your financial intermediary, such as a broker-dealer or bank. Shareholder reports are available online. Each time a report is posted on the Series’ website you will be provided with a link to access the report online, either by mail (hard copy notice) or by email, if you have already signed up for electronic delivery of shareholder reports.
You may elect to receive all future shareholder reports in paper free of charge. If you invest through a financial intermediary, you can contact your financial intermediary to request that you continue to receive paper copies. If you invest directly with the Fund, you can inform the Fund that you wish to continue receiving paper copies by visiting www.manning-napier.com or calling 1-800-466-3863. Your election to receive reports in paper will apply to all funds held with your financial intermediary if you invest through a financial intermediary or all series of the Fund if you invest directly with the Fund.
Additionally, If you have not yet signed up for electronic delivery of shareholder reports and other Fund communications, you may do so by contacting your financial intermediary or, if you are a direct investor, by visiting www.manning-napier.com or calling 1-800-466-3863.
 | Independent Perspective | Real-World Solutions |
A Note from Our CEO
Dear Shareholder,
The obstacles were many, but this year, in so many ways, is a story of triumphant resilience only serving to spotlight just how much more there is to do.
Over the past two years, we’ve endured a recession, a bear market, and a pandemic. Our collective perseverance is now paying off.
We are today experiencing a remarkable economic boom, a historic market rally, and continued medical innovation, all of which have turned a challenging period into one of optimism and hope.
At the same time, political and societal polarization are heightened, social justice concerns have justifiably come to the fore, and the precarious state of our environment presents almost unimaginable challenges for government, business, and finance.
This certainly is a moment of great consequence.
The kind of moment that questions all the rules. Economic rules in how we add value for each other, as well as for ourselves. Social rules in how we interact with each other. Environmental rules that can balance the current needs of emerging economies with the requirements for everyone in the future. Workplace rules in how we get the job done.
Our lives are being redefined, and our society, planet, workplaces, and industry must confront the challenges of the upcoming decade.
Markets reflect us. They mirror our collective thoughts, feelings, expectations, and beliefs – these new life rules.
As we go through this period of change, it will be uncertain and uncomfortable. For those unaccustomed to change, for those reliant on ’set it and forget it’, these may seem like daunting questions, but there is a better way.
Success in an era of change demands flexibility, adaptability, and a roll-up-your-sleeves willingness to do the work.
For over 50 years, independent thinking and tireless work have underpinned every decision we’ve made on behalf of our investors. We invest for the long-term, we do not speculate. We make active decisions, and we invest with discipline, patience, and confidence. This is the only way we know, to remain true to our values and our fiduciary duty to you, the investors in our mutual funds.
You demand more. At Manning & Napier, we demand more of ourselves. Upon reflection of the year, we’re proud to have continued to deliver more.
We wish you safety and good health, and we appreciate your confidence in our firm and our approach.
 | Sincerely,
Marc Mayer Chief Executive Officer |

Corporate Headquarters | 290 Woodcliff Drive | Fairport, NY 14450 | (585) 325-6880 phone | (800) 551-0224 toll free | www.manning-napier.com
1
High Yield Bond Series
Fund Commentary
(unaudited)
Investment Objective
To provide a high level of long-term total return, which is a combination of income and capital appreciation. Under normal circumstances, the Series will invest at least 80% of its assets in bonds that are rated below investment-grade (junk bonds), and/or securities that are designed to track the performance of non-investment grade securities, principally exchange-traded funds.
Performance Commentary
Despite the ongoing pandemic, lingering inflation concerns, and looming rate hikes, high yield markets generated positive returns for the year backed by robust corporate earnings and loose monetary policy. Overall, credit spreads tightened over the period and remain near historic lows. In general, lower quality issuances outperformed their higher quality counterparts and Energy and Transportation were among the highest returning sectors.
The High Yield Bond Series Class S shares delivered strong absolute and relative returns over the period, returning 9.99% versus 5.29% for its benchmark, the Intercontinental Exchange (ICE) Bank of America (BofA) U.S. Cash Pay High Yield Index.
The Series’ outperformance was driven by strong selection, most notably within the Energy, Basic Industry, and Financial Services sectors.
Going forward, we believe that selection will be key to achieving investor objectives. We continue to focus on businesses that generate positive free cash flow that either pay down debt or focus on improving their business with good relative value. The Series is positioned somewhat shorter than the broad market from a duration perspective as we do not believe investors are being adequately compensated on the longer end for the risks assumed as spread pick-up is minimal. Finally, we continue to find value in smaller, off-the-run high yield securities that offer attractive yields with stronger investor protections than their on-the-run counterparts.
As always, we believe that a select, disciplined approach focused on current valuations and conditions will be key to navigating any challenges and opportunities that arise and ultimately helping investors achieve their objectives.
Performance for the High Yield Bond Series Class S shares is provided above. Performance for other shares classes will differ based on each class’ underlying expenses.
Performance data quoted represents past performance and does not guarantee future results. The investment return and principal value of an investment will fluctuate, so that an investor’s shares, when redeemed, may be worth more or less than their original cost. Current performance may be higher or lower than that quoted; investors can obtain the most recent month-end performance at www.manning-napier.com or by calling (800) 466-3863.
Additional information and associated disclosures can be found on the Performance Update page of this report.
All investments involve risks, including possible loss of principal. There is an inverse relationship between bond prices and interest rates; as interest rates rise, bond prices (and therefore the value of bond funds) fall. Likewise, as interest rates fall, bond prices and the value of bond funds rise. Investments in higher-yielding, lower-rated securities involve additional risks, including a higher risk of default and loss of principal. Investments in derivatives can be highly volatile and involve risks in addition to the risks of the underlying instrument on which the derivative is based, such as counterparty, correlation and liquidity risk. Also, the use of leverage increases exposure to the market and may magnify potential losses.
2
High Yield Bond Series
Performance Update as of December 31, 2021
(unaudited)
| AVERAGE ANNUAL TOTAL RETURNS | |||
| AS OF DECEMBER 31, 2021 | |||
| ONE | FIVE | TEN | |
| YEAR1 | YEAR | YEAR | |
| High Yield Bond Series - Class S2 | 9.99% | 7.36% | 6.95% |
| High Yield Bond Series - Class I2,3 | 10.27% | 7.64% | 7.21% |
| High Yield Bond Series - Class W2,4 | 10.89% | 7.87% | 7.20% |
| High Yield Bond Series - Class Z2,4 | 10.48% | 7.61% | 7.07% |
| Intercontinental Exchange (ICE) Bank of America (BofA) BB-B U.S. Cash Pay High Yield Index5 | 4.63% | 6.09% | 6.57% |
| Intercontinental Exchange (ICE) Bank of America (BofA) U.S. Cash Pay High Yield Index6 | 5.29% | 6.09% | 6.69% |
The following graph compares the value of a $10,000 investment in the High Yield Bond Series - Class S for the ten years ended December 31, 2021 to the Intercontinental Exchange (ICE) Bank of America (BofA) BB-B U.S. Cash Pay High Yield Index and Intercontinental Exchange (ICE) Bank of America (BofA) U.S. Cash Pay High Yield Index.
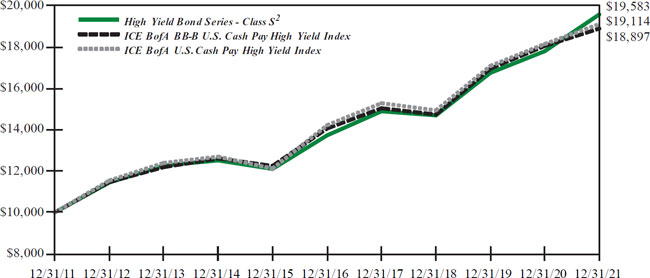
1The returns shown are based on net asset values calculated for shareholder transactions and may differ from the returns shown in the financial highlights, which reflect adjustments made to the net asset values in accordance with accounting principles generally accepted in the United States of America.
2The Series’ performance does not reflect the deduction of taxes that a shareholder would pay on fund distributions or the redemption of shares. The Series’ performance is historical and may not be indicative of future results. The performance returns shown are inclusive of the net expense ratio of the Series. For the year ended December 31, 2021, this net expense ratio was 0.90% for Class S, 0.65% for Class I, 0.10% for Class W and 0.50% for Class Z. The gross expense ratio, which does not account for any voluntary or contractual waivers currently in effect, was 0.95% for Class S, 0.67% for Class I, 0.57% for Class W and 0.57% for Class Z for the year ended December 31, 2021.
3For periods through August 1, 2012 (the inception date of the Class I shares), performance for the Class I shares is based on historical performance of the Class S shares. Because the Class I shares invest in the same portfolio of securities as Class S, performance will only be different to the extent that the Class S shares have a higher expense ratio.
4For periods through March 1, 2019 (the inception date of the Class W and Class Z shares), performance for the Class W and Class Z shares is based on the historical performance of the Class S shares. Because the Class W and Class Z shares invest in the same portfolio of securities as the Class S shares, performance will be different only to the extent that the Class S shares have a higher expense ratio.
3
High Yield Bond Series
Performance Update as of December 31, 2021
(unaudited)
5The Intercontinental Exchange (ICE) Bank of America (BofA) BB-B U.S. Cash Pay High Yield Index is a subset of the ICE BofA U.S. Cash Pay High Yield Index. The Index includes all U.S. dollar denominated below investment grade corporate debt securities currently in a coupon paying period rated BB1 through B3. Qualifying securities must have at least one year remaining term to final maturity, at least 18 months to final maturity at point of issuance, a fixed coupon schedule, and a minimum amount outstanding of $250 million. The Index returns do not reflect any fees or expenses. Index returns provided by ICE Intercontinental Exchange (ICE). Index data referenced herein is the property of ICE Data Indices, LLC, its affiliates (“ICE Data”) and/or its third party suppliers and has been licensed for use by Manning & Napier. ICE Data and its third party suppliers accept no liability in connection with its use. Data provided is not a representation or warranty, express or implied, as to the ability of any index to accurately represent the asset class or market sector that it purports to represent and none of these parties shall have any liability for any errors, omissions, or interruptions of any index or the data included therein. For additional disclosure information, please see: https://go.manning-napier.com/benchmark-provisions.
6The Intercontinental Exchange (ICE) Bank of America (BofA) U.S. Cash Pay High Yield Index tracks the performance of U.S. dollar denominated below investment grade corporate debt, currently in a coupon paying period, issued in the U.S. domestic market. Qualifying securities must have at least one year remaining term to final maturity as of the rebalancing date, at least 18 months to final maturity at the time of issuance, a fixed coupon schedule, and a minimum amount outstanding of $250 million. The Index returns do not reflect any fees or expenses. Index returns provided by ICE Intercontinental Exchange (ICE). Index data referenced herein is the property of ICE Data Indices, LLC, its affiliates (“ICE Data”) and/or its third party suppliers and has been licensed for use by Manning & Napier. ICE Data and its third party suppliers accept no liability in connection with its use. Data provided is not a representation or warranty, express or implied, as to the ability of any index to accurately represent the asset class or market sector that it purports to represent and none of these parties shall have any liability for any errors, omissions, or interruptions of any index or the data included therein. For additional disclosure information, please see: https://go.manning-napier.com/benchmark-provisions.
4
High Yield Bond Series
Shareholder Expense Example
(unaudited)
As a shareholder of the Series, you incur ongoing costs, including management fees, shareholder service fees and other Series expenses. This example is intended to help you understand your ongoing costs (in dollars) of investing in the Series and to compare these costs with the ongoing costs of investing in other mutual funds.
The example is based on an investment of $1,000 invested in each class at the beginning of the period and held for the entire period (July 1, 2021 to December 31, 2021).
Actual Expenses
The Actual lines of the table below provide information about actual account values and actual expenses. You may use the information in these lines, together with the amount you invested, to estimate the expenses that you paid over the period. Simply divide your account value by $1,000 (for example, an $8,600 account value divided by $1,000 = 8.6), then multiply the result by the number in the Actual line for the Class in which you have invested under the heading entitled “Expenses Paid During Period” to estimate the expenses you paid on your account during this period.
Hypothetical Example for Comparison Purposes
The Hypothetical lines of each class in the table below provide information about hypothetical account values and hypothetical expenses based on the Class’ actual expense ratio and an assumed rate of return of 5% per year before expenses, which is not the Class’ actual return. The hypothetical account values and expenses may not be used to estimate the actual ending account balance or expenses you paid during the period. You may use this information to compare the ongoing costs of investing in a class of the Series and other funds. To do so, compare this 5% hypothetical example for the Class in which you have invested with the 5% hypothetical examples that appear in the shareholder reports of the other funds.
Please note that the expenses shown in the table are meant to highlight your ongoing costs only and do not reflect any transaction costs, such as sales charges (loads), redemption fees, or exchange fees that you may incur in other mutual funds. Therefore, the second line of the table is useful in comparing ongoing costs only, and will not help you determine the relative total costs of owning different funds.
| BEGINNING | ENDING | EXPENSES PAID | ANNUALIZED | |
| ACCOUNT VALUE | ACCOUNT VALUE | DURING PERIOD* | EXPENSE | |
| 7/1/21 | 12/31/21 | 7/1/21 - 12/31/21 | RATIO | |
| Class S | ||||
| Actual | $1,000.00 | $1,036.50 | $4.62 | 0.90% |
| Hypothetical | ||||
| (5% return before expenses) | $1,000.00 | $1,020.67 | $4.58 | 0.90% |
| Class I | ||||
| Actual | $1,000.00 | $1,037.20 | $3.34 | 0.65% |
| Hypothetical | ||||
| (5% return before expenses) | $1,000.00 | $1,021.93 | $3.31 | 0.65% |
| Class W | ||||
| Actual | $1,000.00 | $1,039.70 | $0.51 | 0.10% |
| Hypothetical | ||||
| (5% return before expenses) | $1,000.00 | $1,024.70 | $0.51 | 0.10% |
| Class Z | ||||
| Actual | $1,000.00 | $1,038.80 | $2.57 | 0.50% |
| Hypothetical | ||||
| (5% return before expenses) | $1,000.00 | $1,022.68 | $2.55 | 0.50% |
*Expenses are equal to each Class’ annualized expense ratio (for the six-month period), multiplied by the average account value over the period, multiplied by 184/365 (to reflect the one-half year period). Expenses are based on the most recent fiscal half year; therefore, the expense ratios stated above may differ from the expense ratios stated in the financial highlights, which are based on one-year data. The Class’ total return would have been lower had certain expenses not been waived or reimbursed during the period.
5
High Yield Bond Series
Portfolio Composition as of December 31, 2021
(unaudited)
| Sector Allocation1 | |
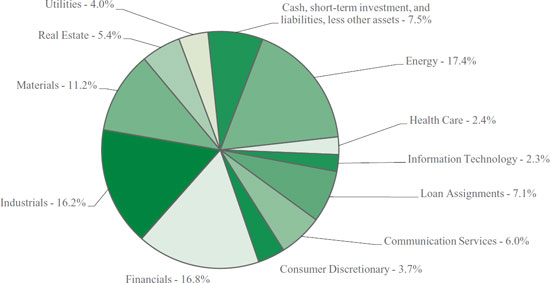 | |
| 1As a percentage of net assets. | |
6
High Yield Bond Series
Investment Portfolio - December 31, 2021
| SHARES/ | ||||||||
| PRINCIPAL | VALUE | |||||||
| AMOUNT1 | (NOTE 2) | |||||||
| COMMON STOCKS - 1.5% | ||||||||
| Energy - 1.5% | ||||||||
| Oil, Gas & Consumable Fuels - 1.5% | ||||||||
| Jonah Energy Parent LLC*2 | ||||||||
| (Identified Cost $980,115) | 65,341 | $ | 4,083,813 | |||||
| PREFERRED STOCKS - 1.9% | ||||||||
| Health Care - 1.0% | ||||||||
| Pharmaceuticals - 1.0% | ||||||||
| Harrow Health, Inc., 8.625%, 4/30/2026 | 94,800 | 2,541,588 | ||||||
| Information Technology - 0.9% | ||||||||
| Software - 0.9% | ||||||||
| Synchronoss Technologies, Inc., 8.375%, 6/30/2026 | 104,700 | 2,487,672 | ||||||
| TOTAL PREFERRED STOCKS | ||||||||
| (Identified Cost $5,011,579) | 5,029,260 | |||||||
| LOAN ASSIGNMENTS - 7.1% | ||||||||
| American Axle & Manufacturing, Inc., | ||||||||
| Tranche B Term Loan, Term B, (3 mo. LIBOR US + 2.250%), 3.00%, 4/6/20243 | 4,811,298 | 4,794,026 | ||||||
| Tutor Perini Corp., Term Loan, Term B, (1 mo. LIBOR US + 4.75%), 5.75%, 8/18/20273 | 3,877,756 | 3,877,756 | ||||||
| Mozart Borrower LP, Initial Dollar Term Loan, Term B, (1 mo. LIBOR US + 3.250%), 3.75%, 10/21/20283 | 3,500,000 | 3,498,460 | ||||||
| The Hertz Corp., Term Loan, Term B-EXIT, (1 mo. LIBOR US + 3.500%), 3.75%, 6/30/20283 | 3,364,359 | 3,364,359 | ||||||
| Term C-EXIT, (1 mo. LIBOR US + 3.500%), 3.75%, 6/30/20283 | 635,641 | 635,641 | ||||||
| Jazz Financing Lux S.A.R.L., Initial Dollar Term Loan, Term B, (1 mo. LIBOR US + 3.500%), 4.00%, 5/5/20283 | 2,487,500 | 2,495,435 | ||||||
| TOTAL LOAN ASSIGNMENTS | ||||||||
| (Identified Cost $18,709,089) | 18,665,677 | |||||||
| CORPORATE BONDS - 82.0% | ||||||||
| Non-Convertible Corporate Bonds- 82.0% | ||||||||
| Communication Services - 6.0% | ||||||||
| Diversified Telecommunication Services - 2.8% | ||||||||
| IHS Holding Ltd. (Nigeria), 6.25%, 11/29/20284 | 3,750,000 | 3,796,875 | ||||||
| Lumen Technologies, Inc., 7.50%, 4/1/2024 | 3,075,000 | 3,367,125 | ||||||
| 7,164,000 | ||||||||
| SHARES/ | ||||||||
| PRINCIPAL | VALUE | |||||||
| AMOUNT1 | (NOTE 2) | |||||||
| CORPORATE BONDS (continued) | ||||||||
| Non-Convertible Corporate Bonds (continued) | ||||||||
| Communication Services (continued) | ||||||||
| Media - 3.2% | ||||||||
| Beasley Mezzanine Holdings LLC, 8.625%, 2/1/20264 | 5,000,000 | $ | 4,937,500 | |||||
| Sirius X.M. Radio, Inc., 4.00%, 7/15/20284 | 3,500,000 | 3,519,565 | ||||||
| 8,457,065 | ||||||||
| Total Communication Services | 15,621,065 | |||||||
| Consumer Discretionary - 3.7% | ||||||||
| Auto Components - 1.3% | ||||||||
| The Goodyear Tire & Rubber Co., 5.00%, 7/15/20294 | 3,250,000 | 3,491,150 | ||||||
| Multiline Retail - 1.4% | ||||||||
| Macy’s Retail Holdings LLC, 4.50%, 12/15/2034 | 3,600,000 | 3,555,000 | ||||||
| Specialty Retail - 1.0% | ||||||||
| Bed Bath & Beyond, Inc., 4.915%, 8/1/2034 | 2,750,000 | 2,476,898 | ||||||
| Total Consumer Discretionary | 9,523,048 | |||||||
| Energy - 15.9% | ||||||||
| Energy Equipment & Services - 4.2% | ||||||||
| Kent Global plc (United Kingdom), 10.00%, 6/28/2026 | 3,420,000 | 3,397,941 | ||||||
| Petrofac Ltd. (United Kingdom), 9.75%, 11/15/20264 | 3,905,000 | 3,983,959 | ||||||
| Tidewater, Inc., 8.50%, 11/16/2026 | 3,600,000 | 3,600,000 | ||||||
| 10,981,900 | ||||||||
| Oil, Gas & Consumable Fuels - 11.7% | ||||||||
| Brooge Petroleum and Gas Investment Co. FZE (United Arab Emirates), 8.50%, 9/24/20254 | 4,053,000 | 4,154,325 | ||||||
| Guara Norte Sarl (Brazil), 5.198%, 6/15/20344 | 3,502,321 | 3,441,065 | ||||||
| Hess Midstream Operations LP, 4.25%, 2/15/20304 | 3,750,000 | 3,721,875 | ||||||
| Moss Creek Resources Holdings, Inc., 7.50%, 1/15/20264 | 3,500,000 | 3,272,500 | ||||||
| Navigator Holdings Ltd., 8.00%, 9/10/20254 | 3,200,000 | 3,344,000 | ||||||
| New Fortress Energy, Inc., 6.75%, 9/15/20254 | 3,787,000 | 3,824,870 | ||||||
| Penn Virginia Holdings LLC, 9.25%, 8/15/20264 | 3,060,000 | 3,174,750 | ||||||
| PetroTal Corp. (Peru), 12.00%, 2/16/2024 (Acquired 02/01/2021 - 11/02/2021, cost $3,583,256)5 | 3,580,000 | 3,741,100 | ||||||
| Ping Petroleum UK Ltd. (Bermuda), 12.00%, 7/29/2024 (Acquired 07/14/2021, cost $1,960,000)5 | 2,000,000 | 1,980,000 |
The accompanying notes are an integral part of the financial statements.
7
High Yield Bond Series
Investment Portfolio - December 31, 2021
| SHARES/ | ||||||||
| PRINCIPAL | VALUE | |||||||
| AMOUNT1 | (NOTE 2) | |||||||
| CORPORATE BONDS (continued) | ||||||||
| Non-Convertible Corporate Bonds (continued) | ||||||||
| Energy (continued) | ||||||||
| Oil, Gas & Consumable Fuels (continued) | ||||||||
| Tiger Holdco Pte Ltd. (India), 13.00%, 6/10/20234,6 | 50,944 | $ | 51,454 | |||||
| 30,705,939 | ||||||||
| Total Energy | 41,687,839 | |||||||
| Financials - 16.8% | ||||||||
| Banks - 2.8% | ||||||||
| Lloyds Bank plc (United Kingdom) (3 mo. LIBOR US + 11.756%), 12.00%4,7,8 | 3,950,000 | 3,996,215 | ||||||
| Popular, Inc. (Puerto Rico), 6.125%, 9/14/2023 | 3,200,000 | 3,405,760 | ||||||
| 7,401,975 | ||||||||
| Capital Markets - 1.8% | ||||||||
| Drawbridge Special Opportunities Fund LP - Drawbridge Special Opportunities Finance Corporation, 3.875%, 2/15/20264 | 2,400,000 | 2,445,735 | ||||||
| StoneX Group, Inc., 8.625%, 6/15/20254 | 2,230,000 | 2,363,800 | ||||||
| 4,809,535 | ||||||||
| Consumer Finance - 4.7% | ||||||||
| Navient Corp., | ||||||||
| 6.75%, 6/25/2025 | 2,325,000 | 2,557,500 | ||||||
| 5.625%, 8/1/2033 | 2,500,000 | 2,381,250 | ||||||
| PRA Group, Inc., 5.00%, 10/1/20294 | 3,750,000 | 3,759,375 | ||||||
| SLM Corp., 3.125%, 11/2/2026 | 3,750,000 | 3,712,500 | ||||||
| 12,410,625 | ||||||||
| Diversified Financial Services - 4.3% | ||||||||
| Coinbase Global, Inc., 3.375%, 10/1/20284 | 3,675,000 | 3,431,531 | ||||||
| FS Energy & Power Fund, 7.50%, 8/15/20234 | 3,640,000 | 3,795,756 | ||||||
| Midcap Financial Issuer Trust, 6.50%, 5/1/20284 | 3,750,000 | 3,909,375 | ||||||
| 11,136,662 | ||||||||
| Mortgage Real Estate Investment Trusts (REITS) - 1.4% | ||||||||
| Ladder Capital Finance Holdings | ||||||||
| LLLP - Ladder Capital Finance | ||||||||
| Corp., 4.25%, 2/1/20274 | 3,500,000 | 3,522,855 | ||||||
| Thrifts & Mortgage Finance - 1.8% | ||||||||
| LD Holdings Group LLC, 6.125%, 4/1/20284 | 2,500,000 | 2,356,250 | ||||||
| United Wholesale Mortgage LLC, 5.50%, 4/15/20294 | 2,500,000 | 2,453,125 | ||||||
| 4,809,375 | ||||||||
| Total Financials | 44,091,027 | |||||||
| SHARES/ | ||||||||
| PRINCIPAL | VALUE | |||||||
| AMOUNT1 | (NOTE 2) | |||||||
| CORPORATE BONDS (continued) | ||||||||
| Non-Convertible Corporate Bonds (continued) | ||||||||
| Health Care - 1.4% | ||||||||
| Pharmaceuticals - 1.4% | ||||||||
| Teva Pharmaceutical Finance | ||||||||
| Netherlands III B.V. (Israel), 7.125%, 1/31/2025 | 3,500,000 | $ | 3,745,000 | |||||
| Industrials - 16.2% | ||||||||
| Airlines - 4.6% | ||||||||
| Alaska Airlines Pass-Through Trust, | ||||||||
| Series 2020-1, Class B, 8.00%, 8/15/20254 | 2,796,223 | 3,113,062 | ||||||
| United Airlines Pass-Through Trust, | ||||||||
| Series 2019-2, Class B, 3.50%, 5/1/2028 | 3,701,648 | 3,666,263 | ||||||
| United Airlines Pass-Through Trust, | ||||||||
| Series 2018-1, Class B, 4.60%, 3/1/2026 | 1,434,396 | 1,455,159 | ||||||
| Western Global Airlines LLC, 10.375%, 8/15/20254 | 3,500,000 | 3,893,750 | ||||||
| 12,128,234 | ||||||||
| Commercial Services & Supplies - 3.3% | ||||||||
| Airswift Global AS (United Kingdom) (3 mo. LIBOR US + 8.500%), 8.654%, 5/12/2025 (Acquired 05/03/2021 - 12/08/2021, cost $3,506,500)3,5 | 3,500,000 | 3,552,500 | ||||||
| Prime Security Services Borrower LLC - Prime Finance, Inc., 5.75%, 4/15/20264 | 4,830,000 | 5,185,826 | ||||||
| 8,738,326 | ||||||||
| Construction & Engineering - 4.7% | ||||||||
| Dycom Industries, Inc., 4.50%, 4/15/20294 | 3,302,000 | 3,363,912 | ||||||
| IEA Energy Services LLC, 6.625%, 8/15/20294 | 5,000,000 | 4,938,750 | ||||||
| Railworks Holdings LP - Railworks Rally, Inc., 8.25%, 11/15/20284 | 3,750,000 | 3,862,500 | ||||||
| 12,165,162 | ||||||||
| Marine - 3.6% | ||||||||
| American Tanker, Inc. (Norway), 7.75%, 7/2/2025 | 5,605,000 | 5,637,696 | ||||||
| Seaspan Corp. (Hong Kong), 6.50%, 2/5/20244 | 3,600,000 | 3,762,000 | ||||||
| 9,399,696 | ||||||||
| Total Industrials | 42,431,418 | |||||||
| Information Technology - 1.4% | ||||||||
| Communications Equipment - 1.4% | ||||||||
| Plantronics, Inc., 4.75%, 3/1/20294 | 3,720,000 | 3,547,950 | ||||||
| Materials - 11.2% | ||||||||
| Metals & Mining - 9.7% | ||||||||
| Copper Mountain Mining Corp. | ||||||||
| (Canada), 8.00%, 4/9/20264 | 4,116,000 | 4,306,571 |
The accompanying notes are an integral part of the financial statements.
8
High Yield Bond Series
Investment Portfolio - December 31, 2021
| SHARES/ | ||||||||
| PRINCIPAL | VALUE | |||||||
| AMOUNT1 | (NOTE 2) | |||||||
| CORPORATE BONDS (continued) | ||||||||
| Non-Convertible Corporate Bonds (continued) | ||||||||
| Materials (continued) | ||||||||
| Metals & Mining (continued) | ||||||||
| Endeavour Mining plc (Burkina Faso), | ||||||||
| 5.00%, 10/14/20264 | 3,750,000 | $ | 3,712,500 | |||||
| Infrabuild Australia Pty Ltd. (Australia), | ||||||||
| 12.00%, 10/1/20244 | 3,479,000 | 3,583,370 | ||||||
| Jervois Mining USA Ltd. (Australia), | ||||||||
| 12.50%, 7/20/20264 | 3,000,000 | 3,170,460 | ||||||
| Northwest Acquisitions ULC - | ||||||||
| Dominion Finco, Inc., 7.125%, 11/1/2022 (Acquired 10/10/2017 - 05/15/2020, cost $1,518,841)5,9 | 6,535,000 | 65 | ||||||
| Pembroke Olive Downs Pty Ltd. | ||||||||
| (Australia), 10.00%, 12/21/2028 (Acquired 12/10/2021, cost $2,509,000)5 | 2,600,000 | 2,522,000 | ||||||
| Tacora Resources, Inc. (Canada), | ||||||||
| 8.25%, 5/15/20264 | 4,260,000 | 4,238,700 | ||||||
| Warrior Met Coal, Inc., 7.875%, | ||||||||
| 12/1/20284 | 3,810,000 | 3,905,250 | ||||||
| 25,438,916 | ||||||||
| Paper & Forest Products - 1.5% | ||||||||
| Clearwater Paper Corp., 4.75%, | ||||||||
| 8/15/20284 | 3,750,000 | 3,815,625 | ||||||
| .Total Materials | 29,254,541 | |||||||
| Real Estate - 5.4% | ||||||||
| Equity Real Estate Investment Trusts (REITS) - 4.3% | ||||||||
| HAT Holdings I LLC - HAT Holdings II LLC, 3.375%, 6/15/20264 | 3,750,000 | 3,787,500 | ||||||
| SHARES/ | ||||||||
| PRINCIPAL | VALUE | |||||||
| AMOUNT1 | (NOTE 2) | |||||||
| CORPORATE BONDS (continued) | ||||||||
| Non-Convertible Corporate Bonds (continued) | ||||||||
| Real Estate (continued) | ||||||||
| Equity Real Estate Investment Trusts (REITS) (continued) | ||||||||
| IIP Operating Partnership LP, 5.50%, | ||||||||
| 5/25/2026 | 4,455,000 | $4,718,490 | ||||||
| Pelorus Fund REIT LLC, 7.00%, | ||||||||
| 9/30/2026 (Acquired 09/21/2021, cost $2,750,000)5 | 2,750,000 | 2,705,892 | ||||||
| 11,211,882 | ||||||||
| Real Estate Management & Development - 1.1% | ||||||||
| Carrington Holding Co. LLC, 8.00%, | ||||||||
| 1/1/20264 | 3,000,000 | 3,024,841 | ||||||
| Total Real Estate | 14,236,723 | |||||||
| Utilities - 4.0% | ||||||||
| Independent Power and Renewable Electricity Producers - 4.0% | ||||||||
| Atlantica Sustainable Infrastructure plc (Spain), 4.125%, 6/15/20284 | 3,250,000 | 3,274,375 | ||||||
| Sunnova Energy Corp., 5.875%, | ||||||||
| 9/1/20264 | 3,500,000 | 3,570,000 | ||||||
| Vistra Operations Co. LLC, 4.375%, | ||||||||
| 5/1/20294 | 3,711,000 | 3,717,049 | ||||||
| Total Utilities | 10,561,424 | |||||||
| TOTAL CORPORATE BONDS | ||||||||
| (Identified Cost $213,700,873) | 214,700,035 | |||||||
| SHORT-TERM INVESTMENT - 8.9% | ||||||||
| Dreyfus Government Cash Management, | ||||||||
| Institutional Shares, 0.03%10 | ||||||||
| (Identified Cost $23,179,519) | 23,179,519 | 23,179,519 | ||||||
| TOTAL INVESTMENTS - 101.4% | ||||||||
| (Identified Cost $261,581,175) | 265,658,304 | |||||||
| LIABILITIES, LESS OTHER ASSETS - (1.4%) | (3,761,677) | |||||||
| NET ASSETS - 100% | $ | 261,896,627 | ||||||
LIBOR - London Interbank Offered Rate
*Non-income producing security.
1Amount is stated in USD unless otherwise noted.
2Security has been valued using significant unobservable inputs.
3Floating rate security. Rate shown is the rate in effect as of December 31, 2021.
4Security purchased or received in a transaction exempt from registration under the Securities Act of 1933, as amended (the “1933 Act”) and determined to be liquid under the Fund’s Liquidity Risk Management Program. The security may be resold pursuant to an exemption from registration under the 1933 Act, typically to qualified institutional buyers. The aggregate value of these securities at December 31, 2021 was $152,521,896, which represented 58.2% of the Series’ Net Assets.
5Security purchased or received in a transaction exempt from registration under the Securities Act of 1933, as amended (the “1933 Act”) and determined to be illiquid under the Fund’s Liquidity Risk Management Program. The security may be resold pursuant to an exemption from registration under the 1933 Act, typically to qualified institutional buyers. The aggregate value of such securities at December 31, 2021 was $14,501,557, or 5.5% of the Series’ Net Assets.
6Represents a Payment-in-Kind bond.
The accompanying notes are an integral part of the financial statements.
9
High Yield Bond Series
Investment Portfolio - December 31, 2021
7Security is perpetual in nature and has no stated maturity date.
8Variable rate security. Security may be issued at a fixed coupon rate, which converts to a variable rate at a specified date. Rate shown is the rate in effect as of December 31, 2021.
9Issuer filed for bankruptcy and/or is in default of interest payments.
10Rate shown is the current yield as of December 31, 2021.
The Global Industry Classification Standard (GICS) was developed by and is the exclusive property and a service mark of MSCI Inc. (MSCI) and Standard & Poor’s, a division of S&P Global Inc. (S&P), and is licensed for use by Manning & Napier when referencing GICS sectors. Neither MSCI, S&P, nor any third party involved in making or compiling the GICS or any GICS classifications makes any express or implied warranties or representations with respect to such standard or classification, nor shall any such party have any liability therefrom.
The accompanying notes are an integral part of the financial statements.
10
High Yield Bond Series
Statement of Assets and Liabilities
December 31, 2021
| ASSETS: | ||||
| Investments, at value (identified cost $261,581,175) (Note 2) | $ | 265,658,304 | ||
| Cash | 3,646 | |||
| Interest receivable | 3,823,059 | |||
| Receivable for fund shares sold | 819,854 | |||
| Dividends receivable | 620 | |||
| Prepaid expenses | 25,610 | |||
| TOTAL ASSETS | 270,331,093 | |||
| LIABILITIES: | ||||
| Accrued sub-transfer agent fees (Note 3) | 48,970 | |||
| Accrued fund accounting and administration fees (Note 3) | 28,223 | |||
| Accrued management fees (Note 3) | 16,026 | |||
| Accrued distribution and service (Rule 12b-1) fees (Class S) (Note 3) | 9,418 | |||
| Accrued Chief Compliance Officer service fees (Note 3) | 1,531 | |||
| Payable for securities purchased | 7,919,670 | |||
| Payable for fund shares repurchased | 374,600 | |||
| Other payables and accrued expenses | 36,028 | |||
| TOTAL LIABILITIES | 8,434,466 | |||
| TOTAL NET ASSETS | $ | 261,896,627 | ||
| NET ASSETS CONSIST OF: | ||||
| Capital stock | $ | 267,585 | ||
| Additional paid-in-capital | 256,510,373 | |||
| Total distributable earnings (loss) | 5,118,669 | |||
| TOTAL NET ASSETS | $ | 261,896,627 | ||
| NET ASSET VALUE, OFFERING PRICE AND REDEMPTION PRICE PER SHARE - Class S | ||||
| ($47,107,855/4,541,402 shares) | $ | 10.37 | ||
| NET ASSET VALUE, OFFERING PRICE AND REDEMPTION PRICE PER SHARE - Class I | ||||
| ($67,760,283/7,841,867 shares) | $ | 8.64 | ||
| NET ASSET VALUE, OFFERING PRICE AND REDEMPTION PRICE PER SHARE - Class W | ||||
| ($137,215,458/13,240,730 shares) | $ | 10.36 | ||
| NET ASSET VALUE, OFFERING PRICE AND REDEMPTION PRICE PER SHARE - Class Z | ||||
| ($9,813,031/1,134,546 shares) | $ | 8.65 | ||
The accompanying notes are an integral part of the financial statements.
11
High Yield Bond Series
Statement of Operations
For the Year Ended December 31, 2021
INVESTMENT INCOME:
| Interest | $ | 12,162,283 | ||
| Dividends | 124,362 | |||
| Other Income | 16,714 | |||
| Total Investment Income | 12,303,359 | |||
| EXPENSES: | ||||
| Management fees (Note 3) | 822,734 | |||
| Fund accounting and administration fees (Note 3) | 79,394 | |||
| Sub-transfer agent fees (Note 3) | 76,157 | |||
| Distribution and service (Rule 12b-1) fees (Class S) (Note 3) | 62,021 | |||
| Directors’ fees (Note 3) | 24,014 | |||
| Chief Compliance Officer service fees (Note 3) | 6,123 | |||
| Registration and filing fees | 65,351 | |||
| Custodian fees | 13,767 | |||
| Miscellaneous | 156,303 | |||
| Total Expenses | 1,305,864 | |||
| Less reduction of expenses (Note 3) | (635,996 | ) | ||
| Net Expenses | 669,868 | |||
| NET INVESTMENT INCOME | 11,633,491 | |||
| REALIZED AND UNREALIZED GAIN (LOSS) ON INVESTMENTS: | ||||
| Net realized gain (loss) on investments | 11,120,514 | |||
| Net change in unrealized appreciation (depreciation) on investments | (2,626,100 | ) | ||
| NET REALIZED AND UNREALIZED GAIN (LOSS) ON INVESTMENTS | 8,494,414 | |||
| NET INCREASE IN NET ASSETS RESULTING FROM OPERATIONS | $ | 20,127,905 |
The accompanying notes are an integral part of the financial statements.
12
High Yield Bond Series
Statements of Changes in Net Assets
| FOR THE | FOR THE | |||||||
| YEAR ENDED | YEAR ENDED | |||||||
| 12/31/21 | 12/31/20 | |||||||
| INCREASE (DECREASE) IN NET ASSETS: | ||||||||
| OPERATIONS: | ||||||||
| Net investment income | $ | 11,633,491 | $ | 8,081,089 | ||||
| Net realized gain (loss) on investments | 11,120,514 | 5,573,961 | ||||||
| Net change in unrealized appreciation (depreciation) on investments | (2,626,100 | ) | 7,395,942 | |||||
| Net increase (decrease) from operations | 20,127,905 | 21,050,992 | ||||||
| DISTRIBUTIONS TO SHAREHOLDERS (Note 9): | ||||||||
| Class S | (2,851,858 | ) | (509,115 | ) | ||||
| Class I | (5,700,231 | ) | (1,217,048 | ) | ||||
| Class W | (11,182,645 | ) | (6,305,940 | ) | ||||
| Class Z | (297,832 | ) | (110,904 | ) | ||||
| Total distributions to shareholders | (20,032,566 | ) | (8,143,007 | ) | ||||
| CAPITAL STOCK ISSUED AND REPURCHASED: | ||||||||
| Net increase (decrease) from capital share transactions (Note 5) | 107,301,099 | 75,515,629 | ||||||
| Net increase (decrease) in net assets | 107,396,438 | 88,423,614 | ||||||
| NET ASSETS: | ||||||||
| Beginning of year | 154,500,189 | 66,076,575 | ||||||
| End of year | $ | 261,896,627 | $ | 154,500,189 | ||||
The accompanying notes are an integral part of the financial statements.
13
High Yield Bond Series
Financial Highlights - Class S
| FOR THE YEAR ENDED | ||||||||||||||||||||
| 12/31/21 | 12/31/20 | 12/31/19 | 12/31/18 | 12/31/17 | ||||||||||||||||
| Per share data (for a share outstanding throughout each year): | ||||||||||||||||||||
| Net asset value - Beginning of year | $10.19 | $10.10 | $9.47 | $10.09 | $9.79 | |||||||||||||||
| Income (loss) from investment operations: | ||||||||||||||||||||
| Net investment income1 | 0.53 | 0.57 | 0.57 | 0.53 | 0.54 | |||||||||||||||
| Net realized and unrealized gain (loss) on investments | 0.47 | 0.03 | 0.73 | (0.65 | ) | 0.28 | ||||||||||||||
| Total from investment operations | 1.00 | 0.60 | 1.30 | (0.12 | ) | 0.82 | ||||||||||||||
| Less distributions to shareholders: | ||||||||||||||||||||
| From net investment income | (0.47 | ) | (0.51 | ) | (0.67 | ) | (0.50 | ) | (0.51 | ) | ||||||||||
| From net realized gain on investments | (0.35 | ) | — | — | — | — | ||||||||||||||
| From return of capital | — | — | — | — | (0.01 | ) | ||||||||||||||
| Total distributions to shareholders | (0.82 | ) | (0.51 | ) | (0.67 | ) | (0.50 | ) | (0.52 | ) | ||||||||||
| Net asset value - End of year | $10.37 | $10.19 | $10.10 | $9.47 | $10.09 | |||||||||||||||
| Net assets - End of year (000’s omitted) | $47,108 | $10,197 | $13,113 | $82,399 | $94,533 | |||||||||||||||
| Total return2 | 9.99% | 6.28% | 13.97% | (1.31%) | 8.49% | |||||||||||||||
| Ratios (to average net assets)/Supplemental Data: | ||||||||||||||||||||
| Expenses* | 0.90% | 0.90% | 0.90% | 0.90% | 0.90% | |||||||||||||||
| Net investment income | 5.02% | 5.91% | 5.90% | 5.32% | 5.31% | |||||||||||||||
| Series portfolio turnover | 128% | 208% | 143% | 100% | 106% | |||||||||||||||
*The investment advisor did not impose all or a portion of its management and/or other fees during the years, and may have paid a portion of the Series’ expenses. If these expenses had been incurred by the Class, the expense ratio (to average net assets) would have increased by the following amounts:
| 0.05% | 0.13% | 0.12% | 0.08% | 0.07% |
1Calculated based on average shares outstanding during the years.
2Represents aggregate total return for the years indicated, and assumes reinvestment of all distributions. Total return would have been lower had certain expenses not been waived or reimbursed during the years.
The accompanying notes are an integral part of the financial statements.
14
High Yield Bond Series
Financial Highlights - Class I
| FOR THE YEAR ENDED | ||||||||||||||||||||
| 12/31/21 | 12/31/20 | 12/31/19 | 12/31/18 | 12/31/17 | ||||||||||||||||
| Per share data (for a share outstanding throughout each year): | ||||||||||||||||||||
| Net asset value - Beginning of year | $8.62 | $8.63 | $8.20 | $8.80 | $8.61 | |||||||||||||||
| Income (loss) from investment operations: | ||||||||||||||||||||
| Net investment income1 | 0.47 | 0.51 | 0.53 | 0.49 | 0.49 | |||||||||||||||
| Net realized and unrealized gain (loss) on investments | 0.40 | 0.02 | 0.61 | (0.57 | ) | 0.25 | ||||||||||||||
| Total from investment operations | 0.87 | 0.53 | 1.14 | (0.08 | ) | 0.74 | ||||||||||||||
| Less distributions to shareholders: | ||||||||||||||||||||
| From net investment income | (0.50 | ) | (0.54 | ) | (0.71 | ) | (0.52 | ) | (0.54 | ) | ||||||||||
| From net realized gain on investments | (0.35 | ) | — | — | — | — | ||||||||||||||
| From return of capital | — | — | — | — | (0.01 | ) | ||||||||||||||
| Total distributions to shareholders | (0.85 | ) | (0.54 | ) | (0.71 | ) | (0.52 | ) | (0.55 | ) | ||||||||||
| Net asset value - End of year | $8.64 | $8.62 | $8.63 | $8.20 | $8.80 | |||||||||||||||
| Net assets - End of year (000’s omitted) | $67,760 | $22,477 | $20,974 | $32,962 | $26,459 | |||||||||||||||
| Total return2 | 10.27% | 6.60% | 14.24% | (0.98% | ) | 8.68% | ||||||||||||||
| Ratios (to average net assets)/Supplemental Data: | ||||||||||||||||||||
| Expenses* | 0.65% | 0.65% | 0.65% | 0.65% | 0.65% | |||||||||||||||
| Net investment income | 5.28% | 6.17% | 6.17% | 5.63% | 5.57% | |||||||||||||||
| Series portfolio turnover | 128% | 208% | 143% | 100% | 106% | |||||||||||||||
*The investment advisor did not impose all or a portion of its management and/or other fees during the years, and may have paid a portion of the Series’ expenses. If these expenses had been incurred by the Class, the expense ratio (to average net assets) would have increased by the following amounts:
| 0.02% | 0.10% | 0.13% | 0.08% | 0.07% |
1Calculated based on average shares outstanding during the years.
2Represents aggregate total return for the years indicated, and assumes reinvestment of all distributions. Total return would have been lower had certain expenses not been waived or reimbursed during the years.
The accompanying notes are an integral part of the financial statements.
15
High Yield Bond Series
Financial Highlights - Class W
| FOR THE YEAR ENDED | FOR THE | |||||||||||
| 12/31/21 | 12/31/20 | PERIOD 3/1/191 TO 12/31/19 | ||||||||||
| Per share data (for a share outstanding throughout each period): | ||||||||||||
| Net asset value - Beginning of period | $10.17 | $10.08 | $10.01 | |||||||||
| Income from investment operations: | ||||||||||||
| Net investment income2 | 0.63 | 0.64 | 0.56 | |||||||||
| Net realized and unrealized gain (loss) on investments | 0.46 | 0.03 | 0.27 | |||||||||
| Total from investment operations | 1.09 | 0.67 | 0.83 | |||||||||
| Less distributions to shareholders: | ||||||||||||
| From net investment income | (0.55 | ) | (0.58 | ) | (0.76 | ) | ||||||
| From net realized gain on investments | (0.35 | ) | — | — | ||||||||
| Total distributions to shareholders | (0.90 | ) | (0.58 | ) | (0.76 | ) | ||||||
| Net asset value - End of period | $10.36 | $10.17 | $10.08 | |||||||||
| Net assets - End of period (000’s omitted) | $137,215 | $119,895 | $30,363 | |||||||||
| Total return3 | 10.89% | �� | 7.11% | 8.63% | ||||||||
| Ratios (to average net assets)/Supplemental Data: | ||||||||||||
| Expenses* | 0.10% | 0.10% | 0.10% | 4 | ||||||||
| Net investment income | 5.92% | 6.76% | 6.66% | 4 | ||||||||
| Series portfolio turnover | 128% | 208% | 143% | |||||||||
*The investment advisor did not impose all or a portion of its management and/or other fees during the periods, and may have paid a portion of the Series’ expenses. If these expenses had been incurred by the Class, the expense ratio (to average net assets) would have increased by the following amounts:
| 0.47% | 0.54% | 0.59% | 4 |
1Commencement of operations.
2Calculated based on average shares outstanding during the periods.
3Represents aggregate total return for the periods indicated, and assumes reinvestment of all distributions. Total return would have been lower had certain expenses not been waived or reimbursed during the periods. Periods less than one year are not annualized.
4Annualized.
The accompanying notes are an integral part of the financial statements.
16
High Yield Bond Series
Financial Highlights - Class Z
| FOR THE YEAR ENDED | FOR THE | |||||||||||
| 12/31/21 | 12/31/20 | PERIOD 3/1/191 TO 12/31/19 | ||||||||||
| Per share data (for a share outstanding throughout each period): | ||||||||||||
| Net asset value - Beginning of period | $8.62 | $8.64 | $8.67 | |||||||||
| Income from investment operations: | ||||||||||||
| Net investment income2 | 0.48 | 0.52 | 0.46 | |||||||||
| Net realized and unrealized gain (loss) on investments | 0.41 | 0.01 | 0.23 | |||||||||
| Total from investment operations | 0.89 | 0.53 | 0.69 | |||||||||
| Less distributions to shareholders: | ||||||||||||
| From net investment income | (0.51 | ) | (0.55 | ) | (0.72 | ) | ||||||
| From net realized gain on investments | (0.35 | ) | — | — | ||||||||
| Total distributions to shareholders | (0.86 | ) | (0.55 | ) | (0.72 | ) | ||||||
| Net asset value - End of period | $8.65 | $8.62 | $8.64 | |||||||||
| Net assets - End of period (000’s omitted) | $9,813 | $1,931 | $1,627 | |||||||||
| Total return3 | 10.48% | 6.59% | 8.26% | |||||||||
| Ratios (to average net assets)/Supplemental Data: | ||||||||||||
| Expenses* | 0.50% | 0.50% | 0.50% | 4 | ||||||||
| Net investment income | 5.41% | 6.32% | 6.26% | 4 | ||||||||
| Series portfolio turnover | 128% | 208% | 143% | |||||||||
*The investment advisor did not impose all or a portion of its management and/or other fees during the periods, and may have paid a portion of the Series’ expenses. If these expenses had been incurred by the Class, the expense ratio (to average net assets) would have increased by the following amounts:
| 0.07% | 0.14% | 0.19% | 4 |
1Commencement of operations.
2Calculated based on average shares outstanding during the periods.
3Represents aggregate total return for the periods indicated, and assumes reinvestment of all distributions. Total return would have been lower had certain expenses not been waived or reimbursed during the periods. Periods less than one year are not annualized.
4Annualized.
The accompanying notes are an integral part of the financial statements.
17
High Yield Bond Series
Notes to Financial Statements
| 1. | Organization |
High Yield Bond Series (the “Series”) is a no-load diversified series of Manning & Napier Fund, Inc. (the “Fund”). The Fund is organized in Maryland and is registered under the Investment Company Act of 1940, as amended, as an open-end management investment company.
The Series’ investment objective is to provide a high level of long-term total return by investing principally in non-investment grade fixed income securities that are issued by government and corporate entities.
The Series is authorized to issue four classes of shares (Class S, I, W, and Z). Each class of shares is substantially the same, except that class specific distribution and shareholder servicing expenses are borne by the specific class of shares to which they relate.
The Fund’s advisor is Manning & Napier Advisors, LLC (the “Advisor”). Shares of the Series are offered to investors, clients and employees of the Advisor and its affiliates. The total authorized capital stock of the Fund consists of 15 billion shares of common stock each having a par value of $0.01. As of December 31, 2021, 6.3 billion shares have been designated in total among 15 series, of which 100 million have been designated as High Yield Bond Series Class I common stock and High Yield Bond Series Class Z common stock, 125 million have been designated as High Yield Bond Series Class S common stock and 50 million have been designated as High Yield Bond Series Class W common stock.
| 2. | Significant Accounting Policies |
The following is a summary of significant accounting policies followed by the Series. The Series is an investment company and, accordingly, follows the investment company accounting and reporting guidance of the Financial Accounting Standards Board Accounting Standards Codification Topic 946 - Investment Companies, which is part of accounting principles generally accepted in the United States of America (“GAAP”).
Security Valuation
Portfolio securities, including domestic equities, foreign equities, warrants and options, listed on an exchange other than the NASDAQ Stock Market are valued at the latest quoted sales price of the exchange on which the security is primarily traded. Securities not traded on valuation date or securities not listed on an exchange are valued at the latest quoted bid price provided by the Fund’s pricing service. Securities listed on the NASDAQ Stock Market are valued in accordance with the NASDAQ Official Closing Price.
Debt securities, including government bonds, foreign bonds, asset-backed securities, structured notes, supranational obligations, sovereign bonds, corporate bonds, loan assignments, and mortgage-backed securities will normally be valued on the basis of evaluated bid prices provided directly by an independent pricing service. The pricing services use multiple valuation techniques to determine fair value. In instances where sufficient market activity exists, the pricing services may utilize a market-based approach through which quotes from market makers are used to determine fair value. In instances where sufficient market activity may not exist or is limited, the pricing services also utilize proprietary valuation models which may consider market characteristics such as benchmark yield curves, option-adjusted spreads, credit spreads, estimated default rates, coupon rates, anticipated timing of principal repayments, underlying collateral, and other unique security features in order to estimate the relevant cash flows, which are then discounted to calculate the fair value. Certain investments in securities held by the Series may be valued on a basis of a price provided directly by a principal market maker. These prices may differ from the value that would have been used had a broader market for securities existed.
The fair value of loan assignments is estimated using recently executed transactions, market price quotations, credit/market events, and cross-asset pricing. Inputs are generally observable market inputs obtained from independent sources. Loan assignments are generally categorized in Level 2 of the fair value hierarchy, unless key inputs are unobservable, in which case they would be categorized in Level 3.
Short-term investments that mature in sixty days or less may be valued at amortized cost, which approximates fair value. Investments in open-end investment companies are valued at their net asset value per share on valuation date.
18
High Yield Bond Series
Notes to Financial Statements (continued)
| 2. | Significant Accounting Policies (continued) |
Security Valuation (continued)
Volume and level of activity in established markets for an asset or liability are evaluated to determine whether recent transactions and quoted prices are determinative of fair value. Where there have been significant decreases in volume and level of activity, further analysis and adjustment may be necessary to estimate fair value. The Series measures fair value in these instances by the use of inputs and valuation techniques which may be based upon current market prices of securities that are comparable in coupon, rating, maturity and industry and/or expectation of future cash flows. As a result of trading in relatively thin markets and/or markets that experience significant volatility, the prices used by the Series to value these securities may differ from the value that would be realized if these securities were sold, and the differences could be material.
Securities for which representative valuations or prices are not available from the Series’ pricing service may be valued at fair value as determined in good faith by the Advisor under procedures approved by and under the general supervision and responsibility of the Fund’s Board of Directors (the “Board”). Due to the inherent uncertainty of valuations of such securities, the fair value may differ significantly from the values that would have been used had a ready market for such securities existed. If trading or events occurring after the close of the principal market in which securities are traded are expected to materially affect the value of those securities, then they may be valued at their fair value, taking this trading or these events into account.
Various inputs are used in determining the value of the Series’ assets or liabilities carried at fair value. These inputs are summarized in three broad levels. Level 1 includes quoted prices in active markets for identical assets and liabilities. Level 2 includes other significant observable inputs (including quoted prices for similar securities, interest rates, prepayment speeds, credit risk, etc.). Level 3 includes significant unobservable inputs (including the Series’ own assumptions in determining the fair value of investments). A financial instrument’s level within the fair value hierarchy is based on the lowest level of any input both individually and in aggregate that is significant to the fair value measurement. The inputs or methodology used for valuing securities are not necessarily an indication of the risk associated with investing in those securities.
The following is a summary of the valuation levels used for major security types as of December 31, 2021 in valuing the Series’ assets or liabilities carried at fair value:
| DESCRIPTION | TOTAL | LEVEL 1 | LEVEL 2 | LEVEL 3 | ||||||||||||
| Assets: | ||||||||||||||||
| Equity securities: | ||||||||||||||||
| Energy | $ | 4,083,813 | $ | — | $ | — | $ | 4,083,813 | ||||||||
| Preferred securities: | ||||||||||||||||
| Health Care | 2,541,588 | 2,541,588 | — | — | ||||||||||||
| Information Technology | 2,487,672 | 2,487,672 | — | — | ||||||||||||
| Debt securities: | ||||||||||||||||
| Loan Assignments | 18,665,677 | — | 18,665,677 | — | ||||||||||||
| Corporate debt: | ||||||||||||||||
| Communication Services | 15,621,065 | — | 15,621,065 | — | ||||||||||||
| Consumer Discretionary | 9,523,048 | — | 9,523,048 | — | ||||||||||||
| Energy | 41,687,839 | — | 41,687,839 | — | ||||||||||||
| Financials | 44,091,027 | — | 44,091,027 | — | ||||||||||||
| Health Care | 3,745,000 | — | 3,745,000 | — | ||||||||||||
| Industrials | 42,431,418 | — | 42,431,418 | — | ||||||||||||
| Information Technology | 3,547,950 | — | 3,547,950 | — | ||||||||||||
| Materials | 29,254,541 | — | 29,254,541 | — | ||||||||||||
| Real Estate | 14,236,723 | — | 14,236,723 | — | ||||||||||||
| Utilities | 10,561,424 | — | 10,561,424 | — | ||||||||||||
| Short-Term Investment | 23,179,519 | 23,179,519 | — | — | ||||||||||||
| Total assets | $ | 265,658,304 | $ | 28,208,779 | $ | 233,365,712 | $ | 4,083,813 | ||||||||
19
High Yield Bond Series
Notes to Financial Statements (continued)
| 2. | Significant Accounting Policies (continued) |
Security Valuation (continued)
The following table is a reconciliation Level 3 investments for which significant unobservable inputs were used to determine fair value:
| LEVEL 3 RECONCILIATION | EQUITY SECURITY | |||
| Balance as of December 31, 2020 (fair value) | $ | 980,115 | ||
| Net realized gain (loss) | — | |||
| Change in unrealized appreciation (depreciation)* | 3,103,698 | |||
| Purchases | — | |||
| Sales | — | |||
| Transfers in | — | |||
| Transfers out | — | |||
| Balance as of 31 December, 2021 (fair value) | $ | 4,083,813 | ||
* The change in unrealized appreciation (depreciation) attributable to securities owned on December 31, 2021 which were valued using significant unobservable inputs (Level 3) amounted to $3,103,698.
The following table summarizes the quantitative inputs and assumptions used for items categorized in Level 3 of the fair value hierarchy as of December 31, 2021.
| QUANTITATIVE INFORMATION ABOUT LEVEL 3 FAIR VALUE MEASUREMENTS | |||||
| VALUATION | AMOUNT OR | ||||
| IMPACT FROM | RANGE/ | ||||
| FAIR VALUE | VALUATION | UNOBSERVABLE | AN INCREASE | WEIGHTED | |
| AT 12/31/2021 | TECHNIQUE | INPUT | IN INPUT | AVERAGE | |
| Common Stock - Energy | $4,083,813 | Market Approach | Imputed Price Based on Potential Transaction Discount for Probability of | Increase | $67.89/NA |
| Transaction | Decrease | 7.9%/NA | |||
The significant unobservable inputs used in the fair value measurement of the Fund’s equity security are the potential of a partial sale transaction and assumptions made to calculate residual equity, converted into unit value and discounted to reflect the pending nature of the transaction.
LIBOR Transition Risk
The United Kingdom’s Financial Conduct Authority announced a phase out of the London Interbank Offered Rate (“LIBOR”). Although many LIBOR rates will cease to be published or no longer will be representative of the underlying market they seek to measure after December 31, 2021, a selection of widely used USD LIBOR rates will continue to be published through June 2023 in order to assist with the transition. The Series may be exposed to financial instruments tied to LIBOR to determine payment obligations, financing terms, hedging strategies or investment value. The transition process away from LIBOR might lead to increased volatility and illiquidity in markets for, and reduce the effectiveness of new hedges placed against, instruments whose terms currently include LIBOR. The ultimate effect of the LIBOR transition process on the Series is uncertain.
Security Transactions, Investment Income and Expenses
Security transactions are accounted for on trade date. Dividend income is recorded on the ex-dividend date, except that if the ex-dividend date has passed, certain dividends from foreign securities are recorded as soon as the Series is informed of the ex-dividend date. Non-cash dividends, if any, are recorded at the fair value of the securities received. Interest income, including
20
High Yield Bond Series
Notes to Financial Statements (continued)
| 2. | Significant Accounting Policies (continued) |
Security Transactions, Investment Income and Expenses (continued)
amortization of premium and accretion of discounts using the effective interest method, is earned from settlement date and accrued daily.
Expenses are recorded on an accrual basis. Most expenses of the Fund can be attributed to a specific series. Expenses which cannot be directly attributed are apportioned among the series in the Fund in such a manner as deemed equitable by the Fund’s Board, taking into consideration, among other things, the nature and type of expense. Income, expenses (other than shareholder services fees), and realized and unrealized gains and losses are prorated among the classes based on the relative net assets of each class. Class specific expenses are directly charged to that Class.
The Series uses the identified cost method for determining realized gain or loss on investments for both financial statement and federal income tax reporting purposes.
Foreign Currency Translation
The books and records of the Series are maintained in U.S. dollars. Foreign currencies, investments and other assets and liabilities are translated into U.S. dollars at the current exchange rates. Purchases and sales of investment securities and income and expenses are translated on the respective dates of such transactions. The Series does not isolate realized and unrealized gains and losses attributable to changes in the exchange rates from gains and losses that arise from changes in the fair value of investments. Such fluctuations are included with net realized and unrealized gain or loss on investments. Net realized foreign currency gains and losses represent foreign currency gains and losses between trade date and settlement date on securities transactions, gains and losses on disposition of foreign currencies and the difference between the amount of income and foreign withholding taxes recorded on the books of the Series and the amounts actually received or paid.
Securities Purchased on a When-Issued Basis or Forward Commitment
The Series may purchase securities on a when-issued basis or forward commitment. These transactions involve a commitment by the Series to purchase securities for a predetermined price with payment and delivery taking place beyond the customary settlement period. When such purchases are outstanding, the Series will designate liquid assets in an amount sufficient to meet the purchase price. When purchasing a security on a delayed delivery basis, the Series assumes the rights and risks of ownership of the security, including the risk of price and yield fluctuations, and takes such fluctuations into account when determining its net asset value. The Series may sell the when-issued securities before they are delivered, which may result in a capital gain or loss. No such investments were held by the Series on December 31, 2021.
In connection with its ability to purchase or sell securities on a forward commitment basis, the Series may enter into forward roll transactions principally using To Be Announced (TBA) securities. Forward roll transactions require the sale of securities for delivery in the current month, and a simultaneous agreement to repurchase substantially similar (same type, coupon and maturity) securities on a specified future date. Risks of entering into forward roll transactions include the potential inability of the counterparty to meet the terms of the agreement; the potential of the Series to receive inferior securities at redelivery as compared to the securities sold to the counterparty; counterparty credit risk; and the potential pay down speed variance between the mortgage-backed pools. During the roll period, the Series forgoes principal and interest paid on the securities. The Series accounts for such dollar rolls as purchases and sales. Information regarding securities purchased on a when-issued basis is included in the Series’ Investment Portfolio. No such investments were held by the Series on December 31, 2021.
Asset-Backed Securities
The Series may invest in asset-backed securities. Asset-backed securities are generally issued as pass-through certificates or as debt instruments. Asset-backed securities issued as pass-through certificates represent undivided fractional ownership interests in an underlying pool of assets. Asset-backed securities issued as debt instruments, which are also known as collateralized obligations, are typically issued as the debt of a special purpose entity organized solely for the purpose of owning such assets and issuing such debt. Asset-backed securities are often backed by a pool of assets representing the obligations of a number of different parties. The yield characteristics of certain asset-backed securities may differ from traditional debt securities. One such major difference is that all or a principal part of the obligations may be prepaid at any time because the underlying assets (i.e.
21
High Yield Bond Series
Notes to Financial Statements (continued)
| 2. | Significant Accounting Policies (continued) |
Asset-Backed Securities (continued)
loans) may be prepaid at any time. As a result, a decrease in interest rates in the market may result in increases in the level of prepayments as borrowers, particularly mortgagors, refinance and repay their loans. An increased prepayment rate with respect to an asset-backed security will have the effect of shortening the maturity of the security. In addition, the Series may subsequently have to reinvest the proceeds at lower interest rates. If the Series has purchased such an asset-backed security at a premium, a faster than anticipated prepayment rate could result in a loss of principal to the extent of the premium paid.
Mortgage-Backed Securities
The Series may invest in mortgage-backed securities (“MBS” or pass-through certificates) that represent an interest in a pool of specific underlying mortgage loans and entitle the Series to the periodic payments of principal and interest from those mortgages. MBS may be issued by government agencies or corporations, or private issuers. Most MBS issued by government agencies are guaranteed; however, the degree of protection differs based on the issuer. For MBS, there are a number of important differences among the agencies and instrumentalities of the U.S. Government that issue mortgage-related securities and among the securities that they issue. For example, mortgage-related securities guaranteed by Ginnie Mae are guaranteed as to the timely payment of principal and interest by Ginnie Mae and such guarantee is backed by the full faith and credit of the United States. However, mortgage-related securities issued by Freddie Mac and Fannie Mae, including Freddie Mac and Fannie Mae guaranteed mortgage pass-through certificates, which are solely the obligations of Freddie Mac and Fannie Mae, are not backed by or entitled to the full faith and credit of the United States, but are supported by the right of the issuer to borrow from the U.S. Treasury. Non-agency mortgage-backed securities are securities issued by non-governmental issuers and have no direct or indirect government guarantees of payment and are subject to various risks. Non-agency mortgage loans are obligations of the borrowers thereunder only and are not typically insured or guaranteed by any other person or entity. The ability of a borrower to repay a loan is dependent upon the income or assets of the borrower. A number of factors, including a general economic downturn, acts of God, terrorism, social unrest and civil disturbances, may impair a borrower’s ability to repay its loans.
Restricted Securities
Restricted securities are purchased in private placement transactions, are not registered under the Securities Act of 1933, as amended, and may have contractual restrictions on resale. Information regarding restricted securities is included at the end of the Series’ Investment Portfolio.
Federal Taxes
The Series’ policy is to comply with the provisions of the Internal Revenue Code applicable to regulated investment companies. The Series is not subject to federal income tax or excise tax to the extent that the Series distributes to shareholders each year its taxable income, including any net realized gains on investments, in accordance with requirements of the Internal Revenue Code. Accordingly, no provision for federal income tax or excise tax has been made in the financial statements.
Management evaluates its tax positions to determine if the tax positions taken meet the minimum recognition threshold in connection with accounting for uncertainties in income tax positions taken or expected to be taken for the purposes of measuring and recognizing tax liabilities in the financial statements. Recognition of tax benefits of an uncertain tax position is required only when the position is “more likely than not” to be sustained assuming examination by taxing authorities. At December 31, 2021, the Series has recorded no liability for net unrecognized tax benefits relating to uncertain income tax positions taken or expected to be taken in future tax returns.
The Series files income tax returns in the U.S. federal jurisdiction, various states and foreign jurisdictions, as required. No income tax returns are currently under investigation. The statute of limitations on the Series’ tax returns remains open for the years ended December 31, 2018 through December 31, 2021. The Series is not aware of any tax positions for which it is reasonably possible that the total amounts of unrecognized tax benefits will significantly change in the next twelve months.
22
High Yield Bond Series
Notes to Financial Statements (continued)
| 2. | Significant Accounting Policies (continued) |
Foreign Taxes
Based on the Series’ understanding of the tax rules and rates related to income, gains and currency purchase/repatriation transactions for foreign jurisdictions in which it invests, the Series will provide for foreign taxes, and where appropriate, deferred foreign tax.
Distributions of Income and Gains
Distributions to shareholders of net investment income are made quarterly. Distributions of net realized gains are made annually. An additional distribution may be necessary to avoid taxation of the Series. Distributions are recorded on the ex-dividend date.
Indemnifications
The Fund’s organizational documents provide former and current directors and officers with a limited indemnification against liabilities arising in connection with the performance of their duties to the Fund. In the normal course of business, the Fund may also enter into contracts that provide general indemnifications. The Fund’s maximum exposure under these arrangements is unknown as this would be dependent on future claims that may be made against the Fund. The risk of material loss from such claims is considered remote.
Other
The preparation of financial statements in conformity with GAAP requires management to make estimates and assumptions that affect the reported amounts of assets and liabilities and the disclosure of contingent assets and liabilities at the date of the financial statements and the reported amounts of income and expenses during the reporting period. Actual results could differ from those estimates.
| 3. | Transactions with Affiliates |
The Fund has an Investment Advisory Agreement (the “Agreement”) with the Advisor, for which the Series pays a fee, computed daily and payable monthly, at an annual rate of 0.40% of the Series’ average daily net assets.
Under the Agreement, personnel of the Advisor provide the Series with advice and assistance in the choice of investments and the execution of securities transactions, and otherwise maintain the Series’ organization. The Advisor also provides the Fund with necessary office space and fund administration and support services. The salaries of all officers of the Fund (except a percentage of the Fund’s Chief Compliance Officer’s salary, which is paid by the Fund), and of all Directors who are “affiliated persons” of the Fund, or of the Advisor, and all personnel of the Fund, or of the Advisor, performing services relating to research, statistical and investment activities, are paid by the Advisor. Each “non-affiliated” Director receives an annual stipend, which is allocated among all the active series of the Fund. In addition, these Directors also receive a fee per Board meeting attended plus a fee for each committee meeting attended and are reimbursed for travel and other out-of-pocket expenses incurred by them in connection with attending such meetings. The Fund also has an Audit Committee Chair, Governance & Nominating Committee Chair and Lead Independent Director, who each receive an additional annual stipend for these roles.
The Fund may enter into agreements with financial intermediaries pursuant to which the Fund may pay financial intermediaries for non-distribution related sub-transfer agency, administrative, sub-accounting, and other shareholder services in an annual amount not to exceed 0.15% of the average daily net assets of the Class I and Class S shares of the Series. Payments made pursuant to such agreements are generally based on the current assets and/or number of accounts of the Series attributable to the financial intermediary. Any payments made pursuant to such agreements may be in addition to, rather than in lieu of, any Distribution and Shareholder Services Fee payable under the Rule 12b-1 plan of the Fund. For the year ended December 31, 2021, the sub-transfer agency expenses incurred by Class S and Class I were $32,652 and $43,505, respectively.
Manning & Napier Investor Services, Inc., a registered broker-dealer affiliate of the Advisor, acts as distributor for the Fund’s shares. The Series compensates the distributor for distributing and servicing the Series’ Class S shares pursuant to a distribution plan adopted under Rule 12b-1 of the 1940 Act, regardless of expenses actually incurred. Under the agreement, the Series pays distribution and service fees to the distributor at an annual rate of 0.25% of average daily net assets attributable to Class S shares. There are no distribution and service fees on the Class I, Class W or Class Z shares. The fees are accrued daily and paid monthly.
23
High Yield Bond Series
Notes to Financial Statements (continued)
| 3. | Transactions with Affiliates (continued) |
Pursuant to a master services agreement dated February 13, 2020, as amended, the Fund pays the Advisor an annual fee related to fund accounting and administration of 0.0085% on the first $25 billion of average daily net assets; 0.0075% on the next $15 billion of average daily net assets; and 0.0065% of average daily net assets in excess of $40 billion; plus a base fee of $30,400 per series. Additionally, certain transaction and out-of-pocket expenses, including charges for reporting relating to the Fund’s compliance program, are charged. The Advisor has agreements with BNY Mellon Investment Servicing (U.S.) Inc. (“BNY”) under which BNY serves as sub-accountant services agent.
Pursuant to an advisory fee waiver agreement, the Advisor has contractually agreed to waive the management fee for the Class W shares. The full management fee will be waived under this agreement because Class W shares are only available to discretionary investment accounts and other accounts managed by the Advisor. These clients pay a management fee to the Advisor that is separate from the Fund’s expenses. In addition, pursuant to a separate expense limitation agreement, the Advisor has contractually agreed to limit its fees and reimburse expenses to the extent necessary so that the total direct annual fund operating expenses, exclusive of the shareholder services fee and/or distribution and service (12b-1) fees and waived Class W management fees (collectively, “excluded expenses”), do not exceed 0.65% of the average daily net assets of the Class S and Class I shares, 0.10% of the average daily net assets of the Class W shares, and 0.50% of the average daily net assets of the Class Z shares. These contractual waivers are expected to continue indefinitely, and may not be amended or terminated by the Advisor without the approval of the Series’ Board of Directors. The Advisor may receive from a Class the difference between the Class’s total direct annual fund operating expenses, not including excluded expenses, and the Class’s contractual expense limit to recoup all or a portion of its prior fee waivers (other than Class W management fee waivers) or expense reimbursements made during the rolling three-year period preceding the recoupment if at any point the total direct annual fund operating expenses, not including excluded expenses, are below the contractual expense limit (a) at the time of the fee waiver and/or expense reimbursement and (b) at the time of the recoupment.
Pursuant to the advisory fee waiver, the Advisor waived $524,289 in management fees for Class W for the year ended December 31, 2021. In addition, pursuant to the separate expense limitation agreement, the Advisor waived or reimbursed expenses of $12,275, $7,047, $88,678 and $3,707 for Class S, Class I, Class W, and Class Z, respectively, for the year ended December 31, 2021. These amounts are included as a reduction of expenses on the Statement of Operations.
As of December 31, 2021, the class specific waivers or reimbursements subject to possible future recoupment under the expense limitation agreement are as follows:
| CLASS | EXPIRING DECEMBER 31, | |||||||||||||||
| 2022 | 2023 | 2024 | TOTAL | |||||||||||||
| Class S | $ | 18,519 | $ | 13,633 | $ | 12,275 | $ | 44,427 | ||||||||
| Class I | 22,088 | 17,756 | 7,047 | 46,891 | ||||||||||||
| Class W | 82,483 | 126,979 | 88,678 | 298,140 | ||||||||||||
| Class Z | 14,052 | 2,226 | 3,707 | 19,985 | ||||||||||||
For the year ended December 31, 2021, the Advisor did not recoup any expenses that have been previously waived or reimbursed.
| 4. | Purchases and Sales of Securities |
For the year ended December 31, 2021, purchases and sales of securities, other than U.S. Government securities and short-term securities, were $333,183,541 and $247,376,907, respectively. There were no purchases or sales of U.S. Government securities.
24
High Yield Bond Series
Notes to Financial Statements (continued)
| 5. | Capital Stock Transactions |
Transactions in Class S, Class I, Class W and Class Z shares of High Yield Bond Series were:
| CLASS S | FOR THE YEAR ENDED | FOR THE YEAR ENDED | ||||||||||||||
| 12/31/21 | 12/31/20 | |||||||||||||||
| SHARES | AMOUNT | SHARES | AMOUNT | |||||||||||||
| Sold | 5,744,521 | $ | 61,132,086 | 1,374,004 | $ | 13,470,435 | ||||||||||
| Reinvested | 215,066 | 2,231,231 | 43,968 | 426,693 | ||||||||||||
| Repurchased | (2,418,892 | ) | (25,703,861 | ) | (1,715,055 | ) | (16,444,271 | ) | ||||||||
| Total | 3,540,695 | $ | 37,659,456 | (297,083 | ) | $ | (2,547,143 | ) | ||||||||
| CLASS I | FOR THE YEAR ENDED | FOR THE YEAR ENDED | ||||||||||||||
| 12/31/21 | 12/31/20 | |||||||||||||||
| SHARES | AMOUNT | SHARES | AMOUNT | |||||||||||||
| Sold | 8,127,738 | $ | 72,620,203 | 1,549,016 | $ | 12,741,074 | ||||||||||
| Reinvested | 638,351 | 5,534,045 | 143,819 | 1,184,486 | ||||||||||||
| Repurchased | (3,532,642 | ) | (31,206,195 | ) | (1,513,585 | ) | (12,480,382 | ) | ||||||||
| Total | 5,233,447 | $ | 46,948,053 | 179,250 | $ | 1,445,178 | ||||||||||
| CLASS W | FOR THE YEAR ENDED | FOR THE YEAR ENDED | ||||||||||||||
| 12/31/21 | 12/31/20 | |||||||||||||||
| SHARES | AMOUNT | SHARES | AMOUNT | |||||||||||||
| Sold | 1,256,616 | $ | 13,115,949 | 9,470,532 | $ | 82,557,027 | ||||||||||
| Reinvested | 1,035,395 | 10,750,624 | 617,247 | 5,999,867 | ||||||||||||
| Repurchased | (840,081 | ) | (8,855,336 | ) | (1,311,183 | ) | (12,237,390 | ) | ||||||||
| Total | 1,451,930 | $ | 15,011,237 | 8,776,596 | $ | 76,319,504 | ||||||||||
| CLASS Z | FOR THE YEAR ENDED | FOR THE YEAR ENDED | ||||||||||||||
| 12/31/21 | 12/31/20 | |||||||||||||||
| SHARES | AMOUNT | SHARES | AMOUNT | |||||||||||||
| Sold | 1,916,130 | $ | 16,799,932 | 27,724 | $ | 236,362 | ||||||||||
| Reinvested | 33,862 | 297,832 | 13,462 | 110,904 | ||||||||||||
| Repurchased | (1,039,362 | ) | (9,415,411 | ) | (5,700 | ) | (49,176 | ) | ||||||||
| Total | 910,630 | $ | 7,682,353 | 35,486 | $ | 298,090 | ||||||||||
Approximately 52% of the shares outstanding are fiduciary accounts where the Advisor has sole investment discretion.
| 6. | Line of Credit |
The Fund has entered into a 364-day, $25 million credit agreement (the “line of credit”) with Bank of New York Mellon. Each series of the Fund may borrow under the line of credit for temporary or emergency purposes, including funding shareholder redemptions and other short-term liquidity purposes. The Fund pays an annual fee on the unused commitment amount, payable quarterly, and is allocated among all the series of the Fund and included in miscellaneous expenses in the Statement of Operations for each series. The line of credit expires in September 2022 unless extended or renewed. During the year ended December 31, 2021, the Series did not borrow under the line of credit.
25
High Yield Bond Series
Notes to Financial Statements (continued)
| 7. | Financial Instruments |
The Series may trade in instruments including written and purchased options, forward foreign currency exchange contracts and futures contracts and other derivatives in the normal course of investing activities to assist in managing exposure to various market risks. The Series may be subject to various elements of risk, which may involve, to a varying degree, elements of risk in excess of the amounts recognized for financial statement purposes. These risks include: the risk that changes in the value of a derivative may not correlate perfectly with the underlying asset, rate or index; counterparty credit risk related to over the counter derivative counterparties’ failure to perform under contract terms; liquidity risk related to the lack of a liquid market for these contracts allowing the fund to close out its position(s); and documentation risk relating to disagreement over contract terms. No such investments were held by the Series as of December 31, 2021.
The Series may invest in a loan assignment of all or a portion of the loans. The Series has direct rights against the borrower on a loan when it purchases an assignment; however, the Series’ rights may be more limited than the lender from which it acquired the assignment and the Series may be able to enforce its rights only through an administrative agent. Loan assignments are vulnerable to market conditions and may become illiquid due to economic conditions or other events may reduce the demand for loan assignments and certain loan assignments which were liquid when purchased may become illiquid.
| 8. | Foreign Securities |
Investing in securities of foreign companies and foreign governments involves special risks and considerations not typically associated with investing in securities of domestic companies and the U.S. Government. These risks include revaluation of currencies and future adverse political and economic developments. Moreover, securities of foreign companies and foreign governments and their markets may be less liquid and their prices more volatile than those of comparable domestic companies and the U.S. Government.
| 9. | Federal Income Tax Information |
The amount and characterization of certain income and capital gains to be distributed are determined in accordance with federal income tax regulations, which may differ from GAAP. These differences are primarily due to differing book and tax treatments in the timing and/or treatment of the recognition of net investment income or gains and losses including tax equalization. The Series may periodically make reclassifications among its capital accounts to reflect income and gains available for distribution (or available capital loss carryovers) under income tax regulations, without impacting the Series’ net asset value. For the year ended December 31, 2021, amounts were reclassified within the capital accounts to increase Additional Paid in Capital by $1,506,660 and decrease Total Distributable Earnings (Loss) by $1,506,660. Any such reclassifications are not reflected in the financial highlights.
The tax character of distributions paid were as follows:
| FOR THE YEAR | FOR THE YEAR | |||||||
| ENDED 12/31/21 | ENDED 12/31/20 | |||||||
| Ordinary income | $ | 19,495,758 | $ | 8,143,007 | ||||
| Long-term capital gains | $ | 536,808 | — | |||||
26
High Yield Bond Series
Notes to Financial Statements (continued)
| 9. | Federal Income Tax Information (continued) |
At December 31, 2021, the tax basis of components of distributable earnings and the net unrealized appreciation based on the identified cost of investments for federal income tax purposes were as follows:
| Cost for federal income tax purposes | $ | 261,685,277 | ||||||
| Unrealized appreciation | 6,963,885 | |||||||
| Unrealized depreciation | (2,990,858 | ) | ||||||
| Net unrealized appreciation | $ | 3,973,027 | ||||||
| Undistributed ordinary income | $ | 742,497 | ||||||
| Undistributed long-term capital gains | $ | 403,143 |
| 10. | Market Event |
In March 2020, the World Health Organization declared COVID-19 (a novel coronavirus) to be a pandemic. The situation is dynamic and a recent resurgence of COVID-19 has caused a continued time of uncertainty. Global financial markets have experienced and may continue to experience significant volatility resulting from the spread of COVID-19. The global economy, the economies of certain nations and individual issuers have been and may continue to be adversely affected by COVID-19, particularly in light of the interconnectivity between economies and financial markets, all of which may negatively impact the Series’ performance. Management of the Series will continue to monitor the impact of COVID-19 on investment performance, financial statements and the Series’ operations.
27
High Yield Bond Series
Report of Independent Registered Public Accounting Firm
To the Board of Directors of Manning & Napier Fund, Inc. and Shareholders of High Yield Bond Series
Opinion on the Financial Statements
We have audited the accompanying statement of assets and liabilities, including the investment portfolio, of High Yield Bond Series (one of the series constituting Manning & Napier Fund, Inc., referred to hereafter as the “Fund”) as of December 31, 2021, the related statement of operations for the year ended December 31, 2021, the statement of changes in net assets for each of the two years in the period ended December 31, 2021, including the related notes, and the financial highlights for each of the periods indicated therein (collectively referred to as the “financial statements”). In our opinion, the financial statements present fairly, in all material respects, the financial position of the Fund as of December 31, 2021, the results of its operations for the year then ended, the changes in its net assets for each of the two years in the period ended December 31, 2021 and the financial highlights for each of the periods indicated therein in conformity with accounting principles generally accepted in the United States of America.
Basis for Opinion
These financial statements are the responsibility of the Fund’s management. Our responsibility is to express an opinion on the Fund’s financial statements based on our audits. We are a public accounting firm registered with the Public Company Accounting Oversight Board (United States) (PCAOB) and are required to be independent with respect to the Fund in accordance with the U.S. federal securities laws and the applicable rules and regulations of the Securities and Exchange Commission and the PCAOB.
We conducted our audits of these financial statements in accordance with the standards of the PCAOB. Those standards require that we plan and perform the audit to obtain reasonable assurance about whether the financial statements are free of material misstatement, whether due to error or fraud.
Our audits included performing procedures to assess the risks of material misstatement of the financial statements, whether due to error or fraud, and performing procedures that respond to those risks. Such procedures included examining, on a test basis, evidence regarding the amounts and disclosures in the financial statements. Our audits also included evaluating the accounting principles used and significant estimates made by management, as well as evaluating the overall presentation of the financial statements. Our procedures included confirmation of securities owned as of December 31, 2021 by correspondence with the custodian, brokers, agent banks and issuers of privately offered securities; when replies were not received from brokers, we performed other auditing procedures. We believe that our audits provide a reasonable basis for our opinion.

New York, New York
February 18, 2022
We have served as the auditor of one or more investment companies in Manning & Napier Mutual Funds since 1992.
28
High Yield Bond Series
Supplemental Tax Information
(unaudited)
All reportings are based on financial information available as of the date of this annual report and, accordingly, are subject to change.
The Series designates $1,543,641 as Long-Term Capital Gain dividends pursuant to Section 852(b)(3) of the Internal Revenue Code for the fiscal year ended December 31, 2021.
29
High Yield Bond Series
Directors’ and Officers’ Information
(unaudited)
The Statement of Additional Information provides additional information about the Fund’s directors and officers and can be obtained without charge by calling 1-800-466-3863, at www.manning-napier.com, or on the EDGAR Database on the SEC Internet web site (http://www.sec.gov). The following chart shows certain information about the Fund’s directors and officers, including their principal occupations during the last five years. Unless specific dates are provided, the individuals have held the listed positions for longer than five years.
Interested Director and Officer
| Name: | Paul Battaglia* |
| Address: | 290 Woodcliff Drive |
| Fairport, NY 14450 | |
| Age: | 43 |
| Current Position(s) Held with Fund: | Principal Executive Officer, President, Chairman and Director |
| Term of Office1 & Length of Time Served: | Indefinite – Chairman and Director since November 2018 |
| Principal Occupation(s) During Past 5 Years: | Chief Financial Officer since 2018; Vice President of Finance (2016 – 2018); Director of Finance (2011 – 2016); Financial Analyst/Internal Auditor (2004- 2006) – Manning & Napier Advisors, LLC and affiliates Holds one or more of the following titles for various subsidiaries and affiliates: Chief Financial Officer |
| Number of Portfolios Overseen within Fund Complex: | 15 |
| Other Directorships Held Outside Fund Complex During Past 5 Years: | N/A |
Independent Directors
| Name: | Stephen B. Ashley |
| Address: | 290 Woodcliff Drive |
| Fairport, NY 14450 | |
| Age: | 81 |
| Current Position(s) Held with Fund: | Director, Audit Committee Member, Governance & Nominating Committee Member |
| Term of Office & Length of Time Served: | Indefinite – Since 1996 |
| Principal Occupation(s) During Past 5 Years: | Chairman and Director since 1997; Chief Executive Officer (1997-2019) - Ashley Companies (property management and investment) |
| Number of Portfolios Overseen within Fund Complex: | 15 |
| Other Directorships Held Outside Fund Complex During Past 5 Years: | Ashley Companies since 1997 |
| Name: | Paul A. Brooke |
| Address: | 290 Woodcliff Drive |
| Fairport, NY 14450 | |
| Age: | 76 |
| Current Position(s) Held with Fund: | Lead Independent Director, Audit Committee Member, Governance & Nominating Committee Member |
| Term of Office & Length of Time Served: | Indefinite – Director, Audit Committee Member, Governance & Nominating Committee Member since 2007; Lead Independent Director since 2017 |
| Principal Occupation(s) During Past 5 Years: | Managing Member since 1991 - PMSV Holdings LLC (investments); Managing Member (2010-2016) - VenBio (investments). |
| Number of Portfolios Overseen within Fund Complex: | 15 |
| Other Directorships Held Outside Fund Complex During Past 5 Years: | Incyte Corp. (biotech) (2000-2020); PureEarth (non-profit) since 2012; Cerus (biomedical) since 2016; Caelum BioSciences (biomedical) since 2018; Cheyne Capital International (investment)(2000-2017); |
30
High Yield Bond Series
Directors’ and Officers’ Information
(unaudited)
Independent Directors (continued)
| Name: | John Glazer |
| Address: | 290 Woodcliff Drive |
| Fairport, NY 14450 | |
| Age: | 56 |
| Current Position(s) Held with Fund: | Director, Audit Committee Member, Governance & Nominating Committee Member |
| Term of Office & Length of Time Served: | Indefinite – Director, Audit Committee Member, Governance & Nominating Committee Member since February 2021 |
| Principal Occupation(s) During Past 5 Years: | Chief Executive Officer since 2020 – Oikos Holdings LLC (Single-Family Office); Head of Corporate Development (2019-2020) – Caelum Biosciences (pharmaceutical development); Head of Private Investments (2015-2018) – AC Limited (Single-Family Office) |
| Number of Portfolios Overseen within Fund Complex: | 15 |
| Other Directorships Held Outside Fund Complex During Past 5 Years: | N/A |
| Name: | Margaret McLaughlin |
| Address: | 290 Woodcliff Drive |
| Fairport, NY 14450 | |
| Age: | 54 |
| Current Position(s) Held with Fund: | Director, Audit Committee Member, Governance & Nominating Committee Member |
| Term of Office & Length of Time Served: | Indefinite – Director, Audit Committee Member, Governance & Nominating Committee Member since February 2021 |
| Principal Occupation(s) During Past 5 Years: | Consultant since 2020 – Bates Group (consultants); Consultant (2019- 2020) – Madison Dearborn Partners (private equity); General Counsel/CCO (2011-2019) – Kramer Van Kirk Credit Strategies L.P./Mariana Systems LLC (Investment Adviser/SaaS Technology) |
| Number of Portfolios Overseen within Fund Complex: | 15 |
| Other Directorships Held Outside Fund Complex During Past 5 Years: | N/A |
| Name: | Russell O. Vernon |
| Address: | 290 Woodcliff Drive |
| Fairport, NY 14450 | |
| Age: | 64 |
| Current Position(s) Held with Fund: | Director, Audit Committee Member, Governance & Nominating Committee Chairman |
| Term of Office & Length of Time Served: | Indefinite – Director, Audit Committee Member, Governance & Nominating Committee Member since April 2020; Governance & Nominating Committee Chairman since November 2020 |
| Principal Occupation(s) During Past 5 Years: | Founder and General Partner (2009-2019) – BVM Capital Management (economic development) |
| Number of Portfolios Overseen within Fund Complex: | 15 |
| Other Directorships Held Outside Fund Complex During Past 5 Years:
| Board Member, Vice Chairman and President since 2010 – Newburgh Armory Unity Center (military); Board Member and Executive Director since 2020 – National Purple Heart Honor Mission, Inc. (military); Board Member, Vice Chairman (2015-2020) – National Purple Heart Hall of Honor, Inc. (military) |
31
High Yield Bond Series
Directors’ and Officers’ Information
(unaudited)
| Independent Directors (continued) | |
| Name: | Chester N. Watson |
| Address: | 290 Woodcliff Drive |
| Fairport, NY 14450 | |
| Age: | 71 |
| Current Position(s) Held with Fund: | Director, Audit Committee Chairman, Governance & Nominating Committee Member |
| Term of Office & Length of Time Served: | Indefinite – Director, Audit Committee Member, Governance & Nominating Committee Member Since 2012; Audit Committee Chairman since 2013 |
| Principal Occupation(s) During Past 5 Years: | General Auditor (2003-2011) - General Motors Company (auto manufacturer) |
| Number of Portfolios Overseen within Fund Complex: | 15 |
Other Directorships Held Outside Fund Complex During Past 5 Years: | Rochester Institute of Technology (University) since 2005; Hudson Valley Center for Innovation, Inc. (New Business and Economic Development) since 2019; Town of Greenburgh, NY Planning Board (Municipal Government) (2015-2019); |
| Officers: | |
| Name: | Elizabeth Craig |
| Address: | 290 Woodcliff Drive |
| Fairport, NY 14450 | |
| Age: | 34 |
| Current Position(s) Held with Fund: | Corporate Secretary |
| Term of Office1 & Length of Time Served: | Since 2016 |
| Principal Occupation(s) During Past 5 Years: | Director of Fund Administration since 2021; Fund Regulatory Administration Manager (2018-2021); Fund Administration Manager (2015-2018); Mutual Fund Compliance Specialist (2009-2015) - Manning & Napier Advisors, LLC; Assistant Corporate Secretary (2011-2016) - Manning & Napier Fund, Inc.; Corporate Secretary, Director since 2019– Manning & Napier Investor Services, Inc. |
| Name: | Samantha Larew |
| Address: | 290 Woodcliff Drive |
| Fairport, NY 14450 | |
| Age: | 41 |
| Current Position(s) Held with Fund: | Chief Compliance Officer and Anti-Money Laundering Compliance Officer |
| Term of Office1 & Length of Time Served: | Chief Compliance Officer since 2019; Anti-Money Laundering Compliance Officer since 2018 |
| Principal Occupation(s) During Past 5 Years: | Co-Director of Compliance since 2018; Compliance Communications Supervisor (2014-2018); Compliance Supervisor (2013-2014); Broker- Dealer Compliance Supervisor (2011-2013); Broker-Dealer Compliance Analyst (2010-2011) - Manning & Napier Advisors, LLC& Affiliates; Broker- Dealer Chief Compliance Officer since 2013; Broker-Dealer Assistant Corporate Secretary since 2011 – Manning & Napier Investor Services, Inc.; Compliance Analyst (2007-2009) – Wall Street Financial Group; Compliance Specialist (2003-2007) – Manning & Napier Advisors, LLC & Affiliates |
| Name: | Scott Morabito |
| Address: | 290 Woodcliff Drive |
| Fairport, NY 14450 | |
| Age: | 34 |
| Current Position(s) Held with Fund: | Vice President |
| Term of Office1 & Length of Time Served: | Vice President since 2019; Assistant Vice President (2017-2019) |
| Principal Occupation(s) During Past 5 Years: | Managing Director, Client Service and Business Operations since 2021; Managing Director of Operations (2019-2021); Director of Funds Group (2017-2019); Fund Product and Strategy Manager (2014-2017); Senior Product and Strategy Analyst (2013-2014); Product and Strategy Analyst (2011-2013) - Manning & Napier Advisors, LLC; President, Director since 2018 – Manning & Napier Investor Services, Inc.; President, Exeter Trust Company since 2021; |
32
High Yield Bond Series
Directors’ and Officers’ Information
(unaudited)
Officers: (continued)
| Name: | Troy Statczar |
| Address: | 290 Woodcliff Drive |
| Fairport, NY 14450 | |
| Age: | 50 |
| Current Position(s) Held with Fund: | Principal Financial Officer, Treasurer |
| Term of Office1 & Length of Time Served: | Principal Financial Officer and Treasurer since 2020 |
| Principal Occupation(s) During Past 5 Years: | Senior Director, Foreside Treasurer Services since 2020 - Foreside Financial Group; Director of Fund Administration (2017-2019) - Thornburg Investment Management, Inc.; Director of U.S. Operations (2008-2017) - Henderson Global Investors N.A., Inc. |
| Name: | Sarah Turner |
| Address: | 290 Woodcliff Drive |
| Fairport, NY 14450 | |
| Age: | 39 |
| Current Position(s) Held with Fund: | Chief Legal Officer; Assistant Corporate Secretary |
| Term of Office1 & Length of Time Served: | Since 2018 |
| Principal Occupation(s) During Past 5 Years: | General Counsel since 2018 - Manning & Napier Advisors, LLC and affiliates; Counsel (2017-2018) – Harter Secrest and Emery LLP; Legal/ Senior Counsel (2010-2017) – Manning & Napier Advisors, LLC and affiliates |
| Holds one or more of the following titles for various affiliates: General Counsel | |
*Interested Director, within the meaning of the 1940 Act by reason of his positions with the Fund’s Advisor, Manning & Napier Advisors, LLC, and Distributor, Manning & Napier Investor Services, Inc.
1The term of office of all officers shall be one year and until their respective successors are chosen and qualified, or his or her earlier resignation or removal as provided in the Fund’s By-Laws.
33
High Yield Bond Series
Literature Requests
(unaudited)
Proxy Voting Policies and Procedures
A description of the policies and procedures that the Fund uses to determine how to vote proxies relating to portfolio securities is available, without charge, upon request:
| By phone | 1-800-466-3863 |
| On the Securities and Exchange | |
| Commission’s (SEC) web site | http://www.sec.gov |
Proxy Voting Record
Information regarding how the Fund voted proxies relating to portfolio securities during the most recent 12-month period ended June 30th is available, without charge, upon request:
| By phone | 1-800-466-3863 |
| On the SEC’s web site | http://www.sec.gov |
Quarterly Portfolio Holdings
The Series’ complete schedule of portfolio holdings for the 1st and 3rd quarters of each fiscal year are provided on Form N-PORT, and are available, without charge, upon request:
| By phone | 1-800-466-3863 |
| On the SEC’s web site | http://www.sec.gov |
Prospectus and Statement of Additional Information (SAI)
For more information about any of the Manning & Napier Fund, Inc. Series, you may obtain a prospectus and SAI at www.manning-napier.com or by calling 1-(800) 466-3863. Before investing, carefully consider the objectives, risks, charges and expenses of the investment and read the prospectus carefully as it contains this and other information about the investment company. In addition, this information can be found on the SEC’s web site, http://www.sec.gov.
Additional information available at www.manning-napier.com
| 1. | Fund Holdings - Month-End |
| 2. | Fund Holdings - Quarter-End |
| 3. | Shareholder Report - Annual |
| 4. | Shareholder Report - Semi-Annual |
The Fund also offers electronic notification or “e-delivery” when certain documents are available on-line to be downloaded or reviewed. Direct shareholders can elect to receive electronic notification when shareholder reports, prospectus updates, and/or statements are available. If you do not currently have on-line access to your account, you can establish access by going to www.manning-napier.com, click on “Login” in the top corner of the page, and follow the prompts to self-enroll. Once enrolled, you can set your electronic notification preferences by clicking on the Account Options tab located within the green toolbar and then select E-Delivery Option. Should you have any questions on either how to establish on-line access or how to update your account settings, please contact Investor Services at 1-800-466-3863.
The Manning & Napier Fund, Inc. is managed by Manning & Napier Advisors, LLC. Manning & Napier Investor Services, Inc., an affiliate of Manning & Napier Advisors, LLC, is the distributor of the Fund shares.
MNHYB-12/21-AR
34

Manning & Napier Fund, Inc.
Unconstrained Bond Series
Paper copies of the Series’ shareholder reports are no longer sent by mail, unless you specifically request them from the Series or from your financial intermediary, such as a broker-dealer or bank. Shareholder reports are available online. Each time a report is posted on the Series’ website you will be provided with a link to access the report online, either by mail (hard copy notice) or by email, if you have already signed up for electronic delivery of shareholder reports.
You may elect to receive all future shareholder reports in paper free of charge. If you invest through a financial intermediary, you can contact your financial intermediary to request that you continue to receive paper copies. If you invest directly with the Fund, you can inform the Fund that you wish to continue receiving paper copies by visiting www.manning-napier.com or calling 1-800-466-3863. Your election to receive reports in paper will apply to all funds held with your financial intermediary if you invest through a financial intermediary or all series of the Fund if you invest directly with the Fund.
Additionally, If you have not yet signed up for electronic delivery of shareholder reports and other Fund communications, you may do so by contacting your financial intermediary or, if you are a direct investor, by visiting www.manning-napier.com or calling 1-800-466-3863.
 | Independent Perspective Real-World Solutions |
A Note from Our CEO
Dear Shareholder,
The obstacles were many, but this year, in so many ways, is a story of triumphant resilience only serving to spotlight just how much more there is to do.
Over the past two years, we’ve endured a recession, a bear market, and a pandemic. Our collective perseverance is now paying off.
We are today experiencing a remarkable economic boom, a historic market rally, and continued medical innovation, all of which have turned a challenging period into one of optimism and hope.
At the same time, political and societal polarization are heightened, social justice concerns have justifiably come to the fore, and the precarious state of our environment presents almost unimaginable challenges for government, business, and finance.
This certainly is a moment of great consequence.
The kind of moment that questions all the rules. Economic rules in how we add value for each other, as well as for ourselves. Social rules in how we interact with each other. Environmental rules that can balance the current needs of emerging economies with the requirements for everyone in the future. Workplace rules in how we get the job done.
Our lives are being redefined, and our society, planet, workplaces, and industry must confront the challenges of the upcoming decade.
Markets reflect us. They mirror our collective thoughts, feelings, expectations, and beliefs – these new life rules.
As we go through this period of change, it will be uncertain and uncomfortable. For those unaccustomed to change, for those reliant on ’set it and forget it’, these may seem like daunting questions, but there is a better way.
Success in an era of change demands flexibility, adaptability, and a roll-up-your-sleeves willingness to do the work.
For over 50 years, independent thinking and tireless work have underpinned every decision we’ve made on behalf of our investors. We invest for the long-term, we do not speculate. We make active decisions, and we invest with discipline, patience, and confidence. This is the only way we know, to remain true to our values and our fiduciary duty to you, the investors in our mutual funds.
You demand more. At Manning & Napier, we demand more of ourselves. Upon reflection of the year, we’re proud to have continued to deliver more.
We wish you safety and good health, and we appreciate your confidence in our firm and our approach.
 | Sincerely,
Marc Mayer Chief Executive Officer |

Corporate Headquarters | 290 Woodcliff Drive | Fairport, NY 14450 | (585) 325-6880 phone | (800) 551-0224 toll free | www.manning-napier.com
1
Unconstrained Bond Series
Fund Commentary
(unaudited)
Investment Objective
Primarily to provide long-term total return, with a secondary objective of preservation of capital. Under normal circumstances, at least 80% of the Series’ assets will be invested in bonds and other financial instruments with economic characteristics similar to bonds. Up to 50% of the Series may be invested in below investment-grade securities and/or in non-US dollar denominated securities, including securities issued by companies located in emerging markets. Derivatives, such as futures, options, swaps, and forwards, may also be used to manage interest rate exposure, duration, or currency risk.
Performance Commentary
Fixed income markets, as measured by the Bloomberg US Aggregate Bond Index, posted negative returns for only the fourth calendar year on record as markets grappled with lingering inflation concerns, potential balance sheet reductions by the Federal Reserve, and looming interest rate hikes. Overall, interest rates generally ended the year higher than they started, the yield curve flattened, and, despite intra-year volatility, credit spreads ended roughly unchanged. From a sector perspective, Treasury Inflation Protected Securities (TIPS) and high yield were the highest returning areas of the market, experiencing positive returns, whereas Treasuries were the worst performing sector.
The Unconstrained Bond Series Class S shares delivered positive absolute returns during 2021, returning 2.59%, and outperformed its benchmark, the FTSE 3-Month Treasury Bill Index, which returned 0.05%. Relative outperformance was primarily attributable to the Series’ notable allocation to credit-related securities.
As the economic cycle moves forward, we are actively becoming more measured in our approach. Given tight credit spreads across much of the bond market and the prospect of interest rates rising off their post-pandemic lows, fixed income investors can generally expect a more challenging environment going forward.
That stated, while the market continued to look expensive from a valuation perspective; we found select opportunities across various sectors. Specifically, we continued to find attractive opportunities in corporate credits, particularly within the Energy and Financials sectors, and, despite tightening valuations, in select BBB-rated issuances from a bottom-up perspective. Additionally, we continued to view asset-backed securities as relatively attractive and focused on securities with seniority in the capital structure that are backed by asset classes with high-quality fundamentals and low credit risk (e.g., student loans, prime autos, etc.). Finally, we’ve seen select opportunities in high yield, collateralized loan obligations and bank loans, and non-US dollar denominated securities.
Performance for the Unconstrained Bond Series Class S shares is provided above. Performance for other shares classes will differ based on each class’ underlying expenses.
Performance data quoted represents past performance and does not guarantee future results. The investment return and principal value of an investment will fluctuate, so that an investor’s shares, when redeemed, may be worth more or less than their original cost. Current performance may be higher or lower than that quoted; investors can obtain the most recent month-end performance at www.manning-napier.com or by calling (800) 466-3863.
Additional information and associated disclosures can be found on the Performance Update page of this report.
All investments involve risks, including possible loss of principal. There is an inverse relationship between bond prices and interest rates; as interest rates rise, bond prices (and therefore the value of bond funds) fall. Likewise, as interest rates fall, bond prices and the value of bond funds rise. Investments in higher-yielding, lower-rated securities involve additional risks, including a higher risk of default and loss of principal. Funds that invest in foreign countries may be subject to the risks of adverse changes in foreign economic, political, regulatory and other conditions as well as risks related to the use of different financial standards. Investments in emerging markets may be more volatile than investments in more developed markets. Investments in derivatives can be highly volatile and involve risks in addition to the risks of the underlying instrument on which the derivative is based, such as counterparty, correlation and liquidity risk. Also, the use of leverage increases exposure to the market and may magnify potential losses.
2
Unconstrained Bond Series
Performance Update as of December 31, 2021
(unaudited)
| AVERAGE ANNUAL TOTAL RETURNS | |||
| AS OF DECEMBER 31, 2021 | |||
| ONE | FIVE | TEN | |
| YEAR1 | YEAR | YEAR | |
| Unconstrained Bond Series - Class S2 | 2.59% | 3.68% | 3.53% |
| Unconstrained Bond Series - Class I2,3 | 2.81% | 3.94% | 3.73% |
| Unconstrained Bond Series - Class W2,4 | 3.19% | 4.09% | 3.73% |
| FTSE 3-Month Treasury Bill Index5 | 0.05% | 1.11% | 0.60% |
| Bloomberg U.S. Aggregate Bond Index6 | (1.54%) | 3.57% | 2.90% |
The following graph compares the value of a $10,000 investment in the Unconstrained Bond Series - Class S for the ten years ended December 31, 2021 to the FTSE 3-Month Treasury Bill Index and Bloomberg Barclays U.S. Aggregate Bond Index.
1The returns shown are based on net asset values calculated for shareholder transactions and may differ from the returns shown in the financial highlights, which reflect adjustments made to the net asset values in accordance with accounting principles generally accepted in the United States of America.
2The Series’ performance does not reflect the deduction of taxes that a shareholder would pay on fund distributions or the redemption of shares. The Series’ performance is historical and may not be indicative of future results. The performance returns shown are inclusive of the net expense ratio of the Series. For the year ended December 31, 2021, this net expense ratio was 0.73% for Class S, 0.49% for Class I and 0.05% for Class W. The gross expense ratio, which does not account for any voluntary or contractual waivers currently in effect, was 0.73% for Class S, 0.49% for Class I and 0.37% for Class W for the year ended December 31, 2021.
3For periods through August 1, 2013 (the inception date of the Class I shares), performance for the Class I shares is based on the historical performance of the Class S shares. Because the Class I shares invest in the same portfolio of securities as Class S, performance will only be different to the extent that the Class S shares have a higher expense ratio.
4For periods through March 1, 2019 (the inception date of the Class W shares), performance for the Class W shares is based on the historical performance of the Class S shares. Because the Class W shares invest in the same portfolio of securities as the Class S shares, performance will be different only to the extent that the Class S shares have a higher expense ratio.
5The FTSE 3-Month Treasury Bill Index is an unmanaged index based on 3-Month U.S. treasury bills. The Index measures the monthly return equivalents of yield averages that are not marked to market. The Index returns do not reflect any fees or expenses. Index returns provided by Interactive Data.
6The Bloomberg U.S. Aggregate Bond Index is an unmanaged, market-value weighted index of U.S. domestic investment-grade debt issues, including government, corporate, asset-backed, and mortgage-backed securities, with maturities of one year or more. Index returns do not reflect any fees or expenses. Index returns provided by Interactive Data. Index data referenced herein is the property of Bloomberg Finance L.P. and its affiliates (“Bloomberg”), and/or its third party suppliers and has been licensed for use by Manning & Napier. Bloomberg and its third party suppliers accept no liability in connection with its use. Data provided is not a representation or warranty, express or implied, as to the ability of any index to accurately represent the asset class or market sector that it purports to represent and none of these parties shall have any liability for any errors, omissions, or interruptions of any index or the data included therein. For additional disclosure information, please see: https:// go.manning-napier.com/benchmark-provisions.
3
Unconstrained Bond Series
Shareholder Expense Example
(unaudited)
As a shareholder of the Series, you incur ongoing costs, including management fees, shareholder service fees and other Series expenses. This example is intended to help you understand your ongoing costs (in dollars) of investing in the Series and to compare these costs with the ongoing costs of investing in other mutual funds.
The example is based on an investment of $1,000 invested in each class at the beginning of the period and held for the entire period (July 1, 2021 to December 31, 2021).
Actual Expenses
The Actual lines of the table below provide information about actual account values and actual expenses. You may use the information in these lines, together with the amount you invested, to estimate the expenses that you paid over the period. Simply divide your account value by $1,000 (for example, an $8,600 account value divided by $1,000 = 8.6), then multiply the result by the number in the Actual line for the Class in which you have invested under the heading entitled “Expenses Paid During Period” to estimate the expenses you paid on your account during this period.
Hypothetical Example for Comparison Purposes
The Hypothetical lines of each class in the table below provide information about hypothetical account values and hypothetical expenses based on the Class’ actual expense ratio and an assumed rate of return of 5% per year before expenses, which is not the Class’ actual return. The hypothetical account values and expenses may not be used to estimate the actual ending account balance or expenses you paid during the period. You may use this information to compare the ongoing costs of investing in a class of the Series and other funds. To do so, compare this 5% hypothetical example for the Class in which you have invested with the 5% hypothetical examples that appear in the shareholder reports of the other funds.
Please note that the expenses shown in the table are meant to highlight your ongoing costs only and do not reflect any transaction costs, such as sales charges (loads), redemption fees, or exchange fees that you may incur in other mutual funds. Therefore, the second line of the table is useful in comparing ongoing costs only, and will not help you determine the relative total costs of owning different funds.
| BEGINNING | ENDING | EXPENSES PAID | ANNUALIZED | |
| ACCOUNT VALUE | ACCOUNT VALUE | DURING PERIOD* | EXPENSE | |
| 7/1/21 | 12/31/21 | 7/1/21 - 12/31/21 | RATIO | |
| Class S | ||||
| Actual | $1,000.00 | $1,003.90 | $3.69 | 0.73% |
| Hypothetical | ||||
| (5% return before expenses) | $1,000.00 | $1,021.53 | $3.72 | 0.73% |
| Class I | ||||
| Actual | $1,000.00 | $1,005.30 | $2.43 | 0.48% |
| Hypothetical | ||||
| (5% return before expenses) | $1,000.00 | $1,022.79 | $2.45 | 0.48% |
| Class W | ||||
| Actual | $1,000.00 | $1,006.90 | $0.25 | 0.05% |
| Hypothetical | ||||
| (5% return before expenses) | $1,000.00 | $1,024.95 | $0.26 | 0.05% |
*Expenses are equal to each Class’ annualized expense ratio (for the six-month period), multiplied by the average account value over the period, multiplied by 184/365 (to reflect the one-half year period). Expenses are based on the most recent fiscal half year; therefore, the expense ratios stated above may differ from the expense ratios stated in the financial highlights, which are based on one-year data. The Class’ total return would have been lower had certain expenses not been waived or reimbursed during the period.
4
Unconstrained Bond Series
Portfolio Composition as of December 31, 2021
(unaudited)
| Sector Allocation1 | |
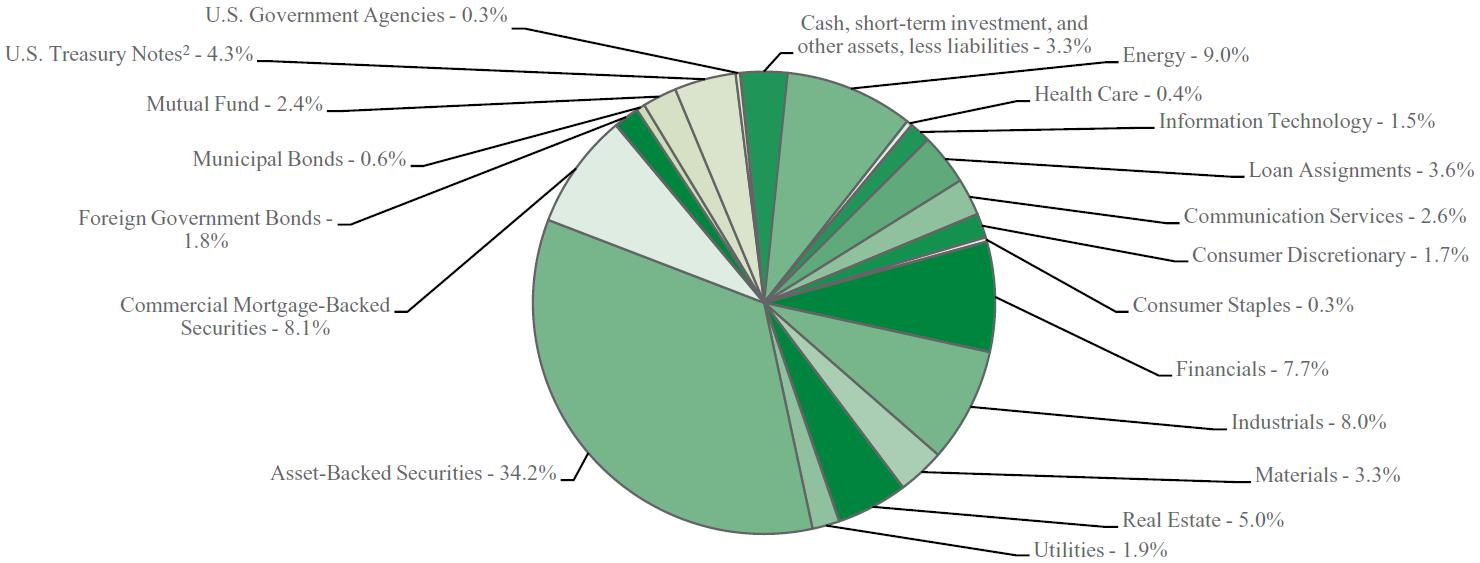 | |
| 1As a percentage of net assets. | |
| 2A U.S. Treasury Note is an intermediate long-term obligation of the U.S. Treasury issued with a maturity period between one and ten years. | |
5
Unconstrained Bond Series
Investment Portfolio - December 31, 2021
| SHARES/ | ||||||||
| PRINCIPAL | VALUE | |||||||
| AMOUNT1 | (NOTE 2) | |||||||
| COMMON STOCKS - 0.7% | ||||||||
| Energy - 0.7% | ||||||||
| Oil, Gas & Consumable Fuels - 0.7% | ||||||||
| Jonah Energy Parent LLC*2 | ||||||||
| (Identified Cost $1,288,725) | 85,915 | $ | 5,369,688 | |||||
| PREFERRED STOCKS - 1.4% | ||||||||
| Health Care - 0.4% | ||||||||
| Pharmaceuticals - 0.4% | ||||||||
| Harrow Health, Inc., 8.625%, 4/30/2026 | 109,800 | 2,943,738 | ||||||
| Information Technology - 1.0% | ||||||||
| Software - 1.0% | ||||||||
| Argo Blockchain plc (United Kingdom), 8.75%, 11/30/2026 | 75,000 | 1,867,500 | ||||||
| Greenidge Generation Holdings, Inc., 8.50%, 10/31/2026 | 70,000 | 1,666,000 | ||||||
| Synchronoss Technologies, Inc., 8.375%, 6/30/2026 | 152,955 | 3,634,211 | ||||||
| TOTAL PREFERRED STOCKS (Identified Cost $10,170,384) | 10,111,449 | |||||||
| LOAN ASSIGNMENTS - 3.6% | ||||||||
| American Axle & Manufacturing, Inc., Tranche B Term Loan, Term B, (3 mo. LIBOR US + 2.250%), 3.00%, 4/6/20243 | 6,933,895 | 6,909,002 | ||||||
| Tutor Perini Corp., Term Loan, Term B, (1 mo. LIBOR US + 4.75%), 5.75%, 8/18/20273 | 6,937,500 | 6,937,500 | ||||||
| Mozart Borrower LP, Initial Dollar Term Loan, Term B, (1 mo. LIBOR US + 3.250%), 3.75%, 10/21/20283 | 3,500,000 | 3,498,460 | ||||||
| The Hertz Corp., Term Loan, Term B-EXIT, (1 mo. LIBOR US + 3.500%), 3.75%, 6/30/20283 | 4,205,448 | 4,205,448 | ||||||
| Term C-EXIT, (1 mo. LIBOR US + 3.500%), 3.75%, 6/30/20283 | 794,552 | 794,552 | ||||||
| Jazz Financing Lux S.A.R.L., Initial Dollar Term Loan, Term B, (1 mo. LIBOR US + 3.500%), 4.00%, 5/5/20283 | 3,482,500 | 3,493,609 | ||||||
| TOTAL LOAN ASSIGNMENTS (Identified Cost $25,798,488) | 25,838,571 | |||||||
CORPORATE BONDS - 39.3% | ||||||||
Non-Convertible Corporate Bonds- 39.3% | ||||||||
Communication Services - 2.6% | ||||||||
| Diversified Telecommunication Services - 1.6% | ||||||||
| Lumen Technologies, Inc., 7.50%, 4/1/2024 | 6,075,000 | 6,652,125 | ||||||
| SHARES/ | ||||||||
| PRINCIPAL | VALUE | |||||||
| AMOUNT1 | (NOTE 2) | |||||||
| CORPORATE BONDS (continued) | ||||||||
| Non-Convertible Corporate Bonds (continued) | ||||||||
| Communication Services (continued) | ||||||||
| Diversified Telecommunication Services (continued) | ||||||||
| Verizon Communications, Inc., 4.272%, 1/15/2036 | 4,000,000 | $ | 4,698,954 | |||||
| 11,351,079 | ||||||||
| Interactive Media & Services - 1.0% | ||||||||
| Tencent Holdings Ltd. (China), 3.975%, 4/11/20294 | 6,650,000 | 7,236,992 | ||||||
| Total Communication Services | 18,588,071 | |||||||
| Consumer Discretionary - 1.7% | ||||||||
| Automobiles - 0.4% | ||||||||
| Ford Motor Credit Co. LLC, | ||||||||
| 3.219%, 1/9/2022 | 950,000 | 950,000 | ||||||
| 2.979%, 8/3/2022 | 2,050,000 | 2,060,393 | ||||||
| 3,010,393 | ||||||||
| Hotels, Restaurants & Leisure - 0.5% | ||||||||
| Expedia Group, Inc., 3.25%, 2/15/2030 | 3,400,000 | 3,473,007 | ||||||
| Internet & Direct Marketing Retail - 0.8% | ||||||||
| Alibaba Group Holding Ltd. (China), 4.00%, 12/6/2037 | 3,210,000 | 3,487,578 | ||||||
| North Investment Group AB (Sweden) (3 mo. STIB + 9.000%), 9.00%, 5/5/2024 (Acquired 04/22/2021, cost $2,818,941)3,5 | SEK | 23,750,000 | 2,628,317 | |||||
| 6,115,895 | ||||||||
| Total Consumer Discretionary | 12,599,295 | |||||||
| Consumer Staples - 0.3% | ||||||||
| Food & Staples Retailing - 0.3% | ||||||||
| Greenfood AB (Sweden) (3 mo. STIB + 7.000%), 7.00%, 11/4/2025 (Acquired 10/28/2021, cost $2,486,820)3,5 | SEK | 21,250,000 | 2,339,894 | |||||
| Energy - 8.3% | ||||||||
| Energy Equipment & Services - 1.5% | ||||||||
| Kent Global plc (United Kingdom), 10.00%, 6/28/2026 | 3,500,000 | 3,477,425 | ||||||
| Petrofac Ltd. (United Kingdom), 9.75%, 11/15/20264 | 3,755,000 | 3,830,926 | ||||||
| Tidewater, Inc., 8.50%, 11/16/2026 | 3,600,000 | 3,600,000 | ||||||
| 10,908,351 | ||||||||
| Oil, Gas & Consumable Fuels - 6.8% | ||||||||
| BP Capital Markets America, Inc., 3.06%, 6/17/2041 | 5,250,000 | 5,328,148 | ||||||
| Brooge Petroleum and Gas Investment Co. FZE (United Arab Emirates), 8.50%, 9/24/20254 | 6,562,000 | 6,726,050 | ||||||
| Cenovus Energy, Inc. (Canada), 6.75%, 11/15/2039 | 3,910,000 | 5,317,204 | ||||||
| Kinder Morgan Energy Partners LP, 6.95%, 1/15/2038 | 3,500,000 | 4,852,836 | ||||||
The accompanying notes are an integral part of the financial statements.
6
Unconstrained Bond Series
Investment Portfolio - December 31, 2021
| SHARES/ | ||||||||
| PRINCIPAL | VALUE | |||||||
| AMOUNT1 | (NOTE 2) | |||||||
| CORPORATE BONDS (continued) | ||||||||
| Non-Convertible Corporate Bonds (continued) | ||||||||
| Energy (continued) | ||||||||
| Oil, Gas & Consumable Fuels (continued) | ||||||||
| Navigator Holdings Ltd., 8.00%, 9/10/20254 | 3,550,000 | $ | 3,709,750 | |||||
| PetroTal Corp. (Peru), 12.00%, 2/16/2024 (Acquired 02/01/2021, cost $3,230,000)5 | 3,400,000 | 3,553,000 | ||||||
| Ping Petroleum UK Ltd. (Bermuda), 12.00%, 7/29/2024 (Acquired 07/14/2021-09/15/2021, cost $2,664,463)5 | 2,715,000 | 2,687,850 | ||||||
| Sabine Pass Liquefaction LLC, 5.75%, 5/15/2024 | 7,000,000 | 7,614,064 | ||||||
| The Williams Companies, Inc., 2.60%, 3/15/2031 | 3,550,000 | 3,529,844 | ||||||
| Tiger Holdco Pte Ltd. (India), 13.00%, 6/10/20234 | 6,228,217 | 6,290,499 | ||||||
| 49,609,245 | ||||||||
| Total Energy | 60,517,596 | |||||||
| Financials - 7.7% | ||||||||
| Banks - 2.9% | ||||||||
| Bank of America Corp., | ||||||||
| (3 mo. LIBOR US + 0.760%), 0.963%, | ||||||||
| 9/15/20263 | 3,561,000 | 3,545,809 | ||||||
| 6.11%, 1/29/2037 | 2,300,000 | 3,100,108 | ||||||
| Citigroup, Inc., 4.45%, 9/29/2027 | 3,700,000 | 4,128,049 | ||||||
| JPMorgan Chase & Co., 8.00%, 4/29/2027 | 3,000,000 | 3,884,364 | ||||||
| Lloyds Bank plc (United Kingdom) (3 mo. LIBOR US + 11.756%), 12.00%4,6,7 | 3,000,000 | 3,035,100 | ||||||
| Popular, Inc. (Puerto Rico), 6.125%, 9/14/2023 | 3,135,000 | 3,336,580 | ||||||
| 21,030,010 | ||||||||
| Capital Markets - 1.6% | ||||||||
| Blackstone Secured Lending Fund, 2.75%, 9/16/2026 | 1,850,000 | 1,850,775 | ||||||
| Drawbridge Special Opportunities Fund LP - Drawbridge Special Opportunities Finance Corporation, 3.875%, 2/15/20264 | 2,850,000 | 2,904,311 | ||||||
| Owl Rock Technology Finance Corp., 3.75%, 6/17/20264 | 3,000,000 | 3,091,767 | ||||||
| StoneX Group, Inc., 8.625%, 6/15/20254 | 3,580,000 | 3,794,800 | ||||||
| 11,641,653 | ||||||||
| Consumer Finance - 1.0% | ||||||||
| Navient Corp., 6.75%, 6/25/2025 | 3,050,000 | 3,355,000 | ||||||
| PRA Group, Inc., 7.375%, 9/1/20254 | 3,570,000 | 3,793,125 | ||||||
| 7,148,125 | ||||||||
| SHARES/ | ||||||||
| PRINCIPAL | VALUE | |||||||
| AMOUNT1 | (NOTE 2) | |||||||
| CORPORATE BONDS (continued) | ||||||||
| Non-Convertible Corporate Bonds (continued) | ||||||||
| Financials (continued) | ||||||||
| Diversified Financial Services - 1.7% | ||||||||
| Blackstone Private Credit Fund, 2.625%, 12/15/20264 | 1,785,000 | $ | 1,741,351 | |||||
| FS Energy & Power Fund, 7.50%, 8/15/20234 | 3,235,000 | 3,373,425 | ||||||
| Liberty Commercial Finance LLC, 6.00%, 6/30/2026 (Acquired 06/22/2021, cost $3,000,000)5 | 3,000,000 | 3,002,939 | ||||||
| Novedo Holding AB (Sweden) (3 mo. STIB + 6.500%), 6.50%, 11/26/2024 (Acquired 11/15/2021, cost $2,280,736)3,5 | SEK | 20,000,000 | 2,213,320 | |||||
| VCT Holdings LLC, 6.00%, 12/30/2026 (Acquired 12/21/2021, cost $2,000,000)5 | 2,000,000 | 1,999,844 | ||||||
| 12,330,879 | ||||||||
| Mortgage Real Estate Investment Trusts (REITS) - 0.5% | ||||||||
| Arbor Realty Trust, Inc., 8.00%, 4/30/2023 (Acquired 05/10/2021, cost $3,785,222)5 | 3,555,000 | 3,705,829 | ||||||
| Total Financials | 55,856,496 | |||||||
| Industrials - 8.0% | ||||||||
| Airlines - 2.1% | ||||||||
| Alaska Airlines Pass-Through Trust, Series 2020-1, Class B, 8.00%, 8/15/20254 | 5,313,632 | 5,915,717 | ||||||
| Southwest Airlines Co., 5.25%, 5/4/2025 | 3,000,000 | 3,333,374 | ||||||
| United Airlines Pass-Through Trust, Series 2019-2, Class B, 3.50%, 5/1/2028 | 3,166,873 | 3,136,600 | ||||||
| United Airlines Pass-Through Trust, Series 2018-1, Class B, 4.60%, 3/1/2026 | 3,130,916 | 3,176,236 | ||||||
| 15,561,927 | ||||||||
| Commercial Services & Supplies - 1.5% | ||||||||
| Airswift Global AS (United Kingdom) (3 mo. LIBOR US + 8.500%), 8.654%, 5/12/2025 (Acquired 05/03/2021, cost $7,000,000)3,5 | 7,000,000 | 7,105,000 | ||||||
| Legal Business Services LLC, 8.00%, 6/15/2026 (Acquired 06/14/2021, cost $4,000,000)5 | 4,000,000 | 3,999,688 | ||||||
| 11,104,688 | ||||||||
| Construction & Engineering - 0.5% | ||||||||
| Railworks Holdings LP - Railworks Rally, Inc., 8.25%, 11/15/20284 | 3,735,000 | 3,847,050 | ||||||
The accompanying notes are an integral part of the financial statements.
7
Unconstrained Bond Series
Investment Portfolio - December 31, 2021
| SHARES/ | ||||||||
| PRINCIPAL | VALUE | |||||||
| AMOUNT1 | (NOTE 2) | |||||||
| CORPORATE BONDS (continued) | ||||||||
| Non-Convertible Corporate Bonds (continued) | ||||||||
| Industrials (continued) | ||||||||
| Electrical Equipment - 0.4% | ||||||||
| Joetul AS (Norway) (3 mo. NIBOR + 6.950%), 7.59%, 10/6/20243 | NOK | 23,000,000 | $ | 2,604,737 | ||||
| Marine - 1.9% | ||||||||
| American Tanker, Inc. (Norway), 7.75%, 7/2/2025 | 6,560,000 | 6,598,266 | ||||||
| Seaspan Corp. (Hong Kong), 6.50%, 2/5/20244 | 7,000,000 | 7,315,000 | ||||||
| 13,913,266 | ||||||||
| Road & Rail - 0.2% | ||||||||
| BNSF Funding Trust I, (3 mo. LIBOR US + 2.350%), 6.613%, 12/15/20557 | 1,500,000 | 1,663,125 | ||||||
| Trading Companies & Distributors - 1.4% | ||||||||
| AerCap Ireland Capital DAC - AerCap Global Aviation Trust (Ireland), 3.00%, 10/29/2028 | 3,750,000 | 3,806,268 | ||||||
| Ashtead Capital, Inc. (United Kingdom), 4.00%, 5/1/20284 | 1,500,000 | 1,568,208 | ||||||
| Avolon Holdings Funding Ltd. (Ireland), 3.25%, 2/15/20274 | 4,500,000 | 4,534,004 | ||||||
| 9,908,480 | ||||||||
| Total Industrials | 58,603,273 | |||||||
Information Technology - 0.5% | ||||||||
Software - 0.5% | ||||||||
Media & Games Invest SE (Malta) | ||||||||
| (3 mo. EURIBOR + 5.750%), 5.75%, | ||||||||
| 11/27/20243,4 | EUR | 3,200,000 | 3,668,702 | |||||
| Materials - 3.3% | ||||||||
| Metals & Mining - 3.3% | ||||||||
| Copper Mountain Mining Corp. (Canada), 8.00%, 4/9/20264 | 3,528,000 | 3,691,346 | ||||||
| Infrabuild Australia Pty Ltd. (Australia), 12.00%, 10/1/20244 | 3,425,000 | 3,527,750 | ||||||
| Jervois Mining USA Ltd. (Australia), 12.50%, 7/20/20264 | 3,500,000 | 3,698,870 | ||||||
| Newcastle Coal Infrastructure Group Pty Ltd. (Australia), 4.40%, 9/29/20274 | 1,750,000 | 1,745,087 | ||||||
| Northwest Acquisitions ULC - Dominion Finco, Inc., 7.125%, 11/1/2022 (Acquired 10/06/2017-09/12/2019, cost $4,353,936)5,8 | 5,870,000 | 59 | ||||||
| Pembroke Olive Downs Pty Ltd. (Australia), 10.00%, 12/21/2028 (Acquired 12/10/2021, cost $579,000)5 | 600,000 | 582,000 | ||||||
| Tacora Resources, Inc. (Canada), 8.25%, 5/15/20264 | 6,880,000 | 6,845,600 | ||||||
| SHARES/ | ||||||||
| PRINCIPAL | VALUE | |||||||
| AMOUNT1 | (NOTE 2) | |||||||
| CORPORATE BONDS (continued) | ||||||||
| Non-Convertible Corporate Bonds (continued) | ||||||||
| Materials (continued) | ||||||||
| Metals & Mining (continued) | ||||||||
| Warrior Met Coal, Inc., 7.875%, 12/1/20284 | 3,760,000 | $ | 3,854,000 | |||||
| Total Materials | 23,944,712 | |||||||
| Real Estate - 5.0% | ||||||||
| Equity Real Estate Investment Trusts (REITS) - 4.1% | ||||||||
| American Tower Corp., 3.80%, 8/15/2029 | 8,250,000 | 8,983,217 | ||||||
| Crown Castle International Corp., | ||||||||
| 3.10%, 11/15/2029 | 5,000,000 | 5,223,172 | ||||||
| 3.30%, 7/1/2030 | 1,850,000 | 1,953,459 | ||||||
| IIP Operating Partnership LP, 5.50%, 5/25/2026 | 3,500,000 | 3,707,006 | ||||||
| Pelorus Fund REIT LLC, 7.00%, 9/30/2026 (Acquired 09/21/2021, cost $3,500,000)5 | 3,500,000 | 3,443,863 | ||||||
| SBA Tower Trust, | ||||||||
| 2.836%, 1/15/20254 | 3,500,000 | 3,591,530 | ||||||
| 1.884%, 1/15/20264 | 2,750,000 | 2,773,251 | ||||||
| 29,675,498 | ||||||||
| Real Estate Management & Development - 0.9% | ||||||||
| Carrington Holding Co. LLC, 8.00%, 1/1/20264 | 3,500,000 | 3,528,981 | ||||||
| Trym AS (Norway) (3 mo. NIBOR + 7.750%), 8.54%, 9/10/2024 (Acquired 08/31/2021, cost $3,446,157)3,5 | NOK | 30,000,000 | 3,355,422 | |||||
| 6,884,403 | ||||||||
| Total Real Estate | 36,559,901 | |||||||
| Utilities - 1.9% | ||||||||
| Electric Utilities - 1.4% | ||||||||
| Alexander Funding Trust, 1.841%, 11/15/20234 | 10,000,000 | 10,036,072 | ||||||
| Independent Power and Renewable Electricity Producers - 0.5% | ||||||||
Vistra Operations Co. LLC, 3.55%, 7/15/20244 | 3,500,000 | 3,604,897 | ||||||
| Total Utilities | 13,640,969 | |||||||
| TOTAL CORPORATE BONDS | ||||||||
| (Identified Cost $286,778,651) | 286,318,909 | |||||||
| ASSET-BACKED SECURITIES - 34.2% | ||||||||
| Aligned Data Centers Issuer LLC, Series 2021-1A, Class A2, 1.937%, 8/15/20464 | 4,500,000 | 4,432,401 | ||||||
| AMSR Trust, Series 2020-SFR4, Class A, 1.355%, 11/17/20374 | 4,833,000 | 4,712,160 | ||||||
The accompanying notes are an integral part of the financial statements.
8
Unconstrained Bond Series
Investment Portfolio - December 31, 2021
| SHARES/ | ||||||||
| PRINCIPAL | VALUE | |||||||
| AMOUNT1 | (NOTE 2) | |||||||
| ASSET-BACKED SECURITIES (continued) | ||||||||
| BRSP Ltd., Series 2021-FL1, Class A, (1 mo. LIBOR US + 1.150%), 1.254%, 8/19/20383,4 | 3,000,000 | $ | 2,989,197 | |||||
| Business Jet Securities LLC, Series 2021-1A, Class A, 2.162%, 4/15/20364 | 4,761,625 | 4,675,827 | ||||||
| CF Hippolyta LLC, | ||||||||
| Series 2020-1, Class A1, 1.69%, 7/15/20604 | 3,774,064 | 3,744,462 | ||||||
| Series 2020-1, Class B1, 2.28%, 7/15/20604 | 1,841,007 | 1,839,360 | ||||||
| CLI Funding VIII LLC, Series 2021-1A, Class A, 1.64%, 2/18/20464 | 6,143,102 | 5,999,569 | ||||||
| College Ave Student Loans LLC, Series 2021-A, Class A2, 1.60%, 7/25/20514 | 2,376,424 | 2,329,735 | ||||||
| Commonbond Student Loan Trust, Series 2019-AGS, Class A1, 2.54%, 1/25/20474 | 2,537,928 | 2,573,963 | ||||||
| CoreVest American Finance Trust, | ||||||||
| Series 2019-1, Class A, 3.324%, 3/15/20524 | 3,949,417 | 4,135,294 | ||||||
| Series 2019-3, Class A, 2.705%, 10/15/20524 | 2,456,334 | 2,509,862 | ||||||
| Series 2020-3, Class A, 1.358%, 8/15/20534. | 1,514,431 | 1,473,873 | ||||||
| Series 2020-4, Class A, 1.174%, 12/15/20524 | 1,155,162 | 1,122,669 | ||||||
| Credit Acceptance Auto Loan Trust, | ||||||||
| Series 2021-2A, Class C, 1.64%, 6/17/20304 | 3,800,000 | 3,749,051 | ||||||
| Series 2021-3A, Class C, 1.63%, 9/16/20304 | 3,000,000 | 2,957,937 | ||||||
| DataBank Issuer, Series 2021-1A, Class A2, 2.06%, 2/27/20514 | 5,200,000 | 5,099,188 | ||||||
| Diamond Infrastructure Funding LLC, Series 2021-1A, Class A, 1.76%, 4/15/20494 | 5,000,000 | 4,884,550 | ||||||
| EDvestinU Private Education Loan Issue No. 1 LLC, | ||||||||
| Series 2019-A, Class A, 3.58%, 11/25/20384 | 2,284,653 | 2,338,637 | ||||||
| Series 2021-A, Class A, 1.80%, 11/25/20454 | 2,312,978 | 2,275,712 | ||||||
| Flexential Issuer, Series 2021-1A, Class A2, 3.25%, 11/27/20514 | 4,760,000 | 4,768,471 | ||||||
| FS RIALTO, Series 2021-FL2, Class A, (Cayman Islands) (1 mo. LIBOR US + 1.220%), 1.328%, 4/16/20283,4 | 3,000,000 | 2,994,064 | ||||||
| GoldentTree Loan Management U.S. CLO 1 Ltd., Series 2021-9A, Class A, (Cayman Islands) (3 mo. LIBOR US + 1.070%), 1.202%, 1/20/20333,4 | 6,000,000 | 5,998,218 | ||||||
| Goodgreen Trust, Series 2020-1A, Class A, 2.63%, 4/15/20554 | 3,976,878 | 3,968,761 | ||||||
| Hertz Vehicle Financing LLC, Series 2021-1A, Class B, 1.56%, 12/26/20254 | 3,000,000 | 2,970,421 | ||||||
| SHARES/ | ||||||||
| PRINCIPAL | VALUE | |||||||
| AMOUNT1 | (NOTE 2) | |||||||
| ASSET-BACKED SECURITIES (continued) | ||||||||
| Hotwire Funding LLC, Series 2021-1, Class A2, 2.311%, 11/20/20514 | 3,500,000 | $ | 3,473,204 | |||||
| HTS Fund I LLC, Series 2021-1, Class A, 1.411%, 8/25/20364 | 1,750,000 | 1,742,488 | ||||||
| ITE Rail Fund Levered LP, Series 2021-3A, Class A, 2.21%, 6/28/20514 | 5,859,263 | 5,836,199 | ||||||
| KREF Ltd., Series 2021-FL2, Class AS, (1 mo. LIBOR US + 1.300%), 1.409%, 2/15/20393,4 | 3,500,000 | 3,498,541 | ||||||
| Laurel Road Prime Student Loan Trust, Series 2019-A, Class A2FX, 2.73%, 10/25/20484 | 735,503 | 741,602 | ||||||
| LCCM Trust, | ||||||||
| Series 2021-FL2, Class AS, (1 mo. LIBOR US + 1.550%), 1.660%, 12/13/20383,4 | 2,000,000 | 1,990,091 | ||||||
| Series 2021-FL2, Class B, (1 mo. LIBOR US + 1.900%), 2.010%, 12/13/20383,4 | 3,000,000 | 2,994,462 | ||||||
| Long Point Park CLO Ltd., Series 2017-1A, Class A2, (3 mo. LIBOR US + 1.375%), 1.497%, 1/17/20303,4 | 2,400,000 | 2,386,121 | ||||||
| Navient Private Education Loan Trust, | ||||||||
| Series 2014-1, Class A3, (1 mo. LIBOR US + 0.510%), 0.613%, 6/25/20313 | 4,638,578 | 4,533,899 | ||||||
| Series 2015-BA, Class A3, (1 mo. LIBOR US + 1.450%), 1.560%, 7/16/20403,4 | 2,355,146 | 2,364,877 | ||||||
| Series 2017-2A, Class A, (1 mo. LIBOR US + 1.050%), 1.153%, 12/27/20663,4 | 3,414,312 | 3,440,942 | ||||||
| Series 2020-1A, Class A1B, (1 mo. LIBOR US + 1.050%), 1.152%, 6/25/20693,4 | 2,639,689 | 2,708,936 | ||||||
| Series 2020-GA, Class A, 1.17%, 9/16/20694 | 874,529 | 870,425 | ||||||
| Series 2021-1A, Class A1A, 1.31%, 12/26/20694 | 6,400,487 | 6,217,086 | ||||||
| Series 2021-A, Class A, 0.84%, 5/15/20694 | 1,294,569 | 1,278,337 | ||||||
| Neuberger Berman Loan Advisers CLO 40 Ltd., Series 2021-40A, Class B, (Cayman Islands) (3 mo. LIBOR US + 1.400%), 1.522%, 4/16/20333,4 | 4,200,000 | 4,161,461 | ||||||
| OCP CLO Ltd., Series 2020-8RA, Class A1, (Cayman Islands) (3 mo. LIBOR US + 1.220%), 1.342%, 1/17/20323,4 | 3,500,000 | 3,499,993 | ||||||
| Octagon Investment Partners 18-R Ltd., Series 2018-18A, Class A1A, (Cayman Islands) (3 mo. LIBOR US + 0.960%), 1.082%, 4/16/20313,4 | 8,000,000 | 8,009,568 | ||||||
| Octagon Investment Partners 42 Ltd., Series 2019-3A, Class BR, (Cayman Islands) (3 mo. LIBOR US + 1.650%), 1.774%, 7/15/20343,4 | 3,750,000 | 3,733,680 | ||||||
The accompanying notes are an integral part of the financial statements.
9
Unconstrained Bond Series
Investment Portfolio - December 31, 2021
| SHARES/ | ||||||||
| PRINCIPAL | VALUE | |||||||
| AMOUNT1 | (NOTE 2) | |||||||
| ASSET-BACKED SECURITIES (continued) | ||||||||
| Oxford Finance Funding LLC, | ||||||||
| Series 2019-1A, Class A2, 4.459%, 2/15/20274 | 5,557,791 | $ | 5,666,891 | |||||
| Series 2020-1A, Class A2, 3.101%, 2/15/20284 | 6,300,000 | 6,366,080 | ||||||
| Series 2020-1A, Class B, 4.037%, 2/15/20284 | 3,700,000 | 3,750,612 | ||||||
| PEAR LLC, Series 2021-1, Class A, 2.60%, 1/15/2034 (Acquired 11/16/2021, cost $6,000,000)5 | 6,000,000 | 5,987,452 | ||||||
| Progress Residential Trust, Series 2019-SFR2, Class A, 3.147%, 5/17/20364 | 8,527,009 | 8,577,171 | ||||||
| Series 2019-SFR4, Class A, 2.687%, 10/17/20364 | 3,800,000 | 3,848,923 | ||||||
| Slam Ltd., Series 2021-1A, Class A, (Cayman Islands), 2.434%, 6/15/20464 | 6,200,320 | 6,080,384 | ||||||
| SMB Private Education Loan Trust, Series 2014-A, Class A3, (1 mo. LIBOR US + 1.500%), 1.610%, 4/15/20323,4 | 3,797,858 | 3,832,912 | ||||||
| Series 2019-B, Class A2A, 2.84%, 6/15/20374 | 3,357,968 | 3,442,471 | ||||||
| Series 2020-B, Class A1A, 1.29%, 7/15/20534 | 1,980,868 | 1,958,363 | ||||||
| SoFi Professional Loan Program LLC, | ||||||||
| Series 2016-C, Class A2B, 2.36%, 12/27/20324 | 50,753 | 51,011 | ||||||
| Series 2017-F, Class A2FX, 2.84%, 1/25/20414 | 271,942 | 276,642 | ||||||
| Stack Infrastructure Issuer LLC, Series 2021-1A, Class A2, 1.877%, 3/26/20464 | 3,400,000 | 3,343,423 | ||||||
| Stonepeak, Series 2021-1A, Class AA, 2.301%, 2/28/20334 | 1,122,323 | 1,110,554 | ||||||
| Store Master Funding I-VII and XIV, Series 2019-1, Class A1, 2.82%, 11/20/20494 | 2,396,044 | 2,454,979 | ||||||
| TCI-Flatiron CLO Ltd., Series 2016-1A, Class CR2, (Cayman Islands) (3 mo. LIBOR US + 2.200%), 2.322%, 1/17/20323,4 | 2,500,000 | 2,500,513 | ||||||
| Textainer Marine Containers VII Ltd., Series 2021-1A, Class A, (China), 1.68%, 2/20/20464 | 6,160,000 | 5,990,210 | ||||||
| Towd Point Mortgage Trust, | ||||||||
| Series 2016-5, Class A1, 2.50%, 10/25/20564,9 | 402,084 | 405,321 | ||||||
| Series 2017-1, Class A1, 2.75%, 10/25/20564,9 | 1,315,687 | 1,327,030 | ||||||
| Series 2018-2, Class A1, 3.25%, 3/25/20584,9 | 813,292 | 830,397 | ||||||
| Series 2019-HY1, Class A1, (1 mo. LIBOR US + 1.000%), 1.102%, 10/25/20483,4 | 1,896,156 | 1,903,753 | ||||||
| Tricon American Homes, Series 2020-SFR1, Class C, 2.249%, 7/17/20384 | 2,500,000 | 2,461,956 | ||||||
| SHARES/ | ||||||||
| PRINCIPAL | VALUE | |||||||
| AMOUNT1 | (NOTE 2) | |||||||
| ASSET-BACKED SECURITIES (continued) | ||||||||
| Trinitas CLO XVII Ltd., Series 2021-17A, Class B1, (Cayman Islands) (3 mo. LIBOR US + 1.700%), 1.838%, 10/20/20343,4 | 5,120,000 | $ | 5,090,022 | |||||
| Trinity Rail Leasing 2018 LLC, Series 2020-1A, Class A, 1.96%, 10/17/20504 | 2,588,407 | 2,558,729 | ||||||
| Trinity Rail Leasing 2021 LLC, Series 2021-1A, Class A, 2.26%, 7/19/20514 | 1,969,334 | 1,958,410 | ||||||
| Triton Container Finance VIII LLC, Series 2021-1A, Class A, 1.86%, 3/20/20464 | 6,179,250 | 6,051,564 | ||||||
| TRP LLC, Series 2021-1, Class A, 2.07%, 6/19/20514 | 2,975,424 | 2,943,991 | ||||||
| Vantage Data Centers LLC, Series 2020-1A, Class A2, 1.645%, 9/15/20454 | 6,500,000 | 6,354,229 | ||||||
| Vertical Bridge Holdings LLC, Series 2020-2A, Class A, 2.636%, 9/15/20504 | 4,000,000 | 4,024,200 | ||||||
| TOTAL ASSET-BACKED SECURITIES | ||||||||
| (Identified Cost $250,431,866) | 249,173,487 | |||||||
| COMMERCIAL MORTGAGE-BACKED SECURITIES - 8.1% | ||||||||
| BDS, Series 2021-FL8, Class B, (Cayman Islands) (1 mo. LIBOR US + 1.350%), 1.454%, 1/18/20363,4 | 3,000,000 | 2,983,932 | ||||||
| Brean Asset Backed Securities Trust, Series 2021-RM2, Class A, 1.75%, 10/25/20614,9 | 2,983,047 | 2,881,991 | ||||||
| CIM Trust, Series 2019-INV1, Class A1, 4.00%, 2/25/20494,9 | 150,575 | 151,871 | ||||||
| Credit Suisse Mortgage Capital Trust, Series 2013-TH1, Class A1, 2.13%, 2/25/20434,9 | 146,393 | 146,831 | ||||||
| Fannie Mae REMICS, Series 2018-31, Class KP, 3.50%, 7/25/2047 | 242,053 | 247,493 | ||||||
| Fontainebleau Miami Beach Trust, Series 2019-FBLU, Class A, 3.144%, 12/10/20364 | 4,480,000 | 4,578,947 | ||||||
| Freddie Mac Multifamily Structured Pass-Through Certificates, | ||||||||
| Series K021, Class X1 (IO), 1.376%, 6/25/20229 | 15,122,477 | 11,830 | ||||||
| Series K030, Class X1 (IO), 0.146%, 4/25/20239 | 50,854,639 | 95,754 | ||||||
| Series K032, Class X1 (IO), 0.072%, 5/25/20239 | 30,365,020 | 39,982 | ||||||
| Series K106, Class X1 (IO), 1.354%, 1/25/20309 | 53,862,208 | 5,161,955 | ||||||
| FREMF Mortgage Trust, | ||||||||
| Series 2013-K28, Class X2A (IO), 0.10%, 6/25/20464 | 79,644,970 | 63,613 | ||||||
| Series 2015-K42, Class B, 3.849%, 1/25/20484,9 | 1,900,000 | 2,007,193 | ||||||
The accompanying notes are an integral part of the financial statements.
10
Unconstrained Bond Series
Investment Portfolio - December 31, 2021
| SHARES/ | ||||||||
| PRINCIPAL | VALUE | |||||||
| AMOUNT1 | (NOTE 2) | |||||||
| COMMERCIAL MORTGAGE-BACKED SECURITIES (continued) | ||||||||
| FREMF Mortgage Trust, (continued) Series 2015-K43, Class B, 3.732%, 2/25/20484,9 | 1,500,000 | $ | 1,584,745 | |||||
| GS Mortgage Securities Corp. Trust, Series 2021-RENT, Class B, (1 mo. LIBOR US + 1.100%), 1.202%, 11/21/20353,4 | 4,000,000 | 3,979,880 | ||||||
| GS Mortgage-Backed Securities Trust, | ||||||||
| Series 2021-GR3, Class A6, 2.50%, 4/25/20524,9 | 6,404,666 | 6,459,360 | ||||||
| Series 2021-PJ9, Class A8, 2.50%, 2/26/20524,9 | 3,817,035 | 3,856,459 | ||||||
| JP Morgan Mortgage Trust, Series 2014-2, Class 1A1, 3.00%, 6/25/20294,9 | 289,210 | 291,781 | ||||||
| Metlife Securitization Trust, Series 2019-1A, Class A, 3.75%, 4/25/20584,9 | 1,041,914 | 1,077,200 | ||||||
| New Residential Mortgage Loan Trust, | ||||||||
| Series 2014-3A, Class AFX3, 3.75%, 11/25/20544,9 | 321,710 | 336,133 | ||||||
| Series 2015-2A, Class A1, 3.75%, 8/25/20554,9 | 461,683 | 481,773 | ||||||
| Series 2019-2A, Class A1, 4.25%, 12/25/20574,9 | �� | 2,314,901 | 2,414,853 | |||||
| RCKT Mortgage Trust, Series 2021-6, Class A5, 2.50%, 12/25/20514,9 | 6,000,000 | 6,037,031 | ||||||
| Sequoia Mortgage Trust, | ||||||||
| Series 2013-2, Class A, 1.874%, 2/25/20439 | 167,068 | 166,533 | ||||||
| Series 2013-6, Class A2, 3.00%, 5/25/20439 | 1,664,281 | 1,661,363 | ||||||
| Series 2013-7, Class A2, 3.00%, 6/25/20439 | 153,957 | 153,899 | ||||||
| Series 2013-8, Class A1, 3.00%, 6/25/20439.. | 178,933 | 179,678 | ||||||
| Series 2020-1, Class A4, 3.50%, 2/25/20504,9 | 43,427 | 43,408 | ||||||
| Starwood Retail Property Trust, Series 2014-STAR, Class A, (1 mo. LIBOR US + 1.470%), 1.580%, 11/15/20273,4 | 1,777,115 | 1,070,709 | ||||||
| Sutherland Commercial Mortgage Trust, Series 2019-SBC8, Class A, 2.86%, 4/25/20414,9 | 2,651,083 | 2,619,727 | ||||||
| Toorak Mortgage Corp. Ltd., Series 2019-1, Class A1, 4.535%, 3/25/20224,10 | 1,337,405 | 1,339,885 | ||||||
| Waikiki Beach Hotel Trust, Series 2019-WBM, Class A, (1 mo. LIBOR US + 1.050%), 1.16%, 12/15/20333,4 | 7,000,000 | 6,987,882 | ||||||
| WinWater Mortgage Loan Trust, Series 2015-1, Class A1, 3.50%, 1/20/20454,9 | 99,849 | 100,801 | ||||||
| TOTAL COMMERCIAL MORTGAGE-BACKED SECURITIES (Identified Cost $57,748,973) | 59,214,492 | |||||||
| SHARES/ | ||||||||
| PRINCIPAL | VALUE | |||||||
| AMOUNT1 | (NOTE 2) | |||||||
| FOREIGN GOVERNMENT BONDS - 1.8% | ||||||||
| Mexican Government Bond (Mexico), 6.50%, 6/9/2022 | MXN | 126,000,000 | $ | 6,153,203 | ||||
| Mexico Government International Bond (Mexico), 4.125%, 1/21/2026 | 1,800,000 | 1,975,518 | ||||||
| Republic of Italy Government International Bond (Italy), 2.375%, 10/17/2024 | 4,500,000 | 4,609,830 | ||||||
| TOTAL FOREIGN GOVERNMENT BONDS (Identified Cost $15,850,375) | 12,738,551 | |||||||
| MUNICIPAL BONDS - 0.6% | ||||||||
| Hawaii, Series GC, G.O. Bond, 2.632%, 10/1/2037 | ||||||||
| (Identified Cost $4,064,913) | 3,905,000 | 3,971,268 | ||||||
| MUTUAL FUND - 2.4% | ||||||||
| VanEck J.P. Morgan EM Local Currency Bond ETF | ||||||||
| (Identified Cost $20,043,402) | 609,000 | 17,417,400 | ||||||
| U.S. TREASURY SECURITIES - 4.3% | ||||||||
| U.S. Treasury Notes - 4.3% | ||||||||
| U.S. Treasury Note | ||||||||
| 0.125%, 8/31/2023 | 21,400,000 | 21,213,586 | ||||||
| 0.375%, 8/15/2024 | 10,460,000 | 10,324,347 | ||||||
| TOTAL U.S. TREASURY SECURITIES | 31,537,933 | |||||||
| (Identified Cost $31,827,115) | ||||||||
| U.S. GOVERNMENT AGENCIES - 0.3% | ||||||||
| Mortgage-Backed Securities - 0.3% | ||||||||
| Fannie Mae | ||||||||
| Pool #888810, UMBS, 5.50%, 11/1/2022 | 141 | 141 | ||||||
| Pool #AD0462, UMBS, 5.50%, 10/1/2024 | 4,242 | 4,400 | ||||||
| Pool #MA0115, UMBS, 4.50%, 7/1/2029 | 36,589 | 39,178 | ||||||
| Pool #MA1834, UMBS, 4.50%, 2/1/2034 | 145,568 | 158,035 | ||||||
| Pool #995876, UMBS, 6.00%, 11/1/2038 | 252,451 | 292,825 | ||||||
| Pool #AW5338, UMBS, 4.50%, 6/1/2044 | 546,635 | 596,145 | ||||||
| Pool #AS3878, UMBS, 4.50%, 11/1/2044 | 491,697 | 540,995 | ||||||
| Pool #BE7845, UMBS, 4.50%, 2/1/2047 | 98,536 | 106,458 | ||||||
The accompanying notes are an integral part of the financial statements.
11
Unconstrained Bond Series
Investment Portfolio - December 31, 2021
| SHARES/ | ||||||||
| PRINCIPAL | VALUE | |||||||
| AMOUNT1 | (NOTE 2) | |||||||
| U.S. GOVERNMENT AGENCIES (continued) | ||||||||
| Mortgage-Backed Securities (continued) | ||||||||
| Freddie Mac | ||||||||
| Pool #G12610, 6.00%, 3/1/2022 | 153 | $ | 153 | |||||
| Pool #G12655, 6.00%, 5/1/2022 | 81 | 81 | ||||||
| Pool #G12988, 6.00%, 1/1/2023 | 928 | 939 | ||||||
| Pool #G13078, 6.00%, 3/1/2023 | 1,311 | 1,326 | ||||||
| Pool #G13331, 5.50%, 10/1/2023 | 1,146 | 1,169 | ||||||
| Pool #C91359, 4.50%, 2/1/2031 | 99,148 | 107,206 | ||||||
| Pool #D98711, 4.50%, 7/1/2031 | 289,233 | 312,734 | ||||||
| Pool #C91746, 4.50%, 12/1/2033 | 214,854 | 233,333 | ||||||
| Pool #G05900, 6.00%, 3/1/2040 | 40,952 | 46,791 | ||||||
| TOTAL U.S. GOVERNMENT AGENCIES (Identified Cost $2,344,026) | 2,441,909 | |||||||
| SHORT-TERM INVESTMENT - 2.6% | ||||||||
| Dreyfus Government Cash Management, Institutional Shares, 0.03%11 | ||||||||
| (Identified Cost $19,172,130) | 19,172,130 | 19,172,130 | ||||||
| TOTAL INVESTMENTS - 99.3% | ||||||||
| (Identified Cost $725,519,048) | 723,305,787 | |||||||
| OTHER ASSETS, LESS LIABILITIES - 0.7% | 4,917,208 | |||||||
| NET ASSETS - 100% | $ | 728,222,995 | ||||||
| FUTURES CONTRACTS: LONG POSITIONS OPEN AT DECEMBER 31, 2021 | |||||
| CONTRACTS PURCHASED | ISSUE | EXCHANGE | EXPIRATION | NOTIONAL VALUE 1 | VALUE/UNREALIZED APPRECIATION/ (DEPRECIATION) |
| 2,850 | 90 Day Euro Dollar | EUREX | December 2022 | 705,054,375 | $(2,500,932) |
| 2,850 | 90 Day Euro Dollar | EUREX | December 2024 | 700,316,250 | 135,318 |
| TOTAL LONG POSITIONS | $(2,365,614) | ||||
| FUTURES CONTRACTS: SHORT POSITIONS OPEN AT DECEMBER 31, 2021 | |||||
| CONTRACTS PURCHASED | ISSUE | EXCHANGE | EXPIRATION | NOTIONAL VALUE 1 | VALUE/UNREALIZED APPRECIATION/ (DEPRECIATION) |
| 130 | Cboe iBoxx iShares Corporate Bond Index | CBOE | February 2022 | 19,665,750 | $(28,642) |
| 132 | Euro-BTP | EUREX | March 2022 | 22,092,957 | 498,757 |
| 37 | Euro-BUXL (30 Year) | EUREX | March 2022 | 8,708,819 | 460,792 |
| 120 | U.S. Treasury Notes (10 Year) | CBOT | March 2022 | 15,656,250 | (158,096) |
| 75 | U.S. Ultra Treasury Bonds (10 Year) | CBOT | March 2022 | 10,982,812 | (161,289) |
| 2,850 | 90 Day Euro Dollar | EUREX | December 2025 | 700,102,500 | (1,216,457) |
| TOTAL SHORT POSITIONS | $(604,935) | ||||
The accompanying notes are an integral part of the financial statements.
12
Unconstrained Bond Series
Investment Portfolio - December 31, 2021
CBOE - Chicago Board Options Exchange
CBOT - Chicago Board of Trade
CLO - Collateralized Loan Obligation
ETF - Exchange-Traded Fund
EUR - Euro
EUREX - Eurex Exchange
EURIBOR - Euro Interbank Offered Rate
G.O. Bond - General Obligation Bond
IO - Interest only
LIBOR - London Interbank Offered Rate
MXN - Mexican Peso
NIBOR - Norwegian Interbank Offered Rate
No. - Number
NOK - Norwegian Krone
REMICS - Real Estate Mortgage Investment Conduits
SEK - Swedish Krona
STIB - Stockholm Interbank Offered Rate
UMBS - Uniform Mortgage-Backed Securities
*Non-income producing security.
1Amount is stated in USD unless otherwise noted.
2Security has been valued using significant unobservable inputs.
3Floating rate security. Rate shown is the rate in effect as of December 31, 2021.
4Security purchased or received in a transaction exempt from registration under the Securities Act of 1933, as amended (the “1933 Act”) and determined to be liquid under the Fund’s Liquidity Risk Management Program. The security may be resold pursuant to an exemption from registration under the 1933 Act, typically to qualified institutional buyers. The aggregate value of these securities at December 31, 2021 was $413,422,302, which represented 56.8% of the Series’ Net Assets.
5Security purchased or received in a transaction exempt from registration under the Securities Act of 1933, as amended (the “1933 Act”) and determined to be illiquid under the Fund’s
Liquidity Risk Management Program. The security may be resold pursuant to an exemption from registration under the 1933 Act, typically to qualified institutional buyers. The aggregate value of such securities at December 31, 2021 was $46,604,477, or 6.4% of the Series’ Net Assets.
6Security is perpetual in nature and has no stated maturity date.
7Variable rate security. Security may be issued at a fixed coupon rate, which converts to a variable rate at a specified date. Rate shown is the rate in effect as of December 31, 2021.
8Issuer filed for bankruptcy and/or is in default of interest payments.
9Variable or floating rate security, the interest rate of which adjusts periodically based on changes in current interest rates and prepayments on the underlying pool of assets. Rate shown is the rate in effect as of December 31, 2021.
10Represents a step-up bond that pays initial coupon rate for the first period and then a higher coupon rate for the following periods. Rate shown reflects the current coupon as of December 31, 2021.
11Rate shown is the current yield as of December 31, 2021.
The Global Industry Classification Standard (GICS) was developed by and is the exclusive property and a service mark of MSCI Inc. (MSCI) and Standard & Poor’s, a division of S&P Global Inc. (S&P), and is licensed for use by Manning & Napier when referencing GICS sectors. Neither MSCI, S&P, nor any third party involved in making or compiling the GICS or any GICS classifications makes any express or implied warranties or representations with respect to such standard or classification, nor shall any such party have any liability therefrom.
The accompanying notes are an integral part of the financial statements.
13
Unconstrained Bond Series
Statement of Assets and Liabilities
December 31, 2021
| ASSETS: | ||||
| Investments in securities, at value (identified cost $725,519,048) (Note 2) | $ | 723,305,787 | ||
| Foreign currency, at value (identified cost $2,686,188) | 2,742,560 | |||
| Interest receivable | 4,431,814 | |||
| Deposits at broker for futures contracts | 4,261,763 | |||
| Receivable for fund shares sold | 1,090,240 | |||
| Dividends receivable | 405 | |||
| Prepaid expenses | 17,138 | |||
| TOTAL ASSETS | 735,849,707 | |||
| LIABILITIES: | ||||
| Accrued fund accounting and administration fees (Note 3) | 47,990 | |||
| Accrued sub-transfer agent fees (Note 3) | 25,226 | |||
| Accrued distribution and service (Rule 12b-1) fees (Class S) (Note 3) | 3,778 | |||
| Accrued Chief Compliance Officer service fees (Note 3) | 1,531 | |||
| Accrued management fees (Note 3) | 238 | |||
| Payable for securities purchased | 7,030,321 | |||
| Payable for fund shares repurchased | 413,193 | |||
| Futures variation margin payable | 62,921 | |||
| Other payables and accrued expenses | 41,514 | |||
| TOTAL LIABILITIES | 7,626,712 | |||
| TOTAL NET ASSETS | $ | 728,222,995 | ||
| NET ASSETS CONSIST OF: | ||||
| Capital stock | $ | 693,663 | ||
| Additional paid-in-capital | 730,723,457 | |||
| Total distributable earnings (loss) | (3,194,125 | ) | ||
| TOTAL NET ASSETS | $ | 728,222,995 | ||
| NET ASSET VALUE, OFFERING PRICE AND REDEMPTION PRICE PER SHARE - Class S ($17,776,191/1,675,554 shares) | $ | 10.61 | ||
| NET ASSET VALUE, OFFERING PRICE AND REDEMPTION PRICE PER SHARE - Class I ($36,639,330/3,943,619 shares) | $ | 9.29 | ||
| NET ASSET VALUE, OFFERING PRICE AND REDEMPTION PRICE PER SHARE - Class W ($673,807,474/63,747,100 shares) | $ | 10.57 | ||
The accompanying notes are an integral part of the financial statements.
14
Unconstrained Bond Series
Statement of Operations
For the Year Ended December 31, 2021
| INVESTMENT INCOME: | ||||
| Interest | $ | 22,781,218 | ||
| Dividend | 1,321,234 | |||
| Other Income | 238,013 | |||
| Total Investment Income | 24,340,465 | |||
| EXPENSES: | ||||
| Management fees (Note 3) | 2,115,194 | |||
| Fund accounting and administration fees (Note 3) | 141,929 | |||
| Directors’ fees (Note 3) | 83,879 | |||
| Accrued sub-transfer agent fees (Note 3) | 54,057 | |||
| Distribution and service (Rule 12b-1) fees (Class S) (Note 3) | 49,145 | |||
| Chief Compliance Officer service fees (Note 3) | 6,123 | |||
| Custodian fees | 39,098 | |||
| Miscellaneous | 239,342 | |||
| Total Expenses | 2,728,767 | |||
| Less reduction of expenses (Note 3) | (2,117,263 | ) | ||
| Net Expenses | 611,504 | |||
| NET INVESTMENT INCOME | 23,728,961 | |||
| REALIZED AND UNREALIZED GAIN (LOSS) ON INVESTMENTS AND FOREIGN CURRENCY: | ||||
| Net realized gain (loss) on- | ||||
| Investments | 20,176,583 | |||
| Futures contracts | 1,558,559 | |||
| Foreign currency and translation of other assets and liabilities | 302,782 | |||
| 22,037,924 | ||||
| Net change in unrealized appreciation (depreciation) on- | ||||
| Investments | (20,721,098 | ) | ||
| Futures contracts | (3,214,126 | ) | ||
| Foreign currency and translation of other assets and liabilities | (89,947 | ) | ||
| (24,025,171 | ) | |||
| NET REALIZED AND UNREALIZED GAIN (LOSS) ON INVESTMENTS AND FOREIGN CURRENCY | (1,987,247 | ) | ||
| NET INCREASE IN NET ASSETS RESULTING FROM OPERATIONS | $ | 21,741,714 |
The accompanying notes are an integral part of the financial statements.
15
Unconstrained Bond Series
Statements of Changes in Net Assets
| FOR THE | FOR THE | |||||||
| YEAR ENDED | YEAR ENDED | |||||||
| 12/31/21 | 12/31/20 | |||||||
| INCREASE (DECREASE) IN NET ASSETS: | ||||||||
| OPERATIONS: | ||||||||
| Net investment income | $ | 23,728,961 | $ | 23,743,828 | ||||
| Net realized gain (loss) on investments and foreign currency | 22,037,924 | 6,384,392 | ||||||
| Net change in unrealized appreciation (depreciation) on investments and foreign currency | (24,025,171 | ) | 13,756,649 | |||||
| Net increase (decrease) from operations | 21,741,714 | 43,884,869 | ||||||
DISTRIBUTIONS TO SHAREHOLDERS (Note 9): | ||||||||
| Class S | (1,000,768 | ) | (530,098 | ) | ||||
| Class I | (2,012,290 | ) | (645,381 | ) | ||||
| Class W | (40,773,813 | ) | (21,495,898 | ) | ||||
| Total distributions to shareholders | (43,786,871 | ) | (22,671,377 | ) | ||||
| CAPITAL STOCK ISSUED AND REPURCHASED: | ||||||||
| Net increase (decrease) from capital share transactions (Note 5) | 76,085,887 | (248,841,791 | ) | |||||
| Net increase (decrease) in net assets | 54,040,730 | (227,628,299 | ) | |||||
| NET ASSETS: | ||||||||
| Beginning of year | 674,182,265 | 901,810,564 | ||||||
| End of year | $ | 728,222,995 | $ | 674,182,265 | ||||
The accompanying notes are an integral part of the financial statements.
16
Unconstrained Bond Series
Financial Highlights - Class S
| FOR THE YEAR ENDED | |||||||||||||||
| 12/31/21 | 12/31/20 | 12/31/19 | 12/31/18 | 12/31/17 | |||||||||||
| Per share data (for a share outstanding throughout each year): | |||||||||||||||
| Net asset value - Beginning of year | $10.93 | $10.44 | $10.18 | $10.42 | $10.33 | ||||||||||
| Income from investment operations: | |||||||||||||||
| Net investment income1 | 0.30 | 0.29 | 0.28 | 0.26 | 0.22 | ||||||||||
| Net realized and unrealized gain (loss) on investments | (0.02 | ) | 0.48 | 0.23 | (0.24 | ) | 0.11 | ||||||||
| Total from investment operations | 0.28 | 0.77 | 0.51 | 0.02 | 0.33 | ||||||||||
| Less distributions to shareholders: | |||||||||||||||
| From net investment income | (0.30 | ) | (0.28 | ) | (0.25 | ) | (0.25 | ) | (0.23 | ) | |||||
| From net realized gain on investments | (0.30 | ) | (0.00 | )2 | — | (0.01 | ) | (0.01 | ) | ||||||
| Total distributions to shareholders | (0.60 | ) | (0.28 | ) | (0.25 | ) | (0.26 | ) | (0.24 | ) | |||||
| Net asset value - End of year | $10.61 | $10.93 | $10.44 | $10.18 | $10.42 | ||||||||||
| Net assets - End of year (000’s omitted) | $17,776 | $20,925 | $22,884 | $685,649 | $770,824 | ||||||||||
| Total return3 | 2.59% | 7.54% | 5.01% | 0.20% | 3.19% | ||||||||||
| Ratios (to average net assets)/Supplemental Data: | |||||||||||||||
| Expenses* | 0.73% | 0.73% | 0.75% | 0.75% | 0.75% | ||||||||||
| Net investment income | 2.71% | 2.74% | 2.80% | 2.56% | 2.08% | ||||||||||
| Series portfolio turnover | 69% | 96% | 75% | 58% | 62% | ||||||||||
*For certain years presented, the investment advisor did not impose all or a portion of its management and/or other fees, and in some years may have paid a portion of the Series’ expenses. If these expenses had been incurred by the Class, the expense ratio (to average net assets) would have increased by the following amounts:
| N/A | N/A | 0.01% | 0.01% | 0.00%4 |
1Calculated based on average shares outstanding during the years.
2Less than $(0.01).
3Represents aggregate total return for the years indicated, and assumes reinvestment of all distributions. Total return would have been lower had certain expenses not been waived or reimbursed during certain years.
4Less than 0.01%.
The accompanying notes are an integral part of the financial statements.
17
Unconstrained Bond Series
Financial Highlights - Class I
| FOR THE YEAR ENDED | |||||||||||||||
| 12/31/21 | 12/31/20 | 12/31/19 | 12/31/18 | 12/31/17 | |||||||||||
| Per share data (for a share outstanding throughout each year): | |||||||||||||||
| Net asset value - Beginning of year | $9.65 | $9.26 | $9.09 | $9.34 | $9.28 | ||||||||||
| Income from investment operations: | |||||||||||||||
| Net investment income1 | 0.29 | 0.28 | 0.28 | 0.26 | 0.22 | ||||||||||
| Net realized and unrealized gain (loss) on investments | (0.02 | ) | 0.42 | 0.20 | (0.22 | ) | 0.11 | ||||||||
| Total from investment operations | 0.27 | 0.70 | 0.48 | 0.04 | 0.33 | ||||||||||
| Less distributions to shareholders: | |||||||||||||||
| From net investment income | (0.33 | ) | (0.31 | ) | (0.31 | ) | (0.28 | ) | (0.26 | ) | |||||
| From net realized gain on investments | (0.30 | ) | (0.00 | )2 | — | (0.01 | ) | (0.01 | ) | ||||||
| Total distributions to shareholders | (0.63 | ) | (0.31 | ) | (0.31 | ) | (0.29 | ) | (0.27 | ) | |||||
| Net asset value - End of year | $9.29 | $9.65 | $9.26 | $9.09 | $9.34 | ||||||||||
| Net assets - End of year (000’s omitted) | $36,639 | $21,687 | $19,039 | $28,499 | $66,543 | ||||||||||
| Total return3 | 2.81% | 7.74% | 5.37% | 0.40% | 3.52% | ||||||||||
| Ratios (to average net assets)/Supplemental Data: | |||||||||||||||
| Expenses* | 0.49% | 0.49% | 0.48% | 0.50% | 0.50% | ||||||||||
| Net investment income | 2.97% | 2.96% | 3.01% | 2.75% | 2.33% | ||||||||||
| Series portfolio turnover | 69% | 96% | 75% | 58% | 62% | ||||||||||
*For certain years presented, the investment advisor did not impose all or a portion of its management and/or other fees, and in some years may have paid a portion of the Series’ expenses. If these expenses had been incurred by the Class, the expense ratio (to average net assets) would have increased by the following amounts:
| N/A | N/A | 0.01% | 0.01% | 0.00%4 |
1Calculated based on average shares outstanding during the years.
2Less than $(0.01).
3Represents aggregate total return for the years indicated, and assumes reinvestment of all distributions. Total return would have been lower had certain expenses not been waived or reimbursed during certain years.
4Less than 0.01%.
The accompanying notes are an integral part of the financial statements.
18
Unconstrained Bond Series
Financial Highlights - Class W
FOR THE YEAR ENDED | FOR THE | ||||||||
| PERIOD | |||||||||
| 3/1/191 TO | |||||||||
12/31/21 | 12/31/20 | 12/31/19 | |||||||
| Per share data (for a share outstanding throughout each period): | |||||||||
| Net asset value - Beginning of period | $10.90 | $10.41 | $10.34 | ||||||
| Income from investment operations: | |||||||||
| Net investment income2 | 0.37 | 0.36 | 0.30 | ||||||
| Net realized and unrealized gain (loss) on investments | (0.03 | ) | 0.49 | 0.12 | |||||
| Total from investment operations | 0.34 | 0.85 | 0.42 | ||||||
| Less distributions to shareholders: | |||||||||
| From net investment income | (0.37 | ) | (0.36 | ) | (0.35 | ) | |||
| From net realized gain on investments | (0.30 | ) | (0.00 | )3 | — | ||||
| Total distributions to shareholders | (0.67 | ) | (0.36 | ) | (0.35 | ) | |||
| Net asset value - End of period | $10.57 | $10.90 | $10.41 | ||||||
| Net assets - End of period (000’s omitted) | $673,807 | $631,570 | $859,888 | ||||||
| Total return4 | 3.19% | 8.29% | 4.10% | 5 | |||||
| Ratios (to average net assets)/Supplemental Data: | |||||||||
| Expenses* | 0.05% | 0.05% | 0.05% | 6 | |||||
| Net investment income | 3.40% | 3.40% | 3.44% | 6 | |||||
| Series portfolio turnover | 69% | 96% | 75% | ||||||
*The investment advisor did not impose all or a portion of its management and/or other fees during the periods, and may have paid a portion of the Series’ expenses. If these expenses had been incurred by the Class, the expense ratio (to average net assets) would have increased by the following amounts:
| 0.32% | 0.32% | 0.31% | 6 |
1Commencement of operations.
2Calculated based on average shares outstanding during the periods.
3Less than $(0.01).
4Represents aggregate total return for the periods indicated, and assumes reinvestment of all distributions. Total return would have been lower had certain expenses not been waived or reimbursed during the periods. Periods less than one year are not annualized.
5Includes litigation proceeds. Excluding this amount, the Class’ total return is 4.00%.
6Annualized.
The accompanying notes are an integral part of the financial statements.
19
Unconstrained Bond Series
Notes to Financial Statements
| 1. | Organization |
Unconstrained Bond Series (the “Series”) is a no-load diversified series of Manning & Napier Fund, Inc. (the “Fund”). The Fund is organized in Maryland and is registered under the Investment Company Act of 1940, as amended, as an open-end management investment company.
The Series’ investment objective is to provide long-term total return, and its secondary objective is to provide preservation of capital.
The Fund’s advisor is Manning & Napier Advisors, LLC (the “Advisor”). Shares of the Series are offered to investors, clients and employees of the Advisor and its affiliates. The Series is authorized to issue four classes of shares (Class S, I, W, and Z). Each class of shares is substantially the same, except that class specific distribution and shareholder servicing expenses are borne by the specific class of shares to which they relate. The total authorized capital stock of the Fund consists of 15 billion shares of common stock each having a par value of $0.01. As of December 31, 2021, 6.3 billion shares have been designated in total among 15 series, of which 100 million have been designated as Unconstrained Bond Series Class I common stock and Unconstrained Bond Series Class Z common stock, 125 million have been designated as Unconstrained Bond Series Class S common stock and 150 million have been designated as Unconstrained Bond Series Class W common stock. Class Z common stock is not currently offered for sale.
| 2. | Significant Accounting Policies |
The following is a summary of significant accounting policies followed by the Series. The Series is an investment company and, accordingly, follows the investment company accounting and reporting guidance of the Financial Accounting Standards Board Accounting Standards Codification Topic 946 - Investment Companies, which is part of accounting principles generally accepted in the United States of America (“GAAP”).
Security Valuation
Portfolio securities, including domestic equities, foreign equities, warrants and options, listed on an exchange other than the NASDAQ Stock Market are valued at the latest quoted sales price of the exchange on which the security is primarily traded. Securities not traded on valuation date or securities not listed on an exchange are valued at the latest quoted bid price provided by the Fund’s pricing service. Securities listed on the NASDAQ Stock Market are valued in accordance with the NASDAQ Official Closing Price.
Debt securities, including government bonds, foreign bonds, asset-backed securities, structured notes, supranational obligations, sovereign bonds, corporate bonds, loan assignments, and mortgage-backed securities will normally be valued on the basis of evaluated bid prices provided directly by an independent pricing service (the “Service”). The pricing services use multiple valuation techniques to determine fair value. In instances where sufficient market activity exists, the pricing services may utilize a market-based approach through which quotes from market makers are used to determine fair value. In instances where sufficient market activity may not exist or is limited, the pricing services also utilize proprietary valuation models which may consider market characteristics such as benchmark yield curves, option-adjusted spreads, credit spreads, estimated default rates, coupon rates, anticipated timing of principal repayments, underlying collateral, and other unique security features in order to estimate the relevant cash flows, which are then discounted to calculate the fair value. Certain investments in securities held by the Series may be valued on a basis of a price provided directly by a principal market maker. These prices may differ from the value that would have been used had a broader market for securities existed.
The fair value of loan assignments is estimated using recently executed transactions, market price quotations, credit/market events, and cross-asset pricing. Inputs are generally observable market inputs obtained from independent sources. Loan assignments are generally categorized in Level 2 of the fair value hierarchy, unless key inputs are unobservable, in which case they would be categorized in Level 3.
Municipal securities will normally be valued on the basis of market valuations provided by the Service. The Service utilizes the latest price quotations and a matrix system (which considers such factors as security prices of similar securities, yields, maturities and ratings). The Service has been approved by the Fund’s Board of Directors (the “Board”).
20
Unconstrained Bond Series
Notes to Financial Statements (continued)
| 2. | Significant Accounting Policies (continued) |
Security Valuation (continued)
Short-term investments that mature in sixty days or less may be valued at amortized cost, which approximates fair value. Investments in open-end investment companies are valued at their net asset value per share on valuation date.
Volume and level of activity in established markets for an asset or liability are evaluated to determine whether recent transactions and quoted prices are determinative of fair value. Where there have been significant decreases in volume and level of activity, further analysis and adjustment may be necessary to estimate fair value. The Series measures fair value in these instances by the use of inputs and valuation techniques which may be based upon current market prices of securities that are comparable in coupon, rating, maturity and industry and/or expectation of future cash flows. As a result of trading in relatively thin markets and/or markets that experience significant volatility, the prices used by the Series to value these securities may differ from the value that would be realized if these securities were sold, and the differences could be material.
Securities for which representative valuations or prices are not available from the Series’ pricing service may be valued at fair value as determined in good faith by the Advisor under procedures approved by and under the general supervision and responsibility of the Fund’s Board of Directors (the “Board”). Due to the inherent uncertainty of valuations of such securities, the fair value may differ significantly from the values that would have been used had a ready market for such securities existed. If trading or events occurring after the close of the principal market in which securities are traded are expected to materially affect the value of those securities, then they may be valued at their fair value, taking this trading or these events into account.
Various inputs are used in determining the value of the Series’ assets or liabilities carried at fair value. These inputs are summarized in three broad levels. Level 1 includes quoted prices in active markets for identical assets and liabilities. Level 2 includes other significant observable inputs (including quoted prices for similar securities, interest rates, prepayment speeds, credit risk, etc.). Level 3 includes significant unobservable inputs (including the Series’ own assumptions in determining the fair value of investments). A financial instrument’s level within the fair value hierarchy is based on the lowest level of any input both individually and in aggregate that is significant to the fair value measurement. The inputs or methodology used for valuing securities are not necessarily an indication of the risk associated with investing in those securities.
The following is a summary of the valuation levels used for major security types as of December 31, 2021 in valuing the Series’ assets or liabilities carried at fair value:
| DESCRIPTION | TOTAL | LEVEL 1 | LEVEL 2 | LEVEL 3 | |||||||||||
| Assets: | |||||||||||||||
| Equity securities: | |||||||||||||||
| Energy | $ | 5,369,688 | $ | — | $ | — | $ | 5,369,688 | |||||||
| Preferred securities: | |||||||||||||||
| Health Care | 2,943,738 | 2,943,738 | — | — | |||||||||||
| Information Technology | 7,167,711 | 7,167,711 | — | — | |||||||||||
| Debt securities: | |||||||||||||||
| Loan Assignments | 25,838,571 | — | 25,838,571 | — | |||||||||||
| U.S. Treasury and other U.S. Government agencies | 33,979,842 | — | 33,979,842 | — | |||||||||||
| States and political subdivisions (municipals) | 3,971,268 | — | 3,971,268 | — | |||||||||||
| Corporate debt: | |||||||||||||||
| Communication Services | 18,588,071 | — | 18,588,071 | — | |||||||||||
| Consumer Discretionary | 12,599,295 | — | 12,599,295 | — | |||||||||||
| Consumer Staples | 2,339,894 | — | 2,339,894 | — | |||||||||||
| Energy | 60,517,596 | — | 60,517,596 | — | |||||||||||
| Financials | 55,856,496 | — | 55,856,496 | — | |||||||||||
| Industrials | 58,603,273 | — | 58,603,273 | — | |||||||||||
| Information Technology | 3,668,702 | — | 3,668,702 | — | |||||||||||
| Materials | 23,944,712 | — | 23,944,712 | — | |||||||||||
21
Unconstrained Bond Series
Notes to Financial Statements (continued)
| 2. | Significant Accounting Policies (continued) |
Security Valuation (continued)
| DESCRIPTION | TOTAL | LEVEL 1 | LEVEL 2 | LEVEL 3 | |||||||||||
| Real Estate | $ | 36,559,901 | $ | — | $ | 36,559,901 | $ | — | |||||||
| Utilities | 13,640,969 | — | 13,640,969 | — | |||||||||||
| Asset-backed securities | 249,173,487 | — | 249,173,487 | — | |||||||||||
| Commercial mortgage-backed securities | 59,214,492 | — | 59,214,492 | — | |||||||||||
| Foreign government bonds | 12,738,551 | — | 12,738,551 | — | |||||||||||
| Mutual fund | 17,417,400 | 17,417,400 | — | — | |||||||||||
| Short-Term Investment | 19,172,130 | 19,172,130 | — | — | |||||||||||
| Other financial instruments:* | |||||||||||||||
| Interest rate contracts | 1,094,867 | 1,094,867 | — | — | |||||||||||
| Total assets | 724,400,654 | 47,795,846 | 671,235,120 | 5,369,688 | |||||||||||
| Liabilities: | |||||||||||||||
| Other financial instruments:* | |||||||||||||||
| Credit contracts | (28,642 | ) | (28,642 | ) | — | — | |||||||||
| Interest rate contracts | (4,036,774 | ) | (4,036,774 | ) | — | — | |||||||||
| Total liabilities | (4,065,416 | ) | (4,065,416 | ) | — | — | |||||||||
| Total | $ | 720,335,238 | $ | 43,730,430 | $ | 671,235,120 | $ | 5,369,688 | |||||||
*Other financial instruments are futures (Level 1). Futures are valued at the unrealized appreciation (depreciation) on the instrument.
LIBOR Transition Risk
The United Kingdom’s Financial Conduct Authority announced a phase out of the London Interbank Offered Rate (“LIBOR”). Although many LIBOR rates will cease to be published or no longer will be representative of the underlying market they seek to measure after December 31, 2021, a selection of widely used USD LIBOR rates will continue to be published through June 2023 in order to assist with the transition. The Series may be exposed to financial instruments tied to LIBOR to determine payment obligations, financing terms, hedging strategies or investment value. The transition process away from LIBOR might lead to increased volatility and illiquidity in markets for, and reduce the effectiveness of new hedges placed against, instruments whose terms currently include LIBOR. The ultimate effect of the LIBOR transition process on the Series is uncertain.
Security Transactions, Investment Income and Expenses
Security transactions are accounted for on trade date. Dividend income is recorded on the ex-dividend date, except that if the ex-dividend date has passed, certain dividends from foreign securities are recorded as soon as the Series is informed of the ex-dividend date. Non-cash dividends, if any, are recorded at the fair value of the securities received. Interest income, including amortization of premium and accretion of discounts using the effective interest method, is earned from settlement date and accrued daily.
Expenses are recorded on an accrual basis. Most expenses of the Fund can be attributed to a specific series. Expenses which cannot be directly attributed are apportioned among the series in the Fund in such a manner as deemed equitable by the Fund’s Board, taking into consideration, among other things, the nature and type of expense. Income, expenses (other than shareholder services fees), and realized and unrealized gains and losses are prorated among the classes based on the relative net assets of each class. Class specific examples are directly charged to that Class.
The Series uses the identified cost method for determining realized gain or loss on investments for both financial statement and federal income tax reporting purposes.
Foreign Currency Translation
The books and records of the Series are maintained in U.S. dollars. Foreign currencies, investments and other assets and liabilities are translated into U.S. dollars at the current exchange rates. Purchases and sales of investment securities and income
22
Unconstrained Bond Series
Notes to Financial Statements (continued)
| 2. | Significant Accounting Policies (continued) |
Foreign Currency Translation (continued)
and expenses are translated on the respective dates of such transactions. The Series does not isolate realized and unrealized gains and losses attributable to changes in the exchange rates from gains and losses that arise from changes in the fair value of investments. Such fluctuations are included with net realized and unrealized gain or loss on investments. Net realized foreign currency gains and losses represent foreign currency gains and losses between trade date and settlement date on securities transactions, gains and losses on disposition of foreign currencies and the difference between the amount of income and foreign withholding taxes recorded on the books of the Series and the amounts actually received or paid.
Forward Foreign Currency Exchange Contracts
The Series may purchase or sell forward foreign currency exchange contracts in order to hedge a portfolio position or specific transaction. Risks may arise if the counterparties to a contract are unable to meet the terms of the contract or if the value of the foreign currency moves unfavorably.
All forward foreign currency exchange contracts are adjusted daily by the exchange rate of the underlying currency and, for financial statement purposes, any gain or loss is recorded as unrealized gain or loss until a contract has been closed.
The Series may regularly trade forward foreign currency exchange contracts with off-balance sheet risk in the normal course of its investing activities to assist in managing exposure to changes in foreign currency exchange rates.
The notional or contractual amount of these instruments represents the investment the Series has in forward foreign currency exchange contracts and does not necessarily represent the amounts potentially at risk. The measurement of the risks associated with forward foreign currency exchange contracts is meaningful only when all related and offsetting transactions are considered. The Series’ forward foreign currency exchange contracts are not subject to master netting arrangements (the right to close out all transactions traded with a counterparty, and net amounts owed or due across transactions). No such investments were held by the Series on December 31, 2021.
Futures
The Series may purchase or sell exchange-traded futures contracts, which are contracts that obligate the Series to make or take delivery of a financial instrument or the cash value of a security index at a specified future date at a specified price. The Series may use futures contracts to manage exposure to the bond market or changes in interest rates and currency values, or for gaining exposure to markets. Risks of entering into futures contracts include the possibility that there may be an illiquid market at the time the Advisor to the Series may be attempting to sell some or all the Series’ holdings or that a change in the value of the contract may not correlate with changes in the value of the underlying securities. Upon entering into a futures contract, a Series is required to deposit either cash or securities (initial margin). Subsequent payments (variation margin) are made or received by the Series, generally on a daily basis. The variation margin payments are equal to the daily changes in the contract value and are recorded as unrealized gains or losses. The Series recognize a realized gain or loss when the contract is closed or expires.
Futures transactions involve minimal counterparty risk since futures contracts are guaranteed against default by the exchange on which they trade. The Series’ futures contracts are not subject to master netting arrangements (the right to close out all transactions traded with a counterparty, and net amounts owed or due across transactions).
Option Contracts
The Series may write (sell) or buy call or put options on securities and other financial instruments. When the Series writes a call, the Series gives the purchaser the right to buy the underlying security from the Series at the price specified in the option contract (the “exercise price”) at any time during the option period. When the Series writes a put option, the Series gives the purchaser the right to sell to the Series the underlying security at the exercise price at any time during the option period. The Series will only write options on a “covered basis.” This means that the Series will own the underlying security when the Series writes a call or the Series will put aside cash, U.S. Government securities, or other liquid assets in an amount not less than the exercise price at all times the put option is outstanding.
23
Unconstrained Bond Series
Notes to Financial Statements (continued)
| 2. | Significant Accounting Policies (continued) |
Option Contracts (continued)
When the Series writes an option, an amount equal to the premium received is reflected as a liability and is subsequently marked-to-market to reflect the current market value of the option. The Series, as a writer of an option, has no control over whether the underlying security or financial instrument may be sold (call) or purchased (put) and, as a result, bears the market risk of an unfavorable change in the price of the security or financial instrument underlying the written option. There is a risk that the Series may not be able to enter into a closing transaction because of an illiquid market.
The Series may also purchase options in an attempt to hedge against fluctuations in the value of its portfolio and to protect against declines in the value of the securities. The premium paid by the Series for the purchase of an option is reflected as an investment and subsequently marked-to-market to reflect the current market value of the option. The risk associated with purchasing options is limited to the premium paid.
When a security is purchased or sold through an exercise of an option, the related premium paid (or received) is added to (or deducted from) the basis of the security acquired or deducted from (or added to) the proceeds of the security sold. When an option expires (or the Series enters into a closing transaction), the Series realizes a gain or loss on the option to the extent of the premium received or paid (or gain or loss to the extent the cost of the closing transaction exceeds the premium paid or received).
The measurement of the risks associated with option contracts is meaningful only when all related and offsetting transactions are considered. No such investments were held by the Series on December 31, 2021.
The following table presents the present value of derivatives held at December 31, 2021 as reflected on the Statement of Assets and Liabilities, and the effect of derivative instruments on the Statement of Operations:
| STATEMENT OF ASSETS AND LIABILITIES | ||||
| Derivative | Assets Location | |||
| Interest rate contracts | Net unrealized appreciation1 | $ | 1,094,867 | |
| Derivative | Liabilities Location | |||
| Credit contracts | Net unrealized depreciation1 | $ | (28,642) | |
| Interest rate contracts | Net unrealized depreciation1 | $ | (4,036,774) | |
| STATEMENT OF OPERATIONS | ||||
| Realized Gain | ||||
| (Loss) on | ||||
| Derivative | Location of Gain or (Loss) on Derivatives | Derivatives | ||
| Foreign currency exchange contracts | Net realized gain (loss) on investments2 | $ | (390,462) | |
| Foreign currency exchange contracts | Net realized gain (loss) on futures contracts | $ | 375,057 | |
| Interest rate contracts | Net realized gain (loss) on futures contracts | $ | 1,183,502 | |
| Unrealized | ||||
| Appreciation | ||||
| Location of Appreciation (Depreciation) on | (Depreciation) | |||
| Derivative | Derivatives | on Derivatives | ||
| Net change in unrealized appreciation (depreciation) | ||||
| Credit contracts | on futures contracts | $ | (28,642) | |
| Net change in unrealized appreciation (depreciation) | ||||
| Interest rate contracts | on futures contracts | $ | (3,185,484) | |
1Includes cumulative appreciation/depreciation on futures contracts as reported in the Investment Portfolio, and is included within Net Assets as the components of capital are not required to be presented separately on the Statement of Assets and Liabilities. Only the current day’s variation margin is reported within the Statement of Assets and Liabilities.
2Options purchased are included in net realized gain (loss) on investments.
24
Unconstrained Bond Series
Notes to Financial Statements (continued)
| 2. | Significant Accounting Policies (continued) |
Option Contracts (continued)
The average month-end balances for the year ended December 31, 2021 were as follows:
| Futures Contracts: | |
| Average number of contracts purchased1 | 2,622 |
| Average number of contracts sold | 1,843 |
| Average notional value of contracts purchased1 | $591,327,453 |
| Average notional value of contracts sold | $396,360,548 |
| Options: | |
| Average number of option contracts purchased1 | 890 |
| Average notional value of option contracts purchased1 | $1,122,878,646 |
1Average notional calculations were performed utilizing the period held rather than 12 months.
Asset-Backed Securities
The Series may invest in asset-backed securities. Asset-backed securities are generally issued as pass-through certificates or as debt instruments. Asset-backed securities issued as pass-through certificates represent undivided fractional ownership interests in an underlying pool of assets. Asset-backed securities issued as debt instruments, which are also known as collateralized obligations, are typically issued as the debt of a special purpose entity organized solely for the purpose of owning such assets and issuing such debt. Asset-backed securities are often backed by a pool of assets representing the obligations of a number of different parties. The yield characteristics of certain asset-backed securities may differ from traditional debt securities. One such major difference is that all or a principal part of the obligations may be prepaid at any time because the underlying assets (i.e. loans) may be prepaid at any time. As a result, a decrease in interest rates in the market may result in increases in the level of prepayments as borrowers, particularly mortgagors, refinance and repay their loans. An increased prepayment rate with respect to an asset-backed security will have the effect of shortening the maturity of the security. In addition, the Series may subsequently have to reinvest the proceeds at lower interest rates. If the Series has purchased such an asset-backed security at a premium, a faster than anticipated prepayment rate could result in a loss of principal to the extent of the premium paid.
Mortgage-Backed Securities
The Series may invest in mortgage-backed securities (“MBS” or pass-through certificates) that represent an interest in a pool of specific underlying mortgage loans and entitle the Series to the periodic payments of principal and interest from those mortgages. MBS may be issued by government agencies or corporations, or private issuers. Most MBS issued by government agencies are guaranteed; however, the degree of protection differs based on the issuer. For MBS there are a number of important differences among the agencies and instrumentalities of the U.S. Government that issue mortgage-related securities and among the securities that they issue. For example, mortgage-related securities guaranteed by Ginnie Mae are guaranteed as to the timely payment of principal and interest by Ginnie Mae and such guarantee is backed by the full faith and credit of the United States. However, mortgage-related securities issued by Freddie Mac and Fannie Mae, including Freddie Mac and Fannie Mae guaranteed mortgage pass-through certificates, which are solely the obligations of Freddie Mac and Fannie Mae, are not backed by or entitled to the full faith and credit of the United States, but are supported by the right of the issuer to borrow from the U.S. Treasury. Non-agency mortgage-backed securities are securities issued by non-governmental issuers and have no direct or indirect government guarantees of payment and are subject to various risks. Non-agency mortgage loans are obligations of the borrowers thereunder only and are not typically insured or guaranteed by any other person or entity. The ability of a borrower to repay a loan is dependent upon the income or assets of the borrower. A number of factors, including a general economic downturn, acts of God, terrorism, social unrest and civil disturbances, may impair a borrower’s ability to repay its loans.
Inflation-Indexed Bonds
The Series may invest in inflation-indexed bonds. Inflation-indexed bonds are fixed income securities whose principal value is periodically adjusted according to the rate of inflation. If the index measuring inflation rises or falls, the principal value of inflation-indexed bonds will be adjusted upward or downward, and consequently the interest payable on these securities (calculated with
25
Unconstrained Bond Series
Notes to Financial Statements (continued)
| 2. | Significant Accounting Policies (continued) |
Inflation-Indexed Bonds (continued)
respect to a larger or smaller principal amount) will be increased or reduced, respectively. Any upward or downward adjustment in the principal amount of an inflation-indexed bond will be included as interest income in the Statement of Operations, even though investors do not receive their principal until maturity. Repayment of the original bond principal upon maturity (as adjusted for inflation) is guaranteed in the case of U.S. Treasury inflation-indexed bonds. For bonds that do not provide a similar guarantee, the adjusted principal value of the bond repaid at maturity may be less than the original principal.
Securities Purchased on a When-Issued Basis or Forward Commitment
The Series may purchase securities on a when-issued basis or forward commitment. These transactions involve a commitment by the Series to purchase securities for a predetermined price with payment and delivery taking place beyond the customary settlement period. When such purchases are outstanding, the Series will designate liquid assets in an amount sufficient to meet the purchase price. When purchasing a security on a delayed delivery basis, the Series assumes the rights and risks of ownership of the security, including the risk of price and yield fluctuations, and takes such fluctuations into account when determining its net asset value. The Series may sell the when-issued securities before they are delivered, which may result in a capital gain or loss. No such investments were held by the Series on December 31, 2021.
In connection with its ability to purchase or sell securities on a forward commitment basis, the Series may enter into forward roll transactions principally using To Be Announced (TBA) securities. Forward roll transactions require the sale of securities for delivery in the current month, and a simultaneous agreement to repurchase substantially similar (same type, coupon and maturity) securities on a specified future date. Risks of entering into forward roll transactions include the potential inability of the counterparty to meet the terms of the agreement; the potential of the Series to receive inferior securities at redelivery as compared to the securities sold to the counterparty; counterparty credit risk; and the potential pay down speed variance between the mortgage-backed pools. During the roll period, the Series forgoes principal and interest paid on the securities. The Series accounts for such dollar rolls as purchases and sales. Information regarding securities purchased on a when-issued basis is included in the Series’ Investment Portfolio. No such investments were held by the Series on December 31, 2021.
Restricted Securities
Restricted securities are purchased in private placement transactions, are not registered under the Securities Act of 1933, as amended, and may have contractual restrictions on resale. Information regarding restricted securities is included at the end of the Series’ Investment Portfolio.
Federal Taxes
The Series’ policy is to comply with the provisions of the Internal Revenue Code applicable to regulated investment companies. The Series is not subject to federal income tax or excise tax to the extent that the Series distributes to shareholders each year its taxable income, including any net realized gains on investments, in accordance with requirements of the Internal Revenue Code. Accordingly, no provision for federal income tax or excise tax has been made in the financial statements.
Management evaluates its tax positions to determine if the tax positions taken meet the minimum recognition threshold in connection with accounting for uncertainties in income tax positions taken or expected to be taken for the purposes of measuring and recognizing tax liabilities in the financial statements. Recognition of tax benefits of an uncertain tax position is required only when the position is “more likely than not” to be sustained assuming examination by taxing authorities. At December 31, 2021, the Series has recorded no liability for net unrecognized tax benefits relating to uncertain income tax positions taken or expected to be taken in future tax returns.
The Series files income tax returns in the U.S. federal jurisdiction, various states and foreign jurisdictions, as required. No income tax returns are currently under investigation. The statute of limitations on the Series’ tax returns remains open for the years ended December 31, 2018 through December 31, 2021. The Series is not aware of any tax positions for which it is reasonably possible that the total amounts of unrecognized tax benefits will significantly change in the next twelve months.
26
Unconstrained Bond Series
Notes to Financial Statements (continued)
| 2. | Significant Accounting Policies (continued) |
Foreign Taxes
Based on the Series’ understanding of the tax rules and rates related to income, gains and currency purchase/repatriation transactions for foreign jurisdictions in which it invests, the Series will provide for foreign taxes, and where appropriate, deferred foreign tax.
Distributions of Income and Gains
Distributions to shareholders of net investment income are made quarterly. Distributions of net realized gains are made annually. An additional distribution may be necessary to avoid taxation of the Series. Distributions are recorded on the ex-dividend date.
Indemnifications
The Fund’s organizational documents provide former and current directors and officers with a limited indemnification against liabilities arising in connection with the performance of their duties to the Fund. In the normal course of business, the Fund may also enter into contracts that provide general indemnifications. The Fund’s maximum exposure under these arrangements is unknown as this would be dependent on future claims that may be made against the Fund. The risk of material loss from such claims is considered remote.
Other
The preparation of financial statements in conformity with GAAP requires management to make estimates and assumptions that affect the reported amounts of assets and liabilities and the disclosure of contingent assets and liabilities at the date of the financial statements and the reported amounts of income and expenses during the reporting period. Actual results could differ from those estimates.
| 3. | Transactions with Affiliates |
The Fund has an Investment Advisory Agreement (the “Agreement”) with the Advisor, for which the Series pays a fee, computed daily and payable monthly, at an annual rate of 0.30% of the Series’ average daily net assets.
Under the Agreement, personnel of the Advisor provide the Series with advice and assistance in the choice of investments and the execution of securities transactions, and otherwise maintain the Series’ organization. The Advisor also provides the Fund with necessary office space and fund administration and support services. The salaries of all officers of the Fund (except a percentage of the Fund’s Chief Compliance Officer’s salary, which is paid by the Fund), and of all Directors who are “affiliated persons” of the Fund, or of the Advisor, and all personnel of the Fund, or of the Advisor, performing services relating to research, statistical and investment activities, are paid by the Advisor. Each “non-affiliated” Director receives an annual stipend, which is allocated among all the active series of the Fund. In addition, these Directors also receive a fee per Board meeting attended plus a fee for each committee meeting attended and are reimbursed for travel and other out-of-pocket expenses incurred by them in connection with attending such meetings. The Fund also has an Audit Committee Chair, Governance & Nominating Committee Chair and Lead Independent Director, who each receive an additional annual stipend for these roles.
The Fund may enter into agreements with financial intermediaries pursuant to which the Fund may pay financial intermediaries for non-distribution related sub-transfer agency, administrative, sub-accounting, and other shareholder services in an annual amount not to exceed 0.15% of the average daily net assets of the Class I and Class S shares of the Series. Payments made pursuant to such agreements are generally based on the current assets and/or number of accounts of the Series attributable to the financial intermediary. Any payments made pursuant to such agreements may be in addition to, rather than in lieu of, any Distribution and Shareholder Services Fee payable under the Rule 12b-1 plan of the Fund. For the year ended December 31, 2021, the sub-transfer agency expenses incurred by Class S and Class I were $21,131 and $32,926, respectively.
Manning & Napier Investor Services, Inc., a registered broker-dealer affiliate of the Advisor, acts as distributor for the Fund’s shares. The Series compensates the distributor for distributing and servicing the Series’ Class S shares pursuant to a distribution plan adopted under Rule 12b-1 of the 1940 Act, regardless of expenses actually incurred. Under the agreement, the Series pays distribution and service fees to the distributor at an annual rate of 0.25% of average daily net assets attributable to Class S shares. There are no distribution and service fees on the Class I, Class W or Class Z shares. The fees are accrued daily and paid monthly.
27
Unconstrained Bond Series
Notes to Financial Statements (continued)
| 3. | Transactions with Affiliates (continued) |
Pursuant to a master services agreement dated February 13, 2020, as amended, the Fund pays the Advisor an annual fee related to fund accounting and administration of 0.0085% on the first $25 billion of average daily net assets; 0.0075% on the next $15 billion of average daily net assets; and 0.0065% of average daily net assets in excess of $40 billion; plus a base fee of $30,400 per series. Additionally, certain transaction and out-of-pocket expenses, including charges for reporting relating to the Fund’s compliance program, are charged. The Advisor has agreements with BNY Mellon Investment Servicing (U.S.) Inc. (“BNY”) under which BNY serves as sub-accountant services agent.
Pursuant to an advisory fee waiver agreement, the Advisor has contractually agreed to waive the management fee for the Class W shares. The full management fee will be waived under this agreement because Class W shares are only available to discretionary investment accounts and other accounts managed by the Advisor. These clients pay a management fee to the Advisor that is separate from the Fund’s expenses. In addition, pursuant to a separate expense limitation agreement, the Advisor has contractually agreed to limit its fees and reimburse expenses to the extent necessary so that the total direct annual fund operating expenses, exclusive of the shareholder services fee and/or distribution and service (12b-1) fees and waived Class W management fees (collectively, “excluded expenses”), do not exceed 0.50% of the average daily net assets of the Class S and Class I shares, 0.05% of the average daily net assets of the Class W shares, and 0.35% of the average daily net assets of the Class Z shares. These contractual waivers are expected to continue indefinitely, and may not be amended or terminated by the Advisor without the approval of the Series’ Board of Directors. The Advisor may receive from a Class the difference between the Class’s total direct annual fund operating expenses, not including excluded expenses, and the Class’s contractual expense limit to recoup all or a portion of its prior fee waivers (other than Class W management fee waivers) or expense reimbursements made during the rolling three-year period preceding the recoupment if at any point the total direct annual fund operating expenses, not including excluded expenses, are below the contractual expense limit (a) at the time of the fee waiver and/or expense reimbursement and (b) at the time of the recoupment.
Pursuant to the advisory fee waiver, the Advisor waived $1,970,242 in management fees for Class W for the year ended December 31, 2021. In addition, pursuant to the separate expense limitation agreement, the Advisor waived or reimbursed expenses of $147,021 for Class W shares for the year ended December 31, 2021. These amounts are included as a reduction of expenses on the Statement of Operations.
As of December 31, 2021, the class specific waivers or reimbursements subject to possible future recoupment under the expense limitation agreement are as follows:
| CLASS | EXPIRING DECEMBER 31, | |||||||||||||||
| 2022 | 2023 | 2024 | TOTAL | |||||||||||||
| Class W | $ | 84,567 | $ | 147,864 | $ | 147,021 | $ | 379,452 | ||||||||
For the year ended December 31, 2021, the Advisor did not recoup any expenses that have been previously waived or reimbursed.
| 4. | Purchases and Sales of Securities |
For the year ended December 31, 2021, purchases and sales of securities, other than U.S. Government securities and short-term securities, were $510,295,210 and $417,332,629, respectively. Purchases and sales of U.S. Government securities, other than short-term securities, were $42,754,859 and $40,112,613, respectively.
28
Unconstrained Bond Series
Notes to Financial Statements (continued)
| 5. | Capital Stock Transactions |
Transactions in Class S, Class I, and Class W shares of Unconstrained Bond Series were:
| CLASS S | FOR THE YEAR ENDED 12/31/21 | FOR THE YEAR ENDED 12/31/20 | ||||||||||||||
| SHARES | AMOUNT | SHARES | AMOUNT | |||||||||||||
| Sold | 884,856 | $ | 9,734,861 | 813,870 | $ | 8,534,928 | ||||||||||
| Reinvested | 80,186 | 858,877 | 45,323 | 481,149 | ||||||||||||
| Repurchased | (1,203,389 | ) | (13,288,062 | ) | (1,136,891 | ) | (11,884,364 | ) | ||||||||
| Total | (238,347 | ) | $ | (2,694,324 | ) | (277,698 | ) | $ | (2,868,287 | ) | ||||||
| CLASS I | FOR THE YEAR ENDED 12/31/21 | FOR THE YEAR ENDED 12/31/20 | ||||||||||||||
| SHARES | AMOUNT | SHARES | AMOUNT | |||||||||||||
| Sold | 4,537,446 | $ | 43,948,757 | 844,626 | $ | 7,997,823 | ||||||||||
| Reinvested | 161,691 | 1,513,399 | 43,160 | 405,892 | ||||||||||||
| Repurchased | (3,002,075 | ) | (29,035,743 | ) | (697,988 | ) | (6,374,607 | ) | ||||||||
| Total | 1,697,062 | $ | 16,426,413 | 189,798 | $ | 2,029,108 | ||||||||||
| CLASS W | FOR THE YEAR ENDED 12/31/21 | FOR THE YEAR ENDED 12/31/20 | ||||||||||||||
| SHARES | AMOUNT | SHARES | AMOUNT | |||||||||||||
| Sold | 5,873,439 | $ | 64,391,385 | 3,946,934 | $ | 41,573,248 | ||||||||||
| Reinvested | 3,676,779 | 39,259,780 | 1,940,080 | 20,442,493 | ||||||||||||
| Repurchased | (3,770,657 | ) | (41,297,367 | ) | (30,558,394 | ) | (310,018,353 | ) | ||||||||
| Total | 5,779,561 | $ | 62,353,798 | (24,671,380 | ) | $ | (248,002,612 | |||||||||
Over 90% of the shares outstanding are fiduciary accounts where the Advisor has sole investment discretion.
| 6. | Line of Credit |
The Fund has entered into a 364-day, $25 million credit agreement (the “line of credit”) with Bank of New York Mellon. Each series of the Fund may borrow under the line of credit for temporary or emergency purposes, including funding shareholder redemptions and other short-term liquidity purposes. The Fund pays an annual fee on the unused commitment amount, payable quarterly, and is allocated among all the series of the Fund and included in miscellaneous expenses in the Statement of Operations for each series. The line of credit expires in September 2022 unless extended or renewed. During the year ended December 31, 2021, the Series did not borrow under the line of credit.
| 7. | Financial Instruments and Loan Assignments |
The Series may trade in instruments including written and purchased options, forward foreign currency exchange contracts and futures contracts and other derivatives in the normal course of investing activities to assist in managing exposure to various market risks. The Series may be subject to various elements of risk, which may involve, to a varying degree, elements of risk in excess of the amounts recognized for financial statement purposes. These risks include: the risk that changes in the value of a derivative may not correlate perfectly with the underlying asset, rate or index; counterparty credit risk related to over the counter derivative counterparties’ failure to perform under contract terms; liquidity risk related to the lack of a liquid market for these contracts allowing the fund to close out its position(s); and documentation risk relating to disagreement over contract terms. For the year ended December 31, 2021, the Series invested in futures contracts (credit and interest rate risk) and options purchased (foreign currency exchange risk).
29
Unconstrained Bond Series
Notes to Financial Statements (continued)
| 7. | Financial Instruments and Loan Assignments (continued) |
The Series may invest in a loan assignment of all or a portion of the loans. The Series has direct rights against the borrower on a loan when it purchases an assignment; however, the Series’ rights may be more limited than the lender from which it acquired the assignment and the Series may be able to enforce its rights only through an administrative agent. Loan assignments are vulnerable to market conditions and may become illiquid due to economic conditions or other events may reduce the demand for loan assignments and certain loan assignments which were liquid when purchased may become illiquid.
| 8. | Foreign Securities |
Investing in securities of foreign companies and foreign governments involves special risks and considerations not typically associated with investing in securities of domestic companies and the U.S. Government. These risks include revaluation of currencies and future adverse political and economic developments. Moreover, securities of foreign companies and foreign governments and their markets may be less liquid and their prices more volatile than those of comparable domestic companies and the U.S. Government.
| 9. | Federal Income Tax Information |
The amount and characterization of certain income and capital gains to be distributed are determined in accordance with federal income tax regulations, which may differ from GAAP. These differences are primarily due to differing book and tax treatments in the timing and/or treatment of the recognition of net investment income or gains and losses including foreign currency gains and losses and tax equalization. The Series may periodically make reclassifications among its capital accounts to reflect income and gains available for distribution (or available capital loss carryovers) under income tax regulations, without impacting the Series’ net asset value. For the year ended December 31, 2021, amounts were reclassified within the capital accounts to increase Additional Paid in Capital by $1,426,640 and decrease Total Distributable Earnings (Loss) by $1,426,640. Any such reclassifications are not reflected in the financial highlights.
The tax character of distributions paid were as follows:
| FOR THE YEAR ENDED 12/31/21 | FOR THE YEAR ENDED 12/31/20 | |||||||
| Ordinary income | $ | 37,118,952 | $ | 22,671,377 | ||||
| Long-term capital gains | $ | 6,667,919 | — | |||||
At December 31, 2021, the tax basis of components of distributable earnings and the net unrealized depreciation based on the identified cost for federal income tax purposes were as follows:
| Cost for federal income tax purposes | $ | 722,314,055 | ||||||
| Unrealized appreciation | 14,650,534 | |||||||
| Unrealized depreciation | (16,629,351 | ) | ||||||
| Net unrealized depreciation | $ | (1,978,817 | ) | |||||
| Post October long-term deferred losses | $ | 1,310,055 |
| 10. | Market Event |
In March 2020, the World Health Organization declared COVID-19 (a novel coronavirus) to be a pandemic. The situation is dynamic and a recent resurgence of COVID-19 has caused a continued time of uncertainty. Global financial markets have experienced and may continue to experience significant volatility resulting from the spread of COVID-19. The global economy, the economies of certain nations and individual issuers have been and may continue to be adversely affected by COVID-19, particularly in light of the interconnectivity between economies and financial markets, all of which may negatively impact the Series’ performance. Management of the Series will continue to monitor the impact of COVID-19 on investment performance, financial statements and the Series’ operations.
30
Unconstrained Bond Series
Report of Independent Registered Public Accounting Firm
To the Board of Directors of Manning & Napier Fund, Inc. and Shareholders of Unconstrained Bond Series
Opinion on the Financial Statements
We have audited the accompanying statement of assets and liabilities, including the investment portfolio, of Unconstrained Bond Series (one of the series constituting Manning & Napier Fund, Inc., referred to hereafter as the “Fund”) as of December 31, 2021, the related statement of operations for the year ended December 31, 2021, the statement of changes in net assets for each of the two years in the period ended December 31, 2021, including the related notes, and the financial highlights for each of the periods indicated therein (collectively referred to as the “financial statements”). In our opinion, the financial statements present fairly, in all material respects, the financial position of the Fund as of December 31, 2021, the results of its operations for the year then ended, the changes in its net assets for each of the two years in the period ended December 31, 2021 and the financial highlights for each of the periods indicated therein in conformity with accounting principles generally accepted in the United States of America.
Basis for Opinion
These financial statements are the responsibility of the Fund’s management. Our responsibility is to express an opinion on the Fund’s financial statements based on our audits. We are a public accounting firm registered with the Public Company Accounting Oversight Board (United States) (PCAOB) and are required to be independent with respect to the Fund in accordance with the U.S. federal securities laws and the applicable rules and regulations of the Securities and Exchange Commission and the PCAOB.
We conducted our audits of these financial statements in accordance with the standards of the PCAOB. Those standards require that we plan and perform the audit to obtain reasonable assurance about whether the financial statements are free of material misstatement, whether due to error or fraud.
Our audits included performing procedures to assess the risks of material misstatement of the financial statements, whether due to error or fraud, and performing procedures that respond to those risks. Such procedures included examining, on a test basis, evidence regarding the amounts and disclosures in the financial statements. Our audits also included evaluating the accounting principles used and significant estimates made by management, as well as evaluating the overall presentation of the financial statements. Our procedures included confirmation of securities owned as of December 31, 2021 by correspondence with the custodian, brokers, agent banks and issuers of privately offered securities; when replies were not received from brokers, we performed other auditing procedures. We believe that our audits provide a reasonable basis for our opinion.

New York, New York
February 18, 2022
We have served as the auditor of one or more investment companies in Manning & Napier Mutual Funds since 1992.
31
Unconstrained Bond Series
Supplemental Tax Information
(unaudited)
All reportings are based on financial information available as of the date of this annual report and, accordingly, are subject to change.
The Series designates $7,857,318 as Long-Term Capital Gain dividends pursuant to Section 852(b)(3) of the Internal Revenue Code for the fiscal year ended December 31, 2021.
32
Unconstrained Bond Series
Directors’ and Officers’ Information
(unaudited)
The Statement of Additional Information provides additional information about the Fund’s directors and officers and can be obtained without charge by calling 1-800-466-3863, at www.manning-napier.com, or on the EDGAR Database on the SEC Internet web site (http://www.sec.gov). The following chart shows certain information about the Fund’s directors and officers, including their principal occupations during the last five years. Unless specific dates are provided, the individuals have held the listed positions for longer than five years.
Interested Director and Officer
| Name: | Paul Battaglia* |
| Address: | 290 Woodcliff Drive |
| Fairport, NY 14450 | |
| Age: | 43 |
| Current Position(s) Held with Fund: | Principal Executive Officer, President, Chairman and Director |
| Term of Office1 & Length of Time Served: | Indefinite – Chairman and Director since November 2018 |
| Principal Occupation(s) During Past 5 Years: | Chief Financial Officer since 2018; Vice President of Finance (2016 – 2018); |
| Director of Finance (2011 – 2016); Financial Analyst/Internal Auditor (2004- | |
| 2006) – Manning & Napier Advisors, LLC and affiliates | |
| Holds one or more of the following titles for various subsidiaries and | |
| affiliates: Chief Financial Officer | |
| Number of Portfolios Overseen within Fund Complex: | 15 |
| Other Directorships Held Outside Fund Complex During Past 5 Years: | N/A |
Independent Directors
| Name: | Stephen B. Ashley |
| Address: | 290 Woodcliff Drive |
| Fairport, NY 14450 | |
| Age: | 81 |
| Current Position(s) Held with Fund: | Director, Audit Committee Member, Governance & Nominating Committee |
| Member | |
| Term of Office & Length of Time Served: | Indefinite – Since 1996 |
| Principal Occupation(s) During Past 5 Years: | Chairman and Director since 1997; Chief Executive Officer (1997-2019) - |
| Ashley Companies (property management and investment) | |
| Number of Portfolios Overseen within Fund Complex: | 15 |
| Other Directorships Held Outside Fund Complex During Past 5 Years: | Ashley Companies since 1997 |
| Name: | Paul A. Brooke |
| Address: | 290 Woodcliff Drive |
| Fairport, NY 14450 | |
| Age: | 76 |
| Current Position(s) Held with Fund: | Lead Independent Director, Audit Committee Member, Governance & |
| Nominating Committee Member | |
| Term of Office & Length of Time Served: | Indefinite – Director, Audit Committee Member, Governance & Nominating |
| Committee Member since 2007; Lead Independent Director since 2017 | |
| Principal Occupation(s) During Past 5 Years: | Managing Member since 1991 - PMSV Holdings LLC (investments); |
| Managing Member (2010-2016) - VenBio (investments). | |
| Numer of Portfolios Overseen within Fund Complex: | 15 |
| Other Directorships Held Outside Fund Complex During Past 5 Years: | Incyte Corp. (biotech) (2000-2020); PureEarth (non-profit) since 2012; Cerus |
| (biomedical) since 2016; Caelum BioSciences (biomedical) since 2018; | |
| Cheyne Capital International (investment)(2000-2017); |
33
Unconstrained Bond Series
Directors’ and Officers’ Information
(unaudited)
Independent Directors (continued)
| Name: | John Glazer |
| Address: | 290 Woodcliff Drive |
| Fairport, NY 14450 | |
| Age: | 56 |
| Current Position(s) Held with Fund: | Director, Audit Committee Member, Governance & Nominating Committee |
| Member | |
| Term of Office & Length of Time Served: | Indefinite – Director, Audit Committee Member, Governance & Nominating |
| Committee Member since February 2021 | |
| Principal Occupation(s) During Past 5 Years: | Chief Executive Officer since 2020 – Oikos Holdings LLC (Single-Family |
| Office); Head of Corporate Development (2019-2020) – Caelum Biosciences | |
| (pharmaceutical development); Head of Private Investments (2015-2018) – | |
| AC Limited (Single-Family Office) | |
| Number of Portfolios Overseen within Fund Complex: | 15 |
| Other Directorships Held Outside Fund Complex During Past 5 Years: | N/A |
| Name: | Margaret McLaughlin |
| Address: | 290 Woodcliff Drive |
| Fairport, NY 14450 | |
| Age: | 54 |
| Current Position(s) Held with Fund: | Director, Audit Committee Member, Governance & Nominating Committee |
| Member | |
| Term of Office & Length of Time Served: | Indefinite – Director, Audit Committee Member, Governance & Nominating |
| Committee Member since February 2021 | |
| Principal Occupation(s) During Past 5 Years: | Consultant since 2020 – Bates Group (consultants); Consultant (2019- |
| 2020) – Madison Dearborn Partners (private equity); General Counsel/CCO | |
| (2011-2019) – Kramer Van Kirk Credit Strategies L.P./Mariana Systems LLC | |
| (Investment Adviser/SaaS Technology) | |
| Number of Portfolios Overseen within Fund Complex: | 15 |
| Other Directorships Held Outside Fund Complex During Past 5 Years: | N/A |
| Name: | Russell O. Vernon |
| Address: | 290 Woodcliff Drive |
| Fairport, NY 14450 | |
| Age: | 64 |
| Current Position(s) Held with Fund: | Director, Audit Committee Member, Governance & Nominating Committee |
| Chairman | |
| Term of Office & Length of Time Served: | Indefinite – Director, Audit Committee Member, Governance & Nominating |
| Committee Member since April 2020; Governance & Nominating Committee | |
| Chairman since November 2020 | |
| Principal Occupation(s) During Past 5 Years: | Founder and General Partner (2009-2019) – BVM Capital Management |
| (economic development) | |
| Number of Portfolios Overseen within Fund Complex: | 15 |
| Other Directorships Held Outside Fund Complex During Past 5 Years: | Board Member, Vice Chairman and President since 2010 – Newburgh |
| Armory Unity Center (military); Board Member and Executive Director since | |
| 2020 – National Purple Heart Honor Mission, Inc. (military); Board Member, | |
| Vice Chairman (2015-2020) – National Purple Heart Hall of Honor, Inc. | |
| (military) |
34
Unconstrained Bond Series
Directors’ and Officers’ Information
(unaudited)
Independent Directors (continued)
| Name: | Chester N. Watson |
| Address: | 290 Woodcliff Drive |
| Fairport, NY 14450 | |
| Age: | 71 |
| Current Position(s) Held with Fund: | Director, Audit Committee Chairman, Governance & Nominating Committee |
| Member | |
| Term of Office & Length of Time Served: | Indefinite – Director, Audit Committee Member, Governance & Nominating |
| Committee Member Since 2012; Audit Committee Chairman since 2013 | |
| Principal Occupation(s) During Past 5 Years: | General Auditor (2003-2011) - General Motors Company (auto |
| manufacturer) | |
| Number of Portfolios Overseen within Fund Complex: | 15 |
| Other Directorships Held Outside Fund Complex During Past 5 Years: | Rochester Institute of Technology (University) since 2005; Hudson Valley |
| Center for Innovation, Inc. (New Business and Economic Development) | |
| since 2019; Town of Greenburgh, NY Planning Board (Municipal | |
| Government) (2015-2019); |
Officers:
| Name: | Elizabeth Craig |
| Address: | 290 Woodcliff Drive |
| Fairport, NY 14450 | |
| Age: | 34 |
| Current Position(s) Held with Fund: | Corporate Secretary |
| Term of Office1 & Length of Time Served: | Since 2016 |
| Principal Occupation(s) During Past 5 Years: | Director of Fund Administration since 2021; Fund Regulatory Administration |
| Manager (2018-2021); Fund Administration Manager (2015-2018); Mutual | |
| Fund Compliance Specialist (2009-2015) - Manning & Napier Advisors, | |
| LLC; Assistant Corporate Secretary (2011-2016) - Manning & Napier Fund, | |
| Inc.; Corporate Secretary, Director since 2019– Manning & Napier Investor | |
| Services, Inc. |
| Name: | Samantha Larew |
| Address: | 290 Woodcliff Drive |
| Fairport, NY 14450 | |
| Age: | 41 |
| Current Position(s) Held with Fund: | Chief Compliance Officer and Anti-Money Laundering Compliance Officer |
| Term of Office1 & Length of Time Served: | Chief Compliance Officer since 2019; Anti-Money Laundering Compliance |
| Officer since 2018 | |
| Principal Occupation(s) During Past 5 Years: | Co-Director of Compliance since 2018; Compliance Communications |
| Supervisor (2014-2018); Compliance Supervisor (2013-2014); Broker- | |
| Dealer Compliance Supervisor (2011-2013); Broker-Dealer Compliance | |
| Analyst (2010-2011) - Manning & Napier Advisors, LLC& Affiliates; Broker- | |
| Dealer Chief Compliance Officer since 2013; Broker-Dealer Assistant | |
| Corporate Secretary since 2011 – Manning & Napier Investor Services, Inc.; | |
| Compliance Analyst (2007-2009) – Wall Street Financial Group; Compliance | |
| Specialist (2003-2007) – Manning & Napier Advisors, LLC & Affiliates |
| Name: | Scott Morabito |
| Address: | 290 Woodcliff Drive |
| Fairport, NY 14450 | |
| Age: | 34 |
| Current Position(s) Held with Fund: | Vice President |
| Term of Office1 & Length of Time Served: | Vice President since 2019; Assistant Vice President (2017-2019) |
| Principal Occupation(s) During Past 5 Years: | Managing Director, Client Service and Business Operations since 2021; |
| Managing Director of Operations (2019-2021); Director of Funds Group | |
| (2017-2019); Fund Product and Strategy Manager (2014-2017); Senior | |
| Product and Strategy Analyst (2013-2014); Product and Strategy Analyst | |
| (2011-2013) - Manning & Napier Advisors, LLC; President, Director since | |
| 2018 – Manning & Napier Investor Services, Inc.; President, Exeter Trust | |
| Company since 2021; |
35
Unconstrained Bond Series
Directors’ and Officers’ Information
(unaudited)
Officers: (continued)
| Name: | Troy Statczar |
| Address: | 290 Woodcliff Drive |
| Fairport, NY 14450 | |
| Age: | 50 |
| Current Position(s) Held with Fund: | Principal Financial Officer, Treasurer |
| Term of Office1 & Length of Time Served: | Principal Financial Officer and Treasurer since 2020 |
| Principal Occupation(s) During Past 5 Years: | Senior Director, Foreside Treasurer Services since 2020 - Foreside Financial |
| Group; Director of Fund Administration (2017-2019) - Thornburg Investment | |
| Management, Inc.; Director of U.S. Operations (2008-2017) - Henderson | |
| Global Investors N.A., Inc. |
| Name: | Sarah Turner |
| Address: | 290 Woodcliff Drive |
| Fairport, NY 14450 | |
| Age: | 39 |
| Current Position(s) Held with Fund: | Chief Legal Officer; Assistant Corporate Secretary |
| Term of Office1 & Length of Time Served: | Since 2018 |
| Principal Occupation(s) During Past 5 Years: | General Counsel since 2018 - Manning & Napier Advisors, LLC and |
| affiliates; Counsel (2017-2018) – Harter Secrest and Emery LLP; Legal/ | |
| Senior Counsel (2010-2017) – Manning & Napier Advisors, LLC and | |
| affiliates | |
| Holds one or more of the following titles for various affiliates: General | |
| Counsel |
*Interested Director, within the meaning of the 1940 Act by reason of his positions with the Fund’s Advisor, Manning & Napier Advisors, LLC, and Distributor, Manning & Napier Investor Services, Inc.
1The term of office of all officers shall be one year and until their respective successors are chosen and qualified, or his or her earlier resignation or removal as provided in the Fund’s By-Laws.
36
{This page intentionally left blank}
37
Unconstrained Bond Series
Literature Requests
(unaudited)
Proxy Voting Policies and Procedures
A description of the policies and procedures that the Fund uses to determine how to vote proxies relating to portfolio securities is available, without charge, upon request:
| By phone | 1-800-466-3863 |
| On the Securities and Exchange Commission’s (SEC) web site | http://www.sec.gov |
Proxy Voting Record
Information regarding how the Fund voted proxies relating to portfolio securities during the most recent 12-month period ended June 30th is available, without charge, upon request:
| By phone | 1-800-466-3863 |
| On the SEC’s web site | http://www.sec.gov |
Quarterly Portfolio Holdings
The Series’ complete schedule of portfolio holdings for the 1st and 3rd quarters of each fiscal year are provided on Form N-PORT, and are available, without charge, upon request:
| By phone | 1-800-466-3863 |
| On the SEC’s web site | http://www.sec.gov |
Prospectus and Statement of Additional Information (SAI)
For more information about any of the Manning & Napier Fund, Inc. Series, you may obtain a prospectus and SAI at www.manning-napier.com or by calling 1-(800) 466-3863. Before investing, carefully consider the objectives, risks, charges and expenses of the investment and read the prospectus carefully as it contains this and other information about the investment company. In addition, this information can be found on the SEC’s web site, http://www.sec.gov.
Additional information available at www.manning-napier.com
1. Fund Holdings - Month-End
2. Fund Holdings - Quarter-End
3. Shareholder Report - Annual
4. Shareholder Report - Semi-Annual
The Fund also offers electronic notification or “e-delivery” when certain documents are available on-line to be downloaded or reviewed. Direct shareholders can elect to receive electronic notification when shareholder reports, prospectus updates, and/or statements are available. If you do not currently have on-line access to your account, you can establish access by going to www.manning-napier.com, click on “Login” in the top corner of the page, and follow the prompts to self-enroll. Once enrolled, you can set your electronic notification preferences by clicking on the Account Options tab located within the green toolbar and then select E-Delivery Option. Should you have any questions on either how to establish on-line access or how to update your account settings, please contact Investor Services at 1-800-466-3863.
The Manning & Napier Fund, Inc. is managed by Manning & Napier Advisors, LLC. Manning & Napier Investor Services, Inc., an affiliate of Manning & Napier Advisors, LLC, is the distributor of the Fund shares.
MNCPB-12/21-AR
38
| (b) | Not applicable. |
| ITEM 2: | CODE OF ETHICS |
| (a) | The registrant has adopted a code of ethics that applies to its principal executive officer, principal financial officer and principal accounting officer. A copy of the registrant's code of ethics is filed herewith as Exhibit 13(a)(1). |
| (b) | During the period covered by this report, no amendments were made to the provisions of the code of ethics adopted in 2(a) above. |
| (c) | During the period covered by this report, no implicit or explicit waivers to the provisions of the code of ethics adopted in 2(a) above were granted. |
| (d) | Not applicable to the registrant due to the response given in 2(c) above. |
| ITEM 3: | AUDIT COMMITTEE FINANCIAL EXPERT |
All of the members of the Audit committee have been determined by the Registrant's Board of Directors to be Audit Committee Financial Experts as defined in this item. The current members of the Audit Committee are: Stephen B. Ashley, Paul A. Brooke, John M. Glazer, Margaret McLaughlin, Russell O. Vernon and Chester N. Watson. All Audit Committee members are independent under applicable rules. This designation will not increase the designee's duties, obligations or liability as compared to their duties, obligations and liability as a member of the Audit Committee and of the Board.
| ITEM 4: | Principal Accountant Fees and Services |
- Registrant may incorporate the following information by reference, if this information has been disclosed in the registrant’s definitive proxy statement or definitive information statement. The proxy statement or information statement must be filed no later than 120 days after the end of the fiscal year covered by the Annual Report.
Principal Accountant Fees and Services
Aggregate fees for professional services rendered for the Manning & Napier Fund, Inc. Core Bond Series, Credit Series, Diversified Tax Exempt Series, High Yield Bond Series, New York Tax Exempt Series, Real Estate Series and Unconstrained Bond Series (collectively the “Fund”) by PricewaterhouseCoopers LLP (“PwC”) as of and for the years ended December 31, 2021 and 2020 were:
| 2021 | 2020 | |||||||
| Audit Fees (a) | $ | 320,488 | $ | 282,088 | ||||
| Audit Related Fees (b) | $ | 0 | $ | 0 | ||||
| Tax Fees (c) | $ | 104,453 | $ | 109,881 | ||||
| All Other Fees (d) | $ | 0 | $ | 0 | ||||
| $ | 424,941 | $ | 391,970 | |||||
| (a) | Audit Fees |
These fees relate to professional services rendered by PwC for the audit of the Fund’s annual financial statements or services normally provided by the accountant in connection with statutory and regulatory filing or engagements. These services include the audits of the financial statements of the Fund, issuance of consents, income tax provision procedures and assistance with review of documents filed with the SEC.
| (b) | Audit-Related Fees |
These fees relate to assurance and related services by PwC that are reasonably related to the performance of the audit of the Fund’s financial statements and are not reported under “Audit Fees” above.
| (c) | Tax Fees |
These tax services provided by PWC relate to professional services rendered for tax compliance, tax advice, tax planning and shareholder reporting.
| (d) | All Other Fees |
These fees relate to products and services provided by PwC other than those reported above under “Audit Fees,” “Audit-Related Fees,” and “Tax Fees” above.
There were no amounts that were approved by the Audit Committee pursuant to the de minimus exception (Rule 2-01(c)(7) of Regulation S-X) for the fiscal years ended December 31, 2021 and 2020.
Non-Audit Services to the Fund’s Service Affiliates that were Pre-Approved by the Fund’s Audit Committee
The Fund’s Audit Committee is required to pre-approve non-audit services which meet both the following criteria:
| i) | Directly relate to the Fund’s operations and financial reporting; and |
| ii) | Rendered by PwC to the Fund’s advisor, Manning & Napier Advisors, LLC, and entities in a control relationship with the advisor (“service affiliate”) that provides ongoing services to the Fund. For purposes of disclosure, Manning & Napier Investor Services, Inc. is considered to be a service affiliate. |
| 2021 | 2020 | |||||||
| Audit Related Fees | $ | 0 | $ | 115,000 | ||||
| Tax Fees | $ | 0 | $ | 0 | ||||
| $ | 0 | $ | 115,000 | |||||
The Audit Related fees for the year ended December 31, 2020 were for work related to a fund liquidation and merger. There were no such fees for the year ended December 31, 2021.
There were no amounts that were approved by the Audit Committee pursuant to the de minimus exception (Rule 2-01(c)(7) of Regulation S-X) for the fiscal years ended December 31, 2021 and 2020.
Aggregate Fees
Aggregate fees billed to the Fund for non-audit services for 2021 and 2020 were $104,453 and $109,881, respectively. Aggregate fees billed to the Fund’s advisor and service affiliates for non-audit services were $0 and $115,000, respectively. These amounts include fees for non-audit services required to be pre-approved and fees for non-audit services that did not require pre-approval since they did not relate to the Fund’s operations and financial reporting.
The Fund’s Audit Committee has considered whether the provisions for non-audit services to the Fund’s advisor and service affiliates, which did not require pre-approval, are compatible with maintaining PwC’s independence.
| Item 5: | Audit Committee of Listed registrants |
Not applicable.
| Item 6: | Investments |
| (a) | See Investment Portfolios under Item 1 on this Form N-CSR. |
| (b) | Not applicable. |
| Item 7: | Disclosure of Proxy Voting Policies and Procedures for Closed-End Management Investment Companies |
Not applicable.
| Item 8: | Portfolio Managers of Closed-End Management Investment Companies |
Not applicable.
| Item 9: | Purchases of Equity Securities by Closed-End Management Investment Company and Affiliated Purchasers |
Not applicable.
| Item 10: | Submission of Matters to a Vote of Security Holders |
There have been no material changes to the procedure by which shareholders may recommend nominees to the registrant’s board of directors.
| Item 11: | Controls and Procedures |
| (a) | Based on their evaluation of the Funds’ disclosure controls and procedures, as of a date within 90 days of the filing date, the Funds’ Principal Executive Officer and Principal Financial Officer have concluded that the Funds’ disclosure controls and procedures are: (i) reasonably designed to ensure that information required to be disclosed in this report is appropriately communicated to the Funds’ officers to allow timely decisions regarding disclosures required in this report; (ii) reasonably designed to ensure that information required to be disclosed in this report is recorded, processed, summarized and reported in a timely manner; and (iii) are effective in achieving the goals described in (i) and (ii) above. |
| (b) | During the period covered by this report there have been no changes in the Funds’ internal control over financial reporting that the above officers believe to have materially affected, or to be reasonably likely to materially affect, the Funds’ internal control over financial reporting. |
| ITEM 12: | DISCLOSURE OF SECURITIES LENDING ACTIVITIES FOR CLOSED-END MANAGEMENT INVESTMENT COMPANIES |
Not applicable.
| Item 13: | Exhibits |
| (a)(1) | Code of ethics that is subject to the disclosure of Item 2 above. |
| (a)(2) | Separate certifications for the Registrant’s principal executive officer and principal financial officer, as required by Section 302 of the Sarbanes-Oxley Act of 2002 and Rule 30a-2(a) under the Investment Company Act of 1940, are attached as EX-99.CERT. |
| (a)(2)(1) | Not applicable. |
| (a)(2)(2) | Not applicable. |
| (b) | A certification of the Registrant’s principal executive officer and principal financial officer, as required by 18 U.S.C Section 1350, as adopted pursuant to Section 906 of the Sarbanes-Oxley Act of 2002, and Rule 30a-2(b) under the Investment Company Act of 1940, is attached as EX-99.906CERT. The certification furnished pursuant to this paragraph is not deemed to be “filed” for purposes of Section 18 of the Securities Exchange Act of 1934, or otherwise subject to the liability of that section. Such certification is not deemed to be incorporated by reference into any filing under the Securities Act of 1933 or the Securities Exchange Act of 1934, except to the extent that the Registrant specifically incorporates them by reference. |
SIGNATURES
Pursuant to the requirements of the Securities Exchange Act of 1934 and the Investment Company Act of 1940, the registrant has duly caused this report to be signed on its behalf by the undersigned, thereunto duly authorized.
Manning & Napier Fund, Inc.
/s/ Paul J. Battaglia
Paul J. Battaglia
President & Principal Executive Officer of Manning & Napier Fund, Inc.
Date: 2/24/2022
Pursuant to the requirements of the Securities Exchange Act of 1934 and the Investment Company Act of 1940, this report has been signed below by the following persons on behalf of the registrant and in the capacities and on the dates indicated.
Manning & Napier Fund, Inc.
/s/ Paul J. Battaglia
Paul J. Battaglia
President & Principal Executive Officer of Manning & Napier Fund, Inc.
Date: 2/24/2022
/s/ Troy M. Statczar
Troy M. Statczar
Treasurer & Principal Financial Officer of Manning & Napier Fund, Inc.
Date: 2/24/2022