UNITED STATES
SECURITIES AND EXCHANGE COMMISSION
Washington, D.C. 20549
FORM N-CSR
CERTIFIED SHAREHOLDER REPORT OF REGISTERED
MANAGEMENT INVESTMENT COMPANIES
Investment Company Act file number 811-4085
Fidelity Income Fund
(Exact name of registrant as specified in charter)
82 Devonshire St., Boston, Massachusetts 02109
(Address of principal executive offices) (Zip code)
Scott C. Goebel, Secretary
82 Devonshire St.
Boston, Massachusetts 02109
(Name and address of agent for service)
Registrant's telephone number, including area code: 617-563-7000
Date of fiscal year end: | August 31 |
| |
Date of reporting period: | February 29, 2012 |
Item 1. Reports to Stockholders
Fidelity®
Government Income
Fund
Semiannual Report
February 29, 2012
(Fidelity Cover Art)
Contents
Shareholder Expense Example | (Click Here) | An example of shareholder expenses. |
Investment Changes | (Click Here) | A summary of major shifts in the fund's investments over the past six months. |
Investments | (Click Here) | A complete list of the fund's investments with their market values. |
Financial Statements | (Click Here) | Statements of assets and liabilities, operations, and changes in net assets,
as well as financial highlights. |
Notes | (Click Here) | Notes to the financial statements. |
Board Approval of Investment Advisory Contracts and Management Fees | (Click Here) | |
To view a fund's proxy voting guidelines and proxy voting record for the 12-month period ended June 30, visit http://www.fidelity.com/proxyvotingresults or visit the Securities and Exchange Commission's (SEC) web site at http://www.sec.gov. You may also call 1-800-544-8544 to request a free copy of the proxy voting guidelines.
Standard & Poor's, S&P and S&P 500 are registered service marks of The McGraw-Hill Companies, Inc. and have been licensed for use by Fidelity Distributors Corporation.
Other third party marks appearing herein are the property of their respective owners.
All other marks appearing herein are registered or unregistered trademarks or service marks of FMR LLC or an affiliated company.
This report and the financial statements contained herein are submitted for the general information of the shareholders of the fund. This report is not authorized for distribution to prospective investors in the fund unless preceded or accompanied by an effective prospectus.
A fund files its complete schedule of portfolio holdings with the SEC for the first and third quarters of each fiscal year on Form N-Q. Forms N-Q are available on the SEC's web site at http://www.sec.gov. A fund's Forms N-Q may be reviewed and copied at the SEC's Public Reference Room in Washington, DC. Information regarding the operation of the SEC's Public Reference Room may be obtained by calling 1-800-SEC-0330. For a complete list of a fund's portfolio holdings, view the most recent holdings listing, semiannual report, or annual report on Fidelity's web site at http://www.fidelity.com, http://www.advisor.fidelity.com, or http://www.401k.com, as applicable.
NOT FDIC INSURED • MAY LOSE VALUE • NO BANK GUARANTEE
Neither the fund nor Fidelity Distributors Corporation is a bank.
Semiannual Report
Shareholder Expense Example
As a shareholder of the Fund, you incur two types of costs: (1) transaction costs, including sales charges (loads) on purchase payments or redemption proceeds, and (2) ongoing costs, including management fees, distribution and/or service (12b-1) fees and other Fund expenses. This Example is intended to help you understand your ongoing costs (in dollars) of investing in the Fund and to compare these costs with the ongoing costs of investing in other mutual funds.
The Example is based on an investment of $1,000 invested at the beginning of the period and held for the entire period (September 1, 2011 to February 29, 2012).
Actual Expenses
The first line of the accompanying table for each class of the Fund provides information about actual account values and actual expenses. You may use the information in this line, together with the amount you invested, to estimate the expenses that you paid over the period. Simply divide your account value by $1,000.00 (for example, an $8,600 account value divided by $1,000.00 = 8.6), then multiply the result by the number in the first line for a class of the Fund under the heading entitled "Expenses Paid During Period" to estimate the expenses you paid on your account during this period. A small balance maintenance fee of $12.00 that is charged once a year may apply for certain accounts with a value of less than $2,000. This fee is not included in the table below. If it was, the estimate of expenses you paid during the period would be higher, and your ending account value lower, by this amount. In addition, the Fund, as a shareholder in the underlying Fidelity Central Funds, will indirectly bear its pro-rata share of the fees and expenses incurred by the underlying Fidelity Central Funds. These fees and expenses are not included in the Fund's annualized expense ratio used to calculate the expense estimate in the table below.
Hypothetical Example for Comparison Purposes
The second line of the accompanying table for each class of the Fund provides information about hypothetical account values and hypothetical expenses based on a Class' actual expense ratio and an assumed rate of return of 5% per year before expenses, which is not the Class' actual return. The hypothetical account values and expenses may not be used to estimate the actual ending account balance or expenses you paid for the period. You may use this information to compare the ongoing costs of investing in the Fund and other funds. To do so, compare this 5% hypothetical example with the 5% hypothetical examples that appear in the shareholder reports of the other funds. A small balance maintenance fee of $12.00 that is charged once a year may apply for certain accounts with a value of less than $2,000. This fee is not included in the table below. If it was, the estimate of expenses you paid during the period would be higher, and your ending account value lower, by this amount. In addition, the Fund, as a shareholder in the underlying Fidelity Central Funds, will indirectly bear its pro-rata share of the fees and expenses incurred by the underlying Fidelity Central Funds. These fees and expenses are not included in the Fund's annualized expense ratio used to calculate the expense estimate in the table below.
Please note that the expenses shown in the table are meant to highlight your ongoing costs only and do not reflect any transaction costs. Therefore, the second line of the table is useful in comparing ongoing costs only, and will not help you determine the relative total costs of owning different funds. In addition, if these transactional costs were included, your costs would have been higher.
Semiannual Report
Shareholder Expense Example - continued
| Annualized Expense Ratio | Beginning
Account Value
September 1, 2011 | Ending
Account Value
February 29, 2012 | Expenses Paid
During Period *
September 1, 2011 to February 29, 2012 |
Class A | .77% | | | |
Actual | | $ 1,000.00 | $ 1,017.90 | $ 3.86 |
HypotheticalA | | $ 1,000.00 | $ 1,021.03 | $ 3.87 |
Class T | .76% | | | |
Actual | | $ 1,000.00 | $ 1,018.00 | $ 3.81 |
HypotheticalA | | $ 1,000.00 | $ 1,021.08 | $ 3.82 |
Class B | 1.50% | | | |
Actual | | $ 1,000.00 | $ 1,014.20 | $ 7.51 |
HypotheticalA | | $ 1,000.00 | $ 1,017.40 | $ 7.52 |
Class C | 1.52% | | | |
Actual | | $ 1,000.00 | $ 1,014.10 | $ 7.61 |
HypotheticalA | | $ 1,000.00 | $ 1,017.30 | $ 7.62 |
Government Income | .45% | | | |
Actual | | $ 1,000.00 | $ 1,020.50 | $ 2.26 |
HypotheticalA | | $ 1,000.00 | $ 1,022.63 | $ 2.26 |
Institutional Class | .52% | | | |
Actual | | $ 1,000.00 | $ 1,019.20 | $ 2.61 |
HypotheticalA | | $ 1,000.00 | $ 1,022.28 | $ 2.61 |
A 5% return per year before expenses
* Expenses are equal to each Class' annualized expense ratio, multiplied by the average account value over the period, multiplied by 182/366 (to reflect the one-half year period). The fees and expenses of the underlying Fidelity Central Funds in which the Fund invests are not included in the Fund's annualized expense ratio.
Semiannual Report
Investment Changes (Unaudited)
Coupon Distribution as of February 29, 2012 |
| % of fund's investments | % of fund's investments
6 months ago |
Zero coupon bonds | 1.2 | 0.7 |
0.01 - 0.99% | 26.5 | 16.7 |
1 - 1.99% | 16.2 | 19.2 |
2 - 2.99% | 6.8 | 5.6 |
3 - 3.99% | 9.1 | 5.5 |
4 - 4.99% | 20.8 | 32.6 |
5 - 5.99% | 16.7 | 19.7 |
6 - 6.99% | 4.6 | 4.2 |
7% and over | 0.5 | 0.8 |
Coupon distribution shows the range of stated interest rates on the fund's investments, excluding short-term investments. The information in the above table is based on the combined investments of the Fund and its pro-rata share of the investments of Fidelity's fixed-income central funds. |
Weighted Average Maturity as of February 29, 2012 |
| | 6 months ago |
Years | 6.3 | 5.7 |
This is a weighted average of all the maturities of the securities held in a fund. Weighted Average Maturity (WAM) can be used as a measure of sensitivity to interest rate changes and market changes. Generally, the longer the maturity, the greater the sensitivity to such changes. WAM is based on the dollar-weighted average length of time until principal payments must be paid. Depending on the types of securities held in a fund, certain maturity shortening devices (e.g., demand features, interest rate resets, and call options) may be taken into account when calculating the WAM. |
Duration as of February 29, 2012 |
| | 6 months ago |
Years | 4.6 | 4.6 |
Duration estimates how much a bond fund's price will change with a change in comparable interest rates. If rates rise 1%, for example, a fund with a 5-year duration is likely to lose about 5% of its value. Other factors also can influence a bond fund's performance and share price. Accordingly, a bond fund's actual performance may differ from this example. Duration takes into account any call or put option embedded in the bonds. |
Asset Allocation (% of fund's net assets) |
As of February 29, 2012 * | As of August 31, 2011 ** |
 | Mortgage
Securities 30.7% | | | Mortgage
Securities 45.5% | |
 | CMOs and Other Mortgage Related Securities 12.3% | | | CMOs and Other Mortgage Related Securities 8.1% | |
 | U.S. Treasury
Obligations 49.8% | | | U.S. Treasury
Obligations 50.1% | |
 | U.S. Government
Agency Obligations†10.7% | | | U.S. Government
Agency Obligations† 12.7% | |
 | Foreign Government & Government Agency Obligations 1.4% | | | Foreign Government & Government Agency Obligations 1.5% | |
 | Short-Term
Investments and
Net Other Assets*** (4.9)% | | | Short-Term
Investments and
Net Other Assets*** (17.9)% | |

* Futures and Swaps | 1.7% | | ** Futures and Swaps | 1.9% | |
† Includes FDIC Guaranteed Corporate Securities and NCUA Guaranteed Notes. | |
*** Short-Term Investments and Net Other Assets are not included in the pie chart. | |
The information in the above table is based on the combined investments of the Fund and its pro-rata share of the investments of Fidelity's fixed-income central funds. A holdings listing for the Fund, which presents direct holdings as well as pro-rata share of any securities and other investments held indirectly through its investment in underlying non-money market Fidelity Central Funds, is available at fidelity.com and/or advisor.fidelity.com as applicable. |
Semiannual Report
Investments February 29, 2012 (Unaudited)
Showing Percentage of Net Assets
U.S. Government and Government Agency Obligations - 60.5% |
| Principal Amount (000s) | | Value (000s) |
U.S. Government Agency Obligations - 6.6% |
Fannie Mae: | | | | |
0.375% 12/28/12 | | $ 50,670 | | $ 50,768 |
0.375% 3/16/15 | | 18,141 | | 18,047 |
0.75% 12/18/13 | | 7,805 | | 7,860 |
1.125% 4/27/17 | | 54,340 | | 54,220 |
4.75% 11/19/12 | | 2,000 | | 2,065 |
Federal Home Loan Bank: | | | | |
0.375% 11/27/13 | | 12,245 | | 12,246 |
0.375% 1/29/14 | | 24,375 | | 24,365 |
0.875% 8/22/12 | | 8,580 | | 8,610 |
Freddie Mac: | | | | |
0.625% 12/29/14 | | 21,293 | | 21,348 |
1% 7/30/14 | | 9,905 | | 10,034 |
1% 8/27/14 | | 15,111 | | 15,309 |
Overseas Private Investment Corp. U.S. Government guaranteed participation certificates 6.77% 11/15/13 | | 1,790 | | 1,886 |
Private Export Funding Corp. secured: | | | | |
4.974% 8/15/13 | | 22,940 | | 24,429 |
5.685% 5/15/12 | | 24,035 | | 24,310 |
Small Business Administration guaranteed development participation certificates: | | | | |
Series 2002-20J Class 1, 4.75% 10/1/22 | | 3,630 | | 3,948 |
Series 2002-20K Class 1, 5.08% 11/1/22 | | 7,244 | | 7,931 |
Series 2003-P10B, Class 1 5.136% 8/10/13 | | 2,055 | | 2,147 |
Series 2004-20H Class 1, 5.17% 8/1/24 | | 2,104 | | 2,327 |
Tennessee Valley Authority: | | | | |
3.875% 2/15/21 | | 33,790 | | 38,359 |
5.25% 9/15/39 | | 12,000 | | 14,990 |
5.375% 4/1/56 | | 8,429 | | 10,960 |
TOTAL U.S. GOVERNMENT AGENCY OBLIGATIONS | | 356,159 |
U.S. Treasury Obligations - 49.8% |
U.S. Treasury Bonds: | | | | |
3.125% 2/15/42 | | 70,290 | | 70,641 |
3.75% 8/15/41 | | 42,345 | | 47,929 |
4.375% 2/15/38 | | 14,154 | | 17,712 |
4.375% 5/15/41 | | 111,265 | | 139,811 |
5% 5/15/37 (c) | | 26,846 | | 36,607 |
5.25% 11/15/28 | | 23,775 | | 32,089 |
5.25% 2/15/29 | | 20,569 | | 27,816 |
6.125% 11/15/27 | | 77,365 | | 112,759 |
U.S. Government and Government Agency Obligations - continued |
| Principal Amount (000s) | | Value (000s) |
U.S. Treasury Obligations - continued |
U.S. Treasury Bonds: - continued | | | | |
6.125% 8/15/29 | | $ 2,877 | | $ 4,266 |
9.875% 11/15/15 | | 10,285 | | 13,804 |
U.S. Treasury Notes: | | | | |
0.125% 8/31/13 | | 82,800 | | 82,625 |
0.125% 12/31/13 | | 40,165 | | 40,041 |
0.25% 1/31/14 | | 108,553 | | 108,456 |
0.25% 9/15/14 | | 71,417 | | 71,171 |
0.25% 12/15/14 | | 30,000 | | 29,871 |
0.25% 1/15/15 | | 100,018 | | 99,573 |
0.25% 2/15/15 | | 143,888 | | 143,180 |
0.375% 7/31/13 | | 11,710 | | 11,730 |
0.375% 11/15/14 | | 30,000 | | 29,979 |
0.5% 8/15/14 | | 83,265 | | 83,525 |
0.5% 10/15/14 | | 90,000 | | 90,253 |
0.625% 7/15/14 | | 86,384 | | 86,924 |
0.75% 6/15/14 | | 30,071 | | 30,348 |
0.875% 11/30/16 | | 51,366 | | 51,502 |
0.875% 2/28/17 | | 182,014 | | 182,042 |
1% 4/30/12 | | 602 | | 603 |
1% 9/30/16 | | 32,048 | | 32,361 |
1% 10/31/16 | | 47,700 | | 48,140 |
1.25% 10/31/15 | | 29,580 | | 30,292 |
1.375% 11/30/15 | | 470 | | 483 |
1.375% 2/28/19 | | 264,653 | | 264,283 |
1.75% 7/31/15 | | 28,800 | | 29,990 |
1.875% 8/31/17 | | 47,000 | | 49,174 |
1.875% 9/30/17 | | 87,400 | | 91,374 |
2% 11/15/21 | | 12,777 | | 12,837 |
2% 2/15/22 | | 41,400 | | 41,471 |
2.125% 11/30/14 | | 21,500 | | 22,499 |
2.125% 5/31/15 | | 4,176 | | 4,395 |
2.125% 8/15/21 | | 33,900 | | 34,567 |
2.375% 8/31/14 | | 20,000 | | 20,988 |
2.375% 9/30/14 | | 13,017 | | 13,680 |
2.375% 10/31/14 | | 77,497 | | 81,529 |
2.375% 6/30/18 | | 26,608 | | 28,479 |
2.5% 6/30/17 | | 10,000 | | 10,800 |
2.625% 7/31/14 (d) | | 16,179 | | 17,059 |
2.75% 11/30/16 | | 18,530 | | 20,190 |
3.125% 1/31/17 | | 60,773 | | 67,382 |
U.S. Government and Government Agency Obligations - continued |
| Principal Amount (000s) | | Value (000s) |
U.S. Treasury Obligations - continued |
U.S. Treasury Notes: - continued | | | | |
3.125% 5/15/21 | | $ 32,410 | | $ 35,973 |
4% 2/15/15 | | 12,619 | | 13,936 |
4.25% 8/15/15 | | 13,117 | | 14,780 |
4.5% 5/15/17 | | 24,685 | | 29,173 |
4.75% 8/15/17 | | 12,983 | | 15,588 |
TOTAL U.S. TREASURY OBLIGATIONS | | 2,676,680 |
Other Government Related - 4.1% |
Bank of America Corp.: | | | | |
2.1% 4/30/12 (FDIC Guaranteed) (a) | | 6,060 | | 6,079 |
3.125% 6/15/12 (FDIC Guaranteed) (a) | | 3,719 | | 3,750 |
Citibank NA 1.875% 5/7/12 (FDIC Guaranteed) (a) | | 37,150 | | 37,256 |
Citigroup Funding, Inc.: | | | | |
1.875% 10/22/12 (FDIC Guaranteed) (a) | | 40,500 | | 40,941 |
1.875% 11/15/12 (FDIC Guaranteed) (a) | | 18,920 | | 19,145 |
General Electric Capital Corp.: | | | | |
2% 9/28/12 (FDIC Guaranteed) (a) | | 11,000 | | 11,116 |
2.625% 12/28/12 (FDIC Guaranteed) (a) | | 16,154 | | 16,479 |
GMAC, Inc. 1.75% 10/30/12 (FDIC Guaranteed) (a) | | 51,106 | | 51,638 |
Goldman Sachs Group, Inc. 3.25% 6/15/12 (FDIC Guaranteed) (a) | | 3,714 | | 3,746 |
JPMorgan Chase & Co. 2.2% 6/15/12 (FDIC Guaranteed) (a) | | 9,200 | | 9,255 |
National Credit Union Administration Guaranteed Notes: | | | | |
Series 2010-A1 Class A, 0.6463% 12/7/20 (NCUA Guaranteed) (e) | | 10,863 | | 10,899 |
Series 2011-R4 Class 1A, 0.6753% 3/6/20 (NCUA Guaranteed) (e) | | 10,530 | | 10,533 |
TOTAL OTHER GOVERNMENT RELATED | | 220,837 |
TOTAL U.S. GOVERNMENT AND GOVERNMENT AGENCY OBLIGATIONS (Cost $3,150,371) | 3,253,676 |
U.S. Government Agency - Mortgage Securities - 6.3% |
|
Fannie Mae: - 3.8% |
1.925% 12/1/34 (e) | | 301 | | 313 |
1.926% 2/1/33 (e) | | 308 | | 322 |
U.S. Government Agency - Mortgage Securities - continued |
| Principal Amount (000s) | | Value (000s) |
Fannie Mae: - continued |
1.93% 10/1/33 (e) | | $ 282 | | $ 293 |
1.952% 3/1/35 (e) | | 265 | | 279 |
1.964% 10/1/33 (e) | | 143 | | 150 |
2.036% 7/1/35 (e) | | 134 | | 141 |
2.05% 3/1/35 (e) | | 48 | | 50 |
2.223% 11/1/33 (e) | | 812 | | 860 |
2.301% 7/1/34 (e) | | 170 | | 180 |
2.303% 6/1/36 (e) | | 223 | | 236 |
2.424% 10/1/33 (e) | | 240 | | 253 |
2.448% 3/1/35 (e) | | 162 | | 170 |
2.448% 2/1/36 (e) | | 683 | | 722 |
2.487% 11/1/36 (e) | | 194 | | 207 |
2.537% 7/1/35 (e) | | 527 | | 560 |
2.609% 5/1/36 (e) | | 415 | | 442 |
3.471% 3/1/40 (e) | | 8,222 | | 8,517 |
3.5% 3/1/42 (b) | | 105,000 | | 108,529 |
4% 9/1/13 to 11/1/41 | | 5,054 | | 5,331 |
4% 3/1/42 (b) | | 28,500 | | 29,995 |
4.5% 3/1/41 to 9/1/41 | | 33,675 | | 36,330 |
5% 2/1/16 to 5/1/38 | | 3,555 | | 3,830 |
5.718% 3/1/36 (e) | | 2,189 | | 2,307 |
5.954% 3/1/37 (e) | | 476 | | 513 |
6.5% 2/1/17 to 5/1/27 | | 1,479 | | 1,654 |
7% 7/1/13 | | 1 | | 1 |
9% 5/1/14 | | 100 | | 103 |
9.5% 10/1/20 | | 42 | | 49 |
11.25% 5/1/14 | | 1 | | 1 |
11.5% 6/15/19 to 1/15/21 | | 175 | | 187 |
| | 202,525 |
Freddie Mac - 0.3% |
1.915% 3/1/35 (e) | | 946 | | 981 |
2.095% 5/1/37 (e) | | 487 | | 504 |
2.549% 2/1/36 (e) | | 106 | | 112 |
2.636% 6/1/35 (e) | | 767 | | 817 |
2.795% 7/1/36 (e) | | 765 | | 814 |
2.798% 7/1/35 (e) | | 1,830 | | 1,936 |
2.943% 3/1/33 (e) | | 56 | | 59 |
3.149% 10/1/35 (e) | | 323 | | 344 |
4.5% 5/1/39 to 10/1/41 | | 9,322 | | 9,990 |
5.138% 4/1/35 (e) | | 290 | | 304 |
5.5% 12/1/27 to 7/1/29 | | 461 | | 501 |
U.S. Government Agency - Mortgage Securities - continued |
| Principal Amount (000s) | | Value (000s) |
Freddie Mac - continued |
9% 9/1/14 | | $ 0* | | $ 0* |
9.5% 5/1/17 to 8/1/21 | | 86 | | 97 |
9.75% 8/1/14 | | 68 | | 75 |
11% 5/1/14 | | 19 | | 20 |
12% 3/1/15 | | 0* | | 0* |
12.5% 2/1/14 to 6/1/15 | | 2 | | 2 |
13% 6/1/14 to 10/1/14 | | 0* | | 0* |
| | 16,556 |
Ginnie Mae - 2.2% |
4.626% 3/1/62 (i) | | 8,382 | | 9,440 |
4.65% 3/1/62 (i) | | 7,224 | | 8,067 |
4.684% 1/20/62 (i) | | 25,534 | | 28,786 |
5.492% 4/20/60 (i) | | 23,524 | | 26,941 |
5.493% 11/20/59 (i) | | 27,952 | | 31,450 |
5.612% 4/20/58 (i) | | 11,672 | | 12,523 |
| | 117,207 |
TOTAL U.S. GOVERNMENT AGENCY - MORTGAGE SECURITIES (Cost $329,870) | 336,288 |
Collateralized Mortgage Obligations - 8.6% |
|
U.S. Government Agency - 8.6% |
Fannie Mae Guaranteed Mtg. pass-thru certificates: | | | | |
floater Series 2010-15 Class FJ, 1.174% 6/25/36 (e) | | 27,110 | | 27,468 |
planned amortization class: | | | | |
Series 1993-240 Class PD, 6.25% 12/25/13 | | 654 | | 674 |
Series 2006-45 Class OP, 6/25/36 (h) | | 3,855 | | 3,501 |
Series 2010-118 Class PB, 4.5% 10/25/40 | | 7,053 | | 7,718 |
sequential payer: | | | | |
Series 2007-113 Class DB, 4.5% 12/25/22 | | 12,440 | | 13,808 |
Series 2009-14 Class EB, 4.5% 3/25/24 | | 7,840 | | 8,535 |
Series 2010-97 Class CX, 4.5% 9/25/25 | | 10,813 | | 12,266 |
Series 2007-113 Class JD, 4.5% 12/25/22 | | 12,766 | | 14,150 |
Series 2010-109 Class IM, 5.5% 9/25/40 (g) | | 19,963 | | 3,022 |
Series 2010-39 Class FG, 1.164% 3/25/36 (e) | | 14,130 | | 14,359 |
Series 2010-97 Class CI, 4.5% 8/25/25 (g) | | 10,184 | | 883 |
Fannie Mae subordinate REMIC pass-thru certificates: | | | | |
floater: | | | | |
Series 2001-38 Class QF, 1.224% 8/25/31 (e) | | 301 | | 305 |
Series 2002-49 Class FB, 0.8455% 11/18/31 (e) | | 366 | | 367 |
Collateralized Mortgage Obligations - continued |
| Principal Amount (000s) | | Value (000s) |
U.S. Government Agency - continued |
Fannie Mae subordinate REMIC pass-thru certificates: - continued | | | | |
floater: | | | | |
Series 2002-60 Class FV, 1.244% 4/25/32 (e) | | $ 154 | | $ 157 |
Series 2002-75 Class FA, 1.244% 11/25/32 (e) | | 316 | | 321 |
planned amortization: | | | | |
Series 2005-19 Class PA, 5.5% 7/25/34 | | 7,794 | | 8,655 |
Series 2005-64 Class PX, 5.5% 6/25/35 | | 7,833 | | 8,746 |
planned amortization class Series 2003-113 Class PE, 4% 11/25/18 | | 7,545 | | 8,101 |
sequential payer: | | | | |
Series 2004-91 Class Z, 5% 12/25/34 | | 9,477 | | 10,677 |
Series 2005-117, Class JN, 4.5% 1/25/36 | | 645 | | 715 |
Series 2005-47 Class HK, 4.5% 6/25/20 | | 7,798 | | 8,475 |
Series 2006-72 Class CY, 6% 8/25/26 | | 10,215 | | 11,643 |
Series 2009-82 Class FD, 1.094% 10/25/39 (e) | | 11,461 | | 11,625 |
Series 2009-85 Class IB, 4.5% 8/25/24 (g) | | 2,858 | | 243 |
Series 2009-93 Class IC, 4.5% 9/25/24 (g) | | 5,074 | | 410 |
Series 2010-139 Class NI, 4.5% 2/25/40 (g) | | 11,402 | | 1,620 |
Freddie Mac planned amortization class Series 2115 Class PE, 6% 1/15/14 | | 126 | | 130 |
Freddie Mac Multi-Class pass-thru certificates: | | | | |
floater: | | | | |
Series 2530 Class FE, 0.8485% 2/15/32 (e) | | 216 | | 217 |
Series 2630 Class FL, 0.7485% 6/15/18 (e) | | 338 | | 341 |
Series 3008 Class SM, 0% 7/15/35 (e) | | 99 | | 97 |
Series 3419 Class FD, 1.0185% 2/15/38 (e) | | 11,542 | | 11,689 |
floater planned amortization Series 3950 Class QF, 0.7485% 8/15/40 (e) | | 20,741 | | 20,789 |
planned amortization class: | | | | |
Series 1141 Class G, 9% 9/15/21 | | 169 | | 195 |
Series 2356 Class GD, 6% 9/15/16 | | 160 | | 172 |
Series 2376 Class JE, 5.5% 11/15/16 | | 1,111 | | 1,189 |
Series 2381 Class OG, 5.5% 11/15/16 | | 697 | | 745 |
Series 2640 Class GE, 4.5% 7/15/18 | | 7,310 | | 7,745 |
Series 2672 Class MG, 5% 9/15/23 | | 7,120 | | 8,061 |
Series 2682 Class LD, 4.5% 10/15/33 | | 777 | | 862 |
Series 2810 Class PD, 6% 6/15/33 | | 532 | | 555 |
sequential payer: | | | | |
Series 2570 Class CU, 4.5% 7/15/17 | | 145 | | 147 |
Series 2587 Class AD, 4.71% 3/15/33 | | 5,785 | | 6,663 |
Series 2773 Class HC, 4.5% 4/15/19 | | 704 | | 777 |
Series 2877 Class ZD, 5% 10/15/34 | | 12,299 | | 13,813 |
Collateralized Mortgage Obligations - continued |
| Principal Amount (000s) | | Value (000s) |
U.S. Government Agency - continued |
Freddie Mac Multi-Class pass-thru certificates: - continued | | | | |
sequential payer: | | | | |
Series 2987 Class HE, 4.5% 6/15/20 | | $ 11,260 | | $ 11,979 |
Series 3007 Class EW, 5.5% 7/15/25 | | 8,875 | | 10,238 |
Series 3277 Class B, 4% 2/15/22 | | 5,900 | | 6,406 |
Series 3578, Class B, 4.5% 9/15/24 | | 7,927 | | 8,685 |
Series 2863 Class DB, 4% 9/15/14 | | 115 | | 115 |
Ginnie Mae: | | | | |
0% 3/1/62 (e)(i) | | 3,370 | | 3,383 |
0% 3/1/62 (e)(i) | | 7,630 | | 7,630 |
Ginnie Mae guaranteed REMIC pass-thru certificates: | | | | |
floater: | | | | |
Series 2008-57 Class BF, 1.0755% 7/20/38 (e) | | 14,271 | | 14,500 |
Series 2008-73: | | | | |
Class FA, 1.1055% 8/20/38 (e) | | 7,068 | | 7,171 |
Class FK, 1.0055% 8/20/38 (e) | | 15,222 | | 15,405 |
Series 2008-83 Class FB, 1.1455% 9/20/38 (e) | | 7,022 | | 7,128 |
Series 2011-H21 Class FA, 0.8455% 10/20/61 (e)(i) | | 10,622 | | 10,605 |
Series 2012-H01 Class FA, 0.9455% 11/20/61 (e)(i) | | 8,321 | | 8,353 |
0% 2/1/62 (e)(i) | | 5,000 | | 4,997 |
planned amortization Series 2011-61 Class OP, 5/20/40 (h) | | 10,524 | | 9,061 |
sequential payer Series 2011-69 Class GX, 4.5% 5/16/40 | | 10,205 | | 11,226 |
Series 2010-42 Class OP, 4/20/40 (h) | | 23,829 | | 20,155 |
Series 2011-71: | | | | |
Class ZB, 5.5% 8/20/34 | | 20,749 | | 24,251 |
Class ZC, 5.5% 7/16/34 | | 23,655 | | 27,751 |
TOTAL COLLATERALIZED MORTGAGE OBLIGATIONS (Cost $449,221) | 461,670 |
Commercial Mortgage Securities - 0.6% |
|
Freddie Mac Multi-Class pass-thru certificates Series K706: | | | | |
Class A1, 1.691% 11/25/44 | | 13,400 | | 13,592 |
Class A2, 2.323% 11/25/44 | | 16,500 | | 16,812 |
TOTAL COMMERCIAL MORTGAGE SECURITIES (Cost $30,348) | 30,404 |
Foreign Government and Government Agency Obligations - 1.4% |
| Principal Amount (000s) | | Value (000s) |
Israeli State (guaranteed by U.S. Government through Agency for International Development) 5.5% 9/18/23
(Cost $60,995) | | $ 59,862 | | $ 76,374 |
Fixed-Income Funds - 25.3% |
| Shares | | |
Fidelity Mortgage Backed Securities Central Fund (f)
(Cost $1,297,209) | 12,534,039 | |
1,359,818
|
Cash Equivalents - 0.7% |
| Maturity Amount (000s) | | |
Investments in repurchase agreements in a joint trading account at 0.14%, dated 2/29/12 due 3/1/12 (Collateralized by U.S. Government Obligations) #
(Cost $36,738) | $ 36,738 | |
36,738
|
TOTAL INVESTMENT PORTFOLIO - 103.4% (Cost $5,354,752) | 5,554,968 |
NET OTHER ASSETS (LIABILITIES) - (3.4)% | (181,163) |
NET ASSETS - 100% | $ 5,373,805 |
TBA Sale Commitments |
| Principal Amount (000s) | | |
Fannie Mae: |
3.5% 3/1/42 | $ (105,000) | | (108,529) |
4.5% 3/1/42 | (28,100) | | (29,948) |
TOTAL TBA SALE COMMITMENTS (Proceeds $138,504) | $ (138,477) |
Futures Contracts |
| Expiration Date | | Underlying Face Amount at Value (000s) | | Unrealized Appreciation/
(Depreciation) (000s) |
Purchased |
Treasury Contracts |
437 CBOT 10-Year U.S. Treasury Bond Contracts | June 2012 | | $ 57,227 | | $ 224 |
452 CBOT 2-Year U.S. Treasury Bond Contracts | June 2012 | | 99,546 | | (8) |
TOTAL TREASURY CONTRACTS | | $ 156,773 | | $ 216 |
|
The face value of futures purchased as a percentage of net assets is 3% |
Swap Agreements |
| | | Notional Amount (000s) | | Value (000s) |
Interest Rate Swaps |
Receive quarterly a floating rate based on 3-month LIBOR and pay semi-annually a fixed rate equal to 3.23% with Credit Suisse First Boston | May 2020 | | $ 50,000 | | $ (5,925) |
Legend |
(a) Under the Temporary Liquidity Guarantee Program, the Federal Deposit Insurance Corporation guarantees principal and interest in the event of payment default or bankruptcy until the earlier of maturity date of the debt or until June 30, 2012. At the end of the period these securities amounted to $199,405,000 or 3.7% of net assets. |
(b) Security or a portion of the security purchased on a delayed delivery or when-issued basis. |
(c) Security or a portion of the security was pledged to cover margin requirements for futures contracts. At the period end, the value of securities pledged amounted to $700,000. |
(d) Security or a portion of the security has been segregated as collateral for open swap agreements. At the period end, the value of securities pledged amounted to $5,525,000. |
(e) Coupon rates for floating and adjustable rate securities reflect the rates in effect at period end. |
(f) Affiliated fund that is available only to investment companies and other accounts managed by Fidelity Investments. A complete unaudited schedule of portfolio holdings for each Fidelity Central Fund is filed with the SEC for the first and third quarters of each fiscal year on Form N-Q and is available upon request or at the SEC's web site at www.sec.gov. An unaudited holdings listing for the Fund, which presents direct holdings as well as the pro rata share of securities and other investments held indirectly through its investment in underlying non-money market Fidelity Central Funds, is available at fidelity.com and/or advisor.fidelity.com, as applicable. In addition, each Fidelity Central Fund's financial statements are available on the SEC's web site or upon request. |
(g) Security represents right to receive monthly interest payments on an underlying pool of mortgages or assets. Principal shown is the outstanding par amount of the pool as of the end of the period. |
(h) Principal Only Strips represent the right to receive the monthly principal payments on an underlying pool of mortgage loans. |
(i) Represents an investment in an underlying pool of reverse mortgages which typically do not require regular principal and interest payments as repayment is deferred until a maturity event. |
* Amount represents less than $1,000. |
# Additional information on each counterparty to the repurchase agreement is as follows: |
Repurchase Agreement / Counterparty | Value
(Amounts in thousands) |
$36,738,000 due 3/01/12 at 0.14% |
Citibank NA | $ 6,439 |
Credit Suisse Securities (USA) LLC | 27,079 |
Merrill Lynch, Pierce, Fenner & Smith, Inc. | 3,220 |
| $ 36,738 |
Affiliated Central Funds |
Information regarding fiscal year to date income earned by the Fund from investments in Fidelity Central Funds is as follows: |
Fund | Income earned
(Amounts in thousands) |
Fidelity Mortgage Backed Securities Central Fund | $ 20,729 |
Additional information regarding the Fund's fiscal year to date purchases and sales, including the ownership percentage, of the non Money Market Central Funds is as follows: |
Fund
(Amounts in thousands) | Value, beginning of period | Purchases | Sales Proceeds | Value,
end of
period | % ownership, end of
period |
Fidelity Mortgage Backed Securities Central Fund | $ 1,334,455 | $ 20,729 | $ - | $ 1,359,818 | 10.4% |
Other Information |
The following is a summary of the inputs used, as of February 29, 2012, involving the Fund's assets and liabilities carried at fair value. The inputs or methodology used for valuing securities may not be an indication of the risk associated with investing in those securities. For more information on valuation inputs, and their aggregation into the levels used in the table below, please refer to the Security Valuation section in the accompanying Notes to Financial Statements. |
Valuation Inputs at Reporting Date: |
Description
(Amounts in thousands) | Total | Level 1 | Level 2 | Level 3 |
Investments in Securities: | | | | |
U.S. Government and Government Agency Obligations | $ 3,253,676 | $ - | $ 3,253,676 | $ - |
U.S. Government Agency - Mortgage Securities | 336,288 | - | 336,288 | - |
Collateralized Mortgage Obligations | 461,670 | - | 461,670 | - |
Commercial Mortgage Securities | 30,404 | - | 30,404 | - |
Foreign Government and Government Agency Obligations | 76,374 | - | 76,374 | - |
Fixed-Income Funds | 1,359,818 | 1,359,818 | - | - |
Cash Equivalents | 36,738 | - | 36,738 | - |
Total Investments in Securities: | $ 5,554,968 | $ 1,359,818 | $ 4,195,150 | $ - |
Derivative Instruments: | | | | |
Assets | | | | |
Futures Contracts | $ 224 | $ 224 | $ - | $ - |
Liabilities | | | | |
Futures Contracts | $ (8) | $ (8) | $ - | $ - |
Swap Agreements | $ (5,925) | $ - | $ (5,925) | $ - |
Total Derivative Instruments: | $ (5,709) | $ 216 | $ (5,925) | $ - |
Other Financial Instruments: | | | | |
TBA Sale Commitments | $ (138,477) | $ - | $ (138,477) | $ - |
Value of Derivative Instruments |
The following table is a summary of the Fund's value of derivative instruments by risk exposure as of February 29, 2012. For additional information on derivative instruments, please refer to the Derivative Instruments section in the accompanying Notes to Financial Statements. |
Risk Exposure /
Derivative Type
(Amounts in thousands) | Value |
| Asset | Liability |
Interest Rate Risk | | |
Futures Contracts (a) | $ 224 | $ (8) |
Swap Agreements (b) | - | (5,925) |
Total Value of Derivatives | $ 224 | $ (5,933) |
(a) Reflects cumulative appreciation/(depreciation) on futures contracts as disclosed on the Schedule of Investments. Only the period end variation margin is separately disclosed on the Statement of Assets and Liabilities. |
(b) Value is disclosed on the Statement of Assets and Liabilities in the Swap agreements, at Value line-items. |
See accompanying notes which are an integral part of the financial statements.
Semiannual Report
Statement of Assets and Liabilities
Amounts in thousands (except per-share amounts) | February 29, 2012 (Unaudited) |
| | |
Assets | | |
Investment in securities, at value (including repurchase agreements of $36,738) - See accompanying schedule: Unaffiliated issuers (cost $4,057,543) | $ 4,195,150 | |
Fidelity Central Funds (cost $1,297,209) | 1,359,818 | |
Total Investments (cost $5,354,752) | | $ 5,554,968 |
Receivable for investments sold, regular delivery | | 182,408 |
Receivable for TBA sale commitments | | 138,504 |
Receivable for fund shares sold | | 11,673 |
Interest receivable | | 13,985 |
Other receivables | | 762 |
Total assets | | 5,902,300 |
| | |
Liabilities | | |
Payable to custodian bank | $ 1 | |
Payable for investments purchased
Regular delivery | 177,685 | |
Delayed delivery | 138,623 | |
TBA sale commitments, at value | 138,477 | |
Payable for fund shares redeemed | 64,171 | |
Distributions payable | 290 | |
Swap agreements at value | 5,925 | |
Accrued management fee | 1,431 | |
Distribution and service plan fees payable | 243 | |
Payable for daily variation margin on futures contracts | 219 | |
Other affiliated payables | 670 | |
Other payables and accrued expenses | 760 | |
Total liabilities | | 528,495 |
| | |
Net Assets | | $ 5,373,805 |
Net Assets consist of: | | |
Paid in capital | | $ 5,137,138 |
Undistributed net investment income | | 2,927 |
Accumulated undistributed net realized gain (loss) on investments | | 39,206 |
Net unrealized appreciation (depreciation) on investments | | 194,534 |
Net Assets | | $ 5,373,805 |
See accompanying notes which are an integral part of the financial statements.
Semiannual Report
Financial Statements - continued
Statement of Assets and Liabilities - continued
Amounts in thousands (except per-share amounts) | February 29, 2012 (Unaudited) |
| | |
Calculation of Maximum Offering Price
Class A:
Net Asset Value and redemption price per share
($370,879 ÷ 34,463 shares) | | $ 10.76 |
| | |
Maximum offering price per share (100/96.00 of $10.76) | | $ 11.21 |
Class T:
Net Asset Value and redemption price per share ($300,883 ÷ 27,963 shares) | | $ 10.76 |
| | |
Maximum offering price per share (100/96.00 of $10.76) | | $ 11.21 |
Class B:
Net Asset Value and offering price per share ($23,186 ÷ 2,155 shares)A | | $ 10.76 |
| | |
Class C:
Net Asset Value and offering price per share ($101,460 ÷ 9,430 shares)A | | $ 10.76 |
| | |
Government Income:
Net Asset Value, offering price and redemption price per share ($4,224,955 ÷ 393,186 shares) | | $ 10.75 |
| | |
Institutional Class:
Net Asset Value, offering price and redemption price per share ($352,442 ÷ 32,753 shares) | | $ 10.76 |
A Redemption price per share is equal to net asset value less any applicable contingent deferred sales charge.
See accompanying notes which are an integral part of the financial statements.
Semiannual Report
Statement of Operations
Amounts in thousands | Six months ended February 29, 2012 (Unaudited) |
| | |
Investment Income | | |
Interest | | $ 37,491 |
Income from Fidelity Central Funds | | 20,729 |
Total income | | 58,220 |
| | |
Expenses | | |
Management fee | $ 8,612 | |
Transfer agent fees | 3,092 | |
Distribution and service plan fees | 1,453 | |
Fund wide operations fee | 897 | |
Independent trustees' compensation | 10 | |
Miscellaneous | 8 | |
Total expenses before reductions | 14,072 | |
Expense reductions | (4) | 14,068 |
Net investment income (loss) | | 44,152 |
Realized and Unrealized Gain (Loss) Net realized gain (loss) on: | | |
Investment securities: | | |
Unaffiliated issuers | 71,542 | |
Futures contracts | (69) | |
Swap agreements | (707) | |
Total net realized gain (loss) | | 70,766 |
Change in net unrealized appreciation (depreciation) on: Investment securities | (7,906) | |
Futures contracts | 203 | |
Swap agreements | (1,325) | |
Delayed delivery commitments | (2,114) | |
Total change in net unrealized appreciation (depreciation) | | (11,142) |
Net gain (loss) | | 59,624 |
Net increase (decrease) in net assets resulting from operations | | $ 103,776 |
See accompanying notes which are an integral part of the financial statements.
Semiannual Report
Financial Statements - continued
Statement of Changes in Net Assets
Amounts in thousands | Six months ended February 29, 2012 (Unaudited) | One month ended
August 31,
2011 | Year ended
July 31,
2011 |
Increase (Decrease) in Net Assets | | | |
Operations | | | |
Net investment income (loss) | $ 44,152 | $ 8,396 | $ 118,879 |
Net realized gain (loss) | 70,766 | 35,205 | 124,737 |
Change in net unrealized appreciation (depreciation) | (11,142) | 64,081 | (82,102) |
Net increase (decrease) in net assets resulting
from operations | 103,776 | 107,682 | 161,514 |
Distributions to shareholders from net investment income | (42,483) | (8,141) | (114,897) |
Distributions to shareholders from net realized gain | (130,853) | - | (140,821) |
Total distributions | (173,336) | (8,141) | (255,718) |
Share transactions - net increase (decrease) | 77,230 | 41,240 | (695,616) |
Total increase (decrease) in net assets | 7,670 | 140,781 | (789,820) |
| | | |
Net Assets | | | |
Beginning of period | 5,366,135 | 5,225,354 | 6,015,174 |
End of period (including undistributed net investment income of $2,927 and undistributed net investment income of $1,258 and undistributed net investment income of $917, respectively) | $ 5,373,805 | $ 5,366,135 | $ 5,225,354 |
See accompanying notes which are an integral part of the financial statements.
Semiannual Report
Financial Highlights - Class A
| Six months ended February 29, 2012 | Years ended August 31, |
| (Unaudited) | 2011 H | 2011 L | 2010 L | 2009 L | 2008 L | 2007 I |
Selected Per-Share Data | | | | | | | |
Net asset value, beginning of period | $ 10.90 | $ 10.70 | $ 10.84 | $ 10.77 | $ 10.40 | $ 10.01 | $ 9.98 |
Income from Investment Operations | | | | | | | |
Net investment income (loss) E | .074 | .015 | .199 | .242 | .356 | .402 | .311 |
Net realized and unrealized gain (loss) | .120 | .199 | .108 | .424 | .466 | .387 | .033 |
Total from investment operations | .194 | .214 | .307 | .666 | .822 | .789 | .344 |
Distributions from net investment income | (.071) | (.014) | (.191) | (.231) | (.352) | (.399) | (.314) |
Distributions from net realized gain | (.263) | - | (.256) | (.365) | (.100) | - | - |
Total distributions | (.334) | (.014) | (.447) | (.596) | (.452) | (.399) | (.314) |
Net asset value, end of period | $ 10.76 | $ 10.90 | $ 10.70 | $ 10.84 | $ 10.77 | $ 10.40 | $ 10.01 |
Total Return B,C,D | 1.79% | 2.00% | 2.94% | 6.44% | 8.03% | 7.96% | 3.49% |
Ratios to Average Net Assets F,J | | | | | | | |
Expenses before reductions | .77% A | .76% A | .77% | .77% | .77% | .81% | .78% A |
Expenses net of fee waivers, if any | .77% A | .76% A | .77% | .77% | .77% | .81% | .78% A |
Expenses net of all reductions | .77% A | .76% A | .77% | .77% | .77% | .80% | .77% A |
Net investment income (loss) | 1.38% A | 1.61% A | 1.88% | 2.28% | 3.33% | 3.88% | 4.08% A |
Supplemental Data | | | | | | | |
Net assets, end of period (in millions) | $ 371 | $ 345 | $ 329 | $ 431 | $ 437 | $ 232 | $ 145 |
Portfolio turnover rate G | 230% A | 466% A,M | 430% | 355% | 380% K | 269% | 164% K |
A Annualized B Total returns for periods of less than one year are not annualized. C Total returns would have been lower if certain expenses had not been reduced during the applicable periods shown. D Total returns do not include the effect of the sales charges. E Calculated based on average shares outstanding during the period. F Fees and expenses of any underlying Fidelity Central Funds are not included in the Fund's expense ratio. The Fund indirectly bears its proportionate share of the expenses of any underlying Fidelity Central Funds. G Amount does not include the portfolio activity of any underlying Fidelity Central Funds. H For the one month period ended August 31. The Fund changed its fiscal year from July 31 to August 31, effective August 31, 2011. I For the period October 24, 2006 (commencement of sale of shares) to July 31, 2007. J Expense ratios reflect operating expenses of the class. Expenses before reductions do not reflect amounts reimbursed by the investment adviser or reductions from brokerage service arrangements or reductions from other expense offset arrangements and do not represent the amount paid by the class during periods when reimbursements or reductions occur. Expense ratios before reductions for start-up periods may not be representative of longer-term operating periods. Expenses net of fee waivers reflect expenses after reimbursement by the investment adviser but prior to reductions from brokerage service arrangements or other expense offset arrangements. Expenses net of all reductions represent the net expenses paid by the class. K The portfolio turnover rate does not include the assets acquired in the merger. L For the period ended July 31. M Portfolio turnover rate excludes securities received or delivered in-kind. |
See accompanying notes which are an integral part of the financial statements.
Semiannual Report
Financial Highlights - Class T
| Six months ended February 29, 2012 | Years ended August 31, |
| (Unaudited) | 2011 H | 2011 L | 2010 L | 2009 L | 2008 L | 2007 I |
Selected Per-Share Data | | | | | | | |
Net asset value, beginning of period | $ 10.90 | $ 10.69 | $ 10.84 | $ 10.77 | $ 10.40 | $ 10.01 | $ 9.98 |
Income from Investment Operations | | | | | | | |
Net investment income (loss) E | .075 | .015 | .201 | .243 | .357 | .404 | .306 |
Net realized and unrealized gain (loss) | .120 | .209 | .098 | .425 | .466 | .387 | .036 |
Total from investment operations | .195 | .224 | .299 | .668 | .823 | .791 | .342 |
Distributions from net investment income | (.072) | (.014) | (.193) | (.233) | (.353) | (.401) | (.312) |
Distributions from net realized gain | (.263) | - | (.256) | (.365) | (.100) | - | - |
Total distributions | (.335) | (.014) | (.449) | (.598) | (.453) | (.401) | (.312) |
Net asset value, end of period | $ 10.76 | $ 10.90 | $ 10.69 | $ 10.84 | $ 10.77 | $ 10.40 | $ 10.01 |
Total Return B,C,D | 1.80% | 2.10% | 2.86% | 6.45% | 8.04% | 7.98% | 3.46% |
Ratios to Average Net Assets F,J | | | | | | | |
Expenses before reductions | .76% A | .75% A | .76% | .76% | .76% | .78% | .79% A |
Expenses net of fee waivers, if any | .76% A | .75% A | .76% | .76% | .76% | .78% | .79% A |
Expenses net of all reductions | .76% A | .75% A | .76% | .76% | .76% | .78% | .79% A |
Net investment income (loss) | 1.40% A | 1.62% A | 1.89% | 2.29% | 3.33% | 3.90% | 4.02% A |
Supplemental Data | | | | | | | |
Net assets, end of period (in millions) | $ 301 | $ 286 | $ 272 | $ 335 | $ 324 | $ 236 | $ 181 |
Portfolio turnover rate G | 230% A | 466% A,M | 430% | 355% | 380% K | 269% | 164% K |
A Annualized B Total returns for periods of less than one year are not annualized. C Total returns would have been lower if certain expenses had not been reduced during the applicable periods shown. D Total returns do not include the effect of the sales charges. E Calculated based on average shares outstanding during the period. F Fees and expenses of any underlying Fidelity Central Funds are not included in the Fund's expense ratio. The Fund indirectly bears its proportionate share of the expenses of any underlying Fidelity Central Funds. G Amount does not include the portfolio activity of any underlying Fidelity Central Funds. H For the one month period ended August 31. The Fund changed its fiscal year from July 31 to August 31, effective August 31, 2011. I For the period October 24, 2006 (commencement of sale of shares) to July 31, 2007. J Expense ratios reflect operating expenses of the class. Expenses before reductions do not reflect amounts reimbursed by the investment adviser or reductions from brokerage service arrangements or reductions from other expense offset arrangements and do not represent the amount paid by the class during periods when reimbursements or reductions occur. Expense ratios before reductions for start-up periods may not be representative of longer-term operating periods. Expenses net of fee waivers reflect expenses after reimbursement by the investment adviser but prior to reductions from brokerage service arrangements or other expense offset arrangements. Expenses net of all reductions represent the net expenses paid by the class. K The portfolio turnover rate does not include the assets acquired in the merger. L For the period ended July 31. M Portfolio turnover rate excludes securities received or delivered in-kind. |
See accompanying notes which are an integral part of the financial statements.
Semiannual Report
Financial Highlights - Class B
| Six months ended February 29, 2012 | Years ended August 31, |
| (Unaudited) | 2011 H | 2011 L | 2010 L | 2009 L | 2008 L | 2007 I |
Selected Per-Share Data | | | | | | | |
Net asset value, beginning of period | $ 10.90 | $ 10.69 | $ 10.84 | $ 10.77 | $ 10.40 | $ 10.01 | $ 9.98 |
Income from Investment Operations | | | | | | | |
Net investment income (loss) E | .035 | .008 | .122 | .164 | .278 | .329 | .251 |
Net realized and unrealized gain (loss) | .120 | .210 | .098 | .425 | .467 | .387 | .037 |
Total from investment operations | .155 | .218 | .220 | .589 | .745 | .716 | .288 |
Distributions from net investment income | (.032) | (.008) | (.114) | (.154) | (.275) | (.326) | (.258) |
Distributions from net realized gain | (.263) | - | (.256) | (.365) | (.100) | - | - |
Total distributions | (.295) | (.008) | (.370) | (.519) | (.375) | (.326) | (.258) |
Net asset value, end of period | $ 10.76 | $ 10.90 | $ 10.69 | $ 10.84 | $ 10.77 | $ 10.40 | $ 10.01 |
Total Return B,C,D | 1.42% | 2.04% | 2.10% | 5.67% | 7.25% | 7.21% | 2.91% |
Ratios to Average Net Assets F,J | | | | | | | |
Expenses before reductions | 1.50% A | 1.49% A | 1.50% | 1.50% | 1.50% | 1.51% | 1.50% A |
Expenses net of fee waivers, if any | 1.50% A | 1.49% A | 1.50% | 1.50% | 1.50% | 1.51% | 1.50% A |
Expenses net of all reductions | 1.50% A | 1.49% A | 1.50% | 1.50% | 1.50% | 1.50% | 1.50% A |
Net investment income (loss) | .65% A | .90% A | 1.15% | 1.55% | 2.60% | 3.17% | 3.30% A |
Supplemental Data | | | | | | | |
Net assets, end of period (in millions) | $ 23 | $ 26 | $ 25 | $ 38 | $ 48 | $ 41 | $ 43 |
Portfolio turnover rate G | 230% A | 466% A,M | 430% | 355% | 380% K | 269% | 164% K |
A Annualized B Total returns for periods of less than one year are not annualized. C Total returns would have been lower if certain expenses had not been reduced during the applicable periods shown. D Total returns do not include the effect of the contingent deferred sales charge. E Calculated based on average shares outstanding during the period. F Fees and expenses of any underlying Fidelity Central Funds are not included in the Fund's expense ratio. The Fund indirectly bears its proportionate share of the expenses of any underlying Fidelity Central Funds. G Amount does not include the portfolio activity of any underlying Fidelity Central Funds. H For the one month period ended August 31. The Fund changed its fiscal year from July 31 to August 31, effective August 31, 2011. I For the period October 24, 2006 (commencement of sale of shares) to July 31, 2007. J Expense ratios reflect operating expenses of the class. Expenses before reductions do not reflect amounts reimbursed by the investment adviser or reductions from brokerage service arrangements or reductions from other expense offset arrangements and do not represent the amount paid by the class during periods when reimbursements or reductions occur. Expense ratios before reductions for start-up periods may not be representative of longer-term operating periods. Expenses net of fee waivers reflect expenses after reimbursement by the investment adviser but prior to reductions from brokerage service arrangements or other expense offset arrangements. Expenses net of all reductions represent the net expenses paid by the class. K The portfolio turnover rate does not include the assets acquired in the merger. L For the period ended July 31. M Portfolio turnover rate excludes securities received or delivered in-kind. |
See accompanying notes which are an integral part of the financial statements.
Semiannual Report
Financial Highlights - Class C
| Six months ended February 29, 2012 | Years ended August 31, |
| (Unaudited) | 2011 H | 2011 L | 2010 L | 2009 L | 2008 L | 2007 I |
Selected Per-Share Data | | | | | | | |
Net asset value, beginning of period | $ 10.90 | $ 10.69 | $ 10.84 | $ 10.77 | $ 10.40 | $ 10.01 | $ 9.98 |
Income from Investment Operations | | | | | | | |
Net investment income (loss) E | .034 | .008 | .121 | .163 | .275 | .326 | .249 |
Net realized and unrealized gain (loss) | .120 | .210 | .098 | .425 | .468 | .387 | .033 |
Total from investment operations | .154 | .218 | .219 | .588 | .743 | .713 | .282 |
Distributions from net investment income | (.031) | (.008) | (.113) | (.153) | (.273) | (.323) | (.252) |
Distributions from net realized gain | (.263) | - | (.256) | (.365) | (.100) | - | - |
Total distributions | (.294) | (.008) | (.369) | (.518) | (.373) | (.323) | (.252) |
Net asset value, end of period | $ 10.76 | $ 10.90 | $ 10.69 | $ 10.84 | $ 10.77 | $ 10.40 | $ 10.01 |
Total Return B,C,D | 1.41% | 2.04% | 2.09% | 5.66% | 7.23% | 7.18% | 2.85% |
Ratios to Average Net Assets F,J | | | | | | | |
Expenses before reductions | 1.52% A | 1.50% A | 1.51% | 1.51% | 1.52% | 1.53% | 1.55% A |
Expenses net of fee waivers, if any | 1.52% A | 1.50% A | 1.51% | 1.51% | 1.52% | 1.53% | 1.55% A |
Expenses net of all reductions | 1.52% A | 1.50% A | 1.51% | 1.51% | 1.51% | 1.53% | 1.55% A |
Net investment income (loss) | .63% A | .88% A | 1.14% | 1.54% | 2.58% | 3.15% | 3.26% A |
Supplemental Data | | | | | | | |
Net assets, end of period (in millions) | $ 101 | $ 95 | $ 89 | $ 118 | $ 131 | $ 71 | $ 39 |
Portfolio turnover rate G | 230% A | 466% A,M | 430% | 355% | 380% K | 269% | 164% K |
A Annualized B Total returns for periods of less than one year are not annualized. C Total returns would have been lower if certain expenses had not been reduced during the applicable periods shown. D Total returns do not include the effect of the contingent deferred sales charge. E Calculated based on average shares outstanding during the period. F Fees and expenses of any underlying Fidelity Central Funds are not included in the Fund's expense ratio. The Fund indirectly bears its proportionate share of the expenses of any underlying Fidelity Central Funds. G Amount does not include the portfolio activity of any underlying Fidelity Central Funds. H For the one month period ended August 31. The Fund changed its fiscal year from July 31 to August 31, effective August 31, 2011. I For the period October 24, 2006 (commencement of sale of shares) to July 31, 2007. J Expense ratios reflect operating expenses of the class. Expenses before reductions do not reflect amounts reimbursed by the investment adviser or reductions from brokerage service arrangements or reductions from other expense offset arrangements and do not represent the amount paid by the class during periods when reimbursements or reductions occur. Expense ratios before reductions for start-up periods may not be representative of longer-term operating periods. Expenses net of fee waivers reflect expenses after reimbursement by the investment adviser but prior to reductions from brokerage service arrangements or other expense offset arrangements. Expenses net of all reductions represent the net expenses paid by the class. K The portfolio turnover rate does not include the assets acquired in the merger. L For the period ended July 31. M Portfolio turnover rate excludes securities received or delivered in-kind. |
See accompanying notes which are an integral part of the financial statements.
Semiannual Report
Financial Highlights - Government Income
| Six months ended February 29, 2012 | Years ended August 31, |
| (Unaudited) | 2011 G | 2011 J | 2010 J | 2009 J | 2008 J | 2007 J |
Selected Per-Share Data | | | | | | | |
Net asset value, beginning of period | $ 10.88 | $ 10.68 | $ 10.82 | $ 10.76 | $ 10.38 | $ 10.00 | $ 9.95 |
Income from Investment Operations | | | | | | | |
Net investment income (loss) D | .091 | .018 | .233 | .275 | .390 | .438 | .443 |
Net realized and unrealized gain (loss) | .130 | .199 | .108 | .415 | .476 | .378 | .068 |
Total from investment operations | .221 | .217 | .341 | .690 | .866 | .816 | .511 |
Distributions from net investment income | (.088) | (.017) | (.225) | (.265) | (.386) | (.436) | (.456) |
Distributions from net realized gain | (.263) | - | (.256) | (.365) | (.100) | - | (.005) |
Total distributions | (.351) | (.017) | (.481) | (.630) | (.486) | (.436) | (.461) |
Net asset value, end of period | $ 10.75 | $ 10.88 | $ 10.68 | $ 10.82 | $ 10.76 | $ 10.38 | $ 10.00 |
Total Return B,C | 2.05% | 2.03% | 3.27% | 6.69% | 8.49% | 8.25% | 5.22% |
Ratios to Average Net Assets E,H | | | | | | | |
Expenses before reductions | .45% A | .45% A | .45% | .45% | .45% | .45% | .45% |
Expenses net of fee waivers, if any | .45% A | .45% A | .45% | .45% | .45% | .45% | .45% |
Expenses net of all reductions | .45% A | .45% A | .45% | .45% | .45% | .45% | .44% |
Net investment income (loss) | 1.70% A | 1.91% A | 2.20% | 2.60% | 3.65% | 4.23% | 4.42% |
Supplemental Data | | | | | | | |
Net assets, end of period (in millions) | $ 4,225 | $ 4,270 | $ 4,167 | $ 4,809 | $ 4,638 | $ 8,154 | $ 6,118 |
Portfolio turnover rate F | 230% A | 466% A,K | 430% | 355% | 380% I | 269% | 164% I |
A Annualized B Total returns for periods of less than one year are not annualized. C Total returns would have been lower if certain expenses had not been reduced during the applicable periods shown. D Calculated based on average shares outstanding during the period. E Fees and expenses of any underlying Fidelity Central Funds are not included in the Fund's expense ratio. The Fund indirectly bears its proportionate share of the expenses of any underlying Fidelity Central Funds. F Amount does not include the portfolio activity of any underlying Fidelity Central Funds. G For the one month period ended August 31. The Fund changed its fiscal year from July 31 to August 31, effective August 31, 2011. H Expense ratios reflect operating expenses of the class. Expenses before reductions do not reflect amounts reimbursed by the investment adviser or reductions from brokerage service arrangements or reductions from other expense offset arrangements and do not represent the amount paid by the class during periods when reimbursements or reductions occur. Expenses net of fee waivers reflect expenses after reimbursement by the investment adviser but prior to reductions from brokerage service arrangements or other expense offset arrangements. Expenses net of all reductions represent the net expenses paid by the class. I The portfolio turnover rate does not include the assets acquired in the merger. J For the period ended July 31. K Portfolio turnover rate excludes securities received or delivered in-kind. |
See accompanying notes which are an integral part of the financial statements.
Semiannual Report
Financial Highlights - Institutional Class
| Six months ended February 29, 2012 | Years ended August 31, |
| (Unaudited) | 2011 G | 2011 K | 2010 K | 2009 K | 2008 K | 2007 H |
Selected Per-Share Data | | | | | | | |
Net asset value, beginning of period | $ 10.90 | $ 10.69 | $ 10.84 | $ 10.77 | $ 10.40 | $ 10.01 | $ 9.98 |
Income from Investment Operations | | | | | | | |
Net investment income (loss) D | .088 | .017 | .225 | .267 | .385 | .432 | .329 |
Net realized and unrealized gain (loss) | .119 | .210 | .099 | .425 | .466 | .388 | .034 |
Total from investment operations | .207 | .227 | .324 | .692 | .851 | .820 | .363 |
Distributions from net investment income | (.084) | (.017) | (.218) | (.257) | (.381) | (.430) | (.333) |
Distributions from net realized gain | (.263) | - | (.256) | (.365) | (.100) | - | - |
Total distributions | (.347) | (.017) | (.474) | (.622) | (.481) | (.430) | (.333) |
Net asset value, end of period | $ 10.76 | $ 10.90 | $ 10.69 | $ 10.84 | $ 10.77 | $ 10.40 | $ 10.01 |
Total Return B,C | 1.92% | 2.12% | 3.10% | 6.70% | 8.32% | 8.28% | 3.67% |
Ratios to Average Net Assets E,I | | | | | | | |
Expenses before reductions | .52% A | .52% A | .52% | .53% | .51% | .51% | .53% A |
Expenses net of fee waivers, if any | .52% A | .52% A | .52% | .53% | .51% | .51% | .53% A |
Expenses net of all reductions | .52% A | .52% A | .52% | .53% | .51% | .51% | .53% A |
Net investment income (loss) | 1.63% A | 1.84% A | 2.13% | 2.52% | 3.59% | 4.17% | 4.32% A |
Supplemental Data | | | | | | | |
Net assets, end of period (in millions) | $ 352 | $ 344 | $ 344 | $ 284 | $ 200 | $ 750 | $ 715 |
Portfolio turnover rate F | 230% A | 466% A,L | 430% | 355% | 380% J | 269% | 164% J |
A Annualized B Total returns for periods of less than one year are not annualized. C Total returns would have been lower if certain expenses had not been reduced during the applicable periods shown. D Calculated based on average shares outstanding during the period. E Fees and expenses of any underlying Fidelity Central Funds are not included in the Fund's expense ratio. The Fund indirectly bears its proportionate share of the expenses of any underlying Fidelity Central Funds. F Amount does not include the portfolio activity of any underlying Fidelity Central Funds. G For the one month period ended August 31. The Fund changed its fiscal year from July 31 to August 31, effective August 31, 2011. H For the period October 24, 2006 (commencement of sale of shares) to July 31, 2007. I Expense ratios reflect operating expenses of the class. Expenses before reductions do not reflect amounts reimbursed by the investment adviser or reductions from brokerage service arrangements or reductions from other expense offset arrangements and do not represent the amount paid by the class during periods when reimbursements or reductions occur. Expense ratios before reductions for start-up periods may not be representative of longer-term operating periods. Expenses net of fee waivers reflect expenses after reimbursement by the investment adviser but prior to reductions from brokerage service arrangements or other expense offset arrangements. Expenses net of all reductions represent the net expenses paid by the class. J The portfolio turnover rate does not include the assets acquired in the merger. K For the period ended July 31. L Portfolio turnover rate excludes securities received or delivered in-kind. |
See accompanying notes which are an integral part of the financial statements.
Semiannual Report
Notes to Financial Statements
For the period ended February 29, 2012 (Unaudited)
(Amounts in thousands except percentages)
1. Organization.
Fidelity® Government Income Fund (the Fund) is a fund of Fidelity Income Fund (the Trust) and is authorized to issue an unlimited number of shares. The Trust is registered under the Investment Company Act of 1940, as amended (the 1940 Act), as an open-end management investment company organized as a Massachusetts business trust. The Fund offers Class A, Class T, Class C, Government Income and Institutional Class shares, each of which, along with Class B shares, has equal rights as to assets and voting privileges. Effective after the close of business on September 1, 2010, Class B shares were closed to new accounts and additional purchases, except for exchanges and reinvestments. Each class has exclusive voting rights with respect to matters that affect that class. Class B shares will automatically convert to Class A shares after a holding period of seven years from the initial date of purchase. Investment income, realized and unrealized capital gains and losses, the common expenses of the Fund, and certain fund-level expense reductions, if any, are allocated on a pro-rata basis to each class based on the relative net assets of each class to the total net assets of the Fund. Each class differs with respect to transfer agent and distribution and service plan fees incurred. Certain expense reductions may also differ by class.
2. Investments in Fidelity Central Funds.
The Fund invests in Fidelity Central Funds, which are open-end investment companies available only to other investment companies and accounts managed by FMR and its affiliates. The Fund's Schedule of Investments lists each of the Fidelity Central Funds held as of period end, if any, as an investment of the Fund, but does not include the underlying holdings of each Fidelity Central Fund. As an Investing Fund, the Fund indirectly bears its proportionate share of the expenses of the underlying Fidelity Central Funds.
Based on their investment objective, each Fidelity Central Fund may invest or participate in various investment vehicles or strategies that are similar to those of the Fund. These strategies are consistent with the investment objectives of the Fund and may involve certain economic risks which may cause a decline in value of each of the Fidelity Central Funds and thus a decline in the value of the Fund. The following summarizes the Fund's investment in each Fidelity Central Fund.
Semiannual Report
Notes to Financial Statements (Unaudited) - continued
(Amounts in thousands except percentages)
2. Investments in Fidelity Central Funds - continued
Fidelity Central Fund | Investment Manager | Investment Objective | Investment Practices |
Fidelity Mortgage Backed Securities Central Fund | Fidelity Investment Money Management, Inc. (FIMM) | Seeks a high level of income by normally investing in investment-grade mortgage-related securities and repurchase agreements for those securities. | Delayed Delivery & When Issued Securities Futures Repurchase Agreements Swap Agreements |
An unaudited holdings listing for the Fund, which presents direct holdings as well as the pro-rata share of any securities and other investments held indirectly through its investment in underlying non-money market Fidelity Central Funds, is available at fidelity.com and/or advisor.fidelity.com, as applicable. A complete unaudited list of holdings for each Fidelity Central Fund is available upon request or at the Securities and Exchange Commission (the SEC) web site at www.sec.gov. In addition, the financial statements of the Fidelity Central Funds which contain the significant accounting policies (including security valuation policies) of those funds are available on the SEC web site or upon request.
3. Significant Accounting Policies.
The financial statements have been prepared in conformity with accounting principles generally accepted in the United States of America (GAAP), which require management to make certain estimates and assumptions at the date of the financial statements. Actual results could differ from those estimates. Subsequent events, if any, through the date that the financial statements were issued have been evaluated in the preparation of the financial statements. The following summarizes the significant accounting policies of the Fund:
Security Valuation. Investments are valued as of 4:00 p.m. Eastern time on the last calendar day of the period. The Fund uses independent pricing services approved by the Board of Trustees to value its investments. When current market prices or quotations are not readily available or reliable, valuations may be determined in good faith in accordance with procedures adopted by the Board of Trustees. Factors used in determining value may include market or security specific events, changes in interest rates and credit quality. The frequency with which these procedures are used cannot be predicted and they may be utilized to a significant extent. The value used for net asset value (NAV) calculation under these procedures may differ from published prices for the same securities.
Semiannual Report
3. Significant Accounting Policies - continued
Security Valuation - continued
The Fund categorizes the inputs to valuation techniques used to value its investments into a disclosure hierarchy consisting of three levels as shown below:
Level 1 - quoted prices in active markets for identical investments
Level 2 - other significant observable inputs (including quoted prices for similar investments, interest rates, prepayment speeds, etc.)
Level 3 - unobservable inputs (including the Fund's own assumptions based on the best information available)
Changes in valuation techniques may result in transfers in or out of an assigned level within the disclosure hierarchy. The aggregate value of investments by input level, as of February 29, 2012 for the Fund's investments, is included at the end of the Fund's Schedule of Investments. Valuation techniques used to value the Fund's investments by major category are as follows:
Debt securities, including restricted securities, are valued based on evaluated prices received from independent pricing services or from dealers who make markets in such securities. For foreign government and government agency obligations and U.S. government and government agency obligations, pricing services utilize matrix pricing which considers yield or price of bonds of comparable quality, coupon, maturity and type as well as dealer supplied prices and are generally categorized as Level 2 in the hierarchy. For collateralized mortgage obligations, commercial mortgage securities and U.S. government agency mortgage securities, pricing services utilize matrix pricing which considers prepayment speed assumptions, attributes of the collateral, yield or price of bonds of comparable quality, coupon, maturity and type as well as dealer supplied prices and, accordingly, such securities are generally categorized as Level 2 in the hierarchy. Swaps are marked-to-market daily based on valuations from independent pricing services or dealer-supplied valuations and changes in value are recorded as unrealized appreciation (depreciation). Pricing services utilize matrix pricing which considers comparisons to interest rate curves, credit spread curves, default possibilities and recovery rates and, as a result, swaps are generally categorized as Level 2 in the hierarchy. When independent prices are unavailable or unreliable, debt securities and swaps may be valued utilizing pricing matrices which consider similar factors that would be used by independent pricing services. These are generally categorized as Level 2 in the hierarchy but may be Level 3 depending on the circumstances.
Semiannual Report
Notes to Financial Statements (Unaudited) - continued
(Amounts in thousands except percentages)
3. Significant Accounting Policies - continued
Security Valuation - continued
Futures contracts are valued at the settlement price established each day by the board of trade or exchange on which they are traded and are categorized as Level 1 in the hierarchy. Investments in open-end mutual funds, including the Fidelity Central Funds, are valued at their closing net asset value each business day and are categorized as Level 1 in the hierarchy. Short-term securities with remaining maturities of sixty days or less may be valued at amortized cost, which approximates fair value, and are categorized as Level 2 in the hierarchy.
New Accounting Pronouncements. In May 2011, the Financial Accounting Standards Board issued Accounting Standard Update No. 2011-04, Fair Value Measurement (Topic 820) - Amendments to Achieve Common Fair Value Measurement and Disclosure Requirements in U.S. GAAP and IFRSs. The update is effective during interim and annual periods beginning after December 15, 2011 and will result in additional disclosure for transfers between levels as well as expanded disclosure for securities categorized as Level 3 under the fair value hierarchy.
In December 2011, the Financial Accounting Standards Board issued Accounting Standard Update No. 2011-11, Disclosures about Offsetting Assets and Liabilities. The update creates new disclosure requirements requiring entities to disclose both gross and net information for derivatives and other financial instruments that are either offset in the Statement of Assets and Liabilities or subject to an enforceable master netting arrangement or similar agreement. The disclosure requirements are effective for interim and annual reporting periods beginning on or after January 1, 2013. Management is currently evaluating the impact of the update's adoption on the Fund's financial statement disclosures.
Investment Transactions and Income. For financial reporting purposes, the Fund's investment holdings and NAV include trades executed through the end of the last business day of the period. The NAV per share for processing shareholder transactions is calculated as of the close of business of the New York Stock Exchange (NYSE), normally 4:00 p.m. Eastern time and includes trades executed through the end of the prior business day. Gains and losses on securities sold are determined on the basis of identified cost. Interest income and distributions from the Fidelity Central Funds are accrued as earned. Interest income includes coupon interest and amortization of premium and accretion of discount on debt securities. The principal amount on inflation-indexed securities is periodically adjusted to the rate of inflation and interest is accrued based on the principal amount. The adjustments to principal due to inflation are reflected as increases or decreases to interest income even though principal is not received until maturity.
Semiannual Report
3. Significant Accounting Policies - continued
Expenses. Expenses directly attributable to a fund are charged to that fund. Expenses attributable to more than one fund are allocated among the respective funds on the basis of relative net assets or other appropriate methods. Expense estimates are accrued in the period to which they relate and adjustments are made when actual amounts are known.
Deferred Trustee Compensation. Under a Deferred Compensation Plan (the Plan), independent Trustees may elect to defer receipt of a portion of their annual compensation. Deferred amounts are invested in a cross-section of Fidelity funds, are marked-to-market and remain in the Fund until distributed in accordance with the Plan. The investment of deferred amounts and the offsetting payable to the Trustees are included in the accompanying Statement of Assets and Liabilities.
Income Tax Information and Distributions to Shareholders. Each year, the Fund intends to qualify as a regulated investment company under Subchapter M of the Internal Revenue Code, including distributing substantially all of its taxable income and realized gains. As a result, no provision for income taxes is required. The Fund files a U.S. federal tax return, in addition to state and local tax returns as required. A fund's federal income tax returns are subject to examination by the Internal Revenue Service (IRS) for a period of three fiscal years after they are filed. State and local tax returns may be subject to examination for an additional fiscal year depending on the jurisdiction.
Dividends are declared and recorded daily and paid monthly from net investment income. Distributions from realized gains, if any, are declared and recorded on the ex-dividend date. Income dividends and capital gain distributions are declared separately for each class. Income and capital gain distributions are determined in accordance with income tax regulations, which may differ from GAAP.
Capital accounts within the financial statements are adjusted for permanent book-tax differences. These adjustments have no impact on net assets or the results of operations. Temporary book-tax differences will reverse in a subsequent period.
Book-tax differences are primarily due to futures transactions, swap agreements, market discount, partnerships (including allocations from Fidelity Central Funds), deferred trustees compensation and losses deferred due to wash sales.
The federal tax cost of investment securities and unrealized appreciation (depreciation) as of period end were as follows:
Gross unrealized appreciation | $ 204,095 |
Gross unrealized depreciation | (4,231) |
Net unrealized appreciation (depreciation) on securities and other investments | $ 199,864 |
Tax cost | $ 5,355,104 |
Semiannual Report
Notes to Financial Statements (Unaudited) - continued
(Amounts in thousands except percentages)
4. Operating Policies.
Repurchase Agreements. FMR has received an Exemptive Order from the SEC which permits the Fund and other affiliated entities of FMR to transfer uninvested cash balances into joint trading accounts which are then invested in repurchase agreements. The Fund may also invest directly with institutions in repurchase agreements. Repurchase agreements are collateralized by government or non-government securities. Upon settlement date, collateral is held in segregated accounts with custodian banks and may be obtained in the event of a default of the counterparty. The Fund monitors, on a daily basis, the value of the collateral to ensure it is at least equal to the principal amount of the repurchase agreement (including accrued interest). In the event of a default by the counterparty, realization of the collateral proceeds could be delayed, during which time the value of the collateral may decline.
Delayed Delivery Transactions and When-Issued Securities. During the period, the Fund transacted in securities on a delayed delivery or when-issued basis. Payment and delivery may take place after the customary settlement period for that security. The price of the underlying securities and the date when the securities will be delivered and paid for are fixed at the time the transaction is negotiated. During the time a delayed delivery sell is outstanding, the contract is marked-to-market daily and equivalent deliverable securities are held for the transaction. The securities purchased on a delayed delivery or when-issued basis are identified as such in the Fund's Schedule of Investments. The Fund may receive compensation for interest forgone in the purchase of a delayed delivery or when-issued security. With respect to purchase commitments, the Fund identifies securities as segregated in its records with a value at least equal to the amount of the commitment. Losses may arise due to changes in the value of the underlying securities or if the counterparty does not perform under the contract's terms, or if the issuer does not issue the securities due to political, economic, or other factors.
To-Be-Announced (TBA) Securities and Mortgage Dollar Rolls. During the period, the Fund transacted in TBA securities that involved buying or selling mortgage-backed securities (MBS) on a forward commitment basis. A TBA transaction typically does not designate the actual security to be delivered and only includes an approximate principal amount however; delivered securities must meet specified terms defined by industry guidelines, including issuer, rate and current principal amount outstanding on underlying mortgage pools. The Fund may enter into a TBA transaction with the intent to take possession of or deliver the underlying MBS, or the Fund may elect to extend the settlement by entering into either a mortgage or reverse mortgage dollar roll. Mortgage dollar rolls are transactions where a fund sells MBS and simultaneously agrees to repurchase MBS on a later date at a lower price and with the same counterparty. Reverse mortgage dollar rolls involve the purchase and simultaneous agreement to sell MBS on a later date at a lower price. Transactions in mortgage dollar rolls and reverse mortgage dollar rolls are accounted for as purchases and sales and may result in an increase to the Fund's portfolio turnover rate.
Semiannual Report
4. Operating Policies - continued
To-Be-Announced (TBA) Securities and Mortgage Dollar Rolls - continued
Purchases and sales of TBA securities involve risks similar to those discussed above for delayed delivery and when-issued securities. Also, if the counterparty in a dollar roll or a reverse dollar roll transaction files for bankruptcy or becomes insolvent, the Fund's right to repurchase or sell securities may be limited. Additionally, when a fund sells TBA securities without already owning or having the right to obtain the deliverable securities (an uncovered forward commitment to sell), it incurs a risk of loss because it could have to purchase the securities at a price that is higher than the price at which it sold them. A fund may be unable to purchase the deliverable securities if the corresponding market is illiquid.
TBA securities subject to a forward commitment to sell at period end are included at the end of the Fund's Schedule of Investments under the caption "TBA Sale Commitments." The proceeds and value of these commitments are reflected in the Fund's Statement of Assets and Liabilities.
5. Derivative Instruments.
Risk Exposures and the Use of Derivative Instruments. The Fund used derivative instruments (derivatives), including futures contracts and swap agreements, in order to meet its investment objectives. The strategy is to use derivatives to increase returns, to gain exposure to certain types of assets and to manage exposure to certain risks as defined below. The success of any strategy involving derivatives depends on analysis of numerous economic factors, and if the strategies for investment do not work as intended, the Fund may not achieve its objectives.
The Fund's use of derivatives increased or decreased its exposure to the following risk:
Interest Rate Risk | Interest rate risk relates to the fluctuations in the value of interest-bearing securities due to changes in the prevailing levels of market interest rates. |
The Fund is also exposed to additional risks from investing in derivatives, such as liquidity risk and counterparty credit risk. Liquidity risk is the risk that the Fund will be unable to close out the derivative in the open market in a timely manner. Counterparty credit risk is the risk that the counterparty will not be able to fulfill its obligation to the Fund. Derivative counterparty credit risk is managed through formal evaluation of the creditworthiness of all potential counterparties. On certain over-the-counter (OTC) derivatives such as swap agreements, the Fund attempts to reduce its exposure to counterparty credit risk by entering into an International Swaps and Derivatives Association (ISDA) Master Agreement on a bilateral basis with each of its counterparties. The
Semiannual Report
Notes to Financial Statements (Unaudited) - continued
(Amounts in thousands except percentages)
5. Derivative Instruments - continued
Risk Exposures and the Use of Derivative Instruments - continued
ISDA Master Agreement gives the Fund the right to terminate all transactions traded under such agreement if there is a certain deterioration in the credit quality of the counterparty. The ISDA Master Agreement gives each party the right, upon an event of default by the other party or a termination of the agreement, to close out all transactions traded under such agreement and to net amounts owed under each transaction to one net payable by one party to the other. To mitigate counterparty credit risk on OTC derivatives, the Fund receives collateral in the form of cash or securities once the Fund's net unrealized appreciation on outstanding derivative contracts under an ISDA Master Agreement exceeds certain applicable thresholds, subject to certain minimum transfer provisions. The collateral received is held in segregated accounts with the Fund's custodian bank in accordance with the collateral agreements entered into between the Fund, the counterparty and the Fund's custodian bank. The Fund could experience delays and costs in gaining access to the collateral even though it is held by the Fund's custodian bank. The Fund's maximum risk of loss from counterparty credit risk related to OTC derivatives is generally the aggregate unrealized appreciation and unpaid counterparty payments in excess of any collateral pledged by the counterparty to the Fund. The Fund may be required to pledge collateral for the benefit of the counterparties on over-the-counter (OTC) derivatives in an amount not less than the counterparty's unrealized appreciation on outstanding derivative contracts, subject to certain minimum transfer provisions, and any such pledged collateral is identified in the Schedule of Investments. Futures contracts are not covered by the ISDA Master Agreement, however, counterparty credit risk related to exchange-traded futures contracts is minimal because of the protection provided by the exchange on which they trade. Derivatives involve, to varying degrees, risk of loss in excess of the amounts recognized in the Statement of Assets and Liabilities.
Net Realized Gain (Loss) and Change in Net Unrealized Appreciation (Depreciation) on Derivatives. The table below, which reflects the impacts of derivatives on the financial performance of the Fund, summarizes the net realized gain (loss) and change in net unrealized appreciation (depreciation) for derivatives during the period.
Risk Exposure / Derivative Type | Net Realized Gain (Loss) | Change in Net Unrealized Appreciation (Depreciation) |
Interest Rate Risk | | |
Futures Contracts | $ (69) | $ 203 |
Swap Agreements | (707) | (1,325) |
Totals (a) | $ (776) | $ (1,122) |
(a) A summary of the value of derivatives by risk exposure as of period end is included at the end of the Schedule of Investments and is representative of activity for the period.
Semiannual Report
5. Derivative Instruments - continued
Futures Contracts. A futures contract is an agreement between two parties to buy or sell a specified underlying instrument for a fixed price at a specified future date. The Fund used futures contracts to manage its exposure to the bond market and to fluctuations in interest rates.
Upon entering into a futures contract, a fund is required to deposit either cash or securities (initial margin) with a clearing broker in an amount equal to a certain percentage of the face value of the contract. Futures contracts are marked-to-market daily and subsequent payments (variation margin) are made or received by a fund depending on the daily fluctuations in the value of the futures contracts and are recorded as unrealized appreciation or (depreciation). This receivable and/or payable is included in daily variation margin on futures contracts in the Statement of Assets and Liabilities. Realized gain or (loss) is recorded upon the expiration or closing of a futures contract. The net realized gain (loss) and change in net unrealized appreciation (depreciation) on futures contracts during the period is included in the Statement of Operations.
The underlying face amount at value of open futures contracts at period end is shown in the Schedule of Investments under the caption "Futures Contracts." This amount reflects each contract's exposure to the underlying instrument at period end. Securities deposited to meet initial margin requirements are identified in the Schedule of Investments.
Swap Agreements. A swap agreement (swap) is a contract between two parties to exchange future cash flows at periodic intervals based on a notional principal amount.
Details of swaps open at period end are included in the Schedule of Investments under the caption "Swap Agreements." Swaps are marked-to-market daily and changes in value are recorded as unrealized appreciation or (depreciation) and reflected in the Statement of Assets and Liabilities. Any upfront premiums paid or received upon entering a swap to compensate for differences between stated terms of the agreement and prevailing market conditions (e.g. credit spreads, interest rates or other factors) are recorded as realized gain or (loss) ratably over the term of the swap. Payments are exchanged at specified intervals, accrued daily commencing with the effective date of the contract and recorded as realized gain or (loss). Realized gain or (loss) is also recorded in the event of an early termination of a swap. The net realized gain (loss) and change in net unrealized appreciation (depreciation) on swaps during the period is included in the Statement of Operations.
Interest Rate Swaps. Interest rate swaps are agreements between counterparties to exchange cash flows, one based on a fixed rate, and the other on a floating rate. The Fund entered into interest rate swaps to manage its exposure to interest rate changes. Changes in interest rates can have an effect on both the value of bond holdings as well as the amount of interest income earned. In general, the value of bonds can fall when interest rates rise and can rise when interest rates fall.
Semiannual Report
Notes to Financial Statements (Unaudited) - continued
(Amounts in thousands except percentages)
6. Purchases and Sales of Investments.
Purchases and sales of securities (including the Fixed-Income Central Funds), other than short-term securities and U.S. government securities, aggregated $20,729 and $4,203, respectively.
7. Fees and Other Transactions with Affiliates.
Management Fee. FMR and its affiliates provide the Fund with investment management related services for which the Fund pays a monthly management fee. The management fee is the sum of an individual fund fee rate that is based on an annual rate of .20% of the Fund's average net assets and an annualized group fee rate that averaged .12% during the period. The group fee rate is based upon the average net assets of all the mutual funds advised by FMR. The group fee rate decreases as assets under management increase and increases as assets under management decrease. For the period, the total annualized management fee rate was .32% of the Fund's average net assets.
Distribution and Service Plan Fees. In accordance with Rule 12b-1 of the 1940 Act, the Fund has adopted separate Distribution and Service Plans for each class of shares. Certain classes pay Fidelity Distributors Corporation (FDC), an affiliate of FMR, separate Distribution and Service Fees, each of which is based on an annual percentage of each class' average net assets. In addition, FDC may pay financial intermediaries for selling shares of the Fund and providing shareholder support services. For the period, the Distribution and Service Fee rates, total fees and amounts retained by FDC were as follows:
| Distribution
Fee | Service
Fee | Total Fees | Retained
by FDC |
Class A | -% | .25% | $ 457 | $ 9 |
Class T | -% | .25% | 373 | 2 |
Class B | .65% | .25% | 114 | 83 |
Class C | .75% | .25% | 509 | 74 |
| | | $ 1,453 | $ 168 |
Sales Load. FDC may receive a front-end sales charge of up to 4.00% for selling Class A shares and Class T shares, some of which is paid to financial intermediaries for selling shares of the Fund. Depending on the holding period, FDC may receive contingent deferred sales charges levied on Class A, Class T, Class B, and Class C redemptions. The deferred sales charges range from 5.00% to 1.00% for Class B, 1.00% for Class C, .75% for certain purchases of Class A shares and .25% for certain purchases of Class T shares.
Semiannual Report
7. Fees and Other Transactions with Affiliates - continued
Sales Load - continued
For the period, sales charge amounts retained by FDC were as follows:
| Retained
by FDC |
Class A | $ 38 |
Class T | 13 |
Class B* | 29 |
Class C* | 8 |
| $ 88 |
* When Class B and Class C shares are initially sold, FDC pays commissions from its own resources to financial intermediaries through which the sales are made.
Transfer Agent Fees. Fidelity Investments Institutional Operations Company, Inc. (FIIOC), an affiliate of FMR, is the transfer, dividend disbursing and shareholder servicing agent for each class of the Fund. FIIOC receives account fees and asset-based fees that vary according to the account size and type of account of the shareholders of the respective classes of the Fund. FIIOC pays for typesetting, printing and mailing of shareholder reports, except proxy statements. For the period, transfer agent fees for each class were as follows:
| Amount | % of
Average
Net Assets* |
Class A | $ 308 | .17 |
Class T | 228 | .15 |
Class B | 31 | .24 |
Class C | 82 | .16 |
Government Income | 2,147 | .10 |
Institutional Class | 296 | .17 |
| $ 3,092 | |
* Annualized
Fund Wide Operations Fee. Pursuant to the Fund Wide Operations and Expense Agreement (FWOE), FMR has agreed to provide for fund level expenses (which do not include transfer agent, Rule 12b-1 fees, compensation of the independent Trustees, interest (including commitment fees), taxes or extraordinary expenses, if any) in return for a FWOE fee equal to .35% less the total amount of the management fee. The FWOE paid by the Fund is reduced by an amount equal to the fees and expenses paid to the independent Trustees. For the period, the FWOE fee was equivalent to an annualized rate of .03% of average net assets.
Semiannual Report
Notes to Financial Statements (Unaudited) - continued
(Amounts in thousands except percentages)
8. Committed Line of Credit.
The Fund participates with other funds managed by FMR or an affiliate in a $4.0 billion credit facility (the "line of credit") to be utilized for temporary or emergency purposes to fund shareholder redemptions or for other short-term liquidity purposes. The Fund has agreed to pay commitment fees on its pro-rata portion of the line of credit, which amounted to $8 and is reflected in Miscellaneous expenses on the Statement of Operations. During the period, there were no borrowings on this line of credit.
9. Security Lending.
The Fund lends portfolio securities from time to time in order to earn additional income. On the settlement date of the loan, the Fund receives collateral (in the form of U.S. Treasury obligations, letters of credit and/or cash) against the loaned securities and maintains collateral in an amount not less than 100% of the market value of the loaned securities during the period of the loan. The market value of the loaned securities is determined at the close of business of the Fund and any additional required collateral is delivered to the Fund on the next business day. If the borrower defaults on its obligation to return the securities loaned because of insolvency or other reasons, a fund could experience delays and costs in recovering the securities loaned or in gaining access to the collateral. Any cash collateral received is maintained at the Fund's custodian and/or invested in cash equivalents. At period end, there were no security loans outstanding. Security lending income represents the income earned on investing cash collateral, less rebates paid to borrowers, plus any premium payments received for lending certain types of securities. Security lending income is presented in the Statement of Operations as a component of interest income. Total security lending income during the period amounted to $113.
10. Expense Reductions.
Through arrangements with the Fund's custodian, credits realized as a result of uninvested cash balances were used to reduce the Fund's expenses. During the period, these credits reduced the Fund's expenses by $4.
Semiannual Report
11. Distributions to Shareholders.
Distributions to shareholders of each class were as follows:
| 6 months ended
February 29, 2012 | One month ended
August 31, 2011 | Year ended
July 31, 2011 |
From net investment income | | | |
Class A | $ 2,393 | $ 449 | $ 6,937 |
Class T | 1,978 | 375 | 5,513 |
Class B | 74 | 18 | 332 |
Class C | 287 | 65 | 1,100 |
Government Income | 34,986 | 6,712 | 94,692 |
Institutional Class | 2,765 | 522 | 6,323 |
Total | $ 42,483 | $ 8,141 | $ 114,897 |
From net realized gain | | | |
Class A | $ 8,696 | $ - | $ 10,104 |
Class T | 7,112 | - | 7,830 |
Class B | 622 | - | 853 |
Class C | 2,398 | - | 2,724 |
Government Income | 103,541 | - | 112,442 |
Institutional Class | 8,484 | - | 6,868 |
Total | $ 130,853 | $ - | $ 140,821 |
12. Share Transactions.
Transactions for each class of shares were as follows:
| Shares |
| 6 months ended February 29, 2012 | One month ended
August 31, 2011 | Year ended
July 31, 2011 |
Class A | | | |
Shares sold | 8,211 | 2,036 | 10,505 |
Reinvestment of distributions | 944 | 38 | 1,423 |
Shares redeemed | (6,368) | (1,114) | (20,985) |
Net increase (decrease) | 2,787 | 960 | (9,057) |
Class T | | | |
Shares sold | 6,692 | 1,638 | 9,053 |
Reinvestment of distributions | 826 | 34 | 1,221 |
Shares redeemed | (5,790) | (844) | (15,795) |
Net increase (decrease) | 1,728 | 828 | (5,521) |
Class B | | | |
Shares sold | 166 | 131 | 275 |
Reinvestment of distributions | 50 | 1 | 93 |
Shares redeemed | (459) | (63) | (1,536) |
Net increase (decrease) | (243) | 69 | (1,168) |
Semiannual Report
Notes to Financial Statements (Unaudited) - continued
(Amounts in thousands except percentages)
12. Share Transactions - continued
| Shares |
| 6 months ended
February 29, 2012 | One month ended
August 31, 2011 | Year ended
July 31, 2011 |
Class C | | | |
Shares sold | 2,059 | 627 | 2,426 |
Reinvestment of distributions | 183 | 4 | 261 |
Shares redeemed | (1,492) | (235) | (5,248) |
Net increase (decrease) | 750 | 396 | (2,561) |
Government Income | | | |
Shares sold | 56,827 | 15,991 | 105,621 |
Reinvestment of distributions | 12,331 | 590 | 18,687 |
Shares redeemed | (68,324) | (14,407) | (178,425) |
Net increase (decrease) | 834 | 2,174 | (54,117) |
Institutional Class | | | |
Shares sold | 8,064 | 1,083 | 12,979 |
Reinvestment of distributions | 979 | 45 | 1,192 |
Shares redeemed | (7,867) | (1,758) | (8,205) |
Net increase (decrease) | 1,176 | (630) | 5,966 |
| Dollars |
| 6 months ended February 29, 2012 | One month ended
August 31, 2011 | Year ended
July 31, 2011 |
Class A | | | |
Shares sold | $ 88,934 | $ 22,105 | $ 111,665 |
Reinvestment of distributions | 10,225 | 412 | 15,111 |
Shares redeemed | (68,816) | (12,108) | (221,593) |
Net increase (decrease) | $ 30,343 | $ 10,409 | $ (94,817) |
Class T | | | |
Shares sold | $ 72,414 | $ 17,802 | $ 96,270 |
Reinvestment of distributions | 8,939 | 366 | 12,970 |
Shares redeemed | (62,592) | (9,169) | (166,943) |
Net increase (decrease) | $ 18,761 | $ 8,999 | $ (57,703) |
Class B | | | |
Shares sold | $ 1,801 | $ 1,417 | $ 2,957 |
Reinvestment of distributions | 543 | 14 | 985 |
Shares redeemed | (4,959) | (683) | (16,266) |
Net increase (decrease) | $ (2,615) | $ 748 | $ (12,324) |
Class C | | | |
Shares sold | $ 22,298 | $ 6,815 | $ 25,890 |
Reinvestment of distributions | 1,983 | 46 | 2,774 |
Shares redeemed | (16,097) | (2,561) | (55,376) |
Net increase (decrease) | $ 8,184 | $ 4,300 | $ (26,712) |
Semiannual Report
12. Share Transactions - continued
| Dollars |
| 6 months ended February 29, 2012 | One month ended
August 31, 2011 | Year ended
July 31, 2011 |
Government Income | | | |
Shares sold | $ 614,097 | $ 173,420 | $ 1,120,288 |
Reinvestment of distributions | 133,373 | 6,422 | 198,243 |
Shares redeemed | (737,698) | (156,265) | (1,885,694) |
Net increase (decrease) | $ 9,772 | $ 23,577 | $ (567,163) |
Institutional Class | | | |
Shares sold | $ 87,188 | $ 11,762 | $ 137,402 |
Reinvestment of distributions | 10,596 | 491 | 12,645 |
Shares redeemed | (84,999) | (19,046) | (86,944) |
Net increase (decrease) | $ 12,785 | $ (6,793) | $ 63,103 |
13. Other.
The Fund's organizational documents provide former and current trustees and officers with a limited indemnification against liabilities arising in connection with the performance of their duties to the Fund. In the normal course of business, the Fund may also enter into contracts that provide general indemnifications. The Fund's maximum exposure under these arrangements is unknown as this would be dependent on future claims that may be made against the Fund. The risk of material loss from such claims is considered remote.
Semiannual Report
Board Approval of Investment Advisory Contracts and Management Fees
Fidelity Government Income Fund
Each year, the Board of Trustees, including the Independent Trustees (together, the Board), votes on the renewal of the management contract and sub-advisory agreements (together, the Advisory Contracts) for the fund. The Board, assisted by the advice of fund counsel and Independent Trustees' counsel, requests and considers a broad range of information relevant to the renewal of the Advisory Contracts throughout the year.
The Board meets regularly and considers at each of its meetings factors that are relevant to its annual consideration of the renewal of the fund's Advisory Contracts, including the services and support provided to the fund and its shareholders. The Board has established three standing committees, Operations, Audit, and Nominating and Governance, each composed of Independent Trustees with varying backgrounds, to which the Board has assigned specific subject matter responsibilities in order to enhance effective decision-making by the Board. The Operations Committee, of which all of the Independent Trustees are members, meets regularly throughout the year and, among other matters, considers matters specifically related to the annual consideration of the renewal of the fund's Advisory Contracts. The Board, acting directly and through its Committees, requests and receives information concerning the annual consideration of the renewal of the fund's Advisory Contracts. The Board also meets as needed to consider matters specifically related to the Board's annual consideration of the renewal of Advisory Contracts. Members of the Board may also meet with trustees of other Fidelity funds through ad hoc joint committees to discuss certain matters relevant to the Fidelity funds.
At its September 2011 meeting, the Board of Trustees, including the Independent Trustees, unanimously determined to renew the fund's Advisory Contracts. In reaching its determination, the Board considered all factors it believed relevant, including (i) the nature, extent, and quality of the services to be provided to the fund and its shareholders (including the investment performance of the fund); (ii) the competitiveness of the fund's management fee and total expense ratio; (iii) the total costs of the services to be provided by and the profits to be realized by Fidelity from its relationship with the fund; (iv) the extent to which economies of scale would be realized as the fund grows; and (v) whether fee levels reflect these economies of scale, if any, for the benefit of fund shareholders.
In considering whether to renew the Advisory Contracts for the fund, the Board reached a determination, with the assistance of fund counsel and Independent Trustees' counsel and through the exercise of its business judgment, that the renewal of the Advisory Contracts is in the best interests of the fund and its shareholders and that the compensation payable under the Advisory Contracts is fair and reasonable. The Board's decision to renew the Advisory Contracts was not based on any single factor, but rather was based on a comprehensive consideration of all the information provided to the Board at its meetings throughout the year. The Board, in reaching its determination to renew the Advisory Contracts, is aware that shareholders in the fund have a broad range of investment choices available to them, including a wide choice among mutual funds offered by Fidelity's competitors, and that the fund's shareholders, who have the opportunity to review and weigh the disclosure provided by the fund in its prospectus and other public disclosures, have chosen to invest in this fund, managed by Fidelity.
Semiannual Report
Nature, Extent, and Quality of Services Provided. The Board considered the staffing within the investment adviser, FMR, and the sub-advisers (together, the Investment Advisers), including the backgrounds of the fund's investment personnel and the fund's investment objective and discipline. The Independent Trustees also had discussions with senior management of Fidelity's investment operations and investment groups. The Board considered the structure of the portfolio manager compensation program and whether this structure provides appropriate incentives to act in the best interests of the fund.
Resources Dedicated to Investment Management and Support Services. The Board reviewed the general qualifications and capabilities of the Investment Advisers' investment staff, including its size, education, experience, and resources, as well as the Investment Advisers' approach to recruiting, managing, and compensating investment personnel. The Board also noted that FMR has devoted increased resources to non-U.S. offices. The Board noted that Fidelity's analysts have extensive resources, tools and capabilities which allow them to conduct sophisticated quantitative and fundamental analysis, as well as credit analysis of issuers, counterparties and enhancers. The Board also believes that Fidelity's investment professionals have sufficient access to global information and data so as to provide competitive investment results over time, and that those professionals also have access to sophisticated tools which permit them to assess portfolio construction and risk and performance attribution characteristics continuously, as well as to transmit new information and research conclusions rapidly around the world. Additionally, in its deliberations, the Board considered the Investment Advisers' trading capabilities and resources which are an integral part of the investment management process.
Shareholder and Administrative Services. The Board considered (i) the nature, extent, quality, and cost of advisory, administrative, and shareholder services performed by the Investment Advisers and their affiliates under the Advisory Contracts and under separate agreements covering transfer agency, pricing and bookkeeping, and securities lending services for the fund; (ii) the nature and extent of the investment adviser's supervision of third party service providers, principally custodians and subcustodians; and (iii) the resources devoted to, and the record of compliance with, the fund's compliance policies and procedures.
The Board noted that the growth of fund assets over time across the complex allows Fidelity to reinvest in the development of services designed to enhance the value or convenience of the Fidelity funds as investment vehicles. These services include 24-hour access to account information and market information through telephone representatives and over the Internet, investor education materials and asset allocation tools, and the expanded availability of Fidelity Investor Centers, with 35 new branches opening since 2010.
Semiannual Report
Board Approval of Investment Advisory Contracts and
Management Fees - continued
Investment in a Large Fund Family. The Board considered the benefits to shareholders of investing in a Fidelity fund, including the benefits of investing in a fund that is part of a large family of funds offering a variety of investment disciplines and providing a large variety of mutual fund investor services. The Board noted that Fidelity had taken, or had made recommendations that resulted in the Fidelity funds taking, a number of actions over the previous year that benefited particular funds, including (i) continuing to dedicate additional resources to investment research and support of the senior management team that oversees asset management; (ii) rationalizing product lines through the mergers of six funds into other funds; (iii) continuing to migrate the Freedom Funds to dedicated lower cost underlying funds; (iv) obtaining shareholder approval to broaden the investment strategies for Fidelity Consumer Finance Portfolio, Fidelity Emerging Asia Fund, and Fidelity Environment and Alternative Energy Portfolio; (v) contractually agreeing to reduce the management fees and impose other expense limitations on Spartan 500 Index Fund and U.S. Bond Index Fund in connection with launching new institutional classes of these funds; (vi) changing the name, primary and supplemental benchmarks, and investment policies of Fidelity Global Strategies Fund to support the fund's flexible investment mandate and global orientation; and (vii) reducing the transfer agency account fee rates on certain accounts.
Investment Performance. The Board considered whether the fund has operated in accordance with its investment objective, as well as its record of compliance with its investment restrictions. It also reviewed the fund's absolute investment performance for each class, as well as the fund's relative investment performance for each class measured over multiple periods against (i) a proprietary custom index, and (ii) a peer group of mutual funds deemed appropriate by Fidelity and reviewed by the Board. The following charts considered by the Board show, over the one-, three-, and five-year periods ended December 31, 2010, as available, the cumulative total returns of the retail class and Class C of the fund, the cumulative total returns of a proprietary custom index ("benchmark"), and a range of cumulative total returns of a peer group of mutual funds identified by Lipper Inc. as having an investment objective similar to that of the fund. The returns of the retail class and Class C show the performance of the highest performing class (based on five-year performance) and the lowest performing class (based on three-year performance), respectively. The box within each chart shows the 25th percentile return (bottom of box) and the 75th percentile return (top of box) of the peer group. Returns shown above the box are in the first quartile and returns shown below the box are in the fourth quartile. The percentage beaten numbers noted below each chart correspond to the percentile box and represent the percentage of funds in the peer group whose performance was equal to or lower than that of the class indicated. The fund's proprietary custom index is an index developed by FMR that represents the performance of the fund's general investment categories.
Semiannual Report
Fidelity Government Income Fund

The Board reviewed the fund's relative investment performance against its peer group and noted that the performance of the retail class of the fund was in the third quartile for the one-year period and the first quartile for the three- and five-year periods. The Board also noted that the investment performance of the retail class of the fund compared favorably to its benchmark for the three- and five-year periods, although the fund's one-year total return was lower than its benchmark. The Board considered that the variations in performance among the fund's classes reflect the variations in class expenses, which result in lower performance for higher expense classes. The Board also reviewed the fund's performance since inception as well as performance in the current year.
Based on its review, the Board concluded that the nature, extent, and quality of services provided to the fund under the Advisory Contracts should benefit the fund's shareholders.
Competitiveness of Management Fee and Total Expense Ratio. The Board considered the fund's management fee and total expense ratio compared to "mapped groups" of competitive funds and classes. Fidelity creates "mapped groups" by combining similar Lipper investment objective categories that have comparable management fee characteristics. Combining Lipper investment objective categories aids the Board's management fee and total expense ratio comparisons by broadening the competitive group used for comparison and by reducing the number of universes to which various Fidelity funds are compared.
Semiannual Report
Board Approval of Investment Advisory Contracts and
Management Fees - continued
Management Fee. The Board considered two proprietary management fee comparisons for the 12-month periods shown in the chart below. The group of Lipper funds used by the Board for management fee comparisons is referred to below as the "Total Mapped Group" and, for the reasons explained above, is broader than the Lipper peer group used by the Board for performance comparisons. The Total Mapped Group comparison focuses on a fund's standing relative to the total universe of comparable funds available to investors in terms of gross management fees before expense reimbursements or caps. "TMG %" represents the percentage of funds in the Total Mapped Group that had management fees that were lower than the fund's. For example, a TMG % of 12% means that 88% of the funds in the Total Mapped Group had higher management fees than the fund. The "Asset-Size Peer Group" (ASPG) comparison focuses on a fund's standing relative to non-Fidelity funds similar in size to the fund within the Total Mapped Group. The ASPG represents at least 15% of the funds in the Total Mapped Group with comparable asset size and management fee characteristics, subject to a minimum of 50 funds (or all funds in the Total Mapped Group if fewer than 50). Additional information, such as the ASPG quartile in which the fund's management fee ranked, is also included in the chart and considered by the Board.
Fidelity Government Income Fund

The Board noted that the fund's management fee ranked below the median of its Total Mapped Group and below the median of its ASPG for 2010.
Semiannual Report
Based on its review, the Board concluded that the fund's management fee is fair and reasonable in light of the services that the fund receives and the other factors considered.
Total Expense Ratio. In its review of each class's total expense ratio, the Board considered the fund's management fee as well as other fund or class expenses, as applicable, such as transfer agent fees, pricing and bookkeeping fees, fund-paid 12b-1 fees, and custodial, legal, and audit fees. The Board also noted the effects of any waivers and reimbursements on fees and expenses. As part of its review, the Board also considered the current and historical total expense ratios of each class of the fund compared to competitive fund median expenses. Each class of the fund is compared to those funds and classes in the Total Mapped Group (used by the Board for management fee comparisons) that have a similar sales load structure.
The Board also considered that the current contractual arrangements for the fund (i) have the effect of setting the total "fund-level" expenses (including, among certain other expenses, the management fee) for each class at 35 basis points, (ii) limit the "class-level" transfer agent fee for the retail class to 10 basis points, and (iii) limit the total expenses for the retail class to 45 basis points. The fees and expenses payable under these contractual arrangements may not be increased without the approval of the Board and the shareholders of the applicable class. The fund's Advisor classes are subject to different "class-level" expenses (transfer agent fees and 12b-1 fees).
The Board noted that the total expense ratio of each class ranked below its competitive median for 2010.
The Board recognized that the fund's management contract incorporates a "group fee" structure, which provides for lower group fee rates as total fund assets under FMR's management increase, and for higher group fee rates as total fund assets under FMR's management decrease. FMR calculates the group fee rates based on a tiered asset "breakpoint" schedule that varies based on asset class. The Board noted, however, that because the current contractual arrangements set the total "fund-level" expenses for each class at 35 basis points, increases or decreases in the management fee due to changes in the group fee rate will not impact the total expense ratio.
Fees Charged to Other Fidelity Clients. The Board also considered Fidelity fee structures and other information with respect to clients of FMR and its affiliates, such as other mutual funds advised or subadvised by FMR or its affiliates, pension plan clients, and other institutional clients. In March 2010, the Board created an ad hoc joint committee with the board of other Fidelity funds (the Committee) to review and compare Fidelity's institutional investment advisory business with its business of providing services to the Fidelity funds, including the differences in services provided, fees charged, and costs incurred, as well as competition in their respective marketplaces.
Semiannual Report
Board Approval of Investment Advisory Contracts and
Management Fees - continued
Based on its review of total expense ratios and fees charged to other Fidelity clients, the Board concluded that the total expense ratio of each class of the fund was reasonable in light of the services that the fund and its shareholders receive and the other factors considered, including the findings of the Committee.
Costs of the Services and Profitability. The Board considered the revenues earned and the expenses incurred by Fidelity in conducting the business of developing, marketing, distributing, managing, administering and servicing the fund and its shareholders. The Board also considered the level of Fidelity's profits in respect of all the Fidelity funds.
On an annual basis, FMR presents to the Board Fidelity's profitability for the fund. Fidelity calculates the profitability for each fund, as well as aggregate profitability for groups of Fidelity funds and all Fidelity funds, using a series of detailed revenue and cost allocation methodologies which originate with the books and records of Fidelity on which Fidelity's audited financial statements are based. The Audit Committee of the Board reviews any significant changes from the prior year's methodologies.
PricewaterhouseCoopers LLP (PwC), independent registered public accounting firm and auditor to Fidelity and certain Fidelity funds, has been engaged annually by the Board as part of the Board's assessment of Fidelity's profitability analysis. PwC's engagement includes the review and assessment of Fidelity's methodologies used in determining the revenues and expenses attributable to Fidelity's mutual fund business, and completion of agreed-upon procedures surrounding the mathematical accuracy of fund profitability and its conformity to allocation methodologies. After considering PwC's reports issued under the engagement and information provided by Fidelity, the Board concluded that while other allocation methods may also be reasonable, Fidelity's profitability methodologies are reasonable in all material respects.
The Board also reviewed Fidelity's non-fund businesses and fall-out benefits related to the mutual fund business as well as cases where Fidelity's affiliates may benefit from or be related to the fund's business.
The Board considered the costs of the services provided by and the profits realized by Fidelity in connection with the operation of the fund and was satisfied that the profitability was not excessive in the circumstances.
Economies of Scale. The Board considered whether there have been economies of scale in respect of the management of the Fidelity funds, whether the Fidelity funds (including the fund) have appropriately benefited from any such economies of scale, and whether there is potential for realization of any further economies of scale. The Board considered the extent to which the fund will benefit from economies of scale through increased services to the fund, through waivers or reimbursements, or through fee or expense reductions. The Board also noted that in 2009, it and the board of other Fidelity funds created an ad hoc committee (the Economies of Scale Committee) to analyze whether FMR attains economies of scale in respect of the management and servicing of the Fidelity funds, whether the Fidelity funds have appropriately benefited from such economies of scale, and whether there is potential for realization of any further economies of scale.
Semiannual Report
The Board concluded, taking into account the analysis of the Economies of Scale Committee, that any potential economies of scale are being appropriately shared between fund shareholders and Fidelity.
Additional Information Requested by the Board. In order to develop fully the factual basis for consideration of the Fidelity funds' Advisory Contracts, the Board requested and received additional information on certain topics, including: (i) Fidelity's fund profitability methodology, profitability trends for certain funds, and the impact of certain factors on fund profitability results; (ii) portfolio manager changes that have occurred during the past year and the amount of the investment that each portfolio manager has made in the Fidelity fund(s) that he or she manages; (iii) Fidelity's compensation structure for portfolio managers, research analysts, and other key personnel, including its effects on fund profitability, the rationale for the compensation structure, and the extent to which current market conditions have affected retention and recruitment; (iv) the compensation paid to fund sub-advisers on behalf of the Fidelity funds; (v) Fidelity's fee structures and rationale for recommending different fees among different categories of funds and classes, as well as Fidelity's voluntary waiver of its fees to maintain minimum yields for certain money market funds and classes; (vi) the reasons why certain expenses affect various funds and classes differently; (vii) Fidelity's transfer agent fees, expenses, and services and how the benefits of decreased costs and new efficiencies can be shared across all of the Fidelity funds; (viii) the reasons for and consequences of changes to certain product lines compared to competitors; (ix) the allocation of and historical trends in Fidelity's realization of fall-out benefits; and (x) explanations regarding the relative total expense ratios of certain funds and classes, total expense competitive trends, and actions that might be taken by FMR to reduce total expense ratios for certain funds and classes or to achieve further economies of scale.
Based on its evaluation of all of the conclusions noted above, and after considering all factors it believed relevant, the Board ultimately concluded that the advisory fee structures are fair and reasonable, and that the fund's Advisory Contracts should be renewed.
Semiannual Report
Investment Adviser
Fidelity Management & Research Company
Boston, MA
Investment Sub-Advisers
Fidelity Management & Research
(U.K.) Inc.
Fidelity Investments
Money Management, Inc.
Fidelity Management & Research
(Hong Kong) Limited
Fidelity Management & Research
(Japan) Inc.
General Distributor
Fidelity Distributors Corporation
Boston, MA
Transfer and Service Agents
Fidelity Investments Institutional
Operations Company, Inc.
Boston, MA
Fidelity Service Company, Inc.
Boston, MA
Custodian
The Bank of New York Mellon
New York, NY
The Fidelity Telephone Connection
Mutual Fund 24-Hour Service
Exchanges/Redemptions
and Account Assistance 1-800-544-6666
Product Information 1-800-544-6666
Retirement Accounts 1-800-544-4774
(8 a.m. - 9 p.m.)
TDD Service 1-800-544-0118
for the deaf and hearing impaired
(9 a.m. - 9 p.m. Eastern time)
Fidelity Automated Service
Telephone (FAST®) 1-800-544-5555
Automated line for quickest service
GOV-USAN-0412
1.789284.108
(Fidelity Investment logo)(registered trademark)
Corporate Headquarters
82 Devonshire St., Boston, MA 02109
www.fidelity.com
(Fidelity Investment logo)(registered trademark)
Fidelity Advisor®
Government Income
Fund - Class A, Class T, Class B
and Class C
Semiannual Report
February 29, 2012
(Fidelity Cover Art)
Class A, Class T, Class B, and Class C are classes of Fidelity® Government Income Fund
Contents
Shareholder Expense Example | (Click Here) | An example of shareholder expenses. |
Investment Changes | (Click Here) | A summary of major shifts in the fund's investments over the past six months. |
Investments | (Click Here) | A complete list of the fund's investments with their market values. |
Financial Statements | (Click Here) | Statements of assets and liabilities, operations, and changes in net assets, as well as financial highlights. |
Notes | (Click Here) | Notes to the financial statements. |
Board Approval of Investment Advisory Contracts and Management Fees | (Click Here) | |
To view a fund's proxy voting guidelines and proxy voting record for the 12-month period ended June 30, visit http://www.fidelity.com/proxyvotingresults or visit the Securities and Exchange Commission's (SEC) web site at http://www.sec.gov. You may also call 1-877-208-0098 to request a free copy of the proxy voting guidelines.
Standard & Poor's, S&P and S&P 500 are registered service marks of The McGraw-Hill Companies, Inc. and have been licensed for use by Fidelity Distributors Corporation.
Other third party marks appearing herein are the property of their respective owners.
All other marks appearing herein are registered or unregistered trademarks or service marks of FMR LLC or an affiliated company.
This report and the financial statements contained herein are submitted for the general information of the shareholders of the fund. This report is not authorized for distribution to prospective investors in the fund unless preceded or accompanied by an effective prospectus.
A fund files its complete schedule of portfolio holdings with the SEC for the first and third quarters of each fiscal year on Form N-Q. Forms N-Q are available on the SEC's web site at http://www.sec.gov. A fund's Forms N-Q may be reviewed and copied at the SEC's Public Reference Room in Washington, DC. Information regarding the operation of the SEC's Public Reference Room may be obtained by calling 1-800-SEC-0330. For a complete list of a fund's portfolio holdings, view the most recent holdings listing, semiannual report, or annual report on Fidelity's web site at http://www.fidelity.com, http://www.advisor.fidelity.com, or http://www.401k.com, as applicable.
NOT FDIC INSURED • MAY LOSE VALUE • NO BANK GUARANTEE
Neither the fund nor Fidelity Distributors Corporation is a bank.
Semiannual Report
Shareholder Expense Example
As a shareholder of the Fund, you incur two types of costs: (1) transaction costs, including sales charges (loads) on purchase payments or redemption proceeds, and (2) ongoing costs, including management fees, distribution and/or service (12b-1) fees and other Fund expenses. This Example is intended to help you understand your ongoing costs (in dollars) of investing in the Fund and to compare these costs with the ongoing costs of investing in other mutual funds.
The Example is based on an investment of $1,000 invested at the beginning of the period and held for the entire period (September 1, 2011 to February 29, 2012).
Actual Expenses
The first line of the accompanying table for each class of the Fund provides information about actual account values and actual expenses. You may use the information in this line, together with the amount you invested, to estimate the expenses that you paid over the period. Simply divide your account value by $1,000.00 (for example, an $8,600 account value divided by $1,000.00 = 8.6), then multiply the result by the number in the first line for a class of the Fund under the heading entitled "Expenses Paid During Period" to estimate the expenses you paid on your account during this period. A small balance maintenance fee of $12.00 that is charged once a year may apply for certain accounts with a value of less than $2,000. This fee is not included in the table below. If it was, the estimate of expenses you paid during the period would be higher, and your ending account value lower, by this amount. In addition, the Fund, as a shareholder in the underlying Fidelity Central Funds, will indirectly bear its pro-rata share of the fees and expenses incurred by the underlying Fidelity Central Funds. These fees and expenses are not included in the Fund's annualized expense ratio used to calculate the expense estimate in the table below.
Hypothetical Example for Comparison Purposes
The second line of the accompanying table for each class of the Fund provides information about hypothetical account values and hypothetical expenses based on a Class' actual expense ratio and an assumed rate of return of 5% per year before expenses, which is not the Class' actual return. The hypothetical account values and expenses may not be used to estimate the actual ending account balance or expenses you paid for the period. You may use this information to compare the ongoing costs of investing in the Fund and other funds. To do so, compare this 5% hypothetical example with the 5% hypothetical examples that appear in the shareholder reports of the other funds. A small balance maintenance fee of $12.00 that is charged once a year may apply for certain accounts with a value of less than $2,000. This fee is not included in the table below. If it was, the estimate of expenses you paid during the period would be higher, and your ending account value lower, by this amount. In addition, the Fund, as a shareholder in the underlying Fidelity Central Funds, will indirectly bear its pro-rata share of the fees and expenses incurred by the underlying Fidelity Central Funds. These fees and expenses are not included in the Fund's annualized expense ratio used to calculate the expense estimate in the table below.
Please note that the expenses shown in the table are meant to highlight your ongoing costs only and do not reflect any transaction costs. Therefore, the second line of the table is useful in comparing ongoing costs only, and will not help you determine the relative total costs of owning different funds. In addition, if these transactional costs were included, your costs would have been higher.
Semiannual Report
Shareholder Expense Example - continued
| Annualized Expense Ratio | Beginning
Account Value
September 1, 2011 | Ending
Account Value
February 29, 2012 | Expenses Paid
During Period *
September 1, 2011 to February 29, 2012 |
Class A | .77% | | | |
Actual | | $ 1,000.00 | $ 1,017.90 | $ 3.86 |
HypotheticalA | | $ 1,000.00 | $ 1,021.03 | $ 3.87 |
Class T | .76% | | | |
Actual | | $ 1,000.00 | $ 1,018.00 | $ 3.81 |
HypotheticalA | | $ 1,000.00 | $ 1,021.08 | $ 3.82 |
Class B | 1.50% | | | |
Actual | | $ 1,000.00 | $ 1,014.20 | $ 7.51 |
HypotheticalA | | $ 1,000.00 | $ 1,017.40 | $ 7.52 |
Class C | 1.52% | | | |
Actual | | $ 1,000.00 | $ 1,014.10 | $ 7.61 |
HypotheticalA | | $ 1,000.00 | $ 1,017.30 | $ 7.62 |
Government Income | .45% | | | |
Actual | | $ 1,000.00 | $ 1,020.50 | $ 2.26 |
HypotheticalA | | $ 1,000.00 | $ 1,022.63 | $ 2.26 |
Institutional Class | .52% | | | |
Actual | | $ 1,000.00 | $ 1,019.20 | $ 2.61 |
HypotheticalA | | $ 1,000.00 | $ 1,022.28 | $ 2.61 |
A 5% return per year before expenses
* Expenses are equal to each Class' annualized expense ratio, multiplied by the average account value over the period, multiplied by 182/366 (to reflect the one-half year period). The fees and expenses of the underlying Fidelity Central Funds in which the Fund invests are not included in the Fund's annualized expense ratio.
Semiannual Report
Investment Changes (Unaudited)
Coupon Distribution as of February 29, 2012 |
| % of fund's investments | % of fund's investments
6 months ago |
Zero coupon bonds | 1.2 | 0.7 |
0.01 - 0.99% | 26.5 | 16.7 |
1 - 1.99% | 16.2 | 19.2 |
2 - 2.99% | 6.8 | 5.6 |
3 - 3.99% | 9.1 | 5.5 |
4 - 4.99% | 20.8 | 32.6 |
5 - 5.99% | 16.7 | 19.7 |
6 - 6.99% | 4.6 | 4.2 |
7% and over | 0.5 | 0.8 |
Coupon distribution shows the range of stated interest rates on the fund's investments, excluding short-term investments. The information in the above table is based on the combined investments of the Fund and its pro-rata share of the investments of Fidelity's fixed-income central funds. |
Weighted Average Maturity as of February 29, 2012 |
| | 6 months ago |
Years | 6.3 | 5.7 |
This is a weighted average of all the maturities of the securities held in a fund. Weighted Average Maturity (WAM) can be used as a measure of sensitivity to interest rate changes and market changes. Generally, the longer the maturity, the greater the sensitivity to such changes. WAM is based on the dollar-weighted average length of time until principal payments must be paid. Depending on the types of securities held in a fund, certain maturity shortening devices (e.g., demand features, interest rate resets, and call options) may be taken into account when calculating the WAM. |
Duration as of February 29, 2012 |
| | 6 months ago |
Years | 4.6 | 4.6 |
Duration estimates how much a bond fund's price will change with a change in comparable interest rates. If rates rise 1%, for example, a fund with a 5-year duration is likely to lose about 5% of its value. Other factors also can influence a bond fund's performance and share price. Accordingly, a bond fund's actual performance may differ from this example. Duration takes into account any call or put option embedded in the bonds. |
Asset Allocation (% of fund's net assets) |
As of February 29, 2012 * | As of August 31, 2011 ** |
| Mortgage
Securities 30.7% | | | Mortgage
Securities 45.5% | |
| CMOs and Other Mortgage Related Securities 12.3% | | | CMOs and Other Mortgage Related Securities 8.1% | |
| U.S. Treasury
Obligations 49.8% | | | U.S. Treasury
Obligations 50.1% | |
| U.S. Government
Agency Obligations†10.7% | | | U.S. Government
Agency Obligations† 12.7% | |
| Foreign Government & Government Agency Obligations 1.4% | | | Foreign Government & Government Agency Obligations 1.5% | |
| Short-Term
Investments and
Net Other Assets*** (4.9)% | | | Short-Term
Investments and
Net Other Assets*** (17.9)% | |

* Futures and Swaps | 1.7% | | ** Futures and Swaps | 1.9% | |
† Includes FDIC Guaranteed Corporate Securities and NCUA Guaranteed Notes. | |
*** Short-Term Investments and Net Other Assets are not included in the pie chart. | |
The information in the above table is based on the combined investments of the Fund and its pro-rata share of the investments of Fidelity's fixed-income central funds. A holdings listing for the Fund, which presents direct holdings as well as pro-rata share of any securities and other investments held indirectly through its investment in underlying non-money market Fidelity Central Funds, is available at fidelity.com and/or advisor.fidelity.com as applicable. |
Semiannual Report
Investments February 29, 2012 (Unaudited)
Showing Percentage of Net Assets
U.S. Government and Government Agency Obligations - 60.5% |
| Principal Amount (000s) | | Value (000s) |
U.S. Government Agency Obligations - 6.6% |
Fannie Mae: | | | | |
0.375% 12/28/12 | | $ 50,670 | | $ 50,768 |
0.375% 3/16/15 | | 18,141 | | 18,047 |
0.75% 12/18/13 | | 7,805 | | 7,860 |
1.125% 4/27/17 | | 54,340 | | 54,220 |
4.75% 11/19/12 | | 2,000 | | 2,065 |
Federal Home Loan Bank: | | | | |
0.375% 11/27/13 | | 12,245 | | 12,246 |
0.375% 1/29/14 | | 24,375 | | 24,365 |
0.875% 8/22/12 | | 8,580 | | 8,610 |
Freddie Mac: | | | | |
0.625% 12/29/14 | | 21,293 | | 21,348 |
1% 7/30/14 | | 9,905 | | 10,034 |
1% 8/27/14 | | 15,111 | | 15,309 |
Overseas Private Investment Corp. U.S. Government guaranteed participation certificates 6.77% 11/15/13 | | 1,790 | | 1,886 |
Private Export Funding Corp. secured: | | | | |
4.974% 8/15/13 | | 22,940 | | 24,429 |
5.685% 5/15/12 | | 24,035 | | 24,310 |
Small Business Administration guaranteed development participation certificates: | | | | |
Series 2002-20J Class 1, 4.75% 10/1/22 | | 3,630 | | 3,948 |
Series 2002-20K Class 1, 5.08% 11/1/22 | | 7,244 | | 7,931 |
Series 2003-P10B, Class 1 5.136% 8/10/13 | | 2,055 | | 2,147 |
Series 2004-20H Class 1, 5.17% 8/1/24 | | 2,104 | | 2,327 |
Tennessee Valley Authority: | | | | |
3.875% 2/15/21 | | 33,790 | | 38,359 |
5.25% 9/15/39 | | 12,000 | | 14,990 |
5.375% 4/1/56 | | 8,429 | | 10,960 |
TOTAL U.S. GOVERNMENT AGENCY OBLIGATIONS | | 356,159 |
U.S. Treasury Obligations - 49.8% |
U.S. Treasury Bonds: | | | | |
3.125% 2/15/42 | | 70,290 | | 70,641 |
3.75% 8/15/41 | | 42,345 | | 47,929 |
4.375% 2/15/38 | | 14,154 | | 17,712 |
4.375% 5/15/41 | | 111,265 | | 139,811 |
5% 5/15/37 (c) | | 26,846 | | 36,607 |
5.25% 11/15/28 | | 23,775 | | 32,089 |
5.25% 2/15/29 | | 20,569 | | 27,816 |
6.125% 11/15/27 | | 77,365 | | 112,759 |
U.S. Government and Government Agency Obligations - continued |
| Principal Amount (000s) | | Value (000s) |
U.S. Treasury Obligations - continued |
U.S. Treasury Bonds: - continued | | | | |
6.125% 8/15/29 | | $ 2,877 | | $ 4,266 |
9.875% 11/15/15 | | 10,285 | | 13,804 |
U.S. Treasury Notes: | | | | |
0.125% 8/31/13 | | 82,800 | | 82,625 |
0.125% 12/31/13 | | 40,165 | | 40,041 |
0.25% 1/31/14 | | 108,553 | | 108,456 |
0.25% 9/15/14 | | 71,417 | | 71,171 |
0.25% 12/15/14 | | 30,000 | | 29,871 |
0.25% 1/15/15 | | 100,018 | | 99,573 |
0.25% 2/15/15 | | 143,888 | | 143,180 |
0.375% 7/31/13 | | 11,710 | | 11,730 |
0.375% 11/15/14 | | 30,000 | | 29,979 |
0.5% 8/15/14 | | 83,265 | | 83,525 |
0.5% 10/15/14 | | 90,000 | | 90,253 |
0.625% 7/15/14 | | 86,384 | | 86,924 |
0.75% 6/15/14 | | 30,071 | | 30,348 |
0.875% 11/30/16 | | 51,366 | | 51,502 |
0.875% 2/28/17 | | 182,014 | | 182,042 |
1% 4/30/12 | | 602 | | 603 |
1% 9/30/16 | | 32,048 | | 32,361 |
1% 10/31/16 | | 47,700 | | 48,140 |
1.25% 10/31/15 | | 29,580 | | 30,292 |
1.375% 11/30/15 | | 470 | | 483 |
1.375% 2/28/19 | | 264,653 | | 264,283 |
1.75% 7/31/15 | | 28,800 | | 29,990 |
1.875% 8/31/17 | | 47,000 | | 49,174 |
1.875% 9/30/17 | | 87,400 | | 91,374 |
2% 11/15/21 | | 12,777 | | 12,837 |
2% 2/15/22 | | 41,400 | | 41,471 |
2.125% 11/30/14 | | 21,500 | | 22,499 |
2.125% 5/31/15 | | 4,176 | | 4,395 |
2.125% 8/15/21 | | 33,900 | | 34,567 |
2.375% 8/31/14 | | 20,000 | | 20,988 |
2.375% 9/30/14 | | 13,017 | | 13,680 |
2.375% 10/31/14 | | 77,497 | | 81,529 |
2.375% 6/30/18 | | 26,608 | | 28,479 |
2.5% 6/30/17 | | 10,000 | | 10,800 |
2.625% 7/31/14 (d) | | 16,179 | | 17,059 |
2.75% 11/30/16 | | 18,530 | | 20,190 |
3.125% 1/31/17 | | 60,773 | | 67,382 |
U.S. Government and Government Agency Obligations - continued |
| Principal Amount (000s) | | Value (000s) |
U.S. Treasury Obligations - continued |
U.S. Treasury Notes: - continued | | | | |
3.125% 5/15/21 | | $ 32,410 | | $ 35,973 |
4% 2/15/15 | | 12,619 | | 13,936 |
4.25% 8/15/15 | | 13,117 | | 14,780 |
4.5% 5/15/17 | | 24,685 | | 29,173 |
4.75% 8/15/17 | | 12,983 | | 15,588 |
TOTAL U.S. TREASURY OBLIGATIONS | | 2,676,680 |
Other Government Related - 4.1% |
Bank of America Corp.: | | | | |
2.1% 4/30/12 (FDIC Guaranteed) (a) | | 6,060 | | 6,079 |
3.125% 6/15/12 (FDIC Guaranteed) (a) | | 3,719 | | 3,750 |
Citibank NA 1.875% 5/7/12 (FDIC Guaranteed) (a) | | 37,150 | | 37,256 |
Citigroup Funding, Inc.: | | | | |
1.875% 10/22/12 (FDIC Guaranteed) (a) | | 40,500 | | 40,941 |
1.875% 11/15/12 (FDIC Guaranteed) (a) | | 18,920 | | 19,145 |
General Electric Capital Corp.: | | | | |
2% 9/28/12 (FDIC Guaranteed) (a) | | 11,000 | | 11,116 |
2.625% 12/28/12 (FDIC Guaranteed) (a) | | 16,154 | | 16,479 |
GMAC, Inc. 1.75% 10/30/12 (FDIC Guaranteed) (a) | | 51,106 | | 51,638 |
Goldman Sachs Group, Inc. 3.25% 6/15/12 (FDIC Guaranteed) (a) | | 3,714 | | 3,746 |
JPMorgan Chase & Co. 2.2% 6/15/12 (FDIC Guaranteed) (a) | | 9,200 | | 9,255 |
National Credit Union Administration Guaranteed Notes: | | | | |
Series 2010-A1 Class A, 0.6463% 12/7/20 (NCUA Guaranteed) (e) | | 10,863 | | 10,899 |
Series 2011-R4 Class 1A, 0.6753% 3/6/20 (NCUA Guaranteed) (e) | | 10,530 | | 10,533 |
TOTAL OTHER GOVERNMENT RELATED | | 220,837 |
TOTAL U.S. GOVERNMENT AND GOVERNMENT AGENCY OBLIGATIONS (Cost $3,150,371) | 3,253,676 |
U.S. Government Agency - Mortgage Securities - 6.3% |
|
Fannie Mae: - 3.8% |
1.925% 12/1/34 (e) | | 301 | | 313 |
1.926% 2/1/33 (e) | | 308 | | 322 |
U.S. Government Agency - Mortgage Securities - continued |
| Principal Amount (000s) | | Value (000s) |
Fannie Mae: - continued |
1.93% 10/1/33 (e) | | $ 282 | | $ 293 |
1.952% 3/1/35 (e) | | 265 | | 279 |
1.964% 10/1/33 (e) | | 143 | | 150 |
2.036% 7/1/35 (e) | | 134 | | 141 |
2.05% 3/1/35 (e) | | 48 | | 50 |
2.223% 11/1/33 (e) | | 812 | | 860 |
2.301% 7/1/34 (e) | | 170 | | 180 |
2.303% 6/1/36 (e) | | 223 | | 236 |
2.424% 10/1/33 (e) | | 240 | | 253 |
2.448% 3/1/35 (e) | | 162 | | 170 |
2.448% 2/1/36 (e) | | 683 | | 722 |
2.487% 11/1/36 (e) | | 194 | | 207 |
2.537% 7/1/35 (e) | | 527 | | 560 |
2.609% 5/1/36 (e) | | 415 | | 442 |
3.471% 3/1/40 (e) | | 8,222 | | 8,517 |
3.5% 3/1/42 (b) | | 105,000 | | 108,529 |
4% 9/1/13 to 11/1/41 | | 5,054 | | 5,331 |
4% 3/1/42 (b) | | 28,500 | | 29,995 |
4.5% 3/1/41 to 9/1/41 | | 33,675 | | 36,330 |
5% 2/1/16 to 5/1/38 | | 3,555 | | 3,830 |
5.718% 3/1/36 (e) | | 2,189 | | 2,307 |
5.954% 3/1/37 (e) | | 476 | | 513 |
6.5% 2/1/17 to 5/1/27 | | 1,479 | | 1,654 |
7% 7/1/13 | | 1 | | 1 |
9% 5/1/14 | | 100 | | 103 |
9.5% 10/1/20 | | 42 | | 49 |
11.25% 5/1/14 | | 1 | | 1 |
11.5% 6/15/19 to 1/15/21 | | 175 | | 187 |
| | 202,525 |
Freddie Mac - 0.3% |
1.915% 3/1/35 (e) | | 946 | | 981 |
2.095% 5/1/37 (e) | | 487 | | 504 |
2.549% 2/1/36 (e) | | 106 | | 112 |
2.636% 6/1/35 (e) | | 767 | | 817 |
2.795% 7/1/36 (e) | | 765 | | 814 |
2.798% 7/1/35 (e) | | 1,830 | | 1,936 |
2.943% 3/1/33 (e) | | 56 | | 59 |
3.149% 10/1/35 (e) | | 323 | | 344 |
4.5% 5/1/39 to 10/1/41 | | 9,322 | | 9,990 |
5.138% 4/1/35 (e) | | 290 | | 304 |
5.5% 12/1/27 to 7/1/29 | | 461 | | 501 |
U.S. Government Agency - Mortgage Securities - continued |
| Principal Amount (000s) | | Value (000s) |
Freddie Mac - continued |
9% 9/1/14 | | $ 0* | | $ 0* |
9.5% 5/1/17 to 8/1/21 | | 86 | | 97 |
9.75% 8/1/14 | | 68 | | 75 |
11% 5/1/14 | | 19 | | 20 |
12% 3/1/15 | | 0* | | 0* |
12.5% 2/1/14 to 6/1/15 | | 2 | | 2 |
13% 6/1/14 to 10/1/14 | | 0* | | 0* |
| | 16,556 |
Ginnie Mae - 2.2% |
4.626% 3/1/62 (i) | | 8,382 | | 9,440 |
4.65% 3/1/62 (i) | | 7,224 | | 8,067 |
4.684% 1/20/62 (i) | | 25,534 | | 28,786 |
5.492% 4/20/60 (i) | | 23,524 | | 26,941 |
5.493% 11/20/59 (i) | | 27,952 | | 31,450 |
5.612% 4/20/58 (i) | | 11,672 | | 12,523 |
| | 117,207 |
TOTAL U.S. GOVERNMENT AGENCY - MORTGAGE SECURITIES (Cost $329,870) | 336,288 |
Collateralized Mortgage Obligations - 8.6% |
|
U.S. Government Agency - 8.6% |
Fannie Mae Guaranteed Mtg. pass-thru certificates: | | | | |
floater Series 2010-15 Class FJ, 1.174% 6/25/36 (e) | | 27,110 | | 27,468 |
planned amortization class: | | | | |
Series 1993-240 Class PD, 6.25% 12/25/13 | | 654 | | 674 |
Series 2006-45 Class OP, 6/25/36 (h) | | 3,855 | | 3,501 |
Series 2010-118 Class PB, 4.5% 10/25/40 | | 7,053 | | 7,718 |
sequential payer: | | | | |
Series 2007-113 Class DB, 4.5% 12/25/22 | | 12,440 | | 13,808 |
Series 2009-14 Class EB, 4.5% 3/25/24 | | 7,840 | | 8,535 |
Series 2010-97 Class CX, 4.5% 9/25/25 | | 10,813 | | 12,266 |
Series 2007-113 Class JD, 4.5% 12/25/22 | | 12,766 | | 14,150 |
Series 2010-109 Class IM, 5.5% 9/25/40 (g) | | 19,963 | | 3,022 |
Series 2010-39 Class FG, 1.164% 3/25/36 (e) | | 14,130 | | 14,359 |
Series 2010-97 Class CI, 4.5% 8/25/25 (g) | | 10,184 | | 883 |
Fannie Mae subordinate REMIC pass-thru certificates: | | | | |
floater: | | | | |
Series 2001-38 Class QF, 1.224% 8/25/31 (e) | | 301 | | 305 |
Series 2002-49 Class FB, 0.8455% 11/18/31 (e) | | 366 | | 367 |
Collateralized Mortgage Obligations - continued |
| Principal Amount (000s) | | Value (000s) |
U.S. Government Agency - continued |
Fannie Mae subordinate REMIC pass-thru certificates: - continued | | | | |
floater: | | | | |
Series 2002-60 Class FV, 1.244% 4/25/32 (e) | | $ 154 | | $ 157 |
Series 2002-75 Class FA, 1.244% 11/25/32 (e) | | 316 | | 321 |
planned amortization: | | | | |
Series 2005-19 Class PA, 5.5% 7/25/34 | | 7,794 | | 8,655 |
Series 2005-64 Class PX, 5.5% 6/25/35 | | 7,833 | | 8,746 |
planned amortization class Series 2003-113 Class PE, 4% 11/25/18 | | 7,545 | | 8,101 |
sequential payer: | | | | |
Series 2004-91 Class Z, 5% 12/25/34 | | 9,477 | | 10,677 |
Series 2005-117, Class JN, 4.5% 1/25/36 | | 645 | | 715 |
Series 2005-47 Class HK, 4.5% 6/25/20 | | 7,798 | | 8,475 |
Series 2006-72 Class CY, 6% 8/25/26 | | 10,215 | | 11,643 |
Series 2009-82 Class FD, 1.094% 10/25/39 (e) | | 11,461 | | 11,625 |
Series 2009-85 Class IB, 4.5% 8/25/24 (g) | | 2,858 | | 243 |
Series 2009-93 Class IC, 4.5% 9/25/24 (g) | | 5,074 | | 410 |
Series 2010-139 Class NI, 4.5% 2/25/40 (g) | | 11,402 | | 1,620 |
Freddie Mac planned amortization class Series 2115 Class PE, 6% 1/15/14 | | 126 | | 130 |
Freddie Mac Multi-Class pass-thru certificates: | | | | |
floater: | | | | |
Series 2530 Class FE, 0.8485% 2/15/32 (e) | | 216 | | 217 |
Series 2630 Class FL, 0.7485% 6/15/18 (e) | | 338 | | 341 |
Series 3008 Class SM, 0% 7/15/35 (e) | | 99 | | 97 |
Series 3419 Class FD, 1.0185% 2/15/38 (e) | | 11,542 | | 11,689 |
floater planned amortization Series 3950 Class QF, 0.7485% 8/15/40 (e) | | 20,741 | | 20,789 |
planned amortization class: | | | | |
Series 1141 Class G, 9% 9/15/21 | | 169 | | 195 |
Series 2356 Class GD, 6% 9/15/16 | | 160 | | 172 |
Series 2376 Class JE, 5.5% 11/15/16 | | 1,111 | | 1,189 |
Series 2381 Class OG, 5.5% 11/15/16 | | 697 | | 745 |
Series 2640 Class GE, 4.5% 7/15/18 | | 7,310 | | 7,745 |
Series 2672 Class MG, 5% 9/15/23 | | 7,120 | | 8,061 |
Series 2682 Class LD, 4.5% 10/15/33 | | 777 | | 862 |
Series 2810 Class PD, 6% 6/15/33 | | 532 | | 555 |
sequential payer: | | | | |
Series 2570 Class CU, 4.5% 7/15/17 | | 145 | | 147 |
Series 2587 Class AD, 4.71% 3/15/33 | | 5,785 | | 6,663 |
Series 2773 Class HC, 4.5% 4/15/19 | | 704 | | 777 |
Series 2877 Class ZD, 5% 10/15/34 | | 12,299 | | 13,813 |
Collateralized Mortgage Obligations - continued |
| Principal Amount (000s) | | Value (000s) |
U.S. Government Agency - continued |
Freddie Mac Multi-Class pass-thru certificates: - continued | | | | |
sequential payer: | | | | |
Series 2987 Class HE, 4.5% 6/15/20 | | $ 11,260 | | $ 11,979 |
Series 3007 Class EW, 5.5% 7/15/25 | | 8,875 | | 10,238 |
Series 3277 Class B, 4% 2/15/22 | | 5,900 | | 6,406 |
Series 3578, Class B, 4.5% 9/15/24 | | 7,927 | | 8,685 |
Series 2863 Class DB, 4% 9/15/14 | | 115 | | 115 |
Ginnie Mae: | | | | |
0% 3/1/62 (e)(i) | | 3,370 | | 3,383 |
0% 3/1/62 (e)(i) | | 7,630 | | 7,630 |
Ginnie Mae guaranteed REMIC pass-thru certificates: | | | | |
floater: | | | | |
Series 2008-57 Class BF, 1.0755% 7/20/38 (e) | | 14,271 | | 14,500 |
Series 2008-73: | | | | |
Class FA, 1.1055% 8/20/38 (e) | | 7,068 | | 7,171 |
Class FK, 1.0055% 8/20/38 (e) | | 15,222 | | 15,405 |
Series 2008-83 Class FB, 1.1455% 9/20/38 (e) | | 7,022 | | 7,128 |
Series 2011-H21 Class FA, 0.8455% 10/20/61 (e)(i) | | 10,622 | | 10,605 |
Series 2012-H01 Class FA, 0.9455% 11/20/61 (e)(i) | | 8,321 | | 8,353 |
0% 2/1/62 (e)(i) | | 5,000 | | 4,997 |
planned amortization Series 2011-61 Class OP, 5/20/40 (h) | | 10,524 | | 9,061 |
sequential payer Series 2011-69 Class GX, 4.5% 5/16/40 | | 10,205 | | 11,226 |
Series 2010-42 Class OP, 4/20/40 (h) | | 23,829 | | 20,155 |
Series 2011-71: | | | | |
Class ZB, 5.5% 8/20/34 | | 20,749 | | 24,251 |
Class ZC, 5.5% 7/16/34 | | 23,655 | | 27,751 |
TOTAL COLLATERALIZED MORTGAGE OBLIGATIONS (Cost $449,221) | 461,670 |
Commercial Mortgage Securities - 0.6% |
|
Freddie Mac Multi-Class pass-thru certificates Series K706: | | | | |
Class A1, 1.691% 11/25/44 | | 13,400 | | 13,592 |
Class A2, 2.323% 11/25/44 | | 16,500 | | 16,812 |
TOTAL COMMERCIAL MORTGAGE SECURITIES (Cost $30,348) | 30,404 |
Foreign Government and Government Agency Obligations - 1.4% |
| Principal Amount (000s) | | Value (000s) |
Israeli State (guaranteed by U.S. Government through Agency for International Development) 5.5% 9/18/23
(Cost $60,995) | | $ 59,862 | | $ 76,374 |
Fixed-Income Funds - 25.3% |
| Shares | | |
Fidelity Mortgage Backed Securities Central Fund (f)
(Cost $1,297,209) | 12,534,039 | |
1,359,818
|
Cash Equivalents - 0.7% |
| Maturity Amount (000s) | | |
Investments in repurchase agreements in a joint trading account at 0.14%, dated 2/29/12 due 3/1/12 (Collateralized by U.S. Government Obligations) #
(Cost $36,738) | $ 36,738 | |
36,738
|
TOTAL INVESTMENT PORTFOLIO - 103.4% (Cost $5,354,752) | 5,554,968 |
NET OTHER ASSETS (LIABILITIES) - (3.4)% | (181,163) |
NET ASSETS - 100% | $ 5,373,805 |
TBA Sale Commitments |
| Principal Amount (000s) | | |
Fannie Mae: |
3.5% 3/1/42 | $ (105,000) | | (108,529) |
4.5% 3/1/42 | (28,100) | | (29,948) |
TOTAL TBA SALE COMMITMENTS (Proceeds $138,504) | $ (138,477) |
Futures Contracts |
| Expiration Date | | Underlying Face Amount at Value (000s) | | Unrealized Appreciation/
(Depreciation) (000s) |
Purchased |
Treasury Contracts |
437 CBOT 10-Year U.S. Treasury Bond Contracts | June 2012 | | $ 57,227 | | $ 224 |
452 CBOT 2-Year U.S. Treasury Bond Contracts | June 2012 | | 99,546 | | (8) |
TOTAL TREASURY CONTRACTS | | $ 156,773 | | $ 216 |
|
The face value of futures purchased as a percentage of net assets is 3% |
Swap Agreements |
| | | Notional Amount (000s) | | Value (000s) |
Interest Rate Swaps |
Receive quarterly a floating rate based on 3-month LIBOR and pay semi-annually a fixed rate equal to 3.23% with Credit Suisse First Boston | May 2020 | | $ 50,000 | | $ (5,925) |
Legend |
(a) Under the Temporary Liquidity Guarantee Program, the Federal Deposit Insurance Corporation guarantees principal and interest in the event of payment default or bankruptcy until the earlier of maturity date of the debt or until June 30, 2012. At the end of the period these securities amounted to $199,405,000 or 3.7% of net assets. |
(b) Security or a portion of the security purchased on a delayed delivery or when-issued basis. |
(c) Security or a portion of the security was pledged to cover margin requirements for futures contracts. At the period end, the value of securities pledged amounted to $700,000. |
(d) Security or a portion of the security has been segregated as collateral for open swap agreements. At the period end, the value of securities pledged amounted to $5,525,000. |
(e) Coupon rates for floating and adjustable rate securities reflect the rates in effect at period end. |
(f) Affiliated fund that is available only to investment companies and other accounts managed by Fidelity Investments. A complete unaudited schedule of portfolio holdings for each Fidelity Central Fund is filed with the SEC for the first and third quarters of each fiscal year on Form N-Q and is available upon request or at the SEC's web site at www.sec.gov. An unaudited holdings listing for the Fund, which presents direct holdings as well as the pro rata share of securities and other investments held indirectly through its investment in underlying non-money market Fidelity Central Funds, is available at fidelity.com and/or advisor.fidelity.com, as applicable. In addition, each Fidelity Central Fund's financial statements are available on the SEC's web site or upon request. |
(g) Security represents right to receive monthly interest payments on an underlying pool of mortgages or assets. Principal shown is the outstanding par amount of the pool as of the end of the period. |
(h) Principal Only Strips represent the right to receive the monthly principal payments on an underlying pool of mortgage loans. |
(i) Represents an investment in an underlying pool of reverse mortgages which typically do not require regular principal and interest payments as repayment is deferred until a maturity event. |
* Amount represents less than $1,000. |
# Additional information on each counterparty to the repurchase agreement is as follows: |
Repurchase Agreement / Counterparty | Value
(Amounts in thousands) |
$36,738,000 due 3/01/12 at 0.14% |
Citibank NA | $ 6,439 |
Credit Suisse Securities (USA) LLC | 27,079 |
Merrill Lynch, Pierce, Fenner & Smith, Inc. | 3,220 |
| $ 36,738 |
Affiliated Central Funds |
Information regarding fiscal year to date income earned by the Fund from investments in Fidelity Central Funds is as follows: |
Fund | Income earned
(Amounts in thousands) |
Fidelity Mortgage Backed Securities Central Fund | $ 20,729 |
Additional information regarding the Fund's fiscal year to date purchases and sales, including the ownership percentage, of the non Money Market Central Funds is as follows: |
Fund
(Amounts in thousands) | Value, beginning of period | Purchases | Sales Proceeds | Value,
end of
period | % ownership, end of
period |
Fidelity Mortgage Backed Securities Central Fund | $ 1,334,455 | $ 20,729 | $ - | $ 1,359,818 | 10.4% |
Other Information |
The following is a summary of the inputs used, as of February 29, 2012, involving the Fund's assets and liabilities carried at fair value. The inputs or methodology used for valuing securities may not be an indication of the risk associated with investing in those securities. For more information on valuation inputs, and their aggregation into the levels used in the table below, please refer to the Security Valuation section in the accompanying Notes to Financial Statements. |
Valuation Inputs at Reporting Date: |
Description
(Amounts in thousands) | Total | Level 1 | Level 2 | Level 3 |
Investments in Securities: | | | | |
U.S. Government and Government Agency Obligations | $ 3,253,676 | $ - | $ 3,253,676 | $ - |
U.S. Government Agency - Mortgage Securities | 336,288 | - | 336,288 | - |
Collateralized Mortgage Obligations | 461,670 | - | 461,670 | - |
Commercial Mortgage Securities | 30,404 | - | 30,404 | - |
Foreign Government and Government Agency Obligations | 76,374 | - | 76,374 | - |
Fixed-Income Funds | 1,359,818 | 1,359,818 | - | - |
Cash Equivalents | 36,738 | - | 36,738 | - |
Total Investments in Securities: | $ 5,554,968 | $ 1,359,818 | $ 4,195,150 | $ - |
Derivative Instruments: | | | | |
Assets | | | | |
Futures Contracts | $ 224 | $ 224 | $ - | $ - |
Liabilities | | | | |
Futures Contracts | $ (8) | $ (8) | $ - | $ - |
Swap Agreements | $ (5,925) | $ - | $ (5,925) | $ - |
Total Derivative Instruments: | $ (5,709) | $ 216 | $ (5,925) | $ - |
Other Financial Instruments: | | | | |
TBA Sale Commitments | $ (138,477) | $ - | $ (138,477) | $ - |
Value of Derivative Instruments |
The following table is a summary of the Fund's value of derivative instruments by risk exposure as of February 29, 2012. For additional information on derivative instruments, please refer to the Derivative Instruments section in the accompanying Notes to Financial Statements. |
Risk Exposure /
Derivative Type
(Amounts in thousands) | Value |
| Asset | Liability |
Interest Rate Risk | | |
Futures Contracts (a) | $ 224 | $ (8) |
Swap Agreements (b) | - | (5,925) |
Total Value of Derivatives | $ 224 | $ (5,933) |
(a) Reflects cumulative appreciation/(depreciation) on futures contracts as disclosed on the Schedule of Investments. Only the period end variation margin is separately disclosed on the Statement of Assets and Liabilities. |
(b) Value is disclosed on the Statement of Assets and Liabilities in the Swap agreements, at Value line-items. |
See accompanying notes which are an integral part of the financial statements.
Semiannual Report
Statement of Assets and Liabilities
Amounts in thousands (except per-share amounts) | February 29, 2012 (Unaudited) |
| | |
Assets | | |
Investment in securities, at value (including repurchase agreements of $36,738) - See accompanying schedule: Unaffiliated issuers (cost $4,057,543) | $ 4,195,150 | |
Fidelity Central Funds (cost $1,297,209) | 1,359,818 | |
Total Investments (cost $5,354,752) | | $ 5,554,968 |
Receivable for investments sold, regular delivery | | 182,408 |
Receivable for TBA sale commitments | | 138,504 |
Receivable for fund shares sold | | 11,673 |
Interest receivable | | 13,985 |
Other receivables | | 762 |
Total assets | | 5,902,300 |
| | |
Liabilities | | |
Payable to custodian bank | $ 1 | |
Payable for investments purchased
Regular delivery | 177,685 | |
Delayed delivery | 138,623 | |
TBA sale commitments, at value | 138,477 | |
Payable for fund shares redeemed | 64,171 | |
Distributions payable | 290 | |
Swap agreements at value | 5,925 | |
Accrued management fee | 1,431 | |
Distribution and service plan fees payable | 243 | |
Payable for daily variation margin on futures contracts | 219 | |
Other affiliated payables | 670 | |
Other payables and accrued expenses | 760 | |
Total liabilities | | 528,495 |
| | |
Net Assets | | $ 5,373,805 |
Net Assets consist of: | | |
Paid in capital | | $ 5,137,138 |
Undistributed net investment income | | 2,927 |
Accumulated undistributed net realized gain (loss) on investments | | 39,206 |
Net unrealized appreciation (depreciation) on investments | | 194,534 |
Net Assets | | $ 5,373,805 |
See accompanying notes which are an integral part of the financial statements.
Semiannual Report
Financial Statements - continued
Statement of Assets and Liabilities - continued
Amounts in thousands (except per-share amounts) | February 29, 2012 (Unaudited) |
| | |
Calculation of Maximum Offering Price
Class A:
Net Asset Value and redemption price per share
($370,879 ÷ 34,463 shares) | | $ 10.76 |
| | |
Maximum offering price per share (100/96.00 of $10.76) | | $ 11.21 |
Class T:
Net Asset Value and redemption price per share ($300,883 ÷ 27,963 shares) | | $ 10.76 |
| | |
Maximum offering price per share (100/96.00 of $10.76) | | $ 11.21 |
Class B:
Net Asset Value and offering price per share ($23,186 ÷ 2,155 shares)A | | $ 10.76 |
| | |
Class C:
Net Asset Value and offering price per share ($101,460 ÷ 9,430 shares)A | | $ 10.76 |
| | |
Government Income:
Net Asset Value, offering price and redemption price per share ($4,224,955 ÷ 393,186 shares) | | $ 10.75 |
| | |
Institutional Class:
Net Asset Value, offering price and redemption price per share ($352,442 ÷ 32,753 shares) | | $ 10.76 |
A Redemption price per share is equal to net asset value less any applicable contingent deferred sales charge.
See accompanying notes which are an integral part of the financial statements.
Semiannual Report
Statement of Operations
Amounts in thousands | Six months ended February 29, 2012 (Unaudited) |
| | |
Investment Income | | |
Interest | | $ 37,491 |
Income from Fidelity Central Funds | | 20,729 |
Total income | | 58,220 |
| | |
Expenses | | |
Management fee | $ 8,612 | |
Transfer agent fees | 3,092 | |
Distribution and service plan fees | 1,453 | |
Fund wide operations fee | 897 | |
Independent trustees' compensation | 10 | |
Miscellaneous | 8 | |
Total expenses before reductions | 14,072 | |
Expense reductions | (4) | 14,068 |
Net investment income (loss) | | 44,152 |
Realized and Unrealized Gain (Loss) Net realized gain (loss) on: | | |
Investment securities: | | |
Unaffiliated issuers | 71,542 | |
Futures contracts | (69) | |
Swap agreements | (707) | |
Total net realized gain (loss) | | 70,766 |
Change in net unrealized appreciation (depreciation) on: Investment securities | (7,906) | |
Futures contracts | 203 | |
Swap agreements | (1,325) | |
Delayed delivery commitments | (2,114) | |
Total change in net unrealized appreciation (depreciation) | | (11,142) |
Net gain (loss) | | 59,624 |
Net increase (decrease) in net assets resulting from operations | | $ 103,776 |
See accompanying notes which are an integral part of the financial statements.
Semiannual Report
Financial Statements - continued
Statement of Changes in Net Assets
Amounts in thousands | Six months ended February 29, 2012 (Unaudited) | One month ended
August 31,
2011 | Year ended
July 31,
2011 |
Increase (Decrease) in Net Assets | | | |
Operations | | | |
Net investment income (loss) | $ 44,152 | $ 8,396 | $ 118,879 |
Net realized gain (loss) | 70,766 | 35,205 | 124,737 |
Change in net unrealized appreciation (depreciation) | (11,142) | 64,081 | (82,102) |
Net increase (decrease) in net assets resulting
from operations | 103,776 | 107,682 | 161,514 |
Distributions to shareholders from net investment income | (42,483) | (8,141) | (114,897) |
Distributions to shareholders from net realized gain | (130,853) | - | (140,821) |
Total distributions | (173,336) | (8,141) | (255,718) |
Share transactions - net increase (decrease) | 77,230 | 41,240 | (695,616) |
Total increase (decrease) in net assets | 7,670 | 140,781 | (789,820) |
| | | |
Net Assets | | | |
Beginning of period | 5,366,135 | 5,225,354 | 6,015,174 |
End of period (including undistributed net investment income of $2,927 and undistributed net investment income of $1,258 and undistributed net investment income of $917, respectively) | $ 5,373,805 | $ 5,366,135 | $ 5,225,354 |
See accompanying notes which are an integral part of the financial statements.
Semiannual Report
Financial Highlights - Class A
| Six months ended February 29, 2012 | Years ended August 31, |
| (Unaudited) | 2011 H | 2011 L | 2010 L | 2009 L | 2008 L | 2007 I |
Selected Per-Share Data | | | | | | | |
Net asset value, beginning of period | $ 10.90 | $ 10.70 | $ 10.84 | $ 10.77 | $ 10.40 | $ 10.01 | $ 9.98 |
Income from Investment Operations | | | | | | | |
Net investment income (loss) E | .074 | .015 | .199 | .242 | .356 | .402 | .311 |
Net realized and unrealized gain (loss) | .120 | .199 | .108 | .424 | .466 | .387 | .033 |
Total from investment operations | .194 | .214 | .307 | .666 | .822 | .789 | .344 |
Distributions from net investment income | (.071) | (.014) | (.191) | (.231) | (.352) | (.399) | (.314) |
Distributions from net realized gain | (.263) | - | (.256) | (.365) | (.100) | - | - |
Total distributions | (.334) | (.014) | (.447) | (.596) | (.452) | (.399) | (.314) |
Net asset value, end of period | $ 10.76 | $ 10.90 | $ 10.70 | $ 10.84 | $ 10.77 | $ 10.40 | $ 10.01 |
Total Return B,C,D | 1.79% | 2.00% | 2.94% | 6.44% | 8.03% | 7.96% | 3.49% |
Ratios to Average Net Assets F,J | | | | | | | |
Expenses before reductions | .77% A | .76% A | .77% | .77% | .77% | .81% | .78% A |
Expenses net of fee waivers, if any | .77% A | .76% A | .77% | .77% | .77% | .81% | .78% A |
Expenses net of all reductions | .77% A | .76% A | .77% | .77% | .77% | .80% | .77% A |
Net investment income (loss) | 1.38% A | 1.61% A | 1.88% | 2.28% | 3.33% | 3.88% | 4.08% A |
Supplemental Data | | | | | | | |
Net assets, end of period (in millions) | $ 371 | $ 345 | $ 329 | $ 431 | $ 437 | $ 232 | $ 145 |
Portfolio turnover rate G | 230% A | 466% A,M | 430% | 355% | 380% K | 269% | 164% K |
A Annualized B Total returns for periods of less than one year are not annualized. C Total returns would have been lower if certain expenses had not been reduced during the applicable periods shown. D Total returns do not include the effect of the sales charges. E Calculated based on average shares outstanding during the period. F Fees and expenses of any underlying Fidelity Central Funds are not included in the Fund's expense ratio. The Fund indirectly bears its proportionate share of the expenses of any underlying Fidelity Central Funds. G Amount does not include the portfolio activity of any underlying Fidelity Central Funds. H For the one month period ended August 31. The Fund changed its fiscal year from July 31 to August 31, effective August 31, 2011. I For the period October 24, 2006 (commencement of sale of shares) to July 31, 2007. J Expense ratios reflect operating expenses of the class. Expenses before reductions do not reflect amounts reimbursed by the investment adviser or reductions from brokerage service arrangements or reductions from other expense offset arrangements and do not represent the amount paid by the class during periods when reimbursements or reductions occur. Expense ratios before reductions for start-up periods may not be representative of longer-term operating periods. Expenses net of fee waivers reflect expenses after reimbursement by the investment adviser but prior to reductions from brokerage service arrangements or other expense offset arrangements. Expenses net of all reductions represent the net expenses paid by the class. K The portfolio turnover rate does not include the assets acquired in the merger. L For the period ended July 31. M Portfolio turnover rate excludes securities received or delivered in-kind. |
See accompanying notes which are an integral part of the financial statements.
Semiannual Report
Financial Highlights - Class T
| Six months ended February 29, 2012 | Years ended August 31, |
| (Unaudited) | 2011 H | 2011 L | 2010 L | 2009 L | 2008 L | 2007 I |
Selected Per-Share Data | | | | | | | |
Net asset value, beginning of period | $ 10.90 | $ 10.69 | $ 10.84 | $ 10.77 | $ 10.40 | $ 10.01 | $ 9.98 |
Income from Investment Operations | | | | | | | |
Net investment income (loss) E | .075 | .015 | .201 | .243 | .357 | .404 | .306 |
Net realized and unrealized gain (loss) | .120 | .209 | .098 | .425 | .466 | .387 | .036 |
Total from investment operations | .195 | .224 | .299 | .668 | .823 | .791 | .342 |
Distributions from net investment income | (.072) | (.014) | (.193) | (.233) | (.353) | (.401) | (.312) |
Distributions from net realized gain | (.263) | - | (.256) | (.365) | (.100) | - | - |
Total distributions | (.335) | (.014) | (.449) | (.598) | (.453) | (.401) | (.312) |
Net asset value, end of period | $ 10.76 | $ 10.90 | $ 10.69 | $ 10.84 | $ 10.77 | $ 10.40 | $ 10.01 |
Total Return B,C,D | 1.80% | 2.10% | 2.86% | 6.45% | 8.04% | 7.98% | 3.46% |
Ratios to Average Net Assets F,J | | | | | | | |
Expenses before reductions | .76% A | .75% A | .76% | .76% | .76% | .78% | .79% A |
Expenses net of fee waivers, if any | .76% A | .75% A | .76% | .76% | .76% | .78% | .79% A |
Expenses net of all reductions | .76% A | .75% A | .76% | .76% | .76% | .78% | .79% A |
Net investment income (loss) | 1.40% A | 1.62% A | 1.89% | 2.29% | 3.33% | 3.90% | 4.02% A |
Supplemental Data | | | | | | | |
Net assets, end of period (in millions) | $ 301 | $ 286 | $ 272 | $ 335 | $ 324 | $ 236 | $ 181 |
Portfolio turnover rate G | 230% A | 466% A,M | 430% | 355% | 380% K | 269% | 164% K |
A Annualized B Total returns for periods of less than one year are not annualized. C Total returns would have been lower if certain expenses had not been reduced during the applicable periods shown. D Total returns do not include the effect of the sales charges. E Calculated based on average shares outstanding during the period. F Fees and expenses of any underlying Fidelity Central Funds are not included in the Fund's expense ratio. The Fund indirectly bears its proportionate share of the expenses of any underlying Fidelity Central Funds. G Amount does not include the portfolio activity of any underlying Fidelity Central Funds. H For the one month period ended August 31. The Fund changed its fiscal year from July 31 to August 31, effective August 31, 2011. I For the period October 24, 2006 (commencement of sale of shares) to July 31, 2007. J Expense ratios reflect operating expenses of the class. Expenses before reductions do not reflect amounts reimbursed by the investment adviser or reductions from brokerage service arrangements or reductions from other expense offset arrangements and do not represent the amount paid by the class during periods when reimbursements or reductions occur. Expense ratios before reductions for start-up periods may not be representative of longer-term operating periods. Expenses net of fee waivers reflect expenses after reimbursement by the investment adviser but prior to reductions from brokerage service arrangements or other expense offset arrangements. Expenses net of all reductions represent the net expenses paid by the class. K The portfolio turnover rate does not include the assets acquired in the merger. L For the period ended July 31. M Portfolio turnover rate excludes securities received or delivered in-kind. |
See accompanying notes which are an integral part of the financial statements.
Semiannual Report
Financial Highlights - Class B
| Six months ended February 29, 2012 | Years ended August 31, |
| (Unaudited) | 2011 H | 2011 L | 2010 L | 2009 L | 2008 L | 2007 I |
Selected Per-Share Data | | | | | | | |
Net asset value, beginning of period | $ 10.90 | $ 10.69 | $ 10.84 | $ 10.77 | $ 10.40 | $ 10.01 | $ 9.98 |
Income from Investment Operations | | | | | | | |
Net investment income (loss) E | .035 | .008 | .122 | .164 | .278 | .329 | .251 |
Net realized and unrealized gain (loss) | .120 | .210 | .098 | .425 | .467 | .387 | .037 |
Total from investment operations | .155 | .218 | .220 | .589 | .745 | .716 | .288 |
Distributions from net investment income | (.032) | (.008) | (.114) | (.154) | (.275) | (.326) | (.258) |
Distributions from net realized gain | (.263) | - | (.256) | (.365) | (.100) | - | - |
Total distributions | (.295) | (.008) | (.370) | (.519) | (.375) | (.326) | (.258) |
Net asset value, end of period | $ 10.76 | $ 10.90 | $ 10.69 | $ 10.84 | $ 10.77 | $ 10.40 | $ 10.01 |
Total Return B,C,D | 1.42% | 2.04% | 2.10% | 5.67% | 7.25% | 7.21% | 2.91% |
Ratios to Average Net Assets F,J | | | | | | | |
Expenses before reductions | 1.50% A | 1.49% A | 1.50% | 1.50% | 1.50% | 1.51% | 1.50% A |
Expenses net of fee waivers, if any | 1.50% A | 1.49% A | 1.50% | 1.50% | 1.50% | 1.51% | 1.50% A |
Expenses net of all reductions | 1.50% A | 1.49% A | 1.50% | 1.50% | 1.50% | 1.50% | 1.50% A |
Net investment income (loss) | .65% A | .90% A | 1.15% | 1.55% | 2.60% | 3.17% | 3.30% A |
Supplemental Data | | | | | | | |
Net assets, end of period (in millions) | $ 23 | $ 26 | $ 25 | $ 38 | $ 48 | $ 41 | $ 43 |
Portfolio turnover rate G | 230% A | 466% A,M | 430% | 355% | 380% K | 269% | 164% K |
A Annualized B Total returns for periods of less than one year are not annualized. C Total returns would have been lower if certain expenses had not been reduced during the applicable periods shown. D Total returns do not include the effect of the contingent deferred sales charge. E Calculated based on average shares outstanding during the period. F Fees and expenses of any underlying Fidelity Central Funds are not included in the Fund's expense ratio. The Fund indirectly bears its proportionate share of the expenses of any underlying Fidelity Central Funds. G Amount does not include the portfolio activity of any underlying Fidelity Central Funds. H For the one month period ended August 31. The Fund changed its fiscal year from July 31 to August 31, effective August 31, 2011. I For the period October 24, 2006 (commencement of sale of shares) to July 31, 2007. J Expense ratios reflect operating expenses of the class. Expenses before reductions do not reflect amounts reimbursed by the investment adviser or reductions from brokerage service arrangements or reductions from other expense offset arrangements and do not represent the amount paid by the class during periods when reimbursements or reductions occur. Expense ratios before reductions for start-up periods may not be representative of longer-term operating periods. Expenses net of fee waivers reflect expenses after reimbursement by the investment adviser but prior to reductions from brokerage service arrangements or other expense offset arrangements. Expenses net of all reductions represent the net expenses paid by the class. K The portfolio turnover rate does not include the assets acquired in the merger. L For the period ended July 31. M Portfolio turnover rate excludes securities received or delivered in-kind. |
See accompanying notes which are an integral part of the financial statements.
Semiannual Report
Financial Highlights - Class C
| Six months ended February 29, 2012 | Years ended August 31, |
| (Unaudited) | 2011 H | 2011 L | 2010 L | 2009 L | 2008 L | 2007 I |
Selected Per-Share Data | | | | | | | |
Net asset value, beginning of period | $ 10.90 | $ 10.69 | $ 10.84 | $ 10.77 | $ 10.40 | $ 10.01 | $ 9.98 |
Income from Investment Operations | | | | | | | |
Net investment income (loss) E | .034 | .008 | .121 | .163 | .275 | .326 | .249 |
Net realized and unrealized gain (loss) | .120 | .210 | .098 | .425 | .468 | .387 | .033 |
Total from investment operations | .154 | .218 | .219 | .588 | .743 | .713 | .282 |
Distributions from net investment income | (.031) | (.008) | (.113) | (.153) | (.273) | (.323) | (.252) |
Distributions from net realized gain | (.263) | - | (.256) | (.365) | (.100) | - | - |
Total distributions | (.294) | (.008) | (.369) | (.518) | (.373) | (.323) | (.252) |
Net asset value, end of period | $ 10.76 | $ 10.90 | $ 10.69 | $ 10.84 | $ 10.77 | $ 10.40 | $ 10.01 |
Total Return B,C,D | 1.41% | 2.04% | 2.09% | 5.66% | 7.23% | 7.18% | 2.85% |
Ratios to Average Net Assets F,J | | | | | | | |
Expenses before reductions | 1.52% A | 1.50% A | 1.51% | 1.51% | 1.52% | 1.53% | 1.55% A |
Expenses net of fee waivers, if any | 1.52% A | 1.50% A | 1.51% | 1.51% | 1.52% | 1.53% | 1.55% A |
Expenses net of all reductions | 1.52% A | 1.50% A | 1.51% | 1.51% | 1.51% | 1.53% | 1.55% A |
Net investment income (loss) | .63% A | .88% A | 1.14% | 1.54% | 2.58% | 3.15% | 3.26% A |
Supplemental Data | | | | | | | |
Net assets, end of period (in millions) | $ 101 | $ 95 | $ 89 | $ 118 | $ 131 | $ 71 | $ 39 |
Portfolio turnover rate G | 230% A | 466% A,M | 430% | 355% | 380% K | 269% | 164% K |
A Annualized B Total returns for periods of less than one year are not annualized. C Total returns would have been lower if certain expenses had not been reduced during the applicable periods shown. D Total returns do not include the effect of the contingent deferred sales charge. E Calculated based on average shares outstanding during the period. F Fees and expenses of any underlying Fidelity Central Funds are not included in the Fund's expense ratio. The Fund indirectly bears its proportionate share of the expenses of any underlying Fidelity Central Funds. G Amount does not include the portfolio activity of any underlying Fidelity Central Funds. H For the one month period ended August 31. The Fund changed its fiscal year from July 31 to August 31, effective August 31, 2011. I For the period October 24, 2006 (commencement of sale of shares) to July 31, 2007. J Expense ratios reflect operating expenses of the class. Expenses before reductions do not reflect amounts reimbursed by the investment adviser or reductions from brokerage service arrangements or reductions from other expense offset arrangements and do not represent the amount paid by the class during periods when reimbursements or reductions occur. Expense ratios before reductions for start-up periods may not be representative of longer-term operating periods. Expenses net of fee waivers reflect expenses after reimbursement by the investment adviser but prior to reductions from brokerage service arrangements or other expense offset arrangements. Expenses net of all reductions represent the net expenses paid by the class. K The portfolio turnover rate does not include the assets acquired in the merger. L For the period ended July 31. M Portfolio turnover rate excludes securities received or delivered in-kind. |
See accompanying notes which are an integral part of the financial statements.
Semiannual Report
Financial Highlights - Government Income
| Six months ended February 29, 2012 | Years ended August 31, |
| (Unaudited) | 2011 G | 2011 J | 2010 J | 2009 J | 2008 J | 2007 J |
Selected Per-Share Data | | | | | | | |
Net asset value, beginning of period | $ 10.88 | $ 10.68 | $ 10.82 | $ 10.76 | $ 10.38 | $ 10.00 | $ 9.95 |
Income from Investment Operations | | | | | | | |
Net investment income (loss) D | .091 | .018 | .233 | .275 | .390 | .438 | .443 |
Net realized and unrealized gain (loss) | .130 | .199 | .108 | .415 | .476 | .378 | .068 |
Total from investment operations | .221 | .217 | .341 | .690 | .866 | .816 | .511 |
Distributions from net investment income | (.088) | (.017) | (.225) | (.265) | (.386) | (.436) | (.456) |
Distributions from net realized gain | (.263) | - | (.256) | (.365) | (.100) | - | (.005) |
Total distributions | (.351) | (.017) | (.481) | (.630) | (.486) | (.436) | (.461) |
Net asset value, end of period | $ 10.75 | $ 10.88 | $ 10.68 | $ 10.82 | $ 10.76 | $ 10.38 | $ 10.00 |
Total Return B,C | 2.05% | 2.03% | 3.27% | 6.69% | 8.49% | 8.25% | 5.22% |
Ratios to Average Net Assets E,H | | | | | | | |
Expenses before reductions | .45% A | .45% A | .45% | .45% | .45% | .45% | .45% |
Expenses net of fee waivers, if any | .45% A | .45% A | .45% | .45% | .45% | .45% | .45% |
Expenses net of all reductions | .45% A | .45% A | .45% | .45% | .45% | .45% | .44% |
Net investment income (loss) | 1.70% A | 1.91% A | 2.20% | 2.60% | 3.65% | 4.23% | 4.42% |
Supplemental Data | | | | | | | |
Net assets, end of period (in millions) | $ 4,225 | $ 4,270 | $ 4,167 | $ 4,809 | $ 4,638 | $ 8,154 | $ 6,118 |
Portfolio turnover rate F | 230% A | 466% A,K | 430% | 355% | 380% I | 269% | 164% I |
A Annualized B Total returns for periods of less than one year are not annualized. C Total returns would have been lower if certain expenses had not been reduced during the applicable periods shown. D Calculated based on average shares outstanding during the period. E Fees and expenses of any underlying Fidelity Central Funds are not included in the Fund's expense ratio. The Fund indirectly bears its proportionate share of the expenses of any underlying Fidelity Central Funds. F Amount does not include the portfolio activity of any underlying Fidelity Central Funds. G For the one month period ended August 31. The Fund changed its fiscal year from July 31 to August 31, effective August 31, 2011. H Expense ratios reflect operating expenses of the class. Expenses before reductions do not reflect amounts reimbursed by the investment adviser or reductions from brokerage service arrangements or reductions from other expense offset arrangements and do not represent the amount paid by the class during periods when reimbursements or reductions occur. Expenses net of fee waivers reflect expenses after reimbursement by the investment adviser but prior to reductions from brokerage service arrangements or other expense offset arrangements. Expenses net of all reductions represent the net expenses paid by the class. I The portfolio turnover rate does not include the assets acquired in the merger. J For the period ended July 31. K Portfolio turnover rate excludes securities received or delivered in-kind. |
See accompanying notes which are an integral part of the financial statements.
Semiannual Report
Financial Highlights - Institutional Class
| Six months ended February 29, 2012 | Years ended August 31, |
| (Unaudited) | 2011 G | 2011 K | 2010 K | 2009 K | 2008 K | 2007 H |
Selected Per-Share Data | | | | | | | |
Net asset value, beginning of period | $ 10.90 | $ 10.69 | $ 10.84 | $ 10.77 | $ 10.40 | $ 10.01 | $ 9.98 |
Income from Investment Operations | | | | | | | |
Net investment income (loss) D | .088 | .017 | .225 | .267 | .385 | .432 | .329 |
Net realized and unrealized gain (loss) | .119 | .210 | .099 | .425 | .466 | .388 | .034 |
Total from investment operations | .207 | .227 | .324 | .692 | .851 | .820 | .363 |
Distributions from net investment income | (.084) | (.017) | (.218) | (.257) | (.381) | (.430) | (.333) |
Distributions from net realized gain | (.263) | - | (.256) | (.365) | (.100) | - | - |
Total distributions | (.347) | (.017) | (.474) | (.622) | (.481) | (.430) | (.333) |
Net asset value, end of period | $ 10.76 | $ 10.90 | $ 10.69 | $ 10.84 | $ 10.77 | $ 10.40 | $ 10.01 |
Total Return B,C | 1.92% | 2.12% | 3.10% | 6.70% | 8.32% | 8.28% | 3.67% |
Ratios to Average Net Assets E,I | | | | | | | |
Expenses before reductions | .52% A | .52% A | .52% | .53% | .51% | .51% | .53% A |
Expenses net of fee waivers, if any | .52% A | .52% A | .52% | .53% | .51% | .51% | .53% A |
Expenses net of all reductions | .52% A | .52% A | .52% | .53% | .51% | .51% | .53% A |
Net investment income (loss) | 1.63% A | 1.84% A | 2.13% | 2.52% | 3.59% | 4.17% | 4.32% A |
Supplemental Data | | | | | | | |
Net assets, end of period (in millions) | $ 352 | $ 344 | $ 344 | $ 284 | $ 200 | $ 750 | $ 715 |
Portfolio turnover rate F | 230% A | 466% A,L | 430% | 355% | 380% J | 269% | 164% J |
A Annualized B Total returns for periods of less than one year are not annualized. C Total returns would have been lower if certain expenses had not been reduced during the applicable periods shown. D Calculated based on average shares outstanding during the period. E Fees and expenses of any underlying Fidelity Central Funds are not included in the Fund's expense ratio. The Fund indirectly bears its proportionate share of the expenses of any underlying Fidelity Central Funds. F Amount does not include the portfolio activity of any underlying Fidelity Central Funds. G For the one month period ended August 31. The Fund changed its fiscal year from July 31 to August 31, effective August 31, 2011. H For the period October 24, 2006 (commencement of sale of shares) to July 31, 2007. I Expense ratios reflect operating expenses of the class. Expenses before reductions do not reflect amounts reimbursed by the investment adviser or reductions from brokerage service arrangements or reductions from other expense offset arrangements and do not represent the amount paid by the class during periods when reimbursements or reductions occur. Expense ratios before reductions for start-up periods may not be representative of longer-term operating periods. Expenses net of fee waivers reflect expenses after reimbursement by the investment adviser but prior to reductions from brokerage service arrangements or other expense offset arrangements. Expenses net of all reductions represent the net expenses paid by the class. J The portfolio turnover rate does not include the assets acquired in the merger. K For the period ended July 31. L Portfolio turnover rate excludes securities received or delivered in-kind. |
See accompanying notes which are an integral part of the financial statements.
Semiannual Report
Notes to Financial Statements
For the period ended February 29, 2012 (Unaudited)
(Amounts in thousands except percentages)
1. Organization.
Fidelity® Government Income Fund (the Fund) is a fund of Fidelity Income Fund (the Trust) and is authorized to issue an unlimited number of shares. The Trust is registered under the Investment Company Act of 1940, as amended (the 1940 Act), as an open-end management investment company organized as a Massachusetts business trust. The Fund offers Class A, Class T, Class C, Government Income and Institutional Class shares, each of which, along with Class B shares, has equal rights as to assets and voting privileges. Effective after the close of business on September 1, 2010, Class B shares were closed to new accounts and additional purchases, except for exchanges and reinvestments. Each class has exclusive voting rights with respect to matters that affect that class. Class B shares will automatically convert to Class A shares after a holding period of seven years from the initial date of purchase. Investment income, realized and unrealized capital gains and losses, the common expenses of the Fund, and certain fund-level expense reductions, if any, are allocated on a pro-rata basis to each class based on the relative net assets of each class to the total net assets of the Fund. Each class differs with respect to transfer agent and distribution and service plan fees incurred. Certain expense reductions may also differ by class.
2. Investments in Fidelity Central Funds.
The Fund invests in Fidelity Central Funds, which are open-end investment companies available only to other investment companies and accounts managed by FMR and its affiliates. The Fund's Schedule of Investments lists each of the Fidelity Central Funds held as of period end, if any, as an investment of the Fund, but does not include the underlying holdings of each Fidelity Central Fund. As an Investing Fund, the Fund indirectly bears its proportionate share of the expenses of the underlying Fidelity Central Funds.
Based on their investment objective, each Fidelity Central Fund may invest or participate in various investment vehicles or strategies that are similar to those of the Fund. These strategies are consistent with the investment objectives of the Fund and may involve certain economic risks which may cause a decline in value of each of the Fidelity Central Funds and thus a decline in the value of the Fund. The following summarizes the Fund's investment in each Fidelity Central Fund.
Semiannual Report
Notes to Financial Statements (Unaudited) - continued
(Amounts in thousands except percentages)
2. Investments in Fidelity Central Funds - continued
Fidelity Central Fund | Investment Manager | Investment Objective | Investment Practices |
Fidelity Mortgage Backed Securities Central Fund | Fidelity Investment Money Management, Inc. (FIMM) | Seeks a high level of income by normally investing in investment-grade mortgage-related securities and repurchase agreements for those securities. | Delayed Delivery & When Issued Securities Futures Repurchase Agreements Swap Agreements |
An unaudited holdings listing for the Fund, which presents direct holdings as well as the pro-rata share of any securities and other investments held indirectly through its investment in underlying non-money market Fidelity Central Funds, is available at fidelity.com and/or advisor.fidelity.com, as applicable. A complete unaudited list of holdings for each Fidelity Central Fund is available upon request or at the Securities and Exchange Commission (the SEC) web site at www.sec.gov. In addition, the financial statements of the Fidelity Central Funds which contain the significant accounting policies (including security valuation policies) of those funds are available on the SEC web site or upon request.
3. Significant Accounting Policies.
The financial statements have been prepared in conformity with accounting principles generally accepted in the United States of America (GAAP), which require management to make certain estimates and assumptions at the date of the financial statements. Actual results could differ from those estimates. Subsequent events, if any, through the date that the financial statements were issued have been evaluated in the preparation of the financial statements. The following summarizes the significant accounting policies of the Fund:
Security Valuation. Investments are valued as of 4:00 p.m. Eastern time on the last calendar day of the period. The Fund uses independent pricing services approved by the Board of Trustees to value its investments. When current market prices or quotations are not readily available or reliable, valuations may be determined in good faith in accordance with procedures adopted by the Board of Trustees. Factors used in determining value may include market or security specific events, changes in interest rates and credit quality. The frequency with which these procedures are used cannot be predicted and they may be utilized to a significant extent. The value used for net asset value (NAV) calculation under these procedures may differ from published prices for the same securities.
Semiannual Report
3. Significant Accounting Policies - continued
Security Valuation - continued
The Fund categorizes the inputs to valuation techniques used to value its investments into a disclosure hierarchy consisting of three levels as shown below:
Level 1 - quoted prices in active markets for identical investments
Level 2 - other significant observable inputs (including quoted prices for similar investments, interest rates, prepayment speeds, etc.)
Level 3 - unobservable inputs (including the Fund's own assumptions based on the best information available)
Changes in valuation techniques may result in transfers in or out of an assigned level within the disclosure hierarchy. The aggregate value of investments by input level, as of February 29, 2012 for the Fund's investments, is included at the end of the Fund's Schedule of Investments. Valuation techniques used to value the Fund's investments by major category are as follows:
Debt securities, including restricted securities, are valued based on evaluated prices received from independent pricing services or from dealers who make markets in such securities. For foreign government and government agency obligations and U.S. government and government agency obligations, pricing services utilize matrix pricing which considers yield or price of bonds of comparable quality, coupon, maturity and type as well as dealer supplied prices and are generally categorized as Level 2 in the hierarchy. For collateralized mortgage obligations, commercial mortgage securities and U.S. government agency mortgage securities, pricing services utilize matrix pricing which considers prepayment speed assumptions, attributes of the collateral, yield or price of bonds of comparable quality, coupon, maturity and type as well as dealer supplied prices and, accordingly, such securities are generally categorized as Level 2 in the hierarchy. Swaps are marked-to-market daily based on valuations from independent pricing services or dealer-supplied valuations and changes in value are recorded as unrealized appreciation (depreciation). Pricing services utilize matrix pricing which considers comparisons to interest rate curves, credit spread curves, default possibilities and recovery rates and, as a result, swaps are generally categorized as Level 2 in the hierarchy. When independent prices are unavailable or unreliable, debt securities and swaps may be valued utilizing pricing matrices which consider similar factors that would be used by independent pricing services. These are generally categorized as Level 2 in the hierarchy but may be Level 3 depending on the circumstances.
Semiannual Report
Notes to Financial Statements (Unaudited) - continued
(Amounts in thousands except percentages)
3. Significant Accounting Policies - continued
Security Valuation - continued
Futures contracts are valued at the settlement price established each day by the board of trade or exchange on which they are traded and are categorized as Level 1 in the hierarchy. Investments in open-end mutual funds, including the Fidelity Central Funds, are valued at their closing net asset value each business day and are categorized as Level 1 in the hierarchy. Short-term securities with remaining maturities of sixty days or less may be valued at amortized cost, which approximates fair value, and are categorized as Level 2 in the hierarchy.
New Accounting Pronouncements. In May 2011, the Financial Accounting Standards Board issued Accounting Standard Update No. 2011-04, Fair Value Measurement (Topic 820) - Amendments to Achieve Common Fair Value Measurement and Disclosure Requirements in U.S. GAAP and IFRSs. The update is effective during interim and annual periods beginning after December 15, 2011 and will result in additional disclosure for transfers between levels as well as expanded disclosure for securities categorized as Level 3 under the fair value hierarchy.
In December 2011, the Financial Accounting Standards Board issued Accounting Standard Update No. 2011-11, Disclosures about Offsetting Assets and Liabilities. The update creates new disclosure requirements requiring entities to disclose both gross and net information for derivatives and other financial instruments that are either offset in the Statement of Assets and Liabilities or subject to an enforceable master netting arrangement or similar agreement. The disclosure requirements are effective for interim and annual reporting periods beginning on or after January 1, 2013. Management is currently evaluating the impact of the update's adoption on the Fund's financial statement disclosures.
Investment Transactions and Income. For financial reporting purposes, the Fund's investment holdings and NAV include trades executed through the end of the last business day of the period. The NAV per share for processing shareholder transactions is calculated as of the close of business of the New York Stock Exchange (NYSE), normally 4:00 p.m. Eastern time and includes trades executed through the end of the prior business day. Gains and losses on securities sold are determined on the basis of identified cost. Interest income and distributions from the Fidelity Central Funds are accrued as earned. Interest income includes coupon interest and amortization of premium and accretion of discount on debt securities. The principal amount on inflation-indexed securities is periodically adjusted to the rate of inflation and interest is accrued based on the principal amount. The adjustments to principal due to inflation are reflected as increases or decreases to interest income even though principal is not received until maturity.
Semiannual Report
3. Significant Accounting Policies - continued
Expenses. Expenses directly attributable to a fund are charged to that fund. Expenses attributable to more than one fund are allocated among the respective funds on the basis of relative net assets or other appropriate methods. Expense estimates are accrued in the period to which they relate and adjustments are made when actual amounts are known.
Deferred Trustee Compensation. Under a Deferred Compensation Plan (the Plan), independent Trustees may elect to defer receipt of a portion of their annual compensation. Deferred amounts are invested in a cross-section of Fidelity funds, are marked-to-market and remain in the Fund until distributed in accordance with the Plan. The investment of deferred amounts and the offsetting payable to the Trustees are included in the accompanying Statement of Assets and Liabilities.
Income Tax Information and Distributions to Shareholders. Each year, the Fund intends to qualify as a regulated investment company under Subchapter M of the Internal Revenue Code, including distributing substantially all of its taxable income and realized gains. As a result, no provision for income taxes is required. The Fund files a U.S. federal tax return, in addition to state and local tax returns as required. A fund's federal income tax returns are subject to examination by the Internal Revenue Service (IRS) for a period of three fiscal years after they are filed. State and local tax returns may be subject to examination for an additional fiscal year depending on the jurisdiction.
Dividends are declared and recorded daily and paid monthly from net investment income. Distributions from realized gains, if any, are declared and recorded on the ex-dividend date. Income dividends and capital gain distributions are declared separately for each class. Income and capital gain distributions are determined in accordance with income tax regulations, which may differ from GAAP.
Capital accounts within the financial statements are adjusted for permanent book-tax differences. These adjustments have no impact on net assets or the results of operations. Temporary book-tax differences will reverse in a subsequent period.
Book-tax differences are primarily due to futures transactions, swap agreements, market discount, partnerships (including allocations from Fidelity Central Funds), deferred trustees compensation and losses deferred due to wash sales.
The federal tax cost of investment securities and unrealized appreciation (depreciation) as of period end were as follows:
Gross unrealized appreciation | $ 204,095 |
Gross unrealized depreciation | (4,231) |
Net unrealized appreciation (depreciation) on securities and other investments | $ 199,864 |
Tax cost | $ 5,355,104 |
Semiannual Report
Notes to Financial Statements (Unaudited) - continued
(Amounts in thousands except percentages)
4. Operating Policies.
Repurchase Agreements. FMR has received an Exemptive Order from the SEC which permits the Fund and other affiliated entities of FMR to transfer uninvested cash balances into joint trading accounts which are then invested in repurchase agreements. The Fund may also invest directly with institutions in repurchase agreements. Repurchase agreements are collateralized by government or non-government securities. Upon settlement date, collateral is held in segregated accounts with custodian banks and may be obtained in the event of a default of the counterparty. The Fund monitors, on a daily basis, the value of the collateral to ensure it is at least equal to the principal amount of the repurchase agreement (including accrued interest). In the event of a default by the counterparty, realization of the collateral proceeds could be delayed, during which time the value of the collateral may decline.
Delayed Delivery Transactions and When-Issued Securities. During the period, the Fund transacted in securities on a delayed delivery or when-issued basis. Payment and delivery may take place after the customary settlement period for that security. The price of the underlying securities and the date when the securities will be delivered and paid for are fixed at the time the transaction is negotiated. During the time a delayed delivery sell is outstanding, the contract is marked-to-market daily and equivalent deliverable securities are held for the transaction. The securities purchased on a delayed delivery or when-issued basis are identified as such in the Fund's Schedule of Investments. The Fund may receive compensation for interest forgone in the purchase of a delayed delivery or when-issued security. With respect to purchase commitments, the Fund identifies securities as segregated in its records with a value at least equal to the amount of the commitment. Losses may arise due to changes in the value of the underlying securities or if the counterparty does not perform under the contract's terms, or if the issuer does not issue the securities due to political, economic, or other factors.
To-Be-Announced (TBA) Securities and Mortgage Dollar Rolls. During the period, the Fund transacted in TBA securities that involved buying or selling mortgage-backed securities (MBS) on a forward commitment basis. A TBA transaction typically does not designate the actual security to be delivered and only includes an approximate principal amount however; delivered securities must meet specified terms defined by industry guidelines, including issuer, rate and current principal amount outstanding on underlying mortgage pools. The Fund may enter into a TBA transaction with the intent to take possession of or deliver the underlying MBS, or the Fund may elect to extend the settlement by entering into either a mortgage or reverse mortgage dollar roll. Mortgage dollar rolls are transactions where a fund sells MBS and simultaneously agrees to repurchase MBS on a later date at a lower price and with the same counterparty. Reverse mortgage dollar rolls involve the purchase and simultaneous agreement to sell MBS on a later date at a lower price. Transactions in mortgage dollar rolls and reverse mortgage dollar rolls are accounted for as purchases and sales and may result in an increase to the Fund's portfolio turnover rate.
Semiannual Report
4. Operating Policies - continued
To-Be-Announced (TBA) Securities and Mortgage Dollar Rolls - continued
Purchases and sales of TBA securities involve risks similar to those discussed above for delayed delivery and when-issued securities. Also, if the counterparty in a dollar roll or a reverse dollar roll transaction files for bankruptcy or becomes insolvent, the Fund's right to repurchase or sell securities may be limited. Additionally, when a fund sells TBA securities without already owning or having the right to obtain the deliverable securities (an uncovered forward commitment to sell), it incurs a risk of loss because it could have to purchase the securities at a price that is higher than the price at which it sold them. A fund may be unable to purchase the deliverable securities if the corresponding market is illiquid.
TBA securities subject to a forward commitment to sell at period end are included at the end of the Fund's Schedule of Investments under the caption "TBA Sale Commitments." The proceeds and value of these commitments are reflected in the Fund's Statement of Assets and Liabilities.
5. Derivative Instruments.
Risk Exposures and the Use of Derivative Instruments. The Fund used derivative instruments (derivatives), including futures contracts and swap agreements, in order to meet its investment objectives. The strategy is to use derivatives to increase returns, to gain exposure to certain types of assets and to manage exposure to certain risks as defined below. The success of any strategy involving derivatives depends on analysis of numerous economic factors, and if the strategies for investment do not work as intended, the Fund may not achieve its objectives.
The Fund's use of derivatives increased or decreased its exposure to the following risk:
Interest Rate Risk | Interest rate risk relates to the fluctuations in the value of interest-bearing securities due to changes in the prevailing levels of market interest rates. |
The Fund is also exposed to additional risks from investing in derivatives, such as liquidity risk and counterparty credit risk. Liquidity risk is the risk that the Fund will be unable to close out the derivative in the open market in a timely manner. Counterparty credit risk is the risk that the counterparty will not be able to fulfill its obligation to the Fund. Derivative counterparty credit risk is managed through formal evaluation of the creditworthiness of all potential counterparties. On certain over-the-counter (OTC) derivatives such as swap agreements, the Fund attempts to reduce its exposure to counterparty credit risk by entering into an International Swaps and Derivatives Association (ISDA) Master Agreement on a bilateral basis with each of its counterparties. The
Semiannual Report
Notes to Financial Statements (Unaudited) - continued
(Amounts in thousands except percentages)
5. Derivative Instruments - continued
Risk Exposures and the Use of Derivative Instruments - continued
ISDA Master Agreement gives the Fund the right to terminate all transactions traded under such agreement if there is a certain deterioration in the credit quality of the counterparty. The ISDA Master Agreement gives each party the right, upon an event of default by the other party or a termination of the agreement, to close out all transactions traded under such agreement and to net amounts owed under each transaction to one net payable by one party to the other. To mitigate counterparty credit risk on OTC derivatives, the Fund receives collateral in the form of cash or securities once the Fund's net unrealized appreciation on outstanding derivative contracts under an ISDA Master Agreement exceeds certain applicable thresholds, subject to certain minimum transfer provisions. The collateral received is held in segregated accounts with the Fund's custodian bank in accordance with the collateral agreements entered into between the Fund, the counterparty and the Fund's custodian bank. The Fund could experience delays and costs in gaining access to the collateral even though it is held by the Fund's custodian bank. The Fund's maximum risk of loss from counterparty credit risk related to OTC derivatives is generally the aggregate unrealized appreciation and unpaid counterparty payments in excess of any collateral pledged by the counterparty to the Fund. The Fund may be required to pledge collateral for the benefit of the counterparties on over-the-counter (OTC) derivatives in an amount not less than the counterparty's unrealized appreciation on outstanding derivative contracts, subject to certain minimum transfer provisions, and any such pledged collateral is identified in the Schedule of Investments. Futures contracts are not covered by the ISDA Master Agreement, however, counterparty credit risk related to exchange-traded futures contracts is minimal because of the protection provided by the exchange on which they trade. Derivatives involve, to varying degrees, risk of loss in excess of the amounts recognized in the Statement of Assets and Liabilities.
Net Realized Gain (Loss) and Change in Net Unrealized Appreciation (Depreciation) on Derivatives. The table below, which reflects the impacts of derivatives on the financial performance of the Fund, summarizes the net realized gain (loss) and change in net unrealized appreciation (depreciation) for derivatives during the period.
Risk Exposure / Derivative Type | Net Realized Gain (Loss) | Change in Net Unrealized Appreciation (Depreciation) |
Interest Rate Risk | | |
Futures Contracts | $ (69) | $ 203 |
Swap Agreements | (707) | (1,325) |
Totals (a) | $ (776) | $ (1,122) |
(a) A summary of the value of derivatives by risk exposure as of period end is included at the end of the Schedule of Investments and is representative of activity for the period.
Semiannual Report
5. Derivative Instruments - continued
Futures Contracts. A futures contract is an agreement between two parties to buy or sell a specified underlying instrument for a fixed price at a specified future date. The Fund used futures contracts to manage its exposure to the bond market and to fluctuations in interest rates.
Upon entering into a futures contract, a fund is required to deposit either cash or securities (initial margin) with a clearing broker in an amount equal to a certain percentage of the face value of the contract. Futures contracts are marked-to-market daily and subsequent payments (variation margin) are made or received by a fund depending on the daily fluctuations in the value of the futures contracts and are recorded as unrealized appreciation or (depreciation). This receivable and/or payable is included in daily variation margin on futures contracts in the Statement of Assets and Liabilities. Realized gain or (loss) is recorded upon the expiration or closing of a futures contract. The net realized gain (loss) and change in net unrealized appreciation (depreciation) on futures contracts during the period is included in the Statement of Operations.
The underlying face amount at value of open futures contracts at period end is shown in the Schedule of Investments under the caption "Futures Contracts." This amount reflects each contract's exposure to the underlying instrument at period end. Securities deposited to meet initial margin requirements are identified in the Schedule of Investments.
Swap Agreements. A swap agreement (swap) is a contract between two parties to exchange future cash flows at periodic intervals based on a notional principal amount.
Details of swaps open at period end are included in the Schedule of Investments under the caption "Swap Agreements." Swaps are marked-to-market daily and changes in value are recorded as unrealized appreciation or (depreciation) and reflected in the Statement of Assets and Liabilities. Any upfront premiums paid or received upon entering a swap to compensate for differences between stated terms of the agreement and prevailing market conditions (e.g. credit spreads, interest rates or other factors) are recorded as realized gain or (loss) ratably over the term of the swap. Payments are exchanged at specified intervals, accrued daily commencing with the effective date of the contract and recorded as realized gain or (loss). Realized gain or (loss) is also recorded in the event of an early termination of a swap. The net realized gain (loss) and change in net unrealized appreciation (depreciation) on swaps during the period is included in the Statement of Operations.
Interest Rate Swaps. Interest rate swaps are agreements between counterparties to exchange cash flows, one based on a fixed rate, and the other on a floating rate. The Fund entered into interest rate swaps to manage its exposure to interest rate changes. Changes in interest rates can have an effect on both the value of bond holdings as well as the amount of interest income earned. In general, the value of bonds can fall when interest rates rise and can rise when interest rates fall.
Semiannual Report
Notes to Financial Statements (Unaudited) - continued
(Amounts in thousands except percentages)
6. Purchases and Sales of Investments.
Purchases and sales of securities (including the Fixed-Income Central Funds), other than short-term securities and U.S. government securities, aggregated $20,729 and $4,203, respectively.
7. Fees and Other Transactions with Affiliates.
Management Fee. FMR and its affiliates provide the Fund with investment management related services for which the Fund pays a monthly management fee. The management fee is the sum of an individual fund fee rate that is based on an annual rate of .20% of the Fund's average net assets and an annualized group fee rate that averaged .12% during the period. The group fee rate is based upon the average net assets of all the mutual funds advised by FMR. The group fee rate decreases as assets under management increase and increases as assets under management decrease. For the period, the total annualized management fee rate was .32% of the Fund's average net assets.
Distribution and Service Plan Fees. In accordance with Rule 12b-1 of the 1940 Act, the Fund has adopted separate Distribution and Service Plans for each class of shares. Certain classes pay Fidelity Distributors Corporation (FDC), an affiliate of FMR, separate Distribution and Service Fees, each of which is based on an annual percentage of each class' average net assets. In addition, FDC may pay financial intermediaries for selling shares of the Fund and providing shareholder support services. For the period, the Distribution and Service Fee rates, total fees and amounts retained by FDC were as follows:
| Distribution
Fee | Service
Fee | Total Fees | Retained
by FDC |
Class A | -% | .25% | $ 457 | $ 9 |
Class T | -% | .25% | 373 | 2 |
Class B | .65% | .25% | 114 | 83 |
Class C | .75% | .25% | 509 | 74 |
| | | $ 1,453 | $ 168 |
Sales Load. FDC may receive a front-end sales charge of up to 4.00% for selling Class A shares and Class T shares, some of which is paid to financial intermediaries for selling shares of the Fund. Depending on the holding period, FDC may receive contingent deferred sales charges levied on Class A, Class T, Class B, and Class C redemptions. The deferred sales charges range from 5.00% to 1.00% for Class B, 1.00% for Class C, .75% for certain purchases of Class A shares and .25% for certain purchases of Class T shares.
Semiannual Report
7. Fees and Other Transactions with Affiliates - continued
Sales Load - continued
For the period, sales charge amounts retained by FDC were as follows:
| Retained
by FDC |
Class A | $ 38 |
Class T | 13 |
Class B* | 29 |
Class C* | 8 |
| $ 88 |
* When Class B and Class C shares are initially sold, FDC pays commissions from its own resources to financial intermediaries through which the sales are made.
Transfer Agent Fees. Fidelity Investments Institutional Operations Company, Inc. (FIIOC), an affiliate of FMR, is the transfer, dividend disbursing and shareholder servicing agent for each class of the Fund. FIIOC receives account fees and asset-based fees that vary according to the account size and type of account of the shareholders of the respective classes of the Fund. FIIOC pays for typesetting, printing and mailing of shareholder reports, except proxy statements. For the period, transfer agent fees for each class were as follows:
| Amount | % of
Average
Net Assets* |
Class A | $ 308 | .17 |
Class T | 228 | .15 |
Class B | 31 | .24 |
Class C | 82 | .16 |
Government Income | 2,147 | .10 |
Institutional Class | 296 | .17 |
| $ 3,092 | |
* Annualized
Fund Wide Operations Fee. Pursuant to the Fund Wide Operations and Expense Agreement (FWOE), FMR has agreed to provide for fund level expenses (which do not include transfer agent, Rule 12b-1 fees, compensation of the independent Trustees, interest (including commitment fees), taxes or extraordinary expenses, if any) in return for a FWOE fee equal to .35% less the total amount of the management fee. The FWOE paid by the Fund is reduced by an amount equal to the fees and expenses paid to the independent Trustees. For the period, the FWOE fee was equivalent to an annualized rate of .03% of average net assets.
Semiannual Report
Notes to Financial Statements (Unaudited) - continued
(Amounts in thousands except percentages)
8. Committed Line of Credit.
The Fund participates with other funds managed by FMR or an affiliate in a $4.0 billion credit facility (the "line of credit") to be utilized for temporary or emergency purposes to fund shareholder redemptions or for other short-term liquidity purposes. The Fund has agreed to pay commitment fees on its pro-rata portion of the line of credit, which amounted to $8 and is reflected in Miscellaneous expenses on the Statement of Operations. During the period, there were no borrowings on this line of credit.
9. Security Lending.
The Fund lends portfolio securities from time to time in order to earn additional income. On the settlement date of the loan, the Fund receives collateral (in the form of U.S. Treasury obligations, letters of credit and/or cash) against the loaned securities and maintains collateral in an amount not less than 100% of the market value of the loaned securities during the period of the loan. The market value of the loaned securities is determined at the close of business of the Fund and any additional required collateral is delivered to the Fund on the next business day. If the borrower defaults on its obligation to return the securities loaned because of insolvency or other reasons, a fund could experience delays and costs in recovering the securities loaned or in gaining access to the collateral. Any cash collateral received is maintained at the Fund's custodian and/or invested in cash equivalents. At period end, there were no security loans outstanding. Security lending income represents the income earned on investing cash collateral, less rebates paid to borrowers, plus any premium payments received for lending certain types of securities. Security lending income is presented in the Statement of Operations as a component of interest income. Total security lending income during the period amounted to $113.
10. Expense Reductions.
Through arrangements with the Fund's custodian, credits realized as a result of uninvested cash balances were used to reduce the Fund's expenses. During the period, these credits reduced the Fund's expenses by $4.
Semiannual Report
11. Distributions to Shareholders.
Distributions to shareholders of each class were as follows:
| 6 months ended
February 29, 2012 | One month ended
August 31, 2011 | Year ended
July 31, 2011 |
From net investment income | | | |
Class A | $ 2,393 | $ 449 | $ 6,937 |
Class T | 1,978 | 375 | 5,513 |
Class B | 74 | 18 | 332 |
Class C | 287 | 65 | 1,100 |
Government Income | 34,986 | 6,712 | 94,692 |
Institutional Class | 2,765 | 522 | 6,323 |
Total | $ 42,483 | $ 8,141 | $ 114,897 |
From net realized gain | | | |
Class A | $ 8,696 | $ - | $ 10,104 |
Class T | 7,112 | - | 7,830 |
Class B | 622 | - | 853 |
Class C | 2,398 | - | 2,724 |
Government Income | 103,541 | - | 112,442 |
Institutional Class | 8,484 | - | 6,868 |
Total | $ 130,853 | $ - | $ 140,821 |
12. Share Transactions.
Transactions for each class of shares were as follows:
| Shares |
| 6 months ended February 29, 2012 | One month ended
August 31, 2011 | Year ended
July 31, 2011 |
Class A | | | |
Shares sold | 8,211 | 2,036 | 10,505 |
Reinvestment of distributions | 944 | 38 | 1,423 |
Shares redeemed | (6,368) | (1,114) | (20,985) |
Net increase (decrease) | 2,787 | 960 | (9,057) |
Class T | | | |
Shares sold | 6,692 | 1,638 | 9,053 |
Reinvestment of distributions | 826 | 34 | 1,221 |
Shares redeemed | (5,790) | (844) | (15,795) |
Net increase (decrease) | 1,728 | 828 | (5,521) |
Class B | | | |
Shares sold | 166 | 131 | 275 |
Reinvestment of distributions | 50 | 1 | 93 |
Shares redeemed | (459) | (63) | (1,536) |
Net increase (decrease) | (243) | 69 | (1,168) |
Semiannual Report
Notes to Financial Statements (Unaudited) - continued
(Amounts in thousands except percentages)
12. Share Transactions - continued
| Shares |
| 6 months ended
February 29, 2012 | One month ended
August 31, 2011 | Year ended
July 31, 2011 |
Class C | | | |
Shares sold | 2,059 | 627 | 2,426 |
Reinvestment of distributions | 183 | 4 | 261 |
Shares redeemed | (1,492) | (235) | (5,248) |
Net increase (decrease) | 750 | 396 | (2,561) |
Government Income | | | |
Shares sold | 56,827 | 15,991 | 105,621 |
Reinvestment of distributions | 12,331 | 590 | 18,687 |
Shares redeemed | (68,324) | (14,407) | (178,425) |
Net increase (decrease) | 834 | 2,174 | (54,117) |
Institutional Class | | | |
Shares sold | 8,064 | 1,083 | 12,979 |
Reinvestment of distributions | 979 | 45 | 1,192 |
Shares redeemed | (7,867) | (1,758) | (8,205) |
Net increase (decrease) | 1,176 | (630) | 5,966 |
| Dollars |
| 6 months ended February 29, 2012 | One month ended
August 31, 2011 | Year ended
July 31, 2011 |
Class A | | | |
Shares sold | $ 88,934 | $ 22,105 | $ 111,665 |
Reinvestment of distributions | 10,225 | 412 | 15,111 |
Shares redeemed | (68,816) | (12,108) | (221,593) |
Net increase (decrease) | $ 30,343 | $ 10,409 | $ (94,817) |
Class T | | | |
Shares sold | $ 72,414 | $ 17,802 | $ 96,270 |
Reinvestment of distributions | 8,939 | 366 | 12,970 |
Shares redeemed | (62,592) | (9,169) | (166,943) |
Net increase (decrease) | $ 18,761 | $ 8,999 | $ (57,703) |
Class B | | | |
Shares sold | $ 1,801 | $ 1,417 | $ 2,957 |
Reinvestment of distributions | 543 | 14 | 985 |
Shares redeemed | (4,959) | (683) | (16,266) |
Net increase (decrease) | $ (2,615) | $ 748 | $ (12,324) |
Class C | | | |
Shares sold | $ 22,298 | $ 6,815 | $ 25,890 |
Reinvestment of distributions | 1,983 | 46 | 2,774 |
Shares redeemed | (16,097) | (2,561) | (55,376) |
Net increase (decrease) | $ 8,184 | $ 4,300 | $ (26,712) |
Semiannual Report
12. Share Transactions - continued
| Dollars |
| 6 months ended February 29, 2012 | One month ended
August 31, 2011 | Year ended
July 31, 2011 |
Government Income | | | |
Shares sold | $ 614,097 | $ 173,420 | $ 1,120,288 |
Reinvestment of distributions | 133,373 | 6,422 | 198,243 |
Shares redeemed | (737,698) | (156,265) | (1,885,694) |
Net increase (decrease) | $ 9,772 | $ 23,577 | $ (567,163) |
Institutional Class | | | |
Shares sold | $ 87,188 | $ 11,762 | $ 137,402 |
Reinvestment of distributions | 10,596 | 491 | 12,645 |
Shares redeemed | (84,999) | (19,046) | (86,944) |
Net increase (decrease) | $ 12,785 | $ (6,793) | $ 63,103 |
13. Other.
The Fund's organizational documents provide former and current trustees and officers with a limited indemnification against liabilities arising in connection with the performance of their duties to the Fund. In the normal course of business, the Fund may also enter into contracts that provide general indemnifications. The Fund's maximum exposure under these arrangements is unknown as this would be dependent on future claims that may be made against the Fund. The risk of material loss from such claims is considered remote.
Semiannual Report
Board Approval of Investment Advisory Contracts and Management Fees
Fidelity Government Income Fund
Each year, the Board of Trustees, including the Independent Trustees (together, the Board), votes on the renewal of the management contract and sub-advisory agreements (together, the Advisory Contracts) for the fund. The Board, assisted by the advice of fund counsel and Independent Trustees' counsel, requests and considers a broad range of information relevant to the renewal of the Advisory Contracts throughout the year.
The Board meets regularly and considers at each of its meetings factors that are relevant to its annual consideration of the renewal of the fund's Advisory Contracts, including the services and support provided to the fund and its shareholders. The Board has established three standing committees, Operations, Audit, and Nominating and Governance, each composed of Independent Trustees with varying backgrounds, to which the Board has assigned specific subject matter responsibilities in order to enhance effective decision-making by the Board. The Operations Committee, of which all of the Independent Trustees are members, meets regularly throughout the year and, among other matters, considers matters specifically related to the annual consideration of the renewal of the fund's Advisory Contracts. The Board, acting directly and through its Committees, requests and receives information concerning the annual consideration of the renewal of the fund's Advisory Contracts. The Board also meets as needed to consider matters specifically related to the Board's annual consideration of the renewal of Advisory Contracts. Members of the Board may also meet with trustees of other Fidelity funds through ad hoc joint committees to discuss certain matters relevant to the Fidelity funds.
At its September 2011 meeting, the Board of Trustees, including the Independent Trustees, unanimously determined to renew the fund's Advisory Contracts. In reaching its determination, the Board considered all factors it believed relevant, including (i) the nature, extent, and quality of the services to be provided to the fund and its shareholders (including the investment performance of the fund); (ii) the competitiveness of the fund's management fee and total expense ratio; (iii) the total costs of the services to be provided by and the profits to be realized by Fidelity from its relationship with the fund; (iv) the extent to which economies of scale would be realized as the fund grows; and (v) whether fee levels reflect these economies of scale, if any, for the benefit of fund shareholders.
In considering whether to renew the Advisory Contracts for the fund, the Board reached a determination, with the assistance of fund counsel and Independent Trustees' counsel and through the exercise of its business judgment, that the renewal of the Advisory Contracts is in the best interests of the fund and its shareholders and that the compensation payable under the Advisory Contracts is fair and reasonable. The Board's decision to renew the Advisory Contracts was not based on any single factor, but rather was based on a comprehensive consideration of all the information provided to the Board at its meetings throughout the year. The Board, in reaching its determination to renew the Advisory Contracts, is aware that shareholders in the fund have a broad range of investment choices available to them, including a wide choice among mutual funds offered by Fidelity's competitors, and that the fund's shareholders, who have the opportunity to review and weigh the disclosure provided by the fund in its prospectus and other public disclosures, have chosen to invest in this fund, managed by Fidelity.
Semiannual Report
Nature, Extent, and Quality of Services Provided. The Board considered the staffing within the investment adviser, FMR, and the sub-advisers (together, the Investment Advisers), including the backgrounds of the fund's investment personnel and the fund's investment objective and discipline. The Independent Trustees also had discussions with senior management of Fidelity's investment operations and investment groups. The Board considered the structure of the portfolio manager compensation program and whether this structure provides appropriate incentives to act in the best interests of the fund.
Resources Dedicated to Investment Management and Support Services. The Board reviewed the general qualifications and capabilities of the Investment Advisers' investment staff, including its size, education, experience, and resources, as well as the Investment Advisers' approach to recruiting, managing, and compensating investment personnel. The Board also noted that FMR has devoted increased resources to non-U.S. offices. The Board noted that Fidelity's analysts have extensive resources, tools and capabilities which allow them to conduct sophisticated quantitative and fundamental analysis, as well as credit analysis of issuers, counterparties and enhancers. The Board also believes that Fidelity's investment professionals have sufficient access to global information and data so as to provide competitive investment results over time, and that those professionals also have access to sophisticated tools which permit them to assess portfolio construction and risk and performance attribution characteristics continuously, as well as to transmit new information and research conclusions rapidly around the world. Additionally, in its deliberations, the Board considered the Investment Advisers' trading capabilities and resources which are an integral part of the investment management process.
Shareholder and Administrative Services. The Board considered (i) the nature, extent, quality, and cost of advisory, administrative, and shareholder services performed by the Investment Advisers and their affiliates under the Advisory Contracts and under separate agreements covering transfer agency, pricing and bookkeeping, and securities lending services for the fund; (ii) the nature and extent of the investment adviser's supervision of third party service providers, principally custodians and subcustodians; and (iii) the resources devoted to, and the record of compliance with, the fund's compliance policies and procedures.
The Board noted that the growth of fund assets over time across the complex allows Fidelity to reinvest in the development of services designed to enhance the value or convenience of the Fidelity funds as investment vehicles. These services include 24-hour access to account information and market information through telephone representatives and over the Internet, investor education materials and asset allocation tools, and the expanded availability of Fidelity Investor Centers, with 35 new branches opening since 2010.
Semiannual Report
Board Approval of Investment Advisory Contracts and
Management Fees - continued
Investment in a Large Fund Family. The Board considered the benefits to shareholders of investing in a Fidelity fund, including the benefits of investing in a fund that is part of a large family of funds offering a variety of investment disciplines and providing a large variety of mutual fund investor services. The Board noted that Fidelity had taken, or had made recommendations that resulted in the Fidelity funds taking, a number of actions over the previous year that benefited particular funds, including (i) continuing to dedicate additional resources to investment research and support of the senior management team that oversees asset management; (ii) rationalizing product lines through the mergers of six funds into other funds; (iii) continuing to migrate the Freedom Funds to dedicated lower cost underlying funds; (iv) obtaining shareholder approval to broaden the investment strategies for Fidelity Consumer Finance Portfolio, Fidelity Emerging Asia Fund, and Fidelity Environment and Alternative Energy Portfolio; (v) contractually agreeing to reduce the management fees and impose other expense limitations on Spartan 500 Index Fund and U.S. Bond Index Fund in connection with launching new institutional classes of these funds; (vi) changing the name, primary and supplemental benchmarks, and investment policies of Fidelity Global Strategies Fund to support the fund's flexible investment mandate and global orientation; and (vii) reducing the transfer agency account fee rates on certain accounts.
Investment Performance. The Board considered whether the fund has operated in accordance with its investment objective, as well as its record of compliance with its investment restrictions. It also reviewed the fund's absolute investment performance for each class, as well as the fund's relative investment performance for each class measured over multiple periods against (i) a proprietary custom index, and (ii) a peer group of mutual funds deemed appropriate by Fidelity and reviewed by the Board. The following charts considered by the Board show, over the one-, three-, and five-year periods ended December 31, 2010, as available, the cumulative total returns of the retail class and Class C of the fund, the cumulative total returns of a proprietary custom index ("benchmark"), and a range of cumulative total returns of a peer group of mutual funds identified by Lipper Inc. as having an investment objective similar to that of the fund. The returns of the retail class and Class C show the performance of the highest performing class (based on five-year performance) and the lowest performing class (based on three-year performance), respectively. The box within each chart shows the 25th percentile return (bottom of box) and the 75th percentile return (top of box) of the peer group. Returns shown above the box are in the first quartile and returns shown below the box are in the fourth quartile. The percentage beaten numbers noted below each chart correspond to the percentile box and represent the percentage of funds in the peer group whose performance was equal to or lower than that of the class indicated. The fund's proprietary custom index is an index developed by FMR that represents the performance of the fund's general investment categories.
Semiannual Report
Fidelity Government Income Fund
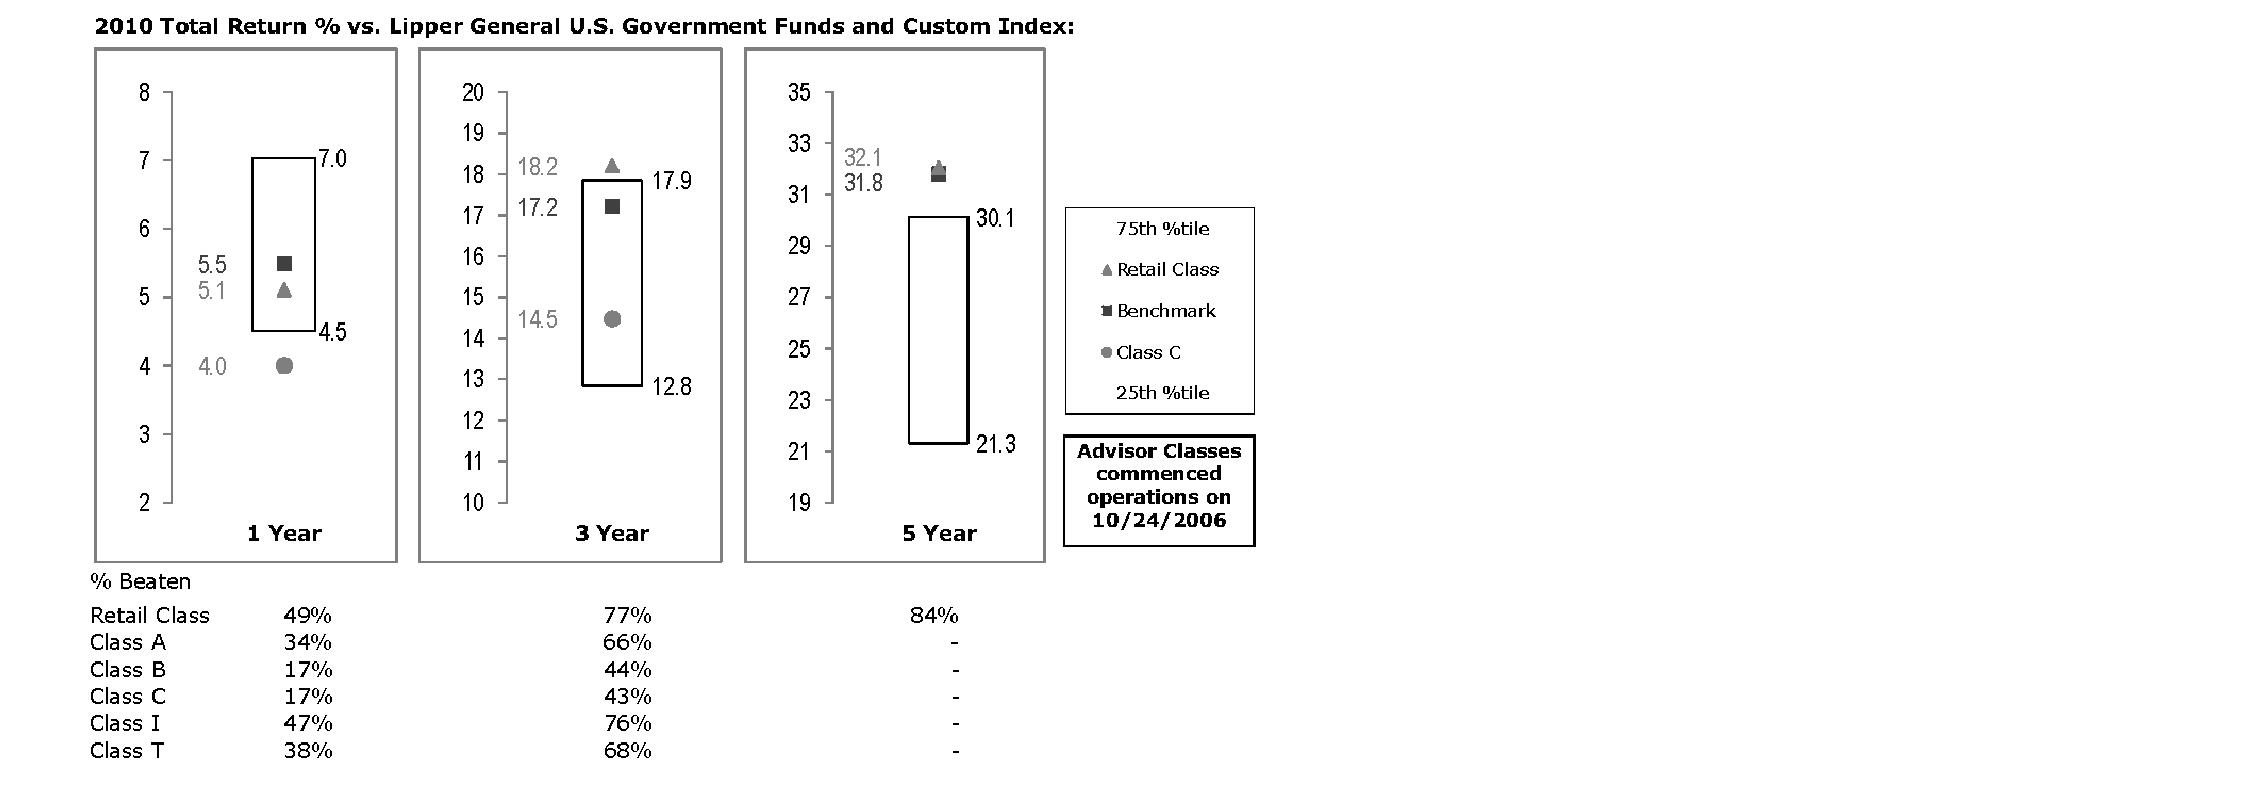
The Board reviewed the fund's relative investment performance against its peer group and noted that the performance of the retail class of the fund was in the third quartile for the one-year period and the first quartile for the three- and five-year periods. The Board also noted that the investment performance of the retail class of the fund compared favorably to its benchmark for the three- and five-year periods, although the fund's one-year total return was lower than its benchmark. The Board considered that the variations in performance among the fund's classes reflect the variations in class expenses, which result in lower performance for higher expense classes. The Board also reviewed the fund's performance since inception as well as performance in the current year.
Based on its review, the Board concluded that the nature, extent, and quality of services provided to the fund under the Advisory Contracts should benefit the fund's shareholders.
Competitiveness of Management Fee and Total Expense Ratio. The Board considered the fund's management fee and total expense ratio compared to "mapped groups" of competitive funds and classes. Fidelity creates "mapped groups" by combining similar Lipper investment objective categories that have comparable management fee characteristics. Combining Lipper investment objective categories aids the Board's management fee and total expense ratio comparisons by broadening the competitive group used for comparison and by reducing the number of universes to which various Fidelity funds are compared.
Semiannual Report
Board Approval of Investment Advisory Contracts and
Management Fees - continued
Management Fee. The Board considered two proprietary management fee comparisons for the 12-month periods shown in the chart below. The group of Lipper funds used by the Board for management fee comparisons is referred to below as the "Total Mapped Group" and, for the reasons explained above, is broader than the Lipper peer group used by the Board for performance comparisons. The Total Mapped Group comparison focuses on a fund's standing relative to the total universe of comparable funds available to investors in terms of gross management fees before expense reimbursements or caps. "TMG %" represents the percentage of funds in the Total Mapped Group that had management fees that were lower than the fund's. For example, a TMG % of 12% means that 88% of the funds in the Total Mapped Group had higher management fees than the fund. The "Asset-Size Peer Group" (ASPG) comparison focuses on a fund's standing relative to non-Fidelity funds similar in size to the fund within the Total Mapped Group. The ASPG represents at least 15% of the funds in the Total Mapped Group with comparable asset size and management fee characteristics, subject to a minimum of 50 funds (or all funds in the Total Mapped Group if fewer than 50). Additional information, such as the ASPG quartile in which the fund's management fee ranked, is also included in the chart and considered by the Board.
Fidelity Government Income Fund
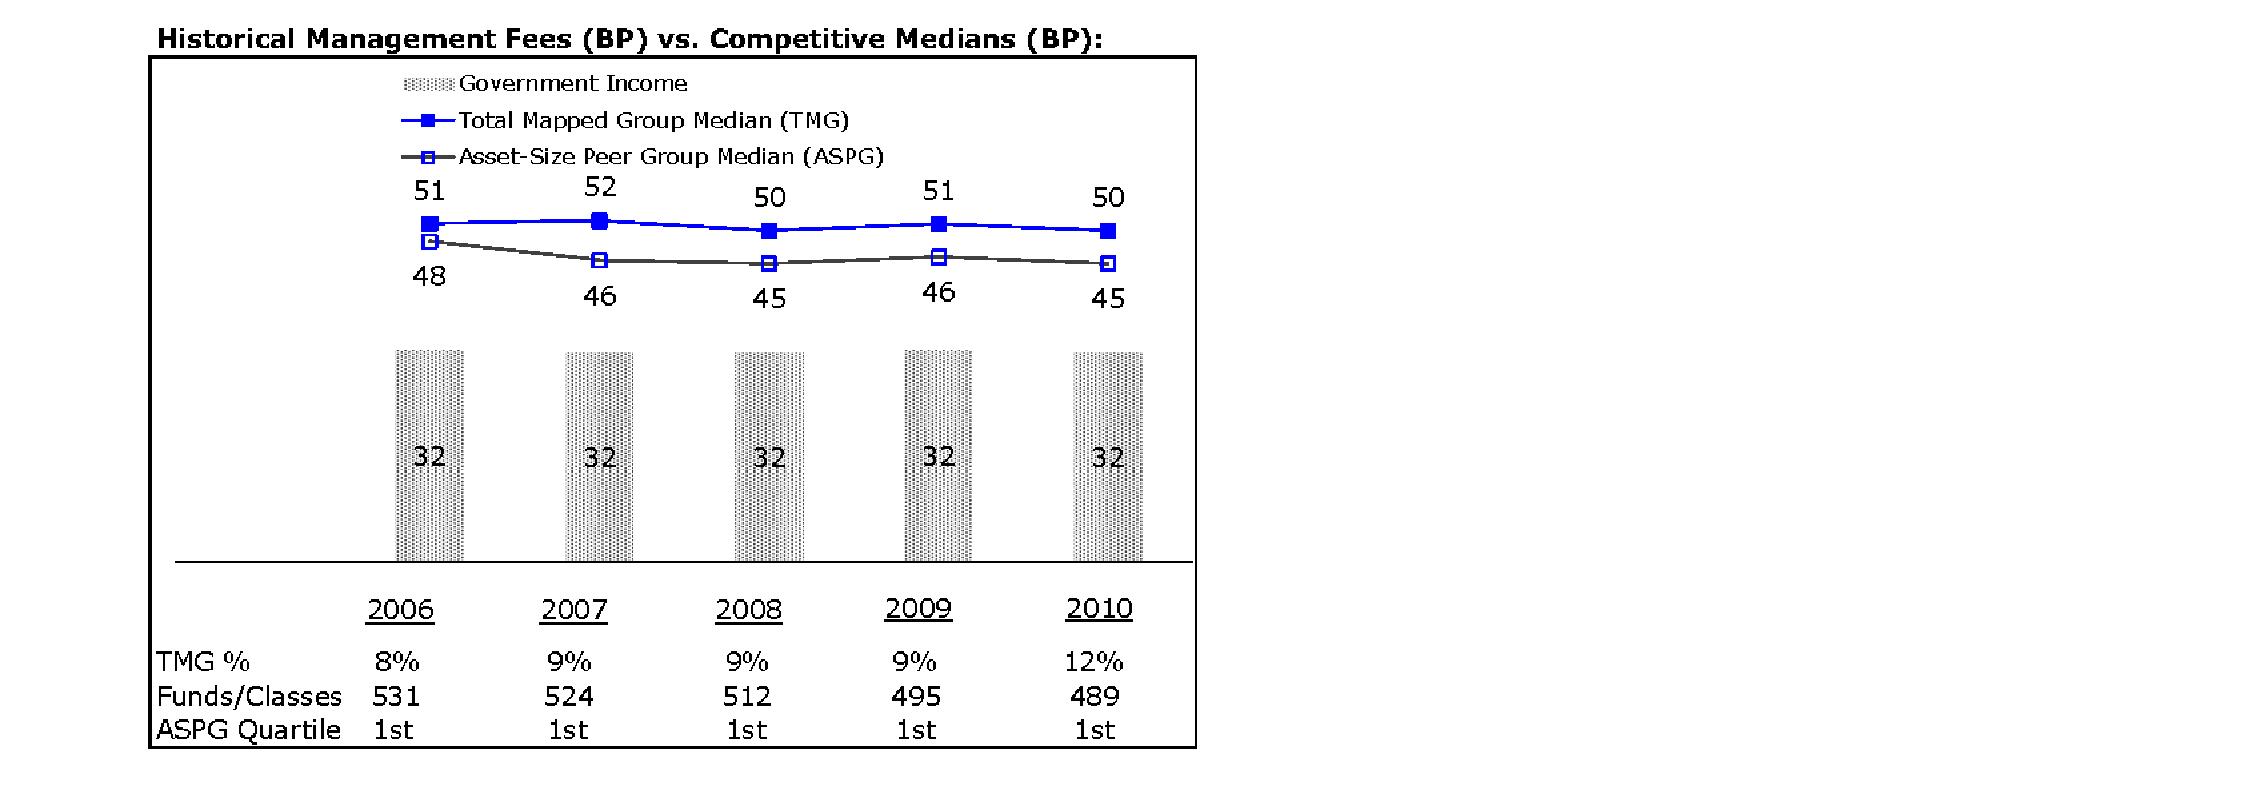
The Board noted that the fund's management fee ranked below the median of its Total Mapped Group and below the median of its ASPG for 2010.
Semiannual Report
Based on its review, the Board concluded that the fund's management fee is fair and reasonable in light of the services that the fund receives and the other factors considered.
Total Expense Ratio. In its review of each class's total expense ratio, the Board considered the fund's management fee as well as other fund or class expenses, as applicable, such as transfer agent fees, pricing and bookkeeping fees, fund-paid 12b-1 fees, and custodial, legal, and audit fees. The Board also noted the effects of any waivers and reimbursements on fees and expenses. As part of its review, the Board also considered the current and historical total expense ratios of each class of the fund compared to competitive fund median expenses. Each class of the fund is compared to those funds and classes in the Total Mapped Group (used by the Board for management fee comparisons) that have a similar sales load structure.
The Board also considered that the current contractual arrangements for the fund (i) have the effect of setting the total "fund-level" expenses (including, among certain other expenses, the management fee) for each class at 35 basis points, (ii) limit the "class-level" transfer agent fee for the retail class to 10 basis points, and (iii) limit the total expenses for the retail class to 45 basis points. The fees and expenses payable under these contractual arrangements may not be increased without the approval of the Board and the shareholders of the applicable class. The fund's Advisor classes are subject to different "class-level" expenses (transfer agent fees and 12b-1 fees).
The Board noted that the total expense ratio of each class ranked below its competitive median for 2010.
The Board recognized that the fund's management contract incorporates a "group fee" structure, which provides for lower group fee rates as total fund assets under FMR's management increase, and for higher group fee rates as total fund assets under FMR's management decrease. FMR calculates the group fee rates based on a tiered asset "breakpoint" schedule that varies based on asset class. The Board noted, however, that because the current contractual arrangements set the total "fund-level" expenses for each class at 35 basis points, increases or decreases in the management fee due to changes in the group fee rate will not impact the total expense ratio.
Fees Charged to Other Fidelity Clients. The Board also considered Fidelity fee structures and other information with respect to clients of FMR and its affiliates, such as other mutual funds advised or subadvised by FMR or its affiliates, pension plan clients, and other institutional clients. In March 2010, the Board created an ad hoc joint committee with the board of other Fidelity funds (the Committee) to review and compare Fidelity's institutional investment advisory business with its business of providing services to the Fidelity funds, including the differences in services provided, fees charged, and costs incurred, as well as competition in their respective marketplaces.
Semiannual Report
Board Approval of Investment Advisory Contracts and
Management Fees - continued
Based on its review of total expense ratios and fees charged to other Fidelity clients, the Board concluded that the total expense ratio of each class of the fund was reasonable in light of the services that the fund and its shareholders receive and the other factors considered, including the findings of the Committee.
Costs of the Services and Profitability. The Board considered the revenues earned and the expenses incurred by Fidelity in conducting the business of developing, marketing, distributing, managing, administering and servicing the fund and its shareholders. The Board also considered the level of Fidelity's profits in respect of all the Fidelity funds.
On an annual basis, FMR presents to the Board Fidelity's profitability for the fund. Fidelity calculates the profitability for each fund, as well as aggregate profitability for groups of Fidelity funds and all Fidelity funds, using a series of detailed revenue and cost allocation methodologies which originate with the books and records of Fidelity on which Fidelity's audited financial statements are based. The Audit Committee of the Board reviews any significant changes from the prior year's methodologies.
PricewaterhouseCoopers LLP (PwC), independent registered public accounting firm and auditor to Fidelity and certain Fidelity funds, has been engaged annually by the Board as part of the Board's assessment of Fidelity's profitability analysis. PwC's engagement includes the review and assessment of Fidelity's methodologies used in determining the revenues and expenses attributable to Fidelity's mutual fund business, and completion of agreed-upon procedures surrounding the mathematical accuracy of fund profitability and its conformity to allocation methodologies. After considering PwC's reports issued under the engagement and information provided by Fidelity, the Board concluded that while other allocation methods may also be reasonable, Fidelity's profitability methodologies are reasonable in all material respects.
The Board also reviewed Fidelity's non-fund businesses and fall-out benefits related to the mutual fund business as well as cases where Fidelity's affiliates may benefit from or be related to the fund's business.
The Board considered the costs of the services provided by and the profits realized by Fidelity in connection with the operation of the fund and was satisfied that the profitability was not excessive in the circumstances.
Economies of Scale. The Board considered whether there have been economies of scale in respect of the management of the Fidelity funds, whether the Fidelity funds (including the fund) have appropriately benefited from any such economies of scale, and whether there is potential for realization of any further economies of scale. The Board considered the extent to which the fund will benefit from economies of scale through increased services to the fund, through waivers or reimbursements, or through fee or expense reductions. The Board also noted that in 2009, it and the board of other Fidelity funds created an ad hoc committee (the Economies of Scale Committee) to analyze whether FMR attains economies of scale in respect of the management and servicing of the Fidelity funds, whether the Fidelity funds have appropriately benefited from such economies of scale, and whether there is potential for realization of any further economies of scale.
Semiannual Report
The Board concluded, taking into account the analysis of the Economies of Scale Committee, that any potential economies of scale are being appropriately shared between fund shareholders and Fidelity.
Additional Information Requested by the Board. In order to develop fully the factual basis for consideration of the Fidelity funds' Advisory Contracts, the Board requested and received additional information on certain topics, including: (i) Fidelity's fund profitability methodology, profitability trends for certain funds, and the impact of certain factors on fund profitability results; (ii) portfolio manager changes that have occurred during the past year and the amount of the investment that each portfolio manager has made in the Fidelity fund(s) that he or she manages; (iii) Fidelity's compensation structure for portfolio managers, research analysts, and other key personnel, including its effects on fund profitability, the rationale for the compensation structure, and the extent to which current market conditions have affected retention and recruitment; (iv) the compensation paid to fund sub-advisers on behalf of the Fidelity funds; (v) Fidelity's fee structures and rationale for recommending different fees among different categories of funds and classes, as well as Fidelity's voluntary waiver of its fees to maintain minimum yields for certain money market funds and classes; (vi) the reasons why certain expenses affect various funds and classes differently; (vii) Fidelity's transfer agent fees, expenses, and services and how the benefits of decreased costs and new efficiencies can be shared across all of the Fidelity funds; (viii) the reasons for and consequences of changes to certain product lines compared to competitors; (ix) the allocation of and historical trends in Fidelity's realization of fall-out benefits; and (x) explanations regarding the relative total expense ratios of certain funds and classes, total expense competitive trends, and actions that might be taken by FMR to reduce total expense ratios for certain funds and classes or to achieve further economies of scale.
Based on its evaluation of all of the conclusions noted above, and after considering all factors it believed relevant, the Board ultimately concluded that the advisory fee structures are fair and reasonable, and that the fund's Advisory Contracts should be renewed.
Semiannual Report
Investment Adviser
Fidelity Management & Research Company
Boston, MA
Investment Sub-Advisers
Fidelity Investments Money
Management, Inc.
Fidelity Management & Research
(U.K.) Inc.
Fidelity Management & Research
(Hong Kong) Limited
Fidelity Management & Research
(Japan) Inc.
General Distributor
Fidelity Distributors Corporation
Boston, MA
Transfer and Service Agents
Fidelity Investments Institutional Operations Company, Inc.
Boston, MA
Fidelity Service Company, Inc.
Boston, MA
Custodian
The Bank of New York Mellon
New York, NY
AGVT-USAN-0412
1.864213.104
(Fidelity Investment logo)(registered trademark)
(Fidelity Investment logo)(registered trademark)
Fidelity Advisor®
Government Income
Fund - Institutional Class
Semiannual Report
February 29, 2012
(Fidelity Cover Art)
Institutional Class is a class of
Fidelity® Government Income Fund
Contents
Shareholder Expense Example | (Click Here) | An example of shareholder expenses. |
Investment Changes | (Click Here) | A summary of major shifts in the fund's investments over the past six months. |
Investments | (Click Here) | A complete list of the fund's investments with their market values. |
Financial Statements | (Click Here) | Statements of assets and liabilities, operations, and changes in net assets, as well as financial highlights. |
Notes | (Click Here) | Notes to the financial statements. |
Board Approval of Investment Advisory Contracts and Management Fees | (Click Here) | |
To view a fund's proxy voting guidelines and proxy voting record for the 12-month period ended June 30, visit http://www.fidelity.com/proxyvotingresults or visit the Securities and Exchange Commission's (SEC) web site at http://www.sec.gov. You may also call 1-877-208-0098 to request a free copy of the proxy voting guidelines.
Standard & Poor's, S&P and S&P 500 are registered service marks of The McGraw-Hill Companies, Inc. and have been licensed for use by Fidelity Distributors Corporation.
Other third party marks appearing herein are the property of their respective owners.
All other marks appearing herein are registered or unregistered trademarks or service marks of FMR LLC or an affiliated company.
This report and the financial statements contained herein are submitted for the general information of the shareholders of the fund. This report is not authorized for distribution to prospective investors in the fund unless preceded or accompanied by an effective prospectus.
A fund files its complete schedule of portfolio holdings with the SEC for the first and third quarters of each fiscal year on Form N-Q. Forms N-Q are available on the SEC's web site at http://www.sec.gov. A fund's Forms N-Q may be reviewed and copied at the SEC's Public Reference Room in Washington, DC. Information regarding the operation of the SEC's Public Reference Room may be obtained by calling 1-800-SEC-0330. For a complete list of a fund's portfolio holdings, view the most recent holdings listing, semiannual report, or annual report on Fidelity's web site at http://www.fidelity.com, http://www.advisor.fidelity.com, or http://www.401k.com, as applicable.
NOT FDIC INSURED • MAY LOSE VALUE • NO BANK GUARANTEE
Neither the fund nor Fidelity Distributors Corporation is a bank.
Semiannual Report
Shareholder Expense Example
As a shareholder of the Fund, you incur two types of costs: (1) transaction costs, including sales charges (loads) on purchase payments or redemption proceeds, and (2) ongoing costs, including management fees, distribution and/or service (12b-1) fees and other Fund expenses. This Example is intended to help you understand your ongoing costs (in dollars) of investing in the Fund and to compare these costs with the ongoing costs of investing in other mutual funds.
The Example is based on an investment of $1,000 invested at the beginning of the period and held for the entire period (September 1, 2011 to February 29, 2012).
Actual Expenses
The first line of the accompanying table for each class of the Fund provides information about actual account values and actual expenses. You may use the information in this line, together with the amount you invested, to estimate the expenses that you paid over the period. Simply divide your account value by $1,000.00 (for example, an $8,600 account value divided by $1,000.00 = 8.6), then multiply the result by the number in the first line for a class of the Fund under the heading entitled "Expenses Paid During Period" to estimate the expenses you paid on your account during this period. A small balance maintenance fee of $12.00 that is charged once a year may apply for certain accounts with a value of less than $2,000. This fee is not included in the table below. If it was, the estimate of expenses you paid during the period would be higher, and your ending account value lower, by this amount. In addition, the Fund, as a shareholder in the underlying Fidelity Central Funds, will indirectly bear its pro-rata share of the fees and expenses incurred by the underlying Fidelity Central Funds. These fees and expenses are not included in the Fund's annualized expense ratio used to calculate the expense estimate in the table below.
Hypothetical Example for Comparison Purposes
The second line of the accompanying table for each class of the Fund provides information about hypothetical account values and hypothetical expenses based on a Class' actual expense ratio and an assumed rate of return of 5% per year before expenses, which is not the Class' actual return. The hypothetical account values and expenses may not be used to estimate the actual ending account balance or expenses you paid for the period. You may use this information to compare the ongoing costs of investing in the Fund and other funds. To do so, compare this 5% hypothetical example with the 5% hypothetical examples that appear in the shareholder reports of the other funds. A small balance maintenance fee of $12.00 that is charged once a year may apply for certain accounts with a value of less than $2,000. This fee is not included in the table below. If it was, the estimate of expenses you paid during the period would be higher, and your ending account value lower, by this amount. In addition, the Fund, as a shareholder in the underlying Fidelity Central Funds, will indirectly bear its pro-rata share of the fees and expenses incurred by the underlying Fidelity Central Funds. These fees and expenses are not included in the Fund's annualized expense ratio used to calculate the expense estimate in the table below.
Please note that the expenses shown in the table are meant to highlight your ongoing costs only and do not reflect any transaction costs. Therefore, the second line of the table is useful in comparing ongoing costs only, and will not help you determine the relative total costs of owning different funds. In addition, if these transactional costs were included, your costs would have been higher.
Semiannual Report
Shareholder Expense Example - continued
| Annualized Expense Ratio | Beginning
Account Value
September 1, 2011 | Ending
Account Value
February 29, 2012 | Expenses Paid
During Period *
September 1, 2011 to February 29, 2012 |
Class A | .77% | | | |
Actual | | $ 1,000.00 | $ 1,017.90 | $ 3.86 |
HypotheticalA | | $ 1,000.00 | $ 1,021.03 | $ 3.87 |
Class T | .76% | | | |
Actual | | $ 1,000.00 | $ 1,018.00 | $ 3.81 |
HypotheticalA | | $ 1,000.00 | $ 1,021.08 | $ 3.82 |
Class B | 1.50% | | | |
Actual | | $ 1,000.00 | $ 1,014.20 | $ 7.51 |
HypotheticalA | | $ 1,000.00 | $ 1,017.40 | $ 7.52 |
Class C | 1.52% | | | |
Actual | | $ 1,000.00 | $ 1,014.10 | $ 7.61 |
HypotheticalA | | $ 1,000.00 | $ 1,017.30 | $ 7.62 |
Government Income | .45% | | | |
Actual | | $ 1,000.00 | $ 1,020.50 | $ 2.26 |
HypotheticalA | | $ 1,000.00 | $ 1,022.63 | $ 2.26 |
Institutional Class | .52% | | | |
Actual | | $ 1,000.00 | $ 1,019.20 | $ 2.61 |
HypotheticalA | | $ 1,000.00 | $ 1,022.28 | $ 2.61 |
A 5% return per year before expenses
* Expenses are equal to each Class' annualized expense ratio, multiplied by the average account value over the period, multiplied by 182/366 (to reflect the one-half year period). The fees and expenses of the underlying Fidelity Central Funds in which the Fund invests are not included in the Fund's annualized expense ratio.
Semiannual Report
Investment Changes (Unaudited)
Coupon Distribution as of February 29, 2012 |
| % of fund's investments | % of fund's investments
6 months ago |
Zero coupon bonds | 1.2 | 0.7 |
0.01 - 0.99% | 26.5 | 16.7 |
1 - 1.99% | 16.2 | 19.2 |
2 - 2.99% | 6.8 | 5.6 |
3 - 3.99% | 9.1 | 5.5 |
4 - 4.99% | 20.8 | 32.6 |
5 - 5.99% | 16.7 | 19.7 |
6 - 6.99% | 4.6 | 4.2 |
7% and over | 0.5 | 0.8 |
Coupon distribution shows the range of stated interest rates on the fund's investments, excluding short-term investments. The information in the above table is based on the combined investments of the Fund and its pro-rata share of the investments of Fidelity's fixed-income central funds. |
Weighted Average Maturity as of February 29, 2012 |
| | 6 months ago |
Years | 6.3 | 5.7 |
This is a weighted average of all the maturities of the securities held in a fund. Weighted Average Maturity (WAM) can be used as a measure of sensitivity to interest rate changes and market changes. Generally, the longer the maturity, the greater the sensitivity to such changes. WAM is based on the dollar-weighted average length of time until principal payments must be paid. Depending on the types of securities held in a fund, certain maturity shortening devices (e.g., demand features, interest rate resets, and call options) may be taken into account when calculating the WAM. |
Duration as of February 29, 2012 |
| | 6 months ago |
Years | 4.6 | 4.6 |
Duration estimates how much a bond fund's price will change with a change in comparable interest rates. If rates rise 1%, for example, a fund with a 5-year duration is likely to lose about 5% of its value. Other factors also can influence a bond fund's performance and share price. Accordingly, a bond fund's actual performance may differ from this example. Duration takes into account any call or put option embedded in the bonds. |
Asset Allocation (% of fund's net assets) |
As of February 29, 2012 * | As of August 31, 2011 ** |
| Mortgage
Securities 30.7% | | | Mortgage
Securities 45.5% | |
| CMOs and Other Mortgage Related Securities 12.3% | | | CMOs and Other Mortgage Related Securities 8.1% | |
| U.S. Treasury
Obligations 49.8% | | | U.S. Treasury
Obligations 50.1% | |
| U.S. Government
Agency Obligations†10.7% | | | U.S. Government
Agency Obligations† 12.7% | |
| Foreign Government & Government Agency Obligations 1.4% | | | Foreign Government & Government Agency Obligations 1.5% | |
| Short-Term
Investments and
Net Other Assets*** (4.9)% | | | Short-Term
Investments and
Net Other Assets*** (17.9)% | |

* Futures and Swaps | 1.7% | | ** Futures and Swaps | 1.9% | |
† Includes FDIC Guaranteed Corporate Securities and NCUA Guaranteed Notes. | |
*** Short-Term Investments and Net Other Assets are not included in the pie chart. | |
The information in the above table is based on the combined investments of the Fund and its pro-rata share of the investments of Fidelity's fixed-income central funds. A holdings listing for the Fund, which presents direct holdings as well as pro-rata share of any securities and other investments held indirectly through its investment in underlying non-money market Fidelity Central Funds, is available at fidelity.com and/or advisor.fidelity.com as applicable. |
Semiannual Report
Investments February 29, 2012 (Unaudited)
Showing Percentage of Net Assets
U.S. Government and Government Agency Obligations - 60.5% |
| Principal Amount (000s) | | Value (000s) |
U.S. Government Agency Obligations - 6.6% |
Fannie Mae: | | | | |
0.375% 12/28/12 | | $ 50,670 | | $ 50,768 |
0.375% 3/16/15 | | 18,141 | | 18,047 |
0.75% 12/18/13 | | 7,805 | | 7,860 |
1.125% 4/27/17 | | 54,340 | | 54,220 |
4.75% 11/19/12 | | 2,000 | | 2,065 |
Federal Home Loan Bank: | | | | |
0.375% 11/27/13 | | 12,245 | | 12,246 |
0.375% 1/29/14 | | 24,375 | | 24,365 |
0.875% 8/22/12 | | 8,580 | | 8,610 |
Freddie Mac: | | | | |
0.625% 12/29/14 | | 21,293 | | 21,348 |
1% 7/30/14 | | 9,905 | | 10,034 |
1% 8/27/14 | | 15,111 | | 15,309 |
Overseas Private Investment Corp. U.S. Government guaranteed participation certificates 6.77% 11/15/13 | | 1,790 | | 1,886 |
Private Export Funding Corp. secured: | | | | |
4.974% 8/15/13 | | 22,940 | | 24,429 |
5.685% 5/15/12 | | 24,035 | | 24,310 |
Small Business Administration guaranteed development participation certificates: | | | | |
Series 2002-20J Class 1, 4.75% 10/1/22 | | 3,630 | | 3,948 |
Series 2002-20K Class 1, 5.08% 11/1/22 | | 7,244 | | 7,931 |
Series 2003-P10B, Class 1 5.136% 8/10/13 | | 2,055 | | 2,147 |
Series 2004-20H Class 1, 5.17% 8/1/24 | | 2,104 | | 2,327 |
Tennessee Valley Authority: | | | | |
3.875% 2/15/21 | | 33,790 | | 38,359 |
5.25% 9/15/39 | | 12,000 | | 14,990 |
5.375% 4/1/56 | | 8,429 | | 10,960 |
TOTAL U.S. GOVERNMENT AGENCY OBLIGATIONS | | 356,159 |
U.S. Treasury Obligations - 49.8% |
U.S. Treasury Bonds: | | | | |
3.125% 2/15/42 | | 70,290 | | 70,641 |
3.75% 8/15/41 | | 42,345 | | 47,929 |
4.375% 2/15/38 | | 14,154 | | 17,712 |
4.375% 5/15/41 | | 111,265 | | 139,811 |
5% 5/15/37 (c) | | 26,846 | | 36,607 |
5.25% 11/15/28 | | 23,775 | | 32,089 |
5.25% 2/15/29 | | 20,569 | | 27,816 |
6.125% 11/15/27 | | 77,365 | | 112,759 |
U.S. Government and Government Agency Obligations - continued |
| Principal Amount (000s) | | Value (000s) |
U.S. Treasury Obligations - continued |
U.S. Treasury Bonds: - continued | | | | |
6.125% 8/15/29 | | $ 2,877 | | $ 4,266 |
9.875% 11/15/15 | | 10,285 | | 13,804 |
U.S. Treasury Notes: | | | | |
0.125% 8/31/13 | | 82,800 | | 82,625 |
0.125% 12/31/13 | | 40,165 | | 40,041 |
0.25% 1/31/14 | | 108,553 | | 108,456 |
0.25% 9/15/14 | | 71,417 | | 71,171 |
0.25% 12/15/14 | | 30,000 | | 29,871 |
0.25% 1/15/15 | | 100,018 | | 99,573 |
0.25% 2/15/15 | | 143,888 | | 143,180 |
0.375% 7/31/13 | | 11,710 | | 11,730 |
0.375% 11/15/14 | | 30,000 | | 29,979 |
0.5% 8/15/14 | | 83,265 | | 83,525 |
0.5% 10/15/14 | | 90,000 | | 90,253 |
0.625% 7/15/14 | | 86,384 | | 86,924 |
0.75% 6/15/14 | | 30,071 | | 30,348 |
0.875% 11/30/16 | | 51,366 | | 51,502 |
0.875% 2/28/17 | | 182,014 | | 182,042 |
1% 4/30/12 | | 602 | | 603 |
1% 9/30/16 | | 32,048 | | 32,361 |
1% 10/31/16 | | 47,700 | | 48,140 |
1.25% 10/31/15 | | 29,580 | | 30,292 |
1.375% 11/30/15 | | 470 | | 483 |
1.375% 2/28/19 | | 264,653 | | 264,283 |
1.75% 7/31/15 | | 28,800 | | 29,990 |
1.875% 8/31/17 | | 47,000 | | 49,174 |
1.875% 9/30/17 | | 87,400 | | 91,374 |
2% 11/15/21 | | 12,777 | | 12,837 |
2% 2/15/22 | | 41,400 | | 41,471 |
2.125% 11/30/14 | | 21,500 | | 22,499 |
2.125% 5/31/15 | | 4,176 | | 4,395 |
2.125% 8/15/21 | | 33,900 | | 34,567 |
2.375% 8/31/14 | | 20,000 | | 20,988 |
2.375% 9/30/14 | | 13,017 | | 13,680 |
2.375% 10/31/14 | | 77,497 | | 81,529 |
2.375% 6/30/18 | | 26,608 | | 28,479 |
2.5% 6/30/17 | | 10,000 | | 10,800 |
2.625% 7/31/14 (d) | | 16,179 | | 17,059 |
2.75% 11/30/16 | | 18,530 | | 20,190 |
3.125% 1/31/17 | | 60,773 | | 67,382 |
U.S. Government and Government Agency Obligations - continued |
| Principal Amount (000s) | | Value (000s) |
U.S. Treasury Obligations - continued |
U.S. Treasury Notes: - continued | | | | |
3.125% 5/15/21 | | $ 32,410 | | $ 35,973 |
4% 2/15/15 | | 12,619 | | 13,936 |
4.25% 8/15/15 | | 13,117 | | 14,780 |
4.5% 5/15/17 | | 24,685 | | 29,173 |
4.75% 8/15/17 | | 12,983 | | 15,588 |
TOTAL U.S. TREASURY OBLIGATIONS | | 2,676,680 |
Other Government Related - 4.1% |
Bank of America Corp.: | | | | |
2.1% 4/30/12 (FDIC Guaranteed) (a) | | 6,060 | | 6,079 |
3.125% 6/15/12 (FDIC Guaranteed) (a) | | 3,719 | | 3,750 |
Citibank NA 1.875% 5/7/12 (FDIC Guaranteed) (a) | | 37,150 | | 37,256 |
Citigroup Funding, Inc.: | | | | |
1.875% 10/22/12 (FDIC Guaranteed) (a) | | 40,500 | | 40,941 |
1.875% 11/15/12 (FDIC Guaranteed) (a) | | 18,920 | | 19,145 |
General Electric Capital Corp.: | | | | |
2% 9/28/12 (FDIC Guaranteed) (a) | | 11,000 | | 11,116 |
2.625% 12/28/12 (FDIC Guaranteed) (a) | | 16,154 | | 16,479 |
GMAC, Inc. 1.75% 10/30/12 (FDIC Guaranteed) (a) | | 51,106 | | 51,638 |
Goldman Sachs Group, Inc. 3.25% 6/15/12 (FDIC Guaranteed) (a) | | 3,714 | | 3,746 |
JPMorgan Chase & Co. 2.2% 6/15/12 (FDIC Guaranteed) (a) | | 9,200 | | 9,255 |
National Credit Union Administration Guaranteed Notes: | | | | |
Series 2010-A1 Class A, 0.6463% 12/7/20 (NCUA Guaranteed) (e) | | 10,863 | | 10,899 |
Series 2011-R4 Class 1A, 0.6753% 3/6/20 (NCUA Guaranteed) (e) | | 10,530 | | 10,533 |
TOTAL OTHER GOVERNMENT RELATED | | 220,837 |
TOTAL U.S. GOVERNMENT AND GOVERNMENT AGENCY OBLIGATIONS (Cost $3,150,371) | 3,253,676 |
U.S. Government Agency - Mortgage Securities - 6.3% |
|
Fannie Mae: - 3.8% |
1.925% 12/1/34 (e) | | 301 | | 313 |
1.926% 2/1/33 (e) | | 308 | | 322 |
U.S. Government Agency - Mortgage Securities - continued |
| Principal Amount (000s) | | Value (000s) |
Fannie Mae: - continued |
1.93% 10/1/33 (e) | | $ 282 | | $ 293 |
1.952% 3/1/35 (e) | | 265 | | 279 |
1.964% 10/1/33 (e) | | 143 | | 150 |
2.036% 7/1/35 (e) | | 134 | | 141 |
2.05% 3/1/35 (e) | | 48 | | 50 |
2.223% 11/1/33 (e) | | 812 | | 860 |
2.301% 7/1/34 (e) | | 170 | | 180 |
2.303% 6/1/36 (e) | | 223 | | 236 |
2.424% 10/1/33 (e) | | 240 | | 253 |
2.448% 3/1/35 (e) | | 162 | | 170 |
2.448% 2/1/36 (e) | | 683 | | 722 |
2.487% 11/1/36 (e) | | 194 | | 207 |
2.537% 7/1/35 (e) | | 527 | | 560 |
2.609% 5/1/36 (e) | | 415 | | 442 |
3.471% 3/1/40 (e) | | 8,222 | | 8,517 |
3.5% 3/1/42 (b) | | 105,000 | | 108,529 |
4% 9/1/13 to 11/1/41 | | 5,054 | | 5,331 |
4% 3/1/42 (b) | | 28,500 | | 29,995 |
4.5% 3/1/41 to 9/1/41 | | 33,675 | | 36,330 |
5% 2/1/16 to 5/1/38 | | 3,555 | | 3,830 |
5.718% 3/1/36 (e) | | 2,189 | | 2,307 |
5.954% 3/1/37 (e) | | 476 | | 513 |
6.5% 2/1/17 to 5/1/27 | | 1,479 | | 1,654 |
7% 7/1/13 | | 1 | | 1 |
9% 5/1/14 | | 100 | | 103 |
9.5% 10/1/20 | | 42 | | 49 |
11.25% 5/1/14 | | 1 | | 1 |
11.5% 6/15/19 to 1/15/21 | | 175 | | 187 |
| | 202,525 |
Freddie Mac - 0.3% |
1.915% 3/1/35 (e) | | 946 | | 981 |
2.095% 5/1/37 (e) | | 487 | | 504 |
2.549% 2/1/36 (e) | | 106 | | 112 |
2.636% 6/1/35 (e) | | 767 | | 817 |
2.795% 7/1/36 (e) | | 765 | | 814 |
2.798% 7/1/35 (e) | | 1,830 | | 1,936 |
2.943% 3/1/33 (e) | | 56 | | 59 |
3.149% 10/1/35 (e) | | 323 | | 344 |
4.5% 5/1/39 to 10/1/41 | | 9,322 | | 9,990 |
5.138% 4/1/35 (e) | | 290 | | 304 |
5.5% 12/1/27 to 7/1/29 | | 461 | | 501 |
U.S. Government Agency - Mortgage Securities - continued |
| Principal Amount (000s) | | Value (000s) |
Freddie Mac - continued |
9% 9/1/14 | | $ 0* | | $ 0* |
9.5% 5/1/17 to 8/1/21 | | 86 | | 97 |
9.75% 8/1/14 | | 68 | | 75 |
11% 5/1/14 | | 19 | | 20 |
12% 3/1/15 | | 0* | | 0* |
12.5% 2/1/14 to 6/1/15 | | 2 | | 2 |
13% 6/1/14 to 10/1/14 | | 0* | | 0* |
| | 16,556 |
Ginnie Mae - 2.2% |
4.626% 3/1/62 (i) | | 8,382 | | 9,440 |
4.65% 3/1/62 (i) | | 7,224 | | 8,067 |
4.684% 1/20/62 (i) | | 25,534 | | 28,786 |
5.492% 4/20/60 (i) | | 23,524 | | 26,941 |
5.493% 11/20/59 (i) | | 27,952 | | 31,450 |
5.612% 4/20/58 (i) | | 11,672 | | 12,523 |
| | 117,207 |
TOTAL U.S. GOVERNMENT AGENCY - MORTGAGE SECURITIES (Cost $329,870) | 336,288 |
Collateralized Mortgage Obligations - 8.6% |
|
U.S. Government Agency - 8.6% |
Fannie Mae Guaranteed Mtg. pass-thru certificates: | | | | |
floater Series 2010-15 Class FJ, 1.174% 6/25/36 (e) | | 27,110 | | 27,468 |
planned amortization class: | | | | |
Series 1993-240 Class PD, 6.25% 12/25/13 | | 654 | | 674 |
Series 2006-45 Class OP, 6/25/36 (h) | | 3,855 | | 3,501 |
Series 2010-118 Class PB, 4.5% 10/25/40 | | 7,053 | | 7,718 |
sequential payer: | | | | |
Series 2007-113 Class DB, 4.5% 12/25/22 | | 12,440 | | 13,808 |
Series 2009-14 Class EB, 4.5% 3/25/24 | | 7,840 | | 8,535 |
Series 2010-97 Class CX, 4.5% 9/25/25 | | 10,813 | | 12,266 |
Series 2007-113 Class JD, 4.5% 12/25/22 | | 12,766 | | 14,150 |
Series 2010-109 Class IM, 5.5% 9/25/40 (g) | | 19,963 | | 3,022 |
Series 2010-39 Class FG, 1.164% 3/25/36 (e) | | 14,130 | | 14,359 |
Series 2010-97 Class CI, 4.5% 8/25/25��(g) | | 10,184 | | 883 |
Fannie Mae subordinate REMIC pass-thru certificates: | | | | |
floater: | | | | |
Series 2001-38 Class QF, 1.224% 8/25/31 (e) | | 301 | | 305 |
Series 2002-49 Class FB, 0.8455% 11/18/31 (e) | | 366 | | 367 |
Collateralized Mortgage Obligations - continued |
| Principal Amount (000s) | | Value (000s) |
U.S. Government Agency - continued |
Fannie Mae subordinate REMIC pass-thru certificates: - continued | | | | |
floater: | | | | |
Series 2002-60 Class FV, 1.244% 4/25/32 (e) | | $ 154 | | $ 157 |
Series 2002-75 Class FA, 1.244% 11/25/32 (e) | | 316 | | 321 |
planned amortization: | | | | |
Series 2005-19 Class PA, 5.5% 7/25/34 | | 7,794 | | 8,655 |
Series 2005-64 Class PX, 5.5% 6/25/35 | | 7,833 | | 8,746 |
planned amortization class Series 2003-113 Class PE, 4% 11/25/18 | | 7,545 | | 8,101 |
sequential payer: | | | | |
Series 2004-91 Class Z, 5% 12/25/34 | | 9,477 | | 10,677 |
Series 2005-117, Class JN, 4.5% 1/25/36 | | 645 | | 715 |
Series 2005-47 Class HK, 4.5% 6/25/20 | | 7,798 | | 8,475 |
Series 2006-72 Class CY, 6% 8/25/26 | | 10,215 | | 11,643 |
Series 2009-82 Class FD, 1.094% 10/25/39 (e) | | 11,461 | | 11,625 |
Series 2009-85 Class IB, 4.5% 8/25/24 (g) | | 2,858 | | 243 |
Series 2009-93 Class IC, 4.5% 9/25/24 (g) | | 5,074 | | 410 |
Series 2010-139 Class NI, 4.5% 2/25/40 (g) | | 11,402 | | 1,620 |
Freddie Mac planned amortization class Series 2115 Class PE, 6% 1/15/14 | | 126 | | 130 |
Freddie Mac Multi-Class pass-thru certificates: | | | | |
floater: | | | | |
Series 2530 Class FE, 0.8485% 2/15/32 (e) | | 216 | | 217 |
Series 2630 Class FL, 0.7485% 6/15/18 (e) | | 338 | | 341 |
Series 3008 Class SM, 0% 7/15/35 (e) | | 99 | | 97 |
Series 3419 Class FD, 1.0185% 2/15/38 (e) | | 11,542 | | 11,689 |
floater planned amortization Series 3950 Class QF, 0.7485% 8/15/40 (e) | | 20,741 | | 20,789 |
planned amortization class: | | | | |
Series 1141 Class G, 9% 9/15/21 | | 169 | | 195 |
Series 2356 Class GD, 6% 9/15/16 | | 160 | | 172 |
Series 2376 Class JE, 5.5% 11/15/16 | | 1,111 | | 1,189 |
Series 2381 Class OG, 5.5% 11/15/16 | | 697 | | 745 |
Series 2640 Class GE, 4.5% 7/15/18 | | 7,310 | | 7,745 |
Series 2672 Class MG, 5% 9/15/23 | | 7,120 | | 8,061 |
Series 2682 Class LD, 4.5% 10/15/33 | | 777 | | 862 |
Series 2810 Class PD, 6% 6/15/33 | | 532 | | 555 |
sequential payer: | | | | |
Series 2570 Class CU, 4.5% 7/15/17 | | 145 | | 147 |
Series 2587 Class AD, 4.71% 3/15/33 | | 5,785 | | 6,663 |
Series 2773 Class HC, 4.5% 4/15/19 | | 704 | | 777 |
Series 2877 Class ZD, 5% 10/15/34 | | 12,299 | | 13,813 |
Collateralized Mortgage Obligations - continued |
| Principal Amount (000s) | | Value (000s) |
U.S. Government Agency - continued |
Freddie Mac Multi-Class pass-thru certificates: - continued | | | | |
sequential payer: | | | | |
Series 2987 Class HE, 4.5% 6/15/20 | | $ 11,260 | | $ 11,979 |
Series 3007 Class EW, 5.5% 7/15/25 | | 8,875 | | 10,238 |
Series 3277 Class B, 4% 2/15/22 | | 5,900 | | 6,406 |
Series 3578, Class B, 4.5% 9/15/24 | | 7,927 | | 8,685 |
Series 2863 Class DB, 4% 9/15/14 | | 115 | | 115 |
Ginnie Mae: | | | | |
0% 3/1/62 (e)(i) | | 3,370 | | 3,383 |
0% 3/1/62 (e)(i) | | 7,630 | | 7,630 |
Ginnie Mae guaranteed REMIC pass-thru certificates: | | | | |
floater: | | | | |
Series 2008-57 Class BF, 1.0755% 7/20/38 (e) | | 14,271 | | 14,500 |
Series 2008-73: | | | | |
Class FA, 1.1055% 8/20/38 (e) | | 7,068 | | 7,171 |
Class FK, 1.0055% 8/20/38 (e) | | 15,222 | | 15,405 |
Series 2008-83 Class FB, 1.1455% 9/20/38 (e) | | 7,022 | | 7,128 |
Series 2011-H21 Class FA, 0.8455% 10/20/61 (e)(i) | | 10,622 | | 10,605 |
Series 2012-H01 Class FA, 0.9455% 11/20/61 (e)(i) | | 8,321 | | 8,353 |
0% 2/1/62 (e)(i) | | 5,000 | | 4,997 |
planned amortization Series 2011-61 Class OP, 5/20/40 (h) | | 10,524 | | 9,061 |
sequential payer Series 2011-69 Class GX, 4.5% 5/16/40 | | 10,205 | | 11,226 |
Series 2010-42 Class OP, 4/20/40 (h) | | 23,829 | | 20,155 |
Series 2011-71: | | | | |
Class ZB, 5.5% 8/20/34 | | 20,749 | | 24,251 |
Class ZC, 5.5% 7/16/34 | | 23,655 | | 27,751 |
TOTAL COLLATERALIZED MORTGAGE OBLIGATIONS (Cost $449,221) | 461,670 |
Commercial Mortgage Securities - 0.6% |
|
Freddie Mac Multi-Class pass-thru certificates Series K706: | | | | |
Class A1, 1.691% 11/25/44 | | 13,400 | | 13,592 |
Class A2, 2.323% 11/25/44 | | 16,500 | | 16,812 |
TOTAL COMMERCIAL MORTGAGE SECURITIES (Cost $30,348) | 30,404 |
Foreign Government and Government Agency Obligations - 1.4% |
| Principal Amount (000s) | | Value (000s) |
Israeli State (guaranteed by U.S. Government through Agency for International Development) 5.5% 9/18/23
(Cost $60,995) | | $ 59,862 | | $ 76,374 |
Fixed-Income Funds - 25.3% |
| Shares | | |
Fidelity Mortgage Backed Securities Central Fund (f)
(Cost $1,297,209) | 12,534,039 | |
1,359,818
|
Cash Equivalents - 0.7% |
| Maturity Amount (000s) | | |
Investments in repurchase agreements in a joint trading account at 0.14%, dated 2/29/12 due 3/1/12 (Collateralized by U.S. Government Obligations) #
(Cost $36,738) | $ 36,738 | |
36,738
|
TOTAL INVESTMENT PORTFOLIO - 103.4% (Cost $5,354,752) | 5,554,968 |
NET OTHER ASSETS (LIABILITIES) - (3.4)% | (181,163) |
NET ASSETS - 100% | $ 5,373,805 |
TBA Sale Commitments |
| Principal Amount (000s) | | |
Fannie Mae: |
3.5% 3/1/42 | $ (105,000) | | (108,529) |
4.5% 3/1/42 | (28,100) | | (29,948) |
TOTAL TBA SALE COMMITMENTS (Proceeds $138,504) | $ (138,477) |
Futures Contracts |
| Expiration Date | | Underlying Face Amount at Value (000s) | | Unrealized Appreciation/
(Depreciation) (000s) |
Purchased |
Treasury Contracts |
437 CBOT 10-Year U.S. Treasury Bond Contracts | June 2012 | | $ 57,227 | | $ 224 |
452 CBOT 2-Year U.S. Treasury Bond Contracts | June 2012 | | 99,546 | | (8) |
TOTAL TREASURY CONTRACTS | | $ 156,773 | | $ 216 |
|
The face value of futures purchased as a percentage of net assets is 3% |
Swap Agreements |
| | | Notional Amount (000s) | | Value (000s) |
Interest Rate Swaps |
Receive quarterly a floating rate based on 3-month LIBOR and pay semi-annually a fixed rate equal to 3.23% with Credit Suisse First Boston | May 2020 | | $ 50,000 | | $ (5,925) |
Legend |
(a) Under the Temporary Liquidity Guarantee Program, the Federal Deposit Insurance Corporation guarantees principal and interest in the event of payment default or bankruptcy until the earlier of maturity date of the debt or until June 30, 2012. At the end of the period these securities amounted to $199,405,000 or 3.7% of net assets. |
(b) Security or a portion of the security purchased on a delayed delivery or when-issued basis. |
(c) Security or a portion of the security was pledged to cover margin requirements for futures contracts. At the period end, the value of securities pledged amounted to $700,000. |
(d) Security or a portion of the security has been segregated as collateral for open swap agreements. At the period end, the value of securities pledged amounted to $5,525,000. |
(e) Coupon rates for floating and adjustable rate securities reflect the rates in effect at period end. |
(f) Affiliated fund that is available only to investment companies and other accounts managed by Fidelity Investments. A complete unaudited schedule of portfolio holdings for each Fidelity Central Fund is filed with the SEC for the first and third quarters of each fiscal year on Form N-Q and is available upon request or at the SEC's web site at www.sec.gov. An unaudited holdings listing for the Fund, which presents direct holdings as well as the pro rata share of securities and other investments held indirectly through its investment in underlying non-money market Fidelity Central Funds, is available at fidelity.com and/or advisor.fidelity.com, as applicable. In addition, each Fidelity Central Fund's financial statements are available on the SEC's web site or upon request. |
(g) Security represents right to receive monthly interest payments on an underlying pool of mortgages or assets. Principal shown is the outstanding par amount of the pool as of the end of the period. |
(h) Principal Only Strips represent the right to receive the monthly principal payments on an underlying pool of mortgage loans. |
(i) Represents an investment in an underlying pool of reverse mortgages which typically do not require regular principal and interest payments as repayment is deferred until a maturity event. |
* Amount represents less than $1,000. |
# Additional information on each counterparty to the repurchase agreement is as follows: |
Repurchase Agreement / Counterparty | Value
(Amounts in thousands) |
$36,738,000 due 3/01/12 at 0.14% |
Citibank NA | $ 6,439 |
Credit Suisse Securities (USA) LLC | 27,079 |
Merrill Lynch, Pierce, Fenner & Smith, Inc. | 3,220 |
| $ 36,738 |
Affiliated Central Funds |
Information regarding fiscal year to date income earned by the Fund from investments in Fidelity Central Funds is as follows: |
Fund | Income earned
(Amounts in thousands) |
Fidelity Mortgage Backed Securities Central Fund | $ 20,729 |
Additional information regarding the Fund's fiscal year to date purchases and sales, including the ownership percentage, of the non Money Market Central Funds is as follows: |
Fund
(Amounts in thousands) | Value, beginning of period | Purchases | Sales Proceeds | Value,
end of
period | % ownership, end of
period |
Fidelity Mortgage Backed Securities Central Fund | $ 1,334,455 | $ 20,729 | $ - | $ 1,359,818 | 10.4% |
Other Information |
The following is a summary of the inputs used, as of February 29, 2012, involving the Fund's assets and liabilities carried at fair value. The inputs or methodology used for valuing securities may not be an indication of the risk associated with investing in those securities. For more information on valuation inputs, and their aggregation into the levels used in the table below, please refer to the Security Valuation section in the accompanying Notes to Financial Statements. |
Valuation Inputs at Reporting Date: |
Description
(Amounts in thousands) | Total | Level 1 | Level 2 | Level 3 |
Investments in Securities: | | | | |
U.S. Government and Government Agency Obligations | $ 3,253,676 | $ - | $ 3,253,676 | $ - |
U.S. Government Agency - Mortgage Securities | 336,288 | - | 336,288 | - |
Collateralized Mortgage Obligations | 461,670 | - | 461,670 | - |
Commercial Mortgage Securities | 30,404 | - | 30,404 | - |
Foreign Government and Government Agency Obligations | 76,374 | - | 76,374 | - |
Fixed-Income Funds | 1,359,818 | 1,359,818 | - | - |
Cash Equivalents | 36,738 | - | 36,738 | - |
Total Investments in Securities: | $ 5,554,968 | $ 1,359,818 | $ 4,195,150 | $ - |
Derivative Instruments: | | | | |
Assets | | | | |
Futures Contracts | $ 224 | $ 224 | $ - | $ - |
Liabilities | | | | |
Futures Contracts | $ (8) | $ (8) | $ - | $ - |
Swap Agreements | $ (5,925) | $ - | $ (5,925) | $ - |
Total Derivative Instruments: | $ (5,709) | $ 216 | $ (5,925) | $ - |
Other Financial Instruments: | | | | |
TBA Sale Commitments | $ (138,477) | $ - | $ (138,477) | $ - |
Value of Derivative Instruments |
The following table is a summary of the Fund's value of derivative instruments by risk exposure as of February 29, 2012. For additional information on derivative instruments, please refer to the Derivative Instruments section in the accompanying Notes to Financial Statements. |
Risk Exposure /
Derivative Type
(Amounts in thousands) | Value |
| Asset | Liability |
Interest Rate Risk | | |
Futures Contracts (a) | $ 224 | $ (8) |
Swap Agreements (b) | - | (5,925) |
Total Value of Derivatives | $ 224 | $ (5,933) |
(a) Reflects cumulative appreciation/(depreciation) on futures contracts as disclosed on the Schedule of Investments. Only the period end variation margin is separately disclosed on the Statement of Assets and Liabilities. |
(b) Value is disclosed on the Statement of Assets and Liabilities in the Swap agreements, at Value line-items. |
See accompanying notes which are an integral part of the financial statements.
Semiannual Report
Statement of Assets and Liabilities
Amounts in thousands (except per-share amounts) | February 29, 2012 (Unaudited) |
| | |
Assets | | |
Investment in securities, at value (including repurchase agreements of $36,738) - See accompanying schedule: Unaffiliated issuers (cost $4,057,543) | $ 4,195,150 | |
Fidelity Central Funds (cost $1,297,209) | 1,359,818 | |
Total Investments (cost $5,354,752) | | $ 5,554,968 |
Receivable for investments sold, regular delivery | | 182,408 |
Receivable for TBA sale commitments | | 138,504 |
Receivable for fund shares sold | | 11,673 |
Interest receivable | | 13,985 |
Other receivables | | 762 |
Total assets | | 5,902,300 |
| | |
Liabilities | | |
Payable to custodian bank | $ 1 | |
Payable for investments purchased
Regular delivery | 177,685 | |
Delayed delivery | 138,623 | |
TBA sale commitments, at value | 138,477 | |
Payable for fund shares redeemed | 64,171 | |
Distributions payable | 290 | |
Swap agreements at value | 5,925 | |
Accrued management fee | 1,431 | |
Distribution and service plan fees payable | 243 | |
Payable for daily variation margin on futures contracts | 219 | |
Other affiliated payables | 670 | |
Other payables and accrued expenses | 760 | |
Total liabilities | | 528,495 |
| | |
Net Assets | | $ 5,373,805 |
Net Assets consist of: | | |
Paid in capital | | $ 5,137,138 |
Undistributed net investment income | | 2,927 |
Accumulated undistributed net realized gain (loss) on investments | | 39,206 |
Net unrealized appreciation (depreciation) on investments | | 194,534 |
Net Assets | | $ 5,373,805 |
See accompanying notes which are an integral part of the financial statements.
Semiannual Report
Financial Statements - continued
Statement of Assets and Liabilities - continued
Amounts in thousands (except per-share amounts) | February 29, 2012 (Unaudited) |
| | |
Calculation of Maximum Offering Price
Class A:
Net Asset Value and redemption price per share
($370,879 ÷ 34,463 shares) | | $ 10.76 |
| | |
Maximum offering price per share (100/96.00 of $10.76) | | $ 11.21 |
Class T:
Net Asset Value and redemption price per share ($300,883 ÷ 27,963 shares) | | $ 10.76 |
| | |
Maximum offering price per share (100/96.00 of $10.76) | | $ 11.21 |
Class B:
Net Asset Value and offering price per share ($23,186 ÷ 2,155 shares)A | | $ 10.76 |
| | |
Class C:
Net Asset Value and offering price per share ($101,460 ÷ 9,430 shares)A | | $ 10.76 |
| | |
Government Income:
Net Asset Value, offering price and redemption price per share ($4,224,955 ÷ 393,186 shares) | | $ 10.75 |
| | |
Institutional Class:
Net Asset Value, offering price and redemption price per share ($352,442 ÷ 32,753 shares) | | $ 10.76 |
A Redemption price per share is equal to net asset value less any applicable contingent deferred sales charge.
See accompanying notes which are an integral part of the financial statements.
Semiannual Report
Statement of Operations
Amounts in thousands | Six months ended February 29, 2012 (Unaudited) |
| | |
Investment Income | | |
Interest | | $ 37,491 |
Income from Fidelity Central Funds | | 20,729 |
Total income | | 58,220 |
| | |
Expenses | | |
Management fee | $ 8,612 | |
Transfer agent fees | 3,092 | |
Distribution and service plan fees | 1,453 | |
Fund wide operations fee | 897 | |
Independent trustees' compensation | 10 | |
Miscellaneous | 8 | |
Total expenses before reductions | 14,072 | |
Expense reductions | (4) | 14,068 |
Net investment income (loss) | | 44,152 |
Realized and Unrealized Gain (Loss) Net realized gain (loss) on: | | |
Investment securities: | | |
Unaffiliated issuers | 71,542 | |
Futures contracts | (69) | |
Swap agreements | (707) | |
Total net realized gain (loss) | | 70,766 |
Change in net unrealized appreciation (depreciation) on: Investment securities | (7,906) | |
Futures contracts | 203 | |
Swap agreements | (1,325) | |
Delayed delivery commitments | (2,114) | |
Total change in net unrealized appreciation (depreciation) | | (11,142) |
Net gain (loss) | | 59,624 |
Net increase (decrease) in net assets resulting from operations | | $ 103,776 |
See accompanying notes which are an integral part of the financial statements.
Semiannual Report
Financial Statements - continued
Statement of Changes in Net Assets
Amounts in thousands | Six months ended February 29, 2012 (Unaudited) | One month ended
August 31,
2011 | Year ended
July 31,
2011 |
Increase (Decrease) in Net Assets | | | |
Operations | | | |
Net investment income (loss) | $ 44,152 | $ 8,396 | $ 118,879 |
Net realized gain (loss) | 70,766 | 35,205 | 124,737 |
Change in net unrealized appreciation (depreciation) | (11,142) | 64,081 | (82,102) |
Net increase (decrease) in net assets resulting
from operations | 103,776 | 107,682 | 161,514 |
Distributions to shareholders from net investment income | (42,483) | (8,141) | (114,897) |
Distributions to shareholders from net realized gain | (130,853) | - | (140,821) |
Total distributions | (173,336) | (8,141) | (255,718) |
Share transactions - net increase (decrease) | 77,230 | 41,240 | (695,616) |
Total increase (decrease) in net assets | 7,670 | 140,781 | (789,820) |
| | | |
Net Assets | | | |
Beginning of period | 5,366,135 | 5,225,354 | 6,015,174 |
End of period (including undistributed net investment income of $2,927 and undistributed net investment income of $1,258 and undistributed net investment income of $917, respectively) | $ 5,373,805 | $ 5,366,135 | $ 5,225,354 |
See accompanying notes which are an integral part of the financial statements.
Semiannual Report
Financial Highlights - Class A
| Six months ended February 29, 2012 | Years ended August 31, |
| (Unaudited) | 2011 H | 2011 L | 2010 L | 2009 L | 2008 L | 2007 I |
Selected Per-Share Data | | | | | | | |
Net asset value, beginning of period | $ 10.90 | $ 10.70 | $ 10.84 | $ 10.77 | $ 10.40 | $ 10.01 | $ 9.98 |
Income from Investment Operations | | | | | | | |
Net investment income (loss) E | .074 | .015 | .199 | .242 | .356 | .402 | .311 |
Net realized and unrealized gain (loss) | .120 | .199 | .108 | .424 | .466 | .387 | .033 |
Total from investment operations | .194 | .214 | .307 | .666 | .822 | .789 | .344 |
Distributions from net investment income | (.071) | (.014) | (.191) | (.231) | (.352) | (.399) | (.314) |
Distributions from net realized gain | (.263) | - | (.256) | (.365) | (.100) | - | - |
Total distributions | (.334) | (.014) | (.447) | (.596) | (.452) | (.399) | (.314) |
Net asset value, end of period | $ 10.76 | $ 10.90 | $ 10.70 | $ 10.84 | $ 10.77 | $ 10.40 | $ 10.01 |
Total Return B,C,D | 1.79% | 2.00% | 2.94% | 6.44% | 8.03% | 7.96% | 3.49% |
Ratios to Average Net Assets F,J | | | | | | | |
Expenses before reductions | .77% A | .76% A | .77% | .77% | .77% | .81% | .78% A |
Expenses net of fee waivers, if any | .77% A | .76% A | .77% | .77% | .77% | .81% | .78% A |
Expenses net of all reductions | .77% A | .76% A | .77% | .77% | .77% | .80% | .77% A |
Net investment income (loss) | 1.38% A | 1.61% A | 1.88% | 2.28% | 3.33% | 3.88% | 4.08% A |
Supplemental Data | | | | | | | |
Net assets, end of period (in millions) | $ 371 | $ 345 | $ 329 | $ 431 | $ 437 | $ 232 | $ 145 |
Portfolio turnover rate G | 230% A | 466% A,M | 430% | 355% | 380% K | 269% | 164% K |
A Annualized B Total returns for periods of less than one year are not annualized. C Total returns would have been lower if certain expenses had not been reduced during the applicable periods shown. D Total returns do not include the effect of the sales charges. E Calculated based on average shares outstanding during the period. F Fees and expenses of any underlying Fidelity Central Funds are not included in the Fund's expense ratio. The Fund indirectly bears its proportionate share of the expenses of any underlying Fidelity Central Funds. G Amount does not include the portfolio activity of any underlying Fidelity Central Funds. H For the one month period ended August 31. The Fund changed its fiscal year from July 31 to August 31, effective August 31, 2011. I For the period October 24, 2006 (commencement of sale of shares) to July 31, 2007. J Expense ratios reflect operating expenses of the class. Expenses before reductions do not reflect amounts reimbursed by the investment adviser or reductions from brokerage service arrangements or reductions from other expense offset arrangements and do not represent the amount paid by the class during periods when reimbursements or reductions occur. Expense ratios before reductions for start-up periods may not be representative of longer-term operating periods. Expenses net of fee waivers reflect expenses after reimbursement by the investment adviser but prior to reductions from brokerage service arrangements or other expense offset arrangements. Expenses net of all reductions represent the net expenses paid by the class. K The portfolio turnover rate does not include the assets acquired in the merger. L For the period ended July 31. M Portfolio turnover rate excludes securities received or delivered in-kind. |
See accompanying notes which are an integral part of the financial statements.
Semiannual Report
Financial Highlights - Class T
| Six months ended February 29, 2012 | Years ended August 31, |
| (Unaudited) | 2011 H | 2011 L | 2010 L | 2009 L | 2008 L | 2007 I |
Selected Per-Share Data | | | | | | | |
Net asset value, beginning of period | $ 10.90 | $ 10.69 | $ 10.84 | $ 10.77 | $ 10.40 | $ 10.01 | $ 9.98 |
Income from Investment Operations | | | | | | | |
Net investment income (loss) E | .075 | .015 | .201 | .243 | .357 | .404 | .306 |
Net realized and unrealized gain (loss) | .120 | .209 | .098 | .425 | .466 | .387 | .036 |
Total from investment operations | .195 | .224 | .299 | .668 | .823 | .791 | .342 |
Distributions from net investment income | (.072) | (.014) | (.193) | (.233) | (.353) | (.401) | (.312) |
Distributions from net realized gain | (.263) | - | (.256) | (.365) | (.100) | - | - |
Total distributions | (.335) | (.014) | (.449) | (.598) | (.453) | (.401) | (.312) |
Net asset value, end of period | $ 10.76 | $ 10.90 | $ 10.69 | $ 10.84 | $ 10.77 | $ 10.40 | $ 10.01 |
Total Return B,C,D | 1.80% | 2.10% | 2.86% | 6.45% | 8.04% | 7.98% | 3.46% |
Ratios to Average Net Assets F,J | | | | | | | |
Expenses before reductions | .76% A | .75% A | .76% | .76% | .76% | .78% | .79% A |
Expenses net of fee waivers, if any | .76% A | .75% A | .76% | .76% | .76% | .78% | .79% A |
Expenses net of all reductions | .76% A | .75% A | .76% | .76% | .76% | .78% | .79% A |
Net investment income (loss) | 1.40% A | 1.62% A | 1.89% | 2.29% | 3.33% | 3.90% | 4.02% A |
Supplemental Data | | | | | | | |
Net assets, end of period (in millions) | $ 301 | $ 286 | $ 272 | $ 335 | $ 324 | $ 236 | $ 181 |
Portfolio turnover rate G | 230% A | 466% A,M | 430% | 355% | 380% K | 269% | 164% K |
A Annualized B Total returns for periods of less than one year are not annualized. C Total returns would have been lower if certain expenses had not been reduced during the applicable periods shown. D Total returns do not include the effect of the sales charges. E Calculated based on average shares outstanding during the period. F Fees and expenses of any underlying Fidelity Central Funds are not included in the Fund's expense ratio. The Fund indirectly bears its proportionate share of the expenses of any underlying Fidelity Central Funds. G Amount does not include the portfolio activity of any underlying Fidelity Central Funds. H For the one month period ended August 31. The Fund changed its fiscal year from July 31 to August 31, effective August 31, 2011. I For the period October 24, 2006 (commencement of sale of shares) to July 31, 2007. J Expense ratios reflect operating expenses of the class. Expenses before reductions do not reflect amounts reimbursed by the investment adviser or reductions from brokerage service arrangements or reductions from other expense offset arrangements and do not represent the amount paid by the class during periods when reimbursements or reductions occur. Expense ratios before reductions for start-up periods may not be representative of longer-term operating periods. Expenses net of fee waivers reflect expenses after reimbursement by the investment adviser but prior to reductions from brokerage service arrangements or other expense offset arrangements. Expenses net of all reductions represent the net expenses paid by the class. K The portfolio turnover rate does not include the assets acquired in the merger. L For the period ended July 31. M Portfolio turnover rate excludes securities received or delivered in-kind. |
See accompanying notes which are an integral part of the financial statements.
Semiannual Report
Financial Highlights - Class B
| Six months ended February 29, 2012 | Years ended August 31, |
| (Unaudited) | 2011 H | 2011 L | 2010 L | 2009 L | 2008 L | 2007 I |
Selected Per-Share Data | | | | | | | |
Net asset value, beginning of period | $ 10.90 | $ 10.69 | $ 10.84 | $ 10.77 | $ 10.40 | $ 10.01 | $ 9.98 |
Income from Investment Operations | | | | | | | |
Net investment income (loss) E | .035 | .008 | .122 | .164 | .278 | .329 | .251 |
Net realized and unrealized gain (loss) | .120 | .210 | .098 | .425 | .467 | .387 | .037 |
Total from investment operations | .155 | .218 | .220 | .589 | .745 | .716 | .288 |
Distributions from net investment income | (.032) | (.008) | (.114) | (.154) | (.275) | (.326) | (.258) |
Distributions from net realized gain | (.263) | - | (.256) | (.365) | (.100) | - | - |
Total distributions | (.295) | (.008) | (.370) | (.519) | (.375) | (.326) | (.258) |
Net asset value, end of period | $ 10.76 | $ 10.90 | $ 10.69 | $ 10.84 | $ 10.77 | $ 10.40 | $ 10.01 |
Total Return B,C,D | 1.42% | 2.04% | 2.10% | 5.67% | 7.25% | 7.21% | 2.91% |
Ratios to Average Net Assets F,J | | | | | | | |
Expenses before reductions | 1.50% A | 1.49% A | 1.50% | 1.50% | 1.50% | 1.51% | 1.50% A |
Expenses net of fee waivers, if any | 1.50% A | 1.49% A | 1.50% | 1.50% | 1.50% | 1.51% | 1.50% A |
Expenses net of all reductions | 1.50% A | 1.49% A | 1.50% | 1.50% | 1.50% | 1.50% | 1.50% A |
Net investment income (loss) | .65% A | .90% A | 1.15% | 1.55% | 2.60% | 3.17% | 3.30% A |
Supplemental Data | | | | | | | |
Net assets, end of period (in millions) | $ 23 | $ 26 | $ 25 | $ 38 | $ 48 | $ 41 | $ 43 |
Portfolio turnover rate G | 230% A | 466% A,M | 430% | 355% | 380% K | 269% | 164% K |
A Annualized B Total returns for periods of less than one year are not annualized. C Total returns would have been lower if certain expenses had not been reduced during the applicable periods shown. D Total returns do not include the effect of the contingent deferred sales charge. E Calculated based on average shares outstanding during the period. F Fees and expenses of any underlying Fidelity Central Funds are not included in the Fund's expense ratio. The Fund indirectly bears its proportionate share of the expenses of any underlying Fidelity Central Funds. G Amount does not include the portfolio activity of any underlying Fidelity Central Funds. H For the one month period ended August 31. The Fund changed its fiscal year from July 31 to August 31, effective August 31, 2011. I For the period October 24, 2006 (commencement of sale of shares) to July 31, 2007. J Expense ratios reflect operating expenses of the class. Expenses before reductions do not reflect amounts reimbursed by the investment adviser or reductions from brokerage service arrangements or reductions from other expense offset arrangements and do not represent the amount paid by the class during periods when reimbursements or reductions occur. Expense ratios before reductions for start-up periods may not be representative of longer-term operating periods. Expenses net of fee waivers reflect expenses after reimbursement by the investment adviser but prior to reductions from brokerage service arrangements or other expense offset arrangements. Expenses net of all reductions represent the net expenses paid by the class. K The portfolio turnover rate does not include the assets acquired in the merger. L For the period ended July 31. M Portfolio turnover rate excludes securities received or delivered in-kind. |
See accompanying notes which are an integral part of the financial statements.
Semiannual Report
Financial Highlights - Class C
| Six months ended February 29, 2012 | Years ended August 31, |
| (Unaudited) | 2011 H | 2011 L | 2010 L | 2009 L | 2008 L | 2007 I |
Selected Per-Share Data | | | | | | | |
Net asset value, beginning of period | $ 10.90 | $ 10.69 | $ 10.84 | $ 10.77 | $ 10.40 | $ 10.01 | $ 9.98 |
Income from Investment Operations | | | | | | | |
Net investment income (loss) E | .034 | .008 | .121 | .163 | .275 | .326 | .249 |
Net realized and unrealized gain (loss) | .120 | .210 | .098 | .425 | .468 | .387 | .033 |
Total from investment operations | .154 | .218 | .219 | .588 | .743 | .713 | .282 |
Distributions from net investment income | (.031) | (.008) | (.113) | (.153) | (.273) | (.323) | (.252) |
Distributions from net realized gain | (.263) | - | (.256) | (.365) | (.100) | - | - |
Total distributions | (.294) | (.008) | (.369) | (.518) | (.373) | (.323) | (.252) |
Net asset value, end of period | $ 10.76 | $ 10.90 | $ 10.69 | $ 10.84 | $ 10.77 | $ 10.40 | $ 10.01 |
Total Return B,C,D | 1.41% | 2.04% | 2.09% | 5.66% | 7.23% | 7.18% | 2.85% |
Ratios to Average Net Assets F,J | | | | | | | |
Expenses before reductions | 1.52% A | 1.50% A | 1.51% | 1.51% | 1.52% | 1.53% | 1.55% A |
Expenses net of fee waivers, if any | 1.52% A | 1.50% A | 1.51% | 1.51% | 1.52% | 1.53% | 1.55% A |
Expenses net of all reductions | 1.52% A | 1.50% A | 1.51% | 1.51% | 1.51% | 1.53% | 1.55% A |
Net investment income (loss) | .63% A | .88% A | 1.14% | 1.54% | 2.58% | 3.15% | 3.26% A |
Supplemental Data | | | | | | | |
Net assets, end of period (in millions) | $ 101 | $ 95 | $ 89 | $ 118 | $ 131 | $ 71 | $ 39 |
Portfolio turnover rate G | 230% A | 466% A,M | 430% | 355% | 380% K | 269% | 164% K |
A Annualized B Total returns for periods of less than one year are not annualized. C Total returns would have been lower if certain expenses had not been reduced during the applicable periods shown. D Total returns do not include the effect of the contingent deferred sales charge. E Calculated based on average shares outstanding during the period. F Fees and expenses of any underlying Fidelity Central Funds are not included in the Fund's expense ratio. The Fund indirectly bears its proportionate share of the expenses of any underlying Fidelity Central Funds. G Amount does not include the portfolio activity of any underlying Fidelity Central Funds. H For the one month period ended August 31. The Fund changed its fiscal year from July 31 to August 31, effective August 31, 2011. I For the period October 24, 2006 (commencement of sale of shares) to July 31, 2007. J Expense ratios reflect operating expenses of the class. Expenses before reductions do not reflect amounts reimbursed by the investment adviser or reductions from brokerage service arrangements or reductions from other expense offset arrangements and do not represent the amount paid by the class during periods when reimbursements or reductions occur. Expense ratios before reductions for start-up periods may not be representative of longer-term operating periods. Expenses net of fee waivers reflect expenses after reimbursement by the investment adviser but prior to reductions from brokerage service arrangements or other expense offset arrangements. Expenses net of all reductions represent the net expenses paid by the class. K The portfolio turnover rate does not include the assets acquired in the merger. L For the period ended July 31. M Portfolio turnover rate excludes securities received or delivered in-kind. |
See accompanying notes which are an integral part of the financial statements.
Semiannual Report
Financial Highlights - Government Income
| Six months ended February 29, 2012 | Years ended August 31, |
| (Unaudited) | 2011 G | 2011 J | 2010 J | 2009 J | 2008 J | 2007 J |
Selected Per-Share Data | | | | | | | |
Net asset value, beginning of period | $ 10.88 | $ 10.68 | $ 10.82 | $ 10.76 | $ 10.38 | $ 10.00 | $ 9.95 |
Income from Investment Operations | | | | | | | |
Net investment income (loss) D | .091 | .018 | .233 | .275 | .390 | .438 | .443 |
Net realized and unrealized gain (loss) | .130 | .199 | .108 | .415 | .476 | .378 | .068 |
Total from investment operations | .221 | .217 | .341 | .690 | .866 | .816 | .511 |
Distributions from net investment income | (.088) | (.017) | (.225) | (.265) | (.386) | (.436) | (.456) |
Distributions from net realized gain | (.263) | - | (.256) | (.365) | (.100) | - | (.005) |
Total distributions | (.351) | (.017) | (.481) | (.630) | (.486) | (.436) | (.461) |
Net asset value, end of period | $ 10.75 | $ 10.88 | $ 10.68 | $ 10.82 | $ 10.76 | $ 10.38 | $ 10.00 |
Total Return B,C | 2.05% | 2.03% | 3.27% | 6.69% | 8.49% | 8.25% | 5.22% |
Ratios to Average Net Assets E,H | | | | | | | |
Expenses before reductions | .45% A | .45% A | .45% | .45% | .45% | .45% | .45% |
Expenses net of fee waivers, if any | .45% A | .45% A | .45% | .45% | .45% | .45% | .45% |
Expenses net of all reductions | .45% A | .45% A | .45% | .45% | .45% | .45% | .44% |
Net investment income (loss) | 1.70% A | 1.91% A | 2.20% | 2.60% | 3.65% | 4.23% | 4.42% |
Supplemental Data | | | | | | | |
Net assets, end of period (in millions) | $ 4,225 | $ 4,270 | $ 4,167 | $ 4,809 | $ 4,638 | $ 8,154 | $ 6,118 |
Portfolio turnover rate F | 230% A | 466% A,K | 430% | 355% | 380% I | 269% | 164% I |
A Annualized B Total returns for periods of less than one year are not annualized. C Total returns would have been lower if certain expenses had not been reduced during the applicable periods shown. D Calculated based on average shares outstanding during the period. E Fees and expenses of any underlying Fidelity Central Funds are not included in the Fund's expense ratio. The Fund indirectly bears its proportionate share of the expenses of any underlying Fidelity Central Funds. F Amount does not include the portfolio activity of any underlying Fidelity Central Funds. G For the one month period ended August 31. The Fund changed its fiscal year from July 31 to August 31, effective August 31, 2011. H Expense ratios reflect operating expenses of the class. Expenses before reductions do not reflect amounts reimbursed by the investment adviser or reductions from brokerage service arrangements or reductions from other expense offset arrangements and do not represent the amount paid by the class during periods when reimbursements or reductions occur. Expenses net of fee waivers reflect expenses after reimbursement by the investment adviser but prior to reductions from brokerage service arrangements or other expense offset arrangements. Expenses net of all reductions represent the net expenses paid by the class. I The portfolio turnover rate does not include the assets acquired in the merger. J For the period ended July 31. K Portfolio turnover rate excludes securities received or delivered in-kind. |
See accompanying notes which are an integral part of the financial statements.
Semiannual Report
Financial Highlights - Institutional Class
| Six months ended February 29, 2012 | Years ended August 31, |
| (Unaudited) | 2011 G | 2011 K | 2010 K | 2009 K | 2008 K | 2007 H |
Selected Per-Share Data | | | | | | | |
Net asset value, beginning of period | $ 10.90 | $ 10.69 | $ 10.84 | $ 10.77 | $ 10.40 | $ 10.01 | $ 9.98 |
Income from Investment Operations | | | | | | | |
Net investment income (loss) D | .088 | .017 | .225 | .267 | .385 | .432 | .329 |
Net realized and unrealized gain (loss) | .119 | .210 | .099 | .425 | .466 | .388 | .034 |
Total from investment operations | .207 | .227 | .324 | .692 | .851 | .820 | .363 |
Distributions from net investment income | (.084) | (.017) | (.218) | (.257) | (.381) | (.430) | (.333) |
Distributions from net realized gain | (.263) | - | (.256) | (.365) | (.100) | - | - |
Total distributions | (.347) | (.017) | (.474) | (.622) | (.481) | (.430) | (.333) |
Net asset value, end of period | $ 10.76 | $ 10.90 | $ 10.69 | $ 10.84 | $ 10.77 | $ 10.40 | $ 10.01 |
Total Return B,C | 1.92% | 2.12% | 3.10% | 6.70% | 8.32% | 8.28% | 3.67% |
Ratios to Average Net Assets E,I | | | | | | | |
Expenses before reductions | .52% A | .52% A | .52% | .53% | .51% | .51% | .53% A |
Expenses net of fee waivers, if any | .52% A | .52% A | .52% | .53% | .51% | .51% | .53% A |
Expenses net of all reductions | .52% A | .52% A | .52% | .53% | .51% | .51% | .53% A |
Net investment income (loss) | 1.63% A | 1.84% A | 2.13% | 2.52% | 3.59% | 4.17% | 4.32% A |
Supplemental Data | | | | | | | |
Net assets, end of period (in millions) | $ 352 | $ 344 | $ 344 | $ 284 | $ 200 | $ 750 | $ 715 |
Portfolio turnover rate F | 230% A | 466% A,L | 430% | 355% | 380% J | 269% | 164% J |
A Annualized B Total returns for periods of less than one year are not annualized. C Total returns would have been lower if certain expenses had not been reduced during the applicable periods shown. D Calculated based on average shares outstanding during the period. E Fees and expenses of any underlying Fidelity Central Funds are not included in the Fund's expense ratio. The Fund indirectly bears its proportionate share of the expenses of any underlying Fidelity Central Funds. F Amount does not include the portfolio activity of any underlying Fidelity Central Funds. G For the one month period ended August 31. The Fund changed its fiscal year from July 31 to August 31, effective August 31, 2011. H For the period October 24, 2006 (commencement of sale of shares) to July 31, 2007. I Expense ratios reflect operating expenses of the class. Expenses before reductions do not reflect amounts reimbursed by the investment adviser or reductions from brokerage service arrangements or reductions from other expense offset arrangements and do not represent the amount paid by the class during periods when reimbursements or reductions occur. Expense ratios before reductions for start-up periods may not be representative of longer-term operating periods. Expenses net of fee waivers reflect expenses after reimbursement by the investment adviser but prior to reductions from brokerage service arrangements or other expense offset arrangements. Expenses net of all reductions represent the net expenses paid by the class. J The portfolio turnover rate does not include the assets acquired in the merger. K For the period ended July 31. L Portfolio turnover rate excludes securities received or delivered in-kind. |
Semiannual Report
See accompanying notes which are an integral part of the financial statements.
Notes to Financial Statements
For the period ended February 29, 2012 (Unaudited)
(Amounts in thousands except percentages)
1. Organization.
Fidelity® Government Income Fund (the Fund) is a fund of Fidelity Income Fund (the Trust) and is authorized to issue an unlimited number of shares. The Trust is registered under the Investment Company Act of 1940, as amended (the 1940 Act), as an open-end management investment company organized as a Massachusetts business trust. The Fund offers Class A, Class T, Class C, Government Income and Institutional Class shares, each of which, along with Class B shares, has equal rights as to assets and voting privileges. Effective after the close of business on September 1, 2010, Class B shares were closed to new accounts and additional purchases, except for exchanges and reinvestments. Each class has exclusive voting rights with respect to matters that affect that class. Class B shares will automatically convert to Class A shares after a holding period of seven years from the initial date of purchase. Investment income, realized and unrealized capital gains and losses, the common expenses of the Fund, and certain fund-level expense reductions, if any, are allocated on a pro-rata basis to each class based on the relative net assets of each class to the total net assets of the Fund. Each class differs with respect to transfer agent and distribution and service plan fees incurred. Certain expense reductions may also differ by class.
2. Investments in Fidelity Central Funds.
The Fund invests in Fidelity Central Funds, which are open-end investment companies available only to other investment companies and accounts managed by FMR and its affiliates. The Fund's Schedule of Investments lists each of the Fidelity Central Funds held as of period end, if any, as an investment of the Fund, but does not include the underlying holdings of each Fidelity Central Fund. As an Investing Fund, the Fund indirectly bears its proportionate share of the expenses of the underlying Fidelity Central Funds.
Based on their investment objective, each Fidelity Central Fund may invest or participate in various investment vehicles or strategies that are similar to those of the Fund. These strategies are consistent with the investment objectives of the Fund and may involve certain economic risks which may cause a decline in value of each of the Fidelity Central Funds and thus a decline in the value of the Fund. The following summarizes the Fund's investment in each Fidelity Central Fund.
Semiannual Report
Notes to Financial Statements (Unaudited) - continued
(Amounts in thousands except percentages)
2. Investments in Fidelity Central Funds - continued
Fidelity Central Fund | Investment Manager | Investment Objective | Investment Practices |
Fidelity Mortgage Backed Securities Central Fund | Fidelity Investment Money Management, Inc. (FIMM) | Seeks a high level of income by normally investing in investment-grade mortgage-related securities and repurchase agreements for those securities. | Delayed Delivery & When Issued Securities Futures Repurchase Agreements Swap Agreements |
An unaudited holdings listing for the Fund, which presents direct holdings as well as the pro-rata share of any securities and other investments held indirectly through its investment in underlying non-money market Fidelity Central Funds, is available at fidelity.com and/or advisor.fidelity.com, as applicable. A complete unaudited list of holdings for each Fidelity Central Fund is available upon request or at the Securities and Exchange Commission (the SEC) web site at www.sec.gov. In addition, the financial statements of the Fidelity Central Funds which contain the significant accounting policies (including security valuation policies) of those funds are available on the SEC web site or upon request.
3. Significant Accounting Policies.
The financial statements have been prepared in conformity with accounting principles generally accepted in the United States of America (GAAP), which require management to make certain estimates and assumptions at the date of the financial statements. Actual results could differ from those estimates. Subsequent events, if any, through the date that the financial statements were issued have been evaluated in the preparation of the financial statements. The following summarizes the significant accounting policies of the Fund:
Security Valuation. Investments are valued as of 4:00 p.m. Eastern time on the last calendar day of the period. The Fund uses independent pricing services approved by the Board of Trustees to value its investments. When current market prices or quotations are not readily available or reliable, valuations may be determined in good faith in accordance with procedures adopted by the Board of Trustees. Factors used in determining value may include market or security specific events, changes in interest rates and credit quality. The frequency with which these procedures are used cannot be predicted and they may be utilized to a significant extent. The value used for net asset value (NAV) calculation under these procedures may differ from published prices for the same securities.
Semiannual Report
3. Significant Accounting Policies - continued
Security Valuation - continued
The Fund categorizes the inputs to valuation techniques used to value its investments into a disclosure hierarchy consisting of three levels as shown below:
Level 1 - quoted prices in active markets for identical investments
Level 2 - other significant observable inputs (including quoted prices for similar investments, interest rates, prepayment speeds, etc.)
Level 3 - unobservable inputs (including the Fund's own assumptions based on the best information available)
Changes in valuation techniques may result in transfers in or out of an assigned level within the disclosure hierarchy. The aggregate value of investments by input level, as of February 29, 2012 for the Fund's investments, is included at the end of the Fund's Schedule of Investments. Valuation techniques used to value the Fund's investments by major category are as follows:
Debt securities, including restricted securities, are valued based on evaluated prices received from independent pricing services or from dealers who make markets in such securities. For foreign government and government agency obligations and U.S. government and government agency obligations, pricing services utilize matrix pricing which considers yield or price of bonds of comparable quality, coupon, maturity and type as well as dealer supplied prices and are generally categorized as Level 2 in the hierarchy. For collateralized mortgage obligations, commercial mortgage securities and U.S. government agency mortgage securities, pricing services utilize matrix pricing which considers prepayment speed assumptions, attributes of the collateral, yield or price of bonds of comparable quality, coupon, maturity and type as well as dealer supplied prices and, accordingly, such securities are generally categorized as Level 2 in the hierarchy. Swaps are marked-to-market daily based on valuations from independent pricing services or dealer-supplied valuations and changes in value are recorded as unrealized appreciation (depreciation). Pricing services utilize matrix pricing which considers comparisons to interest rate curves, credit spread curves, default possibilities and recovery rates and, as a result, swaps are generally categorized as Level 2 in the hierarchy. When independent prices are unavailable or unreliable, debt securities and swaps may be valued utilizing pricing matrices which consider similar factors that would be used by independent pricing services. These are generally categorized as Level 2 in the hierarchy but may be Level 3 depending on the circumstances.
Semiannual Report
Notes to Financial Statements (Unaudited) - continued
(Amounts in thousands except percentages)
3. Significant Accounting Policies - continued
Security Valuation - continued
Futures contracts are valued at the settlement price established each day by the board of trade or exchange on which they are traded and are categorized as Level 1 in the hierarchy. Investments in open-end mutual funds, including the Fidelity Central Funds, are valued at their closing net asset value each business day and are categorized as Level 1 in the hierarchy. Short-term securities with remaining maturities of sixty days or less may be valued at amortized cost, which approximates fair value, and are categorized as Level 2 in the hierarchy.
New Accounting Pronouncements. In May 2011, the Financial Accounting Standards Board issued Accounting Standard Update No. 2011-04, Fair Value Measurement (Topic 820) - Amendments to Achieve Common Fair Value Measurement and Disclosure Requirements in U.S. GAAP and IFRSs. The update is effective during interim and annual periods beginning after December 15, 2011 and will result in additional disclosure for transfers between levels as well as expanded disclosure for securities categorized as Level 3 under the fair value hierarchy.
In December 2011, the Financial Accounting Standards Board issued Accounting Standard Update No. 2011-11, Disclosures about Offsetting Assets and Liabilities. The update creates new disclosure requirements requiring entities to disclose both gross and net information for derivatives and other financial instruments that are either offset in the Statement of Assets and Liabilities or subject to an enforceable master netting arrangement or similar agreement. The disclosure requirements are effective for interim and annual reporting periods beginning on or after January 1, 2013. Management is currently evaluating the impact of the update's adoption on the Fund's financial statement disclosures.
Investment Transactions and Income. For financial reporting purposes, the Fund's investment holdings and NAV include trades executed through the end of the last business day of the period. The NAV per share for processing shareholder transactions is calculated as of the close of business of the New York Stock Exchange (NYSE), normally 4:00 p.m. Eastern time and includes trades executed through the end of the prior business day. Gains and losses on securities sold are determined on the basis of identified cost. Interest income and distributions from the Fidelity Central Funds are accrued as earned. Interest income includes coupon interest and amortization of premium and accretion of discount on debt securities. The principal amount on inflation-indexed securities is periodically adjusted to the rate of inflation and interest is accrued based on the principal amount. The adjustments to principal due to inflation are reflected as increases or decreases to interest income even though principal is not received until maturity.
Semiannual Report
3. Significant Accounting Policies - continued
Expenses. Expenses directly attributable to a fund are charged to that fund. Expenses attributable to more than one fund are allocated among the respective funds on the basis of relative net assets or other appropriate methods. Expense estimates are accrued in the period to which they relate and adjustments are made when actual amounts are known.
Deferred Trustee Compensation. Under a Deferred Compensation Plan (the Plan), independent Trustees may elect to defer receipt of a portion of their annual compensation. Deferred amounts are invested in a cross-section of Fidelity funds, are marked-to-market and remain in the Fund until distributed in accordance with the Plan. The investment of deferred amounts and the offsetting payable to the Trustees are included in the accompanying Statement of Assets and Liabilities.
Income Tax Information and Distributions to Shareholders. Each year, the Fund intends to qualify as a regulated investment company under Subchapter M of the Internal Revenue Code, including distributing substantially all of its taxable income and realized gains. As a result, no provision for income taxes is required. The Fund files a U.S. federal tax return, in addition to state and local tax returns as required. A fund's federal income tax returns are subject to examination by the Internal Revenue Service (IRS) for a period of three fiscal years after they are filed. State and local tax returns may be subject to examination for an additional fiscal year depending on the jurisdiction.
Dividends are declared and recorded daily and paid monthly from net investment income. Distributions from realized gains, if any, are declared and recorded on the ex-dividend date. Income dividends and capital gain distributions are declared separately for each class. Income and capital gain distributions are determined in accordance with income tax regulations, which may differ from GAAP.
Capital accounts within the financial statements are adjusted for permanent book-tax differences. These adjustments have no impact on net assets or the results of operations. Temporary book-tax differences will reverse in a subsequent period.
Book-tax differences are primarily due to futures transactions, swap agreements, market discount, partnerships (including allocations from Fidelity Central Funds), deferred trustees compensation and losses deferred due to wash sales.
The federal tax cost of investment securities and unrealized appreciation (depreciation) as of period end were as follows:
Gross unrealized appreciation | $ 204,095 |
Gross unrealized depreciation | (4,231) |
Net unrealized appreciation (depreciation) on securities and other investments | $ 199,864 |
Tax cost | $ 5,355,104 |
Semiannual Report
Notes to Financial Statements (Unaudited) - continued
(Amounts in thousands except percentages)
4. Operating Policies.
Repurchase Agreements. FMR has received an Exemptive Order from the SEC which permits the Fund and other affiliated entities of FMR to transfer uninvested cash balances into joint trading accounts which are then invested in repurchase agreements. The Fund may also invest directly with institutions in repurchase agreements. Repurchase agreements are collateralized by government or non-government securities. Upon settlement date, collateral is held in segregated accounts with custodian banks and may be obtained in the event of a default of the counterparty. The Fund monitors, on a daily basis, the value of the collateral to ensure it is at least equal to the principal amount of the repurchase agreement (including accrued interest). In the event of a default by the counterparty, realization of the collateral proceeds could be delayed, during which time the value of the collateral may decline.
Delayed Delivery Transactions and When-Issued Securities. During the period, the Fund transacted in securities on a delayed delivery or when-issued basis. Payment and delivery may take place after the customary settlement period for that security. The price of the underlying securities and the date when the securities will be delivered and paid for are fixed at the time the transaction is negotiated. During the time a delayed delivery sell is outstanding, the contract is marked-to-market daily and equivalent deliverable securities are held for the transaction. The securities purchased on a delayed delivery or when-issued basis are identified as such in the Fund's Schedule of Investments. The Fund may receive compensation for interest forgone in the purchase of a delayed delivery or when-issued security. With respect to purchase commitments, the Fund identifies securities as segregated in its records with a value at least equal to the amount of the commitment. Losses may arise due to changes in the value of the underlying securities or if the counterparty does not perform under the contract's terms, or if the issuer does not issue the securities due to political, economic, or other factors.
To-Be-Announced (TBA) Securities and Mortgage Dollar Rolls. During the period, the Fund transacted in TBA securities that involved buying or selling mortgage-backed securities (MBS) on a forward commitment basis. A TBA transaction typically does not designate the actual security to be delivered and only includes an approximate principal amount however; delivered securities must meet specified terms defined by industry guidelines, including issuer, rate and current principal amount outstanding on underlying mortgage pools. The Fund may enter into a TBA transaction with the intent to take possession of or deliver the underlying MBS, or the Fund may elect to extend the settlement by entering into either a mortgage or reverse mortgage dollar roll. Mortgage dollar rolls are transactions where a fund sells MBS and simultaneously agrees to repurchase MBS on a later date at a lower price and with the same counterparty. Reverse mortgage dollar rolls involve the purchase and simultaneous agreement to sell MBS on a later date at a lower price. Transactions in mortgage dollar rolls and reverse mortgage dollar rolls are accounted for as purchases and sales and may result in an increase to the Fund's portfolio turnover rate.
Semiannual Report
4. Operating Policies - continued
To-Be-Announced (TBA) Securities and Mortgage Dollar Rolls - continued
Purchases and sales of TBA securities involve risks similar to those discussed above for delayed delivery and when-issued securities. Also, if the counterparty in a dollar roll or a reverse dollar roll transaction files for bankruptcy or becomes insolvent, the Fund's right to repurchase or sell securities may be limited. Additionally, when a fund sells TBA securities without already owning or having the right to obtain the deliverable securities (an uncovered forward commitment to sell), it incurs a risk of loss because it could have to purchase the securities at a price that is higher than the price at which it sold them. A fund may be unable to purchase the deliverable securities if the corresponding market is illiquid.
TBA securities subject to a forward commitment to sell at period end are included at the end of the Fund's Schedule of Investments under the caption "TBA Sale Commitments." The proceeds and value of these commitments are reflected in the Fund's Statement of Assets and Liabilities.
5. Derivative Instruments.
Risk Exposures and the Use of Derivative Instruments. The Fund used derivative instruments (derivatives), including futures contracts and swap agreements, in order to meet its investment objectives. The strategy is to use derivatives to increase returns, to gain exposure to certain types of assets and to manage exposure to certain risks as defined below. The success of any strategy involving derivatives depends on analysis of numerous economic factors, and if the strategies for investment do not work as intended, the Fund may not achieve its objectives.
The Fund's use of derivatives increased or decreased its exposure to the following risk:
Interest Rate Risk | Interest rate risk relates to the fluctuations in the value of interest-bearing securities due to changes in the prevailing levels of market interest rates. |
The Fund is also exposed to additional risks from investing in derivatives, such as liquidity risk and counterparty credit risk. Liquidity risk is the risk that the Fund will be unable to close out the derivative in the open market in a timely manner. Counterparty credit risk is the risk that the counterparty will not be able to fulfill its obligation to the Fund. Derivative counterparty credit risk is managed through formal evaluation of the creditworthiness of all potential counterparties. On certain over-the-counter (OTC) derivatives such as swap agreements, the Fund attempts to reduce its exposure to counterparty credit risk by entering into an International Swaps and Derivatives Association (ISDA) Master Agreement on a bilateral basis with each of its counterparties. The
Semiannual Report
Notes to Financial Statements (Unaudited) - continued
(Amounts in thousands except percentages)
5. Derivative Instruments - continued
Risk Exposures and the Use of Derivative Instruments - continued
ISDA Master Agreement gives the Fund the right to terminate all transactions traded under such agreement if there is a certain deterioration in the credit quality of the counterparty. The ISDA Master Agreement gives each party the right, upon an event of default by the other party or a termination of the agreement, to close out all transactions traded under such agreement and to net amounts owed under each transaction to one net payable by one party to the other. To mitigate counterparty credit risk on OTC derivatives, the Fund receives collateral in the form of cash or securities once the Fund's net unrealized appreciation on outstanding derivative contracts under an ISDA Master Agreement exceeds certain applicable thresholds, subject to certain minimum transfer provisions. The collateral received is held in segregated accounts with the Fund's custodian bank in accordance with the collateral agreements entered into between the Fund, the counterparty and the Fund's custodian bank. The Fund could experience delays and costs in gaining access to the collateral even though it is held by the Fund's custodian bank. The Fund's maximum risk of loss from counterparty credit risk related to OTC derivatives is generally the aggregate unrealized appreciation and unpaid counterparty payments in excess of any collateral pledged by the counterparty to the Fund. The Fund may be required to pledge collateral for the benefit of the counterparties on over-the-counter (OTC) derivatives in an amount not less than the counterparty's unrealized appreciation on outstanding derivative contracts, subject to certain minimum transfer provisions, and any such pledged collateral is identified in the Schedule of Investments. Futures contracts are not covered by the ISDA Master Agreement, however, counterparty credit risk related to exchange-traded futures contracts is minimal because of the protection provided by the exchange on which they trade. Derivatives involve, to varying degrees, risk of loss in excess of the amounts recognized in the Statement of Assets and Liabilities.
Net Realized Gain (Loss) and Change in Net Unrealized Appreciation (Depreciation) on Derivatives. The table below, which reflects the impacts of derivatives on the financial performance of the Fund, summarizes the net realized gain (loss) and change in net unrealized appreciation (depreciation) for derivatives during the period.
Risk Exposure / Derivative Type | Net Realized Gain (Loss) | Change in Net Unrealized Appreciation (Depreciation) |
Interest Rate Risk | | |
Futures Contracts | $ (69) | $ 203 |
Swap Agreements | (707) | (1,325) |
Totals (a) | $ (776) | $ (1,122) |
(a) A summary of the value of derivatives by risk exposure as of period end is included at the end of the Schedule of Investments and is representative of activity for the period.
Semiannual Report
5. Derivative Instruments - continued
Futures Contracts. A futures contract is an agreement between two parties to buy or sell a specified underlying instrument for a fixed price at a specified future date. The Fund used futures contracts to manage its exposure to the bond market and to fluctuations in interest rates.
Upon entering into a futures contract, a fund is required to deposit either cash or securities (initial margin) with a clearing broker in an amount equal to a certain percentage of the face value of the contract. Futures contracts are marked-to-market daily and subsequent payments (variation margin) are made or received by a fund depending on the daily fluctuations in the value of the futures contracts and are recorded as unrealized appreciation or (depreciation). This receivable and/or payable is included in daily variation margin on futures contracts in the Statement of Assets and Liabilities. Realized gain or (loss) is recorded upon the expiration or closing of a futures contract. The net realized gain (loss) and change in net unrealized appreciation (depreciation) on futures contracts during the period is included in the Statement of Operations.
The underlying face amount at value of open futures contracts at period end is shown in the Schedule of Investments under the caption "Futures Contracts." This amount reflects each contract's exposure to the underlying instrument at period end. Securities deposited to meet initial margin requirements are identified in the Schedule of Investments.
Swap Agreements. A swap agreement (swap) is a contract between two parties to exchange future cash flows at periodic intervals based on a notional principal amount.
Details of swaps open at period end are included in the Schedule of Investments under the caption "Swap Agreements." Swaps are marked-to-market daily and changes in value are recorded as unrealized appreciation or (depreciation) and reflected in the Statement of Assets and Liabilities. Any upfront premiums paid or received upon entering a swap to compensate for differences between stated terms of the agreement and prevailing market conditions (e.g. credit spreads, interest rates or other factors) are recorded as realized gain or (loss) ratably over the term of the swap. Payments are exchanged at specified intervals, accrued daily commencing with the effective date of the contract and recorded as realized gain or (loss). Realized gain or (loss) is also recorded in the event of an early termination of a swap. The net realized gain (loss) and change in net unrealized appreciation (depreciation) on swaps during the period is included in the Statement of Operations.
Interest Rate Swaps. Interest rate swaps are agreements between counterparties to exchange cash flows, one based on a fixed rate, and the other on a floating rate. The Fund entered into interest rate swaps to manage its exposure to interest rate changes. Changes in interest rates can have an effect on both the value of bond holdings as well as the amount of interest income earned. In general, the value of bonds can fall when interest rates rise and can rise when interest rates fall.
Semiannual Report
Notes to Financial Statements (Unaudited) - continued
(Amounts in thousands except percentages)
6. Purchases and Sales of Investments.
Purchases and sales of securities (including the Fixed-Income Central Funds), other than short-term securities and U.S. government securities, aggregated $20,729 and $4,203, respectively.
7. Fees and Other Transactions with Affiliates.
Management Fee. FMR and its affiliates provide the Fund with investment management related services for which the Fund pays a monthly management fee. The management fee is the sum of an individual fund fee rate that is based on an annual rate of .20% of the Fund's average net assets and an annualized group fee rate that averaged .12% during the period. The group fee rate is based upon the average net assets of all the mutual funds advised by FMR. The group fee rate decreases as assets under management increase and increases as assets under management decrease. For the period, the total annualized management fee rate was .32% of the Fund's average net assets.
Distribution and Service Plan Fees. In accordance with Rule 12b-1 of the 1940 Act, the Fund has adopted separate Distribution and Service Plans for each class of shares. Certain classes pay Fidelity Distributors Corporation (FDC), an affiliate of FMR, separate Distribution and Service Fees, each of which is based on an annual percentage of each class' average net assets. In addition, FDC may pay financial intermediaries for selling shares of the Fund and providing shareholder support services. For the period, the Distribution and Service Fee rates, total fees and amounts retained by FDC were as follows:
| Distribution
Fee | Service
Fee | Total Fees | Retained
by FDC |
Class A | -% | .25% | $ 457 | $ 9 |
Class T | -% | .25% | 373 | 2 |
Class B | .65% | .25% | 114 | 83 |
Class C | .75% | .25% | 509 | 74 |
| | | $ 1,453 | $ 168 |
Sales Load. FDC may receive a front-end sales charge of up to 4.00% for selling Class A shares and Class T shares, some of which is paid to financial intermediaries for selling shares of the Fund. Depending on the holding period, FDC may receive contingent deferred sales charges levied on Class A, Class T, Class B, and Class C redemptions. The deferred sales charges range from 5.00% to 1.00% for Class B, 1.00% for Class C, .75% for certain purchases of Class A shares and .25% for certain purchases of Class T shares.
Semiannual Report
7. Fees and Other Transactions with Affiliates - continued
Sales Load - continued
For the period, sales charge amounts retained by FDC were as follows:
| Retained
by FDC |
Class A | $ 38 |
Class T | 13 |
Class B* | 29 |
Class C* | 8 |
| $ 88 |
* When Class B and Class C shares are initially sold, FDC pays commissions from its own resources to financial intermediaries through which the sales are made.
Transfer Agent Fees. Fidelity Investments Institutional Operations Company, Inc. (FIIOC), an affiliate of FMR, is the transfer, dividend disbursing and shareholder servicing agent for each class of the Fund. FIIOC receives account fees and asset-based fees that vary according to the account size and type of account of the shareholders of the respective classes of the Fund. FIIOC pays for typesetting, printing and mailing of shareholder reports, except proxy statements. For the period, transfer agent fees for each class were as follows:
| Amount | % of
Average
Net Assets* |
Class A | $ 308 | .17 |
Class T | 228 | .15 |
Class B | 31 | .24 |
Class C | 82 | .16 |
Government Income | 2,147 | .10 |
Institutional Class | 296 | .17 |
| $ 3,092 | |
* Annualized
Fund Wide Operations Fee. Pursuant to the Fund Wide Operations and Expense Agreement (FWOE), FMR has agreed to provide for fund level expenses (which do not include transfer agent, Rule 12b-1 fees, compensation of the independent Trustees, interest (including commitment fees), taxes or extraordinary expenses, if any) in return for a FWOE fee equal to .35% less the total amount of the management fee. The FWOE paid by the Fund is reduced by an amount equal to the fees and expenses paid to the independent Trustees. For the period, the FWOE fee was equivalent to an annualized rate of .03% of average net assets.
Semiannual Report
Notes to Financial Statements (Unaudited) - continued
(Amounts in thousands except percentages)
8. Committed Line of Credit.
The Fund participates with other funds managed by FMR or an affiliate in a $4.0 billion credit facility (the "line of credit") to be utilized for temporary or emergency purposes to fund shareholder redemptions or for other short-term liquidity purposes. The Fund has agreed to pay commitment fees on its pro-rata portion of the line of credit, which amounted to $8 and is reflected in Miscellaneous expenses on the Statement of Operations. During the period, there were no borrowings on this line of credit.
9. Security Lending.
The Fund lends portfolio securities from time to time in order to earn additional income. On the settlement date of the loan, the Fund receives collateral (in the form of U.S. Treasury obligations, letters of credit and/or cash) against the loaned securities and maintains collateral in an amount not less than 100% of the market value of the loaned securities during the period of the loan. The market value of the loaned securities is determined at the close of business of the Fund and any additional required collateral is delivered to the Fund on the next business day. If the borrower defaults on its obligation to return the securities loaned because of insolvency or other reasons, a fund could experience delays and costs in recovering the securities loaned or in gaining access to the collateral. Any cash collateral received is maintained at the Fund's custodian and/or invested in cash equivalents. At period end, there were no security loans outstanding. Security lending income represents the income earned on investing cash collateral, less rebates paid to borrowers, plus any premium payments received for lending certain types of securities. Security lending income is presented in the Statement of Operations as a component of interest income. Total security lending income during the period amounted to $113.
10. Expense Reductions.
Through arrangements with the Fund's custodian, credits realized as a result of uninvested cash balances were used to reduce the Fund's expenses. During the period, these credits reduced the Fund's expenses by $4.
Semiannual Report
11. Distributions to Shareholders.
Distributions to shareholders of each class were as follows:
| 6 months ended
February 29, 2012 | One month ended
August 31, 2011 | Year ended
July 31, 2011 |
From net investment income | | | |
Class A | $ 2,393 | $ 449 | $ 6,937 |
Class T | 1,978 | 375 | 5,513 |
Class B | 74 | 18 | 332 |
Class C | 287 | 65 | 1,100 |
Government Income | 34,986 | 6,712 | 94,692 |
Institutional Class | 2,765 | 522 | 6,323 |
Total | $ 42,483 | $ 8,141 | $ 114,897 |
From net realized gain | | | |
Class A | $ 8,696 | $ - | $ 10,104 |
Class T | 7,112 | - | 7,830 |
Class B | 622 | - | 853 |
Class C | 2,398 | - | 2,724 |
Government Income | 103,541 | - | 112,442 |
Institutional Class | 8,484 | - | 6,868 |
Total | $ 130,853 | $ - | $ 140,821 |
12. Share Transactions.
Transactions for each class of shares were as follows:
| Shares |
| 6 months ended February 29, 2012 | One month ended
August 31, 2011 | Year ended
July 31, 2011 |
Class A | | | |
Shares sold | 8,211 | 2,036 | 10,505 |
Reinvestment of distributions | 944 | 38 | 1,423 |
Shares redeemed | (6,368) | (1,114) | (20,985) |
Net increase (decrease) | 2,787 | 960 | (9,057) |
Class T | | | |
Shares sold | 6,692 | 1,638 | 9,053 |
Reinvestment of distributions | 826 | 34 | 1,221 |
Shares redeemed | (5,790) | (844) | (15,795) |
Net increase (decrease) | 1,728 | 828 | (5,521) |
Class B | | | |
Shares sold | 166 | 131 | 275 |
Reinvestment of distributions | 50 | 1 | 93 |
Shares redeemed | (459) | (63) | (1,536) |
Net increase (decrease) | (243) | 69 | (1,168) |
Semiannual Report
Notes to Financial Statements (Unaudited) - continued
(Amounts in thousands except percentages)
12. Share Transactions - continued
| Shares |
| 6 months ended
February 29, 2012 | One month ended
August 31, 2011 | Year ended
July 31, 2011 |
Class C | | | |
Shares sold | 2,059 | 627 | 2,426 |
Reinvestment of distributions | 183 | 4 | 261 |
Shares redeemed | (1,492) | (235) | (5,248) |
Net increase (decrease) | 750 | 396 | (2,561) |
Government Income | | | |
Shares sold | 56,827 | 15,991 | 105,621 |
Reinvestment of distributions | 12,331 | 590 | 18,687 |
Shares redeemed | (68,324) | (14,407) | (178,425) |
Net increase (decrease) | 834 | 2,174 | (54,117) |
Institutional Class | | | |
Shares sold | 8,064 | 1,083 | 12,979 |
Reinvestment of distributions | 979 | 45 | 1,192 |
Shares redeemed | (7,867) | (1,758) | (8,205) |
Net increase (decrease) | 1,176 | (630) | 5,966 |
| Dollars |
| 6 months ended February 29, 2012 | One month ended
August 31, 2011 | Year ended
July 31, 2011 |
Class A | | | |
Shares sold | $ 88,934 | $ 22,105 | $ 111,665 |
Reinvestment of distributions | 10,225 | 412 | 15,111 |
Shares redeemed | (68,816) | (12,108) | (221,593) |
Net increase (decrease) | $ 30,343 | $ 10,409 | $ (94,817) |
Class T | | | |
Shares sold | $ 72,414 | $ 17,802 | $ 96,270 |
Reinvestment of distributions | 8,939 | 366 | 12,970 |
Shares redeemed | (62,592) | (9,169) | (166,943) |
Net increase (decrease) | $ 18,761 | $ 8,999 | $ (57,703) |
Class B | | | |
Shares sold | $ 1,801 | $ 1,417 | $ 2,957 |
Reinvestment of distributions | 543 | 14 | 985 |
Shares redeemed | (4,959) | (683) | (16,266) |
Net increase (decrease) | $ (2,615) | $ 748 | $ (12,324) |
Class C | | | |
Shares sold | $ 22,298 | $ 6,815 | $ 25,890 |
Reinvestment of distributions | 1,983 | 46 | 2,774 |
Shares redeemed | (16,097) | (2,561) | (55,376) |
Net increase (decrease) | $ 8,184 | $ 4,300 | $ (26,712) |
Semiannual Report
12. Share Transactions - continued
| Dollars |
| 6 months ended February 29, 2012 | One month ended
August 31, 2011 | Year ended
July 31, 2011 |
Government Income | | | |
Shares sold | $ 614,097 | $ 173,420 | $ 1,120,288 |
Reinvestment of distributions | 133,373 | 6,422 | 198,243 |
Shares redeemed | (737,698) | (156,265) | (1,885,694) |
Net increase (decrease) | $ 9,772 | $ 23,577 | $ (567,163) |
Institutional Class | | | |
Shares sold | $ 87,188 | $ 11,762 | $ 137,402 |
Reinvestment of distributions | 10,596 | 491 | 12,645 |
Shares redeemed | (84,999) | (19,046) | (86,944) |
Net increase (decrease) | $ 12,785 | $ (6,793) | $ 63,103 |
13. Other.
The Fund's organizational documents provide former and current trustees and officers with a limited indemnification against liabilities arising in connection with the performance of their duties to the Fund. In the normal course of business, the Fund may also enter into contracts that provide general indemnifications. The Fund's maximum exposure under these arrangements is unknown as this would be dependent on future claims that may be made against the Fund. The risk of material loss from such claims is considered remote.
Semiannual Report
Board Approval of Investment Advisory Contracts and Management Fees
Fidelity Government Income Fund
Each year, the Board of Trustees, including the Independent Trustees (together, the Board), votes on the renewal of the management contract and sub-advisory agreements (together, the Advisory Contracts) for the fund. The Board, assisted by the advice of fund counsel and Independent Trustees' counsel, requests and considers a broad range of information relevant to the renewal of the Advisory Contracts throughout the year.
The Board meets regularly and considers at each of its meetings factors that are relevant to its annual consideration of the renewal of the fund's Advisory Contracts, including the services and support provided to the fund and its shareholders. The Board has established three standing committees, Operations, Audit, and Nominating and Governance, each composed of Independent Trustees with varying backgrounds, to which the Board has assigned specific subject matter responsibilities in order to enhance effective decision-making by the Board. The Operations Committee, of which all of the Independent Trustees are members, meets regularly throughout the year and, among other matters, considers matters specifically related to the annual consideration of the renewal of the fund's Advisory Contracts. The Board, acting directly and through its Committees, requests and receives information concerning the annual consideration of the renewal of the fund's Advisory Contracts. The Board also meets as needed to consider matters specifically related to the Board's annual consideration of the renewal of Advisory Contracts. Members of the Board may also meet with trustees of other Fidelity funds through ad hoc joint committees to discuss certain matters relevant to the Fidelity funds.
At its September 2011 meeting, the Board of Trustees, including the Independent Trustees, unanimously determined to renew the fund's Advisory Contracts. In reaching its determination, the Board considered all factors it believed relevant, including (i) the nature, extent, and quality of the services to be provided to the fund and its shareholders (including the investment performance of the fund); (ii) the competitiveness of the fund's management fee and total expense ratio; (iii) the total costs of the services to be provided by and the profits to be realized by Fidelity from its relationship with the fund; (iv) the extent to which economies of scale would be realized as the fund grows; and (v) whether fee levels reflect these economies of scale, if any, for the benefit of fund shareholders.
In considering whether to renew the Advisory Contracts for the fund, the Board reached a determination, with the assistance of fund counsel and Independent Trustees' counsel and through the exercise of its business judgment, that the renewal of the Advisory Contracts is in the best interests of the fund and its shareholders and that the compensation payable under the Advisory Contracts is fair and reasonable. The Board's decision to renew the Advisory Contracts was not based on any single factor, but rather was based on a comprehensive consideration of all the information provided to the Board at its meetings throughout the year. The Board, in reaching its determination to renew the Advisory Contracts, is aware that shareholders in the fund have a broad range of investment choices available to them, including a wide choice among mutual funds offered by Fidelity's competitors, and that the fund's shareholders, who have the opportunity to review and weigh the disclosure provided by the fund in its prospectus and other public disclosures, have chosen to invest in this fund, managed by Fidelity.
Semiannual Report
Nature, Extent, and Quality of Services Provided. The Board considered the staffing within the investment adviser, FMR, and the sub-advisers (together, the Investment Advisers), including the backgrounds of the fund's investment personnel and the fund's investment objective and discipline. The Independent Trustees also had discussions with senior management of Fidelity's investment operations and investment groups. The Board considered the structure of the portfolio manager compensation program and whether this structure provides appropriate incentives to act in the best interests of the fund.
Resources Dedicated to Investment Management and Support Services. The Board reviewed the general qualifications and capabilities of the Investment Advisers' investment staff, including its size, education, experience, and resources, as well as the Investment Advisers' approach to recruiting, managing, and compensating investment personnel. The Board also noted that FMR has devoted increased resources to non-U.S. offices. The Board noted that Fidelity's analysts have extensive resources, tools and capabilities which allow them to conduct sophisticated quantitative and fundamental analysis, as well as credit analysis of issuers, counterparties and enhancers. The Board also believes that Fidelity's investment professionals have sufficient access to global information and data so as to provide competitive investment results over time, and that those professionals also have access to sophisticated tools which permit them to assess portfolio construction and risk and performance attribution characteristics continuously, as well as to transmit new information and research conclusions rapidly around the world. Additionally, in its deliberations, the Board considered the Investment Advisers' trading capabilities and resources which are an integral part of the investment management process.
Shareholder and Administrative Services. The Board considered (i) the nature, extent, quality, and cost of advisory, administrative, and shareholder services performed by the Investment Advisers and their affiliates under the Advisory Contracts and under separate agreements covering transfer agency, pricing and bookkeeping, and securities lending services for the fund; (ii) the nature and extent of the investment adviser's supervision of third party service providers, principally custodians and subcustodians; and (iii) the resources devoted to, and the record of compliance with, the fund's compliance policies and procedures.
The Board noted that the growth of fund assets over time across the complex allows Fidelity to reinvest in the development of services designed to enhance the value or convenience of the Fidelity funds as investment vehicles. These services include 24-hour access to account information and market information through telephone representatives and over the Internet, investor education materials and asset allocation tools, and the expanded availability of Fidelity Investor Centers, with 35 new branches opening since 2010.
Semiannual Report
Board Approval of Investment Advisory Contracts and
Management Fees - continued
Investment in a Large Fund Family. The Board considered the benefits to shareholders of investing in a Fidelity fund, including the benefits of investing in a fund that is part of a large family of funds offering a variety of investment disciplines and providing a large variety of mutual fund investor services. The Board noted that Fidelity had taken, or had made recommendations that resulted in the Fidelity funds taking, a number of actions over the previous year that benefited particular funds, including (i) continuing to dedicate additional resources to investment research and support of the senior management team that oversees asset management; (ii) rationalizing product lines through the mergers of six funds into other funds; (iii) continuing to migrate the Freedom Funds to dedicated lower cost underlying funds; (iv) obtaining shareholder approval to broaden the investment strategies for Fidelity Consumer Finance Portfolio, Fidelity Emerging Asia Fund, and Fidelity Environment and Alternative Energy Portfolio; (v) contractually agreeing to reduce the management fees and impose other expense limitations on Spartan 500 Index Fund and U.S. Bond Index Fund in connection with launching new institutional classes of these funds; (vi) changing the name, primary and supplemental benchmarks, and investment policies of Fidelity Global Strategies Fund to support the fund's flexible investment mandate and global orientation; and (vii) reducing the transfer agency account fee rates on certain accounts.
Investment Performance. The Board considered whether the fund has operated in accordance with its investment objective, as well as its record of compliance with its investment restrictions. It also reviewed the fund's absolute investment performance for each class, as well as the fund's relative investment performance for each class measured over multiple periods against (i) a proprietary custom index, and (ii) a peer group of mutual funds deemed appropriate by Fidelity and reviewed by the Board. The following charts considered by the Board show, over the one-, three-, and five-year periods ended December 31, 2010, as available, the cumulative total returns of the retail class and Class C of the fund, the cumulative total returns of a proprietary custom index ("benchmark"), and a range of cumulative total returns of a peer group of mutual funds identified by Lipper Inc. as having an investment objective similar to that of the fund. The returns of the retail class and Class C show the performance of the highest performing class (based on five-year performance) and the lowest performing class (based on three-year performance), respectively. The box within each chart shows the 25th percentile return (bottom of box) and the 75th percentile return (top of box) of the peer group. Returns shown above the box are in the first quartile and returns shown below the box are in the fourth quartile. The percentage beaten numbers noted below each chart correspond to the percentile box and represent the percentage of funds in the peer group whose performance was equal to or lower than that of the class indicated. The fund's proprietary custom index is an index developed by FMR that represents the performance of the fund's general investment categories.
Semiannual Report
Fidelity Government Income Fund

The Board reviewed the fund's relative investment performance against its peer group and noted that the performance of the retail class of the fund was in the third quartile for the one-year period and the first quartile for the three- and five-year periods. The Board also noted that the investment performance of the retail class of the fund compared favorably to its benchmark for the three- and five-year periods, although the fund's one-year total return was lower than its benchmark. The Board considered that the variations in performance among the fund's classes reflect the variations in class expenses, which result in lower performance for higher expense classes. The Board also reviewed the fund's performance since inception as well as performance in the current year.
Based on its review, the Board concluded that the nature, extent, and quality of services provided to the fund under the Advisory Contracts should benefit the fund's shareholders.
Competitiveness of Management Fee and Total Expense Ratio. The Board considered the fund's management fee and total expense ratio compared to "mapped groups" of competitive funds and classes. Fidelity creates "mapped groups" by combining similar Lipper investment objective categories that have comparable management fee characteristics. Combining Lipper investment objective categories aids the Board's management fee and total expense ratio comparisons by broadening the competitive group used for comparison and by reducing the number of universes to which various Fidelity funds are compared.
Semiannual Report
Board Approval of Investment Advisory Contracts and
Management Fees - continued
Management Fee. The Board considered two proprietary management fee comparisons for the 12-month periods shown in the chart below. The group of Lipper funds used by the Board for management fee comparisons is referred to below as the "Total Mapped Group" and, for the reasons explained above, is broader than the Lipper peer group used by the Board for performance comparisons. The Total Mapped Group comparison focuses on a fund's standing relative to the total universe of comparable funds available to investors in terms of gross management fees before expense reimbursements or caps. "TMG %" represents the percentage of funds in the Total Mapped Group that had management fees that were lower than the fund's. For example, a TMG % of 12% means that 88% of the funds in the Total Mapped Group had higher management fees than the fund. The "Asset-Size Peer Group" (ASPG) comparison focuses on a fund's standing relative to non-Fidelity funds similar in size to the fund within the Total Mapped Group. The ASPG represents at least 15% of the funds in the Total Mapped Group with comparable asset size and management fee characteristics, subject to a minimum of 50 funds (or all funds in the Total Mapped Group if fewer than 50). Additional information, such as the ASPG quartile in which the fund's management fee ranked, is also included in the chart and considered by the Board.
Fidelity Government Income Fund

The Board noted that the fund's management fee ranked below the median of its Total Mapped Group and below the median of its ASPG for 2010.
Semiannual Report
Based on its review, the Board concluded that the fund's management fee is fair and reasonable in light of the services that the fund receives and the other factors considered.
Total Expense Ratio. In its review of each class's total expense ratio, the Board considered the fund's management fee as well as other fund or class expenses, as applicable, such as transfer agent fees, pricing and bookkeeping fees, fund-paid 12b-1 fees, and custodial, legal, and audit fees. The Board also noted the effects of any waivers and reimbursements on fees and expenses. As part of its review, the Board also considered the current and historical total expense ratios of each class of the fund compared to competitive fund median expenses. Each class of the fund is compared to those funds and classes in the Total Mapped Group (used by the Board for management fee comparisons) that have a similar sales load structure.
The Board also considered that the current contractual arrangements for the fund (i) have the effect of setting the total "fund-level" expenses (including, among certain other expenses, the management fee) for each class at 35 basis points, (ii) limit the "class-level" transfer agent fee for the retail class to 10 basis points, and (iii) limit the total expenses for the retail class to 45 basis points. The fees and expenses payable under these contractual arrangements may not be increased without the approval of the Board and the shareholders of the applicable class. The fund's Advisor classes are subject to different "class-level" expenses (transfer agent fees and 12b-1 fees).
The Board noted that the total expense ratio of each class ranked below its competitive median for 2010.
The Board recognized that the fund's management contract incorporates a "group fee" structure, which provides for lower group fee rates as total fund assets under FMR's management increase, and for higher group fee rates as total fund assets under FMR's management decrease. FMR calculates the group fee rates based on a tiered asset "breakpoint" schedule that varies based on asset class. The Board noted, however, that because the current contractual arrangements set the total "fund-level" expenses for each class at 35 basis points, increases or decreases in the management fee due to changes in the group fee rate will not impact the total expense ratio.
Fees Charged to Other Fidelity Clients. The Board also considered Fidelity fee structures and other information with respect to clients of FMR and its affiliates, such as other mutual funds advised or subadvised by FMR or its affiliates, pension plan clients, and other institutional clients. In March 2010, the Board created an ad hoc joint committee with the board of other Fidelity funds (the Committee) to review and compare Fidelity's institutional investment advisory business with its business of providing services to the Fidelity funds, including the differences in services provided, fees charged, and costs incurred, as well as competition in their respective marketplaces.
Semiannual Report
Board Approval of Investment Advisory Contracts and
Management Fees - continued
Based on its review of total expense ratios and fees charged to other Fidelity clients, the Board concluded that the total expense ratio of each class of the fund was reasonable in light of the services that the fund and its shareholders receive and the other factors considered, including the findings of the Committee.
Costs of the Services and Profitability. The Board considered the revenues earned and the expenses incurred by Fidelity in conducting the business of developing, marketing, distributing, managing, administering and servicing the fund and its shareholders. The Board also considered the level of Fidelity's profits in respect of all the Fidelity funds.
On an annual basis, FMR presents to the Board Fidelity's profitability for the fund. Fidelity calculates the profitability for each fund, as well as aggregate profitability for groups of Fidelity funds and all Fidelity funds, using a series of detailed revenue and cost allocation methodologies which originate with the books and records of Fidelity on which Fidelity's audited financial statements are based. The Audit Committee of the Board reviews any significant changes from the prior year's methodologies.
PricewaterhouseCoopers LLP (PwC), independent registered public accounting firm and auditor to Fidelity and certain Fidelity funds, has been engaged annually by the Board as part of the Board's assessment of Fidelity's profitability analysis. PwC's engagement includes the review and assessment of Fidelity's methodologies used in determining the revenues and expenses attributable to Fidelity's mutual fund business, and completion of agreed-upon procedures surrounding the mathematical accuracy of fund profitability and its conformity to allocation methodologies. After considering PwC's reports issued under the engagement and information provided by Fidelity, the Board concluded that while other allocation methods may also be reasonable, Fidelity's profitability methodologies are reasonable in all material respects.
The Board also reviewed Fidelity's non-fund businesses and fall-out benefits related to the mutual fund business as well as cases where Fidelity's affiliates may benefit from or be related to the fund's business.
The Board considered the costs of the services provided by and the profits realized by Fidelity in connection with the operation of the fund and was satisfied that the profitability was not excessive in the circumstances.
Economies of Scale. The Board considered whether there have been economies of scale in respect of the management of the Fidelity funds, whether the Fidelity funds (including the fund) have appropriately benefited from any such economies of scale, and whether there is potential for realization of any further economies of scale. The Board considered the extent to which the fund will benefit from economies of scale through increased services to the fund, through waivers or reimbursements, or through fee or expense reductions. The Board also noted that in 2009, it and the board of other Fidelity funds created an ad hoc committee (the Economies of Scale Committee) to analyze whether FMR attains economies of scale in respect of the management and servicing of the Fidelity funds, whether the Fidelity funds have appropriately benefited from such economies of scale, and whether there is potential for realization of any further economies of scale.
Semiannual Report
The Board concluded, taking into account the analysis of the Economies of Scale Committee, that any potential economies of scale are being appropriately shared between fund shareholders and Fidelity.
Additional Information Requested by the Board. In order to develop fully the factual basis for consideration of the Fidelity funds' Advisory Contracts, the Board requested and received additional information on certain topics, including: (i) Fidelity's fund profitability methodology, profitability trends for certain funds, and the impact of certain factors on fund profitability results; (ii) portfolio manager changes that have occurred during the past year and the amount of the investment that each portfolio manager has made in the Fidelity fund(s) that he or she manages; (iii) Fidelity's compensation structure for portfolio managers, research analysts, and other key personnel, including its effects on fund profitability, the rationale for the compensation structure, and the extent to which current market conditions have affected retention and recruitment; (iv) the compensation paid to fund sub-advisers on behalf of the Fidelity funds; (v) Fidelity's fee structures and rationale for recommending different fees among different categories of funds and classes, as well as Fidelity's voluntary waiver of its fees to maintain minimum yields for certain money market funds and classes; (vi) the reasons why certain expenses affect various funds and classes differently; (vii) Fidelity's transfer agent fees, expenses, and services and how the benefits of decreased costs and new efficiencies can be shared across all of the Fidelity funds; (viii) the reasons for and consequences of changes to certain product lines compared to competitors; (ix) the allocation of and historical trends in Fidelity's realization of fall-out benefits; and (x) explanations regarding the relative total expense ratios of certain funds and classes, total expense competitive trends, and actions that might be taken by FMR to reduce total expense ratios for certain funds and classes or to achieve further economies of scale.
Based on its evaluation of all of the conclusions noted above, and after considering all factors it believed relevant, the Board ultimately concluded that the advisory fee structures are fair and reasonable, and that the fund's Advisory Contracts should be renewed.
Semiannual Report
Investment Adviser
Fidelity Management & Research Company
Boston, MA
Investment Sub-Advisers
Fidelity Investments Money
Management, Inc.
Fidelity Management & Research
(U.K.) Inc.
Fidelity Management & Research
(Hong Kong) Limited
Fidelity Management & Research
(Japan) Inc.
General Distributor
Fidelity Distributors Corporation
Boston, MA
Transfer and Service Agents
Fidelity Investments Institutional Operations Company, Inc.
Boston, MA
Fidelity Service Company, Inc.
Boston, MA
Custodian
The Bank of New York Mellon
New York, NY
AGVTI-USAN-0412
1.834234.105
(Fidelity Investment logo)(registered trademark)
Fidelity® Intermediate
Government Income Fund
Semiannual Report
February 29, 2012
(Fidelity Cover Art)
Contents
Shareholder Expense Example | (Click Here) | An example of shareholder expenses. |
Investment Changes | (Click Here) | A summary of major shifts in the fund's investments over the past six months. |
Investments | (Click Here) | A complete list of the fund's investments with their market values. |
Financial Statements | (Click Here) | Statements of assets and liabilities, operations, and changes in net assets,
as well as financial highlights. |
Notes | (Click Here) | Notes to the financial statements. |
Board Approval of Investment Advisory Contracts and Management Fees | (Click Here) | |
To view a fund's proxy voting guidelines and proxy voting record for the 12-month period ended June 30, visit http://www.fidelity.com/proxyvotingresults or visit the Securities and Exchange Commission's (SEC) web site at http://www.sec.gov. You may also call 1-800-544-8544 to request a free copy of the proxy voting guidelines.
Standard & Poor's, S&P and S&P 500 are registered service marks of The McGraw-Hill Companies, Inc. and have been licensed for use by Fidelity Distributors Corporation.
Other third party marks appearing herein are the property of their respective owners.
All other marks appearing herein are registered or unregistered trademarks or service marks of FMR LLC or an affiliated company.
This report and the financial statements contained herein are submitted for the general information of the shareholders of the funds. This report is not authorized for distribution to prospective investors in the funds unless preceded or accompanied by an effective prospectus.
A fund files its complete schedule of portfolio holdings with the SEC for the first and third quarters of each fiscal year on Form N-Q. Forms N-Q are available on the SEC's web site at http://www.sec.gov. A fund's Forms N-Q may be reviewed and copied at the SEC's Public Reference Room in Washington, DC. Information regarding the operation of the SEC's Public Reference Room may be obtained by calling 1-800-SEC-0330. For a complete list of a fund's portfolio holdings, view the most recent holdings listing, semiannual report, or annual report on Fidelity's web site at http://www.fidelity.com, http://www.advisor.fidelity.com, or http://www.401k.com, as applicable.
NOT FDIC INSURED • MAY LOSE VALUE • NO BANK GUARANTEE
Neither the fund nor Fidelity Distributors Corporation is a bank.
Semiannual Report
Shareholder Expense Example
As a shareholder of the Fund, you incur two types of costs: (1) transaction costs, and (2) ongoing costs, including management fees and other Fund expenses. This Example is intended to help you understand your ongoing costs (in dollars) of investing in the Fund and to compare these costs with the ongoing costs of investing in other mutual funds.
The Example is based on an investment of $1,000 invested at the beginning of the period and held for the entire period (September 1, 2011 to February 29, 2012).
Actual Expenses
The first line of the accompanying table provides information about actual account values and actual expenses. You may use the information in this line, together with the amount you invested, to estimate the expenses that you paid over the period. Simply divide your account value by $1,000.00 (for example, an $8,600 account value divided by $1,000.00 = 8.6), then multiply the result by the number in the first line under the heading entitled "Expenses Paid During Period" to estimate the expenses you paid on your account during this period. A small balance maintenance fee of $12.00 that is charged once a year may apply for certain accounts with a value of less than $2,000. This fee is not included in the table below. If it was, the estimate of expenses you paid during the period would be higher, and your ending account value lower, by this amount.
Hypothetical Example for Comparison Purposes
The second line of the accompanying table provides information about hypothetical account values and hypothetical expenses based on the Fund's actual expense ratio and an assumed rate of return of 5% per year before expenses, which is not the Fund's actual return. The hypothetical account values and expenses may not be used to estimate the actual ending account balance or expenses you paid for the period. You may use this information to compare the ongoing costs of investing in the Fund and other funds. To do so, compare this 5% hypothetical example with the 5% hypothetical examples that appear in the shareholder reports of the other funds. A small balance maintenance fee of $12.00 that is charged once a year may apply for certain accounts with a value of less than $2,000. This fee is not included in the table below. If it was, the estimate of expenses you paid during the period would be higher, and your ending account value lower, by this amount.
Please note that the expenses shown in the table are meant to highlight your ongoing costs only and do not reflect any transaction costs. Therefore, the second line of the table is useful in comparing ongoing costs only, and will not help you determine the relative total costs of owning different funds.
| Annualized
Expense Ratio | Beginning
Account Value
September 1, 2011 | Ending
Account Value
February 29, 2012 | Expenses Paid
During Period*
September 1, 2011 to
February 29, 2012 |
Actual | .45% | $ 1,000.00 | $ 1,008.80 | $ 2.25 |
Hypothetical (5% return per year before expenses) | | $ 1,000.00 | $ 1,022.63 | $ 2.26 |
* Expenses are equal to the Fund's annualized expense ratio, multiplied by the average account value over the period, multiplied by 182/366 (to reflect the one-half year period).
Semiannual Report
Investment Changes (Unaudited)
Coupon Distribution as of February 29, 2012 |
| % of fund's investments | % of fund's investments
6 months ago |
Zero coupon bonds | 1.1 | 0.7 |
0.01 - 0.99% | 35.6 | 34.3 |
1 - 1.99% | 19.7 | 18.5 |
2 - 2.99% | 12.3 | 10.5 |
3 - 3.99% | 13.7 | 16.0 |
4 - 4.99% | 7.3 | 10.8 |
5 - 5.99% | 5.7 | 5.5 |
6% and over | 2.5 | 2.5 |
Coupon distribution shows the range of stated interest rates on the fund's investments, excluding short-term investments. |
Weighted Average Maturity as of February 29, 2012 |
| | 6 months ago |
Years | 5.5 | 5.2 |
This is a weighted average of all the maturities of the securities held in a fund. Weighted Average Maturity (WAM) can be used as a measure of sensitivity to interest rate changes and market changes. Generally, the longer the maturity, the greater the sensitivity to such changes. WAM is based on the dollar-weighted average length of time until principal payments must be paid. Depending on the types of securities held in a fund, certain maturity shortening devices (e.g., demand features, interest rate resets, and call options) may be taken into account when calculating the WAM. |
Duration as of February 29, 2012 |
| | 6 months ago |
Years | 3.7 | 3.6 |
Duration estimates how much a bond fund's price will change with a change in comparable interest rates. If rates rise 1%, for example, a fund with a 5-year duration is likely to lose about 5% of its value. Other factors also can influence a bond fund's performance and share price. Accordingly, a bond fund's actual performance may differ from this example. Duration takes into account any call or put option embedded in the bonds. |
Asset Allocation (% of fund's net assets) |
As of February 29, 2012* | As of August 31, 2011** |
| Mortgage Securities 4.7% | | | Mortgage Securities 9.1% | |
| CMOs and
Other Mortgage
Related Securities 19.6% | | | CMOs and
Other Mortgage
Related Securities 13.0% | |
| U.S. Treasury
Obligations 58.6% | | | U.S. Treasury
Obligations 64.4% | |
| U.S. Government
Agency Obligations† 14.3% | | | U.S. Government
Agency Obligations† 15.2% | |
| Foreign Government
& Government
Agency Obligations 1.3% | | | Foreign Government
& Government
Agency Obligations 1.3% | |
 | Short-Term
Investments and
Net Other Assets 1.5% | | | Short-Term
Investments and
Net Other Assets†† (3.0)% | |
* Futures and Swaps | 9.0% | | ** Futures and Swaps | 5.6% | |

† Includes FDIC Guaranteed Corporate Securities and NCUA Guaranteed Notes.
†† Short-Term Investments and Net Other Assets are not included in the pie chart.
Semiannual Report
Investments February 29, 2012 (Unaudited)
Showing Percentage of Net Assets
U.S. Government and Government Agency Obligations - 72.9% |
| Principal Amount (000s) | | Value (000s) |
U.S. Government Agency Obligations - 6.9% |
Fannie Mae: | | | | |
0.375% 12/28/12 | | $ 8,610 | | $ 8,627 |
0.375% 3/16/15 | | 11,662 | | 11,602 |
1.125% 4/27/17 | | 11,744 | | 11,718 |
Federal Home Loan Bank: | | | | |
0.375% 11/27/13 | | 1,505 | | 1,505 |
0.375% 1/29/14 | | 3,000 | | 2,999 |
0.875% 12/27/13 | | 465 | | 470 |
Freddie Mac: | | | | |
0.375% 11/30/12 | | 2,964 | | 2,969 |
0.625% 12/29/14 | | 13,853 | | 13,889 |
1% 7/30/14 | | 5,481 | | 5,553 |
1% 8/27/14 | | 3,738 | | 3,787 |
Private Export Funding Corp. secured: | | | | |
4.974% 8/15/13 | | 3,435 | | 3,658 |
5.685% 5/15/12 | | 3,915 | | 3,960 |
Small Business Administration guaranteed development participation certificates Series 2004-20H Class 1, 5.17% 8/1/24 | | 406 | | 449 |
Tennessee Valley Authority 3.875% 2/15/21 | | 7,910 | | 8,980 |
TOTAL U.S. GOVERNMENT AGENCY OBLIGATIONS | | 80,166 |
U.S. Treasury Obligations - 58.6% |
U.S. Treasury Bonds 8.75% 5/15/17 | | 14,750 | | 20,649 |
U.S. Treasury Notes: | | | | |
0.125% 12/31/13 | | 7,742 | | 7,718 |
0.25% 11/30/13 | | 1,400 | | 1,399 |
0.25% 1/31/14 | | 30,000 | | 29,973 |
0.25% 9/15/14 | | 20,565 | | 20,494 |
0.25% 12/15/14 | | 12,000 | | 11,948 |
0.25% 1/15/15 | | 32,989 | | 32,842 |
0.25% 2/15/15 | | 17,206 | | 17,121 |
0.375% 11/15/14 | | 15,000 | | 14,989 |
0.5% 8/15/14 | | 31,309 | | 31,407 |
0.5% 10/15/14 | | 1,475 | | 1,479 |
0.625% 7/15/14 | | 32,360 | | 32,562 |
0.75% 6/15/14 | | 12,024 | | 12,135 |
0.875% 11/30/16 | | 5,755 | | 5,770 |
0.875% 2/28/17 | | 31,452 | | 31,457 |
1% 9/30/16 | | 30,983 | | 31,286 |
1.375% 11/30/15 | | 941 | | 968 |
U.S. Government and Government Agency Obligations - continued |
| Principal Amount (000s) | | Value (000s) |
U.S. Treasury Obligations - continued |
U.S. Treasury Notes: - continued | | | | |
1.375% 2/28/19 | | $ 76,900 | | $ 76,792 |
1.75% 7/31/15 | | 2,000 | | 2,083 |
1.875% 6/30/15 | | 35,554 | | 37,154 |
2% 11/15/21 | | 5,819 | | 5,846 |
2% 2/15/22 | | 6,212 | | 6,223 |
2.125% 5/31/15 | | 352 | | 370 |
2.125% 8/15/21 | | 26,090 | | 26,604 |
2.375% 8/31/14 | | 9,290 | | 9,749 |
2.375% 9/30/14 | | 4,572 | | 4,805 |
2.375% 10/31/14 | | 16,136 | | 16,976 |
2.375% 7/31/17 | | 12,000 | | 12,879 |
2.375% 6/30/18 | | 6,062 | | 6,488 |
2.5% 3/31/15 | | 7,000 | | 7,435 |
2.5% 6/30/17 | | 1,800 | | 1,944 |
2.625% 2/29/16 | | 12,000 | | 12,938 |
3% 9/30/16 | | 6,641 | | 7,305 |
3% 2/28/17 | | 26,424 | | 29,161 |
3.125% 10/31/16 | | 3,971 | | 4,393 |
3.125% 1/31/17 | | 27,081 | | 30,026 |
3.125% 5/15/19 | | 26,941 | | 30,083 |
3.625% 2/15/20 | | 11,372 | | 13,122 |
4.25% 8/15/15 | | 1,106 | | 1,246 |
4.5% 5/15/17 (b) | | 1,369 | | 1,618 |
4.625% 2/15/17 | | 14,625 | | 17,286 |
4.75% 8/15/17 | | 12,139 | | 14,574 |
TOTAL U.S. TREASURY OBLIGATIONS | | 681,297 |
Other Government Related - 7.4% |
Bank of America Corp.: | | | | |
2.1% 4/30/12 (FDIC Guaranteed) (a) | | 1,493 | | 1,498 |
3.125% 6/15/12 (FDIC Guaranteed) (a) | | 305 | | 308 |
Citigroup Funding, Inc.: | | | | |
1.875% 10/22/12 (FDIC Guaranteed) (a) | | 20,600 | | 20,824 |
1.875% 11/15/12 (FDIC Guaranteed) (a) | | 3,800 | | 3,845 |
General Electric Capital Corp. 2.625% 12/28/12 (FDIC Guaranteed) (a) | | 4,364 | | 4,452 |
GMAC, Inc. 1.75% 10/30/12 (FDIC Guaranteed) (a) | | 15,000 | | 15,156 |
Goldman Sachs Group, Inc. 3.25% 6/15/12 (FDIC Guaranteed) (a) | | 306 | | 309 |
U.S. Government and Government Agency Obligations - continued |
| Principal Amount (000s) | | Value (000s) |
Other Government Related - continued |
National Credit Union Administration Guaranteed Notes: | | | | |
Series 2010-A1 Class A, 0.6463% 12/7/20 (NCUA Guaranteed) (c) | | $ 2,562 | | $ 2,570 |
Series 2011-R1 Class 1A, 0.7453% 1/8/20 (NCUA Guaranteed) (c) | | 3,860 | | 3,869 |
Series 2011-R4 Class 1A, 0.6753% 3/6/20 (NCUA Guaranteed) (c) | | 2,279 | | 2,280 |
National Credit Union Administration Guaranteed Notes Master Trust: | | | | |
1.4% 6/12/15 (NCUA Guaranteed) | | 1,690 | | 1,724 |
2.35% 6/12/17 (NCUA Guaranteed) | | 14,740 | | 15,449 |
3.45% 6/12/21 (NCUA Guaranteed) | | 12,000 | | 13,049 |
TOTAL OTHER GOVERNMENT RELATED | | 85,333 |
TOTAL U.S. GOVERNMENT AND GOVERNMENT AGENCY OBLIGATIONS (Cost $820,946) | 846,796 |
U.S. Government Agency - Mortgage Securities - 4.7% |
|
Fannie Mae: - 0.9% |
1.925% 12/1/34 (c) | | 29 | | 31 |
1.926% 2/1/33 (c) | | 34 | | 35 |
1.952% 3/1/35 (c) | | 33 | | 35 |
1.964% 10/1/33 (c) | | 17 | | 17 |
2.036% 7/1/35 (c) | | 16 | | 17 |
2.05% 3/1/35 (c) | | 5 | | 6 |
2.115% 10/1/35 (c) | | 43 | | 45 |
2.223% 11/1/33 (c) | | 86 | | 90 |
2.301% 7/1/34 (c) | | 20 | | 21 |
2.303% 6/1/36 (c) | | 21 | | 22 |
2.317% 7/1/36 (c) | | 132 | | 138 |
2.322% 1/1/35 (c) | | 154 | | 164 |
2.393% 9/1/36 (c) | | 75 | | 80 |
2.406% 3/1/33 (c) | | 81 | | 85 |
2.424% 10/1/33 (c) | | 30 | | 32 |
2.448% 3/1/35 (c) | | 19 | | 20 |
2.448% 2/1/36 (c) | | 65 | | 68 |
2.487% 11/1/36 (c) | | 196 | | 209 |
2.537% 7/1/35 (c) | | 41 | | 43 |
U.S. Government Agency - Mortgage Securities - continued |
| Principal Amount (000s) | | Value (000s) |
Fannie Mae - continued |
2.538% 2/1/37 (c) | | $ 314 | | $ 331 |
2.571% 6/1/47 (c) | | 89 | | 94 |
2.609% 5/1/36 (c) | | 41 | | 43 |
2.632% 4/1/36 (c) | | 256 | | 273 |
2.929% 8/1/35 (c) | | 435 | | 464 |
3.471% 3/1/40 (c) | | 1,905 | | 1,973 |
4% 9/1/13 | | 60 | | 63 |
5% 2/1/16 to 4/1/22 | | 142 | | 152 |
5.5% 10/1/20 to 4/1/21 | | 3,662 | | 3,992 |
5.954% 3/1/37 (c) | | 45 | | 48 |
6% 6/1/16 to 3/1/34 | | 1,391 | | 1,553 |
6.5% 6/1/16 to 5/1/27 | | 736 | | 811 |
7% 9/1/12 to 9/1/14 | | 21 | | 22 |
10.25% 10/1/18 | | 2 | | 3 |
11% 9/1/15 to 1/1/16 | | 9 | | 9 |
11.25% 5/1/14 to 1/1/16 | | 15 | | 17 |
11.5% 1/1/13 to 6/15/19 | | 19 | | 20 |
12.25% 8/1/13 | | 0* | | 0* |
12.5% 1/1/13 to 7/1/16 | | 41 | | 45 |
13% 10/1/14 | | 15 | | 16 |
| | 11,087 |
Freddie Mac - 1.4% |
1.915% 3/1/35 (c) | | 93 | | 96 |
2.076% 7/1/35 (c) | | 807 | | 851 |
2.095% 5/1/37 (c) | | 47 | | 49 |
2.2% 3/1/37 (c) | | 22 | | 23 |
2.281% 6/1/33 (c) | | 186 | | 193 |
2.292% 11/1/35 (c) | | 169 | | 178 |
2.35% 7/1/35 (c) | | 204 | | 217 |
2.403% 10/1/36 (c) | | 215 | | 225 |
2.41% 10/1/35 (c) | | 184 | | 194 |
2.454% 5/1/37 (c) | | 47 | | 49 |
2.462% 5/1/37 (c) | | 324 | | 343 |
2.469% 5/1/37 (c) | | 611 | | 650 |
2.48% 4/1/34 (c) | | 755 | | 797 |
2.549% 2/1/36 (c) | | 14 | | 15 |
2.62% 2/1/37 (c) | | 35 | | 36 |
2.638% 4/1/37 (c) | | 64 | | 68 |
2.639% 6/1/37 (c) | | 143 | | 153 |
2.795% 7/1/36 (c) | | 75 | | 79 |
2.798% 7/1/35 (c) | | 185 | | 196 |
U.S. Government Agency - Mortgage Securities - continued |
| Principal Amount (000s) | | Value (000s) |
Freddie Mac - continued |
2.943% 3/1/33 (c) | | $ 6 | | $ 6 |
3.149% 10/1/35 (c) | | 31 | | 33 |
5.5% 11/1/18 to 11/1/21 | | 9,560 | | 10,418 |
5.847% 6/1/37 (c) | | 23 | | 24 |
6.5% 12/1/21 | | 294 | | 325 |
6.662% 8/1/37 (c) | | 78 | | 82 |
7.22% 4/1/37 (c) | | 4 | | 4 |
9% 7/1/16 | | 8 | | 8 |
9.5% 7/1/16 to 8/1/21 | | 103 | | 116 |
10% 4/1/15 to 3/1/21 | | 170 | | 192 |
10.5% 1/1/21 | | 2 | | 2 |
11% 9/1/20 | | 6 | | 8 |
11.25% 6/1/14 | | 19 | | 21 |
11.5% 10/1/15 to 11/1/15 | | 14 | | 15 |
12% 2/1/13 to 11/1/19 | | 7 | | 8 |
12.25% 11/1/13 | | 5 | | 5 |
12.5% 1/1/13 to 6/1/19 | | 103 | | 113 |
13% 12/1/13 to 5/1/17 | | 10 | | 11 |
14% 11/1/12 to 4/1/16 | | 1 | | 1 |
| | 15,804 |
Ginnie Mae - 2.4% |
4% 9/15/25 | | 535 | | 577 |
4.626% 3/1/62 (f) | | 1,825 | | 2,055 |
4.65% 3/1/62 (f) | | 1,600 | | 1,787 |
4.684% 1/20/62 (f) | | 5,496 | | 6,196 |
5.5% 2/20/60 (f) | | 12,831 | | 14,394 |
5.612% 4/20/58 (f) | | 2,531 | | 2,715 |
8% 12/15/23 | | 194 | | 226 |
8.5% 6/15/16 to 2/15/17 | | 2 | | 3 |
10.5% 9/15/15 to 10/15/21 | | 274 | | 321 |
11% 5/20/16 to 1/20/21 | | 25 | | 30 |
13% 9/15/13 to 10/15/13 | | 3 | | 3 |
13.25% 8/15/14 | | 3 | | 4 |
13.5% 12/15/14 | | 1 | | 1 |
| | 28,312 |
TOTAL U.S. GOVERNMENT AGENCY - MORTGAGE SECURITIES (Cost $53,426) | 55,203 |
Collateralized Mortgage Obligations - 19.0% |
| Principal Amount (000s) | | Value (000s) |
U.S. Government Agency - 19.0% |
Fannie Mae: | | | | |
floater Series 2011-63 Class FL, 0.644% 7/25/41 (c) | | $ 7,156 | | $ 7,175 |
Series 2011-67 Class AI, 4% 7/25/26 (d) | | 1,097 | | 117 |
Fannie Mae Guaranteed Mtg. pass-thru certificates: | | | | |
floater: | | | | |
Series 1994-42 Class FK, 1.51% 4/25/24 (c) | | 1,479 | | 1,526 |
Series 2010-15 Class FJ, 1.174% 6/25/36 (c) | | 5,866 | | 5,944 |
Series 2011-83 Class FB, 0.744% 9/25/41 (c) | | 5,508 | | 5,506 |
Series 2011-89 Class FP, 0.544% 3/25/39 (c) | | 7,019 | | 7,017 |
planned amortization class: | | | | |
Series 1988-21 Class G, 9.5% 8/25/18 | | 33 | | 37 |
Series 2003-28 Class KG, 5.5% 4/25/23 | | 725 | | 809 |
sequential payer: | | | | |
Series 2007-113 Class DB, 4.5% 12/25/22 | | 2,930 | | 3,252 |
Series 2009-14 Class EB, 4.5% 3/25/24 | | 1,800 | | 1,960 |
Series 2010-97 Class CX, 4.5% 9/25/25 | | 2,500 | | 2,836 |
Series 2010-109 Class IM, 5.5% 9/25/40 (d) | | 4,583 | | 694 |
Series 2010-39 Class FG, 1.164% 3/25/36 (c) | | 3,044 | | 3,093 |
Fannie Mae subordinate REMIC pass-thru certificates: | | | | |
floater: | | | | |
Series 2001-38 Class QF, 1.224% 8/25/31 (c) | | 281 | | 285 |
Series 2002-60 Class FV, 1.244% 4/25/32 (c) | | 77 | | 78 |
Series 2002-74 Class FV, 0.694% 11/25/32 (c) | | 2,551 | | 2,562 |
Series 2002-75 Class FA, 1.244% 11/25/32 (c) | | 158 | | 161 |
Series 2008-76 Class EF, 0.744% 9/25/23 (c) | | 1,045 | | 1,049 |
Series 2011-104 Class FK, 0.614% 3/25/39 (c) | | 4,139 | | 4,133 |
planned amortization: | | | | |
Series 2003-92 Class PD, 4.5% 3/25/17 | | 6,438 | | 6,507 |
Series 2005-19 Class PA, 5.5% 7/25/34 | | 1,680 | | 1,865 |
Series 2005-64 Class PX, 5.5% 6/25/35 | | 1,689 | | 1,886 |
planned amortization class: | | | | |
Series 2002-16 Class PG, 6% 4/25/17 | | 389 | | 418 |
Series 2002-9 Class PC, 6% 3/25/17 | | 29 | | 31 |
Series 2004-80 Class LD, 4% 1/25/19 | | 659 | | 680 |
Series 2005-52 Class PB, 6.5% 12/25/34 | | 292 | | 311 |
sequential payer: | | | | |
Series 2002-56 Class MC, 5.5% 9/25/17 | | 111 | | 119 |
Series 2002-57 Class BD, 5.5% 9/25/17 | | 99 | | 107 |
Series 2004-72 Class CB, 4% 9/25/19 | | 5,000 | | 5,299 |
Series 2004-91 Class Z, 5% 12/25/34 | | 2,096 | | 2,362 |
Series 2005-47 Class HK, 4.5% 6/25/20 | | 1,790 | | 1,945 |
Collateralized Mortgage Obligations - continued |
| Principal Amount (000s) | | Value (000s) |
U.S. Government Agency - continued |
Fannie Mae subordinate REMIC pass-thru certificates: - continued | | | | |
Series 2009-82 Class FD, 1.094% 10/25/39 (c) | | $ 2,472 | | $ 2,507 |
Series 2010-139 Class NI, 4.5% 2/25/40 (d) | | 2,630 | | 374 |
FHMLC Multi-class participation certificates guaranteed: | | | | |
floater Series 3835 Class FC, 0.5985% 5/15/38 (c) | | 6,932 | | 6,923 |
planned amortization class: | | | | |
Series 3856 Class KF, 0.6985% 5/15/41 (c) | | 4,896 | | 4,885 |
Series 3867, 0.5985% 4/15/40 (c) | | 8,197 | | 8,194 |
Freddie Mac floater 0.5485% 7/15/36 (c) | | 5,713 | | 5,703 |
Freddie Mac Multi-Class pass-thru certificates: | | | | |
floater: | | | | |
Series 2526 Class FC, 0.6485% 11/15/32 (c) | | 394 | | 395 |
Series 2630 Class FL, 0.7485% 6/15/18 (c) | | 36 | | 36 |
Series 3346 Class FA, 0.4785% 2/15/19 (c) | | 4,852 | | 4,859 |
Series 3419 Class FD, 1.0185% 2/15/38 (c) | | 2,493 | | 2,525 |
floater planned amortization Series 3950 Class QF, 0.7485% 8/15/40 (c) | | 4,496 | | 4,506 |
planned amortization class: | | | | |
Series 2356 Class GD, 6% 9/15/16 | | 114 | | 122 |
Series 2376 Class JE, 5.5% 11/15/16 | | 109 | | 116 |
Series 2381 Class OG, 5.5% 11/15/16 | | 68 | | 73 |
Series 2425 Class JH, 6% 3/15/17 | | 136 | | 146 |
Series 2640 Class GE, 4.5% 7/15/18 | | 3,690 | | 3,909 |
Series 2672 Class MG, 5% 9/15/23 | | 1,630 | | 1,845 |
Series 2684 Class FP, 0.7485% 1/15/33 (c) | | 4,112 | | 4,125 |
Series 2695 Class DG, 4% 10/15/18 | | 1,635 | | 1,750 |
Series 2802 Class OB, 6% 5/15/34 | | 1,355 | | 1,575 |
Series 2810 Class PD, 6% 6/15/33 | | 585 | | 611 |
Series 3147 Class PF, 0.5485% 4/15/36 (c) | | 2,456 | | 2,440 |
Series 3741 Class YU, 3.5% 11/15/22 | | 3,140 | | 3,303 |
sequential payer: | | | | |
Series 1929 Class EZ, 7.5% 2/17/27 | | 1,183 | | 1,319 |
Series 2357 Class ZB, 6.5% 9/15/31 | | 995 | | 1,115 |
Series 2570 Class CU, 4.5% 7/15/17 | | 15 | | 16 |
Series 2582 Class CG, 4% 11/15/17 | | 2,890 | | 2,957 |
Series 2877 Class ZD, 5% 10/15/34 | | 2,711 | | 3,044 |
Series 2998 Class LY, 5.5% 7/15/25 | | 295 | | 338 |
Series 3007 Class EW, 5.5% 7/15/25 | | 1,125 | | 1,298 |
Series 3013 Class VJ, 5% 1/15/14 | | 653 | | 676 |
Series 3277 Class B, 4% 2/15/22 | | 1,200 | | 1,303 |
Collateralized Mortgage Obligations - continued |
| Principal Amount (000s) | | Value (000s) |
U.S. Government Agency - continued |
Freddie Mac Multi-Class pass-thru certificates: - continued | | | | |
sequential payer: | | | | |
Series 3578, Class B, 4.5% 9/15/24 | | $ 1,820 | | $ 1,994 |
Series 3659 Class EJ 3% 6/15/18 | | 2,029 | | 2,093 |
Series 3675 Class CA, 3% 4/15/20 | | 15,421 | | 15,939 |
Series 2715 Class NG, 4.5% 12/15/18 | | 890 | | 964 |
Ginnie Mae: | | | | |
0% 3/1/62 (c)(f) | | 960 | | 964 |
0% 3/1/62 (c)(f) | | 2,190 | | 2,190 |
Ginnie Mae guaranteed REMIC pass-thru certificates: | | | | |
floater: | | | | |
Series 2010-H17 Class FA, 0.5755% 7/20/60 (c)(f) | | 3,863 | | 3,795 |
Series 2010-H18 Class AF, 0.5703% 9/20/60 (c)(f) | | 3,960 | | 3,881 |
Series 2010-H19 Class FG, 0.5455% 8/20/60 (c)(f) | | 5,053 | | 4,965 |
Series 2010-H27 Series FA, 0.6255% 12/20/60 (c)(f) | | 1,184 | | 1,168 |
Series 2011-H03 Class FA, 0.7455% 1/20/61 (c)(f) | | 3,690 | | 3,665 |
Series 2011-H05 Class FA, 0.7455% 12/20/60 (c)(f) | | 2,530 | | 2,513 |
Series 2011-H07 Class FA, 0.7455% 2/20/61 (c)(f) | | 4,068 | | 3,999 |
Series 2011-H12 Class FA, 0.7355% 2/20/61 (c)(f) | | 5,060 | | 4,973 |
Series 2011-H13 Class FA, 0.7455% 4/20/61 (c)(f) | | 2,138 | | 2,123 |
Series 2011-H14: | | | | |
Class FB, 0.7455% 5/20/61 (c)(f) | | 2,323 | | 2,295 |
Class FC, 0.7455% 5/20/61 (c)(f) | | 2,372 | | 2,343 |
Series 2011-H17 Class FA, 0.7755% 6/20/61 (c)(f) | | 2,963 | | 2,948 |
Series 2011-H21 Class FA, 0.8455% 10/20/61 (c)(f) | | 3,049 | | 3,044 |
Series 2012-H01 Class FA, 0.9455% 11/20/61 (c)(f) | | 2,388 | | 2,397 |
0% 2/1/62 (c)(f) | | 1,440 | | 1,439 |
planned amortization class Series 2011-79 Class PO, 6/20/40 (e) | | 4,130 | | 3,493 |
Collateralized Mortgage Obligations - continued |
| Principal Amount (000s) | | Value (000s) |
U.S. Government Agency - continued |
Ginnie Mae guaranteed REMIC pass-thru certificates: - continued | | | | |
Series 2010-42 Class OP, 4/20/40 (e) | | $ 5,472 | | $ 4,628 |
Government National Mortgage Association planned amortization class Series 2011-136 Class WI, 4.5% 5/20/40 (d) | | 1,271 | | 254 |
TOTAL COLLATERALIZED MORTGAGE OBLIGATIONS (Cost $219,136) | 220,819 |
Commercial Mortgage Securities - 0.6% |
|
Freddie Mac Multi-Class pass-thru certificates Series K706: | | | | |
Class A1, 1.691% 11/25/44 | | 3,000 | | 3,043 |
Class A2, 2.323% 11/25/44 | | 3,600 | | 3,668 |
TOTAL COMMERCIAL MORTGAGE SECURITIES (Cost $6,699) | 6,711 |
Foreign Government and Government Agency Obligations - 1.3% |
|
Israeli State (guaranteed by U.S. Government through Agency for International Development): | | | | |
5.5% 9/18/23 | | 1,064 | | 1,357 |
5.5% 12/4/23 | | 10,700 | | 13,672 |
TOTAL FOREIGN GOVERNMENT AND GOVERNMENT AGENCY OBLIGATIONS (Cost $13,300) | 15,029 |
Cash Equivalents - 1.9% |
| Maturity Amount (000s) | | Value (000s) |
Investments in repurchase agreements in a joint trading account at 0.14%, dated 2/29/12 due 3/1/12 (Collateralized by U.S. Government Obligations) #
(Cost $22,596) | $ 22,596 | | $ 22,596 |
TOTAL INVESTMENT PORTFOLIO - 100.4% (Cost $1,136,103) | | 1,167,154 |
NET OTHER ASSETS (LIABILITIES) - (0.4)% | | (5,004) |
NET ASSETS - 100% | $ 1,162,150 |
Futures Contracts |
| Expiration Date | | Underlying Face Amount at Value (000s) | | Unrealized Appreciation/
(Depreciation) (000s) |
Purchased |
Treasury Contracts |
473 CBOT 2-Year U.S. Treasury Bond Contracts | June 2012 | | $ 104,171 | | $ (9) |
|
The face value of futures purchased as a percentage of net assets is 9% |
Legend |
(a) Under the Temporary Liquidity Guarantee Program, the Federal Deposit Insurance Corporation guarantees principal and interest in the event of payment default or bankruptcy until the earlier of maturity date of the debt or until June 30, 2012. At the end of the period these securities amounted to $46,392,000 or 4.0% of net assets. |
(b) Security or a portion of the security was pledged to cover margin requirements for futures contracts. At the period end, the value of securities pledged amounted to $189,000. |
(c) Coupon rates for floating and adjustable rate securities reflect the rates in effect at period end. |
(d) Security represents right to receive monthly interest payments on an underlying pool of mortgages or assets. Principal shown is the outstanding par amount of the pool as of the end of the period. |
(e) Principal Only Strips represent the right to receive the monthly principal payments on an underlying pool of mortgage loans. |
(f) Represents an investment in an underlying pool of reverse mortgages which typically do not require regular principal and interest payments as repayment is deferred until a maturity event. |
* Amount represents less than $1,000. |
# Additional information on each counterparty to the repurchase agreement is as follows: |
Repurchase Agreement / Counterparty | Value
(Amounts in thousands) |
$22,596,000 due 3/01/12 at 0.14% |
Citibank NA | $ 3,960 |
Credit Suisse Securities (USA) LLC | 16,656 |
Merrill Lynch, Pierce, Fenner & Smith, Inc. | 1,980 |
| $ 22,596 |
Other Information |
The following is a summary of the inputs used, as of February 29, 2012, involving the Fund's assets and liabilities carried at fair value. The inputs or methodology used for valuing securities may not be an indication of the risk associated with investing in those securities. For more information on valuation inputs, and their aggregation into the levels used in the table below, please refer to the Security Valuation section in the accompanying Notes to Financial Statements. |
Valuation Inputs at Reporting Date: |
Description
(Amounts in thousands) | Total | Level 1 | Level 2 | Level 3 |
Investments in Securities: | | | | |
U.S. Government and Government Agency Obligations | $ 846,796 | $ - | $ 846,796 | $ - |
U.S. Government Agency - Mortgage Securities | 55,203 | - | 55,203 | - |
Collateralized Mortgage Obligations | 220,819 | - | 220,819 | - |
Commercial Mortgage Securities | 6,711 | - | 6,711 | - |
Foreign Government and Government Agency Obligations | 15,029 | - | 15,029 | - |
Cash Equivalents | 22,596 | - | 22,596 | - |
Total Investments in Securities: | $ 1,167,154 | $ - | $ 1,167,154 | $ - |
Derivative Instruments: | | | | |
Liabilities | | | | |
Futures Contracts | $ (9) | $ (9) | $ - | $ - |
Value of Derivative Instruments |
The following table is a summary of the Fund's value of derivative instruments by risk exposure as of February 29, 2012. For additional information on derivative instruments, please refer to the Derivative Instruments section in the accompanying Notes to Financial Statements. |
Risk Exposure /
Derivative Type
(Amounts in thousands) | Value |
| Asset | Liability |
Interest Rate Risk | | |
Futures Contracts (a) | $ - | $ (9) |
Total Value of Derivatives | $ - | $ (9) |
(a) Reflects cumulative appreciation/(depreciation) on futures contracts as disclosed on the Schedule of Investments. Only the period end variation margin is separately disclosed on the Statement of Assets and Liabilities. |
See accompanying notes which are an integral part of the financial statements.
Semiannual Report
Statement of Assets and Liabilities
Amounts in thousands (except per-share amount) | February 29, 2012 (Unaudited) |
| | |
Assets | | |
Investment in securities, at value (including repurchase agreements of $22,596) - See accompanying schedule: Unaffiliated issuers (cost $1,136,103) | | $ 1,167,154 |
Receivable for investments sold | | 17,444 |
Receivable for fund shares sold | | 905 |
Interest receivable | | 2,915 |
Total assets | | 1,188,418 |
| | |
Liabilities | | |
Payable for investments purchased | $ 24,702 | |
Payable for fund shares redeemed | 997 | |
Distributions payable | 99 | |
Accrued management fee | 308 | |
Payable for daily variation margin on futures contracts | 30 | |
Other affiliated payables | 132 | |
Total liabilities | | 26,268 |
| | |
Net Assets | | $ 1,162,150 |
Net Assets consist of: | | |
Paid in capital | | $ 1,123,338 |
Undistributed net investment income | | 108 |
Accumulated undistributed net realized gain (loss) on investments | | 7,662 |
Net unrealized appreciation (depreciation) on investments | | 31,042 |
Net Assets, for 106,010 shares outstanding | | $ 1,162,150 |
Net Asset Value, offering price and redemption price per share ($1,162,150 ÷ 106,010 shares) | | $ 10.96 |
See accompanying notes which are an integral part of the financial statements.
Semiannual Report
Statement of Operations
Amounts in thousands | Six months ended February 29, 2012 (Unaudited) |
| | |
Investment Income | | |
Interest | | $ 9,763 |
| | |
Expenses | | |
Management fee | $ 1,879 | |
Transfer agent fees | 594 | |
Fund wide operations fee | 196 | |
Independent trustees' compensation | 2 | |
Miscellaneous | 2 | |
Total expenses before reductions | 2,673 | |
Expense reductions | (2) | 2,671 |
Net investment income (loss) | | 7,092 |
Realized and Unrealized Gain (Loss) Net realized gain (loss) on: | | |
Investment securities: | | |
Unaffiliated issuers | 11,161 | |
Futures contracts | (112) | |
Total net realized gain (loss) | | 11,049 |
Change in net unrealized appreciation (depreciation) on: Investment securities | (7,092) | |
Futures contracts | (14) | |
Delayed delivery commitments | (48) | |
Total change in net unrealized appreciation (depreciation) | | (7,154) |
Net gain (loss) | | 3,895 |
Net increase (decrease) in net assets resulting from operations | | $ 10,987 |
See accompanying notes which are an integral part of the financial statements.
Semiannual Report
Financial Statements - continued
Statement of Changes in Net Assets
Amounts in thousands | Six months ended February 29, 2012 (Unaudited) | One month ended
August 31,
2011 | Year ended
July 31,
2011 |
Increase (Decrease) in Net Assets | | | |
Operations | | | |
Net investment income (loss) | $ 7,092 | $ 1,396 | $ 20,392 |
Net realized gain (loss) | 11,049 | 6,823 | 29,406 |
Change in net unrealized appreciation (depreciation) | (7,154) | 8,663 | (13,873) |
Net increase (decrease) in net assets resulting
from operations | 10,987 | 16,882 | 35,925 |
Distributions to shareholders from net investment income | (7,413) | (1,500) | (20,486) |
Distributions to shareholders from net realized gain | (20,299) | - | (35,778) |
Total distributions | (27,712) | (1,500) | (56,264) |
Share transactions
Proceeds from sales of shares | 83,977 | 26,596 | 190,884 |
Reinvestment of distributions | 25,260 | 1,354 | 51,734 |
Cost of shares redeemed | (136,445) | (28,700) | (448,298) |
Net increase (decrease) in net assets resulting from share transactions | (27,208) | (750) | (205,680) |
Total increase (decrease) in net assets | (43,933) | 14,632 | (226,019) |
| | | |
Net Assets | | | |
Beginning of period | 1,206,083 | 1,191,451 | 1,417,470 |
End of period (including undistributed net investment income of $108 and undistributed net investment income of $429 and undistributed net investment income of $534, respectively) | $ 1,162,150 | $ 1,206,083 | $ 1,191,451 |
Other Information Shares | | | |
Sold | 7,634 | 2,397 | 17,484 |
Issued in reinvestment of distributions | 2,294 | 122 | 4,756 |
Redeemed | (12,414) | (2,589) | (41,337) |
Net increase (decrease) | (2,486) | (70) | (19,097) |
See accompanying notes which are an integral part of the financial statements.
Semiannual Report
Financial Highlights
| Six months ended
February 29, 2012 |
Years ended August 31, |
| (Unaudited) | 2011E | 2011G | 2010G | 2009G | 2008G | 2007G |
Selected Per-Share Data | | | | | | |
Net asset value, beginning of period | $ 11.12 | $ 10.97 | $ 11.10 | $ 10.80 | $ 10.36 | $ 9.97 | $ 9.92 |
Income from Investment Operations | | | | | | | |
Net investment income (loss)D | .066 | .013 | .171 | .214 | .278 | .398 | .435 |
Net realized and unrealized gain (loss) | .031 | .151 | .155 | .423 | .439 | .413 | .067 |
Total from investment operations | .097 | .164 | .326 | .637 | .717 | .811 | .502 |
Distributions from net investment income | (.069) | (.014) | (.172) | (.212) | (.277) | (.421) | (.452) |
Distributions from net realized gain | (.188) | - | (.284) | (.125) | - | - | - |
Total distributions | (.257) | (.014) | (.456) | (.337) | (.277) | (.421) | (.452) |
Net asset value, end of period | $ 10.96 | $ 11.12 | $ 10.97 | $ 11.10 | $ 10.80 | $ 10.36 | $ 9.97 |
Total ReturnB,C | .88% | 1.49% | 3.04% | 6.02% | 6.98% | 8.24% | 5.14% |
Ratios to Average Net AssetsF | | | | | | |
Expenses before
reductions | .45%A | .45%A | .45% | .45% | .45% | .45% | .45% |
Expenses net of fee waivers, if any | .45%A | .45%A | .45% | .45% | .45% | .45% | .45% |
Expenses net of all
reductions | .45%A | .45%A | .45% | .45% | .45% | .45% | .45% |
Net investment income (loss) | 1.20%A | 1.37%A | 1.57% | 1.98% | 2.59% | 3.86% | 4.36% |
Supplemental Data | | | | | | | |
Net assets, end of period (in millions) | $ 1,162 | $ 1,206 | $ 1,191 | $ 1,417 | $ 1,563 | $ 974 | $ 700 |
Portfolio turnover rate | 182%A | 258%A | 339% | 227% | 305% | 318% | 121% |
A Annualized
B Total returns for periods of less than one year are not annualized.
C Total returns would have been lower if certain expenses had not been reduced during the applicable periods shown.
D Calculated based on average shares outstanding during the period.
E For the one month period ended August 31. The Fund changed its fiscal year end from July 31 to August 31, effective August 31, 2011.
F Expense ratios reflect operating expenses of the Fund. Expenses before reductions do not reflect amounts reimbursed by the investment adviser or reductions from expense offset arrangements and do not represent the amount paid by the Fund during periods when reimbursements or reductions occur. Expenses net of fee waivers reflect expenses after reimbursement by the investment adviser but prior to reductions from expense offset arrangements. Expenses net of all reductions represent the net expenses paid by the Fund.
G For the period ended July 31.
See accompanying notes which are an integral part of the financial statements.
Semiannual Report
Notes to Financial Statements
For the period ended February 29, 2012 (Unaudited)
(Amounts in thousands except percentages)
1. Organization.
Fidelity® Intermediate Government Income Fund (the Fund) is a fund of Fidelity Income Fund (the Trust) and is authorized to issue an unlimited number of shares. The Trust is registered under the Investment Company Act of 1940, as amended (the 1940 Act), as an open-end management investment company organized as a Massachusetts business trust.
2. Significant Accounting Policies.
The financial statements have been prepared in conformity with accounting principles generally accepted in the United States of America (GAAP), which require management to make certain estimates and assumptions at the date of the financial statements. Actual results could differ from those estimates. Subsequent events, if any, through the date that the financial statements were issued have been evaluated in the preparation of the financial statements. The following summarizes the significant accounting policies of the Fund:
Security Valuation. Investments are valued as of 4:00 p.m. Eastern time on the last calendar day of the period. The Fund uses independent pricing services approved by the Board of Trustees to value its investments. When current market prices or quotations are not readily available or reliable, valuations may be determined in good faith in accordance with procedures adopted by the Board of Trustees. Factors used in determining value may include market or security specific events, changes in interest rates and credit quality. The frequency with which these procedures are used cannot be predicted and they may be utilized to a significant extent. The value used for net asset value (NAV) calculation under these procedures may differ from published prices for the same securities.
The Fund categorizes the inputs to valuation techniques used to value its investments into a disclosure hierarchy consisting of three levels as shown below:
Level 1 - quoted prices in active markets for identical investments
Level 2 - other significant observable inputs (including quoted prices for similar investments, interest rates, prepayment speeds, etc.)
Level 3 - unobservable inputs (including the Fund's own assumptions based on the best information available)
Changes in valuation techniques may result in transfers in or out of an assigned level within the disclosure hierarchy. The aggregate value of investments by input level, as of February 29, 2012 for the Fund's investments, is included at the end of the Fund's Schedule of Investments. Valuation techniques used to value the Fund's investments by major category are as follows:
Semiannual Report
Notes to Financial Statements (Unaudited) - continued
(Amounts in thousands except percentages)
2. Significant Accounting Policies - continued
Security Valuation - continued
Debt securities, including restricted securities, are valued based on evaluated prices received from independent pricing services or from dealers who make markets in such securities. For foreign government and government agency obligations and U.S. government and government agency obligations, pricing services utilize matrix pricing which considers yield or price of bonds of comparable quality, coupon, maturity and type as well as dealer supplied prices and are generally categorized as Level 2 in the hierarchy. For collateralized mortgage obligations, commercial mortgage securities and U.S. government agency mortgage securities, pricing services utilize matrix pricing which considers prepayment speed assumptions, attributes of the collateral, yield or price of bonds of comparable quality, coupon, maturity and type as well as dealer supplied prices and, accordingly, such securities are generally categorized as Level 2 in the hierarchy. When independent prices are unavailable or unreliable, debt securities may be valued utilizing pricing matrices which consider similar factors that would be used by independent pricing services. These are generally categorized as Level 2 in the hierarchy but may be Level 3 depending on the circumstances.
Futures contracts are valued at the settlement price established each day by the board of trade or exchange on which they are traded and are categorized as Level 1 in the hierarchy. Short-term securities with remaining maturities of sixty days or less may be valued at amortized cost, which approximates fair value, and are categorized as Level 2 in the hierarchy.
New Accounting Pronouncements. In May 2011, the Financial Accounting Standards Board issued Accounting Standard Update No. 2011-04, Fair Value Measurement (Topic 820) - Amendments to Achieve Common Fair Value Measurement and Disclosure Requirements in U.S. GAAP and IFRSs. The update is effective during interim and annual periods beginning after December 15, 2011 and will result in additional disclosure for transfers between levels as well as expanded disclosure for securities categorized as Level 3 under the fair value hierarchy.
In December 2011, the Financial Accounting Standards Board issued Accounting Standard Update No. 2011-11, Disclosures about Offsetting Assets and Liabilities. The update creates new disclosure requirements requiring entities to disclose both gross and net information for derivatives and other financial instruments that are either offset in the Statement of Assets and Liabilities or subject to an enforceable master netting arrangement or similar agreement. The disclosure requirements are effective for interim and annual reporting periods beginning on or after January 1, 2013. Management is currently evaluating the impact of the update's adoption on the Fund's financial statement disclosures.
Semiannual Report
2. Significant Accounting Policies - continued
Investment Transactions and Income. For financial reporting purposes, the Fund's investment holdings and NAV include trades executed through the end of the last business day of the period. The NAV per share for processing shareholder transactions is calculated as of the close of business of the New York Stock Exchange (NYSE), normally 4:00 p.m. Eastern time and includes trades executed through the end of the prior business day. Gains and losses on securities sold are determined on the basis of identified cost. Interest income is accrued as earned. Interest income includes coupon interest and amortization of premium and accretion of discount on debt securities. The principal amount on inflation-indexed securities is periodically adjusted to the rate of inflation and interest is accrued based on the principal amount. The adjustments to principal due to inflation are reflected as increases or decreases to interest income even though principal is not received until maturity.
Expenses. Expenses directly attributable to a fund are charged to that fund. Expenses attributable to more than one fund are allocated among the respective funds on the basis of relative net assets or other appropriate methods. Expense estimates are accrued in the period to which they relate and adjustments are made when actual amounts are known.
Income Tax Information and Distributions to Shareholders. Each year, the Fund intends to qualify as a regulated investment company under Subchapter M of the Internal Revenue Code, including distributing substantially all of its taxable income and realized gains. As a result, no provision for income taxes is required. The Fund files a U.S. federal tax return, in addition to state and local tax returns as required. A fund's federal income tax returns are subject to examination by the Internal Revenue Service (IRS) for a period of three fiscal years after they are filed. State and local tax returns may be subject to examination for an additional fiscal year depending on the jurisdiction.
Dividends are declared and recorded daily and paid monthly from net investment income. Distributions from realized gains, if any, are declared and recorded on the ex-dividend date. Income and capital gain distributions are determined in accordance with income tax regulations, which may differ from GAAP.
Capital accounts within the financial statements are adjusted for permanent book-tax differences. These adjustments have no impact on net assets or the results of operations. Temporary book-tax differences will reverse in a subsequent period.
Book-tax differences are primarily due to futures transactions, market discount, deferred trustees compensation and loss deferred due to wash sales.
The federal tax cost of investment securities and unrealized appreciation (depreciation) as of period end were as follows:
Semiannual Report
Notes to Financial Statements (Unaudited) - continued
(Amounts in thousands except percentages)
2. Significant Accounting Policies - continued
Income Tax Information and Distributions to Shareholders - continued
Gross unrealized appreciation | $ 32,587 |
Gross unrealized depreciation | (1,385) |
Net unrealized appreciation (depreciation) on securities and other investments | $ 31,202 |
| |
Tax cost | $ 1,135,952 |
3. Operating Policies.
Repurchase Agreements. Fidelity Management & Research Company (FMR) has received an Exemptive Order from the Securities and Exchange Commission (the SEC) which permits the Fund and other affiliated entities of FMR to transfer uninvested cash balances into joint trading accounts which are then invested in repurchase agreements. The Fund may also invest directly with institutions in repurchase agreements. Repurchase agreements are collateralized by government or non-government securities. Upon settlement date, collateral is held in segregated accounts with custodian banks and may be obtained in the event of a default of the counterparty. The Fund monitors, on a daily basis, the value of the collateral to ensure it is at least equal to the principal amount of the repurchase agreement (including accrued interest). In the event of a default by the counterparty, realization of the collateral proceeds could be delayed, during which time the value of the collateral may decline.
4. Derivative Instruments.
Risk Exposures and the Use of Derivative Instruments. The Fund used derivative instruments (derivatives), including futures contracts, in order to meet its investment objectives. The strategy is to use derivatives to increase returns and to manage exposure to certain risks as defined below. The success of any strategy involving derivatives depends on analysis of numerous economic factors, and if the strategies for investment do not work as intended, the Fund may not achieve its objectives.
The Fund's use of derivatives increased or decreased its exposure to the following risk:
Interest Rate Risk | Interest rate risk relates to the fluctuations in the value of interest-bearing securities due to changes in the prevailing levels of market interest rates. |
The Fund is also exposed to additional risks from investing in derivatives, such as liquidity risk and counterparty credit risk. Liquidity risk is the risk that the Fund will be unable to close out the derivative in the open market in a timely manner. Counterparty
Semiannual Report
4. Derivative Instruments - continued
Risk Exposures and the Use of Derivative Instruments - continued
credit risk is the risk that the counterparty will not be able to fulfill its obligation to the Fund. Counterparty credit risk related to exchange-traded futures contracts is minimal because of the protection provided by the exchange on which they trade. Derivatives involve, to varying degrees, risk of loss in excess of the amounts recognized in the Statement of Assets and Liabilities.
Futures Contracts. A futures contract is an agreement between two parties to buy or sell a specified underlying instrument for a fixed price at a specified future date. The Fund used futures contracts to manage its exposure to the bond market, and to fluctuations in interest rates.
Upon entering into a futures contract, a fund is required to deposit either cash or securities (initial margin) with a clearing broker in an amount equal to a certain percentage of the face value of the contract. Futures contracts are marked-to-market daily and subsequent payments (variation margin) are made or received by a fund depending on the daily fluctuations in the value of the futures contracts and are recorded as unrealized appreciation or (depreciation). This receivable and/or payable is included in daily variation margin on futures contracts in the Statement of Assets and Liabilities. Realized gain or (loss) is recorded upon the expiration or closing of a futures contract.
The underlying face amount at value of open futures contracts at period end is shown in the Schedule of Investments under the caption "Futures Contracts." This amount reflects each contract's exposure to the underlying instrument at period end and is representative of activity for the period. Securities deposited to meet initial margin requirements are identified in the Schedule of Investments.
During the period the Fund recognized net realized gain (loss) of ($112) and a change in net unrealized appreciation (depreciation) of ($14) related to its investment in futures contracts. These amounts are included in the Statement of Operations.
5. Purchases and Sales of Investments.
Purchases and sales of securities, other than short-term securities and U.S. government securities, aggregated $- and $1,051, respectively.
6. Fees and Other Transactions with Affiliates.
Management Fee. FMR and its affiliates provide the Fund with investment management related services for which the Fund pays a monthly management fee. The management fee is the sum of an individual fund fee rate that is based on an annual rate of .20% of the Fund's average net assets and an annualized group fee rate that averaged .12%
Semiannual Report
Notes to Financial Statements (Unaudited) - continued
(Amounts in thousands except percentages)
6. Fees and Other Transactions with Affiliates - continued
Management Fee - continued
during the period. The group fee rate is based upon the average net assets of all the mutual funds advised by FMR. The group fee rate decreases as assets under management increase and increases as assets under management decrease. For the period, the total annualized management fee rate was .32% of the Fund's average net assets.
Transfer Agent Fees. Fidelity Investments Institutional Operations Company, Inc. (FIIOC), an affiliate of FMR, is the Fund's transfer, dividend disbursing and shareholder servicing agent. FIIOC receives an asset-based fee of .10% of the Fund's average net assets. FIIOC pays for typesetting, printing and mailing of shareholder reports, except proxy statements.
Fund Wide Operations Fee. Pursuant to the Fund Wide Operations and Expense Agreement (FWOE), FMR has agreed to provide for fund level expenses (which do not include transfer agent, compensation of the independent Trustees, interest (including commitment fees), taxes or extraordinary expenses, if any) in return for a FWOE fee equal to .35% less the total amount of the management fee. The FWOE paid by the Fund is reduced by an amount equal to the fees and expenses paid to the independent Trustees. For the period, the FWOE fee was equivalent to an annualized rate of .03% of average net assets.
7. Committed Line of Credit.
The Fund participates with other funds managed by FMR or an affiliate in a $4.0 billion credit facility (the "line of credit") to be utilized for temporary or emergency purposes to fund shareholder redemptions or for other short-term liquidity purposes. The Fund has agreed to pay commitment fees on its pro-rata portion of the line of credit, which amounted to $2 and is reflected in Miscellaneous expenses on the Statement of Operations. During the period, there were no borrowings on this line of credit.
8. Security Lending.
The Fund lends portfolio securities from time to time in order to earn additional income. On the settlement date of the loan, the Fund receives collateral (in the form of U.S. Treasury obligations, letters of credit and/or cash) against the loaned securities and maintains collateral in an amount not less than 100% of the market value of the loaned securities during the period of the loan. The market value of the loaned securities is determined at the close of business of the Fund and any additional required collateral is delivered to the Fund on the next business day. If the borrower defaults on its obligation to return the securities loaned because of insolvency or other reasons, a fund could experience delays and costs in recovering the securities loaned or in gaining access to
Semiannual Report
8. Security Lending - continued
the collateral. Any cash collateral received is maintained at the Fund's custodian and/or invested in cash equivalents. At period end, there were no security loans outstanding. Security lending income represents the income earned on investing cash collateral, less rebates paid to borrowers, plus any premium payments received for lending certain types of securities. Security lending income is presented in the Statement of Operations as a component of interest income. Total security lending income during the period amounted to $13.
9. Expense Reductions.
Through arrangements with the Fund's custodian, credits realized as a result of uninvested cash balances were used to reduce the Fund's expenses. During the period, these credits reduced the Fund's custody expenses by $2.
10. Other.
The Fund's organizational documents provide former and current trustees and officers with a limited indemnification against liabilities arising in connection with the performance of their duties to the Fund. In the normal course of business, the Fund may also enter into contracts that provide general indemnifications. The Fund's maximum exposure under these arrangements is unknown as this would be dependent on future claims that may be made against the Fund. The risk of material loss from such claims is considered remote.
Semiannual Report
Board Approval of Investment Advisory Contracts and Management Fees
Fidelity Intermediate Government Income Fund
Each year, the Board of Trustees, including the Independent Trustees (together, the Board), votes on the renewal of the management contract and sub-advisory agreements (together, the Advisory Contracts) for the fund. The Board, assisted by the advice of fund counsel and Independent Trustees' counsel, requests and considers a broad range of information relevant to the renewal of the Advisory Contracts throughout the year.
The Board meets regularly and considers at each of its meetings factors that are relevant to its annual consideration of the renewal of the fund's Advisory Contracts, including the services and support provided to the fund and its shareholders. The Board has established three standing committees, Operations, Audit, and Nominating and Governance, each composed of Independent Trustees with varying backgrounds, to which the Board has assigned specific subject matter responsibilities in order to enhance effective decision-making by the Board. The Operations Committee, of which all of the Independent Trustees are members, meets regularly throughout the year and, among other matters, considers matters specifically related to the annual consideration of the renewal of the fund's Advisory Contracts. The Board, acting directly and through its Committees, requests and receives information concerning the annual consideration of the renewal of the fund's Advisory Contracts. The Board also meets as needed to consider matters specifically related to the Board's annual consideration of the renewal of Advisory Contracts. Members of the Board may also meet with trustees of other Fidelity funds through ad hoc joint committees to discuss certain matters relevant to the Fidelity funds.
At its September 2011 meeting, the Board of Trustees, including the Independent Trustees, unanimously determined to renew the fund's Advisory Contracts. In reaching its determination, the Board considered all factors it believed relevant, including (i) the nature, extent, and quality of the services to be provided to the fund and its shareholders (including the investment performance of the fund); (ii) the competitiveness of the fund's management fee and total expense ratio; (iii) the total costs of the services to be provided by and the profits to be realized by Fidelity from its relationship with the fund; (iv) the extent to which economies of scale would be realized as the fund grows; and (v) whether fee levels reflect these economies of scale, if any, for the benefit of fund shareholders.
In considering whether to renew the Advisory Contracts for the fund, the Board reached a determination, with the assistance of fund counsel and Independent Trustees' counsel and through the exercise of its business judgment, that the renewal of the Advisory Contracts is in the best interests of the fund and its shareholders and that the compensation payable under the Advisory Contracts is fair and reasonable. The Board's decision to renew the Advisory Contracts was not based on any single factor, but rather was based on a comprehensive consideration of all the information provided to the Board at its meetings throughout the year. The Board, in reaching its determination to renew the Advisory Contracts, is aware that shareholders in the fund have a broad range of investment choices available to them, including a wide choice among mutual funds offered by Fidelity's competitors, and that the fund's shareholders, who have the opportunity to review and weigh the disclosure provided by the fund in its prospectus and other public disclosures, have chosen to invest in this fund, managed by Fidelity.
Semiannual Report
Board Approval of Investment Advisory Contracts and
Management Fees - continued
Nature, Extent, and Quality of Services Provided. The Board considered the staffing within the investment adviser, FMR, and the sub-advisers (together, the Investment Advisers), including the backgrounds of the fund's investment personnel and the fund's investment objective and discipline. The Independent Trustees also had discussions with senior management of Fidelity's investment operations and investment groups. The Board considered the structure of the portfolio manager compensation program and whether this structure provides appropriate incentives to act in the best interests of the fund.
Resources Dedicated to Investment Management and Support Services. The Board reviewed the general qualifications and capabilities of the Investment Advisers' investment staff, including its size, education, experience, and resources, as well as the Investment Advisers' approach to recruiting, managing, and compensating investment personnel. The Board also noted that FMR has devoted increased resources to non-U.S. offices. The Board noted that Fidelity's analysts have extensive resources, tools and capabilities which allow them to conduct sophisticated quantitative and fundamental analysis, as well as credit analysis of issuers, counterparties and enhancers. The Board also believes that Fidelity's investment professionals have sufficient access to global information and data so as to provide competitive investment results over time, and that those professionals also have access to sophisticated tools which permit them to assess portfolio construction and risk and performance attribution characteristics continuously, as well as to transmit new information and research conclusions rapidly around the world. Additionally, in its deliberations, the Board considered the Investment Advisers' trading capabilities and resources which are an integral part of the investment management process.
Shareholder and Administrative Services. The Board considered (i) the nature, extent, quality, and cost of advisory, administrative, and shareholder services performed by the Investment Advisers and their affiliates under the Advisory Contracts and under separate agreements covering transfer agency, pricing and bookkeeping, and securities lending services for the fund; (ii) the nature and extent of the investment adviser's supervision of third party service providers, principally custodians and subcustodians; and (iii) the resources devoted to, and the record of compliance with, the fund's compliance policies and procedures.
The Board noted that the growth of fund assets over time across the complex allows Fidelity to reinvest in the development of services designed to enhance the value or convenience of the Fidelity funds as investment vehicles. These services include 24-hour access to account information and market information through telephone representatives and over the Internet, investor education materials and asset allocation tools, and the expanded availability of Fidelity Investor Centers, with 35 new branches opening since 2010.
Semiannual Report
Investment in a Large Fund Family. The Board considered the benefits to shareholders of investing in a Fidelity fund, including the benefits of investing in a fund that is part of a large family of funds offering a variety of investment disciplines and providing a large variety of mutual fund investor services. The Board noted that Fidelity had taken, or had made recommendations that resulted in the Fidelity funds taking, a number of actions over the previous year that benefited particular funds, including (i) continuing to dedicate additional resources to investment research and support of the senior management team that oversees asset management; (ii) rationalizing product lines through the mergers of six funds into other funds; (iii) continuing to migrate the Freedom Funds to dedicated lower cost underlying funds; (iv) obtaining shareholder approval to broaden the investment strategies for Fidelity Consumer Finance Portfolio, Fidelity Emerging Asia Fund, and Fidelity Environment and Alternative Energy Portfolio; (v) contractually agreeing to reduce the management fees and impose other expense limitations on Spartan 500 Index Fund and U.S. Bond Index Fund in connection with launching new institutional classes of these funds; (vi) changing the name, primary and supplemental benchmarks, and investment policies of Fidelity Global Strategies Fund to support the fund's flexible investment mandate and global orientation; and (vii) reducing the transfer agency account fee rates on certain accounts.
Investment Performance. The Board considered whether the fund has operated in accordance with its investment objective, as well as its record of compliance with its investment restrictions. It also reviewed the fund's absolute investment performance, as well as the fund's relative investment performance measured over multiple periods against (i) a broad-based securities market index, and (ii) a peer group of mutual funds deemed appropriate by Fidelity and reviewed by the Board. The following charts considered by the Board show, over the one-, three-, and five-year periods ended December 31, 2010, the fund's cumulative total returns, the cumulative total returns of a broad-based securities market index ("benchmark"), and a range of cumulative total returns of a peer group of mutual funds identified by Lipper Inc. as having an investment objective similar to that of the fund. The box within each chart shows the 25th percentile return (bottom of box) and the 75th percentile return (top of box) of the peer group. Returns shown above the box are in the first quartile and returns shown below the box are in the fourth quartile. The percentage beaten number noted below each chart corresponds to the percentile box and represents the percentage of funds in the peer group whose performance was equal to or lower than that of the fund.
Semiannual Report
Board Approval of Investment Advisory Contracts and
Management Fees - continued
Fidelity Intermediate Government Income Fund
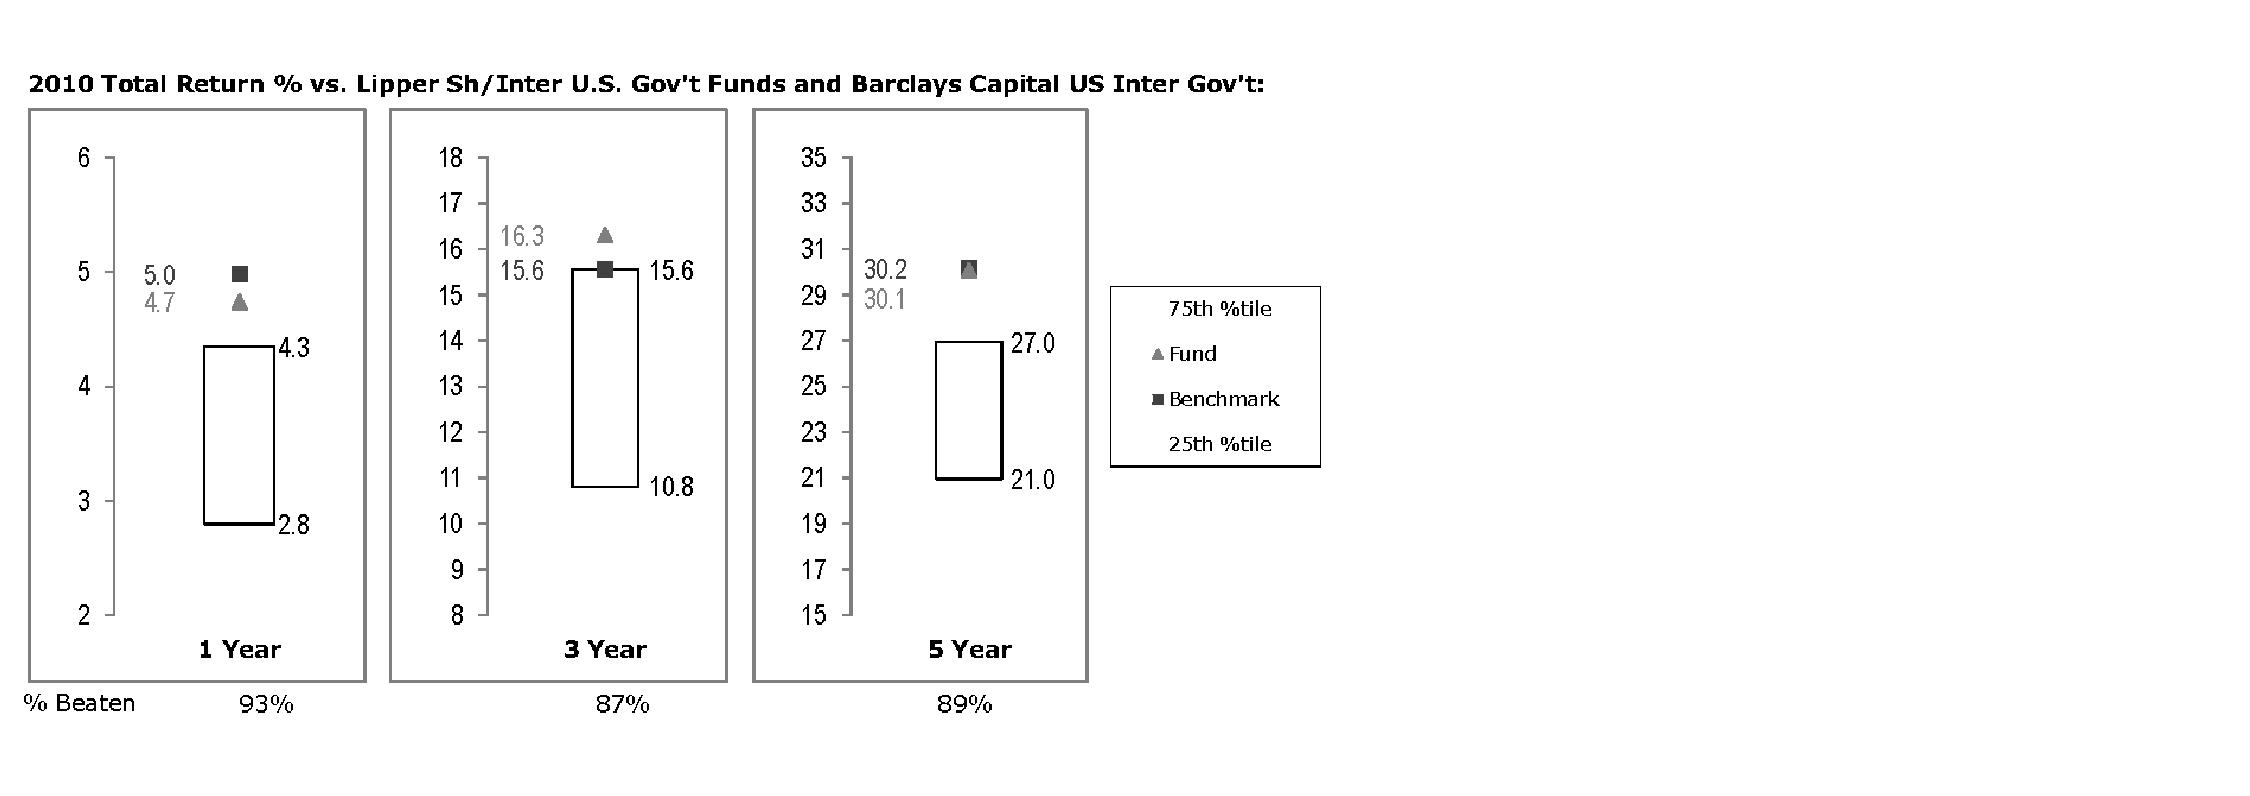
The Board reviewed the fund's relative investment performance against its peer group and noted that the performance of the fund was in the first quartile for all the periods shown. The Board also noted that the investment performance of the fund was lower than its benchmark for the one- and five year periods, although the fund's three-year cumulative total return compared favorably to its benchmark. The Board also reviewed the fund's performance since inception as well as performance in the current year.
Based on its review, the Board concluded that the nature, extent, and quality of services provided to the fund under the Advisory Contracts should benefit the fund's shareholders.
Competitiveness of Management Fee and Total Expense Ratio. The Board considered the fund's management fee and total expense ratio compared to "mapped groups" of competitive funds and classes. Fidelity creates "mapped groups" by combining similar Lipper investment objective categories that have comparable management fee characteristics. Combining Lipper investment objective categories aids the Board's management fee and total expense ratio comparisons by broadening the competitive group used for comparison and by reducing the number of universes to which various Fidelity funds are compared.
Management Fee. The Board considered two proprietary management fee comparisons for the 12-month periods shown in the chart below. The group of Lipper funds used by the Board for management fee comparisons is referred to below as the "Total Mapped Group" and, for the reasons explained above, is broader than the Lipper peer group used by the Board for performance comparisons. The Total Mapped Group comparison focuses on a fund's standing relative to the total universe of comparable funds available to investors in terms of gross management fees before expense reimbursements or caps. "TMG %" represents the percentage of funds in the Total Mapped Group that had management fees that were lower than the fund's. For example, a TMG % of 12% means that 88% of the funds in the Total Mapped Group had higher management fees than the fund. The "Asset-Size Peer Group" (ASPG) comparison focuses on a fund's standing relative to non-Fidelity funds similar in size to the fund within the Total Mapped Group. The ASPG represents at least 15% of the funds in the Total Mapped Group with comparable asset size and management fee characteristics, subject to a minimum of 50 funds (or all funds in the Total Mapped Group if fewer than 50). Additional information, such as the ASPG quartile in which the fund's management fee ranked, is also included in the chart and considered by the Board.
Semiannual Report
Fidelity Intermediate Government Income Fund
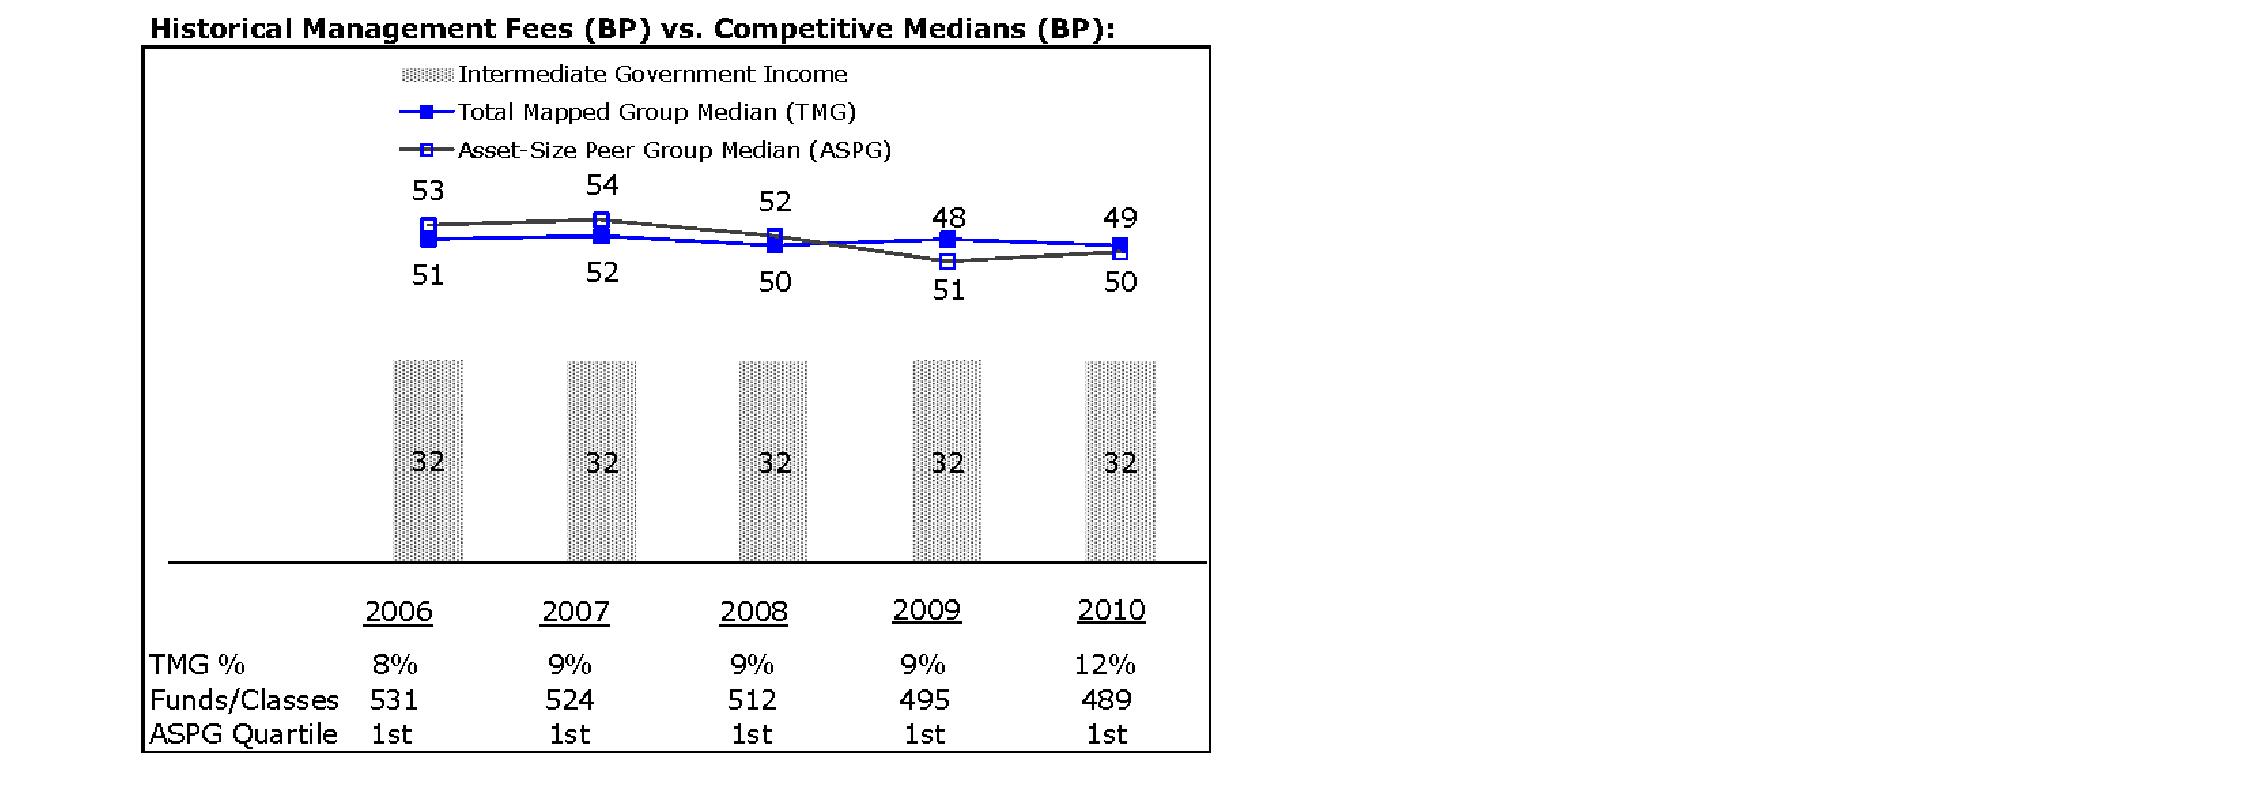
The Board noted that the fund's management fee ranked below the median of its Total Mapped Group and below the median of its ASPG for 2010.
Based on its review, the Board concluded that the fund's management fee is fair and reasonable in light of the services that the fund receives and the other factors considered.
Total Expense Ratio. In its review of the fund's total expense ratio, the Board considered the fund's management fee as well as other fund expenses, such as transfer agent fees, pricing and bookkeeping fees, and custodial, legal, and audit fees. The Board also noted the effects of any waivers and reimbursements on fees and expenses. As part of its review, the Board also considered the current and historical total expense ratios of the fund compared to competitive fund median expenses. The fund is compared to those funds and classes in the Total Mapped Group (used by the Board for management fee comparisons) that have a similar sales load structure.
Semiannual Report
Board Approval of Investment Advisory Contracts and
Management Fees - continued
The Board also considered that the current contractual arrangements for the fund (i) have the effect of setting the total "fund-level" expenses (including, among certain other expenses, the management fee) at 35 basis points, (ii) limit the "class-level" transfer agent fee to 10 basis points, and (iii) limit the fund's total expenses to 45 basis points. The fees and expenses payable under these contractual arrangements may not be increased without Board and shareholder approval.
The Board noted that the fund's total expense ratio ranked below its competitive median for 2010.
The Board recognized that the fund's management contract incorporates a "group fee" structure, which provides for lower group fee rates as total fund assets under FMR's management increase, and for higher group fee rates as total fund assets under FMR's management decrease. FMR calculates the group fee rates based on a tiered asset "breakpoint" schedule that varies based on asset class. The Board noted, however, that because the current contractual arrangements set the fund's total "fund-level" expenses at 35 basis points, increases or decreases in the management fee due to changes in the group fee rate will not impact the total expense ratio.
Fees Charged to Other Fidelity Clients. The Board also considered Fidelity fee structures and other information with respect to clients of FMR and its affiliates, such as other mutual funds advised or subadvised by FMR or its affiliates, pension plan clients, and other institutional clients. In March 2010, the Board created an ad hoc joint committee with the board of other Fidelity funds (the Committee) to review and compare Fidelity's institutional investment advisory business with its business of providing services to the Fidelity funds, including the differences in services provided, fees charged, and costs incurred, as well as competition in their respective marketplaces.
Based on its review of total expense ratios and fees charged to other Fidelity clients, the Board concluded that the fund's total expense ratio was reasonable in light of the services that the fund and its shareholders receive and the other factors considered, including the findings of the Committee.
Costs of the Services and Profitability. The Board considered the revenues earned and the expenses incurred by Fidelity in conducting the business of developing, marketing, distributing, managing, administering and servicing the fund and its shareholders. The Board also considered the level of Fidelity's profits in respect of all the Fidelity funds.
On an annual basis, FMR presents to the Board Fidelity's profitability for the fund. Fidelity calculates the profitability for each fund, as well as aggregate profitability for groups of Fidelity funds and all Fidelity funds, using a series of detailed revenue and cost allocation methodologies which originate with the books and records of Fidelity on which Fidelity's audited financial statements are based. The Audit Committee of the Board reviews any significant changes from the prior year's methodologies.
Semiannual Report
PricewaterhouseCoopers LLP (PwC), independent registered public accounting firm and auditor to Fidelity and certain Fidelity funds, has been engaged annually by the Board as part of the Board's assessment of Fidelity's profitability analysis. PwC's engagement includes the review and assessment of Fidelity's methodologies used in determining the revenues and expenses attributable to Fidelity's mutual fund business, and completion of agreed-upon procedures surrounding the mathematical accuracy of fund profitability and its conformity to allocation methodologies. After considering PwC's reports issued under the engagement and information provided by Fidelity, the Board concluded that while other allocation methods may also be reasonable, Fidelity's profitability methodologies are reasonable in all material respects.
The Board also reviewed Fidelity's non-fund businesses and fall-out benefits related to the mutual fund business as well as cases where Fidelity's affiliates may benefit from or be related to the fund's business.
The Board considered the costs of the services provided by and the profits realized by Fidelity in connection with the operation of the fund and was satisfied that the profitability was not excessive in the circumstances.
Economies of Scale. The Board considered whether there have been economies of scale in respect of the management of the Fidelity funds, whether the Fidelity funds (including the fund) have appropriately benefited from any such economies of scale, and whether there is potential for realization of any further economies of scale. The Board considered the extent to which the fund will benefit from economies of scale through increased services to the fund, through waivers or reimbursements, or through fee or expense reductions. The Board also noted that in 2009, it and the board of other Fidelity funds created an ad hoc committee (the Economies of Scale Committee) to analyze whether FMR attains economies of scale in respect of the management and servicing of the Fidelity funds, whether the Fidelity funds have appropriately benefited from such economies of scale, and whether there is potential for realization of any further economies of scale.
The Board concluded, taking into account the analysis of the Economies of Scale Committee, that any potential economies of scale are being appropriately shared between fund shareholders and Fidelity.
Additional Information Requested by the Board. In order to develop fully the factual basis for consideration of the Fidelity funds' Advisory Contracts, the Board requested and received additional information on certain topics, including: (i) Fidelity's fund profitability methodology, profitability trends for certain funds, and the impact of certain factors on fund profitability results; (ii) portfolio manager changes that have occurred during the past year and the amount of the investment that each portfolio manager has made in the Fidelity fund(s) that he or she manages; (iii) Fidelity's compensation structure for portfolio managers, research analysts, and other key personnel, including its effects on fund profitability, the rationale for the compensation structure, and the extent to which current market conditions have affected retention and recruitment; (iv) the compensation paid to fund sub-advisers on behalf of the Fidelity funds; (v) Fidelity's fee structures and rationale for recommending different fees among different categories of funds and classes, as well as Fidelity's voluntary waiver of its fees to maintain minimum yields for certain money market funds and classes; (vi) the reasons why certain expenses affect various funds and classes differently; (vii) Fidelity's transfer agent fees, expenses, and services and how the benefits of decreased costs and new efficiencies can be shared across all of the Fidelity funds; (viii) the reasons for and consequences of changes to certain product lines compared to competitors; (ix) the allocation of and historical trends in Fidelity's realization of fall-out benefits; and (x) explanations regarding the relative total expense ratios of certain funds and classes, total expense competitive trends, and actions that might be taken by FMR to reduce total expense ratios for certain funds and classes or to achieve further economies of scale.
Semiannual Report
Board Approval of Investment Advisory Contracts and
Management Fees - continued
Based on its evaluation of all of the conclusions noted above, and after considering all factors it believed relevant, the Board ultimately concluded that the advisory fee structures are fair and reasonable, and that the fund's Advisory Contracts should be renewed.
Semiannual Report
Managing Your Investments
Fidelity offers several ways to conveniently manage your personal investments via your telephone or PC. You can access your account information, conduct trades and research your investments 24 hours a day.
By Phone
Fidelity Automated Service Telephone provides a single toll-free number to access account balances, positions, quotes and trading. It's easy to navigate the service, and on your first call, the system will help you create a personal identification number (PIN) for security.
(phone graphic)Fidelity Automated
Service Telephone (FAST®)
1-800-544-5555
Press
1 For mutual fund and brokerage trading.
2 For quotes.*
3 For account balances and holdings.
4 To review orders and mutual
fund activity.
5 To change your PIN.
*0 To speak to a Fidelity representative.
By PC
Fidelity's web site on the Internet provides a wide range of information, including daily financial news, fund performance, interactive planning tools and news about Fidelity products and services.
(computer graphic)Fidelity's Web Site
www.fidelity.com
* When you call the quotes line, please remember that a fund's yield and return will vary and, except for money market funds, share price will also vary. This means that you may have a gain or loss when you sell your shares. There is no assurance that money market funds will be able to maintain a stable $1 share price; an investment in a money market fund is not insured or guaranteed by the U.S. government. Total returns are historical and include changes in share price, reinvestment of dividends and capital gains distributions, and the effects of any sales charges.
Semiannual Report
To Write Fidelity
We'll give your correspondence immediate attention and send you written confirmation upon completion of your request.
(envelope graphic)Making Changes
To Your Account
(such as changing name, address, bank, etc.)
Fidelity Investments
P.O. Box 770001
Cincinnati, OH 45277-0002
(envelope graphic)For Non-Retirement
Accounts
Buying shares
Fidelity Investments
P.O. Box 770001
Cincinnati, OH 45277-0003
Overnight Express
Fidelity Investments
Attn: Distribution Services
100 Crosby Parkway - KC1H
Covington, KY 41015
Selling shares
Fidelity Investments
P.O. Box 770001
Cincinnati, OH 45277-0035
Overnight Express
Fidelity Investments
Attn: Distribution Services
100 Crosby Parkway - KC1H
Covington, KY 41015
General Correspondence
Fidelity Investments
P.O. Box 500
Merrimack, NH 03054-0500
(envelope graphic)For Retirement
Accounts
Buying shares
Fidelity Investments
P.O. Box 770001
Cincinnati, OH 45277-0003
Selling shares
Fidelity Investments
P.O. Box 770001
Cincinnati, OH 45277-0035
Overnight Express
Fidelity Investments
Attn: Distribution Services
100 Crosby Parkway - KC1H
Covington, KY 41015
General Correspondence
Fidelity Investments
P.O. Box 500
Merrimack, NH 03054-0500
Semiannual Report
Investment Adviser
Fidelity Management & Research Company
Boston, MA
Investment Sub-Advisers
Fidelity Management & Research (U.K.) Inc.
Fidelity Investments
Money Management, Inc.
Fidelity Management & Research
(Hong Kong) Limited
Fidelity Management & Research
(Japan) Inc.
General Distributor
Fidelity Distributors Corporation
Boston, MA
Transfer and Service Agents
Fidelity Investments Institutional
Operations Company, Inc.
Boston, MA
Fidelity Service Company, Inc.
Boston, MA
Custodian
The Bank of New York Mellon
New York, NY
The Fidelity Telephone Connection
Mutual Fund 24-Hour Service
Exchanges/Redemptions
and Account Assistance 1-800-544-6666
Product Information 1-800-544-6666
Retirement Accounts 1-800-544-4774
(8 a.m. - 9 p.m.)
TDD Service 1-800-544-0118
for the deaf and hearing impaired
(9 a.m. - 9 p.m. Eastern time)
Fidelity Automated Service
Telephone (FAST®) 1-800-544-5555
Automated line for quickest service
SLM-USAN-0412
1.844595.106
(Fidelity Investment logo)(registered trademark)
Corporate Headquarters
82 Devonshire St., Boston, MA 02109
www.fidelity.com
Fidelity®
Total Bond
Fund
Semiannual Report
February 29, 2012
(Fidelity Cover Art)
Contents
Shareholder Expense Example | (Click Here) | An example of shareholder expenses. |
Investment Changes | (Click Here) | A summary of major shifts in the fund's investments over the past six months. |
Investments | (Click Here) | A complete list of the fund's investments with their market values. |
Financial Statements | (Click Here) | Statements of assets and liabilities, operations, and changes in net assets,
as well as financial highlights. |
Notes | (Click Here) | Notes to the financial statements. |
Report of Independent Registered Public Accounting Firm | (Click Here) | |
Board Approval of Investment Advisory Contracts and Management Fees | (Click Here) | |
To view a fund's proxy voting guidelines and proxy voting record for the 12-month period ended June 30, visit http://www.fidelity.com/proxyvotingresults or visit the Securities and Exchange Commission's (SEC) web site at http://www.sec.gov. You may also call 1-800-544-8544 to request a free copy of the proxy voting guidelines.
Standard & Poor's, S&P and S&P 500 are registered service marks of The McGraw-Hill Companies, Inc. and have been licensed for use by Fidelity Distributors Corporation.
Other third party marks appearing herein are the property of their respective owners.
All other marks appearing herein are registered or unregistered trademarks or service marks of FMR LLC or an affiliated company.
This report and the financial statements contained herein are submitted for the general information of the shareholders of the fund. This report is not authorized for distribution to prospective investors in the fund unless preceded or accompanied by an effective prospectus.
A fund files its complete schedule of portfolio holdings with the SEC for the first and third quarters of each fiscal year on Form N-Q. Forms N-Q are available on the SEC's web site at http://www.sec.gov. A fund's Forms N-Q may be reviewed and copied at the SEC's Public Reference Room in Washington, DC. Information regarding the operation of the SEC's Public Reference Room may be obtained by calling 1-800-SEC-0330. For a complete list of a fund's portfolio holdings, view the most recent holdings listing, semiannual report, or annual report on Fidelity's web site at http://www.fidelity.com, http://www.advisor.fidelity.com, or http://www.401k.com, as applicable.
NOT FDIC INSURED • MAY LOSE VALUE • NO BANK GUARANTEE
Neither the fund nor Fidelity Distributors Corporation is a bank.
Semiannual Report
Shareholder Expense Example
As a shareholder of the Fund, you incur two types of costs: (1) transaction costs, including sales charges (loads) on purchase payments or redemption proceeds, and (2) ongoing costs, including management fees, distribution and/or service (12b-1) fees and other Fund expenses. This Example is intended to help you understand your ongoing costs (in dollars) of investing in the Fund and to compare these costs with the ongoing costs of investing in other mutual funds.
The Example is based on an investment of $1,000 invested at the beginning of the period and held for the entire period (September 1, 2011 to February 29, 2012).
Actual Expenses
The first line of the accompanying table for each class of the Fund provides information about actual account values and actual expenses. You may use the information in this line, together with the amount you invested, to estimate the expenses that you paid over the period. Simply divide your account value by $1,000.00 (for example, an $8,600 account value divided by $1,000.00 = 8.6), then multiply the result by the number in the first line for a class of the Fund under the heading entitled "Expenses Paid During Period" to estimate the expenses you paid on your account during this period. In addition, the Fund, as a shareholder in the underlying Fidelity Central Funds, will indirectly bear its pro-rata share of the fees and expenses incurred by the underlying Fidelity Central Funds. These fees and expenses are not included in the Fund's annualized expense ratio used to calculate the expense estimate in the table below.
Hypothetical Example for Comparison Purposes
The second line of the accompanying table for each class of the Fund provides information about hypothetical account values and hypothetical expenses based on a Class' actual expense ratio and an assumed rate of return of 5% per year before expenses, which is not the Class' actual return. The hypothetical account values and expenses may not be used to estimate the actual ending account balance or expenses you paid for the period. You may use this information to compare the ongoing costs of investing in the Fund and other funds. To do so, compare this 5% hypothetical example with the 5% hypothetical examples that appear in the shareholder reports of the other funds. In addition, the Fund, as a shareholder in the underlying Fidelity Central Funds, will indirectly bear its pro-rata share of the fees and expenses incurred by the underlying Fidelity Central Funds. These fees and expenses are not included in the Fund's annualized expense ratio used to calculate the expense estimate in the table below.
Please note that the expenses shown in the table are meant to highlight your ongoing costs only and do not reflect any transaction costs. Therefore, the second line of the table is useful in comparing ongoing costs only, and will not help you determine the relative total costs of owning different funds. In addition, if these transactional costs were included, your costs would have been higher.
Semiannual Report
Shareholder Expense Example - continued
| Annualized
Expense Ratio | Beginning
Account Value
September 1, 2011 | Ending
Account Value
February 29, 2012 | Expenses Paid
During Period*
September 1, 2011 to
February 29, 2012 |
Class A | .84% | | | |
Actual | | $ 1,000.00 | $ 1,033.70 | $ 4.25 |
HypotheticalA | | $ 1,000.00 | $ 1,020.69 | $ 4.22 |
Class T | .78% | | | |
Actual | | $ 1,000.00 | $ 1,034.10 | $ 3.94 |
HypotheticalA | | $ 1,000.00 | $ 1,020.98 | $ 3.92 |
Class B | 1.51% | | | |
Actual | | $ 1,000.00 | $ 1,030.30 | $ 7.62 |
HypotheticalA | | $ 1,000.00 | $ 1,017.35 | $ 7.57 |
Class C | 1.52% | | | |
Actual | | $ 1,000.00 | $ 1,030.20 | $ 7.67 |
HypotheticalA | | $ 1,000.00 | $ 1,017.30 | $ 7.62 |
Total Bond | .45% | | | |
Actual | | $ 1,000.00 | $ 1,035.70 | $ 2.28 |
HypotheticalA | | $ 1,000.00 | $ 1,022.63 | $ 2.26 |
Institutional Class | .54% | | | |
Actual | | $ 1,000.00 | $ 1,035.30 | $ 2.73 |
HypotheticalA | | $ 1,000.00 | $ 1,022.18 | $ 2.72 |
A 5% return per year before expenses
* Expenses are equal to each Class' annualized expense ratio, multiplied by the average account value over the period, multiplied by 182/366 (to reflect the one-half year period). The fees and expenses of the underlying Fidelity Central Funds in which the Fund invests are not included in the Fund's annualized expense ratio.
Semiannual Report
Investment Changes (Unaudited)
Quality Diversification (% of fund's net assets) |
As of February 29, 2012 | As of August 31, 2011 |
| U.S. Government
and U.S.
Government
Agency
Obligations 59.5% | | | U.S. Government
and U.S.
Government
Agency
Obligations 68.0% | |
 | AAA 5.4% | | | AAA 6.8% | |
 | AA 2.6% | | | AA 2.6% | |
 | A 5.7% | | | A 6.6% | |
| BBB 12.3% | | | BBB 11.3% | |
 | BB and Below 11.0% | | | BB and Below 10.0% | |
 | Not Rated 1.0% | | | Not Rated 0.9% | |
 | Equities 0.2% | | | Equities 0.1% | |
| Short-Term
Investments and
Net Other Assets 2.3% | |  | Short-Term
Investments and
Net Other Assets† (6.3)% | |
We have used ratings from Moody's Investors Service, Inc. Where Moody's® ratings are not available, we have used S&P® ratings. All ratings are as of the date indicated and do not reflect subsequent changes. Securities rated BB or below were rated investment grade at the time of acquisition. The information in the above table is based on the combined investments of the fund and its pro-rata share of the investments of Fidelity's fixed-income central funds. |
Weighted Average Maturity as of February 29, 2012 |
| | 6 months ago |
Years | 6.5 | 6.2 |
This is a weighted average of all the maturities of the securities held in a fund. Weighted Average Maturity (WAM) can be used as a measure of sensitivity to interest rate changes and market changes. Generally, the longer the maturity, the greater the sensitivity to such changes. WAM is based on the dollar-weighted average length of time until principal payments must be paid. Depending on the types of securities held in a fund, certain maturity shortening devices (e.g., demand features, interest rate resets, and call options) may be taken into account when calculating the WAM. |
Duration as of February 29, 2012 |
| | 6 months ago |
Years | 4.6 | 4.3 |
Duration estimates how much a bond fund's price will change with a change in comparable interest rates. If rates rise 1%, for example, a fund with a 5-year duration is likely to lose about 5% of its value. Other factors also can influence a bond fund's performance and share price. Accordingly, a bond fund's actual performance may differ from this example. Duration takes into account any call or put option embedded in the bonds. |
Semiannual Report
Asset Allocation (% of fund's net assets) |
| As of February 29, 2012* | As of August 31, 2011** |
| Corporate Bonds 24.2% | | | Corporate Bonds 23.1% | |
| U.S. Government
and U.S.
Government
Agency
Obligations 59.5% | | | U.S. Government
and U.S.
Government
Agency
Obligations 68.0% | |
| Asset-Backed
Securities 2.0% | | | Asset-Backed
Securities 2.4% | |
| CMOs and Other Mortgage Related Securities 5.8% | | | CMOs and Other Mortgage Related Securities 7.6% | |
| Municipal Bonds 0.3% | | | Municipal Bonds 0.2% | |
| Stocks 0.2% | | | Stocks 0.1% | |
| Other Investments 5.7% | | | Other Investments 4.9% | |
| Short-Term
Investments and
Net Other Assets 2.3% | |  | Short-Term
Investments and
Net Other Assets† (6.3)% | |
* Foreign investments | 5.4% | | ** Foreign investments | 5.3% | |
* Futures and Swaps | 1.0% | | ** Futures and Swaps | 1.1% | |

† Short-Term Investments and Net Other Assets are not included in the pie chart.
The information in the above table is based on the combined investments of the fund and its pro-rata share of the investments of Fidelity's fixed-income central funds. A holdings listing for the Fund, which presents direct holdings as well as the pro-rata share of any securities and other investments held indirectly through its investment in underlying non-money market Fidelity Central Funds is available at fidelity.com/or advisor.fidelity.com as applicable.
Semiannual Report
Investments February 29, 2012
Showing Percentage of Net Assets
Corporate Bonds - 23.9% |
| Principal Amount (c) | | Value |
Convertible Bonds - 0.0% |
FINANCIALS - 0.0% |
Real Estate Investment Trusts - 0.0% |
Developers Diversified Realty Corp. 3% 3/15/12 | | $ 270,000 | | $ 270,000 |
MATERIALS - 0.0% |
Metals & Mining - 0.0% |
Vedanta Resources Jersey II Ltd. 4% 3/30/17 | | 600,000 | | 579,000 |
TOTAL CONVERTIBLE BONDS | | 849,000 |
Nonconvertible Bonds - 23.9% |
CONSUMER DISCRETIONARY - 2.8% |
Auto Components - 0.1% |
American Axle & Manufacturing, Inc. 7.75% 11/15/19 | | 2,845,000 | | 3,022,813 |
Dana Holding Corp.: | | | | |
6.5% 2/15/19 | | 2,755,000 | | 2,982,288 |
6.75% 2/15/21 | | 3,675,000 | | 3,987,375 |
Delphi Corp.: | | | | |
5.875% 5/15/19 (e) | | 1,685,000 | | 1,777,675 |
6.125% 5/15/21 (e) | | 1,615,000 | | 1,729,988 |
Tenneco, Inc.: | | | | |
6.875% 12/15/20 | | 1,505,000 | | 1,617,875 |
7.75% 8/15/18 | | 1,400,000 | | 1,519,000 |
| | 16,637,014 |
Automobiles - 0.1% |
Automotores Gildemeister SA 8.25% 5/24/21 (e) | | 575,000 | | 598,000 |
Chrysler Group LLC/CG Co.-Issuer, Inc.: | | | | |
8% 6/15/19 | | 3,090,000 | | 3,113,175 |
8.25% 6/15/21 | | 5,205,000 | | 5,257,050 |
Ford Motor Co. 7.45% 7/16/31 | | 5,655,000 | | 7,259,606 |
| | 16,227,831 |
Distributors - 0.0% |
AmeriGas Partners LP/AmeriGas Finance Corp.: | | | | |
6.25% 8/20/19 | | 1,255,000 | | 1,267,550 |
6.5% 5/20/21 | | 600,000 | | 606,000 |
Ferrellgas LP/Ferrellgas Finance Corp. 6.5% 5/1/21 | | 1,840,000 | | 1,619,200 |
| | 3,492,750 |
Diversified Consumer Services - 0.0% |
Visant Corp. 10% 10/1/17 | | 1,320,000 | | 1,221,000 |
Corporate Bonds - continued |
| Principal Amount (c) | | Value |
Nonconvertible Bonds - continued |
CONSUMER DISCRETIONARY - continued |
Hotels, Restaurants & Leisure - 0.4% |
Ameristar Casinos, Inc. 7.5% 4/15/21 | | $ 2,570,000 | | $ 2,769,175 |
Chester Downs & Marina LLC 9.25% 2/1/20 (e) | | 320,000 | | 336,000 |
Chukchansi Economic Development Authority 8% 11/15/13 (e) | | 325,000 | | 224,250 |
CityCenter Holdings LLC/CityCenter Finance Corp.: | | | | |
7.625% 1/15/16 | | 3,590,000 | | 3,778,475 |
7.625% 1/15/16 (e) | | 1,930,000 | | 2,012,025 |
11.5% 1/15/17 pay-in-kind (k) | | 2,012,204 | | 2,143,612 |
FelCor Lodging LP 6.75% 6/1/19 | | 4,875,000 | | 4,984,688 |
GWR Operating Partnership LLP/Great Wolf Finance Corp. 10.875% 4/1/17 | | 1,635,000 | | 1,847,550 |
Host Marriott LP 6.375% 3/15/15 | | 250,000 | | 253,125 |
ITT Corp. 7.375% 11/15/15 | | 250,000 | | 287,500 |
MGM Mirage, Inc.: | | | | |
6.625% 7/15/15 | | 7,475,000 | | 7,531,063 |
7.5% 6/1/16 | | 4,130,000 | | 4,191,950 |
7.625% 1/15/17 | | 5,355,000 | | 5,408,550 |
8.625% 2/1/19 (e) | | 2,940,000 | | 3,131,100 |
11.375% 3/1/18 | | 2,460,000 | | 2,896,650 |
MTR Gaming Group, Inc. 11.5% 8/1/19 pay-in-kind (e)(k) | | 1,602,975 | | 1,514,811 |
NPC International, Inc./NPC Operating Co. A, Inc./NPC Operating Co. B, Inc. 10.5% 1/15/20 (e) | | 2,950,000 | | 3,112,250 |
Pinnacle Entertainment, Inc. 7.5% 6/15/15 | | 1,035,000 | | 1,066,050 |
Royal Caribbean Cruises Ltd.: | | | | |
7.25% 3/15/18 | | 465,000 | | 496,946 |
yankee: | | | | |
7.25% 6/15/16 | | 3,985,000 | | 4,383,500 |
7.5% 10/15/27 | | 3,070,000 | | 3,100,700 |
Times Square Hotel Trust 8.528% 8/1/26 (e) | | 863,814 | | 920,766 |
Universal City Development Partners Ltd./UCDP Finance, Inc. 8.875% 11/15/15 | | 784,000 | | 857,012 |
Wynn Las Vegas LLC/Wynn Las Vegas Capital Corp. 7.75% 8/15/20 | | 970,000 | | 1,091,250 |
| | 58,338,998 |
Household Durables - 0.2% |
KB Home: | | | | |
7.25% 6/15/18 | | 1,430,000 | | 1,415,700 |
8% 3/15/20 | | 305,000 | | 306,525 |
Corporate Bonds - continued |
| Principal Amount (c) | | Value |
Nonconvertible Bonds - continued |
CONSUMER DISCRETIONARY - continued |
Household Durables - continued |
Lennar Corp.: | | | | |
6.95% 6/1/18 | | $ 4,640,000 | | $ 4,895,200 |
12.25% 6/1/17 | | 1,135,000 | | 1,452,800 |
Reliance Intermediate Holdings LP 9.5% 12/15/19 (e) | | 2,125,000 | | 2,348,125 |
Reynolds Group Issuer, Inc./Reynolds Group Issuer LLC/Reynolds Group Issuer (Luxembourg) SA: | | | | |
7.875% 8/15/19 (e) | | 3,760,000 | | 4,107,800 |
9% 5/15/18 (e) | | 970,000 | | 974,850 |
9.875% 8/15/19 (e) | | 1,670,000 | | 1,726,363 |
Standard Pacific Corp.: | | | | |
8.375% 5/15/18 | | 6,495,000 | | 6,982,125 |
10.75% 9/15/16 | | 2,370,000 | | 2,722,538 |
Toll Brothers Finance Corp. 5.875% 2/15/22 | | 1,095,000 | | 1,133,325 |
| | 28,065,351 |
Media - 1.9% |
Allbritton Communications Co. 8% 5/15/18 | | 2,630,000 | | 2,768,075 |
AOL Time Warner, Inc. 7.625% 4/15/31 | | 500,000 | | 669,664 |
Cablevision Systems Corp.: | | | | |
7.75% 4/15/18 | | 2,305,000 | | 2,520,979 |
8.625% 9/15/17 | | 3,505,000 | | 3,934,363 |
CCO Holdings LLC/CCO Holdings Capital Corp.: | | | | |
6.5% 4/30/21 | | 3,975,000 | | 4,223,438 |
6.625% 1/31/22 | | 1,755,000 | | 1,877,850 |
7% 1/15/19 | | 8,610,000 | | 9,277,275 |
7.25% 10/30/17 | | 3,380,000 | | 3,658,850 |
7.875% 4/30/18 | | 865,000 | | 945,013 |
Cequel Communications Holdings I LLC/Cequel Capital Corp. 8.625% 11/15/17 (e) | | 10,180,000 | | 10,943,500 |
Comcast Corp.: | | | | |
4.95% 6/15/16 | | 2,344,000 | | 2,649,519 |
5.15% 3/1/20 | | 435,000 | | 509,726 |
5.7% 5/15/18 | | 14,629,000 | | 17,279,146 |
6.4% 3/1/40 | | 4,490,000 | | 5,733,919 |
6.45% 3/15/37 | | 2,196,000 | | 2,737,290 |
6.55% 7/1/39 | | 9,000,000 | | 11,423,178 |
COX Communications, Inc. 4.625% 6/1/13 | | 4,467,000 | | 4,682,229 |
CSC Holdings LLC 8.625% 2/15/19 | | 1,350,000 | | 1,593,000 |
Corporate Bonds - continued |
| Principal Amount (c) | | Value |
Nonconvertible Bonds - continued |
CONSUMER DISCRETIONARY - continued |
Media - continued |
Discovery Communications LLC: | | | | |
3.7% 6/1/15 | | $ 7,129,000 | | $ 7,642,103 |
6.35% 6/1/40 | | 6,392,000 | | 8,036,949 |
Insight Communications, Inc. 9.375% 7/15/18 (e) | | 2,030,000 | | 2,329,425 |
Kabel BW Erste Beteiligungs GmbH/Kabel Baden-Wurttemberg GmbH & Co. KG 7.5% 3/15/19 (e) | | 660,000 | | 712,800 |
Lamar Media Corp. 5.875% 2/1/22 (e) | | 390,000 | | 396,318 |
NBCUniversal Media LLC: | | | | |
3.65% 4/30/15 | | 3,514,000 | | 3,769,591 |
5.15% 4/30/20 | | 11,614,000 | | 13,424,866 |
6.4% 4/30/40 | | 18,278,000 | | 22,866,555 |
News America Holdings, Inc. 7.75% 12/1/45 | | 663,000 | | 797,211 |
News America, Inc.: | | | | |
6.15% 3/1/37 | | 4,759,000 | | 5,478,889 |
6.15% 2/15/41 | | 11,572,000 | | 13,745,927 |
Nielsen Finance LLC/Nielsen Finance Co. 7.75% 10/15/18 | | 2,770,000 | | 3,074,700 |
Quebecor Media, Inc.: | | | | |
7.75% 3/15/16 | | 4,032,000 | | 4,158,000 |
7.75% 3/15/16 | | 2,485,000 | | 2,562,656 |
Time Warner Cable, Inc.: | | | | |
5.4% 7/2/12 | | 3,048,000 | | 3,094,680 |
5.5% 9/1/41 | | 10,000,000 | | 10,988,870 |
5.85% 5/1/17 | | 7,607,000 | | 8,952,222 |
6.2% 7/1/13 | | 2,898,000 | | 3,103,338 |
6.75% 7/1/18 | | 13,763,000 | | 16,917,342 |
Time Warner, Inc.: | | | | |
3.15% 7/15/15 | | 3,115,000 | | 3,308,336 |
5.375% 10/15/41 | | 3,115,000 | | 3,451,831 |
5.875% 11/15/16 | | 368,000 | | 435,168 |
6.2% 3/15/40 | | 11,792,000 | | 13,983,001 |
6.5% 11/15/36 | | 9,243,000 | | 11,278,725 |
TV Azteca SA de CV 7.5% 5/25/18 (Reg. S) | | 850,000 | | 877,625 |
Univision Communications, Inc.: | | | | |
6.875% 5/15/19 (e) | | 2,680,000 | | 2,713,500 |
8.5% 5/15/21 (e) | | 4,695,000 | | 4,648,050 |
UPC Holding BV 9.875% 4/15/18 (e) | | 1,190,000 | | 1,320,900 |
UPCB Finance V Ltd. 7.25% 11/15/21 (e) | | 995,000 | | 1,047,238 |
Corporate Bonds - continued |
| Principal Amount (c) | | Value |
Nonconvertible Bonds - continued |
CONSUMER DISCRETIONARY - continued |
Media - continued |
UPCB Finance VI Ltd. 6.875% 1/15/22 (e) | | $ 930,000 | | $ 949,716 |
Viacom, Inc.: | | | | |
3.5% 4/1/17 | | 7,993,000 | | 8,579,678 |
6.75% 10/5/37 | | 1,460,000 | | 1,883,223 |
| | 273,956,447 |
Specialty Retail - 0.1% |
AutoNation, Inc. 5.5% 2/1/20 | | 890,000 | | 916,700 |
J. Crew Group, Inc. 8.125% 3/1/19 | | 4,694,000 | | 4,699,868 |
PETCO Animal Supplies, Inc. 9.25% 12/1/18 (e) | | 6,315,000 | | 6,962,288 |
Staples, Inc. 7.375% 10/1/12 | | 554,000 | | 574,637 |
Toys 'R' Us, Inc. 7.375% 9/1/16 (e) | | 3,175,000 | | 3,262,313 |
| | 16,415,806 |
Textiles, Apparel & Luxury Goods - 0.0% |
Hanesbrands, Inc. 6.375% 12/15/20 | | 2,500,000 | | 2,606,250 |
TOTAL CONSUMER DISCRETIONARY | | 416,961,447 |
CONSUMER STAPLES - 1.2% |
Beverages - 0.3% |
Anheuser-Busch InBev Worldwide, Inc. 2.5% 3/26/13 | | 8,433,000 | | 8,607,082 |
Cerveceria Nacional Dominicana C por A 8% 3/27/14 (Reg. S) | | 225,000 | | 231,750 |
Diageo Capital PLC 5.2% 1/30/13 | | 1,037,000 | | 1,081,398 |
FBG Finance Ltd. 5.125% 6/15/15 (e) | | 3,662,000 | | 4,039,402 |
Fortune Brands, Inc.: | | | | |
5.375% 1/15/16 | | 321,000 | | 356,356 |
5.875% 1/15/36 | | 16,159,000 | | 16,428,661 |
6.375% 6/15/14 | | 3,374,000 | | 3,724,764 |
SABMiller Holdings, Inc. 3.75% 1/15/22 (e) | | 10,217,000 | | 10,652,673 |
| | 45,122,086 |
Food & Staples Retailing - 0.1% |
Albertsons, Inc.: | | | | |
7.45% 8/1/29 | | 155,000 | | 120,513 |
8% 5/1/31 | | 765,000 | | 594,788 |
BFF International Ltd. 7.25% 1/28/20 (e) | | 800,000 | | 896,000 |
Rite Aid Corp.: | | | | |
9.25% 3/15/20 (e) | | 2,890,000 | | 2,926,125 |
9.375% 12/15/15 | | 955,000 | | 983,650 |
Corporate Bonds - continued |
| Principal Amount (c) | | Value |
Nonconvertible Bonds - continued |
CONSUMER STAPLES - continued |
Food & Staples Retailing - continued |
Rite Aid Corp.: - continued | | | | |
9.5% 6/15/17 | | $ 4,960,000 | | $ 5,034,400 |
SUPERVALU, Inc. 8% 5/1/16 | | 865,000 | | 899,600 |
US Foodservice, Inc. 8.5% 6/30/19 (e) | | 3,625,000 | | 3,661,250 |
| | 15,116,326 |
Food Products - 0.4% |
Cargill, Inc. 6% 11/27/17 (e) | | 9,457,000 | | 11,200,559 |
Gruma SAB de CV 7.75% (Reg. S) (f) | | 1,285,000 | | 1,288,213 |
JBS USA LLC/JBS USA Finance, Inc. 8.25% 2/1/20 (e) | | 705,000 | | 724,388 |
Kraft Foods, Inc.: | | | | |
5.375% 2/10/20 | | 10,631,000 | | 12,392,015 |
6.125% 2/1/18 | | 10,623,000 | | 12,736,361 |
6.5% 8/11/17 | | 10,238,000 | | 12,426,905 |
6.75% 2/19/14 | | 540,000 | | 598,740 |
MHP SA 10.25% 4/29/15 (e) | | 985,000 | | 960,375 |
Post Holdings, Inc. 7.375% 2/15/22 (e) | | 950,000 | | 1,011,750 |
| | 53,339,306 |
Personal Products - 0.0% |
NBTY, Inc. 9% 10/1/18 | | 2,065,000 | | 2,286,988 |
Prestige Brands, Inc. 8.125% 2/1/20 (e) | | 165,000 | | 179,438 |
| | 2,466,426 |
Tobacco - 0.4% |
Altria Group, Inc.: | | | | |
8.5% 11/10/13 | | 326,000 | | 366,339 |
9.7% 11/10/18 | | 23,631,000 | | 32,167,817 |
Philip Morris International, Inc.: | | | | |
4.875% 5/16/13 | | 9,347,000 | | 9,850,261 |
5.65% 5/16/18 | | 7,161,000 | | 8,588,381 |
Reynolds American, Inc.: | | | | |
6.75% 6/15/17 | | 3,719,000 | | 4,430,460 |
7.25% 6/15/37 | | 5,056,000 | | 6,063,448 |
| | 61,466,706 |
TOTAL CONSUMER STAPLES | | 177,510,850 |
Corporate Bonds - continued |
| Principal Amount (c) | | Value |
Nonconvertible Bonds - continued |
ENERGY - 4.0% |
Energy Equipment & Services - 0.6% |
Calfrac Holdings LP 7.5% 12/1/20 (e) | | $ 3,570,000 | | $ 3,587,850 |
Chesapeake Oilfield Operating LLC 6.625% 11/15/19 (e) | | 1,260,000 | | 1,285,200 |
DCP Midstream LLC: | | | | |
4.75% 9/30/21 (e) | | 11,333,000 | | 12,160,502 |
5.35% 3/15/20 (e) | | 8,816,000 | | 9,733,843 |
El Paso Pipeline Partners Operating Co. LLC: | | | | |
4.1% 11/15/15 | | 10,806,000 | | 11,116,078 |
5% 10/1/21 | | 7,366,000 | | 7,689,809 |
6.5% 4/1/20 | | 738,000 | | 822,104 |
Expro Finance Luxembourg SCA 8.5% 12/15/16 (e) | | 3,800,000 | | 3,412,400 |
Exterran Holdings, Inc. 7.25% 12/1/18 | | 6,485,000 | | 6,241,813 |
Forbes Energy Services Ltd. 9% 6/15/19 | | 1,590,000 | | 1,566,150 |
Hornbeck Offshore Services, Inc. 8% 9/1/17 | | 1,605,000 | | 1,701,300 |
Noble Holding International Ltd. 3.45% 8/1/15 | | 632,000 | | 660,996 |
Oil States International, Inc. 6.5% 6/1/19 | | 2,850,000 | | 3,063,750 |
Petroleum Geo-Services ASA 7.375% 12/15/18 (e) | | 2,245,000 | | 2,357,250 |
Precision Drilling Corp.: | | | | |
6.5% 12/15/21 (e) | | 170,000 | | 181,475 |
6.625% 11/15/20 | | 1,890,000 | | 2,022,300 |
SESI LLC 7.125% 12/15/21 (e) | | 2,980,000 | | 3,292,900 |
Transocean, Inc.: | | | | |
5.05% 12/15/16 | | 7,572,000 | | 8,285,260 |
6.375% 12/15/21 | | 9,999,000 | | 11,796,790 |
Weatherford International Ltd.: | | | | |
4.95% 10/15/13 | | 2,173,000 | | 2,287,139 |
5.15% 3/15/13 | | 2,840,000 | | 2,938,060 |
| | 96,202,969 |
Oil, Gas & Consumable Fuels - 3.4% |
Afren PLC 11.5% 2/1/16 (e) | | 520,000 | | 551,200 |
Anadarko Petroleum Corp.: | | | | |
5.95% 9/15/16 | | 485,000 | | 561,564 |
6.375% 9/15/17 | | 19,790,000 | | 23,757,756 |
Antero Resources Finance Corp.: | | | | |
7.25% 8/1/19 (e) | | 1,080,000 | | 1,134,000 |
9.375% 12/1/17 | | 2,915,000 | | 3,191,925 |
Canadian Natural Resources Ltd.: | | | | |
5.15% 2/1/13 | | 5,610,000 | | 5,838,052 |
Corporate Bonds - continued |
| Principal Amount (c) | | Value |
Nonconvertible Bonds - continued |
ENERGY - continued |
Oil, Gas & Consumable Fuels - continued |
Canadian Natural Resources Ltd.: - continued | | | | |
5.7% 5/15/17 | | $ 16,295,000 | | $ 19,502,263 |
Chesapeake Energy Corp.: | | | | |
6.125% 2/15/21 | | 1,505,000 | | 1,516,288 |
6.875% 11/15/20 | | 1,195,000 | | 1,254,750 |
Chesapeake Midstream Partners LP/CHKM Finance Corp.: | | | | |
5.875% 4/15/21 (e) | | 676,000 | | 689,520 |
6.125% 7/15/22 (e) | | 1,240,000 | | 1,280,300 |
ConocoPhillips: | | | | |
4.6% 1/15/15 | | 10,000,000 | | 11,100,330 |
5.75% 2/1/19 | | 2,930,000 | | 3,605,386 |
CONSOL Energy, Inc.: | | | | |
8% 4/1/17 | | 3,515,000 | | 3,813,775 |
8.25% 4/1/20 | | 650,000 | | 708,500 |
Crestwood Midstream Partners LP / Finance Corp. 7.75% 4/1/19 (e) | | 800,000 | | 808,000 |
Denbury Resources, Inc. 6.375% 8/15/21 | | 1,935,000 | | 2,118,825 |
DTEK Finance BV 9.5% 4/28/15 (e) | | 600,000 | | 594,000 |
Duke Capital LLC 6.25% 2/15/13 | | 1,000,000 | | 1,049,266 |
Duke Energy Field Services: | | | | |
5.375% 10/15/15 (e) | | 1,524,000 | | 1,652,897 |
6.45% 11/3/36 (e) | | 1,801,000 | | 2,005,466 |
El Paso Natural Gas Co. 5.95% 4/15/17 | | 1,166,000 | | 1,294,438 |
Enbridge Energy Partners LP 4.2% 9/15/21 | | 13,331,000 | | 14,225,097 |
Encana Holdings Finance Corp. 5.8% 5/1/14 | | 3,602,000 | | 3,908,303 |
Energy Transfer Equity LP 7.5% 10/15/20 | | 2,350,000 | | 2,690,750 |
Enterprise Products Operating LP: | | | | |
5.6% 10/15/14 | | 483,000 | | 532,193 |
5.65% 4/1/13 | | 697,000 | | 731,389 |
EQT Corp. 4.875% 11/15/21 | | 5,066,000 | | 5,181,160 |
EV Energy Partners LP/EV Energy Finance Corp. 8% 4/15/19 | | 1,650,000 | | 1,732,500 |
Frontier Oil Corp.: | | | | |
6.875% 11/15/18 | | 485,000 | | 501,975 |
8.5% 9/15/16 | | 1,950,000 | | 2,086,500 |
Gulf South Pipeline Co. LP 5.75% 8/15/12 (e) | | 4,818,000 | | 4,898,779 |
Gulfstream Natural Gas System LLC 6.95% 6/1/16 (e) | | 221,000 | | 255,758 |
Corporate Bonds - continued |
| Principal Amount (c) | | Value |
Nonconvertible Bonds - continued |
ENERGY - continued |
Oil, Gas & Consumable Fuels - continued |
KazMunaiGaz Finance Sub BV: | | | | |
6.375% 4/9/21 (e) | | $ 850,000 | | $ 937,125 |
7% 5/5/20 (e) | | 1,635,000 | | 1,876,163 |
9.125% 7/2/18 (e) | | 1,855,000 | | 2,300,200 |
11.75% 1/23/15 (e) | | 1,860,000 | | 2,259,900 |
LINN Energy LLC/LINN Energy Finance Corp.: | | | | |
6.5% 5/15/19 (e) | | 3,790,000 | | 3,865,800 |
7.75% 2/1/21 | | 1,950,000 | | 2,086,500 |
8.625% 4/15/20 | | 2,685,000 | | 2,980,350 |
Marathon Petroleum Corp. 5.125% 3/1/21 | | 16,178,000 | | 17,564,972 |
Markwest Energy Partners LP/Markwest Energy Finance Corp. 6.25% 6/15/22 | | 1,245,000 | | 1,335,263 |
Midcontinent Express Pipeline LLC 5.45% 9/15/14 (e) | | 10,834,000 | | 11,220,904 |
Motiva Enterprises LLC: | | | | |
5.75% 1/15/20 (e) | | 4,187,000 | | 4,907,516 |
6.85% 1/15/40 (e) | | 5,937,000 | | 7,857,228 |
Nakilat, Inc. 6.067% 12/31/33 (e) | | 1,975,000 | | 2,123,125 |
Nexen, Inc.: | | | | |
5.2% 3/10/15 | | 1,133,000 | | 1,229,934 |
5.875% 3/10/35 | | 240,000 | | 258,725 |
6.2% 7/30/19 | | 603,000 | | 716,086 |
6.4% 5/15/37 | | 4,379,000 | | 5,014,056 |
NGPL PipeCo LLC 6.514% 12/15/12 (e) | | 3,327,000 | | 3,212,837 |
OGX Petroleo e Gas Participacoes SA 8.5% 6/1/18 (e) | | 1,355,000 | | 1,415,975 |
Overseas Shipholding Group, Inc.: | | | | |
7.5% 2/15/24 | | 500,000 | | 296,250 |
8.125% 3/30/18 | | 2,530,000 | | 1,568,600 |
Pacific Rubiales Energy Corp. 7.25% 12/12/21 (e) | | 1,826,000 | | 2,004,035 |
Pan American Energy LLC 7.875% 5/7/21 (e) | | 4,370,000 | | 4,457,400 |
PBF Holding Co. LLC/PBF Finance Corp. 8.25% 2/15/20 (e) | | 1,775,000 | | 1,783,875 |
Pemex Project Funding Master Trust: | | | | |
5.75% 3/1/18 | | 645,000 | | 720,788 |
6.625% 6/15/35 | | 945,000 | | 1,082,025 |
Petro-Canada: | | | | |
6.05% 5/15/18 | | 3,850,000 | | 4,661,133 |
6.8% 5/15/38 | | 8,950,000 | | 12,038,332 |
PetroBakken Energy Ltd. 8.625% 2/1/20 (e) | | 1,420,000 | | 1,505,200 |
Corporate Bonds - continued |
| Principal Amount (c) | | Value |
Nonconvertible Bonds - continued |
ENERGY - continued |
Oil, Gas & Consumable Fuels - continued |
Petrobras International Finance Co. Ltd.: | | | | |
3.875% 1/27/16 | | $ 10,192,000 | | $ 10,630,898 |
5.375% 1/27/21 | | 9,410,000 | | 10,116,860 |
5.75% 1/20/20 | | 28,708,000 | | 31,578,800 |
6.75% 1/27/41 | | 7,265,000 | | 8,439,968 |
6.875% 1/20/40 | | 470,000 | | 550,840 |
7.875% 3/15/19 | | 10,517,000 | | 12,935,910 |
8.375% 12/10/18 | | 775,000 | | 965,418 |
Petrohawk Energy Corp.: | | | | |
6.25% 6/1/19 | | 1,290,000 | | 1,454,475 |
7.25% 8/15/18 | | 1,330,000 | | 1,522,850 |
Petroleos de Venezuela SA: | | | | |
4.9% 10/28/14 | | 4,265,000 | | 3,753,200 |
5% 10/28/15 | | 380,000 | | 315,400 |
5.375% 4/12/27 | | 3,310,000 | | 2,068,750 |
5.5% 4/12/37 | | 2,530,000 | | 1,530,650 |
8% 11/17/13 | | 975,000 | | 976,950 |
8.5% 11/2/17 (e) | | 7,540,000 | | 6,861,400 |
12.75% 2/17/22 (e) | | 3,580,000 | | 3,651,600 |
Petroleos Mexicanos: | | | | |
4.875% 1/24/22 (e) | | 12,332,000 | | 12,886,940 |
5.5% 1/21/21 | | 12,069,000 | | 13,227,624 |
6% 3/5/20 | | 1,108,000 | | 1,260,350 |
6.5% 6/2/41 | | 350,000 | | 395,640 |
6.5% 6/2/41 (e) | | 15,185,000 | | 17,121,088 |
6.625% (e)(f) | | 3,075,000 | | 3,159,563 |
8% 5/3/19 | | 420,000 | | 527,730 |
Petroleum Co. of Trinidad & Tobago Ltd. (Reg. S) 6% 5/8/22 | | 608,125 | | 620,288 |
Pioneer Natural Resources Co. 6.65% 3/15/17 | | 4,605,000 | | 5,284,238 |
Plains All American Pipeline LP/PAA Finance Corp.: | | | | |
3.95% 9/15/15 | | 5,869,000 | | 6,232,602 |
4.25% 9/1/12 | | 485,000 | | 492,118 |
5% 2/1/21 | | 5,217,000 | | 5,865,953 |
6.125% 1/15/17 | | 6,185,000 | | 7,133,995 |
PT Adaro Indonesia 7.625% 10/22/19 (e) | | 500,000 | | 555,000 |
PT Pertamina Persero: | | | | |
5.25% 5/23/21 (e) | | 815,000 | | 865,938 |
6.5% 5/27/41 (e) | | 595,000 | | 657,475 |
Corporate Bonds - continued |
| Principal Amount (c) | | Value |
Nonconvertible Bonds - continued |
ENERGY - continued |
Oil, Gas & Consumable Fuels - continued |
Quicksilver Resources, Inc.: | | | | |
7.125% 4/1/16 | | $ 4,415,000 | | $ 4,238,400 |
11.75% 1/1/16 | | 2,255,000 | | 2,395,938 |
Range Resources Corp. 5% 8/15/22 (g) | | 1,235,000 | | 1,247,350 |
Ras Laffan Liquefied Natural Gas Co. Ltd. III: | | | | |
4.5% 9/30/12 (e) | | 4,773,000 | | 4,844,595 |
5.5% 9/30/14 (e) | | 6,670,000 | | 7,161,913 |
5.832% 9/30/16 (e) | | 1,299,465 | | 1,396,925 |
6.332% 9/30/27 (e) | | 1,840,000 | | 2,052,005 |
6.75% 9/30/19 (e) | | 4,366,000 | | 5,173,710 |
Rockies Express Pipeline LLC 6.25% 7/15/13 (e) | | 3,392,000 | | 3,459,840 |
Samson Investment Co. 9.75% 2/15/20 (e) | | 2,385,000 | | 2,498,288 |
Schlumberger Investment SA 3.3% 9/14/21 (e) | | 7,355,000 | | 7,591,471 |
Ship Finance International Ltd. 8.5% 12/15/13 | | 2,065,000 | | 2,034,025 |
Southeast Supply Header LLC 4.85% 8/15/14 (e) | | 367,000 | | 389,378 |
Spectra Energy Capital, LLC 5.65% 3/1/20 | | 308,000 | | 351,934 |
Spectra Energy Partners, LP: | | | | |
2.95% 6/15/16 | | 4,717,000 | | 4,802,118 |
4.6% 6/15/21 | | 2,694,000 | | 2,843,563 |
Suncor Energy, Inc. 6.1% 6/1/18 | | 11,154,000 | | 13,609,631 |
Targa Resources Partners LP/Targa Resources Partners Finance Corp.: | | | | |
6.375% 8/1/22 (e) | | 560,000 | | 583,800 |
6.875% 2/1/21 | | 685,000 | | 732,950 |
7.875% 10/15/18 | | 2,205,000 | | 2,403,450 |
TransCapitalInvest Ltd. 5.67% 3/5/14 (e) | | 4,317,000 | | 4,565,228 |
Western Gas Partners LP 5.375% 6/1/21 | | 14,766,000 | | 15,755,765 |
Williams Partners LP 4.125% 11/15/20 | | 2,399,000 | | 2,532,387 |
WPX Energy, Inc.: | | | | |
5.25% 1/15/17 (e) | | 975,000 | | 994,500 |
6% 1/15/22 (e) | | 1,535,000 | | 1,588,725 |
XTO Energy, Inc.: | | | | |
4.9% 2/1/14 | | 267,000 | | 287,723 |
5% 1/31/15 | | 1,749,000 | | 1,956,559 |
Corporate Bonds - continued |
| Principal Amount (c) | | Value |
Nonconvertible Bonds - continued |
ENERGY - continued |
Oil, Gas & Consumable Fuels - continued |
XTO Energy, Inc.: - continued | | | | |
5.65% 4/1/16 | | $ 1,200,000 | | $ 1,416,212 |
YPF SA 10% 11/2/28 | | 445,000 | | 471,700 |
| | 501,073,796 |
TOTAL ENERGY | | 597,276,765 |
FINANCIALS - 8.8% |
Capital Markets - 1.1% |
BlackRock, Inc. 4.25% 5/24/21 | | 5,000,000 | | 5,419,835 |
Equinox Holdings, Inc. 9.5% 2/1/16 (e) | | 2,020,000 | | 2,151,300 |
Goldman Sachs Group, Inc.: | | | | |
5.25% 7/27/21 | | 17,105,000 | | 17,127,921 |
5.625% 1/15/17 | | 3,200,000 | | 3,372,266 |
5.75% 1/24/22 | | 16,123,000 | | 16,824,754 |
5.95% 1/18/18 | | 4,975,000 | | 5,377,259 |
6.75% 10/1/37 | | 9,643,000 | | 9,648,169 |
JPMorgan Chase Capital XX 6.55% 9/29/36 | | 17,904,000 | | 17,993,520 |
JPMorgan Chase Capital XXV 6.8% 10/1/37 | | 7,405,000 | | 7,479,050 |
Lazard Group LLC: | | | | |
6.85% 6/15/17 | | 4,817,000 | | 5,236,594 |
7.125% 5/15/15 | | 1,717,000 | | 1,850,670 |
Merrill Lynch & Co., Inc.: | | | | |
6.11% 1/29/37 | | 4,768,000 | | 4,542,545 |
6.4% 8/28/17 | | 7,843,000 | | 8,259,267 |
Morgan Stanley: | | | | |
4.75% 4/1/14 | | 5,820,000 | | 5,888,368 |
5.5% 7/28/21 | | 11,429,000 | | 11,320,184 |
5.625% 9/23/19 | | 12,714,000 | | 12,708,914 |
6% 4/28/15 | | 1,414,000 | | 1,489,580 |
6.625% 4/1/18 | | 16,118,000 | | 17,091,930 |
| | 153,782,126 |
Commercial Banks - 1.4% |
African Export-Import Bank 8.75% 11/13/14 | | 490,000 | | 536,550 |
Akbank T.A.S. 5.125% 7/22/15 (e) | | 1,365,000 | | 1,353,056 |
Banco Nacional de Desenvolvimento Economico e Social: | | | | |
5.5% 7/12/20 (e) | | 520,000 | | 570,700 |
Corporate Bonds - continued |
| Principal Amount (c) | | Value |
Nonconvertible Bonds - continued |
FINANCIALS - continued |
Commercial Banks - continued |
Banco Nacional de Desenvolvimento Economico e Social: - continued | | | | |
6.5% 6/10/19 (e) | | $ 325,000 | | $ 380,250 |
Bank of America NA 5.3% 3/15/17 | | 6,601,000 | | 6,710,834 |
BBVA Paraguay SA 9.75% 2/11/16 (e) | | 1,145,000 | | 1,213,700 |
CIT Group, Inc.: | | | | |
4.75% 2/15/15 (e) | | 2,175,000 | | 2,207,625 |
5.5% 2/15/19 (e) | | 2,175,000 | | 2,221,219 |
7% 5/4/15 (e) | | 5,689,000 | | 5,703,223 |
7% 5/1/16 | | 458 | | 458 |
7% 5/2/16 (e) | | 3,596,000 | | 3,598,265 |
7% 5/2/17 (e) | | 6,459,000 | | 6,463,069 |
Credit Suisse New York Branch 6% 2/15/18 | | 16,785,000 | | 17,680,698 |
Development Bank of Kazakhstan JSC 5.5% 12/20/15 (e) | | 895,000 | | 935,275 |
Development Bank of Philippines 8.375% (f)(k) | | 1,655,000 | | 1,779,125 |
Discover Bank: | | | | |
7% 4/15/20 | | 2,458,000 | | 2,785,661 |
8.7% 11/18/19 | | 12,480,000 | | 15,018,607 |
Eastern and Southern African Trade and Development Bank 6.875% 1/9/16 (Reg. S) | | 870,000 | | 804,750 |
Fifth Third Bancorp: | | | | |
4.5% 6/1/18 | | 798,000 | | 826,841 |
8.25% 3/1/38 | | 4,667,000 | | 5,977,741 |
Fifth Third Bank 4.75% 2/1/15 | | 1,329,000 | | 1,402,021 |
Fifth Third Capital Trust IV 6.5% 4/15/67 (k) | | 6,912,000 | | 6,860,160 |
HBOS PLC 6.75% 5/21/18 (e) | | 6,067,000 | | 5,451,758 |
HSBK (Europe) BV: | | | | |
7.25% 5/3/17 (e) | | 1,435,000 | | 1,447,556 |
9.25% 10/16/13 (e) | | 1,485,000 | | 1,568,606 |
Huntington Bancshares, Inc. 7% 12/15/20 | | 2,851,000 | | 3,223,495 |
JPMorgan Chase Bank 6% 10/1/17 | | 11,313,000 | | 12,695,494 |
JSC Kazkommertsbank BV 8% 11/3/15 (e) | | 440,000 | | 409,200 |
Kazkommerts International BV 8.5% 4/16/13 (e) | | 546,000 | | 548,730 |
KeyBank NA: | | | | |
5.45% 3/3/16 | | 3,939,000 | | 4,327,460 |
5.8% 7/1/14 | | 9,490,000 | | 10,269,983 |
6.95% 2/1/28 | | 1,977,000 | | 2,223,081 |
KeyCorp. 5.1% 3/24/21 | | 5,572,000 | | 6,055,165 |
Corporate Bonds - continued |
| Principal Amount (c) | | Value |
Nonconvertible Bonds - continued |
FINANCIALS - continued |
Commercial Banks - continued |
Marshall & Ilsley Bank: | | | | |
4.85% 6/16/15 | | $ 4,520,000 | | $ 4,861,567 |
5% 1/17/17 | | 13,700,000 | | 14,629,381 |
5.25% 9/4/12 | | 3,162,000 | | 3,229,667 |
Regions Bank: | | | | |
6.45% 6/26/37 | | 10,658,000 | | 9,805,360 |
7.5% 5/15/18 | | 6,622,000 | | 7,217,980 |
Regions Financial Corp.: | | | | |
0.7438% 6/26/12 (k) | | 338,000 | | 337,720 |
5.75% 6/15/15 | | 2,005,000 | | 2,048,990 |
7.75% 11/10/14 | | 6,404,000 | | 6,837,551 |
RSHB Capital SA: | | | | |
6% 6/3/21 (e) | | 555,000 | | 550,838 |
9% 6/11/14 (e) | | 510,000 | | 564,213 |
The State Export-Import Bank of Ukraine JSC 5.7928% 2/9/16 (Issued by Credit Suisse First Boston International for The State Export-Import Bank of Ukraine JSC) (d) | | 1,335,000 | | 1,064,663 |
Trade & Development Bank of Mongolia LLC 8.5% 10/25/13 | | 555,000 | | 555,000 |
Turkiye Garanti Bankasi A/S 3.0612% 4/20/16 (e)(k) | | 945,000 | | 881,213 |
Turkiye Is Bankasi A/S 5.1% 2/1/16 (e) | | 610,000 | | 613,050 |
UnionBanCal Corp. 5.25% 12/16/13 | | 826,000 | | 855,752 |
Vimpel Communications 8.25% 5/23/16 (Reg. S) (Issued by UBS Luxembourg SA for Vimpel Communications) | | 2,525,000 | | 2,714,375 |
Wachovia Bank NA: | | | | |
4.8% 11/1/14 | | 372,000 | | 400,291 |
4.875% 2/1/15 | | 1,756,000 | | 1,899,442 |
Wachovia Corp.: | | | | |
5.625% 10/15/16 | | 4,239,000 | | 4,764,839 |
5.75% 6/15/17 | | 2,933,000 | | 3,409,011 |
Wells Fargo & Co.: | | | | |
3.625% 4/15/15 | | 5,893,000 | | 6,315,345 |
3.676% 6/15/16 | | 4,301,000 | | 4,609,451 |
Yapi ve Kredi Bankasi A/S 6.75% 2/8/17 (e) | | 1,060,000 | | 1,053,110 |
| | 212,469,165 |
Corporate Bonds - continued |
| Principal Amount (c) | | Value |
Nonconvertible Bonds - continued |
FINANCIALS - continued |
Consumer Finance - 0.7% |
Ally Financial, Inc.: | | | | |
3.71% 2/11/14 (k) | | $ 2,895,000 | | $ 2,844,338 |
5.5% 2/15/17 | | 1,580,000 | | 1,587,900 |
Discover Financial Services: | | | | |
6.45% 6/12/17 | | 10,366,000 | | 11,379,401 |
10.25% 7/15/19 | | 11,672,000 | | 14,882,874 |
Ford Motor Credit Co. LLC: | | | | |
3.875% 1/15/15 | | 7,000,000 | | 7,176,596 |
4.25% 2/3/17 | | 2,435,000 | | 2,504,273 |
5% 5/15/18 | | 6,890,000 | | 7,263,562 |
5.875% 8/2/21 | | 5,260,000 | | 5,868,293 |
12% 5/15/15 | | 3,440,000 | | 4,308,600 |
General Electric Capital Corp.: | | | | |
2.25% 11/9/15 | | 314,000 | | 322,985 |
4.625% 1/7/21 | | 5,706,000 | | 6,194,228 |
5.625% 9/15/17 | | 5,858,000 | | 6,754,456 |
5.625% 5/1/18 | | 25,000,000 | | 28,865,150 |
HSBC Finance Corp. 5.9% 6/19/12 | | 578,000 | | 586,239 |
SLM Corp.: | | | | |
6% 1/25/17 | | 950,000 | | 985,625 |
7.25% 1/25/22 | | 1,020,000 | | 1,068,450 |
| | 102,592,970 |
Diversified Financial Services - 2.0% |
Aquarius Investments Luxemburg 8.25% 2/18/16 | | 1,025,000 | | 1,060,875 |
Bank of America Corp.: | | | | |
5.65% 5/1/18 | | 8,780,000 | | 9,110,549 |
5.75% 12/1/17 | | 27,955,000 | | 29,268,270 |
6.5% 8/1/16 | | 9,000,000 | | 9,729,540 |
Biz Finance PLC 8.375% 4/27/15 (Reg. S) | | 1,525,000 | | 1,414,438 |
BP Capital Markets PLC: | | | | |
3.125% 10/1/15 | | 10,828,000 | | 11,594,752 |
3.625% 5/8/14 | | 711,000 | | 752,616 |
4.5% 10/1/20 | | 650,000 | | 733,102 |
4.742% 3/11/21 | | 8,800,000 | | 10,137,521 |
Calpine Construction Finance Co. LP 8% 6/1/16 (e) | | 2,655,000 | | 2,874,038 |
Capital One Capital V 10.25% 8/15/39 | | 5,267,000 | | 5,490,848 |
CDW LLC/CDW Finance Corp. 8.5% 4/1/19 | | 2,855,000 | | 3,058,276 |
CIT Group, Inc. 6.625% 4/1/18 (e) | | 1,215,000 | | 1,315,238 |
Citigroup, Inc.: | | | | |
3.953% 6/15/16 | | 11,847,000 | | 12,247,547 |
4.5% 1/14/22 | | 5,818,000 | | 5,975,115 |
Corporate Bonds - continued |
| Principal Amount (c) | | Value |
Nonconvertible Bonds - continued |
FINANCIALS - continued |
Diversified Financial Services - continued |
Citigroup, Inc.: - continued | | | | |
4.75% 5/19/15 | | $ 32,881,000 | | $ 34,844,883 |
5.875% 1/30/42 | | 5,043,000 | | 5,360,981 |
6.125% 5/15/18 | | 8,677,000 | | 9,693,346 |
6.5% 8/19/13 | | 13,174,000 | | 13,960,237 |
City of Buenos Aires 12.5% 4/6/15 (e) | | 3,155,000 | | 3,407,400 |
Fibria Overseas Finance Ltd. 6.75% 3/3/21 (e) | | 585,000 | | 576,225 |
General Motors Financial Co., Inc. 6.75% 6/1/18 | | 1,500,000 | | 1,597,500 |
Icahn Enterprises LP/Icahn Enterprises Finance Corp.: | | | | |
7.75% 1/15/16 | | 3,715,000 | | 3,891,463 |
8% 1/15/18 | | 5,875,000 | | 6,227,500 |
8% 1/15/18 (e) | | 2,005,000 | | 2,125,300 |
ILFC E-Capital Trust II 6.25% 12/21/65 (e)(k) | | 1,250,000 | | 837,500 |
Indo Energy Finance BV 7% 5/7/18 (e) | | 525,000 | | 542,063 |
JPMorgan Chase & Co.: | | | | |
3.15% 7/5/16 | | 13,000,000 | | 13,386,828 |
4.35% 8/15/21 | | 13,339,000 | | 13,990,904 |
4.5% 1/24/22 | | 22,046,000 | | 23,417,371 |
4.95% 3/25/20 | | 17,148,000 | | 18,590,507 |
5.4% 1/6/42 | | 5,642,000 | | 6,085,958 |
NSG Holdings II, LLC 7.75% 12/15/25 (e) | | 9,415,000 | | 9,509,150 |
Offshore Group Investment Ltd. 11.5% 8/1/15 | | 3,475,000 | | 3,874,625 |
Reynolds Group DL Escrow LLC 8.75% 10/15/16 (e) | | 3,000,000 | | 3,187,500 |
Steel Capital SA Ln Partner Net Program 6.25% 7/26/16 (e) | | 620,000 | | 621,550 |
Sunwest Management, Inc. 7.9726% 2/10/15 | | 364,436 | | 322,526 |
TECO Finance, Inc.: | | | | |
4% 3/15/16 | | 2,562,000 | | 2,711,190 |
5.15% 3/15/20 | | 3,761,000 | | 4,225,307 |
TMK Capital SA 7.75% 1/27/18 | | 600,000 | | 577,500 |
Unitymedia Hessen GmbH & Co. KG/Unitymedia NRW GmbH 8.125% 12/1/17 (e) | | 370,000 | | 399,600 |
UPCB Finance III Ltd. 6.625% 7/1/20 (e) | | 3,305,000 | | 3,395,888 |
Vnesheconombank Via VEB Finance PLC: | | | | |
5.375% 2/13/17 (e) | | 735,000 | | 751,538 |
Corporate Bonds - continued |
| Principal Amount (c) | | Value |
Nonconvertible Bonds - continued |
FINANCIALS - continued |
Diversified Financial Services - continued |
Vnesheconombank Via VEB Finance PLC: - continued | | | | |
6.8% 11/22/25 (e) | | $ 605,000 | | $ 623,937 |
Wind Acquisition Holdings Finance SA 12.25% 7/15/17 pay-in-kind (e)(k) | | 4,411,476 | | 3,879,219 |
ZFS Finance USA Trust IV 5.875% 5/9/62 (e)(k) | | 1,673,000 | | 1,631,175 |
Zhaikmunai Finance BV 10.5% 10/19/15 (e) | | 1,885,000 | | 1,979,250 |
| | 300,988,646 |
Insurance - 1.5% |
Allstate Corp.: | | | | |
5.2% 1/15/42 | | 20,742,000 | | 22,696,643 |
6.2% 5/16/14 | | 6,893,000 | | 7,656,986 |
American International Group, Inc. 4.875% 9/15/16 | | 7,990,000 | | 8,404,537 |
Aon Corp.: | | | | |
3.125% 5/27/16 | | 11,274,000 | | 11,636,301 |
3.5% 9/30/15 | | 4,451,000 | | 4,653,538 |
5% 9/30/20 | | 3,854,000 | | 4,314,765 |
6.25% 9/30/40 | | 3,160,000 | | 3,928,506 |
Assurant, Inc. 5.625% 2/15/14 | | 2,384,000 | | 2,524,453 |
Axis Capital Holdings Ltd. 5.75% 12/1/14 | | 558,000 | | 593,474 |
Great-West Life & Annuity Insurance Co. 7.153% 5/16/46 (e)(k) | | 1,859,000 | | 1,845,058 |
Hartford Financial Services Group, Inc. 5.375% 3/15/17 | | 194,000 | | 201,807 |
Liberty Mutual Group, Inc.: | | | | |
5% 6/1/21 (e) | | 12,644,000 | | 12,614,337 |
6.5% 3/15/35 (e) | | 1,741,000 | | 1,827,611 |
Marsh & McLennan Companies, Inc. 4.8% 7/15/21 | | 7,090,000 | | 7,902,670 |
Massachusetts Mutual Life Insurance Co. 5.375% 12/1/41 (e) | | 7,139,000 | | 7,579,862 |
MetLife, Inc.: | | | | |
4.75% 2/8/21 | | 4,032,000 | | 4,470,496 |
5% 6/15/15 | | 1,163,000 | | 1,288,043 |
5.875% 2/6/41 | | 4,458,000 | | 5,448,010 |
6.75% 6/1/16 | | 7,610,000 | | 9,108,797 |
Metropolitan Life Global Funding I: | | | | |
5.125% 4/10/13 (e) | | 559,000 | | 583,397 |
5.125% 6/10/14 (e) | | 6,751,000 | | 7,287,124 |
Monumental Global Funding III 5.5% 4/22/13 (e) | | 2,746,000 | | 2,862,263 |
New York Life Insurance Co. 6.75% 11/15/39 (e) | | 3,590,000 | | 4,726,393 |
Corporate Bonds - continued |
| Principal Amount (c) | | Value |
Nonconvertible Bonds - continued |
FINANCIALS - continued |
Insurance - continued |
Northwestern Mutual Life Insurance Co. 6.063% 3/30/40 (e) | | $ 6,155,000 | | $ 7,594,279 |
Pacific Life Insurance Co. 9.25% 6/15/39 (e) | | 5,674,000 | | 7,523,355 |
Pacific LifeCorp 6% 2/10/20 (e) | | 6,323,000 | | 6,913,783 |
Prudential Financial, Inc.: | | | | |
3.625% 9/17/12 | | 11,000,000 | | 11,165,154 |
4.5% 11/16/21 | | 8,000,000 | | 8,577,136 |
4.75% 9/17/15 | | 11,000,000 | | 11,984,478 |
5.15% 1/15/13 | | 2,966,000 | | 3,075,490 |
5.8% 11/16/41 | | 8,381,000 | | 9,362,843 |
6.2% 11/15/40 | | 4,318,000 | | 4,961,183 |
7.375% 6/15/19 | | 3,230,000 | | 3,997,093 |
Symetra Financial Corp. 6.125% 4/1/16 (e) | | 6,375,000 | | 6,524,813 |
Unum Group: | | | | |
5.625% 9/15/20 | | 8,386,000 | | 8,906,963 |
7.125% 9/30/16 | | 587,000 | | 671,532 |
| | 225,413,173 |
Real Estate Investment Trusts - 0.5% |
Alexandria Real Estate Equities, Inc. 4.6% 4/1/22 | | 4,025,000 | | 4,072,221 |
AvalonBay Communities, Inc. 4.95% 3/15/13 | | 367,000 | | 379,285 |
BRE Properties, Inc. 5.5% 3/15/17 | | 661,000 | | 723,945 |
Camden Property Trust: | | | | |
5.375% 12/15/13 | | 4,073,000 | | 4,242,579 |
5.875% 11/30/12 | | 670,000 | | 686,282 |
Developers Diversified Realty Corp.: | | | | |
4.75% 4/15/18 | | 8,570,000 | | 8,797,199 |
5.375% 10/15/12 | | 5,101,000 | | 5,150,133 |
7.5% 4/1/17 | | 5,574,000 | | 6,264,936 |
7.875% 9/1/20 | | 323,000 | | 385,832 |
Duke Realty LP: | | | | |
4.625% 5/15/13 | | 1,106,000 | | 1,142,051 |
5.875% 8/15/12 | | 1,017,000 | | 1,033,222 |
Equity One, Inc.: | | | | |
5.375% 10/15/15 | | 1,403,000 | | 1,483,254 |
6% 9/15/17 | | 890,000 | | 955,939 |
6.25% 12/15/14 | | 6,140,000 | | 6,633,429 |
6.25% 1/15/17 | | 494,000 | | 535,326 |
Corporate Bonds - continued |
| Principal Amount (c) | | Value |
Nonconvertible Bonds - continued |
FINANCIALS - continued |
Real Estate Investment Trusts - continued |
Federal Realty Investment Trust: | | | | |
5.4% 12/1/13 | | $ 441,000 | | $ 465,699 |
5.9% 4/1/20 | | 2,504,000 | | 2,823,663 |
6% 7/15/12 | | 3,658,000 | | 3,715,599 |
6.2% 1/15/17 | | 620,000 | | 701,541 |
HMB Capital Trust V 4.1463% 12/15/36 (b)(e)(k) | | 270,000 | | 0 |
HRPT Properties Trust: | | | | |
5.75% 11/1/15 | | 2,386,000 | | 2,494,947 |
6.25% 6/15/17 | | 1,232,000 | | 1,315,966 |
6.65% 1/15/18 | | 867,000 | | 933,277 |
MPT Operating Partnership LP/MPT Finance Corp. 6.875% 5/1/21 | | 1,760,000 | | 1,874,400 |
Omega Healthcare Investors, Inc.: | | | | |
6.75% 10/15/22 | | 3,190,000 | | 3,461,150 |
7% 1/15/16 | | 3,060,000 | | 3,128,850 |
Senior Housing Properties Trust 6.75% 4/15/20 | | 940,000 | | 1,007,665 |
UDR, Inc. 5.5% 4/1/14 | | 5,222,000 | | 5,487,539 |
Washington (REIT) 5.25% 1/15/14 | | 322,000 | | 337,514 |
| | 70,233,443 |
Real Estate Management & Development - 1.6% |
AMB Property LP 5.9% 8/15/13 | | 2,580,000 | | 2,659,018 |
BioMed Realty LP: | | | | |
3.85% 4/15/16 | | 11,000,000 | | 11,319,297 |
6.125% 4/15/20 | | 3,429,000 | | 3,848,288 |
Brandywine Operating Partnership LP: | | | | |
5.7% 5/1/17 | | 7,049,000 | | 7,328,042 |
5.75% 4/1/12 | | 2,972,000 | | 2,977,730 |
CB Richard Ellis Services, Inc. 6.625% 10/15/20 | | 5,165,000 | | 5,487,813 |
Colonial Properties Trust 6.875% 8/15/12 | | 5,706,000 | | 5,789,918 |
Colonial Realty LP 6.05% 9/1/16 | | 2,000,000 | | 2,066,300 |
Digital Realty Trust LP: | | | | |
4.5% 7/15/15 | | 4,981,000 | | 5,197,260 |
5.25% 3/15/21 | | 5,708,000 | | 6,009,245 |
Duke Realty LP: | | | | |
5.4% 8/15/14 | | 5,561,000 | | 5,935,422 |
5.95% 2/15/17 | | 1,109,000 | | 1,227,535 |
6.25% 5/15/13 | | 14,494,000 | | 15,244,224 |
6.5% 1/15/18 | | 3,795,000 | | 4,301,143 |
Corporate Bonds - continued |
| Principal Amount (c) | | Value |
Nonconvertible Bonds - continued |
FINANCIALS - continued |
Real Estate Management & Development - continued |
Duke Realty LP: - continued | | | | |
6.75% 3/15/20 | | $ 10,379,000 | | $ 12,066,023 |
8.25% 8/15/19 | | 75,000 | | 93,261 |
ERP Operating LP: | | | | |
4.625% 12/15/21 | | 22,997,000 | | 24,632,409 |
4.75% 7/15/20 | | 7,700,000 | | 8,258,897 |
5.25% 9/15/14 | | 1,310,000 | | 1,416,080 |
5.375% 8/1/16 | | 2,768,000 | | 3,084,255 |
5.5% 10/1/12 | | 3,690,000 | | 3,786,368 |
5.75% 6/15/17 | | 14,407,000 | | 16,386,133 |
Forest City Enterprises, Inc.: | | | | |
6.5% 2/1/17 | | 450,000 | | 424,125 |
7.625% 6/1/15 | | 430,000 | | 425,700 |
Highwoods/Forsyth LP 5.85% 3/15/17 | | 615,000 | | 657,623 |
Host Hotels & Resorts LP: | | | | |
5.875% 6/15/19 | | 2,150,000 | | 2,322,000 |
6% 11/1/20 | | 105,000 | | 114,056 |
6% 10/1/21 (e) | | 825,000 | | 899,250 |
Liberty Property LP: | | | | |
4.75% 10/1/20 | | 18,282,000 | | 18,891,266 |
5.125% 3/2/15 | | 1,405,000 | | 1,489,900 |
5.5% 12/15/16 | | 1,891,000 | | 2,071,469 |
6.625% 10/1/17 | | 4,835,000 | | 5,535,311 |
Mack-Cali Realty LP 7.75% 8/15/19 | | 700,000 | | 853,381 |
Post Apartment Homes LP 6.3% 6/1/13 | | 3,812,000 | | 3,961,232 |
Prime Property Funding, Inc.: | | | | |
5.125% 6/1/15 (e) | | 2,806,000 | | 2,856,250 |
5.5% 1/15/14 (e) | | 867,000 | | 887,427 |
5.7% 4/15/17 (e) | | 2,115,000 | | 2,169,235 |
Realogy Corp.: | | | | |
7.625% 1/15/20 (e) | | 1,345,000 | | 1,390,327 |
7.875% 2/15/19 (e) | | 2,880,000 | | 2,800,800 |
9% 1/15/20 (e) | | 870,000 | | 880,875 |
Reckson Operating Partnership LP 6% 3/31/16 | | 3,651,000 | | 3,835,711 |
Regency Centers LP: | | | | |
4.95% 4/15/14 | | 611,000 | | 640,281 |
5.25% 8/1/15 | | 2,133,000 | | 2,296,671 |
5.875% 6/15/17 | | 1,089,000 | | 1,216,925 |
Simon Property Group LP: | | | | |
2.8% 1/30/17 | | 2,603,000 | | 2,706,823 |
4.125% 12/1/21 | | 7,287,000 | | 7,871,519 |
4.2% 2/1/15 | | 3,659,000 | | 3,902,386 |
Corporate Bonds - continued |
| Principal Amount (c) | | Value |
Nonconvertible Bonds - continued |
FINANCIALS - continued |
Real Estate Management & Development - continued |
Tanger Properties LP: | | | | |
6.125% 6/1/20 | | $ 13,473,000 | | $ 15,342,028 |
6.15% 11/15/15 | | 1,777,000 | | 1,991,903 |
Toys 'R' Us Property Co. II LLC 8.5% 12/1/17 | | 2,875,000 | | 3,025,938 |
Ventas Realty LP: | | | | |
4.25% 3/1/22 | | 300,000 | | 298,030 |
6.75% 4/1/17 | | 250,000 | | 258,711 |
| | 241,131,814 |
Thrifts & Mortgage Finance - 0.0% |
Wrightwood Capital LLC 1.9% 4/20/20 | | 112,350 | | 36,851 |
TOTAL FINANCIALS | | 1,306,648,188 |
HEALTH CARE - 0.8% |
Biotechnology - 0.1% |
Amgen, Inc. 5.15% 11/15/41 | | 12,000,000 | | 12,533,340 |
Celgene Corp. 2.45% 10/15/15 | | 613,000 | | 629,726 |
| | 13,163,066 |
Health Care Equipment & Supplies - 0.0% |
Aviv Healthcare Properties LP/Aviv Healthcare Capital Corp. 7.75% 2/15/19 | | 260,000 | | 265,850 |
Health Care Providers & Services - 0.6% |
Aristotle Holding, Inc. 4.75% 11/15/21 (e) | | 22,009,000 | | 23,633,022 |
Community Health Systems, Inc. 8.875% 7/15/15 | | 1,120,000 | | 1,173,200 |
Coventry Health Care, Inc.: | | | | |
5.95% 3/15/17 | | 1,747,000 | | 1,981,308 |
6.3% 8/15/14 | | 3,618,000 | | 3,959,937 |
Emergency Medical Services Corp. 8.125% 6/1/19 | | 4,610,000 | | 4,840,500 |
Express Scripts, Inc.: | | | | |
3.125% 5/15/16 | | 10,525,000 | | 10,882,029 |
5.25% 6/15/12 | | 7,157,000 | | 7,243,034 |
6.25% 6/15/14 | | 2,629,000 | | 2,895,002 |
Corporate Bonds - continued |
| Principal Amount (c) | | Value |
Nonconvertible Bonds - continued |
HEALTH CARE - continued |
Health Care Providers & Services - continued |
Fresenius Medical Care US Finance II, Inc. 5.625% 7/31/19 (e) | | $ 2,315,000 | | $ 2,465,475 |
HCA, Inc.: | | | | |
6.5% 2/15/20 | | 2,705,000 | | 2,894,080 |
7.25% 9/15/20 | | 115,000 | | 125,787 |
HealthSouth Corp. 7.25% 10/1/18 | | 3,300,000 | | 3,555,750 |
IASIS Healthcare LLC/IASIS Capital Corp. 8.375% 5/15/19 | | 4,395,000 | | 4,197,225 |
Medco Health Solutions, Inc.: | | | | |
2.75% 9/15/15 | | 1,176,000 | | 1,191,113 |
4.125% 9/15/20 | | 7,486,000 | | 7,771,763 |
Rural/Metro Corp. 10.125% 7/15/19 (e) | | 740,000 | | 666,000 |
Sabra Health Care LP/Sabra Capital Corp. 8.125% 11/1/18 | | 2,580,000 | | 2,767,050 |
Skilled Healthcare Group, Inc. 11% 1/15/14 | | 164,000 | | 162,360 |
| | 82,404,635 |
Health Care Technology - 0.0% |
DJO Finance LLC/DJO Finance Corp.: | | | | |
7.75% 4/15/18 | | 925,000 | | 795,500 |
10.875% 11/15/14 | | 4,115,000 | | 4,156,150 |
| | 4,951,650 |
Pharmaceuticals - 0.1% |
Endo Pharmaceuticals Holdings, Inc.: | | | | |
7% 7/15/19 | | 860,000 | | 944,968 |
7.25% 1/15/22 | | 860,000 | | 957,868 |
Mylan, Inc.: | | | | |
6% 11/15/18 (e) | | 3,030,000 | | 3,166,350 |
7.625% 7/15/17 (e) | | 1,115,000 | | 1,237,650 |
Valeant Pharmaceuticals International: | | | | |
6.5% 7/15/16 (e) | | 4,500,000 | | 4,595,625 |
6.875% 12/1/18 (e) | | 3,440,000 | | 3,500,200 |
7% 10/1/20 (e) | | 255,000 | | 259,463 |
Watson Pharmaceuticals, Inc. 5% 8/15/14 | | 720,000 | | 768,762 |
| | 15,430,886 |
TOTAL HEALTH CARE | | 116,216,087 |
Corporate Bonds - continued |
| Principal Amount (c) | | Value |
Nonconvertible Bonds - continued |
INDUSTRIALS - 1.0% |
Aerospace & Defense - 0.1% |
BAE Systems Holdings, Inc.: | | | | |
4.95% 6/1/14 (e) | | $ 572,000 | | $ 603,577 |
6.375% 6/1/19 (e) | | 8,071,000 | | 9,275,250 |
BE Aerospace, Inc. 6.875% 10/1/20 | | 2,090,000 | | 2,327,738 |
Huntington Ingalls Industries, Inc. 6.875% 3/15/18 | | 3,100,000 | | 3,262,750 |
| | 15,469,315 |
Airlines - 0.2% |
Continental Airlines, Inc.: | | | | |
pass-thru trust certificates 9.798% 4/1/21 | | 343,926 | | 357,683 |
6.648% 3/15/19 | | 3,249,044 | | 3,411,496 |
6.75% 9/15/15 (e) | | 4,585,000 | | 4,636,352 |
6.9% 7/2/19 | | 857,459 | | 913,194 |
Continental Airlines, Inc. 9.25% 5/10/17 | | 2,564,970 | | 2,718,868 |
Delta Air Lines, Inc. pass-thru trust certificates: | | | | |
6.375% 1/2/16 | | 1,515,000 | | 1,416,525 |
6.75% 11/23/15 | | 1,515,000 | | 1,461,975 |
8.021% 8/10/22 | | 1,368,967 | | 1,389,501 |
8.954% 8/10/14 | | 1,860,940 | | 1,909,883 |
Northwest Airlines, Inc. pass-thru trust certificates 8.028% 11/1/17 | | 700,470 | | 693,466 |
U.S. Airways pass-thru trust certificates: | | | | |
6.85% 1/30/18 | | 1,782,351 | | 1,800,175 |
8.36% 1/20/19 | | 1,441,215 | | 1,462,833 |
United Air Lines, Inc. 9.875% 8/1/13 (e) | | 707,000 | | 738,815 |
United Air Lines, Inc. pass-thru trust certificates: | | | | |
Class B, 7.336% 7/2/19 | | 787,418 | | 755,921 |
9.75% 1/15/17 | | 2,003,727 | | 2,276,835 |
12% 1/15/16 (e) | | 660,640 | | 713,491 |
| | 26,657,013 |
Building Products - 0.1% |
Building Materials Corp. of America: | | | | |
6.75% 5/1/21 (e) | | 4,910,000 | | 5,351,900 |
6.875% 8/15/18 (e) | | 3,715,000 | | 3,993,625 |
Griffon Corp. 7.125% 4/1/18 | | 2,220,000 | | 2,303,250 |
| | 11,648,775 |
Commercial Services & Supplies - 0.3% |
ARAMARK Corp.: | | | | |
4.0469% 2/1/15 (k) | | 5,440,000 | | 5,419,600 |
Corporate Bonds - continued |
| Principal Amount (c) | | Value |
Nonconvertible Bonds - continued |
INDUSTRIALS - continued |
Commercial Services & Supplies - continued |
ARAMARK Corp.: - continued | | | | |
8.5% 2/1/15 | | $ 2,000,000 | | $ 2,055,000 |
ARAMARK Holdings Corp. 8.625% 5/1/16 pay-in-kind (e)(k) | | 7,325,000 | | 7,526,438 |
Covanta Holding Corp. 7.25% 12/1/20 | | 4,950,000 | | 5,279,462 |
International Lease Finance Corp.: | | | | |
5.75% 5/15/16 | | 1,330,000 | | 1,343,300 |
6.25% 5/15/19 | | 1,640,000 | | 1,662,347 |
6.75% 9/1/16 (e) | | 1,620,000 | | 1,753,650 |
8.625% 9/15/15 | | 2,745,000 | | 3,033,225 |
8.625% 1/15/22 | | 3,040,000 | | 3,427,600 |
8.75% 3/15/17 | | 3,700,000 | | 4,144,000 |
8.875% 9/1/17 | | 1,665,000 | | 1,864,800 |
WP Rocket Merger Sub, Inc. 10.125% 7/15/19 (e) | | 2,855,000 | | 2,640,875 |
| | 40,150,297 |
Construction & Engineering - 0.0% |
Amsted Industries, Inc. 8.125% 3/15/18 (e) | | 2,535,000 | | 2,737,800 |
Odebrecht Finance Ltd. 7.5% (e)(f) | | 2,455,000 | | 2,534,788 |
| | 5,272,588 |
Industrial Conglomerates - 0.1% |
General Electric Co. 5.25% 12/6/17 | | 17,730,000 | | 20,928,457 |
Marine - 0.0% |
Navios Maritime Holdings, Inc. 8.875% 11/1/17 | | 700,000 | | 686,000 |
SCF Capital Ltd. 5.375% 10/27/17 (e) | | 280,000 | | 267,400 |
| | 953,400 |
Professional Services - 0.0% |
FTI Consulting, Inc. 6.75% 10/1/20 | | 2,515,000 | | 2,719,470 |
Road & Rail - 0.2% |
Avis Budget Car Rental LLC/Avis Budget Finance, Inc.: | | | | |
7.625% 5/15/14 | | 1,202,000 | | 1,214,020 |
7.75% 5/15/16 | | 1,935,000 | | 1,993,050 |
Georgian Railway Ltd. 9.875% 7/22/15 | | 775,000 | | 815,688 |
Hertz Corp.: | | | | |
6.75% 4/15/19 | | 3,920,000 | | 4,106,200 |
7.5% 10/15/18 | | 8,330,000 | | 8,975,575 |
Corporate Bonds - continued |
| Principal Amount (c) | | Value |
Nonconvertible Bonds - continued |
INDUSTRIALS - continued |
Road & Rail - continued |
Kansas City Southern de Mexico SA de CV 12.5% 4/1/16 | | $ 1,335,000 | | $ 1,548,600 |
Swift Services Holdings, Inc. 10% 11/15/18 | | 3,835,000 | | 4,180,150 |
| | 22,833,283 |
Trading Companies & Distributors - 0.0% |
Aircastle Ltd.: | | | | |
9.75% 8/1/18 | | 1,575,000 | | 1,775,813 |
9.75% 8/1/18 (e) | | 840,000 | | 947,100 |
| | 2,722,913 |
Transportation Infrastructure - 0.0% |
Aeropuertos Argentina 2000 SA 10.75% 12/1/20 (e) | | 843,840 | | 898,690 |
TOTAL INDUSTRIALS | | 150,254,201 |
INFORMATION TECHNOLOGY - 0.3% |
Communications Equipment - 0.1% |
Lucent Technologies, Inc.: | | | | |
6.45% 3/15/29 | | 8,010,000 | | 6,167,700 |
6.5% 1/15/28 | | 1,240,000 | | 942,400 |
| | 7,110,100 |
Computers & Peripherals - 0.0% |
Seagate HDD Cayman: | | | | |
6.875% 5/1/20 | | 410,000 | | 448,950 |
7% 11/1/21 (e) | | 1,870,000 | | 2,071,025 |
| | 2,519,975 |
Electronic Equipment & Components - 0.1% |
Jabil Circuit, Inc. 5.625% 12/15/20 | | 935,000 | | 1,005,125 |
Sanmina-SCI Corp. 7% 5/15/19 (e) | | 5,640,000 | | 5,766,900 |
Tyco Electronics Group SA: | | | | |
5.95% 1/15/14 | | 3,835,000 | | 4,113,858 |
6% 10/1/12 | | 4,835,000 | | 4,982,864 |
6.55% 10/1/17 | | 1,383,000 | | 1,633,793 |
| | 17,502,540 |
Internet Software & Services - 0.0% |
Equinix, Inc. 8.125% 3/1/18 | | 4,300,000 | | 4,762,250 |
Corporate Bonds - continued |
| Principal Amount (c) | | Value |
Nonconvertible Bonds - continued |
INFORMATION TECHNOLOGY - continued |
IT Services - 0.0% |
Ceridian Corp.: | | | | |
11.25% 11/15/15 | | $ 610,000 | | $ 582,550 |
12.25% 11/15/15 pay-in-kind (k) | | 445,000 | | 427,200 |
SunGard Data Systems, Inc.: | | | | |
7.375% 11/15/18 | | 1,095,000 | | 1,182,600 |
10.25% 8/15/15 | | 1,765,000 | | 1,826,775 |
| | 4,019,125 |
Office Electronics - 0.0% |
Xerox Corp.: | | | | |
4.25% 2/15/15 | | 368,000 | | 391,906 |
4.5% 5/15/21 | | 4,102,000 | | 4,185,102 |
5.5% 5/15/12 | | 1,998,000 | | 2,015,498 |
| | 6,592,506 |
Semiconductors & Semiconductor Equipment - 0.1% |
Amkor Technology, Inc.: | | | | |
6.625% 6/1/21 | | 1,466,000 | | 1,528,305 |
7.375% 5/1/18 | | 2,435,000 | | 2,629,800 |
Spansion LLC 7.875% 11/15/17 | | 3,465,000 | | 3,395,700 |
| | 7,553,805 |
TOTAL INFORMATION TECHNOLOGY | | 50,060,301 |
MATERIALS - 1.2% |
Chemicals - 0.5% |
Braskem America Finance Co. 7.125% 7/22/41 (e) | | 735,000 | | 733,163 |
Braskem Finance Ltd. 7% 5/7/20 (e) | | 1,240,000 | | 1,376,400 |
Celanese US Holdings LLC 6.625% 10/15/18 | | 1,935,000 | | 2,118,825 |
Dow Chemical Co.: | | | | |
4.125% 11/15/21 | | 10,888,000 | | 11,583,493 |
4.25% 11/15/20 | | 5,898,000 | | 6,313,202 |
4.85% 8/15/12 | | 11,805,000 | | 12,013,901 |
5.25% 11/15/41 | | 5,421,000 | | 5,960,368 |
7.6% 5/15/14 | | 16,974,000 | | 19,291,138 |
Huntsman International LLC 8.625% 3/15/20 | | 1,160,000 | | 1,310,800 |
Ineos Finance PLC 8.375% 2/15/19 (e) | | 605,000 | | 638,275 |
Inergy LP/Inergy Finance Corp.: | | | | |
6.875% 8/1/21 | | 502,000 | | 483,175 |
7% 10/1/18 | | 1,865,000 | | 1,827,700 |
Corporate Bonds - continued |
| Principal Amount (c) | | Value |
Nonconvertible Bonds - continued |
MATERIALS - continued |
Chemicals - continued |
Kinove German Bondco GmbH 9.625% 6/15/18 (e) | | $ 1,250,000 | | $ 1,278,125 |
Lyondell Chemical Co.: | | | | |
8% 11/1/17 | | 853,000 | | 951,095 |
11% 5/1/18 | | 1,295,163 | | 1,419,822 |
LyondellBasell Industries NV 6% 11/15/21 (e) | | 700,000 | | 766,500 |
NOVA Chemicals Corp. 3.7836% 11/15/13 (k) | | 2,720,000 | | 2,706,400 |
| | 70,772,382 |
Construction Materials - 0.0% |
CRH America, Inc. 6% 9/30/16 | | 2,286,000 | | 2,492,867 |
Headwaters, Inc. 7.625% 4/1/19 | | 2,695,000 | | 2,600,675 |
Rearden G Holdings Eins GmbH 7.875% 3/30/20 (e) | | 1,290,000 | | 1,348,050 |
| | 6,441,592 |
Containers & Packaging - 0.1% |
Ardagh Packaging Finance PLC 7.375% 10/15/17 (e) | | 2,700,000 | | 2,889,000 |
Ball Corp. 5% 3/15/22 (g) | | 1,940,000 | | 1,983,650 |
Rock-Tenn Co.: | | | | |
4.45% 3/1/19 (e) | | 310,000 | | 316,882 |
4.9% 3/1/22 (e) | | 290,000 | | 297,743 |
Sealed Air Corp.: | | | | |
8.125% 9/15/19 (e) | | 5,155,000 | | 5,799,375 |
8.375% 9/15/21 (e) | | 1,325,000 | | 1,530,375 |
| | 12,817,025 |
Metals & Mining - 0.6% |
Alrosa Finance SA: | | | | |
(Reg. S) 8.875% 11/17/14 | | 835,000 | | 916,413 |
7.75% 11/3/20 (e) | | 700,000 | | 743,750 |
Anglo American Capital PLC 9.375% 4/8/14 (e) | | 6,817,000 | | 7,841,500 |
ArcelorMittal SA 3.75% 3/1/16 | | 2,911,000 | | 2,920,417 |
BHP Billiton Financial (USA) Ltd. 5.125% 3/29/12 | | 1,975,000 | | 1,981,279 |
Boart Longyear Management Pty Ltd. 7% 4/1/21 (e) | | 930,000 | | 986,963 |
Corporacion Nacional del Cobre de Chile (Codelco): | | | | |
3.875% 11/3/21 (e) | | 11,456,000 | | 11,738,963 |
6.375% 11/30/12 (e) | | 2,002,000 | | 2,069,646 |
Edgen Murray Corp. 12.25% 1/15/15 | | 4,450,000 | | 4,510,965 |
Essar Steel Algoma, Inc. 9.375% 3/15/15 (e) | | 3,100,000 | | 3,193,000 |
EVRAZ Group SA 8.25% 11/10/15 (e) | | 1,630,000 | | 1,731,875 |
Corporate Bonds - continued |
| Principal Amount (c) | | Value |
Nonconvertible Bonds - continued |
MATERIALS - continued |
Metals & Mining - continued |
FMG Resources (August 2006) Pty Ltd.: | | | | |
6.375% 2/1/16 (e) | | $ 710,000 | | $ 737,477 |
6.875% 2/1/18 (e) | | 1,625,000 | | 1,706,250 |
7% 11/1/15 (e) | | 4,075,000 | | 4,309,313 |
8.25% 11/1/19 (e) | | 3,295,000 | | 3,632,738 |
JMC Steel Group, Inc. 8.25% 3/15/18 (e) | | 5,110,000 | | 5,333,563 |
McJunkin Red Man Corp. 9.5% 12/15/16 | | 5,475,000 | | 5,858,250 |
Metinvest BV 10.25% 5/20/15 (e) | | 935,000 | | 939,675 |
Rio Tinto Finance Ltd. (United States) 3.75% 9/20/21 | | 7,654,000 | | 8,159,271 |
Severstal Columbus LLC 10.25% 2/15/18 | | 4,610,000 | | 5,024,900 |
Southern Copper Corp. 6.75% 4/16/40 | | 920,000 | | 1,005,946 |
Steel Dynamics, Inc.: | | | | |
6.75% 4/1/15 | | 720,000 | | 732,600 |
7.625% 3/15/20 | | 1,290,000 | | 1,438,350 |
Tube City IMS Corp. 9.75% 2/1/15 | | 1,700,000 | | 1,744,625 |
Vale Overseas Ltd. 6.25% 1/23/17 | | 5,581,000 | | 6,445,084 |
Vedanta Resources PLC: | | | | |
6.75% 6/7/16 (e) | | 3,290,000 | | 3,100,825 |
8.25% 6/7/21 (e) | | 845,000 | | 773,175 |
Votorantim Cimentos SA 7.25% 4/5/41 (e) | | 740,000 | | 741,850 |
| | 90,318,663 |
Paper & Forest Products - 0.0% |
Sino-Forest Corp. 6.25% 10/21/17 (e) | | 1,365,000 | | 429,975 |
TOTAL MATERIALS | | 180,779,637 |
TELECOMMUNICATION SERVICES - 1.7% |
Diversified Telecommunication Services - 1.0% |
Alestra SA de RL de CV 11.75% 8/11/14 | | 1,635,000 | | 1,831,200 |
AT&T, Inc.: | | | | |
2.5% 8/15/15 | | 7,670,000 | | 8,013,907 |
3.875% 8/15/21 | | 8,800,000 | | 9,473,367 |
5.35% 9/1/40 | | 4,006,000 | | 4,504,443 |
5.55% 8/15/41 | | 10,000,000 | | 11,712,750 |
6.3% 1/15/38 | | 16,665,000 | | 20,558,511 |
BellSouth Capital Funding Corp. 7.875% 2/15/30 | | 742,000 | | 982,683 |
CenturyLink, Inc.: | | | | |
6.15% 9/15/19 | | 4,793,000 | | 5,033,704 |
Corporate Bonds - continued |
| Principal Amount (c) | | Value |
Nonconvertible Bonds - continued |
TELECOMMUNICATION SERVICES - continued |
Diversified Telecommunication Services - continued |
CenturyLink, Inc.: - continued | | | | |
6.45% 6/15/21 | | $ 10,268,000 | | $ 10,868,154 |
7.6% 9/15/39 | | 1,274,000 | | 1,304,486 |
Embarq Corp. 7.995% 6/1/36 | | 4,717,000 | | 5,033,025 |
Intelsat Ltd. 11.25% 6/15/16 | | 2,570,000 | | 2,717,775 |
Intelsat Luxembourg SA: | | | | |
11.25% 2/4/17 | | 4,215,000 | | 4,336,181 |
11.5% 2/4/17 pay-in-kind (e)(k) | | 1,860,000 | | 1,887,900 |
11.5% 2/4/17 pay-in-kind (k) | | 9,398,205 | | 9,680,151 |
Sprint Capital Corp. 8.75% 3/15/32 | | 885,000 | | 787,650 |
Telefonica Emisiones SAU: | | | | |
5.134% 4/27/20 | | 10,522,000 | | 10,385,761 |
5.462% 2/16/21 | | 6,967,000 | | 7,006,419 |
6.421% 6/20/16 | | 1,162,000 | | 1,251,802 |
Telemar Norte Leste SA 5.5% 10/23/20 (e) | | 530,000 | | 539,275 |
U.S. West Communications 7.5% 6/15/23 | | 3,760,000 | | 3,816,400 |
Verizon Communications, Inc.: | | | | |
3.5% 11/1/21 | | 12,600,000 | | 13,177,181 |
6.1% 4/15/18 | | 6,000,000 | | 7,314,930 |
6.25% 4/1/37 | | 2,348,000 | | 2,878,655 |
6.9% 4/15/38 | | 6,295,000 | | 8,313,253 |
Wind Acquisition Finance SA: | | | | |
7.25% 2/15/18 (e) | | 2,350,000 | | 2,291,250 |
11.75% 7/15/17 (e) | | 1,435,000 | | 1,470,875 |
| | 157,171,688 |
Wireless Telecommunication Services - 0.7% |
America Movil SAB de CV: | | | | |
2.375% 9/8/16 | | 15,982,000 | | 16,321,026 |
3.625% 3/30/15 | | 731,000 | | 771,205 |
Digicel Group Ltd.: | | | | |
8.25% 9/1/17 (e) | | 3,400,000 | | 3,604,000 |
8.875% 1/15/15 (e) | | 5,755,000 | | 5,855,713 |
9.125% 1/15/15 pay-in-kind (e)(k) | | 3,770,000 | | 3,835,975 |
DIRECTV Holdings LLC/DIRECTV Financing, Inc.: | | | | |
5.875% 10/1/19 | | 11,944,000 | | 13,893,070 |
6.35% 3/15/40 | | 3,541,000 | | 4,170,554 |
Intelsat Jackson Holdings SA: | | | | |
7.25% 4/1/19 | | 2,445,000 | | 2,561,138 |
Corporate Bonds - continued |
| Principal Amount (c) | | Value |
Nonconvertible Bonds - continued |
TELECOMMUNICATION SERVICES - continued |
Wireless Telecommunication Services - continued |
Intelsat Jackson Holdings SA: - continued | | | | |
9.5% 6/15/16 | | $ 2,935,000 | | $ 3,081,750 |
MTS International Funding Ltd. 8.625% 6/22/20 (e) | | 2,205,000 | | 2,513,700 |
Nextel Communications, Inc.: | | | | |
5.95% 3/15/14 | | 7,720,000 | | 7,739,300 |
6.875% 10/31/13 | | 9,105,000 | | 9,139,144 |
7.375% 8/1/15 | | 4,995,000 | | 4,932,563 |
NII Capital Corp.: | | | | |
7.625% 4/1/21 | | 1,755,000 | | 1,794,488 |
8.875% 12/15/19 | | 965,000 | | 1,037,375 |
Pakistan Mobile Communications Ltd. 8.625% 11/13/13 (e) | | 2,970,000 | | 2,821,500 |
Sprint Nextel Corp.: | | | | |
6% 12/1/16 | | 3,640,000 | | 3,312,400 |
9% 11/15/18 (e) | | 1,050,000 | | 1,161,510 |
Telemovil Finance Co. Ltd. 8% 10/1/17 (e) | | 1,645,000 | | 1,694,350 |
VimpelCom Holdings BV: | | | | |
4.5758% 6/29/14 (e)(k) | | 1,925,000 | | 1,900,938 |
7.5043% 3/1/22 (e) | | 4,275,000 | | 4,189,500 |
VIP Finance Ireland Ltd. 7.748% 2/2/21 (e) | | 900,000 | | 898,875 |
Vodafone Group PLC 5% 12/16/13 | | 2,864,000 | | 3,073,504 |
| | 100,303,578 |
TOTAL TELECOMMUNICATION SERVICES | | 257,475,266 |
UTILITIES - 2.1% |
Electric Utilities - 1.0% |
Alabama Power Co. 3.375% 10/1/20 | | 5,927,000 | | 6,282,069 |
Ameren Illinois Co. 6.125% 11/15/17 | | 3,112,000 | | 3,526,481 |
AmerenUE 6.4% 6/15/17 | | 2,491,000 | | 2,999,605 |
Cleveland Electric Illuminating Co. 5.65% 12/15/13 | | 1,016,000 | | 1,086,864 |
Duquesne Light Holdings, Inc.: | | | | |
5.9% 12/1/21 (e) | | 6,944,000 | | 7,294,325 |
6.4% 9/15/20 (e) | | 16,661,000 | | 17,986,849 |
Edison International 3.75% 9/15/17 | | 6,674,000 | | 7,094,369 |
EDP Finance BV: | | | | |
4.9% 10/1/19 (e) | | 3,324,000 | | 2,621,639 |
6% 2/2/18 (e) | | 2,157,000 | | 1,836,388 |
Corporate Bonds - continued |
| Principal Amount (c) | | Value |
Nonconvertible Bonds - continued |
UTILITIES - continued |
Electric Utilities - continued |
Empresa Distribuidora y Comercializadora Norte SA 9.75% 10/25/22 (e) | | $ 420,000 | | $ 323,400 |
Enel Finance International SA 5.7% 1/15/13 (e) | | 206,000 | | 210,907 |
FirstEnergy Corp. 7.375% 11/15/31 | | 15,004,000 | | 19,114,241 |
FirstEnergy Solutions Corp.: | | | | |
4.8% 2/15/15 | | 2,432,000 | | 2,628,068 |
6.05% 8/15/21 | | 9,801,000 | | 11,168,720 |
InterGen NV 9% 6/30/17 (e) | | 5,270,000 | | 5,533,500 |
IPALCO Enterprises, Inc. 5% 5/1/18 | | 2,895,000 | | 2,929,451 |
LG&E and KU Energy LLC: | | | | |
2.125% 11/15/15 | | 7,369,000 | | 7,344,719 |
3.75% 11/15/20 | | 1,450,000 | | 1,473,539 |
Majapahit Holding BV: | | | | |
7.75% 1/20/20 (e) | | 850,000 | | 1,037,000 |
8% 8/7/19 (e) | | 485,000 | | 594,125 |
Mirant Americas Generation LLC: | | | | |
8.5% 10/1/21 | | 4,095,000 | | 3,726,450 |
9.125% 5/1/31 | | 2,615,000 | | 2,366,575 |
National Power Corp. 6.875% 11/2/16 (e) | | 390,000 | | 450,450 |
Nevada Power Co.: | | | | |
6.5% 5/15/18 | | 790,000 | | 965,593 |
6.5% 8/1/18 | | 388,000 | | 474,899 |
NV Energy, Inc. 6.25% 11/15/20 | | 2,245,000 | | 2,452,795 |
Otter Tail Corp. 9% 12/15/16 | | 2,410,000 | | 2,578,700 |
Pacific Gas & Electric Co. 3.25% 9/15/21 | | 1,773,000 | | 1,828,656 |
Pennsylvania Electric Co. 6.05% 9/1/17 | | 764,000 | | 878,115 |
Pepco Holdings, Inc. 2.7% 10/1/15 | | 7,047,000 | | 7,138,710 |
Progress Energy, Inc.: | | | | |
4.4% 1/15/21 | | 12,059,000 | | 13,254,360 |
6% 12/1/39 | | 7,150,000 | | 8,978,705 |
Sierra Pacific Power Co. 5.45% 9/1/13 | | 1,945,000 | | 2,063,608 |
| | 150,243,875 |
Gas Utilities - 0.0% |
Intergas Finance BV 6.375% 5/14/17 (Reg. S) | | 665,000 | | 708,225 |
Southern Natural Gas Co. 5.9% 4/1/17 (e) | | 442,000 | | 500,284 |
Corporate Bonds - continued |
| Principal Amount (c) | | Value |
Nonconvertible Bonds - continued |
UTILITIES - continued |
Gas Utilities - continued |
Southern Natural Gas Co. / Southern Natural Issuing Corp. 4.4% 6/15/21 | | $ 3,646,000 | | $ 3,760,849 |
Transportadora de Gas del Sur SA 7.875% 5/14/17 (e) | | 2,065,000 | | 1,941,100 |
| | 6,910,458 |
Independent Power Producers & Energy Traders - 0.4% |
Atlantic Power Corp. 9% 11/15/18 (e) | | 2,790,000 | | 2,845,800 |
Dolphin Subsidiary II, Inc.: | | | | |
6.5% 10/15/16 (e) | | 5,275,000 | | 5,749,750 |
7.25% 10/15/21 (e) | | 3,430,000 | | 3,910,200 |
Duke Capital LLC 5.668% 8/15/14 | | 2,563,000 | | 2,777,774 |
GenOn Energy, Inc.: | | | | |
9.5% 10/15/18 | | 2,295,000 | | 2,191,725 |
9.875% 10/15/20 | | 1,185,000 | | 1,110,938 |
Kinder Morgan Finance Co. LLC 6% 1/15/18 (e) | | 3,030,000 | | 3,208,013 |
Listrindo Capital BV 6.95% 2/21/19 (e) | | 600,000 | | 609,000 |
Power Sector Assets and Liabilities Management Corp.: | | | | |
7.25% 5/27/19 (e) | | 720,000 | | 894,600 |
7.39% 12/2/24 (e) | | 750,000 | | 960,000 |
PPL Energy Supply LLC 6.5% 5/1/18 | | 6,895,000 | | 8,042,783 |
PSEG Power LLC 2.75% 9/15/16 | | 2,786,000 | | 2,830,947 |
RRI Energy, Inc. 7.625% 6/15/14 | | 8,000,000 | | 8,160,000 |
The AES Corp.: | | | | |
7.375% 7/1/21 (e) | | 1,615,000 | | 1,841,100 |
7.75% 10/15/15 | | 2,345,000 | | 2,649,850 |
8% 10/15/17 | | 4,575,000 | | 5,261,250 |
| | 53,043,730 |
Multi-Utilities - 0.7% |
Consolidated Edison Co. of New York, Inc. 5.7% 6/15/40 | | 3,771,000 | | 4,741,995 |
Dominion Resources, Inc.: | | | | |
2.8793% 9/30/66 (k) | | 19,226,000 | | 16,365,844 |
7.5% 6/30/66 (k) | | 10,345,000 | | 10,939,838 |
MidAmerican Energy Holdings, Co.: | | | | |
5.875% 10/1/12 | | 3,506,000 | | 3,605,262 |
6.5% 9/15/37 | | 7,097,000 | | 9,180,324 |
National Grid PLC 6.3% 8/1/16 | | 1,589,000 | | 1,844,983 |
NiSource Finance Corp.: | | | | |
4.45% 12/1/21 | | 4,928,000 | | 5,216,929 |
Corporate Bonds - continued |
| Principal Amount (c) | | Value |
Nonconvertible Bonds - continued |
UTILITIES - continued |
Multi-Utilities - continued |
NiSource Finance Corp.: - continued | | | | |
5.25% 9/15/17 | | $ 843,000 | | $ 938,402 |
5.4% 7/15/14 | | 1,680,000 | | 1,831,771 |
5.45% 9/15/20 | | 854,000 | | 963,702 |
5.8% 2/1/42 | | 6,336,000 | | 6,760,639 |
5.95% 6/15/41 | | 11,832,000 | | 13,308,929 |
6.25% 12/15/40 | | 2,345,000 | | 2,692,822 |
6.4% 3/15/18 | | 1,654,000 | | 1,953,774 |
6.8% 1/15/19 | | 6,774,000 | | 8,121,613 |
Puget Energy, Inc.: | | | | |
6% 9/1/21 | | 2,464,000 | | 2,632,981 |
6.5% 12/15/20 | | 2,275,000 | | 2,491,125 |
Wisconsin Energy Corp. 6.25% 5/15/67 (k) | | 3,860,000 | | 3,956,500 |
| | 97,547,433 |
Water Utilities - 0.0% |
Companhia de Saneamento Basico do Estado de Sao Paulo (SABESP) 6.25% 12/16/20 (e) | | 485,000 | | 511,675 |
TOTAL UTILITIES | | 308,257,171 |
TOTAL NONCONVERTIBLE BONDS | | 3,561,439,913 |
TOTAL CORPORATE BONDS (Cost $3,249,327,509) |
3,562,288,913
|
U.S. Government and Government Agency Obligations - 26.3% |
|
U.S. Government Agency Obligations - 0.4% |
Fannie Mae Guaranteed Mtg. pass-thru certificates 0.375% 3/16/15 | | 11,413,000 | | 11,353,972 |
Freddie Mac 1.75% 9/10/15 | | 40,525,000 | | 42,136,355 |
Tennessee Valley Authority 5.375% 4/1/56 | | 385,000 | | 500,583 |
TOTAL U.S. GOVERNMENT AGENCY OBLIGATIONS | | 53,990,910 |
U.S. Government and Government Agency Obligations - continued |
| Principal Amount (c) | | Value |
U.S. Treasury Inflation Protected Obligations - 1.6% |
U.S. Treasury Inflation-Indexed Bonds: | | | | |
2.125% 2/15/40 | | $ 73,625,837 | | $ 101,095,564 |
2.125% 2/15/41 | | 73,129,315 | | 100,893,114 |
2.5% 1/15/29 | | 21,023,800 | | 28,501,673 |
TOTAL U.S. TREASURY INFLATION PROTECTED OBLIGATIONS | | 230,490,351 |
U.S. Treasury Obligations - 24.3% |
U.S. Treasury Bonds: | | | | |
3.125% 2/15/42 | | 17,083,000 | | 17,168,415 |
4.375% 5/15/41 | | 459,035,000 | | 576,805,879 |
U.S. Treasury Notes: | | | | |
0.125% 12/31/13 | | 60,731,000 | | 60,543,584 |
0.25% 1/31/14 | | 59,276,000 | | 59,222,770 |
0.25% 9/15/14 | | 8,048,000 | | 8,020,331 |
0.25% 12/15/14 | | 805,000 | | 801,541 |
0.5% 8/15/14 | | 12,503,000 | | 12,542,072 |
0.625% 7/15/14 | | 160,373,000 | | 161,375,331 |
0.75% 6/15/14 | | 11,299,000 | | 11,403,165 |
0.875% 11/30/16 | | 1,503,000 | | 1,506,992 |
0.875% 2/28/17 | | 293,221,000 | | 293,266,742 |
1.375% 11/30/15 | | 88,617,000 | | 91,150,915 |
1.375% 2/28/19 | | 83,926,000 | | 83,808,000 |
2% 11/15/21 | | 389,903,000 | | 391,730,865 |
2% 2/15/22 | | 171,534,000 | | 171,828,867 |
2.375% 2/28/15 (h) | | 499,922,000 | | 528,472,045 |
2.625% 7/31/14 | | 316,140,000 | | 333,330,113 |
2.625% 12/31/14 (h) | | 486,380,000 | | 516,360,950 |
3.125% 5/15/21 | | 278,589,000 | | 309,212,060 |
TOTAL U.S. TREASURY OBLIGATIONS | | 3,628,550,637 |
TOTAL U.S. GOVERNMENT AND GOVERNMENT AGENCY OBLIGATIONS (Cost $3,684,694,262) |
3,913,031,898
|
U.S. Government Agency - Mortgage Securities - 12.3% |
| Principal Amount (c) | | Value |
Fannie Mae - 8.8% |
2.105% 10/1/33 (k) | | $ 932,975 | | $ 971,621 |
2.303% 6/1/36 (k) | | 143,797 | | 152,544 |
2.572% 2/1/36 (k) | | 811,155 | | 856,988 |
2.635% 7/1/37 (k) | | 385,649 | | 410,958 |
2.82% 12/1/35 (k) | | 548,010 | | 579,748 |
3% 3/1/27 (g) | | 18,000,000 | | 18,680,852 |
3.5% 3/1/42 (g) | | 144,700,000 | | 149,563,179 |
3.5% 3/1/42 (g) | | 43,800,000 | | 45,272,061 |
3.5% 3/1/42 (g) | | 51,500,000 | | 53,230,848 |
3.5% 3/1/42 (g) | | 5,700,000 | | 5,891,570 |
3.5% 3/1/42 (g) | | 78,500,000 | | 81,138,283 |
3.5% 3/1/42 (g) | | 27,000,000 | | 27,907,435 |
4% 9/1/26 to 11/1/41 | | 113,239,005 | | 120,090,169 |
4% 9/1/41 | | 196,774 | | 207,817 |
4% 10/1/41 | | 7,447,543 | | 7,877,144 |
4.5% 11/1/18 to 11/1/41 | | 188,925,609 | | 203,062,880 |
4.5% 3/1/42 (g) | | 12,100,000 | | 12,895,802 |
5% 5/1/19 to 6/1/40 | | 129,805,722 | | 140,360,029 |
5% 3/1/42 (g) | | 39,000,000 | | 42,118,974 |
5% 3/1/42 (g) | | 31,100,000 | | 33,587,182 |
5% 3/1/42 (g) | | 16,000,000 | | 17,279,579 |
5.5% 3/1/18 to 3/1/39 | | 139,109,518 | | 151,779,963 |
6% 1/1/21 to 4/1/40 | | 178,789,214 | | 196,581,771 |
6.5% 11/1/35 | | 365,282 | | 410,275 |
TOTAL FANNIE MAE | | 1,310,907,672 |
Freddie Mac - 1.7% |
3.149% 10/1/35 (k) | | 210,022 | | 223,772 |
4% 12/1/40 to 10/1/41 | | 23,476,218 | | 24,971,365 |
4% 9/1/41 | | 1,875,687 | | 1,980,000 |
4% 3/1/42 (g) | | 28,000,000 | | 29,372,328 |
4.5% 7/1/25 to 10/1/41 | | 105,412,593 | | 112,904,053 |
4.5% 3/1/42 (g) | | 5,800,000 | | 6,161,069 |
5% 7/1/35 to 8/1/40 | | 34,940,140 | | 37,863,392 |
5.5% 11/1/17 to 1/1/40 | | 29,502,120 | | 32,046,424 |
6% 7/1/37 to 8/1/37 | | 5,192,476 | | 5,730,885 |
TOTAL FREDDIE MAC | | 251,253,288 |
U.S. Government Agency - Mortgage Securities - continued |
| Principal Amount (c) | | Value |
Ginnie Mae - 1.8% |
3.5% 10/15/40 to 2/15/42 | | $ 34,245,756 | | $ 35,951,866 |
4% 1/15/25 to 1/20/42 | | 86,674,972 | | 93,541,220 |
4% 3/1/42 (g) | | 21,700,000 | | 23,370,477 |
4.5% 11/20/33 to 7/20/41 | | 54,865,097 | | 59,955,961 |
4.5% 3/1/42 (g) | | 1,000,000 | | 1,090,144 |
5% 3/15/39 to 9/15/41 | | 32,585,925 | | 36,106,284 |
5% 3/1/42 (g) | | 2,100,000 | | 2,319,460 |
5% 3/1/42 (g) | | 16,000,000 | | 17,672,078 |
6% 9/20/38 | | 4,886,518 | | 5,469,537 |
TOTAL GINNIE MAE | | 275,477,027 |
TOTAL U.S. GOVERNMENT AGENCY - MORTGAGE SECURITIES (Cost $1,817,051,198) |
1,837,637,987
|
Asset-Backed Securities - 2.0% |
|
Accredited Mortgage Loan Trust Series 2005-1 Class M1, 0.714% 4/25/35 (k) | | 1,206,470 | | 651,744 |
ACE Securities Corp. Home Equity Loan Trust: | | | | |
Series 2004-HE1 Class M2, 1.894% 3/25/34 (k) | | 454,461 | | 318,536 |
Series 2005-HE2 Class M2, 0.694% 4/25/35 (k) | | 107,012 | | 103,895 |
Advanta Business Card Master Trust: | | | | |
Series 2006-C1 Class C1, 0.6758% 10/20/14 (k) | | 642,000 | | 6,420 |
Series 2007-D1 Class D, 1.5863% 1/22/13 (e)(k) | | 2,590,000 | | 38,850 |
Airspeed Ltd. Series 2007-1A Class C1, 2.7485% 6/15/32 (e)(k) | | 4,233,602 | | 2,180,305 |
Ally Auto Receivables Trust: | | | | |
Series 2009-A: | | | | |
Class A3, 2.33% 6/17/13 (e) | | 1,420,427 | | 1,426,271 |
Class A4, 3% 10/15/15 (e) | | 4,280,000 | | 4,358,211 |
Series 2010-5 Class A4, 1.75% 3/15/16 | | 4,050,000 | | 4,130,525 |
Series 2011-1 Class A4, 2.23% 3/15/16 | | 18,200,000 | | 18,772,392 |
Ally Master Owner Trust: | | | | |
Series 2010-3 Class A, 2.88% 4/15/15 (e) | | 8,910,000 | | 9,087,109 |
Series 2011-1 Class A2, 2.15% 1/15/16 | | 8,870,000 | | 9,032,918 |
Series 2011-3 Class A2, 1.81% 5/15/16 | | 8,490,000 | | 8,602,352 |
Series 2012-1 Class A2, 0.7% 2/15/17 | | 18,800,000 | | 18,811,468 |
AmeriCredit Automobile Receivables Trust Series 2011-1 Class A3, 1.39% 9/8/15 | | 7,520,000 | | 7,578,985 |
Asset-Backed Securities - continued |
| Principal Amount (c) | | Value |
Ameriquest Mortgage Securities, Inc. pass-thru certificates: | | | | |
Series 2003-10 Class M1, 0.944% 12/25/33 (k) | | $ 83,046 | | $ 65,323 |
Series 2004-R2 Class M3, 0.794% 4/25/34 (k) | | 133,684 | | 41,863 |
Series 2005-R2 Class M1, 0.694% 4/25/35 (k) | | 2,064,696 | | 1,792,641 |
Anthracite CDO I Ltd. Series 2002-CIBA Class B, 6.633% 5/24/37 (e) | | 171,000 | | 171,782 |
Anthracite CDO III Ltd./Anthracite CDO III Corp. Series 2004-1A Class A, 0.6055% 3/23/19 (e)(k) | | 177,068 | | 150,950 |
Argent Securities, Inc. pass-thru certificates: | | | | |
Series 2003-W7 Class A2, 1.0563% 3/25/34 (k) | | 47,932 | | 34,538 |
Series 2004-W11 Class M2, 0.944% 11/25/34 (k) | | 561,149 | | 399,128 |
Series 2004-W7 Class M1, 0.794% 5/25/34 (k) | | 1,542,998 | | 1,104,624 |
Series 2006-W4 Class A2C, 0.404% 5/25/36 (k) | | 1,323,779 | | 323,672 |
Asset Backed Securities Corp. Home Equity Loan Trust: | | | | |
Series 2004-HE2 Class M1, 1.069% 4/25/34 (k) | | 2,531,796 | | 1,716,165 |
Series 2006-HE2 Class M1, 0.614% 3/25/36 (k) | | 120,082 | | 941 |
Axon Financial Funding Ltd. Series 2007-1 Class A1, 1.181% 4/4/17 (b)(e)(k) | | 7,217,000 | | 1 |
Bank of America Auto Trust Series 2009-1A: | | | | |
Class A3, 2.67% 7/15/13 (e) | | 221,634 | | 221,848 |
Class A4, 3.52% 6/15/16 (e) | | 8,300,000 | | 8,421,563 |
BMW Vehicle Lease Trust: | | | | |
Series 2010-1 Class A3, 0.82% 4/15/13 | | 12,743,568 | | 12,757,046 |
Series 2011-1 Class A4, 1.4% 8/20/14 | | 11,060,000 | | 11,137,458 |
Brazos Higher Education Authority, Inc. Series 2006-2 Class A9, 0.5838% 12/25/24 (k) | | 1,400,411 | | 1,234,602 |
Capital Auto Receivables Asset Trust Series 2007-1 Class C, 5.38% 11/15/12 | | 582,000 | | 585,249 |
Capital One Multi-Asset Execution Trust Series 2008-A3 Class A3, 5.05% 2/15/16 | | 5,700,000 | | 5,986,350 |
Capital Trust Ltd. Series 2004-1: | | | | |
Class A2, 0.6955% 7/20/39 (e)(k) | | 276,986 | | 206,354 |
Class B, 0.9955% 7/20/39 (e)(k) | | 263,810 | | 108,162 |
Class C, 1.3455% 7/20/39 (e)(k) | | 339,379 | | 7,636 |
Capital Trust RE CDO Ltd./Capital Trust RE CDO Corp. Series 2005-3A: | | | | |
Class A2, 5.16% 6/25/35 (e) | | 848,404 | | 844,162 |
Class B, 5.267% 6/25/35 (e) | | 1,000,000 | | 950,000 |
CapitalSource Real Estate Loan Trust Series 2006-1A Class A2A, 0.8315% 1/20/37 (e)(k) | | 177,123 | | 143,636 |
Capmark VII Ltd. Series 2006-7A Class H, 1.7985% 8/15/36 (e)(k) | | 528,495 | | 0 |
Asset-Backed Securities - continued |
| Principal Amount (c) | | Value |
Carmax Auto Owner Trust Series 2011-1 Class A3, 1.29% 9/15/15 | | $ 8,210,000 | | $ 8,274,749 |
Carrington Mortgage Loan Trust Series 2007-RFC1 Class A3, 0.384% 12/25/36 (k) | | 1,802,588 | | 570,187 |
CBRE Realty Finance CDO LLC Series 2007-1A Class A1, 0.8325% 4/7/52 (e)(k) | | 1,111,372 | | 757,466 |
Chase Issuance Trust Series 2007-A17 Class A, 5.12% 10/15/14 | | 5,000,000 | | 5,148,852 |
Chrysler Financial Auto Securitization Trust Series 2010-A Class A3, 0.91% 8/8/13 | | 17,510,000 | | 17,529,457 |
Citibank Credit Card Issuance Trust Series 2009-A5 Class A5, 2.25% 12/23/14 | | 35,600,000 | | 36,117,485 |
Countrywide Asset-Backed Certificates Trust: | | | | |
Series 2007-11 Class 2A1, 0.304% 6/25/47 (k) | | 11,782 | | 11,650 |
Series 2007-4 Class A1A, 0.3963% 9/25/37 (k) | | 273,057 | | 266,159 |
Countrywide Home Loan Trust Series 2006-13 Class N, 7% 8/25/37 (e) | | 811,000 | | 0 |
Countrywide Home Loans, Inc.: | | | | |
Series 2003-BC1 Class B1, 5.5436% 3/25/32 (MGIC Investment Corp. Insured) (k) | | 11,800 | | 2,019 |
Series 2004-3 Class M4, 1.214% 4/25/34 (k) | | 159,665 | | 70,348 |
Series 2004-4 Class M2, 1.039% 6/25/34 (k) | | 587,945 | | 265,886 |
Series 2005-3 Class MV1, 0.664% 8/25/35 (k) | | 219,335 | | 216,302 |
Crest Clarendon Street Ltd./Crest Clarendon Corp. Series 2002-1A: | | | | |
Class B1, 6.065% 12/28/35 (e) | | 500,000 | | 410,000 |
Class B2, 1.9238% 12/28/35 (e)(k) | | 500,000 | | 350,000 |
Crest Dartmouth Street Ltd./Crest Dartmouth Street Corp. Series 2003-1A: | | | | |
Class B1, 2.0738% 6/28/38 (e)(k) | | 100,000 | | 88,750 |
Class D, 9% 6/28/38 (e) | | 200,000 | | 140,000 |
Deutsche Financial Capital Securitization LLC Series 1997-I Class M, 7.275% 9/15/27 | | 540,000 | | 495,526 |
Fannie Mae subordinate REMIC pass-thru certificates Series 2004-T5 Class AB3, 0.7513% 5/28/35 (k) | | 38,916 | | 24,977 |
Fieldstone Mortgage Investment Corp. Series 2004-3 Class M5, 2.419% 8/25/34 (k) | | 290,872 | | 169,523 |
First Franklin Mortgage Loan Trust Series 2004-FF2 Class M3, 1.069% 3/25/34 (k) | | 22,872 | | 2,455 |
Ford Credit Auto Lease Trust Series 2010-B Class A3, 0.91% 7/15/13 (e) | | 14,200,000 | | 14,213,190 |
Ford Credit Auto Owner Trust: | | | | |
Series 2009-D: | | | | |
Class A3, 2.17% 10/15/13 | | 1,493,398 | | 1,500,039 |
Asset-Backed Securities - continued |
| Principal Amount (c) | | Value |
Ford Credit Auto Owner Trust: - continued | | | | |
Series 2009-D: | | | | |
Class A4, 2.98% 8/15/14 | | $ 4,800,000 | | $ 4,900,017 |
Series 2010-B Class A3, 0.98% 10/15/14 | | 7,953,833 | | 7,978,427 |
Ford Credit Floorplan Master Owner Trust Series 2010-5 Class A1, 1.5% 9/15/15 | | 10,710,000 | | 10,813,801 |
Fremont Home Loan Trust: | | | | |
Series 2005-A: | | | | |
Class M3, 0.734% 1/25/35 (k) | | 948,695 | | 299,348 |
Class M4, 0.924% 1/25/35 (k) | | 363,547 | | 82,407 |
Series 2006-D Class M1, 0.474% 11/25/36 (k) | | 68,785 | | 276 |
GCO Education Loan Funding Master Trust II Series 2007-1A Class C1L, 0.8706% 2/25/47 (e)(k) | | 2,892,000 | | 1,012,200 |
GCO Slims Trust Series 2006-1A, 5.72% 3/1/22 (e) | | 1,281,987 | | 1,179,428 |
GE Business Loan Trust: | | | | |
Series 2003-1 Class A, 0.6785% 4/15/31 (e)(k) | | 213,676 | | 199,776 |
Series 2006-2A: | | | | |
Class A, 0.4285% 11/15/34 (e)(k) | | 1,913,934 | | 1,583,781 |
Class B, 0.5285% 11/15/34 (e)(k) | | 691,371 | | 445,934 |
Class C, 0.6285% 11/15/34 (e)(k) | | 1,149,030 | | 568,770 |
Class D, 0.9985% 11/15/34 (e)(k) | | 436,323 | | 95,991 |
Goal Capital Funding Trust Series 2007-1 Class C1, 0.9738% 6/25/42 (k) | | 543,917 | | 415,288 |
GSAMP Trust Series 2004-AR1 Class B4, 5% 6/25/34 (e)(k) | | 215,708 | | 63,042 |
Guggenheim Structured Real Estate Funding Ltd. Series 2006-3: | | | | |
Class B, 0.644% 9/25/46 (e)(k) | | 30,129 | | 30,117 |
Class C, 0.794% 9/25/46 (e)(k) | | 1,526,694 | | 778,614 |
Class E, 1.894% 9/25/46 (e)(k) | | 250,000 | | 4,725 |
Home Equity Asset Trust: | | | | |
Series 2003-2 Class M1, 1.564% 8/25/33 (k) | | 393,438 | | 267,740 |
Series 2003-3 Class M1, 1.534% 8/25/33 (k) | | 697,666 | | 503,317 |
Series 2003-5 Class A2, 0.944% 12/25/33 (k) | | 32,929 | | 23,987 |
Series 2005-5 Class 2A2, 0.494% 11/25/35 (k) | | 6,922 | | 6,912 |
Series 2006-1 Class 2A3, 0.469% 4/25/36 (k) | | 395,873 | | 392,574 |
Series 2006-3N Class B, 6.5% 8/27/36 (e) | | 250,000 | | 0 |
HSI Asset Securitization Corp. Trust Series 2007-HE1 Class 2A3, 0.434% 1/25/37 (k) | | 1,522,035 | | 443,376 |
Hyundai Auto Receivables Trust Series 2009-A Class A3, 2.03% 8/15/13 | | 1,533,679 | | 1,538,965 |
John Deere Owner Trust Series 2011-A Class A4, 1.96% 4/16/18 | | 4,810,000 | | 4,927,655 |
Asset-Backed Securities - continued |
| Principal Amount (c) | | Value |
JPMorgan Mortgage Acquisition Trust: | | | | |
Series 2006-NC2 Class M2, 0.544% 7/25/36 (k) | | $ 204,000 | | $ 3,897 |
Series 2007-CH1 Class AV4, 0.374% 11/25/36 (k) | | 1,520,141 | | 1,257,256 |
Keycorp Student Loan Trust: | | | | |
Series 1999-A Class A2, 0.9038% 12/27/29 (k) | | 593,668 | | 521,329 |
Series 2006-A Class 2C, 1.7238% 3/27/42 (k) | | 3,243,000 | | 869,380 |
Long Beach Mortgage Loan Trust: | | | | |
Series 2004-2 Class M2, 1.324% 6/25/34 (k) | | 84,170 | | 49,982 |
Series 2006-10 Class 2A3, 0.404% 11/25/36 (k) | | 5,521,861 | | 1,679,225 |
Marathon Real Estate CDO Ltd. Series 2006-1A Class B, 0.674% 5/25/46 (e)(k) | | 250,000 | | 112,500 |
Marriott Vacation Club Owner Trust Series 2006-2A: | | | | |
Class B, 5.442% 10/20/28 (e) | | 16,295 | | 16,530 |
Class C, 5.691% 10/20/28 (e) | | 7,242 | | 7,313 |
Class D, 6.01% 10/20/28 (e) | | 86,229 | | 86,707 |
MASTR Asset Backed Securities Trust Series 2007-HE1 Class M1, 0.544% 5/25/37 (k) | | 784,792 | | 13,571 |
Meritage Mortgage Loan Trust Series 2004-1 Class M1, 0.994% 7/25/34 (k) | | 168,695 | | 104,530 |
Merrill Lynch Mortgage Investors Trust: | | | | |
Series 2003-OPT1 Class M1, 1.219% 7/25/34 (k) | | 573,205 | | 384,377 |
Series 2006-FM1 Class A2B, 0.354% 4/25/37 (k) | | 1,672,878 | | 1,242,566 |
Series 2006-OPT1 Class A1A, 0.504% 6/25/35 (k) | | 2,960,520 | | 2,213,503 |
Morgan Stanley ABS Capital I Trust: | | | | |
Series 2004-HE6 Class A2, 0.584% 8/25/34 (k) | | 57,368 | | 44,034 |
Series 2004-NC8 Class M6, 1.494% 9/25/34 (k) | | 28,547 | | 16,261 |
Series 2005-NC1 Class M1, 0.684% 1/25/35 (k) | | 399,800 | | 252,476 |
Series 2005-NC2 Class B1, 1.414% 3/25/35 (k) | | 416,362 | | 52,726 |
Series 2007-HE2 Class M1, 0.494% 1/25/37 (k) | | 131,178 | | 381 |
N-Star Real Estate CDO Ltd. Series 1A: | | | | |
Class B1, 2.1656% 8/28/38 (e)(k) | | 220,000 | | 191,400 |
Class C1B, 7.696% 8/28/38 (e) | | 64,212 | | 52,936 |
National Collegiate Student Loan Trust: | | | | |
Series 2004-2 Class AIO, 9.75% 10/27/14 (m) | | 7,651,000 | | 516,443 |
Series 2006-4 Class D, 1.344% 5/25/32 (k) | | 2,481,000 | | 5,288 |
Series 2007-1 Class AIO, 7.27% 4/25/12 (m) | | 33,769,000 | | 540,304 |
Series 2007-2 Class AIO, 6.7% 7/25/12 (m) | | 24,102,186 | | 534,642 |
New Century Home Equity Loan Trust Series 2005-4 Class M2, 0.754% 9/25/35 (k) | | 1,426,957 | | 606,810 |
Nissan Auto Receivables Owner Trust: | | | | |
Series 2010-A Class A4, 1.31% 9/15/16 | | 5,950,000 | | 6,013,329 |
Series 2011-A Class A4, 1.94% 9/15/17 | | 11,750,000 | | 12,084,617 |
Asset-Backed Securities - continued |
| Principal Amount (c) | | Value |
Ocala Funding LLC: | | | | |
Series 2005-1A Class A, 1.7455% 3/20/10 (b)(e)(k) | | $ 566,000 | | $ 0 |
Series 2006-1A Class A, 1.6455% 3/20/11 (b)(e)(k) | | 1,176,000 | | 0 |
Option One Mortgage Loan Trust: | | | | |
Series 2007-5 Class 2A1, 0.334% 5/25/37 (k) | | 19,223 | | 19,101 |
Series 2007-6 Class 2A1, 0.304% 7/25/37 (k) | | 99,166 | | 97,613 |
Park Place Securities, Inc.: | | | | |
Series 2004-WCW1: | | | | |
Class M3, 1.494% 9/25/34 (k) | | 532,896 | | 224,703 |
Class M4, 1.694% 9/25/34 (k) | | 683,353 | | 149,324 |
Series 2005-WCH1 Class M4, 1.074% 1/25/36 (k) | | 1,475,804 | | 657,425 |
Prima Capital CDO Ltd./Prima Capital CDO Corp. Series 2005-1A: | | | | |
Class B, 4.846% 7/24/39 (e) | | 147,188 | | 144,244 |
Class C, 5.08% 7/24/39 (e) | | 185,000 | | 178,988 |
Class D, 5.194% 7/24/39 (e) | | 320,000 | | 300,800 |
Prima Capital Ltd. Series 2006-CR1A Class A2, 5.533% 12/28/48 (e) | | 280,000 | | 266,000 |
Resource Real Estate Funding CDO Series 2007-1A Class J, 3.194% 9/25/46 (e)(k) | | 250,000 | | 37,500 |
Salomon Brothers Mortgage Securities VII, Inc. Series 2003-HE1 Class A, 1.044% 4/25/33 (k) | | 5,108 | | 4,136 |
Saxon Asset Securities Trust Series 2004-1 Class M1, 1.039% 3/25/35 (k) | | 1,335,965 | | 814,955 |
Sierra Receivables Funding Co. Series 2007-1A Class A2, 0.4309% 3/20/19 (FGIC Insured) (e)(k) | | 542,580 | | 519,599 |
SLM Private Credit Student Loan Trust Series 2004-A Class C, 1.4963% 6/15/33 (k) | | 1,272,000 | | 577,106 |
Specialty Underwriting & Residential Finance Trust Series 2006-AB2 Class N1, 5.75% 6/25/37 (e) | | 656,637 | | 0 |
Structured Asset Investment Loan Trust Series 2004-8 Class M5, 1.969% 9/25/34 (k) | | 65,143 | | 20,857 |
SVO VOI Mortgage Corp. Series 2006-AA Class A, 5.28% 2/20/24 (e) | | 575,472 | | 594,242 |
Terwin Mortgage Trust Series 2003-4HE Class A1, 1.104% 9/25/34 (k) | | 28,819 | | 21,391 |
TIAA Real Estate CDO Ltd./TIAA Real Estate CDO Corp.: | | | | |
Series 2002-1A: | | | | |
Class IIFX, 6.77% 5/22/37 (e) | | 244,008 | | 244,008 |
Class IV, 6.84% 5/22/37 (e) | | 235,000 | | 210,913 |
Series 2003-1A Class B2, 5.4802% 12/28/38 (e) | | 111,000 | | 92,130 |
Trapeza CDO XII Ltd./Trapeza CDO XII, Inc. Series 2007-12A Class B, 1.1425% 4/6/42 (e)(k) | | 2,632,814 | | 78,984 |
Asset-Backed Securities - continued |
| Principal Amount (c) | | Value |
Wachovia Ltd./Wachovia LLC: | | | | |
Series 2006-1 Class 1ML, 0% 9/25/26 (e)(k) | | $ 400,000 | | $ 168,000 |
Series 2006-1A: | | | | |
Class A1A, 0.8338% 9/25/26 (e)(k) | | 1,374,838 | | 1,209,857 |
Class A1B, 0.9038% 9/25/26 (e)(k) | | 1,033,000 | | 785,080 |
Class A2A, 0.7938% 9/25/26 (e)(k) | | 902,937 | | 812,643 |
Class A2B, 0.8838% 9/25/26 (e)(k) | | 250,000 | | 207,500 |
Class B, 0.9338% 9/25/26 (e)(k) | | 250,000 | | 187,500 |
Class F, 1.7238% 9/25/26 (e)(k) | | 250,000 | | 167,500 |
Class G, 1.9238% 9/25/26 (e)(k) | | 320,000 | | 208,000 |
WaMu Asset Holdings Corp. Series 2006-8 Class N1, 6.048% 10/25/46 (e) | | 887,552 | | 0 |
Wells Fargo Home Equity Trust Series 2004-3 Class A, 4.5% 11/27/34 (e) | | 7,576 | | 0 |
Whinstone Capital Management Ltd. Series 1A Class B3, 2.3601% 10/25/44 (e)(k) | | 1,789,540 | | 948,456 |
Wrightwood Capital Real Estate CDO Ltd. Series 2005-1A: | | | | |
Class A1, 0.8131% 11/21/40 (e)(k) | | 500,000 | | 385,000 |
Class D, 1.3431% 11/21/40 (e)(k) | | 305,000 | | 91,500 |
TOTAL ASSET-BACKED SECURITIES (Cost $295,817,785) |
298,586,531
|
Collateralized Mortgage Obligations - 0.8% |
|
Private Sponsor - 0.8% |
ABN AMRO Mortgage Corp. Series 2003-9 Class B5, 4.5164% 8/25/18 (e) | | 172,852 | | 22,471 |
Bayview Commercial Asset Trust Series 2006-3A, Class IO, 3.9431% 10/25/36 (e)(k)(m) | | 9,375,877 | | 448,123 |
Bear Stearns ALT-A Trust floater Series 2005-1 Class A1, 0.804% 1/25/35 (k) | | 1,912,591 | | 1,451,121 |
Cobalt CMBS Commercial Mortgage Trust Series 2007-C2 Class B, 5.617% 4/15/47 (k) | | 2,125,000 | | 467,500 |
COMM pass-thru certificates floater Series 2001-J2A Class A2F, 0.7475% 7/16/34 (e)(k) | | 20,551 | | 20,541 |
Countrywide Alternative Loan Trust Series 2006-OC5N Class N, 7.25% 7/25/37 (e) | | 78,237 | | 0 |
Countrywide Home Loans, Inc.: | | | | |
Series 2003-28 Class B3, 5.5% 8/25/33 | | 54,117 | | 26,610 |
Series 2003-35 Class B, 4.6374% 9/25/18 (k) | | 86,087 | | 12,052 |
Credit Suisse First Boston Mortgage Securities Corp.: | | | | |
Series 2003-17 Class B4, 5.389% 6/25/33 (k) | | 232,626 | | 62,809 |
Collateralized Mortgage Obligations - continued |
| Principal Amount (c) | | Value |
Private Sponsor - continued |
Credit Suisse First Boston Mortgage Securities Corp.: - continued | | | | |
Series 2004-3 Class DB4, 5.8243% 4/25/34 (k) | | $ 38,184 | | $ 48 |
CWALT, Inc.: | | | | |
floater Series 2005-56: | | | | |
Class 1A1, 0.974% 11/25/35 (k) | | 31,256,081 | | 16,655,387 |
Class 2A3, 1.6967% 11/25/35 (k) | | 7,463,139 | | 4,232,290 |
Series 2005-56 Class 5A1, 0.564% 11/25/35 (k) | | 9,191,811 | | 4,816,838 |
First Horizon Mortgage pass-thru Trust Series 2004-AR5 Class 2A1, 2.631% 10/25/34 (k) | | 1,423,564 | | 1,310,526 |
FREMF Mortgage Trust: | | | | |
Series 2010 K7 Class B, 5.6185% 4/25/20 (e)(k) | | 1,000,000 | | 1,036,014 |
Series 2010-K6 Class B, 5.5326% 12/25/46 (e)(k) | | 910,000 | | 938,251 |
GMAC Commercial Mortgage Securities, Inc. Series 1993-C3 Class L, 6.974% 8/15/36 | | 8,166 | | 4 |
GMAC Mortgage Loan Trust Series 2003-J10 Class B2, 4.75% 1/25/19 (e) | | 67,876 | | 13,575 |
Granite Master Issuer PLC floater: | | | | |
Series 2005-4 Class C2, 1.3455% 12/20/54 (k) | | 205,017 | | 124,643 |
Series 2006-1A Class C2, 1.4455% 12/20/54 (e)(k) | | 6,523,000 | | 3,979,030 |
Series 2006-2 Class C1, 1.1855% 12/20/54 (k) | | 21,543,000 | | 13,141,230 |
Series 2006-3 Class C2, 0.7455% 12/20/54 (k) | | 1,124,000 | | 685,640 |
Series 2006-4: | | | | |
Class B1, 0.4255% 12/20/54 (k) | | 4,521,000 | | 3,806,682 |
Class C1, 1.0055% 12/20/54 (k) | | 2,767,000 | | 1,687,870 |
Class M1, 0.5855% 12/20/54 (k) | | 1,190,000 | | 907,375 |
Series 2007-1: | | | | |
Class 1C1, 0.8455% 12/20/54 (k) | | 2,234,000 | | 1,362,740 |
Class 1M1, 0.5455% 12/20/54 (k) | | 1,493,000 | | 1,138,413 |
Class 2C1, 1.2055% 12/20/54 (k) | | 1,015,000 | | 619,150 |
Class 2M1, 0.7455% 12/20/54 (k) | | 1,917,000 | | 1,461,713 |
Series 2007-2 Class 2C1, 0.676% 12/17/54 (k) | | 2,654,000 | | 1,618,940 |
Granite Mortgages PLC floater Series 2003-3 Class 1C, 3.0112% 1/20/44 (k) | | 430,241 | | 308,827 |
GSR Mortgage Loan Trust floater Series 2007-AR1 Class 6A1, 4.7361% 3/25/37 (k) | | 5,447,521 | | 5,455,344 |
JPMorgan Chase Commercial Mortgage Securities Trust Series 2007-CB18 Class A3, 5.447% 6/12/47 (k) | | 3,229,003 | | 3,400,234 |
JPMorgan Mortgage Trust sequential payer Series 2006-A5 Class 3A5, 5.8155% 8/25/36 (k) | | 2,346,797 | | 1,770,199 |
LB-UBS Commercial Mortgage Trust sequential payer Series 2006-C6 Class A4, 5.372% 9/15/39 | | 857,000 | | 970,614 |
Collateralized Mortgage Obligations - continued |
| Principal Amount (c) | | Value |
Private Sponsor - continued |
Luminent Mortgage Trust: | | | | |
floater Series 2006-1 Class A1, 0.484% 4/25/36 (k) | | $ 16,721,726 | | $ 8,708,894 |
Series 2006-5 Class A1A, 0.434% 7/25/36 (k) | | 12,554,996 | | 5,910,534 |
MASTR Adjustable Rate Mortgages Trust Series 2007-3 Class 22A2, 0.454% 5/25/47 (k) | | 2,694,571 | | 1,583,833 |
Merrill Lynch Alternative Note Asset Trust floater Series 2007-OAR1 Class A1, 0.414% 2/25/37 (k) | | 6,612,782 | | 4,444,414 |
Merrill Lynch Mortgage Investors Trust Series 1998-C3 Class F, 6% 12/15/30 (e) | | 930,000 | | 960,258 |
Merrill Lynch Mortgage Trust Series 2002-MW1 Class E, 6.219% 7/12/34 (e) | | 101,000 | | 101,175 |
Opteum Mortgage Acceptance Corp. floater Series 2005-3 Class APT, 0.534% 7/25/35 (k) | | 1,998,079 | | 1,554,231 |
RESI Finance LP/RESI Finance DE Corp. floater Series 2003-B: | | | | |
Class B5, 2.6048% 7/10/35 (e)(k) | | 1,306,361 | | 1,061,149 |
Class B6, 3.1048% 7/10/35 (e)(k) | | 291,271 | | 231,808 |
Residential Funding Securities Corp. floater Series 2003-RP2 Class A1, 0.694% 6/25/33 (e)(k) | | 279,432 | | 259,636 |
Salomon Brothers Mortgage Securities VII, Inc. Series 2006-C2 Class H, 6.308% 7/18/33 (e) | | 268,000 | | 91,311 |
Sequoia Mortgage Trust floater Series 2004-6 Class A3B, 1.668% 7/20/34 (k) | | 35,733 | | 25,749 |
Structured Asset Mortgage Investments, Inc. floater Series 2006-AR6 Class 2A1, 0.434% 7/25/46 (k) | | 25,594,134 | | 13,366,311 |
Structured Asset Securities Corp. Series 2003-15A Class 4A, 5.3281% 4/25/33 (k) | | 486,310 | | 450,271 |
TBW Mortgage-Backed pass-thru certificates floater Series 2006-4 Class A3, 0.4763% 9/25/36 (k) | | 3,273,627 | | 2,496,760 |
Wells Fargo Mortgage Backed Securities Trust: | | | | |
Series 2003-12 Class B6, 4.75% 11/25/18 (e) | | 132,742 | | 46,460 |
Series 2005-AR2 Class 1A2, 2.67% 3/25/35 (k) | | 3,182,884 | | 1,020,217 |
TOTAL PRIVATE SPONSOR | | 116,265,815 |
U.S. Government Agency - 0.0% |
Fannie Mae subordinate REMIC pass-thru certificates planned amortization class Series 2002-9 Class PC, 6% 3/25/17 | | 225,450 | | 242,591 |
TOTAL COLLATERALIZED MORTGAGE OBLIGATIONS (Cost $107,382,161) |
116,508,406
|
Commercial Mortgage Securities - 5.0% |
| Principal Amount (c) | | Value |
ACGS Series 2004-1 Class P, 7.4651% 8/1/19 (n) | | $ 566,664 | | $ 547,207 |
Americold LLC Trust Series 2010-ARTA Class D, 7.443% 1/14/29 (e) | | 180,000 | | 196,048 |
Asset Securitization Corp.: | | | | |
Series 1996-D2 Class B1A, 8.9457% 2/14/29 (e)(k) | | 800,000 | | 798,715 |
Series 1997-D4: | | | | |
Class B1, 7.525% 4/14/29 | | 113,757 | | 113,909 |
Class B2, 7.525% 4/14/29 | | 1,498,104 | | 1,511,572 |
Class B5, 7.525% 4/14/29 | | 129,000 | | 110,100 |
Series 1997-D5: | | | | |
Class A2, 7.0826% 2/14/43 (k) | | 1,399,000 | | 1,414,709 |
Class A3, 7.1326% 2/14/43 (k) | | 1,510,000 | | 1,537,219 |
Class A5, 7.2026% 2/14/43 (k) | | 256,000 | | 261,474 |
Class A6, 7.4526% 2/14/43 (k) | | 2,470,000 | | 2,517,498 |
Class A7, 7.6926% 2/14/43 (k) | | 820,000 | | 827,814 |
Class PS1, 1.4363% 2/14/43 (k)(m) | | 5,090,541 | | 56,103 |
Banc of America Commercial Mortgage Trust: | | | | |
sequential payer: | | | | |
Series 2006-2 Class AAB, 5.9028% 5/10/45 (k) | | 1,860,938 | | 1,985,606 |
Series 2006-5: | | | | |
Class A2, 5.317% 9/10/47 | | 6,242,645 | | 6,336,753 |
Class A3, 5.39% 9/10/47 | | 2,653,000 | | 2,802,993 |
Series 2006-6 Class A3, 5.369% 10/10/45 | | 3,804,000 | | 4,057,628 |
Series 2007-4 Class A3, 5.9813% 2/10/51 (k) | | 1,897,000 | | 2,015,151 |
Series 2006-6 Class E, 5.619% 10/10/45 (e) | | 1,098,000 | | 222,455 |
Series 2007-3: | | | | |
Class A3, 5.8426% 6/10/49 (k) | | 3,176,000 | | 3,328,940 |
Class A4, 5.8426% 6/10/49 (k) | | 3,965,000 | | 4,382,102 |
Series 2008-1 Class D, 6.4378% 2/10/51 (e)(k) | | 125,000 | | 72,304 |
Banc of America Commercial Mortgage, Inc.: | | | | |
sequential payer: | | | | |
Series 2001-1 Class A4, 5.451% 1/15/49 | | 4,166,000 | | 4,695,090 |
Series 2002-2 Class F, 5.487% 7/11/43 | | 415,000 | | 421,165 |
Series 2004-2: | | | | |
Class A3, 4.05% 11/10/38 | | 261,164 | | 265,027 |
Class A4, 4.153% 11/10/38 | | 2,412,000 | | 2,505,460 |
Series 2005-1 Class A3, 4.877% 11/10/42 | | 868,339 | | 867,997 |
Series 2007-1 Class A2, 5.381% 1/15/49 | | 1,776,041 | | 1,774,458 |
Series 2001-3 Class H, 6.562% 4/11/37 (e) | | 1,472,000 | | 1,475,932 |
Series 2001-PB1: | | | | |
Class J, 7.166% 5/11/35 (e) | | 177,085 | | 177,141 |
Class K, 6.15% 5/11/35 (e) | | 885,000 | | 862,097 |
Series 2003-1 Class G, 5.608% 9/11/36 (e) | | 310,000 | | 313,863 |
Commercial Mortgage Securities - continued |
| Principal Amount (c) | | Value |
Banc of America Commercial Mortgage, Inc.: - continued | | | | |
Series 2004-1 Class F, 5.279% 11/10/39 (e) | | $ 185,000 | | $ 148,361 |
Series 2004-4: | | | | |
Class K, 4.637% 7/10/42 (e)(k) | | 300,000 | | 2,400 |
Class L, 4.637% 7/10/42 (e)(k) | | 280,000 | | 560 |
Series 2004-5 Class G, 5.7521% 11/10/41 (e)(k) | | 195,000 | | 137,310 |
Series 2005-1 Class CJ, 5.3555% 11/10/42 (k) | | 550,000 | | 559,441 |
Series 2005-3 Class A3B, 5.09% 7/10/43 (k) | | 5,908,000 | | 6,268,713 |
Series 2005-6 Class AJ, 5.3664% 9/10/47 (k) | | 300,000 | | 307,872 |
Banc of America Large Loan Trust floater Series 2010-HLTN Class HLTN, 1.999% 11/15/15 (e)(k) | | 854,014 | | 795,344 |
Banc of America Large Loan, Inc. floater: | | | | |
Series 2005-MIB1: | | | | |
Class B, 0.5085% 3/15/22 (e)(k) | | 297,513 | | 288,587 |
Class C, 0.5585% 3/15/22 (e)(k) | | 1,357,000 | | 1,316,290 |
Class D, 0.6085% 3/15/22 (e)(k) | | 826,000 | | 801,220 |
Class E, 0.6485% 3/15/22 (e)(k) | | 684,000 | | 663,480 |
Class F, 0.7185% 3/15/22 (e)(k) | | 615,784 | | 591,153 |
Class G, 0.7785% 3/15/22 (e)(k) | | 399,119 | | 375,172 |
Class J, 1.2985% 3/15/22 (e)(k) | | 438,000 | | 398,580 |
Class K, 2.2485% 3/15/22 (e)(k) | | 427,499 | | 235,124 |
Series 2006-BIX1: | | | | |
Class D, 0.4585% 10/15/19 (e)(k) | | 1,367,238 | | 1,312,549 |
Class E, 0.4885% 10/15/19 (e)(k) | | 1,385,000 | | 1,315,750 |
Class F, 0.5585% 10/15/19 (e)(k) | | 3,150,730 | | 2,961,686 |
Class G, 0.5785% 10/15/19 (e)(k) | | 1,245,579 | | 1,108,565 |
Bayview Commercial Asset Trust: | | | | |
floater: | | | | |
Series 2003-2 Class M1, 1.094% 12/25/33 (e)(k) | | 65,715 | | 46,539 |
Series 2004-1: | | | | |
Class A, 0.604% 4/25/34 (e)(k) | | 1,135,647 | | 914,196 |
Class B, 2.144% 4/25/34 (e)(k) | | 127,322 | | 73,623 |
Class M1, 0.804% 4/25/34 (e)(k) | | 102,225 | | 71,158 |
Class M2, 1.444% 4/25/34 (e)(k) | | 94,442 | | 65,457 |
Series 2005-2A: | | | | |
Class A1, 0.554% 8/25/35 (e)(k) | | 1,622,513 | | 1,059,196 |
Class M1, 0.674% 8/25/35 (e)(k) | | 80,803 | | 41,582 |
Class M2, 0.724% 8/25/35 (e)(k) | | 133,271 | | 60,689 |
Class M3, 0.744% 8/25/35 (e)(k) | | 73,735 | | 29,348 |
Series 2005-3A: | | | | |
Class A2, 0.644% 11/25/35 (e)(k) | | 590,756 | | 390,268 |
Class M1, 0.684% 11/25/35 (e)(k) | | 70,506 | | 40,432 |
Commercial Mortgage Securities - continued |
| Principal Amount (c) | | Value |
Bayview Commercial Asset Trust: - continued | | | | |
floater: | | | | |
Series 2005-3A: | | | | |
Class M2, 0.734% 11/25/35 (e)(k) | | $ 89,515 | | $ 49,322 |
Class M3, 0.754% 11/25/35 (e)(k) | | 80,115 | | 42,286 |
Class M4, 0.844% 11/25/35 (e)(k) | | 99,815 | | 48,206 |
Series 2005-4A: | | | | |
Class A2, 0.634% 1/25/36 (e)(k) | | 1,339,119 | | 830,137 |
Class B1, 1.644% 1/25/36 (e)(k) | | 115,723 | | 15,350 |
Class M1, 0.694% 1/25/36 (e)(k) | | 431,974 | | 186,423 |
Class M2, 0.714% 1/25/36 (e)(k) | | 129,592 | | 50,302 |
Class M3, 0.744% 1/25/36 (e)(k) | | 189,259 | | 66,206 |
Class M4, 0.854% 1/25/36 (e)(k) | | 104,671 | | 32,523 |
Class M5, 0.894% 1/25/36 (e)(k) | | 104,671 | | 28,325 |
Class M6, 0.944% 1/25/36 (e)(k) | | 111,172 | | 21,491 |
Series 2006-1: | | | | |
Class A2, 0.604% 4/25/36 (e)(k) | | 209,394 | | 144,837 |
Class M1, 0.624% 4/25/36 (e)(k) | | 74,891 | | 42,348 |
Class M2, 0.644% 4/25/36 (e)(k) | | 79,128 | | 41,685 |
Class M3, 0.664% 4/25/36 (e)(k) | | 68,083 | | 33,509 |
Class M4, 0.764% 4/25/36 (e)(k) | | 38,580 | | 17,350 |
Class M5, 0.804% 4/25/36 (e)(k) | | 37,446 | | 14,986 |
Class M6, 0.884% 4/25/36 (e)(k) | | 74,664 | | 28,394 |
Series 2006-2A: | | | | |
Class A1, 0.474% 7/25/36 (e)(k) | | 3,732,269 | | 2,363,036 |
Class A2, 0.524% 7/25/36 (e)(k) | | 184,648 | | 110,789 |
Class B1, 1.114% 7/25/36 (e)(k) | | 69,135 | | 8,158 |
Class B3, 2.944% 7/25/36 (e)(k) | | 104,452 | | 4,257 |
Class M1, 0.554% 7/25/36 (e)(k) | | 193,735 | | 77,623 |
Class M2, 0.574% 7/25/36 (e)(k) | | 136,689 | | 49,292 |
Class M3, 0.594% 7/25/36 (e)(k) | | 113,381 | | 36,863 |
Class M4, 0.664% 7/25/36 (e)(k) | | 76,562 | | 22,047 |
Class M5, 0.714% 7/25/36 (e)(k) | | 94,102 | | 23,322 |
Class M6, 0.784% 7/25/36 (e)(k) | | 140,402 | | 22,559 |
Series 2006-3A: | | | | |
Class B1, 1.044% 10/25/36 (e)(k) | | 134,709 | | 2,690 |
Class M4, 0.674% 10/25/36 (e)(k) | | 150,266 | | 14,769 |
Class M5, 0.724% 10/25/36 (e)(k) | | 179,890 | | 13,095 |
Class M6, 0.804% 10/25/36 (e)(k) | | 352,527 | | 16,321 |
Series 2006-4A: | | | | |
Class A1, 0.474% 12/25/36 (e)(k) | | 778,249 | | 514,861 |
Class A2, 0.514% 12/25/36 (e)(k) | | 3,959,931 | | 2,019,565 |
Class B1, 0.944% 12/25/36 (e)(k) | | 121,078 | | 11,311 |
Class B2, 1.494% 12/25/36 (e)(k) | | 123,415 | | 7,370 |
Class B3, 2.694% 12/25/36 (e)(k) | | 75,445 | | 1,557 |
Commercial Mortgage Securities - continued |
| Principal Amount (c) | | Value |
Bayview Commercial Asset Trust: - continued | | | | |
floater: | | | | |
Series 2006-4A: | | | | |
Class M1, 0.534% 12/25/36 (e)(k) | | $ 253,315 | | $ 96,533 |
Class M2, 0.554% 12/25/36 (e)(k) | | 168,877 | | 56,800 |
Class M3, 0.584% 12/25/36 (e)(k) | | 171,238 | | 49,945 |
Class M4, 0.644% 12/25/36 (e)(k) | | 204,896 | | 47,492 |
Class M5, 0.684% 12/25/36 (e)(k) | | 188,362 | | 31,083 |
Class M6, 0.764% 12/25/36 (e)(k) | | 168,877 | | 20,617 |
Series 2007-1: | | | | |
Class A2, 0.514% 3/25/37 (e)(k) | | 861,239 | | 413,395 |
Class B1, 0.914% 3/25/37 (e)(k) | | 274,013 | | 19,764 |
Class B2, 1.394% 3/25/37 (e)(k) | | 175,766 | | 7,564 |
Class M1, 0.514% 3/25/37 (e)(k) | | 241,100 | | 78,699 |
Class M2, 0.534% 3/25/37 (e)(k) | | 180,074 | | 46,693 |
Class M3, 0.564% 3/25/37 (e)(k) | | 159,701 | | 31,966 |
Class M4, 0.614% 3/25/37 (e)(k) | | 128,348 | | 18,998 |
Class M5, 0.664% 3/25/37 (e)(k) | | 200,354 | | 25,244 |
Class M6, 0.744% 3/25/37 (e)(k) | | 280,509 | | 28,936 |
Series 2007-2A: | | | | |
Class A1, 0.514% 7/25/37 (e)(k) | | 802,823 | | 413,956 |
Class A2, 0.564% 7/25/37 (e)(k) | | 750,129 | | 262,545 |
Class B1, 1.844% 7/25/37 (e)(k) | | 231,019 | | 8,791 |
Class B2, 2.494% 7/25/37 (e)(k) | | 74,211 | | 3,926 |
Class M1, 0.614% 7/25/37 (e)(k) | | 263,403 | | 39,906 |
Class M2, 0.654% 7/25/37 (e)(k) | | 143,934 | | 15,873 |
Class M3, 0.734% 7/25/37 (e)(k) | | 145,942 | | 12,791 |
Class M4, 0.894% 7/25/37 (e)(k) | | 288,138 | | 22,496 |
Class M5, 0.994% 7/25/37 (e)(k) | | 253,999 | | 16,606 |
Class M6, 1.244% 7/25/37 (e)(k) | | 322,055 | | 16,789 |
Series 2007-3: | | | | |
Class A2, 0.534% 7/25/37 (e)(k) | | 802,070 | | 343,136 |
Class B1, 1.194% 7/25/37 (e)(k) | | 194,948 | | 16,261 |
Class B2, 1.844% 7/25/37 (e)(k) | | 487,850 | | 25,988 |
Class B3, 4.244% 7/25/37 (e)(k) | | 60,124 | | 1,359 |
Class M1, 0.554% 7/25/37 (e)(k) | | 174,202 | | 57,498 |
Class M2, 0.584% 7/25/37 (e)(k) | | 186,713 | | 50,676 |
Class M3, 0.614% 7/25/37 (e)(k) | | 294,214 | | 64,743 |
Class M4, 0.744% 7/25/37 (e)(k) | | 461,959 | | 81,507 |
Class M5, 0.844% 7/25/37 (e)(k) | | 239,618 | | 31,933 |
Class M6, 1.044% 7/25/37 (e)(k) | | 182,715 | | 19,943 |
Series 2007-4A: | | | | |
Class B1, 2.794% 9/25/37 (e)(k) | | 196,665 | | 7,075 |
Class M1, 1.194% 9/25/37 (e)(k) | | 297,810 | | 26,096 |
Class M2, 1.294% 9/25/37 (e)(k) | | 297,810 | | 18,083 |
Commercial Mortgage Securities - continued |
| Principal Amount (c) | | Value |
Bayview Commercial Asset Trust: - continued | | | | |
floater: | | | | |
Series 2007-4A: | | | | |
Class M4, 1.844% 9/25/37 (e)(k) | | $ 761,697 | | $ 32,898 |
Class M5, 1.994% 9/25/37 (e)(k) | | 761,697 | | 24,284 |
Class M6, 2.194% 9/25/37 (e)(k) | | 763,176 | | 15,653 |
Series 2004-1, Class IO, 1.25% 4/25/34 (e)(m) | | 3,557,205 | | 129,838 |
Series 2007-5A, Class IO, 4.1484% 10/25/37 (e)(k)(m) | | 8,807,364 | | 833,171 |
Bear Stearns Commercial Mortgage Securities, Inc. Series 2006-PW11 Class AJ, 5.6187% 3/11/39 (k) | | 450,000 | | 420,982 |
Bear Stearns Commercial Mortgage Securities Trust: | | | | |
floater: | | | | |
Series 2006-BBA7: | | | | |
Class H, 0.8985% 3/15/19 (e)(k) | | 416,945 | | 400,453 |
Class J, 1.0985% 3/15/19 (e)(k) | | 407,118 | | 350,222 |
Series 2007-BBA8: | | | | |
Class D, 0.4985% 3/15/22 (e)(k) | | 655,330 | | 562,281 |
Class E, 0.5485% 3/15/22 (e)(k) | | 3,607,157 | | 3,058,912 |
Class F, 0.5985% 3/15/22 (e)(k) | | 2,235,922 | | 1,851,370 |
Class G, 0.6485% 3/15/22 (e)(k) | | 537,549 | | 439,722 |
Class H, 0.7985% 3/15/22 (e)(k) | | 655,330 | | 522,961 |
Class J, 0.9485% 3/15/22 (e)(k) | | 655,330 | | 509,855 |
sequential payer: | | | | |
Series 2003-PWR2 Class A3, 4.834% 5/11/39 | | 100,492 | | 100,634 |
Series 2004-PWR3 Class A3, 4.487% 2/11/41 | | 560,457 | | 571,386 |
Series 2006-PW14 Class AM, 5.243% 12/11/38 | | 600,000 | | 617,755 |
Series 2006-T22 Class AJ, 5.7044% 4/12/38 (k) | | 400,000 | | 370,403 |
Series 2007-PW16 Class A4, 5.9038% 6/11/40 (k) | | 1,112,000 | | 1,275,869 |
Series 1999-C1: | | | | |
Class G, 5.64% 2/14/31 (e) | | 70,000 | | 70,904 |
Class I, 5.64% 2/14/31 (e) | | 198,779 | | 137,810 |
Series 2003-T10 Class B, 4.84% 3/13/40 | | 1,000,000 | | 1,019,028 |
Series 2006-PW13 Class A3, 5.518% 9/11/41 | | 6,714,000 | | 7,013,209 |
Series 2006-PW14 Class X2, 0.8632% 12/11/38 (e)(k)(m) | | 20,026,973 | | 238,257 |
Series 2006-T22: | | | | |
Class A4, 5.7044% 4/12/38 (k) | | 237,000 | | 269,273 |
Class B, 5.7044% 4/12/38 (e)(k) | | 200,000 | | 161,571 |
Series 2006-T24 Class X2, 0.6237% 10/12/41 (e)(k)(m) | | 3,435,357 | | 25,611 |
Series 2007-BBA8: | | | | |
Class K, 1.4485% 3/15/22 (e)(k) | | 120,000 | | 77,761 |
Class L, 2.1485% 3/15/22 (e)(k) | | 253,498 | | 81,883 |
Commercial Mortgage Securities - continued |
| Principal Amount (c) | | Value |
Bear Stearns Commercial Mortgage Securities Trust: - continued | | | | |
Series 2007-PW18 Class X2, 0.4796% 6/11/50 (e)(k)(m) | | $ 133,870,169 | | $ 1,498,677 |
Series 2007-T28 Class X2, 0.3272% 9/11/42 (e)(k)(m) | | 72,025,455 | | 471,407 |
Beckman Coulter, Inc. sequential payer Series 2000-A Class A, 7.4975% 12/15/18 (e) | | 326,945 | | 326,127 |
C-BASS Trust floater Series 2006-SC1 Class A, 0.514% 5/25/36 (e)(k) | | 730,759 | | 602,581 |
CDC Commercial Mortgage Trust Series 2002-FX1: | | | | |
Class G, 6.625% 5/15/35 (e) | | 2,235,000 | | 2,330,750 |
Class XCL, 1.5913% 5/15/35 (e)(k)(m) | | 7,816,648 | | 182,917 |
CFCRE Commercial Mortgage Trust Series 2011-C2 Class B, 5.7454% 12/15/47 (e)(k) | | 750,000 | | 764,264 |
Chase Commercial Mortgage Securities Corp.: | | | | |
Series 1998-1 Class H, 6.34% 5/18/30 (e) | | 800,000 | | 681,686 |
Series 1998-2 Class J, 6.39% 11/18/30 (e) | | 489,102 | | 330,222 |
Chase Manhattan Bank-First Union National Bank Commercial Mortgage Trust Series 1999-1 Class G, 6.4% 8/15/31 (e) | | 174,355 | | 179,735 |
Citigroup Commercial Mortgage Trust: | | | | |
floater Series 2006-FL2: | | | | |
Class G, 0.5835% 8/15/21 (e)(k) | | 255,108 | | 243,141 |
Class H, 0.6235% 8/15/21 (e)(k) | | 433,548 | | 405,160 |
Series 2006-C5 Class AMP2, 5.5005% 10/15/49 (e) | | 2,818,559 | | 2,686,532 |
Series 2007-C6 Class A1, 5.622% 12/10/49 (k) | | 6,336,472 | | 6,336,631 |
Series 2007-FL3A Class A2, 0.3885% 4/15/22 (e)(k) | | 1,587,295 | | 1,498,097 |
Series 2008-C7 Class A2B, 6.2764% 12/10/49 (k) | | 1,792,607 | | 1,844,983 |
Citigroup/Deutsche Bank Commercial Mortgage Trust: | | | | |
sequential payer Series 2007-CD4 Class A4, 5.322% 12/11/49 | | 14,623,000 | | 16,048,772 |
Series 2007-CD4: | | | | |
Class A3, 5.293% 12/11/49 | | 1,852,000 | | 1,979,453 |
Class C, 5.476% 12/11/49 | | 3,581,000 | | 1,025,982 |
Claregold Trust Series 2007-2A: | | | | |
Class F, 5.01% 5/15/44 (e)(k) | CAD | 138,000 | | 104,819 |
Class G, 5.01% 5/15/44 (e)(k) | CAD | 30,000 | | 21,675 |
Class H, 5.01% 5/15/44 (e)(k) | CAD | 20,000 | | 11,660 |
Class J, 5.01% 5/15/44 (e)(k) | CAD | 20,000 | | 10,936 |
Class K, 5.01% 5/15/44 (e)(k) | CAD | 10,000 | | 4,631 |
Class L, 5.01% 5/15/44 (e)(k) | CAD | 36,000 | | 15,387 |
Class M, 5.01% 5/15/44 (e)(k) | CAD | 165,000 | | 65,206 |
Commercial Mortgage Securities - continued |
| Principal Amount (c) | | Value |
Cobalt CMBS Commercial Mortgage Trust: | | | | |
sequential payer Series 2007-C3 Class A3, 6.0104% 5/15/46 (k) | | $ 1,902,000 | | $ 2,041,032 |
Series 2006-C1 Class B, 5.359% 8/15/48 | | 5,706,000 | | 342,360 |
COMM pass-thru certificates: | | | | |
floater: | | | | |
Series 2005-F10A: | | | | |
Class G, 0.7985% 4/15/17 (e)(k) | | 77,877 | | 75,032 |
Class H, 0.8685% 4/15/17 (e)(k) | | 171,562 | | 148,139 |
Class J, 1.0985% 4/15/17 (e)(k) | | 131,565 | | 92,096 |
Series 2005-FL11: | | | | |
Class B, 0.4985% 11/15/17 (e)(k) | | 175,588 | | 163,296 |
Class C, 0.5485% 11/15/17 (e)(k) | | 1,451,600 | | 1,335,472 |
Class D, 0.5885% 11/15/17 (e)(k) | | 75,490 | | 68,696 |
Class E, 0.6385% 11/15/17 (e)(k) | | 268,371 | | 241,534 |
Class F, 0.6985% 11/15/17 (e)(k) | | 185,934 | | 165,481 |
Class G, 0.7485% 11/15/17 (e)(k) | | 128,880 | | 113,414 |
Series 2006-FL12 Class AJ, 0.3785% 12/15/20 (e)(k) | | 4,060,000 | | 3,639,660 |
sequential payer: | | | | |
Series 2003-LB1A Class D, 4.278% 6/10/38 | | 550,000 | | 537,633 |
Series 2004-RS1 Class A, 5.648% 3/3/41 (e) | | 937,412 | | 936,943 |
Series 2006-C8 Class A3, 5.31% 12/10/46 | | 5,420,000 | | 5,638,036 |
Series 2006-CN2A: | | | | |
Class A2FX, 5.449% 2/5/19 (e) | | 3,306,000 | | 3,215,002 |
Class AJFX, 5.478% 2/5/19 (e) | | 5,750,000 | | 5,714,931 |
Series 2001-J2A Class F, 7.2268% 7/16/34 (e)(k) | | 199,000 | | 205,569 |
Series 2006-C8 Class XP, 0.6566% 12/10/46 (k)(m) | | 16,823,805 | | 148,016 |
Commercial Mortgage Acceptance Corp.: | | | | |
Series 1998-C1: | | | | |
Class F, 6.23% 7/15/31 (e) | | 37,184 | | 38,234 |
Class G, 6.21% 7/15/31 (e) | | 554,000 | | 566,335 |
weighted average coupon Series 1998-C2 Class F, 5.44% 9/15/30 (e)(k) | | 161,250 | | 167,778 |
Commercial Mortgage Asset Trust: | | | | |
Series 1999-C1 Class F, 6.25% 1/17/32 (e) | | 550,000 | | 474,164 |
Series 1999-C2 Class G, 6% 11/17/32 | | 302,000 | | 222,305 |
Commercial Mortgage pass-thru certificates: | | | | |
sequential payer Series 2005-C6 Class A2, 4.999% 6/10/44 (k) | | 13,804 | | 13,851 |
Series 2005 C6 Class B, 5.4022% 6/10/44 (k) | | 905,000 | | 660,779 |
Series 2005-C6 Class AJ, 5.209% 6/10/44 (k) | | 390,000 | | 389,458 |
Series 2011-STRT Class C, 4.755% 12/10/24 (e) | | 420,000 | | 420,762 |
Commercial Mortgage Securities - continued |
| Principal Amount (c) | | Value |
Communication Mortgage Trust Series 2011-THL: | | | | |
Class E, 5.949% 6/9/28 (e) | | $ 440,000 | | $ 444,151 |
Class F, 4.867% 6/9/28 (e) | | 645,000 | | 598,639 |
Credit Suisse Commercial Mortgage Trust: | | | | |
sequential payer: | | | | |
Series 2007-C2: | | | | |
Class A2, 5.448% 1/15/49 (k) | | 5,198,366 | | 5,266,542 |
Class A3, 5.542% 1/15/49 (k) | | 3,804,000 | | 4,141,666 |
Series 2007-C3 Class A4, 5.9018% 6/15/39 (k) | | 28,438,000 | | 31,002,397 |
Series 2006-C4 Class AAB, 5.439% 9/15/39 | | 6,584,127 | | 6,711,997 |
Series 2006-C5 Class ASP, 0.8652% 12/15/39 (k)(m) | | 11,245,165 | | 135,144 |
Series 2007-C5 Class A4, 5.695% 9/15/40 (k) | | 1,722,000 | | 1,886,026 |
Credit Suisse First Boston Mortgage Capital Certificates floater Series 2007-TF2A Class B, 0.5985% 4/15/22 (e)(k) | | 6,783,000 | | 5,036,452 |
Credit Suisse First Boston Mortgage Securities Corp.: | | | | |
floater Series 2006-TF2A Class KER, 0.8485% 9/15/21 (e)(k) | | 258,327 | | 167,913 |
sequential payer Series 2004-C1: | | | | |
Class A3, 4.321% 1/15/37 | | 98,168 | | 98,627 |
Class A4, 4.75% 1/15/37 | | 884,000 | | 931,367 |
Series 1997-C2 Class F, 7.46% 1/17/35 (k) | | 929,000 | | 972,532 |
Series 1998-C1: | | | | |
Class F, 6% 5/17/40 (e) | | 2,259,000 | | 2,322,885 |
Class H, 6% 5/17/40 (e) | | 90,318 | | 7,896 |
Series 1998-C2: | | | | |
Class F, 6.75% 11/15/30 (e) | | 1,156,000 | | 1,262,833 |
Class G, 6.75% 11/15/30 (e) | | 180,000 | | 194,633 |
Series 2001-CK6 Class AX, 1.1089% 8/15/36 (k)(m) | | 741,003 | | 1,890 |
Series 2001-CKN5 Class AX, 1.9203% 9/15/34 (e)(k)(m) | | 2,986,271 | | 4,930 |
Series 2003-C3 Class D, 4.131% 5/15/38 | | 120,000 | | 120,540 |
Series 2006-C1 Class A3, 5.5944% 2/15/39 (k) | | 7,052,699 | | 7,536,246 |
Credit Suisse Mortgage Capital Certificates: | | | | |
floater Series 2007-TFL1: | | | | |
Class B, 0.3985% 2/15/22 (e)(k) | | 721,000 | | 647,170 |
Class C: | | | | |
0.4185% 2/15/22 (e)(k) | | 1,864,711 | | 1,654,745 |
0.5185% 2/15/22 (e)(k) | | 665,993 | | 584,209 |
Class F, 0.5685% 2/15/22 (e)(k) | | 1,331,815 | | 1,154,684 |
Class L, 2.1485% 2/15/22 (e)(k) | | 100,000 | | 9,000 |
Commercial Mortgage Securities - continued |
| Principal Amount (c) | | Value |
Credit Suisse Mortgage Capital Certificates: - continued | | | | |
sequential payer Series 2007-C1 Class A2, 5.268% 2/15/40 | | $ 4,969,701 | | $ 4,966,441 |
Series 2007-C1: | | | | |
Class ASP, 0.5721% 2/15/40 (k)(m) | | 29,709,955 | | 219,675 |
Class B, 5.487% 2/15/40 (e)(k) | | 2,907,000 | | 436,050 |
CRESI Finance Ltd. Partnership floater Series 2006-A Class E, 1.894% 3/25/17 (e)(k) | | 160,000 | | 112,000 |
CRESIX Finance Ltd. Series 2006-AA Class F, 4.444% 3/25/17 (e)(k) | | 260,000 | | 169,000 |
DBUBS Mortgage Trust Series 2011-LC1A: | | | | |
Class D, 5.7284% 11/10/46 (e)(k) | | 500,000 | | 494,703 |
Class E, 5.7284% 11/10/46 (e)(k) | | 260,000 | | 240,502 |
Class F, 5.7284% 11/10/46 (e)(k) | | 710,000 | | 506,450 |
Class XB, 0.3189% 11/10/46 (e)(k)(m) | | 20,920,000 | | 320,264 |
Deutsche Mortgage & Asset Receiving Corp. Series 1998-C1 Class J, 6.22% 6/15/31 | | 400,000 | | 332,074 |
DLJ Commercial Mortgage Corp.: | | | | |
Series 1998-CG1 Class B4, 7.4518% 6/10/31 (e)(k) | | 891,000 | | 937,323 |
Series 2000-CKP1 Class B3, 8.0578% 11/10/33 (k) | | 230,000 | | 229,960 |
Extended Stay America Trust: | | | | |
Series 2010-ESHA Class D, 5.4983% 11/5/27 (e) | | 1,990,000 | | 2,022,234 |
Series 2010-ESHA, Class C4, 4.8603% 11/5/27 (e) | | 320,000 | | 328,284 |
FHMLC Multi-class participation certificates guaranteed: | | | | |
Series K013 Class X3, 2.8845% 1/25/43 (k)(m) | | 820,000 | | 135,770 |
Series KAIV Class X2, 3.6146% 6/25/46 (k)(m) | | 420,000 | | 87,260 |
First Union National Bank Commercial Mortgage Trust Series 2001-C4 Class K, 6% 12/12/33 (e) | | 27,257 | | 27,166 |
First Union National Bank-Bank of America Commercial Mortgage Trust Series 2001-C1 Class G, 6.936% 3/15/33 (e) | | 1,692,000 | | 1,707,426 |
First Union-Lehman Brothers-Bank of America Commercial Mortgage Trust sequential payer Series 1998-C2 Class G, 7% 11/18/35 (e)(k) | | 443,000 | | 477,382 |
Four Times Square Trust sequential payer Series 2006-4TS Class A, 5.401% 12/13/28 (e) | | 200,000 | | 230,575 |
Freddie Mac Multi-Class pass-thru certificates: | | | | |
Series K011 Class X3, 2.6618% 12/25/43 (k)(m) | | 1,640,000 | | 248,485 |
Series K012 Class X3, 2.3657% 1/25/41 (k)(m) | | 1,800,000 | | 243,248 |
FREMF Mortgage Trust: | | | | |
Series 2010-K9 Class B, 5.3301% 9/25/45 (e)(k) | | 1,290,000 | | 1,308,594 |
Series 2011-K10 Class B, 4.7561% 11/25/49 (e)(k) | | 240,000 | | 233,392 |
Series 2011-K11 Class B, 4.5694% 12/25/48 (e)(k) | | 750,000 | | 718,276 |
Commercial Mortgage Securities - continued |
| Principal Amount (c) | | Value |
G-Force LLC sequential payer Series 2005-RRA Class A2, 4.83% 8/22/36 (e) | | $ 1,361,495 | | $ 1,252,575 |
GE Capital Commercial Mortgage Corp.: | | | | |
sequential payer Series 2007-C1 Class A4, 5.543% 12/10/49 | | 11,404,000 | | 12,347,077 |
Series 2001-1 Class X1, 1.5729% 5/15/33 (e)(k)(m) | | 2,171,442 | | 19,304 |
Series 2002-1A Class H, 7.3318% 12/10/35 (e)(k) | | 65,000 | | 64,944 |
Series 2007-C1 Class XP, 0.3493% 12/10/49 (k)(m) | | 25,541,983 | | 112,538 |
GMAC Commercial Mortgage Securities, Inc.: | | | | |
Series 1997-C1 Class H, 6.6% 7/15/29 | | 411,904 | | 208,054 |
Series 1997-C2: | | | | |
Class F, 6.75% 4/15/29 (k) | | 654,009 | | 677,411 |
Class G, 6.75% 4/15/29 (k) | | 504,000 | | 548,832 |
Series 1999-C1 Class F, 6.02% 5/15/33 (e) | | 225,989 | | 232,496 |
Series 1999-C2I Class K, 6.481% 9/15/33 (n) | | 385,000 | | 179,971 |
Series 1999-C3: | | | | |
Class G, 6.974% 8/15/36 (e) | | 5,204 | | 5,194 |
Class J, 6.974% 8/15/36 | | 226,000 | | 225,250 |
Class K, 6.974% 8/15/36 | | 427,000 | | 148,388 |
Series 2000-C1 Class K, 7% 3/15/33 | | 38,385 | | 28,713 |
Series 2005-C1 Class X2, 0.7314% 5/10/43 (k)(m) | | 6,595,339 | | 11,298 |
Greenwich Capital Commercial Funding Corp.: | | | | |
floater Series 2006-FL4 Class B, 0.4525% 11/5/21 (e)(k) | | 715,000 | | 694,506 |
sequential payer: | | | | |
Series 2003-C1 Class D, 4.29% 7/5/35 (e) | | 490,000 | | 500,037 |
Series 2007-GG11 Class A2, 5.597% 12/10/49 | | 3,804,000 | | 3,917,047 |
Series 2007-GG9 Class A4, 5.444% 3/10/39 | | 5,530,000 | | 6,139,412 |
Series 2002-C1: | | | | |
Class H, 5.903% 1/11/35 (e) | | 97,000 | | 97,496 |
Class J, 6.306% 1/11/35 (e) | | 760,000 | | 755,761 |
Series 2003-C2 Class J, 5.234% 1/5/36 (e)(k) | | 250,000 | | 219,528 |
Series 2005-GG3 Class B, 4.894% 8/10/42 (k) | | 680,000 | | 654,330 |
Series 2006-GG7 Class A3, 6.079% 7/10/38 (k) | | 3,719,734 | | 3,719,351 |
Series 2007-GG11 Class A1, 0.4565% 12/10/49 (e)(k)(m) | | 40,350,265 | | 250,414 |
GS Mortgage Securities Corp. II: | | | | |
floater: | | | | |
Series 2006-FL8A: | | | | |
Class E, 0.6325% 6/6/20 (e)(k) | | 431,608 | | 411,642 |
Class F, 0.7025% 6/6/20 (e)(k) | | 835,001 | | 788,275 |
Class J, 2.0125% 6/6/20 (e)(k) | | 250,000 | | 204,710 |
Commercial Mortgage Securities - continued |
| Principal Amount (c) | | Value |
GS Mortgage Securities Corp. II: - continued | | | | |
floater: | | | | |
Series 2007-EOP: | | | | |
Class C, 2.1455% 3/6/20 (e)(k) | | $ 1,994,000 | | $ 1,940,561 |
Class D, 2.3636% 3/6/20 (e)(k) | | 4,004,000 | | 3,880,677 |
Class F, 2.8433% 3/6/20 (e)(k) | | 164,000 | | 157,473 |
Class G, 3.0177% 3/6/20 (e)(k) | | 81,000 | | 77,371 |
Class H, 3.5846% 3/6/20 (e)(k) | | 60,000 | | 57,372 |
Class J, 4.4568% 3/6/20 (e)(k) | | 86,000 | | 82,792 |
Class L, 6.4193% 3/6/20 (e)(k) | | 400,000 | | 388,680 |
sequential payer Series 2004-GG2 Class A4, 4.964% 8/10/38 | | 458,663 | | 465,189 |
Series 1997-GL: | | | | |
Class G, 7.7695% 7/13/30 (k) | | 790,614 | | 852,124 |
Class H, 8.0595% 7/13/30 (e)(k) | | 230,000 | | 243,800 |
Series 2005-GG4 Class XP, 0.8961% 7/10/39 (e)(k)(m) | | 28,943,944 | | 62,635 |
Series 2006-GG6 Class A2, 5.506% 4/10/38 | | 5,474,113 | | 5,562,903 |
Series 2006-RR2: | | | | |
Class M, 5.7472% 6/23/46 (e)(k) | | 100,000 | | 0 |
Class N, 5.7472% 6/23/46 (e)(k) | | 100,000 | | 0 |
Series 2010-C1: | | | | |
Class D, 6.1391% 8/10/43 (e)(k) | | 290,000 | | 286,435 |
Class E, 4% 8/10/43 (e) | | 1,200,000 | | 772,960 |
Class X, 1.699% 8/10/43 (e)(k)(m) | | 6,244,063 | | 536,315 |
GS Mortgage Securities Corp. Trust Series 2011-ALF Class E, 4.953% 2/10/21 (e) | | 510,000 | | 490,977 |
GS Mortgage Securities Trust: | | | | |
sequential payer: | | | | |
Series 2006-GG8 Class A2, 5.479% 11/10/39 | | 905,440 | | 910,953 |
Series 2007-GG10 Class A2, 5.778% 8/10/45 | | 9,323,423 | | 9,493,594 |
Series 2010-C2 Class XA, 0.8635% 12/10/43 (e)(k) | | 5,590,552 | | 149,268 |
Series 2011-GC5 Class C, 5.4751% 8/10/44 (e)(k) | | 1,050,000 | | 953,123 |
HVB Mortgage Capital Corp. floater Series 2003-FL1A Class K, 3.1048% 9/10/22 (e)(k) | | 1,120,000 | | 1,071,280 |
JPMorgan Chase Commercial Mortgage Securities Corp.: | | | | |
floater Series 2011-CCHP Class E, 5.15% 7/15/28 (e)(k) | | 500,000 | | 488,669 |
Series 2002-C1 Class E, 6.135% 7/12/37 (e) | | 935,000 | | 939,917 |
Series 2003-C1: | | | | |
Class CM1, 5.6896% 1/12/37 (e)(k) | | 200,157 | | 196,154 |
Class D, 5.192% 1/12/37 | | 270,000 | | 265,375 |
Series 2009-IWST Class D, 7.6935% 12/5/27 (e)(k) | | 1,025,000 | | 1,056,411 |
Commercial Mortgage Securities - continued |
| Principal Amount (c) | | Value |
JPMorgan Chase Commercial Mortgage Securities Corp.: - continued | | | | |
Series 2010-CNTR Class D, 6.3899% 8/5/32 (e)(k) | | $ 695,000 | | $ 652,846 |
Series 2011-C4 Class E, 5.5686% 7/15/46 (e)(k) | | 370,000 | | 305,405 |
JPMorgan Chase Commercial Mortgage Securities Trust: | | | | |
floater: | | | | |
Series 2006-FL1A Class E, 0.6185% 2/15/20 (e)(k) | | 144,283 | | 131,555 |
Series 2006-FLA2: | | | | |
Class A2, 0.3785% 11/15/18 (e)(k) | | 7,706,881 | | 7,441,957 |
Class B, 0.4185% 11/15/18 (e)(k) | | 1,046,104 | | 972,877 |
Class C, 0.4585% 11/15/18 (e)(k) | | 743,228 | | 668,905 |
Class D, 0.4785% 11/15/18 (e)(k) | | 226,403 | | 199,235 |
Class E, 0.5285% 11/15/18 (e)(k) | | 326,598 | | 280,875 |
Class F, 0.5785% 11/15/18 (e)(k) | | 489,002 | | 415,652 |
Class G, 0.6085% 11/15/18 (e)(k) | | 424,901 | | 348,419 |
Class H, 0.7485% 11/15/18 (e)(k) | | 326,672 | | 254,804 |
sequential payer: | | | | |
Series 2006-CB14 Class A3B, 5.674% 12/12/44 (k) | | 4,674,131 | | 4,838,558 |
Series 2006-LDP9: | | | | |
Class A2, 5.134% 5/15/47 (k) | | 722,147 | | 756,105 |
Class A3, 5.336% 5/15/47 | | 9,409,000 | | 10,360,146 |
Series 2007-CB19 Class A4, 5.9303% 2/12/49 (k) | | 6,670,000 | | 7,590,387 |
Series 2007-LD11 Class A2, 5.9895% 6/15/49 (k) | | 5,183,724 | | 5,228,112 |
Series 2007-LDPX: | | | | |
Class A2 S, 5.305% 1/15/49 | | 3,575,983 | | 3,576,730 |
Class A3, 5.42% 1/15/49 | | 25,732,000 | | 28,792,487 |
Series 2004-CBX Class D, 5.097% 1/12/37 (k) | | 170,000 | | 108,954 |
Series 2004-LN2 Class D, 5.4059% 7/15/41 (k) | | 420,000 | | 253,192 |
Series 2005-CB13 Class E, 5.5259% 1/12/43 (e)(k) | | 963,000 | | 49,145 |
Series 2005-LDP3 Class A3, 4.959% 8/15/42 | | 10,011,998 | | 10,215,602 |
Series 2005-LDP5 Class AJ, 5.4938% 12/15/44 (k) | | 360,000 | | 362,862 |
Series 2006-CB17 Class A3, 5.45% 12/12/43 | | 500,167 | | 516,387 |
Series 2007-CB19: | | | | |
Class B, 5.9303% 2/12/49 (k) | | 165,000 | | 61,442 |
Class C, 5.9303% 2/12/49 (k) | | 424,000 | | 124,055 |
Class D, 5.9303% 2/12/49 (k) | | 447,000 | | 62,024 |
Series 2007-LDP10: | | | | |
Class BS, 5.437% 1/15/49 (k) | | 364,000 | | 93,067 |
Class CS, 5.466% 1/15/49 (k) | | 157,000 | | 19,087 |
Class ES, 5.7445% 1/15/49 (e)(k) | | 983,000 | | 51,455 |
Commercial Mortgage Securities - continued |
| Principal Amount (c) | | Value |
JPMorgan Chase Commercial Mortgage Securities Trust: - continued | | | | |
Series 2010-C2: | | | | |
Class D, 5.7126% 11/15/43 (e)(k) | | $ 645,000 | | $ 586,595 |
Class XB, 0.7538% 11/15/43 (e)(k)(m) | | 3,600,000 | | 142,076 |
JPMorgan Chase Commercial Mortgage Security Trust Series 2011-C5: | | | | |
Class B. 5.4912% 8/15/46 (e)(k) | | 980,000 | | 995,887 |
Class C, 5.4912% 8/15/46 (e)(k) | | 250,000 | | 229,592 |
JPMorgan Commercial Mortgage Finance Corp.: | | | | |
Series 1997-C5 Class F, 7.5605% 9/15/29 | | 346,029 | | 350,651 |
Series 2000-C9 Class G, 6.25% 10/15/32 (e) | | 48,921 | | 49,024 |
LB Commercial Conduit Mortgage Trust: | | | | |
sequential payer Series 2007-C3 Class A4, 6.1327% 7/15/44 (k) | | 21,615,000 | | 24,630,725 |
Series 1998-C1 Class D, 6.98% 2/18/30 | | 270,678 | | 275,217 |
Series 1998-C4 Class G, 5.6% 10/15/35 (e) | | 576,583 | | 608,477 |
LB-UBS Commercial Mortgage Trust: | | | | |
sequential payer: | | | | |
Series 2004-C2 Class E, 4.487% 3/15/36 | | 150,000 | | 143,570 |
Series 2005-C3 Class AJ, 4.843% 7/15/40 | | 1,220,000 | | 1,214,810 |
Series 2005-C7: | | | | |
Class AJ, 5.323% 11/15/40 | | 1,210,000 | | 1,237,829 |
Class AM, 5.263% 11/15/40 (k) | | 137,000 | | 146,818 |
Series 2006-C1 Class A2, 5.084% 2/15/31 | | 257,912 | | 260,589 |
Series 2006-C6: | | | | |
Class A2, 5.262% 9/15/39 (k) | | 563,472 | | 564,097 |
Class AM, 5.413% 9/15/39 | | 1,500,000 | | 1,597,740 |
Series 2006-C7: | | | | |
Class A2, 5.3% 11/15/38 | | 1,142,434 | | 1,143,788 |
Class A3, 5.347% 11/15/38 | | 1,417,000 | | 1,599,959 |
Class AM, 5.378% 11/15/38 | | 160,000 | | 160,580 |
Series 2007-C1: | | | | |
Class A3, 5.398% 2/15/40 | | 10,000,000 | | 10,428,450 |
Class A4, 5.424% 2/15/40 | | 5,434,000 | | 6,135,394 |
Series 2007-C2 Class A3, 5.43% 2/15/40 | | 3,967,000 | | 4,408,166 |
Series 2007-C6 Class A2, 5.845% 7/15/40 | | 9,593,209 | | 9,751,746 |
Series 2002-C1 Class J, 6.95% 3/15/34 (e)(k) | | 86,000 | | 86,099 |
Series 2003-C7 Class L, 5.224% 7/15/37 (e)(k) | | 284,000 | | 171,883 |
Series 2004-C2 Class G, 4.595% 3/15/36 (e)(k) | | 225,000 | | 193,145 |
Series 2005-C2 Class AJ, 5.205% 4/15/30 (k) | | 740,000 | | 770,761 |
Series 2005-C3 Class XCP, 0.9042% 7/15/40 (k)(m) | | 4,326,994 | | 9,078 |
Series 2005-C7 Class C, 5.35% 11/15/40 (k) | | 866,000 | | 774,697 |
Commercial Mortgage Securities - continued |
| Principal Amount (c) | | Value |
LB-UBS Commercial Mortgage Trust: - continued | | | | |
Series 2006-C4: | | | | |
Class AJ, 5.8935% 6/15/38 (k) | | $ 660,000 | | $ 551,075 |
Class AM, 6.0868% 6/15/38 (k) | | 500,000 | | 530,074 |
Series 2006-C6 Class XCP, 0.8617% 9/15/39 (k)(m) | | 8,109,240 | | 86,801 |
Series 2007-C1 Class XCP, 0.6167% 2/15/40 (k)(m) | | 3,031,686 | | 25,678 |
Series 2007-C6 Class A4, 5.858% 7/15/40 (k) | | 2,376,000 | | 2,690,951 |
Series 2007-C7: | | | | |
Class A3, 5.866% 9/15/45 | | 2,029,000 | | 2,304,952 |
Class XCP, 0.431% 9/15/45 (k)(m) | | 139,001,657 | | 1,009,291 |
Lehman Brothers Floating Rate Commercial Mortgage Trust floater: | | | | |
Series 2006-LLFA: | | | | |
Class D, 0.4785% 9/15/21 (e)(k) | | 608,683 | | 544,875 |
Class E, 0.5385% 9/15/21 (e)(k) | | 2,196,145 | | 1,900,037 |
Class F, 0.5885% 9/15/21 (e)(k) | | 1,143,094 | | 954,677 |
Class G, 0.6085% 9/15/21 (e)(k) | | 2,258,211 | | 1,818,241 |
Class H, 0.6485% 9/15/21 (e)(k) | | 582,579 | | 445,771 |
Series 2007-LLFA Class E, 1.1485% 6/15/22 (e)(k) | | 760,000 | | 619,400 |
Lehman Large Loan Trust Series 1997-LLI Class E, 7.3% 10/12/34 | | 3,377,000 | | 3,381,981 |
Lstar Commercial Mortgage Trust: | | | | |
Series 2011-1 Class D, 5.6888% 6/25/43 (e)(k) | | 310,000 | | 262,420 |
Series 2011-1 Class B, 5.6888% 6/25/43 (e)(k) | | 540,000 | | 556,894 |
Merrill Lynch Financial Asset, Inc. Series 2006-CA20 Class E, 5.4078% 10/12/39 (e)(k) | CAD | 320,000 | | 288,035 |
Merrill Lynch Mortgage Investors Trust: | | | | |
Series 1997-C2 Class F, 6.25% 12/10/29 (k) | | 499,921 | | 506,878 |
Series 1998-C3 Class E, 7.0079% 12/15/30 (k) | | 173,000 | | 177,421 |
Merrill Lynch Mortgage Trust: | | | | |
Series 05-LC1 Class AJ, 5.5028% 1/12/44 (k) | | 220,000 | | 217,578 |
Series 2004-MKB1 Class F, 5.8353% 2/12/42 (e)(k) | | 180,000 | | 170,767 |
Series 2005-CKI1 Class A3, 5.3913% 11/12/37 (k) | | 1,288,965 | | 1,300,998 |
Series 2005-LC1 Class F, 5.5568% 1/12/44 (e)(k) | | 1,655,000 | | 924,354 |
Series 2006-C1: | | | | |
Class A2, 5.8093% 5/12/39 (k) | | 1,762,126 | | 1,823,402 |
Class AJ, 5.8543% 5/12/39 (k) | | 160,000 | | 142,616 |
Class AM, 5.8093% 5/12/39 (k) | | 100,000 | | 104,299 |
Series 2007-C1 Class A4, 6.0271% 6/12/50 (k) | | 7,199,517 | | 8,097,743 |
Series 2008-C1 Class A4, 5.69% 2/12/51 | | 4,059,000 | | 4,620,498 |
Merrill Lynch-CFC Commercial Mortgage Trust: | | | | |
floater Series 2006-4 Class A2FL, 0.4158% 12/12/49 (k) | | 287,583 | | 287,502 |
Commercial Mortgage Securities - continued |
| Principal Amount (c) | | Value |
Merrill Lynch-CFC Commercial Mortgage Trust: - continued | | | | |
sequential payer: | | | | |
Series 2006-1 Class A3, 5.6568% 2/12/39 (k) | | $ 2,024,000 | | $ 2,056,700 |
Series 2006-4: | | | | |
Class A2, 5.112% 12/12/49 (k) | | 348,537 | | 348,474 |
Class ASB, 5.133% 12/12/49 (k) | | 1,565,372 | | 1,661,858 |
Series 2007-5: | | | | |
Class A3, 5.364% 8/12/48 | | 11,417,000 | | 11,707,974 |
Class A4, 5.378% 8/12/48 | | 76,000 | | 82,169 |
Class B, 5.479% 8/12/48 | | 5,706,000 | | 1,426,500 |
Series 2007-6 Class A4, 5.485% 3/12/51 (k) | | 14,650,000 | | 15,888,028 |
Series 2007-7 Class A4, 5.81% 6/12/50 (k) | | 6,656,000 | | 7,198,531 |
Series 2006-3 Class ASB, 5.382% 7/12/46 (k) | | 7,452,019 | | 7,842,140 |
Series 2006-4 Class XP, 0.8109% 12/12/49 (k)(m) | | 27,872,665 | | 465,055 |
Series 2007-6 Class B, 5.635% 3/12/51 (k) | | 1,902,000 | | 594,114 |
Series 2007-7 Class B, 5.9345% 6/12/50 (k) | | 166,000 | | 13,994 |
Series 2007-8 Class A3, 6.1644% 8/12/49 (k) | | 1,640,000 | | 1,822,206 |
Morgan Stanley Capital I Trust: | | | | |
floater: | | | | |
Series 2006-XLF: | | | | |
Class C, 1.449% 7/15/19 (e)(k) | | 357,716 | | 207,475 |
Class H, 0.629% 7/15/19 (e)(k) | | 108,390 | | 103,512 |
Class J, 0.679% 7/15/19 (e)(k) | | 354,000 | | 299,130 |
Series 2007-XLFA: | | | | |
Class C, 0.409% 10/15/20 (e)(k) | | 1,092,000 | | 989,221 |
Class D, 0.439% 10/15/20 (e)(k) | | 667,354 | | 601,206 |
Class E, 0.499% 10/15/20 (e)(k) | | 834,661 | | 710,196 |
Class F, 0.549% 10/15/20 (e)(k) | | 500,899 | | 381,124 |
Class G, 0.589% 10/15/20 (e)(k) | | 619,188 | | 452,552 |
Class H, 0.679% 10/15/20 (e)(k) | | 389,758 | | 226,403 |
Class J, 0.829% 10/15/20 (e)(k) | | 228,006 | | 94,823 |
Class MHRO, 0.939% 10/15/20 (e)(k) | | 594,748 | | 499,588 |
Class NHRO, 1.139% 10/15/20 (e)(k) | | 902,610 | | 740,140 |
sequential payer: | | | | |
Series 2004-RR2 Class A2, 5.45% 10/28/33 (e) | | 281,085 | | 282,490 |
Series 2005-IQ9 Class A3, 4.54% 7/15/56 | | 1,961,048 | | 1,998,459 |
Series 2006-HQ10 Class AM, 5.36% 11/12/41 | | 620,000 | | 646,649 |
Series 2007-HQ11 Class A31, 5.439% 2/12/44 (k) | | 964,000 | | 1,011,826 |
Series 2007-IQ13: | | | | |
Class A1, 5.05% 3/15/44 | | 12,853 | | 12,841 |
Class A4, 5.364% 3/15/44 | | 10,000,000 | | 11,017,950 |
Commercial Mortgage Securities - continued |
| Principal Amount (c) | | Value |
Morgan Stanley Capital I Trust: - continued | | | | |
sequential payer: | | | | |
Series 1997-RR Class F, 7.398% 4/30/39 (e)(k) | | $ 158,553 | | $ 142,698 |
Series 1998-CF1 Class G, 7.35% 7/15/32 (e) | | 205,756 | | 100,821 |
Series 1999-WF1: | | | | |
Class N, 5.91% 11/15/31 (e) | | 210,000 | | 170,208 |
Class O, 5.91% 11/15/31 (e) | | 197,950 | | 46,832 |
Series 2004-IQ7 Class E, 5.5403% 6/15/38 (e)(k) | | 120,000 | | 84,000 |
Series 2004-RR2 Class C, 5.88% 10/28/33 (e)(k) | | 280,000 | | 212,800 |
Series 2006-HQ10 Class X2, 0.6911% 11/12/41 (e)(k)(m) | | 8,843,355 | | 36,196 |
Series 2006-HQ8 Class A3, 5.6512% 3/12/44 (k) | | 628,661 | | 632,077 |
Series 2006-IQ11: | | | | |
Class A3, 5.859% 10/15/42 (k) | | 1,422,351 | | 1,474,830 |
Class A4, 5.895% 10/15/42 (k) | | 570,000 | | 643,168 |
Series 2006-IQ12 Class AMFX, 5.37% 12/15/43 | | 719,000 | | 765,076 |
Series 2006-T23 Class A3, 5.986% 8/12/41 (k) | | 972,000 | | 1,015,339 |
Series 2007-HQ12 Class A2, 5.7828% 4/12/49 (k) | | 11,641,836 | | 12,000,929 |
Series 2007-IQ14: | | | | |
Class A4, 5.692% 4/15/49 (k) | | 2,852,000 | | 3,126,168 |
Class B, 5.9063% 4/15/49 (k) | | 469,000 | | 127,093 |
Series 2011-C1: | | | | |
Class C, 5.4222% 9/15/47 (e)(k) | | 250,000 | | 248,054 |
Class D, 5.4222% 9/15/47 (e)(k) | | 590,000 | | 544,372 |
Class E, 5.4222% 9/15/47 (e)(k) | | 573,100 | | 485,765 |
Series 2011-C2: | | | | |
Class D, 5.4958% 6/15/44 (e)(k) | | 580,000 | | 534,180 |
Class E, 5.4958% 6/15/44 (e)(k) | | 600,000 | | 506,814 |
Class F, 5.4958% 6/15/44 (e)(k) | | 550,000 | | 404,762 |
Class XB, 0.5399% 6/15/44 (e)(k)(m) | | 9,001,008 | | 278,851 |
Series 2011-C3: | | | | |
Class D, 5.357% 7/15/49 (e) | | 1,130,000 | | 1,011,767 |
Class E, 5.3573% 7/15/49 (e)(k) | | 400,000 | | 327,708 |
Morgan Stanley Dean Witter Capital I Trust: | | | | |
Series 2000-PRIN Class C, 7.9031% 2/23/34 (k) | | 466,000 | | 520,248 |
Series 2001-TOP3 Class E, 7.4705% 7/15/33 (e)(k) | | 150,000 | | 127,917 |
Series 2003-TOP9 Class E, 5.8886% 11/13/36 (e)(k) | | 78,000 | | 77,141 |
NationsLink Funding Corp.: | | | | |
Series 1998-2: | | | | |
Class F, 7.105% 8/20/30 (e) | | 479,927 | | 495,420 |
Class G, 5% 8/20/30 (e) | | 361,875 | | 365,410 |
Class J, 5% 8/20/30 (e) | | 195,000 | | 186,026 |
Series 1999-SL Class X, 11/10/30 (m) | | 113,179 | | 98,749 |
Commercial Mortgage Securities - continued |
| Principal Amount (c) | | Value |
Nomura Asset Securities Corp. Series 1998-D6 Class B1, 6% 3/15/30 (e) | | $ 1,050,000 | | $ 1,077,727 |
Providence Place Group Ltd. Partnership Series 2000-C1 Class A2, 7.75% 7/20/28 (e) | | 770,286 | | 816,503 |
RBSCF Trust Series 2010-MB1 Class D, 4.829% 4/15/24 (e)(k) | | 480,000 | | 463,500 |
Real Estate Asset Liquidity Trust: | | | | |
2006-2 Series L, 4.456% 9/12/38 | CAD | 26,000 | | 14,799 |
Series 2007-1 Class J, 4.57% 4/12/23 (e)(k) | CAD | 42,000 | | 27,664 |
Series 2006-2: | | | | |
Class F, 4.456% 9/12/38 | CAD | 107,000 | | 89,053 |
Class G, 4.456% 9/12/38 | CAD | 54,000 | | 42,982 |
Class H, 4.456% 9/12/38 | CAD | 36,000 | | 26,820 |
Class J, 4.456% 9/12/38 | CAD | 36,000 | | 25,041 |
Class K, 4.456% 9/12/38 | CAD | 18,000 | | 11,030 |
Class M, 4.456% 9/12/38 | CAD | 128,859 | | 36,458 |
Series 2007-1: | | | | |
Class F, 4.57% 4/12/23 (e)(k) | CAD | 126,000 | | 94,449 |
Class G, 4.57% 4/12/23 (e)(k) | CAD | 42,000 | | 30,143 |
Class H, 4.57% 4/12/23 (e)(k) | CAD | 42,000 | | 28,871 |
Class K, 4.57% 4/12/23 (e)(k) | CAD | 21,000 | | 13,259 |
Class L, 4.57% 4/12/23 (e)(k) | CAD | 63,000 | | 38,144 |
Class M, 4.57% 4/12/23 (e)(k) | CAD | 185,000 | | 50,123 |
Salomon Brothers Mortgage Securities VII, Inc. Series 2001-MMA: | | | | |
Class E3, 6.5% 2/18/34 (e)(k) | | 200,000 | | 207,946 |
Class E5, 6.5% 2/18/34 (e)(k) | | 900,000 | | 906,336 |
Structured Asset Securities Corp. Series 1997-LLI: | | | | |
Class D, 7.15% 10/12/34 | | 91,243 | | 91,385 |
Class F, 7.3% 10/12/34 (e) | | 473,000 | | 473,326 |
TIAA Seasoned Commercial Mortgage Trust: | | | | |
sequential payer Series 2007-C4 Class AJ, 5.7188% 8/15/39 (k) | | 170,000 | | 166,911 |
Series 2007-C4 Class F, 5.7188% 8/15/39 (k) | | 820,000 | | 575,844 |
TimberStar Trust I Series 2006-1 Class F, 7.5296% 10/15/36 (e) | | 270,000 | | 251,159 |
UBS Commercial Mortgage Trust Series 2007-FL1: | | | | |
Class F, 0.8235% 7/15/24 (e)(k) | | 110,000 | | 72,095 |
Class G, 0.8235% 7/15/24 (e)(k) | | 200,000 | | 120,082 |
UBS-Citigroup Commercial Mortgage Trust Series 2011-C1 Class B, 6.0708% 1/10/45 (e)(k) | | 284,000 | | 299,239 |
Vornado DP LLC Series 2010-VNO Class D, 6.3555% 9/13/28 (e) | | 180,000 | | 191,040 |
Commercial Mortgage Securities - continued |
| Principal Amount (c) | | Value |
Wachovia Bank Commercial Mortgage Trust: | | | | |
floater: | | | | |
Series 2006-WL7A: | | | | |
Class E, 0.5696% 9/15/21 (e)(k) | | $ 1,770,598 | | $ 1,386,828 |
Class F, 0.6296% 9/15/21 (e)(k) | | 1,877,987 | | 1,414,601 |
Class G, 0.6496% 9/15/21 (e)(k) | | 1,779,101 | | 1,286,742 |
Class J, 0.8896% 9/15/21 (e)(k) | | 395,545 | | 179,282 |
Series 2007-WHL8: | | | | |
Class AP1, 0.9485% 6/15/20 (e)(k) | | 140,220 | | 126,198 |
Class AP2, 1.0485% 6/15/20 (e)(k) | | 235,007 | | 206,806 |
Class F, 0.7285% 6/15/20 (e)(k) | | 4,565,501 | | 2,967,576 |
Class LXR1, 0.9485% 6/15/20 (e)(k) | | 233,916 | | 189,472 |
sequential payer: | | | | |
Series 2003-C7 Class A1, 4.241% 10/15/35 (e) | | 1,598,102 | | 1,609,274 |
Series 2003-C8 Class A3, 4.445% 11/15/35 | | 6,853,479 | | 6,928,648 |
Series 2006-C29 Class A3, 5.313% 11/15/48 | | 5,051,000 | | 5,204,503 |
Series 2007-C30: | | | | |
Class A3, 5.246% 12/15/43 | | 612,481 | | 626,639 |
Class A4, 5.305% 12/15/43 | | 8,604,000 | | 9,143,574 |
Class A5, 5.342% 12/15/43 | | 13,536,000 | | 14,744,210 |
Series 2007-C31 Class A4, 5.509% 4/15/47 | | 13,599,000 | | 14,859,247 |
Series 2007-C32: | | | | |
Class A2, 5.9237% 6/15/49 (k) | | 13,343,546 | | 13,829,438 |
Class A3, 5.9287% 6/15/49 (k) | | 3,229,000 | | 3,554,796 |
Series 2003-C6 Class G, 5.125% 8/15/35 (e)(k) | | 903,000 | | 902,409 |
Series 2004-C10 Class E, 4.931% 2/15/41 | | 340,000 | | 336,682 |
Series 2004-C11: | | | | |
Class D, 5.5485% 1/15/41 (k) | | 360,000 | | 326,672 |
Class E, 5.5985% 1/15/41 (k) | | 327,000 | | 277,115 |
Series 2004-C12 Class D, 5.495% 7/15/41 (k) | | 280,000 | | 283,058 |
Series 2004-C14: | | | | |
Class B, 5.17% 8/15/41 | | 258,500 | | 251,203 |
Class C, 5.21% 8/15/41 | | 170,000 | | 162,456 |
Series 2004-C15 Class 175C, 6.0432% 10/15/41 (e)(k) | | 500,000 | | 486,749 |
Series 2005-C19 Class B, 4.892% 5/15/44 | | 1,902,000 | | 1,730,468 |
Series 2005-C22: | | | | |
Class B, 5.5336% 12/15/44 (k) | | 4,218,000 | | 2,898,905 |
Class F, 5.5336% 12/15/44 (e)(k) | | 3,171,000 | | 766,678 |
Series 2006-C23 Class A5, 5.416% 1/15/45 (k) | | 7,870,000 | | 8,644,243 |
Series 2007-C30: | | | | |
Class B, 5.463% 12/15/43 (k) | | 10,505,000 | | 5,509,505 |
Class C, 5.483% 12/15/43 (k) | | 5,706,000 | | 2,253,271 |
Commercial Mortgage Securities - continued |
| Principal Amount (c) | | Value |
Wachovia Bank Commercial Mortgage Trust: - continued | | | | |
Series 2007-C30: | | | | |
Class D, 5.513% 12/15/43 (k) | | $ 3,044,000 | | $ 776,978 |
Class XP, 0.6327% 12/15/43 (e)(k)(m) | | 17,012,943 | | 166,216 |
Series 2007-C31 Class C, 5.8735% 4/15/47 (k) | | 522,000 | | 106,598 |
Series 2007-C32: | | | | |
Class D, 5.9287% 6/15/49 (k) | | 1,431,000 | | 418,374 |
Class E, 5.9287% 6/15/49 (k) | | 2,252,000 | | 561,874 |
Wachovia Bank Commercial Mortgage Trust pass-thru certificates sequential payer Series 2007-C33 Class A5, 6.0964% 2/15/51 (k) | | 19,259,000 | | 21,264,844 |
Wells Fargo Commercial Mortgage Trust Series 2010-C1 Class XB, 0.5792% 11/15/43 (e)(m) | | 20,614,217 | | 723,559 |
WF-RBS Commercial Mortgage Trust: | | | | |
Series 2011-C3 Class C, 5.335% 3/15/44 (e) | | 360,000 | | 357,602 |
Series 2011-C4 Class E, 5.4179% 6/15/44 (e) | | 320,000 | | 243,907 |
Series 2011-C5: | | | | |
Class C, 5.8247% 11/15/44 (e)(k) | | 260,000 | | 246,568 |
Class D, 5.8247% 11/15/44 (e)(k) | | 200,000 | | 173,656 |
Class XA, 2.2648% 11/15/44 (e)(k)(m) | | 5,241,589 | | 642,252 |
WFDB Commercial Mortgage Trust Series 2011-BXR Class D, 5.914% 7/5/24 (e) | | 1,500,000 | | 1,531,398 |
TOTAL COMMERCIAL MORTGAGE SECURITIES (Cost $636,602,708) |
748,899,380
|
Municipal Securities - 0.3% |
|
Beaver County Indl. Dev. Auth. Poll. Cont. Rev. Bonds (FirstEnergy Nuclear Generation Corp. Proj.) Series 2005 A, 3.375%, tender 7/1/15 (k) | | 3,300,000 | | 3,412,761 |
California Gen. Oblig.: | | | | |
7.5% 4/1/34 | | 14,555,000 | | 18,767,363 |
7.55% 4/1/39 | | 3,020,000 | | 3,998,450 |
7.6% 11/1/40 | | 4,510,000 | | 6,033,298 |
7.625% 3/1/40 | | 3,440,000 | | 4,571,003 |
Illinois Gen. Oblig.: | | | | |
Series 2010, 4.421% 1/1/15 | | 6,825,000 | | 7,170,413 |
Series 2011, 5.877% 3/1/19 | | 2,935,000 | | 3,249,955 |
TOTAL MUNICIPAL SECURITIES (Cost $43,523,400) |
47,203,243
|
Foreign Government and Government Agency Obligations - 1.8% |
| Principal Amount (c) | | Value |
Argentine Republic: | | | | |
discount (with partial capitalization through 12/31/13) 8.28% 12/31/33 | | $ 4,304,209 | | $ 3,368,043 |
2.5% 12/31/38 (d) | | 3,210,000 | | 1,203,750 |
7% 9/12/13 | | 7,320,000 | | 7,294,787 |
7% 10/3/15 | | 10,420,000 | | 9,840,532 |
Bahamian Republic 6.95% 11/20/29 (e) | | 855,000 | | 974,700 |
Bahrain Kingdom 5.5% 3/31/20 | | 550,000 | | 539,000 |
Banco Nacional de Desenvolvimento Economico e Social 6.369% 6/16/18 (e) | | 325,000 | | 373,750 |
Belarus Republic: | | | | |
8.75% 8/3/15 (Reg. S) | | 4,595,000 | | 4,330,788 |
8.95% 1/26/18 | | 1,085,000 | | 1,009,050 |
Bermuda Government 5.603% 7/20/20 (e) | | 470,000 | | 533,450 |
Brazilian Federative Republic: | | | | |
7.125% 1/20/37 | | 540,000 | | 747,900 |
8.25% 1/20/34 | | 290,000 | | 444,425 |
8.75% 2/4/25 | | 245,000 | | 370,563 |
10.125% 5/15/27 | | 1,215,000 | | 2,029,050 |
12.25% 3/6/30 | | 735,000 | | 1,422,225 |
Chilean Republic 3.25% 9/14/21 | | 3,710,000 | | 3,804,605 |
Colombian Republic: | | | | |
4.375% 7/12/21 | | 1,745,000 | | 1,888,963 |
6.125% 1/18/41 | | 1,585,000 | | 1,949,550 |
7.375% 1/27/17 | | 750,000 | | 924,750 |
7.375% 3/18/19 | | 1,070,000 | | 1,372,810 |
7.375% 9/18/37 | | 2,130,000 | | 2,971,350 |
10.375% 1/28/33 | | 2,150,000 | | 3,622,750 |
11.75% 2/25/20 | | 1,050,000 | | 1,669,500 |
Congo Republic 3% 6/30/29 (d) | | 2,080,500 | | 1,560,375 |
Croatia Republic: | | | | |
6.375% 3/24/21 (e) | | 1,725,000 | | 1,625,813 |
6.625% 7/14/20 (e) | | 2,195,000 | | 2,129,150 |
6.75% 11/5/19 (e) | | 2,755,000 | | 2,713,675 |
Democratic Socialist Republic of Sri Lanka: | | | | |
6.25% 10/4/20 (e) | | 2,235,000 | | 2,167,950 |
6.25% 7/27/21 (e) | | 1,610,000 | | 1,561,700 |
7.4% 1/22/15 (e) | | 1,635,000 | | 1,700,400 |
Dominican Republic: | | | | |
1.5522% 8/30/24 (k) | | 1,350,000 | | 1,215,000 |
7.5% 5/6/21 (e) | | 2,580,000 | | 2,644,500 |
9.04% 1/23/18 (e) | | 1,185,880 | | 1,298,539 |
Foreign Government and Government Agency Obligations - continued |
| Principal Amount (c) | | Value |
El Salvador Republic: | | | | |
7.375% 12/1/19 (e) | | $ 940,000 | | $ 1,010,500 |
7.625% 2/1/41 (e) | | 525,000 | | 523,688 |
7.65% 6/15/35 (Reg. S) | | 1,265,000 | | 1,293,463 |
7.75% 1/24/23 (Reg. S) | | 895,000 | | 975,550 |
8.25% 4/10/32 (Reg. S) | | 575,000 | | 626,750 |
Gabonese Republic 8.2% 12/12/17 (e) | | 1,185,000 | | 1,407,188 |
Georgia Republic 6.875% 4/12/21 (e) | | 2,020,000 | | 2,100,800 |
Ghana Republic 8.5% 10/4/17 (e) | | 1,625,000 | | 1,799,688 |
Hungarian Republic: | | | | |
4.75% 2/3/15 | | 4,315,000 | | 4,110,038 |
6.25% 1/29/20 | | 1,430,000 | | 1,351,350 |
7.625% 3/29/41 | | 2,600,000 | | 2,437,500 |
Indonesian Republic: | | | | |
4.875% 5/5/21 (e) | | 1,095,000 | | 1,201,763 |
5.25% 1/17/42 (e) | | 1,030,000 | | 1,099,525 |
5.875% 3/13/20 (e) | | 1,660,000 | | 1,925,600 |
6.625% 2/17/37 (e) | | 1,100,000 | | 1,372,250 |
6.875% 1/17/18 (e) | | 1,105,000 | | 1,331,525 |
7.75% 1/17/38 (e) | | 1,925,000 | | 2,714,250 |
8.5% 10/12/35 (Reg. S) | | 1,685,000 | | 2,527,500 |
11.625% 3/4/19 (e) | | 1,720,000 | | 2,592,900 |
Islamic Republic of Pakistan 7.125% 3/31/16 (e) | | 3,710,000 | | 2,893,800 |
Jordanian Kingdom 3.875% 11/12/15 | | 820,000 | | 768,750 |
Latvian Republic: | | | | |
5.25% 2/22/17 (e) | | 1,335,000 | | 1,366,706 |
5.25% 6/16/21 (e) | | 550,000 | | 533,500 |
Lebanese Republic: | | | | |
4% 12/31/17 | | 3,351,000 | | 3,321,511 |
5.15% 11/12/18 | | 550,000 | | 548,625 |
Lithuanian Republic: | | | | |
6.125% 3/9/21 (e) | | 1,835,000 | | 1,892,436 |
6.625% 2/1/22 (e) | | 1,490,000 | | 1,601,750 |
6.75% 1/15/15 (e) | | 1,215,000 | | 1,306,125 |
7.375% 2/11/20 (e) | | 2,655,000 | | 2,986,875 |
Namibia Republic of 5.5% 11/3/21 (e) | | 1,340,000 | | 1,390,250 |
Peruvian Republic: | | | | |
3% 3/7/27 (d) | | 1,210,000 | | 1,040,600 |
5.625% 11/18/50 | | 1,620,000 | | 1,765,800 |
7.35% 7/21/25 | | 1,550,000 | | 2,088,625 |
8.75% 11/21/33 | | 2,865,000 | | 4,397,775 |
Foreign Government and Government Agency Obligations - continued |
| Principal Amount (c) | | Value |
Philippine Republic: | | | | |
5% 1/13/37 | | $ 725,000 | | $ 772,125 |
6.375% 1/15/32 | | 515,000 | | 637,313 |
6.5% 1/20/20 | | 805,000 | | 984,113 |
7.5% 9/25/24 | | 290,000 | | 379,900 |
7.75% 1/14/31 | | 820,000 | | 1,147,016 |
9.5% 2/2/30 | | 1,780,000 | | 2,848,000 |
9.875% 1/15/19 | | 640,000 | | 913,600 |
10.625% 3/16/25 | | 1,320,000 | | 2,158,200 |
Polish Government: | | | | |
3.875% 7/16/15 | | 840,000 | | 882,000 |
5% 3/23/22 | | 655,000 | | 699,213 |
5.125% 4/21/21 | | 825,000 | | 884,813 |
6.375% 7/15/19 | | 2,200,000 | | 2,574,000 |
Provincia de Cordoba 12.375% 8/17/17 (e) | | 1,360,000 | | 1,224,000 |
Provincia de Neuquen Argentina 7.875% 4/26/21 (e) | | 520,000 | | 535,600 |
Republic of Iraq 5.8% 1/15/28 (Reg. S) | | 4,750,000 | | 3,716,875 |
Republic of Nigeria 6.75% 1/28/21 (e) | | 1,355,000 | | 1,446,463 |
Republic of Serbia 6.75% 11/1/24 (e) | | 7,808,668 | | 7,574,408 |
Romanian Republic 6.75% 2/7/22 (e) | | 2,512,000 | | 2,587,360 |
Russian Federation: | | | | |
7.5% 3/31/30 (Reg. S) | | 7,859,020 | | 9,362,451 |
11% 7/24/18 (Reg. S) | | 385,000 | | 542,850 |
12.75% 6/24/28 (Reg. S) | | 1,950,000 | | 3,478,410 |
Senegal Republic of 8.75% 5/13/21 (e) | | 700,000 | | 701,750 |
State of Qatar 5.75% 1/20/42 (e) | | 945,000 | | 1,027,688 |
Turkish Republic: | | | | |
5.125% 3/25/22 | | 735,000 | | 729,488 |
5.625% 3/30/21 | | 815,000 | | 847,600 |
6% 1/14/41 | | 350,000 | | 342,125 |
6.25% 9/26/22 | | 680,000 | | 725,900 |
6.75% 4/3/18 | | 1,395,000 | | 1,562,400 |
6.75% 5/30/40 | | 805,000 | | 865,375 |
6.875% 3/17/36 | | 2,520,000 | | 2,746,800 |
7% 9/26/16 | | 1,360,000 | | 1,523,200 |
7.25% 3/15/15 | | 730,000 | | 803,000 |
7.25% 3/5/38 | | 1,250,000 | | 1,428,125 |
7.375% 2/5/25 | | 2,430,000 | | 2,834,109 |
7.5% 7/14/17 | | 1,285,000 | | 1,479,678 |
7.5% 11/7/19 | | 745,000 | | 873,513 |
11.875% 1/15/30 | | 960,000 | | 1,617,600 |
Foreign Government and Government Agency Obligations - continued |
| Principal Amount (c) | | Value |
Ukraine Financing of Infrastructure Projects State Enterprise 8.375% 11/3/17 (e) | | $ 1,690,000 | | $ 1,440,725 |
Ukraine Government: | | | | |
6.25% 6/17/16 (e) | | 2,080,000 | | 1,885,104 |
6.385% 6/26/12 (e) | | 4,775,000 | | 4,793,145 |
6.75% 11/14/17 (e) | | 1,895,000 | | 1,700,763 |
6.875% 9/23/15 (e) | | 1,630,000 | | 1,536,275 |
7.65% 6/11/13 (e) | | 3,315,000 | | 3,286,160 |
7.75% 9/23/20 (e) | | 1,430,000 | | 1,283,425 |
7.95% 2/23/21 (e) | | 1,425,000 | | 1,293,188 |
United Arab Emirates 7.75% 10/5/20 (Reg. S) | | 545,000 | | 583,831 |
United Mexican States: | | | | |
3.625% 3/15/22 | | 1,080,000 | | 1,100,520 |
5.125% 1/15/20 | | 920,000 | | 1,050,640 |
5.75% 10/12/10 | | 756,000 | | 807,030 |
5.95% 3/19/19 | | 300,000 | | 359,100 |
6.05% 1/11/40 | | 9,304,000 | | 11,327,620 |
6.75% 9/27/34 | | 720,000 | | 936,000 |
7.5% 4/8/33 | | 425,000 | | 597,125 |
8.3% 8/15/31 | | 420,000 | | 631,050 |
Uruguay Republic: | | | | |
7.875% 1/15/33 pay-in-kind | | 2,345,000 | | 3,247,825 |
8% 11/18/22 | | 2,105,903 | | 2,874,558 |
Venezuelan Republic: | | | | |
6% 12/9/20 | | 620,000 | | 465,000 |
7% 3/31/38 | | 625,000 | | 445,313 |
7.75% 10/13/19 (Reg. S) | | 800,000 | | 676,000 |
8.5% 10/8/14 | | 735,000 | | 738,675 |
9% 5/7/23 (Reg. S) | | 2,490,000 | | 2,122,725 |
9.25% 9/15/27 | | 1,210,000 | | 1,085,975 |
9.25% 5/7/28 (Reg. S) | | 790,000 | | 675,450 |
9.375% 1/13/34 | | 885,000 | | 761,100 |
10.75% 9/19/13 | | 1,300,000 | | 1,358,500 |
11.75% 10/21/26 (Reg. S) | | 1,410,000 | | 1,420,575 |
11.95% 8/5/31 (Reg. S) | | 1,890,000 | | 1,904,175 |
12.75% 8/23/22 | | 4,180,000 | | 4,430,800 |
13.625% 8/15/18 | | 848,000 | | 915,840 |
Vietnamese Socialist Republic: | | | | |
1.3166% 3/12/16 (k) | | 919,565 | | 827,608 |
4% 3/12/28 (d) | | 3,195,000 | | 2,619,900 |
Foreign Government and Government Agency Obligations - continued |
| Principal Amount (c) | | Value |
Vietnamese Socialist Republic: - continued | | | | |
6.75% 1/29/20 (e) | | $ 835,000 | | $ 908,063 |
6.875% 1/15/16 (e) | | 2,280,000 | | 2,473,800 |
TOTAL FOREIGN GOVERNMENT AND GOVERNMENT AGENCY OBLIGATIONS (Cost $237,500,593) |
261,628,993
|
Supranational Obligations - 0.0% |
|
Corporacion Andina de Fomento 5.2% 5/21/13
(Cost $232,967) | | 242,000 | |
251,210
|
Common Stocks - 0.0% |
| Shares | | |
TELECOMMUNICATION SERVICES - 0.0% |
Wireless Telecommunication Services - 0.0% |
CUI Acquisition Corp. Class E (e) (Cost $1,258,919) | 1 | |
863,100
|
Preferred Stocks - 0.1% |
| | | |
Convertible Preferred Stocks - 0.0% |
CONSUMER DISCRETIONARY - 0.0% |
Automobiles - 0.0% |
General Motors Co. 4.75% | 80,100 | | 3,419,469 |
FINANCIALS - 0.0% |
Real Estate Investment Trusts - 0.0% |
Alexandria Real Estate Equities, Inc. Series D 7.00% | 9,000 | | 228,375 |
TOTAL CONVERTIBLE PREFERRED STOCKS | | 3,647,844 |
Nonconvertible Preferred Stocks - 0.1% |
FINANCIALS - 0.1% |
Real Estate Investment Trusts - 0.1% |
Apartment Investment & Management Co. Series U, 7.75% | 5,000 | | 127,050 |
CBL & Associates Properties, Inc. 7.375% | 7,720 | | 194,930 |
Cedar Shopping Centers, Inc. 8.875% | 5,000 | | 125,500 |
Preferred Stocks - continued |
| Shares | | Value |
Nonconvertible Preferred Stocks - continued |
FINANCIALS - continued |
Real Estate Investment Trusts - continued |
Corporate Office Properties Trust Series H, 7.50% | 5,000 | | $ 128,600 |
Digital Realty Trust, Inc. Series E, 7.00% | 10,000 | | 262,800 |
Equity Lifestyle Properties, Inc. 8.034% | 22,162 | | 578,428 |
Essex Property Trust, Inc. Series H, 7.125% | 9,354 | | 248,068 |
Hersha Hospitality Trust Series B, 8.00% | 13,844 | | 340,978 |
Hospitality Properties Trust Series D, 7.125% | 10,000 | | 255,400 |
LaSalle Hotel Properties Series H, 7.50% | 10,000 | | 256,800 |
PS Business Parks, Inc.: | | | |
6.875% | 10,000 | | 266,000 |
Series S, 6.45% | 21,000 | | 533,400 |
Public Storage: | | | |
Series P, 6.50% | 12,000 | | 331,800 |
Series R, 6.35% | 10,500 | | 284,445 |
Series S, 5.90% | 20,000 | | 509,400 |
Realty Income Corp. Series F, 6.625% | 12,000 | | 307,560 |
Regency Centers Corp. Series 6, 6.625% | 5,510 | | 139,679 |
Stag Industrial, Inc. Series A, 9.00% | 20,000 | | 514,200 |
| | 5,405,038 |
TOTAL PREFERRED STOCKS (Cost $9,254,649) |
9,052,882
|
Floating Rate Loans - 0.5% |
| Principal Amount (c) | | |
CONSUMER DISCRETIONARY - 0.2% |
Auto Components - 0.1% |
Federal-Mogul Corp.: | | | | |
Tranche B, term loan 2.1959% 12/27/14 (k) | | $ 3,351,661 | | 3,209,216 |
Tranche C, term loan 2.1887% 12/27/15 (k) | | 2,105,267 | | 2,015,794 |
| | 5,225,010 |
Automobiles - 0.0% |
Chrysler Group LLC Tranche B, term loan 6% 5/24/17 (k) | | 2,790,975 | | 2,801,441 |
Diversified Consumer Services - 0.0% |
Visant Corp. Tranche B, term loan 5.25% 12/22/16 (k) | | 2,015,623 | | 1,929,959 |
Floating Rate Loans - continued |
| Principal Amount (c) | | Value |
CONSUMER DISCRETIONARY - continued |
Hotels, Restaurants & Leisure - 0.0% |
Ameristar Casinos, Inc. Tranche B, term loan 4% 4/14/18 (k) | | $ 913,100 | | $ 914,241 |
Extended Stay America, Inc. term loan 9.75% 11/1/15 | | 1,000,000 | | 1,000,000 |
MGM Mirage, Inc. Tranche B, term loan 7% 2/21/14 (k) | | 1,435,000 | | 1,440,453 |
| | 3,354,694 |
Leisure Equipment & Products - 0.0% |
SRAM LLC.: | | | | |
2nd LN, term loan 8.5% 12/7/18 (k) | | 265,000 | | 266,325 |
Tranche B 1LN, term loan 4.7645% 6/7/18 (k) | | 792,198 | | 791,208 |
| | 1,057,533 |
Media - 0.1% |
Harron Communications LP Tranche B, term loan 5.25% 10/6/17 (k) | | 2,072,963 | | 2,062,598 |
Newsday LLC term loan 10.5% 8/1/13 | | 3,505,000 | | 3,592,625 |
Univision Communications, Inc. term loan 4.494% 3/31/17 (k) | | 4,421,098 | | 4,106,094 |
UPC Broadband Holding BV Tranche AB, term loan 4.75% 12/31/17 (k) | | 1,250,000 | | 1,250,000 |
| | 11,011,317 |
Multiline Retail - 0.0% |
Neiman Marcus Group, Inc. Tranche B, term loan 4.75% 5/16/18 (k) | | 3,680,000 | | 3,657,000 |
Specialty Retail - 0.0% |
PETCO Animal Supplies, Inc. term loan 4.5% 11/24/17 (k) | | 338,100 | | 337,255 |
TOTAL CONSUMER DISCRETIONARY | | 29,374,209 |
CONSUMER STAPLES - 0.0% |
Food & Staples Retailing - 0.0% |
SUPERVALU, Inc. Tranche B 3LN, term loan 4.5% 4/29/18 (k) | | 1,404,388 | | 1,400,877 |
U.S. Foodservice term loan 5.75% 3/31/17 (k) | | 4,871,086 | | 4,834,552 |
| | 6,235,429 |
ENERGY - 0.0% |
Oil, Gas & Consumable Fuels - 0.0% |
FTS International, LLC Tranche B, term loan 6.25% 5/6/16 (k) | | 2,988,581 | | 2,970,052 |
Floating Rate Loans - continued |
| Principal Amount (c) | | Value |
FINANCIALS - 0.1% |
Diversified Financial Services - 0.0% |
Flying Fortress, Inc. Tranche 3, term loan 5% 6/30/17 (k) | | $ 1,615,000 | | $ 1,610,963 |
Insurance - 0.1% |
Asurion Corp.: | | | | |
Tranche 1ST LIEN, term loan 5.5% 5/24/18 (k) | | 1,537,386 | | 1,531,698 |
Tranche 2ND LIEN, term loan 9% 5/24/19 (k) | | 3,255,000 | | 3,316,194 |
Lonestar Inter Super Hld LLC term loan 8/13/19 | | 1,925,000 | | 1,949,063 |
| | 6,796,955 |
Real Estate Management & Development - 0.0% |
Capital Automotive LP term loan 5% 3/11/17 (k) | | 629,400 | | 623,106 |
CityCenter term loan 8.75% 7/1/13 (k) | | 1,000,000 | | 992,500 |
| | 1,615,606 |
TOTAL FINANCIALS | | 10,023,524 |
HEALTH CARE - 0.0% |
Health Care Providers & Services - 0.0% |
Quintiles Transnational Corp. Tranche B, term loan 5% 6/8/18 (k) | | 2,232,753 | | 2,210,425 |
Pharmaceuticals - 0.0% |
Endo Pharmaceuticals Holdings, Inc. Tranche B, term loan 4% 6/17/18 (k) | | 221,588 | | 221,588 |
TOTAL HEALTH CARE | | 2,432,013 |
INDUSTRIALS - 0.1% |
Airlines - 0.1% |
Delta Air Lines, Inc. Tranche B, term loan 5.5% 4/20/17 (k) | | 2,781,025 | | 2,714,280 |
US Airways Group, Inc. term loan 2.744% 3/23/14 (k) | | 2,810,347 | | 2,578,494 |
| | 5,292,774 |
Construction & Engineering - 0.0% |
Drumm Investors LLC Tranche B, term loan 5% 5/4/18 (k) | | 542,210 | | 509,677 |
Floating Rate Loans - continued |
| Principal Amount (c) | | Value |
INDUSTRIALS - continued |
Machinery - 0.0% |
Colfax Corp. Tranche B, term loan 4.5% 9/12/18 (k) | | $ 2,530,000 | | $ 2,530,000 |
Husky Intermediate, Inc. Tranche B, term loan 6.5% 6/30/18 (k) | | 2,283,525 | | 2,277,816 |
| | 4,807,816 |
TOTAL INDUSTRIALS | | 10,610,267 |
MATERIALS - 0.1% |
Chemicals - 0.0% |
Arizona Chemical Tranche B, term loan 7.25% 12/22/17 (k) | | 1,000,000 | | 1,013,750 |
Ashland, Inc. Tranche B, term loan 3.75% 8/23/18 (k) | | 2,068,701 | | 2,079,044 |
| | 3,092,794 |
Containers & Packaging - 0.1% |
Anchor Glass Container Corp. Tranche 2LN, term loan 10% 9/2/16 (k) | | 2,065,000 | | 2,065,000 |
Sealed Air Corp. Tranche B, term loan 4.75% 10/3/18 (k) | | 1,472,575 | | 1,483,619 |
| | 3,548,619 |
Metals & Mining - 0.0% |
JMC Steel Group, Inc. term loan 4.75% 4/1/17 (k) | | 2,108,938 | | 2,108,938 |
TOTAL MATERIALS | | 8,750,351 |
TELECOMMUNICATION SERVICES - 0.0% |
Wireless Telecommunication Services - 0.0% |
Intelsat Jackson Holdings SA term loan 3.2535% 2/1/14 (k) | | 2,425,000 | | 2,364,375 |
MetroPCS Wireless, Inc. Tranche B 3LN, term loan 4.0147% 3/17/18 (k) | | 2,949,306 | | 2,919,813 |
TowerCo Finance LLC Tranche B, term loan 5.25% 2/2/17 (k) | | 2,252,975 | | 2,252,975 |
| | 7,537,163 |
UTILITIES - 0.0% |
Independent Power Producers & Energy Traders - 0.0% |
The AES Corp. Tranche B, term loan 4.25% 5/27/18 (k) | | 372,188 | | 372,187 |
TOTAL FLOATING RATE LOANS (Cost $76,073,479) |
78,305,195
|
Sovereign Loan Participations - 0.0% |
| Principal Amount (c) | | Value |
Indonesian Republic loan participation: | | | | |
Citibank 1.25% 12/14/19 (k) | | $ 1,607,627 | | $ 1,511,170 |
Goldman Sachs 1.25% 12/14/19 (k) | | 1,377,778 | | 1,295,111 |
0% 12/14/19 (k) | | 106,286 | | 99,909 |
TOTAL SOVEREIGN LOAN PARTICIPATIONS (Cost $2,651,440) |
2,906,190
|
Bank Notes - 0.0% |
|
Wachovia Bank NA 6% 11/15/17
(Cost $2,438,852) | | 2,243,000 | |
2,579,795
|
Fixed-Income Funds - 23.1% |
| Shares | | |
Fidelity Floating Rate Central Fund (l) | 5,734,106 | | 578,341,954 |
Fidelity Mortgage Backed Securities Central Fund (l) | 26,421,758 | | 2,866,496,506 |
TOTAL FIXED-INCOME FUNDS (Cost $3,208,191,485) |
3,444,838,460
|
Preferred Securities - 0.0% |
| Principal Amount (c) | | |
CONSUMER DISCRETIONARY - 0.0% |
Media - 0.0% |
Globo Comunicacoes e Participacoes SA 6.25% (d)(e)(f) | $ 1,860,000 | | 1,984,375 |
MATERIALS - 0.0% |
Metals & Mining - 0.0% |
CSN Islands XII Corp. 7% (Reg. S) (f) | 1,980,000 | | 2,005,868 |
TOTAL PREFERRED SECURITIES (Cost $3,813,628) |
3,990,243
|
Money Market Funds - 8.2% |
| Shares | | Value |
Fidelity Cash Central Fund, 0.12% (a)
(Cost $1,220,997,367) | 1,220,997,367 | | $ 1,220,997,367 |
TOTAL INVESTMENT PORTFOLIO - 104.3% (Cost $14,596,812,402) | | 15,549,569,793 |
NET OTHER ASSETS (LIABILITIES) - (4.3)% | | (635,700,084) |
NET ASSETS - 100% | $ 14,913,869,709 |
TBA Sale Commitments |
| Principal
Amount (c) | | |
Fannie Mae |
3.5% 3/1/42 | $ (78,500,000) | | (81,138,283) |
3.5% 3/1/42 | (78,500,000) | | (81,138,283) |
3.5% 3/1/42 | (78,500,000) | | (81,138,283) |
3.5% 3/1/42 | (27,000,000) | | (27,907,435) |
4% 3/1/42 | (23,200,000) | | (24,416,824) |
4.5% 3/1/42 | (43,500,000) | | (46,360,943) |
5% 3/1/42 | (47,000,000) | | (50,758,765) |
5% 3/1/42 | (9,000,000) | | (9,719,763) |
5% 3/1/42 | (16,000,000) | | (17,279,579) |
5% 3/1/42 | (16,000,000) | | (17,279,579) |
6% 3/1/42 | (18,000,000) | | (19,805,891) |
TOTAL FANNIE MAE | | (456,943,628) |
Ginnie Mae |
4% 3/1/42 | (2,700,000) | | (2,907,847) |
TOTAL TBA SALE COMMITMENTS (Proceeds $459,631,945) | $ (459,851,475) |
Swap Agreements |
| Expiration Date | | Notional Amount | | Value |
Credit Default Swaps |
Receive monthly a fixed rate of .15% multiplied by the notional amount and pay to Credit Suisse First Boston upon each credit event of one of the issues of ABX AA 07-01 Index, par value of the proportional notional amount (Rating-C) (Upfront Premium Received/(Paid) $480,000) (j) | Sept. 2037 | | $ 2,154,763 | | $ (2,034,940) |
Receive monthly a fixed rate of .15% multiplied by the notional amount and pay to Credit Suisse First Boston upon each credit event of one of the issues of ABX AA 07-01 Index, par value of the proportional notional amount (Rating-C) (Upfront Premium Received/(Paid) $1,058,000) (j) | Sept. 2037 | | 2,477,977 | | (2,340,181) |
Receive monthly a fixed rate of .15% multiplied by the notional amount and pay to JPMorgan Chase, Inc. upon each credit event of one of the issues of ABX AA 07-01 Index, par value of the proportional notional amount (Rating-C) (Upfront Premium Received/(Paid) $651,000) (j) | Sept. 2037 | | 1,508,334 | | (1,424,458) |
Receive monthly a fixed rate of .15% multiplied by the notional amount and pay to UBS upon each credit event of one of the issues of ABX AA 07-1 Index, par value of the proportional notional amount (Rating-C) (Upfront Premium Received/(Paid) $936,000) (j) | Sept. 2037 | | 3,878,573 | | (3,662,892) |
Receive monthly a fixed rate of .15% multiplied by the notional amount and pay to UBS upon each credit event of one of the issues of ABX AA 07-1 Index, par value of the proportional notional amount (Rating-C) (Upfront Premium Received/(Paid) $347,750) (j) | Sept. 2037 | | 1,400,596 | | (1,322,711) |
Receive monthly notional amount multiplied by .82% and pay UBS upon credit event of Morgan Stanley ABS Capital I, Inc., par value of the notional amount of Morgan Stanley ABS Capital I, Inc. Series 2004-NC6 Class M3, 5.6413% 7/25/34 (Rating-Ca) (i) | August 2034 | | 23,846 | | (18,445) |
Swap Agreements - continued |
| Expiration Date | | Notional Amount | | Value |
Credit Default Swaps - continued |
Receive monthly notional amount multiplied by 2.4% and pay Deutsche Bank upon credit event of Fremont Home Loan Trust, par value of the notional amount of Fremont Home Loan Trust Series 2004-A Class B3, 7.2288% 1/25/34 (Rating-C) (i) | Feb. 2034 | | $ 787 | | $ (736) |
Receive monthly notional amount multiplied by 3.35% and pay Morgan Stanley, Inc. upon credit event of Morgan Stanley ABS Capital I, Inc., par value of the notional amount of Morgan Stanley ABS Capital I, Inc. Series 2004-HE7, Class B3, 9.01% 8/25/34 (Rating-C) (i) | Sept. 2034 | | 23,153 | | (20,187) |
TOTAL CREDIT DEFAULT SWAPS | | $ 11,468,029 | | $ (10,824,550) |
Interest Rate Swaps |
Receive semi-annually a fixed rate equal to 1.2857% and pay quarterly a floating rate based on 3-month LIBOR with JPMorgan Chase, Inc. | June 2012 | | 200,000,000 | | 768,840 |
| | $ 211,468,029 | | $ (10,055,710) |
Currency Abbreviations |
CAD | - | Canadian dollar |
Legend |
(a) Affiliated fund that is available only to investment companies and other accounts managed by Fidelity Investments. The rate quoted is the annualized seven-day yield of the fund at period end. A complete unaudited listing of the fund's holdings as of its most recent quarter end is available upon request. In addition, each Fidelity Central Fund's financial statements, which are not covered by the Fund's Report of Independent Registered Public Accounting Firm, are available on the SEC's website or upon request. |
(b) Non-income producing - Security is in default. |
(c) Principal Amount is stated in United States dollars unless otherwise noted. |
(d) Security initially issued at one coupon which converts to a higher coupon at a specified date. The rate shown is the rate at period end. |
(e) Security exempt from registration under Rule 144A of the Securities Act of 1933. These securities may be resold in transactions exempt from registration, normally to qualified institutional buyers. At the end of the period, the value of these securities amounted to $1,023,002,212 or 6.9% of net assets. |
(f) Security is perpetual in nature with no stated maturity date. |
(g) Security or a portion of the security purchased on a delayed delivery or when-issued basis. |
(h) Security or a portion of the security has been segregated as collateral for open swap agreements. At the period end, the value of securities pledged amounted to $11,216,630. |
(i) Represents a credit default swap contract in which the Fund has sold protection on the underlying reference entity. The value of each credit default swap and the credit rating can be measures of the current payment/performance risk. For the underlying reference entity, ratings disclosed are from Moody's Investors Service, Inc. Where Moody's ratings are not available, S&P ratings are disclosed and are indicated as such. All ratings are as of the report date and do not reflect subsequent changes. Where a credit rating is not disclosed, the value is used as the measure of the payment/performance risk. |
(j) Represents a credit default swap based on a tradable index of home equity asset-backed debt securities. The value of each credit default swap and the credit rating can be measures of the current payment/performance risk. In addition, the swap represents a contract in which the Fund has sold protection on the index of underlying securities. Ratings represent a weighted average of the ratings of all securities included in the index. Ratings used in the weighted average are from Moody's Investors Service, Inc., or S&P where Moody's ratings are not available. All ratings are as of the report date and do not reflect subsequent changes. |
(k) Coupon rates for floating and adjustable rate securities reflect the rates in effect at period end. |
(l) Affiliated fund that is available only to investment companies and other accounts managed by Fidelity Investments. A complete unaudited schedule of portfolio holdings for each Fidelity Central Fund is filed with the SEC for the first and third quarters of each fiscal year on Form N-Q and is available upon request or at the SEC's web site at www.sec.gov. An unaudited holdings listing for the Fund, which presents direct holdings as well as the pro rata share of securities and other investments held indirectly through its investment in underlying non-money market Fidelity Central Funds, is available at fidelity.com and/or advisor.fidelity.com,as applicable. In addition, each Fidelity Central Fund's financial statements, which are not covered by the Fund's Report of Independent Registered Public Accounting Firm, are available on the SEC's web site or upon request. |
(m) Security represents right to receive monthly interest payments on an underlying pool of mortgages or assets. Principal shown is the outstanding par amount of the pool as of the end of the period. |
(n) Restricted securities - Investment in securities not registered under the Securities Act of 1933 (excluding 144A issues). At the end of the period, the value of restricted securities (excluding 144A issues) amounted to $727,178 or 0.0% of net assets. |
Additional information on each restricted holding is as follows: |
Security | Acquisition Date | Acquisition Cost |
ACGS Series 2004-1 Class P, 7.4651% 8/1/19 | 2/17/11 | $ 548,737 |
GMAC Commercial Mortgage Securities, Inc. Series 1999-C2I Class K, 6.481% 9/15/33 | 3/23/07 - 12/4/09 | $ 173,625 |
Affiliated Central Funds |
Information regarding fiscal year to date income earned by the Fund from investments in Fidelity Central Funds is as follows: |
Fund | Income earned |
Fidelity Cash Central Fund | $ 228,566 |
Fidelity Floating Rate Central Fund | 13,423,997 |
Fidelity Mortgage Backed Securities Central Fund | 43,696,283 |
Total | $ 57,348,846 |
Additional information regarding the Fund's fiscal year to date purchases and sales, including the ownership percentage, of the non Money Market Central Funds is as follows: |
Fund | Value,
beginning of
period | Purchases | Sales Proceeds | Value,
end of
period | % ownership,
end of
period |
Fidelity Floating Rate Central Fund | $ 389,816,805 | $ 163,043,361 | $ - | $ 578,341,954 | 31.4% |
Fidelity Mortgage Backed Securities Central Fund | 2,813,030,905 | 43,696,285 | - | 2,866,496,506 | 22.0% |
Total | $ 3,202,847,710 | $ 206,739,646 | $ - | $ 3,444,838,460 | |
Other Information |
The following is a summary of the inputs used, as of February 29, 2012, involving the Fund's assets and liabilities carried at fair value. The inputs or methodology used for valuing securities may not be an indication of the risk associated with investing in those securities. For more information on valuation inputs, and their aggregation into the levels used in the tables below, please refer to the Security Valuation section in the accompanying Notes to Financial Statements. |
Valuation Inputs at Reporting Date: |
Description | Total | Level 1 | Level 2 | Level 3 |
Investments in Securities: | | | | |
Equities: | | | | |
Consumer Discretionary | $ 3,419,469 | $ 3,419,469 | $ - | $ - |
Financials | 5,633,413 | 5,405,038 | 228,375 | - |
Telecommunication Services | 863,100 | - | - | 863,100 |
Corporate Bonds | 3,562,288,913 | - | 3,561,929,536 | 359,377 |
U.S. Government and Government Agency Obligations | 3,913,031,898 | - | 3,913,031,898 | - |
U.S. Government Agency - Mortgage Securities | 1,837,637,987 | - | 1,837,637,987 | - |
Asset-Backed Securities | 298,586,531 | - | 274,208,830 | 24,377,701 |
Collateralized Mortgage Obligations | 116,508,406 | - | 113,004,269 | 3,504,137 |
Commercial Mortgage Securities | 748,899,380 | - | 706,158,037 | 42,741,343 |
Municipal Securities | 47,203,243 | - | 47,203,243 | - |
Foreign Government and Government Agency Obligations | 261,628,993 | - | 260,588,393 | 1,040,600 |
Supranational Obligations | 251,210 | - | 251,210 | - |
Floating Rate Loans | 78,305,195 | - | 76,312,695 | 1,992,500 |
Sovereign Loan Participations | 2,906,190 | - | - | 2,906,190 |
Bank Notes | 2,579,795 | - | 2,579,795 | - |
Fixed-Income Funds | 3,444,838,460 | 3,444,838,460 | - | - |
Preferred Securities | 3,990,243 | - | 3,990,243 | - |
Money Market Funds | 1,220,997,367 | 1,220,997,367 | - | - |
Total Investments in Securities: | $ 15,549,569,793 | $ 4,674,660,334 | $ 10,797,124,511 | $ 77,784,948 |
Derivative Instruments: | | | | |
Assets | | | | |
Swap Agreements | $ 768,840 | $ - | $ 768,840 | $ - |
Liabilities | | | | |
Swap Agreements | $ (10,824,550) | $ - | $ (10,785,182) | $ (39,368) |
Total Derivative Instruments: | $ (10,055,710) | $ - | $ (10,016,342) | $ (39,368) |
Other Financial Instruments: | | | | |
TBA Sale Commitments | $ (459,851,475) | $ - | $ (459,851,475) | $ - |
The following is a reconciliation of Investments in Securities and Derivative Instruments for which Level 3 inputs were used in determining value: |
Investments in Securities: | |
Beginning Balance | $ 93,393,811 |
Total Realized Gain (Loss) | 736,567 |
Total Unrealized Gain (Loss) | (4,374,581) |
Cost of Purchases | 2,218,424 |
Proceeds of Sales | (14,225,697) |
Amortization/Accretion | 157,857 |
Transfers in to Level 3 | 23,126,886 |
Transfers out of Level 3 | (23,248,319) |
Ending Balance | $ 77,784,948 |
The change in unrealized gain (loss) for the period attributable to Level 3 securities held at February 29, 2012 | $ (4,059,170) |
Derivative Instruments: | |
Swap Agreements | |
Beginning Balance | $ (32,859) |
Total Unrealized Gain (Loss) | (6,509) |
Transfers in to Level 3 | - |
Transfers out of Level 3 | - |
Ending Balance | $ (39,368) |
Realized gain (loss) on Swap Agreements for the period | $ 847 |
The change in unrealized gain (loss) for the period attributable to Level 3 Swap Agreements held at February 29, 2012 | $ (6,509) |
The information used in the above reconciliations represents fiscal year to date activity for any Investments in Securities and Derivative Instruments identified as using Level 3 inputs at either the beginning or the end of the current fiscal period. Transfers in or out of Level 3 represent the beginning value of any Security or Instrument where a change in the pricing level occurred from the beginning to the end of the period. The cost of purchases and the proceeds of sales may include securities received or delivered through corporate actions or exchanges. Realized and unrealized gains (losses) disclosed in the reconciliation are included in Net Gain (Loss) on the Fund's Statement of Operations. |
Value of Derivative Instruments |
The following table is a summary of the Fund's value of derivative instruments by risk exposure as of February 29, 2012. For additional information on derivative instruments, please refer to the Derivative Instruments section in the accompanying Notes to Financial Statements. |
Risk Exposure /
Derivative Type | Value |
| Asset | Liability |
Credit Risk | | |
Swap Agreements (a) | $ - | $ (10,824,550) |
Interest Rate Risk | | |
Swap Agreements (a) | 768,840 | - |
Total Value of Derivatives | $ 768,840 | $ (10,824,550) |
(a) Value is disclosed on the Statement of Assets and Liabilities in the Swap agreements, at value line-items. |
See accompanying notes which are an integral part of the financial statements.
Semiannual Report
Statement of Assets and Liabilities
| February 29, 2012 |
| | |
Assets | | |
Investment in securities, at value - See accompanying schedule: Unaffiliated issuers (cost $10,167,623,550) | $ 10,883,733,966 | |
Fidelity Central Funds (cost $4,429,188,852) | 4,665,835,827 | |
Total Investments (cost $14,596,812,402) | | $ 15,549,569,793 |
Cash | | 396,270 |
Receivable for investments sold, regular delivery | | 30,627,061 |
Receivable for TBA sale commitments | | 459,631,945 |
Receivable for fund shares sold | | 68,291,615 |
Dividends receivable | | 49,602 |
Interest receivable | | 82,373,080 |
Distributions receivable from Fidelity Central Funds | | 114,527 |
Swap agreements, at value | | 768,840 |
Other receivables | | 52,956 |
Total assets | | 16,191,875,689 |
| | |
Liabilities | | |
Payable for investments purchased
Regular delivery | $ 7,573,428 | |
Delayed delivery | 571,763,451 | |
TBA sale commitments, at value | 459,851,475 | |
Payable for swap agreements | 437,074 | |
Payable for fund shares redeemed | 219,575,935 | |
Distributions payable | 1,792,312 | |
Swap agreements, at value | 10,824,550 | |
Accrued management fee | 3,902,375 | |
Distribution and service plan fees payable | 381,166 | |
Other affiliated payables | 1,851,224 | |
Other payables and accrued expenses | 52,990 | |
Total liabilities | | 1,278,005,980 |
| | |
Net Assets | | $ 14,913,869,709 |
Net Assets consist of: | | |
Paid in capital | | $ 14,076,252,628 |
Undistributed net investment income | | 56,823,931 |
Accumulated undistributed net realized gain (loss) on investments and foreign currency transactions | | (162,164,212) |
Net unrealized appreciation (depreciation) on investments and assets and liabilities in foreign currencies | | 942,957,362 |
Net Assets | | $ 14,913,869,709 |
See accompanying notes which are an integral part of the financial statements.
Semiannual Report
Financial Statements - continued
Statement of Assets and Liabilities - continued
| February 29, 2012 |
| | |
Calculation of Maximum Offering Price Class A:
Net Asset Value and redemption price per share ($1,455,915,037 ÷ 131,903,359 shares) | | $ 11.04 |
| | |
Maximum offering price per share (100/96.00 of $11.04) | | $ 11.50 |
Class T:
Net Asset Value and redemption price per share ($51,083,887 ÷ 4,633,379 shares) | | $ 11.03 |
| | |
Maximum offering price per share (100/96.00 of $11.03) | | $ 11.49 |
Class B:
Net Asset Value and offering price per share ($10,146,736 ÷ 919,050 shares)A | | $ 11.04 |
| | |
Class C:
Net Asset Value and offering price per share ($80,520,955 ÷ 7,295,759 shares)A | | $ 11.04 |
| | |
Total Bond:
Net Asset Value, offering price and redemption price per share ($12,793,589,188 ÷ 1,159,258,348 shares) | | $ 11.04 |
| | |
Institutional Class:
Net Asset Value, offering price and redemption price per share ($522,613,906 ÷ 47,419,000 shares) | | $ 11.02 |
A Redemption price per share is equal to net asset value less any applicable contingent deferred sales charge.
See accompanying notes which are an integral part of the financial statements.
Semiannual Report
Statement of Operations
| Six months ended February 29, 2012 |
| | |
Investment Income | | |
Dividends | | $ 481,550 |
Interest | | 219,155,566 |
Income from Fidelity Central Funds | | 57,348,846 |
Total income | | 276,985,962 |
| | |
Expenses | | |
Management fee | $ 22,029,268 | |
Transfer agent fees | 8,145,685 | |
Distribution and service plan fees | 2,120,856 | |
Fund wide operations fee | 2,297,369 | |
Independent trustees' compensation | 25,055 | |
Miscellaneous | 18,995 | |
Total expenses before reductions | 34,637,228 | |
Expense reductions | (1,594) | 34,635,634 |
Net investment income (loss) | | 242,350,328 |
Realized and Unrealized Gain (Loss) Net realized gain (loss) on: | | |
Investment securities: | | |
Unaffiliated issuers | 135,469,894 | |
Foreign currency transactions | (537) | |
Swap agreements | (35,135) | |
Total net realized gain (loss) | | 135,434,222 |
Change in net unrealized appreciation (depreciation) on: Investment securities | 116,673,979 | |
Assets and liabilities in foreign currencies | 29 | |
Swap agreements | (31,831) | |
Delayed delivery commitments | (2,162,465) | |
Total change in net unrealized appreciation (depreciation) | | 114,479,712 |
Net gain (loss) | | 249,913,934 |
Net increase (decrease) in net assets resulting from operations | | $ 492,264,262 |
See accompanying notes which are an integral part of the financial statements.
Semiannual Report
Financial Statements - continued
Statement of Changes in Net Assets
| Six months ended February 29,
2012 | Year ended
August 31,
2011 |
Increase (Decrease) in Net Assets | | |
Operations | | |
Net investment income (loss) | $ 242,350,328 | $ 503,424,089 |
Net realized gain (loss) | 135,434,222 | 279,450,476 |
Change in net unrealized appreciation (depreciation) | 114,479,712 | (49,093,458) |
Net increase (decrease) in net assets resulting
from operations | 492,264,262 | 733,781,107 |
Distributions to shareholders from net investment income | (261,764,856) | (485,397,438) |
Distributions to shareholders from net realized gain | (215,970,386) | (244,516,243) |
Total distributions | (477,735,242) | (729,913,681) |
Share transactions - net increase (decrease) | 1,590,674,402 | 417,450,284 |
Total increase (decrease) in net assets | 1,605,203,422 | 421,317,710 |
| | |
Net Assets | | |
Beginning of period | 13,308,666,287 | 12,887,348,577 |
End of period (including undistributed net investment income of $56,823,931 and undistributed net investment income of $76,238,459, respectively) | $ 14,913,869,709 | $ 13,308,666,287 |
See accompanying notes which are an integral part of the financial statements.
Semiannual Report
Financial Highlights - Class A
| Six months ended
February 29, | Years ended August 31, |
| 2012 | 2011 | 2010 | 2009 | 2008 | 2007 |
Selected Per-Share Data | | | | | | |
Net asset value, beginning of period | $ 11.04 | $ 11.05 | $ 10.28 | $ 10.07 | $ 10.27 | $ 10.39 |
Income from Investment Operations | | | | | | |
Net investment income (loss)E | .172 | .381 | .428 | .494 | .488 | .508 |
Net realized and unrealized gain (loss) | .191 | .187 | .778 | .231 | (.189) | (.141) |
Total from investment operations | .363 | .568 | 1.206 | .725 | .299 | .367 |
Distributions from net investment income | (.188) | (.367) | (.402) | (.447) | (.474) | (.470) |
Distributions from net realized gain | (.175) | (.211) | (.034) | (.068) | (.025) | (.017) |
Total distributions | (.363) | (.578) | (.436) | (.515) | (.499) | (.487) |
Net asset value, end of period | $ 11.04 | $ 11.04 | $ 11.05 | $ 10.28 | $ 10.07 | $ 10.27 |
Total ReturnB,C,D | 3.37% | 5.35% | 11.97% | 7.79% | 2.93% | 3.57% |
Ratios to Average Net AssetsF,H | | | | | | |
Expenses before reductions | .84%A | .83% | .82% | .80% | .80% | .77% |
Expenses net of fee waivers, if any | .84%A | .83% | .82% | .80% | .80% | .77% |
Expenses net of all reductions | .84%A | .83% | .82% | .80% | .80% | .77% |
Net investment income (loss) | 3.16%A | 3.50% | 4.00% | 5.17% | 4.77% | 4.93% |
Supplemental Data | | | | | | |
Net assets, end of period (000 omitted) | $ 1,455,915 | $ 1,225,165 | $ 805,816 | $ 107,998 | $ 80,755 | $ 48,076 |
Portfolio turnover rateG | 137%A | 168%I | 130% | 104%I | 122% | 116%I |
A Annualized
B Total returns for periods of less than one year are not annualized.
C Total returns would have been lower if certain expenses had not been reduced during the applicable periods shown.
D Total returns do not include the effect of the sales charges.
E Calculated based on average shares outstanding during the period.
F Fees and expenses of any underlying Fidelity Central Funds are not included in the Fund's expense ratio. The Fund indirectly bears its proportionate share of the expenses of any underlying Fidelity Central Funds.
G Amount does not include the portfolio activity of any underlying Fidelity Central Funds.
H Expense ratios reflect operating expenses of the class. Expenses before reductions do not reflect amounts reimbursed by the investment adviser or reductions from brokerage service arrangements or reductions from other expense offset arrangements and do not represent the amount paid by the class during periods when reimbursements or reductions occur. Expenses net of fee waivers reflect expenses after reimbursement by the investment adviser but prior to reductions from brokerage service arrangements or other expense offset arrangements. Expenses net of all reductions represent the net expenses paid by the class.
I The portfolio turnover rate excludes liquidations and redemptions executed in-kind from Affiliated Central Funds.
See accompanying notes which are an integral part of the financial statements.
Semiannual Report
Financial Highlights - Class T
| Six months ended
February 29, | Years ended August 31, |
| 2012 | 2011 | 2010 | 2009 | 2008 | 2007 |
Selected Per-Share Data | | | | | | |
Net asset value, beginning of period | $ 11.03 | $ 11.04 | $ 10.27 | $ 10.06 | $ 10.26 | $ 10.38 |
Income from Investment Operations | | | | | | |
Net investment income (loss)E | .177 | .386 | .426 | .488 | .489 | .508 |
Net realized and unrealized gain (loss) | .189 | .186 | .778 | .233 | (.191) | (.143) |
Total from investment operations | .366 | .572 | 1.204 | .721 | .298 | .365 |
Distributions from net investment income | (.191) | (.371) | (.400) | (.443) | (.473) | (.468) |
Distributions from net realized gain | (.175) | (.211) | (.034) | (.068) | (.025) | (.017) |
Total distributions | (.366) | (.582) | (.434) | (.511) | (.498) | (.485) |
Net asset value, end of period | $ 11.03 | $ 11.03 | $ 11.04 | $ 10.27 | $ 10.06 | $ 10.26 |
Total ReturnB,C,D | 3.41% | 5.39% | 11.97% | 7.74% | 2.92% | 3.55% |
Ratios to Average Net AssetsF,H | | | | | | |
Expenses before reductions | .78%A | .80% | .82% | .85% | .81% | .78% |
Expenses net of fee waivers, if any | .78%A | .80% | .82% | .85% | .81% | .78% |
Expenses net of all reductions | .78%A | .80% | .82% | .85% | .80% | .78% |
Net investment income (loss) | 3.23%A | 3.54% | 4.01% | 5.12% | 4.76% | 4.92% |
Supplemental Data | | | | | | |
Net assets, end of period (000 omitted) | $ 51,084 | $ 60,500 | $ 71,349 | $ 48,090 | $ 38,574 | $ 42,191 |
Portfolio turnover rateG | 137%A | 168%I | 130% | 104%I | 122% | 116%I |
A Annualized
B Total returns for periods of less than one year are not annualized.
C Total returns would have been lower if certain expenses had not been reduced during the applicable periods shown.
D Total returns do not include the effect of the sales charges.
E Calculated based on average shares outstanding during the period.
F Fees and expenses of any underlying Fidelity Central Funds are not included in the Fund's expense ratio. The Fund indirectly bears its proportionate share of the expenses of any underlying Fidelity Central Funds.
G Amount does not include the portfolio activity of any underlying Fidelity Central Funds.
H Expense ratios reflect operating expenses of the class. Expenses before reductions do not reflect amounts reimbursed by the investment adviser or reductions from brokerage service arrangements or reductions from other expense offset arrangements and do not represent the amount paid by the class during periods when reimbursements or reductions occur. Expenses net of fee waivers reflect expenses after reimbursement by the investment adviser but prior to reductions from brokerage service arrangements or other expense offset arrangements. Expenses net of all reductions represent the net expenses paid by the class.
I The portfolio turnover rate excludes liquidations and redemptions executed in-kind from Affiliated Central Funds.
See accompanying notes which are an integral part of the financial statements.
Semiannual Report
Financial Highlights - Class B
| Six months ended
February 29, | Years ended August 31, |
| 2012 | 2011 | 2010 | 2009 | 2008 | 2007 |
Selected Per-Share Data | | | | | | |
Net asset value, beginning of period | $ 11.04 | $ 11.06 | $ 10.28 | $ 10.07 | $ 10.27 | $ 10.39 |
Income from Investment Operations | | | | | | |
Net investment income (loss)E | .136 | .307 | .351 | .423 | .413 | .432 |
Net realized and unrealized gain (loss) | .191 | .177 | .787 | .233 | (.190) | (.145) |
Total from investment operations | .327 | .484 | 1.138 | .656 | .223 | .287 |
Distributions from net investment income | (.152) | (.293) | (.324) | (.378) | (.398) | (.390) |
Distributions from net realized gain | (.175) | (.211) | (.034) | (.068) | (.025) | (.017) |
Total distributions | (.327) | (.504) | (.358) | (.446) | (.423) | (.407) |
Net asset value, end of period | $ 11.04 | $ 11.04 | $ 11.06 | $ 10.28 | $ 10.07 | $ 10.27 |
Total ReturnB,C,D | 3.03% | 4.54% | 11.26% | 7.01% | 2.17% | 2.77% |
Ratios to Average Net AssetsF,H | | | | | | |
Expenses before reductions | 1.51%A | 1.52% | 1.53% | 1.53% | 1.54% | 1.53% |
Expenses net of fee waivers, if any | 1.51%A | 1.52% | 1.53% | 1.53% | 1.54% | 1.53% |
Expenses net of all reductions | 1.51%A | 1.52% | 1.53% | 1.53% | 1.54% | 1.53% |
Net investment income (loss) | 2.50%A | 2.82% | 3.29% | 4.44% | 4.03% | 4.17% |
Supplemental Data | | | | | | |
Net assets, end of period (000 omitted) | $ 10,147 | $ 9,225 | $ 13,017 | $ 9,054 | $ 9,645 | $ 6,054 |
Portfolio turnover rateG | 137%A | 168%I | 130% | 104%I | 122% | 116%I |
A Annualized
B Total returns for periods of less than one year are not annualized.
C Total returns would have been lower if certain expenses had not been reduced during the applicable periods shown.
D Total returns do not include the effect of the contingent deferred sales charge.
E Calculated based on average shares outstanding during the period.
F Fees and expenses of any underlying Fidelity Central Funds are not included in the Fund's expense ratio. The Fund indirectly bears its proportionate share of the expenses of any underlying Fidelity Central Funds.
G Amount does not include the portfolio activity of any underlying Fidelity Central Funds.
H Expense ratios reflect operating expenses of the class. Expenses before reductions do not reflect amounts reimbursed by the investment adviser or reductions from brokerage service arrangements or reductions from other expense offset arrangements and do not represent the amount paid by the class during periods when reimbursements or reductions occur. Expenses net of fee waivers reflect expenses after reimbursement by the investment adviser but prior to reductions from brokerage service arrangements or other expense offset arrangements. Expenses net of all reductions represent the net expenses paid by the class.
I The portfolio turnover rate excludes liquidations and redemptions executed in-kind from Affiliated Central Funds.
See accompanying notes which are an integral part of the financial statements.
Semiannual Report
Financial Highlights - Class C
| Six months ended
February 29, | Years ended August 31, |
| 2012 | 2011 | 2010 | 2009 | 2008 | 2007 |
Selected Per-Share Data | | | | | | |
Net asset value, beginning of period | $ 11.04 | $ 11.05 | $ 10.28 | $ 10.07 | $ 10.27 | $ 10.39 |
Income from Investment Operations | | | | | | |
Net investment income (loss)E | .135 | .308 | .354 | .425 | .413 | .429 |
Net realized and unrealized gain (loss) | .191 | .187 | .778 | .232 | (.189) | (.145) |
Total from investment operations | .326 | .495 | 1.132 | .657 | .224 | .284 |
Distributions from net investment income | (.151) | (.294) | (.328) | (.379) | (.399) | (.387) |
Distributions from net realized gain | (.175) | (.211) | (.034) | (.068) | (.025) | (.017) |
Total distributions | (.326) | (.505) | (.362) | (.447) | (.424) | (.404) |
Net asset value, end of period | $ 11.04 | $ 11.04 | $ 11.05 | $ 10.28 | $ 10.07 | $ 10.27 |
Total ReturnB,C,D | 3.02% | 4.65% | 11.20% | 7.02% | 2.18% | 2.75% |
Ratios to Average Net AssetsF,H | | | | | | |
Expenses before reductions | 1.52%A | 1.51% | 1.50% | 1.52% | 1.53% | 1.55% |
Expenses net of fee waivers, if any | 1.52%A | 1.51% | 1.50% | 1.52% | 1.53% | 1.55% |
Expenses net of all reductions | 1.52%A | 1.51% | 1.50% | 1.52% | 1.53% | 1.55% |
Net investment income (loss) | 2.48%A | 2.83% | 3.32% | 4.45% | 4.03% | 4.15% |
Supplemental Data | | | | | | |
Net assets, end of period (000 omitted) | $ 80,521 | $ 63,867 | $ 91,439 | $ 55,958 | $ 28,786 | $ 18,890 |
Portfolio turnover rateG | 137%A | 168%I | 130% | 104%I | 122% | 116%I |
A Annualized
B Total returns for periods of less than one year are not annualized.
C Total returns would have been lower if certain expenses had not been reduced during the applicable periods shown.
D Total returns do not include the effect of the contingent deferred sales charge.
E Calculated based on average shares outstanding during the period.
F Fees and expenses of any underlying Fidelity Central Funds are not included in the Fund's expense ratio. The Fund indirectly bears its proportionate share of the expenses of any underlying Fidelity Central Funds.
G Amount does not include the portfolio activity of any underlying Fidelity Central Funds.
H Expense ratios reflect operating expenses of the class. Expenses before reductions do not reflect amounts reimbursed by the investment adviser or reductions from brokerage service arrangements or reductions from other expense offset arrangements and do not represent the amount paid by the class during periods when reimbursements or reductions occur. Expenses net of fee waivers reflect expenses after reimbursement by the investment adviser but prior to reductions from brokerage service arrangements or other expense offset arrangements. Expenses net of all reductions represent the net expenses paid by the class.
I The portfolio turnover rate excludes liquidations and redemptions executed in-kind from Affiliated Central Funds.
See accompanying notes which are an integral part of the financial statements.
Semiannual Report
Financial Highlights - Total Bond
| Six months ended
February 29, | Years ended August 31, |
| 2012 | 2011 | 2010 | 2009 | 2008 | 2007 |
Selected Per-Share Data | | | | | | |
Net asset value, beginning of period | $ 11.04 | $ 11.05 | $ 10.28 | $ 10.07 | $ 10.27 | $ 10.39 |
Income from Investment Operations | | | | | | |
Net investment income (loss)D | .193 | .423 | .466 | .527 | .524 | .543 |
Net realized and unrealized gain (loss) | .191 | .187 | .778 | .232 | (.189) | (.143) |
Total from investment operations | .384 | .610 | 1.244 | .759 | .335 | .400 |
Distributions from net investment income | (.209) | (.409) | (.440) | (.481) | (.510) | (.503) |
Distributions from net realized gain | (.175) | (.211) | (.034) | (.068) | (.025) | (.017) |
Total distributions | (.384) | (.620) | (.474) | (.549) | (.535) | (.520) |
Net asset value, end of period | $ 11.04 | $ 11.04 | $ 11.05 | $ 10.28 | $ 10.07 | $ 10.27 |
Total ReturnB,C | 3.57% | 5.76% | 12.37% | 8.17% | 3.29% | 3.89% |
Ratios to Average Net AssetsE,G | | | | | | |
Expenses before reductions | .45%A | .45% | .45% | .45% | .45% | .45% |
Expenses net of fee waivers, if any | .45%A | .45% | .45% | .45% | .45% | .45% |
Expenses net of all reductions | .45%A | .45% | .45% | .45% | .45% | .45% |
Net investment income (loss) | 3.55%A | 3.89% | 4.37% | 5.52% | 5.12% | 5.25% |
Supplemental Data | | | | | | |
Net assets, end of period (000 omitted) | $ 12,793,589 | $ 11,418,458 | $ 11,342,385 | $ 10,863,828 | $ 9,976,432 | $ 6,450,177 |
Portfolio turnover rateF | 137%A | 168%H | 130% | 104%H | 122% | 116%H |
A Annualized
B Total returns for periods of less than one year are not annualized.
C Total returns would have been lower if certain expenses had not been reduced during the applicable periods shown.
D Calculated based on average shares outstanding during the period.
E Fees and expenses of any underlying Fidelity Central Funds are not included in the Fund's expense ratio. The Fund indirectly bears its proportionate share of the expenses of any underlying Fidelity Central Funds.
F Amount does not include the portfolio activity of any underlying Fidelity Central Funds.
G Expense ratios reflect operating expenses of the class. Expenses before reductions do not reflect amounts reimbursed by the investment adviser or reductions from brokerage service arrangements or reductions from other expense offset arrangements and do not represent the amount paid by the class during periods when reimbursements or reductions occur. Expenses net of fee waivers reflect expenses after reimbursement by the investment adviser but prior to reductions from brokerage service arrangements or other expense offset arrangements. Expenses net of all reductions represent the net expenses paid by the class.
H The portfolio turnover rate excludes liquidations and redemptions executed in-kind from Affiliated Central Funds.
See accompanying notes which are an integral part of the financial statements.
Semiannual Report
Financial Highlights - Institutional Class
| Six months ended
February 29, | Years ended August 31, |
| 2012 | 2011 | 2010 | 2009 | 2008 | 2007 |
Selected Per-Share Data | | | | | | |
Net asset value, beginning of period | $ 11.02 | $ 11.04 | $ 10.26 | $ 10.06 | $ 10.26 | $ 10.38 |
Income from Investment Operations | | | | | | |
Net investment income (loss)D | .188 | .413 | .458 | .518 | .516 | .527 |
Net realized and unrealized gain (loss) | .191 | .178 | .788 | .224 | (.186) | (.134) |
Total from investment operations | .379 | .591 | 1.246 | .742 | .330 | .393 |
Distributions from net investment income | (.204) | (.400) | (.432) | (.474) | (.505) | (.496) |
Distributions from net realized gain | (.175) | (.211) | (.034) | (.068) | (.025) | (.017) |
Total distributions | (.379) | (.611) | (.466) | (.542) | (.530) | (.513) |
Net asset value, end of period | $ 11.02 | $ 11.02 | $ 11.04 | $ 10.26 | $ 10.06 | $ 10.26 |
Total ReturnB,C | 3.53% | 5.58% | 12.41% | 7.99% | 3.24% | 3.83% |
Ratios to Average Net AssetsE,G | | | | | | |
Expenses before reductions | .54%A | .54% | .52% | .53% | .51% | .50% |
Expenses net of fee waivers, if any | .54%A | .54% | .52% | .53% | .51% | .50% |
Expenses net of all reductions | .54%A | .54% | .52% | .53% | .51% | .49% |
Net investment income (loss) | 3.46%A | 3.80% | 4.30% | 5.45% | 5.06% | 5.21% |
Supplemental Data | | | | | | |
Net assets, end of period (000 omitted) | $ 522,614 | $ 531,451 | $ 509,388 | $ 884,991 | $ 947,791 | $ 348,636 |
Portfolio turnover rateF | 137%A | 168%H | 130% | 104%H | 122% | 116%H |
A Annualized
B Total returns for periods of less than one year are not annualized.
C Total returns would have been lower if certain expenses had not been reduced during the applicable periods shown.
D Calculated based on average shares outstanding during the period.
E Fees and expenses of any underlying Fidelity Central Funds are not included in the Fund's expense ratio. The Fund indirectly bears its proportionate share of the expenses of any underlying Fidelity Central Funds.
F Amount does not include the portfolio activity of any underlying Fidelity Central Funds.
G Expense ratios reflect operating expenses of the class. Expenses before reductions do not reflect amounts reimbursed by the investment adviser or reductions from brokerage service arrangements or reductions from other expense offset arrangements and do not represent the amount paid by the class during periods when reimbursements or reductions occur. Expenses net of fee waivers reflect expenses after reimbursement by the investment adviser but prior to reductions from brokerage service arrangements or other expense offset arrangements. Expenses net of all reductions represent the net expenses paid by the class.
H The portfolio turnover rate excludes liquidations and redemptions executed in-kind from Affiliated Central Funds.
See accompanying notes which are an integral part of the financial statements.
Semiannual Report
Notes to Financial Statements
For the period ended February 29, 2012
1. Organization.
Fidelity Total Bond Fund (the Fund) is a fund of Fidelity Income Fund (the Trust) and is authorized to issue an unlimited number of shares. The Trust is registered under the Investment Company Act of 1940, as amended (the 1940 Act), as an open-end management investment company organized as a Massachusetts business trust. The Fund offers Class A, Class T, Class C, Total Bond and Institutional Class shares, each of which, along with Class B shares, has equal rights as to assets and voting privileges. Effective after the close of business on September 1, 2010, Class B shares were closed to new accounts and additional purchases, except for exchanges and reinvestments. The Fund offered Class F shares during the period June 26, 2009 through September 30, 2010, and all outstanding shares were redeemed by September 30, 2010. Each class has exclusive voting rights with respect to matters that affect that class. Class B shares will automatically convert to Class A shares after a holding period of seven years from the initial date of purchase. Investment income, realized and unrealized capital gains and losses, the common expenses of the Fund, and certain fund-level expense reductions, if any, are allocated on a pro-rata basis to each class based on the relative net assets of each class to the total net assets of the Fund. Each class differs with respect to transfer agent and distribution and service plan fees incurred. Certain expense reductions may also differ by class.
2. Investments in Fidelity Central Funds.
The Fund invests in Fidelity Central Funds, which are open-end investment companies available only to other investment companies and accounts managed by Fidelity Management & Research Company (FMR) and its affiliates. The Fund's Schedule of Investments lists each of the Fidelity Central Funds held as of period end, if any, as an investment of the Fund, but does not include the underlying holdings of each Fidelity Central Fund. As an Investing Fund, the Fund indirectly bears its proportionate share of the expenses of the underlying Fidelity Central Funds.
Based on their investment objective, each Fidelity Central Fund may invest or participate in various investment vehicles or strategies that are similar to those of the Fund. These strategies are consistent with the investment objectives of the Fund and may involve certain economic risks which may cause a decline in value of each of the Fidelity Central Funds and thus a decline in the value of the Fund. The Money Market Central Funds seek preservation of capital and current income and are managed by Fidelity Investments Money Management, Inc. (FIMM), an affiliate of FMR.
A complete unaudited list of holdings for each Fidelity Central Fund is available upon request or at the Securities and Exchange Commission (the SEC) web site at www.sec.gov. In addition, the financial statements of the Fidelity Central Funds, which are not covered by the Fund's Report of Independent Registered Public Accounting Firm, are available on the SEC web site or upon request.
Semiannual Report
Notes to Financial Statements - continued
2. Investments in Fidelity Central Funds - continued
Fidelity Central Fund | | Investment Manager | | Investment Objective | | Investment Practices |
Fidelity Floating Rate Central Fund | | FMR Co., Inc. (FMRC) | | Seeks a high level of income by normally investing in floating rate loans and other floating rate securities. | | Loans & Direct Debt Instruments Repurchase Agreements Restricted Securities |
Fidelity Mortgage Backed Securities Central Fund | | FIMM | | Seeks a high level of income by normally investing in investment-grade mortgage-related securities and repurchase agreements for those securities. | | Delayed Delivery & When Issued Securities Futures Repurchase Agreements Swap Agreements |
An unaudited holdings listing for the Fund, which presents direct holdings as well as the pro-rata share of any securities and other investments held indirectly through its investment in underlying non-money market Fidelity Central Funds, is available at fidelity.com and/or advisor.fidelity.com, as applicable. A complete unaudited list of holdings for each Fidelity Central Fund is available upon request or at the Securities and Exchange Commission (the SEC) web site at www.sec.gov. In addition, the financial statements of the Fidelity Central Funds which contain the significant accounting policies (including security valuation policies) of those funds, which are not covered by the Fund's Report of Independent Registered Public Accounting Firm, are available on the SEC web site or upon request.
3. Significant Accounting Policies.
The financial statements have been prepared in conformity with accounting principles generally accepted in the United States of America (GAAP), which require management to make certain estimates and assumptions at the date of the financial statements. Actual results could differ from those estimates. Subsequent events, if any, through the date that the financial statements were issued have been evaluated in the preparation of the financial statements. The following summarizes the significant accounting policies of the Fund:
Security Valuation. Investments are valued as of 4:00 p.m. Eastern time on the last calendar day of the period. The Fund uses independent pricing services approved by the Board of Trustees to value its investments. When current market prices or quotations are not readily available or reliable, valuations may be determined in good faith in accordance with procedures adopted by the Board of Trustees. Factors used in determining
Semiannual Report
3. Significant Accounting Policies - continued
Security Valuation - continued
value may include market or security specific events, changes in interest rates and credit quality. The frequency with which these procedures are used cannot be predicted and they may be utilized to a significant extent. The value used for net asset value (NAV) calculation under these procedures may differ from published prices for the same securities.
The Fund categorizes the inputs to valuation techniques used to value its investments into a disclosure hierarchy consisting of three levels as shown below:
Level 1 - quoted prices in active markets for identical investments
Level 2 - other significant observable inputs (including quoted prices for similar investments, interest rates, prepayment speeds, etc.)
Level 3 - unobservable inputs (including the Fund's own assumptions based on the best information available)
Changes in valuation techniques may result in transfers in or out of an assigned level within the disclosure hierarchy. The aggregate value of investments by input level, as of February 29, 2012 for the Fund's investments, as well as a roll forward of Level 3 securities, is included at the end of the Fund's Schedule of Investments. Valuation techniques used to value the Fund's investments by major category are as follows:
Debt securities, including restricted securities, are valued based on evaluated prices received from independent pricing services or from dealers who make markets in such securities. For corporate bonds, bank notes, floating rate loans, foreign government and government agency obligations, municipal securities, preferred securities, supranational obligations, U.S. government and government agency obligations and sovereign loan participations, pricing services utilize matrix pricing which considers yield or price of bonds of comparable quality, coupon, maturity and type as well as dealer supplied prices and are generally categorized as Level 2 in the hierarchy. For asset backed securities, collateralized mortgage obligations, commercial mortgage securities and U.S. government agency mortgage securities, pricing services utilize matrix pricing which considers prepayment speed assumptions, attributes of the collateral, yield or price of bonds of comparable quality, coupon, maturity and type as well as dealer supplied prices and, accordingly, such securities are generally categorized as Level 2 in the hierarchy. Swaps are marked-to-market daily based on valuations from independent pricing services or dealer-supplied valuations and changes in value are recorded as unrealized appreciation (depreciation). Pricing services utilize matrix pricing which considers comparisons to interest rate curves, credit spread curves, default possibilities and recovery rates and, as a result, swaps are generally categorized as Level 2 in the hierarchy. When independent
Semiannual Report
Notes to Financial Statements - continued
3. Significant Accounting Policies - continued
Security Valuation - continued
prices are unavailable or unreliable, debt securities and swaps may be valued utilizing pricing matrices which consider similar factors that would be used by independent pricing services. These are generally categorized as Level 2 in the hierarchy but may be Level 3 depending on the circumstances.
Equity securities, including restricted securities, for which market quotations are readily available, are valued at the last reported sale price or official closing price as reported by an independent pricing service on the primary market or exchange on which they are traded and are categorized as Level 1 in the hierarchy. In the event there were no sales during the day or closing prices are not available, securities are valued at the last quoted bid price or may be valued using the last available price and are generally categorized as Level 2 in the hierarchy. Utilizing these techniques may result in transfers between Level 1 and Level 2. For restricted securities and private placements where observable inputs are limited, assumptions about market activity and risk are used and are categorized as Level 3 in the hierarchy.
Investments in open-end mutual funds, including the Fidelity Central Funds, are valued at their closing net asset value each business day and are categorized as Level 1 in the hierarchy.
New Accounting Pronouncements. In May 2011, the Financial Accounting Standards Board issued Accounting Standard Update No. 2011-04, Fair Value Measurement (Topic 820) - Amendments to Achieve Common Fair Value Measurement and Disclosure Requirements in U.S. GAAP and IFRSs. The update is effective during interim and annual periods beginning after December 15, 2011 and will result in additional disclosure for transfers between levels as well as expanded disclosure for securities categorized as Level 3 under the fair value hierarchy.
In December 2011, the Financial Accounting Standards Board issued Accounting Standard Update No. 2011-11, Disclosures about Offsetting Assets and Liabilities. The update creates new disclosure requirements requiring entities to disclose both gross and net information for derivatives and other financial instruments that are either offset in the Statement of Assets and Liabilities or subject to an enforceable master netting arrangement or similar agreement. The disclosure requirements are effective for interim and annual reporting periods beginning on or after January 1, 2013. Management is currently evaluating the impact of the update's adoption on the Fund's financial statement disclosures.
Semiannual Report
3. Significant Accounting Policies - continued
Foreign Currency. The Fund may use foreign currency contracts to facilitate transactions in foreign-denominated securities. Gains and losses from these transactions may arise from changes in the value of the foreign currency or if the counterparties do not perform under the contracts' terms.
Foreign-denominated assets, including investment securities, and liabilities are translated into U.S. dollars at the exchange rate at period end. Purchases and sales of investment securities, income and dividends received and expenses denominated in foreign currencies are translated into U.S. dollars at the exchange rate in effect on the transaction date.
The effects of exchange rate fluctuations on investments are included with the net realized and unrealized gain (loss) on investment securities. Other foreign currency transactions resulting in realized and unrealized gain (loss) are disclosed separately.
Investment Transactions and Income. For financial reporting purposes, the Fund's investment holdings and NAV include trades executed through the end of the last business day of the period. The NAV per share for processing shareholder transactions is calculated as of the close of business of the New York Stock Exchange (NYSE), normally 4:00 p.m. Eastern time and includes trades executed through the end of the prior business day. Gains and losses on securities sold are determined on the basis of identified cost. Dividend income is recorded on the ex-dividend date, except for certain dividends from foreign securities where the ex-dividend date may have passed, which are recorded as soon as the Fund is informed of the ex-dividend date. Non-cash dividends included in dividend income, if any, are recorded at the fair market value of the securities received. Distributions received on securities that represent a return of capital or capital gain are recorded as a reduction of cost of investments and/or as a realized gain. The Fund estimates the components of distributions received that may be considered return of capital distributions or capital gain distributions. Interest income and distributions from the Fidelity Central Funds are accrued as earned. Interest income includes coupon interest and amortization of premium and accretion of discount on debt securities. The principal amount on inflation-indexed securities is periodically adjusted to the rate of inflation and interest is accrued based on the principal amount. The adjustments to principal due to inflation are reflected as increases or decreases to interest income even though principal is not received until maturity. Investment income is recorded net of foreign taxes withheld where recovery of such taxes is uncertain. Debt obligations may be placed on non-accrual status and related interest income may be reduced by ceasing current accruals and writing off interest receivables when the collection of all or a portion of interest has become doubtful based on consistently applied procedures. A debt obligation is removed from non-accrual status when the issuer resumes interest payments or when collectability of interest is reasonably assured.
Semiannual Report
Notes to Financial Statements - continued
3. Significant Accounting Policies - continued
Expenses. Expenses directly attributable to a fund are charged to that fund. Expenses attributable to more than one fund are allocated among the respective funds on the basis of relative net assets or other appropriate methods. Expense estimates are accrued in the period to which they relate and adjustments are made when actual amounts are known.
Deferred Trustee Compensation. Under a Deferred Compensation Plan (the Plan), independent Trustees may elect to defer receipt of a portion of their annual compensation. Deferred amounts are invested in a cross-section of Fidelity funds, are marked-to-market and remain in the Fund until distributed in accordance with the Plan. The investment of deferred amounts and the offsetting payable to the Trustees are included in the accompanying Statement of Assets and Liabilities.
Income Tax Information and Distributions to Shareholders. Each year, the Fund intends to qualify as a regulated investment company under Subchapter M of the Internal Revenue Code, including distributing substantially all of its taxable income and realized gains. As a result, no provision for income taxes is required. The Fund files a U.S. federal tax return, in addition to state and local tax returns as required. A fund's federal income tax returns are subject to examination by the Internal Revenue Service (IRS) for a period of three fiscal years after they are filed. State and local tax returns may be subject to examination for an additional fiscal year depending on the jurisdiction. Foreign taxes are provided for based on the Fund's understanding of the tax rules and rates that exist in the foreign markets in which it invests.
Dividends are declared and recorded daily and paid monthly from net investment income. Distributions from realized gains, if any, are declared and recorded on the ex-dividend date. Income dividends and capital gain distributions are declared separately for each class. Income and capital gain distributions are determined in accordance with income tax regulations, which may differ from GAAP.
Capital accounts within the financial statements are adjusted for permanent book-tax differences. These adjustments have no impact on net assets or the results of operations. Temporary book-tax differences will reverse in a subsequent period.
Book-tax differences are primarily due to in-kind transactions, swap agreements, foreign currency transactions, default bonds, market discount, equity-debt classifications, partnerships (including allocations from Fidelity Central Funds), deferred trustee compensation and losses deferred due to wash sales.
Semiannual Report
3. Significant Accounting Policies - continued
Income Tax Information and Distributions to Shareholders - continued
The federal tax cost of investment securities and unrealized appreciation (depreciation) as of period end were as follows:
Gross unrealized appreciation | $ 908,340,228 |
Gross unrealized depreciation | (59,347,264) |
Net unrealized appreciation (depreciation) on securities and other investments | $ 848,992,964 |
| |
Tax cost | $ 14,700,576,829 |
4. Operating Policies.
Delayed Delivery Transactions and When-Issued Securities. During the period, the Fund transacted in securities on a delayed delivery or when-issued basis. Payment and delivery may take place after the customary settlement period for that security. The price of the underlying securities and the date when the securities will be delivered and paid for are fixed at the time the transaction is negotiated. During the time a delayed delivery sell is outstanding, the contract is marked-to-market daily and equivalent deliverable securities are held for the transaction. The securities purchased on a delayed delivery or when-issued basis are identified as such in the Fund's Schedule of Investments. The Fund may receive compensation for interest forgone in the purchase of a delayed delivery or when-issued security. With respect to purchase commitments, the Fund identifies securities as segregated in its records with a value at least equal to the amount of the commitment. Losses may arise due to changes in the value of the underlying securities or if the counterparty does not perform under the contract's terms, or if the issuer does not issue the securities due to political, economic, or other factors.
To-Be-Announced (TBA) Securities and Mortgage Dollar Rolls. During the period, the Fund transacted in TBA securities that involved buying or selling mortgage-backed securities (MBS) on a forward commitment basis. A TBA transaction typically does not designate the actual security to be delivered and only includes an approximate principal amount however; delivered securities must meet specified terms defined by industry guidelines, including issuer, rate and current principal amount outstanding on underlying mortgage pools. The Fund may enter into a TBA transaction with the intent to take possession of or deliver the underlying MBS, or the Fund may elect to extend the settlement by entering into either a mortgage or reverse mortgage dollar roll. Mortgage dollar rolls are transactions where a fund sells MBS and simultaneously agrees to repurchase MBS on a later date at a lower price and with the same counterparty. Reverse mortgage dollar rolls involve the purchase and simultaneous agreement to sell MBS on a later date
Semiannual Report
Notes to Financial Statements - continued
4. Operating Policies - continued
To-Be-Announced (TBA) Securities and Mortgage Dollar Rolls - continued
at a lower price. Transactions in mortgage dollar rolls and reverse mortgage dollar rolls are accounted for as purchases and sales and may result in an increase to the Fund's portfolio turnover rate.
Purchases and sales of TBA securities involve risks similar to those discussed above for delayed delivery and when-issued securities. Also, if the counterparty in a dollar roll or a reverse dollar roll transaction files for bankruptcy or becomes insolvent, the Fund's right to repurchase or sell securities may be limited. Additionally, when a fund sells TBA securities without already owning or having the right to obtain the deliverable securities (an uncovered forward commitment to sell), it incurs a risk of loss because it could have to purchase the securities at a price that is higher than the price at which it sold them. A fund may be unable to purchase the deliverable securities if the corresponding market is illiquid.
TBA securities subject to a forward commitment to sell at period end are included at the end of the Fund's Schedule of Investments under the caption "TBA Sale Commitments." The proceeds and value of these commitments are reflected in the Fund's Statement of Assets and Liabilities.
Restricted Securities. The Fund may invest in securities that are subject to legal or contractual restrictions on resale. These securities generally may be resold in transactions exempt from registration or to the public if the securities are registered. Disposal of these securities may involve time-consuming negotiations and expense, and prompt sale at an acceptable price may be difficult. Information regarding restricted securities is included at the end of the Fund's Schedule of Investments.
Loans and Other Direct Debt Instruments. The Fund invests in direct debt instruments which are interests in amounts owed to lenders by corporate or other borrowers. These instruments may be in the form of loans, trade claims or other receivables and may include standby financing commitments such as revolving credit facilities that obligate the Fund to supply additional cash to the borrower on demand. Loans may be acquired through assignment or participation, or may be made directly to a borrower. The Fund may be contractually obligated to receive approval from the agent bank and/or borrower prior to the sale of these loans.
5. Derivative Instruments.
Risk Exposures and the Use of Derivative Instruments. The Fund used derivative instruments (derivatives) including swap agreements, in order to meet its investment objectives. The strategy is to use derivatives to increase returns, to gain exposure to certain types of assets and to manage exposure to certain risks as defined below. The
Semiannual Report
5. Derivative Instruments - continued
Risk Exposures and the Use of Derivative Instruments - continued
success of any strategy involving derivatives depends on analysis of numerous economic factors, and if the strategies for investment do not work as intended, the Fund may not achieve its objectives.
The Fund's use of derivatives increased or decreased its exposure to the following risks:
Credit Risk | Credit risk relates to the ability of the issuer of a financial instrument to make further principal or interest payments on an obligation or commitment that it has to the Fund. |
Interest Rate Risk | Interest rate risk relates to the fluctuations in the value of interest-bearing securities due to changes in the prevailing levels of market interest rates. |
The Fund is also exposed to additional risks from investing in derivatives, such as liquidity risk and counterparty credit risk. Liquidity risk is the risk that the Fund will be unable to close out the derivative in the open market in a timely manner. Counterparty credit risk is the risk that the counterparty will not be able to fulfill its obligation to the Fund. Derivative counterparty credit risk is managed through formal evaluation of the creditworthiness of all potential counterparties. On certain over-the-counter (OTC) derivatives such as swap agreements, the Fund attempts to reduce its exposure to counterparty credit risk by entering into an International Swaps and Derivatives Association (ISDA) Master Agreement on a bilateral basis with each of its counterparties. The ISDA Master Agreement gives the Fund the right to terminate all transactions traded under such agreement if there is a certain deterioration in the credit quality of the counterparty. The ISDA Master Agreement gives each party the right, upon an event of default by the other party or a termination of the agreement, to close out all transactions traded under such agreement and to net amounts owed under each transaction to one net payable by one party to the other. To mitigate counterparty credit risk on OTC derivatives, the Fund receives collateral in the form of cash or securities once the Fund's net unrealized appreciation on outstanding derivative contracts under an ISDA Master Agreement exceeds certain applicable thresholds, subject to certain minimum transfer provisions. The collateral received is held in segregated accounts with the Fund's custodian bank in accordance with the collateral agreements entered into between the Fund, the counterparty and the Fund's custodian bank. The Fund could experience delays and costs in gaining access to the collateral even though it is held by the Fund's custodian bank. The Fund's maximum risk of loss from counterparty credit risk related to OTC derivatives is generally the aggregate unrealized appreciation and unpaid counterparty payments in excess of any collateral pledged by the counterparty to the Fund. The Fund may be required to pledge collateral for the benefit of the counterparties on OTC derivatives in an amount not less than the counterparty's unrealized appreciation on
Semiannual Report
Notes to Financial Statements - continued
5. Derivative Instruments - continued
Risk Exposures and the Use of Derivative Instruments - continued
outstanding derivative contracts, subject to certain minimum transfer provisions, and any such pledged collateral is identified in the Schedule of Investments. Derivatives involve, to varying degrees, risk of loss in excess of the amounts recognized in the Statement of Assets and Liabilities.
Net Realized Gain (Loss) and Change in Net Unrealized Appreciation (Depreciation) on Derivatives. The table below, which reflects the impacts of derivatives on the financial performance of the Fund, summarizes the net realized gain (loss) and change in net unrealized appreciation (depreciation) for derivatives during the period.
Risk Exposure / Derivative Type | Net Realized
Gain (Loss) | Change in
Net Unrealized Appreciation
(Depreciation) |
Credit Risk | | |
Swap Agreements | $ (1,026,485) | $ 968,549 |
Interest Rate Risk | | |
Swap Agreements | 991,350 | (1,000,380) |
Totals (a) | $ (35,135) | $ (31,831) |
(a) A summary of the value of derivatives by risk exposure as of period end, if any, is included at the end of the Schedule of Investment and is representative of activity for the period.
Swap Agreements. A swap agreement (swap) is a contract between two parties to exchange future cash flows at periodic intervals based on a notional principal amount.
Details of swaps open at period end are included in the Schedule of Investments under the caption "Swap Agreements." Swaps are marked-to-market daily and changes in value are recorded as unrealized appreciation or (depreciation) and reflected in the Statement of Assets and Liabilities. Any upfront premiums paid or received upon entering a swap to compensate for differences between stated terms of the agreement and prevailing market conditions (e.g. credit spreads, interest rates or other factors) are recorded as realized gain or (loss) ratably over the term of the swap. Payments are exchanged at specified intervals, accrued daily commencing with the effective date of the contract and recorded as realized gain or (loss). Realized gain or (loss) is also recorded in the event of an early termination of a swap. The net realized gain (loss) and change in net unrealized appreciation (depreciation) on swaps during the period is included in the Statement of Operations.
Interest Rate Swaps. Interest rate swaps are agreements between counterparties to exchange cash flows, one based on a fixed rate, and the other on a floating rate. The Fund entered into interest rate swaps to manage its exposure to interest rate changes. Changes in interest rates can have an effect on both the value of bond holdings as well as the amount of interest income earned. In general, the value of bonds can fall when interest rates rise and can rise when interest rates fall.
Semiannual Report
5. Derivative Instruments - continued
Credit Default Swaps. Credit default swaps enable the Fund to buy or sell protection on a debt security or a basket of securities against a defined credit event. Under the terms of a credit default swap the buyer of protection (buyer) receives credit protection in exchange for making periodic payments to the seller of protection (seller) based on a fixed percentage applied to a notional principal amount. In return for these payments, the seller acts as a guarantor of the creditworthiness of a reference obligation. The Fund enters into credit default swaps as a seller to gain credit exposure to an issuer and/or as a buyer to provide a measure of protection against defaults of an issuer. The issuer may be either a single issuer or a "basket" of issuers. Periodic payments are made over the life of the contract provided that no credit event occurs.
For credit default swaps on most corporate and sovereign issuers, credit events include bankruptcy, failure to pay, obligation acceleration or repudiation/moratorium. For credit default swaps on corporate or sovereign issuers, the obligation that may be put to the seller is not limited to the specific reference obligation described in the Schedule of Investments. For credit default swaps on asset-backed securities, a credit event may be triggered by events such as failure to pay principal, maturity extension, rating downgrade or write-down. For credit default swaps on asset-backed securities, the reference obligation described represents the security that may be put to the seller.
As a seller, if an underlying credit event occurs, the Fund will either pay the buyer an amount equal to the notional amount of the swap and take delivery of the reference obligation or underlying securities comprising an index or pay a net settlement amount of cash equal to the notional amount of the swap less the recovery value of the reference obligation or underlying securities comprising an index.
As a buyer, if an underlying credit event occurs, the Fund will either receive from the seller an amount equal to the notional amount of the swap and deliver the reference obligation or underlying securities comprising an index or receive a net settlement amount of cash equal to the notional amount of the swap less the recovery value of the reference obligation or underlying securities comprising an index.
Typically, the value of each credit default swap and credit rating disclosed for each reference obligation in the Schedule of Investments, where the Fund is the seller, can be used as measures of the current payment/performance risk of the swap. As the value of the swap changes as a positive or negative percentage of the total notional amount, the payment/performance risk may decrease or increase, respectively. In addition to these measures, FMR monitors a variety of factors including cash flow assumptions, market activity and market sentiment as part of its ongoing process of assessing payment/performance risk.
Semiannual Report
Notes to Financial Statements - continued
5. Derivative Instruments - continued
Credit Default Swaps - continued
The notional amount of credit default swaps is included in the Schedule of Investments and approximates the maximum potential amount of future payments that the Fund could be required to make if the Fund is the seller and a credit event were to occur. The total notional amount of all credit default swaps open at period end where the Fund is the seller amounted to $11,486,029 representing .08% of net assets.
6. Purchases and Sales of Investments.
Purchases and sales of securities (including the Fixed-Income Central Funds), other than short-term securities and U.S. government securities, aggregated $1,367,944,015 and $907,500,375, respectively.
7. Fees and Other Transactions with Affiliates.
Management Fee. FMR and its affiliates provide the Fund with investment management related services for which the Fund pays a monthly management fee. The management fee is the sum of an individual fund fee rate that is based on an annual rate of .20% of the Fund's average net assets and an annualized group fee rate that averaged .12% during the period. The group fee rate is based upon the average net assets of all the mutual funds advised by FMR. The group fee rate decreases as assets under management increase and increases as assets under management decrease. For the period, the total annualized management fee rate was .32% of the Fund's average net assets.
Distribution and Service Plan Fees. In accordance with Rule 12b-1 of the 1940 Act, the Fund has adopted separate Distribution and Service Plans for each class of shares. Certain classes pay Fidelity Distributors Corporation (FDC), an affiliate of FMR, separate Distribution and Service Fees, each of which is based on an annual percentage of each class' average net assets. In addition, FDC may pay financial intermediaries for selling shares of the Fund and providing shareholder support services. For the period, the Distribution and Service Fee rates, total fees and amounts retained by FDC were as follows:
| Distribution
Fee | Service
Fee | Total
Fees | Retained
by FDC |
Class A | -% | .25% | $ 1,660,460 | $ 11,202 |
Class T | -% | .25% | 63,989 | 579 |
Class B | .65% | .25% | 42,115 | 30,441 |
Class C | .75% | .25% | 354,292 | 69,959 |
| | | $ 2,120,856 | $ 112,181 |
Semiannual Report
7. Fees and Other Transactions with Affiliates - continued
Sales Load. FDC may receive a front-end sales charge of up to 4.00% for selling Class A shares and Class T shares, some of which is paid to financial intermediaries for selling shares of the Fund. Depending on the holding period, FDC may receive contingent deferred sales charges levied on Class A, Class T, Class B, and Class C redemptions. The deferred sales charges range from 5.00% to 1.00% for Class B, 1.00% for Class C, .75% for certain purchases of Class A shares and .25% for certain purchases of Class T shares.
For the period, sales charge amounts retained by FDC were as follows:
| Retained
by FDC |
Class A | $ 39,185 |
Class T | 10,423 |
Class B* | 6,181 |
Class C* | 4,600 |
| $ 60,389 |
* When Class B and Class C shares are initially sold, FDC pays commissions from its own resources to financial intermediaries through which the sales are made.
Transfer Agent Fees. Fidelity Investments Institutional Operations Company, Inc. (FIIOC), an affiliate of FMR, is the transfer, dividend disbursing and shareholder servicing agent for each class of the Fund. FIIOC receives account fees and asset-based fees that vary according to the account size and type of account of the shareholders of each respective class of the Fund, with the exception of Total Bond. FIIOC receives an asset-based fee of .10% of Total Bond's average net assets. FIIOC pays for typesetting, printing and mailing of shareholder reports, except proxy statements. For the period, transfer agent fees for each class were as follows:
| Amount | % of
Average
Net Assets* |
Class A | $ 1,566,614 | .24 |
Class T | 44,492 | .17 |
Class B | 11,692 | .25 |
Class C | 57,639 | .16 |
Total Bond | 5,959,911 | .10 |
Institutional Class | 505,337 | .19 |
| $ 8,145,685 | |
* Annualized
Semiannual Report
Notes to Financial Statements - continued
7. Fees and Other Transactions with Affiliates - continued
Fund Wide Operations Fee. Pursuant to the Fund Wide Operations and Expense Agreement (FWOE), FMR has agreed to provide for fund level expenses (which do not include transfer agent, Rule 12b-1 fees, compensation of the independent Trustees, interest (including commitment fees), taxes or extraordinary expenses, if any) in return for a FWOE fee equal to .35% less the total amount of the management fee. The FWOE paid by the Fund is reduced by an amount equal to the fees and expenses paid to the independent Trustees. For the period, the FWOE fee was equivalent to an annualized rate of .03% of average net assets.
8. Committed Line of Credit.
The Fund participates with other funds managed by FMR or an affiliate in a $4.0 billion credit facility (the "line of credit") to be utilized for temporary or emergency purposes to fund shareholder redemptions or for other short-term liquidity purposes. The Fund has agreed to pay commitment fees on its pro-rata portion of the line of credit, which amounted to $18,995 and is reflected in Miscellaneous expenses on the Statement of Operations. During the period, there were no borrowings on this line of credit.
9. Security Lending.
The Fund lends portfolio securities from time to time in order to earn additional income. On the settlement date of the loan, the Fund receives collateral (in the form of U.S. Treasury obligations, letters of credit and/or cash) against the loaned securities and maintains collateral in an amount not less than 100% of the market value of the loaned securities during the period of the loan. The market value of the loaned securities is determined at the close of business of the Fund and any additional required collateral is delivered to the Fund on the next business day. If the borrower defaults on its obligation to return the securities loaned because of insolvency or other reasons, a fund could experience delays and costs in recovering the securities loaned or in gaining access to the collateral. Any cash collateral received is maintained at the Fund's custodian and/or invested in cash equivalents. At period end, there were no security loans outstanding. Security lending income represents the income earned on investing cash collateral, less rebates paid to borrowers, plus any premium payments received for lending certain types of securities. Security lending income is presented in the Statement of Operations as a component of interest income. Total security lending income during the period amounted to $29,546.
Semiannual Report
10. Expense Reductions.
Through arrangements with the Fund's custodian, credits realized as a result of uninvested cash balances were used to reduce the Fund's expenses. During the period, these credits reduced the Fund's custody expenses by $1,594.
11. Distributions to Shareholders.
Distributions to shareholders of each class were as follows:
| Six months ended
February 29, 2012 | Year ended
August 31, 2011A |
From net investment income | | |
Class A | $ 22,736,986 | $ 35,129,345 |
Class T | 889,236 | 1,855,789 |
Class B | 129,517 | 296,985 |
Class C | 970,968 | 2,026,950 |
Total Bond | 227,043,295 | 427,026,328 |
Class F | - | 129,141 |
Institutional Class | 9,994,854 | 18,932,900 |
Total | $ 261,764,856 | $ 485,397,438 |
From net realized gain | | |
Class A | $ 20,452,852 | $ 17,070,006 |
Class T | 936,776 | 1,197,314 |
Class B | 146,504 | 247,157 |
Class C | 1,103,220 | 1,677,741 |
Total Bond | 184,845,253 | 214,891,467 |
Class F | - | - |
Institutional Class | 8,485,781 | 9,432,558 |
Total | $ 215,970,386 | $ 244,516,243 |
A All Class F shares were redeemed on September 30, 2010.
12. Share Transactions.
Transactions for each class of shares were as follows:
| Shares | Dollars |
| Six months ended February 29, 2012 | Year ended
August 31, 2011A | Six months ended February 29, 2012 | Year ended
August 31, 2011A |
Class A | | | | |
Shares sold | 28,031,739 | 70,407,747 | $ 307,445,959 | $ 764,123,344 |
Reinvestment of distributions | 3,889,684 | 4,687,391 | 42,411,973 | 50,970,385 |
Shares redeemed | (11,017,719) | (36,997,892) | (120,804,559) | (404,102,564) |
Net increase (decrease) | 20,903,704 | 38,097,246 | $ 229,053,373 | $ 410,991,165 |
Semiannual Report
Notes to Financial Statements - continued
12. Share Transactions - continued
| Shares | Dollars |
| Six months ended February 29, 2012 | Year ended
August 31, 2011A | Six months ended February 29, 2012 | Year ended
August 31, 2011A |
Class T | | | | |
Shares sold | 1,823,963 | 5,910,533 | $ 19,918,086 | $ 64,536,331 |
Reinvestment of distributions | 150,485 | 246,104 | 1,637,334 | 2,672,918 |
Shares redeemed | (2,828,402) | (7,131,049) | (30,811,992) | (77,181,315) |
Net increase (decrease) | (853,954) | (974,412) | $ (9,256,572) | $ (9,972,066) |
Class B | | | | |
Shares sold | 188,982 | 164,162 | $ 2,073,160 | $ 1,801,729 |
Reinvestment of distributions | 20,468 | 41,104 | 222,991 | 447,251 |
Shares redeemed | (125,981) | (547,045) | (1,382,331) | (5,927,269) |
Net increase (decrease) | 83,469 | (341,779) | $ 913,820 | $ (3,678,289) |
Class C | | | | |
Shares sold | 2,246,075 | 2,834,490 | $ 24,650,760 | $ 30,988,336 |
Reinvestment of distributions | 167,404 | 299,725 | 1,823,526 | 3,259,076 |
Shares redeemed | (904,570) | (5,620,712) | (9,890,550) | (60,917,944) |
Net increase (decrease) | 1,508,909 | (2,486,497) | $ 16,583,736 | $ (26,670,532) |
Total Bond | | | | |
Shares sold | 250,130,185 | 384,874,413 | $ 2,741,615,740 | $ 4,191,107,190 |
Reinvestment of distributions | 36,048,477 | 56,207,634 | 393,133,879 | 611,374,414 |
Shares redeemed | (161,591,730) | (432,717,356) | (1,772,378,308) | (4,723,560,620) |
Net increase (decrease) | 124,586,932 | 8,364,691 | $ 1,362,371,311 | $ 78,920,984 |
Class F | | | | |
Shares sold | - | 320,292 | $ - | $ 3,532,515 |
Reinvestment of distributions | - | 11,655 | - | 129,141 |
Shares redeemed | - | (5,214,738) | - | (57,498,547) |
Net increase (decrease) | - | (4,882,791) | $ - | $ (53,836,891) |
Institutional Class | | | | |
Shares sold | 10,670,431 | 9,397,783 | $ 116,532,117 | $ 102,168,317 |
Reinvestment of distributions | 1,651,656 | 2,572,592 | 17,981,232 | 27,946,248 |
Shares redeemed | (13,122,534) | (9,899,063) | (143,504,615) | (108,418,652) |
Net increase (decrease) | (800,447) | 2,071,312 | $ (8,991,266) | $ 21,695,913 |
A All Class F shares were redeemed on September 30, 2010.
Semiannual Report
13. Other.
The Fund's organizational documents provide former and current trustees and officers with a limited indemnification against liabilities arising in connection with the performance of their duties to the Fund. In the normal course of business, the Fund may also enter into contracts that provide general indemnifications. The Fund's maximum exposure under these arrangements is unknown as this would be dependent on future claims that may be made against the Fund. The risk of material loss from such claims is considered remote.
14. Credit Risk.
The Fund invests a portion of its assets in structured securities of issuers backed by residential mortgage loans, credit card receivables and automotive loans. The value and related income of these securities is sensitive to the changes in economic conditions, including delinquencies and/or defaults.
Semiannual Report
To the Trustees of Fidelity Income Fund and the Shareholders of Fidelity Total Bond Fund:
In our opinion, the accompanying statement of assets and liabilities, including the schedule of investments, and the related statements of operations and of changes in net assets and the financial highlights present fairly, in all material respects, the financial position of Fidelity Total Bond Fund (a fund of Fidelity Income Fund) at February 29, 2012, the results of its operations, the changes in its net assets and the financial highlights for each of the periods indicated, in conformity with accounting principles generally accepted in the United States of America. These financial statements and financial highlights (hereafter referred to as "financial statements") are the responsibility of the Fidelity Total Bond Fund's management. Our responsibility is to express an opinion on these financial statements based on our audits. We conducted our audits of these financial statements in accordance with the standards of the Public Company Accounting Oversight Board (United States). Those standards require that we plan and perform the audit to obtain reasonable assurance about whether the financial statements are free of material misstatement. An audit includes examining, on a test basis, evidence supporting the amounts and disclosures in the financial statements, assessing the accounting principles used and significant estimates made by management, and evaluating the overall financial statement presentation. We believe that our audits, which included confirmation of securities at February 29, 2012 by correspondence with the custodian, agent banks, and brokers, provide a reasonable basis for our opinion.
/s/ PricewaterhouseCoopers LLP
PricewaterhouseCoopers LLP
Boston, Massachusetts
April 18, 2012
Semiannual Report
Board Approval of Investment Advisory Contracts and Management Fees
Fidelity Total Bond Fund
Each year, the Board of Trustees, including the Independent Trustees (together, the Board), votes on the renewal of the management contract and sub-advisory agreements (together, the Advisory Contracts) for the fund. The Board, assisted by the advice of fund counsel and Independent Trustees' counsel, requests and considers a broad range of information relevant to the renewal of the Advisory Contracts throughout the year.
The Board meets regularly and considers at each of its meetings factors that are relevant to its annual consideration of the renewal of the fund's Advisory Contracts, including the services and support provided to the fund and its shareholders. The Board has established three standing committees, Operations, Audit, and Nominating and Governance, each composed of Independent Trustees with varying backgrounds, to which the Board has assigned specific subject matter responsibilities in order to enhance effective decision-making by the Board. The Operations Committee, of which all of the Independent Trustees are members, meets regularly throughout the year and, among other matters, considers matters specifically related to the annual consideration of the renewal of the fund's Advisory Contracts. The Board, acting directly and through its Committees, requests and receives information concerning the annual consideration of the renewal of the fund's Advisory Contracts. The Board also meets as needed to consider matters specifically related to the Board's annual consideration of the renewal of Advisory Contracts. Members of the Board may also meet with trustees of other Fidelity funds through ad hoc joint committees to discuss certain matters relevant to the Fidelity funds.
At its September 2011 meeting, the Board of Trustees, including the Independent Trustees, unanimously determined to renew the fund's Advisory Contracts. In reaching its determination, the Board considered all factors it believed relevant, including (i) the nature, extent, and quality of the services to be provided to the fund and its shareholders (including the investment performance of the fund); (ii) the competitiveness of the fund's management fee and total expense ratio; (iii) the total costs of the services to be provided by and the profits to be realized by Fidelity from its relationship with the fund; (iv) the extent to which economies of scale would be realized as the fund grows; and (v) whether fee levels reflect these economies of scale, if any, for the benefit of fund shareholders.
In considering whether to renew the Advisory Contracts for the fund, the Board reached a determination, with the assistance of fund counsel and Independent Trustees' counsel and through the exercise of its business judgment, that the renewal of the Advisory Contracts is in the best interests of the fund and its shareholders and that the compensation payable under the Advisory Contracts is fair and reasonable. The Board's decision to renew the Advisory Contracts was not based on any single factor, but rather was based on a comprehensive consideration of all the information provided to the Board at its meetings throughout the year. The Board, in reaching its determination to renew the Advisory Contracts, is aware that shareholders in the fund have a broad range of investment choices available to them, including a wide choice among mutual funds offered by Fidelity's competitors, and that the fund's shareholders, who have the opportunity to review and weigh the disclosure provided by the fund in its prospectus and other public disclosures, have chosen to invest in this fund, managed by Fidelity.
Semiannual Report
Nature, Extent, and Quality of Services Provided. The Board considered the staffing within the investment adviser, FMR, and the sub-advisers (together, the Investment Advisers), including the backgrounds of the fund's investment personnel and the fund's investment objective and discipline. The Independent Trustees also had discussions with senior management of Fidelity's investment operations and investment groups. The Board considered the structure of the portfolio manager compensation program and whether this structure provides appropriate incentives to act in the best interests of the fund.
Resources Dedicated to Investment Management and Support Services. The Board reviewed the general qualifications and capabilities of the Investment Advisers' investment staff, including its size, education, experience, and resources, as well as the Investment Advisers' approach to recruiting, managing, and compensating investment personnel. The Board also noted that FMR has devoted increased resources to non-U.S. offices. The Board noted that Fidelity's analysts have extensive resources, tools and capabilities which allow them to conduct sophisticated quantitative and fundamental analysis, as well as credit analysis of issuers, counterparties and enhancers. The Board also believes that Fidelity's investment professionals have sufficient access to global information and data so as to provide competitive investment results over time, and that those professionals also have access to sophisticated tools which permit them to assess portfolio construction and risk and performance attribution characteristics continuously, as well as to transmit new information and research conclusions rapidly around the world. Additionally, in its deliberations, the Board considered the Investment Advisers' trading capabilities and resources which are an integral part of the investment management process.
Shareholder and Administrative Services. The Board considered (i) the nature, extent, quality, and cost of advisory, administrative, and shareholder services performed by the Investment Advisers and their affiliates under the Advisory Contracts and under separate agreements covering transfer agency, pricing and bookkeeping, and securities lending services for the fund; (ii) the nature and extent of the investment adviser's supervision of third party service providers, principally custodians and subcustodians; and (iii) the resources devoted to, and the record of compliance with, the fund's compliance policies and procedures.
The Board noted that the growth of fund assets over time across the complex allows Fidelity to reinvest in the development of services designed to enhance the value or convenience of the Fidelity funds as investment vehicles. These services include 24-hour access to account information and market information through telephone representatives and over the Internet, investor education materials and asset allocation tools, and the expanded availability of Fidelity Investor Centers, with 35 new branches opening since 2010.
Semiannual Report
Board Approval of Investment Advisory Contracts and
Management Fees - continued
Investment in a Large Fund Family. The Board considered the benefits to shareholders of investing in a Fidelity fund, including the benefits of investing in a fund that is part of a large family of funds offering a variety of investment disciplines and providing a large variety of mutual fund investor services. The Board noted that Fidelity had taken, or had made recommendations that resulted in the Fidelity funds taking, a number of actions over the previous year that benefited particular funds, including (i) continuing to dedicate additional resources to investment research and support of the senior management team that oversees asset management; (ii) rationalizing product lines through the mergers of six funds into other funds; (iii) continuing to migrate the Freedom Funds to dedicated lower cost underlying funds; (iv) obtaining shareholder approval to broaden the investment strategies for Fidelity Consumer Finance Portfolio, Fidelity Emerging Asia Fund, and Fidelity Environment and Alternative Energy Portfolio; (v) contractually agreeing to reduce the management fees and impose other expense limitations on Spartan 500 Index Fund and U.S. Bond Index Fund in connection with launching new institutional classes of these funds; (vi) changing the name, primary and supplemental benchmarks, and investment policies of Fidelity Global Strategies Fund to support the fund's flexible investment mandate and global orientation; and (vii) reducing the transfer agency account fee rates on certain accounts.
Investment Performance. The Board considered whether the fund has operated in accordance with its investment objective, as well as its record of compliance with its investment restrictions. It also reviewed the fund's absolute investment performance for each class, as well as the fund's relative investment performance for each class measured over multiple periods against (i) a broad-based securities market index, and (ii) a peer group of mutual funds deemed appropriate by Fidelity and reviewed by the Board. The following charts considered by the Board show, over the one-, three-, and five-year periods ended December 31, 2010, the cumulative total returns of the retail class and Class C of the fund, the cumulative total returns of a broad-based securities market index ("benchmark"), and a range of cumulative total returns of a peer group of mutual funds identified by Lipper Inc. as having an investment objective similar to that of the fund. The returns of the retail class and Class C show the performance of the highest and lowest performing classes, respectively (based on five-year performance). The box within each chart shows the 25th percentile return (bottom of box) and the 75th percentile return (top of box) of the peer group. Returns shown above the box are in the first quartile and returns shown below the box are in the fourth quartile. The percentage beaten numbers noted below each chart correspond to the percentile box and represent the percentage of funds in the peer group whose performance was equal to or lower than that of the class indicated.
Semiannual Report
Fidelity Total Bond Fund

The Board reviewed the fund's relative investment performance against its peer group and noted that the performance of the retail class of the fund was in the second quartile for the one- and five-year periods and the first quartile for the three-year period. The Board also noted that the investment performance of the retail class of the fund compared favorably to its benchmark for all the periods shown. The Board considered that the variations in performance among the fund's classes reflect the variations in class expenses, which result in lower performance for higher expense classes. The Board also reviewed the fund's performance since inception as well as performance in the current year.
Based on its review, the Board concluded that the nature, extent, and quality of services provided to the fund under the Advisory Contracts should benefit the fund's shareholders.
Competitiveness of Management Fee and Total Expense Ratio. The Board considered the fund's management fee and total expense ratio compared to "mapped groups" of competitive funds and classes. Fidelity creates "mapped groups" by combining similar Lipper investment objective categories that have comparable management fee characteristics. Combining Lipper investment objective categories aids the Board's management fee and total expense ratio comparisons by broadening the competitive group used for comparison and by reducing the number of universes to which various Fidelity funds are compared.
Semiannual Report
Board Approval of Investment Advisory Contracts and
Management Fees - continued
Management Fee. The Board considered two proprietary management fee comparisons for the 12-month periods shown in the chart below. The group of Lipper funds used by the Board for management fee comparisons is referred to below as the "Total Mapped Group" and, for the reasons explained above, is broader than the Lipper peer group used by the Board for performance comparisons. The Total Mapped Group comparison focuses on a fund's standing relative to the total universe of comparable funds available to investors in terms of gross management fees before expense reimbursements or caps. "TMG %" represents the percentage of funds in the Total Mapped Group that had management fees that were lower than the fund's. For example, a TMG % of 12% means that 88% of the funds in the Total Mapped Group had higher management fees than the fund. The "Asset-Size Peer Group" (ASPG) comparison focuses on a fund's standing relative to non-Fidelity funds similar in size to the fund within the Total Mapped Group. The ASPG represents at least 15% of the funds in the Total Mapped Group with comparable asset size and management fee characteristics, subject to a minimum of 50 funds (or all funds in the Total Mapped Group if fewer than 50). Additional information, such as the ASPG quartile in which the fund's management fee ranked, is also included in the chart and considered by the Board.
Fidelity Total Bond Fund

The Board noted that the fund's management fee ranked below the median of its Total Mapped Group and below the median of its ASPG for 2010.
Based on its review, the Board concluded that the fund's management fee is fair and reasonable in light of the services that the fund receives and the other factors considered.
Semiannual Report
Total Expense Ratio. In its review of each class's total expense ratio, the Board considered the fund's management fee as well as other fund or class expenses, as applicable, such as transfer agent fees, pricing and bookkeeping fees, fund-paid 12b-1 fees, and custodial, legal, and audit fees. The Board also noted the effects of any waivers and reimbursements on fees and expenses. As part of its review, the Board also considered the current and historical total expense ratios of each class of the fund compared to competitive fund median expenses. Each class of the fund is compared to those funds and classes in the Total Mapped Group (used by the Board for management fee comparisons) that have a similar sales load structure.
The Board also considered that the current contractual arrangements for the fund (i) have the effect of setting the total "fund-level" expenses (including, among certain other expenses, the management fee) for each class at 35 basis points, (ii) limit the "class-level" transfer agent fee for the retail class to 10 basis points, and (iii) limit the total expenses for the retail class to 45 basis points. The fees and expenses payable under these contractual arrangements may not be increased without the approval of the Board and the shareholders of the applicable class. The fund's Advisor classes are subject to different "class-level" expenses (transfer agent fees and 12b-1 fees).
The Board noted that the total expense ratio of each class ranked below its competitive median for 2010.
The Board recognized that the fund's management contract incorporates a "group fee" structure, which provides for lower group fee rates as total fund assets under FMR's management increase, and for higher group fee rates as total fund assets under FMR's management decrease. FMR calculates the group fee rates based on a tiered asset "breakpoint" schedule that varies based on asset class. The Board noted, however, that because the current contractual arrangements set the total "fund-level" expenses for each class at 35 basis points, increases or decreases in the management fee due to changes in the group fee rate will not impact the total expense ratio.
Fees Charged to Other Fidelity Clients. The Board also considered Fidelity fee structures and other information with respect to clients of FMR and its affiliates, such as other mutual funds advised or subadvised by FMR or its affiliates, pension plan clients, and other institutional clients. In March 2010, the Board created an ad hoc joint committee with the board of other Fidelity funds (the Committee) to review and compare Fidelity's institutional investment advisory business with its business of providing services to the Fidelity funds, including the differences in services provided, fees charged, and costs incurred, as well as competition in their respective marketplaces.
Based on its review of total expense ratios and fees charged to other Fidelity clients, the Board concluded that the total expense ratio of each class of the fund was reasonable in light of the services that the fund and its shareholders receive and the other factors considered, including the findings of the Committee.
Semiannual Report
Board Approval of Investment Advisory Contracts and
Management Fees - continued
Costs of the Services and Profitability. The Board considered the revenues earned and the expenses incurred by Fidelity in conducting the business of developing, marketing, distributing, managing, administering and servicing the fund and its shareholders. The Board also considered the level of Fidelity's profits in respect of all the Fidelity funds.
On an annual basis, FMR presents to the Board Fidelity's profitability for the fund. Fidelity calculates the profitability for each fund, as well as aggregate profitability for groups of Fidelity funds and all Fidelity funds, using a series of detailed revenue and cost allocation methodologies which originate with the books and records of Fidelity on which Fidelity's audited financial statements are based. The Audit Committee of the Board reviews any significant changes from the prior year's methodologies.
PricewaterhouseCoopers LLP (PwC), independent registered public accounting firm and auditor to Fidelity and certain Fidelity funds, has been engaged annually by the Board as part of the Board's assessment of Fidelity's profitability analysis. PwC's engagement includes the review and assessment of Fidelity's methodologies used in determining the revenues and expenses attributable to Fidelity's mutual fund business, and completion of agreed-upon procedures surrounding the mathematical accuracy of fund profitability and its conformity to allocation methodologies. After considering PwC's reports issued under the engagement and information provided by Fidelity, the Board concluded that while other allocation methods may also be reasonable, Fidelity's profitability methodologies are reasonable in all material respects.
The Board also reviewed Fidelity's non-fund businesses and fall-out benefits related to the mutual fund business as well as cases where Fidelity's affiliates may benefit from or be related to the fund's business.
The Board considered the costs of the services provided by and the profits realized by Fidelity in connection with the operation of the fund and was satisfied that the profitability was not excessive in the circumstances.
Economies of Scale. The Board considered whether there have been economies of scale in respect of the management of the Fidelity funds, whether the Fidelity funds (including the fund) have appropriately benefited from any such economies of scale, and whether there is potential for realization of any further economies of scale. The Board considered the extent to which the fund will benefit from economies of scale through increased services to the fund, through waivers or reimbursements, or through fee or expense reductions. The Board also noted that in 2009, it and the board of other Fidelity funds created an ad hoc committee (the Economies of Scale Committee) to analyze whether FMR attains economies of scale in respect of the management and servicing of the Fidelity funds, whether the Fidelity funds have appropriately benefited from such economies of scale, and whether there is potential for realization of any further economies of scale.
Semiannual Report
The Board concluded, taking into account the analysis of the Economies of Scale Committee, that any potential economies of scale are being appropriately shared between fund shareholders and Fidelity.
Additional Information Requested by the Board. In order to develop fully the factual basis for consideration of the Fidelity funds' Advisory Contracts, the Board requested and received additional information on certain topics, including: (i) Fidelity's fund profitability methodology, profitability trends for certain funds, and the impact of certain factors on fund profitability results; (ii) portfolio manager changes that have occurred during the past year and the amount of the investment that each portfolio manager has made in the Fidelity fund(s) that he or she manages; (iii) Fidelity's compensation structure for portfolio managers, research analysts, and other key personnel, including its effects on fund profitability, the rationale for the compensation structure, and the extent to which current market conditions have affected retention and recruitment; (iv) the compensation paid to fund sub-advisers on behalf of the Fidelity funds; (v) Fidelity's fee structures and rationale for recommending different fees among different categories of funds and classes, as well as Fidelity's voluntary waiver of its fees to maintain minimum yields for certain money market funds and classes; (vi) the reasons why certain expenses affect various funds and classes differently; (vii) Fidelity's transfer agent fees, expenses, and services and how the benefits of decreased costs and new efficiencies can be shared across all of the Fidelity funds; (viii) the reasons for and consequences of changes to certain product lines compared to competitors; (ix) the allocation of and historical trends in Fidelity's realization of fall-out benefits; and (x) explanations regarding the relative total expense ratios of certain funds and classes, total expense competitive trends, and actions that might be taken by FMR to reduce total expense ratios for certain funds and classes or to achieve further economies of scale.
Based on its evaluation of all of the conclusions noted above, and after considering all factors it believed relevant, the Board ultimately concluded that the advisory fee structures are fair and reasonable, and that the fund's Advisory Contracts should be renewed.
Semiannual Report
Investment Adviser
Fidelity Management & Research Company
Boston, MA
Investment Sub-Advisers
FMR Co., Inc.
Fidelity Management & Research
(U.K.) Inc.
Fidelity Management & Research
(Hong Kong) Limited
Fidelity Management & Research
(Japan) Inc.
Fidelity Investments
Money Management, Inc.
FIL Investments (Japan) Limited
FIL Investment Advisors
FIL Investment Advisors
(UK) Limited
General Distributor
Fidelity Distributors Corporation
Boston, MA
Transfer and Service Agents
Fidelity Investments Institutional
Operations Company, Inc.
Boston, MA
Fidelity Service Company, Inc.
Boston, MA
Custodian
Citibank, N.A.
New York, NY
The Fidelity Telephone Connection
Mutual Fund 24-Hour Service
Exchanges/Redemptions
and Account Assistance 1-800-544-6666
Product Information 1-800-544-6666
Retirement Accounts 1-800-544-4774
(8 a.m. - 9 p.m.)
TDD Service 1-800-544-0118
for the deaf and hearing impaired
(9 a.m. - 9 p.m. Eastern time)
Fidelity Automated Service
Telephone (FAST®) 1-800-544-5555
Automated line for quickest service
TBD-USAN-0412
1.789737.108
(Fidelity Investment logo)(registered trademark)
Corporate Headquarters
82 Devonshire St., Boston, MA 02109
www.fidelity.com
(Fidelity Investment logo)(registered trademark)
Fidelity Advisor®
Total Bond
Fund - Class A, Class T, Class B
and Class C
Semiannual Report
February 29, 2012
(Fidelity Cover Art)
Class A, Class T, Class B,
and Class C are classes of
Fidelity® Total Bond Fund
Contents
Shareholder Expense Example | (Click Here) | An example of shareholder expenses. |
Investment Changes | (Click Here) | A summary of major shifts in the fund's investments over the past six months. |
Investments | (Click Here) | A complete list of the fund's investments with their market values. |
Financial Statements | (Click Here) | Statements of assets and liabilities, operations, and changes in net assets,
as well as financial highlights. |
Notes | (Click Here) | Notes to the financial statements. |
Report of Independent Registered Public Accounting Firm | (Click Here) | |
Board Approval of Investment Advisory Contracts and Management Fees | (Click Here) | |
To view a fund's proxy voting guidelines and proxy voting record for the 12-month period ended June 30, visit http://www.fidelity.com/proxyvotingresults or visit the Securities and Exchange Commission's (SEC) web site at http://www.sec.gov. You may also call 1-877-208-0098 to request a free copy of the proxy voting guidelines.
Standard & Poor's, S&P and S&P 500 are registered service marks of The McGraw-Hill Companies, Inc. and have been licensed for use by Fidelity Distributors Corporation.
Other third party marks appearing herein are the property of their respective owners.
All other marks appearing herein are registered or unregistered trademarks or service marks of FMR LLC or an affiliated company.
This report and the financial statements contained herein are submitted for the general information of the shareholders of the fund. This report is not authorized for distribution to prospective investors in the fund unless preceded or accompanied by an effective prospectus.
A fund files its complete schedule of portfolio holdings with the SEC for the first and third quarters of each fiscal year on Form N-Q. Forms N-Q are available on the SEC's web site at http://www.sec.gov. A fund's Forms N-Q may be reviewed and copied at the SEC's Public Reference Room in Washington, DC. Information regarding the operation of the SEC's Public Reference Room may be obtained by calling 1-800-SEC-0330. For a complete list of a fund's portfolio holdings, view the most recent holdings listing, semiannual report, or annual report on Fidelity's web site at http://www.fidelity.com, http://www.advisor.fidelity.com, or http://www.401k.com, as applicable.
NOT FDIC INSURED • MAY LOSE VALUE • NO BANK GUARANTEE
Neither the fund nor Fidelity Distributors Corporation is a bank.
Semiannual Report
Shareholder Expense Example
As a shareholder of the Fund, you incur two types of costs: (1) transaction costs, including sales charges (loads) on purchase payments or redemption proceeds, and (2) ongoing costs, including management fees, distribution and/or service (12b-1) fees and other Fund expenses. This Example is intended to help you understand your ongoing costs (in dollars) of investing in the Fund and to compare these costs with the ongoing costs of investing in other mutual funds.
The Example is based on an investment of $1,000 invested at the beginning of the period and held for the entire period (September 1, 2011 to February 29, 2012).
Actual Expenses
The first line of the accompanying table for each class of the Fund provides information about actual account values and actual expenses. You may use the information in this line, together with the amount you invested, to estimate the expenses that you paid over the period. Simply divide your account value by $1,000.00 (for example, an $8,600 account value divided by $1,000.00 = 8.6), then multiply the result by the number in the first line for a class of the Fund under the heading entitled "Expenses Paid During Period" to estimate the expenses you paid on your account during this period. In addition, the Fund, as a shareholder in the underlying Fidelity Central Funds, will indirectly bear its pro-rata share of the fees and expenses incurred by the underlying Fidelity Central Funds. These fees and expenses are not included in the Fund's annualized expense ratio used to calculate the expense estimate in the table below.
Hypothetical Example for Comparison Purposes
The second line of the accompanying table for each class of the Fund provides information about hypothetical account values and hypothetical expenses based on a Class' actual expense ratio and an assumed rate of return of 5% per year before expenses, which is not the Class' actual return. The hypothetical account values and expenses may not be used to estimate the actual ending account balance or expenses you paid for the period. You may use this information to compare the ongoing costs of investing in the Fund and other funds. To do so, compare this 5% hypothetical example with the 5% hypothetical examples that appear in the shareholder reports of the other funds. In addition, the Fund, as a shareholder in the underlying Fidelity Central Funds, will indirectly bear its pro-rata share of the fees and expenses incurred by the underlying Fidelity Central Funds. These fees and expenses are not included in the Fund's annualized expense ratio used to calculate the expense estimate in the table below.
Please note that the expenses shown in the table are meant to highlight your ongoing costs only and do not reflect any transaction costs. Therefore, the second line of the table is useful in comparing ongoing costs only, and will not help you determine the relative total costs of owning different funds. In addition, if these transactional costs were included, your costs would have been higher.
Semiannual Report
Shareholder Expense Example - continued
| Annualized
Expense Ratio | Beginning
Account Value
September 1, 2011 | Ending
Account Value
February 29, 2012 | Expenses Paid
During Period*
September 1, 2011 to
February 29, 2012 |
Class A | .84% | | | |
Actual | | $ 1,000.00 | $ 1,033.70 | $ 4.25 |
HypotheticalA | | $ 1,000.00 | $ 1,020.69 | $ 4.22 |
Class T | .78% | | | |
Actual | | $ 1,000.00 | $ 1,034.10 | $ 3.94 |
HypotheticalA | | $ 1,000.00 | $ 1,020.98 | $ 3.92 |
Class B | 1.51% | | | |
Actual | | $ 1,000.00 | $ 1,030.30 | $ 7.62 |
HypotheticalA | | $ 1,000.00 | $ 1,017.35 | $ 7.57 |
Class C | 1.52% | | | |
Actual | | $ 1,000.00 | $ 1,030.20 | $ 7.67 |
HypotheticalA | | $ 1,000.00 | $ 1,017.30 | $ 7.62 |
Total Bond | .45% | | | |
Actual | | $ 1,000.00 | $ 1,035.70 | $ 2.28 |
HypotheticalA | | $ 1,000.00 | $ 1,022.63 | $ 2.26 |
Institutional Class | .54% | | | |
Actual | | $ 1,000.00 | $ 1,035.30 | $ 2.73 |
HypotheticalA | | $ 1,000.00 | $ 1,022.18 | $ 2.72 |
A 5% return per year before expenses
* Expenses are equal to each Class' annualized expense ratio, multiplied by the average account value over the period, multiplied by 182/366 (to reflect the one-half year period). The fees and expenses of the underlying Fidelity Central Funds in which the Fund invests are not included in the Fund's annualized expense ratio.
Semiannual Report
Investment Changes (Unaudited)
Quality Diversification (% of fund's net assets) |
As of February 29, 2012 | As of August 31, 2011 |
| U.S. Government
and U.S.
Government
Agency
Obligations 59.5% | | | U.S. Government
and U.S.
Government
Agency
Obligations 68.0% | |
| AAA 5.4% | | | AAA 6.8% | |
| AA 2.6% | | | AA 2.6% | |
| A 5.7% | | | A 6.6% | |
| BBB 12.3% | | | BBB 11.3% | |
| BB and Below 11.0% | | | BB and Below 10.0% | |
| Not Rated 1.0% | | | Not Rated 0.9% | |
| Equities 0.2% | | | Equities 0.1% | |
| Short-Term
Investments and
Net Other Assets 2.3% | | | Short-Term
Investments and
Net Other Assets† (6.3)% | |
We have used ratings from Moody's Investors Service, Inc. Where Moody's® ratings are not available, we have used S&P® ratings. All ratings are as of the date indicated and do not reflect subsequent changes. Securities rated BB or below were rated investment grade at the time of acquisition. The information in the above table is based on the combined investments of the fund and its pro-rata share of the investments of Fidelity's fixed-income central funds. |
Weighted Average Maturity as of February 29, 2012 |
| | 6 months ago |
Years | 6.5 | 6.2 |
This is a weighted average of all the maturities of the securities held in a fund. Weighted Average Maturity (WAM) can be used as a measure of sensitivity to interest rate changes and market changes. Generally, the longer the maturity, the greater the sensitivity to such changes. WAM is based on the dollar-weighted average length of time until principal payments must be paid. Depending on the types of securities held in a fund, certain maturity shortening devices (e.g., demand features, interest rate resets, and call options) may be taken into account when calculating the WAM. |
Duration as of February 29, 2012 |
| | 6 months ago |
Years | 4.6 | 4.3 |
Duration estimates how much a bond fund's price will change with a change in comparable interest rates. If rates rise 1%, for example, a fund with a 5-year duration is likely to lose about 5% of its value. Other factors also can influence a bond fund's performance and share price. Accordingly, a bond fund's actual performance may differ from this example. Duration takes into account any call or put option embedded in the bonds. |
Semiannual Report
Asset Allocation (% of fund's net assets) |
| As of February 29, 2012* | As of August 31, 2011** |
| Corporate Bonds 24.2% | | | Corporate Bonds 23.1% | |
| U.S. Government
and U.S.
Government
Agency
Obligations 59.5% | | | U.S. Government
and U.S.
Government
Agency
Obligations 68.0% | |
| Asset-Backed
Securities 2.0% | | | Asset-Backed
Securities 2.4% | |
| CMOs and Other Mortgage Related Securities 5.8% | | | CMOs and Other Mortgage Related Securities 7.6% | |
| Municipal Bonds 0.3% | | | Municipal Bonds 0.2% | |
| Stocks 0.2% | | | Stocks 0.1% | |
| Other Investments 5.7% | | | Other Investments 4.9% | |
| Short-Term
Investments and
Net Other Assets 2.3% | | | Short-Term
Investments and
Net Other Assets† (6.3)% | |
* Foreign investments | 5.4% | | ** Foreign investments | 5.3% | |
* Futures and Swaps | 1.0% | | ** Futures and Swaps | 1.1% | |
† Short-Term Investments and Net Other Assets are not included in the pie chart.
The information in the above table is based on the combined investments of the fund and its pro-rata share of the investments of Fidelity's fixed-income central funds. A holdings listing for the Fund, which presents direct holdings as well as the pro-rata share of any securities and other investments held indirectly through its investment in underlying non-money market Fidelity Central Funds is available at fidelity.com/or advisor.fidelity.com as applicable.
Semiannual Report
Investments February 29, 2012
Showing Percentage of Net Assets
Corporate Bonds - 23.9% |
| Principal Amount (c) | | Value |
Convertible Bonds - 0.0% |
FINANCIALS - 0.0% |
Real Estate Investment Trusts - 0.0% |
Developers Diversified Realty Corp. 3% 3/15/12 | | $ 270,000 | | $ 270,000 |
MATERIALS - 0.0% |
Metals & Mining - 0.0% |
Vedanta Resources Jersey II Ltd. 4% 3/30/17 | | 600,000 | | 579,000 |
TOTAL CONVERTIBLE BONDS | | 849,000 |
Nonconvertible Bonds - 23.9% |
CONSUMER DISCRETIONARY - 2.8% |
Auto Components - 0.1% |
American Axle & Manufacturing, Inc. 7.75% 11/15/19 | | 2,845,000 | | 3,022,813 |
Dana Holding Corp.: | | | | |
6.5% 2/15/19 | | 2,755,000 | | 2,982,288 |
6.75% 2/15/21 | | 3,675,000 | | 3,987,375 |
Delphi Corp.: | | | | |
5.875% 5/15/19 (e) | | 1,685,000 | | 1,777,675 |
6.125% 5/15/21 (e) | | 1,615,000 | | 1,729,988 |
Tenneco, Inc.: | | | | |
6.875% 12/15/20 | | 1,505,000 | | 1,617,875 |
7.75% 8/15/18 | | 1,400,000 | | 1,519,000 |
| | 16,637,014 |
Automobiles - 0.1% |
Automotores Gildemeister SA 8.25% 5/24/21 (e) | | 575,000 | | 598,000 |
Chrysler Group LLC/CG Co.-Issuer, Inc.: | | | | |
8% 6/15/19 | | 3,090,000 | | 3,113,175 |
8.25% 6/15/21 | | 5,205,000 | | 5,257,050 |
Ford Motor Co. 7.45% 7/16/31 | | 5,655,000 | | 7,259,606 |
| | 16,227,831 |
Distributors - 0.0% |
AmeriGas Partners LP/AmeriGas Finance Corp.: | | | | |
6.25% 8/20/19 | | 1,255,000 | | 1,267,550 |
6.5% 5/20/21 | | 600,000 | | 606,000 |
Ferrellgas LP/Ferrellgas Finance Corp. 6.5% 5/1/21 | | 1,840,000 | | 1,619,200 |
| | 3,492,750 |
Diversified Consumer Services - 0.0% |
Visant Corp. 10% 10/1/17 | | 1,320,000 | | 1,221,000 |
Corporate Bonds - continued |
| Principal Amount (c) | | Value |
Nonconvertible Bonds - continued |
CONSUMER DISCRETIONARY - continued |
Hotels, Restaurants & Leisure - 0.4% |
Ameristar Casinos, Inc. 7.5% 4/15/21 | | $ 2,570,000 | | $ 2,769,175 |
Chester Downs & Marina LLC 9.25% 2/1/20 (e) | | 320,000 | | 336,000 |
Chukchansi Economic Development Authority 8% 11/15/13 (e) | | 325,000 | | 224,250 |
CityCenter Holdings LLC/CityCenter Finance Corp.: | | | | |
7.625% 1/15/16 | | 3,590,000 | | 3,778,475 |
7.625% 1/15/16 (e) | | 1,930,000 | | 2,012,025 |
11.5% 1/15/17 pay-in-kind (k) | | 2,012,204 | | 2,143,612 |
FelCor Lodging LP 6.75% 6/1/19 | | 4,875,000 | | 4,984,688 |
GWR Operating Partnership LLP/Great Wolf Finance Corp. 10.875% 4/1/17 | | 1,635,000 | | 1,847,550 |
Host Marriott LP 6.375% 3/15/15 | | 250,000 | | 253,125 |
ITT Corp. 7.375% 11/15/15 | | 250,000 | | 287,500 |
MGM Mirage, Inc.: | | | | |
6.625% 7/15/15 | | 7,475,000 | | 7,531,063 |
7.5% 6/1/16 | | 4,130,000 | | 4,191,950 |
7.625% 1/15/17 | | 5,355,000 | | 5,408,550 |
8.625% 2/1/19 (e) | | 2,940,000 | | 3,131,100 |
11.375% 3/1/18 | | 2,460,000 | | 2,896,650 |
MTR Gaming Group, Inc. 11.5% 8/1/19 pay-in-kind (e)(k) | | 1,602,975 | | 1,514,811 |
NPC International, Inc./NPC Operating Co. A, Inc./NPC Operating Co. B, Inc. 10.5% 1/15/20 (e) | | 2,950,000 | | 3,112,250 |
Pinnacle Entertainment, Inc. 7.5% 6/15/15 | | 1,035,000 | | 1,066,050 |
Royal Caribbean Cruises Ltd.: | | | | |
7.25% 3/15/18 | | 465,000 | | 496,946 |
yankee: | | | | |
7.25% 6/15/16 | | 3,985,000 | | 4,383,500 |
7.5% 10/15/27 | | 3,070,000 | | 3,100,700 |
Times Square Hotel Trust 8.528% 8/1/26 (e) | | 863,814 | | 920,766 |
Universal City Development Partners Ltd./UCDP Finance, Inc. 8.875% 11/15/15 | | 784,000 | | 857,012 |
Wynn Las Vegas LLC/Wynn Las Vegas Capital Corp. 7.75% 8/15/20 | | 970,000 | | 1,091,250 |
| | 58,338,998 |
Household Durables - 0.2% |
KB Home: | | | | |
7.25% 6/15/18 | | 1,430,000 | | 1,415,700 |
8% 3/15/20 | | 305,000 | | 306,525 |
Corporate Bonds - continued |
| Principal Amount (c) | | Value |
Nonconvertible Bonds - continued |
CONSUMER DISCRETIONARY - continued |
Household Durables - continued |
Lennar Corp.: | | | | |
6.95% 6/1/18 | | $ 4,640,000 | | $ 4,895,200 |
12.25% 6/1/17 | | 1,135,000 | | 1,452,800 |
Reliance Intermediate Holdings LP 9.5% 12/15/19 (e) | | 2,125,000 | | 2,348,125 |
Reynolds Group Issuer, Inc./Reynolds Group Issuer LLC/Reynolds Group Issuer (Luxembourg) SA: | | | | |
7.875% 8/15/19 (e) | | 3,760,000 | | 4,107,800 |
9% 5/15/18 (e) | | 970,000 | | 974,850 |
9.875% 8/15/19 (e) | | 1,670,000 | | 1,726,363 |
Standard Pacific Corp.: | | | | |
8.375% 5/15/18 | | 6,495,000 | | 6,982,125 |
10.75% 9/15/16 | | 2,370,000 | | 2,722,538 |
Toll Brothers Finance Corp. 5.875% 2/15/22 | | 1,095,000 | | 1,133,325 |
| | 28,065,351 |
Media - 1.9% |
Allbritton Communications Co. 8% 5/15/18 | | 2,630,000 | | 2,768,075 |
AOL Time Warner, Inc. 7.625% 4/15/31 | | 500,000 | | 669,664 |
Cablevision Systems Corp.: | | | | |
7.75% 4/15/18 | | 2,305,000 | | 2,520,979 |
8.625% 9/15/17 | | 3,505,000 | | 3,934,363 |
CCO Holdings LLC/CCO Holdings Capital Corp.: | | | | |
6.5% 4/30/21 | | 3,975,000 | | 4,223,438 |
6.625% 1/31/22 | | 1,755,000 | | 1,877,850 |
7% 1/15/19 | | 8,610,000 | | 9,277,275 |
7.25% 10/30/17 | | 3,380,000 | | 3,658,850 |
7.875% 4/30/18 | | 865,000 | | 945,013 |
Cequel Communications Holdings I LLC/Cequel Capital Corp. 8.625% 11/15/17 (e) | | 10,180,000 | | 10,943,500 |
Comcast Corp.: | | | | |
4.95% 6/15/16 | | 2,344,000 | | 2,649,519 |
5.15% 3/1/20 | | 435,000 | | 509,726 |
5.7% 5/15/18 | | 14,629,000 | | 17,279,146 |
6.4% 3/1/40 | | 4,490,000 | | 5,733,919 |
6.45% 3/15/37 | | 2,196,000 | | 2,737,290 |
6.55% 7/1/39 | | 9,000,000 | | 11,423,178 |
COX Communications, Inc. 4.625% 6/1/13 | | 4,467,000 | | 4,682,229 |
CSC Holdings LLC 8.625% 2/15/19 | | 1,350,000 | | 1,593,000 |
Corporate Bonds - continued |
| Principal Amount (c) | | Value |
Nonconvertible Bonds - continued |
CONSUMER DISCRETIONARY - continued |
Media - continued |
Discovery Communications LLC: | | | | |
3.7% 6/1/15 | | $ 7,129,000 | | $ 7,642,103 |
6.35% 6/1/40 | | 6,392,000 | | 8,036,949 |
Insight Communications, Inc. 9.375% 7/15/18 (e) | | 2,030,000 | | 2,329,425 |
Kabel BW Erste Beteiligungs GmbH/Kabel Baden-Wurttemberg GmbH & Co. KG 7.5% 3/15/19 (e) | | 660,000 | | 712,800 |
Lamar Media Corp. 5.875% 2/1/22 (e) | | 390,000 | | 396,318 |
NBCUniversal Media LLC: | | | | |
3.65% 4/30/15 | | 3,514,000 | | 3,769,591 |
5.15% 4/30/20 | | 11,614,000 | | 13,424,866 |
6.4% 4/30/40 | | 18,278,000 | | 22,866,555 |
News America Holdings, Inc. 7.75% 12/1/45 | | 663,000 | | 797,211 |
News America, Inc.: | | | | |
6.15% 3/1/37 | | 4,759,000 | | 5,478,889 |
6.15% 2/15/41 | | 11,572,000 | | 13,745,927 |
Nielsen Finance LLC/Nielsen Finance Co. 7.75% 10/15/18 | | 2,770,000 | | 3,074,700 |
Quebecor Media, Inc.: | | | | |
7.75% 3/15/16 | | 4,032,000 | | 4,158,000 |
7.75% 3/15/16 | | 2,485,000 | | 2,562,656 |
Time Warner Cable, Inc.: | | | | |
5.4% 7/2/12 | | 3,048,000 | | 3,094,680 |
5.5% 9/1/41 | | 10,000,000 | | 10,988,870 |
5.85% 5/1/17 | | 7,607,000 | | 8,952,222 |
6.2% 7/1/13 | | 2,898,000 | | 3,103,338 |
6.75% 7/1/18 | | 13,763,000 | | 16,917,342 |
Time Warner, Inc.: | | | | |
3.15% 7/15/15 | | 3,115,000 | | 3,308,336 |
5.375% 10/15/41 | | 3,115,000 | | 3,451,831 |
5.875% 11/15/16 | | 368,000 | | 435,168 |
6.2% 3/15/40 | | 11,792,000 | | 13,983,001 |
6.5% 11/15/36 | | 9,243,000 | | 11,278,725 |
TV Azteca SA de CV 7.5% 5/25/18 (Reg. S) | | 850,000 | | 877,625 |
Univision Communications, Inc.: | | | | |
6.875% 5/15/19 (e) | | 2,680,000 | | 2,713,500 |
8.5% 5/15/21 (e) | | 4,695,000 | | 4,648,050 |
UPC Holding BV 9.875% 4/15/18 (e) | | 1,190,000 | | 1,320,900 |
UPCB Finance V Ltd. 7.25% 11/15/21 (e) | | 995,000 | | 1,047,238 |
Corporate Bonds - continued |
| Principal Amount (c) | | Value |
Nonconvertible Bonds - continued |
CONSUMER DISCRETIONARY - continued |
Media - continued |
UPCB Finance VI Ltd. 6.875% 1/15/22 (e) | | $ 930,000 | | $ 949,716 |
Viacom, Inc.: | | | | |
3.5% 4/1/17 | | 7,993,000 | | 8,579,678 |
6.75% 10/5/37 | | 1,460,000 | | 1,883,223 |
| | 273,956,447 |
Specialty Retail - 0.1% |
AutoNation, Inc. 5.5% 2/1/20 | | 890,000 | | 916,700 |
J. Crew Group, Inc. 8.125% 3/1/19 | | 4,694,000 | | 4,699,868 |
PETCO Animal Supplies, Inc. 9.25% 12/1/18 (e) | | 6,315,000 | | 6,962,288 |
Staples, Inc. 7.375% 10/1/12 | | 554,000 | | 574,637 |
Toys 'R' Us, Inc. 7.375% 9/1/16 (e) | | 3,175,000 | | 3,262,313 |
| | 16,415,806 |
Textiles, Apparel & Luxury Goods - 0.0% |
Hanesbrands, Inc. 6.375% 12/15/20 | | 2,500,000 | | 2,606,250 |
TOTAL CONSUMER DISCRETIONARY | | 416,961,447 |
CONSUMER STAPLES - 1.2% |
Beverages - 0.3% |
Anheuser-Busch InBev Worldwide, Inc. 2.5% 3/26/13 | | 8,433,000 | | 8,607,082 |
Cerveceria Nacional Dominicana C por A 8% 3/27/14 (Reg. S) | | 225,000 | | 231,750 |
Diageo Capital PLC 5.2% 1/30/13 | | 1,037,000 | | 1,081,398 |
FBG Finance Ltd. 5.125% 6/15/15 (e) | | 3,662,000 | | 4,039,402 |
Fortune Brands, Inc.: | | | | |
5.375% 1/15/16 | | 321,000 | | 356,356 |
5.875% 1/15/36 | | 16,159,000 | | 16,428,661 |
6.375% 6/15/14 | | 3,374,000 | | 3,724,764 |
SABMiller Holdings, Inc. 3.75% 1/15/22 (e) | | 10,217,000 | | 10,652,673 |
| | 45,122,086 |
Food & Staples Retailing - 0.1% |
Albertsons, Inc.: | | | | |
7.45% 8/1/29 | | 155,000 | | 120,513 |
8% 5/1/31 | | 765,000 | | 594,788 |
BFF International Ltd. 7.25% 1/28/20 (e) | | 800,000 | | 896,000 |
Rite Aid Corp.: | | | | |
9.25% 3/15/20 (e) | | 2,890,000 | | 2,926,125 |
9.375% 12/15/15 | | 955,000 | | 983,650 |
Corporate Bonds - continued |
| Principal Amount (c) | | Value |
Nonconvertible Bonds - continued |
CONSUMER STAPLES - continued |
Food & Staples Retailing - continued |
Rite Aid Corp.: - continued | | | | |
9.5% 6/15/17 | | $ 4,960,000 | | $ 5,034,400 |
SUPERVALU, Inc. 8% 5/1/16 | | 865,000 | | 899,600 |
US Foodservice, Inc. 8.5% 6/30/19 (e) | | 3,625,000 | | 3,661,250 |
| | 15,116,326 |
Food Products - 0.4% |
Cargill, Inc. 6% 11/27/17 (e) | | 9,457,000 | | 11,200,559 |
Gruma SAB de CV 7.75% (Reg. S) (f) | | 1,285,000 | | 1,288,213 |
JBS USA LLC/JBS USA Finance, Inc. 8.25% 2/1/20 (e) | | 705,000 | | 724,388 |
Kraft Foods, Inc.: | | | | |
5.375% 2/10/20 | | 10,631,000 | | 12,392,015 |
6.125% 2/1/18 | | 10,623,000 | | 12,736,361 |
6.5% 8/11/17 | | 10,238,000 | | 12,426,905 |
6.75% 2/19/14 | | 540,000 | | 598,740 |
MHP SA 10.25% 4/29/15 (e) | | 985,000 | | 960,375 |
Post Holdings, Inc. 7.375% 2/15/22 (e) | | 950,000 | | 1,011,750 |
| | 53,339,306 |
Personal Products - 0.0% |
NBTY, Inc. 9% 10/1/18 | | 2,065,000 | | 2,286,988 |
Prestige Brands, Inc. 8.125% 2/1/20 (e) | | 165,000 | | 179,438 |
| | 2,466,426 |
Tobacco - 0.4% |
Altria Group, Inc.: | | | | |
8.5% 11/10/13 | | 326,000 | | 366,339 |
9.7% 11/10/18 | | 23,631,000 | | 32,167,817 |
Philip Morris International, Inc.: | | | | |
4.875% 5/16/13 | | 9,347,000 | | 9,850,261 |
5.65% 5/16/18 | | 7,161,000 | | 8,588,381 |
Reynolds American, Inc.: | | | | |
6.75% 6/15/17 | | 3,719,000 | | 4,430,460 |
7.25% 6/15/37 | | 5,056,000 | | 6,063,448 |
| | 61,466,706 |
TOTAL CONSUMER STAPLES | | 177,510,850 |
Corporate Bonds - continued |
| Principal Amount (c) | | Value |
Nonconvertible Bonds - continued |
ENERGY - 4.0% |
Energy Equipment & Services - 0.6% |
Calfrac Holdings LP 7.5% 12/1/20 (e) | | $ 3,570,000 | | $ 3,587,850 |
Chesapeake Oilfield Operating LLC 6.625% 11/15/19 (e) | | 1,260,000 | | 1,285,200 |
DCP Midstream LLC: | | | | |
4.75% 9/30/21 (e) | | 11,333,000 | | 12,160,502 |
5.35% 3/15/20 (e) | | 8,816,000 | | 9,733,843 |
El Paso Pipeline Partners Operating Co. LLC: | | | | |
4.1% 11/15/15 | | 10,806,000 | | 11,116,078 |
5% 10/1/21 | | 7,366,000 | | 7,689,809 |
6.5% 4/1/20 | | 738,000 | | 822,104 |
Expro Finance Luxembourg SCA 8.5% 12/15/16 (e) | | 3,800,000 | | 3,412,400 |
Exterran Holdings, Inc. 7.25% 12/1/18 | | 6,485,000 | | 6,241,813 |
Forbes Energy Services Ltd. 9% 6/15/19 | | 1,590,000 | | 1,566,150 |
Hornbeck Offshore Services, Inc. 8% 9/1/17 | | 1,605,000 | | 1,701,300 |
Noble Holding International Ltd. 3.45% 8/1/15 | | 632,000 | | 660,996 |
Oil States International, Inc. 6.5% 6/1/19 | | 2,850,000 | | 3,063,750 |
Petroleum Geo-Services ASA 7.375% 12/15/18 (e) | | 2,245,000 | | 2,357,250 |
Precision Drilling Corp.: | | | | |
6.5% 12/15/21 (e) | | 170,000 | | 181,475 |
6.625% 11/15/20 | | 1,890,000 | | 2,022,300 |
SESI LLC 7.125% 12/15/21 (e) | | 2,980,000 | | 3,292,900 |
Transocean, Inc.: | | | | |
5.05% 12/15/16 | | 7,572,000 | | 8,285,260 |
6.375% 12/15/21 | | 9,999,000 | | 11,796,790 |
Weatherford International Ltd.: | | | | |
4.95% 10/15/13 | | 2,173,000 | | 2,287,139 |
5.15% 3/15/13 | | 2,840,000 | | 2,938,060 |
| | 96,202,969 |
Oil, Gas & Consumable Fuels - 3.4% |
Afren PLC 11.5% 2/1/16 (e) | | 520,000 | | 551,200 |
Anadarko Petroleum Corp.: | | | | |
5.95% 9/15/16 | | 485,000 | | 561,564 |
6.375% 9/15/17 | | 19,790,000 | | 23,757,756 |
Antero Resources Finance Corp.: | | | | |
7.25% 8/1/19 (e) | | 1,080,000 | | 1,134,000 |
9.375% 12/1/17 | | 2,915,000 | | 3,191,925 |
Canadian Natural Resources Ltd.: | | | | |
5.15% 2/1/13 | | 5,610,000 | | 5,838,052 |
Corporate Bonds - continued |
| Principal Amount (c) | | Value |
Nonconvertible Bonds - continued |
ENERGY - continued |
Oil, Gas & Consumable Fuels - continued |
Canadian Natural Resources Ltd.: - continued | | | | |
5.7% 5/15/17 | | $ 16,295,000 | | $ 19,502,263 |
Chesapeake Energy Corp.: | | | | |
6.125% 2/15/21 | | 1,505,000 | | 1,516,288 |
6.875% 11/15/20 | | 1,195,000 | | 1,254,750 |
Chesapeake Midstream Partners LP/CHKM Finance Corp.: | | | | |
5.875% 4/15/21 (e) | | 676,000 | | 689,520 |
6.125% 7/15/22 (e) | | 1,240,000 | | 1,280,300 |
ConocoPhillips: | | | | |
4.6% 1/15/15 | | 10,000,000 | | 11,100,330 |
5.75% 2/1/19 | | 2,930,000 | | 3,605,386 |
CONSOL Energy, Inc.: | | | | |
8% 4/1/17 | | 3,515,000 | | 3,813,775 |
8.25% 4/1/20 | | 650,000 | | 708,500 |
Crestwood Midstream Partners LP / Finance Corp. 7.75% 4/1/19 (e) | | 800,000 | | 808,000 |
Denbury Resources, Inc. 6.375% 8/15/21 | | 1,935,000 | | 2,118,825 |
DTEK Finance BV 9.5% 4/28/15 (e) | | 600,000 | | 594,000 |
Duke Capital LLC 6.25% 2/15/13 | | 1,000,000 | | 1,049,266 |
Duke Energy Field Services: | | | | |
5.375% 10/15/15 (e) | | 1,524,000 | | 1,652,897 |
6.45% 11/3/36 (e) | | 1,801,000 | | 2,005,466 |
El Paso Natural Gas Co. 5.95% 4/15/17 | | 1,166,000 | | 1,294,438 |
Enbridge Energy Partners LP 4.2% 9/15/21 | | 13,331,000 | | 14,225,097 |
Encana Holdings Finance Corp. 5.8% 5/1/14 | | 3,602,000 | | 3,908,303 |
Energy Transfer Equity LP 7.5% 10/15/20 | | 2,350,000 | | 2,690,750 |
Enterprise Products Operating LP: | | | | |
5.6% 10/15/14 | | 483,000 | | 532,193 |
5.65% 4/1/13 | | 697,000 | | 731,389 |
EQT Corp. 4.875% 11/15/21 | | 5,066,000 | | 5,181,160 |
EV Energy Partners LP/EV Energy Finance Corp. 8% 4/15/19 | | 1,650,000 | | 1,732,500 |
Frontier Oil Corp.: | | | | |
6.875% 11/15/18 | | 485,000 | | 501,975 |
8.5% 9/15/16 | | 1,950,000 | | 2,086,500 |
Gulf South Pipeline Co. LP 5.75% 8/15/12 (e) | | 4,818,000 | | 4,898,779 |
Gulfstream Natural Gas System LLC 6.95% 6/1/16 (e) | | 221,000 | | 255,758 |
Corporate Bonds - continued |
| Principal Amount (c) | | Value |
Nonconvertible Bonds - continued |
ENERGY - continued |
Oil, Gas & Consumable Fuels - continued |
KazMunaiGaz Finance Sub BV: | | | | |
6.375% 4/9/21 (e) | | $ 850,000 | | $ 937,125 |
7% 5/5/20 (e) | | 1,635,000 | | 1,876,163 |
9.125% 7/2/18 (e) | | 1,855,000 | | 2,300,200 |
11.75% 1/23/15 (e) | | 1,860,000 | | 2,259,900 |
LINN Energy LLC/LINN Energy Finance Corp.: | | | | |
6.5% 5/15/19 (e) | | 3,790,000 | | 3,865,800 |
7.75% 2/1/21 | | 1,950,000 | | 2,086,500 |
8.625% 4/15/20 | | 2,685,000 | | 2,980,350 |
Marathon Petroleum Corp. 5.125% 3/1/21 | | 16,178,000 | | 17,564,972 |
Markwest Energy Partners LP/Markwest Energy Finance Corp. 6.25% 6/15/22 | | 1,245,000 | | 1,335,263 |
Midcontinent Express Pipeline LLC 5.45% 9/15/14 (e) | | 10,834,000 | | 11,220,904 |
Motiva Enterprises LLC: | | | | |
5.75% 1/15/20 (e) | | 4,187,000 | | 4,907,516 |
6.85% 1/15/40 (e) | | 5,937,000 | | 7,857,228 |
Nakilat, Inc. 6.067% 12/31/33 (e) | | 1,975,000 | | 2,123,125 |
Nexen, Inc.: | | | | |
5.2% 3/10/15 | | 1,133,000 | | 1,229,934 |
5.875% 3/10/35 | | 240,000 | | 258,725 |
6.2% 7/30/19 | | 603,000 | | 716,086 |
6.4% 5/15/37 | | 4,379,000 | | 5,014,056 |
NGPL PipeCo LLC 6.514% 12/15/12 (e) | | 3,327,000 | | 3,212,837 |
OGX Petroleo e Gas Participacoes SA 8.5% 6/1/18 (e) | | 1,355,000 | | 1,415,975 |
Overseas Shipholding Group, Inc.: | | | | |
7.5% 2/15/24 | | 500,000 | | 296,250 |
8.125% 3/30/18 | | 2,530,000 | | 1,568,600 |
Pacific Rubiales Energy Corp. 7.25% 12/12/21 (e) | | 1,826,000 | | 2,004,035 |
Pan American Energy LLC 7.875% 5/7/21 (e) | | 4,370,000 | | 4,457,400 |
PBF Holding Co. LLC/PBF Finance Corp. 8.25% 2/15/20 (e) | | 1,775,000 | | 1,783,875 |
Pemex Project Funding Master Trust: | | | | |
5.75% 3/1/18 | | 645,000 | | 720,788 |
6.625% 6/15/35 | | 945,000 | | 1,082,025 |
Petro-Canada: | | | | |
6.05% 5/15/18 | | 3,850,000 | | 4,661,133 |
6.8% 5/15/38 | | 8,950,000 | | 12,038,332 |
PetroBakken Energy Ltd. 8.625% 2/1/20 (e) | | 1,420,000 | | 1,505,200 |
Corporate Bonds - continued |
| Principal Amount (c) | | Value |
Nonconvertible Bonds - continued |
ENERGY - continued |
Oil, Gas & Consumable Fuels - continued |
Petrobras International Finance Co. Ltd.: | | | | |
3.875% 1/27/16 | | $ 10,192,000 | | $ 10,630,898 |
5.375% 1/27/21 | | 9,410,000 | | 10,116,860 |
5.75% 1/20/20 | | 28,708,000 | | 31,578,800 |
6.75% 1/27/41 | | 7,265,000 | | 8,439,968 |
6.875% 1/20/40 | | 470,000 | | 550,840 |
7.875% 3/15/19 | | 10,517,000 | | 12,935,910 |
8.375% 12/10/18 | | 775,000 | | 965,418 |
Petrohawk Energy Corp.: | | | | |
6.25% 6/1/19 | | 1,290,000 | | 1,454,475 |
7.25% 8/15/18 | | 1,330,000 | | 1,522,850 |
Petroleos de Venezuela SA: | | | | |
4.9% 10/28/14 | | 4,265,000 | | 3,753,200 |
5% 10/28/15 | | 380,000 | | 315,400 |
5.375% 4/12/27 | | 3,310,000 | | 2,068,750 |
5.5% 4/12/37 | | 2,530,000 | | 1,530,650 |
8% 11/17/13 | | 975,000 | | 976,950 |
8.5% 11/2/17 (e) | | 7,540,000 | | 6,861,400 |
12.75% 2/17/22 (e) | | 3,580,000 | | 3,651,600 |
Petroleos Mexicanos: | | | | |
4.875% 1/24/22 (e) | | 12,332,000 | | 12,886,940 |
5.5% 1/21/21 | | 12,069,000 | | 13,227,624 |
6% 3/5/20 | | 1,108,000 | | 1,260,350 |
6.5% 6/2/41 | | 350,000 | | 395,640 |
6.5% 6/2/41 (e) | | 15,185,000 | | 17,121,088 |
6.625% (e)(f) | | 3,075,000 | | 3,159,563 |
8% 5/3/19 | | 420,000 | | 527,730 |
Petroleum Co. of Trinidad & Tobago Ltd. (Reg. S) 6% 5/8/22 | | 608,125 | | 620,288 |
Pioneer Natural Resources Co. 6.65% 3/15/17 | | 4,605,000 | | 5,284,238 |
Plains All American Pipeline LP/PAA Finance Corp.: | | | | |
3.95% 9/15/15 | | 5,869,000 | | 6,232,602 |
4.25% 9/1/12 | | 485,000 | | 492,118 |
5% 2/1/21 | | 5,217,000 | | 5,865,953 |
6.125% 1/15/17 | | 6,185,000 | | 7,133,995 |
PT Adaro Indonesia 7.625% 10/22/19 (e) | | 500,000 | | 555,000 |
PT Pertamina Persero: | | | | |
5.25% 5/23/21 (e) | | 815,000 | | 865,938 |
6.5% 5/27/41 (e) | | 595,000 | | 657,475 |
Corporate Bonds - continued |
| Principal Amount (c) | | Value |
Nonconvertible Bonds - continued |
ENERGY - continued |
Oil, Gas & Consumable Fuels - continued |
Quicksilver Resources, Inc.: | | | | |
7.125% 4/1/16 | | $ 4,415,000 | | $ 4,238,400 |
11.75% 1/1/16 | | 2,255,000 | | 2,395,938 |
Range Resources Corp. 5% 8/15/22 (g) | | 1,235,000 | | 1,247,350 |
Ras Laffan Liquefied Natural Gas Co. Ltd. III: | | | | |
4.5% 9/30/12 (e) | | 4,773,000 | | 4,844,595 |
5.5% 9/30/14 (e) | | 6,670,000 | | 7,161,913 |
5.832% 9/30/16 (e) | | 1,299,465 | | 1,396,925 |
6.332% 9/30/27 (e) | | 1,840,000 | | 2,052,005 |
6.75% 9/30/19 (e) | | 4,366,000 | | 5,173,710 |
Rockies Express Pipeline LLC 6.25% 7/15/13 (e) | | 3,392,000 | | 3,459,840 |
Samson Investment Co. 9.75% 2/15/20 (e) | | 2,385,000 | | 2,498,288 |
Schlumberger Investment SA 3.3% 9/14/21 (e) | | 7,355,000 | | 7,591,471 |
Ship Finance International Ltd. 8.5% 12/15/13 | | 2,065,000 | | 2,034,025 |
Southeast Supply Header LLC 4.85% 8/15/14 (e) | | 367,000 | | 389,378 |
Spectra Energy Capital, LLC 5.65% 3/1/20 | | 308,000 | | 351,934 |
Spectra Energy Partners, LP: | | | | |
2.95% 6/15/16 | | 4,717,000 | | 4,802,118 |
4.6% 6/15/21 | | 2,694,000 | | 2,843,563 |
Suncor Energy, Inc. 6.1% 6/1/18 | | 11,154,000 | | 13,609,631 |
Targa Resources Partners LP/Targa Resources Partners Finance Corp.: | | | | |
6.375% 8/1/22 (e) | | 560,000 | | 583,800 |
6.875% 2/1/21 | | 685,000 | | 732,950 |
7.875% 10/15/18 | | 2,205,000 | | 2,403,450 |
TransCapitalInvest Ltd. 5.67% 3/5/14 (e) | | 4,317,000 | | 4,565,228 |
Western Gas Partners LP 5.375% 6/1/21 | | 14,766,000 | | 15,755,765 |
Williams Partners LP 4.125% 11/15/20 | | 2,399,000 | | 2,532,387 |
WPX Energy, Inc.: | | | | |
5.25% 1/15/17 (e) | | 975,000 | | 994,500 |
6% 1/15/22 (e) | | 1,535,000 | | 1,588,725 |
XTO Energy, Inc.: | | | | |
4.9% 2/1/14 | | 267,000 | | 287,723 |
5% 1/31/15 | | 1,749,000 | | 1,956,559 |
Corporate Bonds - continued |
| Principal Amount (c) | | Value |
Nonconvertible Bonds - continued |
ENERGY - continued |
Oil, Gas & Consumable Fuels - continued |
XTO Energy, Inc.: - continued | | | | |
5.65% 4/1/16 | | $ 1,200,000 | | $ 1,416,212 |
YPF SA 10% 11/2/28 | | 445,000 | | 471,700 |
| | 501,073,796 |
TOTAL ENERGY | | 597,276,765 |
FINANCIALS - 8.8% |
Capital Markets - 1.1% |
BlackRock, Inc. 4.25% 5/24/21 | | 5,000,000 | | 5,419,835 |
Equinox Holdings, Inc. 9.5% 2/1/16 (e) | | 2,020,000 | | 2,151,300 |
Goldman Sachs Group, Inc.: | | | | |
5.25% 7/27/21 | | 17,105,000 | | 17,127,921 |
5.625% 1/15/17 | | 3,200,000 | | 3,372,266 |
5.75% 1/24/22 | | 16,123,000 | | 16,824,754 |
5.95% 1/18/18 | | 4,975,000 | | 5,377,259 |
6.75% 10/1/37 | | 9,643,000 | | 9,648,169 |
JPMorgan Chase Capital XX 6.55% 9/29/36 | | 17,904,000 | | 17,993,520 |
JPMorgan Chase Capital XXV 6.8% 10/1/37 | | 7,405,000 | | 7,479,050 |
Lazard Group LLC: | | | | |
6.85% 6/15/17 | | 4,817,000 | | 5,236,594 |
7.125% 5/15/15 | | 1,717,000 | | 1,850,670 |
Merrill Lynch & Co., Inc.: | | | | |
6.11% 1/29/37 | | 4,768,000 | | 4,542,545 |
6.4% 8/28/17 | | 7,843,000 | | 8,259,267 |
Morgan Stanley: | | | | |
4.75% 4/1/14 | | 5,820,000 | | 5,888,368 |
5.5% 7/28/21 | | 11,429,000 | | 11,320,184 |
5.625% 9/23/19 | | 12,714,000 | | 12,708,914 |
6% 4/28/15 | | 1,414,000 | | 1,489,580 |
6.625% 4/1/18 | | 16,118,000 | | 17,091,930 |
| | 153,782,126 |
Commercial Banks - 1.4% |
African Export-Import Bank 8.75% 11/13/14 | | 490,000 | | 536,550 |
Akbank T.A.S. 5.125% 7/22/15 (e) | | 1,365,000 | | 1,353,056 |
Banco Nacional de Desenvolvimento Economico e Social: | | | | |
5.5% 7/12/20 (e) | | 520,000 | | 570,700 |
Corporate Bonds - continued |
| Principal Amount (c) | | Value |
Nonconvertible Bonds - continued |
FINANCIALS - continued |
Commercial Banks - continued |
Banco Nacional de Desenvolvimento Economico e Social: - continued | | | | |
6.5% 6/10/19 (e) | | $ 325,000 | | $ 380,250 |
Bank of America NA 5.3% 3/15/17 | | 6,601,000 | | 6,710,834 |
BBVA Paraguay SA 9.75% 2/11/16 (e) | | 1,145,000 | | 1,213,700 |
CIT Group, Inc.: | | | | |
4.75% 2/15/15 (e) | | 2,175,000 | | 2,207,625 |
5.5% 2/15/19 (e) | | 2,175,000 | | 2,221,219 |
7% 5/4/15 (e) | | 5,689,000 | | 5,703,223 |
7% 5/1/16 | | 458 | | 458 |
7% 5/2/16 (e) | | 3,596,000 | | 3,598,265 |
7% 5/2/17 (e) | | 6,459,000 | | 6,463,069 |
Credit Suisse New York Branch 6% 2/15/18 | | 16,785,000 | | 17,680,698 |
Development Bank of Kazakhstan JSC 5.5% 12/20/15 (e) | | 895,000 | | 935,275 |
Development Bank of Philippines 8.375% (f)(k) | | 1,655,000 | | 1,779,125 |
Discover Bank: | | | | |
7% 4/15/20 | | 2,458,000 | | 2,785,661 |
8.7% 11/18/19 | | 12,480,000 | | 15,018,607 |
Eastern and Southern African Trade and Development Bank 6.875% 1/9/16 (Reg. S) | | 870,000 | | 804,750 |
Fifth Third Bancorp: | | | | |
4.5% 6/1/18 | | 798,000 | | 826,841 |
8.25% 3/1/38 | | 4,667,000 | | 5,977,741 |
Fifth Third Bank 4.75% 2/1/15 | | 1,329,000 | | 1,402,021 |
Fifth Third Capital Trust IV 6.5% 4/15/67 (k) | | 6,912,000 | | 6,860,160 |
HBOS PLC 6.75% 5/21/18 (e) | | 6,067,000 | | 5,451,758 |
HSBK (Europe) BV: | | | | |
7.25% 5/3/17 (e) | | 1,435,000 | | 1,447,556 |
9.25% 10/16/13 (e) | | 1,485,000 | | 1,568,606 |
Huntington Bancshares, Inc. 7% 12/15/20 | | 2,851,000 | | 3,223,495 |
JPMorgan Chase Bank 6% 10/1/17 | | 11,313,000 | | 12,695,494 |
JSC Kazkommertsbank BV 8% 11/3/15 (e) | | 440,000 | | 409,200 |
Kazkommerts International BV 8.5% 4/16/13 (e) | | 546,000 | | 548,730 |
KeyBank NA: | | | | |
5.45% 3/3/16 | | 3,939,000 | | 4,327,460 |
5.8% 7/1/14 | | 9,490,000 | | 10,269,983 |
6.95% 2/1/28 | | 1,977,000 | | 2,223,081 |
KeyCorp. 5.1% 3/24/21 | | 5,572,000 | | 6,055,165 |
Corporate Bonds - continued |
| Principal Amount (c) | | Value |
Nonconvertible Bonds - continued |
FINANCIALS - continued |
Commercial Banks - continued |
Marshall & Ilsley Bank: | | | | |
4.85% 6/16/15 | | $ 4,520,000 | | $ 4,861,567 |
5% 1/17/17 | | 13,700,000 | | 14,629,381 |
5.25% 9/4/12 | | 3,162,000 | | 3,229,667 |
Regions Bank: | | | | |
6.45% 6/26/37 | | 10,658,000 | | 9,805,360 |
7.5% 5/15/18 | | 6,622,000 | | 7,217,980 |
Regions Financial Corp.: | | | | |
0.7438% 6/26/12 (k) | | 338,000 | | 337,720 |
5.75% 6/15/15 | | 2,005,000 | | 2,048,990 |
7.75% 11/10/14 | | 6,404,000 | | 6,837,551 |
RSHB Capital SA: | | | | |
6% 6/3/21 (e) | | 555,000 | | 550,838 |
9% 6/11/14 (e) | | 510,000 | | 564,213 |
The State Export-Import Bank of Ukraine JSC 5.7928% 2/9/16 (Issued by Credit Suisse First Boston International for The State Export-Import Bank of Ukraine JSC) (d) | | 1,335,000 | | 1,064,663 |
Trade & Development Bank of Mongolia LLC 8.5% 10/25/13 | | 555,000 | | 555,000 |
Turkiye Garanti Bankasi A/S 3.0612% 4/20/16 (e)(k) | | 945,000 | | 881,213 |
Turkiye Is Bankasi A/S 5.1% 2/1/16 (e) | | 610,000 | | 613,050 |
UnionBanCal Corp. 5.25% 12/16/13 | | 826,000 | | 855,752 |
Vimpel Communications 8.25% 5/23/16 (Reg. S) (Issued by UBS Luxembourg SA for Vimpel Communications) | | 2,525,000 | | 2,714,375 |
Wachovia Bank NA: | | | | |
4.8% 11/1/14 | | 372,000 | | 400,291 |
4.875% 2/1/15 | | 1,756,000 | | 1,899,442 |
Wachovia Corp.: | | | | |
5.625% 10/15/16 | | 4,239,000 | | 4,764,839 |
5.75% 6/15/17 | | 2,933,000 | | 3,409,011 |
Wells Fargo & Co.: | | | | |
3.625% 4/15/15 | | 5,893,000 | | 6,315,345 |
3.676% 6/15/16 | | 4,301,000 | | 4,609,451 |
Yapi ve Kredi Bankasi A/S 6.75% 2/8/17 (e) | | 1,060,000 | | 1,053,110 |
| | 212,469,165 |
Corporate Bonds - continued |
| Principal Amount (c) | | Value |
Nonconvertible Bonds - continued |
FINANCIALS - continued |
Consumer Finance - 0.7% |
Ally Financial, Inc.: | | | | |
3.71% 2/11/14 (k) | | $ 2,895,000 | | $ 2,844,338 |
5.5% 2/15/17 | | 1,580,000 | | 1,587,900 |
Discover Financial Services: | | | | |
6.45% 6/12/17 | | 10,366,000 | | 11,379,401 |
10.25% 7/15/19 | | 11,672,000 | | 14,882,874 |
Ford Motor Credit Co. LLC: | | | | |
3.875% 1/15/15 | | 7,000,000 | | 7,176,596 |
4.25% 2/3/17 | | 2,435,000 | | 2,504,273 |
5% 5/15/18 | | 6,890,000 | | 7,263,562 |
5.875% 8/2/21 | | 5,260,000 | | 5,868,293 |
12% 5/15/15 | | 3,440,000 | | 4,308,600 |
General Electric Capital Corp.: | | | | |
2.25% 11/9/15 | | 314,000 | | 322,985 |
4.625% 1/7/21 | | 5,706,000 | | 6,194,228 |
5.625% 9/15/17 | | 5,858,000 | | 6,754,456 |
5.625% 5/1/18 | | 25,000,000 | | 28,865,150 |
HSBC Finance Corp. 5.9% 6/19/12 | | 578,000 | | 586,239 |
SLM Corp.: | | | | |
6% 1/25/17 | | 950,000 | | 985,625 |
7.25% 1/25/22 | | 1,020,000 | | 1,068,450 |
| | 102,592,970 |
Diversified Financial Services - 2.0% |
Aquarius Investments Luxemburg 8.25% 2/18/16 | | 1,025,000 | | 1,060,875 |
Bank of America Corp.: | | | | |
5.65% 5/1/18 | | 8,780,000 | | 9,110,549 |
5.75% 12/1/17 | | 27,955,000 | | 29,268,270 |
6.5% 8/1/16 | | 9,000,000 | | 9,729,540 |
Biz Finance PLC 8.375% 4/27/15 (Reg. S) | | 1,525,000 | | 1,414,438 |
BP Capital Markets PLC: | | | | |
3.125% 10/1/15 | | 10,828,000 | | 11,594,752 |
3.625% 5/8/14 | | 711,000 | | 752,616 |
4.5% 10/1/20 | | 650,000 | | 733,102 |
4.742% 3/11/21 | | 8,800,000 | | 10,137,521 |
Calpine Construction Finance Co. LP 8% 6/1/16 (e) | | 2,655,000 | | 2,874,038 |
Capital One Capital V 10.25% 8/15/39 | | 5,267,000 | | 5,490,848 |
CDW LLC/CDW Finance Corp. 8.5% 4/1/19 | | 2,855,000 | | 3,058,276 |
CIT Group, Inc. 6.625% 4/1/18 (e) | | 1,215,000 | | 1,315,238 |
Citigroup, Inc.: | | | | |
3.953% 6/15/16 | | 11,847,000 | | 12,247,547 |
4.5% 1/14/22 | | 5,818,000 | | 5,975,115 |
Corporate Bonds - continued |
| Principal Amount (c) | | Value |
Nonconvertible Bonds - continued |
FINANCIALS - continued |
Diversified Financial Services - continued |
Citigroup, Inc.: - continued | | | | |
4.75% 5/19/15 | | $ 32,881,000 | | $ 34,844,883 |
5.875% 1/30/42 | | 5,043,000 | | 5,360,981 |
6.125% 5/15/18 | | 8,677,000 | | 9,693,346 |
6.5% 8/19/13 | | 13,174,000 | | 13,960,237 |
City of Buenos Aires 12.5% 4/6/15 (e) | | 3,155,000 | | 3,407,400 |
Fibria Overseas Finance Ltd. 6.75% 3/3/21 (e) | | 585,000 | | 576,225 |
General Motors Financial Co., Inc. 6.75% 6/1/18 | | 1,500,000 | | 1,597,500 |
Icahn Enterprises LP/Icahn Enterprises Finance Corp.: | | | | |
7.75% 1/15/16 | | 3,715,000 | | 3,891,463 |
8% 1/15/18 | | 5,875,000 | | 6,227,500 |
8% 1/15/18 (e) | | 2,005,000 | | 2,125,300 |
ILFC E-Capital Trust II 6.25% 12/21/65 (e)(k) | | 1,250,000 | | 837,500 |
Indo Energy Finance BV 7% 5/7/18 (e) | | 525,000 | | 542,063 |
JPMorgan Chase & Co.: | | | | |
3.15% 7/5/16 | | 13,000,000 | | 13,386,828 |
4.35% 8/15/21 | | 13,339,000 | | 13,990,904 |
4.5% 1/24/22 | | 22,046,000 | | 23,417,371 |
4.95% 3/25/20 | | 17,148,000 | | 18,590,507 |
5.4% 1/6/42 | | 5,642,000 | | 6,085,958 |
NSG Holdings II, LLC 7.75% 12/15/25 (e) | | 9,415,000 | | 9,509,150 |
Offshore Group Investment Ltd. 11.5% 8/1/15 | | 3,475,000 | | 3,874,625 |
Reynolds Group DL Escrow LLC 8.75% 10/15/16 (e) | | 3,000,000 | | 3,187,500 |
Steel Capital SA Ln Partner Net Program 6.25% 7/26/16 (e) | | 620,000 | | 621,550 |
Sunwest Management, Inc. 7.9726% 2/10/15 | | 364,436 | | 322,526 |
TECO Finance, Inc.: | | | | |
4% 3/15/16 | | 2,562,000 | | 2,711,190 |
5.15% 3/15/20 | | 3,761,000 | | 4,225,307 |
TMK Capital SA 7.75% 1/27/18 | | 600,000 | | 577,500 |
Unitymedia Hessen GmbH & Co. KG/Unitymedia NRW GmbH 8.125% 12/1/17 (e) | | 370,000 | | 399,600 |
UPCB Finance III Ltd. 6.625% 7/1/20 (e) | | 3,305,000 | | 3,395,888 |
Vnesheconombank Via VEB Finance PLC: | | | | |
5.375% 2/13/17 (e) | | 735,000 | | 751,538 |
Corporate Bonds - continued |
| Principal Amount (c) | | Value |
Nonconvertible Bonds - continued |
FINANCIALS - continued |
Diversified Financial Services - continued |
Vnesheconombank Via VEB Finance PLC: - continued | | | | |
6.8% 11/22/25 (e) | | $ 605,000 | | $ 623,937 |
Wind Acquisition Holdings Finance SA 12.25% 7/15/17 pay-in-kind (e)(k) | | 4,411,476 | | 3,879,219 |
ZFS Finance USA Trust IV 5.875% 5/9/62 (e)(k) | | 1,673,000 | | 1,631,175 |
Zhaikmunai Finance BV 10.5% 10/19/15 (e) | | 1,885,000 | | 1,979,250 |
| | 300,988,646 |
Insurance - 1.5% |
Allstate Corp.: | | | | |
5.2% 1/15/42 | | 20,742,000 | | 22,696,643 |
6.2% 5/16/14 | | 6,893,000 | | 7,656,986 |
American International Group, Inc. 4.875% 9/15/16 | | 7,990,000 | | 8,404,537 |
Aon Corp.: | | | | |
3.125% 5/27/16 | | 11,274,000 | | 11,636,301 |
3.5% 9/30/15 | | 4,451,000 | | 4,653,538 |
5% 9/30/20 | | 3,854,000 | | 4,314,765 |
6.25% 9/30/40 | | 3,160,000 | | 3,928,506 |
Assurant, Inc. 5.625% 2/15/14 | | 2,384,000 | | 2,524,453 |
Axis Capital Holdings Ltd. 5.75% 12/1/14 | | 558,000 | | 593,474 |
Great-West Life & Annuity Insurance Co. 7.153% 5/16/46 (e)(k) | | 1,859,000 | | 1,845,058 |
Hartford Financial Services Group, Inc. 5.375% 3/15/17 | | 194,000 | | 201,807 |
Liberty Mutual Group, Inc.: | | | | |
5% 6/1/21 (e) | | 12,644,000 | | 12,614,337 |
6.5% 3/15/35 (e) | | 1,741,000 | | 1,827,611 |
Marsh & McLennan Companies, Inc. 4.8% 7/15/21 | | 7,090,000 | | 7,902,670 |
Massachusetts Mutual Life Insurance Co. 5.375% 12/1/41 (e) | | 7,139,000 | | 7,579,862 |
MetLife, Inc.: | | | | |
4.75% 2/8/21 | | 4,032,000 | | 4,470,496 |
5% 6/15/15 | | 1,163,000 | | 1,288,043 |
5.875% 2/6/41 | | 4,458,000 | | 5,448,010 |
6.75% 6/1/16 | | 7,610,000 | | 9,108,797 |
Metropolitan Life Global Funding I: | | | | |
5.125% 4/10/13 (e) | | 559,000 | | 583,397 |
5.125% 6/10/14 (e) | | 6,751,000 | | 7,287,124 |
Monumental Global Funding III 5.5% 4/22/13 (e) | | 2,746,000 | | 2,862,263 |
New York Life Insurance Co. 6.75% 11/15/39 (e) | | 3,590,000 | | 4,726,393 |
Corporate Bonds - continued |
| Principal Amount (c) | | Value |
Nonconvertible Bonds - continued |
FINANCIALS - continued |
Insurance - continued |
Northwestern Mutual Life Insurance Co. 6.063% 3/30/40 (e) | | $ 6,155,000 | | $ 7,594,279 |
Pacific Life Insurance Co. 9.25% 6/15/39 (e) | | 5,674,000 | | 7,523,355 |
Pacific LifeCorp 6% 2/10/20 (e) | | 6,323,000 | | 6,913,783 |
Prudential Financial, Inc.: | | | | |
3.625% 9/17/12 | | 11,000,000 | | 11,165,154 |
4.5% 11/16/21 | | 8,000,000 | | 8,577,136 |
4.75% 9/17/15 | | 11,000,000 | | 11,984,478 |
5.15% 1/15/13 | | 2,966,000 | | 3,075,490 |
5.8% 11/16/41 | | 8,381,000 | | 9,362,843 |
6.2% 11/15/40 | | 4,318,000 | | 4,961,183 |
7.375% 6/15/19 | | 3,230,000 | | 3,997,093 |
Symetra Financial Corp. 6.125% 4/1/16 (e) | | 6,375,000 | | 6,524,813 |
Unum Group: | | | | |
5.625% 9/15/20 | | 8,386,000 | | 8,906,963 |
7.125% 9/30/16 | | 587,000 | | 671,532 |
| | 225,413,173 |
Real Estate Investment Trusts - 0.5% |
Alexandria Real Estate Equities, Inc. 4.6% 4/1/22 | | 4,025,000 | | 4,072,221 |
AvalonBay Communities, Inc. 4.95% 3/15/13 | | 367,000 | | 379,285 |
BRE Properties, Inc. 5.5% 3/15/17 | | 661,000 | | 723,945 |
Camden Property Trust: | | | | |
5.375% 12/15/13 | | 4,073,000 | | 4,242,579 |
5.875% 11/30/12 | | 670,000 | | 686,282 |
Developers Diversified Realty Corp.: | | | | |
4.75% 4/15/18 | | 8,570,000 | | 8,797,199 |
5.375% 10/15/12 | | 5,101,000 | | 5,150,133 |
7.5% 4/1/17 | | 5,574,000 | | 6,264,936 |
7.875% 9/1/20 | | 323,000 | | 385,832 |
Duke Realty LP: | | | | |
4.625% 5/15/13 | | 1,106,000 | | 1,142,051 |
5.875% 8/15/12 | | 1,017,000 | | 1,033,222 |
Equity One, Inc.: | | | | |
5.375% 10/15/15 | | 1,403,000 | | 1,483,254 |
6% 9/15/17 | | 890,000 | | 955,939 |
6.25% 12/15/14 | | 6,140,000 | | 6,633,429 |
6.25% 1/15/17 | | 494,000 | | 535,326 |
Corporate Bonds - continued |
| Principal Amount (c) | | Value |
Nonconvertible Bonds - continued |
FINANCIALS - continued |
Real Estate Investment Trusts - continued |
Federal Realty Investment Trust: | | | | |
5.4% 12/1/13 | | $ 441,000 | | $ 465,699 |
5.9% 4/1/20 | | 2,504,000 | | 2,823,663 |
6% 7/15/12 | | 3,658,000 | | 3,715,599 |
6.2% 1/15/17 | | 620,000 | | 701,541 |
HMB Capital Trust V 4.1463% 12/15/36 (b)(e)(k) | | 270,000 | | 0 |
HRPT Properties Trust: | | | | |
5.75% 11/1/15 | | 2,386,000 | | 2,494,947 |
6.25% 6/15/17 | | 1,232,000 | | 1,315,966 |
6.65% 1/15/18 | | 867,000 | | 933,277 |
MPT Operating Partnership LP/MPT Finance Corp. 6.875% 5/1/21 | | 1,760,000 | | 1,874,400 |
Omega Healthcare Investors, Inc.: | | | | |
6.75% 10/15/22 | | 3,190,000 | | 3,461,150 |
7% 1/15/16 | | 3,060,000 | | 3,128,850 |
Senior Housing Properties Trust 6.75% 4/15/20 | | 940,000 | | 1,007,665 |
UDR, Inc. 5.5% 4/1/14 | | 5,222,000 | | 5,487,539 |
Washington (REIT) 5.25% 1/15/14 | | 322,000 | | 337,514 |
| | 70,233,443 |
Real Estate Management & Development - 1.6% |
AMB Property LP 5.9% 8/15/13 | | 2,580,000 | | 2,659,018 |
BioMed Realty LP: | | | | |
3.85% 4/15/16 | | 11,000,000 | | 11,319,297 |
6.125% 4/15/20 | | 3,429,000 | | 3,848,288 |
Brandywine Operating Partnership LP: | | | | |
5.7% 5/1/17 | | 7,049,000 | | 7,328,042 |
5.75% 4/1/12 | | 2,972,000 | | 2,977,730 |
CB Richard Ellis Services, Inc. 6.625% 10/15/20 | | 5,165,000 | | 5,487,813 |
Colonial Properties Trust 6.875% 8/15/12 | | 5,706,000 | | 5,789,918 |
Colonial Realty LP 6.05% 9/1/16 | | 2,000,000 | | 2,066,300 |
Digital Realty Trust LP: | | | | |
4.5% 7/15/15 | | 4,981,000 | | 5,197,260 |
5.25% 3/15/21 | | 5,708,000 | | 6,009,245 |
Duke Realty LP: | | | | |
5.4% 8/15/14 | | 5,561,000 | | 5,935,422 |
5.95% 2/15/17 | | 1,109,000 | | 1,227,535 |
6.25% 5/15/13 | | 14,494,000 | | 15,244,224 |
6.5% 1/15/18 | | 3,795,000 | | 4,301,143 |
Corporate Bonds - continued |
| Principal Amount (c) | | Value |
Nonconvertible Bonds - continued |
FINANCIALS - continued |
Real Estate Management & Development - continued |
Duke Realty LP: - continued | | | | |
6.75% 3/15/20 | | $ 10,379,000 | | $ 12,066,023 |
8.25% 8/15/19 | | 75,000 | | 93,261 |
ERP Operating LP: | | | | |
4.625% 12/15/21 | | 22,997,000 | | 24,632,409 |
4.75% 7/15/20 | | 7,700,000 | | 8,258,897 |
5.25% 9/15/14 | | 1,310,000 | | 1,416,080 |
5.375% 8/1/16 | | 2,768,000 | | 3,084,255 |
5.5% 10/1/12 | | 3,690,000 | | 3,786,368 |
5.75% 6/15/17 | | 14,407,000 | | 16,386,133 |
Forest City Enterprises, Inc.: | | | | |
6.5% 2/1/17 | | 450,000 | | 424,125 |
7.625% 6/1/15 | | 430,000 | | 425,700 |
Highwoods/Forsyth LP 5.85% 3/15/17 | | 615,000 | | 657,623 |
Host Hotels & Resorts LP: | | | | |
5.875% 6/15/19 | | 2,150,000 | | 2,322,000 |
6% 11/1/20 | | 105,000 | | 114,056 |
6% 10/1/21 (e) | | 825,000 | | 899,250 |
Liberty Property LP: | | | | |
4.75% 10/1/20 | | 18,282,000 | | 18,891,266 |
5.125% 3/2/15 | | 1,405,000 | | 1,489,900 |
5.5% 12/15/16 | | 1,891,000 | | 2,071,469 |
6.625% 10/1/17 | | 4,835,000 | | 5,535,311 |
Mack-Cali Realty LP 7.75% 8/15/19 | | 700,000 | | 853,381 |
Post Apartment Homes LP 6.3% 6/1/13 | | 3,812,000 | | 3,961,232 |
Prime Property Funding, Inc.: | | | | |
5.125% 6/1/15 (e) | | 2,806,000 | | 2,856,250 |
5.5% 1/15/14 (e) | | 867,000 | | 887,427 |
5.7% 4/15/17 (e) | | 2,115,000 | | 2,169,235 |
Realogy Corp.: | | | | |
7.625% 1/15/20 (e) | | 1,345,000 | | 1,390,327 |
7.875% 2/15/19 (e) | | 2,880,000 | | 2,800,800 |
9% 1/15/20 (e) | | 870,000 | | 880,875 |
Reckson Operating Partnership LP 6% 3/31/16 | | 3,651,000 | | 3,835,711 |
Regency Centers LP: | | | | |
4.95% 4/15/14 | | 611,000 | | 640,281 |
5.25% 8/1/15 | | 2,133,000 | | 2,296,671 |
5.875% 6/15/17 | | 1,089,000 | | 1,216,925 |
Simon Property Group LP: | | | | |
2.8% 1/30/17 | | 2,603,000 | | 2,706,823 |
4.125% 12/1/21 | | 7,287,000 | | 7,871,519 |
4.2% 2/1/15 | | 3,659,000 | | 3,902,386 |
Corporate Bonds - continued |
| Principal Amount (c) | | Value |
Nonconvertible Bonds - continued |
FINANCIALS - continued |
Real Estate Management & Development - continued |
Tanger Properties LP: | | | | |
6.125% 6/1/20 | | $ 13,473,000 | | $ 15,342,028 |
6.15% 11/15/15 | | 1,777,000 | | 1,991,903 |
Toys 'R' Us Property Co. II LLC 8.5% 12/1/17 | | 2,875,000 | | 3,025,938 |
Ventas Realty LP: | | | | |
4.25% 3/1/22 | | 300,000 | | 298,030 |
6.75% 4/1/17 | | 250,000 | | 258,711 |
| | 241,131,814 |
Thrifts & Mortgage Finance - 0.0% |
Wrightwood Capital LLC 1.9% 4/20/20 | | 112,350 | | 36,851 |
TOTAL FINANCIALS | | 1,306,648,188 |
HEALTH CARE - 0.8% |
Biotechnology - 0.1% |
Amgen, Inc. 5.15% 11/15/41 | | 12,000,000 | | 12,533,340 |
Celgene Corp. 2.45% 10/15/15 | | 613,000 | | 629,726 |
| | 13,163,066 |
Health Care Equipment & Supplies - 0.0% |
Aviv Healthcare Properties LP/Aviv Healthcare Capital Corp. 7.75% 2/15/19 | | 260,000 | | 265,850 |
Health Care Providers & Services - 0.6% |
Aristotle Holding, Inc. 4.75% 11/15/21 (e) | | 22,009,000 | | 23,633,022 |
Community Health Systems, Inc. 8.875% 7/15/15 | | 1,120,000 | | 1,173,200 |
Coventry Health Care, Inc.: | | | | |
5.95% 3/15/17 | | 1,747,000 | | 1,981,308 |
6.3% 8/15/14 | | 3,618,000 | | 3,959,937 |
Emergency Medical Services Corp. 8.125% 6/1/19 | | 4,610,000 | | 4,840,500 |
Express Scripts, Inc.: | | | | |
3.125% 5/15/16 | | 10,525,000 | | 10,882,029 |
5.25% 6/15/12 | | 7,157,000 | | 7,243,034 |
6.25% 6/15/14 | | 2,629,000 | | 2,895,002 |
Corporate Bonds - continued |
| Principal Amount (c) | | Value |
Nonconvertible Bonds - continued |
HEALTH CARE - continued |
Health Care Providers & Services - continued |
Fresenius Medical Care US Finance II, Inc. 5.625% 7/31/19 (e) | | $ 2,315,000 | | $ 2,465,475 |
HCA, Inc.: | | | | |
6.5% 2/15/20 | | 2,705,000 | | 2,894,080 |
7.25% 9/15/20 | | 115,000 | | 125,787 |
HealthSouth Corp. 7.25% 10/1/18 | | 3,300,000 | | 3,555,750 |
IASIS Healthcare LLC/IASIS Capital Corp. 8.375% 5/15/19 | | 4,395,000 | | 4,197,225 |
Medco Health Solutions, Inc.: | | | | |
2.75% 9/15/15 | | 1,176,000 | | 1,191,113 |
4.125% 9/15/20 | | 7,486,000 | | 7,771,763 |
Rural/Metro Corp. 10.125% 7/15/19 (e) | | 740,000 | | 666,000 |
Sabra Health Care LP/Sabra Capital Corp. 8.125% 11/1/18 | | 2,580,000 | | 2,767,050 |
Skilled Healthcare Group, Inc. 11% 1/15/14 | | 164,000 | | 162,360 |
| | 82,404,635 |
Health Care Technology - 0.0% |
DJO Finance LLC/DJO Finance Corp.: | | | | |
7.75% 4/15/18 | | 925,000 | | 795,500 |
10.875% 11/15/14 | | 4,115,000 | | 4,156,150 |
| | 4,951,650 |
Pharmaceuticals - 0.1% |
Endo Pharmaceuticals Holdings, Inc.: | | | | |
7% 7/15/19 | | 860,000 | | 944,968 |
7.25% 1/15/22 | | 860,000 | | 957,868 |
Mylan, Inc.: | | | | |
6% 11/15/18 (e) | | 3,030,000 | | 3,166,350 |
7.625% 7/15/17 (e) | | 1,115,000 | | 1,237,650 |
Valeant Pharmaceuticals International: | | | | |
6.5% 7/15/16 (e) | | 4,500,000 | | 4,595,625 |
6.875% 12/1/18 (e) | | 3,440,000 | | 3,500,200 |
7% 10/1/20 (e) | | 255,000 | | 259,463 |
Watson Pharmaceuticals, Inc. 5% 8/15/14 | | 720,000 | | 768,762 |
| | 15,430,886 |
TOTAL HEALTH CARE | | 116,216,087 |
Corporate Bonds - continued |
| Principal Amount (c) | | Value |
Nonconvertible Bonds - continued |
INDUSTRIALS - 1.0% |
Aerospace & Defense - 0.1% |
BAE Systems Holdings, Inc.: | | | | |
4.95% 6/1/14 (e) | | $ 572,000 | | $ 603,577 |
6.375% 6/1/19 (e) | | 8,071,000 | | 9,275,250 |
BE Aerospace, Inc. 6.875% 10/1/20 | | 2,090,000 | | 2,327,738 |
Huntington Ingalls Industries, Inc. 6.875% 3/15/18 | | 3,100,000 | | 3,262,750 |
| | 15,469,315 |
Airlines - 0.2% |
Continental Airlines, Inc.: | | | | |
pass-thru trust certificates 9.798% 4/1/21 | | 343,926 | | 357,683 |
6.648% 3/15/19 | | 3,249,044 | | 3,411,496 |
6.75% 9/15/15 (e) | | 4,585,000 | | 4,636,352 |
6.9% 7/2/19 | | 857,459 | | 913,194 |
Continental Airlines, Inc. 9.25% 5/10/17 | | 2,564,970 | | 2,718,868 |
Delta Air Lines, Inc. pass-thru trust certificates: | | | | |
6.375% 1/2/16 | | 1,515,000 | | 1,416,525 |
6.75% 11/23/15 | | 1,515,000 | | 1,461,975 |
8.021% 8/10/22 | | 1,368,967 | | 1,389,501 |
8.954% 8/10/14 | | 1,860,940 | | 1,909,883 |
Northwest Airlines, Inc. pass-thru trust certificates 8.028% 11/1/17 | | 700,470 | | 693,466 |
U.S. Airways pass-thru trust certificates: | | | | |
6.85% 1/30/18 | | 1,782,351 | | 1,800,175 |
8.36% 1/20/19 | | 1,441,215 | | 1,462,833 |
United Air Lines, Inc. 9.875% 8/1/13 (e) | | 707,000 | | 738,815 |
United Air Lines, Inc. pass-thru trust certificates: | | | | |
Class B, 7.336% 7/2/19 | | 787,418 | | 755,921 |
9.75% 1/15/17 | | 2,003,727 | | 2,276,835 |
12% 1/15/16 (e) | | 660,640 | | 713,491 |
| | 26,657,013 |
Building Products - 0.1% |
Building Materials Corp. of America: | | | | |
6.75% 5/1/21 (e) | | 4,910,000 | | 5,351,900 |
6.875% 8/15/18 (e) | | 3,715,000 | | 3,993,625 |
Griffon Corp. 7.125% 4/1/18 | | 2,220,000 | | 2,303,250 |
| | 11,648,775 |
Commercial Services & Supplies - 0.3% |
ARAMARK Corp.: | | | | |
4.0469% 2/1/15 (k) | | 5,440,000 | | 5,419,600 |
Corporate Bonds - continued |
| Principal Amount (c) | | Value |
Nonconvertible Bonds - continued |
INDUSTRIALS - continued |
Commercial Services & Supplies - continued |
ARAMARK Corp.: - continued | | | | |
8.5% 2/1/15 | | $ 2,000,000 | | $ 2,055,000 |
ARAMARK Holdings Corp. 8.625% 5/1/16 pay-in-kind (e)(k) | | 7,325,000 | | 7,526,438 |
Covanta Holding Corp. 7.25% 12/1/20 | | 4,950,000 | | 5,279,462 |
International Lease Finance Corp.: | | | | |
5.75% 5/15/16 | | 1,330,000 | | 1,343,300 |
6.25% 5/15/19 | | 1,640,000 | | 1,662,347 |
6.75% 9/1/16 (e) | | 1,620,000 | | 1,753,650 |
8.625% 9/15/15 | | 2,745,000 | | 3,033,225 |
8.625% 1/15/22 | | 3,040,000 | | 3,427,600 |
8.75% 3/15/17 | | 3,700,000 | | 4,144,000 |
8.875% 9/1/17 | | 1,665,000 | | 1,864,800 |
WP Rocket Merger Sub, Inc. 10.125% 7/15/19 (e) | | 2,855,000 | | 2,640,875 |
| | 40,150,297 |
Construction & Engineering - 0.0% |
Amsted Industries, Inc. 8.125% 3/15/18 (e) | | 2,535,000 | | 2,737,800 |
Odebrecht Finance Ltd. 7.5% (e)(f) | | 2,455,000 | | 2,534,788 |
| | 5,272,588 |
Industrial Conglomerates - 0.1% |
General Electric Co. 5.25% 12/6/17 | | 17,730,000 | | 20,928,457 |
Marine - 0.0% |
Navios Maritime Holdings, Inc. 8.875% 11/1/17 | | 700,000 | | 686,000 |
SCF Capital Ltd. 5.375% 10/27/17 (e) | | 280,000 | | 267,400 |
| | 953,400 |
Professional Services - 0.0% |
FTI Consulting, Inc. 6.75% 10/1/20 | | 2,515,000 | | 2,719,470 |
Road & Rail - 0.2% |
Avis Budget Car Rental LLC/Avis Budget Finance, Inc.: | | | | |
7.625% 5/15/14 | | 1,202,000 | | 1,214,020 |
7.75% 5/15/16 | | 1,935,000 | | 1,993,050 |
Georgian Railway Ltd. 9.875% 7/22/15 | | 775,000 | | 815,688 |
Hertz Corp.: | | | | |
6.75% 4/15/19 | | 3,920,000 | | 4,106,200 |
7.5% 10/15/18 | | 8,330,000 | | 8,975,575 |
Corporate Bonds - continued |
| Principal Amount (c) | | Value |
Nonconvertible Bonds - continued |
INDUSTRIALS - continued |
Road & Rail - continued |
Kansas City Southern de Mexico SA de CV 12.5% 4/1/16 | | $ 1,335,000 | | $ 1,548,600 |
Swift Services Holdings, Inc. 10% 11/15/18 | | 3,835,000 | | 4,180,150 |
| | 22,833,283 |
Trading Companies & Distributors - 0.0% |
Aircastle Ltd.: | | | | |
9.75% 8/1/18 | | 1,575,000 | | 1,775,813 |
9.75% 8/1/18 (e) | | 840,000 | | 947,100 |
| | 2,722,913 |
Transportation Infrastructure - 0.0% |
Aeropuertos Argentina 2000 SA 10.75% 12/1/20 (e) | | 843,840 | | 898,690 |
TOTAL INDUSTRIALS | | 150,254,201 |
INFORMATION TECHNOLOGY - 0.3% |
Communications Equipment - 0.1% |
Lucent Technologies, Inc.: | | | | |
6.45% 3/15/29 | | 8,010,000 | | 6,167,700 |
6.5% 1/15/28 | | 1,240,000 | | 942,400 |
| | 7,110,100 |
Computers & Peripherals - 0.0% |
Seagate HDD Cayman: | | | | |
6.875% 5/1/20 | | 410,000 | | 448,950 |
7% 11/1/21 (e) | | 1,870,000 | | 2,071,025 |
| | 2,519,975 |
Electronic Equipment & Components - 0.1% |
Jabil Circuit, Inc. 5.625% 12/15/20 | | 935,000 | | 1,005,125 |
Sanmina-SCI Corp. 7% 5/15/19 (e) | | 5,640,000 | | 5,766,900 |
Tyco Electronics Group SA: | | | | |
5.95% 1/15/14 | | 3,835,000 | | 4,113,858 |
6% 10/1/12 | | 4,835,000 | | 4,982,864 |
6.55% 10/1/17 | | 1,383,000 | | 1,633,793 |
| | 17,502,540 |
Internet Software & Services - 0.0% |
Equinix, Inc. 8.125% 3/1/18 | | 4,300,000 | | 4,762,250 |
Corporate Bonds - continued |
| Principal Amount (c) | | Value |
Nonconvertible Bonds - continued |
INFORMATION TECHNOLOGY - continued |
IT Services - 0.0% |
Ceridian Corp.: | | | | |
11.25% 11/15/15 | | $ 610,000 | | $ 582,550 |
12.25% 11/15/15 pay-in-kind (k) | | 445,000 | | 427,200 |
SunGard Data Systems, Inc.: | | | | |
7.375% 11/15/18 | | 1,095,000 | | 1,182,600 |
10.25% 8/15/15 | | 1,765,000 | | 1,826,775 |
| | 4,019,125 |
Office Electronics - 0.0% |
Xerox Corp.: | | | | |
4.25% 2/15/15 | | 368,000 | | 391,906 |
4.5% 5/15/21 | | 4,102,000 | | 4,185,102 |
5.5% 5/15/12 | | 1,998,000 | | 2,015,498 |
| | 6,592,506 |
Semiconductors & Semiconductor Equipment - 0.1% |
Amkor Technology, Inc.: | | | | |
6.625% 6/1/21 | | 1,466,000 | | 1,528,305 |
7.375% 5/1/18 | | 2,435,000 | | 2,629,800 |
Spansion LLC 7.875% 11/15/17 | | 3,465,000 | | 3,395,700 |
| | 7,553,805 |
TOTAL INFORMATION TECHNOLOGY | | 50,060,301 |
MATERIALS - 1.2% |
Chemicals - 0.5% |
Braskem America Finance Co. 7.125% 7/22/41 (e) | | 735,000 | | 733,163 |
Braskem Finance Ltd. 7% 5/7/20 (e) | | 1,240,000 | | 1,376,400 |
Celanese US Holdings LLC 6.625% 10/15/18 | | 1,935,000 | | 2,118,825 |
Dow Chemical Co.: | | | | |
4.125% 11/15/21 | | 10,888,000 | | 11,583,493 |
4.25% 11/15/20 | | 5,898,000 | | 6,313,202 |
4.85% 8/15/12 | | 11,805,000 | | 12,013,901 |
5.25% 11/15/41 | | 5,421,000 | | 5,960,368 |
7.6% 5/15/14 | | 16,974,000 | | 19,291,138 |
Huntsman International LLC 8.625% 3/15/20 | | 1,160,000 | | 1,310,800 |
Ineos Finance PLC 8.375% 2/15/19 (e) | | 605,000 | | 638,275 |
Inergy LP/Inergy Finance Corp.: | | | | |
6.875% 8/1/21 | | 502,000 | | 483,175 |
7% 10/1/18 | | 1,865,000 | | 1,827,700 |
Corporate Bonds - continued |
| Principal Amount (c) | | Value |
Nonconvertible Bonds - continued |
MATERIALS - continued |
Chemicals - continued |
Kinove German Bondco GmbH 9.625% 6/15/18 (e) | | $ 1,250,000 | | $ 1,278,125 |
Lyondell Chemical Co.: | | | | |
8% 11/1/17 | | 853,000 | | 951,095 |
11% 5/1/18 | | 1,295,163 | | 1,419,822 |
LyondellBasell Industries NV 6% 11/15/21 (e) | | 700,000 | | 766,500 |
NOVA Chemicals Corp. 3.7836% 11/15/13 (k) | | 2,720,000 | | 2,706,400 |
| | 70,772,382 |
Construction Materials - 0.0% |
CRH America, Inc. 6% 9/30/16 | | 2,286,000 | | 2,492,867 |
Headwaters, Inc. 7.625% 4/1/19 | | 2,695,000 | | 2,600,675 |
Rearden G Holdings Eins GmbH 7.875% 3/30/20 (e) | | 1,290,000 | | 1,348,050 |
| | 6,441,592 |
Containers & Packaging - 0.1% |
Ardagh Packaging Finance PLC 7.375% 10/15/17 (e) | | 2,700,000 | | 2,889,000 |
Ball Corp. 5% 3/15/22 (g) | | 1,940,000 | | 1,983,650 |
Rock-Tenn Co.: | | | | |
4.45% 3/1/19 (e) | | 310,000 | | 316,882 |
4.9% 3/1/22 (e) | | 290,000 | | 297,743 |
Sealed Air Corp.: | | | | |
8.125% 9/15/19 (e) | | 5,155,000 | | 5,799,375 |
8.375% 9/15/21 (e) | | 1,325,000 | | 1,530,375 |
| | 12,817,025 |
Metals & Mining - 0.6% |
Alrosa Finance SA: | | | | |
(Reg. S) 8.875% 11/17/14 | | 835,000 | | 916,413 |
7.75% 11/3/20 (e) | | 700,000 | | 743,750 |
Anglo American Capital PLC 9.375% 4/8/14 (e) | | 6,817,000 | | 7,841,500 |
ArcelorMittal SA 3.75% 3/1/16 | | 2,911,000 | | 2,920,417 |
BHP Billiton Financial (USA) Ltd. 5.125% 3/29/12 | | 1,975,000 | | 1,981,279 |
Boart Longyear Management Pty Ltd. 7% 4/1/21 (e) | | 930,000 | | 986,963 |
Corporacion Nacional del Cobre de Chile (Codelco): | | | | |
3.875% 11/3/21 (e) | | 11,456,000 | | 11,738,963 |
6.375% 11/30/12 (e) | | 2,002,000 | | 2,069,646 |
Edgen Murray Corp. 12.25% 1/15/15 | | 4,450,000 | | 4,510,965 |
Essar Steel Algoma, Inc. 9.375% 3/15/15 (e) | | 3,100,000 | | 3,193,000 |
EVRAZ Group SA 8.25% 11/10/15 (e) | | 1,630,000 | | 1,731,875 |
Corporate Bonds - continued |
| Principal Amount (c) | | Value |
Nonconvertible Bonds - continued |
MATERIALS - continued |
Metals & Mining - continued |
FMG Resources (August 2006) Pty Ltd.: | | | | |
6.375% 2/1/16 (e) | | $ 710,000 | | $ 737,477 |
6.875% 2/1/18 (e) | | 1,625,000 | | 1,706,250 |
7% 11/1/15 (e) | | 4,075,000 | | 4,309,313 |
8.25% 11/1/19 (e) | | 3,295,000 | | 3,632,738 |
JMC Steel Group, Inc. 8.25% 3/15/18 (e) | | 5,110,000 | | 5,333,563 |
McJunkin Red Man Corp. 9.5% 12/15/16 | | 5,475,000 | | 5,858,250 |
Metinvest BV 10.25% 5/20/15 (e) | | 935,000 | | 939,675 |
Rio Tinto Finance Ltd. (United States) 3.75% 9/20/21 | | 7,654,000 | | 8,159,271 |
Severstal Columbus LLC 10.25% 2/15/18 | | 4,610,000 | | 5,024,900 |
Southern Copper Corp. 6.75% 4/16/40 | | 920,000 | | 1,005,946 |
Steel Dynamics, Inc.: | | | | |
6.75% 4/1/15 | | 720,000 | | 732,600 |
7.625% 3/15/20 | | 1,290,000 | | 1,438,350 |
Tube City IMS Corp. 9.75% 2/1/15 | | 1,700,000 | | 1,744,625 |
Vale Overseas Ltd. 6.25% 1/23/17 | | 5,581,000 | | 6,445,084 |
Vedanta Resources PLC: | | | | |
6.75% 6/7/16 (e) | | 3,290,000 | | 3,100,825 |
8.25% 6/7/21 (e) | | 845,000 | | 773,175 |
Votorantim Cimentos SA 7.25% 4/5/41 (e) | | 740,000 | | 741,850 |
| | 90,318,663 |
Paper & Forest Products - 0.0% |
Sino-Forest Corp. 6.25% 10/21/17 (e) | | 1,365,000 | | 429,975 |
TOTAL MATERIALS | | 180,779,637 |
TELECOMMUNICATION SERVICES - 1.7% |
Diversified Telecommunication Services - 1.0% |
Alestra SA de RL de CV 11.75% 8/11/14 | | 1,635,000 | | 1,831,200 |
AT&T, Inc.: | | | | |
2.5% 8/15/15 | | 7,670,000 | | 8,013,907 |
3.875% 8/15/21 | | 8,800,000 | | 9,473,367 |
5.35% 9/1/40 | | 4,006,000 | | 4,504,443 |
5.55% 8/15/41 | | 10,000,000 | | 11,712,750 |
6.3% 1/15/38 | | 16,665,000 | | 20,558,511 |
BellSouth Capital Funding Corp. 7.875% 2/15/30 | | 742,000 | | 982,683 |
CenturyLink, Inc.: | | | | |
6.15% 9/15/19 | | 4,793,000 | | 5,033,704 |
Corporate Bonds - continued |
| Principal Amount (c) | | Value |
Nonconvertible Bonds - continued |
TELECOMMUNICATION SERVICES - continued |
Diversified Telecommunication Services - continued |
CenturyLink, Inc.: - continued | | | | |
6.45% 6/15/21 | | $ 10,268,000 | | $ 10,868,154 |
7.6% 9/15/39 | | 1,274,000 | | 1,304,486 |
Embarq Corp. 7.995% 6/1/36 | | 4,717,000 | | 5,033,025 |
Intelsat Ltd. 11.25% 6/15/16 | | 2,570,000 | | 2,717,775 |
Intelsat Luxembourg SA: | | | | |
11.25% 2/4/17 | | 4,215,000 | | 4,336,181 |
11.5% 2/4/17 pay-in-kind (e)(k) | | 1,860,000 | | 1,887,900 |
11.5% 2/4/17 pay-in-kind (k) | | 9,398,205 | | 9,680,151 |
Sprint Capital Corp. 8.75% 3/15/32 | | 885,000 | | 787,650 |
Telefonica Emisiones SAU: | | | | |
5.134% 4/27/20 | | 10,522,000 | | 10,385,761 |
5.462% 2/16/21 | | 6,967,000 | | 7,006,419 |
6.421% 6/20/16 | | 1,162,000 | | 1,251,802 |
Telemar Norte Leste SA 5.5% 10/23/20 (e) | | 530,000 | | 539,275 |
U.S. West Communications 7.5% 6/15/23 | | 3,760,000 | | 3,816,400 |
Verizon Communications, Inc.: | | | | |
3.5% 11/1/21 | | 12,600,000 | | 13,177,181 |
6.1% 4/15/18 | | 6,000,000 | | 7,314,930 |
6.25% 4/1/37 | | 2,348,000 | | 2,878,655 |
6.9% 4/15/38 | | 6,295,000 | | 8,313,253 |
Wind Acquisition Finance SA: | | | | |
7.25% 2/15/18 (e) | | 2,350,000 | | 2,291,250 |
11.75% 7/15/17 (e) | | 1,435,000 | | 1,470,875 |
| | 157,171,688 |
Wireless Telecommunication Services - 0.7% |
America Movil SAB de CV: | | | | |
2.375% 9/8/16 | | 15,982,000 | | 16,321,026 |
3.625% 3/30/15 | | 731,000 | | 771,205 |
Digicel Group Ltd.: | | | | |
8.25% 9/1/17 (e) | | 3,400,000 | | 3,604,000 |
8.875% 1/15/15 (e) | | 5,755,000 | | 5,855,713 |
9.125% 1/15/15 pay-in-kind (e)(k) | | 3,770,000 | | 3,835,975 |
DIRECTV Holdings LLC/DIRECTV Financing, Inc.: | | | | |
5.875% 10/1/19 | | 11,944,000 | | 13,893,070 |
6.35% 3/15/40 | | 3,541,000 | | 4,170,554 |
Intelsat Jackson Holdings SA: | | | | |
7.25% 4/1/19 | | 2,445,000 | | 2,561,138 |
Corporate Bonds - continued |
| Principal Amount (c) | | Value |
Nonconvertible Bonds - continued |
TELECOMMUNICATION SERVICES - continued |
Wireless Telecommunication Services - continued |
Intelsat Jackson Holdings SA: - continued | | | | |
9.5% 6/15/16 | | $ 2,935,000 | | $ 3,081,750 |
MTS International Funding Ltd. 8.625% 6/22/20 (e) | | 2,205,000 | | 2,513,700 |
Nextel Communications, Inc.: | | | | |
5.95% 3/15/14 | | 7,720,000 | | 7,739,300 |
6.875% 10/31/13 | | 9,105,000 | | 9,139,144 |
7.375% 8/1/15 | | 4,995,000 | | 4,932,563 |
NII Capital Corp.: | | | | |
7.625% 4/1/21 | | 1,755,000 | | 1,794,488 |
8.875% 12/15/19 | | 965,000 | | 1,037,375 |
Pakistan Mobile Communications Ltd. 8.625% 11/13/13 (e) | | 2,970,000 | | 2,821,500 |
Sprint Nextel Corp.: | | | | |
6% 12/1/16 | | 3,640,000 | | 3,312,400 |
9% 11/15/18 (e) | | 1,050,000 | | 1,161,510 |
Telemovil Finance Co. Ltd. 8% 10/1/17 (e) | | 1,645,000 | | 1,694,350 |
VimpelCom Holdings BV: | | | | |
4.5758% 6/29/14 (e)(k) | | 1,925,000 | | 1,900,938 |
7.5043% 3/1/22 (e) | | 4,275,000 | | 4,189,500 |
VIP Finance Ireland Ltd. 7.748% 2/2/21 (e) | | 900,000 | | 898,875 |
Vodafone Group PLC 5% 12/16/13 | | 2,864,000 | | 3,073,504 |
| | 100,303,578 |
TOTAL TELECOMMUNICATION SERVICES | | 257,475,266 |
UTILITIES - 2.1% |
Electric Utilities - 1.0% |
Alabama Power Co. 3.375% 10/1/20 | | 5,927,000 | | 6,282,069 |
Ameren Illinois Co. 6.125% 11/15/17 | | 3,112,000 | | 3,526,481 |
AmerenUE 6.4% 6/15/17 | | 2,491,000 | | 2,999,605 |
Cleveland Electric Illuminating Co. 5.65% 12/15/13 | | 1,016,000 | | 1,086,864 |
Duquesne Light Holdings, Inc.: | | | | |
5.9% 12/1/21 (e) | | 6,944,000 | | 7,294,325 |
6.4% 9/15/20 (e) | | 16,661,000 | | 17,986,849 |
Edison International 3.75% 9/15/17 | | 6,674,000 | | 7,094,369 |
EDP Finance BV: | | | | |
4.9% 10/1/19 (e) | | 3,324,000 | | 2,621,639 |
6% 2/2/18 (e) | | 2,157,000 | | 1,836,388 |
Corporate Bonds - continued |
| Principal Amount (c) | | Value |
Nonconvertible Bonds - continued |
UTILITIES - continued |
Electric Utilities - continued |
Empresa Distribuidora y Comercializadora Norte SA 9.75% 10/25/22 (e) | | $ 420,000 | | $ 323,400 |
Enel Finance International SA 5.7% 1/15/13 (e) | | 206,000 | | 210,907 |
FirstEnergy Corp. 7.375% 11/15/31 | | 15,004,000 | | 19,114,241 |
FirstEnergy Solutions Corp.: | | | | |
4.8% 2/15/15 | | 2,432,000 | | 2,628,068 |
6.05% 8/15/21 | | 9,801,000 | | 11,168,720 |
InterGen NV 9% 6/30/17 (e) | | 5,270,000 | | 5,533,500 |
IPALCO Enterprises, Inc. 5% 5/1/18 | | 2,895,000 | | 2,929,451 |
LG&E and KU Energy LLC: | | | | |
2.125% 11/15/15 | | 7,369,000 | | 7,344,719 |
3.75% 11/15/20 | | 1,450,000 | | 1,473,539 |
Majapahit Holding BV: | | | | |
7.75% 1/20/20 (e) | | 850,000 | | 1,037,000 |
8% 8/7/19 (e) | | 485,000 | | 594,125 |
Mirant Americas Generation LLC: | | | | |
8.5% 10/1/21 | | 4,095,000 | | 3,726,450 |
9.125% 5/1/31 | | 2,615,000 | | 2,366,575 |
National Power Corp. 6.875% 11/2/16 (e) | | 390,000 | | 450,450 |
Nevada Power Co.: | | | | |
6.5% 5/15/18 | | 790,000 | | 965,593 |
6.5% 8/1/18 | | 388,000 | | 474,899 |
NV Energy, Inc. 6.25% 11/15/20 | | 2,245,000 | | 2,452,795 |
Otter Tail Corp. 9% 12/15/16 | | 2,410,000 | | 2,578,700 |
Pacific Gas & Electric Co. 3.25% 9/15/21 | | 1,773,000 | | 1,828,656 |
Pennsylvania Electric Co. 6.05% 9/1/17 | | 764,000 | | 878,115 |
Pepco Holdings, Inc. 2.7% 10/1/15 | | 7,047,000 | | 7,138,710 |
Progress Energy, Inc.: | | | | |
4.4% 1/15/21 | | 12,059,000 | | 13,254,360 |
6% 12/1/39 | | 7,150,000 | | 8,978,705 |
Sierra Pacific Power Co. 5.45% 9/1/13 | | 1,945,000 | | 2,063,608 |
| | 150,243,875 |
Gas Utilities - 0.0% |
Intergas Finance BV 6.375% 5/14/17 (Reg. S) | | 665,000 | | 708,225 |
Southern Natural Gas Co. 5.9% 4/1/17 (e) | | 442,000 | | 500,284 |
Corporate Bonds - continued |
| Principal Amount (c) | | Value |
Nonconvertible Bonds - continued |
UTILITIES - continued |
Gas Utilities - continued |
Southern Natural Gas Co. / Southern Natural Issuing Corp. 4.4% 6/15/21 | | $ 3,646,000 | | $ 3,760,849 |
Transportadora de Gas del Sur SA 7.875% 5/14/17 (e) | | 2,065,000 | | 1,941,100 |
| | 6,910,458 |
Independent Power Producers & Energy Traders - 0.4% |
Atlantic Power Corp. 9% 11/15/18 (e) | | 2,790,000 | | 2,845,800 |
Dolphin Subsidiary II, Inc.: | | | | |
6.5% 10/15/16 (e) | | 5,275,000 | | 5,749,750 |
7.25% 10/15/21 (e) | | 3,430,000 | | 3,910,200 |
Duke Capital LLC 5.668% 8/15/14 | | 2,563,000 | | 2,777,774 |
GenOn Energy, Inc.: | | | | |
9.5% 10/15/18 | | 2,295,000 | | 2,191,725 |
9.875% 10/15/20 | | 1,185,000 | | 1,110,938 |
Kinder Morgan Finance Co. LLC 6% 1/15/18 (e) | | 3,030,000 | | 3,208,013 |
Listrindo Capital BV 6.95% 2/21/19 (e) | | 600,000 | | 609,000 |
Power Sector Assets and Liabilities Management Corp.: | | | | |
7.25% 5/27/19 (e) | | 720,000 | | 894,600 |
7.39% 12/2/24 (e) | | 750,000 | | 960,000 |
PPL Energy Supply LLC 6.5% 5/1/18 | | 6,895,000 | | 8,042,783 |
PSEG Power LLC 2.75% 9/15/16 | | 2,786,000 | | 2,830,947 |
RRI Energy, Inc. 7.625% 6/15/14 | | 8,000,000 | | 8,160,000 |
The AES Corp.: | | | | |
7.375% 7/1/21 (e) | | 1,615,000 | | 1,841,100 |
7.75% 10/15/15 | | 2,345,000 | | 2,649,850 |
8% 10/15/17 | | 4,575,000 | | 5,261,250 |
| | 53,043,730 |
Multi-Utilities - 0.7% |
Consolidated Edison Co. of New York, Inc. 5.7% 6/15/40 | | 3,771,000 | | 4,741,995 |
Dominion Resources, Inc.: | | | | |
2.8793% 9/30/66 (k) | | 19,226,000 | | 16,365,844 |
7.5% 6/30/66 (k) | | 10,345,000 | | 10,939,838 |
MidAmerican Energy Holdings, Co.: | | | | |
5.875% 10/1/12 | | 3,506,000 | | 3,605,262 |
6.5% 9/15/37 | | 7,097,000 | | 9,180,324 |
National Grid PLC 6.3% 8/1/16 | | 1,589,000 | | 1,844,983 |
NiSource Finance Corp.: | | | | |
4.45% 12/1/21 | | 4,928,000 | | 5,216,929 |
Corporate Bonds - continued |
| Principal Amount (c) | | Value |
Nonconvertible Bonds - continued |
UTILITIES - continued |
Multi-Utilities - continued |
NiSource Finance Corp.: - continued | | | | |
5.25% 9/15/17 | | $ 843,000 | | $ 938,402 |
5.4% 7/15/14 | | 1,680,000 | | 1,831,771 |
5.45% 9/15/20 | | 854,000 | | 963,702 |
5.8% 2/1/42 | | 6,336,000 | | 6,760,639 |
5.95% 6/15/41 | | 11,832,000 | | 13,308,929 |
6.25% 12/15/40 | | 2,345,000 | | 2,692,822 |
6.4% 3/15/18 | | 1,654,000 | | 1,953,774 |
6.8% 1/15/19 | | 6,774,000 | | 8,121,613 |
Puget Energy, Inc.: | | | | |
6% 9/1/21 | | 2,464,000 | | 2,632,981 |
6.5% 12/15/20 | | 2,275,000 | | 2,491,125 |
Wisconsin Energy Corp. 6.25% 5/15/67 (k) | | 3,860,000 | | 3,956,500 |
| | 97,547,433 |
Water Utilities - 0.0% |
Companhia de Saneamento Basico do Estado de Sao Paulo (SABESP) 6.25% 12/16/20 (e) | | 485,000 | | 511,675 |
TOTAL UTILITIES | | 308,257,171 |
TOTAL NONCONVERTIBLE BONDS | | 3,561,439,913 |
TOTAL CORPORATE BONDS (Cost $3,249,327,509) |
3,562,288,913
|
U.S. Government and Government Agency Obligations - 26.3% |
|
U.S. Government Agency Obligations - 0.4% |
Fannie Mae Guaranteed Mtg. pass-thru certificates 0.375% 3/16/15 | | 11,413,000 | | 11,353,972 |
Freddie Mac 1.75% 9/10/15 | | 40,525,000 | | 42,136,355 |
Tennessee Valley Authority 5.375% 4/1/56 | | 385,000 | | 500,583 |
TOTAL U.S. GOVERNMENT AGENCY OBLIGATIONS | | 53,990,910 |
U.S. Government and Government Agency Obligations - continued |
| Principal Amount (c) | | Value |
U.S. Treasury Inflation Protected Obligations - 1.6% |
U.S. Treasury Inflation-Indexed Bonds: | | | | |
2.125% 2/15/40 | | $ 73,625,837 | | $ 101,095,564 |
2.125% 2/15/41 | | 73,129,315 | | 100,893,114 |
2.5% 1/15/29 | | 21,023,800 | | 28,501,673 |
TOTAL U.S. TREASURY INFLATION PROTECTED OBLIGATIONS | | 230,490,351 |
U.S. Treasury Obligations - 24.3% |
U.S. Treasury Bonds: | | | | |
3.125% 2/15/42 | | 17,083,000 | | 17,168,415 |
4.375% 5/15/41 | | 459,035,000 | | 576,805,879 |
U.S. Treasury Notes: | | | | |
0.125% 12/31/13 | | 60,731,000 | | 60,543,584 |
0.25% 1/31/14 | | 59,276,000 | | 59,222,770 |
0.25% 9/15/14 | | 8,048,000 | | 8,020,331 |
0.25% 12/15/14 | | 805,000 | | 801,541 |
0.5% 8/15/14 | | 12,503,000 | | 12,542,072 |
0.625% 7/15/14 | | 160,373,000 | | 161,375,331 |
0.75% 6/15/14 | | 11,299,000 | | 11,403,165 |
0.875% 11/30/16 | | 1,503,000 | | 1,506,992 |
0.875% 2/28/17 | | 293,221,000 | | 293,266,742 |
1.375% 11/30/15 | | 88,617,000 | | 91,150,915 |
1.375% 2/28/19 | | 83,926,000 | | 83,808,000 |
2% 11/15/21 | | 389,903,000 | | 391,730,865 |
2% 2/15/22 | | 171,534,000 | | 171,828,867 |
2.375% 2/28/15 (h) | | 499,922,000 | | 528,472,045 |
2.625% 7/31/14 | | 316,140,000 | | 333,330,113 |
2.625% 12/31/14 (h) | | 486,380,000 | | 516,360,950 |
3.125% 5/15/21 | | 278,589,000 | | 309,212,060 |
TOTAL U.S. TREASURY OBLIGATIONS | | 3,628,550,637 |
TOTAL U.S. GOVERNMENT AND GOVERNMENT AGENCY OBLIGATIONS (Cost $3,684,694,262) |
3,913,031,898
|
U.S. Government Agency - Mortgage Securities - 12.3% |
| Principal Amount (c) | | Value |
Fannie Mae - 8.8% |
2.105% 10/1/33 (k) | | $ 932,975 | | $ 971,621 |
2.303% 6/1/36 (k) | | 143,797 | | 152,544 |
2.572% 2/1/36 (k) | | 811,155 | | 856,988 |
2.635% 7/1/37 (k) | | 385,649 | | 410,958 |
2.82% 12/1/35 (k) | | 548,010 | | 579,748 |
3% 3/1/27 (g) | | 18,000,000 | | 18,680,852 |
3.5% 3/1/42 (g) | | 144,700,000 | | 149,563,179 |
3.5% 3/1/42 (g) | | 43,800,000 | | 45,272,061 |
3.5% 3/1/42 (g) | | 51,500,000 | | 53,230,848 |
3.5% 3/1/42 (g) | | 5,700,000 | | 5,891,570 |
3.5% 3/1/42 (g) | | 78,500,000 | | 81,138,283 |
3.5% 3/1/42 (g) | | 27,000,000 | | 27,907,435 |
4% 9/1/26 to 11/1/41 | | 113,239,005 | | 120,090,169 |
4% 9/1/41 | | 196,774 | | 207,817 |
4% 10/1/41 | | 7,447,543 | | 7,877,144 |
4.5% 11/1/18 to 11/1/41 | | 188,925,609 | | 203,062,880 |
4.5% 3/1/42 (g) | | 12,100,000 | | 12,895,802 |
5% 5/1/19 to 6/1/40 | | 129,805,722 | | 140,360,029 |
5% 3/1/42 (g) | | 39,000,000 | | 42,118,974 |
5% 3/1/42 (g) | | 31,100,000 | | 33,587,182 |
5% 3/1/42 (g) | | 16,000,000 | | 17,279,579 |
5.5% 3/1/18 to 3/1/39 | | 139,109,518 | | 151,779,963 |
6% 1/1/21 to 4/1/40 | | 178,789,214 | | 196,581,771 |
6.5% 11/1/35 | | 365,282 | | 410,275 |
TOTAL FANNIE MAE | | 1,310,907,672 |
Freddie Mac - 1.7% |
3.149% 10/1/35 (k) | | 210,022 | | 223,772 |
4% 12/1/40 to 10/1/41 | | 23,476,218 | | 24,971,365 |
4% 9/1/41 | | 1,875,687 | | 1,980,000 |
4% 3/1/42 (g) | | 28,000,000 | | 29,372,328 |
4.5% 7/1/25 to 10/1/41 | | 105,412,593 | | 112,904,053 |
4.5% 3/1/42 (g) | | 5,800,000 | | 6,161,069 |
5% 7/1/35 to 8/1/40 | | 34,940,140 | | 37,863,392 |
5.5% 11/1/17 to 1/1/40 | | 29,502,120 | | 32,046,424 |
6% 7/1/37 to 8/1/37 | | 5,192,476 | | 5,730,885 |
TOTAL FREDDIE MAC | | 251,253,288 |
U.S. Government Agency - Mortgage Securities - continued |
| Principal Amount (c) | | Value |
Ginnie Mae - 1.8% |
3.5% 10/15/40 to 2/15/42 | | $ 34,245,756 | | $ 35,951,866 |
4% 1/15/25 to 1/20/42 | | 86,674,972 | | 93,541,220 |
4% 3/1/42 (g) | | 21,700,000 | | 23,370,477 |
4.5% 11/20/33 to 7/20/41 | | 54,865,097 | | 59,955,961 |
4.5% 3/1/42 (g) | | 1,000,000 | | 1,090,144 |
5% 3/15/39 to 9/15/41 | | 32,585,925 | | 36,106,284 |
5% 3/1/42 (g) | | 2,100,000 | | 2,319,460 |
5% 3/1/42 (g) | | 16,000,000 | | 17,672,078 |
6% 9/20/38 | | 4,886,518 | | 5,469,537 |
TOTAL GINNIE MAE | | 275,477,027 |
TOTAL U.S. GOVERNMENT AGENCY - MORTGAGE SECURITIES (Cost $1,817,051,198) |
1,837,637,987
|
Asset-Backed Securities - 2.0% |
|
Accredited Mortgage Loan Trust Series 2005-1 Class M1, 0.714% 4/25/35 (k) | | 1,206,470 | | 651,744 |
ACE Securities Corp. Home Equity Loan Trust: | | | | |
Series 2004-HE1 Class M2, 1.894% 3/25/34 (k) | | 454,461 | | 318,536 |
Series 2005-HE2 Class M2, 0.694% 4/25/35 (k) | | 107,012 | | 103,895 |
Advanta Business Card Master Trust: | | | | |
Series 2006-C1 Class C1, 0.6758% 10/20/14 (k) | | 642,000 | | 6,420 |
Series 2007-D1 Class D, 1.5863% 1/22/13 (e)(k) | | 2,590,000 | | 38,850 |
Airspeed Ltd. Series 2007-1A Class C1, 2.7485% 6/15/32 (e)(k) | | 4,233,602 | | 2,180,305 |
Ally Auto Receivables Trust: | | | | |
Series 2009-A: | | | | |
Class A3, 2.33% 6/17/13 (e) | | 1,420,427 | | 1,426,271 |
Class A4, 3% 10/15/15 (e) | | 4,280,000 | | 4,358,211 |
Series 2010-5 Class A4, 1.75% 3/15/16 | | 4,050,000 | | 4,130,525 |
Series 2011-1 Class A4, 2.23% 3/15/16 | | 18,200,000 | | 18,772,392 |
Ally Master Owner Trust: | | | | |
Series 2010-3 Class A, 2.88% 4/15/15 (e) | | 8,910,000 | | 9,087,109 |
Series 2011-1 Class A2, 2.15% 1/15/16 | | 8,870,000 | | 9,032,918 |
Series 2011-3 Class A2, 1.81% 5/15/16 | | 8,490,000 | | 8,602,352 |
Series 2012-1 Class A2, 0.7% 2/15/17 | | 18,800,000 | | 18,811,468 |
AmeriCredit Automobile Receivables Trust Series 2011-1 Class A3, 1.39% 9/8/15 | | 7,520,000 | | 7,578,985 |
Asset-Backed Securities - continued |
| Principal Amount (c) | | Value |
Ameriquest Mortgage Securities, Inc. pass-thru certificates: | | | | |
Series 2003-10 Class M1, 0.944% 12/25/33 (k) | | $ 83,046 | | $ 65,323 |
Series 2004-R2 Class M3, 0.794% 4/25/34 (k) | | 133,684 | | 41,863 |
Series 2005-R2 Class M1, 0.694% 4/25/35 (k) | | 2,064,696 | | 1,792,641 |
Anthracite CDO I Ltd. Series 2002-CIBA Class B, 6.633% 5/24/37 (e) | | 171,000 | | 171,782 |
Anthracite CDO III Ltd./Anthracite CDO III Corp. Series 2004-1A Class A, 0.6055% 3/23/19 (e)(k) | | 177,068 | | 150,950 |
Argent Securities, Inc. pass-thru certificates: | | | | |
Series 2003-W7 Class A2, 1.0563% 3/25/34 (k) | | 47,932 | | 34,538 |
Series 2004-W11 Class M2, 0.944% 11/25/34 (k) | | 561,149 | | 399,128 |
Series 2004-W7 Class M1, 0.794% 5/25/34 (k) | | 1,542,998 | | 1,104,624 |
Series 2006-W4 Class A2C, 0.404% 5/25/36 (k) | | 1,323,779 | | 323,672 |
Asset Backed Securities Corp. Home Equity Loan Trust: | | | | |
Series 2004-HE2 Class M1, 1.069% 4/25/34 (k) | | 2,531,796 | | 1,716,165 |
Series 2006-HE2 Class M1, 0.614% 3/25/36 (k) | | 120,082 | | 941 |
Axon Financial Funding Ltd. Series 2007-1 Class A1, 1.181% 4/4/17 (b)(e)(k) | | 7,217,000 | | 1 |
Bank of America Auto Trust Series 2009-1A: | | | | |
Class A3, 2.67% 7/15/13 (e) | | 221,634 | | 221,848 |
Class A4, 3.52% 6/15/16 (e) | | 8,300,000 | | 8,421,563 |
BMW Vehicle Lease Trust: | | | | |
Series 2010-1 Class A3, 0.82% 4/15/13 | | 12,743,568 | | 12,757,046 |
Series 2011-1 Class A4, 1.4% 8/20/14 | | 11,060,000 | | 11,137,458 |
Brazos Higher Education Authority, Inc. Series 2006-2 Class A9, 0.5838% 12/25/24 (k) | | 1,400,411 | | 1,234,602 |
Capital Auto Receivables Asset Trust Series 2007-1 Class C, 5.38% 11/15/12 | | 582,000 | | 585,249 |
Capital One Multi-Asset Execution Trust Series 2008-A3 Class A3, 5.05% 2/15/16 | | 5,700,000 | | 5,986,350 |
Capital Trust Ltd. Series 2004-1: | | | | |
Class A2, 0.6955% 7/20/39 (e)(k) | | 276,986 | | 206,354 |
Class B, 0.9955% 7/20/39 (e)(k) | | 263,810 | | 108,162 |
Class C, 1.3455% 7/20/39 (e)(k) | | 339,379 | | 7,636 |
Capital Trust RE CDO Ltd./Capital Trust RE CDO Corp. Series 2005-3A: | | | | |
Class A2, 5.16% 6/25/35 (e) | | 848,404 | | 844,162 |
Class B, 5.267% 6/25/35 (e) | | 1,000,000 | | 950,000 |
CapitalSource Real Estate Loan Trust Series 2006-1A Class A2A, 0.8315% 1/20/37 (e)(k) | | 177,123 | | 143,636 |
Capmark VII Ltd. Series 2006-7A Class H, 1.7985% 8/15/36 (e)(k) | | 528,495 | | 0 |
Asset-Backed Securities - continued |
| Principal Amount (c) | | Value |
Carmax Auto Owner Trust Series 2011-1 Class A3, 1.29% 9/15/15 | | $ 8,210,000 | | $ 8,274,749 |
Carrington Mortgage Loan Trust Series 2007-RFC1 Class A3, 0.384% 12/25/36 (k) | | 1,802,588 | | 570,187 |
CBRE Realty Finance CDO LLC Series 2007-1A Class A1, 0.8325% 4/7/52 (e)(k) | | 1,111,372 | | 757,466 |
Chase Issuance Trust Series 2007-A17 Class A, 5.12% 10/15/14 | | 5,000,000 | | 5,148,852 |
Chrysler Financial Auto Securitization Trust Series 2010-A Class A3, 0.91% 8/8/13 | | 17,510,000 | | 17,529,457 |
Citibank Credit Card Issuance Trust Series 2009-A5 Class A5, 2.25% 12/23/14 | | 35,600,000 | | 36,117,485 |
Countrywide Asset-Backed Certificates Trust: | | | | |
Series 2007-11 Class 2A1, 0.304% 6/25/47 (k) | | 11,782 | | 11,650 |
Series 2007-4 Class A1A, 0.3963% 9/25/37 (k) | | 273,057 | | 266,159 |
Countrywide Home Loan Trust Series 2006-13 Class N, 7% 8/25/37 (e) | | 811,000 | | 0 |
Countrywide Home Loans, Inc.: | | | | |
Series 2003-BC1 Class B1, 5.5436% 3/25/32 (MGIC Investment Corp. Insured) (k) | | 11,800 | | 2,019 |
Series 2004-3 Class M4, 1.214% 4/25/34 (k) | | 159,665 | | 70,348 |
Series 2004-4 Class M2, 1.039% 6/25/34 (k) | | 587,945 | | 265,886 |
Series 2005-3 Class MV1, 0.664% 8/25/35 (k) | | 219,335 | | 216,302 |
Crest Clarendon Street Ltd./Crest Clarendon Corp. Series 2002-1A: | | | | |
Class B1, 6.065% 12/28/35 (e) | | 500,000 | | 410,000 |
Class B2, 1.9238% 12/28/35 (e)(k) | | 500,000 | | 350,000 |
Crest Dartmouth Street Ltd./Crest Dartmouth Street Corp. Series 2003-1A: | | | | |
Class B1, 2.0738% 6/28/38 (e)(k) | | 100,000 | | 88,750 |
Class D, 9% 6/28/38 (e) | | 200,000 | | 140,000 |
Deutsche Financial Capital Securitization LLC Series 1997-I Class M, 7.275% 9/15/27 | | 540,000 | | 495,526 |
Fannie Mae subordinate REMIC pass-thru certificates Series 2004-T5 Class AB3, 0.7513% 5/28/35 (k) | | 38,916 | | 24,977 |
Fieldstone Mortgage Investment Corp. Series 2004-3 Class M5, 2.419% 8/25/34 (k) | | 290,872 | | 169,523 |
First Franklin Mortgage Loan Trust Series 2004-FF2 Class M3, 1.069% 3/25/34 (k) | | 22,872 | | 2,455 |
Ford Credit Auto Lease Trust Series 2010-B Class A3, 0.91% 7/15/13 (e) | | 14,200,000 | | 14,213,190 |
Ford Credit Auto Owner Trust: | | | | |
Series 2009-D: | | | | |
Class A3, 2.17% 10/15/13 | | 1,493,398 | | 1,500,039 |
Asset-Backed Securities - continued |
| Principal Amount (c) | | Value |
Ford Credit Auto Owner Trust: - continued | | | | |
Series 2009-D: | | | | |
Class A4, 2.98% 8/15/14 | | $ 4,800,000 | | $ 4,900,017 |
Series 2010-B Class A3, 0.98% 10/15/14 | | 7,953,833 | | 7,978,427 |
Ford Credit Floorplan Master Owner Trust Series 2010-5 Class A1, 1.5% 9/15/15 | | 10,710,000 | | 10,813,801 |
Fremont Home Loan Trust: | | | | |
Series 2005-A: | | | | |
Class M3, 0.734% 1/25/35 (k) | | 948,695 | | 299,348 |
Class M4, 0.924% 1/25/35 (k) | | 363,547 | | 82,407 |
Series 2006-D Class M1, 0.474% 11/25/36 (k) | | 68,785 | | 276 |
GCO Education Loan Funding Master Trust II Series 2007-1A Class C1L, 0.8706% 2/25/47 (e)(k) | | 2,892,000 | | 1,012,200 |
GCO Slims Trust Series 2006-1A, 5.72% 3/1/22 (e) | | 1,281,987 | | 1,179,428 |
GE Business Loan Trust: | | | | |
Series 2003-1 Class A, 0.6785% 4/15/31 (e)(k) | | 213,676 | | 199,776 |
Series 2006-2A: | | | | |
Class A, 0.4285% 11/15/34 (e)(k) | | 1,913,934 | | 1,583,781 |
Class B, 0.5285% 11/15/34 (e)(k) | | 691,371 | | 445,934 |
Class C, 0.6285% 11/15/34 (e)(k) | | 1,149,030 | | 568,770 |
Class D, 0.9985% 11/15/34 (e)(k) | | 436,323 | | 95,991 |
Goal Capital Funding Trust Series 2007-1 Class C1, 0.9738% 6/25/42 (k) | | 543,917 | | 415,288 |
GSAMP Trust Series 2004-AR1 Class B4, 5% 6/25/34 (e)(k) | | 215,708 | | 63,042 |
Guggenheim Structured Real Estate Funding Ltd. Series 2006-3: | | | | |
Class B, 0.644% 9/25/46 (e)(k) | | 30,129 | | 30,117 |
Class C, 0.794% 9/25/46 (e)(k) | | 1,526,694 | | 778,614 |
Class E, 1.894% 9/25/46 (e)(k) | | 250,000 | | 4,725 |
Home Equity Asset Trust: | | | | |
Series 2003-2 Class M1, 1.564% 8/25/33 (k) | | 393,438 | | 267,740 |
Series 2003-3 Class M1, 1.534% 8/25/33 (k) | | 697,666 | | 503,317 |
Series 2003-5 Class A2, 0.944% 12/25/33 (k) | | 32,929 | | 23,987 |
Series 2005-5 Class 2A2, 0.494% 11/25/35 (k) | | 6,922 | | 6,912 |
Series 2006-1 Class 2A3, 0.469% 4/25/36 (k) | | 395,873 | | 392,574 |
Series 2006-3N Class B, 6.5% 8/27/36 (e) | | 250,000 | | 0 |
HSI Asset Securitization Corp. Trust Series 2007-HE1 Class 2A3, 0.434% 1/25/37 (k) | | 1,522,035 | | 443,376 |
Hyundai Auto Receivables Trust Series 2009-A Class A3, 2.03% 8/15/13 | | 1,533,679 | | 1,538,965 |
John Deere Owner Trust Series 2011-A Class A4, 1.96% 4/16/18 | | 4,810,000 | | 4,927,655 |
Asset-Backed Securities - continued |
| Principal Amount (c) | | Value |
JPMorgan Mortgage Acquisition Trust: | | | | |
Series 2006-NC2 Class M2, 0.544% 7/25/36 (k) | | $ 204,000 | | $ 3,897 |
Series 2007-CH1 Class AV4, 0.374% 11/25/36 (k) | | 1,520,141 | | 1,257,256 |
Keycorp Student Loan Trust: | | | | |
Series 1999-A Class A2, 0.9038% 12/27/29 (k) | | 593,668 | | 521,329 |
Series 2006-A Class 2C, 1.7238% 3/27/42 (k) | | 3,243,000 | | 869,380 |
Long Beach Mortgage Loan Trust: | | | | |
Series 2004-2 Class M2, 1.324% 6/25/34 (k) | | 84,170 | | 49,982 |
Series 2006-10 Class 2A3, 0.404% 11/25/36 (k) | | 5,521,861 | | 1,679,225 |
Marathon Real Estate CDO Ltd. Series 2006-1A Class B, 0.674% 5/25/46 (e)(k) | | 250,000 | | 112,500 |
Marriott Vacation Club Owner Trust Series 2006-2A: | | | | |
Class B, 5.442% 10/20/28 (e) | | 16,295 | | 16,530 |
Class C, 5.691% 10/20/28 (e) | | 7,242 | | 7,313 |
Class D, 6.01% 10/20/28 (e) | | 86,229 | | 86,707 |
MASTR Asset Backed Securities Trust Series 2007-HE1 Class M1, 0.544% 5/25/37 (k) | | 784,792 | | 13,571 |
Meritage Mortgage Loan Trust Series 2004-1 Class M1, 0.994% 7/25/34 (k) | | 168,695 | | 104,530 |
Merrill Lynch Mortgage Investors Trust: | | | | |
Series 2003-OPT1 Class M1, 1.219% 7/25/34 (k) | | 573,205 | | 384,377 |
Series 2006-FM1 Class A2B, 0.354% 4/25/37 (k) | | 1,672,878 | | 1,242,566 |
Series 2006-OPT1 Class A1A, 0.504% 6/25/35 (k) | | 2,960,520 | | 2,213,503 |
Morgan Stanley ABS Capital I Trust: | | | | |
Series 2004-HE6 Class A2, 0.584% 8/25/34 (k) | | 57,368 | | 44,034 |
Series 2004-NC8 Class M6, 1.494% 9/25/34 (k) | | 28,547 | | 16,261 |
Series 2005-NC1 Class M1, 0.684% 1/25/35 (k) | | 399,800 | | 252,476 |
Series 2005-NC2 Class B1, 1.414% 3/25/35 (k) | | 416,362 | | 52,726 |
Series 2007-HE2 Class M1, 0.494% 1/25/37 (k) | | 131,178 | | 381 |
N-Star Real Estate CDO Ltd. Series 1A: | | | | |
Class B1, 2.1656% 8/28/38 (e)(k) | | 220,000 | | 191,400 |
Class C1B, 7.696% 8/28/38 (e) | | 64,212 | | 52,936 |
National Collegiate Student Loan Trust: | | | | |
Series 2004-2 Class AIO, 9.75% 10/27/14 (m) | | 7,651,000 | | 516,443 |
Series 2006-4 Class D, 1.344% 5/25/32 (k) | | 2,481,000 | | 5,288 |
Series 2007-1 Class AIO, 7.27% 4/25/12 (m) | | 33,769,000 | | 540,304 |
Series 2007-2 Class AIO, 6.7% 7/25/12 (m) | | 24,102,186 | | 534,642 |
New Century Home Equity Loan Trust Series 2005-4 Class M2, 0.754% 9/25/35 (k) | | 1,426,957 | | 606,810 |
Nissan Auto Receivables Owner Trust: | | | | |
Series 2010-A Class A4, 1.31% 9/15/16 | | 5,950,000 | | 6,013,329 |
Series 2011-A Class A4, 1.94% 9/15/17 | | 11,750,000 | | 12,084,617 |
Asset-Backed Securities - continued |
| Principal Amount (c) | | Value |
Ocala Funding LLC: | | | | |
Series 2005-1A Class A, 1.7455% 3/20/10 (b)(e)(k) | | $ 566,000 | | $ 0 |
Series 2006-1A Class A, 1.6455% 3/20/11 (b)(e)(k) | | 1,176,000 | | 0 |
Option One Mortgage Loan Trust: | | | | |
Series 2007-5 Class 2A1, 0.334% 5/25/37 (k) | | 19,223 | | 19,101 |
Series 2007-6 Class 2A1, 0.304% 7/25/37 (k) | | 99,166 | | 97,613 |
Park Place Securities, Inc.: | | | | |
Series 2004-WCW1: | | | | |
Class M3, 1.494% 9/25/34 (k) | | 532,896 | | 224,703 |
Class M4, 1.694% 9/25/34 (k) | | 683,353 | | 149,324 |
Series 2005-WCH1 Class M4, 1.074% 1/25/36 (k) | | 1,475,804 | | 657,425 |
Prima Capital CDO Ltd./Prima Capital CDO Corp. Series 2005-1A: | | | | |
Class B, 4.846% 7/24/39 (e) | | 147,188 | | 144,244 |
Class C, 5.08% 7/24/39 (e) | | 185,000 | | 178,988 |
Class D, 5.194% 7/24/39 (e) | | 320,000 | | 300,800 |
Prima Capital Ltd. Series 2006-CR1A Class A2, 5.533% 12/28/48 (e) | | 280,000 | | 266,000 |
Resource Real Estate Funding CDO Series 2007-1A Class J, 3.194% 9/25/46 (e)(k) | | 250,000 | | 37,500 |
Salomon Brothers Mortgage Securities VII, Inc. Series 2003-HE1 Class A, 1.044% 4/25/33 (k) | | 5,108 | | 4,136 |
Saxon Asset Securities Trust Series 2004-1 Class M1, 1.039% 3/25/35 (k) | | 1,335,965 | | 814,955 |
Sierra Receivables Funding Co. Series 2007-1A Class A2, 0.4309% 3/20/19 (FGIC Insured) (e)(k) | | 542,580 | | 519,599 |
SLM Private Credit Student Loan Trust Series 2004-A Class C, 1.4963% 6/15/33 (k) | | 1,272,000 | | 577,106 |
Specialty Underwriting & Residential Finance Trust Series 2006-AB2 Class N1, 5.75% 6/25/37 (e) | | 656,637 | | 0 |
Structured Asset Investment Loan Trust Series 2004-8 Class M5, 1.969% 9/25/34 (k) | | 65,143 | | 20,857 |
SVO VOI Mortgage Corp. Series 2006-AA Class A, 5.28% 2/20/24 (e) | | 575,472 | | 594,242 |
Terwin Mortgage Trust Series 2003-4HE Class A1, 1.104% 9/25/34 (k) | | 28,819 | | 21,391 |
TIAA Real Estate CDO Ltd./TIAA Real Estate CDO Corp.: | | | | |
Series 2002-1A: | | | | |
Class IIFX, 6.77% 5/22/37 (e) | | 244,008 | | 244,008 |
Class IV, 6.84% 5/22/37 (e) | | 235,000 | | 210,913 |
Series 2003-1A Class B2, 5.4802% 12/28/38 (e) | | 111,000 | | 92,130 |
Trapeza CDO XII Ltd./Trapeza CDO XII, Inc. Series 2007-12A Class B, 1.1425% 4/6/42 (e)(k) | | 2,632,814 | | 78,984 |
Asset-Backed Securities - continued |
| Principal Amount (c) | | Value |
Wachovia Ltd./Wachovia LLC: | | | | |
Series 2006-1 Class 1ML, 0% 9/25/26 (e)(k) | | $ 400,000 | | $ 168,000 |
Series 2006-1A: | | | | |
Class A1A, 0.8338% 9/25/26 (e)(k) | | 1,374,838 | | 1,209,857 |
Class A1B, 0.9038% 9/25/26 (e)(k) | | 1,033,000 | | 785,080 |
Class A2A, 0.7938% 9/25/26 (e)(k) | | 902,937 | | 812,643 |
Class A2B, 0.8838% 9/25/26 (e)(k) | | 250,000 | | 207,500 |
Class B, 0.9338% 9/25/26 (e)(k) | | 250,000 | | 187,500 |
Class F, 1.7238% 9/25/26 (e)(k) | | 250,000 | | 167,500 |
Class G, 1.9238% 9/25/26 (e)(k) | | 320,000 | | 208,000 |
WaMu Asset Holdings Corp. Series 2006-8 Class N1, 6.048% 10/25/46 (e) | | 887,552 | | 0 |
Wells Fargo Home Equity Trust Series 2004-3 Class A, 4.5% 11/27/34 (e) | | 7,576 | | 0 |
Whinstone Capital Management Ltd. Series 1A Class B3, 2.3601% 10/25/44 (e)(k) | | 1,789,540 | | 948,456 |
Wrightwood Capital Real Estate CDO Ltd. Series 2005-1A: | | | | |
Class A1, 0.8131% 11/21/40 (e)(k) | | 500,000 | | 385,000 |
Class D, 1.3431% 11/21/40 (e)(k) | | 305,000 | | 91,500 |
TOTAL ASSET-BACKED SECURITIES (Cost $295,817,785) |
298,586,531
|
Collateralized Mortgage Obligations - 0.8% |
|
Private Sponsor - 0.8% |
ABN AMRO Mortgage Corp. Series 2003-9 Class B5, 4.5164% 8/25/18 (e) | | 172,852 | | 22,471 |
Bayview Commercial Asset Trust Series 2006-3A, Class IO, 3.9431% 10/25/36 (e)(k)(m) | | 9,375,877 | | 448,123 |
Bear Stearns ALT-A Trust floater Series 2005-1 Class A1, 0.804% 1/25/35 (k) | | 1,912,591 | | 1,451,121 |
Cobalt CMBS Commercial Mortgage Trust Series 2007-C2 Class B, 5.617% 4/15/47 (k) | | 2,125,000 | | 467,500 |
COMM pass-thru certificates floater Series 2001-J2A Class A2F, 0.7475% 7/16/34 (e)(k) | | 20,551 | | 20,541 |
Countrywide Alternative Loan Trust Series 2006-OC5N Class N, 7.25% 7/25/37 (e) | | 78,237 | | 0 |
Countrywide Home Loans, Inc.: | | | | |
Series 2003-28 Class B3, 5.5% 8/25/33 | | 54,117 | | 26,610 |
Series 2003-35 Class B, 4.6374% 9/25/18 (k) | | 86,087 | | 12,052 |
Credit Suisse First Boston Mortgage Securities Corp.: | | | | |
Series 2003-17 Class B4, 5.389% 6/25/33 (k) | | 232,626 | | 62,809 |
Collateralized Mortgage Obligations - continued |
| Principal Amount (c) | | Value |
Private Sponsor - continued |
Credit Suisse First Boston Mortgage Securities Corp.: - continued | | | | |
Series 2004-3 Class DB4, 5.8243% 4/25/34 (k) | | $ 38,184 | | $ 48 |
CWALT, Inc.: | | | | |
floater Series 2005-56: | | | | |
Class 1A1, 0.974% 11/25/35 (k) | | 31,256,081 | | 16,655,387 |
Class 2A3, 1.6967% 11/25/35 (k) | | 7,463,139 | | 4,232,290 |
Series 2005-56 Class 5A1, 0.564% 11/25/35 (k) | | 9,191,811 | | 4,816,838 |
First Horizon Mortgage pass-thru Trust Series 2004-AR5 Class 2A1, 2.631% 10/25/34 (k) | | 1,423,564 | | 1,310,526 |
FREMF Mortgage Trust: | | | | |
Series 2010 K7 Class B, 5.6185% 4/25/20 (e)(k) | | 1,000,000 | | 1,036,014 |
Series 2010-K6 Class B, 5.5326% 12/25/46 (e)(k) | | 910,000 | | 938,251 |
GMAC Commercial Mortgage Securities, Inc. Series 1993-C3 Class L, 6.974% 8/15/36 | | 8,166 | | 4 |
GMAC Mortgage Loan Trust Series 2003-J10 Class B2, 4.75% 1/25/19 (e) | | 67,876 | | 13,575 |
Granite Master Issuer PLC floater: | | | | |
Series 2005-4 Class C2, 1.3455% 12/20/54 (k) | | 205,017 | | 124,643 |
Series 2006-1A Class C2, 1.4455% 12/20/54 (e)(k) | | 6,523,000 | | 3,979,030 |
Series 2006-2 Class C1, 1.1855% 12/20/54 (k) | | 21,543,000 | | 13,141,230 |
Series 2006-3 Class C2, 0.7455% 12/20/54 (k) | | 1,124,000 | | 685,640 |
Series 2006-4: | | | | |
Class B1, 0.4255% 12/20/54 (k) | | 4,521,000 | | 3,806,682 |
Class C1, 1.0055% 12/20/54 (k) | | 2,767,000 | | 1,687,870 |
Class M1, 0.5855% 12/20/54 (k) | | 1,190,000 | | 907,375 |
Series 2007-1: | | | | |
Class 1C1, 0.8455% 12/20/54 (k) | | 2,234,000 | | 1,362,740 |
Class 1M1, 0.5455% 12/20/54 (k) | | 1,493,000 | | 1,138,413 |
Class 2C1, 1.2055% 12/20/54 (k) | | 1,015,000 | | 619,150 |
Class 2M1, 0.7455% 12/20/54 (k) | | 1,917,000 | | 1,461,713 |
Series 2007-2 Class 2C1, 0.676% 12/17/54 (k) | | 2,654,000 | | 1,618,940 |
Granite Mortgages PLC floater Series 2003-3 Class 1C, 3.0112% 1/20/44 (k) | | 430,241 | | 308,827 |
GSR Mortgage Loan Trust floater Series 2007-AR1 Class 6A1, 4.7361% 3/25/37 (k) | | 5,447,521 | | 5,455,344 |
JPMorgan Chase Commercial Mortgage Securities Trust Series 2007-CB18 Class A3, 5.447% 6/12/47 (k) | | 3,229,003 | | 3,400,234 |
JPMorgan Mortgage Trust sequential payer Series 2006-A5 Class 3A5, 5.8155% 8/25/36 (k) | | 2,346,797 | | 1,770,199 |
LB-UBS Commercial Mortgage Trust sequential payer Series 2006-C6 Class A4, 5.372% 9/15/39 | | 857,000 | | 970,614 |
Collateralized Mortgage Obligations - continued |
| Principal Amount (c) | | Value |
Private Sponsor - continued |
Luminent Mortgage Trust: | | | | |
floater Series 2006-1 Class A1, 0.484% 4/25/36 (k) | | $ 16,721,726 | | $ 8,708,894 |
Series 2006-5 Class A1A, 0.434% 7/25/36 (k) | | 12,554,996 | | 5,910,534 |
MASTR Adjustable Rate Mortgages Trust Series 2007-3 Class 22A2, 0.454% 5/25/47 (k) | | 2,694,571 | | 1,583,833 |
Merrill Lynch Alternative Note Asset Trust floater Series 2007-OAR1 Class A1, 0.414% 2/25/37 (k) | | 6,612,782 | | 4,444,414 |
Merrill Lynch Mortgage Investors Trust Series 1998-C3 Class F, 6% 12/15/30 (e) | | 930,000 | | 960,258 |
Merrill Lynch Mortgage Trust Series 2002-MW1 Class E, 6.219% 7/12/34 (e) | | 101,000 | | 101,175 |
Opteum Mortgage Acceptance Corp. floater Series 2005-3 Class APT, 0.534% 7/25/35 (k) | | 1,998,079 | | 1,554,231 |
RESI Finance LP/RESI Finance DE Corp. floater Series 2003-B: | | | | |
Class B5, 2.6048% 7/10/35 (e)(k) | | 1,306,361 | | 1,061,149 |
Class B6, 3.1048% 7/10/35 (e)(k) | | 291,271 | | 231,808 |
Residential Funding Securities Corp. floater Series 2003-RP2 Class A1, 0.694% 6/25/33 (e)(k) | | 279,432 | | 259,636 |
Salomon Brothers Mortgage Securities VII, Inc. Series 2006-C2 Class H, 6.308% 7/18/33 (e) | | 268,000 | | 91,311 |
Sequoia Mortgage Trust floater Series 2004-6 Class A3B, 1.668% 7/20/34 (k) | | 35,733 | | 25,749 |
Structured Asset Mortgage Investments, Inc. floater Series 2006-AR6 Class 2A1, 0.434% 7/25/46 (k) | | 25,594,134 | | 13,366,311 |
Structured Asset Securities Corp. Series 2003-15A Class 4A, 5.3281% 4/25/33 (k) | | 486,310 | | 450,271 |
TBW Mortgage-Backed pass-thru certificates floater Series 2006-4 Class A3, 0.4763% 9/25/36 (k) | | 3,273,627 | | 2,496,760 |
Wells Fargo Mortgage Backed Securities Trust: | | | | |
Series 2003-12 Class B6, 4.75% 11/25/18 (e) | | 132,742 | | 46,460 |
Series 2005-AR2 Class 1A2, 2.67% 3/25/35 (k) | | 3,182,884 | | 1,020,217 |
TOTAL PRIVATE SPONSOR | | 116,265,815 |
U.S. Government Agency - 0.0% |
Fannie Mae subordinate REMIC pass-thru certificates planned amortization class Series 2002-9 Class PC, 6% 3/25/17 | | 225,450 | | 242,591 |
TOTAL COLLATERALIZED MORTGAGE OBLIGATIONS (Cost $107,382,161) |
116,508,406
|
Commercial Mortgage Securities - 5.0% |
| Principal Amount (c) | | Value |
ACGS Series 2004-1 Class P, 7.4651% 8/1/19 (n) | | $ 566,664 | | $ 547,207 |
Americold LLC Trust Series 2010-ARTA Class D, 7.443% 1/14/29 (e) | | 180,000 | | 196,048 |
Asset Securitization Corp.: | | | | |
Series 1996-D2 Class B1A, 8.9457% 2/14/29 (e)(k) | | 800,000 | | 798,715 |
Series 1997-D4: | | | | |
Class B1, 7.525% 4/14/29 | | 113,757 | | 113,909 |
Class B2, 7.525% 4/14/29 | | 1,498,104 | | 1,511,572 |
Class B5, 7.525% 4/14/29 | | 129,000 | | 110,100 |
Series 1997-D5: | | | | |
Class A2, 7.0826% 2/14/43 (k) | | 1,399,000 | | 1,414,709 |
Class A3, 7.1326% 2/14/43 (k) | | 1,510,000 | | 1,537,219 |
Class A5, 7.2026% 2/14/43 (k) | | 256,000 | | 261,474 |
Class A6, 7.4526% 2/14/43 (k) | | 2,470,000 | | 2,517,498 |
Class A7, 7.6926% 2/14/43 (k) | | 820,000 | | 827,814 |
Class PS1, 1.4363% 2/14/43 (k)(m) | | 5,090,541 | | 56,103 |
Banc of America Commercial Mortgage Trust: | | | | |
sequential payer: | | | | |
Series 2006-2 Class AAB, 5.9028% 5/10/45 (k) | | 1,860,938 | | 1,985,606 |
Series 2006-5: | | | | |
Class A2, 5.317% 9/10/47 | | 6,242,645 | | 6,336,753 |
Class A3, 5.39% 9/10/47 | | 2,653,000 | | 2,802,993 |
Series 2006-6 Class A3, 5.369% 10/10/45 | | 3,804,000 | | 4,057,628 |
Series 2007-4 Class A3, 5.9813% 2/10/51 (k) | | 1,897,000 | | 2,015,151 |
Series 2006-6 Class E, 5.619% 10/10/45 (e) | | 1,098,000 | | 222,455 |
Series 2007-3: | | | | |
Class A3, 5.8426% 6/10/49 (k) | | 3,176,000 | | 3,328,940 |
Class A4, 5.8426% 6/10/49 (k) | | 3,965,000 | | 4,382,102 |
Series 2008-1 Class D, 6.4378% 2/10/51 (e)(k) | | 125,000 | | 72,304 |
Banc of America Commercial Mortgage, Inc.: | | | | |
sequential payer: | | | | |
Series 2001-1 Class A4, 5.451% 1/15/49 | | 4,166,000 | | 4,695,090 |
Series 2002-2 Class F, 5.487% 7/11/43 | | 415,000 | | 421,165 |
Series 2004-2: | | | | |
Class A3, 4.05% 11/10/38 | | 261,164 | | 265,027 |
Class A4, 4.153% 11/10/38 | | 2,412,000 | | 2,505,460 |
Series 2005-1 Class A3, 4.877% 11/10/42 | | 868,339 | | 867,997 |
Series 2007-1 Class A2, 5.381% 1/15/49 | | 1,776,041 | | 1,774,458 |
Series 2001-3 Class H, 6.562% 4/11/37 (e) | | 1,472,000 | | 1,475,932 |
Series 2001-PB1: | | | | |
Class J, 7.166% 5/11/35 (e) | | 177,085 | | 177,141 |
Class K, 6.15% 5/11/35 (e) | | 885,000 | | 862,097 |
Series 2003-1 Class G, 5.608% 9/11/36 (e) | | 310,000 | | 313,863 |
Commercial Mortgage Securities - continued |
| Principal Amount (c) | | Value |
Banc of America Commercial Mortgage, Inc.: - continued | | | | |
Series 2004-1 Class F, 5.279% 11/10/39 (e) | | $ 185,000 | | $ 148,361 |
Series 2004-4: | | | | |
Class K, 4.637% 7/10/42 (e)(k) | | 300,000 | | 2,400 |
Class L, 4.637% 7/10/42 (e)(k) | | 280,000 | | 560 |
Series 2004-5 Class G, 5.7521% 11/10/41 (e)(k) | | 195,000 | | 137,310 |
Series 2005-1 Class CJ, 5.3555% 11/10/42 (k) | | 550,000 | | 559,441 |
Series 2005-3 Class A3B, 5.09% 7/10/43 (k) | | 5,908,000 | | 6,268,713 |
Series 2005-6 Class AJ, 5.3664% 9/10/47 (k) | | 300,000 | | 307,872 |
Banc of America Large Loan Trust floater Series 2010-HLTN Class HLTN, 1.999% 11/15/15 (e)(k) | | 854,014 | | 795,344 |
Banc of America Large Loan, Inc. floater: | | | | |
Series 2005-MIB1: | | | | |
Class B, 0.5085% 3/15/22 (e)(k) | | 297,513 | | 288,587 |
Class C, 0.5585% 3/15/22 (e)(k) | | 1,357,000 | | 1,316,290 |
Class D, 0.6085% 3/15/22 (e)(k) | | 826,000 | | 801,220 |
Class E, 0.6485% 3/15/22 (e)(k) | | 684,000 | | 663,480 |
Class F, 0.7185% 3/15/22 (e)(k) | | 615,784 | | 591,153 |
Class G, 0.7785% 3/15/22 (e)(k) | | 399,119 | | 375,172 |
Class J, 1.2985% 3/15/22 (e)(k) | | 438,000 | | 398,580 |
Class K, 2.2485% 3/15/22 (e)(k) | | 427,499 | | 235,124 |
Series 2006-BIX1: | | | | |
Class D, 0.4585% 10/15/19 (e)(k) | | 1,367,238 | | 1,312,549 |
Class E, 0.4885% 10/15/19 (e)(k) | | 1,385,000 | | 1,315,750 |
Class F, 0.5585% 10/15/19 (e)(k) | | 3,150,730 | | 2,961,686 |
Class G, 0.5785% 10/15/19 (e)(k) | | 1,245,579 | | 1,108,565 |
Bayview Commercial Asset Trust: | | | | |
floater: | | | | |
Series 2003-2 Class M1, 1.094% 12/25/33 (e)(k) | | 65,715 | | 46,539 |
Series 2004-1: | | | | |
Class A, 0.604% 4/25/34 (e)(k) | | 1,135,647 | | 914,196 |
Class B, 2.144% 4/25/34 (e)(k) | | 127,322 | | 73,623 |
Class M1, 0.804% 4/25/34 (e)(k) | | 102,225 | | 71,158 |
Class M2, 1.444% 4/25/34 (e)(k) | | 94,442 | | 65,457 |
Series 2005-2A: | | | | |
Class A1, 0.554% 8/25/35 (e)(k) | | 1,622,513 | | 1,059,196 |
Class M1, 0.674% 8/25/35 (e)(k) | | 80,803 | | 41,582 |
Class M2, 0.724% 8/25/35 (e)(k) | | 133,271 | | 60,689 |
Class M3, 0.744% 8/25/35 (e)(k) | | 73,735 | | 29,348 |
Series 2005-3A: | | | | |
Class A2, 0.644% 11/25/35 (e)(k) | | 590,756 | | 390,268 |
Class M1, 0.684% 11/25/35 (e)(k) | | 70,506 | | 40,432 |
Commercial Mortgage Securities - continued |
| Principal Amount (c) | | Value |
Bayview Commercial Asset Trust: - continued | | | | |
floater: | | | | |
Series 2005-3A: | | | | |
Class M2, 0.734% 11/25/35 (e)(k) | | $ 89,515 | | $ 49,322 |
Class M3, 0.754% 11/25/35 (e)(k) | | 80,115 | | 42,286 |
Class M4, 0.844% 11/25/35 (e)(k) | | 99,815 | | 48,206 |
Series 2005-4A: | | | | |
Class A2, 0.634% 1/25/36 (e)(k) | | 1,339,119 | | 830,137 |
Class B1, 1.644% 1/25/36 (e)(k) | | 115,723 | | 15,350 |
Class M1, 0.694% 1/25/36 (e)(k) | | 431,974 | | 186,423 |
Class M2, 0.714% 1/25/36 (e)(k) | | 129,592 | | 50,302 |
Class M3, 0.744% 1/25/36 (e)(k) | | 189,259 | | 66,206 |
Class M4, 0.854% 1/25/36 (e)(k) | | 104,671 | | 32,523 |
Class M5, 0.894% 1/25/36 (e)(k) | | 104,671 | | 28,325 |
Class M6, 0.944% 1/25/36 (e)(k) | | 111,172 | | 21,491 |
Series 2006-1: | | | | |
Class A2, 0.604% 4/25/36 (e)(k) | | 209,394 | | 144,837 |
Class M1, 0.624% 4/25/36 (e)(k) | | 74,891 | | 42,348 |
Class M2, 0.644% 4/25/36 (e)(k) | | 79,128 | | 41,685 |
Class M3, 0.664% 4/25/36 (e)(k) | | 68,083 | | 33,509 |
Class M4, 0.764% 4/25/36 (e)(k) | | 38,580 | | 17,350 |
Class M5, 0.804% 4/25/36 (e)(k) | | 37,446 | | 14,986 |
Class M6, 0.884% 4/25/36 (e)(k) | | 74,664 | | 28,394 |
Series 2006-2A: | | | | |
Class A1, 0.474% 7/25/36 (e)(k) | | 3,732,269 | | 2,363,036 |
Class A2, 0.524% 7/25/36 (e)(k) | | 184,648 | | 110,789 |
Class B1, 1.114% 7/25/36 (e)(k) | | 69,135 | | 8,158 |
Class B3, 2.944% 7/25/36 (e)(k) | | 104,452 | | 4,257 |
Class M1, 0.554% 7/25/36 (e)(k) | | 193,735 | | 77,623 |
Class M2, 0.574% 7/25/36 (e)(k) | | 136,689 | | 49,292 |
Class M3, 0.594% 7/25/36 (e)(k) | | 113,381 | | 36,863 |
Class M4, 0.664% 7/25/36 (e)(k) | | 76,562 | | 22,047 |
Class M5, 0.714% 7/25/36 (e)(k) | | 94,102 | | 23,322 |
Class M6, 0.784% 7/25/36 (e)(k) | | 140,402 | | 22,559 |
Series 2006-3A: | | | | |
Class B1, 1.044% 10/25/36 (e)(k) | | 134,709 | | 2,690 |
Class M4, 0.674% 10/25/36 (e)(k) | | 150,266 | | 14,769 |
Class M5, 0.724% 10/25/36 (e)(k) | | 179,890 | | 13,095 |
Class M6, 0.804% 10/25/36 (e)(k) | | 352,527 | | 16,321 |
Series 2006-4A: | | | | |
Class A1, 0.474% 12/25/36 (e)(k) | | 778,249 | | 514,861 |
Class A2, 0.514% 12/25/36 (e)(k) | | 3,959,931 | | 2,019,565 |
Class B1, 0.944% 12/25/36 (e)(k) | | 121,078 | | 11,311 |
Class B2, 1.494% 12/25/36 (e)(k) | | 123,415 | | 7,370 |
Class B3, 2.694% 12/25/36 (e)(k) | | 75,445 | | 1,557 |
Commercial Mortgage Securities - continued |
| Principal Amount (c) | | Value |
Bayview Commercial Asset Trust: - continued | | | | |
floater: | | | | |
Series 2006-4A: | | | | |
Class M1, 0.534% 12/25/36 (e)(k) | | $ 253,315 | | $ 96,533 |
Class M2, 0.554% 12/25/36 (e)(k) | | 168,877 | | 56,800 |
Class M3, 0.584% 12/25/36 (e)(k) | | 171,238 | | 49,945 |
Class M4, 0.644% 12/25/36 (e)(k) | | 204,896 | | 47,492 |
Class M5, 0.684% 12/25/36 (e)(k) | | 188,362 | | 31,083 |
Class M6, 0.764% 12/25/36 (e)(k) | | 168,877 | | 20,617 |
Series 2007-1: | | | | |
Class A2, 0.514% 3/25/37 (e)(k) | | 861,239 | | 413,395 |
Class B1, 0.914% 3/25/37 (e)(k) | | 274,013 | | 19,764 |
Class B2, 1.394% 3/25/37 (e)(k) | | 175,766 | | 7,564 |
Class M1, 0.514% 3/25/37 (e)(k) | | 241,100 | | 78,699 |
Class M2, 0.534% 3/25/37 (e)(k) | | 180,074 | | 46,693 |
Class M3, 0.564% 3/25/37 (e)(k) | | 159,701 | | 31,966 |
Class M4, 0.614% 3/25/37 (e)(k) | | 128,348 | | 18,998 |
Class M5, 0.664% 3/25/37 (e)(k) | | 200,354 | | 25,244 |
Class M6, 0.744% 3/25/37 (e)(k) | | 280,509 | | 28,936 |
Series 2007-2A: | | | | |
Class A1, 0.514% 7/25/37 (e)(k) | | 802,823 | | 413,956 |
Class A2, 0.564% 7/25/37 (e)(k) | | 750,129 | | 262,545 |
Class B1, 1.844% 7/25/37 (e)(k) | | 231,019 | | 8,791 |
Class B2, 2.494% 7/25/37 (e)(k) | | 74,211 | | 3,926 |
Class M1, 0.614% 7/25/37 (e)(k) | | 263,403 | | 39,906 |
Class M2, 0.654% 7/25/37 (e)(k) | | 143,934 | | 15,873 |
Class M3, 0.734% 7/25/37 (e)(k) | | 145,942 | | 12,791 |
Class M4, 0.894% 7/25/37 (e)(k) | | 288,138 | | 22,496 |
Class M5, 0.994% 7/25/37 (e)(k) | | 253,999 | | 16,606 |
Class M6, 1.244% 7/25/37 (e)(k) | | 322,055 | | 16,789 |
Series 2007-3: | | | | |
Class A2, 0.534% 7/25/37 (e)(k) | | 802,070 | | 343,136 |
Class B1, 1.194% 7/25/37 (e)(k) | | 194,948 | | 16,261 |
Class B2, 1.844% 7/25/37 (e)(k) | | 487,850 | | 25,988 |
Class B3, 4.244% 7/25/37 (e)(k) | | 60,124 | | 1,359 |
Class M1, 0.554% 7/25/37 (e)(k) | | 174,202 | | 57,498 |
Class M2, 0.584% 7/25/37 (e)(k) | | 186,713 | | 50,676 |
Class M3, 0.614% 7/25/37 (e)(k) | | 294,214 | | 64,743 |
Class M4, 0.744% 7/25/37 (e)(k) | | 461,959 | | 81,507 |
Class M5, 0.844% 7/25/37 (e)(k) | | 239,618 | | 31,933 |
Class M6, 1.044% 7/25/37 (e)(k) | | 182,715 | | 19,943 |
Series 2007-4A: | | | | |
Class B1, 2.794% 9/25/37 (e)(k) | | 196,665 | | 7,075 |
Class M1, 1.194% 9/25/37 (e)(k) | | 297,810 | | 26,096 |
Class M2, 1.294% 9/25/37 (e)(k) | | 297,810 | | 18,083 |
Commercial Mortgage Securities - continued |
| Principal Amount (c) | | Value |
Bayview Commercial Asset Trust: - continued | | | | |
floater: | | | | |
Series 2007-4A: | | | | |
Class M4, 1.844% 9/25/37 (e)(k) | | $ 761,697 | | $ 32,898 |
Class M5, 1.994% 9/25/37 (e)(k) | | 761,697 | | 24,284 |
Class M6, 2.194% 9/25/37 (e)(k) | | 763,176 | | 15,653 |
Series 2004-1, Class IO, 1.25% 4/25/34 (e)(m) | | 3,557,205 | | 129,838 |
Series 2007-5A, Class IO, 4.1484% 10/25/37 (e)(k)(m) | | 8,807,364 | | 833,171 |
Bear Stearns Commercial Mortgage Securities, Inc. Series 2006-PW11 Class AJ, 5.6187% 3/11/39 (k) | | 450,000 | | 420,982 |
Bear Stearns Commercial Mortgage Securities Trust: | | | | |
floater: | | | | |
Series 2006-BBA7: | | | | |
Class H, 0.8985% 3/15/19 (e)(k) | | 416,945 | | 400,453 |
Class J, 1.0985% 3/15/19 (e)(k) | | 407,118 | | 350,222 |
Series 2007-BBA8: | | | | |
Class D, 0.4985% 3/15/22 (e)(k) | | 655,330 | | 562,281 |
Class E, 0.5485% 3/15/22 (e)(k) | | 3,607,157 | | 3,058,912 |
Class F, 0.5985% 3/15/22 (e)(k) | | 2,235,922 | | 1,851,370 |
Class G, 0.6485% 3/15/22 (e)(k) | | 537,549 | | 439,722 |
Class H, 0.7985% 3/15/22 (e)(k) | | 655,330 | | 522,961 |
Class J, 0.9485% 3/15/22 (e)(k) | | 655,330 | | 509,855 |
sequential payer: | | | | |
Series 2003-PWR2 Class A3, 4.834% 5/11/39 | | 100,492 | | 100,634 |
Series 2004-PWR3 Class A3, 4.487% 2/11/41 | | 560,457 | | 571,386 |
Series 2006-PW14 Class AM, 5.243% 12/11/38 | | 600,000 | | 617,755 |
Series 2006-T22 Class AJ, 5.7044% 4/12/38 (k) | | 400,000 | | 370,403 |
Series 2007-PW16 Class A4, 5.9038% 6/11/40 (k) | | 1,112,000 | | 1,275,869 |
Series 1999-C1: | | | | |
Class G, 5.64% 2/14/31 (e) | | 70,000 | | 70,904 |
Class I, 5.64% 2/14/31 (e) | | 198,779 | | 137,810 |
Series 2003-T10 Class B, 4.84% 3/13/40 | | 1,000,000 | | 1,019,028 |
Series 2006-PW13 Class A3, 5.518% 9/11/41 | | 6,714,000 | | 7,013,209 |
Series 2006-PW14 Class X2, 0.8632% 12/11/38 (e)(k)(m) | | 20,026,973 | | 238,257 |
Series 2006-T22: | | | | |
Class A4, 5.7044% 4/12/38 (k) | | 237,000 | | 269,273 |
Class B, 5.7044% 4/12/38 (e)(k) | | 200,000 | | 161,571 |
Series 2006-T24 Class X2, 0.6237% 10/12/41 (e)(k)(m) | | 3,435,357 | | 25,611 |
Series 2007-BBA8: | | | | |
Class K, 1.4485% 3/15/22 (e)(k) | | 120,000 | | 77,761 |
Class L, 2.1485% 3/15/22 (e)(k) | | 253,498 | | 81,883 |
Commercial Mortgage Securities - continued |
| Principal Amount (c) | | Value |
Bear Stearns Commercial Mortgage Securities Trust: - continued | | | | |
Series 2007-PW18 Class X2, 0.4796% 6/11/50 (e)(k)(m) | | $ 133,870,169 | | $ 1,498,677 |
Series 2007-T28 Class X2, 0.3272% 9/11/42 (e)(k)(m) | | 72,025,455 | | 471,407 |
Beckman Coulter, Inc. sequential payer Series 2000-A Class A, 7.4975% 12/15/18 (e) | | 326,945 | | 326,127 |
C-BASS Trust floater Series 2006-SC1 Class A, 0.514% 5/25/36 (e)(k) | | 730,759 | | 602,581 |
CDC Commercial Mortgage Trust Series 2002-FX1: | | | | |
Class G, 6.625% 5/15/35 (e) | | 2,235,000 | | 2,330,750 |
Class XCL, 1.5913% 5/15/35 (e)(k)(m) | | 7,816,648 | | 182,917 |
CFCRE Commercial Mortgage Trust Series 2011-C2 Class B, 5.7454% 12/15/47 (e)(k) | | 750,000 | | 764,264 |
Chase Commercial Mortgage Securities Corp.: | | | | |
Series 1998-1 Class H, 6.34% 5/18/30 (e) | | 800,000 | | 681,686 |
Series 1998-2 Class J, 6.39% 11/18/30 (e) | | 489,102 | | 330,222 |
Chase Manhattan Bank-First Union National Bank Commercial Mortgage Trust Series 1999-1 Class G, 6.4% 8/15/31 (e) | | 174,355 | | 179,735 |
Citigroup Commercial Mortgage Trust: | | | | |
floater Series 2006-FL2: | | | | |
Class G, 0.5835% 8/15/21 (e)(k) | | 255,108 | | 243,141 |
Class H, 0.6235% 8/15/21 (e)(k) | | 433,548 | | 405,160 |
Series 2006-C5 Class AMP2, 5.5005% 10/15/49 (e) | | 2,818,559 | | 2,686,532 |
Series 2007-C6 Class A1, 5.622% 12/10/49 (k) | | 6,336,472 | | 6,336,631 |
Series 2007-FL3A Class A2, 0.3885% 4/15/22 (e)(k) | | 1,587,295 | | 1,498,097 |
Series 2008-C7 Class A2B, 6.2764% 12/10/49 (k) | | 1,792,607 | | 1,844,983 |
Citigroup/Deutsche Bank Commercial Mortgage Trust: | | | | |
sequential payer Series 2007-CD4 Class A4, 5.322% 12/11/49 | | 14,623,000 | | 16,048,772 |
Series 2007-CD4: | | | | |
Class A3, 5.293% 12/11/49 | | 1,852,000 | | 1,979,453 |
Class C, 5.476% 12/11/49 | | 3,581,000 | | 1,025,982 |
Claregold Trust Series 2007-2A: | | | | |
Class F, 5.01% 5/15/44 (e)(k) | CAD | 138,000 | | 104,819 |
Class G, 5.01% 5/15/44 (e)(k) | CAD | 30,000 | | 21,675 |
Class H, 5.01% 5/15/44 (e)(k) | CAD | 20,000 | | 11,660 |
Class J, 5.01% 5/15/44 (e)(k) | CAD | 20,000 | | 10,936 |
Class K, 5.01% 5/15/44 (e)(k) | CAD | 10,000 | | 4,631 |
Class L, 5.01% 5/15/44 (e)(k) | CAD | 36,000 | | 15,387 |
Class M, 5.01% 5/15/44 (e)(k) | CAD | 165,000 | | 65,206 |
Commercial Mortgage Securities - continued |
| Principal Amount (c) | | Value |
Cobalt CMBS Commercial Mortgage Trust: | | | | |
sequential payer Series 2007-C3 Class A3, 6.0104% 5/15/46 (k) | | $ 1,902,000 | | $ 2,041,032 |
Series 2006-C1 Class B, 5.359% 8/15/48 | | 5,706,000 | | 342,360 |
COMM pass-thru certificates: | | | | |
floater: | | | | |
Series 2005-F10A: | | | | |
Class G, 0.7985% 4/15/17 (e)(k) | | 77,877 | | 75,032 |
Class H, 0.8685% 4/15/17 (e)(k) | | 171,562 | | 148,139 |
Class J, 1.0985% 4/15/17 (e)(k) | | 131,565 | | 92,096 |
Series 2005-FL11: | | | | |
Class B, 0.4985% 11/15/17 (e)(k) | | 175,588 | | 163,296 |
Class C, 0.5485% 11/15/17 (e)(k) | | 1,451,600 | | 1,335,472 |
Class D, 0.5885% 11/15/17 (e)(k) | | 75,490 | | 68,696 |
Class E, 0.6385% 11/15/17 (e)(k) | | 268,371 | | 241,534 |
Class F, 0.6985% 11/15/17 (e)(k) | | 185,934 | | 165,481 |
Class G, 0.7485% 11/15/17 (e)(k) | | 128,880 | | 113,414 |
Series 2006-FL12 Class AJ, 0.3785% 12/15/20 (e)(k) | | 4,060,000 | | 3,639,660 |
sequential payer: | | | | |
Series 2003-LB1A Class D, 4.278% 6/10/38 | | 550,000 | | 537,633 |
Series 2004-RS1 Class A, 5.648% 3/3/41 (e) | | 937,412 | | 936,943 |
Series 2006-C8 Class A3, 5.31% 12/10/46 | | 5,420,000 | | 5,638,036 |
Series 2006-CN2A: | | | | |
Class A2FX, 5.449% 2/5/19 (e) | | 3,306,000 | | 3,215,002 |
Class AJFX, 5.478% 2/5/19 (e) | | 5,750,000 | | 5,714,931 |
Series 2001-J2A Class F, 7.2268% 7/16/34 (e)(k) | | 199,000 | | 205,569 |
Series 2006-C8 Class XP, 0.6566% 12/10/46 (k)(m) | | 16,823,805 | | 148,016 |
Commercial Mortgage Acceptance Corp.: | | | | |
Series 1998-C1: | | | | |
Class F, 6.23% 7/15/31 (e) | | 37,184 | | 38,234 |
Class G, 6.21% 7/15/31 (e) | | 554,000 | | 566,335 |
weighted average coupon Series 1998-C2 Class F, 5.44% 9/15/30 (e)(k) | | 161,250 | | 167,778 |
Commercial Mortgage Asset Trust: | | | | |
Series 1999-C1 Class F, 6.25% 1/17/32 (e) | | 550,000 | | 474,164 |
Series 1999-C2 Class G, 6% 11/17/32 | | 302,000 | | 222,305 |
Commercial Mortgage pass-thru certificates: | | | | |
sequential payer Series 2005-C6 Class A2, 4.999% 6/10/44 (k) | | 13,804 | | 13,851 |
Series 2005 C6 Class B, 5.4022% 6/10/44 (k) | | 905,000 | | 660,779 |
Series 2005-C6 Class AJ, 5.209% 6/10/44 (k) | | 390,000 | | 389,458 |
Series 2011-STRT Class C, 4.755% 12/10/24 (e) | | 420,000 | | 420,762 |
Commercial Mortgage Securities - continued |
| Principal Amount (c) | | Value |
Communication Mortgage Trust Series 2011-THL: | | | | |
Class E, 5.949% 6/9/28 (e) | | $ 440,000 | | $ 444,151 |
Class F, 4.867% 6/9/28 (e) | | 645,000 | | 598,639 |
Credit Suisse Commercial Mortgage Trust: | | | | |
sequential payer: | | | | |
Series 2007-C2: | | | | |
Class A2, 5.448% 1/15/49 (k) | | 5,198,366 | | 5,266,542 |
Class A3, 5.542% 1/15/49 (k) | | 3,804,000 | | 4,141,666 |
Series 2007-C3 Class A4, 5.9018% 6/15/39 (k) | | 28,438,000 | | 31,002,397 |
Series 2006-C4 Class AAB, 5.439% 9/15/39 | | 6,584,127 | | 6,711,997 |
Series 2006-C5 Class ASP, 0.8652% 12/15/39 (k)(m) | | 11,245,165 | | 135,144 |
Series 2007-C5 Class A4, 5.695% 9/15/40 (k) | | 1,722,000 | | 1,886,026 |
Credit Suisse First Boston Mortgage Capital Certificates floater Series 2007-TF2A Class B, 0.5985% 4/15/22 (e)(k) | | 6,783,000 | | 5,036,452 |
Credit Suisse First Boston Mortgage Securities Corp.: | | | | |
floater Series 2006-TF2A Class KER, 0.8485% 9/15/21 (e)(k) | | 258,327 | | 167,913 |
sequential payer Series 2004-C1: | | | | |
Class A3, 4.321% 1/15/37 | | 98,168 | | 98,627 |
Class A4, 4.75% 1/15/37 | | 884,000 | | 931,367 |
Series 1997-C2 Class F, 7.46% 1/17/35 (k) | | 929,000 | | 972,532 |
Series 1998-C1: | | | | |
Class F, 6% 5/17/40 (e) | | 2,259,000 | | 2,322,885 |
Class H, 6% 5/17/40 (e) | | 90,318 | | 7,896 |
Series 1998-C2: | | | | |
Class F, 6.75% 11/15/30 (e) | | 1,156,000 | | 1,262,833 |
Class G, 6.75% 11/15/30 (e) | | 180,000 | | 194,633 |
Series 2001-CK6 Class AX, 1.1089% 8/15/36 (k)(m) | | 741,003 | | 1,890 |
Series 2001-CKN5 Class AX, 1.9203% 9/15/34 (e)(k)(m) | | 2,986,271 | | 4,930 |
Series 2003-C3 Class D, 4.131% 5/15/38 | | 120,000 | | 120,540 |
Series 2006-C1 Class A3, 5.5944% 2/15/39 (k) | | 7,052,699 | | 7,536,246 |
Credit Suisse Mortgage Capital Certificates: | | | | |
floater Series 2007-TFL1: | | | | |
Class B, 0.3985% 2/15/22 (e)(k) | | 721,000 | | 647,170 |
Class C: | | | | |
0.4185% 2/15/22 (e)(k) | | 1,864,711 | | 1,654,745 |
0.5185% 2/15/22 (e)(k) | | 665,993 | | 584,209 |
Class F, 0.5685% 2/15/22 (e)(k) | | 1,331,815 | | 1,154,684 |
Class L, 2.1485% 2/15/22 (e)(k) | | 100,000 | | 9,000 |
Commercial Mortgage Securities - continued |
| Principal Amount (c) | | Value |
Credit Suisse Mortgage Capital Certificates: - continued | | | | |
sequential payer Series 2007-C1 Class A2, 5.268% 2/15/40 | | $ 4,969,701 | | $ 4,966,441 |
Series 2007-C1: | | | | |
Class ASP, 0.5721% 2/15/40 (k)(m) | | 29,709,955 | | 219,675 |
Class B, 5.487% 2/15/40 (e)(k) | | 2,907,000 | | 436,050 |
CRESI Finance Ltd. Partnership floater Series 2006-A Class E, 1.894% 3/25/17 (e)(k) | | 160,000 | | 112,000 |
CRESIX Finance Ltd. Series 2006-AA Class F, 4.444% 3/25/17 (e)(k) | | 260,000 | | 169,000 |
DBUBS Mortgage Trust Series 2011-LC1A: | | | | |
Class D, 5.7284% 11/10/46 (e)(k) | | 500,000 | | 494,703 |
Class E, 5.7284% 11/10/46 (e)(k) | | 260,000 | | 240,502 |
Class F, 5.7284% 11/10/46 (e)(k) | | 710,000 | | 506,450 |
Class XB, 0.3189% 11/10/46 (e)(k)(m) | | 20,920,000 | | 320,264 |
Deutsche Mortgage & Asset Receiving Corp. Series 1998-C1 Class J, 6.22% 6/15/31 | | 400,000 | | 332,074 |
DLJ Commercial Mortgage Corp.: | | | | |
Series 1998-CG1 Class B4, 7.4518% 6/10/31 (e)(k) | | 891,000 | | 937,323 |
Series 2000-CKP1 Class B3, 8.0578% 11/10/33 (k) | | 230,000 | | 229,960 |
Extended Stay America Trust: | | | | |
Series 2010-ESHA Class D, 5.4983% 11/5/27 (e) | | 1,990,000 | | 2,022,234 |
Series 2010-ESHA, Class C4, 4.8603% 11/5/27 (e) | | 320,000 | | 328,284 |
FHMLC Multi-class participation certificates guaranteed: | | | | |
Series K013 Class X3, 2.8845% 1/25/43 (k)(m) | | 820,000 | | 135,770 |
Series KAIV Class X2, 3.6146% 6/25/46 (k)(m) | | 420,000 | | 87,260 |
First Union National Bank Commercial Mortgage Trust Series 2001-C4 Class K, 6% 12/12/33 (e) | | 27,257 | | 27,166 |
First Union National Bank-Bank of America Commercial Mortgage Trust Series 2001-C1 Class G, 6.936% 3/15/33 (e) | | 1,692,000 | | 1,707,426 |
First Union-Lehman Brothers-Bank of America Commercial Mortgage Trust sequential payer Series 1998-C2 Class G, 7% 11/18/35 (e)(k) | | 443,000 | | 477,382 |
Four Times Square Trust sequential payer Series 2006-4TS Class A, 5.401% 12/13/28 (e) | | 200,000 | | 230,575 |
Freddie Mac Multi-Class pass-thru certificates: | | | | |
Series K011 Class X3, 2.6618% 12/25/43 (k)(m) | | 1,640,000 | | 248,485 |
Series K012 Class X3, 2.3657% 1/25/41 (k)(m) | | 1,800,000 | | 243,248 |
FREMF Mortgage Trust: | | | | |
Series 2010-K9 Class B, 5.3301% 9/25/45 (e)(k) | | 1,290,000 | | 1,308,594 |
Series 2011-K10 Class B, 4.7561% 11/25/49 (e)(k) | | 240,000 | | 233,392 |
Series 2011-K11 Class B, 4.5694% 12/25/48 (e)(k) | | 750,000 | | 718,276 |
Commercial Mortgage Securities - continued |
| Principal Amount (c) | | Value |
G-Force LLC sequential payer Series 2005-RRA Class A2, 4.83% 8/22/36 (e) | | $ 1,361,495 | | $ 1,252,575 |
GE Capital Commercial Mortgage Corp.: | | | | |
sequential payer Series 2007-C1 Class A4, 5.543% 12/10/49 | | 11,404,000 | | 12,347,077 |
Series 2001-1 Class X1, 1.5729% 5/15/33 (e)(k)(m) | | 2,171,442 | | 19,304 |
Series 2002-1A Class H, 7.3318% 12/10/35 (e)(k) | | 65,000 | | 64,944 |
Series 2007-C1 Class XP, 0.3493% 12/10/49 (k)(m) | | 25,541,983 | | 112,538 |
GMAC Commercial Mortgage Securities, Inc.: | | | | |
Series 1997-C1 Class H, 6.6% 7/15/29 | | 411,904 | | 208,054 |
Series 1997-C2: | | | | |
Class F, 6.75% 4/15/29 (k) | | 654,009 | | 677,411 |
Class G, 6.75% 4/15/29 (k) | | 504,000 | | 548,832 |
Series 1999-C1 Class F, 6.02% 5/15/33 (e) | | 225,989 | | 232,496 |
Series 1999-C2I Class K, 6.481% 9/15/33 (n) | | 385,000 | | 179,971 |
Series 1999-C3: | | | | |
Class G, 6.974% 8/15/36 (e) | | 5,204 | | 5,194 |
Class J, 6.974% 8/15/36 | | 226,000 | | 225,250 |
Class K, 6.974% 8/15/36 | | 427,000 | | 148,388 |
Series 2000-C1 Class K, 7% 3/15/33 | | 38,385 | | 28,713 |
Series 2005-C1 Class X2, 0.7314% 5/10/43 (k)(m) | | 6,595,339 | | 11,298 |
Greenwich Capital Commercial Funding Corp.: | | | | |
floater Series 2006-FL4 Class B, 0.4525% 11/5/21 (e)(k) | | 715,000 | | 694,506 |
sequential payer: | | | | |
Series 2003-C1 Class D, 4.29% 7/5/35 (e) | | 490,000 | | 500,037 |
Series 2007-GG11 Class A2, 5.597% 12/10/49 | | 3,804,000 | | 3,917,047 |
Series 2007-GG9 Class A4, 5.444% 3/10/39 | | 5,530,000 | | 6,139,412 |
Series 2002-C1: | | | | |
Class H, 5.903% 1/11/35 (e) | | 97,000 | | 97,496 |
Class J, 6.306% 1/11/35 (e) | | 760,000 | | 755,761 |
Series 2003-C2 Class J, 5.234% 1/5/36 (e)(k) | | 250,000 | | 219,528 |
Series 2005-GG3 Class B, 4.894% 8/10/42 (k) | | 680,000 | | 654,330 |
Series 2006-GG7 Class A3, 6.079% 7/10/38 (k) | | 3,719,734 | | 3,719,351 |
Series 2007-GG11 Class A1, 0.4565% 12/10/49 (e)(k)(m) | | 40,350,265 | | 250,414 |
GS Mortgage Securities Corp. II: | | | | |
floater: | | | | |
Series 2006-FL8A: | | | | |
Class E, 0.6325% 6/6/20 (e)(k) | | 431,608 | | 411,642 |
Class F, 0.7025% 6/6/20 (e)(k) | | 835,001 | | 788,275 |
Class J, 2.0125% 6/6/20 (e)(k) | | 250,000 | | 204,710 |
Commercial Mortgage Securities - continued |
| Principal Amount (c) | | Value |
GS Mortgage Securities Corp. II: - continued | | | | |
floater: | | | | |
Series 2007-EOP: | | | | |
Class C, 2.1455% 3/6/20 (e)(k) | | $ 1,994,000 | | $ 1,940,561 |
Class D, 2.3636% 3/6/20 (e)(k) | | 4,004,000 | | 3,880,677 |
Class F, 2.8433% 3/6/20 (e)(k) | | 164,000 | | 157,473 |
Class G, 3.0177% 3/6/20 (e)(k) | | 81,000 | | 77,371 |
Class H, 3.5846% 3/6/20 (e)(k) | | 60,000 | | 57,372 |
Class J, 4.4568% 3/6/20 (e)(k) | | 86,000 | | 82,792 |
Class L, 6.4193% 3/6/20 (e)(k) | | 400,000 | | 388,680 |
sequential payer Series 2004-GG2 Class A4, 4.964% 8/10/38 | | 458,663 | | 465,189 |
Series 1997-GL: | | | | |
Class G, 7.7695% 7/13/30 (k) | | 790,614 | | 852,124 |
Class H, 8.0595% 7/13/30 (e)(k) | | 230,000 | | 243,800 |
Series 2005-GG4 Class XP, 0.8961% 7/10/39 (e)(k)(m) | | 28,943,944 | | 62,635 |
Series 2006-GG6 Class A2, 5.506% 4/10/38 | | 5,474,113 | | 5,562,903 |
Series 2006-RR2: | | | | |
Class M, 5.7472% 6/23/46 (e)(k) | | 100,000 | | 0 |
Class N, 5.7472% 6/23/46 (e)(k) | | 100,000 | | 0 |
Series 2010-C1: | | | | |
Class D, 6.1391% 8/10/43 (e)(k) | | 290,000 | | 286,435 |
Class E, 4% 8/10/43 (e) | | 1,200,000 | | 772,960 |
Class X, 1.699% 8/10/43 (e)(k)(m) | | 6,244,063 | | 536,315 |
GS Mortgage Securities Corp. Trust Series 2011-ALF Class E, 4.953% 2/10/21 (e) | | 510,000 | | 490,977 |
GS Mortgage Securities Trust: | | | | |
sequential payer: | | | | |
Series 2006-GG8 Class A2, 5.479% 11/10/39 | | 905,440 | | 910,953 |
Series 2007-GG10 Class A2, 5.778% 8/10/45 | | 9,323,423 | | 9,493,594 |
Series 2010-C2 Class XA, 0.8635% 12/10/43 (e)(k) | | 5,590,552 | | 149,268 |
Series 2011-GC5 Class C, 5.4751% 8/10/44 (e)(k) | | 1,050,000 | | 953,123 |
HVB Mortgage Capital Corp. floater Series 2003-FL1A Class K, 3.1048% 9/10/22 (e)(k) | | 1,120,000 | | 1,071,280 |
JPMorgan Chase Commercial Mortgage Securities Corp.: | | | | |
floater Series 2011-CCHP Class E, 5.15% 7/15/28 (e)(k) | | 500,000 | | 488,669 |
Series 2002-C1 Class E, 6.135% 7/12/37 (e) | | 935,000 | | 939,917 |
Series 2003-C1: | | | | |
Class CM1, 5.6896% 1/12/37 (e)(k) | | 200,157 | | 196,154 |
Class D, 5.192% 1/12/37 | | 270,000 | | 265,375 |
Series 2009-IWST Class D, 7.6935% 12/5/27 (e)(k) | | 1,025,000 | | 1,056,411 |
Commercial Mortgage Securities - continued |
| Principal Amount (c) | | Value |
JPMorgan Chase Commercial Mortgage Securities Corp.: - continued | | | | |
Series 2010-CNTR Class D, 6.3899% 8/5/32 (e)(k) | | $ 695,000 | | $ 652,846 |
Series 2011-C4 Class E, 5.5686% 7/15/46 (e)(k) | | 370,000 | | 305,405 |
JPMorgan Chase Commercial Mortgage Securities Trust: | | | | |
floater: | | | | |
Series 2006-FL1A Class E, 0.6185% 2/15/20 (e)(k) | | 144,283 | | 131,555 |
Series 2006-FLA2: | | | | |
Class A2, 0.3785% 11/15/18 (e)(k) | | 7,706,881 | | 7,441,957 |
Class B, 0.4185% 11/15/18 (e)(k) | | 1,046,104 | | 972,877 |
Class C, 0.4585% 11/15/18 (e)(k) | | 743,228 | | 668,905 |
Class D, 0.4785% 11/15/18 (e)(k) | | 226,403 | | 199,235 |
Class E, 0.5285% 11/15/18 (e)(k) | | 326,598 | | 280,875 |
Class F, 0.5785% 11/15/18 (e)(k) | | 489,002 | | 415,652 |
Class G, 0.6085% 11/15/18 (e)(k) | | 424,901 | | 348,419 |
Class H, 0.7485% 11/15/18 (e)(k) | | 326,672 | | 254,804 |
sequential payer: | | | | |
Series 2006-CB14 Class A3B, 5.674% 12/12/44 (k) | | 4,674,131 | | 4,838,558 |
Series 2006-LDP9: | | | | |
Class A2, 5.134% 5/15/47 (k) | | 722,147 | | 756,105 |
Class A3, 5.336% 5/15/47 | | 9,409,000 | | 10,360,146 |
Series 2007-CB19 Class A4, 5.9303% 2/12/49 (k) | | 6,670,000 | | 7,590,387 |
Series 2007-LD11 Class A2, 5.9895% 6/15/49 (k) | | 5,183,724 | | 5,228,112 |
Series 2007-LDPX: | | | | |
Class A2 S, 5.305% 1/15/49 | | 3,575,983 | | 3,576,730 |
Class A3, 5.42% 1/15/49 | | 25,732,000 | | 28,792,487 |
Series 2004-CBX Class D, 5.097% 1/12/37 (k) | | 170,000 | | 108,954 |
Series 2004-LN2 Class D, 5.4059% 7/15/41 (k) | | 420,000 | | 253,192 |
Series 2005-CB13 Class E, 5.5259% 1/12/43 (e)(k) | | 963,000 | | 49,145 |
Series 2005-LDP3 Class A3, 4.959% 8/15/42 | | 10,011,998 | | 10,215,602 |
Series 2005-LDP5 Class AJ, 5.4938% 12/15/44 (k) | | 360,000 | | 362,862 |
Series 2006-CB17 Class A3, 5.45% 12/12/43 | | 500,167 | | 516,387 |
Series 2007-CB19: | | | | |
Class B, 5.9303% 2/12/49 (k) | | 165,000 | | 61,442 |
Class C, 5.9303% 2/12/49 (k) | | 424,000 | | 124,055 |
Class D, 5.9303% 2/12/49 (k) | | 447,000 | | 62,024 |
Series 2007-LDP10: | | | | |
Class BS, 5.437% 1/15/49 (k) | | 364,000 | | 93,067 |
Class CS, 5.466% 1/15/49 (k) | | 157,000 | | 19,087 |
Class ES, 5.7445% 1/15/49 (e)(k) | | 983,000 | | 51,455 |
Commercial Mortgage Securities - continued |
| Principal Amount (c) | | Value |
JPMorgan Chase Commercial Mortgage Securities Trust: - continued | | | | |
Series 2010-C2: | | | | |
Class D, 5.7126% 11/15/43 (e)(k) | | $ 645,000 | | $ 586,595 |
Class XB, 0.7538% 11/15/43 (e)(k)(m) | | 3,600,000 | | 142,076 |
JPMorgan Chase Commercial Mortgage Security Trust Series 2011-C5: | | | | |
Class B. 5.4912% 8/15/46 (e)(k) | | 980,000 | | 995,887 |
Class C, 5.4912% 8/15/46 (e)(k) | | 250,000 | | 229,592 |
JPMorgan Commercial Mortgage Finance Corp.: | | | | |
Series 1997-C5 Class F, 7.5605% 9/15/29 | | 346,029 | | 350,651 |
Series 2000-C9 Class G, 6.25% 10/15/32 (e) | | 48,921 | | 49,024 |
LB Commercial Conduit Mortgage Trust: | | | | |
sequential payer Series 2007-C3 Class A4, 6.1327% 7/15/44 (k) | | 21,615,000 | | 24,630,725 |
Series 1998-C1 Class D, 6.98% 2/18/30 | | 270,678 | | 275,217 |
Series 1998-C4 Class G, 5.6% 10/15/35 (e) | | 576,583 | | 608,477 |
LB-UBS Commercial Mortgage Trust: | | | | |
sequential payer: | | | | |
Series 2004-C2 Class E, 4.487% 3/15/36 | | 150,000 | | 143,570 |
Series 2005-C3 Class AJ, 4.843% 7/15/40 | | 1,220,000 | | 1,214,810 |
Series 2005-C7: | | | | |
Class AJ, 5.323% 11/15/40 | | 1,210,000 | | 1,237,829 |
Class AM, 5.263% 11/15/40 (k) | | 137,000 | | 146,818 |
Series 2006-C1 Class A2, 5.084% 2/15/31 | | 257,912 | | 260,589 |
Series 2006-C6: | | | | |
Class A2, 5.262% 9/15/39 (k) | | 563,472 | | 564,097 |
Class AM, 5.413% 9/15/39 | | 1,500,000 | | 1,597,740 |
Series 2006-C7: | | | | |
Class A2, 5.3% 11/15/38 | | 1,142,434 | | 1,143,788 |
Class A3, 5.347% 11/15/38 | | 1,417,000 | | 1,599,959 |
Class AM, 5.378% 11/15/38 | | 160,000 | | 160,580 |
Series 2007-C1: | | | | |
Class A3, 5.398% 2/15/40 | | 10,000,000 | | 10,428,450 |
Class A4, 5.424% 2/15/40 | | 5,434,000 | | 6,135,394 |
Series 2007-C2 Class A3, 5.43% 2/15/40 | | 3,967,000 | | 4,408,166 |
Series 2007-C6 Class A2, 5.845% 7/15/40 | | 9,593,209 | | 9,751,746 |
Series 2002-C1 Class J, 6.95% 3/15/34 (e)(k) | | 86,000 | | 86,099 |
Series 2003-C7 Class L, 5.224% 7/15/37 (e)(k) | | 284,000 | | 171,883 |
Series 2004-C2 Class G, 4.595% 3/15/36 (e)(k) | | 225,000 | | 193,145 |
Series 2005-C2 Class AJ, 5.205% 4/15/30 (k) | | 740,000 | | 770,761 |
Series 2005-C3 Class XCP, 0.9042% 7/15/40 (k)(m) | | 4,326,994 | | 9,078 |
Series 2005-C7 Class C, 5.35% 11/15/40 (k) | | 866,000 | | 774,697 |
Commercial Mortgage Securities - continued |
| Principal Amount (c) | | Value |
LB-UBS Commercial Mortgage Trust: - continued | | | | |
Series 2006-C4: | | | | |
Class AJ, 5.8935% 6/15/38 (k) | | $ 660,000 | | $ 551,075 |
Class AM, 6.0868% 6/15/38 (k) | | 500,000 | | 530,074 |
Series 2006-C6 Class XCP, 0.8617% 9/15/39 (k)(m) | | 8,109,240 | | 86,801 |
Series 2007-C1 Class XCP, 0.6167% 2/15/40 (k)(m) | | 3,031,686 | | 25,678 |
Series 2007-C6 Class A4, 5.858% 7/15/40 (k) | | 2,376,000 | | 2,690,951 |
Series 2007-C7: | | | | |
Class A3, 5.866% 9/15/45 | | 2,029,000 | | 2,304,952 |
Class XCP, 0.431% 9/15/45 (k)(m) | | 139,001,657 | | 1,009,291 |
Lehman Brothers Floating Rate Commercial Mortgage Trust floater: | | | | |
Series 2006-LLFA: | | | | |
Class D, 0.4785% 9/15/21 (e)(k) | | 608,683 | | 544,875 |
Class E, 0.5385% 9/15/21 (e)(k) | | 2,196,145 | | 1,900,037 |
Class F, 0.5885% 9/15/21 (e)(k) | | 1,143,094 | | 954,677 |
Class G, 0.6085% 9/15/21 (e)(k) | | 2,258,211 | | 1,818,241 |
Class H, 0.6485% 9/15/21 (e)(k) | | 582,579 | | 445,771 |
Series 2007-LLFA Class E, 1.1485% 6/15/22 (e)(k) | | 760,000 | | 619,400 |
Lehman Large Loan Trust Series 1997-LLI Class E, 7.3% 10/12/34 | | 3,377,000 | | 3,381,981 |
Lstar Commercial Mortgage Trust: | | | | |
Series 2011-1 Class D, 5.6888% 6/25/43 (e)(k) | | 310,000 | | 262,420 |
Series 2011-1 Class B, 5.6888% 6/25/43 (e)(k) | | 540,000 | | 556,894 |
Merrill Lynch Financial Asset, Inc. Series 2006-CA20 Class E, 5.4078% 10/12/39 (e)(k) | CAD | 320,000 | | 288,035 |
Merrill Lynch Mortgage Investors Trust: | | | | |
Series 1997-C2 Class F, 6.25% 12/10/29 (k) | | 499,921 | | 506,878 |
Series 1998-C3 Class E, 7.0079% 12/15/30 (k) | | 173,000 | | 177,421 |
Merrill Lynch Mortgage Trust: | | | | |
Series 05-LC1 Class AJ, 5.5028% 1/12/44 (k) | | 220,000 | | 217,578 |
Series 2004-MKB1 Class F, 5.8353% 2/12/42 (e)(k) | | 180,000 | | 170,767 |
Series 2005-CKI1 Class A3, 5.3913% 11/12/37 (k) | | 1,288,965 | | 1,300,998 |
Series 2005-LC1 Class F, 5.5568% 1/12/44 (e)(k) | | 1,655,000 | | 924,354 |
Series 2006-C1: | | | | |
Class A2, 5.8093% 5/12/39 (k) | | 1,762,126 | | 1,823,402 |
Class AJ, 5.8543% 5/12/39 (k) | | 160,000 | | 142,616 |
Class AM, 5.8093% 5/12/39 (k) | | 100,000 | | 104,299 |
Series 2007-C1 Class A4, 6.0271% 6/12/50 (k) | | 7,199,517 | | 8,097,743 |
Series 2008-C1 Class A4, 5.69% 2/12/51 | | 4,059,000 | | 4,620,498 |
Merrill Lynch-CFC Commercial Mortgage Trust: | | | | |
floater Series 2006-4 Class A2FL, 0.4158% 12/12/49 (k) | | 287,583 | | 287,502 |
Commercial Mortgage Securities - continued |
| Principal Amount (c) | | Value |
Merrill Lynch-CFC Commercial Mortgage Trust: - continued | | | | |
sequential payer: | | | | |
Series 2006-1 Class A3, 5.6568% 2/12/39 (k) | | $ 2,024,000 | | $ 2,056,700 |
Series 2006-4: | | | | |
Class A2, 5.112% 12/12/49 (k) | | 348,537 | | 348,474 |
Class ASB, 5.133% 12/12/49 (k) | | 1,565,372 | | 1,661,858 |
Series 2007-5: | | | | |
Class A3, 5.364% 8/12/48 | | 11,417,000 | | 11,707,974 |
Class A4, 5.378% 8/12/48 | | 76,000 | | 82,169 |
Class B, 5.479% 8/12/48 | | 5,706,000 | | 1,426,500 |
Series 2007-6 Class A4, 5.485% 3/12/51 (k) | | 14,650,000 | | 15,888,028 |
Series 2007-7 Class A4, 5.81% 6/12/50 (k) | | 6,656,000 | | 7,198,531 |
Series 2006-3 Class ASB, 5.382% 7/12/46 (k) | | 7,452,019 | | 7,842,140 |
Series 2006-4 Class XP, 0.8109% 12/12/49 (k)(m) | | 27,872,665 | | 465,055 |
Series 2007-6 Class B, 5.635% 3/12/51 (k) | | 1,902,000 | | 594,114 |
Series 2007-7 Class B, 5.9345% 6/12/50 (k) | | 166,000 | | 13,994 |
Series 2007-8 Class A3, 6.1644% 8/12/49 (k) | | 1,640,000 | | 1,822,206 |
Morgan Stanley Capital I Trust: | | | | |
floater: | | | | |
Series 2006-XLF: | | | | |
Class C, 1.449% 7/15/19 (e)(k) | | 357,716 | | 207,475 |
Class H, 0.629% 7/15/19 (e)(k) | | 108,390 | | 103,512 |
Class J, 0.679% 7/15/19 (e)(k) | | 354,000 | | 299,130 |
Series 2007-XLFA: | | | | |
Class C, 0.409% 10/15/20 (e)(k) | | 1,092,000 | | 989,221 |
Class D, 0.439% 10/15/20 (e)(k) | | 667,354 | | 601,206 |
Class E, 0.499% 10/15/20 (e)(k) | | 834,661 | | 710,196 |
Class F, 0.549% 10/15/20 (e)(k) | | 500,899 | | 381,124 |
Class G, 0.589% 10/15/20 (e)(k) | | 619,188 | | 452,552 |
Class H, 0.679% 10/15/20 (e)(k) | | 389,758 | | 226,403 |
Class J, 0.829% 10/15/20 (e)(k) | | 228,006 | | 94,823 |
Class MHRO, 0.939% 10/15/20 (e)(k) | | 594,748 | | 499,588 |
Class NHRO, 1.139% 10/15/20 (e)(k) | | 902,610 | | 740,140 |
sequential payer: | | | | |
Series 2004-RR2 Class A2, 5.45% 10/28/33 (e) | | 281,085 | | 282,490 |
Series 2005-IQ9 Class A3, 4.54% 7/15/56 | | 1,961,048 | | 1,998,459 |
Series 2006-HQ10 Class AM, 5.36% 11/12/41 | | 620,000 | | 646,649 |
Series 2007-HQ11 Class A31, 5.439% 2/12/44 (k) | | 964,000 | | 1,011,826 |
Series 2007-IQ13: | | | | |
Class A1, 5.05% 3/15/44 | | 12,853 | | 12,841 |
Class A4, 5.364% 3/15/44 | | 10,000,000 | | 11,017,950 |
Commercial Mortgage Securities - continued |
| Principal Amount (c) | | Value |
Morgan Stanley Capital I Trust: - continued | | | | |
sequential payer: | | | | |
Series 1997-RR Class F, 7.398% 4/30/39 (e)(k) | | $ 158,553 | | $ 142,698 |
Series 1998-CF1 Class G, 7.35% 7/15/32 (e) | | 205,756 | | 100,821 |
Series 1999-WF1: | | | | |
Class N, 5.91% 11/15/31 (e) | | 210,000 | | 170,208 |
Class O, 5.91% 11/15/31 (e) | | 197,950 | | 46,832 |
Series 2004-IQ7 Class E, 5.5403% 6/15/38 (e)(k) | | 120,000 | | 84,000 |
Series 2004-RR2 Class C, 5.88% 10/28/33 (e)(k) | | 280,000 | | 212,800 |
Series 2006-HQ10 Class X2, 0.6911% 11/12/41 (e)(k)(m) | | 8,843,355 | | 36,196 |
Series 2006-HQ8 Class A3, 5.6512% 3/12/44 (k) | | 628,661 | | 632,077 |
Series 2006-IQ11: | | | | |
Class A3, 5.859% 10/15/42 (k) | | 1,422,351 | | 1,474,830 |
Class A4, 5.895% 10/15/42 (k) | | 570,000 | | 643,168 |
Series 2006-IQ12 Class AMFX, 5.37% 12/15/43 | | 719,000 | | 765,076 |
Series 2006-T23 Class A3, 5.986% 8/12/41 (k) | | 972,000 | | 1,015,339 |
Series 2007-HQ12 Class A2, 5.7828% 4/12/49 (k) | | 11,641,836 | | 12,000,929 |
Series 2007-IQ14: | | | | |
Class A4, 5.692% 4/15/49 (k) | | 2,852,000 | | 3,126,168 |
Class B, 5.9063% 4/15/49 (k) | | 469,000 | | 127,093 |
Series 2011-C1: | | | | |
Class C, 5.4222% 9/15/47 (e)(k) | | 250,000 | | 248,054 |
Class D, 5.4222% 9/15/47 (e)(k) | | 590,000 | | 544,372 |
Class E, 5.4222% 9/15/47 (e)(k) | | 573,100 | | 485,765 |
Series 2011-C2: | | | | |
Class D, 5.4958% 6/15/44 (e)(k) | | 580,000 | | 534,180 |
Class E, 5.4958% 6/15/44 (e)(k) | | 600,000 | | 506,814 |
Class F, 5.4958% 6/15/44 (e)(k) | | 550,000 | | 404,762 |
Class XB, 0.5399% 6/15/44 (e)(k)(m) | | 9,001,008 | | 278,851 |
Series 2011-C3: | | | | |
Class D, 5.357% 7/15/49 (e) | | 1,130,000 | | 1,011,767 |
Class E, 5.3573% 7/15/49 (e)(k) | | 400,000 | | 327,708 |
Morgan Stanley Dean Witter Capital I Trust: | | | | |
Series 2000-PRIN Class C, 7.9031% 2/23/34 (k) | | 466,000 | | 520,248 |
Series 2001-TOP3 Class E, 7.4705% 7/15/33 (e)(k) | | 150,000 | | 127,917 |
Series 2003-TOP9 Class E, 5.8886% 11/13/36 (e)(k) | | 78,000 | | 77,141 |
NationsLink Funding Corp.: | | | | |
Series 1998-2: | | | | |
Class F, 7.105% 8/20/30 (e) | | 479,927 | | 495,420 |
Class G, 5% 8/20/30 (e) | | 361,875 | | 365,410 |
Class J, 5% 8/20/30 (e) | | 195,000 | | 186,026 |
Series 1999-SL Class X, 11/10/30 (m) | | 113,179 | | 98,749 |
Commercial Mortgage Securities - continued |
| Principal Amount (c) | | Value |
Nomura Asset Securities Corp. Series 1998-D6 Class B1, 6% 3/15/30 (e) | | $ 1,050,000 | | $ 1,077,727 |
Providence Place Group Ltd. Partnership Series 2000-C1 Class A2, 7.75% 7/20/28 (e) | | 770,286 | | 816,503 |
RBSCF Trust Series 2010-MB1 Class D, 4.829% 4/15/24 (e)(k) | | 480,000 | | 463,500 |
Real Estate Asset Liquidity Trust: | | | | |
2006-2 Series L, 4.456% 9/12/38 | CAD | 26,000 | | 14,799 |
Series 2007-1 Class J, 4.57% 4/12/23 (e)(k) | CAD | 42,000 | | 27,664 |
Series 2006-2: | | | | |
Class F, 4.456% 9/12/38 | CAD | 107,000 | | 89,053 |
Class G, 4.456% 9/12/38 | CAD | 54,000 | | 42,982 |
Class H, 4.456% 9/12/38 | CAD | 36,000 | | 26,820 |
Class J, 4.456% 9/12/38 | CAD | 36,000 | | 25,041 |
Class K, 4.456% 9/12/38 | CAD | 18,000 | | 11,030 |
Class M, 4.456% 9/12/38 | CAD | 128,859 | | 36,458 |
Series 2007-1: | | | | |
Class F, 4.57% 4/12/23 (e)(k) | CAD | 126,000 | | 94,449 |
Class G, 4.57% 4/12/23 (e)(k) | CAD | 42,000 | | 30,143 |
Class H, 4.57% 4/12/23 (e)(k) | CAD | 42,000 | | 28,871 |
Class K, 4.57% 4/12/23 (e)(k) | CAD | 21,000 | | 13,259 |
Class L, 4.57% 4/12/23 (e)(k) | CAD | 63,000 | | 38,144 |
Class M, 4.57% 4/12/23 (e)(k) | CAD | 185,000 | | 50,123 |
Salomon Brothers Mortgage Securities VII, Inc. Series 2001-MMA: | | | | |
Class E3, 6.5% 2/18/34 (e)(k) | | 200,000 | | 207,946 |
Class E5, 6.5% 2/18/34 (e)(k) | | 900,000 | | 906,336 |
Structured Asset Securities Corp. Series 1997-LLI: | | | | |
Class D, 7.15% 10/12/34 | | 91,243 | | 91,385 |
Class F, 7.3% 10/12/34 (e) | | 473,000 | | 473,326 |
TIAA Seasoned Commercial Mortgage Trust: | | | | |
sequential payer Series 2007-C4 Class AJ, 5.7188% 8/15/39 (k) | | 170,000 | | 166,911 |
Series 2007-C4 Class F, 5.7188% 8/15/39 (k) | | 820,000 | | 575,844 |
TimberStar Trust I Series 2006-1 Class F, 7.5296% 10/15/36 (e) | | 270,000 | | 251,159 |
UBS Commercial Mortgage Trust Series 2007-FL1: | | | | |
Class F, 0.8235% 7/15/24 (e)(k) | | 110,000 | | 72,095 |
Class G, 0.8235% 7/15/24 (e)(k) | | 200,000 | | 120,082 |
UBS-Citigroup Commercial Mortgage Trust Series 2011-C1 Class B, 6.0708% 1/10/45 (e)(k) | | 284,000 | | 299,239 |
Vornado DP LLC Series 2010-VNO Class D, 6.3555% 9/13/28 (e) | | 180,000 | | 191,040 |
Commercial Mortgage Securities - continued |
| Principal Amount (c) | | Value |
Wachovia Bank Commercial Mortgage Trust: | | | | |
floater: | | | | |
Series 2006-WL7A: | | | | |
Class E, 0.5696% 9/15/21 (e)(k) | | $ 1,770,598 | | $ 1,386,828 |
Class F, 0.6296% 9/15/21 (e)(k) | | 1,877,987 | | 1,414,601 |
Class G, 0.6496% 9/15/21 (e)(k) | | 1,779,101 | | 1,286,742 |
Class J, 0.8896% 9/15/21 (e)(k) | | 395,545 | | 179,282 |
Series 2007-WHL8: | | | | |
Class AP1, 0.9485% 6/15/20 (e)(k) | | 140,220 | | 126,198 |
Class AP2, 1.0485% 6/15/20 (e)(k) | | 235,007 | | 206,806 |
Class F, 0.7285% 6/15/20 (e)(k) | | 4,565,501 | | 2,967,576 |
Class LXR1, 0.9485% 6/15/20 (e)(k) | | 233,916 | | 189,472 |
sequential payer: | | | | |
Series 2003-C7 Class A1, 4.241% 10/15/35 (e) | | 1,598,102 | | 1,609,274 |
Series 2003-C8 Class A3, 4.445% 11/15/35 | | 6,853,479 | | 6,928,648 |
Series 2006-C29 Class A3, 5.313% 11/15/48 | | 5,051,000 | | 5,204,503 |
Series 2007-C30: | | | | |
Class A3, 5.246% 12/15/43 | | 612,481 | | 626,639 |
Class A4, 5.305% 12/15/43 | | 8,604,000 | | 9,143,574 |
Class A5, 5.342% 12/15/43 | | 13,536,000 | | 14,744,210 |
Series 2007-C31 Class A4, 5.509% 4/15/47 | | 13,599,000 | | 14,859,247 |
Series 2007-C32: | | | | |
Class A2, 5.9237% 6/15/49 (k) | | 13,343,546 | | 13,829,438 |
Class A3, 5.9287% 6/15/49 (k) | | 3,229,000 | | 3,554,796 |
Series 2003-C6 Class G, 5.125% 8/15/35 (e)(k) | | 903,000 | | 902,409 |
Series 2004-C10 Class E, 4.931% 2/15/41 | | 340,000 | | 336,682 |
Series 2004-C11: | | | | |
Class D, 5.5485% 1/15/41 (k) | | 360,000 | | 326,672 |
Class E, 5.5985% 1/15/41 (k) | | 327,000 | | 277,115 |
Series 2004-C12 Class D, 5.495% 7/15/41 (k) | | 280,000 | | 283,058 |
Series 2004-C14: | | | | |
Class B, 5.17% 8/15/41 | | 258,500 | | 251,203 |
Class C, 5.21% 8/15/41 | | 170,000 | | 162,456 |
Series 2004-C15 Class 175C, 6.0432% 10/15/41 (e)(k) | | 500,000 | | 486,749 |
Series 2005-C19 Class B, 4.892% 5/15/44 | | 1,902,000 | | 1,730,468 |
Series 2005-C22: | | | | |
Class B, 5.5336% 12/15/44 (k) | | 4,218,000 | | 2,898,905 |
Class F, 5.5336% 12/15/44 (e)(k) | | 3,171,000 | | 766,678 |
Series 2006-C23 Class A5, 5.416% 1/15/45 (k) | | 7,870,000 | | 8,644,243 |
Series 2007-C30: | | | | |
Class B, 5.463% 12/15/43 (k) | | 10,505,000 | | 5,509,505 |
Class C, 5.483% 12/15/43 (k) | | 5,706,000 | | 2,253,271 |
Commercial Mortgage Securities - continued |
| Principal Amount (c) | | Value |
Wachovia Bank Commercial Mortgage Trust: - continued | | | | |
Series 2007-C30: | | | | |
Class D, 5.513% 12/15/43 (k) | | $ 3,044,000 | | $ 776,978 |
Class XP, 0.6327% 12/15/43 (e)(k)(m) | | 17,012,943 | | 166,216 |
Series 2007-C31 Class C, 5.8735% 4/15/47 (k) | | 522,000 | | 106,598 |
Series 2007-C32: | | | | |
Class D, 5.9287% 6/15/49 (k) | | 1,431,000 | | 418,374 |
Class E, 5.9287% 6/15/49 (k) | | 2,252,000 | | 561,874 |
Wachovia Bank Commercial Mortgage Trust pass-thru certificates sequential payer Series 2007-C33 Class A5, 6.0964% 2/15/51 (k) | | 19,259,000 | | 21,264,844 |
Wells Fargo Commercial Mortgage Trust Series 2010-C1 Class XB, 0.5792% 11/15/43 (e)(m) | | 20,614,217 | | 723,559 |
WF-RBS Commercial Mortgage Trust: | | | | |
Series 2011-C3 Class C, 5.335% 3/15/44 (e) | | 360,000 | | 357,602 |
Series 2011-C4 Class E, 5.4179% 6/15/44 (e) | | 320,000 | | 243,907 |
Series 2011-C5: | | | | |
Class C, 5.8247% 11/15/44 (e)(k) | | 260,000 | | 246,568 |
Class D, 5.8247% 11/15/44 (e)(k) | | 200,000 | | 173,656 |
Class XA, 2.2648% 11/15/44 (e)(k)(m) | | 5,241,589 | | 642,252 |
WFDB Commercial Mortgage Trust Series 2011-BXR Class D, 5.914% 7/5/24 (e) | | 1,500,000 | | 1,531,398 |
TOTAL COMMERCIAL MORTGAGE SECURITIES (Cost $636,602,708) |
748,899,380
|
Municipal Securities - 0.3% |
|
Beaver County Indl. Dev. Auth. Poll. Cont. Rev. Bonds (FirstEnergy Nuclear Generation Corp. Proj.) Series 2005 A, 3.375%, tender 7/1/15 (k) | | 3,300,000 | | 3,412,761 |
California Gen. Oblig.: | | | | |
7.5% 4/1/34 | | 14,555,000 | | 18,767,363 |
7.55% 4/1/39 | | 3,020,000 | | 3,998,450 |
7.6% 11/1/40 | | 4,510,000 | | 6,033,298 |
7.625% 3/1/40 | | 3,440,000 | | 4,571,003 |
Illinois Gen. Oblig.: | | | | |
Series 2010, 4.421% 1/1/15 | | 6,825,000 | | 7,170,413 |
Series 2011, 5.877% 3/1/19 | | 2,935,000 | | 3,249,955 |
TOTAL MUNICIPAL SECURITIES (Cost $43,523,400) |
47,203,243
|
Foreign Government and Government Agency Obligations - 1.8% |
| Principal Amount (c) | | Value |
Argentine Republic: | | | | |
discount (with partial capitalization through 12/31/13) 8.28% 12/31/33 | | $ 4,304,209 | | $ 3,368,043 |
2.5% 12/31/38 (d) | | 3,210,000 | | 1,203,750 |
7% 9/12/13 | | 7,320,000 | | 7,294,787 |
7% 10/3/15 | | 10,420,000 | | 9,840,532 |
Bahamian Republic 6.95% 11/20/29 (e) | | 855,000 | | 974,700 |
Bahrain Kingdom 5.5% 3/31/20 | | 550,000 | | 539,000 |
Banco Nacional de Desenvolvimento Economico e Social 6.369% 6/16/18 (e) | | 325,000 | | 373,750 |
Belarus Republic: | | | | |
8.75% 8/3/15 (Reg. S) | | 4,595,000 | | 4,330,788 |
8.95% 1/26/18 | | 1,085,000 | | 1,009,050 |
Bermuda Government 5.603% 7/20/20 (e) | | 470,000 | | 533,450 |
Brazilian Federative Republic: | | | | |
7.125% 1/20/37 | | 540,000 | | 747,900 |
8.25% 1/20/34 | | 290,000 | | 444,425 |
8.75% 2/4/25 | | 245,000 | | 370,563 |
10.125% 5/15/27 | | 1,215,000 | | 2,029,050 |
12.25% 3/6/30 | | 735,000 | | 1,422,225 |
Chilean Republic 3.25% 9/14/21 | | 3,710,000 | | 3,804,605 |
Colombian Republic: | | | | |
4.375% 7/12/21 | | 1,745,000 | | 1,888,963 |
6.125% 1/18/41 | | 1,585,000 | | 1,949,550 |
7.375% 1/27/17 | | 750,000 | | 924,750 |
7.375% 3/18/19 | | 1,070,000 | | 1,372,810 |
7.375% 9/18/37 | | 2,130,000 | | 2,971,350 |
10.375% 1/28/33 | | 2,150,000 | | 3,622,750 |
11.75% 2/25/20 | | 1,050,000 | | 1,669,500 |
Congo Republic 3% 6/30/29 (d) | | 2,080,500 | | 1,560,375 |
Croatia Republic: | | | | |
6.375% 3/24/21 (e) | | 1,725,000 | | 1,625,813 |
6.625% 7/14/20 (e) | | 2,195,000 | | 2,129,150 |
6.75% 11/5/19 (e) | | 2,755,000 | | 2,713,675 |
Democratic Socialist Republic of Sri Lanka: | | | | |
6.25% 10/4/20 (e) | | 2,235,000 | | 2,167,950 |
6.25% 7/27/21 (e) | | 1,610,000 | | 1,561,700 |
7.4% 1/22/15 (e) | | 1,635,000 | | 1,700,400 |
Dominican Republic: | | | | |
1.5522% 8/30/24 (k) | | 1,350,000 | | 1,215,000 |
7.5% 5/6/21 (e) | | 2,580,000 | | 2,644,500 |
9.04% 1/23/18 (e) | | 1,185,880 | | 1,298,539 |
Foreign Government and Government Agency Obligations - continued |
| Principal Amount (c) | | Value |
El Salvador Republic: | | | | |
7.375% 12/1/19 (e) | | $ 940,000 | | $ 1,010,500 |
7.625% 2/1/41 (e) | | 525,000 | | 523,688 |
7.65% 6/15/35 (Reg. S) | | 1,265,000 | | 1,293,463 |
7.75% 1/24/23 (Reg. S) | | 895,000 | | 975,550 |
8.25% 4/10/32 (Reg. S) | | 575,000 | | 626,750 |
Gabonese Republic 8.2% 12/12/17 (e) | | 1,185,000 | | 1,407,188 |
Georgia Republic 6.875% 4/12/21 (e) | | 2,020,000 | | 2,100,800 |
Ghana Republic 8.5% 10/4/17 (e) | | 1,625,000 | | 1,799,688 |
Hungarian Republic: | | | | |
4.75% 2/3/15 | | 4,315,000 | | 4,110,038 |
6.25% 1/29/20 | | 1,430,000 | | 1,351,350 |
7.625% 3/29/41 | | 2,600,000 | | 2,437,500 |
Indonesian Republic: | | | | |
4.875% 5/5/21 (e) | | 1,095,000 | | 1,201,763 |
5.25% 1/17/42 (e) | | 1,030,000 | | 1,099,525 |
5.875% 3/13/20 (e) | | 1,660,000 | | 1,925,600 |
6.625% 2/17/37 (e) | | 1,100,000 | | 1,372,250 |
6.875% 1/17/18 (e) | | 1,105,000 | | 1,331,525 |
7.75% 1/17/38 (e) | | 1,925,000 | | 2,714,250 |
8.5% 10/12/35 (Reg. S) | | 1,685,000 | | 2,527,500 |
11.625% 3/4/19 (e) | | 1,720,000 | | 2,592,900 |
Islamic Republic of Pakistan 7.125% 3/31/16 (e) | | 3,710,000 | | 2,893,800 |
Jordanian Kingdom 3.875% 11/12/15 | | 820,000 | | 768,750 |
Latvian Republic: | | | | |
5.25% 2/22/17 (e) | | 1,335,000 | | 1,366,706 |
5.25% 6/16/21 (e) | | 550,000 | | 533,500 |
Lebanese Republic: | | | | |
4% 12/31/17 | | 3,351,000 | | 3,321,511 |
5.15% 11/12/18 | | 550,000 | | 548,625 |
Lithuanian Republic: | | | | |
6.125% 3/9/21 (e) | | 1,835,000 | | 1,892,436 |
6.625% 2/1/22 (e) | | 1,490,000 | | 1,601,750 |
6.75% 1/15/15 (e) | | 1,215,000 | | 1,306,125 |
7.375% 2/11/20 (e) | | 2,655,000 | | 2,986,875 |
Namibia Republic of 5.5% 11/3/21 (e) | | 1,340,000 | | 1,390,250 |
Peruvian Republic: | | | | |
3% 3/7/27 (d) | | 1,210,000 | | 1,040,600 |
5.625% 11/18/50 | | 1,620,000 | | 1,765,800 |
7.35% 7/21/25 | | 1,550,000 | | 2,088,625 |
8.75% 11/21/33 | | 2,865,000 | | 4,397,775 |
Foreign Government and Government Agency Obligations - continued |
| Principal Amount (c) | | Value |
Philippine Republic: | | | | |
5% 1/13/37 | | $ 725,000 | | $ 772,125 |
6.375% 1/15/32 | | 515,000 | | 637,313 |
6.5% 1/20/20 | | 805,000 | | 984,113 |
7.5% 9/25/24 | | 290,000 | | 379,900 |
7.75% 1/14/31 | | 820,000 | | 1,147,016 |
9.5% 2/2/30 | | 1,780,000 | | 2,848,000 |
9.875% 1/15/19 | | 640,000 | | 913,600 |
10.625% 3/16/25 | | 1,320,000 | | 2,158,200 |
Polish Government: | | | | |
3.875% 7/16/15 | | 840,000 | | 882,000 |
5% 3/23/22 | | 655,000 | | 699,213 |
5.125% 4/21/21 | | 825,000 | | 884,813 |
6.375% 7/15/19 | | 2,200,000 | | 2,574,000 |
Provincia de Cordoba 12.375% 8/17/17 (e) | | 1,360,000 | | 1,224,000 |
Provincia de Neuquen Argentina 7.875% 4/26/21 (e) | | 520,000 | | 535,600 |
Republic of Iraq 5.8% 1/15/28 (Reg. S) | | 4,750,000 | | 3,716,875 |
Republic of Nigeria 6.75% 1/28/21 (e) | | 1,355,000 | | 1,446,463 |
Republic of Serbia 6.75% 11/1/24 (e) | | 7,808,668 | | 7,574,408 |
Romanian Republic 6.75% 2/7/22 (e) | | 2,512,000 | | 2,587,360 |
Russian Federation: | | | | |
7.5% 3/31/30 (Reg. S) | | 7,859,020 | | 9,362,451 |
11% 7/24/18 (Reg. S) | | 385,000 | | 542,850 |
12.75% 6/24/28 (Reg. S) | | 1,950,000 | | 3,478,410 |
Senegal Republic of 8.75% 5/13/21 (e) | | 700,000 | | 701,750 |
State of Qatar 5.75% 1/20/42 (e) | | 945,000 | | 1,027,688 |
Turkish Republic: | | | | |
5.125% 3/25/22 | | 735,000 | | 729,488 |
5.625% 3/30/21 | | 815,000 | | 847,600 |
6% 1/14/41 | | 350,000 | | 342,125 |
6.25% 9/26/22 | | 680,000 | | 725,900 |
6.75% 4/3/18 | | 1,395,000 | | 1,562,400 |
6.75% 5/30/40 | | 805,000 | | 865,375 |
6.875% 3/17/36 | | 2,520,000 | | 2,746,800 |
7% 9/26/16 | | 1,360,000 | | 1,523,200 |
7.25% 3/15/15 | | 730,000 | | 803,000 |
7.25% 3/5/38 | | 1,250,000 | | 1,428,125 |
7.375% 2/5/25 | | 2,430,000 | | 2,834,109 |
7.5% 7/14/17 | | 1,285,000 | | 1,479,678 |
7.5% 11/7/19 | | 745,000 | | 873,513 |
11.875% 1/15/30 | | 960,000 | | 1,617,600 |
Foreign Government and Government Agency Obligations - continued |
| Principal Amount (c) | | Value |
Ukraine Financing of Infrastructure Projects State Enterprise 8.375% 11/3/17 (e) | | $ 1,690,000 | | $ 1,440,725 |
Ukraine Government: | | | | |
6.25% 6/17/16 (e) | | 2,080,000 | | 1,885,104 |
6.385% 6/26/12 (e) | | 4,775,000 | | 4,793,145 |
6.75% 11/14/17 (e) | | 1,895,000 | | 1,700,763 |
6.875% 9/23/15 (e) | | 1,630,000 | | 1,536,275 |
7.65% 6/11/13 (e) | | 3,315,000 | | 3,286,160 |
7.75% 9/23/20 (e) | | 1,430,000 | | 1,283,425 |
7.95% 2/23/21 (e) | | 1,425,000 | | 1,293,188 |
United Arab Emirates 7.75% 10/5/20 (Reg. S) | | 545,000 | | 583,831 |
United Mexican States: | | | | |
3.625% 3/15/22 | | 1,080,000 | | 1,100,520 |
5.125% 1/15/20 | | 920,000 | | 1,050,640 |
5.75% 10/12/10 | | 756,000 | | 807,030 |
5.95% 3/19/19 | | 300,000 | | 359,100 |
6.05% 1/11/40 | | 9,304,000 | | 11,327,620 |
6.75% 9/27/34 | | 720,000 | | 936,000 |
7.5% 4/8/33 | | 425,000 | | 597,125 |
8.3% 8/15/31 | | 420,000 | | 631,050 |
Uruguay Republic: | | | | |
7.875% 1/15/33 pay-in-kind | | 2,345,000 | | 3,247,825 |
8% 11/18/22 | | 2,105,903 | | 2,874,558 |
Venezuelan Republic: | | | | |
6% 12/9/20 | | 620,000 | | 465,000 |
7% 3/31/38 | | 625,000 | | 445,313 |
7.75% 10/13/19 (Reg. S) | | 800,000 | | 676,000 |
8.5% 10/8/14 | | 735,000 | | 738,675 |
9% 5/7/23 (Reg. S) | | 2,490,000 | | 2,122,725 |
9.25% 9/15/27 | | 1,210,000 | | 1,085,975 |
9.25% 5/7/28 (Reg. S) | | 790,000 | | 675,450 |
9.375% 1/13/34 | | 885,000 | | 761,100 |
10.75% 9/19/13 | | 1,300,000 | | 1,358,500 |
11.75% 10/21/26 (Reg. S) | | 1,410,000 | | 1,420,575 |
11.95% 8/5/31 (Reg. S) | | 1,890,000 | | 1,904,175 |
12.75% 8/23/22 | | 4,180,000 | | 4,430,800 |
13.625% 8/15/18 | | 848,000 | | 915,840 |
Vietnamese Socialist Republic: | | | | |
1.3166% 3/12/16 (k) | | 919,565 | | 827,608 |
4% 3/12/28 (d) | | 3,195,000 | | 2,619,900 |
Foreign Government and Government Agency Obligations - continued |
| Principal Amount (c) | | Value |
Vietnamese Socialist Republic: - continued | | | | |
6.75% 1/29/20 (e) | | $ 835,000 | | $ 908,063 |
6.875% 1/15/16 (e) | | 2,280,000 | | 2,473,800 |
TOTAL FOREIGN GOVERNMENT AND GOVERNMENT AGENCY OBLIGATIONS (Cost $237,500,593) |
261,628,993
|
Supranational Obligations - 0.0% |
|
Corporacion Andina de Fomento 5.2% 5/21/13
(Cost $232,967) | | 242,000 | |
251,210
|
Common Stocks - 0.0% |
| Shares | | |
TELECOMMUNICATION SERVICES - 0.0% |
Wireless Telecommunication Services - 0.0% |
CUI Acquisition Corp. Class E (e) (Cost $1,258,919) | 1 | |
863,100
|
Preferred Stocks - 0.1% |
| | | |
Convertible Preferred Stocks - 0.0% |
CONSUMER DISCRETIONARY - 0.0% |
Automobiles - 0.0% |
General Motors Co. 4.75% | 80,100 | | 3,419,469 |
FINANCIALS - 0.0% |
Real Estate Investment Trusts - 0.0% |
Alexandria Real Estate Equities, Inc. Series D 7.00% | 9,000 | | 228,375 |
TOTAL CONVERTIBLE PREFERRED STOCKS | | 3,647,844 |
Nonconvertible Preferred Stocks - 0.1% |
FINANCIALS - 0.1% |
Real Estate Investment Trusts - 0.1% |
Apartment Investment & Management Co. Series U, 7.75% | 5,000 | | 127,050 |
CBL & Associates Properties, Inc. 7.375% | 7,720 | | 194,930 |
Cedar Shopping Centers, Inc. 8.875% | 5,000 | | 125,500 |
Preferred Stocks - continued |
| Shares | | Value |
Nonconvertible Preferred Stocks - continued |
FINANCIALS - continued |
Real Estate Investment Trusts - continued |
Corporate Office Properties Trust Series H, 7.50% | 5,000 | | $ 128,600 |
Digital Realty Trust, Inc. Series E, 7.00% | 10,000 | | 262,800 |
Equity Lifestyle Properties, Inc. 8.034% | 22,162 | | 578,428 |
Essex Property Trust, Inc. Series H, 7.125% | 9,354 | | 248,068 |
Hersha Hospitality Trust Series B, 8.00% | 13,844 | | 340,978 |
Hospitality Properties Trust Series D, 7.125% | 10,000 | | 255,400 |
LaSalle Hotel Properties Series H, 7.50% | 10,000 | | 256,800 |
PS Business Parks, Inc.: | | | |
6.875% | 10,000 | | 266,000 |
Series S, 6.45% | 21,000 | | 533,400 |
Public Storage: | | | |
Series P, 6.50% | 12,000 | | 331,800 |
Series R, 6.35% | 10,500 | | 284,445 |
Series S, 5.90% | 20,000 | | 509,400 |
Realty Income Corp. Series F, 6.625% | 12,000 | | 307,560 |
Regency Centers Corp. Series 6, 6.625% | 5,510 | | 139,679 |
Stag Industrial, Inc. Series A, 9.00% | 20,000 | | 514,200 |
| | 5,405,038 |
TOTAL PREFERRED STOCKS (Cost $9,254,649) |
9,052,882
|
Floating Rate Loans - 0.5% |
| Principal Amount (c) | | |
CONSUMER DISCRETIONARY - 0.2% |
Auto Components - 0.1% |
Federal-Mogul Corp.: | | | | |
Tranche B, term loan 2.1959% 12/27/14 (k) | | $ 3,351,661 | | 3,209,216 |
Tranche C, term loan 2.1887% 12/27/15 (k) | | 2,105,267 | | 2,015,794 |
| | 5,225,010 |
Automobiles - 0.0% |
Chrysler Group LLC Tranche B, term loan 6% 5/24/17 (k) | | 2,790,975 | | 2,801,441 |
Diversified Consumer Services - 0.0% |
Visant Corp. Tranche B, term loan 5.25% 12/22/16 (k) | | 2,015,623 | | 1,929,959 |
Floating Rate Loans - continued |
| Principal Amount (c) | | Value |
CONSUMER DISCRETIONARY - continued |
Hotels, Restaurants & Leisure - 0.0% |
Ameristar Casinos, Inc. Tranche B, term loan 4% 4/14/18 (k) | | $ 913,100 | | $ 914,241 |
Extended Stay America, Inc. term loan 9.75% 11/1/15 | | 1,000,000 | | 1,000,000 |
MGM Mirage, Inc. Tranche B, term loan 7% 2/21/14 (k) | | 1,435,000 | | 1,440,453 |
| | 3,354,694 |
Leisure Equipment & Products - 0.0% |
SRAM LLC.: | | | | |
2nd LN, term loan 8.5% 12/7/18 (k) | | 265,000 | | 266,325 |
Tranche B 1LN, term loan 4.7645% 6/7/18 (k) | | 792,198 | | 791,208 |
| | 1,057,533 |
Media - 0.1% |
Harron Communications LP Tranche B, term loan 5.25% 10/6/17 (k) | | 2,072,963 | | 2,062,598 |
Newsday LLC term loan 10.5% 8/1/13 | | 3,505,000 | | 3,592,625 |
Univision Communications, Inc. term loan 4.494% 3/31/17 (k) | | 4,421,098 | | 4,106,094 |
UPC Broadband Holding BV Tranche AB, term loan 4.75% 12/31/17 (k) | | 1,250,000 | | 1,250,000 |
| | 11,011,317 |
Multiline Retail - 0.0% |
Neiman Marcus Group, Inc. Tranche B, term loan 4.75% 5/16/18 (k) | | 3,680,000 | | 3,657,000 |
Specialty Retail - 0.0% |
PETCO Animal Supplies, Inc. term loan 4.5% 11/24/17 (k) | | 338,100 | | 337,255 |
TOTAL CONSUMER DISCRETIONARY | | 29,374,209 |
CONSUMER STAPLES - 0.0% |
Food & Staples Retailing - 0.0% |
SUPERVALU, Inc. Tranche B 3LN, term loan 4.5% 4/29/18 (k) | | 1,404,388 | | 1,400,877 |
U.S. Foodservice term loan 5.75% 3/31/17 (k) | | 4,871,086 | | 4,834,552 |
| | 6,235,429 |
ENERGY - 0.0% |
Oil, Gas & Consumable Fuels - 0.0% |
FTS International, LLC Tranche B, term loan 6.25% 5/6/16 (k) | | 2,988,581 | | 2,970,052 |
Floating Rate Loans - continued |
| Principal Amount (c) | | Value |
FINANCIALS - 0.1% |
Diversified Financial Services - 0.0% |
Flying Fortress, Inc. Tranche 3, term loan 5% 6/30/17 (k) | | $ 1,615,000 | | $ 1,610,963 |
Insurance - 0.1% |
Asurion Corp.: | | | | |
Tranche 1ST LIEN, term loan 5.5% 5/24/18 (k) | | 1,537,386 | | 1,531,698 |
Tranche 2ND LIEN, term loan 9% 5/24/19 (k) | | 3,255,000 | | 3,316,194 |
Lonestar Inter Super Hld LLC term loan 8/13/19 | | 1,925,000 | | 1,949,063 |
| | 6,796,955 |
Real Estate Management & Development - 0.0% |
Capital Automotive LP term loan 5% 3/11/17 (k) | | 629,400 | | 623,106 |
CityCenter term loan 8.75% 7/1/13 (k) | | 1,000,000 | | 992,500 |
| | 1,615,606 |
TOTAL FINANCIALS | | 10,023,524 |
HEALTH CARE - 0.0% |
Health Care Providers & Services - 0.0% |
Quintiles Transnational Corp. Tranche B, term loan 5% 6/8/18 (k) | | 2,232,753 | | 2,210,425 |
Pharmaceuticals - 0.0% |
Endo Pharmaceuticals Holdings, Inc. Tranche B, term loan 4% 6/17/18 (k) | | 221,588 | | 221,588 |
TOTAL HEALTH CARE | | 2,432,013 |
INDUSTRIALS - 0.1% |
Airlines - 0.1% |
Delta Air Lines, Inc. Tranche B, term loan 5.5% 4/20/17 (k) | | 2,781,025 | | 2,714,280 |
US Airways Group, Inc. term loan 2.744% 3/23/14 (k) | | 2,810,347 | | 2,578,494 |
| | 5,292,774 |
Construction & Engineering - 0.0% |
Drumm Investors LLC Tranche B, term loan 5% 5/4/18 (k) | | 542,210 | | 509,677 |
Floating Rate Loans - continued |
| Principal Amount (c) | | Value |
INDUSTRIALS - continued |
Machinery - 0.0% |
Colfax Corp. Tranche B, term loan 4.5% 9/12/18 (k) | | $ 2,530,000 | | $ 2,530,000 |
Husky Intermediate, Inc. Tranche B, term loan 6.5% 6/30/18 (k) | | 2,283,525 | | 2,277,816 |
| | 4,807,816 |
TOTAL INDUSTRIALS | | 10,610,267 |
MATERIALS - 0.1% |
Chemicals - 0.0% |
Arizona Chemical Tranche B, term loan 7.25% 12/22/17 (k) | | 1,000,000 | | 1,013,750 |
Ashland, Inc. Tranche B, term loan 3.75% 8/23/18 (k) | | 2,068,701 | | 2,079,044 |
| | 3,092,794 |
Containers & Packaging - 0.1% |
Anchor Glass Container Corp. Tranche 2LN, term loan 10% 9/2/16 (k) | | 2,065,000 | | 2,065,000 |
Sealed Air Corp. Tranche B, term loan 4.75% 10/3/18 (k) | | 1,472,575 | | 1,483,619 |
| | 3,548,619 |
Metals & Mining - 0.0% |
JMC Steel Group, Inc. term loan 4.75% 4/1/17 (k) | | 2,108,938 | | 2,108,938 |
TOTAL MATERIALS | | 8,750,351 |
TELECOMMUNICATION SERVICES - 0.0% |
Wireless Telecommunication Services - 0.0% |
Intelsat Jackson Holdings SA term loan 3.2535% 2/1/14 (k) | | 2,425,000 | | 2,364,375 |
MetroPCS Wireless, Inc. Tranche B 3LN, term loan 4.0147% 3/17/18 (k) | | 2,949,306 | | 2,919,813 |
TowerCo Finance LLC Tranche B, term loan 5.25% 2/2/17 (k) | | 2,252,975 | | 2,252,975 |
| | 7,537,163 |
UTILITIES - 0.0% |
Independent Power Producers & Energy Traders - 0.0% |
The AES Corp. Tranche B, term loan 4.25% 5/27/18 (k) | | 372,188 | | 372,187 |
TOTAL FLOATING RATE LOANS (Cost $76,073,479) |
78,305,195
|
Sovereign Loan Participations - 0.0% |
| Principal Amount (c) | | Value |
Indonesian Republic loan participation: | | | | |
Citibank 1.25% 12/14/19 (k) | | $ 1,607,627 | | $ 1,511,170 |
Goldman Sachs 1.25% 12/14/19 (k) | | 1,377,778 | | 1,295,111 |
0% 12/14/19 (k) | | 106,286 | | 99,909 |
TOTAL SOVEREIGN LOAN PARTICIPATIONS (Cost $2,651,440) |
2,906,190
|
Bank Notes - 0.0% |
|
Wachovia Bank NA 6% 11/15/17
(Cost $2,438,852) | | 2,243,000 | |
2,579,795
|
Fixed-Income Funds - 23.1% |
| Shares | | |
Fidelity Floating Rate Central Fund (l) | 5,734,106 | | 578,341,954 |
Fidelity Mortgage Backed Securities Central Fund (l) | 26,421,758 | | 2,866,496,506 |
TOTAL FIXED-INCOME FUNDS (Cost $3,208,191,485) |
3,444,838,460
|
Preferred Securities - 0.0% |
| Principal Amount (c) | | |
CONSUMER DISCRETIONARY - 0.0% |
Media - 0.0% |
Globo Comunicacoes e Participacoes SA 6.25% (d)(e)(f) | $ 1,860,000 | | 1,984,375 |
MATERIALS - 0.0% |
Metals & Mining - 0.0% |
CSN Islands XII Corp. 7% (Reg. S) (f) | 1,980,000 | | 2,005,868 |
TOTAL PREFERRED SECURITIES (Cost $3,813,628) |
3,990,243
|
Money Market Funds - 8.2% |
| Shares | | Value |
Fidelity Cash Central Fund, 0.12% (a)
(Cost $1,220,997,367) | 1,220,997,367 | | $ 1,220,997,367 |
TOTAL INVESTMENT PORTFOLIO - 104.3% (Cost $14,596,812,402) | | 15,549,569,793 |
NET OTHER ASSETS (LIABILITIES) - (4.3)% | | (635,700,084) |
NET ASSETS - 100% | $ 14,913,869,709 |
TBA Sale Commitments |
| Principal
Amount (c) | | |
Fannie Mae |
3.5% 3/1/42 | $ (78,500,000) | | (81,138,283) |
3.5% 3/1/42 | (78,500,000) | | (81,138,283) |
3.5% 3/1/42 | (78,500,000) | | (81,138,283) |
3.5% 3/1/42 | (27,000,000) | | (27,907,435) |
4% 3/1/42 | (23,200,000) | | (24,416,824) |
4.5% 3/1/42 | (43,500,000) | | (46,360,943) |
5% 3/1/42 | (47,000,000) | | (50,758,765) |
5% 3/1/42 | (9,000,000) | | (9,719,763) |
5% 3/1/42 | (16,000,000) | | (17,279,579) |
5% 3/1/42 | (16,000,000) | | (17,279,579) |
6% 3/1/42 | (18,000,000) | | (19,805,891) |
TOTAL FANNIE MAE | | (456,943,628) |
Ginnie Mae |
4% 3/1/42 | (2,700,000) | | (2,907,847) |
TOTAL TBA SALE COMMITMENTS (Proceeds $459,631,945) | $ (459,851,475) |
Swap Agreements |
| Expiration Date | | Notional Amount | | Value |
Credit Default Swaps |
Receive monthly a fixed rate of .15% multiplied by the notional amount and pay to Credit Suisse First Boston upon each credit event of one of the issues of ABX AA 07-01 Index, par value of the proportional notional amount (Rating-C) (Upfront Premium Received/(Paid) $480,000) (j) | Sept. 2037 | | $ 2,154,763 | | $ (2,034,940) |
Receive monthly a fixed rate of .15% multiplied by the notional amount and pay to Credit Suisse First Boston upon each credit event of one of the issues of ABX AA 07-01 Index, par value of the proportional notional amount (Rating-C) (Upfront Premium Received/(Paid) $1,058,000) (j) | Sept. 2037 | | 2,477,977 | | (2,340,181) |
Receive monthly a fixed rate of .15% multiplied by the notional amount and pay to JPMorgan Chase, Inc. upon each credit event of one of the issues of ABX AA 07-01 Index, par value of the proportional notional amount (Rating-C) (Upfront Premium Received/(Paid) $651,000) (j) | Sept. 2037 | | 1,508,334 | | (1,424,458) |
Receive monthly a fixed rate of .15% multiplied by the notional amount and pay to UBS upon each credit event of one of the issues of ABX AA 07-1 Index, par value of the proportional notional amount (Rating-C) (Upfront Premium Received/(Paid) $936,000) (j) | Sept. 2037 | | 3,878,573 | | (3,662,892) |
Receive monthly a fixed rate of .15% multiplied by the notional amount and pay to UBS upon each credit event of one of the issues of ABX AA 07-1 Index, par value of the proportional notional amount (Rating-C) (Upfront Premium Received/(Paid) $347,750) (j) | Sept. 2037 | | 1,400,596 | | (1,322,711) |
Receive monthly notional amount multiplied by .82% and pay UBS upon credit event of Morgan Stanley ABS Capital I, Inc., par value of the notional amount of Morgan Stanley ABS Capital I, Inc. Series 2004-NC6 Class M3, 5.6413% 7/25/34 (Rating-Ca) (i) | August 2034 | | 23,846 | | (18,445) |
Swap Agreements - continued |
| Expiration Date | | Notional Amount | | Value |
Credit Default Swaps - continued |
Receive monthly notional amount multiplied by 2.4% and pay Deutsche Bank upon credit event of Fremont Home Loan Trust, par value of the notional amount of Fremont Home Loan Trust Series 2004-A Class B3, 7.2288% 1/25/34 (Rating-C) (i) | Feb. 2034 | | $ 787 | | $ (736) |
Receive monthly notional amount multiplied by 3.35% and pay Morgan Stanley, Inc. upon credit event of Morgan Stanley ABS Capital I, Inc., par value of the notional amount of Morgan Stanley ABS Capital I, Inc. Series 2004-HE7, Class B3, 9.01% 8/25/34 (Rating-C) (i) | Sept. 2034 | | 23,153 | | (20,187) |
TOTAL CREDIT DEFAULT SWAPS | | $ 11,468,029 | | $ (10,824,550) |
Interest Rate Swaps |
Receive semi-annually a fixed rate equal to 1.2857% and pay quarterly a floating rate based on 3-month LIBOR with JPMorgan Chase, Inc. | June 2012 | | 200,000,000 | | 768,840 |
| | $ 211,468,029 | | $ (10,055,710) |
Currency Abbreviations |
CAD | - | Canadian dollar |
Legend |
(a) Affiliated fund that is available only to investment companies and other accounts managed by Fidelity Investments. The rate quoted is the annualized seven-day yield of the fund at period end. A complete unaudited listing of the fund's holdings as of its most recent quarter end is available upon request. In addition, each Fidelity Central Fund's financial statements, which are not covered by the Fund's Report of Independent Registered Public Accounting Firm, are available on the SEC's website or upon request. |
(b) Non-income producing - Security is in default. |
(c) Principal Amount is stated in United States dollars unless otherwise noted. |
(d) Security initially issued at one coupon which converts to a higher coupon at a specified date. The rate shown is the rate at period end. |
(e) Security exempt from registration under Rule 144A of the Securities Act of 1933. These securities may be resold in transactions exempt from registration, normally to qualified institutional buyers. At the end of the period, the value of these securities amounted to $1,023,002,212 or 6.9% of net assets. |
(f) Security is perpetual in nature with no stated maturity date. |
(g) Security or a portion of the security purchased on a delayed delivery or when-issued basis. |
(h) Security or a portion of the security has been segregated as collateral for open swap agreements. At the period end, the value of securities pledged amounted to $11,216,630. |
(i) Represents a credit default swap contract in which the Fund has sold protection on the underlying reference entity. The value of each credit default swap and the credit rating can be measures of the current payment/performance risk. For the underlying reference entity, ratings disclosed are from Moody's Investors Service, Inc. Where Moody's ratings are not available, S&P ratings are disclosed and are indicated as such. All ratings are as of the report date and do not reflect subsequent changes. Where a credit rating is not disclosed, the value is used as the measure of the payment/performance risk. |
(j) Represents a credit default swap based on a tradable index of home equity asset-backed debt securities. The value of each credit default swap and the credit rating can be measures of the current payment/performance risk. In addition, the swap represents a contract in which the Fund has sold protection on the index of underlying securities. Ratings represent a weighted average of the ratings of all securities included in the index. Ratings used in the weighted average are from Moody's Investors Service, Inc., or S&P where Moody's ratings are not available. All ratings are as of the report date and do not reflect subsequent changes. |
(k) Coupon rates for floating and adjustable rate securities reflect the rates in effect at period end. |
(l) Affiliated fund that is available only to investment companies and other accounts managed by Fidelity Investments. A complete unaudited schedule of portfolio holdings for each Fidelity Central Fund is filed with the SEC for the first and third quarters of each fiscal year on Form N-Q and is available upon request or at the SEC's web site at www.sec.gov. An unaudited holdings listing for the Fund, which presents direct holdings as well as the pro rata share of securities and other investments held indirectly through its investment in underlying non-money market Fidelity Central Funds, is available at fidelity.com and/or advisor.fidelity.com,as applicable. In addition, each Fidelity Central Fund's financial statements, which are not covered by the Fund's Report of Independent Registered Public Accounting Firm, are available on the SEC's web site or upon request. |
(m) Security represents right to receive monthly interest payments on an underlying pool of mortgages or assets. Principal shown is the outstanding par amount of the pool as of the end of the period. |
(n) Restricted securities - Investment in securities not registered under the Securities Act of 1933 (excluding 144A issues). At the end of the period, the value of restricted securities (excluding 144A issues) amounted to $727,178 or 0.0% of net assets. |
Additional information on each restricted holding is as follows: |
Security | Acquisition Date | Acquisition Cost |
ACGS Series 2004-1 Class P, 7.4651% 8/1/19 | 2/17/11 | $ 548,737 |
GMAC Commercial Mortgage Securities, Inc. Series 1999-C2I Class K, 6.481% 9/15/33 | 3/23/07 - 12/4/09 | $ 173,625 |
Affiliated Central Funds |
Information regarding fiscal year to date income earned by the Fund from investments in Fidelity Central Funds is as follows: |
Fund | Income earned |
Fidelity Cash Central Fund | $ 228,566 |
Fidelity Floating Rate Central Fund | 13,423,997 |
Fidelity Mortgage Backed Securities Central Fund | 43,696,283 |
Total | $ 57,348,846 |
Additional information regarding the Fund's fiscal year to date purchases and sales, including the ownership percentage, of the non Money Market Central Funds is as follows: |
Fund | Value,
beginning of
period | Purchases | Sales Proceeds | Value,
end of
period | % ownership,
end of
period |
Fidelity Floating Rate Central Fund | $ 389,816,805 | $ 163,043,361 | $ - | $ 578,341,954 | 31.4% |
Fidelity Mortgage Backed Securities Central Fund | 2,813,030,905 | 43,696,285 | - | 2,866,496,506 | 22.0% |
Total | $ 3,202,847,710 | $ 206,739,646 | $ - | $ 3,444,838,460 | |
Other Information |
The following is a summary of the inputs used, as of February 29, 2012, involving the Fund's assets and liabilities carried at fair value. The inputs or methodology used for valuing securities may not be an indication of the risk associated with investing in those securities. For more information on valuation inputs, and their aggregation into the levels used in the tables below, please refer to the Security Valuation section in the accompanying Notes to Financial Statements. |
Valuation Inputs at Reporting Date: |
Description | Total | Level 1 | Level 2 | Level 3 |
Investments in Securities: | | | | |
Equities: | | | | |
Consumer Discretionary | $ 3,419,469 | $ 3,419,469 | $ - | $ - |
Financials | 5,633,413 | 5,405,038 | 228,375 | - |
Telecommunication Services | 863,100 | - | - | 863,100 |
Corporate Bonds | 3,562,288,913 | - | 3,561,929,536 | 359,377 |
U.S. Government and Government Agency Obligations | 3,913,031,898 | - | 3,913,031,898 | - |
U.S. Government Agency - Mortgage Securities | 1,837,637,987 | - | 1,837,637,987 | - |
Asset-Backed Securities | 298,586,531 | - | 274,208,830 | 24,377,701 |
Collateralized Mortgage Obligations | 116,508,406 | - | 113,004,269 | 3,504,137 |
Commercial Mortgage Securities | 748,899,380 | - | 706,158,037 | 42,741,343 |
Municipal Securities | 47,203,243 | - | 47,203,243 | - |
Foreign Government and Government Agency Obligations | 261,628,993 | - | 260,588,393 | 1,040,600 |
Supranational Obligations | 251,210 | - | 251,210 | - |
Floating Rate Loans | 78,305,195 | - | 76,312,695 | 1,992,500 |
Sovereign Loan Participations | 2,906,190 | - | - | 2,906,190 |
Bank Notes | 2,579,795 | - | 2,579,795 | - |
Fixed-Income Funds | 3,444,838,460 | 3,444,838,460 | - | - |
Preferred Securities | 3,990,243 | - | 3,990,243 | - |
Money Market Funds | 1,220,997,367 | 1,220,997,367 | - | - |
Total Investments in Securities: | $ 15,549,569,793 | $ 4,674,660,334 | $ 10,797,124,511 | $ 77,784,948 |
Derivative Instruments: | | | | |
Assets | | | | |
Swap Agreements | $ 768,840 | $ - | $ 768,840 | $ - |
Liabilities | | | | |
Swap Agreements | $ (10,824,550) | $ - | $ (10,785,182) | $ (39,368) |
Total Derivative Instruments: | $ (10,055,710) | $ - | $ (10,016,342) | $ (39,368) |
Other Financial Instruments: | | | | |
TBA Sale Commitments | $ (459,851,475) | $ - | $ (459,851,475) | $ - |
The following is a reconciliation of Investments in Securities and Derivative Instruments for which Level 3 inputs were used in determining value: |
Investments in Securities: | |
Beginning Balance | $ 93,393,811 |
Total Realized Gain (Loss) | 736,567 |
Total Unrealized Gain (Loss) | (4,374,581) |
Cost of Purchases | 2,218,424 |
Proceeds of Sales | (14,225,697) |
Amortization/Accretion | 157,857 |
Transfers in to Level 3 | 23,126,886 |
Transfers out of Level 3 | (23,248,319) |
Ending Balance | $ 77,784,948 |
The change in unrealized gain (loss) for the period attributable to Level 3 securities held at February 29, 2012 | $ (4,059,170) |
Derivative Instruments: | |
Swap Agreements | |
Beginning Balance | $ (32,859) |
Total Unrealized Gain (Loss) | (6,509) |
Transfers in to Level 3 | - |
Transfers out of Level 3 | - |
Ending Balance | $ (39,368) |
Realized gain (loss) on Swap Agreements for the period | $ 847 |
The change in unrealized gain (loss) for the period attributable to Level 3 Swap Agreements held at February 29, 2012 | $ (6,509) |
The information used in the above reconciliations represents fiscal year to date activity for any Investments in Securities and Derivative Instruments identified as using Level 3 inputs at either the beginning or the end of the current fiscal period. Transfers in or out of Level 3 represent the beginning value of any Security or Instrument where a change in the pricing level occurred from the beginning to the end of the period. The cost of purchases and the proceeds of sales may include securities received or delivered through corporate actions or exchanges. Realized and unrealized gains (losses) disclosed in the reconciliation are included in Net Gain (Loss) on the Fund's Statement of Operations. |
Value of Derivative Instruments |
The following table is a summary of the Fund's value of derivative instruments by risk exposure as of February 29, 2012. For additional information on derivative instruments, please refer to the Derivative Instruments section in the accompanying Notes to Financial Statements. |
Risk Exposure /
Derivative Type | Value |
| Asset | Liability |
Credit Risk | | |
Swap Agreements (a) | $ - | $ (10,824,550) |
Interest Rate Risk | | |
Swap Agreements (a) | 768,840 | - |
Total Value of Derivatives | $ 768,840 | $ (10,824,550) |
(a) Value is disclosed on the Statement of Assets and Liabilities in the Swap agreements, at value line-items. |
See accompanying notes which are an integral part of the financial statements.
Semiannual Report
Statement of Assets and Liabilities
| February 29, 2012 |
| | |
Assets | | |
Investment in securities, at value - See accompanying schedule: Unaffiliated issuers (cost $10,167,623,550) | $ 10,883,733,966 | |
Fidelity Central Funds (cost $4,429,188,852) | 4,665,835,827 | |
Total Investments (cost $14,596,812,402) | | $ 15,549,569,793 |
Cash | | 396,270 |
Receivable for investments sold, regular delivery | | 30,627,061 |
Receivable for TBA sale commitments | | 459,631,945 |
Receivable for fund shares sold | | 68,291,615 |
Dividends receivable | | 49,602 |
Interest receivable | | 82,373,080 |
Distributions receivable from Fidelity Central Funds | | 114,527 |
Swap agreements, at value | | 768,840 |
Other receivables | | 52,956 |
Total assets | | 16,191,875,689 |
| | |
Liabilities | | |
Payable for investments purchased
Regular delivery | $ 7,573,428 | |
Delayed delivery | 571,763,451 | |
TBA sale commitments, at value | 459,851,475 | |
Payable for swap agreements | 437,074 | |
Payable for fund shares redeemed | 219,575,935 | |
Distributions payable | 1,792,312 | |
Swap agreements, at value | 10,824,550 | |
Accrued management fee | 3,902,375 | |
Distribution and service plan fees payable | 381,166 | |
Other affiliated payables | 1,851,224 | |
Other payables and accrued expenses | 52,990 | |
Total liabilities | | 1,278,005,980 |
| | |
Net Assets | | $ 14,913,869,709 |
Net Assets consist of: | | |
Paid in capital | | $ 14,076,252,628 |
Undistributed net investment income | | 56,823,931 |
Accumulated undistributed net realized gain (loss) on investments and foreign currency transactions | | (162,164,212) |
Net unrealized appreciation (depreciation) on investments and assets and liabilities in foreign currencies | | 942,957,362 |
Net Assets | | $ 14,913,869,709 |
See accompanying notes which are an integral part of the financial statements.
Semiannual Report
Financial Statements - continued
Statement of Assets and Liabilities - continued
| February 29, 2012 |
| | |
Calculation of Maximum Offering Price Class A:
Net Asset Value and redemption price per share ($1,455,915,037 ÷ 131,903,359 shares) | | $ 11.04 |
| | |
Maximum offering price per share (100/96.00 of $11.04) | | $ 11.50 |
Class T:
Net Asset Value and redemption price per share ($51,083,887 ÷ 4,633,379 shares) | | $ 11.03 |
| | |
Maximum offering price per share (100/96.00 of $11.03) | | $ 11.49 |
Class B:
Net Asset Value and offering price per share ($10,146,736 ÷ 919,050 shares)A | | $ 11.04 |
| | |
Class C:
Net Asset Value and offering price per share ($80,520,955 ÷ 7,295,759 shares)A | | $ 11.04 |
| | |
Total Bond:
Net Asset Value, offering price and redemption price per share ($12,793,589,188 ÷ 1,159,258,348 shares) | | $ 11.04 |
| | |
Institutional Class:
Net Asset Value, offering price and redemption price per share ($522,613,906 ÷ 47,419,000 shares) | | $ 11.02 |
A Redemption price per share is equal to net asset value less any applicable contingent deferred sales charge.
See accompanying notes which are an integral part of the financial statements.
Semiannual Report
Statement of Operations
| Six months ended February 29, 2012 |
| | |
Investment Income | | |
Dividends | | $ 481,550 |
Interest | | 219,155,566 |
Income from Fidelity Central Funds | | 57,348,846 |
Total income | | 276,985,962 |
| | |
Expenses | | |
Management fee | $ 22,029,268 | |
Transfer agent fees | 8,145,685 | |
Distribution and service plan fees | 2,120,856 | |
Fund wide operations fee | 2,297,369 | |
Independent trustees' compensation | 25,055 | |
Miscellaneous | 18,995 | |
Total expenses before reductions | 34,637,228 | |
Expense reductions | (1,594) | 34,635,634 |
Net investment income (loss) | | 242,350,328 |
Realized and Unrealized Gain (Loss) Net realized gain (loss) on: | | |
Investment securities: | | |
Unaffiliated issuers | 135,469,894 | |
Foreign currency transactions | (537) | |
Swap agreements | (35,135) | |
Total net realized gain (loss) | | 135,434,222 |
Change in net unrealized appreciation (depreciation) on: Investment securities | 116,673,979 | |
Assets and liabilities in foreign currencies | 29 | |
Swap agreements | (31,831) | |
Delayed delivery commitments | (2,162,465) | |
Total change in net unrealized appreciation (depreciation) | | 114,479,712 |
Net gain (loss) | | 249,913,934 |
Net increase (decrease) in net assets resulting from operations | | $ 492,264,262 |
See accompanying notes which are an integral part of the financial statements.
Semiannual Report
Financial Statements - continued
Statement of Changes in Net Assets
| Six months ended February 29,
2012 | Year ended
August 31,
2011 |
Increase (Decrease) in Net Assets | | |
Operations | | |
Net investment income (loss) | $ 242,350,328 | $ 503,424,089 |
Net realized gain (loss) | 135,434,222 | 279,450,476 |
Change in net unrealized appreciation (depreciation) | 114,479,712 | (49,093,458) |
Net increase (decrease) in net assets resulting
from operations | 492,264,262 | 733,781,107 |
Distributions to shareholders from net investment income | (261,764,856) | (485,397,438) |
Distributions to shareholders from net realized gain | (215,970,386) | (244,516,243) |
Total distributions | (477,735,242) | (729,913,681) |
Share transactions - net increase (decrease) | 1,590,674,402 | 417,450,284 |
Total increase (decrease) in net assets | 1,605,203,422 | 421,317,710 |
| | |
Net Assets | | |
Beginning of period | 13,308,666,287 | 12,887,348,577 |
End of period (including undistributed net investment income of $56,823,931 and undistributed net investment income of $76,238,459, respectively) | $ 14,913,869,709 | $ 13,308,666,287 |
See accompanying notes which are an integral part of the financial statements.
Semiannual Report
Financial Highlights - Class A
| Six months ended
February 29, | Years ended August 31, |
| 2012 | 2011 | 2010 | 2009 | 2008 | 2007 |
Selected Per-Share Data | | | | | | |
Net asset value, beginning of period | $ 11.04 | $ 11.05 | $ 10.28 | $ 10.07 | $ 10.27 | $ 10.39 |
Income from Investment Operations | | | | | | |
Net investment income (loss)E | .172 | .381 | .428 | .494 | .488 | .508 |
Net realized and unrealized gain (loss) | .191 | .187 | .778 | .231 | (.189) | (.141) |
Total from investment operations | .363 | .568 | 1.206 | .725 | .299 | .367 |
Distributions from net investment income | (.188) | (.367) | (.402) | (.447) | (.474) | (.470) |
Distributions from net realized gain | (.175) | (.211) | (.034) | (.068) | (.025) | (.017) |
Total distributions | (.363) | (.578) | (.436) | (.515) | (.499) | (.487) |
Net asset value, end of period | $ 11.04 | $ 11.04 | $ 11.05 | $ 10.28 | $ 10.07 | $ 10.27 |
Total ReturnB,C,D | 3.37% | 5.35% | 11.97% | 7.79% | 2.93% | 3.57% |
Ratios to Average Net AssetsF,H | | | | | | |
Expenses before reductions | .84%A | .83% | .82% | .80% | .80% | .77% |
Expenses net of fee waivers, if any | .84%A | .83% | .82% | .80% | .80% | .77% |
Expenses net of all reductions | .84%A | .83% | .82% | .80% | .80% | .77% |
Net investment income (loss) | 3.16%A | 3.50% | 4.00% | 5.17% | 4.77% | 4.93% |
Supplemental Data | | | | | | |
Net assets, end of period (000 omitted) | $ 1,455,915 | $ 1,225,165 | $ 805,816 | $ 107,998 | $ 80,755 | $ 48,076 |
Portfolio turnover rateG | 137%A | 168%I | 130% | 104%I | 122% | 116%I |
A Annualized
B Total returns for periods of less than one year are not annualized.
C Total returns would have been lower if certain expenses had not been reduced during the applicable periods shown.
D Total returns do not include the effect of the sales charges.
E Calculated based on average shares outstanding during the period.
F Fees and expenses of any underlying Fidelity Central Funds are not included in the Fund's expense ratio. The Fund indirectly bears its proportionate share of the expenses of any underlying Fidelity Central Funds.
G Amount does not include the portfolio activity of any underlying Fidelity Central Funds.
H Expense ratios reflect operating expenses of the class. Expenses before reductions do not reflect amounts reimbursed by the investment adviser or reductions from brokerage service arrangements or reductions from other expense offset arrangements and do not represent the amount paid by the class during periods when reimbursements or reductions occur. Expenses net of fee waivers reflect expenses after reimbursement by the investment adviser but prior to reductions from brokerage service arrangements or other expense offset arrangements. Expenses net of all reductions represent the net expenses paid by the class.
I The portfolio turnover rate excludes liquidations and redemptions executed in-kind from Affiliated Central Funds.
See accompanying notes which are an integral part of the financial statements.
Semiannual Report
Financial Highlights - Class T
| Six months ended
February 29, | Years ended August 31, |
| 2012 | 2011 | 2010 | 2009 | 2008 | 2007 |
Selected Per-Share Data | | | | | | |
Net asset value, beginning of period | $ 11.03 | $ 11.04 | $ 10.27 | $ 10.06 | $ 10.26 | $ 10.38 |
Income from Investment Operations | | | | | | |
Net investment income (loss)E | .177 | .386 | .426 | .488 | .489 | .508 |
Net realized and unrealized gain (loss) | .189 | .186 | .778 | .233 | (.191) | (.143) |
Total from investment operations | .366 | .572 | 1.204 | .721 | .298 | .365 |
Distributions from net investment income | (.191) | (.371) | (.400) | (.443) | (.473) | (.468) |
Distributions from net realized gain | (.175) | (.211) | (.034) | (.068) | (.025) | (.017) |
Total distributions | (.366) | (.582) | (.434) | (.511) | (.498) | (.485) |
Net asset value, end of period | $ 11.03 | $ 11.03 | $ 11.04 | $ 10.27 | $ 10.06 | $ 10.26 |
Total ReturnB,C,D | 3.41% | 5.39% | 11.97% | 7.74% | 2.92% | 3.55% |
Ratios to Average Net AssetsF,H | | | | | | |
Expenses before reductions | .78%A | .80% | .82% | .85% | .81% | .78% |
Expenses net of fee waivers, if any | .78%A | .80% | .82% | .85% | .81% | .78% |
Expenses net of all reductions | .78%A | .80% | .82% | .85% | .80% | .78% |
Net investment income (loss) | 3.23%A | 3.54% | 4.01% | 5.12% | 4.76% | 4.92% |
Supplemental Data | | | | | | |
Net assets, end of period (000 omitted) | $ 51,084 | $ 60,500 | $ 71,349 | $ 48,090 | $ 38,574 | $ 42,191 |
Portfolio turnover rateG | 137%A | 168%I | 130% | 104%I | 122% | 116%I |
A Annualized
B Total returns for periods of less than one year are not annualized.
C Total returns would have been lower if certain expenses had not been reduced during the applicable periods shown.
D Total returns do not include the effect of the sales charges.
E Calculated based on average shares outstanding during the period.
F Fees and expenses of any underlying Fidelity Central Funds are not included in the Fund's expense ratio. The Fund indirectly bears its proportionate share of the expenses of any underlying Fidelity Central Funds.
G Amount does not include the portfolio activity of any underlying Fidelity Central Funds.
H Expense ratios reflect operating expenses of the class. Expenses before reductions do not reflect amounts reimbursed by the investment adviser or reductions from brokerage service arrangements or reductions from other expense offset arrangements and do not represent the amount paid by the class during periods when reimbursements or reductions occur. Expenses net of fee waivers reflect expenses after reimbursement by the investment adviser but prior to reductions from brokerage service arrangements or other expense offset arrangements. Expenses net of all reductions represent the net expenses paid by the class.
I The portfolio turnover rate excludes liquidations and redemptions executed in-kind from Affiliated Central Funds.
See accompanying notes which are an integral part of the financial statements.
Semiannual Report
Financial Highlights - Class B
| Six months ended
February 29, | Years ended August 31, |
| 2012 | 2011 | 2010 | 2009 | 2008 | 2007 |
Selected Per-Share Data | | | | | | |
Net asset value, beginning of period | $ 11.04 | $ 11.06 | $ 10.28 | $ 10.07 | $ 10.27 | $ 10.39 |
Income from Investment Operations | | | | | | |
Net investment income (loss)E | .136 | .307 | .351 | .423 | .413 | .432 |
Net realized and unrealized gain (loss) | .191 | .177 | .787 | .233 | (.190) | (.145) |
Total from investment operations | .327 | .484 | 1.138 | .656 | .223 | .287 |
Distributions from net investment income | (.152) | (.293) | (.324) | (.378) | (.398) | (.390) |
Distributions from net realized gain | (.175) | (.211) | (.034) | (.068) | (.025) | (.017) |
Total distributions | (.327) | (.504) | (.358) | (.446) | (.423) | (.407) |
Net asset value, end of period | $ 11.04 | $ 11.04 | $ 11.06 | $ 10.28 | $ 10.07 | $ 10.27 |
Total ReturnB,C,D | 3.03% | 4.54% | 11.26% | 7.01% | 2.17% | 2.77% |
Ratios to Average Net AssetsF,H | | | | | | |
Expenses before reductions | 1.51%A | 1.52% | 1.53% | 1.53% | 1.54% | 1.53% |
Expenses net of fee waivers, if any | 1.51%A | 1.52% | 1.53% | 1.53% | 1.54% | 1.53% |
Expenses net of all reductions | 1.51%A | 1.52% | 1.53% | 1.53% | 1.54% | 1.53% |
Net investment income (loss) | 2.50%A | 2.82% | 3.29% | 4.44% | 4.03% | 4.17% |
Supplemental Data | | | | | | |
Net assets, end of period (000 omitted) | $ 10,147 | $ 9,225 | $ 13,017 | $ 9,054 | $ 9,645 | $ 6,054 |
Portfolio turnover rateG | 137%A | 168%I | 130% | 104%I | 122% | 116%I |
A Annualized
B Total returns for periods of less than one year are not annualized.
C Total returns would have been lower if certain expenses had not been reduced during the applicable periods shown.
D Total returns do not include the effect of the contingent deferred sales charge.
E Calculated based on average shares outstanding during the period.
F Fees and expenses of any underlying Fidelity Central Funds are not included in the Fund's expense ratio. The Fund indirectly bears its proportionate share of the expenses of any underlying Fidelity Central Funds.
G Amount does not include the portfolio activity of any underlying Fidelity Central Funds.
H Expense ratios reflect operating expenses of the class. Expenses before reductions do not reflect amounts reimbursed by the investment adviser or reductions from brokerage service arrangements or reductions from other expense offset arrangements and do not represent the amount paid by the class during periods when reimbursements or reductions occur. Expenses net of fee waivers reflect expenses after reimbursement by the investment adviser but prior to reductions from brokerage service arrangements or other expense offset arrangements. Expenses net of all reductions represent the net expenses paid by the class.
I The portfolio turnover rate excludes liquidations and redemptions executed in-kind from Affiliated Central Funds.
See accompanying notes which are an integral part of the financial statements.
Semiannual Report
Financial Highlights - Class C
| Six months ended
February 29, | Years ended August 31, |
| 2012 | 2011 | 2010 | 2009 | 2008 | 2007 |
Selected Per-Share Data | | | | | | |
Net asset value, beginning of period | $ 11.04 | $ 11.05 | $ 10.28 | $ 10.07 | $ 10.27 | $ 10.39 |
Income from Investment Operations | | | | | | |
Net investment income (loss)E | .135 | .308 | .354 | .425 | .413 | .429 |
Net realized and unrealized gain (loss) | .191 | .187 | .778 | .232 | (.189) | (.145) |
Total from investment operations | .326 | .495 | 1.132 | .657 | .224 | .284 |
Distributions from net investment income | (.151) | (.294) | (.328) | (.379) | (.399) | (.387) |
Distributions from net realized gain | (.175) | (.211) | (.034) | (.068) | (.025) | (.017) |
Total distributions | (.326) | (.505) | (.362) | (.447) | (.424) | (.404) |
Net asset value, end of period | $ 11.04 | $ 11.04 | $ 11.05 | $ 10.28 | $ 10.07 | $ 10.27 |
Total ReturnB,C,D | 3.02% | 4.65% | 11.20% | 7.02% | 2.18% | 2.75% |
Ratios to Average Net AssetsF,H | | | | | | |
Expenses before reductions | 1.52%A | 1.51% | 1.50% | 1.52% | 1.53% | 1.55% |
Expenses net of fee waivers, if any | 1.52%A | 1.51% | 1.50% | 1.52% | 1.53% | 1.55% |
Expenses net of all reductions | 1.52%A | 1.51% | 1.50% | 1.52% | 1.53% | 1.55% |
Net investment income (loss) | 2.48%A | 2.83% | 3.32% | 4.45% | 4.03% | 4.15% |
Supplemental Data | | | | | | |
Net assets, end of period (000 omitted) | $ 80,521 | $ 63,867 | $ 91,439 | $ 55,958 | $ 28,786 | $ 18,890 |
Portfolio turnover rateG | 137%A | 168%I | 130% | 104%I | 122% | 116%I |
A Annualized
B Total returns for periods of less than one year are not annualized.
C Total returns would have been lower if certain expenses had not been reduced during the applicable periods shown.
D Total returns do not include the effect of the contingent deferred sales charge.
E Calculated based on average shares outstanding during the period.
F Fees and expenses of any underlying Fidelity Central Funds are not included in the Fund's expense ratio. The Fund indirectly bears its proportionate share of the expenses of any underlying Fidelity Central Funds.
G Amount does not include the portfolio activity of any underlying Fidelity Central Funds.
H Expense ratios reflect operating expenses of the class. Expenses before reductions do not reflect amounts reimbursed by the investment adviser or reductions from brokerage service arrangements or reductions from other expense offset arrangements and do not represent the amount paid by the class during periods when reimbursements or reductions occur. Expenses net of fee waivers reflect expenses after reimbursement by the investment adviser but prior to reductions from brokerage service arrangements or other expense offset arrangements. Expenses net of all reductions represent the net expenses paid by the class.
I The portfolio turnover rate excludes liquidations and redemptions executed in-kind from Affiliated Central Funds.
See accompanying notes which are an integral part of the financial statements.
Semiannual Report
Financial Highlights - Total Bond
| Six months ended
February 29, | Years ended August 31, |
| 2012 | 2011 | 2010 | 2009 | 2008 | 2007 |
Selected Per-Share Data | | | | | | |
Net asset value, beginning of period | $ 11.04 | $ 11.05 | $ 10.28 | $ 10.07 | $ 10.27 | $ 10.39 |
Income from Investment Operations | | | | | | |
Net investment income (loss)D | .193 | .423 | .466 | .527 | .524 | .543 |
Net realized and unrealized gain (loss) | .191 | .187 | .778 | .232 | (.189) | (.143) |
Total from investment operations | .384 | .610 | 1.244 | .759 | .335 | .400 |
Distributions from net investment income | (.209) | (.409) | (.440) | (.481) | (.510) | (.503) |
Distributions from net realized gain | (.175) | (.211) | (.034) | (.068) | (.025) | (.017) |
Total distributions | (.384) | (.620) | (.474) | (.549) | (.535) | (.520) |
Net asset value, end of period | $ 11.04 | $ 11.04 | $ 11.05 | $ 10.28 | $ 10.07 | $ 10.27 |
Total ReturnB,C | 3.57% | 5.76% | 12.37% | 8.17% | 3.29% | 3.89% |
Ratios to Average Net AssetsE,G | | | | | | |
Expenses before reductions | .45%A | .45% | .45% | .45% | .45% | .45% |
Expenses net of fee waivers, if any | .45%A | .45% | .45% | .45% | .45% | .45% |
Expenses net of all reductions | .45%A | .45% | .45% | .45% | .45% | .45% |
Net investment income (loss) | 3.55%A | 3.89% | 4.37% | 5.52% | 5.12% | 5.25% |
Supplemental Data | | | | | | |
Net assets, end of period (000 omitted) | $ 12,793,589 | $ 11,418,458 | $ 11,342,385 | $ 10,863,828 | $ 9,976,432 | $ 6,450,177 |
Portfolio turnover rateF | 137%A | 168%H | 130% | 104%H | 122% | 116%H |
A Annualized
B Total returns for periods of less than one year are not annualized.
C Total returns would have been lower if certain expenses had not been reduced during the applicable periods shown.
D Calculated based on average shares outstanding during the period.
E Fees and expenses of any underlying Fidelity Central Funds are not included in the Fund's expense ratio. The Fund indirectly bears its proportionate share of the expenses of any underlying Fidelity Central Funds.
F Amount does not include the portfolio activity of any underlying Fidelity Central Funds.
G Expense ratios reflect operating expenses of the class. Expenses before reductions do not reflect amounts reimbursed by the investment adviser or reductions from brokerage service arrangements or reductions from other expense offset arrangements and do not represent the amount paid by the class during periods when reimbursements or reductions occur. Expenses net of fee waivers reflect expenses after reimbursement by the investment adviser but prior to reductions from brokerage service arrangements or other expense offset arrangements. Expenses net of all reductions represent the net expenses paid by the class.
H The portfolio turnover rate excludes liquidations and redemptions executed in-kind from Affiliated Central Funds.
See accompanying notes which are an integral part of the financial statements.
Semiannual Report
Financial Highlights - Institutional Class
| Six months ended
February 29, | Years ended August 31, |
| 2012 | 2011 | 2010 | 2009 | 2008 | 2007 |
Selected Per-Share Data | | | | | | |
Net asset value, beginning of period | $ 11.02 | $ 11.04 | $ 10.26 | $ 10.06 | $ 10.26 | $ 10.38 |
Income from Investment Operations | | | | | | |
Net investment income (loss)D | .188 | .413 | .458 | .518 | .516 | .527 |
Net realized and unrealized gain (loss) | .191 | .178 | .788 | .224 | (.186) | (.134) |
Total from investment operations | .379 | .591 | 1.246 | .742 | .330 | .393 |
Distributions from net investment income | (.204) | (.400) | (.432) | (.474) | (.505) | (.496) |
Distributions from net realized gain | (.175) | (.211) | (.034) | (.068) | (.025) | (.017) |
Total distributions | (.379) | (.611) | (.466) | (.542) | (.530) | (.513) |
Net asset value, end of period | $ 11.02 | $ 11.02 | $ 11.04 | $ 10.26 | $ 10.06 | $ 10.26 |
Total ReturnB,C | 3.53% | 5.58% | 12.41% | 7.99% | 3.24% | 3.83% |
Ratios to Average Net AssetsE,G | | | | | | |
Expenses before reductions | .54%A | .54% | .52% | .53% | .51% | .50% |
Expenses net of fee waivers, if any | .54%A | .54% | .52% | .53% | .51% | .50% |
Expenses net of all reductions | .54%A | .54% | .52% | .53% | .51% | .49% |
Net investment income (loss) | 3.46%A | 3.80% | 4.30% | 5.45% | 5.06% | 5.21% |
Supplemental Data | | | | | | |
Net assets, end of period (000 omitted) | $ 522,614 | $ 531,451 | $ 509,388 | $ 884,991 | $ 947,791 | $ 348,636 |
Portfolio turnover rateF | 137%A | 168%H | 130% | 104%H | 122% | 116%H |
A Annualized
B Total returns for periods of less than one year are not annualized.
C Total returns would have been lower if certain expenses had not been reduced during the applicable periods shown.
D Calculated based on average shares outstanding during the period.
E Fees and expenses of any underlying Fidelity Central Funds are not included in the Fund's expense ratio. The Fund indirectly bears its proportionate share of the expenses of any underlying Fidelity Central Funds.
F Amount does not include the portfolio activity of any underlying Fidelity Central Funds.
G Expense ratios reflect operating expenses of the class. Expenses before reductions do not reflect amounts reimbursed by the investment adviser or reductions from brokerage service arrangements or reductions from other expense offset arrangements and do not represent the amount paid by the class during periods when reimbursements or reductions occur. Expenses net of fee waivers reflect expenses after reimbursement by the investment adviser but prior to reductions from brokerage service arrangements or other expense offset arrangements. Expenses net of all reductions represent the net expenses paid by the class.
H The portfolio turnover rate excludes liquidations and redemptions executed in-kind from Affiliated Central Funds.
See accompanying notes which are an integral part of the financial statements.
Semiannual Report
Notes to Financial Statements
For the period ended February 29, 2012
1. Organization.
Fidelity Total Bond Fund (the Fund) is a fund of Fidelity Income Fund (the Trust) and is authorized to issue an unlimited number of shares. The Trust is registered under the Investment Company Act of 1940, as amended (the 1940 Act), as an open-end management investment company organized as a Massachusetts business trust. The Fund offers Class A, Class T, Class C, Total Bond and Institutional Class shares, each of which, along with Class B shares, has equal rights as to assets and voting privileges. Effective after the close of business on September 1, 2010, Class B shares were closed to new accounts and additional purchases, except for exchanges and reinvestments. The Fund offered Class F shares during the period June 26, 2009 through September 30, 2010, and all outstanding shares were redeemed by September 30, 2010. Each class has exclusive voting rights with respect to matters that affect that class. Class B shares will automatically convert to Class A shares after a holding period of seven years from the initial date of purchase. Investment income, realized and unrealized capital gains and losses, the common expenses of the Fund, and certain fund-level expense reductions, if any, are allocated on a pro-rata basis to each class based on the relative net assets of each class to the total net assets of the Fund. Each class differs with respect to transfer agent and distribution and service plan fees incurred. Certain expense reductions may also differ by class.
2. Investments in Fidelity Central Funds.
The Fund invests in Fidelity Central Funds, which are open-end investment companies available only to other investment companies and accounts managed by Fidelity Management & Research Company (FMR) and its affiliates. The Fund's Schedule of Investments lists each of the Fidelity Central Funds held as of period end, if any, as an investment of the Fund, but does not include the underlying holdings of each Fidelity Central Fund. As an Investing Fund, the Fund indirectly bears its proportionate share of the expenses of the underlying Fidelity Central Funds.
Based on their investment objective, each Fidelity Central Fund may invest or participate in various investment vehicles or strategies that are similar to those of the Fund. These strategies are consistent with the investment objectives of the Fund and may involve certain economic risks which may cause a decline in value of each of the Fidelity Central Funds and thus a decline in the value of the Fund. The Money Market Central Funds seek preservation of capital and current income and are managed by Fidelity Investments Money Management, Inc. (FIMM), an affiliate of FMR.
A complete unaudited list of holdings for each Fidelity Central Fund is available upon request or at the Securities and Exchange Commission (the SEC) web site at www.sec.gov. In addition, the financial statements of the Fidelity Central Funds, which are not covered by the Fund's Report of Independent Registered Public Accounting Firm, are available on the SEC web site or upon request.
Semiannual Report
Notes to Financial Statements - continued
2. Investments in Fidelity Central Funds - continued
Fidelity Central Fund | | Investment Manager | | Investment Objective | | Investment Practices |
Fidelity Floating Rate Central Fund | | FMR Co., Inc. (FMRC) | | Seeks a high level of income by normally investing in floating rate loans and other floating rate securities. | | Loans & Direct Debt Instruments Repurchase Agreements Restricted Securities |
Fidelity Mortgage Backed Securities Central Fund | | FIMM | | Seeks a high level of income by normally investing in investment-grade mortgage-related securities and repurchase agreements for those securities. | | Delayed Delivery & When Issued Securities Futures Repurchase Agreements Swap Agreements |
An unaudited holdings listing for the Fund, which presents direct holdings as well as the pro-rata share of any securities and other investments held indirectly through its investment in underlying non-money market Fidelity Central Funds, is available at fidelity.com and/or advisor.fidelity.com, as applicable. A complete unaudited list of holdings for each Fidelity Central Fund is available upon request or at the Securities and Exchange Commission (the SEC) web site at www.sec.gov. In addition, the financial statements of the Fidelity Central Funds which contain the significant accounting policies (including security valuation policies) of those funds, which are not covered by the Fund's Report of Independent Registered Public Accounting Firm, are available on the SEC web site or upon request.
3. Significant Accounting Policies.
The financial statements have been prepared in conformity with accounting principles generally accepted in the United States of America (GAAP), which require management to make certain estimates and assumptions at the date of the financial statements. Actual results could differ from those estimates. Subsequent events, if any, through the date that the financial statements were issued have been evaluated in the preparation of the financial statements. The following summarizes the significant accounting policies of the Fund:
Security Valuation. Investments are valued as of 4:00 p.m. Eastern time on the last calendar day of the period. The Fund uses independent pricing services approved by the Board of Trustees to value its investments. When current market prices or quotations are not readily available or reliable, valuations may be determined in good faith in accordance with procedures adopted by the Board of Trustees. Factors used in determining
Semiannual Report
3. Significant Accounting Policies - continued
Security Valuation - continued
value may include market or security specific events, changes in interest rates and credit quality. The frequency with which these procedures are used cannot be predicted and they may be utilized to a significant extent. The value used for net asset value (NAV) calculation under these procedures may differ from published prices for the same securities.
The Fund categorizes the inputs to valuation techniques used to value its investments into a disclosure hierarchy consisting of three levels as shown below:
Level 1 - quoted prices in active markets for identical investments
Level 2 - other significant observable inputs (including quoted prices for similar investments, interest rates, prepayment speeds, etc.)
Level 3 - unobservable inputs (including the Fund's own assumptions based on the best information available)
Changes in valuation techniques may result in transfers in or out of an assigned level within the disclosure hierarchy. The aggregate value of investments by input level, as of February 29, 2012 for the Fund's investments, as well as a roll forward of Level 3 securities, is included at the end of the Fund's Schedule of Investments. Valuation techniques used to value the Fund's investments by major category are as follows:
Debt securities, including restricted securities, are valued based on evaluated prices received from independent pricing services or from dealers who make markets in such securities. For corporate bonds, bank notes, floating rate loans, foreign government and government agency obligations, municipal securities, preferred securities, supranational obligations, U.S. government and government agency obligations and sovereign loan participations, pricing services utilize matrix pricing which considers yield or price of bonds of comparable quality, coupon, maturity and type as well as dealer supplied prices and are generally categorized as Level 2 in the hierarchy. For asset backed securities, collateralized mortgage obligations, commercial mortgage securities and U.S. government agency mortgage securities, pricing services utilize matrix pricing which considers prepayment speed assumptions, attributes of the collateral, yield or price of bonds of comparable quality, coupon, maturity and type as well as dealer supplied prices and, accordingly, such securities are generally categorized as Level 2 in the hierarchy. Swaps are marked-to-market daily based on valuations from independent pricing services or dealer-supplied valuations and changes in value are recorded as unrealized appreciation (depreciation). Pricing services utilize matrix pricing which considers comparisons to interest rate curves, credit spread curves, default possibilities and recovery rates and, as a result, swaps are generally categorized as Level 2 in the hierarchy. When independent
Semiannual Report
Notes to Financial Statements - continued
3. Significant Accounting Policies - continued
Security Valuation - continued
prices are unavailable or unreliable, debt securities and swaps may be valued utilizing pricing matrices which consider similar factors that would be used by independent pricing services. These are generally categorized as Level 2 in the hierarchy but may be Level 3 depending on the circumstances.
Equity securities, including restricted securities, for which market quotations are readily available, are valued at the last reported sale price or official closing price as reported by an independent pricing service on the primary market or exchange on which they are traded and are categorized as Level 1 in the hierarchy. In the event there were no sales during the day or closing prices are not available, securities are valued at the last quoted bid price or may be valued using the last available price and are generally categorized as Level 2 in the hierarchy. Utilizing these techniques may result in transfers between Level 1 and Level 2. For restricted securities and private placements where observable inputs are limited, assumptions about market activity and risk are used and are categorized as Level 3 in the hierarchy.
Investments in open-end mutual funds, including the Fidelity Central Funds, are valued at their closing net asset value each business day and are categorized as Level 1 in the hierarchy.
New Accounting Pronouncements. In May 2011, the Financial Accounting Standards Board issued Accounting Standard Update No. 2011-04, Fair Value Measurement (Topic 820) - Amendments to Achieve Common Fair Value Measurement and Disclosure Requirements in U.S. GAAP and IFRSs. The update is effective during interim and annual periods beginning after December 15, 2011 and will result in additional disclosure for transfers between levels as well as expanded disclosure for securities categorized as Level 3 under the fair value hierarchy.
In December 2011, the Financial Accounting Standards Board issued Accounting Standard Update No. 2011-11, Disclosures about Offsetting Assets and Liabilities. The update creates new disclosure requirements requiring entities to disclose both gross and net information for derivatives and other financial instruments that are either offset in the Statement of Assets and Liabilities or subject to an enforceable master netting arrangement or similar agreement. The disclosure requirements are effective for interim and annual reporting periods beginning on or after January 1, 2013. Management is currently evaluating the impact of the update's adoption on the Fund's financial statement disclosures.
Semiannual Report
3. Significant Accounting Policies - continued
Foreign Currency. The Fund may use foreign currency contracts to facilitate transactions in foreign-denominated securities. Gains and losses from these transactions may arise from changes in the value of the foreign currency or if the counterparties do not perform under the contracts' terms.
Foreign-denominated assets, including investment securities, and liabilities are translated into U.S. dollars at the exchange rate at period end. Purchases and sales of investment securities, income and dividends received and expenses denominated in foreign currencies are translated into U.S. dollars at the exchange rate in effect on the transaction date.
The effects of exchange rate fluctuations on investments are included with the net realized and unrealized gain (loss) on investment securities. Other foreign currency transactions resulting in realized and unrealized gain (loss) are disclosed separately.
Investment Transactions and Income. For financial reporting purposes, the Fund's investment holdings and NAV include trades executed through the end of the last business day of the period. The NAV per share for processing shareholder transactions is calculated as of the close of business of the New York Stock Exchange (NYSE), normally 4:00 p.m. Eastern time and includes trades executed through the end of the prior business day. Gains and losses on securities sold are determined on the basis of identified cost. Dividend income is recorded on the ex-dividend date, except for certain dividends from foreign securities where the ex-dividend date may have passed, which are recorded as soon as the Fund is informed of the ex-dividend date. Non-cash dividends included in dividend income, if any, are recorded at the fair market value of the securities received. Distributions received on securities that represent a return of capital or capital gain are recorded as a reduction of cost of investments and/or as a realized gain. The Fund estimates the components of distributions received that may be considered return of capital distributions or capital gain distributions. Interest income and distributions from the Fidelity Central Funds are accrued as earned. Interest income includes coupon interest and amortization of premium and accretion of discount on debt securities. The principal amount on inflation-indexed securities is periodically adjusted to the rate of inflation and interest is accrued based on the principal amount. The adjustments to principal due to inflation are reflected as increases or decreases to interest income even though principal is not received until maturity. Investment income is recorded net of foreign taxes withheld where recovery of such taxes is uncertain. Debt obligations may be placed on non-accrual status and related interest income may be reduced by ceasing current accruals and writing off interest receivables when the collection of all or a portion of interest has become doubtful based on consistently applied procedures. A debt obligation is removed from non-accrual status when the issuer resumes interest payments or when collectability of interest is reasonably assured.
Semiannual Report
Notes to Financial Statements - continued
3. Significant Accounting Policies - continued
Expenses. Expenses directly attributable to a fund are charged to that fund. Expenses attributable to more than one fund are allocated among the respective funds on the basis of relative net assets or other appropriate methods. Expense estimates are accrued in the period to which they relate and adjustments are made when actual amounts are known.
Deferred Trustee Compensation. Under a Deferred Compensation Plan (the Plan), independent Trustees may elect to defer receipt of a portion of their annual compensation. Deferred amounts are invested in a cross-section of Fidelity funds, are marked-to-market and remain in the Fund until distributed in accordance with the Plan. The investment of deferred amounts and the offsetting payable to the Trustees are included in the accompanying Statement of Assets and Liabilities.
Income Tax Information and Distributions to Shareholders. Each year, the Fund intends to qualify as a regulated investment company under Subchapter M of the Internal Revenue Code, including distributing substantially all of its taxable income and realized gains. As a result, no provision for income taxes is required. The Fund files a U.S. federal tax return, in addition to state and local tax returns as required. A fund's federal income tax returns are subject to examination by the Internal Revenue Service (IRS) for a period of three fiscal years after they are filed. State and local tax returns may be subject to examination for an additional fiscal year depending on the jurisdiction. Foreign taxes are provided for based on the Fund's understanding of the tax rules and rates that exist in the foreign markets in which it invests.
Dividends are declared and recorded daily and paid monthly from net investment income. Distributions from realized gains, if any, are declared and recorded on the ex-dividend date. Income dividends and capital gain distributions are declared separately for each class. Income and capital gain distributions are determined in accordance with income tax regulations, which may differ from GAAP.
Capital accounts within the financial statements are adjusted for permanent book-tax differences. These adjustments have no impact on net assets or the results of operations. Temporary book-tax differences will reverse in a subsequent period.
Book-tax differences are primarily due to in-kind transactions, swap agreements, foreign currency transactions, default bonds, market discount, equity-debt classifications, partnerships (including allocations from Fidelity Central Funds), deferred trustee compensation and losses deferred due to wash sales.
Semiannual Report
3. Significant Accounting Policies - continued
Income Tax Information and Distributions to Shareholders - continued
The federal tax cost of investment securities and unrealized appreciation (depreciation) as of period end were as follows:
Gross unrealized appreciation | $ 908,340,228 |
Gross unrealized depreciation | (59,347,264) |
Net unrealized appreciation (depreciation) on securities and other investments | $ 848,992,964 |
| |
Tax cost | $ 14,700,576,829 |
4. Operating Policies.
Delayed Delivery Transactions and When-Issued Securities. During the period, the Fund transacted in securities on a delayed delivery or when-issued basis. Payment and delivery may take place after the customary settlement period for that security. The price of the underlying securities and the date when the securities will be delivered and paid for are fixed at the time the transaction is negotiated. During the time a delayed delivery sell is outstanding, the contract is marked-to-market daily and equivalent deliverable securities are held for the transaction. The securities purchased on a delayed delivery or when-issued basis are identified as such in the Fund's Schedule of Investments. The Fund may receive compensation for interest forgone in the purchase of a delayed delivery or when-issued security. With respect to purchase commitments, the Fund identifies securities as segregated in its records with a value at least equal to the amount of the commitment. Losses may arise due to changes in the value of the underlying securities or if the counterparty does not perform under the contract's terms, or if the issuer does not issue the securities due to political, economic, or other factors.
To-Be-Announced (TBA) Securities and Mortgage Dollar Rolls. During the period, the Fund transacted in TBA securities that involved buying or selling mortgage-backed securities (MBS) on a forward commitment basis. A TBA transaction typically does not designate the actual security to be delivered and only includes an approximate principal amount however; delivered securities must meet specified terms defined by industry guidelines, including issuer, rate and current principal amount outstanding on underlying mortgage pools. The Fund may enter into a TBA transaction with the intent to take possession of or deliver the underlying MBS, or the Fund may elect to extend the settlement by entering into either a mortgage or reverse mortgage dollar roll. Mortgage dollar rolls are transactions where a fund sells MBS and simultaneously agrees to repurchase MBS on a later date at a lower price and with the same counterparty. Reverse mortgage dollar rolls involve the purchase and simultaneous agreement to sell MBS on a later date
Semiannual Report
Notes to Financial Statements - continued
4. Operating Policies - continued
To-Be-Announced (TBA) Securities and Mortgage Dollar Rolls - continued
at a lower price. Transactions in mortgage dollar rolls and reverse mortgage dollar rolls are accounted for as purchases and sales and may result in an increase to the Fund's portfolio turnover rate.
Purchases and sales of TBA securities involve risks similar to those discussed above for delayed delivery and when-issued securities. Also, if the counterparty in a dollar roll or a reverse dollar roll transaction files for bankruptcy or becomes insolvent, the Fund's right to repurchase or sell securities may be limited. Additionally, when a fund sells TBA securities without already owning or having the right to obtain the deliverable securities (an uncovered forward commitment to sell), it incurs a risk of loss because it could have to purchase the securities at a price that is higher than the price at which it sold them. A fund may be unable to purchase the deliverable securities if the corresponding market is illiquid.
TBA securities subject to a forward commitment to sell at period end are included at the end of the Fund's Schedule of Investments under the caption "TBA Sale Commitments." The proceeds and value of these commitments are reflected in the Fund's Statement of Assets and Liabilities.
Restricted Securities. The Fund may invest in securities that are subject to legal or contractual restrictions on resale. These securities generally may be resold in transactions exempt from registration or to the public if the securities are registered. Disposal of these securities may involve time-consuming negotiations and expense, and prompt sale at an acceptable price may be difficult. Information regarding restricted securities is included at the end of the Fund's Schedule of Investments.
Loans and Other Direct Debt Instruments. The Fund invests in direct debt instruments which are interests in amounts owed to lenders by corporate or other borrowers. These instruments may be in the form of loans, trade claims or other receivables and may include standby financing commitments such as revolving credit facilities that obligate the Fund to supply additional cash to the borrower on demand. Loans may be acquired through assignment or participation, or may be made directly to a borrower. The Fund may be contractually obligated to receive approval from the agent bank and/or borrower prior to the sale of these loans.
5. Derivative Instruments.
Risk Exposures and the Use of Derivative Instruments. The Fund used derivative instruments (derivatives) including swap agreements, in order to meet its investment objectives. The strategy is to use derivatives to increase returns, to gain exposure to certain types of assets and to manage exposure to certain risks as defined below. The
Semiannual Report
5. Derivative Instruments - continued
Risk Exposures and the Use of Derivative Instruments - continued
success of any strategy involving derivatives depends on analysis of numerous economic factors, and if the strategies for investment do not work as intended, the Fund may not achieve its objectives.
The Fund's use of derivatives increased or decreased its exposure to the following risks:
Credit Risk | Credit risk relates to the ability of the issuer of a financial instrument to make further principal or interest payments on an obligation or commitment that it has to the Fund. |
Interest Rate Risk | Interest rate risk relates to the fluctuations in the value of interest-bearing securities due to changes in the prevailing levels of market interest rates. |
The Fund is also exposed to additional risks from investing in derivatives, such as liquidity risk and counterparty credit risk. Liquidity risk is the risk that the Fund will be unable to close out the derivative in the open market in a timely manner. Counterparty credit risk is the risk that the counterparty will not be able to fulfill its obligation to the Fund. Derivative counterparty credit risk is managed through formal evaluation of the creditworthiness of all potential counterparties. On certain over-the-counter (OTC) derivatives such as swap agreements, the Fund attempts to reduce its exposure to counterparty credit risk by entering into an International Swaps and Derivatives Association (ISDA) Master Agreement on a bilateral basis with each of its counterparties. The ISDA Master Agreement gives the Fund the right to terminate all transactions traded under such agreement if there is a certain deterioration in the credit quality of the counterparty. The ISDA Master Agreement gives each party the right, upon an event of default by the other party or a termination of the agreement, to close out all transactions traded under such agreement and to net amounts owed under each transaction to one net payable by one party to the other. To mitigate counterparty credit risk on OTC derivatives, the Fund receives collateral in the form of cash or securities once the Fund's net unrealized appreciation on outstanding derivative contracts under an ISDA Master Agreement exceeds certain applicable thresholds, subject to certain minimum transfer provisions. The collateral received is held in segregated accounts with the Fund's custodian bank in accordance with the collateral agreements entered into between the Fund, the counterparty and the Fund's custodian bank. The Fund could experience delays and costs in gaining access to the collateral even though it is held by the Fund's custodian bank. The Fund's maximum risk of loss from counterparty credit risk related to OTC derivatives is generally the aggregate unrealized appreciation and unpaid counterparty payments in excess of any collateral pledged by the counterparty to the Fund. The Fund may be required to pledge collateral for the benefit of the counterparties on OTC derivatives in an amount not less than the counterparty's unrealized appreciation on
Semiannual Report
Notes to Financial Statements - continued
5. Derivative Instruments - continued
Risk Exposures and the Use of Derivative Instruments - continued
outstanding derivative contracts, subject to certain minimum transfer provisions, and any such pledged collateral is identified in the Schedule of Investments. Derivatives involve, to varying degrees, risk of loss in excess of the amounts recognized in the Statement of Assets and Liabilities.
Net Realized Gain (Loss) and Change in Net Unrealized Appreciation (Depreciation) on Derivatives. The table below, which reflects the impacts of derivatives on the financial performance of the Fund, summarizes the net realized gain (loss) and change in net unrealized appreciation (depreciation) for derivatives during the period.
Risk Exposure / Derivative Type | Net Realized
Gain (Loss) | Change in
Net Unrealized Appreciation
(Depreciation) |
Credit Risk | | |
Swap Agreements | $ (1,026,485) | $ 968,549 |
Interest Rate Risk | | |
Swap Agreements | 991,350 | (1,000,380) |
Totals (a) | $ (35,135) | $ (31,831) |
(a) A summary of the value of derivatives by risk exposure as of period end, if any, is included at the end of the Schedule of Investment and is representative of activity for the period.
Swap Agreements. A swap agreement (swap) is a contract between two parties to exchange future cash flows at periodic intervals based on a notional principal amount.
Details of swaps open at period end are included in the Schedule of Investments under the caption "Swap Agreements." Swaps are marked-to-market daily and changes in value are recorded as unrealized appreciation or (depreciation) and reflected in the Statement of Assets and Liabilities. Any upfront premiums paid or received upon entering a swap to compensate for differences between stated terms of the agreement and prevailing market conditions (e.g. credit spreads, interest rates or other factors) are recorded as realized gain or (loss) ratably over the term of the swap. Payments are exchanged at specified intervals, accrued daily commencing with the effective date of the contract and recorded as realized gain or (loss). Realized gain or (loss) is also recorded in the event of an early termination of a swap. The net realized gain (loss) and change in net unrealized appreciation (depreciation) on swaps during the period is included in the Statement of Operations.
Interest Rate Swaps. Interest rate swaps are agreements between counterparties to exchange cash flows, one based on a fixed rate, and the other on a floating rate. The Fund entered into interest rate swaps to manage its exposure to interest rate changes. Changes in interest rates can have an effect on both the value of bond holdings as well as the amount of interest income earned. In general, the value of bonds can fall when interest rates rise and can rise when interest rates fall.
Semiannual Report
5. Derivative Instruments - continued
Credit Default Swaps. Credit default swaps enable the Fund to buy or sell protection on a debt security or a basket of securities against a defined credit event. Under the terms of a credit default swap the buyer of protection (buyer) receives credit protection in exchange for making periodic payments to the seller of protection (seller) based on a fixed percentage applied to a notional principal amount. In return for these payments, the seller acts as a guarantor of the creditworthiness of a reference obligation. The Fund enters into credit default swaps as a seller to gain credit exposure to an issuer and/or as a buyer to provide a measure of protection against defaults of an issuer. The issuer may be either a single issuer or a "basket" of issuers. Periodic payments are made over the life of the contract provided that no credit event occurs.
For credit default swaps on most corporate and sovereign issuers, credit events include bankruptcy, failure to pay, obligation acceleration or repudiation/moratorium. For credit default swaps on corporate or sovereign issuers, the obligation that may be put to the seller is not limited to the specific reference obligation described in the Schedule of Investments. For credit default swaps on asset-backed securities, a credit event may be triggered by events such as failure to pay principal, maturity extension, rating downgrade or write-down. For credit default swaps on asset-backed securities, the reference obligation described represents the security that may be put to the seller.
As a seller, if an underlying credit event occurs, the Fund will either pay the buyer an amount equal to the notional amount of the swap and take delivery of the reference obligation or underlying securities comprising an index or pay a net settlement amount of cash equal to the notional amount of the swap less the recovery value of the reference obligation or underlying securities comprising an index.
As a buyer, if an underlying credit event occurs, the Fund will either receive from the seller an amount equal to the notional amount of the swap and deliver the reference obligation or underlying securities comprising an index or receive a net settlement amount of cash equal to the notional amount of the swap less the recovery value of the reference obligation or underlying securities comprising an index.
Typically, the value of each credit default swap and credit rating disclosed for each reference obligation in the Schedule of Investments, where the Fund is the seller, can be used as measures of the current payment/performance risk of the swap. As the value of the swap changes as a positive or negative percentage of the total notional amount, the payment/performance risk may decrease or increase, respectively. In addition to these measures, FMR monitors a variety of factors including cash flow assumptions, market activity and market sentiment as part of its ongoing process of assessing payment/performance risk.
Semiannual Report
Notes to Financial Statements - continued
5. Derivative Instruments - continued
Credit Default Swaps - continued
The notional amount of credit default swaps is included in the Schedule of Investments and approximates the maximum potential amount of future payments that the Fund could be required to make if the Fund is the seller and a credit event were to occur. The total notional amount of all credit default swaps open at period end where the Fund is the seller amounted to $11,486,029 representing .08% of net assets.
6. Purchases and Sales of Investments.
Purchases and sales of securities (including the Fixed-Income Central Funds), other than short-term securities and U.S. government securities, aggregated $1,367,944,015 and $907,500,375, respectively.
7. Fees and Other Transactions with Affiliates.
Management Fee. FMR and its affiliates provide the Fund with investment management related services for which the Fund pays a monthly management fee. The management fee is the sum of an individual fund fee rate that is based on an annual rate of .20% of the Fund's average net assets and an annualized group fee rate that averaged .12% during the period. The group fee rate is based upon the average net assets of all the mutual funds advised by FMR. The group fee rate decreases as assets under management increase and increases as assets under management decrease. For the period, the total annualized management fee rate was .32% of the Fund's average net assets.
Distribution and Service Plan Fees. In accordance with Rule 12b-1 of the 1940 Act, the Fund has adopted separate Distribution and Service Plans for each class of shares. Certain classes pay Fidelity Distributors Corporation (FDC), an affiliate of FMR, separate Distribution and Service Fees, each of which is based on an annual percentage of each class' average net assets. In addition, FDC may pay financial intermediaries for selling shares of the Fund and providing shareholder support services. For the period, the Distribution and Service Fee rates, total fees and amounts retained by FDC were as follows:
| Distribution
Fee | Service
Fee | Total
Fees | Retained
by FDC |
Class A | -% | .25% | $ 1,660,460 | $ 11,202 |
Class T | -% | .25% | 63,989 | 579 |
Class B | .65% | .25% | 42,115 | 30,441 |
Class C | .75% | .25% | 354,292 | 69,959 |
| | | $ 2,120,856 | $ 112,181 |
Semiannual Report
7. Fees and Other Transactions with Affiliates - continued
Sales Load. FDC may receive a front-end sales charge of up to 4.00% for selling Class A shares and Class T shares, some of which is paid to financial intermediaries for selling shares of the Fund. Depending on the holding period, FDC may receive contingent deferred sales charges levied on Class A, Class T, Class B, and Class C redemptions. The deferred sales charges range from 5.00% to 1.00% for Class B, 1.00% for Class C, .75% for certain purchases of Class A shares and .25% for certain purchases of Class T shares.
For the period, sales charge amounts retained by FDC were as follows:
| Retained
by FDC |
Class A | $ 39,185 |
Class T | 10,423 |
Class B* | 6,181 |
Class C* | 4,600 |
| $ 60,389 |
* When Class B and Class C shares are initially sold, FDC pays commissions from its own resources to financial intermediaries through which the sales are made.
Transfer Agent Fees. Fidelity Investments Institutional Operations Company, Inc. (FIIOC), an affiliate of FMR, is the transfer, dividend disbursing and shareholder servicing agent for each class of the Fund. FIIOC receives account fees and asset-based fees that vary according to the account size and type of account of the shareholders of each respective class of the Fund, with the exception of Total Bond. FIIOC receives an asset-based fee of .10% of Total Bond's average net assets. FIIOC pays for typesetting, printing and mailing of shareholder reports, except proxy statements. For the period, transfer agent fees for each class were as follows:
| Amount | % of
Average
Net Assets* |
Class A | $ 1,566,614 | .24 |
Class T | 44,492 | .17 |
Class B | 11,692 | .25 |
Class C | 57,639 | .16 |
Total Bond | 5,959,911 | .10 |
Institutional Class | 505,337 | .19 |
| $ 8,145,685 | |
* Annualized
Semiannual Report
Notes to Financial Statements - continued
7. Fees and Other Transactions with Affiliates - continued
Fund Wide Operations Fee. Pursuant to the Fund Wide Operations and Expense Agreement (FWOE), FMR has agreed to provide for fund level expenses (which do not include transfer agent, Rule 12b-1 fees, compensation of the independent Trustees, interest (including commitment fees), taxes or extraordinary expenses, if any) in return for a FWOE fee equal to .35% less the total amount of the management fee. The FWOE paid by the Fund is reduced by an amount equal to the fees and expenses paid to the independent Trustees. For the period, the FWOE fee was equivalent to an annualized rate of .03% of average net assets.
8. Committed Line of Credit.
The Fund participates with other funds managed by FMR or an affiliate in a $4.0 billion credit facility (the "line of credit") to be utilized for temporary or emergency purposes to fund shareholder redemptions or for other short-term liquidity purposes. The Fund has agreed to pay commitment fees on its pro-rata portion of the line of credit, which amounted to $18,995 and is reflected in Miscellaneous expenses on the Statement of Operations. During the period, there were no borrowings on this line of credit.
9. Security Lending.
The Fund lends portfolio securities from time to time in order to earn additional income. On the settlement date of the loan, the Fund receives collateral (in the form of U.S. Treasury obligations, letters of credit and/or cash) against the loaned securities and maintains collateral in an amount not less than 100% of the market value of the loaned securities during the period of the loan. The market value of the loaned securities is determined at the close of business of the Fund and any additional required collateral is delivered to the Fund on the next business day. If the borrower defaults on its obligation to return the securities loaned because of insolvency or other reasons, a fund could experience delays and costs in recovering the securities loaned or in gaining access to the collateral. Any cash collateral received is maintained at the Fund's custodian and/or invested in cash equivalents. At period end, there were no security loans outstanding. Security lending income represents the income earned on investing cash collateral, less rebates paid to borrowers, plus any premium payments received for lending certain types of securities. Security lending income is presented in the Statement of Operations as a component of interest income. Total security lending income during the period amounted to $29,546.
Semiannual Report
10. Expense Reductions.
Through arrangements with the Fund's custodian, credits realized as a result of uninvested cash balances were used to reduce the Fund's expenses. During the period, these credits reduced the Fund's custody expenses by $1,594.
11. Distributions to Shareholders.
Distributions to shareholders of each class were as follows:
| Six months ended
February 29, 2012 | Year ended
August 31, 2011A |
From net investment income | | |
Class A | $ 22,736,986 | $ 35,129,345 |
Class T | 889,236 | 1,855,789 |
Class B | 129,517 | 296,985 |
Class C | 970,968 | 2,026,950 |
Total Bond | 227,043,295 | 427,026,328 |
Class F | - | 129,141 |
Institutional Class | 9,994,854 | 18,932,900 |
Total | $ 261,764,856 | $ 485,397,438 |
From net realized gain | | |
Class A | $ 20,452,852 | $ 17,070,006 |
Class T | 936,776 | 1,197,314 |
Class B | 146,504 | 247,157 |
Class C | 1,103,220 | 1,677,741 |
Total Bond | 184,845,253 | 214,891,467 |
Class F | - | - |
Institutional Class | 8,485,781 | 9,432,558 |
Total | $ 215,970,386 | $ 244,516,243 |
A All Class F shares were redeemed on September 30, 2010.
12. Share Transactions.
Transactions for each class of shares were as follows:
| Shares | Dollars |
| Six months ended February 29, 2012 | Year ended
August 31, 2011A | Six months ended February 29, 2012 | Year ended
August 31, 2011A |
Class A | | | | |
Shares sold | 28,031,739 | 70,407,747 | $ 307,445,959 | $ 764,123,344 |
Reinvestment of distributions | 3,889,684 | 4,687,391 | 42,411,973 | 50,970,385 |
Shares redeemed | (11,017,719) | (36,997,892) | (120,804,559) | (404,102,564) |
Net increase (decrease) | 20,903,704 | 38,097,246 | $ 229,053,373 | $ 410,991,165 |
Semiannual Report
Notes to Financial Statements - continued
12. Share Transactions - continued
| Shares | Dollars |
| Six months ended February 29, 2012 | Year ended
August 31, 2011A | Six months ended February 29, 2012 | Year ended
August 31, 2011A |
Class T | | | | |
Shares sold | 1,823,963 | 5,910,533 | $ 19,918,086 | $ 64,536,331 |
Reinvestment of distributions | 150,485 | 246,104 | 1,637,334 | 2,672,918 |
Shares redeemed | (2,828,402) | (7,131,049) | (30,811,992) | (77,181,315) |
Net increase (decrease) | (853,954) | (974,412) | $ (9,256,572) | $ (9,972,066) |
Class B | | | | |
Shares sold | 188,982 | 164,162 | $ 2,073,160 | $ 1,801,729 |
Reinvestment of distributions | 20,468 | 41,104 | 222,991 | 447,251 |
Shares redeemed | (125,981) | (547,045) | (1,382,331) | (5,927,269) |
Net increase (decrease) | 83,469 | (341,779) | $ 913,820 | $ (3,678,289) |
Class C | | | | |
Shares sold | 2,246,075 | 2,834,490 | $ 24,650,760 | $ 30,988,336 |
Reinvestment of distributions | 167,404 | 299,725 | 1,823,526 | 3,259,076 |
Shares redeemed | (904,570) | (5,620,712) | (9,890,550) | (60,917,944) |
Net increase (decrease) | 1,508,909 | (2,486,497) | $ 16,583,736 | $ (26,670,532) |
Total Bond | | | | |
Shares sold | 250,130,185 | 384,874,413 | $ 2,741,615,740 | $ 4,191,107,190 |
Reinvestment of distributions | 36,048,477 | 56,207,634 | 393,133,879 | 611,374,414 |
Shares redeemed | (161,591,730) | (432,717,356) | (1,772,378,308) | (4,723,560,620) |
Net increase (decrease) | 124,586,932 | 8,364,691 | $ 1,362,371,311 | $ 78,920,984 |
Class F | | | | |
Shares sold | - | 320,292 | $ - | $ 3,532,515 |
Reinvestment of distributions | - | 11,655 | - | 129,141 |
Shares redeemed | - | (5,214,738) | - | (57,498,547) |
Net increase (decrease) | - | (4,882,791) | $ - | $ (53,836,891) |
Institutional Class | | | | |
Shares sold | 10,670,431 | 9,397,783 | $ 116,532,117 | $ 102,168,317 |
Reinvestment of distributions | 1,651,656 | 2,572,592 | 17,981,232 | 27,946,248 |
Shares redeemed | (13,122,534) | (9,899,063) | (143,504,615) | (108,418,652) |
Net increase (decrease) | (800,447) | 2,071,312 | $ (8,991,266) | $ 21,695,913 |
A All Class F shares were redeemed on September 30, 2010.
Semiannual Report
13. Other.
The Fund's organizational documents provide former and current trustees and officers with a limited indemnification against liabilities arising in connection with the performance of their duties to the Fund. In the normal course of business, the Fund may also enter into contracts that provide general indemnifications. The Fund's maximum exposure under these arrangements is unknown as this would be dependent on future claims that may be made against the Fund. The risk of material loss from such claims is considered remote.
14. Credit Risk.
The Fund invests a portion of its assets in structured securities of issuers backed by residential mortgage loans, credit card receivables and automotive loans. The value and related income of these securities is sensitive to the changes in economic conditions, including delinquencies and/or defaults.
Semiannual Report
To the Trustees of Fidelity Income Fund and the Shareholders of Fidelity Total Bond Fund:
In our opinion, the accompanying statement of assets and liabilities, including the schedule of investments, and the related statements of operations and of changes in net assets and the financial highlights present fairly, in all material respects, the financial position of Fidelity Total Bond Fund (a fund of Fidelity Income Fund) at February 29, 2012, the results of its operations, the changes in its net assets and the financial highlights for each of the periods indicated, in conformity with accounting principles generally accepted in the United States of America. These financial statements and financial highlights (hereafter referred to as "financial statements") are the responsibility of the Fidelity Total Bond Fund's management. Our responsibility is to express an opinion on these financial statements based on our audits. We conducted our audits of these financial statements in accordance with the standards of the Public Company Accounting Oversight Board (United States). Those standards require that we plan and perform the audit to obtain reasonable assurance about whether the financial statements are free of material misstatement. An audit includes examining, on a test basis, evidence supporting the amounts and disclosures in the financial statements, assessing the accounting principles used and significant estimates made by management, and evaluating the overall financial statement presentation. We believe that our audits, which included confirmation of securities at February 29, 2012 by correspondence with the custodian, agent banks, and brokers, provide a reasonable basis for our opinion.
/s/ PricewaterhouseCoopers LLP
PricewaterhouseCoopers LLP
Boston, Massachusetts
April 18, 2012
Semiannual Report
Board Approval of Investment Advisory Contracts and Management Fees
Fidelity Total Bond Fund
Each year, the Board of Trustees, including the Independent Trustees (together, the Board), votes on the renewal of the management contract and sub-advisory agreements (together, the Advisory Contracts) for the fund. The Board, assisted by the advice of fund counsel and Independent Trustees' counsel, requests and considers a broad range of information relevant to the renewal of the Advisory Contracts throughout the year.
The Board meets regularly and considers at each of its meetings factors that are relevant to its annual consideration of the renewal of the fund's Advisory Contracts, including the services and support provided to the fund and its shareholders. The Board has established three standing committees, Operations, Audit, and Nominating and Governance, each composed of Independent Trustees with varying backgrounds, to which the Board has assigned specific subject matter responsibilities in order to enhance effective decision-making by the Board. The Operations Committee, of which all of the Independent Trustees are members, meets regularly throughout the year and, among other matters, considers matters specifically related to the annual consideration of the renewal of the fund's Advisory Contracts. The Board, acting directly and through its Committees, requests and receives information concerning the annual consideration of the renewal of the fund's Advisory Contracts. The Board also meets as needed to consider matters specifically related to the Board's annual consideration of the renewal of Advisory Contracts. Members of the Board may also meet with trustees of other Fidelity funds through ad hoc joint committees to discuss certain matters relevant to the Fidelity funds.
At its September 2011 meeting, the Board of Trustees, including the Independent Trustees, unanimously determined to renew the fund's Advisory Contracts. In reaching its determination, the Board considered all factors it believed relevant, including (i) the nature, extent, and quality of the services to be provided to the fund and its shareholders (including the investment performance of the fund); (ii) the competitiveness of the fund's management fee and total expense ratio; (iii) the total costs of the services to be provided by and the profits to be realized by Fidelity from its relationship with the fund; (iv) the extent to which economies of scale would be realized as the fund grows; and (v) whether fee levels reflect these economies of scale, if any, for the benefit of fund shareholders.
In considering whether to renew the Advisory Contracts for the fund, the Board reached a determination, with the assistance of fund counsel and Independent Trustees' counsel and through the exercise of its business judgment, that the renewal of the Advisory Contracts is in the best interests of the fund and its shareholders and that the compensation payable under the Advisory Contracts is fair and reasonable. The Board's decision to renew the Advisory Contracts was not based on any single factor, but rather was based on a comprehensive consideration of all the information provided to the Board at its meetings throughout the year. The Board, in reaching its determination to renew the Advisory Contracts, is aware that shareholders in the fund have a broad range of investment choices available to them, including a wide choice among mutual funds offered by Fidelity's competitors, and that the fund's shareholders, who have the opportunity to review and weigh the disclosure provided by the fund in its prospectus and other public disclosures, have chosen to invest in this fund, managed by Fidelity.
Semiannual Report
Nature, Extent, and Quality of Services Provided. The Board considered the staffing within the investment adviser, FMR, and the sub-advisers (together, the Investment Advisers), including the backgrounds of the fund's investment personnel and the fund's investment objective and discipline. The Independent Trustees also had discussions with senior management of Fidelity's investment operations and investment groups. The Board considered the structure of the portfolio manager compensation program and whether this structure provides appropriate incentives to act in the best interests of the fund.
Resources Dedicated to Investment Management and Support Services. The Board reviewed the general qualifications and capabilities of the Investment Advisers' investment staff, including its size, education, experience, and resources, as well as the Investment Advisers' approach to recruiting, managing, and compensating investment personnel. The Board also noted that FMR has devoted increased resources to non-U.S. offices. The Board noted that Fidelity's analysts have extensive resources, tools and capabilities which allow them to conduct sophisticated quantitative and fundamental analysis, as well as credit analysis of issuers, counterparties and enhancers. The Board also believes that Fidelity's investment professionals have sufficient access to global information and data so as to provide competitive investment results over time, and that those professionals also have access to sophisticated tools which permit them to assess portfolio construction and risk and performance attribution characteristics continuously, as well as to transmit new information and research conclusions rapidly around the world. Additionally, in its deliberations, the Board considered the Investment Advisers' trading capabilities and resources which are an integral part of the investment management process.
Shareholder and Administrative Services. The Board considered (i) the nature, extent, quality, and cost of advisory, administrative, and shareholder services performed by the Investment Advisers and their affiliates under the Advisory Contracts and under separate agreements covering transfer agency, pricing and bookkeeping, and securities lending services for the fund; (ii) the nature and extent of the investment adviser's supervision of third party service providers, principally custodians and subcustodians; and (iii) the resources devoted to, and the record of compliance with, the fund's compliance policies and procedures.
The Board noted that the growth of fund assets over time across the complex allows Fidelity to reinvest in the development of services designed to enhance the value or convenience of the Fidelity funds as investment vehicles. These services include 24-hour access to account information and market information through telephone representatives and over the Internet, investor education materials and asset allocation tools, and the expanded availability of Fidelity Investor Centers, with 35 new branches opening since 2010.
Semiannual Report
Board Approval of Investment Advisory Contracts and
Management Fees - continued
Investment in a Large Fund Family. The Board considered the benefits to shareholders of investing in a Fidelity fund, including the benefits of investing in a fund that is part of a large family of funds offering a variety of investment disciplines and providing a large variety of mutual fund investor services. The Board noted that Fidelity had taken, or had made recommendations that resulted in the Fidelity funds taking, a number of actions over the previous year that benefited particular funds, including (i) continuing to dedicate additional resources to investment research and support of the senior management team that oversees asset management; (ii) rationalizing product lines through the mergers of six funds into other funds; (iii) continuing to migrate the Freedom Funds to dedicated lower cost underlying funds; (iv) obtaining shareholder approval to broaden the investment strategies for Fidelity Consumer Finance Portfolio, Fidelity Emerging Asia Fund, and Fidelity Environment and Alternative Energy Portfolio; (v) contractually agreeing to reduce the management fees and impose other expense limitations on Spartan 500 Index Fund and U.S. Bond Index Fund in connection with launching new institutional classes of these funds; (vi) changing the name, primary and supplemental benchmarks, and investment policies of Fidelity Global Strategies Fund to support the fund's flexible investment mandate and global orientation; and (vii) reducing the transfer agency account fee rates on certain accounts.
Investment Performance. The Board considered whether the fund has operated in accordance with its investment objective, as well as its record of compliance with its investment restrictions. It also reviewed the fund's absolute investment performance for each class, as well as the fund's relative investment performance for each class measured over multiple periods against (i) a broad-based securities market index, and (ii) a peer group of mutual funds deemed appropriate by Fidelity and reviewed by the Board. The following charts considered by the Board show, over the one-, three-, and five-year periods ended December 31, 2010, the cumulative total returns of the retail class and Class C of the fund, the cumulative total returns of a broad-based securities market index ("benchmark"), and a range of cumulative total returns of a peer group of mutual funds identified by Lipper Inc. as having an investment objective similar to that of the fund. The returns of the retail class and Class C show the performance of the highest and lowest performing classes, respectively (based on five-year performance). The box within each chart shows the 25th percentile return (bottom of box) and the 75th percentile return (top of box) of the peer group. Returns shown above the box are in the first quartile and returns shown below the box are in the fourth quartile. The percentage beaten numbers noted below each chart correspond to the percentile box and represent the percentage of funds in the peer group whose performance was equal to or lower than that of the class indicated.
Semiannual Report
Fidelity Total Bond Fund
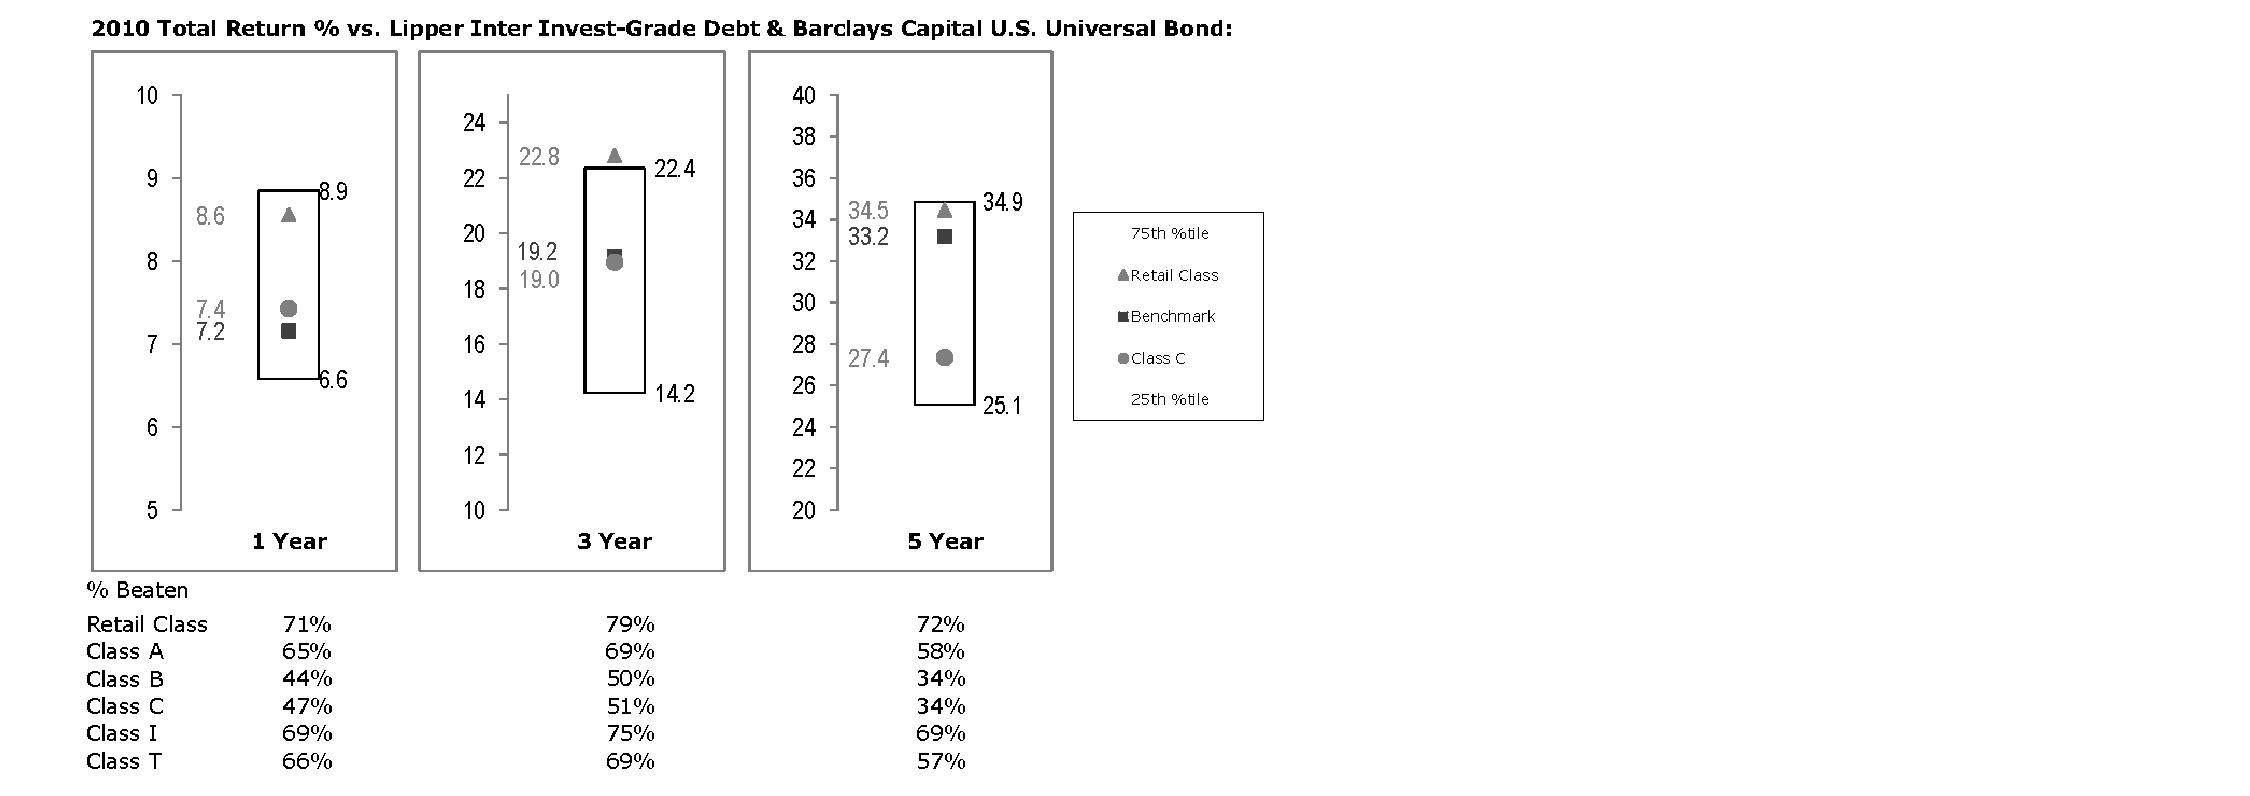
The Board reviewed the fund's relative investment performance against its peer group and noted that the performance of the retail class of the fund was in the second quartile for the one- and five-year periods and the first quartile for the three-year period. The Board also noted that the investment performance of the retail class of the fund compared favorably to its benchmark for all the periods shown. The Board considered that the variations in performance among the fund's classes reflect the variations in class expenses, which result in lower performance for higher expense classes. The Board also reviewed the fund's performance since inception as well as performance in the current year.
Based on its review, the Board concluded that the nature, extent, and quality of services provided to the fund under the Advisory Contracts should benefit the fund's shareholders.
Competitiveness of Management Fee and Total Expense Ratio. The Board considered the fund's management fee and total expense ratio compared to "mapped groups" of competitive funds and classes. Fidelity creates "mapped groups" by combining similar Lipper investment objective categories that have comparable management fee characteristics. Combining Lipper investment objective categories aids the Board's management fee and total expense ratio comparisons by broadening the competitive group used for comparison and by reducing the number of universes to which various Fidelity funds are compared.
Semiannual Report
Board Approval of Investment Advisory Contracts and
Management Fees - continued
Management Fee. The Board considered two proprietary management fee comparisons for the 12-month periods shown in the chart below. The group of Lipper funds used by the Board for management fee comparisons is referred to below as the "Total Mapped Group" and, for the reasons explained above, is broader than the Lipper peer group used by the Board for performance comparisons. The Total Mapped Group comparison focuses on a fund's standing relative to the total universe of comparable funds available to investors in terms of gross management fees before expense reimbursements or caps. "TMG %" represents the percentage of funds in the Total Mapped Group that had management fees that were lower than the fund's. For example, a TMG % of 12% means that 88% of the funds in the Total Mapped Group had higher management fees than the fund. The "Asset-Size Peer Group" (ASPG) comparison focuses on a fund's standing relative to non-Fidelity funds similar in size to the fund within the Total Mapped Group. The ASPG represents at least 15% of the funds in the Total Mapped Group with comparable asset size and management fee characteristics, subject to a minimum of 50 funds (or all funds in the Total Mapped Group if fewer than 50). Additional information, such as the ASPG quartile in which the fund's management fee ranked, is also included in the chart and considered by the Board.
Fidelity Total Bond Fund
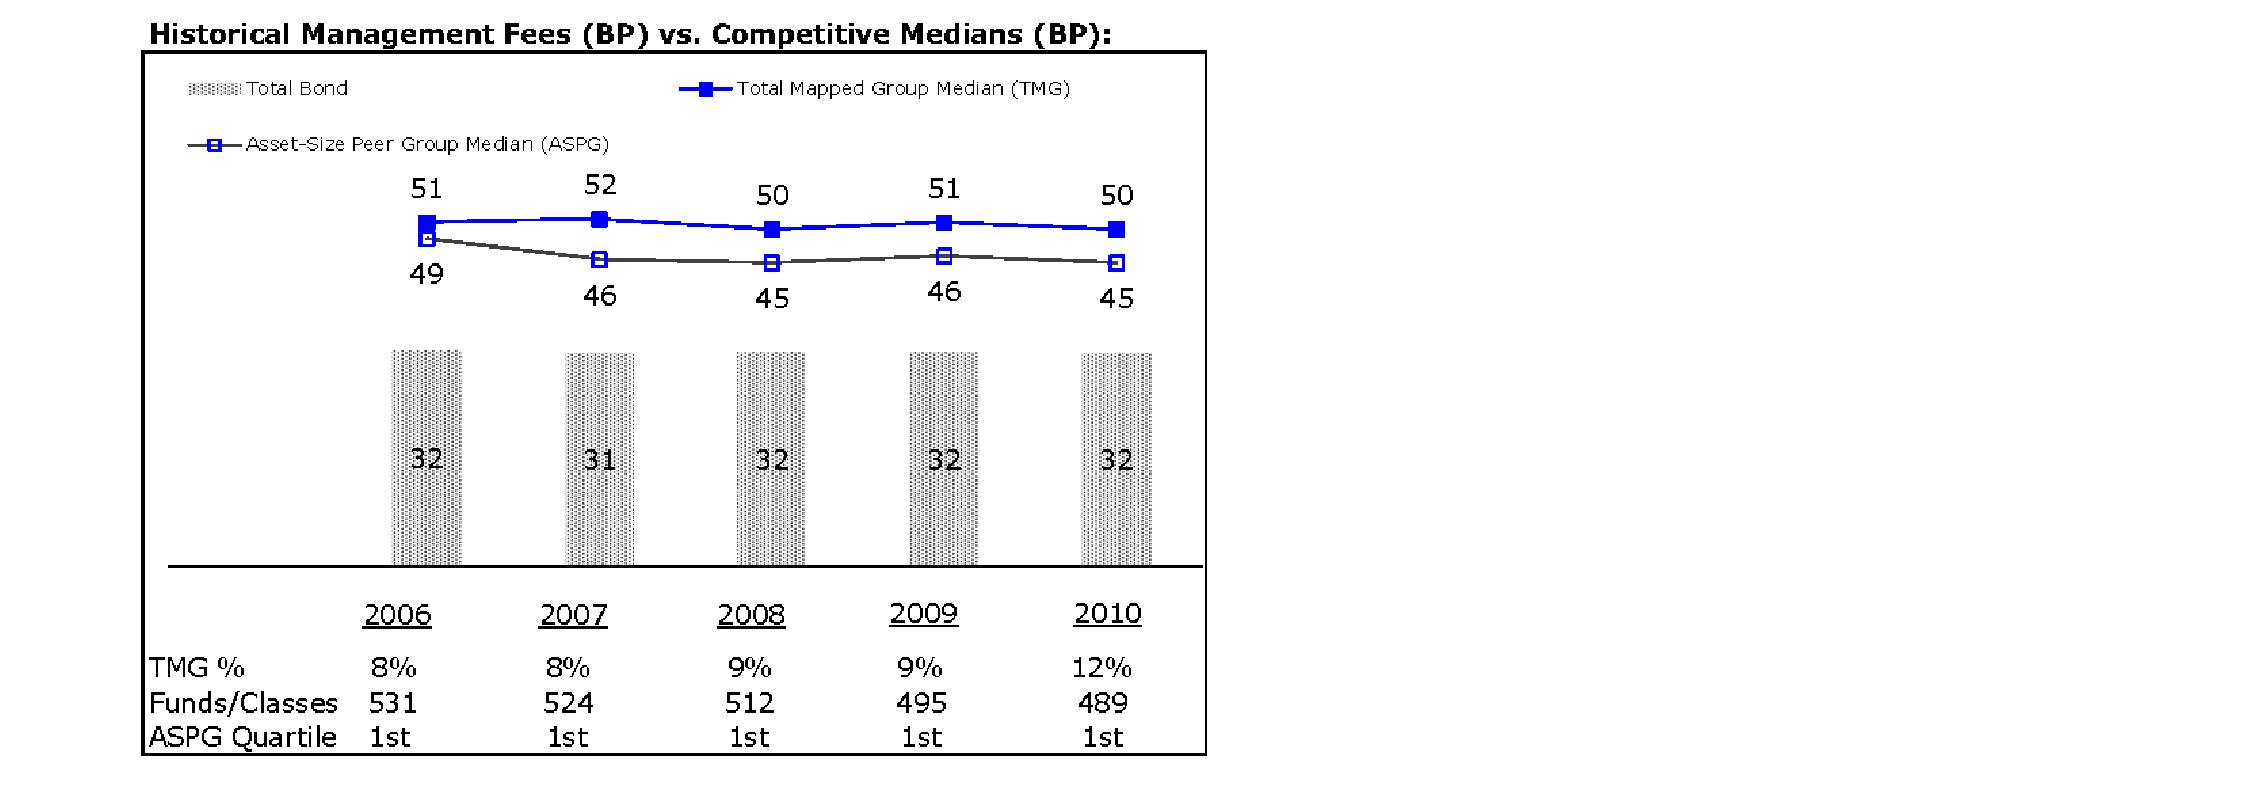
The Board noted that the fund's management fee ranked below the median of its Total Mapped Group and below the median of its ASPG for 2010.
Based on its review, the Board concluded that the fund's management fee is fair and reasonable in light of the services that the fund receives and the other factors considered.
Semiannual Report
Total Expense Ratio. In its review of each class's total expense ratio, the Board considered the fund's management fee as well as other fund or class expenses, as applicable, such as transfer agent fees, pricing and bookkeeping fees, fund-paid 12b-1 fees, and custodial, legal, and audit fees. The Board also noted the effects of any waivers and reimbursements on fees and expenses. As part of its review, the Board also considered the current and historical total expense ratios of each class of the fund compared to competitive fund median expenses. Each class of the fund is compared to those funds and classes in the Total Mapped Group (used by the Board for management fee comparisons) that have a similar sales load structure.
The Board also considered that the current contractual arrangements for the fund (i) have the effect of setting the total "fund-level" expenses (including, among certain other expenses, the management fee) for each class at 35 basis points, (ii) limit the "class-level" transfer agent fee for the retail class to 10 basis points, and (iii) limit the total expenses for the retail class to 45 basis points. The fees and expenses payable under these contractual arrangements may not be increased without the approval of the Board and the shareholders of the applicable class. The fund's Advisor classes are subject to different "class-level" expenses (transfer agent fees and 12b-1 fees).
The Board noted that the total expense ratio of each class ranked below its competitive median for 2010.
The Board recognized that the fund's management contract incorporates a "group fee" structure, which provides for lower group fee rates as total fund assets under FMR's management increase, and for higher group fee rates as total fund assets under FMR's management decrease. FMR calculates the group fee rates based on a tiered asset "breakpoint" schedule that varies based on asset class. The Board noted, however, that because the current contractual arrangements set the total "fund-level" expenses for each class at 35 basis points, increases or decreases in the management fee due to changes in the group fee rate will not impact the total expense ratio.
Fees Charged to Other Fidelity Clients. The Board also considered Fidelity fee structures and other information with respect to clients of FMR and its affiliates, such as other mutual funds advised or subadvised by FMR or its affiliates, pension plan clients, and other institutional clients. In March 2010, the Board created an ad hoc joint committee with the board of other Fidelity funds (the Committee) to review and compare Fidelity's institutional investment advisory business with its business of providing services to the Fidelity funds, including the differences in services provided, fees charged, and costs incurred, as well as competition in their respective marketplaces.
Based on its review of total expense ratios and fees charged to other Fidelity clients, the Board concluded that the total expense ratio of each class of the fund was reasonable in light of the services that the fund and its shareholders receive and the other factors considered, including the findings of the Committee.
Semiannual Report
Board Approval of Investment Advisory Contracts and
Management Fees - continued
Costs of the Services and Profitability. The Board considered the revenues earned and the expenses incurred by Fidelity in conducting the business of developing, marketing, distributing, managing, administering and servicing the fund and its shareholders. The Board also considered the level of Fidelity's profits in respect of all the Fidelity funds.
On an annual basis, FMR presents to the Board Fidelity's profitability for the fund. Fidelity calculates the profitability for each fund, as well as aggregate profitability for groups of Fidelity funds and all Fidelity funds, using a series of detailed revenue and cost allocation methodologies which originate with the books and records of Fidelity on which Fidelity's audited financial statements are based. The Audit Committee of the Board reviews any significant changes from the prior year's methodologies.
PricewaterhouseCoopers LLP (PwC), independent registered public accounting firm and auditor to Fidelity and certain Fidelity funds, has been engaged annually by the Board as part of the Board's assessment of Fidelity's profitability analysis. PwC's engagement includes the review and assessment of Fidelity's methodologies used in determining the revenues and expenses attributable to Fidelity's mutual fund business, and completion of agreed-upon procedures surrounding the mathematical accuracy of fund profitability and its conformity to allocation methodologies. After considering PwC's reports issued under the engagement and information provided by Fidelity, the Board concluded that while other allocation methods may also be reasonable, Fidelity's profitability methodologies are reasonable in all material respects.
The Board also reviewed Fidelity's non-fund businesses and fall-out benefits related to the mutual fund business as well as cases where Fidelity's affiliates may benefit from or be related to the fund's business.
The Board considered the costs of the services provided by and the profits realized by Fidelity in connection with the operation of the fund and was satisfied that the profitability was not excessive in the circumstances.
Economies of Scale. The Board considered whether there have been economies of scale in respect of the management of the Fidelity funds, whether the Fidelity funds (including the fund) have appropriately benefited from any such economies of scale, and whether there is potential for realization of any further economies of scale. The Board considered the extent to which the fund will benefit from economies of scale through increased services to the fund, through waivers or reimbursements, or through fee or expense reductions. The Board also noted that in 2009, it and the board of other Fidelity funds created an ad hoc committee (the Economies of Scale Committee) to analyze whether FMR attains economies of scale in respect of the management and servicing of the Fidelity funds, whether the Fidelity funds have appropriately benefited from such economies of scale, and whether there is potential for realization of any further economies of scale.
Semiannual Report
The Board concluded, taking into account the analysis of the Economies of Scale Committee, that any potential economies of scale are being appropriately shared between fund shareholders and Fidelity.
Additional Information Requested by the Board. In order to develop fully the factual basis for consideration of the Fidelity funds' Advisory Contracts, the Board requested and received additional information on certain topics, including: (i) Fidelity's fund profitability methodology, profitability trends for certain funds, and the impact of certain factors on fund profitability results; (ii) portfolio manager changes that have occurred during the past year and the amount of the investment that each portfolio manager has made in the Fidelity fund(s) that he or she manages; (iii) Fidelity's compensation structure for portfolio managers, research analysts, and other key personnel, including its effects on fund profitability, the rationale for the compensation structure, and the extent to which current market conditions have affected retention and recruitment; (iv) the compensation paid to fund sub-advisers on behalf of the Fidelity funds; (v) Fidelity's fee structures and rationale for recommending different fees among different categories of funds and classes, as well as Fidelity's voluntary waiver of its fees to maintain minimum yields for certain money market funds and classes; (vi) the reasons why certain expenses affect various funds and classes differently; (vii) Fidelity's transfer agent fees, expenses, and services and how the benefits of decreased costs and new efficiencies can be shared across all of the Fidelity funds; (viii) the reasons for and consequences of changes to certain product lines compared to competitors; (ix) the allocation of and historical trends in Fidelity's realization of fall-out benefits; and (x) explanations regarding the relative total expense ratios of certain funds and classes, total expense competitive trends, and actions that might be taken by FMR to reduce total expense ratios for certain funds and classes or to achieve further economies of scale.
Based on its evaluation of all of the conclusions noted above, and after considering all factors it believed relevant, the Board ultimately concluded that the advisory fee structures are fair and reasonable, and that the fund's Advisory Contracts should be renewed.
Semiannual Report
Investment Adviser
Fidelity Management & Research Company
Boston, MA
Investment Sub-Advisers
FMR Co. Inc.
Fidelity Management & Research
(U.K.) Inc.
Fidelity Management & Research
(Hong Kong) Limited
Fidelity Management & Research
(Japan) Inc.
Fidelity Investments
Money Management, Inc.
FIL Investments (Japan) Limited
FIL Investment Advisors
FIL Investment Advisors
(UK) Limited
General Distributor
Fidelity Distributors Corporation
Boston, MA
Transfer and Service Agents
Fidelity Investments Institutional Operations Company, Inc.
Boston, MA
Fidelity Service Company, Inc.
Boston, MA
Custodian
Citibank, N.A.
New York, NY
ATB-USAN-0412
1.804577.107
(Fidelity Investment logo)(registered trademark)
(Fidelity Investment logo)(registered trademark)
Fidelity Advisor®
Total Bond
Fund - Institutional Class
Semiannual Report
February 29, 2012
(Fidelity Cover Art)
Institutional Class is a class of Fidelity® Total Bond Fund
Contents
Shareholder Expense Example | (Click Here) | An example of shareholder expenses. |
Investment Changes | (Click Here) | A summary of major shifts in the fund's investments over the past six months. |
Investments | (Click Here) | A complete list of the fund's investments with their market values. |
Financial Statements | (Click Here) | Statements of assets and liabilities, operations, and changes in net assets,
as well as financial highlights. |
Notes | (Click Here) | Notes to the financial statements. |
Report of Independent Registered Public Accounting Firm | (Click Here) | |
Board Approval of Investment Advisory Contracts and Management Fees | (Click Here) | |
To view a fund's proxy voting guidelines and proxy voting record for the 12-month period ended June 30, visit http://www.fidelity.com/proxyvotingresults or visit the Securities and Exchange Commission's (SEC) web site at http://www.sec.gov. You may also call 1-877-208-0098 to request a free copy of the proxy voting guidelines.
Standard & Poor's, S&P and S&P 500 are registered service marks of The McGraw-Hill Companies, Inc. and have been licensed for use by Fidelity Distributors Corporation.
Other third party marks appearing herein are the property of their respective owners.
All other marks appearing herein are registered or unregistered trademarks or service marks of FMR LLC or an affiliated company.
This report and the financial statements contained herein are submitted for the general information of the shareholders of the fund. This report is not authorized for distribution to prospective investors in the fund unless preceded or accompanied by an effective prospectus.
A fund files its complete schedule of portfolio holdings with the SEC for the first and third quarters of each fiscal year on Form N-Q. Forms N-Q are available on the SEC's web site at http://www.sec.gov. A fund's Forms N-Q may be reviewed and copied at the SEC's Public Reference Room in Washington, DC. Information regarding the operation of the SEC's Public Reference Room may be obtained by calling 1-800-SEC-0330. For a complete list of a fund's portfolio holdings, view the most recent holdings listing, semiannual report, or annual report on Fidelity's web site at http://www.fidelity.com, http://www.advisor.fidelity.com, or http://www.401k.com, as applicable.
NOT FDIC INSURED • MAY LOSE VALUE • NO BANK GUARANTEE
Neither the fund nor Fidelity Distributors Corporation is a bank.
Semiannual Report
Shareholder Expense Example
As a shareholder of the Fund, you incur two types of costs: (1) transaction costs, including sales charges (loads) on purchase payments or redemption proceeds, and (2) ongoing costs, including management fees, distribution and/or service (12b-1) fees and other Fund expenses. This Example is intended to help you understand your ongoing costs (in dollars) of investing in the Fund and to compare these costs with the ongoing costs of investing in other mutual funds.
The Example is based on an investment of $1,000 invested at the beginning of the period and held for the entire period (September 1, 2011 to February 29, 2012).
Actual Expenses
The first line of the accompanying table for each class of the Fund provides information about actual account values and actual expenses. You may use the information in this line, together with the amount you invested, to estimate the expenses that you paid over the period. Simply divide your account value by $1,000.00 (for example, an $8,600 account value divided by $1,000.00 = 8.6), then multiply the result by the number in the first line for a class of the Fund under the heading entitled "Expenses Paid During Period" to estimate the expenses you paid on your account during this period. In addition, the Fund, as a shareholder in the underlying Fidelity Central Funds, will indirectly bear its pro-rata share of the fees and expenses incurred by the underlying Fidelity Central Funds. These fees and expenses are not included in the Fund's annualized expense ratio used to calculate the expense estimate in the table below.
Hypothetical Example for Comparison Purposes
The second line of the accompanying table for each class of the Fund provides information about hypothetical account values and hypothetical expenses based on a Class' actual expense ratio and an assumed rate of return of 5% per year before expenses, which is not the Class' actual return. The hypothetical account values and expenses may not be used to estimate the actual ending account balance or expenses you paid for the period. You may use this information to compare the ongoing costs of investing in the Fund and other funds. To do so, compare this 5% hypothetical example with the 5% hypothetical examples that appear in the shareholder reports of the other funds. In addition, the Fund, as a shareholder in the underlying Fidelity Central Funds, will indirectly bear its pro-rata share of the fees and expenses incurred by the underlying Fidelity Central Funds. These fees and expenses are not included in the Fund's annualized expense ratio used to calculate the expense estimate in the table below.
Please note that the expenses shown in the table are meant to highlight your ongoing costs only and do not reflect any transaction costs. Therefore, the second line of the table is useful in comparing ongoing costs only, and will not help you determine the relative total costs of owning different funds. In addition, if these transactional costs were included, your costs would have been higher.
Semiannual Report
Shareholder Expense Example - continued
| Annualized
Expense Ratio | Beginning
Account Value
September 1, 2011 | Ending
Account Value
February 29, 2012 | Expenses Paid
During Period*
September 1, 2011 to
February 29, 2012 |
Class A | .84% | | | |
Actual | | $ 1,000.00 | $ 1,033.70 | $ 4.25 |
HypotheticalA | | $ 1,000.00 | $ 1,020.69 | $ 4.22 |
Class T | .78% | | | |
Actual | | $ 1,000.00 | $ 1,034.10 | $ 3.94 |
HypotheticalA | | $ 1,000.00 | $ 1,020.98 | $ 3.92 |
Class B | 1.51% | | | |
Actual | | $ 1,000.00 | $ 1,030.30 | $ 7.62 |
HypotheticalA | | $ 1,000.00 | $ 1,017.35 | $ 7.57 |
Class C | 1.52% | | | |
Actual | | $ 1,000.00 | $ 1,030.20 | $ 7.67 |
HypotheticalA | | $ 1,000.00 | $ 1,017.30 | $ 7.62 |
Total Bond | .45% | | | |
Actual | | $ 1,000.00 | $ 1,035.70 | $ 2.28 |
HypotheticalA | | $ 1,000.00 | $ 1,022.63 | $ 2.26 |
Institutional Class | .54% | | | |
Actual | | $ 1,000.00 | $ 1,035.30 | $ 2.73 |
HypotheticalA | | $ 1,000.00 | $ 1,022.18 | $ 2.72 |
A 5% return per year before expenses
* Expenses are equal to each Class' annualized expense ratio, multiplied by the average account value over the period, multiplied by 182/366 (to reflect the one-half year period). The fees and expenses of the underlying Fidelity Central Funds in which the Fund invests are not included in the Fund's annualized expense ratio.
Semiannual Report
Investment Changes (Unaudited)
Quality Diversification (% of fund's net assets) |
As of February 29, 2012 | As of August 31, 2011 |
| U.S. Government
and U.S.
Government
Agency
Obligations 59.5% | | | U.S. Government
and U.S.
Government
Agency
Obligations 68.0% | |
| AAA 5.4% | | | AAA 6.8% | |
| AA 2.6% | | | AA 2.6% | |
| A 5.7% | | | A 6.6% | |
| BBB 12.3% | | | BBB 11.3% | |
| BB and Below 11.0% | | | BB and Below 10.0% | |
| Not Rated 1.0% | | | Not Rated 0.9% | |
| Equities 0.2% | | | Equities 0.1% | |
| Short-Term
Investments and
Net Other Assets 2.3% | | | Short-Term
Investments and
Net Other Assets† (6.3)% | |
We have used ratings from Moody's Investors Service, Inc. Where Moody's® ratings are not available, we have used S&P® ratings. All ratings are as of the date indicated and do not reflect subsequent changes. Securities rated BB or below were rated investment grade at the time of acquisition. The information in the above table is based on the combined investments of the fund and its pro-rata share of the investments of Fidelity's fixed-income central funds. |
Weighted Average Maturity as of February 29, 2012 |
| | 6 months ago |
Years | 6.5 | 6.2 |
This is a weighted average of all the maturities of the securities held in a fund. Weighted Average Maturity (WAM) can be used as a measure of sensitivity to interest rate changes and market changes. Generally, the longer the maturity, the greater the sensitivity to such changes. WAM is based on the dollar-weighted average length of time until principal payments must be paid. Depending on the types of securities held in a fund, certain maturity shortening devices (e.g., demand features, interest rate resets, and call options) may be taken into account when calculating the WAM. |
Duration as of February 29, 2012 |
| | 6 months ago |
Years | 4.6 | 4.3 |
Duration estimates how much a bond fund's price will change with a change in comparable interest rates. If rates rise 1%, for example, a fund with a 5-year duration is likely to lose about 5% of its value. Other factors also can influence a bond fund's performance and share price. Accordingly, a bond fund's actual performance may differ from this example. Duration takes into account any call or put option embedded in the bonds. |
Semiannual Report
Asset Allocation (% of fund's net assets) |
| As of February 29, 2012* | As of August 31, 2011** |
| Corporate Bonds 24.2% | | | Corporate Bonds 23.1% | |
| U.S. Government
and U.S.
Government
Agency
Obligations 59.5% | | | U.S. Government
and U.S.
Government
Agency
Obligations 68.0% | |
| Asset-Backed
Securities 2.0% | | | Asset-Backed
Securities 2.4% | |
| CMOs and Other Mortgage Related Securities 5.8% | | | CMOs and Other Mortgage Related Securities 7.6% | |
| Municipal Bonds 0.3% | | | Municipal Bonds 0.2% | |
| Stocks 0.2% | | | Stocks 0.1% | |
| Other Investments 5.7% | | | Other Investments 4.9% | |
| Short-Term
Investments and
Net Other Assets 2.3% | | | Short-Term
Investments and
Net Other Assets† (6.3)% | |
* Foreign investments | 5.4% | | ** Foreign investments | 5.3% | |
* Futures and Swaps | 1.0% | | ** Futures and Swaps | 1.1% | |
† Short-Term Investments and Net Other Assets are not included in the pie chart.
The information in the above table is based on the combined investments of the fund and its pro-rata share of the investments of Fidelity's fixed-income central funds. A holdings listing for the Fund, which presents direct holdings as well as the pro-rata share of any securities and other investments held indirectly through its investment in underlying non-money market Fidelity Central Funds is available at fidelity.com/or advisor.fidelity.com as applicable.
Semiannual Report
Investments February 29, 2012
Showing Percentage of Net Assets
Corporate Bonds - 23.9% |
| Principal Amount (c) | | Value |
Convertible Bonds - 0.0% |
FINANCIALS - 0.0% |
Real Estate Investment Trusts - 0.0% |
Developers Diversified Realty Corp. 3% 3/15/12 | | $ 270,000 | | $ 270,000 |
MATERIALS - 0.0% |
Metals & Mining - 0.0% |
Vedanta Resources Jersey II Ltd. 4% 3/30/17 | | 600,000 | | 579,000 |
TOTAL CONVERTIBLE BONDS | | 849,000 |
Nonconvertible Bonds - 23.9% |
CONSUMER DISCRETIONARY - 2.8% |
Auto Components - 0.1% |
American Axle & Manufacturing, Inc. 7.75% 11/15/19 | | 2,845,000 | | 3,022,813 |
Dana Holding Corp.: | | | | |
6.5% 2/15/19 | | 2,755,000 | | 2,982,288 |
6.75% 2/15/21 | | 3,675,000 | | 3,987,375 |
Delphi Corp.: | | | | |
5.875% 5/15/19 (e) | | 1,685,000 | | 1,777,675 |
6.125% 5/15/21 (e) | | 1,615,000 | | 1,729,988 |
Tenneco, Inc.: | | | | |
6.875% 12/15/20 | | 1,505,000 | | 1,617,875 |
7.75% 8/15/18 | | 1,400,000 | | 1,519,000 |
| | 16,637,014 |
Automobiles - 0.1% |
Automotores Gildemeister SA 8.25% 5/24/21 (e) | | 575,000 | | 598,000 |
Chrysler Group LLC/CG Co.-Issuer, Inc.: | | | | |
8% 6/15/19 | | 3,090,000 | | 3,113,175 |
8.25% 6/15/21 | | 5,205,000 | | 5,257,050 |
Ford Motor Co. 7.45% 7/16/31 | | 5,655,000 | | 7,259,606 |
| | 16,227,831 |
Distributors - 0.0% |
AmeriGas Partners LP/AmeriGas Finance Corp.: | | | | |
6.25% 8/20/19 | | 1,255,000 | | 1,267,550 |
6.5% 5/20/21 | | 600,000 | | 606,000 |
Ferrellgas LP/Ferrellgas Finance Corp. 6.5% 5/1/21 | | 1,840,000 | | 1,619,200 |
| | 3,492,750 |
Diversified Consumer Services - 0.0% |
Visant Corp. 10% 10/1/17 | | 1,320,000 | | 1,221,000 |
Corporate Bonds - continued |
| Principal Amount (c) | | Value |
Nonconvertible Bonds - continued |
CONSUMER DISCRETIONARY - continued |
Hotels, Restaurants & Leisure - 0.4% |
Ameristar Casinos, Inc. 7.5% 4/15/21 | | $ 2,570,000 | | $ 2,769,175 |
Chester Downs & Marina LLC 9.25% 2/1/20 (e) | | 320,000 | | 336,000 |
Chukchansi Economic Development Authority 8% 11/15/13 (e) | | 325,000 | | 224,250 |
CityCenter Holdings LLC/CityCenter Finance Corp.: | | | | |
7.625% 1/15/16 | | 3,590,000 | | 3,778,475 |
7.625% 1/15/16 (e) | | 1,930,000 | | 2,012,025 |
11.5% 1/15/17 pay-in-kind (k) | | 2,012,204 | | 2,143,612 |
FelCor Lodging LP 6.75% 6/1/19 | | 4,875,000 | | 4,984,688 |
GWR Operating Partnership LLP/Great Wolf Finance Corp. 10.875% 4/1/17 | | 1,635,000 | | 1,847,550 |
Host Marriott LP 6.375% 3/15/15 | | 250,000 | | 253,125 |
ITT Corp. 7.375% 11/15/15 | | 250,000 | | 287,500 |
MGM Mirage, Inc.: | | | | |
6.625% 7/15/15 | | 7,475,000 | | 7,531,063 |
7.5% 6/1/16 | | 4,130,000 | | 4,191,950 |
7.625% 1/15/17 | | 5,355,000 | | 5,408,550 |
8.625% 2/1/19 (e) | | 2,940,000 | | 3,131,100 |
11.375% 3/1/18 | | 2,460,000 | | 2,896,650 |
MTR Gaming Group, Inc. 11.5% 8/1/19 pay-in-kind (e)(k) | | 1,602,975 | | 1,514,811 |
NPC International, Inc./NPC Operating Co. A, Inc./NPC Operating Co. B, Inc. 10.5% 1/15/20 (e) | | 2,950,000 | | 3,112,250 |
Pinnacle Entertainment, Inc. 7.5% 6/15/15 | | 1,035,000 | | 1,066,050 |
Royal Caribbean Cruises Ltd.: | | | | |
7.25% 3/15/18 | | 465,000 | | 496,946 |
yankee: | | | | |
7.25% 6/15/16 | | 3,985,000 | | 4,383,500 |
7.5% 10/15/27 | | 3,070,000 | | 3,100,700 |
Times Square Hotel Trust 8.528% 8/1/26 (e) | | 863,814 | | 920,766 |
Universal City Development Partners Ltd./UCDP Finance, Inc. 8.875% 11/15/15 | | 784,000 | | 857,012 |
Wynn Las Vegas LLC/Wynn Las Vegas Capital Corp. 7.75% 8/15/20 | | 970,000 | | 1,091,250 |
| | 58,338,998 |
Household Durables - 0.2% |
KB Home: | | | | |
7.25% 6/15/18 | | 1,430,000 | | 1,415,700 |
8% 3/15/20 | | 305,000 | | 306,525 |
Corporate Bonds - continued |
| Principal Amount (c) | | Value |
Nonconvertible Bonds - continued |
CONSUMER DISCRETIONARY - continued |
Household Durables - continued |
Lennar Corp.: | | | | |
6.95% 6/1/18 | | $ 4,640,000 | | $ 4,895,200 |
12.25% 6/1/17 | | 1,135,000 | | 1,452,800 |
Reliance Intermediate Holdings LP 9.5% 12/15/19 (e) | | 2,125,000 | | 2,348,125 |
Reynolds Group Issuer, Inc./Reynolds Group Issuer LLC/Reynolds Group Issuer (Luxembourg) SA: | | | | |
7.875% 8/15/19 (e) | | 3,760,000 | | 4,107,800 |
9% 5/15/18 (e) | | 970,000 | | 974,850 |
9.875% 8/15/19 (e) | | 1,670,000 | | 1,726,363 |
Standard Pacific Corp.: | | | | |
8.375% 5/15/18 | | 6,495,000 | | 6,982,125 |
10.75% 9/15/16 | | 2,370,000 | | 2,722,538 |
Toll Brothers Finance Corp. 5.875% 2/15/22 | | 1,095,000 | | 1,133,325 |
| | 28,065,351 |
Media - 1.9% |
Allbritton Communications Co. 8% 5/15/18 | | 2,630,000 | | 2,768,075 |
AOL Time Warner, Inc. 7.625% 4/15/31 | | 500,000 | | 669,664 |
Cablevision Systems Corp.: | | | | |
7.75% 4/15/18 | | 2,305,000 | | 2,520,979 |
8.625% 9/15/17 | | 3,505,000 | | 3,934,363 |
CCO Holdings LLC/CCO Holdings Capital Corp.: | | | | |
6.5% 4/30/21 | | 3,975,000 | | 4,223,438 |
6.625% 1/31/22 | | 1,755,000 | | 1,877,850 |
7% 1/15/19 | | 8,610,000 | | 9,277,275 |
7.25% 10/30/17 | | 3,380,000 | | 3,658,850 |
7.875% 4/30/18 | | 865,000 | | 945,013 |
Cequel Communications Holdings I LLC/Cequel Capital Corp. 8.625% 11/15/17 (e) | | 10,180,000 | | 10,943,500 |
Comcast Corp.: | | | | |
4.95% 6/15/16 | | 2,344,000 | | 2,649,519 |
5.15% 3/1/20 | | 435,000 | | 509,726 |
5.7% 5/15/18 | | 14,629,000 | | 17,279,146 |
6.4% 3/1/40 | | 4,490,000 | | 5,733,919 |
6.45% 3/15/37 | | 2,196,000 | | 2,737,290 |
6.55% 7/1/39 | | 9,000,000 | | 11,423,178 |
COX Communications, Inc. 4.625% 6/1/13 | | 4,467,000 | | 4,682,229 |
CSC Holdings LLC 8.625% 2/15/19 | | 1,350,000 | | 1,593,000 |
Corporate Bonds - continued |
| Principal Amount (c) | | Value |
Nonconvertible Bonds - continued |
CONSUMER DISCRETIONARY - continued |
Media - continued |
Discovery Communications LLC: | | | | |
3.7% 6/1/15 | | $ 7,129,000 | | $ 7,642,103 |
6.35% 6/1/40 | | 6,392,000 | | 8,036,949 |
Insight Communications, Inc. 9.375% 7/15/18 (e) | | 2,030,000 | | 2,329,425 |
Kabel BW Erste Beteiligungs GmbH/Kabel Baden-Wurttemberg GmbH & Co. KG 7.5% 3/15/19 (e) | | 660,000 | | 712,800 |
Lamar Media Corp. 5.875% 2/1/22 (e) | | 390,000 | | 396,318 |
NBCUniversal Media LLC: | | | | |
3.65% 4/30/15 | | 3,514,000 | | 3,769,591 |
5.15% 4/30/20 | | 11,614,000 | | 13,424,866 |
6.4% 4/30/40 | | 18,278,000 | | 22,866,555 |
News America Holdings, Inc. 7.75% 12/1/45 | | 663,000 | | 797,211 |
News America, Inc.: | | | | |
6.15% 3/1/37 | | 4,759,000 | | 5,478,889 |
6.15% 2/15/41 | | 11,572,000 | | 13,745,927 |
Nielsen Finance LLC/Nielsen Finance Co. 7.75% 10/15/18 | | 2,770,000 | | 3,074,700 |
Quebecor Media, Inc.: | | | | |
7.75% 3/15/16 | | 4,032,000 | | 4,158,000 |
7.75% 3/15/16 | | 2,485,000 | | 2,562,656 |
Time Warner Cable, Inc.: | | | | |
5.4% 7/2/12 | | 3,048,000 | | 3,094,680 |
5.5% 9/1/41 | | 10,000,000 | | 10,988,870 |
5.85% 5/1/17 | | 7,607,000 | | 8,952,222 |
6.2% 7/1/13 | | 2,898,000 | | 3,103,338 |
6.75% 7/1/18 | | 13,763,000 | | 16,917,342 |
Time Warner, Inc.: | | | | |
3.15% 7/15/15 | | 3,115,000 | | 3,308,336 |
5.375% 10/15/41 | | 3,115,000 | | 3,451,831 |
5.875% 11/15/16 | | 368,000 | | 435,168 |
6.2% 3/15/40 | | 11,792,000 | | 13,983,001 |
6.5% 11/15/36 | | 9,243,000 | | 11,278,725 |
TV Azteca SA de CV 7.5% 5/25/18 (Reg. S) | | 850,000 | | 877,625 |
Univision Communications, Inc.: | | | | |
6.875% 5/15/19 (e) | | 2,680,000 | | 2,713,500 |
8.5% 5/15/21 (e) | | 4,695,000 | | 4,648,050 |
UPC Holding BV 9.875% 4/15/18 (e) | | 1,190,000 | | 1,320,900 |
UPCB Finance V Ltd. 7.25% 11/15/21 (e) | | 995,000 | | 1,047,238 |
Corporate Bonds - continued |
| Principal Amount (c) | | Value |
Nonconvertible Bonds - continued |
CONSUMER DISCRETIONARY - continued |
Media - continued |
UPCB Finance VI Ltd. 6.875% 1/15/22 (e) | | $ 930,000 | | $ 949,716 |
Viacom, Inc.: | | | | |
3.5% 4/1/17 | | 7,993,000 | | 8,579,678 |
6.75% 10/5/37 | | 1,460,000 | | 1,883,223 |
| | 273,956,447 |
Specialty Retail - 0.1% |
AutoNation, Inc. 5.5% 2/1/20 | | 890,000 | | 916,700 |
J. Crew Group, Inc. 8.125% 3/1/19 | | 4,694,000 | | 4,699,868 |
PETCO Animal Supplies, Inc. 9.25% 12/1/18 (e) | | 6,315,000 | | 6,962,288 |
Staples, Inc. 7.375% 10/1/12 | | 554,000 | | 574,637 |
Toys 'R' Us, Inc. 7.375% 9/1/16 (e) | | 3,175,000 | | 3,262,313 |
| | 16,415,806 |
Textiles, Apparel & Luxury Goods - 0.0% |
Hanesbrands, Inc. 6.375% 12/15/20 | | 2,500,000 | | 2,606,250 |
TOTAL CONSUMER DISCRETIONARY | | 416,961,447 |
CONSUMER STAPLES - 1.2% |
Beverages - 0.3% |
Anheuser-Busch InBev Worldwide, Inc. 2.5% 3/26/13 | | 8,433,000 | | 8,607,082 |
Cerveceria Nacional Dominicana C por A 8% 3/27/14 (Reg. S) | | 225,000 | | 231,750 |
Diageo Capital PLC 5.2% 1/30/13 | | 1,037,000 | | 1,081,398 |
FBG Finance Ltd. 5.125% 6/15/15 (e) | | 3,662,000 | | 4,039,402 |
Fortune Brands, Inc.: | | | | |
5.375% 1/15/16 | | 321,000 | | 356,356 |
5.875% 1/15/36 | | 16,159,000 | | 16,428,661 |
6.375% 6/15/14 | | 3,374,000 | | 3,724,764 |
SABMiller Holdings, Inc. 3.75% 1/15/22 (e) | | 10,217,000 | | 10,652,673 |
| | 45,122,086 |
Food & Staples Retailing - 0.1% |
Albertsons, Inc.: | | | | |
7.45% 8/1/29 | | 155,000 | | 120,513 |
8% 5/1/31 | | 765,000 | | 594,788 |
BFF International Ltd. 7.25% 1/28/20 (e) | | 800,000 | | 896,000 |
Rite Aid Corp.: | | | | |
9.25% 3/15/20 (e) | | 2,890,000 | | 2,926,125 |
9.375% 12/15/15 | | 955,000 | | 983,650 |
Corporate Bonds - continued |
| Principal Amount (c) | | Value |
Nonconvertible Bonds - continued |
CONSUMER STAPLES - continued |
Food & Staples Retailing - continued |
Rite Aid Corp.: - continued | | | | |
9.5% 6/15/17 | | $ 4,960,000 | | $ 5,034,400 |
SUPERVALU, Inc. 8% 5/1/16 | | 865,000 | | 899,600 |
US Foodservice, Inc. 8.5% 6/30/19 (e) | | 3,625,000 | | 3,661,250 |
| | 15,116,326 |
Food Products - 0.4% |
Cargill, Inc. 6% 11/27/17 (e) | | 9,457,000 | | 11,200,559 |
Gruma SAB de CV 7.75% (Reg. S) (f) | | 1,285,000 | | 1,288,213 |
JBS USA LLC/JBS USA Finance, Inc. 8.25% 2/1/20 (e) | | 705,000 | | 724,388 |
Kraft Foods, Inc.: | | | | |
5.375% 2/10/20 | | 10,631,000 | | 12,392,015 |
6.125% 2/1/18 | | 10,623,000 | | 12,736,361 |
6.5% 8/11/17 | | 10,238,000 | | 12,426,905 |
6.75% 2/19/14 | | 540,000 | | 598,740 |
MHP SA 10.25% 4/29/15 (e) | | 985,000 | | 960,375 |
Post Holdings, Inc. 7.375% 2/15/22 (e) | | 950,000 | | 1,011,750 |
| | 53,339,306 |
Personal Products - 0.0% |
NBTY, Inc. 9% 10/1/18 | | 2,065,000 | | 2,286,988 |
Prestige Brands, Inc. 8.125% 2/1/20 (e) | | 165,000 | | 179,438 |
| | 2,466,426 |
Tobacco - 0.4% |
Altria Group, Inc.: | | | | |
8.5% 11/10/13 | | 326,000 | | 366,339 |
9.7% 11/10/18 | | 23,631,000 | | 32,167,817 |
Philip Morris International, Inc.: | | | | |
4.875% 5/16/13 | | 9,347,000 | | 9,850,261 |
5.65% 5/16/18 | | 7,161,000 | | 8,588,381 |
Reynolds American, Inc.: | | | | |
6.75% 6/15/17 | | 3,719,000 | | 4,430,460 |
7.25% 6/15/37 | | 5,056,000 | | 6,063,448 |
| | 61,466,706 |
TOTAL CONSUMER STAPLES | | 177,510,850 |
Corporate Bonds - continued |
| Principal Amount (c) | | Value |
Nonconvertible Bonds - continued |
ENERGY - 4.0% |
Energy Equipment & Services - 0.6% |
Calfrac Holdings LP 7.5% 12/1/20 (e) | | $ 3,570,000 | | $ 3,587,850 |
Chesapeake Oilfield Operating LLC 6.625% 11/15/19 (e) | | 1,260,000 | | 1,285,200 |
DCP Midstream LLC: | | | | |
4.75% 9/30/21 (e) | | 11,333,000 | | 12,160,502 |
5.35% 3/15/20 (e) | | 8,816,000 | | 9,733,843 |
El Paso Pipeline Partners Operating Co. LLC: | | | | |
4.1% 11/15/15 | | 10,806,000 | | 11,116,078 |
5% 10/1/21 | | 7,366,000 | | 7,689,809 |
6.5% 4/1/20 | | 738,000 | | 822,104 |
Expro Finance Luxembourg SCA 8.5% 12/15/16 (e) | | 3,800,000 | | 3,412,400 |
Exterran Holdings, Inc. 7.25% 12/1/18 | | 6,485,000 | | 6,241,813 |
Forbes Energy Services Ltd. 9% 6/15/19 | | 1,590,000 | | 1,566,150 |
Hornbeck Offshore Services, Inc. 8% 9/1/17 | | 1,605,000 | | 1,701,300 |
Noble Holding International Ltd. 3.45% 8/1/15 | | 632,000 | | 660,996 |
Oil States International, Inc. 6.5% 6/1/19 | | 2,850,000 | | 3,063,750 |
Petroleum Geo-Services ASA 7.375% 12/15/18 (e) | | 2,245,000 | | 2,357,250 |
Precision Drilling Corp.: | | | | |
6.5% 12/15/21 (e) | | 170,000 | | 181,475 |
6.625% 11/15/20 | | 1,890,000 | | 2,022,300 |
SESI LLC 7.125% 12/15/21 (e) | | 2,980,000 | | 3,292,900 |
Transocean, Inc.: | | | | |
5.05% 12/15/16 | | 7,572,000 | | 8,285,260 |
6.375% 12/15/21 | | 9,999,000 | | 11,796,790 |
Weatherford International Ltd.: | | | | |
4.95% 10/15/13 | | 2,173,000 | | 2,287,139 |
5.15% 3/15/13 | | 2,840,000 | | 2,938,060 |
| | 96,202,969 |
Oil, Gas & Consumable Fuels - 3.4% |
Afren PLC 11.5% 2/1/16 (e) | | 520,000 | | 551,200 |
Anadarko Petroleum Corp.: | | | | |
5.95% 9/15/16 | | 485,000 | | 561,564 |
6.375% 9/15/17 | | 19,790,000 | | 23,757,756 |
Antero Resources Finance Corp.: | | | | |
7.25% 8/1/19 (e) | | 1,080,000 | | 1,134,000 |
9.375% 12/1/17 | | 2,915,000 | | 3,191,925 |
Canadian Natural Resources Ltd.: | | | | |
5.15% 2/1/13 | | 5,610,000 | | 5,838,052 |
Corporate Bonds - continued |
| Principal Amount (c) | | Value |
Nonconvertible Bonds - continued |
ENERGY - continued |
Oil, Gas & Consumable Fuels - continued |
Canadian Natural Resources Ltd.: - continued | | | | |
5.7% 5/15/17 | | $ 16,295,000 | | $ 19,502,263 |
Chesapeake Energy Corp.: | | | | |
6.125% 2/15/21 | | 1,505,000 | | 1,516,288 |
6.875% 11/15/20 | | 1,195,000 | | 1,254,750 |
Chesapeake Midstream Partners LP/CHKM Finance Corp.: | | | | |
5.875% 4/15/21 (e) | | 676,000 | | 689,520 |
6.125% 7/15/22 (e) | | 1,240,000 | | 1,280,300 |
ConocoPhillips: | | | | |
4.6% 1/15/15 | | 10,000,000 | | 11,100,330 |
5.75% 2/1/19 | | 2,930,000 | | 3,605,386 |
CONSOL Energy, Inc.: | | | | |
8% 4/1/17 | | 3,515,000 | | 3,813,775 |
8.25% 4/1/20 | | 650,000 | | 708,500 |
Crestwood Midstream Partners LP / Finance Corp. 7.75% 4/1/19 (e) | | 800,000 | | 808,000 |
Denbury Resources, Inc. 6.375% 8/15/21 | | 1,935,000 | | 2,118,825 |
DTEK Finance BV 9.5% 4/28/15 (e) | | 600,000 | | 594,000 |
Duke Capital LLC 6.25% 2/15/13 | | 1,000,000 | | 1,049,266 |
Duke Energy Field Services: | | | | |
5.375% 10/15/15 (e) | | 1,524,000 | | 1,652,897 |
6.45% 11/3/36 (e) | | 1,801,000 | | 2,005,466 |
El Paso Natural Gas Co. 5.95% 4/15/17 | | 1,166,000 | | 1,294,438 |
Enbridge Energy Partners LP 4.2% 9/15/21 | | 13,331,000 | | 14,225,097 |
Encana Holdings Finance Corp. 5.8% 5/1/14 | | 3,602,000 | | 3,908,303 |
Energy Transfer Equity LP 7.5% 10/15/20 | | 2,350,000 | | 2,690,750 |
Enterprise Products Operating LP: | | | | |
5.6% 10/15/14 | | 483,000 | | 532,193 |
5.65% 4/1/13 | | 697,000 | | 731,389 |
EQT Corp. 4.875% 11/15/21 | | 5,066,000 | | 5,181,160 |
EV Energy Partners LP/EV Energy Finance Corp. 8% 4/15/19 | | 1,650,000 | | 1,732,500 |
Frontier Oil Corp.: | | | | |
6.875% 11/15/18 | | 485,000 | | 501,975 |
8.5% 9/15/16 | | 1,950,000 | | 2,086,500 |
Gulf South Pipeline Co. LP 5.75% 8/15/12 (e) | | 4,818,000 | | 4,898,779 |
Gulfstream Natural Gas System LLC 6.95% 6/1/16 (e) | | 221,000 | | 255,758 |
Corporate Bonds - continued |
| Principal Amount (c) | | Value |
Nonconvertible Bonds - continued |
ENERGY - continued |
Oil, Gas & Consumable Fuels - continued |
KazMunaiGaz Finance Sub BV: | | | | |
6.375% 4/9/21 (e) | | $ 850,000 | | $ 937,125 |
7% 5/5/20 (e) | | 1,635,000 | | 1,876,163 |
9.125% 7/2/18 (e) | | 1,855,000 | | 2,300,200 |
11.75% 1/23/15 (e) | | 1,860,000 | | 2,259,900 |
LINN Energy LLC/LINN Energy Finance Corp.: | | | | |
6.5% 5/15/19 (e) | | 3,790,000 | | 3,865,800 |
7.75% 2/1/21 | | 1,950,000 | | 2,086,500 |
8.625% 4/15/20 | | 2,685,000 | | 2,980,350 |
Marathon Petroleum Corp. 5.125% 3/1/21 | | 16,178,000 | | 17,564,972 |
Markwest Energy Partners LP/Markwest Energy Finance Corp. 6.25% 6/15/22 | | 1,245,000 | | 1,335,263 |
Midcontinent Express Pipeline LLC 5.45% 9/15/14 (e) | | 10,834,000 | | 11,220,904 |
Motiva Enterprises LLC: | | | | |
5.75% 1/15/20 (e) | | 4,187,000 | | 4,907,516 |
6.85% 1/15/40 (e) | | 5,937,000 | | 7,857,228 |
Nakilat, Inc. 6.067% 12/31/33 (e) | | 1,975,000 | | 2,123,125 |
Nexen, Inc.: | | | | |
5.2% 3/10/15 | | 1,133,000 | | 1,229,934 |
5.875% 3/10/35 | | 240,000 | | 258,725 |
6.2% 7/30/19 | | 603,000 | | 716,086 |
6.4% 5/15/37 | | 4,379,000 | | 5,014,056 |
NGPL PipeCo LLC 6.514% 12/15/12 (e) | | 3,327,000 | | 3,212,837 |
OGX Petroleo e Gas Participacoes SA 8.5% 6/1/18 (e) | | 1,355,000 | | 1,415,975 |
Overseas Shipholding Group, Inc.: | | | | |
7.5% 2/15/24 | | 500,000 | | 296,250 |
8.125% 3/30/18 | | 2,530,000 | | 1,568,600 |
Pacific Rubiales Energy Corp. 7.25% 12/12/21 (e) | | 1,826,000 | | 2,004,035 |
Pan American Energy LLC 7.875% 5/7/21 (e) | | 4,370,000 | | 4,457,400 |
PBF Holding Co. LLC/PBF Finance Corp. 8.25% 2/15/20 (e) | | 1,775,000 | | 1,783,875 |
Pemex Project Funding Master Trust: | | | | |
5.75% 3/1/18 | | 645,000 | | 720,788 |
6.625% 6/15/35 | | 945,000 | | 1,082,025 |
Petro-Canada: | | | | |
6.05% 5/15/18 | | 3,850,000 | | 4,661,133 |
6.8% 5/15/38 | | 8,950,000 | | 12,038,332 |
PetroBakken Energy Ltd. 8.625% 2/1/20 (e) | | 1,420,000 | | 1,505,200 |
Corporate Bonds - continued |
| Principal Amount (c) | | Value |
Nonconvertible Bonds - continued |
ENERGY - continued |
Oil, Gas & Consumable Fuels - continued |
Petrobras International Finance Co. Ltd.: | | | | |
3.875% 1/27/16 | | $ 10,192,000 | | $ 10,630,898 |
5.375% 1/27/21 | | 9,410,000 | | 10,116,860 |
5.75% 1/20/20 | | 28,708,000 | | 31,578,800 |
6.75% 1/27/41 | | 7,265,000 | | 8,439,968 |
6.875% 1/20/40 | | 470,000 | | 550,840 |
7.875% 3/15/19 | | 10,517,000 | | 12,935,910 |
8.375% 12/10/18 | | 775,000 | | 965,418 |
Petrohawk Energy Corp.: | | | | |
6.25% 6/1/19 | | 1,290,000 | | 1,454,475 |
7.25% 8/15/18 | | 1,330,000 | | 1,522,850 |
Petroleos de Venezuela SA: | | | | |
4.9% 10/28/14 | | 4,265,000 | | 3,753,200 |
5% 10/28/15 | | 380,000 | | 315,400 |
5.375% 4/12/27 | | 3,310,000 | | 2,068,750 |
5.5% 4/12/37 | | 2,530,000 | | 1,530,650 |
8% 11/17/13 | | 975,000 | | 976,950 |
8.5% 11/2/17 (e) | | 7,540,000 | | 6,861,400 |
12.75% 2/17/22 (e) | | 3,580,000 | | 3,651,600 |
Petroleos Mexicanos: | | | | |
4.875% 1/24/22 (e) | | 12,332,000 | | 12,886,940 |
5.5% 1/21/21 | | 12,069,000 | | 13,227,624 |
6% 3/5/20 | | 1,108,000 | | 1,260,350 |
6.5% 6/2/41 | | 350,000 | | 395,640 |
6.5% 6/2/41 (e) | | 15,185,000 | | 17,121,088 |
6.625% (e)(f) | | 3,075,000 | | 3,159,563 |
8% 5/3/19 | | 420,000 | | 527,730 |
Petroleum Co. of Trinidad & Tobago Ltd. (Reg. S) 6% 5/8/22 | | 608,125 | | 620,288 |
Pioneer Natural Resources Co. 6.65% 3/15/17 | | 4,605,000 | | 5,284,238 |
Plains All American Pipeline LP/PAA Finance Corp.: | | | | |
3.95% 9/15/15 | | 5,869,000 | | 6,232,602 |
4.25% 9/1/12 | | 485,000 | | 492,118 |
5% 2/1/21 | | 5,217,000 | | 5,865,953 |
6.125% 1/15/17 | | 6,185,000 | | 7,133,995 |
PT Adaro Indonesia 7.625% 10/22/19 (e) | | 500,000 | | 555,000 |
PT Pertamina Persero: | | | | |
5.25% 5/23/21 (e) | | 815,000 | | 865,938 |
6.5% 5/27/41 (e) | | 595,000 | | 657,475 |
Corporate Bonds - continued |
| Principal Amount (c) | | Value |
Nonconvertible Bonds - continued |
ENERGY - continued |
Oil, Gas & Consumable Fuels - continued |
Quicksilver Resources, Inc.: | | | | |
7.125% 4/1/16 | | $ 4,415,000 | | $ 4,238,400 |
11.75% 1/1/16 | | 2,255,000 | | 2,395,938 |
Range Resources Corp. 5% 8/15/22 (g) | | 1,235,000 | | 1,247,350 |
Ras Laffan Liquefied Natural Gas Co. Ltd. III: | | | | |
4.5% 9/30/12 (e) | | 4,773,000 | | 4,844,595 |
5.5% 9/30/14 (e) | | 6,670,000 | | 7,161,913 |
5.832% 9/30/16 (e) | | 1,299,465 | | 1,396,925 |
6.332% 9/30/27 (e) | | 1,840,000 | | 2,052,005 |
6.75% 9/30/19 (e) | | 4,366,000 | | 5,173,710 |
Rockies Express Pipeline LLC 6.25% 7/15/13 (e) | | 3,392,000 | | 3,459,840 |
Samson Investment Co. 9.75% 2/15/20 (e) | | 2,385,000 | | 2,498,288 |
Schlumberger Investment SA 3.3% 9/14/21 (e) | | 7,355,000 | | 7,591,471 |
Ship Finance International Ltd. 8.5% 12/15/13 | | 2,065,000 | | 2,034,025 |
Southeast Supply Header LLC 4.85% 8/15/14 (e) | | 367,000 | | 389,378 |
Spectra Energy Capital, LLC 5.65% 3/1/20 | | 308,000 | | 351,934 |
Spectra Energy Partners, LP: | | | | |
2.95% 6/15/16 | | 4,717,000 | | 4,802,118 |
4.6% 6/15/21 | | 2,694,000 | | 2,843,563 |
Suncor Energy, Inc. 6.1% 6/1/18 | | 11,154,000 | | 13,609,631 |
Targa Resources Partners LP/Targa Resources Partners Finance Corp.: | | | | |
6.375% 8/1/22 (e) | | 560,000 | | 583,800 |
6.875% 2/1/21 | | 685,000 | | 732,950 |
7.875% 10/15/18 | | 2,205,000 | | 2,403,450 |
TransCapitalInvest Ltd. 5.67% 3/5/14 (e) | | 4,317,000 | | 4,565,228 |
Western Gas Partners LP 5.375% 6/1/21 | | 14,766,000 | | 15,755,765 |
Williams Partners LP 4.125% 11/15/20 | | 2,399,000 | | 2,532,387 |
WPX Energy, Inc.: | | | | |
5.25% 1/15/17 (e) | | 975,000 | | 994,500 |
6% 1/15/22 (e) | | 1,535,000 | | 1,588,725 |
XTO Energy, Inc.: | | | | |
4.9% 2/1/14 | | 267,000 | | 287,723 |
5% 1/31/15 | | 1,749,000 | | 1,956,559 |
Corporate Bonds - continued |
| Principal Amount (c) | | Value |
Nonconvertible Bonds - continued |
ENERGY - continued |
Oil, Gas & Consumable Fuels - continued |
XTO Energy, Inc.: - continued | | | | |
5.65% 4/1/16 | | $ 1,200,000 | | $ 1,416,212 |
YPF SA 10% 11/2/28 | | 445,000 | | 471,700 |
| | 501,073,796 |
TOTAL ENERGY | | 597,276,765 |
FINANCIALS - 8.8% |
Capital Markets - 1.1% |
BlackRock, Inc. 4.25% 5/24/21 | | 5,000,000 | | 5,419,835 |
Equinox Holdings, Inc. 9.5% 2/1/16 (e) | | 2,020,000 | | 2,151,300 |
Goldman Sachs Group, Inc.: | | | | |
5.25% 7/27/21 | | 17,105,000 | | 17,127,921 |
5.625% 1/15/17 | | 3,200,000 | | 3,372,266 |
5.75% 1/24/22 | | 16,123,000 | | 16,824,754 |
5.95% 1/18/18 | | 4,975,000 | | 5,377,259 |
6.75% 10/1/37 | | 9,643,000 | | 9,648,169 |
JPMorgan Chase Capital XX 6.55% 9/29/36 | | 17,904,000 | | 17,993,520 |
JPMorgan Chase Capital XXV 6.8% 10/1/37 | | 7,405,000 | | 7,479,050 |
Lazard Group LLC: | | | | |
6.85% 6/15/17 | | 4,817,000 | | 5,236,594 |
7.125% 5/15/15 | | 1,717,000 | | 1,850,670 |
Merrill Lynch & Co., Inc.: | | | | |
6.11% 1/29/37 | | 4,768,000 | | 4,542,545 |
6.4% 8/28/17 | | 7,843,000 | | 8,259,267 |
Morgan Stanley: | | | | |
4.75% 4/1/14 | | 5,820,000 | | 5,888,368 |
5.5% 7/28/21 | | 11,429,000 | | 11,320,184 |
5.625% 9/23/19 | | 12,714,000 | | 12,708,914 |
6% 4/28/15 | | 1,414,000 | | 1,489,580 |
6.625% 4/1/18 | | 16,118,000 | | 17,091,930 |
| | 153,782,126 |
Commercial Banks - 1.4% |
African Export-Import Bank 8.75% 11/13/14 | | 490,000 | | 536,550 |
Akbank T.A.S. 5.125% 7/22/15 (e) | | 1,365,000 | | 1,353,056 |
Banco Nacional de Desenvolvimento Economico e Social: | | | | |
5.5% 7/12/20 (e) | | 520,000 | | 570,700 |
Corporate Bonds - continued |
| Principal Amount (c) | | Value |
Nonconvertible Bonds - continued |
FINANCIALS - continued |
Commercial Banks - continued |
Banco Nacional de Desenvolvimento Economico e Social: - continued | | | | |
6.5% 6/10/19 (e) | | $ 325,000 | | $ 380,250 |
Bank of America NA 5.3% 3/15/17 | | 6,601,000 | | 6,710,834 |
BBVA Paraguay SA 9.75% 2/11/16 (e) | | 1,145,000 | | 1,213,700 |
CIT Group, Inc.: | | | | |
4.75% 2/15/15 (e) | | 2,175,000 | | 2,207,625 |
5.5% 2/15/19 (e) | | 2,175,000 | | 2,221,219 |
7% 5/4/15 (e) | | 5,689,000 | | 5,703,223 |
7% 5/1/16 | | 458 | | 458 |
7% 5/2/16 (e) | | 3,596,000 | | 3,598,265 |
7% 5/2/17 (e) | | 6,459,000 | | 6,463,069 |
Credit Suisse New York Branch 6% 2/15/18 | | 16,785,000 | | 17,680,698 |
Development Bank of Kazakhstan JSC 5.5% 12/20/15 (e) | | 895,000 | | 935,275 |
Development Bank of Philippines 8.375% (f)(k) | | 1,655,000 | | 1,779,125 |
Discover Bank: | | | | |
7% 4/15/20 | | 2,458,000 | | 2,785,661 |
8.7% 11/18/19 | | 12,480,000 | | 15,018,607 |
Eastern and Southern African Trade and Development Bank 6.875% 1/9/16 (Reg. S) | | 870,000 | | 804,750 |
Fifth Third Bancorp: | | | | |
4.5% 6/1/18 | | 798,000 | | 826,841 |
8.25% 3/1/38 | | 4,667,000 | | 5,977,741 |
Fifth Third Bank 4.75% 2/1/15 | | 1,329,000 | | 1,402,021 |
Fifth Third Capital Trust IV 6.5% 4/15/67 (k) | | 6,912,000 | | 6,860,160 |
HBOS PLC 6.75% 5/21/18 (e) | | 6,067,000 | | 5,451,758 |
HSBK (Europe) BV: | | | | |
7.25% 5/3/17 (e) | | 1,435,000 | | 1,447,556 |
9.25% 10/16/13 (e) | | 1,485,000 | | 1,568,606 |
Huntington Bancshares, Inc. 7% 12/15/20 | | 2,851,000 | | 3,223,495 |
JPMorgan Chase Bank 6% 10/1/17 | | 11,313,000 | | 12,695,494 |
JSC Kazkommertsbank BV 8% 11/3/15 (e) | | 440,000 | | 409,200 |
Kazkommerts International BV 8.5% 4/16/13 (e) | | 546,000 | | 548,730 |
KeyBank NA: | | | | |
5.45% 3/3/16 | | 3,939,000 | | 4,327,460 |
5.8% 7/1/14 | | 9,490,000 | | 10,269,983 |
6.95% 2/1/28 | | 1,977,000 | | 2,223,081 |
KeyCorp. 5.1% 3/24/21 | | 5,572,000 | | 6,055,165 |
Corporate Bonds - continued |
| Principal Amount (c) | | Value |
Nonconvertible Bonds - continued |
FINANCIALS - continued |
Commercial Banks - continued |
Marshall & Ilsley Bank: | | | | |
4.85% 6/16/15 | | $ 4,520,000 | | $ 4,861,567 |
5% 1/17/17 | | 13,700,000 | | 14,629,381 |
5.25% 9/4/12 | | 3,162,000 | | 3,229,667 |
Regions Bank: | | | | |
6.45% 6/26/37 | | 10,658,000 | | 9,805,360 |
7.5% 5/15/18 | | 6,622,000 | | 7,217,980 |
Regions Financial Corp.: | | | | |
0.7438% 6/26/12 (k) | | 338,000 | | 337,720 |
5.75% 6/15/15 | | 2,005,000 | | 2,048,990 |
7.75% 11/10/14 | | 6,404,000 | | 6,837,551 |
RSHB Capital SA: | | | | |
6% 6/3/21 (e) | | 555,000 | | 550,838 |
9% 6/11/14 (e) | | 510,000 | | 564,213 |
The State Export-Import Bank of Ukraine JSC 5.7928% 2/9/16 (Issued by Credit Suisse First Boston International for The State Export-Import Bank of Ukraine JSC) (d) | | 1,335,000 | | 1,064,663 |
Trade & Development Bank of Mongolia LLC 8.5% 10/25/13 | | 555,000 | | 555,000 |
Turkiye Garanti Bankasi A/S 3.0612% 4/20/16 (e)(k) | | 945,000 | | 881,213 |
Turkiye Is Bankasi A/S 5.1% 2/1/16 (e) | | 610,000 | | 613,050 |
UnionBanCal Corp. 5.25% 12/16/13 | | 826,000 | | 855,752 |
Vimpel Communications 8.25% 5/23/16 (Reg. S) (Issued by UBS Luxembourg SA for Vimpel Communications) | | 2,525,000 | | 2,714,375 |
Wachovia Bank NA: | | | | |
4.8% 11/1/14 | | 372,000 | | 400,291 |
4.875% 2/1/15 | | 1,756,000 | | 1,899,442 |
Wachovia Corp.: | | | | |
5.625% 10/15/16 | | 4,239,000 | | 4,764,839 |
5.75% 6/15/17 | | 2,933,000 | | 3,409,011 |
Wells Fargo & Co.: | | | | |
3.625% 4/15/15 | | 5,893,000 | | 6,315,345 |
3.676% 6/15/16 | | 4,301,000 | | 4,609,451 |
Yapi ve Kredi Bankasi A/S 6.75% 2/8/17 (e) | | 1,060,000 | | 1,053,110 |
| | 212,469,165 |
Corporate Bonds - continued |
| Principal Amount (c) | | Value |
Nonconvertible Bonds - continued |
FINANCIALS - continued |
Consumer Finance - 0.7% |
Ally Financial, Inc.: | | | | |
3.71% 2/11/14 (k) | | $ 2,895,000 | | $ 2,844,338 |
5.5% 2/15/17 | | 1,580,000 | | 1,587,900 |
Discover Financial Services: | | | | |
6.45% 6/12/17 | | 10,366,000 | | 11,379,401 |
10.25% 7/15/19 | | 11,672,000 | | 14,882,874 |
Ford Motor Credit Co. LLC: | | | | |
3.875% 1/15/15 | | 7,000,000 | | 7,176,596 |
4.25% 2/3/17 | | 2,435,000 | | 2,504,273 |
5% 5/15/18 | | 6,890,000 | | 7,263,562 |
5.875% 8/2/21 | | 5,260,000 | | 5,868,293 |
12% 5/15/15 | | 3,440,000 | | 4,308,600 |
General Electric Capital Corp.: | | | | |
2.25% 11/9/15 | | 314,000 | | 322,985 |
4.625% 1/7/21 | | 5,706,000 | | 6,194,228 |
5.625% 9/15/17 | | 5,858,000 | | 6,754,456 |
5.625% 5/1/18 | | 25,000,000 | | 28,865,150 |
HSBC Finance Corp. 5.9% 6/19/12 | | 578,000 | | 586,239 |
SLM Corp.: | | | | |
6% 1/25/17 | | 950,000 | | 985,625 |
7.25% 1/25/22 | | 1,020,000 | | 1,068,450 |
| | 102,592,970 |
Diversified Financial Services - 2.0% |
Aquarius Investments Luxemburg 8.25% 2/18/16 | | 1,025,000 | | 1,060,875 |
Bank of America Corp.: | | | | |
5.65% 5/1/18 | | 8,780,000 | | 9,110,549 |
5.75% 12/1/17 | | 27,955,000 | | 29,268,270 |
6.5% 8/1/16 | | 9,000,000 | | 9,729,540 |
Biz Finance PLC 8.375% 4/27/15 (Reg. S) | | 1,525,000 | | 1,414,438 |
BP Capital Markets PLC: | | | | |
3.125% 10/1/15 | | 10,828,000 | | 11,594,752 |
3.625% 5/8/14 | | 711,000 | | 752,616 |
4.5% 10/1/20 | | 650,000 | | 733,102 |
4.742% 3/11/21 | | 8,800,000 | | 10,137,521 |
Calpine Construction Finance Co. LP 8% 6/1/16 (e) | | 2,655,000 | | 2,874,038 |
Capital One Capital V 10.25% 8/15/39 | | 5,267,000 | | 5,490,848 |
CDW LLC/CDW Finance Corp. 8.5% 4/1/19 | | 2,855,000 | | 3,058,276 |
CIT Group, Inc. 6.625% 4/1/18 (e) | | 1,215,000 | | 1,315,238 |
Citigroup, Inc.: | | | | |
3.953% 6/15/16 | | 11,847,000 | | 12,247,547 |
4.5% 1/14/22 | | 5,818,000 | | 5,975,115 |
Corporate Bonds - continued |
| Principal Amount (c) | | Value |
Nonconvertible Bonds - continued |
FINANCIALS - continued |
Diversified Financial Services - continued |
Citigroup, Inc.: - continued | | | | |
4.75% 5/19/15 | | $ 32,881,000 | | $ 34,844,883 |
5.875% 1/30/42 | | 5,043,000 | | 5,360,981 |
6.125% 5/15/18 | | 8,677,000 | | 9,693,346 |
6.5% 8/19/13 | | 13,174,000 | | 13,960,237 |
City of Buenos Aires 12.5% 4/6/15 (e) | | 3,155,000 | | 3,407,400 |
Fibria Overseas Finance Ltd. 6.75% 3/3/21 (e) | | 585,000 | | 576,225 |
General Motors Financial Co., Inc. 6.75% 6/1/18 | | 1,500,000 | | 1,597,500 |
Icahn Enterprises LP/Icahn Enterprises Finance Corp.: | | | | |
7.75% 1/15/16 | | 3,715,000 | | 3,891,463 |
8% 1/15/18 | | 5,875,000 | | 6,227,500 |
8% 1/15/18 (e) | | 2,005,000 | | 2,125,300 |
ILFC E-Capital Trust II 6.25% 12/21/65 (e)(k) | | 1,250,000 | | 837,500 |
Indo Energy Finance BV 7% 5/7/18 (e) | | 525,000 | | 542,063 |
JPMorgan Chase & Co.: | | | | |
3.15% 7/5/16 | | 13,000,000 | | 13,386,828 |
4.35% 8/15/21 | | 13,339,000 | | 13,990,904 |
4.5% 1/24/22 | | 22,046,000 | | 23,417,371 |
4.95% 3/25/20 | | 17,148,000 | | 18,590,507 |
5.4% 1/6/42 | | 5,642,000 | | 6,085,958 |
NSG Holdings II, LLC 7.75% 12/15/25 (e) | | 9,415,000 | | 9,509,150 |
Offshore Group Investment Ltd. 11.5% 8/1/15 | | 3,475,000 | | 3,874,625 |
Reynolds Group DL Escrow LLC 8.75% 10/15/16 (e) | | 3,000,000 | | 3,187,500 |
Steel Capital SA Ln Partner Net Program 6.25% 7/26/16 (e) | | 620,000 | | 621,550 |
Sunwest Management, Inc. 7.9726% 2/10/15 | | 364,436 | | 322,526 |
TECO Finance, Inc.: | | | | |
4% 3/15/16 | | 2,562,000 | | 2,711,190 |
5.15% 3/15/20 | | 3,761,000 | | 4,225,307 |
TMK Capital SA 7.75% 1/27/18 | | 600,000 | | 577,500 |
Unitymedia Hessen GmbH & Co. KG/Unitymedia NRW GmbH 8.125% 12/1/17 (e) | | 370,000 | | 399,600 |
UPCB Finance III Ltd. 6.625% 7/1/20 (e) | | 3,305,000 | | 3,395,888 |
Vnesheconombank Via VEB Finance PLC: | | | | |
5.375% 2/13/17 (e) | | 735,000 | | 751,538 |
Corporate Bonds - continued |
| Principal Amount (c) | | Value |
Nonconvertible Bonds - continued |
FINANCIALS - continued |
Diversified Financial Services - continued |
Vnesheconombank Via VEB Finance PLC: - continued | | | | |
6.8% 11/22/25 (e) | | $ 605,000 | | $ 623,937 |
Wind Acquisition Holdings Finance SA 12.25% 7/15/17 pay-in-kind (e)(k) | | 4,411,476 | | 3,879,219 |
ZFS Finance USA Trust IV 5.875% 5/9/62 (e)(k) | | 1,673,000 | | 1,631,175 |
Zhaikmunai Finance BV 10.5% 10/19/15 (e) | | 1,885,000 | | 1,979,250 |
| | 300,988,646 |
Insurance - 1.5% |
Allstate Corp.: | | | | |
5.2% 1/15/42 | | 20,742,000 | | 22,696,643 |
6.2% 5/16/14 | | 6,893,000 | | 7,656,986 |
American International Group, Inc. 4.875% 9/15/16 | | 7,990,000 | | 8,404,537 |
Aon Corp.: | | | | |
3.125% 5/27/16 | | 11,274,000 | | 11,636,301 |
3.5% 9/30/15 | | 4,451,000 | | 4,653,538 |
5% 9/30/20 | | 3,854,000 | | 4,314,765 |
6.25% 9/30/40 | | 3,160,000 | | 3,928,506 |
Assurant, Inc. 5.625% 2/15/14 | | 2,384,000 | | 2,524,453 |
Axis Capital Holdings Ltd. 5.75% 12/1/14 | | 558,000 | | 593,474 |
Great-West Life & Annuity Insurance Co. 7.153% 5/16/46 (e)(k) | | 1,859,000 | | 1,845,058 |
Hartford Financial Services Group, Inc. 5.375% 3/15/17 | | 194,000 | | 201,807 |
Liberty Mutual Group, Inc.: | | | | |
5% 6/1/21 (e) | | 12,644,000 | | 12,614,337 |
6.5% 3/15/35 (e) | | 1,741,000 | | 1,827,611 |
Marsh & McLennan Companies, Inc. 4.8% 7/15/21 | | 7,090,000 | | 7,902,670 |
Massachusetts Mutual Life Insurance Co. 5.375% 12/1/41 (e) | | 7,139,000 | | 7,579,862 |
MetLife, Inc.: | | | | |
4.75% 2/8/21 | | 4,032,000 | | 4,470,496 |
5% 6/15/15 | | 1,163,000 | | 1,288,043 |
5.875% 2/6/41 | | 4,458,000 | | 5,448,010 |
6.75% 6/1/16 | | 7,610,000 | | 9,108,797 |
Metropolitan Life Global Funding I: | | | | |
5.125% 4/10/13 (e) | | 559,000 | | 583,397 |
5.125% 6/10/14 (e) | | 6,751,000 | | 7,287,124 |
Monumental Global Funding III 5.5% 4/22/13 (e) | | 2,746,000 | | 2,862,263 |
New York Life Insurance Co. 6.75% 11/15/39 (e) | | 3,590,000 | | 4,726,393 |
Corporate Bonds - continued |
| Principal Amount (c) | | Value |
Nonconvertible Bonds - continued |
FINANCIALS - continued |
Insurance - continued |
Northwestern Mutual Life Insurance Co. 6.063% 3/30/40 (e) | | $ 6,155,000 | | $ 7,594,279 |
Pacific Life Insurance Co. 9.25% 6/15/39 (e) | | 5,674,000 | | 7,523,355 |
Pacific LifeCorp 6% 2/10/20 (e) | | 6,323,000 | | 6,913,783 |
Prudential Financial, Inc.: | | | | |
3.625% 9/17/12 | | 11,000,000 | | 11,165,154 |
4.5% 11/16/21 | | 8,000,000 | | 8,577,136 |
4.75% 9/17/15 | | 11,000,000 | | 11,984,478 |
5.15% 1/15/13 | | 2,966,000 | | 3,075,490 |
5.8% 11/16/41 | | 8,381,000 | | 9,362,843 |
6.2% 11/15/40 | | 4,318,000 | | 4,961,183 |
7.375% 6/15/19 | | 3,230,000 | | 3,997,093 |
Symetra Financial Corp. 6.125% 4/1/16 (e) | | 6,375,000 | | 6,524,813 |
Unum Group: | | | | |
5.625% 9/15/20 | | 8,386,000 | | 8,906,963 |
7.125% 9/30/16 | | 587,000 | | 671,532 |
| | 225,413,173 |
Real Estate Investment Trusts - 0.5% |
Alexandria Real Estate Equities, Inc. 4.6% 4/1/22 | | 4,025,000 | | 4,072,221 |
AvalonBay Communities, Inc. 4.95% 3/15/13 | | 367,000 | | 379,285 |
BRE Properties, Inc. 5.5% 3/15/17 | | 661,000 | | 723,945 |
Camden Property Trust: | | | | |
5.375% 12/15/13 | | 4,073,000 | | 4,242,579 |
5.875% 11/30/12 | | 670,000 | | 686,282 |
Developers Diversified Realty Corp.: | | | | |
4.75% 4/15/18 | | 8,570,000 | | 8,797,199 |
5.375% 10/15/12 | | 5,101,000 | | 5,150,133 |
7.5% 4/1/17 | | 5,574,000 | | 6,264,936 |
7.875% 9/1/20 | | 323,000 | | 385,832 |
Duke Realty LP: | | | | |
4.625% 5/15/13 | | 1,106,000 | | 1,142,051 |
5.875% 8/15/12 | | 1,017,000 | | 1,033,222 |
Equity One, Inc.: | | | | |
5.375% 10/15/15 | | 1,403,000 | | 1,483,254 |
6% 9/15/17 | | 890,000 | | 955,939 |
6.25% 12/15/14 | | 6,140,000 | | 6,633,429 |
6.25% 1/15/17 | | 494,000 | | 535,326 |
Corporate Bonds - continued |
| Principal Amount (c) | | Value |
Nonconvertible Bonds - continued |
FINANCIALS - continued |
Real Estate Investment Trusts - continued |
Federal Realty Investment Trust: | | | | |
5.4% 12/1/13 | | $ 441,000 | | $ 465,699 |
5.9% 4/1/20 | | 2,504,000 | | 2,823,663 |
6% 7/15/12 | | 3,658,000 | | 3,715,599 |
6.2% 1/15/17 | | 620,000 | | 701,541 |
HMB Capital Trust V 4.1463% 12/15/36 (b)(e)(k) | | 270,000 | | 0 |
HRPT Properties Trust: | | | | |
5.75% 11/1/15 | | 2,386,000 | | 2,494,947 |
6.25% 6/15/17 | | 1,232,000 | | 1,315,966 |
6.65% 1/15/18 | | 867,000 | | 933,277 |
MPT Operating Partnership LP/MPT Finance Corp. 6.875% 5/1/21 | | 1,760,000 | | 1,874,400 |
Omega Healthcare Investors, Inc.: | | | | |
6.75% 10/15/22 | | 3,190,000 | | 3,461,150 |
7% 1/15/16 | | 3,060,000 | | 3,128,850 |
Senior Housing Properties Trust 6.75% 4/15/20 | | 940,000 | | 1,007,665 |
UDR, Inc. 5.5% 4/1/14 | | 5,222,000 | | 5,487,539 |
Washington (REIT) 5.25% 1/15/14 | | 322,000 | | 337,514 |
| | 70,233,443 |
Real Estate Management & Development - 1.6% |
AMB Property LP 5.9% 8/15/13 | | 2,580,000 | | 2,659,018 |
BioMed Realty LP: | | | | |
3.85% 4/15/16 | | 11,000,000 | | 11,319,297 |
6.125% 4/15/20 | | 3,429,000 | | 3,848,288 |
Brandywine Operating Partnership LP: | | | | |
5.7% 5/1/17 | | 7,049,000 | | 7,328,042 |
5.75% 4/1/12 | | 2,972,000 | | 2,977,730 |
CB Richard Ellis Services, Inc. 6.625% 10/15/20 | | 5,165,000 | | 5,487,813 |
Colonial Properties Trust 6.875% 8/15/12 | | 5,706,000 | | 5,789,918 |
Colonial Realty LP 6.05% 9/1/16 | | 2,000,000 | | 2,066,300 |
Digital Realty Trust LP: | | | | |
4.5% 7/15/15 | | 4,981,000 | | 5,197,260 |
5.25% 3/15/21 | | 5,708,000 | | 6,009,245 |
Duke Realty LP: | | | | |
5.4% 8/15/14 | | 5,561,000 | | 5,935,422 |
5.95% 2/15/17 | | 1,109,000 | | 1,227,535 |
6.25% 5/15/13 | | 14,494,000 | | 15,244,224 |
6.5% 1/15/18 | | 3,795,000 | | 4,301,143 |
Corporate Bonds - continued |
| Principal Amount (c) | | Value |
Nonconvertible Bonds - continued |
FINANCIALS - continued |
Real Estate Management & Development - continued |
Duke Realty LP: - continued | | | | |
6.75% 3/15/20 | | $ 10,379,000 | | $ 12,066,023 |
8.25% 8/15/19 | | 75,000 | | 93,261 |
ERP Operating LP: | | | | |
4.625% 12/15/21 | | 22,997,000 | | 24,632,409 |
4.75% 7/15/20 | | 7,700,000 | | 8,258,897 |
5.25% 9/15/14 | | 1,310,000 | | 1,416,080 |
5.375% 8/1/16 | | 2,768,000 | | 3,084,255 |
5.5% 10/1/12 | | 3,690,000 | | 3,786,368 |
5.75% 6/15/17 | | 14,407,000 | | 16,386,133 |
Forest City Enterprises, Inc.: | | | | |
6.5% 2/1/17 | | 450,000 | | 424,125 |
7.625% 6/1/15 | | 430,000 | | 425,700 |
Highwoods/Forsyth LP 5.85% 3/15/17 | | 615,000 | | 657,623 |
Host Hotels & Resorts LP: | | | | |
5.875% 6/15/19 | | 2,150,000 | | 2,322,000 |
6% 11/1/20 | | 105,000 | | 114,056 |
6% 10/1/21 (e) | | 825,000 | | 899,250 |
Liberty Property LP: | | | | |
4.75% 10/1/20 | | 18,282,000 | | 18,891,266 |
5.125% 3/2/15 | | 1,405,000 | | 1,489,900 |
5.5% 12/15/16 | | 1,891,000 | | 2,071,469 |
6.625% 10/1/17 | | 4,835,000 | | 5,535,311 |
Mack-Cali Realty LP 7.75% 8/15/19 | | 700,000 | | 853,381 |
Post Apartment Homes LP 6.3% 6/1/13 | | 3,812,000 | | 3,961,232 |
Prime Property Funding, Inc.: | | | | |
5.125% 6/1/15 (e) | | 2,806,000 | | 2,856,250 |
5.5% 1/15/14 (e) | | 867,000 | | 887,427 |
5.7% 4/15/17 (e) | | 2,115,000 | | 2,169,235 |
Realogy Corp.: | | | | |
7.625% 1/15/20 (e) | | 1,345,000 | | 1,390,327 |
7.875% 2/15/19 (e) | | 2,880,000 | | 2,800,800 |
9% 1/15/20 (e) | | 870,000 | | 880,875 |
Reckson Operating Partnership LP 6% 3/31/16 | | 3,651,000 | | 3,835,711 |
Regency Centers LP: | | | | |
4.95% 4/15/14 | | 611,000 | | 640,281 |
5.25% 8/1/15 | | 2,133,000 | | 2,296,671 |
5.875% 6/15/17 | | 1,089,000 | | 1,216,925 |
Simon Property Group LP: | | | | |
2.8% 1/30/17 | | 2,603,000 | | 2,706,823 |
4.125% 12/1/21 | | 7,287,000 | | 7,871,519 |
4.2% 2/1/15 | | 3,659,000 | | 3,902,386 |
Corporate Bonds - continued |
| Principal Amount (c) | | Value |
Nonconvertible Bonds - continued |
FINANCIALS - continued |
Real Estate Management & Development - continued |
Tanger Properties LP: | | | | |
6.125% 6/1/20 | | $ 13,473,000 | | $ 15,342,028 |
6.15% 11/15/15 | | 1,777,000 | | 1,991,903 |
Toys 'R' Us Property Co. II LLC 8.5% 12/1/17 | | 2,875,000 | | 3,025,938 |
Ventas Realty LP: | | | | |
4.25% 3/1/22 | | 300,000 | | 298,030 |
6.75% 4/1/17 | | 250,000 | | 258,711 |
| | 241,131,814 |
Thrifts & Mortgage Finance - 0.0% |
Wrightwood Capital LLC 1.9% 4/20/20 | | 112,350 | | 36,851 |
TOTAL FINANCIALS | | 1,306,648,188 |
HEALTH CARE - 0.8% |
Biotechnology - 0.1% |
Amgen, Inc. 5.15% 11/15/41 | | 12,000,000 | | 12,533,340 |
Celgene Corp. 2.45% 10/15/15 | | 613,000 | | 629,726 |
| | 13,163,066 |
Health Care Equipment & Supplies - 0.0% |
Aviv Healthcare Properties LP/Aviv Healthcare Capital Corp. 7.75% 2/15/19 | | 260,000 | | 265,850 |
Health Care Providers & Services - 0.6% |
Aristotle Holding, Inc. 4.75% 11/15/21 (e) | | 22,009,000 | | 23,633,022 |
Community Health Systems, Inc. 8.875% 7/15/15 | | 1,120,000 | | 1,173,200 |
Coventry Health Care, Inc.: | | | | |
5.95% 3/15/17 | | 1,747,000 | | 1,981,308 |
6.3% 8/15/14 | | 3,618,000 | | 3,959,937 |
Emergency Medical Services Corp. 8.125% 6/1/19 | | 4,610,000 | | 4,840,500 |
Express Scripts, Inc.: | | | | |
3.125% 5/15/16 | | 10,525,000 | | 10,882,029 |
5.25% 6/15/12 | | 7,157,000 | | 7,243,034 |
6.25% 6/15/14 | | 2,629,000 | | 2,895,002 |
Corporate Bonds - continued |
| Principal Amount (c) | | Value |
Nonconvertible Bonds - continued |
HEALTH CARE - continued |
Health Care Providers & Services - continued |
Fresenius Medical Care US Finance II, Inc. 5.625% 7/31/19 (e) | | $ 2,315,000 | | $ 2,465,475 |
HCA, Inc.: | | | | |
6.5% 2/15/20 | | 2,705,000 | | 2,894,080 |
7.25% 9/15/20 | | 115,000 | | 125,787 |
HealthSouth Corp. 7.25% 10/1/18 | | 3,300,000 | | 3,555,750 |
IASIS Healthcare LLC/IASIS Capital Corp. 8.375% 5/15/19 | | 4,395,000 | | 4,197,225 |
Medco Health Solutions, Inc.: | | | | |
2.75% 9/15/15 | | 1,176,000 | | 1,191,113 |
4.125% 9/15/20 | | 7,486,000 | | 7,771,763 |
Rural/Metro Corp. 10.125% 7/15/19 (e) | | 740,000 | | 666,000 |
Sabra Health Care LP/Sabra Capital Corp. 8.125% 11/1/18 | | 2,580,000 | | 2,767,050 |
Skilled Healthcare Group, Inc. 11% 1/15/14 | | 164,000 | | 162,360 |
| | 82,404,635 |
Health Care Technology - 0.0% |
DJO Finance LLC/DJO Finance Corp.: | | | | |
7.75% 4/15/18 | | 925,000 | | 795,500 |
10.875% 11/15/14 | | 4,115,000 | | 4,156,150 |
| | 4,951,650 |
Pharmaceuticals - 0.1% |
Endo Pharmaceuticals Holdings, Inc.: | | | | |
7% 7/15/19 | | 860,000 | | 944,968 |
7.25% 1/15/22 | | 860,000 | | 957,868 |
Mylan, Inc.: | | | | |
6% 11/15/18 (e) | | 3,030,000 | | 3,166,350 |
7.625% 7/15/17 (e) | | 1,115,000 | | 1,237,650 |
Valeant Pharmaceuticals International: | | | | |
6.5% 7/15/16 (e) | | 4,500,000 | | 4,595,625 |
6.875% 12/1/18 (e) | | 3,440,000 | | 3,500,200 |
7% 10/1/20 (e) | | 255,000 | | 259,463 |
Watson Pharmaceuticals, Inc. 5% 8/15/14 | | 720,000 | | 768,762 |
| | 15,430,886 |
TOTAL HEALTH CARE | | 116,216,087 |
Corporate Bonds - continued |
| Principal Amount (c) | | Value |
Nonconvertible Bonds - continued |
INDUSTRIALS - 1.0% |
Aerospace & Defense - 0.1% |
BAE Systems Holdings, Inc.: | | | | |
4.95% 6/1/14 (e) | | $ 572,000 | | $ 603,577 |
6.375% 6/1/19 (e) | | 8,071,000 | | 9,275,250 |
BE Aerospace, Inc. 6.875% 10/1/20 | | 2,090,000 | | 2,327,738 |
Huntington Ingalls Industries, Inc. 6.875% 3/15/18 | | 3,100,000 | | 3,262,750 |
| | 15,469,315 |
Airlines - 0.2% |
Continental Airlines, Inc.: | | | | |
pass-thru trust certificates 9.798% 4/1/21 | | 343,926 | | 357,683 |
6.648% 3/15/19 | | 3,249,044 | | 3,411,496 |
6.75% 9/15/15 (e) | | 4,585,000 | | 4,636,352 |
6.9% 7/2/19 | | 857,459 | | 913,194 |
Continental Airlines, Inc. 9.25% 5/10/17 | | 2,564,970 | | 2,718,868 |
Delta Air Lines, Inc. pass-thru trust certificates: | | | | |
6.375% 1/2/16 | | 1,515,000 | | 1,416,525 |
6.75% 11/23/15 | | 1,515,000 | | 1,461,975 |
8.021% 8/10/22 | | 1,368,967 | | 1,389,501 |
8.954% 8/10/14 | | 1,860,940 | | 1,909,883 |
Northwest Airlines, Inc. pass-thru trust certificates 8.028% 11/1/17 | | 700,470 | | 693,466 |
U.S. Airways pass-thru trust certificates: | | | | |
6.85% 1/30/18 | | 1,782,351 | | 1,800,175 |
8.36% 1/20/19 | | 1,441,215 | | 1,462,833 |
United Air Lines, Inc. 9.875% 8/1/13 (e) | | 707,000 | | 738,815 |
United Air Lines, Inc. pass-thru trust certificates: | | | | |
Class B, 7.336% 7/2/19 | | 787,418 | | 755,921 |
9.75% 1/15/17 | | 2,003,727 | | 2,276,835 |
12% 1/15/16 (e) | | 660,640 | | 713,491 |
| | 26,657,013 |
Building Products - 0.1% |
Building Materials Corp. of America: | | | | |
6.75% 5/1/21 (e) | | 4,910,000 | | 5,351,900 |
6.875% 8/15/18 (e) | | 3,715,000 | | 3,993,625 |
Griffon Corp. 7.125% 4/1/18 | | 2,220,000 | | 2,303,250 |
| | 11,648,775 |
Commercial Services & Supplies - 0.3% |
ARAMARK Corp.: | | | | |
4.0469% 2/1/15 (k) | | 5,440,000 | | 5,419,600 |
Corporate Bonds - continued |
| Principal Amount (c) | | Value |
Nonconvertible Bonds - continued |
INDUSTRIALS - continued |
Commercial Services & Supplies - continued |
ARAMARK Corp.: - continued | | | | |
8.5% 2/1/15 | | $ 2,000,000 | | $ 2,055,000 |
ARAMARK Holdings Corp. 8.625% 5/1/16 pay-in-kind (e)(k) | | 7,325,000 | | 7,526,438 |
Covanta Holding Corp. 7.25% 12/1/20 | | 4,950,000 | | 5,279,462 |
International Lease Finance Corp.: | | | | |
5.75% 5/15/16 | | 1,330,000 | | 1,343,300 |
6.25% 5/15/19 | | 1,640,000 | | 1,662,347 |
6.75% 9/1/16 (e) | | 1,620,000 | | 1,753,650 |
8.625% 9/15/15 | | 2,745,000 | | 3,033,225 |
8.625% 1/15/22 | | 3,040,000 | | 3,427,600 |
8.75% 3/15/17 | | 3,700,000 | | 4,144,000 |
8.875% 9/1/17 | | 1,665,000 | | 1,864,800 |
WP Rocket Merger Sub, Inc. 10.125% 7/15/19 (e) | | 2,855,000 | | 2,640,875 |
| | 40,150,297 |
Construction & Engineering - 0.0% |
Amsted Industries, Inc. 8.125% 3/15/18 (e) | | 2,535,000 | | 2,737,800 |
Odebrecht Finance Ltd. 7.5% (e)(f) | | 2,455,000 | | 2,534,788 |
| | 5,272,588 |
Industrial Conglomerates - 0.1% |
General Electric Co. 5.25% 12/6/17 | | 17,730,000 | | 20,928,457 |
Marine - 0.0% |
Navios Maritime Holdings, Inc. 8.875% 11/1/17 | | 700,000 | | 686,000 |
SCF Capital Ltd. 5.375% 10/27/17 (e) | | 280,000 | | 267,400 |
| | 953,400 |
Professional Services - 0.0% |
FTI Consulting, Inc. 6.75% 10/1/20 | | 2,515,000 | | 2,719,470 |
Road & Rail - 0.2% |
Avis Budget Car Rental LLC/Avis Budget Finance, Inc.: | | | | |
7.625% 5/15/14 | | 1,202,000 | | 1,214,020 |
7.75% 5/15/16 | | 1,935,000 | | 1,993,050 |
Georgian Railway Ltd. 9.875% 7/22/15 | | 775,000 | | 815,688 |
Hertz Corp.: | | | | |
6.75% 4/15/19 | | 3,920,000 | | 4,106,200 |
7.5% 10/15/18 | | 8,330,000 | | 8,975,575 |
Corporate Bonds - continued |
| Principal Amount (c) | | Value |
Nonconvertible Bonds - continued |
INDUSTRIALS - continued |
Road & Rail - continued |
Kansas City Southern de Mexico SA de CV 12.5% 4/1/16 | | $ 1,335,000 | | $ 1,548,600 |
Swift Services Holdings, Inc. 10% 11/15/18 | | 3,835,000 | | 4,180,150 |
| | 22,833,283 |
Trading Companies & Distributors - 0.0% |
Aircastle Ltd.: | | | | |
9.75% 8/1/18 | | 1,575,000 | | 1,775,813 |
9.75% 8/1/18 (e) | | 840,000 | | 947,100 |
| | 2,722,913 |
Transportation Infrastructure - 0.0% |
Aeropuertos Argentina 2000 SA 10.75% 12/1/20 (e) | | 843,840 | | 898,690 |
TOTAL INDUSTRIALS | | 150,254,201 |
INFORMATION TECHNOLOGY - 0.3% |
Communications Equipment - 0.1% |
Lucent Technologies, Inc.: | | | | |
6.45% 3/15/29 | | 8,010,000 | | 6,167,700 |
6.5% 1/15/28 | | 1,240,000 | | 942,400 |
| | 7,110,100 |
Computers & Peripherals - 0.0% |
Seagate HDD Cayman: | | | | |
6.875% 5/1/20 | | 410,000 | | 448,950 |
7% 11/1/21 (e) | | 1,870,000 | | 2,071,025 |
| | 2,519,975 |
Electronic Equipment & Components - 0.1% |
Jabil Circuit, Inc. 5.625% 12/15/20 | | 935,000 | | 1,005,125 |
Sanmina-SCI Corp. 7% 5/15/19 (e) | | 5,640,000 | | 5,766,900 |
Tyco Electronics Group SA: | | | | |
5.95% 1/15/14 | | 3,835,000 | | 4,113,858 |
6% 10/1/12 | | 4,835,000 | | 4,982,864 |
6.55% 10/1/17 | | 1,383,000 | | 1,633,793 |
| | 17,502,540 |
Internet Software & Services - 0.0% |
Equinix, Inc. 8.125% 3/1/18 | | 4,300,000 | | 4,762,250 |
Corporate Bonds - continued |
| Principal Amount (c) | | Value |
Nonconvertible Bonds - continued |
INFORMATION TECHNOLOGY - continued |
IT Services - 0.0% |
Ceridian Corp.: | | | | |
11.25% 11/15/15 | | $ 610,000 | | $ 582,550 |
12.25% 11/15/15 pay-in-kind (k) | | 445,000 | | 427,200 |
SunGard Data Systems, Inc.: | | | | |
7.375% 11/15/18 | | 1,095,000 | | 1,182,600 |
10.25% 8/15/15 | | 1,765,000 | | 1,826,775 |
| | 4,019,125 |
Office Electronics - 0.0% |
Xerox Corp.: | | | | |
4.25% 2/15/15 | | 368,000 | | 391,906 |
4.5% 5/15/21 | | 4,102,000 | | 4,185,102 |
5.5% 5/15/12 | | 1,998,000 | | 2,015,498 |
| | 6,592,506 |
Semiconductors & Semiconductor Equipment - 0.1% |
Amkor Technology, Inc.: | | | | |
6.625% 6/1/21 | | 1,466,000 | | 1,528,305 |
7.375% 5/1/18 | | 2,435,000 | | 2,629,800 |
Spansion LLC 7.875% 11/15/17 | | 3,465,000 | | 3,395,700 |
| | 7,553,805 |
TOTAL INFORMATION TECHNOLOGY | | 50,060,301 |
MATERIALS - 1.2% |
Chemicals - 0.5% |
Braskem America Finance Co. 7.125% 7/22/41 (e) | | 735,000 | | 733,163 |
Braskem Finance Ltd. 7% 5/7/20 (e) | | 1,240,000 | | 1,376,400 |
Celanese US Holdings LLC 6.625% 10/15/18 | | 1,935,000 | | 2,118,825 |
Dow Chemical Co.: | | | | |
4.125% 11/15/21 | | 10,888,000 | | 11,583,493 |
4.25% 11/15/20 | | 5,898,000 | | 6,313,202 |
4.85% 8/15/12 | | 11,805,000 | | 12,013,901 |
5.25% 11/15/41 | | 5,421,000 | | 5,960,368 |
7.6% 5/15/14 | | 16,974,000 | | 19,291,138 |
Huntsman International LLC 8.625% 3/15/20 | | 1,160,000 | | 1,310,800 |
Ineos Finance PLC 8.375% 2/15/19 (e) | | 605,000 | | 638,275 |
Inergy LP/Inergy Finance Corp.: | | | | |
6.875% 8/1/21 | | 502,000 | | 483,175 |
7% 10/1/18 | | 1,865,000 | | 1,827,700 |
Corporate Bonds - continued |
| Principal Amount (c) | | Value |
Nonconvertible Bonds - continued |
MATERIALS - continued |
Chemicals - continued |
Kinove German Bondco GmbH 9.625% 6/15/18 (e) | | $ 1,250,000 | | $ 1,278,125 |
Lyondell Chemical Co.: | | | | |
8% 11/1/17 | | 853,000 | | 951,095 |
11% 5/1/18 | | 1,295,163 | | 1,419,822 |
LyondellBasell Industries NV 6% 11/15/21 (e) | | 700,000 | | 766,500 |
NOVA Chemicals Corp. 3.7836% 11/15/13 (k) | | 2,720,000 | | 2,706,400 |
| | 70,772,382 |
Construction Materials - 0.0% |
CRH America, Inc. 6% 9/30/16 | | 2,286,000 | | 2,492,867 |
Headwaters, Inc. 7.625% 4/1/19 | | 2,695,000 | | 2,600,675 |
Rearden G Holdings Eins GmbH 7.875% 3/30/20 (e) | | 1,290,000 | | 1,348,050 |
| | 6,441,592 |
Containers & Packaging - 0.1% |
Ardagh Packaging Finance PLC 7.375% 10/15/17 (e) | | 2,700,000 | | 2,889,000 |
Ball Corp. 5% 3/15/22 (g) | | 1,940,000 | | 1,983,650 |
Rock-Tenn Co.: | | | | |
4.45% 3/1/19 (e) | | 310,000 | | 316,882 |
4.9% 3/1/22 (e) | | 290,000 | | 297,743 |
Sealed Air Corp.: | | | | |
8.125% 9/15/19 (e) | | 5,155,000 | | 5,799,375 |
8.375% 9/15/21 (e) | | 1,325,000 | | 1,530,375 |
| | 12,817,025 |
Metals & Mining - 0.6% |
Alrosa Finance SA: | | | | |
(Reg. S) 8.875% 11/17/14 | | 835,000 | | 916,413 |
7.75% 11/3/20 (e) | | 700,000 | | 743,750 |
Anglo American Capital PLC 9.375% 4/8/14 (e) | | 6,817,000 | | 7,841,500 |
ArcelorMittal SA 3.75% 3/1/16 | | 2,911,000 | | 2,920,417 |
BHP Billiton Financial (USA) Ltd. 5.125% 3/29/12 | | 1,975,000 | | 1,981,279 |
Boart Longyear Management Pty Ltd. 7% 4/1/21 (e) | | 930,000 | | 986,963 |
Corporacion Nacional del Cobre de Chile (Codelco): | | | | |
3.875% 11/3/21 (e) | | 11,456,000 | | 11,738,963 |
6.375% 11/30/12 (e) | | 2,002,000 | | 2,069,646 |
Edgen Murray Corp. 12.25% 1/15/15 | | 4,450,000 | | 4,510,965 |
Essar Steel Algoma, Inc. 9.375% 3/15/15 (e) | | 3,100,000 | | 3,193,000 |
EVRAZ Group SA 8.25% 11/10/15 (e) | | 1,630,000 | | 1,731,875 |
Corporate Bonds - continued |
| Principal Amount (c) | | Value |
Nonconvertible Bonds - continued |
MATERIALS - continued |
Metals & Mining - continued |
FMG Resources (August 2006) Pty Ltd.: | | | | |
6.375% 2/1/16 (e) | | $ 710,000 | | $ 737,477 |
6.875% 2/1/18 (e) | | 1,625,000 | | 1,706,250 |
7% 11/1/15 (e) | | 4,075,000 | | 4,309,313 |
8.25% 11/1/19 (e) | | 3,295,000 | | 3,632,738 |
JMC Steel Group, Inc. 8.25% 3/15/18 (e) | | 5,110,000 | | 5,333,563 |
McJunkin Red Man Corp. 9.5% 12/15/16 | | 5,475,000 | | 5,858,250 |
Metinvest BV 10.25% 5/20/15 (e) | | 935,000 | | 939,675 |
Rio Tinto Finance Ltd. (United States) 3.75% 9/20/21 | | 7,654,000 | | 8,159,271 |
Severstal Columbus LLC 10.25% 2/15/18 | | 4,610,000 | | 5,024,900 |
Southern Copper Corp. 6.75% 4/16/40 | | 920,000 | | 1,005,946 |
Steel Dynamics, Inc.: | | | | |
6.75% 4/1/15 | | 720,000 | | 732,600 |
7.625% 3/15/20 | | 1,290,000 | | 1,438,350 |
Tube City IMS Corp. 9.75% 2/1/15 | | 1,700,000 | | 1,744,625 |
Vale Overseas Ltd. 6.25% 1/23/17 | | 5,581,000 | | 6,445,084 |
Vedanta Resources PLC: | | | | |
6.75% 6/7/16 (e) | | 3,290,000 | | 3,100,825 |
8.25% 6/7/21 (e) | | 845,000 | | 773,175 |
Votorantim Cimentos SA 7.25% 4/5/41 (e) | | 740,000 | | 741,850 |
| | 90,318,663 |
Paper & Forest Products - 0.0% |
Sino-Forest Corp. 6.25% 10/21/17 (e) | | 1,365,000 | | 429,975 |
TOTAL MATERIALS | | 180,779,637 |
TELECOMMUNICATION SERVICES - 1.7% |
Diversified Telecommunication Services - 1.0% |
Alestra SA de RL de CV 11.75% 8/11/14 | | 1,635,000 | | 1,831,200 |
AT&T, Inc.: | | | | |
2.5% 8/15/15 | | 7,670,000 | | 8,013,907 |
3.875% 8/15/21 | | 8,800,000 | | 9,473,367 |
5.35% 9/1/40 | | 4,006,000 | | 4,504,443 |
5.55% 8/15/41 | | 10,000,000 | | 11,712,750 |
6.3% 1/15/38 | | 16,665,000 | | 20,558,511 |
BellSouth Capital Funding Corp. 7.875% 2/15/30 | | 742,000 | | 982,683 |
CenturyLink, Inc.: | | | | |
6.15% 9/15/19 | | 4,793,000 | | 5,033,704 |
Corporate Bonds - continued |
| Principal Amount (c) | | Value |
Nonconvertible Bonds - continued |
TELECOMMUNICATION SERVICES - continued |
Diversified Telecommunication Services - continued |
CenturyLink, Inc.: - continued | | | | |
6.45% 6/15/21 | | $ 10,268,000 | | $ 10,868,154 |
7.6% 9/15/39 | | 1,274,000 | | 1,304,486 |
Embarq Corp. 7.995% 6/1/36 | | 4,717,000 | | 5,033,025 |
Intelsat Ltd. 11.25% 6/15/16 | | 2,570,000 | | 2,717,775 |
Intelsat Luxembourg SA: | | | | |
11.25% 2/4/17 | | 4,215,000 | | 4,336,181 |
11.5% 2/4/17 pay-in-kind (e)(k) | | 1,860,000 | | 1,887,900 |
11.5% 2/4/17 pay-in-kind (k) | | 9,398,205 | | 9,680,151 |
Sprint Capital Corp. 8.75% 3/15/32 | | 885,000 | | 787,650 |
Telefonica Emisiones SAU: | | | | |
5.134% 4/27/20 | | 10,522,000 | | 10,385,761 |
5.462% 2/16/21 | | 6,967,000 | | 7,006,419 |
6.421% 6/20/16 | | 1,162,000 | | 1,251,802 |
Telemar Norte Leste SA 5.5% 10/23/20 (e) | | 530,000 | | 539,275 |
U.S. West Communications 7.5% 6/15/23 | | 3,760,000 | | 3,816,400 |
Verizon Communications, Inc.: | | | | |
3.5% 11/1/21 | | 12,600,000 | | 13,177,181 |
6.1% 4/15/18 | | 6,000,000 | | 7,314,930 |
6.25% 4/1/37 | | 2,348,000 | | 2,878,655 |
6.9% 4/15/38 | | 6,295,000 | | 8,313,253 |
Wind Acquisition Finance SA: | | | | |
7.25% 2/15/18 (e) | | 2,350,000 | | 2,291,250 |
11.75% 7/15/17 (e) | | 1,435,000 | | 1,470,875 |
| | 157,171,688 |
Wireless Telecommunication Services - 0.7% |
America Movil SAB de CV: | | | | |
2.375% 9/8/16 | | 15,982,000 | | 16,321,026 |
3.625% 3/30/15 | | 731,000 | | 771,205 |
Digicel Group Ltd.: | | | | |
8.25% 9/1/17 (e) | | 3,400,000 | | 3,604,000 |
8.875% 1/15/15 (e) | | 5,755,000 | | 5,855,713 |
9.125% 1/15/15 pay-in-kind (e)(k) | | 3,770,000 | | 3,835,975 |
DIRECTV Holdings LLC/DIRECTV Financing, Inc.: | | | | |
5.875% 10/1/19 | | 11,944,000 | | 13,893,070 |
6.35% 3/15/40 | | 3,541,000 | | 4,170,554 |
Intelsat Jackson Holdings SA: | | | | |
7.25% 4/1/19 | | 2,445,000 | | 2,561,138 |
Corporate Bonds - continued |
| Principal Amount (c) | | Value |
Nonconvertible Bonds - continued |
TELECOMMUNICATION SERVICES - continued |
Wireless Telecommunication Services - continued |
Intelsat Jackson Holdings SA: - continued | | | | |
9.5% 6/15/16 | | $ 2,935,000 | | $ 3,081,750 |
MTS International Funding Ltd. 8.625% 6/22/20 (e) | | 2,205,000 | | 2,513,700 |
Nextel Communications, Inc.: | | | | |
5.95% 3/15/14 | | 7,720,000 | | 7,739,300 |
6.875% 10/31/13 | | 9,105,000 | | 9,139,144 |
7.375% 8/1/15 | | 4,995,000 | | 4,932,563 |
NII Capital Corp.: | | | | |
7.625% 4/1/21 | | 1,755,000 | | 1,794,488 |
8.875% 12/15/19 | | 965,000 | | 1,037,375 |
Pakistan Mobile Communications Ltd. 8.625% 11/13/13 (e) | | 2,970,000 | | 2,821,500 |
Sprint Nextel Corp.: | | | | |
6% 12/1/16 | | 3,640,000 | | 3,312,400 |
9% 11/15/18 (e) | | 1,050,000 | | 1,161,510 |
Telemovil Finance Co. Ltd. 8% 10/1/17 (e) | | 1,645,000 | | 1,694,350 |
VimpelCom Holdings BV: | | | | |
4.5758% 6/29/14 (e)(k) | | 1,925,000 | | 1,900,938 |
7.5043% 3/1/22 (e) | | 4,275,000 | | 4,189,500 |
VIP Finance Ireland Ltd. 7.748% 2/2/21 (e) | | 900,000 | | 898,875 |
Vodafone Group PLC 5% 12/16/13 | | 2,864,000 | | 3,073,504 |
| | 100,303,578 |
TOTAL TELECOMMUNICATION SERVICES | | 257,475,266 |
UTILITIES - 2.1% |
Electric Utilities - 1.0% |
Alabama Power Co. 3.375% 10/1/20 | | 5,927,000 | | 6,282,069 |
Ameren Illinois Co. 6.125% 11/15/17 | | 3,112,000 | | 3,526,481 |
AmerenUE 6.4% 6/15/17 | | 2,491,000 | | 2,999,605 |
Cleveland Electric Illuminating Co. 5.65% 12/15/13 | | 1,016,000 | | 1,086,864 |
Duquesne Light Holdings, Inc.: | | | | |
5.9% 12/1/21 (e) | | 6,944,000 | | 7,294,325 |
6.4% 9/15/20 (e) | | 16,661,000 | | 17,986,849 |
Edison International 3.75% 9/15/17 | | 6,674,000 | | 7,094,369 |
EDP Finance BV: | | | | |
4.9% 10/1/19 (e) | | 3,324,000 | | 2,621,639 |
6% 2/2/18 (e) | | 2,157,000 | | 1,836,388 |
Corporate Bonds - continued |
| Principal Amount (c) | | Value |
Nonconvertible Bonds - continued |
UTILITIES - continued |
Electric Utilities - continued |
Empresa Distribuidora y Comercializadora Norte SA 9.75% 10/25/22 (e) | | $ 420,000 | | $ 323,400 |
Enel Finance International SA 5.7% 1/15/13 (e) | | 206,000 | | 210,907 |
FirstEnergy Corp. 7.375% 11/15/31 | | 15,004,000 | | 19,114,241 |
FirstEnergy Solutions Corp.: | | | | |
4.8% 2/15/15 | | 2,432,000 | | 2,628,068 |
6.05% 8/15/21 | | 9,801,000 | | 11,168,720 |
InterGen NV 9% 6/30/17 (e) | | 5,270,000 | | 5,533,500 |
IPALCO Enterprises, Inc. 5% 5/1/18 | | 2,895,000 | | 2,929,451 |
LG&E and KU Energy LLC: | | | | |
2.125% 11/15/15 | | 7,369,000 | | 7,344,719 |
3.75% 11/15/20 | | 1,450,000 | | 1,473,539 |
Majapahit Holding BV: | | | | |
7.75% 1/20/20 (e) | | 850,000 | | 1,037,000 |
8% 8/7/19 (e) | | 485,000 | | 594,125 |
Mirant Americas Generation LLC: | | | | |
8.5% 10/1/21 | | 4,095,000 | | 3,726,450 |
9.125% 5/1/31 | | 2,615,000 | | 2,366,575 |
National Power Corp. 6.875% 11/2/16 (e) | | 390,000 | | 450,450 |
Nevada Power Co.: | | | | |
6.5% 5/15/18 | | 790,000 | | 965,593 |
6.5% 8/1/18 | | 388,000 | | 474,899 |
NV Energy, Inc. 6.25% 11/15/20 | | 2,245,000 | | 2,452,795 |
Otter Tail Corp. 9% 12/15/16 | | 2,410,000 | | 2,578,700 |
Pacific Gas & Electric Co. 3.25% 9/15/21 | | 1,773,000 | | 1,828,656 |
Pennsylvania Electric Co. 6.05% 9/1/17 | | 764,000 | | 878,115 |
Pepco Holdings, Inc. 2.7% 10/1/15 | | 7,047,000 | | 7,138,710 |
Progress Energy, Inc.: | | | | |
4.4% 1/15/21 | | 12,059,000 | | 13,254,360 |
6% 12/1/39 | | 7,150,000 | | 8,978,705 |
Sierra Pacific Power Co. 5.45% 9/1/13 | | 1,945,000 | | 2,063,608 |
| | 150,243,875 |
Gas Utilities - 0.0% |
Intergas Finance BV 6.375% 5/14/17 (Reg. S) | | 665,000 | | 708,225 |
Southern Natural Gas Co. 5.9% 4/1/17 (e) | | 442,000 | | 500,284 |
Corporate Bonds - continued |
| Principal Amount (c) | | Value |
Nonconvertible Bonds - continued |
UTILITIES - continued |
Gas Utilities - continued |
Southern Natural Gas Co. / Southern Natural Issuing Corp. 4.4% 6/15/21 | | $ 3,646,000 | | $ 3,760,849 |
Transportadora de Gas del Sur SA 7.875% 5/14/17 (e) | | 2,065,000 | | 1,941,100 |
| | 6,910,458 |
Independent Power Producers & Energy Traders - 0.4% |
Atlantic Power Corp. 9% 11/15/18 (e) | | 2,790,000 | | 2,845,800 |
Dolphin Subsidiary II, Inc.: | | | | |
6.5% 10/15/16 (e) | | 5,275,000 | | 5,749,750 |
7.25% 10/15/21 (e) | | 3,430,000 | | 3,910,200 |
Duke Capital LLC 5.668% 8/15/14 | | 2,563,000 | | 2,777,774 |
GenOn Energy, Inc.: | | | | |
9.5% 10/15/18 | | 2,295,000 | | 2,191,725 |
9.875% 10/15/20 | | 1,185,000 | | 1,110,938 |
Kinder Morgan Finance Co. LLC 6% 1/15/18 (e) | | 3,030,000 | | 3,208,013 |
Listrindo Capital BV 6.95% 2/21/19 (e) | | 600,000 | | 609,000 |
Power Sector Assets and Liabilities Management Corp.: | | | | |
7.25% 5/27/19 (e) | | 720,000 | | 894,600 |
7.39% 12/2/24 (e) | | 750,000 | | 960,000 |
PPL Energy Supply LLC 6.5% 5/1/18 | | 6,895,000 | | 8,042,783 |
PSEG Power LLC 2.75% 9/15/16 | | 2,786,000 | | 2,830,947 |
RRI Energy, Inc. 7.625% 6/15/14 | | 8,000,000 | | 8,160,000 |
The AES Corp.: | | | | |
7.375% 7/1/21 (e) | | 1,615,000 | | 1,841,100 |
7.75% 10/15/15 | | 2,345,000 | | 2,649,850 |
8% 10/15/17 | | 4,575,000 | | 5,261,250 |
| | 53,043,730 |
Multi-Utilities - 0.7% |
Consolidated Edison Co. of New York, Inc. 5.7% 6/15/40 | | 3,771,000 | | 4,741,995 |
Dominion Resources, Inc.: | | | | |
2.8793% 9/30/66 (k) | | 19,226,000 | | 16,365,844 |
7.5% 6/30/66 (k) | | 10,345,000 | | 10,939,838 |
MidAmerican Energy Holdings, Co.: | | | | |
5.875% 10/1/12 | | 3,506,000 | | 3,605,262 |
6.5% 9/15/37 | | 7,097,000 | | 9,180,324 |
National Grid PLC 6.3% 8/1/16 | | 1,589,000 | | 1,844,983 |
NiSource Finance Corp.: | | | | |
4.45% 12/1/21 | | 4,928,000 | | 5,216,929 |
Corporate Bonds - continued |
| Principal Amount (c) | | Value |
Nonconvertible Bonds - continued |
UTILITIES - continued |
Multi-Utilities - continued |
NiSource Finance Corp.: - continued | | | | |
5.25% 9/15/17 | | $ 843,000 | | $ 938,402 |
5.4% 7/15/14 | | 1,680,000 | | 1,831,771 |
5.45% 9/15/20 | | 854,000 | | 963,702 |
5.8% 2/1/42 | | 6,336,000 | | 6,760,639 |
5.95% 6/15/41 | | 11,832,000 | | 13,308,929 |
6.25% 12/15/40 | | 2,345,000 | | 2,692,822 |
6.4% 3/15/18 | | 1,654,000 | | 1,953,774 |
6.8% 1/15/19 | | 6,774,000 | | 8,121,613 |
Puget Energy, Inc.: | | | | |
6% 9/1/21 | | 2,464,000 | | 2,632,981 |
6.5% 12/15/20 | | 2,275,000 | | 2,491,125 |
Wisconsin Energy Corp. 6.25% 5/15/67 (k) | | 3,860,000 | | 3,956,500 |
| | 97,547,433 |
Water Utilities - 0.0% |
Companhia de Saneamento Basico do Estado de Sao Paulo (SABESP) 6.25% 12/16/20 (e) | | 485,000 | | 511,675 |
TOTAL UTILITIES | | 308,257,171 |
TOTAL NONCONVERTIBLE BONDS | | 3,561,439,913 |
TOTAL CORPORATE BONDS (Cost $3,249,327,509) |
3,562,288,913
|
U.S. Government and Government Agency Obligations - 26.3% |
|
U.S. Government Agency Obligations - 0.4% |
Fannie Mae Guaranteed Mtg. pass-thru certificates 0.375% 3/16/15 | | 11,413,000 | | 11,353,972 |
Freddie Mac 1.75% 9/10/15 | | 40,525,000 | | 42,136,355 |
Tennessee Valley Authority 5.375% 4/1/56 | | 385,000 | | 500,583 |
TOTAL U.S. GOVERNMENT AGENCY OBLIGATIONS | | 53,990,910 |
U.S. Government and Government Agency Obligations - continued |
| Principal Amount (c) | | Value |
U.S. Treasury Inflation Protected Obligations - 1.6% |
U.S. Treasury Inflation-Indexed Bonds: | | | | |
2.125% 2/15/40 | | $ 73,625,837 | | $ 101,095,564 |
2.125% 2/15/41 | | 73,129,315 | | 100,893,114 |
2.5% 1/15/29 | | 21,023,800 | | 28,501,673 |
TOTAL U.S. TREASURY INFLATION PROTECTED OBLIGATIONS | | 230,490,351 |
U.S. Treasury Obligations - 24.3% |
U.S. Treasury Bonds: | | | | |
3.125% 2/15/42 | | 17,083,000 | | 17,168,415 |
4.375% 5/15/41 | | 459,035,000 | | 576,805,879 |
U.S. Treasury Notes: | | | | |
0.125% 12/31/13 | | 60,731,000 | | 60,543,584 |
0.25% 1/31/14 | | 59,276,000 | | 59,222,770 |
0.25% 9/15/14 | | 8,048,000 | | 8,020,331 |
0.25% 12/15/14 | | 805,000 | | 801,541 |
0.5% 8/15/14 | | 12,503,000 | | 12,542,072 |
0.625% 7/15/14 | | 160,373,000 | | 161,375,331 |
0.75% 6/15/14 | | 11,299,000 | | 11,403,165 |
0.875% 11/30/16 | | 1,503,000 | | 1,506,992 |
0.875% 2/28/17 | | 293,221,000 | | 293,266,742 |
1.375% 11/30/15 | | 88,617,000 | | 91,150,915 |
1.375% 2/28/19 | | 83,926,000 | | 83,808,000 |
2% 11/15/21 | | 389,903,000 | | 391,730,865 |
2% 2/15/22 | | 171,534,000 | | 171,828,867 |
2.375% 2/28/15 (h) | | 499,922,000 | | 528,472,045 |
2.625% 7/31/14 | | 316,140,000 | | 333,330,113 |
2.625% 12/31/14 (h) | | 486,380,000 | | 516,360,950 |
3.125% 5/15/21 | | 278,589,000 | | 309,212,060 |
TOTAL U.S. TREASURY OBLIGATIONS | | 3,628,550,637 |
TOTAL U.S. GOVERNMENT AND GOVERNMENT AGENCY OBLIGATIONS (Cost $3,684,694,262) |
3,913,031,898
|
U.S. Government Agency - Mortgage Securities - 12.3% |
| Principal Amount (c) | | Value |
Fannie Mae - 8.8% |
2.105% 10/1/33 (k) | | $ 932,975 | | $ 971,621 |
2.303% 6/1/36 (k) | | 143,797 | | 152,544 |
2.572% 2/1/36 (k) | | 811,155 | | 856,988 |
2.635% 7/1/37 (k) | | 385,649 | | 410,958 |
2.82% 12/1/35 (k) | | 548,010 | | 579,748 |
3% 3/1/27 (g) | | 18,000,000 | | 18,680,852 |
3.5% 3/1/42 (g) | | 144,700,000 | | 149,563,179 |
3.5% 3/1/42 (g) | | 43,800,000 | | 45,272,061 |
3.5% 3/1/42 (g) | | 51,500,000 | | 53,230,848 |
3.5% 3/1/42 (g) | | 5,700,000 | | 5,891,570 |
3.5% 3/1/42 (g) | | 78,500,000 | | 81,138,283 |
3.5% 3/1/42 (g) | | 27,000,000 | | 27,907,435 |
4% 9/1/26 to 11/1/41 | | 113,239,005 | | 120,090,169 |
4% 9/1/41 | | 196,774 | | 207,817 |
4% 10/1/41 | | 7,447,543 | | 7,877,144 |
4.5% 11/1/18 to 11/1/41 | | 188,925,609 | | 203,062,880 |
4.5% 3/1/42 (g) | | 12,100,000 | | 12,895,802 |
5% 5/1/19 to 6/1/40 | | 129,805,722 | | 140,360,029 |
5% 3/1/42 (g) | | 39,000,000 | | 42,118,974 |
5% 3/1/42 (g) | | 31,100,000 | | 33,587,182 |
5% 3/1/42 (g) | | 16,000,000 | | 17,279,579 |
5.5% 3/1/18 to 3/1/39 | | 139,109,518 | | 151,779,963 |
6% 1/1/21 to 4/1/40 | | 178,789,214 | | 196,581,771 |
6.5% 11/1/35 | | 365,282 | | 410,275 |
TOTAL FANNIE MAE | | 1,310,907,672 |
Freddie Mac - 1.7% |
3.149% 10/1/35 (k) | | 210,022 | | 223,772 |
4% 12/1/40 to 10/1/41 | | 23,476,218 | | 24,971,365 |
4% 9/1/41 | | 1,875,687 | | 1,980,000 |
4% 3/1/42 (g) | | 28,000,000 | | 29,372,328 |
4.5% 7/1/25 to 10/1/41 | | 105,412,593 | | 112,904,053 |
4.5% 3/1/42 (g) | | 5,800,000 | | 6,161,069 |
5% 7/1/35 to 8/1/40 | | 34,940,140 | | 37,863,392 |
5.5% 11/1/17 to 1/1/40 | | 29,502,120 | | 32,046,424 |
6% 7/1/37 to 8/1/37 | | 5,192,476 | | 5,730,885 |
TOTAL FREDDIE MAC | | 251,253,288 |
U.S. Government Agency - Mortgage Securities - continued |
| Principal Amount (c) | | Value |
Ginnie Mae - 1.8% |
3.5% 10/15/40 to 2/15/42 | | $ 34,245,756 | | $ 35,951,866 |
4% 1/15/25 to 1/20/42 | | 86,674,972 | | 93,541,220 |
4% 3/1/42 (g) | | 21,700,000 | | 23,370,477 |
4.5% 11/20/33 to 7/20/41 | | 54,865,097 | | 59,955,961 |
4.5% 3/1/42 (g) | | 1,000,000 | | 1,090,144 |
5% 3/15/39 to 9/15/41 | | 32,585,925 | | 36,106,284 |
5% 3/1/42 (g) | | 2,100,000 | | 2,319,460 |
5% 3/1/42 (g) | | 16,000,000 | | 17,672,078 |
6% 9/20/38 | | 4,886,518 | | 5,469,537 |
TOTAL GINNIE MAE | | 275,477,027 |
TOTAL U.S. GOVERNMENT AGENCY - MORTGAGE SECURITIES (Cost $1,817,051,198) |
1,837,637,987
|
Asset-Backed Securities - 2.0% |
|
Accredited Mortgage Loan Trust Series 2005-1 Class M1, 0.714% 4/25/35 (k) | | 1,206,470 | | 651,744 |
ACE Securities Corp. Home Equity Loan Trust: | | | | |
Series 2004-HE1 Class M2, 1.894% 3/25/34 (k) | | 454,461 | | 318,536 |
Series 2005-HE2 Class M2, 0.694% 4/25/35 (k) | | 107,012 | | 103,895 |
Advanta Business Card Master Trust: | | | | |
Series 2006-C1 Class C1, 0.6758% 10/20/14 (k) | | 642,000 | | 6,420 |
Series 2007-D1 Class D, 1.5863% 1/22/13 (e)(k) | | 2,590,000 | | 38,850 |
Airspeed Ltd. Series 2007-1A Class C1, 2.7485% 6/15/32 (e)(k) | | 4,233,602 | | 2,180,305 |
Ally Auto Receivables Trust: | | | | |
Series 2009-A: | | | | |
Class A3, 2.33% 6/17/13 (e) | | 1,420,427 | | 1,426,271 |
Class A4, 3% 10/15/15 (e) | | 4,280,000 | | 4,358,211 |
Series 2010-5 Class A4, 1.75% 3/15/16 | | 4,050,000 | | 4,130,525 |
Series 2011-1 Class A4, 2.23% 3/15/16 | | 18,200,000 | | 18,772,392 |
Ally Master Owner Trust: | | | | |
Series 2010-3 Class A, 2.88% 4/15/15 (e) | | 8,910,000 | | 9,087,109 |
Series 2011-1 Class A2, 2.15% 1/15/16 | | 8,870,000 | | 9,032,918 |
Series 2011-3 Class A2, 1.81% 5/15/16 | | 8,490,000 | | 8,602,352 |
Series 2012-1 Class A2, 0.7% 2/15/17 | | 18,800,000 | | 18,811,468 |
AmeriCredit Automobile Receivables Trust Series 2011-1 Class A3, 1.39% 9/8/15 | | 7,520,000 | | 7,578,985 |
Asset-Backed Securities - continued |
| Principal Amount (c) | | Value |
Ameriquest Mortgage Securities, Inc. pass-thru certificates: | | | | |
Series 2003-10 Class M1, 0.944% 12/25/33 (k) | | $ 83,046 | | $ 65,323 |
Series 2004-R2 Class M3, 0.794% 4/25/34 (k) | | 133,684 | | 41,863 |
Series 2005-R2 Class M1, 0.694% 4/25/35 (k) | | 2,064,696 | | 1,792,641 |
Anthracite CDO I Ltd. Series 2002-CIBA Class B, 6.633% 5/24/37 (e) | | 171,000 | | 171,782 |
Anthracite CDO III Ltd./Anthracite CDO III Corp. Series 2004-1A Class A, 0.6055% 3/23/19 (e)(k) | | 177,068 | | 150,950 |
Argent Securities, Inc. pass-thru certificates: | | | | |
Series 2003-W7 Class A2, 1.0563% 3/25/34 (k) | | 47,932 | | 34,538 |
Series 2004-W11 Class M2, 0.944% 11/25/34 (k) | | 561,149 | | 399,128 |
Series 2004-W7 Class M1, 0.794% 5/25/34 (k) | | 1,542,998 | | 1,104,624 |
Series 2006-W4 Class A2C, 0.404% 5/25/36 (k) | | 1,323,779 | | 323,672 |
Asset Backed Securities Corp. Home Equity Loan Trust: | | | | |
Series 2004-HE2 Class M1, 1.069% 4/25/34 (k) | | 2,531,796 | | 1,716,165 |
Series 2006-HE2 Class M1, 0.614% 3/25/36 (k) | | 120,082 | | 941 |
Axon Financial Funding Ltd. Series 2007-1 Class A1, 1.181% 4/4/17 (b)(e)(k) | | 7,217,000 | | 1 |
Bank of America Auto Trust Series 2009-1A: | | | | |
Class A3, 2.67% 7/15/13 (e) | | 221,634 | | 221,848 |
Class A4, 3.52% 6/15/16 (e) | | 8,300,000 | | 8,421,563 |
BMW Vehicle Lease Trust: | | | | |
Series 2010-1 Class A3, 0.82% 4/15/13 | | 12,743,568 | | 12,757,046 |
Series 2011-1 Class A4, 1.4% 8/20/14 | | 11,060,000 | | 11,137,458 |
Brazos Higher Education Authority, Inc. Series 2006-2 Class A9, 0.5838% 12/25/24 (k) | | 1,400,411 | | 1,234,602 |
Capital Auto Receivables Asset Trust Series 2007-1 Class C, 5.38% 11/15/12 | | 582,000 | | 585,249 |
Capital One Multi-Asset Execution Trust Series 2008-A3 Class A3, 5.05% 2/15/16 | | 5,700,000 | | 5,986,350 |
Capital Trust Ltd. Series 2004-1: | | | | |
Class A2, 0.6955% 7/20/39 (e)(k) | | 276,986 | | 206,354 |
Class B, 0.9955% 7/20/39 (e)(k) | | 263,810 | | 108,162 |
Class C, 1.3455% 7/20/39 (e)(k) | | 339,379 | | 7,636 |
Capital Trust RE CDO Ltd./Capital Trust RE CDO Corp. Series 2005-3A: | | | | |
Class A2, 5.16% 6/25/35 (e) | | 848,404 | | 844,162 |
Class B, 5.267% 6/25/35 (e) | | 1,000,000 | | 950,000 |
CapitalSource Real Estate Loan Trust Series 2006-1A Class A2A, 0.8315% 1/20/37 (e)(k) | | 177,123 | | 143,636 |
Capmark VII Ltd. Series 2006-7A Class H, 1.7985% 8/15/36 (e)(k) | | 528,495 | | 0 |
Asset-Backed Securities - continued |
| Principal Amount (c) | | Value |
Carmax Auto Owner Trust Series 2011-1 Class A3, 1.29% 9/15/15 | | $ 8,210,000 | | $ 8,274,749 |
Carrington Mortgage Loan Trust Series 2007-RFC1 Class A3, 0.384% 12/25/36 (k) | | 1,802,588 | | 570,187 |
CBRE Realty Finance CDO LLC Series 2007-1A Class A1, 0.8325% 4/7/52 (e)(k) | | 1,111,372 | | 757,466 |
Chase Issuance Trust Series 2007-A17 Class A, 5.12% 10/15/14 | | 5,000,000 | | 5,148,852 |
Chrysler Financial Auto Securitization Trust Series 2010-A Class A3, 0.91% 8/8/13 | | 17,510,000 | | 17,529,457 |
Citibank Credit Card Issuance Trust Series 2009-A5 Class A5, 2.25% 12/23/14 | | 35,600,000 | | 36,117,485 |
Countrywide Asset-Backed Certificates Trust: | | | | |
Series 2007-11 Class 2A1, 0.304% 6/25/47 (k) | | 11,782 | | 11,650 |
Series 2007-4 Class A1A, 0.3963% 9/25/37 (k) | | 273,057 | | 266,159 |
Countrywide Home Loan Trust Series 2006-13 Class N, 7% 8/25/37 (e) | | 811,000 | | 0 |
Countrywide Home Loans, Inc.: | | | | |
Series 2003-BC1 Class B1, 5.5436% 3/25/32 (MGIC Investment Corp. Insured) (k) | | 11,800 | | 2,019 |
Series 2004-3 Class M4, 1.214% 4/25/34 (k) | | 159,665 | | 70,348 |
Series 2004-4 Class M2, 1.039% 6/25/34 (k) | | 587,945 | | 265,886 |
Series 2005-3 Class MV1, 0.664% 8/25/35 (k) | | 219,335 | | 216,302 |
Crest Clarendon Street Ltd./Crest Clarendon Corp. Series 2002-1A: | | | | |
Class B1, 6.065% 12/28/35 (e) | | 500,000 | | 410,000 |
Class B2, 1.9238% 12/28/35 (e)(k) | | 500,000 | | 350,000 |
Crest Dartmouth Street Ltd./Crest Dartmouth Street Corp. Series 2003-1A: | | | | |
Class B1, 2.0738% 6/28/38 (e)(k) | | 100,000 | | 88,750 |
Class D, 9% 6/28/38 (e) | | 200,000 | | 140,000 |
Deutsche Financial Capital Securitization LLC Series 1997-I Class M, 7.275% 9/15/27 | | 540,000 | | 495,526 |
Fannie Mae subordinate REMIC pass-thru certificates Series 2004-T5 Class AB3, 0.7513% 5/28/35 (k) | | 38,916 | | 24,977 |
Fieldstone Mortgage Investment Corp. Series 2004-3 Class M5, 2.419% 8/25/34 (k) | | 290,872 | | 169,523 |
First Franklin Mortgage Loan Trust Series 2004-FF2 Class M3, 1.069% 3/25/34 (k) | | 22,872 | | 2,455 |
Ford Credit Auto Lease Trust Series 2010-B Class A3, 0.91% 7/15/13 (e) | | 14,200,000 | | 14,213,190 |
Ford Credit Auto Owner Trust: | | | | |
Series 2009-D: | | | | |
Class A3, 2.17% 10/15/13 | | 1,493,398 | | 1,500,039 |
Asset-Backed Securities - continued |
| Principal Amount (c) | | Value |
Ford Credit Auto Owner Trust: - continued | | | | |
Series 2009-D: | | | | |
Class A4, 2.98% 8/15/14 | | $ 4,800,000 | | $ 4,900,017 |
Series 2010-B Class A3, 0.98% 10/15/14 | | 7,953,833 | | 7,978,427 |
Ford Credit Floorplan Master Owner Trust Series 2010-5 Class A1, 1.5% 9/15/15 | | 10,710,000 | | 10,813,801 |
Fremont Home Loan Trust: | | | | |
Series 2005-A: | | | | |
Class M3, 0.734% 1/25/35 (k) | | 948,695 | | 299,348 |
Class M4, 0.924% 1/25/35 (k) | | 363,547 | | 82,407 |
Series 2006-D Class M1, 0.474% 11/25/36 (k) | | 68,785 | | 276 |
GCO Education Loan Funding Master Trust II Series 2007-1A Class C1L, 0.8706% 2/25/47 (e)(k) | | 2,892,000 | | 1,012,200 |
GCO Slims Trust Series 2006-1A, 5.72% 3/1/22 (e) | | 1,281,987 | | 1,179,428 |
GE Business Loan Trust: | | | | |
Series 2003-1 Class A, 0.6785% 4/15/31 (e)(k) | | 213,676 | | 199,776 |
Series 2006-2A: | | | | |
Class A, 0.4285% 11/15/34 (e)(k) | | 1,913,934 | | 1,583,781 |
Class B, 0.5285% 11/15/34 (e)(k) | | 691,371 | | 445,934 |
Class C, 0.6285% 11/15/34 (e)(k) | | 1,149,030 | | 568,770 |
Class D, 0.9985% 11/15/34 (e)(k) | | 436,323 | | 95,991 |
Goal Capital Funding Trust Series 2007-1 Class C1, 0.9738% 6/25/42 (k) | | 543,917 | | 415,288 |
GSAMP Trust Series 2004-AR1 Class B4, 5% 6/25/34 (e)(k) | | 215,708 | | 63,042 |
Guggenheim Structured Real Estate Funding Ltd. Series 2006-3: | | | | |
Class B, 0.644% 9/25/46 (e)(k) | | 30,129 | | 30,117 |
Class C, 0.794% 9/25/46 (e)(k) | | 1,526,694 | | 778,614 |
Class E, 1.894% 9/25/46 (e)(k) | | 250,000 | | 4,725 |
Home Equity Asset Trust: | | | | |
Series 2003-2 Class M1, 1.564% 8/25/33 (k) | | 393,438 | | 267,740 |
Series 2003-3 Class M1, 1.534% 8/25/33 (k) | | 697,666 | | 503,317 |
Series 2003-5 Class A2, 0.944% 12/25/33 (k) | | 32,929 | | 23,987 |
Series 2005-5 Class 2A2, 0.494% 11/25/35 (k) | | 6,922 | | 6,912 |
Series 2006-1 Class 2A3, 0.469% 4/25/36 (k) | | 395,873 | | 392,574 |
Series 2006-3N Class B, 6.5% 8/27/36 (e) | | 250,000 | | 0 |
HSI Asset Securitization Corp. Trust Series 2007-HE1 Class 2A3, 0.434% 1/25/37 (k) | | 1,522,035 | | 443,376 |
Hyundai Auto Receivables Trust Series 2009-A Class A3, 2.03% 8/15/13 | | 1,533,679 | | 1,538,965 |
John Deere Owner Trust Series 2011-A Class A4, 1.96% 4/16/18 | | 4,810,000 | | 4,927,655 |
Asset-Backed Securities - continued |
| Principal Amount (c) | | Value |
JPMorgan Mortgage Acquisition Trust: | | | | |
Series 2006-NC2 Class M2, 0.544% 7/25/36 (k) | | $ 204,000 | | $ 3,897 |
Series 2007-CH1 Class AV4, 0.374% 11/25/36 (k) | | 1,520,141 | | 1,257,256 |
Keycorp Student Loan Trust: | | | | |
Series 1999-A Class A2, 0.9038% 12/27/29 (k) | | 593,668 | | 521,329 |
Series 2006-A Class 2C, 1.7238% 3/27/42 (k) | | 3,243,000 | | 869,380 |
Long Beach Mortgage Loan Trust: | | | | |
Series 2004-2 Class M2, 1.324% 6/25/34 (k) | | 84,170 | | 49,982 |
Series 2006-10 Class 2A3, 0.404% 11/25/36 (k) | | 5,521,861 | | 1,679,225 |
Marathon Real Estate CDO Ltd. Series 2006-1A Class B, 0.674% 5/25/46 (e)(k) | | 250,000 | | 112,500 |
Marriott Vacation Club Owner Trust Series 2006-2A: | | | | |
Class B, 5.442% 10/20/28 (e) | | 16,295 | | 16,530 |
Class C, 5.691% 10/20/28 (e) | | 7,242 | | 7,313 |
Class D, 6.01% 10/20/28 (e) | | 86,229 | | 86,707 |
MASTR Asset Backed Securities Trust Series 2007-HE1 Class M1, 0.544% 5/25/37 (k) | | 784,792 | | 13,571 |
Meritage Mortgage Loan Trust Series 2004-1 Class M1, 0.994% 7/25/34 (k) | | 168,695 | | 104,530 |
Merrill Lynch Mortgage Investors Trust: | | | | |
Series 2003-OPT1 Class M1, 1.219% 7/25/34 (k) | | 573,205 | | 384,377 |
Series 2006-FM1 Class A2B, 0.354% 4/25/37 (k) | | 1,672,878 | | 1,242,566 |
Series 2006-OPT1 Class A1A, 0.504% 6/25/35 (k) | | 2,960,520 | | 2,213,503 |
Morgan Stanley ABS Capital I Trust: | | | | |
Series 2004-HE6 Class A2, 0.584% 8/25/34 (k) | | 57,368 | | 44,034 |
Series 2004-NC8 Class M6, 1.494% 9/25/34 (k) | | 28,547 | | 16,261 |
Series 2005-NC1 Class M1, 0.684% 1/25/35 (k) | | 399,800 | | 252,476 |
Series 2005-NC2 Class B1, 1.414% 3/25/35 (k) | | 416,362 | | 52,726 |
Series 2007-HE2 Class M1, 0.494% 1/25/37 (k) | | 131,178 | | 381 |
N-Star Real Estate CDO Ltd. Series 1A: | | | | |
Class B1, 2.1656% 8/28/38 (e)(k) | | 220,000 | | 191,400 |
Class C1B, 7.696% 8/28/38 (e) | | 64,212 | | 52,936 |
National Collegiate Student Loan Trust: | | | | |
Series 2004-2 Class AIO, 9.75% 10/27/14 (m) | | 7,651,000 | | 516,443 |
Series 2006-4 Class D, 1.344% 5/25/32 (k) | | 2,481,000 | | 5,288 |
Series 2007-1 Class AIO, 7.27% 4/25/12 (m) | | 33,769,000 | | 540,304 |
Series 2007-2 Class AIO, 6.7% 7/25/12 (m) | | 24,102,186 | | 534,642 |
New Century Home Equity Loan Trust Series 2005-4 Class M2, 0.754% 9/25/35 (k) | | 1,426,957 | | 606,810 |
Nissan Auto Receivables Owner Trust: | | | | |
Series 2010-A Class A4, 1.31% 9/15/16 | | 5,950,000 | | 6,013,329 |
Series 2011-A Class A4, 1.94% 9/15/17 | | 11,750,000 | | 12,084,617 |
Asset-Backed Securities - continued |
| Principal Amount (c) | | Value |
Ocala Funding LLC: | | | | |
Series 2005-1A Class A, 1.7455% 3/20/10 (b)(e)(k) | | $ 566,000 | | $ 0 |
Series 2006-1A Class A, 1.6455% 3/20/11 (b)(e)(k) | | 1,176,000 | | 0 |
Option One Mortgage Loan Trust: | | | | |
Series 2007-5 Class 2A1, 0.334% 5/25/37 (k) | | 19,223 | | 19,101 |
Series 2007-6 Class 2A1, 0.304% 7/25/37 (k) | | 99,166 | | 97,613 |
Park Place Securities, Inc.: | | | | |
Series 2004-WCW1: | | | | |
Class M3, 1.494% 9/25/34 (k) | | 532,896 | | 224,703 |
Class M4, 1.694% 9/25/34 (k) | | 683,353 | | 149,324 |
Series 2005-WCH1 Class M4, 1.074% 1/25/36 (k) | | 1,475,804 | | 657,425 |
Prima Capital CDO Ltd./Prima Capital CDO Corp. Series 2005-1A: | | | | |
Class B, 4.846% 7/24/39 (e) | | 147,188 | | 144,244 |
Class C, 5.08% 7/24/39 (e) | | 185,000 | | 178,988 |
Class D, 5.194% 7/24/39 (e) | | 320,000 | | 300,800 |
Prima Capital Ltd. Series 2006-CR1A Class A2, 5.533% 12/28/48 (e) | | 280,000 | | 266,000 |
Resource Real Estate Funding CDO Series 2007-1A Class J, 3.194% 9/25/46 (e)(k) | | 250,000 | | 37,500 |
Salomon Brothers Mortgage Securities VII, Inc. Series 2003-HE1 Class A, 1.044% 4/25/33 (k) | | 5,108 | | 4,136 |
Saxon Asset Securities Trust Series 2004-1 Class M1, 1.039% 3/25/35 (k) | | 1,335,965 | | 814,955 |
Sierra Receivables Funding Co. Series 2007-1A Class A2, 0.4309% 3/20/19 (FGIC Insured) (e)(k) | | 542,580 | | 519,599 |
SLM Private Credit Student Loan Trust Series 2004-A Class C, 1.4963% 6/15/33 (k) | | 1,272,000 | | 577,106 |
Specialty Underwriting & Residential Finance Trust Series 2006-AB2 Class N1, 5.75% 6/25/37 (e) | | 656,637 | | 0 |
Structured Asset Investment Loan Trust Series 2004-8 Class M5, 1.969% 9/25/34 (k) | | 65,143 | | 20,857 |
SVO VOI Mortgage Corp. Series 2006-AA Class A, 5.28% 2/20/24 (e) | | 575,472 | | 594,242 |
Terwin Mortgage Trust Series 2003-4HE Class A1, 1.104% 9/25/34 (k) | | 28,819 | | 21,391 |
TIAA Real Estate CDO Ltd./TIAA Real Estate CDO Corp.: | | | | |
Series 2002-1A: | | | | |
Class IIFX, 6.77% 5/22/37 (e) | | 244,008 | | 244,008 |
Class IV, 6.84% 5/22/37 (e) | | 235,000 | | 210,913 |
Series 2003-1A Class B2, 5.4802% 12/28/38 (e) | | 111,000 | | 92,130 |
Trapeza CDO XII Ltd./Trapeza CDO XII, Inc. Series 2007-12A Class B, 1.1425% 4/6/42 (e)(k) | | 2,632,814 | | 78,984 |
Asset-Backed Securities - continued |
| Principal Amount (c) | | Value |
Wachovia Ltd./Wachovia LLC: | | | | |
Series 2006-1 Class 1ML, 0% 9/25/26 (e)(k) | | $ 400,000 | | $ 168,000 |
Series 2006-1A: | | | | |
Class A1A, 0.8338% 9/25/26 (e)(k) | | 1,374,838 | | 1,209,857 |
Class A1B, 0.9038% 9/25/26 (e)(k) | | 1,033,000 | | 785,080 |
Class A2A, 0.7938% 9/25/26 (e)(k) | | 902,937 | | 812,643 |
Class A2B, 0.8838% 9/25/26 (e)(k) | | 250,000 | | 207,500 |
Class B, 0.9338% 9/25/26 (e)(k) | | 250,000 | | 187,500 |
Class F, 1.7238% 9/25/26 (e)(k) | | 250,000 | | 167,500 |
Class G, 1.9238% 9/25/26 (e)(k) | | 320,000 | | 208,000 |
WaMu Asset Holdings Corp. Series 2006-8 Class N1, 6.048% 10/25/46 (e) | | 887,552 | | 0 |
Wells Fargo Home Equity Trust Series 2004-3 Class A, 4.5% 11/27/34 (e) | | 7,576 | | 0 |
Whinstone Capital Management Ltd. Series 1A Class B3, 2.3601% 10/25/44 (e)(k) | | 1,789,540 | | 948,456 |
Wrightwood Capital Real Estate CDO Ltd. Series 2005-1A: | | | | |
Class A1, 0.8131% 11/21/40 (e)(k) | | 500,000 | | 385,000 |
Class D, 1.3431% 11/21/40 (e)(k) | | 305,000 | | 91,500 |
TOTAL ASSET-BACKED SECURITIES (Cost $295,817,785) |
298,586,531
|
Collateralized Mortgage Obligations - 0.8% |
|
Private Sponsor - 0.8% |
ABN AMRO Mortgage Corp. Series 2003-9 Class B5, 4.5164% 8/25/18 (e) | | 172,852 | | 22,471 |
Bayview Commercial Asset Trust Series 2006-3A, Class IO, 3.9431% 10/25/36 (e)(k)(m) | | 9,375,877 | | 448,123 |
Bear Stearns ALT-A Trust floater Series 2005-1 Class A1, 0.804% 1/25/35 (k) | | 1,912,591 | | 1,451,121 |
Cobalt CMBS Commercial Mortgage Trust Series 2007-C2 Class B, 5.617% 4/15/47 (k) | | 2,125,000 | | 467,500 |
COMM pass-thru certificates floater Series 2001-J2A Class A2F, 0.7475% 7/16/34 (e)(k) | | 20,551 | | 20,541 |
Countrywide Alternative Loan Trust Series 2006-OC5N Class N, 7.25% 7/25/37 (e) | | 78,237 | | 0 |
Countrywide Home Loans, Inc.: | | | | |
Series 2003-28 Class B3, 5.5% 8/25/33 | | 54,117 | | 26,610 |
Series 2003-35 Class B, 4.6374% 9/25/18 (k) | | 86,087 | | 12,052 |
Credit Suisse First Boston Mortgage Securities Corp.: | | | | |
Series 2003-17 Class B4, 5.389% 6/25/33 (k) | | 232,626 | | 62,809 |
Collateralized Mortgage Obligations - continued |
| Principal Amount (c) | | Value |
Private Sponsor - continued |
Credit Suisse First Boston Mortgage Securities Corp.: - continued | | | | |
Series 2004-3 Class DB4, 5.8243% 4/25/34 (k) | | $ 38,184 | | $ 48 |
CWALT, Inc.: | | | | |
floater Series 2005-56: | | | | |
Class 1A1, 0.974% 11/25/35 (k) | | 31,256,081 | | 16,655,387 |
Class 2A3, 1.6967% 11/25/35 (k) | | 7,463,139 | | 4,232,290 |
Series 2005-56 Class 5A1, 0.564% 11/25/35 (k) | | 9,191,811 | | 4,816,838 |
First Horizon Mortgage pass-thru Trust Series 2004-AR5 Class 2A1, 2.631% 10/25/34 (k) | | 1,423,564 | | 1,310,526 |
FREMF Mortgage Trust: | | | | |
Series 2010 K7 Class B, 5.6185% 4/25/20 (e)(k) | | 1,000,000 | | 1,036,014 |
Series 2010-K6 Class B, 5.5326% 12/25/46 (e)(k) | | 910,000 | | 938,251 |
GMAC Commercial Mortgage Securities, Inc. Series 1993-C3 Class L, 6.974% 8/15/36 | | 8,166 | | 4 |
GMAC Mortgage Loan Trust Series 2003-J10 Class B2, 4.75% 1/25/19 (e) | | 67,876 | | 13,575 |
Granite Master Issuer PLC floater: | | | | |
Series 2005-4 Class C2, 1.3455% 12/20/54 (k) | | 205,017 | | 124,643 |
Series 2006-1A Class C2, 1.4455% 12/20/54 (e)(k) | | 6,523,000 | | 3,979,030 |
Series 2006-2 Class C1, 1.1855% 12/20/54 (k) | | 21,543,000 | | 13,141,230 |
Series 2006-3 Class C2, 0.7455% 12/20/54 (k) | | 1,124,000 | | 685,640 |
Series 2006-4: | | | | |
Class B1, 0.4255% 12/20/54 (k) | | 4,521,000 | | 3,806,682 |
Class C1, 1.0055% 12/20/54 (k) | | 2,767,000 | | 1,687,870 |
Class M1, 0.5855% 12/20/54 (k) | | 1,190,000 | | 907,375 |
Series 2007-1: | | | | |
Class 1C1, 0.8455% 12/20/54 (k) | | 2,234,000 | | 1,362,740 |
Class 1M1, 0.5455% 12/20/54 (k) | | 1,493,000 | | 1,138,413 |
Class 2C1, 1.2055% 12/20/54 (k) | | 1,015,000 | | 619,150 |
Class 2M1, 0.7455% 12/20/54 (k) | | 1,917,000 | | 1,461,713 |
Series 2007-2 Class 2C1, 0.676% 12/17/54 (k) | | 2,654,000 | | 1,618,940 |
Granite Mortgages PLC floater Series 2003-3 Class 1C, 3.0112% 1/20/44 (k) | | 430,241 | | 308,827 |
GSR Mortgage Loan Trust floater Series 2007-AR1 Class 6A1, 4.7361% 3/25/37 (k) | | 5,447,521 | | 5,455,344 |
JPMorgan Chase Commercial Mortgage Securities Trust Series 2007-CB18 Class A3, 5.447% 6/12/47 (k) | | 3,229,003 | | 3,400,234 |
JPMorgan Mortgage Trust sequential payer Series 2006-A5 Class 3A5, 5.8155% 8/25/36 (k) | | 2,346,797 | | 1,770,199 |
LB-UBS Commercial Mortgage Trust sequential payer Series 2006-C6 Class A4, 5.372% 9/15/39 | | 857,000 | | 970,614 |
Collateralized Mortgage Obligations - continued |
| Principal Amount (c) | | Value |
Private Sponsor - continued |
Luminent Mortgage Trust: | | | | |
floater Series 2006-1 Class A1, 0.484% 4/25/36 (k) | | $ 16,721,726 | | $ 8,708,894 |
Series 2006-5 Class A1A, 0.434% 7/25/36 (k) | | 12,554,996 | | 5,910,534 |
MASTR Adjustable Rate Mortgages Trust Series 2007-3 Class 22A2, 0.454% 5/25/47 (k) | | 2,694,571 | | 1,583,833 |
Merrill Lynch Alternative Note Asset Trust floater Series 2007-OAR1 Class A1, 0.414% 2/25/37 (k) | | 6,612,782 | | 4,444,414 |
Merrill Lynch Mortgage Investors Trust Series 1998-C3 Class F, 6% 12/15/30 (e) | | 930,000 | | 960,258 |
Merrill Lynch Mortgage Trust Series 2002-MW1 Class E, 6.219% 7/12/34 (e) | | 101,000 | | 101,175 |
Opteum Mortgage Acceptance Corp. floater Series 2005-3 Class APT, 0.534% 7/25/35 (k) | | 1,998,079 | | 1,554,231 |
RESI Finance LP/RESI Finance DE Corp. floater Series 2003-B: | | | | |
Class B5, 2.6048% 7/10/35 (e)(k) | | 1,306,361 | | 1,061,149 |
Class B6, 3.1048% 7/10/35 (e)(k) | | 291,271 | | 231,808 |
Residential Funding Securities Corp. floater Series 2003-RP2 Class A1, 0.694% 6/25/33 (e)(k) | | 279,432 | | 259,636 |
Salomon Brothers Mortgage Securities VII, Inc. Series 2006-C2 Class H, 6.308% 7/18/33 (e) | | 268,000 | | 91,311 |
Sequoia Mortgage Trust floater Series 2004-6 Class A3B, 1.668% 7/20/34 (k) | | 35,733 | | 25,749 |
Structured Asset Mortgage Investments, Inc. floater Series 2006-AR6 Class 2A1, 0.434% 7/25/46 (k) | | 25,594,134 | | 13,366,311 |
Structured Asset Securities Corp. Series 2003-15A Class 4A, 5.3281% 4/25/33 (k) | | 486,310 | | 450,271 |
TBW Mortgage-Backed pass-thru certificates floater Series 2006-4 Class A3, 0.4763% 9/25/36 (k) | | 3,273,627 | | 2,496,760 |
Wells Fargo Mortgage Backed Securities Trust: | | | | |
Series 2003-12 Class B6, 4.75% 11/25/18 (e) | | 132,742 | | 46,460 |
Series 2005-AR2 Class 1A2, 2.67% 3/25/35 (k) | | 3,182,884 | | 1,020,217 |
TOTAL PRIVATE SPONSOR | | 116,265,815 |
U.S. Government Agency - 0.0% |
Fannie Mae subordinate REMIC pass-thru certificates planned amortization class Series 2002-9 Class PC, 6% 3/25/17 | | 225,450 | | 242,591 |
TOTAL COLLATERALIZED MORTGAGE OBLIGATIONS (Cost $107,382,161) |
116,508,406
|
Commercial Mortgage Securities - 5.0% |
| Principal Amount (c) | | Value |
ACGS Series 2004-1 Class P, 7.4651% 8/1/19 (n) | | $ 566,664 | | $ 547,207 |
Americold LLC Trust Series 2010-ARTA Class D, 7.443% 1/14/29 (e) | | 180,000 | | 196,048 |
Asset Securitization Corp.: | | | | |
Series 1996-D2 Class B1A, 8.9457% 2/14/29 (e)(k) | | 800,000 | | 798,715 |
Series 1997-D4: | | | | |
Class B1, 7.525% 4/14/29 | | 113,757 | | 113,909 |
Class B2, 7.525% 4/14/29 | | 1,498,104 | | 1,511,572 |
Class B5, 7.525% 4/14/29 | | 129,000 | | 110,100 |
Series 1997-D5: | | | | |
Class A2, 7.0826% 2/14/43 (k) | | 1,399,000 | | 1,414,709 |
Class A3, 7.1326% 2/14/43 (k) | | 1,510,000 | | 1,537,219 |
Class A5, 7.2026% 2/14/43 (k) | | 256,000 | | 261,474 |
Class A6, 7.4526% 2/14/43 (k) | | 2,470,000 | | 2,517,498 |
Class A7, 7.6926% 2/14/43 (k) | | 820,000 | | 827,814 |
Class PS1, 1.4363% 2/14/43 (k)(m) | | 5,090,541 | | 56,103 |
Banc of America Commercial Mortgage Trust: | | | | |
sequential payer: | | | | |
Series 2006-2 Class AAB, 5.9028% 5/10/45 (k) | | 1,860,938 | | 1,985,606 |
Series 2006-5: | | | | |
Class A2, 5.317% 9/10/47 | | 6,242,645 | | 6,336,753 |
Class A3, 5.39% 9/10/47 | | 2,653,000 | | 2,802,993 |
Series 2006-6 Class A3, 5.369% 10/10/45 | | 3,804,000 | | 4,057,628 |
Series 2007-4 Class A3, 5.9813% 2/10/51 (k) | | 1,897,000 | | 2,015,151 |
Series 2006-6 Class E, 5.619% 10/10/45 (e) | | 1,098,000 | | 222,455 |
Series 2007-3: | | | | |
Class A3, 5.8426% 6/10/49 (k) | | 3,176,000 | | 3,328,940 |
Class A4, 5.8426% 6/10/49 (k) | | 3,965,000 | | 4,382,102 |
Series 2008-1 Class D, 6.4378% 2/10/51 (e)(k) | | 125,000 | | 72,304 |
Banc of America Commercial Mortgage, Inc.: | | | | |
sequential payer: | | | | |
Series 2001-1 Class A4, 5.451% 1/15/49 | | 4,166,000 | | 4,695,090 |
Series 2002-2 Class F, 5.487% 7/11/43 | | 415,000 | | 421,165 |
Series 2004-2: | | | | |
Class A3, 4.05% 11/10/38 | | 261,164 | | 265,027 |
Class A4, 4.153% 11/10/38 | | 2,412,000 | | 2,505,460 |
Series 2005-1 Class A3, 4.877% 11/10/42 | | 868,339 | | 867,997 |
Series 2007-1 Class A2, 5.381% 1/15/49 | | 1,776,041 | | 1,774,458 |
Series 2001-3 Class H, 6.562% 4/11/37 (e) | | 1,472,000 | | 1,475,932 |
Series 2001-PB1: | | | | |
Class J, 7.166% 5/11/35 (e) | | 177,085 | | 177,141 |
Class K, 6.15% 5/11/35 (e) | | 885,000 | | 862,097 |
Series 2003-1 Class G, 5.608% 9/11/36 (e) | | 310,000 | | 313,863 |
Commercial Mortgage Securities - continued |
| Principal Amount (c) | | Value |
Banc of America Commercial Mortgage, Inc.: - continued | | | | |
Series 2004-1 Class F, 5.279% 11/10/39 (e) | | $ 185,000 | | $ 148,361 |
Series 2004-4: | | | | |
Class K, 4.637% 7/10/42 (e)(k) | | 300,000 | | 2,400 |
Class L, 4.637% 7/10/42 (e)(k) | | 280,000 | | 560 |
Series 2004-5 Class G, 5.7521% 11/10/41 (e)(k) | | 195,000 | | 137,310 |
Series 2005-1 Class CJ, 5.3555% 11/10/42 (k) | | 550,000 | | 559,441 |
Series 2005-3 Class A3B, 5.09% 7/10/43 (k) | | 5,908,000 | | 6,268,713 |
Series 2005-6 Class AJ, 5.3664% 9/10/47 (k) | | 300,000 | | 307,872 |
Banc of America Large Loan Trust floater Series 2010-HLTN Class HLTN, 1.999% 11/15/15 (e)(k) | | 854,014 | | 795,344 |
Banc of America Large Loan, Inc. floater: | | | | |
Series 2005-MIB1: | | | | |
Class B, 0.5085% 3/15/22 (e)(k) | | 297,513 | | 288,587 |
Class C, 0.5585% 3/15/22 (e)(k) | | 1,357,000 | | 1,316,290 |
Class D, 0.6085% 3/15/22 (e)(k) | | 826,000 | | 801,220 |
Class E, 0.6485% 3/15/22 (e)(k) | | 684,000 | | 663,480 |
Class F, 0.7185% 3/15/22 (e)(k) | | 615,784 | | 591,153 |
Class G, 0.7785% 3/15/22 (e)(k) | | 399,119 | | 375,172 |
Class J, 1.2985% 3/15/22 (e)(k) | | 438,000 | | 398,580 |
Class K, 2.2485% 3/15/22 (e)(k) | | 427,499 | | 235,124 |
Series 2006-BIX1: | | | | |
Class D, 0.4585% 10/15/19 (e)(k) | | 1,367,238 | | 1,312,549 |
Class E, 0.4885% 10/15/19 (e)(k) | | 1,385,000 | | 1,315,750 |
Class F, 0.5585% 10/15/19 (e)(k) | | 3,150,730 | | 2,961,686 |
Class G, 0.5785% 10/15/19 (e)(k) | | 1,245,579 | | 1,108,565 |
Bayview Commercial Asset Trust: | | | | |
floater: | | | | |
Series 2003-2 Class M1, 1.094% 12/25/33 (e)(k) | | 65,715 | | 46,539 |
Series 2004-1: | | | | |
Class A, 0.604% 4/25/34 (e)(k) | | 1,135,647 | | 914,196 |
Class B, 2.144% 4/25/34 (e)(k) | | 127,322 | | 73,623 |
Class M1, 0.804% 4/25/34 (e)(k) | | 102,225 | | 71,158 |
Class M2, 1.444% 4/25/34 (e)(k) | | 94,442 | | 65,457 |
Series 2005-2A: | | | | |
Class A1, 0.554% 8/25/35 (e)(k) | | 1,622,513 | | 1,059,196 |
Class M1, 0.674% 8/25/35 (e)(k) | | 80,803 | | 41,582 |
Class M2, 0.724% 8/25/35 (e)(k) | | 133,271 | | 60,689 |
Class M3, 0.744% 8/25/35 (e)(k) | | 73,735 | | 29,348 |
Series 2005-3A: | | | | |
Class A2, 0.644% 11/25/35 (e)(k) | | 590,756 | | 390,268 |
Class M1, 0.684% 11/25/35 (e)(k) | | 70,506 | | 40,432 |
Commercial Mortgage Securities - continued |
| Principal Amount (c) | | Value |
Bayview Commercial Asset Trust: - continued | | | | |
floater: | | | | |
Series 2005-3A: | | | | |
Class M2, 0.734% 11/25/35 (e)(k) | | $ 89,515 | | $ 49,322 |
Class M3, 0.754% 11/25/35 (e)(k) | | 80,115 | | 42,286 |
Class M4, 0.844% 11/25/35 (e)(k) | | 99,815 | | 48,206 |
Series 2005-4A: | | | | |
Class A2, 0.634% 1/25/36 (e)(k) | | 1,339,119 | | 830,137 |
Class B1, 1.644% 1/25/36 (e)(k) | | 115,723 | | 15,350 |
Class M1, 0.694% 1/25/36 (e)(k) | | 431,974 | | 186,423 |
Class M2, 0.714% 1/25/36 (e)(k) | | 129,592 | | 50,302 |
Class M3, 0.744% 1/25/36 (e)(k) | | 189,259 | | 66,206 |
Class M4, 0.854% 1/25/36 (e)(k) | | 104,671 | | 32,523 |
Class M5, 0.894% 1/25/36 (e)(k) | | 104,671 | | 28,325 |
Class M6, 0.944% 1/25/36 (e)(k) | | 111,172 | | 21,491 |
Series 2006-1: | | | | |
Class A2, 0.604% 4/25/36 (e)(k) | | 209,394 | | 144,837 |
Class M1, 0.624% 4/25/36 (e)(k) | | 74,891 | | 42,348 |
Class M2, 0.644% 4/25/36 (e)(k) | | 79,128 | | 41,685 |
Class M3, 0.664% 4/25/36 (e)(k) | | 68,083 | | 33,509 |
Class M4, 0.764% 4/25/36 (e)(k) | | 38,580 | | 17,350 |
Class M5, 0.804% 4/25/36 (e)(k) | | 37,446 | | 14,986 |
Class M6, 0.884% 4/25/36 (e)(k) | | 74,664 | | 28,394 |
Series 2006-2A: | | | | |
Class A1, 0.474% 7/25/36 (e)(k) | | 3,732,269 | | 2,363,036 |
Class A2, 0.524% 7/25/36 (e)(k) | | 184,648 | | 110,789 |
Class B1, 1.114% 7/25/36 (e)(k) | | 69,135 | | 8,158 |
Class B3, 2.944% 7/25/36 (e)(k) | | 104,452 | | 4,257 |
Class M1, 0.554% 7/25/36 (e)(k) | | 193,735 | | 77,623 |
Class M2, 0.574% 7/25/36 (e)(k) | | 136,689 | | 49,292 |
Class M3, 0.594% 7/25/36 (e)(k) | | 113,381 | | 36,863 |
Class M4, 0.664% 7/25/36 (e)(k) | | 76,562 | | 22,047 |
Class M5, 0.714% 7/25/36 (e)(k) | | 94,102 | | 23,322 |
Class M6, 0.784% 7/25/36 (e)(k) | | 140,402 | | 22,559 |
Series 2006-3A: | | | | |
Class B1, 1.044% 10/25/36 (e)(k) | | 134,709 | | 2,690 |
Class M4, 0.674% 10/25/36 (e)(k) | | 150,266 | | 14,769 |
Class M5, 0.724% 10/25/36 (e)(k) | | 179,890 | | 13,095 |
Class M6, 0.804% 10/25/36 (e)(k) | | 352,527 | | 16,321 |
Series 2006-4A: | | | | |
Class A1, 0.474% 12/25/36 (e)(k) | | 778,249 | | 514,861 |
Class A2, 0.514% 12/25/36 (e)(k) | | 3,959,931 | | 2,019,565 |
Class B1, 0.944% 12/25/36 (e)(k) | | 121,078 | | 11,311 |
Class B2, 1.494% 12/25/36 (e)(k) | | 123,415 | | 7,370 |
Class B3, 2.694% 12/25/36 (e)(k) | | 75,445 | | 1,557 |
Commercial Mortgage Securities - continued |
| Principal Amount (c) | | Value |
Bayview Commercial Asset Trust: - continued | | | | |
floater: | | | | |
Series 2006-4A: | | | | |
Class M1, 0.534% 12/25/36 (e)(k) | | $ 253,315 | | $ 96,533 |
Class M2, 0.554% 12/25/36 (e)(k) | | 168,877 | | 56,800 |
Class M3, 0.584% 12/25/36 (e)(k) | | 171,238 | | 49,945 |
Class M4, 0.644% 12/25/36 (e)(k) | | 204,896 | | 47,492 |
Class M5, 0.684% 12/25/36 (e)(k) | | 188,362 | | 31,083 |
Class M6, 0.764% 12/25/36 (e)(k) | | 168,877 | | 20,617 |
Series 2007-1: | | | | |
Class A2, 0.514% 3/25/37 (e)(k) | | 861,239 | | 413,395 |
Class B1, 0.914% 3/25/37 (e)(k) | | 274,013 | | 19,764 |
Class B2, 1.394% 3/25/37 (e)(k) | | 175,766 | | 7,564 |
Class M1, 0.514% 3/25/37 (e)(k) | | 241,100 | | 78,699 |
Class M2, 0.534% 3/25/37 (e)(k) | | 180,074 | | 46,693 |
Class M3, 0.564% 3/25/37 (e)(k) | | 159,701 | | 31,966 |
Class M4, 0.614% 3/25/37 (e)(k) | | 128,348 | | 18,998 |
Class M5, 0.664% 3/25/37 (e)(k) | | 200,354 | | 25,244 |
Class M6, 0.744% 3/25/37 (e)(k) | | 280,509 | | 28,936 |
Series 2007-2A: | | | | |
Class A1, 0.514% 7/25/37 (e)(k) | | 802,823 | | 413,956 |
Class A2, 0.564% 7/25/37 (e)(k) | | 750,129 | | 262,545 |
Class B1, 1.844% 7/25/37 (e)(k) | | 231,019 | | 8,791 |
Class B2, 2.494% 7/25/37 (e)(k) | | 74,211 | | 3,926 |
Class M1, 0.614% 7/25/37 (e)(k) | | 263,403 | | 39,906 |
Class M2, 0.654% 7/25/37 (e)(k) | | 143,934 | | 15,873 |
Class M3, 0.734% 7/25/37 (e)(k) | | 145,942 | | 12,791 |
Class M4, 0.894% 7/25/37 (e)(k) | | 288,138 | | 22,496 |
Class M5, 0.994% 7/25/37 (e)(k) | | 253,999 | | 16,606 |
Class M6, 1.244% 7/25/37 (e)(k) | | 322,055 | | 16,789 |
Series 2007-3: | | | | |
Class A2, 0.534% 7/25/37 (e)(k) | | 802,070 | | 343,136 |
Class B1, 1.194% 7/25/37 (e)(k) | | 194,948 | | 16,261 |
Class B2, 1.844% 7/25/37 (e)(k) | | 487,850 | | 25,988 |
Class B3, 4.244% 7/25/37 (e)(k) | | 60,124 | | 1,359 |
Class M1, 0.554% 7/25/37 (e)(k) | | 174,202 | | 57,498 |
Class M2, 0.584% 7/25/37 (e)(k) | | 186,713 | | 50,676 |
Class M3, 0.614% 7/25/37 (e)(k) | | 294,214 | | 64,743 |
Class M4, 0.744% 7/25/37 (e)(k) | | 461,959 | | 81,507 |
Class M5, 0.844% 7/25/37 (e)(k) | | 239,618 | | 31,933 |
Class M6, 1.044% 7/25/37 (e)(k) | | 182,715 | | 19,943 |
Series 2007-4A: | | | | |
Class B1, 2.794% 9/25/37 (e)(k) | | 196,665 | | 7,075 |
Class M1, 1.194% 9/25/37 (e)(k) | | 297,810 | | 26,096 |
Class M2, 1.294% 9/25/37 (e)(k) | | 297,810 | | 18,083 |
Commercial Mortgage Securities - continued |
| Principal Amount (c) | | Value |
Bayview Commercial Asset Trust: - continued | | | | |
floater: | | | | |
Series 2007-4A: | | | | |
Class M4, 1.844% 9/25/37 (e)(k) | | $ 761,697 | | $ 32,898 |
Class M5, 1.994% 9/25/37 (e)(k) | | 761,697 | | 24,284 |
Class M6, 2.194% 9/25/37 (e)(k) | | 763,176 | | 15,653 |
Series 2004-1, Class IO, 1.25% 4/25/34 (e)(m) | | 3,557,205 | | 129,838 |
Series 2007-5A, Class IO, 4.1484% 10/25/37 (e)(k)(m) | | 8,807,364 | | 833,171 |
Bear Stearns Commercial Mortgage Securities, Inc. Series 2006-PW11 Class AJ, 5.6187% 3/11/39 (k) | | 450,000 | | 420,982 |
Bear Stearns Commercial Mortgage Securities Trust: | | | | |
floater: | | | | |
Series 2006-BBA7: | | | | |
Class H, 0.8985% 3/15/19 (e)(k) | | 416,945 | | 400,453 |
Class J, 1.0985% 3/15/19 (e)(k) | | 407,118 | | 350,222 |
Series 2007-BBA8: | | | | |
Class D, 0.4985% 3/15/22 (e)(k) | | 655,330 | | 562,281 |
Class E, 0.5485% 3/15/22 (e)(k) | | 3,607,157 | | 3,058,912 |
Class F, 0.5985% 3/15/22 (e)(k) | | 2,235,922 | | 1,851,370 |
Class G, 0.6485% 3/15/22 (e)(k) | | 537,549 | | 439,722 |
Class H, 0.7985% 3/15/22 (e)(k) | | 655,330 | | 522,961 |
Class J, 0.9485% 3/15/22 (e)(k) | | 655,330 | | 509,855 |
sequential payer: | | | | |
Series 2003-PWR2 Class A3, 4.834% 5/11/39 | | 100,492 | | 100,634 |
Series 2004-PWR3 Class A3, 4.487% 2/11/41 | | 560,457 | | 571,386 |
Series 2006-PW14 Class AM, 5.243% 12/11/38 | | 600,000 | | 617,755 |
Series 2006-T22 Class AJ, 5.7044% 4/12/38 (k) | | 400,000 | | 370,403 |
Series 2007-PW16 Class A4, 5.9038% 6/11/40 (k) | | 1,112,000 | | 1,275,869 |
Series 1999-C1: | | | | |
Class G, 5.64% 2/14/31 (e) | | 70,000 | | 70,904 |
Class I, 5.64% 2/14/31 (e) | | 198,779 | | 137,810 |
Series 2003-T10 Class B, 4.84% 3/13/40 | | 1,000,000 | | 1,019,028 |
Series 2006-PW13 Class A3, 5.518% 9/11/41 | | 6,714,000 | | 7,013,209 |
Series 2006-PW14 Class X2, 0.8632% 12/11/38 (e)(k)(m) | | 20,026,973 | | 238,257 |
Series 2006-T22: | | | | |
Class A4, 5.7044% 4/12/38 (k) | | 237,000 | | 269,273 |
Class B, 5.7044% 4/12/38 (e)(k) | | 200,000 | | 161,571 |
Series 2006-T24 Class X2, 0.6237% 10/12/41 (e)(k)(m) | | 3,435,357 | | 25,611 |
Series 2007-BBA8: | | | | |
Class K, 1.4485% 3/15/22 (e)(k) | | 120,000 | | 77,761 |
Class L, 2.1485% 3/15/22 (e)(k) | | 253,498 | | 81,883 |
Commercial Mortgage Securities - continued |
| Principal Amount (c) | | Value |
Bear Stearns Commercial Mortgage Securities Trust: - continued | | | | |
Series 2007-PW18 Class X2, 0.4796% 6/11/50 (e)(k)(m) | | $ 133,870,169 | | $ 1,498,677 |
Series 2007-T28 Class X2, 0.3272% 9/11/42 (e)(k)(m) | | 72,025,455 | | 471,407 |
Beckman Coulter, Inc. sequential payer Series 2000-A Class A, 7.4975% 12/15/18 (e) | | 326,945 | | 326,127 |
C-BASS Trust floater Series 2006-SC1 Class A, 0.514% 5/25/36 (e)(k) | | 730,759 | | 602,581 |
CDC Commercial Mortgage Trust Series 2002-FX1: | | | | |
Class G, 6.625% 5/15/35 (e) | | 2,235,000 | | 2,330,750 |
Class XCL, 1.5913% 5/15/35 (e)(k)(m) | | 7,816,648 | | 182,917 |
CFCRE Commercial Mortgage Trust Series 2011-C2 Class B, 5.7454% 12/15/47 (e)(k) | | 750,000 | | 764,264 |
Chase Commercial Mortgage Securities Corp.: | | | | |
Series 1998-1 Class H, 6.34% 5/18/30 (e) | | 800,000 | | 681,686 |
Series 1998-2 Class J, 6.39% 11/18/30 (e) | | 489,102 | | 330,222 |
Chase Manhattan Bank-First Union National Bank Commercial Mortgage Trust Series 1999-1 Class G, 6.4% 8/15/31 (e) | | 174,355 | | 179,735 |
Citigroup Commercial Mortgage Trust: | | | | |
floater Series 2006-FL2: | | | | |
Class G, 0.5835% 8/15/21 (e)(k) | | 255,108 | | 243,141 |
Class H, 0.6235% 8/15/21 (e)(k) | | 433,548 | | 405,160 |
Series 2006-C5 Class AMP2, 5.5005% 10/15/49 (e) | | 2,818,559 | | 2,686,532 |
Series 2007-C6 Class A1, 5.622% 12/10/49 (k) | | 6,336,472 | | 6,336,631 |
Series 2007-FL3A Class A2, 0.3885% 4/15/22 (e)(k) | | 1,587,295 | | 1,498,097 |
Series 2008-C7 Class A2B, 6.2764% 12/10/49 (k) | | 1,792,607 | | 1,844,983 |
Citigroup/Deutsche Bank Commercial Mortgage Trust: | | | | |
sequential payer Series 2007-CD4 Class A4, 5.322% 12/11/49 | | 14,623,000 | | 16,048,772 |
Series 2007-CD4: | | | | |
Class A3, 5.293% 12/11/49 | | 1,852,000 | | 1,979,453 |
Class C, 5.476% 12/11/49 | | 3,581,000 | | 1,025,982 |
Claregold Trust Series 2007-2A: | | | | |
Class F, 5.01% 5/15/44 (e)(k) | CAD | 138,000 | | 104,819 |
Class G, 5.01% 5/15/44 (e)(k) | CAD | 30,000 | | 21,675 |
Class H, 5.01% 5/15/44 (e)(k) | CAD | 20,000 | | 11,660 |
Class J, 5.01% 5/15/44 (e)(k) | CAD | 20,000 | | 10,936 |
Class K, 5.01% 5/15/44 (e)(k) | CAD | 10,000 | | 4,631 |
Class L, 5.01% 5/15/44 (e)(k) | CAD | 36,000 | | 15,387 |
Class M, 5.01% 5/15/44 (e)(k) | CAD | 165,000 | | 65,206 |
Commercial Mortgage Securities - continued |
| Principal Amount (c) | | Value |
Cobalt CMBS Commercial Mortgage Trust: | | | | |
sequential payer Series 2007-C3 Class A3, 6.0104% 5/15/46 (k) | | $ 1,902,000 | | $ 2,041,032 |
Series 2006-C1 Class B, 5.359% 8/15/48 | | 5,706,000 | | 342,360 |
COMM pass-thru certificates: | | | | |
floater: | | | | |
Series 2005-F10A: | | | | |
Class G, 0.7985% 4/15/17 (e)(k) | | 77,877 | | 75,032 |
Class H, 0.8685% 4/15/17 (e)(k) | | 171,562 | | 148,139 |
Class J, 1.0985% 4/15/17 (e)(k) | | 131,565 | | 92,096 |
Series 2005-FL11: | | | | |
Class B, 0.4985% 11/15/17 (e)(k) | | 175,588 | | 163,296 |
Class C, 0.5485% 11/15/17 (e)(k) | | 1,451,600 | | 1,335,472 |
Class D, 0.5885% 11/15/17 (e)(k) | | 75,490 | | 68,696 |
Class E, 0.6385% 11/15/17 (e)(k) | | 268,371 | | 241,534 |
Class F, 0.6985% 11/15/17 (e)(k) | | 185,934 | | 165,481 |
Class G, 0.7485% 11/15/17 (e)(k) | | 128,880 | | 113,414 |
Series 2006-FL12 Class AJ, 0.3785% 12/15/20 (e)(k) | | 4,060,000 | | 3,639,660 |
sequential payer: | | | | |
Series 2003-LB1A Class D, 4.278% 6/10/38 | | 550,000 | | 537,633 |
Series 2004-RS1 Class A, 5.648% 3/3/41 (e) | | 937,412 | | 936,943 |
Series 2006-C8 Class A3, 5.31% 12/10/46 | | 5,420,000 | | 5,638,036 |
Series 2006-CN2A: | | | | |
Class A2FX, 5.449% 2/5/19 (e) | | 3,306,000 | | 3,215,002 |
Class AJFX, 5.478% 2/5/19 (e) | | 5,750,000 | | 5,714,931 |
Series 2001-J2A Class F, 7.2268% 7/16/34 (e)(k) | | 199,000 | | 205,569 |
Series 2006-C8 Class XP, 0.6566% 12/10/46 (k)(m) | | 16,823,805 | | 148,016 |
Commercial Mortgage Acceptance Corp.: | | | | |
Series 1998-C1: | | | | |
Class F, 6.23% 7/15/31 (e) | | 37,184 | | 38,234 |
Class G, 6.21% 7/15/31 (e) | | 554,000 | | 566,335 |
weighted average coupon Series 1998-C2 Class F, 5.44% 9/15/30 (e)(k) | | 161,250 | | 167,778 |
Commercial Mortgage Asset Trust: | | | | |
Series 1999-C1 Class F, 6.25% 1/17/32 (e) | | 550,000 | | 474,164 |
Series 1999-C2 Class G, 6% 11/17/32 | | 302,000 | | 222,305 |
Commercial Mortgage pass-thru certificates: | | | | |
sequential payer Series 2005-C6 Class A2, 4.999% 6/10/44 (k) | | 13,804 | | 13,851 |
Series 2005 C6 Class B, 5.4022% 6/10/44 (k) | | 905,000 | | 660,779 |
Series 2005-C6 Class AJ, 5.209% 6/10/44 (k) | | 390,000 | | 389,458 |
Series 2011-STRT Class C, 4.755% 12/10/24 (e) | | 420,000 | | 420,762 |
Commercial Mortgage Securities - continued |
| Principal Amount (c) | | Value |
Communication Mortgage Trust Series 2011-THL: | | | | |
Class E, 5.949% 6/9/28 (e) | | $ 440,000 | | $ 444,151 |
Class F, 4.867% 6/9/28 (e) | | 645,000 | | 598,639 |
Credit Suisse Commercial Mortgage Trust: | | | | |
sequential payer: | | | | |
Series 2007-C2: | | | | |
Class A2, 5.448% 1/15/49 (k) | | 5,198,366 | | 5,266,542 |
Class A3, 5.542% 1/15/49 (k) | | 3,804,000 | | 4,141,666 |
Series 2007-C3 Class A4, 5.9018% 6/15/39 (k) | | 28,438,000 | | 31,002,397 |
Series 2006-C4 Class AAB, 5.439% 9/15/39 | | 6,584,127 | | 6,711,997 |
Series 2006-C5 Class ASP, 0.8652% 12/15/39 (k)(m) | | 11,245,165 | | 135,144 |
Series 2007-C5 Class A4, 5.695% 9/15/40 (k) | | 1,722,000 | | 1,886,026 |
Credit Suisse First Boston Mortgage Capital Certificates floater Series 2007-TF2A Class B, 0.5985% 4/15/22 (e)(k) | | 6,783,000 | | 5,036,452 |
Credit Suisse First Boston Mortgage Securities Corp.: | | | | |
floater Series 2006-TF2A Class KER, 0.8485% 9/15/21 (e)(k) | | 258,327 | | 167,913 |
sequential payer Series 2004-C1: | | | | |
Class A3, 4.321% 1/15/37 | | 98,168 | | 98,627 |
Class A4, 4.75% 1/15/37 | | 884,000 | | 931,367 |
Series 1997-C2 Class F, 7.46% 1/17/35 (k) | | 929,000 | | 972,532 |
Series 1998-C1: | | | | |
Class F, 6% 5/17/40 (e) | | 2,259,000 | | 2,322,885 |
Class H, 6% 5/17/40 (e) | | 90,318 | | 7,896 |
Series 1998-C2: | | | | |
Class F, 6.75% 11/15/30 (e) | | 1,156,000 | | 1,262,833 |
Class G, 6.75% 11/15/30 (e) | | 180,000 | | 194,633 |
Series 2001-CK6 Class AX, 1.1089% 8/15/36 (k)(m) | | 741,003 | | 1,890 |
Series 2001-CKN5 Class AX, 1.9203% 9/15/34 (e)(k)(m) | | 2,986,271 | | 4,930 |
Series 2003-C3 Class D, 4.131% 5/15/38 | | 120,000 | | 120,540 |
Series 2006-C1 Class A3, 5.5944% 2/15/39 (k) | | 7,052,699 | | 7,536,246 |
Credit Suisse Mortgage Capital Certificates: | | | | |
floater Series 2007-TFL1: | | | | |
Class B, 0.3985% 2/15/22 (e)(k) | | 721,000 | | 647,170 |
Class C: | | | | |
0.4185% 2/15/22 (e)(k) | | 1,864,711 | | 1,654,745 |
0.5185% 2/15/22 (e)(k) | | 665,993 | | 584,209 |
Class F, 0.5685% 2/15/22 (e)(k) | | 1,331,815 | | 1,154,684 |
Class L, 2.1485% 2/15/22 (e)(k) | | 100,000 | | 9,000 |
Commercial Mortgage Securities - continued |
| Principal Amount (c) | | Value |
Credit Suisse Mortgage Capital Certificates: - continued | | | | |
sequential payer Series 2007-C1 Class A2, 5.268% 2/15/40 | | $ 4,969,701 | | $ 4,966,441 |
Series 2007-C1: | | | | |
Class ASP, 0.5721% 2/15/40 (k)(m) | | 29,709,955 | | 219,675 |
Class B, 5.487% 2/15/40 (e)(k) | | 2,907,000 | | 436,050 |
CRESI Finance Ltd. Partnership floater Series 2006-A Class E, 1.894% 3/25/17 (e)(k) | | 160,000 | | 112,000 |
CRESIX Finance Ltd. Series 2006-AA Class F, 4.444% 3/25/17 (e)(k) | | 260,000 | | 169,000 |
DBUBS Mortgage Trust Series 2011-LC1A: | | | | |
Class D, 5.7284% 11/10/46 (e)(k) | | 500,000 | | 494,703 |
Class E, 5.7284% 11/10/46 (e)(k) | | 260,000 | | 240,502 |
Class F, 5.7284% 11/10/46 (e)(k) | | 710,000 | | 506,450 |
Class XB, 0.3189% 11/10/46 (e)(k)(m) | | 20,920,000 | | 320,264 |
Deutsche Mortgage & Asset Receiving Corp. Series 1998-C1 Class J, 6.22% 6/15/31 | | 400,000 | | 332,074 |
DLJ Commercial Mortgage Corp.: | | | | |
Series 1998-CG1 Class B4, 7.4518% 6/10/31 (e)(k) | | 891,000 | | 937,323 |
Series 2000-CKP1 Class B3, 8.0578% 11/10/33 (k) | | 230,000 | | 229,960 |
Extended Stay America Trust: | | | | |
Series 2010-ESHA Class D, 5.4983% 11/5/27 (e) | | 1,990,000 | | 2,022,234 |
Series 2010-ESHA, Class C4, 4.8603% 11/5/27 (e) | | 320,000 | | 328,284 |
FHMLC Multi-class participation certificates guaranteed: | | | | |
Series K013 Class X3, 2.8845% 1/25/43 (k)(m) | | 820,000 | | 135,770 |
Series KAIV Class X2, 3.6146% 6/25/46 (k)(m) | | 420,000 | | 87,260 |
First Union National Bank Commercial Mortgage Trust Series 2001-C4 Class K, 6% 12/12/33 (e) | | 27,257 | | 27,166 |
First Union National Bank-Bank of America Commercial Mortgage Trust Series 2001-C1 Class G, 6.936% 3/15/33 (e) | | 1,692,000 | | 1,707,426 |
First Union-Lehman Brothers-Bank of America Commercial Mortgage Trust sequential payer Series 1998-C2 Class G, 7% 11/18/35 (e)(k) | | 443,000 | | 477,382 |
Four Times Square Trust sequential payer Series 2006-4TS Class A, 5.401% 12/13/28 (e) | | 200,000 | | 230,575 |
Freddie Mac Multi-Class pass-thru certificates: | | | | |
Series K011 Class X3, 2.6618% 12/25/43 (k)(m) | | 1,640,000 | | 248,485 |
Series K012 Class X3, 2.3657% 1/25/41 (k)(m) | | 1,800,000 | | 243,248 |
FREMF Mortgage Trust: | | | | |
Series 2010-K9 Class B, 5.3301% 9/25/45 (e)(k) | | 1,290,000 | | 1,308,594 |
Series 2011-K10 Class B, 4.7561% 11/25/49 (e)(k) | | 240,000 | | 233,392 |
Series 2011-K11 Class B, 4.5694% 12/25/48 (e)(k) | | 750,000 | | 718,276 |
Commercial Mortgage Securities - continued |
| Principal Amount (c) | | Value |
G-Force LLC sequential payer Series 2005-RRA Class A2, 4.83% 8/22/36 (e) | | $ 1,361,495 | | $ 1,252,575 |
GE Capital Commercial Mortgage Corp.: | | | | |
sequential payer Series 2007-C1 Class A4, 5.543% 12/10/49 | | 11,404,000 | | 12,347,077 |
Series 2001-1 Class X1, 1.5729% 5/15/33 (e)(k)(m) | | 2,171,442 | | 19,304 |
Series 2002-1A Class H, 7.3318% 12/10/35 (e)(k) | | 65,000 | | 64,944 |
Series 2007-C1 Class XP, 0.3493% 12/10/49 (k)(m) | | 25,541,983 | | 112,538 |
GMAC Commercial Mortgage Securities, Inc.: | | | | |
Series 1997-C1 Class H, 6.6% 7/15/29 | | 411,904 | | 208,054 |
Series 1997-C2: | | | | |
Class F, 6.75% 4/15/29 (k) | | 654,009 | | 677,411 |
Class G, 6.75% 4/15/29 (k) | | 504,000 | | 548,832 |
Series 1999-C1 Class F, 6.02% 5/15/33 (e) | | 225,989 | | 232,496 |
Series 1999-C2I Class K, 6.481% 9/15/33 (n) | | 385,000 | | 179,971 |
Series 1999-C3: | | | | |
Class G, 6.974% 8/15/36 (e) | | 5,204 | | 5,194 |
Class J, 6.974% 8/15/36 | | 226,000 | | 225,250 |
Class K, 6.974% 8/15/36 | | 427,000 | | 148,388 |
Series 2000-C1 Class K, 7% 3/15/33 | | 38,385 | | 28,713 |
Series 2005-C1 Class X2, 0.7314% 5/10/43 (k)(m) | | 6,595,339 | | 11,298 |
Greenwich Capital Commercial Funding Corp.: | | | | |
floater Series 2006-FL4 Class B, 0.4525% 11/5/21 (e)(k) | | 715,000 | | 694,506 |
sequential payer: | | | | |
Series 2003-C1 Class D, 4.29% 7/5/35 (e) | | 490,000 | | 500,037 |
Series 2007-GG11 Class A2, 5.597% 12/10/49 | | 3,804,000 | | 3,917,047 |
Series 2007-GG9 Class A4, 5.444% 3/10/39 | | 5,530,000 | | 6,139,412 |
Series 2002-C1: | | | | |
Class H, 5.903% 1/11/35 (e) | | 97,000 | | 97,496 |
Class J, 6.306% 1/11/35 (e) | | 760,000 | | 755,761 |
Series 2003-C2 Class J, 5.234% 1/5/36 (e)(k) | | 250,000 | | 219,528 |
Series 2005-GG3 Class B, 4.894% 8/10/42 (k) | | 680,000 | | 654,330 |
Series 2006-GG7 Class A3, 6.079% 7/10/38 (k) | | 3,719,734 | | 3,719,351 |
Series 2007-GG11 Class A1, 0.4565% 12/10/49 (e)(k)(m) | | 40,350,265 | | 250,414 |
GS Mortgage Securities Corp. II: | | | | |
floater: | | | | |
Series 2006-FL8A: | | | | |
Class E, 0.6325% 6/6/20 (e)(k) | | 431,608 | | 411,642 |
Class F, 0.7025% 6/6/20 (e)(k) | | 835,001 | | 788,275 |
Class J, 2.0125% 6/6/20 (e)(k) | | 250,000 | | 204,710 |
Commercial Mortgage Securities - continued |
| Principal Amount (c) | | Value |
GS Mortgage Securities Corp. II: - continued | | | | |
floater: | | | | |
Series 2007-EOP: | | | | |
Class C, 2.1455% 3/6/20 (e)(k) | | $ 1,994,000 | | $ 1,940,561 |
Class D, 2.3636% 3/6/20 (e)(k) | | 4,004,000 | | 3,880,677 |
Class F, 2.8433% 3/6/20 (e)(k) | | 164,000 | | 157,473 |
Class G, 3.0177% 3/6/20 (e)(k) | | 81,000 | | 77,371 |
Class H, 3.5846% 3/6/20 (e)(k) | | 60,000 | | 57,372 |
Class J, 4.4568% 3/6/20 (e)(k) | | 86,000 | | 82,792 |
Class L, 6.4193% 3/6/20 (e)(k) | | 400,000 | | 388,680 |
sequential payer Series 2004-GG2 Class A4, 4.964% 8/10/38 | | 458,663 | | 465,189 |
Series 1997-GL: | | | | |
Class G, 7.7695% 7/13/30 (k) | | 790,614 | | 852,124 |
Class H, 8.0595% 7/13/30 (e)(k) | | 230,000 | | 243,800 |
Series 2005-GG4 Class XP, 0.8961% 7/10/39 (e)(k)(m) | | 28,943,944 | | 62,635 |
Series 2006-GG6 Class A2, 5.506% 4/10/38 | | 5,474,113 | | 5,562,903 |
Series 2006-RR2: | | | | |
Class M, 5.7472% 6/23/46 (e)(k) | | 100,000 | | 0 |
Class N, 5.7472% 6/23/46 (e)(k) | | 100,000 | | 0 |
Series 2010-C1: | | | | |
Class D, 6.1391% 8/10/43 (e)(k) | | 290,000 | | 286,435 |
Class E, 4% 8/10/43 (e) | | 1,200,000 | | 772,960 |
Class X, 1.699% 8/10/43 (e)(k)(m) | | 6,244,063 | | 536,315 |
GS Mortgage Securities Corp. Trust Series 2011-ALF Class E, 4.953% 2/10/21 (e) | | 510,000 | | 490,977 |
GS Mortgage Securities Trust: | | | | |
sequential payer: | | | | |
Series 2006-GG8 Class A2, 5.479% 11/10/39 | | 905,440 | | 910,953 |
Series 2007-GG10 Class A2, 5.778% 8/10/45 | | 9,323,423 | | 9,493,594 |
Series 2010-C2 Class XA, 0.8635% 12/10/43 (e)(k) | | 5,590,552 | | 149,268 |
Series 2011-GC5 Class C, 5.4751% 8/10/44 (e)(k) | | 1,050,000 | | 953,123 |
HVB Mortgage Capital Corp. floater Series 2003-FL1A Class K, 3.1048% 9/10/22 (e)(k) | | 1,120,000 | | 1,071,280 |
JPMorgan Chase Commercial Mortgage Securities Corp.: | | | | |
floater Series 2011-CCHP Class E, 5.15% 7/15/28 (e)(k) | | 500,000 | | 488,669 |
Series 2002-C1 Class E, 6.135% 7/12/37 (e) | | 935,000 | | 939,917 |
Series 2003-C1: | | | | |
Class CM1, 5.6896% 1/12/37 (e)(k) | | 200,157 | | 196,154 |
Class D, 5.192% 1/12/37 | | 270,000 | | 265,375 |
Series 2009-IWST Class D, 7.6935% 12/5/27 (e)(k) | | 1,025,000 | | 1,056,411 |
Commercial Mortgage Securities - continued |
| Principal Amount (c) | | Value |
JPMorgan Chase Commercial Mortgage Securities Corp.: - continued | | | | |
Series 2010-CNTR Class D, 6.3899% 8/5/32 (e)(k) | | $ 695,000 | | $ 652,846 |
Series 2011-C4 Class E, 5.5686% 7/15/46 (e)(k) | | 370,000 | | 305,405 |
JPMorgan Chase Commercial Mortgage Securities Trust: | | | | |
floater: | | | | |
Series 2006-FL1A Class E, 0.6185% 2/15/20 (e)(k) | | 144,283 | | 131,555 |
Series 2006-FLA2: | | | | |
Class A2, 0.3785% 11/15/18 (e)(k) | | 7,706,881 | | 7,441,957 |
Class B, 0.4185% 11/15/18 (e)(k) | | 1,046,104 | | 972,877 |
Class C, 0.4585% 11/15/18 (e)(k) | | 743,228 | | 668,905 |
Class D, 0.4785% 11/15/18 (e)(k) | | 226,403 | | 199,235 |
Class E, 0.5285% 11/15/18 (e)(k) | | 326,598 | | 280,875 |
Class F, 0.5785% 11/15/18 (e)(k) | | 489,002 | | 415,652 |
Class G, 0.6085% 11/15/18 (e)(k) | | 424,901 | | 348,419 |
Class H, 0.7485% 11/15/18 (e)(k) | | 326,672 | | 254,804 |
sequential payer: | | | | |
Series 2006-CB14 Class A3B, 5.674% 12/12/44 (k) | | 4,674,131 | | 4,838,558 |
Series 2006-LDP9: | | | | |
Class A2, 5.134% 5/15/47 (k) | | 722,147 | | 756,105 |
Class A3, 5.336% 5/15/47 | | 9,409,000 | | 10,360,146 |
Series 2007-CB19 Class A4, 5.9303% 2/12/49 (k) | | 6,670,000 | | 7,590,387 |
Series 2007-LD11 Class A2, 5.9895% 6/15/49 (k) | | 5,183,724 | | 5,228,112 |
Series 2007-LDPX: | | | | |
Class A2 S, 5.305% 1/15/49 | | 3,575,983 | | 3,576,730 |
Class A3, 5.42% 1/15/49 | | 25,732,000 | | 28,792,487 |
Series 2004-CBX Class D, 5.097% 1/12/37 (k) | | 170,000 | | 108,954 |
Series 2004-LN2 Class D, 5.4059% 7/15/41 (k) | | 420,000 | | 253,192 |
Series 2005-CB13 Class E, 5.5259% 1/12/43 (e)(k) | | 963,000 | | 49,145 |
Series 2005-LDP3 Class A3, 4.959% 8/15/42 | | 10,011,998 | | 10,215,602 |
Series 2005-LDP5 Class AJ, 5.4938% 12/15/44 (k) | | 360,000 | | 362,862 |
Series 2006-CB17 Class A3, 5.45% 12/12/43 | | 500,167 | | 516,387 |
Series 2007-CB19: | | | | |
Class B, 5.9303% 2/12/49 (k) | | 165,000 | | 61,442 |
Class C, 5.9303% 2/12/49 (k) | | 424,000 | | 124,055 |
Class D, 5.9303% 2/12/49 (k) | | 447,000 | | 62,024 |
Series 2007-LDP10: | | | | |
Class BS, 5.437% 1/15/49 (k) | | 364,000 | | 93,067 |
Class CS, 5.466% 1/15/49 (k) | | 157,000 | | 19,087 |
Class ES, 5.7445% 1/15/49 (e)(k) | | 983,000 | | 51,455 |
Commercial Mortgage Securities - continued |
| Principal Amount (c) | | Value |
JPMorgan Chase Commercial Mortgage Securities Trust: - continued | | | | |
Series 2010-C2: | | | | |
Class D, 5.7126% 11/15/43 (e)(k) | | $ 645,000 | | $ 586,595 |
Class XB, 0.7538% 11/15/43 (e)(k)(m) | | 3,600,000 | | 142,076 |
JPMorgan Chase Commercial Mortgage Security Trust Series 2011-C5: | | | | |
Class B. 5.4912% 8/15/46 (e)(k) | | 980,000 | | 995,887 |
Class C, 5.4912% 8/15/46 (e)(k) | | 250,000 | | 229,592 |
JPMorgan Commercial Mortgage Finance Corp.: | | | | |
Series 1997-C5 Class F, 7.5605% 9/15/29 | | 346,029 | | 350,651 |
Series 2000-C9 Class G, 6.25% 10/15/32 (e) | | 48,921 | | 49,024 |
LB Commercial Conduit Mortgage Trust: | | | | |
sequential payer Series 2007-C3 Class A4, 6.1327% 7/15/44 (k) | | 21,615,000 | | 24,630,725 |
Series 1998-C1 Class D, 6.98% 2/18/30 | | 270,678 | | 275,217 |
Series 1998-C4 Class G, 5.6% 10/15/35 (e) | | 576,583 | | 608,477 |
LB-UBS Commercial Mortgage Trust: | | | | |
sequential payer: | | | | |
Series 2004-C2 Class E, 4.487% 3/15/36 | | 150,000 | | 143,570 |
Series 2005-C3 Class AJ, 4.843% 7/15/40 | | 1,220,000 | | 1,214,810 |
Series 2005-C7: | | | | |
Class AJ, 5.323% 11/15/40 | | 1,210,000 | | 1,237,829 |
Class AM, 5.263% 11/15/40 (k) | | 137,000 | | 146,818 |
Series 2006-C1 Class A2, 5.084% 2/15/31 | | 257,912 | | 260,589 |
Series 2006-C6: | | | | |
Class A2, 5.262% 9/15/39 (k) | | 563,472 | | 564,097 |
Class AM, 5.413% 9/15/39 | | 1,500,000 | | 1,597,740 |
Series 2006-C7: | | | | |
Class A2, 5.3% 11/15/38 | | 1,142,434 | | 1,143,788 |
Class A3, 5.347% 11/15/38 | | 1,417,000 | | 1,599,959 |
Class AM, 5.378% 11/15/38 | | 160,000 | | 160,580 |
Series 2007-C1: | | | | |
Class A3, 5.398% 2/15/40 | | 10,000,000 | | 10,428,450 |
Class A4, 5.424% 2/15/40 | | 5,434,000 | | 6,135,394 |
Series 2007-C2 Class A3, 5.43% 2/15/40 | | 3,967,000 | | 4,408,166 |
Series 2007-C6 Class A2, 5.845% 7/15/40 | | 9,593,209 | | 9,751,746 |
Series 2002-C1 Class J, 6.95% 3/15/34 (e)(k) | | 86,000 | | 86,099 |
Series 2003-C7 Class L, 5.224% 7/15/37 (e)(k) | | 284,000 | | 171,883 |
Series 2004-C2 Class G, 4.595% 3/15/36 (e)(k) | | 225,000 | | 193,145 |
Series 2005-C2 Class AJ, 5.205% 4/15/30 (k) | | 740,000 | | 770,761 |
Series 2005-C3 Class XCP, 0.9042% 7/15/40 (k)(m) | | 4,326,994 | | 9,078 |
Series 2005-C7 Class C, 5.35% 11/15/40 (k) | | 866,000 | | 774,697 |
Commercial Mortgage Securities - continued |
| Principal Amount (c) | | Value |
LB-UBS Commercial Mortgage Trust: - continued | | | | |
Series 2006-C4: | | | | |
Class AJ, 5.8935% 6/15/38 (k) | | $ 660,000 | | $ 551,075 |
Class AM, 6.0868% 6/15/38 (k) | | 500,000 | | 530,074 |
Series 2006-C6 Class XCP, 0.8617% 9/15/39 (k)(m) | | 8,109,240 | | 86,801 |
Series 2007-C1 Class XCP, 0.6167% 2/15/40 (k)(m) | | 3,031,686 | | 25,678 |
Series 2007-C6 Class A4, 5.858% 7/15/40 (k) | | 2,376,000 | | 2,690,951 |
Series 2007-C7: | | | | |
Class A3, 5.866% 9/15/45 | | 2,029,000 | | 2,304,952 |
Class XCP, 0.431% 9/15/45 (k)(m) | | 139,001,657 | | 1,009,291 |
Lehman Brothers Floating Rate Commercial Mortgage Trust floater: | | | | |
Series 2006-LLFA: | | | | |
Class D, 0.4785% 9/15/21 (e)(k) | | 608,683 | | 544,875 |
Class E, 0.5385% 9/15/21 (e)(k) | | 2,196,145 | | 1,900,037 |
Class F, 0.5885% 9/15/21 (e)(k) | | 1,143,094 | | 954,677 |
Class G, 0.6085% 9/15/21 (e)(k) | | 2,258,211 | | 1,818,241 |
Class H, 0.6485% 9/15/21 (e)(k) | | 582,579 | | 445,771 |
Series 2007-LLFA Class E, 1.1485% 6/15/22 (e)(k) | | 760,000 | | 619,400 |
Lehman Large Loan Trust Series 1997-LLI Class E, 7.3% 10/12/34 | | 3,377,000 | | 3,381,981 |
Lstar Commercial Mortgage Trust: | | | | |
Series 2011-1 Class D, 5.6888% 6/25/43 (e)(k) | | 310,000 | | 262,420 |
Series 2011-1 Class B, 5.6888% 6/25/43 (e)(k) | | 540,000 | | 556,894 |
Merrill Lynch Financial Asset, Inc. Series 2006-CA20 Class E, 5.4078% 10/12/39 (e)(k) | CAD | 320,000 | | 288,035 |
Merrill Lynch Mortgage Investors Trust: | | | | |
Series 1997-C2 Class F, 6.25% 12/10/29 (k) | | 499,921 | | 506,878 |
Series 1998-C3 Class E, 7.0079% 12/15/30 (k) | | 173,000 | | 177,421 |
Merrill Lynch Mortgage Trust: | | | | |
Series 05-LC1 Class AJ, 5.5028% 1/12/44 (k) | | 220,000 | | 217,578 |
Series 2004-MKB1 Class F, 5.8353% 2/12/42 (e)(k) | | 180,000 | | 170,767 |
Series 2005-CKI1 Class A3, 5.3913% 11/12/37 (k) | | 1,288,965 | | 1,300,998 |
Series 2005-LC1 Class F, 5.5568% 1/12/44 (e)(k) | | 1,655,000 | | 924,354 |
Series 2006-C1: | | | | |
Class A2, 5.8093% 5/12/39 (k) | | 1,762,126 | | 1,823,402 |
Class AJ, 5.8543% 5/12/39 (k) | | 160,000 | | 142,616 |
Class AM, 5.8093% 5/12/39 (k) | | 100,000 | | 104,299 |
Series 2007-C1 Class A4, 6.0271% 6/12/50 (k) | | 7,199,517 | | 8,097,743 |
Series 2008-C1 Class A4, 5.69% 2/12/51 | | 4,059,000 | | 4,620,498 |
Merrill Lynch-CFC Commercial Mortgage Trust: | | | | |
floater Series 2006-4 Class A2FL, 0.4158% 12/12/49 (k) | | 287,583 | | 287,502 |
Commercial Mortgage Securities - continued |
| Principal Amount (c) | | Value |
Merrill Lynch-CFC Commercial Mortgage Trust: - continued | | | | |
sequential payer: | | | | |
Series 2006-1 Class A3, 5.6568% 2/12/39 (k) | | $ 2,024,000 | | $ 2,056,700 |
Series 2006-4: | | | | |
Class A2, 5.112% 12/12/49 (k) | | 348,537 | | 348,474 |
Class ASB, 5.133% 12/12/49 (k) | | 1,565,372 | | 1,661,858 |
Series 2007-5: | | | | |
Class A3, 5.364% 8/12/48 | | 11,417,000 | | 11,707,974 |
Class A4, 5.378% 8/12/48 | | 76,000 | | 82,169 |
Class B, 5.479% 8/12/48 | | 5,706,000 | | 1,426,500 |
Series 2007-6 Class A4, 5.485% 3/12/51 (k) | | 14,650,000 | | 15,888,028 |
Series 2007-7 Class A4, 5.81% 6/12/50 (k) | | 6,656,000 | | 7,198,531 |
Series 2006-3 Class ASB, 5.382% 7/12/46 (k) | | 7,452,019 | | 7,842,140 |
Series 2006-4 Class XP, 0.8109% 12/12/49 (k)(m) | | 27,872,665 | | 465,055 |
Series 2007-6 Class B, 5.635% 3/12/51 (k) | | 1,902,000 | | 594,114 |
Series 2007-7 Class B, 5.9345% 6/12/50 (k) | | 166,000 | | 13,994 |
Series 2007-8 Class A3, 6.1644% 8/12/49 (k) | | 1,640,000 | | 1,822,206 |
Morgan Stanley Capital I Trust: | | | | |
floater: | | | | |
Series 2006-XLF: | | | | |
Class C, 1.449% 7/15/19 (e)(k) | | 357,716 | | 207,475 |
Class H, 0.629% 7/15/19 (e)(k) | | 108,390 | | 103,512 |
Class J, 0.679% 7/15/19 (e)(k) | | 354,000 | | 299,130 |
Series 2007-XLFA: | | | | |
Class C, 0.409% 10/15/20 (e)(k) | | 1,092,000 | | 989,221 |
Class D, 0.439% 10/15/20 (e)(k) | | 667,354 | | 601,206 |
Class E, 0.499% 10/15/20 (e)(k) | | 834,661 | | 710,196 |
Class F, 0.549% 10/15/20 (e)(k) | | 500,899 | | 381,124 |
Class G, 0.589% 10/15/20 (e)(k) | | 619,188 | | 452,552 |
Class H, 0.679% 10/15/20 (e)(k) | | 389,758 | | 226,403 |
Class J, 0.829% 10/15/20 (e)(k) | | 228,006 | | 94,823 |
Class MHRO, 0.939% 10/15/20 (e)(k) | | 594,748 | | 499,588 |
Class NHRO, 1.139% 10/15/20 (e)(k) | | 902,610 | | 740,140 |
sequential payer: | | | | |
Series 2004-RR2 Class A2, 5.45% 10/28/33 (e) | | 281,085 | | 282,490 |
Series 2005-IQ9 Class A3, 4.54% 7/15/56 | | 1,961,048 | | 1,998,459 |
Series 2006-HQ10 Class AM, 5.36% 11/12/41 | | 620,000 | | 646,649 |
Series 2007-HQ11 Class A31, 5.439% 2/12/44 (k) | | 964,000 | | 1,011,826 |
Series 2007-IQ13: | | | | |
Class A1, 5.05% 3/15/44 | | 12,853 | | 12,841 |
Class A4, 5.364% 3/15/44 | | 10,000,000 | | 11,017,950 |
Commercial Mortgage Securities - continued |
| Principal Amount (c) | | Value |
Morgan Stanley Capital I Trust: - continued | | | | |
sequential payer: | | | | |
Series 1997-RR Class F, 7.398% 4/30/39 (e)(k) | | $ 158,553 | | $ 142,698 |
Series 1998-CF1 Class G, 7.35% 7/15/32 (e) | | 205,756 | | 100,821 |
Series 1999-WF1: | | | | |
Class N, 5.91% 11/15/31 (e) | | 210,000 | | 170,208 |
Class O, 5.91% 11/15/31 (e) | | 197,950 | | 46,832 |
Series 2004-IQ7 Class E, 5.5403% 6/15/38 (e)(k) | | 120,000 | | 84,000 |
Series 2004-RR2 Class C, 5.88% 10/28/33 (e)(k) | | 280,000 | | 212,800 |
Series 2006-HQ10 Class X2, 0.6911% 11/12/41 (e)(k)(m) | | 8,843,355 | | 36,196 |
Series 2006-HQ8 Class A3, 5.6512% 3/12/44 (k) | | 628,661 | | 632,077 |
Series 2006-IQ11: | | | | |
Class A3, 5.859% 10/15/42 (k) | | 1,422,351 | | 1,474,830 |
Class A4, 5.895% 10/15/42 (k) | | 570,000 | | 643,168 |
Series 2006-IQ12 Class AMFX, 5.37% 12/15/43 | | 719,000 | | 765,076 |
Series 2006-T23 Class A3, 5.986% 8/12/41 (k) | | 972,000 | | 1,015,339 |
Series 2007-HQ12 Class A2, 5.7828% 4/12/49 (k) | | 11,641,836 | | 12,000,929 |
Series 2007-IQ14: | | | | |
Class A4, 5.692% 4/15/49 (k) | | 2,852,000 | | 3,126,168 |
Class B, 5.9063% 4/15/49 (k) | | 469,000 | | 127,093 |
Series 2011-C1: | | | | |
Class C, 5.4222% 9/15/47 (e)(k) | | 250,000 | | 248,054 |
Class D, 5.4222% 9/15/47 (e)(k) | | 590,000 | | 544,372 |
Class E, 5.4222% 9/15/47 (e)(k) | | 573,100 | | 485,765 |
Series 2011-C2: | | | | |
Class D, 5.4958% 6/15/44 (e)(k) | | 580,000 | | 534,180 |
Class E, 5.4958% 6/15/44 (e)(k) | | 600,000 | | 506,814 |
Class F, 5.4958% 6/15/44 (e)(k) | | 550,000 | | 404,762 |
Class XB, 0.5399% 6/15/44 (e)(k)(m) | | 9,001,008 | | 278,851 |
Series 2011-C3: | | | | |
Class D, 5.357% 7/15/49 (e) | | 1,130,000 | | 1,011,767 |
Class E, 5.3573% 7/15/49 (e)(k) | | 400,000 | | 327,708 |
Morgan Stanley Dean Witter Capital I Trust: | | | | |
Series 2000-PRIN Class C, 7.9031% 2/23/34 (k) | | 466,000 | | 520,248 |
Series 2001-TOP3 Class E, 7.4705% 7/15/33 (e)(k) | | 150,000 | | 127,917 |
Series 2003-TOP9 Class E, 5.8886% 11/13/36 (e)(k) | | 78,000 | | 77,141 |
NationsLink Funding Corp.: | | | | |
Series 1998-2: | | | | |
Class F, 7.105% 8/20/30 (e) | | 479,927 | | 495,420 |
Class G, 5% 8/20/30 (e) | | 361,875 | | 365,410 |
Class J, 5% 8/20/30 (e) | | 195,000 | | 186,026 |
Series 1999-SL Class X, 11/10/30 (m) | | 113,179 | | 98,749 |
Commercial Mortgage Securities - continued |
| Principal Amount (c) | | Value |
Nomura Asset Securities Corp. Series 1998-D6 Class B1, 6% 3/15/30 (e) | | $ 1,050,000 | | $ 1,077,727 |
Providence Place Group Ltd. Partnership Series 2000-C1 Class A2, 7.75% 7/20/28 (e) | | 770,286 | | 816,503 |
RBSCF Trust Series 2010-MB1 Class D, 4.829% 4/15/24 (e)(k) | | 480,000 | | 463,500 |
Real Estate Asset Liquidity Trust: | | | | |
2006-2 Series L, 4.456% 9/12/38 | CAD | 26,000 | | 14,799 |
Series 2007-1 Class J, 4.57% 4/12/23 (e)(k) | CAD | 42,000 | | 27,664 |
Series 2006-2: | | | | |
Class F, 4.456% 9/12/38 | CAD | 107,000 | | 89,053 |
Class G, 4.456% 9/12/38 | CAD | 54,000 | | 42,982 |
Class H, 4.456% 9/12/38 | CAD | 36,000 | | 26,820 |
Class J, 4.456% 9/12/38 | CAD | 36,000 | | 25,041 |
Class K, 4.456% 9/12/38 | CAD | 18,000 | | 11,030 |
Class M, 4.456% 9/12/38 | CAD | 128,859 | | 36,458 |
Series 2007-1: | | | | |
Class F, 4.57% 4/12/23 (e)(k) | CAD | 126,000 | | 94,449 |
Class G, 4.57% 4/12/23 (e)(k) | CAD | 42,000 | | 30,143 |
Class H, 4.57% 4/12/23 (e)(k) | CAD | 42,000 | | 28,871 |
Class K, 4.57% 4/12/23 (e)(k) | CAD | 21,000 | | 13,259 |
Class L, 4.57% 4/12/23 (e)(k) | CAD | 63,000 | | 38,144 |
Class M, 4.57% 4/12/23 (e)(k) | CAD | 185,000 | | 50,123 |
Salomon Brothers Mortgage Securities VII, Inc. Series 2001-MMA: | | | | |
Class E3, 6.5% 2/18/34 (e)(k) | | 200,000 | | 207,946 |
Class E5, 6.5% 2/18/34 (e)(k) | | 900,000 | | 906,336 |
Structured Asset Securities Corp. Series 1997-LLI: | | | | |
Class D, 7.15% 10/12/34 | | 91,243 | | 91,385 |
Class F, 7.3% 10/12/34 (e) | | 473,000 | | 473,326 |
TIAA Seasoned Commercial Mortgage Trust: | | | | |
sequential payer Series 2007-C4 Class AJ, 5.7188% 8/15/39 (k) | | 170,000 | | 166,911 |
Series 2007-C4 Class F, 5.7188% 8/15/39 (k) | | 820,000 | | 575,844 |
TimberStar Trust I Series 2006-1 Class F, 7.5296% 10/15/36 (e) | | 270,000 | | 251,159 |
UBS Commercial Mortgage Trust Series 2007-FL1: | | | | |
Class F, 0.8235% 7/15/24 (e)(k) | | 110,000 | | 72,095 |
Class G, 0.8235% 7/15/24 (e)(k) | | 200,000 | | 120,082 |
UBS-Citigroup Commercial Mortgage Trust Series 2011-C1 Class B, 6.0708% 1/10/45 (e)(k) | | 284,000 | | 299,239 |
Vornado DP LLC Series 2010-VNO Class D, 6.3555% 9/13/28 (e) | | 180,000 | | 191,040 |
Commercial Mortgage Securities - continued |
| Principal Amount (c) | | Value |
Wachovia Bank Commercial Mortgage Trust: | | | | |
floater: | | | | |
Series 2006-WL7A: | | | | |
Class E, 0.5696% 9/15/21 (e)(k) | | $ 1,770,598 | | $ 1,386,828 |
Class F, 0.6296% 9/15/21 (e)(k) | | 1,877,987 | | 1,414,601 |
Class G, 0.6496% 9/15/21 (e)(k) | | 1,779,101 | | 1,286,742 |
Class J, 0.8896% 9/15/21 (e)(k) | | 395,545 | | 179,282 |
Series 2007-WHL8: | | | | |
Class AP1, 0.9485% 6/15/20 (e)(k) | | 140,220 | | 126,198 |
Class AP2, 1.0485% 6/15/20 (e)(k) | | 235,007 | | 206,806 |
Class F, 0.7285% 6/15/20 (e)(k) | | 4,565,501 | | 2,967,576 |
Class LXR1, 0.9485% 6/15/20 (e)(k) | | 233,916 | | 189,472 |
sequential payer: | | | | |
Series 2003-C7 Class A1, 4.241% 10/15/35 (e) | | 1,598,102 | | 1,609,274 |
Series 2003-C8 Class A3, 4.445% 11/15/35 | | 6,853,479 | | 6,928,648 |
Series 2006-C29 Class A3, 5.313% 11/15/48 | | 5,051,000 | | 5,204,503 |
Series 2007-C30: | | | | |
Class A3, 5.246% 12/15/43 | | 612,481 | | 626,639 |
Class A4, 5.305% 12/15/43 | | 8,604,000 | | 9,143,574 |
Class A5, 5.342% 12/15/43 | | 13,536,000 | | 14,744,210 |
Series 2007-C31 Class A4, 5.509% 4/15/47 | | 13,599,000 | | 14,859,247 |
Series 2007-C32: | | | | |
Class A2, 5.9237% 6/15/49 (k) | | 13,343,546 | | 13,829,438 |
Class A3, 5.9287% 6/15/49 (k) | | 3,229,000 | | 3,554,796 |
Series 2003-C6 Class G, 5.125% 8/15/35 (e)(k) | | 903,000 | | 902,409 |
Series 2004-C10 Class E, 4.931% 2/15/41 | | 340,000 | | 336,682 |
Series 2004-C11: | | | | |
Class D, 5.5485% 1/15/41 (k) | | 360,000 | | 326,672 |
Class E, 5.5985% 1/15/41 (k) | | 327,000 | | 277,115 |
Series 2004-C12 Class D, 5.495% 7/15/41 (k) | | 280,000 | | 283,058 |
Series 2004-C14: | | | | |
Class B, 5.17% 8/15/41 | | 258,500 | | 251,203 |
Class C, 5.21% 8/15/41 | | 170,000 | | 162,456 |
Series 2004-C15 Class 175C, 6.0432% 10/15/41 (e)(k) | | 500,000 | | 486,749 |
Series 2005-C19 Class B, 4.892% 5/15/44 | | 1,902,000 | | 1,730,468 |
Series 2005-C22: | | | | |
Class B, 5.5336% 12/15/44 (k) | | 4,218,000 | | 2,898,905 |
Class F, 5.5336% 12/15/44 (e)(k) | | 3,171,000 | | 766,678 |
Series 2006-C23 Class A5, 5.416% 1/15/45 (k) | | 7,870,000 | | 8,644,243 |
Series 2007-C30: | | | | |
Class B, 5.463% 12/15/43 (k) | | 10,505,000 | | 5,509,505 |
Class C, 5.483% 12/15/43 (k) | | 5,706,000 | | 2,253,271 |
Commercial Mortgage Securities - continued |
| Principal Amount (c) | | Value |
Wachovia Bank Commercial Mortgage Trust: - continued | | | | |
Series 2007-C30: | | | | |
Class D, 5.513% 12/15/43 (k) | | $ 3,044,000 | | $ 776,978 |
Class XP, 0.6327% 12/15/43 (e)(k)(m) | | 17,012,943 | | 166,216 |
Series 2007-C31 Class C, 5.8735% 4/15/47 (k) | | 522,000 | | 106,598 |
Series 2007-C32: | | | | |
Class D, 5.9287% 6/15/49 (k) | | 1,431,000 | | 418,374 |
Class E, 5.9287% 6/15/49 (k) | | 2,252,000 | | 561,874 |
Wachovia Bank Commercial Mortgage Trust pass-thru certificates sequential payer Series 2007-C33 Class A5, 6.0964% 2/15/51 (k) | | 19,259,000 | | 21,264,844 |
Wells Fargo Commercial Mortgage Trust Series 2010-C1 Class XB, 0.5792% 11/15/43 (e)(m) | | 20,614,217 | | 723,559 |
WF-RBS Commercial Mortgage Trust: | | | | |
Series 2011-C3 Class C, 5.335% 3/15/44 (e) | | 360,000 | | 357,602 |
Series 2011-C4 Class E, 5.4179% 6/15/44 (e) | | 320,000 | | 243,907 |
Series 2011-C5: | | | | |
Class C, 5.8247% 11/15/44 (e)(k) | | 260,000 | | 246,568 |
Class D, 5.8247% 11/15/44 (e)(k) | | 200,000 | | 173,656 |
Class XA, 2.2648% 11/15/44 (e)(k)(m) | | 5,241,589 | | 642,252 |
WFDB Commercial Mortgage Trust Series 2011-BXR Class D, 5.914% 7/5/24 (e) | | 1,500,000 | | 1,531,398 |
TOTAL COMMERCIAL MORTGAGE SECURITIES (Cost $636,602,708) |
748,899,380
|
Municipal Securities - 0.3% |
|
Beaver County Indl. Dev. Auth. Poll. Cont. Rev. Bonds (FirstEnergy Nuclear Generation Corp. Proj.) Series 2005 A, 3.375%, tender 7/1/15 (k) | | 3,300,000 | | 3,412,761 |
California Gen. Oblig.: | | | | |
7.5% 4/1/34 | | 14,555,000 | | 18,767,363 |
7.55% 4/1/39 | | 3,020,000 | | 3,998,450 |
7.6% 11/1/40 | | 4,510,000 | | 6,033,298 |
7.625% 3/1/40 | | 3,440,000 | | 4,571,003 |
Illinois Gen. Oblig.: | | | | |
Series 2010, 4.421% 1/1/15 | | 6,825,000 | | 7,170,413 |
Series 2011, 5.877% 3/1/19 | | 2,935,000 | | 3,249,955 |
TOTAL MUNICIPAL SECURITIES (Cost $43,523,400) |
47,203,243
|
Foreign Government and Government Agency Obligations - 1.8% |
| Principal Amount (c) | | Value |
Argentine Republic: | | | | |
discount (with partial capitalization through 12/31/13) 8.28% 12/31/33 | | $ 4,304,209 | | $ 3,368,043 |
2.5% 12/31/38 (d) | | 3,210,000 | | 1,203,750 |
7% 9/12/13 | | 7,320,000 | | 7,294,787 |
7% 10/3/15 | | 10,420,000 | | 9,840,532 |
Bahamian Republic 6.95% 11/20/29 (e) | | 855,000 | | 974,700 |
Bahrain Kingdom 5.5% 3/31/20 | | 550,000 | | 539,000 |
Banco Nacional de Desenvolvimento Economico e Social 6.369% 6/16/18 (e) | | 325,000 | | 373,750 |
Belarus Republic: | | | | |
8.75% 8/3/15 (Reg. S) | | 4,595,000 | | 4,330,788 |
8.95% 1/26/18 | | 1,085,000 | | 1,009,050 |
Bermuda Government 5.603% 7/20/20 (e) | | 470,000 | | 533,450 |
Brazilian Federative Republic: | | | | |
7.125% 1/20/37 | | 540,000 | | 747,900 |
8.25% 1/20/34 | | 290,000 | | 444,425 |
8.75% 2/4/25 | | 245,000 | | 370,563 |
10.125% 5/15/27 | | 1,215,000 | | 2,029,050 |
12.25% 3/6/30 | | 735,000 | | 1,422,225 |
Chilean Republic 3.25% 9/14/21 | | 3,710,000 | | 3,804,605 |
Colombian Republic: | | | | |
4.375% 7/12/21 | | 1,745,000 | | 1,888,963 |
6.125% 1/18/41 | | 1,585,000 | | 1,949,550 |
7.375% 1/27/17 | | 750,000 | | 924,750 |
7.375% 3/18/19 | | 1,070,000 | | 1,372,810 |
7.375% 9/18/37 | | 2,130,000 | | 2,971,350 |
10.375% 1/28/33 | | 2,150,000 | | 3,622,750 |
11.75% 2/25/20 | | 1,050,000 | | 1,669,500 |
Congo Republic 3% 6/30/29 (d) | | 2,080,500 | | 1,560,375 |
Croatia Republic: | | | | |
6.375% 3/24/21 (e) | | 1,725,000 | | 1,625,813 |
6.625% 7/14/20 (e) | | 2,195,000 | | 2,129,150 |
6.75% 11/5/19 (e) | | 2,755,000 | | 2,713,675 |
Democratic Socialist Republic of Sri Lanka: | | | | |
6.25% 10/4/20 (e) | | 2,235,000 | | 2,167,950 |
6.25% 7/27/21 (e) | | 1,610,000 | | 1,561,700 |
7.4% 1/22/15 (e) | | 1,635,000 | | 1,700,400 |
Dominican Republic: | | | | |
1.5522% 8/30/24 (k) | | 1,350,000 | | 1,215,000 |
7.5% 5/6/21 (e) | | 2,580,000 | | 2,644,500 |
9.04% 1/23/18 (e) | | 1,185,880 | | 1,298,539 |
Foreign Government and Government Agency Obligations - continued |
| Principal Amount (c) | | Value |
El Salvador Republic: | | | | |
7.375% 12/1/19 (e) | | $ 940,000 | | $ 1,010,500 |
7.625% 2/1/41 (e) | | 525,000 | | 523,688 |
7.65% 6/15/35 (Reg. S) | | 1,265,000 | | 1,293,463 |
7.75% 1/24/23 (Reg. S) | | 895,000 | | 975,550 |
8.25% 4/10/32 (Reg. S) | | 575,000 | | 626,750 |
Gabonese Republic 8.2% 12/12/17 (e) | | 1,185,000 | | 1,407,188 |
Georgia Republic 6.875% 4/12/21 (e) | | 2,020,000 | | 2,100,800 |
Ghana Republic 8.5% 10/4/17 (e) | | 1,625,000 | | 1,799,688 |
Hungarian Republic: | | | | |
4.75% 2/3/15 | | 4,315,000 | | 4,110,038 |
6.25% 1/29/20 | | 1,430,000 | | 1,351,350 |
7.625% 3/29/41 | | 2,600,000 | | 2,437,500 |
Indonesian Republic: | | | | |
4.875% 5/5/21 (e) | | 1,095,000 | | 1,201,763 |
5.25% 1/17/42 (e) | | 1,030,000 | | 1,099,525 |
5.875% 3/13/20 (e) | | 1,660,000 | | 1,925,600 |
6.625% 2/17/37 (e) | | 1,100,000 | | 1,372,250 |
6.875% 1/17/18 (e) | | 1,105,000 | | 1,331,525 |
7.75% 1/17/38 (e) | | 1,925,000 | | 2,714,250 |
8.5% 10/12/35 (Reg. S) | | 1,685,000 | | 2,527,500 |
11.625% 3/4/19 (e) | | 1,720,000 | | 2,592,900 |
Islamic Republic of Pakistan 7.125% 3/31/16 (e) | | 3,710,000 | | 2,893,800 |
Jordanian Kingdom 3.875% 11/12/15 | | 820,000 | | 768,750 |
Latvian Republic: | | | | |
5.25% 2/22/17 (e) | | 1,335,000 | | 1,366,706 |
5.25% 6/16/21 (e) | | 550,000 | | 533,500 |
Lebanese Republic: | | | | |
4% 12/31/17 | | 3,351,000 | | 3,321,511 |
5.15% 11/12/18 | | 550,000 | | 548,625 |
Lithuanian Republic: | | | | |
6.125% 3/9/21 (e) | | 1,835,000 | | 1,892,436 |
6.625% 2/1/22 (e) | | 1,490,000 | | 1,601,750 |
6.75% 1/15/15 (e) | | 1,215,000 | | 1,306,125 |
7.375% 2/11/20 (e) | | 2,655,000 | | 2,986,875 |
Namibia Republic of 5.5% 11/3/21 (e) | | 1,340,000 | | 1,390,250 |
Peruvian Republic: | | | | |
3% 3/7/27 (d) | | 1,210,000 | | 1,040,600 |
5.625% 11/18/50 | | 1,620,000 | | 1,765,800 |
7.35% 7/21/25 | | 1,550,000 | | 2,088,625 |
8.75% 11/21/33 | | 2,865,000 | | 4,397,775 |
Foreign Government and Government Agency Obligations - continued |
| Principal Amount (c) | | Value |
Philippine Republic: | | | | |
5% 1/13/37 | | $ 725,000 | | $ 772,125 |
6.375% 1/15/32 | | 515,000 | | 637,313 |
6.5% 1/20/20 | | 805,000 | | 984,113 |
7.5% 9/25/24 | | 290,000 | | 379,900 |
7.75% 1/14/31 | | 820,000 | | 1,147,016 |
9.5% 2/2/30 | | 1,780,000 | | 2,848,000 |
9.875% 1/15/19 | | 640,000 | | 913,600 |
10.625% 3/16/25 | | 1,320,000 | | 2,158,200 |
Polish Government: | | | | |
3.875% 7/16/15 | | 840,000 | | 882,000 |
5% 3/23/22 | | 655,000 | | 699,213 |
5.125% 4/21/21 | | 825,000 | | 884,813 |
6.375% 7/15/19 | | 2,200,000 | | 2,574,000 |
Provincia de Cordoba 12.375% 8/17/17 (e) | | 1,360,000 | | 1,224,000 |
Provincia de Neuquen Argentina 7.875% 4/26/21 (e) | | 520,000 | | 535,600 |
Republic of Iraq 5.8% 1/15/28 (Reg. S) | | 4,750,000 | | 3,716,875 |
Republic of Nigeria 6.75% 1/28/21 (e) | | 1,355,000 | | 1,446,463 |
Republic of Serbia 6.75% 11/1/24 (e) | | 7,808,668 | | 7,574,408 |
Romanian Republic 6.75% 2/7/22 (e) | | 2,512,000 | | 2,587,360 |
Russian Federation: | | | | |
7.5% 3/31/30 (Reg. S) | | 7,859,020 | | 9,362,451 |
11% 7/24/18 (Reg. S) | | 385,000 | | 542,850 |
12.75% 6/24/28 (Reg. S) | | 1,950,000 | | 3,478,410 |
Senegal Republic of 8.75% 5/13/21 (e) | | 700,000 | | 701,750 |
State of Qatar 5.75% 1/20/42 (e) | | 945,000 | | 1,027,688 |
Turkish Republic: | | | | |
5.125% 3/25/22 | | 735,000 | | 729,488 |
5.625% 3/30/21 | | 815,000 | | 847,600 |
6% 1/14/41 | | 350,000 | | 342,125 |
6.25% 9/26/22 | | 680,000 | | 725,900 |
6.75% 4/3/18 | | 1,395,000 | | 1,562,400 |
6.75% 5/30/40 | | 805,000 | | 865,375 |
6.875% 3/17/36 | | 2,520,000 | | 2,746,800 |
7% 9/26/16 | | 1,360,000 | | 1,523,200 |
7.25% 3/15/15 | | 730,000 | | 803,000 |
7.25% 3/5/38 | | 1,250,000 | | 1,428,125 |
7.375% 2/5/25 | | 2,430,000 | | 2,834,109 |
7.5% 7/14/17 | | 1,285,000 | | 1,479,678 |
7.5% 11/7/19 | | 745,000 | | 873,513 |
11.875% 1/15/30 | | 960,000 | | 1,617,600 |
Foreign Government and Government Agency Obligations - continued |
| Principal Amount (c) | | Value |
Ukraine Financing of Infrastructure Projects State Enterprise 8.375% 11/3/17 (e) | | $ 1,690,000 | | $ 1,440,725 |
Ukraine Government: | | | | |
6.25% 6/17/16 (e) | | 2,080,000 | | 1,885,104 |
6.385% 6/26/12 (e) | | 4,775,000 | | 4,793,145 |
6.75% 11/14/17 (e) | | 1,895,000 | | 1,700,763 |
6.875% 9/23/15 (e) | | 1,630,000 | | 1,536,275 |
7.65% 6/11/13 (e) | | 3,315,000 | | 3,286,160 |
7.75% 9/23/20 (e) | | 1,430,000 | | 1,283,425 |
7.95% 2/23/21 (e) | | 1,425,000 | | 1,293,188 |
United Arab Emirates 7.75% 10/5/20 (Reg. S) | | 545,000 | | 583,831 |
United Mexican States: | | | | |
3.625% 3/15/22 | | 1,080,000 | | 1,100,520 |
5.125% 1/15/20 | | 920,000 | | 1,050,640 |
5.75% 10/12/10 | | 756,000 | | 807,030 |
5.95% 3/19/19 | | 300,000 | | 359,100 |
6.05% 1/11/40 | | 9,304,000 | | 11,327,620 |
6.75% 9/27/34 | | 720,000 | | 936,000 |
7.5% 4/8/33 | | 425,000 | | 597,125 |
8.3% 8/15/31 | | 420,000 | | 631,050 |
Uruguay Republic: | | | | |
7.875% 1/15/33 pay-in-kind | | 2,345,000 | | 3,247,825 |
8% 11/18/22 | | 2,105,903 | | 2,874,558 |
Venezuelan Republic: | | | | |
6% 12/9/20 | | 620,000 | | 465,000 |
7% 3/31/38 | | 625,000 | | 445,313 |
7.75% 10/13/19 (Reg. S) | | 800,000 | | 676,000 |
8.5% 10/8/14 | | 735,000 | | 738,675 |
9% 5/7/23 (Reg. S) | | 2,490,000 | | 2,122,725 |
9.25% 9/15/27 | | 1,210,000 | | 1,085,975 |
9.25% 5/7/28 (Reg. S) | | 790,000 | | 675,450 |
9.375% 1/13/34 | | 885,000 | | 761,100 |
10.75% 9/19/13 | | 1,300,000 | | 1,358,500 |
11.75% 10/21/26 (Reg. S) | | 1,410,000 | | 1,420,575 |
11.95% 8/5/31 (Reg. S) | | 1,890,000 | | 1,904,175 |
12.75% 8/23/22 | | 4,180,000 | | 4,430,800 |
13.625% 8/15/18 | | 848,000 | | 915,840 |
Vietnamese Socialist Republic: | | | | |
1.3166% 3/12/16 (k) | | 919,565 | | 827,608 |
4% 3/12/28 (d) | | 3,195,000 | | 2,619,900 |
Foreign Government and Government Agency Obligations - continued |
| Principal Amount (c) | | Value |
Vietnamese Socialist Republic: - continued | | | | |
6.75% 1/29/20 (e) | | $ 835,000 | | $ 908,063 |
6.875% 1/15/16 (e) | | 2,280,000 | | 2,473,800 |
TOTAL FOREIGN GOVERNMENT AND GOVERNMENT AGENCY OBLIGATIONS (Cost $237,500,593) |
261,628,993
|
Supranational Obligations - 0.0% |
|
Corporacion Andina de Fomento 5.2% 5/21/13
(Cost $232,967) | | 242,000 | |
251,210
|
Common Stocks - 0.0% |
| Shares | | |
TELECOMMUNICATION SERVICES - 0.0% |
Wireless Telecommunication Services - 0.0% |
CUI Acquisition Corp. Class E (e) (Cost $1,258,919) | 1 | |
863,100
|
Preferred Stocks - 0.1% |
| | | |
Convertible Preferred Stocks - 0.0% |
CONSUMER DISCRETIONARY - 0.0% |
Automobiles - 0.0% |
General Motors Co. 4.75% | 80,100 | | 3,419,469 |
FINANCIALS - 0.0% |
Real Estate Investment Trusts - 0.0% |
Alexandria Real Estate Equities, Inc. Series D 7.00% | 9,000 | | 228,375 |
TOTAL CONVERTIBLE PREFERRED STOCKS | | 3,647,844 |
Nonconvertible Preferred Stocks - 0.1% |
FINANCIALS - 0.1% |
Real Estate Investment Trusts - 0.1% |
Apartment Investment & Management Co. Series U, 7.75% | 5,000 | | 127,050 |
CBL & Associates Properties, Inc. 7.375% | 7,720 | | 194,930 |
Cedar Shopping Centers, Inc. 8.875% | 5,000 | | 125,500 |
Preferred Stocks - continued |
| Shares | | Value |
Nonconvertible Preferred Stocks - continued |
FINANCIALS - continued |
Real Estate Investment Trusts - continued |
Corporate Office Properties Trust Series H, 7.50% | 5,000 | | $ 128,600 |
Digital Realty Trust, Inc. Series E, 7.00% | 10,000 | | 262,800 |
Equity Lifestyle Properties, Inc. 8.034% | 22,162 | | 578,428 |
Essex Property Trust, Inc. Series H, 7.125% | 9,354 | | 248,068 |
Hersha Hospitality Trust Series B, 8.00% | 13,844 | | 340,978 |
Hospitality Properties Trust Series D, 7.125% | 10,000 | | 255,400 |
LaSalle Hotel Properties Series H, 7.50% | 10,000 | | 256,800 |
PS Business Parks, Inc.: | | | |
6.875% | 10,000 | | 266,000 |
Series S, 6.45% | 21,000 | | 533,400 |
Public Storage: | | | |
Series P, 6.50% | 12,000 | | 331,800 |
Series R, 6.35% | 10,500 | | 284,445 |
Series S, 5.90% | 20,000 | | 509,400 |
Realty Income Corp. Series F, 6.625% | 12,000 | | 307,560 |
Regency Centers Corp. Series 6, 6.625% | 5,510 | | 139,679 |
Stag Industrial, Inc. Series A, 9.00% | 20,000 | | 514,200 |
| | 5,405,038 |
TOTAL PREFERRED STOCKS (Cost $9,254,649) |
9,052,882
|
Floating Rate Loans - 0.5% |
| Principal Amount (c) | | |
CONSUMER DISCRETIONARY - 0.2% |
Auto Components - 0.1% |
Federal-Mogul Corp.: | | | | |
Tranche B, term loan 2.1959% 12/27/14 (k) | | $ 3,351,661 | | 3,209,216 |
Tranche C, term loan 2.1887% 12/27/15 (k) | | 2,105,267 | | 2,015,794 |
| | 5,225,010 |
Automobiles - 0.0% |
Chrysler Group LLC Tranche B, term loan 6% 5/24/17 (k) | | 2,790,975 | | 2,801,441 |
Diversified Consumer Services - 0.0% |
Visant Corp. Tranche B, term loan 5.25% 12/22/16 (k) | | 2,015,623 | | 1,929,959 |
Floating Rate Loans - continued |
| Principal Amount (c) | | Value |
CONSUMER DISCRETIONARY - continued |
Hotels, Restaurants & Leisure - 0.0% |
Ameristar Casinos, Inc. Tranche B, term loan 4% 4/14/18 (k) | | $ 913,100 | | $ 914,241 |
Extended Stay America, Inc. term loan 9.75% 11/1/15 | | 1,000,000 | | 1,000,000 |
MGM Mirage, Inc. Tranche B, term loan 7% 2/21/14 (k) | | 1,435,000 | | 1,440,453 |
| | 3,354,694 |
Leisure Equipment & Products - 0.0% |
SRAM LLC.: | | | | |
2nd LN, term loan 8.5% 12/7/18 (k) | | 265,000 | | 266,325 |
Tranche B 1LN, term loan 4.7645% 6/7/18 (k) | | 792,198 | | 791,208 |
| | 1,057,533 |
Media - 0.1% |
Harron Communications LP Tranche B, term loan 5.25% 10/6/17 (k) | | 2,072,963 | | 2,062,598 |
Newsday LLC term loan 10.5% 8/1/13 | | 3,505,000 | | 3,592,625 |
Univision Communications, Inc. term loan 4.494% 3/31/17 (k) | | 4,421,098 | | 4,106,094 |
UPC Broadband Holding BV Tranche AB, term loan 4.75% 12/31/17 (k) | | 1,250,000 | | 1,250,000 |
| | 11,011,317 |
Multiline Retail - 0.0% |
Neiman Marcus Group, Inc. Tranche B, term loan 4.75% 5/16/18 (k) | | 3,680,000 | | 3,657,000 |
Specialty Retail - 0.0% |
PETCO Animal Supplies, Inc. term loan 4.5% 11/24/17 (k) | | 338,100 | | 337,255 |
TOTAL CONSUMER DISCRETIONARY | | 29,374,209 |
CONSUMER STAPLES - 0.0% |
Food & Staples Retailing - 0.0% |
SUPERVALU, Inc. Tranche B 3LN, term loan 4.5% 4/29/18 (k) | | 1,404,388 | | 1,400,877 |
U.S. Foodservice term loan 5.75% 3/31/17 (k) | | 4,871,086 | | 4,834,552 |
| | 6,235,429 |
ENERGY - 0.0% |
Oil, Gas & Consumable Fuels - 0.0% |
FTS International, LLC Tranche B, term loan 6.25% 5/6/16 (k) | | 2,988,581 | | 2,970,052 |
Floating Rate Loans - continued |
| Principal Amount (c) | | Value |
FINANCIALS - 0.1% |
Diversified Financial Services - 0.0% |
Flying Fortress, Inc. Tranche 3, term loan 5% 6/30/17 (k) | | $ 1,615,000 | | $ 1,610,963 |
Insurance - 0.1% |
Asurion Corp.: | | | | |
Tranche 1ST LIEN, term loan 5.5% 5/24/18 (k) | | 1,537,386 | | 1,531,698 |
Tranche 2ND LIEN, term loan 9% 5/24/19 (k) | | 3,255,000 | | 3,316,194 |
Lonestar Inter Super Hld LLC term loan 8/13/19 | | 1,925,000 | | 1,949,063 |
| | 6,796,955 |
Real Estate Management & Development - 0.0% |
Capital Automotive LP term loan 5% 3/11/17 (k) | | 629,400 | | 623,106 |
CityCenter term loan 8.75% 7/1/13 (k) | | 1,000,000 | | 992,500 |
| | 1,615,606 |
TOTAL FINANCIALS | | 10,023,524 |
HEALTH CARE - 0.0% |
Health Care Providers & Services - 0.0% |
Quintiles Transnational Corp. Tranche B, term loan 5% 6/8/18 (k) | | 2,232,753 | | 2,210,425 |
Pharmaceuticals - 0.0% |
Endo Pharmaceuticals Holdings, Inc. Tranche B, term loan 4% 6/17/18 (k) | | 221,588 | | 221,588 |
TOTAL HEALTH CARE | | 2,432,013 |
INDUSTRIALS - 0.1% |
Airlines - 0.1% |
Delta Air Lines, Inc. Tranche B, term loan 5.5% 4/20/17 (k) | | 2,781,025 | | 2,714,280 |
US Airways Group, Inc. term loan 2.744% 3/23/14 (k) | | 2,810,347 | | 2,578,494 |
| | 5,292,774 |
Construction & Engineering - 0.0% |
Drumm Investors LLC Tranche B, term loan 5% 5/4/18 (k) | | 542,210 | | 509,677 |
Floating Rate Loans - continued |
| Principal Amount (c) | | Value |
INDUSTRIALS - continued |
Machinery - 0.0% |
Colfax Corp. Tranche B, term loan 4.5% 9/12/18 (k) | | $ 2,530,000 | | $ 2,530,000 |
Husky Intermediate, Inc. Tranche B, term loan 6.5% 6/30/18 (k) | | 2,283,525 | | 2,277,816 |
| | 4,807,816 |
TOTAL INDUSTRIALS | | 10,610,267 |
MATERIALS - 0.1% |
Chemicals - 0.0% |
Arizona Chemical Tranche B, term loan 7.25% 12/22/17 (k) | | 1,000,000 | | 1,013,750 |
Ashland, Inc. Tranche B, term loan 3.75% 8/23/18 (k) | | 2,068,701 | | 2,079,044 |
| | 3,092,794 |
Containers & Packaging - 0.1% |
Anchor Glass Container Corp. Tranche 2LN, term loan 10% 9/2/16 (k) | | 2,065,000 | | 2,065,000 |
Sealed Air Corp. Tranche B, term loan 4.75% 10/3/18 (k) | | 1,472,575 | | 1,483,619 |
| | 3,548,619 |
Metals & Mining - 0.0% |
JMC Steel Group, Inc. term loan 4.75% 4/1/17 (k) | | 2,108,938 | | 2,108,938 |
TOTAL MATERIALS | | 8,750,351 |
TELECOMMUNICATION SERVICES - 0.0% |
Wireless Telecommunication Services - 0.0% |
Intelsat Jackson Holdings SA term loan 3.2535% 2/1/14 (k) | | 2,425,000 | | 2,364,375 |
MetroPCS Wireless, Inc. Tranche B 3LN, term loan 4.0147% 3/17/18 (k) | | 2,949,306 | | 2,919,813 |
TowerCo Finance LLC Tranche B, term loan 5.25% 2/2/17 (k) | | 2,252,975 | | 2,252,975 |
| | 7,537,163 |
UTILITIES - 0.0% |
Independent Power Producers & Energy Traders - 0.0% |
The AES Corp. Tranche B, term loan 4.25% 5/27/18 (k) | | 372,188 | | 372,187 |
TOTAL FLOATING RATE LOANS (Cost $76,073,479) |
78,305,195
|
Sovereign Loan Participations - 0.0% |
| Principal Amount (c) | | Value |
Indonesian Republic loan participation: | | | | |
Citibank 1.25% 12/14/19 (k) | | $ 1,607,627 | | $ 1,511,170 |
Goldman Sachs 1.25% 12/14/19 (k) | | 1,377,778 | | 1,295,111 |
0% 12/14/19 (k) | | 106,286 | | 99,909 |
TOTAL SOVEREIGN LOAN PARTICIPATIONS (Cost $2,651,440) |
2,906,190
|
Bank Notes - 0.0% |
|
Wachovia Bank NA 6% 11/15/17
(Cost $2,438,852) | | 2,243,000 | |
2,579,795
|
Fixed-Income Funds - 23.1% |
| Shares | | |
Fidelity Floating Rate Central Fund (l) | 5,734,106 | | 578,341,954 |
Fidelity Mortgage Backed Securities Central Fund (l) | 26,421,758 | | 2,866,496,506 |
TOTAL FIXED-INCOME FUNDS (Cost $3,208,191,485) |
3,444,838,460
|
Preferred Securities - 0.0% |
| Principal Amount (c) | | |
CONSUMER DISCRETIONARY - 0.0% |
Media - 0.0% |
Globo Comunicacoes e Participacoes SA 6.25% (d)(e)(f) | $ 1,860,000 | | 1,984,375 |
MATERIALS - 0.0% |
Metals & Mining - 0.0% |
CSN Islands XII Corp. 7% (Reg. S) (f) | 1,980,000 | | 2,005,868 |
TOTAL PREFERRED SECURITIES (Cost $3,813,628) |
3,990,243
|
Money Market Funds - 8.2% |
| Shares | | Value |
Fidelity Cash Central Fund, 0.12% (a)
(Cost $1,220,997,367) | 1,220,997,367 | | $ 1,220,997,367 |
TOTAL INVESTMENT PORTFOLIO - 104.3% (Cost $14,596,812,402) | | 15,549,569,793 |
NET OTHER ASSETS (LIABILITIES) - (4.3)% | | (635,700,084) |
NET ASSETS - 100% | $ 14,913,869,709 |
TBA Sale Commitments |
| Principal
Amount (c) | | |
Fannie Mae |
3.5% 3/1/42 | $ (78,500,000) | | (81,138,283) |
3.5% 3/1/42 | (78,500,000) | | (81,138,283) |
3.5% 3/1/42 | (78,500,000) | | (81,138,283) |
3.5% 3/1/42 | (27,000,000) | | (27,907,435) |
4% 3/1/42 | (23,200,000) | | (24,416,824) |
4.5% 3/1/42 | (43,500,000) | | (46,360,943) |
5% 3/1/42 | (47,000,000) | | (50,758,765) |
5% 3/1/42 | (9,000,000) | | (9,719,763) |
5% 3/1/42 | (16,000,000) | | (17,279,579) |
5% 3/1/42 | (16,000,000) | | (17,279,579) |
6% 3/1/42 | (18,000,000) | | (19,805,891) |
TOTAL FANNIE MAE | | (456,943,628) |
Ginnie Mae |
4% 3/1/42 | (2,700,000) | | (2,907,847) |
TOTAL TBA SALE COMMITMENTS (Proceeds $459,631,945) | $ (459,851,475) |
Swap Agreements |
| Expiration Date | | Notional Amount | | Value |
Credit Default Swaps |
Receive monthly a fixed rate of .15% multiplied by the notional amount and pay to Credit Suisse First Boston upon each credit event of one of the issues of ABX AA 07-01 Index, par value of the proportional notional amount (Rating-C) (Upfront Premium Received/(Paid) $480,000) (j) | Sept. 2037 | | $ 2,154,763 | | $ (2,034,940) |
Receive monthly a fixed rate of .15% multiplied by the notional amount and pay to Credit Suisse First Boston upon each credit event of one of the issues of ABX AA 07-01 Index, par value of the proportional notional amount (Rating-C) (Upfront Premium Received/(Paid) $1,058,000) (j) | Sept. 2037 | | 2,477,977 | | (2,340,181) |
Receive monthly a fixed rate of .15% multiplied by the notional amount and pay to JPMorgan Chase, Inc. upon each credit event of one of the issues of ABX AA 07-01 Index, par value of the proportional notional amount (Rating-C) (Upfront Premium Received/(Paid) $651,000) (j) | Sept. 2037 | | 1,508,334 | | (1,424,458) |
Receive monthly a fixed rate of .15% multiplied by the notional amount and pay to UBS upon each credit event of one of the issues of ABX AA 07-1 Index, par value of the proportional notional amount (Rating-C) (Upfront Premium Received/(Paid) $936,000) (j) | Sept. 2037 | | 3,878,573 | | (3,662,892) |
Receive monthly a fixed rate of .15% multiplied by the notional amount and pay to UBS upon each credit event of one of the issues of ABX AA 07-1 Index, par value of the proportional notional amount (Rating-C) (Upfront Premium Received/(Paid) $347,750) (j) | Sept. 2037 | | 1,400,596 | | (1,322,711) |
Receive monthly notional amount multiplied by .82% and pay UBS upon credit event of Morgan Stanley ABS Capital I, Inc., par value of the notional amount of Morgan Stanley ABS Capital I, Inc. Series 2004-NC6 Class M3, 5.6413% 7/25/34 (Rating-Ca) (i) | August 2034 | | 23,846 | | (18,445) |
Swap Agreements - continued |
| Expiration Date | | Notional Amount | | Value |
Credit Default Swaps - continued |
Receive monthly notional amount multiplied by 2.4% and pay Deutsche Bank upon credit event of Fremont Home Loan Trust, par value of the notional amount of Fremont Home Loan Trust Series 2004-A Class B3, 7.2288% 1/25/34 (Rating-C) (i) | Feb. 2034 | | $ 787 | | $ (736) |
Receive monthly notional amount multiplied by 3.35% and pay Morgan Stanley, Inc. upon credit event of Morgan Stanley ABS Capital I, Inc., par value of the notional amount of Morgan Stanley ABS Capital I, Inc. Series 2004-HE7, Class B3, 9.01% 8/25/34 (Rating-C) (i) | Sept. 2034 | | 23,153 | | (20,187) |
TOTAL CREDIT DEFAULT SWAPS | | $ 11,468,029 | | $ (10,824,550) |
Interest Rate Swaps |
Receive semi-annually a fixed rate equal to 1.2857% and pay quarterly a floating rate based on 3-month LIBOR with JPMorgan Chase, Inc. | June 2012 | | 200,000,000 | | 768,840 |
| | $ 211,468,029 | | $ (10,055,710) |
Currency Abbreviations |
CAD | - | Canadian dollar |
Legend |
(a) Affiliated fund that is available only to investment companies and other accounts managed by Fidelity Investments. The rate quoted is the annualized seven-day yield of the fund at period end. A complete unaudited listing of the fund's holdings as of its most recent quarter end is available upon request. In addition, each Fidelity Central Fund's financial statements, which are not covered by the Fund's Report of Independent Registered Public Accounting Firm, are available on the SEC's website or upon request. |
(b) Non-income producing - Security is in default. |
(c) Principal Amount is stated in United States dollars unless otherwise noted. |
(d) Security initially issued at one coupon which converts to a higher coupon at a specified date. The rate shown is the rate at period end. |
(e) Security exempt from registration under Rule 144A of the Securities Act of 1933. These securities may be resold in transactions exempt from registration, normally to qualified institutional buyers. At the end of the period, the value of these securities amounted to $1,023,002,212 or 6.9% of net assets. |
(f) Security is perpetual in nature with no stated maturity date. |
(g) Security or a portion of the security purchased on a delayed delivery or when-issued basis. |
(h) Security or a portion of the security has been segregated as collateral for open swap agreements. At the period end, the value of securities pledged amounted to $11,216,630. |
(i) Represents a credit default swap contract in which the Fund has sold protection on the underlying reference entity. The value of each credit default swap and the credit rating can be measures of the current payment/performance risk. For the underlying reference entity, ratings disclosed are from Moody's Investors Service, Inc. Where Moody's ratings are not available, S&P ratings are disclosed and are indicated as such. All ratings are as of the report date and do not reflect subsequent changes. Where a credit rating is not disclosed, the value is used as the measure of the payment/performance risk. |
(j) Represents a credit default swap based on a tradable index of home equity asset-backed debt securities. The value of each credit default swap and the credit rating can be measures of the current payment/performance risk. In addition, the swap represents a contract in which the Fund has sold protection on the index of underlying securities. Ratings represent a weighted average of the ratings of all securities included in the index. Ratings used in the weighted average are from Moody's Investors Service, Inc., or S&P where Moody's ratings are not available. All ratings are as of the report date and do not reflect subsequent changes. |
(k) Coupon rates for floating and adjustable rate securities reflect the rates in effect at period end. |
(l) Affiliated fund that is available only to investment companies and other accounts managed by Fidelity Investments. A complete unaudited schedule of portfolio holdings for each Fidelity Central Fund is filed with the SEC for the first and third quarters of each fiscal year on Form N-Q and is available upon request or at the SEC's web site at www.sec.gov. An unaudited holdings listing for the Fund, which presents direct holdings as well as the pro rata share of securities and other investments held indirectly through its investment in underlying non-money market Fidelity Central Funds, is available at fidelity.com and/or advisor.fidelity.com,as applicable. In addition, each Fidelity Central Fund's financial statements, which are not covered by the Fund's Report of Independent Registered Public Accounting Firm, are available on the SEC's web site or upon request. |
(m) Security represents right to receive monthly interest payments on an underlying pool of mortgages or assets. Principal shown is the outstanding par amount of the pool as of the end of the period. |
(n) Restricted securities - Investment in securities not registered under the Securities Act of 1933 (excluding 144A issues). At the end of the period, the value of restricted securities (excluding 144A issues) amounted to $727,178 or 0.0% of net assets. |
Additional information on each restricted holding is as follows: |
Security | Acquisition Date | Acquisition Cost |
ACGS Series 2004-1 Class P, 7.4651% 8/1/19 | 2/17/11 | $ 548,737 |
GMAC Commercial Mortgage Securities, Inc. Series 1999-C2I Class K, 6.481% 9/15/33 | 3/23/07 - 12/4/09 | $ 173,625 |
Affiliated Central Funds |
Information regarding fiscal year to date income earned by the Fund from investments in Fidelity Central Funds is as follows: |
Fund | Income earned |
Fidelity Cash Central Fund | $ 228,566 |
Fidelity Floating Rate Central Fund | 13,423,997 |
Fidelity Mortgage Backed Securities Central Fund | 43,696,283 |
Total | $ 57,348,846 |
Additional information regarding the Fund's fiscal year to date purchases and sales, including the ownership percentage, of the non Money Market Central Funds is as follows: |
Fund | Value,
beginning of
period | Purchases | Sales Proceeds | Value,
end of
period | % ownership,
end of
period |
Fidelity Floating Rate Central Fund | $ 389,816,805 | $ 163,043,361 | $ - | $ 578,341,954 | 31.4% |
Fidelity Mortgage Backed Securities Central Fund | 2,813,030,905 | 43,696,285 | - | 2,866,496,506 | 22.0% |
Total | $ 3,202,847,710 | $ 206,739,646 | $ - | $ 3,444,838,460 | |
Other Information |
The following is a summary of the inputs used, as of February 29, 2012, involving the Fund's assets and liabilities carried at fair value. The inputs or methodology used for valuing securities may not be an indication of the risk associated with investing in those securities. For more information on valuation inputs, and their aggregation into the levels used in the tables below, please refer to the Security Valuation section in the accompanying Notes to Financial Statements. |
Valuation Inputs at Reporting Date: |
Description | Total | Level 1 | Level 2 | Level 3 |
Investments in Securities: | | | | |
Equities: | | | | |
Consumer Discretionary | $ 3,419,469 | $ 3,419,469 | $ - | $ - |
Financials | 5,633,413 | 5,405,038 | 228,375 | - |
Telecommunication Services | 863,100 | - | - | 863,100 |
Corporate Bonds | 3,562,288,913 | - | 3,561,929,536 | 359,377 |
U.S. Government and Government Agency Obligations | 3,913,031,898 | - | 3,913,031,898 | - |
U.S. Government Agency - Mortgage Securities | 1,837,637,987 | - | 1,837,637,987 | - |
Asset-Backed Securities | 298,586,531 | - | 274,208,830 | 24,377,701 |
Collateralized Mortgage Obligations | 116,508,406 | - | 113,004,269 | 3,504,137 |
Commercial Mortgage Securities | 748,899,380 | - | 706,158,037 | 42,741,343 |
Municipal Securities | 47,203,243 | - | 47,203,243 | - |
Foreign Government and Government Agency Obligations | 261,628,993 | - | 260,588,393 | 1,040,600 |
Supranational Obligations | 251,210 | - | 251,210 | - |
Floating Rate Loans | 78,305,195 | - | 76,312,695 | 1,992,500 |
Sovereign Loan Participations | 2,906,190 | - | - | 2,906,190 |
Bank Notes | 2,579,795 | - | 2,579,795 | - |
Fixed-Income Funds | 3,444,838,460 | 3,444,838,460 | - | - |
Preferred Securities | 3,990,243 | - | 3,990,243 | - |
Money Market Funds | 1,220,997,367 | 1,220,997,367 | - | - |
Total Investments in Securities: | $ 15,549,569,793 | $ 4,674,660,334 | $ 10,797,124,511 | $ 77,784,948 |
Derivative Instruments: | | | | |
Assets | | | | |
Swap Agreements | $ 768,840 | $ - | $ 768,840 | $ - |
Liabilities | | | | |
Swap Agreements | $ (10,824,550) | $ - | $ (10,785,182) | $ (39,368) |
Total Derivative Instruments: | $ (10,055,710) | $ - | $ (10,016,342) | $ (39,368) |
Other Financial Instruments: | | | | |
TBA Sale Commitments | $ (459,851,475) | $ - | $ (459,851,475) | $ - |
The following is a reconciliation of Investments in Securities and Derivative Instruments for which Level 3 inputs were used in determining value: |
Investments in Securities: | |
Beginning Balance | $ 93,393,811 |
Total Realized Gain (Loss) | 736,567 |
Total Unrealized Gain (Loss) | (4,374,581) |
Cost of Purchases | 2,218,424 |
Proceeds of Sales | (14,225,697) |
Amortization/Accretion | 157,857 |
Transfers in to Level 3 | 23,126,886 |
Transfers out of Level 3 | (23,248,319) |
Ending Balance | $ 77,784,948 |
The change in unrealized gain (loss) for the period attributable to Level 3 securities held at February 29, 2012 | $ (4,059,170) |
Derivative Instruments: | |
Swap Agreements | |
Beginning Balance | $ (32,859) |
Total Unrealized Gain (Loss) | (6,509) |
Transfers in to Level 3 | - |
Transfers out of Level 3 | - |
Ending Balance | $ (39,368) |
Realized gain (loss) on Swap Agreements for the period | $ 847 |
The change in unrealized gain (loss) for the period attributable to Level 3 Swap Agreements held at February 29, 2012 | $ (6,509) |
The information used in the above reconciliations represents fiscal year to date activity for any Investments in Securities and Derivative Instruments identified as using Level 3 inputs at either the beginning or the end of the current fiscal period. Transfers in or out of Level 3 represent the beginning value of any Security or Instrument where a change in the pricing level occurred from the beginning to the end of the period. The cost of purchases and the proceeds of sales may include securities received or delivered through corporate actions or exchanges. Realized and unrealized gains (losses) disclosed in the reconciliation are included in Net Gain (Loss) on the Fund's Statement of Operations. |
Value of Derivative Instruments |
The following table is a summary of the Fund's value of derivative instruments by risk exposure as of February 29, 2012. For additional information on derivative instruments, please refer to the Derivative Instruments section in the accompanying Notes to Financial Statements. |
Risk Exposure /
Derivative Type | Value |
| Asset | Liability |
Credit Risk | | |
Swap Agreements (a) | $ - | $ (10,824,550) |
Interest Rate Risk | | |
Swap Agreements (a) | 768,840 | - |
Total Value of Derivatives | $ 768,840 | $ (10,824,550) |
(a) Value is disclosed on the Statement of Assets and Liabilities in the Swap agreements, at value line-items. |
See accompanying notes which are an integral part of the financial statements.
Semiannual Report
Statement of Assets and Liabilities
| February 29, 2012 |
| | |
Assets | | |
Investment in securities, at value - See accompanying schedule: Unaffiliated issuers (cost $10,167,623,550) | $ 10,883,733,966 | |
Fidelity Central Funds (cost $4,429,188,852) | 4,665,835,827 | |
Total Investments (cost $14,596,812,402) | | $ 15,549,569,793 |
Cash | | 396,270 |
Receivable for investments sold, regular delivery | | 30,627,061 |
Receivable for TBA sale commitments | | 459,631,945 |
Receivable for fund shares sold | | 68,291,615 |
Dividends receivable | | 49,602 |
Interest receivable | | 82,373,080 |
Distributions receivable from Fidelity Central Funds | | 114,527 |
Swap agreements, at value | | 768,840 |
Other receivables | | 52,956 |
Total assets | | 16,191,875,689 |
| | |
Liabilities | | |
Payable for investments purchased
Regular delivery | $ 7,573,428 | |
Delayed delivery | 571,763,451 | |
TBA sale commitments, at value | 459,851,475 | |
Payable for swap agreements | 437,074 | |
Payable for fund shares redeemed | 219,575,935 | |
Distributions payable | 1,792,312 | |
Swap agreements, at value | 10,824,550 | |
Accrued management fee | 3,902,375 | |
Distribution and service plan fees payable | 381,166 | |
Other affiliated payables | 1,851,224 | |
Other payables and accrued expenses | 52,990 | |
Total liabilities | | 1,278,005,980 |
| | |
Net Assets | | $ 14,913,869,709 |
Net Assets consist of: | | |
Paid in capital | | $ 14,076,252,628 |
Undistributed net investment income | | 56,823,931 |
Accumulated undistributed net realized gain (loss) on investments and foreign currency transactions | | (162,164,212) |
Net unrealized appreciation (depreciation) on investments and assets and liabilities in foreign currencies | | 942,957,362 |
Net Assets | | $ 14,913,869,709 |
See accompanying notes which are an integral part of the financial statements.
Semiannual Report
Financial Statements - continued
Statement of Assets and Liabilities - continued
| February 29, 2012 |
| | |
Calculation of Maximum Offering Price Class A:
Net Asset Value and redemption price per share ($1,455,915,037 ÷ 131,903,359 shares) | | $ 11.04 |
| | |
Maximum offering price per share (100/96.00 of $11.04) | | $ 11.50 |
Class T:
Net Asset Value and redemption price per share ($51,083,887 ÷ 4,633,379 shares) | | $ 11.03 |
| | |
Maximum offering price per share (100/96.00 of $11.03) | | $ 11.49 |
Class B:
Net Asset Value and offering price per share ($10,146,736 ÷ 919,050 shares)A | | $ 11.04 |
| | |
Class C:
Net Asset Value and offering price per share ($80,520,955 ÷ 7,295,759 shares)A | | $ 11.04 |
| | |
Total Bond:
Net Asset Value, offering price and redemption price per share ($12,793,589,188 ÷ 1,159,258,348 shares) | | $ 11.04 |
| | |
Institutional Class:
Net Asset Value, offering price and redemption price per share ($522,613,906 ÷ 47,419,000 shares) | | $ 11.02 |
A Redemption price per share is equal to net asset value less any applicable contingent deferred sales charge.
See accompanying notes which are an integral part of the financial statements.
Semiannual Report
Statement of Operations
| Six months ended February 29, 2012 |
| | |
Investment Income | | |
Dividends | | $ 481,550 |
Interest | | 219,155,566 |
Income from Fidelity Central Funds | | 57,348,846 |
Total income | | 276,985,962 |
| | |
Expenses | | |
Management fee | $ 22,029,268 | |
Transfer agent fees | 8,145,685 | |
Distribution and service plan fees | 2,120,856 | |
Fund wide operations fee | 2,297,369 | |
Independent trustees' compensation | 25,055 | |
Miscellaneous | 18,995 | |
Total expenses before reductions | 34,637,228 | |
Expense reductions | (1,594) | 34,635,634 |
Net investment income (loss) | | 242,350,328 |
Realized and Unrealized Gain (Loss) Net realized gain (loss) on: | | |
Investment securities: | | |
Unaffiliated issuers | 135,469,894 | |
Foreign currency transactions | (537) | |
Swap agreements | (35,135) | |
Total net realized gain (loss) | | 135,434,222 |
Change in net unrealized appreciation (depreciation) on: Investment securities | 116,673,979 | |
Assets and liabilities in foreign currencies | 29 | |
Swap agreements | (31,831) | |
Delayed delivery commitments | (2,162,465) | |
Total change in net unrealized appreciation (depreciation) | | 114,479,712 |
Net gain (loss) | | 249,913,934 |
Net increase (decrease) in net assets resulting from operations | | $ 492,264,262 |
See accompanying notes which are an integral part of the financial statements.
Semiannual Report
Financial Statements - continued
Statement of Changes in Net Assets
| Six months ended February 29,
2012 | Year ended
August 31,
2011 |
Increase (Decrease) in Net Assets | | |
Operations | | |
Net investment income (loss) | $ 242,350,328 | $ 503,424,089 |
Net realized gain (loss) | 135,434,222 | 279,450,476 |
Change in net unrealized appreciation (depreciation) | 114,479,712 | (49,093,458) |
Net increase (decrease) in net assets resulting
from operations | 492,264,262 | 733,781,107 |
Distributions to shareholders from net investment income | (261,764,856) | (485,397,438) |
Distributions to shareholders from net realized gain | (215,970,386) | (244,516,243) |
Total distributions | (477,735,242) | (729,913,681) |
Share transactions - net increase (decrease) | 1,590,674,402 | 417,450,284 |
Total increase (decrease) in net assets | 1,605,203,422 | 421,317,710 |
| | |
Net Assets | | |
Beginning of period | 13,308,666,287 | 12,887,348,577 |
End of period (including undistributed net investment income of $56,823,931 and undistributed net investment income of $76,238,459, respectively) | $ 14,913,869,709 | $ 13,308,666,287 |
See accompanying notes which are an integral part of the financial statements.
Semiannual Report
Financial Highlights - Class A
| Six months ended
February 29, | Years ended August 31, |
| 2012 | 2011 | 2010 | 2009 | 2008 | 2007 |
Selected Per-Share Data | | | | | | |
Net asset value, beginning of period | $ 11.04 | $ 11.05 | $ 10.28 | $ 10.07 | $ 10.27 | $ 10.39 |
Income from Investment Operations | | | | | | |
Net investment income (loss)E | .172 | .381 | .428 | .494 | .488 | .508 |
Net realized and unrealized gain (loss) | .191 | .187 | .778 | .231 | (.189) | (.141) |
Total from investment operations | .363 | .568 | 1.206 | .725 | .299 | .367 |
Distributions from net investment income | (.188) | (.367) | (.402) | (.447) | (.474) | (.470) |
Distributions from net realized gain | (.175) | (.211) | (.034) | (.068) | (.025) | (.017) |
Total distributions | (.363) | (.578) | (.436) | (.515) | (.499) | (.487) |
Net asset value, end of period | $ 11.04 | $ 11.04 | $ 11.05 | $ 10.28 | $ 10.07 | $ 10.27 |
Total ReturnB,C,D | 3.37% | 5.35% | 11.97% | 7.79% | 2.93% | 3.57% |
Ratios to Average Net AssetsF,H | | | | | | |
Expenses before reductions | .84%A | .83% | .82% | .80% | .80% | .77% |
Expenses net of fee waivers, if any | .84%A | .83% | .82% | .80% | .80% | .77% |
Expenses net of all reductions | .84%A | .83% | .82% | .80% | .80% | .77% |
Net investment income (loss) | 3.16%A | 3.50% | 4.00% | 5.17% | 4.77% | 4.93% |
Supplemental Data | | | | | | |
Net assets, end of period (000 omitted) | $ 1,455,915 | $ 1,225,165 | $ 805,816 | $ 107,998 | $ 80,755 | $ 48,076 |
Portfolio turnover rateG | 137%A | 168%I | 130% | 104%I | 122% | 116%I |
A Annualized
B Total returns for periods of less than one year are not annualized.
C Total returns would have been lower if certain expenses had not been reduced during the applicable periods shown.
D Total returns do not include the effect of the sales charges.
E Calculated based on average shares outstanding during the period.
F Fees and expenses of any underlying Fidelity Central Funds are not included in the Fund's expense ratio. The Fund indirectly bears its proportionate share of the expenses of any underlying Fidelity Central Funds.
G Amount does not include the portfolio activity of any underlying Fidelity Central Funds.
H Expense ratios reflect operating expenses of the class. Expenses before reductions do not reflect amounts reimbursed by the investment adviser or reductions from brokerage service arrangements or reductions from other expense offset arrangements and do not represent the amount paid by the class during periods when reimbursements or reductions occur. Expenses net of fee waivers reflect expenses after reimbursement by the investment adviser but prior to reductions from brokerage service arrangements or other expense offset arrangements. Expenses net of all reductions represent the net expenses paid by the class.
I The portfolio turnover rate excludes liquidations and redemptions executed in-kind from Affiliated Central Funds.
See accompanying notes which are an integral part of the financial statements.
Semiannual Report
Financial Highlights - Class T
| Six months ended
February 29, | Years ended August 31, |
| 2012 | 2011 | 2010 | 2009 | 2008 | 2007 |
Selected Per-Share Data | | | | | | |
Net asset value, beginning of period | $ 11.03 | $ 11.04 | $ 10.27 | $ 10.06 | $ 10.26 | $ 10.38 |
Income from Investment Operations | | | | | | |
Net investment income (loss)E | .177 | .386 | .426 | .488 | .489 | .508 |
Net realized and unrealized gain (loss) | .189 | .186 | .778 | .233 | (.191) | (.143) |
Total from investment operations | .366 | .572 | 1.204 | .721 | .298 | .365 |
Distributions from net investment income | (.191) | (.371) | (.400) | (.443) | (.473) | (.468) |
Distributions from net realized gain | (.175) | (.211) | (.034) | (.068) | (.025) | (.017) |
Total distributions | (.366) | (.582) | (.434) | (.511) | (.498) | (.485) |
Net asset value, end of period | $ 11.03 | $ 11.03 | $ 11.04 | $ 10.27 | $ 10.06 | $ 10.26 |
Total ReturnB,C,D | 3.41% | 5.39% | 11.97% | 7.74% | 2.92% | 3.55% |
Ratios to Average Net AssetsF,H | | | | | | |
Expenses before reductions | .78%A | .80% | .82% | .85% | .81% | .78% |
Expenses net of fee waivers, if any | .78%A | .80% | .82% | .85% | .81% | .78% |
Expenses net of all reductions | .78%A | .80% | .82% | .85% | .80% | .78% |
Net investment income (loss) | 3.23%A | 3.54% | 4.01% | 5.12% | 4.76% | 4.92% |
Supplemental Data | | | | | | |
Net assets, end of period (000 omitted) | $ 51,084 | $ 60,500 | $ 71,349 | $ 48,090 | $ 38,574 | $ 42,191 |
Portfolio turnover rateG | 137%A | 168%I | 130% | 104%I | 122% | 116%I |
A Annualized
B Total returns for periods of less than one year are not annualized.
C Total returns would have been lower if certain expenses had not been reduced during the applicable periods shown.
D Total returns do not include the effect of the sales charges.
E Calculated based on average shares outstanding during the period.
F Fees and expenses of any underlying Fidelity Central Funds are not included in the Fund's expense ratio. The Fund indirectly bears its proportionate share of the expenses of any underlying Fidelity Central Funds.
G Amount does not include the portfolio activity of any underlying Fidelity Central Funds.
H Expense ratios reflect operating expenses of the class. Expenses before reductions do not reflect amounts reimbursed by the investment adviser or reductions from brokerage service arrangements or reductions from other expense offset arrangements and do not represent the amount paid by the class during periods when reimbursements or reductions occur. Expenses net of fee waivers reflect expenses after reimbursement by the investment adviser but prior to reductions from brokerage service arrangements or other expense offset arrangements. Expenses net of all reductions represent the net expenses paid by the class.
I The portfolio turnover rate excludes liquidations and redemptions executed in-kind from Affiliated Central Funds.
See accompanying notes which are an integral part of the financial statements.
Semiannual Report
Financial Highlights - Class B
| Six months ended
February 29, | Years ended August 31, |
| 2012 | 2011 | 2010 | 2009 | 2008 | 2007 |
Selected Per-Share Data | | | | | | |
Net asset value, beginning of period | $ 11.04 | $ 11.06 | $ 10.28 | $ 10.07 | $ 10.27 | $ 10.39 |
Income from Investment Operations | | | | | | |
Net investment income (loss)E | .136 | .307 | .351 | .423 | .413 | .432 |
Net realized and unrealized gain (loss) | .191 | .177 | .787 | .233 | (.190) | (.145) |
Total from investment operations | .327 | .484 | 1.138 | .656 | .223 | .287 |
Distributions from net investment income | (.152) | (.293) | (.324) | (.378) | (.398) | (.390) |
Distributions from net realized gain | (.175) | (.211) | (.034) | (.068) | (.025) | (.017) |
Total distributions | (.327) | (.504) | (.358) | (.446) | (.423) | (.407) |
Net asset value, end of period | $ 11.04 | $ 11.04 | $ 11.06 | $ 10.28 | $ 10.07 | $ 10.27 |
Total ReturnB,C,D | 3.03% | 4.54% | 11.26% | 7.01% | 2.17% | 2.77% |
Ratios to Average Net AssetsF,H | | | | | | |
Expenses before reductions | 1.51%A | 1.52% | 1.53% | 1.53% | 1.54% | 1.53% |
Expenses net of fee waivers, if any | 1.51%A | 1.52% | 1.53% | 1.53% | 1.54% | 1.53% |
Expenses net of all reductions | 1.51%A | 1.52% | 1.53% | 1.53% | 1.54% | 1.53% |
Net investment income (loss) | 2.50%A | 2.82% | 3.29% | 4.44% | 4.03% | 4.17% |
Supplemental Data | | | | | | |
Net assets, end of period (000 omitted) | $ 10,147 | $ 9,225 | $ 13,017 | $ 9,054 | $ 9,645 | $ 6,054 |
Portfolio turnover rateG | 137%A | 168%I | 130% | 104%I | 122% | 116%I |
A Annualized
B Total returns for periods of less than one year are not annualized.
C Total returns would have been lower if certain expenses had not been reduced during the applicable periods shown.
D Total returns do not include the effect of the contingent deferred sales charge.
E Calculated based on average shares outstanding during the period.
F Fees and expenses of any underlying Fidelity Central Funds are not included in the Fund's expense ratio. The Fund indirectly bears its proportionate share of the expenses of any underlying Fidelity Central Funds.
G Amount does not include the portfolio activity of any underlying Fidelity Central Funds.
H Expense ratios reflect operating expenses of the class. Expenses before reductions do not reflect amounts reimbursed by the investment adviser or reductions from brokerage service arrangements or reductions from other expense offset arrangements and do not represent the amount paid by the class during periods when reimbursements or reductions occur. Expenses net of fee waivers reflect expenses after reimbursement by the investment adviser but prior to reductions from brokerage service arrangements or other expense offset arrangements. Expenses net of all reductions represent the net expenses paid by the class.
I The portfolio turnover rate excludes liquidations and redemptions executed in-kind from Affiliated Central Funds.
See accompanying notes which are an integral part of the financial statements.
Semiannual Report
Financial Highlights - Class C
| Six months ended
February 29, | Years ended August 31, |
| 2012 | 2011 | 2010 | 2009 | 2008 | 2007 |
Selected Per-Share Data | | | | | | |
Net asset value, beginning of period | $ 11.04 | $ 11.05 | $ 10.28 | $ 10.07 | $ 10.27 | $ 10.39 |
Income from Investment Operations | | | | | | |
Net investment income (loss)E | .135 | .308 | .354 | .425 | .413 | .429 |
Net realized and unrealized gain (loss) | .191 | .187 | .778 | .232 | (.189) | (.145) |
Total from investment operations | .326 | .495 | 1.132 | .657 | .224 | .284 |
Distributions from net investment income | (.151) | (.294) | (.328) | (.379) | (.399) | (.387) |
Distributions from net realized gain | (.175) | (.211) | (.034) | (.068) | (.025) | (.017) |
Total distributions | (.326) | (.505) | (.362) | (.447) | (.424) | (.404) |
Net asset value, end of period | $ 11.04 | $ 11.04 | $ 11.05 | $ 10.28 | $ 10.07 | $ 10.27 |
Total ReturnB,C,D | 3.02% | 4.65% | 11.20% | 7.02% | 2.18% | 2.75% |
Ratios to Average Net AssetsF,H | | | | | | |
Expenses before reductions | 1.52%A | 1.51% | 1.50% | 1.52% | 1.53% | 1.55% |
Expenses net of fee waivers, if any | 1.52%A | 1.51% | 1.50% | 1.52% | 1.53% | 1.55% |
Expenses net of all reductions | 1.52%A | 1.51% | 1.50% | 1.52% | 1.53% | 1.55% |
Net investment income (loss) | 2.48%A | 2.83% | 3.32% | 4.45% | 4.03% | 4.15% |
Supplemental Data | | | | | | |
Net assets, end of period (000 omitted) | $ 80,521 | $ 63,867 | $ 91,439 | $ 55,958 | $ 28,786 | $ 18,890 |
Portfolio turnover rateG | 137%A | 168%I | 130% | 104%I | 122% | 116%I |
A Annualized
B Total returns for periods of less than one year are not annualized.
C Total returns would have been lower if certain expenses had not been reduced during the applicable periods shown.
D Total returns do not include the effect of the contingent deferred sales charge.
E Calculated based on average shares outstanding during the period.
F Fees and expenses of any underlying Fidelity Central Funds are not included in the Fund's expense ratio. The Fund indirectly bears its proportionate share of the expenses of any underlying Fidelity Central Funds.
G Amount does not include the portfolio activity of any underlying Fidelity Central Funds.
H Expense ratios reflect operating expenses of the class. Expenses before reductions do not reflect amounts reimbursed by the investment adviser or reductions from brokerage service arrangements or reductions from other expense offset arrangements and do not represent the amount paid by the class during periods when reimbursements or reductions occur. Expenses net of fee waivers reflect expenses after reimbursement by the investment adviser but prior to reductions from brokerage service arrangements or other expense offset arrangements. Expenses net of all reductions represent the net expenses paid by the class.
I The portfolio turnover rate excludes liquidations and redemptions executed in-kind from Affiliated Central Funds.
See accompanying notes which are an integral part of the financial statements.
Semiannual Report
Financial Highlights - Total Bond
| Six months ended
February 29, | Years ended August 31, |
| 2012 | 2011 | 2010 | 2009 | 2008 | 2007 |
Selected Per-Share Data | | | | | | |
Net asset value, beginning of period | $ 11.04 | $ 11.05 | $ 10.28 | $ 10.07 | $ 10.27 | $ 10.39 |
Income from Investment Operations | | | | | | |
Net investment income (loss)D | .193 | .423 | .466 | .527 | .524 | .543 |
Net realized and unrealized gain (loss) | .191 | .187 | .778 | .232 | (.189) | (.143) |
Total from investment operations | .384 | .610 | 1.244 | .759 | .335 | .400 |
Distributions from net investment income | (.209) | (.409) | (.440) | (.481) | (.510) | (.503) |
Distributions from net realized gain | (.175) | (.211) | (.034) | (.068) | (.025) | (.017) |
Total distributions | (.384) | (.620) | (.474) | (.549) | (.535) | (.520) |
Net asset value, end of period | $ 11.04 | $ 11.04 | $ 11.05 | $ 10.28 | $ 10.07 | $ 10.27 |
Total ReturnB,C | 3.57% | 5.76% | 12.37% | 8.17% | 3.29% | 3.89% |
Ratios to Average Net AssetsE,G | | | | | | |
Expenses before reductions | .45%A | .45% | .45% | .45% | .45% | .45% |
Expenses net of fee waivers, if any | .45%A | .45% | .45% | .45% | .45% | .45% |
Expenses net of all reductions | .45%A | .45% | .45% | .45% | .45% | .45% |
Net investment income (loss) | 3.55%A | 3.89% | 4.37% | 5.52% | 5.12% | 5.25% |
Supplemental Data | | | | | | |
Net assets, end of period (000 omitted) | $ 12,793,589 | $ 11,418,458 | $ 11,342,385 | $ 10,863,828 | $ 9,976,432 | $ 6,450,177 |
Portfolio turnover rateF | 137%A | 168%H | 130% | 104%H | 122% | 116%H |
A Annualized
B Total returns for periods of less than one year are not annualized.
C Total returns would have been lower if certain expenses had not been reduced during the applicable periods shown.
D Calculated based on average shares outstanding during the period.
E Fees and expenses of any underlying Fidelity Central Funds are not included in the Fund's expense ratio. The Fund indirectly bears its proportionate share of the expenses of any underlying Fidelity Central Funds.
F Amount does not include the portfolio activity of any underlying Fidelity Central Funds.
G Expense ratios reflect operating expenses of the class. Expenses before reductions do not reflect amounts reimbursed by the investment adviser or reductions from brokerage service arrangements or reductions from other expense offset arrangements and do not represent the amount paid by the class during periods when reimbursements or reductions occur. Expenses net of fee waivers reflect expenses after reimbursement by the investment adviser but prior to reductions from brokerage service arrangements or other expense offset arrangements. Expenses net of all reductions represent the net expenses paid by the class.
H The portfolio turnover rate excludes liquidations and redemptions executed in-kind from Affiliated Central Funds.
See accompanying notes which are an integral part of the financial statements.
Semiannual Report
Financial Highlights - Institutional Class
| Six months ended
February 29, | Years ended August 31, |
| 2012 | 2011 | 2010 | 2009 | 2008 | 2007 |
Selected Per-Share Data | | | | | | |
Net asset value, beginning of period | $ 11.02 | $ 11.04 | $ 10.26 | $ 10.06 | $ 10.26 | $ 10.38 |
Income from Investment Operations | | | | | | |
Net investment income (loss)D | .188 | .413 | .458 | .518 | .516 | .527 |
Net realized and unrealized gain (loss) | .191 | .178 | .788 | .224 | (.186) | (.134) |
Total from investment operations | .379 | .591 | 1.246 | .742 | .330 | .393 |
Distributions from net investment income | (.204) | (.400) | (.432) | (.474) | (.505) | (.496) |
Distributions from net realized gain | (.175) | (.211) | (.034) | (.068) | (.025) | (.017) |
Total distributions | (.379) | (.611) | (.466) | (.542) | (.530) | (.513) |
Net asset value, end of period | $ 11.02 | $ 11.02 | $ 11.04 | $ 10.26 | $ 10.06 | $ 10.26 |
Total ReturnB,C | 3.53% | 5.58% | 12.41% | 7.99% | 3.24% | 3.83% |
Ratios to Average Net AssetsE,G | | | | | | |
Expenses before reductions | .54%A | .54% | .52% | .53% | .51% | .50% |
Expenses net of fee waivers, if any | .54%A | .54% | .52% | .53% | .51% | .50% |
Expenses net of all reductions | .54%A | .54% | .52% | .53% | .51% | .49% |
Net investment income (loss) | 3.46%A | 3.80% | 4.30% | 5.45% | 5.06% | 5.21% |
Supplemental Data | | | | | | |
Net assets, end of period (000 omitted) | $ 522,614 | $ 531,451 | $ 509,388 | $ 884,991 | $ 947,791 | $ 348,636 |
Portfolio turnover rateF | 137%A | 168%H | 130% | 104%H | 122% | 116%H |
A Annualized
B Total returns for periods of less than one year are not annualized.
C Total returns would have been lower if certain expenses had not been reduced during the applicable periods shown.
D Calculated based on average shares outstanding during the period.
E Fees and expenses of any underlying Fidelity Central Funds are not included in the Fund's expense ratio. The Fund indirectly bears its proportionate share of the expenses of any underlying Fidelity Central Funds.
F Amount does not include the portfolio activity of any underlying Fidelity Central Funds.
G Expense ratios reflect operating expenses of the class. Expenses before reductions do not reflect amounts reimbursed by the investment adviser or reductions from brokerage service arrangements or reductions from other expense offset arrangements and do not represent the amount paid by the class during periods when reimbursements or reductions occur. Expenses net of fee waivers reflect expenses after reimbursement by the investment adviser but prior to reductions from brokerage service arrangements or other expense offset arrangements. Expenses net of all reductions represent the net expenses paid by the class.
H The portfolio turnover rate excludes liquidations and redemptions executed in-kind from Affiliated Central Funds.
See accompanying notes which are an integral part of the financial statements.
Semiannual Report
Notes to Financial Statements
For the period ended February 29, 2012
1. Organization.
Fidelity Total Bond Fund (the Fund) is a fund of Fidelity Income Fund (the Trust) and is authorized to issue an unlimited number of shares. The Trust is registered under the Investment Company Act of 1940, as amended (the 1940 Act), as an open-end management investment company organized as a Massachusetts business trust. The Fund offers Class A, Class T, Class C, Total Bond and Institutional Class shares, each of which, along with Class B shares, has equal rights as to assets and voting privileges. Effective after the close of business on September 1, 2010, Class B shares were closed to new accounts and additional purchases, except for exchanges and reinvestments. The Fund offered Class F shares during the period June 26, 2009 through September 30, 2010, and all outstanding shares were redeemed by September 30, 2010. Each class has exclusive voting rights with respect to matters that affect that class. Class B shares will automatically convert to Class A shares after a holding period of seven years from the initial date of purchase. Investment income, realized and unrealized capital gains and losses, the common expenses of the Fund, and certain fund-level expense reductions, if any, are allocated on a pro-rata basis to each class based on the relative net assets of each class to the total net assets of the Fund. Each class differs with respect to transfer agent and distribution and service plan fees incurred. Certain expense reductions may also differ by class.
2. Investments in Fidelity Central Funds.
The Fund invests in Fidelity Central Funds, which are open-end investment companies available only to other investment companies and accounts managed by Fidelity Management & Research Company (FMR) and its affiliates. The Fund's Schedule of Investments lists each of the Fidelity Central Funds held as of period end, if any, as an investment of the Fund, but does not include the underlying holdings of each Fidelity Central Fund. As an Investing Fund, the Fund indirectly bears its proportionate share of the expenses of the underlying Fidelity Central Funds.
Based on their investment objective, each Fidelity Central Fund may invest or participate in various investment vehicles or strategies that are similar to those of the Fund. These strategies are consistent with the investment objectives of the Fund and may involve certain economic risks which may cause a decline in value of each of the Fidelity Central Funds and thus a decline in the value of the Fund. The Money Market Central Funds seek preservation of capital and current income and are managed by Fidelity Investments Money Management, Inc. (FIMM), an affiliate of FMR.
A complete unaudited list of holdings for each Fidelity Central Fund is available upon request or at the Securities and Exchange Commission (the SEC) web site at www.sec.gov. In addition, the financial statements of the Fidelity Central Funds, which are not covered by the Fund's Report of Independent Registered Public Accounting Firm, are available on the SEC web site or upon request.
Semiannual Report
Notes to Financial Statements - continued
2. Investments in Fidelity Central Funds - continued
Fidelity Central Fund | | Investment Manager | | Investment Objective | | Investment Practices |
Fidelity Floating Rate Central Fund | | FMR Co., Inc. (FMRC) | | Seeks a high level of income by normally investing in floating rate loans and other floating rate securities. | | Loans & Direct Debt Instruments Repurchase Agreements Restricted Securities |
Fidelity Mortgage Backed Securities Central Fund | | FIMM | | Seeks a high level of income by normally investing in investment-grade mortgage-related securities and repurchase agreements for those securities. | | Delayed Delivery & When Issued Securities Futures Repurchase Agreements Swap Agreements |
An unaudited holdings listing for the Fund, which presents direct holdings as well as the pro-rata share of any securities and other investments held indirectly through its investment in underlying non-money market Fidelity Central Funds, is available at fidelity.com and/or advisor.fidelity.com, as applicable. A complete unaudited list of holdings for each Fidelity Central Fund is available upon request or at the Securities and Exchange Commission (the SEC) web site at www.sec.gov. In addition, the financial statements of the Fidelity Central Funds which contain the significant accounting policies (including security valuation policies) of those funds, which are not covered by the Fund's Report of Independent Registered Public Accounting Firm, are available on the SEC web site or upon request.
3. Significant Accounting Policies.
The financial statements have been prepared in conformity with accounting principles generally accepted in the United States of America (GAAP), which require management to make certain estimates and assumptions at the date of the financial statements. Actual results could differ from those estimates. Subsequent events, if any, through the date that the financial statements were issued have been evaluated in the preparation of the financial statements. The following summarizes the significant accounting policies of the Fund:
Security Valuation. Investments are valued as of 4:00 p.m. Eastern time on the last calendar day of the period. The Fund uses independent pricing services approved by the Board of Trustees to value its investments. When current market prices or quotations are not readily available or reliable, valuations may be determined in good faith in accordance with procedures adopted by the Board of Trustees. Factors used in determining
Semiannual Report
3. Significant Accounting Policies - continued
Security Valuation - continued
value may include market or security specific events, changes in interest rates and credit quality. The frequency with which these procedures are used cannot be predicted and they may be utilized to a significant extent. The value used for net asset value (NAV) calculation under these procedures may differ from published prices for the same securities.
The Fund categorizes the inputs to valuation techniques used to value its investments into a disclosure hierarchy consisting of three levels as shown below:
Level 1 - quoted prices in active markets for identical investments
Level 2 - other significant observable inputs (including quoted prices for similar investments, interest rates, prepayment speeds, etc.)
Level 3 - unobservable inputs (including the Fund's own assumptions based on the best information available)
Changes in valuation techniques may result in transfers in or out of an assigned level within the disclosure hierarchy. The aggregate value of investments by input level, as of February 29, 2012 for the Fund's investments, as well as a roll forward of Level 3 securities, is included at the end of the Fund's Schedule of Investments. Valuation techniques used to value the Fund's investments by major category are as follows:
Debt securities, including restricted securities, are valued based on evaluated prices received from independent pricing services or from dealers who make markets in such securities. For corporate bonds, bank notes, floating rate loans, foreign government and government agency obligations, municipal securities, preferred securities, supranational obligations, U.S. government and government agency obligations and sovereign loan participations, pricing services utilize matrix pricing which considers yield or price of bonds of comparable quality, coupon, maturity and type as well as dealer supplied prices and are generally categorized as Level 2 in the hierarchy. For asset backed securities, collateralized mortgage obligations, commercial mortgage securities and U.S. government agency mortgage securities, pricing services utilize matrix pricing which considers prepayment speed assumptions, attributes of the collateral, yield or price of bonds of comparable quality, coupon, maturity and type as well as dealer supplied prices and, accordingly, such securities are generally categorized as Level 2 in the hierarchy. Swaps are marked-to-market daily based on valuations from independent pricing services or dealer-supplied valuations and changes in value are recorded as unrealized appreciation (depreciation). Pricing services utilize matrix pricing which considers comparisons to interest rate curves, credit spread curves, default possibilities and recovery rates and, as a result, swaps are generally categorized as Level 2 in the hierarchy. When independent
Semiannual Report
Notes to Financial Statements - continued
3. Significant Accounting Policies - continued
Security Valuation - continued
prices are unavailable or unreliable, debt securities and swaps may be valued utilizing pricing matrices which consider similar factors that would be used by independent pricing services. These are generally categorized as Level 2 in the hierarchy but may be Level 3 depending on the circumstances.
Equity securities, including restricted securities, for which market quotations are readily available, are valued at the last reported sale price or official closing price as reported by an independent pricing service on the primary market or exchange on which they are traded and are categorized as Level 1 in the hierarchy. In the event there were no sales during the day or closing prices are not available, securities are valued at the last quoted bid price or may be valued using the last available price and are generally categorized as Level 2 in the hierarchy. Utilizing these techniques may result in transfers between Level 1 and Level 2. For restricted securities and private placements where observable inputs are limited, assumptions about market activity and risk are used and are categorized as Level 3 in the hierarchy.
Investments in open-end mutual funds, including the Fidelity Central Funds, are valued at their closing net asset value each business day and are categorized as Level 1 in the hierarchy.
New Accounting Pronouncements. In May 2011, the Financial Accounting Standards Board issued Accounting Standard Update No. 2011-04, Fair Value Measurement (Topic 820) - Amendments to Achieve Common Fair Value Measurement and Disclosure Requirements in U.S. GAAP and IFRSs. The update is effective during interim and annual periods beginning after December 15, 2011 and will result in additional disclosure for transfers between levels as well as expanded disclosure for securities categorized as Level 3 under the fair value hierarchy.
In December 2011, the Financial Accounting Standards Board issued Accounting Standard Update No. 2011-11, Disclosures about Offsetting Assets and Liabilities. The update creates new disclosure requirements requiring entities to disclose both gross and net information for derivatives and other financial instruments that are either offset in the Statement of Assets and Liabilities or subject to an enforceable master netting arrangement or similar agreement. The disclosure requirements are effective for interim and annual reporting periods beginning on or after January 1, 2013. Management is currently evaluating the impact of the update's adoption on the Fund's financial statement disclosures.
Semiannual Report
3. Significant Accounting Policies - continued
Foreign Currency. The Fund may use foreign currency contracts to facilitate transactions in foreign-denominated securities. Gains and losses from these transactions may arise from changes in the value of the foreign currency or if the counterparties do not perform under the contracts' terms.
Foreign-denominated assets, including investment securities, and liabilities are translated into U.S. dollars at the exchange rate at period end. Purchases and sales of investment securities, income and dividends received and expenses denominated in foreign currencies are translated into U.S. dollars at the exchange rate in effect on the transaction date.
The effects of exchange rate fluctuations on investments are included with the net realized and unrealized gain (loss) on investment securities. Other foreign currency transactions resulting in realized and unrealized gain (loss) are disclosed separately.
Investment Transactions and Income. For financial reporting purposes, the Fund's investment holdings and NAV include trades executed through the end of the last business day of the period. The NAV per share for processing shareholder transactions is calculated as of the close of business of the New York Stock Exchange (NYSE), normally 4:00 p.m. Eastern time and includes trades executed through the end of the prior business day. Gains and losses on securities sold are determined on the basis of identified cost. Dividend income is recorded on the ex-dividend date, except for certain dividends from foreign securities where the ex-dividend date may have passed, which are recorded as soon as the Fund is informed of the ex-dividend date. Non-cash dividends included in dividend income, if any, are recorded at the fair market value of the securities received. Distributions received on securities that represent a return of capital or capital gain are recorded as a reduction of cost of investments and/or as a realized gain. The Fund estimates the components of distributions received that may be considered return of capital distributions or capital gain distributions. Interest income and distributions from the Fidelity Central Funds are accrued as earned. Interest income includes coupon interest and amortization of premium and accretion of discount on debt securities. The principal amount on inflation-indexed securities is periodically adjusted to the rate of inflation and interest is accrued based on the principal amount. The adjustments to principal due to inflation are reflected as increases or decreases to interest income even though principal is not received until maturity. Investment income is recorded net of foreign taxes withheld where recovery of such taxes is uncertain. Debt obligations may be placed on non-accrual status and related interest income may be reduced by ceasing current accruals and writing off interest receivables when the collection of all or a portion of interest has become doubtful based on consistently applied procedures. A debt obligation is removed from non-accrual status when the issuer resumes interest payments or when collectability of interest is reasonably assured.
Semiannual Report
Notes to Financial Statements - continued
3. Significant Accounting Policies - continued
Expenses. Expenses directly attributable to a fund are charged to that fund. Expenses attributable to more than one fund are allocated among the respective funds on the basis of relative net assets or other appropriate methods. Expense estimates are accrued in the period to which they relate and adjustments are made when actual amounts are known.
Deferred Trustee Compensation. Under a Deferred Compensation Plan (the Plan), independent Trustees may elect to defer receipt of a portion of their annual compensation. Deferred amounts are invested in a cross-section of Fidelity funds, are marked-to-market and remain in the Fund until distributed in accordance with the Plan. The investment of deferred amounts and the offsetting payable to the Trustees are included in the accompanying Statement of Assets and Liabilities.
Income Tax Information and Distributions to Shareholders. Each year, the Fund intends to qualify as a regulated investment company under Subchapter M of the Internal Revenue Code, including distributing substantially all of its taxable income and realized gains. As a result, no provision for income taxes is required. The Fund files a U.S. federal tax return, in addition to state and local tax returns as required. A fund's federal income tax returns are subject to examination by the Internal Revenue Service (IRS) for a period of three fiscal years after they are filed. State and local tax returns may be subject to examination for an additional fiscal year depending on the jurisdiction. Foreign taxes are provided for based on the Fund's understanding of the tax rules and rates that exist in the foreign markets in which it invests.
Dividends are declared and recorded daily and paid monthly from net investment income. Distributions from realized gains, if any, are declared and recorded on the ex-dividend date. Income dividends and capital gain distributions are declared separately for each class. Income and capital gain distributions are determined in accordance with income tax regulations, which may differ from GAAP.
Capital accounts within the financial statements are adjusted for permanent book-tax differences. These adjustments have no impact on net assets or the results of operations. Temporary book-tax differences will reverse in a subsequent period.
Book-tax differences are primarily due to in-kind transactions, swap agreements, foreign currency transactions, default bonds, market discount, equity-debt classifications, partnerships (including allocations from Fidelity Central Funds), deferred trustee compensation and losses deferred due to wash sales.
Semiannual Report
3. Significant Accounting Policies - continued
Income Tax Information and Distributions to Shareholders - continued
The federal tax cost of investment securities and unrealized appreciation (depreciation) as of period end were as follows:
Gross unrealized appreciation | $ 908,340,228 |
Gross unrealized depreciation | (59,347,264) |
Net unrealized appreciation (depreciation) on securities and other investments | $ 848,992,964 |
| |
Tax cost | $ 14,700,576,829 |
4. Operating Policies.
Delayed Delivery Transactions and When-Issued Securities. During the period, the Fund transacted in securities on a delayed delivery or when-issued basis. Payment and delivery may take place after the customary settlement period for that security. The price of the underlying securities and the date when the securities will be delivered and paid for are fixed at the time the transaction is negotiated. During the time a delayed delivery sell is outstanding, the contract is marked-to-market daily and equivalent deliverable securities are held for the transaction. The securities purchased on a delayed delivery or when-issued basis are identified as such in the Fund's Schedule of Investments. The Fund may receive compensation for interest forgone in the purchase of a delayed delivery or when-issued security. With respect to purchase commitments, the Fund identifies securities as segregated in its records with a value at least equal to the amount of the commitment. Losses may arise due to changes in the value of the underlying securities or if the counterparty does not perform under the contract's terms, or if the issuer does not issue the securities due to political, economic, or other factors.
To-Be-Announced (TBA) Securities and Mortgage Dollar Rolls. During the period, the Fund transacted in TBA securities that involved buying or selling mortgage-backed securities (MBS) on a forward commitment basis. A TBA transaction typically does not designate the actual security to be delivered and only includes an approximate principal amount however; delivered securities must meet specified terms defined by industry guidelines, including issuer, rate and current principal amount outstanding on underlying mortgage pools. The Fund may enter into a TBA transaction with the intent to take possession of or deliver the underlying MBS, or the Fund may elect to extend the settlement by entering into either a mortgage or reverse mortgage dollar roll. Mortgage dollar rolls are transactions where a fund sells MBS and simultaneously agrees to repurchase MBS on a later date at a lower price and with the same counterparty. Reverse mortgage dollar rolls involve the purchase and simultaneous agreement to sell MBS on a later date
Semiannual Report
Notes to Financial Statements - continued
4. Operating Policies - continued
To-Be-Announced (TBA) Securities and Mortgage Dollar Rolls - continued
at a lower price. Transactions in mortgage dollar rolls and reverse mortgage dollar rolls are accounted for as purchases and sales and may result in an increase to the Fund's portfolio turnover rate.
Purchases and sales of TBA securities involve risks similar to those discussed above for delayed delivery and when-issued securities. Also, if the counterparty in a dollar roll or a reverse dollar roll transaction files for bankruptcy or becomes insolvent, the Fund's right to repurchase or sell securities may be limited. Additionally, when a fund sells TBA securities without already owning or having the right to obtain the deliverable securities (an uncovered forward commitment to sell), it incurs a risk of loss because it could have to purchase the securities at a price that is higher than the price at which it sold them. A fund may be unable to purchase the deliverable securities if the corresponding market is illiquid.
TBA securities subject to a forward commitment to sell at period end are included at the end of the Fund's Schedule of Investments under the caption "TBA Sale Commitments." The proceeds and value of these commitments are reflected in the Fund's Statement of Assets and Liabilities.
Restricted Securities. The Fund may invest in securities that are subject to legal or contractual restrictions on resale. These securities generally may be resold in transactions exempt from registration or to the public if the securities are registered. Disposal of these securities may involve time-consuming negotiations and expense, and prompt sale at an acceptable price may be difficult. Information regarding restricted securities is included at the end of the Fund's Schedule of Investments.
Loans and Other Direct Debt Instruments. The Fund invests in direct debt instruments which are interests in amounts owed to lenders by corporate or other borrowers. These instruments may be in the form of loans, trade claims or other receivables and may include standby financing commitments such as revolving credit facilities that obligate the Fund to supply additional cash to the borrower on demand. Loans may be acquired through assignment or participation, or may be made directly to a borrower. The Fund may be contractually obligated to receive approval from the agent bank and/or borrower prior to the sale of these loans.
5. Derivative Instruments.
Risk Exposures and the Use of Derivative Instruments. The Fund used derivative instruments (derivatives) including swap agreements, in order to meet its investment objectives. The strategy is to use derivatives to increase returns, to gain exposure to certain types of assets and to manage exposure to certain risks as defined below. The
Semiannual Report
5. Derivative Instruments - continued
Risk Exposures and the Use of Derivative Instruments - continued
success of any strategy involving derivatives depends on analysis of numerous economic factors, and if the strategies for investment do not work as intended, the Fund may not achieve its objectives.
The Fund's use of derivatives increased or decreased its exposure to the following risks:
Credit Risk | Credit risk relates to the ability of the issuer of a financial instrument to make further principal or interest payments on an obligation or commitment that it has to the Fund. |
Interest Rate Risk | Interest rate risk relates to the fluctuations in the value of interest-bearing securities due to changes in the prevailing levels of market interest rates. |
The Fund is also exposed to additional risks from investing in derivatives, such as liquidity risk and counterparty credit risk. Liquidity risk is the risk that the Fund will be unable to close out the derivative in the open market in a timely manner. Counterparty credit risk is the risk that the counterparty will not be able to fulfill its obligation to the Fund. Derivative counterparty credit risk is managed through formal evaluation of the creditworthiness of all potential counterparties. On certain over-the-counter (OTC) derivatives such as swap agreements, the Fund attempts to reduce its exposure to counterparty credit risk by entering into an International Swaps and Derivatives Association (ISDA) Master Agreement on a bilateral basis with each of its counterparties. The ISDA Master Agreement gives the Fund the right to terminate all transactions traded under such agreement if there is a certain deterioration in the credit quality of the counterparty. The ISDA Master Agreement gives each party the right, upon an event of default by the other party or a termination of the agreement, to close out all transactions traded under such agreement and to net amounts owed under each transaction to one net payable by one party to the other. To mitigate counterparty credit risk on OTC derivatives, the Fund receives collateral in the form of cash or securities once the Fund's net unrealized appreciation on outstanding derivative contracts under an ISDA Master Agreement exceeds certain applicable thresholds, subject to certain minimum transfer provisions. The collateral received is held in segregated accounts with the Fund's custodian bank in accordance with the collateral agreements entered into between the Fund, the counterparty and the Fund's custodian bank. The Fund could experience delays and costs in gaining access to the collateral even though it is held by the Fund's custodian bank. The Fund's maximum risk of loss from counterparty credit risk related to OTC derivatives is generally the aggregate unrealized appreciation and unpaid counterparty payments in excess of any collateral pledged by the counterparty to the Fund. The Fund may be required to pledge collateral for the benefit of the counterparties on OTC derivatives in an amount not less than the counterparty's unrealized appreciation on
Semiannual Report
Notes to Financial Statements - continued
5. Derivative Instruments - continued
Risk Exposures and the Use of Derivative Instruments - continued
outstanding derivative contracts, subject to certain minimum transfer provisions, and any such pledged collateral is identified in the Schedule of Investments. Derivatives involve, to varying degrees, risk of loss in excess of the amounts recognized in the Statement of Assets and Liabilities.
Net Realized Gain (Loss) and Change in Net Unrealized Appreciation (Depreciation) on Derivatives. The table below, which reflects the impacts of derivatives on the financial performance of the Fund, summarizes the net realized gain (loss) and change in net unrealized appreciation (depreciation) for derivatives during the period.
Risk Exposure / Derivative Type | Net Realized
Gain (Loss) | Change in
Net Unrealized Appreciation
(Depreciation) |
Credit Risk | | |
Swap Agreements | $ (1,026,485) | $ 968,549 |
Interest Rate Risk | | |
Swap Agreements | 991,350 | (1,000,380) |
Totals (a) | $ (35,135) | $ (31,831) |
(a) A summary of the value of derivatives by risk exposure as of period end, if any, is included at the end of the Schedule of Investment and is representative of activity for the period.
Swap Agreements. A swap agreement (swap) is a contract between two parties to exchange future cash flows at periodic intervals based on a notional principal amount.
Details of swaps open at period end are included in the Schedule of Investments under the caption "Swap Agreements." Swaps are marked-to-market daily and changes in value are recorded as unrealized appreciation or (depreciation) and reflected in the Statement of Assets and Liabilities. Any upfront premiums paid or received upon entering a swap to compensate for differences between stated terms of the agreement and prevailing market conditions (e.g. credit spreads, interest rates or other factors) are recorded as realized gain or (loss) ratably over the term of the swap. Payments are exchanged at specified intervals, accrued daily commencing with the effective date of the contract and recorded as realized gain or (loss). Realized gain or (loss) is also recorded in the event of an early termination of a swap. The net realized gain (loss) and change in net unrealized appreciation (depreciation) on swaps during the period is included in the Statement of Operations.
Interest Rate Swaps. Interest rate swaps are agreements between counterparties to exchange cash flows, one based on a fixed rate, and the other on a floating rate. The Fund entered into interest rate swaps to manage its exposure to interest rate changes. Changes in interest rates can have an effect on both the value of bond holdings as well as the amount of interest income earned. In general, the value of bonds can fall when interest rates rise and can rise when interest rates fall.
Semiannual Report
5. Derivative Instruments - continued
Credit Default Swaps. Credit default swaps enable the Fund to buy or sell protection on a debt security or a basket of securities against a defined credit event. Under the terms of a credit default swap the buyer of protection (buyer) receives credit protection in exchange for making periodic payments to the seller of protection (seller) based on a fixed percentage applied to a notional principal amount. In return for these payments, the seller acts as a guarantor of the creditworthiness of a reference obligation. The Fund enters into credit default swaps as a seller to gain credit exposure to an issuer and/or as a buyer to provide a measure of protection against defaults of an issuer. The issuer may be either a single issuer or a "basket" of issuers. Periodic payments are made over the life of the contract provided that no credit event occurs.
For credit default swaps on most corporate and sovereign issuers, credit events include bankruptcy, failure to pay, obligation acceleration or repudiation/moratorium. For credit default swaps on corporate or sovereign issuers, the obligation that may be put to the seller is not limited to the specific reference obligation described in the Schedule of Investments. For credit default swaps on asset-backed securities, a credit event may be triggered by events such as failure to pay principal, maturity extension, rating downgrade or write-down. For credit default swaps on asset-backed securities, the reference obligation described represents the security that may be put to the seller.
As a seller, if an underlying credit event occurs, the Fund will either pay the buyer an amount equal to the notional amount of the swap and take delivery of the reference obligation or underlying securities comprising an index or pay a net settlement amount of cash equal to the notional amount of the swap less the recovery value of the reference obligation or underlying securities comprising an index.
As a buyer, if an underlying credit event occurs, the Fund will either receive from the seller an amount equal to the notional amount of the swap and deliver the reference obligation or underlying securities comprising an index or receive a net settlement amount of cash equal to the notional amount of the swap less the recovery value of the reference obligation or underlying securities comprising an index.
Typically, the value of each credit default swap and credit rating disclosed for each reference obligation in the Schedule of Investments, where the Fund is the seller, can be used as measures of the current payment/performance risk of the swap. As the value of the swap changes as a positive or negative percentage of the total notional amount, the payment/performance risk may decrease or increase, respectively. In addition to these measures, FMR monitors a variety of factors including cash flow assumptions, market activity and market sentiment as part of its ongoing process of assessing payment/performance risk.
Semiannual Report
Notes to Financial Statements - continued
5. Derivative Instruments - continued
Credit Default Swaps - continued
The notional amount of credit default swaps is included in the Schedule of Investments and approximates the maximum potential amount of future payments that the Fund could be required to make if the Fund is the seller and a credit event were to occur. The total notional amount of all credit default swaps open at period end where the Fund is the seller amounted to $11,486,029 representing .08% of net assets.
6. Purchases and Sales of Investments.
Purchases and sales of securities (including the Fixed-Income Central Funds), other than short-term securities and U.S. government securities, aggregated $1,367,944,015 and $907,500,375, respectively.
7. Fees and Other Transactions with Affiliates.
Management Fee. FMR and its affiliates provide the Fund with investment management related services for which the Fund pays a monthly management fee. The management fee is the sum of an individual fund fee rate that is based on an annual rate of .20% of the Fund's average net assets and an annualized group fee rate that averaged .12% during the period. The group fee rate is based upon the average net assets of all the mutual funds advised by FMR. The group fee rate decreases as assets under management increase and increases as assets under management decrease. For the period, the total annualized management fee rate was .32% of the Fund's average net assets.
Distribution and Service Plan Fees. In accordance with Rule 12b-1 of the 1940 Act, the Fund has adopted separate Distribution and Service Plans for each class of shares. Certain classes pay Fidelity Distributors Corporation (FDC), an affiliate of FMR, separate Distribution and Service Fees, each of which is based on an annual percentage of each class' average net assets. In addition, FDC may pay financial intermediaries for selling shares of the Fund and providing shareholder support services. For the period, the Distribution and Service Fee rates, total fees and amounts retained by FDC were as follows:
| Distribution
Fee | Service
Fee | Total
Fees | Retained
by FDC |
Class A | -% | .25% | $ 1,660,460 | $ 11,202 |
Class T | -% | .25% | 63,989 | 579 |
Class B | .65% | .25% | 42,115 | 30,441 |
Class C | .75% | .25% | 354,292 | 69,959 |
| | | $ 2,120,856 | $ 112,181 |
Semiannual Report
7. Fees and Other Transactions with Affiliates - continued
Sales Load. FDC may receive a front-end sales charge of up to 4.00% for selling Class A shares and Class T shares, some of which is paid to financial intermediaries for selling shares of the Fund. Depending on the holding period, FDC may receive contingent deferred sales charges levied on Class A, Class T, Class B, and Class C redemptions. The deferred sales charges range from 5.00% to 1.00% for Class B, 1.00% for Class C, .75% for certain purchases of Class A shares and .25% for certain purchases of Class T shares.
For the period, sales charge amounts retained by FDC were as follows:
| Retained
by FDC |
Class A | $ 39,185 |
Class T | 10,423 |
Class B* | 6,181 |
Class C* | 4,600 |
| $ 60,389 |
* When Class B and Class C shares are initially sold, FDC pays commissions from its own resources to financial intermediaries through which the sales are made.
Transfer Agent Fees. Fidelity Investments Institutional Operations Company, Inc. (FIIOC), an affiliate of FMR, is the transfer, dividend disbursing and shareholder servicing agent for each class of the Fund. FIIOC receives account fees and asset-based fees that vary according to the account size and type of account of the shareholders of each respective class of the Fund, with the exception of Total Bond. FIIOC receives an asset-based fee of .10% of Total Bond's average net assets. FIIOC pays for typesetting, printing and mailing of shareholder reports, except proxy statements. For the period, transfer agent fees for each class were as follows:
| Amount | % of
Average
Net Assets* |
Class A | $ 1,566,614 | .24 |
Class T | 44,492 | .17 |
Class B | 11,692 | .25 |
Class C | 57,639 | .16 |
Total Bond | 5,959,911 | .10 |
Institutional Class | 505,337 | .19 |
| $ 8,145,685 | |
* Annualized
Semiannual Report
Notes to Financial Statements - continued
7. Fees and Other Transactions with Affiliates - continued
Fund Wide Operations Fee. Pursuant to the Fund Wide Operations and Expense Agreement (FWOE), FMR has agreed to provide for fund level expenses (which do not include transfer agent, Rule 12b-1 fees, compensation of the independent Trustees, interest (including commitment fees), taxes or extraordinary expenses, if any) in return for a FWOE fee equal to .35% less the total amount of the management fee. The FWOE paid by the Fund is reduced by an amount equal to the fees and expenses paid to the independent Trustees. For the period, the FWOE fee was equivalent to an annualized rate of .03% of average net assets.
8. Committed Line of Credit.
The Fund participates with other funds managed by FMR or an affiliate in a $4.0 billion credit facility (the "line of credit") to be utilized for temporary or emergency purposes to fund shareholder redemptions or for other short-term liquidity purposes. The Fund has agreed to pay commitment fees on its pro-rata portion of the line of credit, which amounted to $18,995 and is reflected in Miscellaneous expenses on the Statement of Operations. During the period, there were no borrowings on this line of credit.
9. Security Lending.
The Fund lends portfolio securities from time to time in order to earn additional income. On the settlement date of the loan, the Fund receives collateral (in the form of U.S. Treasury obligations, letters of credit and/or cash) against the loaned securities and maintains collateral in an amount not less than 100% of the market value of the loaned securities during the period of the loan. The market value of the loaned securities is determined at the close of business of the Fund and any additional required collateral is delivered to the Fund on the next business day. If the borrower defaults on its obligation to return the securities loaned because of insolvency or other reasons, a fund could experience delays and costs in recovering the securities loaned or in gaining access to the collateral. Any cash collateral received is maintained at the Fund's custodian and/or invested in cash equivalents. At period end, there were no security loans outstanding. Security lending income represents the income earned on investing cash collateral, less rebates paid to borrowers, plus any premium payments received for lending certain types of securities. Security lending income is presented in the Statement of Operations as a component of interest income. Total security lending income during the period amounted to $29,546.
Semiannual Report
10. Expense Reductions.
Through arrangements with the Fund's custodian, credits realized as a result of uninvested cash balances were used to reduce the Fund's expenses. During the period, these credits reduced the Fund's custody expenses by $1,594.
11. Distributions to Shareholders.
Distributions to shareholders of each class were as follows:
| Six months ended
February 29, 2012 | Year ended
August 31, 2011A |
From net investment income | | |
Class A | $ 22,736,986 | $ 35,129,345 |
Class T | 889,236 | 1,855,789 |
Class B | 129,517 | 296,985 |
Class C | 970,968 | 2,026,950 |
Total Bond | 227,043,295 | 427,026,328 |
Class F | - | 129,141 |
Institutional Class | 9,994,854 | 18,932,900 |
Total | $ 261,764,856 | $ 485,397,438 |
From net realized gain | | |
Class A | $ 20,452,852 | $ 17,070,006 |
Class T | 936,776 | 1,197,314 |
Class B | 146,504 | 247,157 |
Class C | 1,103,220 | 1,677,741 |
Total Bond | 184,845,253 | 214,891,467 |
Class F | - | - |
Institutional Class | 8,485,781 | 9,432,558 |
Total | $ 215,970,386 | $ 244,516,243 |
A All Class F shares were redeemed on September 30, 2010.
12. Share Transactions.
Transactions for each class of shares were as follows:
| Shares | Dollars |
| Six months ended February 29, 2012 | Year ended
August 31, 2011A | Six months ended February 29, 2012 | Year ended
August 31, 2011A |
Class A | | | | |
Shares sold | 28,031,739 | 70,407,747 | $ 307,445,959 | $ 764,123,344 |
Reinvestment of distributions | 3,889,684 | 4,687,391 | 42,411,973 | 50,970,385 |
Shares redeemed | (11,017,719) | (36,997,892) | (120,804,559) | (404,102,564) |
Net increase (decrease) | 20,903,704 | 38,097,246 | $ 229,053,373 | $ 410,991,165 |
Semiannual Report
Notes to Financial Statements - continued
12. Share Transactions - continued
| Shares | Dollars |
| Six months ended February 29, 2012 | Year ended
August 31, 2011A | Six months ended February 29, 2012 | Year ended
August 31, 2011A |
Class T | | | | |
Shares sold | 1,823,963 | 5,910,533 | $ 19,918,086 | $ 64,536,331 |
Reinvestment of distributions | 150,485 | 246,104 | 1,637,334 | 2,672,918 |
Shares redeemed | (2,828,402) | (7,131,049) | (30,811,992) | (77,181,315) |
Net increase (decrease) | (853,954) | (974,412) | $ (9,256,572) | $ (9,972,066) |
Class B | | | | |
Shares sold | 188,982 | 164,162 | $ 2,073,160 | $ 1,801,729 |
Reinvestment of distributions | 20,468 | 41,104 | 222,991 | 447,251 |
Shares redeemed | (125,981) | (547,045) | (1,382,331) | (5,927,269) |
Net increase (decrease) | 83,469 | (341,779) | $ 913,820 | $ (3,678,289) |
Class C | | | | |
Shares sold | 2,246,075 | 2,834,490 | $ 24,650,760 | $ 30,988,336 |
Reinvestment of distributions | 167,404 | 299,725 | 1,823,526 | 3,259,076 |
Shares redeemed | (904,570) | (5,620,712) | (9,890,550) | (60,917,944) |
Net increase (decrease) | 1,508,909 | (2,486,497) | $ 16,583,736 | $ (26,670,532) |
Total Bond | | | | |
Shares sold | 250,130,185 | 384,874,413 | $ 2,741,615,740 | $ 4,191,107,190 |
Reinvestment of distributions | 36,048,477 | 56,207,634 | 393,133,879 | 611,374,414 |
Shares redeemed | (161,591,730) | (432,717,356) | (1,772,378,308) | (4,723,560,620) |
Net increase (decrease) | 124,586,932 | 8,364,691 | $ 1,362,371,311 | $ 78,920,984 |
Class F | | | | |
Shares sold | - | 320,292 | $ - | $ 3,532,515 |
Reinvestment of distributions | - | 11,655 | - | 129,141 |
Shares redeemed | - | (5,214,738) | - | (57,498,547) |
Net increase (decrease) | - | (4,882,791) | $ - | $ (53,836,891) |
Institutional Class | | | | |
Shares sold | 10,670,431 | 9,397,783 | $ 116,532,117 | $ 102,168,317 |
Reinvestment of distributions | 1,651,656 | 2,572,592 | 17,981,232 | 27,946,248 |
Shares redeemed | (13,122,534) | (9,899,063) | (143,504,615) | (108,418,652) |
Net increase (decrease) | (800,447) | 2,071,312 | $ (8,991,266) | $ 21,695,913 |
A All Class F shares were redeemed on September 30, 2010.
Semiannual Report
13. Other.
The Fund's organizational documents provide former and current trustees and officers with a limited indemnification against liabilities arising in connection with the performance of their duties to the Fund. In the normal course of business, the Fund may also enter into contracts that provide general indemnifications. The Fund's maximum exposure under these arrangements is unknown as this would be dependent on future claims that may be made against the Fund. The risk of material loss from such claims is considered remote.
14. Credit Risk.
The Fund invests a portion of its assets in structured securities of issuers backed by residential mortgage loans, credit card receivables and automotive loans. The value and related income of these securities is sensitive to the changes in economic conditions, including delinquencies and/or defaults.
Semiannual Report
To the Trustees of Fidelity Income Fund and the Shareholders of Fidelity Total Bond Fund:
In our opinion, the accompanying statement of assets and liabilities, including the schedule of investments, and the related statements of operations and of changes in net assets and the financial highlights present fairly, in all material respects, the financial position of Fidelity Total Bond Fund (a fund of Fidelity Income Fund) at February 29, 2012, the results of its operations, the changes in its net assets and the financial highlights for each of the periods indicated, in conformity with accounting principles generally accepted in the United States of America. These financial statements and financial highlights (hereafter referred to as "financial statements") are the responsibility of the Fidelity Total Bond Fund's management. Our responsibility is to express an opinion on these financial statements based on our audits. We conducted our audits of these financial statements in accordance with the standards of the Public Company Accounting Oversight Board (United States). Those standards require that we plan and perform the audit to obtain reasonable assurance about whether the financial statements are free of material misstatement. An audit includes examining, on a test basis, evidence supporting the amounts and disclosures in the financial statements, assessing the accounting principles used and significant estimates made by management, and evaluating the overall financial statement presentation. We believe that our audits, which included confirmation of securities at February 29, 2012 by correspondence with the custodian, agent banks, and brokers, provide a reasonable basis for our opinion.
/s/ PricewaterhouseCoopers LLP
PricewaterhouseCoopers LLP
Boston, Massachusetts
April 18, 2012
Semiannual Report
Board Approval of Investment Advisory Contracts and Management Fees
Fidelity Total Bond Fund
Each year, the Board of Trustees, including the Independent Trustees (together, the Board), votes on the renewal of the management contract and sub-advisory agreements (together, the Advisory Contracts) for the fund. The Board, assisted by the advice of fund counsel and Independent Trustees' counsel, requests and considers a broad range of information relevant to the renewal of the Advisory Contracts throughout the year.
The Board meets regularly and considers at each of its meetings factors that are relevant to its annual consideration of the renewal of the fund's Advisory Contracts, including the services and support provided to the fund and its shareholders. The Board has established three standing committees, Operations, Audit, and Nominating and Governance, each composed of Independent Trustees with varying backgrounds, to which the Board has assigned specific subject matter responsibilities in order to enhance effective decision-making by the Board. The Operations Committee, of which all of the Independent Trustees are members, meets regularly throughout the year and, among other matters, considers matters specifically related to the annual consideration of the renewal of the fund's Advisory Contracts. The Board, acting directly and through its Committees, requests and receives information concerning the annual consideration of the renewal of the fund's Advisory Contracts. The Board also meets as needed to consider matters specifically related to the Board's annual consideration of the renewal of Advisory Contracts. Members of the Board may also meet with trustees of other Fidelity funds through ad hoc joint committees to discuss certain matters relevant to the Fidelity funds.
At its September 2011 meeting, the Board of Trustees, including the Independent Trustees, unanimously determined to renew the fund's Advisory Contracts. In reaching its determination, the Board considered all factors it believed relevant, including (i) the nature, extent, and quality of the services to be provided to the fund and its shareholders (including the investment performance of the fund); (ii) the competitiveness of the fund's management fee and total expense ratio; (iii) the total costs of the services to be provided by and the profits to be realized by Fidelity from its relationship with the fund; (iv) the extent to which economies of scale would be realized as the fund grows; and (v) whether fee levels reflect these economies of scale, if any, for the benefit of fund shareholders.
In considering whether to renew the Advisory Contracts for the fund, the Board reached a determination, with the assistance of fund counsel and Independent Trustees' counsel and through the exercise of its business judgment, that the renewal of the Advisory Contracts is in the best interests of the fund and its shareholders and that the compensation payable under the Advisory Contracts is fair and reasonable. The Board's decision to renew the Advisory Contracts was not based on any single factor, but rather was based on a comprehensive consideration of all the information provided to the Board at its meetings throughout the year. The Board, in reaching its determination to renew the Advisory Contracts, is aware that shareholders in the fund have a broad range of investment choices available to them, including a wide choice among mutual funds offered by Fidelity's competitors, and that the fund's shareholders, who have the opportunity to review and weigh the disclosure provided by the fund in its prospectus and other public disclosures, have chosen to invest in this fund, managed by Fidelity.
Semiannual Report
Nature, Extent, and Quality of Services Provided. The Board considered the staffing within the investment adviser, FMR, and the sub-advisers (together, the Investment Advisers), including the backgrounds of the fund's investment personnel and the fund's investment objective and discipline. The Independent Trustees also had discussions with senior management of Fidelity's investment operations and investment groups. The Board considered the structure of the portfolio manager compensation program and whether this structure provides appropriate incentives to act in the best interests of the fund.
Resources Dedicated to Investment Management and Support Services. The Board reviewed the general qualifications and capabilities of the Investment Advisers' investment staff, including its size, education, experience, and resources, as well as the Investment Advisers' approach to recruiting, managing, and compensating investment personnel. The Board also noted that FMR has devoted increased resources to non-U.S. offices. The Board noted that Fidelity's analysts have extensive resources, tools and capabilities which allow them to conduct sophisticated quantitative and fundamental analysis, as well as credit analysis of issuers, counterparties and enhancers. The Board also believes that Fidelity's investment professionals have sufficient access to global information and data so as to provide competitive investment results over time, and that those professionals also have access to sophisticated tools which permit them to assess portfolio construction and risk and performance attribution characteristics continuously, as well as to transmit new information and research conclusions rapidly around the world. Additionally, in its deliberations, the Board considered the Investment Advisers' trading capabilities and resources which are an integral part of the investment management process.
Shareholder and Administrative Services. The Board considered (i) the nature, extent, quality, and cost of advisory, administrative, and shareholder services performed by the Investment Advisers and their affiliates under the Advisory Contracts and under separate agreements covering transfer agency, pricing and bookkeeping, and securities lending services for the fund; (ii) the nature and extent of the investment adviser's supervision of third party service providers, principally custodians and subcustodians; and (iii) the resources devoted to, and the record of compliance with, the fund's compliance policies and procedures.
The Board noted that the growth of fund assets over time across the complex allows Fidelity to reinvest in the development of services designed to enhance the value or convenience of the Fidelity funds as investment vehicles. These services include 24-hour access to account information and market information through telephone representatives and over the Internet, investor education materials and asset allocation tools, and the expanded availability of Fidelity Investor Centers, with 35 new branches opening since 2010.
Semiannual Report
Board Approval of Investment Advisory Contracts and
Management Fees - continued
Investment in a Large Fund Family. The Board considered the benefits to shareholders of investing in a Fidelity fund, including the benefits of investing in a fund that is part of a large family of funds offering a variety of investment disciplines and providing a large variety of mutual fund investor services. The Board noted that Fidelity had taken, or had made recommendations that resulted in the Fidelity funds taking, a number of actions over the previous year that benefited particular funds, including (i) continuing to dedicate additional resources to investment research and support of the senior management team that oversees asset management; (ii) rationalizing product lines through the mergers of six funds into other funds; (iii) continuing to migrate the Freedom Funds to dedicated lower cost underlying funds; (iv) obtaining shareholder approval to broaden the investment strategies for Fidelity Consumer Finance Portfolio, Fidelity Emerging Asia Fund, and Fidelity Environment and Alternative Energy Portfolio; (v) contractually agreeing to reduce the management fees and impose other expense limitations on Spartan 500 Index Fund and U.S. Bond Index Fund in connection with launching new institutional classes of these funds; (vi) changing the name, primary and supplemental benchmarks, and investment policies of Fidelity Global Strategies Fund to support the fund's flexible investment mandate and global orientation; and (vii) reducing the transfer agency account fee rates on certain accounts.
Investment Performance. The Board considered whether the fund has operated in accordance with its investment objective, as well as its record of compliance with its investment restrictions. It also reviewed the fund's absolute investment performance for each class, as well as the fund's relative investment performance for each class measured over multiple periods against (i) a broad-based securities market index, and (ii) a peer group of mutual funds deemed appropriate by Fidelity and reviewed by the Board. The following charts considered by the Board show, over the one-, three-, and five-year periods ended December 31, 2010, the cumulative total returns of the retail class and Class C of the fund, the cumulative total returns of a broad-based securities market index ("benchmark"), and a range of cumulative total returns of a peer group of mutual funds identified by Lipper Inc. as having an investment objective similar to that of the fund. The returns of the retail class and Class C show the performance of the highest and lowest performing classes, respectively (based on five-year performance). The box within each chart shows the 25th percentile return (bottom of box) and the 75th percentile return (top of box) of the peer group. Returns shown above the box are in the first quartile and returns shown below the box are in the fourth quartile. The percentage beaten numbers noted below each chart correspond to the percentile box and represent the percentage of funds in the peer group whose performance was equal to or lower than that of the class indicated.
Semiannual Report
Fidelity Total Bond Fund

The Board reviewed the fund's relative investment performance against its peer group and noted that the performance of the retail class of the fund was in the second quartile for the one- and five-year periods and the first quartile for the three-year period. The Board also noted that the investment performance of the retail class of the fund compared favorably to its benchmark for all the periods shown. The Board considered that the variations in performance among the fund's classes reflect the variations in class expenses, which result in lower performance for higher expense classes. The Board also reviewed the fund's performance since inception as well as performance in the current year.
Based on its review, the Board concluded that the nature, extent, and quality of services provided to the fund under the Advisory Contracts should benefit the fund's shareholders.
Competitiveness of Management Fee and Total Expense Ratio. The Board considered the fund's management fee and total expense ratio compared to "mapped groups" of competitive funds and classes. Fidelity creates "mapped groups" by combining similar Lipper investment objective categories that have comparable management fee characteristics. Combining Lipper investment objective categories aids the Board's management fee and total expense ratio comparisons by broadening the competitive group used for comparison and by reducing the number of universes to which various Fidelity funds are compared.
Semiannual Report
Board Approval of Investment Advisory Contracts and
Management Fees - continued
Management Fee. The Board considered two proprietary management fee comparisons for the 12-month periods shown in the chart below. The group of Lipper funds used by the Board for management fee comparisons is referred to below as the "Total Mapped Group" and, for the reasons explained above, is broader than the Lipper peer group used by the Board for performance comparisons. The Total Mapped Group comparison focuses on a fund's standing relative to the total universe of comparable funds available to investors in terms of gross management fees before expense reimbursements or caps. "TMG %" represents the percentage of funds in the Total Mapped Group that had management fees that were lower than the fund's. For example, a TMG % of 12% means that 88% of the funds in the Total Mapped Group had higher management fees than the fund. The "Asset-Size Peer Group" (ASPG) comparison focuses on a fund's standing relative to non-Fidelity funds similar in size to the fund within the Total Mapped Group. The ASPG represents at least 15% of the funds in the Total Mapped Group with comparable asset size and management fee characteristics, subject to a minimum of 50 funds (or all funds in the Total Mapped Group if fewer than 50). Additional information, such as the ASPG quartile in which the fund's management fee ranked, is also included in the chart and considered by the Board.
Fidelity Total Bond Fund

The Board noted that the fund's management fee ranked below the median of its Total Mapped Group and below the median of its ASPG for 2010.
Based on its review, the Board concluded that the fund's management fee is fair and reasonable in light of the services that the fund receives and the other factors considered.
Semiannual Report
Total Expense Ratio. In its review of each class's total expense ratio, the Board considered the fund's management fee as well as other fund or class expenses, as applicable, such as transfer agent fees, pricing and bookkeeping fees, fund-paid 12b-1 fees, and custodial, legal, and audit fees. The Board also noted the effects of any waivers and reimbursements on fees and expenses. As part of its review, the Board also considered the current and historical total expense ratios of each class of the fund compared to competitive fund median expenses. Each class of the fund is compared to those funds and classes in the Total Mapped Group (used by the Board for management fee comparisons) that have a similar sales load structure.
The Board also considered that the current contractual arrangements for the fund (i) have the effect of setting the total "fund-level" expenses (including, among certain other expenses, the management fee) for each class at 35 basis points, (ii) limit the "class-level" transfer agent fee for the retail class to 10 basis points, and (iii) limit the total expenses for the retail class to 45 basis points. The fees and expenses payable under these contractual arrangements may not be increased without the approval of the Board and the shareholders of the applicable class. The fund's Advisor classes are subject to different "class-level" expenses (transfer agent fees and 12b-1 fees).
The Board noted that the total expense ratio of each class ranked below its competitive median for 2010.
The Board recognized that the fund's management contract incorporates a "group fee" structure, which provides for lower group fee rates as total fund assets under FMR's management increase, and for higher group fee rates as total fund assets under FMR's management decrease. FMR calculates the group fee rates based on a tiered asset "breakpoint" schedule that varies based on asset class. The Board noted, however, that because the current contractual arrangements set the total "fund-level" expenses for each class at 35 basis points, increases or decreases in the management fee due to changes in the group fee rate will not impact the total expense ratio.
Fees Charged to Other Fidelity Clients. The Board also considered Fidelity fee structures and other information with respect to clients of FMR and its affiliates, such as other mutual funds advised or subadvised by FMR or its affiliates, pension plan clients, and other institutional clients. In March 2010, the Board created an ad hoc joint committee with the board of other Fidelity funds (the Committee) to review and compare Fidelity's institutional investment advisory business with its business of providing services to the Fidelity funds, including the differences in services provided, fees charged, and costs incurred, as well as competition in their respective marketplaces.
Based on its review of total expense ratios and fees charged to other Fidelity clients, the Board concluded that the total expense ratio of each class of the fund was reasonable in light of the services that the fund and its shareholders receive and the other factors considered, including the findings of the Committee.
Semiannual Report
Board Approval of Investment Advisory Contracts and
Management Fees - continued
Costs of the Services and Profitability. The Board considered the revenues earned and the expenses incurred by Fidelity in conducting the business of developing, marketing, distributing, managing, administering and servicing the fund and its shareholders. The Board also considered the level of Fidelity's profits in respect of all the Fidelity funds.
On an annual basis, FMR presents to the Board Fidelity's profitability for the fund. Fidelity calculates the profitability for each fund, as well as aggregate profitability for groups of Fidelity funds and all Fidelity funds, using a series of detailed revenue and cost allocation methodologies which originate with the books and records of Fidelity on which Fidelity's audited financial statements are based. The Audit Committee of the Board reviews any significant changes from the prior year's methodologies.
PricewaterhouseCoopers LLP (PwC), independent registered public accounting firm and auditor to Fidelity and certain Fidelity funds, has been engaged annually by the Board as part of the Board's assessment of Fidelity's profitability analysis. PwC's engagement includes the review and assessment of Fidelity's methodologies used in determining the revenues and expenses attributable to Fidelity's mutual fund business, and completion of agreed-upon procedures surrounding the mathematical accuracy of fund profitability and its conformity to allocation methodologies. After considering PwC's reports issued under the engagement and information provided by Fidelity, the Board concluded that while other allocation methods may also be reasonable, Fidelity's profitability methodologies are reasonable in all material respects.
The Board also reviewed Fidelity's non-fund businesses and fall-out benefits related to the mutual fund business as well as cases where Fidelity's affiliates may benefit from or be related to the fund's business.
The Board considered the costs of the services provided by and the profits realized by Fidelity in connection with the operation of the fund and was satisfied that the profitability was not excessive in the circumstances.
Economies of Scale. The Board considered whether there have been economies of scale in respect of the management of the Fidelity funds, whether the Fidelity funds (including the fund) have appropriately benefited from any such economies of scale, and whether there is potential for realization of any further economies of scale. The Board considered the extent to which the fund will benefit from economies of scale through increased services to the fund, through waivers or reimbursements, or through fee or expense reductions. The Board also noted that in 2009, it and the board of other Fidelity funds created an ad hoc committee (the Economies of Scale Committee) to analyze whether FMR attains economies of scale in respect of the management and servicing of the Fidelity funds, whether the Fidelity funds have appropriately benefited from such economies of scale, and whether there is potential for realization of any further economies of scale.
Semiannual Report
The Board concluded, taking into account the analysis of the Economies of Scale Committee, that any potential economies of scale are being appropriately shared between fund shareholders and Fidelity.
Additional Information Requested by the Board. In order to develop fully the factual basis for consideration of the Fidelity funds' Advisory Contracts, the Board requested and received additional information on certain topics, including: (i) Fidelity's fund profitability methodology, profitability trends for certain funds, and the impact of certain factors on fund profitability results; (ii) portfolio manager changes that have occurred during the past year and the amount of the investment that each portfolio manager has made in the Fidelity fund(s) that he or she manages; (iii) Fidelity's compensation structure for portfolio managers, research analysts, and other key personnel, including its effects on fund profitability, the rationale for the compensation structure, and the extent to which current market conditions have affected retention and recruitment; (iv) the compensation paid to fund sub-advisers on behalf of the Fidelity funds; (v) Fidelity's fee structures and rationale for recommending different fees among different categories of funds and classes, as well as Fidelity's voluntary waiver of its fees to maintain minimum yields for certain money market funds and classes; (vi) the reasons why certain expenses affect various funds and classes differently; (vii) Fidelity's transfer agent fees, expenses, and services and how the benefits of decreased costs and new efficiencies can be shared across all of the Fidelity funds; (viii) the reasons for and consequences of changes to certain product lines compared to competitors; (ix) the allocation of and historical trends in Fidelity's realization of fall-out benefits; and (x) explanations regarding the relative total expense ratios of certain funds and classes, total expense competitive trends, and actions that might be taken by FMR to reduce total expense ratios for certain funds and classes or to achieve further economies of scale.
Based on its evaluation of all of the conclusions noted above, and after considering all factors it believed relevant, the Board ultimately concluded that the advisory fee structures are fair and reasonable, and that the fund's Advisory Contracts should be renewed.
Semiannual Report
Investment Adviser
Fidelity Management & Research Company
Boston, MA
Investment Sub-Advisers
FMR Co. Inc.
Fidelity Management & Research
(U.K.) Inc.
Fidelity Management & Research
(Hong Kong) Limited
Fidelity Management & Research
(Japan) Inc.
Fidelity Investments
Money Management, Inc.
FIL Investments (Japan) Limited
FIL Investment Advisors
FIL Investment Advisors
(UK) Limited
General Distributor
Fidelity Distributors Corporation
Boston, MA
Transfer and Service Agents
Fidelity Investments Institutional Operations Company, Inc.
Boston, MA
Fidelity Service Company, Inc.
Boston, MA
Custodian
Citibank, N.A.
New York, NY
ATBI-USAN-0412
1.804584.107
(Fidelity Investment logo)(registered trademark)
Item 2. Code of Ethics
Not applicable.
Item 3. Audit Committee Financial Expert
Not applicable.
Item 4. Principal Accountant Fees and Services
Not applicable.
Item 5. Audit Committee of Listed Registrants
Not applicable.
Item 6. Investments
(a) Not applicable.
(b) Not applicable
Item 7. Disclosure of Proxy Voting Policies and Procedures for Closed-End Management Investment Companies
Not applicable.
Item 8. Portfolio Managers of Closed-End Management Investment Companies
Not applicable.
Item 9. Purchase of Equity Securities by Closed-End Management Investment Company and Affiliated Purchasers
Not applicable.
Item 10. Submission of Matters to a Vote of Security Holders
There were no material changes to the procedures by which shareholders may recommend nominees to the Fidelity Income Fund's Board of Trustees.
Item 11. Controls and Procedures
(a)(i) The President and Treasurer and the Chief Financial Officer have concluded that the Fidelity Income Fund's (the "Trust") disclosure controls and procedures (as defined in Rule 30a-3(c) under the Investment Company Act) provide reasonable assurances that material information relating to the Trust is made known to them by the appropriate persons, based on their evaluation of these controls and procedures as of a date within 90 days of the filing date of this report.
(a)(ii) There was no change in the Trust's internal control over financial reporting (as defined in Rule 30a-3(d) under the Investment Company Act) that occurred during the second fiscal quarter of the period covered by this report that has materially affected, or is reasonably likely to materially affect, the Trust's internal control over financial reporting.
Item 12. Exhibits
(a) | (1) | Not applicable. |
(a) | (2) | Certification pursuant to Rule 30a-2(a) under the Investment Company Act of 1940 (17 CFR 270.30a-2(a)) is filed and attached hereto as Exhibit 99.CERT. |
(a) | (3) | Not applicable. |
(b) | | Certification pursuant to Rule 30a-2(b) under the Investment Company Act of 1940 (17 CFR 270.30a-2(b)) is furnished and attached hereto as Exhibit 99.906CERT. |
SIGNATURES
Pursuant to the requirements of the Securities Exchange Act of 1934 and the Investment Company Act of 1940, the registrant has duly caused this report to be signed on its behalf by the undersigned, thereunto duly authorized.
Fidelity Income Fund
By: | /s/John R. Hebble |
| John R. Hebble |
| President and Treasurer |
| |
Date: | April 20, 2012 |
Pursuant to the requirements of the Securities Exchange Act of 1934 and the Investment Company Act of 1940, this report has been signed below by the following persons on behalf of the registrant and in the capacities and on the dates indicated.
By: | /s/John R. Hebble |
| John R. Hebble |
| President and Treasurer |
| |
Date: | Apri1 20, 2012 |
By: | /s/Christine Reynolds |
| Christine Reynolds |
| Chief Financial Officer |
| |
Date: | April 20, 2012 |