UNITED STATES
SECURITIES AND EXCHANGE COMMISSION
Washington, D.C. 20549
FORM N-CSR
CERTIFIED SHAREHOLDER REPORT OF REGISTERED
MANAGEMENT INVESTMENT COMPANIES
Investment Company Act file number 811-4085
Fidelity Income Fund
(Exact name of registrant as specified in charter)
82 Devonshire St., Boston, Massachusetts 02109
(Address of principal executive offices) (Zip code)
Scott C. Goebel, Secretary
82 Devonshire St.
Boston, Massachusetts 02109
(Name and address of agent for service)
Registrant's telephone number, including area code: 617-563-7000
Date of fiscal year end: | July 31 |
| |
Date of reporting period: | January 31, 2011 |
Item 1. Reports to Stockholders
Fidelity® GNMA Fund
Fidelity Intermediate
Government Income Fund
Semiannual Report
January 31, 2011
(2_fidelity_logos) (Registered_Trademark)
Contents
To view a fund's proxy voting guidelines and proxy voting record for the 12-month period ended June 30, visit http://www.fidelity.com/proxyvotingresults or visit the Securities and Exchange Commission's (SEC) web site at http://www.sec.gov. You may also call 1-800-544-8544 to request a free copy of the proxy voting guidelines.
Standard & Poor's, S&P and S&P 500 are registered service marks of The McGraw-Hill Companies, Inc. and have been licensed for use by Fidelity Distributors Corporation.
Other third party marks appearing herein are the property of their respective owners.
All other marks appearing herein are registered or unregistered trademarks or service marks of FMR LLC or an affiliated company.
This report and the financial statements contained herein are submitted for the general information of the shareholders of the funds. This report is not authorized for distribution to prospective investors in the funds unless preceded or accompanied by an effective prospectus.
A fund files its complete schedule of portfolio holdings with the SEC for the first and third quarters of each fiscal year on Form N-Q. Forms N-Q are available on the SEC's web site at http://www.sec.gov. A fund's Forms N-Q may be reviewed and copied at the SEC's Public Reference Room in Washington, DC. Information regarding the operation of the SEC's Public Reference Room may be obtained by calling 1-800-SEC-0330. For a complete list of a fund's portfolio holdings, view the most recent holdings listing, semiannual report, or annual report on Fidelity's web site at http://www.fidelity.com, http://www.advisor.fidelity.com, or http://www.401k.com, as applicable.
NOT FDIC INSURED • MAY LOSE VALUE • NO BANK GUARANTEE
Neither the funds nor Fidelity Distributors Corporation is a bank.
Semiannual Report
(photo_of_Abigail_P_Johnson)
Dear Shareholder:
Following a year in which the investment environment was volatile but generally supportive of most major asset classes, 2011 began on a positive note. U.S. equities gained ground in January, reaching their highest point since August 2008, amid indications the U.S. economy had turned a corner. Still, questions remained about the longer-term outlook, most notably persistently high unemployment. Financial markets are always unpredictable, of course, but there also are several time-tested investment principles that can help put the odds in your favor.
One of the basic tenets is to invest for the long term. Over time, riding out the markets' inevitable ups and downs has proven much more effective than selling into panic or chasing the hottest trend. Even missing only a few of the markets' best days can significantly diminish investor returns. Patience also affords the benefits of compounding - of earning interest on additional income or reinvested dividends and capital gains. There can be tax advantages and cost benefits to consider as well. While staying the course doesn't eliminate risk, it can considerably lessen the effect of short-term declines.
You can further manage your investing risk through diversification. And today, more than ever, geographic diversification should be taken into account. Studies indicate that asset allocation is the single most important determinant of a portfolio's long-term success. The right mix of stocks, bonds and cash - aligned to your particular risk tolerance and investment objective - is very important. Age-appropriate rebalancing is also an essential aspect of asset allocation. For younger investors, an emphasis on equities - which historically have been the best-performing asset class over time - is encouraged. As investors near their specific goal, such as retirement or sending a child to college, consideration may be given to replacing volatile assets (e.g. common stocks) with more-stable fixed investments (bonds or savings plans).
A third principle - investing regularly - can help lower the average cost of your purchases. Investing a certain amount of money each month or quarter helps ensure you won't pay for all your shares at market highs. This strategy - known as dollar cost averaging - also reduces "emotion" from investing, helping shareholders avoid selling weak performers just prior to an upswing, or chasing a hot performer just before a correction.
We invite you to contact us via the Internet, through our Investor Centers or by phone. It is our privilege to provide you the information you need to make the investments that are right for you.
Sincerely,
(The chairman's signature appears here.)
Abigail P. Johnson
Semiannual Report
Shareholder Expense Example
As a shareholder of a Fund, you incur two types of costs: (1) transaction costs, and (2) ongoing costs, including management fees and other Fund expenses. This Example is intended to help you understand your ongoing costs (in dollars) of investing in the Funds and to compare these costs with the ongoing costs of investing in other mutual funds.
The Example is based on an investment of $1,000 invested at the beginning of the period and held for the entire period (August 1, 2010 to January 31, 2011).
Actual Expenses
The first line of the accompanying table for each fund provides information about actual account values and actual expenses. You may use the information in this line, together with the amount you invested, to estimate the expenses that you paid over the period. Simply divide your account value by $1,000.00 (for example, an $8,600 account value divided by $1,000.00 = 8.6), then multiply the result by the number in the first line for a fund under the heading entitled "Expenses Paid During Period" to estimate the expenses you paid on your account during this period. A small balance maintenance fee of $12.00 that is charged once a year may apply for certain accounts with a value of less than $2,000. This fee is not included in the table below. If it was, the estimate of expenses you paid during the period would be higher, and your ending account value lower, by this amount.
Hypothetical Example for Comparison Purposes
The second line of the accompanying table for each fund provides information about hypothetical account values and hypothetical expenses based on a fund's actual expense ratio and an assumed rate of return of 5% per year before expenses, which is not the Fund's actual return. The hypothetical account values and expenses may not be used to estimate the actual ending account balance or expenses you paid for the period. You may use this information to compare the ongoing costs of investing in the Fund and other funds. To do so, compare this 5% hypothetical example with the 5% hypothetical examples that appear in the shareholder reports of the other funds. A small balance maintenance fee of $12.00 that is charged once a year may apply for certain accounts with a value of less than $2,000. This fee is not included in the table below. If it was, the estimate of expenses you paid during the period would be higher, and your ending account value lower, by this amount.
Please note that the expenses shown in the table are meant to highlight your ongoing costs only and do not reflect any transaction costs. Therefore, the second line of the table is useful in comparing ongoing costs only, and will not help you determine the relative total costs of owning different funds.
Semiannual Report
Shareholder Expense Example - continued
| Annualized
Expense Ratio | Beginning
Account Value
August 1, 2010 | Ending
Account Value
January 31, 2011 | Expenses Paid
During Period*
August 1, 2010
to January 31, 2011 |
Fidelity GNMA Fund | .45% | | | |
Actual | | $ 1,000.00 | $ 1,004.80 | $ 2.27 |
HypotheticalA | | $ 1,000.00 | $ 1,022.94 | $ 2.29 |
Intermediate Government Income Fund | .45% | | | |
Actual | | $ 1,000.00 | $ 999.20 | $ 2.27 |
HypotheticalA | | $ 1,000.00 | $ 1,022.94 | $ 2.29 |
A 5% return per year before expenses
* Expenses are equal to each Fund's annualized expense ratio, multiplied by the average account value over the period, multiplied by 184/365 (to reflect the one-half year period).
Semiannual Report
Fidelity GNMA Fund
Investment Changes (Unaudited)
Coupon Distribution as of January 31, 2011 |
| % of fund's
investments | % of fund's investments
6 months ago |
Less than 4% | 6.1 | 4.4 |
4 - 4.99% | 31.5 | 25.4 |
5 - 5.99% | 43.8 | 34.6 |
6 - 6.99% | 11.6 | 10.7 |
7% and over | 1.9 | 1.5 |
Coupon distribution shows the range of stated interest rates on the fund's investments, excluding short-term investments. |
Weighted Average Maturity as of January 31, 2011 |
| | 6 months ago |
Years | 4.9 | 3.1 |
This is a weighted average of all the maturities of the securities held in a fund. Weighted Average Maturity (WAM) can be used as a measure of sensitivity to interest rate changes and markets changes. Generally, the longer the maturity, the greater the sensitivity to such changes. WAM is based on the dollar-weighted average length of time until principal payments must be paid. Depending on the types of securities held in a fund, certain maturity shortening devices (e.g., demand features, interest rate resets, and call options) may be taken into account when calculating the WAM. |
Duration as of January 31, 2011 |
| | 6 months ago |
Years | 3.7 | 2.6 |
Duration shows how much a bond fund's price fluctuates with changes in comparable interest rates. If rates rise 1%, for example, a fund with a five-year duration is likely to lose about 5% of its value. Other factors also can influence a bond fund's performance and share price. Accordingly, a bond fund's actual performance may differ from this example. |
Asset Allocation (% of fund's net assets) |
As of January 31, 2011*A | As of July 31, 2010**B |
 | Mortgage
Securities 104.6% | | | Mortgage
Securities 100.8% | |
 | CMOs and Other Mortgage Related Securities 10.1% | | | CMOs and Other Mortgage Related Securities 10.2% | |
 | U.S. Government
Agency Obligations 1.6% | |  | U.S. Government
Agency Obligations 0.0% | |
 | Short-Term
Investments and
Net Other Assets† (16.3)% | | | Short-Term
Investments and
Net Other Assets† (11.0)% | |
* GNMA Securities | 108.5% | | ** GNMA Securities | 101.4% | |
A Futures and Swaps | (1.7)% | | B Futures and Swaps | (0.5)% | |

† Short-Term Investments and Net Other Assets are not included in the pie chart. |
Semiannual Report
Fidelity GNMA Fund
Investments January 31, 2011 (Unaudited)
Showing Percentage of Net Assets
U.S. Government and Government Agency Obligations - 1.6% |
| Principal Amount (000s) | | Value (000s) |
Other Government Related - 1.6% |
National Credit Union Administration Guaranteed Notes: | | | | |
Series 2010-A1 Class A, 0.6106% 12/7/20 (NCUA Guaranteed) (d) | | $ 19,107 | | $ 19,128 |
Series 2010-R2 Class 1A, 0.635% 11/6/17 (NCUA Guaranteed) (d) | | 38,589 | | 38,589 |
Series 2010-R3 Class 1A, 0.8238% 12/8/20 (NCUA Guaranteed) (d) | | 39,070 | | 39,095 |
Series 2011-R1 Class 1A, 0.711% 1/8/20 (NCUA Guaranteed) (d) | | 25,900 | | 25,900 |
TOTAL U.S. GOVERNMENT AND GOVERNMENT AGENCY OBLIGATIONS (Cost $122,677) | 122,712 |
U.S. Government Agency - Mortgage Securities - 104.6% |
|
Fannie Mae - 3.9% |
1.987% 10/1/33 (d) | | 1,460 | | 1,497 |
2.142% 3/1/35 (d) | | 159 | | 165 |
2.167% 10/1/33 (d) | | 81 | | 84 |
2.194% 2/1/33 (d) | | 181 | | 187 |
2.213% 7/1/35 (d) | | 76 | | 78 |
2.231% 9/1/33 (d) | | 1,564 | | 1,613 |
2.243% 12/1/34 (d) | | 184 | | 189 |
2.316% 3/1/35 (d) | | 31 | | 32 |
2.49% 5/1/34 (d) | | 1,547 | | 1,613 |
2.498% 7/1/36 (d) | | 444 | | 465 |
2.532% 7/1/34 (d) | | 96 | | 100 |
2.553% 10/1/33 (d) | | 167 | | 176 |
2.632% 3/1/33 (d) | | 431 | | 451 |
2.68% 1/1/35 (d) | | 811 | | 846 |
2.742% 11/1/36 (d) | | 805 | | 846 |
2.774% 8/1/35 (d) | | 1,051 | | 1,101 |
2.804% 7/1/34 (d) | | 1,531 | | 1,620 |
2.839% 9/1/35 (d) | | 901 | | 946 |
2.858% 2/1/34 (d) | | 56 | | 59 |
2.859% 5/1/35 (d) | | 1,306 | | 1,370 |
3% 2/1/26 (a) | | 47,000 | | 45,926 |
3.028% 9/1/36 (d) | | 1,144 | | 1,196 |
3.071% 6/1/47 (d) | | 454 | | 475 |
3.076% 2/1/36 (d) | | 2,140 | | 2,244 |
3.135% 8/1/35 (d) | | 2,206 | | 2,335 |
U.S. Government Agency - Mortgage Securities - continued |
| Principal Amount (000s) | | Value (000s) |
Fannie Mae - continued |
3.5% 2/1/26 (a) | | $ 2,000 | | $ 2,011 |
3.5% 2/1/26 (a) | | 37,000 | | 37,203 |
4% 4/1/24 to 10/1/25 (b) | | 3,828 | | 3,944 |
4.5% 6/1/24 | | 3,748 | | 3,926 |
4.5% 2/1/26 (a)(b) | | 21,000 | | 22,014 |
5% 6/1/20 | | 38,719 | | 41,473 |
5.086% 9/1/34 (d) | | 990 | | 1,042 |
5.5% 12/1/16 to 3/1/20 | | 5,276 | | 5,696 |
5.5% 2/1/41 (a)(b) | | 93,000 | | 99,415 |
5.804% 3/1/36 (d) | | 1,262 | | 1,349 |
6.5% 10/1/17 to 12/1/24 | | 1,746 | | 1,941 |
7% 11/1/16 to 3/1/17 | | 1,030 | | 1,134 |
7.5% 8/1/11 to 4/1/17 | | 416 | | 450 |
8.5% 12/1/27 | | 146 | | 169 |
9.5% 9/1/30 | | 15 | | 19 |
10.25% 10/1/18 | | 5 | | 6 |
11.5% 11/1/14 to 7/1/15 | | 8 | | 9 |
12.5% 10/1/15 to 7/1/16 | | 19 | | 22 |
13.25% 9/1/11 | | 3 | | 3 |
| | 287,440 |
Freddie Mac - 0.6% |
2.131% 12/1/35 (d) | | 794 | | 821 |
2.408% 6/1/33 (d) | | 987 | | 1,030 |
2.452% 11/1/35 (d) | | 1,160 | | 1,211 |
2.574% 10/1/35 (d) | | 1,268 | | 1,325 |
2.631% 7/1/35 (d) | | 1,082 | | 1,129 |
2.649% 6/1/33 (d) | | 2,774 | | 2,916 |
2.765% 3/1/35 (d) | | 4,059 | | 4,287 |
2.799% 1/1/35 (d) | | 2,524 | | 2,653 |
2.885% 6/1/33 (d) | | 2,514 | | 2,651 |
3.087% 8/1/34 (d) | | 403 | | 422 |
3.136% 5/1/37 (d) | | 256 | | 268 |
3.164% 12/1/35 (d) | | 7,091 | | 7,440 |
3.171% 10/1/36 (d) | | 1,217 | | 1,262 |
3.184% 3/1/37 (d) | | 356 | | 367 |
3.513% 3/1/33 (d) | | 29 | | 31 |
5.5% 11/1/17 to 1/1/36 (c) | | 15,903 | | 17,053 |
5.579% 4/1/36 (d) | | 1,174 | | 1,230 |
8.5% 5/1/17 to 6/1/25 | | 32 | | 36 |
9% 7/1/18 to 3/1/20 | | 11 | | 12 |
9.5% 7/1/30 | | 63 | | 75 |
U.S. Government Agency - Mortgage Securities - continued |
| Principal Amount (000s) | | Value (000s) |
Freddie Mac - continued |
10% 4/1/15 to 7/1/19 | | $ 96 | | $ 108 |
10.25% 11/1/16 | | 5 | | 5 |
12% 2/1/13 to 6/1/15 | | 19 | | 21 |
12.5% 11/1/12 to 5/1/15 | | 16 | | 18 |
13% 5/1/14 to 11/1/14 | | 3 | | 3 |
13.5% 9/1/14 to 12/1/14 | | 2 | | 2 |
| | 46,376 |
Ginnie Mae - 100.1% |
3.5% 3/20/34 to 8/15/39 | | 1,334 | | 1,291 |
3.5% 2/1/41 (a) | | 22,500 | | 21,618 |
4% 1/15/25 to 5/15/40 | | 151,053 | | 155,248 |
4% 2/1/41 (a) | | 64,700 | | 64,958 |
4% 2/1/41 (a)(b) | | 48,000 | | 48,191 |
4% 2/1/41 (a) | | 14,000 | | 14,037 |
4% 2/1/41 (a) | | 93,000 | | 93,247 |
4% 2/1/41 (a) | | 74,000 | | 74,197 |
4.5% 7/15/33 to 9/15/40 | | 1,295,331 | | 1,344,216 |
4.5% 2/1/41 (a) | | 113,000 | | 116,884 |
4.5% 2/1/41 (a) | | 150,000 | | 155,155 |
4.5% 2/1/41 (a)(b) | | 162,000 | | 167,568 |
4.5% 2/1/41 (a) | | 499,600 | | 516,852 |
4.5% 2/1/41 (a) | | 2,000 | | 2,069 |
4.5% 2/1/41 (a) | | 66,000 | | 68,279 |
4.5% 2/1/41 (a)(b) | | 33,500 | | 34,657 |
5% 8/15/18 to 9/20/40 | | 1,582,327 | | 1,688,553 |
5% 2/1/41 (a)(b) | | 285,000 | | 302,471 |
5% 2/1/41 (a)(b) | | 121,500 | | 128,948 |
5% 2/1/41 (a)(b) | | 95,000 | | 100,878 |
5.251% 6/20/60 (g) | | 47,458 | | 51,220 |
5.39% 12/20/59 (g) | | 43,505 | | 47,211 |
5.391% 11/20/59 (g) | | 70,237 | | 76,168 |
5.46% 12/20/59 (g) | | 31,068 | | 33,722 |
5.5% 12/20/18 to 7/20/40 | | 953,466 | | 1,035,720 |
5.5% 2/1/41 (a)(b) | | 58,000 | | 62,717 |
5.5% 12/20/59 (g) | | 26,533 | | 28,864 |
6% 8/15/17 to 9/20/40 | | 585,803 | | 644,891 |
6.45% 10/15/31 to 11/15/32 | | 1,316 | | 1,471 |
6.5% 12/15/24 to 12/20/39 | | 255,796 | | 286,639 |
7% 10/20/16 to 9/20/34 | | 60,256 | | 67,990 |
7.25% 9/15/27 | | 117 | | 132 |
7.395% 6/20/25 to 11/20/27 | | 1,287 | | 1,461 |
U.S. Government Agency - Mortgage Securities - continued |
| Principal Amount (000s) | | Value (000s) |
Ginnie Mae - continued |
7.5% 5/15/17 to 9/20/32 | | $ 24,707 | | $ 27,959 |
8% 8/15/18 to 7/15/32 | | 6,534 | | 7,426 |
8.5% 5/15/16 to 2/15/31 | | 1,665 | | 1,861 |
9% 5/15/14 to 5/15/30 | | 834 | | 956 |
9.5% 12/20/15 to 4/20/17 | | 265 | | 296 |
10.5% 1/15/14 to 10/15/18 | | 322 | | 365 |
13% 4/15/13 to 1/15/15 | | 34 | | 37 |
13.5% 1/15/15 | | 3 | | 3 |
| | 7,476,426 |
TOTAL U.S. GOVERNMENT AGENCY - MORTGAGE SECURITIES (Cost $7,675,502) | 7,810,242 |
Collateralized Mortgage Obligations - 10.0% |
|
U.S. Government Agency - 10.0% |
Fannie Mae: | | | | |
sequential payer Series 2010-50 Class FA, 0.61% 1/25/24 (d) | | 6,542 | | 6,581 |
Series 2003-39 Class IA, 5.5% 10/25/22 (d)(e) | | 1,558 | | 136 |
target amortization class Series G94-2 Class D, 6.45% 1/25/24 | | 960 | | 984 |
Fannie Mae Stripped Mortgage-Backed Securities: | | | | |
Series 331 Class 12, 6.5% 2/1/33 (e) | | 1,384 | | 306 |
Series 339 Class 5, 5.5% 8/1/33 (e) | | 2,135 | | 389 |
Series 343 Class 16, 5.5% 5/1/34 (e) | | 1,634 | | 319 |
Fannie Mae subordinate REMIC pass-thru certificates floater: Series 2008-76 Class EF, 0.76% 9/25/23 (d) | | 8,612 | | 8,618 |
Freddie Mac Multi-class participation certificates guaranteed: | | | | |
floater: | | | | |
Series 2861 Class JF, 0.5613% 4/15/17 (d) | | 413 | | 414 |
Series 3279 Class FB, 0.5813% 2/15/37 (d) | | 6,925 | | 6,870 |
Series 3346 Class FA, 0.4913% 2/15/19 (d) | | 68,228 | | 68,194 |
planned amortization class: | | | | |
Series 2220 Class PD, 8% 3/15/30 | | 2,088 | | 2,401 |
Series 40 Class K, 6.5% 8/17/24 | | 919 | | 1,031 |
sequential payer: | | | | |
Series 2204 Class N, 7.5% 12/20/29 | | 4,267 | | 4,849 |
Series 2601 Class TI, 5.5% 10/15/22 (e) | | 5,666 | | 522 |
Series 3427 Class FX, 0.4113% 8/15/18 (d) | | 29,725 | | 29,696 |
Collateralized Mortgage Obligations - continued |
| Principal Amount (000s) | | Value (000s) |
U.S. Government Agency - continued |
Ginnie Mae guaranteed Multi-family REMIC pass-thru securities sequential payer Series 2002-71 Class Z, 5.5% 10/20/32 | | $ 30,188 | | $ 32,752 |
Ginnie Mae guaranteed REMIC pass-thru securities: | | | | |
floater: | | | | |
Series 2001-22 Class FM, 0.6106% 5/20/31 (d) | | 392 | | 395 |
Series 2002-41 Class HF, 0.6613% 6/16/32 (d) | | 457 | | 461 |
Series 2010-H03 Class FA, 0.8106% 3/20/60 (d)(g) | | 23,766 | | 23,825 |
Series 2010-H17 Class FA, 0.5906% 7/20/60 (d)(g) | | 19,600 | | 19,365 |
Series 2010-H18 Class AF, 0.5538% 9/1/60 (d)(g) | | 20,338 | | 20,236 |
Series 2010-H19 Class FG, 0.5656% 8/20/60 (d)(g) | | 26,118 | | 25,700 |
planned amortization class: | | | | |
Series 1993-13 Class PD, 6% 5/20/29 | | 9,546 | | 10,504 |
Series 1994-4 Class KQ, 7.9875% 7/16/24 | | 624 | | 712 |
Series 2000-26 Class PK, 7.5% 9/20/30 | | 1,721 | | 1,960 |
Series 2002-50 Class PE, 6% 7/20/32 | | 12,238 | | 13,492 |
Series 2003-54 Class UE, 5% 6/20/33 | | 20,000 | | 21,087 |
Series 2003-70 Class LE, 5% 7/20/32 | | 44,000 | | 47,084 |
Series 2004-19: | | | | |
Class DJ, 4.5% 3/20/34 | | 575 | | 587 |
Class DP, 5.5% 3/20/34 | | 3,895 | | 4,207 |
Series 2004-64 Class KE, 5.5% 12/20/33 | | 22,978 | | 24,809 |
Series 2005-17 Class IA, 5.5% 8/20/33 (e) | | 2,046 | | 105 |
Series 2005-24 Class TC, 5.5% 3/20/35 | | 5,403 | | 5,772 |
Series 2005-54 Class BM, 5% 7/20/35 | | 9,658 | | 10,346 |
Series 2005-57 Class PB, 5.5% 7/20/35 | | 5,673 | | 6,060 |
Series 2006-50 Class JC, 5% 6/20/36 | | 11,780 | | 12,565 |
Series 2008-28 Class PC, 5.5% 4/20/34 | | 18,652 | | 20,429 |
sequential payer: | | | | |
Series 1995-4 Class CQ, 8% 6/20/25 | | 463 | | 527 |
Series 1998-23 Class ZB, 6.5% 6/20/28 | | 7,065 | | 7,957 |
Series 2001-40 Class Z, 6% 8/20/31 | | 4,491 | | 4,937 |
Series 2001-49 Class Z, 7% 10/16/31 | | 1,995 | | 2,256 |
Series 2002-18 Class ZB, 6% 3/20/32 | | 4,488 | | 4,935 |
Series 2002-29: | | | | |
Class SK, 8.25% 5/20/32 (d)(f) | | 208 | | 228 |
Class Z, 6.5% 5/16/32 | | 6,289 | | 7,066 |
Series 2002-33 Class ZJ, 6.5% 5/20/32 | | 3,733 | | 4,197 |
Series 2002-42 Class ZA, 6% 6/20/32 | | 2,885 | | 3,170 |
Collateralized Mortgage Obligations - continued |
| Principal Amount (000s) | | Value (000s) |
U.S. Government Agency - continued |
Ginnie Mae guaranteed REMIC pass-thru securities: - continued | | | | |
sequential payer: | | | | |
Series 2002-43 Class Z, 6.5% 6/20/32 | | $ 6,963 | | $ 7,815 |
Series 2002-45 Class Z, 6% 6/20/32 | | 1,633 | | 1,798 |
Series 2002-49 Class ZA, 6.5% 7/20/32 | | 24,208 | | 27,122 |
Series 2003-75 Class ZA, 5.5% 9/20/33 | | 11,192 | | 12,145 |
Series 2004-46 Class BZ, 6% 6/20/34 | | 13,366 | | 14,654 |
Series 2004-65 Class VE, 5.5% 7/20/15 | | 2,869 | | 3,092 |
Series 2004-86 Class G, 6% 10/20/34 | | 6,273 | | 6,983 |
Series 2005-28 Class AJ, 5.5% 4/20/35 | | 25,859 | | 28,504 |
Series 2005-47 Class ZY, 6% 6/20/35 | | 5,587 | | 6,300 |
Series 2005-6 Class EX, 5.5% 11/20/34 | | 1,001 | | 1,112 |
Series 2005-82 Class JV, 5% 6/20/35 | | 3,500 | | 3,625 |
Series 1995-6 Class Z, 7% 9/20/25 | | 1,349 | | 1,507 |
Series 2003-42 Class FH, 0.7106% 5/20/33 (d) | | 4,358 | | 4,379 |
Series 2003-92 Class SN, 6.1688% 10/16/33 (d)(e)(f) | | 16,307 | | 2,134 |
Series 2004-32 Class GS, 6.2388% 5/16/34 (d)(e)(f) | | 1,627 | | 255 |
Series 2004-59 Class FC, 0.5613% 8/16/34 (d) | | 8,736 | | 8,722 |
Series 2004-79 Class FA, 0.5606% 1/20/31 (d) | | 6,596 | | 6,605 |
Series 2005-41 Class F, 0.5606% 5/20/35 (d) | | 23,399 | | 23,376 |
Series 2005-6 Class EY, 5.5% 11/20/33 | | 1,016 | | 1,114 |
Series 2006-13 Class DS, 10.7091% 3/20/36 (d)(f) | | 29,005 | | 32,059 |
Series 2007-35 Class SC, 38.6325% 6/16/37 (d)(f) | | 8,697 | | 15,103 |
Series 2008-88 Class BZ, 5.5% 5/20/33 | | 50,388 | | 55,114 |
Series 2010-H010 Class FA, 0.5906% 5/20/60 (d)(g) | | 16,310 | | 16,066 |
TOTAL COLLATERALIZED MORTGAGE OBLIGATIONS (Cost $709,213) | 748,620 |
Commercial Mortgage Securities - 0.1% |
|
Fannie Mae subordinate REMIC pass-thru certificates: | | | | |
Series 1998-M3 Class IB, 0.9076% 1/17/38 (d)(e) | | 5,890 | | 92 |
Series 1998-M4 Class N, 1.2801% 2/25/35 (d)(e) | | 35 | | 0 |
Ginnie Mae guaranteed Multi-family REMIC pass-thru securities: | | | | |
sequential payer Series 2001-58 Class X, 0.7779% 9/16/41 (d)(e) | | 69,461 | | 1,125 |
Series 2001-12 Class X, 0.643% 7/16/40 (d)(e) | | 24,425 | | 414 |
Commercial Mortgage Securities - continued |
| Principal Amount (000s) | | Value (000s) |
Ginnie Mae guaranteed REMIC pass-thru securities: | | | | |
sequential payer Series 2002-81 Class IO, 1.5595% 9/16/42 (d)(e) | | $ 74,263 | | $ 2,172 |
Series 2002-62 Class IO, 1.216% 8/16/42 (d)(e) | | 48,553 | | 1,445 |
Series 2002-85 Class X, 1.5072% 3/16/42 (d)(e) | | 41,656 | | 1,762 |
TOTAL COMMERCIAL MORTGAGE SECURITIES (Cost $18,342) | 7,010 |
Cash Equivalents - 6.4% |
| Maturity Amount (000s) | | |
Investments in repurchase agreements in a joint trading account at 0.23%, dated 1/31/11 due 2/1/11 (Collateralized by U.S. Government Obligations) #
(Cost $473,788) | $ 473,791 | | 473,788 |
TOTAL INVESTMENT PORTFOLIO - 122.7% (Cost $8,999,522) | | 9,162,372 |
NET OTHER ASSETS (LIABILITIES) - (22.7)% | | (1,695,252) |
NET ASSETS - 100% | $ 7,467,120 |
Swap Agreements |
| Expiration Date | | Notional Amount (000s) | | |
Interest Rate Swaps |
Receive quarterly a floating rate based on 3-month LIBOR and pay semi-annually a fixed rate equal to 1.4% with JPMorgan Chase, Inc. | Oct. 2015 | | $ 85,000 | | 2,214 |
Receive quarterly a floating rate based on 3-month LIBOR and pay semi-annually a fixed rate equal to 3.8225% with Credit Suisse First Boston | April 2020 | | 43,200 | | (2,123) |
| | $ 128,200 | | $ 91 |
Legend |
(a) Security or a portion of the security purchased on a delayed delivery or when-issued basis. |
(b) A portion of the security is subject to a forward commitment to sell. |
(c) Security or a portion of the security has been segregated as collateral for open swap agreements. At the period end, the value of securities pledged amounted to $4,751,000. |
(d) Coupon rates for floating and adjustable rate securities reflect the rates in effect at period end. |
(e) Security represents right to receive monthly interest payments on an underlying pool of mortgages or assets. Principal shown is the outstanding par amount of the pool held as of the end of the period. |
(f) Coupon is inversely indexed to a floating interest rate multiplied by a specified factor. The price may be considerably more volatile than the price of a comparable fixed rate security. |
(g) Represents an investment in an underlying pool of reverse mortgages which typically do not require regular principal and interest payments as repayment is deferred until a maturity event. |
# Additional information on each counterparty to the repurchase agreement is as follows: |
Repurchase Agreement / Counterparty | Value
(Amounts in thousands) |
$473,788,000 due 2/01/11 at 0.23% |
BNP Paribas Securities Corp. | $ 22,292 |
Bank of America NA | 145,226 |
Barclays Capital, Inc. | 11,346 |
Citigroup Global Markets, Inc. | 13,112 |
Credit Agricole Securities (USA), Inc. | 18,153 |
Deutsche Bank Securities, Inc. | 13,615 |
HSBC Securities (USA), Inc. | 54,460 |
J.P. Morgan Securities, Inc. | 18,153 |
Merrill Lynch Government Securities, Inc. | 16,338 |
Merrill Lynch, Pierce, Fenner & Smith, Inc. | 18,137 |
Mizuho Securities USA, Inc. | 81,689 |
Societe Generale, New York Branch | 36,306 |
Wells Fargo Securities LLC | 24,961 |
| $ 473,788 |
Other Information |
All investments are categorized as Level 2 under the Fair Value Hierarchy. The inputs or methodology used for valuing securities may not be an indication of the risk associated with investing in those securities. For more information on valuation inputs, please refer to the Security Valuation section in the accompanying Notes to Financial Statements. |
Value of Derivative Instruments |
The following table is a summary of the Fund's value of derivative instruments by risk exposure as of January 31, 2011. For additional information on derivative instruments, please refer to the Derivative Instruments section in the accompanying Notes to Financial Statements. |
Risk Exposure /
Derivative Type
(Amounts in thousands) | Value |
| Asset | Liability |
Interest Rate Risk | | |
Swap Agreements (a) | $ 2,214 | $ (2,123) |
Total Value of Derivatives | $ 2,214 | $ (2,123) |
(a) Value is disclosed on the Statement of Assets and Liabilities in the Unrealized Appreciation and Unrealized Depreciation on Swap Agreements line-items. |
See accompanying notes which are an integral part of the financial statements.
Semiannual Report
Fidelity GNMA Fund
Statement of Assets and Liabilities
Amounts in thousands (except per-share amount) | January 31, 2011 (Unaudited) |
Assets | | |
Investment in securities, at value (including repurchase agreements of $473,788) -
See accompanying schedule: Unaffiliated issuers (cost $8,999,522) | | $ 9,162,372 |
Commitment to sell securities on a delayed delivery basis | $ (542,528) | |
Receivable for securities sold on a delayed delivery basis | 542,088 | (440) |
Receivable for investments sold, regular delivery | | 655,276 |
Cash | | 231 |
Receivable for fund shares sold | | 9,375 |
Interest receivable | | 29,056 |
Unrealized appreciation on swap agreements | | 2,214 |
Other receivables | | 1,307 |
Total assets | | 9,859,391 |
| | |
Liabilities | | |
Payable for investments purchased
Regular delivery | $ 195,249 | |
Delayed delivery | 2,179,133 | |
Payable for fund shares redeemed | 9,540 | |
Distributions payable | 2,092 | |
Unrealized depreciation on swap agreements | 2,123 | |
Accrued management fee | 1,979 | |
Other affiliated payables | 847 | |
Other payables and accrued expenses | 1,308 | |
Total liabilities | | 2,392,271 |
| | |
Net Assets | | $ 7,467,120 |
Net Assets consist of: | | |
Paid in capital | | $ 7,331,396 |
Distributions in excess of net investment income | | (26,275) |
Accumulated undistributed net realized gain (loss) on investments | | (502) |
Net unrealized appreciation (depreciation) on investments | | 162,501 |
Net Assets, for 651,751 shares outstanding | | $ 7,467,120 |
Net Asset Value, offering price and redemption price per share ($7,467,120 ÷ 651,751 shares) | | $ 11.46 |
See accompanying notes which are an integral part of the financial statements.
Semiannual Report
Fidelity GNMA Fund
Financial Statements - continued
Statement of Operations
Amounts in thousands | Six months ended January 31, 2011 (Unaudited) |
Investment Income | | |
Interest | | $ 141,360 |
| | |
Expenses | | |
Management fee | $ 12,820 | |
Transfer agent fees | 4,057 | |
Fund wide operations fee | 1,363 | |
Independent trustees' compensation | 16 | |
Miscellaneous | 15 | |
Total expenses | | 18,271 |
Net investment income | | 123,089 |
Realized and Unrealized Gain (Loss) Net realized gain (loss) on: | | |
Investment securities: | | |
Unaffiliated issuers | 57,185 | |
Swap agreements | (1,160) | |
Total net realized gain (loss) | | 56,025 |
Change in net unrealized appreciation (depreciation) on: Investment securities | (149,260) | |
Swap agreements | 4,228 | |
Delayed delivery commitments | 2,868 | |
Total change in net unrealized appreciation (depreciation) | | (142,164) |
Net gain (loss) | | (86,139) |
Net increase (decrease) in net assets resulting from operations | | $ 36,950 |
See accompanying notes which are an integral part of the financial statements.
Semiannual Report
Statement of Changes in Net Assets
Amounts in thousands | Six months ended
January 31, 2011
(Unaudited) | Year ended
July 31,
2010 |
Increase (Decrease) in Net Assets | | |
Operations | | |
Net investment income | $ 123,089 | $ 215,262 |
Net realized gain (loss) | 56,025 | 269,951 |
Change in net unrealized appreciation (depreciation) | (142,164) | 145,830 |
Net increase (decrease) in net assets resulting
from operations | 36,950 | 631,043 |
Distributions to shareholders from net investment income | (126,981) | (217,763) |
Distributions to shareholders from net realized gain | (226,739) | (74,582) |
Total distributions | (353,720) | (292,345) |
Share transactions
Proceeds from sales of shares | 1,159,607 | 3,765,037 |
Reinvestment of distributions | 318,904 | 260,696 |
Cost of shares redeemed | (1,946,812) | (2,693,893) |
Net increase (decrease) in net assets resulting from share transactions | (468,301) | 1,331,840 |
Total increase (decrease) in net assets | (785,071) | 1,670,538 |
| | |
Net Assets | | |
Beginning of period | 8,252,191 | 6,581,653 |
End of period (including distributions in excess of net investment income of $26,275 and distributions in excess of net investment income of $22,383, respectively) | $ 7,467,120 | $ 8,252,191 |
Other Information Shares | | |
Sold | 99,044 | 325,929 |
Issued in reinvestment of distributions | 27,428 | 22,566 |
Redeemed | (167,701) | (234,206) |
Net increase (decrease) | (41,229) | 114,289 |
See accompanying notes which are an integral part of the financial statements.
Semiannual Report
Financial Highlights
| Six months ended January 31, 2011 | Years ended July 31, |
| (Unaudited) | 2010 | 2009 | 2008 | 2007 | 2006 |
Selected Per-Share Data | | | | | |
Net asset value, beginning of period | $ 11.91 | $ 11.37 | $ 10.86 | $ 10.64 | $ 10.62 | $ 11.00 |
Income from Investment Operations | | | | | | |
Net investment income D | .177 | .337 | .497 | .534 | .537 | .497 |
Net realized and unrealized gain (loss) | (.120) | .660 | .533 | .230 | .017 | (.315) |
Total from investment operations | .057 | .997 | 1.030 | .764 | .554 | .182 |
Distributions from net investment income | (.183) | (.342) | (.520) | (.544) | (.534) | (.542) |
Distributions from net realized gain | (.324) | (.115) | - | - | - | (.020) |
Total distributions | (.507) | (.457) | (.520) | (.544) | (.534) | (.562) |
Net asset value, end of period | $ 11.46 | $ 11.91 | $ 11.37 | $ 10.86 | $ 10.64 | $ 10.62 |
Total Return B, C | .48% | 8.97% | 9.69% | 7.27% | 5.29% | 1.70% |
Ratios to Average Net Assets E | | | | | |
Expenses before reductions | .45% A | .45% | .45% | .45% | .45% | .45% |
Expenses net of fee waivers,
if any | .45% A | .45% | .45% | .45% | .45% | .45% |
Expenses net of all reductions | .45% A | .45% | .45% | .45% | .45% | .45% |
Net investment income | 3.01% A | 2.92% | 4.47% | 4.90% | 5.01% | 4.61% |
Supplemental Data | | | | | | |
Net assets,
end of period
(in millions) | $ 7,467 | $ 8,252 | $ 6,582 | $ 3,480 | $ 3,172 | $ 3,365 |
Portfolio turnover rate | 365% A | 540% | 464% | 227% | 165% | 183% |
A Annualized
B Total returns for periods of less than one year are not annualized.
C Total returns would have been lower had certain expenses not been reduced during the periods shown.
D Calculated based on average shares outstanding during the period.
E Expense ratios reflect operating expenses of the Fund. Expenses before reductions do not reflect amounts reimbursed by the investment adviser or reductions from expense offset arrangements and do not represent the amount paid by the Fund during periods when reimbursements or reductions occur. Expenses net of fee waivers reflect expenses after reimbursement by the investment adviser but prior to reductions from expense offset arrangements. Expenses net of all reductions represent the net expenses paid by the Fund.
See accompanying notes which are an integral part of the financial statements.
Semiannual Report
Fidelity Intermediate Government Income Fund
Investment Changes (Unaudited)
Coupon Distribution as of January 31, 2011 |
| % of fund's
investments | % of fund's investments
6 months ago |
0.01 - 0.99% | 14.5 | 6.5 |
1 - 1.99% | 26.1 | 20.9 |
2 - 2.99% | 19.1 | 16.8 |
3 - 3.99% | 25.4 | 38.4 |
4 - 4.99% | 5.4 | 8.6 |
5 - 5.99% | 5.0 | 5.7 |
6% and over | 2.5 | 2.9 |
Coupon distribution shows the range of stated interest rates on the fund's investments, excluding short-term investments. |
Weighted Average Maturity as of January 31, 2011 |
| | 6 months ago |
Years | 5.1 | 4.7 |
This is a weighted average of all the maturities of the securities held in a fund. Weighted Average Maturity (WAM) can be used as a measure of sensitivity to interest rate changes and markets changes. Generally, the longer the maturity, the greater the sensitivity to such changes. WAM is based on the dollar-weighted average length of time until principal payments must be paid. Depending on the types of securities held in a fund, certain maturity shortening devices (e.g., demand features, interest rate resets, and call options) may be taken into account when calculating the WAM. |
Duration as of January 31, 2011 |
| | 6 months ago |
Years | 3.6 | 3.6 |
Duration shows how much a bond fund's price fluctuates with changes in comparable interest rates. If rates rise 1%, for example, a fund with a five-year duration is likely to lose about 5% of its value. Other factors also can influence a bond fund's performance and share price. Accordingly, a bond fund's actual performance may differ from this example. |
Asset Allocation (% of fund's net assets) |
As of January 31, 2011* | As of July 31, 2010** |
| Mortgage
Securities 15.1% | | | Mortgage
Securities 9.0% | |
 | CMOs and
Other Mortgage
Related Securities 8.3% | | | CMOs and
Other Mortgage
Related Securities 7.4% | |
 | U.S. Treasury
Obligations 63.9% | | | U.S. Treasury
Obligations 63.6% | |
| U.S. Government
Agency Obligations† 18.7% | | | U.S. Government
Agency Obligations† 20.9% | |
| Short-Term
Investments and
Net Other Assets†† (6.0)% | | | Short-Term
Investments and
Net Other Assets†† (0.9)% | |
* Futures and Swaps | 0.6% | | ** Futures and Swaps | 0.0% | |

† Includes FDIC Guaranteed Corporate Securities and NCUA Guaranteed Notes. |
†† Short-Term Investments and Net Other Assets are not included in pie chart. |
Semiannual Report
Fidelity Intermediate Government Income Fund
Investments January 31, 2011 (Unaudited)
Showing Percentage of Net Assets
U.S. Government and Government Agency Obligations - 82.6% |
| Principal Amount (000s) | | Value (000s) |
U.S. Government Agency Obligations - 9.8% |
Fannie Mae: | | | | |
0.375% 12/28/12 | | $ 8,610 | | $ 8,551 |
1.125% 7/30/12 | | 3,780 | | 3,815 |
1.25% 8/20/13 | | 3,330 | | 3,354 |
1.25% 2/27/14 | | 1,437 | | 1,438 |
Federal Home Loan Bank: | | | | |
0.875% 8/22/12 | | 2,100 | | 2,111 |
0.875% 12/27/13 | | 465 | | 462 |
1.5% 1/16/13 | | 5,055 | | 5,130 |
1.875% 6/21/13 | | 12,060 | | 12,354 |
Freddie Mac: | | | | |
0.375% 11/30/12 | | 2,964 | | 2,952 |
0.625% 12/28/12 | | 49,830 | | 49,831 |
1.375% 2/25/14 | | 11,890 | | 11,957 |
4.5% 1/15/14 | | 1,578 | | 1,726 |
Israeli State (guaranteed by U.S. Government through Agency for International Development) 6.8% 2/15/12 | | 3,050 | | 3,061 |
Private Export Funding Corp. secured: | | | | |
4.974% 8/15/13 | | 3,435 | | 3,783 |
5.66% 9/15/11 (a) | | 9,000 | | 9,278 |
5.685% 5/15/12 | | 3,915 | | 4,178 |
Small Business Administration guaranteed development participation certificates Series 2004-20H Class 1, 5.17% 8/1/24 | | 512 | | 548 |
TOTAL U.S. GOVERNMENT AGENCY OBLIGATIONS | | 124,529 |
U.S. Treasury Inflation Protected Obligations - 3.9% |
U.S. Treasury Inflation-Indexed Notes 2.375% 4/15/11 | | 49,804 | | 50,287 |
U.S. Treasury Obligations - 60.0% |
U.S. Treasury Bonds 8.75% 5/15/17 | | 14,750 | | 20,220 |
U.S. Treasury Notes: | | | | |
0.625% 12/31/12 | | 51,525 | | 51,608 |
0.75% 12/15/13 | | 6,346 | | 6,314 |
1% 1/15/14 | | 66,406 | | 66,473 |
1.25% 8/31/15 | | 1,000 | | 977 |
1.375% 2/15/13 | | 9,255 | | 9,400 |
1.375% 11/30/15 | | 48,102 | | 46,982 |
1.5% 12/31/13 | | 4,659 | | 4,734 |
1.75% 4/15/13 | | 6,035 | | 6,180 |
1.75% 7/31/15 | | 2,000 | | 2,003 |
U.S. Government and Government Agency Obligations - continued |
| Principal Amount (000s) | | Value (000s) |
U.S. Treasury Obligations - continued |
U.S. Treasury Notes: - continued | | | | |
1.875% 2/28/14 | | $ 81,000 | | $ 83,133 |
1.875% 4/30/14 | | 1,550 | | 1,589 |
1.875% 6/30/15 | | 35,554 | | 35,862 |
2% 1/31/16 | | 15,000 | | 15,032 |
2.125% 5/31/15 | | 1,574 | | 1,606 |
2.125% 12/31/15 | | 49,392 | | 49,871 |
2.25% 11/30/17 | | 8,000 | | 7,791 |
2.375% 8/31/14 | | 9,290 | | 9,656 |
2.375% 9/30/14 | | 4,572 | | 4,750 |
2.375% 10/31/14 | | 16,136 | | 16,755 |
2.375% 7/31/17 | | 12,000 | | 11,865 |
2.5% 3/31/15 | | 7,000 | | 7,273 |
2.5% 6/30/17 | | 1,800 | | 1,797 |
2.625% 1/31/18 | | 2,980 | | 2,963 |
2.625% 8/15/20 | | 23,705 | | 22,351 |
2.625% 11/15/20 | | 13,900 | | 13,031 |
2.75% 2/15/19 | | 2,505 | | 2,468 |
3% 9/30/16 | | 6,641 | | 6,911 |
3% 2/28/17 | | 26,424 | | 27,308 |
3.125% 8/31/13 | | 13,605 | | 14,430 |
3.125% 10/31/16 | | 33,540 | | 35,083 |
3.125% 1/31/17 | | 27,081 | | 28,221 |
3.125% 5/15/19 | | 26,941 | | 27,177 |
3.375% 6/30/13 | | 1,138 | | 1,211 |
3.5% 2/15/18 | | 14,117 | | 14,848 |
3.5% 5/15/20 | | 14,175 | | 14,450 |
3.625% 8/15/19 | | 9,790 | | 10,203 |
3.625% 2/15/20 | | 11,372 | | 11,762 |
3.75% 11/15/18 | | 15,261 | | 16,200 |
3.875% 2/15/13 | | 5,752 | | 6,139 |
3.875% 5/15/18 | | 2,578 | | 2,770 |
4% 8/15/18 | | 4,633 | | 5,011 |
4.25% 11/15/17 | | 6,260 | | 6,900 |
4.5% 5/15/17 (e) | | 1,369 | | 1,532 |
4.625% 2/15/17 | | 14,625 | | 16,493 |
4.75% 8/15/17 | | 12,139 | | 13,766 |
TOTAL U.S. TREASURY OBLIGATIONS | | 763,099 |
U.S. Government and Government Agency Obligations - continued |
| Principal Amount (000s) | | Value (000s) |
Other Government Related - 8.9% |
Bank of America Corp.: | | | | |
2.1% 4/30/12 (FDIC Guaranteed) (b) | | $ 1,493 | | $ 1,524 |
3.125% 6/15/12 (FDIC Guaranteed) (b) | | 305 | | 316 |
Citibank NA 1.875% 5/7/12 (FDIC Guaranteed) (b) | | 22,000 | | 22,401 |
Citigroup Funding, Inc.: | | | | |
1.875% 10/22/12 (FDIC Guaranteed) (b) | | 20,600 | | 21,034 |
1.875% 11/15/12 (FDIC Guaranteed) (b) | | 3,800 | | 3,882 |
2% 3/30/12 (FDIC Guaranteed) (b) | | 10,000 | | 10,181 |
2.125% 7/12/12 (FDIC Guaranteed) (b) | | 2,384 | | 2,438 |
General Electric Capital Corp.: | | | | |
2% 9/28/12 (FDIC Guaranteed) (b) | | 13,000 | | 13,299 |
2.625% 12/28/12 (FDIC Guaranteed) (b) | | 4,364 | | 4,526 |
3% 12/9/11 (FDIC Guaranteed) (b) | | 1,030 | | 1,053 |
GMAC, Inc. 1.75% 10/30/12 (FDIC Guaranteed) (b) | | 15,000 | | 15,288 |
Goldman Sachs Group, Inc. 3.25% 6/15/12 (FDIC Guaranteed) (b) | | 306 | | 318 |
JPMorgan Chase & Co.: | | | | |
2.2% 6/15/12 (FDIC Guaranteed) (b) | | 2,260 | | 2,308 |
3.125% 12/1/11 (FDIC Guaranteed) (b) | | 170 | | 174 |
National Credit Union Administration Guaranteed Notes: | | | | |
Series 2010-A1 Class A, 0.6106% 12/7/20
(NCUA Guaranteed) (f) | | 3,199 | | 3,202 |
Series 2010-R3 Class 1A, 0.8238% 12/8/20
(NCUA Guaranteed) (f) | | 6,520 | | 6,524 |
Series 2011-R1 Class 1A, 0.711% 1/8/20
(NCUA Guaranteed) (f) | | 4,400 | | 4,400 |
TOTAL OTHER GOVERNMENT RELATED | | 112,868 |
TOTAL U.S. GOVERNMENT AND GOVERNMENT AGENCY OBLIGATIONS (Cost $1,041,036) | 1,050,783 |
U.S. Government Agency - Mortgage Securities - 15.1% |
|
Fannie Mae - 10.5% |
2.142% 3/1/35 (f) | | 35 | | 37 |
2.167% 10/1/33 (f) | | 18 | | 18 |
2.194% 2/1/33 (f) | | 38 | | 39 |
2.213% 7/1/35 (f) | | 17 | | 17 |
2.243% 12/1/34 (f) | | 37 | | 38 |
U.S. Government Agency - Mortgage Securities - continued |
| Principal Amount (000s) | | Value (000s) |
Fannie Mae - continued |
2.295% 11/1/33 (f) | | $ 103 | | $ 107 |
2.316% 3/1/35 (f) | | 7 | | 7 |
2.474% 10/1/35 (f) | | 53 | | 55 |
2.49% 5/1/34 (f) | | 336 | | 351 |
2.498% 7/1/36 (f) | | 158 | | 165 |
2.532% 7/1/34 (f) | | 21 | | 22 |
2.553% 10/1/33 (f) | | 34 | | 36 |
2.582% 3/1/35 (f) | | 22 | | 23 |
2.589% 6/1/36 (f) | | 24 | | 26 |
2.632% 3/1/33 (f) | | 99 | | 103 |
2.642% 7/1/35 (f) | | 213 | | 225 |
2.68% 1/1/35 (f) | | 184 | | 192 |
2.733% 7/1/35 (f) | | 48 | | 51 |
2.742% 11/1/36 (f) | | 222 | | 233 |
2.779% 7/1/35 (f) | | 659 | | 690 |
2.829% 9/1/36 (f) | | 101 | | 106 |
2.839% 9/1/35 (f) | | 272 | | 285 |
2.858% 2/1/34 (f) | | 13 | | 13 |
3.071% 6/1/47 (f) | | 99 | | 104 |
3.076% 2/1/36 (f) | | 491 | | 515 |
3.135% 8/1/35 (f) | | 500 | | 529 |
3.326% 2/1/37 (f) | | 385 | | 404 |
3.36% 1/1/40 (f) | | 11,712 | | 12,110 |
3.5% 2/1/26 (c)(d) | | 65,200 | | 65,558 |
3.5% 2/1/26 (c)(d) | | 40,400 | | 40,622 |
3.5% 12/1/40 to 1/1/41 (c) | | 6,999 | | 6,678 |
4% 9/1/13 | | 143 | | 147 |
4.661% 2/1/34 (f) | | 279 | | 291 |
4.724% 2/1/36 (f) | | 71 | | 74 |
5% 2/1/16 to 4/1/22 | | 224 | | 239 |
5.579% 4/1/36 (f) | | 364 | | 382 |
5.801% 5/1/36 (f) | | 67 | | 70 |
5.963% 3/1/37 (f) | | 56 | | 60 |
6% 6/1/16 to 3/1/34 | | 1,837 | | 2,025 |
6.5% 6/1/16 to 7/1/32 | | 981 | | 1,080 |
7% 3/1/12 to 9/1/14 | | 63 | | 66 |
9% 2/1/13 | | 3 | | 3 |
10.25% 10/1/18 | | 3 | | 3 |
11% 9/1/15 to 1/1/16 | | 12 | | 14 |
11.25% 5/1/14 to 1/1/16 | | 22 | | 25 |
11.5% 1/1/13 to 6/15/19 | | 38 | | 41 |
12.25% 8/1/13 | | 1 | | 1 |
U.S. Government Agency - Mortgage Securities - continued |
| Principal Amount (000s) | | Value (000s) |
Fannie Mae - continued |
12.5% 1/1/13 to 7/1/16 | | $ 68 | | $ 77 |
12.75% 10/1/11 to 4/1/12 | | 1 | | 1 |
13% 10/1/14 | | 19 | | 22 |
13.25% 9/1/11 | | 4 | | 4 |
13.5% 11/1/14 | | 2 | | 2 |
15% 4/1/12 | | 0 | | 1 |
| | 133,987 |
Freddie Mac - 0.8% |
2.041% 3/1/35 (f) | | 131 | | 135 |
2.108% 5/1/37 (f) | | 83 | | 85 |
2.349% 7/1/35 (f) | | 977 | | 1,012 |
2.408% 6/1/33 (f) | | 216 | | 225 |
2.452% 11/1/35 (f) | | 252 | | 263 |
2.54% 6/1/37 (f) | | 201 | | 212 |
2.548% 12/1/36 (f) | | 852 | | 890 |
2.551% 5/1/37 (f) | | 714 | | 751 |
2.565% 12/1/33 (f) | | 470 | | 493 |
2.574% 10/1/35 (f) | | 277 | | 290 |
2.579% 5/1/37 (f) | | 458 | | 480 |
2.605% 4/1/34 (f) | | 790 | | 830 |
2.631% 7/1/35 (f) | | 239 | | 250 |
2.663% 6/1/35 (f) | | 75 | | 79 |
2.799% 1/1/35 (f) | | 550 | | 578 |
2.894% 4/1/37 (f) | | 78 | | 82 |
3.022% 7/1/35 (f) | | 196 | | 207 |
3.136% 5/1/37 (f) | | 56 | | 59 |
3.171% 10/1/36 (f) | | 277 | | 288 |
3.184% 3/1/37 (f) | | 79 | | 81 |
3.352% 10/1/35 (f) | | 35 | | 37 |
3.513% 3/1/33 (f) | | 6 | | 7 |
3.71% 1/1/36 (f) | | 231 | | 240 |
4.199% 3/1/36 (f) | | 731 | | 763 |
4.441% 2/1/36 (f) | | 22 | | 23 |
5.527% 1/1/36 (f) | | 210 | | 219 |
5.847% 6/1/37 (f) | | 24 | | 25 |
6.141% 7/1/36 (f) | | 86 | | 91 |
6.308% 8/1/37 (f) | | 133 | | 142 |
6.473% 2/1/37 (f) | | 49 | | 52 |
6.5% 12/1/21 | | 415 | | 454 |
7.22% 4/1/37 (f) | | 4 | | 4 |
9% 7/1/16 | | 16 | | 18 |
U.S. Government Agency - Mortgage Securities - continued |
| Principal Amount (000s) | | Value (000s) |
Freddie Mac - continued |
9.5% 7/1/16 to 8/1/21 | | $ 128 | | $ 145 |
10% 4/1/15 to 3/1/21 | | 240 | | 274 |
10.5% 1/1/21 | | 2 | | 3 |
11% 9/1/20 | | 10 | | 12 |
11.25% 6/1/14 | | 28 | | 31 |
11.5% 10/1/15 to 11/1/15 | | 19 | | 21 |
12% 2/1/13 to 11/1/19 | | 16 | | 18 |
12.25% 11/1/13 to 8/1/15 | | 18 | | 21 |
12.5% 8/1/12 to 6/1/19 | | 166 | | 186 |
13% 11/1/12 to 5/1/17 | | 19 | | 21 |
14% 11/1/12 to 4/1/16 | | 2 | | 2 |
| | 10,099 |
Ginnie Mae - 3.8% |
4% 9/15/25 | | 611 | | 639 |
5.5% 1/20/60 (g) | | 7,083 | | 7,694 |
5.5% 2/20/60 (g) | | 12,524 | | 13,620 |
5.5% 3/20/60 (g) | | 8,305 | | 9,023 |
5.5% 3/20/60 (g) | | 15,231 | | 16,550 |
8% 12/15/23 | | 226 | | 257 |
8.5% 6/15/16 to 2/15/17 | | 3 | | 3 |
10.5% 9/15/15 to 10/15/21 | | 346 | | 409 |
11% 5/20/16 to 1/20/21 | | 29 | | 34 |
13% 9/15/13 to 10/15/13 | | 5 | | 5 |
13.25% 8/15/14 | | 5 | | 6 |
13.5% 12/15/14 | | 1 | | 1 |
14% 6/15/11 | | 1 | | 1 |
| | 48,242 |
TOTAL U.S. GOVERNMENT AGENCY - MORTGAGE SECURITIES (Cost $190,710) | 192,328 |
Collateralized Mortgage Obligations - 8.3% |
|
U.S. Government Agency - 8.3% |
Fannie Mae: | | | | |
floater: | | | | |
Series 1994-42 Class FK, 2.87% 4/25/24 (f) | | 1,861 | | 1,880 |
Series 2006-56 Class PF, 0.61% 7/25/36 (f) | | 4,115 | | 4,100 |
Series 2010-09 Class PF, 0.66% 10/25/40 (f) | | 7,253 | | 7,208 |
planned amortization class: | | | | |
Series 1988-21 Class G, 9.5% 8/25/18 | | 42 | | 48 |
Collateralized Mortgage Obligations - continued |
| Principal Amount (000s) | | Value (000s) |
U.S. Government Agency - continued |
Fannie Mae: - continued | | | | |
planned amortization class: | | | | |
Series 2003-28 Class KG, 5.5% 4/25/23 | | $ 725 | | $ 789 |
sequential payer Series 2007-113 Class DB, 4.5% 12/25/22 | | 2,930 | | 3,110 |
Series 2006-127 Class FD, 0.54% 7/25/36 (f) | | 3,420 | | 3,385 |
Series 2006-44 Class FK, 0.69% 6/25/36 (f) | | 1,236 | | 1,232 |
Fannie Mae subordinate REMIC pass-thru certificates: | | | | |
floater: | | | | |
Series 2001-38 Class QF, 1.24% 8/25/31 (f) | | 358 | | 365 |
Series 2002-60 Class FV, 1.26% 4/25/32 (f) | | 112 | | 114 |
Series 2002-74 Class FV, 0.71% 11/25/32 (f) | | 3,084 | | 3,099 |
Series 2002-75 Class FA, 1.26% 11/25/32 (f) | | 229 | | 234 |
Series 2005-56 Class F, 0.55% 7/25/35 (f) | | 5,450 | | 5,408 |
Series 2006-79 Class PF, 0.66% 8/25/36 (f) | | 2,829 | | 2,820 |
Series 2008-76 Class EF, 0.76% 9/25/23 (f) | | 1,518 | | 1,519 |
planned amortization class: | | | | |
Series 2002-16 Class PG, 6% 4/25/17 | | 587 | | 635 |
Series 2002-9 Class PC, 6% 3/25/17 | | 42 | | 46 |
Series 2004-80 Class LD, 4% 1/25/19 | | 980 | | 1,022 |
Series 2004-81 Class KD, 4.5% 7/25/18 | | 1,535 | | 1,615 |
Series 2005-52 Class PB, 6.5% 12/25/34 | | 516 | | 554 |
sequential payer: | | | | |
Series 2002-56 Class MC, 5.5% 9/25/17 | | 164 | | 176 |
Series 2002-57 Class BD, 5.5% 9/25/17 | | 147 | | 160 |
Series 2004-72 Class CB, 4% 9/25/19 | | 5,000 | | 5,249 |
Series 2003-79 Class FC, 0.71% 8/25/33 (f) | | 2,732 | | 2,732 |
Freddie Mac Multi-class participation certificates guaranteed: | | | | |
floater: | | | | |
Series 2526 Class FC, 0.6613% 11/15/32 (f) | | 440 | | 441 |
Series 2630 Class FL, 0.7613% 6/15/18 (f) | | 55 | | 56 |
Series 2925 Class CQ, 0% 1/15/35 (f) | | 19 | | 19 |
Series 3279 Class FB, 0.5813% 2/15/37 (f) | | 1,206 | | 1,196 |
Series 3346 Class FA, 0.4913% 2/15/19 (f) | | 7,364 | | 7,361 |
planned amortization class: | | | | |
Series 2356 Class GD, 6% 9/15/16 | | 172 | | 186 |
Series 2376 Class JE, 5.5% 11/15/16 | | 158 | | 170 |
Series 2381 Class OG, 5.5% 11/15/16 | | 109 | | 116 |
Series 2425 Class JH, 6% 3/15/17 | | 199 | | 215 |
Series 2628 Class OE, 4.5% 6/15/18 | | 705 | | 757 |
Collateralized Mortgage Obligations - continued |
| Principal Amount (000s) | | Value (000s) |
U.S. Government Agency - continued |
Freddie Mac Multi-class participation certificates guaranteed: - continued | | | | |
planned amortization class: | | | | |
Series 2640 Class GE, 4.5% 7/15/18 | | $ 3,690 | | $ 3,977 |
Series 2695 Class DG, 4% 10/15/18 | | 1,635 | | 1,726 |
Series 2802 Class OB, 6% 5/15/34 | | 1,355 | | 1,492 |
Series 2810 Class PD, 6% 6/15/33 | | 897 | | 947 |
Series 2831 Class PB, 5% 7/15/19 | | 1,975 | | 2,149 |
Series 2866 Class XE, 4% 12/15/18 | | 2,895 | | 3,026 |
Series 3122 Class FE, 0.5613% 3/15/36 (f) | | 3,654 | | 3,663 |
Series 3147 Class PF, 0.5613% 4/15/36 (f) | | 3,080 | | 3,083 |
Series 3741 Class YU, 3.5% 11/15/22 | | 3,140 | | 3,182 |
sequential payer: | | | | |
Series 1929 Class EZ, 7.5% 2/17/27 | | 1,356 | | 1,490 |
Series 2570 Class CU, 4.5% 7/15/17 | | 52 | | 53 |
Series 2572 Class HK, 4% 2/15/17 | | 45 | | 45 |
Series 2668 Class AZ, 4% 9/15/18 | | 2,024 | | 2,120 |
Series 2729 Class GB, 5% 1/15/19 | | 795 | | 849 |
Series 2860 Class CP, 4% 10/15/17 | | 25 | | 25 |
Series 2998 Class LY, 5.5% 7/15/25 | | 295 | | 322 |
Series 3007 Class EW, 5.5% 7/15/25 | | 1,125 | | 1,227 |
Series 3013 Class VJ, 5% 1/15/14 | | 997 | | 1,048 |
Series 2715 Class NG, 4.5% 12/15/18 | | 890 | | 959 |
Ginnie Mae guaranteed REMIC pass-thru securities: | | | | |
floater: | | | | |
Series 2010-H17 Class FA, 0.5906% 7/20/60 (f)(g) | | 3,422 | | 3,381 |
Series 2010-H18 Class AF, 0.5538% 9/1/60 (f)(g) | | 3,463 | | 3,445 |
Series 2010-H19 Class FG, 0.5656% 8/20/60 (f)(g) | | 4,464 | | 4,393 |
Series 2011-H03 Class FA, 0.755% 1/20/61 (f)(g) | | 3,600 | | 3,600 |
Series 2004-79 Class FA, 0.5606% 1/20/31 (f) | | 1,222 | | 1,224 |
TOTAL COLLATERALIZED MORTGAGE OBLIGATIONS (Cost $103,681) | 105,443 |
Cash Equivalents - 2.1% |
| Maturity Amount (000s) | | Value (000s) |
Investments in repurchase agreements in a joint trading account at 0.23%, dated 1/31/11 due 2/1/11 (Collateralized by U.S. Government Obligations) #
(Cost $27,161) | $ 27,161 | | $ 27,161 |
TOTAL INVESTMENT PORTFOLIO - 108.1% (Cost $1,362,588) | | 1,375,715 |
NET OTHER ASSETS (LIABILITIES) - (8.1)% | | (103,299) |
NET ASSETS - 100% | $ 1,272,416 |
Futures Contracts |
| Expiration Date | | Underlying Face Amount at Value (000s) | | Unrealized
Appreciation/
(Depreciation) (000s) |
Purchased |
Treasury Index Contracts |
35 CBOT 2 Year U.S. Treasury Notes Index Contracts | April 2011 | | $ 7,672 | | $ 6 |
|
The face value of futures purchased as a percentage of net assets is 0.6% |
Legend |
(a) Security exempt from registration under Rule 144A of the Securities Act of 1933. These securities may be resold in transactions exempt from registration, normally to qualified institutional buyers. At the end of the period, the value of these securities amounted to $9,278,000 or 0.7% of net assets. |
(b) Under the Temporary Liquidity Guarantee Program, the Federal Deposit Insurance Corporation guarantees principal and interest in the event of payment default or bankruptcy until the earlier of maturity date of the debt or until June 30, 2012. At the end of the period these securities amounted to $98,742,000 or 7.8% of net assets. |
(c) Security or a portion of the security purchased on a delayed delivery or when-issued basis. |
(d) A portion of the security is subject to a forward commitment to sell. |
(e) Security or a portion of the security was pledged to cover margin requirements for futures contracts. At the period end, the value of securities pledged amounted to $56,000. |
(f) Coupon rates for floating and adjustable rate securities reflect the rates in effect at period end. |
(g) Represents an investment in an underlying pool of reverse mortgages which typically do not require regular principal and interest payments as repayment is deferred until a maturity event. |
# Additional information on each counterparty to the repurchase agreement is as follows: |
Repurchase Agreement / Counterparty | Value
(Amounts in
thousands) |
$27,161,000 due 2/01/11 at 0.23% |
BNP Paribas Securities Corp. | $ 1,278 |
Bank of America NA | 8,324 |
Barclays Capital, Inc. | 650 |
Citigroup Global Markets, Inc. | $ 752 |
Credit Agricole Securities (USA), Inc. | 1,041 |
Deutsche Bank Securities, Inc. | 781 |
HSBC Securities (USA), Inc. | 3,122 |
J.P. Morgan Securities, Inc. | 1,041 |
Merrill Lynch Government Securities, Inc. | 937 |
Merrill Lynch, Pierce, Fenner & Smith, Inc. | 1,040 |
Mizuho Securities USA,
Inc. | 4,683 |
Societe Generale, New York Branch | 2,081 |
Wells Fargo Securities LLC | 1,431 |
| $ 27,161 |
Other Information |
The following is a summary of the inputs used, as of January 31, 2011, involving the Fund's assets and liabilities carried at fair value. The inputs or methodology used for valuing securities may not be an indication of the risk associated with investing in those securities. For more information on valuation inputs, and their aggregation into the levels used in the table below, please refer to the Security Valuation section in the accompanying Notes to Financial Statements. |
Valuation Inputs at Reporting Date: |
Description
(Amounts in thousands) | Total | Level 1 | Level 2 | Level 3 |
Investments in Securities: | | | | |
U.S. Government and Government Agency Obligations | $ 1,050,783 | $ - | $ 1,050,783 | $ - |
U.S. Government Agency - Mortgage Securities | 192,328 | - | 192,328 | - |
Collateralized Mortgage Obligations | 105,443 | - | 105,443 | - |
Cash Equivalents | 27,161 | - | 27,161 | - |
Total Investments in Securities: | $ 1,375,715 | $ - | $ 1,375,715 | $ - |
Derivative Instruments: | | | | |
Assets | | | | |
Futures Contracts | $ 6 | $ 6 | $ - | $ - |
Other Financial Instruments: | $ 136 | $ - | $ 136 | $ - |
Value of Derivative Instruments |
The following table is a summary of the Fund's value of derivative instruments by risk exposure as of January 31, 2011. For additional information on derivative instruments, please refer to the Derivative Instruments section in the accompanying Notes to Financial Statements. |
Risk Exposure /
Derivative Type
(Amounts in thousands) | Value |
| Asset | Liability |
Interest Rate Risk | | |
Futures Contracts (a) | $ 6 | $ - |
Total Value of Derivatives | $ 6 | $ 6 |
(a) Reflects cumulative appreciation/(depreciation) on futures contracts as disclosed on the Schedule of Investments. Only the period end variation margin is separately disclosed on the Statement of Assets and Liabilities. |
See accompanying notes which are an integral part of the financial statements.
Semiannual Report
Fidelity Intermediate Government Income Fund
Statement of Assets and Liabilities
Amounts in thousands (except per-share amount) | January 31, 2011 (Unaudited) |
Assets | | |
Investment in securities, at value (including repurchase agreements of $27,161) -
See accompanying schedule: Unaffiliated issuers (cost $1,362,588) | | $ 1,375,715 |
Commitment to sell securities on a delayed delivery basis | $ (65,558) | |
Receivable for securities sold on a delayed delivery basis | 65,694 | 136 |
Receivable for investments sold, regular delivery | | 18,313 |
Cash | | 1,807 |
Receivable for fund shares sold | | 1,126 |
Interest receivable | | 6,787 |
Total assets | | 1,403,884 |
| | |
Liabilities | | |
Payable for investments purchased
Regular delivery | $ 18,361 | |
Delayed delivery | 108,535 | |
Payable for fund shares redeemed | 3,946 | |
Distributions payable | 137 | |
Accrued management fee | 339 | |
Payable for daily variation on futures contracts | 3 | |
Other affiliated payables | 147 | |
Total liabilities | | 131,468 |
| | |
Net Assets | | $ 1,272,416 |
Net Assets consist of: | | |
Paid in capital | | $ 1,258,008 |
Undistributed net investment income | | 412 |
Accumulated undistributed net realized gain (loss) on investments | | 727 |
Net unrealized appreciation (depreciation) on investments | | 13,269 |
Net Assets, for 118,656 shares outstanding | | $ 1,272,416 |
Net Asset Value, offering price and redemption price per share ($1,272,416 ÷ 118,656 shares) | | $ 10.72 |
See accompanying notes which are an integral part of the financial statements.
Semiannual Report
Fidelity Intermediate Government Income Fund
Financial Statements - continued
Statement of Operations
Amounts in thousands | Six months ended January 31, 2011 (Unaudited) |
| | |
Investment Income | | |
Interest | | $ 13,965 |
| | |
Expenses | | |
Management fee | $ 2,184 | |
Transfer agent fees | 691 | |
Fund wide operations fee | 232 | |
Independent trustees' compensation | 3 | |
Miscellaneous | 3 | |
Total expenses | | 3,113 |
Net investment income | | 10,852 |
Realized and Unrealized Gain (Loss) Net realized gain (loss) on: | | |
Investment securities: | | |
Unaffiliated issuers | 18,564 | |
Futures contracts | 32 | |
Total net realized gain (loss) | | 18,596 |
Change in net unrealized appreciation (depreciation) on: Investment securities | (30,278) | |
Futures contracts | 6 | |
Delayed delivery commitments | 135 | |
Total change in net unrealized appreciation (depreciation) | | (30,137) |
Net gain (loss) | | (11,541) |
Net increase (decrease) in net assets resulting from operations | | $ (689) |
See accompanying notes which are an integral part of the financial statements.
Semiannual Report
Statement of Changes in Net Assets
Amounts in thousands | Six months ended
January 31, 2011
(Unaudited) | Year ended
July 31,
2010 |
Increase (Decrease) in Net Assets | | |
Operations | | |
Net investment income | $ 10,852 | $ 29,126 |
Net realized gain (loss) | 18,596 | 26,348 |
Change in net unrealized appreciation (depreciation) | (30,137) | 29,967 |
Net increase (decrease) in net assets resulting
from operations | (689) | 85,441 |
Distributions to shareholders from net investment income | (11,116) | (28,870) |
Distributions to shareholders from net realized gain | (35,778) | (17,774) |
Total distributions | (46,894) | (46,644) |
Share transactions
Proceeds from sales of shares | 112,744 | 356,483 |
Reinvestment of distributions | 43,263 | 43,213 |
Cost of shares redeemed | (253,478) | (583,721) |
Net increase (decrease) in net assets resulting from share transactions | (97,471) | (184,025) |
Total increase (decrease) in net assets | (145,054) | (145,228) |
| | |
Net Assets | | |
Beginning of period | 1,417,470 | 1,562,698 |
End of period (including undistributed net investment income of $412 and undistributed net investment income of $676, respectively) | $ 1,272,416 | $ 1,417,470 |
Other Information Shares | | |
Sold | 10,241 | 32,895 |
Issued in reinvestment of distributions | 3,972 | 3,989 |
Redeemed | (23,220) | (53,973) |
Net increase (decrease) | (9,007) | (17,089) |
See accompanying notes which are an integral part of the financial statements.
Semiannual Report
Financial Highlights
| Six months ended January 31, 2011 | Years ended July 31, |
| (Unaudited) | 2010 | 2009 | 2008 | 2007 | 2006 |
Selected Per-Share Data | | | | | |
Net asset value, beginning of period | $ 11.10 | $ 10.80 | $ 10.36 | $ 9.97 | $ 9.92 | $ 10.11 |
Income from Investment Operations | | | | | | |
Net investment income D | .086 | .214 | .278 | .398 | .435 | .414 |
Net realized and unrealized gain (loss) | (.094) | .423 | .439 | .413 | .067 | (.219) |
Total from investment operations | (.008) | .637 | .717 | .811 | .502 | .195 |
Distributions from net investment income | (.088) | (.212) | (.277) | (.421) | (.452) | (.385) |
Distributions from net realized gain | (.284) | (.125) | - | - | - | - |
Total distributions | (.372) | (.337) | (.277) | (.421) | (.452) | (.385) |
Net asset value, end of period | $ 10.72 | $ 11.10 | $ 10.80 | $ 10.36 | $ 9.97 | $ 9.92 |
Total Return B, C | (.08)% | 6.02% | 6.98% | 8.24% | 5.14% | 1.97% |
Ratios to Average Net Assets E | | | | | |
Expenses before reductions | .45% A | .45% | .45% | .45% | .45% | .45% |
Expenses net of fee waivers, if any | .45% A | .45% | .45% | .45% | .45% | .45% |
Expenses net of all reductions | .45% A | .45% | .45% | .45% | .45% | .45% |
Net investment income | 1.56% A | 1.98% | 2.59% | 3.86% | 4.36% | 4.14% |
Supplemental Data | | | | | | |
Net assets,
end of period
(in millions) | $ 1,272 | $ 1,417 | $ 1,563 | $ 974 | $ 700 | $ 759 |
Portfolio turnover rate | 251% A | 227% | 305% | 318% | 121% | 97% |
A Annualized
B Total returns for periods of less than one year are not annualized.
C Total returns would have been lower had certain expenses not been reduced during the periods shown.
D Calculated based on average shares outstanding during the period.
E Expense ratios reflect operating expenses of the Fund. Expenses before reductions do not reflect amounts reimbursed by the investment adviser or reductions from expense offset arrangements and do not represent the amount paid by the Fund during periods when reimbursements or reductions occur. Expenses net of fee waivers reflect expenses after reimbursement by the investment adviser but prior to reductions from expense offset arrangements. Expenses net of all reductions represent the net expenses paid by the Fund.
See accompanying notes which are an integral part of the financial statements.
Semiannual Report
Notes to Financial Statements
For the period ended January 31, 2011 (Unaudited)
(Amounts in thousands except ratios)
1. Organization.
Fidelity GNMA Fund and Fidelity Intermediate Government Income Fund (the Funds) are funds of Fidelity Income Fund (the Trust). The Trust is registered under the Investment Company Act of 1940, as amended (the 1940 Act), as an open-end management investment company organized as a Massachusetts business trust. Each Fund is authorized to issue an unlimited number of shares.
2. Significant Accounting Policies.
The financial statements have been prepared in conformity with accounting principles generally accepted in the United States of America (GAAP), which require management to make certain estimates and assumptions at the date of the financial statements. Actual results could differ from those estimates. Subsequent events, if any, through the date that the financial statements were issued have been evaluated in the preparation of the financial statements. The following summarizes the significant accounting policies of the Funds:
Security Valuation. Investments are valued as of 4:00 p.m. Eastern time on the last calendar day of the period. Each Fund uses independent pricing services approved by the Board of Trustees to value their investments. When current market prices or quotations are not readily available or reliable, valuations may be determined in good faith in accordance with procedures adopted by the Board of Trustees. Factors used in determining value may include market or security specific events, changes in interest rates and credit quality. The frequency with which these procedures are used cannot be predicted and they may be utilized to a significant extent. The value used for net asset value (NAV) calculation under these procedures may differ from published prices for the same securities.
Each Fund categorizes the inputs to valuation techniques used to value their investments into a disclosure hierarchy consisting of three levels as shown below.
Level 1 - quoted prices in active markets for identical investments
Level 2 - other significant observable inputs (including quoted prices for similar investments, interest rates, prepayment speeds, etc.)
Level 3 - unobservable inputs (including the Fund's own assumptions based on the best information available)
Changes in valuation techniques may result in transfers in or out of an assigned level within the disclosure hierarchy. Valuation techniques used to value each Fund's investments by major category are as follows.
Semiannual Report
Notes to Financial Statements (Unaudited) - continued
(Amounts in thousands except ratios)
2. Significant Accounting Policies - continued
Security Valuation - continued
Debt securities, including restricted securities, are valued based on evaluated prices received from independent pricing services or from dealers who make markets in such securities. For U.S. government and government agency obligations, pricing services utilize matrix pricing which considers yield or price of bonds of comparable quality, coupon, maturity and type as well as dealer supplied prices and are generally categorized as Level 2 in the hierarchy. For collateralized mortgage obligations, commercial mortgage securities and U.S. government agency mortgage securities, pricing services utilize matrix pricing which considers prepayment speed assumptions, attributes of the collateral, yield or price of bonds of comparable quality, coupon, maturity and type as well as dealer supplied prices and, accordingly, such securities are generally categorized as Level 2 in the hierarchy. Short-term securities with remaining maturities of sixty days or less for which quotations are not readily available are valued at amortized cost, which approximates fair value and are categorized as Level 2 in the hierarchy.
Swaps are marked-to-market daily based on valuations from independent pricing services or dealer-supplied valuations and changes in value are recorded as unrealized appreciation (depreciation). Pricing services utilize matrix pricing which considers comparisons to interest rate curves, credit spread curves, default possibilities and recovery rates and, as a result, swaps are generally categorized as Level 2 in the hierarchy.
When independent prices are unavailable or unreliable, debt securities and swaps may be valued utilizing pricing matrices which consider similar factors that would be used by independent pricing services. These are generally categorized as Level 2 in the hierarchy but may be Level 3 depending on the circumstances.
Futures contracts are valued at the settlement price established each day by the board of trade or exchange on which they are traded and are categorized as Level 1 in the hierarchy. Investments in open-end mutual funds are valued at their closing net asset value each business day and are categorized as Level 1 in the hierarchy.
Investment Transactions and Income. For financial reporting purposes, the Funds' investment holdings and NAV include trades executed through the end of the last business day of the period. The NAV per share for processing shareholder transactions is calculated as of the close of business of the New York Stock Exchange (NYSE), normally 4:00 p.m. Eastern time and includes trades executed through the end of the prior business day. Gains and losses on securities sold are determined on the basis of identified cost. Interest income is accrued as earned. Interest income includes coupon interest and amortization of premium and accretion of discount on debt securities. The principal
Semiannual Report
2. Significant Accounting Policies - continued
Investment Transactions and Income - continued
value on inflation-indexed securities is periodically adjusted to the rate of inflation and interest is accrued based on the principal value. The adjustments to principal due to inflation are reflected as increases or decreases to interest income even though principal is not received until maturity.
Expenses. Expenses directly attributable to a fund are charged to that fund. Expenses attributable to more than one fund are allocated among the respective funds on the basis of relative net assets or other appropriate methods. Expense estimates are accrued in the period to which they relate and adjustments are made when actual amounts are known.
Deferred Trustee Compensation. Under a Deferred Compensation Plan (the Plan) for Fidelity GNMA Fund independent Trustees may elect to defer receipt of a portion of their annual compensation. Deferred amounts are invested in a cross-section of Fidelity funds, are marked-to-market and remain in the Fund until distributed in accordance with the Plan. The investment of deferred amounts and the offsetting payable to the Trustees are included in the accompanying Statement of Assets and Liabilities.
Income Tax Information and Distributions to Shareholders. Each year each Fund intends to qualify as a regulated investment company, including distributing substantially all of its taxable income and realized gains under Subchapter M of the Internal Revenue Code and filing its U.S. federal tax return. As a result, no provision for income taxes is required. A fund's federal tax return is subject to examination by the Internal Revenue Service (IRS) for a period of three years.
Dividends are declared and recorded daily and paid monthly from net investment income. Distributions from realized gains, if any, are declared and recorded on the ex-dividend date. Income and capital gain distributions are determined in accordance with income tax regulations, which may differ from GAAP.
Capital accounts within the financial statements are adjusted for permanent book-tax differences. These adjustments have no impact on net assets or the results of operations. Temporary book-tax differences will reverse in a subsequent period.
Book-tax differences are primarily due to futures transactions, swap agreements, prior period premium and discount on debt securities, market discount, deferred trustee compensation, financing transactions and losses deferred due to wash sales.
Semiannual Report
Notes to Financial Statements (Unaudited) - continued
(Amounts in thousands except ratios)
2. Significant Accounting Policies - continued
Income Tax Information and Distributions to Shareholders - continued
The federal tax cost of investment securities and unrealized appreciation (depreciation) as of period end were as follows for each Fund:
| Tax cost | Gross unrealized
appreciation | Gross unrealized
depreciation | Net unrealized
appreciation
(depreciation) on
securities and
other investments |
GNMA Fund | $ 8,999,861 | $ 202,030 | $ (39,519) | $ 162,511 |
Intermediate Government Income Fund | 1,362,237 | 17,934 | (4,456) | 13,478 |
3. Operating Policies.
Repurchase Agreements. Fidelity Management & Research Company (FMR) has received an Exemptive Order from the Securities and Exchange Commission (the SEC) which permits certain Funds and other affiliated entities of FMR to transfer uninvested cash balances into joint trading accounts which are then invested in repurchase agreements. Certain Funds may also invest directly with institutions in repurchase agreements. Repurchase agreements are collateralized by government or non-government securities. Upon settlement date, collateral is held in segregated accounts with custodian banks and may be obtained in the event of a default of the counterparty. Each applicable Fund monitors, on a daily basis, the value of the collateral to ensure it is at least equal to the principal amount of the repurchase agreement (including accrued interest). In the event of a default by the counterparty, realization of the collateral proceeds could be delayed, during which time the value of the collateral may decline.
Delayed Delivery Transactions and When-Issued Securities. Certain Funds may purchase or sell securities on a delayed delivery or when-issued basis. Payment and delivery may take place after the customary settlement period for that security. The price of the underlying securities and the date when the securities will be delivered and paid for are fixed at the time the transaction is negotiated. During the time a delayed delivery sell is outstanding, the contract is marked-to-market daily and equivalent deliverable securities are held for the transaction. The securities purchased on a delayed delivery or when-issued basis are identified as such in each applicable Fund's Schedule of Investments. Certain Funds may receive compensation for interest forgone in the purchase of a delayed delivery or when-issued security. With respect to purchase commitments, each applicable Fund identifies securities as segregated in its records with a value at least equal to the amount of the commitment. Losses may arise due to changes in the value of the underlying securities or if the counterparty does not perform under the contract's terms, or if the issuer does not issue the securities due to political, economic, or other factors.
Semiannual Report
3. Operating Policies - continued
Restricted Securities. Certain Funds may invest in securities that are subject to legal or contractual restrictions on resale. These securities generally may be resold in transactions exempt from registration or to the public if the securities are registered. Disposal of these securities may involve time-consuming negotiations and expense, and prompt sale at an acceptable price may be difficult. Information regarding restricted securities is included at the end of each applicable Fund's Schedule of Investments.
4. Derivative Instruments.
Risk Exposures and the Use of Derivative Instruments. The Funds used derivative instruments (derivatives), including futures contracts and swap agreements, in order to meet their investment objectives. The strategy is to use derivatives to increase returns, to gain exposure to certain types of assets and to manage exposure to certain risks as defined below. The success of any strategy involving derivatives depends on analysis of numerous economic factors, and if the strategies for investment do not work as intended, the Funds may not achieve their objectives.
The Funds' use of derivatives increased or decreased their exposure to the following risk:
Interest Rate Risk | Interest rate risk relates to the fluctuations in the value of interest-bearing securities due to changes in the prevailing levels of market interest rates. |
The Funds are also exposed to additional risks from investing in derivatives, such as liquidity risk and counterparty credit risk. Liquidity risk is the risk that the Funds will be unable to sell the derivative in the open market in a timely manner. Counterparty credit risk is the risk that the counterparty will not be able to fulfill its obligation to the Funds. Derivative counterparty credit risk is managed through formal evaluation of the creditworthiness of all potential counterparties. On certain over-the-counter derivatives, the Funds attempt to reduce their exposure to counterparty credit risk by entering into an International Swaps and Derivatives Association (ISDA) Master Agreement on a bilateral basis with each of its counterparties. The ISDA Master Agreement gives each counterparty the right to terminate all transactions traded under such agreement if there is a certain deterioration in the credit quality of the other party. The ISDA Master Agreement gives the Funds the right, upon an event of default by the applicable counterparty or a termination of the agreement, to close out all transactions traded under such agreement and to net amounts owed under each transaction to one net payable by one party to the other. To mitigate counterparty credit risk, the Funds offset certain payables and/or receivables with collateral. Collateral in the form of cash or securities, if required, is held in segregated accounts with the Funds' custodian bank in accordance with the collateral agreements entered into between the Funds, the swap counterparty and the Funds' custodian bank, and is identified in the Schedule of Investments. The Funds could
Semiannual Report
Notes to Financial Statements (Unaudited) - continued
(Amounts in thousands except ratios)
4. Derivative Instruments - continued
Risk Exposures and the Use of Derivative Instruments - continued
experience delays and costs in gaining access to the collateral even though it is held by the Funds' custodian bank. The Funds' maximum risk of loss from counterparty credit risk is generally the aggregate unrealized appreciation and unpaid counterparty fees in excess of any collateral pledged by the counterparty to the Funds. Counterparty risk related to exchange-traded futures contracts is minimal because of the protection provided by the exchange on which they trade. Derivatives involve, to varying degrees, risk of loss in excess of the amounts recognized in the Statement of Assets and Liabilities.
Net Realized Gain (Loss) and Change in Net Unrealized Appreciation (Depreciation) on Derivatives. The table below, which reflects the impacts of derivatives on the financial performance of the Funds, summarizes the net realized gain (loss) and change in net unrealized appreciation (depreciation) for derivatives during the period.
Risk Exposure / Derivative Type | Net Realized Gain
(Loss) | Change in Net
Unrealized
Appreciation
(Depreciation) |
GNMA Fund | | |
Interest Rate Risk | | |
Swap Agreements (a) | $ (1,160) | $ 4,228 |
Intermediate Government Income Fund | | |
Interest Rate Risk | | |
Futures Contracts (a) | $ 32 | $ 6 |
(a) A summary of the value of derivatives by risk exposure as of period end is included at the end of the Schedule of Investments and is representative of activity for the period.
Futures Contracts. A futures contract is an agreement between two parties to buy or sell a specified underlying instrument for a fixed price at a specified future date. Intermediate Government Income Fund used futures contracts to manage its exposure to the bond market, and to fluctuations in interest rates.
Upon entering into a futures contract, a fund is required to deposit either cash or securities (initial margin) with a clearing broker in an amount equal to a certain percentage of the face value of the contract. Futures contracts are marked-to-market daily and subsequent payments (variation margin) are made or received by a fund depending on the daily fluctuations in the value of the futures contracts and are recorded as unrealized appreciation or (depreciation). Realized gain or (loss) is recorded upon the expiration or closing of a futures contract. The net realized gain (loss) and change in net unrealized appreciation (depreciation) on futures contracts during the period is included in the Statement of Operations.
Semiannual Report
4. Derivative Instruments - continued
Futures Contracts - continued
The underlying face amount at value of open futures contracts at period end is shown in the Schedule of Investments under the caption "Futures Contracts." This amount reflects each contract's exposure to the underlying instrument at period end. Securities deposited to meet initial margin requirements are identified in the Schedule of Investments. The receivable and/or payable for the variation margin are reflected in the Statement of Assets and Liabilities.
Certain risks arise upon entering into futures contracts, including the risk that an illiquid market limits the ability to close out a futures contract prior to settlement date.
Swap Agreements. A swap agreement (swap) is a contract between two parties to exchange future cash flows at periodic intervals based on a notional principal amount.
Details of swaps open at period end, if any, are included in the Schedule of Investments under the caption "Swap Agreements." Swaps are marked-to-market daily and changes in value are recorded as unrealized appreciation or (depreciation) and reflected in the Statement of Assets and Liabilities. Any upfront payments made or received upon entering a swap to compensate for differences between stated terms of the agreement and prevailing market conditions (e.g. credit spreads, interest rates or other factors) are recorded as realized gain or (loss) ratably over the term of the swap. Payments are exchanged at specified intervals, accrued daily commencing with the effective date of the contract and recorded as realized gain or (loss). Realized gain or (loss) is also recorded in the event of an early termination of a swap. The net realized gain (loss) and change in net unrealized appreciation (depreciation) on swaps during the period is included in the Statement of Operations.
Risks of loss include interest rate risk. In addition, there is the risk of failure by the counterparty to perform under the terms of the agreement and lack of liquidity in the market.
Interest Rate Swaps. Interest rate swaps are agreements between counterparties to exchange cash flows, one based on a fixed rate, and the other on a floating rate. GNMA Fund entered into interest rate swaps to manage its exposure to interest rate changes. Changes in interest rates can have an effect on both the value of bond holdings as well as the amount of interest income earned. In general, the value of bonds can fall when interest rates rise and can rise when interest rates fall.
Semiannual Report
Notes to Financial Statements (Unaudited) - continued
(Amounts in thousands except ratios)
5. Fees and Other Transactions with Affiliates.
Management Fee. FMR and its affiliates provide the Funds with investment management related services for which the Funds pay a monthly management fee. The management fee is the sum of an individual fund fee rate and a group fee rate. The individual fund fee rate is applied to each Fund's average net assets. The group fee rate is based upon the average net assets of all the mutual funds advised by FMR. The group fee rate decreases as assets under management increase and increases as assets under management decrease. For the period, each Fund's annualized management fee rate expressed as a percentage of each Fund's average net assets was as follows:
| Individual Rate | Group Rate | Total |
GNMA Fund | .20% | .12% | .32% |
Intermediate Government Income Fund | .20% | .12% | .32% |
Transfer Agent Fees. Fidelity Investments Institutional Operations Company, Inc. (FIIOC), an affiliate of FMR, is the Funds' transfer, dividend disbursing and shareholder servicing agent. FIIOC receives an asset-based fee of .10% of each Fund's average net assets. FIIOC pays for typesetting, printing and mailing of shareholder reports, except proxy statements.
Fund Wide Operations Fee. Pursuant to the Fund Wide Operations and Expense Agreement (FWOE), FMR has agreed to provide for fund level expenses (which do not include transfer agent, the compensation of the independent Trustees, interest (including commitment fees), taxes or extraordinary expenses, if any) in return for a FWOE fee equal to .35% less the total amount of the management fee. The FWOE paid by the Fund is reduced by an amount equal to the fees and expenses paid to the independent Trustees. For the period, the FWOE fees were equivalent to the following annualized rates expressed as a percentage of average net assets:
GNMA Fund | .03% |
Intermediate Government Income Fund | .03% |
6. Committed Line of Credit.
Certain Funds participate with other funds managed by FMR or an affiliate in a $3.75 billion credit facility (the "line of credit") to be utilized for temporary or emergency purposes to fund shareholder redemptions or for other short-term liquidity purposes. The participating funds have agreed to pay commitment fees on their pro-rata portion of the line of credit, which are reflected in Miscellaneous expenses on the Statement of Operations, and are as follows:
GNMA Fund | $ 15 |
Intermediate Government Income Fund | 3 |
During the period, there were no borrowings on this line of credit.
Semiannual Report
7. Security Lending.
Certain Funds lend portfolio securities through a lending agent from time to time in order to earn additional income. On the settlement date of the loan, each applicable Fund receives collateral (in the form of U.S. Treasury obligations, letters of credit and/or cash) against the loaned securities and maintains collateral in an amount not less than 100% of the market value of the loaned securities during the period of the loan. The market value of the loaned securities is determined at the close of business of the Funds and any additional required collateral is delivered to the Funds on the next business day. If the borrower defaults on its obligation to return the securities loaned because of insolvency or other reasons, a fund could experience delays and costs in recovering the securities loaned or in gaining access to the collateral. Any cash collateral received is invested in cash equivalents. At period end, there were no security loans outstanding. Security lending income represents the income earned on investing cash collateral, less rebates paid to borrowers and lending agent fees associated with the loan, plus any premium payments received for lending certain types of securities. Security lending income is presented on each applicable Fund's Statement of Operations as a component of interest income. Security lending activity as of and during the period was as follows:
| Total Security
Lending Income |
Intermediate Government Income Fund | $ 2 |
8. Bank Borrowings.
Each Fund is permitted to have bank borrowings for temporary or emergency purposes to fund shareholder redemptions. Each Fund has established borrowing arrangements with certain banks. The interest rate on the borrowings is the bank's base rate, as revised from time to time. At period end, there were no bank borrowings outstanding. Each applicable Fund's activity in this program during the period for which loans were outstanding was as follows:
| Average Daily
Loan Balance | Weighted
Average
Interest Rate | Interest Expense |
Intermediate Government Income Fund | $ 8,816 | .68% | $ -* |
* Amount of interest expense totaled three hundred and thirty-three dollars.
Semiannual Report
Notes to Financial Statements (Unaudited) - continued
(Amounts in thousands except ratios)
9. Other.
The Funds' organizational documents provide former and current trustees and officers with a limited indemnification against liabilities arising in connection with the performance of their duties to the Funds. In the normal course of business, the Funds may also enter into contracts that provide general indemnifications. The Funds' maximum exposure under these arrangements is unknown as this would be dependent on future claims that may be made against the Funds. The risk of material loss from such claims is considered remote.
Semiannual Report
Board Approval of Investment Advisory Contracts and Management Fees
Fidelity GNMA (formerly known as Fidelity Ginnie Mae Fund) /
Fidelity Intermediate Government Income Fund
Each year, the Board of Trustees, including the Independent Trustees (together, the Board), votes on the renewal of the management contract and sub-advisory agreements (together, the Advisory Contracts) for each fund. The Board, assisted by the advice of fund counsel and Independent Trustees' counsel, requests and considers a broad range of information relevant to the renewal of the Advisory Contracts throughout the year.
The Board meets regularly and considers at each of its meetings factors that are relevant to its annual consideration of the renewal of each fund's Advisory Contracts, including the services and support provided to each fund and its shareholders. The Board has established three standing committees, each composed of Independent Trustees with varying backgrounds, to which the Board has assigned specific subject matter responsibilities in order to enhance effective decision-making by the Board. The Operations Committee, of which all of the Independent Trustees are members, meets regularly throughout the year and, among other matters, considers matters specifically related to the annual consideration of the renewal of each fund's Advisory Contracts. The Board, acting directly and through its Committees, requests and receives information concerning the annual consideration of the renewal of each fund's Advisory Contracts. The Board also meets as needed to consider matters specifically related to the Board's annual consideration of the renewal of Advisory Contracts. Members of the Board may also meet with trustees of other Fidelity funds through ad hoc joint committees to discuss certain matters relevant to the Fidelity funds.
At its September 2010 meeting, the Board of Trustees, including the Independent Trustees, unanimously determined to renew each fund's Advisory Contracts. In reaching its determination, the Board considered all factors it believed relevant, including (i) the nature, extent, and quality of the services to be provided to each fund and its shareholders (including the investment performance of each fund); (ii) the competitiveness of each fund's management fee and total expenses; (iii) the total costs of the services to be provided by and the profits to be realized by Fidelity from its relationship with each fund; (iv) the extent to which economies of scale would be realized as each fund grows; and (v) whether fee levels reflect these economies of scale, if any, for the benefit of fund shareholders.
In considering whether to renew the Advisory Contracts for each fund, the Board reached a determination, with the assistance of fund counsel and Independent Trustees' counsel and through the exercise of its business judgment, that the renewal of the Advisory Contracts is in the best interests of each fund and its shareholders and that the compensation to be received by Fidelity under the management contracts is fair and reasonable. The Board's decision to renew the Advisory Contracts was not based on any single factor, but rather was based on a comprehensive consideration of all the information provided to the Board at its meetings throughout the year. The Board, in reaching its determination to renew the Advisory Contracts, is aware that shareholders in each fund have a broad range of investment choices available to them, including a wide choice among mutual funds offered by Fidelity's competitors, and that each fund's shareholders, with the opportunity to review and weigh the disclosure provided by the fund in its prospectus and other public disclosures, have chosen to invest in that fund, managed by Fidelity.
Semiannual Report
Board Approval of Investment Advisory Contracts and
Management Fees - continued
Nature, Extent, and Quality of Services Provided. The Board considered the staffing within the investment adviser, FMR, and the sub-advisers (together, the Investment Advisers), including the backgrounds of the funds' investment personnel and the funds' investment objectives and disciplines. The Independent Trustees also had discussions with senior management of Fidelity's investment operations and investment groups. The Board considered the structure of the portfolio manager compensation program and whether this structure provides appropriate incentives to act in the best interest of each fund.
Resources Dedicated to Investment Management and Support Services. The Board reviewed the size, education, and experience of the Investment Advisers' investment staff, their use of technology, and the Investment Advisers' approach to recruiting, training, and retaining portfolio managers and other research, advisory, and management personnel. The Board noted that Fidelity's analysts have access to a variety of technological tools and market and securities data that enable them to perform both fundamental and quantitative analysis and to specialize in various disciplines. The Board considered Fidelity's extensive global research capabilities that enable the Investment Advisers to aggregate data from various sources in an effort to produce positive investment results. The Board also considered that Fidelity's portfolio managers and analysts have access to daily portfolio attribution that allows for monitoring of a fund's portfolio, as well as an electronic communication system that provides immediate real-time access to research concerning issuers and credit enhancers. In addition, the Board considered the trading resources that are an integral part of the fixed-income portfolio management investment process.
Shareholder and Administrative Services. The Board considered (i) the nature, extent, quality, and cost of advisory, administrative, and shareholder services performed by the Investment Advisers and their affiliates under the Advisory Contracts and under separate agreements covering transfer agency, pricing and bookkeeping, and securities lending services for each fund; (ii) the nature and extent of the investment adviser's supervision of third party service providers, principally custodians and subcustodians; and (iii) the resources devoted to, and the record of compliance with, each fund's compliance policies and procedures.
Semiannual Report
The Board noted that the growth of fund assets over time across the complex allows Fidelity to reinvest in the development of services designed to enhance the value or convenience of the Fidelity funds as investment vehicles. These services include 24-hour access to account information and market information through telephone representatives and over the Internet, and investor education materials and asset allocation tools.
Investment in a Large Fund Family. The Board considered the benefits to shareholders of investing in a Fidelity fund, including the benefits of investing in a fund that is part of a large family of funds offering a variety of investment disciplines and providing a large variety of mutual fund investor services. The Board noted that Fidelity had taken, or had made recommendations that resulted in the Fidelity funds taking, a number of actions over the previous year that benefited particular funds, including (i) dedicating additional resources to investment research and restructuring and broadening the focus of the investment research teams; (ii) bolstering the senior management team that oversees asset management; (iii) launching Class F of certain funds as a lower-fee class available to Freedom K and Freedom Index Funds; (iv) lowering the initial investment minimums and ongoing balance requirements for Real Estate High Income Fund; (v) eliminating subsequent purchase minimums for all funds and adding a waiver of the investment minimum requirement for new accounts opened with the proceeds of a systematic withdrawal plan; (vi) eliminating the withdrawal minimum and maximum limits for systematic withdrawals from Advisor funds; (vii) expanding sales load waivers on Class A shares for Destiny Planholders and expanding Institutional Class eligibility for Class O Destiny Planholders; and (viii) changing certain Class A and Class T sales charge structures to further align them with industry practices.
Investment Performance. The Board considered whether each fund has operated in accordance with its investment objective, as well as its record of compliance with its investment restrictions. It also reviewed each fund's absolute investment performance, as well as each fund's relative investment performance measured over multiple periods against (i) a broad-based securities market index, and (ii) a peer group of mutual funds deemed appropriate by Fidelity and reviewed by the Board. For each fund, the following charts considered by the Board show, over the one-, three-, and five-year periods ended December 31, 2009, the fund's cumulative total returns, the cumulative total returns of a broad-based securities market index ("benchmark"), and a range of cumulative total returns of a peer group of mutual funds identified by Lipper Inc. as having an investment objective similar to that of the fund. The box within each chart shows the 25th percentile return (bottom of box) and the 75th percentile return (top of box) of the peer group. Returns shown above the box are in the first quartile and returns shown below the box are in the fourth quartile. The percentage beaten number noted below each chart corresponds to the percentile box and represents the percentage of funds in the peer group whose performance was equal to or lower than that of the fund.
Semiannual Report
Board Approval of Investment Advisory Contracts and
Management Fees - continued
Fidelity GNMA Fund
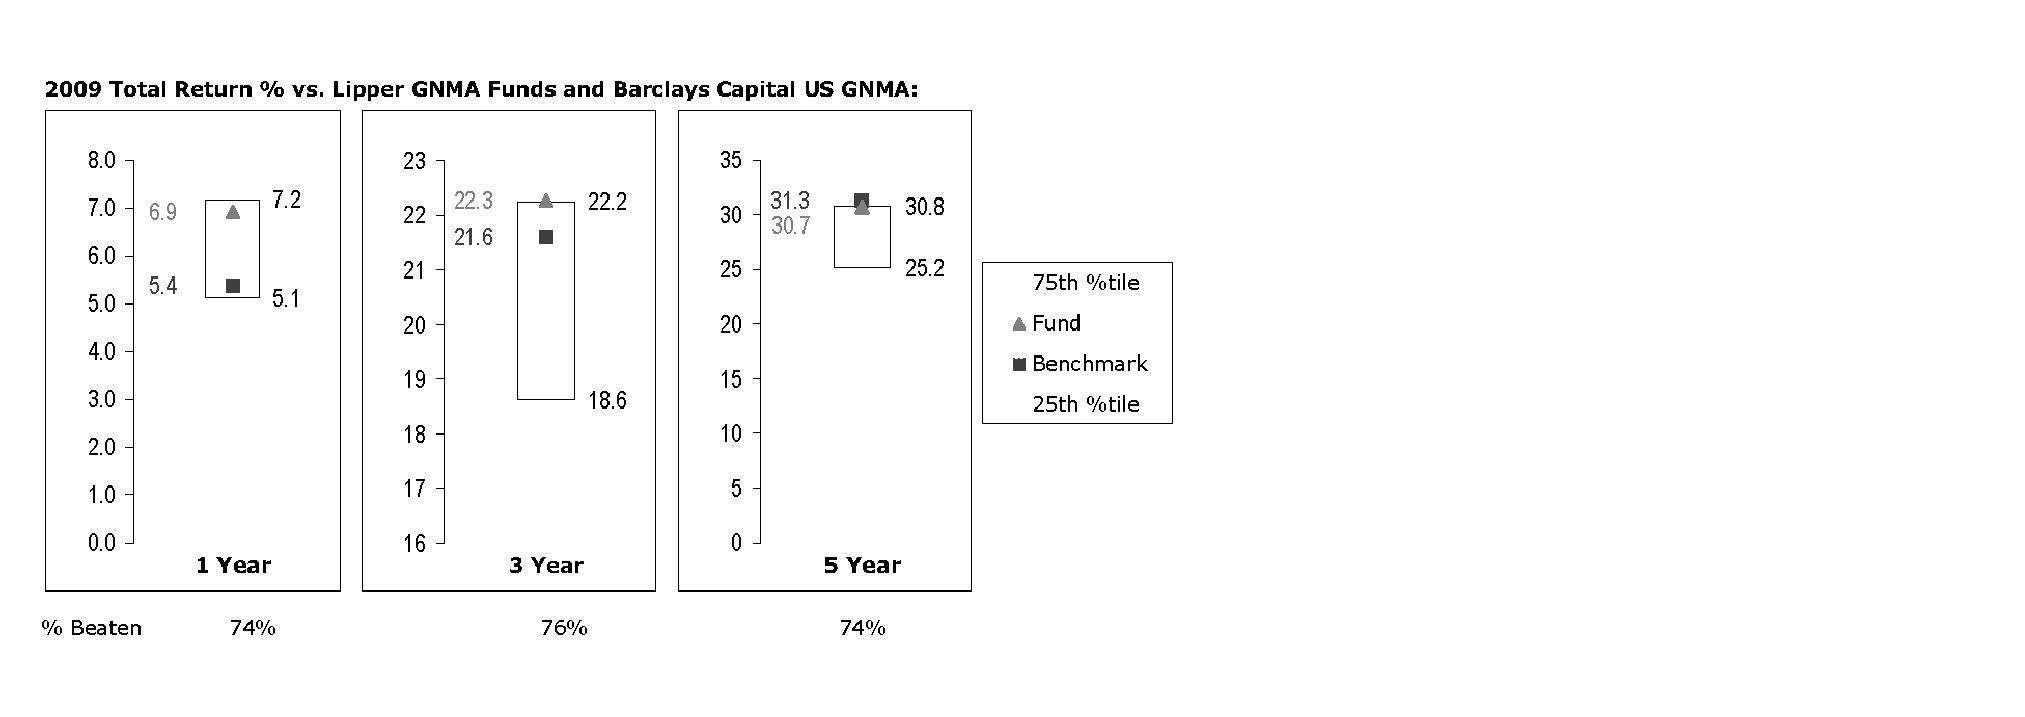
The Board reviewed the fund's relative investment performance against its peer group and noted that the performance of the fund was in the second quartile for the one- and five-year periods and the first quartile for the three-year period. The Board also noted that the investment performance of the fund compared favorably to its benchmark for the one- and three-year periods, although the fund's five-year cumulative total return was lower than its benchmark. The Board also reviewed the fund's performance since inception as well as performance in the current year.
Semiannual Report
Fidelity Intermediate Government Income Fund
The Board reviewed the fund's relative investment performance against its peer group and noted that the performance of the fund was in the fourth quartile for the one-year period and the first quartile for the three- and five-year periods. The Board also noted that the investment performance of the fund compared favorably to its benchmark for the one- and three-year periods, although the fund's five-year cumulative total return was lower than its benchmark. The Board also reviewed the fund's performance since inception as well as performance in the current year.
Based on its review, and giving particular weight to the nature and quality of the resources dedicated by the Investment Advisers to maintain and improve relative performance and factoring in the unprecedented market events in recent years, the Board concluded that the nature, extent, and quality of investment management and support services and of shareholder and administrative services provided to each fund will benefit each fund's shareholders, particularly in light of the Board's view that each fund's shareholders benefit from investing in a fund that is part of a large family of funds offering a variety of investment disciplines and services.
Competitiveness of Management Fee and Total Fund Expenses. The Board considered each fund's management fee and total expenses compared to "mapped groups" of competitive funds and classes. Fidelity creates "mapped groups" by combining similar Lipper investment objective categories that have comparable management fee characteristics. Combining Lipper investment objective categories aids the Board's management fee and total expense comparisons by broadening the competitive group used for comparison and by reducing the number of universes to which various Fidelity funds are compared.
Semiannual Report
Board Approval of Investment Advisory Contracts and
Management Fees - continued
Management Fee. The Board considered two proprietary management fee comparisons for the 12-month periods shown in the charts below. The group of Lipper funds used by the Board for management fee comparisons is referred to below as the "Total Mapped Group" and, for the reasons explained above, is broader than the Lipper peer group used by the Board for performance comparisons. The Total Mapped Group comparison focuses on a fund's standing relative to the total universe of comparable funds available to investors, in terms of gross management fees before expense reimbursements or caps. "TMG %" represents the percentage of funds in the Total Mapped Group that had management fees that were lower than a fund's. For example, a TMG % of 9% means that 91% of the funds in the Total Mapped Group had higher management fees than a fund. The "Asset-Size Peer Group" (ASPG) comparison focuses on a fund's standing relative to non-Fidelity funds similar in size to the fund within the Total Mapped Group. The ASPG represents at least 15% of the funds in the Total Mapped Group with comparable asset size and management fee characteristics, subject to a minimum of 50 funds (or all funds in the Total Mapped Group if fewer than 50). Additional information, such as the ASPG quartile in which a fund's management fee ranked, is also included in the charts and considered by the Board.
Fidelity GNMA Fund
Semiannual Report
Fidelity Intermediate Government Income Fund
The Board noted that each fund's management fee ranked below the median of its Total Mapped Group and below the median of its ASPG for 2009.
Furthermore, the Board considered that it had approved an amendment (effective June 1, 2005) to each fund's management contract that lowered the fund's individual fund fee rate from 30 basis points to 20 basis points. The Board considered that each fund's chart reflects the fund's lower management fee for 2005, as if the lower rate were in effect for the entire year.
Based on its review, the Board concluded that each fund's management fee is fair and reasonable in light of the services that the fund receives and the other factors considered.
Total Expenses. In its review of each fund's total expenses, the Board considered the fund's management fee as well as other fund expenses, such as transfer agent fees, pricing and bookkeeping fees, and custodial, legal, and audit fees. The Board also noted the effects of any waivers and reimbursements on fees and expenses. As part of its review, the Board also considered current and historical total expenses of each fund compared to competitive fund median expenses. Each fund is compared to those funds and classes in the Total Mapped Group (used by the Board for management fee comparisons) that have a similar sales load structure.
The Board also considered that the current contractual arrangements for each fund (i) have the effect of setting the total "fund-level" expenses (including, among certain other expenses, the management fee) at 35 basis points, (ii) lower and limit the "class-level" transfer agent fee to 10 basis points, and (iii) limit each fund's total expenses to 45 basis points. The fees and expenses payable under these contractual arrangements may not be increased without Board and shareholder approval.
Semiannual Report
Board Approval of Investment Advisory Contracts and
Management Fees - continued
The Board noted that each fund's total expenses ranked below its competitive median for 2009.
The Board recognized that each fund's management contract incorporates a "group fee" structure, which provides for lower group fee rates as total fund assets under FMR's management increase, and for higher group fee rates as total fund assets under FMR's management decrease. FMR calculates the group fee rates based on a tiered asset "breakpoint" schedule that varies based on asset class. The Board noted, however, that because the current contractual arrangements set each fund's total "fund-level" expenses at 35 basis points, increases or decreases in the management fee due to changes in the group fee rate will not impact total expenses.
Fees Charged to Other Fidelity Clients. The Board also considered Fidelity fee structures and other information with respect to clients of FMR and its affiliates, such as other mutual funds advised or subadvised by FMR or its affiliates, pension plan clients, and other institutional clients. In March 2010, the Board created an ad hoc joint committee with the board of other Fidelity funds (the Committee) to review and compare Fidelity's institutional investment advisory business with its business of providing services to the Fidelity funds, including the differences in services provided, fees charged, and costs incurred, as well as competition in their respective marketplaces.
Based on its review of total expenses and fees charged to other Fidelity clients, the Board concluded that each fund's total expenses were reasonable in light of the services that the fund and its shareholders receive and the other factors considered, including the findings of the Committee.
Costs of the Services and Profitability. The Board considered the revenues earned and the expenses incurred by Fidelity in conducting the business of developing, marketing, distributing, managing, administering and servicing each fund and its shareholders. The Board also considered the level of Fidelity's profits in respect of all the Fidelity funds.
On an annual basis, FMR presents to the Board Fidelity's profitability for each fund. Fidelity calculates the profitability for each fund, as well as aggregate profitability for groups of Fidelity funds and all Fidelity funds, using a series of detailed revenue and cost allocation methodologies which originate with the audited books and records of Fidelity. The Audit Committee of the Board reviews any significant changes from the prior year's methodologies.
PricewaterhouseCoopers LLP (PwC), independent registered public accounting firm and auditor to Fidelity and certain Fidelity funds, has been engaged annually by the Board as part of the Board's assessment of Fidelity's profitability analysis. PwC's engagement includes the review and assessment of Fidelity's methodologies used in determining the revenues and expenses attributable to Fidelity's mutual fund business, and completion of agreed-upon procedures surrounding the mathematical accuracy of fund profitability and its conformity to allocation methodologies. After considering PwC's reports issued under the engagement and information provided by Fidelity, the Board believes that while other allocation methods may also be reasonable, Fidelity's profitability methodologies are reasonable in all material respects.
Semiannual Report
The Board has also reviewed Fidelity's non-fund businesses and fall-out benefits related to the mutual fund business as well as cases where Fidelity's affiliates may benefit from or be related to the funds' business.
The Board considered the costs of the services provided by and the profits realized by Fidelity in connection with the operation of each fund and were satisfied that the profitability was not excessive in the circumstances.
Economies of Scale. The Board considered whether there have been economies of scale in respect of the management of the Fidelity funds, whether the Fidelity funds (including each fund) have appropriately benefited from any such economies of scale, and whether there is potential for realization of any further economies of scale. The Board considered the extent to which each fund will benefit from economies of scale through increased services to the fund, through waivers or reimbursements, or through fee or expense reductions.
In February 2009, the Board and the board of other Fidelity funds created an ad hoc committee (the Economies of Scale Committee) to analyze whether FMR attains economies of scale in respect of the management and servicing of the Fidelity funds, whether the Fidelity funds have appropriately benefited from such economies of scale, and whether there is potential for realization of any further economies of scale.
The Board concluded, considering the findings of the Economies of Scale Committee, that any potential economies of scale are being appropriately shared between fund shareholders and Fidelity.
Additional Information Requested by the Board. In order to develop fully the factual basis for consideration of the Fidelity funds' Advisory Contracts, the Board requested and received additional information on certain topics, including (i) fund performance trends, actions to be taken by FMR to improve certain funds' overall performance, and Fidelity's long-term strategies for certain funds; (ii) Fidelity's fund profitability methodology and profitability trends for certain funds; (iii) portfolio manager changes that have occurred during the past year and the amount of the investment that each portfolio manager has made in the Fidelity fund(s) that he or she manages; (iv) Fidelity's compensation structure for portfolio managers, research analysts, and other key personnel, including its effects on fund profitability, the rationale for the compensation structure, and the extent to which current market conditions have affected retention and recruitment; (v) the compensation paid by FMR to fund sub-advisers on behalf of the Fidelity funds; (vi) Fidelity's fee structures and rationale for recommending different fees among different categories of funds and classes, as well as Fidelity's voluntary waiver of fees to maintain minimum yields for certain funds and classes; (vii) the rationale for any differences between fund fee structures and fee structures in place for other Fidelity clients; and (viii) explanations regarding the relative total expenses borne by certain funds and classes, total expense competitive trends, and actions that might be taken by FMR to reduce total expenses for certain funds and classes or to achieve further economies of scale.
Semiannual Report
Board Approval of Investment Advisory Contracts and
Management Fees - continued
Based on its evaluation of all of the conclusions noted above, and after considering all factors it believed relevant, the Board ultimately concluded that the advisory fee structures are fair and reasonable, and that each fund's Advisory Contracts should be renewed.
Semiannual Report
Investment Adviser
Fidelity Management & Research Company
Boston, MA
Investment Sub-Advisers
Fidelity Management & Research (U.K.) Inc.
Fidelity Investments
Money Management, Inc.
Fidelity Management & Research
(Hong Kong) Limited
Fidelity Management & Research
(Japan) Inc.
General Distributor
Fidelity Distributors Corporation
Boston, MA
Transfer and Service Agents
Fidelity Investments Institutional
Operations Company, Inc.
Boston, MA
Fidelity Service Company, Inc.
Boston, MA
Custodian
The Bank of New York Mellon
New York, NY
The Fidelity Telephone Connection
Mutual Fund 24-Hour Service
Exchanges/Redemptions
and Account Assistance 1-800-544-6666
Product Information 1-800-544-6666
Retirement Accounts 1-800-544-4774
(8 a.m. - 9 p.m.)
TDD Service 1-800-544-0118
for the deaf and hearing impaired
(9 a.m. - 9 p.m. Eastern time)
Fidelity Automated Service
Telephone (FAST®) 1-800-544-5555
Automated line for quickest service
GMIG-USAN-0311
1.844595.105

Fidelity®
Government Income
Fund
Semiannual Report
January 31, 2011
(2_fidelity_logos) (Registered_Trademark)
Contents
Chairman's Message | <Click Here> | The Chairman's message to shareholders. |
Shareholder Expense Example | <Click Here> | An example of shareholder expenses. |
Investment Changes | <Click Here> | A summary of major shifts in the fund's investments over the past six months. |
Investments | <Click Here> | A complete list of the fund's investments with their market values. |
Financial Statements | <Click Here> | Statements of assets and liabilities, operations, and changes in net assets,
as well as financial highlights. |
Notes | <Click Here> | Notes to the financial statements. |
Board Approval of Investment Advisory Contracts and Management Fees | <Click Here> | |
To view a fund's proxy voting guidelines and proxy voting record for the 12-month period ended June 30, visit http://www.fidelity.com/proxyvotingresults or visit the Securities and Exchange Commission's (SEC) web site at http://www.sec.gov. You may also call 1-800-544-8544 to request a free copy of the proxy voting guidelines.
Standard & Poor's, S&P and S&P 500 are registered service marks of The McGraw-Hill Companies, Inc. and have been licensed for use by Fidelity Distributors Corporation.
Other third party marks appearing herein are the property of their respective owners.
All other marks appearing herein are registered or unregistered trademarks or service marks of FMR LLC or an affiliated company.
This report and the financial statements contained herein are submitted for the general information of the shareholders of the fund. This report is not authorized for distribution to prospective investors in the fund unless preceded or accompanied by an effective prospectus.
A fund files its complete schedule of portfolio holdings with the SEC for the first and third quarters of each fiscal year on Form N-Q. Forms N-Q are available on the SEC's web site at http://www.sec.gov. A fund's Forms N-Q may be reviewed and copied at the SEC's Public Reference Room in Washington, DC. Information regarding the operation of the SEC's Public Reference Room may be obtained by calling 1-800-SEC-0330. For a complete list of a fund's portfolio holdings, view the most recent holdings listing, semiannual report, or annual report on Fidelity's web site at http://www.fidelity.com, http://www.advisor.fidelity.com, or http://www.401k.com, as applicable.
NOT FDIC INSURED • MAY LOSE VALUE • NO BANK GUARANTEE
Neither the fund nor Fidelity Distributors Corporation is a bank.
Semiannual Report
(photo_of_Abigail_P_Johnson)
Dear Shareholder:
Following a year in which the investment environment was volatile but generally supportive of most major asset classes, 2011 began on a positive note. U.S. equities gained ground in January, reaching their highest point since August 2008, amid indications the U.S. economy had turned a corner. Still, questions remained about the longer-term outlook, most notably persistently high unemployment. Financial markets are always unpredictable, of course, but there also are several time-tested investment principles that can help put the odds in your favor.
One of the basic tenets is to invest for the long term. Over time, riding out the markets' inevitable ups and downs has proven much more effective than selling into panic or chasing the hottest trend. Even missing only a few of the markets' best days can significantly diminish investor returns. Patience also affords the benefits of compounding - of earning interest on additional income or reinvested dividends and capital gains. There can be tax advantages and cost benefits to consider as well. While staying the course doesn't eliminate risk, it can considerably lessen the effect of short-term declines.
You can further manage your investing risk through diversification. And today, more than ever, geographic diversification should be taken into account. Studies indicate that asset allocation is the single most important determinant of a portfolio's long-term success. The right mix of stocks, bonds and cash - aligned to your particular risk tolerance and investment objective - is very important. Age-appropriate rebalancing is also an essential aspect of asset allocation. For younger investors, an emphasis on equities - which historically have been the best-performing asset class over time - is encouraged. As investors near their specific goal, such as retirement or sending a child to college, consideration may be given to replacing volatile assets (e.g. common stocks) with more-stable fixed investments (bonds or savings plans).
A third principle - investing regularly - can help lower the average cost of your purchases. Investing a certain amount of money each month or quarter helps ensure you won't pay for all your shares at market highs. This strategy - known as dollar cost averaging - also reduces "emotion" from investing, helping shareholders avoid selling weak performers just prior to an upswing, or chasing a hot performer just before a correction.
We invite you to contact us via the Internet, through our Investor Centers or by phone. It is our privilege to provide you the information you need to make the investments that are right for you.
Sincerely,
(The chairman's signature appears here.)
Abigail P. Johnson
Semiannual Report
Shareholder Expense Example
As a shareholder of the Fund, you incur two types of costs: (1) transaction costs, including sales charges (loads) on purchase payments or redemption proceeds, and (2) ongoing costs, including management fees, distribution and/or service (12b-1) fees and other Fund expenses. This Example is intended to help you understand your ongoing costs (in dollars) of investing in the Fund and to compare these costs with the ongoing costs of investing in other mutual funds.
The Example is based on an investment of $1,000 invested at the beginning of the period and held for the entire period (August 1, 2010 to January 31, 2011).
Actual Expenses
The first line of the accompanying table for each class of the Fund provides information about actual account values and actual expenses. You may use the information in this line, together with the amount you invested, to estimate the expenses that you paid over the period. Simply divide your account value by $1,000.00 (for example, an $8,600 account value divided by $1,000.00 = 8.6), then multiply the result by the number in the first line for a class of the Fund under the heading entitled "Expenses Paid During Period" to estimate the expenses you paid on your account during this period. A small balance maintenance fee of $12.00 that is charged once a year may apply for certain accounts with a value of less than $2,000. This fee is not included in the table below. If it was, the estimate of expenses you paid during the period would be higher, and your ending account value lower, by this amount.
Hypothetical Example for Comparison Purposes
The second line of the accompanying table for each class of the Fund provides information about hypothetical account values and hypothetical expenses based on a Class' actual expense ratio and an assumed rate of return of 5% per year before expenses, which is not the Class' actual return. The hypothetical account values and expenses may not be used to estimate the actual ending account balance or expenses you paid for the period. You may use this information to compare the ongoing costs of investing in the Fund and other funds. To do so, compare this 5% hypothetical example with the 5% hypothetical examples that appear in the shareholder reports of the other funds. A small balance maintenance fee of $12.00 that is charged once a year may apply for certain accounts with a value of less than $2,000. This fee is not included in the table below. If it was, the estimate of expenses you paid during the period would be higher, and your ending account value lower, by this amount.
Please note that the expenses shown in the table are meant to highlight your ongoing costs only and do not reflect any transaction costs. Therefore, the second line of the table is useful in comparing ongoing costs only, and will not help you determine the relative total costs of owning different funds. In addition, if these transactional costs were included, your costs would have been higher.
Semiannual Report
Shareholder Expense Example - continued
| Annualized
Expense Ratio | Beginning
Account Value
August 1, 2010 | Ending
Account Value
January 31, 2011 | Expenses Paid
During Period*
August 1, 2010
to January 31, 2011 |
Class A | .76% | | | |
Actual | | $ 1,000.00 | $ 994.30 | $ 3.82 |
HypotheticalA | | $ 1,000.00 | $ 1,021.37 | $ 3.87 |
Class T | .75% | | | |
Actual | | $ 1,000.00 | $ 993.40 | $ 3.77 |
HypotheticalA | | $ 1,000.00 | $ 1,021.42 | $ 3.82 |
Class B | 1.49% | | | |
Actual | | $ 1,000.00 | $ 989.80 | $ 7.47 |
HypotheticalA | | $ 1,000.00 | $ 1,017.69 | $ 7.58 |
Class C | 1.50% | | | |
Actual | | $ 1,000.00 | $ 989.70 | $ 7.52 |
HypotheticalA | | $ 1,000.00 | $ 1,017.64 | $ 7.63 |
Government Income | .45% | | | |
Actual | | $ 1,000.00 | $ 995.90 | $ 2.26 |
HypotheticalA | | $ 1,000.00 | $ 1,022.94 | $ 2.29 |
Institutional Class | .52% | | | |
Actual | | $ 1,000.00 | $ 994.60 | $ 2.61 |
HypotheticalA | | $ 1,000.00 | $ 1,022.58 | $ 2.65 |
A 5% return per year before expenses
* Expenses are equal to each Class' annualized expense ratio, multiplied by the average account value over the period, multiplied by 184/365 (to reflect the one-half year period).
Semiannual Report
Investment Changes (Unaudited)
Coupon Distribution as of January 31, 2011 |
| % of fund's
investments | % of fund's investments
6 months ago |
Zero coupon bonds | 1.3 | 1.9 |
0.01 - 0.99% | 8.9 | 7.5 |
1 - 1.99% | 15.3 | 16.6 |
2 - 2.99% | 12.7 | 8.3 |
3 - 3.99% | 15.1 | 16.5 |
4 - 4.99% | 14.9 | 17.0 |
5 - 5.99% | 16.2 | 15.3 |
6 - 6.99% | 7.6 | 6.5 |
7% and over | 4.0 | 3.9 |
Coupon distribution shows the range of stated interest rates on the fund's investments, excluding short-term investments. |
Weighted Average Maturity as of January 31, 2011 |
| | 6 months ago |
Years | 6.0 | 5.2 |
This is a weighted average of all the maturities of the securities held in a fund. Weighted Average Maturity (WAM) can be used as a measure of sensitivity to interest rate changes and markets changes. Generally, the longer the maturity, the greater the sensitivity to such changes. WAM is based on the dollar-weighted average length of time until principal payments must be paid. Depending on the types of securities held in a fund, certain maturity shortening devices (e.g., demand features, interest rate resets, and call options) may be taken into account when calculating the WAM. |
Duration as of January 31, 2011 |
| | 6 months ago |
Years | 4.5 | 4.2 |
Duration shows how much a bond fund's price fluctuates with changes in comparable interest rates. If rates rise 1%, for example, a fund with a five-year duration is likely to lose about 5% of its value. Other factors also can influence a bond fund's performance and share price. Accordingly, a bond fund's actual performance may differ from this example. |
Asset Allocation (% of fund's net assets) |
As of January 31, 2011* | As of July 31, 2010** |
| Mortgage
Securities 39.6% | | | Mortgage
Securities 32.2% | |
 | CMOs and Other
Mortgage Related
Securities 9.3% | | | CMOs and Other
Mortgage Related
Securities 10.8% | |
| U.S. Treasury
Obligations 48.6% | | | U.S. Treasury
Obligations 53.3% | |
| U.S. Government
Agency Obligations† 17.8% | | | U.S. Government
Agency Obligations† 16.6% | |
| Short-Term
Investments and
Net Other Assets*** (15.3)% | | | Short-Term
Investments and
Net Other Assets*** (12.9)% | |
* Futures and Swaps | (2.5)% | | ** Futures and Swaps | (1.1)% | |

† Includes FDIC Guaranteed Corporate Securities. |
*** Short-Term Investments and Net Other Assets are not included in the pie chart. |
Semiannual Report
Investments January 31, 2011 (Unaudited)
Showing Percentage of Net Assets
U.S. Government and Government Agency Obligations - 66.4% |
| Principal Amount (000s) | | Value (000s) |
U.S. Government Agency Obligations - 10.1% |
Fannie Mae: | | | | |
0.375% 12/28/12 | | $ 50,670 | | $ 50,324 |
4.75% 11/19/12 | | 2,000 | | 2,149 |
Federal Home Loan Bank: | | | | |
0.875% 8/22/12 | | 8,580 | | 8,626 |
1.5% 1/16/13 | | 40,950 | | 41,555 |
1.875% 6/21/13 | | 97,650 | | 100,032 |
Freddie Mac: | | | | |
0.625% 12/28/12 | | 103,830 | | 103,831 |
1.375% 2/25/14 | | 17,725 | | 17,825 |
2.5% 1/7/14 | | 26,670 | | 27,646 |
4.125% 12/21/12 | | 5,375 | | 5,725 |
Israeli State (guaranteed by U.S. Government through Agency for International Development): | | | | |
5.5% 9/18/23 | | 55,500 | | 63,178 |
6.8% 2/15/12 | | 12,199 | | 12,246 |
Overseas Private Investment Corp. U.S. Government guaranteed participation certificates 6.77% 11/15/13 | | 3,069 | | 3,275 |
Private Export Funding Corp. secured: | | | | |
4.974% 8/15/13 | | 22,940 | | 25,263 |
5.66% 9/15/11 (a) | | 18,000 | | 18,556 |
5.685% 5/15/12 | | 24,035 | | 25,653 |
Small Business Administration guaranteed development participation certificates: | | | | |
Series 2002-20J Class 1, 4.75% 10/1/22 | | 4,120 | | 4,363 |
Series 2002-20K Class 1, 5.08% 11/1/22 | | 8,806 | | 9,409 |
Series 2003-P10B, Class 1 5.136% 8/10/13 | | 3,284 | | 3,478 |
Series 2004-20H Class 1, 5.17% 8/1/24 | | 2,650 | | 2,840 |
Tennessee Valley Authority: | | | | |
5.25% 9/15/39 | | 12,000 | | 12,311 |
5.375% 4/1/56 | | 8,429 | | 8,719 |
TOTAL U.S. GOVERNMENT AGENCY OBLIGATIONS | | 547,004 |
U.S. Treasury Inflation Protected Obligations - 3.9% |
U.S. Treasury Inflation-Indexed Notes 2.375% 4/15/11 | | 211,388 | | 213,440 |
U.S. Treasury Obligations - 44.7% |
U.S. Treasury Bonds: | | | | |
3.875% 8/15/40 | | 121,361 | | 107,386 |
4.25% 11/15/40 | | 21,096 | | 19,946 |
4.375% 2/15/38 | | 14,154 | | 13,787 |
U.S. Government and Government Agency Obligations - continued |
| Principal Amount (000s) | | Value (000s) |
U.S. Treasury Obligations - continued |
U.S. Treasury Bonds: - continued | | | | |
5% 5/15/37 | | $ 55,700 | | $ 59,956 |
5.25% 2/15/29 | | 78,950 | | 88,584 |
6.125% 11/15/27 | | 37,365 | | 46,047 |
6.125% 8/15/29 | | 2,877 | | 3,559 |
6.25% 8/15/23 | | 23,100 | | 28,752 |
7.25% 5/15/16 | | 51,167 | | 64,598 |
7.5% 11/15/16 | | 120,574 | | 155,154 |
8% 11/15/21 | | 14,605 | | 20,529 |
9.875% 11/15/15 | | 10,285 | | 14,111 |
U.S. Treasury Notes: | | | | |
0.5% 11/30/12 | | 19,000 | | 18,993 |
0.625% 12/31/12 | | 42,188 | | 42,256 |
0.75% 11/30/11 | | 64,680 | | 64,948 |
0.75% 12/15/13 | | 88,576 | | 88,126 |
0.875% 1/31/12 | | 31,081 | | 31,259 |
1% 12/31/11 | | 64,001 | | 64,424 |
1% 4/30/12 | | 602 | | 607 |
1% 1/15/14 | | 208,152 | | 208,363 |
1.25% 8/31/15 | | 500 | | 489 |
1.25% 10/31/15 | | 29,580 | | 28,780 |
1.375% 11/15/12 | | 19,743 | | 20,045 |
1.375% 11/30/15 | | 3,611 | | 3,527 |
1.75% 4/15/13 | | 10 | | 10 |
1.75% 7/31/15 | | 28,800 | | 28,841 |
1.875% 4/30/14 | | 53,549 | | 54,900 |
1.875% 8/31/17 | | 47,000 | | 44,955 |
1.875% 9/30/17 | | 87,400 | | 83,358 |
2.125% 5/31/15 | | 18,669 | | 19,054 |
2.125% 12/31/15 | | 90,816 | | 91,696 |
2.25% 11/30/17 | | 10,000 | | 9,738 |
2.375% 8/31/14 | | 20,000 | | 20,788 |
2.375% 9/30/14 | | 13,017 | | 13,524 |
2.375% 10/31/14 | | 77,497 | | 80,470 |
2.5% 6/30/17 | | 10,000 | | 9,981 |
2.625% 7/31/14 | | 83,808 | | 87,894 |
2.625% 4/30/16 | | 30,591 | | 31,451 |
2.625% 1/31/18 | | 31,840 | | 31,656 |
2.625% 8/15/20 | | 42,940 | | 40,488 |
2.625% 11/15/20 | | 38,089 | | 35,708 |
2.75% 11/30/16 | | 18,530 | | 18,970 |
U.S. Government and Government Agency Obligations - continued |
| Principal Amount (000s) | | Value (000s) |
U.S. Treasury Obligations - continued |
U.S. Treasury Notes: - continued | | | | |
2.75% 2/15/19 | | $ 13,700 | | $ 13,500 |
3% 9/30/16 | | 68,254 | | 71,032 |
3.125% 8/31/13 (e) | | 36,935 | | 39,174 |
3.125% 10/31/16 | | 88,448 | | 92,518 |
3.125% 1/31/17 | | 60,773 | | 63,332 |
3.5% 5/15/20 | | 44,137 | | 44,992 |
3.625% 8/15/19 | | 33,225 | | 34,627 |
3.625% 2/15/20 | | 67,640 | | 69,960 |
3.75% 11/15/18 | | 15,801 | | 16,774 |
4% 2/15/15 | | 12,619 | | 13,881 |
4.25% 11/15/17 | | 27,475 | | 30,283 |
4.5% 5/15/17 | | 24,685 | | 27,616 |
4.75% 8/15/17 | | 12,983 | | 14,724 |
TOTAL U.S. TREASURY OBLIGATIONS | | 2,430,121 |
Other Government Related - 7.7% |
Bank of America Corp.: | | | | |
2.1% 4/30/12 (FDIC Guaranteed) (b) | | 6,060 | | 6,185 |
3.125% 6/15/12 (FDIC Guaranteed) (b) | | 3,719 | | 3,855 |
Citibank NA: | | | | |
1.875% 5/7/12 (FDIC Guaranteed) (b) | | 87,150 | | 88,739 |
1.875% 6/4/12 (FDIC Guaranteed) (b) | | 33,000 | | 33,584 |
Citigroup Funding, Inc.: | | | | |
1.875% 10/22/12 (FDIC Guaranteed) (b) | | 40,500 | | 41,353 |
1.875% 11/15/12 (FDIC Guaranteed) (b) | | 18,920 | | 19,329 |
2% 3/30/12 (FDIC Guaranteed) (b) | | 16,000 | | 16,289 |
2.125% 7/12/12 (FDIC Guaranteed) (b) | | 8,784 | | 8,982 |
General Electric Capital Corp.: | | | | |
1.8% 3/11/11 (FDIC Guaranteed) (b) | | 60,000 | | 60,104 |
2% 9/28/12 (FDIC Guaranteed) (b) | | 11,000 | | 11,253 |
2.625% 12/28/12 (FDIC Guaranteed) (b) | | 16,154 | | 16,754 |
3% 12/9/11 (FDIC Guaranteed) (b) | | 4,720 | | 4,827 |
GMAC, Inc. 1.75% 10/30/12 (FDIC Guaranteed) (b) | | 51,106 | | 52,088 |
Goldman Sachs Group, Inc. 3.25% 6/15/12 (FDIC Guaranteed) (b) | | 3,714 | | 3,854 |
JPMorgan Chase & Co.: | | | | |
2.2% 6/15/12 (FDIC Guaranteed) (b) | | 9,200 | | 9,395 |
3.125% 12/1/11 (FDIC Guaranteed) (b) | | 790 | | 808 |
U.S. Government and Government Agency Obligations - continued |
| Principal Amount (000s) | | Value (000s) |
Other Government Related - continued |
National Credit Union Administration Guaranteed Notes: | | | | |
Series 2010-A1 Class A, 0.6106% 12/7/20 (NCUA Guaranteed) (f) | | $ 13,567 | | $ 13,581 |
Series 2010-R3 Class 1A, 0.8238% 12/8/20 (NCUA Guaranteed) (f) | | 27,754 | | 27,771 |
TOTAL OTHER GOVERNMENT RELATED | | 418,751 |
TOTAL U.S. GOVERNMENT AND GOVERNMENT AGENCY OBLIGATIONS (Cost $3,571,340) | 3,609,316 |
U.S. Government Agency - Mortgage Securities - 39.6% |
|
Fannie Mae - 26.2% |
2.017% 10/1/33 (f) | | 347 | | 358 |
2.142% 3/1/35 (f) | | 283 | | 293 |
2.167% 10/1/33 (f) | | 152 | | 157 |
2.194% 2/1/33 (f) | | 349 | | 361 |
2.213% 7/1/35 (f) | | 141 | | 146 |
2.243% 12/1/34 (f) | | 375 | | 386 |
2.295% 11/1/33 (f) | | 974 | | 1,015 |
2.316% 3/1/35 (f) | | 59 | | 61 |
2.532% 7/1/34 (f) | | 182 | | 190 |
2.553% 10/1/33 (f) | | 275 | | 289 |
2.582% 3/1/35 (f) | | 182 | | 191 |
2.589% 6/1/36 (f) | | 260 | | 271 |
2.642% 7/1/35 (f) | | 2,254 | | 2,377 |
2.733% 7/1/35 (f) | | 630 | | 661 |
2.742% 11/1/36 (f) | | 220 | | 231 |
2.839% 9/1/35 (f) | | 2,786 | | 2,924 |
2.858% 2/1/34 (f) | | 113 | | 119 |
3% 2/1/26 (c) | | 36,000 | | 35,177 |
3.5% 2/1/26 (c)(d) | | 162,000 | | 162,889 |
3.5% 2/1/26 (c) | | 172,000 | | 172,943 |
3.5% 11/1/40 to 1/1/41 | | 41,086 | | 39,198 |
4% 9/1/13 to 11/1/40 (d) | | 81,202 | | 81,032 |
4% 2/1/26 (c) | | 3,000 | | 3,089 |
4% 2/1/26 (c) | | 3,000 | | 3,089 |
4% 2/1/41 (c) | | 14,000 | | 13,876 |
4.5% 6/1/25 to 11/1/40 | | 72,611 | | 74,305 |
U.S. Government Agency - Mortgage Securities - continued |
| Principal Amount (000s) | | Value (000s) |
Fannie Mae - continued |
4.5% 2/1/26 (c) | | $ 1,000 | | $ 1,048 |
4.5% 2/1/41 (c)(d) | | 30,000 | | 30,670 |
4.5% 2/1/41 (c)(d) | | 22,000 | | 22,491 |
4.5% 2/1/41 (c) | | 2,000 | | 2,045 |
4.5% 2/1/41 (c) | | 2,000 | | 2,045 |
4.5% 2/1/41 (c)(d) | | 18,000 | | 18,402 |
4.5% 2/1/41 (c)(d) | | 13,000 | | 13,290 |
4.5% 2/1/41 (c)(d) | | 12,000 | | 12,268 |
4.5% 3/1/41 (c) | | 67,000 | | 68,269 |
4.661% 2/1/34 (f) | | 2,947 | | 3,074 |
4.667% 8/1/36 (f) | | 2,681 | | 2,840 |
4.724% 2/1/36 (f) | | 751 | | 785 |
5% 6/1/14 to 9/1/40 | | 115,180 | | 121,428 |
5% 2/1/41 (c)(d) | | 53,000 | | 55,603 |
5% 2/1/41 (c) | | 59,000 | | 61,898 |
5.5% 10/1/20 to 3/1/39 | | 84,622 | | 90,735 |
5.5% 2/1/41 (c)(d) | | 66,000 | | 70,552 |
5.801% 5/1/36 (f) | | 687 | | 717 |
5.804% 3/1/36 (f) | | 2,706 | | 2,894 |
5.963% 3/1/37 (f) | | 595 | | 636 |
6% 3/1/17 to 9/1/39 | | 124,655 | | 135,438 |
6% 2/1/41 (c)(d) | | 50,000 | | 54,358 |
6% 2/1/41 (c)(d) | | 20,500 | | 22,287 |
6.5% 2/1/12 to 4/1/37 | | 17,728 | | 19,615 |
6.5% 2/1/41 (c)(d) | | 11,000 | | 12,244 |
7% 7/1/13 to 7/1/32 | | 2,891 | | 3,251 |
7.5% 7/1/11 to 4/1/29 | | 20 | | 23 |
8.5% 1/1/15 to 7/1/31 | | 254 | | 281 |
9% 5/1/14 | | 187 | | 195 |
9.5% 4/1/16 to 10/1/20 | | 300 | | 345 |
11.25% 5/1/14 | | 2 | | 2 |
11.5% 6/15/19 to 1/15/21 | | 382 | | 416 |
12.5% 8/1/15 to 3/1/16 | | 1 | | 1 |
| | 1,425,774 |
Freddie Mac - 4.9% |
2.041% 3/1/35 (f) | | 1,340 | | 1,377 |
2.108% 5/1/37 (f) | | 848 | | 876 |
2.615% 6/1/35 (f) | | 771 | | 812 |
2.663% 6/1/35 (f) | | 578 | | 606 |
3.022% 7/1/35 (f) | | 1,943 | | 2,053 |
3.352% 10/1/35 (f) | | 360 | | 381 |
U.S. Government Agency - Mortgage Securities - continued |
| Principal Amount (000s) | | Value (000s) |
Freddie Mac - continued |
3.513% 3/1/33 (f) | | $ 59 | | $ 62 |
3.71% 1/1/36 (f) | | 2,244 | | 2,327 |
4.441% 2/1/36 (f) | | 168 | | 177 |
4.5% 7/1/25 to 10/1/40 | | 11,046 | | 11,353 |
4.5% 2/1/41 (c)(d) | | 59,000 | | 60,244 |
4.5% 3/1/41 (c) | | 59,000 | | 60,041 |
5% 8/1/35 to 9/1/40 | | 23,382 | | 24,547 |
5.138% 4/1/35 (f) | | 291 | | 307 |
5.5% 8/1/16 to 1/1/40 | | 42,862 | | 46,174 |
5.527% 1/1/36 (f) | | 2,076 | | 2,170 |
6% 7/1/16 to 7/1/37 | | 14,160 | | 15,416 |
6.141% 7/1/36 (f) | | 884 | | 933 |
6.5% 3/1/11 to 3/1/36 | | 22,623 | | 24,877 |
6.5% 2/1/41 (c)(d) | | 9,000 | | 10,001 |
7% 4/1/11 | | 0 * | | 0 * |
7.5% 5/1/11 to 7/1/16 | | 736 | | 799 |
8.5% 5/1/17 to 9/1/29 | | 124 | | 142 |
9% 9/1/14 to 10/1/20 | | 23 | | 25 |
9.5% 5/1/17 to 8/1/21 | | 144 | | 163 |
9.75% 8/1/14 | | 97 | | 106 |
10% 11/15/18 to 8/1/21 | | 9 | | 10 |
11% 5/1/14 | | 29 | | 32 |
12% 3/1/15 | | 1 | | 1 |
12.5% 2/1/14 to 6/1/19 | | 5 | | 6 |
13% 6/1/14 to 6/1/15 | | 2 | | 2 |
| | 266,020 |
Ginnie Mae - 8.5% |
4% 1/15/25 to 10/20/25 | | 34,745 | | 36,343 |
4% 2/1/41 (c) | | 10,000 | | 10,027 |
4% 2/1/41 (c) | | 37,000 | | 37,098 |
4.5% 3/15/40 to 6/15/40 | | 24,499 | | 25,487 |
4.5% 2/1/41 (c) | | 52,000 | | 53,787 |
4.5% 2/1/41 (c) | | 22,000 | | 22,756 |
4.5% 2/1/41 (c)(d) | | 15,000 | | 15,518 |
5% 9/20/33 to 4/15/40 | | 51,693 | | 55,261 |
5% 2/1/41 (c) | | 1,300 | | 1,380 |
5.492% 4/20/60 (i) | | 22,890 | | 24,862 |
5.493% 11/20/59 (i) | | 28,188 | | 30,662 |
5.5% 12/15/38 to 3/15/39 | | 580 | | 627 |
5.5% 1/20/60 (i) | | 27,513 | | 29,889 |
5.5% 3/20/60 (i) | | 33,750 | | 36,668 |
U.S. Government Agency - Mortgage Securities - continued |
| Principal Amount (000s) | | Value (000s) |
Ginnie Mae - continued |
5.5% 3/20/60 (i) | | $ 29,684 | | $ 32,253 |
5.513% 2/20/60 (i) | | 25,184 | | 27,374 |
6% 11/20/31 to 11/20/33 | | 11,110 | | 12,215 |
6.5% 3/20/31 to 10/15/35 | | 7,552 | | 8,515 |
7% 10/15/26 to 8/15/32 | | 73 | | 83 |
7.5% 3/15/28 to 8/15/29 | | 66 | | 75 |
8% 7/15/19 to 12/15/23 | | 818 | | 930 |
8.5% 1/15/25 | | 1 | | 1 |
9.5% 2/15/25 | | 1 | | 1 |
10.5% 4/15/14 to 1/20/18 | | 53 | | 62 |
| | 461,874 |
TOTAL U.S. GOVERNMENT AGENCY - MORTGAGE SECURITIES (Cost $2,135,430) | 2,153,668 |
Collateralized Mortgage Obligations - 9.3% |
|
U.S. Government Agency - 9.3% |
Fannie Mae: | | | | |
floater Series 2007-89 Class EF, 0.82% 9/25/37 (f) | | 10,662 | | 10,673 |
planned amortization class: | | | | |
Series 1992-168 Class KB, 7% 10/25/22 | | 769 | | 849 |
Series 1993-207 Class H, 6.5% 11/25/23 | | 11,556 | | 12,989 |
Series 1993-240 Class PD, 6.25% 12/25/13 | | 1,371 | | 1,436 |
Series 1994-23 Class PZ, 6% 2/25/24 | | 12,400 | | 14,290 |
Series 1996-28 Class PK, 6.5% 7/25/25 | | 2,240 | | 2,487 |
Series 2003-28 Class KG, 5.5% 4/25/23 | | 4,940 | | 5,376 |
Series 2006-45 Class OP, 6/25/36 (h) | | 4,178 | | 3,689 |
Series 2006-62 Class KP, 4/25/36 (h) | | 9,052 | | 7,468 |
sequential payer: | | | | |
Series 1997-41 Class J, 7.5% 6/18/27 | | 1,647 | | 1,870 |
Series 2007-113 Class DB, 4.5% 12/25/22 | | 12,440 | | 13,204 |
Series 2007-115 Class BE, 4.5% 12/25/22 | | 15,400 | | 16,471 |
Series 2006-127 Class FD, 0.54% 7/25/36 (f) | | 14,254 | | 14,106 |
Series 2006-44 Class FK, 0.69% 6/25/36 (f) | | 5,174 | | 5,158 |
Series 2007-113 Class JD, 4.5% 12/25/22 | | 12,766 | | 13,504 |
Series 2010-37 Class GI, 5% 4/25/25 (g) | | 3,860 | | 370 |
Fannie Mae Stripped Mortgage-Backed Securities: | | | | |
sequential payer Series 377 Class 1, 10/1/36 (h) | | 11,913 | | 10,103 |
Series 384 Class 6, 5% 7/25/37 (g) | | 13,563 | | 2,320 |
Collateralized Mortgage Obligations - continued |
| Principal Amount (000s) | | Value (000s) |
U.S. Government Agency - continued |
Fannie Mae subordinate REMIC pass-thru certificates: | | | | |
floater: | | | | |
Series 2001-38 Class QF, 1.24% 8/25/31 (f) | | $ 383 | | $ 391 |
Series 2002-49 Class FB, 0.8613% 11/18/31 (f) | | 530 | | 533 |
Series 2002-60 Class FV, 1.26% 4/25/32 (f) | | 223 | | 228 |
Series 2002-75 Class FA, 1.26% 11/25/32 (f) | | 458 | | 467 |
Series 2006-79 Class PF, 0.66% 8/25/36 (f) | | 11,583 | | 11,547 |
Series 2008-76 Class EF, 0.76% 9/25/23 (f) | | 6,357 | | 6,361 |
planned amortization class: | | | | |
Series 2003-113 Class PE, 4% 11/25/18 | | 7,545 | | 7,933 |
Series 2004-21 Class QE, 4.5% 11/25/32 | | 1,500 | | 1,572 |
Series 2005-102 Class CO, 11/25/35 (h) | | 4,148 | | 3,582 |
Series 2005-81 Class PC, 5.5% 9/25/35 | | 2,150 | | 2,328 |
Series 2006-12 Class BO, 10/25/35 (h) | | 18,545 | | 16,003 |
Series 2006-37 Class OW, 5/25/36 (h) | | 4,606 | | 3,812 |
sequential payer: | | | | |
Series 1999-25 Class Z, 6% 6/25/29 | | 3,492 | | 3,845 |
Series 2001-20 Class Z, 6% 5/25/31 | | 10,772 | | 11,811 |
Series 2001-46 Class ZG, 6% 9/25/31 | | 3,919 | | 4,311 |
Series 2002-79 Class Z, 5.5% 11/25/22 | | 8,078 | | 8,717 |
Series 2005-117, Class JN, 4.5% 1/25/36 | | 645 | | 648 |
Series 2006-72 Class CY, 6% 8/25/26 | | 10,215 | | 11,225 |
Freddie Mac: | | | | |
planned amortization class Series 2115 Class PE, 6% 1/15/14 | | 262 | | 276 |
sequential payer Series 2114 Class ZM, 6% 1/15/29 | | 1,230 | | 1,353 |
Freddie Mac Manufactured Housing participation certificates guaranteed: | | | | |
floater Series 1686 Class FA, 1.2125% 2/15/24 (f) | | 1,017 | | 1,042 |
planned amortization class Series 1681 Class PJ, 7% 12/15/23 | | 666 | | 668 |
Freddie Mac Multi-class participation certificates guaranteed: | | | | |
floater: | | | | |
Series 2530 Class FE, 0.8613% 2/15/32 (f) | | 289 | | 291 |
Series 2630 Class FL, 0.7613% 6/15/18 (f) | | 523 | | 528 |
Series 3008 Class SM, 0% 7/15/35 (f) | | 141 | | 140 |
Series 3279 Class FB, 0.5813% 2/15/37 (f) | | 5,072 | | 5,031 |
Series 3346 Class FA, 0.4913% 2/15/19 (f) | | 12,002 | | 11,996 |
planned amortization class: | | | | |
Series 1141 Class G, 9% 9/15/21 | | 209 | | 239 |
Series 2006-15 Class OP, 3/25/36 (h) | | 5,504 | | 4,509 |
Collateralized Mortgage Obligations - continued |
| Principal Amount (000s) | | Value (000s) |
U.S. Government Agency - continued |
Freddie Mac Multi-class participation certificates guaranteed: - continued | | | | |
planned amortization class: | | | | |
Series 2356 Class GD, 6% 9/15/16 | | $ 243 | | $ 262 |
Series 2376 Class JE, 5.5% 11/15/16 | | 1,619 | | 1,734 |
Series 2381 Class OG, 5.5% 11/15/16 | | 1,112 | | 1,188 |
Series 2628 Class OE, 4.5% 6/15/18 | | 6,815 | | 7,316 |
Series 2640 Class GE, 4.5% 7/15/18 | | 7,310 | | 7,879 |
Series 2682 Class LD, 4.5% 10/15/33 | | 777 | | 800 |
Series 2802 Class OB, 6% 5/15/34 | | 10,455 | | 11,511 |
Series 2810 Class PD, 6% 6/15/33 | | 815 | | 861 |
Series 2937 Class KC, 4.5% 2/15/20 | | 19,686 | | 21,206 |
Series 2962 Class BE, 4.5% 4/15/20 | | 15,015 | | 16,154 |
Series 3110 Class OP, 9/15/35 (h) | | 11,021 | | 9,046 |
Series 3119 Class PO, 2/15/36 (h) | | 13,546 | | 11,143 |
Series 3121 Class KO, 3/15/36 (h) | | 4,089 | | 3,489 |
Series 3123 Class LO, 3/15/36 (h) | | 8,820 | | 7,201 |
Series 3145 Class GO, 4/15/36 (h) | | 7,879 | | 6,494 |
Series 3147 Class PF, 0.5613% 4/15/36 (f) | | 12,885 | | 12,897 |
Series 3741 Class YU, 3.5% 11/15/22 | | 13,420 | | 13,601 |
sequential payer: | | | | |
Series 2135 Class JE, 6% 3/15/29 | | 1,464 | | 1,613 |
Series 2281 Class ZB, 6% 3/15/30 | | 2,523 | | 2,775 |
Series 2546 Class MJ, 5.5% 3/15/23 | | 2,861 | | 3,117 |
Series 2570 Class CU, 4.5% 7/15/17 | | 488 | | 501 |
Series 2587 Class AD, 4.71% 3/15/33 | | 5,785 | | 5,868 |
Series 2601 Class TB, 5.5% 4/15/23 | | 869 | | 950 |
Series 2729 Class GB, 5% 1/15/19 | | 7,359 | | 7,862 |
Series 2773 Class HC, 4.5% 4/15/19 | | 704 | | 746 |
Series 2860 Class CP, 4% 10/15/17 | | 259 | | 259 |
Series 2987 Class HE, 4.5% 6/15/20 | | 11,260 | | 12,000 |
Series 2998 Class LY, 5.5% 7/15/25 | | 2,011 | | 2,194 |
Series 3007 Class EW, 5.5% 7/15/25 | | 8,875 | | 9,679 |
Series 3013 Class VJ, 5% 1/15/14 | | 1,069 | | 1,124 |
Series 2863 Class DB, 4% 9/15/14 | | 632 | | 645 |
Series 3772 Class BI, 4.5% 10/15/18 (g) | | 16,056 | | 1,407 |
target amortization class: | | | | |
Series 2156 Class TC, 6.25% 5/15/29 | | 5,290 | | 5,802 |
Series 2877 Class JC, 5% 10/15/34 | | 260 | | 269 |
Ginnie Mae guaranteed REMIC pass-thru securities: | | | | |
floater: | | | | |
Series 2010-H17 Class FA, 0.5906% 7/20/60 (f)(i) | | 14,405 | | 14,232 |
Collateralized Mortgage Obligations - continued |
| Principal Amount (000s) | | Value (000s) |
U.S. Government Agency - continued |
Ginnie Mae guaranteed REMIC pass-thru securities: - continued | | | | |
floater: | | | | |
Series 2010-H18 Class AF, 0.5538% 9/1/60 (f)(i) | | $ 14,839 | | $ 14,765 |
Series 2010-H19 Class FG, 0.5656% 8/20/60 (f)(i) | | 18,986 | | 18,682 |
planned amortization class Series 1997-8 Class PE, 7.5% 5/16/27 | | 2,627 | | 2,997 |
Series 2004-79 Class FA, 0.5606% 1/20/31 (f) | | 5,025 | | 5,032 |
TOTAL COLLATERALIZED MORTGAGE OBLIGATIONS (Cost $484,584) | 503,051 |
Cash Equivalents - 4.5% |
| Maturity Amount (000s) | | |
Investments in repurchase agreements in a joint trading account at 0.23%, dated 1/31/11 due 2/1/11 (Collateralized by U.S. Government Obligations) #
(Cost $244,427) | $ 244,429 | | 244,427 |
TOTAL INVESTMENT PORTFOLIO - 119.8% (Cost $6,435,781) | 6,510,462 |
NET OTHER ASSETS (LIABILITIES) - (19.8)% | (1,073,883) |
NET ASSETS - 100% | $ 5,436,579 |
Swap Agreements |
| Expiration Date | | Notional Amount (000s) | | |
Interest Rate Swaps |
Receive quarterly a floating rate based on 3-month LIBOR and pay semi-annually a fixed rate equal to 0.682% with JPMorgan Chase, Inc. | August 2012 | | $ 84,000 | | $ (308) |
Receive quarterly a floating rate based on 3-month LIBOR and pay semi-annually a fixed rate equal to 3.23% with Credit Suisse First Boston | May 2020 | | 50,000 | | 331 |
| | $ 134,000 | | $ 23 |
Legend |
(a) Security exempt from registration under Rule 144A of the Securities Act of 1933. These securities may be resold in transactions exempt from registration, normally to qualified institutional buyers. At the end of the period, the value of these securities amounted to $18,556,000 or 0.3% of net assets. |
(b) Under the Temporary Liquidity Guarantee Program, the Federal Deposit Insurance Corporation guarantees principal and interest in the event of payment default or bankruptcy until the earlier of maturity date of the debt or until June 30, 2012. At the end of the period these securities amounted to $377,399,000 or 6.9% of net assets. |
(c) Security or a portion of the security purchased on a delayed delivery or when-issued basis. |
(d) A portion of the security is subject to a forward commitment to sell. |
(e) Security or a portion of the security has been segregated as collateral for open swap agreements. At the period end, the value of securities pledged amounted to $1,061,000. |
(f) Coupon rates for floating and adjustable rate securities reflect the rates in effect at period end. |
(g) Security represents right to receive monthly interest payments on an underlying pool of mortgages or assets. Principal shown is the outstanding par amount of the pool held as of the end of the period. |
(h) Principal Only Strips represent the right to receive the monthly principal payments on an underlying pool of mortgage loans. |
(i) Represents an investment in an underlying pool of reverse mortgages which typically do not require regular principal and interest payments as repayment is deferred until a maturity event. |
* Amount repesents less than $1,000. |
# Additional information on each counterparty to the repurchase agreement is as follows: |
Repurchase Agreement / Counterparty | Value
(Amounts in thousands) |
$244,427,000 due 2/01/11 at 0.23% |
BNP Paribas Securities Corp. | $ 11,501 |
Bank of America NA | 74,921 |
Barclays Capital, Inc. | 5,853 |
Citigroup Global Markets, Inc. | 6,765 |
Credit Agricole Securities (USA), Inc. | 9,365 |
Deutsche Bank Securities, Inc. | 7,024 |
HSBC Securities (USA), Inc. | 28,096 |
J.P. Morgan Securities, Inc. | 9,365 |
Merrill Lynch Government Securities, Inc. | 8,429 |
Merrill Lynch, Pierce, Fenner & Smith, Inc. | 9,357 |
Mizuho Securities USA, Inc. | 42,144 |
Societe Generale, New York Branch | 18,730 |
Wells Fargo Securities LLC | 12,877 |
| $ 244,427 |
Other Information |
All investments are categorized as Level 2 under the Fair Value Hierarchy. The inputs or methodology used for valuing securities may not be an indication of the risk associated with investing in those securities. For more information on valuation inputs, please refer to the Security Valuation section in the accompanying Notes to Financial Statements. |
Value of Derivative Instruments |
The following table is a summary of the Fund's value of derivative instruments by risk exposure as of January 31, 2011. For additional information on derivative instruments, please refer to the Derivative Instruments section in the accompanying Notes to Financial Statements. |
Risk Exposure /
Derivative Type | Value
(Amounts in thousands) |
| Asset | Liability |
Interest Rate Risk | | |
Swap Agreements (a) | $ 331 | $ (308) |
Total Value of Derivatives | $ 331 | $ (308) |
(a) Value is disclosed on the Statement of Assets and Liabilities in the Unrealized Appreciation and Unrealized Depreciation on Swap Agreements line-items. |
See accompanying notes which are an integral part of the financial statements.
Semiannual Report
Statement of Assets and Liabilities
Amounts in thousands (except per-share amounts) | January 31, 2011 (Unaudited) |
| | |
Assets | | |
Investment in securities, at value (including repurchase agreements of $244,427) -
See accompanying schedule: Unaffiliated issuers (cost $6,435,781) | | $ 6,510,462 |
Commitment to sell securities on a delayed delivery basis | $ (594,237) | |
Receivable for securities sold on a delayed delivery basis | 594,169 | (68) |
Receivable for investments sold
Regular delivery | | 64,692 |
Delayed delivery | | 293 |
Receivable for fund shares sold | | 14,802 |
Interest receivable | | 32,797 |
Unrealized appreciation on swap agreements | | 331 |
Other receivables | | 758 |
Total assets | | 6,624,067 |
| | |
Liabilities | | |
Payable to custodian bank | $ 292 | |
Payable for investments purchased
Regular delivery | 58,102 | |
Delayed delivery | 1,113,210 | |
Payable for fund shares redeemed | 11,958 | |
Distributions payable | 478 | |
Unrealized depreciation on swap agreements | 308 | |
Accrued management fee | 1,444 | |
Distribution and service plan fees payable | 255 | |
Other affiliated payables | 684 | |
Other payables and accrued expenses | 757 | |
Total liabilities | | 1,187,488 |
| | |
Net Assets | | $ 5,436,579 |
Net Assets consist of: | | |
Paid in capital | | $ 5,353,039 |
Undistributed net investment income | | 3,540 |
Accumulated undistributed net realized gain (loss) on investments | | 5,364 |
Net unrealized appreciation (depreciation) on investments | | 74,636 |
Net Assets | | $ 5,436,579 |
See accompanying notes which are an integral part of the financial statements.
Semiannual Report
Financial Statements - continued
Statement of Assets and Liabilities - continued
Amounts in thousands (except per-share amounts) | January 31, 2011 (Unaudited) |
| | |
Calculation of Maximum Offering Price
Class A:
Net Asset Value and redemption price per share
($379,477 ÷ 36,397.7 shares) | | $ 10.43 |
| | |
Maximum offering price per share (100/96.00 of $10.43) | | $ 10.86 |
Class T:
Net Asset Value and redemption price per share ($300,963 ÷ 28,870.9 shares) | | $ 10.42 |
| | |
Maximum offering price per share (100/96.00 of $10.42) | | $ 10.85 |
Class B:
Net Asset Value and offering price per share ($30,026 ÷ 2,880.9 shares)A | | $ 10.42 |
| | |
Class C:
Net Asset Value and offering price per share ($101,833 ÷ 9,769.2 shares)A | | $ 10.42 |
| | |
Government Income:
Net Asset Value, offering price and redemption price per share ($4,321,327 ÷ 415,077.7 shares) | | $ 10.41 |
| | |
Institutional Class:
Net Asset Value, offering price and redemption price per share ($302,953 ÷ 29,060.5 shares) | | $ 10.42 |
A Redemption price per share is equal to net asset value less any applicable contingent deferred sales charge.
See accompanying notes which are an integral part of the financial statements.
Semiannual Report
Statement of Operations
Amounts in thousands | Six months ended January 31, 2011 (Unaudited) |
| | |
Investment Income | | |
Interest | | $ 76,058 |
| | |
Expenses | | |
Management fee | $ 9,314 | |
Transfer agent fees | 3,344 | |
Distribution and service plan fees | 1,665 | |
Fund wide operations fee | 988 | |
Independent trustees' compensation | 12 | |
Miscellaneous | 12 | |
Total expenses | | 15,335 |
Net investment income | | 60,723 |
Realized and Unrealized Gain (Loss) Net realized gain (loss) on: | | |
Investment securities: | | |
Unaffiliated issuers | 67,918 | |
Futures contracts | 95 | |
Swap agreements | (5,245) | |
Total net realized gain (loss) | | 62,768 |
Change in net unrealized appreciation (depreciation) on: Investment securities | (158,471) | |
Swap agreements | 5,601 | |
Delayed delivery commitments | 3,809 | |
Total change in net unrealized appreciation (depreciation) | | (149,061) |
Net gain (loss) | | (86,293) |
Net increase (decrease) in net assets resulting from operations | | $ (25,570) |
See accompanying notes which are an integral part of the financial statements.
Semiannual Report
Financial Statements - continued
Statement of Changes in Net Assets
Amounts in thousands | Six months ended January 31, 2011 (Unaudited) | Year ended
July 31,
2010 |
Increase (Decrease) in Net Assets | | |
Operations | | |
Net investment income | $ 60,723 | $ 145,918 |
Net realized gain (loss) | 62,768 | 139,116 |
Change in net unrealized appreciation (depreciation) | (149,061) | 85,404 |
Net increase (decrease) in net assets resulting
from operations | (25,570) | 370,438 |
Distributions to shareholders from net investment income | (59,877) | (140,387) |
Distributions to shareholders from net realized gain | (140,821) | (196,760) |
Total distributions | (200,698) | (337,147) |
Share transactions - net increase (decrease) | (352,327) | 203,871 |
Total increase (decrease) in net assets | (578,595) | 237,162 |
| | |
Net Assets | | |
Beginning of period | 6,015,174 | 5,778,012 |
End of period (including undistributed net investment income of $3,540 and undistributed net investment income of $2,694, respectively) | $ 5,436,579 | $ 6,015,174 |
See accompanying notes which are an integral part of the financial statements.
Semiannual Report
Financial Highlights - Class A
| Six months ended
January 31, 2011 | Years ended July 31, |
| (Unaudited) | 2010 | 2009 | 2008 | 2007 F |
Selected Per-Share Data | | | | | |
Net asset value, beginning of period | $ 10.84 | $ 10.77 | $ 10.40 | $ 10.01 | $ 9.98 |
Income from Investment Operations | | | | | |
Net investment income E | .097 | .242 | .356 | .402 | .311 |
Net realized and unrealized gain (loss) | (.156) | .424 | .466 | .387 | .033 |
Total from investment operations | (.059) | .666 | .822 | .789 | .344 |
Distributions from net investment income | (.095) | (.231) | (.352) | (.399) | (.314) |
Distributions from net realized gain | (.256) | (.365) | (.100) | - | - |
Total distributions | (.351) | (.596) | (.452) | (.399) | (.314) |
Net asset value, end of period | $ 10.43 | $ 10.84 | $ 10.77 | $ 10.40 | $ 10.01 |
Total Return B, C, D | (.57)% | 6.44% | 8.03% | 7.96% | 3.49% |
Ratios to Average Net Assets G | | | | |
Expenses before reductions | .76% A | .77% | .77% | .81% | .78% A |
Expenses net of fee waivers, if any | .76% A | .77% | .77% | .81% | .78% A |
Expenses net of all reductions | .76% A | .77% | .77% | .80% | .77% A |
Net investment income | 1.80% A | 2.28% | 3.33% | 3.88% | 4.08% A |
Supplemental Data | | | | | |
Net assets, end of period (in millions) | $ 379 | $ 431 | $ 437 | $ 232 | $ 145 |
Portfolio turnover rate | 420% A | 355% | 380% H | 269% | 164% H |
A Annualized
B Total returns for periods of less than one year are not annualized.
C Total returns would have been lower had certain expenses not been reduced during the periods shown.
D Total returns do not include the effect of the sales charges.
E Calculated based on average shares outstanding during the period.
F For the period October 24, 2006 (commencement of sale of shares) to July 31, 2007.
G Expense ratios reflect operating expenses of the class. Expenses before reductions do not reflect amounts reimbursed by the investment adviser or reductions from expense offset arrangements and do not represent the amount paid by the class during periods when reimbursements or reductions occur. Expenses net of fee waivers reflect expenses after reimbursement by the investment adviser but prior to reductions from expense offset arrangements. Expenses net of all reductions represent the net expenses paid by the class.
H The portfolio turnover rate does not include the assets acquired in the merger.
See accompanying notes which are an integral part of the financial statements.
Semiannual Report
Financial Highlights - Class T
| Six months ended
January 31, 2011 | Years ended July 31, |
| (Unaudited) | 2010 | 2009 | 2008 | 2007 F |
Selected Per-Share Data | | | | | |
Net asset value, beginning of period | $ 10.84 | $ 10.77 | $ 10.40 | $ 10.01 | $ 9.98 |
Income from Investment Operations | | | | | |
Net investment income E | .098 | .243 | .357 | .404 | .306 |
Net realized and unrealized gain (loss) | (.166) | .425 | .466 | .387 | .036 |
Total from investment operations | (.068) | .668 | .823 | .791 | .342 |
Distributions from net investment income | (.096) | (.233) | (.353) | (.401) | (.312) |
Distributions from net realized gain | (.256) | (.365) | (.100) | - | - |
Total distributions | (.352) | (.598) | (.453) | (.401) | (.312) |
Net asset value, end of period | $ 10.42 | $ 10.84 | $ 10.77 | $ 10.40 | $ 10.01 |
Total Return B, C, D | (.66)% | 6.45% | 8.04% | 7.98% | 3.46% |
Ratios to Average Net Assets G | | | | |
Expenses before reductions | .75% A | .76% | .76% | .78% | .79% A |
Expenses net of fee waivers, if any | .75% A | .76% | .76% | .78% | .79% A |
Expenses net of all reductions | .75% A | .76% | .76% | .78% | .79% A |
Net investment income | 1.81% A | 2.29% | 3.33% | 3.90% | 4.02% A |
Supplemental Data | | | | | |
Net assets, end of period (in millions) | $ 301 | $ 335 | $ 324 | $ 236 | $ 181 |
Portfolio turnover rate | 420% A | 355% | 380% H | 269% | 164% H |
A Annualized
B Total returns for periods of less than one year are not annualized.
C Total returns would have been lower had certain expenses not been reduced during the periods shown.
D Total returns do not include the effect of the sales charges.
E Calculated based on average shares outstanding during the period.
F For the period October 24, 2006 (commencement of sale of shares) to July 31, 2007.
G Expense ratios reflect operating expenses of the class. Expenses before reductions do not reflect amounts reimbursed by the investment adviser or reductions from expense offset arrangements and do not represent the amount paid by the class during periods when reimbursements or reductions occur. Expenses net of fee waivers reflect expenses after reimbursement by the investment adviser but prior to reductions from expense offset arrangements. Expenses net of all reductions represent the net expenses paid by the class.
H The portfolio turnover rate does not include the assets acquired in the merger.
See accompanying notes which are an integral part of the financial statements.
Semiannual Report
Financial Highlights - Class B
| Six months ended
January 31, 2011 | Years ended July 31, |
| (Unaudited) | 2010 | 2009 | 2008 | 2007 F |
Selected Per-Share Data | | | | | |
Net asset value, beginning of period | $ 10.84 | $ 10.77 | $ 10.40 | $ 10.01 | $ 9.98 |
Income from Investment Operations | | | | | |
Net investment income E | .058 | .164 | .278 | .329 | .251 |
Net realized and unrealized gain (loss) | (.166) | .425 | .467 | .387 | .037 |
Total from investment operations | (.108) | .589 | .745 | .716 | .288 |
Distributions from net investment income | (.056) | (.154) | (.275) | (.326) | (.258) |
Distributions from net realized gain | (.256) | (.365) | (.100) | - | - |
Total distributions | (.312) | (.519) | (.375) | (.326) | (.258) |
Net asset value, end of period | $ 10.42 | $ 10.84 | $ 10.77 | $ 10.40 | $ 10.01 |
Total Return B, C, D | (1.02)% | 5.67% | 7.25% | 7.21% | 2.91% |
Ratios to Average Net Assets G | | | | |
Expenses before reductions | 1.49% A | 1.50% | 1.50% | 1.51% | 1.50% A |
Expenses net of fee waivers, if any | 1.49% A | 1.50% | 1.50% | 1.51% | 1.50% A |
Expenses net of all reductions | 1.49% A | 1.50% | 1.50% | 1.50% | 1.50% A |
Net investment income | 1.08% A | 1.55% | 2.60% | 3.17% | 3.30% A |
Supplemental Data | | | | | |
Net assets, end of period (in millions) | $ 30 | $ 38 | $ 48 | $ 41 | $ 43 |
Portfolio turnover rate | 420% A | 355% | 380% H | 269% | 164% H |
A Annualized
B Total returns for periods of less than one year are not annualized.
C Total returns would have been lower had certain expenses not been reduced during the periods shown.
D Total returns do not include the effect of the contingent deferred sales charge.
E Calculated based on average shares outstanding during the period.
F For the period October 24, 2006 (commencement of sale of shares) to July 31, 2007.
G Expense ratios reflect operating expenses of the class. Expenses before reductions do not reflect amounts reimbursed by the investment adviser or reductions from expense offset arrangements and do not represent the amount paid by the class during periods when reimbursements or reductions occur. Expenses net of fee waivers reflect expenses after reimbursement by the investment adviser but prior to reductions from expense offset arrangements. Expenses net of all reductions represent the net expenses paid by the class.
H The portfolio turnover rate does not include the assets acquired in the merger.
See accompanying notes which are an integral part of the financial statements.
Semiannual Report
Financial Highlights - Class C
| Six months ended
January 31, 2011 | Years ended July 31, |
| (Unaudited) | 2010 | 2009 | 2008 | 2007 F |
Selected Per-Share Data | | | | | |
Net asset value, beginning of period | $ 10.84 | $ 10.77 | $ 10.40 | $ 10.01 | $ 9.98 |
Income from Investment Operations | | | | | |
Net investment income E | .057 | .163 | .275 | .326 | .249 |
Net realized and unrealized gain (loss) | (.165) | .425 | .468 | .387 | .033 |
Total from investment operations | (.108) | .588 | .743 | .713 | .282 |
Distributions from net investment income | (.056) | (.153) | (.273) | (.323) | (.252) |
Distributions from net realized gain | (.256) | (.365) | (.100) | - | - |
Total distributions | (.312) | (.518) | (.373) | (.323) | (.252) |
Net asset value, end of period | $ 10.42 | $ 10.84 | $ 10.77 | $ 10.40 | $ 10.01 |
Total Return B, C, D | (1.03)% | 5.66% | 7.23% | 7.18% | 2.85% |
Ratios to Average Net Assets G | | | | |
Expenses before reductions | 1.50% A | 1.51% | 1.52% | 1.53% | 1.55% A |
Expenses net of fee waivers, if any | 1.50% A | 1.51% | 1.52% | 1.53% | 1.55% A |
Expenses net of all reductions | 1.50% A | 1.51% | 1.51% | 1.53% | 1.55% A |
Net investment income | 1.06% A | 1.54% | 2.58% | 3.15% | 3.26% A |
Supplemental Data | | | | | |
Net assets, end of period (in millions) | $ 102 | $ 118 | $ 131 | $ 71 | $ 39 |
Portfolio turnover rate | 420% A | 355% | 380% H | 269% | 164% H |
A Annualized
B Total returns for periods of less than one year are not annualized.
C Total returns would have been lower had certain expenses not been reduced during the periods shown.
D Total returns do not include the effect of the contingent deferred sales charge.
E Calculated based on average shares outstanding during the period.
F For the period October 24, 2006 (commencement of sale of shares) to July 31, 2007.
G Expense ratios reflect operating expenses of the class. Expenses before reductions do not reflect amounts reimbursed by the investment adviser or reductions from expense offset arrangements and do not represent the amount paid by the class during periods when reimbursements or reductions occur. Expenses net of fee waivers reflect expenses after reimbursement by the investment adviser but prior to reductions from expense offset arrangements. Expenses net of all reductions represent the net expenses paid by the class.
H The portfolio turnover rate does not include the assets acquired in the merger.
See accompanying notes which are an integral part of the financial statements.
Semiannual Report
Financial Highlights - Government Income
| Six months ended
January 31, 2011 | Years ended July 31, |
| (Unaudited) | 2010 | 2009 | 2008 | 2007 | 2006 |
Selected Per-Share Data | | | | | |
Net asset value, beginning of period | $ 10.82 | $ 10.76 | $ 10.38 | $ 10.00 | $ 9.95 | $ 10.20 |
Income from Investment Operations | | | | | | |
Net investment income D | .114 | .275 | .390 | .438 | .443 | .429 |
Net realized and unrealized gain (loss) | (.156) | .415 | .476 | .378 | .068 | (.274) |
Total from investment operations | (.042) | .690 | .866 | .816 | .511 | .155 |
Distributions from net investment income | (.112) | (.265) | (.386) | (.436) | (.456) | (.405) |
Distributions from net realized gain | (.256) | (.365) | (.100) | - | (.005) | - |
Total distributions | (.368) | (.630) | (.486) | (.436) | (.461) | (.405) |
Net asset value, end of period | $ 10.41 | $ 10.82 | $ 10.76 | $ 10.38 | $ 10.00 | $ 9.95 |
Total Return B, C | (.41)% | 6.69% | 8.49% | 8.25% | 5.22% | 1.56% |
Ratios to Average Net Assets E | | | | | |
Expenses before reductions | .45% A | .45% | .45% | .45% | .45% | .45% |
Expenses net of fee waivers, if any | .45% A | .45% | .45% | .45% | .45% | .45% |
Expenses net of all reductions | .45% A | .45% | .45% | .45% | .44% | .44% |
Net investment income | 2.11% A | 2.60% | 3.65% | 4.23% | 4.42% | 4.27% |
Supplemental Data | | | | | |
Net assets, end of period (in millions) | $ 4,321 | $ 4,809 | $ 4,638 | $ 8,154 | $ 6,118 | $ 5,331 |
Portfolio turnover rate | 420% A | 355% | 380% F | 269% | 164% F | 108% |
A Annualized
B Total returns for periods of less than one year are not annualized.
C Total returns would have been lower had certain expenses not been reduced during the periods shown.
D Calculated based on average shares outstanding during the period.
E Expense ratios reflect operating expenses of the class. Expenses before reductions do not reflect amounts reimbursed by the investment adviser or reductions from expense offset arrangements and do not represent the amount paid by the class during periods when reimbursements or reductions occur. Expenses net of fee waivers reflect expenses after reimbursement by the investment adviser but prior to reductions from expense offset arrangements. Expenses net of all reductions represent the net expenses paid by the class.
F The portfolio turnover rate does not include the assets acquired in the merger.
See accompanying notes which are an integral part of the financial statements.
Semiannual Report
Financial Highlights - Institutional Class
| Six months ended
January 31, 2011 | Years ended July 31, |
| (Unaudited) | 2010 | 2009 | 2008 | 2007 E |
Selected Per-Share Data | | | | | |
Net asset value, beginning of period | $ 10.84 | $ 10.77 | $ 10.40 | $ 10.01 | $ 9.98 |
Income from Investment Operations | | | | | |
Net investment income D | .110 | .267 | .385 | .432 | .329 |
Net realized and unrealized gain (loss) | (.166) | .425 | .466 | .388 | .034 |
Total from investment operations | (.056) | .692 | .851 | .820 | .363 |
Distributions from net investment income | (.108) | (.257) | (.381) | (.430) | (.333) |
Distributions from net realized gain | (.256) | (.365) | (.100) | - | - |
Total distributions | (.364) | (.622) | (.481) | (.430) | (.333) |
Net asset value, end of period | $ 10.42 | $ 10.84 | $ 10.77 | $ 10.40 | $ 10.01 |
Total Return B, C | (.54)% | 6.70% | 8.32% | 8.28% | 3.67% |
Ratios to Average Net Assets F | | | | |
Expenses before reductions | .52% A | .53% | .51% | .51% | .53% A |
Expenses net of fee waivers, if any | .52% A | .53% | .51% | .51% | .53% A |
Expenses net of all reductions | .52% A | .53% | .51% | .51% | .53% A |
Net investment income | 2.04% A | 2.52% | 3.59% | 4.17% | 4.32% A |
Supplemental Data | | | | | |
Net assets, end of period (in millions) | $ 303 | $ 284 | $ 200 | $ 750 | $ 715 |
Portfolio turnover rate | 420% A | 355% | 380% G | 269% | 164% G |
A Annualized
B Total returns for periods of less than one year are not annualized.
C Total returns would have been lower had certain expenses not been reduced during the periods shown.
D Calculated based on average shares outstanding during the period.
E For the period October 24, 2006 (commencement of sale of shares) to July 31, 2007.
F Expense ratios reflect operating expenses of the class. Expenses before reductions do not reflect amounts reimbursed by the investment adviser or reductions from expense offset arrangements and do not represent the amount paid by the class during periods when reimbursements or reductions occur. Expenses net of fee waivers reflect expenses after reimbursement by the investment adviser but prior to reductions from expense offset arrangements. Expenses net of all reductions represent the net expenses paid by the class.
G The portfolio turnover rate does not include the assets acquired in the merger.
See accompanying notes which are an integral part of the financial statements.
Semiannual Report
Notes to Financial Statements
For the period ended January 31, 2011 (Unaudited)
(Amounts in thousands except ratios)
1. Organization.
Fidelity Government Income Fund (the Fund) is a fund of Fidelity Income Fund (the Trust) and is authorized to issue an unlimited number of shares. The Trust is registered under the Investment Company Act of 1940, as amended (the 1940 Act), as an open-end management investment company organized as a Massachusetts business trust. The Fund offers Class A, Class T, Class C, Government Income and Institutional Class shares, each of which, along with Class B shares, has equal rights as to assets and voting privileges. Effective after the close of business on September 1, 2010, Class B shares were closed to new accounts and additional purchases by existing shareholders. Each class has exclusive voting rights with respect to matters that affect that class. Class B shares will automatically convert to Class A shares after a holding period of seven years from the initial date of purchase. Investment income, realized and unrealized capital gains and losses, the common expenses of the Fund, and certain fund-level expense reductions, if any, are allocated on a pro-rata basis to each class based on the relative net assets of each class to the total net assets of the Fund. Each class differs with respect to transfer agent and distribution and service plan fees incurred. Certain expense reductions may also differ by class.
2. Significant Accounting Policies.
The financial statements have been prepared in conformity with accounting principles generally accepted in the United States of America (GAAP), which require management to make certain estimates and assumptions at the date of the financial statements. Actual results could differ from those estimates. Subsequent events, if any, through the date that the financial statements were issued have been evaluated in the preparation of the financial statements. The following summarizes the significant accounting policies of the Fund:
Security Valuation. Investments are valued as of 4:00 p.m. Eastern time on the last calendar day of the period. The Fund uses independent pricing services approved by the Board of Trustees to value its investments. When current market prices or quotations are not readily available or reliable, valuations may be determined in good faith in accordance with procedures adopted by the Board of Trustees. Factors used in determining value may include market or security specific events, changes in interest rates and credit quality. The frequency with which these procedures are used cannot be predicted and they may be utilized to a significant extent. The value used for net asset value (NAV) calculation under these procedures may differ from published prices for the same securities.
Semiannual Report
2. Significant Accounting Policies - continued
Security Valuation - continued
The Fund categorizes the inputs to valuation techniques used to value its investments into a disclosure hierarchy consisting of three levels as shown below.
Level 1 - quoted prices in active markets for identical investments
Level 2 - other significant observable inputs (including quoted prices for similar investments, interest rates, prepayment speeds, etc.)
Level 3 - unobservable inputs (including the Fund's own assumptions based on the best information available)
Changes in valuation techniques may result in transfers in or out of an assigned level within the disclosure hierarchy. Valuation techniques used to value the Fund's investments by major category are as follows.
Debt securities, including restricted securities, are valued based on evaluated prices received from independent pricing services or from dealers who make markets in such securities. For U.S. government and government agency obligations, pricing services utilize matrix pricing which considers yield or price of bonds of comparable quality, coupon, maturity and type as well as dealer supplied prices and are generally categorized as Level 2 in the hierarchy. For collateralized mortgage obligations and U.S. government agency mortgage securities, pricing services utilize matrix pricing which considers prepayment speed assumptions, attributes of the collateral, yield or price of bonds of comparable quality, coupon, maturity and type as well as dealer supplied prices and, accordingly, such securities are generally categorized as Level 2 in the hierarchy. Short-term securities with remaining maturities of sixty days or less for which quotations are not readily available are valued at amortized cost, which approximates fair value and are categorized as Level 2 in the hierarchy.
Swaps are marked-to-market daily based on valuations from independent pricing services or dealer-supplied valuations and changes in value are recorded as unrealized appreciation (depreciation). Pricing services utilize matrix pricing which considers comparisons to interest rate curves, credit spread curves, default possibilities and recovery rates and, as a result, swaps are generally categorized as Level 2 in the hierarchy.
When independent prices are unavailable or unreliable, debt securities and swaps may be valued utilizing pricing matrices which consider similar factors that would be used by independent pricing services. These are generally categorized as Level 2 in the hierarchy but may be Level 3 depending on the circumstances.
Semiannual Report
Notes to Financial Statements (Unaudited) - continued
(Amounts in thousands except ratios)
2. Significant Accounting Policies - continued
Investment Transactions and Income. For financial reporting purposes, the Fund's investment holdings and NAV include trades executed through the end of the last business day of the period. The NAV per share for processing shareholder transactions is calculated as of the close of business of the New York Stock Exchange (NYSE), normally 4:00 p.m. Eastern time and includes trades executed through the end of the prior business day. Gains and losses on securities sold are determined on the basis of identified cost. Interest income is accrued as earned. Interest income includes coupon interest and amortization of premium and accretion of discount on debt securities. The principal value on inflation-indexed securities is periodically adjusted to the rate of inflation and interest is accrued based on the principal value. The adjustments to principal due to inflation are reflected as increases or decreases to interest income even though principal is not received until maturity.
Expenses. Expenses directly attributable to a fund are charged to that fund. Expenses attributable to more than one fund are allocated among the respective funds on the basis of relative net assets or other appropriate methods. Expense estimates are accrued in the period to which they relate and adjustments are made when actual amounts are known.
Deferred Trustee Compensation. Under a Deferred Compensation Plan (the Plan), independent Trustees may elect to defer receipt of a portion of their annual compensation. Deferred amounts are invested in a cross-section of Fidelity funds, are marked-to-market and remain in the Fund until distributed in accordance with the Plan. The investment of deferred amounts and the offsetting payable to the Trustees are included in the accompanying Statement of Assets and Liabilities.
Income Tax Information and Distributions to Shareholders. Each year the Fund intends to qualify as a regulated investment company, including distributing substantially all of its taxable income and realized gains under Subchapter M of the Internal Revenue Code and filing its U.S. federal tax return. As a result, no provision for income taxes is required. A fund's federal tax return is subject to examination by the Internal Revenue Service (IRS) for a period of three years.
Dividends are declared and recorded daily and paid monthly from net investment income. Distributions from realized gains, if any, are declared and recorded on the ex-dividend date. Income dividends and capital gain distributions are declared separately for each class. Income and capital gain distributions are determined in accordance with income tax regulations, which may differ from GAAP.
Capital accounts within the financial statements are adjusted for permanent book-tax differences. These adjustments have no impact on net assets or the results of operations. Temporary book-tax differences will reverse in a subsequent period.
Semiannual Report
2. Significant Accounting Policies - continued
Income Tax Information and Distributions to Shareholders - continued
Book-tax differences are primarily due to swap agreements, market discount, deferred trustees compensation and losses deferred due to wash sales.
The federal tax cost of investment securities and unrealized appreciation (depreciation) as of period end were as follows:
Gross unrealized appreciation | $ 118,841 |
Gross unrealized depreciation | (43,098) |
Net unrealized appreciation (depreciation) on securities and other investments | $ 75,743 |
| |
Tax cost | $ 6,434,719 |
3. Operating Policies.
Repurchase Agreements. Fidelity Management & Research Company (FMR) has received an Exemptive Order from the Securities and Exchange Commission (the SEC) which permits the Fund and other affiliated entities of FMR to transfer uninvested cash balances into joint trading accounts which are then invested in repurchase agreements. The Fund may also invest directly with institutions in repurchase agreements. Repurchase agreements are collateralized by government or non-government securities. Upon settlement date, collateral is held in segregated accounts with custodian banks and may be obtained in the event of a default of the counterparty. The Fund monitors, on a daily basis, the value of the collateral to ensure it is at least equal to the principal amount of the repurchase agreement (including accrued interest). In the event of a default by the counterparty, realization of the collateral proceeds could be delayed, during which time the value of the collateral may decline.
Delayed Delivery Transactions and When-Issued Securities. The Fund may purchase or sell securities on a delayed delivery or when-issued basis. Payment and delivery may take place after the customary settlement period for that security. The price of the underlying securities and the date when the securities will be delivered and paid for are fixed at the time the transaction is negotiated. During the time a delayed delivery sell is outstanding, the contract is marked-to-market daily and equivalent deliverable securities are held for the transaction. The securities purchased on a delayed delivery or when-issued basis are identified as such in the Fund's Schedule of Investments. The Fund may receive compensation for interest forgone in the purchase of a delayed delivery or when-issued security. With respect to purchase commitments, the Fund identifies securities as segregated in its records with a value at least equal to the amount of the
Semiannual Report
Notes to Financial Statements (Unaudited) - continued
(Amounts in thousands except ratios)
3. Operating Policies - continued
Delayed Delivery Transactions and When-Issued Securities - continued
commitment. Losses may arise due to changes in the value of the underlying securities or if the counterparty does not perform under the contract's terms, or if the issuer does not issue the securities due to political, economic, or other factors.
Restricted Securities. The Fund may invest in securities that are subject to legal or contractual restrictions on resale. These securities generally may be resold in transactions exempt from registration or to the public if the securities are registered. Disposal of these securities may involve time-consuming negotiations and expense, and prompt sale at an acceptable price may be difficult. Information regarding restricted securities is included at the end of the Fund's Schedule of Investments.
4. Derivative Instruments.
Risk Exposures and the Use of Derivative Instruments. The Fund used derivative instruments (derivatives), including futures contracts and swap agreements, in order to meet its investment objectives. The strategy is to use derivatives to increase returns, to gain exposure to certain types of assets and to manage exposure to certain risks as defined below. The success of any strategy involving derivatives depends on analysis of numerous economic factors, and if the strategies for investment do not work as intended, the Fund may not achieve its objectives.
The Fund's use of derivatives increased or decreased its exposure to the following risk:
Interest Rate Risk | Interest rate risk relates to the fluctuations in the value of interest-bearing securities due to changes in the prevailing levels of market interest rates. |
The Fund is also exposed to additional risks from investing in derivatives, such as liquidity risk and counterparty credit risk. Liquidity risk is the risk that the Fund will be unable to sell the derivative in the open market in a timely manner. Counterparty credit risk is the risk that the counterparty will not be able to fulfill its obligation to the Fund. Derivative counterparty credit risk is managed through formal evaluation of the creditworthiness of all potential counterparties. On certain over-the-counter derivatives, the Fund attempts to reduce its exposure to counterparty credit risk by entering into an International Swaps and Derivatives Association (ISDA) Master Agreement on a bilateral basis with each of its counterparties. The ISDA Master Agreement gives each counterparty the right to terminate all transactions traded under such agreement if there is a certain deterioration in the credit quality of the other party. The ISDA Master Agreement gives the Fund the right, upon an event of default by the applicable counterparty or a termination of the agreement, to close out all transactions traded under such agreement and to net amounts owed under each transaction to one net payable by one
Semiannual Report
4. Derivative Instruments - continued
Risk Exposures and the Use of Derivative Instruments - continued
party to the other. To mitigate counterparty credit risk, the Fund offsets certain payables and/or receivables with collateral. Collateral in the form of cash or securities, if required, is held in segregated accounts with the Fund's custodian bank in accordance with the collateral agreements entered into between the Fund, the swap counterparty and the Fund's custodian bank, and is identified in the Schedule of Investments. The Fund could experience delays and costs in gaining access to the collateral even though it is held by the Fund's custodian bank. The Fund's maximum risk of loss from counterparty credit risk is generally the aggregate unrealized appreciation and unpaid counterparty fees in excess of any collateral pledged by the counterparty to the Fund. Counterparty risk related to exchange-traded futures contracts is minimal because of the protection provided by the exchange on which they trade. Derivatives involve, to varying degrees, risk of loss in excess of the amounts recognized in the Statement of Assets and Liabilities.
Net Realized Gain (Loss) and Change in Net Unrealized Appreciation (Depreciation) on Derivatives. The table below, which reflects the impacts of derivatives on the financial performance of the Fund, summarizes the net realized gain (loss) and change in net unrealized appreciation (depreciation) for derivatives during the period.
Risk Exposure / Derivative Type | Net Realized Gain
(Loss) | Change in Net
Unrealized
Appreciation
(Depreciation) |
Interest Rate Risk | | |
Futures Contracts | $ 95 | $ - |
Swap Agreements | (5,245) | 5,601 |
Total Interest Rate Risk (a)(b) | $ (5,150) | $ 5,601 |
(a) A summary of the value of derivatives by risk exposure as of period end, if any, is included at the end of the Schedule of Investments and is
representative of activity for the period.
(b) Total derivatives net realized gain (loss) included in the Statement of Operations is comprised of $95 for futures contracts and $(5,245) for
swap agreements.
Futures Contracts. A futures contract is an agreement between two parties to buy or sell a specified underlying instrument for a fixed price at a specified future date. The Fund used futures contracts to manage its exposure to the bond market, and to fluctuations in interest rates.
Upon entering into a futures contract, a fund is required to deposit either cash or securities (initial margin) with a clearing broker in an amount equal to a certain percentage of the face value of the contract. Futures contracts are marked-to-market daily and subsequent payments (variation margin) are made or received by a fund depending on the daily fluctuations in the value of the futures contracts and are recorded as unrealized
Semiannual Report
Notes to Financial Statements (Unaudited) - continued
(Amounts in thousands except ratios)
4. Derivative Instruments - continued
Futures Contracts - continued
appreciation or (depreciation). Realized gain or (loss) is recorded upon the expiration or closing of a futures contract. The net realized gain (loss) and change in net unrealized appreciation (depreciation) on futures contracts during the period is included in the Statement of Operations.
The underlying face amount at value of open futures contracts at period end, if any, is shown in the Schedule of Investments under the caption "Futures Contracts." This amount reflects each contract's exposure to the underlying instrument at period end. Securities deposited to meet initial margin requirements are identified in the Schedule of Investments. The receivable and/or payable for the variation margin are reflected in the Statement of Assets and Liabilities.
Certain risks arise upon entering into futures contracts, including the risk that an illiquid market limits the ability to close out a futures contract prior to settlement date.
Swap Agreements. A swap agreement (swap) is a contract between two parties to exchange future cash flows at periodic intervals based on a notional principal amount.
Details of swaps open at period end are included in the Schedule of Investments under the caption "Swap Agreements." Swaps are marked-to-market daily and changes in value are recorded as unrealized appreciation or (depreciation) and reflected in the Statement of Assets and Liabilities. Any upfront payments made or received upon entering a swap to compensate for differences between stated terms of the agreement and prevailing market conditions (e.g. credit spreads, interest rates or other factors) are recorded as realized gain or (loss) ratably over the term of the swap. Payments are exchanged at specified intervals, accrued daily commencing with the effective date of the contract and recorded as realized gain or (loss). Realized gain or (loss) is also recorded in the event of an early termination of a swap. The net realized gain (loss) and change in net unrealized appreciation (depreciation) on swaps during the period is included in the Statement of Operations.
Risks of loss include interest rate risk. In addition, there is the risk of failure by the counterparty to perform under the terms of the agreement and lack of liquidity in the market.
Interest Rate Swaps. Interest rate swaps are agreements between counterparties to exchange cash flows, one based on a fixed rate, and the other on a floating rate. The Fund entered into interest rate swaps to manage its exposure to interest rate changes. Changes in interest rates can have an effect on both the value of bond holdings as well as the amount of interest income earned. In general, the value of bonds can fall when interest rates rise and can rise when interest rates fall.
Semiannual Report
5. Fees and Other Transactions with Affiliates.
Management Fee. FMR and its affiliates provide the Fund with investment management related services for which the Fund pays a monthly management fee. The management fee is the sum of an individual fund fee rate that is based on an annual rate of .20% of the Fund's average net assets and a group fee rate that averaged .12% during the period. The group fee rate is based upon the average net assets of all the mutual funds advised by FMR. The group fee rate decreases as assets under management increase and increases as assets under management decrease. For the period, the total annualized management fee rate was .32% of the Fund's average net assets.
Distribution and Service Plan Fees. In accordance with Rule 12b-1 of the 1940 Act, the Fund has adopted separate Distribution and Service Plans for each class of shares. Certain classes pay Fidelity Distributors Corporation (FDC), an affiliate of FMR, separate Distribution and Service Fees, each of which is based on an annual percentage of each class' average net assets. In addition, FDC may pay financial intermediaries for selling shares of the Fund and providing shareholder support services. For the period, the Distribution and Service Fee rates, total fees and amounts retained by FDC were as follows:
| Distribution
Fee | Service
Fee | Total Fees | Retained
by FDC |
Class A | -% | .25% | $ 527 | $ 11 |
Class T | -% | .25% | 409 | - |
Class B | .65% | .25% | 157 | 114 |
Class C | .75% | .25% | 572 | 107 |
| | | $ 1,665 | $ 232 |
Sales Load. FDC receives a front-end sales charge of up to 4.00% for selling Class A shares and Class T shares, some of which is paid to financial intermediaries for selling shares of the Fund. FDC receives the proceeds of contingent deferred sales charges levied on Class A, Class T, Class B, and Class C redemptions. These charges depend on the holding period. The deferred sales charges range from 5% to 1% for Class B, 1% for Class C, ..75% for certain purchases of Class A shares and .25% for certain purchases of Class T shares.
For the period, sales charge amounts retained by FDC were as follows:
| Retained
by FDC |
Class A | $ 24 |
Class T | 9 |
Class B | 60 |
Class C | 16 |
| $ 109 |
* When Class B and Class C shares are initially sold, FDC pays commissions from its own resources to financial intermediaries through which the sales are made.
Semiannual Report
Notes to Financial Statements (Unaudited) - continued
(Amounts in thousands except ratios)
5. Fees and Other Transactions with Affiliates - continued
Transfer Agent Fees. Fidelity Investments Institutional Operations Company, Inc. (FIIOC), an affiliate of FMR, is the transfer, dividend disbursing and shareholder servicing agent for each class of the Fund. FIIOC receives account fees and asset-based fees that vary according to the account size and type of account of the shareholders of the respective classes of the Fund. FIIOC pays for typesetting, printing and mailing of shareholder reports, except proxy statements. For the period, transfer agent fees for each class were as follows:
| Amount | % of
Average
Net Assets* |
Class A | $ 355 | .17 |
Class T | 253 | .15 |
Class B | 43 | .24 |
Class C | 90 | .16 |
Government Income | 2,351 | .10 |
Institutional Class | 252 | .17 |
| $ 3,344 | |
* Annualized
Fund Wide Operations Fee. Pursuant to the Fund Wide Operations and Expense Agreement (FWOE), FMR has agreed to provide for fund level expenses (which do not include transfer agent, Rule 12b-1 fees, compensation of the independent Trustees, interest (including commitment fees), taxes or extraordinary expenses, if any) in return for a FWOE fee equal to .35% less the total amount of the management fee. The FWOE paid by the Fund is reduced by an amount equal to the fees and expenses paid to the independent Trustees. For the period, the FWOE fee was equivalent to an annualized rate of .03% of average net assets.
6. Committed Line of Credit.
The Fund participates with other funds managed by FMR or an affiliate in a $3.75 billion credit facility (the "line of credit") to be utilized for temporary or emergency purposes to fund shareholder redemptions or for other short-term liquidity purposes. The Fund has agreed to pay commitment fees on its pro-rata portion of the line of credit, which amounted to $12 and is reflected in Miscellaneous expenses on the Statement of Operations. During the period, there were no borrowings on this line of credit.
Semiannual Report
7. Security Lending.
The Fund lends portfolio securities through a lending agent from time to time in order to earn additional income. On the settlement date of the loan, the Fund receives collateral (in the form of U.S. Treasury obligations, letters of credit and/or cash) against the loaned securities and maintains collateral in an amount not less than 100% of the market value of the loaned securities during the period of the loan. The market value of the loaned securities is determined at the close of business of the Fund and any additional required collateral is delivered to the Fund on the next business day. If the borrower defaults on its obligation to return the securities loaned because of insolvency or other reasons, a fund could experience delays and costs in recovering the securities loaned or in gaining access to the collateral. Any cash collateral received is invested in the cash equivalents. At period end, there were no security loans outstanding. Security lending income represents the income earned on investing cash collateral, less rebates paid to borrowers and lending agent fees associated with the loan, plus any premium payments received for lending certain types of securities. Security lending income is presented in the Statement of Operations as a component of interest income. Total security lending income during the period amounted to $31.
8. Distributions to Shareholders.
Distributions to shareholders of each class were as follows:
| Six months ended
January 31,
2011 | Year ended
July 31,
2010 |
From net investment income | | |
Class A | $ 3,759 | $ 9,342 |
Class T | 2,937 | 6,865 |
Class B | 184 | 606 |
Class C | 596 | 1,669 |
Government Income | 49,420 | 116,185 |
Institutional Class | 2,981 | 5,720 |
Total | $ 59,877 | $ 140,387 |
From net realized gain | | |
Class A | $ 10,104 | $ 14,726 |
Class T | 7,830 | 10,744 |
Class B | 853 | 1,543 |
Class C | 2,724 | 4,162 |
Government Income | 112,442 | 158,363 |
Institutional Class | 6,868 | 7,222 |
Total | $ 140,821 | $ 196,760 |
Semiannual Report
Notes to Financial Statements (Unaudited) - continued
(Amounts in thousands except ratios)
9. Share Transactions.
Transactions for each class of shares were as follows:
| Shares | Dollars |
| Six months ended January 31, 2011 | Year ended
July 31, 2010 | Six months ended January 31, 2011 | Year ended
July 31, 2010 |
Class A | | | | |
Shares sold | 6,071 | 17,922 | $ 65,107 | $ 190,342 |
Reinvestment of distributions | 1,156 | 1,943 | 12,308 | 20,562 |
Shares redeemed | (10,602) | (20,615) | (112,639) | (218,378) |
Net increase (decrease) | (3,375) | (750) | $ (35,224) | $ (7,474) |
Class T | | | | |
Shares sold | 5,075 | 13,716 | $ 54,442 | $ 145,586 |
Reinvestment of distributions | 984 | 1,616 | 10,476 | 17,109 |
Shares redeemed | (8,116) | (14,473) | (86,528) | (153,287) |
Net increase (decrease) | (2,057) | 859 | $ (21,610) | $ 9,408 |
Class B | | | | |
Shares sold | 201 | 1,036 | $ 2,177 | $ 11,019 |
Reinvestment of distributions | 82 | 165 | 874 | 1,747 |
Shares redeemed | (900) | (2,202) | (9,613) | (23,321) |
Net increase (decrease) | (617) | (1,001) | $ (6,562) | $ (10,555) |
Class C | | | | |
Shares sold | 1,693 | 3,916 | $ 18,182 | $ 41,596 |
Reinvestment of distributions | 228 | 390 | 2,427 | 4,131 |
Shares redeemed | (2,997) | (5,610) | (31,838) | (59,334) |
Net increase (decrease) | (1,076) | (1,304) | $ (11,229) | $ (13,607) |
Government Income | | | | |
Shares sold | 66,216 | 155,285 | $ 707,086 | $ 1,646,227 |
Reinvestment of distributions | 14,567 | 24,826 | 154,944 | 262,396 |
Shares redeemed | (110,000) | (166,873) | (1,169,626) | (1,763,484) |
Net increase (decrease) | (29,217) | 13,238 | $ (307,596) | $ 145,139 |
Institutional Class | | | | |
Shares sold | 6,299 | 13,487 | $ 67,140 | $ 143,092 |
Reinvestment of distributions | 885 | 1,193 | 9,414 | 12,621 |
Shares redeemed | (4,364) | (7,047) | (46,660) | (74,753) |
Net increase (decrease) | 2,820 | 7,633 | $ 29,894 | $ 80,960 |
Semiannual Report
10. Other.
The Fund's organizational documents provide former and current trustees and officers with a limited indemnification against liabilities arising in connection with the performance of their duties to the Fund. In the normal course of business, the Fund may also enter into contracts that provide general indemnifications. The Fund's maximum exposure under these arrangements is unknown as this would be dependent on future claims that may be made against the Fund. The risk of material loss from such claims is considered remote.
Semiannual Report
Board Approval of Investment Advisory Contracts and Management Fees
Fidelity Government Income Fund
Each year, the Board of Trustees, including the Independent Trustees (together, the Board), votes on the renewal of the management contract and sub-advisory agreements (together, the Advisory Contracts) for the fund. The Board, assisted by the advice of fund counsel and Independent Trustees' counsel, requests and considers a broad range of information relevant to the renewal of the Advisory Contracts throughout the year.
The Board meets regularly and considers at each of its meetings factors that are relevant to its annual consideration of the renewal of the fund's Advisory Contracts, including the services and support provided to the fund and its shareholders. The Board has established three standing committees, each composed of Independent Trustees with varying backgrounds, to which the Board has assigned specific subject matter responsibilities in order to enhance effective decision-making by the Board. The Operations Committee, of which all of the Independent Trustees are members, meets regularly throughout the year and, among other matters, considers matters specifically related to the annual consideration of the renewal of the fund's Advisory Contracts. The Board, acting directly and through its Committees, requests and receives information concerning the annual consideration of the renewal of the fund's Advisory Contracts. The Board also meets as needed to consider matters specifically related to the Board's annual consideration of the renewal of Advisory Contracts. Members of the Board may also meet with trustees of other Fidelity funds through ad hoc joint committees to discuss certain matters relevant to the Fidelity funds.
At its September 2010 meeting, the Board of Trustees, including the Independent Trustees, unanimously determined to renew the fund's Advisory Contracts. In reaching its determination, the Board considered all factors it believed relevant, including (i) the nature, extent, and quality of the services to be provided to the fund and its shareholders (including the investment performance of the fund); (ii) the competitiveness of the fund's management fee and total expenses; (iii) the total costs of the services to be provided by and the profits to be realized by Fidelity from its relationship with the fund; (iv) the extent to which economies of scale would be realized as the fund grows; and (v) whether fee levels reflect these economies of scale, if any, for the benefit of fund shareholders.
In considering whether to renew the Advisory Contracts for the fund, the Board reached a determination, with the assistance of fund counsel and Independent Trustees' counsel and through the exercise of its business judgment, that the renewal of the Advisory Contracts is in the best interests of the fund and its shareholders and that the compensation to be received by Fidelity under the management contract is fair and reasonable. The Board's decision to renew the Advisory Contracts was not based on any single factor, but rather was based on a comprehensive consideration of all the information provided to the Board at its meetings throughout the year. The Board, in reaching its determination to renew the Advisory Contracts, is aware that shareholders in the fund have a broad range of investment choices available to them, including a wide choice among mutual funds offered by Fidelity's competitors, and that the fund's shareholders, with the opportunity to review and weigh the disclosure provided by the fund in its prospectus and other public disclosures, have chosen to invest in this fund, managed by Fidelity.
Semiannual Report
Board Approval of Investment Advisory Contracts and
Management Fees - continued
Nature, Extent, and Quality of Services Provided. The Board considered the staffing within the investment adviser, FMR, and the sub-advisers (together, the Investment Advisers), including the backgrounds of the fund's investment personnel and the fund's investment objective and discipline. The Independent Trustees also had discussions with senior management of Fidelity's investment operations and investment groups. The Board considered the structure of the portfolio manager compensation program and whether this structure provides appropriate incentives to act in the best interest of the fund.
Resources Dedicated to Investment Management and Support Services. The Board reviewed the size, education, and experience of the Investment Advisers' investment staff, their use of technology, and the Investment Advisers' approach to recruiting, training, and retaining portfolio managers and other research, advisory, and management personnel. The Board noted that Fidelity's analysts have access to a variety of technological tools and market and securities data that enable them to perform both fundamental and quantitative analysis and to specialize in various disciplines. The Board considered Fidelity's extensive global research capabilities that enable the Investment Advisers to aggregate data from various sources in an effort to produce positive investment results. The Board also considered that Fidelity's portfolio managers and analysts have access to daily portfolio attribution that allows for monitoring of a fund's portfolio, as well as an electronic communication system that provides immediate real-time access to research concerning issuers and credit enhancers. In addition, the Board considered the trading resources that are an integral part of the fixed-income portfolio management investment process.
Shareholder and Administrative Services. The Board considered (i) the nature, extent, quality, and cost of advisory, administrative, and shareholder services performed by the Investment Advisers and their affiliates under the Advisory Contracts and under separate agreements covering transfer agency, pricing and bookkeeping, and securities lending services for the fund; (ii) the nature and extent of the investment adviser's supervision of third party service providers, principally custodians and subcustodians; and (iii) the resources devoted to, and the record of compliance with, the fund's compliance policies and procedures.
The Board noted that the growth of fund assets over time across the complex allows Fidelity to reinvest in the development of services designed to enhance the value or convenience of the Fidelity funds as investment vehicles. These services include 24-hour access to account information and market information through telephone representatives and over the Internet, and investor education materials and asset allocation tools.
Semiannual Report
Investment in a Large Fund Family. The Board considered the benefits to shareholders of investing in a Fidelity fund, including the benefits of investing in a fund that is part of a large family of funds offering a variety of investment disciplines and providing a large variety of mutual fund investor services. The Board noted that Fidelity had taken, or had made recommendations that resulted in the Fidelity funds taking, a number of actions over the previous year that benefited particular funds, including (i) dedicating additional resources to investment research and restructuring and broadening the focus of the investment research teams; (ii) bolstering the senior management team that oversees asset management; (iii) launching Class F of certain funds as a lower-fee class available to Freedom K and Freedom Index Funds; (iv) lowering the initial investment minimums and ongoing balance requirements for Real Estate High Income Fund; (v) eliminating subsequent purchase minimums for all funds and adding a waiver of the investment minimum requirement for new accounts opened with the proceeds of a systematic withdrawal plan; (vi) eliminating the withdrawal minimum and maximum limits for systematic withdrawals from Advisor funds; (vii) expanding sales load waivers on Class A shares for Destiny Planholders and expanding Institutional Class eligibility for Class O Destiny Planholders; and (viii) changing certain Class A and Class T sales charge structures to further align them with industry practices.
Investment Performance. The Board considered whether the fund has operated in accordance with its investment objective, as well as its record of compliance with its investment restrictions. It also reviewed the fund's absolute investment performance for each class, as well as the fund's relative investment performance for each class measured over multiple periods against (i) a proprietary custom index, and (ii) a peer group of mutual funds deemed appropriate by Fidelity and reviewed by the Board. The following charts considered by the Board show, over the one-, three-, and five-year periods ended December 31, 2009, as available, the cumulative total returns of the retail class and Class C of the fund, the cumulative total returns of a proprietary custom index ("benchmark"), and a range of cumulative total returns of a peer group of mutual funds identified by Lipper Inc. as having an investment objective similar to that of the fund. The returns of the retail class and Class C show the performance of the highest performing class (based on five-year performance) and the lowest performing class (based on three-year performance), respectively. The box within each chart shows the 25th percentile return (bottom of box) and the 75th percentile return (top of box) of the peer group. Returns shown above the box are in the first quartile and returns shown below the box are in the fourth quartile. The percentage beaten numbers noted below each chart correspond to the percentile box and represent the percentage of funds in the peer group whose performance was equal to or lower than that of the class indicated. The fund's proprietary custom index is an index developed by FMR that represents the performance of the fund's general investment categories.
Semiannual Report
Board Approval of Investment Advisory Contracts and
Management Fees - continued
Fidelity Government Income Fund
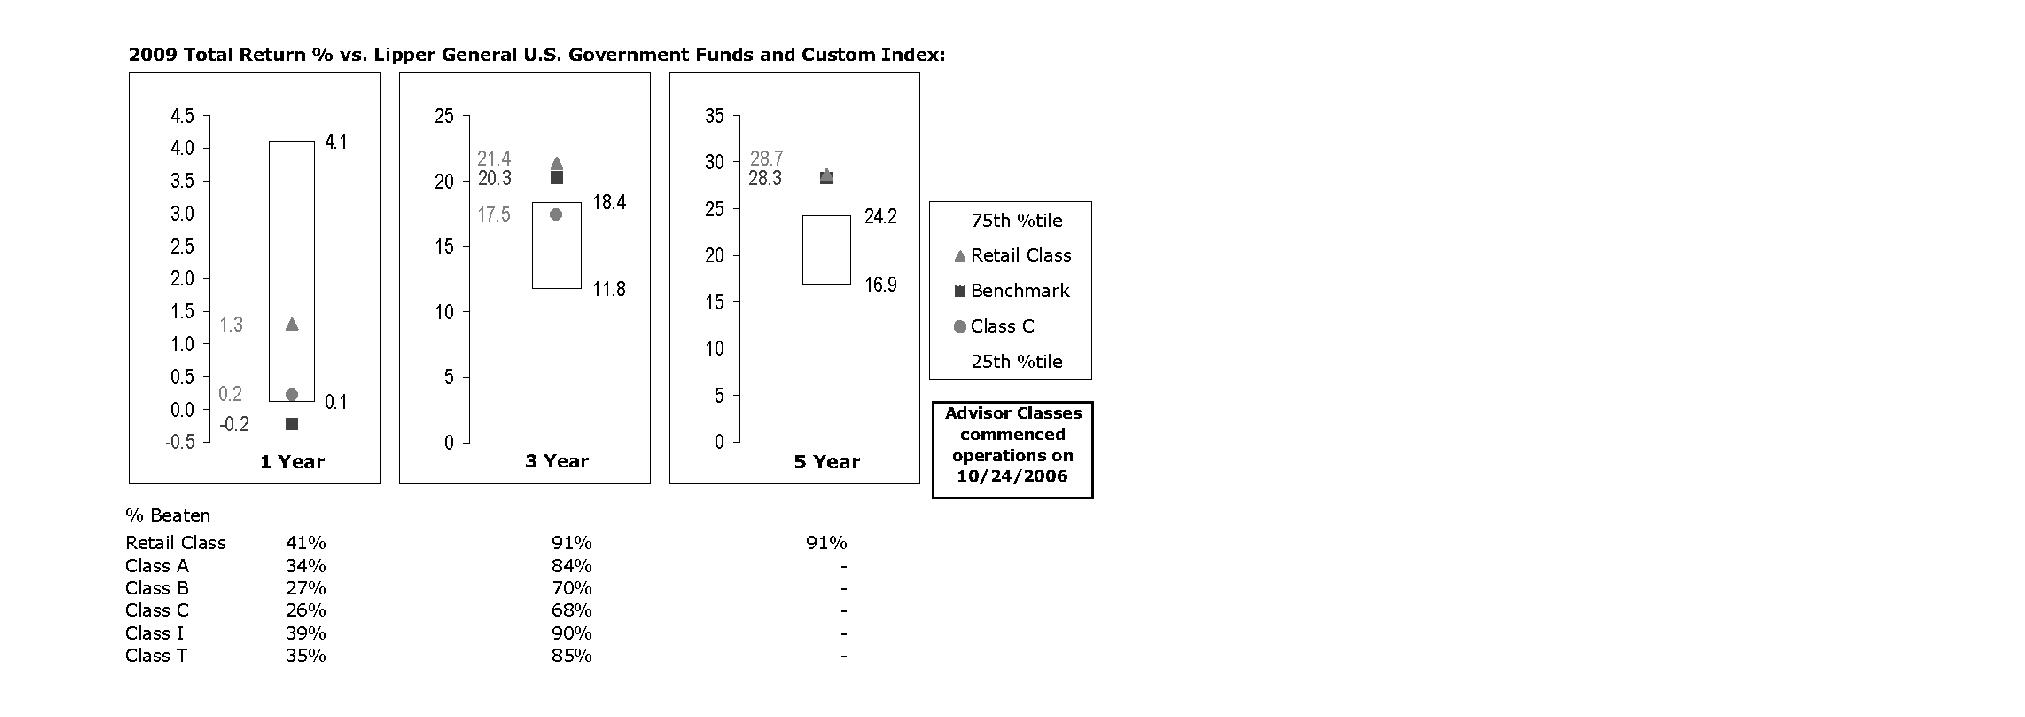
The Board reviewed the fund's relative investment performance against its peer group and noted that the performance of the retail class of the fund was in the third quartile for the one-year period and the first quartile for the three- and five-year periods. The Board also noted that the investment performance of the retail class of the fund compared favorably to its benchmark for all the periods shown. The Board considered that the variations in performance among the fund's classes reflect the variations in class expenses, which result in lower performance for higher expense classes. The Board also reviewed the fund's performance since inception as well as performance in the current year.
Based on its review, and giving particular weight to the nature and quality of the resources dedicated by the Investment Advisers to maintain and improve relative performance and factoring in the unprecedented market events in recent years, the Board concluded that the nature, extent, and quality of investment management and support services and of shareholder and administrative services provided to the fund will benefit the fund's shareholders, particularly in light of the Board's view that the fund's shareholders benefit from investing in a fund that is part of a large family of funds offering a variety of investment disciplines and services.
Competitiveness of Management Fee and Total Fund Expenses. The Board considered the fund's management fee and total expenses compared to "mapped groups" of competitive funds and classes. Fidelity creates "mapped groups" by combining similar Lipper investment objective categories that have comparable management fee characteristics. Combining Lipper investment objective categories aids the Board's management fee and total expense comparisons by broadening the competitive group used for comparison and by reducing the number of universes to which various Fidelity funds are compared.
Semiannual Report
Management Fee. The Board considered two proprietary management fee comparisons for the 12-month periods shown in the chart below. The group of Lipper funds used by the Board for management fee comparisons is referred to below as the "Total Mapped Group" and, for the reasons explained above, is broader than the Lipper peer group used by the Board for performance comparisons. The Total Mapped Group comparison focuses on a fund's standing relative to the total universe of comparable funds available to investors, in terms of gross management fees before expense reimbursements or caps. "TMG %" represents the percentage of funds in the Total Mapped Group that had management fees that were lower than the fund's. For example, a TMG % of 9% means that 91% of the funds in the Total Mapped Group had higher management fees than the fund. The "Asset-Size Peer Group" (ASPG) comparison focuses on a fund's standing relative to non-Fidelity funds similar in size to the fund within the Total Mapped Group. The ASPG represents at least 15% of the funds in the Total Mapped Group with comparable asset size and management fee characteristics, subject to a minimum of 50 funds (or all funds in the Total Mapped Group if fewer than 50). Additional information, such as the ASPG quartile in which the fund's management fee ranked, is also included in the chart and considered by the Board.
Fidelity Government Income Fund
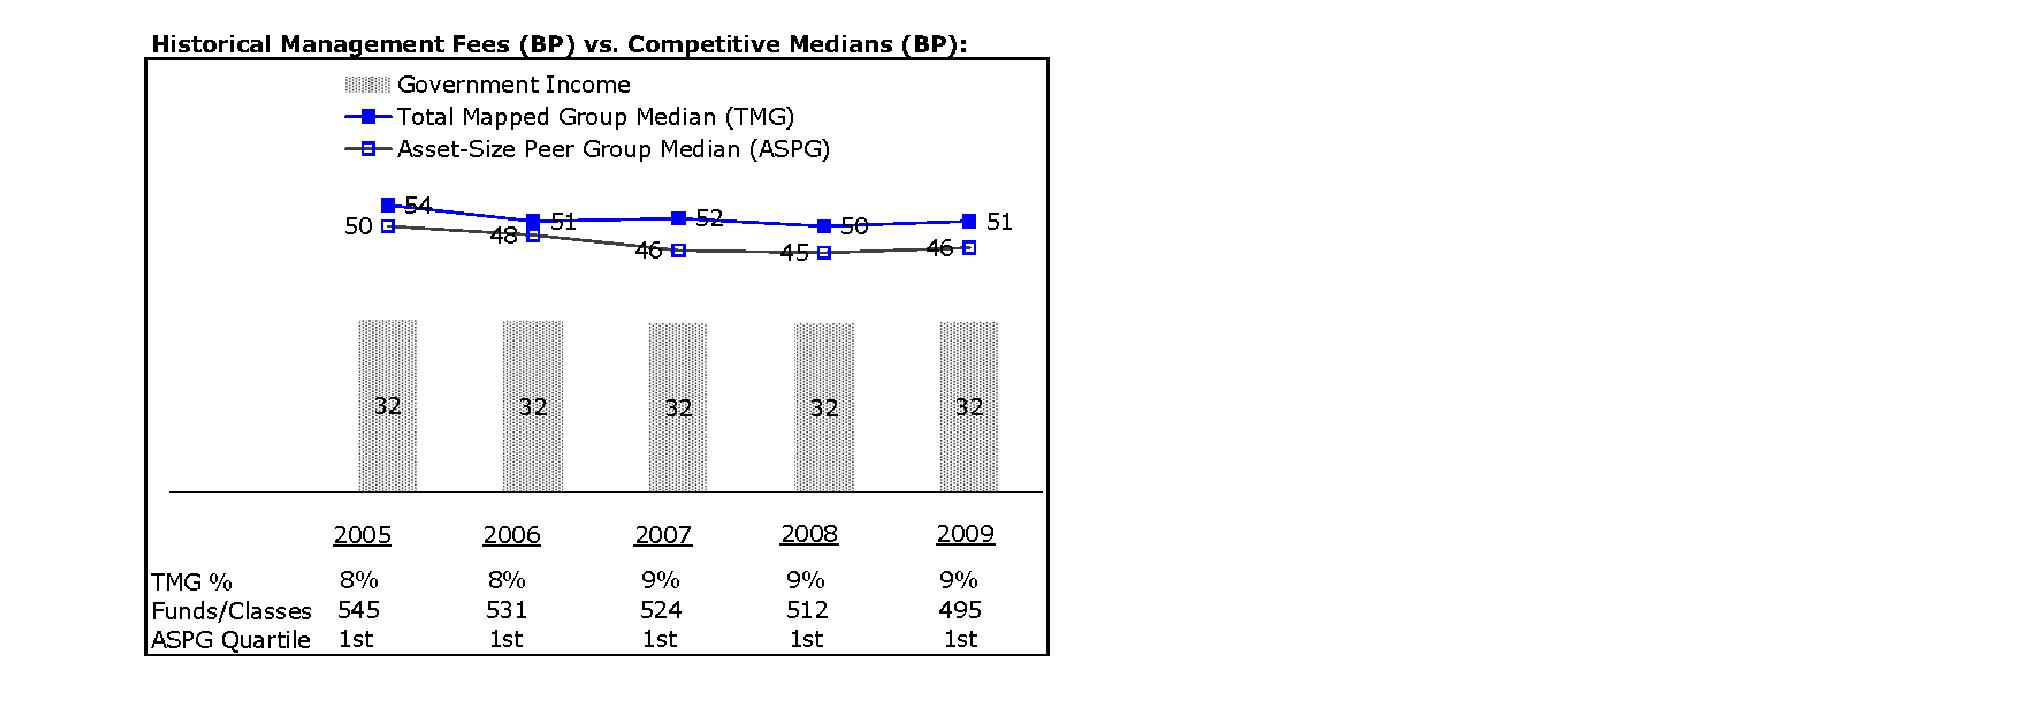
Semiannual Report
Board Approval of Investment Advisory Contracts and
Management Fees - continued
The Board noted that the fund's management fee ranked below the median of its Total Mapped Group and below the median of its ASPG for 2009.
Furthermore, the Board considered that it had approved an amendment (effective June 1, 2005) to the fund's management contract that lowered the fund's individual fund fee rate from 30 basis points to 20 basis points. The Board considered that the chart reflects the fund's lower management fee for 2005, as if the lower rate were in effect for the entire year.
Based on its review, the Board concluded that the fund's management fee is fair and reasonable in light of the services that the fund receives and the other factors considered.
Total Expenses. In its review of each class's total expenses, the Board considered the fund's management fee as well as other fund or class expenses, as applicable, such as transfer agent fees, pricing and bookkeeping fees, fund-paid 12b-1 fees, and custodial, legal, and audit fees. The Board also noted the effects of any waivers and reimbursements on fees and expenses. As part of its review, the Board also considered current and historical total expenses of each class of the fund compared to competitive fund median expenses. Each class of the fund is compared to those funds and classes in the Total Mapped Group (used by the Board for management fee comparisons) that have a similar sales load structure.
The Board also considered that the current contractual arrangements for the fund (i) have the effect of setting the total "fund-level" expenses (including, among certain other expenses, the management fee) for each class at 35 basis points, (ii) lower and limit the "class-level" transfer agent fee for the retail class to 10 basis points, and (iii) limit the total expenses for the retail class to 45 basis points. The fees and expenses payable under these contractual arrangements may not be increased without the approval of the Board and the shareholders of the applicable class. The fund's Advisor classes are subject to different "class-level" expenses (transfer agent fees and 12b-1 fees).
The Board noted that the total expenses of each class ranked below its competitive median for 2009.
The Board recognized that the fund's management contract incorporates a "group fee" structure, which provides for lower group fee rates as total fund assets under FMR's management increase, and for higher group fee rates as total fund assets under FMR's management decrease. FMR calculates the group fee rates based on a tiered asset "breakpoint" schedule that varies based on asset class. The Board noted, however, that because the current contractual arrangements set the total "fund-level" expenses for each class at 35 basis points, increases or decreases in the management fee due to changes in the group fee rate will not impact total expenses.
Fees Charged to Other Fidelity Clients. The Board also considered Fidelity fee structures and other information with respect to clients of FMR and its affiliates, such as other mutual funds advised or subadvised by FMR or its affiliates, pension plan clients, and other institutional clients. In March 2010, the Board created an ad hoc joint committee with the board of other Fidelity funds (the Committee) to review and compare Fidelity's institutional investment advisory business with its business of providing services to the Fidelity funds, including the differences in services provided, fees charged, and costs incurred, as well as competition in their respective marketplaces.
Semiannual Report
Based on its review of total expenses and fees charged to other Fidelity clients, the Board concluded that the total expenses of each class of the fund were reasonable in light of the services that the fund and its shareholders receive and the other factors considered, including the findings of the Committee.
Costs of the Services and Profitability. The Board considered the revenues earned and the expenses incurred by Fidelity in conducting the business of developing, marketing, distributing, managing, administering and servicing the fund and its shareholders. The Board also considered the level of Fidelity's profits in respect of all the Fidelity funds.
On an annual basis, FMR presents to the Board Fidelity's profitability for the fund. Fidelity calculates the profitability for each fund, as well as aggregate profitability for groups of Fidelity funds and all Fidelity funds, using a series of detailed revenue and cost allocation methodologies which originate with the audited books and records of Fidelity. The Audit Committee of the Board reviews any significant changes from the prior year's methodologies.
PricewaterhouseCoopers LLP (PwC), independent registered public accounting firm and auditor to Fidelity and certain Fidelity funds, has been engaged annually by the Board as part of the Board's assessment of Fidelity's profitability analysis. PwC's engagement includes the review and assessment of Fidelity's methodologies used in determining the revenues and expenses attributable to Fidelity's mutual fund business, and completion of agreed-upon procedures surrounding the mathematical accuracy of fund profitability and its conformity to allocation methodologies. After considering PwC's reports issued under the engagement and information provided by Fidelity, the Board believes that while other allocation methods may also be reasonable, Fidelity's profitability methodologies are reasonable in all material respects.
The Board has also reviewed Fidelity's non-fund businesses and fall-out benefits related to the mutual fund business as well as cases where Fidelity's affiliates may benefit from or be related to the fund's business.
The Board considered the costs of the services provided by and the profits realized by Fidelity in connection with the operation of the fund and were satisfied that the profitability was not excessive in the circumstances.
Economies of Scale. The Board considered whether there have been economies of scale in respect of the management of the Fidelity funds, whether the Fidelity funds (including the fund) have appropriately benefited from any such economies of scale, and whether there is potential for realization of any further economies of scale. The Board considered the extent to which the fund will benefit from economies of scale through increased services to the fund, through waivers or reimbursements, or through fee or expense reductions.
Semiannual Report
Board Approval of Investment Advisory Contracts and
Management Fees - continued
In February 2009, the Board and the board of other Fidelity funds created an ad hoc committee (the Economies of Scale Committee) to analyze whether FMR attains economies of scale in respect of the management and servicing of the Fidelity funds, whether the Fidelity funds have appropriately benefited from such economies of scale, and whether there is potential for realization of any further economies of scale.
The Board concluded, considering the findings of the Economies of Scale Committee, that any potential economies of scale are being appropriately shared between fund shareholders and Fidelity.
Additional Information Requested by the Board. In order to develop fully the factual basis for consideration of the Fidelity funds' Advisory Contracts, the Board requested and received additional information on certain topics, including (i) fund performance trends, actions to be taken by FMR to improve certain funds' overall performance, and Fidelity's long-term strategies for certain funds; (ii) Fidelity's fund profitability methodology and profitability trends for certain funds; (iii) portfolio manager changes that have occurred during the past year and the amount of the investment that each portfolio manager has made in the Fidelity fund(s) that he or she manages; (iv) Fidelity's compensation structure for portfolio managers, research analysts, and other key personnel, including its effects on fund profitability, the rationale for the compensation structure, and the extent to which current market conditions have affected retention and recruitment; (v) the compensation paid by FMR to fund sub-advisers on behalf of the Fidelity funds; (vi) Fidelity's fee structures and rationale for recommending different fees among different categories of funds and classes, as well as Fidelity's voluntary waiver of fees to maintain minimum yields for certain funds and classes; (vii) the rationale for any differences between fund fee structures and fee structures in place for other Fidelity clients; and (viii) explanations regarding the relative total expenses borne by certain funds and classes, total expense competitive trends, and actions that might be taken by FMR to reduce total expenses for certain funds and classes or to achieve further economies of scale.
Based on its evaluation of all of the conclusions noted above, and after considering all factors it believed relevant, the Board ultimately concluded that the advisory fee structures are fair and reasonable, and that the fund's Advisory Contracts should be renewed.
Semiannual Report
Managing Your Investments
Fidelity offers several ways to conveniently manage your personal investments via your telephone or PC. You can access your account information, conduct trades and research your investments 24 hours a day.
By Phone
Fidelity Automated Service Telephone provides a single toll-free number to access account balances, positions, quotes and trading. It's easy to navigate the service, and on your first call, the system will help you create a personal identification number (PIN) for security.
(phone_graphic)
Fidelity Automated
Service Telephone (FAST®)
1-800-544-5555
Press
 For mutual fund and brokerage trading.
 For quotes.*
 For account balances and holdings.
 To review orders and mutual
fund activity.
 To change your PIN.

 To speak to a Fidelity representative.
By PC
Fidelity's web site on the Internet provides a wide range of information, including daily financial news, fund performance, interactive planning tools and news about Fidelity products and services.
(computer_graphic)
Fidelity's Web Site
www.fidelity.com
* When you call the quotes line, please remember that a fund's yield and return will vary and, except for money market funds, share price will also vary. This means that you may have a gain or loss when you sell your shares. There is no assurance that money market funds will be able to maintain a stable $1 share price; an investment in a money market fund is not insured or guaranteed by the U.S. government. Total returns are historical and include changes in share price, reinvestment of dividends and capital gains distributions, and the effects of any sales charges.
Semiannual Report
To Visit Fidelity
For directions and hours,
please call 1-800-544-9797.
Arizona
7001 West Ray Road
Chandler, AZ
15445 N. Scottsdale Road
Scottsdale, AZ
17550 North 75th Avenue
Glendale, AZ
5330 E. Broadway Blvd
Tucson, AZ
California
815 East Birch Street
Brea, CA
1411 Chapin Avenue
Burlingame, CA
851 East Hamilton Avenue
Campbell, CA
601 Larkspur Landing Circle
Larkspur, CA
2000 Avenue of the Stars
Los Angeles, CA
27101 Puerta Real
Mission Viejo, CA
73575 El Paseo
Palm Desert, CA
251 University Avenue
Palo Alto, CA
123 South Lake Avenue
Pasadena, CA
16656 Bernardo Ctr. Drive
Rancho Bernardo, CA
1220 Roseville Parkway
Roseville, CA
1740 Arden Way
Sacramento, CA
7676 Hazard Center Drive
San Diego, CA
11943 El Camino Real
San Diego, CA
8 Montgomery Street
San Francisco, CA
3793 State Street
Santa Barbara, CA
1200 Wilshire Boulevard
Santa Monica, CA
398 West El Camino Real
Sunnyvale, CA
111 South Westlake Blvd
Thousand Oaks, CA
21701 Hawthorne Boulevard
Torrance, CA
2001 North Main Street
Walnut Creek, CA
6326 Canoga Avenue
Woodland Hills, CA
2211 Michelson Drive
Irvine, CA
Colorado
281 East Flatiron Circle
Broomfield, CO
1625 Broadway
Denver, CO
9185 Westview Road
Lone Tree, CO
Connecticut
48 West Putnam Avenue
Greenwich, CT
265 Church Street
New Haven, CT
300 Atlantic Street
Stamford, CT
29 South Main Street
West Hartford, CT
1261 Post Road
Fairfield, CT
Delaware
400 Delaware Avenue
Wilmington, DE
Florida
175 East Altamonte Drive
Altamonte Springs, FL
1400 Glades Road
Boca Raton, FL
121 Alhambra Plaza
Coral Gables, FL
2948 N. Federal Highway
Ft. Lauderdale, FL
4671 Town Center Parkway
Jacksonville, FL
8880 Tamiami Trail, North
Naples, FL
230 Royal Palm Way
Palm Beach, FL
3501 PGA Boulevard
Palm Beach Gardens, FL
3550 Tamiami Trail, South
Sarasota, FL
1502 N. Westshore Blvd.
Tampa, FL
2465 State Road 7
Wellington, FL
Georgia
3242 Peachtree Road
Atlanta, GA
1000 Abernathy Road
Atlanta, GA
Illinois
One North LaSalle Street
Chicago, IL
401 North Michigan Avenue
Chicago, IL
One Skokie Valley Road
Highland Park, IL
1415 West 22nd Street
Oak Brook, IL
15105 S LaGrange Road
Orland Park, IL
1572 East Golf Road
Schaumburg, IL
1823 Freedom Drive
Naperville, IL
Indiana
8480 Keystone Crossing
Indianapolis, IN
Kansas
5400 College Boulevard
Overland Park, KS
Maine
Three Canal Plaza
Portland, ME
Maryland
7315 Wisconsin Avenue
Bethesda, MD
610 York Road
Towson, MD
Massachusetts
801 Boylston Street
Boston, MA
155 Congress Street
Boston, MA
300 Granite Street
Braintree, MA
44 Mall Road
Burlington, MA
238 Main Street
Cambridge, MA
200 Endicott Street
Danvers, MA
Semiannual Report
405 Cochituate Road
Framingham, MA
551 Boston Turnpike
Shrewsbury, MA
Michigan
500 E. Eisenhower Pkwy.
Ann Arbor, MI
280 N. Old Woodward Ave.
Birmingham, MI
30200 Northwestern Hwy.
Farmington Hills, MI
43420 Grand River Avenue
Novi, MI
3480 28th Street
Grand Rapids, MI
2425 S. Linden Road STE E
Flint, MI
Minnesota
7740 France Avenue South
Edina, MN
8342 3rd Street North
Oakdale, MN
Missouri
1524 South Lindbergh Blvd.
St. Louis, MO
Nevada
2225 Village Walk Drive
Henderson, NV
New Jersey
501 Route 73 South
Marlton, NJ
150 Essex Street
Millburn, NJ
35 Morris Street
Morristown, NJ
396 Route 17, North
Paramus, NJ
3518 Route 1 North
Princeton, NJ
530 Broad Street
Shrewsbury, NJ
New Mexico
2261 Q Street NE
Albuquerque, NM
New York
1130 Franklin Avenue
Garden City, NY
37 West Jericho Turnpike
Huntington Station, NY
1271 Avenue of the Americas
New York, NY
980 Madison Avenue
New York, NY
61 Broadway
New York, NY
350 Park Avenue
New York, NY
200 Fifth Avenue
New York, NY
733 Third Avenue
New York, NY
2070 Broadway
New York, NY
1075 Northern Blvd.
Roslyn, NY
799 Central Park Avenue
Scarsdale, NY
3349 Monroe Avenue
Rochester, NY
North Carolina
4611 Sharon Road
Charlotte, NC
7011 Fayetteville Road
Durham, NC
Ohio
3805 Edwards Road
Cincinnati, OH
1324 Polaris Parkway
Columbus, OH
1800 Crocker Road
Westlake, OH
28699 Chagrin Boulevard
Woodmere Village, OH
Oregon
7493 SW Bridgeport Road
Tigard, OR
Pennsylvania
600 West DeKalb Pike
King of Prussia, PA
1735 Market Street
Philadelphia, PA
12001 Perry Highway
Wexford, PA
Rhode Island
10 Memorial Boulevard
Providence, RI
Tennessee
3018 Peoples Street
Johnson City, TN
7628 West Farmington Blvd.
Germantown, TN
2035 Mallory Lane
Franklin, TN
Texas
10000 Research Boulevard
Austin, TX
4001 Northwest Parkway
Dallas, TX
12532 Memorial Drive
Houston, TX
2701 Drexel Drive
Houston, TX
6560 Fannin Street
Houston, TX
1701 Lake Robbins Drive
The Woodlands, TX
6500 N. MacArthur Blvd.
Irving, TX
6005 West Park Boulevard
Plano, TX
1576 East Southlake Blvd.
Southlake, TX
15600 Southwest Freeway
Sugar Land, TX
139 N. Loop 1604 East
San Antonio, TX
Utah
279 West South Temple
Salt Lake City, UT
Virginia
1861 International Drive
McLean, VA
11957 Democracy Drive
Reston, VA
Washington
10500 NE 8th Street
Bellevue, WA
1518 6th Avenue
Seattle, WA
304 Strander Blvd
Tukwila, WA
Washington, DC
1900 K Street, N.W.
Washington, DC
Wisconsin
16020 West Bluemound Road
Brookfield, WI
Fidelity Brokerage Services, Inc., 100 Summer St., Boston, MA 02110 Member NYSE/SIPC
Semiannual Report
To Write Fidelity
We'll give your correspondence immediate attention and send you written confirmation upon completion of your request.
(letter_graphic)
Making Changes
To Your Account
(such as changing name, address, bank, etc.)
Fidelity Investments
P.O. Box 770001
Cincinnati, OH 45277-0002
(letter_graphic)
For Non-Retirement
Accounts
Buying shares
Fidelity Investments
P.O. Box 770001
Cincinnati, OH 45277-0003
Overnight Express
Fidelity Investments
Attn: Distribution Services
100 Crosby Parkway - KC1H
Covington, KY 41015
Selling shares
Fidelity Investments
P.O. Box 770001
Cincinnati, OH 45277-0035
Overnight Express
Fidelity Investments
Attn: Distribution Services
100 Crosby Parkway - KC1H
Covington, KY 41015
General Correspondence
Fidelity Investments
P.O. Box 500
Merrimack, NH 03054-0500
(letter_graphic)
For Retirement
Accounts
Buying shares
Fidelity Investments
P.O. Box 770001
Cincinnati, OH 45277-0003
Selling shares
Fidelity Investments
P.O. Box 770001
Cincinnati, OH 45277-0035
Overnight Express
Fidelity Investments
Attn: Distribution Services
100 Crosby Parkway - KC1H
Covington, KY 41015
General Correspondence
Fidelity Investments
P.O. Box 500
Merrimack, NH 03054-0500
Semiannual Report
Investment Adviser
Fidelity Management & Research Company
Boston, MA
Investment Sub-Advisers
Fidelity Management & Research
(U.K.) Inc.
Fidelity Investments
Money Management, Inc.
Fidelity Management & Research
(Hong Kong) Limited
Fidelity Management & Research
(Japan) Inc.
General Distributor
Fidelity Distributors Corporation
Boston, MA
Transfer and Service Agents
Fidelity Investments Institutional
Operations Company, Inc.
Boston, MA
Fidelity Service Company, Inc.
Boston, MA
Custodian
The Bank of New York Mellon
New York, NY
The Fidelity Telephone Connection
Mutual Fund 24-Hour Service
Exchanges/Redemptions
and Account Assistance 1-800-544-6666
Product Information 1-800-544-6666
Retirement Accounts 1-800-544-4774
(8 a.m. - 9 p.m.)
TDD Service 1-800-544-0118
for the deaf and hearing impaired
(9 a.m. - 9 p.m. Eastern time)
Fidelity Automated Service
Telephone (FAST) 1-800-544-5555
Automated line for quickest service
GVT-USAN-0311
1.789284.107

(Fidelity Investment logo)(registered trademark)
Fidelity Advisor®
Government Income
Fund - Class A, Class T, Class B
and Class C
Semiannual Report
January 31, 2011
(2_fidelity_logos) (Registered_Trademark)
Class A, Class T, Class B, and Class C are classes of Fidelity® Government Income Fund
Contents
Chairman's Message | <Click Here> | The Chairman's message to shareholders. |
Shareholder Expense Example | <Click Here> | An example of shareholder expenses. |
Investment Changes | <Click Here> | A summary of major shifts in the fund's investments over the past six months. |
Investments | <Click Here> | A complete list of the fund's investments with their market values. |
Financial Statements | <Click Here> | Statements of assets and liabilities, operations, and changes in net assets, as well as financial highlights. |
Notes | <Click Here> | Notes to the financial statements. |
Board Approval of Investment Advisory Contracts and Management Fees | <Click Here> | |
To view a fund's proxy voting guidelines and proxy voting record for the 12-month period ended June 30, visit http://www.fidelity.com/proxyvotingresults or visit the Securities and Exchange Commission's (SEC) web site at http://www.sec.gov. You may also call 1-877-208-0098 to request a free copy of the proxy voting guidelines.
Standard & Poor's, S&P and S&P 500 are registered service marks of The McGraw-Hill Companies, Inc. and have been licensed for use by Fidelity Distributors Corporation.
Other third party marks appearing herein are the property of their respective owners.
All other marks appearing herein are registered or unregistered trademarks or service marks of FMR LLC or an affiliated company.
This report and the financial statements contained herein are submitted for the general information of the shareholders of the fund. This report is not authorized for distribution to prospective investors in the fund unless preceded or accompanied by an effective prospectus.
A fund files its complete schedule of portfolio holdings with the SEC for the first and third quarters of each fiscal year on Form N-Q. Forms N-Q are available on the SEC's web site at http://www.sec.gov. A fund's Forms N-Q may be reviewed and copied at the SEC's Public Reference Room in Washington, DC. Information regarding the operation of the SEC's Public Reference Room may be obtained by calling 1-800-SEC-0330. For a complete list of a fund's portfolio holdings, view the most recent holdings listing, semiannual report, or annual report on Fidelity's web site at http://www.fidelity.com, http://www.advisor.fidelity.com, or http://www.401k.com, as applicable.
NOT FDIC INSURED • MAY LOSE VALUE • NO BANK GUARANTEE
Neither the fund nor Fidelity Distributors Corporation is a bank.
Semiannual Report
(photo_of_Abigail_P_Johnson)
Dear Shareholder:
Following a year in which the investment environment was volatile but generally supportive of most major asset classes, 2011 began on a positive note. U.S. equities gained ground in January, reaching their highest point since August 2008, amid indications the U.S. economy had turned a corner. Still, questions remained about the longer-term outlook, most notably persistently high unemployment. Financial markets are always unpredictable, of course, but there also are several time-tested investment principles that can help put the odds in your favor.
One of the basic tenets is to invest for the long term. Over time, riding out the markets' inevitable ups and downs has proven much more effective than selling into panic or chasing the hottest trend. Even missing only a few of the markets' best days can significantly diminish investor returns. Patience also affords the benefits of compounding - of earning interest on additional income or reinvested dividends and capital gains. There can be tax advantages and cost benefits to consider as well. While staying the course doesn't eliminate risk, it can considerably lessen the effect of short-term declines.
You can further manage your investing risk through diversification. And today, more than ever, geographic diversification should be taken into account. Studies indicate that asset allocation is the single most important determinant of a portfolio's long-term success. The right mix of stocks, bonds and cash - aligned to your particular risk tolerance and investment objective - is very important. Age-appropriate rebalancing is also an essential aspect of asset allocation. For younger investors, an emphasis on equities - which historically have been the best-performing asset class over time - is encouraged. As investors near their specific goal, such as retirement or sending a child to college, consideration may be given to replacing volatile assets (e.g. common stocks) with more-stable fixed investments (bonds or savings plans).
A third principle - investing regularly - can help lower the average cost of your purchases. Investing a certain amount of money each month or quarter helps ensure you won't pay for all your shares at market highs. This strategy - known as dollar cost averaging - also reduces "emotion" from investing, helping shareholders avoid selling weak performers just prior to an upswing, or chasing a hot performer just before a correction.
We invite you to contact us via the Internet, through our Investor Centers or by phone. It is our privilege to provide you the information you need to make the investments that are right for you.
Sincerely,
(The chairman's signature appears here.)
Abigail P. Johnson
Semiannual Report
Shareholder Expense Example
As a shareholder of the Fund, you incur two types of costs: (1) transaction costs, including sales charges (loads) on purchase payments or redemption proceeds, and (2) ongoing costs, including management fees, distribution and/or service (12b-1) fees and other Fund expenses. This Example is intended to help you understand your ongoing costs (in dollars) of investing in the Fund and to compare these costs with the ongoing costs of investing in other mutual funds.
The Example is based on an investment of $1,000 invested at the beginning of the period and held for the entire period (August 1, 2010 to January 31, 2011).
Actual Expenses
The first line of the accompanying table for each class of the Fund provides information about actual account values and actual expenses. You may use the information in this line, together with the amount you invested, to estimate the expenses that you paid over the period. Simply divide your account value by $1,000.00 (for example, an $8,600 account value divided by $1,000.00 = 8.6), then multiply the result by the number in the first line for a class of the Fund under the heading entitled "Expenses Paid During Period" to estimate the expenses you paid on your account during this period. A small balance maintenance fee of $12.00 that is charged once a year may apply for certain accounts with a value of less than $2,000. This fee is not included in the table below. If it was, the estimate of expenses you paid during the period would be higher, and your ending account value lower, by this amount.
Hypothetical Example for Comparison Purposes
The second line of the accompanying table for each class of the Fund provides information about hypothetical account values and hypothetical expenses based on a Class' actual expense ratio and an assumed rate of return of 5% per year before expenses, which is not the Class' actual return. The hypothetical account values and expenses may not be used to estimate the actual ending account balance or expenses you paid for the period. You may use this information to compare the ongoing costs of investing in the Fund and other funds. To do so, compare this 5% hypothetical example with the 5% hypothetical examples that appear in the shareholder reports of the other funds. A small balance maintenance fee of $12.00 that is charged once a year may apply for certain accounts with a value of less than $2,000. This fee is not included in the table below. If it was, the estimate of expenses you paid during the period would be higher, and your ending account value lower, by this amount.
Please note that the expenses shown in the table are meant to highlight your ongoing costs only and do not reflect any transaction costs. Therefore, the second line of the table is useful in comparing ongoing costs only, and will not help you determine the relative total costs of owning different funds. In addition, if these transactional costs were included, your costs would have been higher.
Semiannual Report
Shareholder Expense Example - continued
| Annualized
Expense Ratio | Beginning
Account Value
August 1, 2010 | Ending
Account Value
January 31, 2011 | Expenses Paid
During Period*
August 1, 2010
to January 31, 2011 |
Class A | .76% | | | |
Actual | | $ 1,000.00 | $ 994.30 | $ 3.82 |
HypotheticalA | | $ 1,000.00 | $ 1,021.37 | $ 3.87 |
Class T | .75% | | | |
Actual | | $ 1,000.00 | $ 993.40 | $ 3.77 |
HypotheticalA | | $ 1,000.00 | $ 1,021.42 | $ 3.82 |
Class B | 1.49% | | | |
Actual | | $ 1,000.00 | $ 989.80 | $ 7.47 |
HypotheticalA | | $ 1,000.00 | $ 1,017.69 | $ 7.58 |
Class C | 1.50% | | | |
Actual | | $ 1,000.00 | $ 989.70 | $ 7.52 |
HypotheticalA | | $ 1,000.00 | $ 1,017.64 | $ 7.63 |
Government Income | .45% | | | |
Actual | | $ 1,000.00 | $ 995.90 | $ 2.26 |
HypotheticalA | | $ 1,000.00 | $ 1,022.94 | $ 2.29 |
Institutional Class | .52% | | | |
Actual | | $ 1,000.00 | $ 994.60 | $ 2.61 |
HypotheticalA | | $ 1,000.00 | $ 1,022.58 | $ 2.65 |
A 5% return per year before expenses
* Expenses are equal to each Class' annualized expense ratio, multiplied by the average account value over the period, multiplied by 184/365 (to reflect the one-half year period).
Semiannual Report
Investment Changes (Unaudited)
Coupon Distribution as of January 31, 2011 |
| % of fund's
investments | % of fund's investments
6 months ago |
Zero coupon bonds | 1.3 | 1.9 |
0.01 - 0.99% | 8.9 | 7.5 |
1 - 1.99% | 15.3 | 16.6 |
2 - 2.99% | 12.7 | 8.3 |
3 - 3.99% | 15.1 | 16.5 |
4 - 4.99% | 14.9 | 17.0 |
5 - 5.99% | 16.2 | 15.3 |
6 - 6.99% | 7.6 | 6.5 |
7% and over | 4.0 | 3.9 |
Coupon distribution shows the range of stated interest rates on the fund's investments, excluding short-term investments. |
Weighted Average Maturity as of January 31, 2011 |
| | 6 months ago |
Years | 6.0 | 5.2 |
This is a weighted average of all the maturities of the securities held in a fund. Weighted Average Maturity (WAM) can be used as a measure of sensitivity to interest rate changes and markets changes. Generally, the longer the maturity, the greater the sensitivity to such changes. WAM is based on the dollar-weighted average length of time until principal payments must be paid. Depending on the types of securities held in a fund, certain maturity shortening devices (e.g., demand features, interest rate resets, and call options) may be taken into account when calculating the WAM. |
Duration as of January 31, 2011 |
| | 6 months ago |
Years | 4.5 | 4.2 |
Duration shows how much a bond fund's price fluctuates with changes in comparable interest rates. If rates rise 1%, for example, a fund with a five-year duration is likely to lose about 5% of its value. Other factors also can influence a bond fund's performance and share price. Accordingly, a bond fund's actual performance may differ from this example. |
Asset Allocation (% of fund's net assets) |
As of January 31, 2011* | As of July 31, 2010** |
| Mortgage
Securities 39.6% | | | Mortgage
Securities 32.2% | |
| CMOs and Other
Mortgage Related
Securities 9.3% | | | CMOs and Other
Mortgage Related
Securities 10.8% | |
| U.S. Treasury
Obligations 48.6% | | | U.S. Treasury
Obligations 53.3% | |
| U.S. Government
Agency Obligations† 17.8% | | | U.S. Government
Agency Obligations† 16.6% | |
| Short-Term
Investments and
Net Other Assets*** (15.3)% | | | Short-Term
Investments and
Net Other Assets*** (12.9)% | |
* Futures and Swaps | (2.5)% | | ** Futures and Swaps | (1.1)% | |

† Includes FDIC Guaranteed Corporate Securities. |
*** Short-Term Investments and Net Other Assets are not included in the pie chart. |
Semiannual Report
Investments January 31, 2011 (Unaudited)
Showing Percentage of Net Assets
U.S. Government and Government Agency Obligations - 66.4% |
| Principal Amount (000s) | | Value (000s) |
U.S. Government Agency Obligations - 10.1% |
Fannie Mae: | | | | |
0.375% 12/28/12 | | $ 50,670 | | $ 50,324 |
4.75% 11/19/12 | | 2,000 | | 2,149 |
Federal Home Loan Bank: | | | | |
0.875% 8/22/12 | | 8,580 | | 8,626 |
1.5% 1/16/13 | | 40,950 | | 41,555 |
1.875% 6/21/13 | | 97,650 | | 100,032 |
Freddie Mac: | | | | |
0.625% 12/28/12 | | 103,830 | | 103,831 |
1.375% 2/25/14 | | 17,725 | | 17,825 |
2.5% 1/7/14 | | 26,670 | | 27,646 |
4.125% 12/21/12 | | 5,375 | | 5,725 |
Israeli State (guaranteed by U.S. Government through Agency for International Development): | | | | |
5.5% 9/18/23 | | 55,500 | | 63,178 |
6.8% 2/15/12 | | 12,199 | | 12,246 |
Overseas Private Investment Corp. U.S. Government guaranteed participation certificates 6.77% 11/15/13 | | 3,069 | | 3,275 |
Private Export Funding Corp. secured: | | | | |
4.974% 8/15/13 | | 22,940 | | 25,263 |
5.66% 9/15/11 (a) | | 18,000 | | 18,556 |
5.685% 5/15/12 | | 24,035 | | 25,653 |
Small Business Administration guaranteed development participation certificates: | | | | |
Series 2002-20J Class 1, 4.75% 10/1/22 | | 4,120 | | 4,363 |
Series 2002-20K Class 1, 5.08% 11/1/22 | | 8,806 | | 9,409 |
Series 2003-P10B, Class 1 5.136% 8/10/13 | | 3,284 | | 3,478 |
Series 2004-20H Class 1, 5.17% 8/1/24 | | 2,650 | | 2,840 |
Tennessee Valley Authority: | | | | |
5.25% 9/15/39 | | 12,000 | | 12,311 |
5.375% 4/1/56 | | 8,429 | | 8,719 |
TOTAL U.S. GOVERNMENT AGENCY OBLIGATIONS | | 547,004 |
U.S. Treasury Inflation Protected Obligations - 3.9% |
U.S. Treasury Inflation-Indexed Notes 2.375% 4/15/11 | | 211,388 | | 213,440 |
U.S. Treasury Obligations - 44.7% |
U.S. Treasury Bonds: | | | | |
3.875% 8/15/40 | | 121,361 | | 107,386 |
4.25% 11/15/40 | | 21,096 | | 19,946 |
4.375% 2/15/38 | | 14,154 | | 13,787 |
U.S. Government and Government Agency Obligations - continued |
| Principal Amount (000s) | | Value (000s) |
U.S. Treasury Obligations - continued |
U.S. Treasury Bonds: - continued | | | | |
5% 5/15/37 | | $ 55,700 | | $ 59,956 |
5.25% 2/15/29 | | 78,950 | | 88,584 |
6.125% 11/15/27 | | 37,365 | | 46,047 |
6.125% 8/15/29 | | 2,877 | | 3,559 |
6.25% 8/15/23 | | 23,100 | | 28,752 |
7.25% 5/15/16 | | 51,167 | | 64,598 |
7.5% 11/15/16 | | 120,574 | | 155,154 |
8% 11/15/21 | | 14,605 | | 20,529 |
9.875% 11/15/15 | | 10,285 | | 14,111 |
U.S. Treasury Notes: | | | | |
0.5% 11/30/12 | | 19,000 | | 18,993 |
0.625% 12/31/12 | | 42,188 | | 42,256 |
0.75% 11/30/11 | | 64,680 | | 64,948 |
0.75% 12/15/13 | | 88,576 | | 88,126 |
0.875% 1/31/12 | | 31,081 | | 31,259 |
1% 12/31/11 | | 64,001 | | 64,424 |
1% 4/30/12 | | 602 | | 607 |
1% 1/15/14 | | 208,152 | | 208,363 |
1.25% 8/31/15 | | 500 | | 489 |
1.25% 10/31/15 | | 29,580 | | 28,780 |
1.375% 11/15/12 | | 19,743 | | 20,045 |
1.375% 11/30/15 | | 3,611 | | 3,527 |
1.75% 4/15/13 | | 10 | | 10 |
1.75% 7/31/15 | | 28,800 | | 28,841 |
1.875% 4/30/14 | | 53,549 | | 54,900 |
1.875% 8/31/17 | | 47,000 | | 44,955 |
1.875% 9/30/17 | | 87,400 | | 83,358 |
2.125% 5/31/15 | | 18,669 | | 19,054 |
2.125% 12/31/15 | | 90,816 | | 91,696 |
2.25% 11/30/17 | | 10,000 | | 9,738 |
2.375% 8/31/14 | | 20,000 | | 20,788 |
2.375% 9/30/14 | | 13,017 | | 13,524 |
2.375% 10/31/14 | | 77,497 | | 80,470 |
2.5% 6/30/17 | | 10,000 | | 9,981 |
2.625% 7/31/14 | | 83,808 | | 87,894 |
2.625% 4/30/16 | | 30,591 | | 31,451 |
2.625% 1/31/18 | | 31,840 | | 31,656 |
2.625% 8/15/20 | | 42,940 | | 40,488 |
2.625% 11/15/20 | | 38,089 | | 35,708 |
2.75% 11/30/16 | | 18,530 | | 18,970 |
U.S. Government and Government Agency Obligations - continued |
| Principal Amount (000s) | | Value (000s) |
U.S. Treasury Obligations - continued |
U.S. Treasury Notes: - continued | | | | |
2.75% 2/15/19 | | $ 13,700 | | $ 13,500 |
3% 9/30/16 | | 68,254 | | 71,032 |
3.125% 8/31/13 (e) | | 36,935 | | 39,174 |
3.125% 10/31/16 | | 88,448 | | 92,518 |
3.125% 1/31/17 | | 60,773 | | 63,332 |
3.5% 5/15/20 | | 44,137 | | 44,992 |
3.625% 8/15/19 | | 33,225 | | 34,627 |
3.625% 2/15/20 | | 67,640 | | 69,960 |
3.75% 11/15/18 | | 15,801 | | 16,774 |
4% 2/15/15 | | 12,619 | | 13,881 |
4.25% 11/15/17 | | 27,475 | | 30,283 |
4.5% 5/15/17 | | 24,685 | | 27,616 |
4.75% 8/15/17 | | 12,983 | | 14,724 |
TOTAL U.S. TREASURY OBLIGATIONS | | 2,430,121 |
Other Government Related - 7.7% |
Bank of America Corp.: | | | | |
2.1% 4/30/12 (FDIC Guaranteed) (b) | | 6,060 | | 6,185 |
3.125% 6/15/12 (FDIC Guaranteed) (b) | | 3,719 | | 3,855 |
Citibank NA: | | | | |
1.875% 5/7/12 (FDIC Guaranteed) (b) | | 87,150 | | 88,739 |
1.875% 6/4/12 (FDIC Guaranteed) (b) | | 33,000 | | 33,584 |
Citigroup Funding, Inc.: | | | | |
1.875% 10/22/12 (FDIC Guaranteed) (b) | | 40,500 | | 41,353 |
1.875% 11/15/12 (FDIC Guaranteed) (b) | | 18,920 | | 19,329 |
2% 3/30/12 (FDIC Guaranteed) (b) | | 16,000 | | 16,289 |
2.125% 7/12/12 (FDIC Guaranteed) (b) | | 8,784 | | 8,982 |
General Electric Capital Corp.: | | | | |
1.8% 3/11/11 (FDIC Guaranteed) (b) | | 60,000 | | 60,104 |
2% 9/28/12 (FDIC Guaranteed) (b) | | 11,000 | | 11,253 |
2.625% 12/28/12 (FDIC Guaranteed) (b) | | 16,154 | | 16,754 |
3% 12/9/11 (FDIC Guaranteed) (b) | | 4,720 | | 4,827 |
GMAC, Inc. 1.75% 10/30/12 (FDIC Guaranteed) (b) | | 51,106 | | 52,088 |
Goldman Sachs Group, Inc. 3.25% 6/15/12 (FDIC Guaranteed) (b) | | 3,714 | | 3,854 |
JPMorgan Chase & Co.: | | | | |
2.2% 6/15/12 (FDIC Guaranteed) (b) | | 9,200 | | 9,395 |
3.125% 12/1/11 (FDIC Guaranteed) (b) | | 790 | | 808 |
U.S. Government and Government Agency Obligations - continued |
| Principal Amount (000s) | | Value (000s) |
Other Government Related - continued |
National Credit Union Administration Guaranteed Notes: | | | | |
Series 2010-A1 Class A, 0.6106% 12/7/20 (NCUA Guaranteed) (f) | | $ 13,567 | | $ 13,581 |
Series 2010-R3 Class 1A, 0.8238% 12/8/20 (NCUA Guaranteed) (f) | | 27,754 | | 27,771 |
TOTAL OTHER GOVERNMENT RELATED | | 418,751 |
TOTAL U.S. GOVERNMENT AND GOVERNMENT AGENCY OBLIGATIONS (Cost $3,571,340) | 3,609,316 |
U.S. Government Agency - Mortgage Securities - 39.6% |
|
Fannie Mae - 26.2% |
2.017% 10/1/33 (f) | | 347 | | 358 |
2.142% 3/1/35 (f) | | 283 | | 293 |
2.167% 10/1/33 (f) | | 152 | | 157 |
2.194% 2/1/33 (f) | | 349 | | 361 |
2.213% 7/1/35 (f) | | 141 | | 146 |
2.243% 12/1/34 (f) | | 375 | | 386 |
2.295% 11/1/33 (f) | | 974 | | 1,015 |
2.316% 3/1/35 (f) | | 59 | | 61 |
2.532% 7/1/34 (f) | | 182 | | 190 |
2.553% 10/1/33 (f) | | 275 | | 289 |
2.582% 3/1/35 (f) | | 182 | | 191 |
2.589% 6/1/36 (f) | | 260 | | 271 |
2.642% 7/1/35 (f) | | 2,254 | | 2,377 |
2.733% 7/1/35 (f) | | 630 | | 661 |
2.742% 11/1/36 (f) | | 220 | | 231 |
2.839% 9/1/35 (f) | | 2,786 | | 2,924 |
2.858% 2/1/34 (f) | | 113 | | 119 |
3% 2/1/26 (c) | | 36,000 | | 35,177 |
3.5% 2/1/26 (c)(d) | | 162,000 | | 162,889 |
3.5% 2/1/26 (c) | | 172,000 | | 172,943 |
3.5% 11/1/40 to 1/1/41 | | 41,086 | | 39,198 |
4% 9/1/13 to 11/1/40 (d) | | 81,202 | | 81,032 |
4% 2/1/26 (c) | | 3,000 | | 3,089 |
4% 2/1/26 (c) | | 3,000 | | 3,089 |
4% 2/1/41 (c) | | 14,000 | | 13,876 |
4.5% 6/1/25 to 11/1/40 | | 72,611 | | 74,305 |
U.S. Government Agency - Mortgage Securities - continued |
| Principal Amount (000s) | | Value (000s) |
Fannie Mae - continued |
4.5% 2/1/26 (c) | | $ 1,000 | | $ 1,048 |
4.5% 2/1/41 (c)(d) | | 30,000 | | 30,670 |
4.5% 2/1/41 (c)(d) | | 22,000 | | 22,491 |
4.5% 2/1/41 (c) | | 2,000 | | 2,045 |
4.5% 2/1/41 (c) | | 2,000 | | 2,045 |
4.5% 2/1/41 (c)(d) | | 18,000 | | 18,402 |
4.5% 2/1/41 (c)(d) | | 13,000 | | 13,290 |
4.5% 2/1/41 (c)(d) | | 12,000 | | 12,268 |
4.5% 3/1/41 (c) | | 67,000 | | 68,269 |
4.661% 2/1/34 (f) | | 2,947 | | 3,074 |
4.667% 8/1/36 (f) | | 2,681 | | 2,840 |
4.724% 2/1/36 (f) | | 751 | | 785 |
5% 6/1/14 to 9/1/40 | | 115,180 | | 121,428 |
5% 2/1/41 (c)(d) | | 53,000 | | 55,603 |
5% 2/1/41 (c) | | 59,000 | | 61,898 |
5.5% 10/1/20 to 3/1/39 | | 84,622 | | 90,735 |
5.5% 2/1/41 (c)(d) | | 66,000 | | 70,552 |
5.801% 5/1/36 (f) | | 687 | | 717 |
5.804% 3/1/36 (f) | | 2,706 | | 2,894 |
5.963% 3/1/37 (f) | | 595 | | 636 |
6% 3/1/17 to 9/1/39 | | 124,655 | | 135,438 |
6% 2/1/41 (c)(d) | | 50,000 | | 54,358 |
6% 2/1/41 (c)(d) | | 20,500 | | 22,287 |
6.5% 2/1/12 to 4/1/37 | | 17,728 | | 19,615 |
6.5% 2/1/41 (c)(d) | | 11,000 | | 12,244 |
7% 7/1/13 to 7/1/32 | | 2,891 | | 3,251 |
7.5% 7/1/11 to 4/1/29 | | 20 | | 23 |
8.5% 1/1/15 to 7/1/31 | | 254 | | 281 |
9% 5/1/14 | | 187 | | 195 |
9.5% 4/1/16 to 10/1/20 | | 300 | | 345 |
11.25% 5/1/14 | | 2 | | 2 |
11.5% 6/15/19 to 1/15/21 | | 382 | | 416 |
12.5% 8/1/15 to 3/1/16 | | 1 | | 1 |
| | 1,425,774 |
Freddie Mac - 4.9% |
2.041% 3/1/35 (f) | | 1,340 | | 1,377 |
2.108% 5/1/37 (f) | | 848 | | 876 |
2.615% 6/1/35 (f) | | 771 | | 812 |
2.663% 6/1/35 (f) | | 578 | | 606 |
3.022% 7/1/35 (f) | | 1,943 | | 2,053 |
3.352% 10/1/35 (f) | | 360 | | 381 |
U.S. Government Agency - Mortgage Securities - continued |
| Principal Amount (000s) | | Value (000s) |
Freddie Mac - continued |
3.513% 3/1/33 (f) | | $ 59 | | $ 62 |
3.71% 1/1/36 (f) | | 2,244 | | 2,327 |
4.441% 2/1/36 (f) | | 168 | | 177 |
4.5% 7/1/25 to 10/1/40 | | 11,046 | | 11,353 |
4.5% 2/1/41 (c)(d) | | 59,000 | | 60,244 |
4.5% 3/1/41 (c) | | 59,000 | | 60,041 |
5% 8/1/35 to 9/1/40 | | 23,382 | | 24,547 |
5.138% 4/1/35 (f) | | 291 | | 307 |
5.5% 8/1/16 to 1/1/40 | | 42,862 | | 46,174 |
5.527% 1/1/36 (f) | | 2,076 | | 2,170 |
6% 7/1/16 to 7/1/37 | | 14,160 | | 15,416 |
6.141% 7/1/36 (f) | | 884 | | 933 |
6.5% 3/1/11 to 3/1/36 | | 22,623 | | 24,877 |
6.5% 2/1/41 (c)(d) | | 9,000 | | 10,001 |
7% 4/1/11 | | 0 * | | 0 * |
7.5% 5/1/11 to 7/1/16 | | 736 | | 799 |
8.5% 5/1/17 to 9/1/29 | | 124 | | 142 |
9% 9/1/14 to 10/1/20 | | 23 | | 25 |
9.5% 5/1/17 to 8/1/21 | | 144 | | 163 |
9.75% 8/1/14 | | 97 | | 106 |
10% 11/15/18 to 8/1/21 | | 9 | | 10 |
11% 5/1/14 | | 29 | | 32 |
12% 3/1/15 | | 1 | | 1 |
12.5% 2/1/14 to 6/1/19 | | 5 | | 6 |
13% 6/1/14 to 6/1/15 | | 2 | | 2 |
| | 266,020 |
Ginnie Mae - 8.5% |
4% 1/15/25 to 10/20/25 | | 34,745 | | 36,343 |
4% 2/1/41 (c) | | 10,000 | | 10,027 |
4% 2/1/41 (c) | | 37,000 | | 37,098 |
4.5% 3/15/40 to 6/15/40 | | 24,499 | | 25,487 |
4.5% 2/1/41 (c) | | 52,000 | | 53,787 |
4.5% 2/1/41 (c) | | 22,000 | | 22,756 |
4.5% 2/1/41 (c)(d) | | 15,000 | | 15,518 |
5% 9/20/33 to 4/15/40 | | 51,693 | | 55,261 |
5% 2/1/41 (c) | | 1,300 | | 1,380 |
5.492% 4/20/60 (i) | | 22,890 | | 24,862 |
5.493% 11/20/59 (i) | | 28,188 | | 30,662 |
5.5% 12/15/38 to 3/15/39 | | 580 | | 627 |
5.5% 1/20/60 (i) | | 27,513 | | 29,889 |
5.5% 3/20/60 (i) | | 33,750 | | 36,668 |
U.S. Government Agency - Mortgage Securities - continued |
| Principal Amount (000s) | | Value (000s) |
Ginnie Mae - continued |
5.5% 3/20/60 (i) | | $ 29,684 | | $ 32,253 |
5.513% 2/20/60 (i) | | 25,184 | | 27,374 |
6% 11/20/31 to 11/20/33 | | 11,110 | | 12,215 |
6.5% 3/20/31 to 10/15/35 | | 7,552 | | 8,515 |
7% 10/15/26 to 8/15/32 | | 73 | | 83 |
7.5% 3/15/28 to 8/15/29 | | 66 | | 75 |
8% 7/15/19 to 12/15/23 | | 818 | | 930 |
8.5% 1/15/25 | | 1 | | 1 |
9.5% 2/15/25 | | 1 | | 1 |
10.5% 4/15/14 to 1/20/18 | | 53 | | 62 |
| | 461,874 |
TOTAL U.S. GOVERNMENT AGENCY - MORTGAGE SECURITIES (Cost $2,135,430) | 2,153,668 |
Collateralized Mortgage Obligations - 9.3% |
|
U.S. Government Agency - 9.3% |
Fannie Mae: | | | | |
floater Series 2007-89 Class EF, 0.82% 9/25/37 (f) | | 10,662 | | 10,673 |
planned amortization class: | | | | |
Series 1992-168 Class KB, 7% 10/25/22 | | 769 | | 849 |
Series 1993-207 Class H, 6.5% 11/25/23 | | 11,556 | | 12,989 |
Series 1993-240 Class PD, 6.25% 12/25/13 | | 1,371 | | 1,436 |
Series 1994-23 Class PZ, 6% 2/25/24 | | 12,400 | | 14,290 |
Series 1996-28 Class PK, 6.5% 7/25/25 | | 2,240 | | 2,487 |
Series 2003-28 Class KG, 5.5% 4/25/23 | | 4,940 | | 5,376 |
Series 2006-45 Class OP, 6/25/36 (h) | | 4,178 | | 3,689 |
Series 2006-62 Class KP, 4/25/36 (h) | | 9,052 | | 7,468 |
sequential payer: | | | | |
Series 1997-41 Class J, 7.5% 6/18/27 | | 1,647 | | 1,870 |
Series 2007-113 Class DB, 4.5% 12/25/22 | | 12,440 | | 13,204 |
Series 2007-115 Class BE, 4.5% 12/25/22 | | 15,400 | | 16,471 |
Series 2006-127 Class FD, 0.54% 7/25/36 (f) | | 14,254 | | 14,106 |
Series 2006-44 Class FK, 0.69% 6/25/36 (f) | | 5,174 | | 5,158 |
Series 2007-113 Class JD, 4.5% 12/25/22 | | 12,766 | | 13,504 |
Series 2010-37 Class GI, 5% 4/25/25 (g) | | 3,860 | | 370 |
Fannie Mae Stripped Mortgage-Backed Securities: | | | | |
sequential payer Series 377 Class 1, 10/1/36 (h) | | 11,913 | | 10,103 |
Series 384 Class 6, 5% 7/25/37 (g) | | 13,563 | | 2,320 |
Collateralized Mortgage Obligations - continued |
| Principal Amount (000s) | | Value (000s) |
U.S. Government Agency - continued |
Fannie Mae subordinate REMIC pass-thru certificates: | | | | |
floater: | | | | |
Series 2001-38 Class QF, 1.24% 8/25/31 (f) | | $ 383 | | $ 391 |
Series 2002-49 Class FB, 0.8613% 11/18/31 (f) | | 530 | | 533 |
Series 2002-60 Class FV, 1.26% 4/25/32 (f) | | 223 | | 228 |
Series 2002-75 Class FA, 1.26% 11/25/32 (f) | | 458 | | 467 |
Series 2006-79 Class PF, 0.66% 8/25/36 (f) | | 11,583 | | 11,547 |
Series 2008-76 Class EF, 0.76% 9/25/23 (f) | | 6,357 | | 6,361 |
planned amortization class: | | | | |
Series 2003-113 Class PE, 4% 11/25/18 | | 7,545 | | 7,933 |
Series 2004-21 Class QE, 4.5% 11/25/32 | | 1,500 | | 1,572 |
Series 2005-102 Class CO, 11/25/35 (h) | | 4,148 | | 3,582 |
Series 2005-81 Class PC, 5.5% 9/25/35 | | 2,150 | | 2,328 |
Series 2006-12 Class BO, 10/25/35 (h) | | 18,545 | | 16,003 |
Series 2006-37 Class OW, 5/25/36 (h) | | 4,606 | | 3,812 |
sequential payer: | | | | |
Series 1999-25 Class Z, 6% 6/25/29 | | 3,492 | | 3,845 |
Series 2001-20 Class Z, 6% 5/25/31 | | 10,772 | | 11,811 |
Series 2001-46 Class ZG, 6% 9/25/31 | | 3,919 | | 4,311 |
Series 2002-79 Class Z, 5.5% 11/25/22 | | 8,078 | | 8,717 |
Series 2005-117, Class JN, 4.5% 1/25/36 | | 645 | | 648 |
Series 2006-72 Class CY, 6% 8/25/26 | | 10,215 | | 11,225 |
Freddie Mac: | | | | |
planned amortization class Series 2115 Class PE, 6% 1/15/14 | | 262 | | 276 |
sequential payer Series 2114 Class ZM, 6% 1/15/29 | | 1,230 | | 1,353 |
Freddie Mac Manufactured Housing participation certificates guaranteed: | | | | |
floater Series 1686 Class FA, 1.2125% 2/15/24 (f) | | 1,017 | | 1,042 |
planned amortization class Series 1681 Class PJ, 7% 12/15/23 | | 666 | | 668 |
Freddie Mac Multi-class participation certificates guaranteed: | | | | |
floater: | | | | |
Series 2530 Class FE, 0.8613% 2/15/32 (f) | | 289 | | 291 |
Series 2630 Class FL, 0.7613% 6/15/18 (f) | | 523 | | 528 |
Series 3008 Class SM, 0% 7/15/35 (f) | | 141 | | 140 |
Series 3279 Class FB, 0.5813% 2/15/37 (f) | | 5,072 | | 5,031 |
Series 3346 Class FA, 0.4913% 2/15/19 (f) | | 12,002 | | 11,996 |
planned amortization class: | | | | |
Series 1141 Class G, 9% 9/15/21 | | 209 | | 239 |
Series 2006-15 Class OP, 3/25/36 (h) | | 5,504 | | 4,509 |
Collateralized Mortgage Obligations - continued |
| Principal Amount (000s) | | Value (000s) |
U.S. Government Agency - continued |
Freddie Mac Multi-class participation certificates guaranteed: - continued | | | | |
planned amortization class: | | | | |
Series 2356 Class GD, 6% 9/15/16 | | $ 243 | | $ 262 |
Series 2376 Class JE, 5.5% 11/15/16 | | 1,619 | | 1,734 |
Series 2381 Class OG, 5.5% 11/15/16 | | 1,112 | | 1,188 |
Series 2628 Class OE, 4.5% 6/15/18 | | 6,815 | | 7,316 |
Series 2640 Class GE, 4.5% 7/15/18 | | 7,310 | | 7,879 |
Series 2682 Class LD, 4.5% 10/15/33 | | 777 | | 800 |
Series 2802 Class OB, 6% 5/15/34 | | 10,455 | | 11,511 |
Series 2810 Class PD, 6% 6/15/33 | | 815 | | 861 |
Series 2937 Class KC, 4.5% 2/15/20 | | 19,686 | | 21,206 |
Series 2962 Class BE, 4.5% 4/15/20 | | 15,015 | | 16,154 |
Series 3110 Class OP, 9/15/35 (h) | | 11,021 | | 9,046 |
Series 3119 Class PO, 2/15/36 (h) | | 13,546 | | 11,143 |
Series 3121 Class KO, 3/15/36 (h) | | 4,089 | | 3,489 |
Series 3123 Class LO, 3/15/36 (h) | | 8,820 | | 7,201 |
Series 3145 Class GO, 4/15/36 (h) | | 7,879 | | 6,494 |
Series 3147 Class PF, 0.5613% 4/15/36 (f) | | 12,885 | | 12,897 |
Series 3741 Class YU, 3.5% 11/15/22 | | 13,420 | | 13,601 |
sequential payer: | | | | |
Series 2135 Class JE, 6% 3/15/29 | | 1,464 | | 1,613 |
Series 2281 Class ZB, 6% 3/15/30 | | 2,523 | | 2,775 |
Series 2546 Class MJ, 5.5% 3/15/23 | | 2,861 | | 3,117 |
Series 2570 Class CU, 4.5% 7/15/17 | | 488 | | 501 |
Series 2587 Class AD, 4.71% 3/15/33 | | 5,785 | | 5,868 |
Series 2601 Class TB, 5.5% 4/15/23 | | 869 | | 950 |
Series 2729 Class GB, 5% 1/15/19 | | 7,359 | | 7,862 |
Series 2773 Class HC, 4.5% 4/15/19 | | 704 | | 746 |
Series 2860 Class CP, 4% 10/15/17 | | 259 | | 259 |
Series 2987 Class HE, 4.5% 6/15/20 | | 11,260 | | 12,000 |
Series 2998 Class LY, 5.5% 7/15/25 | | 2,011 | | 2,194 |
Series 3007 Class EW, 5.5% 7/15/25 | | 8,875 | | 9,679 |
Series 3013 Class VJ, 5% 1/15/14 | | 1,069 | | 1,124 |
Series 2863 Class DB, 4% 9/15/14 | | 632 | | 645 |
Series 3772 Class BI, 4.5% 10/15/18 (g) | | 16,056 | | 1,407 |
target amortization class: | | | | |
Series 2156 Class TC, 6.25% 5/15/29 | | 5,290 | | 5,802 |
Series 2877 Class JC, 5% 10/15/34 | | 260 | | 269 |
Ginnie Mae guaranteed REMIC pass-thru securities: | | | | |
floater: | | | | |
Series 2010-H17 Class FA, 0.5906% 7/20/60 (f)(i) | | 14,405 | | 14,232 |
Collateralized Mortgage Obligations - continued |
| Principal Amount (000s) | | Value (000s) |
U.S. Government Agency - continued |
Ginnie Mae guaranteed REMIC pass-thru securities: - continued | | | | |
floater: | | | | |
Series 2010-H18 Class AF, 0.5538% 9/1/60 (f)(i) | | $ 14,839 | | $ 14,765 |
Series 2010-H19 Class FG, 0.5656% 8/20/60 (f)(i) | | 18,986 | | 18,682 |
planned amortization class Series 1997-8 Class PE, 7.5% 5/16/27 | | 2,627 | | 2,997 |
Series 2004-79 Class FA, 0.5606% 1/20/31 (f) | | 5,025 | | 5,032 |
TOTAL COLLATERALIZED MORTGAGE OBLIGATIONS (Cost $484,584) | 503,051 |
Cash Equivalents - 4.5% |
| Maturity Amount (000s) | | |
Investments in repurchase agreements in a joint trading account at 0.23%, dated 1/31/11 due 2/1/11 (Collateralized by U.S. Government Obligations) #
(Cost $244,427) | $ 244,429 | | 244,427 |
TOTAL INVESTMENT PORTFOLIO - 119.8% (Cost $6,435,781) | 6,510,462 |
NET OTHER ASSETS (LIABILITIES) - (19.8)% | (1,073,883) |
NET ASSETS - 100% | $ 5,436,579 |
Swap Agreements |
| Expiration Date | | Notional Amount (000s) | | |
Interest Rate Swaps |
Receive quarterly a floating rate based on 3-month LIBOR and pay semi-annually a fixed rate equal to 0.682% with JPMorgan Chase, Inc. | August 2012 | | $ 84,000 | | $ (308) |
Receive quarterly a floating rate based on 3-month LIBOR and pay semi-annually a fixed rate equal to 3.23% with Credit Suisse First Boston | May 2020 | | 50,000 | | 331 |
| | $ 134,000 | | $ 23 |
Legend |
(a) Security exempt from registration under Rule 144A of the Securities Act of 1933. These securities may be resold in transactions exempt from registration, normally to qualified institutional buyers. At the end of the period, the value of these securities amounted to $18,556,000 or 0.3% of net assets. |
(b) Under the Temporary Liquidity Guarantee Program, the Federal Deposit Insurance Corporation guarantees principal and interest in the event of payment default or bankruptcy until the earlier of maturity date of the debt or until June 30, 2012. At the end of the period these securities amounted to $377,399,000 or 6.9% of net assets. |
(c) Security or a portion of the security purchased on a delayed delivery or when-issued basis. |
(d) A portion of the security is subject to a forward commitment to sell. |
(e) Security or a portion of the security has been segregated as collateral for open swap agreements. At the period end, the value of securities pledged amounted to $1,061,000. |
(f) Coupon rates for floating and adjustable rate securities reflect the rates in effect at period end. |
(g) Security represents right to receive monthly interest payments on an underlying pool of mortgages or assets. Principal shown is the outstanding par amount of the pool held as of the end of the period. |
(h) Principal Only Strips represent the right to receive the monthly principal payments on an underlying pool of mortgage loans. |
(i) Represents an investment in an underlying pool of reverse mortgages which typically do not require regular principal and interest payments as repayment is deferred until a maturity event. |
* Amount repesents less than $1,000. |
# Additional information on each counterparty to the repurchase agreement is as follows: |
Repurchase Agreement / Counterparty | Value
(Amounts in thousands) |
$244,427,000 due 2/01/11 at 0.23% |
BNP Paribas Securities Corp. | $ 11,501 |
Bank of America NA | 74,921 |
Barclays Capital, Inc. | 5,853 |
Citigroup Global Markets, Inc. | 6,765 |
Credit Agricole Securities (USA), Inc. | 9,365 |
Deutsche Bank Securities, Inc. | 7,024 |
HSBC Securities (USA), Inc. | 28,096 |
J.P. Morgan Securities, Inc. | 9,365 |
Merrill Lynch Government Securities, Inc. | 8,429 |
Merrill Lynch, Pierce, Fenner & Smith, Inc. | 9,357 |
Mizuho Securities USA, Inc. | 42,144 |
Societe Generale, New York Branch | 18,730 |
Wells Fargo Securities LLC | 12,877 |
| $ 244,427 |
Other Information |
All investments are categorized as Level 2 under the Fair Value Hierarchy. The inputs or methodology used for valuing securities may not be an indication of the risk associated with investing in those securities. For more information on valuation inputs, please refer to the Security Valuation section in the accompanying Notes to Financial Statements. |
Value of Derivative Instruments |
The following table is a summary of the Fund's value of derivative instruments by risk exposure as of January 31, 2011. For additional information on derivative instruments, please refer to the Derivative Instruments section in the accompanying Notes to Financial Statements. |
Risk Exposure /
Derivative Type | Value
(Amounts in thousands) |
| Asset | Liability |
Interest Rate Risk | | |
Swap Agreements (a) | $ 331 | $ (308) |
Total Value of Derivatives | $ 331 | $ (308) |
(a) Value is disclosed on the Statement of Assets and Liabilities in the Unrealized Appreciation and Unrealized Depreciation on Swap Agreements line-items. |
See accompanying notes which are an integral part of the financial statements.
Semiannual Report
Statement of Assets and Liabilities
Amounts in thousands (except per-share amounts) | January 31, 2011 (Unaudited) |
| | |
Assets | | |
Investment in securities, at value (including repurchase agreements of $244,427) -
See accompanying schedule: Unaffiliated issuers (cost $6,435,781) | | $ 6,510,462 |
Commitment to sell securities on a delayed delivery basis | $ (594,237) | |
Receivable for securities sold on a delayed delivery basis | 594,169 | (68) |
Receivable for investments sold
Regular delivery | | 64,692 |
Delayed delivery | | 293 |
Receivable for fund shares sold | | 14,802 |
Interest receivable | | 32,797 |
Unrealized appreciation on swap agreements | | 331 |
Other receivables | | 758 |
Total assets | | 6,624,067 |
| | |
Liabilities | | |
Payable to custodian bank | $ 292 | |
Payable for investments purchased
Regular delivery | 58,102 | |
Delayed delivery | 1,113,210 | |
Payable for fund shares redeemed | 11,958 | |
Distributions payable | 478 | |
Unrealized depreciation on swap agreements | 308 | |
Accrued management fee | 1,444 | |
Distribution and service plan fees payable | 255 | |
Other affiliated payables | 684 | |
Other payables and accrued expenses | 757 | |
Total liabilities | | 1,187,488 |
| | |
Net Assets | | $ 5,436,579 |
Net Assets consist of: | | |
Paid in capital | | $ 5,353,039 |
Undistributed net investment income | | 3,540 |
Accumulated undistributed net realized gain (loss) on investments | | 5,364 |
Net unrealized appreciation (depreciation) on investments | | 74,636 |
Net Assets | | $ 5,436,579 |
See accompanying notes which are an integral part of the financial statements.
Semiannual Report
Financial Statements - continued
Statement of Assets and Liabilities - continued
Amounts in thousands (except per-share amounts) | January 31, 2011 (Unaudited) |
| | |
Calculation of Maximum Offering Price
Class A:
Net Asset Value and redemption price per share
($379,477 ÷ 36,397.7 shares) | | $ 10.43 |
| | |
Maximum offering price per share (100/96.00 of $10.43) | | $ 10.86 |
Class T:
Net Asset Value and redemption price per share ($300,963 ÷ 28,870.9 shares) | | $ 10.42 |
| | |
Maximum offering price per share (100/96.00 of $10.42) | | $ 10.85 |
Class B:
Net Asset Value and offering price per share ($30,026 ÷ 2,880.9 shares)A | | $ 10.42 |
| | |
Class C:
Net Asset Value and offering price per share ($101,833 ÷ 9,769.2 shares)A | | $ 10.42 |
| | |
Government Income:
Net Asset Value, offering price and redemption price per share ($4,321,327 ÷ 415,077.7 shares) | | $ 10.41 |
| | |
Institutional Class:
Net Asset Value, offering price and redemption price per share ($302,953 ÷ 29,060.5 shares) | | $ 10.42 |
A Redemption price per share is equal to net asset value less any applicable contingent deferred sales charge.
See accompanying notes which are an integral part of the financial statements.
Semiannual Report
Statement of Operations
Amounts in thousands | Six months ended January 31, 2011 (Unaudited) |
| | |
Investment Income | | |
Interest | | $ 76,058 |
| | |
Expenses | | |
Management fee | $ 9,314 | |
Transfer agent fees | 3,344 | |
Distribution and service plan fees | 1,665 | |
Fund wide operations fee | 988 | |
Independent trustees' compensation | 12 | |
Miscellaneous | 12 | |
Total expenses | | 15,335 |
Net investment income | | 60,723 |
Realized and Unrealized Gain (Loss) Net realized gain (loss) on: | | |
Investment securities: | | |
Unaffiliated issuers | 67,918 | |
Futures contracts | 95 | |
Swap agreements | (5,245) | |
Total net realized gain (loss) | | 62,768 |
Change in net unrealized appreciation (depreciation) on: Investment securities | (158,471) | |
Swap agreements | 5,601 | |
Delayed delivery commitments | 3,809 | |
Total change in net unrealized appreciation (depreciation) | | (149,061) |
Net gain (loss) | | (86,293) |
Net increase (decrease) in net assets resulting from operations | | $ (25,570) |
See accompanying notes which are an integral part of the financial statements.
Semiannual Report
Financial Statements - continued
Statement of Changes in Net Assets
Amounts in thousands | Six months ended January 31, 2011 (Unaudited) | Year ended
July 31,
2010 |
Increase (Decrease) in Net Assets | | |
Operations | | |
Net investment income | $ 60,723 | $ 145,918 |
Net realized gain (loss) | 62,768 | 139,116 |
Change in net unrealized appreciation (depreciation) | (149,061) | 85,404 |
Net increase (decrease) in net assets resulting
from operations | (25,570) | 370,438 |
Distributions to shareholders from net investment income | (59,877) | (140,387) |
Distributions to shareholders from net realized gain | (140,821) | (196,760) |
Total distributions | (200,698) | (337,147) |
Share transactions - net increase (decrease) | (352,327) | 203,871 |
Total increase (decrease) in net assets | (578,595) | 237,162 |
| | |
Net Assets | | |
Beginning of period | 6,015,174 | 5,778,012 |
End of period (including undistributed net investment income of $3,540 and undistributed net investment income of $2,694, respectively) | $ 5,436,579 | $ 6,015,174 |
See accompanying notes which are an integral part of the financial statements.
Semiannual Report
Financial Highlights - Class A
| Six months ended
January 31, 2011 | Years ended July 31, |
| (Unaudited) | 2010 | 2009 | 2008 | 2007 F |
Selected Per-Share Data | | | | | |
Net asset value, beginning of period | $ 10.84 | $ 10.77 | $ 10.40 | $ 10.01 | $ 9.98 |
Income from Investment Operations | | | | | |
Net investment income E | .097 | .242 | .356 | .402 | .311 |
Net realized and unrealized gain (loss) | (.156) | .424 | .466 | .387 | .033 |
Total from investment operations | (.059) | .666 | .822 | .789 | .344 |
Distributions from net investment income | (.095) | (.231) | (.352) | (.399) | (.314) |
Distributions from net realized gain | (.256) | (.365) | (.100) | - | - |
Total distributions | (.351) | (.596) | (.452) | (.399) | (.314) |
Net asset value, end of period | $ 10.43 | $ 10.84 | $ 10.77 | $ 10.40 | $ 10.01 |
Total Return B, C, D | (.57)% | 6.44% | 8.03% | 7.96% | 3.49% |
Ratios to Average Net Assets G | | | | |
Expenses before reductions | .76% A | .77% | .77% | .81% | .78% A |
Expenses net of fee waivers, if any | .76% A | .77% | .77% | .81% | .78% A |
Expenses net of all reductions | .76% A | .77% | .77% | .80% | .77% A |
Net investment income | 1.80% A | 2.28% | 3.33% | 3.88% | 4.08% A |
Supplemental Data | | | | | |
Net assets, end of period (in millions) | $ 379 | $ 431 | $ 437 | $ 232 | $ 145 |
Portfolio turnover rate | 420% A | 355% | 380% H | 269% | 164% H |
A Annualized
B Total returns for periods of less than one year are not annualized.
C Total returns would have been lower had certain expenses not been reduced during the periods shown.
D Total returns do not include the effect of the sales charges.
E Calculated based on average shares outstanding during the period.
F For the period October 24, 2006 (commencement of sale of shares) to July 31, 2007.
G Expense ratios reflect operating expenses of the class. Expenses before reductions do not reflect amounts reimbursed by the investment adviser or reductions from expense offset arrangements and do not represent the amount paid by the class during periods when reimbursements or reductions occur. Expenses net of fee waivers reflect expenses after reimbursement by the investment adviser but prior to reductions from expense offset arrangements. Expenses net of all reductions represent the net expenses paid by the class.
H The portfolio turnover rate does not include the assets acquired in the merger.
See accompanying notes which are an integral part of the financial statements.
Semiannual Report
Financial Highlights - Class T
| Six months ended
January 31, 2011 | Years ended July 31, |
| (Unaudited) | 2010 | 2009 | 2008 | 2007 F |
Selected Per-Share Data | | | | | |
Net asset value, beginning of period | $ 10.84 | $ 10.77 | $ 10.40 | $ 10.01 | $ 9.98 |
Income from Investment Operations | | | | | |
Net investment income E | .098 | .243 | .357 | .404 | .306 |
Net realized and unrealized gain (loss) | (.166) | .425 | .466 | .387 | .036 |
Total from investment operations | (.068) | .668 | .823 | .791 | .342 |
Distributions from net investment income | (.096) | (.233) | (.353) | (.401) | (.312) |
Distributions from net realized gain | (.256) | (.365) | (.100) | - | - |
Total distributions | (.352) | (.598) | (.453) | (.401) | (.312) |
Net asset value, end of period | $ 10.42 | $ 10.84 | $ 10.77 | $ 10.40 | $ 10.01 |
Total Return B, C, D | (.66)% | 6.45% | 8.04% | 7.98% | 3.46% |
Ratios to Average Net Assets G | | | | |
Expenses before reductions | .75% A | .76% | .76% | .78% | .79% A |
Expenses net of fee waivers, if any | .75% A | .76% | .76% | .78% | .79% A |
Expenses net of all reductions | .75% A | .76% | .76% | .78% | .79% A |
Net investment income | 1.81% A | 2.29% | 3.33% | 3.90% | 4.02% A |
Supplemental Data | | | | | |
Net assets, end of period (in millions) | $ 301 | $ 335 | $ 324 | $ 236 | $ 181 |
Portfolio turnover rate | 420% A | 355% | 380% H | 269% | 164% H |
A Annualized
B Total returns for periods of less than one year are not annualized.
C Total returns would have been lower had certain expenses not been reduced during the periods shown.
D Total returns do not include the effect of the sales charges.
E Calculated based on average shares outstanding during the period.
F For the period October 24, 2006 (commencement of sale of shares) to July 31, 2007.
G Expense ratios reflect operating expenses of the class. Expenses before reductions do not reflect amounts reimbursed by the investment adviser or reductions from expense offset arrangements and do not represent the amount paid by the class during periods when reimbursements or reductions occur. Expenses net of fee waivers reflect expenses after reimbursement by the investment adviser but prior to reductions from expense offset arrangements. Expenses net of all reductions represent the net expenses paid by the class.
H The portfolio turnover rate does not include the assets acquired in the merger.
See accompanying notes which are an integral part of the financial statements.
Semiannual Report
Financial Highlights - Class B
| Six months ended
January 31, 2011 | Years ended July 31, |
| (Unaudited) | 2010 | 2009 | 2008 | 2007 F |
Selected Per-Share Data | | | | | |
Net asset value, beginning of period | $ 10.84 | $ 10.77 | $ 10.40 | $ 10.01 | $ 9.98 |
Income from Investment Operations | | | | | |
Net investment income E | .058 | .164 | .278 | .329 | .251 |
Net realized and unrealized gain (loss) | (.166) | .425 | .467 | .387 | .037 |
Total from investment operations | (.108) | .589 | .745 | .716 | .288 |
Distributions from net investment income | (.056) | (.154) | (.275) | (.326) | (.258) |
Distributions from net realized gain | (.256) | (.365) | (.100) | - | - |
Total distributions | (.312) | (.519) | (.375) | (.326) | (.258) |
Net asset value, end of period | $ 10.42 | $ 10.84 | $ 10.77 | $ 10.40 | $ 10.01 |
Total Return B, C, D | (1.02)% | 5.67% | 7.25% | 7.21% | 2.91% |
Ratios to Average Net Assets G | | | | |
Expenses before reductions | 1.49% A | 1.50% | 1.50% | 1.51% | 1.50% A |
Expenses net of fee waivers, if any | 1.49% A | 1.50% | 1.50% | 1.51% | 1.50% A |
Expenses net of all reductions | 1.49% A | 1.50% | 1.50% | 1.50% | 1.50% A |
Net investment income | 1.08% A | 1.55% | 2.60% | 3.17% | 3.30% A |
Supplemental Data | | | | | |
Net assets, end of period (in millions) | $ 30 | $ 38 | $ 48 | $ 41 | $ 43 |
Portfolio turnover rate | 420% A | 355% | 380% H | 269% | 164% H |
A Annualized
B Total returns for periods of less than one year are not annualized.
C Total returns would have been lower had certain expenses not been reduced during the periods shown.
D Total returns do not include the effect of the contingent deferred sales charge.
E Calculated based on average shares outstanding during the period.
F For the period October 24, 2006 (commencement of sale of shares) to July 31, 2007.
G Expense ratios reflect operating expenses of the class. Expenses before reductions do not reflect amounts reimbursed by the investment adviser or reductions from expense offset arrangements and do not represent the amount paid by the class during periods when reimbursements or reductions occur. Expenses net of fee waivers reflect expenses after reimbursement by the investment adviser but prior to reductions from expense offset arrangements. Expenses net of all reductions represent the net expenses paid by the class.
H The portfolio turnover rate does not include the assets acquired in the merger.
See accompanying notes which are an integral part of the financial statements.
Semiannual Report
Financial Highlights - Class C
| Six months ended
January 31, 2011 | Years ended July 31, |
| (Unaudited) | 2010 | 2009 | 2008 | 2007 F |
Selected Per-Share Data | | | | | |
Net asset value, beginning of period | $ 10.84 | $ 10.77 | $ 10.40 | $ 10.01 | $ 9.98 |
Income from Investment Operations | | | | | |
Net investment income E | .057 | .163 | .275 | .326 | .249 |
Net realized and unrealized gain (loss) | (.165) | .425 | .468 | .387 | .033 |
Total from investment operations | (.108) | .588 | .743 | .713 | .282 |
Distributions from net investment income | (.056) | (.153) | (.273) | (.323) | (.252) |
Distributions from net realized gain | (.256) | (.365) | (.100) | - | - |
Total distributions | (.312) | (.518) | (.373) | (.323) | (.252) |
Net asset value, end of period | $ 10.42 | $ 10.84 | $ 10.77 | $ 10.40 | $ 10.01 |
Total Return B, C, D | (1.03)% | 5.66% | 7.23% | 7.18% | 2.85% |
Ratios to Average Net Assets G | | | | |
Expenses before reductions | 1.50% A | 1.51% | 1.52% | 1.53% | 1.55% A |
Expenses net of fee waivers, if any | 1.50% A | 1.51% | 1.52% | 1.53% | 1.55% A |
Expenses net of all reductions | 1.50% A | 1.51% | 1.51% | 1.53% | 1.55% A |
Net investment income | 1.06% A | 1.54% | 2.58% | 3.15% | 3.26% A |
Supplemental Data | | | | | |
Net assets, end of period (in millions) | $ 102 | $ 118 | $ 131 | $ 71 | $ 39 |
Portfolio turnover rate | 420% A | 355% | 380% H | 269% | 164% H |
A Annualized
B Total returns for periods of less than one year are not annualized.
C Total returns would have been lower had certain expenses not been reduced during the periods shown.
D Total returns do not include the effect of the contingent deferred sales charge.
E Calculated based on average shares outstanding during the period.
F For the period October 24, 2006 (commencement of sale of shares) to July 31, 2007.
G Expense ratios reflect operating expenses of the class. Expenses before reductions do not reflect amounts reimbursed by the investment adviser or reductions from expense offset arrangements and do not represent the amount paid by the class during periods when reimbursements or reductions occur. Expenses net of fee waivers reflect expenses after reimbursement by the investment adviser but prior to reductions from expense offset arrangements. Expenses net of all reductions represent the net expenses paid by the class.
H The portfolio turnover rate does not include the assets acquired in the merger.
See accompanying notes which are an integral part of the financial statements.
Semiannual Report
Financial Highlights - Government Income
| Six months ended
January 31, 2011 | Years ended July 31, |
| (Unaudited) | 2010 | 2009 | 2008 | 2007 | 2006 |
Selected Per-Share Data | | | | | |
Net asset value, beginning of period | $ 10.82 | $ 10.76 | $ 10.38 | $ 10.00 | $ 9.95 | $ 10.20 |
Income from Investment Operations | | | | | | |
Net investment income D | .114 | .275 | .390 | .438 | .443 | .429 |
Net realized and unrealized gain (loss) | (.156) | .415 | .476 | .378 | .068 | (.274) |
Total from investment operations | (.042) | .690 | .866 | .816 | .511 | .155 |
Distributions from net investment income | (.112) | (.265) | (.386) | (.436) | (.456) | (.405) |
Distributions from net realized gain | (.256) | (.365) | (.100) | - | (.005) | - |
Total distributions | (.368) | (.630) | (.486) | (.436) | (.461) | (.405) |
Net asset value, end of period | $ 10.41 | $ 10.82 | $ 10.76 | $ 10.38 | $ 10.00 | $ 9.95 |
Total Return B, C | (.41)% | 6.69% | 8.49% | 8.25% | 5.22% | 1.56% |
Ratios to Average Net Assets E | | | | | |
Expenses before reductions | .45% A | .45% | .45% | .45% | .45% | .45% |
Expenses net of fee waivers, if any | .45% A | .45% | .45% | .45% | .45% | .45% |
Expenses net of all reductions | .45% A | .45% | .45% | .45% | .44% | .44% |
Net investment income | 2.11% A | 2.60% | 3.65% | 4.23% | 4.42% | 4.27% |
Supplemental Data | | | | | |
Net assets, end of period (in millions) | $ 4,321 | $ 4,809 | $ 4,638 | $ 8,154 | $ 6,118 | $ 5,331 |
Portfolio turnover rate | 420% A | 355% | 380% F | 269% | 164% F | 108% |
A Annualized
B Total returns for periods of less than one year are not annualized.
C Total returns would have been lower had certain expenses not been reduced during the periods shown.
D Calculated based on average shares outstanding during the period.
E Expense ratios reflect operating expenses of the class. Expenses before reductions do not reflect amounts reimbursed by the investment adviser or reductions from expense offset arrangements and do not represent the amount paid by the class during periods when reimbursements or reductions occur. Expenses net of fee waivers reflect expenses after reimbursement by the investment adviser but prior to reductions from expense offset arrangements. Expenses net of all reductions represent the net expenses paid by the class.
F The portfolio turnover rate does not include the assets acquired in the merger.
See accompanying notes which are an integral part of the financial statements.
Semiannual Report
Financial Highlights - Institutional Class
| Six months ended
January 31, 2011 | Years ended July 31, |
| (Unaudited) | 2010 | 2009 | 2008 | 2007 E |
Selected Per-Share Data | | | | | |
Net asset value, beginning of period | $ 10.84 | $ 10.77 | $ 10.40 | $ 10.01 | $ 9.98 |
Income from Investment Operations | | | | | |
Net investment income D | .110 | .267 | .385 | .432 | .329 |
Net realized and unrealized gain (loss) | (.166) | .425 | .466 | .388 | .034 |
Total from investment operations | (.056) | .692 | .851 | .820 | .363 |
Distributions from net investment income | (.108) | (.257) | (.381) | (.430) | (.333) |
Distributions from net realized gain | (.256) | (.365) | (.100) | - | - |
Total distributions | (.364) | (.622) | (.481) | (.430) | (.333) |
Net asset value, end of period | $ 10.42 | $ 10.84 | $ 10.77 | $ 10.40 | $ 10.01 |
Total Return B, C | (.54)% | 6.70% | 8.32% | 8.28% | 3.67% |
Ratios to Average Net Assets F | | | | |
Expenses before reductions | .52% A | .53% | .51% | .51% | .53% A |
Expenses net of fee waivers, if any | .52% A | .53% | .51% | .51% | .53% A |
Expenses net of all reductions | .52% A | .53% | .51% | .51% | .53% A |
Net investment income | 2.04% A | 2.52% | 3.59% | 4.17% | 4.32% A |
Supplemental Data | | | | | |
Net assets, end of period (in millions) | $ 303 | $ 284 | $ 200 | $ 750 | $ 715 |
Portfolio turnover rate | 420% A | 355% | 380% G | 269% | 164% G |
A Annualized
B Total returns for periods of less than one year are not annualized.
C Total returns would have been lower had certain expenses not been reduced during the periods shown.
D Calculated based on average shares outstanding during the period.
E For the period October 24, 2006 (commencement of sale of shares) to July 31, 2007.
F Expense ratios reflect operating expenses of the class. Expenses before reductions do not reflect amounts reimbursed by the investment adviser or reductions from expense offset arrangements and do not represent the amount paid by the class during periods when reimbursements or reductions occur. Expenses net of fee waivers reflect expenses after reimbursement by the investment adviser but prior to reductions from expense offset arrangements. Expenses net of all reductions represent the net expenses paid by the class.
G The portfolio turnover rate does not include the assets acquired in the merger.
See accompanying notes which are an integral part of the financial statements.
Semiannual Report
Notes to Financial Statements
For the period ended January 31, 2011 (Unaudited)
(Amounts in thousands except ratios)
1. Organization.
Fidelity Government Income Fund (the Fund) is a fund of Fidelity Income Fund (the Trust) and is authorized to issue an unlimited number of shares. The Trust is registered under the Investment Company Act of 1940, as amended (the 1940 Act), as an open-end management investment company organized as a Massachusetts business trust. The Fund offers Class A, Class T, Class C, Government Income and Institutional Class shares, each of which, along with Class B shares, has equal rights as to assets and voting privileges. Effective after the close of business on September 1, 2010, Class B shares were closed to new accounts and additional purchases by existing shareholders. Each class has exclusive voting rights with respect to matters that affect that class. Class B shares will automatically convert to Class A shares after a holding period of seven years from the initial date of purchase. Investment income, realized and unrealized capital gains and losses, the common expenses of the Fund, and certain fund-level expense reductions, if any, are allocated on a pro-rata basis to each class based on the relative net assets of each class to the total net assets of the Fund. Each class differs with respect to transfer agent and distribution and service plan fees incurred. Certain expense reductions may also differ by class.
2. Significant Accounting Policies.
The financial statements have been prepared in conformity with accounting principles generally accepted in the United States of America (GAAP), which require management to make certain estimates and assumptions at the date of the financial statements. Actual results could differ from those estimates. Subsequent events, if any, through the date that the financial statements were issued have been evaluated in the preparation of the financial statements. The following summarizes the significant accounting policies of the Fund:
Security Valuation. Investments are valued as of 4:00 p.m. Eastern time on the last calendar day of the period. The Fund uses independent pricing services approved by the Board of Trustees to value its investments. When current market prices or quotations are not readily available or reliable, valuations may be determined in good faith in accordance with procedures adopted by the Board of Trustees. Factors used in determining value may include market or security specific events, changes in interest rates and credit quality. The frequency with which these procedures are used cannot be predicted and they may be utilized to a significant extent. The value used for net asset value (NAV) calculation under these procedures may differ from published prices for the same securities.
Semiannual Report
2. Significant Accounting Policies - continued
Security Valuation - continued
The Fund categorizes the inputs to valuation techniques used to value its investments into a disclosure hierarchy consisting of three levels as shown below.
Level 1 - quoted prices in active markets for identical investments
Level 2 - other significant observable inputs (including quoted prices for similar investments, interest rates, prepayment speeds, etc.)
Level 3 - unobservable inputs (including the Fund's own assumptions based on the best information available)
Changes in valuation techniques may result in transfers in or out of an assigned level within the disclosure hierarchy. Valuation techniques used to value the Fund's investments by major category are as follows.
Debt securities, including restricted securities, are valued based on evaluated prices received from independent pricing services or from dealers who make markets in such securities. For U.S. government and government agency obligations, pricing services utilize matrix pricing which considers yield or price of bonds of comparable quality, coupon, maturity and type as well as dealer supplied prices and are generally categorized as Level 2 in the hierarchy. For collateralized mortgage obligations and U.S. government agency mortgage securities, pricing services utilize matrix pricing which considers prepayment speed assumptions, attributes of the collateral, yield or price of bonds of comparable quality, coupon, maturity and type as well as dealer supplied prices and, accordingly, such securities are generally categorized as Level 2 in the hierarchy. Short-term securities with remaining maturities of sixty days or less for which quotations are not readily available are valued at amortized cost, which approximates fair value and are categorized as Level 2 in the hierarchy.
Swaps are marked-to-market daily based on valuations from independent pricing services or dealer-supplied valuations and changes in value are recorded as unrealized appreciation (depreciation). Pricing services utilize matrix pricing which considers comparisons to interest rate curves, credit spread curves, default possibilities and recovery rates and, as a result, swaps are generally categorized as Level 2 in the hierarchy.
When independent prices are unavailable or unreliable, debt securities and swaps may be valued utilizing pricing matrices which consider similar factors that would be used by independent pricing services. These are generally categorized as Level 2 in the hierarchy but may be Level 3 depending on the circumstances.
Semiannual Report
Notes to Financial Statements (Unaudited) - continued
(Amounts in thousands except ratios)
2. Significant Accounting Policies - continued
Investment Transactions and Income. For financial reporting purposes, the Fund's investment holdings and NAV include trades executed through the end of the last business day of the period. The NAV per share for processing shareholder transactions is calculated as of the close of business of the New York Stock Exchange (NYSE), normally 4:00 p.m. Eastern time and includes trades executed through the end of the prior business day. Gains and losses on securities sold are determined on the basis of identified cost. Interest income is accrued as earned. Interest income includes coupon interest and amortization of premium and accretion of discount on debt securities. The principal value on inflation-indexed securities is periodically adjusted to the rate of inflation and interest is accrued based on the principal value. The adjustments to principal due to inflation are reflected as increases or decreases to interest income even though principal is not received until maturity.
Expenses. Expenses directly attributable to a fund are charged to that fund. Expenses attributable to more than one fund are allocated among the respective funds on the basis of relative net assets or other appropriate methods. Expense estimates are accrued in the period to which they relate and adjustments are made when actual amounts are known.
Deferred Trustee Compensation. Under a Deferred Compensation Plan (the Plan), independent Trustees may elect to defer receipt of a portion of their annual compensation. Deferred amounts are invested in a cross-section of Fidelity funds, are marked-to-market and remain in the Fund until distributed in accordance with the Plan. The investment of deferred amounts and the offsetting payable to the Trustees are included in the accompanying Statement of Assets and Liabilities.
Income Tax Information and Distributions to Shareholders. Each year the Fund intends to qualify as a regulated investment company, including distributing substantially all of its taxable income and realized gains under Subchapter M of the Internal Revenue Code and filing its U.S. federal tax return. As a result, no provision for income taxes is required. A fund's federal tax return is subject to examination by the Internal Revenue Service (IRS) for a period of three years.
Dividends are declared and recorded daily and paid monthly from net investment income. Distributions from realized gains, if any, are declared and recorded on the ex-dividend date. Income dividends and capital gain distributions are declared separately for each class. Income and capital gain distributions are determined in accordance with income tax regulations, which may differ from GAAP.
Capital accounts within the financial statements are adjusted for permanent book-tax differences. These adjustments have no impact on net assets or the results of operations. Temporary book-tax differences will reverse in a subsequent period.
Semiannual Report
2. Significant Accounting Policies - continued
Income Tax Information and Distributions to Shareholders - continued
Book-tax differences are primarily due to swap agreements, market discount, deferred trustees compensation and losses deferred due to wash sales.
The federal tax cost of investment securities and unrealized appreciation (depreciation) as of period end were as follows:
Gross unrealized appreciation | $ 118,841 |
Gross unrealized depreciation | (43,098) |
Net unrealized appreciation (depreciation) on securities and other investments | $ 75,743 |
| |
Tax cost | $ 6,434,719 |
3. Operating Policies.
Repurchase Agreements. Fidelity Management & Research Company (FMR) has received an Exemptive Order from the Securities and Exchange Commission (the SEC) which permits the Fund and other affiliated entities of FMR to transfer uninvested cash balances into joint trading accounts which are then invested in repurchase agreements. The Fund may also invest directly with institutions in repurchase agreements. Repurchase agreements are collateralized by government or non-government securities. Upon settlement date, collateral is held in segregated accounts with custodian banks and may be obtained in the event of a default of the counterparty. The Fund monitors, on a daily basis, the value of the collateral to ensure it is at least equal to the principal amount of the repurchase agreement (including accrued interest). In the event of a default by the counterparty, realization of the collateral proceeds could be delayed, during which time the value of the collateral may decline.
Delayed Delivery Transactions and When-Issued Securities. The Fund may purchase or sell securities on a delayed delivery or when-issued basis. Payment and delivery may take place after the customary settlement period for that security. The price of the underlying securities and the date when the securities will be delivered and paid for are fixed at the time the transaction is negotiated. During the time a delayed delivery sell is outstanding, the contract is marked-to-market daily and equivalent deliverable securities are held for the transaction. The securities purchased on a delayed delivery or when-issued basis are identified as such in the Fund's Schedule of Investments. The Fund may receive compensation for interest forgone in the purchase of a delayed delivery or when-issued security. With respect to purchase commitments, the Fund identifies securities as segregated in its records with a value at least equal to the amount of the
Semiannual Report
Notes to Financial Statements (Unaudited) - continued
(Amounts in thousands except ratios)
3. Operating Policies - continued
Delayed Delivery Transactions and When-Issued Securities - continued
commitment. Losses may arise due to changes in the value of the underlying securities or if the counterparty does not perform under the contract's terms, or if the issuer does not issue the securities due to political, economic, or other factors.
Restricted Securities. The Fund may invest in securities that are subject to legal or contractual restrictions on resale. These securities generally may be resold in transactions exempt from registration or to the public if the securities are registered. Disposal of these securities may involve time-consuming negotiations and expense, and prompt sale at an acceptable price may be difficult. Information regarding restricted securities is included at the end of the Fund's Schedule of Investments.
4. Derivative Instruments.
Risk Exposures and the Use of Derivative Instruments. The Fund used derivative instruments (derivatives), including futures contracts and swap agreements, in order to meet its investment objectives. The strategy is to use derivatives to increase returns, to gain exposure to certain types of assets and to manage exposure to certain risks as defined below. The success of any strategy involving derivatives depends on analysis of numerous economic factors, and if the strategies for investment do not work as intended, the Fund may not achieve its objectives.
The Fund's use of derivatives increased or decreased its exposure to the following risk:
Interest Rate Risk | Interest rate risk relates to the fluctuations in the value of interest-bearing securities due to changes in the prevailing levels of market interest rates. |
The Fund is also exposed to additional risks from investing in derivatives, such as liquidity risk and counterparty credit risk. Liquidity risk is the risk that the Fund will be unable to sell the derivative in the open market in a timely manner. Counterparty credit risk is the risk that the counterparty will not be able to fulfill its obligation to the Fund. Derivative counterparty credit risk is managed through formal evaluation of the creditworthiness of all potential counterparties. On certain over-the-counter derivatives, the Fund attempts to reduce its exposure to counterparty credit risk by entering into an International Swaps and Derivatives Association (ISDA) Master Agreement on a bilateral basis with each of its counterparties. The ISDA Master Agreement gives each counterparty the right to terminate all transactions traded under such agreement if there is a certain deterioration in the credit quality of the other party. The ISDA Master Agreement gives the Fund the right, upon an event of default by the applicable counterparty or a termination of the agreement, to close out all transactions traded under such agreement and to net amounts owed under each transaction to one net payable by one
Semiannual Report
4. Derivative Instruments - continued
Risk Exposures and the Use of Derivative Instruments - continued
party to the other. To mitigate counterparty credit risk, the Fund offsets certain payables and/or receivables with collateral. Collateral in the form of cash or securities, if required, is held in segregated accounts with the Fund's custodian bank in accordance with the collateral agreements entered into between the Fund, the swap counterparty and the Fund's custodian bank, and is identified in the Schedule of Investments. The Fund could experience delays and costs in gaining access to the collateral even though it is held by the Fund's custodian bank. The Fund's maximum risk of loss from counterparty credit risk is generally the aggregate unrealized appreciation and unpaid counterparty fees in excess of any collateral pledged by the counterparty to the Fund. Counterparty risk related to exchange-traded futures contracts is minimal because of the protection provided by the exchange on which they trade. Derivatives involve, to varying degrees, risk of loss in excess of the amounts recognized in the Statement of Assets and Liabilities.
Net Realized Gain (Loss) and Change in Net Unrealized Appreciation (Depreciation) on Derivatives. The table below, which reflects the impacts of derivatives on the financial performance of the Fund, summarizes the net realized gain (loss) and change in net unrealized appreciation (depreciation) for derivatives during the period.
Risk Exposure / Derivative Type | Net Realized Gain
(Loss) | Change in Net
Unrealized
Appreciation
(Depreciation) |
Interest Rate Risk | | |
Futures Contracts | $ 95 | $ - |
Swap Agreements | (5,245) | 5,601 |
Total Interest Rate Risk (a)(b) | $ (5,150) | $ 5,601 |
(a) A summary of the value of derivatives by risk exposure as of period end, if any, is included at the end of the Schedule of Investments and is
representative of activity for the period.
(b) Total derivatives net realized gain (loss) included in the Statement of Operations is comprised of $95 for futures contracts and $(5,245) for
swap agreements.
Futures Contracts. A futures contract is an agreement between two parties to buy or sell a specified underlying instrument for a fixed price at a specified future date. The Fund used futures contracts to manage its exposure to the bond market, and to fluctuations in interest rates.
Upon entering into a futures contract, a fund is required to deposit either cash or securities (initial margin) with a clearing broker in an amount equal to a certain percentage of the face value of the contract. Futures contracts are marked-to-market daily and subsequent payments (variation margin) are made or received by a fund depending on the daily fluctuations in the value of the futures contracts and are recorded as unrealized
Semiannual Report
Notes to Financial Statements (Unaudited) - continued
(Amounts in thousands except ratios)
4. Derivative Instruments - continued
Futures Contracts - continued
appreciation or (depreciation). Realized gain or (loss) is recorded upon the expiration or closing of a futures contract. The net realized gain (loss) and change in net unrealized appreciation (depreciation) on futures contracts during the period is included in the Statement of Operations.
The underlying face amount at value of open futures contracts at period end, if any, is shown in the Schedule of Investments under the caption "Futures Contracts." This amount reflects each contract's exposure to the underlying instrument at period end. Securities deposited to meet initial margin requirements are identified in the Schedule of Investments. The receivable and/or payable for the variation margin are reflected in the Statement of Assets and Liabilities.
Certain risks arise upon entering into futures contracts, including the risk that an illiquid market limits the ability to close out a futures contract prior to settlement date.
Swap Agreements. A swap agreement (swap) is a contract between two parties to exchange future cash flows at periodic intervals based on a notional principal amount.
Details of swaps open at period end are included in the Schedule of Investments under the caption "Swap Agreements." Swaps are marked-to-market daily and changes in value are recorded as unrealized appreciation or (depreciation) and reflected in the Statement of Assets and Liabilities. Any upfront payments made or received upon entering a swap to compensate for differences between stated terms of the agreement and prevailing market conditions (e.g. credit spreads, interest rates or other factors) are recorded as realized gain or (loss) ratably over the term of the swap. Payments are exchanged at specified intervals, accrued daily commencing with the effective date of the contract and recorded as realized gain or (loss). Realized gain or (loss) is also recorded in the event of an early termination of a swap. The net realized gain (loss) and change in net unrealized appreciation (depreciation) on swaps during the period is included in the Statement of Operations.
Risks of loss include interest rate risk. In addition, there is the risk of failure by the counterparty to perform under the terms of the agreement and lack of liquidity in the market.
Interest Rate Swaps. Interest rate swaps are agreements between counterparties to exchange cash flows, one based on a fixed rate, and the other on a floating rate. The Fund entered into interest rate swaps to manage its exposure to interest rate changes. Changes in interest rates can have an effect on both the value of bond holdings as well as the amount of interest income earned. In general, the value of bonds can fall when interest rates rise and can rise when interest rates fall.
Semiannual Report
5. Fees and Other Transactions with Affiliates.
Management Fee. FMR and its affiliates provide the Fund with investment management related services for which the Fund pays a monthly management fee. The management fee is the sum of an individual fund fee rate that is based on an annual rate of .20% of the Fund's average net assets and a group fee rate that averaged .12% during the period. The group fee rate is based upon the average net assets of all the mutual funds advised by FMR. The group fee rate decreases as assets under management increase and increases as assets under management decrease. For the period, the total annualized management fee rate was .32% of the Fund's average net assets.
Distribution and Service Plan Fees. In accordance with Rule 12b-1 of the 1940 Act, the Fund has adopted separate Distribution and Service Plans for each class of shares. Certain classes pay Fidelity Distributors Corporation (FDC), an affiliate of FMR, separate Distribution and Service Fees, each of which is based on an annual percentage of each class' average net assets. In addition, FDC may pay financial intermediaries for selling shares of the Fund and providing shareholder support services. For the period, the Distribution and Service Fee rates, total fees and amounts retained by FDC were as follows:
| Distribution
Fee | Service
Fee | Total Fees | Retained
by FDC |
Class A | -% | .25% | $ 527 | $ 11 |
Class T | -% | .25% | 409 | - |
Class B | .65% | .25% | 157 | 114 |
Class C | .75% | .25% | 572 | 107 |
| | | $ 1,665 | $ 232 |
Sales Load. FDC receives a front-end sales charge of up to 4.00% for selling Class A shares and Class T shares, some of which is paid to financial intermediaries for selling shares of the Fund. FDC receives the proceeds of contingent deferred sales charges levied on Class A, Class T, Class B, and Class C redemptions. These charges depend on the holding period. The deferred sales charges range from 5% to 1% for Class B, 1% for Class C, ..75% for certain purchases of Class A shares and .25% for certain purchases of Class T shares.
For the period, sales charge amounts retained by FDC were as follows:
| Retained
by FDC |
Class A | $ 24 |
Class T | 9 |
Class B | 60 |
Class C | 16 |
| $ 109 |
* When Class B and Class C shares are initially sold, FDC pays commissions from its own resources to financial intermediaries through which the sales are made.
Semiannual Report
Notes to Financial Statements (Unaudited) - continued
(Amounts in thousands except ratios)
5. Fees and Other Transactions with Affiliates - continued
Transfer Agent Fees. Fidelity Investments Institutional Operations Company, Inc. (FIIOC), an affiliate of FMR, is the transfer, dividend disbursing and shareholder servicing agent for each class of the Fund. FIIOC receives account fees and asset-based fees that vary according to the account size and type of account of the shareholders of the respective classes of the Fund. FIIOC pays for typesetting, printing and mailing of shareholder reports, except proxy statements. For the period, transfer agent fees for each class were as follows:
| Amount | % of
Average
Net Assets* |
Class A | $ 355 | .17 |
Class T | 253 | .15 |
Class B | 43 | .24 |
Class C | 90 | .16 |
Government Income | 2,351 | .10 |
Institutional Class | 252 | .17 |
| $ 3,344 | |
* Annualized
Fund Wide Operations Fee. Pursuant to the Fund Wide Operations and Expense Agreement (FWOE), FMR has agreed to provide for fund level expenses (which do not include transfer agent, Rule 12b-1 fees, compensation of the independent Trustees, interest (including commitment fees), taxes or extraordinary expenses, if any) in return for a FWOE fee equal to .35% less the total amount of the management fee. The FWOE paid by the Fund is reduced by an amount equal to the fees and expenses paid to the independent Trustees. For the period, the FWOE fee was equivalent to an annualized rate of .03% of average net assets.
6. Committed Line of Credit.
The Fund participates with other funds managed by FMR or an affiliate in a $3.75 billion credit facility (the "line of credit") to be utilized for temporary or emergency purposes to fund shareholder redemptions or for other short-term liquidity purposes. The Fund has agreed to pay commitment fees on its pro-rata portion of the line of credit, which amounted to $12 and is reflected in Miscellaneous expenses on the Statement of Operations. During the period, there were no borrowings on this line of credit.
Semiannual Report
7. Security Lending.
The Fund lends portfolio securities through a lending agent from time to time in order to earn additional income. On the settlement date of the loan, the Fund receives collateral (in the form of U.S. Treasury obligations, letters of credit and/or cash) against the loaned securities and maintains collateral in an amount not less than 100% of the market value of the loaned securities during the period of the loan. The market value of the loaned securities is determined at the close of business of the Fund and any additional required collateral is delivered to the Fund on the next business day. If the borrower defaults on its obligation to return the securities loaned because of insolvency or other reasons, a fund could experience delays and costs in recovering the securities loaned or in gaining access to the collateral. Any cash collateral received is invested in the cash equivalents. At period end, there were no security loans outstanding. Security lending income represents the income earned on investing cash collateral, less rebates paid to borrowers and lending agent fees associated with the loan, plus any premium payments received for lending certain types of securities. Security lending income is presented in the Statement of Operations as a component of interest income. Total security lending income during the period amounted to $31.
8. Distributions to Shareholders.
Distributions to shareholders of each class were as follows:
| Six months ended
January 31,
2011 | Year ended
July 31,
2010 |
From net investment income | | |
Class A | $ 3,759 | $ 9,342 |
Class T | 2,937 | 6,865 |
Class B | 184 | 606 |
Class C | 596 | 1,669 |
Government Income | 49,420 | 116,185 |
Institutional Class | 2,981 | 5,720 |
Total | $ 59,877 | $ 140,387 |
From net realized gain | | |
Class A | $ 10,104 | $ 14,726 |
Class T | 7,830 | 10,744 |
Class B | 853 | 1,543 |
Class C | 2,724 | 4,162 |
Government Income | 112,442 | 158,363 |
Institutional Class | 6,868 | 7,222 |
Total | $ 140,821 | $ 196,760 |
Semiannual Report
Notes to Financial Statements (Unaudited) - continued
(Amounts in thousands except ratios)
9. Share Transactions.
Transactions for each class of shares were as follows:
| Shares | Dollars |
| Six months ended January 31, 2011 | Year ended
July 31, 2010 | Six months ended January 31, 2011 | Year ended
July 31, 2010 |
Class A | | | | |
Shares sold | 6,071 | 17,922 | $ 65,107 | $ 190,342 |
Reinvestment of distributions | 1,156 | 1,943 | 12,308 | 20,562 |
Shares redeemed | (10,602) | (20,615) | (112,639) | (218,378) |
Net increase (decrease) | (3,375) | (750) | $ (35,224) | $ (7,474) |
Class T | | | | |
Shares sold | 5,075 | 13,716 | $ 54,442 | $ 145,586 |
Reinvestment of distributions | 984 | 1,616 | 10,476 | 17,109 |
Shares redeemed | (8,116) | (14,473) | (86,528) | (153,287) |
Net increase (decrease) | (2,057) | 859 | $ (21,610) | $ 9,408 |
Class B | | | | |
Shares sold | 201 | 1,036 | $ 2,177 | $ 11,019 |
Reinvestment of distributions | 82 | 165 | 874 | 1,747 |
Shares redeemed | (900) | (2,202) | (9,613) | (23,321) |
Net increase (decrease) | (617) | (1,001) | $ (6,562) | $ (10,555) |
Class C | | | | |
Shares sold | 1,693 | 3,916 | $ 18,182 | $ 41,596 |
Reinvestment of distributions | 228 | 390 | 2,427 | 4,131 |
Shares redeemed | (2,997) | (5,610) | (31,838) | (59,334) |
Net increase (decrease) | (1,076) | (1,304) | $ (11,229) | $ (13,607) |
Government Income | | | | |
Shares sold | 66,216 | 155,285 | $ 707,086 | $ 1,646,227 |
Reinvestment of distributions | 14,567 | 24,826 | 154,944 | 262,396 |
Shares redeemed | (110,000) | (166,873) | (1,169,626) | (1,763,484) |
Net increase (decrease) | (29,217) | 13,238 | $ (307,596) | $ 145,139 |
Institutional Class | | | | |
Shares sold | 6,299 | 13,487 | $ 67,140 | $ 143,092 |
Reinvestment of distributions | 885 | 1,193 | 9,414 | 12,621 |
Shares redeemed | (4,364) | (7,047) | (46,660) | (74,753) |
Net increase (decrease) | 2,820 | 7,633 | $ 29,894 | $ 80,960 |
Semiannual Report
10. Other.
The Fund's organizational documents provide former and current trustees and officers with a limited indemnification against liabilities arising in connection with the performance of their duties to the Fund. In the normal course of business, the Fund may also enter into contracts that provide general indemnifications. The Fund's maximum exposure under these arrangements is unknown as this would be dependent on future claims that may be made against the Fund. The risk of material loss from such claims is considered remote.
Semiannual Report
Board Approval of Investment Advisory Contracts and Management Fees
Fidelity Government Income Fund
Each year, the Board of Trustees, including the Independent Trustees (together, the Board), votes on the renewal of the management contract and sub-advisory agreements (together, the Advisory Contracts) for the fund. The Board, assisted by the advice of fund counsel and Independent Trustees' counsel, requests and considers a broad range of information relevant to the renewal of the Advisory Contracts throughout the year.
The Board meets regularly and considers at each of its meetings factors that are relevant to its annual consideration of the renewal of the fund's Advisory Contracts, including the services and support provided to the fund and its shareholders. The Board has established three standing committees, each composed of Independent Trustees with varying backgrounds, to which the Board has assigned specific subject matter responsibilities in order to enhance effective decision-making by the Board. The Operations Committee, of which all of the Independent Trustees are members, meets regularly throughout the year and, among other matters, considers matters specifically related to the annual consideration of the renewal of the fund's Advisory Contracts. The Board, acting directly and through its Committees, requests and receives information concerning the annual consideration of the renewal of the fund's Advisory Contracts. The Board also meets as needed to consider matters specifically related to the Board's annual consideration of the renewal of Advisory Contracts. Members of the Board may also meet with trustees of other Fidelity funds through ad hoc joint committees to discuss certain matters relevant to the Fidelity funds.
At its September 2010 meeting, the Board of Trustees, including the Independent Trustees, unanimously determined to renew the fund's Advisory Contracts. In reaching its determination, the Board considered all factors it believed relevant, including (i) the nature, extent, and quality of the services to be provided to the fund and its shareholders (including the investment performance of the fund); (ii) the competitiveness of the fund's management fee and total expenses; (iii) the total costs of the services to be provided by and the profits to be realized by Fidelity from its relationship with the fund; (iv) the extent to which economies of scale would be realized as the fund grows; and (v) whether fee levels reflect these economies of scale, if any, for the benefit of fund shareholders.
In considering whether to renew the Advisory Contracts for the fund, the Board reached a determination, with the assistance of fund counsel and Independent Trustees' counsel and through the exercise of its business judgment, that the renewal of the Advisory Contracts is in the best interests of the fund and its shareholders and that the compensation to be received by Fidelity under the management contract is fair and reasonable. The Board's decision to renew the Advisory Contracts was not based on any single factor, but rather was based on a comprehensive consideration of all the information provided to the Board at its meetings throughout the year. The Board, in reaching its determination to renew the Advisory Contracts, is aware that shareholders in the fund have a broad range of investment choices available to them, including a wide choice among mutual funds offered by Fidelity's competitors, and that the fund's shareholders, with the opportunity to review and weigh the disclosure provided by the fund in its prospectus and other public disclosures, have chosen to invest in this fund, managed by Fidelity.
Semiannual Report
Board Approval of Investment Advisory Contracts and
Management Fees - continued
Nature, Extent, and Quality of Services Provided. The Board considered the staffing within the investment adviser, FMR, and the sub-advisers (together, the Investment Advisers), including the backgrounds of the fund's investment personnel and the fund's investment objective and discipline. The Independent Trustees also had discussions with senior management of Fidelity's investment operations and investment groups. The Board considered the structure of the portfolio manager compensation program and whether this structure provides appropriate incentives to act in the best interest of the fund.
Resources Dedicated to Investment Management and Support Services. The Board reviewed the size, education, and experience of the Investment Advisers' investment staff, their use of technology, and the Investment Advisers' approach to recruiting, training, and retaining portfolio managers and other research, advisory, and management personnel. The Board noted that Fidelity's analysts have access to a variety of technological tools and market and securities data that enable them to perform both fundamental and quantitative analysis and to specialize in various disciplines. The Board considered Fidelity's extensive global research capabilities that enable the Investment Advisers to aggregate data from various sources in an effort to produce positive investment results. The Board also considered that Fidelity's portfolio managers and analysts have access to daily portfolio attribution that allows for monitoring of a fund's portfolio, as well as an electronic communication system that provides immediate real-time access to research concerning issuers and credit enhancers. In addition, the Board considered the trading resources that are an integral part of the fixed-income portfolio management investment process.
Shareholder and Administrative Services. The Board considered (i) the nature, extent, quality, and cost of advisory, administrative, and shareholder services performed by the Investment Advisers and their affiliates under the Advisory Contracts and under separate agreements covering transfer agency, pricing and bookkeeping, and securities lending services for the fund; (ii) the nature and extent of the investment adviser's supervision of third party service providers, principally custodians and subcustodians; and (iii) the resources devoted to, and the record of compliance with, the fund's compliance policies and procedures.
The Board noted that the growth of fund assets over time across the complex allows Fidelity to reinvest in the development of services designed to enhance the value or convenience of the Fidelity funds as investment vehicles. These services include 24-hour access to account information and market information through telephone representatives and over the Internet, and investor education materials and asset allocation tools.
Semiannual Report
Investment in a Large Fund Family. The Board considered the benefits to shareholders of investing in a Fidelity fund, including the benefits of investing in a fund that is part of a large family of funds offering a variety of investment disciplines and providing a large variety of mutual fund investor services. The Board noted that Fidelity had taken, or had made recommendations that resulted in the Fidelity funds taking, a number of actions over the previous year that benefited particular funds, including (i) dedicating additional resources to investment research and restructuring and broadening the focus of the investment research teams; (ii) bolstering the senior management team that oversees asset management; (iii) launching Class F of certain funds as a lower-fee class available to Freedom K and Freedom Index Funds; (iv) lowering the initial investment minimums and ongoing balance requirements for Real Estate High Income Fund; (v) eliminating subsequent purchase minimums for all funds and adding a waiver of the investment minimum requirement for new accounts opened with the proceeds of a systematic withdrawal plan; (vi) eliminating the withdrawal minimum and maximum limits for systematic withdrawals from Advisor funds; (vii) expanding sales load waivers on Class A shares for Destiny Planholders and expanding Institutional Class eligibility for Class O Destiny Planholders; and (viii) changing certain Class A and Class T sales charge structures to further align them with industry practices.
Investment Performance. The Board considered whether the fund has operated in accordance with its investment objective, as well as its record of compliance with its investment restrictions. It also reviewed the fund's absolute investment performance for each class, as well as the fund's relative investment performance for each class measured over multiple periods against (i) a proprietary custom index, and (ii) a peer group of mutual funds deemed appropriate by Fidelity and reviewed by the Board. The following charts considered by the Board show, over the one-, three-, and five-year periods ended December 31, 2009, as available, the cumulative total returns of the retail class and Class C of the fund, the cumulative total returns of a proprietary custom index ("benchmark"), and a range of cumulative total returns of a peer group of mutual funds identified by Lipper Inc. as having an investment objective similar to that of the fund. The returns of the retail class and Class C show the performance of the highest performing class (based on five-year performance) and the lowest performing class (based on three-year performance), respectively. The box within each chart shows the 25th percentile return (bottom of box) and the 75th percentile return (top of box) of the peer group. Returns shown above the box are in the first quartile and returns shown below the box are in the fourth quartile. The percentage beaten numbers noted below each chart correspond to the percentile box and represent the percentage of funds in the peer group whose performance was equal to or lower than that of the class indicated. The fund's proprietary custom index is an index developed by FMR that represents the performance of the fund's general investment categories.
Semiannual Report
Board Approval of Investment Advisory Contracts and
Management Fees - continued
Fidelity Government Income Fund
The Board reviewed the fund's relative investment performance against its peer group and noted that the performance of the retail class of the fund was in the third quartile for the one-year period and the first quartile for the three- and five-year periods. The Board also noted that the investment performance of the retail class of the fund compared favorably to its benchmark for all the periods shown. The Board considered that the variations in performance among the fund's classes reflect the variations in class expenses, which result in lower performance for higher expense classes. The Board also reviewed the fund's performance since inception as well as performance in the current year.
Based on its review, and giving particular weight to the nature and quality of the resources dedicated by the Investment Advisers to maintain and improve relative performance and factoring in the unprecedented market events in recent years, the Board concluded that the nature, extent, and quality of investment management and support services and of shareholder and administrative services provided to the fund will benefit the fund's shareholders, particularly in light of the Board's view that the fund's shareholders benefit from investing in a fund that is part of a large family of funds offering a variety of investment disciplines and services.
Competitiveness of Management Fee and Total Fund Expenses. The Board considered the fund's management fee and total expenses compared to "mapped groups" of competitive funds and classes. Fidelity creates "mapped groups" by combining similar Lipper investment objective categories that have comparable management fee characteristics. Combining Lipper investment objective categories aids the Board's management fee and total expense comparisons by broadening the competitive group used for comparison and by reducing the number of universes to which various Fidelity funds are compared.
Semiannual Report
Management Fee. The Board considered two proprietary management fee comparisons for the 12-month periods shown in the chart below. The group of Lipper funds used by the Board for management fee comparisons is referred to below as the "Total Mapped Group" and, for the reasons explained above, is broader than the Lipper peer group used by the Board for performance comparisons. The Total Mapped Group comparison focuses on a fund's standing relative to the total universe of comparable funds available to investors, in terms of gross management fees before expense reimbursements or caps. "TMG %" represents the percentage of funds in the Total Mapped Group that had management fees that were lower than the fund's. For example, a TMG % of 9% means that 91% of the funds in the Total Mapped Group had higher management fees than the fund. The "Asset-Size Peer Group" (ASPG) comparison focuses on a fund's standing relative to non-Fidelity funds similar in size to the fund within the Total Mapped Group. The ASPG represents at least 15% of the funds in the Total Mapped Group with comparable asset size and management fee characteristics, subject to a minimum of 50 funds (or all funds in the Total Mapped Group if fewer than 50). Additional information, such as the ASPG quartile in which the fund's management fee ranked, is also included in the chart and considered by the Board.
Fidelity Government Income Fund
Semiannual Report
Board Approval of Investment Advisory Contracts and
Management Fees - continued
The Board noted that the fund's management fee ranked below the median of its Total Mapped Group and below the median of its ASPG for 2009.
Furthermore, the Board considered that it had approved an amendment (effective June 1, 2005) to the fund's management contract that lowered the fund's individual fund fee rate from 30 basis points to 20 basis points. The Board considered that the chart reflects the fund's lower management fee for 2005, as if the lower rate were in effect for the entire year.
Based on its review, the Board concluded that the fund's management fee is fair and reasonable in light of the services that the fund receives and the other factors considered.
Total Expenses. In its review of each class's total expenses, the Board considered the fund's management fee as well as other fund or class expenses, as applicable, such as transfer agent fees, pricing and bookkeeping fees, fund-paid 12b-1 fees, and custodial, legal, and audit fees. The Board also noted the effects of any waivers and reimbursements on fees and expenses. As part of its review, the Board also considered current and historical total expenses of each class of the fund compared to competitive fund median expenses. Each class of the fund is compared to those funds and classes in the Total Mapped Group (used by the Board for management fee comparisons) that have a similar sales load structure.
The Board also considered that the current contractual arrangements for the fund (i) have the effect of setting the total "fund-level" expenses (including, among certain other expenses, the management fee) for each class at 35 basis points, (ii) lower and limit the "class-level" transfer agent fee for the retail class to 10 basis points, and (iii) limit the total expenses for the retail class to 45 basis points. The fees and expenses payable under these contractual arrangements may not be increased without the approval of the Board and the shareholders of the applicable class. The fund's Advisor classes are subject to different "class-level" expenses (transfer agent fees and 12b-1 fees).
The Board noted that the total expenses of each class ranked below its competitive median for 2009.
The Board recognized that the fund's management contract incorporates a "group fee" structure, which provides for lower group fee rates as total fund assets under FMR's management increase, and for higher group fee rates as total fund assets under FMR's management decrease. FMR calculates the group fee rates based on a tiered asset "breakpoint" schedule that varies based on asset class. The Board noted, however, that because the current contractual arrangements set the total "fund-level" expenses for each class at 35 basis points, increases or decreases in the management fee due to changes in the group fee rate will not impact total expenses.
Fees Charged to Other Fidelity Clients. The Board also considered Fidelity fee structures and other information with respect to clients of FMR and its affiliates, such as other mutual funds advised or subadvised by FMR or its affiliates, pension plan clients, and other institutional clients. In March 2010, the Board created an ad hoc joint committee with the board of other Fidelity funds (the Committee) to review and compare Fidelity's institutional investment advisory business with its business of providing services to the Fidelity funds, including the differences in services provided, fees charged, and costs incurred, as well as competition in their respective marketplaces.
Semiannual Report
Based on its review of total expenses and fees charged to other Fidelity clients, the Board concluded that the total expenses of each class of the fund were reasonable in light of the services that the fund and its shareholders receive and the other factors considered, including the findings of the Committee.
Costs of the Services and Profitability. The Board considered the revenues earned and the expenses incurred by Fidelity in conducting the business of developing, marketing, distributing, managing, administering and servicing the fund and its shareholders. The Board also considered the level of Fidelity's profits in respect of all the Fidelity funds.
On an annual basis, FMR presents to the Board Fidelity's profitability for the fund. Fidelity calculates the profitability for each fund, as well as aggregate profitability for groups of Fidelity funds and all Fidelity funds, using a series of detailed revenue and cost allocation methodologies which originate with the audited books and records of Fidelity. The Audit Committee of the Board reviews any significant changes from the prior year's methodologies.
PricewaterhouseCoopers LLP (PwC), independent registered public accounting firm and auditor to Fidelity and certain Fidelity funds, has been engaged annually by the Board as part of the Board's assessment of Fidelity's profitability analysis. PwC's engagement includes the review and assessment of Fidelity's methodologies used in determining the revenues and expenses attributable to Fidelity's mutual fund business, and completion of agreed-upon procedures surrounding the mathematical accuracy of fund profitability and its conformity to allocation methodologies. After considering PwC's reports issued under the engagement and information provided by Fidelity, the Board believes that while other allocation methods may also be reasonable, Fidelity's profitability methodologies are reasonable in all material respects.
The Board has also reviewed Fidelity's non-fund businesses and fall-out benefits related to the mutual fund business as well as cases where Fidelity's affiliates may benefit from or be related to the fund's business.
The Board considered the costs of the services provided by and the profits realized by Fidelity in connection with the operation of the fund and were satisfied that the profitability was not excessive in the circumstances.
Economies of Scale. The Board considered whether there have been economies of scale in respect of the management of the Fidelity funds, whether the Fidelity funds (including the fund) have appropriately benefited from any such economies of scale, and whether there is potential for realization of any further economies of scale. The Board considered the extent to which the fund will benefit from economies of scale through increased services to the fund, through waivers or reimbursements, or through fee or expense reductions.
Semiannual Report
Board Approval of Investment Advisory Contracts and
Management Fees - continued
In February 2009, the Board and the board of other Fidelity funds created an ad hoc committee (the Economies of Scale Committee) to analyze whether FMR attains economies of scale in respect of the management and servicing of the Fidelity funds, whether the Fidelity funds have appropriately benefited from such economies of scale, and whether there is potential for realization of any further economies of scale.
The Board concluded, considering the findings of the Economies of Scale Committee, that any potential economies of scale are being appropriately shared between fund shareholders and Fidelity.
Additional Information Requested by the Board. In order to develop fully the factual basis for consideration of the Fidelity funds' Advisory Contracts, the Board requested and received additional information on certain topics, including (i) fund performance trends, actions to be taken by FMR to improve certain funds' overall performance, and Fidelity's long-term strategies for certain funds; (ii) Fidelity's fund profitability methodology and profitability trends for certain funds; (iii) portfolio manager changes that have occurred during the past year and the amount of the investment that each portfolio manager has made in the Fidelity fund(s) that he or she manages; (iv) Fidelity's compensation structure for portfolio managers, research analysts, and other key personnel, including its effects on fund profitability, the rationale for the compensation structure, and the extent to which current market conditions have affected retention and recruitment; (v) the compensation paid by FMR to fund sub-advisers on behalf of the Fidelity funds; (vi) Fidelity's fee structures and rationale for recommending different fees among different categories of funds and classes, as well as Fidelity's voluntary waiver of fees to maintain minimum yields for certain funds and classes; (vii) the rationale for any differences between fund fee structures and fee structures in place for other Fidelity clients; and (viii) explanations regarding the relative total expenses borne by certain funds and classes, total expense competitive trends, and actions that might be taken by FMR to reduce total expenses for certain funds and classes or to achieve further economies of scale.
Based on its evaluation of all of the conclusions noted above, and after considering all factors it believed relevant, the Board ultimately concluded that the advisory fee structures are fair and reasonable, and that the fund's Advisory Contracts should be renewed.
Semiannual Report
Investment Adviser
Fidelity Management & Research Company
Boston, MA
Investment Sub-Advisers
Fidelity Investments Money
Management, Inc.
Fidelity Management & Research
(U.K.) Inc.
Fidelity Management & Research
(Hong Kong) Limited
Fidelity Management & Research
(Japan) Inc.
General Distributor
Fidelity Distributors Corporation
Boston, MA
Transfer and Service Agents
Fidelity Investments Institutional Operations Company, Inc.
Boston, MA
Fidelity Service Company, Inc.
Boston, MA
Custodian
The Bank of New York Mellon
New York, NY
AGVT-USAN-0311
1.864213.103

(Fidelity Investment logo)(registered trademark)
Fidelity Advisor®
Government Income
Fund - Institutional Class
Semiannual Report
January 31, 2011
(2_fidelity_logos) (Registered_Trademark)
Institutional Class is a class of
Fidelity® Government Income Fund
Contents
Chairman's Message | <Click Here> | The Chairman's message to shareholders. |
Shareholder Expense Example | <Click Here> | An example of shareholder expenses. |
Investment Changes | <Click Here> | A summary of major shifts in the fund's investments over the past six months. |
Investments | <Click Here> | A complete list of the fund's investments with their market values. |
Financial Statements | <Click Here> | Statements of assets and liabilities, operations, and changes in net assets, as well as financial highlights. |
Notes | <Click Here> | Notes to the financial statements. |
Board Approval of Investment Advisory Contracts and Management Fees | <Click Here> | |
To view a fund's proxy voting guidelines and proxy voting record for the 12-month period ended June 30, visit http://www.fidelity.com/proxyvotingresults or visit the Securities and Exchange Commission's (SEC) web site at http://www.sec.gov. You may also call 1-877-208-0098 to request a free copy of the proxy voting guidelines.
Standard & Poor's, S&P and S&P 500 are registered service marks of The McGraw-Hill Companies, Inc. and have been licensed for use by Fidelity Distributors Corporation.
Other third party marks appearing herein are the property of their respective owners.
All other marks appearing herein are registered or unregistered trademarks or service marks of FMR LLC or an affiliated company.
This report and the financial statements contained herein are submitted for the general information of the shareholders of the fund. This report is not authorized for distribution to prospective investors in the fund unless preceded or accompanied by an effective prospectus.
A fund files its complete schedule of portfolio holdings with the SEC for the first and third quarters of each fiscal year on Form N-Q. Forms N-Q are available on the SEC's web site at http://www.sec.gov. A fund's Forms N-Q may be reviewed and copied at the SEC's Public Reference Room in Washington, DC. Information regarding the operation of the SEC's Public Reference Room may be obtained by calling 1-800-SEC-0330. For a complete list of a fund's portfolio holdings, view the most recent holdings listing, semiannual report, or annual report on Fidelity's web site at http://www.fidelity.com, http://www.advisor.fidelity.com, or http://www.401k.com, as applicable.
NOT FDIC INSURED • MAY LOSE VALUE • NO BANK GUARANTEE
Neither the fund nor Fidelity Distributors Corporation is a bank.
Semiannual Report
(photo_of_Abigail_P_Johnson)
Dear Shareholder:
Following a year in which the investment environment was volatile but generally supportive of most major asset classes, 2011 began on a positive note. U.S. equities gained ground in January, reaching their highest point since August 2008, amid indications the U.S. economy had turned a corner. Still, questions remained about the longer-term outlook, most notably persistently high unemployment. Financial markets are always unpredictable, of course, but there also are several time-tested investment principles that can help put the odds in your favor.
One of the basic tenets is to invest for the long term. Over time, riding out the markets' inevitable ups and downs has proven much more effective than selling into panic or chasing the hottest trend. Even missing only a few of the markets' best days can significantly diminish investor returns. Patience also affords the benefits of compounding - of earning interest on additional income or reinvested dividends and capital gains. There can be tax advantages and cost benefits to consider as well. While staying the course doesn't eliminate risk, it can considerably lessen the effect of short-term declines.
You can further manage your investing risk through diversification. And today, more than ever, geographic diversification should be taken into account. Studies indicate that asset allocation is the single most important determinant of a portfolio's long-term success. The right mix of stocks, bonds and cash - aligned to your particular risk tolerance and investment objective - is very important. Age-appropriate rebalancing is also an essential aspect of asset allocation. For younger investors, an emphasis on equities - which historically have been the best-performing asset class over time - is encouraged. As investors near their specific goal, such as retirement or sending a child to college, consideration may be given to replacing volatile assets (e.g. common stocks) with more-stable fixed investments (bonds or savings plans).
A third principle - investing regularly - can help lower the average cost of your purchases. Investing a certain amount of money each month or quarter helps ensure you won't pay for all your shares at market highs. This strategy - known as dollar cost averaging - also reduces "emotion" from investing, helping shareholders avoid selling weak performers just prior to an upswing, or chasing a hot performer just before a correction.
We invite you to contact us via the Internet, through our Investor Centers or by phone. It is our privilege to provide you the information you need to make the investments that are right for you.
Sincerely,
(The chairman's signature appears here.)
Abigail P. Johnson
Semiannual Report
Shareholder Expense Example
As a shareholder of the Fund, you incur two types of costs: (1) transaction costs, including sales charges (loads) on purchase payments or redemption proceeds, and (2) ongoing costs, including management fees, distribution and/or service (12b-1) fees and other Fund expenses. This Example is intended to help you understand your ongoing costs (in dollars) of investing in the Fund and to compare these costs with the ongoing costs of investing in other mutual funds.
The Example is based on an investment of $1,000 invested at the beginning of the period and held for the entire period (August 1, 2010 to January 31, 2011).
Actual Expenses
The first line of the accompanying table for each class of the Fund provides information about actual account values and actual expenses. You may use the information in this line, together with the amount you invested, to estimate the expenses that you paid over the period. Simply divide your account value by $1,000.00 (for example, an $8,600 account value divided by $1,000.00 = 8.6), then multiply the result by the number in the first line for a class of the Fund under the heading entitled "Expenses Paid During Period" to estimate the expenses you paid on your account during this period. A small balance maintenance fee of $12.00 that is charged once a year may apply for certain accounts with a value of less than $2,000. This fee is not included in the table below. If it was, the estimate of expenses you paid during the period would be higher, and your ending account value lower, by this amount.
Hypothetical Example for Comparison Purposes
The second line of the accompanying table for each class of the Fund provides information about hypothetical account values and hypothetical expenses based on a Class' actual expense ratio and an assumed rate of return of 5% per year before expenses, which is not the Class' actual return. The hypothetical account values and expenses may not be used to estimate the actual ending account balance or expenses you paid for the period. You may use this information to compare the ongoing costs of investing in the Fund and other funds. To do so, compare this 5% hypothetical example with the 5% hypothetical examples that appear in the shareholder reports of the other funds. A small balance maintenance fee of $12.00 that is charged once a year may apply for certain accounts with a value of less than $2,000. This fee is not included in the table below. If it was, the estimate of expenses you paid during the period would be higher, and your ending account value lower, by this amount.
Please note that the expenses shown in the table are meant to highlight your ongoing costs only and do not reflect any transaction costs. Therefore, the second line of the table is useful in comparing ongoing costs only, and will not help you determine the relative total costs of owning different funds. In addition, if these transactional costs were included, your costs would have been higher.
Semiannual Report
Shareholder Expense Example - continued
| Annualized
Expense Ratio | Beginning
Account Value
August 1, 2010 | Ending
Account Value
January 31, 2011 | Expenses Paid
During Period*
August 1, 2010
to January 31, 2011 |
Class A | .76% | | | |
Actual | | $ 1,000.00 | $ 994.30 | $ 3.82 |
HypotheticalA | | $ 1,000.00 | $ 1,021.37 | $ 3.87 |
Class T | .75% | | | |
Actual | | $ 1,000.00 | $ 993.40 | $ 3.77 |
HypotheticalA | | $ 1,000.00 | $ 1,021.42 | $ 3.82 |
Class B | 1.49% | | | |
Actual | | $ 1,000.00 | $ 989.80 | $ 7.47 |
HypotheticalA | | $ 1,000.00 | $ 1,017.69 | $ 7.58 |
Class C | 1.50% | | | |
Actual | | $ 1,000.00 | $ 989.70 | $ 7.52 |
HypotheticalA | | $ 1,000.00 | $ 1,017.64 | $ 7.63 |
Government Income | .45% | | | |
Actual | | $ 1,000.00 | $ 995.90 | $ 2.26 |
HypotheticalA | | $ 1,000.00 | $ 1,022.94 | $ 2.29 |
Institutional Class | .52% | | | |
Actual | | $ 1,000.00 | $ 994.60 | $ 2.61 |
HypotheticalA | | $ 1,000.00 | $ 1,022.58 | $ 2.65 |
A 5% return per year before expenses
* Expenses are equal to each Class' annualized expense ratio, multiplied by the average account value over the period, multiplied by 184/365 (to reflect the one-half year period).
Semiannual Report
Investment Changes (Unaudited)
Coupon Distribution as of January 31, 2011 |
| % of fund's
investments | % of fund's investments
6 months ago |
Zero coupon bonds | 1.3 | 1.9 |
0.01 - 0.99% | 8.9 | 7.5 |
1 - 1.99% | 15.3 | 16.6 |
2 - 2.99% | 12.7 | 8.3 |
3 - 3.99% | 15.1 | 16.5 |
4 - 4.99% | 14.9 | 17.0 |
5 - 5.99% | 16.2 | 15.3 |
6 - 6.99% | 7.6 | 6.5 |
7% and over | 4.0 | 3.9 |
Coupon distribution shows the range of stated interest rates on the fund's investments, excluding short-term investments. |
Weighted Average Maturity as of January 31, 2011 |
| | 6 months ago |
Years | 6.0 | 5.2 |
This is a weighted average of all the maturities of the securities held in a fund. Weighted Average Maturity (WAM) can be used as a measure of sensitivity to interest rate changes and markets changes. Generally, the longer the maturity, the greater the sensitivity to such changes. WAM is based on the dollar-weighted average length of time until principal payments must be paid. Depending on the types of securities held in a fund, certain maturity shortening devices (e.g., demand features, interest rate resets, and call options) may be taken into account when calculating the WAM. |
Duration as of January 31, 2011 |
| | 6 months ago |
Years | 4.5 | 4.2 |
Duration shows how much a bond fund's price fluctuates with changes in comparable interest rates. If rates rise 1%, for example, a fund with a five-year duration is likely to lose about 5% of its value. Other factors also can influence a bond fund's performance and share price. Accordingly, a bond fund's actual performance may differ from this example. |
Asset Allocation (% of fund's net assets) |
As of January 31, 2011* | As of July 31, 2010** |
| Mortgage
Securities 39.6% | | | Mortgage
Securities 32.2% | |
| CMOs and Other
Mortgage Related
Securities 9.3% | | | CMOs and Other
Mortgage Related
Securities 10.8% | |
| U.S. Treasury
Obligations 48.6% | | | U.S. Treasury
Obligations 53.3% | |
| U.S. Government
Agency Obligations† 17.8% | | | U.S. Government
Agency Obligations† 16.6% | |
| Short-Term
Investments and
Net Other Assets*** (15.3)% | | | Short-Term
Investments and
Net Other Assets*** (12.9)% | |
* Futures and Swaps | (2.5)% | | ** Futures and Swaps | (1.1)% | |

† Includes FDIC Guaranteed Corporate Securities. |
*** Short-Term Investments and Net Other Assets are not included in the pie chart. |
Semiannual Report
Investments January 31, 2011 (Unaudited)
Showing Percentage of Net Assets
U.S. Government and Government Agency Obligations - 66.4% |
| Principal Amount (000s) | | Value (000s) |
U.S. Government Agency Obligations - 10.1% |
Fannie Mae: | | | | |
0.375% 12/28/12 | | $ 50,670 | | $ 50,324 |
4.75% 11/19/12 | | 2,000 | | 2,149 |
Federal Home Loan Bank: | | | | |
0.875% 8/22/12 | | 8,580 | | 8,626 |
1.5% 1/16/13 | | 40,950 | | 41,555 |
1.875% 6/21/13 | | 97,650 | | 100,032 |
Freddie Mac: | | | | |
0.625% 12/28/12 | | 103,830 | | 103,831 |
1.375% 2/25/14 | | 17,725 | | 17,825 |
2.5% 1/7/14 | | 26,670 | | 27,646 |
4.125% 12/21/12 | | 5,375 | | 5,725 |
Israeli State (guaranteed by U.S. Government through Agency for International Development): | | | | |
5.5% 9/18/23 | | 55,500 | | 63,178 |
6.8% 2/15/12 | | 12,199 | | 12,246 |
Overseas Private Investment Corp. U.S. Government guaranteed participation certificates 6.77% 11/15/13 | | 3,069 | | 3,275 |
Private Export Funding Corp. secured: | | | | |
4.974% 8/15/13 | | 22,940 | | 25,263 |
5.66% 9/15/11 (a) | | 18,000 | | 18,556 |
5.685% 5/15/12 | | 24,035 | | 25,653 |
Small Business Administration guaranteed development participation certificates: | | | | |
Series 2002-20J Class 1, 4.75% 10/1/22 | | 4,120 | | 4,363 |
Series 2002-20K Class 1, 5.08% 11/1/22 | | 8,806 | | 9,409 |
Series 2003-P10B, Class 1 5.136% 8/10/13 | | 3,284 | | 3,478 |
Series 2004-20H Class 1, 5.17% 8/1/24 | | 2,650 | | 2,840 |
Tennessee Valley Authority: | | | | |
5.25% 9/15/39 | | 12,000 | | 12,311 |
5.375% 4/1/56 | | 8,429 | | 8,719 |
TOTAL U.S. GOVERNMENT AGENCY OBLIGATIONS | | 547,004 |
U.S. Treasury Inflation Protected Obligations - 3.9% |
U.S. Treasury Inflation-Indexed Notes 2.375% 4/15/11 | | 211,388 | | 213,440 |
U.S. Treasury Obligations - 44.7% |
U.S. Treasury Bonds: | | | | |
3.875% 8/15/40 | | 121,361 | | 107,386 |
4.25% 11/15/40 | | 21,096 | | 19,946 |
4.375% 2/15/38 | | 14,154 | | 13,787 |
U.S. Government and Government Agency Obligations - continued |
| Principal Amount (000s) | | Value (000s) |
U.S. Treasury Obligations - continued |
U.S. Treasury Bonds: - continued | | | | |
5% 5/15/37 | | $ 55,700 | | $ 59,956 |
5.25% 2/15/29 | | 78,950 | | 88,584 |
6.125% 11/15/27 | | 37,365 | | 46,047 |
6.125% 8/15/29 | | 2,877 | | 3,559 |
6.25% 8/15/23 | | 23,100 | | 28,752 |
7.25% 5/15/16 | | 51,167 | | 64,598 |
7.5% 11/15/16 | | 120,574 | | 155,154 |
8% 11/15/21 | | 14,605 | | 20,529 |
9.875% 11/15/15 | | 10,285 | | 14,111 |
U.S. Treasury Notes: | | | | |
0.5% 11/30/12 | | 19,000 | | 18,993 |
0.625% 12/31/12 | | 42,188 | | 42,256 |
0.75% 11/30/11 | | 64,680 | | 64,948 |
0.75% 12/15/13 | | 88,576 | | 88,126 |
0.875% 1/31/12 | | 31,081 | | 31,259 |
1% 12/31/11 | | 64,001 | | 64,424 |
1% 4/30/12 | | 602 | | 607 |
1% 1/15/14 | | 208,152 | | 208,363 |
1.25% 8/31/15 | | 500 | | 489 |
1.25% 10/31/15 | | 29,580 | | 28,780 |
1.375% 11/15/12 | | 19,743 | | 20,045 |
1.375% 11/30/15 | | 3,611 | | 3,527 |
1.75% 4/15/13 | | 10 | | 10 |
1.75% 7/31/15 | | 28,800 | | 28,841 |
1.875% 4/30/14 | | 53,549 | | 54,900 |
1.875% 8/31/17 | | 47,000 | | 44,955 |
1.875% 9/30/17 | | 87,400 | | 83,358 |
2.125% 5/31/15 | | 18,669 | | 19,054 |
2.125% 12/31/15 | | 90,816 | | 91,696 |
2.25% 11/30/17 | | 10,000 | | 9,738 |
2.375% 8/31/14 | | 20,000 | | 20,788 |
2.375% 9/30/14 | | 13,017 | | 13,524 |
2.375% 10/31/14 | | 77,497 | | 80,470 |
2.5% 6/30/17 | | 10,000 | | 9,981 |
2.625% 7/31/14 | | 83,808 | | 87,894 |
2.625% 4/30/16 | | 30,591 | | 31,451 |
2.625% 1/31/18 | | 31,840 | | 31,656 |
2.625% 8/15/20 | | 42,940 | | 40,488 |
2.625% 11/15/20 | | 38,089 | | 35,708 |
2.75% 11/30/16 | | 18,530 | | 18,970 |
U.S. Government and Government Agency Obligations - continued |
| Principal Amount (000s) | | Value (000s) |
U.S. Treasury Obligations - continued |
U.S. Treasury Notes: - continued | | | | |
2.75% 2/15/19 | | $ 13,700 | | $ 13,500 |
3% 9/30/16 | | 68,254 | | 71,032 |
3.125% 8/31/13 (e) | | 36,935 | | 39,174 |
3.125% 10/31/16 | | 88,448 | | 92,518 |
3.125% 1/31/17 | | 60,773 | | 63,332 |
3.5% 5/15/20 | | 44,137 | | 44,992 |
3.625% 8/15/19 | | 33,225 | | 34,627 |
3.625% 2/15/20 | | 67,640 | | 69,960 |
3.75% 11/15/18 | | 15,801 | | 16,774 |
4% 2/15/15 | | 12,619 | | 13,881 |
4.25% 11/15/17 | | 27,475 | | 30,283 |
4.5% 5/15/17 | | 24,685 | | 27,616 |
4.75% 8/15/17 | | 12,983 | | 14,724 |
TOTAL U.S. TREASURY OBLIGATIONS | | 2,430,121 |
Other Government Related - 7.7% |
Bank of America Corp.: | | | | |
2.1% 4/30/12 (FDIC Guaranteed) (b) | | 6,060 | | 6,185 |
3.125% 6/15/12 (FDIC Guaranteed) (b) | | 3,719 | | 3,855 |
Citibank NA: | | | | |
1.875% 5/7/12 (FDIC Guaranteed) (b) | | 87,150 | | 88,739 |
1.875% 6/4/12 (FDIC Guaranteed) (b) | | 33,000 | | 33,584 |
Citigroup Funding, Inc.: | | | | |
1.875% 10/22/12 (FDIC Guaranteed) (b) | | 40,500 | | 41,353 |
1.875% 11/15/12 (FDIC Guaranteed) (b) | | 18,920 | | 19,329 |
2% 3/30/12 (FDIC Guaranteed) (b) | | 16,000 | | 16,289 |
2.125% 7/12/12 (FDIC Guaranteed) (b) | | 8,784 | | 8,982 |
General Electric Capital Corp.: | | | | |
1.8% 3/11/11 (FDIC Guaranteed) (b) | | 60,000 | | 60,104 |
2% 9/28/12 (FDIC Guaranteed) (b) | | 11,000 | | 11,253 |
2.625% 12/28/12 (FDIC Guaranteed) (b) | | 16,154 | | 16,754 |
3% 12/9/11 (FDIC Guaranteed) (b) | | 4,720 | | 4,827 |
GMAC, Inc. 1.75% 10/30/12 (FDIC Guaranteed) (b) | | 51,106 | | 52,088 |
Goldman Sachs Group, Inc. 3.25% 6/15/12 (FDIC Guaranteed) (b) | | 3,714 | | 3,854 |
JPMorgan Chase & Co.: | | | | |
2.2% 6/15/12 (FDIC Guaranteed) (b) | | 9,200 | | 9,395 |
3.125% 12/1/11 (FDIC Guaranteed) (b) | | 790 | | 808 |
U.S. Government and Government Agency Obligations - continued |
| Principal Amount (000s) | | Value (000s) |
Other Government Related - continued |
National Credit Union Administration Guaranteed Notes: | | | | |
Series 2010-A1 Class A, 0.6106% 12/7/20 (NCUA Guaranteed) (f) | | $ 13,567 | | $ 13,581 |
Series 2010-R3 Class 1A, 0.8238% 12/8/20 (NCUA Guaranteed) (f) | | 27,754 | | 27,771 |
TOTAL OTHER GOVERNMENT RELATED | | 418,751 |
TOTAL U.S. GOVERNMENT AND GOVERNMENT AGENCY OBLIGATIONS (Cost $3,571,340) | 3,609,316 |
U.S. Government Agency - Mortgage Securities - 39.6% |
|
Fannie Mae - 26.2% |
2.017% 10/1/33 (f) | | 347 | | 358 |
2.142% 3/1/35 (f) | | 283 | | 293 |
2.167% 10/1/33 (f) | | 152 | | 157 |
2.194% 2/1/33 (f) | | 349 | | 361 |
2.213% 7/1/35 (f) | | 141 | | 146 |
2.243% 12/1/34 (f) | | 375 | | 386 |
2.295% 11/1/33 (f) | | 974 | | 1,015 |
2.316% 3/1/35 (f) | | 59 | | 61 |
2.532% 7/1/34 (f) | | 182 | | 190 |
2.553% 10/1/33 (f) | | 275 | | 289 |
2.582% 3/1/35 (f) | | 182 | | 191 |
2.589% 6/1/36 (f) | | 260 | | 271 |
2.642% 7/1/35 (f) | | 2,254 | | 2,377 |
2.733% 7/1/35 (f) | | 630 | | 661 |
2.742% 11/1/36 (f) | | 220 | | 231 |
2.839% 9/1/35 (f) | | 2,786 | | 2,924 |
2.858% 2/1/34 (f) | | 113 | | 119 |
3% 2/1/26 (c) | | 36,000 | | 35,177 |
3.5% 2/1/26 (c)(d) | | 162,000 | | 162,889 |
3.5% 2/1/26 (c) | | 172,000 | | 172,943 |
3.5% 11/1/40 to 1/1/41 | | 41,086 | | 39,198 |
4% 9/1/13 to 11/1/40 (d) | | 81,202 | | 81,032 |
4% 2/1/26 (c) | | 3,000 | | 3,089 |
4% 2/1/26 (c) | | 3,000 | | 3,089 |
4% 2/1/41 (c) | | 14,000 | | 13,876 |
4.5% 6/1/25 to 11/1/40 | | 72,611 | | 74,305 |
U.S. Government Agency - Mortgage Securities - continued |
| Principal Amount (000s) | | Value (000s) |
Fannie Mae - continued |
4.5% 2/1/26 (c) | | $ 1,000 | | $ 1,048 |
4.5% 2/1/41 (c)(d) | | 30,000 | | 30,670 |
4.5% 2/1/41 (c)(d) | | 22,000 | | 22,491 |
4.5% 2/1/41 (c) | | 2,000 | | 2,045 |
4.5% 2/1/41 (c) | | 2,000 | | 2,045 |
4.5% 2/1/41 (c)(d) | | 18,000 | | 18,402 |
4.5% 2/1/41 (c)(d) | | 13,000 | | 13,290 |
4.5% 2/1/41 (c)(d) | | 12,000 | | 12,268 |
4.5% 3/1/41 (c) | | 67,000 | | 68,269 |
4.661% 2/1/34 (f) | | 2,947 | | 3,074 |
4.667% 8/1/36 (f) | | 2,681 | | 2,840 |
4.724% 2/1/36 (f) | | 751 | | 785 |
5% 6/1/14 to 9/1/40 | | 115,180 | | 121,428 |
5% 2/1/41 (c)(d) | | 53,000 | | 55,603 |
5% 2/1/41 (c) | | 59,000 | | 61,898 |
5.5% 10/1/20 to 3/1/39 | | 84,622 | | 90,735 |
5.5% 2/1/41 (c)(d) | | 66,000 | | 70,552 |
5.801% 5/1/36 (f) | | 687 | | 717 |
5.804% 3/1/36 (f) | | 2,706 | | 2,894 |
5.963% 3/1/37 (f) | | 595 | | 636 |
6% 3/1/17 to 9/1/39 | | 124,655 | | 135,438 |
6% 2/1/41 (c)(d) | | 50,000 | | 54,358 |
6% 2/1/41 (c)(d) | | 20,500 | | 22,287 |
6.5% 2/1/12 to 4/1/37 | | 17,728 | | 19,615 |
6.5% 2/1/41 (c)(d) | | 11,000 | | 12,244 |
7% 7/1/13 to 7/1/32 | | 2,891 | | 3,251 |
7.5% 7/1/11 to 4/1/29 | | 20 | | 23 |
8.5% 1/1/15 to 7/1/31 | | 254 | | 281 |
9% 5/1/14 | | 187 | | 195 |
9.5% 4/1/16 to 10/1/20 | | 300 | | 345 |
11.25% 5/1/14 | | 2 | | 2 |
11.5% 6/15/19 to 1/15/21 | | 382 | | 416 |
12.5% 8/1/15 to 3/1/16 | | 1 | | 1 |
| | 1,425,774 |
Freddie Mac - 4.9% |
2.041% 3/1/35 (f) | | 1,340 | | 1,377 |
2.108% 5/1/37 (f) | | 848 | | 876 |
2.615% 6/1/35 (f) | | 771 | | 812 |
2.663% 6/1/35 (f) | | 578 | | 606 |
3.022% 7/1/35 (f) | | 1,943 | | 2,053 |
3.352% 10/1/35 (f) | | 360 | | 381 |
U.S. Government Agency - Mortgage Securities - continued |
| Principal Amount (000s) | | Value (000s) |
Freddie Mac - continued |
3.513% 3/1/33 (f) | | $ 59 | | $ 62 |
3.71% 1/1/36 (f) | | 2,244 | | 2,327 |
4.441% 2/1/36 (f) | | 168 | | 177 |
4.5% 7/1/25 to 10/1/40 | | 11,046 | | 11,353 |
4.5% 2/1/41 (c)(d) | | 59,000 | | 60,244 |
4.5% 3/1/41 (c) | | 59,000 | | 60,041 |
5% 8/1/35 to 9/1/40 | | 23,382 | | 24,547 |
5.138% 4/1/35 (f) | | 291 | | 307 |
5.5% 8/1/16 to 1/1/40 | | 42,862 | | 46,174 |
5.527% 1/1/36 (f) | | 2,076 | | 2,170 |
6% 7/1/16 to 7/1/37 | | 14,160 | | 15,416 |
6.141% 7/1/36 (f) | | 884 | | 933 |
6.5% 3/1/11 to 3/1/36 | | 22,623 | | 24,877 |
6.5% 2/1/41 (c)(d) | | 9,000 | | 10,001 |
7% 4/1/11 | | 0 * | | 0 * |
7.5% 5/1/11 to 7/1/16 | | 736 | | 799 |
8.5% 5/1/17 to 9/1/29 | | 124 | | 142 |
9% 9/1/14 to 10/1/20 | | 23 | | 25 |
9.5% 5/1/17 to 8/1/21 | | 144 | | 163 |
9.75% 8/1/14 | | 97 | | 106 |
10% 11/15/18 to 8/1/21 | | 9 | | 10 |
11% 5/1/14 | | 29 | | 32 |
12% 3/1/15 | | 1 | | 1 |
12.5% 2/1/14 to 6/1/19 | | 5 | | 6 |
13% 6/1/14 to 6/1/15 | | 2 | | 2 |
| | 266,020 |
Ginnie Mae - 8.5% |
4% 1/15/25 to 10/20/25 | | 34,745 | | 36,343 |
4% 2/1/41 (c) | | 10,000 | | 10,027 |
4% 2/1/41 (c) | | 37,000 | | 37,098 |
4.5% 3/15/40 to 6/15/40 | | 24,499 | | 25,487 |
4.5% 2/1/41 (c) | | 52,000 | | 53,787 |
4.5% 2/1/41 (c) | | 22,000 | | 22,756 |
4.5% 2/1/41 (c)(d) | | 15,000 | | 15,518 |
5% 9/20/33 to 4/15/40 | | 51,693 | | 55,261 |
5% 2/1/41 (c) | | 1,300 | | 1,380 |
5.492% 4/20/60 (i) | | 22,890 | | 24,862 |
5.493% 11/20/59 (i) | | 28,188 | | 30,662 |
5.5% 12/15/38 to 3/15/39 | | 580 | | 627 |
5.5% 1/20/60 (i) | | 27,513 | | 29,889 |
5.5% 3/20/60 (i) | | 33,750 | | 36,668 |
U.S. Government Agency - Mortgage Securities - continued |
| Principal Amount (000s) | | Value (000s) |
Ginnie Mae - continued |
5.5% 3/20/60 (i) | | $ 29,684 | | $ 32,253 |
5.513% 2/20/60 (i) | | 25,184 | | 27,374 |
6% 11/20/31 to 11/20/33 | | 11,110 | | 12,215 |
6.5% 3/20/31 to 10/15/35 | | 7,552 | | 8,515 |
7% 10/15/26 to 8/15/32 | | 73 | | 83 |
7.5% 3/15/28 to 8/15/29 | | 66 | | 75 |
8% 7/15/19 to 12/15/23 | | 818 | | 930 |
8.5% 1/15/25 | | 1 | | 1 |
9.5% 2/15/25 | | 1 | | 1 |
10.5% 4/15/14 to 1/20/18 | | 53 | | 62 |
| | 461,874 |
TOTAL U.S. GOVERNMENT AGENCY - MORTGAGE SECURITIES (Cost $2,135,430) | 2,153,668 |
Collateralized Mortgage Obligations - 9.3% |
|
U.S. Government Agency - 9.3% |
Fannie Mae: | | | | |
floater Series 2007-89 Class EF, 0.82% 9/25/37 (f) | | 10,662 | | 10,673 |
planned amortization class: | | | | |
Series 1992-168 Class KB, 7% 10/25/22 | | 769 | | 849 |
Series 1993-207 Class H, 6.5% 11/25/23 | | 11,556 | | 12,989 |
Series 1993-240 Class PD, 6.25% 12/25/13 | | 1,371 | | 1,436 |
Series 1994-23 Class PZ, 6% 2/25/24 | | 12,400 | | 14,290 |
Series 1996-28 Class PK, 6.5% 7/25/25 | | 2,240 | | 2,487 |
Series 2003-28 Class KG, 5.5% 4/25/23 | | 4,940 | | 5,376 |
Series 2006-45 Class OP, 6/25/36 (h) | | 4,178 | | 3,689 |
Series 2006-62 Class KP, 4/25/36 (h) | | 9,052 | | 7,468 |
sequential payer: | | | | |
Series 1997-41 Class J, 7.5% 6/18/27 | | 1,647 | | 1,870 |
Series 2007-113 Class DB, 4.5% 12/25/22 | | 12,440 | | 13,204 |
Series 2007-115 Class BE, 4.5% 12/25/22 | | 15,400 | | 16,471 |
Series 2006-127 Class FD, 0.54% 7/25/36 (f) | | 14,254 | | 14,106 |
Series 2006-44 Class FK, 0.69% 6/25/36 (f) | | 5,174 | | 5,158 |
Series 2007-113 Class JD, 4.5% 12/25/22 | | 12,766 | | 13,504 |
Series 2010-37 Class GI, 5% 4/25/25 (g) | | 3,860 | | 370 |
Fannie Mae Stripped Mortgage-Backed Securities: | | | | |
sequential payer Series 377 Class 1, 10/1/36 (h) | | 11,913 | | 10,103 |
Series 384 Class 6, 5% 7/25/37 (g) | | 13,563 | | 2,320 |
Collateralized Mortgage Obligations - continued |
| Principal Amount (000s) | | Value (000s) |
U.S. Government Agency - continued |
Fannie Mae subordinate REMIC pass-thru certificates: | | | | |
floater: | | | | |
Series 2001-38 Class QF, 1.24% 8/25/31 (f) | | $ 383 | | $ 391 |
Series 2002-49 Class FB, 0.8613% 11/18/31 (f) | | 530 | | 533 |
Series 2002-60 Class FV, 1.26% 4/25/32 (f) | | 223 | | 228 |
Series 2002-75 Class FA, 1.26% 11/25/32 (f) | | 458 | | 467 |
Series 2006-79 Class PF, 0.66% 8/25/36 (f) | | 11,583 | | 11,547 |
Series 2008-76 Class EF, 0.76% 9/25/23 (f) | | 6,357 | | 6,361 |
planned amortization class: | | | | |
Series 2003-113 Class PE, 4% 11/25/18 | | 7,545 | | 7,933 |
Series 2004-21 Class QE, 4.5% 11/25/32 | | 1,500 | | 1,572 |
Series 2005-102 Class CO, 11/25/35 (h) | | 4,148 | | 3,582 |
Series 2005-81 Class PC, 5.5% 9/25/35 | | 2,150 | | 2,328 |
Series 2006-12 Class BO, 10/25/35 (h) | | 18,545 | | 16,003 |
Series 2006-37 Class OW, 5/25/36 (h) | | 4,606 | | 3,812 |
sequential payer: | | | | |
Series 1999-25 Class Z, 6% 6/25/29 | | 3,492 | | 3,845 |
Series 2001-20 Class Z, 6% 5/25/31 | | 10,772 | | 11,811 |
Series 2001-46 Class ZG, 6% 9/25/31 | | 3,919 | | 4,311 |
Series 2002-79 Class Z, 5.5% 11/25/22 | | 8,078 | | 8,717 |
Series 2005-117, Class JN, 4.5% 1/25/36 | | 645 | | 648 |
Series 2006-72 Class CY, 6% 8/25/26 | | 10,215 | | 11,225 |
Freddie Mac: | | | | |
planned amortization class Series 2115 Class PE, 6% 1/15/14 | | 262 | | 276 |
sequential payer Series 2114 Class ZM, 6% 1/15/29 | | 1,230 | | 1,353 |
Freddie Mac Manufactured Housing participation certificates guaranteed: | | | | |
floater Series 1686 Class FA, 1.2125% 2/15/24 (f) | | 1,017 | | 1,042 |
planned amortization class Series 1681 Class PJ, 7% 12/15/23 | | 666 | | 668 |
Freddie Mac Multi-class participation certificates guaranteed: | | | | |
floater: | | | | |
Series 2530 Class FE, 0.8613% 2/15/32 (f) | | 289 | | 291 |
Series 2630 Class FL, 0.7613% 6/15/18 (f) | | 523 | | 528 |
Series 3008 Class SM, 0% 7/15/35 (f) | | 141 | | 140 |
Series 3279 Class FB, 0.5813% 2/15/37 (f) | | 5,072 | | 5,031 |
Series 3346 Class FA, 0.4913% 2/15/19 (f) | | 12,002 | | 11,996 |
planned amortization class: | | | | |
Series 1141 Class G, 9% 9/15/21 | | 209 | | 239 |
Series 2006-15 Class OP, 3/25/36 (h) | | 5,504 | | 4,509 |
Collateralized Mortgage Obligations - continued |
| Principal Amount (000s) | | Value (000s) |
U.S. Government Agency - continued |
Freddie Mac Multi-class participation certificates guaranteed: - continued | | | | |
planned amortization class: | | | | |
Series 2356 Class GD, 6% 9/15/16 | | $ 243 | | $ 262 |
Series 2376 Class JE, 5.5% 11/15/16 | | 1,619 | | 1,734 |
Series 2381 Class OG, 5.5% 11/15/16 | | 1,112 | | 1,188 |
Series 2628 Class OE, 4.5% 6/15/18 | | 6,815 | | 7,316 |
Series 2640 Class GE, 4.5% 7/15/18 | | 7,310 | | 7,879 |
Series 2682 Class LD, 4.5% 10/15/33 | | 777 | | 800 |
Series 2802 Class OB, 6% 5/15/34 | | 10,455 | | 11,511 |
Series 2810 Class PD, 6% 6/15/33 | | 815 | | 861 |
Series 2937 Class KC, 4.5% 2/15/20 | | 19,686 | | 21,206 |
Series 2962 Class BE, 4.5% 4/15/20 | | 15,015 | | 16,154 |
Series 3110 Class OP, 9/15/35 (h) | | 11,021 | | 9,046 |
Series 3119 Class PO, 2/15/36 (h) | | 13,546 | | 11,143 |
Series 3121 Class KO, 3/15/36 (h) | | 4,089 | | 3,489 |
Series 3123 Class LO, 3/15/36 (h) | | 8,820 | | 7,201 |
Series 3145 Class GO, 4/15/36 (h) | | 7,879 | | 6,494 |
Series 3147 Class PF, 0.5613% 4/15/36 (f) | | 12,885 | | 12,897 |
Series 3741 Class YU, 3.5% 11/15/22 | | 13,420 | | 13,601 |
sequential payer: | | | | |
Series 2135 Class JE, 6% 3/15/29 | | 1,464 | | 1,613 |
Series 2281 Class ZB, 6% 3/15/30 | | 2,523 | | 2,775 |
Series 2546 Class MJ, 5.5% 3/15/23 | | 2,861 | | 3,117 |
Series 2570 Class CU, 4.5% 7/15/17 | | 488 | | 501 |
Series 2587 Class AD, 4.71% 3/15/33 | | 5,785 | | 5,868 |
Series 2601 Class TB, 5.5% 4/15/23 | | 869 | | 950 |
Series 2729 Class GB, 5% 1/15/19 | | 7,359 | | 7,862 |
Series 2773 Class HC, 4.5% 4/15/19 | | 704 | | 746 |
Series 2860 Class CP, 4% 10/15/17 | | 259 | | 259 |
Series 2987 Class HE, 4.5% 6/15/20 | | 11,260 | | 12,000 |
Series 2998 Class LY, 5.5% 7/15/25 | | 2,011 | | 2,194 |
Series 3007 Class EW, 5.5% 7/15/25 | | 8,875 | | 9,679 |
Series 3013 Class VJ, 5% 1/15/14 | | 1,069 | | 1,124 |
Series 2863 Class DB, 4% 9/15/14 | | 632 | | 645 |
Series 3772 Class BI, 4.5% 10/15/18 (g) | | 16,056 | | 1,407 |
target amortization class: | | | | |
Series 2156 Class TC, 6.25% 5/15/29 | | 5,290 | | 5,802 |
Series 2877 Class JC, 5% 10/15/34 | | 260 | | 269 |
Ginnie Mae guaranteed REMIC pass-thru securities: | | | | |
floater: | | | | |
Series 2010-H17 Class FA, 0.5906% 7/20/60 (f)(i) | | 14,405 | | 14,232 |
Collateralized Mortgage Obligations - continued |
| Principal Amount (000s) | | Value (000s) |
U.S. Government Agency - continued |
Ginnie Mae guaranteed REMIC pass-thru securities: - continued | | | | |
floater: | | | | |
Series 2010-H18 Class AF, 0.5538% 9/1/60 (f)(i) | | $ 14,839 | | $ 14,765 |
Series 2010-H19 Class FG, 0.5656% 8/20/60 (f)(i) | | 18,986 | | 18,682 |
planned amortization class Series 1997-8 Class PE, 7.5% 5/16/27 | | 2,627 | | 2,997 |
Series 2004-79 Class FA, 0.5606% 1/20/31 (f) | | 5,025 | | 5,032 |
TOTAL COLLATERALIZED MORTGAGE OBLIGATIONS (Cost $484,584) | 503,051 |
Cash Equivalents - 4.5% |
| Maturity Amount (000s) | | |
Investments in repurchase agreements in a joint trading account at 0.23%, dated 1/31/11 due 2/1/11 (Collateralized by U.S. Government Obligations) #
(Cost $244,427) | $ 244,429 | | 244,427 |
TOTAL INVESTMENT PORTFOLIO - 119.8% (Cost $6,435,781) | 6,510,462 |
NET OTHER ASSETS (LIABILITIES) - (19.8)% | (1,073,883) |
NET ASSETS - 100% | $ 5,436,579 |
Swap Agreements |
| Expiration Date | | Notional Amount (000s) | | |
Interest Rate Swaps |
Receive quarterly a floating rate based on 3-month LIBOR and pay semi-annually a fixed rate equal to 0.682% with JPMorgan Chase, Inc. | August 2012 | | $ 84,000 | | $ (308) |
Receive quarterly a floating rate based on 3-month LIBOR and pay semi-annually a fixed rate equal to 3.23% with Credit Suisse First Boston | May 2020 | | 50,000 | | 331 |
| | $ 134,000 | | $ 23 |
Legend |
(a) Security exempt from registration under Rule 144A of the Securities Act of 1933. These securities may be resold in transactions exempt from registration, normally to qualified institutional buyers. At the end of the period, the value of these securities amounted to $18,556,000 or 0.3% of net assets. |
(b) Under the Temporary Liquidity Guarantee Program, the Federal Deposit Insurance Corporation guarantees principal and interest in the event of payment default or bankruptcy until the earlier of maturity date of the debt or until June 30, 2012. At the end of the period these securities amounted to $377,399,000 or 6.9% of net assets. |
(c) Security or a portion of the security purchased on a delayed delivery or when-issued basis. |
(d) A portion of the security is subject to a forward commitment to sell. |
(e) Security or a portion of the security has been segregated as collateral for open swap agreements. At the period end, the value of securities pledged amounted to $1,061,000. |
(f) Coupon rates for floating and adjustable rate securities reflect the rates in effect at period end. |
(g) Security represents right to receive monthly interest payments on an underlying pool of mortgages or assets. Principal shown is the outstanding par amount of the pool held as of the end of the period. |
(h) Principal Only Strips represent the right to receive the monthly principal payments on an underlying pool of mortgage loans. |
(i) Represents an investment in an underlying pool of reverse mortgages which typically do not require regular principal and interest payments as repayment is deferred until a maturity event. |
* Amount repesents less than $1,000. |
# Additional information on each counterparty to the repurchase agreement is as follows: |
Repurchase Agreement / Counterparty | Value
(Amounts in thousands) |
$244,427,000 due 2/01/11 at 0.23% |
BNP Paribas Securities Corp. | $ 11,501 |
Bank of America NA | 74,921 |
Barclays Capital, Inc. | 5,853 |
Citigroup Global Markets, Inc. | 6,765 |
Credit Agricole Securities (USA), Inc. | 9,365 |
Deutsche Bank Securities, Inc. | 7,024 |
HSBC Securities (USA), Inc. | 28,096 |
J.P. Morgan Securities, Inc. | 9,365 |
Merrill Lynch Government Securities, Inc. | 8,429 |
Merrill Lynch, Pierce, Fenner & Smith, Inc. | 9,357 |
Mizuho Securities USA, Inc. | 42,144 |
Societe Generale, New York Branch | 18,730 |
Wells Fargo Securities LLC | 12,877 |
| $ 244,427 |
Other Information |
All investments are categorized as Level 2 under the Fair Value Hierarchy. The inputs or methodology used for valuing securities may not be an indication of the risk associated with investing in those securities. For more information on valuation inputs, please refer to the Security Valuation section in the accompanying Notes to Financial Statements. |
Value of Derivative Instruments |
The following table is a summary of the Fund's value of derivative instruments by risk exposure as of January 31, 2011. For additional information on derivative instruments, please refer to the Derivative Instruments section in the accompanying Notes to Financial Statements. |
Risk Exposure /
Derivative Type | Value
(Amounts in thousands) |
| Asset | Liability |
Interest Rate Risk | | |
Swap Agreements (a) | $ 331 | $ (308) |
Total Value of Derivatives | $ 331 | $ (308) |
(a) Value is disclosed on the Statement of Assets and Liabilities in the Unrealized Appreciation and Unrealized Depreciation on Swap Agreements line-items. |
See accompanying notes which are an integral part of the financial statements.
Semiannual Report
Statement of Assets and Liabilities
Amounts in thousands (except per-share amounts) | January 31, 2011 (Unaudited) |
| | |
Assets | | |
Investment in securities, at value (including repurchase agreements of $244,427) -
See accompanying schedule: Unaffiliated issuers (cost $6,435,781) | | $ 6,510,462 |
Commitment to sell securities on a delayed delivery basis | $ (594,237) | |
Receivable for securities sold on a delayed delivery basis | 594,169 | (68) |
Receivable for investments sold
Regular delivery | | 64,692 |
Delayed delivery | | 293 |
Receivable for fund shares sold | | 14,802 |
Interest receivable | | 32,797 |
Unrealized appreciation on swap agreements | | 331 |
Other receivables | | 758 |
Total assets | | 6,624,067 |
| | |
Liabilities | | |
Payable to custodian bank | $ 292 | |
Payable for investments purchased
Regular delivery | 58,102 | |
Delayed delivery | 1,113,210 | |
Payable for fund shares redeemed | 11,958 | |
Distributions payable | 478 | |
Unrealized depreciation on swap agreements | 308 | |
Accrued management fee | 1,444 | |
Distribution and service plan fees payable | 255 | |
Other affiliated payables | 684 | |
Other payables and accrued expenses | 757 | |
Total liabilities | | 1,187,488 |
| | |
Net Assets | | $ 5,436,579 |
Net Assets consist of: | | |
Paid in capital | | $ 5,353,039 |
Undistributed net investment income | | 3,540 |
Accumulated undistributed net realized gain (loss) on investments | | 5,364 |
Net unrealized appreciation (depreciation) on investments | | 74,636 |
Net Assets | | $ 5,436,579 |
See accompanying notes which are an integral part of the financial statements.
Semiannual Report
Financial Statements - continued
Statement of Assets and Liabilities - continued
Amounts in thousands (except per-share amounts) | January 31, 2011 (Unaudited) |
| | |
Calculation of Maximum Offering Price
Class A:
Net Asset Value and redemption price per share
($379,477 ÷ 36,397.7 shares) | | $ 10.43 |
| | |
Maximum offering price per share (100/96.00 of $10.43) | | $ 10.86 |
Class T:
Net Asset Value and redemption price per share ($300,963 ÷ 28,870.9 shares) | | $ 10.42 |
| | |
Maximum offering price per share (100/96.00 of $10.42) | | $ 10.85 |
Class B:
Net Asset Value and offering price per share ($30,026 ÷ 2,880.9 shares)A | | $ 10.42 |
| | |
Class C:
Net Asset Value and offering price per share ($101,833 ÷ 9,769.2 shares)A | | $ 10.42 |
| | |
Government Income:
Net Asset Value, offering price and redemption price per share ($4,321,327 ÷ 415,077.7 shares) | | $ 10.41 |
| | |
Institutional Class:
Net Asset Value, offering price and redemption price per share ($302,953 ÷ 29,060.5 shares) | | $ 10.42 |
A Redemption price per share is equal to net asset value less any applicable contingent deferred sales charge.
See accompanying notes which are an integral part of the financial statements.
Semiannual Report
Statement of Operations
Amounts in thousands | Six months ended January 31, 2011 (Unaudited) |
| | |
Investment Income | | |
Interest | | $ 76,058 |
| | |
Expenses | | |
Management fee | $ 9,314 | |
Transfer agent fees | 3,344 | |
Distribution and service plan fees | 1,665 | |
Fund wide operations fee | 988 | |
Independent trustees' compensation | 12 | |
Miscellaneous | 12 | |
Total expenses | | 15,335 |
Net investment income | | 60,723 |
Realized and Unrealized Gain (Loss) Net realized gain (loss) on: | | |
Investment securities: | | |
Unaffiliated issuers | 67,918 | |
Futures contracts | 95 | |
Swap agreements | (5,245) | |
Total net realized gain (loss) | | 62,768 |
Change in net unrealized appreciation (depreciation) on: Investment securities | (158,471) | |
Swap agreements | 5,601 | |
Delayed delivery commitments | 3,809 | |
Total change in net unrealized appreciation (depreciation) | | (149,061) |
Net gain (loss) | | (86,293) |
Net increase (decrease) in net assets resulting from operations | | $ (25,570) |
See accompanying notes which are an integral part of the financial statements.
Semiannual Report
Financial Statements - continued
Statement of Changes in Net Assets
Amounts in thousands | Six months ended January 31, 2011 (Unaudited) | Year ended
July 31,
2010 |
Increase (Decrease) in Net Assets | | |
Operations | | |
Net investment income | $ 60,723 | $ 145,918 |
Net realized gain (loss) | 62,768 | 139,116 |
Change in net unrealized appreciation (depreciation) | (149,061) | 85,404 |
Net increase (decrease) in net assets resulting
from operations | (25,570) | 370,438 |
Distributions to shareholders from net investment income | (59,877) | (140,387) |
Distributions to shareholders from net realized gain | (140,821) | (196,760) |
Total distributions | (200,698) | (337,147) |
Share transactions - net increase (decrease) | (352,327) | 203,871 |
Total increase (decrease) in net assets | (578,595) | 237,162 |
| | |
Net Assets | | |
Beginning of period | 6,015,174 | 5,778,012 |
End of period (including undistributed net investment income of $3,540 and undistributed net investment income of $2,694, respectively) | $ 5,436,579 | $ 6,015,174 |
See accompanying notes which are an integral part of the financial statements.
Semiannual Report
Financial Highlights - Class A
| Six months ended
January 31, 2011 | Years ended July 31, |
| (Unaudited) | 2010 | 2009 | 2008 | 2007 F |
Selected Per-Share Data | | | | | |
Net asset value, beginning of period | $ 10.84 | $ 10.77 | $ 10.40 | $ 10.01 | $ 9.98 |
Income from Investment Operations | | | | | |
Net investment income E | .097 | .242 | .356 | .402 | .311 |
Net realized and unrealized gain (loss) | (.156) | .424 | .466 | .387 | .033 |
Total from investment operations | (.059) | .666 | .822 | .789 | .344 |
Distributions from net investment income | (.095) | (.231) | (.352) | (.399) | (.314) |
Distributions from net realized gain | (.256) | (.365) | (.100) | - | - |
Total distributions | (.351) | (.596) | (.452) | (.399) | (.314) |
Net asset value, end of period | $ 10.43 | $ 10.84 | $ 10.77 | $ 10.40 | $ 10.01 |
Total Return B, C, D | (.57)% | 6.44% | 8.03% | 7.96% | 3.49% |
Ratios to Average Net Assets G | | | | |
Expenses before reductions | .76% A | .77% | .77% | .81% | .78% A |
Expenses net of fee waivers, if any | .76% A | .77% | .77% | .81% | .78% A |
Expenses net of all reductions | .76% A | .77% | .77% | .80% | .77% A |
Net investment income | 1.80% A | 2.28% | 3.33% | 3.88% | 4.08% A |
Supplemental Data | | | | | |
Net assets, end of period (in millions) | $ 379 | $ 431 | $ 437 | $ 232 | $ 145 |
Portfolio turnover rate | 420% A | 355% | 380% H | 269% | 164% H |
A Annualized
B Total returns for periods of less than one year are not annualized.
C Total returns would have been lower had certain expenses not been reduced during the periods shown.
D Total returns do not include the effect of the sales charges.
E Calculated based on average shares outstanding during the period.
F For the period October 24, 2006 (commencement of sale of shares) to July 31, 2007.
G Expense ratios reflect operating expenses of the class. Expenses before reductions do not reflect amounts reimbursed by the investment adviser or reductions from expense offset arrangements and do not represent the amount paid by the class during periods when reimbursements or reductions occur. Expenses net of fee waivers reflect expenses after reimbursement by the investment adviser but prior to reductions from expense offset arrangements. Expenses net of all reductions represent the net expenses paid by the class.
H The portfolio turnover rate does not include the assets acquired in the merger.
See accompanying notes which are an integral part of the financial statements.
Semiannual Report
Financial Highlights - Class T
| Six months ended
January 31, 2011 | Years ended July 31, |
| (Unaudited) | 2010 | 2009 | 2008 | 2007 F |
Selected Per-Share Data | | | | | |
Net asset value, beginning of period | $ 10.84 | $ 10.77 | $ 10.40 | $ 10.01 | $ 9.98 |
Income from Investment Operations | | | | | |
Net investment income E | .098 | .243 | .357 | .404 | .306 |
Net realized and unrealized gain (loss) | (.166) | .425 | .466 | .387 | .036 |
Total from investment operations | (.068) | .668 | .823 | .791 | .342 |
Distributions from net investment income | (.096) | (.233) | (.353) | (.401) | (.312) |
Distributions from net realized gain | (.256) | (.365) | (.100) | - | - |
Total distributions | (.352) | (.598) | (.453) | (.401) | (.312) |
Net asset value, end of period | $ 10.42 | $ 10.84 | $ 10.77 | $ 10.40 | $ 10.01 |
Total Return B, C, D | (.66)% | 6.45% | 8.04% | 7.98% | 3.46% |
Ratios to Average Net Assets G | | | | |
Expenses before reductions | .75% A | .76% | .76% | .78% | .79% A |
Expenses net of fee waivers, if any | .75% A | .76% | .76% | .78% | .79% A |
Expenses net of all reductions | .75% A | .76% | .76% | .78% | .79% A |
Net investment income | 1.81% A | 2.29% | 3.33% | 3.90% | 4.02% A |
Supplemental Data | | | | | |
Net assets, end of period (in millions) | $ 301 | $ 335 | $ 324 | $ 236 | $ 181 |
Portfolio turnover rate | 420% A | 355% | 380% H | 269% | 164% H |
A Annualized
B Total returns for periods of less than one year are not annualized.
C Total returns would have been lower had certain expenses not been reduced during the periods shown.
D Total returns do not include the effect of the sales charges.
E Calculated based on average shares outstanding during the period.
F For the period October 24, 2006 (commencement of sale of shares) to July 31, 2007.
G Expense ratios reflect operating expenses of the class. Expenses before reductions do not reflect amounts reimbursed by the investment adviser or reductions from expense offset arrangements and do not represent the amount paid by the class during periods when reimbursements or reductions occur. Expenses net of fee waivers reflect expenses after reimbursement by the investment adviser but prior to reductions from expense offset arrangements. Expenses net of all reductions represent the net expenses paid by the class.
H The portfolio turnover rate does not include the assets acquired in the merger.
See accompanying notes which are an integral part of the financial statements.
Semiannual Report
Financial Highlights - Class B
| Six months ended
January 31, 2011 | Years ended July 31, |
| (Unaudited) | 2010 | 2009 | 2008 | 2007 F |
Selected Per-Share Data | | | | | |
Net asset value, beginning of period | $ 10.84 | $ 10.77 | $ 10.40 | $ 10.01 | $ 9.98 |
Income from Investment Operations | | | | | |
Net investment income E | .058 | .164 | .278 | .329 | .251 |
Net realized and unrealized gain (loss) | (.166) | .425 | .467 | .387 | .037 |
Total from investment operations | (.108) | .589 | .745 | .716 | .288 |
Distributions from net investment income | (.056) | (.154) | (.275) | (.326) | (.258) |
Distributions from net realized gain | (.256) | (.365) | (.100) | - | - |
Total distributions | (.312) | (.519) | (.375) | (.326) | (.258) |
Net asset value, end of period | $ 10.42 | $ 10.84 | $ 10.77 | $ 10.40 | $ 10.01 |
Total Return B, C, D | (1.02)% | 5.67% | 7.25% | 7.21% | 2.91% |
Ratios to Average Net Assets G | | | | |
Expenses before reductions | 1.49% A | 1.50% | 1.50% | 1.51% | 1.50% A |
Expenses net of fee waivers, if any | 1.49% A | 1.50% | 1.50% | 1.51% | 1.50% A |
Expenses net of all reductions | 1.49% A | 1.50% | 1.50% | 1.50% | 1.50% A |
Net investment income | 1.08% A | 1.55% | 2.60% | 3.17% | 3.30% A |
Supplemental Data | | | | | |
Net assets, end of period (in millions) | $ 30 | $ 38 | $ 48 | $ 41 | $ 43 |
Portfolio turnover rate | 420% A | 355% | 380% H | 269% | 164% H |
A Annualized
B Total returns for periods of less than one year are not annualized.
C Total returns would have been lower had certain expenses not been reduced during the periods shown.
D Total returns do not include the effect of the contingent deferred sales charge.
E Calculated based on average shares outstanding during the period.
F For the period October 24, 2006 (commencement of sale of shares) to July 31, 2007.
G Expense ratios reflect operating expenses of the class. Expenses before reductions do not reflect amounts reimbursed by the investment adviser or reductions from expense offset arrangements and do not represent the amount paid by the class during periods when reimbursements or reductions occur. Expenses net of fee waivers reflect expenses after reimbursement by the investment adviser but prior to reductions from expense offset arrangements. Expenses net of all reductions represent the net expenses paid by the class.
H The portfolio turnover rate does not include the assets acquired in the merger.
See accompanying notes which are an integral part of the financial statements.
Semiannual Report
Financial Highlights - Class C
| Six months ended
January 31, 2011 | Years ended July 31, |
| (Unaudited) | 2010 | 2009 | 2008 | 2007 F |
Selected Per-Share Data | | | | | |
Net asset value, beginning of period | $ 10.84 | $ 10.77 | $ 10.40 | $ 10.01 | $ 9.98 |
Income from Investment Operations | | | | | |
Net investment income E | .057 | .163 | .275 | .326 | .249 |
Net realized and unrealized gain (loss) | (.165) | .425 | .468 | .387 | .033 |
Total from investment operations | (.108) | .588 | .743 | .713 | .282 |
Distributions from net investment income | (.056) | (.153) | (.273) | (.323) | (.252) |
Distributions from net realized gain | (.256) | (.365) | (.100) | - | - |
Total distributions | (.312) | (.518) | (.373) | (.323) | (.252) |
Net asset value, end of period | $ 10.42 | $ 10.84 | $ 10.77 | $ 10.40 | $ 10.01 |
Total Return B, C, D | (1.03)% | 5.66% | 7.23% | 7.18% | 2.85% |
Ratios to Average Net Assets G | | | | |
Expenses before reductions | 1.50% A | 1.51% | 1.52% | 1.53% | 1.55% A |
Expenses net of fee waivers, if any | 1.50% A | 1.51% | 1.52% | 1.53% | 1.55% A |
Expenses net of all reductions | 1.50% A | 1.51% | 1.51% | 1.53% | 1.55% A |
Net investment income | 1.06% A | 1.54% | 2.58% | 3.15% | 3.26% A |
Supplemental Data | | | | | |
Net assets, end of period (in millions) | $ 102 | $ 118 | $ 131 | $ 71 | $ 39 |
Portfolio turnover rate | 420% A | 355% | 380% H | 269% | 164% H |
A Annualized
B Total returns for periods of less than one year are not annualized.
C Total returns would have been lower had certain expenses not been reduced during the periods shown.
D Total returns do not include the effect of the contingent deferred sales charge.
E Calculated based on average shares outstanding during the period.
F For the period October 24, 2006 (commencement of sale of shares) to July 31, 2007.
G Expense ratios reflect operating expenses of the class. Expenses before reductions do not reflect amounts reimbursed by the investment adviser or reductions from expense offset arrangements and do not represent the amount paid by the class during periods when reimbursements or reductions occur. Expenses net of fee waivers reflect expenses after reimbursement by the investment adviser but prior to reductions from expense offset arrangements. Expenses net of all reductions represent the net expenses paid by the class.
H The portfolio turnover rate does not include the assets acquired in the merger.
See accompanying notes which are an integral part of the financial statements.
Semiannual Report
Financial Highlights - Government Income
| Six months ended
January 31, 2011 | Years ended July 31, |
| (Unaudited) | 2010 | 2009 | 2008 | 2007 | 2006 |
Selected Per-Share Data | | | | | |
Net asset value, beginning of period | $ 10.82 | $ 10.76 | $ 10.38 | $ 10.00 | $ 9.95 | $ 10.20 |
Income from Investment Operations | | | | | | |
Net investment income D | .114 | .275 | .390 | .438 | .443 | .429 |
Net realized and unrealized gain (loss) | (.156) | .415 | .476 | .378 | .068 | (.274) |
Total from investment operations | (.042) | .690 | .866 | .816 | .511 | .155 |
Distributions from net investment income | (.112) | (.265) | (.386) | (.436) | (.456) | (.405) |
Distributions from net realized gain | (.256) | (.365) | (.100) | - | (.005) | - |
Total distributions | (.368) | (.630) | (.486) | (.436) | (.461) | (.405) |
Net asset value, end of period | $ 10.41 | $ 10.82 | $ 10.76 | $ 10.38 | $ 10.00 | $ 9.95 |
Total Return B, C | (.41)% | 6.69% | 8.49% | 8.25% | 5.22% | 1.56% |
Ratios to Average Net Assets E | | | | | |
Expenses before reductions | .45% A | .45% | .45% | .45% | .45% | .45% |
Expenses net of fee waivers, if any | .45% A | .45% | .45% | .45% | .45% | .45% |
Expenses net of all reductions | .45% A | .45% | .45% | .45% | .44% | .44% |
Net investment income | 2.11% A | 2.60% | 3.65% | 4.23% | 4.42% | 4.27% |
Supplemental Data | | | | | |
Net assets, end of period (in millions) | $ 4,321 | $ 4,809 | $ 4,638 | $ 8,154 | $ 6,118 | $ 5,331 |
Portfolio turnover rate | 420% A | 355% | 380% F | 269% | 164% F | 108% |
A Annualized
B Total returns for periods of less than one year are not annualized.
C Total returns would have been lower had certain expenses not been reduced during the periods shown.
D Calculated based on average shares outstanding during the period.
E Expense ratios reflect operating expenses of the class. Expenses before reductions do not reflect amounts reimbursed by the investment adviser or reductions from expense offset arrangements and do not represent the amount paid by the class during periods when reimbursements or reductions occur. Expenses net of fee waivers reflect expenses after reimbursement by the investment adviser but prior to reductions from expense offset arrangements. Expenses net of all reductions represent the net expenses paid by the class.
F The portfolio turnover rate does not include the assets acquired in the merger.
See accompanying notes which are an integral part of the financial statements.
Semiannual Report
Financial Highlights - Institutional Class
| Six months ended
January 31, 2011 | Years ended July 31, |
| (Unaudited) | 2010 | 2009 | 2008 | 2007 E |
Selected Per-Share Data | | | | | |
Net asset value, beginning of period | $ 10.84 | $ 10.77 | $ 10.40 | $ 10.01 | $ 9.98 |
Income from Investment Operations | | | | | |
Net investment income D | .110 | .267 | .385 | .432 | .329 |
Net realized and unrealized gain (loss) | (.166) | .425 | .466 | .388 | .034 |
Total from investment operations | (.056) | .692 | .851 | .820 | .363 |
Distributions from net investment income | (.108) | (.257) | (.381) | (.430) | (.333) |
Distributions from net realized gain | (.256) | (.365) | (.100) | - | - |
Total distributions | (.364) | (.622) | (.481) | (.430) | (.333) |
Net asset value, end of period | $ 10.42 | $ 10.84 | $ 10.77 | $ 10.40 | $ 10.01 |
Total Return B, C | (.54)% | 6.70% | 8.32% | 8.28% | 3.67% |
Ratios to Average Net Assets F | | | | |
Expenses before reductions | .52% A | .53% | .51% | .51% | .53% A |
Expenses net of fee waivers, if any | .52% A | .53% | .51% | .51% | .53% A |
Expenses net of all reductions | .52% A | .53% | .51% | .51% | .53% A |
Net investment income | 2.04% A | 2.52% | 3.59% | 4.17% | 4.32% A |
Supplemental Data | | | | | |
Net assets, end of period (in millions) | $ 303 | $ 284 | $ 200 | $ 750 | $ 715 |
Portfolio turnover rate | 420% A | 355% | 380% G | 269% | 164% G |
A Annualized
B Total returns for periods of less than one year are not annualized.
C Total returns would have been lower had certain expenses not been reduced during the periods shown.
D Calculated based on average shares outstanding during the period.
E For the period October 24, 2006 (commencement of sale of shares) to July 31, 2007.
F Expense ratios reflect operating expenses of the class. Expenses before reductions do not reflect amounts reimbursed by the investment adviser or reductions from expense offset arrangements and do not represent the amount paid by the class during periods when reimbursements or reductions occur. Expenses net of fee waivers reflect expenses after reimbursement by the investment adviser but prior to reductions from expense offset arrangements. Expenses net of all reductions represent the net expenses paid by the class.
G The portfolio turnover rate does not include the assets acquired in the merger.
See accompanying notes which are an integral part of the financial statements.
Semiannual Report
Notes to Financial Statements
For the period ended January 31, 2011 (Unaudited)
(Amounts in thousands except ratios)
1. Organization.
Fidelity Government Income Fund (the Fund) is a fund of Fidelity Income Fund (the Trust) and is authorized to issue an unlimited number of shares. The Trust is registered under the Investment Company Act of 1940, as amended (the 1940 Act), as an open-end management investment company organized as a Massachusetts business trust. The Fund offers Class A, Class T, Class C, Government Income and Institutional Class shares, each of which, along with Class B shares, has equal rights as to assets and voting privileges. Effective after the close of business on September 1, 2010, Class B shares were closed to new accounts and additional purchases by existing shareholders. Each class has exclusive voting rights with respect to matters that affect that class. Class B shares will automatically convert to Class A shares after a holding period of seven years from the initial date of purchase. Investment income, realized and unrealized capital gains and losses, the common expenses of the Fund, and certain fund-level expense reductions, if any, are allocated on a pro-rata basis to each class based on the relative net assets of each class to the total net assets of the Fund. Each class differs with respect to transfer agent and distribution and service plan fees incurred. Certain expense reductions may also differ by class.
2. Significant Accounting Policies.
The financial statements have been prepared in conformity with accounting principles generally accepted in the United States of America (GAAP), which require management to make certain estimates and assumptions at the date of the financial statements. Actual results could differ from those estimates. Subsequent events, if any, through the date that the financial statements were issued have been evaluated in the preparation of the financial statements. The following summarizes the significant accounting policies of the Fund:
Security Valuation. Investments are valued as of 4:00 p.m. Eastern time on the last calendar day of the period. The Fund uses independent pricing services approved by the Board of Trustees to value its investments. When current market prices or quotations are not readily available or reliable, valuations may be determined in good faith in accordance with procedures adopted by the Board of Trustees. Factors used in determining value may include market or security specific events, changes in interest rates and credit quality. The frequency with which these procedures are used cannot be predicted and they may be utilized to a significant extent. The value used for net asset value (NAV) calculation under these procedures may differ from published prices for the same securities.
Semiannual Report
2. Significant Accounting Policies - continued
Security Valuation - continued
The Fund categorizes the inputs to valuation techniques used to value its investments into a disclosure hierarchy consisting of three levels as shown below.
Level 1 - quoted prices in active markets for identical investments
Level 2 - other significant observable inputs (including quoted prices for similar investments, interest rates, prepayment speeds, etc.)
Level 3 - unobservable inputs (including the Fund's own assumptions based on the best information available)
Changes in valuation techniques may result in transfers in or out of an assigned level within the disclosure hierarchy. Valuation techniques used to value the Fund's investments by major category are as follows.
Debt securities, including restricted securities, are valued based on evaluated prices received from independent pricing services or from dealers who make markets in such securities. For U.S. government and government agency obligations, pricing services utilize matrix pricing which considers yield or price of bonds of comparable quality, coupon, maturity and type as well as dealer supplied prices and are generally categorized as Level 2 in the hierarchy. For collateralized mortgage obligations and U.S. government agency mortgage securities, pricing services utilize matrix pricing which considers prepayment speed assumptions, attributes of the collateral, yield or price of bonds of comparable quality, coupon, maturity and type as well as dealer supplied prices and, accordingly, such securities are generally categorized as Level 2 in the hierarchy. Short-term securities with remaining maturities of sixty days or less for which quotations are not readily available are valued at amortized cost, which approximates fair value and are categorized as Level 2 in the hierarchy.
Swaps are marked-to-market daily based on valuations from independent pricing services or dealer-supplied valuations and changes in value are recorded as unrealized appreciation (depreciation). Pricing services utilize matrix pricing which considers comparisons to interest rate curves, credit spread curves, default possibilities and recovery rates and, as a result, swaps are generally categorized as Level 2 in the hierarchy.
When independent prices are unavailable or unreliable, debt securities and swaps may be valued utilizing pricing matrices which consider similar factors that would be used by independent pricing services. These are generally categorized as Level 2 in the hierarchy but may be Level 3 depending on the circumstances.
Semiannual Report
Notes to Financial Statements (Unaudited) - continued
(Amounts in thousands except ratios)
2. Significant Accounting Policies - continued
Investment Transactions and Income. For financial reporting purposes, the Fund's investment holdings and NAV include trades executed through the end of the last business day of the period. The NAV per share for processing shareholder transactions is calculated as of the close of business of the New York Stock Exchange (NYSE), normally 4:00 p.m. Eastern time and includes trades executed through the end of the prior business day. Gains and losses on securities sold are determined on the basis of identified cost. Interest income is accrued as earned. Interest income includes coupon interest and amortization of premium and accretion of discount on debt securities. The principal value on inflation-indexed securities is periodically adjusted to the rate of inflation and interest is accrued based on the principal value. The adjustments to principal due to inflation are reflected as increases or decreases to interest income even though principal is not received until maturity.
Expenses. Expenses directly attributable to a fund are charged to that fund. Expenses attributable to more than one fund are allocated among the respective funds on the basis of relative net assets or other appropriate methods. Expense estimates are accrued in the period to which they relate and adjustments are made when actual amounts are known.
Deferred Trustee Compensation. Under a Deferred Compensation Plan (the Plan), independent Trustees may elect to defer receipt of a portion of their annual compensation. Deferred amounts are invested in a cross-section of Fidelity funds, are marked-to-market and remain in the Fund until distributed in accordance with the Plan. The investment of deferred amounts and the offsetting payable to the Trustees are included in the accompanying Statement of Assets and Liabilities.
Income Tax Information and Distributions to Shareholders. Each year the Fund intends to qualify as a regulated investment company, including distributing substantially all of its taxable income and realized gains under Subchapter M of the Internal Revenue Code and filing its U.S. federal tax return. As a result, no provision for income taxes is required. A fund's federal tax return is subject to examination by the Internal Revenue Service (IRS) for a period of three years.
Dividends are declared and recorded daily and paid monthly from net investment income. Distributions from realized gains, if any, are declared and recorded on the ex-dividend date. Income dividends and capital gain distributions are declared separately for each class. Income and capital gain distributions are determined in accordance with income tax regulations, which may differ from GAAP.
Capital accounts within the financial statements are adjusted for permanent book-tax differences. These adjustments have no impact on net assets or the results of operations. Temporary book-tax differences will reverse in a subsequent period.
Semiannual Report
2. Significant Accounting Policies - continued
Income Tax Information and Distributions to Shareholders - continued
Book-tax differences are primarily due to swap agreements, market discount, deferred trustees compensation and losses deferred due to wash sales.
The federal tax cost of investment securities and unrealized appreciation (depreciation) as of period end were as follows:
Gross unrealized appreciation | $ 118,841 |
Gross unrealized depreciation | (43,098) |
Net unrealized appreciation (depreciation) on securities and other investments | $ 75,743 |
| |
Tax cost | $ 6,434,719 |
3. Operating Policies.
Repurchase Agreements. Fidelity Management & Research Company (FMR) has received an Exemptive Order from the Securities and Exchange Commission (the SEC) which permits the Fund and other affiliated entities of FMR to transfer uninvested cash balances into joint trading accounts which are then invested in repurchase agreements. The Fund may also invest directly with institutions in repurchase agreements. Repurchase agreements are collateralized by government or non-government securities. Upon settlement date, collateral is held in segregated accounts with custodian banks and may be obtained in the event of a default of the counterparty. The Fund monitors, on a daily basis, the value of the collateral to ensure it is at least equal to the principal amount of the repurchase agreement (including accrued interest). In the event of a default by the counterparty, realization of the collateral proceeds could be delayed, during which time the value of the collateral may decline.
Delayed Delivery Transactions and When-Issued Securities. The Fund may purchase or sell securities on a delayed delivery or when-issued basis. Payment and delivery may take place after the customary settlement period for that security. The price of the underlying securities and the date when the securities will be delivered and paid for are fixed at the time the transaction is negotiated. During the time a delayed delivery sell is outstanding, the contract is marked-to-market daily and equivalent deliverable securities are held for the transaction. The securities purchased on a delayed delivery or when-issued basis are identified as such in the Fund's Schedule of Investments. The Fund may receive compensation for interest forgone in the purchase of a delayed delivery or when-issued security. With respect to purchase commitments, the Fund identifies securities as segregated in its records with a value at least equal to the amount of the
Semiannual Report
Notes to Financial Statements (Unaudited) - continued
(Amounts in thousands except ratios)
3. Operating Policies - continued
Delayed Delivery Transactions and When-Issued Securities - continued
commitment. Losses may arise due to changes in the value of the underlying securities or if the counterparty does not perform under the contract's terms, or if the issuer does not issue the securities due to political, economic, or other factors.
Restricted Securities. The Fund may invest in securities that are subject to legal or contractual restrictions on resale. These securities generally may be resold in transactions exempt from registration or to the public if the securities are registered. Disposal of these securities may involve time-consuming negotiations and expense, and prompt sale at an acceptable price may be difficult. Information regarding restricted securities is included at the end of the Fund's Schedule of Investments.
4. Derivative Instruments.
Risk Exposures and the Use of Derivative Instruments. The Fund used derivative instruments (derivatives), including futures contracts and swap agreements, in order to meet its investment objectives. The strategy is to use derivatives to increase returns, to gain exposure to certain types of assets and to manage exposure to certain risks as defined below. The success of any strategy involving derivatives depends on analysis of numerous economic factors, and if the strategies for investment do not work as intended, the Fund may not achieve its objectives.
The Fund's use of derivatives increased or decreased its exposure to the following risk:
Interest Rate Risk | Interest rate risk relates to the fluctuations in the value of interest-bearing securities due to changes in the prevailing levels of market interest rates. |
The Fund is also exposed to additional risks from investing in derivatives, such as liquidity risk and counterparty credit risk. Liquidity risk is the risk that the Fund will be unable to sell the derivative in the open market in a timely manner. Counterparty credit risk is the risk that the counterparty will not be able to fulfill its obligation to the Fund. Derivative counterparty credit risk is managed through formal evaluation of the creditworthiness of all potential counterparties. On certain over-the-counter derivatives, the Fund attempts to reduce its exposure to counterparty credit risk by entering into an International Swaps and Derivatives Association (ISDA) Master Agreement on a bilateral basis with each of its counterparties. The ISDA Master Agreement gives each counterparty the right to terminate all transactions traded under such agreement if there is a certain deterioration in the credit quality of the other party. The ISDA Master Agreement gives the Fund the right, upon an event of default by the applicable counterparty or a termination of the agreement, to close out all transactions traded under such agreement and to net amounts owed under each transaction to one net payable by one
Semiannual Report
4. Derivative Instruments - continued
Risk Exposures and the Use of Derivative Instruments - continued
party to the other. To mitigate counterparty credit risk, the Fund offsets certain payables and/or receivables with collateral. Collateral in the form of cash or securities, if required, is held in segregated accounts with the Fund's custodian bank in accordance with the collateral agreements entered into between the Fund, the swap counterparty and the Fund's custodian bank, and is identified in the Schedule of Investments. The Fund could experience delays and costs in gaining access to the collateral even though it is held by the Fund's custodian bank. The Fund's maximum risk of loss from counterparty credit risk is generally the aggregate unrealized appreciation and unpaid counterparty fees in excess of any collateral pledged by the counterparty to the Fund. Counterparty risk related to exchange-traded futures contracts is minimal because of the protection provided by the exchange on which they trade. Derivatives involve, to varying degrees, risk of loss in excess of the amounts recognized in the Statement of Assets and Liabilities.
Net Realized Gain (Loss) and Change in Net Unrealized Appreciation (Depreciation) on Derivatives. The table below, which reflects the impacts of derivatives on the financial performance of the Fund, summarizes the net realized gain (loss) and change in net unrealized appreciation (depreciation) for derivatives during the period.
Risk Exposure / Derivative Type | Net Realized Gain
(Loss) | Change in Net
Unrealized
Appreciation
(Depreciation) |
Interest Rate Risk | | |
Futures Contracts | $ 95 | $ - |
Swap Agreements | (5,245) | 5,601 |
Total Interest Rate Risk (a)(b) | $ (5,150) | $ 5,601 |
(a) A summary of the value of derivatives by risk exposure as of period end, if any, is included at the end of the Schedule of Investments and is
representative of activity for the period.
(b) Total derivatives net realized gain (loss) included in the Statement of Operations is comprised of $95 for futures contracts and $(5,245) for
swap agreements.
Futures Contracts. A futures contract is an agreement between two parties to buy or sell a specified underlying instrument for a fixed price at a specified future date. The Fund used futures contracts to manage its exposure to the bond market, and to fluctuations in interest rates.
Upon entering into a futures contract, a fund is required to deposit either cash or securities (initial margin) with a clearing broker in an amount equal to a certain percentage of the face value of the contract. Futures contracts are marked-to-market daily and subsequent payments (variation margin) are made or received by a fund depending on the daily fluctuations in the value of the futures contracts and are recorded as unrealized
Semiannual Report
Notes to Financial Statements (Unaudited) - continued
(Amounts in thousands except ratios)
4. Derivative Instruments - continued
Futures Contracts - continued
appreciation or (depreciation). Realized gain or (loss) is recorded upon the expiration or closing of a futures contract. The net realized gain (loss) and change in net unrealized appreciation (depreciation) on futures contracts during the period is included in the Statement of Operations.
The underlying face amount at value of open futures contracts at period end, if any, is shown in the Schedule of Investments under the caption "Futures Contracts." This amount reflects each contract's exposure to the underlying instrument at period end. Securities deposited to meet initial margin requirements are identified in the Schedule of Investments. The receivable and/or payable for the variation margin are reflected in the Statement of Assets and Liabilities.
Certain risks arise upon entering into futures contracts, including the risk that an illiquid market limits the ability to close out a futures contract prior to settlement date.
Swap Agreements. A swap agreement (swap) is a contract between two parties to exchange future cash flows at periodic intervals based on a notional principal amount.
Details of swaps open at period end are included in the Schedule of Investments under the caption "Swap Agreements." Swaps are marked-to-market daily and changes in value are recorded as unrealized appreciation or (depreciation) and reflected in the Statement of Assets and Liabilities. Any upfront payments made or received upon entering a swap to compensate for differences between stated terms of the agreement and prevailing market conditions (e.g. credit spreads, interest rates or other factors) are recorded as realized gain or (loss) ratably over the term of the swap. Payments are exchanged at specified intervals, accrued daily commencing with the effective date of the contract and recorded as realized gain or (loss). Realized gain or (loss) is also recorded in the event of an early termination of a swap. The net realized gain (loss) and change in net unrealized appreciation (depreciation) on swaps during the period is included in the Statement of Operations.
Risks of loss include interest rate risk. In addition, there is the risk of failure by the counterparty to perform under the terms of the agreement and lack of liquidity in the market.
Interest Rate Swaps. Interest rate swaps are agreements between counterparties to exchange cash flows, one based on a fixed rate, and the other on a floating rate. The Fund entered into interest rate swaps to manage its exposure to interest rate changes. Changes in interest rates can have an effect on both the value of bond holdings as well as the amount of interest income earned. In general, the value of bonds can fall when interest rates rise and can rise when interest rates fall.
Semiannual Report
5. Fees and Other Transactions with Affiliates.
Management Fee. FMR and its affiliates provide the Fund with investment management related services for which the Fund pays a monthly management fee. The management fee is the sum of an individual fund fee rate that is based on an annual rate of .20% of the Fund's average net assets and a group fee rate that averaged .12% during the period. The group fee rate is based upon the average net assets of all the mutual funds advised by FMR. The group fee rate decreases as assets under management increase and increases as assets under management decrease. For the period, the total annualized management fee rate was .32% of the Fund's average net assets.
Distribution and Service Plan Fees. In accordance with Rule 12b-1 of the 1940 Act, the Fund has adopted separate Distribution and Service Plans for each class of shares. Certain classes pay Fidelity Distributors Corporation (FDC), an affiliate of FMR, separate Distribution and Service Fees, each of which is based on an annual percentage of each class' average net assets. In addition, FDC may pay financial intermediaries for selling shares of the Fund and providing shareholder support services. For the period, the Distribution and Service Fee rates, total fees and amounts retained by FDC were as follows:
| Distribution
Fee | Service
Fee | Total Fees | Retained
by FDC |
Class A | -% | .25% | $ 527 | $ 11 |
Class T | -% | .25% | 409 | - |
Class B | .65% | .25% | 157 | 114 |
Class C | .75% | .25% | 572 | 107 |
| | | $ 1,665 | $ 232 |
Sales Load. FDC receives a front-end sales charge of up to 4.00% for selling Class A shares and Class T shares, some of which is paid to financial intermediaries for selling shares of the Fund. FDC receives the proceeds of contingent deferred sales charges levied on Class A, Class T, Class B, and Class C redemptions. These charges depend on the holding period. The deferred sales charges range from 5% to 1% for Class B, 1% for Class C, ..75% for certain purchases of Class A shares and .25% for certain purchases of Class T shares.
For the period, sales charge amounts retained by FDC were as follows:
| Retained
by FDC |
Class A | $ 24 |
Class T | 9 |
Class B | 60 |
Class C | 16 |
| $ 109 |
* When Class B and Class C shares are initially sold, FDC pays commissions from its own resources to financial intermediaries through which the sales are made.
Semiannual Report
Notes to Financial Statements (Unaudited) - continued
(Amounts in thousands except ratios)
5. Fees and Other Transactions with Affiliates - continued
Transfer Agent Fees. Fidelity Investments Institutional Operations Company, Inc. (FIIOC), an affiliate of FMR, is the transfer, dividend disbursing and shareholder servicing agent for each class of the Fund. FIIOC receives account fees and asset-based fees that vary according to the account size and type of account of the shareholders of the respective classes of the Fund. FIIOC pays for typesetting, printing and mailing of shareholder reports, except proxy statements. For the period, transfer agent fees for each class were as follows:
| Amount | % of
Average
Net Assets* |
Class A | $ 355 | .17 |
Class T | 253 | .15 |
Class B | 43 | .24 |
Class C | 90 | .16 |
Government Income | 2,351 | .10 |
Institutional Class | 252 | .17 |
| $ 3,344 | |
* Annualized
Fund Wide Operations Fee. Pursuant to the Fund Wide Operations and Expense Agreement (FWOE), FMR has agreed to provide for fund level expenses (which do not include transfer agent, Rule 12b-1 fees, compensation of the independent Trustees, interest (including commitment fees), taxes or extraordinary expenses, if any) in return for a FWOE fee equal to .35% less the total amount of the management fee. The FWOE paid by the Fund is reduced by an amount equal to the fees and expenses paid to the independent Trustees. For the period, the FWOE fee was equivalent to an annualized rate of .03% of average net assets.
6. Committed Line of Credit.
The Fund participates with other funds managed by FMR or an affiliate in a $3.75 billion credit facility (the "line of credit") to be utilized for temporary or emergency purposes to fund shareholder redemptions or for other short-term liquidity purposes. The Fund has agreed to pay commitment fees on its pro-rata portion of the line of credit, which amounted to $12 and is reflected in Miscellaneous expenses on the Statement of Operations. During the period, there were no borrowings on this line of credit.
Semiannual Report
7. Security Lending.
The Fund lends portfolio securities through a lending agent from time to time in order to earn additional income. On the settlement date of the loan, the Fund receives collateral (in the form of U.S. Treasury obligations, letters of credit and/or cash) against the loaned securities and maintains collateral in an amount not less than 100% of the market value of the loaned securities during the period of the loan. The market value of the loaned securities is determined at the close of business of the Fund and any additional required collateral is delivered to the Fund on the next business day. If the borrower defaults on its obligation to return the securities loaned because of insolvency or other reasons, a fund could experience delays and costs in recovering the securities loaned or in gaining access to the collateral. Any cash collateral received is invested in the cash equivalents. At period end, there were no security loans outstanding. Security lending income represents the income earned on investing cash collateral, less rebates paid to borrowers and lending agent fees associated with the loan, plus any premium payments received for lending certain types of securities. Security lending income is presented in the Statement of Operations as a component of interest income. Total security lending income during the period amounted to $31.
8. Distributions to Shareholders.
Distributions to shareholders of each class were as follows:
| Six months ended
January 31,
2011 | Year ended
July 31,
2010 |
From net investment income | | |
Class A | $ 3,759 | $ 9,342 |
Class T | 2,937 | 6,865 |
Class B | 184 | 606 |
Class C | 596 | 1,669 |
Government Income | 49,420 | 116,185 |
Institutional Class | 2,981 | 5,720 |
Total | $ 59,877 | $ 140,387 |
From net realized gain | | |
Class A | $ 10,104 | $ 14,726 |
Class T | 7,830 | 10,744 |
Class B | 853 | 1,543 |
Class C | 2,724 | 4,162 |
Government Income | 112,442 | 158,363 |
Institutional Class | 6,868 | 7,222 |
Total | $ 140,821 | $ 196,760 |
Semiannual Report
Notes to Financial Statements (Unaudited) - continued
(Amounts in thousands except ratios)
9. Share Transactions.
Transactions for each class of shares were as follows:
| Shares | Dollars |
| Six months ended January 31, 2011 | Year ended
July 31, 2010 | Six months ended January 31, 2011 | Year ended
July 31, 2010 |
Class A | | | | |
Shares sold | 6,071 | 17,922 | $ 65,107 | $ 190,342 |
Reinvestment of distributions | 1,156 | 1,943 | 12,308 | 20,562 |
Shares redeemed | (10,602) | (20,615) | (112,639) | (218,378) |
Net increase (decrease) | (3,375) | (750) | $ (35,224) | $ (7,474) |
Class T | | | | |
Shares sold | 5,075 | 13,716 | $ 54,442 | $ 145,586 |
Reinvestment of distributions | 984 | 1,616 | 10,476 | 17,109 |
Shares redeemed | (8,116) | (14,473) | (86,528) | (153,287) |
Net increase (decrease) | (2,057) | 859 | $ (21,610) | $ 9,408 |
Class B | | | | |
Shares sold | 201 | 1,036 | $ 2,177 | $ 11,019 |
Reinvestment of distributions | 82 | 165 | 874 | 1,747 |
Shares redeemed | (900) | (2,202) | (9,613) | (23,321) |
Net increase (decrease) | (617) | (1,001) | $ (6,562) | $ (10,555) |
Class C | | | | |
Shares sold | 1,693 | 3,916 | $ 18,182 | $ 41,596 |
Reinvestment of distributions | 228 | 390 | 2,427 | 4,131 |
Shares redeemed | (2,997) | (5,610) | (31,838) | (59,334) |
Net increase (decrease) | (1,076) | (1,304) | $ (11,229) | $ (13,607) |
Government Income | | | | |
Shares sold | 66,216 | 155,285 | $ 707,086 | $ 1,646,227 |
Reinvestment of distributions | 14,567 | 24,826 | 154,944 | 262,396 |
Shares redeemed | (110,000) | (166,873) | (1,169,626) | (1,763,484) |
Net increase (decrease) | (29,217) | 13,238 | $ (307,596) | $ 145,139 |
Institutional Class | | | | |
Shares sold | 6,299 | 13,487 | $ 67,140 | $ 143,092 |
Reinvestment of distributions | 885 | 1,193 | 9,414 | 12,621 |
Shares redeemed | (4,364) | (7,047) | (46,660) | (74,753) |
Net increase (decrease) | 2,820 | 7,633 | $ 29,894 | $ 80,960 |
Semiannual Report
10. Other.
The Fund's organizational documents provide former and current trustees and officers with a limited indemnification against liabilities arising in connection with the performance of their duties to the Fund. In the normal course of business, the Fund may also enter into contracts that provide general indemnifications. The Fund's maximum exposure under these arrangements is unknown as this would be dependent on future claims that may be made against the Fund. The risk of material loss from such claims is considered remote.
Semiannual Report
Board Approval of Investment Advisory Contracts and Management Fees
Fidelity Government Income Fund
Each year, the Board of Trustees, including the Independent Trustees (together, the Board), votes on the renewal of the management contract and sub-advisory agreements (together, the Advisory Contracts) for the fund. The Board, assisted by the advice of fund counsel and Independent Trustees' counsel, requests and considers a broad range of information relevant to the renewal of the Advisory Contracts throughout the year.
The Board meets regularly and considers at each of its meetings factors that are relevant to its annual consideration of the renewal of the fund's Advisory Contracts, including the services and support provided to the fund and its shareholders. The Board has established three standing committees, each composed of Independent Trustees with varying backgrounds, to which the Board has assigned specific subject matter responsibilities in order to enhance effective decision-making by the Board. The Operations Committee, of which all of the Independent Trustees are members, meets regularly throughout the year and, among other matters, considers matters specifically related to the annual consideration of the renewal of the fund's Advisory Contracts. The Board, acting directly and through its Committees, requests and receives information concerning the annual consideration of the renewal of the fund's Advisory Contracts. The Board also meets as needed to consider matters specifically related to the Board's annual consideration of the renewal of Advisory Contracts. Members of the Board may also meet with trustees of other Fidelity funds through ad hoc joint committees to discuss certain matters relevant to the Fidelity funds.
At its September 2010 meeting, the Board of Trustees, including the Independent Trustees, unanimously determined to renew the fund's Advisory Contracts. In reaching its determination, the Board considered all factors it believed relevant, including (i) the nature, extent, and quality of the services to be provided to the fund and its shareholders (including the investment performance of the fund); (ii) the competitiveness of the fund's management fee and total expenses; (iii) the total costs of the services to be provided by and the profits to be realized by Fidelity from its relationship with the fund; (iv) the extent to which economies of scale would be realized as the fund grows; and (v) whether fee levels reflect these economies of scale, if any, for the benefit of fund shareholders.
In considering whether to renew the Advisory Contracts for the fund, the Board reached a determination, with the assistance of fund counsel and Independent Trustees' counsel and through the exercise of its business judgment, that the renewal of the Advisory Contracts is in the best interests of the fund and its shareholders and that the compensation to be received by Fidelity under the management contract is fair and reasonable. The Board's decision to renew the Advisory Contracts was not based on any single factor, but rather was based on a comprehensive consideration of all the information provided to the Board at its meetings throughout the year. The Board, in reaching its determination to renew the Advisory Contracts, is aware that shareholders in the fund have a broad range of investment choices available to them, including a wide choice among mutual funds offered by Fidelity's competitors, and that the fund's shareholders, with the opportunity to review and weigh the disclosure provided by the fund in its prospectus and other public disclosures, have chosen to invest in this fund, managed by Fidelity.
Semiannual Report
Board Approval of Investment Advisory Contracts and
Management Fees - continued
Nature, Extent, and Quality of Services Provided. The Board considered the staffing within the investment adviser, FMR, and the sub-advisers (together, the Investment Advisers), including the backgrounds of the fund's investment personnel and the fund's investment objective and discipline. The Independent Trustees also had discussions with senior management of Fidelity's investment operations and investment groups. The Board considered the structure of the portfolio manager compensation program and whether this structure provides appropriate incentives to act in the best interest of the fund.
Resources Dedicated to Investment Management and Support Services. The Board reviewed the size, education, and experience of the Investment Advisers' investment staff, their use of technology, and the Investment Advisers' approach to recruiting, training, and retaining portfolio managers and other research, advisory, and management personnel. The Board noted that Fidelity's analysts have access to a variety of technological tools and market and securities data that enable them to perform both fundamental and quantitative analysis and to specialize in various disciplines. The Board considered Fidelity's extensive global research capabilities that enable the Investment Advisers to aggregate data from various sources in an effort to produce positive investment results. The Board also considered that Fidelity's portfolio managers and analysts have access to daily portfolio attribution that allows for monitoring of a fund's portfolio, as well as an electronic communication system that provides immediate real-time access to research concerning issuers and credit enhancers. In addition, the Board considered the trading resources that are an integral part of the fixed-income portfolio management investment process.
Shareholder and Administrative Services. The Board considered (i) the nature, extent, quality, and cost of advisory, administrative, and shareholder services performed by the Investment Advisers and their affiliates under the Advisory Contracts and under separate agreements covering transfer agency, pricing and bookkeeping, and securities lending services for the fund; (ii) the nature and extent of the investment adviser's supervision of third party service providers, principally custodians and subcustodians; and (iii) the resources devoted to, and the record of compliance with, the fund's compliance policies and procedures.
The Board noted that the growth of fund assets over time across the complex allows Fidelity to reinvest in the development of services designed to enhance the value or convenience of the Fidelity funds as investment vehicles. These services include 24-hour access to account information and market information through telephone representatives and over the Internet, and investor education materials and asset allocation tools.
Semiannual Report
Investment in a Large Fund Family. The Board considered the benefits to shareholders of investing in a Fidelity fund, including the benefits of investing in a fund that is part of a large family of funds offering a variety of investment disciplines and providing a large variety of mutual fund investor services. The Board noted that Fidelity had taken, or had made recommendations that resulted in the Fidelity funds taking, a number of actions over the previous year that benefited particular funds, including (i) dedicating additional resources to investment research and restructuring and broadening the focus of the investment research teams; (ii) bolstering the senior management team that oversees asset management; (iii) launching Class F of certain funds as a lower-fee class available to Freedom K and Freedom Index Funds; (iv) lowering the initial investment minimums and ongoing balance requirements for Real Estate High Income Fund; (v) eliminating subsequent purchase minimums for all funds and adding a waiver of the investment minimum requirement for new accounts opened with the proceeds of a systematic withdrawal plan; (vi) eliminating the withdrawal minimum and maximum limits for systematic withdrawals from Advisor funds; (vii) expanding sales load waivers on Class A shares for Destiny Planholders and expanding Institutional Class eligibility for Class O Destiny Planholders; and (viii) changing certain Class A and Class T sales charge structures to further align them with industry practices.
Investment Performance. The Board considered whether the fund has operated in accordance with its investment objective, as well as its record of compliance with its investment restrictions. It also reviewed the fund's absolute investment performance for each class, as well as the fund's relative investment performance for each class measured over multiple periods against (i) a proprietary custom index, and (ii) a peer group of mutual funds deemed appropriate by Fidelity and reviewed by the Board. The following charts considered by the Board show, over the one-, three-, and five-year periods ended December 31, 2009, as available, the cumulative total returns of the retail class and Class C of the fund, the cumulative total returns of a proprietary custom index ("benchmark"), and a range of cumulative total returns of a peer group of mutual funds identified by Lipper Inc. as having an investment objective similar to that of the fund. The returns of the retail class and Class C show the performance of the highest performing class (based on five-year performance) and the lowest performing class (based on three-year performance), respectively. The box within each chart shows the 25th percentile return (bottom of box) and the 75th percentile return (top of box) of the peer group. Returns shown above the box are in the first quartile and returns shown below the box are in the fourth quartile. The percentage beaten numbers noted below each chart correspond to the percentile box and represent the percentage of funds in the peer group whose performance was equal to or lower than that of the class indicated. The fund's proprietary custom index is an index developed by FMR that represents the performance of the fund's general investment categories.
Semiannual Report
Board Approval of Investment Advisory Contracts and
Management Fees - continued
Fidelity Government Income Fund
The Board reviewed the fund's relative investment performance against its peer group and noted that the performance of the retail class of the fund was in the third quartile for the one-year period and the first quartile for the three- and five-year periods. The Board also noted that the investment performance of the retail class of the fund compared favorably to its benchmark for all the periods shown. The Board considered that the variations in performance among the fund's classes reflect the variations in class expenses, which result in lower performance for higher expense classes. The Board also reviewed the fund's performance since inception as well as performance in the current year.
Based on its review, and giving particular weight to the nature and quality of the resources dedicated by the Investment Advisers to maintain and improve relative performance and factoring in the unprecedented market events in recent years, the Board concluded that the nature, extent, and quality of investment management and support services and of shareholder and administrative services provided to the fund will benefit the fund's shareholders, particularly in light of the Board's view that the fund's shareholders benefit from investing in a fund that is part of a large family of funds offering a variety of investment disciplines and services.
Competitiveness of Management Fee and Total Fund Expenses. The Board considered the fund's management fee and total expenses compared to "mapped groups" of competitive funds and classes. Fidelity creates "mapped groups" by combining similar Lipper investment objective categories that have comparable management fee characteristics. Combining Lipper investment objective categories aids the Board's management fee and total expense comparisons by broadening the competitive group used for comparison and by reducing the number of universes to which various Fidelity funds are compared.
Semiannual Report
Management Fee. The Board considered two proprietary management fee comparisons for the 12-month periods shown in the chart below. The group of Lipper funds used by the Board for management fee comparisons is referred to below as the "Total Mapped Group" and, for the reasons explained above, is broader than the Lipper peer group used by the Board for performance comparisons. The Total Mapped Group comparison focuses on a fund's standing relative to the total universe of comparable funds available to investors, in terms of gross management fees before expense reimbursements or caps. "TMG %" represents the percentage of funds in the Total Mapped Group that had management fees that were lower than the fund's. For example, a TMG % of 9% means that 91% of the funds in the Total Mapped Group had higher management fees than the fund. The "Asset-Size Peer Group" (ASPG) comparison focuses on a fund's standing relative to non-Fidelity funds similar in size to the fund within the Total Mapped Group. The ASPG represents at least 15% of the funds in the Total Mapped Group with comparable asset size and management fee characteristics, subject to a minimum of 50 funds (or all funds in the Total Mapped Group if fewer than 50). Additional information, such as the ASPG quartile in which the fund's management fee ranked, is also included in the chart and considered by the Board.
Fidelity Government Income Fund
Semiannual Report
Board Approval of Investment Advisory Contracts and
Management Fees - continued
The Board noted that the fund's management fee ranked below the median of its Total Mapped Group and below the median of its ASPG for 2009.
Furthermore, the Board considered that it had approved an amendment (effective June 1, 2005) to the fund's management contract that lowered the fund's individual fund fee rate from 30 basis points to 20 basis points. The Board considered that the chart reflects the fund's lower management fee for 2005, as if the lower rate were in effect for the entire year.
Based on its review, the Board concluded that the fund's management fee is fair and reasonable in light of the services that the fund receives and the other factors considered.
Total Expenses. In its review of each class's total expenses, the Board considered the fund's management fee as well as other fund or class expenses, as applicable, such as transfer agent fees, pricing and bookkeeping fees, fund-paid 12b-1 fees, and custodial, legal, and audit fees. The Board also noted the effects of any waivers and reimbursements on fees and expenses. As part of its review, the Board also considered current and historical total expenses of each class of the fund compared to competitive fund median expenses. Each class of the fund is compared to those funds and classes in the Total Mapped Group (used by the Board for management fee comparisons) that have a similar sales load structure.
The Board also considered that the current contractual arrangements for the fund (i) have the effect of setting the total "fund-level" expenses (including, among certain other expenses, the management fee) for each class at 35 basis points, (ii) lower and limit the "class-level" transfer agent fee for the retail class to 10 basis points, and (iii) limit the total expenses for the retail class to 45 basis points. The fees and expenses payable under these contractual arrangements may not be increased without the approval of the Board and the shareholders of the applicable class. The fund's Advisor classes are subject to different "class-level" expenses (transfer agent fees and 12b-1 fees).
The Board noted that the total expenses of each class ranked below its competitive median for 2009.
The Board recognized that the fund's management contract incorporates a "group fee" structure, which provides for lower group fee rates as total fund assets under FMR's management increase, and for higher group fee rates as total fund assets under FMR's management decrease. FMR calculates the group fee rates based on a tiered asset "breakpoint" schedule that varies based on asset class. The Board noted, however, that because the current contractual arrangements set the total "fund-level" expenses for each class at 35 basis points, increases or decreases in the management fee due to changes in the group fee rate will not impact total expenses.
Fees Charged to Other Fidelity Clients. The Board also considered Fidelity fee structures and other information with respect to clients of FMR and its affiliates, such as other mutual funds advised or subadvised by FMR or its affiliates, pension plan clients, and other institutional clients. In March 2010, the Board created an ad hoc joint committee with the board of other Fidelity funds (the Committee) to review and compare Fidelity's institutional investment advisory business with its business of providing services to the Fidelity funds, including the differences in services provided, fees charged, and costs incurred, as well as competition in their respective marketplaces.
Semiannual Report
Based on its review of total expenses and fees charged to other Fidelity clients, the Board concluded that the total expenses of each class of the fund were reasonable in light of the services that the fund and its shareholders receive and the other factors considered, including the findings of the Committee.
Costs of the Services and Profitability. The Board considered the revenues earned and the expenses incurred by Fidelity in conducting the business of developing, marketing, distributing, managing, administering and servicing the fund and its shareholders. The Board also considered the level of Fidelity's profits in respect of all the Fidelity funds.
On an annual basis, FMR presents to the Board Fidelity's profitability for the fund. Fidelity calculates the profitability for each fund, as well as aggregate profitability for groups of Fidelity funds and all Fidelity funds, using a series of detailed revenue and cost allocation methodologies which originate with the audited books and records of Fidelity. The Audit Committee of the Board reviews any significant changes from the prior year's methodologies.
PricewaterhouseCoopers LLP (PwC), independent registered public accounting firm and auditor to Fidelity and certain Fidelity funds, has been engaged annually by the Board as part of the Board's assessment of Fidelity's profitability analysis. PwC's engagement includes the review and assessment of Fidelity's methodologies used in determining the revenues and expenses attributable to Fidelity's mutual fund business, and completion of agreed-upon procedures surrounding the mathematical accuracy of fund profitability and its conformity to allocation methodologies. After considering PwC's reports issued under the engagement and information provided by Fidelity, the Board believes that while other allocation methods may also be reasonable, Fidelity's profitability methodologies are reasonable in all material respects.
The Board has also reviewed Fidelity's non-fund businesses and fall-out benefits related to the mutual fund business as well as cases where Fidelity's affiliates may benefit from or be related to the fund's business.
The Board considered the costs of the services provided by and the profits realized by Fidelity in connection with the operation of the fund and were satisfied that the profitability was not excessive in the circumstances.
Economies of Scale. The Board considered whether there have been economies of scale in respect of the management of the Fidelity funds, whether the Fidelity funds (including the fund) have appropriately benefited from any such economies of scale, and whether there is potential for realization of any further economies of scale. The Board considered the extent to which the fund will benefit from economies of scale through increased services to the fund, through waivers or reimbursements, or through fee or expense reductions.
Semiannual Report
Board Approval of Investment Advisory Contracts and
Management Fees - continued
In February 2009, the Board and the board of other Fidelity funds created an ad hoc committee (the Economies of Scale Committee) to analyze whether FMR attains economies of scale in respect of the management and servicing of the Fidelity funds, whether the Fidelity funds have appropriately benefited from such economies of scale, and whether there is potential for realization of any further economies of scale.
The Board concluded, considering the findings of the Economies of Scale Committee, that any potential economies of scale are being appropriately shared between fund shareholders and Fidelity.
Additional Information Requested by the Board. In order to develop fully the factual basis for consideration of the Fidelity funds' Advisory Contracts, the Board requested and received additional information on certain topics, including (i) fund performance trends, actions to be taken by FMR to improve certain funds' overall performance, and Fidelity's long-term strategies for certain funds; (ii) Fidelity's fund profitability methodology and profitability trends for certain funds; (iii) portfolio manager changes that have occurred during the past year and the amount of the investment that each portfolio manager has made in the Fidelity fund(s) that he or she manages; (iv) Fidelity's compensation structure for portfolio managers, research analysts, and other key personnel, including its effects on fund profitability, the rationale for the compensation structure, and the extent to which current market conditions have affected retention and recruitment; (v) the compensation paid by FMR to fund sub-advisers on behalf of the Fidelity funds; (vi) Fidelity's fee structures and rationale for recommending different fees among different categories of funds and classes, as well as Fidelity's voluntary waiver of fees to maintain minimum yields for certain funds and classes; (vii) the rationale for any differences between fund fee structures and fee structures in place for other Fidelity clients; and (viii) explanations regarding the relative total expenses borne by certain funds and classes, total expense competitive trends, and actions that might be taken by FMR to reduce total expenses for certain funds and classes or to achieve further economies of scale.
Based on its evaluation of all of the conclusions noted above, and after considering all factors it believed relevant, the Board ultimately concluded that the advisory fee structures are fair and reasonable, and that the fund's Advisory Contracts should be renewed.
Semiannual Report
Investment Adviser
Fidelity Management & Research Company
Boston, MA
Investment Sub-Advisers
Fidelity Investments Money
Management, Inc.
Fidelity Management & Research
(U.K.) Inc.
Fidelity Management & Research
(Hong Kong) Limited
Fidelity Management & Research
(Japan) Inc.
General Distributor
Fidelity Distributors Corporation
Boston, MA
Transfer and Service Agents
Fidelity Investments Institutional Operations Company, Inc.
Boston, MA
Fidelity Service Company, Inc.
Boston, MA
Custodian
The Bank of New York Mellon
New York, NY
AGVTI-USAN-0311
1.834234.104
Fidelity Income Replacement FundsSM -
2016, 2018, 2020, 2022, 2024, 2026, 2028, 2030, 2032, 2034, 2036, 2038, 2040, 2042
Semiannual Report
January 31, 2011
(2_fidelity_logos) (Registered_Trademark)
Contents
Semiannual Report
This report and the financial statements contained herein are submitted for the general information of the shareholders of the funds. This report is not authorized for distribution to prospective investors in the funds unless preceded or accompanied by an effective prospectus.
A fund files its complete schedule of portfolio holdings with the SEC for the first and third quarters of each fiscal year on Form N-Q. Forms N-Q are available on the SEC's web site at http://www.sec.gov. A fund's Forms N-Q may be reviewed and copied at the SEC's Public Reference Room in Washington, DC. Information regarding the operation of the SEC's Public Reference Room may be obtained by calling 1-800-SEC-0330. For a complete list of a fund's portfolio holdings, view the most recent holdings listing, semiannual report, or annual report on Fidelity's web site at http://www.fidelity.com, http://www.advisor.fidelity.com, or http://www.401k.com, as applicable.
NOT FDIC INSURED • MAY LOSE VALUE • NO BANK GUARANTEE
Neither the funds nor Fidelity Distributors Corporation is a bank.
To view a fund's proxy voting guidelines and proxy voting record for the 12-month period ended June 30, visit http://www.fidelity.com/proxyvotingresults or visit the Securities and Exchange Commission's (SEC) web site at http://www.sec.gov. You may also call 1-800-544-8544 to request a free copy of the proxy voting guidelines.
Standard & Poor's, S&P and S&P 500 are registered service marks of The McGraw-Hill Companies, Inc. and have been licensed for use by Fidelity Distributors Corporation.
Other third party marks appearing herein are the property of their respective owners.
All other marks appearing herein are registered or unregistered trademarks or service marks of FMR LLC or an affiliated company.
Semiannual Report
(photo_of_Abigail_P_Johnson)
Dear Shareholder:
Following a year in which the investment environment was volatile but generally supportive of most major asset classes, 2011 began on a positive note. U.S. equities gained ground in January, reaching their highest point since August 2008, amid indications the U.S. economy had turned a corner. Still, questions remained about the longer-term outlook, most notably persistently high unemployment. Financial markets are always unpredictable, of course, but there also are several time-tested investment principles that can help put the odds in your favor.
One of the basic tenets is to invest for the long term. Over time, riding out the markets' inevitable ups and downs has proven much more effective than selling into panic or chasing the hottest trend. Even missing only a few of the markets' best days can significantly diminish investor returns. Patience also affords the benefits of compounding - of earning interest on additional income or reinvested dividends and capital gains. There can be tax advantages and cost benefits to consider as well. While staying the course doesn't eliminate risk, it can considerably lessen the effect of short-term declines.
You can further manage your investing risk through diversification. And today, more than ever, geographic diversification should be taken into account. Studies indicate that asset allocation is the single most important determinant of a portfolio's long-term success. The right mix of stocks, bonds and cash - aligned to your particular risk tolerance and investment objective - is very important. Age-appropriate rebalancing is also an essential aspect of asset allocation. For younger investors, an emphasis on equities - which historically have been the best-performing asset class over time - is encouraged. As investors near their specific goal, such as retirement or sending a child to college, consideration may be given to replacing volatile assets (e.g. common stocks) with more-stable fixed investments (bonds or savings plans).
A third principle - investing regularly - can help lower the average cost of your purchases. Investing a certain amount of money each month or quarter helps ensure you won't pay for all your shares at market highs. This strategy - known as dollar cost averaging - also reduces "emotion" from investing, helping shareholders avoid selling weak performers just prior to an upswing, or chasing a hot performer just before a correction.
We invite you to contact us via the Internet, through our Investor Centers or by phone. It is our privilege to provide you the information you need to make the investments that are right for you.
Sincerely,
(The chairman's signature appears here.)
Abigail P. Johnson
Semiannual Report
As a shareholder of a Fund, you incur two types of costs: (1) transaction costs, including sales charges (loads) on purchase payments or redemption proceeds, and (2) ongoing costs, including distribution and/or service (12b-1) fees and other Fund expenses. This Example is intended to help you understand your ongoing costs (in dollars) of investing in the Funds and to compare these costs with the ongoing costs of investing in other mutual funds.
The Example is based on an investment of $1,000 invested at the beginning of the period and held for the entire period (August 1, 2010 to January 31, 2011).
Actual Expenses
The first line of the accompanying table for each class of each fund provides information about actual account values and actual expenses. You may use the information in this line, together with the amount you invested, to estimate the expenses that you paid over the period. Simply divide your account value by $1,000.00 (for example, an $8,600 account value divided by $1,000.00 = 8.6), then multiply the result by the number in the first line for a class of the fund under the heading entitled "Expenses Paid During Period" to estimate the expenses you paid on your account during this period. In addition, each Fund, as a shareholder in underlying Fidelity Funds, will indirectly bear its pro-rata share of the fees and expenses incurred by the underlying Fidelity Funds. These fees and expenses are not included in each Fund's annualized expense ratio used to calculate the expense estimates in the table below.
Hypothetical Example for Comparison Purposes
The second line of the accompanying table for each class of each fund provides information about hypothetical account values and hypothetical expenses based on a Class' actual expense ratio and an assumed rate of return of 5% per year before expenses, which is not the Class' actual return. The hypothetical account values and expenses may not be used to estimate the actual ending account balance or expenses you paid for the period. You may use this information to compare the ongoing costs of investing in the Fund and other funds. To do so, compare this 5% hypothetical example with the 5% hypothetical examples that appear in the shareholder reports of the other funds. In addition, each Fund, as a shareholder in underlying Fidelity Funds, will indirectly bear its pro-rata share of the fees and expenses incurred by the underlying Fidelity Funds. These fees and expenses are not included in each Fund's annualized expense ratio used to calculate the expense estimates in the table below.
Please note that the expenses shown in the table are meant to highlight your ongoing costs only and do not reflect any transaction costs. Therefore, the second line of the table is useful in comparing ongoing costs only, and will not help you determine the relative total costs of owning different funds. In addition, if these transactional costs were included, your costs would have been higher.
| Annualized
Expense Ratio | Beginning
Account Value
August 1, 2010 | Ending
Account Value
January 31, 2011 | Expenses Paid
During Period*
August 1, 2010 to
January 31, 2011 |
Fidelity Income Replacement 2016 Fund | | | | |
Class A | .25% | | | |
Actual | | $ 1,000.00 | $ 1,061.40 | $ 1.30 |
HypotheticalA | | $ 1,000.00 | $ 1,023.95 | $ 1.28 |
Class T | .50% | | | |
Actual | | $ 1,000.00 | $ 1,060.10 | $ 2.60 |
HypotheticalA | | $ 1,000.00 | $ 1,022.68 | $ 2.55 |
Class C | 1.00% | | | |
Actual | | $ 1,000.00 | $ 1,057.50 | $ 5.19 |
HypotheticalA | | $ 1,000.00 | $ 1,020.16 | $ 5.09 |
Income Replacement 2016 | .00% | | | |
Actual | | $ 1,000.00 | $ 1,062.70 | $ .00 |
HypotheticalA | | $ 1,000.00 | $ 1,025.21 | $ .00 |
Institutional Class | .00% | | | |
Actual | | $ 1,000.00 | $ 1,062.70 | $ .00 |
HypotheticalA | | $ 1,000.00 | $ 1,025.21 | $ .00 |
Fidelity Income Replacement 2018 Fund | | | | |
Class A | .25% | | | |
Actual | | $ 1,000.00 | $ 1,076.10 | $ 1.31 |
HypotheticalA | | $ 1,000.00 | $ 1,023.95 | $ 1.28 |
Class T | .50% | | | |
Actual | | $ 1,000.00 | $ 1,074.90 | $ 2.61 |
HypotheticalA | | $ 1,000.00 | $ 1,022.68 | $ 2.55 |
| Annualized
Expense Ratio | Beginning
Account Value
August 1, 2010 | Ending
Account Value
January 31, 2011 | Expenses Paid
During Period*
August 1, 2010 to
January 31, 2011 |
Fidelity Income Replacement 2018 Fund | | | | |
Class C | 1.00% | | | |
Actual | | $ 1,000.00 | $ 1,072.10 | $ 5.22 |
HypotheticalA | | $ 1,000.00 | $ 1,020.16 | $ 5.09 |
Income Replacement 2018 | .00% | | | |
Actual | | $ 1,000.00 | $ 1,077.40 | $ .00 |
HypotheticalA | | $ 1,000.00 | $ 1,025.21 | $ .00 |
Institutional Class | .00% | | | |
Actual | | $ 1,000.00 | $ 1,077.60 | $ .00 |
HypotheticalA | | $ 1,000.00 | $ 1,025.21 | $ .00 |
Fidelity Income Replacement 2020 Fund | | | | |
Class A | .25% | | | |
Actual | | $ 1,000.00 | $ 1,087.40 | $ 1.32 |
HypotheticalA | | $ 1,000.00 | $ 1,023.95 | $ 1.28 |
Class T | .50% | | | |
Actual | | $ 1,000.00 | $ 1,086.10 | $ 2.63 |
HypotheticalA | | $ 1,000.00 | $ 1,022.68 | $ 2.55 |
Class C | 1.00% | | | |
Actual | | $ 1,000.00 | $ 1,083.40 | $ 5.25 |
HypotheticalA | | $ 1,000.00 | $ 1,020.16 | $ 5.09 |
Income Replacement 2020 | .00% | | | |
Actual | | $ 1,000.00 | $ 1,088.80 | $ .00 |
HypotheticalA | | $ 1,000.00 | $ 1,025.21 | $ .00 |
Institutional Class | .00% | | | |
Actual | | $ 1,000.00 | $ 1,088.80 | $ .00 |
HypotheticalA | | $ 1,000.00 | $ 1,025.21 | $ .00 |
Fidelity Income Replacement 2022 Fund | | | | |
Class A | .25% | | | |
Actual | | $ 1,000.00 | $ 1,095.60 | $ 1.32 |
HypotheticalA | | $ 1,000.00 | $ 1,023.95 | $ 1.28 |
Class T | .50% | | | |
Actual | | $ 1,000.00 | $ 1,094.20 | $ 2.64 |
HypotheticalA | | $ 1,000.00 | $ 1,022.68 | $ 2.55 |
Class C | 1.00% | | | |
Actual | | $ 1,000.00 | $ 1,091.40 | $ 5.27 |
HypotheticalA | | $ 1,000.00 | $ 1,020.16 | $ 5.09 |
Income Replacement 2022 | .00% | | | |
Actual | | $ 1,000.00 | $ 1,097.10 | $ .00 |
HypotheticalA | | $ 1,000.00 | $ 1,025.21 | $ .00 |
Institutional Class | .00% | | | |
Actual | | $ 1,000.00 | $ 1,096.90 | $ .00 |
HypotheticalA | | $ 1,000.00 | $ 1,025.21 | $ .00 |
Fidelity Income Replacement 2024 Fund | | | | |
Class A | .25% | | | |
Actual | | $ 1,000.00 | $ 1,101.60 | $ 1.32 |
HypotheticalA | | $ 1,000.00 | $ 1,023.95 | $ 1.28 |
Class T | .50% | | | |
Actual | | $ 1,000.00 | $ 1,100.10 | $ 2.65 |
HypotheticalA | | $ 1,000.00 | $ 1,022.68 | $ 2.55 |
| Annualized
Expense Ratio | Beginning
Account Value
August 1, 2010 | Ending
Account Value
January 31, 2011 | Expenses Paid
During Period*
August 1, 2010 to
January 31, 2011 |
Fidelity Income Replacement 2024 Fund | | | | |
Class C | 1.00% | | | |
Actual | | $ 1,000.00 | $ 1,097.30 | $ 5.29 |
HypotheticalA | | $ 1,000.00 | $ 1,020.16 | $ 5.09 |
Income Replacement 2024 | .00% | | | |
Actual | | $ 1,000.00 | $ 1,102.80 | $ .00 |
HypotheticalA | | $ 1,000.00 | $ 1,025.21 | $ .00 |
Institutional Class | .00% | | | |
Actual | | $ 1,000.00 | $ 1,102.80 | $ .00 |
HypotheticalA | | $ 1,000.00 | $ 1,025.21 | $ .00 |
Fidelity Income Replacement 2026 Fund | | | | |
Class A | .25% | | | |
Actual | | $ 1,000.00 | $ 1,105.70 | $ 1.33 |
HypotheticalA | | $ 1,000.00 | $ 1,023.95 | $ 1.28 |
Class T | .50% | | | |
Actual | | $ 1,000.00 | $ 1,104.40 | $ 2.65 |
HypotheticalA | | $ 1,000.00 | $ 1,022.68 | $ 2.55 |
Class C | 1.00% | | | |
Actual | | $ 1,000.00 | $ 1,101.70 | $ 5.30 |
HypotheticalA | | $ 1,000.00 | $ 1,020.16 | $ 5.09 |
Income Replacement 2026 | .00% | | | |
Actual | | $ 1,000.00 | $ 1,107.40 | $ .00 |
HypotheticalA | | $ 1,000.00 | $ 1,025.21 | $ .00 |
Institutional Class | .00% | | | |
Actual | | $ 1,000.00 | $ 1,107.10 | $ .00 |
HypotheticalA | | $ 1,000.00 | $ 1,025.21 | $ .00 |
Fidelity Income Replacement 2028 Fund | | | | |
Class A | .25% | | | |
Actual | | $ 1,000.00 | $ 1,109.30 | $ 1.33 |
HypotheticalA | | $ 1,000.00 | $ 1,023.95 | $ 1.28 |
Class T | .50% | | | |
Actual | | $ 1,000.00 | $ 1,108.10 | $ 2.66 |
HypotheticalA | | $ 1,000.00 | $ 1,022.68 | $ 2.55 |
Class C | 1.00% | | | |
Actual | | $ 1,000.00 | $ 1,105.00 | $ 5.31 |
HypotheticalA | | $ 1,000.00 | $ 1,020.16 | $ 5.09 |
Income Replacement 2028 | .00% | | | |
Actual | | $ 1,000.00 | $ 1,110.60 | $ .00 |
HypotheticalA | | $ 1,000.00 | $ 1,025.21 | $ .00 |
Institutional Class | .00% | | | |
Actual | | $ 1,000.00 | $ 1,110.60 | $ .00 |
HypotheticalA | | $ 1,000.00 | $ 1,025.21 | $ .00 |
Fidelity Income Replacement 2030 Fund | | | | |
Class A | .25% | | | |
Actual | | $ 1,000.00 | $ 1,112.50 | $ 1.33 |
HypotheticalA | | $ 1,000.00 | $ 1,023.95 | $ 1.28 |
Class T | .50% | | | |
Actual | | $ 1,000.00 | $ 1,110.90 | $ 2.66 |
HypotheticalA | | $ 1,000.00 | $ 1,022.68 | $ 2.55 |
| Annualized
Expense Ratio | Beginning
Account Value
August 1, 2010 | Ending
Account Value
January 31, 2011 | Expenses Paid
During Period*
August 1, 2010 to
January 31, 2011 |
Fidelity Income Replacement 2030 Fund | | | | |
Class C | 1.00% | | | |
Actual | | $ 1,000.00 | $ 1,108.30 | $ 5.31 |
HypotheticalA | | $ 1,000.00 | $ 1,020.16 | $ 5.09 |
Income Replacement 2030 | .00% | | | |
Actual | | $ 1,000.00 | $ 1,113.90 | $ .00 |
HypotheticalA | | $ 1,000.00 | $ 1,025.21 | $ .00 |
Institutional Class | .00% | | | |
Actual | | $ 1,000.00 | $ 1,113.70 | $ .00 |
HypotheticalA | | $ 1,000.00 | $ 1,025.21 | $ .00 |
Fidelity Income Replacement 2032 Fund | | | | |
Class A | .25% | | | |
Actual | | $ 1,000.00 | $ 1,115.00 | $ 1.33 |
HypotheticalA | | $ 1,000.00 | $ 1,023.95 | $ 1.28 |
Class T | .50% | | | |
Actual | | $ 1,000.00 | $ 1,113.80 | $ 2.66 |
HypotheticalA | | $ 1,000.00 | $ 1,022.68 | $ 2.55 |
Class C | 1.00% | | | |
Actual | | $ 1,000.00 | $ 1,111.00 | $ 5.32 |
HypotheticalA | | $ 1,000.00 | $ 1,020.16 | $ 5.09 |
Income Replacement 2032 | .00% | | | |
Actual | | $ 1,000.00 | $ 1,116.60 | $ .00 |
HypotheticalA | | $ 1,000.00 | $ 1,025.21 | $ .00 |
Institutional Class | .00% | | | |
Actual | | $ 1,000.00 | $ 1,116.60 | $ .00 |
HypotheticalA | | $ 1,000.00 | $ 1,025.21 | $ .00 |
Fidelity Income Replacement 2034 Fund | | | | |
Class A | .25% | | | |
Actual | | $ 1,000.00 | $ 1,118.10 | $ 1.33 |
HypotheticalA | | $ 1,000.00 | $ 1,023.95 | $ 1.28 |
Class T | .50% | | | |
Actual | | $ 1,000.00 | $ 1,116.70 | $ 2.67 |
HypotheticalA | | $ 1,000.00 | $ 1,022.68 | $ 2.55 |
Class C | 1.00% | | | |
Actual | | $ 1,000.00 | $ 1,113.90 | $ 5.33 |
HypotheticalA | | $ 1,000.00 | $ 1,020.16 | $ 5.09 |
Income Replacement 2034 | .00% | | | |
Actual | | $ 1,000.00 | $ 1,119.30 | $ .00 |
HypotheticalA | | $ 1,000.00 | $ 1,025.21 | $ .00 |
Institutional Class | .00% | | | |
Actual | | $ 1,000.00 | $ 1,119.60 | $ .00 |
HypotheticalA | | $ 1,000.00 | $ 1,025.21 | $ .00 |
Fidelity Income Replacement 2036 Fund | | | | |
Class A | .25% | | | |
Actual | | $ 1,000.00 | $ 1,121.50 | $ 1.34 |
HypotheticalA | | $ 1,000.00 | $ 1,023.95 | $ 1.28 |
Class T | .50% | | | |
Actual | | $ 1,000.00 | $ 1,119.90 | $ 2.67 |
HypotheticalA | | $ 1,000.00 | $ 1,022.68 | $ 2.55 |
| Annualized
Expense Ratio | Beginning
Account Value
August 1, 2010 | Ending
Account Value
January 31, 2011 | Expenses Paid
During Period*
August 1, 2010 to
January 31, 2011 |
Fidelity Income Replacement 2036 Fund | | | | |
Class C | 1.00% | | | |
Actual | | $ 1,000.00 | $ 1,117.30 | $ 5.34 |
HypotheticalA | | $ 1,000.00 | $ 1,020.16 | $ 5.09 |
Income Replacement 2036 | .00% | | | |
Actual | | $ 1,000.00 | $ 1,122.70 | $ .00 |
HypotheticalA | | $ 1,000.00 | $ 1,025.21 | $ .00 |
Institutional Class | .00% | | | |
Actual | | $ 1,000.00 | $ 1,122.70 | $ .00 |
HypotheticalA | | $ 1,000.00 | $ 1,025.21 | $ .00 |
Fidelity Income Replacement 2038 Fund | | | | |
Class A | .25% | | | |
Actual | | $ 1,000.00 | $ 1,125.50 | $ 1.34 |
HypotheticalA | | $ 1,000.00 | $ 1,023.95 | $ 1.28 |
Class T | .50% | | | |
Actual | | $ 1,000.00 | $ 1,124.00 | $ 2.68 |
HypotheticalA | | $ 1,000.00 | $ 1,022.68 | $ 2.55 |
Class C | 1.00% | | | |
Actual | | $ 1,000.00 | $ 1,121.40 | $ 5.35 |
HypotheticalA | | $ 1,000.00 | $ 1,020.16 | $ 5.09 |
Income Replacement 2038 | .00% | | | |
Actual | | $ 1,000.00 | $ 1,127.10 | $ .00 |
HypotheticalA | | $ 1,000.00 | $ 1,025.21 | $ .00 |
Institutional Class | .00% | | | |
Actual | | $ 1,000.00 | $ 1,126.90 | $ .00 |
HypotheticalA | | $ 1,000.00 | $ 1,025.21 | $ .00 |
Fidelity Income Replacement 2040 Fund | | | | |
Class A | .25% | | | |
Actual | | $ 1,000.00 | $ 1,130.10 | $ 1.34 |
HypotheticalA | | $ 1,000.00 | $ 1,023.95 | $ 1.28 |
Class T | .50% | | | |
Actual | | $ 1,000.00 | $ 1,128.60 | $ 2.68 |
HypotheticalA | | $ 1,000.00 | $ 1,022.68 | $ 2.55 |
Class C | 1.00% | | | |
Actual | | $ 1,000.00 | $ 1,125.70 | $ 5.36 |
HypotheticalA | | $ 1,000.00 | $ 1,020.16 | $ 5.09 |
Income Replacement 2040 | .00% | | | |
Actual | | $ 1,000.00 | $ 1,131.60 | $ .00 |
HypotheticalA | | $ 1,000.00 | $ 1,025.21 | $ .00 |
Institutional Class | .00% | | | |
Actual | | $ 1,000.00 | $ 1,131.60 | $ .00 |
HypotheticalA | | $ 1,000.00 | $ 1,025.21 | $ .00 |
Fidelity Income Replacement 2042 Fund | | | | |
Class A | .25% | | | |
Actual | | $ 1,000.00 | $ 1,132.10 | $ 1.34 |
HypotheticalA | | $ 1,000.00 | $ 1,023.95 | $ 1.28 |
Class T | .50% | | | |
Actual | | $ 1,000.00 | $ 1,130.90 | $ 2.69 |
HypotheticalA | | $ 1,000.00 | $ 1,022.68 | $ 2.55 |
| Annualized
Expense Ratio | Beginning
Account Value
August 1, 2010 | Ending
Account Value
January 31, 2011 | Expenses Paid
During Period*
August 1, 2010 to
January 31, 2011 |
Fidelity Income Replacement 2042 Fund | | | | |
Class C | 1.00% | | | |
Actual | | $ 1,000.00 | $ 1,127.90 | $ 5.36 |
HypotheticalA | | $ 1,000.00 | $ 1,020.16 | $ 5.09 |
Income Replacement 2042 | .00% | | | |
Actual | | $ 1,000.00 | $ 1,133.60 | $ .00 |
HypotheticalA | | $ 1,000.00 | $ 1,025.21 | $ .00 |
Institutional Class | .00% | | | |
Actual | | $ 1,000.00 | $ 1,133.60 | $ .00 |
HypotheticalA | | $ 1,000.00 | $ 1,025.21 | $ .00 |
A 5% return per year before expenses
* Expenses are equal to each Class' annualized expense ratio, multiplied by the average account value over the period, multiplied by 184/365 (to reflect the one-half year period). The fees and expenses of the underlying Fidelity Funds in which the Fund invests are not included in the Fund's annualized expense ratio.
Semiannual Report
Fidelity Income Replacement 2016 Fund
Investment Changes (Unaudited)
Fund Holdings as of January 31, 2011 |
| % of fund's
net assets | % of fund's net assets
6 months ago |
Domestic Equity Funds | | |
Fidelity Advisor Mid Cap II Fund Institutional Class | 2.7 | 2.9 |
Fidelity Disciplined Equity Fund | 2.8 | 3.0 |
Fidelity Equity-Income Fund | 2.8 | 3.1 |
Fidelity Large Cap Core Enhanced Index Fund | 4.5 | 4.9 |
Fidelity Series 100 Index Fund | 3.4 | 3.7 |
Fidelity Series Broad Market Opportunities Fund | 4.5 | 4.9 |
Fidelity Series Small Cap Opportunities Fund | 1.8 | 2.0 |
| 22.5 | 24.5 |
International Equity Funds | | |
Fidelity Advisor International Discovery Fund Institutional Class | 1.8 | 2.3 |
Investment Grade Fixed-Income Funds | | |
Fidelity Government Income Fund | 8.5 | 8.3 |
Fidelity Strategic Real Return Fund | 8.5 | 8.5 |
Fidelity Total Bond Fund | 25.4 | 25.1 |
| 42.4 | 41.9 |
Short-Term Funds | | |
Fidelity Institutional Money Market Portfolio Institutional Class | 16.7 | 15.6 |
Fidelity Short-Term Bond Fund | 16.6 | 15.7 |
| 33.3 | 31.3 |
Net Other Assets (Liabilities)* | 0.0 | 0.0 |
| 100.0 | 100.0 |
* Amount represents less than 0.1% |
Asset Allocation (% of fund's net assets) |
Current |
 | Domestic Equity Funds | 22.5% | |
 | International Equity Funds | 1.8% | |
 | Investment Grade Fixed-Income Funds | 42.4% | |
 | Short-Term Funds | 33.3% | |

Six months ago |
| Domestic Equity Funds | 24.5% | |
| International Equity Funds | 2.3% | |
| Investment Grade Fixed-Income Funds | 41.9% | |
| Short-Term Funds | 31.3% | |

Expected |
| Domestic Equity Funds | 21.2% | |
| International Equity Funds | 0.8% | |
| Investment Grade Fixed-Income Funds | 41.1% | |
| Short-Term Funds | 36.9% | |

The fund invests according to an asset allocation strategy that becomes increasingly conservative over time. The six months ago allocation is based on the fund's holdings as of July 31, 2010. The current allocation is based on the fund's holdings as of January 31, 2011. The expected allocation represents the fund's anticipated allocation at July 31, 2011. |
Semiannual Report
Fidelity Income Replacement 2016 Fund
Investments January 31, 2011 (Unaudited)
Showing Percentage of Net Assets
Equity Funds - 24.3% |
| Shares | | Value |
Domestic Equity Funds - 22.5% |
Fidelity Advisor Mid Cap II Fund Institutional Class | 15,787 | | $ 289,373 |
Fidelity Disciplined Equity Fund | 12,970 | | 301,162 |
Fidelity Equity-Income Fund | 6,609 | | 301,162 |
Fidelity Large Cap Core Enhanced Index Fund | 55,056 | | 482,289 |
Fidelity Series 100 Index Fund | 40,475 | | 362,252 |
Fidelity Series Broad Market Opportunities Fund | 46,915 | | 482,288 |
Fidelity Series Small Cap Opportunities Fund | 17,634 | | 192,915 |
TOTAL DOMESTIC EQUITY FUNDS | | 2,411,441 |
International Equity Funds - 1.8% |
Fidelity Advisor International Discovery Fund Institutional Class | 5,861 | | 193,987 |
TOTAL EQUITY FUNDS (Cost $2,327,382) | 2,605,428 |
Fixed-Income Funds - 42.4% |
| Shares | | Value |
Investment Grade Fixed-Income Funds - 42.4% |
Fidelity Government Income Fund | 87,305 | | $ 908,846 |
Fidelity Strategic Real Return Fund | 93,695 | | 908,846 |
Fidelity Total Bond Fund | 253,768 | | 2,725,464 |
TOTAL FIXED-INCOME FUNDS (Cost $4,354,464) | 4,543,156 |
Short-Term Funds - 33.3% |
| | | |
Fidelity Institutional Money Market Portfolio Institutional Class | 1,784,703 | | 1,784,703 |
Fidelity Short-Term Bond Fund | 210,432 | | 1,784,467 |
TOTAL SHORT-TERM FUNDS (Cost $3,545,981) | 3,569,170 |
TOTAL INVESTMENT PORTFOLIO - 100.0% (Cost $10,227,827) | | 10,717,754 |
NET OTHER ASSETS (LIABILITIES) - 0.0% | | (2,308) |
NET ASSETS - 100% | $ 10,715,446 |
Other Information |
All investments are categorized as Level 1 under the Fair Value Hierarchy. The inputs or methodology used for valuing securities may not be an indication of the risk associated with investing in those securities. For more information on valuation inputs, please refer to the Security Valuation section in the accompanying Notes to Financial Statements. |
Income Tax Information |
At July 31, 2010, the Fund had a capital loss carryforward of approximately $245,395 of which $11,321 and $234,074 will expire in fiscal 2017 and 2018, respectively. Capital loss carryforwards are only available to offset future capital gains of the Fund to the extent provided by regulations and may be limited. |
See accompanying notes which are an integral part of the financial statements.
Semiannual Report
Fidelity Income Replacement 2016 Fund
Statement of Assets and Liabilities
| January 31, 2011 (Unaudited) |
| | |
Assets | | |
Investment in securities, at value (cost $10,227,827) - See accompanying schedule | | $ 10,717,754 |
Cash | | 11 |
Receivable for investments sold | | 130,215 |
Total assets | | 10,847,980 |
| | |
Liabilities | | |
Payable for investments purchased | $ 69,616 | |
Payable for fund shares redeemed | 61,267 | |
Distribution and service plan fees payable | 1,651 | |
Total liabilities | | 132,534 |
| | |
Net Assets | | $ 10,715,446 |
Net Assets consist of: | | |
Paid in capital | | $ 10,823,220 |
Undistributed net investment income | | 2,916 |
Accumulated undistributed net realized gain (loss) on investments | | (600,617) |
Net unrealized appreciation (depreciation) on investments | | 489,927 |
Net Assets | | $ 10,715,446 |
Calculation of Maximum Offering Price Class A:
Net Asset Value and redemption price per share ($2,057,157 ÷ 41,836.9 shares) | | $ 49.17 |
| | |
Maximum offering price per share (100/94.25 of $49.17) | | $ 52.17 |
Class T:
Net Asset Value and redemption price per share ($636,574 ÷ 12,947.1 shares) | | $ 49.17 |
| | |
Maximum offering price per share (100/96.50 of $49.17) | | $ 50.95 |
| | |
Class C:
Net Asset Value and offering price per share ($1,143,432 ÷ 23,259.5 shares)A | | $ 49.16 |
| | |
Income Replacement 2016:
Net Asset Value, offering price and redemption price per share ($6,739,718 ÷ 137,040.0 shares) | | $ 49.18 |
| | |
Institutional Class:
Net Asset Value, offering price and redemption price per share ($138,565 ÷ 2,817.4 shares) | | $ 49.18 |
A Redemption price per share is equal to net asset value less any applicable contingent deferred sales charge.
Statement of Operations
Six months ended January 31, 2011 (Unaudited) |
| | |
Investment Income | | |
Income distributions from underlying funds | | $ 123,564 |
| | |
Expenses | | |
Distribution and service plan fees | $ 9,905 | |
Independent trustees' compensation | 21 | |
Total expenses before reductions | 9,926 | |
Expense reductions | (21) | 9,905 |
Net investment income (loss) | | 113,659 |
Realized and Unrealized Gain (Loss) Realized gain (loss) on sale of underlying fund shares | (124,567) | |
Capital gain distributions from underlying funds | 78,190 | |
Total net realized gain (loss) | | (46,377) |
Change in net unrealized appreciation (depreciation) on underlying funds | | 606,670 |
Net gain (loss) | | 560,293 |
Net increase (decrease) in net assets resulting from operations | | $ 673,952 |
See accompanying notes which are an integral part of the financial statements.
Semiannual Report
Fidelity Income Replacement 2016 Fund
Financial Statements - continued
Statement of Changes in Net Assets
| Six months ended
January 31, 2011 (Unaudited) | Year ended
July 31,
2010 |
Increase (Decrease) in Net Assets | | |
Operations | | |
Net investment income (loss) | $ 113,659 | $ 190,860 |
Net realized gain (loss) | (46,377) | (128,722) |
Change in net unrealized appreciation (depreciation) | 606,670 | 877,831 |
Net increase (decrease) in net assets resulting from operations | 673,952 | 939,969 |
Distributions to shareholders from net investment income | (114,553) | (190,322) |
Distributions to shareholders from net realized gain | (58,747) | (25,833) |
Total distributions | (173,300) | (216,155) |
Share transactions - net increase (decrease) | (859,062) | 1,239,040 |
Total increase (decrease) in net assets | (358,410) | 1,962,854 |
| | |
Net Assets | | |
Beginning of period | 11,073,856 | 9,111,002 |
End of period (including undistributed net investment income of $2,916 and undistributed net investment income of $3,810, respectively) | $ 10,715,446 | $ 11,073,856 |
Financial Highlights - Class A
| Six months ended January 31, 2011 | Years ended July 31, |
| (Unaudited) | 2010 | 2009 | 2008 G |
Selected Per-Share Data | | | | |
Net asset value, beginning of period | $ 47.04 | $ 43.62 | $ 47.76 | $ 50.00 |
Income from Investment Operations | | | | |
Net investment income (loss) E | .474 | .831 | 1.118 | 1.233 |
Net realized and unrealized gain (loss) | 2.400 | 3.539 | (3.686) | (2.204) |
Total from investment operations | 2.874 | 4.370 | (2.568) | (.971) |
Distributions from net investment income | (.483) | (.830) | (1.132) | (1.129) |
Distributions from net realized gain | (.261) | (.120) | (.440) | (.140) |
Total distributions | (.744) | (.950) | (1.572) | (1.269) |
Net asset value, end of period | $ 49.17 | $ 47.04 | $ 43.62 | $ 47.76 |
Total Return B, C, D | 6.14% | 10.08% | (5.07)% | (2.02)% |
Ratios to Average Net Assets F, H | | | | |
Expenses before reductions | .25% A | .25% | .25% | .25%A |
Expenses net of fee waivers, if any | .25%A | .25% | .25% | .25%A |
Expenses net of all reductions | .25%A | .25% | .25% | .25%A |
Net investment income (loss) | 1.96%A | 1.80% | 2.72% | 2.76%A |
Supplemental Data | | | | |
Net assets, end of period (000 omitted) | $ 2,057 | $ 2,308 | $ 2,599 | $ 2,214 |
Portfolio turnover rate | 36%A | 40% | 54% | 56%A |
A Annualized
B Total returns for periods of less than one year are not annualized.
C Total returns would have been lower had certain expenses not been reduced during the periods shown.
D Total returns do not include the effect of the sales charges.
E Calculated based on average shares outstanding during the period.
F Amounts do not include the activity of the underlying funds.
G For the period August 30, 2007 (commencement of operations) to July 31, 2008.
H Expense ratios reflect operating expenses of the class. Expenses before reductions do not reflect amounts reimbursed by the investment adviser or reductions from expense offset arrangements and do not represent the amount paid by the class during periods when reimbursements or reductions occur. Expenses net of fee waivers reflect expenses after reimbursement by the investment adviser but prior to reductions from expense offset arrangements. Expenses net of all reductions represent the net expenses paid by the class but do not include expenses of the investment companies in which the Fund invests.
See accompanying notes which are an integral part of the financial statements.
Semiannual Report
Financial Highlights - Class T
| Six months ended January 31, 2011 | Years ended July 31, |
| (Unaudited) | 2010 | 2009 | 2008 G |
Selected Per-Share Data | | | | |
Net asset value, beginning of period | $ 47.04 | $ 43.62 | $ 47.75 | $ 50.00 |
Income from Investment Operations | | | | |
Net investment income (loss) E | .413 | .716 | 1.025 | 1.128 |
Net realized and unrealized gain (loss) | 2.402 | 3.540 | (3.690) | (2.219) |
Total from investment operations | 2.815 | 4.256 | (2.665) | (1.091) |
Distributions from net investment income | (.424) | (.716) | (1.025) | (1.019) |
Distributions from net realized gain | (.261) | (.120) | (.440) | (.140) |
Total distributions | (.685) | (.836) | (1.465) | (1.159) |
Net asset value, end of period | $ 49.17 | $ 47.04 | $ 43.62 | $ 47.75 |
Total Return B, C, D | 6.01% | 9.81% | (5.30)% | (2.26)% |
Ratios to Average Net Assets F, H | | | | |
Expenses before reductions | .50% A | .50% | .50% | .50%A |
Expenses net of fee waivers, if any | .50%A | .50% | .50% | .50%A |
Expenses net of all reductions | .50%A | .50% | .50% | .50%A |
Net investment income (loss) | 1.71%A | 1.55% | 2.47% | 2.51%A |
Supplemental Data | | | | |
Net assets, end of period (000 omitted) | $ 637 | $ 638 | $ 499 | $ 673 |
Portfolio turnover rate | 36%A | 40% | 54% | 56%A |
A Annualized
B Total returns for periods of less than one year are not annualized.
C Total returns would have been lower had certain expenses not been reduced during the periods shown.
D Total returns do not include the effect of the sales charges.
E Calculated based on average shares outstanding during the period.
F Amounts do not include the activity of the underlying funds.
G For the period August 30, 2007 (commencement of operations) to July 31, 2008.
H Expense ratios reflect operating expenses of the class. Expenses before reductions do not reflect amounts reimbursed by the investment adviser or reductions from expense offset arrangements and do not represent the amount paid by the class during periods when reimbursements or reductions occur. Expenses net of fee waivers reflect expenses after reimbursement by the investment adviser but prior to reductions from expense offset arrangements. Expenses net of all reductions represent the net expenses paid by the class but do not include expenses of the investment companies in which the Fund invests.
Financial Highlights - Class C
| Six months ended January 31, 2011 | Years ended July 31, |
| (Unaudited) | 2010 | 2009 | 2008 G |
Selected Per-Share Data | | | | |
Net asset value, beginning of period | $ 47.03 | $ 43.61 | $ 47.73 | $ 50.00 |
Income from Investment Operations | | | | |
Net investment income (loss)E | .292 | .485 | .822 | .904 |
Net realized and unrealized gain (loss) | 2.405 | 3.531 | (3.689) | (2.227) |
Total from investment operations | 2.697 | 4.016 | (2.867) | (1.323) |
Distributions from net investment income | (.306) | (.476) | (.813) | (.807) |
Distributions from net realized gain | (.261) | (.120) | (.440) | (.140) |
Total distributions | (.567) | (.596) | (1.253) | (.947) |
Net asset value, end of period | $ 49.16 | $ 47.03 | $ 43.61 | $ 47.73 |
Total Return B, C, D | 5.75% | 9.24% | (5.76)% | (2.71)% |
Ratios to Average Net Assets F, H | | | | |
Expenses before reductions | 1.00%A | 1.00% | 1.00% | 1.00%A |
Expenses net of fee waivers, if any | 1.00%A | 1.00% | 1.00% | 1.00%A |
Expenses net of all reductions | 1.00%A | 1.00% | 1.00% | 1.00%A |
Net investment income (loss) | 1.21%A | 1.05% | 1.97% | 2.01%A |
Supplemental Data | | | | |
Net assets, end of period (000 omitted) | $ 1,143 | $ 1,075 | $ 1,171 | $ 1,595 |
Portfolio turnover rate | 36%A | 40% | 54% | 56%A |
A Annualized
B Total returns for periods of less than one year are not annualized.
C Total returns would have been lower had certain expenses not been reduced during the periods shown.
D Total returns do not include the effect of the contingent deferred sales charge.
E Calculated based on average shares outstanding during the period.
F Amounts do not include the activity of the underlying funds.
G For the period August 30, 2007 (commencement of operations) to July 31, 2008.
H Expense ratios reflect operating expenses of the class. Expenses before reductions do not reflect amounts reimbursed by the investment adviser or reductions from expense offset arrangements and do not represent the amount paid by the class during periods when reimbursements or reductions occur. Expenses net of fee waivers reflect expenses after reimbursement by the investment adviser but prior to reductions from expense offset arrangements. Expenses net of all reductions represent the net expenses paid by the class but do not include expenses of the investment companies in which the Fund invests.
See accompanying notes which are an integral part of the financial statements.
Semiannual Report
Financial Highlights - Income Replacement 2016
| Six months ended January 31,2011 | Years ended July 31, |
| (Unaudited) | 2010 | 2009 | 2008G |
Selected Per-Share Data | | | | |
Net asset value, beginning of period | $ 47.05 | $ 43.63 | $ 47.77 | $ 50.00 |
Income from Investment Operations | | | | |
Net investment income (loss)D | .534 | .948 | 1.231 | 1.356 |
Net realized and unrealized gain (loss) | 2.401 | 3.539 | (3.692) | (2.217) |
Total from investment operations | 2.935 | 4.487 | (2.461) | (.861) |
Distributions from net investment income | (.544) | (.947) | (1.239) | (1.229) |
Distributions from net realized gain | (.261) | (.120) | (.440) | (.140) |
Total distributions | (.805) | (1.067) | (1.679) | (1.369) |
Net asset value, end of period | $ 49.18 | $ 47.05 | $ 43.63 | $ 47.77 |
Total Return B, C | 6.27% | 10.36% | (4.82)% | (1.81)% |
Ratios to Average Net Assets E, H | | | | |
Expenses before reductions F | .00%A | .00% | .00% | .00%A |
Expenses net of fee waivers, if any | .00%A | .00% | .00% | .00%A |
Expenses net of all reductions | .00%A | .00% | .00% | .00%A |
Net investment income (loss) | 2.21% A | 2.05% | 2.97% | 3.00% A |
Supplemental Data | | | | |
Net assets, end of period (000 omitted) | $ 6,740 | $ 6,946 | $ 4,733 | $ 4,880 |
Portfolio turnover rate | 36%A | 40% | 54% | 56%A |
A Annualized
B Total returns for periods of less than one year are not annualized.
C Total returns would have been lower had certain expenses not been reduced during the periods shown.
D Calculated based on average shares outstanding during the period.
E Amounts do not include the activity of the underlying funds.
F Amount represents less than .01%.
G For the period August 30, 2007 (commencement of operations) to July 31, 2008.
H Expense ratios reflect operating expenses of the class. Expenses before reductions do not reflect amounts reimbursed by the investment adviser or reductions from expense offset arrangements and do not represent the amount paid by the class during periods when reimbursements or reductions occur. Expenses net of fee waivers reflect expenses after reimbursement by the investment adviser but prior to reductions from expense offset arrangements. Expenses net of all reductions represent the net expenses paid by the class but do not include expenses of the investment companies in which the Fund invests.
Financial Highlights - Institutional Class
| Six months ended January 31, 2011 | Years ended July 31, |
| (Unaudited) | 2010 | 2009 | 2008 G |
Selected Per-Share Data | | | | |
Net asset value, beginning of period | $ 47.05 | $ 43.64 | $ 47.77 | $ 50.00 |
Income from Investment Operations | | | | |
Net investment income (loss)D | .533 | .947 | 1.235 | 1.370 |
Net realized and unrealized gain (loss) | 2.402 | 3.530 | (3.686) | (2.231) |
Total from investment operations | 2.935 | 4.477 | (2.451) | (.861) |
Distributions from net investment income | (.544) | (.947) | (1.239) | (1.229) |
Distributions from net realized gain | (.261) | (.120) | (.440) | (.140) |
Total distributions | (.805) | (1.067) | (1.679) | (1.369) |
Net asset value, end of period | $ 49.18 | $ 47.05 | $ 43.64 | $ 47.77 |
Total Return B, C | 6.27% | 10.33% | (4.80)% | (1.81)% |
Ratios to Average Net Assets E, H | | | | |
Expenses before reductions F | .00% A | .00% | .00% | .00%A |
Expenses net of fee waivers, if any | .00% A | .00% | .00% | .00%A |
Expenses net of all reductions | .00% A | .00% | .00% | .00%A |
Net investment income (loss) | 2.21%A | 2.05% | 2.97% | 3.00%A |
Supplemental Data | | | | |
Net assets, end of period (000 omitted) | $ 139 | $ 108 | $ 109 | $ 184 |
Portfolio turnover rate | 36%A | 40% | 54% | 56%A |
A Annualized
B Total returns for periods of less than one year are not annualized.
C Total returns would have been lower had certain expenses not been reduced during the periods shown.
D Calculated based on average shares outstanding during the period.
E Amounts do not include the activity of the underlying funds.
F Amount represents less than .01%.
G For the period August 30, 2007 (commencement of operations) to July 31, 2008.
H Expense ratios reflect operating expenses of the class. Expenses before reductions do not reflect amounts reimbursed by the investment adviser or reductions from expense offset arrangements and do not represent the amount paid by the class during periods when reimbursements or reductions occur. Expenses net of fee waivers reflect expenses after reimbursement by the investment adviser but prior to reductions from expense offset arrangements. Expenses net of all reductions represent the net expenses paid by the class but do not include expenses of the investment companies in which the Fund invests.
See accompanying notes which are an integral part of the financial statements.
Semiannual Report
Fidelity Income Replacement 2018 Fund
Investment Changes (Unaudited)
Fund Holdings as of January 31, 2011 |
| % of fund's
net assets | % of fund's net assets
6 months ago |
Domestic Equity Funds | | |
Fidelity Advisor Mid Cap II Fund Institutional Class | 3.5 | 3.7 |
Fidelity Disciplined Equity Fund | 3.7 | 3.8 |
Fidelity Equity-Income Fund | 3.7 | 3.9 |
Fidelity Large Cap Core Enhanced Index Fund | 5.9 | 6.2 |
Fidelity Series 100 Index Fund | 4.4 | 4.7 |
Fidelity Series Broad Market Opportunities Fund | 5.9 | 6.2 |
Fidelity Series Small Cap Opportunities Fund | 2.4 | 2.5 |
| 29.5 | 31.0 |
International Equity Funds | | |
Fidelity Advisor International Discovery Fund Institutional Class | 2.9 | 3.2 |
High Yield Fixed-Income Funds | | |
Fidelity Capital & Income Fund | 0.9 | 1.1 |
Fidelity Strategic Income Fund | 0.8 | 1.1 |
| 1.7 | 2.2 |
Investment Grade Fixed-Income Funds | | |
Fidelity Government Income Fund | 7.8 | 7.6 |
Fidelity Strategic Real Return Fund | 7.8 | 7.7 |
Fidelity Total Bond Fund | 23.3 | 22.9 |
| 38.9 | 38.2 |
Short-Term Funds | | |
Fidelity Institutional Money Market Portfolio Institutional Class | 13.5 | 12.7 |
Fidelity Short-Term Bond Fund | 13.5 | 12.7 |
| 27.0 | 25.4 |
Net Other Assets (Liabilities)* | 0.0 | 0.0 |
| 100.0 | 100.0 |
* Amount represents less than 0.1% |
Asset Allocation (% of fund's net assets) |
Current |
| Domestic Equity Funds | 29.5% | |
| International Equity Funds | 2.9% | |
| High Yield Fixed-Income Funds | 1.7% | |
 | Investment Grade Fixed-Income Funds | 38.9% | |
| Short-Term Funds | 27.0% | |

Six months ago |
| Domestic Equity Funds | 31.0% | |
| International Equity Funds | 3.2% | |
| High Yield Fixed-Income Funds | 2.2% | |
| Investment Grade Fixed-Income Funds | 38.2% | |
| Short-Term Funds | 25.4% | |

Expected |
| Domestic Equity Funds | 27.8% | |
| International Equity Funds | 2.7% | |
| High Yield Fixed-Income Funds | 0.8% | |
| Investment Grade Fixed-Income Funds | 39.9% | |
| Short-Term Funds | 28.8% | |

The fund invests according to an asset allocation strategy that becomes increasingly conservative over time. The six months ago allocation is based on the fund's holdings as of July 31, 2010. The current allocation is based on the fund's holdings as of January 31, 2011. The expected allocation represents the fund's anticipated allocation at July 31, 2011. |
Semiannual Report
Fidelity Income Replacement 2018 Fund
Investments January 31, 2011 (Unaudited)
Showing Percentage of Net Assets
Equity Funds - 32.4% |
| Shares | | Value |
Domestic Equity Funds - 29.5% |
Fidelity Advisor Mid Cap II Fund Institutional Class | 11,244 | | $ 206,109 |
Fidelity Disciplined Equity Fund | 9,254 | | 214,867 |
Fidelity Equity-Income Fund | 4,715 | | 214,867 |
Fidelity Large Cap Core Enhanced Index Fund | 39,258 | | 343,904 |
Fidelity Series 100 Index Fund | 28,835 | | 258,074 |
Fidelity Series Broad Market Opportunities Fund | 33,454 | | 343,904 |
Fidelity Series Small Cap Opportunities Fund | 12,596 | | 137,795 |
TOTAL DOMESTIC EQUITY FUNDS | | 1,719,520 |
International Equity Funds - 2.9% |
Fidelity Advisor International Discovery Fund Institutional Class | 5,116 | | 169,324 |
TOTAL EQUITY FUNDS (Cost $1,870,401) | 1,888,844 |
Fixed-Income Funds - 40.6% |
| | | |
High Yield Fixed-Income Funds - 1.7% |
Fidelity Capital & Income Fund | 5,253 | | 50,797 |
Fidelity Strategic Income Fund | 4,544 | | 50,797 |
TOTAL HIGH YIELD FIXED-INCOME FUNDS | | 101,594 |
|
| Shares | | Value |
Investment Grade Fixed-Income Funds - 38.9% |
Fidelity Government Income Fund | 43,580 | | $ 453,673 |
Fidelity Strategic Real Return Fund | 46,770 | | 453,673 |
Fidelity Total Bond Fund | 126,833 | | 1,362,185 |
TOTAL INVESTMENT GRADE
FIXED-INCOME FUNDS | | 2,269,531 |
TOTAL FIXED-INCOME FUNDS (Cost $2,300,361) | 2,371,125 |
Short-Term Funds - 27.0% |
| | | |
Fidelity Institutional Money Market Portfolio Institutional Class | 789,402 | | 789,402 |
Fidelity Short-Term Bond Fund | 93,090 | | 789,402 |
TOTAL SHORT-TERM FUNDS (Cost $1,572,383) | 1,578,804 |
TOTAL INVESTMENT PORTFOLIO - 100.0% (Cost $5,743,145) | | 5,838,773 |
NET OTHER ASSETS (LIABILITIES) - 0.0% | | (437) |
NET ASSETS - 100% | $ 5,838,336 |
Other Information |
All investments are categorized as Level 1 under the Fair Value Hierarchy. The inputs or methodology used for valuing securities may not be an indication of the risk associated with investing in those securities. For more information on valuation inputs, please refer to the Security Valuation section in the accompanying Notes to Financial Statements. |
Income Tax Information |
At July 31, 2010, the Fund had a capital loss carryforward of approximately $534,410 of which $123,548 and $410,862 will expire in fiscal 2017 and 2018, respectively. Capital loss carryforwards are only available to offset future capital gains of the Fund to the extent provided by regulations and may be limited. |
See accompanying notes which are an integral part of the financial statements.
Semiannual Report
Fidelity Income Replacement 2018 Fund
Statement of Assets and Liabilities
| January 31, 2011 (Unaudited) |
| | |
Assets | | |
Investment in securities, at value (cost $5,743,145) - See accompanying schedule | | $ 5,838,773 |
Receivable for investments sold | | 49,743 |
Total assets | | 5,888,516 |
| | |
Liabilities | | |
Payable for investments purchased | $ 49,749 | |
Distribution and service plan fees payable | 431 | |
Total liabilities | | 50,180 |
| | |
Net Assets | | $ 5,838,336 |
Net Assets consist of: | | |
Paid in capital | | $ 6,434,781 |
Undistributed net investment income | | 1,608 |
Accumulated undistributed net realized gain (loss) on investments | | (693,681) |
Net unrealized appreciation (depreciation) on investments | | 95,628 |
Net Assets | | $ 5,838,336 |
Calculation of Maximum Offering Price Class A:
Net Asset Value and redemption price per share ($1,117,749 ÷ 22,704.4 shares) | | $ 49.23 |
| | |
Maximum offering price per share (100/94.25 of $49.23) | | $ 52.23 |
Class T:
Net Asset Value and redemption price per share ($52,337 ÷ 1,062.3 shares) | | $ 49.27 |
| | |
Maximum offering price per share (100/96.50 of $49.27) | | $ 51.06 |
| | |
Class C:
Net Asset Value and offering price per share ($202,288 ÷ 4,110.8 shares)A | | $ 49.21 |
| | |
Income Replacement 2018:
Net Asset Value, offering price and redemption price per share ($4,097,222 ÷ 83,204.2 shares) | | $ 49.24 |
| | |
Institutional Class:
Net Asset Value, offering price and redemption price per share ($368,740 ÷ 7,487.5 shares) | | $ 49.25 |
A Redemption price per share is equal to net asset value less any applicable contingent deferred sales charge.
Statement of Operations
Six months ended January 31, 2011 (Unaudited) |
| | |
Investment Income | | |
Income distributions from underlying funds | | $ 67,884 |
| | |
Expenses | | |
Distribution and service plan fees | $ 2,656 | |
Independent trustees' compensation | 11 | |
Total expenses before reductions | 2,667 | |
Expense reductions | (11) | 2,656 |
Net investment income (loss) | | 65,228 |
Realized and Unrealized Gain (Loss) Realized gain (loss) on sale of underlying fund shares | (26,570) | |
Capital gain distributions from underlying funds | 38,528 | |
Total net realized gain (loss) | | 11,958 |
Change in net unrealized appreciation (depreciation) on underlying funds | | 357,615 |
Net gain (loss) | | 369,573 |
Net increase (decrease) in net assets resulting from operations | | $ 434,801 |
See accompanying notes which are an integral part of the financial statements.
Semiannual Report
Statement of Changes in Net Assets
| Six months ended January 31, 2011 (Unaudited) | Year ended
July 31,
2010 |
Increase (Decrease) in Net Assets | | |
Operations | | |
Net investment income (loss) | $ 65,228 | $ 103,982 |
Net realized gain (loss) | 11,958 | (68,006) |
Change in net unrealized appreciation (depreciation) | 357,615 | 484,491 |
Net increase (decrease) in net assets resulting from operations | 434,801 | 520,467 |
Distributions to shareholders from net investment income | (65,436) | (103,950) |
Distributions to shareholders from net realized gain | (28,806) | (13,543) |
Total distributions | (94,242) | (117,493) |
Share transactions - net increase (decrease) | 66,549 | 211,898 |
Total increase (decrease) in net assets | 407,108 | 614,872 |
| | |
Net Assets | | |
Beginning of period | 5,431,228 | 4,816,356 |
End of period (including undistributed net investment income of $1,608 and undistributed net investment income of $1,816, respectively) | $ 5,838,336 | $ 5,431,228 |
Financial Highlights - Class A
| Six months ended January 31, 2011 | Years ended July 31, |
| (Unaudited) | 2010 | 2009 | 2008 G |
Selected Per-Share Data | | | | |
Net asset value, beginning of period | $ 46.45 | $ 42.81 | $ 47.46 | $ 50.00 |
Income from Investment Operations | | | | |
Net investment income (loss) E | .501 | .836 | 1.092 | 1.163 |
Net realized and unrealized gain (loss) | 3.017 | 3.763 | (4.138) | (2.454) |
Total from investment operations | 3.518 | 4.599 | (3.046) | (1.291) |
Distributions from net investment income | (.501) | (.839) | (1.124) | (1.119) |
Distributions from net realized gain | (.237) | (.120) | (.480) | (.130) |
Total distributions | (.738) | (.959) | (1.604) | (1.249) |
Net asset value, end of period | $ 49.23 | $ 46.45 | $ 42.81 | $ 47.46 |
Total Return B, C, D | 7.61% | 10.80% | (6.06)% | (2.68)% |
Ratios to Average Net Assets F, H | | | | |
Expenses before reductions | .25% A | .25% | .25% | .25%A |
Expenses net of fee waivers, if any | .25%A | .25% | .25% | .25%A |
Expenses net of all reductions | .25%A | .25% | .25% | .25%A |
Net investment income (loss) | 2.09%A | 1.83% | 2.69% | 2.60%A |
Supplemental Data | | | | |
Net assets, end of period (000 omitted) | $ 1,118 | $ 1,147 | $ 833 | $ 1,107 |
Portfolio turnover rate | 46%A | 24% | 51% | 46%A |
A Annualized
B Total returns for periods of less than one year are not annualized.
C Total returns would have been lower had certain expenses not been reduced during the periods shown.
D Total returns do not include the effect of the sales charges.
E Calculated based on average shares outstanding during the period.
F Amounts do not include the activity of the underlying funds.
G For the period August 30, 2007 (commencement of operations) to July 31, 2008.
H Expense ratios reflect operating expenses of the class. Expenses before reductions do not reflect amounts reimbursed by the investment adviser or reductions from expense offset arrangements and do not represent the amount paid by the class during periods when reimbursements or reductions occur. Expenses net of fee waivers reflect expenses after reimbursement by the investment adviser but prior to reductions from expense offset arrangements. Expenses net of all reductions represent the net expenses paid by the class but do not include expenses of the investment companies in which the Fund invests.
See accompanying notes which are an integral part of the financial statements.
Semiannual Report
Financial Highlights - Class T
| Six months ended January 31, 2011 | Years ended July 31, |
| (Unaudited) | 2010 | 2009 | 2008 G |
Selected Per-Share Data | | | | |
Net asset value, beginning of period | $ 46.48 | $ 42.83 | $ 47.46 | $ 50.00 |
Income from Investment Operations | | | | |
Net investment income (loss)E | .440 | .722 | .989 | 1.075 |
Net realized and unrealized gain (loss) | 3.028 | 3.759 | (4.128) | (2.483) |
Total from investment operations | 3.468 | 4.481 | (3.139) | (1.408) |
Distributions from net investment income | (.441) | (.711) | (1.011) | (1.002) |
Distributions from net realized gain | (.237) | (.120) | (.480) | (.130) |
Total distributions | (.678) | (.831) | (1.491) | (1.132) |
Net asset value, end of period | $ 49.27 | $ 46.48 | $ 42.83 | $ 47.46 |
Total Return B, C, D | 7.49% | 10.51% | (6.28)% | (2.91)% |
Ratios to Average Net Assets F, H | | | | |
Expenses before reductions | .50%A | .50% | .50% | .50%A |
Expenses net of fee waivers, if any | .50%A | .50% | .50% | .50%A |
Expenses net of all reductions | .50%A | .50% | .50% | .50%A |
Net investment income (loss) | 1.83%A | 1.58% | 2.44% | 2.35%A |
Supplemental Data | | | | |
Net assets, end of period (000 omitted) | $ 52 | $ 52 | $ 91 | $ 154 |
Portfolio turnover rate | 46%A | 24% | 51% | 46%A |
A Annualized
B Total returns for periods of less than one year are not annualized.
C Total returns would have been lower had certain expenses not been reduced during the periods shown.
D Total returns do not include the effect of the sales charges.
E Calculated based on average shares outstanding during the period.
F Amounts do not include the activity of the underlying funds.
G For the period August 30, 2007 (commencement of operations) to July 31, 2008.
H Expense ratios reflect operating expenses of the class. Expenses before reductions do not reflect amounts reimbursed by the investment adviser or reductions from expense offset arrangements and do not represent the amount paid by the class during periods when reimbursements or reductions occur. Expenses net of fee waivers reflect expenses after reimbursement by the investment adviser but prior to reductions from expense offset arrangements. Expenses net of all reductions represent the net expenses paid by the class but do not include expenses of the investment companies in which the Fund invests.
Financial Highlights - Class C
| Six months ended January 31, 2011 | Years ended July 31, |
| (Unaudited) | 2010 | 2009 | 2008 G |
Selected Per-Share Data | | | | |
Net asset value, beginning of period | $ 46.43 | $ 42.80 | $ 47.41 | $ 50.00 |
Income from Investment Operations | | | | |
Net investment income (loss) E | .320 | .495 | .786 | .836 |
Net realized and unrealized gain (loss) | 3.019 | 3.760 | (4.122) | (2.476) |
Total from investment operations | 3.339 | 4.255 | (3.336) | (1.640) |
Distributions from net investment income | (.322) | (.505) | (.794) | (.820) |
Distributions from net realized gain | (.237) | (.120) | (.480) | (.130) |
Total distributions | (.559) | (.625) | (1.274) | (.950) |
Net asset value, end of period | $ 49.21 | $ 46.43 | $ 42.80 | $ 47.41 |
Total Return B, C, D | 7.21% | 9.98% | (6.75)% | (3.36)% |
Ratios to Average Net Assets F, H | | | | |
Expenses before reductions | 1.00%A | 1.00% | 1.00% | 1.00%A |
Expenses net of fee waivers, if any | 1.00%A | 1.00% | 1.00% | 1.00%A |
Expenses net of all reductions | 1.00%A | 1.00% | 1.00% | 1.00%A |
Net investment income (loss) | 1.34%A | 1.08% | 1.94% | 1.85%A |
Supplemental Data | | | | |
Net assets, end of period (000 omitted) | $ 202 | $ 201 | $ 131 | $ 365 |
Portfolio turnover rate | 46%A | 24% | 51% | 46%A |
A Annualized
B Total returns for periods of less than one year are not annualized.
C Total returns would have been lower had certain expenses not been reduced during the periods shown.
D Total returns do not include the effect of the contingent deferred sales charge.
E Calculated based on average shares outstanding during the period.
F Amounts do not include the activity of the underlying funds.
G For the period August 30, 2007 (commencement of operations) to July 31, 2008.
H Expense ratios reflect operating expenses of the class. Expenses before reductions do not reflect amounts reimbursed by the investment adviser or reductions from expense offset arrangements and do not represent the amount paid by the class during periods when reimbursements or reductions occur. Expenses net of fee waivers reflect expenses after reimbursement by the investment adviser but prior to reductions from expense offset arrangements. Expenses net of all reductions represent the net expenses paid by the class but do not include expenses of the investment companies in which the Fund invests.
See accompanying notes which are an integral part of the financial statements.
Semiannual Report
Financial Highlights - Income Replacement 2018
| Six months ended January 31, 2011 | Years ended July 31, |
| (Unaudited) | 2010 | 2009 | 2008 G |
Selected Per-Share Data | | | | |
Net asset value, beginning of period | $ 46.46 | $ 42.82 | $ 47.46 | $ 50.00 |
Income from Investment Operations | | | | |
Net investment income (loss)D | .561 | .950 | 1.202 | 1.280 |
Net realized and unrealized gain (loss) | 3.016 | 3.761 | (4.138) | (2.469) |
Total from investment operations | 3.577 | 4.711 | (2.936) | (1.189) |
Distributions from net investment income | (.560) | (.951) | (1.224) | (1.221) |
Distributions from net realized gain | (.237) | (.120) | (.480) | (.130) |
Total distributions | (.797) | (1.071) | (1.704) | (1.351) |
Net asset value, end of period | $ 49.24 | $ 46.46 | $ 42.82 | $ 47.46 |
Total Return B, C | 7.74% | 11.07% | (5.81)% | (2.48)% |
Ratios to Average Net Assets E, H | | | | |
Expenses before reductions F | .00% A | .00% | .00% | .00%A |
Expenses net of fee waivers, if any | .00% A | .00% | .00% | .00%A |
Expenses net of all reductions | .00% A | .00% | .00% | .00%A |
Net investment income (loss) | 2.34%A | 2.08% | 2.94% | 2.85%A |
Supplemental Data | | | | |
Net assets, end of period (000 omitted) | $ 4,097 | $ 3,681 | $ 3,435 | $ 5,167 |
Portfolio turnover rate | 46%A | 24% | 51% | 46%A |
A Annualized
B Total returns for periods of less than one year are not annualized.
C Total returns would have been lower had certain expenses not been reduced during the periods shown.
D Calculated based on average shares outstanding during the period.
E Amounts do not include the activity of the underlying funds.
F Amount represents less than .01%.
G For the period August 30, 2007 (commencement of operations) to July 31, 2008.
H Expense ratios reflect operating expenses of the class. Expenses before reductions do not reflect amounts reimbursed by the investment adviser or reductions from expense offset arrangements and do not represent the amount paid by the class during periods when reimbursements or reductions occur. Expenses net of fee waivers reflect expenses after reimbursement by the investment adviser but prior to reductions from expense offset arrangements. Expenses net of all reductions represent the net expenses paid by the class but do not include expenses of the investment companies in which the Fund invests.
Financial Highlights - Institutional Class
| Six months ended January 31, 2011 | Years ended July 31, |
| (Unaudited) | 2010 | 2009 | 2008 G |
Selected Per-Share Data | | | | |
Net asset value, beginning of period | $ 46.46 | $ 42.82 | $ 47.47 | $ 50.00 |
Income from Investment Operations | | | | |
Net investment income (loss) D | .561 | .950 | 1.175 | 1.295 |
Net realized and unrealized gain (loss) | 3.026 | 3.761 | (4.121) | (2.474) |
Total from investment operations | 3.587 | 4.711 | (2.946) | (1.179) |
Distributions from net investment income | (.560) | (.951) | (1.224) | (1.221) |
Distributions from net realized gain | (.237) | (.120) | (.480) | (.130) |
Total distributions | (.797) | (1.071) | (1.704) | (1.351) |
Net asset value, end of period | $ 49.25 | $ 46.46 | $ 42.82 | $ 47.47 |
Total Return B, C | 7.76% | 11.07% | (5.83)% | (2.46)% |
Ratios to Average Net Assets E, H | | | | |
Expenses before reductions F | .00% A | .00% | .00% | .00%A |
Expenses net of fee waivers, if any | .00%A | .00% | .00% | .00%A |
Expenses net of all reductions | .00%A | .00% | .00% | .00%A |
Net investment income (loss) | 2.34%A | 2.08% | 2.94% | 2.85%A |
Supplemental Data | | | | |
Net assets, end of period (000 omitted) | $ 369 | $ 350 | $ 326 | $ 214 |
Portfolio turnover rate | 46%A | 24% | 51% | 46%A |
A Annualized
B Total returns for periods of less than one year are not annualized.
C Total returns would have been lower had certain expenses not been reduced during the periods shown.
D Calculated based on average shares outstanding during the period.
E Amounts do not include the activity of the underlying funds.
F Amount represents less than .01%.
G For the period August 30, 2007 (commencement of operations) to July 31, 2008.
H Expense ratios reflect operating expenses of the class. Expenses before reductions do not reflect amounts reimbursed by the investment adviser or reductions from expense offset arrangements and do not represent the amount paid by the class during periods when reimbursements or reductions occur. Expenses net of fee waivers reflect expenses after reimbursement by the investment adviser but prior to reductions from expense offset arrangements. Expenses net of all reductions represent the net expenses paid by the class but do not include expenses of the investment companies in which the Fund invests.
See accompanying notes which are an integral part of the financial statements.
Semiannual Report
Fidelity Income Replacement 2020 Fund
Investment Changes (Unaudited)
Fund Holdings as of January 31, 2011 |
| % of fund's
net assets | % of fund's net assets
6 months ago |
Domestic Equity Funds | | |
Fidelity Advisor Mid Cap II Fund Institutional Class | 4.2 | 4.3 |
Fidelity Disciplined Equity Fund | 4.3 | 4.4 |
Fidelity Equity-Income Fund | 4.3 | 4.5 |
Fidelity Large Cap Core Enhanced Index Fund | 7.0 | 7.2 |
Fidelity Series 100 Index Fund | 5.2 | 5.4 |
Fidelity Series Broad Market Opportunities Fund | 7.0 | 7.2 |
Fidelity Series Small Cap Opportunities Fund | 2.8 | 2.9 |
| 34.8 | 35.9 |
International Equity Funds | | |
Fidelity Advisor International Discovery Fund Institutional Class | 3.9 | 4.2 |
High Yield Fixed-Income Funds | | |
Fidelity Capital & Income Fund | 1.4 | 1.5 |
Fidelity Strategic Income Fund | 1.4 | 1.5 |
| 2.8 | 3.0 |
Investment Grade Fixed-Income Funds | | |
Fidelity Government Income Fund | 7.2 | 7.1 |
Fidelity Strategic Real Return Fund | 7.2 | 7.2 |
Fidelity Total Bond Fund | 21.6 | 21.3 |
| 36.0 | 35.6 |
Short-Term Funds | | |
Fidelity Institutional Money Market Portfolio Institutional Class | 11.3 | 10.6 |
Fidelity Short-Term Bond Fund | 11.2 | 10.7 |
| 22.5 | 21.3 |
Net Other Assets (Liabilities)* | 0.0 | 0.0 |
| 100.0 | 100.0 |
* Amount represents less than 0.1%
Asset Allocation (% of fund's net assets) |
Current |
| Domestic Equity Funds | 34.8% | |
 | International Equity Funds | 3.9% | |
 | High Yield Fixed-Income Funds | 2.8% | |
| Investment Grade Fixed-Income Funds | 36.0% | |
| Short-Term Funds | 22.5% | |

Six months ago |
| Domestic Equity Funds | 35.9% | |
| International Equity Funds | 4.2% | |
| High Yield Fixed-Income Funds | 3.0% | |
| Investment Grade Fixed-Income Funds | 35.6% | |
| Short-Term Funds | 21.3% | |

Expected |
| Domestic Equity Funds | 33.6% | |
| International Equity Funds | 3.6% | |
| High Yield Fixed-Income Funds | 2.6% | |
| Investment Grade Fixed-Income Funds | 36.7% | |
| Short-Term Funds | 23.5% | |

The fund invests according to an asset allocation strategy that becomes increasingly conservative over time. The six months ago allocation is based on the fund's holdings as of July 31, 2010. The current allocation is based on the fund's holdings as of January 31, 2011. The expected allocation represents the fund's anticipated allocation at July 31, 2011. |
Semiannual Report
Fidelity Income Replacement 2020 Fund
Investments January 31, 2011 (Unaudited)
Showing Percentage of Net Assets
Equity Funds - 38.7% |
| Shares | | Value |
Domestic Equity Funds - 34.8% |
Fidelity Advisor Mid Cap II Fund Institutional Class | 9,599 | | $ 175,949 |
Fidelity Disciplined Equity Fund | 7,886 | | 183,105 |
Fidelity Equity-Income Fund | 4,018 | | 183,105 |
Fidelity Large Cap Core Enhanced Index Fund | 33,444 | | 292,968 |
Fidelity Series 100 Index Fund | 24,550 | | 219,726 |
Fidelity Series Broad Market Opportunities Fund | 28,499 | | 292,968 |
Fidelity Series Small Cap Opportunities Fund | 10,696 | | 117,019 |
TOTAL DOMESTIC EQUITY FUNDS | | 1,464,840 |
International Equity Funds - 3.9% |
Fidelity Advisor International Discovery Fund Institutional Class | 4,896 | | 162,059 |
TOTAL EQUITY FUNDS (Cost $1,402,682) | 1,626,899 |
Fixed-Income Funds - 38.8% |
| | | |
High Yield Fixed-Income Funds - 2.8% |
Fidelity Capital & Income Fund | 6,094 | | 58,930 |
Fidelity Strategic Income Fund | 5,271 | | 58,930 |
TOTAL HIGH YIELD FIXED-INCOME FUNDS | | 117,860 |
|
| Shares | | Value |
Investment Grade Fixed-Income Funds - 36.0% |
Fidelity Government Income Fund | 29,154 | | $ 303,491 |
Fidelity Strategic Real Return Fund | 31,288 | | 303,492 |
Fidelity Total Bond Fund | 84,696 | | 909,634 |
TOTAL INVESTMENT GRADE FIXED-INCOME FUNDS | | 1,516,617 |
TOTAL FIXED-INCOME FUNDS (Cost $1,556,030) | 1,634,477 |
Short-Term Funds - 22.5% |
| | | |
Fidelity Institutional Money Market Portfolio Institutional Class | 473,969 | | 473,969 |
Fidelity Short-Term Bond Fund | 55,893 | | 473,969 |
TOTAL SHORT-TERM FUNDS (Cost $940,842) | 947,938 |
TOTAL INVESTMENT PORTFOLIO - 100.0% (Cost $3,899,554) | | 4,209,314 |
NET OTHER ASSETS (LIABILITIES) - 0.0% | | (453) |
NET ASSETS - 100% | $ 4,208,861 |
Other Information |
All investments are categorized as Level 1 under the Fair Value Hierarchy. The inputs or methodology used for valuing securities may not be an indication of the risk associated with investing in those securities. For more information on valuation inputs, please refer to the Security Valuation section in the accompanying Notes to Financial Statements. |
Income Tax Information |
At July 31, 2010, the Fund had a capital loss carryforward of approximately $122,224 of which $3,778 and $118,446 will expire in fiscal 2017 and 2018, respectively. Capital loss carryforwards are only available to offset future capital gains of the Fund to the extent provided by regulations and may be limited. |
See accompanying notes which are an integral part of the financial statements.
Semiannual Report
Fidelity Income Replacement 2020 Fund
Statement of Assets and Liabilities
| January 31, 2011 (Unaudited) |
| | |
Assets | | |
Investment in securities, at value (cost $3,899,554) - See accompanying schedule | | $ 4,209,314 |
Receivable for investments sold | | 27,295 |
Total assets | | 4,236,609 |
| | |
Liabilities | | |
Payable for investments purchased | $ 27,300 | |
Distribution and service plan fees payable | 448 | |
Total liabilities | | 27,748 |
| | |
Net Assets | | $ 4,208,861 |
Net Assets consist of: | | |
Paid in capital | | $ 4,127,939 |
Undistributed net investment income | | 1,051 |
Accumulated undistributed net realized gain (loss) on investments | | (229,889) |
Net unrealized appreciation (depreciation) on investments | | 309,760 |
Net Assets | | $ 4,208,861 |
Calculation of Maximum Offering Price Class A:
Net Asset Value and redemption price per share ($630,977 ÷ 12,779 shares) | | $ 49.38 |
| | |
Maximum offering price per share (100/94.25 of $49.38) | | $ 52.39 |
Class T:
Net Asset Value and redemption price per share ($145,366 ÷ 2,944 shares) | | $ 49.38 |
| | |
Maximum offering price per share (100/96.50 of $49.38) | | $ 51.17 |
| | |
Class C:
Net Asset Value and offering price per share ($290,075 ÷ 5,878 shares)A | | $ 49.35 |
| | |
Income Replacement 2020:
Net Asset Value, offering price and redemption price per share ($3,089,160 ÷ 62,559 shares) | | $ 49.38 |
| | |
Institutional Class:
Net Asset Value, offering price and redemption price per share ($53,283 ÷ 1,079 shares) | | $ 49.38 |
A Redemption price per share is equal to net asset value less any applicable contingent deferred sales charge.
Statement of Operations
Six months ended January 31, 2011 (Unaudited) |
| | |
Investment Income | | |
Income distributions from underlying funds | | $ 43,428 |
| | |
Expenses | | |
Distribution and service plan fees | $ 2,651 | |
Independent trustees' compensation | 7 | |
Total expenses before reductions | 2,658 | |
Expense reductions | (7) | 2,651 |
Net investment income (loss) | | 40,777 |
Realized and Unrealized Gain (Loss) Realized gain (loss) on sale of underlying fund shares | (3,356) | |
Capital gain distributions from underlying funds | 22,741 | |
Total net realized gain (loss) | | 19,385 |
Change in net unrealized appreciation (depreciation) on underlying funds | | 241,426 |
Net gain (loss) | | 260,811 |
Net increase (decrease) in net assets resulting from operations | | $ 301,588 |
See accompanying notes which are an integral part of the financial statements.
Semiannual Report
Statement of Changes in Net Assets
| Six months ended January 31, 2011 (Unaudited) | Year ended
July 31,
2010 |
Increase (Decrease) in Net Assets | | |
Operations | | |
Net investment income (loss) | $ 40,777 | $ 58,358 |
Net realized gain (loss) | 19,385 | (17,761) |
Change in net unrealized appreciation (depreciation) | 241,426 | 270,430 |
Net increase (decrease) in net assets resulting from operations | 301,588 | 311,027 |
Distributions to shareholders from net investment income | (40,738) | (58,210) |
Distributions to shareholders from net realized gain | (16,958) | (7,714) |
Total distributions | (57,696) | (65,924) |
Share transactions - net increase (decrease) | 655,215 | 451,360 |
Total increase (decrease) in net assets | 899,107 | 696,463 |
| | |
Net Assets | | |
Beginning of period | 3,309,754 | 2,613,291 |
End of period (including undistributed net investment income of $1,051 and undistributed net investment income of $1,012, respectively) | $ 4,208,861 | $ 3,309,754 |
Financial Highlights - Class A
| Six months ended January 31, 2011 | Years ended July 31, |
| (Unaudited) | 2010 | 2009 | 2008 G |
Selected Per-Share Data | | | | |
Net asset value, beginning of period | $ 46.09 | $ 42.28 | $ 47.11 | $ 50.00 |
Income from Investment Operations | | | | |
Net investment income (loss) E | .513 | .812 | 1.027 | 1.085 |
Net realized and unrealized gain (loss) | 3.500 | 3.930 | (4.465) | (2.692) |
Total from investment operations | 4.013 | 4.742 | (3.438) | (1.607) |
Distributions from net investment income | (.504) | (.817) | (1.032) | (1.113) |
Distributions from net realized gain | (.219) | (.115) | (.360) | (.170) |
Total distributions | (.723) | (.932) | (1.392) | (1.283) |
Net asset value, end of period | $ 49.38 | $ 46.09 | $ 42.28 | $ 47.11 |
Total Return B, C, D | 8.74% | 11.27% | (7.00)% | (3.33)% |
Ratios to Average Net Assets F, H | | | | |
Expenses before reductions | .25% A | .25% | .25% | .25% A |
Expenses net of fee waivers, if any | .25% A | .25% | .25% | .25% A |
Expenses net of all reductions | .25% A | .25% | .25% | .25% A |
Net investment income (loss) | 2.14% A | 1.79% | 2.60% | 2.42% A |
Supplemental Data | | | | |
Net assets, end of period (000 omitted) | $ 631 | $ 607 | $ 502 | $ 503 |
Portfolio turnover rate | 41% A | 38% | 60% | 21% A |
A Annualized
B Total returns for periods of less than one year are not annualized.
C Total returns would have been lower had certain expenses not been reduced during the periods shown.
D Total returns do not include the effect of the sales charges.
E Calculated based on average shares outstanding during the period.
F Amounts do not include the activity of the underlying funds.
G For the period August 30, 2007 (commencement of operations) to July 31, 2008.
H Expense ratios reflect operating expenses of the class. Expenses before reductions do not reflect amounts reimbursed by the investment adviser or reductions from expense offset arrangements and do not represent the amount paid by the class during periods when reimbursements or reductions occur. Expenses net of fee waivers reflect expenses after reimbursement by the investment adviser but prior to reductions from expense offset arrangements. Expenses net of all reductions represent the net expenses paid by the class but do not include expenses of the investment companies in which the Fund invests.
See accompanying notes which are an integral part of the financial statements.
Semiannual Report
Financial Highlights - Class T
| Six months ended January 31, 2011 | Years ended July 31, |
| (Unaudited) | 2010 | 2009 | 2008 G |
Selected Per-Share Data | | | | |
Net asset value, beginning of period | $ 46.09 | $ 42.28 | $ 47.10 | $ 50.00 |
Income from Investment Operations | | | | |
Net investment income (loss) E | .453 | .696 | .926 | .985 |
Net realized and unrealized gain (loss) | 3.500 | 3.928 | (4.460) | (2.707) |
Total from investment operations | 3.953 | 4.624 | (3.534) | (1.722) |
Distributions from net investment income | (.444) | (.699) | (.926) | (1.008) |
Distributions from net realized gain | (.219) | (.115) | (.360) | (.170) |
Total distributions | (.663) | (.814) | (1.286) | (1.178) |
Net asset value, end of period | $ 49.38 | $ 46.09 | $ 42.28 | $ 47.10 |
Total Return B, C, D | 8.61% | 10.98% | (7.23)% | (3.56)% |
Ratios to Average Net Assets F, H | | | | |
Expenses before reductions | .50% A | .50% | .50% | .50% A |
Expenses net of fee waivers, if any | .50% A | .50% | .50% | .50% A |
Expenses net of all reductions | .50% A | .50% | .50% | .50% A |
Net investment income (loss) | 1.89% A | 1.54% | 2.35% | 2.17% A |
Supplemental Data | | | | |
Net assets, end of period (000 omitted) | $ 145 | $ 134 | $ 171 | $ 187 |
Portfolio turnover rate | 41% A | 38% | 60% | 21% A |
A Annualized
B Total returns for periods of less than one year are not annualized.
C Total returns would have been lower had certain expenses not been reduced during the periods shown.
D Total returns do not include the effect of the sales charges.
E Calculated based on average shares outstanding during the period.
F Amounts do not include the activity of the underlying funds.
G For the period August 30, 2007 (commencement of operations) to July 31, 2008.
H Expense ratios reflect operating expenses of the class. Expenses before reductions do not reflect amounts reimbursed by the investment adviser or reductions from expense offset arrangements and do not represent the amount paid by the class during periods when reimbursements or reductions occur. Expenses net of fee waivers reflect expenses after reimbursement by the investment adviser but prior to reductions from expense offset arrangements. Expenses net of all reductions represent the net expenses paid by the class but do not include expenses of the investment companies in which the Fund invests.
Financial Highlights - Class C
| Six months ended January 31, 2011 | Years ended July 31, |
| (Unaudited) | 2010 | 2009 | 2008 G |
Selected Per-Share Data | | | | |
Net asset value, beginning of period | $ 46.06 | $ 42.26 | $ 47.08 | $ 50.00 |
Income from Investment Operations | | | | |
Net investment income (loss) E | .333 | .473 | .736 | .755 |
Net realized and unrealized gain (loss) | 3.498 | 3.923 | (4.471) | (2.699) |
Total from investment operations | 3.831 | 4.396 | (3.735) | (1.944) |
Distributions from net investment income | (.322) | (.481) | (.725) | (.806) |
Distributions from net realized gain | (.219) | (.115) | (.360) | (.170) |
Total distributions | (.541) | (.596) | (1.085) | (.976) |
Net asset value, end of period | $ 49.35 | $ 46.06 | $ 42.26 | $ 47.08 |
Total Return B, C, D | 8.34% | 10.43% | (7.70)% | (3.99)% |
Ratios to Average Net Assets F, H | | | | |
Expenses before reductions | 1.00% A | 1.00% | 1.00% | 1.00% A |
Expenses net of fee waivers, if any | 1.00% A | 1.00% | 1.00% | 1.00% A |
Expenses net of all reductions | 1.00% A | 1.00% | 1.00% | 1.00% A |
Net investment income (loss) | 1.39% A | 1.05% | 1.85% | 1.67% A |
Supplemental Data | | | | |
Net assets, end of period (000 omitted) | $ 290 | $ 295 | $ 221 | $ 275 |
Portfolio turnover rate | 41% A | 38% | 60% | 21% A |
A Annualized
B Total returns for periods of less than one year are not annualized.
C Total returns would have been lower had certain expenses not been reduced during the periods shown.
D Total returns do not include the effect of the contingent deferred sales charge.
E Calculated based on average shares outstanding during the period.
F Amounts do not include the activity of the underlying funds.
G For the period August 30, 2007 (commencement of operations) to July 31, 2008.
H Expense ratios reflect operating expenses of the class. Expenses before reductions do not reflect amounts reimbursed by the investment adviser or reductions from expense offset arrangements and do not represent the amount paid by the class during periods when reimbursements or reductions occur. Expenses net of fee waivers reflect expenses after reimbursement by the investment adviser but prior to reductions from expense offset arrangements. Expenses net of all reductions represent the net expenses paid by the class but do not include expenses of the investment companies in which the Fund invests.
See accompanying notes which are an integral part of the financial statements.
Semiannual Report
Financial Highlights - Income Replacement 2020
| Six months ended January 31, 2011 | Years ended July 31, |
| (Unaudited) | 2010 | 2009 | 2008 G |
Selected Per-Share Data | | | | |
Net asset value, beginning of period | $ 46.09 | $ 42.29 | $ 47.12 | $ 50.00 |
Income from Investment Operations | | | | |
Net investment income (loss) D | .573 | .925 | 1.125 | 1.190 |
Net realized and unrealized gain (loss) | 3.499 | 3.919 | (4.464) | (2.677) |
Total from investment operations | 4.072 | 4.844 | (3.339) | (1.487) |
Distributions from net investment income | (.563) | (.929) | (1.131) | (1.223) |
Distributions from net realized gain | (.219) | (.115) | (.360) | (.170) |
Total distributions | (.782) | (1.044) | (1.491) | (1.393) |
Net asset value, end of period | $ 49.38 | $ 46.09 | $ 42.29 | $ 47.12 |
Total Return B, C | 8.88% | 11.52% | (6.76)% | (3.10)% |
Ratios to Average Net Assets E, H | | | | |
Expenses before reductions F | .00% A | .00% | .00% | .00% A |
Expenses net of fee waivers, if any | .00% A | .00% | .00% | .00% A |
Expenses net of all reductions | .00% A | .00% | .00% | .00% A |
Net investment income (loss) | 2.39% A | 2.04% | 2.86% | 2.67% A |
Supplemental Data | | | | |
Net assets, end of period (000 omitted) | $ 3,089 | $ 2,225 | $ 1,624 | $ 1,233 |
Portfolio turnover rate | 41% A | 38% | 60% | 21% A |
A Annualized
B Total returns for periods of less than one year are not annualized.
C Total returns would have been lower had certain expenses not been reduced during the periods shown.
D Calculated based on average shares outstanding during the period.
E Amounts do not include the activity of the underlying funds.
F Amount represents less than .01%.
G For the period August 30, 2007 (commencement of operations) to July 31, 2008.
H Expense ratios reflect operating expenses of the class. Expenses before reductions do not reflect amounts reimbursed by the investment adviser or reductions from expense offset arrangements and do not represent the amount paid by the class during periods when reimbursements or reductions occur. Expenses net of fee waivers reflect expenses after reimbursement by the investment adviser but prior to reductions from expense offset arrangements. Expenses net of all reductions represent the net expenses paid by the class but do not include expenses of the investment companies in which the Fund invests.
Financial Highlights - Institutional Class
| Six months ended January 31, 2011 | Years ended July 31, |
| (Unaudited) | 2010 | 2009 | 2008 G |
Selected Per-Share Data | | | | |
Net asset value, beginning of period | $ 46.09 | $ 42.29 | $ 47.12 | $ 50.00 |
Income from Investment Operations | | | | |
Net investment income (loss) D | .573 | .928 | 1.138 | 1.215 |
Net realized and unrealized gain (loss) | 3.499 | 3.916 | (4.477) | (2.702) |
Total from investment operations | 4.072 | 4.844 | (3.339) | (1.487) |
Distributions from net investment income | (.563) | (.929) | (1.131) | (1.223) |
Distributions from net realized gain | (.219) | (.115) | (.360) | (.170) |
Total distributions | (.782) | (1.044) | (1.491) | (1.393) |
Net asset value, end of period | $ 49.38 | $ 46.09 | $ 42.29 | $ 47.12 |
Total Return B, C | 8.88% | 11.52% | (6.76)% | (3.10)% |
Ratios to Average Net Assets E, H | | | | |
Expenses before reductions F | .00% A | .00% | .00% | .00% A |
Expenses net of fee waivers, if any | .00% A | .00% | .00% | .00% A |
Expenses net of all reductions | .00% A | .00% | .00% | .00% A |
Net investment income (loss) | 2.39% A | 2.04% | 2.85% | 2.67% A |
Supplemental Data | | | | |
Net assets, end of period (000 omitted) | $ 53 | $ 49 | $ 95 | $ 163 |
Portfolio turnover rate | 41% A | 38% | 60% | 21% A |
A Annualized
B Total returns for periods of less than one year are not annualized.
C Total returns would have been lower had certain expenses not been reduced during the periods shown.
D Calculated based on average shares outstanding during the period.
E Amounts do not include the activity of the underlying funds.
F Amount represents less than .01%.
G For the period August 30, 2007 (commencement of operations) to July 31, 2008.
H Expense ratios reflect operating expenses of the class. Expenses before reductions do not reflect amounts reimbursed by the investment adviser or reductions from expense offset arrangements and do not represent the amount paid by the class during periods when reimbursements or reductions occur. Expenses net of fee waivers reflect expenses after reimbursement by the investment adviser but prior to reductions from expense offset arrangements. Expenses net of all reductions represent the net expenses paid by the class but do not include expenses of the investment companies in which the Fund invests.
See accompanying notes which are an integral part of the financial statements.
Semiannual Report
Fidelity Income Replacement 2022 Fund
Investment Changes (Unaudited)
Fund Holdings as of January 31, 2011 |
| % of fund's
net assets | % of fund's net assets
6 months ago |
Domestic Equity Funds | | |
Fidelity Advisor Mid Cap II Fund Institutional Class | 4.6 | 4.7 |
Fidelity Disciplined Equity Fund | 4.8 | 4.9 |
Fidelity Equity-Income Fund | 4.8 | 4.9 |
Fidelity Large Cap Core Enhanced Index Fund | 7.8 | 7.9 |
Fidelity Series 100 Index Fund | 5.8 | 5.9 |
Fidelity Series Broad Market Opportunities Fund | 7.8 | 7.9 |
Fidelity Series Small Cap Opportunities Fund | 3.1 | 3.2 |
| 38.7 | 39.4 |
International Equity Funds | | |
Fidelity Advisor International Discovery Fund Institutional Class | 4.8 | 5.1 |
High Yield Fixed-Income Funds | | |
Fidelity Capital & Income Fund | 1.7 | 1.9 |
Fidelity Strategic Income Fund | 1.8 | 1.8 |
| 3.5 | 3.7 |
Investment Grade Fixed-Income Funds | | |
Fidelity Government Income Fund | 6.7 | 6.6 |
Fidelity Strategic Real Return Fund | 6.8 | 6.8 |
Fidelity Total Bond Fund | 20.3 | 20.0 |
| 33.8 | 33.4 |
Short-Term Funds | | |
Fidelity Institutional Money Market Portfolio Institutional Class | 9.6 | 9.2 |
Fidelity Short-Term Bond Fund | 9.6 | 9.2 |
| 19.2 | 18.4 |
Net Other Assets (Liabilities)* | 0.0 | 0.0 |
| 100.0 | 100.0 |
* Amount represents less than 0.1%
Asset Allocation (% of fund's net assets) |
Current |
| Domestic Equity Funds | 38.7% | |
| International Equity Funds | 4.8% | |
| High Yield Fixed-Income Funds | 3.5% | |
| Investment Grade Fixed-Income Funds | 33.8% | |
| Short-Term Funds | 19.2% | |

Six months ago |
| Domestic Equity Funds | 39.4% | |
| International Equity Funds | 5.1% | |
| High Yield Fixed-Income Funds | 3.7% | |
| Investment Grade Fixed-Income Funds | 33.4% | |
| Short-Term Funds | 18.4% | |

Expected |
| Domestic Equity Funds | 37.9% | |
| International Equity Funds | 4.5% | |
| High Yield Fixed-Income Funds | 3.4% | |
| Investment Grade Fixed-Income Funds | 34.3% | |
| Short-Term Funds | 19.9% | |

The fund invests according to an asset allocation strategy that becomes increasingly conservative over time. The six months ago allocation is based on the fund's holdings as of July 31, 2010. The current allocation is based on the fund's holdings as of January 31, 2011. The expected allocation represents the fund's anticipated allocation at July 31, 2011. |
Semiannual Report
Fidelity Income Replacement 2022 Fund
Investments January 31, 2011 (Unaudited)
Showing Percentage of Net Assets
Equity Funds - 43.5% |
| Shares | | Value |
Domestic Equity Funds - 38.7% |
Fidelity Advisor Mid Cap II Fund Institutional Class | 7,801 | | $ 142,997 |
Fidelity Disciplined Equity Fund | 6,423 | | 149,147 |
Fidelity Equity-Income Fund | 3,273 | | 149,147 |
Fidelity Large Cap Core Enhanced Index Fund | 27,206 | | 238,328 |
Fidelity Series 100 Index Fund | 19,963 | | 178,669 |
Fidelity Series Broad Market Opportunities Fund | 23,184 | | 238,328 |
Fidelity Series Small Cap Opportunities Fund | 8,714 | | 95,331 |
TOTAL DOMESTIC EQUITY FUNDS | | 1,191,947 |
International Equity Funds - 4.8% |
Fidelity Advisor International Discovery Fund Institutional Class | 4,432 | | 146,687 |
TOTAL EQUITY FUNDS (Cost $1,373,374) | 1,338,634 |
Fixed-Income Funds - 37.3% |
| | | |
High Yield Fixed-Income Funds - 3.5% |
Fidelity Capital & Income Fund | 5,597 | | 54,124 |
Fidelity Strategic Income Fund | 4,841 | | 54,124 |
TOTAL HIGH YIELD FIXED-INCOME FUNDS | | 108,248 |
|
| Shares | | Value |
Investment Grade Fixed-Income Funds - 33.8% |
Fidelity Government Income Fund | 19,940 | | $ 207,576 |
Fidelity Strategic Real Return Fund | 21,400 | | 207,576 |
Fidelity Total Bond Fund | 58,097 | | 623,959 |
TOTAL INVESTMENT GRADE FIXED-INCOME FUNDS | | 1,039,111 |
TOTAL FIXED-INCOME FUNDS (Cost $1,116,176) | 1,147,359 |
Short-Term Funds - 19.2% |
| | | |
Fidelity Institutional Money Market Portfolio Institutional Class | 294,604 | | 294,604 |
Fidelity Short-Term Bond Fund | 34,741 | | 294,604 |
TOTAL SHORT-TERM FUNDS (Cost $587,674) | 589,208 |
TOTAL INVESTMENT PORTFOLIO - 100.0% (Cost $3,077,224) | | 3,075,201 |
NET OTHER ASSETS (LIABILITIES) - 0.0% | | (73) |
NET ASSETS - 100% | $ 3,075,128 |
Other Information |
All investments are categorized as Level 1 under the Fair Value Hierarchy. The inputs or methodology used for valuing securities may not be an indication of the risk associated with investing in those securities. For more information on valuation inputs, please refer to the Security Valuation section in the accompanying Notes to Financial Statements. |
Income Tax Information |
At July 31, 2010, the Fund had a capital loss carryforward of approximately $545,422 of which $64,025 and $481,397 will expire in fiscal 2017 and 2018, respectively. Capital loss carryforwards are only available to offset future capital gains of the Fund to the extent provided by regulations and may be limited. |
The Fund intends to elect to defer to its fiscal year ending July 31, 2011 approximately $109,973 of losses recognized during the period November 1, 2009 to July 31, 2010. |
See accompanying notes which are an integral part of the financial statements.
Semiannual Report
Fidelity Income Replacement 2022 Fund
Statement of Assets and Liabilities
| January 31, 2011 (Unaudited) |
| | |
Assets | | |
Investment in securities, at value (cost $3,077,224) - See accompanying schedule | | $ 3,075,201 |
Receivable for investments sold | | 16,946 |
Receivable for fund shares sold | | 3,000 |
Total assets | | 3,095,147 |
| | |
Liabilities | | |
Payable for investments purchased | $ 19,940 | |
Distribution and service plan fees payable | 79 | |
Total liabilities | | 20,019 |
| | |
Net Assets | | $ 3,075,128 |
Net Assets consist of: | | |
Paid in capital | | $ 3,778,963 |
Undistributed net investment income | | 791 |
Accumulated undistributed net realized gain (loss) on investments | | (702,603) |
Net unrealized appreciation (depreciation) on investments | | (2,023) |
Net Assets | | $ 3,075,128 |
Calculation of Maximum Offering Price Class A:
Net Asset Value and redemption price per share ($72,193 ÷ 1,467.6 shares) | | $ 49.19 |
| | |
Maximum offering price per share (100/94.25 of $49.19) | | $ 52.19 |
Class T:
Net Asset Value and redemption price per share ($78,280 ÷ 1,591.6 shares) | | $ 49.18 |
| | |
Maximum offering price per share (100/96.50 of $49.18) | | $ 50.96 |
| | |
Class C:
Net Asset Value and offering price per share ($37,158 ÷ 755.2 shares)A | | $ 49.20 |
| | |
Income Replacement 2022:
Net Asset Value, offering price and redemption price per share ($2,883,136 ÷ 58,624.5 shares) | | $ 49.18 |
| | |
Institutional Class:
Net Asset Value, offering price and redemption price per share ($4,361 ÷ 88.7 shares) | | $ 49.17 |
A Redemption price per share is equal to net asset value less any applicable contingent deferred sales charge.
Statement of Operations
Six months ended January 31, 2011 (Unaudited) |
| | |
Investment Income | | |
Income distributions from underlying funds | | $ 33,877 |
| | |
Expenses | | |
Distribution and service plan fees | $ 461 | |
Independent trustees' compensation | 5 | |
Total expenses before reductions | 466 | |
Expense reductions | (5) | 461 |
Net investment income (loss) | | 33,416 |
Realized and Unrealized Gain (Loss) Realized gain (loss) on sale of underlying fund shares | (14,224) | |
Capital gain distributions from underlying funds | 16,889 | |
Total net realized gain (loss) | | 2,665 |
Change in net unrealized appreciation (depreciation) on underlying funds | | 217,883 |
Net gain (loss) | | 220,548 |
Net increase (decrease) in net assets resulting from operations | | $ 253,964 |
See accompanying notes which are an integral part of the financial statements.
Semiannual Report
Fidelity Income Replacement 2022 Fund
Financial Statements - continued
Statement of Changes in Net Assets
| Six months ended January 31, 2011 (Unaudited) | Year ended
July 31,
2010 |
Increase (Decrease) in Net Assets | | |
Operations | | |
Net investment income (loss) | $ 33,416 | $ 57,048 |
Net realized gain (loss) | 2,665 | (60,204) |
Change in net unrealized appreciation (depreciation) | 217,883 | 328,653 |
Net increase (decrease) in net assets resulting from operations | 253,964 | 325,497 |
Distributions to shareholders from net investment income | (33,441) | (57,173) |
Distributions to shareholders from net realized gain | (12,730) | (19,734) |
Total distributions | (46,171) | (76,907) |
Share transactions - net increase (decrease) | 304,213 | (508,119) |
Total increase (decrease) in net assets | 512,006 | (259,529) |
| | |
Net Assets | | |
Beginning of period | 2,563,122 | 2,822,651 |
End of period (including undistributed net investment income of $791 and undistributed net investment income of $816, respectively) | $ 3,075,128 | $ 2,563,122 |
Financial Highlights - Class A
| Six months ended January 31, 2011 | Years ended July 31, |
| (Unaudited) | 2010 | 2009 | 2008 G |
Selected Per-Share Data | | | | |
Net asset value, beginning of period | $ 45.58 | $ 41.87 | $ 47.05 | $ 50.00 |
Income from Investment Operations | | | | |
Net investment income (loss) E | .520 | .815 | 1.035 | 1.087 |
Net realized and unrealized gain (loss) | 3.819 | 3.980 | (4.739) | (2.853) |
Total from investment operations | 4.339 | 4.795 | (3.704) | (1.766) |
Distributions from net investment income | (.515) | (.793) | (1.056) | (1.014) |
Distributions from net realized gain | (.214) | (.292) | (.420) | (.170) |
Total distributions | (.729) | (1.085) | (1.476) | (1.184) |
Net asset value, end of period | $ 49.19 | $ 45.58 | $ 41.87 | $ 47.05 |
Total Return B, C, D | 9.56% | 11.53% | (7.53)% | (3.64)% |
Ratios to Average Net Assets F, H | | | | |
Expenses before reductions | .25% A | .25% | .26% | .25% A |
Expenses net of fee waivers, if any | .25% A | .25% | .26% | .25% A |
Expenses net of all reductions | .25% A | .25% | .26% | .25% A |
Net investment income (loss) | 2.19% A | 1.82% | 2.62% | 2.41% A |
Supplemental Data | | | | |
Net assets, end of period (000 omitted) | $ 72 | $ 42 | $ 122 | $ 289 |
Portfolio turnover rate | 24% A | 24% | 22% | 32% A |
A Annualized
B Total returns for periods of less than one year are not annualized.
C Total returns would have been lower had certain expenses not been reduced during the periods shown.
D Total returns do not include the effect of the sales charges.
E Calculated based on average shares outstanding during the period.
F Amounts do not include the activity of the underlying funds.
G For the period August 30, 2007 (commencement of operations) to July 31, 2008.
H Expense ratios reflect operating expenses of the class. Expenses before reductions do not reflect amounts reimbursed by the investment adviser or reductions from expense offset arrangements and do not represent the amount paid by the class during periods when reimbursements or reductions occur. Expenses net of fee waivers reflect expenses after reimbursement by the investment adviser but prior to reductions from expense offset arrangements. Expenses net of all reductions represent the net expenses paid by the class but do not include expenses of the investment companies in which the Fund invests.
See accompanying notes which are an integral part of the financial statements.
Semiannual Report
Financial Highlights - Class T
| Six months ended January 31, 2011 | Years ended July 31, |
| (Unaudited) | 2010 | 2009 | 2008 G |
Selected Per-Share Data | | | | |
Net asset value, beginning of period | $ 45.57 | $ 41.86 | $ 47.04 | $ 50.00 |
Income from Investment Operations | | | | |
Net investment income (loss) E | .461 | .702 | .933 | .982 |
Net realized and unrealized gain (loss) | 3.818 | 3.985 | (4.736) | (2.862) |
Total from investment operations | 4.279 | 4.687 | (3.803) | (1.880) |
Distributions from net investment income | (.455) | (.685) | (.957) | (.910) |
Distributions from net realized gain | (.214) | (.292) | (.420) | (.170) |
Total distributions | (.669) | (.977) | (1.377) | (1.080) |
Net asset value, end of period | $ 49.18 | $ 45.57 | $ 41.86 | $ 47.04 |
Total Return B, C, D | 9.42% | 11.27% | (7.77)% | (3.87)% |
Ratios to Average Net Assets F, H | | | | |
Expenses before reductions | .50% A | .50% | .51% | .50% A |
Expenses net of fee waivers, if any | .50% A | .50% | .51% | .50% A |
Expenses net of all reductions | .50% A | .50% | .51% | .50% A |
Net investment income (loss) | 1.94% A | 1.57% | 2.37% | 2.16% A |
Supplemental Data | | | | |
Net assets, end of period (000 omitted) | $ 78 | $ 77 | $ 112 | $ 187 |
Portfolio turnover rate | 24% A | 24% | 22% | 32% A |
A Annualized
B Total returns for periods of less than one year are not annualized.
C Total returns would have been lower had certain expenses not been reduced during the periods shown.
D Total returns do not include the effect of the sales charges.
E Calculated based on average shares outstanding during the period.
F Amounts do not include the activity of the underlying funds.
G For the period August 30, 2007 (commencement of operations) to July 31, 2008.
H Expense ratios reflect operating expenses of the class. Expenses before reductions do not reflect amounts reimbursed by the investment adviser or reductions from expense offset arrangements and do not represent the amount paid by the class during periods when reimbursements or reductions occur. Expenses net of fee waivers reflect expenses after reimbursement by the investment adviser but prior to reductions from expense offset arrangements. Expenses net of all reductions represent the net expenses paid by the class but do not include expenses of the investment companies in which the Fund invests.
Financial Highlights - Class C
| Six months ended January 31, 2011 | Years ended July 31, |
| (Unaudited) | 2010 | 2009 | 2008 G |
Selected Per-Share Data | | | | |
Net asset value, beginning of period | $ 45.58 | $ 41.86 | $ 47.04 | $ 50.00 |
Income from Investment Operations | | | | |
Net investment income (loss) E | .341 | .477 | .737 | .760 |
Net realized and unrealized gain (loss) | 3.818 | 3.989 | (4.745) | (2.860) |
Total from investment operations | 4.159 | 4.466 | (4.008) | (2.100) |
Distributions from net investment income | (.325) | (.454) | (.752) | (.690) |
Distributions from net realized gain | (.214) | (.292) | (.420) | (.170) |
Total distributions | (.539) | (.746) | (1.172) | (.860) |
Net asset value, end of period | $ 49.20 | $ 45.58 | $ 41.86 | $ 47.04 |
Total Return B, C, D | 9.14% | 10.72% | (8.25)% | (4.29)% |
Ratios to Average Net Assets F, H | | | | |
Expenses before reductions | 1.00% A | 1.00% | 1.01% | 1.00% A |
Expenses net of fee waivers, if any | 1.00% A | 1.00% | 1.01% | 1.00% A |
Expenses net of all reductions | 1.00% A | 1.00% | 1.01% | 1.00% A |
Net investment income (loss) | 1.44% A | 1.07% | 1.87% | 1.66% A |
Supplemental Data | | | | |
Net assets, end of period (000 omitted) | $ 37 | $ 44 | $ 69 | $ 120 |
Portfolio turnover rate | 24% A | 24% | 22% | 32% A |
A Annualized
B Total returns for periods of less than one year are not annualized.
C Total returns would have been lower had certain expenses not been reduced during the periods shown.
D Total returns do not include the effect of the contingent deferred sales charge.
E Calculated based on average shares outstanding during the period.
F Amounts do not include the activity of the underlying funds.
G For the period August 30, 2007 (commencement of operations) to July 31, 2008.
H Expense ratios reflect operating expenses of the class. Expenses before reductions do not reflect amounts reimbursed by the investment adviser or reductions from expense offset arrangements and do not represent the amount paid by the class during periods when reimbursements or reductions occur. Expenses net of fee waivers reflect expenses after reimbursement by the investment adviser but prior to reductions from expense offset arrangements. Expenses net of all reductions represent the net expenses paid by the class but do not include expenses of the investment companies in which the Fund invests.
See accompanying notes which are an integral part of the financial statements.
Semiannual Report
Financial Highlights - Income Replacement 2022
| Six months ended January 31, 2011 | Years ended July 31, |
| (Unaudited) | 2010 | 2009 | 2008 G |
Selected Per-Share Data | | | | |
Net asset value, beginning of period | $ 45.56 | $ 41.87 | $ 47.06 | $ 50.00 |
Income from Investment Operations | | | | |
Net investment income (loss) D | .579 | .925 | 1.144 | 1.190 |
Net realized and unrealized gain (loss) | 3.826 | 3.978 | (4.752) | (2.836) |
Total from investment operations | 4.405 | 4.903 | (3.608) | (1.646) |
Distributions from net investment income | (.571) | (.921) | (1.162) | (1.124) |
Distributions from net realized gain | (.214) | (.292) | (.420) | (.170) |
Total distributions | (.785) | (1.213) | (1.582) | (1.294) |
Net asset value, end of period | $ 49.18 | $ 45.56 | $ 41.87 | $ 47.06 |
Total Return B, C | 9.71% | 11.80% | (7.30)% | (3.41)% |
Ratios to Average Net Assets E, H | | | | |
Expenses before reductions | .00% A, F | .00% F | .01% | .00% A, F |
Expenses net of fee waivers, if any | .00% A | .00% | .01% | .00% A |
Expenses net of all reductions | .00% A | .00% | .01% | .00% A |
Net investment income (loss) | 2.44% A | 2.07% | 2.87% | 2.66% A |
Supplemental Data | | | | |
Net assets, end of period (000 omitted) | $ 2,883 | $ 2,395 | $ 2,353 | $ 4,666 |
Portfolio turnover rate | 24% A | 24% | 22% | 32% A |
A Annualized
B Total returns for periods of less than one year are not annualized.
C Total returns would have been lower had certain expenses not been reduced during the periods shown.
D Calculated based on average shares outstanding during the period.
E Amounts do not include the activity of the underlying funds.
F Amount represents less than .01%.
G For the period August 30, 2007 (commencement of operations) to July 31, 2008.
H Expense ratios reflect operating expenses of the class. Expenses before reductions do not reflect amounts reimbursed by the investment adviser or reductions from expense offset arrangements and do not represent the amount paid by the class during periods when reimbursements or reductions occur. Expenses net of fee waivers reflect expenses after reimbursement by the investment adviser but prior to reductions from expense offset arrangements. Expenses net of all reductions represent the net expenses paid by the class but do not include expenses of the investment companies in which the Fund invests.
Financial Highlights - Institutional Class
| Six months ended January 31, 2011 | Years ended July 31, |
| (Unaudited) | 2010 | 2009 | 2008 G |
Selected Per-Share Data | | | | |
Net asset value, beginning of period | $ 45.56 | $ 41.86 | $ 47.06 | $ 50.00 |
Income from Investment Operations | | | | |
Net investment income (loss) D | .577 | .918 | 1.131 | 1.208 |
Net realized and unrealized gain (loss) | 3.818 | 3.995 | (4.749) | (2.854) |
Total from investment operations | 4.395 | 4.913 | (3.618) | (1.646) |
Distributions from net investment income | (.571) | (.921) | (1.162) | (1.124) |
Distributions from net realized gain | (.214) | (.292) | (.420) | (.170) |
Total distributions | (.785) | (1.213) | (1.582) | (1.294) |
Net asset value, end of period | $ 49.17 | $ 45.56 | $ 41.86 | $ 47.06 |
Total Return B, C | 9.69% | 11.83% | (7.33)% | (3.41)% |
Ratios to Average Net Assets E, H | | | | |
Expenses before reductions | .00% A, F | .00% F | .01% | .00% A, F |
Expenses net of fee waivers, if any | .00% A | .00% | .01% | .00% A |
Expenses net of all reductions | .00% A | .00% | .01% | .00% A |
Net investment income (loss) | 2.44% A | 2.07% | 2.87% | 2.66% A |
Supplemental Data | | | | |
Net assets, end of period (000 omitted) | $ 4 | $ 5 | $ 166 | $ 277 |
Portfolio turnover rate | 24% A | 24% | 22% | 32% A |
A Annualized
B Total returns for periods of less than one year are not annualized.
C Total returns would have been lower had certain expenses not been reduced during the periods shown.
D Calculated based on average shares outstanding during the period.
E Amounts do not include the activity of the underlying funds.
F Amount represents less than .01%.
G For the period August 30, 2007 (commencement of operations) to July 31, 2008.
H Expense ratios reflect operating expenses of the class. Expenses before reductions do not reflect amounts reimbursed by the investment adviser or reductions from expense offset arrangements and do not represent the amount paid by the class during periods when reimbursements or reductions occur. Expenses net of fee waivers reflect expenses after reimbursement by the investment adviser but prior to reductions from expense offset arrangements. Expenses net of all reductions represent the net expenses paid by the class but do not include expenses of the investment companies in which the Fund invests.
See accompanying notes which are an integral part of the financial statements.
Semiannual Report
Fidelity Income Replacement 2024 Fund
Investment Changes (Unaudited)
Fund Holdings as of January 31, 2011 |
| % of fund's
net assets | % of fund's net assets
6 months ago |
Domestic Equity Funds | | |
Fidelity Advisor Mid Cap II Fund Institutional Class | 4.9 | 4.9 |
Fidelity Disciplined Equity Fund | 5.1 | 5.2 |
Fidelity Equity-Income Fund | 5.1 | 5.2 |
Fidelity Large Cap Core Enhanced Index Fund | 8.3 | 8.3 |
Fidelity Series 100 Index Fund | 6.2 | 6.3 |
Fidelity Series Broad Market Opportunities Fund | 8.3 | 8.3 |
Fidelity Series Small Cap Opportunities Fund | 3.3 | 3.4 |
| 41.2 | 41.6 |
International Equity Funds | | |
Fidelity Advisor International Discovery Fund Institutional Class | 5.6 | 5.9 |
High Yield Fixed-Income Funds | | |
Fidelity Capital & Income Fund | 2.0 | 2.1 |
Fidelity Strategic Income Fund | 2.0 | 2.1 |
| 4.0 | 4.2 |
Investment Grade Fixed-Income Funds | | |
Fidelity Government Income Fund | 6.4 | 6.3 |
Fidelity Strategic Real Return Fund | 6.5 | 6.5 |
Fidelity Total Bond Fund | 19.3 | 19.1 |
| 32.2 | 31.9 |
Short-Term Funds | | |
Fidelity Institutional Money Market Portfolio Institutional Class | 8.5 | 8.2 |
Fidelity Short-Term Bond Fund | 8.5 | 8.2 |
| 17.0 | 16.4 |
Net Other Assets (Liabilities)* | 0.0 | 0.0 |
| 100.0 | 100.0 |
* Amount represents less than 0.1%
Asset Allocation (% of fund's net assets) |
Current |
| Domestic Equity Funds | 41.2% | |
| International Equity Funds | 5.6% | |
| High Yield Fixed-Income Funds | 4.0% | |
| Investment Grade Fixed-Income Funds | 32.2% | |
| Short-Term Funds | 17.0% | |

Six months ago |
| Domestic Equity Funds | 41.6% | |
| International Equity Funds | 5.9% | |
| High Yield Fixed-Income Funds | 4.2% | |
| Investment Grade Fixed-Income Funds | 31.9% | |
| Short-Term Funds | 16.4% | |

Expected |
| Domestic Equity Funds | 40.7% | |
| International Equity Funds | 5.4% | |
| High Yield Fixed-Income Funds | 3.9% | |
| Investment Grade Fixed-Income Funds | 32.5% | |
| Short-Term Funds | 17.5% | |

The fund invests according to an asset allocation strategy that becomes increasingly conservative over time. The six months ago allocation is based on the fund's holdings as of July 31, 2010. The current allocation is based on the fund's holdings as of January 31, 2011. The expected allocation represents the fund's anticipated allocation at July 31, 2011. |
Semiannual Report
Fidelity Income Replacement 2024 Fund
Investments January 31, 2011 (Unaudited)
Showing Percentage of Net Assets
Equity Funds - 46.8% |
| Shares | | Value |
Domestic Equity Funds - 41.2% |
Fidelity Advisor Mid Cap II Fund Institutional Class | 4,521 | | $ 82,866 |
Fidelity Disciplined Equity Fund | 3,713 | | 86,214 |
Fidelity Equity-Income Fund | 1,892 | | 86,214 |
Fidelity Large Cap Core Enhanced Index Fund | 15,766 | | 138,110 |
Fidelity Series 100 Index Fund | 11,559 | | 103,457 |
Fidelity Series Broad Market Opportunities Fund | 13,435 | | 138,110 |
Fidelity Series Small Cap Opportunities Fund | 5,050 | | 55,244 |
TOTAL DOMESTIC EQUITY FUNDS | | 690,215 |
International Equity Funds - 5.6% |
Fidelity Advisor International Discovery Fund Institutional Class | 2,832 | | 93,748 |
TOTAL EQUITY FUNDS (Cost $716,100) | 783,963 |
Fixed-Income Funds - 36.2% |
| | | |
High Yield Fixed-Income Funds - 4.0% |
Fidelity Capital & Income Fund | 3,480 | | 33,649 |
Fidelity Strategic Income Fund | 3,010 | | 33,649 |
TOTAL HIGH YIELD FIXED-INCOME FUNDS | | 67,298 |
|
| Shares | | Value |
Investment Grade Fixed-Income Funds - 32.2% |
Fidelity Government Income Fund | 10,356 | | $ 107,810 |
Fidelity Strategic Real Return Fund | 11,114 | | 107,810 |
Fidelity Total Bond Fund | 30,130 | | 323,599 |
TOTAL INVESTMENT GRADE FIXED-INCOME FUNDS | | 539,219 |
TOTAL FIXED-INCOME FUNDS (Cost $579,066) | 606,517 |
Short-Term Funds - 17.0% |
| | | |
Fidelity Institutional Money Market Portfolio Institutional Class | 141,793 | | 141,793 |
Fidelity Short-Term Bond Fund | 16,721 | | 141,793 |
TOTAL SHORT-TERM FUNDS (Cost $281,039) | 283,586 |
TOTAL INVESTMENT PORTFOLIO - 100.0% (Cost $1,576,205) | | 1,674,066 |
NET OTHER ASSETS (LIABILITIES) - 0.0% | | (143) |
NET ASSETS - 100% | $ 1,673,923 |
Other Information |
All investments are categorized as Level 1 under the Fair Value Hierarchy. The inputs or methodology used for valuing securities may not be an indication of the risk associated with investing in those securities. For more information on valuation inputs, please refer to the Security Valuation section in the accompanying Notes to Financial Statements. |
Income Tax Information |
At July 31, 2010, the Fund had a capital loss carryforward of approximately $76,448 of which $9,801 and $66,647 will expire in fiscal 2017 and 2018, respectively. Capital loss carryforwards are only available to offset future capital gains of the Fund to the extent provided by regulations and may be limited. |
The Fund intends to elect to defer to its fiscal year ending July 31, 2011 approximately $47,112 of losses recognized during the period November 1, 2009 to July 31, 2010. |
See accompanying notes which are an integral part of the financial statements.
Semiannual Report
Fidelity Income Replacement 2024 Fund
Statement of Assets and Liabilities
| January 31, 2011 (Unaudited) |
| | |
Assets | | |
Investment in securities, at value (cost $1,576,205) - See accompanying schedule | | $ 1,674,066 |
Cash | | 72 |
Receivable for investments sold | | 8,936 |
Total assets | | 1,683,074 |
| | |
Liabilities | | |
Payable for investments purchased | $ 8,934 | |
Distribution and service plan fees payable | 217 | |
Total liabilities | | 9,151 |
| | |
Net Assets | | $ 1,673,923 |
Net Assets consist of: | | |
Paid in capital | | $ 1,741,502 |
Undistributed net investment income | | 382 |
Accumulated undistributed net realized gain (loss) on investments | | (165,822) |
Net unrealized appreciation (depreciation) on investments | | 97,861 |
Net Assets | | $ 1,673,923 |
Calculation of Maximum Offering Price Class A:
Net Asset Value and redemption price per share ($256,379 ÷ 5,205.1 shares) | | $ 49.26 |
| | |
Maximum offering price per share (100/94.25 of $49.26) | | $ 52.27 |
Class T:
Net Asset Value and redemption price per share ($46,077 ÷ 935.1 shares) | | $ 49.27 |
| | |
Maximum offering price per share (100/96.50 of $49.27) | | $ 51.06 |
| | |
Class C:
Net Asset Value and offering price per share ($171,691 ÷ 3,488.0 shares)A | | $ 49.22 |
| | |
Income Replacement 2024:
Net Asset Value, offering price and redemption price per share ($1,168,214 ÷ 23,713.5 shares) | | $ 49.26 |
| | |
Institutional Class:
Net Asset Value, offering price and redemption price per share ($31,562 ÷ 640.7 shares) | | $ 49.26 |
A Redemption price per share is equal to net asset value less any applicable contingent deferred sales charge.
Statement of Operations
Six months ended January 31, 2011 (Unaudited) |
| | |
Investment Income | | |
Income distributions from underlying funds | | $ 19,307 |
| | |
Expenses | | |
Distribution and service plan fees | $ 1,286 | |
Independent trustees' compensation | 3 | |
Total expenses before reductions | 1,289 | |
Expense reductions | (3) | 1,286 |
Net investment income (loss) | | 18,021 |
Realized and Unrealized Gain (Loss) Realized gain (loss) on sale of underlying fund shares | (15,388) | |
Capital gain distributions from underlying funds | 9,198 | |
Total net realized gain (loss) | | (6,190) |
Change in net unrealized appreciation (depreciation) on underlying funds | | 141,054 |
Net gain (loss) | | 134,864 |
Net increase (decrease) in net assets resulting from operations | | $ 152,885 |
See accompanying notes which are an integral part of the financial statements.
Semiannual Report
Statement of Changes in Net Assets
| Six months ended January 31, 2011 (Unaudited) | Year ended
July 31,
2010 |
Increase (Decrease) in Net Assets | | |
Operations | | |
Net investment income (loss) | $ 18,021 | $ 30,872 |
Net realized gain (loss) | (6,190) | (37,364) |
Change in net unrealized appreciation (depreciation) | 141,054 | 180,425 |
Net increase (decrease) in net assets resulting from operations | 152,885 | 173,933 |
Distributions to shareholders from net investment income | (18,077) | (30,833) |
Distributions to shareholders from net realized gain | (7,078) | (4,233) |
Total distributions | (25,155) | (35,066) |
Share transactions - net increase (decrease) | 10,676 | 87,922 |
Total increase (decrease) in net assets | 138,406 | 226,789 |
| | |
Net Assets | | |
Beginning of period | 1,535,517 | 1,308,728 |
End of period (including undistributed net investment income of $382 and undistributed net investment income of $438, respectively) | $ 1,673,923 | $ 1,535,517 |
Financial Highlights - Class A
| Six months ended January 31, 2011 | Years ended July 31, |
| (Unaudited) | 2010 | 2009 | 2008 G |
Selected Per-Share Data | | | | |
Net asset value, beginning of period | $ 45.41 | $ 41.48 | $ 46.97 | $ 50.00 |
Income from Investment Operations | | | | |
Net investment income (loss) E | .519 | .811 | 1.014 | 1.063 |
Net realized and unrealized gain (loss) | 4.077 | 4.020 | (5.004) | (2.884) |
Total from investment operations | 4.596 | 4.831 | (3.990) | (1.821) |
Distributions from net investment income | (.529) | (.791) | (1.020) | (1.039) |
Distributions from net realized gain | (.217) | (.110) | (.480) | (.170) |
Total distributions | (.746) | (.901) | (1.500) | (1.209) |
Net asset value, end of period | $ 49.26 | $ 45.41 | $ 41.48 | $ 46.97 |
Total Return B, C, D | 10.16% | 11.70% | (8.10)% | (3.77)% |
Ratios to Average Net Assets F, H | | | | |
Expenses before reductions | .25% A | .25% | .25% | .25% A |
Expenses net of fee waivers, if any | .25% A | .25% | .25% | .25% A |
Expenses net of all reductions | .25% A | .25% | .25% | .25% A |
Net investment income (loss) | 2.19% A | 1.82% | 2.62% | 2.35% A |
Supplemental Data | | | | |
Net assets, end of period (000 omitted) | $ 256 | $ 260 | $ 287 | $ 286 |
Portfolio turnover rate | 28% A | 34% | 64% | 41% A |
A Annualized
B Total returns for periods of less than one year are not annualized.
C Total returns would have been lower had certain expenses not been reduced during the periods shown.
D Total returns do not include the effect of the sales charges.
E Calculated based on average shares outstanding during the period.
F Amounts do not include the activity of the underlying funds.
G For the period August 30, 2007 (commencement of operations) to July 31, 2008.
H Expense ratios reflect operating expenses of the class. Expenses before reductions do not reflect amounts reimbursed by the investment adviser or reductions from expense offset arrangements and do not represent the amount paid by the class during periods when reimbursements or reductions occur. Expenses net of fee waivers reflect expenses after reimbursement by the investment adviser but prior to reductions from expense offset arrangements. Expenses net of all reductions represent the net expenses paid by the class but do not include expenses of the investment companies in which the Fund invests.
See accompanying notes which are an integral part of the financial statements.
Semiannual Report
Financial Highlights - Class T
| Six months ended January 31, 2011 | Years ended July 31, |
| (Unaudited) | 2010 | 2009 | 2008 G |
Selected Per-Share Data | | | | |
Net asset value, beginning of period | $ 45.42 | $ 41.48 | $ 46.97 | $ 50.00 |
Income from Investment Operations | | | | |
Net investment income (loss) E | .459 | .701 | .919 | .966 |
Net realized and unrealized gain (loss) | 4.070 | 4.025 | (5.010) | (2.903) |
Total from investment operations | 4.529 | 4.726 | (4.091) | (1.937) |
Distributions from net investment income | (.462) | (.676) | (.919) | (.923) |
Distributions from net realized gain | (.217) | (.110) | (.480) | (.170) |
Total distributions | (.679) | (.786) | (1.399) | (1.093) |
Net asset value, end of period | $ 49.27 | $ 45.42 | $ 41.48 | $ 46.97 |
Total Return B, C, D | 10.01% | 11.43% | (8.34)% | (3.99)% |
Ratios to Average Net Assets F, H | | | | |
Expenses before reductions | .50% A | .50% | .50% | .50% A |
Expenses net of fee waivers, if any | .50% A | .50% | .50% | .50% A |
Expenses net of all reductions | .50% A | .50% | .50% | .50% A |
Net investment income (loss) | 1.93% A | 1.57% | 2.37% | 2.11% A |
Supplemental Data | | | | |
Net assets, end of period (000 omitted) | $ 46 | $ 54 | $ 69 | $ 96 |
Portfolio turnover rate | 28% A | 34% | 64% | 41% A |
A Annualized
B Total returns for periods of less than one year are not annualized.
C Total returns would have been lower had certain expenses not been reduced during the periods shown.
D Total returns do not include the effect of the sales charges.
E Calculated based on average shares outstanding during the period.
F Amounts do not include the activity of the underlying funds.
G For the period August 30, 2007 (commencement of operations) to July 31, 2008.
H Expense ratios reflect operating expenses of the class. Expenses before reductions do not reflect amounts reimbursed by the investment adviser or reductions from expense offset arrangements and do not represent the amount paid by the class during periods when reimbursements or reductions occur. Expenses net of fee waivers reflect expenses after reimbursement by the investment adviser but prior to reductions from expense offset arrangements. Expenses net of all reductions represent the net expenses paid by the class but do not include expenses of the investment companies in which the Fund invests.
Financial Highlights - Class C
| Six months ended January 31, 2011 | Years ended July 31, |
| (Unaudited) | 2010 | 2009 | 2008 G |
Selected Per-Share Data | | | | |
Net asset value, beginning of period | $ 45.38 | $ 41.45 | $ 46.93 | $ 50.00 |
Income from Investment Operations | | | | |
Net investment income (loss) E | .340 | .476 | .726 | .728 |
Net realized and unrealized gain (loss) | 4.067 | 4.020 | (5.005) | (2.903) |
Total from investment operations | 4.407 | 4.496 | (4.279) | (2.175) |
Distributions from net investment income | (.350) | (.456) | (.721) | (.725) |
Distributions from net realized gain | (.217) | (.110) | (.480) | (.170) |
Total distributions | (.567) | (.566) | (1.201) | (.895) |
Net asset value, end of period | $ 49.22 | $ 45.38 | $ 41.45 | $ 46.93 |
Total Return B, C, D | 9.73% | 10.87% | (8.80)% | (4.45)% |
Ratios to Average Net Assets F, H | | | | |
Expenses before reductions | 1.00% A | 1.00% | 1.00% | 1.00% A |
Expenses net of fee waivers, if any | 1.00% A | 1.00% | 1.00% | 1.00% A |
Expenses net of all reductions | 1.00% A | 1.00% | 1.00% | 1.00% A |
Net investment income (loss) | 1.43% A | 1.07% | 1.87% | 1.61% A |
Supplemental Data | | | | |
Net assets, end of period (000 omitted) | $ 172 | $ 159 | $ 147 | $ 233 |
Portfolio turnover rate | 28% A | 34% | 64% | 41% A |
A Annualized
B Total returns for periods of less than one year are not annualized.
C Total returns would have been lower had certain expenses not been reduced during the periods shown.
D Total returns do not include the effect of the contingent deferred sales charge.
E Calculated based on average shares outstanding during the period.
F Amounts do not include the activity of the underlying funds.
G For the period August 30, 2007 (commencement of operations) to July 31, 2008.
H Expense ratios reflect operating expenses of the class. Expenses before reductions do not reflect amounts reimbursed by the investment adviser or reductions from expense offset arrangements and do not represent the amount paid by the class during periods when reimbursements or reductions occur. Expenses net of fee waivers reflect expenses after reimbursement by the investment adviser but prior to reductions from expense offset arrangements. Expenses net of all reductions represent the net expenses paid by the class but do not include expenses of the investment companies in which the Fund invests.
See accompanying notes which are an integral part of the financial statements.
Semiannual Report
Financial Highlights - Income Replacement 2024
| Six months ended January 31, 2011 | Years ended July 31, |
| (Unaudited) | 2010 | 2009 | 2008 G |
Selected Per-Share Data | | | | |
Net asset value, beginning of period | $ 45.42 | $ 41.49 | $ 46.98 | $ 50.00 |
Income from Investment Operations | | | | |
Net investment income (loss) D | .578 | .924 | 1.118 | 1.166 |
Net realized and unrealized gain (loss) | 4.067 | 4.020 | (5.011) | (2.868) |
Total from investment operations | 4.645 | 4.944 | (3.893) | (1.702) |
Distributions from net investment income | (.588) | (.904) | (1.117) | (1.148) |
Distributions from net realized gain | (.217) | (.110) | (.480) | (.170) |
Total distributions | (.805) | (1.014) | (1.597) | (1.318) |
Net asset value, end of period | $ 49.26 | $ 45.42 | $ 41.49 | $ 46.98 |
Total Return B, C | 10.28% | 11.98% | (7.87)% | (3.53)% |
Ratios to Average Net Assets E, H | | | | |
Expenses before reductions F | .00% A | .00% | .00% | .00% A |
Expenses net of fee waivers, if any | .00% A | .00% | .00% | .00% A |
Expenses net of all reductions | .00% A | .00% | .00% | .00% A |
Net investment income (loss) | 2.44% A | 2.07% | 2.87% | 2.60% A |
Supplemental Data | | | | |
Net assets, end of period (000 omitted) | $ 1,168 | $ 1,026 | $ 749 | $ 714 |
Portfolio turnover rate | 28% A | 34% | 64% | 41% A |
A Annualized
B Total returns for periods of less than one year are not annualized.
C Total returns would have been lower had certain expenses not been reduced during the periods shown.
D Calculated based on average shares outstanding during the period.
E Amounts do not include the activity of the underlying funds.
F Amount represents less than .01%.
G For the period August 30, 2007 (commencement of operations) to July 31, 2008.
H Expense ratios reflect operating expenses of the class. Expenses before reductions do not reflect amounts reimbursed by the investment adviser or reductions from expense offset arrangements and do not represent the amount paid by the class during periods when reimbursements or reductions occur. Expenses net of fee waivers reflect expenses after reimbursement by the investment adviser but prior to reductions from expense offset arrangements. Expenses net of all reductions represent the net expenses paid by the class but do not include expenses of the investment companies in which the Fund invests.
Financial Highlights - Institutional Class
| Six months ended January 31, 2011 | Years ended July 31, |
| (Unaudited) | 2010 | 2009 | 2008 G |
Selected Per-Share Data | | | | |
Net asset value, beginning of period | $ 45.42 | $ 41.48 | $ 46.98 | $ 50.00 |
Income from Investment Operations | | | | |
Net investment income (loss) D | .578 | .922 | 1.119 | 1.194 |
Net realized and unrealized gain (loss) | 4.067 | 4.032 | (5.022) | (2.896) |
Total from investment operations | 4.645 | 4.954 | (3.903) | (1.702) |
Distributions from net investment income | (.588) | (.904) | (1.117) | (1.148) |
Distributions from net realized gain | (.217) | (.110) | (.480) | (.170) |
Total distributions | (.805) | (1.014) | (1.597) | (1.318) |
Net asset value, end of period | $ 49.26 | $ 45.42 | $ 41.48 | $ 46.98 |
Total Return B, C | 10.28% | 12.00% | (7.89)% | (3.53)% |
Ratios to Average Net Assets E, H | | | | |
Expenses before reductions F | .00% A | .00% | .00% | .00% A |
Expenses net of fee waivers, if any | .00% A | .00% | .00% | .00% A |
Expenses net of all reductions | .00% A | .00% | .00% | .00% A |
Net investment income (loss) | 2.44% A | 2.07% | 2.87% | 2.60% A |
Supplemental Data | | | | |
Net assets, end of period (000 omitted) | $ 32 | $ 37 | $ 57 | $ 97 |
Portfolio turnover rate | 28% A | 34% | 64% | 41% A |
A Annualized
B Total returns for periods of less than one year are not annualized.
C Total returns would have been lower had certain expenses not been reduced during the periods shown.
D Calculated based on average shares outstanding during the period.
E Amounts do not include the activity of the underlying funds.
F Amount represents less than .01%.
G For the period August 30, 2007 (commencement of operations) to July 31, 2008.
H Expense ratios reflect operating expenses of the class. Expenses before reductions do not reflect amounts reimbursed by the investment adviser or reductions from expense offset arrangements and do not represent the amount paid by the class during periods when reimbursements or reductions occur. Expenses net of fee waivers reflect expenses after reimbursement by the investment adviser but prior to reductions from expense offset arrangements. Expenses net of all reductions represent the net expenses paid by the class but do not include expenses of the investment companies in which the Fund invests.
See accompanying notes which are an integral part of the financial statements.
Semiannual Report
Fidelity Income Replacement 2026 Fund
Investment Changes (Unaudited)
Fund Holdings as of January 31, 2011 |
| % of fund's
net assets | % of fund's net assets
6 months ago |
Domestic Equity Funds | | |
Fidelity Advisor Mid Cap II Fund Institutional Class | 5.2 | 5.1 |
Fidelity Disciplined Equity Fund | 5.4 | 5.4 |
Fidelity Equity-Income Fund | 5.4 | 5.4 |
Fidelity Large Cap Core Enhanced Index Fund | 8.6 | 8.6 |
Fidelity Series 100 Index Fund | 6.4 | 6.5 |
Fidelity Series Broad Market Opportunities Fund | 8.6 | 8.7 |
Fidelity Series Small Cap Opportunities Fund | 3.4 | 3.5 |
| 43.0 | 43.2 |
International Equity Funds | | |
Fidelity Advisor International Discovery Fund Institutional Class | 6.4 | 6.7 |
High Yield Fixed-Income Funds | | |
Fidelity Capital & Income Fund | 2.2 | 2.3 |
Fidelity Strategic Income Fund | 2.2 | 2.2 |
| 4.4 | 4.5 |
Investment Grade Fixed-Income Funds | | |
Fidelity Government Income Fund | 6.1 | 6.0 |
Fidelity Strategic Real Return Fund | 6.1 | 6.2 |
Fidelity Total Bond Fund | 18.4 | 18.3 |
| 30.6 | 30.5 |
Short-Term Funds | | |
Fidelity Institutional Money Market Portfolio Institutional Class | 7.8 | 7.5 |
Fidelity Short-Term Bond Fund | 7.8 | 7.6 |
| 15.6 | 15.1 |
Net Other Assets (Liabilities)* | 0.0 | 0.0 |
| 100.0 | 100.0 |
* Amount represents less than 0.1%
Asset Allocation (% of fund's net assets) |
Current |
| Domestic Equity Funds | 43.0% | |
| International Equity Funds | 6.4% | |
| High Yield Fixed-Income Funds | 4.4% | |
| Investment Grade Fixed-Income Funds | 30.6% | |
| Short-Term Funds | 15.6% | |

Six months ago |
| Domestic Equity Funds | 43.2% | |
| International Equity Funds | 6.7% | |
| High Yield Fixed-Income Funds | 4.5% | |
| Investment Grade Fixed-Income Funds | 30.5% | |
| Short-Term Funds | 15.1% | |

Expected |
| Domestic Equity Funds | 42.6% | |
| International Equity Funds | 6.2% | |
| High Yield Fixed-Income Funds | 4.3% | |
| Investment Grade Fixed-Income Funds | 30.9% | |
| Short-Term Funds | 16.0% | |

The fund invests according to an asset allocation strategy that becomes increasingly conservative over time. The six months ago allocation is based on the fund's holdings as of July 31, 2010. The current allocation is based on the fund's holdings as of January 31, 2011. The expected allocation represents the fund's anticipated allocation at July 31, 2011. |
Semiannual Report
Fidelity Income Replacement 2026 Fund
Investments January 31, 2011 (Unaudited)
Showing Percentage of Net Assets
Equity Funds - 49.4% |
| Shares | | Value |
Domestic Equity Funds - 43.0% |
Fidelity Advisor Mid Cap II Fund Institutional Class | 4,024 | | $ 73,760 |
Fidelity Disciplined Equity Fund | 3,306 | | 76,762 |
Fidelity Equity-Income Fund | 1,684 | | 76,762 |
Fidelity Large Cap Core Enhanced Index Fund | 14,017 | | 122,791 |
Fidelity Series 100 Index Fund | 10,286 | | 92,057 |
Fidelity Series Broad Market Opportunities Fund | 11,945 | | 122,791 |
Fidelity Series Small Cap Opportunities Fund | 4,495 | | 49,173 |
TOTAL DOMESTIC EQUITY FUNDS | | 614,096 |
International Equity Funds - 6.4% |
Fidelity Advisor International Discovery Fund Institutional Class | 2,764 | | 91,486 |
TOTAL EQUITY FUNDS (Cost $676,787) | 705,582 |
Fixed-Income Funds - 35.0% |
| | | |
High Yield Fixed-Income Funds - 4.4% |
Fidelity Capital & Income Fund | 3,252 | | 31,449 |
Fidelity Strategic Income Fund | 2,813 | | 31,449 |
TOTAL HIGH YIELD FIXED-INCOME FUNDS | | 62,898 |
|
| Shares | | Value |
Investment Grade Fixed-Income Funds - 30.6% |
Fidelity Government Income Fund | 8,404 | | $ 87,484 |
Fidelity Strategic Real Return Fund | 9,019 | | 87,483 |
Fidelity Total Bond Fund | 24,437 | | 262,450 |
TOTAL INVESTMENT GRADE FIXED-INCOME FUNDS | | 437,417 |
TOTAL FIXED-INCOME FUNDS (Cost $488,421) | 500,315 |
Short-Term Funds - 15.6% |
| | | |
Fidelity Institutional Money Market Portfolio Institutional Class | 111,719 | | 111,719 |
Fidelity Short-Term Bond Fund | 13,182 | | 111,784 |
TOTAL SHORT-TERM FUNDS (Cost $223,012) | 223,503 |
TOTAL INVESTMENT PORTFOLIO - 100.0% (Cost $1,388,220) | | 1,429,400 |
NET OTHER ASSETS (LIABILITIES) - 0.0% | | (217) |
NET ASSETS - 100% | $ 1,429,183 |
Other Information |
All investments are categorized as Level 1 under the Fair Value Hierarchy. The inputs or methodology used for valuing securities may not be an indication of the risk associated with investing in those securities. For more information on valuation inputs, please refer to the Security Valuation section in the accompanying Notes to Financial Statements. |
Income Tax Information |
At July 31, 2010, the Fund had a capital loss carryforward of approximately $240,189 of which $4,903 and $235,286 will expire in fiscal 2017 and 2018, respectively. Capital loss carryforwards are only available to offset future capital gains of the Fund to the extent provided by regulations and may be limited. |
See accompanying notes which are an integral part of the financial statements.
Semiannual Report
Fidelity Income Replacement 2026 Fund
Statement of Assets and Liabilities
| January 31, 2011 (Unaudited) |
| | |
Assets | | |
Investment in securities, at value (cost $1,388,220) - See accompanying schedule | | $ 1,429,400 |
Receivable for investments sold | | 98,883 |
Total assets | | 1,528,283 |
| | |
Liabilities | | |
Payable for fund shares redeemed | $ 98,884 | |
Distribution and service plan fees payable | 216 | |
Total liabilities | | 99,100 |
| | |
Net Assets | | $ 1,429,183 |
Net Assets consist of: | | |
Paid in capital | | $ 1,658,234 |
Undistributed net investment income | | 299 |
Accumulated undistributed net realized gain (loss) on investments | | (270,530) |
Net unrealized appreciation (depreciation) on investments | | 41,180 |
Net Assets | | $ 1,429,183 |
Calculation of Maximum Offering Price Class A:
Net Asset Value and redemption price per share ($38,416 �� 784.95 shares) | | $ 48.94 |
| | |
Maximum offering price per share (100/94.25 of $48.94) | | $ 51.93 |
Class T:
Net Asset Value and redemption price per share ($127,451 ÷ 2,604.55 shares) | | $ 48.93 |
| | |
Maximum offering price per share (100/96.50 of $48.93) | | $ 50.70 |
| | |
Class C:
Net Asset Value and offering price per share ($186,532 ÷ 3,814.43 shares)A | | $ 48.90 |
| | |
Income Replacement 2026:
Net Asset Value, offering price and redemption price per share ($1,045,347 ÷ 21,361.82 shares) | | $ 48.94 |
| | |
Institutional Class:
Net Asset Value, offering price and redemption price per share ($31,437 ÷ 642.43 shares) | | $ 48.93 |
A Redemption price per share is equal to net asset value less any applicable contingent deferred sales charge.
Statement of Operations
Six months ended January 31, 2011 (Unaudited) |
| | |
Investment Income | | |
Income distributions from underlying funds | | $ 13,487 |
| | |
Expenses | | |
Distribution and service plan fees | $ 1,258 | |
Independent trustees' compensation | 2 | |
Total expenses before reductions | 1,260 | |
Expense reductions | (2) | 1,258 |
Net investment income (loss) | | 12,229 |
Realized and Unrealized Gain (Loss) Realized gain (loss) on sale of underlying fund shares | 784 | |
Capital gain distributions from underlying funds | 6,098 | |
Total net realized gain (loss) | | 6,882 |
Change in net unrealized appreciation (depreciation) on underlying funds | | 90,189 |
Net gain (loss) | | 97,071 |
Net increase (decrease) in net assets resulting from operations | | $ 109,300 |
See accompanying notes which are an integral part of the financial statements.
Semiannual Report
Fidelity Income Replacement 2026 Fund
Financial Statements - continued
Statement of Changes in Net Assets
| Six months ended January 31, 2011 (Unaudited) | Year ended
July 31,
2010 |
Increase (Decrease) in Net Assets | | |
Operations | | |
Net investment income (loss) | $ 12,229 | $ 13,583 |
Net realized gain (loss) | 6,882 | (46,103) |
Change in net unrealized appreciation (depreciation) | 90,189 | 120,286 |
Net increase (decrease) in net assets resulting from operations | 109,300 | 87,766 |
Distributions to shareholders from net investment income | (12,189) | (13,653) |
Distributions to shareholders from net realized gain | (4,626) | (1,823) |
Total distributions | (16,815) | (15,476) |
Share transactions - net increase (decrease) | 344,200 | 199,973 |
Total increase (decrease) in net assets | 436,685 | 272,263 |
| | |
Net Assets | | |
Beginning of period | 992,498 | 720,235 |
End of period (including undistributed net investment income of $299 and undistributed net investment income of $259, respectively) | $ 1,429,183 | $ 992,498 |
Financial Highlights - Class A
| Six months ended January 31, 2011 | Years ended July 31, |
| (Unaudited) | 2010 | 2009 | 2008 G |
Selected Per-Share Data | | | | |
Net asset value, beginning of period | $ 44.93 | $ 40.97 | $ 46.76 | $ 50.00 |
Income from Investment Operations | | | | |
Net investment income (loss) E | .520 | .743 | 1.042 | 1.076 |
Net realized and unrealized gain (loss) | 4.210 | 4.098 | (5.184) | (3.105) |
Total from investment operations | 4.730 | 4.841 | (4.142) | (2.029) |
Distributions from net investment income | (.520) | (.771) | (1.028) | (1.031) |
Distributions from net realized gain | (.200) | (.110) | (.620) | (.180) |
Total distributions | (.720) | (.881) | (1.648) | (1.211) |
Net asset value, end of period | $ 48.94 | $ 44.93 | $ 40.97 | $ 46.76 |
Total Return B, C, D | 10.57% | 11.87% | (8.56)% | (4.19)% |
Ratios to Average Net Assets F, H | | | | |
Expenses before reductions | .25% A | .25% | .25% | .25% A |
Expenses net of fee waivers, if any | .25% A | .25% | .25% | .25% A |
Expenses net of all reductions | .25% A | .25% | .25% | .25% A |
Net investment income (loss) | 2.21% A | 1.68% | 2.70% | 2.36% A |
Supplemental Data | | | | |
Net assets, end of period (000 omitted) | $ 38 | $ 45 | $ 69 | $ 131 |
Portfolio turnover rate | 38% A | 61% | 26% | 21% A |
A Annualized
B Total returns for periods of less than one year are not annualized.
C Total returns would have been lower had certain expenses not been reduced during the periods shown.
D Total returns do not include the effect of the sales charges.
E Calculated based on average shares outstanding during the period.
F Amounts do not include the activity of the underlying funds.
G For the period August 30, 2007 (commencement of operations) to July 31, 2008.
H Expense ratios reflect operating expenses of the class. Expenses before reductions do not reflect amounts reimbursed by the investment adviser or reductions from expense offset arrangements and do not represent the amount paid by the class during periods when reimbursements or reductions occur. Expenses net of fee waivers reflect expenses after reimbursement by the investment adviser but prior to reductions from expense offset arrangements. Expenses net of all reductions represent the net expenses paid by the class but do not include expenses of the investment companies in which the Fund invests.
See accompanying notes which are an integral part of the financial statements.
Semiannual Report
Financial Highlights - Class T
| Six months ended January 31, 2011 | Years ended July 31, |
| (Unaudited) | 2010 | 2009 | 2008 G |
Selected Per-Share Data | | | | |
Net asset value, beginning of period | $ 44.92 | $ 40.97 | $ 46.76 | $ 50.00 |
Income from Investment Operations | | | | |
Net investment income (loss) E | .461 | .638 | .944 | .966 |
Net realized and unrealized gain (loss) | 4.212 | 4.092 | (5.184) | (3.110) |
Total from investment operations | 4.673 | 4.730 | (4.240) | (2.144) |
Distributions from net investment income | (.463) | (.670) | (.930) | (.916) |
Distributions from net realized gain | (.200) | (.110) | (.620) | (.180) |
Total distributions | (.663) | (.780) | (1.550) | (1.096) |
Net asset value, end of period | $ 48.93 | $ 44.92 | $ 40.97 | $ 46.76 |
Total Return B, C, D | 10.44% | 11.59% | (8.79)% | (4.41)% |
Ratios to Average Net Assets F, H | | | | |
Expenses before reductions | .50% A | .50% | .50% | .50% A |
Expenses net of fee waivers, if any | .50% A | .50% | .50% | .50% A |
Expenses net of all reductions | .50% A | .50% | .50% | .50% A |
Net investment income (loss) | 1.96% A | 1.44% | 2.45% | 2.11% A |
Supplemental Data | | | | |
Net assets, end of period (000 omitted) | $ 127 | $ 116 | $ 55 | $ 96 |
Portfolio turnover rate | 38% A | 61% | 26% | 21% A |
A Annualized
B Total returns for periods of less than one year are not annualized.
C Total returns would have been lower had certain expenses not been reduced during the periods shown.
D Total returns do not include the effect of the sales charges.
E Calculated based on average shares outstanding during the period.
F Amounts do not include the activity of the underlying funds.
G For the period August 30, 2007 (commencement of operations) to July 31, 2008.
H Expense ratios reflect operating expenses of the class. Expenses before reductions do not reflect amounts reimbursed by the investment adviser or reductions from expense offset arrangements and do not represent the amount paid by the class during periods when reimbursements or reductions occur. Expenses net of fee waivers reflect expenses after reimbursement by the investment adviser but prior to reductions from expense offset arrangements. Expenses net of all reductions represent the net expenses paid by the class but do not include expenses of the investment companies in which the Fund invests.
Financial Highlights - Class C
| Six months ended January 31, 2011 | Years ended July 31, |
| (Unaudited) | 2010 | 2009 | 2008 G |
Selected Per-Share Data | | | | |
Net asset value, beginning of period | $ 44.89 | $ 40.95 | $ 46.72 | $ 50.00 |
Income from Investment Operations | | | | |
Net investment income (loss) E | .343 | .412 | .757 | .723 |
Net realized and unrealized gain (loss) | 4.211 | 4.087 | (5.183) | (3.090) |
Total from investment operations | 4.554 | 4.499 | (4.426) | (2.367) |
Distributions from net investment income | (.344) | (.449) | (.724) | (.733) |
Distributions from net realized gain | (.200) | (.110) | (.620) | (.180) |
Total distributions | (.544) | (.559) | (1.344) | (.913) |
Net asset value, end of period | $ 48.90 | $ 44.89 | $ 40.95 | $ 46.72 |
Total Return B, C, D | 10.17% | 11.01% | (9.25)% | (4.85)% |
Ratios to Average Net Assets F, H | | | | |
Expenses before reductions | 1.00% A | 1.00% | 1.00% | 1.00% A |
Expenses net of fee waivers, if any | 1.00% A | 1.00% | 1.00% | 1.00% A |
Expenses net of all reductions | 1.00% A | 1.00% | 1.00% | 1.00% A |
Net investment income (loss) | 1.46% A | .94% | 1.95% | 1.61% A |
Supplemental Data | | | | |
Net assets, end of period (000 omitted) | $ 187 | $ 174 | $ 183 | $ 485 |
Portfolio turnover rate | 38% A | 61% | 26% | 21% A |
A Annualized
B Total returns for periods of less than one year are not annualized.
C Total returns would have been lower had certain expenses not been reduced during the periods shown.
D Total returns do not include the effect of the contingent deferred sales charge.
E Calculated based on average shares outstanding during the period.
F Amounts do not include the activity of the underlying funds.
G For the period August 30, 2007 (commencement of operations) to July 31, 2008.
H Expense ratios reflect operating expenses of the class. Expenses before reductions do not reflect amounts reimbursed by the investment adviser or reductions from expense offset arrangements and do not represent the amount paid by the class during periods when reimbursements or reductions occur. Expenses net of fee waivers reflect expenses after reimbursement by the investment adviser but prior to reductions from expense offset arrangements. Expenses net of all reductions represent the net expenses paid by the class but do not include expenses of the investment companies in which the Fund invests.
See accompanying notes which are an integral part of the financial statements.
Semiannual Report
Financial Highlights - Income Replacement 2026
| Six months ended January 31, 2011 | Years ended July 31, |
| (Unaudited) | 2010 | 2009 | 2008 F |
Selected Per-Share Data | | | | |
Net asset value, beginning of period | $ 44.92 | $ 40.97 | $ 46.77 | $ 50.00 |
Income from Investment Operations | | | | |
Net investment income (loss) D | .579 | .856 | 1.138 | 1.168 |
Net realized and unrealized gain (loss) | 4.221 | 4.091 | (5.190) | (3.079) |
Total from investment operations | 4.800 | 4.947 | (4.052) | (1.911) |
Distributions from net investment income | (.580) | (.887) | (1.128) | (1.139) |
Distributions from net realized gain | (.200) | (.110) | (.620) | (.180) |
Total distributions | (.780) | (.997) | (1.748) | (1.319) |
Net asset value, end of period | $ 48.94 | $ 44.92 | $ 40.97 | $ 46.77 |
Total Return B, C | 10.74% | 12.14% | (8.34)% | (3.96)% |
Ratios to Average Net Assets E, G | | | | |
Expenses before reductions H | .00% A | .00% | .00% | .00% A |
Expenses net of fee waivers, if any | .00% A | .00% | .00% | .00% A |
Expenses net of all reductions | .00% A | .00% | .00% | .00% A |
Net investment income (loss) | 2.46% A | 1.94% | 2.95% | 2.61% A |
Supplemental Data | | | | |
Net assets, end of period (000 omitted) | $ 1,045 | $ 622 | $ 357 | $ 783 |
Portfolio turnover rate | 38% A | 61% | 26% | 21% A |
A Annualized
B Total returns for periods of less than one year are not annualized.
C Total returns would have been lower had certain expenses not been reduced during the periods shown.
D Calculated based on average shares outstanding during the period.
E Amounts do not include the activity of the underlying funds.
F For the period August 30, 2007 (commencement of operations) to July 31, 2008.
G Expense ratios reflect operating expenses of the class. Expenses before reductions do not reflect amounts reimbursed by the investment adviser or reductions from expense offset arrangements and do not represent the amount paid by the class during periods when reimbursements or reductions occur. Expenses net of fee waivers reflect expenses after reimbursement by the investment adviser but prior to reductions from expense offset arrangements. Expenses net of all reductions represent the net expenses paid by the class but do not include expenses of the investment companies in which the Fund invests.
H Amount represents less than $.01 per share.
Financial Highlights - Institutional Class
| Six months ended January 31, 2011 | Years ended July 31, |
| (Unaudited) | 2010 | 2009 | 2008 F |
Selected Per-Share Data | | | | |
Net asset value, beginning of period | $ 44.92 | $ 40.97 | $ 46.77 | $ 50.00 |
Income from Investment Operations | | | | |
Net investment income (loss) D | .579 | .855 | 1.136 | 1.196 |
Net realized and unrealized gain (loss) | 4.211 | 4.092 | (5.188) | (3.107) |
Total from investment operations | 4.790 | 4.947 | (4.052) | (1.911) |
Distributions from net investment income | (.580) | (.887) | (1.128) | (1.139) |
Distributions from net realized gain | (.200) | (.110) | (.620) | (.180) |
Total distributions | (.780) | (.997) | (1.748) | (1.319) |
Net asset value, end of period | $ 48.93 | $ 44.92 | $ 40.97 | $ 46.77 |
Total Return B, C | 10.71% | 12.14% | (8.34)% | (3.96)% |
Ratios to Average Net Assets E, G | | | | |
Expenses before reductions H | .00% A | .00% | .00% | .00% A |
Expenses net of fee waivers, if any | .00% A | .00% | .00% | .00% A |
Expenses net of all reductions | .00% A | .00% | .00% | .00% A |
Net investment income (loss) | 2.46% A | 1.94% | 2.95% | 2.61% A |
Supplemental Data | | | | |
Net assets, end of period (000 omitted) | $ 31 | $ 36 | $ 56 | $ 96 |
Portfolio turnover rate | 38% A | 61% | 26% | 21% A |
A Annualized
B Total returns for periods of less than one year are not annualized.
C Total returns would have been lower had certain expenses not been reduced during the periods shown.
D Calculated based on average shares outstanding during the period.
E Amounts do not include the activity of the underlying funds.
F For the period August 30, 2007 (commencement of operations) to July 31, 2008.
G Expense ratios reflect operating expenses of the class. Expenses before reductions do not reflect amounts reimbursed by the investment adviser or reductions from expense offset arrangements and do not represent the amount paid by the class during periods when reimbursements or reductions occur. Expenses net of fee waivers reflect expenses after reimbursement by the investment adviser but prior to reductions from expense offset arrangements. Expenses net of all reductions represent the net expenses paid by the class but do not include expenses of the investment companies in which the Fund invests.
H Amount represents less than $.01 per share.
See accompanying notes which are an integral part of the financial statements.
Semiannual Report
Fidelity Income Replacement 2028 Fund
Investment Changes (Unaudited)
Fund Holdings as of January 31, 2011 |
| % of fund's
net assets | % of fund's net assets
6 months ago |
Domestic Equity Funds | | |
Fidelity Advisor Mid Cap II Fund Institutional Class | 5.3 | 5.2 |
Fidelity Disciplined Equity Fund | 5.5 | 5.5 |
Fidelity Equity-Income Fund | 5.5 | 5.6 |
Fidelity Large Cap Core Enhanced Index Fund | 8.9 | 8.8 |
Fidelity Series 100 Index Fund | 6.6 | 6.7 |
Fidelity Series Broad Market Opportunities Fund | 8.9 | 8.9 |
Fidelity Series Small Cap Opportunities Fund | 3.5 | 3.6 |
| 44.2 | 44.3 |
International Equity Funds | | |
Fidelity Advisor International Discovery Fund Institutional Class | 7.2 | 7.5 |
High Yield Fixed-Income Funds | | |
Fidelity Capital & Income Fund | 2.4 | 2.5 |
Fidelity Strategic Income Fund | 2.3 | 2.4 |
| 4.7 | 4.9 |
Investment Grade Fixed-Income Funds | | |
Fidelity Government Income Fund | 5.9 | 5.9 |
Fidelity Strategic Real Return Fund | 6.0 | 6.0 |
Fidelity Total Bond Fund | 17.8 | 17.7 |
| 29.7 | 29.6 |
Short-Term Funds | | |
Fidelity Institutional Money Market Portfolio Institutional Class | 7.1 | 6.8 |
Fidelity Short-Term Bond Fund | 7.1 | 6.9 |
| 14.2 | 13.7 |
Net Other Assets (Liabilities)* | 0.0 | 0.0 |
| 100.0 | 100.0 |
* Amount represents less than 0.1%
Asset Allocation (% of fund's net assets) |
Current |
| Domestic Equity Funds | 44.2% | |
| International Equity Funds | 7.2% | |
| High Yield Fixed-Income Funds | 4.7% | |
| Investment Grade Fixed-Income Funds | 29.7% | |
| Short-Term Funds | 14.2% | |

Six months ago |
| Domestic Equity Funds | 44.3% | |
| International Equity Funds | 7.5% | |
| High Yield Fixed-Income Funds | 4.9% | |
| Investment Grade Fixed-Income Funds | 29.6% | |
| Short-Term Funds | 13.7% | |

Expected |
| Domestic Equity Funds | 43.9% | |
| International Equity Funds | 7.0% | |
| High Yield Fixed-Income Funds | 4.6% | |
| Investment Grade Fixed-Income Funds | 29.9% | |
| Short-Term Funds | 14.6% | |

The fund invests according to an asset allocation strategy that becomes increasingly conservative over time. The six months ago allocation is based on the fund's holdings as of July 31, 2010. The current allocation is based on the fund's holdings as of January 31, 2011. The expected allocation represents the fund's anticipated allocation at July 31, 2011. |
Semiannual Report
Fidelity Income Replacement 2028 Fund
Investments January 31, 2011 (Unaudited)
Showing Percentage of Net Assets
Equity Funds - 51.4% |
| Shares | | Value |
Domestic Equity Funds - 44.2% |
Fidelity Advisor Mid Cap II Fund Institutional Class | 18,753 | | $ 343,734 |
Fidelity Disciplined Equity Fund | 15,417 | | 357,975 |
Fidelity Equity-Income Fund | 7,856 | | 357,975 |
Fidelity Large Cap Core Enhanced Index Fund | 65,398 | | 572,890 |
Fidelity Series 100 Index Fund | 48,026 | | 429,830 |
Fidelity Series Broad Market Opportunities Fund | 55,729 | | 572,890 |
Fidelity Series Small Cap Opportunities Fund | 20,947 | | 229,156 |
TOTAL DOMESTIC EQUITY FUNDS | | 2,864,450 |
International Equity Funds - 7.2% |
Fidelity Advisor International Discovery Fund Institutional Class | 14,042 | | 464,786 |
TOTAL EQUITY FUNDS (Cost $3,141,194) | 3,329,236 |
Fixed-Income Funds - 34.4% |
| | | |
High Yield Fixed-Income Funds - 4.7% |
Fidelity Capital & Income Fund | 15,798 | | 152,771 |
Fidelity Strategic Income Fund | 13,665 | | 152,771 |
TOTAL HIGH YIELD FIXED-INCOME FUNDS | | 305,542 |
|
| Shares | | Value |
Investment Grade Fixed-Income Funds - 29.7% |
Fidelity Government Income Fund | 36,875 | | $ 383,869 |
Fidelity Strategic Real Return Fund | 39,574 | | 383,869 |
Fidelity Total Bond Fund | 107,105 | | 1,150,311 |
TOTAL INVESTMENT GRADE FIXED-INCOME FUNDS | | 1,918,049 |
TOTAL FIXED-INCOME FUNDS (Cost $2,132,032) | 2,223,591 |
Short-Term Funds - 14.2% |
| | | |
Fidelity Institutional Money Market Portfolio Institutional Class | 460,254 | | 460,254 |
Fidelity Short-Term Bond Fund | 54,275 | | 460,254 |
TOTAL SHORT-TERM FUNDS (Cost $914,301) | 920,508 |
TOTAL INVESTMENT PORTFOLIO - 100.0% (Cost $6,187,527) | | 6,473,335 |
NET OTHER ASSETS (LIABILITIES) - 0.0% | | (174) |
NET ASSETS - 100% | $ 6,473,161 |
Other Information |
All investments are categorized as Level 1 under the Fair Value Hierarchy. The inputs or methodology used for valuing securities may not be an indication of the risk associated with investing in those securities. For more information on valuation inputs, please refer to the Security Valuation section in the accompanying Notes to Financial Statements. |
Income Tax Information |
At July 31, 2010, the Fund had a capital loss carryforward of approximately $389,576 of which $7,815 and $381,761 will expire in fiscal 2017 and 2018, respectively. Capital loss carryforwards are only available to offset future capital gains of the Fund to the extent provided by regulations and may be limited. |
The Fund intends to elect to defer to its fiscal year ending July 31, 2011 approximately $153,499 of losses recognized during the period November 1, 2009 to July 31, 2010. |
See accompanying notes which are an integral part of the financial statements.
Semiannual Report
Fidelity Income Replacement 2028 Fund
Statement of Assets and Liabilities
| January 31, 2011 (Unaudited) |
| | |
Assets | | |
Investment in securities, at value (cost $6,187,527) - See accompanying schedule | | $ 6,473,335 |
Cash | | 1 |
Receivable for investments sold | | 31,697 |
Total assets | | 6,505,033 |
| | |
Liabilities | | |
Payable for investments purchased | $ 31,323 | |
Payable for fund shares redeemed | 370 | |
Distribution and service plan fees payable | 179 | |
Total liabilities | | 31,872 |
| | |
Net Assets | | $ 6,473,161 |
Net Assets consist of: | | |
Paid in capital | | $ 6,909,032 |
Undistributed net investment income | | 1,498 |
Accumulated undistributed net realized gain (loss) on investments | | (723,177) |
Net unrealized appreciation (depreciation) on investments | | 285,808 |
Net Assets | | $ 6,473,161 |
Calculation of Maximum Offering Price Class A:
Net Asset Value and redemption price per share ($386,401 ÷ 7,831.63 shares) | | $ 49.34 |
| | |
Maximum offering price per share (100/94.25 of $49.34) | | $ 52.35 |
Class T:
Net Asset Value and redemption price per share ($130,906 ÷ 2,651.76 shares) | | $ 49.37 |
| | |
Maximum offering price per share (100/96.50 of $49.37) | | $ 51.16 |
| | |
Class C:
Net Asset Value and offering price per share ($53,152 ÷ 1,076.78 shares) A | | $ 49.36 |
| | |
Income Replacement 2028:
Net Asset Value, offering price and redemption price per share ($5,871,315 ÷ 118,976.73 shares) | | $ 49.35 |
| | |
Institutional Class:
Net Asset Value, offering price and redemption price per share ($31,387 ÷ 636.03 shares) | | $ 49.35 |
A Redemption price per share is equal to net asset value less any applicable contingent deferred sales charge.
Statement of Operations
Six months ended January 31, 2011 (Unaudited) |
| | |
Investment Income | | |
Income distributions from underlying funds | | $ 74,688 |
| | |
Expenses | | |
Distribution and service plan fees | $ 1,092 | |
Independent trustees' compensation | 12 | |
Total expenses before reductions | 1,104 | |
Expense reductions | (12) | 1,092 |
Net investment income (loss) | | 73,596 |
Realized and Unrealized Gain (Loss) Realized gain (loss) on sale of underlying fund shares | (46,701) | |
Capital gain distributions from underlying funds | 33,605 | |
Total net realized gain (loss) | | (13,096) |
Change in net unrealized appreciation (depreciation) on underlying funds | | 575,123 |
Net gain (loss) | | 562,027 |
Net increase (decrease) in net assets resulting from operations | | $ 635,623 |
See accompanying notes which are an integral part of the financial statements.
Semiannual Report
Statement of Changes in Net Assets
| Six months ended
January 31, 2011
(Unaudited) | Year ended
July 31,
2010 |
Increase (Decrease) in Net Assets | | |
Operations | | |
Net investment income (loss) | $ 73,596 | $ 130,949 |
Net realized gain (loss) | (13,096) | (193,465) |
Change in net unrealized appreciation (depreciation) | 575,123 | 828,403 |
Net increase (decrease) in net assets resulting from operations | 635,623 | 765,887 |
Distributions to shareholders from net investment income | (73,937) | (131,065) |
Distributions to shareholders from net realized gain | (25,763) | (16,965) |
Total distributions | (99,700) | (148,030) |
Share transactions - net increase (decrease) | (218,783) | (832,893) |
Total increase (decrease) in net assets | 317,140 | (215,036) |
| | |
Net Assets | | |
Beginning of period | 6,156,021 | 6,371,057 |
End of period (including undistributed net investment income of $1,498 and undistributed net investment income of $1,839, respectively) | $ 6,473,161 | $ 6,156,021 |
Financial Highlights - Class A
| Six months ended
January 31, 2011 | Years ended July 31, |
| (Unaudited) | 2010 | 2009 | 2008 G |
Selected Per-Share Data | | | | |
Net asset value, beginning of period | $ 45.17 | $ 41.16 | $ 46.81 | $ 50.00 |
Income from Investment Operations | | | | |
Net investment income (loss) E | .521 | .789 | 1.000 | .966 |
Net realized and unrealized gain (loss) | 4.395 | 4.116 | (5.341) | (3.085) |
Total from investment operations | 4.916 | 4.905 | (4.341) | (2.119) |
Distributions from net investment income | (.537) | (.785) | (.979) | (.911) |
Distributions from net realized gain | (.209) | (.110) | (.330) | (.160) |
Total distributions | (.746) | (.895) | (1.309) | (1.071) |
Net asset value, end of period | $ 49.34 | $ 45.17 | $ 41.16 | $ 46.81 |
Total Return B, C, D | 10.93% | 11.96% | (8.93)% | (4.36)% |
Ratios to Average Net Assets F, H | | | | |
Expenses before reductions | .25% A | .25% | .25% | .25% A |
Expenses net of fee waivers, if any | .25% A | .25% | .25% | .25% A |
Expenses net of all reductions | .25% A | .25% | .25% | .25% A |
Net investment income (loss) | 2.20% A | 1.78% | 2.60% | 2.16% A |
Supplemental Data | | | | |
Net assets, end of period (000 omitted) | $ 386 | $ 359 | $ 278 | $ 371 |
Portfolio turnover rate | 32% A | 16% | 53% | 33% A |
A Annualized
B Total returns for periods of less than one year are not annualized.
C Total returns would have been lower had certain expenses not been reduced during the periods shown.
D Total returns do not include the effect of the sales charges.
E Calculated based on average shares outstanding during the period.
F Amounts do not include the activity of the underlying funds.
G For the period August 30, 2007 (commencement of operations) to July 31, 2008.
H Expense ratios reflect operating expenses of the class. Expenses before reductions do not reflect amounts reimbursed by the investment adviser or reductions from expense offset arrangements and do not represent the amount paid by the class during periods when reimbursements or reductions occur. Expenses net of fee waivers reflect expenses after reimbursement by the investment adviser but prior to reductions from expense offset arrangements. Expenses net of all reductions represent the net expenses paid by the class but do not include expenses of the investment companies in which the Fund invests.
See accompanying notes which are an integral part of the financial statements.
Semiannual Report
Financial Highlights - Class T
| Six months ended
January 31, 2011 | Years ended July 31, |
| (Unaudited) | 2010 | 2009 | 2008 G |
Selected Per-Share Data | | | | |
Net asset value, beginning of period | $ 45.16 | $ 41.16 | $ 46.80 | $ 50.00 |
Income from Investment Operations | | | | |
Net investment income (loss) E | .455 | .678 | .905 | .847 |
Net realized and unrealized gain (loss) | 4.415 | 4.107 | (5.340) | (3.079) |
Total from investment operations | 4.870 | 4.785 | (4.435) | (2.232) |
Distributions from net investment income | (.451) | (.675) | (.875) | (.808) |
Distributions from net realized gain | (.209) | (.110) | (.330) | (.160) |
Total distributions | (.660) | (.785) | (1.205) | (.968) |
Net asset value, end of period | $ 49.37 | $ 45.16 | $ 41.16 | $ 46.80 |
Total Return B, C, D | 10.81% | 11.66% | (9.15)% | (4.57)% |
Ratios to Average Net Assets F, H | | | | |
Expenses before reductions | .50% A | .50% | .50% | .50% A |
Expenses net of fee waivers, if any | .50% A | .50% | .50% | .50% A |
Expenses net of all reductions | .50% A | .50% | .50% | .50% A |
Net investment income (loss) | 1.95% A | 1.53% | 2.35% | 1.91% A |
Supplemental Data | | | | |
Net assets, end of period (000 omitted) | $ 131 | $ 328 | $ 311 | $ 606 |
Portfolio turnover rate | 32% A | 16% | 53% | 33% A |
A Annualized
B Total returns for periods of less than one year are not annualized.
C Total returns would have been lower had certain expenses not been reduced during the periods shown.
D Total returns do not include the effect of the sales charges.
E Calculated based on average shares outstanding during the period.
F Amounts do not include the activity of the underlying funds.
G For the period August 30, 2007 (commencement of operations) to July 31, 2008.
H Expense ratios reflect operating expenses of the class. Expenses before reductions do not reflect amounts reimbursed by the investment adviser or reductions from expense offset arrangements and do not represent the amount paid by the class during periods when reimbursements or reductions occur. Expenses net of fee waivers reflect expenses after reimbursement by the investment adviser but prior to reductions from expense offset arrangements. Expenses net of all reductions represent the net expenses paid by the class but do not include expenses of the investment companies in which the Fund invests.
Financial Highlights - Class C
| Six months ended
January 31, 2011 | Years ended July 31, |
| (Unaudited) | 2010 | 2009 | 2008 G |
Selected Per-Share Data | | | | |
Net asset value, beginning of period | $ 45.19 | $ 41.16 | $ 46.79 | $ 50.00 |
Income from Investment Operations | | | | |
Net investment income (loss) E | .344 | .454 | .711 | .639 |
Net realized and unrealized gain (loss) | 4.392 | 4.117 | (5.333) | (3.104) |
Total from investment operations | 4.736 | 4.571 | (4.622) | (2.465) |
Distributions from net investment income | (.357) | (.431) | (.678) | (.585) |
Distributions from net realized gain | (.209) | (.110) | (.330) | (.160) |
Total distributions | (.566) | (.541) | (1.008) | (.745) |
Net asset value, end of period | $ 49.36 | $ 45.19 | $ 41.16 | $ 46.79 |
Total Return B, C, D | 10.50% | 11.13% | (9.60)% | (5.02)% |
Ratios to Average Net Assets F, H | | | | |
Expenses before reductions | 1.00% A | 1.00% | 1.00% | 1.00% A |
Expenses net of fee waivers, if any | 1.00% A | 1.00% | 1.00% | 1.00% A |
Expenses net of all reductions | 1.00% A | 1.00% | 1.00% | 1.00% A |
Net investment income (loss) | 1.45% A | 1.02% | 1.84% | 1.41% A |
Supplemental Data | | | | |
Net assets, end of period (000 omitted) | $ 53 | $ 51 | $ 86 | $ 150 |
Portfolio turnover rate | 32% A | 16% | 53% | 33% A |
A Annualized
B Total returns for periods of less than one year are not annualized.
C Total returns would have been lower had certain expenses not been reduced during the periods shown.
D Total returns do not include the effect of the contingent deferred sales charge.
E Calculated based on average shares outstanding during the period.
F Amounts do not include the activity of the underlying funds.
G For the period August 30, 2007 (commencement of operations) to July 31, 2008.
H Expense ratios reflect operating expenses of the class. Expenses before reductions do not reflect amounts reimbursed by the investment adviser or reductions from expense offset arrangements and do not represent the amount paid by the class during periods when reimbursements or reductions occur. Expenses net of fee waivers reflect expenses after reimbursement by the investment adviser but prior to reductions from expense offset arrangements. Expenses net of all reductions represent the net expenses paid by the class but do not include expenses of the investment companies in which the Fund invests.
See accompanying notes which are an integral part of the financial statements.
Semiannual Report
Financial Highlights - Income Replacement 2028
| Six months ended
January 31, 2011 | Years ended July 31, |
| (Unaudited) | 2010 | 2009 | 2008 F |
Selected Per-Share Data | | | | |
Net asset value, beginning of period | $ 45.18 | $ 41.17 | $ 46.82 | $ 50.00 |
Income from Investment Operations | | | | |
Net investment income (loss) D | .580 | .900 | 1.087 | 1.067 |
Net realized and unrealized gain (loss) | 4.395 | 4.115 | (5.330) | (3.072) |
Total from investment operations | 4.975 | 5.015 | (4.243) | (2.005) |
Distributions from net investment income | (.596) | (.895) | (1.077) | (1.015) |
Distributions from net realized gain | (.209) | (.110) | (.330) | (.160) |
Total distributions | (.805) | (1.005) | (1.407) | (1.175) |
Net asset value, end of period | $ 49.35 | $ 45.18 | $ 41.17 | $ 46.82 |
Total Return B, C | 11.06% | 12.24% | (8.69)% | (4.14)% |
Ratios to Average Net Assets E, G | | | | |
Expenses before reductions H | .00% A | .00% | .00% | .00% A |
Expenses net of fee waivers, if any | .00% A | .00% | .00% | .00% A |
Expenses net of all reductions | .00% A | .00% | .00% | .00% A |
Net investment income (loss) | 2.45% A | 2.03% | 2.85% | 2.40% A |
Supplemental Data | | | | |
Net assets, end of period (000 omitted) | $ 5,871 | $ 5,383 | $ 5,641 | $ 6,068 |
Portfolio turnover rate | 32% A | 16% | 53% | 33% A |
A Annualized
B Total returns for periods of less than one year are not annualized.
C Total returns would have been lower had certain expenses not been reduced during the periods shown.
D Calculated based on average shares outstanding during the period.
E Amounts do not include the activity of the underlying funds.
F For the period August 30, 2007 (commencement of operations) to July 31, 2008.
G Expense ratios reflect operating expenses of the class. Expenses before reductions do not reflect amounts reimbursed by the investment adviser or reductions from expense offset arrangements and do not represent the amount paid by the class during periods when reimbursements or reductions occur. Expenses net of fee waivers reflect expenses after reimbursement by the investment adviser but prior to reductions from expense offset arrangements. Expenses net of all reductions represent the net expenses paid by the class but do not include expenses of the investment companies in which the Fund invests.
H Amount represents less than $.01 per share.
Financial Highlights - Institutional Class
| Six months ended
January 31, 2011 | Years ended July 31, |
| (Unaudited) | 2010 | 2009 | 2008 F |
Selected Per-Share Data | | | | |
Net asset value, beginning of period | $ 45.18 | $ 41.17 | $ 46.82 | $ 50.00 |
Income from Investment Operations | | | | |
Net investment income (loss) D | .580 | .899 | 1.097 | 1.101 |
Net realized and unrealized gain (loss) | 4.395 | 4.116 | (5.340) | (3.106) |
Total from investment operations | 4.975 | 5.015 | (4.243) | (2.005) |
Distributions from net investment income | (.596) | (.895) | (1.077) | (1.015) |
Distributions from net realized gain | (.209) | (.110) | (.330) | (.160) |
Total distributions | (.805) | (1.005) | (1.407) | (1.175) |
Net asset value, end of period | $ 49.35 | $ 45.18 | $ 41.17 | $ 46.82 |
Total Return B, C | 11.06% | 12.24% | (8.69)% | (4.14)% |
Ratios to Average Net Assets E, G | | | | |
Expenses before reductions H | .00% A | .00% | .00% | .00% A |
Expenses net of fee waivers, if any | .00% A | .00% | .00% | .00% A |
Expenses net of all reductions | .00% A | .00% | .00% | .00% A |
Net investment income (loss) | 2.45% A | 2.03% | 2.85% | 2.40% A |
Supplemental Data | | | | |
Net assets, end of period (000 omitted) | $ 31 | $ 36 | $ 56 | $ 96 |
Portfolio turnover rate | 32% A | 16% | 53% | 33% A |
A Annualized
B Total returns for periods of less than one year are not annualized.
C Total returns would have been lower had certain expenses not been reduced during the periods shown.
D Calculated based on average shares outstanding during the period.
E Amounts do not include the activity of the underlying funds.
F For the period August 30, 2007 (commencement of operations) to July 31, 2008.
G Expense ratios reflect operating expenses of the class. Expenses before reductions do not reflect amounts reimbursed by the investment adviser or reductions from expense offset arrangements and do not represent the amount paid by the class during periods when reimbursements or reductions occur. Expenses net of fee waivers reflect expenses after reimbursement by the investment adviser but prior to reductions from expense offset arrangements. Expenses net of all reductions represent the net expenses paid by the class but do not include expenses of the investment companies in which the Fund invests.
H Amount represents less than $.01 per share.
See accompanying notes which are an integral part of the financial statements.
Semiannual Report
Fidelity Income Replacement 2030 Fund
Investment Changes (Unaudited)
Fund Holdings as of January 31, 2011 |
| % of fund's
net assets | % of fund's net assets
6 months ago |
Domestic Equity Funds | | |
Fidelity Advisor Mid Cap II Fund Institutional Class | 5.4 | 5.4 |
Fidelity Disciplined Equity Fund | 5.7 | 5.6 |
Fidelity Equity-Income Fund | 5.7 | 5.7 |
Fidelity Large Cap Core Enhanced Index Fund | 9.0 | 9.0 |
Fidelity Series 100 Index Fund | 6.8 | 6.8 |
Fidelity Series Broad Market Opportunities Fund | 9.0 | 9.0 |
Fidelity Series Small Cap Opportunities Fund | 3.6 | 3.7 |
| 45.2 | 45.2 |
International Equity Funds | | |
Fidelity Advisor International Discovery Fund Institutional Class | 8.0 | 8.2 |
High Yield Fixed-Income Funds | | |
Fidelity Capital & Income Fund | 2.5 | 2.5 |
Fidelity Strategic Income Fund | 2.5 | 2.6 |
| 5.0 | 5.1 |
Investment Grade Fixed-Income Funds | | |
Fidelity Government Income Fund | 5.7 | 5.7 |
Fidelity Strategic Real Return Fund | 5.7 | 5.7 |
Fidelity Total Bond Fund | 17.1 | 17.1 |
| 28.5 | 28.5 |
Short-Term Funds | | |
Fidelity Institutional Money Market Portfolio Institutional Class | 6.6 | 6.5 |
Fidelity Short-Term Bond Fund | 6.7 | 6.5 |
| 13.3 | 13.0 |
Net Other Assets (Liabilities)* | 0.0 | 0.0 |
| 100.0 | 100.0 |
* Amount represents less than 0.1%
Asset Allocation (% of fund's net assets) |
Current |
| Domestic Equity Funds | 45.2% | |
| International Equity Funds | 8.0% | |
| High Yield Fixed-Income Funds | 5.0% | |
| Investment Grade Fixed-Income Funds | 28.5% | |
| Short-Term Funds | 13.3% | |

Six months ago |
| Domestic Equity Funds | 45.2% | |
| International Equity Funds | 8.2% | |
| High Yield Fixed-Income Funds | 5.1% | |
| Investment Grade Fixed-Income Funds | 28.5% | |
| Short-Term Funds | 13.0% | |

Expected |
| Domestic Equity Funds | 45.0% | |
| International Equity Funds | 7.7% | |
| High Yield Fixed-Income Funds | 4.9% | |
| Investment Grade Fixed-Income Funds | 29.0% | |
| Short-Term Funds | 13.4% | |

The fund invests according to an asset allocation strategy that becomes increasingly conservative over time. The six months ago allocation is based on the fund's holdings as of July 31, 2010. The current allocation is based on the fund's holdings as of January 31, 2011. The expected allocation represents the fund's anticipated allocation at July 31, 2011. |
Semiannual Report
Fidelity Income Replacement 2030 Fund
Investments January 31, 2011 (Unaudited)
Showing Percentage of Net Assets
Equity Funds - 53.2% |
| Shares | | Value |
Domestic Equity Funds - 45.2% |
Fidelity Advisor Mid Cap II Fund Institutional Class | 8,898 | | $ 163,100 |
Fidelity Disciplined Equity Fund | 7,322 | | 170,021 |
Fidelity Equity-Income Fund | 3,731 | | 170,021 |
Fidelity Large Cap Core Enhanced Index Fund | 31,054 | | 272,034 |
Fidelity Series 100 Index Fund | 22,796 | | 204,026 |
Fidelity Series Broad Market Opportunities Fund | 26,462 | | 272,034 |
Fidelity Series Small Cap Opportunities Fund | 9,957 | | 108,934 |
TOTAL DOMESTIC EQUITY FUNDS | | 1,360,170 |
International Equity Funds - 8.0% |
Fidelity Advisor International Discovery Fund Institutional Class | 7,228 | | 239,234 |
TOTAL EQUITY FUNDS (Cost $1,442,797) | 1,599,404 |
Fixed-Income Funds - 33.5% |
| | | |
High Yield Fixed-Income Funds - 5.0% |
Fidelity Capital & Income Fund | 7,749 | | 74,930 |
Fidelity Strategic Income Fund | 6,702 | | 74,930 |
TOTAL HIGH YIELD FIXED-INCOME FUNDS | | 149,860 |
|
| Shares | | Value |
Investment Grade Fixed-Income Funds - 28.5% |
Fidelity Government Income Fund | 16,506 | | $ 171,827 |
Fidelity Strategic Real Return Fund | 17,714 | | 171,827 |
Fidelity Total Bond Fund | 47,996 | | 515,480 |
TOTAL INVESTMENT GRADE FIXED-INCOME FUNDS | | 859,134 |
TOTAL FIXED-INCOME FUNDS (Cost $991,531) | 1,008,994 |
Short-Term Funds - 13.3% |
| | | |
Fidelity Institutional Money Market Portfolio Institutional Class | 200,415 | | 200,415 |
Fidelity Short-Term Bond Fund | 23,634 | | 200,415 |
TOTAL SHORT-TERM FUNDS (Cost $399,222) | 400,830 |
TOTAL INVESTMENT PORTFOLIO - 100.0% (Cost $2,833,550) | | 3,009,228 |
NET OTHER ASSETS (LIABILITIES) - 0.0% | | (197) |
NET ASSETS - 100% | $ 3,009,031 |
Other Information |
All investments are categorized as Level 1 under the Fair Value Hierarchy. The inputs or methodology used for valuing securities may not be an indication of the risk associated with investing in those securities. For more information on valuation inputs, please refer to the Security Valuation section in the accompanying Notes to Financial Statements. |
Income Tax Information |
At July 31, 2010, the Fund had a capital loss carryforward of approximately $125,799 of which $39,903 and $85,896 will expire in fiscal 2017 and 2018, respectively. Capital loss carryforwards are only available to offset future capital gains of the Fund to the extent provided by regulations and may be limited. |
See accompanying notes which are an integral part of the financial statements.
Semiannual Report
Fidelity Income Replacement 2030 Fund
Statement of Assets and Liabilities
| January 31, 2011 (Unaudited) |
| | |
Assets | | |
Investment in securities, at value (cost $2,833,550) - See accompanying schedule | | $ 3,009,228 |
Receivable for investments sold | | 14,732 |
Total assets | | 3,023,960 |
| | |
Liabilities | | |
Payable for investments purchased | $ 14,735 | |
Distribution and service plan fees payable | 194 | |
Total liabilities | | 14,929 |
| | |
Net Assets | | $ 3,009,031 |
Net Assets consist of: | | |
Paid in capital | | $ 3,003,339 |
Undistributed net investment income | | 699 |
Accumulated undistributed net realized gain (loss) on investments | | (170,685) |
Net unrealized appreciation (depreciation) on investments | | 175,678 |
Net Assets | | $ 3,009,031 |
Calculation of Maximum Offering Price Class A:
Net Asset Value and redemption price per share ($56,048 ÷ 1,142.0 shares) | | $ 49.08 |
| | |
Maximum offering price per share (100/94.25 of $49.08) | | $ 52.07 |
Class T:
Net Asset Value and redemption price per share ($9,526 ÷ 194.0 shares) | | $ 49.10 |
| | |
Maximum offering price per share (100/96.50 of $49.10) | | $ 50.88 |
| | |
Class C:
Net Asset Value and offering price per share ($214,004 ÷ 4,363.3 shares) A | | $ 49.05 |
| | |
Income Replacement 2030:
Net Asset Value, offering price and redemption price per share ($2,698,105 ÷ 54,986.9 shares) | | $ 49.07 |
| | |
Institutional Class:
Net Asset Value, offering price and redemption price per share ($31,348 ÷ 638.9 shares) | | $ 49.07 |
A Redemption price per share is equal to net asset value less any applicable contingent deferred sales charge.
Statement of Operations
Six months ended January 31, 2011 (Unaudited) |
| | |
Investment Income | | |
Income distributions from underlying funds | | $ 32,637 |
| | |
Expenses | | |
Distribution and service plan fees | $ 1,148 | |
Independent trustees' compensation | 4 | |
Total expenses before reductions | 1,152 | |
Expense reductions | (4) | 1,148 |
Net investment income (loss) | | 31,489 |
Realized and Unrealized Gain (Loss) Realized gain (loss) on sale of underlying fund shares | (21,542) | |
Capital gain distributions from underlying funds | 14,193 | |
Total net realized gain (loss) | | (7,349) |
Change in net unrealized appreciation (depreciation) on underlying funds | | 231,747 |
Net gain (loss) | | 224,398 |
Net increase (decrease) in net assets resulting from operations | | $ 255,887 |
See accompanying notes which are an integral part of the financial statements.
Semiannual Report
Statement of Changes in Net Assets
| Six months ended
January 31, 2011
(Unaudited) | Year ended
July 31,
2010 |
Increase (Decrease) in Net Assets | | |
Operations | | |
Net investment income (loss) | $ 31,489 | $ 14,472 |
Net realized gain (loss) | (7,349) | 212 |
Change in net unrealized appreciation (depreciation) | 231,747 | 65,683 |
Net increase (decrease) in net assets resulting from operations | 255,887 | 80,367 |
Distributions to shareholders from net investment income | (31,229) | (14,213) |
Distributions to shareholders from net realized gain | (10,723) | (1,857) |
Total distributions | (41,952) | (16,070) |
Share transactions - net increase (decrease) | 834,197 | 1,233,775 |
Total increase (decrease) in net assets | 1,048,132 | 1,298,072 |
| | |
Net Assets | | |
Beginning of period | 1,960,899 | 662,827 |
End of period (including undistributed net investment income of $699 and undistributed net investment income of $439, respectively) | $ 3,009,031 | $ 1,960,899 |
Financial Highlights - Class A
| Six months ended
January 31, 2011 | Years ended July 31, |
| (Unaudited) | 2010 | 2009 | 2008 G |
Selected Per-Share Data | | | | |
Net asset value, beginning of period | $ 44.77 | $ 40.69 | $ 46.61 | $ 50.00 |
Income from Investment Operations | | | | |
Net investment income (loss) E | .565 | .718 | .978 | 1.034 |
Net realized and unrealized gain (loss) | 4.452 | 4.180 | (5.404) | (3.239) |
Total from investment operations | 5.017 | 4.898 | (4.426) | (2.205) |
Distributions from net investment income | (.531) | (.713) | (1.004) | (.995) |
Distributions from net realized gain | (.176) | (.105) | (.490) | (.190) |
Total distributions | (.707) | (.818) | (1.494) | (1.185) |
Net asset value, end of period | $ 49.08 | $ 44.77 | $ 40.69 | $ 46.61 |
Total Return B, C, D | 11.25% | 12.08% | (9.22)% | (4.55)% |
Ratios to Average Net Assets F, H | | | | |
Expenses before reductions | .25% A | .25% | .25% | .25% A |
Expenses net of fee waivers, if any | .25% A | .25% | .25% | .25% A |
Expenses net of all reductions | .25% A | .25% | .25% | .25% A |
Net investment income (loss) | 2.41% A | 1.63% | 2.57% | 2.26% A |
Supplemental Data | | | | |
Net assets, end of period (000 omitted) | $ 56 | $ 66 | $ 55 | $ 95 |
Portfolio turnover rate | 43% A | 31% | 53% | 12% A |
A Annualized
B Total returns for periods of less than one year are not annualized.
C Total returns would have been lower had certain expenses not been reduced during the periods shown.
D Total returns do not include the effect of the sales charges.
E Calculated based on average shares outstanding during the period.
F Amounts do not include the activity of the underlying funds.
G For the period August 30, 2007 (commencement of operations) to July 31, 2008.
H Expense ratios reflect operating expenses of the class. Expenses before reductions do not reflect amounts reimbursed by the investment adviser or reductions from expense offset arrangements and do not represent the amount paid by the class during periods when reimbursements or reductions occur. Expenses net of fee waivers reflect expenses after reimbursement by the investment adviser but prior to reductions from expense offset arrangements. Expenses net of all reductions represent the net expenses paid by the class but do not include expenses of the investment companies in which the Fund invests.
See accompanying notes which are an integral part of the financial statements.
Semiannual Report
Financial Highlights - Class T
| Six months ended
January 31, 2011 | Years ended July 31, |
| (Unaudited) | 2010 | 2009 | 2008 G |
Selected Per-Share Data | | | | |
Net asset value, beginning of period | $ 44.78 | $ 40.69 | $ 46.61 | $ 50.00 |
Income from Investment Operations | | | | |
Net investment income (loss) E | .504 | .603 | .881 | .920 |
Net realized and unrealized gain (loss) | 4.449 | 4.182 | (5.402) | (3.234) |
Total from investment operations | 4.953 | 4.785 | (4.521) | (2.314) |
Distributions from net investment income | (.457) | (.590) | (.909) | (.886) |
Distributions from net realized gain | (.176) | (.105) | (.490) | (.190) |
Total distributions | (.633) | (.695) | (1.399) | (1.076) |
Net asset value, end of period | $ 49.10 | $ 44.78 | $ 40.69 | $ 46.61 |
Total Return B, C, D | 11.09% | 11.79% | (9.45)% | (4.76)% |
Ratios to Average Net Assets F, H | | | | |
Expenses before reductions | .50% A | .50% | .50% | .50% A |
Expenses net of fee waivers, if any | .50% A | .50% | .50% | .50% A |
Expenses net of all reductions | .50% A | .50% | .50% | .50% A |
Net investment income (loss) | 2.16% A | 1.37% | 2.32% | 2.01% A |
Supplemental Data | | | | |
Net assets, end of period (000 omitted) | $ 10 | $ 45 | $ 71 | $ 95 |
Portfolio turnover rate | 43% A | 31% | 53% | 12% A |
A Annualized
B Total returns for periods of less than one year are not annualized.
C Total returns would have been lower had certain expenses not been reduced during the periods shown.
D Total returns do not include the effect of the sales charges.
E Calculated based on average shares outstanding during the period.
F Amounts do not include the activity of the underlying funds.
G For the period August 30, 2007 (commencement of operations) to July 31, 2008.
H Expense ratios reflect operating expenses of the class. Expenses before reductions do not reflect amounts reimbursed by the investment adviser or reductions from expense offset arrangements and do not represent the amount paid by the class during periods when reimbursements or reductions occur. Expenses net of fee waivers reflect expenses after reimbursement by the investment adviser but prior to reductions from expense offset arrangements. Expenses net of all reductions represent the net expenses paid by the class but do not include expenses of the investment companies in which the Fund invests.
Financial Highlights - Class C
| Six months ended
January 31, 2011 | Years ended July 31, |
| (Unaudited) | 2010 | 2009 | 2008 G |
Selected Per-Share Data | | | | |
Net asset value, beginning of period | $ 44.75 | $ 40.67 | $ 46.58 | $ 50.00 |
Income from Investment Operations | | | | |
Net investment income (loss) E | .390 | .385 | .693 | .682 |
Net realized and unrealized gain (loss) | 4.446 | 4.185 | (5.400) | (3.227) |
Total from investment operations | 4.836 | 4.570 | (4.707) | (2.545) |
Distributions from net investment income | (.360) | (.385) | (.713) | (.685) |
Distributions from net realized gain | (.176) | (.105) | (.490) | (.190) |
Total distributions | (.536) | (.490) | (1.203) | (.875) |
Net asset value, end of period | $ 49.05 | $ 44.75 | $ 40.67 | $ 46.58 |
Total Return B, C, D | 10.83% | 11.26% | (9.91)% | (5.21)% |
Ratios to Average Net Assets F, H | | | | |
Expenses before reductions | 1.00% A | 1.00% | 1.00% | 1.00% A |
Expenses net of fee waivers, if any | 1.00% A | 1.00% | 1.00% | 1.00% A |
Expenses net of all reductions | 1.00% A | 1.00% | 1.00% | 1.00% A |
Net investment income (loss) | 1.66% A | .88% | 1.82% | 1.51% A |
Supplemental Data | | | | |
Net assets, end of period (000 omitted) | $ 214 | $ 186 | $ 178 | $ 297 |
Portfolio turnover rate | 43% A | 31% | 53% | 12% A |
A Annualized
B Total returns for periods of less than one year are not annualized.
C Total returns would have been lower had certain expenses not been reduced during the periods shown.
D Total returns do not include the effect of the contingent deferred sales charge.
E Calculated based on average shares outstanding during the period.
F Amounts do not include the activity of the underlying funds.
G For the period August 30, 2007 (commencement of operations) to July 31, 2008.
H Expense ratios reflect operating expenses of the class. Expenses before reductions do not reflect amounts reimbursed by the investment adviser or reductions from expense offset arrangements and do not represent the amount paid by the class during periods when reimbursements or reductions occur. Expenses net of fee waivers reflect expenses after reimbursement by the investment adviser but prior to reductions from expense offset arrangements. Expenses net of all reductions represent the net expenses paid by the class but do not include expenses of the investment companies in which the Fund invests.
See accompanying notes which are an integral part of the financial statements.
Semiannual Report
Financial Highlights - Income Replacement 2030
| Six months ended
January 31, 2011 | Years ended July 31, |
| (Unaudited) | 2010 | 2009 | 2008 F |
Selected Per-Share Data | | | | |
Net asset value, beginning of period | $ 44.76 | $ 40.69 | $ 46.61 | $ 50.00 |
Income from Investment Operations | | | | |
Net investment income (loss) D | .626 | .821 | 1.101 | 1.117 |
Net realized and unrealized gain (loss) | 4.451 | 4.178 | (5.429) | (3.209) |
Total from investment operations | 5.077 | 4.999 | (4.328) | (2.092) |
Distributions from net investment income | (.591) | (.824) | (1.102) | (1.108) |
Distributions from net realized gain | (.176) | (.105) | (.490) | (.190) |
Total distributions | (.767) | (.929) | (1.592) | (1.298) |
Net asset value, end of period | $ 49.07 | $ 44.76 | $ 40.69 | $ 46.61 |
Total Return B, C | 11.39% | 12.34% | (8.99)% | (4.33)% |
Ratios to Average Net Assets E, G | | | | |
Expenses before reductions H | .00% A | .00% | .00% | .00% A |
Expenses net of fee waivers, if any | .00% A | .00% | .00% | .00% A |
Expenses net all reductions | .00% A | .00% | .00% | .00% A |
Net investment income (loss) | 2.66% A | 1.88% | 2.82% | 2.51% A |
Supplemental Data | | | | |
Net assets, end of period (000 omitted) | $ 2,698 | $ 1,628 | $ 303 | $ 653 |
Portfolio turnover rate | 43% A | 31% | 53% | 12% A |
A Annualized
B Total returns for periods of less than one year are not annualized.
C Total returns would have been lower had certain expenses not been reduced during the periods shown.
D Calculated based on average shares outstanding during the period.
E Amounts do not include the activity of the underlying funds.
F For the period August 30, 2007 (commencement of operations) to July 31, 2008.
G Expense ratios reflect operating expenses of the class. Expenses before reductions do not reflect amounts reimbursed by the investment adviser or reductions from expense offset arrangements and do not represent the amount paid by the class during periods when reimbursements or reductions occur. Expenses net of fee waivers reflect expenses after reimbursement by the investment adviser but prior to reductions from expense offset arrangements. Expenses net of all reductions represent the net expenses paid by the class but do not include expenses of the investment companies in which the Fund invests.
H Amount represents less than $.01 per share.
Financial Highlights - Institutional Class
| Six months ended
January 31, 2011 | Years ended July 31, |
| (Unaudited) | 2010 | 2009 | 2008 F |
Selected Per-Share Data | | | | |
Net asset value, beginning of period | $ 44.77 | $ 40.69 | $ 46.61 | $ 50.00 |
Income from Investment Operations | | | | |
Net investment income (loss) D | .625 | .825 | 1.074 | 1.149 |
Net realized and unrealized gain (loss) | 4.442 | 4.184 | (5.402) | (3.241) |
Total from investment operations | 5.067 | 5.009 | (4.328) | (2.092) |
Distributions from net investment income | (.591) | (.824) | (1.102) | (1.108) |
Distributions from net realized gain | (.176) | (.105) | (.490) | (.190) |
Total distributions | (.767) | (.929) | (1.592) | (1.298) |
Net asset value, end of period | $ 49.07 | $ 44.77 | $ 40.69 | $ 46.61 |
Total Return B, C | 11.37% | 12.36% | (8.99)% | (4.33)% |
Ratios to Average Net Assets E, G | | | | |
Expenses before reductions H | .00% A | .00% | .00% | .00% A |
Expenses net of fee waivers, if any | .00% A | .00% | .00% | .00% A |
Expenses net of all reductions | .00% A | .00% | .00% | .00% A |
Net investment income (loss) | 2.66% A | 1.88% | 2.82% | 2.51% A |
Supplemental Data | | | | |
Net assets, end of period (000 omitted) | $ 31 | $ 36 | $ 55 | $ 96 |
Portfolio turnover rate | 43% A | 31% | 53% | 12% A |
A Annualized
B Total returns for periods of less than one year are not annualized.
C Total returns would have been lower had certain expenses not been reduced during the periods shown.
D Calculated based on average shares outstanding during the period.
E Amounts do not include the activity of the underlying funds.
F For the period August 30, 2007 (commencement of operations) to July 31, 2008.
G Expense ratios reflect operating expenses of the class. Expenses before reductions do not reflect amounts reimbursed by the investment adviser or reductions from expense offset arrangements and do not represent the amount paid by the class during periods when reimbursements or reductions occur. Expenses net of fee waivers reflect expenses after reimbursement by the investment adviser but prior to reductions from expense offset arrangements. Expenses net of all reductions represent the net expenses paid by the class but do not include expenses of the investment companies in which the Fund invests.
H Amount represents less than $.01 per share.
See accompanying notes which are an integral part of the financial statements.
Semiannual Report
Fidelity Income Replacement 2032 Fund
Investment Changes (Unaudited)
Fund Holdings as of January 31, 2011 |
| % of fund's
net assets | % of fund's net assets
6 months ago |
Domestic Equity Funds | | |
Fidelity Advisor Mid Cap II Fund Institutional Class | 5.5 | 5.5 |
Fidelity Disciplined Equity Fund | 5.8 | 5.7 |
Fidelity Equity-Income Fund | 5.7 | 5.8 |
Fidelity Large Cap Core Enhanced Index Fund | 9.2 | 9.2 |
Fidelity Series 100 Index Fund | 6.9 | 6.9 |
Fidelity Series Broad Market Opportunities Fund | 9.2 | 9.2 |
Fidelity Series Small Cap Opportunities Fund | 3.7 | 3.7 |
| 46.0 | 46.0 |
International Equity Funds | | |
Fidelity Advisor International Discovery Fund Institutional Class | 8.8 | 9.1 |
High Yield Fixed-Income Funds | | |
Fidelity Capital & Income Fund | 2.6 | 2.7 |
Fidelity Strategic Income Fund | 2.6 | 2.7 |
| 5.2 | 5.4 |
Investment Grade Fixed-Income Funds | | |
Fidelity Government Income Fund | 5.6 | 5.5 |
Fidelity Strategic Real Return Fund | 5.6 | 5.7 |
Fidelity Total Bond Fund | 16.7 | 16.7 |
| 27.9 | 27.9 |
Short-Term Funds | | |
Fidelity Institutional Money Market Portfolio Institutional Class | 6.1 | 5.8 |
Fidelity Short-Term Bond Fund | 6.0 | 5.8 |
| 12.1 | 11.6 |
Net Other Assets (Liabilities)* | 0.0 | 0.0 |
| 100.0 | 100.0 |
* Amount represents less than 0.1%
Asset Allocation (% of fund's net assets) |
Current |
| Domestic Equity Funds | 46.0% | |
| International Equity Funds | 8.8% | |
| High Yield Fixed-Income Funds | 5.2% | |
| Investment Grade Fixed-Income Funds | 27.9% | |
| Short-Term Funds | 12.1% | |
Six months ago |
| Domestic Equity Funds | 46.0% | |
| International Equity Funds | 9.1% | |
| High Yield Fixed-Income Funds | 5.4% | |
| Investment Grade Fixed-Income Funds | 27.9% | |
| Short-Term Funds | 11.6% | |
Expected |
| Domestic Equity Funds | 45.8% | |
| International Equity Funds | 8.5% | |
| High Yield Fixed-Income Funds | 5.2% | |
| Investment Grade Fixed-Income Funds | 28.0% | |
| Short-Term Funds | 12.5% | |
The fund invests according to an asset allocation strategy that becomes increasingly conservative over time. The six months ago allocation is based on the fund's holdings as of July 31, 2010. The current allocation is based on the fund's holdings as of January 31, 2011. The expected allocation represents the fund's anticipated allocation at July 31, 2011. |
Semiannual Report
Fidelity Income Replacement 2032 Fund
Investments January 31, 2011 (Unaudited)
Showing Percentage of Net Assets
Equity Funds - 54.8% |
| Shares | | Value |
Domestic Equity Funds - 46.0% |
Fidelity Advisor Mid Cap II Fund Institutional Class | 6,574 | | $ 120,500 |
Fidelity Disciplined Equity Fund | 5,406 | | 125,521 |
Fidelity Equity-Income Fund | 2,754 | | 125,521 |
Fidelity Large Cap Core Enhanced Index Fund | 22,926 | | 200,834 |
Fidelity Series 100 Index Fund | 16,830 | | 150,625 |
Fidelity Series Broad Market Opportunities Fund | 19,536 | | 200,834 |
Fidelity Series Small Cap Opportunities Fund | 7,343 | | 80,333 |
TOTAL DOMESTIC EQUITY FUNDS | | 1,004,168 |
International Equity Funds - 8.8% |
Fidelity Advisor International Discovery Fund Institutional Class | 5,764 | | 190,792 |
TOTAL EQUITY FUNDS (Cost $917,411) | 1,194,960 |
Fixed-Income Funds - 33.1% |
| | | |
High Yield Fixed-Income Funds - 5.2% |
Fidelity Capital & Income Fund | 5,892 | | 56,976 |
Fidelity Strategic Income Fund | 5,096 | | 56,976 |
TOTAL HIGH YIELD FIXED-INCOME FUNDS | | 113,952 |
|
| Shares | | Value |
Investment Grade Fixed-Income Funds - 27.9% |
Fidelity Government Income Fund | 11,701 | | $ 121,810 |
Fidelity Strategic Real Return Fund | 12,558 | | 121,810 |
Fidelity Total Bond Fund | 34,025 | | 365,429 |
TOTAL INVESTMENT GRADE FIXED-INCOME FUNDS | | 609,049 |
TOTAL FIXED-INCOME FUNDS (Cost $681,040) | 723,001 |
Short-Term Funds - 12.1% |
| | | |
Fidelity Institutional Money Market Portfolio Institutional Class | 132,507 | | 132,507 |
Fidelity Short-Term Bond Fund | 15,626 | | 132,507 |
TOTAL SHORT-TERM FUNDS (Cost $262,171) | 265,014 |
TOTAL INVESTMENT PORTFOLIO - 100.0% (Cost $1,860,622) | | 2,182,975 |
NET OTHER ASSETS (LIABILITIES) - 0.0% | | (80) |
NET ASSETS - 100% | $ 2,182,895 |
Other Information |
All investments are categorized as Level 1 under the Fair Value Hierarchy. The inputs or methodology used for valuing securities may not be an indication of the risk associated with investing in those securities. For more information on valuation inputs, please refer to the Security Valuation section in the accompanying Notes to Financial Statements. |
Income Tax Information |
At July 31, 2010, the Fund had a capital loss carryforward of approximately $352,265 of which $9,927 and $342,338 will expire in fiscal 2017 and 2018, respectively. Capital loss carryforwards are only available to offset future capital gains of the Fund to the extent provided by regulations and may be limited. |
See accompanying notes which are an integral part of the financial statements.
Semiannual Report
Fidelity Income Replacement 2032 Fund
Statement of Assets and Liabilities
| January 31, 2011 (Unaudited) |
| | |
Assets | | |
Investment in securities, at value (cost $1,860,622) - See accompanying schedule | | $ 2,182,975 |
Receivable for investments sold | | 11,555 |
Total assets | | 2,194,530 |
| | |
Liabilities | | |
Payable for investments purchased | $ 11,551 | |
Distribution and service plan fees payable | 84 | |
Total liabilities | | 11,635 |
| | |
Net Assets | | $ 2,182,895 |
Net Assets consist of: | | |
Paid in capital | | $ 2,202,156 |
Undistributed net investment income | | 510 |
Accumulated undistributed net realized gain (loss) on investments | | (342,124) |
Net unrealized appreciation (depreciation) on investments | | 322,353 |
Net Assets | | $ 2,182,895 |
Calculation of Maximum Offering Price Class A:
Net Asset Value and redemption price per share ($254,753 ÷ 5,248.6 shares) | | $ 48.54 |
| | |
Maximum offering price per share (100/94.25 of $48.54) | | $ 51.50 |
Class T:
Net Asset Value and redemption price per share ($30,700 ÷ 632.2 shares) | | $ 48.56 |
| | |
Maximum offering price per share (100/96.50 of $48.56) | | $ 50.32 |
| | |
Class C:
Net Asset Value and offering price per share ($25,499 ÷ 524.8 shares)A | | $ 48.59 |
| | |
Income Replacement 2032:
Net Asset Value, offering price and redemption price per share ($1,850,519 ÷ 38,118.0 shares) | | $ 48.55 |
| | |
Institutional Class:
Net Asset Value, offering price and redemption price per share ($21,424 ÷ 441.3 shares) | | $ 48.55 |
A Redemption price per share is equal to net asset value less any applicable contingent deferred sales charge.
Statement of Operations
Six months ended January 31, 2011 (Unaudited) |
| | |
Investment Income | | |
Income distributions from underlying funds | | $ 26,059 |
| | |
Expenses | | |
Distribution and service plan fees | $ 487 | |
Independent trustees' compensation | 4 | |
Total expenses before reductions | 491 | |
Expense reductions | (4) | 487 |
Net investment income (loss) | | 25,572 |
Realized and Unrealized Gain (Loss) Realized gain (loss) on sale of underlying fund shares | 13,658 | |
Capital gain distributions from underlying funds | 11,198 | |
Total net realized gain (loss) | | 24,856 |
Change in net unrealized appreciation (depreciation) on underlying funds | | 175,892 |
Net gain (loss) | | 200,748 |
Net increase (decrease) in net assets resulting from operations | | $ 226,320 |
See accompanying notes which are an integral part of the financial statements.
Semiannual Report
Fidelity Income Replacement 2032 Fund
Financial Statements - continued
Statement of Changes in Net Assets
| Six months ended January 31, 2011 (Unaudited) | Year ended
July 31,
2010 |
Increase (Decrease) in Net Assets | | |
Operations | | |
Net investment income (loss) | $ 25,572 | $ 18,688 |
Net realized gain (loss) | 24,856 | (147,241) |
Change in net unrealized appreciation (depreciation) | 175,892 | 292,353 |
Net increase (decrease) in net assets resulting from operations | 226,320 | 163,800 |
Distributions to shareholders from net investment income | (25,555) | (18,690) |
Distributions to shareholders from net realized gain | (8,488) | (2,138) |
Total distributions | (34,043) | (20,828) |
Share transactions - net increase (decrease) | 273,436 | (49,316) |
Total increase (decrease) in net assets | 465,713 | 93,656 |
| | |
Net Assets | | |
Beginning of period | 1,717,182 | 1,623,526 |
End of period (including undistributed net investment income of $510 and undistributed net investment income of $493, respectively) | $ 2,182,895 | $ 1,717,182 |
Financial Highlights - Class A
| Six months ended January 31, 2011 | Years ended July 31, |
| (Unaudited) | 2010 | 2009 | 2008 G |
Selected Per-Share Data | | | | |
Net asset value, beginning of period | $ 44.19 | $ 40.21 | $ 46.52 | $ 50.00 |
Income from Investment Operations | | | | |
Net investment income (loss) E | .539 | .727 | .930 | 1.019 |
Net realized and unrealized gain (loss) | 4.525 | 4.154 | (5.570) | (3.322) |
Total from investment operations | 5.064 | 4.881 | (4.640) | (2.303) |
Distributions from net investment income | (.524) | (.796) | (.960) | (.987) |
Distributions from net realized gain | (.190) | (.105) | (.710) | (.190) |
Total distributions | (.714) | (.901) | (1.670) | (1.177) |
Net asset value, end of period | $ 48.54 | $ 44.19 | $ 40.21 | $ 46.52 |
Total Return B,C,D | 11.50% | 12.19% | (9.66)% | (4.75)% |
Ratios to Average Net Assets F,H | | | | |
Expenses before reductions | .25% A | .25% | .25% | .25% A |
Expenses net of fee waivers, if any | .25% A | .25% | .25% | .25% A |
Expenses net of all reductions | .25% A | .25% | .25% | .25% A |
Net investment income (loss) | 2.32% A | 1.67% | 2.43% | 2.27% A |
Supplemental Data | | | | |
Net assets, end of period (000 omitted) | $ 255 | $ 200 | $ 183 | $ 402 |
Portfolio turnover rate | 25% A | 95% | 82% | 23% A |
A Annualized
B Total returns for periods of less than one year are not annualized.
C Total returns would have been lower had certain expenses not been reduced during the periods shown.
D Total returns do not include the effect of the sales charges.
E Calculated based on average shares outstanding during the period.
F Amounts do not include the activity of the underlying funds.
G For the period August 30, 2007 (commencement of operations) to July 31, 2008.
H Expense ratios reflect operating expenses of the class. Expenses before reductions do not reflect amounts reimbursed by the investment adviser or reductions from expense offset arrangements and do not represent the amount paid by the class during periods when reimbursements or reductions occur. Expenses net of fee waivers reflect expenses after reimbursement by the investment adviser but prior to reductions from expense offset arrangements. Expenses net of all reductions represent the net expenses paid by the class but do not include expenses of the investment companies in which the Fund invests.
See accompanying notes which are an integral part of the financial statements.
Semiannual Report
Financial Highlights - Class T
| Six months ended January 31, 2011 | Years ended July 31, |
| (Unaudited) | 2010 | 2009 | 2008 G |
Selected Per-Share Data | | | | |
Net asset value, beginning of period | $ 44.20 | $ 40.22 | $ 46.52 | $ 50.00 |
Income from Investment Operations | | | | |
Net investment income (loss) E | .480 | .620 | .821 | .918 |
Net realized and unrealized gain (loss) | 4.533 | 4.147 | (5.548) | (3.339) |
Total from investment operations | 5.013 | 4.767 | (4.727) | (2.421) |
Distributions from net investment income | (.463) | (.682) | (.863) | (.869) |
Distributions from net realized gain | (.190) | (.105) | (.710) | (.190) |
Total distributions | (.653) | (.787) | (1.573) | (1.059) |
Net asset value, end of period | $ 48.56 | $ 44.20 | $ 40.22 | $ 46.52 |
Total Return B,C,D | 11.38% | 11.90% | (9.88)% | (4.98)% |
Ratios to Average Net Assets F,H | | | | |
Expenses before reductions | .50% A | .50% | .50% | .50% A |
Expenses net of fee waivers, if any | .50% A | .50% | .50% | .50% A |
Expenses net of all reductions | .50% A | .50% | .50% | .50% A |
Net investment income (loss) | 2.07% A | 1.43% | 2.18% | 2.02% A |
Supplemental Data | | | | |
Net assets, end of period (000 omitted) | $ 31 | $ 35 | $ 54 | $ 95 |
Portfolio turnover rate | 25% A | 95% | 82% | 23% A |
A Annualized
B Total returns for periods of less than one year are not annualized.
C Total returns would have been lower had certain expenses not been reduced during the periods shown.
D Total returns do not include the effect of the sales charges.
E Calculated based on average shares outstanding during the period.
F Amounts do not include the activity of the underlying funds.
G For the period August 30, 2007 (commencement of operations) to July 31, 2008.
H Expense ratios reflect operating expenses of the class. Expenses before reductions do not reflect amounts reimbursed by the investment adviser or reductions from expense offset arrangements and do not represent the amount paid by the class during periods when reimbursements or reductions occur. Expenses net of fee waivers reflect expenses after reimbursement by the investment adviser but prior to reductions from expense offset arrangements. Expenses net of all reductions represent the net expenses paid by the class but do not include expenses of the investment companies in which the Fund invests.
Financial Highlights - Class C
| Six months ended January 31, 2011 | Years ended July 31, |
| (Unaudited) | 2010 | 2009 | 2008 G |
Selected Per-Share Data | | | | |
Net asset value, beginning of period | $ 44.22 | $ 40.23 | $ 46.51 | $ 50.00 |
Income from Investment Operations | | | | |
Net investment income (loss) E | .365 | .403 | .624 | .690 |
Net realized and unrealized gain (loss) | 4.537 | 4.143 | (5.532) | (3.342) |
Total from investment operations | 4.902 | 4.546 | (4.908) | (2.652) |
Distributions from net investment income | (.342) | (.451) | (.662) | (.648) |
Distributions from net realized gain | (.190) | (.105) | (.710) | (.190) |
Total distributions | (.532) | (.556) | (1.372) | (.838) |
Net asset value, end of period | $ 48.59 | $ 44.22 | $ 40.23 | $ 46.51 |
Total Return B,C,D | 11.10% | 11.33% | (10.32)% | (5.42)% |
Ratios to Average Net Assets F,H | | | | |
Expenses before reductions | 1.00% A | 1.00% | 1.00% | 1.00% A |
Expenses net of fee waivers, if any | 1.00% A | 1.00% | 1.00% | 1.00% A |
Expenses net of all reductions | 1.00% A | 1.00% | 1.00% | 1.00% A |
Net investment income (loss) | 1.57% A | .93% | 1.68% | 1.52% A |
Supplemental Data | | | | |
Net assets, end of period (000 omitted) | $ 25 | $ 29 | $ 46 | $ 95 |
Portfolio turnover rate | 25% A | 95% | 82% | 23% A |
A Annualized
B Total returns for periods of less than one year are not annualized.
C Total returns would have been lower had certain expenses not been reduced during the periods shown.
D Total returns do not include the effect of the contingent deferred sales charge.
E Calculated based on average shares outstanding during the period.
F Amounts do not include the activity of the underlying funds.
G For the period August 30, 2007 (commencement of operations) to July 31, 2008.
H Expense ratios reflect operating expenses of the class. Expenses before reductions do not reflect amounts reimbursed by the investment adviser or reductions from expense offset arrangements and do not represent the amount paid by the class during periods when reimbursements or reductions occur. Expenses net of fee waivers reflect expenses after reimbursement by the investment adviser but prior to reductions from expense offset arrangements. Expenses net of all reductions represent the net expenses paid by the class but do not include expenses of the investment companies in which the Fund invests.
See accompanying notes which are an integral part of the financial statements.
Semiannual Report
Financial Highlights - Income Replacement 2032
| Six months ended January 31, 2011 | Years ended July 31, |
| (Unaudited) | 2010 | 2009 | 2008 F |
Selected Per-Share Data | | | | |
Net asset value, beginning of period | $ 44.19 | $ 40.22 | $ 46.53 | $ 50.00 |
Income from Investment Operations | | | | |
Net investment income (loss) D | .598 | .832 | 1.014 | 1.122 |
Net realized and unrealized gain (loss) | 4.533 | 4.147 | (5.557) | (3.310) |
Total from investment operations | 5.131 | 4.979 | (4.543) | (2.188) |
Distributions from net investment income | (.581) | (.904) | (1.057) | (1.092) |
Distributions from net realized gain | (.190) | (.105) | (.710) | (.190) |
Total distributions | (.771) | (1.009) | (1.767) | (1.282) |
Net asset value, end of period | $ 48.55 | $ 44.19 | $ 40.22 | $ 46.53 |
Total Return B,C | 11.66% | 12.44% | (9.43)% | (4.53)% |
Ratios to Average Net Assets E,G | | | | |
Expenses before reductions H | .00% A | .00% | .00% | .00% A |
Expenses net of fee waivers, if any | .00% A | .00% | .00% | .00% A |
Expenses net of all reductions | .00% A | .00% | .00% | .00% A |
Net investment income (loss) | 2.57% A | 1.92% | 2.68% | 2.52% A |
Supplemental Data | | | | |
Net assets, end of period (000 omitted) | $ 1,851 | $ 1,391 | $ 1,285 | $ 731 |
Portfolio turnover rate | 25% A | 95% | 82% | 23% A |
A Annualized
B Total returns for periods of less than one year are not annualized.
C Total returns would have been lower had certain expenses not been reduced during the periods shown.
D Calculated based on average shares outstanding during the period.
E Amounts do not include the activity of the underlying funds.
F For the period August 30, 2007 (commencement of operations) to July 31, 2008.
G Expense ratios reflect operating expenses of the class. Expenses before reductions do not reflect amounts reimbursed by the investment adviser or reductions from expense offset arrangements and do not represent the amount paid by the class during periods when reimbursements or reductions occur. Expenses net of fee waivers reflect expenses after reimbursement by the investment adviser but prior to reductions from expense offset arrangements. Expenses net of all reductions represent the net expenses paid by the class but do not include expenses of the investment companies in which the Fund invests.
H Amount represents less than $.01 per share.
Financial Highlights - Institutional Class
| Six months ended January 31, 2011 | Years ended July 31, |
| (Unaudited) | 2010 | 2009 | 2008 F |
Selected Per-Share Data | | | | |
Net asset value, beginning of period | $ 44.19 | $ 40.22 | $ 46.53 | $ 50.00 |
Income from Investment Operations | | | | |
Net investment income (loss) D | .601 | .834 | 1.009 | 1.147 |
Net realized and unrealized gain (loss) | 4.530 | 4.145 | (5.552) | (3.335) |
Total from investment operations | 5.131 | 4.979 | (4.543) | (2.188) |
Distributions from net investment income | (.581) | (.904) | (1.057) | (1.092) |
Distributions from net realized gain | (.190) | (.105) | (.710) | (.190) |
Total distributions | (.771) | (1.009) | (1.767) | (1.282) |
Net asset value, end of period | $ 48.55 | $ 44.19 | $ 40.22 | $ 46.53 |
Total Return B,C | 11.66% | 12.44% | (9.43)% | (4.53)% |
Ratios to Average Net Assets E,G | | | | |
Expenses before reductions H | .00% A | .00% | .00% | .00% A |
Expenses net of fee waivers, if any | .00% A | .00% | .00% | .00% A |
Expenses net of all reductions | .00% A | .00% | .00% | .00% A |
Net investment income (loss) | 2.57% A | 1.92% | 2.68% | 2.52% A |
Supplemental Data | | | | |
Net assets, end of period (000 omitted) | $ 21 | $ 61 | $ 55 | $ 96 |
Portfolio turnover rate | 25% A | 95% | 82% | 23% A |
A Annualized
B Total returns for periods of less than one year are not annualized.
C Total returns would have been lower had certain expenses not been reduced during the periods shown.
D Calculated based on average shares outstanding during the period.
E Amounts do not include the activity of the underlying funds.
F For the period August 30, 2007 (commencement of operations) to July 31, 2008.
G Expense ratios reflect operating expenses of the class. Expenses before reductions do not reflect amounts reimbursed by the investment adviser or reductions from expense offset arrangements and do not represent the amount paid by the class during periods when reimbursements or reductions occur. Expenses net of fee waivers reflect expenses after reimbursement by the investment adviser but prior to reductions from expense offset arrangements. Expenses net of all reductions represent the net expenses paid by the class but do not include expenses of the investment companies in which the Fund invests.
H Amount represents less than $.01 per share.
See accompanying notes which are an integral part of the financial statements.
Semiannual Report
Fidelity Income Replacement 2034 Fund
Investment Changes (Unaudited)
Fund Holdings as of January 31, 2011 |
| % of fund's
net assets | % of fund's net assets
6 months ago |
Domestic Equity Funds | | |
Fidelity Advisor Mid Cap II Fund Institutional Class | 5.6 | 5.6 |
Fidelity Disciplined Equity Fund | 5.8 | 5.8 |
Fidelity Equity-Income Fund | 5.9 | 5.9 |
Fidelity Large Cap Core Enhanced Index Fund | 9.4 | 9.4 |
Fidelity Series 100 Index Fund | 7.0 | 7.0 |
Fidelity Series Broad Market Opportunities Fund | 9.4 | 9.4 |
Fidelity Series Small Cap Opportunities Fund | 3.7 | 3.8 |
| 46.8 | 46.9 |
International Equity Funds | | |
Fidelity Advisor International Discovery Fund Institutional Class | 9.6 | 9.9 |
High Yield Fixed-Income Funds | | |
Fidelity Capital & Income Fund | 2.7 | 2.8 |
Fidelity Strategic Income Fund | 2.7 | 2.8 |
| 5.4 | 5.6 |
Investment Grade Fixed-Income Funds | | |
Fidelity Government Income Fund | 5.5 | 5.4 |
Fidelity Strategic Real Return Fund | 5.5 | 5.5 |
Fidelity Total Bond Fund | 16.6 | 16.4 |
| 27.6 | 27.3 |
Short-Term Funds | | |
Fidelity Institutional Money Market Portfolio Institutional Class | 5.3 | 5.1 |
Fidelity Short-Term Bond Fund | 5.3 | 5.2 |
| 10.6 | 10.3 |
Net Other Assets (Liabilities)* | 0.0 | 0.0 |
| 100.0 | 100.0 |
* Amounts represent less than 0.1%
Asset Allocation (% of fund's net assets) |
Current |
| Domestic Equity Funds | 46.8% | |
| International Equity Funds | 9.6% | |
| High Yield Fixed-Income Funds | 5.4% | |
| Investment Grade Fixed-Income Funds | 27.6% | |
| Short-Term Funds | 10.6% | |

Six months ago |
| Domestic Equity Funds | 46.9% | |
| International Equity Funds | 9.9% | |
| High Yield Fixed-Income Funds | 5.6% | |
| Investment Grade Fixed-Income Funds | 27.3% | |
| Short-Term Funds | 10.3% | |

Expected |
| Domestic Equity Funds | 46.6% | |
| International Equity Funds | 9.4% | |
| High Yield Fixed-Income Funds | 5.4% | |
| Investment Grade Fixed-Income Funds | 27.6% | |
| Short-Term Funds | 11.0% | |

The fund invests according to an asset allocation strategy that becomes increasingly conservative over time. The six months ago allocation is based on the fund's holdings as of July 31, 2010. The current allocation is based on the fund's holdings as of January 31, 2011. The expected allocation represents the fund's anticipated allocation at July 31, 2011. |
Semiannual Report
Fidelity Income Replacement 2034 Fund
Investments January 31, 2011 (Unaudited)
Showing Percentage of Net Assets
Equity Funds - 56.4% |
| Shares | | Value |
Domestic Equity Funds - 46.8% |
Fidelity Advisor Mid Cap II Fund Institutional Class | 6,250 | | $ 114,570 |
Fidelity Disciplined Equity Fund | 5,136 | | 119,259 |
Fidelity Equity-Income Fund | 2,617 | | 119,259 |
Fidelity Large Cap Core Enhanced Index Fund | 21,782 | | 190,814 |
Fidelity Series 100 Index Fund | 15,990 | | 143,111 |
Fidelity Series Broad Market Opportunities Fund | 18,562 | | 190,814 |
Fidelity Series Small Cap Opportunities Fund | 6,988 | | 76,448 |
TOTAL DOMESTIC EQUITY FUNDS | | 954,275 |
International Equity Funds - 9.6% |
Fidelity Advisor International Discovery Fund Institutional Class | 5,888 | | 194,891 |
TOTAL EQUITY FUNDS (Cost $930,803) | 1,149,166 |
Fixed-Income Funds - 33.0% |
| | | |
High Yield Fixed-Income Funds - 5.4% |
Fidelity Capital & Income Fund | 5,755 | | 55,654 |
Fidelity Strategic Income Fund | 4,978 | | 55,654 |
TOTAL HIGH YIELD FIXED-INCOME FUNDS | | 111,308 |
|
| Shares | | Value |
Investment Grade Fixed-Income Funds - 27.6% |
Fidelity Government Income Fund | 10,790 | | $ 112,328 |
Fidelity Strategic Real Return Fund | 11,580 | | 112,328 |
Fidelity Total Bond Fund | 31,414 | | 337,389 |
TOTAL INVESTMENT GRADE FIXED-INCOME FUNDS | | 562,045 |
TOTAL FIXED-INCOME FUNDS (Cost $618,518) | 673,353 |
Short-Term Funds - 10.6% |
| | | |
Fidelity Institutional Money Market Portfolio Institutional Class | 108,046 | | 108,046 |
Fidelity Short-Term Bond Fund | 12,741 | | 108,047 |
TOTAL SHORT-TERM FUNDS (Cost $212,996) | 216,093 |
TOTAL INVESTMENT PORTFOLIO - 100.0% (Cost $1,762,317) | | 2,038,612 |
NET OTHER ASSETS (LIABILITIES) - 0.0% | | (37) |
NET ASSETS - 100% | $ 2,038,575 |
Other Information |
All investments are categorized as Level 1 under the Fair Value Hierarchy. The inputs or methodology used for valuing securities may not be an indication of the risk associated with investing in those securities. For more information on valuation inputs, please refer to the Security Valuation section in the accompanying Notes to Financial Statements. |
Income Tax Information |
At July 31, 2010, the Fund had a capital loss carryforward of approximately $62,824 all of which will expire in fiscal 2018. Capital loss carryforwards are only available to offset future capital gains of the Fund to the extent provided by regulations and may be limited. |
The Fund intends to elect to defer to its fiscal year ending July 31, 2011 approximately $32,680 of losses recognized during the period November 1, 2009 to July 31, 2010. |
See accompanying notes which are an integral part of the financial statements.
Semiannual Report
Fidelity Income Replacement 2034 Fund
Statement of Assets and Liabilities
| January 31, 2011 (Unaudited) |
| | |
Assets | | |
Investment in securities, at value (cost $1,762,317) - See accompanying schedule | | $ 2,038,612 |
Receivable for investments sold | | 11,553 |
Total assets | | 2,050,165 |
| | |
Liabilities | | |
Payable for investments purchased | $ 11,553 | |
Distribution and service plan fees payable | 37 | |
Total liabilities | | 11,590 |
| | |
Net Assets | | $ 2,038,575 |
Net Assets consist of: | | |
Paid in capital | | $ 1,911,678 |
Undistributed net investment income | | 500 |
Accumulated undistributed net realized gain (loss) on investments | | (149,898) |
Net unrealized appreciation (depreciation) on investments | | 276,295 |
Net Assets | | $ 2,038,575 |
Calculation of Maximum Offering Price Class A:
Net Asset Value and redemption price per share ($23,177 ÷ 475.2 shares) | | $ 48.77 |
| | |
Maximum offering price per share (100/94.25 of $48.77) | | $ 51.75 |
Class T:
Net Asset Value and redemption price per share ($30,536 ÷ 626.1 shares) | | $ 48.77 |
| | |
Maximum offering price per share (100/96.50 of $48.77) | | $ 50.54 |
| | |
Class C:
Net Asset Value and offering price per share ($23,179 ÷ 474.9 shares)A | | $ 48.81 |
| | |
Income Replacement 2034:
Net Asset Value, offering price and redemption price per share ($1,856,407 ÷ 38,078.1 shares) | | $ 48.75 |
| | |
Institutional Class:
Net Asset Value, offering price and redemption price per share ($105,276 ÷ 2,159.2 shares) | | $ 48.76 |
A Redemption price per share is equal to net asset value less any applicable contingent deferred sales charge.
Statement of Operations
Six months ended January 31, 2011 (Unaudited) |
| | |
Investment Income | | |
Income distributions from underlying funds | | $ 24,667 |
| | |
Expenses | | |
Distribution and service plan fees | $ 233 | |
Independent trustees' compensation | 4 | |
Total expenses before reductions | 237 | |
Expense reductions | (4) | 233 |
Net investment income (loss) | | 24,434 |
Realized and Unrealized Gain (Loss) Realized gain (loss) on sale of underlying fund shares | (15,873) | |
Capital gain distributions from underlying funds | 10,419 | |
Total net realized gain (loss) | | (5,454) |
Change in net unrealized appreciation (depreciation) on underlying funds | | 200,112 |
Net gain (loss) | | 194,658 |
Net increase (decrease) in net assets resulting from operations | | $ 219,092 |
See accompanying notes which are an integral part of the financial statements.
Semiannual Report
Statement of Changes in Net Assets
| Six months ended January 31, 2011 (Unaudited) | Year ended
July 31,
2010 |
Increase (Decrease) in Net Assets | | |
Operations | | |
Net investment income (loss) | $ 24,434 | $ 38,285 |
Net realized gain (loss) | (5,454) | (69,132) |
Change in net unrealized appreciation (depreciation) | 200,112 | 253,583 |
Net increase (decrease) in net assets resulting from operations | 219,092 | 222,736 |
Distributions to shareholders from net investment income | (24,452) | (38,318) |
Distributions to shareholders from net realized gain | (8,111) | (8,464) |
Total distributions | (32,563) | (46,782) |
Share transactions - net increase (decrease) | (2,342) | (216,059) |
Total increase (decrease) in net assets | 184,187 | (40,105) |
| | |
Net Assets | | |
Beginning of period | 1,854,388 | 1,894,493 |
End of period (including undistributed net investment income of $500 and undistributed net investment income of $518, respectively) | $ 2,038,575 | $ 1,854,388 |
Financial Highlights - Class A
| Six months ended January 31, 2011 | Years ended July 31, |
| (Unaudited) | 2010 | 2009 | 2008 G |
Selected Per-Share Data | | | | |
Net asset value, beginning of period | $ 44.27 | $ 40.29 | $ 46.40 | $ 50.00 |
Income from Investment Operations | | | | |
Net investment income (loss) E | .528 | .753 | .923 | .994 |
Net realized and unrealized gain (loss) | 4.680 | 4.174 | (5.753) | (3.438) |
Total from investment operations | 5.208 | 4.927 | (4.830) | (2.444) |
Distributions from net investment income | (.508) | (.758) | (.890) | (.956) |
Distributions from net realized gain | (.200) | (.189) | (.390) | (.200) |
Total distributions | (.708) | (.947) | (1.280) | (1.156) |
Net asset value, end of period | $ 48.77 | $ 44.27 | $ 40.29 | $ 46.40 |
Total Return B,C,D | 11.81% | 12.29% | (10.20)% | (5.04)% |
Ratios to Average Net Assets F,H | | | | |
Expenses before reductions | .25% A | .25% | .26% | .25% A |
Expenses net of fee waivers, if any | .25% A | .25% | .26% | .25% A |
Expenses net of all reductions | .25% A | .25% | .26% | .25% A |
Net investment income (loss) | 2.27% A | 1.73% | 2.46% | 2.19% A |
Supplemental Data | | | | |
Net assets, end of period (000 omitted) | $ 23 | $ 27 | $ 63 | $ 138 |
Portfolio turnover rate | 46% A | 22% | 46% | 12% A |
A Annualized
B Total returns for periods of less than one year are not annualized.
C Total returns would have been lower had certain expenses not been reduced during the periods shown.
D Total returns do not include the effect of the sales charges.
E Calculated based on average shares outstanding during the period.
F Amounts do not include the activity of the underlying funds.
G For the period August 30, 2007 (commencement of operations) to July 31, 2008.
H Expense ratios reflect operating expenses of the class. Expenses before reductions do not reflect amounts reimbursed by the investment adviser or reductions from expense offset arrangements and do not represent the amount paid by the class during periods when reimbursements or reductions occur. Expenses net of fee waivers reflect expenses after reimbursement by the investment adviser but prior to reductions from expense offset arrangements. Expenses net of all reductions represent the net expenses paid by the class but do not include expenses of the investment companies in which the Fund invests.
See accompanying notes which are an integral part of the financial statements.
Semiannual Report
Financial Highlights - Class T
| Six months ended January 31, 2011 | Years ended July 31, |
| (Unaudited) | 2010 | 2009 | 2008 G |
Selected Per-Share Data | | | | |
Net asset value, beginning of period | $ 44.27 | $ 40.29 | $ 46.40 | $ 50.00 |
Income from Investment Operations | | | | |
Net investment income (loss) E | .471 | .645 | .828 | .875 |
Net realized and unrealized gain (loss) | 4.681 | 4.175 | (5.757) | (3.431) |
Total from investment operations | 5.152 | 4.820 | (4.929) | (2.556) |
Distributions from net investment income | (.452) | (.651) | (.791) | (.844) |
Distributions from net realized gain | (.200) | (.189) | (.390) | (.200) |
Total distributions | (.652) | (.840) | (1.181) | (1.044) |
Net asset value, end of period | $ 48.77 | $ 44.27 | $ 40.29 | $ 46.40 |
Total Return B,C,D | 11.67% | 12.01% | (10.44)% | (5.25)% |
Ratios to Average Net Assets F,H | | | | |
Expenses before reductions | .50% A | .50% | .51% | .50% A |
Expenses net of fee waivers, if any | .50% A | .50% | .51% | .50% A |
Expenses net of all reductions | .50% A | .50% | .51% | .50% A |
Net investment income (loss) | 2.02% A | 1.48% | 2.21% | 1.94% A |
Supplemental Data | | | | |
Net assets, end of period (000 omitted) | $ 31 | $ 35 | $ 54 | $ 95 |
Portfolio turnover rate | 46% A | 22% | 46% | 12% A |
A Annualized
B Total returns for periods of less than one year are not annualized.
C Total returns would have been lower had certain expenses not been reduced during the periods shown.
D Total returns do not include the effect of the sales charges.
E Calculated based on average shares outstanding during the period.
F Amounts do not include the activity of the underlying funds.
G For the period August 30, 2007 (commencement of operations) to July 31, 2008.
H Expense ratios reflect operating expenses of the class. Expenses before reductions do not reflect amounts reimbursed by the investment adviser or reductions from expense offset arrangements and do not represent the amount paid by the class during periods when reimbursements or reductions occur. Expenses net of fee waivers reflect expenses after reimbursement by the investment adviser but prior to reductions from expense offset arrangements. Expenses net of all reductions represent the net expenses paid by the class but do not include expenses of the investment companies in which the Fund invests.
Financial Highlights - Class C
| Six months ended January 31, 2011 | Years ended July 31, |
| (Unaudited) | 2010 | 2009 | 2008 G |
Selected Per-Share Data | | | | |
Net asset value, beginning of period | $ 44.30 | $ 40.30 | $ 46.39 | $ 50.00 |
Income from Investment Operations | | | | |
Net investment income (loss) E | .355 | .426 | .631 | .658 |
Net realized and unrealized gain (loss) | 4.681 | 4.185 | (5.740) | (3.448) |
Total from investment operations | 5.036 | 4.611 | (5.109) | (2.790) |
Distributions from net investment income | (.326) | (.422) | (.591) | (.620) |
Distributions from net realized gain | (.200) | (.189) | (.390) | (.200) |
Total distributions | (.526) | (.611) | (.981) | (.820) |
Net asset value, end of period | $ 48.81 | $ 44.30 | $ 40.30 | $ 46.39 |
Total Return B,C,D | 11.39% | 11.47% | (10.88)% | (5.70)% |
Ratios to Average Net Assets F,H | | | | |
Expenses before reductions | 1.00% A | 1.00% | 1.01% | 1.00% A |
Expenses net of fee waivers, if any | 1.00% A | 1.00% | 1.01% | 1.00% A |
Expenses net of all reductions | 1.00% A | 1.00% | 1.01% | 1.00% A |
Net investment income (loss) | 1.52% A | .98% | 1.71% | 1.44% A |
Supplemental Data | | | | |
Net assets, end of period (000 omitted) | $ 23 | $ 27 | $ 41 | $ 94 |
Portfolio turnover rate | 46% A | 22% | 46% | 12% A |
A Annualized
B Total returns for periods of less than one year are not annualized.
C Total returns would have been lower had certain expenses not been reduced during the periods shown.
D Total returns do not include the effect of the contingent deferred sales charge.
E Calculated based on average shares outstanding during the period.
F Amounts do not include the activity of the underlying funds.
G For the period August 30, 2007 (commencement of operations) to July 31, 2008.
H Expense ratios reflect operating expenses of the class. Expenses before reductions do not reflect amounts reimbursed by the investment adviser or reductions from expense offset arrangements and do not represent the amount paid by the class during periods when reimbursements or reductions occur. Expenses net of fee waivers reflect expenses after reimbursement by the investment adviser but prior to reductions from expense offset arrangements. Expenses net of all reductions represent the net expenses paid by the class but do not include expenses of the investment companies in which the Fund invests.
See accompanying notes which are an integral part of the financial statements.
Semiannual Report
Financial Highlights - Income Replacement 2034
| Six months ended January 31, 2011 | Years ended July 31, |
| (Unaudited) | 2010 | 2009 | 2008 F |
Selected Per-Share Data | | | | |
Net asset value, beginning of period | $ 44.26 | $ 40.28 | $ 46.40 | $ 50.00 |
Income from Investment Operations | | | | |
Net investment income (loss) D | .588 | .862 | .988 | 1.090 |
Net realized and unrealized gain (loss) | 4.670 | 4.183 | (5.729) | (3.425) |
Total from investment operations | 5.258 | 5.045 | (4.741) | (2.335) |
Distributions from net investment income | (.568) | (.876) | (.989) | (1.065) |
Distributions from net realized gain | (.200) | (.189) | (.390) | (.200) |
Total distributions | (.768) | (1.065) | (1.379) | (1.265) |
Net asset value, end of period | $ 48.75 | $ 44.26 | $ 40.28 | $ 46.40 |
Total Return B,C | 11.93% | 12.59% | (9.98)% | (4.83)% |
Ratios to Average Net Assets E,G | | | | |
Expenses before reductions | .00% A,H | .00% H | .01% | .00% A,H |
Expenses net of fee waivers, if any | .00% A | .00% | .01% | .00% A |
Expenses net of all reductions | .00% A | .00% | .01% | .00% A |
Net investment income (loss) | 2.52% A | 1.98% | 2.71% | 2.44% A |
Supplemental Data | | | | |
Net assets, end of period (000 omitted) | $ 1,856 | $ 1,672 | $ 1,628 | $ 552 |
Portfolio turnover rate | 46% A | 22% | 46% | 12% A |
A Annualized
B Total returns for periods of less than one year are not annualized.
C Total returns would have been lower had certain expenses not been reduced during the periods shown.
D Calculated based on average shares outstanding during the period.
E Amounts do not include the activity of the underlying funds.
F For the period August 30, 2007 (commencement of operations) to July 31, 2008.
G Expense ratios reflect operating expenses of the class. Expenses before reductions do not reflect amounts reimbursed by the investment adviser or reductions from expense offset arrangements and do not represent the amount paid by the class during periods when reimbursements or reductions occur. Expenses net of fee waivers reflect expenses after reimbursement by the investment adviser but prior to reductions from expense offset arrangements. Expenses net of all reductions represent the net expenses paid by the class but do not include expenses of the investment companies in which the Fund invests.
H Amount represents less than $.01 per share.
Financial Highlights - Institutional Class
| Six months ended January 31, 2011 | Years ended July 31, |
| (Unaudited) | 2010 | 2009 | 2008 F |
Selected Per-Share Data | | | | |
Net asset value, beginning of period | $ 44.26 | $ 40.28 | $ 46.41 | $ 50.00 |
Income from Investment Operations | | | | |
Net investment income (loss) D | .588 | .860 | 1.002 | 1.114 |
Net realized and unrealized gain (loss) | 4.680 | 4.185 | (5.753) | (3.439) |
Total from investment operations | 5.268 | 5.045 | (4.751) | (2.325) |
Distributions from net investment income | (.568) | (.876) | (.989) | (1.065) |
Distributions from net realized gain | (.200) | (.189) | (.390) | (.200) |
Total distributions | (.768) | (1.065) | (1.379) | (1.265) |
Net asset value, end of period | $ 48.76 | $ 44.26 | $ 40.28 | $ 46.41 |
Total Return B,C | 11.96% | 12.59% | (10.00)% | (4.81)% |
Ratios to Average Net Assets E,G | | | | |
Expenses before reductions | .00% A,H | .00% H | .01% | .00% A,H |
Expenses net of fee waivers, if any | .00% A | .00% | .01% | .00% A |
Expenses net of all reductions | .00% A | .00% | .01% | .00% A |
Net investment income (loss) | 2.52% A | 1.98% | 2.71% | 2.44% A |
Supplemental Data | | | | |
Net assets, end of period (000 omitted) | $ 105 | $ 94 | $ 108 | $ 95 |
Portfolio turnover rate | 46% A | 22% | 46% | 12% A |
A Annualized
B Total returns for periods of less than one year are not annualized.
C Total returns would have been lower had certain expenses not been reduced during the periods shown.
D Calculated based on average shares outstanding during the period.
E Amounts do not include the activity of the underlying funds.
F For the period August 30, 2007 (commencement of operations) to July 31, 2008.
G Expense ratios reflect operating expenses of the class. Expenses before reductions do not reflect amounts reimbursed by the investment adviser or reductions from expense offset arrangements and do not represent the amount paid by the class during periods when reimbursements or reductions occur. Expenses net of fee waivers reflect expenses after reimbursement by the investment adviser but prior to reductions from expense offset arrangements. Expenses net of all reductions represent the net expenses paid by the class but do not include expenses of the investment companies in which the Fund invests.
H Amount represents less than $.01 per share.
See accompanying notes which are an integral part of the financial statements.
Semiannual Report
Fidelity Income Replacement 2036 Fund
Investment Changes (Unaudited)
Fund Holdings as of January 31, 2011 |
| % of fund's
net assets | % of fund's net assets
6 months ago |
Domestic Equity Funds | | |
Fidelity Advisor Mid Cap II Fund Institutional Class | 5.7 | 5.7 |
Fidelity Disciplined Equity Fund | 6.0 | 5.9 |
Fidelity Equity-Income Fund | 6.0 | 6.0 |
Fidelity Large Cap Core Enhanced Index Fund | 9.6 | 9.5 |
Fidelity Series 100 Index Fund | 7.2 | 7.2 |
Fidelity Series Broad Market Opportunities Fund | 9.5 | 9.6 |
Fidelity Series Small Cap Opportunities Fund | 3.8 | 3.9 |
| 47.8 | 47.8 |
International Equity Funds | | |
Fidelity Advisor International Discovery Fund Institutional Class | 10.4 | 10.8 |
High Yield Fixed-Income Funds | | |
Fidelity Capital & Income Fund | 2.9 | 3.0 |
Fidelity Strategic Income Fund | 2.8 | 2.9 |
| 5.7 | 5.9 |
Investment Grade Fixed-Income Funds | | |
Fidelity Government Income Fund | 5.4 | 5.3 |
Fidelity Strategic Real Return Fund | 5.3 | 5.4 |
Fidelity Total Bond Fund | 16.0 | 16.0 |
| 26.7 | 26.7 |
Short-Term Funds | | |
Fidelity Institutional Money Market Portfolio Institutional Class | 4.7 | 4.4 |
Fidelity Short-Term Bond Fund | 4.7 | 4.4 |
| 9.4 | 8.8 |
Net Other Assets (Liabilities)* | 0.0 | 0.0 |
| 100.0 | 100.0 |
* Amount represents less than 0.1%
Asset Allocation (% of fund's net assets) |
Current |
| Domestic Equity Funds | 47.8% | |
| International Equity Funds | 10.4% | |
| High Yield Fixed-Income Funds | 5.7% | |
| Investment Grade Fixed-Income Funds | 26.7% | |
| Short-Term Funds | 9.4% | |

Six months ago |
| Domestic Equity Funds | 47.8% | |
| International Equity Funds | 10.8% | |
| High Yield Fixed-Income Funds | 5.9% | |
| Investment Grade Fixed-Income Funds | 26.7% | |
| Short-Term Funds | 8.8% | |

Expected |
| Domestic Equity Funds | 47.5% | |
| International Equity Funds | 10.2% | |
| High Yield Fixed-Income Funds | 5.7% | |
| Investment Grade Fixed-Income Funds | 26.8% | |
| Short-Term Funds | 9.8% | |

The fund invests according to an asset allocation strategy that becomes increasingly conservative over time. The six months ago allocation is based on the fund's holdings as of July 31, 2010. The current allocation is based on the fund's holdings as of January 31, 2011. The expected allocation represents the fund's anticipated allocation at July 31, 2011. |
Semiannual Report
Fidelity Income Replacement 2036 Fund
Investments January 31, 2011 (Unaudited)
Showing Percentage of Net Assets
Equity Funds - 58.2% |
| Shares | | Value |
Domestic Equity Funds - 47.8% |
Fidelity Advisor Mid Cap II Fund Institutional Class | 6,094 | | $ 111,703 |
Fidelity Disciplined Equity Fund | 5,012 | | 116,382 |
Fidelity Equity-Income Fund | 2,554 | | 116,382 |
Fidelity Large Cap Core Enhanced Index Fund | 21,252 | | 186,172 |
Fidelity Series 100 Index Fund | 15,596 | | 139,580 |
Fidelity Series Broad Market Opportunities Fund | 18,110 | | 186,172 |
Fidelity Series Small Cap Opportunities Fund | 6,807 | | 74,469 |
TOTAL DOMESTIC EQUITY FUNDS | | 930,860 |
International Equity Funds - 10.4% |
Fidelity Advisor International Discovery Fund Institutional Class | 6,155 | | 203,717 |
TOTAL EQUITY FUNDS (Cost $1,125,747) | 1,134,577 |
Fixed-Income Funds - 32.4% |
| | | |
High Yield Fixed-Income Funds - 5.7% |
Fidelity Capital & Income Fund | 5,766 | | 55,754 |
Fidelity Strategic Income Fund | 4,987 | | 55,754 |
TOTAL HIGH YIELD FIXED-INCOME FUNDS | | 111,508 |
|
| Shares | | Value |
Investment Grade Fixed-Income Funds - 26.7% |
Fidelity Government Income Fund | 10,000 | | $ 104,100 |
Fidelity Strategic Real Return Fund | 10,732 | | 104,100 |
Fidelity Total Bond Fund | 29,042 | | 311,909 |
TOTAL INVESTMENT GRADE FIXED-INCOME FUNDS | | 520,109 |
TOTAL FIXED-INCOME FUNDS (Cost $618,059) | 631,617 |
Short-Term Funds - 9.4% |
| | | |
Fidelity Institutional Money Market Portfolio Institutional Class | 91,624 | | 91,624 |
Fidelity Short-Term Bond Fund | 10,805 | | 91,624 |
TOTAL SHORT-TERM FUNDS (Cost $183,048) | 183,248 |
TOTAL INVESTMENT PORTFOLIO - 100.0% (Cost $1,926,854) | | 1,949,442 |
NET OTHER ASSETS (LIABILITIES) - 0.0% | | (154) |
NET ASSETS - 100% | $ 1,949,288 |
Other Information |
All investments are categorized as Level 1 under the Fair Value Hierarchy. The inputs or methodology used for valuing securities may not be an indication of the risk associated with investing in those securities. For more information on valuation inputs, please refer to the Security Valuation section in the accompanying Notes to Financial Statements. |
Income Tax Information |
At July 31, 2010, the Fund had a capital loss carryforward of approximately $203,731 of which $19,968 and $183,763 will expire in fiscal 2017 and 2018, respectively. Capital loss carryforwards are only available to offset future capital gains of the Fund to the extent provided by regulations and may be limited. |
The Fund intends to elect to defer to its fiscal year ending July 31, 2011 approximately $17,259 of losses recognized during the period November 1, 2009 to July 31, 2010. |
See accompanying notes which are an integral part of the financial statements.
Semiannual Report
Fidelity Income Replacement 2036 Fund
Statement of Assets and Liabilities
| January 31, 2011 (Unaudited) |
| | |
Assets | | |
Investment in securities, at value (cost $1,926,854) - See accompanying schedule | | $ 1,949,442 |
Cash | | 74 |
Receivable for investments sold | | 10,222 |
Total assets | | 1,959,738 |
| | |
Liabilities | | |
Payable for investments purchased | $ 10,219 | |
Distribution and service plan fees payable | 231 | |
Total liabilities | | 10,450 |
| | |
Net Assets | | $ 1,949,288 |
Net Assets consist of: | | |
Paid in capital | | $ 2,177,484 |
Undistributed net investment income | | 395 |
Accumulated undistributed net realized gain (loss) on investments | | (251,179) |
Net unrealized appreciation (depreciation) on investments | | 22,588 |
Net Assets | | $ 1,949,288 |
Calculation of Maximum Offering Price Class A:
Net Asset Value and redemption price per share ($34,766 ÷ 719.2 shares) | | $ 48.34 |
| | |
Maximum offering price per share (100/94.25 of $48.34) | | $ 51.29 |
Class T:
Net Asset Value and redemption price per share ($288,177 ÷ 5,963.7 shares) | | $ 48.32 |
| | |
Maximum offering price per share (100/96.50 of $48.32) | | $ 50.07 |
| | |
Class C:
Net Asset Value and offering price per share ($123,671 ÷ 2,558.5 shares)A | | $ 48.34 |
| | |
Income Replacement 2036:
Net Asset Value, offering price and redemption price per share ($1,409,570 ÷ 29,162.7 shares) | | $ 48.33 |
| | |
Institutional Class:
Net Asset Value, offering price and redemption price per share ($93,104 ÷ 1,926.3 shares) | | $ 48.33 |
A Redemption price per share is equal to net asset value less any applicable contingent deferred sales charge.
Statement of Operations
Six months ended January 31, 2011 (Unaudited) |
| | |
Investment Income | | |
Income distributions from underlying funds | | $ 21,854 |
| | |
Expenses | | |
Distribution and service plan fees | $ 1,344 | |
Independent trustees' compensation | 3 | |
Total expenses before reductions | 1,347 | |
Expense reductions | (3) | 1,344 |
Net investment income (loss) | | 20,510 |
Realized and Unrealized Gain (Loss) Realized gain (loss) on sale of underlying fund shares | (11,727) | |
Capital gain distributions from underlying funds | 8,461 | |
Total net realized gain (loss) | | (3,266) |
Change in net unrealized appreciation (depreciation) on underlying funds | | 143,005 |
Net gain (loss) | | 139,739 |
Net increase (decrease) in net assets resulting from operations | | $ 160,249 |
See accompanying notes which are an integral part of the financial statements.
Semiannual Report
Statement of Changes in Net Assets
| Six months ended January 31, 2011 (Unaudited) | Year ended
July 31,
2010 |
Increase (Decrease) in Net Assets | | |
Operations | | |
Net investment income (loss) | $ 20,510 | $ 19,710 |
Net realized gain (loss) | (3,266) | (40,612) |
Change in net unrealized appreciation (depreciation) | 143,005 | 163,539 |
Net increase (decrease) in net assets resulting from operations | 160,249 | 142,637 |
Distributions to shareholders from net investment income | (20,368) | (19,743) |
Distributions to shareholders from net realized gain | (6,329) | (3,949) |
Total distributions | (26,697) | (23,692) |
Share transactions - net increase (decrease) | 690,902 | (128,803) |
Total increase (decrease) in net assets | 824,454 | (9,858) |
| | |
Net Assets | | |
Beginning of period | 1,124,834 | 1,134,692 |
End of period (including undistributed net investment income of $395 and undistributed net investment income of $253, respectively) | $ 1,949,288 | $ 1,124,834 |
Financial Highlights - Class A
| Six months ended January 31, 2011 | Years ended July 31, |
| (Unaudited) | 2010 | 2009 | 2008 G |
Selected Per-Share Data | | | | |
Net asset value, beginning of period | $ 43.73 | $ 39.70 | $ 46.40 | $ 50.00 |
Income from Investment Operations | | | | |
Net investment income (loss) E | .621 | .748 | .937 | .951 |
Net realized and unrealized gain (loss) | 4.672 | 4.178 | (6.127) | (3.464) |
Total from investment operations | 5.293 | 4.926 | (5.190) | (2.513) |
Distributions from net investment income | (.527) | (.752) | (.940) | (.897) |
Distributions from net realized gain | (.156) | (.144) | (.570) | (.190) |
Total distributions | (.683) | (.896) | (1.510) | (1.087) |
Net asset value, end of period | $ 48.34 | $ 43.73 | $ 39.70 | $ 46.40 |
Total Return B, C, D | 12.15% | 12.46% | (10.72)% | (5.17)% |
Ratios to Average Net Assets F, H | | | | |
Expenses before reductions | .25% A | .25% | .25% | .25% A |
Expenses net of fee waivers, if any | .25% A | .25% | .25% | .25% A |
Expenses net of all reductions | .25% A | .25% | .25% | .25% A |
Net investment income (loss) | 2.69% A | 1.74% | 2.52% | 2.08% A |
Supplemental Data | | | | |
Net assets, end of period (000 omitted) | $ 35 | $ 40 | $ 54 | $ 95 |
Portfolio turnover rate | 26% A | 26% | 39% | 44% A |
A Annualized
B Total returns for periods of less than one year are not annualized.
C Total returns would have been lower had certain expenses not been reduced during the periods shown.
D Total returns do not include the effect of the sales charges.
E Calculated based on average shares outstanding during the period.
F Amounts do not include the activity of the underlying funds.
G For the period August 30, 2007 (commencement of operations) to July 31, 2008.
H Expense ratios reflect operating expenses of the class. Expenses before reductions do not reflect amounts reimbursed by the investment adviser or reductions from expense offset arrangements and do not represent the amount paid by the class during periods when reimbursements or reductions occur. Expenses net of fee waivers reflect expenses after reimbursement by the investment adviser but prior to reductions from expense offset arrangements. Expenses net of all reductions represent the net expenses paid by the class but do not include expenses of the investment companies in which the Fund invests.
See accompanying notes which are an integral part of the financial statements.
Semiannual Report
Financial Highlights - Class T
| Six months ended January 31, 2011 | Years ended July 31, |
| (Unaudited) | 2010 | 2009 | 2008 G |
Selected Per-Share Data | | | | |
Net asset value, beginning of period | $ 43.72 | $ 39.69 | $ 46.39 | $ 50.00 |
Income from Investment Operations | | | | |
Net investment income (loss) E | .563 | .639 | .844 | .823 |
Net realized and unrealized gain (loss) | 4.665 | 4.183 | (6.122) | (3.449) |
Total from investment operations | 5.228 | 4.822 | (5.278) | (2.626) |
Distributions from net investment income | (.472) | (.648) | (.852) | (.794) |
Distributions from net realized gain | (.156) | (.144) | (.570) | (.190) |
Total distributions | (.628) | (.792) | (1.422) | (.984) |
Net asset value, end of period | $ 48.32 | $ 43.72 | $ 39.69 | $ 46.39 |
Total Return B, C, D | 11.99% | 12.19% | (10.93)% | (5.39)% |
Ratios to Average Net Assets F, H | | | | |
Expenses before reductions | .50% A | .50% | .50% | .50% A |
Expenses net of fee waivers, if any | .50% A | .50% | .50% | .50% A |
Expenses net of all reductions | .50% A | .50% | .50% | .50% A |
Net investment income (loss) | 2.44% A | 1.49% | 2.28% | 1.83% A |
Supplemental Data | | | | |
Net assets, end of period (000 omitted) | $ 288 | $ 265 | $ 265 | $ 384 |
Portfolio turnover rate | 26% A | 26% | 39% | 44% A |
A Annualized
B Total returns for periods of less than one year are not annualized.
C Total returns would have been lower had certain expenses not been reduced during the periods shown.
D Total returns do not include the effect of the sales charges.
E Calculated based on average shares outstanding during the period.
F Amounts do not include the activity of the underlying funds.
G For the period August 30, 2007 (commencement of operations) to July 31, 2008.
H Expense ratios reflect operating expenses of the class. Expenses before reductions do not reflect amounts reimbursed by the investment adviser or reductions from expense offset arrangements and do not represent the amount paid by the class during periods when reimbursements or reductions occur. Expenses net of fee waivers reflect expenses after reimbursement by the investment adviser but prior to reductions from expense offset arrangements. Expenses net of all reductions represent the net expenses paid by the class but do not include expenses of the investment companies in which the Fund invests.
Financial Highlights - Class C
| Six months ended January 31, 2011 | Years ended July 31, |
| (Unaudited) | 2010 | 2009 | 2008 G |
Selected Per-Share Data | | | | |
Net asset value, beginning of period | $ 43.74 | $ 39.71 | $ 46.39 | $ 50.00 |
Income from Investment Operations | | | | |
Net investment income (loss) E | .448 | .424 | .655 | .609 |
Net realized and unrealized gain (loss) | 4.673 | 4.179 | (6.114) | (3.465) |
Total from investment operations | 5.121 | 4.603 | (5.459) | (2.856) |
Distributions from net investment income | (.365) | (.429) | (.651) | (.564) |
Distributions from net realized gain | (.156) | (.144) | (.570) | (.190) |
Total distributions | (.521) | (.573) | (1.221) | (.754) |
Net asset value, end of period | $ 48.34 | $ 43.74 | $ 39.71 | $ 46.39 |
Total Return B, C, D | 11.73% | 11.61% | (11.38)% | (5.82)% |
Ratios to Average Net Assets F, H | | | | |
Expenses before reductions | 1.00% A | 1.00% | 1.00% | 1.00% A |
Expenses net of fee waivers, if any | 1.00% A | 1.00% | 1.00% | 1.00% A |
Expenses net of all reductions | 1.00% A | 1.00% | 1.00% | 1.00% A |
Net investment income (loss) | 1.94% A | .99% | 1.77% | 1.33% A |
Supplemental Data | | | | |
Net assets, end of period (000 omitted) | $ 124 | $ 119 | $ 116 | $ 94 |
Portfolio turnover rate | 26% A | 26% | 39% | 44% A |
A Annualized
B Total returns for periods of less than one year are not annualized.
C Total returns would have been lower had certain expenses not been reduced during the periods shown.
D Total returns do not include the effect of the contingent deferred sales charge.
E Calculated based on average shares outstanding during the period.
F Amounts do not include the activity of the underlying funds.
G For the period August 30, 2007 (commencement of operations) to July 31, 2008.
H Expense ratios reflect operating expenses of the class. Expenses before reductions do not reflect amounts reimbursed by the investment adviser or reductions from expense offset arrangements and do not represent the amount paid by the class during periods when reimbursements or reductions occur. Expenses net of fee waivers reflect expenses after reimbursement by the investment adviser but prior to reductions from expense offset arrangements. Expenses net of all reductions represent the net expenses paid by the class but do not include expenses of the investment companies in which the Fund invests.
See accompanying notes which are an integral part of the financial statements.
Semiannual Report
Financial Highlights - Income Replacement 2036
| Six months ended January 31, 2011 | Years ended July 31, |
| (Unaudited) | 2010 | 2009 | 2008 G |
Selected Per-Share Data | | | | |
Net asset value, beginning of period | $ 43.73 | $ 39.70 | $ 46.40 | $ 50.00 |
Income from Investment Operations | | | | |
Net investment income (loss) D | .682 | .854 | 1.034 | 1.043 |
Net realized and unrealized gain (loss) | 4.662 | 4.183 | (6.126) | (3.445) |
Total from investment operations | 5.344 | 5.037 | (5.092) | (2.402) |
Distributions from net investment income | (.588) | (.863) | (1.038) | (1.008) |
Distributions from net realized gain | (.156) | (.144) | (.570) | (.190) |
Total distributions | (.744) | (1.007) | (1.608) | (1.198) |
Net asset value, end of period | $ 48.33 | $ 43.73 | $ 39.70 | $ 46.40 |
Total Return B, C | 12.27% | 12.75% | (10.48)% | (4.96)% |
Ratios to Average Net Assets E, H | | | | |
Expenses before reductions F | .00% A | .00% | .00% | .00% A |
Expenses net of fee waivers, if any | .00% A | .00% | .00% | .00% A |
Expenses net of all reductions | .00% A | .00% | .00% | .00% A |
Net investment income (loss) | 2.94% A | 1.99% | 2.78% | 2.33% A |
Supplemental Data | | | | |
Net assets, end of period (000 omitted) | $ 1,410 | $ 598 | $ 632 | $ 986 |
Portfolio turnover rate | 26% A | 26% | 39% | 44% A |
A Annualized
B Total returns for periods of less than one year are not annualized.
C Total returns would have been lower had certain expenses not been reduced during the periods shown.
D Calculated based on average shares outstanding during the period.
E Amounts do not include the activity of the underlying funds.
F Amount represents less than .01%.
G For the period August 30, 2007 (commencement of operations) to July 31, 2008.
H Expense ratios reflect operating expenses of the class. Expenses before reductions do not reflect amounts reimbursed by the investment adviser or reductions from expense offset arrangements and do not represent the amount paid by the class during periods when reimbursements or reductions occur. Expenses net of fee waivers reflect expenses after reimbursement by the investment adviser but prior to reductions from expense offset arrangements. Expenses net of all reductions represent the net expenses paid by the class but do not include expenses of the investment companies in which the Fund invests.
Financial Highlights - Institutional Class
| Six months ended January 31, 2011 | Years ended July 31, |
| (Unaudited) | 2010 | 2009 | 2008 G |
Selected Per-Share Data | | | | |
Net asset value, beginning of period | $ 43.73 | $ 39.70 | $ 46.40 | $ 50.00 |
Income from Investment Operations | | | | |
Net investment income (loss) D | .678 | .851 | 1.031 | 1.064 |
Net realized and unrealized gain (loss) | 4.666 | 4.186 | (6.123) | (3.466) |
Total from investment operations | 5.344 | 5.037 | (5.092) | (2.402) |
Distributions from net investment income | (.588) | (.863) | (1.038) | (1.008) |
Distributions from net realized gain | (.156) | (.144) | (.570) | (.190) |
Total distributions | (.744) | (1.007) | (1.608) | (1.198) |
Net asset value, end of period | $ 48.33 | $ 43.73 | $ 39.70 | $ 46.40 |
Total Return B, C | 12.27% | 12.75% | (10.48)% | (4.96)% |
Ratios to Average Net Assets E, H | | | | |
Expenses before reductions F | .00% A | .00% | .00% | .00% A |
Expenses net of fee waivers, if any | .00% A | .00% | .00% | .00% A |
Expenses net of all reductions | .00% A | .00% | .00% | .00% A |
Net investment income (loss) | 2.94% A | 1.99% | 2.78% | 2.33% A |
Supplemental Data | | | | |
Net assets, end of period (000 omitted) | $ 93 | $ 103 | $ 67 | $ 119 |
Portfolio turnover rate | 26% A | 26% | 39% | 44% A |
A Annualized
B Total returns for periods of less than one year are not annualized.
C Total returns would have been lower had certain expenses not been reduced during the periods shown.
D Calculated based on average shares outstanding during the period.
E Amounts do not include the activity of the underlying funds.
F Amount represents less than .01%.
G For the period August 30, 2007 (commencement of operations) to July 31, 2008.
H Expense ratios reflect operating expenses of the class. Expenses before reductions do not reflect amounts reimbursed by the investment adviser or reductions from expense offset arrangements and do not represent the amount paid by the class during periods when reimbursements or reductions occur. Expenses net of fee waivers reflect expenses after reimbursement by the investment adviser but prior to reductions from expense offset arrangements. Expenses net of all reductions represent the net expenses paid by the class but do not include expenses of the investment companies in which the Fund invests.
See accompanying notes which are an integral part of the financial statements.
Semiannual Report
Fidelity Income Replacement 2038 Fund
Investment Changes (Unaudited)
Fund Holdings as of January 31, 2011 |
| % of fund's
net assets | % of fund's net assets
6 months ago |
Domestic Equity Funds | | |
Fidelity Advisor Mid Cap II Fund Institutional Class | 5.9 | 5.8 |
Fidelity Disciplined Equity Fund | 6.1 | 6.1 |
Fidelity Equity-Income Fund | 6.1 | 6.1 |
Fidelity Large Cap Core Enhanced Index Fund | 9.8 | 9.8 |
Fidelity Series 100 Index Fund | 7.3 | 7.4 |
Fidelity Series Broad Market Opportunities Fund | 9.8 | 9.8 |
Fidelity Series Small Cap Opportunities Fund | 3.9 | 4.0 |
| 48.9 | 49.0 |
International Equity Funds | | |
Fidelity Advisor International Discovery Fund Institutional Class | 11.4 | 11.9 |
High Yield Fixed-Income Funds | | |
Fidelity Capital & Income Fund | 3.1 | 3.1 |
Fidelity Strategic Income Fund | 3.0 | 3.1 |
| 6.1 | 6.2 |
Investment Grade Fixed-Income Funds | | |
Fidelity Government Income Fund | 5.2 | 5.3 |
Fidelity Strategic Real Return Fund | 5.3 | 5.4 |
Fidelity Total Bond Fund | 15.8 | 15.8 |
| 26.3 | 26.5 |
Short-Term Funds | | |
Fidelity Institutional Money Market Portfolio Institutional Class | 3.7 | 3.2 |
Fidelity Short-Term Bond Fund | 3.6 | 3.2 |
| 7.3 | 6.4 |
Net Other Assets (Liabilities)* | 0.0 | 0.0 |
| 100.0 | 100.0 |
* Amount represents less than 0.1%
Asset Allocation (% of fund's net assets) |
Current |
| Domestic Equity Funds | 48.9% | |
| International Equity Funds | 11.4% | |
| High Yield Fixed-Income Funds | 6.1% | |
| Investment Grade Fixed-Income Funds | 26.3% | |
| Short-Term Funds | 7.3% | |

Six months ago |
| Domestic Equity Funds | 49.0% | |
| International Equity Funds | 11.9% | |
| High Yield Fixed-Income Funds | 6.2% | |
| Investment Grade Fixed-Income Funds | 26.5% | |
| Short-Term Funds | 6.4% | |

Expected |
| Domestic Equity Funds | 48.6% | |
| International Equity Funds | 11.2% | |
| High Yield Fixed-Income Funds | 6.0% | |
| Investment Grade Fixed-Income Funds | 26.4% | |
| Short-Term Funds | 7.8% | |

The fund invests according to an asset allocation strategy that becomes increasingly conservative over time. The six months ago allocation is based on the fund's holdings as of July 31, 2010. The current allocation is based on the fund's holdings as of January 31, 2011. The expected allocation represents the fund's anticipated allocation at July 31, 2011. |
Semiannual Report
Fidelity Income Replacement 2038 Fund
Investments January 31, 2011 (Unaudited)
Showing Percentage of Net Assets
Equity Funds - 60.3% |
| Shares | | Value |
Domestic Equity Funds - 48.9% |
Fidelity Advisor Mid Cap II Fund Institutional Class | 5,014 | | $ 91,903 |
Fidelity Disciplined Equity Fund | 4,120 | | 95,661 |
Fidelity Equity-Income Fund | 2,099 | | 95,661 |
Fidelity Large Cap Core Enhanced Index Fund | 17,479 | | 153,120 |
Fidelity Series 100 Index Fund | 12,840 | | 114,918 |
Fidelity Series Broad Market Opportunities Fund | 14,895 | | 153,120 |
Fidelity Series Small Cap Opportunities Fund | 5,596 | | 61,217 |
TOTAL DOMESTIC EQUITY FUNDS | | 765,600 |
International Equity Funds - 11.4% |
Fidelity Advisor International Discovery Fund Institutional Class | 5,411 | | 179,109 |
TOTAL EQUITY FUNDS (Cost $754,796) | 944,709 |
Fixed-Income Funds - 32.4% |
| | | |
High Yield Fixed-Income Funds - 6.1% |
Fidelity Capital & Income Fund | 4,906 | | 47,439 |
Fidelity Strategic Income Fund | 4,243 | | 47,439 |
TOTAL HIGH YIELD FIXED-INCOME FUNDS | | 94,878 |
|
| Shares | | Value |
Investment Grade Fixed-Income Funds - 26.3% |
Fidelity Government Income Fund | 7,926 | | $ 82,509 |
Fidelity Strategic Real Return Fund | 8,506 | | 82,509 |
Fidelity Total Bond Fund | 23,033 | | 247,369 |
TOTAL INVESTMENT GRADE FIXED-INCOME FUNDS | | 412,387 |
TOTAL FIXED-INCOME FUNDS (Cost $468,560) | 507,265 |
Short-Term Funds - 7.3% |
| | | |
Fidelity Institutional Money Market Portfolio Institutional Class | 56,833 | | 56,833 |
Fidelity Short-Term Bond Fund | 6,702 | | 56,833 |
TOTAL SHORT-TERM FUNDS (Cost $112,042) | 113,666 |
TOTAL INVESTMENT PORTFOLIO - 100.0% (Cost $1,335,398) | | 1,565,640 |
NET OTHER ASSETS (LIABILITIES) - 0.0% | | (47) |
NET ASSETS - 100% | $ 1,565,593 |
Other Information |
All investments are categorized as Level 1 under the Fair Value Hierarchy. The inputs or methodology used for valuing securities may not be an indication of the risk associated with investing in those securities. For more information on valuation inputs, please refer to the Security Valuation section in the accompanying Notes to Financial Statements. |
Income Tax Information |
At July 31, 2010, the Fund had a capital loss carryforward of approximately $11,570 all of which will expire in fiscal 2018. Capital loss carryforwards are only available to offset future capital gains of the Fund to the extent provided by regulations and may be limited. |
The Fund intends to elect to defer to its fiscal year ending July 31, 2011 approximately $33,505 of losses recognized during the period November 1, 2009 to July 31, 2010. |
See accompanying notes which are an integral part of the financial statements.
Semiannual Report
Fidelity Income Replacement 2038 Fund
Statement of Assets and Liabilities
| January 31, 2011 (Unaudited) |
| | |
Assets | | |
Investment in securities, at value (cost $1,335,398) - See accompanying schedule | | $ 1,565,640 |
Cash | | 39 |
Receivable for investments sold | | 878,327 |
Total assets | | 2,444,006 |
| | |
Liabilities | | |
Payable for fund shares redeemed | $ 878,327 | |
Distribution and service plan fees payable | 86 | |
Total liabilities | | 878,413 |
| | |
Net Assets | | $ 1,565,593 |
Net Assets consist of: | | |
Paid in capital | | $ 1,431,006 |
Undistributed net investment income | | 534 |
Accumulated undistributed net realized gain (loss) on investments | | (96,189) |
Net unrealized appreciation (depreciation) on investments | | 230,242 |
Net Assets | | $ 1,565,593 |
Calculation of Maximum Offering Price Class A:
Net Asset Value and redemption price per share ($33,754 ÷ 708.4 shares) | | $ 47.65 |
| | |
Maximum offering price per share (100/94.25 of $47.65) | | $ 50.56 |
Class T:
Net Asset Value and redemption price per share ($32,640 ÷ 685.0 shares) | | $ 47.65 |
| | |
Maximum offering price per share (100/96.50 of $47.65) | | $ 49.38 |
| | |
Class C:
Net Asset Value and offering price per share ($79,281 ÷ 1,664.6 shares)A | | $ 47.63 |
| | |
Income Replacement 2038:
Net Asset Value, offering price and redemption price per share ($1,386,759 ÷ 29,105.9 shares) | | $ 47.65 |
| | |
Institutional Class:
Net Asset Value, offering price and redemption price per share ($33,159 ÷ 696.0 shares) | | $ 47.64 |
A Redemption price per share is equal to net asset value less any applicable contingent deferred sales charge.
Statement of Operations
Six months ended January 31, 2011 (Unaudited) |
| | |
Investment Income | | |
Income distributions from underlying funds | | $ 30,684 |
| | |
Expenses | | |
Distribution and service plan fees | $ 545 | |
Independent trustees' compensation | 4 | |
Total expenses before reductions | 549 | |
Expense reductions | (4) | 545 |
Net investment income (loss) | | 30,139 |
Realized and Unrealized Gain (Loss) Realized gain (loss) on sale of underlying fund shares | (25,636) | |
Capital gain distributions from underlying funds | 12,674 | |
Total net realized gain (loss) | | (12,962) |
Change in net unrealized appreciation (depreciation) on underlying funds | | 261,566 |
Net gain (loss) | | 248,604 |
Net increase (decrease) in net assets resulting from operations | | $ 278,743 |
See accompanying notes which are an integral part of the financial statements.
Semiannual Report
Fidelity Income Replacement 2038 Fund
Financial Statements - continued
Statement of Changes in Net Assets
| Six months ended January 31, 2011 (Unaudited) | Year ended
July 31,
2010 |
Increase (Decrease) in Net Assets | | |
Operations | | |
Net investment income (loss) | $ 30,139 | $ 44,672 |
Net realized gain (loss) | (12,962) | (45,293) |
Change in net unrealized appreciation (depreciation) | 261,566 | 254,403 |
Net increase (decrease) in net assets resulting from operations | 278,743 | 253,782 |
Distributions to shareholders from net investment income | (30,223) | (44,437) |
Distributions to shareholders from net realized gain | (9,861) | (9,084) |
Total distributions | (40,084) | (53,521) |
Share transactions - net increase (decrease) | (921,274) | 597,064 |
Total increase (decrease) in net assets | (682,615) | 797,325 |
| | |
Net Assets | | |
Beginning of period | 2,248,208 | 1,450,883 |
End of period (including undistributed net investment income of $534 and undistributed net investment income of $618, respectively) | $ 1,565,593 | $ 2,248,208 |
Financial Highlights - Class A
| Six months ended January 31, 2011 | Years ended July 31, |
| (Unaudited) | 2010 | 2009 | 2008 G |
Selected Per-Share Data | | | | |
Net asset value, beginning of period | $ 43.01 | $ 38.95 | $ 45.26 | $ 50.00 |
Income from Investment Operations | | | | |
Net investment income (loss) E | .538 | .744 | .856 | .442 |
Net realized and unrealized gain (loss) | 4.838 | 4.191 | (6.093) | (4.811) |
Total from investment operations | 5.376 | 4.935 | (5.237) | (4.369) |
Distributions from net investment income | (.543) | (.710) | (.873) | (.371) |
Distributions from net realized gain | (.193) | (.165) | (.200) | - |
Total distributions | (.736) | (.875) | (1.073) | (.371) |
Net asset value, end of period | $ 47.65 | $ 43.01 | $ 38.95 | $ 45.26 |
Total Return B, C, D | 12.55% | 12.72% | (11.24)% | (8.76)% |
Ratios to Average Net Assets F, H | | | | |
Expenses before reductions | .25% A | .25% | .25% | .25% A |
Expenses net of fee waivers, if any | .25% A | .25% | .25% | .25% A |
Expenses net of all reductions | .25% A | .25% | .25% | .25% A |
Net investment income (loss) | 2.37% A | 1.76% | 2.44% | 1.59% A |
Supplemental Data | | | | |
Net assets, end of period (000 omitted) | $ 34 | $ 32 | $ 115 | $ 91 |
Portfolio turnover rate | 19% A | 23% | 41% | 13% A |
A Annualized
B Total returns for periods of less than one year are not annualized.
C Total returns would have been lower had certain expenses not been reduced during the periods shown.
D Total returns do not include the effect of the sales charges.
E Calculated based on average shares outstanding during the period.
F Amounts do not include the activity of the underlying funds.
G For the period December 31, 2007 (commencement of operations) to July 31, 2008.
H Expense ratios reflect operating expenses of the class. Expenses before reductions do not reflect amounts reimbursed by the investment adviser or reductions from expense offset arrangements and do not represent the amount paid by the class during periods when reimbursements or reductions occur. Expenses net of fee waivers reflect expenses after reimbursement by the investment adviser but prior to reductions from expense offset arrangements. Expenses net of all reductions represent the net expenses paid by the class but do not include expenses of the investment companies in which the Fund invests.
See accompanying notes which are an integral part of the financial statements.
Semiannual Report
Financial Highlights - Class T
| Six months ended January 31, 2011 | Years ended July 31, |
| (Unaudited) | 2010 | 2009 | 2008 G |
Selected Per-Share Data | | | | |
Net asset value, beginning of period | $ 43.01 | $ 38.96 | $ 45.26 | $ 50.00 |
Income from Investment Operations | | | | |
Net investment income (loss) E | .481 | .636 | .791 | .373 |
Net realized and unrealized gain (loss) | 4.837 | 4.191 | (6.111) | (4.809) |
Total from investment operations | 5.318 | 4.827 | (5.320) | (4.436) |
Distributions from net investment income | (.485) | (.612) | (.780) | (.304) |
Distributions from net realized gain | (.193) | (.165) | (.200) | - |
Total distributions | (.678) | (.777) | (.980) | (.304) |
Net asset value, end of period | $ 47.65 | $ 43.01 | $ 38.96 | $ 45.26 |
Total Return B, C, D | 12.40% | 12.43% | (11.45)% | (8.89)% |
Ratios to Average Net Assets F, H | | | | |
Expenses before reductions | .50% A | .50% | .50% | .50% A |
Expenses net of fee waivers, if any | .50% A | .50% | .50% | .50% A |
Expenses net of all reductions | .50% A | .50% | .50% | .50% A |
Net investment income (loss) | 2.12% A | 1.50% | 2.20% | 1.34% A |
Supplemental Data | | | | |
Net assets, end of period (000 omitted) | $ 33 | $ 37 | $ 57 | $ 91 |
Portfolio turnover rate | 19% A | 23% | 41% | 13% A |
A Annualized
B Total returns for periods of less than one year are not annualized.
C Total returns would have been lower had certain expenses not been reduced during the periods shown.
D Total returns do not include the effect of the sales charges.
E Calculated based on average shares outstanding during the period.
F Amounts do not include the activity of the underlying funds.
G For the period December 31, 2007 (commencement of operations) to July 31, 2008.
H Expense ratios reflect operating expenses of the class. Expenses before reductions do not reflect amounts reimbursed by the investment adviser or reductions from expense offset arrangements and do not represent the amount paid by the class during periods when reimbursements or reductions occur. Expenses net of fee waivers reflect expenses after reimbursement by the investment adviser but prior to reductions from expense offset arrangements. Expenses net of all reductions represent the net expenses paid by the class but do not include expenses of the investment companies in which the Fund invests.
Financial Highlights - Class C
| Six months ended January 31, 2011 | Years ended July 31, |
| (Unaudited) | 2010 | 2009 | 2008 G |
Selected Per-Share Data | | | | |
Net asset value, beginning of period | $ 42.98 | $ 38.95 | $ 45.24 | $ 50.00 |
Income from Investment Operations | | | | |
Net investment income (loss) E | .368 | .424 | .611 | .233 |
Net realized and unrealized gain (loss) | 4.840 | 4.192 | (6.107) | (4.812) |
Total from investment operations | 5.208 | 4.616 | (5.496) | (4.579) |
Distributions from net investment income | (.365) | (.421) | (.594) | (.181) |
Distributions from net realized gain | (.193) | (.165) | (.200) | - |
Total distributions | (.558) | (.586) | (.794) | (.181) |
Net asset value, end of period | $ 47.63 | $ 42.98 | $ 38.95 | $ 45.24 |
Total Return B, C, D | 12.14% | 11.87% | (11.89)% | (9.17)% |
Ratios to Average Net Assets F, H | | | | |
Expenses before reductions | 1.00% A | 1.00% | 1.00% | 1.00% A |
Expenses net of fee waivers, if any | 1.00% A | 1.00% | 1.00% | 1.00% A |
Expenses net of all reductions | 1.00% A | 1.00% | 1.00% | 1.00% A |
Net investment income (loss) | 1.62% A | 1.01% | 1.70% | .84% A |
Supplemental Data | | | | |
Net assets, end of period (000 omitted) | $ 79 | $ 91 | $ 57 | $ 91 |
Portfolio turnover rate | 19% A | 23% | 41% | 13% A |
A Annualized
B Total returns for periods of less than one year are not annualized.
C Total returns would have been lower had certain expenses not been reduced during the periods shown.
D Total returns do not include the effect of the contingent deferred sales charge.
E Calculated based on average shares outstanding during the period.
F Amounts do not include the activity of the underlying funds.
G For the period December 31, 2007 (commencement of operations) to July 31, 2008.
H Expense ratios reflect operating expenses of the class. Expenses before reductions do not reflect amounts reimbursed by the investment adviser or reductions from expense offset arrangements and do not represent the amount paid by the class during periods when reimbursements or reductions occur. Expenses net of fee waivers reflect expenses after reimbursement by the investment adviser but prior to reductions from expense offset arrangements. Expenses net of all reductions represent the net expenses paid by the class but do not include expenses of the investment companies in which the Fund invests.
See accompanying notes which are an integral part of the financial statements.
Semiannual Report
Financial Highlights - Income Replacement 2038
| Six months ended January 31, 2011 | Years ended July 31, |
| (Unaudited) | 2010 | 2009 | 2008 G |
Selected Per-Share Data | | | | |
Net asset value, beginning of period | $ 43.00 | $ 38.96 | $ 45.27 | $ 50.00 |
Income from Investment Operations | | | | |
Net investment income (loss) D | .597 | .849 | .965 | .502 |
Net realized and unrealized gain (loss) | 4.846 | 4.187 | (6.112) | (4.795) |
Total from investment operations | 5.443 | 5.036 | (5.147) | (4.293) |
Distributions from net investment income | (.600) | (.831) | (.963) | (.437) |
Distributions from net realized gain | (.193) | (.165) | (.200) | - |
Total distributions | (.793) | (.996) | (1.163) | (.437) |
Net asset value, end of period | $ 47.65 | $ 43.00 | $ 38.96 | $ 45.27 |
Total Return B, C | 12.71% | 12.99% | (11.02)% | (8.61)% |
Ratios to Average Net Assets E, H | | | | |
Expenses before reductions F | .00% A | .00% | .00% | .00% A |
Expenses net of fee waivers, if any | .00% A | .00% | .00% | .00% A |
Expenses net of all reductions | .00% A | .00% | .00% | .00% A |
Net investment income (loss) | 2.62% A | 2.01% | 2.69% | 1.84% A |
Supplemental Data | | | | |
Net assets, end of period (000 omitted) | $ 1,387 | $ 2,051 | $ 1,165 | $ 1,122 |
Portfolio turnover rate | 19% A | 23% | 41% | 13% A |
A Annualized
B Total returns for periods of less than one year are not annualized.
C Total returns would have been lower had certain expenses not been reduced during the periods shown.
D Calculated based on average shares outstanding during the period.
E Amounts do not include the activity of the underlying funds.
F Amount represents less than .01%.
G For the period December 31, 2007 (commencement of operations) to July 31, 2008.
H Expense ratios reflect operating expenses of the class. Expenses before reductions do not reflect amounts reimbursed by the investment adviser or reductions from expense offset arrangements and do not represent the amount paid by the class during periods when reimbursements or reductions occur. Expenses net of fee waivers reflect expenses after reimbursement by the investment adviser but prior to reductions from expense offset arrangements. Expenses net of all reductions represent the net expenses paid by the class but do not include expenses of the investment companies in which the Fund invests.
Financial Highlights - Institutional Class
| Six months ended January 31, 2011 | Years ended July 31, |
| (Unaudited) | 2010 | 2009 | 2008 G |
Selected Per-Share Data | | | | |
Net asset value, beginning of period | $ 43.00 | $ 38.96 | $ 45.26 | $ 50.00 |
Income from Investment Operations | | | | |
Net investment income (loss) D | .594 | .848 | .974 | .511 |
Net realized and unrealized gain (loss) | 4.839 | 4.188 | (6.111) | (4.814) |
Total from investment operations | 5.433 | 5.036 | (5.137) | (4.303) |
Distributions from net investment income | (.600) | (.831) | (.963) | (.437) |
Distributions from net realized gain | (.193) | (.165) | (.200) | - |
Total distributions | (.793) | (.996) | (1.163) | (.437) |
Net asset value, end of period | $ 47.64 | $ 43.00 | $ 38.96 | $ 45.26 |
Total Return B, C | 12.69% | 12.99% | (11.00)% | (8.63)% |
Ratios to Average Net Assets E, H | | | | |
Expenses before reductions F | .00% A | .00% | .00% | .00% A |
Expenses net of fee waivers, if any | .00% A | .00% | .00% | .00% A |
Expenses net of all reductions | .00% A | .00% | .00% | .00% A |
Net investment income (loss) | 2.62% A | 2.01% | 2.69% | 1.84% A |
Supplemental Data | | | | |
Net assets, end of period (000 omitted) | $ 33 | $ 38 | $ 58 | $ 91 |
Portfolio turnover rate | 19% A | 23% | 41% | 13% A |
A Annualized
B Total returns for periods of less than one year are not annualized.
C Total returns would have been lower had certain expenses not been reduced during the periods shown.
D Calculated based on average shares outstanding during the period.
E Amounts do not include the activity of the underlying funds.
F Amount represents less than .01%.
G For the period December 31, 2007 (commencement of operations) to July 31, 2008.
H Expense ratios reflect operating expenses of the class. Expenses before reductions do not reflect amounts reimbursed by the investment adviser or reductions from expense offset arrangements and do not represent the amount paid by the class during periods when reimbursements or reductions occur. Expenses net of fee waivers reflect expenses after reimbursement by the investment adviser but prior to reductions from expense offset arrangements. Expenses net of all reductions represent the net expenses paid by the class but do not include expenses of the investment companies in which the Fund invests.
See accompanying notes which are an integral part of the financial statements.
Semiannual Report
Fidelity Income Replacement 2040 Fund
Investment Changes (Unaudited)
Fund Holdings as of January 31, 2011 |
| % of fund's
net assets | % of fund's net assets
6 months ago |
Domestic Equity Funds | | |
Fidelity Advisor Mid Cap II Fund Institutional Class | 6.0 | 6.0 |
Fidelity Disciplined Equity Fund | 6.3 | 6.2 |
Fidelity Equity-Income Fund | 6.3 | 6.3 |
Fidelity Large Cap Core Enhanced Index Fund | 10.1 | 10.0 |
Fidelity Series 100 Index Fund | 7.5 | 7.6 |
Fidelity Series Broad Market Opportunities Fund | 10.1 | 10.1 |
Fidelity Series Small Cap Opportunities Fund | 4.0 | 4.1 |
| 50.3 | 50.3 |
International Equity Funds | | |
Fidelity Advisor International Discovery Fund Institutional Class | 12.6 | 12.8 |
High Yield Fixed-Income Funds | | |
Fidelity Capital & Income Fund | 3.2 | 3.3 |
Fidelity Strategic Income Fund | 3.2 | 3.3 |
| 6.4 | 6.6 |
Investment Grade Fixed-Income Funds | | |
Fidelity Government Income Fund | 5.2 | 5.2 |
Fidelity Strategic Real Return Fund | 5.2 | 5.3 |
Fidelity Total Bond Fund | 15.7 | 15.7 |
| 26.1 | 26.2 |
Short-Term Funds | | |
Fidelity Institutional Money Market Portfolio Institutional Class | 2.3 | 2.0 |
Fidelity Short-Term Bond Fund | 2.3 | 2.1 |
| 4.6 | 4.1 |
Net Other Assets (Liabilities)* | 0.0 | 0.0 |
| 100.0 | 100.0 |
* Amount represents less than 0.1%
Asset Allocation (% of fund's net assets) |
Current |
| Domestic Equity Funds | 50.3% | |
| International Equity Funds | 12.6% | |
| High Yield Fixed-Income Funds | 6.4% | |
| Investment Grade Fixed-Income Funds | 26.1% | |
| Short-Term Funds | 4.6% | |

Six months ago |
| Domestic Equity Funds | 50.3% | |
| International Equity Funds | 12.8% | |
| High Yield Fixed-Income Funds | 6.6% | |
| Investment Grade Fixed-Income Funds | 26.2% | |
| Short-Term Funds | 4.1% | |

Expected |
| Domestic Equity Funds | 50.0% | |
| International Equity Funds | 12.3% | |
| High Yield Fixed-Income Funds | 6.3% | |
| Investment Grade Fixed-Income Funds | 26.1% | |
| Short-Term Funds | 5.3% | |

The fund invests according to an asset allocation strategy that becomes increasingly conservative over time. The six months ago allocation is based on the fund's holdings as of July 31, 2010. The current allocation is based on the fund's holdings as of January 31, 2011. The expected allocation represents the fund's anticipated allocation at July 31, 2011. |
Semiannual Report
Fidelity Income Replacement 2040 Fund
Investments January 31, 2011 (Unaudited)
Showing Percentage of Net Assets
Equity Funds - 62.9% |
| Shares | | Value |
Domestic Equity Funds - 50.3% |
Fidelity Advisor Mid Cap II Fund Institutional Class | 6,811 | | $ 124,855 |
Fidelity Disciplined Equity Fund | 5,600 | | 130,023 |
Fidelity Equity-Income Fund | 2,853 | | 130,022 |
Fidelity Large Cap Core Enhanced Index Fund | 23,763 | | 208,160 |
Fidelity Series 100 Index Fund | 17,438 | | 156,068 |
Fidelity Series Broad Market Opportunities Fund | 20,249 | | 208,160 |
Fidelity Series Small Cap Opportunities Fund | 7,615 | | 83,305 |
TOTAL DOMESTIC EQUITY FUNDS | | 1,040,593 |
International Equity Funds - 12.6% |
Fidelity Advisor International Discovery Fund Institutional Class | 7,838 | | 259,425 |
TOTAL EQUITY FUNDS (Cost $1,129,442) | 1,300,018 |
Fixed-Income Funds - 32.5% |
| | | |
High Yield Fixed-Income Funds - 6.4% |
Fidelity Capital & Income Fund | 6,883 | | 66,562 |
Fidelity Strategic Income Fund | 5,954 | | 66,562 |
TOTAL HIGH YIELD FIXED-INCOME FUNDS | | 133,124 |
|
| Shares | | Value |
Investment Grade Fixed-Income Funds - 26.1% |
Fidelity Government Income Fund | 10,346 | | $ 107,698 |
Fidelity Strategic Real Return Fund | 11,103 | | 107,698 |
Fidelity Total Bond Fund | 30,122 | | 323,506 |
TOTAL INVESTMENT GRADE FIXED-INCOME FUNDS | | 538,902 |
TOTAL FIXED-INCOME FUNDS (Cost $648,649) | 672,026 |
Short-Term Funds - 4.6% |
| | | |
Fidelity Institutional Money Market Portfolio Institutional Class | 47,544 | | 47,544 |
Fidelity Short-Term Bond Fund | 5,607 | | 47,544 |
TOTAL SHORT-TERM FUNDS (Cost $94,688) | 95,088 |
TOTAL INVESTMENT PORTFOLIO - 100.0% (Cost $1,872,779) | | 2,067,132 |
NET OTHER ASSETS (LIABILITIES) - 0.0% | | (105) |
NET ASSETS - 100% | $ 2,067,027 |
Other Information |
All investments are categorized as Level 1 under the Fair Value Hierarchy. The inputs or methodology used for valuing securities may not be an indication of the risk associated with investing in those securities. For more information on valuation inputs, please refer to the Security Valuation section in the accompanying Notes to Financial Statements. |
Income Tax Information |
At July 31, 2010, the Fund had a capital loss carryforward of approximately $153,270 of which $763 and $152,507 will expire in fiscal 2017 and 2018, respectively. Capital loss carryforwards are only available to offset future capital gains of the Fund to the extent provided by regulations and may be limited. |
See accompanying notes which are an integral part of the financial statements.
Semiannual Report
Fidelity Income Replacement 2040 Fund
Statement of Assets and Liabilities
| January 31, 2011 (Unaudited) |
| | |
Assets | | |
Investment in securities, at value (cost $1,872,779) - See accompanying schedule | | $ 2,067,132 |
Cash | | 39 |
Receivable for investments sold | | 7,438 |
Receivable for fund shares sold | | 6,205 |
Total assets | | 2,080,814 |
| | |
Liabilities | | |
Payable for investments purchased | $ 13,645 | |
Distribution and service plan fees payable | 142 | |
Total liabilities | | 13,787 |
| | |
Net Assets | | $ 2,067,027 |
Net Assets consist of: | | |
Paid in capital | | $ 2,112,823 |
Undistributed net investment income | | 444 |
Accumulated undistributed net realized gain (loss) on investments | | (240,593) |
Net unrealized appreciation (depreciation) on investments | | 194,353 |
Net Assets | | $ 2,067,027 |
Calculation of Maximum Offering Price Class A:
Net Asset Value and redemption price per share ($86,283 ÷ 1,802.3 shares) | | $ 47.87 |
| | |
Maximum offering price per share (100/94.25 of $47.87) | | $ 50.79 |
Class T:
Net Asset Value and redemption price per share ($127,114 ÷ 2,654.8 shares) | | $ 47.88 |
| | |
Maximum offering price per share (100/96.50 of $47.88) | | $ 49.62 |
| | |
Class C:
Net Asset Value and offering price per share ($86,681 ÷ 1,810.2 shares)A | | $ 47.88 |
| | |
Income Replacement 2040:
Net Asset Value, offering price and redemption price per share ($1,712,185 ÷ 35,762.3 shares) | | $ 47.88 |
| | |
Institutional Class:
Net Asset Value, offering price and redemption price per share ($54,764 ÷ 1,143.8 shares) | | $ 47.88 |
A Redemption price per share is equal to net asset value less any applicable contingent deferred sales charge.
Statement of Operations
Six months ended January 31, 2011 (Unaudited) |
| | |
Investment Income | | |
Income distributions from underlying funds | | $ 22,912 |
| | |
Expenses | | |
Distribution and service plan fees | $ 825 | |
Independent trustees' compensation | 3 | |
Total expenses before reductions | 828 | |
Expense reductions | (3) | 825 |
Net investment income (loss) | | 22,087 |
Realized and Unrealized Gain (Loss) Realized gain (loss) on sale of underlying fund shares | 25,387 | |
Capital gain distributions from underlying funds | 9,243 | |
Total net realized gain (loss) | | 34,630 |
Change in net unrealized appreciation (depreciation) on underlying funds | | 147,363 |
Net gain (loss) | | 181,993 |
Net increase (decrease) in net assets resulting from operations | | $ 204,080 |
See accompanying notes which are an integral part of the financial statements.
Semiannual Report
Statement of Changes in Net Assets
| Six months ended January 31, 2011 (Unaudited) | Year ended
July 31,
2010 |
Increase (Decrease) in Net Assets | | |
Operations | | |
Net investment income (loss) | $ 22,087 | $ 23,376 |
Net realized gain (loss) | 34,630 | (127,348) |
Change in net unrealized appreciation (depreciation) | 147,363 | 184,622 |
Net increase (decrease) in net assets resulting from operations | 204,080 | 80,650 |
Distributions to shareholders from net investment income | (22,028) | (23,219) |
Distributions to shareholders from net realized gain | (7,263) | (2,847) |
Total distributions | (29,291) | (26,066) |
Share transactions - net increase (decrease) | 324,089 | 856,629 |
Total increase (decrease) in net assets | 498,878 | 911,213 |
| | |
Net Assets | | |
Beginning of period | 1,568,149 | 656,936 |
End of period (including undistributed net investment income of $444 and undistributed net investment income of $385, respectively) | $ 2,067,027 | $ 1,568,149 |
Financial Highlights - Class A
| Six months ended January 31, 2011 | Years ended July 31, |
| (Unaudited) | 2010 | 2009 | 2008 G |
Selected Per-Share Data | | | | |
Net asset value, beginning of period | $ 43.04 | $ 38.83 | $ 45.23 | $ 50.00 |
Income from Investment Operations | | | | |
Net investment income (loss) E | .565 | .722 | .933 | .442 |
Net realized and unrealized gain (loss) | 5.015 | 4.298 | (6.238) | (4.814) |
Total from investment operations | 5.580 | 5.020 | (5.305) | (4.372) |
Distributions from net investment income | (.558) | (.710) | (.885) | (.398) |
Distributions from net realized gain | (.192) | (.100) | (.210) | - |
Total distributions | (.750) | (.810) | (1.095) | (.398) |
Net asset value, end of period | $ 47.87 | $ 43.04 | $ 38.83 | $ 45.23 |
Total Return B, C, D | 13.01% | 12.97% | (11.41)% | (8.77)% |
Ratios to Average Net Assets F, H | | | | |
Expenses before reductions | .25% A | .25% | .25% | .25% A |
Expenses net of fee waivers, if any | .25% A | .25% | .25% | .25% A |
Expenses net of all reductions | .25% A | .25% | .25% | .25% A |
Net investment income (loss) | 2.47% A | 1.70% | 2.60% | 1.60% A |
Supplemental Data | | | | |
Net assets, end of period (000 omitted) | $ 86 | $ 34 | $ 57 | $ 91 |
Portfolio turnover rate | 44% A | 129% | 50% | 4% A |
A Annualized
B Total returns for periods of less than one year are not annualized.
C Total returns would have been lower had certain expenses not been reduced during the periods shown.
D Total returns do not include the effect of the sales charges.
E Calculated based on average shares outstanding during the period.
F Amounts do not include the activity of the underlying funds.
G For the period December 31, 2007 (commencement of operations) to July 31, 2008.
H Expense ratios reflect operating expenses of the class. Expenses before reductions do not reflect amounts reimbursed by the investment adviser or reductions from expense offset arrangements and do not represent the amount paid by the class during periods when reimbursements or reductions occur. Expenses net of fee waivers reflect expenses after reimbursement by the investment adviser but prior to reductions from expense offset arrangements. Expenses net of all reductions represent the net expenses paid by the class but do not include expenses of the investment companies in which the Fund invests.
See accompanying notes which are an integral part of the financial statements.
Semiannual Report
Financial Highlights - Class T
| Six months ended January 31, 2011 | Years ended July 31, |
| (Unaudited) | 2010 | 2009 | 2008 G |
Selected Per-Share Data | | | | |
Net asset value, beginning of period | $ 43.05 | $ 38.84 | $ 45.23 | $ 50.00 |
Income from Investment Operations | | | | |
Net investment income (loss) E | .504 | .616 | .836 | .371 |
Net realized and unrealized gain (loss) | 5.013 | 4.301 | (6.227) | (4.809) |
Total from investment operations | 5.517 | 4.917 | (5.391) | (4.438) |
Distributions from net investment income | (.495) | (.607) | (.789) | (.332) |
Distributions from net realized gain | (.192) | (.100) | (.210) | - |
Total distributions | (.687) | (.707) | (.999) | (.332) |
Net asset value, end of period | $ 47.88 | $ 43.05 | $ 38.84 | $ 45.23 |
Total Return B, C, D | 12.86% | 12.69% | (11.62)% | (8.90)% |
Ratios to Average Net Assets F, H | | | | |
Expenses before reductions | .50% A | .50% | .50% | .50% A |
Expenses net of fee waivers, if any | .50% A | .50% | .50% | .50% A |
Expenses net of all reductions | .50% A | .50% | .50% | .50% A |
Net investment income (loss) | 2.21% A | 1.45% | 2.35% | 1.35% A |
Supplemental Data | | | | |
Net assets, end of period (000 omitted) | $ 127 | $ 111 | $ 102 | $ 132 |
Portfolio turnover rate | 44% A | 129% | 50% | 4% A |
A Annualized
B Total returns for periods of less than one year are not annualized.
C Total returns would have been lower had certain expenses not been reduced during the periods shown.
D Total returns do not include the effect of the sales charges.
E Calculated based on average shares outstanding during the period.
F Amounts do not include the activity of the underlying funds.
G For the period December 31, 2007 (commencement of operations) to July 31, 2008.
H Expense ratios reflect operating expenses of the class. Expenses before reductions do not reflect amounts reimbursed by the investment adviser or reductions from expense offset arrangements and do not represent the amount paid by the class during periods when reimbursements or reductions occur. Expenses net of fee waivers reflect expenses after reimbursement by the investment adviser but prior to reductions from expense offset arrangements. Expenses net of all reductions represent the net expenses paid by the class but do not include expenses of the investment companies in which the Fund invests.
Financial Highlights - Class C
| Six months ended January 31, 2011 | Years ended July 31, |
| (Unaudited) | 2010 | 2009 | 2008 G |
Selected Per-Share Data | | | | |
Net asset value, beginning of period | $ 43.05 | $ 38.84 | $ 45.22 | $ 50.00 |
Income from Investment Operations | | | | |
Net investment income (loss) E | .390 | .402 | .664 | .234 |
Net realized and unrealized gain (loss) | 5.012 | 4.305 | (6.229) | (4.816) |
Total from investment operations | 5.402 | 4.707 | (5.565) | (4.582) |
Distributions from net investment income | (.380) | (.397) | (.605) | (.198) |
Distributions from net realized gain | (.192) | (.100) | (.210) | - |
Total distributions | (.572) | (.497) | (.815) | (.198) |
Net asset value, end of period | $ 47.88 | $ 43.05 | $ 38.84 | $ 45.22 |
Total Return B, C, D | 12.57% | 12.13% | (12.06)% | (9.18)% |
Ratios to Average Net Assets F, H | | | | |
Expenses before reductions | 1.00% A | 1.00% | 1.00% | 1.00% A |
Expenses net of fee waivers, if any | 1.00% A | 1.00% | 1.00% | 1.00% A |
Expenses net of all reductions | 1.00% A | 1.00% | 1.00% | 1.00% A |
Net investment income (loss) | 1.71% A | .95% | 1.85% | .84% A |
Supplemental Data | | | | |
Net assets, end of period (000 omitted) | $ 87 | $ 99 | $ 57 | $ 91 |
Portfolio turnover rate | 44% A | 129% | 50% | 4% A |
A Annualized
B Total returns for periods of less than one year are not annualized.
C Total returns would have been lower had certain expenses not been reduced during the periods shown.
D Total returns do not include the effect of the contingent deferred sales charge.
E Calculated based on average shares outstanding during the period.
F Amounts do not include the activity of the underlying funds.
G For the period December 31, 2007 (commencement of operations) to July 31, 2008.
H Expense ratios reflect operating expenses of the class. Expenses before reductions do not reflect amounts reimbursed by the investment adviser or reductions from expense offset arrangements and do not represent the amount paid by the class during periods when reimbursements or reductions occur. Expenses net of fee waivers reflect expenses after reimbursement by the investment adviser but prior to reductions from expense offset arrangements. Expenses net of all reductions represent the net expenses paid by the class but do not include expenses of the investment companies in which the Fund invests.
See accompanying notes which are an integral part of the financial statements.
Semiannual Report
Financial Highlights - Income Replacement 2040
| Six months ended January 31, 2011 | Years ended July 31, |
| (Unaudited) | 2010 | 2009 | 2008 G |
Selected Per-Share Data | | | | |
Net asset value, beginning of period | $ 43.04 | $ 38.83 | $ 45.23 | $ 50.00 |
Income from Investment Operations | | | | |
Net investment income (loss) D | .618 | .833 | 1.015 | .504 |
Net realized and unrealized gain (loss) | 5.022 | 4.297 | (6.231) | (4.810) |
Total from investment operations | 5.640 | 5.130 | (5.216) | (4.306) |
Distributions from net investment income | (.608) | (.820) | (.974) | (.464) |
Distributions from net realized gain | (.192) | (.100) | (.210) | - |
Total distributions | (.800) | (.920) | (1.184) | (.464) |
Net asset value, end of period | $ 47.88 | $ 43.04 | $ 38.83 | $ 45.23 |
Total Return B, C | 13.16% | 13.26% | (11.19)% | (8.64)% |
Ratios to Average Net Assets E, H | | | | |
Expenses before reductions F | .00% A | .00% | .00% | .00% A |
Expenses net of fee waivers, if any | .00% A | .00% | .00% | .00% A |
Expenses net of all reductions | .00% A | .00% | .00% | .00% A |
Net investment income (loss) | 2.72% A | 1.96% | 2.85% | 1.85% A |
Supplemental Data | | | | |
Net assets, end of period (000 omitted) | $ 1,712 | $ 1,262 | $ 384 | $ 598 |
Portfolio turnover rate | 44% A | 129% | 50% | 4% A |
A Annualized
B Total returns for periods of less than one year are not annualized.
C Total returns would have been lower had certain expenses not been reduced during the periods shown.
D Calculated based on average shares outstanding during the period.
E Amounts do not include the activity of the underlying funds.
F Amount represents less than .01%.
G For the period December 31, 2007 (commencement of operations) to July 31, 2008.
H Expense ratios reflect operating expenses of the class. Expenses before reductions do not reflect amounts reimbursed by the investment adviser or reductions from expense offset arrangements and do not represent the amount paid by the class during periods when reimbursements or reductions occur. Expenses net of fee waivers reflect expenses after reimbursement by the investment adviser but prior to reductions from expense offset arrangements. Expenses net of all reductions represent the net expenses paid by the class but do not include expenses of the investment companies in which the Fund invests.
Financial Highlights - Institutional Class
| Six months ended January 31, 2011 | Years ended July 31, |
| (Unaudited) | 2010 | 2009 | 2008 G |
Selected Per-Share Data | | | | |
Net asset value, beginning of period | $ 43.04 | $ 38.83 | $ 45.23 | $ 50.00 |
Income from Investment Operations | | | | |
Net investment income (loss) D | .618 | .828 | 1.022 | .512 |
Net realized and unrealized gain (loss) | 5.022 | 4.302 | (6.238) | (4.818) |
Total from investment operations | 5.640 | 5.130 | (5.216) | (4.306) |
Distributions from net investment income | (.608) | (.820) | (.974) | (.464) |
Distributions from net realized gain | (.192) | (.100) | (.210) | - |
Total distributions | (.800) | (.920) | (1.184) | (.464) |
Net asset value, end of period | $ 47.88 | $ 43.04 | $ 38.83 | $ 45.23 |
Total Return B, C | 13.16% | 13.26% | (11.19)% | (8.64)% |
Ratios to Average Net Assets E, H | | | | |
Expenses before reductions F | .00% A | .00% | .00% | .00% A |
Expenses net of fee waivers, if any | .00% A | .00% | .00% | .00% A |
Expenses net of all reductions | .00% A | .00% | .00% | .00% A |
Net investment income (loss) | 2.72% A | 1.96% | 2.85% | 1.85% A |
Supplemental Data | | | | |
Net assets, end of period (000 omitted) | $ 55 | $ 62 | $ 57 | $ 91 |
Portfolio turnover rate | 44% A | 129% | 50% | 4% A |
A Annualized
B Total returns for periods of less than one year are not annualized.
C Total returns would have been lower had certain expenses not been reduced during the periods shown.
D Calculated based on average shares outstanding during the period.
E Amounts do not include the activity of the underlying funds.
F Amount represents less than .01%.
G For the period December 31, 2007 (commencement of operations) to July 31, 2008.
H Expense ratios reflect operating expenses of the class. Expenses before reductions do not reflect amounts reimbursed by the investment adviser or reductions from expense offset arrangements and do not represent the amount paid by the class during periods when reimbursements or reductions occur. Expenses net of fee waivers reflect expenses after reimbursement by the investment adviser but prior to reductions from expense offset arrangements. Expenses net of all reductions represent the net expenses paid by the class but do not include expenses of the investment companies in which the Fund invests.
See accompanying notes which are an integral part of the financial statements.
Semiannual Report
Fidelity Income Replacement 2042 Fund
Investment Changes (Unaudited)
Fund Holdings as of January 31, 2011 |
| % of fund's
net assets | % of fund's net assets
6 months ago |
Domestic Equity Funds | | |
Fidelity Advisor Mid Cap II Fund Institutional Class | 6.1 | 6.1 |
Fidelity Disciplined Equity Fund | 6.4 | 6.3 |
Fidelity Equity-Income Fund | 6.4 | 6.4 |
Fidelity Large Cap Core Enhanced Index Fund | 10.2 | 10.2 |
Fidelity Series 100 Index Fund | 7.7 | 7.7 |
Fidelity Series Broad Market Opportunities Fund | 10.3 | 10.2 |
Fidelity Series Small Cap Opportunities Fund | 4.1 | 4.2 |
| 51.2 | 51.1 |
International Equity Funds | | |
Fidelity Advisor International Discovery Fund Institutional Class | 12.8 | 13.0 |
High Yield Fixed-Income Funds | | |
Fidelity Capital & Income Fund | 3.3 | 3.4 |
Fidelity Strategic Income Fund | 3.4 | 3.4 |
| 6.7 | 6.8 |
Investment Grade Fixed-Income Funds | | |
Fidelity Government Income Fund | 5.2 | 5.2 |
Fidelity Strategic Real Return Fund | 5.2 | 5.3 |
Fidelity Total Bond Fund | 15.6 | 15.7 |
| 26.0 | 26.2 |
Short-Term Funds | | |
Fidelity Institutional Money Market Portfolio Institutional Class | 1.7 | 1.4 |
Fidelity Short-Term Bond Fund | 1.6 | 1.5 |
| 3.3 | 2.9 |
Net Other Assets (Liabilities)* | 0.0 | 0.0 |
| 100.0 | 100.0 |
* Amount represents less than 0.1%
Asset Allocation (% of fund's net assets) |
Current |
| Domestic Equity Funds | 51.2% | |
| International Equity Funds | 12.8% | |
| High Yield Fixed-Income Funds | 6.7% | |
| Investment Grade Fixed-Income Funds | 26.0% | |
| Short-Term Funds | 3.3% | |

Six months ago |
| Domestic Equity Funds | 51.1% | |
| International Equity Funds | 13.0% | |
| High Yield Fixed-Income Funds | 6.8% | |
| Investment Grade Fixed-Income Funds | 26.2% | |
| Short-Term Funds | 2.9% | |

Expected |
| Domestic Equity Funds | 51.0% | |
| International Equity Funds | 12.8% | |
| High Yield Fixed-Income Funds | 6.6% | |
| Investment Grade Fixed-Income Funds | 26.0% | |
| Short-Term Funds | 3.6% | |

The fund invests according to an asset allocation strategy that becomes increasingly conservative over time. The six months ago allocation is based on the fund's holdings as of July 31, 2010. The current allocation is based on the fund's holdings as of January 31, 2011. The expected allocation represents the fund's anticipated allocation at July 31, 2011. |
Semiannual Report
Fidelity Income Replacement 2042 Fund
Investments January 31, 2011 (Unaudited)
Showing Percentage of Net Assets
Equity Funds - 64.0% |
| Shares | | Value |
Domestic Equity Funds - 51.2% |
Fidelity Advisor Mid Cap II Fund Institutional Class | 15,747 | | $ 288,648 |
Fidelity Disciplined Equity Fund | 12,957 | | 300,870 |
Fidelity Equity-Income Fund | 6,602 | | 300,870 |
Fidelity Large Cap Core Enhanced Index Fund | 54,953 | | 481,393 |
Fidelity Series 100 Index Fund | 40,340 | | 361,044 |
Fidelity Series Broad Market Opportunities Fund | 46,828 | | 481,393 |
Fidelity Series Small Cap Opportunities Fund | 17,618 | | 192,745 |
TOTAL DOMESTIC EQUITY FUNDS | | 2,406,963 |
International Equity Funds - 12.8% |
Fidelity Advisor International Discovery Fund Institutional Class | 18,179 | | 601,741 |
TOTAL EQUITY FUNDS (Cost $2,623,955) | 3,008,704 |
Fixed-Income Funds - 32.7% |
| | | |
High Yield Fixed-Income Funds - 6.7% |
Fidelity Capital & Income Fund | 16,286 | | 157,487 |
Fidelity Strategic Income Fund | 14,086 | | 157,487 |
TOTAL HIGH YIELD FIXED-INCOME FUNDS | | 314,974 |
|
| Shares | | Value |
Investment Grade Fixed-Income Funds - 26.0% |
Fidelity Government Income Fund | 23,528 | | $ 244,927 |
Fidelity Strategic Real Return Fund | 25,250 | | 244,927 |
Fidelity Total Bond Fund | 68,372 | | 734,312 |
TOTAL INVESTMENT GRADE FIXED-INCOME FUNDS | | 1,224,166 |
TOTAL FIXED-INCOME FUNDS (Cost $1,453,204) | 1,539,140 |
Short-Term Funds - 3.3% |
| | | |
Fidelity Institutional Money Market Portfolio Institutional Class | 76,628 | | 76,628 |
Fidelity Short-Term Bond Fund | 9,036 | | 76,628 |
TOTAL SHORT-TERM FUNDS (Cost $152,177) | 153,256 |
TOTAL INVESTMENT PORTFOLIO - 100.0% (Cost $4,229,336) | | 4,701,100 |
NET OTHER ASSETS (LIABILITIES) - 0.0% | | (3) |
NET ASSETS - 100% | $ 4,701,097 |
Other Information |
All investments are categorized as Level 1 under the Fair Value Hierarchy. The inputs or methodology used for valuing securities may not be an indication of the risk associated with investing in those securities. For more information on valuation inputs, please refer to the Security Valuation section in the accompanying Notes to Financial Statements. |
Income Tax Information |
At July 31, 2010, the Fund had a capital loss carryforward of approximately $17,454 of which $2,106 and $15,348 will expire in fiscal 2017 and 2018, respectively. Capital loss carryforwards are only available to offset future capital gains of the Fund to the extent provided by regulations and may be limited. |
See accompanying notes which are an integral part of the financial statements.
Semiannual Report
Fidelity Income Replacement 2042 Fund
Statement of Assets and Liabilities
| January 31, 2011 (Unaudited) |
| | |
Assets | | |
Investment in securities, at value (cost $4,229,336) - See accompanying schedule | | $ 4,701,100 |
Cash | | 40 |
Receivable for fund shares sold | | 883,327 |
Total assets | | 5,584,467 |
| | |
Liabilities | | |
Payable for investments purchased | $ 883,324 | |
Distribution and service plan fees payable | 46 | |
Total liabilities | | 883,370 |
| | |
Net Assets | | $ 4,701,097 |
Net Assets consist of: | | |
Paid in capital | | $ 4,337,652 |
Undistributed net investment income | | 901 |
Accumulated undistributed net realized gain (loss) on investments | | (109,220) |
Net unrealized appreciation (depreciation) on investments | | 471,764 |
Net Assets | | $ 4,701,097 |
Calculation of Maximum Offering Price Class A:
Net Asset Value and redemption price per share ($25,696 ÷ 535.9 shares) | | $ 47.95 |
| | |
Maximum offering price per share (100/94.25 of $47.95) | | $ 50.88 |
Class T:
Net Asset Value and redemption price per share ($32,835 ÷ 684.7 shares) | | $ 47.96 |
| | |
Maximum offering price per share (100/96.50 of $47.96) | | $ 49.70 |
| | |
Class C:
Net Asset Value and offering price per share ($32,321 ÷ 673.8 shares)A | | $ 47.97 |
| | |
Income Replacement 2042:
Net Asset Value, offering price and redemption price per share ($4,576,885 ÷ 95,468.2 shares) | | $ 47.94 |
| | |
Institutional Class:
Net Asset Value, offering price and redemption price per share ($33,360 ÷ 695.9 shares) | | $ 47.94 |
A Redemption price per share is equal to net asset value less any applicable contingent deferred sales charge.
Statement of Operations
Six months ended January 31, 2011 (Unaudited) |
| | |
Investment Income | | |
Income distributions from underlying funds | | $ 49,692 |
| | |
Expenses | | |
Distribution and service plan fees | $ 292 | |
Independent trustees' compensation | 7 | |
Total expenses before reductions | 299 | |
Expense reductions | (7) | 292 |
Net investment income (loss) | | 49,400 |
Realized and Unrealized Gain (Loss) Realized gain (loss) on sale of underlying fund shares | (38,568) | |
Capital gain distributions from underlying funds | 20,282 | |
Total net realized gain (loss) | | (18,286) |
Change in net unrealized appreciation (depreciation) on underlying funds | | 431,347 |
Net gain (loss) | | 413,061 |
Net increase (decrease) in net assets resulting from operations | | $ 462,461 |
See accompanying notes which are an integral part of the financial statements.
Semiannual Report
Fidelity Income Replacement 2042 Fund
Financial Statements - continued
Statement of Changes in Net Assets
| Six months ended January 31, 2011 (Unaudited) | Year ended
July 31,
2010 |
Increase (Decrease) in Net Assets | | |
Operations | | |
Net investment income (loss) | $ 49,400 | $ 58,360 |
Net realized gain (loss) | (18,286) | (3,503) |
Change in net unrealized appreciation (depreciation) | 431,347 | 231,761 |
Net increase (decrease) in net assets resulting from operations | 462,461 | 286,618 |
Distributions to shareholders from net investment income | (49,432) | (57,943) |
Distributions to shareholders from net realized gain | (15,604) | (7,508) |
Total distributions | (65,036) | (65,451) |
Share transactions - net increase (decrease) | 768,588 | 1,660,037 |
Total increase (decrease) in net assets | 1,166,013 | 1,881,204 |
| | |
Net Assets | | |
Beginning of period | 3,535,084 | 1,653,880 |
End of period (including undistributed net investment income of $901 and undistributed net investment income of $933, respectively) | $ 4,701,097 | $ 3,535,084 |
Financial Highlights - Class A
| Six months ended January 31, 2011 | Years ended July 31, |
| (Unaudited) | 2010 | 2009 | 2008 G |
Selected Per-Share Data | | | | |
Net asset value, beginning of period | $ 43.04 | $ 38.83 | $ 45.20 | $ 50.00 |
Income from Investment Operations | | | | |
Net investment income (loss) E | .557 | .747 | .819 | .425 |
Net realized and unrealized gain (loss) | 5.106 | 4.285 | (6.123) | (4.836) |
Total from investment operations | 5.663 | 5.032 | (5.304) | (4.411) |
Distributions from net investment income | (.558) | (.717) | (.866) | (.389) |
Distributions from net realized gain | (.195) | (.105) | (.200) | - |
Total distributions | (.753) | (.822) | (1.066) | (.389) |
Net asset value, end of period | $ 47.95 | $ 43.04 | $ 38.83 | $ 45.20 |
Total Return B, C, D | 13.21% | 13.00% | (11.40)% | (8.85)% |
Ratios to Average Net Assets F, H | | | | |
Expenses before reductions | .25% A | .25% | .25% | .25% A |
Expenses net of fee waivers, if any | .25% A | .25% | .25% | .25% A |
Expenses net of all reductions | .25% A | .25% | .25% | .25% A |
Net investment income (loss) | 2.44% A | 1.77% | 2.32% | 1.57% A |
Supplemental Data | | | | |
Net assets, end of period (000 omitted) | $ 26 | $ 29 | $ 88 | $ 91 |
Portfolio turnover rate | 27% A | 20% | 37% | 8% A |
A Annualized
B Total returns for periods of less than one year are not annualized.
C Total returns would have been lower had certain expenses not been reduced during the periods shown.
D Total returns do not include the effect of the sales charges.
E Calculated based on average shares outstanding during the period.
F Amounts do not include the activity of the underlying funds.
G For the period December 31, 2007 (commencement of operations) to July 31, 2008.
H Expense ratios reflect operating expenses of the class. Expenses before reductions do not reflect amounts reimbursed by the investment adviser or reductions from expense offset arrangements and do not represent the amount paid by the class during periods when reimbursements or reductions occur. Expenses net of fee waivers reflect expenses after reimbursement by the investment adviser but prior to reductions from expense offset arrangements. Expenses net of all reductions represent the net expenses paid by the class but do not include expenses of the investment companies in which the Fund invests.
See accompanying notes which are an integral part of the financial statements.
Semiannual Report
Financial Highlights - Class T
| Six months ended January 31, 2011 | Years ended July 31, |
| (Unaudited) | 2010 | 2009 | 2008 G |
Selected Per-Share Data | | | | |
Net asset value, beginning of period | $ 43.04 | $ 38.83 | $ 45.19 | $ 50.00 |
Income from Investment Operations | | | | |
Net investment income (loss) E | .500 | .642 | .739 | .365 |
Net realized and unrealized gain (loss) | 5.117 | 4.281 | (6.128) | (4.852) |
Total from investment operations | 5.617 | 4.923 | (5.389) | (4.487) |
Distributions from net investment income | (.502) | (.608) | (.771) | (.323) |
Distributions from net realized gain | (.195) | (.105) | (.200) | - |
Total distributions | (.697) | (.713) | (.971) | (.323) |
Net asset value, end of period | $ 47.96 | $ 43.04 | $ 38.83 | $ 45.19 |
Total Return B, C, D | 13.09% | 12.71% | (11.62)% | (9.00)% |
Ratios to Average Net Assets F, H | | | | |
Expenses before reductions | .50% A | .50% | .50% | .50% A |
Expenses net of fee waivers, if any | .50% A | .50% | .50% | .50% A |
Expenses net of all reductions | .50% A | .50% | .50% | .50% A |
Net investment income (loss) | 2.19% A | 1.52% | 2.07% | 1.32% A |
Supplemental Data | | | | |
Net assets, end of period (000 omitted) | $ 33 | $ 37 | $ 57 | $ 91 |
Portfolio turnover rate | 27% A | 20% | 37% | 8% A |
A Annualized
B Total returns for periods of less than one year are not annualized.
C Total returns would have been lower had certain expenses not been reduced during the periods shown.
D Total returns do not include the effect of the sales charges.
E Calculated based on average shares outstanding during the period.
F Amounts do not include the activity of the underlying funds.
G For the period December 31, 2007 (commencement of operations) to July 31, 2008.
H Expense ratios reflect operating expenses of the class. Expenses before reductions do not reflect amounts reimbursed by the investment adviser or reductions from expense offset arrangements and do not represent the amount paid by the class during periods when reimbursements or reductions occur. Expenses net of fee waivers reflect expenses after reimbursement by the investment adviser but prior to reductions from expense offset arrangements. Expenses net of all reductions represent the net expenses paid by the class but do not include expenses of the investment companies in which the Fund invests.
Financial Highlights - Class C
| Six months ended January 31, 2011 | Years ended July 31, |
| (Unaudited) | 2010 | 2009 | 2008 G |
Selected Per-Share Data | | | | |
Net asset value, beginning of period | $ 43.05 | $ 38.84 | $ 45.19 | $ 50.00 |
Income from Investment Operations | | | | |
Net investment income (loss) E | .386 | .430 | .560 | .226 |
Net realized and unrealized gain (loss) | 5.112 | 4.275 | (6.123) | (4.846) |
Total from investment operations | 5.498 | 4.705 | (5.563) | (4.620) |
Distributions from net investment income | (.383) | (.390) | (.587) | (.190) |
Distributions from net realized gain | (.195) | (.105) | (.200) | - |
Total distributions | (.578) | (.495) | (.787) | (.190) |
Net asset value, end of period | $ 47.97 | $ 43.05 | $ 38.84 | $ 45.19 |
Total Return B, C, D | 12.79% | 12.12% | (12.05)% | (9.25)% |
Ratios to Average Net Assets F, H | | | | |
Expenses before reductions | 1.00% A | 1.00% | 1.00% | 1.00% A |
Expenses net of fee waivers, if any | 1.00% A | 1.00% | 1.00% | 1.00% A |
Expenses net of all reductions | 1.00% A | 1.00% | 1.00% | 1.00% A |
Net investment income (loss) | 1.69% A | 1.02% | 1.57% | .82% A |
Supplemental Data | | | | |
Net assets, end of period (000 omitted) | $ 32 | $ 37 | $ 56 | $ 91 |
Portfolio turnover rate | 27% A | 20% | 37% | 8% A |
A Annualized
B Total returns for periods of less than one year are not annualized.
C Total returns would have been lower had certain expenses not been reduced during the periods shown.
D Total returns do not include the effect of the contingent deferred sales charge.
E Calculated based on average shares outstanding during the period.
F Amounts do not include the activity of the underlying funds.
G For the period December 31, 2007 (commencement of operations) to July 31, 2008.
H Expense ratios reflect operating expenses of the class. Expenses before reductions do not reflect amounts reimbursed by the investment adviser or reductions from expense offset arrangements and do not represent the amount paid by the class during periods when reimbursements or reductions occur. Expenses net of fee waivers reflect expenses after reimbursement by the investment adviser but prior to reductions from expense offset arrangements. Expenses net of all reductions represent the net expenses paid by the class but do not include expenses of the investment companies in which the Fund invests.
See accompanying notes which are an integral part of the financial statements.
Semiannual Report
Financial Highlights - Income Replacement 2042
| Six months ended January 31, 2011 | Years ended July 31, |
| (Unaudited) | 2010 | 2009 | 2008 G |
Selected Per-Share Data | | | | |
Net asset value, beginning of period | $ 43.03 | $ 38.83 | $ 45.20 | $ 50.00 |
Income from Investment Operations | | | | |
Net investment income (loss) D | .613 | .857 | .900 | .496 |
Net realized and unrealized gain (loss) | 5.110 | 4.279 | (6.114) | (4.840) |
Total from investment operations | 5.723 | 5.136 | (5.214) | (4.344) |
Distributions from net investment income | (.618) | (.831) | (.956) | (.456) |
Distributions from net realized gain | (.195) | (.105) | (.200) | - |
Total distributions | (.813) | (.936) | (1.156) | (.456) |
Net asset value, end of period | $ 47.94 | $ 43.03 | $ 38.83 | $ 45.20 |
Total Return B, C | 13.36% | 13.27% | (11.18)% | (8.72)% |
Ratios to Average Net Assets E, H | | | | |
Expenses before reductions F | .00% A | .00% | .00% | .00% A |
Expenses net of fee waivers, if any | .00% A | .00% | .00% | .00% A |
Expenses net of all reductions | .00% A | .00% | .00% | .00% A |
Net investment income (loss) | 2.70% A | 2.02% | 2.57% | 1.82% A |
Supplemental Data | | | | |
Net assets, end of period (000 omitted) | $ 4,577 | $ 3,395 | $ 1,395 | $ 969 |
Portfolio turnover rate | 27% A | 20% | 37% | 8% A |
A Annualized
B Total returns for periods of less than one year are not annualized.
C Total returns would have been lower had certain expenses not been reduced during the periods shown.
D Calculated based on average shares outstanding during the period.
E Amounts do not include the activity of the underlying funds.
F Amount represents less than .01%.
G For the period December 31, 2007 (commencement of operations) to July 31, 2008.
H Expense ratios reflect operating expenses of the class. Expenses before reductions do not reflect amounts reimbursed by the investment adviser or reductions from expense offset arrangements and do not represent the amount paid by the class during periods when reimbursements or reductions occur. Expenses net of fee waivers reflect expenses after reimbursement by the investment adviser but prior to reductions from expense offset arrangements. Expenses net of all reductions represent the net expenses paid by the class but do not include expenses of the investment companies in which the Fund invests.
Financial Highlights - Institutional Class
| Six months ended January 31, 2011 | Years ended July 31, |
| (Unaudited) | 2010 | 2009 | 2008 G |
Selected Per-Share Data | | | | |
Net asset value, beginning of period | $ 43.03 | $ 38.83 | $ 45.20 | $ 50.00 |
Income from Investment Operations | | | | |
Net investment income (loss) D | .614 | .855 | .918 | .504 |
Net realized and unrealized gain (loss) | 5.109 | 4.281 | (6.132) | (4.848) |
Total from investment operations | 5.723 | 5.136 | (5.214) | (4.344) |
Distributions from net investment income | (.618) | (.831) | (.956) | (.456) |
Distributions from net realized gain | (.195) | (.105) | (.200) | - |
Total distributions | (.813) | (.936) | (1.156) | (.456) |
Net asset value, end of period | $ 47.94 | $ 43.03 | $ 38.83 | $ 45.20 |
Total Return B, C | 13.36% | 13.27% | (11.18)% | (8.72)% |
Ratios to Average Net Assets E, H | | | | |
Expenses before reductions F | .00% A | .00% | .00% | .00% A |
Expenses net of fee waivers, if any | .00% A | .00% | .00% | .00% A |
Expenses net of all reductions | .00% A | .00% | .00% | .00% A |
Net investment income (loss) | 2.70% A | 2.02% | 2.57% | 1.82% A |
Supplemental Data | | | | |
Net assets, end of period (000 omitted) | $ 33 | $ 38 | $ 57 | $ 91 |
Portfolio turnover rate | 27% A | 20% | 37% | 8% A |
A Annualized
B Total returns for periods of less than one year are not annualized.
C Total returns would have been lower had certain expenses not been reduced during the periods shown.
D Calculated based on average shares outstanding during the period.
E Amounts do not include the activity of the underlying funds.
F Amount represents less than .01%.
G For the period December 31, 2007 (commencement of operations) to July 31, 2008.
H Expense ratios reflect operating expenses of the class. Expenses before reductions do not reflect amounts reimbursed by the investment adviser or reductions from expense offset arrangements and do not represent the amount paid by the class during periods when reimbursements or reductions occur. Expenses net of fee waivers reflect expenses after reimbursement by the investment adviser but prior to reductions from expense offset arrangements. Expenses net of all reductions represent the net expenses paid by the class but do not include expenses of the investment companies in which the Fund invests.
See accompanying notes which are an integral part of the financial statements.
Semiannual Report
Notes to Financial Statements
For the period ended January 31, 2011 (Unaudited)
1. Organization.
Fidelity Income Replacement 2016 Fund, Fidelity Income Replacement 2018 Fund, Fidelity Income Replacement 2020 Fund, Fidelity Income Replacement 2022 Fund, Fidelity Income Replacement 2024 Fund, Fidelity Income Replacement 2026 Fund, Fidelity Income Replacement 2028 Fund, Fidelity Income Replacement 2030 Fund, Fidelity Income Replacement 2032 Fund, Fidelity Income Replacement 2034 Fund, Fidelity Income Replacement 2036 Fund, Fidelity Income Replacement 2038 Fund, Fidelity Income Replacement 2040 Fund and Fidelity Income Replacement 2042 Fund (the Funds) are funds of Fidelity Income Fund (the Trust). The Trust is registered under the Investment Company Act of 1940, as amended (the 1940 Act), as an open-end management investment company organized as a Massachusetts business trust. Each Fund is authorized to issue an unlimited number of shares. The Funds invest primarily in a combination of other Fidelity equity, bond, and short-term funds (the Underlying Funds) managed by Fidelity Management & Research Company (FMR).
The Funds are designed for investors who seek to convert accumulated assets into regular payments over a defined period of time. The payment strategy for each Fund is designed to be implemented through a shareholder's voluntary participation in the Smart Payment Program. Participation in the Smart Payment Program will result in the gradual liquidation of the shareholder's entire investment in the Fund by its horizon date. Each Fund's name refers to the year of its horizon date.
Each Fund offers Class A, Class T, Class C, Income Replacement and Institutional Class shares. All classes have equal rights and voting privileges, except for matters affecting a single class. Investment income, realized and unrealized capital gains and losses, the common expenses of the Fund, and certain fund-level expense reductions, if any, are allocated on a pro-rata basis to each class based on the relative net assets of each class to the total net assets of the Fund. Each class differs with respect to distribution and service plan fees incurred. Certain expense reductions may also differ by class.
2. Significant Accounting Policies.
The financial statements have been prepared in conformity with accounting principles generally accepted in the United States of America (GAAP), which require management to make certain estimates and assumptions at the date of the financial statements. Actual results could differ from those estimates. Subsequent events, if any, through the date that the financial statements were issued have been evaluated in the preparation of the financial statements. The following summarizes the significant accounting policies of the Funds:
Security Valuation. Investments are valued as of 4:00 p.m. Eastern time on the last calendar day of the period. Each Fund categorizes the inputs to valuation techniques used to value their investments into a disclosure hierarchy consisting of three levels as shown below.
Level 1 - quoted prices in active markets for identical investments
Level 2 - other significant observable inputs (including quoted prices for similar investments, interest rates, prepayment speeds, etc.)
Level 3 - unobservable inputs (including the Fund's own assumptions based on the best information available)
Valuation techniques used to value each Fund's investments by major category are as follows. Investments in the Underlying Funds are valued at their closing net asset value (NAV) each business day and are categorized as Level 1 in the hierarchy.
Investment Transactions and Income. For financial reporting purposes, the Funds' investment holdings and NAV include trades executed through the end of the last business day of the period. The NAV per share for processing shareholder transactions is calculated as of the close of business of the New York Stock Exchange (NYSE), normally 4:00 p.m. Eastern time and includes trades executed through the end of the prior business day. Gains and losses on securities sold are determined on the basis of identified cost. Income and capital gain distributions from the Underlying Funds, if any, are recorded on the ex-dividend date.
Expenses. Expenses directly attributable to a fund are charged to that fund. Expenses attributable to more than one fund are allocated among the respective funds on the basis of relative net assets or other appropriate methods. Expenses included in the accompanying financial statements reflect the expenses of the Fund and do not include any expenses associated with the Underlying Funds. Expense estimates are accrued in the period to which they relate and adjustments are made when actual amounts are known.
Income Tax Information and Distributions to Shareholders. Each year, each Fund intends to qualify as a regulated investment company, including distributing substantially all of its taxable income and realized gains under Subchapter M of the Internal Revenue Code and filing its U.S. federal tax return. As a result, no provision for income taxes is required. A fund's federal tax return is subject to examination by the Internal Revenue Service (IRS) for a period of three years.
Distributions are declared and recorded on the ex-dividend date. Income dividends and capital gain distributions are declared separately for each class. Income and capital gain distributions are determined in accordance with income tax regulations, which may differ from GAAP.
Semiannual Report
2. Significant Accounting Policies - continued
Income Tax Information and Distributions to Shareholders - continued
Capital accounts within the financial statements are adjusted for permanent book-tax differences. These adjustments have no impact on net assets or the results of operations. Temporary book-tax differences will reverse in a subsequent period.
Book-tax differences are primarily due to the short-term gain distributions from the Underlying Funds, capital loss carryforwards, losses deferred due to wash sales and excise tax regulations.
The federal tax cost of investment securities and unrealized appreciation (depreciation) as of period end were as follows for each Fund:
| Tax
cost | Gross unrealized
appreciation | Gross unrealized
depreciation | Net unrealized appreciation (depreciation) on securities and other investments |
Fidelity Income Replacement 2016 Fund | $ 10,371,851 | $ 498,542 | $ (152,639) | $ 345,903 |
Fidelity Income Replacement 2018 Fund | 5,831,249 | 177,344 | (169,820) | 7,524 |
Fidelity Income Replacement 2020 Fund | 3,991,666 | 288,500 | (70,852) | 217,648 |
Fidelity Income Replacement 2022 Fund | 3,120,356 | 92,610 | (137,765) | (45,155) |
Fidelity Income Replacement 2024 Fund | 1,607,060 | 103,826 | (36,820) | 67,006 |
Fidelity Income Replacement 2026 Fund | 1,411,924 | 58,900 | (41,424) | 17,476 |
Fidelity Income Replacement 2028 Fund | 6,309,752 | 335,884 | (172,301) | 163,583 |
Fidelity Income Replacement 2030 Fund | 2,883,230 | 179,090 | (53,092) | 125,998 |
Fidelity Income Replacement 2032 Fund | 1,861,326 | 326,913 | (5,264) | 321,649 |
Fidelity Income Replacement 2034 Fund | 1,801,035 | 246,946 | (9,369) | 237,577 |
Fidelity Income Replacement 2036 Fund | 1,943,004 | 82,232 | (75,794) | 6,438 |
Fidelity Income Replacement 2038 Fund | 1,350,162 | 219,956 | (4,478) | 215,478 |
Fidelity Income Replacement 2040 Fund | 1,949,267 | 152,140 | (34,275) | 117,865 |
Fidelity Income Replacement 2042 Fund | 4,287,193 | 482,493 | (68,586) | 413,907 |
3. Purchases and Sales of Investments.
Purchases and redemptions of the Underlying Fund shares are noted in the table below.
| Purchases ($) | Redemptions ($) |
Fidelity Income Replacement 2016 Fund | 2,007,711 | 2,848,246 |
Fidelity Income Replacement 2018 Fund | 1,387,027 | 1,310,923 |
Fidelity Income Replacement 2020 Fund | 1,409,214 | 748,150 |
Fidelity Income Replacement 2022 Fund | 643,300 | 334,955 |
Fidelity Income Replacement 2024 Fund | 231,135 | 218,151 |
Fidelity Income Replacement 2026 Fund | 553,139 | 207,412 |
Fidelity Income Replacement 2028 Fund | 959,598 | 1,170,953 |
Fidelity Income Replacement 2030 Fund | 1,353,434 | 515,496 |
Fidelity Income Replacement 2032 Fund | 530,997 | 254,831 |
Fidelity Income Replacement 2034 Fund | 449,976 | 450,032 |
Fidelity Income Replacement 2036 Fund | 886,175 | 192,978 |
Fidelity Income Replacement 2038 Fund | 203,244 | 1,121,802 |
Fidelity Income Replacement 2040 Fund | 700,560 | 374,423 |
Fidelity Income Replacement 2042 Fund | 1,278,621 | 505,395 |
4. Fees and Other Transactions with Affiliates.
Management Fee. Strategic Advisers, Inc. (Strategic Advisers), an affiliate of FMR, provides the Funds with investment management related services. The Funds do not pay any fees for these services. Under the management contract, Strategic Advisers pays all other fund-level expenses, except the compensation of the independent Trustees and certain other expenses such as interest expense. The management fee paid by each Fund is reduced by an amount equal to the fees and expenses paid by the Fund to the independent Trustees.
Semiannual Report
Notes to Financial Statements (Unaudited) - continued
4. Fees and Other Transactions with Affiliates - continued
Distribution and Service Plan Fees. In accordance with Rule 12b-1 of the 1940 Act, the Funds have adopted separate Distribution and Service Plans for each class of shares. Certain classes pay Fidelity Distributors Corporation (FDC), an affiliate of FMR, separate Distribution and Service Fees, each of which is based on an annual percentage of each class' average net assets. In addition, FDC may pay financial intermediaries for selling shares of the Funds and providing shareholder support services. For the period, the Distribution and Service Fee rates, total fees and amounts retained by FDC were as follows:
Fidelity Income Replacement 2016 Fund | Distribution
Fee | Service
Fee | Paid
to FDC | Retained
by FDC |
Class A | -% | .25% | $ 2,771 | $ - |
Class T | .25% | .25% | 1,596 | - |
Class C | .75% | .25% | 5,538 | 118 |
| | | $ 9,905 | $ 118 |
Fidelity Income Replacement 2018 Fund | | | | |
Class A | -% | .25% | $ 1,514 | $ 12 |
Class T | .25% | .25% | 132 | 6 |
Class C | .75% | .25% | 1,010 | 334 |
| | | $ 2,656 | $ 352 |
Fidelity Income Replacement 2020 Fund | | | | |
Class A | -% | .25% | $ 776 | $ 259 |
Class T | .25% | .25% | 350 | - |
Class C | .75% | .25% | 1,525 | 54 |
| | | $ 2,651 | $ 313 |
Fidelity Income Replacement 2022 Fund | | | | |
Class A | -% | .25% | $ 68 | $ 2 |
Class T | .25% | .25% | 192 | 4 |
Class C | .75% | .25% | 201 | 82 |
| | | $ 461 | $ 88 |
Fidelity Income Replacement 2024 Fund | | | | |
Class A | -% | .25% | $ 332 | $ 4 |
Class T | .25% | .25% | 124 | 88 |
Class C | .75% | .25% | 830 | 15 |
| | | $ 1,286 | $ 107 |
Fidelity Income Replacement 2026 Fund | | | | |
Class A | -% | .25% | $ 51 | $ 17 |
Class T | .25% | .25% | 304 | 14 |
Class C | .75% | .25% | 903 | 35 |
| | | $ 1,258 | $ 66 |
Fidelity Income Replacement 2028 Fund | | | | |
Class A | -% | .25% | $ 466 | $ 16 |
Class T | .25% | .25% | 370 | - |
Class C | .75% | .25% | 256 | - |
| | | $ 1,092 | $ 16 |
Fidelity Income Replacement 2030 Fund | | | | |
Class A | -% | .25% | $ 76 | $ 22 |
Class T | .25% | .25% | 71 | 33 |
Class C | .75% | .25% | 1,001 | 92 |
| | | $ 1,148 | $ 147 |
Fidelity Income Replacement 2032 Fund | | | | |
Class A | -% | .25% | $ 269 | $ 3 |
Class T | .25% | .25% | 82 | 82 |
Class C | .75% | .25% | 136 | 136 |
| | | $ 487 | $ 221 |
Fidelity Income Replacement 2034 Fund | | | | |
Class A | -% | .25% | $ 30 | $ 30 |
Class T | .25% | .25% | 80 | 80 |
Class C | .75% | .25% | 123 | 123 |
| | | $ 233 | $ 233 |
Semiannual Report
4. Fees and Other Transactions with Affiliates - continued
Distribution and Service Plan Fees - continued
Fidelity Income Replacement 2036 Fund | Distribution
Fee | Service
Fee | Paid
to FDC | Retained
by FDC |
Class A | -% | .25% | $ 46 | $ 38 |
Class T | .25% | .25% | 692 | 8 |
Class C | .75% | .25% | 606 | 10 |
| | | $ 1,344 | $ 56 |
Fidelity Income Replacement 2038 Fund | | | | |
Class A | -% | .25% | $ 40 | $ 2 |
Class T | .25% | .25% | 86 | 86 |
Class C | .75% | .25% | 419 | 418 |
| | | $ 545 | $ 506 |
Fidelity Income Replacement 2040 Fund | | | | |
Class A | -% | .25% | $ 66 | $ 38 |
Class T | .25% | .25% | 300 | 14 |
Class C | .75% | .25% | 459 | 458 |
| | | $ 825 | $ 510 |
Fidelity Income Replacement 2042 Fund | | | | |
Class A | -% | .25% | $ 34 | $ 17 |
Class T | .25% | .25% | 86 | 86 |
Class C | .75% | .25% | 172 | 172 |
| | | $ 292 | $ 275 |
Sales Load. FDC receives a front-end sales charge of up to 5.75% for selling Class A shares, and 3.50% for selling Class T shares, some of which is paid to financial intermediaries for selling shares of the Funds. FDC receives the proceeds of contingent deferred sales charges levied on Class A, Class T, and Class C redemptions. These charges depend on the holding period. The deferred sales charges range from 1% for Class C, 1.00% for certain purchases of Class A shares and .25% for certain purchases of Class T shares.
For the period, sales charge amounts retained by FDC were as follows:
Fidelity Income Replacement 2016 Fund | Retained
by FDC |
Class A | $ 249 |
Class C* | 9 |
| $ 258 |
Fidelity Income Replacement 2018 Fund | |
Class A | $ 563 |
| |
Fidelity Income Replacement 2020 Fund | |
Class A | $ 1 |
| |
Fidelity Income Replacement 2022 Fund | |
Class A | $ 215 |
| |
Fidelity Income Replacement 2026 Fund | |
Class T | $ 4 |
| |
Fidelity Income Replacement 2036 Fund | |
Class T | $ 3 |
| |
Fidelity Income Replacement 2040 Fund | |
Class A | $ 441 |
* When Class C shares are initially sold, FDC pays commissions from its own resources to financial intermediaries through which the sales are made.
Semiannual Report
Notes to Financial Statements (Unaudited) - continued
5. Expense Reductions.
FMR voluntarily agreed to reimburse the Funds to the extent annual operating expenses exceeded distribution and service fees applicable to each class. Some expenses, for example interest expense, are excluded from this reimbursement.
The following Funds were in reimbursement during the period:
| Reimbursement
from adviser* |
Fidelity Income Replacement 2016 Fund | $ 21 |
Fidelity Income Replacement 2018 Fund | 11 |
Fidelity Income Replacement 2020 Fund | 7 |
Fidelity Income Replacement 2022 Fund | 5 |
Fidelity Income Replacement 2024 Fund | 3 |
Fidelity Income Replacement 2026 Fund | 2 |
Fidelity Income Replacement 2028 Fund | 12 |
Fidelity Income Replacement 2030 Fund | 4 |
Fidelity Income Replacement 2032 Fund | 4 |
Fidelity Income Replacement 2034 Fund | 4 |
Fidelity Income Replacement 2036 Fund | 3 |
Fidelity Income Replacement 2038 Fund | 4 |
Fidelity Income Replacement 2040 Fund | 3 |
Fidelity Income Replacement 2042 Fund | 7 |
* Represents total amount reimbursed to the Fund. Each class has received pro-rata allocation of reimbursement.
6. Distributions to Shareholders.
Distributions to shareholders of each class were as follows:
| Six months ended
January 31,
2011 | Year ended
July 31,
2010 |
Fidelity Income Replacement 2016 Fund | | |
From net investment income | | |
Class A | $ 21,459 | $ 44,617 |
Class T | 5,559 | 10,060 |
Class C | 7,097 | 12,552 |
Income Replacement 2016 | 79,257 | 120,802 |
Institutional Class | 1,181 | 2,291 |
Total | $ 114,553 | $ 190,322 |
From net realized gain | | |
Class A | $ 11,231 | $ 6,094 |
Class T | 3,381 | 1,771 |
Class C | 6,082 | 3,226 |
Income Replacement 2016 | 37,507 | 14,426 |
Institutional Class | 546 | 316 |
Total | $ 58,747 | $ 25,833 |
Fidelity Income Replacement 2018 Fund | | |
From net investment income | | |
Class A | $ 12,700 | $ 17,039 |
Class T | 474 | 1,142 |
Class C | 1,346 | 1,710 |
Income Replacement 2018 | 46,716 | 76,857 |
Institutional Class | 4,200 | 7,202 |
Total | $ 65,436 | $ 103,950 |
From net realized gain | | |
Class A | $ 5,977 | $ 2,282 |
Class T | 252 | 200 |
Class C | 980 | 353 |
Income Replacement 2018 | 19,822 | 9,798 |
Institutional Class | 1,775 | 910 |
Total | $ 28,806 | $ 13,543 |
Semiannual Report
6. Distributions to Shareholders - continued
| Six months ended
January 31,
2011 | Year ended
July 31,
2010 |
Fidelity Income Replacement 2020 Fund | | |
From net investment income | | |
Class A | $ 6,493 | $ 11,250 |
Class T | 1,297 | 2,566 |
Class C | 2,066 | 2,829 |
Income Replacement 2020 | 30,280 | 39,529 |
Institutional Class | 602 | 2,036 |
Total | $ 40,738 | $ 58,210 |
From net realized gain | | |
Class A | $ 2,797 | $ 1,618 |
Class T | 638 | 468 |
Class C | 1,402 | 667 |
Income Replacement 2020 | 11,887 | 4,645 |
Institutional Class | 234 | 316 |
Total | $ 16,958 | $ 7,714 |
Fidelity Income Replacement 2022 Fund | | |
From net investment income | | |
Class A | $ 682 | $ 760 |
Class T | 737 | 1,377 |
Class C | 250 | 583 |
Income Replacement 2022 | 31,719 | 52,195 |
Institutional Class | 53 | 2,258 |
Total | $ 33,441 | $ 57,173 |
From net realized gain | | |
Class A | $ 313 | $ 290 |
Class T | 343 | 657 |
Class C | 169 | 426 |
Income Replacement 2022 | 11,885 | 17,200 |
Institutional Class | 20 | 1,161 |
Total | $ 12,730 | $ 19,734 |
Fidelity Income Replacement 2024 Fund | | |
From net investment income | | |
Class A | $ 2,898 | $ 5,225 |
Class T | 444 | 1,024 |
Class C | 1,221 | 1,614 |
Income Replacement 2024 | 13,124 | 22,024 |
Institutional Class | 390 | 946 |
Total | $ 18,077 | $ 30,833 |
From net realized gain | | |
Class A | $ 1,169 | $ 733 |
Class T | 211 | 173 |
Class C | 755 | 389 |
Income Replacement 2024 | 4,799 | 2,820 |
Institutional Class | 144 | 118 |
Total | $ 7,078 | $ 4,233 |
Fidelity Income Replacement 2026 Fund | | |
From net investment income | | |
Class A | $ 421 | $ 1,002 |
Class T | 1,196 | 1,567 |
Class C | 1,311 | 1,940 |
Income Replacement 2026 | 8,875 | 8,207 |
Institutional Class | 386 | 937 |
Total | $ 12,189 | $ 13,653 |
Semiannual Report
Notes to Financial Statements (Unaudited) - continued
6. Distributions to Shareholders - continued
| Six months ended
January 31,
2011 | Year ended
July 31,
2010 |
Fidelity Income Replacement 2026 Fund | | |
From net realized gain | | |
Class A | $ 163 | $ 145 |
Class T | 515 | 294 |
Class C | 762 | 484 |
Income Replacement 2026 | 3,053 | 782 |
Institutional Class | 133 | 118 |
Total | $ 4,626 | $ 1,823 |
Fidelity Income Replacement 2028 Fund | | |
From net investment income | | |
Class A | $ 4,198 | $ 6,274 |
Class T | 1,195 | 5,032 |
Class C | 384 | 669 |
Income Replacement 2028 | 67,768 | 118,159 |
Institutional Class | 392 | 931 |
Total | $ 73,937 | $ 131,065 |
From net realized gain | | |
Class A | $ 1,624 | $ 885 |
Class T | 551 | 821 |
Class C | 224 | 172 |
Income Replacement 2028 | 23,226 | 14,970 |
Institutional Class | 138 | 117 |
Total | $ 25,763 | $ 16,965 |
Fidelity Income Replacement 2030 Fund | | |
From net investment income | | |
Class A | $ 629 | $ 944 |
Class T | 147 | 802 |
Class C | 1,578 | 1,647 |
Income Replacement 2030 | 28,486 | 9,950 |
Institutional Class | 389 | 870 |
Total | $ 31,229 | $ 14,213 |
From net realized gain | | |
Class A | $ 210 | $ 112 |
Class T | 35 | 143 |
Class C | 777 | 448 |
Income Replacement 2030 | 9,584 | 1,042 |
Institutional Class | 117 | 112 |
Total | $ 10,723 | $ 1,857 |
Fidelity Income Replacement 2032 Fund | | |
From net investment income | | |
Class A | $ 2,430 | $ 3,578 |
Class T | 299 | 726 |
Class C | 180 | 409 |
Income Replacement 2032 | 21,767 | 12,987 |
Institutional Class | 879 | 990 |
Total | $ 25,555 | $ 18,690 |
From net realized gain | | |
Class A | $ 874 | $ 469 |
Class T | 125 | 112 |
Class C | 104 | 93 |
Income Replacement 2032 | 7,076 | 1,351 |
Institutional Class | 309 | 113 |
Total | $ 8,488 | $ 2,138 |
Semiannual Report
6. Distributions to Shareholders - continued
| Six months ended
January 31,
2011 | Year ended
July 31,
2010 |
Fidelity Income Replacement 2034 Fund | | |
From net investment income | | |
Class A | $ 248 | $ 592 |
Class T | 289 | 675 |
Class C | 155 | 337 |
Income Replacement 2034 | 22,542 | 34,804 |
Institutional Class | 1,218 | 1,910 |
Total | $ 24,452 | $ 38,318 |
From net realized gain | | |
Class A | $ 99 | $ 165 |
Class T | 130 | 218 |
Class C | 99 | 166 |
Income Replacement 2034 | 7,355 | 7,479 |
Institutional Class | 428 | 436 |
Total | $ 8,111 | $ 8,464 |
Fidelity Income Replacement 2036 Fund | | |
From net investment income | | |
Class A | $ 388 | $ 811 |
Class T | 2,822 | 4,274 |
Class C | 932 | 1,320 |
Income Replacement 2036 | 15,066 | 12,138 |
Institutional Class | 1,160 | 1,200 |
Total | $ 20,368 | $ 19,743 |
From net realized gain | | |
Class A | $ 116 | $ 162 |
Class T | 928 | 958 |
Class C | 398 | 467 |
Income Replacement 2036 | 4,588 | 2,158 |
Institutional Class | 299 | 204 |
Total | $ 6,329 | $ 3,949 |
Fidelity Income Replacement 2038 Fund | | |
From net investment income | | |
Class A | $ 381 | $ 1,542 |
Class T | 338 | 689 |
Class C | 607 | 569 |
Income Replacement 2038 | 28,468 | 40,695 |
Institutional Class | 429 | 942 |
Total | $ 30,223 | $ 44,437 |
From net realized gain | | |
Class A | $ 135 | $ 413 |
Class T | 137 | 207 |
Class C | 333 | 205 |
Income Replacement 2038 | 9,117 | 8,050 |
Institutional Class | 139 | 209 |
Total | $ 9,861 | $ 9,084 |
Fidelity Income Replacement 2040 Fund | | |
From net investment income | | |
Class A | $ 887 | $ 1,022 |
Class T | 1,296 | 1,586 |
Class C | 687 | 487 |
Income Replacement 2040 | 18,445 | 18,680 |
Institutional Class | 713 | 1,444 |
Total | $ 22,028 | $ 23,219 |
Semiannual Report
Notes to Financial Statements (Unaudited) - continued
6. Distributions to Shareholders - continued
| Six months ended
January 31,
2011 | Year ended
July 31,
2010 |
Fidelity Income Replacement 2040 Fund | | |
From net realized gain | | |
Class A | $ 360 | $ 174 |
Class T | 502 | 273 |
Class C | 361 | 112 |
Income Replacement 2040 | 5,813 | 2,099 |
Institutional Class | 227 | 189 |
Total | $ 7,263 | $ 2,847 |
Fidelity Income Replacement 2042 Fund | | |
From net investment income | | |
Class A | $ 305 | $ 1,305 |
Class T | 349 | 687 |
Class C | 257 | 442 |
Income Replacement 2042 | 48,080 | 54,565 |
Institutional Class | 441 | 944 |
Total | $ 49,432 | $ 57,943 |
From net realized gain | | |
Class A | $ 108 | $ 247 |
Class T | 138 | 121 |
Class C | 136 | 120 |
Income Replacement 2042 | 15,082 | 6,898 |
Institutional Class | 140 | 122 |
Total | $ 15,604 | $ 7,508 |
7. Share Transactions.
Transactions for each class of shares were as follows:
| Shares | Dollars |
| Six months ended
January 31,
2011 | Year ended
July 31,
2010 | Six months ended
January 31,
2011 | Year ended
July 31,
2010 |
Fidelity Income Replacement 2016 Fund | | | | |
Class A | | | | |
Shares sold | 1,447 | 10,966 | $ 70,361 | $ 505,595 |
Reinvestment of distributions | 574 | 904 | 27,889 | 41,700 |
Shares redeemed | (9,242) | (22,378) | (449,186) | (1,033,263) |
Net increase (decrease) | (7,221) | (10,508) | $ (350,936) | $ (485,968) |
Class T | | | | |
Shares sold | - | 6,546 | $ - | $ 302,409 |
Reinvestment of distributions | 152 | 199 | 7,395 | 9,206 |
Shares redeemed | (762) | (4,625) | (36,775) | (215,246) |
Net increase (decrease) | (610) | 2,120 | $ (29,380) | $ 96,369 |
Class C | | | | |
Shares sold | 1,029 | 3,920 | $ 50,000 | $ 176,110 |
Reinvestment of distributions | 201 | 252 | 9,798 | 11,639 |
Shares redeemed | (820) | (8,175) | (39,550) | (376,188) |
Net increase (decrease) | 410 | (4,003) | $ 20,248 | $ (188,439) |
Income Replacement 2016 | | | | |
Shares sold | 18,781 | 78,978 | $ 909,318 | $ 3,659,239 |
Reinvestment of distributions | 1,069 | 721 | 52,164 | 33,372 |
Shares redeemed | (30,441) | (40,547) | (1,486,686) | (1,866,323) |
Net increase (decrease) | (10,591) | 39,152 | $ (525,204) | $ 1,826,288 |
Semiannual Report
7. Share Transactions - continued
| Shares | Dollars |
| Six months ended
January 31,
2011 | Year ended
July 31,
2010 | Six months ended
January 31,
2011 | Year ended
July 31,
2010 |
Fidelity Income Replacement 2016 Fund | | | | |
Institutional Class | | | | |
Shares sold | 777 | 751 | $ 38,200 | $ 34,781 |
Reinvestment of distributions | 6 | 15 | 280 | 690 |
Shares redeemed | (257) | (975) | (12,270) | (44,681) |
Net increase (decrease) | 526 | (209) | $ 26,210 | $ (9,210) |
Fidelity Income Replacement 2018 Fund | | | | |
Class A | | | | |
Shares sold | 1,564 | 6,590 | $ 72,093 | $ 305,640 |
Reinvestment of distributions | 177 | 248 | 8,571 | 11,354 |
Shares redeemed | (3,740) | (1,601) | (181,952) | (73,103) |
Net increase (decrease) | (1,999) | 5,237 | $ (101,288) | $ 243,891 |
Class T | | | | |
Shares sold | - | - | $ - | $ - |
Reinvestment of distributions | 10 | 21 | 479 | 968 |
Shares redeemed | (63) | (1,030) | (3,015) | (46,978) |
Net increase (decrease) | (53) | (1,009) | $ (2,536) | $ (46,010) |
Class C | | | | |
Shares sold | - | 1,627 | $ - | $ 75,000 |
Reinvestment of distributions | 38 | 26 | 1,833 | 1,209 |
Shares redeemed | (260) | (373) | (12,426) | (17,000) |
Net increase (decrease) | (222) | 1,280 | $ (10,593) | $ 59,209 |
Income Replacement 2018 | | | | |
Shares sold | 16,142 | 11,957 | $ 764,740 | $ 541,219 |
Reinvestment of distributions | 413 | 258 | 20,212 | 11,837 |
Shares redeemed | (12,586) | (13,199) | (602,010) | (594,109) |
Net increase (decrease) | 3,969 | (984) | $ 182,942 | $ (41,053) |
Institutional Class | | | | |
Shares sold | - | - | $ - | $ - |
Reinvestment of distributions | 6 | 8 | 274 | 361 |
Shares redeemed | (47) | (100) | (2,250) | (4,500) |
Net increase (decrease) | (41) | (92) | $ (1,976) | $ (4,139) |
Fidelity Income Replacement 2020 Fund | | | | |
Class A | | | | |
Shares sold | 3 | 4,988 | $ 134 | $ 223,504 |
Reinvestment of distributions | 148 | 166 | 7,184 | 7,568 |
Shares redeemed | (548) | (3,855) | (26,167) | (179,660) |
Net increase (decrease) | (397) | 1,299 | $ (18,849) | $ 51,412 |
Class T | | | | |
Shares sold | - | 1,680 | $ - | $ 80,000 |
Reinvestment of distributions | 40 | 67 | 1,935 | 3,033 |
Shares redeemed | - | (2,893) | - | (131,000) |
Net increase (decrease) | 40 | (1,146) | $ 1,935 | $ (47,967) |
Class C | | | | |
Shares sold | - | 1,102 | $ - | $ 49,985 |
Reinvestment of distributions | 52 | 67 | 2,514 | 3,032 |
Shares redeemed | (569) | - | (28,016) | - |
Net increase (decrease) | (517) | 1,169 | $ (25,502) | $ 53,017 |
Income Replacement 2020 | | | | |
Shares sold | 22,067 | 20,661 | $ 1,076,822 | $ 932,116 |
Reinvestment of distributions | 339 | 202 | 16,582 | 9,173 |
Shares redeemed | (8,120) | (10,998) | (396,608) | (493,006) |
Net increase (decrease) | 14,286 | 9,865 | $ 696,796 | $ 448,283 |
Semiannual Report
Notes to Financial Statements (Unaudited) - continued
7. Share Transactions - continued
| Shares | Dollars |
| Six months ended
January 31,
2011 | Year ended
July 31,
2010 | Six months ended
January 31,
2011 | Year ended
July 31,
2010 |
Fidelity Income Replacement 2020 Fund | | | | |
Institutional Class | | | | |
Shares sold | - | 996 | $ - | $ 45,000 |
Reinvestment of distributions | 17 | 25 | 835 | 1,133 |
Shares redeemed | - | (2,202) | - | (99,518) |
Net increase (decrease) | 17 | (1,181) | $ 835 | $ (53,385) |
Fidelity Income Replacement 2022 Fund | | | | |
Class A | | | | |
Shares sold | 567 | - | $ 27,240 | $ - |
Reinvestment of distributions | 11 | 8 | 547 | 338 |
Shares redeemed | (31) | (2,006) | (1,444) | (84,777) |
Net increase (decrease) | 547 | (1,998) | $ 26,343 | $ (84,439) |
Class T | | | | |
Shares sold | - | 1,105 | $ - | $ 48,498 |
Reinvestment of distributions | 13 | 31 | 614 | 1,374 |
Shares redeemed | (113) | (2,115) | (5,366) | (94,162) |
Net increase (decrease) | (100) | (979) | $ (4,752) | $ (44,290) |
Class C | | | | |
Shares sold | - | - | $ - | $ - |
Reinvestment of distributions | 3 | 14 | 152 | 640 |
Shares redeemed | (212) | (699) | (9,959) | (31,230) |
Net increase (decrease) | (209) | (685) | $ (9,807) | $ (30,590) |
Income Replacement 2022 | | | | |
Shares sold | 7,565 | 9,043 | $ 364,469 | $ 391,098 |
Reinvestment of distributions | 265 | 462 | 12,940 | 20,398 |
Shares redeemed | (1,772) | (13,142) | (83,894) | (587,330) |
Net increase (decrease) | 6,058 | (3,637) | $ 293,515 | $ (175,834) |
Institutional Class | | | | |
Shares sold | - | - | $ - | $ - |
Reinvestment of distributions | 2 | 4 | 72 | 166 |
Shares redeemed | (25) | (3,867) | (1,158) | (173,132) |
Net increase (decrease) | (23) | (3,863) | $ (1,086) | $ (172,966) |
Fidelity Income Replacement 2024 Fund | | | | |
Class A | | | | |
Shares sold | - | - | $ - | $ - |
Reinvestment of distributions | 68 | 108 | 3,305 | 4,833 |
Shares redeemed | (598) | (1,295) | (28,922) | (57,768) |
Net increase (decrease) | (530) | (1,187) | $ (25,617) | $ (52,935) |
Class T | | | | |
Shares sold | - | 295 | $ - | $ 13,015 |
Reinvestment of distributions | 14 | 27 | 655 | 1,197 |
Shares redeemed | (261) | (804) | (12,189) | (35,887) |
Net increase (decrease) | (247) | (482) | $ (11,534) | $ (21,675) |
Class C | | | | |
Shares sold | - | - | $ - | $ - |
Reinvestment of distributions | 19 | 19 | 912 | 835 |
Shares redeemed | (35) | (71) | (1,630) | (2,945) |
Net increase (decrease) | (16) | (52) | $ (718) | $ (2,110) |
Income Replacement 2024 | | | | |
Shares sold | 1,730 | 9,741 | $ 84,592 | $ 422,106 |
Reinvestment of distributions | 124 | 143 | 6,073 | 6,430 |
Shares redeemed | (723) | (5,344) | (34,320) | (239,126) |
Net increase (decrease) | 1,131 | 4,540 | $ 56,345 | $ 189,410 |
Semiannual Report
7. Share Transactions - continued
| Shares | Dollars |
| Six months ended
January 31,
2011 | Year ended
July 31,
2010 | Six months ended
January 31,
2011 | Year ended
July 31,
2010 |
Fidelity Income Replacement 2024 Fund | | | | |
Institutional Class | | | | |
Shares sold | - | - | $ - | $ - |
Reinvestment of distributions | 11 | 24 | 534 | 1,064 |
Shares redeemed | (177) | (580) | (8,334) | (25,832) |
Net increase (decrease) | (166) | (556) | $ (7,800) | $ (24,768) |
Fidelity Income Replacement 2026 Fund | | | | |
Class A | | | | |
Shares sold | - | - | $ - | $ - |
Reinvestment of distributions | 12 | 26 | 584 | 1,147 |
Shares redeemed | (218) | (713) | (10,135) | (31,427) |
Net increase (decrease) | (206) | (687) | $ (9,551) | $ (30,280) |
Class T | | | | |
Shares sold | 145 | 2,332 | $ 6,445 | $ 103,846 |
Reinvestment of distributions | 29 | 39 | 1,415 | 1,739 |
Shares redeemed | (149) | (1,146) | (6,598) | (50,896) |
Net increase (decrease) | 25 | 1,225 | $ 1,262 | $ 54,689 |
Class C | | | | |
Shares sold | - | - | $ - | $ - |
Reinvestment of distributions | 43 | 55 | 2,073 | 2,424 |
Shares redeemed | (105) | (653) | (4,952) | (29,483) |
Net increase (decrease) | (62) | (598) | $ (2,879) | $ (27,059) |
Income Replacement 2026 | | | | |
Shares sold | 9,591 | 11,631 | $ 464,049 | $ 516,873 |
Reinvestment of distributions | 156 | 139 | 7,505 | 6,162 |
Shares redeemed | (2,224) | (6,640) | (108,432) | (295,846) |
Net increase (decrease) | 7,523 | 5,130 | $ 363,122 | $ 227,189 |
Institutional Class | | | | |
Shares sold | - | - | $ - | $ - |
Reinvestment of distributions | 11 | 24 | 519 | 1,055 |
Shares redeemed | (178) | (581) | (8,273) | (25,621) |
Net increase (decrease) | (167) | (557) | $ (7,754) | $ (24,566) |
Fidelity Income Replacement 2028 Fund | | | | |
Class A | | | | |
Shares sold | - | 1,688 | $ - | $ 71,316 |
Reinvestment of distributions | 121 | 161 | 5,822 | 7,159 |
Shares redeemed | (227) | (672) | (10,731) | (29,955) |
Net increase (decrease) | (106) | 1,177 | $ (4,909) | $ 48,520 |
Class T | | | | |
Shares sold | - | - | $ - | $ - |
Reinvestment of distributions | 24 | 46 | 1,174 | 2,069 |
Shares redeemed | (4,633) | (340) | (207,261) | (15,095) |
Net increase (decrease) | (4,609) | (294) | $ (206,087) | $ (13,026) |
Class C | | | | |
Shares sold | - | - | $ - | $ - |
Reinvestment of distributions | 3 | 8 | 154 | 379 |
Shares redeemed | (50) | (965) | (2,212) | (42,703) |
Net increase (decrease) | (47) | (957) | $ (2,058) | $ (42,324) |
Income Replacement 2028 | | | | |
Shares sold | 8,817 | 7,291 | $ 431,917 | $ 328,341 |
Reinvestment of distributions | 774 | 860 | 37,731 | 38,493 |
Shares redeemed | (9,764) | (26,019) | (467,669) | (1,168,445) |
Net increase (decrease) | (173) | (17,868) | $ 1,979 | $ (801,611) |
Semiannual Report
Notes to Financial Statements (Unaudited) - continued
7. Share Transactions - continued
| Shares | Dollars |
| Six months ended
January 31,
2011 | Year ended
July 31,
2010 | Six months ended
January 31,
2011 | Year ended
July 31,
2010 |
Fidelity Income Replacement 2028 Fund | | | | |
Institutional Class | | | | |
Shares sold | - | - | $ - | $ - |
Reinvestment of distributions | 11 | 24 | 530 | 1,048 |
Shares redeemed | (176) | (575) | (8,238) | (25,500) |
Net increase (decrease) | (165) | (551) | $ (7,708) | $ (24,452) |
Fidelity Income Replacement 2030 Fund | | | | |
Class A | | | | |
Shares sold | - | 1,608 | $ - | $ 70,708 |
Reinvestment of distributions | 10 | 22 | 470 | 972 |
Shares redeemed | (343) | (1,510) | (15,896) | (65,796) |
Net increase (decrease) | (333) | 120 | $ (15,426) | $ 5,884 |
Class T | | | | |
Shares sold | - | - | $ - | $ - |
Reinvestment of distributions | 3 | 14 | 131 | 632 |
Shares redeemed | (811) | (767) | (38,608) | (33,663) |
Net increase (decrease) | (808) | (753) | $ (38,477) | $ (33,031) |
Class C | | | | |
Shares sold | 519 | - | $ 25,006 | $ - |
Reinvestment of distributions | 49 | 47 | 2,355 | 2,094 |
Shares redeemed | (367) | (250) | (17,545) | (10,986) |
Net increase (decrease) | 201 | (203) | $ 9,816 | $ (8,892) |
Income Replacement 2030 | | | | |
Shares sold | 24,184 | 30,831 | $ 1,154,235 | $ 1,381,260 |
Reinvestment of distributions | 376 | 68 | 18,252 | 3,035 |
Shares redeemed | (5,934) | (1,995) | (286,502) | (90,075) |
Net increase (decrease) | 18,626 | 28,904 | $ 885,985 | $ 1,294,220 |
Institutional Class | | | | |
Shares sold | - | - | $ - | $ - |
Reinvestment of distributions | 11 | 22 | 506 | 982 |
Shares redeemed | (177) | (578) | (8,207) | (25,388) |
Net increase (decrease) | (166) | (556) | $ (7,701) | $ (24,406) |
Fidelity Income Replacement 2032 Fund | | | | |
Class A | | | | |
Shares sold | 642 | - | $ 31,087 | $ - |
Reinvestment of distributions | 70 | 93 | 3,304 | 4,047 |
Shares redeemed | - | (107) | - | (4,502) |
Net increase (decrease) | 712 | (14) | $ 34,391 | $ (455) |
Class T | | | | |
Shares sold | - | - | $ - | $ - |
Reinvestment of distributions | 9 | 19 | 424 | 838 |
Shares redeemed | (175) | (575) | (8,035) | (24,937) |
Net increase (decrease) | (166) | (556) | $ (7,611) | $ (24,099) |
Class C | | | | |
Shares sold | - | - | $ - | $ - |
Reinvestment of distributions | 6 | 12 | 283 | 502 |
Shares redeemed | (146) | (480) | (6,687) | (20,831) |
Net increase (decrease) | (140) | (468) | $ (6,404) | $ (20,329) |
Income Replacement 2032 | | | | |
Shares sold | 6,614 | 20,546 | $ 297,485 | $ 869,619 |
Reinvestment of distributions | 421 | 269 | 20,058 | 11,717 |
Shares redeemed | (397) | (21,297) | (18,331) | (886,611) |
Net increase (decrease) | 6,638 | (482) | $ 299,212 | $ (5,275) |
Semiannual Report
7. Share Transactions - continued
| Shares | Dollars |
| Six months ended
January 31,
2011 | Year ended
July 31,
2010 | Six months ended
January 31,
2011 | Year ended
July 31,
2010 |
Fidelity Income Replacement 2032 Fund | | | | |
Institutional Class | | | | |
Shares sold | 550 | 565 | $ 25,000 | $ 25,000 |
Reinvestment of distributions | 8 | 25 | 387 | 1,078 |
Shares redeemed | (1,493) | (582) | (71,539) | (25,236) |
Net increase (decrease) | (935) | 8 | $ (46,152) | $ 842 |
Fidelity Income Replacement 2034 Fund | | | | |
Class A | | | | |
Shares sold | - | - | $ - | $ - |
Reinvestment of distributions | 7 | 17 | 347 | 757 |
Shares redeemed | (132) | (984) | (6,047) | (41,642) |
Net increase (decrease) | (125) | (967) | $ (5,700) | $ (40,885) |
Class T | | | | |
Shares sold | - | - | $ - | $ - |
Reinvestment of distributions | 9 | 20 | 419 | 892 |
Shares redeemed | (174) | (569) | (7,975) | (24,737) |
Net increase (decrease) | (165) | (549) | $ (7,556) | $ (23,845) |
Class C | | | | |
Shares sold | - | - | $ - | $ - |
Reinvestment of distributions | 5 | 12 | 254 | 503 |
Shares redeemed | (132) | (434) | (6,064) | (18,880) |
Net increase (decrease) | (127) | (422) | $ (5,810) | $ (18,377) |
Income Replacement 2034 | | | | |
Shares sold | 5,686 | 5,032 | $ 275,526 | $ 225,749 |
Reinvestment of distributions | 295 | 383 | 14,230 | 16,703 |
Shares redeemed | (5,678) | (8,062) | (274,219) | (352,058) |
Net increase (decrease) | 303 | (2,647) | $ 15,537 | $ (109,606) |
Institutional Class | | | | |
Shares sold | - | - | $ - | $ - |
Reinvestment of distributions | 25 | 39 | 1,208 | 1,717 |
Shares redeemed | - | (586) | (21) | (25,063) |
Net increase (decrease) | 25 | (547) | $ 1,187 | $ (23,346) |
Fidelity Income Replacement 2036 Fund | | | | |
Class A | | | | |
Shares sold | - | 128 | $ - | $ 5,725 |
Reinvestment of distributions | 11 | 23 | 504 | 973 |
Shares redeemed | (199) | (600) | (9,048) | (25,767) |
Net increase (decrease) | (188) | (449) | $ (8,544) | $ (19,069) |
Class T | | | | |
Shares sold | 12 | 82 | $ 553 | $ 3,536 |
Reinvestment of distributions | 40 | 54 | 1,913 | 2,334 |
Shares redeemed | (150) | (756) | (6,897) | (33,710) |
Net increase (decrease) | (98) | (620) | $ (4,431) | $ (27,840) |
Class C | | | | |
Shares sold | - | 979 | $ - | $ 39,435 |
Reinvestment of distributions | 28 | 41 | 1,330 | 1,752 |
Shares redeemed | (188) | (1,217) | (8,716) | (52,088) |
Net increase (decrease) | (160) | (197) | $ (7,386) | $ (10,901) |
Income Replacement 2036 | | | | |
Shares sold | 15,889 | 2,159 | $ 750,000 | $ 86,419 |
Reinvestment of distributions | 239 | 99 | 11,414 | 4,266 |
Shares redeemed | (644) | (4,508) | (30,743) | (191,085) |
Net increase (decrease) | 15,484 | (2,250) | $ 730,671 | $ (100,400) |
Semiannual Report
Notes to Financial Statements (Unaudited) - continued
7. Share Transactions - continued
| Shares | Dollars |
| Six months ended
January 31,
2011 | Year ended
July 31,
2010 | Six months ended
January 31,
2011 | Year ended
July 31,
2010 |
Fidelity Income Replacement 2036 Fund | | | | |
Institutional Class | | | | |
Shares sold | 28 | 1,348 | $ 1,283 | $ 59,043 |
Reinvestment of distributions | 31 | 33 | 1,459 | 1,403 |
Shares redeemed | (491) | (723) | (22,150) | (31,039) |
Net increase (decrease) | (432) | 658 | $ (19,408) | $ 29,407 |
Fidelity Income Replacement 2038 Fund | | | | |
Class A | | | | |
Shares sold | - | 667 | $ - | $ 28,000 |
Reinvestment of distributions | 11 | 24 | 516 | 996 |
Shares redeemed | (37) | (2,898) | (1,526) | (123,534) |
Net increase (decrease) | (26) | (2,207) | $ (1,010) | $ (94,538) |
Class T | | | | |
Shares sold | - | - | $ - | $ - |
Reinvestment of distributions | 10 | 21 | 475 | 896 |
Shares redeemed | (190) | (622) | (8,472) | (26,247) |
Net increase (decrease) | (180) | (601) | $ (7,997) | $ (25,351) |
Class C | | | | |
Shares sold | - | 1,458 | $ - | $ 65,000 |
Reinvestment of distributions | 20 | 18 | 940 | 774 |
Shares redeemed | (462) | (823) | (20,624) | (34,657) |
Net increase (decrease) | (442) | 653 | $ (19,684) | $ 31,117 |
Income Replacement 2038 | | | | |
Shares sold | 102 | 19,983 | $ 4,637 | $ 804,508 |
Reinvestment of distributions | 496 | 594 | 23,240 | 25,218 |
Shares redeemed | (19,191) | (2,784) | (912,335) | (118,526) |
Net increase (decrease) | (18,593) | 17,793 | $ (884,458) | $ 711,200 |
Institutional Class | | | | |
Shares sold | - | - | $ - | $ - |
Reinvestment of distributions | 12 | 27 | 568 | 1,151 |
Shares redeemed | (192) | (628) | (8,693) | (26,515) |
Net increase (decrease) | (180) | (601) | $ (8,125) | $ (25,364) |
Fidelity Income Replacement 2040 Fund | | | | |
Class A | | | | |
Shares sold | 1,226 | - | $ 56,828 | $ - |
Reinvestment of distributions | 20 | 21 | 957 | 909 |
Shares redeemed | (241) | (697) | (10,977) | (29,560) |
Net increase (decrease) | 1,005 | (676) | $ 46,808 | $ (28,651) |
Class T | | | | |
Shares sold | 31 | 766 | $ 1,384 | $ 32,205 |
Reinvestment of distributions | 38 | 44 | 1,798 | 1,859 |
Shares redeemed | (1) | (849) | (45) | (35,678) |
Net increase (decrease) | 68 | (39) | $ 3,137 | $ (1,614) |
Class C | | | | |
Shares sold | - | 1,585 | $ - | $ 67,225 |
Reinvestment of distributions | 22 | 14 | 1,047 | 599 |
Shares redeemed | (502) | (765) | (22,474) | (32,264) |
Net increase (decrease) | (480) | 834 | $ (21,427) | $ 35,560 |
Income Replacement 2040 | | | | |
Shares sold | 12,026 | 51,547 | $ 569,527 | $ 2,203,936 |
Reinvestment of distributions | 327 | 391 | 15,370 | 16,805 |
Shares redeemed | (5,911) | (32,503) | (276,118) | (1,366,427) |
Net increase (decrease) | 6,442 | 19,435 | $ 308,779 | $ 854,314 |
Semiannual Report
7. Share Transactions - continued
| Shares | Dollars |
| Six months ended
January 31,
2011 | Year ended
July 31,
2010 | Six months ended
January 31,
2011 | Year ended
July 31,
2010 |
Fidelity Income Replacement 2040 Fund | | | | |
Institutional Class | | | | |
Shares sold | - | 857 | $ - | $ 35,012 |
Reinvestment of distributions | 20 | 39 | 940 | 1,633 |
Shares redeemed | (316) | (935) | (14,148) | (39,625) |
Net increase (decrease) | (296) | (39) | $ (13,208) | $ (2,980) |
Fidelity Income Replacement 2042 Fund | | | | |
Class A | | | | |
Shares sold | 4 | 1,685 | $ 169 | $ 72,288 |
Reinvestment of distributions | 9 | 36 | 413 | 1,552 |
Shares redeemed | (147) | (3,326) | (6,605) | (142,410) |
Net increase (decrease) | (134) | (1,605) | $ (6,023) | $ (68,570) |
Class T | | | | |
Shares sold | - | - | $ - | $ - |
Reinvestment of distributions | 10 | 19 | 487 | 808 |
Shares redeemed | (189) | (621) | (8,485) | (26,230) |
Net increase (decrease) | (179) | (602) | $ (7,998) | $ (25,422) |
Class C | | | | |
Shares sold | - | - | $ - | $ - |
Reinvestment of distributions | 8 | 13 | 393 | 562 |
Shares redeemed | (187) | (615) | (8,365) | (25,273) |
Net increase (decrease) | (179) | (602) | $ (7,972) | $ (24,711) |
Income Replacement 2042 | | | | |
Shares sold | 20,501 | 45,150 | $ 979,327 | $ 1,897,966 |
Reinvestment of distributions | 963 | 960 | 45,246 | 40,980 |
Shares redeemed | (4,882) | (3,141) | (225,966) | (134,772) |
Net increase (decrease) | 16,582 | 42,969 | $ 798,607 | $ 1,804,174 |
Institutional Class | | | | |
Shares sold | - | - | $ - | $ - |
Reinvestment of distributions | 12 | 25 | 581 | 1,066 |
Shares redeemed | (192) | (627) | (8,607) | (26,500) |
Net increase (decrease) | (180) | (602) | $ (8,026) | $ (25,434) |
8. Other.
The Funds' organizational documents provide former and current trustees and officers with a limited indemnification against liabilities arising in connection with the performance of their duties to the Funds. In the normal course of business, the Funds may also enter into contracts that provide general indemnifications. The Funds' maximum exposure under these arrangements is unknown as this would be dependent on future claims that may be made against the Funds. The risk of material loss from such claims is considered remote.
The Funds do not invest in the Underlying Funds for the purpose of exercising management or control; however, investments by the Funds within their principle investments strategies may represent a significant portion of the Underlying Fund's net assets. At the end of the period, the following Funds were the owners of record of 10% or more of the total outstanding shares of the Underlying Funds.
Fund | Income Replacement 2016 Fund | Income Replacement 2028 Fund | Income Replacement 2042 Fund |
Fidelity Series Broad Market Opportunities Fund | 12% | 15% | 12% |
The Funds, in aggregate, were the owners of record of more than 20% of the total outstanding shares of the following Underlying Funds.
Fund | % of shares held |
Fidelity Series Broad Market Opportunities Fund | 100% |
Semiannual Report
Board Approval of Investment Advisory Contracts and Management Fees
Fidelity Income Replacement Funds
Each year, the Board of Trustees, including the Independent Trustees (together, the Board), votes on the renewal of the management contract (the Advisory Contract) for each fund. The Board, assisted by the advice of fund counsel and Independent Trustees' counsel, requests and considers a broad range of information relevant to the renewal of the Advisory Contracts throughout the year.
The Board meets regularly and considers at each of its meetings factors that are relevant to its annual consideration of the renewal of each fund's Advisory Contract, including the services and support provided to each fund and its shareholders. The Board has established three standing committees, each composed of Independent Trustees with varying backgrounds, to which the Board has assigned specific subject matter responsibilities in order to enhance effective decision-making by the Board. The Operations Committee, of which all of the Independent Trustees are members, meets regularly throughout the year and, among other matters, considers matters specifically related to the annual consideration of the renewal of each fund's Advisory Contract. The Board, acting directly and through its Committees, requests and receives information concerning the annual consideration of the renewal of each fund's Advisory Contract. The Board also meets as needed to consider matters specifically related to the Board's annual consideration of the renewal of Advisory Contract. Members of the Board may also meet with trustees of other Fidelity funds through ad hoc joint committees to discuss certain matters relevant to the Fidelity funds.
At its September 2010 meeting, the Board of Trustees, including the Independent Trustees, unanimously determined to renew each fund's Advisory Contract. In reaching its determination, the Board considered all factors it believed relevant and reached a determination, with the assistance of fund counsel and Independent Trustees' counsel and through the exercise of its business judgment, that the renewal of each fund's Advisory Contract and is in the best interests of each fund and its shareholders and that the lack of compensation to be received by Fidelity under the management contracts is fair and reasonable. The Board's decision to renew each fund's Advisory Contract was not based on any single factor, but rather was based on a comprehensive consideration of all the information provided to the Board at its meetings throughout the year. In reaching its determination, the Board is aware that shareholders in each fund have a broad range of investment choices available to them, including a wide choice among mutual funds offered by Fidelity's competitors, and that each fund's shareholders, with the opportunity to review and weigh the disclosure provided by the fund in its prospectus and other public disclosures, have chosen to invest in that fund, managed by Fidelity.
Nature, Extent, and Quality of Services Provided. The Board considered the staffing within the investment adviser, Strategic Advisers, Inc. (the Investment Adviser), including the backgrounds of the funds' investment personnel and the funds' investment objectives and disciplines. The Independent Trustees also had discussions with senior management of Fidelity's investment operations and investment groups. The Board considered the structure of the portfolio manager compensation program and whether this structure provides appropriate incentives to act in the best interest of each fund.
Resources Dedicated to Investment Management and Support Services. The Board reviewed the size, education, and experience of the Investment Adviser's investment staff, its use of technology, and the Investment Adviser's approach to recruiting, training, and retaining portfolio managers and other research, advisory, and management personnel. The Board noted that Fidelity's analysts have access to a variety of technological tools and market and securities data that enable them to perform both fundamental and quantitative analysis and to specialize in various disciplines. The Board noted FMR's continued focus on strengthening the organization and discipline of equity portfolio management and research.
Shareholder and Administrative Services. The Board considered (i) the nature, extent, quality, and cost of advisory, administrative, and shareholder services performed by the Investment Adviser and its affiliates under the each fund's Advisory Contract and under separate agreements covering transfer agency, pricing and bookkeeping, and securities lending services for each fund; (ii) the nature and extent of the investment adviser's supervision of third party service providers, principally custodians and subcustodians; and (iii) the resources devoted to, and the record of compliance with, each fund's compliance policies and procedures.
The Board noted that the growth of fund assets over time across the complex allows Fidelity to reinvest in the development of services designed to enhance the value or convenience of the Fidelity funds as investment vehicles. These services include 24-hour access to account information and market information through telephone representatives and over the Internet, and investor education materials and asset allocation tools.
Investment in a Large Fund Family. The Board considered the benefits to shareholders of investing in a Fidelity fund, including the benefits of investing in a fund that is part of a large family of funds offering a variety of investment disciplines and providing a large variety of mutual fund investor services. The Board noted that Fidelity had taken, or had made recommendations that resulted in the Fidelity funds taking, a number of actions over the previous year that benefited particular funds, including (i) dedicating additional resources to investment research and restructuring and broadening the focus of the investment research teams; (ii) bolstering the senior management team that oversees asset management; (iii) launching Class F of certain funds as a lower-fee class available to Freedom K and Freedom Index Funds; (iv) lowering the initial investment minimums and ongoing balance requirements for Real Estate High Income Fund; (v) eliminating subsequent purchase minimums for all funds and adding a waiver of the investment minimum requirement for new accounts opened with the proceeds of a systematic withdrawal plan; (vi) eliminating the withdrawal minimum and maximum limits for systematic withdrawals from Advisor funds; (vii) expanding sales load waivers on Class A shares for Destiny Planholders and expanding Institutional Class eligibility for Class O Destiny Planholders; and (viii) changing certain Class A and Class T sales charge structures to further align them with industry practices.
Semiannual Report
Investment Performance. The Board considered whether each fund has operated in accordance with its investment objective, as well as its record of compliance with its investment restrictions. It also reviewed each fund's absolute investment performance for each class, as well as each fund's relative investment performance for each class measured against a proprietary custom index. The Board noted that FMR does not believe that a meaningful peer group exists against which to compare any of the funds' performance.
Because each of Income Replacement 2016 Fund, Income Replacement 2020 Fund, Income Replacement 2028 Fund, Income Replacement 2030 Fund, Income Replacement 2032 Fund, Income Replacement 2034 Fund, Income Replacement 2036 Fund, and Income Replacement 2040 Fund had been in existence less than three calendar years, for each fund the following chart considered by the Board shows, for the one-year period ended December 31, 2009, the total returns of the retail class and Class C of the fund, and the total return of a proprietary custom index ("benchmark"). The returns of the retail class and Class C show the performance of the highest and lowest performing classes, respectively.
Because each of Income Replacement 2018 Fund, Income Replacement 2022 Fund, Income Replacement 2024 Fund, Income Replacement 2026 Fund, Income Replacement 2038 Fund, and Income Replacement 2042 Fund had been in existence less than three calendar years, for each fund the following chart considered by the Board shows, for the one-year period ended December 31, 2009, the total returns of Institutional Class (Class I) and Class C of the fund, and the total return of a proprietary custom index ("benchmark"). The returns of Institutional Class (Class I) and Class C show the performance of the highest and lowest performing classes, respectively.
For each fund, the proprietary custom index is an index developed by FMR that represents the performance of the fund's asset classes according to their respective weightings.
Income Replacement 2016
The Board noted that the investment performance of the retail class of the fund compared favorably to its benchmark for the period shown. The Board considered that the variations in performance among the fund's classes reflect the variations in class expenses, which result in lower performance for higher expense classes. The Board also reviewed the fund's performance since inception as well as performance in the current year. The Board noted that it is difficult to evaluate in any comprehensive fashion the performance of the fund, in light of its relatively recent commencement of operations.
Semiannual Report
Board Approval of Investment Advisory Contracts and Management Fees - continued
Income Replacement 2018
The Board noted that the investment performance of Institutional Class (Class I) of the fund compared favorably to its benchmark for the period shown. The Board considered that the variations in performance among the fund's classes reflect the variations in class expenses, which result in lower performance for higher expense classes. The Board also reviewed the fund's performance since inception as well as performance in the current year. The Board noted that it is difficult to evaluate in any comprehensive fashion the performance of the fund, in light of its relatively recent commencement of operations.
Income Replacement 2020
The Board noted that the investment performance of the retail class of the fund compared favorably to its benchmark for the period shown. The Board considered that the variations in performance among the fund's classes reflect the variations in class expenses, which result in lower performance for higher expense classes. The Board also reviewed the fund's performance since inception as well as performance in the current year. The Board noted that it is difficult to evaluate in any comprehensive fashion the performance of the fund, in light of its relatively recent commencement of operations.
Semiannual Report
Income Replacement 2022
The Board noted that the investment performance of Institutional Class (Class I) of the fund compared favorably to its benchmark for the period shown. The Board considered that the variations in performance among the fund's classes reflect the variations in class expenses, which result in lower performance for higher expense classes. The Board also reviewed the fund's performance since inception as well as performance in the current year. The Board noted that it is difficult to evaluate in any comprehensive fashion the performance of the fund, in light of its relatively recent commencement of operations.
Income Replacement 2024
The Board noted that the investment performance of Institutional Class (Class I) of the fund compared favorably to its benchmark for the period shown. The Board considered that the variations in performance among the fund's classes reflect the variations in class expenses, which result in lower performance for higher expense classes. The Board also reviewed the fund's performance since inception as well as performance in the current year. The Board noted that it is difficult to evaluate in any comprehensive fashion the performance of the fund, in light of its relatively recent commencement of operations.
Semiannual Report
Board Approval of Investment Advisory Contracts and Management Fees - continued
Income Replacement 2026
The Board noted that the investment performance of Institutional Class (Class I) of the fund compared favorably to its benchmark for the period shown. The Board considered that the variations in performance among the fund's classes reflect the variations in class expenses, which result in lower performance for higher expense classes. The Board also reviewed the fund's performance since inception as well as performance in the current year. The Board noted that it is difficult to evaluate in any comprehensive fashion the performance of the fund, in light of its relatively recent commencement of operations.
Income Replacement 2028
The Board noted that the investment performance of the retail class of the fund compared favorably to its benchmark for the period shown. The Board considered that the variations in performance among the fund's classes reflect the variations in class expenses, which result in lower performance for higher expense classes. The Board also reviewed the fund's performance since inception as well as performance in the current year. The Board noted that it is difficult to evaluate in any comprehensive fashion the performance of the fund, in light of its relatively recent commencement of operations.
Semiannual Report
Income Replacement 2030
The Board noted that the investment performance of the retail class of the fund compared favorably to its benchmark for the period shown. The Board considered that the variations in performance among the fund's classes reflect the variations in class expenses, which result in lower performance for higher expense classes. The Board also reviewed the fund's performance since inception as well as performance in the current year. The Board noted that it is difficult to evaluate in any comprehensive fashion the performance of the fund, in light of its relatively recent commencement of operations.
Income Replacement 2032
The Board noted that the investment performance of the retail class of the fund compared favorably to its benchmark for the period shown. The Board considered that the variations in performance among the fund's classes reflect the variations in class expenses, which result in lower performance for higher expense classes. The Board also reviewed the fund's performance since inception as well as performance in the current year. The Board noted that it is difficult to evaluate in any comprehensive fashion the performance of the fund, in light of its relatively recent commencement of operations.
Semiannual Report
Board Approval of Investment Advisory Contracts and Management Fees - continued
Income Replacement 2034
The Board noted that the investment performance of the retail class of the fund compared favorably to its benchmark for the period shown. The Board considered that the variations in performance among the fund's classes reflect the variations in class expenses, which result in lower performance for higher expense classes. The Board also reviewed the fund's performance since inception as well as performance in the current year. The Board noted that it is difficult to evaluate in any comprehensive fashion the performance of the fund, in light of its relatively recent commencement of operations.
Income Replacement 2036
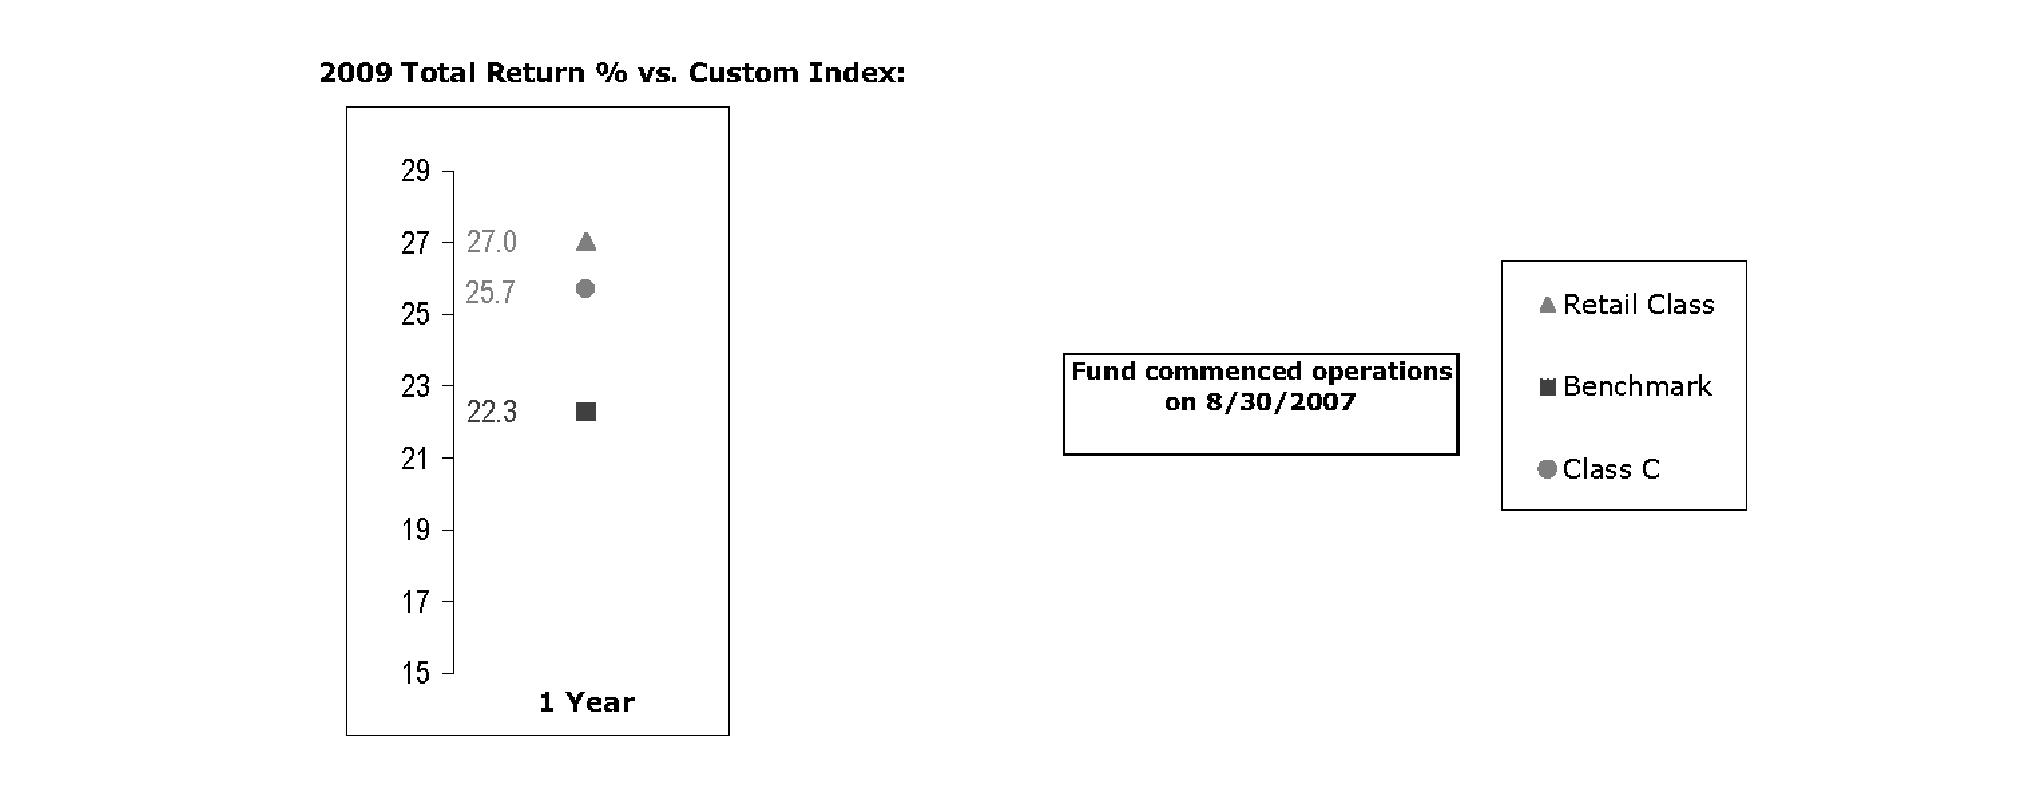
The Board noted that the investment performance of the retail class of the fund compared favorably to its benchmark for the period shown. The Board considered that the variations in performance among the fund's classes reflect the variations in class expenses, which result in lower performance for higher expense classes. The Board also reviewed the fund's performance since inception as well as performance in the current year. The Board noted that it is difficult to evaluate in any comprehensive fashion the performance of the fund, in light of its relatively recent commencement of operations.
Semiannual Report
Income Replacement 2038
The Board noted that the investment performance of Institutional Class (Class I) of the fund compared favorably to its benchmark for the period shown. The Board considered that the variations in performance among the fund's classes reflect the variations in class expenses, which result in lower performance for higher expense classes. The Board also reviewed the fund's performance since inception as well as performance in the current year. The Board noted that it is difficult to evaluate in any comprehensive fashion the performance of the fund, in light of its relatively recent commencement of operations.
Income Replacement 2040
The Board noted that the investment performance of the retail class of the fund compared favorably to its benchmark for the period shown. The Board considered that the variations in performance among the fund's classes reflect the variations in class expenses, which result in lower performance for higher expense classes. The Board also reviewed the fund's performance since inception as well as performance in the current year. The Board noted that it is difficult to evaluate in any comprehensive fashion the performance of the fund, in light of its relatively recent commencement of operations.
Semiannual Report
Board Approval of Investment Advisory Contracts and Management Fees - continued
Income Replacement 2042
The Board noted that the investment performance of Institutional Class (Class I) of the fund compared favorably to its benchmark for the period shown. The Board considered that the variations in performance among the fund's classes reflect the variations in class expenses, which result in lower performance for higher expense classes. The Board also reviewed the fund's performance since inception as well as performance in the current year. The Board noted that it is difficult to evaluate in any comprehensive fashion the performance of the fund, in light of its relatively recent commencement of operations.
Based on its review, and giving particular weight to the nature and quality of the resources dedicated by the Investment Adviser to maintain and improve relative performance and factoring in the unprecedented market events in recent years, the Board concluded that the nature, extent, and quality of investment management and support services and of shareholder and administrative services provided to each fund will benefit each fund's shareholders, particularly in light of the Board's view that each fund's shareholders benefit from investing in a fund that is part of a large family of funds offering a variety of investment disciplines and services.
Competitiveness of Management Fee and Total Fund Expenses. The Board noted that the funds do not pay the Investment Adviser a management fee for investment advisory services. The Board considered each fund's management fee and total expenses compared to "mapped groups" of competitive funds and classes. Fidelity creates "mapped groups" by combining similar Lipper investment objective categories that have comparable management fee characteristics. Combining Lipper investment objective categories aids the Board's management fee and total expense comparisons by broadening the competitive group used for comparison and by reducing the number of universes to which various Fidelity funds are compared.
Management Fee. The Board considered two proprietary management fee comparisons for the 12-month (or shorter) periods shown in the charts below. The group of Lipper funds used by the Board for management fee comparisons is referred to below as the "Total Mapped Group." The Total Mapped Group comparison focuses on a fund's standing relative to the total universe of comparable funds available to investors, in terms of gross management fees before expense reimbursements or caps. "TMG %" represents the percentage of funds in the Total Mapped Group that had management fees that were lower than a fund's. For example, a TMG % of 0% means that 100% of the funds in the Total Mapped Group had higher management fees than a fund. The "Asset-Size Peer Group" (ASPG) comparison focuses on a fund's standing relative to non-Fidelity funds similar in size to the fund within the Total Mapped Group. The ASPG represents at least 15% of the funds in the Total Mapped Group with comparable asset size and management fee characteristics, subject to a minimum of 50 funds (or all funds in the Total Mapped Group if fewer than 50). Additional information, such as the ASPG quartile in which a fund's management fee ranked, is also included in the charts and considered by the Board.
Semiannual Report
Income Replacement 2016 Fund
Income Replacement 2018 Fund
Semiannual Report
Board Approval of Investment Advisory Contracts and Management Fees - continued
Income Replacement 2020 Fund
Income Replacement 2022 Fund
Semiannual Report
Income Replacement 2024 Fund
Income Replacement 2026 Fund
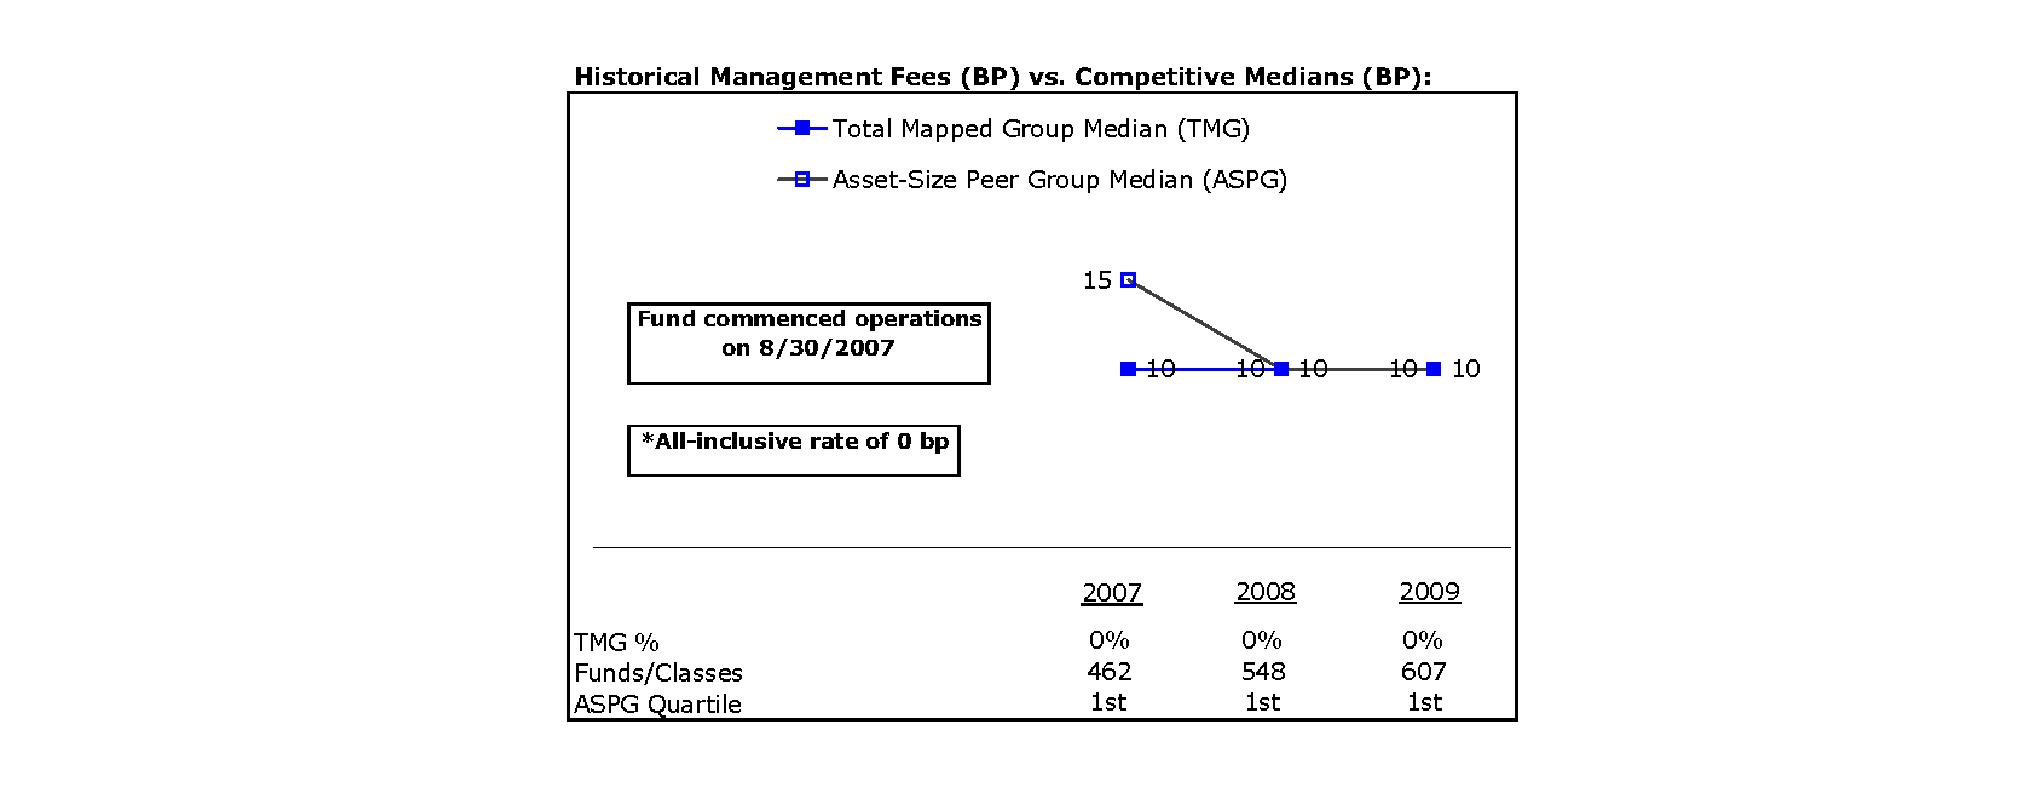
Semiannual Report
Board Approval of Investment Advisory Contracts and Management Fees - continued
Income Replacement 2028 Fund
Income Replacement 2030 Fund
Semiannual Report
Income Replacement 2032 Fund
Income Replacement 2034 Fund
Semiannual Report
Board Approval of Investment Advisory Contracts and Management Fees - continued
Income Replacement 2036 Fund
Income Replacement 2038 Fund
Semiannual Report
Income Replacement 2040 Fund
Income Replacement 2042 Fund
The Board noted that each fund's management fee ranked below the median of its Total Mapped Group and below the median of its ASPG for 2009.
Based on its review, the Board concluded that each fund's management fee is fair and reasonable in light of the services that the fund receives and the other factors considered.
Total Expenses. In its review of the total expenses of each class of each fund, the Board noted that each fund invests in Institutional Class of the underlying fund (if that underlying fund offers multiple classes of shares) to avoid charging fund-paid 12b-1 fees at both fund levels. The Board considered that the funds do not pay transfer agent fees. Instead, Institutional Class of each underlying fund (or the underlying fund, if that underlying fund does not offer multiple classes of shares) bears its pro rata portion of each fund's transfer agent fee according to the percentage of each fund's assets invested in that underlying fund. The Board further noted that the Investment Adviser pays all other expenses of each fund, with limited exceptions.
The Board noted that each fund offers multiple classes, each of which has a different sales load and 12b-1 fee structure, and that the multiple structures are intended to offer a range of pricing options for the intermediary market. The Board also noted that the total expenses of the classes of each fund vary primarily by the level of their 12b-1 fees.
For each of Income Replacement 2016 Fund, Income Replacement 2018 Fund, Income Replacement 2020 Fund, Income Replacement 2024 Fund, Income Replacement 2028 Fund, Income Replacement 2032 Fund, Income Replacement 2036 Fund, Income Replacement 2038 Fund, Income Replacement 2040 Fund, and Income Replacement 2042 Fund, the Board noted that the total expenses of each of Class A, Class C, Institutional Class, and the retail class of each fund ranked below its competitive median for 2009 and the total expenses of Class T ranked equal to its competitive median for 2009.
Semiannual Report
Board Approval of Investment Advisory Contracts and Management Fees - continued
For each of Income Replacement 2022 Fund, Income Replacement 2030 Fund, and Income Replacement 2034 Fund, the Board noted that the total expenses of each of Class A, Class C, Institutional Class, and the retail class of each fund ranked below its competitive median for 2009 and the total expenses of Class T ranked above its competitive median for 2009. The Board considered that the total expenses for Class T were above the median primarily because its 12b-1 fee is higher than the typical front-end load class. The Board noted that each fund offers multiple classes, each of which has a different sales load and 12b-1 fee structure, and that the multiple structures are intended to offer a range of pricing options for the intermediary market. The Board also noted that the total expenses of the classes vary primarily by the level of their 12b-1 fees, although differences in transfer agent fees may also causes expenses to vary from class to class.
For Income Replacement 2026 Fund, the Board noted that the total expenses of each class ranked below its competitive median for 2009.
Fees Charged to Other Fidelity Clients. The Board also considered Fidelity fee structures and other information with respect to clients of FMR and its affiliates, such as other mutual funds advised or subadvised by FMR or its affiliates, pension plan clients, and other institutional clients. In March 2010, the Board created an ad hoc joint committee with the board of other Fidelity funds (the Committee) to review and compare Fidelity's institutional investment advisory business with its business of providing services to the Fidelity funds, including the differences in services provided, fees charged, and costs incurred, as well as competition in their respective marketplaces.
Based on its review of total expenses and fees charged to other Fidelity clients, the Board concluded that the total expenses of each class of each fund were reasonable, although in some cases above the median of the universe presented for comparison, in light of the services that the fund and its shareholders receive and the other factors considered, including the findings of the Committee.
Costs of the Services and Profitability. The Board considered the level of Fidelity's profits in respect of all the Fidelity funds.
PricewaterhouseCoopers LLP (PwC), independent registered public accounting firm and auditor to Fidelity and certain Fidelity funds, has been engaged annually by the Board as part of the Board's assessment of Fidelity's profitability analysis. PwC's engagement includes the review and assessment of Fidelity's methodologies used in determining the revenues and expenses attributable to Fidelity's mutual fund business, and completion of agreed-upon procedures surrounding the mathematical accuracy of fund profitability and its conformity to allocation methodologies. After considering PwC's reports issued under the engagement and information provided by Fidelity, the Board believes that while other allocation methods may also be reasonable, Fidelity's profitability methodologies are reasonable in all material respects.
The Board has also reviewed Fidelity's non-fund businesses and fall-out benefits related to the mutual fund business as well as cases where Fidelity's affiliates may benefit from or be related to the funds' business.
The Board concluded that the costs of the services provided by and the profits realized by Fidelity in connection with the operation of each fund were not relevant to the renewal of each fund's Advisory Contract because the funds do not pay management fees and FMR pays all other expenses of each fund, with limited exceptions.
Economies of Scale. The Board concluded that because the funds do not pay management fees and the Investment Adviser pays all other expenses of each fund, with limited exceptions, economies of scale cannot be realized by the funds, but may be realized by the other Fidelity funds in which each fund invests.
Additional Information Requested by the Board. In order to develop fully the factual basis for consideration of the Fidelity funds' Advisory Contracts, the Board requested and received additional information on certain topics, including (i) fund performance trends, actions to be taken by FMR to improve certain funds' overall performance, and Fidelity's long-term strategies for certain funds; (ii) Fidelity's fund profitability methodology and profitability trends for certain funds; (iii) portfolio manager changes that have occurred during the past year and the amount of the investment that each portfolio manager has made in the Fidelity fund(s) that he or she manages; (iv) Fidelity's compensation structure for portfolio managers, research analysts, and other key personnel, including its effects on fund profitability, the rationale for the compensation structure, and the extent to which current market conditions have affected retention and recruitment; (v) the compensation paid by FMR to fund sub-advisers on behalf of the Fidelity funds; (vi) Fidelity's fee structures and rationale for recommending different fees among different categories of funds and classes, as well as Fidelity's voluntary waiver of fees to maintain minimum yields for certain funds and classes; (vii) the rationale for any differences between fund fee structures and fee structures in place for other Fidelity clients; and (viii) explanations regarding the relative total expenses borne by certain funds and classes, total expense competitive trends, and actions that might be taken by FMR to reduce total expenses for certain funds and classes or to achieve further economies of scale.
Based on its evaluation of all of the conclusions noted above, and after considering all factors it believed relevant, the Board ultimately concluded that the advisory fee structures are fair and reasonable, and that each fund's Advisory Contract should be renewed.
Semiannual Report
Investment Adviser
Strategic Advisers, Inc.
Boston, MA
General Distributor
Fidelity Distributors Corporation
Boston, MA
Transfer and Service Agents
Fidelity Investments Institutional Operations Company, Inc.
Boston, MA
Fidelity Service Company, Inc.
Boston, MA
Custodian
The Bank of New York Mellon
New York, NY
The Fidelity Telephone Connection
Mutual Fund 24-Hour Service
Exchanges/Redemptions
and Account Assistance 1-800-544-6666
Product Information 1-800-544-6666
Retirement Accounts 1-800-544-4774
(8 a.m. - 9 p.m.)
TDD Service 1-800-544-0118
for the deaf and hearing impaired
(9 a.m. - 9 p.m. Eastern time)
Fidelity Automated Service
Telephone (FAST®) 1-800-544-5555
Automated line for quickest service
RW-USAN-0311
1.848177.103
Fidelity Advisor Income Replacement FundsSM -
2016, 2018, 2020, 2022, 2024, 2026, 2028, 2030, 2032, 2034, 2036, 2038, 2040, 2042 -
Class A, Class T, and Class C
Semiannual Report
January 31, 2011
Each Class A, Class T, and Class C are
classes of Fidelity Income Replacement FundsSM
(2_fidelity_logos) (Registered_Trademark)
Contents
Semiannual Report
This report and the financial statements contained herein are submitted for the general information of the shareholders of the funds. This report is not authorized for distribution to prospective investors in the funds unless preceded or accompanied by an effective prospectus.
A fund files its complete schedule of portfolio holdings with the SEC for the first and third quarters of each fiscal year on Form N-Q. Forms N-Q are available on the SEC's web site at http://www.sec.gov. A fund's Forms N-Q may be reviewed and copied at the SEC's Public Reference Room in Washington, DC. Information regarding the operation of the SEC's Public Reference Room may be obtained by calling 1-800-SEC-0330. For a complete list of a fund's portfolio holdings, view the most recent quarterly holdings listing, semiannual report, or annual report on Fidelity's web site at http://www.fidelity.com, http://www.advisor.fidelity.com, or http://www.401k.com, as applicable.
NOT FDIC INSURED • MAY LOSE VALUE • NO BANK GUARANTEE
Neither the funds nor Fidelity Distributors Corporation is a bank.
To view a fund's proxy voting guidelines and proxy voting record for the 12-month period ended June 30, visit http://www.fidelity.com/proxyvotingresults or visit the Securities and Exchange Commission's (SEC) web site at http://www.sec.gov. You may also call 1-877-208-0098 to request a free copy of the proxy voting guidelines.
Standard & Poor's, S&P and S&P 500 are registered service marks of The McGraw-Hill Companies, Inc. and have been licensed for use by Fidelity Distributors Corporation.
Other third party marks appearing herein are the property of their respective owners.
All other marks appearing herein are registered or unregistered trademarks or service marks of FMR LLC or an affiliated company.
Semiannual Report
(photo_of_Abigail_P_Johnson)
Dear Shareholder:
Following a year in which the investment environment was volatile but generally supportive of most major asset classes, 2011 began on a positive note. U.S. equities gained ground in January, reaching their highest point since August 2008, amid indications the U.S. economy had turned a corner. Still, questions remained about the longer-term outlook, most notably persistently high unemployment. Financial markets are always unpredictable, of course, but there also are several time-tested investment principles that can help put the odds in your favor.
One of the basic tenets is to invest for the long term. Over time, riding out the markets' inevitable ups and downs has proven much more effective than selling into panic or chasing the hottest trend. Even missing only a few of the markets' best days can significantly diminish investor returns. Patience also affords the benefits of compounding - of earning interest on additional income or reinvested dividends and capital gains. There can be tax advantages and cost benefits to consider as well. While staying the course doesn't eliminate risk, it can considerably lessen the effect of short-term declines.
You can further manage your investing risk through diversification. And today, more than ever, geographic diversification should be taken into account. Studies indicate that asset allocation is the single most important determinant of a portfolio's long-term success. The right mix of stocks, bonds and cash - aligned to your particular risk tolerance and investment objective - is very important. Age-appropriate rebalancing is also an essential aspect of asset allocation. For younger investors, an emphasis on equities - which historically have been the best-performing asset class over time - is encouraged. As investors near their specific goal, such as retirement or sending a child to college, consideration may be given to replacing volatile assets (e.g. common stocks) with more-stable fixed investments (bonds or savings plans).
A third principle - investing regularly - can help lower the average cost of your purchases. Investing a certain amount of money each month or quarter helps ensure you won't pay for all your shares at market highs. This strategy - known as dollar cost averaging - also reduces "emotion" from investing, helping shareholders avoid selling weak performers just prior to an upswing, or chasing a hot performer just before a correction.
We invite you to contact us via the Internet, through our Investor Centers or by phone. It is our privilege to provide you the information you need to make the investments that are right for you.
Sincerely,
(The chairman's signature appears here.)
Abigail P. Johnson
Semiannual Report
As a shareholder of a Fund, you incur two types of costs: (1) transaction costs, including sales charges (loads) on purchase payments or redemption proceeds, and (2) ongoing costs, including distribution and/or service (12b-1) fees and other Fund expenses. This Example is intended to help you understand your ongoing costs (in dollars) of investing in the Funds and to compare these costs with the ongoing costs of investing in other mutual funds.
The Example is based on an investment of $1,000 invested at the beginning of the period and held for the entire period (August 1, 2010 to January 31, 2011).
Actual Expenses
The first line of the accompanying table for each class of each fund provides information about actual account values and actual expenses. You may use the information in this line, together with the amount you invested, to estimate the expenses that you paid over the period. Simply divide your account value by $1,000.00 (for example, an $8,600 account value divided by $1,000.00 = 8.6), then multiply the result by the number in the first line for a class of the fund under the heading entitled "Expenses Paid During Period" to estimate the expenses you paid on your account during this period. In addition, each Fund, as a shareholder in underlying Fidelity Funds, will indirectly bear its pro-rata share of the fees and expenses incurred by the underlying Fidelity Funds. These fees and expenses are not included in each Fund's annualized expense ratio used to calculate the expense estimates in the table below.
Hypothetical Example for Comparison Purposes
The second line of the accompanying table for each class of each fund provides information about hypothetical account values and hypothetical expenses based on a Class' actual expense ratio and an assumed rate of return of 5% per year before expenses, which is not the Class' actual return. The hypothetical account values and expenses may not be used to estimate the actual ending account balance or expenses you paid for the period. You may use this information to compare the ongoing costs of investing in the Fund and other funds. To do so, compare this 5% hypothetical example with the 5% hypothetical examples that appear in the shareholder reports of the other funds. In addition, each Fund, as a shareholder in underlying Fidelity Funds, will indirectly bear its pro-rata share of the fees and expenses incurred by the underlying Fidelity Funds. These fees and expenses are not included in each Fund's annualized expense ratio used to calculate the expense estimates in the table below.
Please note that the expenses shown in the table are meant to highlight your ongoing costs only and do not reflect any transaction costs. Therefore, the second line of the table is useful in comparing ongoing costs only, and will not help you determine the relative total costs of owning different funds. In addition, if these transactional costs were included, your costs would have been higher.
| Annualized
Expense Ratio | Beginning
Account Value
August 1, 2010 | Ending
Account Value
January 31, 2011 | Expenses Paid
During Period*
August 1, 2010 to
January 31, 2011 |
Fidelity Income Replacement 2016 Fund | | | | |
Class A | .25% | | | |
Actual | | $ 1,000.00 | $ 1,061.40 | $ 1.30 |
HypotheticalA | | $ 1,000.00 | $ 1,023.95 | $ 1.28 |
Class T | .50% | | | |
Actual | | $ 1,000.00 | $ 1,060.10 | $ 2.60 |
HypotheticalA | | $ 1,000.00 | $ 1,022.68 | $ 2.55 |
Class C | 1.00% | | | |
Actual | | $ 1,000.00 | $ 1,057.50 | $ 5.19 |
HypotheticalA | | $ 1,000.00 | $ 1,020.16 | $ 5.09 |
Income Replacement 2016 | .00% | | | |
Actual | | $ 1,000.00 | $ 1,062.70 | $ .00 |
HypotheticalA | | $ 1,000.00 | $ 1,025.21 | $ .00 |
Institutional Class | .00% | | | |
Actual | | $ 1,000.00 | $ 1,062.70 | $ .00 |
HypotheticalA | | $ 1,000.00 | $ 1,025.21 | $ .00 |
Fidelity Income Replacement 2018 Fund | | | | |
Class A | .25% | | | |
Actual | | $ 1,000.00 | $ 1,076.10 | $ 1.31 |
HypotheticalA | | $ 1,000.00 | $ 1,023.95 | $ 1.28 |
Class T | .50% | | | |
Actual | | $ 1,000.00 | $ 1,074.90 | $ 2.61 |
HypotheticalA | | $ 1,000.00 | $ 1,022.68 | $ 2.55 |
| Annualized
Expense Ratio | Beginning
Account Value
August 1, 2010 | Ending
Account Value
January 31, 2011 | Expenses Paid
During Period*
August 1, 2010 to
January 31, 2011 |
Fidelity Income Replacement 2018 Fund | | | | |
Class C | 1.00% | | | |
Actual | | $ 1,000.00 | $ 1,072.10 | $ 5.22 |
HypotheticalA | | $ 1,000.00 | $ 1,020.16 | $ 5.09 |
Income Replacement 2018 | .00% | | | |
Actual | | $ 1,000.00 | $ 1,077.40 | $ .00 |
HypotheticalA | | $ 1,000.00 | $ 1,025.21 | $ .00 |
Institutional Class | .00% | | | |
Actual | | $ 1,000.00 | $ 1,077.60 | $ .00 |
HypotheticalA | | $ 1,000.00 | $ 1,025.21 | $ .00 |
Fidelity Income Replacement 2020 Fund | | | | |
Class A | .25% | | | |
Actual | | $ 1,000.00 | $ 1,087.40 | $ 1.32 |
HypotheticalA | | $ 1,000.00 | $ 1,023.95 | $ 1.28 |
Class T | .50% | | | |
Actual | | $ 1,000.00 | $ 1,086.10 | $ 2.63 |
HypotheticalA | | $ 1,000.00 | $ 1,022.68 | $ 2.55 |
Class C | 1.00% | | | |
Actual | | $ 1,000.00 | $ 1,083.40 | $ 5.25 |
HypotheticalA | | $ 1,000.00 | $ 1,020.16 | $ 5.09 |
Income Replacement 2020 | .00% | | | |
Actual | | $ 1,000.00 | $ 1,088.80 | $ .00 |
HypotheticalA | | $ 1,000.00 | $ 1,025.21 | $ .00 |
Institutional Class | .00% | | | |
Actual | | $ 1,000.00 | $ 1,088.80 | $ .00 |
HypotheticalA | | $ 1,000.00 | $ 1,025.21 | $ .00 |
Fidelity Income Replacement 2022 Fund | | | | |
Class A | .25% | | | |
Actual | | $ 1,000.00 | $ 1,095.60 | $ 1.32 |
HypotheticalA | | $ 1,000.00 | $ 1,023.95 | $ 1.28 |
Class T | .50% | | | |
Actual | | $ 1,000.00 | $ 1,094.20 | $ 2.64 |
HypotheticalA | | $ 1,000.00 | $ 1,022.68 | $ 2.55 |
Class C | 1.00% | | | |
Actual | | $ 1,000.00 | $ 1,091.40 | $ 5.27 |
HypotheticalA | | $ 1,000.00 | $ 1,020.16 | $ 5.09 |
Income Replacement 2022 | .00% | | | |
Actual | | $ 1,000.00 | $ 1,097.10 | $ .00 |
HypotheticalA | | $ 1,000.00 | $ 1,025.21 | $ .00 |
Institutional Class | .00% | | | |
Actual | | $ 1,000.00 | $ 1,096.90 | $ .00 |
HypotheticalA | | $ 1,000.00 | $ 1,025.21 | $ .00 |
Fidelity Income Replacement 2024 Fund | | | | |
Class A | .25% | | | |
Actual | | $ 1,000.00 | $ 1,101.60 | $ 1.32 |
HypotheticalA | | $ 1,000.00 | $ 1,023.95 | $ 1.28 |
Class T | .50% | | | |
Actual | | $ 1,000.00 | $ 1,100.10 | $ 2.65 |
HypotheticalA | | $ 1,000.00 | $ 1,022.68 | $ 2.55 |
| Annualized
Expense Ratio | Beginning
Account Value
August 1, 2010 | Ending
Account Value
January 31, 2011 | Expenses Paid
During Period*
August 1, 2010 to
January 31, 2011 |
Fidelity Income Replacement 2024 Fund | | | | |
Class C | 1.00% | | | |
Actual | | $ 1,000.00 | $ 1,097.30 | $ 5.29 |
HypotheticalA | | $ 1,000.00 | $ 1,020.16 | $ 5.09 |
Income Replacement 2024 | .00% | | | |
Actual | | $ 1,000.00 | $ 1,102.80 | $ .00 |
HypotheticalA | | $ 1,000.00 | $ 1,025.21 | $ .00 |
Institutional Class | .00% | | | |
Actual | | $ 1,000.00 | $ 1,102.80 | $ .00 |
HypotheticalA | | $ 1,000.00 | $ 1,025.21 | $ .00 |
Fidelity Income Replacement 2026 Fund | | | | |
Class A | .25% | | | |
Actual | | $ 1,000.00 | $ 1,105.70 | $ 1.33 |
HypotheticalA | | $ 1,000.00 | $ 1,023.95 | $ 1.28 |
Class T | .50% | | | |
Actual | | $ 1,000.00 | $ 1,104.40 | $ 2.65 |
HypotheticalA | | $ 1,000.00 | $ 1,022.68 | $ 2.55 |
Class C | 1.00% | | | |
Actual | | $ 1,000.00 | $ 1,101.70 | $ 5.30 |
HypotheticalA | | $ 1,000.00 | $ 1,020.16 | $ 5.09 |
Income Replacement 2026 | .00% | | | |
Actual | | $ 1,000.00 | $ 1,107.40 | $ .00 |
HypotheticalA | | $ 1,000.00 | $ 1,025.21 | $ .00 |
Institutional Class | .00% | | | |
Actual | | $ 1,000.00 | $ 1,107.10 | $ .00 |
HypotheticalA | | $ 1,000.00 | $ 1,025.21 | $ .00 |
Fidelity Income Replacement 2028 Fund | | | | |
Class A | .25% | | | |
Actual | | $ 1,000.00 | $ 1,109.30 | $ 1.33 |
HypotheticalA | | $ 1,000.00 | $ 1,023.95 | $ 1.28 |
Class T | .50% | | | |
Actual | | $ 1,000.00 | $ 1,108.10 | $ 2.66 |
HypotheticalA | | $ 1,000.00 | $ 1,022.68 | $ 2.55 |
Class C | 1.00% | | | |
Actual | | $ 1,000.00 | $ 1,105.00 | $ 5.31 |
HypotheticalA | | $ 1,000.00 | $ 1,020.16 | $ 5.09 |
Income Replacement 2028 | .00% | | | |
Actual | | $ 1,000.00 | $ 1,110.60 | $ .00 |
HypotheticalA | | $ 1,000.00 | $ 1,025.21 | $ .00 |
Institutional Class | .00% | | | |
Actual | | $ 1,000.00 | $ 1,110.60 | $ .00 |
HypotheticalA | | $ 1,000.00 | $ 1,025.21 | $ .00 |
Fidelity Income Replacement 2030 Fund | | | | |
Class A | .25% | | | |
Actual | | $ 1,000.00 | $ 1,112.50 | $ 1.33 |
HypotheticalA | | $ 1,000.00 | $ 1,023.95 | $ 1.28 |
Class T | .50% | | | |
Actual | | $ 1,000.00 | $ 1,110.90 | $ 2.66 |
HypotheticalA | | $ 1,000.00 | $ 1,022.68 | $ 2.55 |
| Annualized
Expense Ratio | Beginning
Account Value
August 1, 2010 | Ending
Account Value
January 31, 2011 | Expenses Paid
During Period*
August 1, 2010 to
January 31, 2011 |
Fidelity Income Replacement 2030 Fund | | | | |
Class C | 1.00% | | | |
Actual | | $ 1,000.00 | $ 1,108.30 | $ 5.31 |
HypotheticalA | | $ 1,000.00 | $ 1,020.16 | $ 5.09 |
Income Replacement 2030 | .00% | | | |
Actual | | $ 1,000.00 | $ 1,113.90 | $ .00 |
HypotheticalA | | $ 1,000.00 | $ 1,025.21 | $ .00 |
Institutional Class | .00% | | | |
Actual | | $ 1,000.00 | $ 1,113.70 | $ .00 |
HypotheticalA | | $ 1,000.00 | $ 1,025.21 | $ .00 |
Fidelity Income Replacement 2032 Fund | | | | |
Class A | .25% | | | |
Actual | | $ 1,000.00 | $ 1,115.00 | $ 1.33 |
HypotheticalA | | $ 1,000.00 | $ 1,023.95 | $ 1.28 |
Class T | .50% | | | |
Actual | | $ 1,000.00 | $ 1,113.80 | $ 2.66 |
HypotheticalA | | $ 1,000.00 | $ 1,022.68 | $ 2.55 |
Class C | 1.00% | | | |
Actual | | $ 1,000.00 | $ 1,111.00 | $ 5.32 |
HypotheticalA | | $ 1,000.00 | $ 1,020.16 | $ 5.09 |
Income Replacement 2032 | .00% | | | |
Actual | | $ 1,000.00 | $ 1,116.60 | $ .00 |
HypotheticalA | | $ 1,000.00 | $ 1,025.21 | $ .00 |
Institutional Class | .00% | | | |
Actual | | $ 1,000.00 | $ 1,116.60 | $ .00 |
HypotheticalA | | $ 1,000.00 | $ 1,025.21 | $ .00 |
Fidelity Income Replacement 2034 Fund | | | | |
Class A | .25% | | | |
Actual | | $ 1,000.00 | $ 1,118.10 | $ 1.33 |
HypotheticalA | | $ 1,000.00 | $ 1,023.95 | $ 1.28 |
Class T | .50% | | | |
Actual | | $ 1,000.00 | $ 1,116.70 | $ 2.67 |
HypotheticalA | | $ 1,000.00 | $ 1,022.68 | $ 2.55 |
Class C | 1.00% | | | |
Actual | | $ 1,000.00 | $ 1,113.90 | $ 5.33 |
HypotheticalA | | $ 1,000.00 | $ 1,020.16 | $ 5.09 |
Income Replacement 2034 | .00% | | | |
Actual | | $ 1,000.00 | $ 1,119.30 | $ .00 |
HypotheticalA | | $ 1,000.00 | $ 1,025.21 | $ .00 |
Institutional Class | .00% | | | |
Actual | | $ 1,000.00 | $ 1,119.60 | $ .00 |
HypotheticalA | | $ 1,000.00 | $ 1,025.21 | $ .00 |
Fidelity Income Replacement 2036 Fund | | | | |
Class A | .25% | | | |
Actual | | $ 1,000.00 | $ 1,121.50 | $ 1.34 |
HypotheticalA | | $ 1,000.00 | $ 1,023.95 | $ 1.28 |
Class T | .50% | | | |
Actual | | $ 1,000.00 | $ 1,119.90 | $ 2.67 |
HypotheticalA | | $ 1,000.00 | $ 1,022.68 | $ 2.55 |
| Annualized
Expense Ratio | Beginning
Account Value
August 1, 2010 | Ending
Account Value
January 31, 2011 | Expenses Paid
During Period*
August 1, 2010 to
January 31, 2011 |
Fidelity Income Replacement 2036 Fund | | | | |
Class C | 1.00% | | | |
Actual | | $ 1,000.00 | $ 1,117.30 | $ 5.34 |
HypotheticalA | | $ 1,000.00 | $ 1,020.16 | $ 5.09 |
Income Replacement 2036 | .00% | | | |
Actual | | $ 1,000.00 | $ 1,122.70 | $ .00 |
HypotheticalA | | $ 1,000.00 | $ 1,025.21 | $ .00 |
Institutional Class | .00% | | | |
Actual | | $ 1,000.00 | $ 1,122.70 | $ .00 |
HypotheticalA | | $ 1,000.00 | $ 1,025.21 | $ .00 |
Fidelity Income Replacement 2038 Fund | | | | |
Class A | .25% | | | |
Actual | | $ 1,000.00 | $ 1,125.50 | $ 1.34 |
HypotheticalA | | $ 1,000.00 | $ 1,023.95 | $ 1.28 |
Class T | .50% | | | |
Actual | | $ 1,000.00 | $ 1,124.00 | $ 2.68 |
HypotheticalA | | $ 1,000.00 | $ 1,022.68 | $ 2.55 |
Class C | 1.00% | | | |
Actual | | $ 1,000.00 | $ 1,121.40 | $ 5.35 |
HypotheticalA | | $ 1,000.00 | $ 1,020.16 | $ 5.09 |
Income Replacement 2038 | .00% | | | |
Actual | | $ 1,000.00 | $ 1,127.10 | $ .00 |
HypotheticalA | | $ 1,000.00 | $ 1,025.21 | $ .00 |
Institutional Class | .00% | | | |
Actual | | $ 1,000.00 | $ 1,126.90 | $ .00 |
HypotheticalA | | $ 1,000.00 | $ 1,025.21 | $ .00 |
Fidelity Income Replacement 2040 Fund | | | | |
Class A | .25% | | | |
Actual | | $ 1,000.00 | $ 1,130.10 | $ 1.34 |
HypotheticalA | | $ 1,000.00 | $ 1,023.95 | $ 1.28 |
Class T | .50% | | | |
Actual | | $ 1,000.00 | $ 1,128.60 | $ 2.68 |
HypotheticalA | | $ 1,000.00 | $ 1,022.68 | $ 2.55 |
Class C | 1.00% | | | |
Actual | | $ 1,000.00 | $ 1,125.70 | $ 5.36 |
HypotheticalA | | $ 1,000.00 | $ 1,020.16 | $ 5.09 |
Income Replacement 2040 | .00% | | | |
Actual | | $ 1,000.00 | $ 1,131.60 | $ .00 |
HypotheticalA | | $ 1,000.00 | $ 1,025.21 | $ .00 |
Institutional Class | .00% | | | |
Actual | | $ 1,000.00 | $ 1,131.60 | $ .00 |
HypotheticalA | | $ 1,000.00 | $ 1,025.21 | $ .00 |
Fidelity Income Replacement 2042 Fund | | | | |
Class A | .25% | | | |
Actual | | $ 1,000.00 | $ 1,132.10 | $ 1.34 |
HypotheticalA | | $ 1,000.00 | $ 1,023.95 | $ 1.28 |
Class T | .50% | | | |
Actual | | $ 1,000.00 | $ 1,130.90 | $ 2.69 |
HypotheticalA | | $ 1,000.00 | $ 1,022.68 | $ 2.55 |
| Annualized
Expense Ratio | Beginning
Account Value
August 1, 2010 | Ending
Account Value
January 31, 2011 | Expenses Paid
During Period*
August 1, 2010 to
January 31, 2011 |
Fidelity Income Replacement 2042 Fund | | | | |
Class C | 1.00% | | | |
Actual | | $ 1,000.00 | $ 1,127.90 | $ 5.36 |
HypotheticalA | | $ 1,000.00 | $ 1,020.16 | $ 5.09 |
Income Replacement 2042 | .00% | | | |
Actual | | $ 1,000.00 | $ 1,133.60 | $ .00 |
HypotheticalA | | $ 1,000.00 | $ 1,025.21 | $ .00 |
Institutional Class | .00% | | | |
Actual | | $ 1,000.00 | $ 1,133.60 | $ .00 |
HypotheticalA | | $ 1,000.00 | $ 1,025.21 | $ .00 |
A 5% return per year before expenses
* Expenses are equal to each Class' annualized expense ratio, multiplied by the average account value over the period, multiplied by 184/365 (to reflect the one-half year period). The fees and expenses of the underlying Fidelity Funds in which the Fund invests are not included in the Fund's annualized expense ratio.
Semiannual Report
Fidelity Income Replacement 2016 Fund
Investment Changes (Unaudited)
Fund Holdings as of January 31, 2011 |
| % of fund's
net assets | % of fund's net assets
6 months ago |
Domestic Equity Funds | | |
Fidelity Advisor Mid Cap II Fund Institutional Class | 2.7 | 2.9 |
Fidelity Disciplined Equity Fund | 2.8 | 3.0 |
Fidelity Equity-Income Fund | 2.8 | 3.1 |
Fidelity Large Cap Core Enhanced Index Fund | 4.5 | 4.9 |
Fidelity Series 100 Index Fund | 3.4 | 3.7 |
Fidelity Series Broad Market Opportunities Fund | 4.5 | 4.9 |
Fidelity Series Small Cap Opportunities Fund | 1.8 | 2.0 |
| 22.5 | 24.5 |
International Equity Funds | | |
Fidelity Advisor International Discovery Fund Institutional Class | 1.8 | 2.3 |
Investment Grade Fixed-Income Funds | | |
Fidelity Government Income Fund | 8.5 | 8.3 |
Fidelity Strategic Real Return Fund | 8.5 | 8.5 |
Fidelity Total Bond Fund | 25.4 | 25.1 |
| 42.4 | 41.9 |
Short-Term Funds | | |
Fidelity Institutional Money Market Portfolio Institutional Class | 16.7 | 15.6 |
Fidelity Short-Term Bond Fund | 16.6 | 15.7 |
| 33.3 | 31.3 |
Net Other Assets (Liabilities)* | 0.0 | 0.0 |
| 100.0 | 100.0 |
* Amount represents less than 0.1% |
Asset Allocation (% of fund's net assets) |
Current |
| Domestic Equity Funds | 22.5% | |
| International Equity Funds | 1.8% | |
| Investment Grade Fixed-Income Funds | 42.4% | |
| Short-Term Funds | 33.3% | |
Six months ago |
| Domestic Equity Funds | 24.5% | |
| International Equity Funds | 2.3% | |
| Investment Grade Fixed-Income Funds | 41.9% | |
| Short-Term Funds | 31.3% | |
Expected |
| Domestic Equity Funds | 21.2% | |
| International Equity Funds | 0.8% | |
| Investment Grade Fixed-Income Funds | 41.1% | |
| Short-Term Funds | 36.9% | |
The fund invests according to an asset allocation strategy that becomes increasingly conservative over time. The six months ago allocation is based on the fund's holdings as of July 31, 2010. The current allocation is based on the fund's holdings as of January 31, 2011. The expected allocation represents the fund's anticipated allocation at July 31, 2011. |
Semiannual Report
Fidelity Income Replacement 2016 Fund
Investments January 31, 2011 (Unaudited)
Showing Percentage of Net Assets
Equity Funds - 24.3% |
| Shares | | Value |
Domestic Equity Funds - 22.5% |
Fidelity Advisor Mid Cap II Fund Institutional Class | 15,787 | | $ 289,373 |
Fidelity Disciplined Equity Fund | 12,970 | | 301,162 |
Fidelity Equity-Income Fund | 6,609 | | 301,162 |
Fidelity Large Cap Core Enhanced Index Fund | 55,056 | | 482,289 |
Fidelity Series 100 Index Fund | 40,475 | | 362,252 |
Fidelity Series Broad Market Opportunities Fund | 46,915 | | 482,288 |
Fidelity Series Small Cap Opportunities Fund | 17,634 | | 192,915 |
TOTAL DOMESTIC EQUITY FUNDS | | 2,411,441 |
International Equity Funds - 1.8% |
Fidelity Advisor International Discovery Fund Institutional Class | 5,861 | | 193,987 |
TOTAL EQUITY FUNDS (Cost $2,327,382) | 2,605,428 |
Fixed-Income Funds - 42.4% |
| Shares | | Value |
Investment Grade Fixed-Income Funds - 42.4% |
Fidelity Government Income Fund | 87,305 | | $ 908,846 |
Fidelity Strategic Real Return Fund | 93,695 | | 908,846 |
Fidelity Total Bond Fund | 253,768 | | 2,725,464 |
TOTAL FIXED-INCOME FUNDS (Cost $4,354,464) | 4,543,156 |
Short-Term Funds - 33.3% |
| | | |
Fidelity Institutional Money Market Portfolio Institutional Class | 1,784,703 | | 1,784,703 |
Fidelity Short-Term Bond Fund | 210,432 | | 1,784,467 |
TOTAL SHORT-TERM FUNDS (Cost $3,545,981) | 3,569,170 |
TOTAL INVESTMENT PORTFOLIO - 100.0% (Cost $10,227,827) | | 10,717,754 |
NET OTHER ASSETS (LIABILITIES) - 0.0% | | (2,308) |
NET ASSETS - 100% | $ 10,715,446 |
Other Information |
All investments are categorized as Level 1 under the Fair Value Hierarchy. The inputs or methodology used for valuing securities may not be an indication of the risk associated with investing in those securities. For more information on valuation inputs, please refer to the Security Valuation section in the accompanying Notes to Financial Statements. |
Income Tax Information |
At July 31, 2010, the Fund had a capital loss carryforward of approximately $245,395 of which $11,321 and $234,074 will expire in fiscal 2017 and 2018, respectively. Capital loss carryforwards are only available to offset future capital gains of the Fund to the extent provided by regulations and may be limited. |
See accompanying notes which are an integral part of the financial statements.
Semiannual Report
Fidelity Income Replacement 2016 Fund
Statement of Assets and Liabilities
| January 31, 2011 (Unaudited) |
| | |
Assets | | |
Investment in securities, at value (cost $10,227,827) - See accompanying schedule | | $ 10,717,754 |
Cash | | 11 |
Receivable for investments sold | | 130,215 |
Total assets | | 10,847,980 |
| | |
Liabilities | | |
Payable for investments purchased | $ 69,616 | |
Payable for fund shares redeemed | 61,267 | |
Distribution and service plan fees payable | 1,651 | |
Total liabilities | | 132,534 |
| | |
Net Assets | | $ 10,715,446 |
Net Assets consist of: | | |
Paid in capital | | $ 10,823,220 |
Undistributed net investment income | | 2,916 |
Accumulated undistributed net realized gain (loss) on investments | | (600,617) |
Net unrealized appreciation (depreciation) on investments | | 489,927 |
Net Assets | | $ 10,715,446 |
Calculation of Maximum Offering Price Class A:
Net Asset Value and redemption price per share ($2,057,157 ÷ 41,836.9 shares) | | $ 49.17 |
| | |
Maximum offering price per share (100/94.25 of $49.17) | | $ 52.17 |
Class T:
Net Asset Value and redemption price per share ($636,574 ÷ 12,947.1 shares) | | $ 49.17 |
| | |
Maximum offering price per share (100/96.50 of $49.17) | | $ 50.95 |
| | |
Class C:
Net Asset Value and offering price per share ($1,143,432 ÷ 23,259.5 shares)A | | $ 49.16 |
| | |
Income Replacement 2016:
Net Asset Value, offering price and redemption price per share ($6,739,718 ÷ 137,040.0 shares) | | $ 49.18 |
| | |
Institutional Class:
Net Asset Value, offering price and redemption price per share ($138,565 ÷ 2,817.4 shares) | | $ 49.18 |
A Redemption price per share is equal to net asset value less any applicable contingent deferred sales charge.
Statement of Operations
Six months ended January 31, 2011 (Unaudited) |
| | |
Investment Income | | |
Income distributions from underlying funds | | $ 123,564 |
| | |
Expenses | | |
Distribution and service plan fees | $ 9,905 | |
Independent trustees' compensation | 21 | |
Total expenses before reductions | 9,926 | |
Expense reductions | (21) | 9,905 |
Net investment income (loss) | | 113,659 |
Realized and Unrealized Gain (Loss) Realized gain (loss) on sale of underlying fund shares | (124,567) | |
Capital gain distributions from underlying funds | 78,190 | |
Total net realized gain (loss) | | (46,377) |
Change in net unrealized appreciation (depreciation) on underlying funds | | 606,670 |
Net gain (loss) | | 560,293 |
Net increase (decrease) in net assets resulting from operations | | $ 673,952 |
See accompanying notes which are an integral part of the financial statements.
Semiannual Report
Fidelity Income Replacement 2016 Fund
Financial Statements - continued
Statement of Changes in Net Assets
| Six months ended
January 31, 2011 (Unaudited) | Year ended
July 31,
2010 |
Increase (Decrease) in Net Assets | | |
Operations | | |
Net investment income (loss) | $ 113,659 | $ 190,860 |
Net realized gain (loss) | (46,377) | (128,722) |
Change in net unrealized appreciation (depreciation) | 606,670 | 877,831 |
Net increase (decrease) in net assets resulting from operations | 673,952 | 939,969 |
Distributions to shareholders from net investment income | (114,553) | (190,322) |
Distributions to shareholders from net realized gain | (58,747) | (25,833) |
Total distributions | (173,300) | (216,155) |
Share transactions - net increase (decrease) | (859,062) | 1,239,040 |
Total increase (decrease) in net assets | (358,410) | 1,962,854 |
| | |
Net Assets | | |
Beginning of period | 11,073,856 | 9,111,002 |
End of period (including undistributed net investment income of $2,916 and undistributed net investment income of $3,810, respectively) | $ 10,715,446 | $ 11,073,856 |
Financial Highlights - Class A
| Six months ended January 31, 2011 | Years ended July 31, |
| (Unaudited) | 2010 | 2009 | 2008 G |
Selected Per-Share Data | | | | |
Net asset value, beginning of period | $ 47.04 | $ 43.62 | $ 47.76 | $ 50.00 |
Income from Investment Operations | | | | |
Net investment income (loss) E | .474 | .831 | 1.118 | 1.233 |
Net realized and unrealized gain (loss) | 2.400 | 3.539 | (3.686) | (2.204) |
Total from investment operations | 2.874 | 4.370 | (2.568) | (.971) |
Distributions from net investment income | (.483) | (.830) | (1.132) | (1.129) |
Distributions from net realized gain | (.261) | (.120) | (.440) | (.140) |
Total distributions | (.744) | (.950) | (1.572) | (1.269) |
Net asset value, end of period | $ 49.17 | $ 47.04 | $ 43.62 | $ 47.76 |
Total Return B, C, D | 6.14% | 10.08% | (5.07)% | (2.02)% |
Ratios to Average Net Assets F, H | | | | |
Expenses before reductions | .25% A | .25% | .25% | .25%A |
Expenses net of fee waivers, if any | .25%A | .25% | .25% | .25%A |
Expenses net of all reductions | .25%A | .25% | .25% | .25%A |
Net investment income (loss) | 1.96%A | 1.80% | 2.72% | 2.76%A |
Supplemental Data | | | | |
Net assets, end of period (000 omitted) | $ 2,057 | $ 2,308 | $ 2,599 | $ 2,214 |
Portfolio turnover rate | 36%A | 40% | 54% | 56%A |
A Annualized
B Total returns for periods of less than one year are not annualized.
C Total returns would have been lower had certain expenses not been reduced during the periods shown.
D Total returns do not include the effect of the sales charges.
E Calculated based on average shares outstanding during the period.
F Amounts do not include the activity of the underlying funds.
G For the period August 30, 2007 (commencement of operations) to July 31, 2008.
H Expense ratios reflect operating expenses of the class. Expenses before reductions do not reflect amounts reimbursed by the investment adviser or reductions from expense offset arrangements and do not represent the amount paid by the class during periods when reimbursements or reductions occur. Expenses net of fee waivers reflect expenses after reimbursement by the investment adviser but prior to reductions from expense offset arrangements. Expenses net of all reductions represent the net expenses paid by the class but do not include expenses of the investment companies in which the Fund invests.
See accompanying notes which are an integral part of the financial statements.
Semiannual Report
Financial Highlights - Class T
| Six months ended January 31, 2011 | Years ended July 31, |
| (Unaudited) | 2010 | 2009 | 2008 G |
Selected Per-Share Data | | | | |
Net asset value, beginning of period | $ 47.04 | $ 43.62 | $ 47.75 | $ 50.00 |
Income from Investment Operations | | | | |
Net investment income (loss) E | .413 | .716 | 1.025 | 1.128 |
Net realized and unrealized gain (loss) | 2.402 | 3.540 | (3.690) | (2.219) |
Total from investment operations | 2.815 | 4.256 | (2.665) | (1.091) |
Distributions from net investment income | (.424) | (.716) | (1.025) | (1.019) |
Distributions from net realized gain | (.261) | (.120) | (.440) | (.140) |
Total distributions | (.685) | (.836) | (1.465) | (1.159) |
Net asset value, end of period | $ 49.17 | $ 47.04 | $ 43.62 | $ 47.75 |
Total Return B, C, D | 6.01% | 9.81% | (5.30)% | (2.26)% |
Ratios to Average Net Assets F, H | | | | |
Expenses before reductions | .50% A | .50% | .50% | .50%A |
Expenses net of fee waivers, if any | .50%A | .50% | .50% | .50%A |
Expenses net of all reductions | .50%A | .50% | .50% | .50%A |
Net investment income (loss) | 1.71%A | 1.55% | 2.47% | 2.51%A |
Supplemental Data | | | | |
Net assets, end of period (000 omitted) | $ 637 | $ 638 | $ 499 | $ 673 |
Portfolio turnover rate | 36%A | 40% | 54% | 56%A |
A Annualized
B Total returns for periods of less than one year are not annualized.
C Total returns would have been lower had certain expenses not been reduced during the periods shown.
D Total returns do not include the effect of the sales charges.
E Calculated based on average shares outstanding during the period.
F Amounts do not include the activity of the underlying funds.
G For the period August 30, 2007 (commencement of operations) to July 31, 2008.
H Expense ratios reflect operating expenses of the class. Expenses before reductions do not reflect amounts reimbursed by the investment adviser or reductions from expense offset arrangements and do not represent the amount paid by the class during periods when reimbursements or reductions occur. Expenses net of fee waivers reflect expenses after reimbursement by the investment adviser but prior to reductions from expense offset arrangements. Expenses net of all reductions represent the net expenses paid by the class but do not include expenses of the investment companies in which the Fund invests.
Financial Highlights - Class C
| Six months ended January 31, 2011 | Years ended July 31, |
| (Unaudited) | 2010 | 2009 | 2008 G |
Selected Per-Share Data | | | | |
Net asset value, beginning of period | $ 47.03 | $ 43.61 | $ 47.73 | $ 50.00 |
Income from Investment Operations | | | | |
Net investment income (loss)E | .292 | .485 | .822 | .904 |
Net realized and unrealized gain (loss) | 2.405 | 3.531 | (3.689) | (2.227) |
Total from investment operations | 2.697 | 4.016 | (2.867) | (1.323) |
Distributions from net investment income | (.306) | (.476) | (.813) | (.807) |
Distributions from net realized gain | (.261) | (.120) | (.440) | (.140) |
Total distributions | (.567) | (.596) | (1.253) | (.947) |
Net asset value, end of period | $ 49.16 | $ 47.03 | $ 43.61 | $ 47.73 |
Total Return B, C, D | 5.75% | 9.24% | (5.76)% | (2.71)% |
Ratios to Average Net Assets F, H | | | | |
Expenses before reductions | 1.00%A | 1.00% | 1.00% | 1.00%A |
Expenses net of fee waivers, if any | 1.00%A | 1.00% | 1.00% | 1.00%A |
Expenses net of all reductions | 1.00%A | 1.00% | 1.00% | 1.00%A |
Net investment income (loss) | 1.21%A | 1.05% | 1.97% | 2.01%A |
Supplemental Data | | | | |
Net assets, end of period (000 omitted) | $ 1,143 | $ 1,075 | $ 1,171 | $ 1,595 |
Portfolio turnover rate | 36%A | 40% | 54% | 56%A |
A Annualized
B Total returns for periods of less than one year are not annualized.
C Total returns would have been lower had certain expenses not been reduced during the periods shown.
D Total returns do not include the effect of the contingent deferred sales charge.
E Calculated based on average shares outstanding during the period.
F Amounts do not include the activity of the underlying funds.
G For the period August 30, 2007 (commencement of operations) to July 31, 2008.
H Expense ratios reflect operating expenses of the class. Expenses before reductions do not reflect amounts reimbursed by the investment adviser or reductions from expense offset arrangements and do not represent the amount paid by the class during periods when reimbursements or reductions occur. Expenses net of fee waivers reflect expenses after reimbursement by the investment adviser but prior to reductions from expense offset arrangements. Expenses net of all reductions represent the net expenses paid by the class but do not include expenses of the investment companies in which the Fund invests.
See accompanying notes which are an integral part of the financial statements.
Semiannual Report
Financial Highlights - Income Replacement 2016
| Six months ended January 31,2011 | Years ended July 31, |
| (Unaudited) | 2010 | 2009 | 2008G |
Selected Per-Share Data | | | | |
Net asset value, beginning of period | $ 47.05 | $ 43.63 | $ 47.77 | $ 50.00 |
Income from Investment Operations | | | | |
Net investment income (loss)D | .534 | .948 | 1.231 | 1.356 |
Net realized and unrealized gain (loss) | 2.401 | 3.539 | (3.692) | (2.217) |
Total from investment operations | 2.935 | 4.487 | (2.461) | (.861) |
Distributions from net investment income | (.544) | (.947) | (1.239) | (1.229) |
Distributions from net realized gain | (.261) | (.120) | (.440) | (.140) |
Total distributions | (.805) | (1.067) | (1.679) | (1.369) |
Net asset value, end of period | $ 49.18 | $ 47.05 | $ 43.63 | $ 47.77 |
Total Return B, C | 6.27% | 10.36% | (4.82)% | (1.81)% |
Ratios to Average Net Assets E, H | | | | |
Expenses before reductions F | .00%A | .00% | .00% | .00%A |
Expenses net of fee waivers, if any | .00%A | .00% | .00% | .00%A |
Expenses net of all reductions | .00%A | .00% | .00% | .00%A |
Net investment income (loss) | 2.21% A | 2.05% | 2.97% | 3.00% A |
Supplemental Data | | | | |
Net assets, end of period (000 omitted) | $ 6,740 | $ 6,946 | $ 4,733 | $ 4,880 |
Portfolio turnover rate | 36%A | 40% | 54% | 56%A |
A Annualized
B Total returns for periods of less than one year are not annualized.
C Total returns would have been lower had certain expenses not been reduced during the periods shown.
D Calculated based on average shares outstanding during the period.
E Amounts do not include the activity of the underlying funds.
F Amount represents less than .01%.
G For the period August 30, 2007 (commencement of operations) to July 31, 2008.
H Expense ratios reflect operating expenses of the class. Expenses before reductions do not reflect amounts reimbursed by the investment adviser or reductions from expense offset arrangements and do not represent the amount paid by the class during periods when reimbursements or reductions occur. Expenses net of fee waivers reflect expenses after reimbursement by the investment adviser but prior to reductions from expense offset arrangements. Expenses net of all reductions represent the net expenses paid by the class but do not include expenses of the investment companies in which the Fund invests.
Financial Highlights - Institutional Class
| Six months ended January 31, 2011 | Years ended July 31, |
| (Unaudited) | 2010 | 2009 | 2008 G |
Selected Per-Share Data | | | | |
Net asset value, beginning of period | $ 47.05 | $ 43.64 | $ 47.77 | $ 50.00 |
Income from Investment Operations | | | | |
Net investment income (loss)D | .533 | .947 | 1.235 | 1.370 |
Net realized and unrealized gain (loss) | 2.402 | 3.530 | (3.686) | (2.231) |
Total from investment operations | 2.935 | 4.477 | (2.451) | (.861) |
Distributions from net investment income | (.544) | (.947) | (1.239) | (1.229) |
Distributions from net realized gain | (.261) | (.120) | (.440) | (.140) |
Total distributions | (.805) | (1.067) | (1.679) | (1.369) |
Net asset value, end of period | $ 49.18 | $ 47.05 | $ 43.64 | $ 47.77 |
Total Return B, C | 6.27% | 10.33% | (4.80)% | (1.81)% |
Ratios to Average Net Assets E, H | | | | |
Expenses before reductions F | .00% A | .00% | .00% | .00%A |
Expenses net of fee waivers, if any | .00% A | .00% | .00% | .00%A |
Expenses net of all reductions | .00% A | .00% | .00% | .00%A |
Net investment income (loss) | 2.21%A | 2.05% | 2.97% | 3.00%A |
Supplemental Data | | | | |
Net assets, end of period (000 omitted) | $ 139 | $ 108 | $ 109 | $ 184 |
Portfolio turnover rate | 36%A | 40% | 54% | 56%A |
A Annualized
B Total returns for periods of less than one year are not annualized.
C Total returns would have been lower had certain expenses not been reduced during the periods shown.
D Calculated based on average shares outstanding during the period.
E Amounts do not include the activity of the underlying funds.
F Amount represents less than .01%.
G For the period August 30, 2007 (commencement of operations) to July 31, 2008.
H Expense ratios reflect operating expenses of the class. Expenses before reductions do not reflect amounts reimbursed by the investment adviser or reductions from expense offset arrangements and do not represent the amount paid by the class during periods when reimbursements or reductions occur. Expenses net of fee waivers reflect expenses after reimbursement by the investment adviser but prior to reductions from expense offset arrangements. Expenses net of all reductions represent the net expenses paid by the class but do not include expenses of the investment companies in which the Fund invests.
See accompanying notes which are an integral part of the financial statements.
Semiannual Report
Fidelity Income Replacement 2018 Fund
Investment Changes (Unaudited)
Fund Holdings as of January 31, 2011 |
| % of fund's
net assets | % of fund's net assets
6 months ago |
Domestic Equity Funds | | |
Fidelity Advisor Mid Cap II Fund Institutional Class | 3.5 | 3.7 |
Fidelity Disciplined Equity Fund | 3.7 | 3.8 |
Fidelity Equity-Income Fund | 3.7 | 3.9 |
Fidelity Large Cap Core Enhanced Index Fund | 5.9 | 6.2 |
Fidelity Series 100 Index Fund | 4.4 | 4.7 |
Fidelity Series Broad Market Opportunities Fund | 5.9 | 6.2 |
Fidelity Series Small Cap Opportunities Fund | 2.4 | 2.5 |
| 29.5 | 31.0 |
International Equity Funds | | |
Fidelity Advisor International Discovery Fund Institutional Class | 2.9 | 3.2 |
High Yield Fixed-Income Funds | | |
Fidelity Capital & Income Fund | 0.9 | 1.1 |
Fidelity Strategic Income Fund | 0.8 | 1.1 |
| 1.7 | 2.2 |
Investment Grade Fixed-Income Funds | | |
Fidelity Government Income Fund | 7.8 | 7.6 |
Fidelity Strategic Real Return Fund | 7.8 | 7.7 |
Fidelity Total Bond Fund | 23.3 | 22.9 |
| 38.9 | 38.2 |
Short-Term Funds | | |
Fidelity Institutional Money Market Portfolio Institutional Class | 13.5 | 12.7 |
Fidelity Short-Term Bond Fund | 13.5 | 12.7 |
| 27.0 | 25.4 |
Net Other Assets (Liabilities)* | 0.0 | 0.0 |
| 100.0 | 100.0 |
* Amount represents less than 0.1% |
Asset Allocation (% of fund's net assets) |
Current |
| Domestic Equity Funds | 29.5% | |
| International Equity Funds | 2.9% | |
| High Yield Fixed-Income Funds | 1.7% | |
| Investment Grade Fixed-Income Funds | 38.9% | |
| Short-Term Funds | 27.0% | |
Six months ago |
| Domestic Equity Funds | 31.0% | |
| International Equity Funds | 3.2% | |
| High Yield Fixed-Income Funds | 2.2% | |
| Investment Grade Fixed-Income Funds | 38.2% | |
| Short-Term Funds | 25.4% | |
Expected |
| Domestic Equity Funds | 27.8% | |
| International Equity Funds | 2.7% | |
| High Yield Fixed-Income Funds | 0.8% | |
| Investment Grade Fixed-Income Funds | 39.9% | |
| Short-Term Funds | 28.8% | |
The fund invests according to an asset allocation strategy that becomes increasingly conservative over time. The six months ago allocation is based on the fund's holdings as of July 31, 2010. The current allocation is based on the fund's holdings as of January 31, 2011. The expected allocation represents the fund's anticipated allocation at July 31, 2011. |
Semiannual Report
Fidelity Income Replacement 2018 Fund
Investments January 31, 2011 (Unaudited)
Showing Percentage of Net Assets
Equity Funds - 32.4% |
| Shares | | Value |
Domestic Equity Funds - 29.5% |
Fidelity Advisor Mid Cap II Fund Institutional Class | 11,244 | | $ 206,109 |
Fidelity Disciplined Equity Fund | 9,254 | | 214,867 |
Fidelity Equity-Income Fund | 4,715 | | 214,867 |
Fidelity Large Cap Core Enhanced Index Fund | 39,258 | | 343,904 |
Fidelity Series 100 Index Fund | 28,835 | | 258,074 |
Fidelity Series Broad Market Opportunities Fund | 33,454 | | 343,904 |
Fidelity Series Small Cap Opportunities Fund | 12,596 | | 137,795 |
TOTAL DOMESTIC EQUITY FUNDS | | 1,719,520 |
International Equity Funds - 2.9% |
Fidelity Advisor International Discovery Fund Institutional Class | 5,116 | | 169,324 |
TOTAL EQUITY FUNDS (Cost $1,870,401) | 1,888,844 |
Fixed-Income Funds - 40.6% |
| | | |
High Yield Fixed-Income Funds - 1.7% |
Fidelity Capital & Income Fund | 5,253 | | 50,797 |
Fidelity Strategic Income Fund | 4,544 | | 50,797 |
TOTAL HIGH YIELD FIXED-INCOME FUNDS | | 101,594 |
|
| Shares | | Value |
Investment Grade Fixed-Income Funds - 38.9% |
Fidelity Government Income Fund | 43,580 | | $ 453,673 |
Fidelity Strategic Real Return Fund | 46,770 | | 453,673 |
Fidelity Total Bond Fund | 126,833 | | 1,362,185 |
TOTAL INVESTMENT GRADE
FIXED-INCOME FUNDS | | 2,269,531 |
TOTAL FIXED-INCOME FUNDS (Cost $2,300,361) | 2,371,125 |
Short-Term Funds - 27.0% |
| | | |
Fidelity Institutional Money Market Portfolio Institutional Class | 789,402 | | 789,402 |
Fidelity Short-Term Bond Fund | 93,090 | | 789,402 |
TOTAL SHORT-TERM FUNDS (Cost $1,572,383) | 1,578,804 |
TOTAL INVESTMENT PORTFOLIO - 100.0% (Cost $5,743,145) | | 5,838,773 |
NET OTHER ASSETS (LIABILITIES) - 0.0% | | (437) |
NET ASSETS - 100% | $ 5,838,336 |
Other Information |
All investments are categorized as Level 1 under the Fair Value Hierarchy. The inputs or methodology used for valuing securities may not be an indication of the risk associated with investing in those securities. For more information on valuation inputs, please refer to the Security Valuation section in the accompanying Notes to Financial Statements. |
Income Tax Information |
At July 31, 2010, the Fund had a capital loss carryforward of approximately $534,410 of which $123,548 and $410,862 will expire in fiscal 2017 and 2018, respectively. Capital loss carryforwards are only available to offset future capital gains of the Fund to the extent provided by regulations and may be limited. |
See accompanying notes which are an integral part of the financial statements.
Semiannual Report
Fidelity Income Replacement 2018 Fund
Statement of Assets and Liabilities
| January 31, 2011 (Unaudited) |
| | |
Assets | | |
Investment in securities, at value (cost $5,743,145) - See accompanying schedule | | $ 5,838,773 |
Receivable for investments sold | | 49,743 |
Total assets | | 5,888,516 |
| | |
Liabilities | | |
Payable for investments purchased | $ 49,749 | |
Distribution and service plan fees payable | 431 | |
Total liabilities | | 50,180 |
| | |
Net Assets | | $ 5,838,336 |
Net Assets consist of: | | |
Paid in capital | | $ 6,434,781 |
Undistributed net investment income | | 1,608 |
Accumulated undistributed net realized gain (loss) on investments | | (693,681) |
Net unrealized appreciation (depreciation) on investments | | 95,628 |
Net Assets | | $ 5,838,336 |
Calculation of Maximum Offering Price Class A:
Net Asset Value and redemption price per share ($1,117,749 ÷ 22,704.4 shares) | | $ 49.23 |
| | |
Maximum offering price per share (100/94.25 of $49.23) | | $ 52.23 |
Class T:
Net Asset Value and redemption price per share ($52,337 ÷ 1,062.3 shares) | | $ 49.27 |
| | |
Maximum offering price per share (100/96.50 of $49.27) | | $ 51.06 |
| | |
Class C:
Net Asset Value and offering price per share ($202,288 ÷ 4,110.8 shares)A | | $ 49.21 |
| | |
Income Replacement 2018:
Net Asset Value, offering price and redemption price per share ($4,097,222 ÷ 83,204.2 shares) | | $ 49.24 |
| | |
Institutional Class:
Net Asset Value, offering price and redemption price per share ($368,740 ÷ 7,487.5 shares) | | $ 49.25 |
A Redemption price per share is equal to net asset value less any applicable contingent deferred sales charge.
Statement of Operations
Six months ended January 31, 2011 (Unaudited) |
| | |
Investment Income | | |
Income distributions from underlying funds | | $ 67,884 |
| | |
Expenses | | |
Distribution and service plan fees | $ 2,656 | |
Independent trustees' compensation | 11 | |
Total expenses before reductions | 2,667 | |
Expense reductions | (11) | 2,656 |
Net investment income (loss) | | 65,228 |
Realized and Unrealized Gain (Loss) Realized gain (loss) on sale of underlying fund shares | (26,570) | |
Capital gain distributions from underlying funds | 38,528 | |
Total net realized gain (loss) | | 11,958 |
Change in net unrealized appreciation (depreciation) on underlying funds | | 357,615 |
Net gain (loss) | | 369,573 |
Net increase (decrease) in net assets resulting from operations | | $ 434,801 |
See accompanying notes which are an integral part of the financial statements.
Semiannual Report
Statement of Changes in Net Assets
| Six months ended January 31, 2011 (Unaudited) | Year ended
July 31,
2010 |
Increase (Decrease) in Net Assets | | |
Operations | | |
Net investment income (loss) | $ 65,228 | $ 103,982 |
Net realized gain (loss) | 11,958 | (68,006) |
Change in net unrealized appreciation (depreciation) | 357,615 | 484,491 |
Net increase (decrease) in net assets resulting from operations | 434,801 | 520,467 |
Distributions to shareholders from net investment income | (65,436) | (103,950) |
Distributions to shareholders from net realized gain | (28,806) | (13,543) |
Total distributions | (94,242) | (117,493) |
Share transactions - net increase (decrease) | 66,549 | 211,898 |
Total increase (decrease) in net assets | 407,108 | 614,872 |
| | |
Net Assets | | |
Beginning of period | 5,431,228 | 4,816,356 |
End of period (including undistributed net investment income of $1,608 and undistributed net investment income of $1,816, respectively) | $ 5,838,336 | $ 5,431,228 |
Financial Highlights - Class A
| Six months ended January 31, 2011 | Years ended July 31, |
| (Unaudited) | 2010 | 2009 | 2008 G |
Selected Per-Share Data | | | | |
Net asset value, beginning of period | $ 46.45 | $ 42.81 | $ 47.46 | $ 50.00 |
Income from Investment Operations | | | | |
Net investment income (loss) E | .501 | .836 | 1.092 | 1.163 |
Net realized and unrealized gain (loss) | 3.017 | 3.763 | (4.138) | (2.454) |
Total from investment operations | 3.518 | 4.599 | (3.046) | (1.291) |
Distributions from net investment income | (.501) | (.839) | (1.124) | (1.119) |
Distributions from net realized gain | (.237) | (.120) | (.480) | (.130) |
Total distributions | (.738) | (.959) | (1.604) | (1.249) |
Net asset value, end of period | $ 49.23 | $ 46.45 | $ 42.81 | $ 47.46 |
Total Return B, C, D | 7.61% | 10.80% | (6.06)% | (2.68)% |
Ratios to Average Net Assets F, H | | | | |
Expenses before reductions | .25% A | .25% | .25% | .25%A |
Expenses net of fee waivers, if any | .25%A | .25% | .25% | .25%A |
Expenses net of all reductions | .25%A | .25% | .25% | .25%A |
Net investment income (loss) | 2.09%A | 1.83% | 2.69% | 2.60%A |
Supplemental Data | | | | |
Net assets, end of period (000 omitted) | $ 1,118 | $ 1,147 | $ 833 | $ 1,107 |
Portfolio turnover rate | 46%A | 24% | 51% | 46%A |
A Annualized
B Total returns for periods of less than one year are not annualized.
C Total returns would have been lower had certain expenses not been reduced during the periods shown.
D Total returns do not include the effect of the sales charges.
E Calculated based on average shares outstanding during the period.
F Amounts do not include the activity of the underlying funds.
G For the period August 30, 2007 (commencement of operations) to July 31, 2008.
H Expense ratios reflect operating expenses of the class. Expenses before reductions do not reflect amounts reimbursed by the investment adviser or reductions from expense offset arrangements and do not represent the amount paid by the class during periods when reimbursements or reductions occur. Expenses net of fee waivers reflect expenses after reimbursement by the investment adviser but prior to reductions from expense offset arrangements. Expenses net of all reductions represent the net expenses paid by the class but do not include expenses of the investment companies in which the Fund invests.
See accompanying notes which are an integral part of the financial statements.
Semiannual Report
Financial Highlights - Class T
| Six months ended January 31, 2011 | Years ended July 31, |
| (Unaudited) | 2010 | 2009 | 2008 G |
Selected Per-Share Data | | | | |
Net asset value, beginning of period | $ 46.48 | $ 42.83 | $ 47.46 | $ 50.00 |
Income from Investment Operations | | | | |
Net investment income (loss)E | .440 | .722 | .989 | 1.075 |
Net realized and unrealized gain (loss) | 3.028 | 3.759 | (4.128) | (2.483) |
Total from investment operations | 3.468 | 4.481 | (3.139) | (1.408) |
Distributions from net investment income | (.441) | (.711) | (1.011) | (1.002) |
Distributions from net realized gain | (.237) | (.120) | (.480) | (.130) |
Total distributions | (.678) | (.831) | (1.491) | (1.132) |
Net asset value, end of period | $ 49.27 | $ 46.48 | $ 42.83 | $ 47.46 |
Total Return B, C, D | 7.49% | 10.51% | (6.28)% | (2.91)% |
Ratios to Average Net Assets F, H | | | | |
Expenses before reductions | .50%A | .50% | .50% | .50%A |
Expenses net of fee waivers, if any | .50%A | .50% | .50% | .50%A |
Expenses net of all reductions | .50%A | .50% | .50% | .50%A |
Net investment income (loss) | 1.83%A | 1.58% | 2.44% | 2.35%A |
Supplemental Data | | | | |
Net assets, end of period (000 omitted) | $ 52 | $ 52 | $ 91 | $ 154 |
Portfolio turnover rate | 46%A | 24% | 51% | 46%A |
A Annualized
B Total returns for periods of less than one year are not annualized.
C Total returns would have been lower had certain expenses not been reduced during the periods shown.
D Total returns do not include the effect of the sales charges.
E Calculated based on average shares outstanding during the period.
F Amounts do not include the activity of the underlying funds.
G For the period August 30, 2007 (commencement of operations) to July 31, 2008.
H Expense ratios reflect operating expenses of the class. Expenses before reductions do not reflect amounts reimbursed by the investment adviser or reductions from expense offset arrangements and do not represent the amount paid by the class during periods when reimbursements or reductions occur. Expenses net of fee waivers reflect expenses after reimbursement by the investment adviser but prior to reductions from expense offset arrangements. Expenses net of all reductions represent the net expenses paid by the class but do not include expenses of the investment companies in which the Fund invests.
Financial Highlights - Class C
| Six months ended January 31, 2011 | Years ended July 31, |
| (Unaudited) | 2010 | 2009 | 2008 G |
Selected Per-Share Data | | | | |
Net asset value, beginning of period | $ 46.43 | $ 42.80 | $ 47.41 | $ 50.00 |
Income from Investment Operations | | | | |
Net investment income (loss) E | .320 | .495 | .786 | .836 |
Net realized and unrealized gain (loss) | 3.019 | 3.760 | (4.122) | (2.476) |
Total from investment operations | 3.339 | 4.255 | (3.336) | (1.640) |
Distributions from net investment income | (.322) | (.505) | (.794) | (.820) |
Distributions from net realized gain | (.237) | (.120) | (.480) | (.130) |
Total distributions | (.559) | (.625) | (1.274) | (.950) |
Net asset value, end of period | $ 49.21 | $ 46.43 | $ 42.80 | $ 47.41 |
Total Return B, C, D | 7.21% | 9.98% | (6.75)% | (3.36)% |
Ratios to Average Net Assets F, H | | | | |
Expenses before reductions | 1.00%A | 1.00% | 1.00% | 1.00%A |
Expenses net of fee waivers, if any | 1.00%A | 1.00% | 1.00% | 1.00%A |
Expenses net of all reductions | 1.00%A | 1.00% | 1.00% | 1.00%A |
Net investment income (loss) | 1.34%A | 1.08% | 1.94% | 1.85%A |
Supplemental Data | | | | |
Net assets, end of period (000 omitted) | $ 202 | $ 201 | $ 131 | $ 365 |
Portfolio turnover rate | 46%A | 24% | 51% | 46%A |
A Annualized
B Total returns for periods of less than one year are not annualized.
C Total returns would have been lower had certain expenses not been reduced during the periods shown.
D Total returns do not include the effect of the contingent deferred sales charge.
E Calculated based on average shares outstanding during the period.
F Amounts do not include the activity of the underlying funds.
G For the period August 30, 2007 (commencement of operations) to July 31, 2008.
H Expense ratios reflect operating expenses of the class. Expenses before reductions do not reflect amounts reimbursed by the investment adviser or reductions from expense offset arrangements and do not represent the amount paid by the class during periods when reimbursements or reductions occur. Expenses net of fee waivers reflect expenses after reimbursement by the investment adviser but prior to reductions from expense offset arrangements. Expenses net of all reductions represent the net expenses paid by the class but do not include expenses of the investment companies in which the Fund invests.
See accompanying notes which are an integral part of the financial statements.
Semiannual Report
Financial Highlights - Income Replacement 2018
| Six months ended January 31, 2011 | Years ended July 31, |
| (Unaudited) | 2010 | 2009 | 2008 G |
Selected Per-Share Data | | | | |
Net asset value, beginning of period | $ 46.46 | $ 42.82 | $ 47.46 | $ 50.00 |
Income from Investment Operations | | | | |
Net investment income (loss)D | .561 | .950 | 1.202 | 1.280 |
Net realized and unrealized gain (loss) | 3.016 | 3.761 | (4.138) | (2.469) |
Total from investment operations | 3.577 | 4.711 | (2.936) | (1.189) |
Distributions from net investment income | (.560) | (.951) | (1.224) | (1.221) |
Distributions from net realized gain | (.237) | (.120) | (.480) | (.130) |
Total distributions | (.797) | (1.071) | (1.704) | (1.351) |
Net asset value, end of period | $ 49.24 | $ 46.46 | $ 42.82 | $ 47.46 |
Total Return B, C | 7.74% | 11.07% | (5.81)% | (2.48)% |
Ratios to Average Net Assets E, H | | | | |
Expenses before reductions F | .00% A | .00% | .00% | .00%A |
Expenses net of fee waivers, if any | .00% A | .00% | .00% | .00%A |
Expenses net of all reductions | .00% A | .00% | .00% | .00%A |
Net investment income (loss) | 2.34%A | 2.08% | 2.94% | 2.85%A |
Supplemental Data | | | | |
Net assets, end of period (000 omitted) | $ 4,097 | $ 3,681 | $ 3,435 | $ 5,167 |
Portfolio turnover rate | 46%A | 24% | 51% | 46%A |
A Annualized
B Total returns for periods of less than one year are not annualized.
C Total returns would have been lower had certain expenses not been reduced during the periods shown.
D Calculated based on average shares outstanding during the period.
E Amounts do not include the activity of the underlying funds.
F Amount represents less than .01%.
G For the period August 30, 2007 (commencement of operations) to July 31, 2008.
H Expense ratios reflect operating expenses of the class. Expenses before reductions do not reflect amounts reimbursed by the investment adviser or reductions from expense offset arrangements and do not represent the amount paid by the class during periods when reimbursements or reductions occur. Expenses net of fee waivers reflect expenses after reimbursement by the investment adviser but prior to reductions from expense offset arrangements. Expenses net of all reductions represent the net expenses paid by the class but do not include expenses of the investment companies in which the Fund invests.
Financial Highlights - Institutional Class
| Six months ended January 31, 2011 | Years ended July 31, |
| (Unaudited) | 2010 | 2009 | 2008 G |
Selected Per-Share Data | | | | |
Net asset value, beginning of period | $ 46.46 | $ 42.82 | $ 47.47 | $ 50.00 |
Income from Investment Operations | | | | |
Net investment income (loss) D | .561 | .950 | 1.175 | 1.295 |
Net realized and unrealized gain (loss) | 3.026 | 3.761 | (4.121) | (2.474) |
Total from investment operations | 3.587 | 4.711 | (2.946) | (1.179) |
Distributions from net investment income | (.560) | (.951) | (1.224) | (1.221) |
Distributions from net realized gain | (.237) | (.120) | (.480) | (.130) |
Total distributions | (.797) | (1.071) | (1.704) | (1.351) |
Net asset value, end of period | $ 49.25 | $ 46.46 | $ 42.82 | $ 47.47 |
Total Return B, C | 7.76% | 11.07% | (5.83)% | (2.46)% |
Ratios to Average Net Assets E, H | | | | |
Expenses before reductions F | .00% A | .00% | .00% | .00%A |
Expenses net of fee waivers, if any | .00%A | .00% | .00% | .00%A |
Expenses net of all reductions | .00%A | .00% | .00% | .00%A |
Net investment income (loss) | 2.34%A | 2.08% | 2.94% | 2.85%A |
Supplemental Data | | | | |
Net assets, end of period (000 omitted) | $ 369 | $ 350 | $ 326 | $ 214 |
Portfolio turnover rate | 46%A | 24% | 51% | 46%A |
A Annualized
B Total returns for periods of less than one year are not annualized.
C Total returns would have been lower had certain expenses not been reduced during the periods shown.
D Calculated based on average shares outstanding during the period.
E Amounts do not include the activity of the underlying funds.
F Amount represents less than .01%.
G For the period August 30, 2007 (commencement of operations) to July 31, 2008.
H Expense ratios reflect operating expenses of the class. Expenses before reductions do not reflect amounts reimbursed by the investment adviser or reductions from expense offset arrangements and do not represent the amount paid by the class during periods when reimbursements or reductions occur. Expenses net of fee waivers reflect expenses after reimbursement by the investment adviser but prior to reductions from expense offset arrangements. Expenses net of all reductions represent the net expenses paid by the class but do not include expenses of the investment companies in which the Fund invests.
See accompanying notes which are an integral part of the financial statements.
Semiannual Report
Fidelity Income Replacement 2020 Fund
Investment Changes (Unaudited)
Fund Holdings as of January 31, 2011 |
| % of fund's
net assets | % of fund's net assets
6 months ago |
Domestic Equity Funds | | |
Fidelity Advisor Mid Cap II Fund Institutional Class | 4.2 | 4.3 |
Fidelity Disciplined Equity Fund | 4.3 | 4.4 |
Fidelity Equity-Income Fund | 4.3 | 4.5 |
Fidelity Large Cap Core Enhanced Index Fund | 7.0 | 7.2 |
Fidelity Series 100 Index Fund | 5.2 | 5.4 |
Fidelity Series Broad Market Opportunities Fund | 7.0 | 7.2 |
Fidelity Series Small Cap Opportunities Fund | 2.8 | 2.9 |
| 34.8 | 35.9 |
International Equity Funds | | |
Fidelity Advisor International Discovery Fund Institutional Class | 3.9 | 4.2 |
High Yield Fixed-Income Funds | | |
Fidelity Capital & Income Fund | 1.4 | 1.5 |
Fidelity Strategic Income Fund | 1.4 | 1.5 |
| 2.8 | 3.0 |
Investment Grade Fixed-Income Funds | | |
Fidelity Government Income Fund | 7.2 | 7.1 |
Fidelity Strategic Real Return Fund | 7.2 | 7.2 |
Fidelity Total Bond Fund | 21.6 | 21.3 |
| 36.0 | 35.6 |
Short-Term Funds | | |
Fidelity Institutional Money Market Portfolio Institutional Class | 11.3 | 10.6 |
Fidelity Short-Term Bond Fund | 11.2 | 10.7 |
| 22.5 | 21.3 |
Net Other Assets (Liabilities)* | 0.0 | 0.0 |
| 100.0 | 100.0 |
* Amount represents less than 0.1%
Asset Allocation (% of fund's net assets) |
Current |
| Domestic Equity Funds | 34.8% | |
| International Equity Funds | 3.9% | |
| High Yield Fixed-Income Funds | 2.8% | |
| Investment Grade Fixed-Income Funds | 36.0% | |
| Short-Term Funds | 22.5% | |
Six months ago |
| Domestic Equity Funds | 35.9% | |
| International Equity Funds | 4.2% | |
| High Yield Fixed-Income Funds | 3.0% | |
| Investment Grade Fixed-Income Funds | 35.6% | |
| Short-Term Funds | 21.3% | |
Expected |
| Domestic Equity Funds | 33.6% | |
| International Equity Funds | 3.6% | |
| High Yield Fixed-Income Funds | 2.6% | |
| Investment Grade Fixed-Income Funds | 36.7% | |
| Short-Term Funds | 23.5% | |
The fund invests according to an asset allocation strategy that becomes increasingly conservative over time. The six months ago allocation is based on the fund's holdings as of July 31, 2010. The current allocation is based on the fund's holdings as of January 31, 2011. The expected allocation represents the fund's anticipated allocation at July 31, 2011. |
Semiannual Report
Fidelity Income Replacement 2020 Fund
Investments January 31, 2011 (Unaudited)
Showing Percentage of Net Assets
Equity Funds - 38.7% |
| Shares | | Value |
Domestic Equity Funds - 34.8% |
Fidelity Advisor Mid Cap II Fund Institutional Class | 9,599 | | $ 175,949 |
Fidelity Disciplined Equity Fund | 7,886 | | 183,105 |
Fidelity Equity-Income Fund | 4,018 | | 183,105 |
Fidelity Large Cap Core Enhanced Index Fund | 33,444 | | 292,968 |
Fidelity Series 100 Index Fund | 24,550 | | 219,726 |
Fidelity Series Broad Market Opportunities Fund | 28,499 | | 292,968 |
Fidelity Series Small Cap Opportunities Fund | 10,696 | | 117,019 |
TOTAL DOMESTIC EQUITY FUNDS | | 1,464,840 |
International Equity Funds - 3.9% |
Fidelity Advisor International Discovery Fund Institutional Class | 4,896 | | 162,059 |
TOTAL EQUITY FUNDS (Cost $1,402,682) | 1,626,899 |
Fixed-Income Funds - 38.8% |
| | | |
High Yield Fixed-Income Funds - 2.8% |
Fidelity Capital & Income Fund | 6,094 | | 58,930 |
Fidelity Strategic Income Fund | 5,271 | | 58,930 |
TOTAL HIGH YIELD FIXED-INCOME FUNDS | | 117,860 |
|
| Shares | | Value |
Investment Grade Fixed-Income Funds - 36.0% |
Fidelity Government Income Fund | 29,154 | | $ 303,491 |
Fidelity Strategic Real Return Fund | 31,288 | | 303,492 |
Fidelity Total Bond Fund | 84,696 | | 909,634 |
TOTAL INVESTMENT GRADE FIXED-INCOME FUNDS | | 1,516,617 |
TOTAL FIXED-INCOME FUNDS (Cost $1,556,030) | 1,634,477 |
Short-Term Funds - 22.5% |
| | | |
Fidelity Institutional Money Market Portfolio Institutional Class | 473,969 | | 473,969 |
Fidelity Short-Term Bond Fund | 55,893 | | 473,969 |
TOTAL SHORT-TERM FUNDS (Cost $940,842) | 947,938 |
TOTAL INVESTMENT PORTFOLIO - 100.0% (Cost $3,899,554) | | 4,209,314 |
NET OTHER ASSETS (LIABILITIES) - 0.0% | | (453) |
NET ASSETS - 100% | $ 4,208,861 |
Other Information |
All investments are categorized as Level 1 under the Fair Value Hierarchy. The inputs or methodology used for valuing securities may not be an indication of the risk associated with investing in those securities. For more information on valuation inputs, please refer to the Security Valuation section in the accompanying Notes to Financial Statements. |
Income Tax Information |
At July 31, 2010, the Fund had a capital loss carryforward of approximately $122,224 of which $3,778 and $118,446 will expire in fiscal 2017 and 2018, respectively. Capital loss carryforwards are only available to offset future capital gains of the Fund to the extent provided by regulations and may be limited. |
See accompanying notes which are an integral part of the financial statements.
Semiannual Report
Fidelity Income Replacement 2020 Fund
Statement of Assets and Liabilities
| January 31, 2011 (Unaudited) |
| | |
Assets | | |
Investment in securities, at value (cost $3,899,554) - See accompanying schedule | | $ 4,209,314 |
Receivable for investments sold | | 27,295 |
Total assets | | 4,236,609 |
| | |
Liabilities | | |
Payable for investments purchased | $ 27,300 | |
Distribution and service plan fees payable | 448 | |
Total liabilities | | 27,748 |
| | |
Net Assets | | $ 4,208,861 |
Net Assets consist of: | | |
Paid in capital | | $ 4,127,939 |
Undistributed net investment income | | 1,051 |
Accumulated undistributed net realized gain (loss) on investments | | (229,889) |
Net unrealized appreciation (depreciation) on investments | | 309,760 |
Net Assets | | $ 4,208,861 |
Calculation of Maximum Offering Price Class A:
Net Asset Value and redemption price per share ($630,977 ÷ 12,779 shares) | | $ 49.38 |
| | |
Maximum offering price per share (100/94.25 of $49.38) | | $ 52.39 |
Class T:
Net Asset Value and redemption price per share ($145,366 ÷ 2,944 shares) | | $ 49.38 |
| | |
Maximum offering price per share (100/96.50 of $49.38) | | $ 51.17 |
| | |
Class C:
Net Asset Value and offering price per share ($290,075 ÷ 5,878 shares)A | | $ 49.35 |
| | |
Income Replacement 2020:
Net Asset Value, offering price and redemption price per share ($3,089,160 ÷ 62,559 shares) | | $ 49.38 |
| | |
Institutional Class:
Net Asset Value, offering price and redemption price per share ($53,283 ÷ 1,079 shares) | | $ 49.38 |
A Redemption price per share is equal to net asset value less any applicable contingent deferred sales charge.
Statement of Operations
Six months ended January 31, 2011 (Unaudited) |
| | |
Investment Income | | |
Income distributions from underlying funds | | $ 43,428 |
| | |
Expenses | | |
Distribution and service plan fees | $ 2,651 | |
Independent trustees' compensation | 7 | |
Total expenses before reductions | 2,658 | |
Expense reductions | (7) | 2,651 |
Net investment income (loss) | | 40,777 |
Realized and Unrealized Gain (Loss) Realized gain (loss) on sale of underlying fund shares | (3,356) | |
Capital gain distributions from underlying funds | 22,741 | |
Total net realized gain (loss) | | 19,385 |
Change in net unrealized appreciation (depreciation) on underlying funds | | 241,426 |
Net gain (loss) | | 260,811 |
Net increase (decrease) in net assets resulting from operations | | $ 301,588 |
See accompanying notes which are an integral part of the financial statements.
Semiannual Report
Statement of Changes in Net Assets
| Six months ended January 31, 2011 (Unaudited) | Year ended
July 31,
2010 |
Increase (Decrease) in Net Assets | | |
Operations | | |
Net investment income (loss) | $ 40,777 | $ 58,358 |
Net realized gain (loss) | 19,385 | (17,761) |
Change in net unrealized appreciation (depreciation) | 241,426 | 270,430 |
Net increase (decrease) in net assets resulting from operations | 301,588 | 311,027 |
Distributions to shareholders from net investment income | (40,738) | (58,210) |
Distributions to shareholders from net realized gain | (16,958) | (7,714) |
Total distributions | (57,696) | (65,924) |
Share transactions - net increase (decrease) | 655,215 | 451,360 |
Total increase (decrease) in net assets | 899,107 | 696,463 |
| | |
Net Assets | | |
Beginning of period | 3,309,754 | 2,613,291 |
End of period (including undistributed net investment income of $1,051 and undistributed net investment income of $1,012, respectively) | $ 4,208,861 | $ 3,309,754 |
Financial Highlights - Class A
| Six months ended January 31, 2011 | Years ended July 31, |
| (Unaudited) | 2010 | 2009 | 2008 G |
Selected Per-Share Data | | | | |
Net asset value, beginning of period | $ 46.09 | $ 42.28 | $ 47.11 | $ 50.00 |
Income from Investment Operations | | | | |
Net investment income (loss) E | .513 | .812 | 1.027 | 1.085 |
Net realized and unrealized gain (loss) | 3.500 | 3.930 | (4.465) | (2.692) |
Total from investment operations | 4.013 | 4.742 | (3.438) | (1.607) |
Distributions from net investment income | (.504) | (.817) | (1.032) | (1.113) |
Distributions from net realized gain | (.219) | (.115) | (.360) | (.170) |
Total distributions | (.723) | (.932) | (1.392) | (1.283) |
Net asset value, end of period | $ 49.38 | $ 46.09 | $ 42.28 | $ 47.11 |
Total Return B, C, D | 8.74% | 11.27% | (7.00)% | (3.33)% |
Ratios to Average Net Assets F, H | | | | |
Expenses before reductions | .25% A | .25% | .25% | .25% A |
Expenses net of fee waivers, if any | .25% A | .25% | .25% | .25% A |
Expenses net of all reductions | .25% A | .25% | .25% | .25% A |
Net investment income (loss) | 2.14% A | 1.79% | 2.60% | 2.42% A |
Supplemental Data | | | | |
Net assets, end of period (000 omitted) | $ 631 | $ 607 | $ 502 | $ 503 |
Portfolio turnover rate | 41% A | 38% | 60% | 21% A |
A Annualized
B Total returns for periods of less than one year are not annualized.
C Total returns would have been lower had certain expenses not been reduced during the periods shown.
D Total returns do not include the effect of the sales charges.
E Calculated based on average shares outstanding during the period.
F Amounts do not include the activity of the underlying funds.
G For the period August 30, 2007 (commencement of operations) to July 31, 2008.
H Expense ratios reflect operating expenses of the class. Expenses before reductions do not reflect amounts reimbursed by the investment adviser or reductions from expense offset arrangements and do not represent the amount paid by the class during periods when reimbursements or reductions occur. Expenses net of fee waivers reflect expenses after reimbursement by the investment adviser but prior to reductions from expense offset arrangements. Expenses net of all reductions represent the net expenses paid by the class but do not include expenses of the investment companies in which the Fund invests.
See accompanying notes which are an integral part of the financial statements.
Semiannual Report
Financial Highlights - Class T
| Six months ended January 31, 2011 | Years ended July 31, |
| (Unaudited) | 2010 | 2009 | 2008 G |
Selected Per-Share Data | | | | |
Net asset value, beginning of period | $ 46.09 | $ 42.28 | $ 47.10 | $ 50.00 |
Income from Investment Operations | | | | |
Net investment income (loss) E | .453 | .696 | .926 | .985 |
Net realized and unrealized gain (loss) | 3.500 | 3.928 | (4.460) | (2.707) |
Total from investment operations | 3.953 | 4.624 | (3.534) | (1.722) |
Distributions from net investment income | (.444) | (.699) | (.926) | (1.008) |
Distributions from net realized gain | (.219) | (.115) | (.360) | (.170) |
Total distributions | (.663) | (.814) | (1.286) | (1.178) |
Net asset value, end of period | $ 49.38 | $ 46.09 | $ 42.28 | $ 47.10 |
Total Return B, C, D | 8.61% | 10.98% | (7.23)% | (3.56)% |
Ratios to Average Net Assets F, H | | | | |
Expenses before reductions | .50% A | .50% | .50% | .50% A |
Expenses net of fee waivers, if any | .50% A | .50% | .50% | .50% A |
Expenses net of all reductions | .50% A | .50% | .50% | .50% A |
Net investment income (loss) | 1.89% A | 1.54% | 2.35% | 2.17% A |
Supplemental Data | | | | |
Net assets, end of period (000 omitted) | $ 145 | $ 134 | $ 171 | $ 187 |
Portfolio turnover rate | 41% A | 38% | 60% | 21% A |
A Annualized
B Total returns for periods of less than one year are not annualized.
C Total returns would have been lower had certain expenses not been reduced during the periods shown.
D Total returns do not include the effect of the sales charges.
E Calculated based on average shares outstanding during the period.
F Amounts do not include the activity of the underlying funds.
G For the period August 30, 2007 (commencement of operations) to July 31, 2008.
H Expense ratios reflect operating expenses of the class. Expenses before reductions do not reflect amounts reimbursed by the investment adviser or reductions from expense offset arrangements and do not represent the amount paid by the class during periods when reimbursements or reductions occur. Expenses net of fee waivers reflect expenses after reimbursement by the investment adviser but prior to reductions from expense offset arrangements. Expenses net of all reductions represent the net expenses paid by the class but do not include expenses of the investment companies in which the Fund invests.
Financial Highlights - Class C
| Six months ended January 31, 2011 | Years ended July 31, |
| (Unaudited) | 2010 | 2009 | 2008 G |
Selected Per-Share Data | | | | |
Net asset value, beginning of period | $ 46.06 | $ 42.26 | $ 47.08 | $ 50.00 |
Income from Investment Operations | | | | |
Net investment income (loss) E | .333 | .473 | .736 | .755 |
Net realized and unrealized gain (loss) | 3.498 | 3.923 | (4.471) | (2.699) |
Total from investment operations | 3.831 | 4.396 | (3.735) | (1.944) |
Distributions from net investment income | (.322) | (.481) | (.725) | (.806) |
Distributions from net realized gain | (.219) | (.115) | (.360) | (.170) |
Total distributions | (.541) | (.596) | (1.085) | (.976) |
Net asset value, end of period | $ 49.35 | $ 46.06 | $ 42.26 | $ 47.08 |
Total Return B, C, D | 8.34% | 10.43% | (7.70)% | (3.99)% |
Ratios to Average Net Assets F, H | | | | |
Expenses before reductions | 1.00% A | 1.00% | 1.00% | 1.00% A |
Expenses net of fee waivers, if any | 1.00% A | 1.00% | 1.00% | 1.00% A |
Expenses net of all reductions | 1.00% A | 1.00% | 1.00% | 1.00% A |
Net investment income (loss) | 1.39% A | 1.05% | 1.85% | 1.67% A |
Supplemental Data | | | | |
Net assets, end of period (000 omitted) | $ 290 | $ 295 | $ 221 | $ 275 |
Portfolio turnover rate | 41% A | 38% | 60% | 21% A |
A Annualized
B Total returns for periods of less than one year are not annualized.
C Total returns would have been lower had certain expenses not been reduced during the periods shown.
D Total returns do not include the effect of the contingent deferred sales charge.
E Calculated based on average shares outstanding during the period.
F Amounts do not include the activity of the underlying funds.
G For the period August 30, 2007 (commencement of operations) to July 31, 2008.
H Expense ratios reflect operating expenses of the class. Expenses before reductions do not reflect amounts reimbursed by the investment adviser or reductions from expense offset arrangements and do not represent the amount paid by the class during periods when reimbursements or reductions occur. Expenses net of fee waivers reflect expenses after reimbursement by the investment adviser but prior to reductions from expense offset arrangements. Expenses net of all reductions represent the net expenses paid by the class but do not include expenses of the investment companies in which the Fund invests.
See accompanying notes which are an integral part of the financial statements.
Semiannual Report
Financial Highlights - Income Replacement 2020
| Six months ended January 31, 2011 | Years ended July 31, |
| (Unaudited) | 2010 | 2009 | 2008 G |
Selected Per-Share Data | | | | |
Net asset value, beginning of period | $ 46.09 | $ 42.29 | $ 47.12 | $ 50.00 |
Income from Investment Operations | | | | |
Net investment income (loss) D | .573 | .925 | 1.125 | 1.190 |
Net realized and unrealized gain (loss) | 3.499 | 3.919 | (4.464) | (2.677) |
Total from investment operations | 4.072 | 4.844 | (3.339) | (1.487) |
Distributions from net investment income | (.563) | (.929) | (1.131) | (1.223) |
Distributions from net realized gain | (.219) | (.115) | (.360) | (.170) |
Total distributions | (.782) | (1.044) | (1.491) | (1.393) |
Net asset value, end of period | $ 49.38 | $ 46.09 | $ 42.29 | $ 47.12 |
Total Return B, C | 8.88% | 11.52% | (6.76)% | (3.10)% |
Ratios to Average Net Assets E, H | | | | |
Expenses before reductions F | .00% A | .00% | .00% | .00% A |
Expenses net of fee waivers, if any | .00% A | .00% | .00% | .00% A |
Expenses net of all reductions | .00% A | .00% | .00% | .00% A |
Net investment income (loss) | 2.39% A | 2.04% | 2.86% | 2.67% A |
Supplemental Data | | | | |
Net assets, end of period (000 omitted) | $ 3,089 | $ 2,225 | $ 1,624 | $ 1,233 |
Portfolio turnover rate | 41% A | 38% | 60% | 21% A |
A Annualized
B Total returns for periods of less than one year are not annualized.
C Total returns would have been lower had certain expenses not been reduced during the periods shown.
D Calculated based on average shares outstanding during the period.
E Amounts do not include the activity of the underlying funds.
F Amount represents less than .01%.
G For the period August 30, 2007 (commencement of operations) to July 31, 2008.
H Expense ratios reflect operating expenses of the class. Expenses before reductions do not reflect amounts reimbursed by the investment adviser or reductions from expense offset arrangements and do not represent the amount paid by the class during periods when reimbursements or reductions occur. Expenses net of fee waivers reflect expenses after reimbursement by the investment adviser but prior to reductions from expense offset arrangements. Expenses net of all reductions represent the net expenses paid by the class but do not include expenses of the investment companies in which the Fund invests.
Financial Highlights - Institutional Class
| Six months ended January 31, 2011 | Years ended July 31, |
| (Unaudited) | 2010 | 2009 | 2008 G |
Selected Per-Share Data | | | | |
Net asset value, beginning of period | $ 46.09 | $ 42.29 | $ 47.12 | $ 50.00 |
Income from Investment Operations | | | | |
Net investment income (loss) D | .573 | .928 | 1.138 | 1.215 |
Net realized and unrealized gain (loss) | 3.499 | 3.916 | (4.477) | (2.702) |
Total from investment operations | 4.072 | 4.844 | (3.339) | (1.487) |
Distributions from net investment income | (.563) | (.929) | (1.131) | (1.223) |
Distributions from net realized gain | (.219) | (.115) | (.360) | (.170) |
Total distributions | (.782) | (1.044) | (1.491) | (1.393) |
Net asset value, end of period | $ 49.38 | $ 46.09 | $ 42.29 | $ 47.12 |
Total Return B, C | 8.88% | 11.52% | (6.76)% | (3.10)% |
Ratios to Average Net Assets E, H | | | | |
Expenses before reductions F | .00% A | .00% | .00% | .00% A |
Expenses net of fee waivers, if any | .00% A | .00% | .00% | .00% A |
Expenses net of all reductions | .00% A | .00% | .00% | .00% A |
Net investment income (loss) | 2.39% A | 2.04% | 2.85% | 2.67% A |
Supplemental Data | | | | |
Net assets, end of period (000 omitted) | $ 53 | $ 49 | $ 95 | $ 163 |
Portfolio turnover rate | 41% A | 38% | 60% | 21% A |
A Annualized
B Total returns for periods of less than one year are not annualized.
C Total returns would have been lower had certain expenses not been reduced during the periods shown.
D Calculated based on average shares outstanding during the period.
E Amounts do not include the activity of the underlying funds.
F Amount represents less than .01%.
G For the period August 30, 2007 (commencement of operations) to July 31, 2008.
H Expense ratios reflect operating expenses of the class. Expenses before reductions do not reflect amounts reimbursed by the investment adviser or reductions from expense offset arrangements and do not represent the amount paid by the class during periods when reimbursements or reductions occur. Expenses net of fee waivers reflect expenses after reimbursement by the investment adviser but prior to reductions from expense offset arrangements. Expenses net of all reductions represent the net expenses paid by the class but do not include expenses of the investment companies in which the Fund invests.
See accompanying notes which are an integral part of the financial statements.
Semiannual Report
Fidelity Income Replacement 2022 Fund
Investment Changes (Unaudited)
Fund Holdings as of January 31, 2011 |
| % of fund's
net assets | % of fund's net assets
6 months ago |
Domestic Equity Funds | | |
Fidelity Advisor Mid Cap II Fund Institutional Class | 4.6 | 4.7 |
Fidelity Disciplined Equity Fund | 4.8 | 4.9 |
Fidelity Equity-Income Fund | 4.8 | 4.9 |
Fidelity Large Cap Core Enhanced Index Fund | 7.8 | 7.9 |
Fidelity Series 100 Index Fund | 5.8 | 5.9 |
Fidelity Series Broad Market Opportunities Fund | 7.8 | 7.9 |
Fidelity Series Small Cap Opportunities Fund | 3.1 | 3.2 |
| 38.7 | 39.4 |
International Equity Funds | | |
Fidelity Advisor International Discovery Fund Institutional Class | 4.8 | 5.1 |
High Yield Fixed-Income Funds | | |
Fidelity Capital & Income Fund | 1.7 | 1.9 |
Fidelity Strategic Income Fund | 1.8 | 1.8 |
| 3.5 | 3.7 |
Investment Grade Fixed-Income Funds | | |
Fidelity Government Income Fund | 6.7 | 6.6 |
Fidelity Strategic Real Return Fund | 6.8 | 6.8 |
Fidelity Total Bond Fund | 20.3 | 20.0 |
| 33.8 | 33.4 |
Short-Term Funds | | |
Fidelity Institutional Money Market Portfolio Institutional Class | 9.6 | 9.2 |
Fidelity Short-Term Bond Fund | 9.6 | 9.2 |
| 19.2 | 18.4 |
Net Other Assets (Liabilities)* | 0.0 | 0.0 |
| 100.0 | 100.0 |
* Amount represents less than 0.1%
Asset Allocation (% of fund's net assets) |
Current |
| Domestic Equity Funds | 38.7% | |
| International Equity Funds | 4.8% | |
| High Yield Fixed-Income Funds | 3.5% | |
| Investment Grade Fixed-Income Funds | 33.8% | |
| Short-Term Funds | 19.2% | |
Six months ago |
| Domestic Equity Funds | 39.4% | |
| International Equity Funds | 5.1% | |
| High Yield Fixed-Income Funds | 3.7% | |
| Investment Grade Fixed-Income Funds | 33.4% | |
| Short-Term Funds | 18.4% | |
Expected |
| Domestic Equity Funds | 37.9% | |
| International Equity Funds | 4.5% | |
| High Yield Fixed-Income Funds | 3.4% | |
| Investment Grade Fixed-Income Funds | 34.3% | |
| Short-Term Funds | 19.9% | |
The fund invests according to an asset allocation strategy that becomes increasingly conservative over time. The six months ago allocation is based on the fund's holdings as of July 31, 2010. The current allocation is based on the fund's holdings as of January 31, 2011. The expected allocation represents the fund's anticipated allocation at July 31, 2011. |
Semiannual Report
Fidelity Income Replacement 2022 Fund
Investments January 31, 2011 (Unaudited)
Showing Percentage of Net Assets
Equity Funds - 43.5% |
| Shares | | Value |
Domestic Equity Funds - 38.7% |
Fidelity Advisor Mid Cap II Fund Institutional Class | 7,801 | | $ 142,997 |
Fidelity Disciplined Equity Fund | 6,423 | | 149,147 |
Fidelity Equity-Income Fund | 3,273 | | 149,147 |
Fidelity Large Cap Core Enhanced Index Fund | 27,206 | | 238,328 |
Fidelity Series 100 Index Fund | 19,963 | | 178,669 |
Fidelity Series Broad Market Opportunities Fund | 23,184 | | 238,328 |
Fidelity Series Small Cap Opportunities Fund | 8,714 | | 95,331 |
TOTAL DOMESTIC EQUITY FUNDS | | 1,191,947 |
International Equity Funds - 4.8% |
Fidelity Advisor International Discovery Fund Institutional Class | 4,432 | | 146,687 |
TOTAL EQUITY FUNDS (Cost $1,373,374) | 1,338,634 |
Fixed-Income Funds - 37.3% |
| | | |
High Yield Fixed-Income Funds - 3.5% |
Fidelity Capital & Income Fund | 5,597 | | 54,124 |
Fidelity Strategic Income Fund | 4,841 | | 54,124 |
TOTAL HIGH YIELD FIXED-INCOME FUNDS | | 108,248 |
|
| Shares | | Value |
Investment Grade Fixed-Income Funds - 33.8% |
Fidelity Government Income Fund | 19,940 | | $ 207,576 |
Fidelity Strategic Real Return Fund | 21,400 | | 207,576 |
Fidelity Total Bond Fund | 58,097 | | 623,959 |
TOTAL INVESTMENT GRADE FIXED-INCOME FUNDS | | 1,039,111 |
TOTAL FIXED-INCOME FUNDS (Cost $1,116,176) | 1,147,359 |
Short-Term Funds - 19.2% |
| | | |
Fidelity Institutional Money Market Portfolio Institutional Class | 294,604 | | 294,604 |
Fidelity Short-Term Bond Fund | 34,741 | | 294,604 |
TOTAL SHORT-TERM FUNDS (Cost $587,674) | 589,208 |
TOTAL INVESTMENT PORTFOLIO - 100.0% (Cost $3,077,224) | | 3,075,201 |
NET OTHER ASSETS (LIABILITIES) - 0.0% | | (73) |
NET ASSETS - 100% | $ 3,075,128 |
Other Information |
All investments are categorized as Level 1 under the Fair Value Hierarchy. The inputs or methodology used for valuing securities may not be an indication of the risk associated with investing in those securities. For more information on valuation inputs, please refer to the Security Valuation section in the accompanying Notes to Financial Statements. |
Income Tax Information |
At July 31, 2010, the Fund had a capital loss carryforward of approximately $545,422 of which $64,025 and $481,397 will expire in fiscal 2017 and 2018, respectively. Capital loss carryforwards are only available to offset future capital gains of the Fund to the extent provided by regulations and may be limited. |
The Fund intends to elect to defer to its fiscal year ending July 31, 2011 approximately $109,973 of losses recognized during the period November 1, 2009 to July 31, 2010. |
See accompanying notes which are an integral part of the financial statements.
Semiannual Report
Fidelity Income Replacement 2022 Fund
Statement of Assets and Liabilities
| January 31, 2011 (Unaudited) |
| | |
Assets | | |
Investment in securities, at value (cost $3,077,224) - See accompanying schedule | | $ 3,075,201 |
Receivable for investments sold | | 16,946 |
Receivable for fund shares sold | | 3,000 |
Total assets | | 3,095,147 |
| | |
Liabilities | | |
Payable for investments purchased | $ 19,940 | |
Distribution and service plan fees payable | 79 | |
Total liabilities | | 20,019 |
| | |
Net Assets | | $ 3,075,128 |
Net Assets consist of: | | |
Paid in capital | | $ 3,778,963 |
Undistributed net investment income | | 791 |
Accumulated undistributed net realized gain (loss) on investments | | (702,603) |
Net unrealized appreciation (depreciation) on investments | | (2,023) |
Net Assets | | $ 3,075,128 |
Calculation of Maximum Offering Price Class A:
Net Asset Value and redemption price per share ($72,193 ÷ 1,467.6 shares) | | $ 49.19 |
| | |
Maximum offering price per share (100/94.25 of $49.19) | | $ 52.19 |
Class T:
Net Asset Value and redemption price per share ($78,280 ÷ 1,591.6 shares) | | $ 49.18 |
| | |
Maximum offering price per share (100/96.50 of $49.18) | | $ 50.96 |
| | |
Class C:
Net Asset Value and offering price per share ($37,158 ÷ 755.2 shares)A | | $ 49.20 |
| | |
Income Replacement 2022:
Net Asset Value, offering price and redemption price per share ($2,883,136 ÷ 58,624.5 shares) | | $ 49.18 |
| | |
Institutional Class:
Net Asset Value, offering price and redemption price per share ($4,361 ÷ 88.7 shares) | | $ 49.17 |
A Redemption price per share is equal to net asset value less any applicable contingent deferred sales charge.
Statement of Operations
Six months ended January 31, 2011 (Unaudited) |
| | |
Investment Income | | |
Income distributions from underlying funds | | $ 33,877 |
| | |
Expenses | | |
Distribution and service plan fees | $ 461 | |
Independent trustees' compensation | 5 | |
Total expenses before reductions | 466 | |
Expense reductions | (5) | 461 |
Net investment income (loss) | | 33,416 |
Realized and Unrealized Gain (Loss) Realized gain (loss) on sale of underlying fund shares | (14,224) | |
Capital gain distributions from underlying funds | 16,889 | |
Total net realized gain (loss) | | 2,665 |
Change in net unrealized appreciation (depreciation) on underlying funds | | 217,883 |
Net gain (loss) | | 220,548 |
Net increase (decrease) in net assets resulting from operations | | $ 253,964 |
See accompanying notes which are an integral part of the financial statements.
Semiannual Report
Fidelity Income Replacement 2022 Fund
Financial Statements - continued
Statement of Changes in Net Assets
| Six months ended January 31, 2011 (Unaudited) | Year ended
July 31,
2010 |
Increase (Decrease) in Net Assets | | |
Operations | | |
Net investment income (loss) | $ 33,416 | $ 57,048 |
Net realized gain (loss) | 2,665 | (60,204) |
Change in net unrealized appreciation (depreciation) | 217,883 | 328,653 |
Net increase (decrease) in net assets resulting from operations | 253,964 | 325,497 |
Distributions to shareholders from net investment income | (33,441) | (57,173) |
Distributions to shareholders from net realized gain | (12,730) | (19,734) |
Total distributions | (46,171) | (76,907) |
Share transactions - net increase (decrease) | 304,213 | (508,119) |
Total increase (decrease) in net assets | 512,006 | (259,529) |
| | |
Net Assets | | |
Beginning of period | 2,563,122 | 2,822,651 |
End of period (including undistributed net investment income of $791 and undistributed net investment income of $816, respectively) | $ 3,075,128 | $ 2,563,122 |
Financial Highlights - Class A
| Six months ended January 31, 2011 | Years ended July 31, |
| (Unaudited) | 2010 | 2009 | 2008 G |
Selected Per-Share Data | | | | |
Net asset value, beginning of period | $ 45.58 | $ 41.87 | $ 47.05 | $ 50.00 |
Income from Investment Operations | | | | |
Net investment income (loss) E | .520 | .815 | 1.035 | 1.087 |
Net realized and unrealized gain (loss) | 3.819 | 3.980 | (4.739) | (2.853) |
Total from investment operations | 4.339 | 4.795 | (3.704) | (1.766) |
Distributions from net investment income | (.515) | (.793) | (1.056) | (1.014) |
Distributions from net realized gain | (.214) | (.292) | (.420) | (.170) |
Total distributions | (.729) | (1.085) | (1.476) | (1.184) |
Net asset value, end of period | $ 49.19 | $ 45.58 | $ 41.87 | $ 47.05 |
Total Return B, C, D | 9.56% | 11.53% | (7.53)% | (3.64)% |
Ratios to Average Net Assets F, H | | | | |
Expenses before reductions | .25% A | .25% | .26% | .25% A |
Expenses net of fee waivers, if any | .25% A | .25% | .26% | .25% A |
Expenses net of all reductions | .25% A | .25% | .26% | .25% A |
Net investment income (loss) | 2.19% A | 1.82% | 2.62% | 2.41% A |
Supplemental Data | | | | |
Net assets, end of period (000 omitted) | $ 72 | $ 42 | $ 122 | $ 289 |
Portfolio turnover rate | 24% A | 24% | 22% | 32% A |
A Annualized
B Total returns for periods of less than one year are not annualized.
C Total returns would have been lower had certain expenses not been reduced during the periods shown.
D Total returns do not include the effect of the sales charges.
E Calculated based on average shares outstanding during the period.
F Amounts do not include the activity of the underlying funds.
G For the period August 30, 2007 (commencement of operations) to July 31, 2008.
H Expense ratios reflect operating expenses of the class. Expenses before reductions do not reflect amounts reimbursed by the investment adviser or reductions from expense offset arrangements and do not represent the amount paid by the class during periods when reimbursements or reductions occur. Expenses net of fee waivers reflect expenses after reimbursement by the investment adviser but prior to reductions from expense offset arrangements. Expenses net of all reductions represent the net expenses paid by the class but do not include expenses of the investment companies in which the Fund invests.
See accompanying notes which are an integral part of the financial statements.
Semiannual Report
Financial Highlights - Class T
| Six months ended January 31, 2011 | Years ended July 31, |
| (Unaudited) | 2010 | 2009 | 2008 G |
Selected Per-Share Data | | | | |
Net asset value, beginning of period | $ 45.57 | $ 41.86 | $ 47.04 | $ 50.00 |
Income from Investment Operations | | | | |
Net investment income (loss) E | .461 | .702 | .933 | .982 |
Net realized and unrealized gain (loss) | 3.818 | 3.985 | (4.736) | (2.862) |
Total from investment operations | 4.279 | 4.687 | (3.803) | (1.880) |
Distributions from net investment income | (.455) | (.685) | (.957) | (.910) |
Distributions from net realized gain | (.214) | (.292) | (.420) | (.170) |
Total distributions | (.669) | (.977) | (1.377) | (1.080) |
Net asset value, end of period | $ 49.18 | $ 45.57 | $ 41.86 | $ 47.04 |
Total Return B, C, D | 9.42% | 11.27% | (7.77)% | (3.87)% |
Ratios to Average Net Assets F, H | | | | |
Expenses before reductions | .50% A | .50% | .51% | .50% A |
Expenses net of fee waivers, if any | .50% A | .50% | .51% | .50% A |
Expenses net of all reductions | .50% A | .50% | .51% | .50% A |
Net investment income (loss) | 1.94% A | 1.57% | 2.37% | 2.16% A |
Supplemental Data | | | | |
Net assets, end of period (000 omitted) | $ 78 | $ 77 | $ 112 | $ 187 |
Portfolio turnover rate | 24% A | 24% | 22% | 32% A |
A Annualized
B Total returns for periods of less than one year are not annualized.
C Total returns would have been lower had certain expenses not been reduced during the periods shown.
D Total returns do not include the effect of the sales charges.
E Calculated based on average shares outstanding during the period.
F Amounts do not include the activity of the underlying funds.
G For the period August 30, 2007 (commencement of operations) to July 31, 2008.
H Expense ratios reflect operating expenses of the class. Expenses before reductions do not reflect amounts reimbursed by the investment adviser or reductions from expense offset arrangements and do not represent the amount paid by the class during periods when reimbursements or reductions occur. Expenses net of fee waivers reflect expenses after reimbursement by the investment adviser but prior to reductions from expense offset arrangements. Expenses net of all reductions represent the net expenses paid by the class but do not include expenses of the investment companies in which the Fund invests.
Financial Highlights - Class C
| Six months ended January 31, 2011 | Years ended July 31, |
| (Unaudited) | 2010 | 2009 | 2008 G |
Selected Per-Share Data | | | | |
Net asset value, beginning of period | $ 45.58 | $ 41.86 | $ 47.04 | $ 50.00 |
Income from Investment Operations | | | | |
Net investment income (loss) E | .341 | .477 | .737 | .760 |
Net realized and unrealized gain (loss) | 3.818 | 3.989 | (4.745) | (2.860) |
Total from investment operations | 4.159 | 4.466 | (4.008) | (2.100) |
Distributions from net investment income | (.325) | (.454) | (.752) | (.690) |
Distributions from net realized gain | (.214) | (.292) | (.420) | (.170) |
Total distributions | (.539) | (.746) | (1.172) | (.860) |
Net asset value, end of period | $ 49.20 | $ 45.58 | $ 41.86 | $ 47.04 |
Total Return B, C, D | 9.14% | 10.72% | (8.25)% | (4.29)% |
Ratios to Average Net Assets F, H | | | | |
Expenses before reductions | 1.00% A | 1.00% | 1.01% | 1.00% A |
Expenses net of fee waivers, if any | 1.00% A | 1.00% | 1.01% | 1.00% A |
Expenses net of all reductions | 1.00% A | 1.00% | 1.01% | 1.00% A |
Net investment income (loss) | 1.44% A | 1.07% | 1.87% | 1.66% A |
Supplemental Data | | | | |
Net assets, end of period (000 omitted) | $ 37 | $ 44 | $ 69 | $ 120 |
Portfolio turnover rate | 24% A | 24% | 22% | 32% A |
A Annualized
B Total returns for periods of less than one year are not annualized.
C Total returns would have been lower had certain expenses not been reduced during the periods shown.
D Total returns do not include the effect of the contingent deferred sales charge.
E Calculated based on average shares outstanding during the period.
F Amounts do not include the activity of the underlying funds.
G For the period August 30, 2007 (commencement of operations) to July 31, 2008.
H Expense ratios reflect operating expenses of the class. Expenses before reductions do not reflect amounts reimbursed by the investment adviser or reductions from expense offset arrangements and do not represent the amount paid by the class during periods when reimbursements or reductions occur. Expenses net of fee waivers reflect expenses after reimbursement by the investment adviser but prior to reductions from expense offset arrangements. Expenses net of all reductions represent the net expenses paid by the class but do not include expenses of the investment companies in which the Fund invests.
See accompanying notes which are an integral part of the financial statements.
Semiannual Report
Financial Highlights - Income Replacement 2022
| Six months ended January 31, 2011 | Years ended July 31, |
| (Unaudited) | 2010 | 2009 | 2008 G |
Selected Per-Share Data | | | | |
Net asset value, beginning of period | $ 45.56 | $ 41.87 | $ 47.06 | $ 50.00 |
Income from Investment Operations | | | | |
Net investment income (loss) D | .579 | .925 | 1.144 | 1.190 |
Net realized and unrealized gain (loss) | 3.826 | 3.978 | (4.752) | (2.836) |
Total from investment operations | 4.405 | 4.903 | (3.608) | (1.646) |
Distributions from net investment income | (.571) | (.921) | (1.162) | (1.124) |
Distributions from net realized gain | (.214) | (.292) | (.420) | (.170) |
Total distributions | (.785) | (1.213) | (1.582) | (1.294) |
Net asset value, end of period | $ 49.18 | $ 45.56 | $ 41.87 | $ 47.06 |
Total Return B, C | 9.71% | 11.80% | (7.30)% | (3.41)% |
Ratios to Average Net Assets E, H | | | | |
Expenses before reductions | .00% A, F | .00% F | .01% | .00% A, F |
Expenses net of fee waivers, if any | .00% A | .00% | .01% | .00% A |
Expenses net of all reductions | .00% A | .00% | .01% | .00% A |
Net investment income (loss) | 2.44% A | 2.07% | 2.87% | 2.66% A |
Supplemental Data | | | | |
Net assets, end of period (000 omitted) | $ 2,883 | $ 2,395 | $ 2,353 | $ 4,666 |
Portfolio turnover rate | 24% A | 24% | 22% | 32% A |
A Annualized
B Total returns for periods of less than one year are not annualized.
C Total returns would have been lower had certain expenses not been reduced during the periods shown.
D Calculated based on average shares outstanding during the period.
E Amounts do not include the activity of the underlying funds.
F Amount represents less than .01%.
G For the period August 30, 2007 (commencement of operations) to July 31, 2008.
H Expense ratios reflect operating expenses of the class. Expenses before reductions do not reflect amounts reimbursed by the investment adviser or reductions from expense offset arrangements and do not represent the amount paid by the class during periods when reimbursements or reductions occur. Expenses net of fee waivers reflect expenses after reimbursement by the investment adviser but prior to reductions from expense offset arrangements. Expenses net of all reductions represent the net expenses paid by the class but do not include expenses of the investment companies in which the Fund invests.
Financial Highlights - Institutional Class
| Six months ended January 31, 2011 | Years ended July 31, |
| (Unaudited) | 2010 | 2009 | 2008 G |
Selected Per-Share Data | | | | |
Net asset value, beginning of period | $ 45.56 | $ 41.86 | $ 47.06 | $ 50.00 |
Income from Investment Operations | | | | |
Net investment income (loss) D | .577 | .918 | 1.131 | 1.208 |
Net realized and unrealized gain (loss) | 3.818 | 3.995 | (4.749) | (2.854) |
Total from investment operations | 4.395 | 4.913 | (3.618) | (1.646) |
Distributions from net investment income | (.571) | (.921) | (1.162) | (1.124) |
Distributions from net realized gain | (.214) | (.292) | (.420) | (.170) |
Total distributions | (.785) | (1.213) | (1.582) | (1.294) |
Net asset value, end of period | $ 49.17 | $ 45.56 | $ 41.86 | $ 47.06 |
Total Return B, C | 9.69% | 11.83% | (7.33)% | (3.41)% |
Ratios to Average Net Assets E, H | | | | |
Expenses before reductions | .00% A, F | .00% F | .01% | .00% A, F |
Expenses net of fee waivers, if any | .00% A | .00% | .01% | .00% A |
Expenses net of all reductions | .00% A | .00% | .01% | .00% A |
Net investment income (loss) | 2.44% A | 2.07% | 2.87% | 2.66% A |
Supplemental Data | | | | |
Net assets, end of period (000 omitted) | $ 4 | $ 5 | $ 166 | $ 277 |
Portfolio turnover rate | 24% A | 24% | 22% | 32% A |
A Annualized
B Total returns for periods of less than one year are not annualized.
C Total returns would have been lower had certain expenses not been reduced during the periods shown.
D Calculated based on average shares outstanding during the period.
E Amounts do not include the activity of the underlying funds.
F Amount represents less than .01%.
G For the period August 30, 2007 (commencement of operations) to July 31, 2008.
H Expense ratios reflect operating expenses of the class. Expenses before reductions do not reflect amounts reimbursed by the investment adviser or reductions from expense offset arrangements and do not represent the amount paid by the class during periods when reimbursements or reductions occur. Expenses net of fee waivers reflect expenses after reimbursement by the investment adviser but prior to reductions from expense offset arrangements. Expenses net of all reductions represent the net expenses paid by the class but do not include expenses of the investment companies in which the Fund invests.
See accompanying notes which are an integral part of the financial statements.
Semiannual Report
Fidelity Income Replacement 2024 Fund
Investment Changes (Unaudited)
Fund Holdings as of January 31, 2011 |
| % of fund's
net assets | % of fund's net assets
6 months ago |
Domestic Equity Funds | | |
Fidelity Advisor Mid Cap II Fund Institutional Class | 4.9 | 4.9 |
Fidelity Disciplined Equity Fund | 5.1 | 5.2 |
Fidelity Equity-Income Fund | 5.1 | 5.2 |
Fidelity Large Cap Core Enhanced Index Fund | 8.3 | 8.3 |
Fidelity Series 100 Index Fund | 6.2 | 6.3 |
Fidelity Series Broad Market Opportunities Fund | 8.3 | 8.3 |
Fidelity Series Small Cap Opportunities Fund | 3.3 | 3.4 |
| 41.2 | 41.6 |
International Equity Funds | | |
Fidelity Advisor International Discovery Fund Institutional Class | 5.6 | 5.9 |
High Yield Fixed-Income Funds | | |
Fidelity Capital & Income Fund | 2.0 | 2.1 |
Fidelity Strategic Income Fund | 2.0 | 2.1 |
| 4.0 | 4.2 |
Investment Grade Fixed-Income Funds | | |
Fidelity Government Income Fund | 6.4 | 6.3 |
Fidelity Strategic Real Return Fund | 6.5 | 6.5 |
Fidelity Total Bond Fund | 19.3 | 19.1 |
| 32.2 | 31.9 |
Short-Term Funds | | |
Fidelity Institutional Money Market Portfolio Institutional Class | 8.5 | 8.2 |
Fidelity Short-Term Bond Fund | 8.5 | 8.2 |
| 17.0 | 16.4 |
Net Other Assets (Liabilities)* | 0.0 | 0.0 |
| 100.0 | 100.0 |
* Amount represents less than 0.1%
Asset Allocation (% of fund's net assets) |
Current |
| Domestic Equity Funds | 41.2% | |
| International Equity Funds | 5.6% | |
| High Yield Fixed-Income Funds | 4.0% | |
| Investment Grade Fixed-Income Funds | 32.2% | |
| Short-Term Funds | 17.0% | |
Six months ago |
| Domestic Equity Funds | 41.6% | |
| International Equity Funds | 5.9% | |
| High Yield Fixed-Income Funds | 4.2% | |
| Investment Grade Fixed-Income Funds | 31.9% | |
| Short-Term Funds | 16.4% | |
Expected |
| Domestic Equity Funds | 40.7% | |
| International Equity Funds | 5.4% | |
| High Yield Fixed-Income Funds | 3.9% | |
| Investment Grade Fixed-Income Funds | 32.5% | |
| Short-Term Funds | 17.5% | |
The fund invests according to an asset allocation strategy that becomes increasingly conservative over time. The six months ago allocation is based on the fund's holdings as of July 31, 2010. The current allocation is based on the fund's holdings as of January 31, 2011. The expected allocation represents the fund's anticipated allocation at July 31, 2011. |
Semiannual Report
Fidelity Income Replacement 2024 Fund
Investments January 31, 2011 (Unaudited)
Showing Percentage of Net Assets
Equity Funds - 46.8% |
| Shares | | Value |
Domestic Equity Funds - 41.2% |
Fidelity Advisor Mid Cap II Fund Institutional Class | 4,521 | | $ 82,866 |
Fidelity Disciplined Equity Fund | 3,713 | | 86,214 |
Fidelity Equity-Income Fund | 1,892 | | 86,214 |
Fidelity Large Cap Core Enhanced Index Fund | 15,766 | | 138,110 |
Fidelity Series 100 Index Fund | 11,559 | | 103,457 |
Fidelity Series Broad Market Opportunities Fund | 13,435 | | 138,110 |
Fidelity Series Small Cap Opportunities Fund | 5,050 | | 55,244 |
TOTAL DOMESTIC EQUITY FUNDS | | 690,215 |
International Equity Funds - 5.6% |
Fidelity Advisor International Discovery Fund Institutional Class | 2,832 | | 93,748 |
TOTAL EQUITY FUNDS (Cost $716,100) | 783,963 |
Fixed-Income Funds - 36.2% |
| | | |
High Yield Fixed-Income Funds - 4.0% |
Fidelity Capital & Income Fund | 3,480 | | 33,649 |
Fidelity Strategic Income Fund | 3,010 | | 33,649 |
TOTAL HIGH YIELD FIXED-INCOME FUNDS | | 67,298 |
|
| Shares | | Value |
Investment Grade Fixed-Income Funds - 32.2% |
Fidelity Government Income Fund | 10,356 | | $ 107,810 |
Fidelity Strategic Real Return Fund | 11,114 | | 107,810 |
Fidelity Total Bond Fund | 30,130 | | 323,599 |
TOTAL INVESTMENT GRADE FIXED-INCOME FUNDS | | 539,219 |
TOTAL FIXED-INCOME FUNDS (Cost $579,066) | 606,517 |
Short-Term Funds - 17.0% |
| | | |
Fidelity Institutional Money Market Portfolio Institutional Class | 141,793 | | 141,793 |
Fidelity Short-Term Bond Fund | 16,721 | | 141,793 |
TOTAL SHORT-TERM FUNDS (Cost $281,039) | 283,586 |
TOTAL INVESTMENT PORTFOLIO - 100.0% (Cost $1,576,205) | | 1,674,066 |
NET OTHER ASSETS (LIABILITIES) - 0.0% | | (143) |
NET ASSETS - 100% | $ 1,673,923 |
Other Information |
All investments are categorized as Level 1 under the Fair Value Hierarchy. The inputs or methodology used for valuing securities may not be an indication of the risk associated with investing in those securities. For more information on valuation inputs, please refer to the Security Valuation section in the accompanying Notes to Financial Statements. |
Income Tax Information |
At July 31, 2010, the Fund had a capital loss carryforward of approximately $76,448 of which $9,801 and $66,647 will expire in fiscal 2017 and 2018, respectively. Capital loss carryforwards are only available to offset future capital gains of the Fund to the extent provided by regulations and may be limited. |
The Fund intends to elect to defer to its fiscal year ending July 31, 2011 approximately $47,112 of losses recognized during the period November 1, 2009 to July 31, 2010. |
See accompanying notes which are an integral part of the financial statements.
Semiannual Report
Fidelity Income Replacement 2024 Fund
Statement of Assets and Liabilities
| January 31, 2011 (Unaudited) |
| | |
Assets | | |
Investment in securities, at value (cost $1,576,205) - See accompanying schedule | | $ 1,674,066 |
Cash | | 72 |
Receivable for investments sold | | 8,936 |
Total assets | | 1,683,074 |
| | |
Liabilities | | |
Payable for investments purchased | $ 8,934 | |
Distribution and service plan fees payable | 217 | |
Total liabilities | | 9,151 |
| | |
Net Assets | | $ 1,673,923 |
Net Assets consist of: | | |
Paid in capital | | $ 1,741,502 |
Undistributed net investment income | | 382 |
Accumulated undistributed net realized gain (loss) on investments | | (165,822) |
Net unrealized appreciation (depreciation) on investments | | 97,861 |
Net Assets | | $ 1,673,923 |
Calculation of Maximum Offering Price Class A:
Net Asset Value and redemption price per share ($256,379 ÷ 5,205.1 shares) | | $ 49.26 |
| | |
Maximum offering price per share (100/94.25 of $49.26) | | $ 52.27 |
Class T:
Net Asset Value and redemption price per share ($46,077 ÷ 935.1 shares) | | $ 49.27 |
| | |
Maximum offering price per share (100/96.50 of $49.27) | | $ 51.06 |
| | |
Class C:
Net Asset Value and offering price per share ($171,691 ÷ 3,488.0 shares)A | | $ 49.22 |
| | |
Income Replacement 2024:
Net Asset Value, offering price and redemption price per share ($1,168,214 ÷ 23,713.5 shares) | | $ 49.26 |
| | |
Institutional Class:
Net Asset Value, offering price and redemption price per share ($31,562 ÷ 640.7 shares) | | $ 49.26 |
A Redemption price per share is equal to net asset value less any applicable contingent deferred sales charge.
Statement of Operations
Six months ended January 31, 2011 (Unaudited) |
| | |
Investment Income | | |
Income distributions from underlying funds | | $ 19,307 |
| | |
Expenses | | |
Distribution and service plan fees | $ 1,286 | |
Independent trustees' compensation | 3 | |
Total expenses before reductions | 1,289 | |
Expense reductions | (3) | 1,286 |
Net investment income (loss) | | 18,021 |
Realized and Unrealized Gain (Loss) Realized gain (loss) on sale of underlying fund shares | (15,388) | |
Capital gain distributions from underlying funds | 9,198 | |
Total net realized gain (loss) | | (6,190) |
Change in net unrealized appreciation (depreciation) on underlying funds | | 141,054 |
Net gain (loss) | | 134,864 |
Net increase (decrease) in net assets resulting from operations | | $ 152,885 |
See accompanying notes which are an integral part of the financial statements.
Semiannual Report
Statement of Changes in Net Assets
| Six months ended January 31, 2011 (Unaudited) | Year ended
July 31,
2010 |
Increase (Decrease) in Net Assets | | |
Operations | | |
Net investment income (loss) | $ 18,021 | $ 30,872 |
Net realized gain (loss) | (6,190) | (37,364) |
Change in net unrealized appreciation (depreciation) | 141,054 | 180,425 |
Net increase (decrease) in net assets resulting from operations | 152,885 | 173,933 |
Distributions to shareholders from net investment income | (18,077) | (30,833) |
Distributions to shareholders from net realized gain | (7,078) | (4,233) |
Total distributions | (25,155) | (35,066) |
Share transactions - net increase (decrease) | 10,676 | 87,922 |
Total increase (decrease) in net assets | 138,406 | 226,789 |
| | |
Net Assets | | |
Beginning of period | 1,535,517 | 1,308,728 |
End of period (including undistributed net investment income of $382 and undistributed net investment income of $438, respectively) | $ 1,673,923 | $ 1,535,517 |
Financial Highlights - Class A
| Six months ended January 31, 2011 | Years ended July 31, |
| (Unaudited) | 2010 | 2009 | 2008 G |
Selected Per-Share Data | | | | |
Net asset value, beginning of period | $ 45.41 | $ 41.48 | $ 46.97 | $ 50.00 |
Income from Investment Operations | | | | |
Net investment income (loss) E | .519 | .811 | 1.014 | 1.063 |
Net realized and unrealized gain (loss) | 4.077 | 4.020 | (5.004) | (2.884) |
Total from investment operations | 4.596 | 4.831 | (3.990) | (1.821) |
Distributions from net investment income | (.529) | (.791) | (1.020) | (1.039) |
Distributions from net realized gain | (.217) | (.110) | (.480) | (.170) |
Total distributions | (.746) | (.901) | (1.500) | (1.209) |
Net asset value, end of period | $ 49.26 | $ 45.41 | $ 41.48 | $ 46.97 |
Total Return B, C, D | 10.16% | 11.70% | (8.10)% | (3.77)% |
Ratios to Average Net Assets F, H | | | | |
Expenses before reductions | .25% A | .25% | .25% | .25% A |
Expenses net of fee waivers, if any | .25% A | .25% | .25% | .25% A |
Expenses net of all reductions | .25% A | .25% | .25% | .25% A |
Net investment income (loss) | 2.19% A | 1.82% | 2.62% | 2.35% A |
Supplemental Data | | | | |
Net assets, end of period (000 omitted) | $ 256 | $ 260 | $ 287 | $ 286 |
Portfolio turnover rate | 28% A | 34% | 64% | 41% A |
A Annualized
B Total returns for periods of less than one year are not annualized.
C Total returns would have been lower had certain expenses not been reduced during the periods shown.
D Total returns do not include the effect of the sales charges.
E Calculated based on average shares outstanding during the period.
F Amounts do not include the activity of the underlying funds.
G For the period August 30, 2007 (commencement of operations) to July 31, 2008.
H Expense ratios reflect operating expenses of the class. Expenses before reductions do not reflect amounts reimbursed by the investment adviser or reductions from expense offset arrangements and do not represent the amount paid by the class during periods when reimbursements or reductions occur. Expenses net of fee waivers reflect expenses after reimbursement by the investment adviser but prior to reductions from expense offset arrangements. Expenses net of all reductions represent the net expenses paid by the class but do not include expenses of the investment companies in which the Fund invests.
See accompanying notes which are an integral part of the financial statements.
Semiannual Report
Financial Highlights - Class T
| Six months ended January 31, 2011 | Years ended July 31, |
| (Unaudited) | 2010 | 2009 | 2008 G |
Selected Per-Share Data | | | | |
Net asset value, beginning of period | $ 45.42 | $ 41.48 | $ 46.97 | $ 50.00 |
Income from Investment Operations | | | | |
Net investment income (loss) E | .459 | .701 | .919 | .966 |
Net realized and unrealized gain (loss) | 4.070 | 4.025 | (5.010) | (2.903) |
Total from investment operations | 4.529 | 4.726 | (4.091) | (1.937) |
Distributions from net investment income | (.462) | (.676) | (.919) | (.923) |
Distributions from net realized gain | (.217) | (.110) | (.480) | (.170) |
Total distributions | (.679) | (.786) | (1.399) | (1.093) |
Net asset value, end of period | $ 49.27 | $ 45.42 | $ 41.48 | $ 46.97 |
Total Return B, C, D | 10.01% | 11.43% | (8.34)% | (3.99)% |
Ratios to Average Net Assets F, H | | | | |
Expenses before reductions | .50% A | .50% | .50% | .50% A |
Expenses net of fee waivers, if any | .50% A | .50% | .50% | .50% A |
Expenses net of all reductions | .50% A | .50% | .50% | .50% A |
Net investment income (loss) | 1.93% A | 1.57% | 2.37% | 2.11% A |
Supplemental Data | | | | |
Net assets, end of period (000 omitted) | $ 46 | $ 54 | $ 69 | $ 96 |
Portfolio turnover rate | 28% A | 34% | 64% | 41% A |
A Annualized
B Total returns for periods of less than one year are not annualized.
C Total returns would have been lower had certain expenses not been reduced during the periods shown.
D Total returns do not include the effect of the sales charges.
E Calculated based on average shares outstanding during the period.
F Amounts do not include the activity of the underlying funds.
G For the period August 30, 2007 (commencement of operations) to July 31, 2008.
H Expense ratios reflect operating expenses of the class. Expenses before reductions do not reflect amounts reimbursed by the investment adviser or reductions from expense offset arrangements and do not represent the amount paid by the class during periods when reimbursements or reductions occur. Expenses net of fee waivers reflect expenses after reimbursement by the investment adviser but prior to reductions from expense offset arrangements. Expenses net of all reductions represent the net expenses paid by the class but do not include expenses of the investment companies in which the Fund invests.
Financial Highlights - Class C
| Six months ended January 31, 2011 | Years ended July 31, |
| (Unaudited) | 2010 | 2009 | 2008 G |
Selected Per-Share Data | | | | |
Net asset value, beginning of period | $ 45.38 | $ 41.45 | $ 46.93 | $ 50.00 |
Income from Investment Operations | | | | |
Net investment income (loss) E | .340 | .476 | .726 | .728 |
Net realized and unrealized gain (loss) | 4.067 | 4.020 | (5.005) | (2.903) |
Total from investment operations | 4.407 | 4.496 | (4.279) | (2.175) |
Distributions from net investment income | (.350) | (.456) | (.721) | (.725) |
Distributions from net realized gain | (.217) | (.110) | (.480) | (.170) |
Total distributions | (.567) | (.566) | (1.201) | (.895) |
Net asset value, end of period | $ 49.22 | $ 45.38 | $ 41.45 | $ 46.93 |
Total Return B, C, D | 9.73% | 10.87% | (8.80)% | (4.45)% |
Ratios to Average Net Assets F, H | | | | |
Expenses before reductions | 1.00% A | 1.00% | 1.00% | 1.00% A |
Expenses net of fee waivers, if any | 1.00% A | 1.00% | 1.00% | 1.00% A |
Expenses net of all reductions | 1.00% A | 1.00% | 1.00% | 1.00% A |
Net investment income (loss) | 1.43% A | 1.07% | 1.87% | 1.61% A |
Supplemental Data | | | | |
Net assets, end of period (000 omitted) | $ 172 | $ 159 | $ 147 | $ 233 |
Portfolio turnover rate | 28% A | 34% | 64% | 41% A |
A Annualized
B Total returns for periods of less than one year are not annualized.
C Total returns would have been lower had certain expenses not been reduced during the periods shown.
D Total returns do not include the effect of the contingent deferred sales charge.
E Calculated based on average shares outstanding during the period.
F Amounts do not include the activity of the underlying funds.
G For the period August 30, 2007 (commencement of operations) to July 31, 2008.
H Expense ratios reflect operating expenses of the class. Expenses before reductions do not reflect amounts reimbursed by the investment adviser or reductions from expense offset arrangements and do not represent the amount paid by the class during periods when reimbursements or reductions occur. Expenses net of fee waivers reflect expenses after reimbursement by the investment adviser but prior to reductions from expense offset arrangements. Expenses net of all reductions represent the net expenses paid by the class but do not include expenses of the investment companies in which the Fund invests.
See accompanying notes which are an integral part of the financial statements.
Semiannual Report
Financial Highlights - Income Replacement 2024
| Six months ended January 31, 2011 | Years ended July 31, |
| (Unaudited) | 2010 | 2009 | 2008 G |
Selected Per-Share Data | | | | |
Net asset value, beginning of period | $ 45.42 | $ 41.49 | $ 46.98 | $ 50.00 |
Income from Investment Operations | | | | |
Net investment income (loss) D | .578 | .924 | 1.118 | 1.166 |
Net realized and unrealized gain (loss) | 4.067 | 4.020 | (5.011) | (2.868) |
Total from investment operations | 4.645 | 4.944 | (3.893) | (1.702) |
Distributions from net investment income | (.588) | (.904) | (1.117) | (1.148) |
Distributions from net realized gain | (.217) | (.110) | (.480) | (.170) |
Total distributions | (.805) | (1.014) | (1.597) | (1.318) |
Net asset value, end of period | $ 49.26 | $ 45.42 | $ 41.49 | $ 46.98 |
Total Return B, C | 10.28% | 11.98% | (7.87)% | (3.53)% |
Ratios to Average Net Assets E, H | | | | |
Expenses before reductions F | .00% A | .00% | .00% | .00% A |
Expenses net of fee waivers, if any | .00% A | .00% | .00% | .00% A |
Expenses net of all reductions | .00% A | .00% | .00% | .00% A |
Net investment income (loss) | 2.44% A | 2.07% | 2.87% | 2.60% A |
Supplemental Data | | | | |
Net assets, end of period (000 omitted) | $ 1,168 | $ 1,026 | $ 749 | $ 714 |
Portfolio turnover rate | 28% A | 34% | 64% | 41% A |
A Annualized
B Total returns for periods of less than one year are not annualized.
C Total returns would have been lower had certain expenses not been reduced during the periods shown.
D Calculated based on average shares outstanding during the period.
E Amounts do not include the activity of the underlying funds.
F Amount represents less than .01%.
G For the period August 30, 2007 (commencement of operations) to July 31, 2008.
H Expense ratios reflect operating expenses of the class. Expenses before reductions do not reflect amounts reimbursed by the investment adviser or reductions from expense offset arrangements and do not represent the amount paid by the class during periods when reimbursements or reductions occur. Expenses net of fee waivers reflect expenses after reimbursement by the investment adviser but prior to reductions from expense offset arrangements. Expenses net of all reductions represent the net expenses paid by the class but do not include expenses of the investment companies in which the Fund invests.
Financial Highlights - Institutional Class
| Six months ended January 31, 2011 | Years ended July 31, |
| (Unaudited) | 2010 | 2009 | 2008 G |
Selected Per-Share Data | | | | |
Net asset value, beginning of period | $ 45.42 | $ 41.48 | $ 46.98 | $ 50.00 |
Income from Investment Operations | | | | |
Net investment income (loss) D | .578 | .922 | 1.119 | 1.194 |
Net realized and unrealized gain (loss) | 4.067 | 4.032 | (5.022) | (2.896) |
Total from investment operations | 4.645 | 4.954 | (3.903) | (1.702) |
Distributions from net investment income | (.588) | (.904) | (1.117) | (1.148) |
Distributions from net realized gain | (.217) | (.110) | (.480) | (.170) |
Total distributions | (.805) | (1.014) | (1.597) | (1.318) |
Net asset value, end of period | $ 49.26 | $ 45.42 | $ 41.48 | $ 46.98 |
Total Return B, C | 10.28% | 12.00% | (7.89)% | (3.53)% |
Ratios to Average Net Assets E, H | | | | |
Expenses before reductions F | .00% A | .00% | .00% | .00% A |
Expenses net of fee waivers, if any | .00% A | .00% | .00% | .00% A |
Expenses net of all reductions | .00% A | .00% | .00% | .00% A |
Net investment income (loss) | 2.44% A | 2.07% | 2.87% | 2.60% A |
Supplemental Data | | | | |
Net assets, end of period (000 omitted) | $ 32 | $ 37 | $ 57 | $ 97 |
Portfolio turnover rate | 28% A | 34% | 64% | 41% A |
A Annualized
B Total returns for periods of less than one year are not annualized.
C Total returns would have been lower had certain expenses not been reduced during the periods shown.
D Calculated based on average shares outstanding during the period.
E Amounts do not include the activity of the underlying funds.
F Amount represents less than .01%.
G For the period August 30, 2007 (commencement of operations) to July 31, 2008.
H Expense ratios reflect operating expenses of the class. Expenses before reductions do not reflect amounts reimbursed by the investment adviser or reductions from expense offset arrangements and do not represent the amount paid by the class during periods when reimbursements or reductions occur. Expenses net of fee waivers reflect expenses after reimbursement by the investment adviser but prior to reductions from expense offset arrangements. Expenses net of all reductions represent the net expenses paid by the class but do not include expenses of the investment companies in which the Fund invests.
See accompanying notes which are an integral part of the financial statements.
Semiannual Report
Fidelity Income Replacement 2026 Fund
Investment Changes (Unaudited)
Fund Holdings as of January 31, 2011 |
| % of fund's
net assets | % of fund's net assets
6 months ago |
Domestic Equity Funds | | |
Fidelity Advisor Mid Cap II Fund Institutional Class | 5.2 | 5.1 |
Fidelity Disciplined Equity Fund | 5.4 | 5.4 |
Fidelity Equity-Income Fund | 5.4 | 5.4 |
Fidelity Large Cap Core Enhanced Index Fund | 8.6 | 8.6 |
Fidelity Series 100 Index Fund | 6.4 | 6.5 |
Fidelity Series Broad Market Opportunities Fund | 8.6 | 8.7 |
Fidelity Series Small Cap Opportunities Fund | 3.4 | 3.5 |
| 43.0 | 43.2 |
International Equity Funds | | |
Fidelity Advisor International Discovery Fund Institutional Class | 6.4 | 6.7 |
High Yield Fixed-Income Funds | | |
Fidelity Capital & Income Fund | 2.2 | 2.3 |
Fidelity Strategic Income Fund | 2.2 | 2.2 |
| 4.4 | 4.5 |
Investment Grade Fixed-Income Funds | | |
Fidelity Government Income Fund | 6.1 | 6.0 |
Fidelity Strategic Real Return Fund | 6.1 | 6.2 |
Fidelity Total Bond Fund | 18.4 | 18.3 |
| 30.6 | 30.5 |
Short-Term Funds | | |
Fidelity Institutional Money Market Portfolio Institutional Class | 7.8 | 7.5 |
Fidelity Short-Term Bond Fund | 7.8 | 7.6 |
| 15.6 | 15.1 |
Net Other Assets (Liabilities)* | 0.0 | 0.0 |
| 100.0 | 100.0 |
* Amount represents less than 0.1%
Asset Allocation (% of fund's net assets) |
Current |
| Domestic Equity Funds | 43.0% | |
| International Equity Funds | 6.4% | |
| High Yield Fixed-Income Funds | 4.4% | |
| Investment Grade Fixed-Income Funds | 30.6% | |
| Short-Term Funds | 15.6% | |
Six months ago |
| Domestic Equity Funds | 43.2% | |
| International Equity Funds | 6.7% | |
| High Yield Fixed-Income Funds | 4.5% | |
| Investment Grade Fixed-Income Funds | 30.5% | |
| Short-Term Funds | 15.1% | |
Expected |
| Domestic Equity Funds | 42.6% | |
| International Equity Funds | 6.2% | |
| High Yield Fixed-Income Funds | 4.3% | |
| Investment Grade Fixed-Income Funds | 30.9% | |
| Short-Term Funds | 16.0% | |
The fund invests according to an asset allocation strategy that becomes increasingly conservative over time. The six months ago allocation is based on the fund's holdings as of July 31, 2010. The current allocation is based on the fund's holdings as of January 31, 2011. The expected allocation represents the fund's anticipated allocation at July 31, 2011. |
Semiannual Report
Fidelity Income Replacement 2026 Fund
Investments January 31, 2011 (Unaudited)
Showing Percentage of Net Assets
Equity Funds - 49.4% |
| Shares | | Value |
Domestic Equity Funds - 43.0% |
Fidelity Advisor Mid Cap II Fund Institutional Class | 4,024 | | $ 73,760 |
Fidelity Disciplined Equity Fund | 3,306 | | 76,762 |
Fidelity Equity-Income Fund | 1,684 | | 76,762 |
Fidelity Large Cap Core Enhanced Index Fund | 14,017 | | 122,791 |
Fidelity Series 100 Index Fund | 10,286 | | 92,057 |
Fidelity Series Broad Market Opportunities Fund | 11,945 | | 122,791 |
Fidelity Series Small Cap Opportunities Fund | 4,495 | | 49,173 |
TOTAL DOMESTIC EQUITY FUNDS | | 614,096 |
International Equity Funds - 6.4% |
Fidelity Advisor International Discovery Fund Institutional Class | 2,764 | | 91,486 |
TOTAL EQUITY FUNDS (Cost $676,787) | 705,582 |
Fixed-Income Funds - 35.0% |
| | | |
High Yield Fixed-Income Funds - 4.4% |
Fidelity Capital & Income Fund | 3,252 | | 31,449 |
Fidelity Strategic Income Fund | 2,813 | | 31,449 |
TOTAL HIGH YIELD FIXED-INCOME FUNDS | | 62,898 |
|
| Shares | | Value |
Investment Grade Fixed-Income Funds - 30.6% |
Fidelity Government Income Fund | 8,404 | | $ 87,484 |
Fidelity Strategic Real Return Fund | 9,019 | | 87,483 |
Fidelity Total Bond Fund | 24,437 | | 262,450 |
TOTAL INVESTMENT GRADE FIXED-INCOME FUNDS | | 437,417 |
TOTAL FIXED-INCOME FUNDS (Cost $488,421) | 500,315 |
Short-Term Funds - 15.6% |
| | | |
Fidelity Institutional Money Market Portfolio Institutional Class | 111,719 | | 111,719 |
Fidelity Short-Term Bond Fund | 13,182 | | 111,784 |
TOTAL SHORT-TERM FUNDS (Cost $223,012) | 223,503 |
TOTAL INVESTMENT PORTFOLIO - 100.0% (Cost $1,388,220) | | 1,429,400 |
NET OTHER ASSETS (LIABILITIES) - 0.0% | | (217) |
NET ASSETS - 100% | $ 1,429,183 |
Other Information |
All investments are categorized as Level 1 under the Fair Value Hierarchy. The inputs or methodology used for valuing securities may not be an indication of the risk associated with investing in those securities. For more information on valuation inputs, please refer to the Security Valuation section in the accompanying Notes to Financial Statements. |
Income Tax Information |
At July 31, 2010, the Fund had a capital loss carryforward of approximately $240,189 of which $4,903 and $235,286 will expire in fiscal 2017 and 2018, respectively. Capital loss carryforwards are only available to offset future capital gains of the Fund to the extent provided by regulations and may be limited. |
See accompanying notes which are an integral part of the financial statements.
Semiannual Report
Fidelity Income Replacement 2026 Fund
Statement of Assets and Liabilities
| January 31, 2011 (Unaudited) |
| | |
Assets | | |
Investment in securities, at value (cost $1,388,220) - See accompanying schedule | | $ 1,429,400 |
Receivable for investments sold | | 98,883 |
Total assets | | 1,528,283 |
| | |
Liabilities | | |
Payable for fund shares redeemed | $ 98,884 | |
Distribution and service plan fees payable | 216 | |
Total liabilities | | 99,100 |
| | |
Net Assets | | $ 1,429,183 |
Net Assets consist of: | | |
Paid in capital | | $ 1,658,234 |
Undistributed net investment income | | 299 |
Accumulated undistributed net realized gain (loss) on investments | | (270,530) |
Net unrealized appreciation (depreciation) on investments | | 41,180 |
Net Assets | | $ 1,429,183 |
Calculation of Maximum Offering Price Class A:
Net Asset Value and redemption price per share ($38,416 ÷ 784.95 shares) | | $ 48.94 |
| | |
Maximum offering price per share (100/94.25 of $48.94) | | $ 51.93 |
Class T:
Net Asset Value and redemption price per share ($127,451 ÷ 2,604.55 shares) | | $ 48.93 |
| | |
Maximum offering price per share (100/96.50 of $48.93) | | $ 50.70 |
| | |
Class C:
Net Asset Value and offering price per share ($186,532 ÷ 3,814.43 shares)A | | $ 48.90 |
| | |
Income Replacement 2026:
Net Asset Value, offering price and redemption price per share ($1,045,347 ÷ 21,361.82 shares) | | $ 48.94 |
| | |
Institutional Class:
Net Asset Value, offering price and redemption price per share ($31,437 ÷ 642.43 shares) | | $ 48.93 |
A Redemption price per share is equal to net asset value less any applicable contingent deferred sales charge.
Statement of Operations
Six months ended January 31, 2011 (Unaudited) |
| | |
Investment Income | | |
Income distributions from underlying funds | | $ 13,487 |
| | |
Expenses | | |
Distribution and service plan fees | $ 1,258 | |
Independent trustees' compensation | 2 | |
Total expenses before reductions | 1,260 | |
Expense reductions | (2) | 1,258 |
Net investment income (loss) | | 12,229 |
Realized and Unrealized Gain (Loss) Realized gain (loss) on sale of underlying fund shares | 784 | |
Capital gain distributions from underlying funds | 6,098 | |
Total net realized gain (loss) | | 6,882 |
Change in net unrealized appreciation (depreciation) on underlying funds | | 90,189 |
Net gain (loss) | | 97,071 |
Net increase (decrease) in net assets resulting from operations | | $ 109,300 |
See accompanying notes which are an integral part of the financial statements.
Semiannual Report
Fidelity Income Replacement 2026 Fund
Financial Statements - continued
Statement of Changes in Net Assets
| Six months ended January 31, 2011 (Unaudited) | Year ended
July 31,
2010 |
Increase (Decrease) in Net Assets | | |
Operations | | |
Net investment income (loss) | $ 12,229 | $ 13,583 |
Net realized gain (loss) | 6,882 | (46,103) |
Change in net unrealized appreciation (depreciation) | 90,189 | 120,286 |
Net increase (decrease) in net assets resulting from operations | 109,300 | 87,766 |
Distributions to shareholders from net investment income | (12,189) | (13,653) |
Distributions to shareholders from net realized gain | (4,626) | (1,823) |
Total distributions | (16,815) | (15,476) |
Share transactions - net increase (decrease) | 344,200 | 199,973 |
Total increase (decrease) in net assets | 436,685 | 272,263 |
| | |
Net Assets | | |
Beginning of period | 992,498 | 720,235 |
End of period (including undistributed net investment income of $299 and undistributed net investment income of $259, respectively) | $ 1,429,183 | $ 992,498 |
Financial Highlights - Class A
| Six months ended January 31, 2011 | Years ended July 31, |
| (Unaudited) | 2010 | 2009 | 2008 G |
Selected Per-Share Data | | | | |
Net asset value, beginning of period | $ 44.93 | $ 40.97 | $ 46.76 | $ 50.00 |
Income from Investment Operations | | | | |
Net investment income (loss) E | .520 | .743 | 1.042 | 1.076 |
Net realized and unrealized gain (loss) | 4.210 | 4.098 | (5.184) | (3.105) |
Total from investment operations | 4.730 | 4.841 | (4.142) | (2.029) |
Distributions from net investment income | (.520) | (.771) | (1.028) | (1.031) |
Distributions from net realized gain | (.200) | (.110) | (.620) | (.180) |
Total distributions | (.720) | (.881) | (1.648) | (1.211) |
Net asset value, end of period | $ 48.94 | $ 44.93 | $ 40.97 | $ 46.76 |
Total Return B, C, D | 10.57% | 11.87% | (8.56)% | (4.19)% |
Ratios to Average Net Assets F, H | | | | |
Expenses before reductions | .25% A | .25% | .25% | .25% A |
Expenses net of fee waivers, if any | .25% A | .25% | .25% | .25% A |
Expenses net of all reductions | .25% A | .25% | .25% | .25% A |
Net investment income (loss) | 2.21% A | 1.68% | 2.70% | 2.36% A |
Supplemental Data | | | | |
Net assets, end of period (000 omitted) | $ 38 | $ 45 | $ 69 | $ 131 |
Portfolio turnover rate | 38% A | 61% | 26% | 21% A |
A Annualized
B Total returns for periods of less than one year are not annualized.
C Total returns would have been lower had certain expenses not been reduced during the periods shown.
D Total returns do not include the effect of the sales charges.
E Calculated based on average shares outstanding during the period.
F Amounts do not include the activity of the underlying funds.
G For the period August 30, 2007 (commencement of operations) to July 31, 2008.
H Expense ratios reflect operating expenses of the class. Expenses before reductions do not reflect amounts reimbursed by the investment adviser or reductions from expense offset arrangements and do not represent the amount paid by the class during periods when reimbursements or reductions occur. Expenses net of fee waivers reflect expenses after reimbursement by the investment adviser but prior to reductions from expense offset arrangements. Expenses net of all reductions represent the net expenses paid by the class but do not include expenses of the investment companies in which the Fund invests.
See accompanying notes which are an integral part of the financial statements.
Semiannual Report
Financial Highlights - Class T
| Six months ended January 31, 2011 | Years ended July 31, |
| (Unaudited) | 2010 | 2009 | 2008 G |
Selected Per-Share Data | | | | |
Net asset value, beginning of period | $ 44.92 | $ 40.97 | $ 46.76 | $ 50.00 |
Income from Investment Operations | | | | |
Net investment income (loss) E | .461 | .638 | .944 | .966 |
Net realized and unrealized gain (loss) | 4.212 | 4.092 | (5.184) | (3.110) |
Total from investment operations | 4.673 | 4.730 | (4.240) | (2.144) |
Distributions from net investment income | (.463) | (.670) | (.930) | (.916) |
Distributions from net realized gain | (.200) | (.110) | (.620) | (.180) |
Total distributions | (.663) | (.780) | (1.550) | (1.096) |
Net asset value, end of period | $ 48.93 | $ 44.92 | $ 40.97 | $ 46.76 |
Total Return B, C, D | 10.44% | 11.59% | (8.79)% | (4.41)% |
Ratios to Average Net Assets F, H | | | | |
Expenses before reductions | .50% A | .50% | .50% | .50% A |
Expenses net of fee waivers, if any | .50% A | .50% | .50% | .50% A |
Expenses net of all reductions | .50% A | .50% | .50% | .50% A |
Net investment income (loss) | 1.96% A | 1.44% | 2.45% | 2.11% A |
Supplemental Data | | | | |
Net assets, end of period (000 omitted) | $ 127 | $ 116 | $ 55 | $ 96 |
Portfolio turnover rate | 38% A | 61% | 26% | 21% A |
A Annualized
B Total returns for periods of less than one year are not annualized.
C Total returns would have been lower had certain expenses not been reduced during the periods shown.
D Total returns do not include the effect of the sales charges.
E Calculated based on average shares outstanding during the period.
F Amounts do not include the activity of the underlying funds.
G For the period August 30, 2007 (commencement of operations) to July 31, 2008.
H Expense ratios reflect operating expenses of the class. Expenses before reductions do not reflect amounts reimbursed by the investment adviser or reductions from expense offset arrangements and do not represent the amount paid by the class during periods when reimbursements or reductions occur. Expenses net of fee waivers reflect expenses after reimbursement by the investment adviser but prior to reductions from expense offset arrangements. Expenses net of all reductions represent the net expenses paid by the class but do not include expenses of the investment companies in which the Fund invests.
Financial Highlights - Class C
| Six months ended January 31, 2011 | Years ended July 31, |
| (Unaudited) | 2010 | 2009 | 2008 G |
Selected Per-Share Data | | | | |
Net asset value, beginning of period | $ 44.89 | $ 40.95 | $ 46.72 | $ 50.00 |
Income from Investment Operations | | | | |
Net investment income (loss) E | .343 | .412 | .757 | .723 |
Net realized and unrealized gain (loss) | 4.211 | 4.087 | (5.183) | (3.090) |
Total from investment operations | 4.554 | 4.499 | (4.426) | (2.367) |
Distributions from net investment income | (.344) | (.449) | (.724) | (.733) |
Distributions from net realized gain | (.200) | (.110) | (.620) | (.180) |
Total distributions | (.544) | (.559) | (1.344) | (.913) |
Net asset value, end of period | $ 48.90 | $ 44.89 | $ 40.95 | $ 46.72 |
Total Return B, C, D | 10.17% | 11.01% | (9.25)% | (4.85)% |
Ratios to Average Net Assets F, H | | | | |
Expenses before reductions | 1.00% A | 1.00% | 1.00% | 1.00% A |
Expenses net of fee waivers, if any | 1.00% A | 1.00% | 1.00% | 1.00% A |
Expenses net of all reductions | 1.00% A | 1.00% | 1.00% | 1.00% A |
Net investment income (loss) | 1.46% A | .94% | 1.95% | 1.61% A |
Supplemental Data | | | | |
Net assets, end of period (000 omitted) | $ 187 | $ 174 | $ 183 | $ 485 |
Portfolio turnover rate | 38% A | 61% | 26% | 21% A |
A Annualized
B Total returns for periods of less than one year are not annualized.
C Total returns would have been lower had certain expenses not been reduced during the periods shown.
D Total returns do not include the effect of the contingent deferred sales charge.
E Calculated based on average shares outstanding during the period.
F Amounts do not include the activity of the underlying funds.
G For the period August 30, 2007 (commencement of operations) to July 31, 2008.
H Expense ratios reflect operating expenses of the class. Expenses before reductions do not reflect amounts reimbursed by the investment adviser or reductions from expense offset arrangements and do not represent the amount paid by the class during periods when reimbursements or reductions occur. Expenses net of fee waivers reflect expenses after reimbursement by the investment adviser but prior to reductions from expense offset arrangements. Expenses net of all reductions represent the net expenses paid by the class but do not include expenses of the investment companies in which the Fund invests.
See accompanying notes which are an integral part of the financial statements.
Semiannual Report
Financial Highlights - Income Replacement 2026
| Six months ended January 31, 2011 | Years ended July 31, |
| (Unaudited) | 2010 | 2009 | 2008 F |
Selected Per-Share Data | | | | |
Net asset value, beginning of period | $ 44.92 | $ 40.97 | $ 46.77 | $ 50.00 |
Income from Investment Operations | | | | |
Net investment income (loss) D | .579 | .856 | 1.138 | 1.168 |
Net realized and unrealized gain (loss) | 4.221 | 4.091 | (5.190) | (3.079) |
Total from investment operations | 4.800 | 4.947 | (4.052) | (1.911) |
Distributions from net investment income | (.580) | (.887) | (1.128) | (1.139) |
Distributions from net realized gain | (.200) | (.110) | (.620) | (.180) |
Total distributions | (.780) | (.997) | (1.748) | (1.319) |
Net asset value, end of period | $ 48.94 | $ 44.92 | $ 40.97 | $ 46.77 |
Total Return B, C | 10.74% | 12.14% | (8.34)% | (3.96)% |
Ratios to Average Net Assets E, G | | | | |
Expenses before reductions H | .00% A | .00% | .00% | .00% A |
Expenses net of fee waivers, if any | .00% A | .00% | .00% | .00% A |
Expenses net of all reductions | .00% A | .00% | .00% | .00% A |
Net investment income (loss) | 2.46% A | 1.94% | 2.95% | 2.61% A |
Supplemental Data | | | | |
Net assets, end of period (000 omitted) | $ 1,045 | $ 622 | $ 357 | $ 783 |
Portfolio turnover rate | 38% A | 61% | 26% | 21% A |
A Annualized
B Total returns for periods of less than one year are not annualized.
C Total returns would have been lower had certain expenses not been reduced during the periods shown.
D Calculated based on average shares outstanding during the period.
E Amounts do not include the activity of the underlying funds.
F For the period August 30, 2007 (commencement of operations) to July 31, 2008.
G Expense ratios reflect operating expenses of the class. Expenses before reductions do not reflect amounts reimbursed by the investment adviser or reductions from expense offset arrangements and do not represent the amount paid by the class during periods when reimbursements or reductions occur. Expenses net of fee waivers reflect expenses after reimbursement by the investment adviser but prior to reductions from expense offset arrangements. Expenses net of all reductions represent the net expenses paid by the class but do not include expenses of the investment companies in which the Fund invests.
H Amount represents less than $.01 per share.
Financial Highlights - Institutional Class
| Six months ended January 31, 2011 | Years ended July 31, |
| (Unaudited) | 2010 | 2009 | 2008 F |
Selected Per-Share Data | | | | |
Net asset value, beginning of period | $ 44.92 | $ 40.97 | $ 46.77 | $ 50.00 |
Income from Investment Operations | | | | |
Net investment income (loss) D | .579 | .855 | 1.136 | 1.196 |
Net realized and unrealized gain (loss) | 4.211 | 4.092 | (5.188) | (3.107) |
Total from investment operations | 4.790 | 4.947 | (4.052) | (1.911) |
Distributions from net investment income | (.580) | (.887) | (1.128) | (1.139) |
Distributions from net realized gain | (.200) | (.110) | (.620) | (.180) |
Total distributions | (.780) | (.997) | (1.748) | (1.319) |
Net asset value, end of period | $ 48.93 | $ 44.92 | $ 40.97 | $ 46.77 |
Total Return B, C | 10.71% | 12.14% | (8.34)% | (3.96)% |
Ratios to Average Net Assets E, G | | | | |
Expenses before reductions H | .00% A | .00% | .00% | .00% A |
Expenses net of fee waivers, if any | .00% A | .00% | .00% | .00% A |
Expenses net of all reductions | .00% A | .00% | .00% | .00% A |
Net investment income (loss) | 2.46% A | 1.94% | 2.95% | 2.61% A |
Supplemental Data | | | | |
Net assets, end of period (000 omitted) | $ 31 | $ 36 | $ 56 | $ 96 |
Portfolio turnover rate | 38% A | 61% | 26% | 21% A |
A Annualized
B Total returns for periods of less than one year are not annualized.
C Total returns would have been lower had certain expenses not been reduced during the periods shown.
D Calculated based on average shares outstanding during the period.
E Amounts do not include the activity of the underlying funds.
F For the period August 30, 2007 (commencement of operations) to July 31, 2008.
G Expense ratios reflect operating expenses of the class. Expenses before reductions do not reflect amounts reimbursed by the investment adviser or reductions from expense offset arrangements and do not represent the amount paid by the class during periods when reimbursements or reductions occur. Expenses net of fee waivers reflect expenses after reimbursement by the investment adviser but prior to reductions from expense offset arrangements. Expenses net of all reductions represent the net expenses paid by the class but do not include expenses of the investment companies in which the Fund invests.
H Amount represents less than $.01 per share.
See accompanying notes which are an integral part of the financial statements.
Semiannual Report
Fidelity Income Replacement 2028 Fund
Investment Changes (Unaudited)
Fund Holdings as of January 31, 2011 |
| % of fund's
net assets | % of fund's net assets
6 months ago |
Domestic Equity Funds | | |
Fidelity Advisor Mid Cap II Fund Institutional Class | 5.3 | 5.2 |
Fidelity Disciplined Equity Fund | 5.5 | 5.5 |
Fidelity Equity-Income Fund | 5.5 | 5.6 |
Fidelity Large Cap Core Enhanced Index Fund | 8.9 | 8.8 |
Fidelity Series 100 Index Fund | 6.6 | 6.7 |
Fidelity Series Broad Market Opportunities Fund | 8.9 | 8.9 |
Fidelity Series Small Cap Opportunities Fund | 3.5 | 3.6 |
| 44.2 | 44.3 |
International Equity Funds | | |
Fidelity Advisor International Discovery Fund Institutional Class | 7.2 | 7.5 |
High Yield Fixed-Income Funds | | |
Fidelity Capital & Income Fund | 2.4 | 2.5 |
Fidelity Strategic Income Fund | 2.3 | 2.4 |
| 4.7 | 4.9 |
Investment Grade Fixed-Income Funds | | |
Fidelity Government Income Fund | 5.9 | 5.9 |
Fidelity Strategic Real Return Fund | 6.0 | 6.0 |
Fidelity Total Bond Fund | 17.8 | 17.7 |
| 29.7 | 29.6 |
Short-Term Funds | | |
Fidelity Institutional Money Market Portfolio Institutional Class | 7.1 | 6.8 |
Fidelity Short-Term Bond Fund | 7.1 | 6.9 |
| 14.2 | 13.7 |
Net Other Assets (Liabilities)* | 0.0 | 0.0 |
| 100.0 | 100.0 |
* Amount represents less than 0.1%
Asset Allocation (% of fund's net assets) |
Current |
| Domestic Equity Funds | 44.2% | |
| International Equity Funds | 7.2% | |
| High Yield Fixed-Income Funds | 4.7% | |
| Investment Grade Fixed-Income Funds | 29.7% | |
| Short-Term Funds | 14.2% | |
Six months ago |
| Domestic Equity Funds | 44.3% | |
| International Equity Funds | 7.5% | |
| High Yield Fixed-Income Funds | 4.9% | |
| Investment Grade Fixed-Income Funds | 29.6% | |
| Short-Term Funds | 13.7% | |
Expected |
| Domestic Equity Funds | 43.9% | |
| International Equity Funds | 7.0% | |
| High Yield Fixed-Income Funds | 4.6% | |
| Investment Grade Fixed-Income Funds | 29.9% | |
| Short-Term Funds | 14.6% | |
The fund invests according to an asset allocation strategy that becomes increasingly conservative over time. The six months ago allocation is based on the fund's holdings as of July 31, 2010. The current allocation is based on the fund's holdings as of January 31, 2011. The expected allocation represents the fund's anticipated allocation at July 31, 2011. |
Semiannual Report
Fidelity Income Replacement 2028 Fund
Investments January 31, 2011 (Unaudited)
Showing Percentage of Net Assets
Equity Funds - 51.4% |
| Shares | | Value |
Domestic Equity Funds - 44.2% |
Fidelity Advisor Mid Cap II Fund Institutional Class | 18,753 | | $ 343,734 |
Fidelity Disciplined Equity Fund | 15,417 | | 357,975 |
Fidelity Equity-Income Fund | 7,856 | | 357,975 |
Fidelity Large Cap Core Enhanced Index Fund | 65,398 | | 572,890 |
Fidelity Series 100 Index Fund | 48,026 | | 429,830 |
Fidelity Series Broad Market Opportunities Fund | 55,729 | | 572,890 |
Fidelity Series Small Cap Opportunities Fund | 20,947 | | 229,156 |
TOTAL DOMESTIC EQUITY FUNDS | | 2,864,450 |
International Equity Funds - 7.2% |
Fidelity Advisor International Discovery Fund Institutional Class | 14,042 | | 464,786 |
TOTAL EQUITY FUNDS (Cost $3,141,194) | 3,329,236 |
Fixed-Income Funds - 34.4% |
| | | |
High Yield Fixed-Income Funds - 4.7% |
Fidelity Capital & Income Fund | 15,798 | | 152,771 |
Fidelity Strategic Income Fund | 13,665 | | 152,771 |
TOTAL HIGH YIELD FIXED-INCOME FUNDS | | 305,542 |
|
| Shares | | Value |
Investment Grade Fixed-Income Funds - 29.7% |
Fidelity Government Income Fund | 36,875 | | $ 383,869 |
Fidelity Strategic Real Return Fund | 39,574 | | 383,869 |
Fidelity Total Bond Fund | 107,105 | | 1,150,311 |
TOTAL INVESTMENT GRADE FIXED-INCOME FUNDS | | 1,918,049 |
TOTAL FIXED-INCOME FUNDS (Cost $2,132,032) | 2,223,591 |
Short-Term Funds - 14.2% |
| | | |
Fidelity Institutional Money Market Portfolio Institutional Class | 460,254 | | 460,254 |
Fidelity Short-Term Bond Fund | 54,275 | | 460,254 |
TOTAL SHORT-TERM FUNDS (Cost $914,301) | 920,508 |
TOTAL INVESTMENT PORTFOLIO - 100.0% (Cost $6,187,527) | | 6,473,335 |
NET OTHER ASSETS (LIABILITIES) - 0.0% | | (174) |
NET ASSETS - 100% | $ 6,473,161 |
Other Information |
All investments are categorized as Level 1 under the Fair Value Hierarchy. The inputs or methodology used for valuing securities may not be an indication of the risk associated with investing in those securities. For more information on valuation inputs, please refer to the Security Valuation section in the accompanying Notes to Financial Statements. |
Income Tax Information |
At July 31, 2010, the Fund had a capital loss carryforward of approximately $389,576 of which $7,815 and $381,761 will expire in fiscal 2017 and 2018, respectively. Capital loss carryforwards are only available to offset future capital gains of the Fund to the extent provided by regulations and may be limited. |
The Fund intends to elect to defer to its fiscal year ending July 31, 2011 approximately $153,499 of losses recognized during the period November 1, 2009 to July 31, 2010. |
See accompanying notes which are an integral part of the financial statements.
Semiannual Report
Fidelity Income Replacement 2028 Fund
Statement of Assets and Liabilities
| January 31, 2011 (Unaudited) |
| | |
Assets | | |
Investment in securities, at value (cost $6,187,527) - See accompanying schedule | | $ 6,473,335 |
Cash | | 1 |
Receivable for investments sold | | 31,697 |
Total assets | | 6,505,033 |
| | |
Liabilities | | |
Payable for investments purchased | $ 31,323 | |
Payable for fund shares redeemed | 370 | |
Distribution and service plan fees payable | 179 | |
Total liabilities | | 31,872 |
| | |
Net Assets | | $ 6,473,161 |
Net Assets consist of: | | |
Paid in capital | | $ 6,909,032 |
Undistributed net investment income | | 1,498 |
Accumulated undistributed net realized gain (loss) on investments | | (723,177) |
Net unrealized appreciation (depreciation) on investments | | 285,808 |
Net Assets | | $ 6,473,161 |
Calculation of Maximum Offering Price Class A:
Net Asset Value and redemption price per share ($386,401 ÷ 7,831.63 shares) | | $ 49.34 |
| | |
Maximum offering price per share (100/94.25 of $49.34) | | $ 52.35 |
Class T:
Net Asset Value and redemption price per share ($130,906 ÷ 2,651.76 shares) | | $ 49.37 |
| | |
Maximum offering price per share (100/96.50 of $49.37) | | $ 51.16 |
| | |
Class C:
Net Asset Value and offering price per share ($53,152 ÷ 1,076.78 shares) A | | $ 49.36 |
| | |
Income Replacement 2028:
Net Asset Value, offering price and redemption price per share ($5,871,315 ÷ 118,976.73 shares) | | $ 49.35 |
| | |
Institutional Class:
Net Asset Value, offering price and redemption price per share ($31,387 ÷ 636.03 shares) | | $ 49.35 |
A Redemption price per share is equal to net asset value less any applicable contingent deferred sales charge.
Statement of Operations
Six months ended January 31, 2011 (Unaudited) |
| | |
Investment Income | | |
Income distributions from underlying funds | | $ 74,688 |
| | |
Expenses | | |
Distribution and service plan fees | $ 1,092 | |
Independent trustees' compensation | 12 | |
Total expenses before reductions | 1,104 | |
Expense reductions | (12) | 1,092 |
Net investment income (loss) | | 73,596 |
Realized and Unrealized Gain (Loss) Realized gain (loss) on sale of underlying fund shares | (46,701) | |
Capital gain distributions from underlying funds | 33,605 | |
Total net realized gain (loss) | | (13,096) |
Change in net unrealized appreciation (depreciation) on underlying funds | | 575,123 |
Net gain (loss) | | 562,027 |
Net increase (decrease) in net assets resulting from operations | | $ 635,623 |
See accompanying notes which are an integral part of the financial statements.
Semiannual Report
Statement of Changes in Net Assets
| Six months ended
January 31, 2011
(Unaudited) | Year ended
July 31,
2010 |
Increase (Decrease) in Net Assets | | |
Operations | | |
Net investment income (loss) | $ 73,596 | $ 130,949 |
Net realized gain (loss) | (13,096) | (193,465) |
Change in net unrealized appreciation (depreciation) | 575,123 | 828,403 |
Net increase (decrease) in net assets resulting from operations | 635,623 | 765,887 |
Distributions to shareholders from net investment income | (73,937) | (131,065) |
Distributions to shareholders from net realized gain | (25,763) | (16,965) |
Total distributions | (99,700) | (148,030) |
Share transactions - net increase (decrease) | (218,783) | (832,893) |
Total increase (decrease) in net assets | 317,140 | (215,036) |
| | |
Net Assets | | |
Beginning of period | 6,156,021 | 6,371,057 |
End of period (including undistributed net investment income of $1,498 and undistributed net investment income of $1,839, respectively) | $ 6,473,161 | $ 6,156,021 |
Financial Highlights - Class A
| Six months ended
January 31, 2011 | Years ended July 31, |
| (Unaudited) | 2010 | 2009 | 2008 G |
Selected Per-Share Data | | | | |
Net asset value, beginning of period | $ 45.17 | $ 41.16 | $ 46.81 | $ 50.00 |
Income from Investment Operations | | | | |
Net investment income (loss) E | .521 | .789 | 1.000 | .966 |
Net realized and unrealized gain (loss) | 4.395 | 4.116 | (5.341) | (3.085) |
Total from investment operations | 4.916 | 4.905 | (4.341) | (2.119) |
Distributions from net investment income | (.537) | (.785) | (.979) | (.911) |
Distributions from net realized gain | (.209) | (.110) | (.330) | (.160) |
Total distributions | (.746) | (.895) | (1.309) | (1.071) |
Net asset value, end of period | $ 49.34 | $ 45.17 | $ 41.16 | $ 46.81 |
Total Return B, C, D | 10.93% | 11.96% | (8.93)% | (4.36)% |
Ratios to Average Net Assets F, H | | | | |
Expenses before reductions | .25% A | .25% | .25% | .25% A |
Expenses net of fee waivers, if any | .25% A | .25% | .25% | .25% A |
Expenses net of all reductions | .25% A | .25% | .25% | .25% A |
Net investment income (loss) | 2.20% A | 1.78% | 2.60% | 2.16% A |
Supplemental Data | | | | |
Net assets, end of period (000 omitted) | $ 386 | $ 359 | $ 278 | $ 371 |
Portfolio turnover rate | 32% A | 16% | 53% | 33% A |
A Annualized
B Total returns for periods of less than one year are not annualized.
C Total returns would have been lower had certain expenses not been reduced during the periods shown.
D Total returns do not include the effect of the sales charges.
E Calculated based on average shares outstanding during the period.
F Amounts do not include the activity of the underlying funds.
G For the period August 30, 2007 (commencement of operations) to July 31, 2008.
H Expense ratios reflect operating expenses of the class. Expenses before reductions do not reflect amounts reimbursed by the investment adviser or reductions from expense offset arrangements and do not represent the amount paid by the class during periods when reimbursements or reductions occur. Expenses net of fee waivers reflect expenses after reimbursement by the investment adviser but prior to reductions from expense offset arrangements. Expenses net of all reductions represent the net expenses paid by the class but do not include expenses of the investment companies in which the Fund invests.
See accompanying notes which are an integral part of the financial statements.
Semiannual Report
Financial Highlights - Class T
| Six months ended
January 31, 2011 | Years ended July 31, |
| (Unaudited) | 2010 | 2009 | 2008 G |
Selected Per-Share Data | | | | |
Net asset value, beginning of period | $ 45.16 | $ 41.16 | $ 46.80 | $ 50.00 |
Income from Investment Operations | | | | |
Net investment income (loss) E | .455 | .678 | .905 | .847 |
Net realized and unrealized gain (loss) | 4.415 | 4.107 | (5.340) | (3.079) |
Total from investment operations | 4.870 | 4.785 | (4.435) | (2.232) |
Distributions from net investment income | (.451) | (.675) | (.875) | (.808) |
Distributions from net realized gain | (.209) | (.110) | (.330) | (.160) |
Total distributions | (.660) | (.785) | (1.205) | (.968) |
Net asset value, end of period | $ 49.37 | $ 45.16 | $ 41.16 | $ 46.80 |
Total Return B, C, D | 10.81% | 11.66% | (9.15)% | (4.57)% |
Ratios to Average Net Assets F, H | | | | |
Expenses before reductions | .50% A | .50% | .50% | .50% A |
Expenses net of fee waivers, if any | .50% A | .50% | .50% | .50% A |
Expenses net of all reductions | .50% A | .50% | .50% | .50% A |
Net investment income (loss) | 1.95% A | 1.53% | 2.35% | 1.91% A |
Supplemental Data | | | | |
Net assets, end of period (000 omitted) | $ 131 | $ 328 | $ 311 | $ 606 |
Portfolio turnover rate | 32% A | 16% | 53% | 33% A |
A Annualized
B Total returns for periods of less than one year are not annualized.
C Total returns would have been lower had certain expenses not been reduced during the periods shown.
D Total returns do not include the effect of the sales charges.
E Calculated based on average shares outstanding during the period.
F Amounts do not include the activity of the underlying funds.
G For the period August 30, 2007 (commencement of operations) to July 31, 2008.
H Expense ratios reflect operating expenses of the class. Expenses before reductions do not reflect amounts reimbursed by the investment adviser or reductions from expense offset arrangements and do not represent the amount paid by the class during periods when reimbursements or reductions occur. Expenses net of fee waivers reflect expenses after reimbursement by the investment adviser but prior to reductions from expense offset arrangements. Expenses net of all reductions represent the net expenses paid by the class but do not include expenses of the investment companies in which the Fund invests.
Financial Highlights - Class C
| Six months ended
January 31, 2011 | Years ended July 31, |
| (Unaudited) | 2010 | 2009 | 2008 G |
Selected Per-Share Data | | | | |
Net asset value, beginning of period | $ 45.19 | $ 41.16 | $ 46.79 | $ 50.00 |
Income from Investment Operations | | | | |
Net investment income (loss) E | .344 | .454 | .711 | .639 |
Net realized and unrealized gain (loss) | 4.392 | 4.117 | (5.333) | (3.104) |
Total from investment operations | 4.736 | 4.571 | (4.622) | (2.465) |
Distributions from net investment income | (.357) | (.431) | (.678) | (.585) |
Distributions from net realized gain | (.209) | (.110) | (.330) | (.160) |
Total distributions | (.566) | (.541) | (1.008) | (.745) |
Net asset value, end of period | $ 49.36 | $ 45.19 | $ 41.16 | $ 46.79 |
Total Return B, C, D | 10.50% | 11.13% | (9.60)% | (5.02)% |
Ratios to Average Net Assets F, H | | | | |
Expenses before reductions | 1.00% A | 1.00% | 1.00% | 1.00% A |
Expenses net of fee waivers, if any | 1.00% A | 1.00% | 1.00% | 1.00% A |
Expenses net of all reductions | 1.00% A | 1.00% | 1.00% | 1.00% A |
Net investment income (loss) | 1.45% A | 1.02% | 1.84% | 1.41% A |
Supplemental Data | | | | |
Net assets, end of period (000 omitted) | $ 53 | $ 51 | $ 86 | $ 150 |
Portfolio turnover rate | 32% A | 16% | 53% | 33% A |
A Annualized
B Total returns for periods of less than one year are not annualized.
C Total returns would have been lower had certain expenses not been reduced during the periods shown.
D Total returns do not include the effect of the contingent deferred sales charge.
E Calculated based on average shares outstanding during the period.
F Amounts do not include the activity of the underlying funds.
G For the period August 30, 2007 (commencement of operations) to July 31, 2008.
H Expense ratios reflect operating expenses of the class. Expenses before reductions do not reflect amounts reimbursed by the investment adviser or reductions from expense offset arrangements and do not represent the amount paid by the class during periods when reimbursements or reductions occur. Expenses net of fee waivers reflect expenses after reimbursement by the investment adviser but prior to reductions from expense offset arrangements. Expenses net of all reductions represent the net expenses paid by the class but do not include expenses of the investment companies in which the Fund invests.
See accompanying notes which are an integral part of the financial statements.
Semiannual Report
Financial Highlights - Income Replacement 2028
| Six months ended
January 31, 2011 | Years ended July 31, |
| (Unaudited) | 2010 | 2009 | 2008 F |
Selected Per-Share Data | | | | |
Net asset value, beginning of period | $ 45.18 | $ 41.17 | $ 46.82 | $ 50.00 |
Income from Investment Operations | | | | |
Net investment income (loss) D | .580 | .900 | 1.087 | 1.067 |
Net realized and unrealized gain (loss) | 4.395 | 4.115 | (5.330) | (3.072) |
Total from investment operations | 4.975 | 5.015 | (4.243) | (2.005) |
Distributions from net investment income | (.596) | (.895) | (1.077) | (1.015) |
Distributions from net realized gain | (.209) | (.110) | (.330) | (.160) |
Total distributions | (.805) | (1.005) | (1.407) | (1.175) |
Net asset value, end of period | $ 49.35 | $ 45.18 | $ 41.17 | $ 46.82 |
Total Return B, C | 11.06% | 12.24% | (8.69)% | (4.14)% |
Ratios to Average Net Assets E, G | | | | |
Expenses before reductions H | .00% A | .00% | .00% | .00% A |
Expenses net of fee waivers, if any | .00% A | .00% | .00% | .00% A |
Expenses net of all reductions | .00% A | .00% | .00% | .00% A |
Net investment income (loss) | 2.45% A | 2.03% | 2.85% | 2.40% A |
Supplemental Data | | | | |
Net assets, end of period (000 omitted) | $ 5,871 | $ 5,383 | $ 5,641 | $ 6,068 |
Portfolio turnover rate | 32% A | 16% | 53% | 33% A |
A Annualized
B Total returns for periods of less than one year are not annualized.
C Total returns would have been lower had certain expenses not been reduced during the periods shown.
D Calculated based on average shares outstanding during the period.
E Amounts do not include the activity of the underlying funds.
F For the period August 30, 2007 (commencement of operations) to July 31, 2008.
G Expense ratios reflect operating expenses of the class. Expenses before reductions do not reflect amounts reimbursed by the investment adviser or reductions from expense offset arrangements and do not represent the amount paid by the class during periods when reimbursements or reductions occur. Expenses net of fee waivers reflect expenses after reimbursement by the investment adviser but prior to reductions from expense offset arrangements. Expenses net of all reductions represent the net expenses paid by the class but do not include expenses of the investment companies in which the Fund invests.
H Amount represents less than $.01 per share.
Financial Highlights - Institutional Class
| Six months ended
January 31, 2011 | Years ended July 31, |
| (Unaudited) | 2010 | 2009 | 2008 F |
Selected Per-Share Data | | | | |
Net asset value, beginning of period | $ 45.18 | $ 41.17 | $ 46.82 | $ 50.00 |
Income from Investment Operations | | | | |
Net investment income (loss) D | .580 | .899 | 1.097 | 1.101 |
Net realized and unrealized gain (loss) | 4.395 | 4.116 | (5.340) | (3.106) |
Total from investment operations | 4.975 | 5.015 | (4.243) | (2.005) |
Distributions from net investment income | (.596) | (.895) | (1.077) | (1.015) |
Distributions from net realized gain | (.209) | (.110) | (.330) | (.160) |
Total distributions | (.805) | (1.005) | (1.407) | (1.175) |
Net asset value, end of period | $ 49.35 | $ 45.18 | $ 41.17 | $ 46.82 |
Total Return B, C | 11.06% | 12.24% | (8.69)% | (4.14)% |
Ratios to Average Net Assets E, G | | | | |
Expenses before reductions H | .00% A | .00% | .00% | .00% A |
Expenses net of fee waivers, if any | .00% A | .00% | .00% | .00% A |
Expenses net of all reductions | .00% A | .00% | .00% | .00% A |
Net investment income (loss) | 2.45% A | 2.03% | 2.85% | 2.40% A |
Supplemental Data | | | | |
Net assets, end of period (000 omitted) | $ 31 | $ 36 | $ 56 | $ 96 |
Portfolio turnover rate | 32% A | 16% | 53% | 33% A |
A Annualized
B Total returns for periods of less than one year are not annualized.
C Total returns would have been lower had certain expenses not been reduced during the periods shown.
D Calculated based on average shares outstanding during the period.
E Amounts do not include the activity of the underlying funds.
F For the period August 30, 2007 (commencement of operations) to July 31, 2008.
G Expense ratios reflect operating expenses of the class. Expenses before reductions do not reflect amounts reimbursed by the investment adviser or reductions from expense offset arrangements and do not represent the amount paid by the class during periods when reimbursements or reductions occur. Expenses net of fee waivers reflect expenses after reimbursement by the investment adviser but prior to reductions from expense offset arrangements. Expenses net of all reductions represent the net expenses paid by the class but do not include expenses of the investment companies in which the Fund invests.
H Amount represents less than $.01 per share.
See accompanying notes which are an integral part of the financial statements.
Semiannual Report
Fidelity Income Replacement 2030 Fund
Investment Changes (Unaudited)
Fund Holdings as of January 31, 2011 |
| % of fund's
net assets | % of fund's net assets
6 months ago |
Domestic Equity Funds | | |
Fidelity Advisor Mid Cap II Fund Institutional Class | 5.4 | 5.4 |
Fidelity Disciplined Equity Fund | 5.7 | 5.6 |
Fidelity Equity-Income Fund | 5.7 | 5.7 |
Fidelity Large Cap Core Enhanced Index Fund | 9.0 | 9.0 |
Fidelity Series 100 Index Fund | 6.8 | 6.8 |
Fidelity Series Broad Market Opportunities Fund | 9.0 | 9.0 |
Fidelity Series Small Cap Opportunities Fund | 3.6 | 3.7 |
| 45.2 | 45.2 |
International Equity Funds | | |
Fidelity Advisor International Discovery Fund Institutional Class | 8.0 | 8.2 |
High Yield Fixed-Income Funds | | |
Fidelity Capital & Income Fund | 2.5 | 2.5 |
Fidelity Strategic Income Fund | 2.5 | 2.6 |
| 5.0 | 5.1 |
Investment Grade Fixed-Income Funds | | |
Fidelity Government Income Fund | 5.7 | 5.7 |
Fidelity Strategic Real Return Fund | 5.7 | 5.7 |
Fidelity Total Bond Fund | 17.1 | 17.1 |
| 28.5 | 28.5 |
Short-Term Funds | | |
Fidelity Institutional Money Market Portfolio Institutional Class | 6.6 | 6.5 |
Fidelity Short-Term Bond Fund | 6.7 | 6.5 |
| 13.3 | 13.0 |
Net Other Assets (Liabilities)* | 0.0 | 0.0 |
| 100.0 | 100.0 |
* Amount represents less than 0.1%
Asset Allocation (% of fund's net assets) |
Current |
| Domestic Equity Funds | 45.2% | |
| International Equity Funds | 8.0% | |
| High Yield Fixed-Income Funds | 5.0% | |
| Investment Grade Fixed-Income Funds | 28.5% | |
| Short-Term Funds | 13.3% | |
Six months ago |
| Domestic Equity Funds | 45.2% | |
| International Equity Funds | 8.2% | |
| High Yield Fixed-Income Funds | 5.1% | |
| Investment Grade Fixed-Income Funds | 28.5% | |
| Short-Term Funds | 13.0% | |
Expected |
| Domestic Equity Funds | 45.0% | |
| International Equity Funds | 7.7% | |
| High Yield Fixed-Income Funds | 4.9% | |
| Investment Grade Fixed-Income Funds | 29.0% | |
| Short-Term Funds | 13.4% | |
The fund invests according to an asset allocation strategy that becomes increasingly conservative over time. The six months ago allocation is based on the fund's holdings as of July 31, 2010. The current allocation is based on the fund's holdings as of January 31, 2011. The expected allocation represents the fund's anticipated allocation at July 31, 2011. |
Semiannual Report
Fidelity Income Replacement 2030 Fund
Investments January 31, 2011 (Unaudited)
Showing Percentage of Net Assets
Equity Funds - 53.2% |
| Shares | | Value |
Domestic Equity Funds - 45.2% |
Fidelity Advisor Mid Cap II Fund Institutional Class | 8,898 | | $ 163,100 |
Fidelity Disciplined Equity Fund | 7,322 | | 170,021 |
Fidelity Equity-Income Fund | 3,731 | | 170,021 |
Fidelity Large Cap Core Enhanced Index Fund | 31,054 | | 272,034 |
Fidelity Series 100 Index Fund | 22,796 | | 204,026 |
Fidelity Series Broad Market Opportunities Fund | 26,462 | | 272,034 |
Fidelity Series Small Cap Opportunities Fund | 9,957 | | 108,934 |
TOTAL DOMESTIC EQUITY FUNDS | | 1,360,170 |
International Equity Funds - 8.0% |
Fidelity Advisor International Discovery Fund Institutional Class | 7,228 | | 239,234 |
TOTAL EQUITY FUNDS (Cost $1,442,797) | 1,599,404 |
Fixed-Income Funds - 33.5% |
| | | |
High Yield Fixed-Income Funds - 5.0% |
Fidelity Capital & Income Fund | 7,749 | | 74,930 |
Fidelity Strategic Income Fund | 6,702 | | 74,930 |
TOTAL HIGH YIELD FIXED-INCOME FUNDS | | 149,860 |
|
| Shares | | Value |
Investment Grade Fixed-Income Funds - 28.5% |
Fidelity Government Income Fund | 16,506 | | $ 171,827 |
Fidelity Strategic Real Return Fund | 17,714 | | 171,827 |
Fidelity Total Bond Fund | 47,996 | | 515,480 |
TOTAL INVESTMENT GRADE FIXED-INCOME FUNDS | | 859,134 |
TOTAL FIXED-INCOME FUNDS (Cost $991,531) | 1,008,994 |
Short-Term Funds - 13.3% |
| | | |
Fidelity Institutional Money Market Portfolio Institutional Class | 200,415 | | 200,415 |
Fidelity Short-Term Bond Fund | 23,634 | | 200,415 |
TOTAL SHORT-TERM FUNDS (Cost $399,222) | 400,830 |
TOTAL INVESTMENT PORTFOLIO - 100.0% (Cost $2,833,550) | | 3,009,228 |
NET OTHER ASSETS (LIABILITIES) - 0.0% | | (197) |
NET ASSETS - 100% | $ 3,009,031 |
Other Information |
All investments are categorized as Level 1 under the Fair Value Hierarchy. The inputs or methodology used for valuing securities may not be an indication of the risk associated with investing in those securities. For more information on valuation inputs, please refer to the Security Valuation section in the accompanying Notes to Financial Statements. |
Income Tax Information |
At July 31, 2010, the Fund had a capital loss carryforward of approximately $125,799 of which $39,903 and $85,896 will expire in fiscal 2017 and 2018, respectively. Capital loss carryforwards are only available to offset future capital gains of the Fund to the extent provided by regulations and may be limited. |
See accompanying notes which are an integral part of the financial statements.
Semiannual Report
Fidelity Income Replacement 2030 Fund
Statement of Assets and Liabilities
| January 31, 2011 (Unaudited) |
| | |
Assets | | |
Investment in securities, at value (cost $2,833,550) - See accompanying schedule | | $ 3,009,228 |
Receivable for investments sold | | 14,732 |
Total assets | | 3,023,960 |
| | |
Liabilities | | |
Payable for investments purchased | $ 14,735 | |
Distribution and service plan fees payable | 194 | |
Total liabilities | | 14,929 |
| | |
Net Assets | | $ 3,009,031 |
Net Assets consist of: | | |
Paid in capital | | $ 3,003,339 |
Undistributed net investment income | | 699 |
Accumulated undistributed net realized gain (loss) on investments | | (170,685) |
Net unrealized appreciation (depreciation) on investments | | 175,678 |
Net Assets | | $ 3,009,031 |
Calculation of Maximum Offering Price Class A:
Net Asset Value and redemption price per share ($56,048 ÷ 1,142.0 shares) | | $ 49.08 |
| | |
Maximum offering price per share (100/94.25 of $49.08) | | $ 52.07 |
Class T:
Net Asset Value and redemption price per share ($9,526 ÷ 194.0 shares) | | $ 49.10 |
| | |
Maximum offering price per share (100/96.50 of $49.10) | | $ 50.88 |
| | |
Class C:
Net Asset Value and offering price per share ($214,004 ÷ 4,363.3 shares) A | | $ 49.05 |
| | |
Income Replacement 2030:
Net Asset Value, offering price and redemption price per share ($2,698,105 ÷ 54,986.9 shares) | | $ 49.07 |
| | |
Institutional Class:
Net Asset Value, offering price and redemption price per share ($31,348 ÷ 638.9 shares) | | $ 49.07 |
A Redemption price per share is equal to net asset value less any applicable contingent deferred sales charge.
Statement of Operations
Six months ended January 31, 2011 (Unaudited) |
| | |
Investment Income | | |
Income distributions from underlying funds | | $ 32,637 |
| | |
Expenses | | |
Distribution and service plan fees | $ 1,148 | |
Independent trustees' compensation | 4 | |
Total expenses before reductions | 1,152 | |
Expense reductions | (4) | 1,148 |
Net investment income (loss) | | 31,489 |
Realized and Unrealized Gain (Loss) Realized gain (loss) on sale of underlying fund shares | (21,542) | |
Capital gain distributions from underlying funds | 14,193 | |
Total net realized gain (loss) | | (7,349) |
Change in net unrealized appreciation (depreciation) on underlying funds | | 231,747 |
Net gain (loss) | | 224,398 |
Net increase (decrease) in net assets resulting from operations | | $ 255,887 |
See accompanying notes which are an integral part of the financial statements.
Semiannual Report
Statement of Changes in Net Assets
| Six months ended
January 31, 2011
(Unaudited) | Year ended
July 31,
2010 |
Increase (Decrease) in Net Assets | | |
Operations | | |
Net investment income (loss) | $ 31,489 | $ 14,472 |
Net realized gain (loss) | (7,349) | 212 |
Change in net unrealized appreciation (depreciation) | 231,747 | 65,683 |
Net increase (decrease) in net assets resulting from operations | 255,887 | 80,367 |
Distributions to shareholders from net investment income | (31,229) | (14,213) |
Distributions to shareholders from net realized gain | (10,723) | (1,857) |
Total distributions | (41,952) | (16,070) |
Share transactions - net increase (decrease) | 834,197 | 1,233,775 |
Total increase (decrease) in net assets | 1,048,132 | 1,298,072 |
| | |
Net Assets | | |
Beginning of period | 1,960,899 | 662,827 |
End of period (including undistributed net investment income of $699 and undistributed net investment income of $439, respectively) | $ 3,009,031 | $ 1,960,899 |
Financial Highlights - Class A
| Six months ended
January 31, 2011 | Years ended July 31, |
| (Unaudited) | 2010 | 2009 | 2008 G |
Selected Per-Share Data | | | | |
Net asset value, beginning of period | $ 44.77 | $ 40.69 | $ 46.61 | $ 50.00 |
Income from Investment Operations | | | | |
Net investment income (loss) E | .565 | .718 | .978 | 1.034 |
Net realized and unrealized gain (loss) | 4.452 | 4.180 | (5.404) | (3.239) |
Total from investment operations | 5.017 | 4.898 | (4.426) | (2.205) |
Distributions from net investment income | (.531) | (.713) | (1.004) | (.995) |
Distributions from net realized gain | (.176) | (.105) | (.490) | (.190) |
Total distributions | (.707) | (.818) | (1.494) | (1.185) |
Net asset value, end of period | $ 49.08 | $ 44.77 | $ 40.69 | $ 46.61 |
Total Return B, C, D | 11.25% | 12.08% | (9.22)% | (4.55)% |
Ratios to Average Net Assets F, H | | | | |
Expenses before reductions | .25% A | .25% | .25% | .25% A |
Expenses net of fee waivers, if any | .25% A | .25% | .25% | .25% A |
Expenses net of all reductions | .25% A | .25% | .25% | .25% A |
Net investment income (loss) | 2.41% A | 1.63% | 2.57% | 2.26% A |
Supplemental Data | | | | |
Net assets, end of period (000 omitted) | $ 56 | $ 66 | $ 55 | $ 95 |
Portfolio turnover rate | 43% A | 31% | 53% | 12% A |
A Annualized
B Total returns for periods of less than one year are not annualized.
C Total returns would have been lower had certain expenses not been reduced during the periods shown.
D Total returns do not include the effect of the sales charges.
E Calculated based on average shares outstanding during the period.
F Amounts do not include the activity of the underlying funds.
G For the period August 30, 2007 (commencement of operations) to July 31, 2008.
H Expense ratios reflect operating expenses of the class. Expenses before reductions do not reflect amounts reimbursed by the investment adviser or reductions from expense offset arrangements and do not represent the amount paid by the class during periods when reimbursements or reductions occur. Expenses net of fee waivers reflect expenses after reimbursement by the investment adviser but prior to reductions from expense offset arrangements. Expenses net of all reductions represent the net expenses paid by the class but do not include expenses of the investment companies in which the Fund invests.
See accompanying notes which are an integral part of the financial statements.
Semiannual Report
Financial Highlights - Class T
| Six months ended
January 31, 2011 | Years ended July 31, |
| (Unaudited) | 2010 | 2009 | 2008 G |
Selected Per-Share Data | | | | |
Net asset value, beginning of period | $ 44.78 | $ 40.69 | $ 46.61 | $ 50.00 |
Income from Investment Operations | | | | |
Net investment income (loss) E | .504 | .603 | .881 | .920 |
Net realized and unrealized gain (loss) | 4.449 | 4.182 | (5.402) | (3.234) |
Total from investment operations | 4.953 | 4.785 | (4.521) | (2.314) |
Distributions from net investment income | (.457) | (.590) | (.909) | (.886) |
Distributions from net realized gain | (.176) | (.105) | (.490) | (.190) |
Total distributions | (.633) | (.695) | (1.399) | (1.076) |
Net asset value, end of period | $ 49.10 | $ 44.78 | $ 40.69 | $ 46.61 |
Total Return B, C, D | 11.09% | 11.79% | (9.45)% | (4.76)% |
Ratios to Average Net Assets F, H | | | | |
Expenses before reductions | .50% A | .50% | .50% | .50% A |
Expenses net of fee waivers, if any | .50% A | .50% | .50% | .50% A |
Expenses net of all reductions | .50% A | .50% | .50% | .50% A |
Net investment income (loss) | 2.16% A | 1.37% | 2.32% | 2.01% A |
Supplemental Data | | | | |
Net assets, end of period (000 omitted) | $ 10 | $ 45 | $ 71 | $ 95 |
Portfolio turnover rate | 43% A | 31% | 53% | 12% A |
A Annualized
B Total returns for periods of less than one year are not annualized.
C Total returns would have been lower had certain expenses not been reduced during the periods shown.
D Total returns do not include the effect of the sales charges.
E Calculated based on average shares outstanding during the period.
F Amounts do not include the activity of the underlying funds.
G For the period August 30, 2007 (commencement of operations) to July 31, 2008.
H Expense ratios reflect operating expenses of the class. Expenses before reductions do not reflect amounts reimbursed by the investment adviser or reductions from expense offset arrangements and do not represent the amount paid by the class during periods when reimbursements or reductions occur. Expenses net of fee waivers reflect expenses after reimbursement by the investment adviser but prior to reductions from expense offset arrangements. Expenses net of all reductions represent the net expenses paid by the class but do not include expenses of the investment companies in which the Fund invests.
Financial Highlights - Class C
| Six months ended
January 31, 2011 | Years ended July 31, |
| (Unaudited) | 2010 | 2009 | 2008 G |
Selected Per-Share Data | | | | |
Net asset value, beginning of period | $ 44.75 | $ 40.67 | $ 46.58 | $ 50.00 |
Income from Investment Operations | | | | |
Net investment income (loss) E | .390 | .385 | .693 | .682 |
Net realized and unrealized gain (loss) | 4.446 | 4.185 | (5.400) | (3.227) |
Total from investment operations | 4.836 | 4.570 | (4.707) | (2.545) |
Distributions from net investment income | (.360) | (.385) | (.713) | (.685) |
Distributions from net realized gain | (.176) | (.105) | (.490) | (.190) |
Total distributions | (.536) | (.490) | (1.203) | (.875) |
Net asset value, end of period | $ 49.05 | $ 44.75 | $ 40.67 | $ 46.58 |
Total Return B, C, D | 10.83% | 11.26% | (9.91)% | (5.21)% |
Ratios to Average Net Assets F, H | | | | |
Expenses before reductions | 1.00% A | 1.00% | 1.00% | 1.00% A |
Expenses net of fee waivers, if any | 1.00% A | 1.00% | 1.00% | 1.00% A |
Expenses net of all reductions | 1.00% A | 1.00% | 1.00% | 1.00% A |
Net investment income (loss) | 1.66% A | .88% | 1.82% | 1.51% A |
Supplemental Data | | | | |
Net assets, end of period (000 omitted) | $ 214 | $ 186 | $ 178 | $ 297 |
Portfolio turnover rate | 43% A | 31% | 53% | 12% A |
A Annualized
B Total returns for periods of less than one year are not annualized.
C Total returns would have been lower had certain expenses not been reduced during the periods shown.
D Total returns do not include the effect of the contingent deferred sales charge.
E Calculated based on average shares outstanding during the period.
F Amounts do not include the activity of the underlying funds.
G For the period August 30, 2007 (commencement of operations) to July 31, 2008.
H Expense ratios reflect operating expenses of the class. Expenses before reductions do not reflect amounts reimbursed by the investment adviser or reductions from expense offset arrangements and do not represent the amount paid by the class during periods when reimbursements or reductions occur. Expenses net of fee waivers reflect expenses after reimbursement by the investment adviser but prior to reductions from expense offset arrangements. Expenses net of all reductions represent the net expenses paid by the class but do not include expenses of the investment companies in which the Fund invests.
See accompanying notes which are an integral part of the financial statements.
Semiannual Report
Financial Highlights - Income Replacement 2030
| Six months ended
January 31, 2011 | Years ended July 31, |
| (Unaudited) | 2010 | 2009 | 2008 F |
Selected Per-Share Data | | | | |
Net asset value, beginning of period | $ 44.76 | $ 40.69 | $ 46.61 | $ 50.00 |
Income from Investment Operations | | | | |
Net investment income (loss) D | .626 | .821 | 1.101 | 1.117 |
Net realized and unrealized gain (loss) | 4.451 | 4.178 | (5.429) | (3.209) |
Total from investment operations | 5.077 | 4.999 | (4.328) | (2.092) |
Distributions from net investment income | (.591) | (.824) | (1.102) | (1.108) |
Distributions from net realized gain | (.176) | (.105) | (.490) | (.190) |
Total distributions | (.767) | (.929) | (1.592) | (1.298) |
Net asset value, end of period | $ 49.07 | $ 44.76 | $ 40.69 | $ 46.61 |
Total Return B, C | 11.39% | 12.34% | (8.99)% | (4.33)% |
Ratios to Average Net Assets E, G | | | | |
Expenses before reductions H | .00% A | .00% | .00% | .00% A |
Expenses net of fee waivers, if any | .00% A | .00% | .00% | .00% A |
Expenses net all reductions | .00% A | .00% | .00% | .00% A |
Net investment income (loss) | 2.66% A | 1.88% | 2.82% | 2.51% A |
Supplemental Data | | | | |
Net assets, end of period (000 omitted) | $ 2,698 | $ 1,628 | $ 303 | $ 653 |
Portfolio turnover rate | 43% A | 31% | 53% | 12% A |
A Annualized
B Total returns for periods of less than one year are not annualized.
C Total returns would have been lower had certain expenses not been reduced during the periods shown.
D Calculated based on average shares outstanding during the period.
E Amounts do not include the activity of the underlying funds.
F For the period August 30, 2007 (commencement of operations) to July 31, 2008.
G Expense ratios reflect operating expenses of the class. Expenses before reductions do not reflect amounts reimbursed by the investment adviser or reductions from expense offset arrangements and do not represent the amount paid by the class during periods when reimbursements or reductions occur. Expenses net of fee waivers reflect expenses after reimbursement by the investment adviser but prior to reductions from expense offset arrangements. Expenses net of all reductions represent the net expenses paid by the class but do not include expenses of the investment companies in which the Fund invests.
H Amount represents less than $.01 per share.
Financial Highlights - Institutional Class
| Six months ended
January 31, 2011 | Years ended July 31, |
| (Unaudited) | 2010 | 2009 | 2008 F |
Selected Per-Share Data | | | | |
Net asset value, beginning of period | $ 44.77 | $ 40.69 | $ 46.61 | $ 50.00 |
Income from Investment Operations | | | | |
Net investment income (loss) D | .625 | .825 | 1.074 | 1.149 |
Net realized and unrealized gain (loss) | 4.442 | 4.184 | (5.402) | (3.241) |
Total from investment operations | 5.067 | 5.009 | (4.328) | (2.092) |
Distributions from net investment income | (.591) | (.824) | (1.102) | (1.108) |
Distributions from net realized gain | (.176) | (.105) | (.490) | (.190) |
Total distributions | (.767) | (.929) | (1.592) | (1.298) |
Net asset value, end of period | $ 49.07 | $ 44.77 | $ 40.69 | $ 46.61 |
Total Return B, C | 11.37% | 12.36% | (8.99)% | (4.33)% |
Ratios to Average Net Assets E, G | | | | |
Expenses before reductions H | .00% A | .00% | .00% | .00% A |
Expenses net of fee waivers, if any | .00% A | .00% | .00% | .00% A |
Expenses net of all reductions | .00% A | .00% | .00% | .00% A |
Net investment income (loss) | 2.66% A | 1.88% | 2.82% | 2.51% A |
Supplemental Data | | | | |
Net assets, end of period (000 omitted) | $ 31 | $ 36 | $ 55 | $ 96 |
Portfolio turnover rate | 43% A | 31% | 53% | 12% A |
A Annualized
B Total returns for periods of less than one year are not annualized.
C Total returns would have been lower had certain expenses not been reduced during the periods shown.
D Calculated based on average shares outstanding during the period.
E Amounts do not include the activity of the underlying funds.
F For the period August 30, 2007 (commencement of operations) to July 31, 2008.
G Expense ratios reflect operating expenses of the class. Expenses before reductions do not reflect amounts reimbursed by the investment adviser or reductions from expense offset arrangements and do not represent the amount paid by the class during periods when reimbursements or reductions occur. Expenses net of fee waivers reflect expenses after reimbursement by the investment adviser but prior to reductions from expense offset arrangements. Expenses net of all reductions represent the net expenses paid by the class but do not include expenses of the investment companies in which the Fund invests.
H Amount represents less than $.01 per share.
See accompanying notes which are an integral part of the financial statements.
Semiannual Report
Fidelity Income Replacement 2032 Fund
Investment Changes (Unaudited)
Fund Holdings as of January 31, 2011 |
| % of fund's
net assets | % of fund's net assets
6 months ago |
Domestic Equity Funds | | |
Fidelity Advisor Mid Cap II Fund Institutional Class | 5.5 | 5.5 |
Fidelity Disciplined Equity Fund | 5.8 | 5.7 |
Fidelity Equity-Income Fund | 5.7 | 5.8 |
Fidelity Large Cap Core Enhanced Index Fund | 9.2 | 9.2 |
Fidelity Series 100 Index Fund | 6.9 | 6.9 |
Fidelity Series Broad Market Opportunities Fund | 9.2 | 9.2 |
Fidelity Series Small Cap Opportunities Fund | 3.7 | 3.7 |
| 46.0 | 46.0 |
International Equity Funds | | |
Fidelity Advisor International Discovery Fund Institutional Class | 8.8 | 9.1 |
High Yield Fixed-Income Funds | | |
Fidelity Capital & Income Fund | 2.6 | 2.7 |
Fidelity Strategic Income Fund | 2.6 | 2.7 |
| 5.2 | 5.4 |
Investment Grade Fixed-Income Funds | | |
Fidelity Government Income Fund | 5.6 | 5.5 |
Fidelity Strategic Real Return Fund | 5.6 | 5.7 |
Fidelity Total Bond Fund | 16.7 | 16.7 |
| 27.9 | 27.9 |
Short-Term Funds | | |
Fidelity Institutional Money Market Portfolio Institutional Class | 6.1 | 5.8 |
Fidelity Short-Term Bond Fund | 6.0 | 5.8 |
| 12.1 | 11.6 |
Net Other Assets (Liabilities)* | 0.0 | 0.0 |
| 100.0 | 100.0 |
* Amount represents less than 0.1%
Asset Allocation (% of fund's net assets) |
Current |
| Domestic Equity Funds | 46.0% | |
| International Equity Funds | 8.8% | |
| High Yield Fixed-Income Funds | 5.2% | |
| Investment Grade Fixed-Income Funds | 27.9% | |
| Short-Term Funds | 12.1% | |
Six months ago |
| Domestic Equity Funds | 46.0% | |
| International Equity Funds | 9.1% | |
| High Yield Fixed-Income Funds | 5.4% | |
| Investment Grade Fixed-Income Funds | 27.9% | |
| Short-Term Funds | 11.6% | |
Expected |
| Domestic Equity Funds | 45.8% | |
| International Equity Funds | 8.5% | |
| High Yield Fixed-Income Funds | 5.2% | |
| Investment Grade Fixed-Income Funds | 28.0% | |
| Short-Term Funds | 12.5% | |
The fund invests according to an asset allocation strategy that becomes increasingly conservative over time. The six months ago allocation is based on the fund's holdings as of July 31, 2010. The current allocation is based on the fund's holdings as of January 31, 2011. The expected allocation represents the fund's anticipated allocation at July 31, 2011. |
Semiannual Report
Fidelity Income Replacement 2032 Fund
Investments January 31, 2011 (Unaudited)
Showing Percentage of Net Assets
Equity Funds - 54.8% |
| Shares | | Value |
Domestic Equity Funds - 46.0% |
Fidelity Advisor Mid Cap II Fund Institutional Class | 6,574 | | $ 120,500 |
Fidelity Disciplined Equity Fund | 5,406 | | 125,521 |
Fidelity Equity-Income Fund | 2,754 | | 125,521 |
Fidelity Large Cap Core Enhanced Index Fund | 22,926 | | 200,834 |
Fidelity Series 100 Index Fund | 16,830 | | 150,625 |
Fidelity Series Broad Market Opportunities Fund | 19,536 | | 200,834 |
Fidelity Series Small Cap Opportunities Fund | 7,343 | | 80,333 |
TOTAL DOMESTIC EQUITY FUNDS | | 1,004,168 |
International Equity Funds - 8.8% |
Fidelity Advisor International Discovery Fund Institutional Class | 5,764 | | 190,792 |
TOTAL EQUITY FUNDS (Cost $917,411) | 1,194,960 |
Fixed-Income Funds - 33.1% |
| | | |
High Yield Fixed-Income Funds - 5.2% |
Fidelity Capital & Income Fund | 5,892 | | 56,976 |
Fidelity Strategic Income Fund | 5,096 | | 56,976 |
TOTAL HIGH YIELD FIXED-INCOME FUNDS | | 113,952 |
|
| Shares | | Value |
Investment Grade Fixed-Income Funds - 27.9% |
Fidelity Government Income Fund | 11,701 | | $ 121,810 |
Fidelity Strategic Real Return Fund | 12,558 | | 121,810 |
Fidelity Total Bond Fund | 34,025 | | 365,429 |
TOTAL INVESTMENT GRADE FIXED-INCOME FUNDS | | 609,049 |
TOTAL FIXED-INCOME FUNDS (Cost $681,040) | 723,001 |
Short-Term Funds - 12.1% |
| | | |
Fidelity Institutional Money Market Portfolio Institutional Class | 132,507 | | 132,507 |
Fidelity Short-Term Bond Fund | 15,626 | | 132,507 |
TOTAL SHORT-TERM FUNDS (Cost $262,171) | 265,014 |
TOTAL INVESTMENT PORTFOLIO - 100.0% (Cost $1,860,622) | | 2,182,975 |
NET OTHER ASSETS (LIABILITIES) - 0.0% | | (80) |
NET ASSETS - 100% | $ 2,182,895 |
Other Information |
All investments are categorized as Level 1 under the Fair Value Hierarchy. The inputs or methodology used for valuing securities may not be an indication of the risk associated with investing in those securities. For more information on valuation inputs, please refer to the Security Valuation section in the accompanying Notes to Financial Statements. |
Income Tax Information |
At July 31, 2010, the Fund had a capital loss carryforward of approximately $352,265 of which $9,927 and $342,338 will expire in fiscal 2017 and 2018, respectively. Capital loss carryforwards are only available to offset future capital gains of the Fund to the extent provided by regulations and may be limited. |
See accompanying notes which are an integral part of the financial statements.
Semiannual Report
Fidelity Income Replacement 2032 Fund
Statement of Assets and Liabilities
| January 31, 2011 (Unaudited) |
| | |
Assets | | |
Investment in securities, at value (cost $1,860,622) - See accompanying schedule | | $ 2,182,975 |
Receivable for investments sold | | 11,555 |
Total assets | | 2,194,530 |
| | |
Liabilities | | |
Payable for investments purchased | $ 11,551 | |
Distribution and service plan fees payable | 84 | |
Total liabilities | | 11,635 |
| | |
Net Assets | | $ 2,182,895 |
Net Assets consist of: | | |
Paid in capital | | $ 2,202,156 |
Undistributed net investment income | | 510 |
Accumulated undistributed net realized gain (loss) on investments | | (342,124) |
Net unrealized appreciation (depreciation) on investments | | 322,353 |
Net Assets | | $ 2,182,895 |
Calculation of Maximum Offering Price Class A:
Net Asset Value and redemption price per share ($254,753 ÷ 5,248.6 shares) | | $ 48.54 |
| | |
Maximum offering price per share (100/94.25 of $48.54) | | $ 51.50 |
Class T:
Net Asset Value and redemption price per share ($30,700 ÷ 632.2 shares) | | $ 48.56 |
| | |
Maximum offering price per share (100/96.50 of $48.56) | | $ 50.32 |
| | |
Class C:
Net Asset Value and offering price per share ($25,499 ÷ 524.8 shares)A | | $ 48.59 |
| | |
Income Replacement 2032:
Net Asset Value, offering price and redemption price per share ($1,850,519 ÷ 38,118.0 shares) | | $ 48.55 |
| | |
Institutional Class:
Net Asset Value, offering price and redemption price per share ($21,424 ÷ 441.3 shares) | | $ 48.55 |
A Redemption price per share is equal to net asset value less any applicable contingent deferred sales charge.
Statement of Operations
Six months ended January 31, 2011 (Unaudited) |
| | |
Investment Income | | |
Income distributions from underlying funds | | $ 26,059 |
| | |
Expenses | | |
Distribution and service plan fees | $ 487 | |
Independent trustees' compensation | 4 | |
Total expenses before reductions | 491 | |
Expense reductions | (4) | 487 |
Net investment income (loss) | | 25,572 |
Realized and Unrealized Gain (Loss) Realized gain (loss) on sale of underlying fund shares | 13,658 | |
Capital gain distributions from underlying funds | 11,198 | |
Total net realized gain (loss) | | 24,856 |
Change in net unrealized appreciation (depreciation) on underlying funds | | 175,892 |
Net gain (loss) | | 200,748 |
Net increase (decrease) in net assets resulting from operations | | $ 226,320 |
See accompanying notes which are an integral part of the financial statements.
Semiannual Report
Fidelity Income Replacement 2032 Fund
Financial Statements - continued
Statement of Changes in Net Assets
| Six months ended January 31, 2011 (Unaudited) | Year ended
July 31,
2010 |
Increase (Decrease) in Net Assets | | |
Operations | | |
Net investment income (loss) | $ 25,572 | $ 18,688 |
Net realized gain (loss) | 24,856 | (147,241) |
Change in net unrealized appreciation (depreciation) | 175,892 | 292,353 |
Net increase (decrease) in net assets resulting from operations | 226,320 | 163,800 |
Distributions to shareholders from net investment income | (25,555) | (18,690) |
Distributions to shareholders from net realized gain | (8,488) | (2,138) |
Total distributions | (34,043) | (20,828) |
Share transactions - net increase (decrease) | 273,436 | (49,316) |
Total increase (decrease) in net assets | 465,713 | 93,656 |
| | |
Net Assets | | |
Beginning of period | 1,717,182 | 1,623,526 |
End of period (including undistributed net investment income of $510 and undistributed net investment income of $493, respectively) | $ 2,182,895 | $ 1,717,182 |
Financial Highlights - Class A
| Six months ended January 31, 2011 | Years ended July 31, |
| (Unaudited) | 2010 | 2009 | 2008 G |
Selected Per-Share Data | | | | |
Net asset value, beginning of period | $ 44.19 | $ 40.21 | $ 46.52 | $ 50.00 |
Income from Investment Operations | | | | |
Net investment income (loss) E | .539 | .727 | .930 | 1.019 |
Net realized and unrealized gain (loss) | 4.525 | 4.154 | (5.570) | (3.322) |
Total from investment operations | 5.064 | 4.881 | (4.640) | (2.303) |
Distributions from net investment income | (.524) | (.796) | (.960) | (.987) |
Distributions from net realized gain | (.190) | (.105) | (.710) | (.190) |
Total distributions | (.714) | (.901) | (1.670) | (1.177) |
Net asset value, end of period | $ 48.54 | $ 44.19 | $ 40.21 | $ 46.52 |
Total Return B,C,D | 11.50% | 12.19% | (9.66)% | (4.75)% |
Ratios to Average Net Assets F,H | | | | |
Expenses before reductions | .25% A | .25% | .25% | .25% A |
Expenses net of fee waivers, if any | .25% A | .25% | .25% | .25% A |
Expenses net of all reductions | .25% A | .25% | .25% | .25% A |
Net investment income (loss) | 2.32% A | 1.67% | 2.43% | 2.27% A |
Supplemental Data | | | | |
Net assets, end of period (000 omitted) | $ 255 | $ 200 | $ 183 | $ 402 |
Portfolio turnover rate | 25% A | 95% | 82% | 23% A |
A Annualized
B Total returns for periods of less than one year are not annualized.
C Total returns would have been lower had certain expenses not been reduced during the periods shown.
D Total returns do not include the effect of the sales charges.
E Calculated based on average shares outstanding during the period.
F Amounts do not include the activity of the underlying funds.
G For the period August 30, 2007 (commencement of operations) to July 31, 2008.
H Expense ratios reflect operating expenses of the class. Expenses before reductions do not reflect amounts reimbursed by the investment adviser or reductions from expense offset arrangements and do not represent the amount paid by the class during periods when reimbursements or reductions occur. Expenses net of fee waivers reflect expenses after reimbursement by the investment adviser but prior to reductions from expense offset arrangements. Expenses net of all reductions represent the net expenses paid by the class but do not include expenses of the investment companies in which the Fund invests.
See accompanying notes which are an integral part of the financial statements.
Semiannual Report
Financial Highlights - Class T
| Six months ended January 31, 2011 | Years ended July 31, |
| (Unaudited) | 2010 | 2009 | 2008 G |
Selected Per-Share Data | | | | |
Net asset value, beginning of period | $ 44.20 | $ 40.22 | $ 46.52 | $ 50.00 |
Income from Investment Operations | | | | |
Net investment income (loss) E | .480 | .620 | .821 | .918 |
Net realized and unrealized gain (loss) | 4.533 | 4.147 | (5.548) | (3.339) |
Total from investment operations | 5.013 | 4.767 | (4.727) | (2.421) |
Distributions from net investment income | (.463) | (.682) | (.863) | (.869) |
Distributions from net realized gain | (.190) | (.105) | (.710) | (.190) |
Total distributions | (.653) | (.787) | (1.573) | (1.059) |
Net asset value, end of period | $ 48.56 | $ 44.20 | $ 40.22 | $ 46.52 |
Total Return B,C,D | 11.38% | 11.90% | (9.88)% | (4.98)% |
Ratios to Average Net Assets F,H | | | | |
Expenses before reductions | .50% A | .50% | .50% | .50% A |
Expenses net of fee waivers, if any | .50% A | .50% | .50% | .50% A |
Expenses net of all reductions | .50% A | .50% | .50% | .50% A |
Net investment income (loss) | 2.07% A | 1.43% | 2.18% | 2.02% A |
Supplemental Data | | | | |
Net assets, end of period (000 omitted) | $ 31 | $ 35 | $ 54 | $ 95 |
Portfolio turnover rate | 25% A | 95% | 82% | 23% A |
A Annualized
B Total returns for periods of less than one year are not annualized.
C Total returns would have been lower had certain expenses not been reduced during the periods shown.
D Total returns do not include the effect of the sales charges.
E Calculated based on average shares outstanding during the period.
F Amounts do not include the activity of the underlying funds.
G For the period August 30, 2007 (commencement of operations) to July 31, 2008.
H Expense ratios reflect operating expenses of the class. Expenses before reductions do not reflect amounts reimbursed by the investment adviser or reductions from expense offset arrangements and do not represent the amount paid by the class during periods when reimbursements or reductions occur. Expenses net of fee waivers reflect expenses after reimbursement by the investment adviser but prior to reductions from expense offset arrangements. Expenses net of all reductions represent the net expenses paid by the class but do not include expenses of the investment companies in which the Fund invests.
Financial Highlights - Class C
| Six months ended January 31, 2011 | Years ended July 31, |
| (Unaudited) | 2010 | 2009 | 2008 G |
Selected Per-Share Data | | | | |
Net asset value, beginning of period | $ 44.22 | $ 40.23 | $ 46.51 | $ 50.00 |
Income from Investment Operations | | | | |
Net investment income (loss) E | .365 | .403 | .624 | .690 |
Net realized and unrealized gain (loss) | 4.537 | 4.143 | (5.532) | (3.342) |
Total from investment operations | 4.902 | 4.546 | (4.908) | (2.652) |
Distributions from net investment income | (.342) | (.451) | (.662) | (.648) |
Distributions from net realized gain | (.190) | (.105) | (.710) | (.190) |
Total distributions | (.532) | (.556) | (1.372) | (.838) |
Net asset value, end of period | $ 48.59 | $ 44.22 | $ 40.23 | $ 46.51 |
Total Return B,C,D | 11.10% | 11.33% | (10.32)% | (5.42)% |
Ratios to Average Net Assets F,H | | | | |
Expenses before reductions | 1.00% A | 1.00% | 1.00% | 1.00% A |
Expenses net of fee waivers, if any | 1.00% A | 1.00% | 1.00% | 1.00% A |
Expenses net of all reductions | 1.00% A | 1.00% | 1.00% | 1.00% A |
Net investment income (loss) | 1.57% A | .93% | 1.68% | 1.52% A |
Supplemental Data | | | | |
Net assets, end of period (000 omitted) | $ 25 | $ 29 | $ 46 | $ 95 |
Portfolio turnover rate | 25% A | 95% | 82% | 23% A |
A Annualized
B Total returns for periods of less than one year are not annualized.
C Total returns would have been lower had certain expenses not been reduced during the periods shown.
D Total returns do not include the effect of the contingent deferred sales charge.
E Calculated based on average shares outstanding during the period.
F Amounts do not include the activity of the underlying funds.
G For the period August 30, 2007 (commencement of operations) to July 31, 2008.
H Expense ratios reflect operating expenses of the class. Expenses before reductions do not reflect amounts reimbursed by the investment adviser or reductions from expense offset arrangements and do not represent the amount paid by the class during periods when reimbursements or reductions occur. Expenses net of fee waivers reflect expenses after reimbursement by the investment adviser but prior to reductions from expense offset arrangements. Expenses net of all reductions represent the net expenses paid by the class but do not include expenses of the investment companies in which the Fund invests.
See accompanying notes which are an integral part of the financial statements.
Semiannual Report
Financial Highlights - Income Replacement 2032
| Six months ended January 31, 2011 | Years ended July 31, |
| (Unaudited) | 2010 | 2009 | 2008 F |
Selected Per-Share Data | | | | |
Net asset value, beginning of period | $ 44.19 | $ 40.22 | $ 46.53 | $ 50.00 |
Income from Investment Operations | | | | |
Net investment income (loss) D | .598 | .832 | 1.014 | 1.122 |
Net realized and unrealized gain (loss) | 4.533 | 4.147 | (5.557) | (3.310) |
Total from investment operations | 5.131 | 4.979 | (4.543) | (2.188) |
Distributions from net investment income | (.581) | (.904) | (1.057) | (1.092) |
Distributions from net realized gain | (.190) | (.105) | (.710) | (.190) |
Total distributions | (.771) | (1.009) | (1.767) | (1.282) |
Net asset value, end of period | $ 48.55 | $ 44.19 | $ 40.22 | $ 46.53 |
Total Return B,C | 11.66% | 12.44% | (9.43)% | (4.53)% |
Ratios to Average Net Assets E,G | | | | |
Expenses before reductions H | .00% A | .00% | .00% | .00% A |
Expenses net of fee waivers, if any | .00% A | .00% | .00% | .00% A |
Expenses net of all reductions | .00% A | .00% | .00% | .00% A |
Net investment income (loss) | 2.57% A | 1.92% | 2.68% | 2.52% A |
Supplemental Data | | | | |
Net assets, end of period (000 omitted) | $ 1,851 | $ 1,391 | $ 1,285 | $ 731 |
Portfolio turnover rate | 25% A | 95% | 82% | 23% A |
A Annualized
B Total returns for periods of less than one year are not annualized.
C Total returns would have been lower had certain expenses not been reduced during the periods shown.
D Calculated based on average shares outstanding during the period.
E Amounts do not include the activity of the underlying funds.
F For the period August 30, 2007 (commencement of operations) to July 31, 2008.
G Expense ratios reflect operating expenses of the class. Expenses before reductions do not reflect amounts reimbursed by the investment adviser or reductions from expense offset arrangements and do not represent the amount paid by the class during periods when reimbursements or reductions occur. Expenses net of fee waivers reflect expenses after reimbursement by the investment adviser but prior to reductions from expense offset arrangements. Expenses net of all reductions represent the net expenses paid by the class but do not include expenses of the investment companies in which the Fund invests.
H Amount represents less than $.01 per share.
Financial Highlights - Institutional Class
| Six months ended January 31, 2011 | Years ended July 31, |
| (Unaudited) | 2010 | 2009 | 2008 F |
Selected Per-Share Data | | | | |
Net asset value, beginning of period | $ 44.19 | $ 40.22 | $ 46.53 | $ 50.00 |
Income from Investment Operations | | | | |
Net investment income (loss) D | .601 | .834 | 1.009 | 1.147 |
Net realized and unrealized gain (loss) | 4.530 | 4.145 | (5.552) | (3.335) |
Total from investment operations | 5.131 | 4.979 | (4.543) | (2.188) |
Distributions from net investment income | (.581) | (.904) | (1.057) | (1.092) |
Distributions from net realized gain | (.190) | (.105) | (.710) | (.190) |
Total distributions | (.771) | (1.009) | (1.767) | (1.282) |
Net asset value, end of period | $ 48.55 | $ 44.19 | $ 40.22 | $ 46.53 |
Total Return B,C | 11.66% | 12.44% | (9.43)% | (4.53)% |
Ratios to Average Net Assets E,G | | | | |
Expenses before reductions H | .00% A | .00% | .00% | .00% A |
Expenses net of fee waivers, if any | .00% A | .00% | .00% | .00% A |
Expenses net of all reductions | .00% A | .00% | .00% | .00% A |
Net investment income (loss) | 2.57% A | 1.92% | 2.68% | 2.52% A |
Supplemental Data | | | | |
Net assets, end of period (000 omitted) | $ 21 | $ 61 | $ 55 | $ 96 |
Portfolio turnover rate | 25% A | 95% | 82% | 23% A |
A Annualized
B Total returns for periods of less than one year are not annualized.
C Total returns would have been lower had certain expenses not been reduced during the periods shown.
D Calculated based on average shares outstanding during the period.
E Amounts do not include the activity of the underlying funds.
F For the period August 30, 2007 (commencement of operations) to July 31, 2008.
G Expense ratios reflect operating expenses of the class. Expenses before reductions do not reflect amounts reimbursed by the investment adviser or reductions from expense offset arrangements and do not represent the amount paid by the class during periods when reimbursements or reductions occur. Expenses net of fee waivers reflect expenses after reimbursement by the investment adviser but prior to reductions from expense offset arrangements. Expenses net of all reductions represent the net expenses paid by the class but do not include expenses of the investment companies in which the Fund invests.
H Amount represents less than $.01 per share.
See accompanying notes which are an integral part of the financial statements.
Semiannual Report
Fidelity Income Replacement 2034 Fund
Investment Changes (Unaudited)
Fund Holdings as of January 31, 2011 |
| % of fund's
net assets | % of fund's net assets
6 months ago |
Domestic Equity Funds | | |
Fidelity Advisor Mid Cap II Fund Institutional Class | 5.6 | 5.6 |
Fidelity Disciplined Equity Fund | 5.8 | 5.8 |
Fidelity Equity-Income Fund | 5.9 | 5.9 |
Fidelity Large Cap Core Enhanced Index Fund | 9.4 | 9.4 |
Fidelity Series 100 Index Fund | 7.0 | 7.0 |
Fidelity Series Broad Market Opportunities Fund | 9.4 | 9.4 |
Fidelity Series Small Cap Opportunities Fund | 3.7 | 3.8 |
| 46.8 | 46.9 |
International Equity Funds | | |
Fidelity Advisor International Discovery Fund Institutional Class | 9.6 | 9.9 |
High Yield Fixed-Income Funds | | |
Fidelity Capital & Income Fund | 2.7 | 2.8 |
Fidelity Strategic Income Fund | 2.7 | 2.8 |
| 5.4 | 5.6 |
Investment Grade Fixed-Income Funds | | |
Fidelity Government Income Fund | 5.5 | 5.4 |
Fidelity Strategic Real Return Fund | 5.5 | 5.5 |
Fidelity Total Bond Fund | 16.6 | 16.4 |
| 27.6 | 27.3 |
Short-Term Funds | | |
Fidelity Institutional Money Market Portfolio Institutional Class | 5.3 | 5.1 |
Fidelity Short-Term Bond Fund | 5.3 | 5.2 |
| 10.6 | 10.3 |
Net Other Assets (Liabilities)* | 0.0 | 0.0 |
| 100.0 | 100.0 |
* Amounts represent less than 0.1%
Asset Allocation (% of fund's net assets) |
Current |
| Domestic Equity Funds | 46.8% | |
| International Equity Funds | 9.6% | |
| High Yield Fixed-Income Funds | 5.4% | |
| Investment Grade Fixed-Income Funds | 27.6% | |
| Short-Term Funds | 10.6% | |
Six months ago |
| Domestic Equity Funds | 46.9% | |
| International Equity Funds | 9.9% | |
| High Yield Fixed-Income Funds | 5.6% | |
| Investment Grade Fixed-Income Funds | 27.3% | |
| Short-Term Funds | 10.3% | |
Expected |
| Domestic Equity Funds | 46.6% | |
| International Equity Funds | 9.4% | |
| High Yield Fixed-Income Funds | 5.4% | |
| Investment Grade Fixed-Income Funds | 27.6% | |
| Short-Term Funds | 11.0% | |
The fund invests according to an asset allocation strategy that becomes increasingly conservative over time. The six months ago allocation is based on the fund's holdings as of July 31, 2010. The current allocation is based on the fund's holdings as of January 31, 2011. The expected allocation represents the fund's anticipated allocation at July 31, 2011. |
Semiannual Report
Fidelity Income Replacement 2034 Fund
Investments January 31, 2011 (Unaudited)
Showing Percentage of Net Assets
Equity Funds - 56.4% |
| Shares | | Value |
Domestic Equity Funds - 46.8% |
Fidelity Advisor Mid Cap II Fund Institutional Class | 6,250 | | $ 114,570 |
Fidelity Disciplined Equity Fund | 5,136 | | 119,259 |
Fidelity Equity-Income Fund | 2,617 | | 119,259 |
Fidelity Large Cap Core Enhanced Index Fund | 21,782 | | 190,814 |
Fidelity Series 100 Index Fund | 15,990 | | 143,111 |
Fidelity Series Broad Market Opportunities Fund | 18,562 | | 190,814 |
Fidelity Series Small Cap Opportunities Fund | 6,988 | | 76,448 |
TOTAL DOMESTIC EQUITY FUNDS | | 954,275 |
International Equity Funds - 9.6% |
Fidelity Advisor International Discovery Fund Institutional Class | 5,888 | | 194,891 |
TOTAL EQUITY FUNDS (Cost $930,803) | 1,149,166 |
Fixed-Income Funds - 33.0% |
| | | |
High Yield Fixed-Income Funds - 5.4% |
Fidelity Capital & Income Fund | 5,755 | | 55,654 |
Fidelity Strategic Income Fund | 4,978 | | 55,654 |
TOTAL HIGH YIELD FIXED-INCOME FUNDS | | 111,308 |
|
| Shares | | Value |
Investment Grade Fixed-Income Funds - 27.6% |
Fidelity Government Income Fund | 10,790 | | $ 112,328 |
Fidelity Strategic Real Return Fund | 11,580 | | 112,328 |
Fidelity Total Bond Fund | 31,414 | | 337,389 |
TOTAL INVESTMENT GRADE FIXED-INCOME FUNDS | | 562,045 |
TOTAL FIXED-INCOME FUNDS (Cost $618,518) | 673,353 |
Short-Term Funds - 10.6% |
| | | |
Fidelity Institutional Money Market Portfolio Institutional Class | 108,046 | | 108,046 |
Fidelity Short-Term Bond Fund | 12,741 | | 108,047 |
TOTAL SHORT-TERM FUNDS (Cost $212,996) | 216,093 |
TOTAL INVESTMENT PORTFOLIO - 100.0% (Cost $1,762,317) | | 2,038,612 |
NET OTHER ASSETS (LIABILITIES) - 0.0% | | (37) |
NET ASSETS - 100% | $ 2,038,575 |
Other Information |
All investments are categorized as Level 1 under the Fair Value Hierarchy. The inputs or methodology used for valuing securities may not be an indication of the risk associated with investing in those securities. For more information on valuation inputs, please refer to the Security Valuation section in the accompanying Notes to Financial Statements. |
Income Tax Information |
At July 31, 2010, the Fund had a capital loss carryforward of approximately $62,824 all of which will expire in fiscal 2018. Capital loss carryforwards are only available to offset future capital gains of the Fund to the extent provided by regulations and may be limited. |
The Fund intends to elect to defer to its fiscal year ending July 31, 2011 approximately $32,680 of losses recognized during the period November 1, 2009 to July 31, 2010. |
See accompanying notes which are an integral part of the financial statements.
Semiannual Report
Fidelity Income Replacement 2034 Fund
Statement of Assets and Liabilities
| January 31, 2011 (Unaudited) |
| | |
Assets | | |
Investment in securities, at value (cost $1,762,317) - See accompanying schedule | | $ 2,038,612 |
Receivable for investments sold | | 11,553 |
Total assets | | 2,050,165 |
| | |
Liabilities | | |
Payable for investments purchased | $ 11,553 | |
Distribution and service plan fees payable | 37 | |
Total liabilities | | 11,590 |
| | |
Net Assets | | $ 2,038,575 |
Net Assets consist of: | | |
Paid in capital | | $ 1,911,678 |
Undistributed net investment income | | 500 |
Accumulated undistributed net realized gain (loss) on investments | | (149,898) |
Net unrealized appreciation (depreciation) on investments | | 276,295 |
Net Assets | | $ 2,038,575 |
Calculation of Maximum Offering Price Class A:
Net Asset Value and redemption price per share ($23,177 ÷ 475.2 shares) | | $ 48.77 |
| | |
Maximum offering price per share (100/94.25 of $48.77) | | $ 51.75 |
Class T:
Net Asset Value and redemption price per share ($30,536 ÷ 626.1 shares) | | $ 48.77 |
| | |
Maximum offering price per share (100/96.50 of $48.77) | | $ 50.54 |
| | |
Class C:
Net Asset Value and offering price per share ($23,179 ÷ 474.9 shares)A | | $ 48.81 |
| | |
Income Replacement 2034:
Net Asset Value, offering price and redemption price per share ($1,856,407 ÷ 38,078.1 shares) | | $ 48.75 |
| | |
Institutional Class:
Net Asset Value, offering price and redemption price per share ($105,276 ÷ 2,159.2 shares) | | $ 48.76 |
A Redemption price per share is equal to net asset value less any applicable contingent deferred sales charge.
Statement of Operations
Six months ended January 31, 2011 (Unaudited) |
| | |
Investment Income | | |
Income distributions from underlying funds | | $ 24,667 |
| | |
Expenses | | |
Distribution and service plan fees | $ 233 | |
Independent trustees' compensation | 4 | |
Total expenses before reductions | 237 | |
Expense reductions | (4) | 233 |
Net investment income (loss) | | 24,434 |
Realized and Unrealized Gain (Loss) Realized gain (loss) on sale of underlying fund shares | (15,873) | |
Capital gain distributions from underlying funds | 10,419 | |
Total net realized gain (loss) | | (5,454) |
Change in net unrealized appreciation (depreciation) on underlying funds | | 200,112 |
Net gain (loss) | | 194,658 |
Net increase (decrease) in net assets resulting from operations | | $ 219,092 |
See accompanying notes which are an integral part of the financial statements.
Semiannual Report
Statement of Changes in Net Assets
| Six months ended January 31, 2011 (Unaudited) | Year ended
July 31,
2010 |
Increase (Decrease) in Net Assets | | |
Operations | | |
Net investment income (loss) | $ 24,434 | $ 38,285 |
Net realized gain (loss) | (5,454) | (69,132) |
Change in net unrealized appreciation (depreciation) | 200,112 | 253,583 |
Net increase (decrease) in net assets resulting from operations | 219,092 | 222,736 |
Distributions to shareholders from net investment income | (24,452) | (38,318) |
Distributions to shareholders from net realized gain | (8,111) | (8,464) |
Total distributions | (32,563) | (46,782) |
Share transactions - net increase (decrease) | (2,342) | (216,059) |
Total increase (decrease) in net assets | 184,187 | (40,105) |
| | |
Net Assets | | |
Beginning of period | 1,854,388 | 1,894,493 |
End of period (including undistributed net investment income of $500 and undistributed net investment income of $518, respectively) | $ 2,038,575 | $ 1,854,388 |
Financial Highlights - Class A
| Six months ended January 31, 2011 | Years ended July 31, |
| (Unaudited) | 2010 | 2009 | 2008 G |
Selected Per-Share Data | | | | |
Net asset value, beginning of period | $ 44.27 | $ 40.29 | $ 46.40 | $ 50.00 |
Income from Investment Operations | | | | |
Net investment income (loss) E | .528 | .753 | .923 | .994 |
Net realized and unrealized gain (loss) | 4.680 | 4.174 | (5.753) | (3.438) |
Total from investment operations | 5.208 | 4.927 | (4.830) | (2.444) |
Distributions from net investment income | (.508) | (.758) | (.890) | (.956) |
Distributions from net realized gain | (.200) | (.189) | (.390) | (.200) |
Total distributions | (.708) | (.947) | (1.280) | (1.156) |
Net asset value, end of period | $ 48.77 | $ 44.27 | $ 40.29 | $ 46.40 |
Total Return B,C,D | 11.81% | 12.29% | (10.20)% | (5.04)% |
Ratios to Average Net Assets F,H | | | | |
Expenses before reductions | .25% A | .25% | .26% | .25% A |
Expenses net of fee waivers, if any | .25% A | .25% | .26% | .25% A |
Expenses net of all reductions | .25% A | .25% | .26% | .25% A |
Net investment income (loss) | 2.27% A | 1.73% | 2.46% | 2.19% A |
Supplemental Data | | | | |
Net assets, end of period (000 omitted) | $ 23 | $ 27 | $ 63 | $ 138 |
Portfolio turnover rate | 46% A | 22% | 46% | 12% A |
A Annualized
B Total returns for periods of less than one year are not annualized.
C Total returns would have been lower had certain expenses not been reduced during the periods shown.
D Total returns do not include the effect of the sales charges.
E Calculated based on average shares outstanding during the period.
F Amounts do not include the activity of the underlying funds.
G For the period August 30, 2007 (commencement of operations) to July 31, 2008.
H Expense ratios reflect operating expenses of the class. Expenses before reductions do not reflect amounts reimbursed by the investment adviser or reductions from expense offset arrangements and do not represent the amount paid by the class during periods when reimbursements or reductions occur. Expenses net of fee waivers reflect expenses after reimbursement by the investment adviser but prior to reductions from expense offset arrangements. Expenses net of all reductions represent the net expenses paid by the class but do not include expenses of the investment companies in which the Fund invests.
See accompanying notes which are an integral part of the financial statements.
Semiannual Report
Financial Highlights - Class T
| Six months ended January 31, 2011 | Years ended July 31, |
| (Unaudited) | 2010 | 2009 | 2008 G |
Selected Per-Share Data | | | | |
Net asset value, beginning of period | $ 44.27 | $ 40.29 | $ 46.40 | $ 50.00 |
Income from Investment Operations | | | | |
Net investment income (loss) E | .471 | .645 | .828 | .875 |
Net realized and unrealized gain (loss) | 4.681 | 4.175 | (5.757) | (3.431) |
Total from investment operations | 5.152 | 4.820 | (4.929) | (2.556) |
Distributions from net investment income | (.452) | (.651) | (.791) | (.844) |
Distributions from net realized gain | (.200) | (.189) | (.390) | (.200) |
Total distributions | (.652) | (.840) | (1.181) | (1.044) |
Net asset value, end of period | $ 48.77 | $ 44.27 | $ 40.29 | $ 46.40 |
Total Return B,C,D | 11.67% | 12.01% | (10.44)% | (5.25)% |
Ratios to Average Net Assets F,H | | | | |
Expenses before reductions | .50% A | .50% | .51% | .50% A |
Expenses net of fee waivers, if any | .50% A | .50% | .51% | .50% A |
Expenses net of all reductions | .50% A | .50% | .51% | .50% A |
Net investment income (loss) | 2.02% A | 1.48% | 2.21% | 1.94% A |
Supplemental Data | | | | |
Net assets, end of period (000 omitted) | $ 31 | $ 35 | $ 54 | $ 95 |
Portfolio turnover rate | 46% A | 22% | 46% | 12% A |
A Annualized
B Total returns for periods of less than one year are not annualized.
C Total returns would have been lower had certain expenses not been reduced during the periods shown.
D Total returns do not include the effect of the sales charges.
E Calculated based on average shares outstanding during the period.
F Amounts do not include the activity of the underlying funds.
G For the period August 30, 2007 (commencement of operations) to July 31, 2008.
H Expense ratios reflect operating expenses of the class. Expenses before reductions do not reflect amounts reimbursed by the investment adviser or reductions from expense offset arrangements and do not represent the amount paid by the class during periods when reimbursements or reductions occur. Expenses net of fee waivers reflect expenses after reimbursement by the investment adviser but prior to reductions from expense offset arrangements. Expenses net of all reductions represent the net expenses paid by the class but do not include expenses of the investment companies in which the Fund invests.
Financial Highlights - Class C
| Six months ended January 31, 2011 | Years ended July 31, |
| (Unaudited) | 2010 | 2009 | 2008 G |
Selected Per-Share Data | | | | |
Net asset value, beginning of period | $ 44.30 | $ 40.30 | $ 46.39 | $ 50.00 |
Income from Investment Operations | | | | |
Net investment income (loss) E | .355 | .426 | .631 | .658 |
Net realized and unrealized gain (loss) | 4.681 | 4.185 | (5.740) | (3.448) |
Total from investment operations | 5.036 | 4.611 | (5.109) | (2.790) |
Distributions from net investment income | (.326) | (.422) | (.591) | (.620) |
Distributions from net realized gain | (.200) | (.189) | (.390) | (.200) |
Total distributions | (.526) | (.611) | (.981) | (.820) |
Net asset value, end of period | $ 48.81 | $ 44.30 | $ 40.30 | $ 46.39 |
Total Return B,C,D | 11.39% | 11.47% | (10.88)% | (5.70)% |
Ratios to Average Net Assets F,H | | | | |
Expenses before reductions | 1.00% A | 1.00% | 1.01% | 1.00% A |
Expenses net of fee waivers, if any | 1.00% A | 1.00% | 1.01% | 1.00% A |
Expenses net of all reductions | 1.00% A | 1.00% | 1.01% | 1.00% A |
Net investment income (loss) | 1.52% A | .98% | 1.71% | 1.44% A |
Supplemental Data | | | | |
Net assets, end of period (000 omitted) | $ 23 | $ 27 | $ 41 | $ 94 |
Portfolio turnover rate | 46% A | 22% | 46% | 12% A |
A Annualized
B Total returns for periods of less than one year are not annualized.
C Total returns would have been lower had certain expenses not been reduced during the periods shown.
D Total returns do not include the effect of the contingent deferred sales charge.
E Calculated based on average shares outstanding during the period.
F Amounts do not include the activity of the underlying funds.
G For the period August 30, 2007 (commencement of operations) to July 31, 2008.
H Expense ratios reflect operating expenses of the class. Expenses before reductions do not reflect amounts reimbursed by the investment adviser or reductions from expense offset arrangements and do not represent the amount paid by the class during periods when reimbursements or reductions occur. Expenses net of fee waivers reflect expenses after reimbursement by the investment adviser but prior to reductions from expense offset arrangements. Expenses net of all reductions represent the net expenses paid by the class but do not include expenses of the investment companies in which the Fund invests.
See accompanying notes which are an integral part of the financial statements.
Semiannual Report
Financial Highlights - Income Replacement 2034
| Six months ended January 31, 2011 | Years ended July 31, |
| (Unaudited) | 2010 | 2009 | 2008 F |
Selected Per-Share Data | | | | |
Net asset value, beginning of period | $ 44.26 | $ 40.28 | $ 46.40 | $ 50.00 |
Income from Investment Operations | | | | |
Net investment income (loss) D | .588 | .862 | .988 | 1.090 |
Net realized and unrealized gain (loss) | 4.670 | 4.183 | (5.729) | (3.425) |
Total from investment operations | 5.258 | 5.045 | (4.741) | (2.335) |
Distributions from net investment income | (.568) | (.876) | (.989) | (1.065) |
Distributions from net realized gain | (.200) | (.189) | (.390) | (.200) |
Total distributions | (.768) | (1.065) | (1.379) | (1.265) |
Net asset value, end of period | $ 48.75 | $ 44.26 | $ 40.28 | $ 46.40 |
Total Return B,C | 11.93% | 12.59% | (9.98)% | (4.83)% |
Ratios to Average Net Assets E,G | | | | |
Expenses before reductions | .00% A,H | .00% H | .01% | .00% A,H |
Expenses net of fee waivers, if any | .00% A | .00% | .01% | .00% A |
Expenses net of all reductions | .00% A | .00% | .01% | .00% A |
Net investment income (loss) | 2.52% A | 1.98% | 2.71% | 2.44% A |
Supplemental Data | | | | |
Net assets, end of period (000 omitted) | $ 1,856 | $ 1,672 | $ 1,628 | $ 552 |
Portfolio turnover rate | 46% A | 22% | 46% | 12% A |
A Annualized
B Total returns for periods of less than one year are not annualized.
C Total returns would have been lower had certain expenses not been reduced during the periods shown.
D Calculated based on average shares outstanding during the period.
E Amounts do not include the activity of the underlying funds.
F For the period August 30, 2007 (commencement of operations) to July 31, 2008.
G Expense ratios reflect operating expenses of the class. Expenses before reductions do not reflect amounts reimbursed by the investment adviser or reductions from expense offset arrangements and do not represent the amount paid by the class during periods when reimbursements or reductions occur. Expenses net of fee waivers reflect expenses after reimbursement by the investment adviser but prior to reductions from expense offset arrangements. Expenses net of all reductions represent the net expenses paid by the class but do not include expenses of the investment companies in which the Fund invests.
H Amount represents less than $.01 per share.
Financial Highlights - Institutional Class
| Six months ended January 31, 2011 | Years ended July 31, |
| (Unaudited) | 2010 | 2009 | 2008 F |
Selected Per-Share Data | | | | |
Net asset value, beginning of period | $ 44.26 | $ 40.28 | $ 46.41 | $ 50.00 |
Income from Investment Operations | | | | |
Net investment income (loss) D | .588 | .860 | 1.002 | 1.114 |
Net realized and unrealized gain (loss) | 4.680 | 4.185 | (5.753) | (3.439) |
Total from investment operations | 5.268 | 5.045 | (4.751) | (2.325) |
Distributions from net investment income | (.568) | (.876) | (.989) | (1.065) |
Distributions from net realized gain | (.200) | (.189) | (.390) | (.200) |
Total distributions | (.768) | (1.065) | (1.379) | (1.265) |
Net asset value, end of period | $ 48.76 | $ 44.26 | $ 40.28 | $ 46.41 |
Total Return B,C | 11.96% | 12.59% | (10.00)% | (4.81)% |
Ratios to Average Net Assets E,G | | | | |
Expenses before reductions | .00% A,H | .00% H | .01% | .00% A,H |
Expenses net of fee waivers, if any | .00% A | .00% | .01% | .00% A |
Expenses net of all reductions | .00% A | .00% | .01% | .00% A |
Net investment income (loss) | 2.52% A | 1.98% | 2.71% | 2.44% A |
Supplemental Data | | | | |
Net assets, end of period (000 omitted) | $ 105 | $ 94 | $ 108 | $ 95 |
Portfolio turnover rate | 46% A | 22% | 46% | 12% A |
A Annualized
B Total returns for periods of less than one year are not annualized.
C Total returns would have been lower had certain expenses not been reduced during the periods shown.
D Calculated based on average shares outstanding during the period.
E Amounts do not include the activity of the underlying funds.
F For the period August 30, 2007 (commencement of operations) to July 31, 2008.
G Expense ratios reflect operating expenses of the class. Expenses before reductions do not reflect amounts reimbursed by the investment adviser or reductions from expense offset arrangements and do not represent the amount paid by the class during periods when reimbursements or reductions occur. Expenses net of fee waivers reflect expenses after reimbursement by the investment adviser but prior to reductions from expense offset arrangements. Expenses net of all reductions represent the net expenses paid by the class but do not include expenses of the investment companies in which the Fund invests.
H Amount represents less than $.01 per share.
See accompanying notes which are an integral part of the financial statements.
Semiannual Report
Fidelity Income Replacement 2036 Fund
Investment Changes (Unaudited)
Fund Holdings as of January 31, 2011 |
| % of fund's
net assets | % of fund's net assets
6 months ago |
Domestic Equity Funds | | |
Fidelity Advisor Mid Cap II Fund Institutional Class | 5.7 | 5.7 |
Fidelity Disciplined Equity Fund | 6.0 | 5.9 |
Fidelity Equity-Income Fund | 6.0 | 6.0 |
Fidelity Large Cap Core Enhanced Index Fund | 9.6 | 9.5 |
Fidelity Series 100 Index Fund | 7.2 | 7.2 |
Fidelity Series Broad Market Opportunities Fund | 9.5 | 9.6 |
Fidelity Series Small Cap Opportunities Fund | 3.8 | 3.9 |
| 47.8 | 47.8 |
International Equity Funds | | |
Fidelity Advisor International Discovery Fund Institutional Class | 10.4 | 10.8 |
High Yield Fixed-Income Funds | | |
Fidelity Capital & Income Fund | 2.9 | 3.0 |
Fidelity Strategic Income Fund | 2.8 | 2.9 |
| 5.7 | 5.9 |
Investment Grade Fixed-Income Funds | | |
Fidelity Government Income Fund | 5.4 | 5.3 |
Fidelity Strategic Real Return Fund | 5.3 | 5.4 |
Fidelity Total Bond Fund | 16.0 | 16.0 |
| 26.7 | 26.7 |
Short-Term Funds | | |
Fidelity Institutional Money Market Portfolio Institutional Class | 4.7 | 4.4 |
Fidelity Short-Term Bond Fund | 4.7 | 4.4 |
| 9.4 | 8.8 |
Net Other Assets (Liabilities)* | 0.0 | 0.0 |
| 100.0 | 100.0 |
* Amount represents less than 0.1%
Asset Allocation (% of fund's net assets) |
Current |
| Domestic Equity Funds | 47.8% | |
| International Equity Funds | 10.4% | |
| High Yield Fixed-Income Funds | 5.7% | |
| Investment Grade Fixed-Income Funds | 26.7% | |
| Short-Term Funds | 9.4% | |
Six months ago |
| Domestic Equity Funds | 47.8% | |
| International Equity Funds | 10.8% | |
| High Yield Fixed-Income Funds | 5.9% | |
| Investment Grade Fixed-Income Funds | 26.7% | |
| Short-Term Funds | 8.8% | |
Expected |
| Domestic Equity Funds | 47.5% | |
| International Equity Funds | 10.2% | |
| High Yield Fixed-Income Funds | 5.7% | |
| Investment Grade Fixed-Income Funds | 26.8% | |
| Short-Term Funds | 9.8% | |
The fund invests according to an asset allocation strategy that becomes increasingly conservative over time. The six months ago allocation is based on the fund's holdings as of July 31, 2010. The current allocation is based on the fund's holdings as of January 31, 2011. The expected allocation represents the fund's anticipated allocation at July 31, 2011. |
Semiannual Report
Fidelity Income Replacement 2036 Fund
Investments January 31, 2011 (Unaudited)
Showing Percentage of Net Assets
Equity Funds - 58.2% |
| Shares | | Value |
Domestic Equity Funds - 47.8% |
Fidelity Advisor Mid Cap II Fund Institutional Class | 6,094 | | $ 111,703 |
Fidelity Disciplined Equity Fund | 5,012 | | 116,382 |
Fidelity Equity-Income Fund | 2,554 | | 116,382 |
Fidelity Large Cap Core Enhanced Index Fund | 21,252 | | 186,172 |
Fidelity Series 100 Index Fund | 15,596 | | 139,580 |
Fidelity Series Broad Market Opportunities Fund | 18,110 | | 186,172 |
Fidelity Series Small Cap Opportunities Fund | 6,807 | | 74,469 |
TOTAL DOMESTIC EQUITY FUNDS | | 930,860 |
International Equity Funds - 10.4% |
Fidelity Advisor International Discovery Fund Institutional Class | 6,155 | | 203,717 |
TOTAL EQUITY FUNDS (Cost $1,125,747) | 1,134,577 |
Fixed-Income Funds - 32.4% |
| | | |
High Yield Fixed-Income Funds - 5.7% |
Fidelity Capital & Income Fund | 5,766 | | 55,754 |
Fidelity Strategic Income Fund | 4,987 | | 55,754 |
TOTAL HIGH YIELD FIXED-INCOME FUNDS | | 111,508 |
|
| Shares | | Value |
Investment Grade Fixed-Income Funds - 26.7% |
Fidelity Government Income Fund | 10,000 | | $ 104,100 |
Fidelity Strategic Real Return Fund | 10,732 | | 104,100 |
Fidelity Total Bond Fund | 29,042 | | 311,909 |
TOTAL INVESTMENT GRADE FIXED-INCOME FUNDS | | 520,109 |
TOTAL FIXED-INCOME FUNDS (Cost $618,059) | 631,617 |
Short-Term Funds - 9.4% |
| | | |
Fidelity Institutional Money Market Portfolio Institutional Class | 91,624 | | 91,624 |
Fidelity Short-Term Bond Fund | 10,805 | | 91,624 |
TOTAL SHORT-TERM FUNDS (Cost $183,048) | 183,248 |
TOTAL INVESTMENT PORTFOLIO - 100.0% (Cost $1,926,854) | | 1,949,442 |
NET OTHER ASSETS (LIABILITIES) - 0.0% | | (154) |
NET ASSETS - 100% | $ 1,949,288 |
Other Information |
All investments are categorized as Level 1 under the Fair Value Hierarchy. The inputs or methodology used for valuing securities may not be an indication of the risk associated with investing in those securities. For more information on valuation inputs, please refer to the Security Valuation section in the accompanying Notes to Financial Statements. |
Income Tax Information |
At July 31, 2010, the Fund had a capital loss carryforward of approximately $203,731 of which $19,968 and $183,763 will expire in fiscal 2017 and 2018, respectively. Capital loss carryforwards are only available to offset future capital gains of the Fund to the extent provided by regulations and may be limited. |
The Fund intends to elect to defer to its fiscal year ending July 31, 2011 approximately $17,259 of losses recognized during the period November 1, 2009 to July 31, 2010. |
See accompanying notes which are an integral part of the financial statements.
Semiannual Report
Fidelity Income Replacement 2036 Fund
Statement of Assets and Liabilities
| January 31, 2011 (Unaudited) |
| | |
Assets | | |
Investment in securities, at value (cost $1,926,854) - See accompanying schedule | | $ 1,949,442 |
Cash | | 74 |
Receivable for investments sold | | 10,222 |
Total assets | | 1,959,738 |
| | |
Liabilities | | |
Payable for investments purchased | $ 10,219 | |
Distribution and service plan fees payable | 231 | |
Total liabilities | | 10,450 |
| | |
Net Assets | | $ 1,949,288 |
Net Assets consist of: | | |
Paid in capital | | $ 2,177,484 |
Undistributed net investment income | | 395 |
Accumulated undistributed net realized gain (loss) on investments | | (251,179) |
Net unrealized appreciation (depreciation) on investments | | 22,588 |
Net Assets | | $ 1,949,288 |
Calculation of Maximum Offering Price Class A:
Net Asset Value and redemption price per share ($34,766 ÷ 719.2 shares) | | $ 48.34 |
| | |
Maximum offering price per share (100/94.25 of $48.34) | | $ 51.29 |
Class T:
Net Asset Value and redemption price per share ($288,177 ÷ 5,963.7 shares) | | $ 48.32 |
| | |
Maximum offering price per share (100/96.50 of $48.32) | | $ 50.07 |
| | |
Class C:
Net Asset Value and offering price per share ($123,671 ÷ 2,558.5 shares)A | | $ 48.34 |
| | |
Income Replacement 2036:
Net Asset Value, offering price and redemption price per share ($1,409,570 ÷ 29,162.7 shares) | | $ 48.33 |
| | |
Institutional Class:
Net Asset Value, offering price and redemption price per share ($93,104 ÷ 1,926.3 shares) | | $ 48.33 |
A Redemption price per share is equal to net asset value less any applicable contingent deferred sales charge.
Statement of Operations
Six months ended January 31, 2011 (Unaudited) |
| | |
Investment Income | | |
Income distributions from underlying funds | | $ 21,854 |
| | |
Expenses | | |
Distribution and service plan fees | $ 1,344 | |
Independent trustees' compensation | 3 | |
Total expenses before reductions | 1,347 | |
Expense reductions | (3) | 1,344 |
Net investment income (loss) | | 20,510 |
Realized and Unrealized Gain (Loss) Realized gain (loss) on sale of underlying fund shares | (11,727) | |
Capital gain distributions from underlying funds | 8,461 | |
Total net realized gain (loss) | | (3,266) |
Change in net unrealized appreciation (depreciation) on underlying funds | | 143,005 |
Net gain (loss) | | 139,739 |
Net increase (decrease) in net assets resulting from operations | | $ 160,249 |
See accompanying notes which are an integral part of the financial statements.
Semiannual Report
Statement of Changes in Net Assets
| Six months ended January 31, 2011 (Unaudited) | Year ended
July 31,
2010 |
Increase (Decrease) in Net Assets | | |
Operations | | |
Net investment income (loss) | $ 20,510 | $ 19,710 |
Net realized gain (loss) | (3,266) | (40,612) |
Change in net unrealized appreciation (depreciation) | 143,005 | 163,539 |
Net increase (decrease) in net assets resulting from operations | 160,249 | 142,637 |
Distributions to shareholders from net investment income | (20,368) | (19,743) |
Distributions to shareholders from net realized gain | (6,329) | (3,949) |
Total distributions | (26,697) | (23,692) |
Share transactions - net increase (decrease) | 690,902 | (128,803) |
Total increase (decrease) in net assets | 824,454 | (9,858) |
| | |
Net Assets | | |
Beginning of period | 1,124,834 | 1,134,692 |
End of period (including undistributed net investment income of $395 and undistributed net investment income of $253, respectively) | $ 1,949,288 | $ 1,124,834 |
Financial Highlights - Class A
| Six months ended January 31, 2011 | Years ended July 31, |
| (Unaudited) | 2010 | 2009 | 2008 G |
Selected Per-Share Data | | | | |
Net asset value, beginning of period | $ 43.73 | $ 39.70 | $ 46.40 | $ 50.00 |
Income from Investment Operations | | | | |
Net investment income (loss) E | .621 | .748 | .937 | .951 |
Net realized and unrealized gain (loss) | 4.672 | 4.178 | (6.127) | (3.464) |
Total from investment operations | 5.293 | 4.926 | (5.190) | (2.513) |
Distributions from net investment income | (.527) | (.752) | (.940) | (.897) |
Distributions from net realized gain | (.156) | (.144) | (.570) | (.190) |
Total distributions | (.683) | (.896) | (1.510) | (1.087) |
Net asset value, end of period | $ 48.34 | $ 43.73 | $ 39.70 | $ 46.40 |
Total Return B, C, D | 12.15% | 12.46% | (10.72)% | (5.17)% |
Ratios to Average Net Assets F, H | | | | |
Expenses before reductions | .25% A | .25% | .25% | .25% A |
Expenses net of fee waivers, if any | .25% A | .25% | .25% | .25% A |
Expenses net of all reductions | .25% A | .25% | .25% | .25% A |
Net investment income (loss) | 2.69% A | 1.74% | 2.52% | 2.08% A |
Supplemental Data | | | | |
Net assets, end of period (000 omitted) | $ 35 | $ 40 | $ 54 | $ 95 |
Portfolio turnover rate | 26% A | 26% | 39% | 44% A |
A Annualized
B Total returns for periods of less than one year are not annualized.
C Total returns would have been lower had certain expenses not been reduced during the periods shown.
D Total returns do not include the effect of the sales charges.
E Calculated based on average shares outstanding during the period.
F Amounts do not include the activity of the underlying funds.
G For the period August 30, 2007 (commencement of operations) to July 31, 2008.
H Expense ratios reflect operating expenses of the class. Expenses before reductions do not reflect amounts reimbursed by the investment adviser or reductions from expense offset arrangements and do not represent the amount paid by the class during periods when reimbursements or reductions occur. Expenses net of fee waivers reflect expenses after reimbursement by the investment adviser but prior to reductions from expense offset arrangements. Expenses net of all reductions represent the net expenses paid by the class but do not include expenses of the investment companies in which the Fund invests.
See accompanying notes which are an integral part of the financial statements.
Semiannual Report
Financial Highlights - Class T
| Six months ended January 31, 2011 | Years ended July 31, |
| (Unaudited) | 2010 | 2009 | 2008 G |
Selected Per-Share Data | | | | |
Net asset value, beginning of period | $ 43.72 | $ 39.69 | $ 46.39 | $ 50.00 |
Income from Investment Operations | | | | |
Net investment income (loss) E | .563 | .639 | .844 | .823 |
Net realized and unrealized gain (loss) | 4.665 | 4.183 | (6.122) | (3.449) |
Total from investment operations | 5.228 | 4.822 | (5.278) | (2.626) |
Distributions from net investment income | (.472) | (.648) | (.852) | (.794) |
Distributions from net realized gain | (.156) | (.144) | (.570) | (.190) |
Total distributions | (.628) | (.792) | (1.422) | (.984) |
Net asset value, end of period | $ 48.32 | $ 43.72 | $ 39.69 | $ 46.39 |
Total Return B, C, D | 11.99% | 12.19% | (10.93)% | (5.39)% |
Ratios to Average Net Assets F, H | | | | |
Expenses before reductions | .50% A | .50% | .50% | .50% A |
Expenses net of fee waivers, if any | .50% A | .50% | .50% | .50% A |
Expenses net of all reductions | .50% A | .50% | .50% | .50% A |
Net investment income (loss) | 2.44% A | 1.49% | 2.28% | 1.83% A |
Supplemental Data | | | | |
Net assets, end of period (000 omitted) | $ 288 | $ 265 | $ 265 | $ 384 |
Portfolio turnover rate | 26% A | 26% | 39% | 44% A |
A Annualized
B Total returns for periods of less than one year are not annualized.
C Total returns would have been lower had certain expenses not been reduced during the periods shown.
D Total returns do not include the effect of the sales charges.
E Calculated based on average shares outstanding during the period.
F Amounts do not include the activity of the underlying funds.
G For the period August 30, 2007 (commencement of operations) to July 31, 2008.
H Expense ratios reflect operating expenses of the class. Expenses before reductions do not reflect amounts reimbursed by the investment adviser or reductions from expense offset arrangements and do not represent the amount paid by the class during periods when reimbursements or reductions occur. Expenses net of fee waivers reflect expenses after reimbursement by the investment adviser but prior to reductions from expense offset arrangements. Expenses net of all reductions represent the net expenses paid by the class but do not include expenses of the investment companies in which the Fund invests.
Financial Highlights - Class C
| Six months ended January 31, 2011 | Years ended July 31, |
| (Unaudited) | 2010 | 2009 | 2008 G |
Selected Per-Share Data | | | | |
Net asset value, beginning of period | $ 43.74 | $ 39.71 | $ 46.39 | $ 50.00 |
Income from Investment Operations | | | | |
Net investment income (loss) E | .448 | .424 | .655 | .609 |
Net realized and unrealized gain (loss) | 4.673 | 4.179 | (6.114) | (3.465) |
Total from investment operations | 5.121 | 4.603 | (5.459) | (2.856) |
Distributions from net investment income | (.365) | (.429) | (.651) | (.564) |
Distributions from net realized gain | (.156) | (.144) | (.570) | (.190) |
Total distributions | (.521) | (.573) | (1.221) | (.754) |
Net asset value, end of period | $ 48.34 | $ 43.74 | $ 39.71 | $ 46.39 |
Total Return B, C, D | 11.73% | 11.61% | (11.38)% | (5.82)% |
Ratios to Average Net Assets F, H | | | | |
Expenses before reductions | 1.00% A | 1.00% | 1.00% | 1.00% A |
Expenses net of fee waivers, if any | 1.00% A | 1.00% | 1.00% | 1.00% A |
Expenses net of all reductions | 1.00% A | 1.00% | 1.00% | 1.00% A |
Net investment income (loss) | 1.94% A | .99% | 1.77% | 1.33% A |
Supplemental Data | | | | |
Net assets, end of period (000 omitted) | $ 124 | $ 119 | $ 116 | $ 94 |
Portfolio turnover rate | 26% A | 26% | 39% | 44% A |
A Annualized
B Total returns for periods of less than one year are not annualized.
C Total returns would have been lower had certain expenses not been reduced during the periods shown.
D Total returns do not include the effect of the contingent deferred sales charge.
E Calculated based on average shares outstanding during the period.
F Amounts do not include the activity of the underlying funds.
G For the period August 30, 2007 (commencement of operations) to July 31, 2008.
H Expense ratios reflect operating expenses of the class. Expenses before reductions do not reflect amounts reimbursed by the investment adviser or reductions from expense offset arrangements and do not represent the amount paid by the class during periods when reimbursements or reductions occur. Expenses net of fee waivers reflect expenses after reimbursement by the investment adviser but prior to reductions from expense offset arrangements. Expenses net of all reductions represent the net expenses paid by the class but do not include expenses of the investment companies in which the Fund invests.
See accompanying notes which are an integral part of the financial statements.
Semiannual Report
Financial Highlights - Income Replacement 2036
| Six months ended January 31, 2011 | Years ended July 31, |
| (Unaudited) | 2010 | 2009 | 2008 G |
Selected Per-Share Data | | | | |
Net asset value, beginning of period | $ 43.73 | $ 39.70 | $ 46.40 | $ 50.00 |
Income from Investment Operations | | | | |
Net investment income (loss) D | .682 | .854 | 1.034 | 1.043 |
Net realized and unrealized gain (loss) | 4.662 | 4.183 | (6.126) | (3.445) |
Total from investment operations | 5.344 | 5.037 | (5.092) | (2.402) |
Distributions from net investment income | (.588) | (.863) | (1.038) | (1.008) |
Distributions from net realized gain | (.156) | (.144) | (.570) | (.190) |
Total distributions | (.744) | (1.007) | (1.608) | (1.198) |
Net asset value, end of period | $ 48.33 | $ 43.73 | $ 39.70 | $ 46.40 |
Total Return B, C | 12.27% | 12.75% | (10.48)% | (4.96)% |
Ratios to Average Net Assets E, H | | | | |
Expenses before reductions F | .00% A | .00% | .00% | .00% A |
Expenses net of fee waivers, if any | .00% A | .00% | .00% | .00% A |
Expenses net of all reductions | .00% A | .00% | .00% | .00% A |
Net investment income (loss) | 2.94% A | 1.99% | 2.78% | 2.33% A |
Supplemental Data | | | | |
Net assets, end of period (000 omitted) | $ 1,410 | $ 598 | $ 632 | $ 986 |
Portfolio turnover rate | 26% A | 26% | 39% | 44% A |
A Annualized
B Total returns for periods of less than one year are not annualized.
C Total returns would have been lower had certain expenses not been reduced during the periods shown.
D Calculated based on average shares outstanding during the period.
E Amounts do not include the activity of the underlying funds.
F Amount represents less than .01%.
G For the period August 30, 2007 (commencement of operations) to July 31, 2008.
H Expense ratios reflect operating expenses of the class. Expenses before reductions do not reflect amounts reimbursed by the investment adviser or reductions from expense offset arrangements and do not represent the amount paid by the class during periods when reimbursements or reductions occur. Expenses net of fee waivers reflect expenses after reimbursement by the investment adviser but prior to reductions from expense offset arrangements. Expenses net of all reductions represent the net expenses paid by the class but do not include expenses of the investment companies in which the Fund invests.
Financial Highlights - Institutional Class
| Six months ended January 31, 2011 | Years ended July 31, |
| (Unaudited) | 2010 | 2009 | 2008 G |
Selected Per-Share Data | | | | |
Net asset value, beginning of period | $ 43.73 | $ 39.70 | $ 46.40 | $ 50.00 |
Income from Investment Operations | | | | |
Net investment income (loss) D | .678 | .851 | 1.031 | 1.064 |
Net realized and unrealized gain (loss) | 4.666 | 4.186 | (6.123) | (3.466) |
Total from investment operations | 5.344 | 5.037 | (5.092) | (2.402) |
Distributions from net investment income | (.588) | (.863) | (1.038) | (1.008) |
Distributions from net realized gain | (.156) | (.144) | (.570) | (.190) |
Total distributions | (.744) | (1.007) | (1.608) | (1.198) |
Net asset value, end of period | $ 48.33 | $ 43.73 | $ 39.70 | $ 46.40 |
Total Return B, C | 12.27% | 12.75% | (10.48)% | (4.96)% |
Ratios to Average Net Assets E, H | | | | |
Expenses before reductions F | .00% A | .00% | .00% | .00% A |
Expenses net of fee waivers, if any | .00% A | .00% | .00% | .00% A |
Expenses net of all reductions | .00% A | .00% | .00% | .00% A |
Net investment income (loss) | 2.94% A | 1.99% | 2.78% | 2.33% A |
Supplemental Data | | | | |
Net assets, end of period (000 omitted) | $ 93 | $ 103 | $ 67 | $ 119 |
Portfolio turnover rate | 26% A | 26% | 39% | 44% A |
A Annualized
B Total returns for periods of less than one year are not annualized.
C Total returns would have been lower had certain expenses not been reduced during the periods shown.
D Calculated based on average shares outstanding during the period.
E Amounts do not include the activity of the underlying funds.
F Amount represents less than .01%.
G For the period August 30, 2007 (commencement of operations) to July 31, 2008.
H Expense ratios reflect operating expenses of the class. Expenses before reductions do not reflect amounts reimbursed by the investment adviser or reductions from expense offset arrangements and do not represent the amount paid by the class during periods when reimbursements or reductions occur. Expenses net of fee waivers reflect expenses after reimbursement by the investment adviser but prior to reductions from expense offset arrangements. Expenses net of all reductions represent the net expenses paid by the class but do not include expenses of the investment companies in which the Fund invests.
See accompanying notes which are an integral part of the financial statements.
Semiannual Report
Fidelity Income Replacement 2038 Fund
Investment Changes (Unaudited)
Fund Holdings as of January 31, 2011 |
| % of fund's
net assets | % of fund's net assets
6 months ago |
Domestic Equity Funds | | |
Fidelity Advisor Mid Cap II Fund Institutional Class | 5.9 | 5.8 |
Fidelity Disciplined Equity Fund | 6.1 | 6.1 |
Fidelity Equity-Income Fund | 6.1 | 6.1 |
Fidelity Large Cap Core Enhanced Index Fund | 9.8 | 9.8 |
Fidelity Series 100 Index Fund | 7.3 | 7.4 |
Fidelity Series Broad Market Opportunities Fund | 9.8 | 9.8 |
Fidelity Series Small Cap Opportunities Fund | 3.9 | 4.0 |
| 48.9 | 49.0 |
International Equity Funds | | |
Fidelity Advisor International Discovery Fund Institutional Class | 11.4 | 11.9 |
High Yield Fixed-Income Funds | | |
Fidelity Capital & Income Fund | 3.1 | 3.1 |
Fidelity Strategic Income Fund | 3.0 | 3.1 |
| 6.1 | 6.2 |
Investment Grade Fixed-Income Funds | | |
Fidelity Government Income Fund | 5.2 | 5.3 |
Fidelity Strategic Real Return Fund | 5.3 | 5.4 |
Fidelity Total Bond Fund | 15.8 | 15.8 |
| 26.3 | 26.5 |
Short-Term Funds | | |
Fidelity Institutional Money Market Portfolio Institutional Class | 3.7 | 3.2 |
Fidelity Short-Term Bond Fund | 3.6 | 3.2 |
| 7.3 | 6.4 |
Net Other Assets (Liabilities)* | 0.0 | 0.0 |
| 100.0 | 100.0 |
* Amount represents less than 0.1%
Asset Allocation (% of fund's net assets) |
Current |
| Domestic Equity Funds | 48.9% | |
| International Equity Funds | 11.4% | |
| High Yield Fixed-Income Funds | 6.1% | |
| Investment Grade Fixed-Income Funds | 26.3% | |
| Short-Term Funds | 7.3% | |
Six months ago |
| Domestic Equity Funds | 49.0% | |
| International Equity Funds | 11.9% | |
| High Yield Fixed-Income Funds | 6.2% | |
| Investment Grade Fixed-Income Funds | 26.5% | |
| Short-Term Funds | 6.4% | |
Expected |
| Domestic Equity Funds | 48.6% | |
| International Equity Funds | 11.2% | |
| High Yield Fixed-Income Funds | 6.0% | |
| Investment Grade Fixed-Income Funds | 26.4% | |
| Short-Term Funds | 7.8% | |
The fund invests according to an asset allocation strategy that becomes increasingly conservative over time. The six months ago allocation is based on the fund's holdings as of July 31, 2010. The current allocation is based on the fund's holdings as of January 31, 2011. The expected allocation represents the fund's anticipated allocation at July 31, 2011. |
Semiannual Report
Fidelity Income Replacement 2038 Fund
Investments January 31, 2011 (Unaudited)
Showing Percentage of Net Assets
Equity Funds - 60.3% |
| Shares | | Value |
Domestic Equity Funds - 48.9% |
Fidelity Advisor Mid Cap II Fund Institutional Class | 5,014 | | $ 91,903 |
Fidelity Disciplined Equity Fund | 4,120 | | 95,661 |
Fidelity Equity-Income Fund | 2,099 | | 95,661 |
Fidelity Large Cap Core Enhanced Index Fund | 17,479 | | 153,120 |
Fidelity Series 100 Index Fund | 12,840 | | 114,918 |
Fidelity Series Broad Market Opportunities Fund | 14,895 | | 153,120 |
Fidelity Series Small Cap Opportunities Fund | 5,596 | | 61,217 |
TOTAL DOMESTIC EQUITY FUNDS | | 765,600 |
International Equity Funds - 11.4% |
Fidelity Advisor International Discovery Fund Institutional Class | 5,411 | | 179,109 |
TOTAL EQUITY FUNDS (Cost $754,796) | 944,709 |
Fixed-Income Funds - 32.4% |
| | | |
High Yield Fixed-Income Funds - 6.1% |
Fidelity Capital & Income Fund | 4,906 | | 47,439 |
Fidelity Strategic Income Fund | 4,243 | | 47,439 |
TOTAL HIGH YIELD FIXED-INCOME FUNDS | | 94,878 |
|
| Shares | | Value |
Investment Grade Fixed-Income Funds - 26.3% |
Fidelity Government Income Fund | 7,926 | | $ 82,509 |
Fidelity Strategic Real Return Fund | 8,506 | | 82,509 |
Fidelity Total Bond Fund | 23,033 | | 247,369 |
TOTAL INVESTMENT GRADE FIXED-INCOME FUNDS | | 412,387 |
TOTAL FIXED-INCOME FUNDS (Cost $468,560) | 507,265 |
Short-Term Funds - 7.3% |
| | | |
Fidelity Institutional Money Market Portfolio Institutional Class | 56,833 | | 56,833 |
Fidelity Short-Term Bond Fund | 6,702 | | 56,833 |
TOTAL SHORT-TERM FUNDS (Cost $112,042) | 113,666 |
TOTAL INVESTMENT PORTFOLIO - 100.0% (Cost $1,335,398) | | 1,565,640 |
NET OTHER ASSETS (LIABILITIES) - 0.0% | | (47) |
NET ASSETS - 100% | $ 1,565,593 |
Other Information |
All investments are categorized as Level 1 under the Fair Value Hierarchy. The inputs or methodology used for valuing securities may not be an indication of the risk associated with investing in those securities. For more information on valuation inputs, please refer to the Security Valuation section in the accompanying Notes to Financial Statements. |
Income Tax Information |
At July 31, 2010, the Fund had a capital loss carryforward of approximately $11,570 all of which will expire in fiscal 2018. Capital loss carryforwards are only available to offset future capital gains of the Fund to the extent provided by regulations and may be limited. |
The Fund intends to elect to defer to its fiscal year ending July 31, 2011 approximately $33,505 of losses recognized during the period November 1, 2009 to July 31, 2010. |
See accompanying notes which are an integral part of the financial statements.
Semiannual Report
Fidelity Income Replacement 2038 Fund
Statement of Assets and Liabilities
| January 31, 2011 (Unaudited) |
| | |
Assets | | |
Investment in securities, at value (cost $1,335,398) - See accompanying schedule | | $ 1,565,640 |
Cash | | 39 |
Receivable for investments sold | | 878,327 |
Total assets | | 2,444,006 |
| | |
Liabilities | | |
Payable for fund shares redeemed | $ 878,327 | |
Distribution and service plan fees payable | 86 | |
Total liabilities | | 878,413 |
| | |
Net Assets | | $ 1,565,593 |
Net Assets consist of: | | |
Paid in capital | | $ 1,431,006 |
Undistributed net investment income | | 534 |
Accumulated undistributed net realized gain (loss) on investments | | (96,189) |
Net unrealized appreciation (depreciation) on investments | | 230,242 |
Net Assets | | $ 1,565,593 |
Calculation of Maximum Offering Price Class A:
Net Asset Value and redemption price per share ($33,754 ÷ 708.4 shares) | | $ 47.65 |
| | |
Maximum offering price per share (100/94.25 of $47.65) | | $ 50.56 |
Class T:
Net Asset Value and redemption price per share ($32,640 ÷ 685.0 shares) | | $ 47.65 |
| | |
Maximum offering price per share (100/96.50 of $47.65) | | $ 49.38 |
| | |
Class C:
Net Asset Value and offering price per share ($79,281 ÷ 1,664.6 shares)A | | $ 47.63 |
| | |
Income Replacement 2038:
Net Asset Value, offering price and redemption price per share ($1,386,759 ÷ 29,105.9 shares) | | $ 47.65 |
| | |
Institutional Class:
Net Asset Value, offering price and redemption price per share ($33,159 ÷ 696.0 shares) | | $ 47.64 |
A Redemption price per share is equal to net asset value less any applicable contingent deferred sales charge.
Statement of Operations
Six months ended January 31, 2011 (Unaudited) |
| | |
Investment Income | | |
Income distributions from underlying funds | | $ 30,684 |
| | |
Expenses | | |
Distribution and service plan fees | $ 545 | |
Independent trustees' compensation | 4 | |
Total expenses before reductions | 549 | |
Expense reductions | (4) | 545 |
Net investment income (loss) | | 30,139 |
Realized and Unrealized Gain (Loss) Realized gain (loss) on sale of underlying fund shares | (25,636) | |
Capital gain distributions from underlying funds | 12,674 | |
Total net realized gain (loss) | | (12,962) |
Change in net unrealized appreciation (depreciation) on underlying funds | | 261,566 |
Net gain (loss) | | 248,604 |
Net increase (decrease) in net assets resulting from operations | | $ 278,743 |
See accompanying notes which are an integral part of the financial statements.
Semiannual Report
Fidelity Income Replacement 2038 Fund
Financial Statements - continued
Statement of Changes in Net Assets
| Six months ended January 31, 2011 (Unaudited) | Year ended
July 31,
2010 |
Increase (Decrease) in Net Assets | | |
Operations | | |
Net investment income (loss) | $ 30,139 | $ 44,672 |
Net realized gain (loss) | (12,962) | (45,293) |
Change in net unrealized appreciation (depreciation) | 261,566 | 254,403 |
Net increase (decrease) in net assets resulting from operations | 278,743 | 253,782 |
Distributions to shareholders from net investment income | (30,223) | (44,437) |
Distributions to shareholders from net realized gain | (9,861) | (9,084) |
Total distributions | (40,084) | (53,521) |
Share transactions - net increase (decrease) | (921,274) | 597,064 |
Total increase (decrease) in net assets | (682,615) | 797,325 |
| | |
Net Assets | | |
Beginning of period | 2,248,208 | 1,450,883 |
End of period (including undistributed net investment income of $534 and undistributed net investment income of $618, respectively) | $ 1,565,593 | $ 2,248,208 |
Financial Highlights - Class A
| Six months ended January 31, 2011 | Years ended July 31, |
| (Unaudited) | 2010 | 2009 | 2008 G |
Selected Per-Share Data | | | | |
Net asset value, beginning of period | $ 43.01 | $ 38.95 | $ 45.26 | $ 50.00 |
Income from Investment Operations | | | | |
Net investment income (loss) E | .538 | .744 | .856 | .442 |
Net realized and unrealized gain (loss) | 4.838 | 4.191 | (6.093) | (4.811) |
Total from investment operations | 5.376 | 4.935 | (5.237) | (4.369) |
Distributions from net investment income | (.543) | (.710) | (.873) | (.371) |
Distributions from net realized gain | (.193) | (.165) | (.200) | - |
Total distributions | (.736) | (.875) | (1.073) | (.371) |
Net asset value, end of period | $ 47.65 | $ 43.01 | $ 38.95 | $ 45.26 |
Total Return B, C, D | 12.55% | 12.72% | (11.24)% | (8.76)% |
Ratios to Average Net Assets F, H | | | | |
Expenses before reductions | .25% A | .25% | .25% | .25% A |
Expenses net of fee waivers, if any | .25% A | .25% | .25% | .25% A |
Expenses net of all reductions | .25% A | .25% | .25% | .25% A |
Net investment income (loss) | 2.37% A | 1.76% | 2.44% | 1.59% A |
Supplemental Data | | | | |
Net assets, end of period (000 omitted) | $ 34 | $ 32 | $ 115 | $ 91 |
Portfolio turnover rate | 19% A | 23% | 41% | 13% A |
A Annualized
B Total returns for periods of less than one year are not annualized.
C Total returns would have been lower had certain expenses not been reduced during the periods shown.
D Total returns do not include the effect of the sales charges.
E Calculated based on average shares outstanding during the period.
F Amounts do not include the activity of the underlying funds.
G For the period December 31, 2007 (commencement of operations) to July 31, 2008.
H Expense ratios reflect operating expenses of the class. Expenses before reductions do not reflect amounts reimbursed by the investment adviser or reductions from expense offset arrangements and do not represent the amount paid by the class during periods when reimbursements or reductions occur. Expenses net of fee waivers reflect expenses after reimbursement by the investment adviser but prior to reductions from expense offset arrangements. Expenses net of all reductions represent the net expenses paid by the class but do not include expenses of the investment companies in which the Fund invests.
See accompanying notes which are an integral part of the financial statements.
Semiannual Report
Financial Highlights - Class T
| Six months ended January 31, 2011 | Years ended July 31, |
| (Unaudited) | 2010 | 2009 | 2008 G |
Selected Per-Share Data | | | | |
Net asset value, beginning of period | $ 43.01 | $ 38.96 | $ 45.26 | $ 50.00 |
Income from Investment Operations | | | | |
Net investment income (loss) E | .481 | .636 | .791 | .373 |
Net realized and unrealized gain (loss) | 4.837 | 4.191 | (6.111) | (4.809) |
Total from investment operations | 5.318 | 4.827 | (5.320) | (4.436) |
Distributions from net investment income | (.485) | (.612) | (.780) | (.304) |
Distributions from net realized gain | (.193) | (.165) | (.200) | - |
Total distributions | (.678) | (.777) | (.980) | (.304) |
Net asset value, end of period | $ 47.65 | $ 43.01 | $ 38.96 | $ 45.26 |
Total Return B, C, D | 12.40% | 12.43% | (11.45)% | (8.89)% |
Ratios to Average Net Assets F, H | | | | |
Expenses before reductions | .50% A | .50% | .50% | .50% A |
Expenses net of fee waivers, if any | .50% A | .50% | .50% | .50% A |
Expenses net of all reductions | .50% A | .50% | .50% | .50% A |
Net investment income (loss) | 2.12% A | 1.50% | 2.20% | 1.34% A |
Supplemental Data | | | | |
Net assets, end of period (000 omitted) | $ 33 | $ 37 | $ 57 | $ 91 |
Portfolio turnover rate | 19% A | 23% | 41% | 13% A |
A Annualized
B Total returns for periods of less than one year are not annualized.
C Total returns would have been lower had certain expenses not been reduced during the periods shown.
D Total returns do not include the effect of the sales charges.
E Calculated based on average shares outstanding during the period.
F Amounts do not include the activity of the underlying funds.
G For the period December 31, 2007 (commencement of operations) to July 31, 2008.
H Expense ratios reflect operating expenses of the class. Expenses before reductions do not reflect amounts reimbursed by the investment adviser or reductions from expense offset arrangements and do not represent the amount paid by the class during periods when reimbursements or reductions occur. Expenses net of fee waivers reflect expenses after reimbursement by the investment adviser but prior to reductions from expense offset arrangements. Expenses net of all reductions represent the net expenses paid by the class but do not include expenses of the investment companies in which the Fund invests.
Financial Highlights - Class C
| Six months ended January 31, 2011 | Years ended July 31, |
| (Unaudited) | 2010 | 2009 | 2008 G |
Selected Per-Share Data | | | | |
Net asset value, beginning of period | $ 42.98 | $ 38.95 | $ 45.24 | $ 50.00 |
Income from Investment Operations | | | | |
Net investment income (loss) E | .368 | .424 | .611 | .233 |
Net realized and unrealized gain (loss) | 4.840 | 4.192 | (6.107) | (4.812) |
Total from investment operations | 5.208 | 4.616 | (5.496) | (4.579) |
Distributions from net investment income | (.365) | (.421) | (.594) | (.181) |
Distributions from net realized gain | (.193) | (.165) | (.200) | - |
Total distributions | (.558) | (.586) | (.794) | (.181) |
Net asset value, end of period | $ 47.63 | $ 42.98 | $ 38.95 | $ 45.24 |
Total Return B, C, D | 12.14% | 11.87% | (11.89)% | (9.17)% |
Ratios to Average Net Assets F, H | | | | |
Expenses before reductions | 1.00% A | 1.00% | 1.00% | 1.00% A |
Expenses net of fee waivers, if any | 1.00% A | 1.00% | 1.00% | 1.00% A |
Expenses net of all reductions | 1.00% A | 1.00% | 1.00% | 1.00% A |
Net investment income (loss) | 1.62% A | 1.01% | 1.70% | .84% A |
Supplemental Data | | | | |
Net assets, end of period (000 omitted) | $ 79 | $ 91 | $ 57 | $ 91 |
Portfolio turnover rate | 19% A | 23% | 41% | 13% A |
A Annualized
B Total returns for periods of less than one year are not annualized.
C Total returns would have been lower had certain expenses not been reduced during the periods shown.
D Total returns do not include the effect of the contingent deferred sales charge.
E Calculated based on average shares outstanding during the period.
F Amounts do not include the activity of the underlying funds.
G For the period December 31, 2007 (commencement of operations) to July 31, 2008.
H Expense ratios reflect operating expenses of the class. Expenses before reductions do not reflect amounts reimbursed by the investment adviser or reductions from expense offset arrangements and do not represent the amount paid by the class during periods when reimbursements or reductions occur. Expenses net of fee waivers reflect expenses after reimbursement by the investment adviser but prior to reductions from expense offset arrangements. Expenses net of all reductions represent the net expenses paid by the class but do not include expenses of the investment companies in which the Fund invests.
See accompanying notes which are an integral part of the financial statements.
Semiannual Report
Financial Highlights - Income Replacement 2038
| Six months ended January 31, 2011 | Years ended July 31, |
| (Unaudited) | 2010 | 2009 | 2008 G |
Selected Per-Share Data | | | | |
Net asset value, beginning of period | $ 43.00 | $ 38.96 | $ 45.27 | $ 50.00 |
Income from Investment Operations | | | | |
Net investment income (loss) D | .597 | .849 | .965 | .502 |
Net realized and unrealized gain (loss) | 4.846 | 4.187 | (6.112) | (4.795) |
Total from investment operations | 5.443 | 5.036 | (5.147) | (4.293) |
Distributions from net investment income | (.600) | (.831) | (.963) | (.437) |
Distributions from net realized gain | (.193) | (.165) | (.200) | - |
Total distributions | (.793) | (.996) | (1.163) | (.437) |
Net asset value, end of period | $ 47.65 | $ 43.00 | $ 38.96 | $ 45.27 |
Total Return B, C | 12.71% | 12.99% | (11.02)% | (8.61)% |
Ratios to Average Net Assets E, H | | | | |
Expenses before reductions F | .00% A | .00% | .00% | .00% A |
Expenses net of fee waivers, if any | .00% A | .00% | .00% | .00% A |
Expenses net of all reductions | .00% A | .00% | .00% | .00% A |
Net investment income (loss) | 2.62% A | 2.01% | 2.69% | 1.84% A |
Supplemental Data | | | | |
Net assets, end of period (000 omitted) | $ 1,387 | $ 2,051 | $ 1,165 | $ 1,122 |
Portfolio turnover rate | 19% A | 23% | 41% | 13% A |
A Annualized
B Total returns for periods of less than one year are not annualized.
C Total returns would have been lower had certain expenses not been reduced during the periods shown.
D Calculated based on average shares outstanding during the period.
E Amounts do not include the activity of the underlying funds.
F Amount represents less than .01%.
G For the period December 31, 2007 (commencement of operations) to July 31, 2008.
H Expense ratios reflect operating expenses of the class. Expenses before reductions do not reflect amounts reimbursed by the investment adviser or reductions from expense offset arrangements and do not represent the amount paid by the class during periods when reimbursements or reductions occur. Expenses net of fee waivers reflect expenses after reimbursement by the investment adviser but prior to reductions from expense offset arrangements. Expenses net of all reductions represent the net expenses paid by the class but do not include expenses of the investment companies in which the Fund invests.
Financial Highlights - Institutional Class
| Six months ended January 31, 2011 | Years ended July 31, |
| (Unaudited) | 2010 | 2009 | 2008 G |
Selected Per-Share Data | | | | |
Net asset value, beginning of period | $ 43.00 | $ 38.96 | $ 45.26 | $ 50.00 |
Income from Investment Operations | | | | |
Net investment income (loss) D | .594 | .848 | .974 | .511 |
Net realized and unrealized gain (loss) | 4.839 | 4.188 | (6.111) | (4.814) |
Total from investment operations | 5.433 | 5.036 | (5.137) | (4.303) |
Distributions from net investment income | (.600) | (.831) | (.963) | (.437) |
Distributions from net realized gain | (.193) | (.165) | (.200) | - |
Total distributions | (.793) | (.996) | (1.163) | (.437) |
Net asset value, end of period | $ 47.64 | $ 43.00 | $ 38.96 | $ 45.26 |
Total Return B, C | 12.69% | 12.99% | (11.00)% | (8.63)% |
Ratios to Average Net Assets E, H | | | | |
Expenses before reductions F | .00% A | .00% | .00% | .00% A |
Expenses net of fee waivers, if any | .00% A | .00% | .00% | .00% A |
Expenses net of all reductions | .00% A | .00% | .00% | .00% A |
Net investment income (loss) | 2.62% A | 2.01% | 2.69% | 1.84% A |
Supplemental Data | | | | |
Net assets, end of period (000 omitted) | $ 33 | $ 38 | $ 58 | $ 91 |
Portfolio turnover rate | 19% A | 23% | 41% | 13% A |
A Annualized
B Total returns for periods of less than one year are not annualized.
C Total returns would have been lower had certain expenses not been reduced during the periods shown.
D Calculated based on average shares outstanding during the period.
E Amounts do not include the activity of the underlying funds.
F Amount represents less than .01%.
G For the period December 31, 2007 (commencement of operations) to July 31, 2008.
H Expense ratios reflect operating expenses of the class. Expenses before reductions do not reflect amounts reimbursed by the investment adviser or reductions from expense offset arrangements and do not represent the amount paid by the class during periods when reimbursements or reductions occur. Expenses net of fee waivers reflect expenses after reimbursement by the investment adviser but prior to reductions from expense offset arrangements. Expenses net of all reductions represent the net expenses paid by the class but do not include expenses of the investment companies in which the Fund invests.
See accompanying notes which are an integral part of the financial statements.
Semiannual Report
Fidelity Income Replacement 2040 Fund
Investment Changes (Unaudited)
Fund Holdings as of January 31, 2011 |
| % of fund's
net assets | % of fund's net assets
6 months ago |
Domestic Equity Funds | | |
Fidelity Advisor Mid Cap II Fund Institutional Class | 6.0 | 6.0 |
Fidelity Disciplined Equity Fund | 6.3 | 6.2 |
Fidelity Equity-Income Fund | 6.3 | 6.3 |
Fidelity Large Cap Core Enhanced Index Fund | 10.1 | 10.0 |
Fidelity Series 100 Index Fund | 7.5 | 7.6 |
Fidelity Series Broad Market Opportunities Fund | 10.1 | 10.1 |
Fidelity Series Small Cap Opportunities Fund | 4.0 | 4.1 |
| 50.3 | 50.3 |
International Equity Funds | | |
Fidelity Advisor International Discovery Fund Institutional Class | 12.6 | 12.8 |
High Yield Fixed-Income Funds | | |
Fidelity Capital & Income Fund | 3.2 | 3.3 |
Fidelity Strategic Income Fund | 3.2 | 3.3 |
| 6.4 | 6.6 |
Investment Grade Fixed-Income Funds | | |
Fidelity Government Income Fund | 5.2 | 5.2 |
Fidelity Strategic Real Return Fund | 5.2 | 5.3 |
Fidelity Total Bond Fund | 15.7 | 15.7 |
| 26.1 | 26.2 |
Short-Term Funds | | |
Fidelity Institutional Money Market Portfolio Institutional Class | 2.3 | 2.0 |
Fidelity Short-Term Bond Fund | 2.3 | 2.1 |
| 4.6 | 4.1 |
Net Other Assets (Liabilities)* | 0.0 | 0.0 |
| 100.0 | 100.0 |
* Amount represents less than 0.1%
Asset Allocation (% of fund's net assets) |
Current |
| Domestic Equity Funds | 50.3% | |
| International Equity Funds | 12.6% | |
| High Yield Fixed-Income Funds | 6.4% | |
| Investment Grade Fixed-Income Funds | 26.1% | |
| Short-Term Funds | 4.6% | |
Six months ago |
| Domestic Equity Funds | 50.3% | |
 | International Equity Funds | 12.8% | |
| High Yield Fixed-Income Funds | 6.6% | |
| Investment Grade Fixed-Income Funds | 26.2% | |
| Short-Term Funds | 4.1% | |
Expected |
| Domestic Equity Funds | 50.0% | |
| International Equity Funds | 12.3% | |
| High Yield Fixed-Income Funds | 6.3% | |
| Investment Grade Fixed-Income Funds | 26.1% | |
| Short-Term Funds | 5.3% | |
The fund invests according to an asset allocation strategy that becomes increasingly conservative over time. The six months ago allocation is based on the fund's holdings as of July 31, 2010. The current allocation is based on the fund's holdings as of January 31, 2011. The expected allocation represents the fund's anticipated allocation at July 31, 2011. |
Semiannual Report
Fidelity Income Replacement 2040 Fund
Investments January 31, 2011 (Unaudited)
Showing Percentage of Net Assets
Equity Funds - 62.9% |
| Shares | | Value |
Domestic Equity Funds - 50.3% |
Fidelity Advisor Mid Cap II Fund Institutional Class | 6,811 | | $ 124,855 |
Fidelity Disciplined Equity Fund | 5,600 | | 130,023 |
Fidelity Equity-Income Fund | 2,853 | | 130,022 |
Fidelity Large Cap Core Enhanced Index Fund | 23,763 | | 208,160 |
Fidelity Series 100 Index Fund | 17,438 | | 156,068 |
Fidelity Series Broad Market Opportunities Fund | 20,249 | | 208,160 |
Fidelity Series Small Cap Opportunities Fund | 7,615 | | 83,305 |
TOTAL DOMESTIC EQUITY FUNDS | | 1,040,593 |
International Equity Funds - 12.6% |
Fidelity Advisor International Discovery Fund Institutional Class | 7,838 | | 259,425 |
TOTAL EQUITY FUNDS (Cost $1,129,442) | 1,300,018 |
Fixed-Income Funds - 32.5% |
| | | |
High Yield Fixed-Income Funds - 6.4% |
Fidelity Capital & Income Fund | 6,883 | | 66,562 |
Fidelity Strategic Income Fund | 5,954 | | 66,562 |
TOTAL HIGH YIELD FIXED-INCOME FUNDS | | 133,124 |
|
| Shares | | Value |
Investment Grade Fixed-Income Funds - 26.1% |
Fidelity Government Income Fund | 10,346 | | $ 107,698 |
Fidelity Strategic Real Return Fund | 11,103 | | 107,698 |
Fidelity Total Bond Fund | 30,122 | | 323,506 |
TOTAL INVESTMENT GRADE FIXED-INCOME FUNDS | | 538,902 |
TOTAL FIXED-INCOME FUNDS (Cost $648,649) | 672,026 |
Short-Term Funds - 4.6% |
| | | |
Fidelity Institutional Money Market Portfolio Institutional Class | 47,544 | | 47,544 |
Fidelity Short-Term Bond Fund | 5,607 | | 47,544 |
TOTAL SHORT-TERM FUNDS (Cost $94,688) | 95,088 |
TOTAL INVESTMENT PORTFOLIO - 100.0% (Cost $1,872,779) | | 2,067,132 |
NET OTHER ASSETS (LIABILITIES) - 0.0% | | (105) |
NET ASSETS - 100% | $ 2,067,027 |
Other Information |
All investments are categorized as Level 1 under the Fair Value Hierarchy. The inputs or methodology used for valuing securities may not be an indication of the risk associated with investing in those securities. For more information on valuation inputs, please refer to the Security Valuation section in the accompanying Notes to Financial Statements. |
Income Tax Information |
At July 31, 2010, the Fund had a capital loss carryforward of approximately $153,270 of which $763 and $152,507 will expire in fiscal 2017 and 2018, respectively. Capital loss carryforwards are only available to offset future capital gains of the Fund to the extent provided by regulations and may be limited. |
See accompanying notes which are an integral part of the financial statements.
Semiannual Report
Fidelity Income Replacement 2040 Fund
Statement of Assets and Liabilities
| January 31, 2011 (Unaudited) |
| | |
Assets | | |
Investment in securities, at value (cost $1,872,779) - See accompanying schedule | | $ 2,067,132 |
Cash | | 39 |
Receivable for investments sold | | 7,438 |
Receivable for fund shares sold | | 6,205 |
Total assets | | 2,080,814 |
| | |
Liabilities | | |
Payable for investments purchased | $ 13,645 | |
Distribution and service plan fees payable | 142 | |
Total liabilities | | 13,787 |
| | |
Net Assets | | $ 2,067,027 |
Net Assets consist of: | | |
Paid in capital | | $ 2,112,823 |
Undistributed net investment income | | 444 |
Accumulated undistributed net realized gain (loss) on investments | | (240,593) |
Net unrealized appreciation (depreciation) on investments | | 194,353 |
Net Assets | | $ 2,067,027 |
Calculation of Maximum Offering Price Class A:
Net Asset Value and redemption price per share ($86,283 ÷ 1,802.3 shares) | | $ 47.87 |
| | |
Maximum offering price per share (100/94.25 of $47.87) | | $ 50.79 |
Class T:
Net Asset Value and redemption price per share ($127,114 ÷ 2,654.8 shares) | | $ 47.88 |
| | |
Maximum offering price per share (100/96.50 of $47.88) | | $ 49.62 |
| | |
Class C:
Net Asset Value and offering price per share ($86,681 ÷ 1,810.2 shares)A | | $ 47.88 |
| | |
Income Replacement 2040:
Net Asset Value, offering price and redemption price per share ($1,712,185 ÷ 35,762.3 shares) | | $ 47.88 |
| | |
Institutional Class:
Net Asset Value, offering price and redemption price per share ($54,764 ÷ 1,143.8 shares) | | $ 47.88 |
A Redemption price per share is equal to net asset value less any applicable contingent deferred sales charge.
Statement of Operations
Six months ended January 31, 2011 (Unaudited) |
| | |
Investment Income | | |
Income distributions from underlying funds | | $ 22,912 |
| | |
Expenses | | |
Distribution and service plan fees | $ 825 | |
Independent trustees' compensation | 3 | |
Total expenses before reductions | 828 | |
Expense reductions | (3) | 825 |
Net investment income (loss) | | 22,087 |
Realized and Unrealized Gain (Loss) Realized gain (loss) on sale of underlying fund shares | 25,387 | |
Capital gain distributions from underlying funds | 9,243 | |
Total net realized gain (loss) | | 34,630 |
Change in net unrealized appreciation (depreciation) on underlying funds | | 147,363 |
Net gain (loss) | | 181,993 |
Net increase (decrease) in net assets resulting from operations | | $ 204,080 |
See accompanying notes which are an integral part of the financial statements.
Semiannual Report
Statement of Changes in Net Assets
| Six months ended January 31, 2011 (Unaudited) | Year ended
July 31,
2010 |
Increase (Decrease) in Net Assets | | |
Operations | | |
Net investment income (loss) | $ 22,087 | $ 23,376 |
Net realized gain (loss) | 34,630 | (127,348) |
Change in net unrealized appreciation (depreciation) | 147,363 | 184,622 |
Net increase (decrease) in net assets resulting from operations | 204,080 | 80,650 |
Distributions to shareholders from net investment income | (22,028) | (23,219) |
Distributions to shareholders from net realized gain | (7,263) | (2,847) |
Total distributions | (29,291) | (26,066) |
Share transactions - net increase (decrease) | 324,089 | 856,629 |
Total increase (decrease) in net assets | 498,878 | 911,213 |
| | |
Net Assets | | |
Beginning of period | 1,568,149 | 656,936 |
End of period (including undistributed net investment income of $444 and undistributed net investment income of $385, respectively) | $ 2,067,027 | $ 1,568,149 |
Financial Highlights - Class A
| Six months ended January 31, 2011 | Years ended July 31, |
| (Unaudited) | 2010 | 2009 | 2008 G |
Selected Per-Share Data | | | | |
Net asset value, beginning of period | $ 43.04 | $ 38.83 | $ 45.23 | $ 50.00 |
Income from Investment Operations | | | | |
Net investment income (loss) E | .565 | .722 | .933 | .442 |
Net realized and unrealized gain (loss) | 5.015 | 4.298 | (6.238) | (4.814) |
Total from investment operations | 5.580 | 5.020 | (5.305) | (4.372) |
Distributions from net investment income | (.558) | (.710) | (.885) | (.398) |
Distributions from net realized gain | (.192) | (.100) | (.210) | - |
Total distributions | (.750) | (.810) | (1.095) | (.398) |
Net asset value, end of period | $ 47.87 | $ 43.04 | $ 38.83 | $ 45.23 |
Total Return B, C, D | 13.01% | 12.97% | (11.41)% | (8.77)% |
Ratios to Average Net Assets F, H | | | | |
Expenses before reductions | .25% A | .25% | .25% | .25% A |
Expenses net of fee waivers, if any | .25% A | .25% | .25% | .25% A |
Expenses net of all reductions | .25% A | .25% | .25% | .25% A |
Net investment income (loss) | 2.47% A | 1.70% | 2.60% | 1.60% A |
Supplemental Data | | | | |
Net assets, end of period (000 omitted) | $ 86 | $ 34 | $ 57 | $ 91 |
Portfolio turnover rate | 44% A | 129% | 50% | 4% A |
A Annualized
B Total returns for periods of less than one year are not annualized.
C Total returns would have been lower had certain expenses not been reduced during the periods shown.
D Total returns do not include the effect of the sales charges.
E Calculated based on average shares outstanding during the period.
F Amounts do not include the activity of the underlying funds.
G For the period December 31, 2007 (commencement of operations) to July 31, 2008.
H Expense ratios reflect operating expenses of the class. Expenses before reductions do not reflect amounts reimbursed by the investment adviser or reductions from expense offset arrangements and do not represent the amount paid by the class during periods when reimbursements or reductions occur. Expenses net of fee waivers reflect expenses after reimbursement by the investment adviser but prior to reductions from expense offset arrangements. Expenses net of all reductions represent the net expenses paid by the class but do not include expenses of the investment companies in which the Fund invests.
See accompanying notes which are an integral part of the financial statements.
Semiannual Report
Financial Highlights - Class T
| Six months ended January 31, 2011 | Years ended July 31, |
| (Unaudited) | 2010 | 2009 | 2008 G |
Selected Per-Share Data | | | | |
Net asset value, beginning of period | $ 43.05 | $ 38.84 | $ 45.23 | $ 50.00 |
Income from Investment Operations | | | | |
Net investment income (loss) E | .504 | .616 | .836 | .371 |
Net realized and unrealized gain (loss) | 5.013 | 4.301 | (6.227) | (4.809) |
Total from investment operations | 5.517 | 4.917 | (5.391) | (4.438) |
Distributions from net investment income | (.495) | (.607) | (.789) | (.332) |
Distributions from net realized gain | (.192) | (.100) | (.210) | - |
Total distributions | (.687) | (.707) | (.999) | (.332) |
Net asset value, end of period | $ 47.88 | $ 43.05 | $ 38.84 | $ 45.23 |
Total Return B, C, D | 12.86% | 12.69% | (11.62)% | (8.90)% |
Ratios to Average Net Assets F, H | | | | |
Expenses before reductions | .50% A | .50% | .50% | .50% A |
Expenses net of fee waivers, if any | .50% A | .50% | .50% | .50% A |
Expenses net of all reductions | .50% A | .50% | .50% | .50% A |
Net investment income (loss) | 2.21% A | 1.45% | 2.35% | 1.35% A |
Supplemental Data | | | | |
Net assets, end of period (000 omitted) | $ 127 | $ 111 | $ 102 | $ 132 |
Portfolio turnover rate | 44% A | 129% | 50% | 4% A |
A Annualized
B Total returns for periods of less than one year are not annualized.
C Total returns would have been lower had certain expenses not been reduced during the periods shown.
D Total returns do not include the effect of the sales charges.
E Calculated based on average shares outstanding during the period.
F Amounts do not include the activity of the underlying funds.
G For the period December 31, 2007 (commencement of operations) to July 31, 2008.
H Expense ratios reflect operating expenses of the class. Expenses before reductions do not reflect amounts reimbursed by the investment adviser or reductions from expense offset arrangements and do not represent the amount paid by the class during periods when reimbursements or reductions occur. Expenses net of fee waivers reflect expenses after reimbursement by the investment adviser but prior to reductions from expense offset arrangements. Expenses net of all reductions represent the net expenses paid by the class but do not include expenses of the investment companies in which the Fund invests.
Financial Highlights - Class C
| Six months ended January 31, 2011 | Years ended July 31, |
| (Unaudited) | 2010 | 2009 | 2008 G |
Selected Per-Share Data | | | | |
Net asset value, beginning of period | $ 43.05 | $ 38.84 | $ 45.22 | $ 50.00 |
Income from Investment Operations | | | | |
Net investment income (loss) E | .390 | .402 | .664 | .234 |
Net realized and unrealized gain (loss) | 5.012 | 4.305 | (6.229) | (4.816) |
Total from investment operations | 5.402 | 4.707 | (5.565) | (4.582) |
Distributions from net investment income | (.380) | (.397) | (.605) | (.198) |
Distributions from net realized gain | (.192) | (.100) | (.210) | - |
Total distributions | (.572) | (.497) | (.815) | (.198) |
Net asset value, end of period | $ 47.88 | $ 43.05 | $ 38.84 | $ 45.22 |
Total Return B, C, D | 12.57% | 12.13% | (12.06)% | (9.18)% |
Ratios to Average Net Assets F, H | | | | |
Expenses before reductions | 1.00% A | 1.00% | 1.00% | 1.00% A |
Expenses net of fee waivers, if any | 1.00% A | 1.00% | 1.00% | 1.00% A |
Expenses net of all reductions | 1.00% A | 1.00% | 1.00% | 1.00% A |
Net investment income (loss) | 1.71% A | .95% | 1.85% | .84% A |
Supplemental Data | | | | |
Net assets, end of period (000 omitted) | $ 87 | $ 99 | $ 57 | $ 91 |
Portfolio turnover rate | 44% A | 129% | 50% | 4% A |
A Annualized
B Total returns for periods of less than one year are not annualized.
C Total returns would have been lower had certain expenses not been reduced during the periods shown.
D Total returns do not include the effect of the contingent deferred sales charge.
E Calculated based on average shares outstanding during the period.
F Amounts do not include the activity of the underlying funds.
G For the period December 31, 2007 (commencement of operations) to July 31, 2008.
H Expense ratios reflect operating expenses of the class. Expenses before reductions do not reflect amounts reimbursed by the investment adviser or reductions from expense offset arrangements and do not represent the amount paid by the class during periods when reimbursements or reductions occur. Expenses net of fee waivers reflect expenses after reimbursement by the investment adviser but prior to reductions from expense offset arrangements. Expenses net of all reductions represent the net expenses paid by the class but do not include expenses of the investment companies in which the Fund invests.
See accompanying notes which are an integral part of the financial statements.
Semiannual Report
Financial Highlights - Income Replacement 2040
| Six months ended January 31, 2011 | Years ended July 31, |
| (Unaudited) | 2010 | 2009 | 2008 G |
Selected Per-Share Data | | | | |
Net asset value, beginning of period | $ 43.04 | $ 38.83 | $ 45.23 | $ 50.00 |
Income from Investment Operations | | | | |
Net investment income (loss) D | .618 | .833 | 1.015 | .504 |
Net realized and unrealized gain (loss) | 5.022 | 4.297 | (6.231) | (4.810) |
Total from investment operations | 5.640 | 5.130 | (5.216) | (4.306) |
Distributions from net investment income | (.608) | (.820) | (.974) | (.464) |
Distributions from net realized gain | (.192) | (.100) | (.210) | - |
Total distributions | (.800) | (.920) | (1.184) | (.464) |
Net asset value, end of period | $ 47.88 | $ 43.04 | $ 38.83 | $ 45.23 |
Total Return B, C | 13.16% | 13.26% | (11.19)% | (8.64)% |
Ratios to Average Net Assets E, H | | | | |
Expenses before reductions F | .00% A | .00% | .00% | .00% A |
Expenses net of fee waivers, if any | .00% A | .00% | .00% | .00% A |
Expenses net of all reductions | .00% A | .00% | .00% | .00% A |
Net investment income (loss) | 2.72% A | 1.96% | 2.85% | 1.85% A |
Supplemental Data | | | | |
Net assets, end of period (000 omitted) | $ 1,712 | $ 1,262 | $ 384 | $ 598 |
Portfolio turnover rate | 44% A | 129% | 50% | 4% A |
A Annualized
B Total returns for periods of less than one year are not annualized.
C Total returns would have been lower had certain expenses not been reduced during the periods shown.
D Calculated based on average shares outstanding during the period.
E Amounts do not include the activity of the underlying funds.
F Amount represents less than .01%.
G For the period December 31, 2007 (commencement of operations) to July 31, 2008.
H Expense ratios reflect operating expenses of the class. Expenses before reductions do not reflect amounts reimbursed by the investment adviser or reductions from expense offset arrangements and do not represent the amount paid by the class during periods when reimbursements or reductions occur. Expenses net of fee waivers reflect expenses after reimbursement by the investment adviser but prior to reductions from expense offset arrangements. Expenses net of all reductions represent the net expenses paid by the class but do not include expenses of the investment companies in which the Fund invests.
Financial Highlights - Institutional Class
| Six months ended January 31, 2011 | Years ended July 31, |
| (Unaudited) | 2010 | 2009 | 2008 G |
Selected Per-Share Data | | | | |
Net asset value, beginning of period | $ 43.04 | $ 38.83 | $ 45.23 | $ 50.00 |
Income from Investment Operations | | | | |
Net investment income (loss) D | .618 | .828 | 1.022 | .512 |
Net realized and unrealized gain (loss) | 5.022 | 4.302 | (6.238) | (4.818) |
Total from investment operations | 5.640 | 5.130 | (5.216) | (4.306) |
Distributions from net investment income | (.608) | (.820) | (.974) | (.464) |
Distributions from net realized gain | (.192) | (.100) | (.210) | - |
Total distributions | (.800) | (.920) | (1.184) | (.464) |
Net asset value, end of period | $ 47.88 | $ 43.04 | $ 38.83 | $ 45.23 |
Total Return B, C | 13.16% | 13.26% | (11.19)% | (8.64)% |
Ratios to Average Net Assets E, H | | | | |
Expenses before reductions F | .00% A | .00% | .00% | .00% A |
Expenses net of fee waivers, if any | .00% A | .00% | .00% | .00% A |
Expenses net of all reductions | .00% A | .00% | .00% | .00% A |
Net investment income (loss) | 2.72% A | 1.96% | 2.85% | 1.85% A |
Supplemental Data | | | | |
Net assets, end of period (000 omitted) | $ 55 | $ 62 | $ 57 | $ 91 |
Portfolio turnover rate | 44% A | 129% | 50% | 4% A |
A Annualized
B Total returns for periods of less than one year are not annualized.
C Total returns would have been lower had certain expenses not been reduced during the periods shown.
D Calculated based on average shares outstanding during the period.
E Amounts do not include the activity of the underlying funds.
F Amount represents less than .01%.
G For the period December 31, 2007 (commencement of operations) to July 31, 2008.
H Expense ratios reflect operating expenses of the class. Expenses before reductions do not reflect amounts reimbursed by the investment adviser or reductions from expense offset arrangements and do not represent the amount paid by the class during periods when reimbursements or reductions occur. Expenses net of fee waivers reflect expenses after reimbursement by the investment adviser but prior to reductions from expense offset arrangements. Expenses net of all reductions represent the net expenses paid by the class but do not include expenses of the investment companies in which the Fund invests.
See accompanying notes which are an integral part of the financial statements.
Semiannual Report
Fidelity Income Replacement 2042 Fund
Investment Changes (Unaudited)
Fund Holdings as of January 31, 2011 |
| % of fund's
net assets | % of fund's net assets
6 months ago |
Domestic Equity Funds | | |
Fidelity Advisor Mid Cap II Fund Institutional Class | 6.1 | 6.1 |
Fidelity Disciplined Equity Fund | 6.4 | 6.3 |
Fidelity Equity-Income Fund | 6.4 | 6.4 |
Fidelity Large Cap Core Enhanced Index Fund | 10.2 | 10.2 |
Fidelity Series 100 Index Fund | 7.7 | 7.7 |
Fidelity Series Broad Market Opportunities Fund | 10.3 | 10.2 |
Fidelity Series Small Cap Opportunities Fund | 4.1 | 4.2 |
| 51.2 | 51.1 |
International Equity Funds | | |
Fidelity Advisor International Discovery Fund Institutional Class | 12.8 | 13.0 |
High Yield Fixed-Income Funds | | |
Fidelity Capital & Income Fund | 3.3 | 3.4 |
Fidelity Strategic Income Fund | 3.4 | 3.4 |
| 6.7 | 6.8 |
Investment Grade Fixed-Income Funds | | |
Fidelity Government Income Fund | 5.2 | 5.2 |
Fidelity Strategic Real Return Fund | 5.2 | 5.3 |
Fidelity Total Bond Fund | 15.6 | 15.7 |
| 26.0 | 26.2 |
Short-Term Funds | | |
Fidelity Institutional Money Market Portfolio Institutional Class | 1.7 | 1.4 |
Fidelity Short-Term Bond Fund | 1.6 | 1.5 |
| 3.3 | 2.9 |
Net Other Assets (Liabilities)* | 0.0 | 0.0 |
| 100.0 | 100.0 |
* Amount represents less than 0.1%
Asset Allocation (% of fund's net assets) |
Current |
| Domestic Equity Funds | 51.2% | |
| International Equity Funds | 12.8% | |
| High Yield Fixed-Income Funds | 6.7% | |
| Investment Grade Fixed-Income Funds | 26.0% | |
| Short-Term Funds | 3.3% | |
Six months ago |
| Domestic Equity Funds | 51.1% | |
| International Equity Funds | 13.0% | |
| High Yield Fixed-Income Funds | 6.8% | |
| Investment Grade Fixed-Income Funds | 26.2% | |
| Short-Term Funds | 2.9% | |
Expected |
| Domestic Equity Funds | 51.0% | |
| International Equity Funds | 12.8% | |
| High Yield Fixed-Income Funds | 6.6% | |
| Investment Grade Fixed-Income Funds | 26.0% | |
| Short-Term Funds | 3.6% | |
The fund invests according to an asset allocation strategy that becomes increasingly conservative over time. The six months ago allocation is based on the fund's holdings as of July 31, 2010. The current allocation is based on the fund's holdings as of January 31, 2011. The expected allocation represents the fund's anticipated allocation at July 31, 2011. |
Semiannual Report
Fidelity Income Replacement 2042 Fund
Investments January 31, 2011 (Unaudited)
Showing Percentage of Net Assets
Equity Funds - 64.0% |
| Shares | | Value |
Domestic Equity Funds - 51.2% |
Fidelity Advisor Mid Cap II Fund Institutional Class | 15,747 | | $ 288,648 |
Fidelity Disciplined Equity Fund | 12,957 | | 300,870 |
Fidelity Equity-Income Fund | 6,602 | | 300,870 |
Fidelity Large Cap Core Enhanced Index Fund | 54,953 | | 481,393 |
Fidelity Series 100 Index Fund | 40,340 | | 361,044 |
Fidelity Series Broad Market Opportunities Fund | 46,828 | | 481,393 |
Fidelity Series Small Cap Opportunities Fund | 17,618 | | 192,745 |
TOTAL DOMESTIC EQUITY FUNDS | | 2,406,963 |
International Equity Funds - 12.8% |
Fidelity Advisor International Discovery Fund Institutional Class | 18,179 | | 601,741 |
TOTAL EQUITY FUNDS (Cost $2,623,955) | 3,008,704 |
Fixed-Income Funds - 32.7% |
| | | |
High Yield Fixed-Income Funds - 6.7% |
Fidelity Capital & Income Fund | 16,286 | | 157,487 |
Fidelity Strategic Income Fund | 14,086 | | 157,487 |
TOTAL HIGH YIELD FIXED-INCOME FUNDS | | 314,974 |
|
| Shares | | Value |
Investment Grade Fixed-Income Funds - 26.0% |
Fidelity Government Income Fund | 23,528 | | $ 244,927 |
Fidelity Strategic Real Return Fund | 25,250 | | 244,927 |
Fidelity Total Bond Fund | 68,372 | | 734,312 |
TOTAL INVESTMENT GRADE FIXED-INCOME FUNDS | | 1,224,166 |
TOTAL FIXED-INCOME FUNDS (Cost $1,453,204) | 1,539,140 |
Short-Term Funds - 3.3% |
| | | |
Fidelity Institutional Money Market Portfolio Institutional Class | 76,628 | | 76,628 |
Fidelity Short-Term Bond Fund | 9,036 | | 76,628 |
TOTAL SHORT-TERM FUNDS (Cost $152,177) | 153,256 |
TOTAL INVESTMENT PORTFOLIO - 100.0% (Cost $4,229,336) | | 4,701,100 |
NET OTHER ASSETS (LIABILITIES) - 0.0% | | (3) |
NET ASSETS - 100% | $ 4,701,097 |
Other Information |
All investments are categorized as Level 1 under the Fair Value Hierarchy. The inputs or methodology used for valuing securities may not be an indication of the risk associated with investing in those securities. For more information on valuation inputs, please refer to the Security Valuation section in the accompanying Notes to Financial Statements. |
Income Tax Information |
At July 31, 2010, the Fund had a capital loss carryforward of approximately $17,454 of which $2,106 and $15,348 will expire in fiscal 2017 and 2018, respectively. Capital loss carryforwards are only available to offset future capital gains of the Fund to the extent provided by regulations and may be limited. |
See accompanying notes which are an integral part of the financial statements.
Semiannual Report
Fidelity Income Replacement 2042 Fund
Statement of Assets and Liabilities
| January 31, 2011 (Unaudited) |
| | |
Assets | | |
Investment in securities, at value (cost $4,229,336) - See accompanying schedule | | $ 4,701,100 |
Cash | | 40 |
Receivable for fund shares sold | | 883,327 |
Total assets | | 5,584,467 |
| | |
Liabilities | | |
Payable for investments purchased | $ 883,324 | |
Distribution and service plan fees payable | 46 | |
Total liabilities | | 883,370 |
| | |
Net Assets | | $ 4,701,097 |
Net Assets consist of: | | |
Paid in capital | | $ 4,337,652 |
Undistributed net investment income | | 901 |
Accumulated undistributed net realized gain (loss) on investments | | (109,220) |
Net unrealized appreciation (depreciation) on investments | | 471,764 |
Net Assets | | $ 4,701,097 |
Calculation of Maximum Offering Price Class A:
Net Asset Value and redemption price per share ($25,696 ÷ 535.9 shares) | | $ 47.95 |
| | |
Maximum offering price per share (100/94.25 of $47.95) | | $ 50.88 |
Class T:
Net Asset Value and redemption price per share ($32,835 ÷ 684.7 shares) | | $ 47.96 |
| | |
Maximum offering price per share (100/96.50 of $47.96) | | $ 49.70 |
| | |
Class C:
Net Asset Value and offering price per share ($32,321 ÷ 673.8 shares)A | | $ 47.97 |
| | |
Income Replacement 2042:
Net Asset Value, offering price and redemption price per share ($4,576,885 ÷ 95,468.2 shares) | | $ 47.94 |
| | |
Institutional Class:
Net Asset Value, offering price and redemption price per share ($33,360 ÷ 695.9 shares) | | $ 47.94 |
A Redemption price per share is equal to net asset value less any applicable contingent deferred sales charge.
Statement of Operations
Six months ended January 31, 2011 (Unaudited) |
| | |
Investment Income | | |
Income distributions from underlying funds | | $ 49,692 |
| | |
Expenses | | |
Distribution and service plan fees | $ 292 | |
Independent trustees' compensation | 7 | |
Total expenses before reductions | 299 | |
Expense reductions | (7) | 292 |
Net investment income (loss) | | 49,400 |
Realized and Unrealized Gain (Loss) Realized gain (loss) on sale of underlying fund shares | (38,568) | |
Capital gain distributions from underlying funds | 20,282 | |
Total net realized gain (loss) | | (18,286) |
Change in net unrealized appreciation (depreciation) on underlying funds | | 431,347 |
Net gain (loss) | | 413,061 |
Net increase (decrease) in net assets resulting from operations | | $ 462,461 |
See accompanying notes which are an integral part of the financial statements.
Semiannual Report
Fidelity Income Replacement 2042 Fund
Financial Statements - continued
Statement of Changes in Net Assets
| Six months ended January 31, 2011 (Unaudited) | Year ended
July 31,
2010 |
Increase (Decrease) in Net Assets | | |
Operations | | |
Net investment income (loss) | $ 49,400 | $ 58,360 |
Net realized gain (loss) | (18,286) | (3,503) |
Change in net unrealized appreciation (depreciation) | 431,347 | 231,761 |
Net increase (decrease) in net assets resulting from operations | 462,461 | 286,618 |
Distributions to shareholders from net investment income | (49,432) | (57,943) |
Distributions to shareholders from net realized gain | (15,604) | (7,508) |
Total distributions | (65,036) | (65,451) |
Share transactions - net increase (decrease) | 768,588 | 1,660,037 |
Total increase (decrease) in net assets | 1,166,013 | 1,881,204 |
| | |
Net Assets | | |
Beginning of period | 3,535,084 | 1,653,880 |
End of period (including undistributed net investment income of $901 and undistributed net investment income of $933, respectively) | $ 4,701,097 | $ 3,535,084 |
Financial Highlights - Class A
| Six months ended January 31, 2011 | Years ended July 31, |
| (Unaudited) | 2010 | 2009 | 2008 G |
Selected Per-Share Data | | | | |
Net asset value, beginning of period | $ 43.04 | $ 38.83 | $ 45.20 | $ 50.00 |
Income from Investment Operations | | | | |
Net investment income (loss) E | .557 | .747 | .819 | .425 |
Net realized and unrealized gain (loss) | 5.106 | 4.285 | (6.123) | (4.836) |
Total from investment operations | 5.663 | 5.032 | (5.304) | (4.411) |
Distributions from net investment income | (.558) | (.717) | (.866) | (.389) |
Distributions from net realized gain | (.195) | (.105) | (.200) | - |
Total distributions | (.753) | (.822) | (1.066) | (.389) |
Net asset value, end of period | $ 47.95 | $ 43.04 | $ 38.83 | $ 45.20 |
Total Return B, C, D | 13.21% | 13.00% | (11.40)% | (8.85)% |
Ratios to Average Net Assets F, H | | | | |
Expenses before reductions | .25% A | .25% | .25% | .25% A |
Expenses net of fee waivers, if any | .25% A | .25% | .25% | .25% A |
Expenses net of all reductions | .25% A | .25% | .25% | .25% A |
Net investment income (loss) | 2.44% A | 1.77% | 2.32% | 1.57% A |
Supplemental Data | | | | |
Net assets, end of period (000 omitted) | $ 26 | $ 29 | $ 88 | $ 91 |
Portfolio turnover rate | 27% A | 20% | 37% | 8% A |
A Annualized
B Total returns for periods of less than one year are not annualized.
C Total returns would have been lower had certain expenses not been reduced during the periods shown.
D Total returns do not include the effect of the sales charges.
E Calculated based on average shares outstanding during the period.
F Amounts do not include the activity of the underlying funds.
G For the period December 31, 2007 (commencement of operations) to July 31, 2008.
H Expense ratios reflect operating expenses of the class. Expenses before reductions do not reflect amounts reimbursed by the investment adviser or reductions from expense offset arrangements and do not represent the amount paid by the class during periods when reimbursements or reductions occur. Expenses net of fee waivers reflect expenses after reimbursement by the investment adviser but prior to reductions from expense offset arrangements. Expenses net of all reductions represent the net expenses paid by the class but do not include expenses of the investment companies in which the Fund invests.
See accompanying notes which are an integral part of the financial statements.
Semiannual Report
Financial Highlights - Class T
| Six months ended January 31, 2011 | Years ended July 31, |
| (Unaudited) | 2010 | 2009 | 2008 G |
Selected Per-Share Data | | | | |
Net asset value, beginning of period | $ 43.04 | $ 38.83 | $ 45.19 | $ 50.00 |
Income from Investment Operations | | | | |
Net investment income (loss) E | .500 | .642 | .739 | .365 |
Net realized and unrealized gain (loss) | 5.117 | 4.281 | (6.128) | (4.852) |
Total from investment operations | 5.617 | 4.923 | (5.389) | (4.487) |
Distributions from net investment income | (.502) | (.608) | (.771) | (.323) |
Distributions from net realized gain | (.195) | (.105) | (.200) | - |
Total distributions | (.697) | (.713) | (.971) | (.323) |
Net asset value, end of period | $ 47.96 | $ 43.04 | $ 38.83 | $ 45.19 |
Total Return B, C, D | 13.09% | 12.71% | (11.62)% | (9.00)% |
Ratios to Average Net Assets F, H | | | | |
Expenses before reductions | .50% A | .50% | .50% | .50% A |
Expenses net of fee waivers, if any | .50% A | .50% | .50% | .50% A |
Expenses net of all reductions | .50% A | .50% | .50% | .50% A |
Net investment income (loss) | 2.19% A | 1.52% | 2.07% | 1.32% A |
Supplemental Data | | | | |
Net assets, end of period (000 omitted) | $ 33 | $ 37 | $ 57 | $ 91 |
Portfolio turnover rate | 27% A | 20% | 37% | 8% A |
A Annualized
B Total returns for periods of less than one year are not annualized.
C Total returns would have been lower had certain expenses not been reduced during the periods shown.
D Total returns do not include the effect of the sales charges.
E Calculated based on average shares outstanding during the period.
F Amounts do not include the activity of the underlying funds.
G For the period December 31, 2007 (commencement of operations) to July 31, 2008.
H Expense ratios reflect operating expenses of the class. Expenses before reductions do not reflect amounts reimbursed by the investment adviser or reductions from expense offset arrangements and do not represent the amount paid by the class during periods when reimbursements or reductions occur. Expenses net of fee waivers reflect expenses after reimbursement by the investment adviser but prior to reductions from expense offset arrangements. Expenses net of all reductions represent the net expenses paid by the class but do not include expenses of the investment companies in which the Fund invests.
Financial Highlights - Class C
| Six months ended January 31, 2011 | Years ended July 31, |
| (Unaudited) | 2010 | 2009 | 2008 G |
Selected Per-Share Data | | | | |
Net asset value, beginning of period | $ 43.05 | $ 38.84 | $ 45.19 | $ 50.00 |
Income from Investment Operations | | | | |
Net investment income (loss) E | .386 | .430 | .560 | .226 |
Net realized and unrealized gain (loss) | 5.112 | 4.275 | (6.123) | (4.846) |
Total from investment operations | 5.498 | 4.705 | (5.563) | (4.620) |
Distributions from net investment income | (.383) | (.390) | (.587) | (.190) |
Distributions from net realized gain | (.195) | (.105) | (.200) | - |
Total distributions | (.578) | (.495) | (.787) | (.190) |
Net asset value, end of period | $ 47.97 | $ 43.05 | $ 38.84 | $ 45.19 |
Total Return B, C, D | 12.79% | 12.12% | (12.05)% | (9.25)% |
Ratios to Average Net Assets F, H | | | | |
Expenses before reductions | 1.00% A | 1.00% | 1.00% | 1.00% A |
Expenses net of fee waivers, if any | 1.00% A | 1.00% | 1.00% | 1.00% A |
Expenses net of all reductions | 1.00% A | 1.00% | 1.00% | 1.00% A |
Net investment income (loss) | 1.69% A | 1.02% | 1.57% | .82% A |
Supplemental Data | | | | |
Net assets, end of period (000 omitted) | $ 32 | $ 37 | $ 56 | $ 91 |
Portfolio turnover rate | 27% A | 20% | 37% | 8% A |
A Annualized
B Total returns for periods of less than one year are not annualized.
C Total returns would have been lower had certain expenses not been reduced during the periods shown.
D Total returns do not include the effect of the contingent deferred sales charge.
E Calculated based on average shares outstanding during the period.
F Amounts do not include the activity of the underlying funds.
G For the period December 31, 2007 (commencement of operations) to July 31, 2008.
H Expense ratios reflect operating expenses of the class. Expenses before reductions do not reflect amounts reimbursed by the investment adviser or reductions from expense offset arrangements and do not represent the amount paid by the class during periods when reimbursements or reductions occur. Expenses net of fee waivers reflect expenses after reimbursement by the investment adviser but prior to reductions from expense offset arrangements. Expenses net of all reductions represent the net expenses paid by the class but do not include expenses of the investment companies in which the Fund invests.
See accompanying notes which are an integral part of the financial statements.
Semiannual Report
Financial Highlights - Income Replacement 2042
| Six months ended January 31, 2011 | Years ended July 31, |
| (Unaudited) | 2010 | 2009 | 2008 G |
Selected Per-Share Data | | | | |
Net asset value, beginning of period | $ 43.03 | $ 38.83 | $ 45.20 | $ 50.00 |
Income from Investment Operations | | | | |
Net investment income (loss) D | .613 | .857 | .900 | .496 |
Net realized and unrealized gain (loss) | 5.110 | 4.279 | (6.114) | (4.840) |
Total from investment operations | 5.723 | 5.136 | (5.214) | (4.344) |
Distributions from net investment income | (.618) | (.831) | (.956) | (.456) |
Distributions from net realized gain | (.195) | (.105) | (.200) | - |
Total distributions | (.813) | (.936) | (1.156) | (.456) |
Net asset value, end of period | $ 47.94 | $ 43.03 | $ 38.83 | $ 45.20 |
Total Return B, C | 13.36% | 13.27% | (11.18)% | (8.72)% |
Ratios to Average Net Assets E, H | | | | |
Expenses before reductions F | .00% A | .00% | .00% | .00% A |
Expenses net of fee waivers, if any | .00% A | .00% | .00% | .00% A |
Expenses net of all reductions | .00% A | .00% | .00% | .00% A |
Net investment income (loss) | 2.70% A | 2.02% | 2.57% | 1.82% A |
Supplemental Data | | | | |
Net assets, end of period (000 omitted) | $ 4,577 | $ 3,395 | $ 1,395 | $ 969 |
Portfolio turnover rate | 27% A | 20% | 37% | 8% A |
A Annualized
B Total returns for periods of less than one year are not annualized.
C Total returns would have been lower had certain expenses not been reduced during the periods shown.
D Calculated based on average shares outstanding during the period.
E Amounts do not include the activity of the underlying funds.
F Amount represents less than .01%.
G For the period December 31, 2007 (commencement of operations) to July 31, 2008.
H Expense ratios reflect operating expenses of the class. Expenses before reductions do not reflect amounts reimbursed by the investment adviser or reductions from expense offset arrangements and do not represent the amount paid by the class during periods when reimbursements or reductions occur. Expenses net of fee waivers reflect expenses after reimbursement by the investment adviser but prior to reductions from expense offset arrangements. Expenses net of all reductions represent the net expenses paid by the class but do not include expenses of the investment companies in which the Fund invests.
Financial Highlights - Institutional Class
| Six months ended January 31, 2011 | Years ended July 31, |
| (Unaudited) | 2010 | 2009 | 2008 G |
Selected Per-Share Data | | | | |
Net asset value, beginning of period | $ 43.03 | $ 38.83 | $ 45.20 | $ 50.00 |
Income from Investment Operations | | | | |
Net investment income (loss) D | .614 | .855 | .918 | .504 |
Net realized and unrealized gain (loss) | 5.109 | 4.281 | (6.132) | (4.848) |
Total from investment operations | 5.723 | 5.136 | (5.214) | (4.344) |
Distributions from net investment income | (.618) | (.831) | (.956) | (.456) |
Distributions from net realized gain | (.195) | (.105) | (.200) | - |
Total distributions | (.813) | (.936) | (1.156) | (.456) |
Net asset value, end of period | $ 47.94 | $ 43.03 | $ 38.83 | $ 45.20 |
Total Return B, C | 13.36% | 13.27% | (11.18)% | (8.72)% |
Ratios to Average Net Assets E, H | | | | |
Expenses before reductions F | .00% A | .00% | .00% | .00% A |
Expenses net of fee waivers, if any | .00% A | .00% | .00% | .00% A |
Expenses net of all reductions | .00% A | .00% | .00% | .00% A |
Net investment income (loss) | 2.70% A | 2.02% | 2.57% | 1.82% A |
Supplemental Data | | | | |
Net assets, end of period (000 omitted) | $ 33 | $ 38 | $ 57 | $ 91 |
Portfolio turnover rate | 27% A | 20% | 37% | 8% A |
A Annualized
B Total returns for periods of less than one year are not annualized.
C Total returns would have been lower had certain expenses not been reduced during the periods shown.
D Calculated based on average shares outstanding during the period.
E Amounts do not include the activity of the underlying funds.
F Amount represents less than .01%.
G For the period December 31, 2007 (commencement of operations) to July 31, 2008.
H Expense ratios reflect operating expenses of the class. Expenses before reductions do not reflect amounts reimbursed by the investment adviser or reductions from expense offset arrangements and do not represent the amount paid by the class during periods when reimbursements or reductions occur. Expenses net of fee waivers reflect expenses after reimbursement by the investment adviser but prior to reductions from expense offset arrangements. Expenses net of all reductions represent the net expenses paid by the class but do not include expenses of the investment companies in which the Fund invests.
See accompanying notes which are an integral part of the financial statements.
Semiannual Report
Notes to Financial Statements
For the period ended January 31, 2011 (Unaudited)
1. Organization.
Fidelity Income Replacement 2016 Fund, Fidelity Income Replacement 2018 Fund, Fidelity Income Replacement 2020 Fund, Fidelity Income Replacement 2022 Fund, Fidelity Income Replacement 2024 Fund, Fidelity Income Replacement 2026 Fund, Fidelity Income Replacement 2028 Fund, Fidelity Income Replacement 2030 Fund, Fidelity Income Replacement 2032 Fund, Fidelity Income Replacement 2034 Fund, Fidelity Income Replacement 2036 Fund, Fidelity Income Replacement 2038 Fund, Fidelity Income Replacement 2040 Fund and Fidelity Income Replacement 2042 Fund (the Funds) are funds of Fidelity Income Fund (the Trust). The Trust is registered under the Investment Company Act of 1940, as amended (the 1940 Act), as an open-end management investment company organized as a Massachusetts business trust. Each Fund is authorized to issue an unlimited number of shares. The Funds invest primarily in a combination of other Fidelity equity, bond, and short-term funds (the Underlying Funds) managed by Fidelity Management & Research Company (FMR).
The Funds are designed for investors who seek to convert accumulated assets into regular payments over a defined period of time. The payment strategy for each Fund is designed to be implemented through a shareholder's voluntary participation in the Smart Payment Program. Participation in the Smart Payment Program will result in the gradual liquidation of the shareholder's entire investment in the Fund by its horizon date. Each Fund's name refers to the year of its horizon date.
Each Fund offers Class A, Class T, Class C, Income Replacement and Institutional Class shares. All classes have equal rights and voting privileges, except for matters affecting a single class. Investment income, realized and unrealized capital gains and losses, the common expenses of the Fund, and certain fund-level expense reductions, if any, are allocated on a pro-rata basis to each class based on the relative net assets of each class to the total net assets of the Fund. Each class differs with respect to distribution and service plan fees incurred. Certain expense reductions may also differ by class.
2. Significant Accounting Policies.
The financial statements have been prepared in conformity with accounting principles generally accepted in the United States of America (GAAP), which require management to make certain estimates and assumptions at the date of the financial statements. Actual results could differ from those estimates. Subsequent events, if any, through the date that the financial statements were issued have been evaluated in the preparation of the financial statements. The following summarizes the significant accounting policies of the Funds:
Security Valuation. Investments are valued as of 4:00 p.m. Eastern time on the last calendar day of the period. Each Fund categorizes the inputs to valuation techniques used to value their investments into a disclosure hierarchy consisting of three levels as shown below.
Level 1 - quoted prices in active markets for identical investments
Level 2 - other significant observable inputs (including quoted prices for similar investments, interest rates, prepayment speeds, etc.)
Level 3 - unobservable inputs (including the Fund's own assumptions based on the best information available)
Valuation techniques used to value each Fund's investments by major category are as follows. Investments in the Underlying Funds are valued at their closing net asset value (NAV) each business day and are categorized as Level 1 in the hierarchy.
Investment Transactions and Income. For financial reporting purposes, the Funds' investment holdings and NAV include trades executed through the end of the last business day of the period. The NAV per share for processing shareholder transactions is calculated as of the close of business of the New York Stock Exchange (NYSE), normally 4:00 p.m. Eastern time and includes trades executed through the end of the prior business day. Gains and losses on securities sold are determined on the basis of identified cost. Income and capital gain distributions from the Underlying Funds, if any, are recorded on the ex-dividend date.
Expenses. Expenses directly attributable to a fund are charged to that fund. Expenses attributable to more than one fund are allocated among the respective funds on the basis of relative net assets or other appropriate methods. Expenses included in the accompanying financial statements reflect the expenses of the Fund and do not include any expenses associated with the Underlying Funds. Expense estimates are accrued in the period to which they relate and adjustments are made when actual amounts are known.
Income Tax Information and Distributions to Shareholders. Each year, each Fund intends to qualify as a regulated investment company, including distributing substantially all of its taxable income and realized gains under Subchapter M of the Internal Revenue Code and filing its U.S. federal tax return. As a result, no provision for income taxes is required. A fund's federal tax return is subject to examination by the Internal Revenue Service (IRS) for a period of three years.
Distributions are declared and recorded on the ex-dividend date. Income dividends and capital gain distributions are declared separately for each class. Income and capital gain distributions are determined in accordance with income tax regulations, which may differ from GAAP.
Semiannual Report
2. Significant Accounting Policies - continued
Income Tax Information and Distributions to Shareholders - continued
Capital accounts within the financial statements are adjusted for permanent book-tax differences. These adjustments have no impact on net assets or the results of operations. Temporary book-tax differences will reverse in a subsequent period.
Book-tax differences are primarily due to the short-term gain distributions from the Underlying Funds, capital loss carryforwards, losses deferred due to wash sales and excise tax regulations.
The federal tax cost of investment securities and unrealized appreciation (depreciation) as of period end were as follows for each Fund:
| Tax
cost | Gross unrealized
appreciation | Gross unrealized
depreciation | Net unrealized appreciation (depreciation) on securities and other investments |
Fidelity Income Replacement 2016 Fund | $ 10,371,851 | $ 498,542 | $ (152,639) | $ 345,903 |
Fidelity Income Replacement 2018 Fund | 5,831,249 | 177,344 | (169,820) | 7,524 |
Fidelity Income Replacement 2020 Fund | 3,991,666 | 288,500 | (70,852) | 217,648 |
Fidelity Income Replacement 2022 Fund | 3,120,356 | 92,610 | (137,765) | (45,155) |
Fidelity Income Replacement 2024 Fund | 1,607,060 | 103,826 | (36,820) | 67,006 |
Fidelity Income Replacement 2026 Fund | 1,411,924 | 58,900 | (41,424) | 17,476 |
Fidelity Income Replacement 2028 Fund | 6,309,752 | 335,884 | (172,301) | 163,583 |
Fidelity Income Replacement 2030 Fund | 2,883,230 | 179,090 | (53,092) | 125,998 |
Fidelity Income Replacement 2032 Fund | 1,861,326 | 326,913 | (5,264) | 321,649 |
Fidelity Income Replacement 2034 Fund | 1,801,035 | 246,946 | (9,369) | 237,577 |
Fidelity Income Replacement 2036 Fund | 1,943,004 | 82,232 | (75,794) | 6,438 |
Fidelity Income Replacement 2038 Fund | 1,350,162 | 219,956 | (4,478) | 215,478 |
Fidelity Income Replacement 2040 Fund | 1,949,267 | 152,140 | (34,275) | 117,865 |
Fidelity Income Replacement 2042 Fund | 4,287,193 | 482,493 | (68,586) | 413,907 |
3. Purchases and Sales of Investments.
Purchases and redemptions of the Underlying Fund shares are noted in the table below.
| Purchases ($) | Redemptions ($) |
Fidelity Income Replacement 2016 Fund | 2,007,711 | 2,848,246 |
Fidelity Income Replacement 2018 Fund | 1,387,027 | 1,310,923 |
Fidelity Income Replacement 2020 Fund | 1,409,214 | 748,150 |
Fidelity Income Replacement 2022 Fund | 643,300 | 334,955 |
Fidelity Income Replacement 2024 Fund | 231,135 | 218,151 |
Fidelity Income Replacement 2026 Fund | 553,139 | 207,412 |
Fidelity Income Replacement 2028 Fund | 959,598 | 1,170,953 |
Fidelity Income Replacement 2030 Fund | 1,353,434 | 515,496 |
Fidelity Income Replacement 2032 Fund | 530,997 | 254,831 |
Fidelity Income Replacement 2034 Fund | 449,976 | 450,032 |
Fidelity Income Replacement 2036 Fund | 886,175 | 192,978 |
Fidelity Income Replacement 2038 Fund | 203,244 | 1,121,802 |
Fidelity Income Replacement 2040 Fund | 700,560 | 374,423 |
Fidelity Income Replacement 2042 Fund | 1,278,621 | 505,395 |
4. Fees and Other Transactions with Affiliates.
Management Fee. Strategic Advisers, Inc. (Strategic Advisers), an affiliate of FMR, provides the Funds with investment management related services. The Funds do not pay any fees for these services. Under the management contract, Strategic Advisers pays all other fund-level expenses, except the compensation of the independent Trustees and certain other expenses such as interest expense. The management fee paid by each Fund is reduced by an amount equal to the fees and expenses paid by the Fund to the independent Trustees.
Semiannual Report
Notes to Financial Statements (Unaudited) - continued
4. Fees and Other Transactions with Affiliates - continued
Distribution and Service Plan Fees. In accordance with Rule 12b-1 of the 1940 Act, the Funds have adopted separate Distribution and Service Plans for each class of shares. Certain classes pay Fidelity Distributors Corporation (FDC), an affiliate of FMR, separate Distribution and Service Fees, each of which is based on an annual percentage of each class' average net assets. In addition, FDC may pay financial intermediaries for selling shares of the Funds and providing shareholder support services. For the period, the Distribution and Service Fee rates, total fees and amounts retained by FDC were as follows:
Fidelity Income Replacement 2016 Fund | Distribution
Fee | Service
Fee | Paid
to FDC | Retained
by FDC |
Class A | -% | .25% | $ 2,771 | $ - |
Class T | .25% | .25% | 1,596 | - |
Class C | .75% | .25% | 5,538 | 118 |
| | | $ 9,905 | $ 118 |
Fidelity Income Replacement 2018 Fund | | | | |
Class A | -% | .25% | $ 1,514 | $ 12 |
Class T | .25% | .25% | 132 | 6 |
Class C | .75% | .25% | 1,010 | 334 |
| | | $ 2,656 | $ 352 |
Fidelity Income Replacement 2020 Fund | | | | |
Class A | -% | .25% | $ 776 | $ 259 |
Class T | .25% | .25% | 350 | - |
Class C | .75% | .25% | 1,525 | 54 |
| | | $ 2,651 | $ 313 |
Fidelity Income Replacement 2022 Fund | | | | |
Class A | -% | .25% | $ 68 | $ 2 |
Class T | .25% | .25% | 192 | 4 |
Class C | .75% | .25% | 201 | 82 |
| | | $ 461 | $ 88 |
Fidelity Income Replacement 2024 Fund | | | | |
Class A | -% | .25% | $ 332 | $ 4 |
Class T | .25% | .25% | 124 | 88 |
Class C | .75% | .25% | 830 | 15 |
| | | $ 1,286 | $ 107 |
Fidelity Income Replacement 2026 Fund | | | | |
Class A | -% | .25% | $ 51 | $ 17 |
Class T | .25% | .25% | 304 | 14 |
Class C | .75% | .25% | 903 | 35 |
| | | $ 1,258 | $ 66 |
Fidelity Income Replacement 2028 Fund | | | | |
Class A | -% | .25% | $ 466 | $ 16 |
Class T | .25% | .25% | 370 | - |
Class C | .75% | .25% | 256 | - |
| | | $ 1,092 | $ 16 |
Fidelity Income Replacement 2030 Fund | | | | |
Class A | -% | .25% | $ 76 | $ 22 |
Class T | .25% | .25% | 71 | 33 |
Class C | .75% | .25% | 1,001 | 92 |
| | | $ 1,148 | $ 147 |
Fidelity Income Replacement 2032 Fund | | | | |
Class A | -% | .25% | $ 269 | $ 3 |
Class T | .25% | .25% | 82 | 82 |
Class C | .75% | .25% | 136 | 136 |
| | | $ 487 | $ 221 |
Fidelity Income Replacement 2034 Fund | | | | |
Class A | -% | .25% | $ 30 | $ 30 |
Class T | .25% | .25% | 80 | 80 |
Class C | .75% | .25% | 123 | 123 |
| | | $ 233 | $ 233 |
Semiannual Report
4. Fees and Other Transactions with Affiliates - continued
Distribution and Service Plan Fees - continued
Fidelity Income Replacement 2036 Fund | Distribution
Fee | Service
Fee | Paid
to FDC | Retained
by FDC |
Class A | -% | .25% | $ 46 | $ 38 |
Class T | .25% | .25% | 692 | 8 |
Class C | .75% | .25% | 606 | 10 |
| | | $ 1,344 | $ 56 |
Fidelity Income Replacement 2038 Fund | | | | |
Class A | -% | .25% | $ 40 | $ 2 |
Class T | .25% | .25% | 86 | 86 |
Class C | .75% | .25% | 419 | 418 |
| | | $ 545 | $ 506 |
Fidelity Income Replacement 2040 Fund | | | | |
Class A | -% | .25% | $ 66 | $ 38 |
Class T | .25% | .25% | 300 | 14 |
Class C | .75% | .25% | 459 | 458 |
| | | $ 825 | $ 510 |
Fidelity Income Replacement 2042 Fund | | | | |
Class A | -% | .25% | $ 34 | $ 17 |
Class T | .25% | .25% | 86 | 86 |
Class C | .75% | .25% | 172 | 172 |
| | | $ 292 | $ 275 |
Sales Load. FDC receives a front-end sales charge of up to 5.75% for selling Class A shares, and 3.50% for selling Class T shares, some of which is paid to financial intermediaries for selling shares of the Funds. FDC receives the proceeds of contingent deferred sales charges levied on Class A, Class T, and Class C redemptions. These charges depend on the holding period. The deferred sales charges range from 1% for Class C, 1.00% for certain purchases of Class A shares and .25% for certain purchases of Class T shares.
For the period, sales charge amounts retained by FDC were as follows:
Fidelity Income Replacement 2016 Fund | Retained
by FDC |
Class A | $ 249 |
Class C* | 9 |
| $ 258 |
Fidelity Income Replacement 2018 Fund | |
Class A | $ 563 |
| |
Fidelity Income Replacement 2020 Fund | |
Class A | $ 1 |
| |
Fidelity Income Replacement 2022 Fund | |
Class A | $ 215 |
| |
Fidelity Income Replacement 2026 Fund | |
Class T | $ 4 |
| |
Fidelity Income Replacement 2036 Fund | |
Class T | $ 3 |
| |
Fidelity Income Replacement 2040 Fund | |
Class A | $ 441 |
* When Class C shares are initially sold, FDC pays commissions from its own resources to financial intermediaries through which the sales are made.
Semiannual Report
Notes to Financial Statements (Unaudited) - continued
5. Expense Reductions.
FMR voluntarily agreed to reimburse the Funds to the extent annual operating expenses exceeded distribution and service fees applicable to each class. Some expenses, for example interest expense, are excluded from this reimbursement.
The following Funds were in reimbursement during the period:
| Reimbursement
from adviser* |
Fidelity Income Replacement 2016 Fund | $ 21 |
Fidelity Income Replacement 2018 Fund | 11 |
Fidelity Income Replacement 2020 Fund | 7 |
Fidelity Income Replacement 2022 Fund | 5 |
Fidelity Income Replacement 2024 Fund | 3 |
Fidelity Income Replacement 2026 Fund | 2 |
Fidelity Income Replacement 2028 Fund | 12 |
Fidelity Income Replacement 2030 Fund | 4 |
Fidelity Income Replacement 2032 Fund | 4 |
Fidelity Income Replacement 2034 Fund | 4 |
Fidelity Income Replacement 2036 Fund | 3 |
Fidelity Income Replacement 2038 Fund | 4 |
Fidelity Income Replacement 2040 Fund | 3 |
Fidelity Income Replacement 2042 Fund | 7 |
* Represents total amount reimbursed to the Fund. Each class has received pro-rata allocation of reimbursement.
6. Distributions to Shareholders.
Distributions to shareholders of each class were as follows:
| Six months ended
January 31,
2011 | Year ended
July 31,
2010 |
Fidelity Income Replacement 2016 Fund | | |
From net investment income | | |
Class A | $ 21,459 | $ 44,617 |
Class T | 5,559 | 10,060 |
Class C | 7,097 | 12,552 |
Income Replacement 2016 | 79,257 | 120,802 |
Institutional Class | 1,181 | 2,291 |
Total | $ 114,553 | $ 190,322 |
From net realized gain | | |
Class A | $ 11,231 | $ 6,094 |
Class T | 3,381 | 1,771 |
Class C | 6,082 | 3,226 |
Income Replacement 2016 | 37,507 | 14,426 |
Institutional Class | 546 | 316 |
Total | $ 58,747 | $ 25,833 |
Fidelity Income Replacement 2018 Fund | | |
From net investment income | | |
Class A | $ 12,700 | $ 17,039 |
Class T | 474 | 1,142 |
Class C | 1,346 | 1,710 |
Income Replacement 2018 | 46,716 | 76,857 |
Institutional Class | 4,200 | 7,202 |
Total | $ 65,436 | $ 103,950 |
From net realized gain | | |
Class A | $ 5,977 | $ 2,282 |
Class T | 252 | 200 |
Class C | 980 | 353 |
Income Replacement 2018 | 19,822 | 9,798 |
Institutional Class | 1,775 | 910 |
Total | $ 28,806 | $ 13,543 |
Semiannual Report
6. Distributions to Shareholders - continued
| Six months ended
January 31,
2011 | Year ended
July 31,
2010 |
Fidelity Income Replacement 2020 Fund | | |
From net investment income | | |
Class A | $ 6,493 | $ 11,250 |
Class T | 1,297 | 2,566 |
Class C | 2,066 | 2,829 |
Income Replacement 2020 | 30,280 | 39,529 |
Institutional Class | 602 | 2,036 |
Total | $ 40,738 | $ 58,210 |
From net realized gain | | |
Class A | $ 2,797 | $ 1,618 |
Class T | 638 | 468 |
Class C | 1,402 | 667 |
Income Replacement 2020 | 11,887 | 4,645 |
Institutional Class | 234 | 316 |
Total | $ 16,958 | $ 7,714 |
Fidelity Income Replacement 2022 Fund | | |
From net investment income | | |
Class A | $ 682 | $ 760 |
Class T | 737 | 1,377 |
Class C | 250 | 583 |
Income Replacement 2022 | 31,719 | 52,195 |
Institutional Class | 53 | 2,258 |
Total | $ 33,441 | $ 57,173 |
From net realized gain | | |
Class A | $ 313 | $ 290 |
Class T | 343 | 657 |
Class C | 169 | 426 |
Income Replacement 2022 | 11,885 | 17,200 |
Institutional Class | 20 | 1,161 |
Total | $ 12,730 | $ 19,734 |
Fidelity Income Replacement 2024 Fund | | |
From net investment income | | |
Class A | $ 2,898 | $ 5,225 |
Class T | 444 | 1,024 |
Class C | 1,221 | 1,614 |
Income Replacement 2024 | 13,124 | 22,024 |
Institutional Class | 390 | 946 |
Total | $ 18,077 | $ 30,833 |
From net realized gain | | |
Class A | $ 1,169 | $ 733 |
Class T | 211 | 173 |
Class C | 755 | 389 |
Income Replacement 2024 | 4,799 | 2,820 |
Institutional Class | 144 | 118 |
Total | $ 7,078 | $ 4,233 |
Fidelity Income Replacement 2026 Fund | | |
From net investment income | | |
Class A | $ 421 | $ 1,002 |
Class T | 1,196 | 1,567 |
Class C | 1,311 | 1,940 |
Income Replacement 2026 | 8,875 | 8,207 |
Institutional Class | 386 | 937 |
Total | $ 12,189 | $ 13,653 |
Semiannual Report
Notes to Financial Statements (Unaudited) - continued
6. Distributions to Shareholders - continued
| Six months ended
January 31,
2011 | Year ended
July 31,
2010 |
Fidelity Income Replacement 2026 Fund | | |
From net realized gain | | |
Class A | $ 163 | $ 145 |
Class T | 515 | 294 |
Class C | 762 | 484 |
Income Replacement 2026 | 3,053 | 782 |
Institutional Class | 133 | 118 |
Total | $ 4,626 | $ 1,823 |
Fidelity Income Replacement 2028 Fund | | |
From net investment income | | |
Class A | $ 4,198 | $ 6,274 |
Class T | 1,195 | 5,032 |
Class C | 384 | 669 |
Income Replacement 2028 | 67,768 | 118,159 |
Institutional Class | 392 | 931 |
Total | $ 73,937 | $ 131,065 |
From net realized gain | | |
Class A | $ 1,624 | $ 885 |
Class T | 551 | 821 |
Class C | 224 | 172 |
Income Replacement 2028 | 23,226 | 14,970 |
Institutional Class | 138 | 117 |
Total | $ 25,763 | $ 16,965 |
Fidelity Income Replacement 2030 Fund | | |
From net investment income | | |
Class A | $ 629 | $ 944 |
Class T | 147 | 802 |
Class C | 1,578 | 1,647 |
Income Replacement 2030 | 28,486 | 9,950 |
Institutional Class | 389 | 870 |
Total | $ 31,229 | $ 14,213 |
From net realized gain | | |
Class A | $ 210 | $ 112 |
Class T | 35 | 143 |
Class C | 777 | 448 |
Income Replacement 2030 | 9,584 | 1,042 |
Institutional Class | 117 | 112 |
Total | $ 10,723 | $ 1,857 |
Fidelity Income Replacement 2032 Fund | | |
From net investment income | | |
Class A | $ 2,430 | $ 3,578 |
Class T | 299 | 726 |
Class C | 180 | 409 |
Income Replacement 2032 | 21,767 | 12,987 |
Institutional Class | 879 | 990 |
Total | $ 25,555 | $ 18,690 |
From net realized gain | | |
Class A | $ 874 | $ 469 |
Class T | 125 | 112 |
Class C | 104 | 93 |
Income Replacement 2032 | 7,076 | 1,351 |
Institutional Class | 309 | 113 |
Total | $ 8,488 | $ 2,138 |
Semiannual Report
6. Distributions to Shareholders - continued
| Six months ended
January 31,
2011 | Year ended
July 31,
2010 |
Fidelity Income Replacement 2034 Fund | | |
From net investment income | | |
Class A | $ 248 | $ 592 |
Class T | 289 | 675 |
Class C | 155 | 337 |
Income Replacement 2034 | 22,542 | 34,804 |
Institutional Class | 1,218 | 1,910 |
Total | $ 24,452 | $ 38,318 |
From net realized gain | | |
Class A | $ 99 | $ 165 |
Class T | 130 | 218 |
Class C | 99 | 166 |
Income Replacement 2034 | 7,355 | 7,479 |
Institutional Class | 428 | 436 |
Total | $ 8,111 | $ 8,464 |
Fidelity Income Replacement 2036 Fund | | |
From net investment income | | |
Class A | $ 388 | $ 811 |
Class T | 2,822 | 4,274 |
Class C | 932 | 1,320 |
Income Replacement 2036 | 15,066 | 12,138 |
Institutional Class | 1,160 | 1,200 |
Total | $ 20,368 | $ 19,743 |
From net realized gain | | |
Class A | $ 116 | $ 162 |
Class T | 928 | 958 |
Class C | 398 | 467 |
Income Replacement 2036 | 4,588 | 2,158 |
Institutional Class | 299 | 204 |
Total | $ 6,329 | $ 3,949 |
Fidelity Income Replacement 2038 Fund | | |
From net investment income | | |
Class A | $ 381 | $ 1,542 |
Class T | 338 | 689 |
Class C | 607 | 569 |
Income Replacement 2038 | 28,468 | 40,695 |
Institutional Class | 429 | 942 |
Total | $ 30,223 | $ 44,437 |
From net realized gain | | |
Class A | $ 135 | $ 413 |
Class T | 137 | 207 |
Class C | 333 | 205 |
Income Replacement 2038 | 9,117 | 8,050 |
Institutional Class | 139 | 209 |
Total | $ 9,861 | $ 9,084 |
Fidelity Income Replacement 2040 Fund | | |
From net investment income | | |
Class A | $ 887 | $ 1,022 |
Class T | 1,296 | 1,586 |
Class C | 687 | 487 |
Income Replacement 2040 | 18,445 | 18,680 |
Institutional Class | 713 | 1,444 |
Total | $ 22,028 | $ 23,219 |
Semiannual Report
Notes to Financial Statements (Unaudited) - continued
6. Distributions to Shareholders - continued
| Six months ended
January 31,
2011 | Year ended
July 31,
2010 |
Fidelity Income Replacement 2040 Fund | | |
From net realized gain | | |
Class A | $ 360 | $ 174 |
Class T | 502 | 273 |
Class C | 361 | 112 |
Income Replacement 2040 | 5,813 | 2,099 |
Institutional Class | 227 | 189 |
Total | $ 7,263 | $ 2,847 |
Fidelity Income Replacement 2042 Fund | | |
From net investment income | | |
Class A | $ 305 | $ 1,305 |
Class T | 349 | 687 |
Class C | 257 | 442 |
Income Replacement 2042 | 48,080 | 54,565 |
Institutional Class | 441 | 944 |
Total | $ 49,432 | $ 57,943 |
From net realized gain | | |
Class A | $ 108 | $ 247 |
Class T | 138 | 121 |
Class C | 136 | 120 |
Income Replacement 2042 | 15,082 | 6,898 |
Institutional Class | 140 | 122 |
Total | $ 15,604 | $ 7,508 |
7. Share Transactions.
Transactions for each class of shares were as follows:
| Shares | Dollars |
| Six months ended
January 31,
2011 | Year ended
July 31,
2010 | Six months ended
January 31,
2011 | Year ended
July 31,
2010 |
Fidelity Income Replacement 2016 Fund | | | | |
Class A | | | | |
Shares sold | 1,447 | 10,966 | $ 70,361 | $ 505,595 |
Reinvestment of distributions | 574 | 904 | 27,889 | 41,700 |
Shares redeemed | (9,242) | (22,378) | (449,186) | (1,033,263) |
Net increase (decrease) | (7,221) | (10,508) | $ (350,936) | $ (485,968) |
Class T | | | | |
Shares sold | - | 6,546 | $ - | $ 302,409 |
Reinvestment of distributions | 152 | 199 | 7,395 | 9,206 |
Shares redeemed | (762) | (4,625) | (36,775) | (215,246) |
Net increase (decrease) | (610) | 2,120 | $ (29,380) | $ 96,369 |
Class C | | | | |
Shares sold | 1,029 | 3,920 | $ 50,000 | $ 176,110 |
Reinvestment of distributions | 201 | 252 | 9,798 | 11,639 |
Shares redeemed | (820) | (8,175) | (39,550) | (376,188) |
Net increase (decrease) | 410 | (4,003) | $ 20,248 | $ (188,439) |
Income Replacement 2016 | | | | |
Shares sold | 18,781 | 78,978 | $ 909,318 | $ 3,659,239 |
Reinvestment of distributions | 1,069 | 721 | 52,164 | 33,372 |
Shares redeemed | (30,441) | (40,547) | (1,486,686) | (1,866,323) |
Net increase (decrease) | (10,591) | 39,152 | $ (525,204) | $ 1,826,288 |
Semiannual Report
7. Share Transactions - continued
| Shares | Dollars |
| Six months ended
January 31,
2011 | Year ended
July 31,
2010 | Six months ended
January 31,
2011 | Year ended
July 31,
2010 |
Fidelity Income Replacement 2016 Fund | | | | |
Institutional Class | | | | |
Shares sold | 777 | 751 | $ 38,200 | $ 34,781 |
Reinvestment of distributions | 6 | 15 | 280 | 690 |
Shares redeemed | (257) | (975) | (12,270) | (44,681) |
Net increase (decrease) | 526 | (209) | $ 26,210 | $ (9,210) |
Fidelity Income Replacement 2018 Fund | | | | |
Class A | | | | |
Shares sold | 1,564 | 6,590 | $ 72,093 | $ 305,640 |
Reinvestment of distributions | 177 | 248 | 8,571 | 11,354 |
Shares redeemed | (3,740) | (1,601) | (181,952) | (73,103) |
Net increase (decrease) | (1,999) | 5,237 | $ (101,288) | $ 243,891 |
Class T | | | | |
Shares sold | - | - | $ - | $ - |
Reinvestment of distributions | 10 | 21 | 479 | 968 |
Shares redeemed | (63) | (1,030) | (3,015) | (46,978) |
Net increase (decrease) | (53) | (1,009) | $ (2,536) | $ (46,010) |
Class C | | | | |
Shares sold | - | 1,627 | $ - | $ 75,000 |
Reinvestment of distributions | 38 | 26 | 1,833 | 1,209 |
Shares redeemed | (260) | (373) | (12,426) | (17,000) |
Net increase (decrease) | (222) | 1,280 | $ (10,593) | $ 59,209 |
Income Replacement 2018 | | | | |
Shares sold | 16,142 | 11,957 | $ 764,740 | $ 541,219 |
Reinvestment of distributions | 413 | 258 | 20,212 | 11,837 |
Shares redeemed | (12,586) | (13,199) | (602,010) | (594,109) |
Net increase (decrease) | 3,969 | (984) | $ 182,942 | $ (41,053) |
Institutional Class | | | | |
Shares sold | - | - | $ - | $ - |
Reinvestment of distributions | 6 | 8 | 274 | 361 |
Shares redeemed | (47) | (100) | (2,250) | (4,500) |
Net increase (decrease) | (41) | (92) | $ (1,976) | $ (4,139) |
Fidelity Income Replacement 2020 Fund | | | | |
Class A | | | | |
Shares sold | 3 | 4,988 | $ 134 | $ 223,504 |
Reinvestment of distributions | 148 | 166 | 7,184 | 7,568 |
Shares redeemed | (548) | (3,855) | (26,167) | (179,660) |
Net increase (decrease) | (397) | 1,299 | $ (18,849) | $ 51,412 |
Class T | | | | |
Shares sold | - | 1,680 | $ - | $ 80,000 |
Reinvestment of distributions | 40 | 67 | 1,935 | 3,033 |
Shares redeemed | - | (2,893) | - | (131,000) |
Net increase (decrease) | 40 | (1,146) | $ 1,935 | $ (47,967) |
Class C | | | | |
Shares sold | - | 1,102 | $ - | $ 49,985 |
Reinvestment of distributions | 52 | 67 | 2,514 | 3,032 |
Shares redeemed | (569) | - | (28,016) | - |
Net increase (decrease) | (517) | 1,169 | $ (25,502) | $ 53,017 |
Income Replacement 2020 | | | | |
Shares sold | 22,067 | 20,661 | $ 1,076,822 | $ 932,116 |
Reinvestment of distributions | 339 | 202 | 16,582 | 9,173 |
Shares redeemed | (8,120) | (10,998) | (396,608) | (493,006) |
Net increase (decrease) | 14,286 | 9,865 | $ 696,796 | $ 448,283 |
Semiannual Report
Notes to Financial Statements (Unaudited) - continued
7. Share Transactions - continued
| Shares | Dollars |
| Six months ended
January 31,
2011 | Year ended
July 31,
2010 | Six months ended
January 31,
2011 | Year ended
July 31,
2010 |
Fidelity Income Replacement 2020 Fund | | | | |
Institutional Class | | | | |
Shares sold | - | 996 | $ - | $ 45,000 |
Reinvestment of distributions | 17 | 25 | 835 | 1,133 |
Shares redeemed | - | (2,202) | - | (99,518) |
Net increase (decrease) | 17 | (1,181) | $ 835 | $ (53,385) |
Fidelity Income Replacement 2022 Fund | | | | |
Class A | | | | |
Shares sold | 567 | - | $ 27,240 | $ - |
Reinvestment of distributions | 11 | 8 | 547 | 338 |
Shares redeemed | (31) | (2,006) | (1,444) | (84,777) |
Net increase (decrease) | 547 | (1,998) | $ 26,343 | $ (84,439) |
Class T | | | | |
Shares sold | - | 1,105 | $ - | $ 48,498 |
Reinvestment of distributions | 13 | 31 | 614 | 1,374 |
Shares redeemed | (113) | (2,115) | (5,366) | (94,162) |
Net increase (decrease) | (100) | (979) | $ (4,752) | $ (44,290) |
Class C | | | | |
Shares sold | - | - | $ - | $ - |
Reinvestment of distributions | 3 | 14 | 152 | 640 |
Shares redeemed | (212) | (699) | (9,959) | (31,230) |
Net increase (decrease) | (209) | (685) | $ (9,807) | $ (30,590) |
Income Replacement 2022 | | | | |
Shares sold | 7,565 | 9,043 | $ 364,469 | $ 391,098 |
Reinvestment of distributions | 265 | 462 | 12,940 | 20,398 |
Shares redeemed | (1,772) | (13,142) | (83,894) | (587,330) |
Net increase (decrease) | 6,058 | (3,637) | $ 293,515 | $ (175,834) |
Institutional Class | | | | |
Shares sold | - | - | $ - | $ - |
Reinvestment of distributions | 2 | 4 | 72 | 166 |
Shares redeemed | (25) | (3,867) | (1,158) | (173,132) |
Net increase (decrease) | (23) | (3,863) | $ (1,086) | $ (172,966) |
Fidelity Income Replacement 2024 Fund | | | | |
Class A | | | | |
Shares sold | - | - | $ - | $ - |
Reinvestment of distributions | 68 | 108 | 3,305 | 4,833 |
Shares redeemed | (598) | (1,295) | (28,922) | (57,768) |
Net increase (decrease) | (530) | (1,187) | $ (25,617) | $ (52,935) |
Class T | | | | |
Shares sold | - | 295 | $ - | $ 13,015 |
Reinvestment of distributions | 14 | 27 | 655 | 1,197 |
Shares redeemed | (261) | (804) | (12,189) | (35,887) |
Net increase (decrease) | (247) | (482) | $ (11,534) | $ (21,675) |
Class C | | | | |
Shares sold | - | - | $ - | $ - |
Reinvestment of distributions | 19 | 19 | 912 | 835 |
Shares redeemed | (35) | (71) | (1,630) | (2,945) |
Net increase (decrease) | (16) | (52) | $ (718) | $ (2,110) |
Income Replacement 2024 | | | | |
Shares sold | 1,730 | 9,741 | $ 84,592 | $ 422,106 |
Reinvestment of distributions | 124 | 143 | 6,073 | 6,430 |
Shares redeemed | (723) | (5,344) | (34,320) | (239,126) |
Net increase (decrease) | 1,131 | 4,540 | $ 56,345 | $ 189,410 |
Semiannual Report
7. Share Transactions - continued
| Shares | Dollars |
| Six months ended
January 31,
2011 | Year ended
July 31,
2010 | Six months ended
January 31,
2011 | Year ended
July 31,
2010 |
Fidelity Income Replacement 2024 Fund | | | | |
Institutional Class | | | | |
Shares sold | - | - | $ - | $ - |
Reinvestment of distributions | 11 | 24 | 534 | 1,064 |
Shares redeemed | (177) | (580) | (8,334) | (25,832) |
Net increase (decrease) | (166) | (556) | $ (7,800) | $ (24,768) |
Fidelity Income Replacement 2026 Fund | | | | |
Class A | | | | |
Shares sold | - | - | $ - | $ - |
Reinvestment of distributions | 12 | 26 | 584 | 1,147 |
Shares redeemed | (218) | (713) | (10,135) | (31,427) |
Net increase (decrease) | (206) | (687) | $ (9,551) | $ (30,280) |
Class T | | | | |
Shares sold | 145 | 2,332 | $ 6,445 | $ 103,846 |
Reinvestment of distributions | 29 | 39 | 1,415 | 1,739 |
Shares redeemed | (149) | (1,146) | (6,598) | (50,896) |
Net increase (decrease) | 25 | 1,225 | $ 1,262 | $ 54,689 |
Class C | | | | |
Shares sold | - | - | $ - | $ - |
Reinvestment of distributions | 43 | 55 | 2,073 | 2,424 |
Shares redeemed | (105) | (653) | (4,952) | (29,483) |
Net increase (decrease) | (62) | (598) | $ (2,879) | $ (27,059) |
Income Replacement 2026 | | | | |
Shares sold | 9,591 | 11,631 | $ 464,049 | $ 516,873 |
Reinvestment of distributions | 156 | 139 | 7,505 | 6,162 |
Shares redeemed | (2,224) | (6,640) | (108,432) | (295,846) |
Net increase (decrease) | 7,523 | 5,130 | $ 363,122 | $ 227,189 |
Institutional Class | | | | |
Shares sold | - | - | $ - | $ - |
Reinvestment of distributions | 11 | 24 | 519 | 1,055 |
Shares redeemed | (178) | (581) | (8,273) | (25,621) |
Net increase (decrease) | (167) | (557) | $ (7,754) | $ (24,566) |
Fidelity Income Replacement 2028 Fund | | | | |
Class A | | | | |
Shares sold | - | 1,688 | $ - | $ 71,316 |
Reinvestment of distributions | 121 | 161 | 5,822 | 7,159 |
Shares redeemed | (227) | (672) | (10,731) | (29,955) |
Net increase (decrease) | (106) | 1,177 | $ (4,909) | $ 48,520 |
Class T | | | | |
Shares sold | - | - | $ - | $ - |
Reinvestment of distributions | 24 | 46 | 1,174 | 2,069 |
Shares redeemed | (4,633) | (340) | (207,261) | (15,095) |
Net increase (decrease) | (4,609) | (294) | $ (206,087) | $ (13,026) |
Class C | | | | |
Shares sold | - | - | $ - | $ - |
Reinvestment of distributions | 3 | 8 | 154 | 379 |
Shares redeemed | (50) | (965) | (2,212) | (42,703) |
Net increase (decrease) | (47) | (957) | $ (2,058) | $ (42,324) |
Income Replacement 2028 | | | | |
Shares sold | 8,817 | 7,291 | $ 431,917 | $ 328,341 |
Reinvestment of distributions | 774 | 860 | 37,731 | 38,493 |
Shares redeemed | (9,764) | (26,019) | (467,669) | (1,168,445) |
Net increase (decrease) | (173) | (17,868) | $ 1,979 | $ (801,611) |
Semiannual Report
Notes to Financial Statements (Unaudited) - continued
7. Share Transactions - continued
| Shares | Dollars |
| Six months ended
January 31,
2011 | Year ended
July 31,
2010 | Six months ended
January 31,
2011 | Year ended
July 31,
2010 |
Fidelity Income Replacement 2028 Fund | | | | |
Institutional Class | | | | |
Shares sold | - | - | $ - | $ - |
Reinvestment of distributions | 11 | 24 | 530 | 1,048 |
Shares redeemed | (176) | (575) | (8,238) | (25,500) |
Net increase (decrease) | (165) | (551) | $ (7,708) | $ (24,452) |
Fidelity Income Replacement 2030 Fund | | | | |
Class A | | | | |
Shares sold | - | 1,608 | $ - | $ 70,708 |
Reinvestment of distributions | 10 | 22 | 470 | 972 |
Shares redeemed | (343) | (1,510) | (15,896) | (65,796) |
Net increase (decrease) | (333) | 120 | $ (15,426) | $ 5,884 |
Class T | | | | |
Shares sold | - | - | $ - | $ - |
Reinvestment of distributions | 3 | 14 | 131 | 632 |
Shares redeemed | (811) | (767) | (38,608) | (33,663) |
Net increase (decrease) | (808) | (753) | $ (38,477) | $ (33,031) |
Class C | | | | |
Shares sold | 519 | - | $ 25,006 | $ - |
Reinvestment of distributions | 49 | 47 | 2,355 | 2,094 |
Shares redeemed | (367) | (250) | (17,545) | (10,986) |
Net increase (decrease) | 201 | (203) | $ 9,816 | $ (8,892) |
Income Replacement 2030 | | | | |
Shares sold | 24,184 | 30,831 | $ 1,154,235 | $ 1,381,260 |
Reinvestment of distributions | 376 | 68 | 18,252 | 3,035 |
Shares redeemed | (5,934) | (1,995) | (286,502) | (90,075) |
Net increase (decrease) | 18,626 | 28,904 | $ 885,985 | $ 1,294,220 |
Institutional Class | | | | |
Shares sold | - | - | $ - | $ - |
Reinvestment of distributions | 11 | 22 | 506 | 982 |
Shares redeemed | (177) | (578) | (8,207) | (25,388) |
Net increase (decrease) | (166) | (556) | $ (7,701) | $ (24,406) |
Fidelity Income Replacement 2032 Fund | | | | |
Class A | | | | |
Shares sold | 642 | - | $ 31,087 | $ - |
Reinvestment of distributions | 70 | 93 | 3,304 | 4,047 |
Shares redeemed | - | (107) | - | (4,502) |
Net increase (decrease) | 712 | (14) | $ 34,391 | $ (455) |
Class T | | | | |
Shares sold | - | - | $ - | $ - |
Reinvestment of distributions | 9 | 19 | 424 | 838 |
Shares redeemed | (175) | (575) | (8,035) | (24,937) |
Net increase (decrease) | (166) | (556) | $ (7,611) | $ (24,099) |
Class C | | | | |
Shares sold | - | - | $ - | $ - |
Reinvestment of distributions | 6 | 12 | 283 | 502 |
Shares redeemed | (146) | (480) | (6,687) | (20,831) |
Net increase (decrease) | (140) | (468) | $ (6,404) | $ (20,329) |
Income Replacement 2032 | | | | |
Shares sold | 6,614 | 20,546 | $ 297,485 | $ 869,619 |
Reinvestment of distributions | 421 | 269 | 20,058 | 11,717 |
Shares redeemed | (397) | (21,297) | (18,331) | (886,611) |
Net increase (decrease) | 6,638 | (482) | $ 299,212 | $ (5,275) |
Semiannual Report
7. Share Transactions - continued
| Shares | Dollars |
| Six months ended
January 31,
2011 | Year ended
July 31,
2010 | Six months ended
January 31,
2011 | Year ended
July 31,
2010 |
Fidelity Income Replacement 2032 Fund | | | | |
Institutional Class | | | | |
Shares sold | 550 | 565 | $ 25,000 | $ 25,000 |
Reinvestment of distributions | 8 | 25 | 387 | 1,078 |
Shares redeemed | (1,493) | (582) | (71,539) | (25,236) |
Net increase (decrease) | (935) | 8 | $ (46,152) | $ 842 |
Fidelity Income Replacement 2034 Fund | | | | |
Class A | | | | |
Shares sold | - | - | $ - | $ - |
Reinvestment of distributions | 7 | 17 | 347 | 757 |
Shares redeemed | (132) | (984) | (6,047) | (41,642) |
Net increase (decrease) | (125) | (967) | $ (5,700) | $ (40,885) |
Class T | | | | |
Shares sold | - | - | $ - | $ - |
Reinvestment of distributions | 9 | 20 | 419 | 892 |
Shares redeemed | (174) | (569) | (7,975) | (24,737) |
Net increase (decrease) | (165) | (549) | $ (7,556) | $ (23,845) |
Class C | | | | |
Shares sold | - | - | $ - | $ - |
Reinvestment of distributions | 5 | 12 | 254 | 503 |
Shares redeemed | (132) | (434) | (6,064) | (18,880) |
Net increase (decrease) | (127) | (422) | $ (5,810) | $ (18,377) |
Income Replacement 2034 | | | | |
Shares sold | 5,686 | 5,032 | $ 275,526 | $ 225,749 |
Reinvestment of distributions | 295 | 383 | 14,230 | 16,703 |
Shares redeemed | (5,678) | (8,062) | (274,219) | (352,058) |
Net increase (decrease) | 303 | (2,647) | $ 15,537 | $ (109,606) |
Institutional Class | | | | |
Shares sold | - | - | $ - | $ - |
Reinvestment of distributions | 25 | 39 | 1,208 | 1,717 |
Shares redeemed | - | (586) | (21) | (25,063) |
Net increase (decrease) | 25 | (547) | $ 1,187 | $ (23,346) |
Fidelity Income Replacement 2036 Fund | | | | |
Class A | | | | |
Shares sold | - | 128 | $ - | $ 5,725 |
Reinvestment of distributions | 11 | 23 | 504 | 973 |
Shares redeemed | (199) | (600) | (9,048) | (25,767) |
Net increase (decrease) | (188) | (449) | $ (8,544) | $ (19,069) |
Class T | | | | |
Shares sold | 12 | 82 | $ 553 | $ 3,536 |
Reinvestment of distributions | 40 | 54 | 1,913 | 2,334 |
Shares redeemed | (150) | (756) | (6,897) | (33,710) |
Net increase (decrease) | (98) | (620) | $ (4,431) | $ (27,840) |
Class C | | | | |
Shares sold | - | 979 | $ - | $ 39,435 |
Reinvestment of distributions | 28 | 41 | 1,330 | 1,752 |
Shares redeemed | (188) | (1,217) | (8,716) | (52,088) |
Net increase (decrease) | (160) | (197) | $ (7,386) | $ (10,901) |
Income Replacement 2036 | | | | |
Shares sold | 15,889 | 2,159 | $ 750,000 | $ 86,419 |
Reinvestment of distributions | 239 | 99 | 11,414 | 4,266 |
Shares redeemed | (644) | (4,508) | (30,743) | (191,085) |
Net increase (decrease) | 15,484 | (2,250) | $ 730,671 | $ (100,400) |
Semiannual Report
Notes to Financial Statements (Unaudited) - continued
7. Share Transactions - continued
| Shares | Dollars |
| Six months ended
January 31,
2011 | Year ended
July 31,
2010 | Six months ended
January 31,
2011 | Year ended
July 31,
2010 |
Fidelity Income Replacement 2036 Fund | | | | |
Institutional Class | | | | |
Shares sold | 28 | 1,348 | $ 1,283 | $ 59,043 |
Reinvestment of distributions | 31 | 33 | 1,459 | 1,403 |
Shares redeemed | (491) | (723) | (22,150) | (31,039) |
Net increase (decrease) | (432) | 658 | $ (19,408) | $ 29,407 |
Fidelity Income Replacement 2038 Fund | | | | |
Class A | | | | |
Shares sold | - | 667 | $ - | $ 28,000 |
Reinvestment of distributions | 11 | 24 | 516 | 996 |
Shares redeemed | (37) | (2,898) | (1,526) | (123,534) |
Net increase (decrease) | (26) | (2,207) | $ (1,010) | $ (94,538) |
Class T | | | | |
Shares sold | - | - | $ - | $ - |
Reinvestment of distributions | 10 | 21 | 475 | 896 |
Shares redeemed | (190) | (622) | (8,472) | (26,247) |
Net increase (decrease) | (180) | (601) | $ (7,997) | $ (25,351) |
Class C | | | | |
Shares sold | - | 1,458 | $ - | $ 65,000 |
Reinvestment of distributions | 20 | 18 | 940 | 774 |
Shares redeemed | (462) | (823) | (20,624) | (34,657) |
Net increase (decrease) | (442) | 653 | $ (19,684) | $ 31,117 |
Income Replacement 2038 | | | | |
Shares sold | 102 | 19,983 | $ 4,637 | $ 804,508 |
Reinvestment of distributions | 496 | 594 | 23,240 | 25,218 |
Shares redeemed | (19,191) | (2,784) | (912,335) | (118,526) |
Net increase (decrease) | (18,593) | 17,793 | $ (884,458) | $ 711,200 |
Institutional Class | | | | |
Shares sold | - | - | $ - | $ - |
Reinvestment of distributions | 12 | 27 | 568 | 1,151 |
Shares redeemed | (192) | (628) | (8,693) | (26,515) |
Net increase (decrease) | (180) | (601) | $ (8,125) | $ (25,364) |
Fidelity Income Replacement 2040 Fund | | | | |
Class A | | | | |
Shares sold | 1,226 | - | $ 56,828 | $ - |
Reinvestment of distributions | 20 | 21 | 957 | 909 |
Shares redeemed | (241) | (697) | (10,977) | (29,560) |
Net increase (decrease) | 1,005 | (676) | $ 46,808 | $ (28,651) |
Class T | | | | |
Shares sold | 31 | 766 | $ 1,384 | $ 32,205 |
Reinvestment of distributions | 38 | 44 | 1,798 | 1,859 |
Shares redeemed | (1) | (849) | (45) | (35,678) |
Net increase (decrease) | 68 | (39) | $ 3,137 | $ (1,614) |
Class C | | | | |
Shares sold | - | 1,585 | $ - | $ 67,225 |
Reinvestment of distributions | 22 | 14 | 1,047 | 599 |
Shares redeemed | (502) | (765) | (22,474) | (32,264) |
Net increase (decrease) | (480) | 834 | $ (21,427) | $ 35,560 |
Income Replacement 2040 | | | | |
Shares sold | 12,026 | 51,547 | $ 569,527 | $ 2,203,936 |
Reinvestment of distributions | 327 | 391 | 15,370 | 16,805 |
Shares redeemed | (5,911) | (32,503) | (276,118) | (1,366,427) |
Net increase (decrease) | 6,442 | 19,435 | $ 308,779 | $ 854,314 |
Semiannual Report
7. Share Transactions - continued
| Shares | Dollars |
| Six months ended
January 31,
2011 | Year ended
July 31,
2010 | Six months ended
January 31,
2011 | Year ended
July 31,
2010 |
Fidelity Income Replacement 2040 Fund | | | | |
Institutional Class | | | | |
Shares sold | - | 857 | $ - | $ 35,012 |
Reinvestment of distributions | 20 | 39 | 940 | 1,633 |
Shares redeemed | (316) | (935) | (14,148) | (39,625) |
Net increase (decrease) | (296) | (39) | $ (13,208) | $ (2,980) |
Fidelity Income Replacement 2042 Fund | | | | |
Class A | | | | |
Shares sold | 4 | 1,685 | $ 169 | $ 72,288 |
Reinvestment of distributions | 9 | 36 | 413 | 1,552 |
Shares redeemed | (147) | (3,326) | (6,605) | (142,410) |
Net increase (decrease) | (134) | (1,605) | $ (6,023) | $ (68,570) |
Class T | | | | |
Shares sold | - | - | $ - | $ - |
Reinvestment of distributions | 10 | 19 | 487 | 808 |
Shares redeemed | (189) | (621) | (8,485) | (26,230) |
Net increase (decrease) | (179) | (602) | $ (7,998) | $ (25,422) |
Class C | | | | |
Shares sold | - | - | $ - | $ - |
Reinvestment of distributions | 8 | 13 | 393 | 562 |
Shares redeemed | (187) | (615) | (8,365) | (25,273) |
Net increase (decrease) | (179) | (602) | $ (7,972) | $ (24,711) |
Income Replacement 2042 | | | | |
Shares sold | 20,501 | 45,150 | $ 979,327 | $ 1,897,966 |
Reinvestment of distributions | 963 | 960 | 45,246 | 40,980 |
Shares redeemed | (4,882) | (3,141) | (225,966) | (134,772) |
Net increase (decrease) | 16,582 | 42,969 | $ 798,607 | $ 1,804,174 |
Institutional Class | | | | |
Shares sold | - | - | $ - | $ - |
Reinvestment of distributions | 12 | 25 | 581 | 1,066 |
Shares redeemed | (192) | (627) | (8,607) | (26,500) |
Net increase (decrease) | (180) | (602) | $ (8,026) | $ (25,434) |
8. Other.
The Funds' organizational documents provide former and current trustees and officers with a limited indemnification against liabilities arising in connection with the performance of their duties to the Funds. In the normal course of business, the Funds may also enter into contracts that provide general indemnifications. The Funds' maximum exposure under these arrangements is unknown as this would be dependent on future claims that may be made against the Funds. The risk of material loss from such claims is considered remote.
The Funds do not invest in the Underlying Funds for the purpose of exercising management or control; however, investments by the Funds within their principle investments strategies may represent a significant portion of the Underlying Fund's net assets. At the end of the period, the following Funds were the owners of record of 10% or more of the total outstanding shares of the Underlying Funds.
Fund | Income Replacement 2016 Fund | Income Replacement 2028 Fund | Income Replacement 2042 Fund |
Fidelity Series Broad Market Opportunities Fund | 12% | 15% | 12% |
The Funds, in aggregate, were the owners of record of more than 20% of the total outstanding shares of the following Underlying Funds.
Fund | % of shares held |
Fidelity Series Broad Market Opportunities Fund | 100% |
Semiannual Report
Board Approval of Investment Advisory Contracts and Management Fees
Fidelity Income Replacement Funds
Each year, the Board of Trustees, including the Independent Trustees (together, the Board), votes on the renewal of the management contract (the Advisory Contract) for each fund. The Board, assisted by the advice of fund counsel and Independent Trustees' counsel, requests and considers a broad range of information relevant to the renewal of the Advisory Contracts throughout the year.
The Board meets regularly and considers at each of its meetings factors that are relevant to its annual consideration of the renewal of each fund's Advisory Contract, including the services and support provided to each fund and its shareholders. The Board has established three standing committees, each composed of Independent Trustees with varying backgrounds, to which the Board has assigned specific subject matter responsibilities in order to enhance effective decision-making by the Board. The Operations Committee, of which all of the Independent Trustees are members, meets regularly throughout the year and, among other matters, considers matters specifically related to the annual consideration of the renewal of each fund's Advisory Contract. The Board, acting directly and through its Committees, requests and receives information concerning the annual consideration of the renewal of each fund's Advisory Contract. The Board also meets as needed to consider matters specifically related to the Board's annual consideration of the renewal of Advisory Contract. Members of the Board may also meet with trustees of other Fidelity funds through ad hoc joint committees to discuss certain matters relevant to the Fidelity funds.
At its September 2010 meeting, the Board of Trustees, including the Independent Trustees, unanimously determined to renew each fund's Advisory Contract. In reaching its determination, the Board considered all factors it believed relevant and reached a determination, with the assistance of fund counsel and Independent Trustees' counsel and through the exercise of its business judgment, that the renewal of each fund's Advisory Contract and is in the best interests of each fund and its shareholders and that the lack of compensation to be received by Fidelity under the management contracts is fair and reasonable. The Board's decision to renew each fund's Advisory Contract was not based on any single factor, but rather was based on a comprehensive consideration of all the information provided to the Board at its meetings throughout the year. In reaching its determination, the Board is aware that shareholders in each fund have a broad range of investment choices available to them, including a wide choice among mutual funds offered by Fidelity's competitors, and that each fund's shareholders, with the opportunity to review and weigh the disclosure provided by the fund in its prospectus and other public disclosures, have chosen to invest in that fund, managed by Fidelity.
Nature, Extent, and Quality of Services Provided. The Board considered the staffing within the investment adviser, Strategic Advisers, Inc. (the Investment Adviser), including the backgrounds of the funds' investment personnel and the funds' investment objectives and disciplines. The Independent Trustees also had discussions with senior management of Fidelity's investment operations and investment groups. The Board considered the structure of the portfolio manager compensation program and whether this structure provides appropriate incentives to act in the best interest of each fund.
Resources Dedicated to Investment Management and Support Services. The Board reviewed the size, education, and experience of the Investment Adviser's investment staff, its use of technology, and the Investment Adviser's approach to recruiting, training, and retaining portfolio managers and other research, advisory, and management personnel. The Board noted that Fidelity's analysts have access to a variety of technological tools and market and securities data that enable them to perform both fundamental and quantitative analysis and to specialize in various disciplines. The Board noted FMR's continued focus on strengthening the organization and discipline of equity portfolio management and research.
Shareholder and Administrative Services. The Board considered (i) the nature, extent, quality, and cost of advisory, administrative, and shareholder services performed by the Investment Adviser and its affiliates under the each fund's Advisory Contract and under separate agreements covering transfer agency, pricing and bookkeeping, and securities lending services for each fund; (ii) the nature and extent of the investment adviser's supervision of third party service providers, principally custodians and subcustodians; and (iii) the resources devoted to, and the record of compliance with, each fund's compliance policies and procedures.
The Board noted that the growth of fund assets over time across the complex allows Fidelity to reinvest in the development of services designed to enhance the value or convenience of the Fidelity funds as investment vehicles. These services include 24-hour access to account information and market information through telephone representatives and over the Internet, and investor education materials and asset allocation tools.
Investment in a Large Fund Family. The Board considered the benefits to shareholders of investing in a Fidelity fund, including the benefits of investing in a fund that is part of a large family of funds offering a variety of investment disciplines and providing a large variety of mutual fund investor services. The Board noted that Fidelity had taken, or had made recommendations that resulted in the Fidelity funds taking, a number of actions over the previous year that benefited particular funds, including (i) dedicating additional resources to investment research and restructuring and broadening the focus of the investment research teams; (ii) bolstering the senior management team that oversees asset management; (iii) launching Class F of certain funds as a lower-fee class available to Freedom K and Freedom Index Funds; (iv) lowering the initial investment minimums and ongoing balance requirements for Real Estate High Income Fund; (v) eliminating subsequent purchase minimums for all funds and adding a waiver of the investment minimum requirement for new accounts opened with the proceeds of a systematic withdrawal plan; (vi) eliminating the withdrawal minimum and maximum limits for systematic withdrawals from Advisor funds; (vii) expanding sales load waivers on Class A shares for Destiny Planholders and expanding Institutional Class eligibility for Class O Destiny Planholders; and (viii) changing certain Class A and Class T sales charge structures to further align them with industry practices.
Semiannual Report
Investment Performance. The Board considered whether each fund has operated in accordance with its investment objective, as well as its record of compliance with its investment restrictions. It also reviewed each fund's absolute investment performance for each class, as well as each fund's relative investment performance for each class measured against a proprietary custom index. The Board noted that FMR does not believe that a meaningful peer group exists against which to compare any of the funds' performance.
Because each of Income Replacement 2016 Fund, Income Replacement 2020 Fund, Income Replacement 2028 Fund, Income Replacement 2030 Fund, Income Replacement 2032 Fund, Income Replacement 2034 Fund, Income Replacement 2036 Fund, and Income Replacement 2040 Fund had been in existence less than three calendar years, for each fund the following chart considered by the Board shows, for the one-year period ended December 31, 2009, the total returns of the retail class and Class C of the fund, and the total return of a proprietary custom index ("benchmark"). The returns of the retail class and Class C show the performance of the highest and lowest performing classes, respectively.
Because each of Income Replacement 2018 Fund, Income Replacement 2022 Fund, Income Replacement 2024 Fund, Income Replacement 2026 Fund, Income Replacement 2038 Fund, and Income Replacement 2042 Fund had been in existence less than three calendar years, for each fund the following chart considered by the Board shows, for the one-year period ended December 31, 2009, the total returns of Institutional Class (Class I) and Class C of the fund, and the total return of a proprietary custom index ("benchmark"). The returns of Institutional Class (Class I) and Class C show the performance of the highest and lowest performing classes, respectively.
For each fund, the proprietary custom index is an index developed by FMR that represents the performance of the fund's asset classes according to their respective weightings.
Income Replacement 2016
The Board noted that the investment performance of the retail class of the fund compared favorably to its benchmark for the period shown. The Board considered that the variations in performance among the fund's classes reflect the variations in class expenses, which result in lower performance for higher expense classes. The Board also reviewed the fund's performance since inception as well as performance in the current year. The Board noted that it is difficult to evaluate in any comprehensive fashion the performance of the fund, in light of its relatively recent commencement of operations.
Semiannual Report
Board Approval of Investment Advisory Contracts and Management Fees - continued
Income Replacement 2018
The Board noted that the investment performance of Institutional Class (Class I) of the fund compared favorably to its benchmark for the period shown. The Board considered that the variations in performance among the fund's classes reflect the variations in class expenses, which result in lower performance for higher expense classes. The Board also reviewed the fund's performance since inception as well as performance in the current year. The Board noted that it is difficult to evaluate in any comprehensive fashion the performance of the fund, in light of its relatively recent commencement of operations.
Income Replacement 2020
The Board noted that the investment performance of the retail class of the fund compared favorably to its benchmark for the period shown. The Board considered that the variations in performance among the fund's classes reflect the variations in class expenses, which result in lower performance for higher expense classes. The Board also reviewed the fund's performance since inception as well as performance in the current year. The Board noted that it is difficult to evaluate in any comprehensive fashion the performance of the fund, in light of its relatively recent commencement of operations.
Semiannual Report
Income Replacement 2022
The Board noted that the investment performance of Institutional Class (Class I) of the fund compared favorably to its benchmark for the period shown. The Board considered that the variations in performance among the fund's classes reflect the variations in class expenses, which result in lower performance for higher expense classes. The Board also reviewed the fund's performance since inception as well as performance in the current year. The Board noted that it is difficult to evaluate in any comprehensive fashion the performance of the fund, in light of its relatively recent commencement of operations.
Income Replacement 2024
The Board noted that the investment performance of Institutional Class (Class I) of the fund compared favorably to its benchmark for the period shown. The Board considered that the variations in performance among the fund's classes reflect the variations in class expenses, which result in lower performance for higher expense classes. The Board also reviewed the fund's performance since inception as well as performance in the current year. The Board noted that it is difficult to evaluate in any comprehensive fashion the performance of the fund, in light of its relatively recent commencement of operations.
Semiannual Report
Board Approval of Investment Advisory Contracts and Management Fees - continued
Income Replacement 2026
The Board noted that the investment performance of Institutional Class (Class I) of the fund compared favorably to its benchmark for the period shown. The Board considered that the variations in performance among the fund's classes reflect the variations in class expenses, which result in lower performance for higher expense classes. The Board also reviewed the fund's performance since inception as well as performance in the current year. The Board noted that it is difficult to evaluate in any comprehensive fashion the performance of the fund, in light of its relatively recent commencement of operations.
Income Replacement 2028
The Board noted that the investment performance of the retail class of the fund compared favorably to its benchmark for the period shown. The Board considered that the variations in performance among the fund's classes reflect the variations in class expenses, which result in lower performance for higher expense classes. The Board also reviewed the fund's performance since inception as well as performance in the current year. The Board noted that it is difficult to evaluate in any comprehensive fashion the performance of the fund, in light of its relatively recent commencement of operations.
Semiannual Report
Income Replacement 2030
The Board noted that the investment performance of the retail class of the fund compared favorably to its benchmark for the period shown. The Board considered that the variations in performance among the fund's classes reflect the variations in class expenses, which result in lower performance for higher expense classes. The Board also reviewed the fund's performance since inception as well as performance in the current year. The Board noted that it is difficult to evaluate in any comprehensive fashion the performance of the fund, in light of its relatively recent commencement of operations.
Income Replacement 2032
The Board noted that the investment performance of the retail class of the fund compared favorably to its benchmark for the period shown. The Board considered that the variations in performance among the fund's classes reflect the variations in class expenses, which result in lower performance for higher expense classes. The Board also reviewed the fund's performance since inception as well as performance in the current year. The Board noted that it is difficult to evaluate in any comprehensive fashion the performance of the fund, in light of its relatively recent commencement of operations.
Semiannual Report
Board Approval of Investment Advisory Contracts and Management Fees - continued
Income Replacement 2034
The Board noted that the investment performance of the retail class of the fund compared favorably to its benchmark for the period shown. The Board considered that the variations in performance among the fund's classes reflect the variations in class expenses, which result in lower performance for higher expense classes. The Board also reviewed the fund's performance since inception as well as performance in the current year. The Board noted that it is difficult to evaluate in any comprehensive fashion the performance of the fund, in light of its relatively recent commencement of operations.
Income Replacement 2036
The Board noted that the investment performance of the retail class of the fund compared favorably to its benchmark for the period shown. The Board considered that the variations in performance among the fund's classes reflect the variations in class expenses, which result in lower performance for higher expense classes. The Board also reviewed the fund's performance since inception as well as performance in the current year. The Board noted that it is difficult to evaluate in any comprehensive fashion the performance of the fund, in light of its relatively recent commencement of operations.
Semiannual Report
Income Replacement 2038
The Board noted that the investment performance of Institutional Class (Class I) of the fund compared favorably to its benchmark for the period shown. The Board considered that the variations in performance among the fund's classes reflect the variations in class expenses, which result in lower performance for higher expense classes. The Board also reviewed the fund's performance since inception as well as performance in the current year. The Board noted that it is difficult to evaluate in any comprehensive fashion the performance of the fund, in light of its relatively recent commencement of operations.
Income Replacement 2040
The Board noted that the investment performance of the retail class of the fund compared favorably to its benchmark for the period shown. The Board considered that the variations in performance among the fund's classes reflect the variations in class expenses, which result in lower performance for higher expense classes. The Board also reviewed the fund's performance since inception as well as performance in the current year. The Board noted that it is difficult to evaluate in any comprehensive fashion the performance of the fund, in light of its relatively recent commencement of operations.
Semiannual Report
Board Approval of Investment Advisory Contracts and Management Fees - continued
Income Replacement 2042
The Board noted that the investment performance of Institutional Class (Class I) of the fund compared favorably to its benchmark for the period shown. The Board considered that the variations in performance among the fund's classes reflect the variations in class expenses, which result in lower performance for higher expense classes. The Board also reviewed the fund's performance since inception as well as performance in the current year. The Board noted that it is difficult to evaluate in any comprehensive fashion the performance of the fund, in light of its relatively recent commencement of operations.
Based on its review, and giving particular weight to the nature and quality of the resources dedicated by the Investment Adviser to maintain and improve relative performance and factoring in the unprecedented market events in recent years, the Board concluded that the nature, extent, and quality of investment management and support services and of shareholder and administrative services provided to each fund will benefit each fund's shareholders, particularly in light of the Board's view that each fund's shareholders benefit from investing in a fund that is part of a large family of funds offering a variety of investment disciplines and services.
Competitiveness of Management Fee and Total Fund Expenses. The Board noted that the funds do not pay the Investment Adviser a management fee for investment advisory services. The Board considered each fund's management fee and total expenses compared to "mapped groups" of competitive funds and classes. Fidelity creates "mapped groups" by combining similar Lipper investment objective categories that have comparable management fee characteristics. Combining Lipper investment objective categories aids the Board's management fee and total expense comparisons by broadening the competitive group used for comparison and by reducing the number of universes to which various Fidelity funds are compared.
Management Fee. The Board considered two proprietary management fee comparisons for the 12-month (or shorter) periods shown in the charts below. The group of Lipper funds used by the Board for management fee comparisons is referred to below as the "Total Mapped Group." The Total Mapped Group comparison focuses on a fund's standing relative to the total universe of comparable funds available to investors, in terms of gross management fees before expense reimbursements or caps. "TMG %" represents the percentage of funds in the Total Mapped Group that had management fees that were lower than a fund's. For example, a TMG % of 0% means that 100% of the funds in the Total Mapped Group had higher management fees than a fund. The "Asset-Size Peer Group" (ASPG) comparison focuses on a fund's standing relative to non-Fidelity funds similar in size to the fund within the Total Mapped Group. The ASPG represents at least 15% of the funds in the Total Mapped Group with comparable asset size and management fee characteristics, subject to a minimum of 50 funds (or all funds in the Total Mapped Group if fewer than 50). Additional information, such as the ASPG quartile in which a fund's management fee ranked, is also included in the charts and considered by the Board.
Semiannual Report
Income Replacement 2016 Fund
Income Replacement 2018 Fund
Semiannual Report
Board Approval of Investment Advisory Contracts and Management Fees - continued
Income Replacement 2020 Fund
Income Replacement 2022 Fund
Semiannual Report
Income Replacement 2024 Fund
Income Replacement 2026 Fund
Semiannual Report
Board Approval of Investment Advisory Contracts and Management Fees - continued
Income Replacement 2028 Fund
Income Replacement 2030 Fund
Semiannual Report
Income Replacement 2032 Fund
Income Replacement 2034 Fund
Semiannual Report
Board Approval of Investment Advisory Contracts and Management Fees - continued
Income Replacement 2036 Fund
Income Replacement 2038 Fund
Semiannual Report
Income Replacement 2040 Fund
Income Replacement 2042 Fund
The Board noted that each fund's management fee ranked below the median of its Total Mapped Group and below the median of its ASPG for 2009.
Based on its review, the Board concluded that each fund's management fee is fair and reasonable in light of the services that the fund receives and the other factors considered.
Total Expenses. In its review of the total expenses of each class of each fund, the Board noted that each fund invests in Institutional Class of the underlying fund (if that underlying fund offers multiple classes of shares) to avoid charging fund-paid 12b-1 fees at both fund levels. The Board considered that the funds do not pay transfer agent fees. Instead, Institutional Class of each underlying fund (or the underlying fund, if that underlying fund does not offer multiple classes of shares) bears its pro rata portion of each fund's transfer agent fee according to the percentage of each fund's assets invested in that underlying fund. The Board further noted that the Investment Adviser pays all other expenses of each fund, with limited exceptions.
The Board noted that each fund offers multiple classes, each of which has a different sales load and 12b-1 fee structure, and that the multiple structures are intended to offer a range of pricing options for the intermediary market. The Board also noted that the total expenses of the classes of each fund vary primarily by the level of their 12b-1 fees.
For each of Income Replacement 2016 Fund, Income Replacement 2018 Fund, Income Replacement 2020 Fund, Income Replacement 2024 Fund, Income Replacement 2028 Fund, Income Replacement 2032 Fund, Income Replacement 2036 Fund, Income Replacement 2038 Fund, Income Replacement 2040 Fund, and Income Replacement 2042 Fund, the Board noted that the total expenses of each of Class A, Class C, Institutional Class, and the retail class of each fund ranked below its competitive median for 2009 and the total expenses of Class T ranked equal to its competitive median for 2009.
Semiannual Report
Board Approval of Investment Advisory Contracts and Management Fees - continued
For each of Income Replacement 2022 Fund, Income Replacement 2030 Fund, and Income Replacement 2034 Fund, the Board noted that the total expenses of each of Class A, Class C, Institutional Class, and the retail class of each fund ranked below its competitive median for 2009 and the total expenses of Class T ranked above its competitive median for 2009. The Board considered that the total expenses for Class T were above the median primarily because its 12b-1 fee is higher than the typical front-end load class. The Board noted that each fund offers multiple classes, each of which has a different sales load and 12b-1 fee structure, and that the multiple structures are intended to offer a range of pricing options for the intermediary market. The Board also noted that the total expenses of the classes vary primarily by the level of their 12b-1 fees, although differences in transfer agent fees may also causes expenses to vary from class to class.
For Income Replacement 2026 Fund, the Board noted that the total expenses of each class ranked below its competitive median for 2009.
Fees Charged to Other Fidelity Clients. The Board also considered Fidelity fee structures and other information with respect to clients of FMR and its affiliates, such as other mutual funds advised or subadvised by FMR or its affiliates, pension plan clients, and other institutional clients. In March 2010, the Board created an ad hoc joint committee with the board of other Fidelity funds (the Committee) to review and compare Fidelity's institutional investment advisory business with its business of providing services to the Fidelity funds, including the differences in services provided, fees charged, and costs incurred, as well as competition in their respective marketplaces.
Based on its review of total expenses and fees charged to other Fidelity clients, the Board concluded that the total expenses of each class of each fund were reasonable, although in some cases above the median of the universe presented for comparison, in light of the services that the fund and its shareholders receive and the other factors considered, including the findings of the Committee.
Costs of the Services and Profitability. The Board considered the level of Fidelity's profits in respect of all the Fidelity funds.
PricewaterhouseCoopers LLP (PwC), independent registered public accounting firm and auditor to Fidelity and certain Fidelity funds, has been engaged annually by the Board as part of the Board's assessment of Fidelity's profitability analysis. PwC's engagement includes the review and assessment of Fidelity's methodologies used in determining the revenues and expenses attributable to Fidelity's mutual fund business, and completion of agreed-upon procedures surrounding the mathematical accuracy of fund profitability and its conformity to allocation methodologies. After considering PwC's reports issued under the engagement and information provided by Fidelity, the Board believes that while other allocation methods may also be reasonable, Fidelity's profitability methodologies are reasonable in all material respects.
The Board has also reviewed Fidelity's non-fund businesses and fall-out benefits related to the mutual fund business as well as cases where Fidelity's affiliates may benefit from or be related to the funds' business.
The Board concluded that the costs of the services provided by and the profits realized by Fidelity in connection with the operation of each fund were not relevant to the renewal of each fund's Advisory Contract because the funds do not pay management fees and FMR pays all other expenses of each fund, with limited exceptions.
Economies of Scale. The Board concluded that because the funds do not pay management fees and the Investment Adviser pays all other expenses of each fund, with limited exceptions, economies of scale cannot be realized by the funds, but may be realized by the other Fidelity funds in which each fund invests.
Additional Information Requested by the Board. In order to develop fully the factual basis for consideration of the Fidelity funds' Advisory Contracts, the Board requested and received additional information on certain topics, including (i) fund performance trends, actions to be taken by FMR to improve certain funds' overall performance, and Fidelity's long-term strategies for certain funds; (ii) Fidelity's fund profitability methodology and profitability trends for certain funds; (iii) portfolio manager changes that have occurred during the past year and the amount of the investment that each portfolio manager has made in the Fidelity fund(s) that he or she manages; (iv) Fidelity's compensation structure for portfolio managers, research analysts, and other key personnel, including its effects on fund profitability, the rationale for the compensation structure, and the extent to which current market conditions have affected retention and recruitment; (v) the compensation paid by FMR to fund sub-advisers on behalf of the Fidelity funds; (vi) Fidelity's fee structures and rationale for recommending different fees among different categories of funds and classes, as well as Fidelity's voluntary waiver of fees to maintain minimum yields for certain funds and classes; (vii) the rationale for any differences between fund fee structures and fee structures in place for other Fidelity clients; and (viii) explanations regarding the relative total expenses borne by certain funds and classes, total expense competitive trends, and actions that might be taken by FMR to reduce total expenses for certain funds and classes or to achieve further economies of scale.
Based on its evaluation of all of the conclusions noted above, and after considering all factors it believed relevant, the Board ultimately concluded that the advisory fee structures are fair and reasonable, and that each fund's Advisory Contract should be renewed.
Semiannual Report
Investment Adviser
Strategic Advisers, Inc.
Boston, MA
General Distributor
Fidelity Distributors Corporation
Boston, MA
Transfer and Service Agents
Fidelity Investments Institutional Operations Company, Inc.
Boston, MA
Fidelity Service Company, Inc.
Boston, MA
Custodian
The Bank of New York Mellon
New York, NY
ARW-USAN-0311
1.848194.103
Fidelity Advisor Income Replacement FundsSM -
2016, 2018, 2020, 2022, 2024, 2026, 2028, 2030, 2032, 2034, 2036, 2038, 2040, 2042 -
Institutional Class
Semiannual Report
January 31, 2011
Each Institutional Class is a class of
Fidelity Income Replacement FundsSM
(2_fidelity_logos) (Registered_Trademark)
Contents
This report and the financial statements contained herein are submitted for the general information of the shareholders of the funds. This report is not authorized for distribution to prospective investors in the funds unless preceded or accompanied by an effective prospectus.
A fund files its complete schedule of portfolio holdings with the SEC for the first and third quarters of each fiscal year on Form N-Q. Forms N-Q are available on the SEC's web site at http://www.sec.gov. A fund's Forms N-Q may be reviewed and copied at the SEC's Public Reference Room in Washington, DC. Information regarding the operation of the SEC's Public Reference Room may be obtained by calling 1-800-SEC-0330. For a complete list of a fund's portfolio holdings, view the most recent holdings listing, semiannual report, or annual report on Fidelity's web site at http://www.fidelity.com, http://www.advisor.fidelity.com, or http://www.401k.com, as applicable.
NOT FDIC INSURED • MAY LOSE VALUE • NO BANK GUARANTEE
Neither the funds nor Fidelity Distributors Corporation is a bank.
Semiannual Report
To view a fund's proxy voting guidelines and proxy voting record for the 12-month period ended June 30, visit http://www.fidelity.com/proxyvotingresults or visit the Securities and Exchange Commission's (SEC) web site at http://www.sec.gov. You may also call 1-877-208-0098 to request a free copy of the proxy voting guidelines.
Standard & Poor's, S&P and S&P 500 are registered service marks of The McGraw-Hill Companies, Inc. and have been licensed for use by Fidelity Distributors Corporation.
Other third party marks appearing herein are the property of their respective owners.
All other marks appearing herein are registered or unregistered trademarks or service marks of FMR LLC or an affiliated company.
Semiannual Report
(photo_of_Abigail_P_Johnson)
Dear Shareholder:
Following a year in which the investment environment was volatile but generally supportive of most major asset classes, 2011 began on a positive note. U.S. equities gained ground in January, reaching their highest point since August 2008, amid indications the U.S. economy had turned a corner. Still, questions remained about the longer-term outlook, most notably persistently high unemployment. Financial markets are always unpredictable, of course, but there also are several time-tested investment principles that can help put the odds in your favor.
One of the basic tenets is to invest for the long term. Over time, riding out the markets' inevitable ups and downs has proven much more effective than selling into panic or chasing the hottest trend. Even missing only a few of the markets' best days can significantly diminish investor returns. Patience also affords the benefits of compounding - of earning interest on additional income or reinvested dividends and capital gains. There can be tax advantages and cost benefits to consider as well. While staying the course doesn't eliminate risk, it can considerably lessen the effect of short-term declines.
You can further manage your investing risk through diversification. And today, more than ever, geographic diversification should be taken into account. Studies indicate that asset allocation is the single most important determinant of a portfolio's long-term success. The right mix of stocks, bonds and cash - aligned to your particular risk tolerance and investment objective - is very important. Age-appropriate rebalancing is also an essential aspect of asset allocation. For younger investors, an emphasis on equities - which historically have been the best-performing asset class over time - is encouraged. As investors near their specific goal, such as retirement or sending a child to college, consideration may be given to replacing volatile assets (e.g. common stocks) with more-stable fixed investments (bonds or savings plans).
A third principle - investing regularly - can help lower the average cost of your purchases. Investing a certain amount of money each month or quarter helps ensure you won't pay for all your shares at market highs. This strategy - known as dollar cost averaging - also reduces "emotion" from investing, helping shareholders avoid selling weak performers just prior to an upswing, or chasing a hot performer just before a correction.
We invite you to contact us via the Internet, through our Investor Centers or by phone. It is our privilege to provide you the information you need to make the investments that are right for you.
Sincerely,
(The chairman's signature appears here.)
Abigail P. Johnson
Semiannual Report
As a shareholder of a Fund, you incur two types of costs: (1) transaction costs, including sales charges (loads) on purchase payments or redemption proceeds, and (2) ongoing costs, including distribution and/or service (12b-1) fees and other Fund expenses. This Example is intended to help you understand your ongoing costs (in dollars) of investing in the Funds and to compare these costs with the ongoing costs of investing in other mutual funds.
The Example is based on an investment of $1,000 invested at the beginning of the period and held for the entire period (August 1, 2010 to January 31, 2011).
Actual Expenses
The first line of the accompanying table for each class of each fund provides information about actual account values and actual expenses. You may use the information in this line, together with the amount you invested, to estimate the expenses that you paid over the period. Simply divide your account value by $1,000.00 (for example, an $8,600 account value divided by $1,000.00 = 8.6), then multiply the result by the number in the first line for a class of the fund under the heading entitled "Expenses Paid During Period" to estimate the expenses you paid on your account during this period. In addition, each Fund, as a shareholder in underlying Fidelity Funds, will indirectly bear its pro-rata share of the fees and expenses incurred by the underlying Fidelity Funds. These fees and expenses are not included in each Fund's annualized expense ratio used to calculate the expense estimates in the table below.
Hypothetical Example for Comparison Purposes
The second line of the accompanying table for each class of each fund provides information about hypothetical account values and hypothetical expenses based on a Class' actual expense ratio and an assumed rate of return of 5% per year before expenses, which is not the Class' actual return. The hypothetical account values and expenses may not be used to estimate the actual ending account balance or expenses you paid for the period. You may use this information to compare the ongoing costs of investing in the Fund and other funds. To do so, compare this 5% hypothetical example with the 5% hypothetical examples that appear in the shareholder reports of the other funds. In addition, each Fund, as a shareholder in underlying Fidelity Funds, will indirectly bear its pro-rata share of the fees and expenses incurred by the underlying Fidelity Funds. These fees and expenses are not included in each Fund's annualized expense ratio used to calculate the expense estimates in the table below.
Please note that the expenses shown in the table are meant to highlight your ongoing costs only and do not reflect any transaction costs. Therefore, the second line of the table is useful in comparing ongoing costs only, and will not help you determine the relative total costs of owning different funds. In addition, if these transactional costs were included, your costs would have been higher.
| Annualized
Expense Ratio | Beginning
Account Value
August 1, 2010 | Ending
Account Value
January 31, 2011 | Expenses Paid
During Period*
August 1, 2010 to
January 31, 2011 |
Fidelity Income Replacement 2016 Fund | | | | |
Class A | .25% | | | |
Actual | | $ 1,000.00 | $ 1,061.40 | $ 1.30 |
HypotheticalA | | $ 1,000.00 | $ 1,023.95 | $ 1.28 |
Class T | .50% | | | |
Actual | | $ 1,000.00 | $ 1,060.10 | $ 2.60 |
HypotheticalA | | $ 1,000.00 | $ 1,022.68 | $ 2.55 |
Class C | 1.00% | | | |
Actual | | $ 1,000.00 | $ 1,057.50 | $ 5.19 |
HypotheticalA | | $ 1,000.00 | $ 1,020.16 | $ 5.09 |
Income Replacement 2016 | .00% | | | |
Actual | | $ 1,000.00 | $ 1,062.70 | $ .00 |
HypotheticalA | | $ 1,000.00 | $ 1,025.21 | $ .00 |
Institutional Class | .00% | | | |
Actual | | $ 1,000.00 | $ 1,062.70 | $ .00 |
HypotheticalA | | $ 1,000.00 | $ 1,025.21 | $ .00 |
Fidelity Income Replacement 2018 Fund | | | | |
Class A | .25% | | | |
Actual | | $ 1,000.00 | $ 1,076.10 | $ 1.31 |
HypotheticalA | | $ 1,000.00 | $ 1,023.95 | $ 1.28 |
Class T | .50% | | | |
Actual | | $ 1,000.00 | $ 1,074.90 | $ 2.61 |
HypotheticalA | | $ 1,000.00 | $ 1,022.68 | $ 2.55 |
| Annualized
Expense Ratio | Beginning
Account Value
August 1, 2010 | Ending
Account Value
January 31, 2011 | Expenses Paid
During Period*
August 1, 2010 to
January 31, 2011 |
Fidelity Income Replacement 2018 Fund | | | | |
Class C | 1.00% | | | |
Actual | | $ 1,000.00 | $ 1,072.10 | $ 5.22 |
HypotheticalA | | $ 1,000.00 | $ 1,020.16 | $ 5.09 |
Income Replacement 2018 | .00% | | | |
Actual | | $ 1,000.00 | $ 1,077.40 | $ .00 |
HypotheticalA | | $ 1,000.00 | $ 1,025.21 | $ .00 |
Institutional Class | .00% | | | |
Actual | | $ 1,000.00 | $ 1,077.60 | $ .00 |
HypotheticalA | | $ 1,000.00 | $ 1,025.21 | $ .00 |
Fidelity Income Replacement 2020 Fund | | | | |
Class A | .25% | | | |
Actual | | $ 1,000.00 | $ 1,087.40 | $ 1.32 |
HypotheticalA | | $ 1,000.00 | $ 1,023.95 | $ 1.28 |
Class T | .50% | | | |
Actual | | $ 1,000.00 | $ 1,086.10 | $ 2.63 |
HypotheticalA | | $ 1,000.00 | $ 1,022.68 | $ 2.55 |
Class C | 1.00% | | | |
Actual | | $ 1,000.00 | $ 1,083.40 | $ 5.25 |
HypotheticalA | | $ 1,000.00 | $ 1,020.16 | $ 5.09 |
Income Replacement 2020 | .00% | | | |
Actual | | $ 1,000.00 | $ 1,088.80 | $ .00 |
HypotheticalA | | $ 1,000.00 | $ 1,025.21 | $ .00 |
Institutional Class | .00% | | | |
Actual | | $ 1,000.00 | $ 1,088.80 | $ .00 |
HypotheticalA | | $ 1,000.00 | $ 1,025.21 | $ .00 |
Fidelity Income Replacement 2022 Fund | | | | |
Class A | .25% | | | |
Actual | | $ 1,000.00 | $ 1,095.60 | $ 1.32 |
HypotheticalA | | $ 1,000.00 | $ 1,023.95 | $ 1.28 |
Class T | .50% | | | |
Actual | | $ 1,000.00 | $ 1,094.20 | $ 2.64 |
HypotheticalA | | $ 1,000.00 | $ 1,022.68 | $ 2.55 |
Class C | 1.00% | | | |
Actual | | $ 1,000.00 | $ 1,091.40 | $ 5.27 |
HypotheticalA | | $ 1,000.00 | $ 1,020.16 | $ 5.09 |
Income Replacement 2022 | .00% | | | |
Actual | | $ 1,000.00 | $ 1,097.10 | $ .00 |
HypotheticalA | | $ 1,000.00 | $ 1,025.21 | $ .00 |
Institutional Class | .00% | | | |
Actual | | $ 1,000.00 | $ 1,096.90 | $ .00 |
HypotheticalA | | $ 1,000.00 | $ 1,025.21 | $ .00 |
Fidelity Income Replacement 2024 Fund | | | | |
Class A | .25% | | | |
Actual | | $ 1,000.00 | $ 1,101.60 | $ 1.32 |
HypotheticalA | | $ 1,000.00 | $ 1,023.95 | $ 1.28 |
Class T | .50% | | | |
Actual | | $ 1,000.00 | $ 1,100.10 | $ 2.65 |
HypotheticalA | | $ 1,000.00 | $ 1,022.68 | $ 2.55 |
| Annualized
Expense Ratio | Beginning
Account Value
August 1, 2010 | Ending
Account Value
January 31, 2011 | Expenses Paid
During Period*
August 1, 2010 to
January 31, 2011 |
Fidelity Income Replacement 2024 Fund | | | | |
Class C | 1.00% | | | |
Actual | | $ 1,000.00 | $ 1,097.30 | $ 5.29 |
HypotheticalA | | $ 1,000.00 | $ 1,020.16 | $ 5.09 |
Income Replacement 2024 | .00% | | | |
Actual | | $ 1,000.00 | $ 1,102.80 | $ .00 |
HypotheticalA | | $ 1,000.00 | $ 1,025.21 | $ .00 |
Institutional Class | .00% | | | |
Actual | | $ 1,000.00 | $ 1,102.80 | $ .00 |
HypotheticalA | | $ 1,000.00 | $ 1,025.21 | $ .00 |
Fidelity Income Replacement 2026 Fund | | | | |
Class A | .25% | | | |
Actual | | $ 1,000.00 | $ 1,105.70 | $ 1.33 |
HypotheticalA | | $ 1,000.00 | $ 1,023.95 | $ 1.28 |
Class T | .50% | | | |
Actual | | $ 1,000.00 | $ 1,104.40 | $ 2.65 |
HypotheticalA | | $ 1,000.00 | $ 1,022.68 | $ 2.55 |
Class C | 1.00% | | | |
Actual | | $ 1,000.00 | $ 1,101.70 | $ 5.30 |
HypotheticalA | | $ 1,000.00 | $ 1,020.16 | $ 5.09 |
Income Replacement 2026 | .00% | | | |
Actual | | $ 1,000.00 | $ 1,107.40 | $ .00 |
HypotheticalA | | $ 1,000.00 | $ 1,025.21 | $ .00 |
Institutional Class | .00% | | | |
Actual | | $ 1,000.00 | $ 1,107.10 | $ .00 |
HypotheticalA | | $ 1,000.00 | $ 1,025.21 | $ .00 |
Fidelity Income Replacement 2028 Fund | | | | |
Class A | .25% | | | |
Actual | | $ 1,000.00 | $ 1,109.30 | $ 1.33 |
HypotheticalA | | $ 1,000.00 | $ 1,023.95 | $ 1.28 |
Class T | .50% | | | |
Actual | | $ 1,000.00 | $ 1,108.10 | $ 2.66 |
HypotheticalA | | $ 1,000.00 | $ 1,022.68 | $ 2.55 |
Class C | 1.00% | | | |
Actual | | $ 1,000.00 | $ 1,105.00 | $ 5.31 |
HypotheticalA | | $ 1,000.00 | $ 1,020.16 | $ 5.09 |
Income Replacement 2028 | .00% | | | |
Actual | | $ 1,000.00 | $ 1,110.60 | $ .00 |
HypotheticalA | | $ 1,000.00 | $ 1,025.21 | $ .00 |
Institutional Class | .00% | | | |
Actual | | $ 1,000.00 | $ 1,110.60 | $ .00 |
HypotheticalA | | $ 1,000.00 | $ 1,025.21 | $ .00 |
Fidelity Income Replacement 2030 Fund | | | | |
Class A | .25% | | | |
Actual | | $ 1,000.00 | $ 1,112.50 | $ 1.33 |
HypotheticalA | | $ 1,000.00 | $ 1,023.95 | $ 1.28 |
Class T | .50% | | | |
Actual | | $ 1,000.00 | $ 1,110.90 | $ 2.66 |
HypotheticalA | | $ 1,000.00 | $ 1,022.68 | $ 2.55 |
| Annualized
Expense Ratio | Beginning
Account Value
August 1, 2010 | Ending
Account Value
January 31, 2011 | Expenses Paid
During Period*
August 1, 2010 to
January 31, 2011 |
Fidelity Income Replacement 2030 Fund | | | | |
Class C | 1.00% | | | |
Actual | | $ 1,000.00 | $ 1,108.30 | $ 5.31 |
HypotheticalA | | $ 1,000.00 | $ 1,020.16 | $ 5.09 |
Income Replacement 2030 | .00% | | | |
Actual | | $ 1,000.00 | $ 1,113.90 | $ .00 |
HypotheticalA | | $ 1,000.00 | $ 1,025.21 | $ .00 |
Institutional Class | .00% | | | |
Actual | | $ 1,000.00 | $ 1,113.70 | $ .00 |
HypotheticalA | | $ 1,000.00 | $ 1,025.21 | $ .00 |
Fidelity Income Replacement 2032 Fund | | | | |
Class A | .25% | | | |
Actual | | $ 1,000.00 | $ 1,115.00 | $ 1.33 |
HypotheticalA | | $ 1,000.00 | $ 1,023.95 | $ 1.28 |
Class T | .50% | | | |
Actual | | $ 1,000.00 | $ 1,113.80 | $ 2.66 |
HypotheticalA | | $ 1,000.00 | $ 1,022.68 | $ 2.55 |
Class C | 1.00% | | | |
Actual | | $ 1,000.00 | $ 1,111.00 | $ 5.32 |
HypotheticalA | | $ 1,000.00 | $ 1,020.16 | $ 5.09 |
Income Replacement 2032 | .00% | | | |
Actual | | $ 1,000.00 | $ 1,116.60 | $ .00 |
HypotheticalA | | $ 1,000.00 | $ 1,025.21 | $ .00 |
Institutional Class | .00% | | | |
Actual | | $ 1,000.00 | $ 1,116.60 | $ .00 |
HypotheticalA | | $ 1,000.00 | $ 1,025.21 | $ .00 |
Fidelity Income Replacement 2034 Fund | | | | |
Class A | .25% | | | |
Actual | | $ 1,000.00 | $ 1,118.10 | $ 1.33 |
HypotheticalA | | $ 1,000.00 | $ 1,023.95 | $ 1.28 |
Class T | .50% | | | |
Actual | | $ 1,000.00 | $ 1,116.70 | $ 2.67 |
HypotheticalA | | $ 1,000.00 | $ 1,022.68 | $ 2.55 |
Class C | 1.00% | | | |
Actual | | $ 1,000.00 | $ 1,113.90 | $ 5.33 |
HypotheticalA | | $ 1,000.00 | $ 1,020.16 | $ 5.09 |
Income Replacement 2034 | .00% | | | |
Actual | | $ 1,000.00 | $ 1,119.30 | $ .00 |
HypotheticalA | | $ 1,000.00 | $ 1,025.21 | $ .00 |
Institutional Class | .00% | | | |
Actual | | $ 1,000.00 | $ 1,119.60 | $ .00 |
HypotheticalA | | $ 1,000.00 | $ 1,025.21 | $ .00 |
Fidelity Income Replacement 2036 Fund | | | | |
Class A | .25% | | | |
Actual | | $ 1,000.00 | $ 1,121.50 | $ 1.34 |
HypotheticalA | | $ 1,000.00 | $ 1,023.95 | $ 1.28 |
Class T | .50% | | | |
Actual | | $ 1,000.00 | $ 1,119.90 | $ 2.67 |
HypotheticalA | | $ 1,000.00 | $ 1,022.68 | $ 2.55 |
| Annualized
Expense Ratio | Beginning
Account Value
August 1, 2010 | Ending
Account Value
January 31, 2011 | Expenses Paid
During Period*
August 1, 2010 to
January 31, 2011 |
Fidelity Income Replacement 2036 Fund | | | | |
Class C | 1.00% | | | |
Actual | | $ 1,000.00 | $ 1,117.30 | $ 5.34 |
HypotheticalA | | $ 1,000.00 | $ 1,020.16 | $ 5.09 |
Income Replacement 2036 | .00% | | | |
Actual | | $ 1,000.00 | $ 1,122.70 | $ .00 |
HypotheticalA | | $ 1,000.00 | $ 1,025.21 | $ .00 |
Institutional Class | .00% | | | |
Actual | | $ 1,000.00 | $ 1,122.70 | $ .00 |
HypotheticalA | | $ 1,000.00 | $ 1,025.21 | $ .00 |
Fidelity Income Replacement 2038 Fund | | | | |
Class A | .25% | | | |
Actual | | $ 1,000.00 | $ 1,125.50 | $ 1.34 |
HypotheticalA | | $ 1,000.00 | $ 1,023.95 | $ 1.28 |
Class T | .50% | | | |
Actual | | $ 1,000.00 | $ 1,124.00 | $ 2.68 |
HypotheticalA | | $ 1,000.00 | $ 1,022.68 | $ 2.55 |
Class C | 1.00% | | | |
Actual | | $ 1,000.00 | $ 1,121.40 | $ 5.35 |
HypotheticalA | | $ 1,000.00 | $ 1,020.16 | $ 5.09 |
Income Replacement 2038 | .00% | | | |
Actual | | $ 1,000.00 | $ 1,127.10 | $ .00 |
HypotheticalA | | $ 1,000.00 | $ 1,025.21 | $ .00 |
Institutional Class | .00% | | | |
Actual | | $ 1,000.00 | $ 1,126.90 | $ .00 |
HypotheticalA | | $ 1,000.00 | $ 1,025.21 | $ .00 |
Fidelity Income Replacement 2040 Fund | | | | |
Class A | .25% | | | |
Actual | | $ 1,000.00 | $ 1,130.10 | $ 1.34 |
HypotheticalA | | $ 1,000.00 | $ 1,023.95 | $ 1.28 |
Class T | .50% | | | |
Actual | | $ 1,000.00 | $ 1,128.60 | $ 2.68 |
HypotheticalA | | $ 1,000.00 | $ 1,022.68 | $ 2.55 |
Class C | 1.00% | | | |
Actual | | $ 1,000.00 | $ 1,125.70 | $ 5.36 |
HypotheticalA | | $ 1,000.00 | $ 1,020.16 | $ 5.09 |
Income Replacement 2040 | .00% | | | |
Actual | | $ 1,000.00 | $ 1,131.60 | $ .00 |
HypotheticalA | | $ 1,000.00 | $ 1,025.21 | $ .00 |
Institutional Class | .00% | | | |
Actual | | $ 1,000.00 | $ 1,131.60 | $ .00 |
HypotheticalA | | $ 1,000.00 | $ 1,025.21 | $ .00 |
Fidelity Income Replacement 2042 Fund | | | | |
Class A | .25% | | | |
Actual | | $ 1,000.00 | $ 1,132.10 | $ 1.34 |
HypotheticalA | | $ 1,000.00 | $ 1,023.95 | $ 1.28 |
Class T | .50% | | | |
Actual | | $ 1,000.00 | $ 1,130.90 | $ 2.69 |
HypotheticalA | | $ 1,000.00 | $ 1,022.68 | $ 2.55 |
| Annualized
Expense Ratio | Beginning
Account Value
August 1, 2010 | Ending
Account Value
January 31, 2011 | Expenses Paid
During Period*
August 1, 2010 to
January 31, 2011 |
Fidelity Income Replacement 2042 Fund | | | | |
Class C | 1.00% | | | |
Actual | | $ 1,000.00 | $ 1,127.90 | $ 5.36 |
HypotheticalA | | $ 1,000.00 | $ 1,020.16 | $ 5.09 |
Income Replacement 2042 | .00% | | | |
Actual | | $ 1,000.00 | $ 1,133.60 | $ .00 |
HypotheticalA | | $ 1,000.00 | $ 1,025.21 | $ .00 |
Institutional Class | .00% | | | |
Actual | | $ 1,000.00 | $ 1,133.60 | $ .00 |
HypotheticalA | | $ 1,000.00 | $ 1,025.21 | $ .00 |
A 5% return per year before expenses
* Expenses are equal to each Class' annualized expense ratio, multiplied by the average account value over the period, multiplied by 184/365 (to reflect the one-half year period). The fees and expenses of the underlying Fidelity Funds in which the Fund invests are not included in the Fund's annualized expense ratio.
Semiannual Report
Fidelity Income Replacement 2016 Fund
Investment Changes (Unaudited)
Fund Holdings as of January 31, 2011 |
| % of fund's
net assets | % of fund's net assets
6 months ago |
Domestic Equity Funds | | |
Fidelity Advisor Mid Cap II Fund Institutional Class | 2.7 | 2.9 |
Fidelity Disciplined Equity Fund | 2.8 | 3.0 |
Fidelity Equity-Income Fund | 2.8 | 3.1 |
Fidelity Large Cap Core Enhanced Index Fund | 4.5 | 4.9 |
Fidelity Series 100 Index Fund | 3.4 | 3.7 |
Fidelity Series Broad Market Opportunities Fund | 4.5 | 4.9 |
Fidelity Series Small Cap Opportunities Fund | 1.8 | 2.0 |
| 22.5 | 24.5 |
International Equity Funds | | |
Fidelity Advisor International Discovery Fund Institutional Class | 1.8 | 2.3 |
Investment Grade Fixed-Income Funds | | |
Fidelity Government Income Fund | 8.5 | 8.3 |
Fidelity Strategic Real Return Fund | 8.5 | 8.5 |
Fidelity Total Bond Fund | 25.4 | 25.1 |
| 42.4 | 41.9 |
Short-Term Funds | | |
Fidelity Institutional Money Market Portfolio Institutional Class | 16.7 | 15.6 |
Fidelity Short-Term Bond Fund | 16.6 | 15.7 |
| 33.3 | 31.3 |
Net Other Assets (Liabilities)* | 0.0 | 0.0 |
| 100.0 | 100.0 |
* Amount represents less than 0.1% |
Asset Allocation (% of fund's net assets) |
Current |
| Domestic Equity Funds | 22.5% | |
| International Equity Funds | 1.8% | |
| Investment Grade Fixed-Income Funds | 42.4% | |
| Short-Term Funds | 33.3% | |
Six months ago |
| Domestic Equity Funds | 24.5% | |
| International Equity Funds | 2.3% | |
| Investment Grade Fixed-Income Funds | 41.9% | |
| Short-Term Funds | 31.3% | |
Expected |
| Domestic Equity Funds | 21.2% | |
| International Equity Funds | 0.8% | |
| Investment Grade Fixed-Income Funds | 41.1% | |
| Short-Term Funds | 36.9% | |
The fund invests according to an asset allocation strategy that becomes increasingly conservative over time. The six months ago allocation is based on the fund's holdings as of July 31, 2010. The current allocation is based on the fund's holdings as of January 31, 2011. The expected allocation represents the fund's anticipated allocation at July 31, 2011. |
Semiannual Report
Fidelity Income Replacement 2016 Fund
Investments January 31, 2011 (Unaudited)
Showing Percentage of Net Assets
Equity Funds - 24.3% |
| Shares | | Value |
Domestic Equity Funds - 22.5% |
Fidelity Advisor Mid Cap II Fund Institutional Class | 15,787 | | $ 289,373 |
Fidelity Disciplined Equity Fund | 12,970 | | 301,162 |
Fidelity Equity-Income Fund | 6,609 | | 301,162 |
Fidelity Large Cap Core Enhanced Index Fund | 55,056 | | 482,289 |
Fidelity Series 100 Index Fund | 40,475 | | 362,252 |
Fidelity Series Broad Market Opportunities Fund | 46,915 | | 482,288 |
Fidelity Series Small Cap Opportunities Fund | 17,634 | | 192,915 |
TOTAL DOMESTIC EQUITY FUNDS | | 2,411,441 |
International Equity Funds - 1.8% |
Fidelity Advisor International Discovery Fund Institutional Class | 5,861 | | 193,987 |
TOTAL EQUITY FUNDS (Cost $2,327,382) | 2,605,428 |
Fixed-Income Funds - 42.4% |
| Shares | | Value |
Investment Grade Fixed-Income Funds - 42.4% |
Fidelity Government Income Fund | 87,305 | | $ 908,846 |
Fidelity Strategic Real Return Fund | 93,695 | | 908,846 |
Fidelity Total Bond Fund | 253,768 | | 2,725,464 |
TOTAL FIXED-INCOME FUNDS (Cost $4,354,464) | 4,543,156 |
Short-Term Funds - 33.3% |
| | | |
Fidelity Institutional Money Market Portfolio Institutional Class | 1,784,703 | | 1,784,703 |
Fidelity Short-Term Bond Fund | 210,432 | | 1,784,467 |
TOTAL SHORT-TERM FUNDS (Cost $3,545,981) | 3,569,170 |
TOTAL INVESTMENT PORTFOLIO - 100.0% (Cost $10,227,827) | | 10,717,754 |
NET OTHER ASSETS (LIABILITIES) - 0.0% | | (2,308) |
NET ASSETS - 100% | $ 10,715,446 |
Other Information |
All investments are categorized as Level 1 under the Fair Value Hierarchy. The inputs or methodology used for valuing securities may not be an indication of the risk associated with investing in those securities. For more information on valuation inputs, please refer to the Security Valuation section in the accompanying Notes to Financial Statements. |
Income Tax Information |
At July 31, 2010, the Fund had a capital loss carryforward of approximately $245,395 of which $11,321 and $234,074 will expire in fiscal 2017 and 2018, respectively. Capital loss carryforwards are only available to offset future capital gains of the Fund to the extent provided by regulations and may be limited. |
See accompanying notes which are an integral part of the financial statements.
Semiannual Report
Fidelity Income Replacement 2016 Fund
Statement of Assets and Liabilities
| January 31, 2011 (Unaudited) |
| | |
Assets | | |
Investment in securities, at value (cost $10,227,827) - See accompanying schedule | | $ 10,717,754 |
Cash | | 11 |
Receivable for investments sold | | 130,215 |
Total assets | | 10,847,980 |
| | |
Liabilities | | |
Payable for investments purchased | $ 69,616 | |
Payable for fund shares redeemed | 61,267 | |
Distribution and service plan fees payable | 1,651 | |
Total liabilities | | 132,534 |
| | |
Net Assets | | $ 10,715,446 |
Net Assets consist of: | | |
Paid in capital | | $ 10,823,220 |
Undistributed net investment income | | 2,916 |
Accumulated undistributed net realized gain (loss) on investments | | (600,617) |
Net unrealized appreciation (depreciation) on investments | | 489,927 |
Net Assets | | $ 10,715,446 |
Calculation of Maximum Offering Price Class A:
Net Asset Value and redemption price per share ($2,057,157 ÷ 41,836.9 shares) | | $ 49.17 |
| | |
Maximum offering price per share (100/94.25 of $49.17) | | $ 52.17 |
Class T:
Net Asset Value and redemption price per share ($636,574 ÷ 12,947.1 shares) | | $ 49.17 |
| | |
Maximum offering price per share (100/96.50 of $49.17) | | $ 50.95 |
| | |
Class C:
Net Asset Value and offering price per share ($1,143,432 ÷ 23,259.5 shares)A | | $ 49.16 |
| | |
Income Replacement 2016:
Net Asset Value, offering price and redemption price per share ($6,739,718 ÷ 137,040.0 shares) | | $ 49.18 |
| | |
Institutional Class:
Net Asset Value, offering price and redemption price per share ($138,565 ÷ 2,817.4 shares) | | $ 49.18 |
A Redemption price per share is equal to net asset value less any applicable contingent deferred sales charge.
Statement of Operations
Six months ended January 31, 2011 (Unaudited) |
| | |
Investment Income | | |
Income distributions from underlying funds | | $ 123,564 |
| | |
Expenses | | |
Distribution and service plan fees | $ 9,905 | |
Independent trustees' compensation | 21 | |
Total expenses before reductions | 9,926 | |
Expense reductions | (21) | 9,905 |
Net investment income (loss) | | 113,659 |
Realized and Unrealized Gain (Loss) Realized gain (loss) on sale of underlying fund shares | (124,567) | |
Capital gain distributions from underlying funds | 78,190 | |
Total net realized gain (loss) | | (46,377) |
Change in net unrealized appreciation (depreciation) on underlying funds | | 606,670 |
Net gain (loss) | | 560,293 |
Net increase (decrease) in net assets resulting from operations | | $ 673,952 |
See accompanying notes which are an integral part of the financial statements.
Semiannual Report
Fidelity Income Replacement 2016 Fund
Financial Statements - continued
Statement of Changes in Net Assets
| Six months ended
January 31, 2011 (Unaudited) | Year ended
July 31,
2010 |
Increase (Decrease) in Net Assets | | |
Operations | | |
Net investment income (loss) | $ 113,659 | $ 190,860 |
Net realized gain (loss) | (46,377) | (128,722) |
Change in net unrealized appreciation (depreciation) | 606,670 | 877,831 |
Net increase (decrease) in net assets resulting from operations | 673,952 | 939,969 |
Distributions to shareholders from net investment income | (114,553) | (190,322) |
Distributions to shareholders from net realized gain | (58,747) | (25,833) |
Total distributions | (173,300) | (216,155) |
Share transactions - net increase (decrease) | (859,062) | 1,239,040 |
Total increase (decrease) in net assets | (358,410) | 1,962,854 |
| | |
Net Assets | | |
Beginning of period | 11,073,856 | 9,111,002 |
End of period (including undistributed net investment income of $2,916 and undistributed net investment income of $3,810, respectively) | $ 10,715,446 | $ 11,073,856 |
Financial Highlights - Class A
| Six months ended January 31, 2011 | Years ended July 31, |
| (Unaudited) | 2010 | 2009 | 2008 G |
Selected Per-Share Data | | | | |
Net asset value, beginning of period | $ 47.04 | $ 43.62 | $ 47.76 | $ 50.00 |
Income from Investment Operations | | | | |
Net investment income (loss) E | .474 | .831 | 1.118 | 1.233 |
Net realized and unrealized gain (loss) | 2.400 | 3.539 | (3.686) | (2.204) |
Total from investment operations | 2.874 | 4.370 | (2.568) | (.971) |
Distributions from net investment income | (.483) | (.830) | (1.132) | (1.129) |
Distributions from net realized gain | (.261) | (.120) | (.440) | (.140) |
Total distributions | (.744) | (.950) | (1.572) | (1.269) |
Net asset value, end of period | $ 49.17 | $ 47.04 | $ 43.62 | $ 47.76 |
Total Return B, C, D | 6.14% | 10.08% | (5.07)% | (2.02)% |
Ratios to Average Net Assets F, H | | | | |
Expenses before reductions | .25% A | .25% | .25% | .25%A |
Expenses net of fee waivers, if any | .25%A | .25% | .25% | .25%A |
Expenses net of all reductions | .25%A | .25% | .25% | .25%A |
Net investment income (loss) | 1.96%A | 1.80% | 2.72% | 2.76%A |
Supplemental Data | | | | |
Net assets, end of period (000 omitted) | $ 2,057 | $ 2,308 | $ 2,599 | $ 2,214 |
Portfolio turnover rate | 36%A | 40% | 54% | 56%A |
A Annualized
B Total returns for periods of less than one year are not annualized.
C Total returns would have been lower had certain expenses not been reduced during the periods shown.
D Total returns do not include the effect of the sales charges.
E Calculated based on average shares outstanding during the period.
F Amounts do not include the activity of the underlying funds.
G For the period August 30, 2007 (commencement of operations) to July 31, 2008.
H Expense ratios reflect operating expenses of the class. Expenses before reductions do not reflect amounts reimbursed by the investment adviser or reductions from expense offset arrangements and do not represent the amount paid by the class during periods when reimbursements or reductions occur. Expenses net of fee waivers reflect expenses after reimbursement by the investment adviser but prior to reductions from expense offset arrangements. Expenses net of all reductions represent the net expenses paid by the class but do not include expenses of the investment companies in which the Fund invests.
See accompanying notes which are an integral part of the financial statements.
Semiannual Report
Financial Highlights - Class T
| Six months ended January 31, 2011 | Years ended July 31, |
| (Unaudited) | 2010 | 2009 | 2008 G |
Selected Per-Share Data | | | | |
Net asset value, beginning of period | $ 47.04 | $ 43.62 | $ 47.75 | $ 50.00 |
Income from Investment Operations | | | | |
Net investment income (loss) E | .413 | .716 | 1.025 | 1.128 |
Net realized and unrealized gain (loss) | 2.402 | 3.540 | (3.690) | (2.219) |
Total from investment operations | 2.815 | 4.256 | (2.665) | (1.091) |
Distributions from net investment income | (.424) | (.716) | (1.025) | (1.019) |
Distributions from net realized gain | (.261) | (.120) | (.440) | (.140) |
Total distributions | (.685) | (.836) | (1.465) | (1.159) |
Net asset value, end of period | $ 49.17 | $ 47.04 | $ 43.62 | $ 47.75 |
Total Return B, C, D | 6.01% | 9.81% | (5.30)% | (2.26)% |
Ratios to Average Net Assets F, H | | | | |
Expenses before reductions | .50% A | .50% | .50% | .50%A |
Expenses net of fee waivers, if any | .50%A | .50% | .50% | .50%A |
Expenses net of all reductions | .50%A | .50% | .50% | .50%A |
Net investment income (loss) | 1.71%A | 1.55% | 2.47% | 2.51%A |
Supplemental Data | | | | |
Net assets, end of period (000 omitted) | $ 637 | $ 638 | $ 499 | $ 673 |
Portfolio turnover rate | 36%A | 40% | 54% | 56%A |
A Annualized
B Total returns for periods of less than one year are not annualized.
C Total returns would have been lower had certain expenses not been reduced during the periods shown.
D Total returns do not include the effect of the sales charges.
E Calculated based on average shares outstanding during the period.
F Amounts do not include the activity of the underlying funds.
G For the period August 30, 2007 (commencement of operations) to July 31, 2008.
H Expense ratios reflect operating expenses of the class. Expenses before reductions do not reflect amounts reimbursed by the investment adviser or reductions from expense offset arrangements and do not represent the amount paid by the class during periods when reimbursements or reductions occur. Expenses net of fee waivers reflect expenses after reimbursement by the investment adviser but prior to reductions from expense offset arrangements. Expenses net of all reductions represent the net expenses paid by the class but do not include expenses of the investment companies in which the Fund invests.
Financial Highlights - Class C
| Six months ended January 31, 2011 | Years ended July 31, |
| (Unaudited) | 2010 | 2009 | 2008 G |
Selected Per-Share Data | | | | |
Net asset value, beginning of period | $ 47.03 | $ 43.61 | $ 47.73 | $ 50.00 |
Income from Investment Operations | | | | |
Net investment income (loss)E | .292 | .485 | .822 | .904 |
Net realized and unrealized gain (loss) | 2.405 | 3.531 | (3.689) | (2.227) |
Total from investment operations | 2.697 | 4.016 | (2.867) | (1.323) |
Distributions from net investment income | (.306) | (.476) | (.813) | (.807) |
Distributions from net realized gain | (.261) | (.120) | (.440) | (.140) |
Total distributions | (.567) | (.596) | (1.253) | (.947) |
Net asset value, end of period | $ 49.16 | $ 47.03 | $ 43.61 | $ 47.73 |
Total Return B, C, D | 5.75% | 9.24% | (5.76)% | (2.71)% |
Ratios to Average Net Assets F, H | | | | |
Expenses before reductions | 1.00%A | 1.00% | 1.00% | 1.00%A |
Expenses net of fee waivers, if any | 1.00%A | 1.00% | 1.00% | 1.00%A |
Expenses net of all reductions | 1.00%A | 1.00% | 1.00% | 1.00%A |
Net investment income (loss) | 1.21%A | 1.05% | 1.97% | 2.01%A |
Supplemental Data | | | | |
Net assets, end of period (000 omitted) | $ 1,143 | $ 1,075 | $ 1,171 | $ 1,595 |
Portfolio turnover rate | 36%A | 40% | 54% | 56%A |
A Annualized
B Total returns for periods of less than one year are not annualized.
C Total returns would have been lower had certain expenses not been reduced during the periods shown.
D Total returns do not include the effect of the contingent deferred sales charge.
E Calculated based on average shares outstanding during the period.
F Amounts do not include the activity of the underlying funds.
G For the period August 30, 2007 (commencement of operations) to July 31, 2008.
H Expense ratios reflect operating expenses of the class. Expenses before reductions do not reflect amounts reimbursed by the investment adviser or reductions from expense offset arrangements and do not represent the amount paid by the class during periods when reimbursements or reductions occur. Expenses net of fee waivers reflect expenses after reimbursement by the investment adviser but prior to reductions from expense offset arrangements. Expenses net of all reductions represent the net expenses paid by the class but do not include expenses of the investment companies in which the Fund invests.
See accompanying notes which are an integral part of the financial statements.
Semiannual Report
Financial Highlights - Income Replacement 2016
| Six months ended January 31,2011 | Years ended July 31, |
| (Unaudited) | 2010 | 2009 | 2008G |
Selected Per-Share Data | | | | |
Net asset value, beginning of period | $ 47.05 | $ 43.63 | $ 47.77 | $ 50.00 |
Income from Investment Operations | | | | |
Net investment income (loss)D | .534 | .948 | 1.231 | 1.356 |
Net realized and unrealized gain (loss) | 2.401 | 3.539 | (3.692) | (2.217) |
Total from investment operations | 2.935 | 4.487 | (2.461) | (.861) |
Distributions from net investment income | (.544) | (.947) | (1.239) | (1.229) |
Distributions from net realized gain | (.261) | (.120) | (.440) | (.140) |
Total distributions | (.805) | (1.067) | (1.679) | (1.369) |
Net asset value, end of period | $ 49.18 | $ 47.05 | $ 43.63 | $ 47.77 |
Total Return B, C | 6.27% | 10.36% | (4.82)% | (1.81)% |
Ratios to Average Net Assets E, H | | | | |
Expenses before reductions F | .00%A | .00% | .00% | .00%A |
Expenses net of fee waivers, if any | .00%A | .00% | .00% | .00%A |
Expenses net of all reductions | .00%A | .00% | .00% | .00%A |
Net investment income (loss) | 2.21% A | 2.05% | 2.97% | 3.00% A |
Supplemental Data | | | | |
Net assets, end of period (000 omitted) | $ 6,740 | $ 6,946 | $ 4,733 | $ 4,880 |
Portfolio turnover rate | 36%A | 40% | 54% | 56%A |
A Annualized
B Total returns for periods of less than one year are not annualized.
C Total returns would have been lower had certain expenses not been reduced during the periods shown.
D Calculated based on average shares outstanding during the period.
E Amounts do not include the activity of the underlying funds.
F Amount represents less than .01%.
G For the period August 30, 2007 (commencement of operations) to July 31, 2008.
H Expense ratios reflect operating expenses of the class. Expenses before reductions do not reflect amounts reimbursed by the investment adviser or reductions from expense offset arrangements and do not represent the amount paid by the class during periods when reimbursements or reductions occur. Expenses net of fee waivers reflect expenses after reimbursement by the investment adviser but prior to reductions from expense offset arrangements. Expenses net of all reductions represent the net expenses paid by the class but do not include expenses of the investment companies in which the Fund invests.
Financial Highlights - Institutional Class
| Six months ended January 31, 2011 | Years ended July 31, |
| (Unaudited) | 2010 | 2009 | 2008 G |
Selected Per-Share Data | | | | |
Net asset value, beginning of period | $ 47.05 | $ 43.64 | $ 47.77 | $ 50.00 |
Income from Investment Operations | | | | |
Net investment income (loss)D | .533 | .947 | 1.235 | 1.370 |
Net realized and unrealized gain (loss) | 2.402 | 3.530 | (3.686) | (2.231) |
Total from investment operations | 2.935 | 4.477 | (2.451) | (.861) |
Distributions from net investment income | (.544) | (.947) | (1.239) | (1.229) |
Distributions from net realized gain | (.261) | (.120) | (.440) | (.140) |
Total distributions | (.805) | (1.067) | (1.679) | (1.369) |
Net asset value, end of period | $ 49.18 | $ 47.05 | $ 43.64 | $ 47.77 |
Total Return B, C | 6.27% | 10.33% | (4.80)% | (1.81)% |
Ratios to Average Net Assets E, H | | | | |
Expenses before reductions F | .00% A | .00% | .00% | .00%A |
Expenses net of fee waivers, if any | .00% A | .00% | .00% | .00%A |
Expenses net of all reductions | .00% A | .00% | .00% | .00%A |
Net investment income (loss) | 2.21%A | 2.05% | 2.97% | 3.00%A |
Supplemental Data | | | | |
Net assets, end of period (000 omitted) | $ 139 | $ 108 | $ 109 | $ 184 |
Portfolio turnover rate | 36%A | 40% | 54% | 56%A |
A Annualized
B Total returns for periods of less than one year are not annualized.
C Total returns would have been lower had certain expenses not been reduced during the periods shown.
D Calculated based on average shares outstanding during the period.
E Amounts do not include the activity of the underlying funds.
F Amount represents less than .01%.
G For the period August 30, 2007 (commencement of operations) to July 31, 2008.
H Expense ratios reflect operating expenses of the class. Expenses before reductions do not reflect amounts reimbursed by the investment adviser or reductions from expense offset arrangements and do not represent the amount paid by the class during periods when reimbursements or reductions occur. Expenses net of fee waivers reflect expenses after reimbursement by the investment adviser but prior to reductions from expense offset arrangements. Expenses net of all reductions represent the net expenses paid by the class but do not include expenses of the investment companies in which the Fund invests.
See accompanying notes which are an integral part of the financial statements.
Semiannual Report
Fidelity Income Replacement 2018 Fund
Investment Changes (Unaudited)
Fund Holdings as of January 31, 2011 |
| % of fund's
net assets | % of fund's net assets
6 months ago |
Domestic Equity Funds | | |
Fidelity Advisor Mid Cap II Fund Institutional Class | 3.5 | 3.7 |
Fidelity Disciplined Equity Fund | 3.7 | 3.8 |
Fidelity Equity-Income Fund | 3.7 | 3.9 |
Fidelity Large Cap Core Enhanced Index Fund | 5.9 | 6.2 |
Fidelity Series 100 Index Fund | 4.4 | 4.7 |
Fidelity Series Broad Market Opportunities Fund | 5.9 | 6.2 |
Fidelity Series Small Cap Opportunities Fund | 2.4 | 2.5 |
| 29.5 | 31.0 |
International Equity Funds | | |
Fidelity Advisor International Discovery Fund Institutional Class | 2.9 | 3.2 |
High Yield Fixed-Income Funds | | |
Fidelity Capital & Income Fund | 0.9 | 1.1 |
Fidelity Strategic Income Fund | 0.8 | 1.1 |
| 1.7 | 2.2 |
Investment Grade Fixed-Income Funds | | |
Fidelity Government Income Fund | 7.8 | 7.6 |
Fidelity Strategic Real Return Fund | 7.8 | 7.7 |
Fidelity Total Bond Fund | 23.3 | 22.9 |
| 38.9 | 38.2 |
Short-Term Funds | | |
Fidelity Institutional Money Market Portfolio Institutional Class | 13.5 | 12.7 |
Fidelity Short-Term Bond Fund | 13.5 | 12.7 |
| 27.0 | 25.4 |
Net Other Assets (Liabilities)* | 0.0 | 0.0 |
| 100.0 | 100.0 |
* Amount represents less than 0.1% |
Asset Allocation (% of fund's net assets) |
Current |
| Domestic Equity Funds | 29.5% | |
| International Equity Funds | 2.9% | |
| High Yield Fixed-Income Funds | 1.7% | |
| Investment Grade Fixed-Income Funds | 38.9% | |
| Short-Term Funds | 27.0% | |
Six months ago |
| Domestic Equity Funds | 31.0% | |
| International Equity Funds | 3.2% | |
| High Yield Fixed-Income Funds | 2.2% | |
| Investment Grade Fixed-Income Funds | 38.2% | |
| Short-Term Funds | 25.4% | |
Expected |
| Domestic Equity Funds | 27.8% | |
| International Equity Funds | 2.7% | |
| High Yield Fixed-Income Funds | 0.8% | |
| Investment Grade Fixed-Income Funds | 39.9% | |
| Short-Term Funds | 28.8% | |
The fund invests according to an asset allocation strategy that becomes increasingly conservative over time. The six months ago allocation is based on the fund's holdings as of July 31, 2010. The current allocation is based on the fund's holdings as of January 31, 2011. The expected allocation represents the fund's anticipated allocation at July 31, 2011. |
Semiannual Report
Fidelity Income Replacement 2018 Fund
Investments January 31, 2011 (Unaudited)
Showing Percentage of Net Assets
Equity Funds - 32.4% |
| Shares | | Value |
Domestic Equity Funds - 29.5% |
Fidelity Advisor Mid Cap II Fund Institutional Class | 11,244 | | $ 206,109 |
Fidelity Disciplined Equity Fund | 9,254 | | 214,867 |
Fidelity Equity-Income Fund | 4,715 | | 214,867 |
Fidelity Large Cap Core Enhanced Index Fund | 39,258 | | 343,904 |
Fidelity Series 100 Index Fund | 28,835 | | 258,074 |
Fidelity Series Broad Market Opportunities Fund | 33,454 | | 343,904 |
Fidelity Series Small Cap Opportunities Fund | 12,596 | | 137,795 |
TOTAL DOMESTIC EQUITY FUNDS | | 1,719,520 |
International Equity Funds - 2.9% |
Fidelity Advisor International Discovery Fund Institutional Class | 5,116 | | 169,324 |
TOTAL EQUITY FUNDS (Cost $1,870,401) | 1,888,844 |
Fixed-Income Funds - 40.6% |
| | | |
High Yield Fixed-Income Funds - 1.7% |
Fidelity Capital & Income Fund | 5,253 | | 50,797 |
Fidelity Strategic Income Fund | 4,544 | | 50,797 |
TOTAL HIGH YIELD FIXED-INCOME FUNDS | | 101,594 |
|
| Shares | | Value |
Investment Grade Fixed-Income Funds - 38.9% |
Fidelity Government Income Fund | 43,580 | | $ 453,673 |
Fidelity Strategic Real Return Fund | 46,770 | | 453,673 |
Fidelity Total Bond Fund | 126,833 | | 1,362,185 |
TOTAL INVESTMENT GRADE
FIXED-INCOME FUNDS | | 2,269,531 |
TOTAL FIXED-INCOME FUNDS (Cost $2,300,361) | 2,371,125 |
Short-Term Funds - 27.0% |
| | | |
Fidelity Institutional Money Market Portfolio Institutional Class | 789,402 | | 789,402 |
Fidelity Short-Term Bond Fund | 93,090 | | 789,402 |
TOTAL SHORT-TERM FUNDS (Cost $1,572,383) | 1,578,804 |
TOTAL INVESTMENT PORTFOLIO - 100.0% (Cost $5,743,145) | | 5,838,773 |
NET OTHER ASSETS (LIABILITIES) - 0.0% | | (437) |
NET ASSETS - 100% | $ 5,838,336 |
Other Information |
All investments are categorized as Level 1 under the Fair Value Hierarchy. The inputs or methodology used for valuing securities may not be an indication of the risk associated with investing in those securities. For more information on valuation inputs, please refer to the Security Valuation section in the accompanying Notes to Financial Statements. |
Income Tax Information |
At July 31, 2010, the Fund had a capital loss carryforward of approximately $534,410 of which $123,548 and $410,862 will expire in fiscal 2017 and 2018, respectively. Capital loss carryforwards are only available to offset future capital gains of the Fund to the extent provided by regulations and may be limited. |
See accompanying notes which are an integral part of the financial statements.
Semiannual Report
Fidelity Income Replacement 2018 Fund
Statement of Assets and Liabilities
| January 31, 2011 (Unaudited) |
| | |
Assets | | |
Investment in securities, at value (cost $5,743,145) - See accompanying schedule | | $ 5,838,773 |
Receivable for investments sold | | 49,743 |
Total assets | | 5,888,516 |
| | |
Liabilities | | |
Payable for investments purchased | $ 49,749 | |
Distribution and service plan fees payable | 431 | |
Total liabilities | | 50,180 |
| | |
Net Assets | | $ 5,838,336 |
Net Assets consist of: | | |
Paid in capital | | $ 6,434,781 |
Undistributed net investment income | | 1,608 |
Accumulated undistributed net realized gain (loss) on investments | | (693,681) |
Net unrealized appreciation (depreciation) on investments | | 95,628 |
Net Assets | | $ 5,838,336 |
Calculation of Maximum Offering Price Class A:
Net Asset Value and redemption price per share ($1,117,749 ÷ 22,704.4 shares) | | $ 49.23 |
| | |
Maximum offering price per share (100/94.25 of $49.23) | | $ 52.23 |
Class T:
Net Asset Value and redemption price per share ($52,337 ÷ 1,062.3 shares) | | $ 49.27 |
| | |
Maximum offering price per share (100/96.50 of $49.27) | | $ 51.06 |
| | |
Class C:
Net Asset Value and offering price per share ($202,288 ÷ 4,110.8 shares)A | | $ 49.21 |
| | |
Income Replacement 2018:
Net Asset Value, offering price and redemption price per share ($4,097,222 ÷ 83,204.2 shares) | | $ 49.24 |
| | |
Institutional Class:
Net Asset Value, offering price and redemption price per share ($368,740 ÷ 7,487.5 shares) | | $ 49.25 |
A Redemption price per share is equal to net asset value less any applicable contingent deferred sales charge.
Statement of Operations
Six months ended January 31, 2011 (Unaudited) |
| | |
Investment Income | | |
Income distributions from underlying funds | | $ 67,884 |
| | |
Expenses | | |
Distribution and service plan fees | $ 2,656 | |
Independent trustees' compensation | 11 | |
Total expenses before reductions | 2,667 | |
Expense reductions | (11) | 2,656 |
Net investment income (loss) | | 65,228 |
Realized and Unrealized Gain (Loss) Realized gain (loss) on sale of underlying fund shares | (26,570) | |
Capital gain distributions from underlying funds | 38,528 | |
Total net realized gain (loss) | | 11,958 |
Change in net unrealized appreciation (depreciation) on underlying funds | | 357,615 |
Net gain (loss) | | 369,573 |
Net increase (decrease) in net assets resulting from operations | | $ 434,801 |
See accompanying notes which are an integral part of the financial statements.
Semiannual Report
Statement of Changes in Net Assets
| Six months ended January 31, 2011 (Unaudited) | Year ended
July 31,
2010 |
Increase (Decrease) in Net Assets | | |
Operations | | |
Net investment income (loss) | $ 65,228 | $ 103,982 |
Net realized gain (loss) | 11,958 | (68,006) |
Change in net unrealized appreciation (depreciation) | 357,615 | 484,491 |
Net increase (decrease) in net assets resulting from operations | 434,801 | 520,467 |
Distributions to shareholders from net investment income | (65,436) | (103,950) |
Distributions to shareholders from net realized gain | (28,806) | (13,543) |
Total distributions | (94,242) | (117,493) |
Share transactions - net increase (decrease) | 66,549 | 211,898 |
Total increase (decrease) in net assets | 407,108 | 614,872 |
| | |
Net Assets | | |
Beginning of period | 5,431,228 | 4,816,356 |
End of period (including undistributed net investment income of $1,608 and undistributed net investment income of $1,816, respectively) | $ 5,838,336 | $ 5,431,228 |
Financial Highlights - Class A
| Six months ended January 31, 2011 | Years ended July 31, |
| (Unaudited) | 2010 | 2009 | 2008 G |
Selected Per-Share Data | | | | |
Net asset value, beginning of period | $ 46.45 | $ 42.81 | $ 47.46 | $ 50.00 |
Income from Investment Operations | | | | |
Net investment income (loss) E | .501 | .836 | 1.092 | 1.163 |
Net realized and unrealized gain (loss) | 3.017 | 3.763 | (4.138) | (2.454) |
Total from investment operations | 3.518 | 4.599 | (3.046) | (1.291) |
Distributions from net investment income | (.501) | (.839) | (1.124) | (1.119) |
Distributions from net realized gain | (.237) | (.120) | (.480) | (.130) |
Total distributions | (.738) | (.959) | (1.604) | (1.249) |
Net asset value, end of period | $ 49.23 | $ 46.45 | $ 42.81 | $ 47.46 |
Total Return B, C, D | 7.61% | 10.80% | (6.06)% | (2.68)% |
Ratios to Average Net Assets F, H | | | | |
Expenses before reductions | .25% A | .25% | .25% | .25%A |
Expenses net of fee waivers, if any | .25%A | .25% | .25% | .25%A |
Expenses net of all reductions | .25%A | .25% | .25% | .25%A |
Net investment income (loss) | 2.09%A | 1.83% | 2.69% | 2.60%A |
Supplemental Data | | | | |
Net assets, end of period (000 omitted) | $ 1,118 | $ 1,147 | $ 833 | $ 1,107 |
Portfolio turnover rate | 46%A | 24% | 51% | 46%A |
A Annualized
B Total returns for periods of less than one year are not annualized.
C Total returns would have been lower had certain expenses not been reduced during the periods shown.
D Total returns do not include the effect of the sales charges.
E Calculated based on average shares outstanding during the period.
F Amounts do not include the activity of the underlying funds.
G For the period August 30, 2007 (commencement of operations) to July 31, 2008.
H Expense ratios reflect operating expenses of the class. Expenses before reductions do not reflect amounts reimbursed by the investment adviser or reductions from expense offset arrangements and do not represent the amount paid by the class during periods when reimbursements or reductions occur. Expenses net of fee waivers reflect expenses after reimbursement by the investment adviser but prior to reductions from expense offset arrangements. Expenses net of all reductions represent the net expenses paid by the class but do not include expenses of the investment companies in which the Fund invests.
See accompanying notes which are an integral part of the financial statements.
Semiannual Report
Financial Highlights - Class T
| Six months ended January 31, 2011 | Years ended July 31, |
| (Unaudited) | 2010 | 2009 | 2008 G |
Selected Per-Share Data | | | | |
Net asset value, beginning of period | $ 46.48 | $ 42.83 | $ 47.46 | $ 50.00 |
Income from Investment Operations | | | | |
Net investment income (loss)E | .440 | .722 | .989 | 1.075 |
Net realized and unrealized gain (loss) | 3.028 | 3.759 | (4.128) | (2.483) |
Total from investment operations | 3.468 | 4.481 | (3.139) | (1.408) |
Distributions from net investment income | (.441) | (.711) | (1.011) | (1.002) |
Distributions from net realized gain | (.237) | (.120) | (.480) | (.130) |
Total distributions | (.678) | (.831) | (1.491) | (1.132) |
Net asset value, end of period | $ 49.27 | $ 46.48 | $ 42.83 | $ 47.46 |
Total Return B, C, D | 7.49% | 10.51% | (6.28)% | (2.91)% |
Ratios to Average Net Assets F, H | | | | |
Expenses before reductions | .50%A | .50% | .50% | .50%A |
Expenses net of fee waivers, if any | .50%A | .50% | .50% | .50%A |
Expenses net of all reductions | .50%A | .50% | .50% | .50%A |
Net investment income (loss) | 1.83%A | 1.58% | 2.44% | 2.35%A |
Supplemental Data | | | | |
Net assets, end of period (000 omitted) | $ 52 | $ 52 | $ 91 | $ 154 |
Portfolio turnover rate | 46%A | 24% | 51% | 46%A |
A Annualized
B Total returns for periods of less than one year are not annualized.
C Total returns would have been lower had certain expenses not been reduced during the periods shown.
D Total returns do not include the effect of the sales charges.
E Calculated based on average shares outstanding during the period.
F Amounts do not include the activity of the underlying funds.
G For the period August 30, 2007 (commencement of operations) to July 31, 2008.
H Expense ratios reflect operating expenses of the class. Expenses before reductions do not reflect amounts reimbursed by the investment adviser or reductions from expense offset arrangements and do not represent the amount paid by the class during periods when reimbursements or reductions occur. Expenses net of fee waivers reflect expenses after reimbursement by the investment adviser but prior to reductions from expense offset arrangements. Expenses net of all reductions represent the net expenses paid by the class but do not include expenses of the investment companies in which the Fund invests.
Financial Highlights - Class C
| Six months ended January 31, 2011 | Years ended July 31, |
| (Unaudited) | 2010 | 2009 | 2008 G |
Selected Per-Share Data | | | | |
Net asset value, beginning of period | $ 46.43 | $ 42.80 | $ 47.41 | $ 50.00 |
Income from Investment Operations | | | | |
Net investment income (loss) E | .320 | .495 | .786 | .836 |
Net realized and unrealized gain (loss) | 3.019 | 3.760 | (4.122) | (2.476) |
Total from investment operations | 3.339 | 4.255 | (3.336) | (1.640) |
Distributions from net investment income | (.322) | (.505) | (.794) | (.820) |
Distributions from net realized gain | (.237) | (.120) | (.480) | (.130) |
Total distributions | (.559) | (.625) | (1.274) | (.950) |
Net asset value, end of period | $ 49.21 | $ 46.43 | $ 42.80 | $ 47.41 |
Total Return B, C, D | 7.21% | 9.98% | (6.75)% | (3.36)% |
Ratios to Average Net Assets F, H | | | | |
Expenses before reductions | 1.00%A | 1.00% | 1.00% | 1.00%A |
Expenses net of fee waivers, if any | 1.00%A | 1.00% | 1.00% | 1.00%A |
Expenses net of all reductions | 1.00%A | 1.00% | 1.00% | 1.00%A |
Net investment income (loss) | 1.34%A | 1.08% | 1.94% | 1.85%A |
Supplemental Data | | | | |
Net assets, end of period (000 omitted) | $ 202 | $ 201 | $ 131 | $ 365 |
Portfolio turnover rate | 46%A | 24% | 51% | 46%A |
A Annualized
B Total returns for periods of less than one year are not annualized.
C Total returns would have been lower had certain expenses not been reduced during the periods shown.
D Total returns do not include the effect of the contingent deferred sales charge.
E Calculated based on average shares outstanding during the period.
F Amounts do not include the activity of the underlying funds.
G For the period August 30, 2007 (commencement of operations) to July 31, 2008.
H Expense ratios reflect operating expenses of the class. Expenses before reductions do not reflect amounts reimbursed by the investment adviser or reductions from expense offset arrangements and do not represent the amount paid by the class during periods when reimbursements or reductions occur. Expenses net of fee waivers reflect expenses after reimbursement by the investment adviser but prior to reductions from expense offset arrangements. Expenses net of all reductions represent the net expenses paid by the class but do not include expenses of the investment companies in which the Fund invests.
See accompanying notes which are an integral part of the financial statements.
Semiannual Report
Financial Highlights - Income Replacement 2018
| Six months ended January 31, 2011 | Years ended July 31, |
| (Unaudited) | 2010 | 2009 | 2008 G |
Selected Per-Share Data | | | | |
Net asset value, beginning of period | $ 46.46 | $ 42.82 | $ 47.46 | $ 50.00 |
Income from Investment Operations | | | | |
Net investment income (loss)D | .561 | .950 | 1.202 | 1.280 |
Net realized and unrealized gain (loss) | 3.016 | 3.761 | (4.138) | (2.469) |
Total from investment operations | 3.577 | 4.711 | (2.936) | (1.189) |
Distributions from net investment income | (.560) | (.951) | (1.224) | (1.221) |
Distributions from net realized gain | (.237) | (.120) | (.480) | (.130) |
Total distributions | (.797) | (1.071) | (1.704) | (1.351) |
Net asset value, end of period | $ 49.24 | $ 46.46 | $ 42.82 | $ 47.46 |
Total Return B, C | 7.74% | 11.07% | (5.81)% | (2.48)% |
Ratios to Average Net Assets E, H | | | | |
Expenses before reductions F | .00% A | .00% | .00% | .00%A |
Expenses net of fee waivers, if any | .00% A | .00% | .00% | .00%A |
Expenses net of all reductions | .00% A | .00% | .00% | .00%A |
Net investment income (loss) | 2.34%A | 2.08% | 2.94% | 2.85%A |
Supplemental Data | | | | |
Net assets, end of period (000 omitted) | $ 4,097 | $ 3,681 | $ 3,435 | $ 5,167 |
Portfolio turnover rate | 46%A | 24% | 51% | 46%A |
A Annualized
B Total returns for periods of less than one year are not annualized.
C Total returns would have been lower had certain expenses not been reduced during the periods shown.
D Calculated based on average shares outstanding during the period.
E Amounts do not include the activity of the underlying funds.
F Amount represents less than .01%.
G For the period August 30, 2007 (commencement of operations) to July 31, 2008.
H Expense ratios reflect operating expenses of the class. Expenses before reductions do not reflect amounts reimbursed by the investment adviser or reductions from expense offset arrangements and do not represent the amount paid by the class during periods when reimbursements or reductions occur. Expenses net of fee waivers reflect expenses after reimbursement by the investment adviser but prior to reductions from expense offset arrangements. Expenses net of all reductions represent the net expenses paid by the class but do not include expenses of the investment companies in which the Fund invests.
Financial Highlights - Institutional Class
| Six months ended January 31, 2011 | Years ended July 31, |
| (Unaudited) | 2010 | 2009 | 2008 G |
Selected Per-Share Data | | | | |
Net asset value, beginning of period | $ 46.46 | $ 42.82 | $ 47.47 | $ 50.00 |
Income from Investment Operations | | | | |
Net investment income (loss) D | .561 | .950 | 1.175 | 1.295 |
Net realized and unrealized gain (loss) | 3.026 | 3.761 | (4.121) | (2.474) |
Total from investment operations | 3.587 | 4.711 | (2.946) | (1.179) |
Distributions from net investment income | (.560) | (.951) | (1.224) | (1.221) |
Distributions from net realized gain | (.237) | (.120) | (.480) | (.130) |
Total distributions | (.797) | (1.071) | (1.704) | (1.351) |
Net asset value, end of period | $ 49.25 | $ 46.46 | $ 42.82 | $ 47.47 |
Total Return B, C | 7.76% | 11.07% | (5.83)% | (2.46)% |
Ratios to Average Net Assets E, H | | | | |
Expenses before reductions F | .00% A | .00% | .00% | .00%A |
Expenses net of fee waivers, if any | .00%A | .00% | .00% | .00%A |
Expenses net of all reductions | .00%A | .00% | .00% | .00%A |
Net investment income (loss) | 2.34%A | 2.08% | 2.94% | 2.85%A |
Supplemental Data | | | | |
Net assets, end of period (000 omitted) | $ 369 | $ 350 | $ 326 | $ 214 |
Portfolio turnover rate | 46%A | 24% | 51% | 46%A |
A Annualized
B Total returns for periods of less than one year are not annualized.
C Total returns would have been lower had certain expenses not been reduced during the periods shown.
D Calculated based on average shares outstanding during the period.
E Amounts do not include the activity of the underlying funds.
F Amount represents less than .01%.
G For the period August 30, 2007 (commencement of operations) to July 31, 2008.
H Expense ratios reflect operating expenses of the class. Expenses before reductions do not reflect amounts reimbursed by the investment adviser or reductions from expense offset arrangements and do not represent the amount paid by the class during periods when reimbursements or reductions occur. Expenses net of fee waivers reflect expenses after reimbursement by the investment adviser but prior to reductions from expense offset arrangements. Expenses net of all reductions represent the net expenses paid by the class but do not include expenses of the investment companies in which the Fund invests.
See accompanying notes which are an integral part of the financial statements.
Semiannual Report
Fidelity Income Replacement 2020 Fund
Investment Changes (Unaudited)
Fund Holdings as of January 31, 2011 |
| % of fund's
net assets | % of fund's net assets
6 months ago |
Domestic Equity Funds | | |
Fidelity Advisor Mid Cap II Fund Institutional Class | 4.2 | 4.3 |
Fidelity Disciplined Equity Fund | 4.3 | 4.4 |
Fidelity Equity-Income Fund | 4.3 | 4.5 |
Fidelity Large Cap Core Enhanced Index Fund | 7.0 | 7.2 |
Fidelity Series 100 Index Fund | 5.2 | 5.4 |
Fidelity Series Broad Market Opportunities Fund | 7.0 | 7.2 |
Fidelity Series Small Cap Opportunities Fund | 2.8 | 2.9 |
| 34.8 | 35.9 |
International Equity Funds | | |
Fidelity Advisor International Discovery Fund Institutional Class | 3.9 | 4.2 |
High Yield Fixed-Income Funds | | |
Fidelity Capital & Income Fund | 1.4 | 1.5 |
Fidelity Strategic Income Fund | 1.4 | 1.5 |
| 2.8 | 3.0 |
Investment Grade Fixed-Income Funds | | |
Fidelity Government Income Fund | 7.2 | 7.1 |
Fidelity Strategic Real Return Fund | 7.2 | 7.2 |
Fidelity Total Bond Fund | 21.6 | 21.3 |
| 36.0 | 35.6 |
Short-Term Funds | | |
Fidelity Institutional Money Market Portfolio Institutional Class | 11.3 | 10.6 |
Fidelity Short-Term Bond Fund | 11.2 | 10.7 |
| 22.5 | 21.3 |
Net Other Assets (Liabilities)* | 0.0 | 0.0 |
| 100.0 | 100.0 |
* Amount represents less than 0.1%
Asset Allocation (% of fund's net assets) |
Current |
| Domestic Equity Funds | 34.8% | |
| International Equity Funds | 3.9% | |
| High Yield Fixed-Income Funds | 2.8% | |
| Investment Grade Fixed-Income Funds | 36.0% | |
| Short-Term Funds | 22.5% | |
Six months ago |
| Domestic Equity Funds | 35.9% | |
| International Equity Funds | 4.2% | |
| High Yield Fixed-Income Funds | 3.0% | |
| Investment Grade Fixed-Income Funds | 35.6% | |
| Short-Term Funds | 21.3% | |
Expected |
| Domestic Equity Funds | 33.6% | |
| International Equity Funds | 3.6% | |
| High Yield Fixed-Income Funds | 2.6% | |
| Investment Grade Fixed-Income Funds | 36.7% | |
| Short-Term Funds | 23.5% | |
The fund invests according to an asset allocation strategy that becomes increasingly conservative over time. The six months ago allocation is based on the fund's holdings as of July 31, 2010. The current allocation is based on the fund's holdings as of January 31, 2011. The expected allocation represents the fund's anticipated allocation at July 31, 2011. |
Semiannual Report
Fidelity Income Replacement 2020 Fund
Investments January 31, 2011 (Unaudited)
Showing Percentage of Net Assets
Equity Funds - 38.7% |
| Shares | | Value |
Domestic Equity Funds - 34.8% |
Fidelity Advisor Mid Cap II Fund Institutional Class | 9,599 | | $ 175,949 |
Fidelity Disciplined Equity Fund | 7,886 | | 183,105 |
Fidelity Equity-Income Fund | 4,018 | | 183,105 |
Fidelity Large Cap Core Enhanced Index Fund | 33,444 | | 292,968 |
Fidelity Series 100 Index Fund | 24,550 | | 219,726 |
Fidelity Series Broad Market Opportunities Fund | 28,499 | | 292,968 |
Fidelity Series Small Cap Opportunities Fund | 10,696 | | 117,019 |
TOTAL DOMESTIC EQUITY FUNDS | | 1,464,840 |
International Equity Funds - 3.9% |
Fidelity Advisor International Discovery Fund Institutional Class | 4,896 | | 162,059 |
TOTAL EQUITY FUNDS (Cost $1,402,682) | 1,626,899 |
Fixed-Income Funds - 38.8% |
| | | |
High Yield Fixed-Income Funds - 2.8% |
Fidelity Capital & Income Fund | 6,094 | | 58,930 |
Fidelity Strategic Income Fund | 5,271 | | 58,930 |
TOTAL HIGH YIELD FIXED-INCOME FUNDS | | 117,860 |
|
| Shares | | Value |
Investment Grade Fixed-Income Funds - 36.0% |
Fidelity Government Income Fund | 29,154 | | $ 303,491 |
Fidelity Strategic Real Return Fund | 31,288 | | 303,492 |
Fidelity Total Bond Fund | 84,696 | | 909,634 |
TOTAL INVESTMENT GRADE FIXED-INCOME FUNDS | | 1,516,617 |
TOTAL FIXED-INCOME FUNDS (Cost $1,556,030) | 1,634,477 |
Short-Term Funds - 22.5% |
| | | |
Fidelity Institutional Money Market Portfolio Institutional Class | 473,969 | | 473,969 |
Fidelity Short-Term Bond Fund | 55,893 | | 473,969 |
TOTAL SHORT-TERM FUNDS (Cost $940,842) | 947,938 |
TOTAL INVESTMENT PORTFOLIO - 100.0% (Cost $3,899,554) | | 4,209,314 |
NET OTHER ASSETS (LIABILITIES) - 0.0% | | (453) |
NET ASSETS - 100% | $ 4,208,861 |
Other Information |
All investments are categorized as Level 1 under the Fair Value Hierarchy. The inputs or methodology used for valuing securities may not be an indication of the risk associated with investing in those securities. For more information on valuation inputs, please refer to the Security Valuation section in the accompanying Notes to Financial Statements. |
Income Tax Information |
At July 31, 2010, the Fund had a capital loss carryforward of approximately $122,224 of which $3,778 and $118,446 will expire in fiscal 2017 and 2018, respectively. Capital loss carryforwards are only available to offset future capital gains of the Fund to the extent provided by regulations and may be limited. |
See accompanying notes which are an integral part of the financial statements.
Semiannual Report
Fidelity Income Replacement 2020 Fund
Statement of Assets and Liabilities
| January 31, 2011 (Unaudited) |
| | |
Assets | | |
Investment in securities, at value (cost $3,899,554) - See accompanying schedule | | $ 4,209,314 |
Receivable for investments sold | | 27,295 |
Total assets | | 4,236,609 |
| | |
Liabilities | | |
Payable for investments purchased | $ 27,300 | |
Distribution and service plan fees payable | 448 | |
Total liabilities | | 27,748 |
| | |
Net Assets | | $ 4,208,861 |
Net Assets consist of: | | |
Paid in capital | | $ 4,127,939 |
Undistributed net investment income | | 1,051 |
Accumulated undistributed net realized gain (loss) on investments | | (229,889) |
Net unrealized appreciation (depreciation) on investments | | 309,760 |
Net Assets | | $ 4,208,861 |
Calculation of Maximum Offering Price Class A:
Net Asset Value and redemption price per share ($630,977 ÷ 12,779 shares) | | $ 49.38 |
| | |
Maximum offering price per share (100/94.25 of $49.38) | | $ 52.39 |
Class T:
Net Asset Value and redemption price per share ($145,366 ÷ 2,944 shares) | | $ 49.38 |
| | |
Maximum offering price per share (100/96.50 of $49.38) | | $ 51.17 |
| | |
Class C:
Net Asset Value and offering price per share ($290,075 ÷ 5,878 shares)A | | $ 49.35 |
| | |
Income Replacement 2020:
Net Asset Value, offering price and redemption price per share ($3,089,160 ÷ 62,559 shares) | | $ 49.38 |
| | |
Institutional Class:
Net Asset Value, offering price and redemption price per share ($53,283 ÷ 1,079 shares) | | $ 49.38 |
A Redemption price per share is equal to net asset value less any applicable contingent deferred sales charge.
Statement of Operations
Six months ended January 31, 2011 (Unaudited) |
| | |
Investment Income | | |
Income distributions from underlying funds | | $ 43,428 |
| | |
Expenses | | |
Distribution and service plan fees | $ 2,651 | |
Independent trustees' compensation | 7 | |
Total expenses before reductions | 2,658 | |
Expense reductions | (7) | 2,651 |
Net investment income (loss) | | 40,777 |
Realized and Unrealized Gain (Loss) Realized gain (loss) on sale of underlying fund shares | (3,356) | |
Capital gain distributions from underlying funds | 22,741 | |
Total net realized gain (loss) | | 19,385 |
Change in net unrealized appreciation (depreciation) on underlying funds | | 241,426 |
Net gain (loss) | | 260,811 |
Net increase (decrease) in net assets resulting from operations | | $ 301,588 |
See accompanying notes which are an integral part of the financial statements.
Semiannual Report
Statement of Changes in Net Assets
| Six months ended January 31, 2011 (Unaudited) | Year ended
July 31,
2010 |
Increase (Decrease) in Net Assets | | |
Operations | | |
Net investment income (loss) | $ 40,777 | $ 58,358 |
Net realized gain (loss) | 19,385 | (17,761) |
Change in net unrealized appreciation (depreciation) | 241,426 | 270,430 |
Net increase (decrease) in net assets resulting from operations | 301,588 | 311,027 |
Distributions to shareholders from net investment income | (40,738) | (58,210) |
Distributions to shareholders from net realized gain | (16,958) | (7,714) |
Total distributions | (57,696) | (65,924) |
Share transactions - net increase (decrease) | 655,215 | 451,360 |
Total increase (decrease) in net assets | 899,107 | 696,463 |
| | |
Net Assets | | |
Beginning of period | 3,309,754 | 2,613,291 |
End of period (including undistributed net investment income of $1,051 and undistributed net investment income of $1,012, respectively) | $ 4,208,861 | $ 3,309,754 |
Financial Highlights - Class A
| Six months ended January 31, 2011 | Years ended July 31, |
| (Unaudited) | 2010 | 2009 | 2008 G |
Selected Per-Share Data | | | | |
Net asset value, beginning of period | $ 46.09 | $ 42.28 | $ 47.11 | $ 50.00 |
Income from Investment Operations | | | | |
Net investment income (loss) E | .513 | .812 | 1.027 | 1.085 |
Net realized and unrealized gain (loss) | 3.500 | 3.930 | (4.465) | (2.692) |
Total from investment operations | 4.013 | 4.742 | (3.438) | (1.607) |
Distributions from net investment income | (.504) | (.817) | (1.032) | (1.113) |
Distributions from net realized gain | (.219) | (.115) | (.360) | (.170) |
Total distributions | (.723) | (.932) | (1.392) | (1.283) |
Net asset value, end of period | $ 49.38 | $ 46.09 | $ 42.28 | $ 47.11 |
Total Return B, C, D | 8.74% | 11.27% | (7.00)% | (3.33)% |
Ratios to Average Net Assets F, H | | | | |
Expenses before reductions | .25% A | .25% | .25% | .25% A |
Expenses net of fee waivers, if any | .25% A | .25% | .25% | .25% A |
Expenses net of all reductions | .25% A | .25% | .25% | .25% A |
Net investment income (loss) | 2.14% A | 1.79% | 2.60% | 2.42% A |
Supplemental Data | | | | |
Net assets, end of period (000 omitted) | $ 631 | $ 607 | $ 502 | $ 503 |
Portfolio turnover rate | 41% A | 38% | 60% | 21% A |
A Annualized
B Total returns for periods of less than one year are not annualized.
C Total returns would have been lower had certain expenses not been reduced during the periods shown.
D Total returns do not include the effect of the sales charges.
E Calculated based on average shares outstanding during the period.
F Amounts do not include the activity of the underlying funds.
G For the period August 30, 2007 (commencement of operations) to July 31, 2008.
H Expense ratios reflect operating expenses of the class. Expenses before reductions do not reflect amounts reimbursed by the investment adviser or reductions from expense offset arrangements and do not represent the amount paid by the class during periods when reimbursements or reductions occur. Expenses net of fee waivers reflect expenses after reimbursement by the investment adviser but prior to reductions from expense offset arrangements. Expenses net of all reductions represent the net expenses paid by the class but do not include expenses of the investment companies in which the Fund invests.
See accompanying notes which are an integral part of the financial statements.
Semiannual Report
Financial Highlights - Class T
| Six months ended January 31, 2011 | Years ended July 31, |
| (Unaudited) | 2010 | 2009 | 2008 G |
Selected Per-Share Data | | | | |
Net asset value, beginning of period | $ 46.09 | $ 42.28 | $ 47.10 | $ 50.00 |
Income from Investment Operations | | | | |
Net investment income (loss) E | .453 | .696 | .926 | .985 |
Net realized and unrealized gain (loss) | 3.500 | 3.928 | (4.460) | (2.707) |
Total from investment operations | 3.953 | 4.624 | (3.534) | (1.722) |
Distributions from net investment income | (.444) | (.699) | (.926) | (1.008) |
Distributions from net realized gain | (.219) | (.115) | (.360) | (.170) |
Total distributions | (.663) | (.814) | (1.286) | (1.178) |
Net asset value, end of period | $ 49.38 | $ 46.09 | $ 42.28 | $ 47.10 |
Total Return B, C, D | 8.61% | 10.98% | (7.23)% | (3.56)% |
Ratios to Average Net Assets F, H | | | | |
Expenses before reductions | .50% A | .50% | .50% | .50% A |
Expenses net of fee waivers, if any | .50% A | .50% | .50% | .50% A |
Expenses net of all reductions | .50% A | .50% | .50% | .50% A |
Net investment income (loss) | 1.89% A | 1.54% | 2.35% | 2.17% A |
Supplemental Data | | | | |
Net assets, end of period (000 omitted) | $ 145 | $ 134 | $ 171 | $ 187 |
Portfolio turnover rate | 41% A | 38% | 60% | 21% A |
A Annualized
B Total returns for periods of less than one year are not annualized.
C Total returns would have been lower had certain expenses not been reduced during the periods shown.
D Total returns do not include the effect of the sales charges.
E Calculated based on average shares outstanding during the period.
F Amounts do not include the activity of the underlying funds.
G For the period August 30, 2007 (commencement of operations) to July 31, 2008.
H Expense ratios reflect operating expenses of the class. Expenses before reductions do not reflect amounts reimbursed by the investment adviser or reductions from expense offset arrangements and do not represent the amount paid by the class during periods when reimbursements or reductions occur. Expenses net of fee waivers reflect expenses after reimbursement by the investment adviser but prior to reductions from expense offset arrangements. Expenses net of all reductions represent the net expenses paid by the class but do not include expenses of the investment companies in which the Fund invests.
Financial Highlights - Class C
| Six months ended January 31, 2011 | Years ended July 31, |
| (Unaudited) | 2010 | 2009 | 2008 G |
Selected Per-Share Data | | | | |
Net asset value, beginning of period | $ 46.06 | $ 42.26 | $ 47.08 | $ 50.00 |
Income from Investment Operations | | | | |
Net investment income (loss) E | .333 | .473 | .736 | .755 |
Net realized and unrealized gain (loss) | 3.498 | 3.923 | (4.471) | (2.699) |
Total from investment operations | 3.831 | 4.396 | (3.735) | (1.944) |
Distributions from net investment income | (.322) | (.481) | (.725) | (.806) |
Distributions from net realized gain | (.219) | (.115) | (.360) | (.170) |
Total distributions | (.541) | (.596) | (1.085) | (.976) |
Net asset value, end of period | $ 49.35 | $ 46.06 | $ 42.26 | $ 47.08 |
Total Return B, C, D | 8.34% | 10.43% | (7.70)% | (3.99)% |
Ratios to Average Net Assets F, H | | | | |
Expenses before reductions | 1.00% A | 1.00% | 1.00% | 1.00% A |
Expenses net of fee waivers, if any | 1.00% A | 1.00% | 1.00% | 1.00% A |
Expenses net of all reductions | 1.00% A | 1.00% | 1.00% | 1.00% A |
Net investment income (loss) | 1.39% A | 1.05% | 1.85% | 1.67% A |
Supplemental Data | | | | |
Net assets, end of period (000 omitted) | $ 290 | $ 295 | $ 221 | $ 275 |
Portfolio turnover rate | 41% A | 38% | 60% | 21% A |
A Annualized
B Total returns for periods of less than one year are not annualized.
C Total returns would have been lower had certain expenses not been reduced during the periods shown.
D Total returns do not include the effect of the contingent deferred sales charge.
E Calculated based on average shares outstanding during the period.
F Amounts do not include the activity of the underlying funds.
G For the period August 30, 2007 (commencement of operations) to July 31, 2008.
H Expense ratios reflect operating expenses of the class. Expenses before reductions do not reflect amounts reimbursed by the investment adviser or reductions from expense offset arrangements and do not represent the amount paid by the class during periods when reimbursements or reductions occur. Expenses net of fee waivers reflect expenses after reimbursement by the investment adviser but prior to reductions from expense offset arrangements. Expenses net of all reductions represent the net expenses paid by the class but do not include expenses of the investment companies in which the Fund invests.
See accompanying notes which are an integral part of the financial statements.
Semiannual Report
Financial Highlights - Income Replacement 2020
| Six months ended January 31, 2011 | Years ended July 31, |
| (Unaudited) | 2010 | 2009 | 2008 G |
Selected Per-Share Data | | | | |
Net asset value, beginning of period | $ 46.09 | $ 42.29 | $ 47.12 | $ 50.00 |
Income from Investment Operations | | | | |
Net investment income (loss) D | .573 | .925 | 1.125 | 1.190 |
Net realized and unrealized gain (loss) | 3.499 | 3.919 | (4.464) | (2.677) |
Total from investment operations | 4.072 | 4.844 | (3.339) | (1.487) |
Distributions from net investment income | (.563) | (.929) | (1.131) | (1.223) |
Distributions from net realized gain | (.219) | (.115) | (.360) | (.170) |
Total distributions | (.782) | (1.044) | (1.491) | (1.393) |
Net asset value, end of period | $ 49.38 | $ 46.09 | $ 42.29 | $ 47.12 |
Total Return B, C | 8.88% | 11.52% | (6.76)% | (3.10)% |
Ratios to Average Net Assets E, H | | | | |
Expenses before reductions F | .00% A | .00% | .00% | .00% A |
Expenses net of fee waivers, if any | .00% A | .00% | .00% | .00% A |
Expenses net of all reductions | .00% A | .00% | .00% | .00% A |
Net investment income (loss) | 2.39% A | 2.04% | 2.86% | 2.67% A |
Supplemental Data | | | | |
Net assets, end of period (000 omitted) | $ 3,089 | $ 2,225 | $ 1,624 | $ 1,233 |
Portfolio turnover rate | 41% A | 38% | 60% | 21% A |
A Annualized
B Total returns for periods of less than one year are not annualized.
C Total returns would have been lower had certain expenses not been reduced during the periods shown.
D Calculated based on average shares outstanding during the period.
E Amounts do not include the activity of the underlying funds.
F Amount represents less than .01%.
G For the period August 30, 2007 (commencement of operations) to July 31, 2008.
H Expense ratios reflect operating expenses of the class. Expenses before reductions do not reflect amounts reimbursed by the investment adviser or reductions from expense offset arrangements and do not represent the amount paid by the class during periods when reimbursements or reductions occur. Expenses net of fee waivers reflect expenses after reimbursement by the investment adviser but prior to reductions from expense offset arrangements. Expenses net of all reductions represent the net expenses paid by the class but do not include expenses of the investment companies in which the Fund invests.
Financial Highlights - Institutional Class
| Six months ended January 31, 2011 | Years ended July 31, |
| (Unaudited) | 2010 | 2009 | 2008 G |
Selected Per-Share Data | | | | |
Net asset value, beginning of period | $ 46.09 | $ 42.29 | $ 47.12 | $ 50.00 |
Income from Investment Operations | | | | |
Net investment income (loss) D | .573 | .928 | 1.138 | 1.215 |
Net realized and unrealized gain (loss) | 3.499 | 3.916 | (4.477) | (2.702) |
Total from investment operations | 4.072 | 4.844 | (3.339) | (1.487) |
Distributions from net investment income | (.563) | (.929) | (1.131) | (1.223) |
Distributions from net realized gain | (.219) | (.115) | (.360) | (.170) |
Total distributions | (.782) | (1.044) | (1.491) | (1.393) |
Net asset value, end of period | $ 49.38 | $ 46.09 | $ 42.29 | $ 47.12 |
Total Return B, C | 8.88% | 11.52% | (6.76)% | (3.10)% |
Ratios to Average Net Assets E, H | | | | |
Expenses before reductions F | .00% A | .00% | .00% | .00% A |
Expenses net of fee waivers, if any | .00% A | .00% | .00% | .00% A |
Expenses net of all reductions | .00% A | .00% | .00% | .00% A |
Net investment income (loss) | 2.39% A | 2.04% | 2.85% | 2.67% A |
Supplemental Data | | | | |
Net assets, end of period (000 omitted) | $ 53 | $ 49 | $ 95 | $ 163 |
Portfolio turnover rate | 41% A | 38% | 60% | 21% A |
A Annualized
B Total returns for periods of less than one year are not annualized.
C Total returns would have been lower had certain expenses not been reduced during the periods shown.
D Calculated based on average shares outstanding during the period.
E Amounts do not include the activity of the underlying funds.
F Amount represents less than .01%.
G For the period August 30, 2007 (commencement of operations) to July 31, 2008.
H Expense ratios reflect operating expenses of the class. Expenses before reductions do not reflect amounts reimbursed by the investment adviser or reductions from expense offset arrangements and do not represent the amount paid by the class during periods when reimbursements or reductions occur. Expenses net of fee waivers reflect expenses after reimbursement by the investment adviser but prior to reductions from expense offset arrangements. Expenses net of all reductions represent the net expenses paid by the class but do not include expenses of the investment companies in which the Fund invests.
See accompanying notes which are an integral part of the financial statements.
Semiannual Report
Fidelity Income Replacement 2022 Fund
Investment Changes (Unaudited)
Fund Holdings as of January 31, 2011 |
| % of fund's
net assets | % of fund's net assets
6 months ago |
Domestic Equity Funds | | |
Fidelity Advisor Mid Cap II Fund Institutional Class | 4.6 | 4.7 |
Fidelity Disciplined Equity Fund | 4.8 | 4.9 |
Fidelity Equity-Income Fund | 4.8 | 4.9 |
Fidelity Large Cap Core Enhanced Index Fund | 7.8 | 7.9 |
Fidelity Series 100 Index Fund | 5.8 | 5.9 |
Fidelity Series Broad Market Opportunities Fund | 7.8 | 7.9 |
Fidelity Series Small Cap Opportunities Fund | 3.1 | 3.2 |
| 38.7 | 39.4 |
International Equity Funds | | |
Fidelity Advisor International Discovery Fund Institutional Class | 4.8 | 5.1 |
High Yield Fixed-Income Funds | | |
Fidelity Capital & Income Fund | 1.7 | 1.9 |
Fidelity Strategic Income Fund | 1.8 | 1.8 |
| 3.5 | 3.7 |
Investment Grade Fixed-Income Funds | | |
Fidelity Government Income Fund | 6.7 | 6.6 |
Fidelity Strategic Real Return Fund | 6.8 | 6.8 |
Fidelity Total Bond Fund | 20.3 | 20.0 |
| 33.8 | 33.4 |
Short-Term Funds | | |
Fidelity Institutional Money Market Portfolio Institutional Class | 9.6 | 9.2 |
Fidelity Short-Term Bond Fund | 9.6 | 9.2 |
| 19.2 | 18.4 |
Net Other Assets (Liabilities)* | 0.0 | 0.0 |
| 100.0 | 100.0 |
* Amount represents less than 0.1%
Asset Allocation (% of fund's net assets) |
Current |
| Domestic Equity Funds | 38.7% | |
| International Equity Funds | 4.8% | |
| High Yield Fixed-Income Funds | 3.5% | |
| Investment Grade Fixed-Income Funds | 33.8% | |
| Short-Term Funds | 19.2% | |
Six months ago |
| Domestic Equity Funds | 39.4% | |
| International Equity Funds | 5.1% | |
| High Yield Fixed-Income Funds | 3.7% | |
| Investment Grade Fixed-Income Funds | 33.4% | |
| Short-Term Funds | 18.4% | |
Expected |
| Domestic Equity Funds | 37.9% | |
| International Equity Funds | 4.5% | |
| High Yield Fixed-Income Funds | 3.4% | |
| Investment Grade Fixed-Income Funds | 34.3% | |
| Short-Term Funds | 19.9% | |
The fund invests according to an asset allocation strategy that becomes increasingly conservative over time. The six months ago allocation is based on the fund's holdings as of July 31, 2010. The current allocation is based on the fund's holdings as of January 31, 2011. The expected allocation represents the fund's anticipated allocation at July 31, 2011. |
Semiannual Report
Fidelity Income Replacement 2022 Fund
Investments January 31, 2011 (Unaudited)
Showing Percentage of Net Assets
Equity Funds - 43.5% |
| Shares | | Value |
Domestic Equity Funds - 38.7% |
Fidelity Advisor Mid Cap II Fund Institutional Class | 7,801 | | $ 142,997 |
Fidelity Disciplined Equity Fund | 6,423 | | 149,147 |
Fidelity Equity-Income Fund | 3,273 | | 149,147 |
Fidelity Large Cap Core Enhanced Index Fund | 27,206 | | 238,328 |
Fidelity Series 100 Index Fund | 19,963 | | 178,669 |
Fidelity Series Broad Market Opportunities Fund | 23,184 | | 238,328 |
Fidelity Series Small Cap Opportunities Fund | 8,714 | | 95,331 |
TOTAL DOMESTIC EQUITY FUNDS | | 1,191,947 |
International Equity Funds - 4.8% |
Fidelity Advisor International Discovery Fund Institutional Class | 4,432 | | 146,687 |
TOTAL EQUITY FUNDS (Cost $1,373,374) | 1,338,634 |
Fixed-Income Funds - 37.3% |
| | | |
High Yield Fixed-Income Funds - 3.5% |
Fidelity Capital & Income Fund | 5,597 | | 54,124 |
Fidelity Strategic Income Fund | 4,841 | | 54,124 |
TOTAL HIGH YIELD FIXED-INCOME FUNDS | | 108,248 |
|
| Shares | | Value |
Investment Grade Fixed-Income Funds - 33.8% |
Fidelity Government Income Fund | 19,940 | | $ 207,576 |
Fidelity Strategic Real Return Fund | 21,400 | | 207,576 |
Fidelity Total Bond Fund | 58,097 | | 623,959 |
TOTAL INVESTMENT GRADE FIXED-INCOME FUNDS | | 1,039,111 |
TOTAL FIXED-INCOME FUNDS (Cost $1,116,176) | 1,147,359 |
Short-Term Funds - 19.2% |
| | | |
Fidelity Institutional Money Market Portfolio Institutional Class | 294,604 | | 294,604 |
Fidelity Short-Term Bond Fund | 34,741 | | 294,604 |
TOTAL SHORT-TERM FUNDS (Cost $587,674) | 589,208 |
TOTAL INVESTMENT PORTFOLIO - 100.0% (Cost $3,077,224) | | 3,075,201 |
NET OTHER ASSETS (LIABILITIES) - 0.0% | | (73) |
NET ASSETS - 100% | $ 3,075,128 |
Other Information |
All investments are categorized as Level 1 under the Fair Value Hierarchy. The inputs or methodology used for valuing securities may not be an indication of the risk associated with investing in those securities. For more information on valuation inputs, please refer to the Security Valuation section in the accompanying Notes to Financial Statements. |
Income Tax Information |
At July 31, 2010, the Fund had a capital loss carryforward of approximately $545,422 of which $64,025 and $481,397 will expire in fiscal 2017 and 2018, respectively. Capital loss carryforwards are only available to offset future capital gains of the Fund to the extent provided by regulations and may be limited. |
The Fund intends to elect to defer to its fiscal year ending July 31, 2011 approximately $109,973 of losses recognized during the period November 1, 2009 to July 31, 2010. |
See accompanying notes which are an integral part of the financial statements.
Semiannual Report
Fidelity Income Replacement 2022 Fund
Statement of Assets and Liabilities
| January 31, 2011 (Unaudited) |
| | |
Assets | | |
Investment in securities, at value (cost $3,077,224) - See accompanying schedule | | $ 3,075,201 |
Receivable for investments sold | | 16,946 |
Receivable for fund shares sold | | 3,000 |
Total assets | | 3,095,147 |
| | |
Liabilities | | |
Payable for investments purchased | $ 19,940 | |
Distribution and service plan fees payable | 79 | |
Total liabilities | | 20,019 |
| | |
Net Assets | | $ 3,075,128 |
Net Assets consist of: | | |
Paid in capital | | $ 3,778,963 |
Undistributed net investment income | | 791 |
Accumulated undistributed net realized gain (loss) on investments | | (702,603) |
Net unrealized appreciation (depreciation) on investments | | (2,023) |
Net Assets | | $ 3,075,128 |
Calculation of Maximum Offering Price Class A:
Net Asset Value and redemption price per share ($72,193 ÷ 1,467.6 shares) | | $ 49.19 |
| | |
Maximum offering price per share (100/94.25 of $49.19) | | $ 52.19 |
Class T:
Net Asset Value and redemption price per share ($78,280 ÷ 1,591.6 shares) | | $ 49.18 |
| | |
Maximum offering price per share (100/96.50 of $49.18) | | $ 50.96 |
| | |
Class C:
Net Asset Value and offering price per share ($37,158 ÷ 755.2 shares)A | | $ 49.20 |
| | |
Income Replacement 2022:
Net Asset Value, offering price and redemption price per share ($2,883,136 ÷ 58,624.5 shares) | | $ 49.18 |
| | |
Institutional Class:
Net Asset Value, offering price and redemption price per share ($4,361 ÷ 88.7 shares) | | $ 49.17 |
A Redemption price per share is equal to net asset value less any applicable contingent deferred sales charge.
Statement of Operations
Six months ended January 31, 2011 (Unaudited) |
| | |
Investment Income | | |
Income distributions from underlying funds | | $ 33,877 |
| | |
Expenses | | |
Distribution and service plan fees | $ 461 | |
Independent trustees' compensation | 5 | |
Total expenses before reductions | 466 | |
Expense reductions | (5) | 461 |
Net investment income (loss) | | 33,416 |
Realized and Unrealized Gain (Loss) Realized gain (loss) on sale of underlying fund shares | (14,224) | |
Capital gain distributions from underlying funds | 16,889 | |
Total net realized gain (loss) | | 2,665 |
Change in net unrealized appreciation (depreciation) on underlying funds | | 217,883 |
Net gain (loss) | | 220,548 |
Net increase (decrease) in net assets resulting from operations | | $ 253,964 |
See accompanying notes which are an integral part of the financial statements.
Semiannual Report
Fidelity Income Replacement 2022 Fund
Financial Statements - continued
Statement of Changes in Net Assets
| Six months ended January 31, 2011 (Unaudited) | Year ended
July 31,
2010 |
Increase (Decrease) in Net Assets | | |
Operations | | |
Net investment income (loss) | $ 33,416 | $ 57,048 |
Net realized gain (loss) | 2,665 | (60,204) |
Change in net unrealized appreciation (depreciation) | 217,883 | 328,653 |
Net increase (decrease) in net assets resulting from operations | 253,964 | 325,497 |
Distributions to shareholders from net investment income | (33,441) | (57,173) |
Distributions to shareholders from net realized gain | (12,730) | (19,734) |
Total distributions | (46,171) | (76,907) |
Share transactions - net increase (decrease) | 304,213 | (508,119) |
Total increase (decrease) in net assets | 512,006 | (259,529) |
| | |
Net Assets | | |
Beginning of period | 2,563,122 | 2,822,651 |
End of period (including undistributed net investment income of $791 and undistributed net investment income of $816, respectively) | $ 3,075,128 | $ 2,563,122 |
Financial Highlights - Class A
| Six months ended January 31, 2011 | Years ended July 31, |
| (Unaudited) | 2010 | 2009 | 2008 G |
Selected Per-Share Data | | | | |
Net asset value, beginning of period | $ 45.58 | $ 41.87 | $ 47.05 | $ 50.00 |
Income from Investment Operations | | | | |
Net investment income (loss) E | .520 | .815 | 1.035 | 1.087 |
Net realized and unrealized gain (loss) | 3.819 | 3.980 | (4.739) | (2.853) |
Total from investment operations | 4.339 | 4.795 | (3.704) | (1.766) |
Distributions from net investment income | (.515) | (.793) | (1.056) | (1.014) |
Distributions from net realized gain | (.214) | (.292) | (.420) | (.170) |
Total distributions | (.729) | (1.085) | (1.476) | (1.184) |
Net asset value, end of period | $ 49.19 | $ 45.58 | $ 41.87 | $ 47.05 |
Total Return B, C, D | 9.56% | 11.53% | (7.53)% | (3.64)% |
Ratios to Average Net Assets F, H | | | | |
Expenses before reductions | .25% A | .25% | .26% | .25% A |
Expenses net of fee waivers, if any | .25% A | .25% | .26% | .25% A |
Expenses net of all reductions | .25% A | .25% | .26% | .25% A |
Net investment income (loss) | 2.19% A | 1.82% | 2.62% | 2.41% A |
Supplemental Data | | | | |
Net assets, end of period (000 omitted) | $ 72 | $ 42 | $ 122 | $ 289 |
Portfolio turnover rate | 24% A | 24% | 22% | 32% A |
A Annualized
B Total returns for periods of less than one year are not annualized.
C Total returns would have been lower had certain expenses not been reduced during the periods shown.
D Total returns do not include the effect of the sales charges.
E Calculated based on average shares outstanding during the period.
F Amounts do not include the activity of the underlying funds.
G For the period August 30, 2007 (commencement of operations) to July 31, 2008.
H Expense ratios reflect operating expenses of the class. Expenses before reductions do not reflect amounts reimbursed by the investment adviser or reductions from expense offset arrangements and do not represent the amount paid by the class during periods when reimbursements or reductions occur. Expenses net of fee waivers reflect expenses after reimbursement by the investment adviser but prior to reductions from expense offset arrangements. Expenses net of all reductions represent the net expenses paid by the class but do not include expenses of the investment companies in which the Fund invests.
See accompanying notes which are an integral part of the financial statements.
Semiannual Report
Financial Highlights - Class T
| Six months ended January 31, 2011 | Years ended July 31, |
| (Unaudited) | 2010 | 2009 | 2008 G |
Selected Per-Share Data | | | | |
Net asset value, beginning of period | $ 45.57 | $ 41.86 | $ 47.04 | $ 50.00 |
Income from Investment Operations | | | | |
Net investment income (loss) E | .461 | .702 | .933 | .982 |
Net realized and unrealized gain (loss) | 3.818 | 3.985 | (4.736) | (2.862) |
Total from investment operations | 4.279 | 4.687 | (3.803) | (1.880) |
Distributions from net investment income | (.455) | (.685) | (.957) | (.910) |
Distributions from net realized gain | (.214) | (.292) | (.420) | (.170) |
Total distributions | (.669) | (.977) | (1.377) | (1.080) |
Net asset value, end of period | $ 49.18 | $ 45.57 | $ 41.86 | $ 47.04 |
Total Return B, C, D | 9.42% | 11.27% | (7.77)% | (3.87)% |
Ratios to Average Net Assets F, H | | | | |
Expenses before reductions | .50% A | .50% | .51% | .50% A |
Expenses net of fee waivers, if any | .50% A | .50% | .51% | .50% A |
Expenses net of all reductions | .50% A | .50% | .51% | .50% A |
Net investment income (loss) | 1.94% A | 1.57% | 2.37% | 2.16% A |
Supplemental Data | | | | |
Net assets, end of period (000 omitted) | $ 78 | $ 77 | $ 112 | $ 187 |
Portfolio turnover rate | 24% A | 24% | 22% | 32% A |
A Annualized
B Total returns for periods of less than one year are not annualized.
C Total returns would have been lower had certain expenses not been reduced during the periods shown.
D Total returns do not include the effect of the sales charges.
E Calculated based on average shares outstanding during the period.
F Amounts do not include the activity of the underlying funds.
G For the period August 30, 2007 (commencement of operations) to July 31, 2008.
H Expense ratios reflect operating expenses of the class. Expenses before reductions do not reflect amounts reimbursed by the investment adviser or reductions from expense offset arrangements and do not represent the amount paid by the class during periods when reimbursements or reductions occur. Expenses net of fee waivers reflect expenses after reimbursement by the investment adviser but prior to reductions from expense offset arrangements. Expenses net of all reductions represent the net expenses paid by the class but do not include expenses of the investment companies in which the Fund invests.
Financial Highlights - Class C
| Six months ended January 31, 2011 | Years ended July 31, |
| (Unaudited) | 2010 | 2009 | 2008 G |
Selected Per-Share Data | | | | |
Net asset value, beginning of period | $ 45.58 | $ 41.86 | $ 47.04 | $ 50.00 |
Income from Investment Operations | | | | |
Net investment income (loss) E | .341 | .477 | .737 | .760 |
Net realized and unrealized gain (loss) | 3.818 | 3.989 | (4.745) | (2.860) |
Total from investment operations | 4.159 | 4.466 | (4.008) | (2.100) |
Distributions from net investment income | (.325) | (.454) | (.752) | (.690) |
Distributions from net realized gain | (.214) | (.292) | (.420) | (.170) |
Total distributions | (.539) | (.746) | (1.172) | (.860) |
Net asset value, end of period | $ 49.20 | $ 45.58 | $ 41.86 | $ 47.04 |
Total Return B, C, D | 9.14% | 10.72% | (8.25)% | (4.29)% |
Ratios to Average Net Assets F, H | | | | |
Expenses before reductions | 1.00% A | 1.00% | 1.01% | 1.00% A |
Expenses net of fee waivers, if any | 1.00% A | 1.00% | 1.01% | 1.00% A |
Expenses net of all reductions | 1.00% A | 1.00% | 1.01% | 1.00% A |
Net investment income (loss) | 1.44% A | 1.07% | 1.87% | 1.66% A |
Supplemental Data | | | | |
Net assets, end of period (000 omitted) | $ 37 | $ 44 | $ 69 | $ 120 |
Portfolio turnover rate | 24% A | 24% | 22% | 32% A |
A Annualized
B Total returns for periods of less than one year are not annualized.
C Total returns would have been lower had certain expenses not been reduced during the periods shown.
D Total returns do not include the effect of the contingent deferred sales charge.
E Calculated based on average shares outstanding during the period.
F Amounts do not include the activity of the underlying funds.
G For the period August 30, 2007 (commencement of operations) to July 31, 2008.
H Expense ratios reflect operating expenses of the class. Expenses before reductions do not reflect amounts reimbursed by the investment adviser or reductions from expense offset arrangements and do not represent the amount paid by the class during periods when reimbursements or reductions occur. Expenses net of fee waivers reflect expenses after reimbursement by the investment adviser but prior to reductions from expense offset arrangements. Expenses net of all reductions represent the net expenses paid by the class but do not include expenses of the investment companies in which the Fund invests.
See accompanying notes which are an integral part of the financial statements.
Semiannual Report
Financial Highlights - Income Replacement 2022
| Six months ended January 31, 2011 | Years ended July 31, |
| (Unaudited) | 2010 | 2009 | 2008 G |
Selected Per-Share Data | | | | |
Net asset value, beginning of period | $ 45.56 | $ 41.87 | $ 47.06 | $ 50.00 |
Income from Investment Operations | | | | |
Net investment income (loss) D | .579 | .925 | 1.144 | 1.190 |
Net realized and unrealized gain (loss) | 3.826 | 3.978 | (4.752) | (2.836) |
Total from investment operations | 4.405 | 4.903 | (3.608) | (1.646) |
Distributions from net investment income | (.571) | (.921) | (1.162) | (1.124) |
Distributions from net realized gain | (.214) | (.292) | (.420) | (.170) |
Total distributions | (.785) | (1.213) | (1.582) | (1.294) |
Net asset value, end of period | $ 49.18 | $ 45.56 | $ 41.87 | $ 47.06 |
Total Return B, C | 9.71% | 11.80% | (7.30)% | (3.41)% |
Ratios to Average Net Assets E, H | | | | |
Expenses before reductions | .00% A, F | .00% F | .01% | .00% A, F |
Expenses net of fee waivers, if any | .00% A | .00% | .01% | .00% A |
Expenses net of all reductions | .00% A | .00% | .01% | .00% A |
Net investment income (loss) | 2.44% A | 2.07% | 2.87% | 2.66% A |
Supplemental Data | | | | |
Net assets, end of period (000 omitted) | $ 2,883 | $ 2,395 | $ 2,353 | $ 4,666 |
Portfolio turnover rate | 24% A | 24% | 22% | 32% A |
A Annualized
B Total returns for periods of less than one year are not annualized.
C Total returns would have been lower had certain expenses not been reduced during the periods shown.
D Calculated based on average shares outstanding during the period.
E Amounts do not include the activity of the underlying funds.
F Amount represents less than .01%.
G For the period August 30, 2007 (commencement of operations) to July 31, 2008.
H Expense ratios reflect operating expenses of the class. Expenses before reductions do not reflect amounts reimbursed by the investment adviser or reductions from expense offset arrangements and do not represent the amount paid by the class during periods when reimbursements or reductions occur. Expenses net of fee waivers reflect expenses after reimbursement by the investment adviser but prior to reductions from expense offset arrangements. Expenses net of all reductions represent the net expenses paid by the class but do not include expenses of the investment companies in which the Fund invests.
Financial Highlights - Institutional Class
| Six months ended January 31, 2011 | Years ended July 31, |
| (Unaudited) | 2010 | 2009 | 2008 G |
Selected Per-Share Data | | | | |
Net asset value, beginning of period | $ 45.56 | $ 41.86 | $ 47.06 | $ 50.00 |
Income from Investment Operations | | | | |
Net investment income (loss) D | .577 | .918 | 1.131 | 1.208 |
Net realized and unrealized gain (loss) | 3.818 | 3.995 | (4.749) | (2.854) |
Total from investment operations | 4.395 | 4.913 | (3.618) | (1.646) |
Distributions from net investment income | (.571) | (.921) | (1.162) | (1.124) |
Distributions from net realized gain | (.214) | (.292) | (.420) | (.170) |
Total distributions | (.785) | (1.213) | (1.582) | (1.294) |
Net asset value, end of period | $ 49.17 | $ 45.56 | $ 41.86 | $ 47.06 |
Total Return B, C | 9.69% | 11.83% | (7.33)% | (3.41)% |
Ratios to Average Net Assets E, H | | | | |
Expenses before reductions | .00% A, F | .00% F | .01% | .00% A, F |
Expenses net of fee waivers, if any | .00% A | .00% | .01% | .00% A |
Expenses net of all reductions | .00% A | .00% | .01% | .00% A |
Net investment income (loss) | 2.44% A | 2.07% | 2.87% | 2.66% A |
Supplemental Data | | | | |
Net assets, end of period (000 omitted) | $ 4 | $ 5 | $ 166 | $ 277 |
Portfolio turnover rate | 24% A | 24% | 22% | 32% A |
A Annualized
B Total returns for periods of less than one year are not annualized.
C Total returns would have been lower had certain expenses not been reduced during the periods shown.
D Calculated based on average shares outstanding during the period.
E Amounts do not include the activity of the underlying funds.
F Amount represents less than .01%.
G For the period August 30, 2007 (commencement of operations) to July 31, 2008.
H Expense ratios reflect operating expenses of the class. Expenses before reductions do not reflect amounts reimbursed by the investment adviser or reductions from expense offset arrangements and do not represent the amount paid by the class during periods when reimbursements or reductions occur. Expenses net of fee waivers reflect expenses after reimbursement by the investment adviser but prior to reductions from expense offset arrangements. Expenses net of all reductions represent the net expenses paid by the class but do not include expenses of the investment companies in which the Fund invests.
See accompanying notes which are an integral part of the financial statements.
Semiannual Report
Fidelity Income Replacement 2024 Fund
Investment Changes (Unaudited)
Fund Holdings as of January 31, 2011 |
| % of fund's
net assets | % of fund's net assets
6 months ago |
Domestic Equity Funds | | |
Fidelity Advisor Mid Cap II Fund Institutional Class | 4.9 | 4.9 |
Fidelity Disciplined Equity Fund | 5.1 | 5.2 |
Fidelity Equity-Income Fund | 5.1 | 5.2 |
Fidelity Large Cap Core Enhanced Index Fund | 8.3 | 8.3 |
Fidelity Series 100 Index Fund | 6.2 | 6.3 |
Fidelity Series Broad Market Opportunities Fund | 8.3 | 8.3 |
Fidelity Series Small Cap Opportunities Fund | 3.3 | 3.4 |
| 41.2 | 41.6 |
International Equity Funds | | |
Fidelity Advisor International Discovery Fund Institutional Class | 5.6 | 5.9 |
High Yield Fixed-Income Funds | | |
Fidelity Capital & Income Fund | 2.0 | 2.1 |
Fidelity Strategic Income Fund | 2.0 | 2.1 |
| 4.0 | 4.2 |
Investment Grade Fixed-Income Funds | | |
Fidelity Government Income Fund | 6.4 | 6.3 |
Fidelity Strategic Real Return Fund | 6.5 | 6.5 |
Fidelity Total Bond Fund | 19.3 | 19.1 |
| 32.2 | 31.9 |
Short-Term Funds | | |
Fidelity Institutional Money Market Portfolio Institutional Class | 8.5 | 8.2 |
Fidelity Short-Term Bond Fund | 8.5 | 8.2 |
| 17.0 | 16.4 |
Net Other Assets (Liabilities)* | 0.0 | 0.0 |
| 100.0 | 100.0 |
* Amount represents less than 0.1%
Asset Allocation (% of fund's net assets) |
Current |
| Domestic Equity Funds | 41.2% | |
| International Equity Funds | 5.6% | |
| High Yield Fixed-Income Funds | 4.0% | |
| Investment Grade Fixed-Income Funds | 32.2% | |
| Short-Term Funds | 17.0% | |
Six months ago |
| Domestic Equity Funds | 41.6% | |
| International Equity Funds | 5.9% | |
| High Yield Fixed-Income Funds | 4.2% | |
| Investment Grade Fixed-Income Funds | 31.9% | |
| Short-Term Funds | 16.4% | |
Expected |
| Domestic Equity Funds | 40.7% | |
| International Equity Funds | 5.4% | |
| High Yield Fixed-Income Funds | 3.9% | |
| Investment Grade Fixed-Income Funds | 32.5% | |
| Short-Term Funds | 17.5% | |
The fund invests according to an asset allocation strategy that becomes increasingly conservative over time. The six months ago allocation is based on the fund's holdings as of July 31, 2010. The current allocation is based on the fund's holdings as of January 31, 2011. The expected allocation represents the fund's anticipated allocation at July 31, 2011. |
Semiannual Report
Fidelity Income Replacement 2024 Fund
Investments January 31, 2011 (Unaudited)
Showing Percentage of Net Assets
Equity Funds - 46.8% |
| Shares | | Value |
Domestic Equity Funds - 41.2% |
Fidelity Advisor Mid Cap II Fund Institutional Class | 4,521 | | $ 82,866 |
Fidelity Disciplined Equity Fund | 3,713 | | 86,214 |
Fidelity Equity-Income Fund | 1,892 | | 86,214 |
Fidelity Large Cap Core Enhanced Index Fund | 15,766 | | 138,110 |
Fidelity Series 100 Index Fund | 11,559 | | 103,457 |
Fidelity Series Broad Market Opportunities Fund | 13,435 | | 138,110 |
Fidelity Series Small Cap Opportunities Fund | 5,050 | | 55,244 |
TOTAL DOMESTIC EQUITY FUNDS | | 690,215 |
International Equity Funds - 5.6% |
Fidelity Advisor International Discovery Fund Institutional Class | 2,832 | | 93,748 |
TOTAL EQUITY FUNDS (Cost $716,100) | 783,963 |
Fixed-Income Funds - 36.2% |
| | | |
High Yield Fixed-Income Funds - 4.0% |
Fidelity Capital & Income Fund | 3,480 | | 33,649 |
Fidelity Strategic Income Fund | 3,010 | | 33,649 |
TOTAL HIGH YIELD FIXED-INCOME FUNDS | | 67,298 |
|
| Shares | | Value |
Investment Grade Fixed-Income Funds - 32.2% |
Fidelity Government Income Fund | 10,356 | | $ 107,810 |
Fidelity Strategic Real Return Fund | 11,114 | | 107,810 |
Fidelity Total Bond Fund | 30,130 | | 323,599 |
TOTAL INVESTMENT GRADE FIXED-INCOME FUNDS | | 539,219 |
TOTAL FIXED-INCOME FUNDS (Cost $579,066) | 606,517 |
Short-Term Funds - 17.0% |
| | | |
Fidelity Institutional Money Market Portfolio Institutional Class | 141,793 | | 141,793 |
Fidelity Short-Term Bond Fund | 16,721 | | 141,793 |
TOTAL SHORT-TERM FUNDS (Cost $281,039) | 283,586 |
TOTAL INVESTMENT PORTFOLIO - 100.0% (Cost $1,576,205) | | 1,674,066 |
NET OTHER ASSETS (LIABILITIES) - 0.0% | | (143) |
NET ASSETS - 100% | $ 1,673,923 |
Other Information |
All investments are categorized as Level 1 under the Fair Value Hierarchy. The inputs or methodology used for valuing securities may not be an indication of the risk associated with investing in those securities. For more information on valuation inputs, please refer to the Security Valuation section in the accompanying Notes to Financial Statements. |
Income Tax Information |
At July 31, 2010, the Fund had a capital loss carryforward of approximately $76,448 of which $9,801 and $66,647 will expire in fiscal 2017 and 2018, respectively. Capital loss carryforwards are only available to offset future capital gains of the Fund to the extent provided by regulations and may be limited. |
The Fund intends to elect to defer to its fiscal year ending July 31, 2011 approximately $47,112 of losses recognized during the period November 1, 2009 to July 31, 2010. |
See accompanying notes which are an integral part of the financial statements.
Semiannual Report
Fidelity Income Replacement 2024 Fund
Statement of Assets and Liabilities
| January 31, 2011 (Unaudited) |
| | |
Assets | | |
Investment in securities, at value (cost $1,576,205) - See accompanying schedule | | $ 1,674,066 |
Cash | | 72 |
Receivable for investments sold | | 8,936 |
Total assets | | 1,683,074 |
| | |
Liabilities | | |
Payable for investments purchased | $ 8,934 | |
Distribution and service plan fees payable | 217 | |
Total liabilities | | 9,151 |
| | |
Net Assets | | $ 1,673,923 |
Net Assets consist of: | | |
Paid in capital | | $ 1,741,502 |
Undistributed net investment income | | 382 |
Accumulated undistributed net realized gain (loss) on investments | | (165,822) |
Net unrealized appreciation (depreciation) on investments | | 97,861 |
Net Assets | | $ 1,673,923 |
Calculation of Maximum Offering Price Class A:
Net Asset Value and redemption price per share ($256,379 ÷ 5,205.1 shares) | | $ 49.26 |
| | |
Maximum offering price per share (100/94.25 of $49.26) | | $ 52.27 |
Class T:
Net Asset Value and redemption price per share ($46,077 ÷ 935.1 shares) | | $ 49.27 |
| | |
Maximum offering price per share (100/96.50 of $49.27) | | $ 51.06 |
| | |
Class C:
Net Asset Value and offering price per share ($171,691 ÷ 3,488.0 shares)A | | $ 49.22 |
| | |
Income Replacement 2024:
Net Asset Value, offering price and redemption price per share ($1,168,214 ÷ 23,713.5 shares) | | $ 49.26 |
| | |
Institutional Class:
Net Asset Value, offering price and redemption price per share ($31,562 ÷ 640.7 shares) | | $ 49.26 |
A Redemption price per share is equal to net asset value less any applicable contingent deferred sales charge.
Statement of Operations
Six months ended January 31, 2011 (Unaudited) |
| | |
Investment Income | | |
Income distributions from underlying funds | | $ 19,307 |
| | |
Expenses | | |
Distribution and service plan fees | $ 1,286 | |
Independent trustees' compensation | 3 | |
Total expenses before reductions | 1,289 | |
Expense reductions | (3) | 1,286 |
Net investment income (loss) | | 18,021 |
Realized and Unrealized Gain (Loss) Realized gain (loss) on sale of underlying fund shares | (15,388) | |
Capital gain distributions from underlying funds | 9,198 | |
Total net realized gain (loss) | | (6,190) |
Change in net unrealized appreciation (depreciation) on underlying funds | | 141,054 |
Net gain (loss) | | 134,864 |
Net increase (decrease) in net assets resulting from operations | | $ 152,885 |
See accompanying notes which are an integral part of the financial statements.
Semiannual Report
Statement of Changes in Net Assets
| Six months ended January 31, 2011 (Unaudited) | Year ended
July 31,
2010 |
Increase (Decrease) in Net Assets | | |
Operations | | |
Net investment income (loss) | $ 18,021 | $ 30,872 |
Net realized gain (loss) | (6,190) | (37,364) |
Change in net unrealized appreciation (depreciation) | 141,054 | 180,425 |
Net increase (decrease) in net assets resulting from operations | 152,885 | 173,933 |
Distributions to shareholders from net investment income | (18,077) | (30,833) |
Distributions to shareholders from net realized gain | (7,078) | (4,233) |
Total distributions | (25,155) | (35,066) |
Share transactions - net increase (decrease) | 10,676 | 87,922 |
Total increase (decrease) in net assets | 138,406 | 226,789 |
| | |
Net Assets | | |
Beginning of period | 1,535,517 | 1,308,728 |
End of period (including undistributed net investment income of $382 and undistributed net investment income of $438, respectively) | $ 1,673,923 | $ 1,535,517 |
Financial Highlights - Class A
| Six months ended January 31, 2011 | Years ended July 31, |
| (Unaudited) | 2010 | 2009 | 2008 G |
Selected Per-Share Data | | | | |
Net asset value, beginning of period | $ 45.41 | $ 41.48 | $ 46.97 | $ 50.00 |
Income from Investment Operations | | | | |
Net investment income (loss) E | .519 | .811 | 1.014 | 1.063 |
Net realized and unrealized gain (loss) | 4.077 | 4.020 | (5.004) | (2.884) |
Total from investment operations | 4.596 | 4.831 | (3.990) | (1.821) |
Distributions from net investment income | (.529) | (.791) | (1.020) | (1.039) |
Distributions from net realized gain | (.217) | (.110) | (.480) | (.170) |
Total distributions | (.746) | (.901) | (1.500) | (1.209) |
Net asset value, end of period | $ 49.26 | $ 45.41 | $ 41.48 | $ 46.97 |
Total Return B, C, D | 10.16% | 11.70% | (8.10)% | (3.77)% |
Ratios to Average Net Assets F, H | | | | |
Expenses before reductions | .25% A | .25% | .25% | .25% A |
Expenses net of fee waivers, if any | .25% A | .25% | .25% | .25% A |
Expenses net of all reductions | .25% A | .25% | .25% | .25% A |
Net investment income (loss) | 2.19% A | 1.82% | 2.62% | 2.35% A |
Supplemental Data | | | | |
Net assets, end of period (000 omitted) | $ 256 | $ 260 | $ 287 | $ 286 |
Portfolio turnover rate | 28% A | 34% | 64% | 41% A |
A Annualized
B Total returns for periods of less than one year are not annualized.
C Total returns would have been lower had certain expenses not been reduced during the periods shown.
D Total returns do not include the effect of the sales charges.
E Calculated based on average shares outstanding during the period.
F Amounts do not include the activity of the underlying funds.
G For the period August 30, 2007 (commencement of operations) to July 31, 2008.
H Expense ratios reflect operating expenses of the class. Expenses before reductions do not reflect amounts reimbursed by the investment adviser or reductions from expense offset arrangements and do not represent the amount paid by the class during periods when reimbursements or reductions occur. Expenses net of fee waivers reflect expenses after reimbursement by the investment adviser but prior to reductions from expense offset arrangements. Expenses net of all reductions represent the net expenses paid by the class but do not include expenses of the investment companies in which the Fund invests.
See accompanying notes which are an integral part of the financial statements.
Semiannual Report
Financial Highlights - Class T
| Six months ended January 31, 2011 | Years ended July 31, |
| (Unaudited) | 2010 | 2009 | 2008 G |
Selected Per-Share Data | | | | |
Net asset value, beginning of period | $ 45.42 | $ 41.48 | $ 46.97 | $ 50.00 |
Income from Investment Operations | | | | |
Net investment income (loss) E | .459 | .701 | .919 | .966 |
Net realized and unrealized gain (loss) | 4.070 | 4.025 | (5.010) | (2.903) |
Total from investment operations | 4.529 | 4.726 | (4.091) | (1.937) |
Distributions from net investment income | (.462) | (.676) | (.919) | (.923) |
Distributions from net realized gain | (.217) | (.110) | (.480) | (.170) |
Total distributions | (.679) | (.786) | (1.399) | (1.093) |
Net asset value, end of period | $ 49.27 | $ 45.42 | $ 41.48 | $ 46.97 |
Total Return B, C, D | 10.01% | 11.43% | (8.34)% | (3.99)% |
Ratios to Average Net Assets F, H | | | | |
Expenses before reductions | .50% A | .50% | .50% | .50% A |
Expenses net of fee waivers, if any | .50% A | .50% | .50% | .50% A |
Expenses net of all reductions | .50% A | .50% | .50% | .50% A |
Net investment income (loss) | 1.93% A | 1.57% | 2.37% | 2.11% A |
Supplemental Data | | | | |
Net assets, end of period (000 omitted) | $ 46 | $ 54 | $ 69 | $ 96 |
Portfolio turnover rate | 28% A | 34% | 64% | 41% A |
A Annualized
B Total returns for periods of less than one year are not annualized.
C Total returns would have been lower had certain expenses not been reduced during the periods shown.
D Total returns do not include the effect of the sales charges.
E Calculated based on average shares outstanding during the period.
F Amounts do not include the activity of the underlying funds.
G For the period August 30, 2007 (commencement of operations) to July 31, 2008.
H Expense ratios reflect operating expenses of the class. Expenses before reductions do not reflect amounts reimbursed by the investment adviser or reductions from expense offset arrangements and do not represent the amount paid by the class during periods when reimbursements or reductions occur. Expenses net of fee waivers reflect expenses after reimbursement by the investment adviser but prior to reductions from expense offset arrangements. Expenses net of all reductions represent the net expenses paid by the class but do not include expenses of the investment companies in which the Fund invests.
Financial Highlights - Class C
| Six months ended January 31, 2011 | Years ended July 31, |
| (Unaudited) | 2010 | 2009 | 2008 G |
Selected Per-Share Data | | | | |
Net asset value, beginning of period | $ 45.38 | $ 41.45 | $ 46.93 | $ 50.00 |
Income from Investment Operations | | | | |
Net investment income (loss) E | .340 | .476 | .726 | .728 |
Net realized and unrealized gain (loss) | 4.067 | 4.020 | (5.005) | (2.903) |
Total from investment operations | 4.407 | 4.496 | (4.279) | (2.175) |
Distributions from net investment income | (.350) | (.456) | (.721) | (.725) |
Distributions from net realized gain | (.217) | (.110) | (.480) | (.170) |
Total distributions | (.567) | (.566) | (1.201) | (.895) |
Net asset value, end of period | $ 49.22 | $ 45.38 | $ 41.45 | $ 46.93 |
Total Return B, C, D | 9.73% | 10.87% | (8.80)% | (4.45)% |
Ratios to Average Net Assets F, H | | | | |
Expenses before reductions | 1.00% A | 1.00% | 1.00% | 1.00% A |
Expenses net of fee waivers, if any | 1.00% A | 1.00% | 1.00% | 1.00% A |
Expenses net of all reductions | 1.00% A | 1.00% | 1.00% | 1.00% A |
Net investment income (loss) | 1.43% A | 1.07% | 1.87% | 1.61% A |
Supplemental Data | | | | |
Net assets, end of period (000 omitted) | $ 172 | $ 159 | $ 147 | $ 233 |
Portfolio turnover rate | 28% A | 34% | 64% | 41% A |
A Annualized
B Total returns for periods of less than one year are not annualized.
C Total returns would have been lower had certain expenses not been reduced during the periods shown.
D Total returns do not include the effect of the contingent deferred sales charge.
E Calculated based on average shares outstanding during the period.
F Amounts do not include the activity of the underlying funds.
G For the period August 30, 2007 (commencement of operations) to July 31, 2008.
H Expense ratios reflect operating expenses of the class. Expenses before reductions do not reflect amounts reimbursed by the investment adviser or reductions from expense offset arrangements and do not represent the amount paid by the class during periods when reimbursements or reductions occur. Expenses net of fee waivers reflect expenses after reimbursement by the investment adviser but prior to reductions from expense offset arrangements. Expenses net of all reductions represent the net expenses paid by the class but do not include expenses of the investment companies in which the Fund invests.
See accompanying notes which are an integral part of the financial statements.
Semiannual Report
Financial Highlights - Income Replacement 2024
| Six months ended January 31, 2011 | Years ended July 31, |
| (Unaudited) | 2010 | 2009 | 2008 G |
Selected Per-Share Data | | | | |
Net asset value, beginning of period | $ 45.42 | $ 41.49 | $ 46.98 | $ 50.00 |
Income from Investment Operations | | | | |
Net investment income (loss) D | .578 | .924 | 1.118 | 1.166 |
Net realized and unrealized gain (loss) | 4.067 | 4.020 | (5.011) | (2.868) |
Total from investment operations | 4.645 | 4.944 | (3.893) | (1.702) |
Distributions from net investment income | (.588) | (.904) | (1.117) | (1.148) |
Distributions from net realized gain | (.217) | (.110) | (.480) | (.170) |
Total distributions | (.805) | (1.014) | (1.597) | (1.318) |
Net asset value, end of period | $ 49.26 | $ 45.42 | $ 41.49 | $ 46.98 |
Total Return B, C | 10.28% | 11.98% | (7.87)% | (3.53)% |
Ratios to Average Net Assets E, H | | | | |
Expenses before reductions F | .00% A | .00% | .00% | .00% A |
Expenses net of fee waivers, if any | .00% A | .00% | .00% | .00% A |
Expenses net of all reductions | .00% A | .00% | .00% | .00% A |
Net investment income (loss) | 2.44% A | 2.07% | 2.87% | 2.60% A |
Supplemental Data | | | | |
Net assets, end of period (000 omitted) | $ 1,168 | $ 1,026 | $ 749 | $ 714 |
Portfolio turnover rate | 28% A | 34% | 64% | 41% A |
A Annualized
B Total returns for periods of less than one year are not annualized.
C Total returns would have been lower had certain expenses not been reduced during the periods shown.
D Calculated based on average shares outstanding during the period.
E Amounts do not include the activity of the underlying funds.
F Amount represents less than .01%.
G For the period August 30, 2007 (commencement of operations) to July 31, 2008.
H Expense ratios reflect operating expenses of the class. Expenses before reductions do not reflect amounts reimbursed by the investment adviser or reductions from expense offset arrangements and do not represent the amount paid by the class during periods when reimbursements or reductions occur. Expenses net of fee waivers reflect expenses after reimbursement by the investment adviser but prior to reductions from expense offset arrangements. Expenses net of all reductions represent the net expenses paid by the class but do not include expenses of the investment companies in which the Fund invests.
Financial Highlights - Institutional Class
| Six months ended January 31, 2011 | Years ended July 31, |
| (Unaudited) | 2010 | 2009 | 2008 G |
Selected Per-Share Data | | | | |
Net asset value, beginning of period | $ 45.42 | $ 41.48 | $ 46.98 | $ 50.00 |
Income from Investment Operations | | | | |
Net investment income (loss) D | .578 | .922 | 1.119 | 1.194 |
Net realized and unrealized gain (loss) | 4.067 | 4.032 | (5.022) | (2.896) |
Total from investment operations | 4.645 | 4.954 | (3.903) | (1.702) |
Distributions from net investment income | (.588) | (.904) | (1.117) | (1.148) |
Distributions from net realized gain | (.217) | (.110) | (.480) | (.170) |
Total distributions | (.805) | (1.014) | (1.597) | (1.318) |
Net asset value, end of period | $ 49.26 | $ 45.42 | $ 41.48 | $ 46.98 |
Total Return B, C | 10.28% | 12.00% | (7.89)% | (3.53)% |
Ratios to Average Net Assets E, H | | | | |
Expenses before reductions F | .00% A | .00% | .00% | .00% A |
Expenses net of fee waivers, if any | .00% A | .00% | .00% | .00% A |
Expenses net of all reductions | .00% A | .00% | .00% | .00% A |
Net investment income (loss) | 2.44% A | 2.07% | 2.87% | 2.60% A |
Supplemental Data | | | | |
Net assets, end of period (000 omitted) | $ 32 | $ 37 | $ 57 | $ 97 |
Portfolio turnover rate | 28% A | 34% | 64% | 41% A |
A Annualized
B Total returns for periods of less than one year are not annualized.
C Total returns would have been lower had certain expenses not been reduced during the periods shown.
D Calculated based on average shares outstanding during the period.
E Amounts do not include the activity of the underlying funds.
F Amount represents less than .01%.
G For the period August 30, 2007 (commencement of operations) to July 31, 2008.
H Expense ratios reflect operating expenses of the class. Expenses before reductions do not reflect amounts reimbursed by the investment adviser or reductions from expense offset arrangements and do not represent the amount paid by the class during periods when reimbursements or reductions occur. Expenses net of fee waivers reflect expenses after reimbursement by the investment adviser but prior to reductions from expense offset arrangements. Expenses net of all reductions represent the net expenses paid by the class but do not include expenses of the investment companies in which the Fund invests.
See accompanying notes which are an integral part of the financial statements.
Semiannual Report
Fidelity Income Replacement 2026 Fund
Investment Changes (Unaudited)
Fund Holdings as of January 31, 2011 |
| % of fund's
net assets | % of fund's net assets
6 months ago |
Domestic Equity Funds | | |
Fidelity Advisor Mid Cap II Fund Institutional Class | 5.2 | 5.1 |
Fidelity Disciplined Equity Fund | 5.4 | 5.4 |
Fidelity Equity-Income Fund | 5.4 | 5.4 |
Fidelity Large Cap Core Enhanced Index Fund | 8.6 | 8.6 |
Fidelity Series 100 Index Fund | 6.4 | 6.5 |
Fidelity Series Broad Market Opportunities Fund | 8.6 | 8.7 |
Fidelity Series Small Cap Opportunities Fund | 3.4 | 3.5 |
| 43.0 | 43.2 |
International Equity Funds | | |
Fidelity Advisor International Discovery Fund Institutional Class | 6.4 | 6.7 |
High Yield Fixed-Income Funds | | |
Fidelity Capital & Income Fund | 2.2 | 2.3 |
Fidelity Strategic Income Fund | 2.2 | 2.2 |
| 4.4 | 4.5 |
Investment Grade Fixed-Income Funds | | |
Fidelity Government Income Fund | 6.1 | 6.0 |
Fidelity Strategic Real Return Fund | 6.1 | 6.2 |
Fidelity Total Bond Fund | 18.4 | 18.3 |
| 30.6 | 30.5 |
Short-Term Funds | | |
Fidelity Institutional Money Market Portfolio Institutional Class | 7.8 | 7.5 |
Fidelity Short-Term Bond Fund | 7.8 | 7.6 |
| 15.6 | 15.1 |
Net Other Assets (Liabilities)* | 0.0 | 0.0 |
| 100.0 | 100.0 |
* Amount represents less than 0.1%
Asset Allocation (% of fund's net assets) |
Current |
| Domestic Equity Funds | 43.0% | |
| International Equity Funds | 6.4% | |
| High Yield Fixed-Income Funds | 4.4% | |
| Investment Grade Fixed-Income Funds | 30.6% | |
| Short-Term Funds | 15.6% | |
Six months ago |
| Domestic Equity Funds | 43.2% | |
| International Equity Funds | 6.7% | |
| High Yield Fixed-Income Funds | 4.5% | |
| Investment Grade Fixed-Income Funds | 30.5% | |
| Short-Term Funds | 15.1% | |
Expected |
| Domestic Equity Funds | 42.6% | |
| International Equity Funds | 6.2% | |
| High Yield Fixed-Income Funds | 4.3% | |
| Investment Grade Fixed-Income Funds | 30.9% | |
| Short-Term Funds | 16.0% | |
The fund invests according to an asset allocation strategy that becomes increasingly conservative over time. The six months ago allocation is based on the fund's holdings as of July 31, 2010. The current allocation is based on the fund's holdings as of January 31, 2011. The expected allocation represents the fund's anticipated allocation at July 31, 2011. |
Semiannual Report
Fidelity Income Replacement 2026 Fund
Investments January 31, 2011 (Unaudited)
Showing Percentage of Net Assets
Equity Funds - 49.4% |
| Shares | | Value |
Domestic Equity Funds - 43.0% |
Fidelity Advisor Mid Cap II Fund Institutional Class | 4,024 | | $ 73,760 |
Fidelity Disciplined Equity Fund | 3,306 | | 76,762 |
Fidelity Equity-Income Fund | 1,684 | | 76,762 |
Fidelity Large Cap Core Enhanced Index Fund | 14,017 | | 122,791 |
Fidelity Series 100 Index Fund | 10,286 | | 92,057 |
Fidelity Series Broad Market Opportunities Fund | 11,945 | | 122,791 |
Fidelity Series Small Cap Opportunities Fund | 4,495 | | 49,173 |
TOTAL DOMESTIC EQUITY FUNDS | | 614,096 |
International Equity Funds - 6.4% |
Fidelity Advisor International Discovery Fund Institutional Class | 2,764 | | 91,486 |
TOTAL EQUITY FUNDS (Cost $676,787) | 705,582 |
Fixed-Income Funds - 35.0% |
| | | |
High Yield Fixed-Income Funds - 4.4% |
Fidelity Capital & Income Fund | 3,252 | | 31,449 |
Fidelity Strategic Income Fund | 2,813 | | 31,449 |
TOTAL HIGH YIELD FIXED-INCOME FUNDS | | 62,898 |
|
| Shares | | Value |
Investment Grade Fixed-Income Funds - 30.6% |
Fidelity Government Income Fund | 8,404 | | $ 87,484 |
Fidelity Strategic Real Return Fund | 9,019 | | 87,483 |
Fidelity Total Bond Fund | 24,437 | | 262,450 |
TOTAL INVESTMENT GRADE FIXED-INCOME FUNDS | | 437,417 |
TOTAL FIXED-INCOME FUNDS (Cost $488,421) | 500,315 |
Short-Term Funds - 15.6% |
| | | |
Fidelity Institutional Money Market Portfolio Institutional Class | 111,719 | | 111,719 |
Fidelity Short-Term Bond Fund | 13,182 | | 111,784 |
TOTAL SHORT-TERM FUNDS (Cost $223,012) | 223,503 |
TOTAL INVESTMENT PORTFOLIO - 100.0% (Cost $1,388,220) | | 1,429,400 |
NET OTHER ASSETS (LIABILITIES) - 0.0% | | (217) |
NET ASSETS - 100% | $ 1,429,183 |
Other Information |
All investments are categorized as Level 1 under the Fair Value Hierarchy. The inputs or methodology used for valuing securities may not be an indication of the risk associated with investing in those securities. For more information on valuation inputs, please refer to the Security Valuation section in the accompanying Notes to Financial Statements. |
Income Tax Information |
At July 31, 2010, the Fund had a capital loss carryforward of approximately $240,189 of which $4,903 and $235,286 will expire in fiscal 2017 and 2018, respectively. Capital loss carryforwards are only available to offset future capital gains of the Fund to the extent provided by regulations and may be limited. |
See accompanying notes which are an integral part of the financial statements.
Semiannual Report
Fidelity Income Replacement 2026 Fund
Statement of Assets and Liabilities
| January 31, 2011 (Unaudited) |
| | |
Assets | | |
Investment in securities, at value (cost $1,388,220) - See accompanying schedule | | $ 1,429,400 |
Receivable for investments sold | | 98,883 |
Total assets | | 1,528,283 |
| | |
Liabilities | | |
Payable for fund shares redeemed | $ 98,884 | |
Distribution and service plan fees payable | 216 | |
Total liabilities | | 99,100 |
| | |
Net Assets | | $ 1,429,183 |
Net Assets consist of: | | |
Paid in capital | | $ 1,658,234 |
Undistributed net investment income | | 299 |
Accumulated undistributed net realized gain (loss) on investments | | (270,530) |
Net unrealized appreciation (depreciation) on investments | | 41,180 |
Net Assets | | $ 1,429,183 |
Calculation of Maximum Offering Price Class A:
Net Asset Value and redemption price per share ($38,416 ÷ 784.95 shares) | | $ 48.94 |
| | |
Maximum offering price per share (100/94.25 of $48.94) | | $ 51.93 |
Class T:
Net Asset Value and redemption price per share ($127,451 ÷ 2,604.55 shares) | | $ 48.93 |
| | |
Maximum offering price per share (100/96.50 of $48.93) | | $ 50.70 |
| | |
Class C:
Net Asset Value and offering price per share ($186,532 ÷ 3,814.43 shares)A | | $ 48.90 |
| | |
Income Replacement 2026:
Net Asset Value, offering price and redemption price per share ($1,045,347 ÷ 21,361.82 shares) | | $ 48.94 |
| | |
Institutional Class:
Net Asset Value, offering price and redemption price per share ($31,437 ÷ 642.43 shares) | | $ 48.93 |
A Redemption price per share is equal to net asset value less any applicable contingent deferred sales charge.
Statement of Operations
Six months ended January 31, 2011 (Unaudited) |
| | |
Investment Income | | |
Income distributions from underlying funds | | $ 13,487 |
| | |
Expenses | | |
Distribution and service plan fees | $ 1,258 | |
Independent trustees' compensation | 2 | |
Total expenses before reductions | 1,260 | |
Expense reductions | (2) | 1,258 |
Net investment income (loss) | | 12,229 |
Realized and Unrealized Gain (Loss) Realized gain (loss) on sale of underlying fund shares | 784 | |
Capital gain distributions from underlying funds | 6,098 | |
Total net realized gain (loss) | | 6,882 |
Change in net unrealized appreciation (depreciation) on underlying funds | | 90,189 |
Net gain (loss) | | 97,071 |
Net increase (decrease) in net assets resulting from operations | | $ 109,300 |
See accompanying notes which are an integral part of the financial statements.
Semiannual Report
Fidelity Income Replacement 2026 Fund
Financial Statements - continued
Statement of Changes in Net Assets
| Six months ended January 31, 2011 (Unaudited) | Year ended
July 31,
2010 |
Increase (Decrease) in Net Assets | | |
Operations | | |
Net investment income (loss) | $ 12,229 | $ 13,583 |
Net realized gain (loss) | 6,882 | (46,103) |
Change in net unrealized appreciation (depreciation) | 90,189 | 120,286 |
Net increase (decrease) in net assets resulting from operations | 109,300 | 87,766 |
Distributions to shareholders from net investment income | (12,189) | (13,653) |
Distributions to shareholders from net realized gain | (4,626) | (1,823) |
Total distributions | (16,815) | (15,476) |
Share transactions - net increase (decrease) | 344,200 | 199,973 |
Total increase (decrease) in net assets | 436,685 | 272,263 |
| | |
Net Assets | | |
Beginning of period | 992,498 | 720,235 |
End of period (including undistributed net investment income of $299 and undistributed net investment income of $259, respectively) | $ 1,429,183 | $ 992,498 |
Financial Highlights - Class A
| Six months ended January 31, 2011 | Years ended July 31, |
| (Unaudited) | 2010 | 2009 | 2008 G |
Selected Per-Share Data | | | | |
Net asset value, beginning of period | $ 44.93 | $ 40.97 | $ 46.76 | $ 50.00 |
Income from Investment Operations | | | | |
Net investment income (loss) E | .520 | .743 | 1.042 | 1.076 |
Net realized and unrealized gain (loss) | 4.210 | 4.098 | (5.184) | (3.105) |
Total from investment operations | 4.730 | 4.841 | (4.142) | (2.029) |
Distributions from net investment income | (.520) | (.771) | (1.028) | (1.031) |
Distributions from net realized gain | (.200) | (.110) | (.620) | (.180) |
Total distributions | (.720) | (.881) | (1.648) | (1.211) |
Net asset value, end of period | $ 48.94 | $ 44.93 | $ 40.97 | $ 46.76 |
Total Return B, C, D | 10.57% | 11.87% | (8.56)% | (4.19)% |
Ratios to Average Net Assets F, H | | | | |
Expenses before reductions | .25% A | .25% | .25% | .25% A |
Expenses net of fee waivers, if any | .25% A | .25% | .25% | .25% A |
Expenses net of all reductions | .25% A | .25% | .25% | .25% A |
Net investment income (loss) | 2.21% A | 1.68% | 2.70% | 2.36% A |
Supplemental Data | | | | |
Net assets, end of period (000 omitted) | $ 38 | $ 45 | $ 69 | $ 131 |
Portfolio turnover rate | 38% A | 61% | 26% | 21% A |
A Annualized
B Total returns for periods of less than one year are not annualized.
C Total returns would have been lower had certain expenses not been reduced during the periods shown.
D Total returns do not include the effect of the sales charges.
E Calculated based on average shares outstanding during the period.
F Amounts do not include the activity of the underlying funds.
G For the period August 30, 2007 (commencement of operations) to July 31, 2008.
H Expense ratios reflect operating expenses of the class. Expenses before reductions do not reflect amounts reimbursed by the investment adviser or reductions from expense offset arrangements and do not represent the amount paid by the class during periods when reimbursements or reductions occur. Expenses net of fee waivers reflect expenses after reimbursement by the investment adviser but prior to reductions from expense offset arrangements. Expenses net of all reductions represent the net expenses paid by the class but do not include expenses of the investment companies in which the Fund invests.
See accompanying notes which are an integral part of the financial statements.
Semiannual Report
Financial Highlights - Class T
| Six months ended January 31, 2011 | Years ended July 31, |
| (Unaudited) | 2010 | 2009 | 2008 G |
Selected Per-Share Data | | | | |
Net asset value, beginning of period | $ 44.92 | $ 40.97 | $ 46.76 | $ 50.00 |
Income from Investment Operations | | | | |
Net investment income (loss) E | .461 | .638 | .944 | .966 |
Net realized and unrealized gain (loss) | 4.212 | 4.092 | (5.184) | (3.110) |
Total from investment operations | 4.673 | 4.730 | (4.240) | (2.144) |
Distributions from net investment income | (.463) | (.670) | (.930) | (.916) |
Distributions from net realized gain | (.200) | (.110) | (.620) | (.180) |
Total distributions | (.663) | (.780) | (1.550) | (1.096) |
Net asset value, end of period | $ 48.93 | $ 44.92 | $ 40.97 | $ 46.76 |
Total Return B, C, D | 10.44% | 11.59% | (8.79)% | (4.41)% |
Ratios to Average Net Assets F, H | | | | |
Expenses before reductions | .50% A | .50% | .50% | .50% A |
Expenses net of fee waivers, if any | .50% A | .50% | .50% | .50% A |
Expenses net of all reductions | .50% A | .50% | .50% | .50% A |
Net investment income (loss) | 1.96% A | 1.44% | 2.45% | 2.11% A |
Supplemental Data | | | | |
Net assets, end of period (000 omitted) | $ 127 | $ 116 | $ 55 | $ 96 |
Portfolio turnover rate | 38% A | 61% | 26% | 21% A |
A Annualized
B Total returns for periods of less than one year are not annualized.
C Total returns would have been lower had certain expenses not been reduced during the periods shown.
D Total returns do not include the effect of the sales charges.
E Calculated based on average shares outstanding during the period.
F Amounts do not include the activity of the underlying funds.
G For the period August 30, 2007 (commencement of operations) to July 31, 2008.
H Expense ratios reflect operating expenses of the class. Expenses before reductions do not reflect amounts reimbursed by the investment adviser or reductions from expense offset arrangements and do not represent the amount paid by the class during periods when reimbursements or reductions occur. Expenses net of fee waivers reflect expenses after reimbursement by the investment adviser but prior to reductions from expense offset arrangements. Expenses net of all reductions represent the net expenses paid by the class but do not include expenses of the investment companies in which the Fund invests.
Financial Highlights - Class C
| Six months ended January 31, 2011 | Years ended July 31, |
| (Unaudited) | 2010 | 2009 | 2008 G |
Selected Per-Share Data | | | | |
Net asset value, beginning of period | $ 44.89 | $ 40.95 | $ 46.72 | $ 50.00 |
Income from Investment Operations | | | | |
Net investment income (loss) E | .343 | .412 | .757 | .723 |
Net realized and unrealized gain (loss) | 4.211 | 4.087 | (5.183) | (3.090) |
Total from investment operations | 4.554 | 4.499 | (4.426) | (2.367) |
Distributions from net investment income | (.344) | (.449) | (.724) | (.733) |
Distributions from net realized gain | (.200) | (.110) | (.620) | (.180) |
Total distributions | (.544) | (.559) | (1.344) | (.913) |
Net asset value, end of period | $ 48.90 | $ 44.89 | $ 40.95 | $ 46.72 |
Total Return B, C, D | 10.17% | 11.01% | (9.25)% | (4.85)% |
Ratios to Average Net Assets F, H | | | | |
Expenses before reductions | 1.00% A | 1.00% | 1.00% | 1.00% A |
Expenses net of fee waivers, if any | 1.00% A | 1.00% | 1.00% | 1.00% A |
Expenses net of all reductions | 1.00% A | 1.00% | 1.00% | 1.00% A |
Net investment income (loss) | 1.46% A | .94% | 1.95% | 1.61% A |
Supplemental Data | | | | |
Net assets, end of period (000 omitted) | $ 187 | $ 174 | $ 183 | $ 485 |
Portfolio turnover rate | 38% A | 61% | 26% | 21% A |
A Annualized
B Total returns for periods of less than one year are not annualized.
C Total returns would have been lower had certain expenses not been reduced during the periods shown.
D Total returns do not include the effect of the contingent deferred sales charge.
E Calculated based on average shares outstanding during the period.
F Amounts do not include the activity of the underlying funds.
G For the period August 30, 2007 (commencement of operations) to July 31, 2008.
H Expense ratios reflect operating expenses of the class. Expenses before reductions do not reflect amounts reimbursed by the investment adviser or reductions from expense offset arrangements and do not represent the amount paid by the class during periods when reimbursements or reductions occur. Expenses net of fee waivers reflect expenses after reimbursement by the investment adviser but prior to reductions from expense offset arrangements. Expenses net of all reductions represent the net expenses paid by the class but do not include expenses of the investment companies in which the Fund invests.
See accompanying notes which are an integral part of the financial statements.
Semiannual Report
Financial Highlights - Income Replacement 2026
| Six months ended January 31, 2011 | Years ended July 31, |
| (Unaudited) | 2010 | 2009 | 2008 F |
Selected Per-Share Data | | | | |
Net asset value, beginning of period | $ 44.92 | $ 40.97 | $ 46.77 | $ 50.00 |
Income from Investment Operations | | | | |
Net investment income (loss) D | .579 | .856 | 1.138 | 1.168 |
Net realized and unrealized gain (loss) | 4.221 | 4.091 | (5.190) | (3.079) |
Total from investment operations | 4.800 | 4.947 | (4.052) | (1.911) |
Distributions from net investment income | (.580) | (.887) | (1.128) | (1.139) |
Distributions from net realized gain | (.200) | (.110) | (.620) | (.180) |
Total distributions | (.780) | (.997) | (1.748) | (1.319) |
Net asset value, end of period | $ 48.94 | $ 44.92 | $ 40.97 | $ 46.77 |
Total Return B, C | 10.74% | 12.14% | (8.34)% | (3.96)% |
Ratios to Average Net Assets E, G | | | | |
Expenses before reductions H | .00% A | .00% | .00% | .00% A |
Expenses net of fee waivers, if any | .00% A | .00% | .00% | .00% A |
Expenses net of all reductions | .00% A | .00% | .00% | .00% A |
Net investment income (loss) | 2.46% A | 1.94% | 2.95% | 2.61% A |
Supplemental Data | | | | |
Net assets, end of period (000 omitted) | $ 1,045 | $ 622 | $ 357 | $ 783 |
Portfolio turnover rate | 38% A | 61% | 26% | 21% A |
A Annualized
B Total returns for periods of less than one year are not annualized.
C Total returns would have been lower had certain expenses not been reduced during the periods shown.
D Calculated based on average shares outstanding during the period.
E Amounts do not include the activity of the underlying funds.
F For the period August 30, 2007 (commencement of operations) to July 31, 2008.
G Expense ratios reflect operating expenses of the class. Expenses before reductions do not reflect amounts reimbursed by the investment adviser or reductions from expense offset arrangements and do not represent the amount paid by the class during periods when reimbursements or reductions occur. Expenses net of fee waivers reflect expenses after reimbursement by the investment adviser but prior to reductions from expense offset arrangements. Expenses net of all reductions represent the net expenses paid by the class but do not include expenses of the investment companies in which the Fund invests.
H Amount represents less than $.01 per share.
Financial Highlights - Institutional Class
| Six months ended January 31, 2011 | Years ended July 31, |
| (Unaudited) | 2010 | 2009 | 2008 F |
Selected Per-Share Data | | | | |
Net asset value, beginning of period | $ 44.92 | $ 40.97 | $ 46.77 | $ 50.00 |
Income from Investment Operations | | | | |
Net investment income (loss) D | .579 | .855 | 1.136 | 1.196 |
Net realized and unrealized gain (loss) | 4.211 | 4.092 | (5.188) | (3.107) |
Total from investment operations | 4.790 | 4.947 | (4.052) | (1.911) |
Distributions from net investment income | (.580) | (.887) | (1.128) | (1.139) |
Distributions from net realized gain | (.200) | (.110) | (.620) | (.180) |
Total distributions | (.780) | (.997) | (1.748) | (1.319) |
Net asset value, end of period | $ 48.93 | $ 44.92 | $ 40.97 | $ 46.77 |
Total Return B, C | 10.71% | 12.14% | (8.34)% | (3.96)% |
Ratios to Average Net Assets E, G | | | | |
Expenses before reductions H | .00% A | .00% | .00% | .00% A |
Expenses net of fee waivers, if any | .00% A | .00% | .00% | .00% A |
Expenses net of all reductions | .00% A | .00% | .00% | .00% A |
Net investment income (loss) | 2.46% A | 1.94% | 2.95% | 2.61% A |
Supplemental Data | | | | |
Net assets, end of period (000 omitted) | $ 31 | $ 36 | $ 56 | $ 96 |
Portfolio turnover rate | 38% A | 61% | 26% | 21% A |
A Annualized
B Total returns for periods of less than one year are not annualized.
C Total returns would have been lower had certain expenses not been reduced during the periods shown.
D Calculated based on average shares outstanding during the period.
E Amounts do not include the activity of the underlying funds.
F For the period August 30, 2007 (commencement of operations) to July 31, 2008.
G Expense ratios reflect operating expenses of the class. Expenses before reductions do not reflect amounts reimbursed by the investment adviser or reductions from expense offset arrangements and do not represent the amount paid by the class during periods when reimbursements or reductions occur. Expenses net of fee waivers reflect expenses after reimbursement by the investment adviser but prior to reductions from expense offset arrangements. Expenses net of all reductions represent the net expenses paid by the class but do not include expenses of the investment companies in which the Fund invests.
H Amount represents less than $.01 per share.
See accompanying notes which are an integral part of the financial statements.
Semiannual Report
Fidelity Income Replacement 2028 Fund
Investment Changes (Unaudited)
Fund Holdings as of January 31, 2011 |
| % of fund's
net assets | % of fund's net assets
6 months ago |
Domestic Equity Funds | | |
Fidelity Advisor Mid Cap II Fund Institutional Class | 5.3 | 5.2 |
Fidelity Disciplined Equity Fund | 5.5 | 5.5 |
Fidelity Equity-Income Fund | 5.5 | 5.6 |
Fidelity Large Cap Core Enhanced Index Fund | 8.9 | 8.8 |
Fidelity Series 100 Index Fund | 6.6 | 6.7 |
Fidelity Series Broad Market Opportunities Fund | 8.9 | 8.9 |
Fidelity Series Small Cap Opportunities Fund | 3.5 | 3.6 |
| 44.2 | 44.3 |
International Equity Funds | | |
Fidelity Advisor International Discovery Fund Institutional Class | 7.2 | 7.5 |
High Yield Fixed-Income Funds | | |
Fidelity Capital & Income Fund | 2.4 | 2.5 |
Fidelity Strategic Income Fund | 2.3 | 2.4 |
| 4.7 | 4.9 |
Investment Grade Fixed-Income Funds | | |
Fidelity Government Income Fund | 5.9 | 5.9 |
Fidelity Strategic Real Return Fund | 6.0 | 6.0 |
Fidelity Total Bond Fund | 17.8 | 17.7 |
| 29.7 | 29.6 |
Short-Term Funds | | |
Fidelity Institutional Money Market Portfolio Institutional Class | 7.1 | 6.8 |
Fidelity Short-Term Bond Fund | 7.1 | 6.9 |
| 14.2 | 13.7 |
Net Other Assets (Liabilities)* | 0.0 | 0.0 |
| 100.0 | 100.0 |
* Amount represents less than 0.1%
Asset Allocation (% of fund's net assets) |
Current |
| Domestic Equity Funds | 44.2% | |
| International Equity Funds | 7.2% | |
| High Yield Fixed-Income Funds | 4.7% | |
| Investment Grade Fixed-Income Funds | 29.7% | |
| Short-Term Funds | 14.2% | |
Six months ago |
| Domestic Equity Funds | 44.3% | |
| International Equity Funds | 7.5% | |
| High Yield Fixed-Income Funds | 4.9% | |
| Investment Grade Fixed-Income Funds | 29.6% | |
| Short-Term Funds | 13.7% | |
Expected |
| Domestic Equity Funds | 43.9% | |
| International Equity Funds | 7.0% | |
| High Yield Fixed-Income Funds | 4.6% | |
| Investment Grade Fixed-Income Funds | 29.9% | |
| Short-Term Funds | 14.6% | |
The fund invests according to an asset allocation strategy that becomes increasingly conservative over time. The six months ago allocation is based on the fund's holdings as of July 31, 2010. The current allocation is based on the fund's holdings as of January 31, 2011. The expected allocation represents the fund's anticipated allocation at July 31, 2011. |
Semiannual Report
Fidelity Income Replacement 2028 Fund
Investments January 31, 2011 (Unaudited)
Showing Percentage of Net Assets
Equity Funds - 51.4% |
| Shares | | Value |
Domestic Equity Funds - 44.2% |
Fidelity Advisor Mid Cap II Fund Institutional Class | 18,753 | | $ 343,734 |
Fidelity Disciplined Equity Fund | 15,417 | | 357,975 |
Fidelity Equity-Income Fund | 7,856 | | 357,975 |
Fidelity Large Cap Core Enhanced Index Fund | 65,398 | | 572,890 |
Fidelity Series 100 Index Fund | 48,026 | | 429,830 |
Fidelity Series Broad Market Opportunities Fund | 55,729 | | 572,890 |
Fidelity Series Small Cap Opportunities Fund | 20,947 | | 229,156 |
TOTAL DOMESTIC EQUITY FUNDS | | 2,864,450 |
International Equity Funds - 7.2% |
Fidelity Advisor International Discovery Fund Institutional Class | 14,042 | | 464,786 |
TOTAL EQUITY FUNDS (Cost $3,141,194) | 3,329,236 |
Fixed-Income Funds - 34.4% |
| | | |
High Yield Fixed-Income Funds - 4.7% |
Fidelity Capital & Income Fund | 15,798 | | 152,771 |
Fidelity Strategic Income Fund | 13,665 | | 152,771 |
TOTAL HIGH YIELD FIXED-INCOME FUNDS | | 305,542 |
|
| Shares | | Value |
Investment Grade Fixed-Income Funds - 29.7% |
Fidelity Government Income Fund | 36,875 | | $ 383,869 |
Fidelity Strategic Real Return Fund | 39,574 | | 383,869 |
Fidelity Total Bond Fund | 107,105 | | 1,150,311 |
TOTAL INVESTMENT GRADE FIXED-INCOME FUNDS | | 1,918,049 |
TOTAL FIXED-INCOME FUNDS (Cost $2,132,032) | 2,223,591 |
Short-Term Funds - 14.2% |
| | | |
Fidelity Institutional Money Market Portfolio Institutional Class | 460,254 | | 460,254 |
Fidelity Short-Term Bond Fund | 54,275 | | 460,254 |
TOTAL SHORT-TERM FUNDS (Cost $914,301) | 920,508 |
TOTAL INVESTMENT PORTFOLIO - 100.0% (Cost $6,187,527) | | 6,473,335 |
NET OTHER ASSETS (LIABILITIES) - 0.0% | | (174) |
NET ASSETS - 100% | $ 6,473,161 |
Other Information |
All investments are categorized as Level 1 under the Fair Value Hierarchy. The inputs or methodology used for valuing securities may not be an indication of the risk associated with investing in those securities. For more information on valuation inputs, please refer to the Security Valuation section in the accompanying Notes to Financial Statements. |
Income Tax Information |
At July 31, 2010, the Fund had a capital loss carryforward of approximately $389,576 of which $7,815 and $381,761 will expire in fiscal 2017 and 2018, respectively. Capital loss carryforwards are only available to offset future capital gains of the Fund to the extent provided by regulations and may be limited. |
The Fund intends to elect to defer to its fiscal year ending July 31, 2011 approximately $153,499 of losses recognized during the period November 1, 2009 to July 31, 2010. |
See accompanying notes which are an integral part of the financial statements.
Semiannual Report
Fidelity Income Replacement 2028 Fund
Statement of Assets and Liabilities
| January 31, 2011 (Unaudited) |
| | |
Assets | | |
Investment in securities, at value (cost $6,187,527) - See accompanying schedule | | $ 6,473,335 |
Cash | | 1 |
Receivable for investments sold | | 31,697 |
Total assets | | 6,505,033 |
| | |
Liabilities | | |
Payable for investments purchased | $ 31,323 | |
Payable for fund shares redeemed | 370 | |
Distribution and service plan fees payable | 179 | |
Total liabilities | | 31,872 |
| | |
Net Assets | | $ 6,473,161 |
Net Assets consist of: | | |
Paid in capital | | $ 6,909,032 |
Undistributed net investment income | | 1,498 |
Accumulated undistributed net realized gain (loss) on investments | | (723,177) |
Net unrealized appreciation (depreciation) on investments | | 285,808 |
Net Assets | | $ 6,473,161 |
Calculation of Maximum Offering Price Class A:
Net Asset Value and redemption price per share ($386,401 ÷ 7,831.63 shares) | | $ 49.34 |
| | |
Maximum offering price per share (100/94.25 of $49.34) | | $ 52.35 |
Class T:
Net Asset Value and redemption price per share ($130,906 ÷ 2,651.76 shares) | | $ 49.37 |
| | |
Maximum offering price per share (100/96.50 of $49.37) | | $ 51.16 |
| | |
Class C:
Net Asset Value and offering price per share ($53,152 ÷ 1,076.78 shares) A | | $ 49.36 |
| | |
Income Replacement 2028:
Net Asset Value, offering price and redemption price per share ($5,871,315 ÷ 118,976.73 shares) | | $ 49.35 |
| | |
Institutional Class:
Net Asset Value, offering price and redemption price per share ($31,387 ÷ 636.03 shares) | | $ 49.35 |
A Redemption price per share is equal to net asset value less any applicable contingent deferred sales charge.
Statement of Operations
Six months ended January 31, 2011 (Unaudited) |
| | |
Investment Income | | |
Income distributions from underlying funds | | $ 74,688 |
| | |
Expenses | | |
Distribution and service plan fees | $ 1,092 | |
Independent trustees' compensation | 12 | |
Total expenses before reductions | 1,104 | |
Expense reductions | (12) | 1,092 |
Net investment income (loss) | | 73,596 |
Realized and Unrealized Gain (Loss) Realized gain (loss) on sale of underlying fund shares | (46,701) | |
Capital gain distributions from underlying funds | 33,605 | |
Total net realized gain (loss) | | (13,096) |
Change in net unrealized appreciation (depreciation) on underlying funds | | 575,123 |
Net gain (loss) | | 562,027 |
Net increase (decrease) in net assets resulting from operations | | $ 635,623 |
See accompanying notes which are an integral part of the financial statements.
Semiannual Report
Statement of Changes in Net Assets
| Six months ended
January 31, 2011
(Unaudited) | Year ended
July 31,
2010 |
Increase (Decrease) in Net Assets | | |
Operations | | |
Net investment income (loss) | $ 73,596 | $ 130,949 |
Net realized gain (loss) | (13,096) | (193,465) |
Change in net unrealized appreciation (depreciation) | 575,123 | 828,403 |
Net increase (decrease) in net assets resulting from operations | 635,623 | 765,887 |
Distributions to shareholders from net investment income | (73,937) | (131,065) |
Distributions to shareholders from net realized gain | (25,763) | (16,965) |
Total distributions | (99,700) | (148,030) |
Share transactions - net increase (decrease) | (218,783) | (832,893) |
Total increase (decrease) in net assets | 317,140 | (215,036) |
| | |
Net Assets | | |
Beginning of period | 6,156,021 | 6,371,057 |
End of period (including undistributed net investment income of $1,498 and undistributed net investment income of $1,839, respectively) | $ 6,473,161 | $ 6,156,021 |
Financial Highlights - Class A
| Six months ended
January 31, 2011 | Years ended July 31, |
| (Unaudited) | 2010 | 2009 | 2008 G |
Selected Per-Share Data | | | | |
Net asset value, beginning of period | $ 45.17 | $ 41.16 | $ 46.81 | $ 50.00 |
Income from Investment Operations | | | | |
Net investment income (loss) E | .521 | .789 | 1.000 | .966 |
Net realized and unrealized gain (loss) | 4.395 | 4.116 | (5.341) | (3.085) |
Total from investment operations | 4.916 | 4.905 | (4.341) | (2.119) |
Distributions from net investment income | (.537) | (.785) | (.979) | (.911) |
Distributions from net realized gain | (.209) | (.110) | (.330) | (.160) |
Total distributions | (.746) | (.895) | (1.309) | (1.071) |
Net asset value, end of period | $ 49.34 | $ 45.17 | $ 41.16 | $ 46.81 |
Total Return B, C, D | 10.93% | 11.96% | (8.93)% | (4.36)% |
Ratios to Average Net Assets F, H | | | | |
Expenses before reductions | .25% A | .25% | .25% | .25% A |
Expenses net of fee waivers, if any | .25% A | .25% | .25% | .25% A |
Expenses net of all reductions | .25% A | .25% | .25% | .25% A |
Net investment income (loss) | 2.20% A | 1.78% | 2.60% | 2.16% A |
Supplemental Data | | | | |
Net assets, end of period (000 omitted) | $ 386 | $ 359 | $ 278 | $ 371 |
Portfolio turnover rate | 32% A | 16% | 53% | 33% A |
A Annualized
B Total returns for periods of less than one year are not annualized.
C Total returns would have been lower had certain expenses not been reduced during the periods shown.
D Total returns do not include the effect of the sales charges.
E Calculated based on average shares outstanding during the period.
F Amounts do not include the activity of the underlying funds.
G For the period August 30, 2007 (commencement of operations) to July 31, 2008.
H Expense ratios reflect operating expenses of the class. Expenses before reductions do not reflect amounts reimbursed by the investment adviser or reductions from expense offset arrangements and do not represent the amount paid by the class during periods when reimbursements or reductions occur. Expenses net of fee waivers reflect expenses after reimbursement by the investment adviser but prior to reductions from expense offset arrangements. Expenses net of all reductions represent the net expenses paid by the class but do not include expenses of the investment companies in which the Fund invests.
See accompanying notes which are an integral part of the financial statements.
Semiannual Report
Financial Highlights - Class T
| Six months ended
January 31, 2011 | Years ended July 31, |
| (Unaudited) | 2010 | 2009 | 2008 G |
Selected Per-Share Data | | | | |
Net asset value, beginning of period | $ 45.16 | $ 41.16 | $ 46.80 | $ 50.00 |
Income from Investment Operations | | | | |
Net investment income (loss) E | .455 | .678 | .905 | .847 |
Net realized and unrealized gain (loss) | 4.415 | 4.107 | (5.340) | (3.079) |
Total from investment operations | 4.870 | 4.785 | (4.435) | (2.232) |
Distributions from net investment income | (.451) | (.675) | (.875) | (.808) |
Distributions from net realized gain | (.209) | (.110) | (.330) | (.160) |
Total distributions | (.660) | (.785) | (1.205) | (.968) |
Net asset value, end of period | $ 49.37 | $ 45.16 | $ 41.16 | $ 46.80 |
Total Return B, C, D | 10.81% | 11.66% | (9.15)% | (4.57)% |
Ratios to Average Net Assets F, H | | | | |
Expenses before reductions | .50% A | .50% | .50% | .50% A |
Expenses net of fee waivers, if any | .50% A | .50% | .50% | .50% A |
Expenses net of all reductions | .50% A | .50% | .50% | .50% A |
Net investment income (loss) | 1.95% A | 1.53% | 2.35% | 1.91% A |
Supplemental Data | | | | |
Net assets, end of period (000 omitted) | $ 131 | $ 328 | $ 311 | $ 606 |
Portfolio turnover rate | 32% A | 16% | 53% | 33% A |
A Annualized
B Total returns for periods of less than one year are not annualized.
C Total returns would have been lower had certain expenses not been reduced during the periods shown.
D Total returns do not include the effect of the sales charges.
E Calculated based on average shares outstanding during the period.
F Amounts do not include the activity of the underlying funds.
G For the period August 30, 2007 (commencement of operations) to July 31, 2008.
H Expense ratios reflect operating expenses of the class. Expenses before reductions do not reflect amounts reimbursed by the investment adviser or reductions from expense offset arrangements and do not represent the amount paid by the class during periods when reimbursements or reductions occur. Expenses net of fee waivers reflect expenses after reimbursement by the investment adviser but prior to reductions from expense offset arrangements. Expenses net of all reductions represent the net expenses paid by the class but do not include expenses of the investment companies in which the Fund invests.
Financial Highlights - Class C
| Six months ended
January 31, 2011 | Years ended July 31, |
| (Unaudited) | 2010 | 2009 | 2008 G |
Selected Per-Share Data | | | | |
Net asset value, beginning of period | $ 45.19 | $ 41.16 | $ 46.79 | $ 50.00 |
Income from Investment Operations | | | | |
Net investment income (loss) E | .344 | .454 | .711 | .639 |
Net realized and unrealized gain (loss) | 4.392 | 4.117 | (5.333) | (3.104) |
Total from investment operations | 4.736 | 4.571 | (4.622) | (2.465) |
Distributions from net investment income | (.357) | (.431) | (.678) | (.585) |
Distributions from net realized gain | (.209) | (.110) | (.330) | (.160) |
Total distributions | (.566) | (.541) | (1.008) | (.745) |
Net asset value, end of period | $ 49.36 | $ 45.19 | $ 41.16 | $ 46.79 |
Total Return B, C, D | 10.50% | 11.13% | (9.60)% | (5.02)% |
Ratios to Average Net Assets F, H | | | | |
Expenses before reductions | 1.00% A | 1.00% | 1.00% | 1.00% A |
Expenses net of fee waivers, if any | 1.00% A | 1.00% | 1.00% | 1.00% A |
Expenses net of all reductions | 1.00% A | 1.00% | 1.00% | 1.00% A |
Net investment income (loss) | 1.45% A | 1.02% | 1.84% | 1.41% A |
Supplemental Data | | | | |
Net assets, end of period (000 omitted) | $ 53 | $ 51 | $ 86 | $ 150 |
Portfolio turnover rate | 32% A | 16% | 53% | 33% A |
A Annualized
B Total returns for periods of less than one year are not annualized.
C Total returns would have been lower had certain expenses not been reduced during the periods shown.
D Total returns do not include the effect of the contingent deferred sales charge.
E Calculated based on average shares outstanding during the period.
F Amounts do not include the activity of the underlying funds.
G For the period August 30, 2007 (commencement of operations) to July 31, 2008.
H Expense ratios reflect operating expenses of the class. Expenses before reductions do not reflect amounts reimbursed by the investment adviser or reductions from expense offset arrangements and do not represent the amount paid by the class during periods when reimbursements or reductions occur. Expenses net of fee waivers reflect expenses after reimbursement by the investment adviser but prior to reductions from expense offset arrangements. Expenses net of all reductions represent the net expenses paid by the class but do not include expenses of the investment companies in which the Fund invests.
See accompanying notes which are an integral part of the financial statements.
Semiannual Report
Financial Highlights - Income Replacement 2028
| Six months ended
January 31, 2011 | Years ended July 31, |
| (Unaudited) | 2010 | 2009 | 2008 F |
Selected Per-Share Data | | | | |
Net asset value, beginning of period | $ 45.18 | $ 41.17 | $ 46.82 | $ 50.00 |
Income from Investment Operations | | | | |
Net investment income (loss) D | .580 | .900 | 1.087 | 1.067 |
Net realized and unrealized gain (loss) | 4.395 | 4.115 | (5.330) | (3.072) |
Total from investment operations | 4.975 | 5.015 | (4.243) | (2.005) |
Distributions from net investment income | (.596) | (.895) | (1.077) | (1.015) |
Distributions from net realized gain | (.209) | (.110) | (.330) | (.160) |
Total distributions | (.805) | (1.005) | (1.407) | (1.175) |
Net asset value, end of period | $ 49.35 | $ 45.18 | $ 41.17 | $ 46.82 |
Total Return B, C | 11.06% | 12.24% | (8.69)% | (4.14)% |
Ratios to Average Net Assets E, G | | | | |
Expenses before reductions H | .00% A | .00% | .00% | .00% A |
Expenses net of fee waivers, if any | .00% A | .00% | .00% | .00% A |
Expenses net of all reductions | .00% A | .00% | .00% | .00% A |
Net investment income (loss) | 2.45% A | 2.03% | 2.85% | 2.40% A |
Supplemental Data | | | | |
Net assets, end of period (000 omitted) | $ 5,871 | $ 5,383 | $ 5,641 | $ 6,068 |
Portfolio turnover rate | 32% A | 16% | 53% | 33% A |
A Annualized
B Total returns for periods of less than one year are not annualized.
C Total returns would have been lower had certain expenses not been reduced during the periods shown.
D Calculated based on average shares outstanding during the period.
E Amounts do not include the activity of the underlying funds.
F For the period August 30, 2007 (commencement of operations) to July 31, 2008.
G Expense ratios reflect operating expenses of the class. Expenses before reductions do not reflect amounts reimbursed by the investment adviser or reductions from expense offset arrangements and do not represent the amount paid by the class during periods when reimbursements or reductions occur. Expenses net of fee waivers reflect expenses after reimbursement by the investment adviser but prior to reductions from expense offset arrangements. Expenses net of all reductions represent the net expenses paid by the class but do not include expenses of the investment companies in which the Fund invests.
H Amount represents less than $.01 per share.
Financial Highlights - Institutional Class
| Six months ended
January 31, 2011 | Years ended July 31, |
| (Unaudited) | 2010 | 2009 | 2008 F |
Selected Per-Share Data | | | | |
Net asset value, beginning of period | $ 45.18 | $ 41.17 | $ 46.82 | $ 50.00 |
Income from Investment Operations | | | | |
Net investment income (loss) D | .580 | .899 | 1.097 | 1.101 |
Net realized and unrealized gain (loss) | 4.395 | 4.116 | (5.340) | (3.106) |
Total from investment operations | 4.975 | 5.015 | (4.243) | (2.005) |
Distributions from net investment income | (.596) | (.895) | (1.077) | (1.015) |
Distributions from net realized gain | (.209) | (.110) | (.330) | (.160) |
Total distributions | (.805) | (1.005) | (1.407) | (1.175) |
Net asset value, end of period | $ 49.35 | $ 45.18 | $ 41.17 | $ 46.82 |
Total Return B, C | 11.06% | 12.24% | (8.69)% | (4.14)% |
Ratios to Average Net Assets E, G | | | | |
Expenses before reductions H | .00% A | .00% | .00% | .00% A |
Expenses net of fee waivers, if any | .00% A | .00% | .00% | .00% A |
Expenses net of all reductions | .00% A | .00% | .00% | .00% A |
Net investment income (loss) | 2.45% A | 2.03% | 2.85% | 2.40% A |
Supplemental Data | | | | |
Net assets, end of period (000 omitted) | $ 31 | $ 36 | $ 56 | $ 96 |
Portfolio turnover rate | 32% A | 16% | 53% | 33% A |
A Annualized
B Total returns for periods of less than one year are not annualized.
C Total returns would have been lower had certain expenses not been reduced during the periods shown.
D Calculated based on average shares outstanding during the period.
E Amounts do not include the activity of the underlying funds.
F For the period August 30, 2007 (commencement of operations) to July 31, 2008.
G Expense ratios reflect operating expenses of the class. Expenses before reductions do not reflect amounts reimbursed by the investment adviser or reductions from expense offset arrangements and do not represent the amount paid by the class during periods when reimbursements or reductions occur. Expenses net of fee waivers reflect expenses after reimbursement by the investment adviser but prior to reductions from expense offset arrangements. Expenses net of all reductions represent the net expenses paid by the class but do not include expenses of the investment companies in which the Fund invests.
H Amount represents less than $.01 per share.
See accompanying notes which are an integral part of the financial statements.
Semiannual Report
Fidelity Income Replacement 2030 Fund
Investment Changes (Unaudited)
Fund Holdings as of January 31, 2011 |
| % of fund's
net assets | % of fund's net assets
6 months ago |
Domestic Equity Funds | | |
Fidelity Advisor Mid Cap II Fund Institutional Class | 5.4 | 5.4 |
Fidelity Disciplined Equity Fund | 5.7 | 5.6 |
Fidelity Equity-Income Fund | 5.7 | 5.7 |
Fidelity Large Cap Core Enhanced Index Fund | 9.0 | 9.0 |
Fidelity Series 100 Index Fund | 6.8 | 6.8 |
Fidelity Series Broad Market Opportunities Fund | 9.0 | 9.0 |
Fidelity Series Small Cap Opportunities Fund | 3.6 | 3.7 |
| 45.2 | 45.2 |
International Equity Funds | | |
Fidelity Advisor International Discovery Fund Institutional Class | 8.0 | 8.2 |
High Yield Fixed-Income Funds | | |
Fidelity Capital & Income Fund | 2.5 | 2.5 |
Fidelity Strategic Income Fund | 2.5 | 2.6 |
| 5.0 | 5.1 |
Investment Grade Fixed-Income Funds | | |
Fidelity Government Income Fund | 5.7 | 5.7 |
Fidelity Strategic Real Return Fund | 5.7 | 5.7 |
Fidelity Total Bond Fund | 17.1 | 17.1 |
| 28.5 | 28.5 |
Short-Term Funds | | |
Fidelity Institutional Money Market Portfolio Institutional Class | 6.6 | 6.5 |
Fidelity Short-Term Bond Fund | 6.7 | 6.5 |
| 13.3 | 13.0 |
Net Other Assets (Liabilities)* | 0.0 | 0.0 |
| 100.0 | 100.0 |
* Amount represents less than 0.1%
Asset Allocation (% of fund's net assets) |
Current |
| Domestic Equity Funds | 45.2% | |
| International Equity Funds | 8.0% | |
| High Yield Fixed-Income Funds | 5.0% | |
| Investment Grade Fixed-Income Funds | 28.5% | |
| Short-Term Funds | 13.3% | |
Six months ago |
| Domestic Equity Funds | 45.2% | |
| International Equity Funds | 8.2% | |
| High Yield Fixed-Income Funds | 5.1% | |
| Investment Grade Fixed-Income Funds | 28.5% | |
| Short-Term Funds | 13.0% | |
Expected |
| Domestic Equity Funds | 45.0% | |
| International Equity Funds | 7.7% | |
| High Yield Fixed-Income Funds | 4.9% | |
| Investment Grade Fixed-Income Funds | 29.0% | |
| Short-Term Funds | 13.4% | |
The fund invests according to an asset allocation strategy that becomes increasingly conservative over time. The six months ago allocation is based on the fund's holdings as of July 31, 2010. The current allocation is based on the fund's holdings as of January 31, 2011. The expected allocation represents the fund's anticipated allocation at July 31, 2011. |
Semiannual Report
Fidelity Income Replacement 2030 Fund
Investments January 31, 2011 (Unaudited)
Showing Percentage of Net Assets
Equity Funds - 53.2% |
| Shares | | Value |
Domestic Equity Funds - 45.2% |
Fidelity Advisor Mid Cap II Fund Institutional Class | 8,898 | | $ 163,100 |
Fidelity Disciplined Equity Fund | 7,322 | | 170,021 |
Fidelity Equity-Income Fund | 3,731 | | 170,021 |
Fidelity Large Cap Core Enhanced Index Fund | 31,054 | | 272,034 |
Fidelity Series 100 Index Fund | 22,796 | | 204,026 |
Fidelity Series Broad Market Opportunities Fund | 26,462 | | 272,034 |
Fidelity Series Small Cap Opportunities Fund | 9,957 | | 108,934 |
TOTAL DOMESTIC EQUITY FUNDS | | 1,360,170 |
International Equity Funds - 8.0% |
Fidelity Advisor International Discovery Fund Institutional Class | 7,228 | | 239,234 |
TOTAL EQUITY FUNDS (Cost $1,442,797) | 1,599,404 |
Fixed-Income Funds - 33.5% |
| | | |
High Yield Fixed-Income Funds - 5.0% |
Fidelity Capital & Income Fund | 7,749 | | 74,930 |
Fidelity Strategic Income Fund | 6,702 | | 74,930 |
TOTAL HIGH YIELD FIXED-INCOME FUNDS | | 149,860 |
|
| Shares | | Value |
Investment Grade Fixed-Income Funds - 28.5% |
Fidelity Government Income Fund | 16,506 | | $ 171,827 |
Fidelity Strategic Real Return Fund | 17,714 | | 171,827 |
Fidelity Total Bond Fund | 47,996 | | 515,480 |
TOTAL INVESTMENT GRADE FIXED-INCOME FUNDS | | 859,134 |
TOTAL FIXED-INCOME FUNDS (Cost $991,531) | 1,008,994 |
Short-Term Funds - 13.3% |
| | | |
Fidelity Institutional Money Market Portfolio Institutional Class | 200,415 | | 200,415 |
Fidelity Short-Term Bond Fund | 23,634 | | 200,415 |
TOTAL SHORT-TERM FUNDS (Cost $399,222) | 400,830 |
TOTAL INVESTMENT PORTFOLIO - 100.0% (Cost $2,833,550) | | 3,009,228 |
NET OTHER ASSETS (LIABILITIES) - 0.0% | | (197) |
NET ASSETS - 100% | $ 3,009,031 |
Other Information |
All investments are categorized as Level 1 under the Fair Value Hierarchy. The inputs or methodology used for valuing securities may not be an indication of the risk associated with investing in those securities. For more information on valuation inputs, please refer to the Security Valuation section in the accompanying Notes to Financial Statements. |
Income Tax Information |
At July 31, 2010, the Fund had a capital loss carryforward of approximately $125,799 of which $39,903 and $85,896 will expire in fiscal 2017 and 2018, respectively. Capital loss carryforwards are only available to offset future capital gains of the Fund to the extent provided by regulations and may be limited. |
See accompanying notes which are an integral part of the financial statements.
Semiannual Report
Fidelity Income Replacement 2030 Fund
Statement of Assets and Liabilities
| January 31, 2011 (Unaudited) |
| | |
Assets | | |
Investment in securities, at value (cost $2,833,550) - See accompanying schedule | | $ 3,009,228 |
Receivable for investments sold | | 14,732 |
Total assets | | 3,023,960 |
| | |
Liabilities | | |
Payable for investments purchased | $ 14,735 | |
Distribution and service plan fees payable | 194 | |
Total liabilities | | 14,929 |
| | |
Net Assets | | $ 3,009,031 |
Net Assets consist of: | | |
Paid in capital | | $ 3,003,339 |
Undistributed net investment income | | 699 |
Accumulated undistributed net realized gain (loss) on investments | | (170,685) |
Net unrealized appreciation (depreciation) on investments | | 175,678 |
Net Assets | | $ 3,009,031 |
Calculation of Maximum Offering Price Class A:
Net Asset Value and redemption price per share ($56,048 ÷ 1,142.0 shares) | | $ 49.08 |
| | |
Maximum offering price per share (100/94.25 of $49.08) | | $ 52.07 |
Class T:
Net Asset Value and redemption price per share ($9,526 ÷ 194.0 shares) | | $ 49.10 |
| | |
Maximum offering price per share (100/96.50 of $49.10) | | $ 50.88 |
| | |
Class C:
Net Asset Value and offering price per share ($214,004 ÷ 4,363.3 shares) A | | $ 49.05 |
| | |
Income Replacement 2030:
Net Asset Value, offering price and redemption price per share ($2,698,105 ÷ 54,986.9 shares) | | $ 49.07 |
| | |
Institutional Class:
Net Asset Value, offering price and redemption price per share ($31,348 ÷ 638.9 shares) | | $ 49.07 |
A Redemption price per share is equal to net asset value less any applicable contingent deferred sales charge.
Statement of Operations
Six months ended January 31, 2011 (Unaudited) |
| | |
Investment Income | | |
Income distributions from underlying funds | | $ 32,637 |
| | |
Expenses | | |
Distribution and service plan fees | $ 1,148 | |
Independent trustees' compensation | 4 | |
Total expenses before reductions | 1,152 | |
Expense reductions | (4) | 1,148 |
Net investment income (loss) | | 31,489 |
Realized and Unrealized Gain (Loss) Realized gain (loss) on sale of underlying fund shares | (21,542) | |
Capital gain distributions from underlying funds | 14,193 | |
Total net realized gain (loss) | | (7,349) |
Change in net unrealized appreciation (depreciation) on underlying funds | | 231,747 |
Net gain (loss) | | 224,398 |
Net increase (decrease) in net assets resulting from operations | | $ 255,887 |
See accompanying notes which are an integral part of the financial statements.
Semiannual Report
Statement of Changes in Net Assets
| Six months ended
January 31, 2011
(Unaudited) | Year ended
July 31,
2010 |
Increase (Decrease) in Net Assets | | |
Operations | | |
Net investment income (loss) | $ 31,489 | $ 14,472 |
Net realized gain (loss) | (7,349) | 212 |
Change in net unrealized appreciation (depreciation) | 231,747 | 65,683 |
Net increase (decrease) in net assets resulting from operations | 255,887 | 80,367 |
Distributions to shareholders from net investment income | (31,229) | (14,213) |
Distributions to shareholders from net realized gain | (10,723) | (1,857) |
Total distributions | (41,952) | (16,070) |
Share transactions - net increase (decrease) | 834,197 | 1,233,775 |
Total increase (decrease) in net assets | 1,048,132 | 1,298,072 |
| | |
Net Assets | | |
Beginning of period | 1,960,899 | 662,827 |
End of period (including undistributed net investment income of $699 and undistributed net investment income of $439, respectively) | $ 3,009,031 | $ 1,960,899 |
Financial Highlights - Class A
| Six months ended
January 31, 2011 | Years ended July 31, |
| (Unaudited) | 2010 | 2009 | 2008 G |
Selected Per-Share Data | | | | |
Net asset value, beginning of period | $ 44.77 | $ 40.69 | $ 46.61 | $ 50.00 |
Income from Investment Operations | | | | |
Net investment income (loss) E | .565 | .718 | .978 | 1.034 |
Net realized and unrealized gain (loss) | 4.452 | 4.180 | (5.404) | (3.239) |
Total from investment operations | 5.017 | 4.898 | (4.426) | (2.205) |
Distributions from net investment income | (.531) | (.713) | (1.004) | (.995) |
Distributions from net realized gain | (.176) | (.105) | (.490) | (.190) |
Total distributions | (.707) | (.818) | (1.494) | (1.185) |
Net asset value, end of period | $ 49.08 | $ 44.77 | $ 40.69 | $ 46.61 |
Total Return B, C, D | 11.25% | 12.08% | (9.22)% | (4.55)% |
Ratios to Average Net Assets F, H | | | | |
Expenses before reductions | .25% A | .25% | .25% | .25% A |
Expenses net of fee waivers, if any | .25% A | .25% | .25% | .25% A |
Expenses net of all reductions | .25% A | .25% | .25% | .25% A |
Net investment income (loss) | 2.41% A | 1.63% | 2.57% | 2.26% A |
Supplemental Data | | | | |
Net assets, end of period (000 omitted) | $ 56 | $ 66 | $ 55 | $ 95 |
Portfolio turnover rate | 43% A | 31% | 53% | 12% A |
A Annualized
B Total returns for periods of less than one year are not annualized.
C Total returns would have been lower had certain expenses not been reduced during the periods shown.
D Total returns do not include the effect of the sales charges.
E Calculated based on average shares outstanding during the period.
F Amounts do not include the activity of the underlying funds.
G For the period August 30, 2007 (commencement of operations) to July 31, 2008.
H Expense ratios reflect operating expenses of the class. Expenses before reductions do not reflect amounts reimbursed by the investment adviser or reductions from expense offset arrangements and do not represent the amount paid by the class during periods when reimbursements or reductions occur. Expenses net of fee waivers reflect expenses after reimbursement by the investment adviser but prior to reductions from expense offset arrangements. Expenses net of all reductions represent the net expenses paid by the class but do not include expenses of the investment companies in which the Fund invests.
See accompanying notes which are an integral part of the financial statements.
Semiannual Report
Financial Highlights - Class T
| Six months ended
January 31, 2011 | Years ended July 31, |
| (Unaudited) | 2010 | 2009 | 2008 G |
Selected Per-Share Data | | | | |
Net asset value, beginning of period | $ 44.78 | $ 40.69 | $ 46.61 | $ 50.00 |
Income from Investment Operations | | | | |
Net investment income (loss) E | .504 | .603 | .881 | .920 |
Net realized and unrealized gain (loss) | 4.449 | 4.182 | (5.402) | (3.234) |
Total from investment operations | 4.953 | 4.785 | (4.521) | (2.314) |
Distributions from net investment income | (.457) | (.590) | (.909) | (.886) |
Distributions from net realized gain | (.176) | (.105) | (.490) | (.190) |
Total distributions | (.633) | (.695) | (1.399) | (1.076) |
Net asset value, end of period | $ 49.10 | $ 44.78 | $ 40.69 | $ 46.61 |
Total Return B, C, D | 11.09% | 11.79% | (9.45)% | (4.76)% |
Ratios to Average Net Assets F, H | | | | |
Expenses before reductions | .50% A | .50% | .50% | .50% A |
Expenses net of fee waivers, if any | .50% A | .50% | .50% | .50% A |
Expenses net of all reductions | .50% A | .50% | .50% | .50% A |
Net investment income (loss) | 2.16% A | 1.37% | 2.32% | 2.01% A |
Supplemental Data | | | | |
Net assets, end of period (000 omitted) | $ 10 | $ 45 | $ 71 | $ 95 |
Portfolio turnover rate | 43% A | 31% | 53% | 12% A |
A Annualized
B Total returns for periods of less than one year are not annualized.
C Total returns would have been lower had certain expenses not been reduced during the periods shown.
D Total returns do not include the effect of the sales charges.
E Calculated based on average shares outstanding during the period.
F Amounts do not include the activity of the underlying funds.
G For the period August 30, 2007 (commencement of operations) to July 31, 2008.
H Expense ratios reflect operating expenses of the class. Expenses before reductions do not reflect amounts reimbursed by the investment adviser or reductions from expense offset arrangements and do not represent the amount paid by the class during periods when reimbursements or reductions occur. Expenses net of fee waivers reflect expenses after reimbursement by the investment adviser but prior to reductions from expense offset arrangements. Expenses net of all reductions represent the net expenses paid by the class but do not include expenses of the investment companies in which the Fund invests.
Financial Highlights - Class C
| Six months ended
January 31, 2011 | Years ended July 31, |
| (Unaudited) | 2010 | 2009 | 2008 G |
Selected Per-Share Data | | | | |
Net asset value, beginning of period | $ 44.75 | $ 40.67 | $ 46.58 | $ 50.00 |
Income from Investment Operations | | | | |
Net investment income (loss) E | .390 | .385 | .693 | .682 |
Net realized and unrealized gain (loss) | 4.446 | 4.185 | (5.400) | (3.227) |
Total from investment operations | 4.836 | 4.570 | (4.707) | (2.545) |
Distributions from net investment income | (.360) | (.385) | (.713) | (.685) |
Distributions from net realized gain | (.176) | (.105) | (.490) | (.190) |
Total distributions | (.536) | (.490) | (1.203) | (.875) |
Net asset value, end of period | $ 49.05 | $ 44.75 | $ 40.67 | $ 46.58 |
Total Return B, C, D | 10.83% | 11.26% | (9.91)% | (5.21)% |
Ratios to Average Net Assets F, H | | | | |
Expenses before reductions | 1.00% A | 1.00% | 1.00% | 1.00% A |
Expenses net of fee waivers, if any | 1.00% A | 1.00% | 1.00% | 1.00% A |
Expenses net of all reductions | 1.00% A | 1.00% | 1.00% | 1.00% A |
Net investment income (loss) | 1.66% A | .88% | 1.82% | 1.51% A |
Supplemental Data | | | | |
Net assets, end of period (000 omitted) | $ 214 | $ 186 | $ 178 | $ 297 |
Portfolio turnover rate | 43% A | 31% | 53% | 12% A |
A Annualized
B Total returns for periods of less than one year are not annualized.
C Total returns would have been lower had certain expenses not been reduced during the periods shown.
D Total returns do not include the effect of the contingent deferred sales charge.
E Calculated based on average shares outstanding during the period.
F Amounts do not include the activity of the underlying funds.
G For the period August 30, 2007 (commencement of operations) to July 31, 2008.
H Expense ratios reflect operating expenses of the class. Expenses before reductions do not reflect amounts reimbursed by the investment adviser or reductions from expense offset arrangements and do not represent the amount paid by the class during periods when reimbursements or reductions occur. Expenses net of fee waivers reflect expenses after reimbursement by the investment adviser but prior to reductions from expense offset arrangements. Expenses net of all reductions represent the net expenses paid by the class but do not include expenses of the investment companies in which the Fund invests.
See accompanying notes which are an integral part of the financial statements.
Semiannual Report
Financial Highlights - Income Replacement 2030
| Six months ended
January 31, 2011 | Years ended July 31, |
| (Unaudited) | 2010 | 2009 | 2008 F |
Selected Per-Share Data | | | | |
Net asset value, beginning of period | $ 44.76 | $ 40.69 | $ 46.61 | $ 50.00 |
Income from Investment Operations | | | | |
Net investment income (loss) D | .626 | .821 | 1.101 | 1.117 |
Net realized and unrealized gain (loss) | 4.451 | 4.178 | (5.429) | (3.209) |
Total from investment operations | 5.077 | 4.999 | (4.328) | (2.092) |
Distributions from net investment income | (.591) | (.824) | (1.102) | (1.108) |
Distributions from net realized gain | (.176) | (.105) | (.490) | (.190) |
Total distributions | (.767) | (.929) | (1.592) | (1.298) |
Net asset value, end of period | $ 49.07 | $ 44.76 | $ 40.69 | $ 46.61 |
Total Return B, C | 11.39% | 12.34% | (8.99)% | (4.33)% |
Ratios to Average Net Assets E, G | | | | |
Expenses before reductions H | .00% A | .00% | .00% | .00% A |
Expenses net of fee waivers, if any | .00% A | .00% | .00% | .00% A |
Expenses net all reductions | .00% A | .00% | .00% | .00% A |
Net investment income (loss) | 2.66% A | 1.88% | 2.82% | 2.51% A |
Supplemental Data | | | | |
Net assets, end of period (000 omitted) | $ 2,698 | $ 1,628 | $ 303 | $ 653 |
Portfolio turnover rate | 43% A | 31% | 53% | 12% A |
A Annualized
B Total returns for periods of less than one year are not annualized.
C Total returns would have been lower had certain expenses not been reduced during the periods shown.
D Calculated based on average shares outstanding during the period.
E Amounts do not include the activity of the underlying funds.
F For the period August 30, 2007 (commencement of operations) to July 31, 2008.
G Expense ratios reflect operating expenses of the class. Expenses before reductions do not reflect amounts reimbursed by the investment adviser or reductions from expense offset arrangements and do not represent the amount paid by the class during periods when reimbursements or reductions occur. Expenses net of fee waivers reflect expenses after reimbursement by the investment adviser but prior to reductions from expense offset arrangements. Expenses net of all reductions represent the net expenses paid by the class but do not include expenses of the investment companies in which the Fund invests.
H Amount represents less than $.01 per share.
Financial Highlights - Institutional Class
| Six months ended
January 31, 2011 | Years ended July 31, |
| (Unaudited) | 2010 | 2009 | 2008 F |
Selected Per-Share Data | | | | |
Net asset value, beginning of period | $ 44.77 | $ 40.69 | $ 46.61 | $ 50.00 |
Income from Investment Operations | | | | |
Net investment income (loss) D | .625 | .825 | 1.074 | 1.149 |
Net realized and unrealized gain (loss) | 4.442 | 4.184 | (5.402) | (3.241) |
Total from investment operations | 5.067 | 5.009 | (4.328) | (2.092) |
Distributions from net investment income | (.591) | (.824) | (1.102) | (1.108) |
Distributions from net realized gain | (.176) | (.105) | (.490) | (.190) |
Total distributions | (.767) | (.929) | (1.592) | (1.298) |
Net asset value, end of period | $ 49.07 | $ 44.77 | $ 40.69 | $ 46.61 |
Total Return B, C | 11.37% | 12.36% | (8.99)% | (4.33)% |
Ratios to Average Net Assets E, G | | | | |
Expenses before reductions H | .00% A | .00% | .00% | .00% A |
Expenses net of fee waivers, if any | .00% A | .00% | .00% | .00% A |
Expenses net of all reductions | .00% A | .00% | .00% | .00% A |
Net investment income (loss) | 2.66% A | 1.88% | 2.82% | 2.51% A |
Supplemental Data | | | | |
Net assets, end of period (000 omitted) | $ 31 | $ 36 | $ 55 | $ 96 |
Portfolio turnover rate | 43% A | 31% | 53% | 12% A |
A Annualized
B Total returns for periods of less than one year are not annualized.
C Total returns would have been lower had certain expenses not been reduced during the periods shown.
D Calculated based on average shares outstanding during the period.
E Amounts do not include the activity of the underlying funds.
F For the period August 30, 2007 (commencement of operations) to July 31, 2008.
G Expense ratios reflect operating expenses of the class. Expenses before reductions do not reflect amounts reimbursed by the investment adviser or reductions from expense offset arrangements and do not represent the amount paid by the class during periods when reimbursements or reductions occur. Expenses net of fee waivers reflect expenses after reimbursement by the investment adviser but prior to reductions from expense offset arrangements. Expenses net of all reductions represent the net expenses paid by the class but do not include expenses of the investment companies in which the Fund invests.
H Amount represents less than $.01 per share.
See accompanying notes which are an integral part of the financial statements.
Semiannual Report
Fidelity Income Replacement 2032 Fund
Investment Changes (Unaudited)
Fund Holdings as of January 31, 2011 |
| % of fund's
net assets | % of fund's net assets
6 months ago |
Domestic Equity Funds | | |
Fidelity Advisor Mid Cap II Fund Institutional Class | 5.5 | 5.5 |
Fidelity Disciplined Equity Fund | 5.8 | 5.7 |
Fidelity Equity-Income Fund | 5.7 | 5.8 |
Fidelity Large Cap Core Enhanced Index Fund | 9.2 | 9.2 |
Fidelity Series 100 Index Fund | 6.9 | 6.9 |
Fidelity Series Broad Market Opportunities Fund | 9.2 | 9.2 |
Fidelity Series Small Cap Opportunities Fund | 3.7 | 3.7 |
| 46.0 | 46.0 |
International Equity Funds | | |
Fidelity Advisor International Discovery Fund Institutional Class | 8.8 | 9.1 |
High Yield Fixed-Income Funds | | |
Fidelity Capital & Income Fund | 2.6 | 2.7 |
Fidelity Strategic Income Fund | 2.6 | 2.7 |
| 5.2 | 5.4 |
Investment Grade Fixed-Income Funds | | |
Fidelity Government Income Fund | 5.6 | 5.5 |
Fidelity Strategic Real Return Fund | 5.6 | 5.7 |
Fidelity Total Bond Fund | 16.7 | 16.7 |
| 27.9 | 27.9 |
Short-Term Funds | | |
Fidelity Institutional Money Market Portfolio Institutional Class | 6.1 | 5.8 |
Fidelity Short-Term Bond Fund | 6.0 | 5.8 |
| 12.1 | 11.6 |
Net Other Assets (Liabilities)* | 0.0 | 0.0 |
| 100.0 | 100.0 |
* Amount represents less than 0.1%
Asset Allocation (% of fund's net assets) |
Current |
| Domestic Equity Funds | 46.0% | |
| International Equity Funds | 8.8% | |
| High Yield Fixed-Income Funds | 5.2% | |
| Investment Grade Fixed-Income Funds | 27.9% | |
| Short-Term Funds | 12.1% | |
Six months ago |
| Domestic Equity Funds | 46.0% | |
| International Equity Funds | 9.1% | |
| High Yield Fixed-Income Funds | 5.4% | |
| Investment Grade Fixed-Income Funds | 27.9% | |
| Short-Term Funds | 11.6% | |
Expected |
| Domestic Equity Funds | 45.8% | |
| International Equity Funds | 8.5% | |
| High Yield Fixed-Income Funds | 5.2% | |
| Investment Grade Fixed-Income Funds | 28.0% | |
| Short-Term Funds | 12.5% | |
The fund invests according to an asset allocation strategy that becomes increasingly conservative over time. The six months ago allocation is based on the fund's holdings as of July 31, 2010. The current allocation is based on the fund's holdings as of January 31, 2011. The expected allocation represents the fund's anticipated allocation at July 31, 2011. |
Semiannual Report
Fidelity Income Replacement 2032 Fund
Investments January 31, 2011 (Unaudited)
Showing Percentage of Net Assets
Equity Funds - 54.8% |
| Shares | | Value |
Domestic Equity Funds - 46.0% |
Fidelity Advisor Mid Cap II Fund Institutional Class | 6,574 | | $ 120,500 |
Fidelity Disciplined Equity Fund | 5,406 | | 125,521 |
Fidelity Equity-Income Fund | 2,754 | | 125,521 |
Fidelity Large Cap Core Enhanced Index Fund | 22,926 | | 200,834 |
Fidelity Series 100 Index Fund | 16,830 | | 150,625 |
Fidelity Series Broad Market Opportunities Fund | 19,536 | | 200,834 |
Fidelity Series Small Cap Opportunities Fund | 7,343 | | 80,333 |
TOTAL DOMESTIC EQUITY FUNDS | | 1,004,168 |
International Equity Funds - 8.8% |
Fidelity Advisor International Discovery Fund Institutional Class | 5,764 | | 190,792 |
TOTAL EQUITY FUNDS (Cost $917,411) | 1,194,960 |
Fixed-Income Funds - 33.1% |
| | | |
High Yield Fixed-Income Funds - 5.2% |
Fidelity Capital & Income Fund | 5,892 | | 56,976 |
Fidelity Strategic Income Fund | 5,096 | | 56,976 |
TOTAL HIGH YIELD FIXED-INCOME FUNDS | | 113,952 |
|
| Shares | | Value |
Investment Grade Fixed-Income Funds - 27.9% |
Fidelity Government Income Fund | 11,701 | | $ 121,810 |
Fidelity Strategic Real Return Fund | 12,558 | | 121,810 |
Fidelity Total Bond Fund | 34,025 | | 365,429 |
TOTAL INVESTMENT GRADE FIXED-INCOME FUNDS | | 609,049 |
TOTAL FIXED-INCOME FUNDS (Cost $681,040) | 723,001 |
Short-Term Funds - 12.1% |
| | | |
Fidelity Institutional Money Market Portfolio Institutional Class | 132,507 | | 132,507 |
Fidelity Short-Term Bond Fund | 15,626 | | 132,507 |
TOTAL SHORT-TERM FUNDS (Cost $262,171) | 265,014 |
TOTAL INVESTMENT PORTFOLIO - 100.0% (Cost $1,860,622) | | 2,182,975 |
NET OTHER ASSETS (LIABILITIES) - 0.0% | | (80) |
NET ASSETS - 100% | $ 2,182,895 |
Other Information |
All investments are categorized as Level 1 under the Fair Value Hierarchy. The inputs or methodology used for valuing securities may not be an indication of the risk associated with investing in those securities. For more information on valuation inputs, please refer to the Security Valuation section in the accompanying Notes to Financial Statements. |
Income Tax Information |
At July 31, 2010, the Fund had a capital loss carryforward of approximately $352,265 of which $9,927 and $342,338 will expire in fiscal 2017 and 2018, respectively. Capital loss carryforwards are only available to offset future capital gains of the Fund to the extent provided by regulations and may be limited. |
See accompanying notes which are an integral part of the financial statements.
Semiannual Report
Fidelity Income Replacement 2032 Fund
Statement of Assets and Liabilities
| January 31, 2011 (Unaudited) |
| | |
Assets | | |
Investment in securities, at value (cost $1,860,622) - See accompanying schedule | | $ 2,182,975 |
Receivable for investments sold | | 11,555 |
Total assets | | 2,194,530 |
| | |
Liabilities | | |
Payable for investments purchased | $ 11,551 | |
Distribution and service plan fees payable | 84 | |
Total liabilities | | 11,635 |
| | |
Net Assets | | $ 2,182,895 |
Net Assets consist of: | | |
Paid in capital | | $ 2,202,156 |
Undistributed net investment income | | 510 |
Accumulated undistributed net realized gain (loss) on investments | | (342,124) |
Net unrealized appreciation (depreciation) on investments | | 322,353 |
Net Assets | | $ 2,182,895 |
Calculation of Maximum Offering Price Class A:
Net Asset Value and redemption price per share ($254,753 ÷ 5,248.6 shares) | | $ 48.54 |
| | |
Maximum offering price per share (100/94.25 of $48.54) | | $ 51.50 |
Class T:
Net Asset Value and redemption price per share ($30,700 ÷ 632.2 shares) | | $ 48.56 |
| | |
Maximum offering price per share (100/96.50 of $48.56) | | $ 50.32 |
| | |
Class C:
Net Asset Value and offering price per share ($25,499 ÷ 524.8 shares)A | | $ 48.59 |
| | |
Income Replacement 2032:
Net Asset Value, offering price and redemption price per share ($1,850,519 ÷ 38,118.0 shares) | | $ 48.55 |
| | |
Institutional Class:
Net Asset Value, offering price and redemption price per share ($21,424 ÷ 441.3 shares) | | $ 48.55 |
A Redemption price per share is equal to net asset value less any applicable contingent deferred sales charge.
Statement of Operations
Six months ended January 31, 2011 (Unaudited) |
| | |
Investment Income | | |
Income distributions from underlying funds | | $ 26,059 |
| | |
Expenses | | |
Distribution and service plan fees | $ 487 | |
Independent trustees' compensation | 4 | |
Total expenses before reductions | 491 | |
Expense reductions | (4) | 487 |
Net investment income (loss) | | 25,572 |
Realized and Unrealized Gain (Loss) Realized gain (loss) on sale of underlying fund shares | 13,658 | |
Capital gain distributions from underlying funds | 11,198 | |
Total net realized gain (loss) | | 24,856 |
Change in net unrealized appreciation (depreciation) on underlying funds | | 175,892 |
Net gain (loss) | | 200,748 |
Net increase (decrease) in net assets resulting from operations | | $ 226,320 |
See accompanying notes which are an integral part of the financial statements.
Semiannual Report
Fidelity Income Replacement 2032 Fund
Financial Statements - continued
Statement of Changes in Net Assets
| Six months ended January 31, 2011 (Unaudited) | Year ended
July 31,
2010 |
Increase (Decrease) in Net Assets | | |
Operations | | |
Net investment income (loss) | $ 25,572 | $ 18,688 |
Net realized gain (loss) | 24,856 | (147,241) |
Change in net unrealized appreciation (depreciation) | 175,892 | 292,353 |
Net increase (decrease) in net assets resulting from operations | 226,320 | 163,800 |
Distributions to shareholders from net investment income | (25,555) | (18,690) |
Distributions to shareholders from net realized gain | (8,488) | (2,138) |
Total distributions | (34,043) | (20,828) |
Share transactions - net increase (decrease) | 273,436 | (49,316) |
Total increase (decrease) in net assets | 465,713 | 93,656 |
| | |
Net Assets | | |
Beginning of period | 1,717,182 | 1,623,526 |
End of period (including undistributed net investment income of $510 and undistributed net investment income of $493, respectively) | $ 2,182,895 | $ 1,717,182 |
Financial Highlights - Class A
| Six months ended January 31, 2011 | Years ended July 31, |
| (Unaudited) | 2010 | 2009 | 2008 G |
Selected Per-Share Data | | | | |
Net asset value, beginning of period | $ 44.19 | $ 40.21 | $ 46.52 | $ 50.00 |
Income from Investment Operations | | | | |
Net investment income (loss) E | .539 | .727 | .930 | 1.019 |
Net realized and unrealized gain (loss) | 4.525 | 4.154 | (5.570) | (3.322) |
Total from investment operations | 5.064 | 4.881 | (4.640) | (2.303) |
Distributions from net investment income | (.524) | (.796) | (.960) | (.987) |
Distributions from net realized gain | (.190) | (.105) | (.710) | (.190) |
Total distributions | (.714) | (.901) | (1.670) | (1.177) |
Net asset value, end of period | $ 48.54 | $ 44.19 | $ 40.21 | $ 46.52 |
Total Return B,C,D | 11.50% | 12.19% | (9.66)% | (4.75)% |
Ratios to Average Net Assets F,H | | | | |
Expenses before reductions | .25% A | .25% | .25% | .25% A |
Expenses net of fee waivers, if any | .25% A | .25% | .25% | .25% A |
Expenses net of all reductions | .25% A | .25% | .25% | .25% A |
Net investment income (loss) | 2.32% A | 1.67% | 2.43% | 2.27% A |
Supplemental Data | | | | |
Net assets, end of period (000 omitted) | $ 255 | $ 200 | $ 183 | $ 402 |
Portfolio turnover rate | 25% A | 95% | 82% | 23% A |
A Annualized
B Total returns for periods of less than one year are not annualized.
C Total returns would have been lower had certain expenses not been reduced during the periods shown.
D Total returns do not include the effect of the sales charges.
E Calculated based on average shares outstanding during the period.
F Amounts do not include the activity of the underlying funds.
G For the period August 30, 2007 (commencement of operations) to July 31, 2008.
H Expense ratios reflect operating expenses of the class. Expenses before reductions do not reflect amounts reimbursed by the investment adviser or reductions from expense offset arrangements and do not represent the amount paid by the class during periods when reimbursements or reductions occur. Expenses net of fee waivers reflect expenses after reimbursement by the investment adviser but prior to reductions from expense offset arrangements. Expenses net of all reductions represent the net expenses paid by the class but do not include expenses of the investment companies in which the Fund invests.
See accompanying notes which are an integral part of the financial statements.
Semiannual Report
Financial Highlights - Class T
| Six months ended January 31, 2011 | Years ended July 31, |
| (Unaudited) | 2010 | 2009 | 2008 G |
Selected Per-Share Data | | | | |
Net asset value, beginning of period | $ 44.20 | $ 40.22 | $ 46.52 | $ 50.00 |
Income from Investment Operations | | | | |
Net investment income (loss) E | .480 | .620 | .821 | .918 |
Net realized and unrealized gain (loss) | 4.533 | 4.147 | (5.548) | (3.339) |
Total from investment operations | 5.013 | 4.767 | (4.727) | (2.421) |
Distributions from net investment income | (.463) | (.682) | (.863) | (.869) |
Distributions from net realized gain | (.190) | (.105) | (.710) | (.190) |
Total distributions | (.653) | (.787) | (1.573) | (1.059) |
Net asset value, end of period | $ 48.56 | $ 44.20 | $ 40.22 | $ 46.52 |
Total Return B,C,D | 11.38% | 11.90% | (9.88)% | (4.98)% |
Ratios to Average Net Assets F,H | | | | |
Expenses before reductions | .50% A | .50% | .50% | .50% A |
Expenses net of fee waivers, if any | .50% A | .50% | .50% | .50% A |
Expenses net of all reductions | .50% A | .50% | .50% | .50% A |
Net investment income (loss) | 2.07% A | 1.43% | 2.18% | 2.02% A |
Supplemental Data | | | | |
Net assets, end of period (000 omitted) | $ 31 | $ 35 | $ 54 | $ 95 |
Portfolio turnover rate | 25% A | 95% | 82% | 23% A |
A Annualized
B Total returns for periods of less than one year are not annualized.
C Total returns would have been lower had certain expenses not been reduced during the periods shown.
D Total returns do not include the effect of the sales charges.
E Calculated based on average shares outstanding during the period.
F Amounts do not include the activity of the underlying funds.
G For the period August 30, 2007 (commencement of operations) to July 31, 2008.
H Expense ratios reflect operating expenses of the class. Expenses before reductions do not reflect amounts reimbursed by the investment adviser or reductions from expense offset arrangements and do not represent the amount paid by the class during periods when reimbursements or reductions occur. Expenses net of fee waivers reflect expenses after reimbursement by the investment adviser but prior to reductions from expense offset arrangements. Expenses net of all reductions represent the net expenses paid by the class but do not include expenses of the investment companies in which the Fund invests.
Financial Highlights - Class C
| Six months ended January 31, 2011 | Years ended July 31, |
| (Unaudited) | 2010 | 2009 | 2008 G |
Selected Per-Share Data | | | | |
Net asset value, beginning of period | $ 44.22 | $ 40.23 | $ 46.51 | $ 50.00 |
Income from Investment Operations | | | | |
Net investment income (loss) E | .365 | .403 | .624 | .690 |
Net realized and unrealized gain (loss) | 4.537 | 4.143 | (5.532) | (3.342) |
Total from investment operations | 4.902 | 4.546 | (4.908) | (2.652) |
Distributions from net investment income | (.342) | (.451) | (.662) | (.648) |
Distributions from net realized gain | (.190) | (.105) | (.710) | (.190) |
Total distributions | (.532) | (.556) | (1.372) | (.838) |
Net asset value, end of period | $ 48.59 | $ 44.22 | $ 40.23 | $ 46.51 |
Total Return B,C,D | 11.10% | 11.33% | (10.32)% | (5.42)% |
Ratios to Average Net Assets F,H | | | | |
Expenses before reductions | 1.00% A | 1.00% | 1.00% | 1.00% A |
Expenses net of fee waivers, if any | 1.00% A | 1.00% | 1.00% | 1.00% A |
Expenses net of all reductions | 1.00% A | 1.00% | 1.00% | 1.00% A |
Net investment income (loss) | 1.57% A | .93% | 1.68% | 1.52% A |
Supplemental Data | | | | |
Net assets, end of period (000 omitted) | $ 25 | $ 29 | $ 46 | $ 95 |
Portfolio turnover rate | 25% A | 95% | 82% | 23% A |
A Annualized
B Total returns for periods of less than one year are not annualized.
C Total returns would have been lower had certain expenses not been reduced during the periods shown.
D Total returns do not include the effect of the contingent deferred sales charge.
E Calculated based on average shares outstanding during the period.
F Amounts do not include the activity of the underlying funds.
G For the period August 30, 2007 (commencement of operations) to July 31, 2008.
H Expense ratios reflect operating expenses of the class. Expenses before reductions do not reflect amounts reimbursed by the investment adviser or reductions from expense offset arrangements and do not represent the amount paid by the class during periods when reimbursements or reductions occur. Expenses net of fee waivers reflect expenses after reimbursement by the investment adviser but prior to reductions from expense offset arrangements. Expenses net of all reductions represent the net expenses paid by the class but do not include expenses of the investment companies in which the Fund invests.
See accompanying notes which are an integral part of the financial statements.
Semiannual Report
Financial Highlights - Income Replacement 2032
| Six months ended January 31, 2011 | Years ended July 31, |
| (Unaudited) | 2010 | 2009 | 2008 F |
Selected Per-Share Data | | | | |
Net asset value, beginning of period | $ 44.19 | $ 40.22 | $ 46.53 | $ 50.00 |
Income from Investment Operations | | | | |
Net investment income (loss) D | .598 | .832 | 1.014 | 1.122 |
Net realized and unrealized gain (loss) | 4.533 | 4.147 | (5.557) | (3.310) |
Total from investment operations | 5.131 | 4.979 | (4.543) | (2.188) |
Distributions from net investment income | (.581) | (.904) | (1.057) | (1.092) |
Distributions from net realized gain | (.190) | (.105) | (.710) | (.190) |
Total distributions | (.771) | (1.009) | (1.767) | (1.282) |
Net asset value, end of period | $ 48.55 | $ 44.19 | $ 40.22 | $ 46.53 |
Total Return B,C | 11.66% | 12.44% | (9.43)% | (4.53)% |
Ratios to Average Net Assets E,G | | | | |
Expenses before reductions H | .00% A | .00% | .00% | .00% A |
Expenses net of fee waivers, if any | .00% A | .00% | .00% | .00% A |
Expenses net of all reductions | .00% A | .00% | .00% | .00% A |
Net investment income (loss) | 2.57% A | 1.92% | 2.68% | 2.52% A |
Supplemental Data | | | | |
Net assets, end of period (000 omitted) | $ 1,851 | $ 1,391 | $ 1,285 | $ 731 |
Portfolio turnover rate | 25% A | 95% | 82% | 23% A |
A Annualized
B Total returns for periods of less than one year are not annualized.
C Total returns would have been lower had certain expenses not been reduced during the periods shown.
D Calculated based on average shares outstanding during the period.
E Amounts do not include the activity of the underlying funds.
F For the period August 30, 2007 (commencement of operations) to July 31, 2008.
G Expense ratios reflect operating expenses of the class. Expenses before reductions do not reflect amounts reimbursed by the investment adviser or reductions from expense offset arrangements and do not represent the amount paid by the class during periods when reimbursements or reductions occur. Expenses net of fee waivers reflect expenses after reimbursement by the investment adviser but prior to reductions from expense offset arrangements. Expenses net of all reductions represent the net expenses paid by the class but do not include expenses of the investment companies in which the Fund invests.
H Amount represents less than $.01 per share.
Financial Highlights - Institutional Class
| Six months ended January 31, 2011 | Years ended July 31, |
| (Unaudited) | 2010 | 2009 | 2008 F |
Selected Per-Share Data | | | | |
Net asset value, beginning of period | $ 44.19 | $ 40.22 | $ 46.53 | $ 50.00 |
Income from Investment Operations | | | | |
Net investment income (loss) D | .601 | .834 | 1.009 | 1.147 |
Net realized and unrealized gain (loss) | 4.530 | 4.145 | (5.552) | (3.335) |
Total from investment operations | 5.131 | 4.979 | (4.543) | (2.188) |
Distributions from net investment income | (.581) | (.904) | (1.057) | (1.092) |
Distributions from net realized gain | (.190) | (.105) | (.710) | (.190) |
Total distributions | (.771) | (1.009) | (1.767) | (1.282) |
Net asset value, end of period | $ 48.55 | $ 44.19 | $ 40.22 | $ 46.53 |
Total Return B,C | 11.66% | 12.44% | (9.43)% | (4.53)% |
Ratios to Average Net Assets E,G | | | | |
Expenses before reductions H | .00% A | .00% | .00% | .00% A |
Expenses net of fee waivers, if any | .00% A | .00% | .00% | .00% A |
Expenses net of all reductions | .00% A | .00% | .00% | .00% A |
Net investment income (loss) | 2.57% A | 1.92% | 2.68% | 2.52% A |
Supplemental Data | | | | |
Net assets, end of period (000 omitted) | $ 21 | $ 61 | $ 55 | $ 96 |
Portfolio turnover rate | 25% A | 95% | 82% | 23% A |
A Annualized
B Total returns for periods of less than one year are not annualized.
C Total returns would have been lower had certain expenses not been reduced during the periods shown.
D Calculated based on average shares outstanding during the period.
E Amounts do not include the activity of the underlying funds.
F For the period August 30, 2007 (commencement of operations) to July 31, 2008.
G Expense ratios reflect operating expenses of the class. Expenses before reductions do not reflect amounts reimbursed by the investment adviser or reductions from expense offset arrangements and do not represent the amount paid by the class during periods when reimbursements or reductions occur. Expenses net of fee waivers reflect expenses after reimbursement by the investment adviser but prior to reductions from expense offset arrangements. Expenses net of all reductions represent the net expenses paid by the class but do not include expenses of the investment companies in which the Fund invests.
H Amount represents less than $.01 per share.
See accompanying notes which are an integral part of the financial statements.
Semiannual Report
Fidelity Income Replacement 2034 Fund
Investment Changes (Unaudited)
Fund Holdings as of January 31, 2011 |
| % of fund's
net assets | % of fund's net assets
6 months ago |
Domestic Equity Funds | | |
Fidelity Advisor Mid Cap II Fund Institutional Class | 5.6 | 5.6 |
Fidelity Disciplined Equity Fund | 5.8 | 5.8 |
Fidelity Equity-Income Fund | 5.9 | 5.9 |
Fidelity Large Cap Core Enhanced Index Fund | 9.4 | 9.4 |
Fidelity Series 100 Index Fund | 7.0 | 7.0 |
Fidelity Series Broad Market Opportunities Fund | 9.4 | 9.4 |
Fidelity Series Small Cap Opportunities Fund | 3.7 | 3.8 |
| 46.8 | 46.9 |
International Equity Funds | | |
Fidelity Advisor International Discovery Fund Institutional Class | 9.6 | 9.9 |
High Yield Fixed-Income Funds | | |
Fidelity Capital & Income Fund | 2.7 | 2.8 |
Fidelity Strategic Income Fund | 2.7 | 2.8 |
| 5.4 | 5.6 |
Investment Grade Fixed-Income Funds | | |
Fidelity Government Income Fund | 5.5 | 5.4 |
Fidelity Strategic Real Return Fund | 5.5 | 5.5 |
Fidelity Total Bond Fund | 16.6 | 16.4 |
| 27.6 | 27.3 |
Short-Term Funds | | |
Fidelity Institutional Money Market Portfolio Institutional Class | 5.3 | 5.1 |
Fidelity Short-Term Bond Fund | 5.3 | 5.2 |
| 10.6 | 10.3 |
Net Other Assets (Liabilities)* | 0.0 | 0.0 |
| 100.0 | 100.0 |
* Amounts represent less than 0.1%
Asset Allocation (% of fund's net assets) |
Current |
| Domestic Equity Funds | 46.8% | |
| International Equity Funds | 9.6% | |
| High Yield Fixed-Income Funds | 5.4% | |
| Investment Grade Fixed-Income Funds | 27.6% | |
| Short-Term Funds | 10.6% | |
Six months ago |
| Domestic Equity Funds | 46.9% | |
| International Equity Funds | 9.9% | |
| High Yield Fixed-Income Funds | 5.6% | |
| Investment Grade Fixed-Income Funds | 27.3% | |
| Short-Term Funds | 10.3% | |
Expected |
| Domestic Equity Funds | 46.6% | |
| International Equity Funds | 9.4% | |
| High Yield Fixed-Income Funds | 5.4% | |
| Investment Grade Fixed-Income Funds | 27.6% | |
| Short-Term Funds | 11.0% | |
The fund invests according to an asset allocation strategy that becomes increasingly conservative over time. The six months ago allocation is based on the fund's holdings as of July 31, 2010. The current allocation is based on the fund's holdings as of January 31, 2011. The expected allocation represents the fund's anticipated allocation at July 31, 2011. |
Semiannual Report
Fidelity Income Replacement 2034 Fund
Investments January 31, 2011 (Unaudited)
Showing Percentage of Net Assets
Equity Funds - 56.4% |
| Shares | | Value |
Domestic Equity Funds - 46.8% |
Fidelity Advisor Mid Cap II Fund Institutional Class | 6,250 | | $ 114,570 |
Fidelity Disciplined Equity Fund | 5,136 | | 119,259 |
Fidelity Equity-Income Fund | 2,617 | | 119,259 |
Fidelity Large Cap Core Enhanced Index Fund | 21,782 | | 190,814 |
Fidelity Series 100 Index Fund | 15,990 | | 143,111 |
Fidelity Series Broad Market Opportunities Fund | 18,562 | | 190,814 |
Fidelity Series Small Cap Opportunities Fund | 6,988 | | 76,448 |
TOTAL DOMESTIC EQUITY FUNDS | | 954,275 |
International Equity Funds - 9.6% |
Fidelity Advisor International Discovery Fund Institutional Class | 5,888 | | 194,891 |
TOTAL EQUITY FUNDS (Cost $930,803) | 1,149,166 |
Fixed-Income Funds - 33.0% |
| | | |
High Yield Fixed-Income Funds - 5.4% |
Fidelity Capital & Income Fund | 5,755 | | 55,654 |
Fidelity Strategic Income Fund | 4,978 | | 55,654 |
TOTAL HIGH YIELD FIXED-INCOME FUNDS | | 111,308 |
|
| Shares | | Value |
Investment Grade Fixed-Income Funds - 27.6% |
Fidelity Government Income Fund | 10,790 | | $ 112,328 |
Fidelity Strategic Real Return Fund | 11,580 | | 112,328 |
Fidelity Total Bond Fund | 31,414 | | 337,389 |
TOTAL INVESTMENT GRADE FIXED-INCOME FUNDS | | 562,045 |
TOTAL FIXED-INCOME FUNDS (Cost $618,518) | 673,353 |
Short-Term Funds - 10.6% |
| | | |
Fidelity Institutional Money Market Portfolio Institutional Class | 108,046 | | 108,046 |
Fidelity Short-Term Bond Fund | 12,741 | | 108,047 |
TOTAL SHORT-TERM FUNDS (Cost $212,996) | 216,093 |
TOTAL INVESTMENT PORTFOLIO - 100.0% (Cost $1,762,317) | | 2,038,612 |
NET OTHER ASSETS (LIABILITIES) - 0.0% | | (37) |
NET ASSETS - 100% | $ 2,038,575 |
Other Information |
All investments are categorized as Level 1 under the Fair Value Hierarchy. The inputs or methodology used for valuing securities may not be an indication of the risk associated with investing in those securities. For more information on valuation inputs, please refer to the Security Valuation section in the accompanying Notes to Financial Statements. |
Income Tax Information |
At July 31, 2010, the Fund had a capital loss carryforward of approximately $62,824 all of which will expire in fiscal 2018. Capital loss carryforwards are only available to offset future capital gains of the Fund to the extent provided by regulations and may be limited. |
The Fund intends to elect to defer to its fiscal year ending July 31, 2011 approximately $32,680 of losses recognized during the period November 1, 2009 to July 31, 2010. |
See accompanying notes which are an integral part of the financial statements.
Semiannual Report
Fidelity Income Replacement 2034 Fund
Statement of Assets and Liabilities
| January 31, 2011 (Unaudited) |
| | |
Assets | | |
Investment in securities, at value (cost $1,762,317) - See accompanying schedule | | $ 2,038,612 |
Receivable for investments sold | | 11,553 |
Total assets | | 2,050,165 |
| | |
Liabilities | | |
Payable for investments purchased | $ 11,553 | |
Distribution and service plan fees payable | 37 | |
Total liabilities | | 11,590 |
| | |
Net Assets | | $ 2,038,575 |
Net Assets consist of: | | |
Paid in capital | | $ 1,911,678 |
Undistributed net investment income | | 500 |
Accumulated undistributed net realized gain (loss) on investments | | (149,898) |
Net unrealized appreciation (depreciation) on investments | | 276,295 |
Net Assets | | $ 2,038,575 |
Calculation of Maximum Offering Price Class A:
Net Asset Value and redemption price per share ($23,177 ÷ 475.2 shares) | | $ 48.77 |
| | |
Maximum offering price per share (100/94.25 of $48.77) | | $ 51.75 |
Class T:
Net Asset Value and redemption price per share ($30,536 ÷ 626.1 shares) | | $ 48.77 |
| | |
Maximum offering price per share (100/96.50 of $48.77) | | $ 50.54 |
| | |
Class C:
Net Asset Value and offering price per share ($23,179 ÷ 474.9 shares)A | | $ 48.81 |
| | |
Income Replacement 2034:
Net Asset Value, offering price and redemption price per share ($1,856,407 ÷ 38,078.1 shares) | | $ 48.75 |
| | |
Institutional Class:
Net Asset Value, offering price and redemption price per share ($105,276 ÷ 2,159.2 shares) | | $ 48.76 |
A Redemption price per share is equal to net asset value less any applicable contingent deferred sales charge.
Statement of Operations
Six months ended January 31, 2011 (Unaudited) |
| | |
Investment Income | | |
Income distributions from underlying funds | | $ 24,667 |
| | |
Expenses | | |
Distribution and service plan fees | $ 233 | |
Independent trustees' compensation | 4 | |
Total expenses before reductions | 237 | |
Expense reductions | (4) | 233 |
Net investment income (loss) | | 24,434 |
Realized and Unrealized Gain (Loss) Realized gain (loss) on sale of underlying fund shares | (15,873) | |
Capital gain distributions from underlying funds | 10,419 | |
Total net realized gain (loss) | | (5,454) |
Change in net unrealized appreciation (depreciation) on underlying funds | | 200,112 |
Net gain (loss) | | 194,658 |
Net increase (decrease) in net assets resulting from operations | | $ 219,092 |
See accompanying notes which are an integral part of the financial statements.
Semiannual Report
Statement of Changes in Net Assets
| Six months ended January 31, 2011 (Unaudited) | Year ended
July 31,
2010 |
Increase (Decrease) in Net Assets | | |
Operations | | |
Net investment income (loss) | $ 24,434 | $ 38,285 |
Net realized gain (loss) | (5,454) | (69,132) |
Change in net unrealized appreciation (depreciation) | 200,112 | 253,583 |
Net increase (decrease) in net assets resulting from operations | 219,092 | 222,736 |
Distributions to shareholders from net investment income | (24,452) | (38,318) |
Distributions to shareholders from net realized gain | (8,111) | (8,464) |
Total distributions | (32,563) | (46,782) |
Share transactions - net increase (decrease) | (2,342) | (216,059) |
Total increase (decrease) in net assets | 184,187 | (40,105) |
| | |
Net Assets | | |
Beginning of period | 1,854,388 | 1,894,493 |
End of period (including undistributed net investment income of $500 and undistributed net investment income of $518, respectively) | $ 2,038,575 | $ 1,854,388 |
Financial Highlights - Class A
| Six months ended January 31, 2011 | Years ended July 31, |
| (Unaudited) | 2010 | 2009 | 2008 G |
Selected Per-Share Data | | | | |
Net asset value, beginning of period | $ 44.27 | $ 40.29 | $ 46.40 | $ 50.00 |
Income from Investment Operations | | | | |
Net investment income (loss) E | .528 | .753 | .923 | .994 |
Net realized and unrealized gain (loss) | 4.680 | 4.174 | (5.753) | (3.438) |
Total from investment operations | 5.208 | 4.927 | (4.830) | (2.444) |
Distributions from net investment income | (.508) | (.758) | (.890) | (.956) |
Distributions from net realized gain | (.200) | (.189) | (.390) | (.200) |
Total distributions | (.708) | (.947) | (1.280) | (1.156) |
Net asset value, end of period | $ 48.77 | $ 44.27 | $ 40.29 | $ 46.40 |
Total Return B,C,D | 11.81% | 12.29% | (10.20)% | (5.04)% |
Ratios to Average Net Assets F,H | | | | |
Expenses before reductions | .25% A | .25% | .26% | .25% A |
Expenses net of fee waivers, if any | .25% A | .25% | .26% | .25% A |
Expenses net of all reductions | .25% A | .25% | .26% | .25% A |
Net investment income (loss) | 2.27% A | 1.73% | 2.46% | 2.19% A |
Supplemental Data | | | | |
Net assets, end of period (000 omitted) | $ 23 | $ 27 | $ 63 | $ 138 |
Portfolio turnover rate | 46% A | 22% | 46% | 12% A |
A Annualized
B Total returns for periods of less than one year are not annualized.
C Total returns would have been lower had certain expenses not been reduced during the periods shown.
D Total returns do not include the effect of the sales charges.
E Calculated based on average shares outstanding during the period.
F Amounts do not include the activity of the underlying funds.
G For the period August 30, 2007 (commencement of operations) to July 31, 2008.
H Expense ratios reflect operating expenses of the class. Expenses before reductions do not reflect amounts reimbursed by the investment adviser or reductions from expense offset arrangements and do not represent the amount paid by the class during periods when reimbursements or reductions occur. Expenses net of fee waivers reflect expenses after reimbursement by the investment adviser but prior to reductions from expense offset arrangements. Expenses net of all reductions represent the net expenses paid by the class but do not include expenses of the investment companies in which the Fund invests.
See accompanying notes which are an integral part of the financial statements.
Semiannual Report
Financial Highlights - Class T
| Six months ended January 31, 2011 | Years ended July 31, |
| (Unaudited) | 2010 | 2009 | 2008 G |
Selected Per-Share Data | | | | |
Net asset value, beginning of period | $ 44.27 | $ 40.29 | $ 46.40 | $ 50.00 |
Income from Investment Operations | | | | |
Net investment income (loss) E | .471 | .645 | .828 | .875 |
Net realized and unrealized gain (loss) | 4.681 | 4.175 | (5.757) | (3.431) |
Total from investment operations | 5.152 | 4.820 | (4.929) | (2.556) |
Distributions from net investment income | (.452) | (.651) | (.791) | (.844) |
Distributions from net realized gain | (.200) | (.189) | (.390) | (.200) |
Total distributions | (.652) | (.840) | (1.181) | (1.044) |
Net asset value, end of period | $ 48.77 | $ 44.27 | $ 40.29 | $ 46.40 |
Total Return B,C,D | 11.67% | 12.01% | (10.44)% | (5.25)% |
Ratios to Average Net Assets F,H | | | | |
Expenses before reductions | .50% A | .50% | .51% | .50% A |
Expenses net of fee waivers, if any | .50% A | .50% | .51% | .50% A |
Expenses net of all reductions | .50% A | .50% | .51% | .50% A |
Net investment income (loss) | 2.02% A | 1.48% | 2.21% | 1.94% A |
Supplemental Data | | | | |
Net assets, end of period (000 omitted) | $ 31 | $ 35 | $ 54 | $ 95 |
Portfolio turnover rate | 46% A | 22% | 46% | 12% A |
A Annualized
B Total returns for periods of less than one year are not annualized.
C Total returns would have been lower had certain expenses not been reduced during the periods shown.
D Total returns do not include the effect of the sales charges.
E Calculated based on average shares outstanding during the period.
F Amounts do not include the activity of the underlying funds.
G For the period August 30, 2007 (commencement of operations) to July 31, 2008.
H Expense ratios reflect operating expenses of the class. Expenses before reductions do not reflect amounts reimbursed by the investment adviser or reductions from expense offset arrangements and do not represent the amount paid by the class during periods when reimbursements or reductions occur. Expenses net of fee waivers reflect expenses after reimbursement by the investment adviser but prior to reductions from expense offset arrangements. Expenses net of all reductions represent the net expenses paid by the class but do not include expenses of the investment companies in which the Fund invests.
Financial Highlights - Class C
| Six months ended January 31, 2011 | Years ended July 31, |
| (Unaudited) | 2010 | 2009 | 2008 G |
Selected Per-Share Data | | | | |
Net asset value, beginning of period | $ 44.30 | $ 40.30 | $ 46.39 | $ 50.00 |
Income from Investment Operations | | | | |
Net investment income (loss) E | .355 | .426 | .631 | .658 |
Net realized and unrealized gain (loss) | 4.681 | 4.185 | (5.740) | (3.448) |
Total from investment operations | 5.036 | 4.611 | (5.109) | (2.790) |
Distributions from net investment income | (.326) | (.422) | (.591) | (.620) |
Distributions from net realized gain | (.200) | (.189) | (.390) | (.200) |
Total distributions | (.526) | (.611) | (.981) | (.820) |
Net asset value, end of period | $ 48.81 | $ 44.30 | $ 40.30 | $ 46.39 |
Total Return B,C,D | 11.39% | 11.47% | (10.88)% | (5.70)% |
Ratios to Average Net Assets F,H | | | | |
Expenses before reductions | 1.00% A | 1.00% | 1.01% | 1.00% A |
Expenses net of fee waivers, if any | 1.00% A | 1.00% | 1.01% | 1.00% A |
Expenses net of all reductions | 1.00% A | 1.00% | 1.01% | 1.00% A |
Net investment income (loss) | 1.52% A | .98% | 1.71% | 1.44% A |
Supplemental Data | | | | |
Net assets, end of period (000 omitted) | $ 23 | $ 27 | $ 41 | $ 94 |
Portfolio turnover rate | 46% A | 22% | 46% | 12% A |
A Annualized
B Total returns for periods of less than one year are not annualized.
C Total returns would have been lower had certain expenses not been reduced during the periods shown.
D Total returns do not include the effect of the contingent deferred sales charge.
E Calculated based on average shares outstanding during the period.
F Amounts do not include the activity of the underlying funds.
G For the period August 30, 2007 (commencement of operations) to July 31, 2008.
H Expense ratios reflect operating expenses of the class. Expenses before reductions do not reflect amounts reimbursed by the investment adviser or reductions from expense offset arrangements and do not represent the amount paid by the class during periods when reimbursements or reductions occur. Expenses net of fee waivers reflect expenses after reimbursement by the investment adviser but prior to reductions from expense offset arrangements. Expenses net of all reductions represent the net expenses paid by the class but do not include expenses of the investment companies in which the Fund invests.
See accompanying notes which are an integral part of the financial statements.
Semiannual Report
Financial Highlights - Income Replacement 2034
| Six months ended January 31, 2011 | Years ended July 31, |
| (Unaudited) | 2010 | 2009 | 2008 F |
Selected Per-Share Data | | | | |
Net asset value, beginning of period | $ 44.26 | $ 40.28 | $ 46.40 | $ 50.00 |
Income from Investment Operations | | | | |
Net investment income (loss) D | .588 | .862 | .988 | 1.090 |
Net realized and unrealized gain (loss) | 4.670 | 4.183 | (5.729) | (3.425) |
Total from investment operations | 5.258 | 5.045 | (4.741) | (2.335) |
Distributions from net investment income | (.568) | (.876) | (.989) | (1.065) |
Distributions from net realized gain | (.200) | (.189) | (.390) | (.200) |
Total distributions | (.768) | (1.065) | (1.379) | (1.265) |
Net asset value, end of period | $ 48.75 | $ 44.26 | $ 40.28 | $ 46.40 |
Total Return B,C | 11.93% | 12.59% | (9.98)% | (4.83)% |
Ratios to Average Net Assets E,G | | | | |
Expenses before reductions | .00% A,H | .00% H | .01% | .00% A,H |
Expenses net of fee waivers, if any | .00% A | .00% | .01% | .00% A |
Expenses net of all reductions | .00% A | .00% | .01% | .00% A |
Net investment income (loss) | 2.52% A | 1.98% | 2.71% | 2.44% A |
Supplemental Data | | | | |
Net assets, end of period (000 omitted) | $ 1,856 | $ 1,672 | $ 1,628 | $ 552 |
Portfolio turnover rate | 46% A | 22% | 46% | 12% A |
A Annualized
B Total returns for periods of less than one year are not annualized.
C Total returns would have been lower had certain expenses not been reduced during the periods shown.
D Calculated based on average shares outstanding during the period.
E Amounts do not include the activity of the underlying funds.
F For the period August 30, 2007 (commencement of operations) to July 31, 2008.
G Expense ratios reflect operating expenses of the class. Expenses before reductions do not reflect amounts reimbursed by the investment adviser or reductions from expense offset arrangements and do not represent the amount paid by the class during periods when reimbursements or reductions occur. Expenses net of fee waivers reflect expenses after reimbursement by the investment adviser but prior to reductions from expense offset arrangements. Expenses net of all reductions represent the net expenses paid by the class but do not include expenses of the investment companies in which the Fund invests.
H Amount represents less than $.01 per share.
Financial Highlights - Institutional Class
| Six months ended January 31, 2011 | Years ended July 31, |
| (Unaudited) | 2010 | 2009 | 2008 F |
Selected Per-Share Data | | | | |
Net asset value, beginning of period | $ 44.26 | $ 40.28 | $ 46.41 | $ 50.00 |
Income from Investment Operations | | | | |
Net investment income (loss) D | .588 | .860 | 1.002 | 1.114 |
Net realized and unrealized gain (loss) | 4.680 | 4.185 | (5.753) | (3.439) |
Total from investment operations | 5.268 | 5.045 | (4.751) | (2.325) |
Distributions from net investment income | (.568) | (.876) | (.989) | (1.065) |
Distributions from net realized gain | (.200) | (.189) | (.390) | (.200) |
Total distributions | (.768) | (1.065) | (1.379) | (1.265) |
Net asset value, end of period | $ 48.76 | $ 44.26 | $ 40.28 | $ 46.41 |
Total Return B,C | 11.96% | 12.59% | (10.00)% | (4.81)% |
Ratios to Average Net Assets E,G | | | | |
Expenses before reductions | .00% A,H | .00% H | .01% | .00% A,H |
Expenses net of fee waivers, if any | .00% A | .00% | .01% | .00% A |
Expenses net of all reductions | .00% A | .00% | .01% | .00% A |
Net investment income (loss) | 2.52% A | 1.98% | 2.71% | 2.44% A |
Supplemental Data | | | | |
Net assets, end of period (000 omitted) | $ 105 | $ 94 | $ 108 | $ 95 |
Portfolio turnover rate | 46% A | 22% | 46% | 12% A |
A Annualized
B Total returns for periods of less than one year are not annualized.
C Total returns would have been lower had certain expenses not been reduced during the periods shown.
D Calculated based on average shares outstanding during the period.
E Amounts do not include the activity of the underlying funds.
F For the period August 30, 2007 (commencement of operations) to July 31, 2008.
G Expense ratios reflect operating expenses of the class. Expenses before reductions do not reflect amounts reimbursed by the investment adviser or reductions from expense offset arrangements and do not represent the amount paid by the class during periods when reimbursements or reductions occur. Expenses net of fee waivers reflect expenses after reimbursement by the investment adviser but prior to reductions from expense offset arrangements. Expenses net of all reductions represent the net expenses paid by the class but do not include expenses of the investment companies in which the Fund invests.
H Amount represents less than $.01 per share.
See accompanying notes which are an integral part of the financial statements.
Semiannual Report
Fidelity Income Replacement 2036 Fund
Investment Changes (Unaudited)
Fund Holdings as of January 31, 2011 |
| % of fund's
net assets | % of fund's net assets
6 months ago |
Domestic Equity Funds | | |
Fidelity Advisor Mid Cap II Fund Institutional Class | 5.7 | 5.7 |
Fidelity Disciplined Equity Fund | 6.0 | 5.9 |
Fidelity Equity-Income Fund | 6.0 | 6.0 |
Fidelity Large Cap Core Enhanced Index Fund | 9.6 | 9.5 |
Fidelity Series 100 Index Fund | 7.2 | 7.2 |
Fidelity Series Broad Market Opportunities Fund | 9.5 | 9.6 |
Fidelity Series Small Cap Opportunities Fund | 3.8 | 3.9 |
| 47.8 | 47.8 |
International Equity Funds | | |
Fidelity Advisor International Discovery Fund Institutional Class | 10.4 | 10.8 |
High Yield Fixed-Income Funds | | |
Fidelity Capital & Income Fund | 2.9 | 3.0 |
Fidelity Strategic Income Fund | 2.8 | 2.9 |
| 5.7 | 5.9 |
Investment Grade Fixed-Income Funds | | |
Fidelity Government Income Fund | 5.4 | 5.3 |
Fidelity Strategic Real Return Fund | 5.3 | 5.4 |
Fidelity Total Bond Fund | 16.0 | 16.0 |
| 26.7 | 26.7 |
Short-Term Funds | | |
Fidelity Institutional Money Market Portfolio Institutional Class | 4.7 | 4.4 |
Fidelity Short-Term Bond Fund | 4.7 | 4.4 |
| 9.4 | 8.8 |
Net Other Assets (Liabilities)* | 0.0 | 0.0 |
| 100.0 | 100.0 |
* Amount represents less than 0.1%
Asset Allocation (% of fund's net assets) |
Current |
| Domestic Equity Funds | 47.8% | |
| International Equity Funds | 10.4% | |
| High Yield Fixed-Income Funds | 5.7% | |
| Investment Grade Fixed-Income Funds | 26.7% | |
| Short-Term Funds | 9.4% | |
Six months ago |
| Domestic Equity Funds | 47.8% | |
| International Equity Funds | 10.8% | |
| High Yield Fixed-Income Funds | 5.9% | |
| Investment Grade Fixed-Income Funds | 26.7% | |
| Short-Term Funds | 8.8% | |
Expected |
| Domestic Equity Funds | 47.5% | |
| International Equity Funds | 10.2% | |
| High Yield Fixed-Income Funds | 5.7% | |
| Investment Grade Fixed-Income Funds | 26.8% | |
| Short-Term Funds | 9.8% | |
The fund invests according to an asset allocation strategy that becomes increasingly conservative over time. The six months ago allocation is based on the fund's holdings as of July 31, 2010. The current allocation is based on the fund's holdings as of January 31, 2011. The expected allocation represents the fund's anticipated allocation at July 31, 2011. |
Semiannual Report
Fidelity Income Replacement 2036 Fund
Investments January 31, 2011 (Unaudited)
Showing Percentage of Net Assets
Equity Funds - 58.2% |
| Shares | | Value |
Domestic Equity Funds - 47.8% |
Fidelity Advisor Mid Cap II Fund Institutional Class | 6,094 | | $ 111,703 |
Fidelity Disciplined Equity Fund | 5,012 | | 116,382 |
Fidelity Equity-Income Fund | 2,554 | | 116,382 |
Fidelity Large Cap Core Enhanced Index Fund | 21,252 | | 186,172 |
Fidelity Series 100 Index Fund | 15,596 | | 139,580 |
Fidelity Series Broad Market Opportunities Fund | 18,110 | | 186,172 |
Fidelity Series Small Cap Opportunities Fund | 6,807 | | 74,469 |
TOTAL DOMESTIC EQUITY FUNDS | | 930,860 |
International Equity Funds - 10.4% |
Fidelity Advisor International Discovery Fund Institutional Class | 6,155 | | 203,717 |
TOTAL EQUITY FUNDS (Cost $1,125,747) | 1,134,577 |
Fixed-Income Funds - 32.4% |
| | | |
High Yield Fixed-Income Funds - 5.7% |
Fidelity Capital & Income Fund | 5,766 | | 55,754 |
Fidelity Strategic Income Fund | 4,987 | | 55,754 |
TOTAL HIGH YIELD FIXED-INCOME FUNDS | | 111,508 |
|
| Shares | | Value |
Investment Grade Fixed-Income Funds - 26.7% |
Fidelity Government Income Fund | 10,000 | | $ 104,100 |
Fidelity Strategic Real Return Fund | 10,732 | | 104,100 |
Fidelity Total Bond Fund | 29,042 | | 311,909 |
TOTAL INVESTMENT GRADE FIXED-INCOME FUNDS | | 520,109 |
TOTAL FIXED-INCOME FUNDS (Cost $618,059) | 631,617 |
Short-Term Funds - 9.4% |
| | | |
Fidelity Institutional Money Market Portfolio Institutional Class | 91,624 | | 91,624 |
Fidelity Short-Term Bond Fund | 10,805 | | 91,624 |
TOTAL SHORT-TERM FUNDS (Cost $183,048) | 183,248 |
TOTAL INVESTMENT PORTFOLIO - 100.0% (Cost $1,926,854) | | 1,949,442 |
NET OTHER ASSETS (LIABILITIES) - 0.0% | | (154) |
NET ASSETS - 100% | $ 1,949,288 |
Other Information |
All investments are categorized as Level 1 under the Fair Value Hierarchy. The inputs or methodology used for valuing securities may not be an indication of the risk associated with investing in those securities. For more information on valuation inputs, please refer to the Security Valuation section in the accompanying Notes to Financial Statements. |
Income Tax Information |
At July 31, 2010, the Fund had a capital loss carryforward of approximately $203,731 of which $19,968 and $183,763 will expire in fiscal 2017 and 2018, respectively. Capital loss carryforwards are only available to offset future capital gains of the Fund to the extent provided by regulations and may be limited. |
The Fund intends to elect to defer to its fiscal year ending July 31, 2011 approximately $17,259 of losses recognized during the period November 1, 2009 to July 31, 2010. |
See accompanying notes which are an integral part of the financial statements.
Semiannual Report
Fidelity Income Replacement 2036 Fund
Statement of Assets and Liabilities
| January 31, 2011 (Unaudited) |
| | |
Assets | | |
Investment in securities, at value (cost $1,926,854) - See accompanying schedule | | $ 1,949,442 |
Cash | | 74 |
Receivable for investments sold | | 10,222 |
Total assets | | 1,959,738 |
| | |
Liabilities | | |
Payable for investments purchased | $ 10,219 | |
Distribution and service plan fees payable | 231 | |
Total liabilities | | 10,450 |
| | |
Net Assets | | $ 1,949,288 |
Net Assets consist of: | | |
Paid in capital | | $ 2,177,484 |
Undistributed net investment income | | 395 |
Accumulated undistributed net realized gain (loss) on investments | | (251,179) |
Net unrealized appreciation (depreciation) on investments | | 22,588 |
Net Assets | | $ 1,949,288 |
Calculation of Maximum Offering Price Class A:
Net Asset Value and redemption price per share ($34,766 ÷ 719.2 shares) | | $ 48.34 |
| | |
Maximum offering price per share (100/94.25 of $48.34) | | $ 51.29 |
Class T:
Net Asset Value and redemption price per share ($288,177 ÷ 5,963.7 shares) | | $ 48.32 |
| | |
Maximum offering price per share (100/96.50 of $48.32) | | $ 50.07 |
| | |
Class C:
Net Asset Value and offering price per share ($123,671 ÷ 2,558.5 shares)A | | $ 48.34 |
| | |
Income Replacement 2036:
Net Asset Value, offering price and redemption price per share ($1,409,570 ÷ 29,162.7 shares) | | $ 48.33 |
| | |
Institutional Class:
Net Asset Value, offering price and redemption price per share ($93,104 ÷ 1,926.3 shares) | | $ 48.33 |
A Redemption price per share is equal to net asset value less any applicable contingent deferred sales charge.
Statement of Operations
Six months ended January 31, 2011 (Unaudited) |
| | |
Investment Income | | |
Income distributions from underlying funds | | $ 21,854 |
| | |
Expenses | | |
Distribution and service plan fees | $ 1,344 | |
Independent trustees' compensation | 3 | |
Total expenses before reductions | 1,347 | |
Expense reductions | (3) | 1,344 |
Net investment income (loss) | | 20,510 |
Realized and Unrealized Gain (Loss) Realized gain (loss) on sale of underlying fund shares | (11,727) | |
Capital gain distributions from underlying funds | 8,461 | |
Total net realized gain (loss) | | (3,266) |
Change in net unrealized appreciation (depreciation) on underlying funds | | 143,005 |
Net gain (loss) | | 139,739 |
Net increase (decrease) in net assets resulting from operations | | $ 160,249 |
See accompanying notes which are an integral part of the financial statements.
Semiannual Report
Statement of Changes in Net Assets
| Six months ended January 31, 2011 (Unaudited) | Year ended
July 31,
2010 |
Increase (Decrease) in Net Assets | | |
Operations | | |
Net investment income (loss) | $ 20,510 | $ 19,710 |
Net realized gain (loss) | (3,266) | (40,612) |
Change in net unrealized appreciation (depreciation) | 143,005 | 163,539 |
Net increase (decrease) in net assets resulting from operations | 160,249 | 142,637 |
Distributions to shareholders from net investment income | (20,368) | (19,743) |
Distributions to shareholders from net realized gain | (6,329) | (3,949) |
Total distributions | (26,697) | (23,692) |
Share transactions - net increase (decrease) | 690,902 | (128,803) |
Total increase (decrease) in net assets | 824,454 | (9,858) |
| | |
Net Assets | | |
Beginning of period | 1,124,834 | 1,134,692 |
End of period (including undistributed net investment income of $395 and undistributed net investment income of $253, respectively) | $ 1,949,288 | $ 1,124,834 |
Financial Highlights - Class A
| Six months ended January 31, 2011 | Years ended July 31, |
| (Unaudited) | 2010 | 2009 | 2008 G |
Selected Per-Share Data | | | | |
Net asset value, beginning of period | $ 43.73 | $ 39.70 | $ 46.40 | $ 50.00 |
Income from Investment Operations | | | | |
Net investment income (loss) E | .621 | .748 | .937 | .951 |
Net realized and unrealized gain (loss) | 4.672 | 4.178 | (6.127) | (3.464) |
Total from investment operations | 5.293 | 4.926 | (5.190) | (2.513) |
Distributions from net investment income | (.527) | (.752) | (.940) | (.897) |
Distributions from net realized gain | (.156) | (.144) | (.570) | (.190) |
Total distributions | (.683) | (.896) | (1.510) | (1.087) |
Net asset value, end of period | $ 48.34 | $ 43.73 | $ 39.70 | $ 46.40 |
Total Return B, C, D | 12.15% | 12.46% | (10.72)% | (5.17)% |
Ratios to Average Net Assets F, H | | | | |
Expenses before reductions | .25% A | .25% | .25% | .25% A |
Expenses net of fee waivers, if any | .25% A | .25% | .25% | .25% A |
Expenses net of all reductions | .25% A | .25% | .25% | .25% A |
Net investment income (loss) | 2.69% A | 1.74% | 2.52% | 2.08% A |
Supplemental Data | | | | |
Net assets, end of period (000 omitted) | $ 35 | $ 40 | $ 54 | $ 95 |
Portfolio turnover rate | 26% A | 26% | 39% | 44% A |
A Annualized
B Total returns for periods of less than one year are not annualized.
C Total returns would have been lower had certain expenses not been reduced during the periods shown.
D Total returns do not include the effect of the sales charges.
E Calculated based on average shares outstanding during the period.
F Amounts do not include the activity of the underlying funds.
G For the period August 30, 2007 (commencement of operations) to July 31, 2008.
H Expense ratios reflect operating expenses of the class. Expenses before reductions do not reflect amounts reimbursed by the investment adviser or reductions from expense offset arrangements and do not represent the amount paid by the class during periods when reimbursements or reductions occur. Expenses net of fee waivers reflect expenses after reimbursement by the investment adviser but prior to reductions from expense offset arrangements. Expenses net of all reductions represent the net expenses paid by the class but do not include expenses of the investment companies in which the Fund invests.
See accompanying notes which are an integral part of the financial statements.
Semiannual Report
Financial Highlights - Class T
| Six months ended January 31, 2011 | Years ended July 31, |
| (Unaudited) | 2010 | 2009 | 2008 G |
Selected Per-Share Data | | | | |
Net asset value, beginning of period | $ 43.72 | $ 39.69 | $ 46.39 | $ 50.00 |
Income from Investment Operations | | | | |
Net investment income (loss) E | .563 | .639 | .844 | .823 |
Net realized and unrealized gain (loss) | 4.665 | 4.183 | (6.122) | (3.449) |
Total from investment operations | 5.228 | 4.822 | (5.278) | (2.626) |
Distributions from net investment income | (.472) | (.648) | (.852) | (.794) |
Distributions from net realized gain | (.156) | (.144) | (.570) | (.190) |
Total distributions | (.628) | (.792) | (1.422) | (.984) |
Net asset value, end of period | $ 48.32 | $ 43.72 | $ 39.69 | $ 46.39 |
Total Return B, C, D | 11.99% | 12.19% | (10.93)% | (5.39)% |
Ratios to Average Net Assets F, H | | | | |
Expenses before reductions | .50% A | .50% | .50% | .50% A |
Expenses net of fee waivers, if any | .50% A | .50% | .50% | .50% A |
Expenses net of all reductions | .50% A | .50% | .50% | .50% A |
Net investment income (loss) | 2.44% A | 1.49% | 2.28% | 1.83% A |
Supplemental Data | | | | |
Net assets, end of period (000 omitted) | $ 288 | $ 265 | $ 265 | $ 384 |
Portfolio turnover rate | 26% A | 26% | 39% | 44% A |
A Annualized
B Total returns for periods of less than one year are not annualized.
C Total returns would have been lower had certain expenses not been reduced during the periods shown.
D Total returns do not include the effect of the sales charges.
E Calculated based on average shares outstanding during the period.
F Amounts do not include the activity of the underlying funds.
G For the period August 30, 2007 (commencement of operations) to July 31, 2008.
H Expense ratios reflect operating expenses of the class. Expenses before reductions do not reflect amounts reimbursed by the investment adviser or reductions from expense offset arrangements and do not represent the amount paid by the class during periods when reimbursements or reductions occur. Expenses net of fee waivers reflect expenses after reimbursement by the investment adviser but prior to reductions from expense offset arrangements. Expenses net of all reductions represent the net expenses paid by the class but do not include expenses of the investment companies in which the Fund invests.
Financial Highlights - Class C
| Six months ended January 31, 2011 | Years ended July 31, |
| (Unaudited) | 2010 | 2009 | 2008 G |
Selected Per-Share Data | | | | |
Net asset value, beginning of period | $ 43.74 | $ 39.71 | $ 46.39 | $ 50.00 |
Income from Investment Operations | | | | |
Net investment income (loss) E | .448 | .424 | .655 | .609 |
Net realized and unrealized gain (loss) | 4.673 | 4.179 | (6.114) | (3.465) |
Total from investment operations | 5.121 | 4.603 | (5.459) | (2.856) |
Distributions from net investment income | (.365) | (.429) | (.651) | (.564) |
Distributions from net realized gain | (.156) | (.144) | (.570) | (.190) |
Total distributions | (.521) | (.573) | (1.221) | (.754) |
Net asset value, end of period | $ 48.34 | $ 43.74 | $ 39.71 | $ 46.39 |
Total Return B, C, D | 11.73% | 11.61% | (11.38)% | (5.82)% |
Ratios to Average Net Assets F, H | | | | |
Expenses before reductions | 1.00% A | 1.00% | 1.00% | 1.00% A |
Expenses net of fee waivers, if any | 1.00% A | 1.00% | 1.00% | 1.00% A |
Expenses net of all reductions | 1.00% A | 1.00% | 1.00% | 1.00% A |
Net investment income (loss) | 1.94% A | .99% | 1.77% | 1.33% A |
Supplemental Data | | | | |
Net assets, end of period (000 omitted) | $ 124 | $ 119 | $ 116 | $ 94 |
Portfolio turnover rate | 26% A | 26% | 39% | 44% A |
A Annualized
B Total returns for periods of less than one year are not annualized.
C Total returns would have been lower had certain expenses not been reduced during the periods shown.
D Total returns do not include the effect of the contingent deferred sales charge.
E Calculated based on average shares outstanding during the period.
F Amounts do not include the activity of the underlying funds.
G For the period August 30, 2007 (commencement of operations) to July 31, 2008.
H Expense ratios reflect operating expenses of the class. Expenses before reductions do not reflect amounts reimbursed by the investment adviser or reductions from expense offset arrangements and do not represent the amount paid by the class during periods when reimbursements or reductions occur. Expenses net of fee waivers reflect expenses after reimbursement by the investment adviser but prior to reductions from expense offset arrangements. Expenses net of all reductions represent the net expenses paid by the class but do not include expenses of the investment companies in which the Fund invests.
See accompanying notes which are an integral part of the financial statements.
Semiannual Report
Financial Highlights - Income Replacement 2036
| Six months ended January 31, 2011 | Years ended July 31, |
| (Unaudited) | 2010 | 2009 | 2008 G |
Selected Per-Share Data | | | | |
Net asset value, beginning of period | $ 43.73 | $ 39.70 | $ 46.40 | $ 50.00 |
Income from Investment Operations | | | | |
Net investment income (loss) D | .682 | .854 | 1.034 | 1.043 |
Net realized and unrealized gain (loss) | 4.662 | 4.183 | (6.126) | (3.445) |
Total from investment operations | 5.344 | 5.037 | (5.092) | (2.402) |
Distributions from net investment income | (.588) | (.863) | (1.038) | (1.008) |
Distributions from net realized gain | (.156) | (.144) | (.570) | (.190) |
Total distributions | (.744) | (1.007) | (1.608) | (1.198) |
Net asset value, end of period | $ 48.33 | $ 43.73 | $ 39.70 | $ 46.40 |
Total Return B, C | 12.27% | 12.75% | (10.48)% | (4.96)% |
Ratios to Average Net Assets E, H | | | | |
Expenses before reductions F | .00% A | .00% | .00% | .00% A |
Expenses net of fee waivers, if any | .00% A | .00% | .00% | .00% A |
Expenses net of all reductions | .00% A | .00% | .00% | .00% A |
Net investment income (loss) | 2.94% A | 1.99% | 2.78% | 2.33% A |
Supplemental Data | | | | |
Net assets, end of period (000 omitted) | $ 1,410 | $ 598 | $ 632 | $ 986 |
Portfolio turnover rate | 26% A | 26% | 39% | 44% A |
A Annualized
B Total returns for periods of less than one year are not annualized.
C Total returns would have been lower had certain expenses not been reduced during the periods shown.
D Calculated based on average shares outstanding during the period.
E Amounts do not include the activity of the underlying funds.
F Amount represents less than .01%.
G For the period August 30, 2007 (commencement of operations) to July 31, 2008.
H Expense ratios reflect operating expenses of the class. Expenses before reductions do not reflect amounts reimbursed by the investment adviser or reductions from expense offset arrangements and do not represent the amount paid by the class during periods when reimbursements or reductions occur. Expenses net of fee waivers reflect expenses after reimbursement by the investment adviser but prior to reductions from expense offset arrangements. Expenses net of all reductions represent the net expenses paid by the class but do not include expenses of the investment companies in which the Fund invests.
Financial Highlights - Institutional Class
| Six months ended January 31, 2011 | Years ended July 31, |
| (Unaudited) | 2010 | 2009 | 2008 G |
Selected Per-Share Data | | | | |
Net asset value, beginning of period | $ 43.73 | $ 39.70 | $ 46.40 | $ 50.00 |
Income from Investment Operations | | | | |
Net investment income (loss) D | .678 | .851 | 1.031 | 1.064 |
Net realized and unrealized gain (loss) | 4.666 | 4.186 | (6.123) | (3.466) |
Total from investment operations | 5.344 | 5.037 | (5.092) | (2.402) |
Distributions from net investment income | (.588) | (.863) | (1.038) | (1.008) |
Distributions from net realized gain | (.156) | (.144) | (.570) | (.190) |
Total distributions | (.744) | (1.007) | (1.608) | (1.198) |
Net asset value, end of period | $ 48.33 | $ 43.73 | $ 39.70 | $ 46.40 |
Total Return B, C | 12.27% | 12.75% | (10.48)% | (4.96)% |
Ratios to Average Net Assets E, H | | | | |
Expenses before reductions F | .00% A | .00% | .00% | .00% A |
Expenses net of fee waivers, if any | .00% A | .00% | .00% | .00% A |
Expenses net of all reductions | .00% A | .00% | .00% | .00% A |
Net investment income (loss) | 2.94% A | 1.99% | 2.78% | 2.33% A |
Supplemental Data | | | | |
Net assets, end of period (000 omitted) | $ 93 | $ 103 | $ 67 | $ 119 |
Portfolio turnover rate | 26% A | 26% | 39% | 44% A |
A Annualized
B Total returns for periods of less than one year are not annualized.
C Total returns would have been lower had certain expenses not been reduced during the periods shown.
D Calculated based on average shares outstanding during the period.
E Amounts do not include the activity of the underlying funds.
F Amount represents less than .01%.
G For the period August 30, 2007 (commencement of operations) to July 31, 2008.
H Expense ratios reflect operating expenses of the class. Expenses before reductions do not reflect amounts reimbursed by the investment adviser or reductions from expense offset arrangements and do not represent the amount paid by the class during periods when reimbursements or reductions occur. Expenses net of fee waivers reflect expenses after reimbursement by the investment adviser but prior to reductions from expense offset arrangements. Expenses net of all reductions represent the net expenses paid by the class but do not include expenses of the investment companies in which the Fund invests.
See accompanying notes which are an integral part of the financial statements.
Semiannual Report
Fidelity Income Replacement 2038 Fund
Investment Changes (Unaudited)
Fund Holdings as of January 31, 2011 |
| % of fund's
net assets | % of fund's net assets
6 months ago |
Domestic Equity Funds | | |
Fidelity Advisor Mid Cap II Fund Institutional Class | 5.9 | 5.8 |
Fidelity Disciplined Equity Fund | 6.1 | 6.1 |
Fidelity Equity-Income Fund | 6.1 | 6.1 |
Fidelity Large Cap Core Enhanced Index Fund | 9.8 | 9.8 |
Fidelity Series 100 Index Fund | 7.3 | 7.4 |
Fidelity Series Broad Market Opportunities Fund | 9.8 | 9.8 |
Fidelity Series Small Cap Opportunities Fund | 3.9 | 4.0 |
| 48.9 | 49.0 |
International Equity Funds | | |
Fidelity Advisor International Discovery Fund Institutional Class | 11.4 | 11.9 |
High Yield Fixed-Income Funds | | |
Fidelity Capital & Income Fund | 3.1 | 3.1 |
Fidelity Strategic Income Fund | 3.0 | 3.1 |
| 6.1 | 6.2 |
Investment Grade Fixed-Income Funds | | |
Fidelity Government Income Fund | 5.2 | 5.3 |
Fidelity Strategic Real Return Fund | 5.3 | 5.4 |
Fidelity Total Bond Fund | 15.8 | 15.8 |
| 26.3 | 26.5 |
Short-Term Funds | | |
Fidelity Institutional Money Market Portfolio Institutional Class | 3.7 | 3.2 |
Fidelity Short-Term Bond Fund | 3.6 | 3.2 |
| 7.3 | 6.4 |
Net Other Assets (Liabilities)* | 0.0 | 0.0 |
| 100.0 | 100.0 |
* Amount represents less than 0.1%
Asset Allocation (% of fund's net assets) |
Current |
| Domestic Equity Funds | 48.9% | |
| International Equity Funds | 11.4% | |
| High Yield Fixed-Income Funds | 6.1% | |
| Investment Grade Fixed-Income Funds | 26.3% | |
| Short-Term Funds | 7.3% | |
Six months ago |
| Domestic Equity Funds | 49.0% | |
| International Equity Funds | 11.9% | |
| High Yield Fixed-Income Funds | 6.2% | |
| Investment Grade Fixed-Income Funds | 26.5% | |
| Short-Term Funds | 6.4% | |
Expected |
| Domestic Equity Funds | 48.6% | |
| International Equity Funds | 11.2% | |
| High Yield Fixed-Income Funds | 6.0% | |
| Investment Grade Fixed-Income Funds | 26.4% | |
| Short-Term Funds | 7.8% | |
The fund invests according to an asset allocation strategy that becomes increasingly conservative over time. The six months ago allocation is based on the fund's holdings as of July 31, 2010. The current allocation is based on the fund's holdings as of January 31, 2011. The expected allocation represents the fund's anticipated allocation at July 31, 2011. |
Semiannual Report
Fidelity Income Replacement 2038 Fund
Investments January 31, 2011 (Unaudited)
Showing Percentage of Net Assets
Equity Funds - 60.3% |
| Shares | | Value |
Domestic Equity Funds - 48.9% |
Fidelity Advisor Mid Cap II Fund Institutional Class | 5,014 | | $ 91,903 |
Fidelity Disciplined Equity Fund | 4,120 | | 95,661 |
Fidelity Equity-Income Fund | 2,099 | | 95,661 |
Fidelity Large Cap Core Enhanced Index Fund | 17,479 | | 153,120 |
Fidelity Series 100 Index Fund | 12,840 | | 114,918 |
Fidelity Series Broad Market Opportunities Fund | 14,895 | | 153,120 |
Fidelity Series Small Cap Opportunities Fund | 5,596 | | 61,217 |
TOTAL DOMESTIC EQUITY FUNDS | | 765,600 |
International Equity Funds - 11.4% |
Fidelity Advisor International Discovery Fund Institutional Class | 5,411 | | 179,109 |
TOTAL EQUITY FUNDS (Cost $754,796) | 944,709 |
Fixed-Income Funds - 32.4% |
| | | |
High Yield Fixed-Income Funds - 6.1% |
Fidelity Capital & Income Fund | 4,906 | | 47,439 |
Fidelity Strategic Income Fund | 4,243 | | 47,439 |
TOTAL HIGH YIELD FIXED-INCOME FUNDS | | 94,878 |
|
| Shares | | Value |
Investment Grade Fixed-Income Funds - 26.3% |
Fidelity Government Income Fund | 7,926 | | $ 82,509 |
Fidelity Strategic Real Return Fund | 8,506 | | 82,509 |
Fidelity Total Bond Fund | 23,033 | | 247,369 |
TOTAL INVESTMENT GRADE FIXED-INCOME FUNDS | | 412,387 |
TOTAL FIXED-INCOME FUNDS (Cost $468,560) | 507,265 |
Short-Term Funds - 7.3% |
| | | |
Fidelity Institutional Money Market Portfolio Institutional Class | 56,833 | | 56,833 |
Fidelity Short-Term Bond Fund | 6,702 | | 56,833 |
TOTAL SHORT-TERM FUNDS (Cost $112,042) | 113,666 |
TOTAL INVESTMENT PORTFOLIO - 100.0% (Cost $1,335,398) | | 1,565,640 |
NET OTHER ASSETS (LIABILITIES) - 0.0% | | (47) |
NET ASSETS - 100% | $ 1,565,593 |
Other Information |
All investments are categorized as Level 1 under the Fair Value Hierarchy. The inputs or methodology used for valuing securities may not be an indication of the risk associated with investing in those securities. For more information on valuation inputs, please refer to the Security Valuation section in the accompanying Notes to Financial Statements. |
Income Tax Information |
At July 31, 2010, the Fund had a capital loss carryforward of approximately $11,570 all of which will expire in fiscal 2018. Capital loss carryforwards are only available to offset future capital gains of the Fund to the extent provided by regulations and may be limited. |
The Fund intends to elect to defer to its fiscal year ending July 31, 2011 approximately $33,505 of losses recognized during the period November 1, 2009 to July 31, 2010. |
See accompanying notes which are an integral part of the financial statements.
Semiannual Report
Fidelity Income Replacement 2038 Fund
Statement of Assets and Liabilities
| January 31, 2011 (Unaudited) |
| | |
Assets | | |
Investment in securities, at value (cost $1,335,398) - See accompanying schedule | | $ 1,565,640 |
Cash | | 39 |
Receivable for investments sold | | 878,327 |
Total assets | | 2,444,006 |
| | |
Liabilities | | |
Payable for fund shares redeemed | $ 878,327 | |
Distribution and service plan fees payable | 86 | |
Total liabilities | | 878,413 |
| | |
Net Assets | | $ 1,565,593 |
Net Assets consist of: | | |
Paid in capital | | $ 1,431,006 |
Undistributed net investment income | | 534 |
Accumulated undistributed net realized gain (loss) on investments | | (96,189) |
Net unrealized appreciation (depreciation) on investments | | 230,242 |
Net Assets | | $ 1,565,593 |
Calculation of Maximum Offering Price Class A:
Net Asset Value and redemption price per share ($33,754 ÷ 708.4 shares) | | $ 47.65 |
| | |
Maximum offering price per share (100/94.25 of $47.65) | | $ 50.56 |
Class T:
Net Asset Value and redemption price per share ($32,640 ÷ 685.0 shares) | | $ 47.65 |
| | |
Maximum offering price per share (100/96.50 of $47.65) | | $ 49.38 |
| | |
Class C:
Net Asset Value and offering price per share ($79,281 ÷ 1,664.6 shares)A | | $ 47.63 |
| | |
Income Replacement 2038:
Net Asset Value, offering price and redemption price per share ($1,386,759 ÷ 29,105.9 shares) | | $ 47.65 |
| | |
Institutional Class:
Net Asset Value, offering price and redemption price per share ($33,159 ÷ 696.0 shares) | | $ 47.64 |
A Redemption price per share is equal to net asset value less any applicable contingent deferred sales charge.
Statement of Operations
Six months ended January 31, 2011 (Unaudited) |
| | |
Investment Income | | |
Income distributions from underlying funds | | $ 30,684 |
| | |
Expenses | | |
Distribution and service plan fees | $ 545 | |
Independent trustees' compensation | 4 | |
Total expenses before reductions | 549 | |
Expense reductions | (4) | 545 |
Net investment income (loss) | | 30,139 |
Realized and Unrealized Gain (Loss) Realized gain (loss) on sale of underlying fund shares | (25,636) | |
Capital gain distributions from underlying funds | 12,674 | |
Total net realized gain (loss) | | (12,962) |
Change in net unrealized appreciation (depreciation) on underlying funds | | 261,566 |
Net gain (loss) | | 248,604 |
Net increase (decrease) in net assets resulting from operations | | $ 278,743 |
See accompanying notes which are an integral part of the financial statements.
Semiannual Report
Fidelity Income Replacement 2038 Fund
Financial Statements - continued
Statement of Changes in Net Assets
| Six months ended January 31, 2011 (Unaudited) | Year ended
July 31,
2010 |
Increase (Decrease) in Net Assets | | |
Operations | | |
Net investment income (loss) | $ 30,139 | $ 44,672 |
Net realized gain (loss) | (12,962) | (45,293) |
Change in net unrealized appreciation (depreciation) | 261,566 | 254,403 |
Net increase (decrease) in net assets resulting from operations | 278,743 | 253,782 |
Distributions to shareholders from net investment income | (30,223) | (44,437) |
Distributions to shareholders from net realized gain | (9,861) | (9,084) |
Total distributions | (40,084) | (53,521) |
Share transactions - net increase (decrease) | (921,274) | 597,064 |
Total increase (decrease) in net assets | (682,615) | 797,325 |
| | |
Net Assets | | |
Beginning of period | 2,248,208 | 1,450,883 |
End of period (including undistributed net investment income of $534 and undistributed net investment income of $618, respectively) | $ 1,565,593 | $ 2,248,208 |
Financial Highlights - Class A
| Six months ended January 31, 2011 | Years ended July 31, |
| (Unaudited) | 2010 | 2009 | 2008 G |
Selected Per-Share Data | | | | |
Net asset value, beginning of period | $ 43.01 | $ 38.95 | $ 45.26 | $ 50.00 |
Income from Investment Operations | | | | |
Net investment income (loss) E | .538 | .744 | .856 | .442 |
Net realized and unrealized gain (loss) | 4.838 | 4.191 | (6.093) | (4.811) |
Total from investment operations | 5.376 | 4.935 | (5.237) | (4.369) |
Distributions from net investment income | (.543) | (.710) | (.873) | (.371) |
Distributions from net realized gain | (.193) | (.165) | (.200) | - |
Total distributions | (.736) | (.875) | (1.073) | (.371) |
Net asset value, end of period | $ 47.65 | $ 43.01 | $ 38.95 | $ 45.26 |
Total Return B, C, D | 12.55% | 12.72% | (11.24)% | (8.76)% |
Ratios to Average Net Assets F, H | | | | |
Expenses before reductions | .25% A | .25% | .25% | .25% A |
Expenses net of fee waivers, if any | .25% A | .25% | .25% | .25% A |
Expenses net of all reductions | .25% A | .25% | .25% | .25% A |
Net investment income (loss) | 2.37% A | 1.76% | 2.44% | 1.59% A |
Supplemental Data | | | | |
Net assets, end of period (000 omitted) | $ 34 | $ 32 | $ 115 | $ 91 |
Portfolio turnover rate | 19% A | 23% | 41% | 13% A |
A Annualized
B Total returns for periods of less than one year are not annualized.
C Total returns would have been lower had certain expenses not been reduced during the periods shown.
D Total returns do not include the effect of the sales charges.
E Calculated based on average shares outstanding during the period.
F Amounts do not include the activity of the underlying funds.
G For the period December 31, 2007 (commencement of operations) to July 31, 2008.
H Expense ratios reflect operating expenses of the class. Expenses before reductions do not reflect amounts reimbursed by the investment adviser or reductions from expense offset arrangements and do not represent the amount paid by the class during periods when reimbursements or reductions occur. Expenses net of fee waivers reflect expenses after reimbursement by the investment adviser but prior to reductions from expense offset arrangements. Expenses net of all reductions represent the net expenses paid by the class but do not include expenses of the investment companies in which the Fund invests.
See accompanying notes which are an integral part of the financial statements.
Semiannual Report
Financial Highlights - Class T
| Six months ended January 31, 2011 | Years ended July 31, |
| (Unaudited) | 2010 | 2009 | 2008 G |
Selected Per-Share Data | | | | |
Net asset value, beginning of period | $ 43.01 | $ 38.96 | $ 45.26 | $ 50.00 |
Income from Investment Operations | | | | |
Net investment income (loss) E | .481 | .636 | .791 | .373 |
Net realized and unrealized gain (loss) | 4.837 | 4.191 | (6.111) | (4.809) |
Total from investment operations | 5.318 | 4.827 | (5.320) | (4.436) |
Distributions from net investment income | (.485) | (.612) | (.780) | (.304) |
Distributions from net realized gain | (.193) | (.165) | (.200) | - |
Total distributions | (.678) | (.777) | (.980) | (.304) |
Net asset value, end of period | $ 47.65 | $ 43.01 | $ 38.96 | $ 45.26 |
Total Return B, C, D | 12.40% | 12.43% | (11.45)% | (8.89)% |
Ratios to Average Net Assets F, H | | | | |
Expenses before reductions | .50% A | .50% | .50% | .50% A |
Expenses net of fee waivers, if any | .50% A | .50% | .50% | .50% A |
Expenses net of all reductions | .50% A | .50% | .50% | .50% A |
Net investment income (loss) | 2.12% A | 1.50% | 2.20% | 1.34% A |
Supplemental Data | | | | |
Net assets, end of period (000 omitted) | $ 33 | $ 37 | $ 57 | $ 91 |
Portfolio turnover rate | 19% A | 23% | 41% | 13% A |
A Annualized
B Total returns for periods of less than one year are not annualized.
C Total returns would have been lower had certain expenses not been reduced during the periods shown.
D Total returns do not include the effect of the sales charges.
E Calculated based on average shares outstanding during the period.
F Amounts do not include the activity of the underlying funds.
G For the period December 31, 2007 (commencement of operations) to July 31, 2008.
H Expense ratios reflect operating expenses of the class. Expenses before reductions do not reflect amounts reimbursed by the investment adviser or reductions from expense offset arrangements and do not represent the amount paid by the class during periods when reimbursements or reductions occur. Expenses net of fee waivers reflect expenses after reimbursement by the investment adviser but prior to reductions from expense offset arrangements. Expenses net of all reductions represent the net expenses paid by the class but do not include expenses of the investment companies in which the Fund invests.
Financial Highlights - Class C
| Six months ended January 31, 2011 | Years ended July 31, |
| (Unaudited) | 2010 | 2009 | 2008 G |
Selected Per-Share Data | | | | |
Net asset value, beginning of period | $ 42.98 | $ 38.95 | $ 45.24 | $ 50.00 |
Income from Investment Operations | | | | |
Net investment income (loss) E | .368 | .424 | .611 | .233 |
Net realized and unrealized gain (loss) | 4.840 | 4.192 | (6.107) | (4.812) |
Total from investment operations | 5.208 | 4.616 | (5.496) | (4.579) |
Distributions from net investment income | (.365) | (.421) | (.594) | (.181) |
Distributions from net realized gain | (.193) | (.165) | (.200) | - |
Total distributions | (.558) | (.586) | (.794) | (.181) |
Net asset value, end of period | $ 47.63 | $ 42.98 | $ 38.95 | $ 45.24 |
Total Return B, C, D | 12.14% | 11.87% | (11.89)% | (9.17)% |
Ratios to Average Net Assets F, H | | | | |
Expenses before reductions | 1.00% A | 1.00% | 1.00% | 1.00% A |
Expenses net of fee waivers, if any | 1.00% A | 1.00% | 1.00% | 1.00% A |
Expenses net of all reductions | 1.00% A | 1.00% | 1.00% | 1.00% A |
Net investment income (loss) | 1.62% A | 1.01% | 1.70% | .84% A |
Supplemental Data | | | | |
Net assets, end of period (000 omitted) | $ 79 | $ 91 | $ 57 | $ 91 |
Portfolio turnover rate | 19% A | 23% | 41% | 13% A |
A Annualized
B Total returns for periods of less than one year are not annualized.
C Total returns would have been lower had certain expenses not been reduced during the periods shown.
D Total returns do not include the effect of the contingent deferred sales charge.
E Calculated based on average shares outstanding during the period.
F Amounts do not include the activity of the underlying funds.
G For the period December 31, 2007 (commencement of operations) to July 31, 2008.
H Expense ratios reflect operating expenses of the class. Expenses before reductions do not reflect amounts reimbursed by the investment adviser or reductions from expense offset arrangements and do not represent the amount paid by the class during periods when reimbursements or reductions occur. Expenses net of fee waivers reflect expenses after reimbursement by the investment adviser but prior to reductions from expense offset arrangements. Expenses net of all reductions represent the net expenses paid by the class but do not include expenses of the investment companies in which the Fund invests.
See accompanying notes which are an integral part of the financial statements.
Semiannual Report
Financial Highlights - Income Replacement 2038
| Six months ended January 31, 2011 | Years ended July 31, |
| (Unaudited) | 2010 | 2009 | 2008 G |
Selected Per-Share Data | | | | |
Net asset value, beginning of period | $ 43.00 | $ 38.96 | $ 45.27 | $ 50.00 |
Income from Investment Operations | | | | |
Net investment income (loss) D | .597 | .849 | .965 | .502 |
Net realized and unrealized gain (loss) | 4.846 | 4.187 | (6.112) | (4.795) |
Total from investment operations | 5.443 | 5.036 | (5.147) | (4.293) |
Distributions from net investment income | (.600) | (.831) | (.963) | (.437) |
Distributions from net realized gain | (.193) | (.165) | (.200) | - |
Total distributions | (.793) | (.996) | (1.163) | (.437) |
Net asset value, end of period | $ 47.65 | $ 43.00 | $ 38.96 | $ 45.27 |
Total Return B, C | 12.71% | 12.99% | (11.02)% | (8.61)% |
Ratios to Average Net Assets E, H | | | | |
Expenses before reductions F | .00% A | .00% | .00% | .00% A |
Expenses net of fee waivers, if any | .00% A | .00% | .00% | .00% A |
Expenses net of all reductions | .00% A | .00% | .00% | .00% A |
Net investment income (loss) | 2.62% A | 2.01% | 2.69% | 1.84% A |
Supplemental Data | | | | |
Net assets, end of period (000 omitted) | $ 1,387 | $ 2,051 | $ 1,165 | $ 1,122 |
Portfolio turnover rate | 19% A | 23% | 41% | 13% A |
A Annualized
B Total returns for periods of less than one year are not annualized.
C Total returns would have been lower had certain expenses not been reduced during the periods shown.
D Calculated based on average shares outstanding during the period.
E Amounts do not include the activity of the underlying funds.
F Amount represents less than .01%.
G For the period December 31, 2007 (commencement of operations) to July 31, 2008.
H Expense ratios reflect operating expenses of the class. Expenses before reductions do not reflect amounts reimbursed by the investment adviser or reductions from expense offset arrangements and do not represent the amount paid by the class during periods when reimbursements or reductions occur. Expenses net of fee waivers reflect expenses after reimbursement by the investment adviser but prior to reductions from expense offset arrangements. Expenses net of all reductions represent the net expenses paid by the class but do not include expenses of the investment companies in which the Fund invests.
Financial Highlights - Institutional Class
| Six months ended January 31, 2011 | Years ended July 31, |
| (Unaudited) | 2010 | 2009 | 2008 G |
Selected Per-Share Data | | | | |
Net asset value, beginning of period | $ 43.00 | $ 38.96 | $ 45.26 | $ 50.00 |
Income from Investment Operations | | | | |
Net investment income (loss) D | .594 | .848 | .974 | .511 |
Net realized and unrealized gain (loss) | 4.839 | 4.188 | (6.111) | (4.814) |
Total from investment operations | 5.433 | 5.036 | (5.137) | (4.303) |
Distributions from net investment income | (.600) | (.831) | (.963) | (.437) |
Distributions from net realized gain | (.193) | (.165) | (.200) | - |
Total distributions | (.793) | (.996) | (1.163) | (.437) |
Net asset value, end of period | $ 47.64 | $ 43.00 | $ 38.96 | $ 45.26 |
Total Return B, C | 12.69% | 12.99% | (11.00)% | (8.63)% |
Ratios to Average Net Assets E, H | | | | |
Expenses before reductions F | .00% A | .00% | .00% | .00% A |
Expenses net of fee waivers, if any | .00% A | .00% | .00% | .00% A |
Expenses net of all reductions | .00% A | .00% | .00% | .00% A |
Net investment income (loss) | 2.62% A | 2.01% | 2.69% | 1.84% A |
Supplemental Data | | | | |
Net assets, end of period (000 omitted) | $ 33 | $ 38 | $ 58 | $ 91 |
Portfolio turnover rate | 19% A | 23% | 41% | 13% A |
A Annualized
B Total returns for periods of less than one year are not annualized.
C Total returns would have been lower had certain expenses not been reduced during the periods shown.
D Calculated based on average shares outstanding during the period.
E Amounts do not include the activity of the underlying funds.
F Amount represents less than .01%.
G For the period December 31, 2007 (commencement of operations) to July 31, 2008.
H Expense ratios reflect operating expenses of the class. Expenses before reductions do not reflect amounts reimbursed by the investment adviser or reductions from expense offset arrangements and do not represent the amount paid by the class during periods when reimbursements or reductions occur. Expenses net of fee waivers reflect expenses after reimbursement by the investment adviser but prior to reductions from expense offset arrangements. Expenses net of all reductions represent the net expenses paid by the class but do not include expenses of the investment companies in which the Fund invests.
See accompanying notes which are an integral part of the financial statements.
Semiannual Report
Fidelity Income Replacement 2040 Fund
Investment Changes (Unaudited)
Fund Holdings as of January 31, 2011 |
| % of fund's
net assets | % of fund's net assets
6 months ago |
Domestic Equity Funds | | |
Fidelity Advisor Mid Cap II Fund Institutional Class | 6.0 | 6.0 |
Fidelity Disciplined Equity Fund | 6.3 | 6.2 |
Fidelity Equity-Income Fund | 6.3 | 6.3 |
Fidelity Large Cap Core Enhanced Index Fund | 10.1 | 10.0 |
Fidelity Series 100 Index Fund | 7.5 | 7.6 |
Fidelity Series Broad Market Opportunities Fund | 10.1 | 10.1 |
Fidelity Series Small Cap Opportunities Fund | 4.0 | 4.1 |
| 50.3 | 50.3 |
International Equity Funds | | |
Fidelity Advisor International Discovery Fund Institutional Class | 12.6 | 12.8 |
High Yield Fixed-Income Funds | | |
Fidelity Capital & Income Fund | 3.2 | 3.3 |
Fidelity Strategic Income Fund | 3.2 | 3.3 |
| 6.4 | 6.6 |
Investment Grade Fixed-Income Funds | | |
Fidelity Government Income Fund | 5.2 | 5.2 |
Fidelity Strategic Real Return Fund | 5.2 | 5.3 |
Fidelity Total Bond Fund | 15.7 | 15.7 |
| 26.1 | 26.2 |
Short-Term Funds | | |
Fidelity Institutional Money Market Portfolio Institutional Class | 2.3 | 2.0 |
Fidelity Short-Term Bond Fund | 2.3 | 2.1 |
| 4.6 | 4.1 |
Net Other Assets (Liabilities)* | 0.0 | 0.0 |
| 100.0 | 100.0 |
* Amount represents less than 0.1%
Asset Allocation (% of fund's net assets) |
Current |
| Domestic Equity Funds | 50.3% | |
| International Equity Funds | 12.6% | |
| High Yield Fixed-Income Funds | 6.4% | |
| Investment Grade Fixed-Income Funds | 26.1% | |
| Short-Term Funds | 4.6% | |
Six months ago |
| Domestic Equity Funds | 50.3% | |
| International Equity Funds | 12.8% | |
| High Yield Fixed-Income Funds | 6.6% | |
| Investment Grade Fixed-Income Funds | 26.2% | |
| Short-Term Funds | 4.1% | |
Expected |
| Domestic Equity Funds | 50.0% | |
| International Equity Funds | 12.3% | |
| High Yield Fixed-Income Funds | 6.3% | |
| Investment Grade Fixed-Income Funds | 26.1% | |
| Short-Term Funds | 5.3% | |
The fund invests according to an asset allocation strategy that becomes increasingly conservative over time. The six months ago allocation is based on the fund's holdings as of July 31, 2010. The current allocation is based on the fund's holdings as of January 31, 2011. The expected allocation represents the fund's anticipated allocation at July 31, 2011. |
Semiannual Report
Fidelity Income Replacement 2040 Fund
Investments January 31, 2011 (Unaudited)
Showing Percentage of Net Assets
Equity Funds - 62.9% |
| Shares | | Value |
Domestic Equity Funds - 50.3% |
Fidelity Advisor Mid Cap II Fund Institutional Class | 6,811 | | $ 124,855 |
Fidelity Disciplined Equity Fund | 5,600 | | 130,023 |
Fidelity Equity-Income Fund | 2,853 | | 130,022 |
Fidelity Large Cap Core Enhanced Index Fund | 23,763 | | 208,160 |
Fidelity Series 100 Index Fund | 17,438 | | 156,068 |
Fidelity Series Broad Market Opportunities Fund | 20,249 | | 208,160 |
Fidelity Series Small Cap Opportunities Fund | 7,615 | | 83,305 |
TOTAL DOMESTIC EQUITY FUNDS | | 1,040,593 |
International Equity Funds - 12.6% |
Fidelity Advisor International Discovery Fund Institutional Class | 7,838 | | 259,425 |
TOTAL EQUITY FUNDS (Cost $1,129,442) | 1,300,018 |
Fixed-Income Funds - 32.5% |
| | | |
High Yield Fixed-Income Funds - 6.4% |
Fidelity Capital & Income Fund | 6,883 | | 66,562 |
Fidelity Strategic Income Fund | 5,954 | | 66,562 |
TOTAL HIGH YIELD FIXED-INCOME FUNDS | | 133,124 |
|
| Shares | | Value |
Investment Grade Fixed-Income Funds - 26.1% |
Fidelity Government Income Fund | 10,346 | | $ 107,698 |
Fidelity Strategic Real Return Fund | 11,103 | | 107,698 |
Fidelity Total Bond Fund | 30,122 | | 323,506 |
TOTAL INVESTMENT GRADE FIXED-INCOME FUNDS | | 538,902 |
TOTAL FIXED-INCOME FUNDS (Cost $648,649) | 672,026 |
Short-Term Funds - 4.6% |
| | | |
Fidelity Institutional Money Market Portfolio Institutional Class | 47,544 | | 47,544 |
Fidelity Short-Term Bond Fund | 5,607 | | 47,544 |
TOTAL SHORT-TERM FUNDS (Cost $94,688) | 95,088 |
TOTAL INVESTMENT PORTFOLIO - 100.0% (Cost $1,872,779) | | 2,067,132 |
NET OTHER ASSETS (LIABILITIES) - 0.0% | | (105) |
NET ASSETS - 100% | $ 2,067,027 |
Other Information |
All investments are categorized as Level 1 under the Fair Value Hierarchy. The inputs or methodology used for valuing securities may not be an indication of the risk associated with investing in those securities. For more information on valuation inputs, please refer to the Security Valuation section in the accompanying Notes to Financial Statements. |
Income Tax Information |
At July 31, 2010, the Fund had a capital loss carryforward of approximately $153,270 of which $763 and $152,507 will expire in fiscal 2017 and 2018, respectively. Capital loss carryforwards are only available to offset future capital gains of the Fund to the extent provided by regulations and may be limited. |
See accompanying notes which are an integral part of the financial statements.
Semiannual Report
Fidelity Income Replacement 2040 Fund
Statement of Assets and Liabilities
| January 31, 2011 (Unaudited) |
| | |
Assets | | |
Investment in securities, at value (cost $1,872,779) - See accompanying schedule | | $ 2,067,132 |
Cash | | 39 |
Receivable for investments sold | | 7,438 |
Receivable for fund shares sold | | 6,205 |
Total assets | | 2,080,814 |
| | |
Liabilities | | |
Payable for investments purchased | $ 13,645 | |
Distribution and service plan fees payable | 142 | |
Total liabilities | | 13,787 |
| | |
Net Assets | | $ 2,067,027 |
Net Assets consist of: | | |
Paid in capital | | $ 2,112,823 |
Undistributed net investment income | | 444 |
Accumulated undistributed net realized gain (loss) on investments | | (240,593) |
Net unrealized appreciation (depreciation) on investments | | 194,353 |
Net Assets | | $ 2,067,027 |
Calculation of Maximum Offering Price Class A:
Net Asset Value and redemption price per share ($86,283 ÷ 1,802.3 shares) | | $ 47.87 |
| | |
Maximum offering price per share (100/94.25 of $47.87) | | $ 50.79 |
Class T:
Net Asset Value and redemption price per share ($127,114 ÷ 2,654.8 shares) | | $ 47.88 |
| | |
Maximum offering price per share (100/96.50 of $47.88) | | $ 49.62 |
| | |
Class C:
Net Asset Value and offering price per share ($86,681 ÷ 1,810.2 shares)A | | $ 47.88 |
| | |
Income Replacement 2040:
Net Asset Value, offering price and redemption price per share ($1,712,185 ÷ 35,762.3 shares) | | $ 47.88 |
| | |
Institutional Class:
Net Asset Value, offering price and redemption price per share ($54,764 ÷ 1,143.8 shares) | | $ 47.88 |
A Redemption price per share is equal to net asset value less any applicable contingent deferred sales charge.
Statement of Operations
Six months ended January 31, 2011 (Unaudited) |
| | |
Investment Income | | |
Income distributions from underlying funds | | $ 22,912 |
| | |
Expenses | | |
Distribution and service plan fees | $ 825 | |
Independent trustees' compensation | 3 | |
Total expenses before reductions | 828 | |
Expense reductions | (3) | 825 |
Net investment income (loss) | | 22,087 |
Realized and Unrealized Gain (Loss) Realized gain (loss) on sale of underlying fund shares | 25,387 | |
Capital gain distributions from underlying funds | 9,243 | |
Total net realized gain (loss) | | 34,630 |
Change in net unrealized appreciation (depreciation) on underlying funds | | 147,363 |
Net gain (loss) | | 181,993 |
Net increase (decrease) in net assets resulting from operations | | $ 204,080 |
See accompanying notes which are an integral part of the financial statements.
Semiannual Report
Statement of Changes in Net Assets
| Six months ended January 31, 2011 (Unaudited) | Year ended
July 31,
2010 |
Increase (Decrease) in Net Assets | | |
Operations | | |
Net investment income (loss) | $ 22,087 | $ 23,376 |
Net realized gain (loss) | 34,630 | (127,348) |
Change in net unrealized appreciation (depreciation) | 147,363 | 184,622 |
Net increase (decrease) in net assets resulting from operations | 204,080 | 80,650 |
Distributions to shareholders from net investment income | (22,028) | (23,219) |
Distributions to shareholders from net realized gain | (7,263) | (2,847) |
Total distributions | (29,291) | (26,066) |
Share transactions - net increase (decrease) | 324,089 | 856,629 |
Total increase (decrease) in net assets | 498,878 | 911,213 |
| | |
Net Assets | | |
Beginning of period | 1,568,149 | 656,936 |
End of period (including undistributed net investment income of $444 and undistributed net investment income of $385, respectively) | $ 2,067,027 | $ 1,568,149 |
Financial Highlights - Class A
| Six months ended January 31, 2011 | Years ended July 31, |
| (Unaudited) | 2010 | 2009 | 2008 G |
Selected Per-Share Data | | | | |
Net asset value, beginning of period | $ 43.04 | $ 38.83 | $ 45.23 | $ 50.00 |
Income from Investment Operations | | | | |
Net investment income (loss) E | .565 | .722 | .933 | .442 |
Net realized and unrealized gain (loss) | 5.015 | 4.298 | (6.238) | (4.814) |
Total from investment operations | 5.580 | 5.020 | (5.305) | (4.372) |
Distributions from net investment income | (.558) | (.710) | (.885) | (.398) |
Distributions from net realized gain | (.192) | (.100) | (.210) | - |
Total distributions | (.750) | (.810) | (1.095) | (.398) |
Net asset value, end of period | $ 47.87 | $ 43.04 | $ 38.83 | $ 45.23 |
Total Return B, C, D | 13.01% | 12.97% | (11.41)% | (8.77)% |
Ratios to Average Net Assets F, H | | | | |
Expenses before reductions | .25% A | .25% | .25% | .25% A |
Expenses net of fee waivers, if any | .25% A | .25% | .25% | .25% A |
Expenses net of all reductions | .25% A | .25% | .25% | .25% A |
Net investment income (loss) | 2.47% A | 1.70% | 2.60% | 1.60% A |
Supplemental Data | | | | |
Net assets, end of period (000 omitted) | $ 86 | $ 34 | $ 57 | $ 91 |
Portfolio turnover rate | 44% A | 129% | 50% | 4% A |
A Annualized
B Total returns for periods of less than one year are not annualized.
C Total returns would have been lower had certain expenses not been reduced during the periods shown.
D Total returns do not include the effect of the sales charges.
E Calculated based on average shares outstanding during the period.
F Amounts do not include the activity of the underlying funds.
G For the period December 31, 2007 (commencement of operations) to July 31, 2008.
H Expense ratios reflect operating expenses of the class. Expenses before reductions do not reflect amounts reimbursed by the investment adviser or reductions from expense offset arrangements and do not represent the amount paid by the class during periods when reimbursements or reductions occur. Expenses net of fee waivers reflect expenses after reimbursement by the investment adviser but prior to reductions from expense offset arrangements. Expenses net of all reductions represent the net expenses paid by the class but do not include expenses of the investment companies in which the Fund invests.
See accompanying notes which are an integral part of the financial statements.
Semiannual Report
Financial Highlights - Class T
| Six months ended January 31, 2011 | Years ended July 31, |
| (Unaudited) | 2010 | 2009 | 2008 G |
Selected Per-Share Data | | | | |
Net asset value, beginning of period | $ 43.05 | $ 38.84 | $ 45.23 | $ 50.00 |
Income from Investment Operations | | | | |
Net investment income (loss) E | .504 | .616 | .836 | .371 |
Net realized and unrealized gain (loss) | 5.013 | 4.301 | (6.227) | (4.809) |
Total from investment operations | 5.517 | 4.917 | (5.391) | (4.438) |
Distributions from net investment income | (.495) | (.607) | (.789) | (.332) |
Distributions from net realized gain | (.192) | (.100) | (.210) | - |
Total distributions | (.687) | (.707) | (.999) | (.332) |
Net asset value, end of period | $ 47.88 | $ 43.05 | $ 38.84 | $ 45.23 |
Total Return B, C, D | 12.86% | 12.69% | (11.62)% | (8.90)% |
Ratios to Average Net Assets F, H | | | | |
Expenses before reductions | .50% A | .50% | .50% | .50% A |
Expenses net of fee waivers, if any | .50% A | .50% | .50% | .50% A |
Expenses net of all reductions | .50% A | .50% | .50% | .50% A |
Net investment income (loss) | 2.21% A | 1.45% | 2.35% | 1.35% A |
Supplemental Data | | | | |
Net assets, end of period (000 omitted) | $ 127 | $ 111 | $ 102 | $ 132 |
Portfolio turnover rate | 44% A | 129% | 50% | 4% A |
A Annualized
B Total returns for periods of less than one year are not annualized.
C Total returns would have been lower had certain expenses not been reduced during the periods shown.
D Total returns do not include the effect of the sales charges.
E Calculated based on average shares outstanding during the period.
F Amounts do not include the activity of the underlying funds.
G For the period December 31, 2007 (commencement of operations) to July 31, 2008.
H Expense ratios reflect operating expenses of the class. Expenses before reductions do not reflect amounts reimbursed by the investment adviser or reductions from expense offset arrangements and do not represent the amount paid by the class during periods when reimbursements or reductions occur. Expenses net of fee waivers reflect expenses after reimbursement by the investment adviser but prior to reductions from expense offset arrangements. Expenses net of all reductions represent the net expenses paid by the class but do not include expenses of the investment companies in which the Fund invests.
Financial Highlights - Class C
| Six months ended January 31, 2011 | Years ended July 31, |
| (Unaudited) | 2010 | 2009 | 2008 G |
Selected Per-Share Data | | | | |
Net asset value, beginning of period | $ 43.05 | $ 38.84 | $ 45.22 | $ 50.00 |
Income from Investment Operations | | | | |
Net investment income (loss) E | .390 | .402 | .664 | .234 |
Net realized and unrealized gain (loss) | 5.012 | 4.305 | (6.229) | (4.816) |
Total from investment operations | 5.402 | 4.707 | (5.565) | (4.582) |
Distributions from net investment income | (.380) | (.397) | (.605) | (.198) |
Distributions from net realized gain | (.192) | (.100) | (.210) | - |
Total distributions | (.572) | (.497) | (.815) | (.198) |
Net asset value, end of period | $ 47.88 | $ 43.05 | $ 38.84 | $ 45.22 |
Total Return B, C, D | 12.57% | 12.13% | (12.06)% | (9.18)% |
Ratios to Average Net Assets F, H | | | | |
Expenses before reductions | 1.00% A | 1.00% | 1.00% | 1.00% A |
Expenses net of fee waivers, if any | 1.00% A | 1.00% | 1.00% | 1.00% A |
Expenses net of all reductions | 1.00% A | 1.00% | 1.00% | 1.00% A |
Net investment income (loss) | 1.71% A | .95% | 1.85% | .84% A |
Supplemental Data | | | | |
Net assets, end of period (000 omitted) | $ 87 | $ 99 | $ 57 | $ 91 |
Portfolio turnover rate | 44% A | 129% | 50% | 4% A |
A Annualized
B Total returns for periods of less than one year are not annualized.
C Total returns would have been lower had certain expenses not been reduced during the periods shown.
D Total returns do not include the effect of the contingent deferred sales charge.
E Calculated based on average shares outstanding during the period.
F Amounts do not include the activity of the underlying funds.
G For the period December 31, 2007 (commencement of operations) to July 31, 2008.
H Expense ratios reflect operating expenses of the class. Expenses before reductions do not reflect amounts reimbursed by the investment adviser or reductions from expense offset arrangements and do not represent the amount paid by the class during periods when reimbursements or reductions occur. Expenses net of fee waivers reflect expenses after reimbursement by the investment adviser but prior to reductions from expense offset arrangements. Expenses net of all reductions represent the net expenses paid by the class but do not include expenses of the investment companies in which the Fund invests.
See accompanying notes which are an integral part of the financial statements.
Semiannual Report
Financial Highlights - Income Replacement 2040
| Six months ended January 31, 2011 | Years ended July 31, |
| (Unaudited) | 2010 | 2009 | 2008 G |
Selected Per-Share Data | | | | |
Net asset value, beginning of period | $ 43.04 | $ 38.83 | $ 45.23 | $ 50.00 |
Income from Investment Operations | | | | |
Net investment income (loss) D | .618 | .833 | 1.015 | .504 |
Net realized and unrealized gain (loss) | 5.022 | 4.297 | (6.231) | (4.810) |
Total from investment operations | 5.640 | 5.130 | (5.216) | (4.306) |
Distributions from net investment income | (.608) | (.820) | (.974) | (.464) |
Distributions from net realized gain | (.192) | (.100) | (.210) | - |
Total distributions | (.800) | (.920) | (1.184) | (.464) |
Net asset value, end of period | $ 47.88 | $ 43.04 | $ 38.83 | $ 45.23 |
Total Return B, C | 13.16% | 13.26% | (11.19)% | (8.64)% |
Ratios to Average Net Assets E, H | | | | |
Expenses before reductions F | .00% A | .00% | .00% | .00% A |
Expenses net of fee waivers, if any | .00% A | .00% | .00% | .00% A |
Expenses net of all reductions | .00% A | .00% | .00% | .00% A |
Net investment income (loss) | 2.72% A | 1.96% | 2.85% | 1.85% A |
Supplemental Data | | | | |
Net assets, end of period (000 omitted) | $ 1,712 | $ 1,262 | $ 384 | $ 598 |
Portfolio turnover rate | 44% A | 129% | 50% | 4% A |
A Annualized
B Total returns for periods of less than one year are not annualized.
C Total returns would have been lower had certain expenses not been reduced during the periods shown.
D Calculated based on average shares outstanding during the period.
E Amounts do not include the activity of the underlying funds.
F Amount represents less than .01%.
G For the period December 31, 2007 (commencement of operations) to July 31, 2008.
H Expense ratios reflect operating expenses of the class. Expenses before reductions do not reflect amounts reimbursed by the investment adviser or reductions from expense offset arrangements and do not represent the amount paid by the class during periods when reimbursements or reductions occur. Expenses net of fee waivers reflect expenses after reimbursement by the investment adviser but prior to reductions from expense offset arrangements. Expenses net of all reductions represent the net expenses paid by the class but do not include expenses of the investment companies in which the Fund invests.
Financial Highlights - Institutional Class
| Six months ended January 31, 2011 | Years ended July 31, |
| (Unaudited) | 2010 | 2009 | 2008 G |
Selected Per-Share Data | | | | |
Net asset value, beginning of period | $ 43.04 | $ 38.83 | $ 45.23 | $ 50.00 |
Income from Investment Operations | | | | |
Net investment income (loss) D | .618 | .828 | 1.022 | .512 |
Net realized and unrealized gain (loss) | 5.022 | 4.302 | (6.238) | (4.818) |
Total from investment operations | 5.640 | 5.130 | (5.216) | (4.306) |
Distributions from net investment income | (.608) | (.820) | (.974) | (.464) |
Distributions from net realized gain | (.192) | (.100) | (.210) | - |
Total distributions | (.800) | (.920) | (1.184) | (.464) |
Net asset value, end of period | $ 47.88 | $ 43.04 | $ 38.83 | $ 45.23 |
Total Return B, C | 13.16% | 13.26% | (11.19)% | (8.64)% |
Ratios to Average Net Assets E, H | | | | |
Expenses before reductions F | .00% A | .00% | .00% | .00% A |
Expenses net of fee waivers, if any | .00% A | .00% | .00% | .00% A |
Expenses net of all reductions | .00% A | .00% | .00% | .00% A |
Net investment income (loss) | 2.72% A | 1.96% | 2.85% | 1.85% A |
Supplemental Data | | | | |
Net assets, end of period (000 omitted) | $ 55 | $ 62 | $ 57 | $ 91 |
Portfolio turnover rate | 44% A | 129% | 50% | 4% A |
A Annualized
B Total returns for periods of less than one year are not annualized.
C Total returns would have been lower had certain expenses not been reduced during the periods shown.
D Calculated based on average shares outstanding during the period.
E Amounts do not include the activity of the underlying funds.
F Amount represents less than .01%.
G For the period December 31, 2007 (commencement of operations) to July 31, 2008.
H Expense ratios reflect operating expenses of the class. Expenses before reductions do not reflect amounts reimbursed by the investment adviser or reductions from expense offset arrangements and do not represent the amount paid by the class during periods when reimbursements or reductions occur. Expenses net of fee waivers reflect expenses after reimbursement by the investment adviser but prior to reductions from expense offset arrangements. Expenses net of all reductions represent the net expenses paid by the class but do not include expenses of the investment companies in which the Fund invests.
See accompanying notes which are an integral part of the financial statements.
Semiannual Report
Fidelity Income Replacement 2042 Fund
Investment Changes (Unaudited)
Fund Holdings as of January 31, 2011 |
| % of fund's
net assets | % of fund's net assets
6 months ago |
Domestic Equity Funds | | |
Fidelity Advisor Mid Cap II Fund Institutional Class | 6.1 | 6.1 |
Fidelity Disciplined Equity Fund | 6.4 | 6.3 |
Fidelity Equity-Income Fund | 6.4 | 6.4 |
Fidelity Large Cap Core Enhanced Index Fund | 10.2 | 10.2 |
Fidelity Series 100 Index Fund | 7.7 | 7.7 |
Fidelity Series Broad Market Opportunities Fund | 10.3 | 10.2 |
Fidelity Series Small Cap Opportunities Fund | 4.1 | 4.2 |
| 51.2 | 51.1 |
International Equity Funds | | |
Fidelity Advisor International Discovery Fund Institutional Class | 12.8 | 13.0 |
High Yield Fixed-Income Funds | | |
Fidelity Capital & Income Fund | 3.3 | 3.4 |
Fidelity Strategic Income Fund | 3.4 | 3.4 |
| 6.7 | 6.8 |
Investment Grade Fixed-Income Funds | | |
Fidelity Government Income Fund | 5.2 | 5.2 |
Fidelity Strategic Real Return Fund | 5.2 | 5.3 |
Fidelity Total Bond Fund | 15.6 | 15.7 |
| 26.0 | 26.2 |
Short-Term Funds | | |
Fidelity Institutional Money Market Portfolio Institutional Class | 1.7 | 1.4 |
Fidelity Short-Term Bond Fund | 1.6 | 1.5 |
| 3.3 | 2.9 |
Net Other Assets (Liabilities)* | 0.0 | 0.0 |
| 100.0 | 100.0 |
* Amount represents less than 0.1%
Asset Allocation (% of fund's net assets) |
Current |
| Domestic Equity Funds | 51.2% | |
| International Equity Funds | 12.8% | |
| High Yield Fixed-Income Funds | 6.7% | |
| Investment Grade Fixed-Income Funds | 26.0% | |
| Short-Term Funds | 3.3% | |
Six months ago |
| Domestic Equity Funds | 51.1% | |
| International Equity Funds | 13.0% | |
| High Yield Fixed-Income Funds | 6.8% | |
| Investment Grade Fixed-Income Funds | 26.2% | |
| Short-Term Funds | 2.9% | |
Expected |
| Domestic Equity Funds | 51.0% | |
| International Equity Funds | 12.8% | |
| High Yield Fixed-Income Funds | 6.6% | |
| Investment Grade Fixed-Income Funds | 26.0% | |
| Short-Term Funds | 3.6% | |
The fund invests according to an asset allocation strategy that becomes increasingly conservative over time. The six months ago allocation is based on the fund's holdings as of July 31, 2010. The current allocation is based on the fund's holdings as of January 31, 2011. The expected allocation represents the fund's anticipated allocation at July 31, 2011. |
Semiannual Report
Fidelity Income Replacement 2042 Fund
Investments January 31, 2011 (Unaudited)
Showing Percentage of Net Assets
Equity Funds - 64.0% |
| Shares | | Value |
Domestic Equity Funds - 51.2% |
Fidelity Advisor Mid Cap II Fund Institutional Class | 15,747 | | $ 288,648 |
Fidelity Disciplined Equity Fund | 12,957 | | 300,870 |
Fidelity Equity-Income Fund | 6,602 | | 300,870 |
Fidelity Large Cap Core Enhanced Index Fund | 54,953 | | 481,393 |
Fidelity Series 100 Index Fund | 40,340 | | 361,044 |
Fidelity Series Broad Market Opportunities Fund | 46,828 | | 481,393 |
Fidelity Series Small Cap Opportunities Fund | 17,618 | | 192,745 |
TOTAL DOMESTIC EQUITY FUNDS | | 2,406,963 |
International Equity Funds - 12.8% |
Fidelity Advisor International Discovery Fund Institutional Class | 18,179 | | 601,741 |
TOTAL EQUITY FUNDS (Cost $2,623,955) | 3,008,704 |
Fixed-Income Funds - 32.7% |
| | | |
High Yield Fixed-Income Funds - 6.7% |
Fidelity Capital & Income Fund | 16,286 | | 157,487 |
Fidelity Strategic Income Fund | 14,086 | | 157,487 |
TOTAL HIGH YIELD FIXED-INCOME FUNDS | | 314,974 |
|
| Shares | | Value |
Investment Grade Fixed-Income Funds - 26.0% |
Fidelity Government Income Fund | 23,528 | | $ 244,927 |
Fidelity Strategic Real Return Fund | 25,250 | | 244,927 |
Fidelity Total Bond Fund | 68,372 | | 734,312 |
TOTAL INVESTMENT GRADE FIXED-INCOME FUNDS | | 1,224,166 |
TOTAL FIXED-INCOME FUNDS (Cost $1,453,204) | 1,539,140 |
Short-Term Funds - 3.3% |
| | | |
Fidelity Institutional Money Market Portfolio Institutional Class | 76,628 | | 76,628 |
Fidelity Short-Term Bond Fund | 9,036 | | 76,628 |
TOTAL SHORT-TERM FUNDS (Cost $152,177) | 153,256 |
TOTAL INVESTMENT PORTFOLIO - 100.0% (Cost $4,229,336) | | 4,701,100 |
NET OTHER ASSETS (LIABILITIES) - 0.0% | | (3) |
NET ASSETS - 100% | $ 4,701,097 |
Other Information |
All investments are categorized as Level 1 under the Fair Value Hierarchy. The inputs or methodology used for valuing securities may not be an indication of the risk associated with investing in those securities. For more information on valuation inputs, please refer to the Security Valuation section in the accompanying Notes to Financial Statements. |
Income Tax Information |
At July 31, 2010, the Fund had a capital loss carryforward of approximately $17,454 of which $2,106 and $15,348 will expire in fiscal 2017 and 2018, respectively. Capital loss carryforwards are only available to offset future capital gains of the Fund to the extent provided by regulations and may be limited. |
See accompanying notes which are an integral part of the financial statements.
Semiannual Report
Fidelity Income Replacement 2042 Fund
Statement of Assets and Liabilities
| January 31, 2011 (Unaudited) |
| | |
Assets | | |
Investment in securities, at value (cost $4,229,336) - See accompanying schedule | | $ 4,701,100 |
Cash | | 40 |
Receivable for fund shares sold | | 883,327 |
Total assets | | 5,584,467 |
| | |
Liabilities | | |
Payable for investments purchased | $ 883,324 | |
Distribution and service plan fees payable | 46 | |
Total liabilities | | 883,370 |
| | |
Net Assets | | $ 4,701,097 |
Net Assets consist of: | | |
Paid in capital | | $ 4,337,652 |
Undistributed net investment income | | 901 |
Accumulated undistributed net realized gain (loss) on investments | | (109,220) |
Net unrealized appreciation (depreciation) on investments | | 471,764 |
Net Assets | | $ 4,701,097 |
Calculation of Maximum Offering Price Class A:
Net Asset Value and redemption price per share ($25,696 ÷ 535.9 shares) | | $ 47.95 |
| | |
Maximum offering price per share (100/94.25 of $47.95) | | $ 50.88 |
Class T:
Net Asset Value and redemption price per share ($32,835 ÷ 684.7 shares) | | $ 47.96 |
| | |
Maximum offering price per share (100/96.50 of $47.96) | | $ 49.70 |
| | |
Class C:
Net Asset Value and offering price per share ($32,321 ÷ 673.8 shares)A | | $ 47.97 |
| | |
Income Replacement 2042:
Net Asset Value, offering price and redemption price per share ($4,576,885 ÷ 95,468.2 shares) | | $ 47.94 |
| | |
Institutional Class:
Net Asset Value, offering price and redemption price per share ($33,360 ÷ 695.9 shares) | | $ 47.94 |
A Redemption price per share is equal to net asset value less any applicable contingent deferred sales charge.
Statement of Operations
Six months ended January 31, 2011 (Unaudited) |
| | |
Investment Income | | |
Income distributions from underlying funds | | $ 49,692 |
| | |
Expenses | | |
Distribution and service plan fees | $ 292 | |
Independent trustees' compensation | 7 | |
Total expenses before reductions | 299 | |
Expense reductions | (7) | 292 |
Net investment income (loss) | | 49,400 |
Realized and Unrealized Gain (Loss) Realized gain (loss) on sale of underlying fund shares | (38,568) | |
Capital gain distributions from underlying funds | 20,282 | |
Total net realized gain (loss) | | (18,286) |
Change in net unrealized appreciation (depreciation) on underlying funds | | 431,347 |
Net gain (loss) | | 413,061 |
Net increase (decrease) in net assets resulting from operations | | $ 462,461 |
See accompanying notes which are an integral part of the financial statements.
Semiannual Report
Fidelity Income Replacement 2042 Fund
Financial Statements - continued
Statement of Changes in Net Assets
| Six months ended January 31, 2011 (Unaudited) | Year ended
July 31,
2010 |
Increase (Decrease) in Net Assets | | |
Operations | | |
Net investment income (loss) | $ 49,400 | $ 58,360 |
Net realized gain (loss) | (18,286) | (3,503) |
Change in net unrealized appreciation (depreciation) | 431,347 | 231,761 |
Net increase (decrease) in net assets resulting from operations | 462,461 | 286,618 |
Distributions to shareholders from net investment income | (49,432) | (57,943) |
Distributions to shareholders from net realized gain | (15,604) | (7,508) |
Total distributions | (65,036) | (65,451) |
Share transactions - net increase (decrease) | 768,588 | 1,660,037 |
Total increase (decrease) in net assets | 1,166,013 | 1,881,204 |
| | |
Net Assets | | |
Beginning of period | 3,535,084 | 1,653,880 |
End of period (including undistributed net investment income of $901 and undistributed net investment income of $933, respectively) | $ 4,701,097 | $ 3,535,084 |
Financial Highlights - Class A
| Six months ended January 31, 2011 | Years ended July 31, |
| (Unaudited) | 2010 | 2009 | 2008 G |
Selected Per-Share Data | | | | |
Net asset value, beginning of period | $ 43.04 | $ 38.83 | $ 45.20 | $ 50.00 |
Income from Investment Operations | | | | |
Net investment income (loss) E | .557 | .747 | .819 | .425 |
Net realized and unrealized gain (loss) | 5.106 | 4.285 | (6.123) | (4.836) |
Total from investment operations | 5.663 | 5.032 | (5.304) | (4.411) |
Distributions from net investment income | (.558) | (.717) | (.866) | (.389) |
Distributions from net realized gain | (.195) | (.105) | (.200) | - |
Total distributions | (.753) | (.822) | (1.066) | (.389) |
Net asset value, end of period | $ 47.95 | $ 43.04 | $ 38.83 | $ 45.20 |
Total Return B, C, D | 13.21% | 13.00% | (11.40)% | (8.85)% |
Ratios to Average Net Assets F, H | | | | |
Expenses before reductions | .25% A | .25% | .25% | .25% A |
Expenses net of fee waivers, if any | .25% A | .25% | .25% | .25% A |
Expenses net of all reductions | .25% A | .25% | .25% | .25% A |
Net investment income (loss) | 2.44% A | 1.77% | 2.32% | 1.57% A |
Supplemental Data | | | | |
Net assets, end of period (000 omitted) | $ 26 | $ 29 | $ 88 | $ 91 |
Portfolio turnover rate | 27% A | 20% | 37% | 8% A |
A Annualized
B Total returns for periods of less than one year are not annualized.
C Total returns would have been lower had certain expenses not been reduced during the periods shown.
D Total returns do not include the effect of the sales charges.
E Calculated based on average shares outstanding during the period.
F Amounts do not include the activity of the underlying funds.
G For the period December 31, 2007 (commencement of operations) to July 31, 2008.
H Expense ratios reflect operating expenses of the class. Expenses before reductions do not reflect amounts reimbursed by the investment adviser or reductions from expense offset arrangements and do not represent the amount paid by the class during periods when reimbursements or reductions occur. Expenses net of fee waivers reflect expenses after reimbursement by the investment adviser but prior to reductions from expense offset arrangements. Expenses net of all reductions represent the net expenses paid by the class but do not include expenses of the investment companies in which the Fund invests.
See accompanying notes which are an integral part of the financial statements.
Semiannual Report
Financial Highlights - Class T
| Six months ended January 31, 2011 | Years ended July 31, |
| (Unaudited) | 2010 | 2009 | 2008 G |
Selected Per-Share Data | | | | |
Net asset value, beginning of period | $ 43.04 | $ 38.83 | $ 45.19 | $ 50.00 |
Income from Investment Operations | | | | |
Net investment income (loss) E | .500 | .642 | .739 | .365 |
Net realized and unrealized gain (loss) | 5.117 | 4.281 | (6.128) | (4.852) |
Total from investment operations | 5.617 | 4.923 | (5.389) | (4.487) |
Distributions from net investment income | (.502) | (.608) | (.771) | (.323) |
Distributions from net realized gain | (.195) | (.105) | (.200) | - |
Total distributions | (.697) | (.713) | (.971) | (.323) |
Net asset value, end of period | $ 47.96 | $ 43.04 | $ 38.83 | $ 45.19 |
Total Return B, C, D | 13.09% | 12.71% | (11.62)% | (9.00)% |
Ratios to Average Net Assets F, H | | | | |
Expenses before reductions | .50% A | .50% | .50% | .50% A |
Expenses net of fee waivers, if any | .50% A | .50% | .50% | .50% A |
Expenses net of all reductions | .50% A | .50% | .50% | .50% A |
Net investment income (loss) | 2.19% A | 1.52% | 2.07% | 1.32% A |
Supplemental Data | | | | |
Net assets, end of period (000 omitted) | $ 33 | $ 37 | $ 57 | $ 91 |
Portfolio turnover rate | 27% A | 20% | 37% | 8% A |
A Annualized
B Total returns for periods of less than one year are not annualized.
C Total returns would have been lower had certain expenses not been reduced during the periods shown.
D Total returns do not include the effect of the sales charges.
E Calculated based on average shares outstanding during the period.
F Amounts do not include the activity of the underlying funds.
G For the period December 31, 2007 (commencement of operations) to July 31, 2008.
H Expense ratios reflect operating expenses of the class. Expenses before reductions do not reflect amounts reimbursed by the investment adviser or reductions from expense offset arrangements and do not represent the amount paid by the class during periods when reimbursements or reductions occur. Expenses net of fee waivers reflect expenses after reimbursement by the investment adviser but prior to reductions from expense offset arrangements. Expenses net of all reductions represent the net expenses paid by the class but do not include expenses of the investment companies in which the Fund invests.
Financial Highlights - Class C
| Six months ended January 31, 2011 | Years ended July 31, |
| (Unaudited) | 2010 | 2009 | 2008 G |
Selected Per-Share Data | | | | |
Net asset value, beginning of period | $ 43.05 | $ 38.84 | $ 45.19 | $ 50.00 |
Income from Investment Operations | | | | |
Net investment income (loss) E | .386 | .430 | .560 | .226 |
Net realized and unrealized gain (loss) | 5.112 | 4.275 | (6.123) | (4.846) |
Total from investment operations | 5.498 | 4.705 | (5.563) | (4.620) |
Distributions from net investment income | (.383) | (.390) | (.587) | (.190) |
Distributions from net realized gain | (.195) | (.105) | (.200) | - |
Total distributions | (.578) | (.495) | (.787) | (.190) |
Net asset value, end of period | $ 47.97 | $ 43.05 | $ 38.84 | $ 45.19 |
Total Return B, C, D | 12.79% | 12.12% | (12.05)% | (9.25)% |
Ratios to Average Net Assets F, H | | | | |
Expenses before reductions | 1.00% A | 1.00% | 1.00% | 1.00% A |
Expenses net of fee waivers, if any | 1.00% A | 1.00% | 1.00% | 1.00% A |
Expenses net of all reductions | 1.00% A | 1.00% | 1.00% | 1.00% A |
Net investment income (loss) | 1.69% A | 1.02% | 1.57% | .82% A |
Supplemental Data | | | | |
Net assets, end of period (000 omitted) | $ 32 | $ 37 | $ 56 | $ 91 |
Portfolio turnover rate | 27% A | 20% | 37% | 8% A |
A Annualized
B Total returns for periods of less than one year are not annualized.
C Total returns would have been lower had certain expenses not been reduced during the periods shown.
D Total returns do not include the effect of the contingent deferred sales charge.
E Calculated based on average shares outstanding during the period.
F Amounts do not include the activity of the underlying funds.
G For the period December 31, 2007 (commencement of operations) to July 31, 2008.
H Expense ratios reflect operating expenses of the class. Expenses before reductions do not reflect amounts reimbursed by the investment adviser or reductions from expense offset arrangements and do not represent the amount paid by the class during periods when reimbursements or reductions occur. Expenses net of fee waivers reflect expenses after reimbursement by the investment adviser but prior to reductions from expense offset arrangements. Expenses net of all reductions represent the net expenses paid by the class but do not include expenses of the investment companies in which the Fund invests.
See accompanying notes which are an integral part of the financial statements.
Semiannual Report
Financial Highlights - Income Replacement 2042
| Six months ended January 31, 2011 | Years ended July 31, |
| (Unaudited) | 2010 | 2009 | 2008 G |
Selected Per-Share Data | | | | |
Net asset value, beginning of period | $ 43.03 | $ 38.83 | $ 45.20 | $ 50.00 |
Income from Investment Operations | | | | |
Net investment income (loss) D | .613 | .857 | .900 | .496 |
Net realized and unrealized gain (loss) | 5.110 | 4.279 | (6.114) | (4.840) |
Total from investment operations | 5.723 | 5.136 | (5.214) | (4.344) |
Distributions from net investment income | (.618) | (.831) | (.956) | (.456) |
Distributions from net realized gain | (.195) | (.105) | (.200) | - |
Total distributions | (.813) | (.936) | (1.156) | (.456) |
Net asset value, end of period | $ 47.94 | $ 43.03 | $ 38.83 | $ 45.20 |
Total Return B, C | 13.36% | 13.27% | (11.18)% | (8.72)% |
Ratios to Average Net Assets E, H | | | | |
Expenses before reductions F | .00% A | .00% | .00% | .00% A |
Expenses net of fee waivers, if any | .00% A | .00% | .00% | .00% A |
Expenses net of all reductions | .00% A | .00% | .00% | .00% A |
Net investment income (loss) | 2.70% A | 2.02% | 2.57% | 1.82% A |
Supplemental Data | | | | |
Net assets, end of period (000 omitted) | $ 4,577 | $ 3,395 | $ 1,395 | $ 969 |
Portfolio turnover rate | 27% A | 20% | 37% | 8% A |
A Annualized
B Total returns for periods of less than one year are not annualized.
C Total returns would have been lower had certain expenses not been reduced during the periods shown.
D Calculated based on average shares outstanding during the period.
E Amounts do not include the activity of the underlying funds.
F Amount represents less than .01%.
G For the period December 31, 2007 (commencement of operations) to July 31, 2008.
H Expense ratios reflect operating expenses of the class. Expenses before reductions do not reflect amounts reimbursed by the investment adviser or reductions from expense offset arrangements and do not represent the amount paid by the class during periods when reimbursements or reductions occur. Expenses net of fee waivers reflect expenses after reimbursement by the investment adviser but prior to reductions from expense offset arrangements. Expenses net of all reductions represent the net expenses paid by the class but do not include expenses of the investment companies in which the Fund invests.
Financial Highlights - Institutional Class
| Six months ended January 31, 2011 | Years ended July 31, |
| (Unaudited) | 2010 | 2009 | 2008 G |
Selected Per-Share Data | | | | |
Net asset value, beginning of period | $ 43.03 | $ 38.83 | $ 45.20 | $ 50.00 |
Income from Investment Operations | | | | |
Net investment income (loss) D | .614 | .855 | .918 | .504 |
Net realized and unrealized gain (loss) | 5.109 | 4.281 | (6.132) | (4.848) |
Total from investment operations | 5.723 | 5.136 | (5.214) | (4.344) |
Distributions from net investment income | (.618) | (.831) | (.956) | (.456) |
Distributions from net realized gain | (.195) | (.105) | (.200) | - |
Total distributions | (.813) | (.936) | (1.156) | (.456) |
Net asset value, end of period | $ 47.94 | $ 43.03 | $ 38.83 | $ 45.20 |
Total Return B, C | 13.36% | 13.27% | (11.18)% | (8.72)% |
Ratios to Average Net Assets E, H | | | | |
Expenses before reductions F | .00% A | .00% | .00% | .00% A |
Expenses net of fee waivers, if any | .00% A | .00% | .00% | .00% A |
Expenses net of all reductions | .00% A | .00% | .00% | .00% A |
Net investment income (loss) | 2.70% A | 2.02% | 2.57% | 1.82% A |
Supplemental Data | | | | |
Net assets, end of period (000 omitted) | $ 33 | $ 38 | $ 57 | $ 91 |
Portfolio turnover rate | 27% A | 20% | 37% | 8% A |
A Annualized
B Total returns for periods of less than one year are not annualized.
C Total returns would have been lower had certain expenses not been reduced during the periods shown.
D Calculated based on average shares outstanding during the period.
E Amounts do not include the activity of the underlying funds.
F Amount represents less than .01%.
G For the period December 31, 2007 (commencement of operations) to July 31, 2008.
H Expense ratios reflect operating expenses of the class. Expenses before reductions do not reflect amounts reimbursed by the investment adviser or reductions from expense offset arrangements and do not represent the amount paid by the class during periods when reimbursements or reductions occur. Expenses net of fee waivers reflect expenses after reimbursement by the investment adviser but prior to reductions from expense offset arrangements. Expenses net of all reductions represent the net expenses paid by the class but do not include expenses of the investment companies in which the Fund invests.
See accompanying notes which are an integral part of the financial statements.
Semiannual Report
Notes to Financial Statements
For the period ended January 31, 2011 (Unaudited)
1. Organization.
Fidelity Income Replacement 2016 Fund, Fidelity Income Replacement 2018 Fund, Fidelity Income Replacement 2020 Fund, Fidelity Income Replacement 2022 Fund, Fidelity Income Replacement 2024 Fund, Fidelity Income Replacement 2026 Fund, Fidelity Income Replacement 2028 Fund, Fidelity Income Replacement 2030 Fund, Fidelity Income Replacement 2032 Fund, Fidelity Income Replacement 2034 Fund, Fidelity Income Replacement 2036 Fund, Fidelity Income Replacement 2038 Fund, Fidelity Income Replacement 2040 Fund and Fidelity Income Replacement 2042 Fund (the Funds) are funds of Fidelity Income Fund (the Trust). The Trust is registered under the Investment Company Act of 1940, as amended (the 1940 Act), as an open-end management investment company organized as a Massachusetts business trust. Each Fund is authorized to issue an unlimited number of shares. The Funds invest primarily in a combination of other Fidelity equity, bond, and short-term funds (the Underlying Funds) managed by Fidelity Management & Research Company (FMR).
The Funds are designed for investors who seek to convert accumulated assets into regular payments over a defined period of time. The payment strategy for each Fund is designed to be implemented through a shareholder's voluntary participation in the Smart Payment Program. Participation in the Smart Payment Program will result in the gradual liquidation of the shareholder's entire investment in the Fund by its horizon date. Each Fund's name refers to the year of its horizon date.
Each Fund offers Class A, Class T, Class C, Income Replacement and Institutional Class shares. All classes have equal rights and voting privileges, except for matters affecting a single class. Investment income, realized and unrealized capital gains and losses, the common expenses of the Fund, and certain fund-level expense reductions, if any, are allocated on a pro-rata basis to each class based on the relative net assets of each class to the total net assets of the Fund. Each class differs with respect to distribution and service plan fees incurred. Certain expense reductions may also differ by class.
2. Significant Accounting Policies.
The financial statements have been prepared in conformity with accounting principles generally accepted in the United States of America (GAAP), which require management to make certain estimates and assumptions at the date of the financial statements. Actual results could differ from those estimates. Subsequent events, if any, through the date that the financial statements were issued have been evaluated in the preparation of the financial statements. The following summarizes the significant accounting policies of the Funds:
Security Valuation. Investments are valued as of 4:00 p.m. Eastern time on the last calendar day of the period. Each Fund categorizes the inputs to valuation techniques used to value their investments into a disclosure hierarchy consisting of three levels as shown below.
Level 1 - quoted prices in active markets for identical investments
Level 2 - other significant observable inputs (including quoted prices for similar investments, interest rates, prepayment speeds, etc.)
Level 3 - unobservable inputs (including the Fund's own assumptions based on the best information available)
Valuation techniques used to value each Fund's investments by major category are as follows. Investments in the Underlying Funds are valued at their closing net asset value (NAV) each business day and are categorized as Level 1 in the hierarchy.
Investment Transactions and Income. For financial reporting purposes, the Funds' investment holdings and NAV include trades executed through the end of the last business day of the period. The NAV per share for processing shareholder transactions is calculated as of the close of business of the New York Stock Exchange (NYSE), normally 4:00 p.m. Eastern time and includes trades executed through the end of the prior business day. Gains and losses on securities sold are determined on the basis of identified cost. Income and capital gain distributions from the Underlying Funds, if any, are recorded on the ex-dividend date.
Expenses. Expenses directly attributable to a fund are charged to that fund. Expenses attributable to more than one fund are allocated among the respective funds on the basis of relative net assets or other appropriate methods. Expenses included in the accompanying financial statements reflect the expenses of the Fund and do not include any expenses associated with the Underlying Funds. Expense estimates are accrued in the period to which they relate and adjustments are made when actual amounts are known.
Income Tax Information and Distributions to Shareholders. Each year, each Fund intends to qualify as a regulated investment company, including distributing substantially all of its taxable income and realized gains under Subchapter M of the Internal Revenue Code and filing its U.S. federal tax return. As a result, no provision for income taxes is required. A fund's federal tax return is subject to examination by the Internal Revenue Service (IRS) for a period of three years.
Distributions are declared and recorded on the ex-dividend date. Income dividends and capital gain distributions are declared separately for each class. Income and capital gain distributions are determined in accordance with income tax regulations, which may differ from GAAP.
Semiannual Report
2. Significant Accounting Policies - continued
Income Tax Information and Distributions to Shareholders - continued
Capital accounts within the financial statements are adjusted for permanent book-tax differences. These adjustments have no impact on net assets or the results of operations. Temporary book-tax differences will reverse in a subsequent period.
Book-tax differences are primarily due to the short-term gain distributions from the Underlying Funds, capital loss carryforwards, losses deferred due to wash sales and excise tax regulations.
The federal tax cost of investment securities and unrealized appreciation (depreciation) as of period end were as follows for each Fund:
| Tax
cost | Gross unrealized
appreciation | Gross unrealized
depreciation | Net unrealized appreciation (depreciation) on securities and other investments |
Fidelity Income Replacement 2016 Fund | $ 10,371,851 | $ 498,542 | $ (152,639) | $ 345,903 |
Fidelity Income Replacement 2018 Fund | 5,831,249 | 177,344 | (169,820) | 7,524 |
Fidelity Income Replacement 2020 Fund | 3,991,666 | 288,500 | (70,852) | 217,648 |
Fidelity Income Replacement 2022 Fund | 3,120,356 | 92,610 | (137,765) | (45,155) |
Fidelity Income Replacement 2024 Fund | 1,607,060 | 103,826 | (36,820) | 67,006 |
Fidelity Income Replacement 2026 Fund | 1,411,924 | 58,900 | (41,424) | 17,476 |
Fidelity Income Replacement 2028 Fund | 6,309,752 | 335,884 | (172,301) | 163,583 |
Fidelity Income Replacement 2030 Fund | 2,883,230 | 179,090 | (53,092) | 125,998 |
Fidelity Income Replacement 2032 Fund | 1,861,326 | 326,913 | (5,264) | 321,649 |
Fidelity Income Replacement 2034 Fund | 1,801,035 | 246,946 | (9,369) | 237,577 |
Fidelity Income Replacement 2036 Fund | 1,943,004 | 82,232 | (75,794) | 6,438 |
Fidelity Income Replacement 2038 Fund | 1,350,162 | 219,956 | (4,478) | 215,478 |
Fidelity Income Replacement 2040 Fund | 1,949,267 | 152,140 | (34,275) | 117,865 |
Fidelity Income Replacement 2042 Fund | 4,287,193 | 482,493 | (68,586) | 413,907 |
3. Purchases and Sales of Investments.
Purchases and redemptions of the Underlying Fund shares are noted in the table below.
| Purchases ($) | Redemptions ($) |
Fidelity Income Replacement 2016 Fund | 2,007,711 | 2,848,246 |
Fidelity Income Replacement 2018 Fund | 1,387,027 | 1,310,923 |
Fidelity Income Replacement 2020 Fund | 1,409,214 | 748,150 |
Fidelity Income Replacement 2022 Fund | 643,300 | 334,955 |
Fidelity Income Replacement 2024 Fund | 231,135 | 218,151 |
Fidelity Income Replacement 2026 Fund | 553,139 | 207,412 |
Fidelity Income Replacement 2028 Fund | 959,598 | 1,170,953 |
Fidelity Income Replacement 2030 Fund | 1,353,434 | 515,496 |
Fidelity Income Replacement 2032 Fund | 530,997 | 254,831 |
Fidelity Income Replacement 2034 Fund | 449,976 | 450,032 |
Fidelity Income Replacement 2036 Fund | 886,175 | 192,978 |
Fidelity Income Replacement 2038 Fund | 203,244 | 1,121,802 |
Fidelity Income Replacement 2040 Fund | 700,560 | 374,423 |
Fidelity Income Replacement 2042 Fund | 1,278,621 | 505,395 |
4. Fees and Other Transactions with Affiliates.
Management Fee. Strategic Advisers, Inc. (Strategic Advisers), an affiliate of FMR, provides the Funds with investment management related services. The Funds do not pay any fees for these services. Under the management contract, Strategic Advisers pays all other fund-level expenses, except the compensation of the independent Trustees and certain other expenses such as interest expense. The management fee paid by each Fund is reduced by an amount equal to the fees and expenses paid by the Fund to the independent Trustees.
Semiannual Report
Notes to Financial Statements (Unaudited) - continued
4. Fees and Other Transactions with Affiliates - continued
Distribution and Service Plan Fees. In accordance with Rule 12b-1 of the 1940 Act, the Funds have adopted separate Distribution and Service Plans for each class of shares. Certain classes pay Fidelity Distributors Corporation (FDC), an affiliate of FMR, separate Distribution and Service Fees, each of which is based on an annual percentage of each class' average net assets. In addition, FDC may pay financial intermediaries for selling shares of the Funds and providing shareholder support services. For the period, the Distribution and Service Fee rates, total fees and amounts retained by FDC were as follows:
Fidelity Income Replacement 2016 Fund | Distribution
Fee | Service
Fee | Paid
to FDC | Retained
by FDC |
Class A | -% | .25% | $ 2,771 | $ - |
Class T | .25% | .25% | 1,596 | - |
Class C | .75% | .25% | 5,538 | 118 |
| | | $ 9,905 | $ 118 |
Fidelity Income Replacement 2018 Fund | | | | |
Class A | -% | .25% | $ 1,514 | $ 12 |
Class T | .25% | .25% | 132 | 6 |
Class C | .75% | .25% | 1,010 | 334 |
| | | $ 2,656 | $ 352 |
Fidelity Income Replacement 2020 Fund | | | | |
Class A | -% | .25% | $ 776 | $ 259 |
Class T | .25% | .25% | 350 | - |
Class C | .75% | .25% | 1,525 | 54 |
| | | $ 2,651 | $ 313 |
Fidelity Income Replacement 2022 Fund | | | | |
Class A | -% | .25% | $ 68 | $ 2 |
Class T | .25% | .25% | 192 | 4 |
Class C | .75% | .25% | 201 | 82 |
| | | $ 461 | $ 88 |
Fidelity Income Replacement 2024 Fund | | | | |
Class A | -% | .25% | $ 332 | $ 4 |
Class T | .25% | .25% | 124 | 88 |
Class C | .75% | .25% | 830 | 15 |
| | | $ 1,286 | $ 107 |
Fidelity Income Replacement 2026 Fund | | | | |
Class A | -% | .25% | $ 51 | $ 17 |
Class T | .25% | .25% | 304 | 14 |
Class C | .75% | .25% | 903 | 35 |
| | | $ 1,258 | $ 66 |
Fidelity Income Replacement 2028 Fund | | | | |
Class A | -% | .25% | $ 466 | $ 16 |
Class T | .25% | .25% | 370 | - |
Class C | .75% | .25% | 256 | - |
| | | $ 1,092 | $ 16 |
Fidelity Income Replacement 2030 Fund | | | | |
Class A | -% | .25% | $ 76 | $ 22 |
Class T | .25% | .25% | 71 | 33 |
Class C | .75% | .25% | 1,001 | 92 |
| | | $ 1,148 | $ 147 |
Fidelity Income Replacement 2032 Fund | | | | |
Class A | -% | .25% | $ 269 | $ 3 |
Class T | .25% | .25% | 82 | 82 |
Class C | .75% | .25% | 136 | 136 |
| | | $ 487 | $ 221 |
Fidelity Income Replacement 2034 Fund | | | | |
Class A | -% | .25% | $ 30 | $ 30 |
Class T | .25% | .25% | 80 | 80 |
Class C | .75% | .25% | 123 | 123 |
| | | $ 233 | $ 233 |
Semiannual Report
4. Fees and Other Transactions with Affiliates - continued
Distribution and Service Plan Fees - continued
Fidelity Income Replacement 2036 Fund | Distribution
Fee | Service
Fee | Paid
to FDC | Retained
by FDC |
Class A | -% | .25% | $ 46 | $ 38 |
Class T | .25% | .25% | 692 | 8 |
Class C | .75% | .25% | 606 | 10 |
| | | $ 1,344 | $ 56 |
Fidelity Income Replacement 2038 Fund | | | | |
Class A | -% | .25% | $ 40 | $ 2 |
Class T | .25% | .25% | 86 | 86 |
Class C | .75% | .25% | 419 | 418 |
| | | $ 545 | $ 506 |
Fidelity Income Replacement 2040 Fund | | | | |
Class A | -% | .25% | $ 66 | $ 38 |
Class T | .25% | .25% | 300 | 14 |
Class C | .75% | .25% | 459 | 458 |
| | | $ 825 | $ 510 |
Fidelity Income Replacement 2042 Fund | | | | |
Class A | -% | .25% | $ 34 | $ 17 |
Class T | .25% | .25% | 86 | 86 |
Class C | .75% | .25% | 172 | 172 |
| | | $ 292 | $ 275 |
Sales Load. FDC receives a front-end sales charge of up to 5.75% for selling Class A shares, and 3.50% for selling Class T shares, some of which is paid to financial intermediaries for selling shares of the Funds. FDC receives the proceeds of contingent deferred sales charges levied on Class A, Class T, and Class C redemptions. These charges depend on the holding period. The deferred sales charges range from 1% for Class C, 1.00% for certain purchases of Class A shares and .25% for certain purchases of Class T shares.
For the period, sales charge amounts retained by FDC were as follows:
Fidelity Income Replacement 2016 Fund | Retained
by FDC |
Class A | $ 249 |
Class C* | 9 |
| $ 258 |
Fidelity Income Replacement 2018 Fund | |
Class A | $ 563 |
| |
Fidelity Income Replacement 2020 Fund | |
Class A | $ 1 |
| |
Fidelity Income Replacement 2022 Fund | |
Class A | $ 215 |
| |
Fidelity Income Replacement 2026 Fund | |
Class T | $ 4 |
| |
Fidelity Income Replacement 2036 Fund | |
Class T | $ 3 |
| |
Fidelity Income Replacement 2040 Fund | |
Class A | $ 441 |
* When Class C shares are initially sold, FDC pays commissions from its own resources to financial intermediaries through which the sales are made.
Semiannual Report
Notes to Financial Statements (Unaudited) - continued
5. Expense Reductions.
FMR voluntarily agreed to reimburse the Funds to the extent annual operating expenses exceeded distribution and service fees applicable to each class. Some expenses, for example interest expense, are excluded from this reimbursement.
The following Funds were in reimbursement during the period:
| Reimbursement
from adviser* |
Fidelity Income Replacement 2016 Fund | $ 21 |
Fidelity Income Replacement 2018 Fund | 11 |
Fidelity Income Replacement 2020 Fund | 7 |
Fidelity Income Replacement 2022 Fund | 5 |
Fidelity Income Replacement 2024 Fund | 3 |
Fidelity Income Replacement 2026 Fund | 2 |
Fidelity Income Replacement 2028 Fund | 12 |
Fidelity Income Replacement 2030 Fund | 4 |
Fidelity Income Replacement 2032 Fund | 4 |
Fidelity Income Replacement 2034 Fund | 4 |
Fidelity Income Replacement 2036 Fund | 3 |
Fidelity Income Replacement 2038 Fund | 4 |
Fidelity Income Replacement 2040 Fund | 3 |
Fidelity Income Replacement 2042 Fund | 7 |
* Represents total amount reimbursed to the Fund. Each class has received pro-rata allocation of reimbursement.
6. Distributions to Shareholders.
Distributions to shareholders of each class were as follows:
| Six months ended
January 31,
2011 | Year ended
July 31,
2010 |
Fidelity Income Replacement 2016 Fund | | |
From net investment income | | |
Class A | $ 21,459 | $ 44,617 |
Class T | 5,559 | 10,060 |
Class C | 7,097 | 12,552 |
Income Replacement 2016 | 79,257 | 120,802 |
Institutional Class | 1,181 | 2,291 |
Total | $ 114,553 | $ 190,322 |
From net realized gain | | |
Class A | $ 11,231 | $ 6,094 |
Class T | 3,381 | 1,771 |
Class C | 6,082 | 3,226 |
Income Replacement 2016 | 37,507 | 14,426 |
Institutional Class | 546 | 316 |
Total | $ 58,747 | $ 25,833 |
Fidelity Income Replacement 2018 Fund | | |
From net investment income | | |
Class A | $ 12,700 | $ 17,039 |
Class T | 474 | 1,142 |
Class C | 1,346 | 1,710 |
Income Replacement 2018 | 46,716 | 76,857 |
Institutional Class | 4,200 | 7,202 |
Total | $ 65,436 | $ 103,950 |
From net realized gain | | |
Class A | $ 5,977 | $ 2,282 |
Class T | 252 | 200 |
Class C | 980 | 353 |
Income Replacement 2018 | 19,822 | 9,798 |
Institutional Class | 1,775 | 910 |
Total | $ 28,806 | $ 13,543 |
Semiannual Report
6. Distributions to Shareholders - continued
| Six months ended
January 31,
2011 | Year ended
July 31,
2010 |
Fidelity Income Replacement 2020 Fund | | |
From net investment income | | |
Class A | $ 6,493 | $ 11,250 |
Class T | 1,297 | 2,566 |
Class C | 2,066 | 2,829 |
Income Replacement 2020 | 30,280 | 39,529 |
Institutional Class | 602 | 2,036 |
Total | $ 40,738 | $ 58,210 |
From net realized gain | | |
Class A | $ 2,797 | $ 1,618 |
Class T | 638 | 468 |
Class C | 1,402 | 667 |
Income Replacement 2020 | 11,887 | 4,645 |
Institutional Class | 234 | 316 |
Total | $ 16,958 | $ 7,714 |
Fidelity Income Replacement 2022 Fund | | |
From net investment income | | |
Class A | $ 682 | $ 760 |
Class T | 737 | 1,377 |
Class C | 250 | 583 |
Income Replacement 2022 | 31,719 | 52,195 |
Institutional Class | 53 | 2,258 |
Total | $ 33,441 | $ 57,173 |
From net realized gain | | |
Class A | $ 313 | $ 290 |
Class T | 343 | 657 |
Class C | 169 | 426 |
Income Replacement 2022 | 11,885 | 17,200 |
Institutional Class | 20 | 1,161 |
Total | $ 12,730 | $ 19,734 |
Fidelity Income Replacement 2024 Fund | | |
From net investment income | | |
Class A | $ 2,898 | $ 5,225 |
Class T | 444 | 1,024 |
Class C | 1,221 | 1,614 |
Income Replacement 2024 | 13,124 | 22,024 |
Institutional Class | 390 | 946 |
Total | $ 18,077 | $ 30,833 |
From net realized gain | | |
Class A | $ 1,169 | $ 733 |
Class T | 211 | 173 |
Class C | 755 | 389 |
Income Replacement 2024 | 4,799 | 2,820 |
Institutional Class | 144 | 118 |
Total | $ 7,078 | $ 4,233 |
Fidelity Income Replacement 2026 Fund | | |
From net investment income | | |
Class A | $ 421 | $ 1,002 |
Class T | 1,196 | 1,567 |
Class C | 1,311 | 1,940 |
Income Replacement 2026 | 8,875 | 8,207 |
Institutional Class | 386 | 937 |
Total | $ 12,189 | $ 13,653 |
Semiannual Report
Notes to Financial Statements (Unaudited) - continued
6. Distributions to Shareholders - continued
| Six months ended
January 31,
2011 | Year ended
July 31,
2010 |
Fidelity Income Replacement 2026 Fund | | |
From net realized gain | | |
Class A | $ 163 | $ 145 |
Class T | 515 | 294 |
Class C | 762 | 484 |
Income Replacement 2026 | 3,053 | 782 |
Institutional Class | 133 | 118 |
Total | $ 4,626 | $ 1,823 |
Fidelity Income Replacement 2028 Fund | | |
From net investment income | | |
Class A | $ 4,198 | $ 6,274 |
Class T | 1,195 | 5,032 |
Class C | 384 | 669 |
Income Replacement 2028 | 67,768 | 118,159 |
Institutional Class | 392 | 931 |
Total | $ 73,937 | $ 131,065 |
From net realized gain | | |
Class A | $ 1,624 | $ 885 |
Class T | 551 | 821 |
Class C | 224 | 172 |
Income Replacement 2028 | 23,226 | 14,970 |
Institutional Class | 138 | 117 |
Total | $ 25,763 | $ 16,965 |
Fidelity Income Replacement 2030 Fund | | |
From net investment income | | |
Class A | $ 629 | $ 944 |
Class T | 147 | 802 |
Class C | 1,578 | 1,647 |
Income Replacement 2030 | 28,486 | 9,950 |
Institutional Class | 389 | 870 |
Total | $ 31,229 | $ 14,213 |
From net realized gain | | |
Class A | $ 210 | $ 112 |
Class T | 35 | 143 |
Class C | 777 | 448 |
Income Replacement 2030 | 9,584 | 1,042 |
Institutional Class | 117 | 112 |
Total | $ 10,723 | $ 1,857 |
Fidelity Income Replacement 2032 Fund | | |
From net investment income | | |
Class A | $ 2,430 | $ 3,578 |
Class T | 299 | 726 |
Class C | 180 | 409 |
Income Replacement 2032 | 21,767 | 12,987 |
Institutional Class | 879 | 990 |
Total | $ 25,555 | $ 18,690 |
From net realized gain | | |
Class A | $ 874 | $ 469 |
Class T | 125 | 112 |
Class C | 104 | 93 |
Income Replacement 2032 | 7,076 | 1,351 |
Institutional Class | 309 | 113 |
Total | $ 8,488 | $ 2,138 |
Semiannual Report
6. Distributions to Shareholders - continued
| Six months ended
January 31,
2011 | Year ended
July 31,
2010 |
Fidelity Income Replacement 2034 Fund | | |
From net investment income | | |
Class A | $ 248 | $ 592 |
Class T | 289 | 675 |
Class C | 155 | 337 |
Income Replacement 2034 | 22,542 | 34,804 |
Institutional Class | 1,218 | 1,910 |
Total | $ 24,452 | $ 38,318 |
From net realized gain | | |
Class A | $ 99 | $ 165 |
Class T | 130 | 218 |
Class C | 99 | 166 |
Income Replacement 2034 | 7,355 | 7,479 |
Institutional Class | 428 | 436 |
Total | $ 8,111 | $ 8,464 |
Fidelity Income Replacement 2036 Fund | | |
From net investment income | | |
Class A | $ 388 | $ 811 |
Class T | 2,822 | 4,274 |
Class C | 932 | 1,320 |
Income Replacement 2036 | 15,066 | 12,138 |
Institutional Class | 1,160 | 1,200 |
Total | $ 20,368 | $ 19,743 |
From net realized gain | | |
Class A | $ 116 | $ 162 |
Class T | 928 | 958 |
Class C | 398 | 467 |
Income Replacement 2036 | 4,588 | 2,158 |
Institutional Class | 299 | 204 |
Total | $ 6,329 | $ 3,949 |
Fidelity Income Replacement 2038 Fund | | |
From net investment income | | |
Class A | $ 381 | $ 1,542 |
Class T | 338 | 689 |
Class C | 607 | 569 |
Income Replacement 2038 | 28,468 | 40,695 |
Institutional Class | 429 | 942 |
Total | $ 30,223 | $ 44,437 |
From net realized gain | | |
Class A | $ 135 | $ 413 |
Class T | 137 | 207 |
Class C | 333 | 205 |
Income Replacement 2038 | 9,117 | 8,050 |
Institutional Class | 139 | 209 |
Total | $ 9,861 | $ 9,084 |
Fidelity Income Replacement 2040 Fund | | |
From net investment income | | |
Class A | $ 887 | $ 1,022 |
Class T | 1,296 | 1,586 |
Class C | 687 | 487 |
Income Replacement 2040 | 18,445 | 18,680 |
Institutional Class | 713 | 1,444 |
Total | $ 22,028 | $ 23,219 |
Semiannual Report
Notes to Financial Statements (Unaudited) - continued
6. Distributions to Shareholders - continued
| Six months ended
January 31,
2011 | Year ended
July 31,
2010 |
Fidelity Income Replacement 2040 Fund | | |
From net realized gain | | |
Class A | $ 360 | $ 174 |
Class T | 502 | 273 |
Class C | 361 | 112 |
Income Replacement 2040 | 5,813 | 2,099 |
Institutional Class | 227 | 189 |
Total | $ 7,263 | $ 2,847 |
Fidelity Income Replacement 2042 Fund | | |
From net investment income | | |
Class A | $ 305 | $ 1,305 |
Class T | 349 | 687 |
Class C | 257 | 442 |
Income Replacement 2042 | 48,080 | 54,565 |
Institutional Class | 441 | 944 |
Total | $ 49,432 | $ 57,943 |
From net realized gain | | |
Class A | $ 108 | $ 247 |
Class T | 138 | 121 |
Class C | 136 | 120 |
Income Replacement 2042 | 15,082 | 6,898 |
Institutional Class | 140 | 122 |
Total | $ 15,604 | $ 7,508 |
7. Share Transactions.
Transactions for each class of shares were as follows:
| Shares | Dollars |
| Six months ended
January 31,
2011 | Year ended
July 31,
2010 | Six months ended
January 31,
2011 | Year ended
July 31,
2010 |
Fidelity Income Replacement 2016 Fund | | | | |
Class A | | | | |
Shares sold | 1,447 | 10,966 | $ 70,361 | $ 505,595 |
Reinvestment of distributions | 574 | 904 | 27,889 | 41,700 |
Shares redeemed | (9,242) | (22,378) | (449,186) | (1,033,263) |
Net increase (decrease) | (7,221) | (10,508) | $ (350,936) | $ (485,968) |
Class T | | | | |
Shares sold | - | 6,546 | $ - | $ 302,409 |
Reinvestment of distributions | 152 | 199 | 7,395 | 9,206 |
Shares redeemed | (762) | (4,625) | (36,775) | (215,246) |
Net increase (decrease) | (610) | 2,120 | $ (29,380) | $ 96,369 |
Class C | | | | |
Shares sold | 1,029 | 3,920 | $ 50,000 | $ 176,110 |
Reinvestment of distributions | 201 | 252 | 9,798 | 11,639 |
Shares redeemed | (820) | (8,175) | (39,550) | (376,188) |
Net increase (decrease) | 410 | (4,003) | $ 20,248 | $ (188,439) |
Income Replacement 2016 | | | | |
Shares sold | 18,781 | 78,978 | $ 909,318 | $ 3,659,239 |
Reinvestment of distributions | 1,069 | 721 | 52,164 | 33,372 |
Shares redeemed | (30,441) | (40,547) | (1,486,686) | (1,866,323) |
Net increase (decrease) | (10,591) | 39,152 | $ (525,204) | $ 1,826,288 |
Semiannual Report
7. Share Transactions - continued
| Shares | Dollars |
| Six months ended
January 31,
2011 | Year ended
July 31,
2010 | Six months ended
January 31,
2011 | Year ended
July 31,
2010 |
Fidelity Income Replacement 2016 Fund | | | | |
Institutional Class | | | | |
Shares sold | 777 | 751 | $ 38,200 | $ 34,781 |
Reinvestment of distributions | 6 | 15 | 280 | 690 |
Shares redeemed | (257) | (975) | (12,270) | (44,681) |
Net increase (decrease) | 526 | (209) | $ 26,210 | $ (9,210) |
Fidelity Income Replacement 2018 Fund | | | | |
Class A | | | | |
Shares sold | 1,564 | 6,590 | $ 72,093 | $ 305,640 |
Reinvestment of distributions | 177 | 248 | 8,571 | 11,354 |
Shares redeemed | (3,740) | (1,601) | (181,952) | (73,103) |
Net increase (decrease) | (1,999) | 5,237 | $ (101,288) | $ 243,891 |
Class T | | | | |
Shares sold | - | - | $ - | $ - |
Reinvestment of distributions | 10 | 21 | 479 | 968 |
Shares redeemed | (63) | (1,030) | (3,015) | (46,978) |
Net increase (decrease) | (53) | (1,009) | $ (2,536) | $ (46,010) |
Class C | | | | |
Shares sold | - | 1,627 | $ - | $ 75,000 |
Reinvestment of distributions | 38 | 26 | 1,833 | 1,209 |
Shares redeemed | (260) | (373) | (12,426) | (17,000) |
Net increase (decrease) | (222) | 1,280 | $ (10,593) | $ 59,209 |
Income Replacement 2018 | | | | |
Shares sold | 16,142 | 11,957 | $ 764,740 | $ 541,219 |
Reinvestment of distributions | 413 | 258 | 20,212 | 11,837 |
Shares redeemed | (12,586) | (13,199) | (602,010) | (594,109) |
Net increase (decrease) | 3,969 | (984) | $ 182,942 | $ (41,053) |
Institutional Class | | | | |
Shares sold | - | - | $ - | $ - |
Reinvestment of distributions | 6 | 8 | 274 | 361 |
Shares redeemed | (47) | (100) | (2,250) | (4,500) |
Net increase (decrease) | (41) | (92) | $ (1,976) | $ (4,139) |
Fidelity Income Replacement 2020 Fund | | | | |
Class A | | | | |
Shares sold | 3 | 4,988 | $ 134 | $ 223,504 |
Reinvestment of distributions | 148 | 166 | 7,184 | 7,568 |
Shares redeemed | (548) | (3,855) | (26,167) | (179,660) |
Net increase (decrease) | (397) | 1,299 | $ (18,849) | $ 51,412 |
Class T | | | | |
Shares sold | - | 1,680 | $ - | $ 80,000 |
Reinvestment of distributions | 40 | 67 | 1,935 | 3,033 |
Shares redeemed | - | (2,893) | - | (131,000) |
Net increase (decrease) | 40 | (1,146) | $ 1,935 | $ (47,967) |
Class C | | | | |
Shares sold | - | 1,102 | $ - | $ 49,985 |
Reinvestment of distributions | 52 | 67 | 2,514 | 3,032 |
Shares redeemed | (569) | - | (28,016) | - |
Net increase (decrease) | (517) | 1,169 | $ (25,502) | $ 53,017 |
Income Replacement 2020 | | | | |
Shares sold | 22,067 | 20,661 | $ 1,076,822 | $ 932,116 |
Reinvestment of distributions | 339 | 202 | 16,582 | 9,173 |
Shares redeemed | (8,120) | (10,998) | (396,608) | (493,006) |
Net increase (decrease) | 14,286 | 9,865 | $ 696,796 | $ 448,283 |
Semiannual Report
Notes to Financial Statements (Unaudited) - continued
7. Share Transactions - continued
| Shares | Dollars |
| Six months ended
January 31,
2011 | Year ended
July 31,
2010 | Six months ended
January 31,
2011 | Year ended
July 31,
2010 |
Fidelity Income Replacement 2020 Fund | | | | |
Institutional Class | | | | |
Shares sold | - | 996 | $ - | $ 45,000 |
Reinvestment of distributions | 17 | 25 | 835 | 1,133 |
Shares redeemed | - | (2,202) | - | (99,518) |
Net increase (decrease) | 17 | (1,181) | $ 835 | $ (53,385) |
Fidelity Income Replacement 2022 Fund | | | | |
Class A | | | | |
Shares sold | 567 | - | $ 27,240 | $ - |
Reinvestment of distributions | 11 | 8 | 547 | 338 |
Shares redeemed | (31) | (2,006) | (1,444) | (84,777) |
Net increase (decrease) | 547 | (1,998) | $ 26,343 | $ (84,439) |
Class T | | | | |
Shares sold | - | 1,105 | $ - | $ 48,498 |
Reinvestment of distributions | 13 | 31 | 614 | 1,374 |
Shares redeemed | (113) | (2,115) | (5,366) | (94,162) |
Net increase (decrease) | (100) | (979) | $ (4,752) | $ (44,290) |
Class C | | | | |
Shares sold | - | - | $ - | $ - |
Reinvestment of distributions | 3 | 14 | 152 | 640 |
Shares redeemed | (212) | (699) | (9,959) | (31,230) |
Net increase (decrease) | (209) | (685) | $ (9,807) | $ (30,590) |
Income Replacement 2022 | | | | |
Shares sold | 7,565 | 9,043 | $ 364,469 | $ 391,098 |
Reinvestment of distributions | 265 | 462 | 12,940 | 20,398 |
Shares redeemed | (1,772) | (13,142) | (83,894) | (587,330) |
Net increase (decrease) | 6,058 | (3,637) | $ 293,515 | $ (175,834) |
Institutional Class | | | | |
Shares sold | - | - | $ - | $ - |
Reinvestment of distributions | 2 | 4 | 72 | 166 |
Shares redeemed | (25) | (3,867) | (1,158) | (173,132) |
Net increase (decrease) | (23) | (3,863) | $ (1,086) | $ (172,966) |
Fidelity Income Replacement 2024 Fund | | | | |
Class A | | | | |
Shares sold | - | - | $ - | $ - |
Reinvestment of distributions | 68 | 108 | 3,305 | 4,833 |
Shares redeemed | (598) | (1,295) | (28,922) | (57,768) |
Net increase (decrease) | (530) | (1,187) | $ (25,617) | $ (52,935) |
Class T | | | | |
Shares sold | - | 295 | $ - | $ 13,015 |
Reinvestment of distributions | 14 | 27 | 655 | 1,197 |
Shares redeemed | (261) | (804) | (12,189) | (35,887) |
Net increase (decrease) | (247) | (482) | $ (11,534) | $ (21,675) |
Class C | | | | |
Shares sold | - | - | $ - | $ - |
Reinvestment of distributions | 19 | 19 | 912 | 835 |
Shares redeemed | (35) | (71) | (1,630) | (2,945) |
Net increase (decrease) | (16) | (52) | $ (718) | $ (2,110) |
Income Replacement 2024 | | | | |
Shares sold | 1,730 | 9,741 | $ 84,592 | $ 422,106 |
Reinvestment of distributions | 124 | 143 | 6,073 | 6,430 |
Shares redeemed | (723) | (5,344) | (34,320) | (239,126) |
Net increase (decrease) | 1,131 | 4,540 | $ 56,345 | $ 189,410 |
Semiannual Report
7. Share Transactions - continued
| Shares | Dollars |
| Six months ended
January 31,
2011 | Year ended
July 31,
2010 | Six months ended
January 31,
2011 | Year ended
July 31,
2010 |
Fidelity Income Replacement 2024 Fund | | | | |
Institutional Class | | | | |
Shares sold | - | - | $ - | $ - |
Reinvestment of distributions | 11 | 24 | 534 | 1,064 |
Shares redeemed | (177) | (580) | (8,334) | (25,832) |
Net increase (decrease) | (166) | (556) | $ (7,800) | $ (24,768) |
Fidelity Income Replacement 2026 Fund | | | | |
Class A | | | | |
Shares sold | - | - | $ - | $ - |
Reinvestment of distributions | 12 | 26 | 584 | 1,147 |
Shares redeemed | (218) | (713) | (10,135) | (31,427) |
Net increase (decrease) | (206) | (687) | $ (9,551) | $ (30,280) |
Class T | | | | |
Shares sold | 145 | 2,332 | $ 6,445 | $ 103,846 |
Reinvestment of distributions | 29 | 39 | 1,415 | 1,739 |
Shares redeemed | (149) | (1,146) | (6,598) | (50,896) |
Net increase (decrease) | 25 | 1,225 | $ 1,262 | $ 54,689 |
Class C | | | | |
Shares sold | - | - | $ - | $ - |
Reinvestment of distributions | 43 | 55 | 2,073 | 2,424 |
Shares redeemed | (105) | (653) | (4,952) | (29,483) |
Net increase (decrease) | (62) | (598) | $ (2,879) | $ (27,059) |
Income Replacement 2026 | | | | |
Shares sold | 9,591 | 11,631 | $ 464,049 | $ 516,873 |
Reinvestment of distributions | 156 | 139 | 7,505 | 6,162 |
Shares redeemed | (2,224) | (6,640) | (108,432) | (295,846) |
Net increase (decrease) | 7,523 | 5,130 | $ 363,122 | $ 227,189 |
Institutional Class | | | | |
Shares sold | - | - | $ - | $ - |
Reinvestment of distributions | 11 | 24 | 519 | 1,055 |
Shares redeemed | (178) | (581) | (8,273) | (25,621) |
Net increase (decrease) | (167) | (557) | $ (7,754) | $ (24,566) |
Fidelity Income Replacement 2028 Fund | | | | |
Class A | | | | |
Shares sold | - | 1,688 | $ - | $ 71,316 |
Reinvestment of distributions | 121 | 161 | 5,822 | 7,159 |
Shares redeemed | (227) | (672) | (10,731) | (29,955) |
Net increase (decrease) | (106) | 1,177 | $ (4,909) | $ 48,520 |
Class T | | | | |
Shares sold | - | - | $ - | $ - |
Reinvestment of distributions | 24 | 46 | 1,174 | 2,069 |
Shares redeemed | (4,633) | (340) | (207,261) | (15,095) |
Net increase (decrease) | (4,609) | (294) | $ (206,087) | $ (13,026) |
Class C | | | | |
Shares sold | - | - | $ - | $ - |
Reinvestment of distributions | 3 | 8 | 154 | 379 |
Shares redeemed | (50) | (965) | (2,212) | (42,703) |
Net increase (decrease) | (47) | (957) | $ (2,058) | $ (42,324) |
Income Replacement 2028 | | | | |
Shares sold | 8,817 | 7,291 | $ 431,917 | $ 328,341 |
Reinvestment of distributions | 774 | 860 | 37,731 | 38,493 |
Shares redeemed | (9,764) | (26,019) | (467,669) | (1,168,445) |
Net increase (decrease) | (173) | (17,868) | $ 1,979 | $ (801,611) |
Semiannual Report
Notes to Financial Statements (Unaudited) - continued
7. Share Transactions - continued
| Shares | Dollars |
| Six months ended
January 31,
2011 | Year ended
July 31,
2010 | Six months ended
January 31,
2011 | Year ended
July 31,
2010 |
Fidelity Income Replacement 2028 Fund | | | | |
Institutional Class | | | | |
Shares sold | - | - | $ - | $ - |
Reinvestment of distributions | 11 | 24 | 530 | 1,048 |
Shares redeemed | (176) | (575) | (8,238) | (25,500) |
Net increase (decrease) | (165) | (551) | $ (7,708) | $ (24,452) |
Fidelity Income Replacement 2030 Fund | | | | |
Class A | | | | |
Shares sold | - | 1,608 | $ - | $ 70,708 |
Reinvestment of distributions | 10 | 22 | 470 | 972 |
Shares redeemed | (343) | (1,510) | (15,896) | (65,796) |
Net increase (decrease) | (333) | 120 | $ (15,426) | $ 5,884 |
Class T | | | | |
Shares sold | - | - | $ - | $ - |
Reinvestment of distributions | 3 | 14 | 131 | 632 |
Shares redeemed | (811) | (767) | (38,608) | (33,663) |
Net increase (decrease) | (808) | (753) | $ (38,477) | $ (33,031) |
Class C | | | | |
Shares sold | 519 | - | $ 25,006 | $ - |
Reinvestment of distributions | 49 | 47 | 2,355 | 2,094 |
Shares redeemed | (367) | (250) | (17,545) | (10,986) |
Net increase (decrease) | 201 | (203) | $ 9,816 | $ (8,892) |
Income Replacement 2030 | | | | |
Shares sold | 24,184 | 30,831 | $ 1,154,235 | $ 1,381,260 |
Reinvestment of distributions | 376 | 68 | 18,252 | 3,035 |
Shares redeemed | (5,934) | (1,995) | (286,502) | (90,075) |
Net increase (decrease) | 18,626 | 28,904 | $ 885,985 | $ 1,294,220 |
Institutional Class | | | | |
Shares sold | - | - | $ - | $ - |
Reinvestment of distributions | 11 | 22 | 506 | 982 |
Shares redeemed | (177) | (578) | (8,207) | (25,388) |
Net increase (decrease) | (166) | (556) | $ (7,701) | $ (24,406) |
Fidelity Income Replacement 2032 Fund | | | | |
Class A | | | | |
Shares sold | 642 | - | $ 31,087 | $ - |
Reinvestment of distributions | 70 | 93 | 3,304 | 4,047 |
Shares redeemed | - | (107) | - | (4,502) |
Net increase (decrease) | 712 | (14) | $ 34,391 | $ (455) |
Class T | | | | |
Shares sold | - | - | $ - | $ - |
Reinvestment of distributions | 9 | 19 | 424 | 838 |
Shares redeemed | (175) | (575) | (8,035) | (24,937) |
Net increase (decrease) | (166) | (556) | $ (7,611) | $ (24,099) |
Class C | | | | |
Shares sold | - | - | $ - | $ - |
Reinvestment of distributions | 6 | 12 | 283 | 502 |
Shares redeemed | (146) | (480) | (6,687) | (20,831) |
Net increase (decrease) | (140) | (468) | $ (6,404) | $ (20,329) |
Income Replacement 2032 | | | | |
Shares sold | 6,614 | 20,546 | $ 297,485 | $ 869,619 |
Reinvestment of distributions | 421 | 269 | 20,058 | 11,717 |
Shares redeemed | (397) | (21,297) | (18,331) | (886,611) |
Net increase (decrease) | 6,638 | (482) | $ 299,212 | $ (5,275) |
Semiannual Report
7. Share Transactions - continued
| Shares | Dollars |
| Six months ended
January 31,
2011 | Year ended
July 31,
2010 | Six months ended
January 31,
2011 | Year ended
July 31,
2010 |
Fidelity Income Replacement 2032 Fund | | | | |
Institutional Class | | | | |
Shares sold | 550 | 565 | $ 25,000 | $ 25,000 |
Reinvestment of distributions | 8 | 25 | 387 | 1,078 |
Shares redeemed | (1,493) | (582) | (71,539) | (25,236) |
Net increase (decrease) | (935) | 8 | $ (46,152) | $ 842 |
Fidelity Income Replacement 2034 Fund | | | | |
Class A | | | | |
Shares sold | - | - | $ - | $ - |
Reinvestment of distributions | 7 | 17 | 347 | 757 |
Shares redeemed | (132) | (984) | (6,047) | (41,642) |
Net increase (decrease) | (125) | (967) | $ (5,700) | $ (40,885) |
Class T | | | | |
Shares sold | - | - | $ - | $ - |
Reinvestment of distributions | 9 | 20 | 419 | 892 |
Shares redeemed | (174) | (569) | (7,975) | (24,737) |
Net increase (decrease) | (165) | (549) | $ (7,556) | $ (23,845) |
Class C | | | | |
Shares sold | - | - | $ - | $ - |
Reinvestment of distributions | 5 | 12 | 254 | 503 |
Shares redeemed | (132) | (434) | (6,064) | (18,880) |
Net increase (decrease) | (127) | (422) | $ (5,810) | $ (18,377) |
Income Replacement 2034 | | | | |
Shares sold | 5,686 | 5,032 | $ 275,526 | $ 225,749 |
Reinvestment of distributions | 295 | 383 | 14,230 | 16,703 |
Shares redeemed | (5,678) | (8,062) | (274,219) | (352,058) |
Net increase (decrease) | 303 | (2,647) | $ 15,537 | $ (109,606) |
Institutional Class | | | | |
Shares sold | - | - | $ - | $ - |
Reinvestment of distributions | 25 | 39 | 1,208 | 1,717 |
Shares redeemed | - | (586) | (21) | (25,063) |
Net increase (decrease) | 25 | (547) | $ 1,187 | $ (23,346) |
Fidelity Income Replacement 2036 Fund | | | | |
Class A | | | | |
Shares sold | - | 128 | $ - | $ 5,725 |
Reinvestment of distributions | 11 | 23 | 504 | 973 |
Shares redeemed | (199) | (600) | (9,048) | (25,767) |
Net increase (decrease) | (188) | (449) | $ (8,544) | $ (19,069) |
Class T | | | | |
Shares sold | 12 | 82 | $ 553 | $ 3,536 |
Reinvestment of distributions | 40 | 54 | 1,913 | 2,334 |
Shares redeemed | (150) | (756) | (6,897) | (33,710) |
Net increase (decrease) | (98) | (620) | $ (4,431) | $ (27,840) |
Class C | | | | |
Shares sold | - | 979 | $ - | $ 39,435 |
Reinvestment of distributions | 28 | 41 | 1,330 | 1,752 |
Shares redeemed | (188) | (1,217) | (8,716) | (52,088) |
Net increase (decrease) | (160) | (197) | $ (7,386) | $ (10,901) |
Income Replacement 2036 | | | | |
Shares sold | 15,889 | 2,159 | $ 750,000 | $ 86,419 |
Reinvestment of distributions | 239 | 99 | 11,414 | 4,266 |
Shares redeemed | (644) | (4,508) | (30,743) | (191,085) |
Net increase (decrease) | 15,484 | (2,250) | $ 730,671 | $ (100,400) |
Semiannual Report
Notes to Financial Statements (Unaudited) - continued
7. Share Transactions - continued
| Shares | Dollars |
| Six months ended
January 31,
2011 | Year ended
July 31,
2010 | Six months ended
January 31,
2011 | Year ended
July 31,
2010 |
Fidelity Income Replacement 2036 Fund | | | | |
Institutional Class | | | | |
Shares sold | 28 | 1,348 | $ 1,283 | $ 59,043 |
Reinvestment of distributions | 31 | 33 | 1,459 | 1,403 |
Shares redeemed | (491) | (723) | (22,150) | (31,039) |
Net increase (decrease) | (432) | 658 | $ (19,408) | $ 29,407 |
Fidelity Income Replacement 2038 Fund | | | | |
Class A | | | | |
Shares sold | - | 667 | $ - | $ 28,000 |
Reinvestment of distributions | 11 | 24 | 516 | 996 |
Shares redeemed | (37) | (2,898) | (1,526) | (123,534) |
Net increase (decrease) | (26) | (2,207) | $ (1,010) | $ (94,538) |
Class T | | | | |
Shares sold | - | - | $ - | $ - |
Reinvestment of distributions | 10 | 21 | 475 | 896 |
Shares redeemed | (190) | (622) | (8,472) | (26,247) |
Net increase (decrease) | (180) | (601) | $ (7,997) | $ (25,351) |
Class C | | | | |
Shares sold | - | 1,458 | $ - | $ 65,000 |
Reinvestment of distributions | 20 | 18 | 940 | 774 |
Shares redeemed | (462) | (823) | (20,624) | (34,657) |
Net increase (decrease) | (442) | 653 | $ (19,684) | $ 31,117 |
Income Replacement 2038 | | | | |
Shares sold | 102 | 19,983 | $ 4,637 | $ 804,508 |
Reinvestment of distributions | 496 | 594 | 23,240 | 25,218 |
Shares redeemed | (19,191) | (2,784) | (912,335) | (118,526) |
Net increase (decrease) | (18,593) | 17,793 | $ (884,458) | $ 711,200 |
Institutional Class | | | | |
Shares sold | - | - | $ - | $ - |
Reinvestment of distributions | 12 | 27 | 568 | 1,151 |
Shares redeemed | (192) | (628) | (8,693) | (26,515) |
Net increase (decrease) | (180) | (601) | $ (8,125) | $ (25,364) |
Fidelity Income Replacement 2040 Fund | | | | |
Class A | | | | |
Shares sold | 1,226 | - | $ 56,828 | $ - |
Reinvestment of distributions | 20 | 21 | 957 | 909 |
Shares redeemed | (241) | (697) | (10,977) | (29,560) |
Net increase (decrease) | 1,005 | (676) | $ 46,808 | $ (28,651) |
Class T | | | | |
Shares sold | 31 | 766 | $ 1,384 | $ 32,205 |
Reinvestment of distributions | 38 | 44 | 1,798 | 1,859 |
Shares redeemed | (1) | (849) | (45) | (35,678) |
Net increase (decrease) | 68 | (39) | $ 3,137 | $ (1,614) |
Class C | | | | |
Shares sold | - | 1,585 | $ - | $ 67,225 |
Reinvestment of distributions | 22 | 14 | 1,047 | 599 |
Shares redeemed | (502) | (765) | (22,474) | (32,264) |
Net increase (decrease) | (480) | 834 | $ (21,427) | $ 35,560 |
Income Replacement 2040 | | | | |
Shares sold | 12,026 | 51,547 | $ 569,527 | $ 2,203,936 |
Reinvestment of distributions | 327 | 391 | 15,370 | 16,805 |
Shares redeemed | (5,911) | (32,503) | (276,118) | (1,366,427) |
Net increase (decrease) | 6,442 | 19,435 | $ 308,779 | $ 854,314 |
Semiannual Report
7. Share Transactions - continued
| Shares | Dollars |
| Six months ended
January 31,
2011 | Year ended
July 31,
2010 | Six months ended
January 31,
2011 | Year ended
July 31,
2010 |
Fidelity Income Replacement 2040 Fund | | | | |
Institutional Class | | | | |
Shares sold | - | 857 | $ - | $ 35,012 |
Reinvestment of distributions | 20 | 39 | 940 | 1,633 |
Shares redeemed | (316) | (935) | (14,148) | (39,625) |
Net increase (decrease) | (296) | (39) | $ (13,208) | $ (2,980) |
Fidelity Income Replacement 2042 Fund | | | | |
Class A | | | | |
Shares sold | 4 | 1,685 | $ 169 | $ 72,288 |
Reinvestment of distributions | 9 | 36 | 413 | 1,552 |
Shares redeemed | (147) | (3,326) | (6,605) | (142,410) |
Net increase (decrease) | (134) | (1,605) | $ (6,023) | $ (68,570) |
Class T | | | | |
Shares sold | - | - | $ - | $ - |
Reinvestment of distributions | 10 | 19 | 487 | 808 |
Shares redeemed | (189) | (621) | (8,485) | (26,230) |
Net increase (decrease) | (179) | (602) | $ (7,998) | $ (25,422) |
Class C | | | | |
Shares sold | - | - | $ - | $ - |
Reinvestment of distributions | 8 | 13 | 393 | 562 |
Shares redeemed | (187) | (615) | (8,365) | (25,273) |
Net increase (decrease) | (179) | (602) | $ (7,972) | $ (24,711) |
Income Replacement 2042 | | | | |
Shares sold | 20,501 | 45,150 | $ 979,327 | $ 1,897,966 |
Reinvestment of distributions | 963 | 960 | 45,246 | 40,980 |
Shares redeemed | (4,882) | (3,141) | (225,966) | (134,772) |
Net increase (decrease) | 16,582 | 42,969 | $ 798,607 | $ 1,804,174 |
Institutional Class | | | | |
Shares sold | - | - | $ - | $ - |
Reinvestment of distributions | 12 | 25 | 581 | 1,066 |
Shares redeemed | (192) | (627) | (8,607) | (26,500) |
Net increase (decrease) | (180) | (602) | $ (8,026) | $ (25,434) |
8. Other.
The Funds' organizational documents provide former and current trustees and officers with a limited indemnification against liabilities arising in connection with the performance of their duties to the Funds. In the normal course of business, the Funds may also enter into contracts that provide general indemnifications. The Funds' maximum exposure under these arrangements is unknown as this would be dependent on future claims that may be made against the Funds. The risk of material loss from such claims is considered remote.
The Funds do not invest in the Underlying Funds for the purpose of exercising management or control; however, investments by the Funds within their principle investments strategies may represent a significant portion of the Underlying Fund's net assets. At the end of the period, the following Funds were the owners of record of 10% or more of the total outstanding shares of the Underlying Funds.
Fund | Income Replacement 2016 Fund | Income Replacement 2028 Fund | Income Replacement 2042 Fund |
Fidelity Series Broad Market Opportunities Fund | 12% | 15% | 12% |
The Funds, in aggregate, were the owners of record of more than 20% of the total outstanding shares of the following Underlying Funds.
Fund | % of shares held |
Fidelity Series Broad Market Opportunities Fund | 100% |
Semiannual Report
Board Approval of Investment Advisory Contracts and Management Fees
Fidelity Income Replacement Funds
Each year, the Board of Trustees, including the Independent Trustees (together, the Board), votes on the renewal of the management contract (the Advisory Contract) for each fund. The Board, assisted by the advice of fund counsel and Independent Trustees' counsel, requests and considers a broad range of information relevant to the renewal of the Advisory Contracts throughout the year.
The Board meets regularly and considers at each of its meetings factors that are relevant to its annual consideration of the renewal of each fund's Advisory Contract, including the services and support provided to each fund and its shareholders. The Board has established three standing committees, each composed of Independent Trustees with varying backgrounds, to which the Board has assigned specific subject matter responsibilities in order to enhance effective decision-making by the Board. The Operations Committee, of which all of the Independent Trustees are members, meets regularly throughout the year and, among other matters, considers matters specifically related to the annual consideration of the renewal of each fund's Advisory Contract. The Board, acting directly and through its Committees, requests and receives information concerning the annual consideration of the renewal of each fund's Advisory Contract. The Board also meets as needed to consider matters specifically related to the Board's annual consideration of the renewal of Advisory Contract. Members of the Board may also meet with trustees of other Fidelity funds through ad hoc joint committees to discuss certain matters relevant to the Fidelity funds.
At its September 2010 meeting, the Board of Trustees, including the Independent Trustees, unanimously determined to renew each fund's Advisory Contract. In reaching its determination, the Board considered all factors it believed relevant and reached a determination, with the assistance of fund counsel and Independent Trustees' counsel and through the exercise of its business judgment, that the renewal of each fund's Advisory Contract and is in the best interests of each fund and its shareholders and that the lack of compensation to be received by Fidelity under the management contracts is fair and reasonable. The Board's decision to renew each fund's Advisory Contract was not based on any single factor, but rather was based on a comprehensive consideration of all the information provided to the Board at its meetings throughout the year. In reaching its determination, the Board is aware that shareholders in each fund have a broad range of investment choices available to them, including a wide choice among mutual funds offered by Fidelity's competitors, and that each fund's shareholders, with the opportunity to review and weigh the disclosure provided by the fund in its prospectus and other public disclosures, have chosen to invest in that fund, managed by Fidelity.
Nature, Extent, and Quality of Services Provided. The Board considered the staffing within the investment adviser, Strategic Advisers, Inc. (the Investment Adviser), including the backgrounds of the funds' investment personnel and the funds' investment objectives and disciplines. The Independent Trustees also had discussions with senior management of Fidelity's investment operations and investment groups. The Board considered the structure of the portfolio manager compensation program and whether this structure provides appropriate incentives to act in the best interest of each fund.
Resources Dedicated to Investment Management and Support Services. The Board reviewed the size, education, and experience of the Investment Adviser's investment staff, its use of technology, and the Investment Adviser's approach to recruiting, training, and retaining portfolio managers and other research, advisory, and management personnel. The Board noted that Fidelity's analysts have access to a variety of technological tools and market and securities data that enable them to perform both fundamental and quantitative analysis and to specialize in various disciplines. The Board noted FMR's continued focus on strengthening the organization and discipline of equity portfolio management and research.
Shareholder and Administrative Services. The Board considered (i) the nature, extent, quality, and cost of advisory, administrative, and shareholder services performed by the Investment Adviser and its affiliates under the each fund's Advisory Contract and under separate agreements covering transfer agency, pricing and bookkeeping, and securities lending services for each fund; (ii) the nature and extent of the investment adviser's supervision of third party service providers, principally custodians and subcustodians; and (iii) the resources devoted to, and the record of compliance with, each fund's compliance policies and procedures.
The Board noted that the growth of fund assets over time across the complex allows Fidelity to reinvest in the development of services designed to enhance the value or convenience of the Fidelity funds as investment vehicles. These services include 24-hour access to account information and market information through telephone representatives and over the Internet, and investor education materials and asset allocation tools.
Investment in a Large Fund Family. The Board considered the benefits to shareholders of investing in a Fidelity fund, including the benefits of investing in a fund that is part of a large family of funds offering a variety of investment disciplines and providing a large variety of mutual fund investor services. The Board noted that Fidelity had taken, or had made recommendations that resulted in the Fidelity funds taking, a number of actions over the previous year that benefited particular funds, including (i) dedicating additional resources to investment research and restructuring and broadening the focus of the investment research teams; (ii) bolstering the senior management team that oversees asset management; (iii) launching Class F of certain funds as a lower-fee class available to Freedom K and Freedom Index Funds; (iv) lowering the initial investment minimums and ongoing balance requirements for Real Estate High Income Fund; (v) eliminating subsequent purchase minimums for all funds and adding a waiver of the investment minimum requirement for new accounts opened with the proceeds of a systematic withdrawal plan; (vi) eliminating the withdrawal minimum and maximum limits for systematic withdrawals from Advisor funds; (vii) expanding sales load waivers on Class A shares for Destiny Planholders and expanding Institutional Class eligibility for Class O Destiny Planholders; and (viii) changing certain Class A and Class T sales charge structures to further align them with industry practices.
Semiannual Report
Investment Performance. The Board considered whether each fund has operated in accordance with its investment objective, as well as its record of compliance with its investment restrictions. It also reviewed each fund's absolute investment performance for each class, as well as each fund's relative investment performance for each class measured against a proprietary custom index. The Board noted that FMR does not believe that a meaningful peer group exists against which to compare any of the funds' performance.
Because each of Income Replacement 2016 Fund, Income Replacement 2020 Fund, Income Replacement 2028 Fund, Income Replacement 2030 Fund, Income Replacement 2032 Fund, Income Replacement 2034 Fund, Income Replacement 2036 Fund, and Income Replacement 2040 Fund had been in existence less than three calendar years, for each fund the following chart considered by the Board shows, for the one-year period ended December 31, 2009, the total returns of the retail class and Class C of the fund, and the total return of a proprietary custom index ("benchmark"). The returns of the retail class and Class C show the performance of the highest and lowest performing classes, respectively.
Because each of Income Replacement 2018 Fund, Income Replacement 2022 Fund, Income Replacement 2024 Fund, Income Replacement 2026 Fund, Income Replacement 2038 Fund, and Income Replacement 2042 Fund had been in existence less than three calendar years, for each fund the following chart considered by the Board shows, for the one-year period ended December 31, 2009, the total returns of Institutional Class (Class I) and Class C of the fund, and the total return of a proprietary custom index ("benchmark"). The returns of Institutional Class (Class I) and Class C show the performance of the highest and lowest performing classes, respectively.
For each fund, the proprietary custom index is an index developed by FMR that represents the performance of the fund's asset classes according to their respective weightings.
Income Replacement 2016
The Board noted that the investment performance of the retail class of the fund compared favorably to its benchmark for the period shown. The Board considered that the variations in performance among the fund's classes reflect the variations in class expenses, which result in lower performance for higher expense classes. The Board also reviewed the fund's performance since inception as well as performance in the current year. The Board noted that it is difficult to evaluate in any comprehensive fashion the performance of the fund, in light of its relatively recent commencement of operations.
Semiannual Report
Board Approval of Investment Advisory Contracts and Management Fees - continued
Income Replacement 2018
The Board noted that the investment performance of Institutional Class (Class I) of the fund compared favorably to its benchmark for the period shown. The Board considered that the variations in performance among the fund's classes reflect the variations in class expenses, which result in lower performance for higher expense classes. The Board also reviewed the fund's performance since inception as well as performance in the current year. The Board noted that it is difficult to evaluate in any comprehensive fashion the performance of the fund, in light of its relatively recent commencement of operations.
Income Replacement 2020
The Board noted that the investment performance of the retail class of the fund compared favorably to its benchmark for the period shown. The Board considered that the variations in performance among the fund's classes reflect the variations in class expenses, which result in lower performance for higher expense classes. The Board also reviewed the fund's performance since inception as well as performance in the current year. The Board noted that it is difficult to evaluate in any comprehensive fashion the performance of the fund, in light of its relatively recent commencement of operations.
Semiannual Report
Income Replacement 2022
The Board noted that the investment performance of Institutional Class (Class I) of the fund compared favorably to its benchmark for the period shown. The Board considered that the variations in performance among the fund's classes reflect the variations in class expenses, which result in lower performance for higher expense classes. The Board also reviewed the fund's performance since inception as well as performance in the current year. The Board noted that it is difficult to evaluate in any comprehensive fashion the performance of the fund, in light of its relatively recent commencement of operations.
Income Replacement 2024
The Board noted that the investment performance of Institutional Class (Class I) of the fund compared favorably to its benchmark for the period shown. The Board considered that the variations in performance among the fund's classes reflect the variations in class expenses, which result in lower performance for higher expense classes. The Board also reviewed the fund's performance since inception as well as performance in the current year. The Board noted that it is difficult to evaluate in any comprehensive fashion the performance of the fund, in light of its relatively recent commencement of operations.
Semiannual Report
Board Approval of Investment Advisory Contracts and Management Fees - continued
Income Replacement 2026
The Board noted that the investment performance of Institutional Class (Class I) of the fund compared favorably to its benchmark for the period shown. The Board considered that the variations in performance among the fund's classes reflect the variations in class expenses, which result in lower performance for higher expense classes. The Board also reviewed the fund's performance since inception as well as performance in the current year. The Board noted that it is difficult to evaluate in any comprehensive fashion the performance of the fund, in light of its relatively recent commencement of operations.
Income Replacement 2028
The Board noted that the investment performance of the retail class of the fund compared favorably to its benchmark for the period shown. The Board considered that the variations in performance among the fund's classes reflect the variations in class expenses, which result in lower performance for higher expense classes. The Board also reviewed the fund's performance since inception as well as performance in the current year. The Board noted that it is difficult to evaluate in any comprehensive fashion the performance of the fund, in light of its relatively recent commencement of operations.
Semiannual Report
Income Replacement 2030
The Board noted that the investment performance of the retail class of the fund compared favorably to its benchmark for the period shown. The Board considered that the variations in performance among the fund's classes reflect the variations in class expenses, which result in lower performance for higher expense classes. The Board also reviewed the fund's performance since inception as well as performance in the current year. The Board noted that it is difficult to evaluate in any comprehensive fashion the performance of the fund, in light of its relatively recent commencement of operations.
Income Replacement 2032
The Board noted that the investment performance of the retail class of the fund compared favorably to its benchmark for the period shown. The Board considered that the variations in performance among the fund's classes reflect the variations in class expenses, which result in lower performance for higher expense classes. The Board also reviewed the fund's performance since inception as well as performance in the current year. The Board noted that it is difficult to evaluate in any comprehensive fashion the performance of the fund, in light of its relatively recent commencement of operations.
Semiannual Report
Board Approval of Investment Advisory Contracts and Management Fees - continued
Income Replacement 2034
The Board noted that the investment performance of the retail class of the fund compared favorably to its benchmark for the period shown. The Board considered that the variations in performance among the fund's classes reflect the variations in class expenses, which result in lower performance for higher expense classes. The Board also reviewed the fund's performance since inception as well as performance in the current year. The Board noted that it is difficult to evaluate in any comprehensive fashion the performance of the fund, in light of its relatively recent commencement of operations.
Income Replacement 2036
The Board noted that the investment performance of the retail class of the fund compared favorably to its benchmark for the period shown. The Board considered that the variations in performance among the fund's classes reflect the variations in class expenses, which result in lower performance for higher expense classes. The Board also reviewed the fund's performance since inception as well as performance in the current year. The Board noted that it is difficult to evaluate in any comprehensive fashion the performance of the fund, in light of its relatively recent commencement of operations.
Semiannual Report
Income Replacement 2038
The Board noted that the investment performance of Institutional Class (Class I) of the fund compared favorably to its benchmark for the period shown. The Board considered that the variations in performance among the fund's classes reflect the variations in class expenses, which result in lower performance for higher expense classes. The Board also reviewed the fund's performance since inception as well as performance in the current year. The Board noted that it is difficult to evaluate in any comprehensive fashion the performance of the fund, in light of its relatively recent commencement of operations.
Income Replacement 2040
The Board noted that the investment performance of the retail class of the fund compared favorably to its benchmark for the period shown. The Board considered that the variations in performance among the fund's classes reflect the variations in class expenses, which result in lower performance for higher expense classes. The Board also reviewed the fund's performance since inception as well as performance in the current year. The Board noted that it is difficult to evaluate in any comprehensive fashion the performance of the fund, in light of its relatively recent commencement of operations.
Semiannual Report
Board Approval of Investment Advisory Contracts and Management Fees - continued
Income Replacement 2042
The Board noted that the investment performance of Institutional Class (Class I) of the fund compared favorably to its benchmark for the period shown. The Board considered that the variations in performance among the fund's classes reflect the variations in class expenses, which result in lower performance for higher expense classes. The Board also reviewed the fund's performance since inception as well as performance in the current year. The Board noted that it is difficult to evaluate in any comprehensive fashion the performance of the fund, in light of its relatively recent commencement of operations.
Based on its review, and giving particular weight to the nature and quality of the resources dedicated by the Investment Adviser to maintain and improve relative performance and factoring in the unprecedented market events in recent years, the Board concluded that the nature, extent, and quality of investment management and support services and of shareholder and administrative services provided to each fund will benefit each fund's shareholders, particularly in light of the Board's view that each fund's shareholders benefit from investing in a fund that is part of a large family of funds offering a variety of investment disciplines and services.
Competitiveness of Management Fee and Total Fund Expenses. The Board noted that the funds do not pay the Investment Adviser a management fee for investment advisory services. The Board considered each fund's management fee and total expenses compared to "mapped groups" of competitive funds and classes. Fidelity creates "mapped groups" by combining similar Lipper investment objective categories that have comparable management fee characteristics. Combining Lipper investment objective categories aids the Board's management fee and total expense comparisons by broadening the competitive group used for comparison and by reducing the number of universes to which various Fidelity funds are compared.
Management Fee. The Board considered two proprietary management fee comparisons for the 12-month (or shorter) periods shown in the charts below. The group of Lipper funds used by the Board for management fee comparisons is referred to below as the "Total Mapped Group." The Total Mapped Group comparison focuses on a fund's standing relative to the total universe of comparable funds available to investors, in terms of gross management fees before expense reimbursements or caps. "TMG %" represents the percentage of funds in the Total Mapped Group that had management fees that were lower than a fund's. For example, a TMG % of 0% means that 100% of the funds in the Total Mapped Group had higher management fees than a fund. The "Asset-Size Peer Group" (ASPG) comparison focuses on a fund's standing relative to non-Fidelity funds similar in size to the fund within the Total Mapped Group. The ASPG represents at least 15% of the funds in the Total Mapped Group with comparable asset size and management fee characteristics, subject to a minimum of 50 funds (or all funds in the Total Mapped Group if fewer than 50). Additional information, such as the ASPG quartile in which a fund's management fee ranked, is also included in the charts and considered by the Board.
Semiannual Report
Income Replacement 2016 Fund
Income Replacement 2018 Fund
Semiannual Report
Board Approval of Investment Advisory Contracts and Management Fees - continued
Income Replacement 2020 Fund
Income Replacement 2022 Fund
Semiannual Report
Income Replacement 2024 Fund
Income Replacement 2026 Fund
Semiannual Report
Board Approval of Investment Advisory Contracts and Management Fees - continued
Income Replacement 2028 Fund
Income Replacement 2030 Fund
Semiannual Report
Income Replacement 2032 Fund
Income Replacement 2034 Fund
Semiannual Report
Board Approval of Investment Advisory Contracts and Management Fees - continued
Income Replacement 2036 Fund
Income Replacement 2038 Fund
Semiannual Report
Income Replacement 2040 Fund
Income Replacement 2042 Fund
The Board noted that each fund's management fee ranked below the median of its Total Mapped Group and below the median of its ASPG for 2009.
Based on its review, the Board concluded that each fund's management fee is fair and reasonable in light of the services that the fund receives and the other factors considered.
Total Expenses. In its review of the total expenses of each class of each fund, the Board noted that each fund invests in Institutional Class of the underlying fund (if that underlying fund offers multiple classes of shares) to avoid charging fund-paid 12b-1 fees at both fund levels. The Board considered that the funds do not pay transfer agent fees. Instead, Institutional Class of each underlying fund (or the underlying fund, if that underlying fund does not offer multiple classes of shares) bears its pro rata portion of each fund's transfer agent fee according to the percentage of each fund's assets invested in that underlying fund. The Board further noted that the Investment Adviser pays all other expenses of each fund, with limited exceptions.
The Board noted that each fund offers multiple classes, each of which has a different sales load and 12b-1 fee structure, and that the multiple structures are intended to offer a range of pricing options for the intermediary market. The Board also noted that the total expenses of the classes of each fund vary primarily by the level of their 12b-1 fees.
For each of Income Replacement 2016 Fund, Income Replacement 2018 Fund, Income Replacement 2020 Fund, Income Replacement 2024 Fund, Income Replacement 2028 Fund, Income Replacement 2032 Fund, Income Replacement 2036 Fund, Income Replacement 2038 Fund, Income Replacement 2040 Fund, and Income Replacement 2042 Fund, the Board noted that the total expenses of each of Class A, Class C, Institutional Class, and the retail class of each fund ranked below its competitive median for 2009 and the total expenses of Class T ranked equal to its competitive median for 2009.
Semiannual Report
Board Approval of Investment Advisory Contracts and Management Fees - continued
For each of Income Replacement 2022 Fund, Income Replacement 2030 Fund, and Income Replacement 2034 Fund, the Board noted that the total expenses of each of Class A, Class C, Institutional Class, and the retail class of each fund ranked below its competitive median for 2009 and the total expenses of Class T ranked above its competitive median for 2009. The Board considered that the total expenses for Class T were above the median primarily because its 12b-1 fee is higher than the typical front-end load class. The Board noted that each fund offers multiple classes, each of which has a different sales load and 12b-1 fee structure, and that the multiple structures are intended to offer a range of pricing options for the intermediary market. The Board also noted that the total expenses of the classes vary primarily by the level of their 12b-1 fees, although differences in transfer agent fees may also causes expenses to vary from class to class.
For Income Replacement 2026 Fund, the Board noted that the total expenses of each class ranked below its competitive median for 2009.
Fees Charged to Other Fidelity Clients. The Board also considered Fidelity fee structures and other information with respect to clients of FMR and its affiliates, such as other mutual funds advised or subadvised by FMR or its affiliates, pension plan clients, and other institutional clients. In March 2010, the Board created an ad hoc joint committee with the board of other Fidelity funds (the Committee) to review and compare Fidelity's institutional investment advisory business with its business of providing services to the Fidelity funds, including the differences in services provided, fees charged, and costs incurred, as well as competition in their respective marketplaces.
Based on its review of total expenses and fees charged to other Fidelity clients, the Board concluded that the total expenses of each class of each fund were reasonable, although in some cases above the median of the universe presented for comparison, in light of the services that the fund and its shareholders receive and the other factors considered, including the findings of the Committee.
Costs of the Services and Profitability. The Board considered the level of Fidelity's profits in respect of all the Fidelity funds.
PricewaterhouseCoopers LLP (PwC), independent registered public accounting firm and auditor to Fidelity and certain Fidelity funds, has been engaged annually by the Board as part of the Board's assessment of Fidelity's profitability analysis. PwC's engagement includes the review and assessment of Fidelity's methodologies used in determining the revenues and expenses attributable to Fidelity's mutual fund business, and completion of agreed-upon procedures surrounding the mathematical accuracy of fund profitability and its conformity to allocation methodologies. After considering PwC's reports issued under the engagement and information provided by Fidelity, the Board believes that while other allocation methods may also be reasonable, Fidelity's profitability methodologies are reasonable in all material respects.
The Board has also reviewed Fidelity's non-fund businesses and fall-out benefits related to the mutual fund business as well as cases where Fidelity's affiliates may benefit from or be related to the funds' business.
The Board concluded that the costs of the services provided by and the profits realized by Fidelity in connection with the operation of each fund were not relevant to the renewal of each fund's Advisory Contract because the funds do not pay management fees and FMR pays all other expenses of each fund, with limited exceptions.
Economies of Scale. The Board concluded that because the funds do not pay management fees and the Investment Adviser pays all other expenses of each fund, with limited exceptions, economies of scale cannot be realized by the funds, but may be realized by the other Fidelity funds in which each fund invests.
Additional Information Requested by the Board. In order to develop fully the factual basis for consideration of the Fidelity funds' Advisory Contracts, the Board requested and received additional information on certain topics, including (i) fund performance trends, actions to be taken by FMR to improve certain funds' overall performance, and Fidelity's long-term strategies for certain funds; (ii) Fidelity's fund profitability methodology and profitability trends for certain funds; (iii) portfolio manager changes that have occurred during the past year and the amount of the investment that each portfolio manager has made in the Fidelity fund(s) that he or she manages; (iv) Fidelity's compensation structure for portfolio managers, research analysts, and other key personnel, including its effects on fund profitability, the rationale for the compensation structure, and the extent to which current market conditions have affected retention and recruitment; (v) the compensation paid by FMR to fund sub-advisers on behalf of the Fidelity funds; (vi) Fidelity's fee structures and rationale for recommending different fees among different categories of funds and classes, as well as Fidelity's voluntary waiver of fees to maintain minimum yields for certain funds and classes; (vii) the rationale for any differences between fund fee structures and fee structures in place for other Fidelity clients; and (viii) explanations regarding the relative total expenses borne by certain funds and classes, total expense competitive trends, and actions that might be taken by FMR to reduce total expenses for certain funds and classes or to achieve further economies of scale.
Based on its evaluation of all of the conclusions noted above, and after considering all factors it believed relevant, the Board ultimately concluded that the advisory fee structures are fair and reasonable, and that each fund's Advisory Contract should be renewed.
Semiannual Report
Investment Adviser
Strategic Advisers, Inc.
Boston, MA
General Distributor
Fidelity Distributors Corporation
Boston, MA
Transfer and Service Agents
Fidelity Investments Institutional Operations Company, Inc.
Boston, MA
Fidelity Service Company, Inc.
Boston, MA
Custodian
The Bank of New York Mellon
New York, NY
ARWI-USAN-0311
1.848186.103
Fidelity®
Ultra-Short Bond
Fund
Semiannual Report
January 31, 2011
(2_fidelity_logos) (Registered_Trademark)
Contents
Chairman's Message | <Click Here> | The Chairman's message to shareholders. |
Shareholder Expense Example | <Click Here> | An example of shareholder expenses. |
Investment Changes | <Click Here> | A summary of major shifts in the fund's investments over the past six months. |
Investments | <Click Here> | A complete list of the fund's investments with their market values. |
Financial Statements | <Click Here> | Statements of assets and liabilities, operations, and changes in net assets,
as well as financial highlights. |
Notes | <Click Here> | Notes to the financial statements. |
Board Approval of Investment Advisory Contracts and Management Fees | <Click Here> | |
To view a fund's proxy voting guidelines and proxy voting record for the 12-month period ended June 30, visit http://www.fidelity.com/proxyvotingresults or visit the Securities and Exchange Commission's (SEC) web site at http://www.sec.gov. You may also call 1-800-544-8544 to request a free copy of the proxy voting guidelines.
Standard & Poor's, S&P and S&P 500 are registered service marks of The McGraw-Hill Companies, Inc. and have been licensed for use by Fidelity Distributors Corporation.
Other third party marks appearing herein are the property of their respective owners.
All other marks appearing herein are registered or unregistered trademarks or service marks of FMR LLC or an affiliated company.
This report and the financial statements contained herein are submitted for the general information of the shareholders of the fund. This report is not authorized for distribution to prospective investors in the fund unless preceded or accompanied by an effective prospectus.
A fund files its complete schedule of portfolio holdings with the SEC for the first and third quarters of each fiscal year on Form N-Q. Forms N-Q are available on the SEC's web site at http://www.sec.gov. A fund's Forms N-Q may be reviewed and copied at the SEC's Public Reference Room in Washington, DC. Information regarding the operation of the SEC's Public Reference Room may be obtained by calling 1-800-SEC-0330. For a complete list of a fund's portfolio holdings, view the most recent holdings listing, semiannual report, or annual report on Fidelity's web site at http://www.fidelity.com, http://www.advisor.fidelity.com, or http://www.401k.com, as applicable.
NOT FDIC INSURED • MAY LOSE VALUE • NO BANK GUARANTEE
Neither the fund nor Fidelity Distributors Corporation is a bank.
Semiannual Report
(photo_of_Abigail_P_Johnson)
Dear Shareholder:
Following a year in which the investment environment was volatile but generally supportive of most major asset classes, 2011 began on a positive note. U.S. equities gained ground in January, reaching their highest point since August 2008, amid indications the U.S. economy had turned a corner. Still, questions remained about the longer-term outlook, most notably persistently high unemployment. Financial markets are always unpredictable, of course, but there also are several time-tested investment principles that can help put the odds in your favor.
One of the basic tenets is to invest for the long term. Over time, riding out the markets' inevitable ups and downs has proven much more effective than selling into panic or chasing the hottest trend. Even missing only a few of the markets' best days can significantly diminish investor returns. Patience also affords the benefits of compounding - of earning interest on additional income or reinvested dividends and capital gains. There can be tax advantages and cost benefits to consider as well. While staying the course doesn't eliminate risk, it can considerably lessen the effect of short-term declines.
You can further manage your investing risk through diversification. And today, more than ever, geographic diversification should be taken into account. Studies indicate that asset allocation is the single most important determinant of a portfolio's long-term success. The right mix of stocks, bonds and cash - aligned to your particular risk tolerance and investment objective - is very important. Age-appropriate rebalancing is also an essential aspect of asset allocation. For younger investors, an emphasis on equities - which historically have been the best-performing asset class over time - is encouraged. As investors near their specific goal, such as retirement or sending a child to college, consideration may be given to replacing volatile assets (e.g. common stocks) with more-stable fixed investments (bonds or savings plans).
A third principle - investing regularly - can help lower the average cost of your purchases. Investing a certain amount of money each month or quarter helps ensure you won't pay for all your shares at market highs. This strategy - known as dollar cost averaging - also reduces "emotion" from investing, helping shareholders avoid selling weak performers just prior to an upswing, or chasing a hot performer just before a correction.
We invite you to contact us via the Internet, through our Investor Centers or by phone. It is our privilege to provide you the information you need to make the investments that are right for you.
Sincerely,
(The chairman's signature appears here.)
Abigail P. Johnson
Semiannual Report
Shareholder Expense Example
As a shareholder of the Fund, you incur two types of costs: (1) transaction costs, including redemption fees, and (2) ongoing costs, including management fees, distribution and/or service (12b-1) fees and other Fund expenses. This Example is intended to help you understand your ongoing costs (in dollars) of investing in the Fund and to compare these costs with the ongoing costs of investing in other mutual funds.
The Example is based on an investment of $1,000 invested at the beginning of the period and held for the entire period (August 1, 2010 to January 31, 2011).
Actual Expenses
The first line of the accompanying table for each class of the Fund provides information about actual account values and actual expenses. You may use the information in this line, together with the amount you invested, to estimate the expenses that you paid over the period. Simply divide your account value by $1,000.00 (for example, an $8,600 account value divided by $1,000.00 = 8.6), then multiply the result by the number in the first line for a class of the Fund under the heading entitled "Expenses Paid During Period" to estimate the expenses you paid on your account during this period.
Hypothetical Example for Comparison Purposes
The second line of the accompanying table for each class of the Fund provides information about hypothetical account values and hypothetical expenses based on a Class' actual expense ratio and an assumed rate of return of 5% per year before expenses, which is not the Class' actual return. The hypothetical account values and expenses may not be used to estimate the actual ending account balance or expenses you paid for the period. You may use this information to compare the ongoing costs of investing in the Fund and other funds. To do so, compare this 5% hypothetical example with the 5% hypothetical examples that appear in the shareholder reports of the other funds.
Please note that the expenses shown in the table are meant to highlight your ongoing costs only and do not reflect any transaction costs. Therefore, the second line of the table is useful in comparing ongoing costs only, and will not help you determine the relative total costs of owning different funds. In addition, if these transactional costs were included, your costs would have been higher.
Semiannual Report
Shareholder Expense Example - continued
| Annualized
Expense
Ratio | Beginning
Account Value
August 1, 2010 | Ending
Account Value
January 31, 2011 | Expenses Paid
During Period*
August 1, 2010 to
January 31, 2011 |
Class A | .62% | | | |
Actual | | $ 1,000.00 | $ 1,003.90 | $ 3.13 |
HypotheticalA | | $ 1,000.00 | $ 1,022.08 | $ 3.16 |
Class T | .66% | | | |
Actual | | $ 1,000.00 | $ 1,005.00 | $ 3.34 |
HypotheticalA | | $ 1,000.00 | $ 1,021.88 | $ 3.36 |
Ultra-Short Bond | .45% | | | |
Actual | | $ 1,000.00 | $ 1,006.10 | $ 2.28 |
HypotheticalA | | $ 1,000.00 | $ 1,022.94 | $ 2.29 |
Institutional Class | .48% | | | |
Actual | | $ 1,000.00 | $ 1,005.90 | $ 2.43 |
HypotheticalA | | $ 1,000.00 | $ 1,022.79 | $ 2.45 |
A 5% return per year before expenses
* Expenses are equal to each Class' annualized expense ratio, multiplied by the average account value over the period, multiplied by 184/365 (to reflect the one-half year period).
Semiannual Report
Investment Changes (Unaudited)
Quality Diversification (% of fund's net assets) |
As of January 31, 2011 | As of July 31, 2010 |
| U.S. Government and
U.S. Government
Agency
Obligations† 40.8% | | | U.S. Government and
U.S. Government
Agency
Obligations† 39.0% | |
 | AAA 15.5% | | | AAA 16.5% | |
| AA 14.3% | | | AA 9.5% | |
| A 9.6% | | | A 6.0% | |
 | BBB 9.2% | | | BBB 7.9% | |
| BB and Below 0.3% | | | BB and Below 0.2% | |
 | Not Rated 1.1% | | | Not Rated 0.8% | |
 | Short-Term
Investments and
Net Other Assets 9.2% | | | Short-Term
Investments and
Net Other Assets 20.1% | |

We have used ratings from Moody's Investors Service, Inc. Where Moody's® ratings are not available, we have used S&P® ratings. All ratings are as of the report date and do not reflect subsequent changes. Securities rated BB or below were rated investment grade at the time of acquisition. |
Weighted Average Maturity as of January 31, 2011 |
| | 6 months ago |
Years | 1.3 | 0.9 |
This is a weighted average of all the maturities of the securities held in a fund. Weighted Average Maturity (WAM) can be used as a measure of sensitivity to interest rate changes and markets changes. Generally, the longer the maturity, the greater the sensitivity to such changes. WAM is based on the dollar-weighted average length of time until principal payments must be paid. Depending on the types of securities held in a fund, certain maturity shortening devices (e.g., demand features, interest rate resets, and call options) may be taken into account when calculating the WAM. |
Duration as of January 31, 2011 |
| | 6 months ago |
Years | 0.4 | 0.4 |
Duration shows how much a bond fund's price fluctuates with changes in comparable interest rates. If rates rise 1%, for example, a fund with a five-year duration is likely to lose about 5% of its value. Other factors also can influence a bond fund's performance and share price. Accordingly, a bond fund's actual performance may differ from this example. |
Asset Allocation (% of fund's net assets) |
As of January 31, 2011* | As of July 31, 2010** |
| Corporate Bonds 30.5% | | | Corporate Bonds 22.0% | |
| U.S. Government and
U.S. Government
Agency
Obligations† 40.8% | | | U.S. Government and
U.S. Government
Agency
Obligations† 39.0% | |
| Asset-Backed
Securities 15.7% | | | Asset-Backed
Securities 15.6% | |
 | CMOs and
Other Mortgage
Related Securities 2.6% | | | CMOs and
Other Mortgage
Related Securities 2.5% | |
| Other Investments 1.2% | | | Other Investments 0.8% | |
| Short-Term
Investments and
Net Other Assets 9.2% | | | Short-Term
Investments and
Net Other Assets 20.1% | |
* Foreign investments | 12.5% | | ** Foreign investments | 10.3% | |
* Futures and Swaps | 3.7% | | ** Futures and Swaps | 3.8% | |
† Includes FDIC Guaranteed Corporate Securities |

Semiannual Report
Investments January 31, 2011 (Unaudited)
Showing Percentage of Net Assets
Nonconvertible Bonds - 30.5% |
| Principal Amount | | Value |
CONSUMER DISCRETIONARY - 1.9% |
Auto Components - 0.7% |
DaimlerChrysler NA Holding Corp.: | | | | |
5.75% 9/8/11 | | $ 1,500,000 | | $ 1,544,858 |
5.875% 3/15/11 | | 500,000 | | 503,081 |
| | 2,047,939 |
Media - 0.8% |
AOL Time Warner, Inc. 6.875% 5/1/12 | | 1,000,000 | | 1,071,289 |
COX Communications, Inc. 6.75% 3/15/11 | | 1,000,000 | | 1,007,311 |
| | 2,078,600 |
Specialty Retail - 0.4% |
Staples, Inc. 7.75% 4/1/11 | | 1,000,000 | | 1,011,014 |
TOTAL CONSUMER DISCRETIONARY | | 5,137,553 |
CONSUMER STAPLES - 2.0% |
Beverages - 1.9% |
Anheuser-Busch InBev Worldwide, Inc. 1.0328% 3/26/13 (e) | | 2,000,000 | | 2,018,774 |
Diageo Finance BV 3.875% 4/1/11 | | 1,000,000 | | 1,005,489 |
SABMiller PLC 6.2% 7/1/11 (b) | | 2,000,000 | | 2,044,154 |
| | 5,068,417 |
Food Products - 0.1% |
Kraft Foods, Inc. 5.625% 11/1/11 | | 258,000 | | 267,119 |
TOTAL CONSUMER STAPLES | | 5,335,536 |
ENERGY - 1.5% |
Oil, Gas & Consumable Fuels - 1.5% |
Kinder Morgan Energy Partners LP 6.75% 3/15/11 | | 1,000,000 | | 1,006,697 |
Shell International Finance BV 1.3% 9/22/11 | | 1,000,000 | | 1,006,279 |
Total Capital Canada Ltd. 0.6758% 1/17/14 (e) | | 2,000,000 | | 1,997,074 |
| | 4,010,050 |
FINANCIALS - 18.1% |
Capital Markets - 3.0% |
Goldman Sachs Group, Inc. 0.7028% 10/7/11 (e) | | 1,000,000 | | 1,002,468 |
HSBC Bank PLC 1.1031% 1/17/14 (b)(e) | | 2,000,000 | | 1,997,094 |
JPMorgan Chase & Co. 1.1031% 1/24/14 (e) | | 2,000,000 | | 2,002,334 |
Nonconvertible Bonds - continued |
| Principal Amount | | Value |
FINANCIALS - continued |
Capital Markets - continued |
Morgan Stanley 1.9025% 1/24/14 (e) | | $ 1,500,000 | | $ 1,506,504 |
UBS AG Stamford Branch 1.3044% 1/28/14 (e) | | 1,500,000 | | 1,500,000 |
| | 8,008,400 |
Commercial Banks - 8.2% |
ANZ Banking Group Ltd. 0.3024% 1/10/14 (b)(e) | | 1,000,000 | | 998,549 |
Barclays Bank PLC 1.3431% 1/13/14 (e) | | 1,000,000 | | 1,005,780 |
Commonwealth Bank of Australia 0.8538% 3/19/13 (b)(e) | | 1,500,000 | | 1,503,086 |
Credit Agricole SA 0.6359% 2/2/12 (b)(e) | | 2,000,000 | | 1,993,458 |
Credit Suisse New York Branch 1.2631% 1/14/14 (e) | | 1,000,000 | | 1,004,625 |
Deutsche Bank New York Branch 0.9531% 1/18/13 (e) | | 2,000,000 | | 2,002,710 |
Fifth Third Bank 0.3944% 5/17/13 (e) | | 1,000,000 | | 973,357 |
ING Bank NV 1.6231% 10/18/13 (b)(e) | | 2,000,000 | | 1,997,292 |
Marshall & Ilsley Bank 6.375% 9/1/11 | | 287,000 | | 293,735 |
National Australia Bank Ltd. 0.7831% 1/8/13 (b)(e) | | 1,000,000 | | 1,004,508 |
Santander US Debt SA Unipersonal 1.1028% 3/30/12 (b)(e) | | 800,000 | | 791,291 |
Sovereign Bank 1.9969% 8/1/13 (e) | | 500,000 | | 500,000 |
SunTrust Bank 6.375% 4/1/11 | | 1,000,000 | | 1,008,495 |
Svenska Handelsbanken AB 1.3016% 9/14/12 (b)(e) | | 2,000,000 | | 2,006,376 |
U.S. Bank NA 0.5231% 10/26/12 (e) | | 2,000,000 | | 2,005,518 |
Wachovia Corp. 0.4459% 3/1/12 (e) | | 2,000,000 | | 2,001,122 |
Westpac Banking Corp. 0.8531% 4/8/13 (b)(e) | | 1,000,000 | | 1,002,359 |
| | 22,092,261 |
Consumer Finance - 2.4% |
American Express Credit Corp. 0.4213% 6/16/11 (e) | | 1,500,000 | | 1,500,323 |
American Honda Finance Corp. 0.6539% 11/7/12 (b)(e) | | 2,000,000 | | 1,998,244 |
Capital One Financial Corp. 5.7% 9/15/11 | | 1,000,000 | | 1,028,631 |
General Electric Capital Corp. 1.1528% 1/7/14 (e) | | 2,000,000 | | 2,006,320 |
| | 6,533,518 |
Diversified Financial Services - 1.6% |
BNP Paribas 1.2031% 1/10/14 (e) | | 1,000,000 | | 1,000,280 |
BP Capital Markets PLC 1.55% 8/11/11 | | 1,350,000 | | 1,355,889 |
Citigroup, Inc. 1.7531% 1/13/14 (e) | | 2,000,000 | | 2,002,848 |
| | 4,359,017 |
Insurance - 2.1% |
Berkshire Hathaway Finance Corp. 0.6331% 1/10/14 (e) | | 2,000,000 | | 2,001,158 |
Nonconvertible Bonds - continued |
| Principal Amount | | Value |
FINANCIALS - continued |
Insurance - continued |
Metropolitan Life Global Funding I: | | | | |
1.0531% 1/10/14 (b)(e) | | $ 1,000,000 | | $ 997,113 |
5.75% 7/25/11 (b) | | 1,500,000 | | 1,535,089 |
Unum Group 7.625% 3/1/11 | | 1,000,000 | | 1,004,487 |
| | 5,537,847 |
Thrifts & Mortgage Finance - 0.8% |
Bank of America Corp. 1.7138% 1/30/14 (e) | | 2,000,000 | | 2,005,244 |
TOTAL FINANCIALS | | 48,536,287 |
HEALTH CARE - 1.1% |
Health Care Providers & Services - 0.4% |
UnitedHealth Group, Inc. 5.25% 3/15/11 | | 1,000,000 | | 1,005,207 |
Pharmaceuticals - 0.7% |
Merck & Co., Inc. 1.875% 6/30/11 | | 2,000,000 | | 2,013,960 |
TOTAL HEALTH CARE | | 3,019,167 |
INDUSTRIALS - 0.8% |
Aerospace & Defense - 0.8% |
BAE Systems Holdings, Inc. 6.4% 12/15/11 (b) | | 2,000,000 | | 2,097,288 |
INFORMATION TECHNOLOGY - 0.3% |
Computers & Peripherals - 0.1% |
Hewlett-Packard Co. 2.25% 5/27/11 | | 286,000 | | 288,054 |
Office Electronics - 0.2% |
Xerox Corp. 6.875% 8/15/11 | | 500,000 | | 514,983 |
TOTAL INFORMATION TECHNOLOGY | | 803,037 |
TELECOMMUNICATION SERVICES - 3.1% |
Diversified Telecommunication Services - 1.7% |
Deutsche Telekom International Financial BV 5.375% 3/23/11 | | 1,000,000 | | 1,006,841 |
SBC Communications, Inc. 6.25% 3/15/11 | | 2,000,000 | | 2,013,634 |
Telecom Italia Capital SA: | | | | |
0.7669% 2/1/11 (e) | | 500,000 | | 500,000 |
6.2% 7/18/11 | | 1,000,000 | | 1,022,413 |
| | 4,542,888 |
Nonconvertible Bonds - continued |
| Principal Amount | | Value |
TELECOMMUNICATION SERVICES - continued |
Wireless Telecommunication Services - 1.4% |
Verizon Wireless Capital LLC 3.75% 5/20/11 | | $ 1,683,000 | | $ 1,699,249 |
Vodafone Group PLC 0.5719% 2/27/12 (e) | | 2,000,000 | | 2,002,854 |
| | 3,702,103 |
TOTAL TELECOMMUNICATION SERVICES | | 8,244,991 |
UTILITIES - 1.7% |
Electric Utilities - 1.3% |
Progress Energy, Inc. 7.1% 3/1/11 | | 2,000,000 | | 2,010,086 |
Southern Co. 0.7031% 10/21/11 (e) | | 1,500,000 | | 1,504,215 |
| | 3,514,301 |
Multi-Utilities - 0.4% |
Wisconsin Energy Corp. 6.5% 4/1/11 | | 1,000,000 | | 1,009,744 |
TOTAL UTILITIES | | 4,524,045 |
TOTAL NONCONVERTIBLE BONDS (Cost $81,588,366) | 81,707,954 |
U.S. Government and Government Agency Obligations - 34.1% |
|
U.S. Government Agency Obligations - 15.4% |
Fannie Mae 1% 4/4/12 | | 35,000,000 | | 35,243,455 |
Freddie Mac 1.625% 4/26/11 | | 6,000,000 | | 6,020,310 |
TOTAL U.S. GOVERNMENT AGENCY OBLIGATIONS | | 41,263,765 |
U.S. Treasury Inflation Protected Obligations - 0.5% |
U.S. Treasury Inflation-Indexed Notes 2.375% 4/15/11 | | 1,471,624 | | 1,485,911 |
U.S. Treasury Obligations - 15.0% |
U.S. Treasury Notes: | | | | |
0.875% 5/31/11 (d) | | 20,000,000 | | 20,044,540 |
1% 7/31/11 | | 20,000,000 | | 20,079,680 |
TOTAL U.S. TREASURY OBLIGATIONS | | 40,124,220 |
Other Government Related - 3.2% |
Bank of America Corp. 0.6044% 4/30/12 (FDIC Guaranteed) (c)(e) | | 1,500,000 | | 1,507,170 |
Citibank NA 1.5% 7/12/11 (FDIC Guaranteed) (c) | | 690,000 | | 694,031 |
U.S. Government and Government Agency Obligations - continued |
| Principal Amount | | Value |
Other Government Related - continued |
Citigroup Funding, Inc. 1.375% 5/5/11 (FDIC Guaranteed) (c) | | $ 470,000 | | $ 471,381 |
General Electric Capital Corp. 1.8% 3/11/11 (FDIC Guaranteed) (c) | | 870,000 | | 871,509 |
Goldman Sachs Group, Inc.: | | | | |
0.5356% 11/9/11 (FDIC Guaranteed) (c)(e) | | 2,000,000 | | 2,005,106 |
1.7% 3/15/11 (FDIC Guaranteed) (c) | | 1,000,000 | | 1,001,797 |
JPMorgan Chase & Co. 0.3644% 2/23/11 (FDIC Guaranteed) (c)(e) | | 2,000,000 | | 2,000,188 |
TOTAL OTHER GOVERNMENT RELATED | | 8,551,182 |
TOTAL U.S. GOVERNMENT AND GOVERNMENT AGENCY OBLIGATIONS (Cost $91,327,297) | 91,425,078 |
U.S. Government Agency - Mortgage Securities - 3.5% |
|
Fannie Mae - 3.1% |
2.556% 12/1/34 (e) | | 654,315 | | 688,896 |
2.557% 6/1/35 (e) | | 441,981 | | 461,673 |
2.634% 6/1/35 (e) | | 1,142,533 | | 1,200,809 |
2.635% 11/1/34 (e) | | 601,818 | | 628,398 |
2.636% 7/1/33 (e) | | 171,201 | | 179,158 |
2.639% 7/1/35 (e) | | 935,198 | | 982,612 |
2.645% 8/1/33 (e) | | 144,832 | | 150,937 |
2.652% 7/1/34 (e) | | 541,637 | | 568,551 |
2.71% 11/1/34 (e) | | 650,215 | | 685,906 |
2.73% 10/1/35 (e) | | 1,253,170 | | 1,315,414 |
2.811% 2/1/34 (e) | | 348,430 | | 361,031 |
3.768% 10/1/39 (e) | | 945,270 | | 988,326 |
TOTAL FANNIE MAE | | 8,211,711 |
Freddie Mac - 0.4% |
2.663% 6/1/35 (e) | | 994,888 | | 1,043,575 |
TOTAL U.S. GOVERNMENT AGENCY - MORTGAGE SECURITIES (Cost $9,036,428) | 9,255,286 |
Asset-Backed Securities - 15.7% |
| Principal Amount | | Value |
ACE Securities Corp. Home Equity Loan Trust
Series 2004-HE1 Class M1, 1.01% 3/25/34 (e) | | $ 7,153 | | $ 7,051 |
Ally Auto Receivables Trust: | | | | |
Series 2009-A Class A2, 1.32% 3/15/12 (b) | | 584,873 | | 585,531 |
Series 2009-B Class A2, 1.21% 6/15/12 (b) | | 1,033,161 | | 1,034,643 |
Series 2010-4 Class A2, 0.71% 2/15/13 | | 1,000,000 | | 999,456 |
Ally Master Owner Trust: | | | | |
Series 2010-1 Class A, 2.0113% 1/15/15 (b)(e) | | 700,000 | | 712,996 |
Series 2011-1 Class A1, 1.13% 1/15/16 (e) | | 500,000 | | 500,000 |
AmeriCredit Automobile Receivables Trust: | | | | |
Series 2007-AX Class A4, 0.3006% 10/6/13 (e) | | 1,006,479 | | 1,000,948 |
Series 2010-3 Class A2, 0.77% 12/9/13 | | 1,000,000 | | 999,986 |
Series 2010-B Class A2, 1.18% 2/6/14 (Assured Guaranty Corp. Insured) | | 1,000,000 | | 998,405 |
Series 2011-1 Class A2, 0.84% 9/10/12 | | 1,000,000 | | 1,000,000 |
Bank of America Auto Trust: | | | | |
Series 2009-1A Class A3, 2.67% 7/15/13 (b) | | 771,732 | | 779,829 |
Series 2010-2 Class A2, 0.91% 10/15/12 | | 1,000,000 | | 1,001,579 |
BMW Vehicle Lease Trust: | | | | |
Series 2009-1 Class A3, 2.91% 3/15/12 | | 509,857 | | 513,732 |
Series 2010-1 Class A2, 0.58% 9/17/12 | | 2,000,000 | | 2,000,652 |
Capital One Auto Finance Trust Series 2007-C Class A4, 5.23% 7/15/14 (FGIC Insured) | | 495,731 | | 510,504 |
Capital One Multi-Asset Execution Trust Series 2009-A2 Class A2, 3.2% 4/15/14 | | 1,500,000 | | 1,514,357 |
CarMax Auto Owner Trust Series 2009-2 Class A2, 1% 6/15/12 | | 644,965 | | 645,303 |
Chase Issuance Trust: | | | | |
Series 2005-A2 Class A2, 0.3313% 12/15/14 (e) | | 1,600,000 | | 1,597,460 |
Series 2005-A6 Class A6, 0.3312% 7/15/14 (e) | | 1,730,000 | | 1,726,689 |
Series 2006-A4 Class A4, 0.2813% 10/15/13 (e) | | 1,000,000 | | 999,022 |
Series 2007-A17 Class A, 5.12% 10/15/14 | | 480,000 | | 514,421 |
Series 2008-9 Class A, 4.26% 5/15/13 | | 100,000 | | 101,077 |
Series 2009-A2 Class A2, 1.8112% 4/15/14 (e) | | 2,500,000 | | 2,538,758 |
Series 2009-A3 Class A3, 2.4% 6/17/13 | | 780,000 | | 785,423 |
Chrysler Financial Auto Securitization Trust
Series 2010-A Class A2, 0.78% 1/8/13 | | 1,500,000 | | 1,499,551 |
Chrysler Financial Lease Trust Series 2010-A Class A2, 1.78% 6/15/11 (b) | | 153,233 | | 153,333 |
Citibank Credit Card Issuance Trust Series 2006-A4 Class A4, 5.45% 5/10/13 | | 200,000 | | 202,780 |
CitiFinancial Auto Issuance Trust Series 2009-1 Class A2, 1.83% 11/15/12 (b) | | 249,661 | | 250,357 |
Asset-Backed Securities - continued |
| Principal Amount | | Value |
Fannie Mae subordinate REMIC pass-thru certificates Series 2004-T5: | | | | |
Class AB1, 0.7353% 5/28/35 (e) | | $ 80,751 | | $ 64,403 |
Class AB3, 0.6842% 5/28/35 (e) | | 32,052 | | 23,445 |
Ford Credit Auto Lease Trust: | | | | |
Series 2010-A Class A2, 1.04% 3/15/13 (b) | | 514,208 | | 514,601 |
Series 2010-B Class A2, 0.68% 10/15/12 (b) | | 2,000,000 | | 1,999,679 |
Ford Credit Auto Owner Trust: | | | | |
Series 2009-D Class A3, 2.17% 10/15/13 | | 98,013 | | 99,094 |
Series 2009-E Class A2, 1% 3/15/12 | | 710,615 | | 710,840 |
Series 2010-B Class A2, 0.65% 12/15/12 | | 1,500,000 | | 1,500,818 |
Ford Credit Floorplan Master Owner Trust: | | | | |
Series 2006-4 Class A, 0.5113% 6/15/13 (e) | | 1,000,000 | | 997,624 |
Series 2010-1 Class A, 1.9113% 12/15/14 (b)(e) | | 490,000 | | 498,600 |
Series 2010-5 Class A1, 1.5% 9/15/15 | | 240,000 | | 238,340 |
Fremont Home Loan Trust Series 2005-A Class M4, 0.94% 1/25/35 (e) | | 125,000 | | 39,378 |
GE Capital Credit Card Master Note Trust Series 2009-3 Class A, 2.54% 9/15/14 | | 1,000,000 | | 1,011,245 |
GSAMP Trust Series 2007-HE1 Class M1, 0.51% 3/25/47 (e) | | 335,000 | | 18,726 |
Guggenheim Structured Real Estate Funding Ltd. Series 2005-1 Class C, 1.34% 5/25/30 (b)(e) | | 367,417 | | 187,383 |
Home Equity Asset Trust Series 2003-5 Class A2, 0.96% 12/25/33 (e) | | 10,566 | | 7,370 |
Hyundai Auto Receivables Trust: | | | | |
Series 2009-A: | | | | |
Class A2, 1.11% 2/15/12 | | 461,755 | | 462,008 |
Class A3, 2.03% 8/15/13 | | 130,000 | | 131,349 |
Series 2011-A Class A2, 0.69% 11/15/13 | | 1,000,000 | | 999,934 |
John Deere Owner Trust Series 2009-B Class A-2, 0.85% 3/15/12 | | 219,718 | | 219,745 |
Mercedes-Benz Auto Receivables Trust Series 2009-1: | | | | |
Class A2, 0.83% 3/15/12 | | 526,045 | | 526,277 |
Class A3, 1.67% 1/15/14 | | 180,000 | | 181,753 |
Merrill Lynch Mortgage Investors Trust Series 2004-HE2 Class A1B, 0.73% 8/25/35 (e) | | 21,560 | | 19,469 |
Morgan Stanley ABS Capital I Trust Series 2004-HE6 Class A2, 0.6% 8/25/34 (e) | | 65,756 | | 54,147 |
Nissan Auto Lease Trust: | | | | |
Series 2009-B: | | | | |
Class A2, 1.22% 9/15/11 | | 199,996 | | 200,049 |
Class A3, 2.07% 1/15/15 | | 270,000 | | 271,508 |
Series 2010-B Class A2, 0.9% 5/15/13 | | 1,000,000 | | 1,000,499 |
Asset-Backed Securities - continued |
| Principal Amount | | Value |
Ocala Funding LLC Series 2006-1A Class A, 1.6606% 3/20/11 (a)(b)(e) | | $ 965,000 | | $ 0 |
Park Place Securities, Inc.: | | | | |
Series 2004-WCW1 Class M4, 1.71% 9/25/34 (e) | | 435,000 | | 109,707 |
Series 2004-WWF1 Class M4, 1.36% 12/25/34 (e) | | 945,000 | | 288,415 |
Series 2005-WCH1 Class M3, 0.82% 1/25/36 (e) | | 425,000 | | 298,230 |
Salomon Brothers Mortgage Securities VII, Inc.
Series 2003-HE1 Class A, 1.06% 4/25/33 (e) | | 1,451 | | 1,275 |
Santander Drive Auto Receivables Trust Series 2010-3 Class A2, 0.93% 6/17/13 | | 500,000 | | 499,952 |
Terwin Mortgage Trust Series 2003-4HE Class A1, 1.12% 9/25/34 (e) | | 21,802 | | 16,862 |
USAA Auto Owner Trust Series 2010-1 Class A3, 1.3% 6/16/14 | | 950,000 | | 955,696 |
Volkswagen Auto Lease Trust: | | | | |
Series 2009-A Class A3, 3.41% 4/16/12 | | 773,166 | | 780,289 |
Series 2010-A Class A2, 0.77% 1/22/13 | | 1,000,000 | | 1,000,467 |
Wachovia Auto Owner Trust Series 2008-A Class A4B, 1.4106% 3/20/14 (e) | | 1,000,000 | | 1,008,669 |
TOTAL ASSET-BACKED SECURITIES (Cost $44,735,042) | 42,111,689 |
Collateralized Mortgage Obligations - 4.8% |
|
Private Sponsor - 1.6% |
Fosse Master Issuer PLC floater Series 2007-1A Class A2, 0.3831% 10/18/54 (b)(e) | | 641,030 | | 638,445 |
Gracechurch Mortgage Financing PLC floater
Series 2007-1A Class 3A1, 0.3644% 11/20/56 (b)(e) | | 445,554 | | 438,966 |
GSR Mortgage Loan Trust floater Series 2004-11 Class 2A1, 0.59% 12/25/34 (e) | | 272,553 | | 241,488 |
Holmes Master Issuer PLC floater: | | | | |
Series 2007-1 Class 3A1, 0.3831% 7/15/40 (e) | | 1,100,000 | | 1,097,226 |
Series 2007-2A Class 3A1, 0.3831% 7/15/21 (e) | | 840,000 | | 835,049 |
Permanent Master Issuer PLC floater Series 2007-1 Class 4A, 0.3831% 10/15/33 (e) | | 360,000 | | 355,427 |
TBW Mortgage-Backed pass-thru certificates floater Series 2006-4 Class A3, 0.46% 9/25/36 (e) | | 1,000,000 | | 579,190 |
TOTAL PRIVATE SPONSOR | | 4,185,791 |
Collateralized Mortgage Obligations - continued |
| Principal Amount | | Value |
U.S. Government Agency - 3.2% |
Fannie Mae subordinate REMIC pass-thru certificates: | | | | |
floater: | | | | |
Series 2008-76 Class EF, 0.76% 9/25/23 (e) | | $ 91,503 | | $ 91,562 |
Series 2010-86 Class FE, 0.71% 8/25/25 (e) | | 785,675 | | 786,653 |
sequential payer Series 2003-129 Class GF, 0.66% 4/25/30 (e) | | 1,259,179 | | 1,262,148 |
Freddie Mac Multi-Class participation certificates guaranteed: | | | | |
floater Series 3346 Class FA, 0.4913% 2/15/19 (e) | | 2,913,070 | | 2,911,602 |
sequential payer: | | | | |
Series 3560 Class LA, 2% 8/15/14 | | 1,725,235 | | 1,746,394 |
Series 3573 Class LC, 1.85% 8/15/14 | | 1,787,687 | | 1,807,227 |
TOTAL U.S. GOVERNMENT AGENCY | | 8,605,586 |
TOTAL COLLATERALIZED MORTGAGE OBLIGATIONS (Cost $13,238,553) | 12,791,377 |
Commercial Mortgage Securities - 1.0% |
|
COMM pass-thru certificates floater Series 2006-CN2A Class A2FL, 0.4806% 2/5/19 (b)(e) | | 800,000 | | 788,621 |
Greenwich Capital Commercial Funding Corp. sequential payer Series 2005-GG3 Class A2, 4.305% 8/10/42 (e) | | 1,248,009 | | 1,257,997 |
GS Mortgage Securities Corp. II sequential payer
Series 2005-GG4 Class A3, 4.607% 7/10/39 | | 150,000 | | 153,236 |
GS Mortgage Securities Trust sequential payer
Series 2006-GG8 Class A2, 5.479% 11/10/39 | | 130,000 | | 132,259 |
Morgan Stanley Capital I Trust floater: | | | | |
Series 2006-XLF Class C, 1.462% 7/15/19 (b)(e) | | 247,826 | | 128,870 |
Series 2007-XLFA Class B, 0.392% 10/15/20 (b)(e) | | 440,000 | | 330,000 |
TOTAL COMMERCIAL MORTGAGE SECURITIES (Cost $3,280,029) | 2,790,983 |
Municipal Securities - 0.5% |
| Principal Amount | | Value |
Kentucky Econ. Dev. Fin. Auth. Solid Waste Disp. Rev. Bonds (Republic Svcs., Inc. Proj.) Series A, 2.5%, tender 3/1/11 (e)(f) | | $ 300,000 | | $ 299,988 |
Louisville/Jefferson County Metropolitan Govt. Poll. Cont. Rev. Bonds (Louisville Gas and Electronic Co. Proj.): | | | | |
Series 2003 A, 1.9%, tender 4/2/12 (e) | | 500,000 | | 500,285 |
Series 2007 B, 1.9%, tender 6/1/12 (e) | | 500,000 | | 500,460 |
TOTAL MUNICIPAL SECURITIES (Cost $1,300,000) | 1,300,733 |
Foreign Government and Government Agency Obligations - 0.8% |
|
Ontario Province 0.4344% 11/19/12 (e)
(Cost $2,000,000) | | 2,000,000 | | 2,001,400 |
Bank Notes - 0.7% |
|
National City Bank, Cleveland 0.3959% 3/1/13 (e)
(Cost $1,972,968) | | 2,000,000 | | 1,983,578 |
Certificates of Deposit - 0.8% |
|
Bank of Tokyo-Mitsubishi yankee 0.54% 2/3/11
(Cost $2,000,000) | | 2,000,000 | | 2,000,045 |
Cash Equivalents - 8.2% |
| Maturity
Amount | | |
Investments in repurchase agreements in a joint trading account at 0.23%, dated 1/31/11 due 2/1/11 (Collateralized by U.S. Government Obligations) #
(Cost $22,045,000) | $ 22,045,142 | | 22,045,000 |
TOTAL INVESTMENT PORTFOLIO - 100.6% (Cost $272,523,683) | 269,413,123 |
NET OTHER ASSETS (LIABILITIES) - (0.6)% | (1,508,682) |
NET ASSETS - 100% | $ 267,904,441 |
Futures Contracts |
| Expiration
Date | | Underlying
Face Amount
at Value | | Unrealized
Appreciation/
(Depreciation) |
Purchased |
Eurodollar Contracts |
10 Eurodollar 90 Day Index Contracts | March 2011 | | $ 9,991,375 | | $ 10,350 |
10 Eurodollar 90 Day Index Contracts | June 2011 | | 9,989,375 | | 4,225 |
10 Eurodollar 90 Day Index Contracts | Sept. 2011 | | 9,987,000 | | (651) |
TOTAL EURODOLLAR CONTRACTS | | $ 13,924 |
Legend |
(a) Non-income producing - Security is in default. |
(b) Security exempt from registration under Rule 144A of the Securities Act of 1933. These securities may be resold in transactions exempt from registration, normally to qualified institutional buyers. At the end of the period, the value of these securities amounted to $31,364,805 or 11.7% of net assets. |
(c) Under the Temporary Liquidity Guarantee Program, the Federal Deposit Insurance Corporation guarantees principal and interest in the event of payment default or bankruptcy until the earlier of maturity date of the debt or until June 30, 2012. At the end of the period these securities amounted to $8,551,182 or 3.2% of net assets. |
(d) Security or a portion of the security was pledged to cover margin requirements for futures contracts. At the period end, the value of securities pledged amounted to $35,078. |
(e) Coupon rates for floating and adjustable rate securities reflect the rates in effect at period end. |
(f) Private activity obligations whose interest is subject to the federal alternative minimum tax for individuals. |
# Additional information on each counterparty to the repurchase agreement is as follows: |
Repurchase Agreement / Counterparty | Value |
$22,045,000 due 2/01/11 at 0.23% |
BNP Paribas Securities Corp. | $ 1,037,236 |
Bank of America NA | 6,757,241 |
Barclays Capital, Inc. | 527,909 |
Citigroup Global Markets, Inc. | 610,099 |
Credit Agricole Securities (USA), Inc. | 844,655 |
Deutsche Bank Securities, Inc. | 633,491 |
HSBC Securities (USA), Inc. | 2,533,965 |
J.P. Morgan Securities, Inc. | 844,655 |
Merrill Lynch Government Securities, Inc. | 760,189 |
Merrill Lynch, Pierce, Fenner & Smith, Inc. | 843,902 |
Mizuho Securities USA, Inc. | 3,800,947 |
Societe Generale, New York Branch | 1,689,310 |
Wells Fargo Securities LLC | 1,161,401 |
| $ 22,045,000 |
Other Information |
The following is a summary of the inputs used, as of January 31, 2011, involving the Fund's assets and liabilities carried at fair value. The inputs or methodology used for valuing securities may not be an indication of the risk associated with investing in those securities. For more information on valuation inputs, and their aggregation into the levels used in the tables below, please refer to the Security Valuation section in the accompanying Notes to Financial Statements. |
Valuation Inputs at Reporting Date: |
Description | Total | Level 1 | Level 2 | Level 3 |
Investments in Securities: | | | | |
Corporate Bonds | $ 81,707,954 | $ - | $ 81,707,954 | $ - |
U.S. Government and Government Agency Obligations | 91,425,078 | - | 91,425,078 | - |
U.S. Government Agency - Mortgage Securities | 9,255,286 | - | 9,255,286 | - |
Asset-Backed Securities | 42,111,689 | - | 41,586,350 | 525,339 |
Collateralized Mortgage Obligations | 12,791,377 | - | 12,791,377 | - |
Commercial Mortgage Securities | 2,790,983 | - | 2,662,113 | 128,870 |
Municipal Securities | 1,300,733 | - | 1,300,733 | - |
Foreign Government and Government Agency Obligations | 2,001,400 | - | 2,001,400 | - |
Bank Notes | 1,983,578 | - | 1,983,578 | - |
Certificates of Deposit | 2,000,045 | - | 2,000,045 | - |
Cash Equivalents | 22,045,000 | - | 22,045,000 | - |
Total Investments in Securities: | $ 269,413,123 | $ - | $ 268,758,914 | $ 654,209 |
Derivative Instruments: | | | | |
Assets | | | | |
Futures Contracts | $ 14,575 | $ 14,575 | $ - | $ - |
Liabilities | | | | |
Futures Contracts | $ (651) | $ (651) | $ - | $ - |
Total Derivative Instruments: | $ 13,924 | $ 13,924 | $ - | $ - |
The following is a reconciliation of Investments in Securities for which Level 3 inputs were used in determining value: |
Investments in Securities: | |
Beginning Balance | $ 583,242 |
Total Realized Gain (Loss) | (1,566,340) |
Total Unrealized Gain (Loss) | 1,805,751 |
Cost of Purchases | 2,324 |
Proceeds of Sales | (408,257) |
Amortization/Accretion | (11,302) |
Transfers in to Level 3 | 248,791 |
Transfers out of Level 3 | - |
Ending Balance | $ 654,209 |
The change in unrealized gain (loss) for the period attributable to Level 3 securities held at January 31, 2011 | $ 146,949 |
The information used in the above reconciliation represents fiscal year to date activity for any Investments in Securities identified as using Level 3 inputs at either the beginning or the end of the current fiscal period. Transfers in or out of Level 3 represent the beginning value of any Security or Instrument where a change in the pricing level occurred from the beginning to the end of the period. The cost of purchases and the proceeds of sales may include securities received or delivered through corporate actions or exchanges. Realized and unrealized gains (losses) disclosed in the reconciliation are included in Net Gain (Loss) on the Fund's Statement of Operations. |
Value of Derivative Instruments |
The following table is a summary of the Fund's value of derivative instruments by risk exposure as of January 31, 2011. For additional information on derivative instruments, please refer to the Derivative Instruments section in the accompanying Notes to Financial Statements. |
Risk Exposure /
Derivative Type | Value |
| Asset | Liability |
Interest Rate Risk | | |
Futures Contracts (a) | $ 14,575 | $ (651) |
Total Value of Derivatives | $ 14,575 | $ (651) |
(a) Reflects cumulative appreciation/(depreciation) on futures contracts as disclosed on the Schedule of Investments. Only the period end variation margin is separately disclosed on the Statement of Assets and Liabilities. |
Other Information |
Distribution of investments by country of issue, as a percentage of total net assets, is as follows: (Unaudited) |
United States of America | 87.5% |
United Kingdom | 4.5% |
Netherlands | 1.9% |
Australia | 1.8% |
Canada | 1.5% |
France | 1.1% |
Others (Individually Less Than 1%) | 1.7% |
| 100.0% |
Income Tax Information |
At July 31, 2010, the Fund had a capital loss carryforward of approximately $121,849,643 of which $1,917,431, $518,690, $12,186,304, $97,397,499 and $9,829,719 will expire in fiscal 2014, 2015, 2016, 2017 and 2018, respectively. Capital loss carryforwards are only available to offset future capital gains of the Fund to the extent provided by regulations and may be limited. |
The Fund intends to elect to defer to its fiscal year ending July 31, 2011 approximately $3,569,895 of losses recognized during the period November 1, 2009 to July 31, 2010. |
See accompanying notes which are an integral part of the financial statements.
Semiannual Report
Statement of Assets and Liabilities
| January 31, 2011 (Unaudited) |
| | |
Assets | | |
Investment in securities, at value (including repurchase agreements of $22,045,000) - See accompanying schedule: Unaffiliated issuers (cost $272,523,683) | | $ 269,413,123 |
Cash | | 2,344 |
Receivable for investments sold | | 677,916 |
Receivable for fund shares sold | | 407,388 |
Interest receivable | | 795,288 |
Other receivables | | 3 |
Total assets | | 271,296,062 |
| | |
Liabilities | | |
Payable for investments purchased | $ 2,999,957 | |
Payable for fund shares redeemed | 286,079 | |
Distributions payable | 1,489 | |
Accrued management fee | 70,390 | |
Distribution and service plan fees payable | 2,215 | |
Payable for daily variation on futures contracts | 625 | |
Other affiliated payables | 30,866 | |
Total liabilities | | 3,391,621 |
| | |
Net Assets | | $ 267,904,441 |
Net Assets consist of: | | |
Paid in capital | | $ 397,953,801 |
Distributions in excess of net investment income | | (233,045) |
Accumulated undistributed net realized gain (loss) on investments | | (126,719,678) |
Net unrealized appreciation (depreciation) on investments | | (3,096,637) |
Net Assets | | $ 267,904,441 |
See accompanying notes which are an integral part of the financial statements.
Semiannual Report
Financial Statements - continued
Statement of Assets and Liabilities - continued
| January 31, 2011 (Unaudited) |
| | |
Calculation of Maximum Offering Price Class A:
Net Asset Value and redemption price per share ($13,344,499 ÷ 1,632,418 shares) | | $ 8.17 |
| | |
Maximum offering price per share (100/98.50 of $8.17) | | $ 8.29 |
Class T:
Net Asset Value and redemption price per share ($4,208,138 ÷ 514,742 shares) | | $ 8.18 |
| | |
Maximum offering price per share (100/98.50 of $8.18) | | $ 8.30 |
Ultra-Short Bond:
Net Asset Value, offering price and redemption price per share ($249,219,578 ÷ 30,483,269 shares) | | $ 8.18 |
| | |
Institutional Class:
Net Asset Value, offering price and redemption price per share ($1,132,226 ÷ 138,496 shares) | | $ 8.18 |
See accompanying notes which are an integral part of the financial statements.
Semiannual Report
Statement of Operations
Six months ended January 31, 2011 (Unaudited) |
| | |
Investment Income | | |
Interest | | $ 970,530 |
| | |
Expenses | | |
Management fee | $ 414,427 | |
Transfer agent fees | 135,188 | |
Distribution and service plan fees | 15,743 | |
Fund wide operations fee | 44,130 | |
Independent trustees' compensation | 501 | |
Miscellaneous | 477 | |
Total expenses before reductions | 610,466 | |
Expense reductions | (74) | 610,392 |
Net investment income | | 360,138 |
Realized and Unrealized Gain (Loss) Net realized gain (loss) on: | | |
Investment securities: | | |
Unaffiliated issuers | (1,297,501) | |
Futures contracts | 13,056 | |
Total net realized gain (loss) | | (1,284,445) |
Change in net unrealized appreciation (depreciation) on: Investment securities | 2,201,141 | |
Futures contracts | (1,771) | |
Total change in net unrealized appreciation (depreciation) | | 2,199,370 |
Net gain (loss) | | 914,925 |
Net increase (decrease) in net assets resulting from operations | | $ 1,275,063 |
See accompanying notes which are an integral part of the financial statements.
Semiannual Report
Financial Statements - continued
Statement of Changes in Net Assets
| Six months ended
January 31, 2011
(Unaudited) | Year ended
July 31, 2010 |
Increase (Decrease) in Net Assets | | |
Operations | | |
Net investment income | $ 360,138 | $ 1,890,067 |
Net realized gain (loss) | (1,284,445) | (8,164,438) |
Change in net unrealized appreciation (depreciation) | 2,199,370 | 9,508,825 |
Net increase (decrease) in net assets resulting
from operations | 1,275,063 | 3,234,454 |
Distributions to shareholders from net investment income | (604,929) | (1,887,049) |
Share transactions - net increase (decrease) | 3,293,749 | 33,525,237 |
Redemption fees | 5,946 | 9,556 |
Total increase (decrease) in net assets | 3,969,829 | 34,882,198 |
| | |
Net Assets | | |
Beginning of period | 263,934,612 | 229,052,414 |
End of period (including distributions in excess of net investment income of $233,045 and undistributed net investment income of $11,746, respectively) | $ 267,904,441 | $ 263,934,612 |
See accompanying notes which are an integral part of the financial statements.
Semiannual Report
Financial Highlights - Class A
| Six months ended
January 31, 2011 | Years ended July 31, |
| (Unaudited) | 2010 | 2009 | 2008 | 2007 | 2006 |
Selected Per-Share Data | | | | | |
Net asset value, beginning of period | $ 8.15 | $ 8.11 | $ 8.26 | $ 9.82 | $ 10.02 | $ 10.03 |
Income from Investment Operations | | | | | | |
Net investment income E | .005 | .047 | .091 | .384 | .493 | .400 |
Net realized and unrealized gain (loss) | .027 | .040 | (.167) | (1.612) | (.198) | (.009) |
Total from investment operations | .032 | .087 | (.076) | (1.228) | .295 | .391 |
Distributions from net investment income | (.012) | (.047) | (.071) | (.294) | (.495) | (.401) |
Tax return of capital | - | - | (.003) | (.039) | - | - |
Total distributions | (.012) | (.047) | (.074) | (.333) | (.495) | (.401) |
Redemption fees added to paid in capital E | - G | - G | - G | .001 | - G | - G |
Net asset value, end of period | $ 8.17 | $ 8.15 | $ 8.11 | $ 8.26 | $ 9.82 | $ 10.02 |
Total Return B,C,D | .39% | 1.08% | (.92)% | (12.71)% | 2.97% | 3.97% |
Ratios to Average Net Assets F | | | | | |
Expenses before reductions | .62% A | .64% | .68% | .67% | .66% | .70% |
Expenses net of fee waivers, if any | .62% A | .64% | .68% | .67% | .66% | .70% |
Expenses net of all reductions | .62% A | .64% | .67% | .66% | .66% | .70% |
Net investment income | .11% A | .58% | 1.13% | 4.26% | 4.96% | 4.00% |
Supplemental Data | | | | | | |
Net assets, end of period (000 omitted) | $ 13,344 | $ 18,129 | $ 8,033 | $ 6,268 | $ 13,735 | $ 4,553 |
Portfolio turnover rate | 84% A | 95% | 92% | 11% | 29% | 39% |
A Annualized
B Total returns for periods of less than one year are not annualized.
C Total returns would have been lower had certain expenses not been reduced during the periods shown.
D Total returns do not include the effect of the sales charges.
E Calculated based on average shares outstanding during the period.
F Expense ratios reflect operating expenses of the class. Expenses before reductions do not reflect amounts reimbursed by the investment adviser or reductions from expense offset arrangements and do not represent the amount paid by the class during periods when reimbursements or reductions occur. Expenses net of fee waivers reflect expenses after reimbursement by the investment adviser but prior to reductions from expense offset arrangements. Expenses net of all reductions represent the net expenses paid by the class.
G Amount represents less than $.001 per share.
See accompanying notes which are an integral part of the financial statements.
Semiannual Report
Financial Highlights - Class T
| Six months ended
January 31, 2011 | Years ended July 31, |
| (Unaudited) | 2010 | 2009 | 2008 | 2007 | 2006 |
Selected Per-Share Data | | | | | |
Net asset value, beginning of period | $ 8.15 | $ 8.11 | $ 8.26 | $ 9.82 | $ 10.02 | $ 10.03 |
Income from Investment Operations | | | | | | |
Net investment income E | .003 | .044 | .090 | .377 | .491 | .404 |
Net realized and unrealized gain (loss) | .038 | .040 | (.168) | (1.607) | (.199) | (.011) |
Total from investment operations | .041 | .084 | (.078) | (1.230) | .292 | .393 |
Distributions from net investment income | (.011) | (.044) | (.069) | (.292) | (.492) | (.403) |
Tax return of capital | - | - | (.003) | (.039) | - | - |
Total distributions | (.011) | (.044) | (.072) | (.331) | (.492) | (.403) |
Redemption fees added to paid in capital E | - G | - G | - G | .001 | - G | - G |
Net asset value, end of period | $ 8.18 | $ 8.15 | $ 8.11 | $ 8.26 | $ 9.82 | $ 10.02 |
Total Return B,C,D | .50% | 1.03% | (.94)% | (12.72)% | 2.95% | 4.00% |
Ratios to Average Net Assets F | | | | | |
Expenses before reductions | .66% A | .68% | .69% | .69% | .69% | .68% |
Expenses net of fee waivers, if any | .66% A | .68% | .69% | .69% | .69% | .68% |
Expenses net of all reductions | .66% A | .68% | .69% | .69% | .69% | .68% |
Net investment income | .08% A | .54% | 1.11% | 4.23% | 4.93% | 4.03% |
Supplemental Data | | | | | | |
Net assets, end of period (000 omitted) | $ 4,208 | $ 5,334 | $ 3,114 | $ 2,910 | $ 4,818 | $ 4,624 |
Portfolio turnover rate | 84% A | 95% | 92% | 11% | 29% | 39% |
A Annualized
B Total returns for periods of less than one year are not annualized.
C Total returns would have been lower had certain expenses not been reduced during the periods shown.
D Total returns do not include the effect of the sales charges.
E Calculated based on average shares outstanding during the period.
F Expense ratios reflect operating expenses of the class. Expenses before reductions do not reflect amounts reimbursed by the investment adviser or reductions from expense offset arrangements and do not represent the amount paid by the class during periods when reimbursements or reductions occur. Expenses net of fee waivers reflect expenses after reimbursement by the investment adviser but prior to reductions from expense offset arrangements. Expenses net of all reductions represent the net expenses paid by the class.
G Amount represents less than $.001 per share.
See accompanying notes which are an integral part of the financial statements.
Semiannual Report
Financial Highlights - Ultra-Short Bond
| Six months ended
January 31, 2011 | Years ended July 31, |
| (Unaudited) | 2010 | 2009 | 2008 | 2007 | 2006 |
Selected Per-Share Data | | | | | |
Net asset value, beginning of period | $ 8.15 | $ 8.11 | $ 8.26 | $ 9.81 | $ 10.02 | $ 10.03 |
Income from Investment Operations | | | | | | |
Net investment income D | .012 | .063 | .111 | .404 | .516 | .427 |
Net realized and unrealized gain (loss) | .037 | .040 | (.169) | (1.603) | (.210) | (.011) |
Total from investment operations | .049 | .103 | (.058) | (1.199) | .306 | .416 |
Distributions from net investment income | (.019) | (.063) | (.088) | (.310) | (.516) | (.426) |
Tax return of capital | - | - | (.004) | (.042) | - | - |
Total distributions | (.019) | (.063) | (.092) | (.352) | (.516) | (.426) |
Redemption fees added to paid in capital D | - F | - F | - F | .001 | - F | - F |
Net asset value, end of period | $ 8.18 | $ 8.15 | $ 8.11 | $ 8.26 | $ 9.81 | $ 10.02 |
Total Return B,C | .61% | 1.27% | (.70)% | (12.42)% | 3.09% | 4.23% |
Ratios to Average Net Assets E | | | | | |
Expenses before reductions | .45% A | .45% | .45% | .45% | .45% | .45% |
Expenses net of fee waivers, if any | .45% A | .45% | .45% | .45% | .45% | .45% |
Expenses net of all reductions | .45% A | .45% | .44% | .45% | .45% | .45% |
Net investment income | .29% A | .77% | 1.36% | 4.47% | 5.17% | 4.26% |
Supplemental Data | | | | | | |
Net assets, end of period (000 omitted) | $ 249,220 | $ 239,266 | $ 217,282 | $ 315,401 | $ 974,602 | $ 850,329 |
Portfolio turnover rate | 84% A | 95% | 92% | 11% | 29% | 39% |
A Annualized
B Total returns for periods of less than one year are not annualized.
C Total returns would have been lower had certain expenses not been reduced during the periods shown.
D Calculated based on average shares outstanding during the period.
E Expense ratios reflect operating expenses of the class. Expenses before reductions do not reflect amounts reimbursed by the investment adviser or reductions from expense offset arrangements and do not represent the amount paid by the class during periods when reimbursements or reductions occur. Expenses net of fee waivers reflect expenses after reimbursement by the investment adviser but prior to reductions from expense offset arrangements. Expenses net of all reductions represent the net expenses paid by the class.
F Amount represents less than $.001 per share.
See accompanying notes which are an integral part of the financial statements.
Semiannual Report
Financial Highlights - Institutional Class
| Six months ended
January 31, 2011 | Years ended July 31, |
| (Unaudited) | 2010 | 2009 | 2008 | 2007 | 2006 |
Selected Per-Share Data | | | | | |
Net asset value, beginning of period | $ 8.15 | $ 8.11 | $ 8.26 | $ 9.81 | $ 10.02 | $ 10.03 |
Income from Investment Operations | | | | | | |
Net investment income D | .010 | .057 | .102 | .416 | .510 | .420 |
Net realized and unrealized gain (loss) | .038 | .040 | (.168) | (1.619) | (.206) | (.008) |
Total from investment operations | .048 | .097 | (.066) | (1.203) | .304 | .412 |
Distributions from net investment income | (.018) | (.057) | (.081) | (.306) | (.514) | (.422) |
Tax return of capital | - | - | (.003) | (.042) | - | - |
Total distributions | (.018) | (.057) | (.084) | (.348) | (.514) | (.422) |
Redemption fees added to paid in capital D | - F | - F | - F | .001 | - F | - F |
Net asset value, end of period | $ 8.18 | $ 8.15 | $ 8.11 | $ 8.26 | $ 9.81 | $ 10.02 |
Total Return B,C | .59% | 1.20% | (.80)% | (12.46)% | 3.06% | 4.19% |
Ratios to Average Net Assets E | | | | | |
Expenses before reductions | .48% A | .52% | .58% | .48% | .48% | .49% |
Expenses net of fee waivers, if any | .48% A | .52% | .55% | .48% | .48% | .49% |
Expenses net of all reductions | .48% A | .52% | .54% | .48% | .48% | .49% |
Net investment income | .25% A | .70% | 1.26% | 4.44% | 5.14% | 4.22% |
Supplemental Data | | | | | | |
Net assets, end of period (000 omitted) | $ 1,132 | $ 1,206 | $ 623 | $ 594 | $ 8,312 | $ 1,987 |
Portfolio turnover rate | 84% A | 95% | 92% | 11% | 29% | 39% |
A Annualized
B Total returns for periods of less than one year are not annualized.
C Total returns would have been lower had certain expenses not been reduced during the periods shown.
D Calculated based on average shares outstanding during the period.
E Expense ratios reflect operating expenses of the class. Expenses before reductions do not reflect amounts reimbursed by the investment adviser or reductions from expense offset arrangements and do not represent the amount paid by the class during periods when reimbursements or reductions occur. Expenses net of fee waivers reflect expenses after reimbursement by the investment adviser but prior to reductions from expense offset arrangements. Expenses net of all reductions represent the net expenses paid by the class.
F Amount represents less than $.001 per share.
See accompanying notes which are an integral part of the financial statements.
Semiannual Report
Notes to Financial Statements
For the period ended January 31, 2011 (Unaudited)
1. Organization.
Fidelity Ultra-Short Bond Fund (the Fund) is a fund of Fidelity Income Fund (the Trust) and is authorized to issue an unlimited number of shares. The Trust is registered under the Investment Company Act of 1940, as amended (the 1940 Act), as an open-end management investment company organized as a Massachusetts business trust. The Fund offers Class A, Class T, Ultra-Short Bond and Institutional Class shares, each of which has equal rights as to assets and voting privileges. Each class has exclusive voting rights with respect to matters that affect that class. Investment income, realized and unrealized capital gains and losses, the common expenses of the Fund, and certain fund-level expense reductions, if any, are allocated on a pro-rata basis to each class based on the relative net assets of each class to the total net assets of the Fund. Each class differs with respect to transfer agent and distribution and service plan fees incurred. Certain expense reductions may also differ by class.
2. Significant Accounting Policies.
The financial statements have been prepared in conformity with accounting principles generally accepted in the United States of America (GAAP), which require management to make certain estimates and assumptions at the date of the financial statements. Actual results could differ from those estimates. Subsequent events, if any, through the date that the financial statements were issued have been evaluated in the preparation of the financial statements. The following summarizes the significant accounting policies of the Fund:
Security Valuation. Investments are valued as of 4:00 p.m. Eastern time on the last calendar day of the period. The Fund uses independent pricing services approved by the Board of Trustees to value its investments. When current market prices or quotations are not readily available or reliable, valuations may be determined in good faith in accordance with procedures adopted by the Board of Trustees. Factors used in determining value may include market or security specific events, changes in interest rates and credit quality. The frequency with which these procedures are used cannot be predicted and they may be utilized to a significant extent. The value used for net asset value (NAV) calculation under these procedures may differ from published prices for the same securities.
The Fund categorizes the inputs to valuation techniques used to value its investments into a disclosure hierarchy consisting of three levels as shown below.
Level 1 - quoted prices in active markets for identical investments
Level 2 - other significant observable inputs (including quoted prices for similar investments, interest rates, prepayment speeds, etc.)
Level 3 - unobservable inputs (including the Fund's own assumptions based on the best information available)
Semiannual Report
Notes to Financial Statements (Unaudited) - continued
2. Significant Accounting Policies - continued
Security Valuation - continued
Changes in valuation techniques may result in transfers in or out of an assigned level within the disclosure hierarchy. The aggregate value of investments by input level, as of January 31, 2011, for the Fund's investments, as well as a roll forward of Level 3 securities, is included at the end of the Fund's Schedule of Investments. Valuation techniques used to value the Fund's investments by major category are as follows.
Debt securities, including restricted securities, are valued based on evaluated prices received from independent pricing services or from dealers who make markets in such securities. For corporate bonds, bank notes, foreign government and government agency obligations, municipal securities, U.S. government and government agency obligations and certificates of deposit, pricing services utilize matrix pricing which considers yield or price of bonds of comparable quality, coupon, maturity and type as well as dealer supplied prices and are generally categorized as Level 2 in the hierarchy. For asset backed securities, collateralized mortgage obligations, commercial mortgage securities and U.S. government agency mortgage securities, pricing services utilize matrix pricing which considers prepayment speed assumptions, attributes of the collateral, yield or price of bonds of comparable quality, coupon, maturity and type as well as dealer supplied prices and, accordingly, such securities are generally categorized as Level 2 in the hierarchy. Short-term securities with remaining maturities of sixty days or less for which quotations are not readily available are valued at amortized cost, which approximates fair value and are categorized as Level 2 in the hierarchy.
When independent prices are unavailable or unreliable, debt securities may be valued utilizing pricing matrices which consider similar factors that would be used by independent pricing services. These are generally categorized as Level 2 in the hierarchy but may be Level 3 depending on the circumstances.
Futures contracts are valued at the settlement price established each day by the board of trade or exchange on which they are traded and are categorized as Level 1 in the hierarchy.
Investment Transactions and Income. For financial reporting purposes, the Fund's investment holdings and NAV include trades executed through the end of the last business day of the period. The NAV per share for processing shareholder transactions is calculated as of the close of business of the New York Stock Exchange (NYSE), normally 4:00 p.m. Eastern time and includes trades executed through the end of the prior business day. Gains and losses on securities sold are determined on the basis of identified cost. Interest income is accrued as earned. Interest income includes coupon interest and
Semiannual Report
2. Significant Accounting Policies - continued
Investment Transactions and Income - continued
amortization of premium and accretion of discount on debt securities. The principal value on inflation-indexed securities is periodically adjusted to the rate of inflation and interest is accrued based on the principal value. The adjustments to principal due to inflation are reflected as increases or decreases to interest income even though principal is not received until maturity. Debt obligations may be placed on non-accrual status and related interest income may be reduced by ceasing current accruals and writing off interest receivables when the collection of all or a portion of interest has become doubtful based on consistently applied procedures. A debt obligation is removed from non-accrual status when the issuer resumes interest payments or when collectability of interest is reasonably assured.
Expenses. Expenses directly attributable to a fund are charged to that fund. Expenses attributable to more than one fund are allocated among the respective funds on the basis of relative net assets or other appropriate methods. Expense estimates are accrued in the period to which they relate and adjustments are made when actual amounts are known.
Income Tax Information and Distributions to Shareholders. Each year the Fund intends to qualify as a regulated investment company, including distributing substantially all of its taxable income and realized gains under Subchapter M of the Internal Revenue Code and filing its U.S. federal tax return. As a result, no provision for income taxes is required. A fund's federal tax return is subject to examination by the Internal Revenue Service (IRS) for a period of three years.
Dividends are declared and recorded daily and paid monthly from net investment income. Distributions from realized gains, if any, are declared and recorded on the ex-dividend date. Income dividends and capital gain distributions are declared separately for each class. Income and capital gain distributions are determined in accordance with income tax regulations, which may differ from GAAP.
Capital accounts within the financial statements are adjusted for permanent book-tax differences. These adjustments have no impact on net assets or the results of operations. Temporary book-tax differences will reverse in a subsequent period.
Book-tax differences are primarily due to futures transactions, market discount, capital loss carryforwards and losses deferred due to excise tax regulations.
Semiannual Report
Notes to Financial Statements (Unaudited) - continued
2. Significant Accounting Policies - continued
Income Tax Information and Distributions to Shareholders - continued
The federal tax cost of investment securities and unrealized appreciation (depreciation) as of period end were as follows:
Gross unrealized appreciation | $ 602,393 |
Gross unrealized depreciation | (3,677,239) |
Net unrealized appreciation (depreciation) on securities and other investments | $ (3,074,846) |
| |
Tax cost | $ 272,487,969 |
Short-Term Trading (Redemption) Fees. Shares held by investors in the Fund less than 60 days are subject to a redemption fee equal to .25% of the net asset value of shares redeemed. All redemption fees, which reduce the proceeds of the shareholder redemption, are retained by the Fund and accounted for as an addition to paid in capital.
3. Operating Policies.
Repurchase Agreements. Fidelity Management & Research Company (FMR) has received an Exemptive Order from the Securities and Exchange Commission (the SEC) which permits the Fund and other affiliated entities of FMR to transfer uninvested cash balances into joint trading accounts which are then invested in repurchase agreements. The Fund may also invest directly with institutions in repurchase agreements. Repurchase agreements are collateralized by government or non-government securities. Upon settlement date, collateral is held in segregated accounts with custodian banks and may be obtained in the event of a default of the counterparty. The Fund monitors, on a daily basis, the value of the collateral to ensure it is at least equal to the principal amount of the repurchase agreement (including accrued interest). In the event of a default by the counterparty, realization of the collateral proceeds could be delayed, during which time the value of the collateral may decline.
Restricted Securities. The Fund may invest in securities that are subject to legal or contractual restrictions on resale. These securities generally may be resold in transactions exempt from registration or to the public if the securities are registered. Disposal of these securities may involve time-consuming negotiations and expense, and prompt sale at an acceptable price may be difficult. Information regarding restricted securities is included at the end of the Fund's Schedule of Investments.
Semiannual Report
4. Derivative Instruments.
Risk Exposures and the Use of Derivative Instruments. The Fund used derivative instruments (derivatives), including futures contracts, in order to meet its investment objectives. The strategy is to use derivatives to increase returns and to manage exposure to certain risks as defined below. The success of any strategy involving derivatives depends on analysis of numerous economic factors, and if the strategies for investment do not work as intended, the Fund may not achieve its objectives.
The Fund's use of derivatives increased or decreased its exposure to the following risk:
Interest Rate Risk | Interest rate risk relates to the fluctuations in the value of interest-bearing securities due to changes in the prevailing levels of market interest rates. |
The Fund is also exposed to additional risks from investing in derivatives, such as liquidity risk and counterparty credit risk. Liquidity risk is the risk that the Fund will be unable to sell the derivative in the open market in a timely manner. Counterparty credit risk is the risk that the counterparty will not be able to fulfill its obligation to the Fund. The Fund's maximum risk of loss from counterparty credit risk is generally the aggregate unrealized appreciation and unpaid counterparty fees in excess of any collateral pledged by the counterparty to the Fund. Counterparty risk related to exchange-traded futures contracts is minimal because of the protection provided by the exchange on which they trade. Derivatives involve, to varying degrees, risk of loss in excess of the amounts recognized in the Statement of Assets and Liabilities.
Futures Contracts. A futures contract is an agreement between two parties to buy or sell a specified underlying instrument for a fixed price at a specified future date. The Fund used futures contracts to manage its exposure to the bond market, and to fluctuations in interest rates.
Upon entering into a futures contract, a fund is required to deposit either cash or securities (initial margin) with a clearing broker in an amount equal to a certain percentage of the face value of the contract. Futures contracts are marked-to-market daily and subsequent payments (variation margin) are made or received by a fund depending on the daily fluctuations in the value of the futures contracts and are recorded as unrealized appreciation or (depreciation). Realized gain or (loss) is recorded upon the expiration or closing of a futures contract.
The underlying face amount at value of open futures contracts at period end is shown in the Schedule of Investments under the caption "Futures Contracts." This amount reflects each contract's exposure to the underlying instrument at period end and is representative of activity for the period. Securities deposited to meet initial margin requirements
Semiannual Report
Notes to Financial Statements (Unaudited) - continued
4. Derivative Instruments - continued
Futures Contracts - continued
are identified in the Schedule of Investments. The receivable and/or payable for the variation margin are reflected in the Statement of Assets and Liabilities.
Certain risks arise upon entering into futures contracts, including the risk that an illiquid market limits the ability to close out a futures contract prior to settlement date.
During the period the Fund recognized net realized gain (loss) of $13,056 and a change in net unrealized appreciation (depreciation) of $(1,771) related to its investment in futures contracts. These amounts are included in the Statement of Operations.
5. Purchases and Sales of Investments.
Purchases and sales of securities, other than short-term securities and U.S. government securities, aggregated $72,320,730 and $54,784,503, respectively.
6. Fees and Other Transactions with Affiliates.
Management Fee. FMR and its affiliates provide the Fund with investment management related services for which the Fund pays a monthly management fee. The management fee is the sum of an individual fund fee rate that is based on an annual rate of .20% of the Fund's average net assets and a group fee rate that averaged .12% during the period. The group fee rate is based upon the average net assets of all the mutual funds advised by FMR. The group fee rate decreases as assets under management increase and increases as assets under management decrease. For the period, the total annualized management fee rate was .32% of the Fund's average net assets.
Distribution and Service Plan Fees. In accordance with Rule 12b-1 of the 1940 Act, the Fund has adopted separate Distribution and Service Plans for each class of shares. Certain classes pay Fidelity Distributors Corporation (FDC), an affiliate of FMR, separate Distribution and Service Fees, each of which is based on an annual percentage of each class' average net assets. In addition, FDC may pay financial intermediaries for selling shares of the Fund and providing shareholder support services. For the period, the Distribution and Service Fee rates, total fees and amounts retained by FDC were as follows:
| Distribution
Fee | Service
Fee | Paid
to FDC | Retained
by FDC |
Class A | 0% | .15% | $ 12,188 | $ 1,101 |
Class T | 0% | .15% | 3,555 | - |
| | | $ 15,743 | $ 1,101 |
Semiannual Report
6. Fees and Other Transactions with Affiliates - continued
Sales Load. FDC receives a front-end sales charge of up to 1.50% for selling Class A and Class T shares, some of which is paid to financial intermediaries for selling shares of the Fund. FDC receives the proceeds of a contingent deferred sales charges levied on Class A and Class T redemptions. These charges depend on the holding period. The deferred sales charges range from .75% for certain purchases of Class A shares and .25% for certain purchases of Class T shares.
For the period, sales charge amounts retained by FDC were as follows:
| Retained
by FDC |
Class A | $ 4,152 |
Class T | 197 |
| $ 4,349 |
Transfer Agent Fees. Fidelity Investments Institutional Operations Company, Inc. (FIIOC), an affiliate of FMR, is the transfer, dividend disbursing and shareholder servicing agent for each class of the Fund. FIIOC receives account fees and asset-based fees that vary according to the account size and type of account of the shareholders of each respective class of the Fund, with the exception of Ultra-Short Bond. FIIOC receives an asset-based fee of .10% of Ultra-Short Bond's average net assets. FIIOC pays for typesetting, printing and mailing of shareholder reports, except proxy statements. For the period, transfer agent fees for each class were as follows:
| Amount | % of
Average
Net Assets* |
Class A | $ 10,441 | .13 |
Class T | 3,843 | .16 |
Ultra-Short Bond | 120,034 | .10 |
Institutional Class | 870 | .14 |
| $ 135,188 | |
* Annualized
Fund Wide Operations Fee. Pursuant to the Fund Wide Operations and Expense Agreement (FWOE), FMR has agreed to provide for fund level expenses (which do not include transfer agent, Rule 12b-1 fees, compensation of the independent Trustees, interest (including commitment fees), taxes or extraordinary expenses, if any) in return for a FWOE fee equal to .35% less the total amount of the management fee. The FWOE paid by the Fund is reduced by an amount equal to the fees and expenses paid to the independent Trustees. For the period, the FWOE fee was equivalent to an annualized rate of .03% of average net assets.
Semiannual Report
Notes to Financial Statements (Unaudited) - continued
7. Committed Line of Credit.
The Fund participates with other funds managed by FMR or an affiliate in a $3.75 billion credit facility (the "line of credit") to be utilized for temporary or emergency purposes to fund shareholder redemptions or for other short-term liquidity purposes. The Fund has agreed to pay commitment fees on its pro-rata portion of the line of credit, which amounted to $477 and is reflected in Miscellaneous expenses on the Statement of Operations. During the period, there were no borrowings on this line of credit.
8. Expense Reductions.
Through arrangements with the Fund's custodian, credits realized as a result of uninvested cash balances were used to reduce the Fund's expenses. During the period, these credits reduced the Fund's expenses by $74.
9. Distributions to Shareholders.
Distributions to shareholders of each class were as follows:
| Six months ended
January 31, 2011 | Year ended
July 31, 2010 |
From net investment income | | |
Class A | $ 26,485 | $ 70,804 |
Class T | 6,774 | 19,435 |
Ultra-Short Bond | 568,894 | 1,791,150 |
Institutional Class | 2,776 | 5,660 |
Total | $ 604,929 | $ 1,887,049 |
10. Share Transactions.
Transactions for each class of shares were as follows:
| Shares | Dollars |
| Six months ended
January 31, 2011 | Year ended
July 31, 2010 | Six months ended
January 31, 2011 | Year ended
July 31, 2010 |
Class A | | | | |
Shares sold | 512,483 | 1,996,126 | $ 4,183,693 | $ 16,257,557 |
Reinvestment of distributions | 2,369 | 6,739 | 19,343 | 54,896 |
Shares redeemed | (1,105,851) | (770,234) | (9,032,924) | (6,273,379) |
Net increase (decrease) | (590,999) | 1,232,631 | $ (4,829,888) | $ 10,039,074 |
Class T | | | | |
Shares sold | 37,318 | 590,657 | $ 304,769 | $ 4,813,729 |
Reinvestment of distributions | 738 | 2,161 | 6,027 | 17,605 |
Shares redeemed | (177,433) | (322,791) | (1,449,408) | (2,628,531) |
Net increase (decrease) | (139,377) | 270,027 | $ (1,138,612) | $ 2,202,803 |
Semiannual Report
10. Share Transactions - continued
Transactions for each class of shares were as follows: - continued
| Shares | Dollars |
| Six months ended
January 31, 2011 | Year ended
July 31, 2010 | Six months ended
January 31, 2011 | Year ended
July 31, 2010 |
Ultra-Short Bond | | | | |
Shares sold | 5,520,778 | 9,420,448 | $ 45,102,197 | $ 76,695,898 |
Reinvestment of distributions | 67,305 | 211,789 | 549,679 | 1,725,137 |
Shares redeemed | (4,446,034) | (7,087,084) | (36,312,399) | (57,716,904) |
Net increase (decrease) | 1,142,049 | 2,545,153 | $ 9,339,477 | $ 20,704,131 |
Institutional Class | | | | |
Shares sold | 46,527 | 142,602 | $ 380,060 | $ 1,161,563 |
Reinvestment of distributions | 239 | 362 | 1,954 | 2,947 |
Shares redeemed | (56,207) | (71,879) | (459,242) | (585,281) |
Net increase (decrease) | (9,441) | 71,085 | $ (77,228) | $ 579,229 |
11. Other.
The Fund's organizational documents provide former and current trustees and officers with a limited indemnification against liabilities arising in connection with the performance of their duties to the Fund. In the normal course of business, the Fund may also enter into contracts that provide general indemnifications. The Fund's maximum exposure under these arrangements is unknown as this would be dependent on future claims that may be made against the Fund. The risk of material loss from such claims is considered remote.
Semiannual Report
Board Approval of Investment Advisory Contracts and Management Fees
Fidelity Ultra-Short Bond Fund
Each year, the Board of Trustees, including the Independent Trustees (together, the Board), votes on the renewal of the management contract and sub-advisory agreements (together, the Advisory Contracts) for the fund. The Board, assisted by the advice of fund counsel and Independent Trustees' counsel, requests and considers a broad range of information relevant to the renewal of the Advisory Contracts throughout the year.
The Board meets regularly and considers at each of its meetings factors that are relevant to its annual consideration of the renewal of the fund's Advisory Contracts, including the services and support provided to the fund and its shareholders. The Board has established three standing committees, each composed of Independent Trustees with varying backgrounds, to which the Board has assigned specific subject matter responsibilities in order to enhance effective decision-making by the Board. The Operations Committee, of which all of the Independent Trustees are members, meets regularly throughout the year and, among other matters, considers matters specifically related to the annual consideration of the renewal of the fund's Advisory Contracts. The Board, acting directly and through its Committees, requests and receives information concerning the annual consideration of the renewal of the fund's Advisory Contracts. The Board also meets as needed to consider matters specifically related to the Board's annual consideration of the renewal of Advisory Contracts. Members of the Board may also meet with trustees of other Fidelity funds through ad hoc joint committees to discuss certain matters relevant to the Fidelity funds.
At its September 2010 meeting, the Board of Trustees, including the Independent Trustees, unanimously determined to renew the fund's Advisory Contracts. In reaching its determination, the Board considered all factors it believed relevant, including (i) the nature, extent, and quality of the services to be provided to the fund and its shareholders (including the investment performance of the fund); (ii) the competitiveness of the fund's management fee and total expenses; (iii) the total costs of the services to be provided by and the profits to be realized by Fidelity from its relationship with the fund; (iv) the extent to which economies of scale would be realized as the fund grows; and (v) whether fee levels reflect these economies of scale, if any, for the benefit of fund shareholders.
In considering whether to renew the Advisory Contracts for the fund, the Board reached a determination, with the assistance of fund counsel and Independent Trustees' counsel and through the exercise of its business judgment, that the renewal of the Advisory Contracts is in the best interests of the fund and its shareholders and that the compensation to be received by Fidelity under the management contract is fair and reasonable. The Board's decision to renew the Advisory Contracts was not based on any single factor, but rather was based on a comprehensive consideration of all the information provided to the Board at its meetings throughout the year. The Board, in reaching its determination to renew the Advisory Contracts, is aware that shareholders in the fund have a broad range of investment choices available to them, including a wide choice among mutual funds offered by Fidelity's competitors, and that the fund's shareholders, with the opportunity to review and weigh the disclosure provided by the fund in its prospectus and other public disclosures, have chosen to invest in this fund, managed by Fidelity.
Semiannual Report
Nature, Extent, and Quality of Services Provided. The Board considered the staffing within the investment adviser, FMR, and the sub-advisers (together, the Investment Advisers), including the backgrounds of the fund's investment personnel and the fund's investment objective and discipline. The Independent Trustees also had discussions with senior management of Fidelity's investment operations and investment groups. The Board considered the structure of the portfolio manager compensation program and whether this structure provides appropriate incentives to act in the best interest of the fund.
Resources Dedicated to Investment Management and Support Services. The Board reviewed the size, education, and experience of the Investment Advisers' investment staff, their use of technology, and the Investment Advisers' approach to recruiting, training, and retaining portfolio managers and other research, advisory, and management personnel. The Board noted that Fidelity's analysts have access to a variety of technological tools and market and securities data that enable them to perform both fundamental and quantitative analysis and to specialize in various disciplines. The Board considered Fidelity's extensive global research capabilities that enable the Investment Advisers to aggregate data from various sources in an effort to produce positive investment results. The Board also considered that Fidelity's portfolio managers and analysts have access to daily portfolio attribution that allows for monitoring of a fund's portfolio, as well as an electronic communication system that provides immediate real-time access to research concerning issuers and credit enhancers. In addition, the Board considered the trading resources that are an integral part of the fixed-income portfolio management investment process.
Shareholder and Administrative Services. The Board considered (i) the nature, extent, quality, and cost of advisory, administrative, and shareholder services performed by the Investment Advisers and their affiliates under the Advisory Contracts and under separate agreements covering transfer agency, pricing and bookkeeping, and securities lending services for the fund; (ii) the nature and extent of the investment adviser's supervision of third party service providers, principally custodians and subcustodians; and (iii) the resources devoted to, and the record of compliance with, the fund's compliance policies and procedures.
The Board noted that the growth of fund assets over time across the complex allows Fidelity to reinvest in the development of services designed to enhance the value or convenience of the Fidelity funds as investment vehicles. These services include 24-hour access to account information and market information through telephone representatives and over the Internet, and investor education materials and asset allocation tools.
Semiannual Report
Board Approval of Investment Advisory Contracts and
Management Fees - continued
Investment in a Large Fund Family. The Board considered the benefits to shareholders of investing in a Fidelity fund, including the benefits of investing in a fund that is part of a large family of funds offering a variety of investment disciplines and providing a large variety of mutual fund investor services. The Board noted that Fidelity had taken, or had made recommendations that resulted in the Fidelity funds taking, a number of actions over the previous year that benefited particular funds, including (i) dedicating additional resources to investment research and restructuring and broadening the focus of the investment research teams; (ii) bolstering the senior management team that oversees asset management; (iii) launching Class F of certain funds as a lower-fee class available to Freedom K and Freedom Index Funds; (iv) lowering the initial investment minimums and ongoing balance requirements for Real Estate High Income Fund; (v) eliminating subsequent purchase minimums for all funds and adding a waiver of the investment minimum requirement for new accounts opened with the proceeds of a systematic withdrawal plan; (vi) eliminating the withdrawal minimum and maximum limits for systematic withdrawals from Advisor funds; (vii) expanding sales load waivers on Class A shares for Destiny Planholders and expanding Institutional Class eligibility for Class O Destiny Planholders; and (viii) changing certain Class A and Class T sales charge structures to further align them with industry practices.
Investment Performance. The Board considered whether the fund has operated in accordance with its investment objective, as well as its record of compliance with its investment restrictions. It also reviewed the fund's absolute investment performance for each class, as well as the fund's relative investment performance for each class measured over multiple periods against (i) a broad-based securities market index, and (ii) a peer group of mutual funds deemed appropriate by Fidelity and reviewed by the Board. The following charts considered by the Board show, over the one-, three-, and five-year periods ended December 31, 2009, the cumulative total returns of the retail class and Class T of the fund, the cumulative total returns of a broad-based securities market index ("benchmark"), and a range of cumulative total returns of a peer group of mutual funds identified by Lipper Inc. as having an investment objective similar to that of the fund. The returns of the retail class and Class T show the performance of the highest and lowest performing classes, respectively (based on five-year performance). The box within each chart shows the 25th percentile return (bottom of box) and the 75th percentile return (top of box) of the peer group. Returns shown above the box are in the first quartile and returns shown below the box are in the fourth quartile. The percentage beaten numbers noted below each chart correspond to the percentile box and represent the percentage of funds in the peer group whose performance was equal to or lower than that of the class indicated.
Semiannual Report
Fidelity Ultra-Short Bond Fund
The Board reviewed the fund's relative investment performance against its peer group and noted that the performance of the retail class of the fund was in the fourth quartile for all the periods shown. The Board also noted that the investment performance of the fund was lower than its benchmark for all the periods shown. The Board considered that the variations in performance among the fund's classes reflect the variations in class expenses, which result in lower performance for higher expense classes. The Board discussed with FMR actions that have been taken by FMR to improve the fund's disappointing performance and how investment personnel evaluate potential for incremental return against the risks involved in obtaining that incremental return. The Board considered the steps that FMR has taken to strengthen and refine its risk management processes in light of recent credit events that have affected various sectors of the fixed-income markets. The Board noted that this fund had underperformed in 2008 and discussed with FMR its disappointment with the continued underperformance of the fund. The Board also reviewed the fund's performance since inception as well as performance in the current year. The Board will continue to closely monitor the performance of the fund in the coming year and discuss with FMR other appropriate actions to address the performance of the fund.
Based on its review, and giving particular weight to the nature and quality of the resources dedicated by the Investment Advisers to maintain and improve relative performance and factoring in the unprecedented market events in recent years, the Board concluded that the nature, extent, and quality of investment management and support services and of shareholder and administrative services provided to the fund will benefit the fund's shareholders, particularly in light of the Board's view that the fund's shareholders benefit from investing in a fund that is part of a large family of funds offering a variety of investment disciplines and services.
Semiannual Report
Board Approval of Investment Advisory Contracts and
Management Fees - continued
Competitiveness of Management Fee and Total Fund Expenses. The Board considered the fund's management fee and total expenses compared to "mapped groups" of competitive funds and classes. Fidelity creates "mapped groups" by combining similar Lipper investment objective categories that have comparable management fee characteristics. Combining Lipper investment objective categories aids the Board's management fee and total expense comparisons by broadening the competitive group used for comparison and by reducing the number of universes to which various Fidelity funds are compared.
Management Fee. The Board considered two proprietary management fee comparisons for the 12-month periods shown in the chart below. The group of Lipper funds used by the Board for management fee comparisons is referred to below as the "Total Mapped Group" and, for the reasons explained above, is broader than the Lipper peer group used by the Board for performance comparisons. The Total Mapped Group comparison focuses on a fund's standing relative to the total universe of comparable funds available to investors, in terms of gross management fees before expense reimbursements or caps. "TMG %" represents the percentage of funds in the Total Mapped Group that had management fees that were lower than the fund's. For example, a TMG % of 22% means that 78% of the funds in the Total Mapped Group had higher management fees than the fund. The "Asset-Size Peer Group" (ASPG) comparison focuses on a fund's standing relative to non-Fidelity funds similar in size to the fund within the Total Mapped Group. The ASPG represents at least 15% of the funds in the Total Mapped Group with comparable asset size and management fee characteristics, subject to a minimum of 50 funds (or all funds in the Total Mapped Group if fewer than 50). Additional information, such as the ASPG quartile in which the fund's management fee ranked, is also included in the chart and considered by the Board.
Semiannual Report
Fidelity Ultra-Short Bond Fund
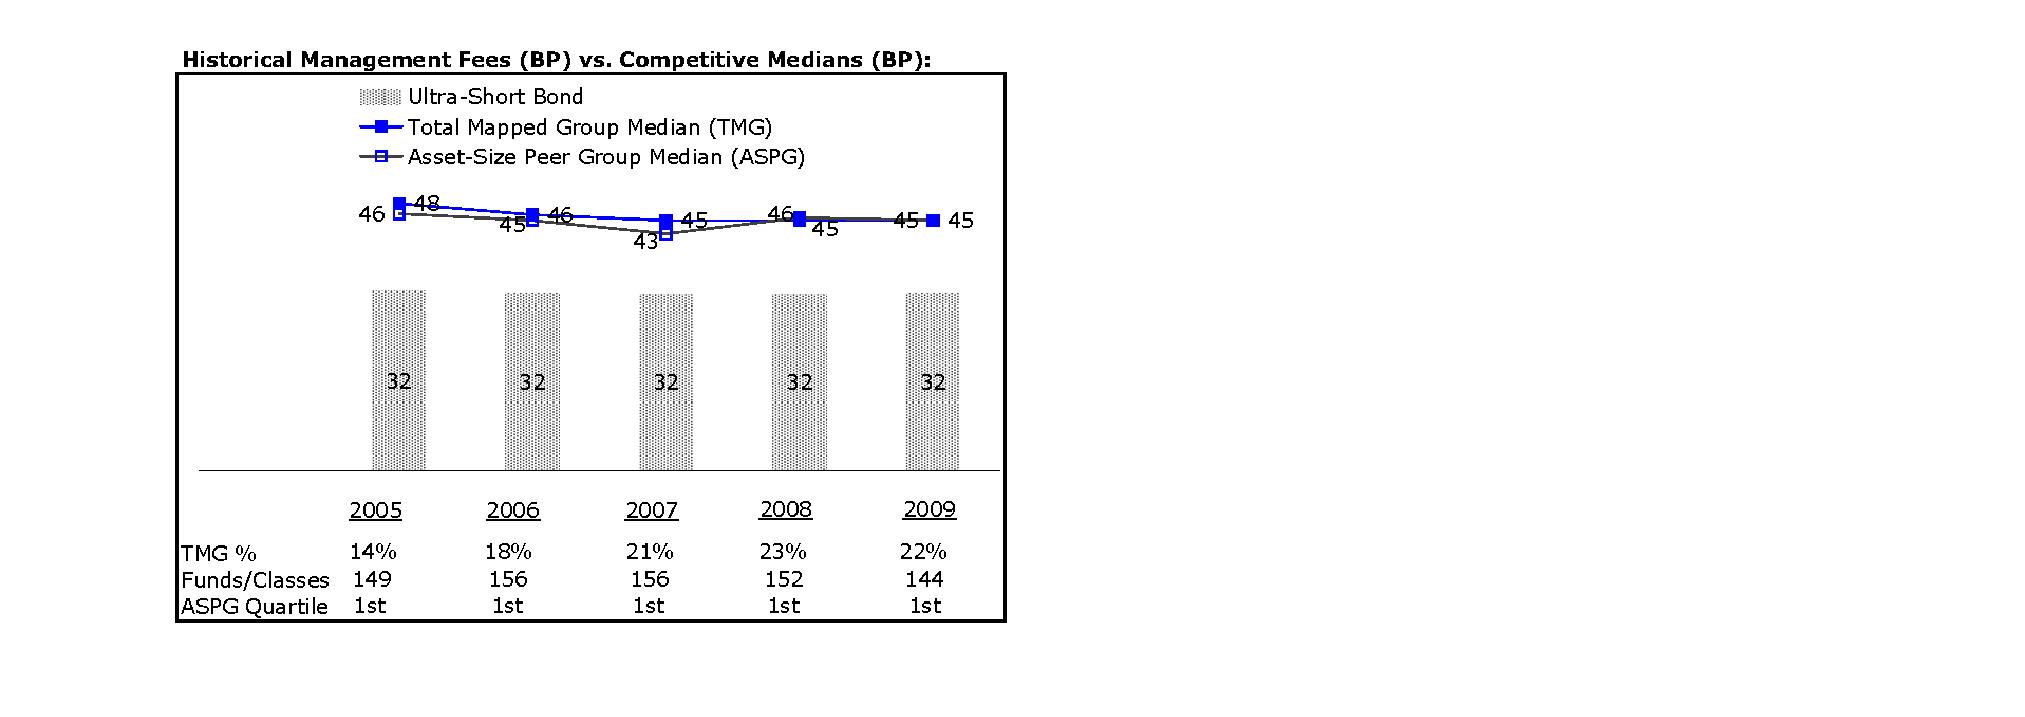
The Board noted that the fund's management fee ranked below the median of its Total Mapped Group and below the median of its ASPG for 2009.
Furthermore, the Board considered that it had approved an amendment (effective June 1, 2005) to the fund's management contract that lowered the fund's individual fund fee rate from 30 basis points to 20 basis points. The Board considered that the chart reflects the fund's lower management fee for 2005, as if the lower rate were in effect for the entire year.
Based on its review, the Board concluded that the fund's management fee is fair and reasonable in light of the services that the fund receives and the other factors considered.
Total Expenses. In its review of each class's total expenses, the Board considered the fund's management fee as well as other fund or class expenses, as applicable, such as transfer agent fees, pricing and bookkeeping fees, fund-paid 12b-1 fees, and custodial, legal, and audit fees. The Board also noted the effects of any waivers and reimbursements on fees and expenses. As part of its review, the Board also considered current and historical total expenses of each class of the fund compared to competitive fund median expenses. Each class of the fund is compared to those funds and classes in the Total Mapped Group (used by the Board for management fee comparisons) that have a similar sales load structure.
The Board also considered that the current contractual arrangements for the fund (i) have the effect of setting the total "fund-level" expenses (including, among certain other expenses, the management fee) for each class at 35 basis points, (ii) lower and limit the "class-level" transfer agent fee for the retail class to 10 basis points, and (iii) limit the total expenses for the retail class to 45 basis points. The fees and expenses payable under these contractual arrangements may not be increased without the approval of the Board and the shareholders of the applicable class. The fund's Advisor classes are subject to different "class-level" expenses (transfer agent fees and 12b-1 fees).
Semiannual Report
Board Approval of Investment Advisory Contracts and
Management Fees - continued
The Board noted that the total expenses of each of Class A, Class T, and the retail class ranked below its competitive median for 2009 and the total expenses of Institutional Class ranked above its competitive median for 2009. The Board noted that Institutional Class has a significantly lower investment minimum than certain funds and classes in the Total Mapped Group that have a similar sales load structure and that, when compared to funds with the same or lower investment minimum, Institutional Class ranked equal to its median for 2009. The Board noted that the fund offers multiple classes, each of which has a different sales load and 12b-1 fee structure, and that the multiple structures are intended to offer a range of pricing options for the intermediary market. The Board also noted that the total expenses of the classes vary primarily by the level of their 12b-1 fees, although differences in transfer agent fees may also cause expenses to vary from class to class.
The Board recognized that the fund's management contract incorporates a "group fee" structure, which provides for lower group fee rates as total fund assets under FMR's management increase, and for higher group fee rates as total fund assets under FMR's management decrease. FMR calculates the group fee rates based on a tiered asset "breakpoint" schedule that varies based on asset class. The Board noted, however, that because the current contractual arrangements set the total "fund-level" expenses for each class at 35 basis points, increases or decreases in the management fee due to changes in the group fee rate will not impact total expenses.
Fees Charged to Other Fidelity Clients. The Board also considered Fidelity fee structures and other information with respect to clients of FMR and its affiliates, such as other mutual funds advised or subadvised by FMR or its affiliates, pension plan clients, and other institutional clients. In March 2010, the Board created an ad hoc joint committee with the board of other Fidelity funds (the Committee) to review and compare Fidelity's institutional investment advisory business with its business of providing services to the Fidelity funds, including the differences in services provided, fees charged, and costs incurred, as well as competition in their respective marketplaces.
Based on its review of total expenses and fees charged to other Fidelity clients, the Board concluded that the total expenses of each class of the fund were reasonable, although in one case above the median of the universe presented for comparison, in light of the services that the fund and its shareholders receive and the other factors considered, including the findings of the Committee.
Semiannual Report
Costs of the Services and Profitability. The Board considered the revenues earned and the expenses incurred by Fidelity in conducting the business of developing, marketing, distributing, managing, administering and servicing the fund and its shareholders. The Board also considered the level of Fidelity's profits in respect of all the Fidelity funds.
On an annual basis, FMR presents to the Board Fidelity's profitability for the fund. Fidelity calculates the profitability for each fund, as well as aggregate profitability for groups of Fidelity funds and all Fidelity funds, using a series of detailed revenue and cost allocation methodologies which originate with the audited books and records of Fidelity. The Audit Committee of the Board reviews any significant changes from the prior year's methodologies.
PricewaterhouseCoopers LLP (PwC), independent registered public accounting firm and auditor to Fidelity and certain Fidelity funds, has been engaged annually by the Board as part of the Board's assessment of Fidelity's profitability analysis. PwC's engagement includes the review and assessment of Fidelity's methodologies used in determining the revenues and expenses attributable to Fidelity's mutual fund business, and completion of agreed-upon procedures surrounding the mathematical accuracy of fund profitability and its conformity to allocation methodologies. After considering PwC's reports issued under the engagement and information provided by Fidelity, the Board believes that while other allocation methods may also be reasonable, Fidelity's profitability methodologies are reasonable in all material respects.
The Board has also reviewed Fidelity's non-fund businesses and fall-out benefits related to the mutual fund business as well as cases where Fidelity's affiliates may benefit from or be related to the fund's business.
The Board considered the costs of the services provided by and the profits realized by Fidelity in connection with the operation of the fund and were satisfied that the profitability was not excessive in the circumstances.
Economies of Scale. The Board considered whether there have been economies of scale in respect of the management of the Fidelity funds, whether the Fidelity funds (including the fund) have appropriately benefited from any such economies of scale, and whether there is potential for realization of any further economies of scale. The Board considered the extent to which the fund will benefit from economies of scale through increased services to the fund, through waivers or reimbursements, or through fee or expense reductions.
In February 2009, the Board and the board of other Fidelity funds created an ad hoc committee (the Economies of Scale Committee) to analyze whether FMR attains economies of scale in respect of the management and servicing of the Fidelity funds, whether the Fidelity funds have appropriately benefited from such economies of scale, and whether there is potential for realization of any further economies of scale.
Semiannual Report
Board Approval of Investment Advisory Contracts and
Management Fees - continued
The Board concluded, considering the findings of the Economies of Scale Committee, that any potential economies of scale are being appropriately shared between fund shareholders and Fidelity.
Additional Information Requested by the Board. In order to develop fully the factual basis for consideration of the Fidelity funds' Advisory Contracts, the Board requested and received additional information on certain topics, including (i) fund performance trends, actions to be taken by FMR to improve certain funds' overall performance, and Fidelity's long-term strategies for certain funds; (ii) Fidelity's fund profitability methodology and profitability trends for certain funds; (iii) portfolio manager changes that have occurred during the past year and the amount of the investment that each portfolio manager has made in the Fidelity fund(s) that he or she manages; (iv) Fidelity's compensation structure for portfolio managers, research analysts, and other key personnel, including its effects on fund profitability, the rationale for the compensation structure, and the extent to which current market conditions have affected retention and recruitment; (v) the compensation paid by FMR to fund sub-advisers on behalf of the Fidelity funds; (vi) Fidelity's fee structures and rationale for recommending different fees among different categories of funds and classes, as well as Fidelity's voluntary waiver of fees to maintain minimum yields for certain funds and classes; (vii) the rationale for any differences between fund fee structures and fee structures in place for other Fidelity clients; and (viii) explanations regarding the relative total expenses borne by certain funds and classes, total expense competitive trends, and actions that might be taken by FMR to reduce total expenses for certain funds and classes or to achieve further economies of scale.
Based on its evaluation of all of the conclusions noted above, and after considering all factors it believed relevant, the Board ultimately concluded that the advisory fee structures are fair and reasonable, and that the fund's Advisory Contracts should be renewed.
Semiannual Report
Managing Your Investments
Fidelity offers several ways to conveniently manage your personal investments via your telephone or PC. You can access your account information, conduct trades and research your investments 24 hours a day.
By Phone
Fidelity Automated Service Telephone provides a single toll-free number to access account balances, positions, quotes and trading. It's easy to navigate the service, and on your first call, the system will help you create a personal identification number (PIN) for security.
(phone_graphic)
Fidelity Automated
Service Telephone (FAST®)
1-800-544-5555
Press
For mutual fund and brokerage trading.
For quotes.*
For account balances and holdings.
To review orders and mutual
fund activity.
To change your PIN.
To speak to a Fidelity representative.
By PC
Fidelity's web site on the Internet provides a wide range of information, including daily financial news, fund performance, interactive planning tools and news about Fidelity products and services.
(computer_graphic)
Fidelity's Web Site
www.fidelity.com
* When you call the quotes line, please remember that a fund's yield and return will vary and, except for money market funds, share price will also vary. This means that you may have a gain or loss when you sell your shares. There is no assurance that money market funds will be able to maintain a stable $1 share price; an investment in a money market fund is not insured or guaranteed by the U.S. government. Total returns are historical and include changes in share price, reinvestment of dividends and capital gains distributions, and the effects of any sales charges.
Semiannual Report
To Write Fidelity
We'll give your correspondence immediate attention and send you written confirmation upon completion of your request.
(letter_graphic)
Making Changes
To Your Account
(such as changing name, address, bank, etc.)
Fidelity Investments
P.O. Box 770001
Cincinnati, OH 45277-0002
(letter_graphic)
For Non-Retirement
Accounts
Buying shares
Fidelity Investments
P.O. Box 770001
Cincinnati, OH 45277-0003
Overnight Express
Fidelity Investments
Attn: Distribution Services
100 Crosby Parkway - KC1H
Covington, KY 41015
Selling shares
Fidelity Investments
P.O. Box 770001
Cincinnati, OH 45277-0035
Overnight Express
Fidelity Investments
Attn: Distribution Services
100 Crosby Parkway - KC1H
Covington, KY 41015
General Correspondence
Fidelity Investments
P.O. Box 500
Merrimack, NH 03054-0500
(letter_graphic)
For Retirement
Accounts
Buying shares
Fidelity Investments
P.O. Box 770001
Cincinnati, OH 45277-0003
Selling shares
Fidelity Investments
P.O. Box 770001
Cincinnati, OH 45277-0035
Overnight Express
Fidelity Investments
Attn: Distribution Services
100 Crosby Parkway - KC1H
Covington, KY 41015
General Correspondence
Fidelity Investments
P.O. Box 500
Merrimack, NH 03054-0500
Semiannual Report
To Visit Fidelity
For directions and hours,
please call 1-800-544-9797.
Arizona
7001 West Ray Road
Chandler, AZ
15445 N. Scottsdale Road
Scottsdale, AZ
17550 North 75th Avenue
Glendale, AZ
5330 E. Broadway Blvd
Tucson, AZ
California
815 East Birch Street
Brea, CA
1411 Chapin Avenue
Burlingame, CA
851 East Hamilton Avenue
Campbell, CA
601 Larkspur Landing Circle
Larkspur, CA
2000 Avenue of the Stars
Los Angeles, CA
27101 Puerta Real
Mission Viejo, CA
73575 El Paseo
Palm Desert, CA
251 University Avenue
Palo Alto, CA
123 South Lake Avenue
Pasadena, CA
16656 Bernardo Ctr. Drive
Rancho Bernardo, CA
1220 Roseville Parkway
Roseville, CA
1740 Arden Way
Sacramento, CA
7676 Hazard Center Drive
San Diego, CA
11943 El Camino Real
San Diego, CA
8 Montgomery Street
San Francisco, CA
3793 State Street
Santa Barbara, CA
1200 Wilshire Boulevard
Santa Monica, CA
398 West El Camino Real
Sunnyvale, CA
111 South Westlake Blvd
Thousand Oaks, CA
21701 Hawthorne Boulevard
Torrance, CA
2001 North Main Street
Walnut Creek, CA
6326 Canoga Avenue
Woodland Hills, CA
2211 Michelson Drive
Irvine, CA
Colorado
281 East Flatiron Circle
Broomfield, CO
1625 Broadway
Denver, CO
9185 Westview Road
Lone Tree, CO
Connecticut
48 West Putnam Avenue
Greenwich, CT
265 Church Street
New Haven, CT
300 Atlantic Street
Stamford, CT
29 South Main Street
West Hartford, CT
1261 Post Road
Fairfield, CT
Delaware
400 Delaware Avenue
Wilmington, DE
Florida
175 East Altamonte Drive
Altamonte Springs, FL
1400 Glades Road
Boca Raton, FL
121 Alhambra Plaza
Coral Gables, FL
2948 N. Federal Highway
Ft. Lauderdale, FL
4671 Town Center Parkway
Jacksonville, FL
8880 Tamiami Trail, North
Naples, FL
230 Royal Palm Way
Palm Beach, FL
3501 PGA Boulevard
Palm Beach Gardens, FL
3550 Tamiami Trail, South
Sarasota, FL
1502 N. Westshore Blvd.
Tampa, FL
2465 State Road 7
Wellington, FL
Georgia
3242 Peachtree Road
Atlanta, GA
1000 Abernathy Road
Atlanta, GA
Illinois
One North LaSalle Street
Chicago, IL
401 North Michigan Avenue
Chicago, IL
One Skokie Valley Road
Highland Park, IL
1415 West 22nd Street
Oak Brook, IL
15105 S LaGrange Road
Orland Park, IL
1572 East Golf Road
Schaumburg, IL
1823 Freedom Drive
Naperville, IL
Indiana
8480 Keystone Crossing
Indianapolis, IN
Kansas
5400 College Boulevard
Overland Park, KS
Maine
Three Canal Plaza
Portland, ME
Maryland
7315 Wisconsin Avenue
Bethesda, MD
610 York Road
Towson, MD
Massachusetts
801 Boylston Street
Boston, MA
155 Congress Street
Boston, MA
300 Granite Street
Braintree, MA
44 Mall Road
Burlington, MA
238 Main Street
Cambridge, MA
200 Endicott Street
Danvers, MA
Fidelity Brokerage Services, Inc., 100 Summer St., Boston, MA 02110 Member NYSE/SIPC
Semiannual Report
405 Cochituate Road
Framingham, MA
551 Boston Turnpike
Shrewsbury, MA
Michigan
500 E. Eisenhower Pkwy.
Ann Arbor, MI
280 N. Old Woodward Ave.
Birmingham, MI
30200 Northwestern Hwy.
Farmington Hills, MI
43420 Grand River Avenue
Novi, MI
3480 28th Street
Grand Rapids, MI
2425 S. Linden Road STE E
Flint, MI
Minnesota
7740 France Avenue South
Edina, MN
8342 3rd Street North
Oakdale, MN
Missouri
1524 South Lindbergh Blvd.
St. Louis, MO
Nevada
2225 Village Walk Drive
Henderson, NV
New Jersey
501 Route 73 South
Marlton, NJ
150 Essex Street
Millburn, NJ
35 Morris Street
Morristown, NJ
396 Route 17, North
Paramus, NJ
3518 Route 1 North
Princeton, NJ
530 Broad Street
Shrewsbury, NJ
New Mexico
2261 Q Street NE
Albuquerque, NM
New York
1130 Franklin Avenue
Garden City, NY
37 West Jericho Turnpike
Huntington Station, NY
1271 Avenue of the Americas
New York, NY
980 Madison Avenue
New York, NY
61 Broadway
New York, NY
350 Park Avenue
New York, NY
200 Fifth Avenue
New York, NY
733 Third Avenue
New York, NY
2070 Broadway
New York, NY
1075 Northern Blvd.
Roslyn, NY
799 Central Park Avenue
Scarsdale, NY
3349 Monroe Avenue
Rochester, NY
North Carolina
4611 Sharon Road
Charlotte, NC
7011 Fayetteville Road
Durham, NC
Ohio
3805 Edwards Road
Cincinnati, OH
1324 Polaris Parkway
Columbus, OH
1800 Crocker Road
Westlake, OH
28699 Chagrin Boulevard
Woodmere Village, OH
Oregon
7493 SW Bridgeport Road
Tigard, OR
Pennsylvania
600 West DeKalb Pike
King of Prussia, PA
1735 Market Street
Philadelphia, PA
12001 Perry Highway
Wexford, PA
Rhode Island
10 Memorial Boulevard
Providence, RI
Tennessee
3018 Peoples Street
Johnson City, TN
7628 West Farmington Blvd.
Germantown, TN
2035 Mallory Lane
Franklin, TN
Texas
10000 Research Boulevard
Austin, TX
4001 Northwest Parkway
Dallas, TX
12532 Memorial Drive
Houston, TX
2701 Drexel Drive
Houston, TX
6560 Fannin Street
Houston, TX
1701 Lake Robbins Drive
The Woodlands, TX
6500 N. MacArthur Blvd.
Irving, TX
6005 West Park Boulevard
Plano, TX
1576 East Southlake Blvd.
Southlake, TX
15600 Southwest Freeway
Sugar Land, TX
139 N. Loop 1604 East
San Antonio, TX
Utah
279 West South Temple
Salt Lake City, UT
Virginia
1861 International Drive
McLean, VA
11957 Democracy Drive
Reston, VA
Washington
10500 NE 8th Street
Bellevue, WA
1518 6th Avenue
Seattle, WA
304 Strander Blvd
Tukwila, WA
Washington, DC
1900 K Street, N.W.
Washington, DC
Wisconsin
16020 West Bluemound Road
Brookfield, WI
Semiannual Report
Investment Adviser
Fidelity Management & Research Company
Boston, MA
Investment Sub-Advisers
Fidelity Investments
Money Management, Inc.
Fidelity Management & Research
(U.K.) Inc.
Fidelity Management & Research
(Japan) Inc.
Fidelity Management & Research
(Hong Kong) Limited
General Distributor
Fidelity Distributors Corporation
Boston, MA
Transfer and Service Agents
Fidelity Investments Institutional
Operations Company, Inc.
Boston, MA
Fidelity Service Company, Inc.
Boston, MA
Custodian
Citibank, N.A.
New York, NY
The Fidelity Telephone Connection
Mutual Fund 24-Hour Service
Exchanges/Redemptions
and Account Assistance 1-800-544-6666
Product Information 1-800-544-6666
Retirement Accounts 1-800-544-4774
(8 a.m. - 9 p.m.)
TDD Service 1-800-544-0118
for the deaf and hearing impaired
(9 a.m. - 9 p.m. Eastern time)
Fidelity Automated Service
Telephone (FAST®) 1-800-544-5555
Automated line for quickest service
ULB-USAN-0311
1.789738.107
(Fidelity Investment logo)(registered trademark)
Fidelity Advisor®
Ultra-Short Bond
Fund - Class A and Class T
Semiannual Report
January 31, 2011
(2_fidelity_logos) (Registered_Trademark)
Class A and Class T
are classes of
Fidelity® Ultra-Short Bond Fund
Contents
Chairman's Message | <Click Here> | The Chairman's message to shareholders. |
Shareholder Expense Example | <Click Here> | An example of shareholder expenses. |
Investment Changes | <Click Here> | A summary of major shifts in the fund's investments over the past six months. |
Investments | <Click Here> | A complete list of the fund's investments with their market values. |
Financial Statements | <Click Here> | Statements of assets and liabilities, operations, and changes in net assets,
as well as financial highlights. |
Notes | <Click Here> | Notes to the financial statements. |
Board Approval of Investment Advisory Contracts and Management Fees | <Click Here> | |
To view a fund's proxy voting guidelines and proxy voting record for the 12-month period ended June 30, visit http://www.fidelity.com/proxyvotingresults or visit the Securities and Exchange Commission's (SEC) web site at http://www.sec.gov. You may also call 1-877-208-0098 to request a free copy of the proxy voting guidelines.
Standard & Poor's, S&P and S&P 500 are registered service marks of The McGraw-Hill Companies, Inc. and have been licensed for use by Fidelity Distributors Corporation.
Other third party marks appearing herein are the property of their respective owners.
All other marks appearing herein are registered or unregistered trademarks or service marks of FMR LLC or an affiliated company.
This report and the financial statements contained herein are submitted for the general information of the shareholders of the fund. This report is not authorized for distribution to prospective investors in the fund unless preceded or accompanied by an effective prospectus.
A fund files its complete schedule of portfolio holdings with the SEC for the first and third quarters of each fiscal year on Form N-Q. Forms N-Q are available on the SEC's web site at http://www.sec.gov. A fund's Forms N-Q may be reviewed and copied at the SEC's Public Reference Room in Washington, DC. Information regarding the operation of the SEC's Public Reference Room may be obtained by calling 1-800-SEC-0330. For a complete list of a fund's portfolio holdings, view the most recent holdings listing, semiannual report, or annual report on Fidelity's web site at http://www.fidelity.com, http://www.advisor.fidelity.com, or http://www.401k.com, as applicable.
NOT FDIC INSURED • MAY LOSE VALUE • NO BANK GUARANTEE
Neither the fund nor Fidelity Distributors Corporation is a bank.
Semiannual Report
(photo_of_Abigail_P_Johnson)
Dear Shareholder:
Following a year in which the investment environment was volatile but generally supportive of most major asset classes, 2011 began on a positive note. U.S. equities gained ground in January, reaching their highest point since August 2008, amid indications the U.S. economy had turned a corner. Still, questions remained about the longer-term outlook, most notably persistently high unemployment. Financial markets are always unpredictable, of course, but there also are several time-tested investment principles that can help put the odds in your favor.
One of the basic tenets is to invest for the long term. Over time, riding out the markets' inevitable ups and downs has proven much more effective than selling into panic or chasing the hottest trend. Even missing only a few of the markets' best days can significantly diminish investor returns. Patience also affords the benefits of compounding - of earning interest on additional income or reinvested dividends and capital gains. There can be tax advantages and cost benefits to consider as well. While staying the course doesn't eliminate risk, it can considerably lessen the effect of short-term declines.
You can further manage your investing risk through diversification. And today, more than ever, geographic diversification should be taken into account. Studies indicate that asset allocation is the single most important determinant of a portfolio's long-term success. The right mix of stocks, bonds and cash - aligned to your particular risk tolerance and investment objective - is very important. Age-appropriate rebalancing is also an essential aspect of asset allocation. For younger investors, an emphasis on equities - which historically have been the best-performing asset class over time - is encouraged. As investors near their specific goal, such as retirement or sending a child to college, consideration may be given to replacing volatile assets (e.g. common stocks) with more-stable fixed investments (bonds or savings plans).
A third principle - investing regularly - can help lower the average cost of your purchases. Investing a certain amount of money each month or quarter helps ensure you won't pay for all your shares at market highs. This strategy - known as dollar cost averaging - also reduces "emotion" from investing, helping shareholders avoid selling weak performers just prior to an upswing, or chasing a hot performer just before a correction.
We invite you to contact us via the Internet, through our Investor Centers or by phone. It is our privilege to provide you the information you need to make the investments that are right for you.
Sincerely,
(The chairman's signature appears here.)
Abigail P. Johnson
Semiannual Report
Shareholder Expense Example
As a shareholder of the Fund, you incur two types of costs: (1) transaction costs, including redemption fees, and (2) ongoing costs, including management fees, distribution and/or service (12b-1) fees and other Fund expenses. This Example is intended to help you understand your ongoing costs (in dollars) of investing in the Fund and to compare these costs with the ongoing costs of investing in other mutual funds.
The Example is based on an investment of $1,000 invested at the beginning of the period and held for the entire period (August 1, 2010 to January 31, 2011).
Actual Expenses
The first line of the accompanying table for each class of the Fund provides information about actual account values and actual expenses. You may use the information in this line, together with the amount you invested, to estimate the expenses that you paid over the period. Simply divide your account value by $1,000.00 (for example, an $8,600 account value divided by $1,000.00 = 8.6), then multiply the result by the number in the first line for a class of the Fund under the heading entitled "Expenses Paid During Period" to estimate the expenses you paid on your account during this period.
Hypothetical Example for Comparison Purposes
The second line of the accompanying table for each class of the Fund provides information about hypothetical account values and hypothetical expenses based on a Class' actual expense ratio and an assumed rate of return of 5% per year before expenses, which is not the Class' actual return. The hypothetical account values and expenses may not be used to estimate the actual ending account balance or expenses you paid for the period. You may use this information to compare the ongoing costs of investing in the Fund and other funds. To do so, compare this 5% hypothetical example with the 5% hypothetical examples that appear in the shareholder reports of the other funds.
Please note that the expenses shown in the table are meant to highlight your ongoing costs only and do not reflect any transaction costs. Therefore, the second line of the table is useful in comparing ongoing costs only, and will not help you determine the relative total costs of owning different funds. In addition, if these transactional costs were included, your costs would have been higher.
Semiannual Report
Shareholder Expense Example - continued
| Annualized
Expense
Ratio | Beginning
Account Value
August 1, 2010 | Ending
Account Value
January 31, 2011 | Expenses Paid
During Period*
August 1, 2010 to
January 31, 2011 |
Class A | .62% | | | |
Actual | | $ 1,000.00 | $ 1,003.90 | $ 3.13 |
HypotheticalA | | $ 1,000.00 | $ 1,022.08 | $ 3.16 |
Class T | .66% | | | |
Actual | | $ 1,000.00 | $ 1,005.00 | $ 3.34 |
HypotheticalA | | $ 1,000.00 | $ 1,021.88 | $ 3.36 |
Ultra-Short Bond | .45% | | | |
Actual | | $ 1,000.00 | $ 1,006.10 | $ 2.28 |
HypotheticalA | | $ 1,000.00 | $ 1,022.94 | $ 2.29 |
Institutional Class | .48% | | | |
Actual | | $ 1,000.00 | $ 1,005.90 | $ 2.43 |
HypotheticalA | | $ 1,000.00 | $ 1,022.79 | $ 2.45 |
A 5% return per year before expenses
* Expenses are equal to each Class' annualized expense ratio, multiplied by the average account value over the period, multiplied by 184/365 (to reflect the one-half year period).
Semiannual Report
Investment Changes (Unaudited)
Quality Diversification (% of fund's net assets) |
As of January 31, 2011 | As of July 31, 2010 |
| U.S. Government and
U.S. Government
Agency
Obligations† 40.8% | | | U.S. Government and
U.S. Government
Agency
Obligations† 39.0% | |
| AAA 15.5% | | | AAA 16.5% | |
| AA 14.3% | | | AA 9.5% | |
| A 9.6% | | | A 6.0% | |
| BBB 9.2% | | | BBB 7.9% | |
| BB and Below 0.3% | | | BB and Below 0.2% | |
| Not Rated 1.1% | | | Not Rated 0.8% | |
| Short-Term
Investments and
Net Other Assets 9.2% | | | Short-Term
Investments and
Net Other Assets 20.1% | |
We have used ratings from Moody's Investors Service, Inc. Where Moody's® ratings are not available, we have used S&P® ratings. All ratings are as of the report date and do not reflect subsequent changes. Securities rated BB or below were rated investment grade at the time of acquisition. |
Weighted Average Maturity as of January 31, 2011 |
| | 6 months ago |
Years | 1.3 | 0.9 |
This is a weighted average of all the maturities of the securities held in a fund. Weighted Average Maturity (WAM) can be used as a measure of sensitivity to interest rate changes and markets changes. Generally, the longer the maturity, the greater the sensitivity to such changes. WAM is based on the dollar-weighted average length of time until principal payments must be paid. Depending on the types of securities held in a fund, certain maturity shortening devices (e.g., demand features, interest rate resets, and call options) may be taken into account when calculating the WAM. |
Duration as of January 31, 2011 |
| | 6 months ago |
Years | 0.4 | 0.4 |
Duration shows how much a bond fund's price fluctuates with changes in comparable interest rates. If rates rise 1%, for example, a fund with a five-year duration is likely to lose about 5% of its value. Other factors also can influence a bond fund's performance and share price. Accordingly, a bond fund's actual performance may differ from this example. |
Asset Allocation (% of fund's net assets) |
As of January 31, 2011* | As of July 31, 2010** |
| Corporate Bonds 30.5% | | | Corporate Bonds 22.0% | |
| U.S. Government and
U.S. Government
Agency
Obligations† 40.8% | | | U.S. Government and
U.S. Government
Agency
Obligations† 39.0% | |
| Asset-Backed
Securities 15.7% | | | Asset-Backed
Securities 15.6% | |
| CMOs and
Other Mortgage
Related Securities 2.6% | | | CMOs and
Other Mortgage
Related Securities 2.5% | |
| Other Investments 1.2% | | | Other Investments 0.8% | |
| Short-Term
Investments and
Net Other Assets 9.2% | | | Short-Term
Investments and
Net Other Assets 20.1% | |
* Foreign investments | 12.5% | | ** Foreign investments | 10.3% | |
* Futures and Swaps | 3.7% | | ** Futures and Swaps | 3.8% | |
† Includes FDIC Guaranteed Corporate Securities |
Semiannual Report
Investments January 31, 2011 (Unaudited)
Showing Percentage of Net Assets
Nonconvertible Bonds - 30.5% |
| Principal Amount | | Value |
CONSUMER DISCRETIONARY - 1.9% |
Auto Components - 0.7% |
DaimlerChrysler NA Holding Corp.: | | | | |
5.75% 9/8/11 | | $ 1,500,000 | | $ 1,544,858 |
5.875% 3/15/11 | | 500,000 | | 503,081 |
| | 2,047,939 |
Media - 0.8% |
AOL Time Warner, Inc. 6.875% 5/1/12 | | 1,000,000 | | 1,071,289 |
COX Communications, Inc. 6.75% 3/15/11 | | 1,000,000 | | 1,007,311 |
| | 2,078,600 |
Specialty Retail - 0.4% |
Staples, Inc. 7.75% 4/1/11 | | 1,000,000 | | 1,011,014 |
TOTAL CONSUMER DISCRETIONARY | | 5,137,553 |
CONSUMER STAPLES - 2.0% |
Beverages - 1.9% |
Anheuser-Busch InBev Worldwide, Inc. 1.0328% 3/26/13 (e) | | 2,000,000 | | 2,018,774 |
Diageo Finance BV 3.875% 4/1/11 | | 1,000,000 | | 1,005,489 |
SABMiller PLC 6.2% 7/1/11 (b) | | 2,000,000 | | 2,044,154 |
| | 5,068,417 |
Food Products - 0.1% |
Kraft Foods, Inc. 5.625% 11/1/11 | | 258,000 | | 267,119 |
TOTAL CONSUMER STAPLES | | 5,335,536 |
ENERGY - 1.5% |
Oil, Gas & Consumable Fuels - 1.5% |
Kinder Morgan Energy Partners LP 6.75% 3/15/11 | | 1,000,000 | | 1,006,697 |
Shell International Finance BV 1.3% 9/22/11 | | 1,000,000 | | 1,006,279 |
Total Capital Canada Ltd. 0.6758% 1/17/14 (e) | | 2,000,000 | | 1,997,074 |
| | 4,010,050 |
FINANCIALS - 18.1% |
Capital Markets - 3.0% |
Goldman Sachs Group, Inc. 0.7028% 10/7/11 (e) | | 1,000,000 | | 1,002,468 |
HSBC Bank PLC 1.1031% 1/17/14 (b)(e) | | 2,000,000 | | 1,997,094 |
JPMorgan Chase & Co. 1.1031% 1/24/14 (e) | | 2,000,000 | | 2,002,334 |
Nonconvertible Bonds - continued |
| Principal Amount | | Value |
FINANCIALS - continued |
Capital Markets - continued |
Morgan Stanley 1.9025% 1/24/14 (e) | | $ 1,500,000 | | $ 1,506,504 |
UBS AG Stamford Branch 1.3044% 1/28/14 (e) | | 1,500,000 | | 1,500,000 |
| | 8,008,400 |
Commercial Banks - 8.2% |
ANZ Banking Group Ltd. 0.3024% 1/10/14 (b)(e) | | 1,000,000 | | 998,549 |
Barclays Bank PLC 1.3431% 1/13/14 (e) | | 1,000,000 | | 1,005,780 |
Commonwealth Bank of Australia 0.8538% 3/19/13 (b)(e) | | 1,500,000 | | 1,503,086 |
Credit Agricole SA 0.6359% 2/2/12 (b)(e) | | 2,000,000 | | 1,993,458 |
Credit Suisse New York Branch 1.2631% 1/14/14 (e) | | 1,000,000 | | 1,004,625 |
Deutsche Bank New York Branch 0.9531% 1/18/13 (e) | | 2,000,000 | | 2,002,710 |
Fifth Third Bank 0.3944% 5/17/13 (e) | | 1,000,000 | | 973,357 |
ING Bank NV 1.6231% 10/18/13 (b)(e) | | 2,000,000 | | 1,997,292 |
Marshall & Ilsley Bank 6.375% 9/1/11 | | 287,000 | | 293,735 |
National Australia Bank Ltd. 0.7831% 1/8/13 (b)(e) | | 1,000,000 | | 1,004,508 |
Santander US Debt SA Unipersonal 1.1028% 3/30/12 (b)(e) | | 800,000 | | 791,291 |
Sovereign Bank 1.9969% 8/1/13 (e) | | 500,000 | | 500,000 |
SunTrust Bank 6.375% 4/1/11 | | 1,000,000 | | 1,008,495 |
Svenska Handelsbanken AB 1.3016% 9/14/12 (b)(e) | | 2,000,000 | | 2,006,376 |
U.S. Bank NA 0.5231% 10/26/12 (e) | | 2,000,000 | | 2,005,518 |
Wachovia Corp. 0.4459% 3/1/12 (e) | | 2,000,000 | | 2,001,122 |
Westpac Banking Corp. 0.8531% 4/8/13 (b)(e) | | 1,000,000 | | 1,002,359 |
| | 22,092,261 |
Consumer Finance - 2.4% |
American Express Credit Corp. 0.4213% 6/16/11 (e) | | 1,500,000 | | 1,500,323 |
American Honda Finance Corp. 0.6539% 11/7/12 (b)(e) | | 2,000,000 | | 1,998,244 |
Capital One Financial Corp. 5.7% 9/15/11 | | 1,000,000 | | 1,028,631 |
General Electric Capital Corp. 1.1528% 1/7/14 (e) | | 2,000,000 | | 2,006,320 |
| | 6,533,518 |
Diversified Financial Services - 1.6% |
BNP Paribas 1.2031% 1/10/14 (e) | | 1,000,000 | | 1,000,280 |
BP Capital Markets PLC 1.55% 8/11/11 | | 1,350,000 | | 1,355,889 |
Citigroup, Inc. 1.7531% 1/13/14 (e) | | 2,000,000 | | 2,002,848 |
| | 4,359,017 |
Insurance - 2.1% |
Berkshire Hathaway Finance Corp. 0.6331% 1/10/14 (e) | | 2,000,000 | | 2,001,158 |
Nonconvertible Bonds - continued |
| Principal Amount | | Value |
FINANCIALS - continued |
Insurance - continued |
Metropolitan Life Global Funding I: | | | | |
1.0531% 1/10/14 (b)(e) | | $ 1,000,000 | | $ 997,113 |
5.75% 7/25/11 (b) | | 1,500,000 | | 1,535,089 |
Unum Group 7.625% 3/1/11 | | 1,000,000 | | 1,004,487 |
| | 5,537,847 |
Thrifts & Mortgage Finance - 0.8% |
Bank of America Corp. 1.7138% 1/30/14 (e) | | 2,000,000 | | 2,005,244 |
TOTAL FINANCIALS | | 48,536,287 |
HEALTH CARE - 1.1% |
Health Care Providers & Services - 0.4% |
UnitedHealth Group, Inc. 5.25% 3/15/11 | | 1,000,000 | | 1,005,207 |
Pharmaceuticals - 0.7% |
Merck & Co., Inc. 1.875% 6/30/11 | | 2,000,000 | | 2,013,960 |
TOTAL HEALTH CARE | | 3,019,167 |
INDUSTRIALS - 0.8% |
Aerospace & Defense - 0.8% |
BAE Systems Holdings, Inc. 6.4% 12/15/11 (b) | | 2,000,000 | | 2,097,288 |
INFORMATION TECHNOLOGY - 0.3% |
Computers & Peripherals - 0.1% |
Hewlett-Packard Co. 2.25% 5/27/11 | | 286,000 | | 288,054 |
Office Electronics - 0.2% |
Xerox Corp. 6.875% 8/15/11 | | 500,000 | | 514,983 |
TOTAL INFORMATION TECHNOLOGY | | 803,037 |
TELECOMMUNICATION SERVICES - 3.1% |
Diversified Telecommunication Services - 1.7% |
Deutsche Telekom International Financial BV 5.375% 3/23/11 | | 1,000,000 | | 1,006,841 |
SBC Communications, Inc. 6.25% 3/15/11 | | 2,000,000 | | 2,013,634 |
Telecom Italia Capital SA: | | | | |
0.7669% 2/1/11 (e) | | 500,000 | | 500,000 |
6.2% 7/18/11 | | 1,000,000 | | 1,022,413 |
| | 4,542,888 |
Nonconvertible Bonds - continued |
| Principal Amount | | Value |
TELECOMMUNICATION SERVICES - continued |
Wireless Telecommunication Services - 1.4% |
Verizon Wireless Capital LLC 3.75% 5/20/11 | | $ 1,683,000 | | $ 1,699,249 |
Vodafone Group PLC 0.5719% 2/27/12 (e) | | 2,000,000 | | 2,002,854 |
| | 3,702,103 |
TOTAL TELECOMMUNICATION SERVICES | | 8,244,991 |
UTILITIES - 1.7% |
Electric Utilities - 1.3% |
Progress Energy, Inc. 7.1% 3/1/11 | | 2,000,000 | | 2,010,086 |
Southern Co. 0.7031% 10/21/11 (e) | | 1,500,000 | | 1,504,215 |
| | 3,514,301 |
Multi-Utilities - 0.4% |
Wisconsin Energy Corp. 6.5% 4/1/11 | | 1,000,000 | | 1,009,744 |
TOTAL UTILITIES | | 4,524,045 |
TOTAL NONCONVERTIBLE BONDS (Cost $81,588,366) | 81,707,954 |
U.S. Government and Government Agency Obligations - 34.1% |
|
U.S. Government Agency Obligations - 15.4% |
Fannie Mae 1% 4/4/12 | | 35,000,000 | | 35,243,455 |
Freddie Mac 1.625% 4/26/11 | | 6,000,000 | | 6,020,310 |
TOTAL U.S. GOVERNMENT AGENCY OBLIGATIONS | | 41,263,765 |
U.S. Treasury Inflation Protected Obligations - 0.5% |
U.S. Treasury Inflation-Indexed Notes 2.375% 4/15/11 | | 1,471,624 | | 1,485,911 |
U.S. Treasury Obligations - 15.0% |
U.S. Treasury Notes: | | | | |
0.875% 5/31/11 (d) | | 20,000,000 | | 20,044,540 |
1% 7/31/11 | | 20,000,000 | | 20,079,680 |
TOTAL U.S. TREASURY OBLIGATIONS | | 40,124,220 |
Other Government Related - 3.2% |
Bank of America Corp. 0.6044% 4/30/12 (FDIC Guaranteed) (c)(e) | | 1,500,000 | | 1,507,170 |
Citibank NA 1.5% 7/12/11 (FDIC Guaranteed) (c) | | 690,000 | | 694,031 |
U.S. Government and Government Agency Obligations - continued |
| Principal Amount | | Value |
Other Government Related - continued |
Citigroup Funding, Inc. 1.375% 5/5/11 (FDIC Guaranteed) (c) | | $ 470,000 | | $ 471,381 |
General Electric Capital Corp. 1.8% 3/11/11 (FDIC Guaranteed) (c) | | 870,000 | | 871,509 |
Goldman Sachs Group, Inc.: | | | | |
0.5356% 11/9/11 (FDIC Guaranteed) (c)(e) | | 2,000,000 | | 2,005,106 |
1.7% 3/15/11 (FDIC Guaranteed) (c) | | 1,000,000 | | 1,001,797 |
JPMorgan Chase & Co. 0.3644% 2/23/11 (FDIC Guaranteed) (c)(e) | | 2,000,000 | | 2,000,188 |
TOTAL OTHER GOVERNMENT RELATED | | 8,551,182 |
TOTAL U.S. GOVERNMENT AND GOVERNMENT AGENCY OBLIGATIONS (Cost $91,327,297) | 91,425,078 |
U.S. Government Agency - Mortgage Securities - 3.5% |
|
Fannie Mae - 3.1% |
2.556% 12/1/34 (e) | | 654,315 | | 688,896 |
2.557% 6/1/35 (e) | | 441,981 | | 461,673 |
2.634% 6/1/35 (e) | | 1,142,533 | | 1,200,809 |
2.635% 11/1/34 (e) | | 601,818 | | 628,398 |
2.636% 7/1/33 (e) | | 171,201 | | 179,158 |
2.639% 7/1/35 (e) | | 935,198 | | 982,612 |
2.645% 8/1/33 (e) | | 144,832 | | 150,937 |
2.652% 7/1/34 (e) | | 541,637 | | 568,551 |
2.71% 11/1/34 (e) | | 650,215 | | 685,906 |
2.73% 10/1/35 (e) | | 1,253,170 | | 1,315,414 |
2.811% 2/1/34 (e) | | 348,430 | | 361,031 |
3.768% 10/1/39 (e) | | 945,270 | | 988,326 |
TOTAL FANNIE MAE | | 8,211,711 |
Freddie Mac - 0.4% |
2.663% 6/1/35 (e) | | 994,888 | | 1,043,575 |
TOTAL U.S. GOVERNMENT AGENCY - MORTGAGE SECURITIES (Cost $9,036,428) | 9,255,286 |
Asset-Backed Securities - 15.7% |
| Principal Amount | | Value |
ACE Securities Corp. Home Equity Loan Trust
Series 2004-HE1 Class M1, 1.01% 3/25/34 (e) | | $ 7,153 | | $ 7,051 |
Ally Auto Receivables Trust: | | | | |
Series 2009-A Class A2, 1.32% 3/15/12 (b) | | 584,873 | | 585,531 |
Series 2009-B Class A2, 1.21% 6/15/12 (b) | | 1,033,161 | | 1,034,643 |
Series 2010-4 Class A2, 0.71% 2/15/13 | | 1,000,000 | | 999,456 |
Ally Master Owner Trust: | | | | |
Series 2010-1 Class A, 2.0113% 1/15/15 (b)(e) | | 700,000 | | 712,996 |
Series 2011-1 Class A1, 1.13% 1/15/16 (e) | | 500,000 | | 500,000 |
AmeriCredit Automobile Receivables Trust: | | | | |
Series 2007-AX Class A4, 0.3006% 10/6/13 (e) | | 1,006,479 | | 1,000,948 |
Series 2010-3 Class A2, 0.77% 12/9/13 | | 1,000,000 | | 999,986 |
Series 2010-B Class A2, 1.18% 2/6/14 (Assured Guaranty Corp. Insured) | | 1,000,000 | | 998,405 |
Series 2011-1 Class A2, 0.84% 9/10/12 | | 1,000,000 | | 1,000,000 |
Bank of America Auto Trust: | | | | |
Series 2009-1A Class A3, 2.67% 7/15/13 (b) | | 771,732 | | 779,829 |
Series 2010-2 Class A2, 0.91% 10/15/12 | | 1,000,000 | | 1,001,579 |
BMW Vehicle Lease Trust: | | | | |
Series 2009-1 Class A3, 2.91% 3/15/12 | | 509,857 | | 513,732 |
Series 2010-1 Class A2, 0.58% 9/17/12 | | 2,000,000 | | 2,000,652 |
Capital One Auto Finance Trust Series 2007-C Class A4, 5.23% 7/15/14 (FGIC Insured) | | 495,731 | | 510,504 |
Capital One Multi-Asset Execution Trust Series 2009-A2 Class A2, 3.2% 4/15/14 | | 1,500,000 | | 1,514,357 |
CarMax Auto Owner Trust Series 2009-2 Class A2, 1% 6/15/12 | | 644,965 | | 645,303 |
Chase Issuance Trust: | | | | |
Series 2005-A2 Class A2, 0.3313% 12/15/14 (e) | | 1,600,000 | | 1,597,460 |
Series 2005-A6 Class A6, 0.3312% 7/15/14 (e) | | 1,730,000 | | 1,726,689 |
Series 2006-A4 Class A4, 0.2813% 10/15/13 (e) | | 1,000,000 | | 999,022 |
Series 2007-A17 Class A, 5.12% 10/15/14 | | 480,000 | | 514,421 |
Series 2008-9 Class A, 4.26% 5/15/13 | | 100,000 | | 101,077 |
Series 2009-A2 Class A2, 1.8112% 4/15/14 (e) | | 2,500,000 | | 2,538,758 |
Series 2009-A3 Class A3, 2.4% 6/17/13 | | 780,000 | | 785,423 |
Chrysler Financial Auto Securitization Trust
Series 2010-A Class A2, 0.78% 1/8/13 | | 1,500,000 | | 1,499,551 |
Chrysler Financial Lease Trust Series 2010-A Class A2, 1.78% 6/15/11 (b) | | 153,233 | | 153,333 |
Citibank Credit Card Issuance Trust Series 2006-A4 Class A4, 5.45% 5/10/13 | | 200,000 | | 202,780 |
CitiFinancial Auto Issuance Trust Series 2009-1 Class A2, 1.83% 11/15/12 (b) | | 249,661 | | 250,357 |
Asset-Backed Securities - continued |
| Principal Amount | | Value |
Fannie Mae subordinate REMIC pass-thru certificates Series 2004-T5: | | | | |
Class AB1, 0.7353% 5/28/35 (e) | | $ 80,751 | | $ 64,403 |
Class AB3, 0.6842% 5/28/35 (e) | | 32,052 | | 23,445 |
Ford Credit Auto Lease Trust: | | | | |
Series 2010-A Class A2, 1.04% 3/15/13 (b) | | 514,208 | | 514,601 |
Series 2010-B Class A2, 0.68% 10/15/12 (b) | | 2,000,000 | | 1,999,679 |
Ford Credit Auto Owner Trust: | | | | |
Series 2009-D Class A3, 2.17% 10/15/13 | | 98,013 | | 99,094 |
Series 2009-E Class A2, 1% 3/15/12 | | 710,615 | | 710,840 |
Series 2010-B Class A2, 0.65% 12/15/12 | | 1,500,000 | | 1,500,818 |
Ford Credit Floorplan Master Owner Trust: | | | | |
Series 2006-4 Class A, 0.5113% 6/15/13 (e) | | 1,000,000 | | 997,624 |
Series 2010-1 Class A, 1.9113% 12/15/14 (b)(e) | | 490,000 | | 498,600 |
Series 2010-5 Class A1, 1.5% 9/15/15 | | 240,000 | | 238,340 |
Fremont Home Loan Trust Series 2005-A Class M4, 0.94% 1/25/35 (e) | | 125,000 | | 39,378 |
GE Capital Credit Card Master Note Trust Series 2009-3 Class A, 2.54% 9/15/14 | | 1,000,000 | | 1,011,245 |
GSAMP Trust Series 2007-HE1 Class M1, 0.51% 3/25/47 (e) | | 335,000 | | 18,726 |
Guggenheim Structured Real Estate Funding Ltd. Series 2005-1 Class C, 1.34% 5/25/30 (b)(e) | | 367,417 | | 187,383 |
Home Equity Asset Trust Series 2003-5 Class A2, 0.96% 12/25/33 (e) | | 10,566 | | 7,370 |
Hyundai Auto Receivables Trust: | | | | |
Series 2009-A: | | | | |
Class A2, 1.11% 2/15/12 | | 461,755 | | 462,008 |
Class A3, 2.03% 8/15/13 | | 130,000 | | 131,349 |
Series 2011-A Class A2, 0.69% 11/15/13 | | 1,000,000 | | 999,934 |
John Deere Owner Trust Series 2009-B Class A-2, 0.85% 3/15/12 | | 219,718 | | 219,745 |
Mercedes-Benz Auto Receivables Trust Series 2009-1: | | | | |
Class A2, 0.83% 3/15/12 | | 526,045 | | 526,277 |
Class A3, 1.67% 1/15/14 | | 180,000 | | 181,753 |
Merrill Lynch Mortgage Investors Trust Series 2004-HE2 Class A1B, 0.73% 8/25/35 (e) | | 21,560 | | 19,469 |
Morgan Stanley ABS Capital I Trust Series 2004-HE6 Class A2, 0.6% 8/25/34 (e) | | 65,756 | | 54,147 |
Nissan Auto Lease Trust: | | | | |
Series 2009-B: | | | | |
Class A2, 1.22% 9/15/11 | | 199,996 | | 200,049 |
Class A3, 2.07% 1/15/15 | | 270,000 | | 271,508 |
Series 2010-B Class A2, 0.9% 5/15/13 | | 1,000,000 | | 1,000,499 |
Asset-Backed Securities - continued |
| Principal Amount | | Value |
Ocala Funding LLC Series 2006-1A Class A, 1.6606% 3/20/11 (a)(b)(e) | | $ 965,000 | | $ 0 |
Park Place Securities, Inc.: | | | | |
Series 2004-WCW1 Class M4, 1.71% 9/25/34 (e) | | 435,000 | | 109,707 |
Series 2004-WWF1 Class M4, 1.36% 12/25/34 (e) | | 945,000 | | 288,415 |
Series 2005-WCH1 Class M3, 0.82% 1/25/36 (e) | | 425,000 | | 298,230 |
Salomon Brothers Mortgage Securities VII, Inc.
Series 2003-HE1 Class A, 1.06% 4/25/33 (e) | | 1,451 | | 1,275 |
Santander Drive Auto Receivables Trust Series 2010-3 Class A2, 0.93% 6/17/13 | | 500,000 | | 499,952 |
Terwin Mortgage Trust Series 2003-4HE Class A1, 1.12% 9/25/34 (e) | | 21,802 | | 16,862 |
USAA Auto Owner Trust Series 2010-1 Class A3, 1.3% 6/16/14 | | 950,000 | | 955,696 |
Volkswagen Auto Lease Trust: | | | | |
Series 2009-A Class A3, 3.41% 4/16/12 | | 773,166 | | 780,289 |
Series 2010-A Class A2, 0.77% 1/22/13 | | 1,000,000 | | 1,000,467 |
Wachovia Auto Owner Trust Series 2008-A Class A4B, 1.4106% 3/20/14 (e) | | 1,000,000 | | 1,008,669 |
TOTAL ASSET-BACKED SECURITIES (Cost $44,735,042) | 42,111,689 |
Collateralized Mortgage Obligations - 4.8% |
|
Private Sponsor - 1.6% |
Fosse Master Issuer PLC floater Series 2007-1A Class A2, 0.3831% 10/18/54 (b)(e) | | 641,030 | | 638,445 |
Gracechurch Mortgage Financing PLC floater
Series 2007-1A Class 3A1, 0.3644% 11/20/56 (b)(e) | | 445,554 | | 438,966 |
GSR Mortgage Loan Trust floater Series 2004-11 Class 2A1, 0.59% 12/25/34 (e) | | 272,553 | | 241,488 |
Holmes Master Issuer PLC floater: | | | | |
Series 2007-1 Class 3A1, 0.3831% 7/15/40 (e) | | 1,100,000 | | 1,097,226 |
Series 2007-2A Class 3A1, 0.3831% 7/15/21 (e) | | 840,000 | | 835,049 |
Permanent Master Issuer PLC floater Series 2007-1 Class 4A, 0.3831% 10/15/33 (e) | | 360,000 | | 355,427 |
TBW Mortgage-Backed pass-thru certificates floater Series 2006-4 Class A3, 0.46% 9/25/36 (e) | | 1,000,000 | | 579,190 |
TOTAL PRIVATE SPONSOR | | 4,185,791 |
Collateralized Mortgage Obligations - continued |
| Principal Amount | | Value |
U.S. Government Agency - 3.2% |
Fannie Mae subordinate REMIC pass-thru certificates: | | | | |
floater: | | | | |
Series 2008-76 Class EF, 0.76% 9/25/23 (e) | | $ 91,503 | | $ 91,562 |
Series 2010-86 Class FE, 0.71% 8/25/25 (e) | | 785,675 | | 786,653 |
sequential payer Series 2003-129 Class GF, 0.66% 4/25/30 (e) | | 1,259,179 | | 1,262,148 |
Freddie Mac Multi-Class participation certificates guaranteed: | | | | |
floater Series 3346 Class FA, 0.4913% 2/15/19 (e) | | 2,913,070 | | 2,911,602 |
sequential payer: | | | | |
Series 3560 Class LA, 2% 8/15/14 | | 1,725,235 | | 1,746,394 |
Series 3573 Class LC, 1.85% 8/15/14 | | 1,787,687 | | 1,807,227 |
TOTAL U.S. GOVERNMENT AGENCY | | 8,605,586 |
TOTAL COLLATERALIZED MORTGAGE OBLIGATIONS (Cost $13,238,553) | 12,791,377 |
Commercial Mortgage Securities - 1.0% |
|
COMM pass-thru certificates floater Series 2006-CN2A Class A2FL, 0.4806% 2/5/19 (b)(e) | | 800,000 | | 788,621 |
Greenwich Capital Commercial Funding Corp. sequential payer Series 2005-GG3 Class A2, 4.305% 8/10/42 (e) | | 1,248,009 | | 1,257,997 |
GS Mortgage Securities Corp. II sequential payer
Series 2005-GG4 Class A3, 4.607% 7/10/39 | | 150,000 | | 153,236 |
GS Mortgage Securities Trust sequential payer
Series 2006-GG8 Class A2, 5.479% 11/10/39 | | 130,000 | | 132,259 |
Morgan Stanley Capital I Trust floater: | | | | |
Series 2006-XLF Class C, 1.462% 7/15/19 (b)(e) | | 247,826 | | 128,870 |
Series 2007-XLFA Class B, 0.392% 10/15/20 (b)(e) | | 440,000 | | 330,000 |
TOTAL COMMERCIAL MORTGAGE SECURITIES (Cost $3,280,029) | 2,790,983 |
Municipal Securities - 0.5% |
| Principal Amount | | Value |
Kentucky Econ. Dev. Fin. Auth. Solid Waste Disp. Rev. Bonds (Republic Svcs., Inc. Proj.) Series A, 2.5%, tender 3/1/11 (e)(f) | | $ 300,000 | | $ 299,988 |
Louisville/Jefferson County Metropolitan Govt. Poll. Cont. Rev. Bonds (Louisville Gas and Electronic Co. Proj.): | | | | |
Series 2003 A, 1.9%, tender 4/2/12 (e) | | 500,000 | | 500,285 |
Series 2007 B, 1.9%, tender 6/1/12 (e) | | 500,000 | | 500,460 |
TOTAL MUNICIPAL SECURITIES (Cost $1,300,000) | 1,300,733 |
Foreign Government and Government Agency Obligations - 0.8% |
|
Ontario Province 0.4344% 11/19/12 (e)
(Cost $2,000,000) | | 2,000,000 | | 2,001,400 |
Bank Notes - 0.7% |
|
National City Bank, Cleveland 0.3959% 3/1/13 (e)
(Cost $1,972,968) | | 2,000,000 | | 1,983,578 |
Certificates of Deposit - 0.8% |
|
Bank of Tokyo-Mitsubishi yankee 0.54% 2/3/11
(Cost $2,000,000) | | 2,000,000 | | 2,000,045 |
Cash Equivalents - 8.2% |
| Maturity
Amount | | |
Investments in repurchase agreements in a joint trading account at 0.23%, dated 1/31/11 due 2/1/11 (Collateralized by U.S. Government Obligations) #
(Cost $22,045,000) | $ 22,045,142 | | 22,045,000 |
TOTAL INVESTMENT PORTFOLIO - 100.6% (Cost $272,523,683) | 269,413,123 |
NET OTHER ASSETS (LIABILITIES) - (0.6)% | (1,508,682) |
NET ASSETS - 100% | $ 267,904,441 |
Futures Contracts |
| Expiration
Date | | Underlying
Face Amount
at Value | | Unrealized
Appreciation/
(Depreciation) |
Purchased |
Eurodollar Contracts |
10 Eurodollar 90 Day Index Contracts | March 2011 | | $ 9,991,375 | | $ 10,350 |
10 Eurodollar 90 Day Index Contracts | June 2011 | | 9,989,375 | | 4,225 |
10 Eurodollar 90 Day Index Contracts | Sept. 2011 | | 9,987,000 | | (651) |
TOTAL EURODOLLAR CONTRACTS | | $ 13,924 |
Legend |
(a) Non-income producing - Security is in default. |
(b) Security exempt from registration under Rule 144A of the Securities Act of 1933. These securities may be resold in transactions exempt from registration, normally to qualified institutional buyers. At the end of the period, the value of these securities amounted to $31,364,805 or 11.7% of net assets. |
(c) Under the Temporary Liquidity Guarantee Program, the Federal Deposit Insurance Corporation guarantees principal and interest in the event of payment default or bankruptcy until the earlier of maturity date of the debt or until June 30, 2012. At the end of the period these securities amounted to $8,551,182 or 3.2% of net assets. |
(d) Security or a portion of the security was pledged to cover margin requirements for futures contracts. At the period end, the value of securities pledged amounted to $35,078. |
(e) Coupon rates for floating and adjustable rate securities reflect the rates in effect at period end. |
(f) Private activity obligations whose interest is subject to the federal alternative minimum tax for individuals. |
# Additional information on each counterparty to the repurchase agreement is as follows: |
Repurchase Agreement / Counterparty | Value |
$22,045,000 due 2/01/11 at 0.23% |
BNP Paribas Securities Corp. | $ 1,037,236 |
Bank of America NA | 6,757,241 |
Barclays Capital, Inc. | 527,909 |
Citigroup Global Markets, Inc. | 610,099 |
Credit Agricole Securities (USA), Inc. | 844,655 |
Deutsche Bank Securities, Inc. | 633,491 |
HSBC Securities (USA), Inc. | 2,533,965 |
J.P. Morgan Securities, Inc. | 844,655 |
Merrill Lynch Government Securities, Inc. | 760,189 |
Merrill Lynch, Pierce, Fenner & Smith, Inc. | 843,902 |
Mizuho Securities USA, Inc. | 3,800,947 |
Societe Generale, New York Branch | 1,689,310 |
Wells Fargo Securities LLC | 1,161,401 |
| $ 22,045,000 |
Other Information |
The following is a summary of the inputs used, as of January 31, 2011, involving the Fund's assets and liabilities carried at fair value. The inputs or methodology used for valuing securities may not be an indication of the risk associated with investing in those securities. For more information on valuation inputs, and their aggregation into the levels used in the tables below, please refer to the Security Valuation section in the accompanying Notes to Financial Statements. |
Valuation Inputs at Reporting Date: |
Description | Total | Level 1 | Level 2 | Level 3 |
Investments in Securities: | | | | |
Corporate Bonds | $ 81,707,954 | $ - | $ 81,707,954 | $ - |
U.S. Government and Government Agency Obligations | 91,425,078 | - | 91,425,078 | - |
U.S. Government Agency - Mortgage Securities | 9,255,286 | - | 9,255,286 | - |
Asset-Backed Securities | 42,111,689 | - | 41,586,350 | 525,339 |
Collateralized Mortgage Obligations | 12,791,377 | - | 12,791,377 | - |
Commercial Mortgage Securities | 2,790,983 | - | 2,662,113 | 128,870 |
Municipal Securities | 1,300,733 | - | 1,300,733 | - |
Foreign Government and Government Agency Obligations | 2,001,400 | - | 2,001,400 | - |
Bank Notes | 1,983,578 | - | 1,983,578 | - |
Certificates of Deposit | 2,000,045 | - | 2,000,045 | - |
Cash Equivalents | 22,045,000 | - | 22,045,000 | - |
Total Investments in Securities: | $ 269,413,123 | $ - | $ 268,758,914 | $ 654,209 |
Derivative Instruments: | | | | |
Assets | | | | |
Futures Contracts | $ 14,575 | $ 14,575 | $ - | $ - |
Liabilities | | | | |
Futures Contracts | $ (651) | $ (651) | $ - | $ - |
Total Derivative Instruments: | $ 13,924 | $ 13,924 | $ - | $ - |
The following is a reconciliation of Investments in Securities for which Level 3 inputs were used in determining value: |
Investments in Securities: | |
Beginning Balance | $ 583,242 |
Total Realized Gain (Loss) | (1,566,340) |
Total Unrealized Gain (Loss) | 1,805,751 |
Cost of Purchases | 2,324 |
Proceeds of Sales | (408,257) |
Amortization/Accretion | (11,302) |
Transfers in to Level 3 | 248,791 |
Transfers out of Level 3 | - |
Ending Balance | $ 654,209 |
The change in unrealized gain (loss) for the period attributable to Level 3 securities held at January 31, 2011 | $ 146,949 |
The information used in the above reconciliation represents fiscal year to date activity for any Investments in Securities identified as using Level 3 inputs at either the beginning or the end of the current fiscal period. Transfers in or out of Level 3 represent the beginning value of any Security or Instrument where a change in the pricing level occurred from the beginning to the end of the period. The cost of purchases and the proceeds of sales may include securities received or delivered through corporate actions or exchanges. Realized and unrealized gains (losses) disclosed in the reconciliation are included in Net Gain (Loss) on the Fund's Statement of Operations. |
Value of Derivative Instruments |
The following table is a summary of the Fund's value of derivative instruments by risk exposure as of January 31, 2011. For additional information on derivative instruments, please refer to the Derivative Instruments section in the accompanying Notes to Financial Statements. |
Risk Exposure /
Derivative Type | Value |
| Asset | Liability |
Interest Rate Risk | | |
Futures Contracts (a) | $ 14,575 | $ (651) |
Total Value of Derivatives | $ 14,575 | $ (651) |
(a) Reflects cumulative appreciation/(depreciation) on futures contracts as disclosed on the Schedule of Investments. Only the period end variation margin is separately disclosed on the Statement of Assets and Liabilities. |
Other Information |
Distribution of investments by country of issue, as a percentage of total net assets, is as follows: (Unaudited) |
United States of America | 87.5% |
United Kingdom | 4.5% |
Netherlands | 1.9% |
Australia | 1.8% |
Canada | 1.5% |
France | 1.1% |
Others (Individually Less Than 1%) | 1.7% |
| 100.0% |
Income Tax Information |
At July 31, 2010, the Fund had a capital loss carryforward of approximately $121,849,643 of which $1,917,431, $518,690, $12,186,304, $97,397,499 and $9,829,719 will expire in fiscal 2014, 2015, 2016, 2017 and 2018, respectively. Capital loss carryforwards are only available to offset future capital gains of the Fund to the extent provided by regulations and may be limited. |
The Fund intends to elect to defer to its fiscal year ending July 31, 2011 approximately $3,569,895 of losses recognized during the period November 1, 2009 to July 31, 2010. |
See accompanying notes which are an integral part of the financial statements.
Semiannual Report
Statement of Assets and Liabilities
| January 31, 2011 (Unaudited) |
| | |
Assets | | |
Investment in securities, at value (including repurchase agreements of $22,045,000) - See accompanying schedule: Unaffiliated issuers (cost $272,523,683) | | $ 269,413,123 |
Cash | | 2,344 |
Receivable for investments sold | | 677,916 |
Receivable for fund shares sold | | 407,388 |
Interest receivable | | 795,288 |
Other receivables | | 3 |
Total assets | | 271,296,062 |
| | |
Liabilities | | |
Payable for investments purchased | $ 2,999,957 | |
Payable for fund shares redeemed | 286,079 | |
Distributions payable | 1,489 | |
Accrued management fee | 70,390 | |
Distribution and service plan fees payable | 2,215 | |
Payable for daily variation on futures contracts | 625 | |
Other affiliated payables | 30,866 | |
Total liabilities | | 3,391,621 |
| | |
Net Assets | | $ 267,904,441 |
Net Assets consist of: | | |
Paid in capital | | $ 397,953,801 |
Distributions in excess of net investment income | | (233,045) |
Accumulated undistributed net realized gain (loss) on investments | | (126,719,678) |
Net unrealized appreciation (depreciation) on investments | | (3,096,637) |
Net Assets | | $ 267,904,441 |
See accompanying notes which are an integral part of the financial statements.
Semiannual Report
Financial Statements - continued
Statement of Assets and Liabilities - continued
| January 31, 2011 (Unaudited) |
| | |
Calculation of Maximum Offering Price Class A:
Net Asset Value and redemption price per share ($13,344,499 ÷ 1,632,418 shares) | | $ 8.17 |
| | |
Maximum offering price per share (100/98.50 of $8.17) | | $ 8.29 |
Class T:
Net Asset Value and redemption price per share ($4,208,138 ÷ 514,742 shares) | | $ 8.18 |
| | |
Maximum offering price per share (100/98.50 of $8.18) | | $ 8.30 |
Ultra-Short Bond:
Net Asset Value, offering price and redemption price per share ($249,219,578 ÷ 30,483,269 shares) | | $ 8.18 |
| | |
Institutional Class:
Net Asset Value, offering price and redemption price per share ($1,132,226 ÷ 138,496 shares) | | $ 8.18 |
See accompanying notes which are an integral part of the financial statements.
Semiannual Report
Statement of Operations
Six months ended January 31, 2011 (Unaudited) |
| | |
Investment Income | | |
Interest | | $ 970,530 |
| | |
Expenses | | |
Management fee | $ 414,427 | |
Transfer agent fees | 135,188 | |
Distribution and service plan fees | 15,743 | |
Fund wide operations fee | 44,130 | |
Independent trustees' compensation | 501 | |
Miscellaneous | 477 | |
Total expenses before reductions | 610,466 | |
Expense reductions | (74) | 610,392 |
Net investment income | | 360,138 |
Realized and Unrealized Gain (Loss) Net realized gain (loss) on: | | |
Investment securities: | | |
Unaffiliated issuers | (1,297,501) | |
Futures contracts | 13,056 | |
Total net realized gain (loss) | | (1,284,445) |
Change in net unrealized appreciation (depreciation) on: Investment securities | 2,201,141 | |
Futures contracts | (1,771) | |
Total change in net unrealized appreciation (depreciation) | | 2,199,370 |
Net gain (loss) | | 914,925 |
Net increase (decrease) in net assets resulting from operations | | $ 1,275,063 |
See accompanying notes which are an integral part of the financial statements.
Semiannual Report
Financial Statements - continued
Statement of Changes in Net Assets
| Six months ended
January 31, 2011
(Unaudited) | Year ended
July 31, 2010 |
Increase (Decrease) in Net Assets | | |
Operations | | |
Net investment income | $ 360,138 | $ 1,890,067 |
Net realized gain (loss) | (1,284,445) | (8,164,438) |
Change in net unrealized appreciation (depreciation) | 2,199,370 | 9,508,825 |
Net increase (decrease) in net assets resulting
from operations | 1,275,063 | 3,234,454 |
Distributions to shareholders from net investment income | (604,929) | (1,887,049) |
Share transactions - net increase (decrease) | 3,293,749 | 33,525,237 |
Redemption fees | 5,946 | 9,556 |
Total increase (decrease) in net assets | 3,969,829 | 34,882,198 |
| | |
Net Assets | | |
Beginning of period | 263,934,612 | 229,052,414 |
End of period (including distributions in excess of net investment income of $233,045 and undistributed net investment income of $11,746, respectively) | $ 267,904,441 | $ 263,934,612 |
See accompanying notes which are an integral part of the financial statements.
Semiannual Report
Financial Highlights - Class A
| Six months ended
January 31, 2011 | Years ended July 31, |
| (Unaudited) | 2010 | 2009 | 2008 | 2007 | 2006 |
Selected Per-Share Data | | | | | |
Net asset value, beginning of period | $ 8.15 | $ 8.11 | $ 8.26 | $ 9.82 | $ 10.02 | $ 10.03 |
Income from Investment Operations | | | | | | |
Net investment income E | .005 | .047 | .091 | .384 | .493 | .400 |
Net realized and unrealized gain (loss) | .027 | .040 | (.167) | (1.612) | (.198) | (.009) |
Total from investment operations | .032 | .087 | (.076) | (1.228) | .295 | .391 |
Distributions from net investment income | (.012) | (.047) | (.071) | (.294) | (.495) | (.401) |
Tax return of capital | - | - | (.003) | (.039) | - | - |
Total distributions | (.012) | (.047) | (.074) | (.333) | (.495) | (.401) |
Redemption fees added to paid in capital E | - G | - G | - G | .001 | - G | - G |
Net asset value, end of period | $ 8.17 | $ 8.15 | $ 8.11 | $ 8.26 | $ 9.82 | $ 10.02 |
Total Return B,C,D | .39% | 1.08% | (.92)% | (12.71)% | 2.97% | 3.97% |
Ratios to Average Net Assets F | | | | | |
Expenses before reductions | .62% A | .64% | .68% | .67% | .66% | .70% |
Expenses net of fee waivers, if any | .62% A | .64% | .68% | .67% | .66% | .70% |
Expenses net of all reductions | .62% A | .64% | .67% | .66% | .66% | .70% |
Net investment income | .11% A | .58% | 1.13% | 4.26% | 4.96% | 4.00% |
Supplemental Data | | | | | | |
Net assets, end of period (000 omitted) | $ 13,344 | $ 18,129 | $ 8,033 | $ 6,268 | $ 13,735 | $ 4,553 |
Portfolio turnover rate | 84% A | 95% | 92% | 11% | 29% | 39% |
A Annualized
B Total returns for periods of less than one year are not annualized.
C Total returns would have been lower had certain expenses not been reduced during the periods shown.
D Total returns do not include the effect of the sales charges.
E Calculated based on average shares outstanding during the period.
F Expense ratios reflect operating expenses of the class. Expenses before reductions do not reflect amounts reimbursed by the investment adviser or reductions from expense offset arrangements and do not represent the amount paid by the class during periods when reimbursements or reductions occur. Expenses net of fee waivers reflect expenses after reimbursement by the investment adviser but prior to reductions from expense offset arrangements. Expenses net of all reductions represent the net expenses paid by the class.
G Amount represents less than $.001 per share.
See accompanying notes which are an integral part of the financial statements.
Semiannual Report
Financial Highlights - Class T
| Six months ended
January 31, 2011 | Years ended July 31, |
| (Unaudited) | 2010 | 2009 | 2008 | 2007 | 2006 |
Selected Per-Share Data | | | | | |
Net asset value, beginning of period | $ 8.15 | $ 8.11 | $ 8.26 | $ 9.82 | $ 10.02 | $ 10.03 |
Income from Investment Operations | | | | | | |
Net investment income E | .003 | .044 | .090 | .377 | .491 | .404 |
Net realized and unrealized gain (loss) | .038 | .040 | (.168) | (1.607) | (.199) | (.011) |
Total from investment operations | .041 | .084 | (.078) | (1.230) | .292 | .393 |
Distributions from net investment income | (.011) | (.044) | (.069) | (.292) | (.492) | (.403) |
Tax return of capital | - | - | (.003) | (.039) | - | - |
Total distributions | (.011) | (.044) | (.072) | (.331) | (.492) | (.403) |
Redemption fees added to paid in capital E | - G | - G | - G | .001 | - G | - G |
Net asset value, end of period | $ 8.18 | $ 8.15 | $ 8.11 | $ 8.26 | $ 9.82 | $ 10.02 |
Total Return B,C,D | .50% | 1.03% | (.94)% | (12.72)% | 2.95% | 4.00% |
Ratios to Average Net Assets F | | | | | |
Expenses before reductions | .66% A | .68% | .69% | .69% | .69% | .68% |
Expenses net of fee waivers, if any | .66% A | .68% | .69% | .69% | .69% | .68% |
Expenses net of all reductions | .66% A | .68% | .69% | .69% | .69% | .68% |
Net investment income | .08% A | .54% | 1.11% | 4.23% | 4.93% | 4.03% |
Supplemental Data | | | | | | |
Net assets, end of period (000 omitted) | $ 4,208 | $ 5,334 | $ 3,114 | $ 2,910 | $ 4,818 | $ 4,624 |
Portfolio turnover rate | 84% A | 95% | 92% | 11% | 29% | 39% |
A Annualized
B Total returns for periods of less than one year are not annualized.
C Total returns would have been lower had certain expenses not been reduced during the periods shown.
D Total returns do not include the effect of the sales charges.
E Calculated based on average shares outstanding during the period.
F Expense ratios reflect operating expenses of the class. Expenses before reductions do not reflect amounts reimbursed by the investment adviser or reductions from expense offset arrangements and do not represent the amount paid by the class during periods when reimbursements or reductions occur. Expenses net of fee waivers reflect expenses after reimbursement by the investment adviser but prior to reductions from expense offset arrangements. Expenses net of all reductions represent the net expenses paid by the class.
G Amount represents less than $.001 per share.
See accompanying notes which are an integral part of the financial statements.
Semiannual Report
Financial Highlights - Ultra-Short Bond
| Six months ended
January 31, 2011 | Years ended July 31, |
| (Unaudited) | 2010 | 2009 | 2008 | 2007 | 2006 |
Selected Per-Share Data | | | | | |
Net asset value, beginning of period | $ 8.15 | $ 8.11 | $ 8.26 | $ 9.81 | $ 10.02 | $ 10.03 |
Income from Investment Operations | | | | | | |
Net investment income D | .012 | .063 | .111 | .404 | .516 | .427 |
Net realized and unrealized gain (loss) | .037 | .040 | (.169) | (1.603) | (.210) | (.011) |
Total from investment operations | .049 | .103 | (.058) | (1.199) | .306 | .416 |
Distributions from net investment income | (.019) | (.063) | (.088) | (.310) | (.516) | (.426) |
Tax return of capital | - | - | (.004) | (.042) | - | - |
Total distributions | (.019) | (.063) | (.092) | (.352) | (.516) | (.426) |
Redemption fees added to paid in capital D | - F | - F | - F | .001 | - F | - F |
Net asset value, end of period | $ 8.18 | $ 8.15 | $ 8.11 | $ 8.26 | $ 9.81 | $ 10.02 |
Total Return B,C | .61% | 1.27% | (.70)% | (12.42)% | 3.09% | 4.23% |
Ratios to Average Net Assets E | | | | | |
Expenses before reductions | .45% A | .45% | .45% | .45% | .45% | .45% |
Expenses net of fee waivers, if any | .45% A | .45% | .45% | .45% | .45% | .45% |
Expenses net of all reductions | .45% A | .45% | .44% | .45% | .45% | .45% |
Net investment income | .29% A | .77% | 1.36% | 4.47% | 5.17% | 4.26% |
Supplemental Data | | | | | | |
Net assets, end of period (000 omitted) | $ 249,220 | $ 239,266 | $ 217,282 | $ 315,401 | $ 974,602 | $ 850,329 |
Portfolio turnover rate | 84% A | 95% | 92% | 11% | 29% | 39% |
A Annualized
B Total returns for periods of less than one year are not annualized.
C Total returns would have been lower had certain expenses not been reduced during the periods shown.
D Calculated based on average shares outstanding during the period.
E Expense ratios reflect operating expenses of the class. Expenses before reductions do not reflect amounts reimbursed by the investment adviser or reductions from expense offset arrangements and do not represent the amount paid by the class during periods when reimbursements or reductions occur. Expenses net of fee waivers reflect expenses after reimbursement by the investment adviser but prior to reductions from expense offset arrangements. Expenses net of all reductions represent the net expenses paid by the class.
F Amount represents less than $.001 per share.
See accompanying notes which are an integral part of the financial statements.
Semiannual Report
Financial Highlights - Institutional Class
| Six months ended
January 31, 2011 | Years ended July 31, |
| (Unaudited) | 2010 | 2009 | 2008 | 2007 | 2006 |
Selected Per-Share Data | | | | | |
Net asset value, beginning of period | $ 8.15 | $ 8.11 | $ 8.26 | $ 9.81 | $ 10.02 | $ 10.03 |
Income from Investment Operations | | | | | | |
Net investment income D | .010 | .057 | .102 | .416 | .510 | .420 |
Net realized and unrealized gain (loss) | .038 | .040 | (.168) | (1.619) | (.206) | (.008) |
Total from investment operations | .048 | .097 | (.066) | (1.203) | .304 | .412 |
Distributions from net investment income | (.018) | (.057) | (.081) | (.306) | (.514) | (.422) |
Tax return of capital | - | - | (.003) | (.042) | - | - |
Total distributions | (.018) | (.057) | (.084) | (.348) | (.514) | (.422) |
Redemption fees added to paid in capital D | - F | - F | - F | .001 | - F | - F |
Net asset value, end of period | $ 8.18 | $ 8.15 | $ 8.11 | $ 8.26 | $ 9.81 | $ 10.02 |
Total Return B,C | .59% | 1.20% | (.80)% | (12.46)% | 3.06% | 4.19% |
Ratios to Average Net Assets E | | | | | |
Expenses before reductions | .48% A | .52% | .58% | .48% | .48% | .49% |
Expenses net of fee waivers, if any | .48% A | .52% | .55% | .48% | .48% | .49% |
Expenses net of all reductions | .48% A | .52% | .54% | .48% | .48% | .49% |
Net investment income | .25% A | .70% | 1.26% | 4.44% | 5.14% | 4.22% |
Supplemental Data | | | | | | |
Net assets, end of period (000 omitted) | $ 1,132 | $ 1,206 | $ 623 | $ 594 | $ 8,312 | $ 1,987 |
Portfolio turnover rate | 84% A | 95% | 92% | 11% | 29% | 39% |
A Annualized
B Total returns for periods of less than one year are not annualized.
C Total returns would have been lower had certain expenses not been reduced during the periods shown.
D Calculated based on average shares outstanding during the period.
E Expense ratios reflect operating expenses of the class. Expenses before reductions do not reflect amounts reimbursed by the investment adviser or reductions from expense offset arrangements and do not represent the amount paid by the class during periods when reimbursements or reductions occur. Expenses net of fee waivers reflect expenses after reimbursement by the investment adviser but prior to reductions from expense offset arrangements. Expenses net of all reductions represent the net expenses paid by the class.
F Amount represents less than $.001 per share.
See accompanying notes which are an integral part of the financial statements.
Semiannual Report
Notes to Financial Statements
For the period ended January 31, 2011 (Unaudited)
1. Organization.
Fidelity Ultra-Short Bond Fund (the Fund) is a fund of Fidelity Income Fund (the Trust) and is authorized to issue an unlimited number of shares. The Trust is registered under the Investment Company Act of 1940, as amended (the 1940 Act), as an open-end management investment company organized as a Massachusetts business trust. The Fund offers Class A, Class T, Ultra-Short Bond and Institutional Class shares, each of which has equal rights as to assets and voting privileges. Each class has exclusive voting rights with respect to matters that affect that class. Investment income, realized and unrealized capital gains and losses, the common expenses of the Fund, and certain fund-level expense reductions, if any, are allocated on a pro-rata basis to each class based on the relative net assets of each class to the total net assets of the Fund. Each class differs with respect to transfer agent and distribution and service plan fees incurred. Certain expense reductions may also differ by class.
2. Significant Accounting Policies.
The financial statements have been prepared in conformity with accounting principles generally accepted in the United States of America (GAAP), which require management to make certain estimates and assumptions at the date of the financial statements. Actual results could differ from those estimates. Subsequent events, if any, through the date that the financial statements were issued have been evaluated in the preparation of the financial statements. The following summarizes the significant accounting policies of the Fund:
Security Valuation. Investments are valued as of 4:00 p.m. Eastern time on the last calendar day of the period. The Fund uses independent pricing services approved by the Board of Trustees to value its investments. When current market prices or quotations are not readily available or reliable, valuations may be determined in good faith in accordance with procedures adopted by the Board of Trustees. Factors used in determining value may include market or security specific events, changes in interest rates and credit quality. The frequency with which these procedures are used cannot be predicted and they may be utilized to a significant extent. The value used for net asset value (NAV) calculation under these procedures may differ from published prices for the same securities.
The Fund categorizes the inputs to valuation techniques used to value its investments into a disclosure hierarchy consisting of three levels as shown below.
Level 1 - quoted prices in active markets for identical investments
Level 2 - other significant observable inputs (including quoted prices for similar investments, interest rates, prepayment speeds, etc.)
Level 3 - unobservable inputs (including the Fund's own assumptions based on the best information available)
Semiannual Report
Notes to Financial Statements (Unaudited) - continued
2. Significant Accounting Policies - continued
Security Valuation - continued
Changes in valuation techniques may result in transfers in or out of an assigned level within the disclosure hierarchy. The aggregate value of investments by input level, as of January 31, 2011, for the Fund's investments, as well as a roll forward of Level 3 securities, is included at the end of the Fund's Schedule of Investments. Valuation techniques used to value the Fund's investments by major category are as follows.
Debt securities, including restricted securities, are valued based on evaluated prices received from independent pricing services or from dealers who make markets in such securities. For corporate bonds, bank notes, foreign government and government agency obligations, municipal securities, U.S. government and government agency obligations and certificates of deposit, pricing services utilize matrix pricing which considers yield or price of bonds of comparable quality, coupon, maturity and type as well as dealer supplied prices and are generally categorized as Level 2 in the hierarchy. For asset backed securities, collateralized mortgage obligations, commercial mortgage securities and U.S. government agency mortgage securities, pricing services utilize matrix pricing which considers prepayment speed assumptions, attributes of the collateral, yield or price of bonds of comparable quality, coupon, maturity and type as well as dealer supplied prices and, accordingly, such securities are generally categorized as Level 2 in the hierarchy. Short-term securities with remaining maturities of sixty days or less for which quotations are not readily available are valued at amortized cost, which approximates fair value and are categorized as Level 2 in the hierarchy.
When independent prices are unavailable or unreliable, debt securities may be valued utilizing pricing matrices which consider similar factors that would be used by independent pricing services. These are generally categorized as Level 2 in the hierarchy but may be Level 3 depending on the circumstances.
Futures contracts are valued at the settlement price established each day by the board of trade or exchange on which they are traded and are categorized as Level 1 in the hierarchy.
Investment Transactions and Income. For financial reporting purposes, the Fund's investment holdings and NAV include trades executed through the end of the last business day of the period. The NAV per share for processing shareholder transactions is calculated as of the close of business of the New York Stock Exchange (NYSE), normally 4:00 p.m. Eastern time and includes trades executed through the end of the prior business day. Gains and losses on securities sold are determined on the basis of identified cost. Interest income is accrued as earned. Interest income includes coupon interest and
Semiannual Report
2. Significant Accounting Policies - continued
Investment Transactions and Income - continued
amortization of premium and accretion of discount on debt securities. The principal value on inflation-indexed securities is periodically adjusted to the rate of inflation and interest is accrued based on the principal value. The adjustments to principal due to inflation are reflected as increases or decreases to interest income even though principal is not received until maturity. Debt obligations may be placed on non-accrual status and related interest income may be reduced by ceasing current accruals and writing off interest receivables when the collection of all or a portion of interest has become doubtful based on consistently applied procedures. A debt obligation is removed from non-accrual status when the issuer resumes interest payments or when collectability of interest is reasonably assured.
Expenses. Expenses directly attributable to a fund are charged to that fund. Expenses attributable to more than one fund are allocated among the respective funds on the basis of relative net assets or other appropriate methods. Expense estimates are accrued in the period to which they relate and adjustments are made when actual amounts are known.
Income Tax Information and Distributions to Shareholders. Each year the Fund intends to qualify as a regulated investment company, including distributing substantially all of its taxable income and realized gains under Subchapter M of the Internal Revenue Code and filing its U.S. federal tax return. As a result, no provision for income taxes is required. A fund's federal tax return is subject to examination by the Internal Revenue Service (IRS) for a period of three years.
Dividends are declared and recorded daily and paid monthly from net investment income. Distributions from realized gains, if any, are declared and recorded on the ex-dividend date. Income dividends and capital gain distributions are declared separately for each class. Income and capital gain distributions are determined in accordance with income tax regulations, which may differ from GAAP.
Capital accounts within the financial statements are adjusted for permanent book-tax differences. These adjustments have no impact on net assets or the results of operations. Temporary book-tax differences will reverse in a subsequent period.
Book-tax differences are primarily due to futures transactions, market discount, capital loss carryforwards and losses deferred due to excise tax regulations.
Semiannual Report
Notes to Financial Statements (Unaudited) - continued
2. Significant Accounting Policies - continued
Income Tax Information and Distributions to Shareholders - continued
The federal tax cost of investment securities and unrealized appreciation (depreciation) as of period end were as follows:
Gross unrealized appreciation | $ 602,393 |
Gross unrealized depreciation | (3,677,239) |
Net unrealized appreciation (depreciation) on securities and other investments | $ (3,074,846) |
| |
Tax cost | $ 272,487,969 |
Short-Term Trading (Redemption) Fees. Shares held by investors in the Fund less than 60 days are subject to a redemption fee equal to .25% of the net asset value of shares redeemed. All redemption fees, which reduce the proceeds of the shareholder redemption, are retained by the Fund and accounted for as an addition to paid in capital.
3. Operating Policies.
Repurchase Agreements. Fidelity Management & Research Company (FMR) has received an Exemptive Order from the Securities and Exchange Commission (the SEC) which permits the Fund and other affiliated entities of FMR to transfer uninvested cash balances into joint trading accounts which are then invested in repurchase agreements. The Fund may also invest directly with institutions in repurchase agreements. Repurchase agreements are collateralized by government or non-government securities. Upon settlement date, collateral is held in segregated accounts with custodian banks and may be obtained in the event of a default of the counterparty. The Fund monitors, on a daily basis, the value of the collateral to ensure it is at least equal to the principal amount of the repurchase agreement (including accrued interest). In the event of a default by the counterparty, realization of the collateral proceeds could be delayed, during which time the value of the collateral may decline.
Restricted Securities. The Fund may invest in securities that are subject to legal or contractual restrictions on resale. These securities generally may be resold in transactions exempt from registration or to the public if the securities are registered. Disposal of these securities may involve time-consuming negotiations and expense, and prompt sale at an acceptable price may be difficult. Information regarding restricted securities is included at the end of the Fund's Schedule of Investments.
Semiannual Report
4. Derivative Instruments.
Risk Exposures and the Use of Derivative Instruments. The Fund used derivative instruments (derivatives), including futures contracts, in order to meet its investment objectives. The strategy is to use derivatives to increase returns and to manage exposure to certain risks as defined below. The success of any strategy involving derivatives depends on analysis of numerous economic factors, and if the strategies for investment do not work as intended, the Fund may not achieve its objectives.
The Fund's use of derivatives increased or decreased its exposure to the following risk:
Interest Rate Risk | Interest rate risk relates to the fluctuations in the value of interest-bearing securities due to changes in the prevailing levels of market interest rates. |
The Fund is also exposed to additional risks from investing in derivatives, such as liquidity risk and counterparty credit risk. Liquidity risk is the risk that the Fund will be unable to sell the derivative in the open market in a timely manner. Counterparty credit risk is the risk that the counterparty will not be able to fulfill its obligation to the Fund. The Fund's maximum risk of loss from counterparty credit risk is generally the aggregate unrealized appreciation and unpaid counterparty fees in excess of any collateral pledged by the counterparty to the Fund. Counterparty risk related to exchange-traded futures contracts is minimal because of the protection provided by the exchange on which they trade. Derivatives involve, to varying degrees, risk of loss in excess of the amounts recognized in the Statement of Assets and Liabilities.
Futures Contracts. A futures contract is an agreement between two parties to buy or sell a specified underlying instrument for a fixed price at a specified future date. The Fund used futures contracts to manage its exposure to the bond market, and to fluctuations in interest rates.
Upon entering into a futures contract, a fund is required to deposit either cash or securities (initial margin) with a clearing broker in an amount equal to a certain percentage of the face value of the contract. Futures contracts are marked-to-market daily and subsequent payments (variation margin) are made or received by a fund depending on the daily fluctuations in the value of the futures contracts and are recorded as unrealized appreciation or (depreciation). Realized gain or (loss) is recorded upon the expiration or closing of a futures contract.
The underlying face amount at value of open futures contracts at period end is shown in the Schedule of Investments under the caption "Futures Contracts." This amount reflects each contract's exposure to the underlying instrument at period end and is representative of activity for the period. Securities deposited to meet initial margin requirements
Semiannual Report
Notes to Financial Statements (Unaudited) - continued
4. Derivative Instruments - continued
Futures Contracts - continued
are identified in the Schedule of Investments. The receivable and/or payable for the variation margin are reflected in the Statement of Assets and Liabilities.
Certain risks arise upon entering into futures contracts, including the risk that an illiquid market limits the ability to close out a futures contract prior to settlement date.
During the period the Fund recognized net realized gain (loss) of $13,056 and a change in net unrealized appreciation (depreciation) of $(1,771) related to its investment in futures contracts. These amounts are included in the Statement of Operations.
5. Purchases and Sales of Investments.
Purchases and sales of securities, other than short-term securities and U.S. government securities, aggregated $72,320,730 and $54,784,503, respectively.
6. Fees and Other Transactions with Affiliates.
Management Fee. FMR and its affiliates provide the Fund with investment management related services for which the Fund pays a monthly management fee. The management fee is the sum of an individual fund fee rate that is based on an annual rate of .20% of the Fund's average net assets and a group fee rate that averaged .12% during the period. The group fee rate is based upon the average net assets of all the mutual funds advised by FMR. The group fee rate decreases as assets under management increase and increases as assets under management decrease. For the period, the total annualized management fee rate was .32% of the Fund's average net assets.
Distribution and Service Plan Fees. In accordance with Rule 12b-1 of the 1940 Act, the Fund has adopted separate Distribution and Service Plans for each class of shares. Certain classes pay Fidelity Distributors Corporation (FDC), an affiliate of FMR, separate Distribution and Service Fees, each of which is based on an annual percentage of each class' average net assets. In addition, FDC may pay financial intermediaries for selling shares of the Fund and providing shareholder support services. For the period, the Distribution and Service Fee rates, total fees and amounts retained by FDC were as follows:
| Distribution
Fee | Service
Fee | Paid
to FDC | Retained
by FDC |
Class A | 0% | .15% | $ 12,188 | $ 1,101 |
Class T | 0% | .15% | 3,555 | - |
| | | $ 15,743 | $ 1,101 |
Semiannual Report
6. Fees and Other Transactions with Affiliates - continued
Sales Load. FDC receives a front-end sales charge of up to 1.50% for selling Class A and Class T shares, some of which is paid to financial intermediaries for selling shares of the Fund. FDC receives the proceeds of a contingent deferred sales charges levied on Class A and Class T redemptions. These charges depend on the holding period. The deferred sales charges range from .75% for certain purchases of Class A shares and .25% for certain purchases of Class T shares.
For the period, sales charge amounts retained by FDC were as follows:
| Retained
by FDC |
Class A | $ 4,152 |
Class T | 197 |
| $ 4,349 |
Transfer Agent Fees. Fidelity Investments Institutional Operations Company, Inc. (FIIOC), an affiliate of FMR, is the transfer, dividend disbursing and shareholder servicing agent for each class of the Fund. FIIOC receives account fees and asset-based fees that vary according to the account size and type of account of the shareholders of each respective class of the Fund, with the exception of Ultra-Short Bond. FIIOC receives an asset-based fee of .10% of Ultra-Short Bond's average net assets. FIIOC pays for typesetting, printing and mailing of shareholder reports, except proxy statements. For the period, transfer agent fees for each class were as follows:
| Amount | % of
Average
Net Assets* |
Class A | $ 10,441 | .13 |
Class T | 3,843 | .16 |
Ultra-Short Bond | 120,034 | .10 |
Institutional Class | 870 | .14 |
| $ 135,188 | |
* Annualized
Fund Wide Operations Fee. Pursuant to the Fund Wide Operations and Expense Agreement (FWOE), FMR has agreed to provide for fund level expenses (which do not include transfer agent, Rule 12b-1 fees, compensation of the independent Trustees, interest (including commitment fees), taxes or extraordinary expenses, if any) in return for a FWOE fee equal to .35% less the total amount of the management fee. The FWOE paid by the Fund is reduced by an amount equal to the fees and expenses paid to the independent Trustees. For the period, the FWOE fee was equivalent to an annualized rate of .03% of average net assets.
Semiannual Report
Notes to Financial Statements (Unaudited) - continued
7. Committed Line of Credit.
The Fund participates with other funds managed by FMR or an affiliate in a $3.75 billion credit facility (the "line of credit") to be utilized for temporary or emergency purposes to fund shareholder redemptions or for other short-term liquidity purposes. The Fund has agreed to pay commitment fees on its pro-rata portion of the line of credit, which amounted to $477 and is reflected in Miscellaneous expenses on the Statement of Operations. During the period, there were no borrowings on this line of credit.
8. Expense Reductions.
Through arrangements with the Fund's custodian, credits realized as a result of uninvested cash balances were used to reduce the Fund's expenses. During the period, these credits reduced the Fund's expenses by $74.
9. Distributions to Shareholders.
Distributions to shareholders of each class were as follows:
| Six months ended
January 31, 2011 | Year ended
July 31, 2010 |
From net investment income | | |
Class A | $ 26,485 | $ 70,804 |
Class T | 6,774 | 19,435 |
Ultra-Short Bond | 568,894 | 1,791,150 |
Institutional Class | 2,776 | 5,660 |
Total | $ 604,929 | $ 1,887,049 |
10. Share Transactions.
Transactions for each class of shares were as follows:
| Shares | Dollars |
| Six months ended
January 31, 2011 | Year ended
July 31, 2010 | Six months ended
January 31, 2011 | Year ended
July 31, 2010 |
Class A | | | | |
Shares sold | 512,483 | 1,996,126 | $ 4,183,693 | $ 16,257,557 |
Reinvestment of distributions | 2,369 | 6,739 | 19,343 | 54,896 |
Shares redeemed | (1,105,851) | (770,234) | (9,032,924) | (6,273,379) |
Net increase (decrease) | (590,999) | 1,232,631 | $ (4,829,888) | $ 10,039,074 |
Class T | | | | |
Shares sold | 37,318 | 590,657 | $ 304,769 | $ 4,813,729 |
Reinvestment of distributions | 738 | 2,161 | 6,027 | 17,605 |
Shares redeemed | (177,433) | (322,791) | (1,449,408) | (2,628,531) |
Net increase (decrease) | (139,377) | 270,027 | $ (1,138,612) | $ 2,202,803 |
Semiannual Report
10. Share Transactions - continued
Transactions for each class of shares were as follows: - continued
| Shares | Dollars |
| Six months ended
January 31, 2011 | Year ended
July 31, 2010 | Six months ended
January 31, 2011 | Year ended
July 31, 2010 |
Ultra-Short Bond | | | | |
Shares sold | 5,520,778 | 9,420,448 | $ 45,102,197 | $ 76,695,898 |
Reinvestment of distributions | 67,305 | 211,789 | 549,679 | 1,725,137 |
Shares redeemed | (4,446,034) | (7,087,084) | (36,312,399) | (57,716,904) |
Net increase (decrease) | 1,142,049 | 2,545,153 | $ 9,339,477 | $ 20,704,131 |
Institutional Class | | | | |
Shares sold | 46,527 | 142,602 | $ 380,060 | $ 1,161,563 |
Reinvestment of distributions | 239 | 362 | 1,954 | 2,947 |
Shares redeemed | (56,207) | (71,879) | (459,242) | (585,281) |
Net increase (decrease) | (9,441) | 71,085 | $ (77,228) | $ 579,229 |
11. Other.
The Fund's organizational documents provide former and current trustees and officers with a limited indemnification against liabilities arising in connection with the performance of their duties to the Fund. In the normal course of business, the Fund may also enter into contracts that provide general indemnifications. The Fund's maximum exposure under these arrangements is unknown as this would be dependent on future claims that may be made against the Fund. The risk of material loss from such claims is considered remote.
Semiannual Report
Board Approval of Investment Advisory Contracts and Management Fees
Fidelity Ultra-Short Bond Fund
Each year, the Board of Trustees, including the Independent Trustees (together, the Board), votes on the renewal of the management contract and sub-advisory agreements (together, the Advisory Contracts) for the fund. The Board, assisted by the advice of fund counsel and Independent Trustees' counsel, requests and considers a broad range of information relevant to the renewal of the Advisory Contracts throughout the year.
The Board meets regularly and considers at each of its meetings factors that are relevant to its annual consideration of the renewal of the fund's Advisory Contracts, including the services and support provided to the fund and its shareholders. The Board has established three standing committees, each composed of Independent Trustees with varying backgrounds, to which the Board has assigned specific subject matter responsibilities in order to enhance effective decision-making by the Board. The Operations Committee, of which all of the Independent Trustees are members, meets regularly throughout the year and, among other matters, considers matters specifically related to the annual consideration of the renewal of the fund's Advisory Contracts. The Board, acting directly and through its Committees, requests and receives information concerning the annual consideration of the renewal of the fund's Advisory Contracts. The Board also meets as needed to consider matters specifically related to the Board's annual consideration of the renewal of Advisory Contracts. Members of the Board may also meet with trustees of other Fidelity funds through ad hoc joint committees to discuss certain matters relevant to the Fidelity funds.
At its September 2010 meeting, the Board of Trustees, including the Independent Trustees, unanimously determined to renew the fund's Advisory Contracts. In reaching its determination, the Board considered all factors it believed relevant, including (i) the nature, extent, and quality of the services to be provided to the fund and its shareholders (including the investment performance of the fund); (ii) the competitiveness of the fund's management fee and total expenses; (iii) the total costs of the services to be provided by and the profits to be realized by Fidelity from its relationship with the fund; (iv) the extent to which economies of scale would be realized as the fund grows; and (v) whether fee levels reflect these economies of scale, if any, for the benefit of fund shareholders.
In considering whether to renew the Advisory Contracts for the fund, the Board reached a determination, with the assistance of fund counsel and Independent Trustees' counsel and through the exercise of its business judgment, that the renewal of the Advisory Contracts is in the best interests of the fund and its shareholders and that the compensation to be received by Fidelity under the management contract is fair and reasonable. The Board's decision to renew the Advisory Contracts was not based on any single factor, but rather was based on a comprehensive consideration of all the information provided to the Board at its meetings throughout the year. The Board, in reaching its determination to renew the Advisory Contracts, is aware that shareholders in the fund have a broad range of investment choices available to them, including a wide choice among mutual funds offered by Fidelity's competitors, and that the fund's shareholders, with the opportunity to review and weigh the disclosure provided by the fund in its prospectus and other public disclosures, have chosen to invest in this fund, managed by Fidelity.
Semiannual Report
Nature, Extent, and Quality of Services Provided. The Board considered the staffing within the investment adviser, FMR, and the sub-advisers (together, the Investment Advisers), including the backgrounds of the fund's investment personnel and the fund's investment objective and discipline. The Independent Trustees also had discussions with senior management of Fidelity's investment operations and investment groups. The Board considered the structure of the portfolio manager compensation program and whether this structure provides appropriate incentives to act in the best interest of the fund.
Resources Dedicated to Investment Management and Support Services. The Board reviewed the size, education, and experience of the Investment Advisers' investment staff, their use of technology, and the Investment Advisers' approach to recruiting, training, and retaining portfolio managers and other research, advisory, and management personnel. The Board noted that Fidelity's analysts have access to a variety of technological tools and market and securities data that enable them to perform both fundamental and quantitative analysis and to specialize in various disciplines. The Board considered Fidelity's extensive global research capabilities that enable the Investment Advisers to aggregate data from various sources in an effort to produce positive investment results. The Board also considered that Fidelity's portfolio managers and analysts have access to daily portfolio attribution that allows for monitoring of a fund's portfolio, as well as an electronic communication system that provides immediate real-time access to research concerning issuers and credit enhancers. In addition, the Board considered the trading resources that are an integral part of the fixed-income portfolio management investment process.
Shareholder and Administrative Services. The Board considered (i) the nature, extent, quality, and cost of advisory, administrative, and shareholder services performed by the Investment Advisers and their affiliates under the Advisory Contracts and under separate agreements covering transfer agency, pricing and bookkeeping, and securities lending services for the fund; (ii) the nature and extent of the investment adviser's supervision of third party service providers, principally custodians and subcustodians; and (iii) the resources devoted to, and the record of compliance with, the fund's compliance policies and procedures.
The Board noted that the growth of fund assets over time across the complex allows Fidelity to reinvest in the development of services designed to enhance the value or convenience of the Fidelity funds as investment vehicles. These services include 24-hour access to account information and market information through telephone representatives and over the Internet, and investor education materials and asset allocation tools.
Semiannual Report
Board Approval of Investment Advisory Contracts and
Management Fees - continued
Investment in a Large Fund Family. The Board considered the benefits to shareholders of investing in a Fidelity fund, including the benefits of investing in a fund that is part of a large family of funds offering a variety of investment disciplines and providing a large variety of mutual fund investor services. The Board noted that Fidelity had taken, or had made recommendations that resulted in the Fidelity funds taking, a number of actions over the previous year that benefited particular funds, including (i) dedicating additional resources to investment research and restructuring and broadening the focus of the investment research teams; (ii) bolstering the senior management team that oversees asset management; (iii) launching Class F of certain funds as a lower-fee class available to Freedom K and Freedom Index Funds; (iv) lowering the initial investment minimums and ongoing balance requirements for Real Estate High Income Fund; (v) eliminating subsequent purchase minimums for all funds and adding a waiver of the investment minimum requirement for new accounts opened with the proceeds of a systematic withdrawal plan; (vi) eliminating the withdrawal minimum and maximum limits for systematic withdrawals from Advisor funds; (vii) expanding sales load waivers on Class A shares for Destiny Planholders and expanding Institutional Class eligibility for Class O Destiny Planholders; and (viii) changing certain Class A and Class T sales charge structures to further align them with industry practices.
Investment Performance. The Board considered whether the fund has operated in accordance with its investment objective, as well as its record of compliance with its investment restrictions. It also reviewed the fund's absolute investment performance for each class, as well as the fund's relative investment performance for each class measured over multiple periods against (i) a broad-based securities market index, and (ii) a peer group of mutual funds deemed appropriate by Fidelity and reviewed by the Board. The following charts considered by the Board show, over the one-, three-, and five-year periods ended December 31, 2009, the cumulative total returns of the retail class and Class T of the fund, the cumulative total returns of a broad-based securities market index ("benchmark"), and a range of cumulative total returns of a peer group of mutual funds identified by Lipper Inc. as having an investment objective similar to that of the fund. The returns of the retail class and Class T show the performance of the highest and lowest performing classes, respectively (based on five-year performance). The box within each chart shows the 25th percentile return (bottom of box) and the 75th percentile return (top of box) of the peer group. Returns shown above the box are in the first quartile and returns shown below the box are in the fourth quartile. The percentage beaten numbers noted below each chart correspond to the percentile box and represent the percentage of funds in the peer group whose performance was equal to or lower than that of the class indicated.
Semiannual Report
Fidelity Ultra-Short Bond Fund
The Board reviewed the fund's relative investment performance against its peer group and noted that the performance of the retail class of the fund was in the fourth quartile for all the periods shown. The Board also noted that the investment performance of the fund was lower than its benchmark for all the periods shown. The Board considered that the variations in performance among the fund's classes reflect the variations in class expenses, which result in lower performance for higher expense classes. The Board discussed with FMR actions that have been taken by FMR to improve the fund's disappointing performance and how investment personnel evaluate potential for incremental return against the risks involved in obtaining that incremental return. The Board considered the steps that FMR has taken to strengthen and refine its risk management processes in light of recent credit events that have affected various sectors of the fixed-income markets. The Board noted that this fund had underperformed in 2008 and discussed with FMR its disappointment with the continued underperformance of the fund. The Board also reviewed the fund's performance since inception as well as performance in the current year. The Board will continue to closely monitor the performance of the fund in the coming year and discuss with FMR other appropriate actions to address the performance of the fund.
Based on its review, and giving particular weight to the nature and quality of the resources dedicated by the Investment Advisers to maintain and improve relative performance and factoring in the unprecedented market events in recent years, the Board concluded that the nature, extent, and quality of investment management and support services and of shareholder and administrative services provided to the fund will benefit the fund's shareholders, particularly in light of the Board's view that the fund's shareholders benefit from investing in a fund that is part of a large family of funds offering a variety of investment disciplines and services.
Semiannual Report
Board Approval of Investment Advisory Contracts and
Management Fees - continued
Competitiveness of Management Fee and Total Fund Expenses. The Board considered the fund's management fee and total expenses compared to "mapped groups" of competitive funds and classes. Fidelity creates "mapped groups" by combining similar Lipper investment objective categories that have comparable management fee characteristics. Combining Lipper investment objective categories aids the Board's management fee and total expense comparisons by broadening the competitive group used for comparison and by reducing the number of universes to which various Fidelity funds are compared.
Management Fee. The Board considered two proprietary management fee comparisons for the 12-month periods shown in the chart below. The group of Lipper funds used by the Board for management fee comparisons is referred to below as the "Total Mapped Group" and, for the reasons explained above, is broader than the Lipper peer group used by the Board for performance comparisons. The Total Mapped Group comparison focuses on a fund's standing relative to the total universe of comparable funds available to investors, in terms of gross management fees before expense reimbursements or caps. "TMG %" represents the percentage of funds in the Total Mapped Group that had management fees that were lower than the fund's. For example, a TMG % of 22% means that 78% of the funds in the Total Mapped Group had higher management fees than the fund. The "Asset-Size Peer Group" (ASPG) comparison focuses on a fund's standing relative to non-Fidelity funds similar in size to the fund within the Total Mapped Group. The ASPG represents at least 15% of the funds in the Total Mapped Group with comparable asset size and management fee characteristics, subject to a minimum of 50 funds (or all funds in the Total Mapped Group if fewer than 50). Additional information, such as the ASPG quartile in which the fund's management fee ranked, is also included in the chart and considered by the Board.
Semiannual Report
Fidelity Ultra-Short Bond Fund
The Board noted that the fund's management fee ranked below the median of its Total Mapped Group and below the median of its ASPG for 2009.
Furthermore, the Board considered that it had approved an amendment (effective June 1, 2005) to the fund's management contract that lowered the fund's individual fund fee rate from 30 basis points to 20 basis points. The Board considered that the chart reflects the fund's lower management fee for 2005, as if the lower rate were in effect for the entire year.
Based on its review, the Board concluded that the fund's management fee is fair and reasonable in light of the services that the fund receives and the other factors considered.
Total Expenses. In its review of each class's total expenses, the Board considered the fund's management fee as well as other fund or class expenses, as applicable, such as transfer agent fees, pricing and bookkeeping fees, fund-paid 12b-1 fees, and custodial, legal, and audit fees. The Board also noted the effects of any waivers and reimbursements on fees and expenses. As part of its review, the Board also considered current and historical total expenses of each class of the fund compared to competitive fund median expenses. Each class of the fund is compared to those funds and classes in the Total Mapped Group (used by the Board for management fee comparisons) that have a similar sales load structure.
The Board also considered that the current contractual arrangements for the fund (i) have the effect of setting the total "fund-level" expenses (including, among certain other expenses, the management fee) for each class at 35 basis points, (ii) lower and limit the "class-level" transfer agent fee for the retail class to 10 basis points, and (iii) limit the total expenses for the retail class to 45 basis points. The fees and expenses payable under these contractual arrangements may not be increased without the approval of the Board and the shareholders of the applicable class. The fund's Advisor classes are subject to different "class-level" expenses (transfer agent fees and 12b-1 fees).
Semiannual Report
Board Approval of Investment Advisory Contracts and
Management Fees - continued
The Board noted that the total expenses of each of Class A, Class T, and the retail class ranked below its competitive median for 2009 and the total expenses of Institutional Class ranked above its competitive median for 2009. The Board noted that Institutional Class has a significantly lower investment minimum than certain funds and classes in the Total Mapped Group that have a similar sales load structure and that, when compared to funds with the same or lower investment minimum, Institutional Class ranked equal to its median for 2009. The Board noted that the fund offers multiple classes, each of which has a different sales load and 12b-1 fee structure, and that the multiple structures are intended to offer a range of pricing options for the intermediary market. The Board also noted that the total expenses of the classes vary primarily by the level of their 12b-1 fees, although differences in transfer agent fees may also cause expenses to vary from class to class.
The Board recognized that the fund's management contract incorporates a "group fee" structure, which provides for lower group fee rates as total fund assets under FMR's management increase, and for higher group fee rates as total fund assets under FMR's management decrease. FMR calculates the group fee rates based on a tiered asset "breakpoint" schedule that varies based on asset class. The Board noted, however, that because the current contractual arrangements set the total "fund-level" expenses for each class at 35 basis points, increases or decreases in the management fee due to changes in the group fee rate will not impact total expenses.
Fees Charged to Other Fidelity Clients. The Board also considered Fidelity fee structures and other information with respect to clients of FMR and its affiliates, such as other mutual funds advised or subadvised by FMR or its affiliates, pension plan clients, and other institutional clients. In March 2010, the Board created an ad hoc joint committee with the board of other Fidelity funds (the Committee) to review and compare Fidelity's institutional investment advisory business with its business of providing services to the Fidelity funds, including the differences in services provided, fees charged, and costs incurred, as well as competition in their respective marketplaces.
Based on its review of total expenses and fees charged to other Fidelity clients, the Board concluded that the total expenses of each class of the fund were reasonable, although in one case above the median of the universe presented for comparison, in light of the services that the fund and its shareholders receive and the other factors considered, including the findings of the Committee.
Semiannual Report
Costs of the Services and Profitability. The Board considered the revenues earned and the expenses incurred by Fidelity in conducting the business of developing, marketing, distributing, managing, administering and servicing the fund and its shareholders. The Board also considered the level of Fidelity's profits in respect of all the Fidelity funds.
On an annual basis, FMR presents to the Board Fidelity's profitability for the fund. Fidelity calculates the profitability for each fund, as well as aggregate profitability for groups of Fidelity funds and all Fidelity funds, using a series of detailed revenue and cost allocation methodologies which originate with the audited books and records of Fidelity. The Audit Committee of the Board reviews any significant changes from the prior year's methodologies.
PricewaterhouseCoopers LLP (PwC), independent registered public accounting firm and auditor to Fidelity and certain Fidelity funds, has been engaged annually by the Board as part of the Board's assessment of Fidelity's profitability analysis. PwC's engagement includes the review and assessment of Fidelity's methodologies used in determining the revenues and expenses attributable to Fidelity's mutual fund business, and completion of agreed-upon procedures surrounding the mathematical accuracy of fund profitability and its conformity to allocation methodologies. After considering PwC's reports issued under the engagement and information provided by Fidelity, the Board believes that while other allocation methods may also be reasonable, Fidelity's profitability methodologies are reasonable in all material respects.
The Board has also reviewed Fidelity's non-fund businesses and fall-out benefits related to the mutual fund business as well as cases where Fidelity's affiliates may benefit from or be related to the fund's business.
The Board considered the costs of the services provided by and the profits realized by Fidelity in connection with the operation of the fund and were satisfied that the profitability was not excessive in the circumstances.
Economies of Scale. The Board considered whether there have been economies of scale in respect of the management of the Fidelity funds, whether the Fidelity funds (including the fund) have appropriately benefited from any such economies of scale, and whether there is potential for realization of any further economies of scale. The Board considered the extent to which the fund will benefit from economies of scale through increased services to the fund, through waivers or reimbursements, or through fee or expense reductions.
In February 2009, the Board and the board of other Fidelity funds created an ad hoc committee (the Economies of Scale Committee) to analyze whether FMR attains economies of scale in respect of the management and servicing of the Fidelity funds, whether the Fidelity funds have appropriately benefited from such economies of scale, and whether there is potential for realization of any further economies of scale.
Semiannual Report
Board Approval of Investment Advisory Contracts and
Management Fees - continued
The Board concluded, considering the findings of the Economies of Scale Committee, that any potential economies of scale are being appropriately shared between fund shareholders and Fidelity.
Additional Information Requested by the Board. In order to develop fully the factual basis for consideration of the Fidelity funds' Advisory Contracts, the Board requested and received additional information on certain topics, including (i) fund performance trends, actions to be taken by FMR to improve certain funds' overall performance, and Fidelity's long-term strategies for certain funds; (ii) Fidelity's fund profitability methodology and profitability trends for certain funds; (iii) portfolio manager changes that have occurred during the past year and the amount of the investment that each portfolio manager has made in the Fidelity fund(s) that he or she manages; (iv) Fidelity's compensation structure for portfolio managers, research analysts, and other key personnel, including its effects on fund profitability, the rationale for the compensation structure, and the extent to which current market conditions have affected retention and recruitment; (v) the compensation paid by FMR to fund sub-advisers on behalf of the Fidelity funds; (vi) Fidelity's fee structures and rationale for recommending different fees among different categories of funds and classes, as well as Fidelity's voluntary waiver of fees to maintain minimum yields for certain funds and classes; (vii) the rationale for any differences between fund fee structures and fee structures in place for other Fidelity clients; and (viii) explanations regarding the relative total expenses borne by certain funds and classes, total expense competitive trends, and actions that might be taken by FMR to reduce total expenses for certain funds and classes or to achieve further economies of scale.
Based on its evaluation of all of the conclusions noted above, and after considering all factors it believed relevant, the Board ultimately concluded that the advisory fee structures are fair and reasonable, and that the fund's Advisory Contracts should be renewed.
Semiannual Report
Investment Adviser
Fidelity Management & Research Company
Boston, MA
Investment Sub-Advisers
Fidelity Investments
Money Management, Inc.
Fidelity Management & Research
(U.K.) Inc.
Fidelity Management & Research
(Japan) Inc.
Fidelity Management & Research
(Hong Kong) Limited
General Distributor
Fidelity Distributors Corporation
Boston, MA
Transfer and Service Agents
Fidelity Investments Institutional
Operations Company, Inc.
Boston, MA
Fidelity Service Company, Inc.
Boston, MA
Custodian
Citibank, N.A.
New York, NY
AUSB-USAN-0311
1.804590.107
(Fidelity Investment logo)(registered trademark)
Fidelity Advisor®
Ultra-Short Bond
Fund - Institutional Class
Semiannual Report
January 31, 2011
(2_fidelity_logos) (Registered_Trademark)
Institutional Class
is a class of
Fidelity® Ultra-Short Bond Fund
Contents
Chairman's Message | <Click Here> | The Chairman's message to shareholders. |
Shareholder Expense Example | <Click Here> | An example of shareholder expenses. |
Investment Changes | <Click Here> | A summary of major shifts in the fund's investments over the past six months. |
Investments | <Click Here> | A complete list of the fund's investments with their market values. |
Financial Statements | <Click Here> | Statements of assets and liabilities, operations, and changes in net assets,
as well as financial highlights. |
Notes | <Click Here> | Notes to the financial statements. |
Board Approval of Investment Advisory Contracts and Management Fees | <Click Here> | |
To view a fund's proxy voting guidelines and proxy voting record for the 12-month period ended June 30, visit http://www.fidelity.com/proxyvotingresults or visit the Securities and Exchange Commission's (SEC) web site at http://www.sec.gov. You may also call 1-877-208-0098 to request a free copy of the proxy voting guidelines.
Standard & Poor's, S&P and S&P 500 are registered service marks of The McGraw-Hill Companies, Inc. and have been licensed for use by Fidelity Distributors Corporation.
Other third party marks appearing herein are the property of their respective owners.
All other marks appearing herein are registered or unregistered trademarks or service marks of FMR LLC or an affiliated company.
This report and the financial statements contained herein are submitted for the general information of the shareholders of the fund. This report is not authorized for distribution to prospective investors in the fund unless preceded or accompanied by an effective prospectus.
A fund files its complete schedule of portfolio holdings with the SEC for the first and third quarters of each fiscal year on Form N-Q. Forms N-Q are available on the SEC's web site at http://www.sec.gov. A fund's Forms N-Q may be reviewed and copied at the SEC's Public Reference Room in Washington, DC. Information regarding the operation of the SEC's Public Reference Room may be obtained by calling 1-800-SEC-0330. For a complete list of a fund's portfolio holdings, view the most recent holdings listing, semiannual report, or annual report on Fidelity's web site at http://www.fidelity.com, http://www.advisor.fidelity.com, or http://www.401k.com, as applicable.
NOT FDIC INSURED • MAY LOSE VALUE • NO BANK GUARANTEE
Neither the fund nor Fidelity Distributors Corporation is a bank.
Semiannual Report
(photo_of_Abigail_P_Johnson)
Dear Shareholder:
Following a year in which the investment environment was volatile but generally supportive of most major asset classes, 2011 began on a positive note. U.S. equities gained ground in January, reaching their highest point since August 2008, amid indications the U.S. economy had turned a corner. Still, questions remained about the longer-term outlook, most notably persistently high unemployment. Financial markets are always unpredictable, of course, but there also are several time-tested investment principles that can help put the odds in your favor.
One of the basic tenets is to invest for the long term. Over time, riding out the markets' inevitable ups and downs has proven much more effective than selling into panic or chasing the hottest trend. Even missing only a few of the markets' best days can significantly diminish investor returns. Patience also affords the benefits of compounding - of earning interest on additional income or reinvested dividends and capital gains. There can be tax advantages and cost benefits to consider as well. While staying the course doesn't eliminate risk, it can considerably lessen the effect of short-term declines.
You can further manage your investing risk through diversification. And today, more than ever, geographic diversification should be taken into account. Studies indicate that asset allocation is the single most important determinant of a portfolio's long-term success. The right mix of stocks, bonds and cash - aligned to your particular risk tolerance and investment objective - is very important. Age-appropriate rebalancing is also an essential aspect of asset allocation. For younger investors, an emphasis on equities - which historically have been the best-performing asset class over time - is encouraged. As investors near their specific goal, such as retirement or sending a child to college, consideration may be given to replacing volatile assets (e.g. common stocks) with more-stable fixed investments (bonds or savings plans).
A third principle - investing regularly - can help lower the average cost of your purchases. Investing a certain amount of money each month or quarter helps ensure you won't pay for all your shares at market highs. This strategy - known as dollar cost averaging - also reduces "emotion" from investing, helping shareholders avoid selling weak performers just prior to an upswing, or chasing a hot performer just before a correction.
We invite you to contact us via the Internet, through our Investor Centers or by phone. It is our privilege to provide you the information you need to make the investments that are right for you.
Sincerely,
(The chairman's signature appears here.)
Abigail P. Johnson
Semiannual Report
Shareholder Expense Example
As a shareholder of the Fund, you incur two types of costs: (1) transaction costs, including redemption fees, and (2) ongoing costs, including management fees, distribution and/or service (12b-1) fees and other Fund expenses. This Example is intended to help you understand your ongoing costs (in dollars) of investing in the Fund and to compare these costs with the ongoing costs of investing in other mutual funds.
The Example is based on an investment of $1,000 invested at the beginning of the period and held for the entire period (August 1, 2010 to January 31, 2011).
Actual Expenses
The first line of the accompanying table for each class of the Fund provides information about actual account values and actual expenses. You may use the information in this line, together with the amount you invested, to estimate the expenses that you paid over the period. Simply divide your account value by $1,000.00 (for example, an $8,600 account value divided by $1,000.00 = 8.6), then multiply the result by the number in the first line for a class of the Fund under the heading entitled "Expenses Paid During Period" to estimate the expenses you paid on your account during this period.
Hypothetical Example for Comparison Purposes
The second line of the accompanying table for each class of the Fund provides information about hypothetical account values and hypothetical expenses based on a Class' actual expense ratio and an assumed rate of return of 5% per year before expenses, which is not the Class' actual return. The hypothetical account values and expenses may not be used to estimate the actual ending account balance or expenses you paid for the period. You may use this information to compare the ongoing costs of investing in the Fund and other funds. To do so, compare this 5% hypothetical example with the 5% hypothetical examples that appear in the shareholder reports of the other funds.
Please note that the expenses shown in the table are meant to highlight your ongoing costs only and do not reflect any transaction costs. Therefore, the second line of the table is useful in comparing ongoing costs only, and will not help you determine the relative total costs of owning different funds. In addition, if these transactional costs were included, your costs would have been higher.
Semiannual Report
Shareholder Expense Example - continued
| Annualized
Expense
Ratio | Beginning
Account Value
August 1, 2010 | Ending
Account Value
January 31, 2011 | Expenses Paid
During Period*
August 1, 2010 to
January 31, 2011 |
Class A | .62% | | | |
Actual | | $ 1,000.00 | $ 1,003.90 | $ 3.13 |
HypotheticalA | | $ 1,000.00 | $ 1,022.08 | $ 3.16 |
Class T | .66% | | | |
Actual | | $ 1,000.00 | $ 1,005.00 | $ 3.34 |
HypotheticalA | | $ 1,000.00 | $ 1,021.88 | $ 3.36 |
Ultra-Short Bond | .45% | | | |
Actual | | $ 1,000.00 | $ 1,006.10 | $ 2.28 |
HypotheticalA | | $ 1,000.00 | $ 1,022.94 | $ 2.29 |
Institutional Class | .48% | | | |
Actual | | $ 1,000.00 | $ 1,005.90 | $ 2.43 |
HypotheticalA | | $ 1,000.00 | $ 1,022.79 | $ 2.45 |
A 5% return per year before expenses
* Expenses are equal to each Class' annualized expense ratio, multiplied by the average account value over the period, multiplied by 184/365 (to reflect the one-half year period).
Semiannual Report
Investment Changes (Unaudited)
Quality Diversification (% of fund's net assets) |
As of January 31, 2011 | As of July 31, 2010 |
| U.S. Government and
U.S. Government
Agency
Obligations† 40.8% | | | U.S. Government and
U.S. Government
Agency
Obligations† 39.0% | |
| AAA 15.5% | | | AAA 16.5% | |
| AA 14.3% | | | AA 9.5% | |
| A 9.6% | | | A 6.0% | |
| BBB 9.2% | | | BBB 7.9% | |
| BB and Below 0.3% | | | BB and Below 0.2% | |
| Not Rated 1.1% | | | Not Rated 0.8% | |
| Short-Term
Investments and
Net Other Assets 9.2% | | | Short-Term
Investments and
Net Other Assets 20.1% | |
We have used ratings from Moody's Investors Service, Inc. Where Moody's® ratings are not available, we have used S&P® ratings. All ratings are as of the report date and do not reflect subsequent changes. Securities rated BB or below were rated investment grade at the time of acquisition. |
Weighted Average Maturity as of January 31, 2011 |
| | 6 months ago |
Years | 1.3 | 0.9 |
This is a weighted average of all the maturities of the securities held in a fund. Weighted Average Maturity (WAM) can be used as a measure of sensitivity to interest rate changes and markets changes. Generally, the longer the maturity, the greater the sensitivity to such changes. WAM is based on the dollar-weighted average length of time until principal payments must be paid. Depending on the types of securities held in a fund, certain maturity shortening devices (e.g., demand features, interest rate resets, and call options) may be taken into account when calculating the WAM. |
Duration as of January 31, 2011 |
| | 6 months ago |
Years | 0.4 | 0.4 |
Duration shows how much a bond fund's price fluctuates with changes in comparable interest rates. If rates rise 1%, for example, a fund with a five-year duration is likely to lose about 5% of its value. Other factors also can influence a bond fund's performance and share price. Accordingly, a bond fund's actual performance may differ from this example. |
Asset Allocation (% of fund's net assets) |
As of January 31, 2011* | As of July 31, 2010** |
| Corporate Bonds 30.5% | | | Corporate Bonds 22.0% | |
| U.S. Government and
U.S. Government
Agency
Obligations† 40.8% | | | U.S. Government and
U.S. Government
Agency
Obligations† 39.0% | |
| Asset-Backed
Securities 15.7% | | | Asset-Backed
Securities 15.6% | |
| CMOs and
Other Mortgage
Related Securities 2.6% | | | CMOs and
Other Mortgage
Related Securities 2.5% | |
| Other Investments 1.2% | | | Other Investments 0.8% | |
| Short-Term
Investments and
Net Other Assets 9.2% | | | Short-Term
Investments and
Net Other Assets 20.1% | |
* Foreign investments | 12.5% | | ** Foreign investments | 10.3% | |
* Futures and Swaps | 3.7% | | ** Futures and Swaps | 3.8% | |
† Includes FDIC Guaranteed Corporate Securities |
Semiannual Report
Investments January 31, 2011 (Unaudited)
Showing Percentage of Net Assets
Nonconvertible Bonds - 30.5% |
| Principal Amount | | Value |
CONSUMER DISCRETIONARY - 1.9% |
Auto Components - 0.7% |
DaimlerChrysler NA Holding Corp.: | | | | |
5.75% 9/8/11 | | $ 1,500,000 | | $ 1,544,858 |
5.875% 3/15/11 | | 500,000 | | 503,081 |
| | 2,047,939 |
Media - 0.8% |
AOL Time Warner, Inc. 6.875% 5/1/12 | | 1,000,000 | | 1,071,289 |
COX Communications, Inc. 6.75% 3/15/11 | | 1,000,000 | | 1,007,311 |
| | 2,078,600 |
Specialty Retail - 0.4% |
Staples, Inc. 7.75% 4/1/11 | | 1,000,000 | | 1,011,014 |
TOTAL CONSUMER DISCRETIONARY | | 5,137,553 |
CONSUMER STAPLES - 2.0% |
Beverages - 1.9% |
Anheuser-Busch InBev Worldwide, Inc. 1.0328% 3/26/13 (e) | | 2,000,000 | | 2,018,774 |
Diageo Finance BV 3.875% 4/1/11 | | 1,000,000 | | 1,005,489 |
SABMiller PLC 6.2% 7/1/11 (b) | | 2,000,000 | | 2,044,154 |
| | 5,068,417 |
Food Products - 0.1% |
Kraft Foods, Inc. 5.625% 11/1/11 | | 258,000 | | 267,119 |
TOTAL CONSUMER STAPLES | | 5,335,536 |
ENERGY - 1.5% |
Oil, Gas & Consumable Fuels - 1.5% |
Kinder Morgan Energy Partners LP 6.75% 3/15/11 | | 1,000,000 | | 1,006,697 |
Shell International Finance BV 1.3% 9/22/11 | | 1,000,000 | | 1,006,279 |
Total Capital Canada Ltd. 0.6758% 1/17/14 (e) | | 2,000,000 | | 1,997,074 |
| | 4,010,050 |
FINANCIALS - 18.1% |
Capital Markets - 3.0% |
Goldman Sachs Group, Inc. 0.7028% 10/7/11 (e) | | 1,000,000 | | 1,002,468 |
HSBC Bank PLC 1.1031% 1/17/14 (b)(e) | | 2,000,000 | | 1,997,094 |
JPMorgan Chase & Co. 1.1031% 1/24/14 (e) | | 2,000,000 | | 2,002,334 |
Nonconvertible Bonds - continued |
| Principal Amount | | Value |
FINANCIALS - continued |
Capital Markets - continued |
Morgan Stanley 1.9025% 1/24/14 (e) | | $ 1,500,000 | | $ 1,506,504 |
UBS AG Stamford Branch 1.3044% 1/28/14 (e) | | 1,500,000 | | 1,500,000 |
| | 8,008,400 |
Commercial Banks - 8.2% |
ANZ Banking Group Ltd. 0.3024% 1/10/14 (b)(e) | | 1,000,000 | | 998,549 |
Barclays Bank PLC 1.3431% 1/13/14 (e) | | 1,000,000 | | 1,005,780 |
Commonwealth Bank of Australia 0.8538% 3/19/13 (b)(e) | | 1,500,000 | | 1,503,086 |
Credit Agricole SA 0.6359% 2/2/12 (b)(e) | | 2,000,000 | | 1,993,458 |
Credit Suisse New York Branch 1.2631% 1/14/14 (e) | | 1,000,000 | | 1,004,625 |
Deutsche Bank New York Branch 0.9531% 1/18/13 (e) | | 2,000,000 | | 2,002,710 |
Fifth Third Bank 0.3944% 5/17/13 (e) | | 1,000,000 | | 973,357 |
ING Bank NV 1.6231% 10/18/13 (b)(e) | | 2,000,000 | | 1,997,292 |
Marshall & Ilsley Bank 6.375% 9/1/11 | | 287,000 | | 293,735 |
National Australia Bank Ltd. 0.7831% 1/8/13 (b)(e) | | 1,000,000 | | 1,004,508 |
Santander US Debt SA Unipersonal 1.1028% 3/30/12 (b)(e) | | 800,000 | | 791,291 |
Sovereign Bank 1.9969% 8/1/13 (e) | | 500,000 | | 500,000 |
SunTrust Bank 6.375% 4/1/11 | | 1,000,000 | | 1,008,495 |
Svenska Handelsbanken AB 1.3016% 9/14/12 (b)(e) | | 2,000,000 | | 2,006,376 |
U.S. Bank NA 0.5231% 10/26/12 (e) | | 2,000,000 | | 2,005,518 |
Wachovia Corp. 0.4459% 3/1/12 (e) | | 2,000,000 | | 2,001,122 |
Westpac Banking Corp. 0.8531% 4/8/13 (b)(e) | | 1,000,000 | | 1,002,359 |
| | 22,092,261 |
Consumer Finance - 2.4% |
American Express Credit Corp. 0.4213% 6/16/11 (e) | | 1,500,000 | | 1,500,323 |
American Honda Finance Corp. 0.6539% 11/7/12 (b)(e) | | 2,000,000 | | 1,998,244 |
Capital One Financial Corp. 5.7% 9/15/11 | | 1,000,000 | | 1,028,631 |
General Electric Capital Corp. 1.1528% 1/7/14 (e) | | 2,000,000 | | 2,006,320 |
| | 6,533,518 |
Diversified Financial Services - 1.6% |
BNP Paribas 1.2031% 1/10/14 (e) | | 1,000,000 | | 1,000,280 |
BP Capital Markets PLC 1.55% 8/11/11 | | 1,350,000 | | 1,355,889 |
Citigroup, Inc. 1.7531% 1/13/14 (e) | | 2,000,000 | | 2,002,848 |
| | 4,359,017 |
Insurance - 2.1% |
Berkshire Hathaway Finance Corp. 0.6331% 1/10/14 (e) | | 2,000,000 | | 2,001,158 |
Nonconvertible Bonds - continued |
| Principal Amount | | Value |
FINANCIALS - continued |
Insurance - continued |
Metropolitan Life Global Funding I: | | | | |
1.0531% 1/10/14 (b)(e) | | $ 1,000,000 | | $ 997,113 |
5.75% 7/25/11 (b) | | 1,500,000 | | 1,535,089 |
Unum Group 7.625% 3/1/11 | | 1,000,000 | | 1,004,487 |
| | 5,537,847 |
Thrifts & Mortgage Finance - 0.8% |
Bank of America Corp. 1.7138% 1/30/14 (e) | | 2,000,000 | | 2,005,244 |
TOTAL FINANCIALS | | 48,536,287 |
HEALTH CARE - 1.1% |
Health Care Providers & Services - 0.4% |
UnitedHealth Group, Inc. 5.25% 3/15/11 | | 1,000,000 | | 1,005,207 |
Pharmaceuticals - 0.7% |
Merck & Co., Inc. 1.875% 6/30/11 | | 2,000,000 | | 2,013,960 |
TOTAL HEALTH CARE | | 3,019,167 |
INDUSTRIALS - 0.8% |
Aerospace & Defense - 0.8% |
BAE Systems Holdings, Inc. 6.4% 12/15/11 (b) | | 2,000,000 | | 2,097,288 |
INFORMATION TECHNOLOGY - 0.3% |
Computers & Peripherals - 0.1% |
Hewlett-Packard Co. 2.25% 5/27/11 | | 286,000 | | 288,054 |
Office Electronics - 0.2% |
Xerox Corp. 6.875% 8/15/11 | | 500,000 | | 514,983 |
TOTAL INFORMATION TECHNOLOGY | | 803,037 |
TELECOMMUNICATION SERVICES - 3.1% |
Diversified Telecommunication Services - 1.7% |
Deutsche Telekom International Financial BV 5.375% 3/23/11 | | 1,000,000 | | 1,006,841 |
SBC Communications, Inc. 6.25% 3/15/11 | | 2,000,000 | | 2,013,634 |
Telecom Italia Capital SA: | | | | |
0.7669% 2/1/11 (e) | | 500,000 | | 500,000 |
6.2% 7/18/11 | | 1,000,000 | | 1,022,413 |
| | 4,542,888 |
Nonconvertible Bonds - continued |
| Principal Amount | | Value |
TELECOMMUNICATION SERVICES - continued |
Wireless Telecommunication Services - 1.4% |
Verizon Wireless Capital LLC 3.75% 5/20/11 | | $ 1,683,000 | | $ 1,699,249 |
Vodafone Group PLC 0.5719% 2/27/12 (e) | | 2,000,000 | | 2,002,854 |
| | 3,702,103 |
TOTAL TELECOMMUNICATION SERVICES | | 8,244,991 |
UTILITIES - 1.7% |
Electric Utilities - 1.3% |
Progress Energy, Inc. 7.1% 3/1/11 | | 2,000,000 | | 2,010,086 |
Southern Co. 0.7031% 10/21/11 (e) | | 1,500,000 | | 1,504,215 |
| | 3,514,301 |
Multi-Utilities - 0.4% |
Wisconsin Energy Corp. 6.5% 4/1/11 | | 1,000,000 | | 1,009,744 |
TOTAL UTILITIES | | 4,524,045 |
TOTAL NONCONVERTIBLE BONDS (Cost $81,588,366) | 81,707,954 |
U.S. Government and Government Agency Obligations - 34.1% |
|
U.S. Government Agency Obligations - 15.4% |
Fannie Mae 1% 4/4/12 | | 35,000,000 | | 35,243,455 |
Freddie Mac 1.625% 4/26/11 | | 6,000,000 | | 6,020,310 |
TOTAL U.S. GOVERNMENT AGENCY OBLIGATIONS | | 41,263,765 |
U.S. Treasury Inflation Protected Obligations - 0.5% |
U.S. Treasury Inflation-Indexed Notes 2.375% 4/15/11 | | 1,471,624 | | 1,485,911 |
U.S. Treasury Obligations - 15.0% |
U.S. Treasury Notes: | | | | |
0.875% 5/31/11 (d) | | 20,000,000 | | 20,044,540 |
1% 7/31/11 | | 20,000,000 | | 20,079,680 |
TOTAL U.S. TREASURY OBLIGATIONS | | 40,124,220 |
Other Government Related - 3.2% |
Bank of America Corp. 0.6044% 4/30/12 (FDIC Guaranteed) (c)(e) | | 1,500,000 | | 1,507,170 |
Citibank NA 1.5% 7/12/11 (FDIC Guaranteed) (c) | | 690,000 | | 694,031 |
U.S. Government and Government Agency Obligations - continued |
| Principal Amount | | Value |
Other Government Related - continued |
Citigroup Funding, Inc. 1.375% 5/5/11 (FDIC Guaranteed) (c) | | $ 470,000 | | $ 471,381 |
General Electric Capital Corp. 1.8% 3/11/11 (FDIC Guaranteed) (c) | | 870,000 | | 871,509 |
Goldman Sachs Group, Inc.: | | | | |
0.5356% 11/9/11 (FDIC Guaranteed) (c)(e) | | 2,000,000 | | 2,005,106 |
1.7% 3/15/11 (FDIC Guaranteed) (c) | | 1,000,000 | | 1,001,797 |
JPMorgan Chase & Co. 0.3644% 2/23/11 (FDIC Guaranteed) (c)(e) | | 2,000,000 | | 2,000,188 |
TOTAL OTHER GOVERNMENT RELATED | | 8,551,182 |
TOTAL U.S. GOVERNMENT AND GOVERNMENT AGENCY OBLIGATIONS (Cost $91,327,297) | 91,425,078 |
U.S. Government Agency - Mortgage Securities - 3.5% |
|
Fannie Mae - 3.1% |
2.556% 12/1/34 (e) | | 654,315 | | 688,896 |
2.557% 6/1/35 (e) | | 441,981 | | 461,673 |
2.634% 6/1/35 (e) | | 1,142,533 | | 1,200,809 |
2.635% 11/1/34 (e) | | 601,818 | | 628,398 |
2.636% 7/1/33 (e) | | 171,201 | | 179,158 |
2.639% 7/1/35 (e) | | 935,198 | | 982,612 |
2.645% 8/1/33 (e) | | 144,832 | | 150,937 |
2.652% 7/1/34 (e) | | 541,637 | | 568,551 |
2.71% 11/1/34 (e) | | 650,215 | | 685,906 |
2.73% 10/1/35 (e) | | 1,253,170 | | 1,315,414 |
2.811% 2/1/34 (e) | | 348,430 | | 361,031 |
3.768% 10/1/39 (e) | | 945,270 | | 988,326 |
TOTAL FANNIE MAE | | 8,211,711 |
Freddie Mac - 0.4% |
2.663% 6/1/35 (e) | | 994,888 | | 1,043,575 |
TOTAL U.S. GOVERNMENT AGENCY - MORTGAGE SECURITIES (Cost $9,036,428) | 9,255,286 |
Asset-Backed Securities - 15.7% |
| Principal Amount | | Value |
ACE Securities Corp. Home Equity Loan Trust
Series 2004-HE1 Class M1, 1.01% 3/25/34 (e) | | $ 7,153 | | $ 7,051 |
Ally Auto Receivables Trust: | | | | |
Series 2009-A Class A2, 1.32% 3/15/12 (b) | | 584,873 | | 585,531 |
Series 2009-B Class A2, 1.21% 6/15/12 (b) | | 1,033,161 | | 1,034,643 |
Series 2010-4 Class A2, 0.71% 2/15/13 | | 1,000,000 | | 999,456 |
Ally Master Owner Trust: | | | | |
Series 2010-1 Class A, 2.0113% 1/15/15 (b)(e) | | 700,000 | | 712,996 |
Series 2011-1 Class A1, 1.13% 1/15/16 (e) | | 500,000 | | 500,000 |
AmeriCredit Automobile Receivables Trust: | | | | |
Series 2007-AX Class A4, 0.3006% 10/6/13 (e) | | 1,006,479 | | 1,000,948 |
Series 2010-3 Class A2, 0.77% 12/9/13 | | 1,000,000 | | 999,986 |
Series 2010-B Class A2, 1.18% 2/6/14 (Assured Guaranty Corp. Insured) | | 1,000,000 | | 998,405 |
Series 2011-1 Class A2, 0.84% 9/10/12 | | 1,000,000 | | 1,000,000 |
Bank of America Auto Trust: | | | | |
Series 2009-1A Class A3, 2.67% 7/15/13 (b) | | 771,732 | | 779,829 |
Series 2010-2 Class A2, 0.91% 10/15/12 | | 1,000,000 | | 1,001,579 |
BMW Vehicle Lease Trust: | | | | |
Series 2009-1 Class A3, 2.91% 3/15/12 | | 509,857 | | 513,732 |
Series 2010-1 Class A2, 0.58% 9/17/12 | | 2,000,000 | | 2,000,652 |
Capital One Auto Finance Trust Series 2007-C Class A4, 5.23% 7/15/14 (FGIC Insured) | | 495,731 | | 510,504 |
Capital One Multi-Asset Execution Trust Series 2009-A2 Class A2, 3.2% 4/15/14 | | 1,500,000 | | 1,514,357 |
CarMax Auto Owner Trust Series 2009-2 Class A2, 1% 6/15/12 | | 644,965 | | 645,303 |
Chase Issuance Trust: | | | | |
Series 2005-A2 Class A2, 0.3313% 12/15/14 (e) | | 1,600,000 | | 1,597,460 |
Series 2005-A6 Class A6, 0.3312% 7/15/14 (e) | | 1,730,000 | | 1,726,689 |
Series 2006-A4 Class A4, 0.2813% 10/15/13 (e) | | 1,000,000 | | 999,022 |
Series 2007-A17 Class A, 5.12% 10/15/14 | | 480,000 | | 514,421 |
Series 2008-9 Class A, 4.26% 5/15/13 | | 100,000 | | 101,077 |
Series 2009-A2 Class A2, 1.8112% 4/15/14 (e) | | 2,500,000 | | 2,538,758 |
Series 2009-A3 Class A3, 2.4% 6/17/13 | | 780,000 | | 785,423 |
Chrysler Financial Auto Securitization Trust
Series 2010-A Class A2, 0.78% 1/8/13 | | 1,500,000 | | 1,499,551 |
Chrysler Financial Lease Trust Series 2010-A Class A2, 1.78% 6/15/11 (b) | | 153,233 | | 153,333 |
Citibank Credit Card Issuance Trust Series 2006-A4 Class A4, 5.45% 5/10/13 | | 200,000 | | 202,780 |
CitiFinancial Auto Issuance Trust Series 2009-1 Class A2, 1.83% 11/15/12 (b) | | 249,661 | | 250,357 |
Asset-Backed Securities - continued |
| Principal Amount | | Value |
Fannie Mae subordinate REMIC pass-thru certificates Series 2004-T5: | | | | |
Class AB1, 0.7353% 5/28/35 (e) | | $ 80,751 | | $ 64,403 |
Class AB3, 0.6842% 5/28/35 (e) | | 32,052 | | 23,445 |
Ford Credit Auto Lease Trust: | | | | |
Series 2010-A Class A2, 1.04% 3/15/13 (b) | | 514,208 | | 514,601 |
Series 2010-B Class A2, 0.68% 10/15/12 (b) | | 2,000,000 | | 1,999,679 |
Ford Credit Auto Owner Trust: | | | | |
Series 2009-D Class A3, 2.17% 10/15/13 | | 98,013 | | 99,094 |
Series 2009-E Class A2, 1% 3/15/12 | | 710,615 | | 710,840 |
Series 2010-B Class A2, 0.65% 12/15/12 | | 1,500,000 | | 1,500,818 |
Ford Credit Floorplan Master Owner Trust: | | | | |
Series 2006-4 Class A, 0.5113% 6/15/13 (e) | | 1,000,000 | | 997,624 |
Series 2010-1 Class A, 1.9113% 12/15/14 (b)(e) | | 490,000 | | 498,600 |
Series 2010-5 Class A1, 1.5% 9/15/15 | | 240,000 | | 238,340 |
Fremont Home Loan Trust Series 2005-A Class M4, 0.94% 1/25/35 (e) | | 125,000 | | 39,378 |
GE Capital Credit Card Master Note Trust Series 2009-3 Class A, 2.54% 9/15/14 | | 1,000,000 | | 1,011,245 |
GSAMP Trust Series 2007-HE1 Class M1, 0.51% 3/25/47 (e) | | 335,000 | | 18,726 |
Guggenheim Structured Real Estate Funding Ltd. Series 2005-1 Class C, 1.34% 5/25/30 (b)(e) | | 367,417 | | 187,383 |
Home Equity Asset Trust Series 2003-5 Class A2, 0.96% 12/25/33 (e) | | 10,566 | | 7,370 |
Hyundai Auto Receivables Trust: | | | | |
Series 2009-A: | | | | |
Class A2, 1.11% 2/15/12 | | 461,755 | | 462,008 |
Class A3, 2.03% 8/15/13 | | 130,000 | | 131,349 |
Series 2011-A Class A2, 0.69% 11/15/13 | | 1,000,000 | | 999,934 |
John Deere Owner Trust Series 2009-B Class A-2, 0.85% 3/15/12 | | 219,718 | | 219,745 |
Mercedes-Benz Auto Receivables Trust Series 2009-1: | | | | |
Class A2, 0.83% 3/15/12 | | 526,045 | | 526,277 |
Class A3, 1.67% 1/15/14 | | 180,000 | | 181,753 |
Merrill Lynch Mortgage Investors Trust Series 2004-HE2 Class A1B, 0.73% 8/25/35 (e) | | 21,560 | | 19,469 |
Morgan Stanley ABS Capital I Trust Series 2004-HE6 Class A2, 0.6% 8/25/34 (e) | | 65,756 | | 54,147 |
Nissan Auto Lease Trust: | | | | |
Series 2009-B: | | | | |
Class A2, 1.22% 9/15/11 | | 199,996 | | 200,049 |
Class A3, 2.07% 1/15/15 | | 270,000 | | 271,508 |
Series 2010-B Class A2, 0.9% 5/15/13 | | 1,000,000 | | 1,000,499 |
Asset-Backed Securities - continued |
| Principal Amount | | Value |
Ocala Funding LLC Series 2006-1A Class A, 1.6606% 3/20/11 (a)(b)(e) | | $ 965,000 | | $ 0 |
Park Place Securities, Inc.: | | | | |
Series 2004-WCW1 Class M4, 1.71% 9/25/34 (e) | | 435,000 | | 109,707 |
Series 2004-WWF1 Class M4, 1.36% 12/25/34 (e) | | 945,000 | | 288,415 |
Series 2005-WCH1 Class M3, 0.82% 1/25/36 (e) | | 425,000 | | 298,230 |
Salomon Brothers Mortgage Securities VII, Inc.
Series 2003-HE1 Class A, 1.06% 4/25/33 (e) | | 1,451 | | 1,275 |
Santander Drive Auto Receivables Trust Series 2010-3 Class A2, 0.93% 6/17/13 | | 500,000 | | 499,952 |
Terwin Mortgage Trust Series 2003-4HE Class A1, 1.12% 9/25/34 (e) | | 21,802 | | 16,862 |
USAA Auto Owner Trust Series 2010-1 Class A3, 1.3% 6/16/14 | | 950,000 | | 955,696 |
Volkswagen Auto Lease Trust: | | | | |
Series 2009-A Class A3, 3.41% 4/16/12 | | 773,166 | | 780,289 |
Series 2010-A Class A2, 0.77% 1/22/13 | | 1,000,000 | | 1,000,467 |
Wachovia Auto Owner Trust Series 2008-A Class A4B, 1.4106% 3/20/14 (e) | | 1,000,000 | | 1,008,669 |
TOTAL ASSET-BACKED SECURITIES (Cost $44,735,042) | 42,111,689 |
Collateralized Mortgage Obligations - 4.8% |
|
Private Sponsor - 1.6% |
Fosse Master Issuer PLC floater Series 2007-1A Class A2, 0.3831% 10/18/54 (b)(e) | | 641,030 | | 638,445 |
Gracechurch Mortgage Financing PLC floater
Series 2007-1A Class 3A1, 0.3644% 11/20/56 (b)(e) | | 445,554 | | 438,966 |
GSR Mortgage Loan Trust floater Series 2004-11 Class 2A1, 0.59% 12/25/34 (e) | | 272,553 | | 241,488 |
Holmes Master Issuer PLC floater: | | | | |
Series 2007-1 Class 3A1, 0.3831% 7/15/40 (e) | | 1,100,000 | | 1,097,226 |
Series 2007-2A Class 3A1, 0.3831% 7/15/21 (e) | | 840,000 | | 835,049 |
Permanent Master Issuer PLC floater Series 2007-1 Class 4A, 0.3831% 10/15/33 (e) | | 360,000 | | 355,427 |
TBW Mortgage-Backed pass-thru certificates floater Series 2006-4 Class A3, 0.46% 9/25/36 (e) | | 1,000,000 | | 579,190 |
TOTAL PRIVATE SPONSOR | | 4,185,791 |
Collateralized Mortgage Obligations - continued |
| Principal Amount | | Value |
U.S. Government Agency - 3.2% |
Fannie Mae subordinate REMIC pass-thru certificates: | | | | |
floater: | | | | |
Series 2008-76 Class EF, 0.76% 9/25/23 (e) | | $ 91,503 | | $ 91,562 |
Series 2010-86 Class FE, 0.71% 8/25/25 (e) | | 785,675 | | 786,653 |
sequential payer Series 2003-129 Class GF, 0.66% 4/25/30 (e) | | 1,259,179 | | 1,262,148 |
Freddie Mac Multi-Class participation certificates guaranteed: | | | | |
floater Series 3346 Class FA, 0.4913% 2/15/19 (e) | | 2,913,070 | | 2,911,602 |
sequential payer: | | | | |
Series 3560 Class LA, 2% 8/15/14 | | 1,725,235 | | 1,746,394 |
Series 3573 Class LC, 1.85% 8/15/14 | | 1,787,687 | | 1,807,227 |
TOTAL U.S. GOVERNMENT AGENCY | | 8,605,586 |
TOTAL COLLATERALIZED MORTGAGE OBLIGATIONS (Cost $13,238,553) | 12,791,377 |
Commercial Mortgage Securities - 1.0% |
|
COMM pass-thru certificates floater Series 2006-CN2A Class A2FL, 0.4806% 2/5/19 (b)(e) | | 800,000 | | 788,621 |
Greenwich Capital Commercial Funding Corp. sequential payer Series 2005-GG3 Class A2, 4.305% 8/10/42 (e) | | 1,248,009 | | 1,257,997 |
GS Mortgage Securities Corp. II sequential payer
Series 2005-GG4 Class A3, 4.607% 7/10/39 | | 150,000 | | 153,236 |
GS Mortgage Securities Trust sequential payer
Series 2006-GG8 Class A2, 5.479% 11/10/39 | | 130,000 | | 132,259 |
Morgan Stanley Capital I Trust floater: | | | | |
Series 2006-XLF Class C, 1.462% 7/15/19 (b)(e) | | 247,826 | | 128,870 |
Series 2007-XLFA Class B, 0.392% 10/15/20 (b)(e) | | 440,000 | | 330,000 |
TOTAL COMMERCIAL MORTGAGE SECURITIES (Cost $3,280,029) | 2,790,983 |
Municipal Securities - 0.5% |
| Principal Amount | | Value |
Kentucky Econ. Dev. Fin. Auth. Solid Waste Disp. Rev. Bonds (Republic Svcs., Inc. Proj.) Series A, 2.5%, tender 3/1/11 (e)(f) | | $ 300,000 | | $ 299,988 |
Louisville/Jefferson County Metropolitan Govt. Poll. Cont. Rev. Bonds (Louisville Gas and Electronic Co. Proj.): | | | | |
Series 2003 A, 1.9%, tender 4/2/12 (e) | | 500,000 | | 500,285 |
Series 2007 B, 1.9%, tender 6/1/12 (e) | | 500,000 | | 500,460 |
TOTAL MUNICIPAL SECURITIES (Cost $1,300,000) | 1,300,733 |
Foreign Government and Government Agency Obligations - 0.8% |
|
Ontario Province 0.4344% 11/19/12 (e)
(Cost $2,000,000) | | 2,000,000 | | 2,001,400 |
Bank Notes - 0.7% |
|
National City Bank, Cleveland 0.3959% 3/1/13 (e)
(Cost $1,972,968) | | 2,000,000 | | 1,983,578 |
Certificates of Deposit - 0.8% |
|
Bank of Tokyo-Mitsubishi yankee 0.54% 2/3/11
(Cost $2,000,000) | | 2,000,000 | | 2,000,045 |
Cash Equivalents - 8.2% |
| Maturity
Amount | | |
Investments in repurchase agreements in a joint trading account at 0.23%, dated 1/31/11 due 2/1/11 (Collateralized by U.S. Government Obligations) #
(Cost $22,045,000) | $ 22,045,142 | | 22,045,000 |
TOTAL INVESTMENT PORTFOLIO - 100.6% (Cost $272,523,683) | 269,413,123 |
NET OTHER ASSETS (LIABILITIES) - (0.6)% | (1,508,682) |
NET ASSETS - 100% | $ 267,904,441 |
Futures Contracts |
| Expiration
Date | | Underlying
Face Amount
at Value | | Unrealized
Appreciation/
(Depreciation) |
Purchased |
Eurodollar Contracts |
10 Eurodollar 90 Day Index Contracts | March 2011 | | $ 9,991,375 | | $ 10,350 |
10 Eurodollar 90 Day Index Contracts | June 2011 | | 9,989,375 | | 4,225 |
10 Eurodollar 90 Day Index Contracts | Sept. 2011 | | 9,987,000 | | (651) |
TOTAL EURODOLLAR CONTRACTS | | $ 13,924 |
Legend |
(a) Non-income producing - Security is in default. |
(b) Security exempt from registration under Rule 144A of the Securities Act of 1933. These securities may be resold in transactions exempt from registration, normally to qualified institutional buyers. At the end of the period, the value of these securities amounted to $31,364,805 or 11.7% of net assets. |
(c) Under the Temporary Liquidity Guarantee Program, the Federal Deposit Insurance Corporation guarantees principal and interest in the event of payment default or bankruptcy until the earlier of maturity date of the debt or until June 30, 2012. At the end of the period these securities amounted to $8,551,182 or 3.2% of net assets. |
(d) Security or a portion of the security was pledged to cover margin requirements for futures contracts. At the period end, the value of securities pledged amounted to $35,078. |
(e) Coupon rates for floating and adjustable rate securities reflect the rates in effect at period end. |
(f) Private activity obligations whose interest is subject to the federal alternative minimum tax for individuals. |
# Additional information on each counterparty to the repurchase agreement is as follows: |
Repurchase Agreement / Counterparty | Value |
$22,045,000 due 2/01/11 at 0.23% |
BNP Paribas Securities Corp. | $ 1,037,236 |
Bank of America NA | 6,757,241 |
Barclays Capital, Inc. | 527,909 |
Citigroup Global Markets, Inc. | 610,099 |
Credit Agricole Securities (USA), Inc. | 844,655 |
Deutsche Bank Securities, Inc. | 633,491 |
HSBC Securities (USA), Inc. | 2,533,965 |
J.P. Morgan Securities, Inc. | 844,655 |
Merrill Lynch Government Securities, Inc. | 760,189 |
Merrill Lynch, Pierce, Fenner & Smith, Inc. | 843,902 |
Mizuho Securities USA, Inc. | 3,800,947 |
Societe Generale, New York Branch | 1,689,310 |
Wells Fargo Securities LLC | 1,161,401 |
| $ 22,045,000 |
Other Information |
The following is a summary of the inputs used, as of January 31, 2011, involving the Fund's assets and liabilities carried at fair value. The inputs or methodology used for valuing securities may not be an indication of the risk associated with investing in those securities. For more information on valuation inputs, and their aggregation into the levels used in the tables below, please refer to the Security Valuation section in the accompanying Notes to Financial Statements. |
Valuation Inputs at Reporting Date: |
Description | Total | Level 1 | Level 2 | Level 3 |
Investments in Securities: | | | | |
Corporate Bonds | $ 81,707,954 | $ - | $ 81,707,954 | $ - |
U.S. Government and Government Agency Obligations | 91,425,078 | - | 91,425,078 | - |
U.S. Government Agency - Mortgage Securities | 9,255,286 | - | 9,255,286 | - |
Asset-Backed Securities | 42,111,689 | - | 41,586,350 | 525,339 |
Collateralized Mortgage Obligations | 12,791,377 | - | 12,791,377 | - |
Commercial Mortgage Securities | 2,790,983 | - | 2,662,113 | 128,870 |
Municipal Securities | 1,300,733 | - | 1,300,733 | - |
Foreign Government and Government Agency Obligations | 2,001,400 | - | 2,001,400 | - |
Bank Notes | 1,983,578 | - | 1,983,578 | - |
Certificates of Deposit | 2,000,045 | - | 2,000,045 | - |
Cash Equivalents | 22,045,000 | - | 22,045,000 | - |
Total Investments in Securities: | $ 269,413,123 | $ - | $ 268,758,914 | $ 654,209 |
Derivative Instruments: | | | | |
Assets | | | | |
Futures Contracts | $ 14,575 | $ 14,575 | $ - | $ - |
Liabilities | | | | |
Futures Contracts | $ (651) | $ (651) | $ - | $ - |
Total Derivative Instruments: | $ 13,924 | $ 13,924 | $ - | $ - |
The following is a reconciliation of Investments in Securities for which Level 3 inputs were used in determining value: |
Investments in Securities: | |
Beginning Balance | $ 583,242 |
Total Realized Gain (Loss) | (1,566,340) |
Total Unrealized Gain (Loss) | 1,805,751 |
Cost of Purchases | 2,324 |
Proceeds of Sales | (408,257) |
Amortization/Accretion | (11,302) |
Transfers in to Level 3 | 248,791 |
Transfers out of Level 3 | - |
Ending Balance | $ 654,209 |
The change in unrealized gain (loss) for the period attributable to Level 3 securities held at January 31, 2011 | $ 146,949 |
The information used in the above reconciliation represents fiscal year to date activity for any Investments in Securities identified as using Level 3 inputs at either the beginning or the end of the current fiscal period. Transfers in or out of Level 3 represent the beginning value of any Security or Instrument where a change in the pricing level occurred from the beginning to the end of the period. The cost of purchases and the proceeds of sales may include securities received or delivered through corporate actions or exchanges. Realized and unrealized gains (losses) disclosed in the reconciliation are included in Net Gain (Loss) on the Fund's Statement of Operations. |
Value of Derivative Instruments |
The following table is a summary of the Fund's value of derivative instruments by risk exposure as of January 31, 2011. For additional information on derivative instruments, please refer to the Derivative Instruments section in the accompanying Notes to Financial Statements. |
Risk Exposure /
Derivative Type | Value |
| Asset | Liability |
Interest Rate Risk | | |
Futures Contracts (a) | $ 14,575 | $ (651) |
Total Value of Derivatives | $ 14,575 | $ (651) |
(a) Reflects cumulative appreciation/(depreciation) on futures contracts as disclosed on the Schedule of Investments. Only the period end variation margin is separately disclosed on the Statement of Assets and Liabilities. |
Other Information |
Distribution of investments by country of issue, as a percentage of total net assets, is as follows: (Unaudited) |
United States of America | 87.5% |
United Kingdom | 4.5% |
Netherlands | 1.9% |
Australia | 1.8% |
Canada | 1.5% |
France | 1.1% |
Others (Individually Less Than 1%) | 1.7% |
| 100.0% |
Income Tax Information |
At July 31, 2010, the Fund had a capital loss carryforward of approximately $121,849,643 of which $1,917,431, $518,690, $12,186,304, $97,397,499 and $9,829,719 will expire in fiscal 2014, 2015, 2016, 2017 and 2018, respectively. Capital loss carryforwards are only available to offset future capital gains of the Fund to the extent provided by regulations and may be limited. |
The Fund intends to elect to defer to its fiscal year ending July 31, 2011 approximately $3,569,895 of losses recognized during the period November 1, 2009 to July 31, 2010. |
See accompanying notes which are an integral part of the financial statements.
Semiannual Report
Statement of Assets and Liabilities
| January 31, 2011 (Unaudited) |
| | |
Assets | | |
Investment in securities, at value (including repurchase agreements of $22,045,000) - See accompanying schedule: Unaffiliated issuers (cost $272,523,683) | | $ 269,413,123 |
Cash | | 2,344 |
Receivable for investments sold | | 677,916 |
Receivable for fund shares sold | | 407,388 |
Interest receivable | | 795,288 |
Other receivables | | 3 |
Total assets | | 271,296,062 |
| | |
Liabilities | | |
Payable for investments purchased | $ 2,999,957 | |
Payable for fund shares redeemed | 286,079 | |
Distributions payable | 1,489 | |
Accrued management fee | 70,390 | |
Distribution and service plan fees payable | 2,215 | |
Payable for daily variation on futures contracts | 625 | |
Other affiliated payables | 30,866 | |
Total liabilities | | 3,391,621 |
| | |
Net Assets | | $ 267,904,441 |
Net Assets consist of: | | |
Paid in capital | | $ 397,953,801 |
Distributions in excess of net investment income | | (233,045) |
Accumulated undistributed net realized gain (loss) on investments | | (126,719,678) |
Net unrealized appreciation (depreciation) on investments | | (3,096,637) |
Net Assets | | $ 267,904,441 |
See accompanying notes which are an integral part of the financial statements.
Semiannual Report
Financial Statements - continued
Statement of Assets and Liabilities - continued
| January 31, 2011 (Unaudited) |
| | |
Calculation of Maximum Offering Price Class A:
Net Asset Value and redemption price per share ($13,344,499 ÷ 1,632,418 shares) | | $ 8.17 |
| | |
Maximum offering price per share (100/98.50 of $8.17) | | $ 8.29 |
Class T:
Net Asset Value and redemption price per share ($4,208,138 ÷ 514,742 shares) | | $ 8.18 |
| | |
Maximum offering price per share (100/98.50 of $8.18) | | $ 8.30 |
Ultra-Short Bond:
Net Asset Value, offering price and redemption price per share ($249,219,578 ÷ 30,483,269 shares) | | $ 8.18 |
| | |
Institutional Class:
Net Asset Value, offering price and redemption price per share ($1,132,226 ÷ 138,496 shares) | | $ 8.18 |
See accompanying notes which are an integral part of the financial statements.
Semiannual Report
Statement of Operations
Six months ended January 31, 2011 (Unaudited) |
| | |
Investment Income | | |
Interest | | $ 970,530 |
| | |
Expenses | | |
Management fee | $ 414,427 | |
Transfer agent fees | 135,188 | |
Distribution and service plan fees | 15,743 | |
Fund wide operations fee | 44,130 | |
Independent trustees' compensation | 501 | |
Miscellaneous | 477 | |
Total expenses before reductions | 610,466 | |
Expense reductions | (74) | 610,392 |
Net investment income | | 360,138 |
Realized and Unrealized Gain (Loss) Net realized gain (loss) on: | | |
Investment securities: | | |
Unaffiliated issuers | (1,297,501) | |
Futures contracts | 13,056 | |
Total net realized gain (loss) | | (1,284,445) |
Change in net unrealized appreciation (depreciation) on: Investment securities | 2,201,141 | |
Futures contracts | (1,771) | |
Total change in net unrealized appreciation (depreciation) | | 2,199,370 |
Net gain (loss) | | 914,925 |
Net increase (decrease) in net assets resulting from operations | | $ 1,275,063 |
See accompanying notes which are an integral part of the financial statements.
Semiannual Report
Financial Statements - continued
Statement of Changes in Net Assets
| Six months ended
January 31, 2011
(Unaudited) | Year ended
July 31, 2010 |
Increase (Decrease) in Net Assets | | |
Operations | | |
Net investment income | $ 360,138 | $ 1,890,067 |
Net realized gain (loss) | (1,284,445) | (8,164,438) |
Change in net unrealized appreciation (depreciation) | 2,199,370 | 9,508,825 |
Net increase (decrease) in net assets resulting
from operations | 1,275,063 | 3,234,454 |
Distributions to shareholders from net investment income | (604,929) | (1,887,049) |
Share transactions - net increase (decrease) | 3,293,749 | 33,525,237 |
Redemption fees | 5,946 | 9,556 |
Total increase (decrease) in net assets | 3,969,829 | 34,882,198 |
| | |
Net Assets | | |
Beginning of period | 263,934,612 | 229,052,414 |
End of period (including distributions in excess of net investment income of $233,045 and undistributed net investment income of $11,746, respectively) | $ 267,904,441 | $ 263,934,612 |
See accompanying notes which are an integral part of the financial statements.
Semiannual Report
Financial Highlights - Class A
| Six months ended
January 31, 2011 | Years ended July 31, |
| (Unaudited) | 2010 | 2009 | 2008 | 2007 | 2006 |
Selected Per-Share Data | | | | | |
Net asset value, beginning of period | $ 8.15 | $ 8.11 | $ 8.26 | $ 9.82 | $ 10.02 | $ 10.03 |
Income from Investment Operations | | | | | | |
Net investment income E | .005 | .047 | .091 | .384 | .493 | .400 |
Net realized and unrealized gain (loss) | .027 | .040 | (.167) | (1.612) | (.198) | (.009) |
Total from investment operations | .032 | .087 | (.076) | (1.228) | .295 | .391 |
Distributions from net investment income | (.012) | (.047) | (.071) | (.294) | (.495) | (.401) |
Tax return of capital | - | - | (.003) | (.039) | - | - |
Total distributions | (.012) | (.047) | (.074) | (.333) | (.495) | (.401) |
Redemption fees added to paid in capital E | - G | - G | - G | .001 | - G | - G |
Net asset value, end of period | $ 8.17 | $ 8.15 | $ 8.11 | $ 8.26 | $ 9.82 | $ 10.02 |
Total Return B,C,D | .39% | 1.08% | (.92)% | (12.71)% | 2.97% | 3.97% |
Ratios to Average Net Assets F | | | | | |
Expenses before reductions | .62% A | .64% | .68% | .67% | .66% | .70% |
Expenses net of fee waivers, if any | .62% A | .64% | .68% | .67% | .66% | .70% |
Expenses net of all reductions | .62% A | .64% | .67% | .66% | .66% | .70% |
Net investment income | .11% A | .58% | 1.13% | 4.26% | 4.96% | 4.00% |
Supplemental Data | | | | | | |
Net assets, end of period (000 omitted) | $ 13,344 | $ 18,129 | $ 8,033 | $ 6,268 | $ 13,735 | $ 4,553 |
Portfolio turnover rate | 84% A | 95% | 92% | 11% | 29% | 39% |
A Annualized
B Total returns for periods of less than one year are not annualized.
C Total returns would have been lower had certain expenses not been reduced during the periods shown.
D Total returns do not include the effect of the sales charges.
E Calculated based on average shares outstanding during the period.
F Expense ratios reflect operating expenses of the class. Expenses before reductions do not reflect amounts reimbursed by the investment adviser or reductions from expense offset arrangements and do not represent the amount paid by the class during periods when reimbursements or reductions occur. Expenses net of fee waivers reflect expenses after reimbursement by the investment adviser but prior to reductions from expense offset arrangements. Expenses net of all reductions represent the net expenses paid by the class.
G Amount represents less than $.001 per share.
See accompanying notes which are an integral part of the financial statements.
Semiannual Report
Financial Highlights - Class T
| Six months ended
January 31, 2011 | Years ended July 31, |
| (Unaudited) | 2010 | 2009 | 2008 | 2007 | 2006 |
Selected Per-Share Data | | | | | |
Net asset value, beginning of period | $ 8.15 | $ 8.11 | $ 8.26 | $ 9.82 | $ 10.02 | $ 10.03 |
Income from Investment Operations | | | | | | |
Net investment income E | .003 | .044 | .090 | .377 | .491 | .404 |
Net realized and unrealized gain (loss) | .038 | .040 | (.168) | (1.607) | (.199) | (.011) |
Total from investment operations | .041 | .084 | (.078) | (1.230) | .292 | .393 |
Distributions from net investment income | (.011) | (.044) | (.069) | (.292) | (.492) | (.403) |
Tax return of capital | - | - | (.003) | (.039) | - | - |
Total distributions | (.011) | (.044) | (.072) | (.331) | (.492) | (.403) |
Redemption fees added to paid in capital E | - G | - G | - G | .001 | - G | - G |
Net asset value, end of period | $ 8.18 | $ 8.15 | $ 8.11 | $ 8.26 | $ 9.82 | $ 10.02 |
Total Return B,C,D | .50% | 1.03% | (.94)% | (12.72)% | 2.95% | 4.00% |
Ratios to Average Net Assets F | | | | | |
Expenses before reductions | .66% A | .68% | .69% | .69% | .69% | .68% |
Expenses net of fee waivers, if any | .66% A | .68% | .69% | .69% | .69% | .68% |
Expenses net of all reductions | .66% A | .68% | .69% | .69% | .69% | .68% |
Net investment income | .08% A | .54% | 1.11% | 4.23% | 4.93% | 4.03% |
Supplemental Data | | | | | | |
Net assets, end of period (000 omitted) | $ 4,208 | $ 5,334 | $ 3,114 | $ 2,910 | $ 4,818 | $ 4,624 |
Portfolio turnover rate | 84% A | 95% | 92% | 11% | 29% | 39% |
A Annualized
B Total returns for periods of less than one year are not annualized.
C Total returns would have been lower had certain expenses not been reduced during the periods shown.
D Total returns do not include the effect of the sales charges.
E Calculated based on average shares outstanding during the period.
F Expense ratios reflect operating expenses of the class. Expenses before reductions do not reflect amounts reimbursed by the investment adviser or reductions from expense offset arrangements and do not represent the amount paid by the class during periods when reimbursements or reductions occur. Expenses net of fee waivers reflect expenses after reimbursement by the investment adviser but prior to reductions from expense offset arrangements. Expenses net of all reductions represent the net expenses paid by the class.
G Amount represents less than $.001 per share.
See accompanying notes which are an integral part of the financial statements.
Semiannual Report
Financial Highlights - Ultra-Short Bond
| Six months ended
January 31, 2011 | Years ended July 31, |
| (Unaudited) | 2010 | 2009 | 2008 | 2007 | 2006 |
Selected Per-Share Data | | | | | |
Net asset value, beginning of period | $ 8.15 | $ 8.11 | $ 8.26 | $ 9.81 | $ 10.02 | $ 10.03 |
Income from Investment Operations | | | | | | |
Net investment income D | .012 | .063 | .111 | .404 | .516 | .427 |
Net realized and unrealized gain (loss) | .037 | .040 | (.169) | (1.603) | (.210) | (.011) |
Total from investment operations | .049 | .103 | (.058) | (1.199) | .306 | .416 |
Distributions from net investment income | (.019) | (.063) | (.088) | (.310) | (.516) | (.426) |
Tax return of capital | - | - | (.004) | (.042) | - | - |
Total distributions | (.019) | (.063) | (.092) | (.352) | (.516) | (.426) |
Redemption fees added to paid in capital D | - F | - F | - F | .001 | - F | - F |
Net asset value, end of period | $ 8.18 | $ 8.15 | $ 8.11 | $ 8.26 | $ 9.81 | $ 10.02 |
Total Return B,C | .61% | 1.27% | (.70)% | (12.42)% | 3.09% | 4.23% |
Ratios to Average Net Assets E | | | | | |
Expenses before reductions | .45% A | .45% | .45% | .45% | .45% | .45% |
Expenses net of fee waivers, if any | .45% A | .45% | .45% | .45% | .45% | .45% |
Expenses net of all reductions | .45% A | .45% | .44% | .45% | .45% | .45% |
Net investment income | .29% A | .77% | 1.36% | 4.47% | 5.17% | 4.26% |
Supplemental Data | | | | | | |
Net assets, end of period (000 omitted) | $ 249,220 | $ 239,266 | $ 217,282 | $ 315,401 | $ 974,602 | $ 850,329 |
Portfolio turnover rate | 84% A | 95% | 92% | 11% | 29% | 39% |
A Annualized
B Total returns for periods of less than one year are not annualized.
C Total returns would have been lower had certain expenses not been reduced during the periods shown.
D Calculated based on average shares outstanding during the period.
E Expense ratios reflect operating expenses of the class. Expenses before reductions do not reflect amounts reimbursed by the investment adviser or reductions from expense offset arrangements and do not represent the amount paid by the class during periods when reimbursements or reductions occur. Expenses net of fee waivers reflect expenses after reimbursement by the investment adviser but prior to reductions from expense offset arrangements. Expenses net of all reductions represent the net expenses paid by the class.
F Amount represents less than $.001 per share.
See accompanying notes which are an integral part of the financial statements.
Semiannual Report
Financial Highlights - Institutional Class
| Six months ended
January 31, 2011 | Years ended July 31, |
| (Unaudited) | 2010 | 2009 | 2008 | 2007 | 2006 |
Selected Per-Share Data | | | | | |
Net asset value, beginning of period | $ 8.15 | $ 8.11 | $ 8.26 | $ 9.81 | $ 10.02 | $ 10.03 |
Income from Investment Operations | | | | | | |
Net investment income D | .010 | .057 | .102 | .416 | .510 | .420 |
Net realized and unrealized gain (loss) | .038 | .040 | (.168) | (1.619) | (.206) | (.008) |
Total from investment operations | .048 | .097 | (.066) | (1.203) | .304 | .412 |
Distributions from net investment income | (.018) | (.057) | (.081) | (.306) | (.514) | (.422) |
Tax return of capital | - | - | (.003) | (.042) | - | - |
Total distributions | (.018) | (.057) | (.084) | (.348) | (.514) | (.422) |
Redemption fees added to paid in capital D | - F | - F | - F | .001 | - F | - F |
Net asset value, end of period | $ 8.18 | $ 8.15 | $ 8.11 | $ 8.26 | $ 9.81 | $ 10.02 |
Total Return B,C | .59% | 1.20% | (.80)% | (12.46)% | 3.06% | 4.19% |
Ratios to Average Net Assets E | | | | | |
Expenses before reductions | .48% A | .52% | .58% | .48% | .48% | .49% |
Expenses net of fee waivers, if any | .48% A | .52% | .55% | .48% | .48% | .49% |
Expenses net of all reductions | .48% A | .52% | .54% | .48% | .48% | .49% |
Net investment income | .25% A | .70% | 1.26% | 4.44% | 5.14% | 4.22% |
Supplemental Data | | | | | | |
Net assets, end of period (000 omitted) | $ 1,132 | $ 1,206 | $ 623 | $ 594 | $ 8,312 | $ 1,987 |
Portfolio turnover rate | 84% A | 95% | 92% | 11% | 29% | 39% |
A Annualized
B Total returns for periods of less than one year are not annualized.
C Total returns would have been lower had certain expenses not been reduced during the periods shown.
D Calculated based on average shares outstanding during the period.
E Expense ratios reflect operating expenses of the class. Expenses before reductions do not reflect amounts reimbursed by the investment adviser or reductions from expense offset arrangements and do not represent the amount paid by the class during periods when reimbursements or reductions occur. Expenses net of fee waivers reflect expenses after reimbursement by the investment adviser but prior to reductions from expense offset arrangements. Expenses net of all reductions represent the net expenses paid by the class.
F Amount represents less than $.001 per share.
See accompanying notes which are an integral part of the financial statements.
Semiannual Report
Notes to Financial Statements
For the period ended January 31, 2011 (Unaudited)
1. Organization.
Fidelity Ultra-Short Bond Fund (the Fund) is a fund of Fidelity Income Fund (the Trust) and is authorized to issue an unlimited number of shares. The Trust is registered under the Investment Company Act of 1940, as amended (the 1940 Act), as an open-end management investment company organized as a Massachusetts business trust. The Fund offers Class A, Class T, Ultra-Short Bond and Institutional Class shares, each of which has equal rights as to assets and voting privileges. Each class has exclusive voting rights with respect to matters that affect that class. Investment income, realized and unrealized capital gains and losses, the common expenses of the Fund, and certain fund-level expense reductions, if any, are allocated on a pro-rata basis to each class based on the relative net assets of each class to the total net assets of the Fund. Each class differs with respect to transfer agent and distribution and service plan fees incurred. Certain expense reductions may also differ by class.
2. Significant Accounting Policies.
The financial statements have been prepared in conformity with accounting principles generally accepted in the United States of America (GAAP), which require management to make certain estimates and assumptions at the date of the financial statements. Actual results could differ from those estimates. Subsequent events, if any, through the date that the financial statements were issued have been evaluated in the preparation of the financial statements. The following summarizes the significant accounting policies of the Fund:
Security Valuation. Investments are valued as of 4:00 p.m. Eastern time on the last calendar day of the period. The Fund uses independent pricing services approved by the Board of Trustees to value its investments. When current market prices or quotations are not readily available or reliable, valuations may be determined in good faith in accordance with procedures adopted by the Board of Trustees. Factors used in determining value may include market or security specific events, changes in interest rates and credit quality. The frequency with which these procedures are used cannot be predicted and they may be utilized to a significant extent. The value used for net asset value (NAV) calculation under these procedures may differ from published prices for the same securities.
The Fund categorizes the inputs to valuation techniques used to value its investments into a disclosure hierarchy consisting of three levels as shown below.
Level 1 - quoted prices in active markets for identical investments
Level 2 - other significant observable inputs (including quoted prices for similar investments, interest rates, prepayment speeds, etc.)
Level 3 - unobservable inputs (including the Fund's own assumptions based on the best information available)
Semiannual Report
Notes to Financial Statements (Unaudited) - continued
2. Significant Accounting Policies - continued
Security Valuation - continued
Changes in valuation techniques may result in transfers in or out of an assigned level within the disclosure hierarchy. The aggregate value of investments by input level, as of January 31, 2011, for the Fund's investments, as well as a roll forward of Level 3 securities, is included at the end of the Fund's Schedule of Investments. Valuation techniques used to value the Fund's investments by major category are as follows.
Debt securities, including restricted securities, are valued based on evaluated prices received from independent pricing services or from dealers who make markets in such securities. For corporate bonds, bank notes, foreign government and government agency obligations, municipal securities, U.S. government and government agency obligations and certificates of deposit, pricing services utilize matrix pricing which considers yield or price of bonds of comparable quality, coupon, maturity and type as well as dealer supplied prices and are generally categorized as Level 2 in the hierarchy. For asset backed securities, collateralized mortgage obligations, commercial mortgage securities and U.S. government agency mortgage securities, pricing services utilize matrix pricing which considers prepayment speed assumptions, attributes of the collateral, yield or price of bonds of comparable quality, coupon, maturity and type as well as dealer supplied prices and, accordingly, such securities are generally categorized as Level 2 in the hierarchy. Short-term securities with remaining maturities of sixty days or less for which quotations are not readily available are valued at amortized cost, which approximates fair value and are categorized as Level 2 in the hierarchy.
When independent prices are unavailable or unreliable, debt securities may be valued utilizing pricing matrices which consider similar factors that would be used by independent pricing services. These are generally categorized as Level 2 in the hierarchy but may be Level 3 depending on the circumstances.
Futures contracts are valued at the settlement price established each day by the board of trade or exchange on which they are traded and are categorized as Level 1 in the hierarchy.
Investment Transactions and Income. For financial reporting purposes, the Fund's investment holdings and NAV include trades executed through the end of the last business day of the period. The NAV per share for processing shareholder transactions is calculated as of the close of business of the New York Stock Exchange (NYSE), normally 4:00 p.m. Eastern time and includes trades executed through the end of the prior business day. Gains and losses on securities sold are determined on the basis of identified cost. Interest income is accrued as earned. Interest income includes coupon interest and
Semiannual Report
2. Significant Accounting Policies - continued
Investment Transactions and Income - continued
amortization of premium and accretion of discount on debt securities. The principal value on inflation-indexed securities is periodically adjusted to the rate of inflation and interest is accrued based on the principal value. The adjustments to principal due to inflation are reflected as increases or decreases to interest income even though principal is not received until maturity. Debt obligations may be placed on non-accrual status and related interest income may be reduced by ceasing current accruals and writing off interest receivables when the collection of all or a portion of interest has become doubtful based on consistently applied procedures. A debt obligation is removed from non-accrual status when the issuer resumes interest payments or when collectability of interest is reasonably assured.
Expenses. Expenses directly attributable to a fund are charged to that fund. Expenses attributable to more than one fund are allocated among the respective funds on the basis of relative net assets or other appropriate methods. Expense estimates are accrued in the period to which they relate and adjustments are made when actual amounts are known.
Income Tax Information and Distributions to Shareholders. Each year the Fund intends to qualify as a regulated investment company, including distributing substantially all of its taxable income and realized gains under Subchapter M of the Internal Revenue Code and filing its U.S. federal tax return. As a result, no provision for income taxes is required. A fund's federal tax return is subject to examination by the Internal Revenue Service (IRS) for a period of three years.
Dividends are declared and recorded daily and paid monthly from net investment income. Distributions from realized gains, if any, are declared and recorded on the ex-dividend date. Income dividends and capital gain distributions are declared separately for each class. Income and capital gain distributions are determined in accordance with income tax regulations, which may differ from GAAP.
Capital accounts within the financial statements are adjusted for permanent book-tax differences. These adjustments have no impact on net assets or the results of operations. Temporary book-tax differences will reverse in a subsequent period.
Book-tax differences are primarily due to futures transactions, market discount, capital loss carryforwards and losses deferred due to excise tax regulations.
Semiannual Report
Notes to Financial Statements (Unaudited) - continued
2. Significant Accounting Policies - continued
Income Tax Information and Distributions to Shareholders - continued
The federal tax cost of investment securities and unrealized appreciation (depreciation) as of period end were as follows:
Gross unrealized appreciation | $ 602,393 |
Gross unrealized depreciation | (3,677,239) |
Net unrealized appreciation (depreciation) on securities and other investments | $ (3,074,846) |
| |
Tax cost | $ 272,487,969 |
Short-Term Trading (Redemption) Fees. Shares held by investors in the Fund less than 60 days are subject to a redemption fee equal to .25% of the net asset value of shares redeemed. All redemption fees, which reduce the proceeds of the shareholder redemption, are retained by the Fund and accounted for as an addition to paid in capital.
3. Operating Policies.
Repurchase Agreements. Fidelity Management & Research Company (FMR) has received an Exemptive Order from the Securities and Exchange Commission (the SEC) which permits the Fund and other affiliated entities of FMR to transfer uninvested cash balances into joint trading accounts which are then invested in repurchase agreements. The Fund may also invest directly with institutions in repurchase agreements. Repurchase agreements are collateralized by government or non-government securities. Upon settlement date, collateral is held in segregated accounts with custodian banks and may be obtained in the event of a default of the counterparty. The Fund monitors, on a daily basis, the value of the collateral to ensure it is at least equal to the principal amount of the repurchase agreement (including accrued interest). In the event of a default by the counterparty, realization of the collateral proceeds could be delayed, during which time the value of the collateral may decline.
Restricted Securities. The Fund may invest in securities that are subject to legal or contractual restrictions on resale. These securities generally may be resold in transactions exempt from registration or to the public if the securities are registered. Disposal of these securities may involve time-consuming negotiations and expense, and prompt sale at an acceptable price may be difficult. Information regarding restricted securities is included at the end of the Fund's Schedule of Investments.
Semiannual Report
4. Derivative Instruments.
Risk Exposures and the Use of Derivative Instruments. The Fund used derivative instruments (derivatives), including futures contracts, in order to meet its investment objectives. The strategy is to use derivatives to increase returns and to manage exposure to certain risks as defined below. The success of any strategy involving derivatives depends on analysis of numerous economic factors, and if the strategies for investment do not work as intended, the Fund may not achieve its objectives.
The Fund's use of derivatives increased or decreased its exposure to the following risk:
Interest Rate Risk | Interest rate risk relates to the fluctuations in the value of interest-bearing securities due to changes in the prevailing levels of market interest rates. |
The Fund is also exposed to additional risks from investing in derivatives, such as liquidity risk and counterparty credit risk. Liquidity risk is the risk that the Fund will be unable to sell the derivative in the open market in a timely manner. Counterparty credit risk is the risk that the counterparty will not be able to fulfill its obligation to the Fund. The Fund's maximum risk of loss from counterparty credit risk is generally the aggregate unrealized appreciation and unpaid counterparty fees in excess of any collateral pledged by the counterparty to the Fund. Counterparty risk related to exchange-traded futures contracts is minimal because of the protection provided by the exchange on which they trade. Derivatives involve, to varying degrees, risk of loss in excess of the amounts recognized in the Statement of Assets and Liabilities.
Futures Contracts. A futures contract is an agreement between two parties to buy or sell a specified underlying instrument for a fixed price at a specified future date. The Fund used futures contracts to manage its exposure to the bond market, and to fluctuations in interest rates.
Upon entering into a futures contract, a fund is required to deposit either cash or securities (initial margin) with a clearing broker in an amount equal to a certain percentage of the face value of the contract. Futures contracts are marked-to-market daily and subsequent payments (variation margin) are made or received by a fund depending on the daily fluctuations in the value of the futures contracts and are recorded as unrealized appreciation or (depreciation). Realized gain or (loss) is recorded upon the expiration or closing of a futures contract.
The underlying face amount at value of open futures contracts at period end is shown in the Schedule of Investments under the caption "Futures Contracts." This amount reflects each contract's exposure to the underlying instrument at period end and is representative of activity for the period. Securities deposited to meet initial margin requirements
Semiannual Report
Notes to Financial Statements (Unaudited) - continued
4. Derivative Instruments - continued
Futures Contracts - continued
are identified in the Schedule of Investments. The receivable and/or payable for the variation margin are reflected in the Statement of Assets and Liabilities.
Certain risks arise upon entering into futures contracts, including the risk that an illiquid market limits the ability to close out a futures contract prior to settlement date.
During the period the Fund recognized net realized gain (loss) of $13,056 and a change in net unrealized appreciation (depreciation) of $(1,771) related to its investment in futures contracts. These amounts are included in the Statement of Operations.
5. Purchases and Sales of Investments.
Purchases and sales of securities, other than short-term securities and U.S. government securities, aggregated $72,320,730 and $54,784,503, respectively.
6. Fees and Other Transactions with Affiliates.
Management Fee. FMR and its affiliates provide the Fund with investment management related services for which the Fund pays a monthly management fee. The management fee is the sum of an individual fund fee rate that is based on an annual rate of .20% of the Fund's average net assets and a group fee rate that averaged .12% during the period. The group fee rate is based upon the average net assets of all the mutual funds advised by FMR. The group fee rate decreases as assets under management increase and increases as assets under management decrease. For the period, the total annualized management fee rate was .32% of the Fund's average net assets.
Distribution and Service Plan Fees. In accordance with Rule 12b-1 of the 1940 Act, the Fund has adopted separate Distribution and Service Plans for each class of shares. Certain classes pay Fidelity Distributors Corporation (FDC), an affiliate of FMR, separate Distribution and Service Fees, each of which is based on an annual percentage of each class' average net assets. In addition, FDC may pay financial intermediaries for selling shares of the Fund and providing shareholder support services. For the period, the Distribution and Service Fee rates, total fees and amounts retained by FDC were as follows:
| Distribution
Fee | Service
Fee | Paid
to FDC | Retained
by FDC |
Class A | 0% | .15% | $ 12,188 | $ 1,101 |
Class T | 0% | .15% | 3,555 | - |
| | | $ 15,743 | $ 1,101 |
Semiannual Report
6. Fees and Other Transactions with Affiliates - continued
Sales Load. FDC receives a front-end sales charge of up to 1.50% for selling Class A and Class T shares, some of which is paid to financial intermediaries for selling shares of the Fund. FDC receives the proceeds of a contingent deferred sales charges levied on Class A and Class T redemptions. These charges depend on the holding period. The deferred sales charges range from .75% for certain purchases of Class A shares and .25% for certain purchases of Class T shares.
For the period, sales charge amounts retained by FDC were as follows:
| Retained
by FDC |
Class A | $ 4,152 |
Class T | 197 |
| $ 4,349 |
Transfer Agent Fees. Fidelity Investments Institutional Operations Company, Inc. (FIIOC), an affiliate of FMR, is the transfer, dividend disbursing and shareholder servicing agent for each class of the Fund. FIIOC receives account fees and asset-based fees that vary according to the account size and type of account of the shareholders of each respective class of the Fund, with the exception of Ultra-Short Bond. FIIOC receives an asset-based fee of .10% of Ultra-Short Bond's average net assets. FIIOC pays for typesetting, printing and mailing of shareholder reports, except proxy statements. For the period, transfer agent fees for each class were as follows:
| Amount | % of
Average
Net Assets* |
Class A | $ 10,441 | .13 |
Class T | 3,843 | .16 |
Ultra-Short Bond | 120,034 | .10 |
Institutional Class | 870 | .14 |
| $ 135,188 | |
* Annualized
Fund Wide Operations Fee. Pursuant to the Fund Wide Operations and Expense Agreement (FWOE), FMR has agreed to provide for fund level expenses (which do not include transfer agent, Rule 12b-1 fees, compensation of the independent Trustees, interest (including commitment fees), taxes or extraordinary expenses, if any) in return for a FWOE fee equal to .35% less the total amount of the management fee. The FWOE paid by the Fund is reduced by an amount equal to the fees and expenses paid to the independent Trustees. For the period, the FWOE fee was equivalent to an annualized rate of .03% of average net assets.
Semiannual Report
Notes to Financial Statements (Unaudited) - continued
7. Committed Line of Credit.
The Fund participates with other funds managed by FMR or an affiliate in a $3.75 billion credit facility (the "line of credit") to be utilized for temporary or emergency purposes to fund shareholder redemptions or for other short-term liquidity purposes. The Fund has agreed to pay commitment fees on its pro-rata portion of the line of credit, which amounted to $477 and is reflected in Miscellaneous expenses on the Statement of Operations. During the period, there were no borrowings on this line of credit.
8. Expense Reductions.
Through arrangements with the Fund's custodian, credits realized as a result of uninvested cash balances were used to reduce the Fund's expenses. During the period, these credits reduced the Fund's expenses by $74.
9. Distributions to Shareholders.
Distributions to shareholders of each class were as follows:
| Six months ended
January 31, 2011 | Year ended
July 31, 2010 |
From net investment income | | |
Class A | $ 26,485 | $ 70,804 |
Class T | 6,774 | 19,435 |
Ultra-Short Bond | 568,894 | 1,791,150 |
Institutional Class | 2,776 | 5,660 |
Total | $ 604,929 | $ 1,887,049 |
10. Share Transactions.
Transactions for each class of shares were as follows:
| Shares | Dollars |
| Six months ended
January 31, 2011 | Year ended
July 31, 2010 | Six months ended
January 31, 2011 | Year ended
July 31, 2010 |
Class A | | | | |
Shares sold | 512,483 | 1,996,126 | $ 4,183,693 | $ 16,257,557 |
Reinvestment of distributions | 2,369 | 6,739 | 19,343 | 54,896 |
Shares redeemed | (1,105,851) | (770,234) | (9,032,924) | (6,273,379) |
Net increase (decrease) | (590,999) | 1,232,631 | $ (4,829,888) | $ 10,039,074 |
Class T | | | | |
Shares sold | 37,318 | 590,657 | $ 304,769 | $ 4,813,729 |
Reinvestment of distributions | 738 | 2,161 | 6,027 | 17,605 |
Shares redeemed | (177,433) | (322,791) | (1,449,408) | (2,628,531) |
Net increase (decrease) | (139,377) | 270,027 | $ (1,138,612) | $ 2,202,803 |
Semiannual Report
10. Share Transactions - continued
Transactions for each class of shares were as follows: - continued
| Shares | Dollars |
| Six months ended
January 31, 2011 | Year ended
July 31, 2010 | Six months ended
January 31, 2011 | Year ended
July 31, 2010 |
Ultra-Short Bond | | | | |
Shares sold | 5,520,778 | 9,420,448 | $ 45,102,197 | $ 76,695,898 |
Reinvestment of distributions | 67,305 | 211,789 | 549,679 | 1,725,137 |
Shares redeemed | (4,446,034) | (7,087,084) | (36,312,399) | (57,716,904) |
Net increase (decrease) | 1,142,049 | 2,545,153 | $ 9,339,477 | $ 20,704,131 |
Institutional Class | | | | |
Shares sold | 46,527 | 142,602 | $ 380,060 | $ 1,161,563 |
Reinvestment of distributions | 239 | 362 | 1,954 | 2,947 |
Shares redeemed | (56,207) | (71,879) | (459,242) | (585,281) |
Net increase (decrease) | (9,441) | 71,085 | $ (77,228) | $ 579,229 |
11. Other.
The Fund's organizational documents provide former and current trustees and officers with a limited indemnification against liabilities arising in connection with the performance of their duties to the Fund. In the normal course of business, the Fund may also enter into contracts that provide general indemnifications. The Fund's maximum exposure under these arrangements is unknown as this would be dependent on future claims that may be made against the Fund. The risk of material loss from such claims is considered remote.
Semiannual Report
Board Approval of Investment Advisory Contracts and Management Fees
Fidelity Ultra-Short Bond Fund
Each year, the Board of Trustees, including the Independent Trustees (together, the Board), votes on the renewal of the management contract and sub-advisory agreements (together, the Advisory Contracts) for the fund. The Board, assisted by the advice of fund counsel and Independent Trustees' counsel, requests and considers a broad range of information relevant to the renewal of the Advisory Contracts throughout the year.
The Board meets regularly and considers at each of its meetings factors that are relevant to its annual consideration of the renewal of the fund's Advisory Contracts, including the services and support provided to the fund and its shareholders. The Board has established three standing committees, each composed of Independent Trustees with varying backgrounds, to which the Board has assigned specific subject matter responsibilities in order to enhance effective decision-making by the Board. The Operations Committee, of which all of the Independent Trustees are members, meets regularly throughout the year and, among other matters, considers matters specifically related to the annual consideration of the renewal of the fund's Advisory Contracts. The Board, acting directly and through its Committees, requests and receives information concerning the annual consideration of the renewal of the fund's Advisory Contracts. The Board also meets as needed to consider matters specifically related to the Board's annual consideration of the renewal of Advisory Contracts. Members of the Board may also meet with trustees of other Fidelity funds through ad hoc joint committees to discuss certain matters relevant to the Fidelity funds.
At its September 2010 meeting, the Board of Trustees, including the Independent Trustees, unanimously determined to renew the fund's Advisory Contracts. In reaching its determination, the Board considered all factors it believed relevant, including (i) the nature, extent, and quality of the services to be provided to the fund and its shareholders (including the investment performance of the fund); (ii) the competitiveness of the fund's management fee and total expenses; (iii) the total costs of the services to be provided by and the profits to be realized by Fidelity from its relationship with the fund; (iv) the extent to which economies of scale would be realized as the fund grows; and (v) whether fee levels reflect these economies of scale, if any, for the benefit of fund shareholders.
In considering whether to renew the Advisory Contracts for the fund, the Board reached a determination, with the assistance of fund counsel and Independent Trustees' counsel and through the exercise of its business judgment, that the renewal of the Advisory Contracts is in the best interests of the fund and its shareholders and that the compensation to be received by Fidelity under the management contract is fair and reasonable. The Board's decision to renew the Advisory Contracts was not based on any single factor, but rather was based on a comprehensive consideration of all the information provided to the Board at its meetings throughout the year. The Board, in reaching its determination to renew the Advisory Contracts, is aware that shareholders in the fund have a broad range of investment choices available to them, including a wide choice among mutual funds offered by Fidelity's competitors, and that the fund's shareholders, with the opportunity to review and weigh the disclosure provided by the fund in its prospectus and other public disclosures, have chosen to invest in this fund, managed by Fidelity.
Semiannual Report
Nature, Extent, and Quality of Services Provided. The Board considered the staffing within the investment adviser, FMR, and the sub-advisers (together, the Investment Advisers), including the backgrounds of the fund's investment personnel and the fund's investment objective and discipline. The Independent Trustees also had discussions with senior management of Fidelity's investment operations and investment groups. The Board considered the structure of the portfolio manager compensation program and whether this structure provides appropriate incentives to act in the best interest of the fund.
Resources Dedicated to Investment Management and Support Services. The Board reviewed the size, education, and experience of the Investment Advisers' investment staff, their use of technology, and the Investment Advisers' approach to recruiting, training, and retaining portfolio managers and other research, advisory, and management personnel. The Board noted that Fidelity's analysts have access to a variety of technological tools and market and securities data that enable them to perform both fundamental and quantitative analysis and to specialize in various disciplines. The Board considered Fidelity's extensive global research capabilities that enable the Investment Advisers to aggregate data from various sources in an effort to produce positive investment results. The Board also considered that Fidelity's portfolio managers and analysts have access to daily portfolio attribution that allows for monitoring of a fund's portfolio, as well as an electronic communication system that provides immediate real-time access to research concerning issuers and credit enhancers. In addition, the Board considered the trading resources that are an integral part of the fixed-income portfolio management investment process.
Shareholder and Administrative Services. The Board considered (i) the nature, extent, quality, and cost of advisory, administrative, and shareholder services performed by the Investment Advisers and their affiliates under the Advisory Contracts and under separate agreements covering transfer agency, pricing and bookkeeping, and securities lending services for the fund; (ii) the nature and extent of the investment adviser's supervision of third party service providers, principally custodians and subcustodians; and (iii) the resources devoted to, and the record of compliance with, the fund's compliance policies and procedures.
The Board noted that the growth of fund assets over time across the complex allows Fidelity to reinvest in the development of services designed to enhance the value or convenience of the Fidelity funds as investment vehicles. These services include 24-hour access to account information and market information through telephone representatives and over the Internet, and investor education materials and asset allocation tools.
Semiannual Report
Board Approval of Investment Advisory Contracts and
Management Fees - continued
Investment in a Large Fund Family. The Board considered the benefits to shareholders of investing in a Fidelity fund, including the benefits of investing in a fund that is part of a large family of funds offering a variety of investment disciplines and providing a large variety of mutual fund investor services. The Board noted that Fidelity had taken, or had made recommendations that resulted in the Fidelity funds taking, a number of actions over the previous year that benefited particular funds, including (i) dedicating additional resources to investment research and restructuring and broadening the focus of the investment research teams; (ii) bolstering the senior management team that oversees asset management; (iii) launching Class F of certain funds as a lower-fee class available to Freedom K and Freedom Index Funds; (iv) lowering the initial investment minimums and ongoing balance requirements for Real Estate High Income Fund; (v) eliminating subsequent purchase minimums for all funds and adding a waiver of the investment minimum requirement for new accounts opened with the proceeds of a systematic withdrawal plan; (vi) eliminating the withdrawal minimum and maximum limits for systematic withdrawals from Advisor funds; (vii) expanding sales load waivers on Class A shares for Destiny Planholders and expanding Institutional Class eligibility for Class O Destiny Planholders; and (viii) changing certain Class A and Class T sales charge structures to further align them with industry practices.
Investment Performance. The Board considered whether the fund has operated in accordance with its investment objective, as well as its record of compliance with its investment restrictions. It also reviewed the fund's absolute investment performance for each class, as well as the fund's relative investment performance for each class measured over multiple periods against (i) a broad-based securities market index, and (ii) a peer group of mutual funds deemed appropriate by Fidelity and reviewed by the Board. The following charts considered by the Board show, over the one-, three-, and five-year periods ended December 31, 2009, the cumulative total returns of the retail class and Class T of the fund, the cumulative total returns of a broad-based securities market index ("benchmark"), and a range of cumulative total returns of a peer group of mutual funds identified by Lipper Inc. as having an investment objective similar to that of the fund. The returns of the retail class and Class T show the performance of the highest and lowest performing classes, respectively (based on five-year performance). The box within each chart shows the 25th percentile return (bottom of box) and the 75th percentile return (top of box) of the peer group. Returns shown above the box are in the first quartile and returns shown below the box are in the fourth quartile. The percentage beaten numbers noted below each chart correspond to the percentile box and represent the percentage of funds in the peer group whose performance was equal to or lower than that of the class indicated.
Semiannual Report
Fidelity Ultra-Short Bond Fund
The Board reviewed the fund's relative investment performance against its peer group and noted that the performance of the retail class of the fund was in the fourth quartile for all the periods shown. The Board also noted that the investment performance of the fund was lower than its benchmark for all the periods shown. The Board considered that the variations in performance among the fund's classes reflect the variations in class expenses, which result in lower performance for higher expense classes. The Board discussed with FMR actions that have been taken by FMR to improve the fund's disappointing performance and how investment personnel evaluate potential for incremental return against the risks involved in obtaining that incremental return. The Board considered the steps that FMR has taken to strengthen and refine its risk management processes in light of recent credit events that have affected various sectors of the fixed-income markets. The Board noted that this fund had underperformed in 2008 and discussed with FMR its disappointment with the continued underperformance of the fund. The Board also reviewed the fund's performance since inception as well as performance in the current year. The Board will continue to closely monitor the performance of the fund in the coming year and discuss with FMR other appropriate actions to address the performance of the fund.
Based on its review, and giving particular weight to the nature and quality of the resources dedicated by the Investment Advisers to maintain and improve relative performance and factoring in the unprecedented market events in recent years, the Board concluded that the nature, extent, and quality of investment management and support services and of shareholder and administrative services provided to the fund will benefit the fund's shareholders, particularly in light of the Board's view that the fund's shareholders benefit from investing in a fund that is part of a large family of funds offering a variety of investment disciplines and services.
Semiannual Report
Board Approval of Investment Advisory Contracts and
Management Fees - continued
Competitiveness of Management Fee and Total Fund Expenses. The Board considered the fund's management fee and total expenses compared to "mapped groups" of competitive funds and classes. Fidelity creates "mapped groups" by combining similar Lipper investment objective categories that have comparable management fee characteristics. Combining Lipper investment objective categories aids the Board's management fee and total expense comparisons by broadening the competitive group used for comparison and by reducing the number of universes to which various Fidelity funds are compared.
Management Fee. The Board considered two proprietary management fee comparisons for the 12-month periods shown in the chart below. The group of Lipper funds used by the Board for management fee comparisons is referred to below as the "Total Mapped Group" and, for the reasons explained above, is broader than the Lipper peer group used by the Board for performance comparisons. The Total Mapped Group comparison focuses on a fund's standing relative to the total universe of comparable funds available to investors, in terms of gross management fees before expense reimbursements or caps. "TMG %" represents the percentage of funds in the Total Mapped Group that had management fees that were lower than the fund's. For example, a TMG % of 22% means that 78% of the funds in the Total Mapped Group had higher management fees than the fund. The "Asset-Size Peer Group" (ASPG) comparison focuses on a fund's standing relative to non-Fidelity funds similar in size to the fund within the Total Mapped Group. The ASPG represents at least 15% of the funds in the Total Mapped Group with comparable asset size and management fee characteristics, subject to a minimum of 50 funds (or all funds in the Total Mapped Group if fewer than 50). Additional information, such as the ASPG quartile in which the fund's management fee ranked, is also included in the chart and considered by the Board.
Semiannual Report
Fidelity Ultra-Short Bond Fund
The Board noted that the fund's management fee ranked below the median of its Total Mapped Group and below the median of its ASPG for 2009.
Furthermore, the Board considered that it had approved an amendment (effective June 1, 2005) to the fund's management contract that lowered the fund's individual fund fee rate from 30 basis points to 20 basis points. The Board considered that the chart reflects the fund's lower management fee for 2005, as if the lower rate were in effect for the entire year.
Based on its review, the Board concluded that the fund's management fee is fair and reasonable in light of the services that the fund receives and the other factors considered.
Total Expenses. In its review of each class's total expenses, the Board considered the fund's management fee as well as other fund or class expenses, as applicable, such as transfer agent fees, pricing and bookkeeping fees, fund-paid 12b-1 fees, and custodial, legal, and audit fees. The Board also noted the effects of any waivers and reimbursements on fees and expenses. As part of its review, the Board also considered current and historical total expenses of each class of the fund compared to competitive fund median expenses. Each class of the fund is compared to those funds and classes in the Total Mapped Group (used by the Board for management fee comparisons) that have a similar sales load structure.
The Board also considered that the current contractual arrangements for the fund (i) have the effect of setting the total "fund-level" expenses (including, among certain other expenses, the management fee) for each class at 35 basis points, (ii) lower and limit the "class-level" transfer agent fee for the retail class to 10 basis points, and (iii) limit the total expenses for the retail class to 45 basis points. The fees and expenses payable under these contractual arrangements may not be increased without the approval of the Board and the shareholders of the applicable class. The fund's Advisor classes are subject to different "class-level" expenses (transfer agent fees and 12b-1 fees).
Semiannual Report
Board Approval of Investment Advisory Contracts and
Management Fees - continued
The Board noted that the total expenses of each of Class A, Class T, and the retail class ranked below its competitive median for 2009 and the total expenses of Institutional Class ranked above its competitive median for 2009. The Board noted that Institutional Class has a significantly lower investment minimum than certain funds and classes in the Total Mapped Group that have a similar sales load structure and that, when compared to funds with the same or lower investment minimum, Institutional Class ranked equal to its median for 2009. The Board noted that the fund offers multiple classes, each of which has a different sales load and 12b-1 fee structure, and that the multiple structures are intended to offer a range of pricing options for the intermediary market. The Board also noted that the total expenses of the classes vary primarily by the level of their 12b-1 fees, although differences in transfer agent fees may also cause expenses to vary from class to class.
The Board recognized that the fund's management contract incorporates a "group fee" structure, which provides for lower group fee rates as total fund assets under FMR's management increase, and for higher group fee rates as total fund assets under FMR's management decrease. FMR calculates the group fee rates based on a tiered asset "breakpoint" schedule that varies based on asset class. The Board noted, however, that because the current contractual arrangements set the total "fund-level" expenses for each class at 35 basis points, increases or decreases in the management fee due to changes in the group fee rate will not impact total expenses.
Fees Charged to Other Fidelity Clients. The Board also considered Fidelity fee structures and other information with respect to clients of FMR and its affiliates, such as other mutual funds advised or subadvised by FMR or its affiliates, pension plan clients, and other institutional clients. In March 2010, the Board created an ad hoc joint committee with the board of other Fidelity funds (the Committee) to review and compare Fidelity's institutional investment advisory business with its business of providing services to the Fidelity funds, including the differences in services provided, fees charged, and costs incurred, as well as competition in their respective marketplaces.
Based on its review of total expenses and fees charged to other Fidelity clients, the Board concluded that the total expenses of each class of the fund were reasonable, although in one case above the median of the universe presented for comparison, in light of the services that the fund and its shareholders receive and the other factors considered, including the findings of the Committee.
Semiannual Report
Costs of the Services and Profitability. The Board considered the revenues earned and the expenses incurred by Fidelity in conducting the business of developing, marketing, distributing, managing, administering and servicing the fund and its shareholders. The Board also considered the level of Fidelity's profits in respect of all the Fidelity funds.
On an annual basis, FMR presents to the Board Fidelity's profitability for the fund. Fidelity calculates the profitability for each fund, as well as aggregate profitability for groups of Fidelity funds and all Fidelity funds, using a series of detailed revenue and cost allocation methodologies which originate with the audited books and records of Fidelity. The Audit Committee of the Board reviews any significant changes from the prior year's methodologies.
PricewaterhouseCoopers LLP (PwC), independent registered public accounting firm and auditor to Fidelity and certain Fidelity funds, has been engaged annually by the Board as part of the Board's assessment of Fidelity's profitability analysis. PwC's engagement includes the review and assessment of Fidelity's methodologies used in determining the revenues and expenses attributable to Fidelity's mutual fund business, and completion of agreed-upon procedures surrounding the mathematical accuracy of fund profitability and its conformity to allocation methodologies. After considering PwC's reports issued under the engagement and information provided by Fidelity, the Board believes that while other allocation methods may also be reasonable, Fidelity's profitability methodologies are reasonable in all material respects.
The Board has also reviewed Fidelity's non-fund businesses and fall-out benefits related to the mutual fund business as well as cases where Fidelity's affiliates may benefit from or be related to the fund's business.
The Board considered the costs of the services provided by and the profits realized by Fidelity in connection with the operation of the fund and were satisfied that the profitability was not excessive in the circumstances.
Economies of Scale. The Board considered whether there have been economies of scale in respect of the management of the Fidelity funds, whether the Fidelity funds (including the fund) have appropriately benefited from any such economies of scale, and whether there is potential for realization of any further economies of scale. The Board considered the extent to which the fund will benefit from economies of scale through increased services to the fund, through waivers or reimbursements, or through fee or expense reductions.
In February 2009, the Board and the board of other Fidelity funds created an ad hoc committee (the Economies of Scale Committee) to analyze whether FMR attains economies of scale in respect of the management and servicing of the Fidelity funds, whether the Fidelity funds have appropriately benefited from such economies of scale, and whether there is potential for realization of any further economies of scale.
Semiannual Report
Board Approval of Investment Advisory Contracts and
Management Fees - continued
The Board concluded, considering the findings of the Economies of Scale Committee, that any potential economies of scale are being appropriately shared between fund shareholders and Fidelity.
Additional Information Requested by the Board. In order to develop fully the factual basis for consideration of the Fidelity funds' Advisory Contracts, the Board requested and received additional information on certain topics, including (i) fund performance trends, actions to be taken by FMR to improve certain funds' overall performance, and Fidelity's long-term strategies for certain funds; (ii) Fidelity's fund profitability methodology and profitability trends for certain funds; (iii) portfolio manager changes that have occurred during the past year and the amount of the investment that each portfolio manager has made in the Fidelity fund(s) that he or she manages; (iv) Fidelity's compensation structure for portfolio managers, research analysts, and other key personnel, including its effects on fund profitability, the rationale for the compensation structure, and the extent to which current market conditions have affected retention and recruitment; (v) the compensation paid by FMR to fund sub-advisers on behalf of the Fidelity funds; (vi) Fidelity's fee structures and rationale for recommending different fees among different categories of funds and classes, as well as Fidelity's voluntary waiver of fees to maintain minimum yields for certain funds and classes; (vii) the rationale for any differences between fund fee structures and fee structures in place for other Fidelity clients; and (viii) explanations regarding the relative total expenses borne by certain funds and classes, total expense competitive trends, and actions that might be taken by FMR to reduce total expenses for certain funds and classes or to achieve further economies of scale.
Based on its evaluation of all of the conclusions noted above, and after considering all factors it believed relevant, the Board ultimately concluded that the advisory fee structures are fair and reasonable, and that the fund's Advisory Contracts should be renewed.
Semiannual Report
Investment Adviser
Fidelity Management & Research Company
Boston, MA
Investment Sub-Advisers
Fidelity Investments
Money Management, Inc.
Fidelity Management & Research
(U.K.) Inc.
Fidelity Management & Research
(Japan) Inc.
Fidelity Management & Research
(Hong Kong) Limited
General Distributor
Fidelity Distributors Corporation
Boston, MA
Transfer and Service Agents
Fidelity Investments Institutional
Operations Company, Inc.
Boston, MA
Fidelity Service Company, Inc.
Boston, MA
Custodian
Citibank, N.A.
New York, NY
AUSBI-USAN-0311
1.804596.107
Item 2. Code of Ethics
Not applicable.
Item 3. Audit Committee Financial Expert
Not applicable.
Item 4. Principal Accountant Fees and Services
Not applicable.
Item 5. Audit Committee of Listed Registrants
Not applicable.
Item 6. Investments
(a) Not applicable.
(b) Not applicable
Item 7. Disclosure of Proxy Voting Policies and Procedures for Closed-End Management Investment Companies
Not applicable.
Item 8. Portfolio Managers of Closed-End Management Investment Companies
Not applicable.
Item 9. Purchase of Equity Securities by Closed-End Management Investment Company and Affiliated Purchasers
Not applicable.
Item 10. Submission of Matters to a Vote of Security Holders
There were no material changes to the procedures by which shareholders may recommend nominees to the Fidelity Income Fund's Board of Trustees.
Item 11. Controls and Procedures
(a)(i) The President and Treasurer and the Chief Financial Officer have concluded that the Fidelity Income Fund's (the "Trust") disclosure controls and procedures (as defined in Rule 30a-3(c) under the Investment Company Act) provide reasonable assurances that material information relating to the Trust is made known to them by the appropriate persons, based on their evaluation of these controls and procedures as of a date within 90 days of the filing date of this report.
(a)(ii) There was no change in the Trust's internal control over financial reporting (as defined in Rule 30a-3(d) under the Investment Company Act) that occurred during the second fiscal quarter of the period covered by this report that has materially affected, or is reasonably likely to materially affect, the Trust's internal control over financial reporting.
Item 12. Exhibits
(a) | (1) | Not applicable. |
(a) | (2) | Certification pursuant to Rule 30a-2(a) under the Investment Company Act of 1940 (17 CFR 270.30a-2(a)) is filed and attached hereto as Exhibit 99.CERT. |
(a) | (3) | Not applicable. |
(b) | | Certification pursuant to Rule 30a-2(b) under the Investment Company Act of 1940 (17 CFR 270.30a-2(b)) is furnished and attached hereto as Exhibit 99.906CERT. |
SIGNATURES
Pursuant to the requirements of the Securities Exchange Act of 1934 and the Investment Company Act of 1940, the registrant has duly caused this report to be signed on its behalf by the undersigned, thereunto duly authorized.
Fidelity Income Fund
By: | /s/ John R. Hebble |
| John R. Hebble |
| President and Treasurer |
| |
Date: | March 28, 2011 |
Pursuant to the requirements of the Securities Exchange Act of 1934 and the Investment Company Act of 1940, this report has been signed below by the following persons on behalf of the registrant and in the capacities and on the dates indicated.
By: | /s/ John R. Hebble |
| John R. Hebble |
| President and Treasurer |
| |
Date: | March 28, 2011 |
By: | /s/ Christine Reynolds |
| Christine Reynolds |
| Chief Financial Officer |
| |
Date: | March 28, 2011 |