UNITED STATES
SECURITIES AND EXCHANGE COMMISSION
Washington, D.C. 20549
FORM N-CSR
CERTIFIED SHAREHOLDER REPORT OF REGISTERED
MANAGEMENT INVESTMENT COMPANIES
Investment Company Act file number 811-4085
Fidelity Income Fund
(Exact name of registrant as specified in charter)
82 Devonshire St., Boston, Massachusetts 02109
(Address of principal executive offices) (Zip code)
Eric D. Roiter, Secretary
82 Devonshire St.
Boston, Massachusetts 02109
(Name and address of agent for service)
Registrant's telephone number, including area code: 617-563-7000
Date of fiscal year end: | August 31 |
| |
Date of reporting period: | August 31, 2007 |
Item 1. Reports to Stockholders
Fidelity
Total Bond
Fund
Annual Report
August 31, 2007
(2_fidelity_logos) (Registered_Trademark)
Contents
Notes to Shareholders | <Click Here> | An explanation of the changes to the fund. |
Chairman's Message | <Click Here> | Ned Johnson's message to shareholders. |
Performance | <Click Here> | How the fund has done over time. |
Management's Discussion | <Click Here> | The manager's review of fund performance, strategy and outlook |
Shareholder Expense Example | <Click Here> | An example of shareholder expenses. |
Investment Changes | <Click Here> | A summary of major shifts in the fund's investments over the past six months. |
Investments | <Click Here> | A complete list of the fund's investments with their market values. |
Financial Statements | <Click Here> | Statements of assets and liabilities, operations, and changes in net assets,
as well as financial highlights. |
Notes | <Click Here> | Notes to the financial statements. |
Report of Independent Registered Public Accounting Firm | <Click Here> | |
Trustees and Officers | <Click Here> | |
Distributions | <Click Here> | |
Board Approval of Investment Advisory Contracts and Management Fees | <Click Here> | |
| | |
To view a fund's proxy voting guidelines and proxy voting record for the 12-month period ended June 30, visit http://www.fidelity.com (search for "proxy voting guidelines") or visit the Securities and Exchange Commission's (SEC) web site at http://www.sec.gov. You may also call 1-800-544-8544 to request a free copy of the proxy voting guidelines.
Standard & Poor's, S&P and S&P 500 are registered service marks of The McGraw-Hill Companies, Inc. and have been licensed for use by Fidelity Distributors Corporation.
Other third party marks appearing herein are the property of their respective owners.
All other marks appearing herein are registered or unregistered trademarks or service marks of FMR LLC or an affiliated company.
Annual Report
This report and the financial statements contained herein are submitted for the general information of the shareholders of the fund. This report is not authorized for distribution to prospective investors in the fund unless preceded or accompanied by an effective prospectus.
A fund files its complete schedule of portfolio holdings with the SEC for the first and third quarters of each fiscal year on Form N-Q. Forms N-Q are available on the SEC's web site at http://www.sec.gov. A fund's Forms N-Q may be reviewed and copied at the SEC's Public Reference Room in Washington, DC. Information regarding the operation of the SEC's Public Reference Room may be obtained by calling 1-800-SEC-0330. For a complete list of a fund's portfolio holdings, view the most recent holdings listing, semiannual report, or annual report on Fidelity's web site at http://www.fidelity.com or http://www.advisor.fidelity.com, as applicable.
NOT FDIC INSURED · MAY LOSE VALUE · NO BANK GUARANTEE
Neither the fund nor Fidelity Distributors Corporation is a bank.
Annual Report
Notes to Shareholders:
As discussed in prior shareholder reports, the fund changed its investment approach in the way it invests in the investment-grade debt market, seeking exposure to various types of securities by investing in central funds as well as investing directly in individual investment-grade securities. Central funds are Fidelity mutual funds used by this fund and other Fidelity funds as an investment vehicle to gain pooled exposure to a particular core market sector, such as corporate bonds or mortgage-backed securities. Instead of multiple funds each investing in investment-grade debt securities individually, they can now take advantage of consolidating investments in a single, larger pool of investment-grade debt by investing directly in central funds. Shares of the central funds are offered only to other Fidelity mutual funds and accounts; investors cannot directly invest in them.
It's important to point out that investing in central funds does not impact the fund's investment objective or risk profile, only the mechanics of how we manage its investment portfolio. The portfolio managers continue to be responsible for choosing appropriate investments for their funds, whether they elect to purchase shares of a central fund or individual securities. Fidelity does not charge any additional management fees for central funds.
Investing in central funds does change the way this report presents the fund's holdings. The Investments section continues to list direct investments of the fund, including each central fund. However, many of the individual investment-grade debt securities previously held by the fund were transferred to the central funds, so they are no longer directly held and thus not listed. The financial statements and a complete schedule of portfolio holdings for each of the fixed-income central funds are available upon request or at the SEC's web site at www.sec.gov.
Annual Report
Chairman's Message
(photo_of_Edward_C_Johnson_3d)
Dear Shareholder:
Many stock and bond markets around the world have been unsettled of late; however, volatility can often lead to opportunity for patient investors. Financial markets are always unpredictable, but there are a number of time-tested principles that can put the historical odds in your favor.
One of the basic tenets is to invest for the long term. Over time, riding out the markets' inevitable ups and downs has proven much more effective than selling into panic or chasing the hottest trend. Even missing only a few of the markets' best days can significantly diminish investor returns. Patience also affords the benefits of compounding - of earning interest on additional income or reinvested dividends and capital gains. There are tax advantages and cost benefits to consider as well. The more you sell, the more taxes you pay, and the more you trade, the higher the costs. While staying the course doesn't eliminate risk, it can considerably lessen the effect of short-term declines.
You can further manage your investing risk through diversification. And today, more than ever, geographic diversification should be taken into account. Studies indicate that asset allocation is the single most important determinant of a portfolio's long-term success. The right mix of stocks, bonds and cash - aligned to your particular risk tolerance and investment objective - is very important. Age-appropriate rebalancing is also an essential aspect of asset allocation. For younger investors, an emphasis on equities - which historically have been the best-performing asset class over time - is encouraged. As investors near their specific goal, such as retirement or sending a child to college, consideration may be given to replacing volatile assets (e.g. common stocks) with more-stable fixed investments (bonds or savings plans).
A third investment principle - investing regularly - can help lower the average cost of your purchases. Investing a certain amount of money each month or quarter helps ensure you won't pay for all your shares at market highs. This strategy - known as dollar cost averaging - also reduces unconstructive "emotion" from investing, helping shareholders avoid selling weak performers just prior to an upswing, or chasing a hot performer just before a correction.
We invite you to contact us via the Internet, through our Investor Centers or over the phone. It is our privilege to provide you the information you need to make the investments that are right for you.
Sincerely,
/s/Edward C. Johnson 3d
Edward C. Johnson 3d
Annual Report
Performance: The Bottom Line
Average annual total return reflects the change in the value of an investment, assuming reinvestment of Total Bond's dividend income and capital gains (the profits earned upon the sale of securities that have grown in value) and assuming a constant rate of performance each year. The $10,000 table and the fund's returns do not reflect the deduction of taxes that a shareholder would pay on fund distributions or the redemption of fund shares. During periods of reimbursement by Fidelity, a fund's total return will be greater than it would be had the reimbursement not occurred. How a fund did yesterday is no guarantee of how it will do tomorrow.
Average Annual Total Returns
Periods ended August 31, 2007 | Past 1
year | Life of
Fund A |
Total Bond | 3.89% | 4.90% |
A From October 15, 2002.
$10,000 Over Life of Fund
Let's say hypothetically that $10,000 was invested in Total Bond, a class of the fund, on October 15, 2002, when the fund started. The chart shows how the value of your investment would have changed, and also shows how the Lehman Brothers® U.S. Aggregate Index performed over the same period.
Annual Report
Management's Discussion of Fund Performance
Comments from Ford O'Neil, Portfolio Manager of Fidelity Total Bond Fund
A subprime mortgage loan crisis and an emerging credit crunch contributed to subpar performance for some sectors of the investment-grade bond market during the 12-month period ending August 31, 2007. While returns for high-grade debt were fairly solid overall, they also were tempered to an extent by the Federal Reserve Board's decision not to lower interest rates as bond investors had hoped. The Lehman Brothers® U.S. Aggregate Index gained 5.26%. Within the index, Treasuries - the bond market's highest-quality debt instrument - fared best, as many investors fled riskier fixed-income securities. The asset-backed category - home to volatile subprime mortgages, as well as credit card debt and auto loans - had the weakest performance.
During the year, Total Bond returned 3.89%, lagging the Lehman Brothers Aggregate index and the 5.31% return of the Lehman Brothers U.S. Universal Index. I hold securities directly and indirectly through separately managed subportfolios and Fidelity fixed-income central funds, available only to other Fidelity funds and which allow me to gain exposure to particular segments of the bond market. I also invested in Fidelity® Ultra-Short Central Fund, a diversified pool of short-term assets. As I address performance, I'll be discussing direct investments and those of the subportfolios and central funds. Sector selection - with significant underweightings in plain-vanilla U.S. Treasury bonds and agency securities, as well as stakes in securitized bonds such as commercial mortgage-backed and asset-backed securities - proved to be the biggest detractor versus the Aggregate index. Treasuries and agencies were bolstered by a global flight to quality as the subprime mortgage market meltdown forced a repricing of risk, but securitized products were hurt by the same developments. Among securitized products, our exposure to subprime mortgage securities was especially detrimental to performance. Overweighted exposure to commercial mortgage-backed securities also hurt. They suffered from worries about what might have been lax lending standards in the commercial property market. Elsewhere, what we lost by owning emerging-markets holdings - which came under pressure as investors avoided riskier assets - we more than offset by holding high-yield corporate securities, which outpaced the benchmark. Within the high-yield allocation, a small exposure to floating-rate securities hurt because they, too, suffered as risk aversion escalated. My decision to modestly underweight investment-grade corporate bonds helped, as did favorable security selection within the sector.
The views expressed above reflect those of the portfolio manager(s) only through the end of the period as stated on the cover of this report and do not necessarily represent the views of Fidelity or any other person in the Fidelity organization. Any such views are subject to change at any time based upon market or other conditions and Fidelity disclaims any responsibility to update such views. These views may not be relied on as investment advice and, because investment decisions for a Fidelity fund are based on numerous factors, may not be relied on as an indication of trading intent on behalf of any Fidelity fund.
Annual Report
Shareholder Expense Example
As a shareholder of the Fund, you incur two types of costs: (1) transaction costs, including sales charges (loads) on purchase payments or redemption proceeds, and (2) ongoing costs, including management fees, distribution and/or service (12b-1) fees and other Fund expenses. This Example is intended to help you understand your ongoing costs (in dollars) of investing in the Fund and to compare these costs with the ongoing costs of investing in other mutual funds.
The Example is based on an investment of $1,000 invested at the beginning of the period and held for the entire period (March 1, 2007 to August 31, 2007).
Actual Expenses
The first line of the accompanying table for each class of the Fund provides information about actual account values and actual expenses. You may use the information in this line, together with the amount you invested, to estimate the expenses that you paid over the period. Simply divide your account value by $1,000.00 (for example, an $8,600 account value divided by $1,000.00 = 8.6), then multiply the result by the number in the first line for a class of the Fund under the heading entitled "Expenses Paid During Period" to estimate the expenses you paid on your account during this period. In addition, the Fund, as a shareholder in the underlying Fidelity Central Funds, will indirectly bear its pro rata share of the fees and expenses incurred by the underlying Fidelity Central Funds. These fees and expenses are not included in the Fund's annualized expense ratio used to calculate the expense estimate in the table below.
Hypothetical Example for Comparison Purposes
The second line of the accompanying table for each class of the Fund provides information about hypothetical account values and hypothetical expenses based on a Class' actual expense ratio and an assumed rate of return of 5% per year before expenses, which is not the Class' actual return. The hypothetical account values and expenses may not be used to estimate the actual ending account balance or expenses you paid for the period. You may use this information to compare the ongoing costs of investing in the Fund and other funds. To do so, compare this 5% hypothetical example with the 5% hypothetical examples that appear in the shareholder reports of the other funds. In addition, the Fund, as a shareholder in the underlying Fidelity Central Funds, will indirectly bear its pro rata share of the fees and expenses incurred by the underlying Fidelity Central Funds. These fees and expenses are not included in the Fund's annualized expense ratio used to calculate the expense estimate in the table below.
Please note that the expenses shown in the table are meant to highlight your ongoing costs only and do not reflect any transaction costs. Therefore, the second line of the table is useful in comparing ongoing costs only, and will not help you determine the relative total costs of owning different funds. In addition, if these transactional costs were included, your costs would have been higher.
Annual Report
| Beginning
Account Value
March 1, 2007 | Ending
Account Value
August 31, 2007 | Expenses Paid
During Period*
March 1, 2007
to August 31, 2007 |
Class A | | | |
Actual | $ 1,000.00 | $ 999.50 | $ 4.03 |
Hypothetical A | $ 1,000.00 | $ 1,021.17 | $ 4.08 |
Class T | | | |
Actual | $ 1,000.00 | $ 999.60 | $ 3.88 |
Hypothetical A | $ 1,000.00 | $ 1,021.32 | $ 3.92 |
Class B | | | |
Actual | $ 1,000.00 | $ 995.80 | $ 7.65 |
Hypothetical A | $ 1,000.00 | $ 1,017.54 | $ 7.73 |
Class C | | | |
Actual | $ 1,000.00 | $ 995.70 | $ 7.70 |
Hypothetical A | $ 1,000.00 | $ 1,017.49 | $ 7.78 |
Total Bond | | | |
Actual | $ 1,000.00 | $ 1,001.20 | $ 2.27 |
Hypothetical A | $ 1,000.00 | $ 1,022.94 | $ 2.29 |
Institutional Class | | | |
Actual | $ 1,000.00 | $ 1,001.00 | $ 2.52 |
Hypothetical A | $ 1,000.00 | $ 1,022.68 | $ 2.55 |
A 5% return per year before expenses
* Expenses are equal to each Class' annualized expense ratio (shown in the table below); multiplied by the average account value over the period, multiplied by 184/365 (to reflect the one-half year period). The fees and expenses of the underlying Fidelity Central Funds in which the Fund invests are not included in the Fund's annualized expense ratio.
| Annualized
Expense Ratio |
Class A | .80% |
Class T | .77% |
Class B | 1.52% |
Class C | 1.53% |
Total Bond | . .45% |
Institutional Class | .50% |
Annual Report
Investment Changes
The information in the following tables is based on the combined investments of the Fund and its pro rata share of its investments in each Fidelity Central Fund. |
Quality Diversification (% of fund's net assets) |
As of August 31, 2007 | As of February 28, 2007 |
 | U.S. Government and
U.S. Government
Agency Obligations 55.2% | | | U.S. Government and
U.S. Government
Agency Obligations 52.5% | |
 | AAA 13.8% | | | AAA 14.7% | |
 | AA 5.0% | | | AA 4.5% | |
 | A 3.8% | | | A 5.0% | |
 | BBB 13.7% | | | BBB 12.9% | |
 | BB and Below 8.4% | | | BB and Below 9.5% | |
 | Not Rated 1.3% | | | Not Rated 2.0% | |
 | Equities 0.1% | |  | Equities 0.0% | |
 | Short-Term
Investments and
Net Other Assets(dagger) (1.3)% | | | Short-Term
Investments and
Net Other Assets(dagger) (1.1)% | |

We have used ratings from Moody's ® Investors Services, Inc. Where Moody's ratings are not available, we have used S&P ® ratings. All ratings are as of the report date and do not reflect subsequent downgrades. |
Weighted Average Maturity as of August 31, 2007 |
| | 6 months ago |
Years | 5.0 | 5.7 |
The weighted average maturity is based on the dollar-weighted average length of time until principal payments are expected or until securities reach maturity, taking into account any maturity shortening feature such as a call, refunding or redemption provision. |
Duration as of August 31, 2007 |
| | 6 months ago |
Years | 4.4 | 4.1 |
Duration shows how much a bond fund's price fluctuates with changes in comparable interest rates. If rates rise 1%, for example, a fund with a five-year duration is likely to lose about 5% of its value. Other factors also can influence a bond fund's performance and share price. Accordingly, a bond fund's actual performance may differ from this example. |
Asset Allocation (% of fund's net assets) |
As of August 31, 2007* | As of February 28, 2007** |
| Corporate Bonds 20.2% | | | Corporate Bonds 21.8% | |
 | U.S. Government and
U.S. Government
Agency Obligations 55.2% | | | U.S. Government and
U.S. Government
Agency Obligations 52.5% | |
| Asset-Backed
Securities 9.9% | | | Asset-Backed
Securities 10.7% | |
| CMOs and Other Mortgage Related Securities 11.5% | | | CMOs and Other Mortgage Related Securities 11.0% | |
| Stocks 0.1% | | | Stocks 0.0% | |
 | Other Investments 4.4% | | | Other Investments 5.1% | |
| Short-Term
Investments and
Net Other Assets(dagger) (1.3)% | | | Short-Term
Investments and
Net Other Assets(dagger) (1.1)% | |
* Foreign investments | 9.2% | | ** Foreign investments | 9.3% | |
* Futures and Swaps | 13.0% | | ** Futures and Swaps | 16.1% | |

(dagger) Short-term Investments and Net Other Assets are not included in the pie chart. |
A holdings list for the Fund, which presents direct holdings as well as the pro rata share of any securities and other investments held indirectly through its investment in underlying non-money market Fidelity Central Funds, is available at fidelity.com and/or advisor.fidelity.com, as applicable. |
Annual Report
Investments August 31, 2007
Showing Percentage of Net Assets
Corporate Bonds - 7.7% |
| Principal Amount (b) | | Value |
Convertible Bonds - 0.1% |
ENERGY - 0.0% |
Oil, Gas & Consumable Fuels - 0.0% |
Chesapeake Energy Corp. 2.75% 11/15/35 | | $ 2,060,000 | | $ 2,115,414 |
FINANCIALS - 0.0% |
Real Estate Investment Trusts - 0.0% |
American Financial Realty Trust 4.375% 7/15/24 | | 50,000 | | 46,750 |
INFORMATION TECHNOLOGY - 0.1% |
Communications Equipment - 0.1% |
Nortel Networks Corp. 1.75% 4/15/12 (f) | | 3,160,000 | | 2,618,850 |
Semiconductors & Semiconductor Equipment - 0.0% |
Advanced Micro Devices, Inc. 6% 5/1/15 | | 350,000 | | 302,313 |
TOTAL INFORMATION TECHNOLOGY | | 2,921,163 |
TOTAL CONVERTIBLE BONDS | | 5,083,327 |
Nonconvertible Bonds - 7.6% |
CONSUMER DISCRETIONARY - 1.3% |
Auto Components - 0.0% |
ArvinMeritor, Inc.: | | | | |
8.125% 9/15/15 | | 305,000 | | 284,413 |
8.75% 3/1/12 | | 400,000 | | 392,000 |
Tenneco, Inc. 8.625% 11/15/14 | | 805,000 | | 784,875 |
| | 1,461,288 |
Diversified Consumer Services - 0.0% |
Affinion Group, Inc. 11.5% 10/15/15 | | 740,000 | | 741,850 |
Education Management LLC/Education Management Finance Corp.: | | | | |
8.75% 6/1/14 | | 300,000 | | 304,500 |
10.25% 6/1/16 | | 300,000 | | 307,500 |
Service Corp. International: | | | | |
6.75% 4/1/15 | | 970,000 | | 940,900 |
7.5% 4/1/27 | | 1,105,000 | | 1,005,550 |
| | 3,300,300 |
Hotels, Restaurants & Leisure - 0.4% |
Carrols Corp. 9% 1/15/13 | | 105,000 | | 98,700 |
Chukchansi Economic Development Authority 8% 11/15/13 (f) | | 565,000 | | 562,175 |
Corporate Bonds - continued |
| Principal
Amount (b) | | Value |
Nonconvertible Bonds - continued |
CONSUMER DISCRETIONARY - continued |
Hotels, Restaurants & Leisure - continued |
Fontainebleau Las Vegas Holdings LLC/Fontainebleau Las Vegas Capital Corp. 10.25% 6/15/15 (f) | | $ 565,000 | | $ 485,900 |
Host Marriott LP: | | | | |
6.375% 3/15/15 | | 250,000 | | 239,375 |
6.75% 6/1/16 | | 100,000 | | 97,250 |
7.125% 11/1/13 | | 2,870,000 | | 2,848,475 |
ITT Corp. 7.375% 11/15/15 | | 250,000 | | 255,000 |
Landry's Seafood Restaurants, Inc. 7.5% 12/15/14 | | 2,385,000 | | 2,379,038 |
MGM Mirage, Inc.: | | | | |
5.875% 2/27/14 | | 1,955,000 | | 1,805,931 |
6.625% 7/15/15 | | 300,000 | | 282,000 |
6.75% 9/1/12 | | 500,000 | | 487,500 |
6.875% 4/1/16 | | 1,635,000 | | 1,549,163 |
7.625% 1/15/17 | | 3,445,000 | | 3,410,550 |
8.375% 2/1/11 | | 180,000 | | 184,050 |
Mohegan Tribal Gaming Authority 7.125% 8/15/14 | | 540,000 | | 523,125 |
NCL Corp. Ltd. 10.625% 7/15/14 | | 1,000,000 | | 995,000 |
Park Place Entertainment Corp. 7% 4/15/13 | | 540,000 | | 554,850 |
Penn National Gaming, Inc.: | | | | |
6.75% 3/1/15 | | 350,000 | | 353,500 |
6.875% 12/1/11 | | 80,000 | | 79,800 |
Royal Caribbean Cruises Ltd. yankee: | | | | |
7.25% 6/15/16 | | 190,000 | | 182,400 |
7.5% 10/15/27 | | 125,000 | | 113,750 |
Seminole Hard Rock Entertainment, Inc. 7.86% 3/15/14 (f)(i) | | 1,040,000 | | 1,019,200 |
Seneca Gaming Corp.: | | | | |
Series B, 7.25% 5/1/12 | | 70,000 | | 70,000 |
7.25% 5/1/12 | | 350,000 | | 350,000 |
Shingle Springs Tribal Gaming Authority 9.375% 6/15/15 (f) | | 180,000 | | 177,300 |
Six Flags, Inc.: | | | | |
8.875% 2/1/10 | | 400,000 | | 348,000 |
9.625% 6/1/14 | | 1,090,000 | | 882,900 |
9.75% 4/15/13 | | 730,000 | | 605,900 |
Starwood Hotels & Resorts Worldwide, Inc. 7.875% 5/1/12 | | 250,000 | | 267,725 |
Station Casinos, Inc.: | | | | |
6.625% 3/15/18 | | 100,000 | | 80,625 |
Corporate Bonds - continued |
| Principal
Amount (b) | | Value |
Nonconvertible Bonds - continued |
CONSUMER DISCRETIONARY - continued |
Hotels, Restaurants & Leisure - continued |
Station Casinos, Inc.: - continued | | | | |
6.875% 3/1/16 | | $ 1,255,000 | | $ 1,044,788 |
7.75% 8/15/16 | | 365,000 | | 346,750 |
Town Sports International Holdings, Inc. 0% 2/1/14 (c) | | 1,000,000 | | 915,000 |
Virgin River Casino Corp./RBG LLC/B&BB, Inc.: | | | | |
0% 1/15/13 (c) | | 40,000 | | 29,600 |
9% 1/15/12 | | 280,000 | | 277,200 |
Wheeling Island Gaming, Inc. 10.125% 12/15/09 | | 1,000,000 | | 1,000,000 |
Wynn Las Vegas LLC/Wynn Las Vegas Capital Corp. 6.625% 12/1/14 | | 1,545,000 | | 1,494,788 |
| | 26,397,308 |
Household Durables - 0.0% |
Fortune Brands, Inc. 5.875% 1/15/36 | | 1,075,000 | | 969,211 |
Goodman Global Holdings, Inc. 7.875% 12/15/12 | | 430,000 | | 423,550 |
K. Hovnanian Enterprises, Inc.: | | | | |
6.25% 1/15/15 | | 245,000 | | 191,100 |
8.875% 4/1/12 | | 5,000 | | 3,950 |
KB Home 7.75% 2/1/10 | | 185,000 | | 179,450 |
Urbi, Desarrollos Urbanos, SA de CV 8.5% 4/19/16 (f) | | 260,000 | | 258,700 |
| | 2,025,961 |
Media - 0.7% |
AMC Entertainment, Inc. 8% 3/1/14 | | 1,700,000 | | 1,564,000 |
AOL Time Warner, Inc. 7.625% 4/15/31 | | 500,000 | | 541,952 |
Cablemas SA de CV (Reg. S) 9.375% 11/15/15 | | 700,000 | | 749,000 |
Cablevision Systems Corp.: | | | | |
8% 4/15/12 | | 555,000 | | 527,250 |
9.82% 4/1/09 (i) | | 340,000 | | 344,250 |
Charter Communications Holdings I LLC 9.92% 4/1/14 | | 495,000 | | 405,900 |
Charter Communications Holdings I LLC/Charter Communications Holdings I Capital Corp. 11% 10/1/15 | | 2,035,000 | | 1,973,950 |
Charter Communications Holdings II LLC/Charter Communications Holdings II Capital Corp.: | | | | |
Series B, 10.25% 9/15/10 | | 100,000 | | 99,750 |
10.25% 9/15/10 | | 615,000 | | 624,225 |
Charter Communications Operating LLC/Charter Communications Operating Capital Corp. 8.375% 4/30/14 (f) | | 370,000 | | 364,450 |
Cox Communications, Inc. 6.45% 12/1/36 (f) | | 1,365,000 | | 1,307,838 |
Corporate Bonds - continued |
| Principal
Amount (b) | | Value |
Nonconvertible Bonds - continued |
CONSUMER DISCRETIONARY - continued |
Media - continued |
CSC Holdings, Inc.: | | | | |
7.25% 4/15/12 | | $ 460,000 | | $ 437,000 |
7.625% 4/1/11 | | 1,000,000 | | 985,000 |
7.625% 7/15/18 | | 235,000 | | 215,613 |
8.125% 7/15/09 | | 365,000 | | 367,738 |
EchoStar Communications Corp.: | | | | |
6.375% 10/1/11 | | 1,630,000 | | 1,597,400 |
6.625% 10/1/14 | | 1,430,000 | | 1,376,375 |
7.125% 2/1/16 | | 750,000 | | 730,350 |
Insight Midwest LP/Insight Capital, Inc. 9.75% 10/1/09 | | 52,000 | | 52,455 |
Kabel Deutschland GmbH 10.625% 7/1/14 | | 2,000,000 | | 2,115,000 |
Liberty Media Corp.: | | | | |
5.7% 5/15/13 | | 450,000 | | 416,250 |
8.25% 2/1/30 | | 405,000 | | 392,850 |
8.5% 7/15/29 | | 630,000 | | 632,442 |
News America Holdings, Inc. 7.75% 12/1/45 | | 170,000 | | 186,075 |
News America, Inc.: | | | | |
6.15% 3/1/37 | | 2,970,000 | | 2,759,287 |
6.2% 12/15/34 | | 5,330,000 | | 4,949,150 |
Nexstar Broadcasting, Inc. 7% 1/15/14 | | 700,000 | | 661,500 |
Nielsen Finance LLC/Co.: | | | | |
0% 8/1/16 (c)(f) | | 2,300,000 | | 1,546,750 |
10% 8/1/14 (f) | | 400,000 | | 410,000 |
PanAmSat Corp.: | | | | |
6.375% 1/15/08 | | 200,000 | | 198,000 |
9% 8/15/14 | | 84,000 | | 85,369 |
Quebecor Media, Inc. 7.75% 3/15/16 | | 1,000,000 | | 945,000 |
Rainbow National LLC & RNS Co. Corp.: | | | | |
8.75% 9/1/12 (f) | | 280,000 | | 285,600 |
10.375% 9/1/14 (f) | | 20,000 | | 21,500 |
The Reader's Digest Association, Inc. 9% 2/15/17 (f) | | 1,700,000 | | 1,462,000 |
Time Warner Cable, Inc.: | | | | |
5.85% 5/1/17 (f) | | 2,607,000 | | 2,548,045 |
6.55% 5/1/37 (f) | | 3,118,000 | | 3,030,774 |
Time Warner, Inc. 6.625% 5/15/29 | | 4,415,000 | | 4,327,927 |
TL Acquisitions, Inc. 10.5% 1/15/15 (f) | | 1,115,000 | | 1,053,675 |
Umbrella Acquisition, Inc. 9.75% 3/15/15
pay-in-kind (f) | | 2,915,000 | | 2,812,975 |
Corporate Bonds - continued |
| Principal
Amount (b) | | Value |
Nonconvertible Bonds - continued |
CONSUMER DISCRETIONARY - continued |
Media - continued |
Valassis Communications, Inc. 8.25% 3/1/15 | | $ 1,475,000 | | $ 1,246,375 |
Visant Holding Corp. 8.75% 12/1/13 | | 450,000 | | 450,000 |
| | 46,801,040 |
Specialty Retail - 0.1% |
GSC Holdings Corp./Gamestop, Inc. 8% 10/1/12 | | 35,000 | | 36,050 |
Michaels Stores, Inc. 10% 11/1/14 (f) | | 300,000 | | 300,750 |
Nebraska Book Co., Inc. 8.625% 3/15/12 | | 1,090,000 | | 1,073,650 |
Toys 'R' US, Inc.: | | | | |
7.375% 10/15/18 | | 445,000 | | 347,100 |
7.625% 8/1/11 | | 755,000 | | 668,175 |
7.875% 4/15/13 | | 1,290,000 | | 1,086,825 |
| | 3,512,550 |
Textiles, Apparel & Luxury Goods - 0.1% |
Hanesbrands, Inc. 8.735% 12/15/14 (f)(i) | | 1,480,000 | | 1,465,200 |
Jostens IH Corp. 7.625% 10/1/12 | | 190,000 | | 190,000 |
Levi Strauss & Co.: | | | | |
8.875% 4/1/16 | | 2,100,000 | | 2,100,000 |
9.75% 1/15/15 | | 180,000 | | 185,400 |
12.25% 12/15/12 | | 315,000 | | 336,263 |
| | 4,276,863 |
TOTAL CONSUMER DISCRETIONARY | | 87,775,310 |
CONSUMER STAPLES - 0.3% |
Food & Staples Retailing - 0.1% |
Albertsons, Inc.: | | | | |
7.45% 8/1/29 | | 250,000 | | 237,372 |
7.75% 6/15/26 | | 210,000 | | 199,500 |
CVS Caremark Corp. 6.302% 6/1/37 (i) | | 8,615,000 | | 8,321,616 |
Rite Aid Corp. 7.5% 3/1/17 | | 1,000,000 | | 927,500 |
SUPERVALU, Inc. 7.5% 11/15/14 | | 785,000 | | 788,925 |
| | 10,474,913 |
Food Products - 0.1% |
Bertin Ltda 10.25% 10/5/16 (f) | | 205,000 | | 209,100 |
Dean Foods Co. 6.9% 10/15/17 | | 2,000,000 | | 1,805,000 |
Gruma SA de CV 7.75% | | 795,000 | | 791,025 |
Kraft Foods, Inc. 7% 8/11/37 | | 435,000 | | 447,739 |
Corporate Bonds - continued |
| Principal
Amount (b) | | Value |
Nonconvertible Bonds - continued |
CONSUMER STAPLES - continued |
Food Products - continued |
National Beef Packing Co. LLC/National Beef Finance Corp. 10.5% 8/1/11 | | $ 595,000 | | $ 609,875 |
Pierre Foods, Inc. 9.875% 7/15/12 | | 540,000 | | 523,800 |
Smithfield Foods, Inc. 7.75% 7/1/17 | | 725,000 | | 725,000 |
| | 5,111,539 |
Household Products - 0.0% |
Kimberly-Clark Corp. 6.625% 8/1/37 | | 2,207,000 | | 2,327,504 |
Tobacco - 0.1% |
Reynolds American, Inc.: | | | | |
7.25% 6/15/37 | | 4,865,000 | | 4,930,507 |
7.3% 7/15/15 | | 195,000 | | 200,850 |
| | 5,131,357 |
TOTAL CONSUMER STAPLES | | 23,045,313 |
ENERGY - 0.9% |
Energy Equipment & Services - 0.1% |
Compagnie Generale de Geophysique SA: | | | | |
7.5% 5/15/15 | | 535,000 | | 537,675 |
7.75% 5/15/17 | | 1,195,000 | | 1,209,938 |
Complete Production Services, Inc. 8% 12/15/16 | | 2,260,000 | | 2,175,250 |
Hanover Equipment Trust 8.75% 9/1/11 | | 50,000 | | 50,750 |
Seitel, Inc. 9.75% 2/15/14 (f) | | 1,000,000 | | 930,000 |
| | 4,903,613 |
Oil, Gas & Consumable Fuels - 0.8% |
Arch Western Finance LLC 6.75% 7/1/13 | | 1,350,000 | | 1,269,000 |
Atlas Pipeline Partners LP 8.125% 12/15/15 | | 2,290,000 | | 2,272,825 |
Chaparral Energy, Inc.: | | | | |
8.5% 12/1/15 | | 530,000 | | 473,025 |
8.875% 2/1/17 (f) | | 210,000 | | 189,000 |
Chesapeake Energy Corp.: | | | | |
6.5% 8/15/17 | | 1,625,000 | | 1,547,813 |
6.625% 1/15/16 | | 1,195,000 | | 1,156,163 |
6.875% 1/15/16 | | 1,020,000 | | 1,002,150 |
6.875% 11/15/20 | | 630,000 | | 604,800 |
7.5% 9/15/13 | | 300,000 | | 306,000 |
7.625% 7/15/13 | | 200,000 | | 203,500 |
7.75% 1/15/15 | | 430,000 | | 436,450 |
Corporate Bonds - continued |
| Principal
Amount (b) | | Value |
Nonconvertible Bonds - continued |
ENERGY - continued |
Oil, Gas & Consumable Fuels - continued |
Drummond Co., Inc. 7.375% 2/15/16 (f) | | $ 630,000 | | $ 567,000 |
Duke Capital LLC 6.75% 2/15/32 | | 1,195,000 | | 1,186,563 |
Duke Energy Field Services 6.45% 11/3/36 (f) | | 2,400,000 | | 2,372,069 |
Forest Oil Corp.: | | | | |
7.25% 6/15/19 (f) | | 500,000 | | 481,250 |
7.75% 5/1/14 | | 675,000 | | 676,688 |
Kinder Morgan Energy Partners LP 6.95% 1/15/38 | | 800,000 | | 804,874 |
Massey Energy Co.: | | | | |
6.625% 11/15/10 | | 40,000 | | 38,800 |
6.875% 12/15/13 | | 2,485,000 | | 2,248,925 |
Nakilat, Inc. 6.067% 12/31/33 (f) | | 2,885,000 | | 2,790,026 |
National Gas Co. of Trinidad & Tobago Ltd. 6.05% 1/15/36 (f) | | 240,000 | | 230,291 |
Nexen, Inc.: | | | | |
5.875% 3/10/35 | | 240,000 | | 217,518 |
6.4% 5/15/37 | | 3,645,000 | | 3,546,005 |
OPTI Canada, Inc.: | | | | |
7.875% 12/15/14 (f) | | 1,175,000 | | 1,177,938 |
8.25% 12/15/14 (f) | | 635,000 | | 642,938 |
Pan American Energy LLC 7.75% 2/9/12 (f) | | 2,475,000 | | 2,406,938 |
Peabody Energy Corp. 7.375% 11/1/16 | | 725,000 | | 731,344 |
Pemex Project Funding Master Trust 6.625% 6/15/35 | | 625,000 | | 640,625 |
Petrohawk Energy Corp. 9.125% 7/15/13 | | 1,270,000 | | 1,323,975 |
Petroleos de Venezuela SA: | | | | |
5.25% 4/12/17 | | 1,485,000 | | 1,028,363 |
5.375% 4/12/27 | | 1,270,000 | | 742,950 |
Petrozuata Finance, Inc.: | | | | |
7.63% 4/1/09 (f) | | 1,329,739 | | 1,319,766 |
8.22% 4/1/17 (f) | | 950,000 | | 950,000 |
Pioneer Natural Resources Co. 6.65% 3/15/17 | | 2,715,000 | | 2,511,375 |
Plains All American Pipeline LP: | | | | |
6.125% 1/15/17 | | 930,000 | | 932,867 |
6.65% 1/15/37 | | 1,740,000 | | 1,722,085 |
Plains Exploration & Production Co. 7% 3/15/17 | | 970,000 | | 887,550 |
Range Resources Corp.: | | | | |
6.375% 3/15/15 (Reg. S) | | 710,000 | | 678,050 |
7.375% 7/15/13 | | 440,000 | | 442,200 |
7.5% 5/15/16 | | 3,000,000 | | 3,052,500 |
Corporate Bonds - continued |
| Principal
Amount (b) | | Value |
Nonconvertible Bonds - continued |
ENERGY - continued |
Oil, Gas & Consumable Fuels - continued |
Ras Laffan Liquid Natural Gas Co. Ltd. III 6.332% 9/30/27 (f) | | $ 1,840,000 | | $ 1,838,381 |
Ship Finance International Ltd. 8.5% 12/15/13 | | 330,000 | | 335,775 |
Talisman Energy, Inc. yankee 6.25% 2/1/38 | | 2,290,000 | | 2,151,405 |
Teekay Corp. 8.875% 7/15/11 | | 115,000 | | 117,300 |
Valero Energy Corp. 6.625% 6/15/37 | | 1,510,000 | | 1,522,539 |
W&T Offshore, Inc. 8.25% 6/15/14 (f) | | 1,600,000 | | 1,520,000 |
Williams Companies, Inc. 8.75% 3/15/32 | | 165,000 | | 182,325 |
Williams Partners LP/Williams Partners Finance Corp. 7.25% 2/1/17 | | 485,000 | | 481,363 |
YPF SA 10% 11/2/28 | | 375,000 | | 431,250 |
| | 54,392,537 |
TOTAL ENERGY | | 59,296,150 |
FINANCIALS - 1.8% |
Capital Markets - 0.5% |
Bear Stearns Companies, Inc. 6.9% 8/15/12 | | 10,705,000 | | 10,777,591 |
Deutsche Bank AG London 6% 9/1/17 | | 4,440,000 | | 4,479,609 |
E*TRADE Financial Corp.: | | | | |
7.375% 9/15/13 | | 290,000 | | 246,500 |
7.875% 12/1/15 | | 400,000 | | 346,000 |
Goldman Sachs Group, Inc. 5.625% 1/15/17 | | 3,200,000 | | 3,058,755 |
JPMorgan Chase Capital XX 6.55% 9/29/36 | | 10,020,000 | | 9,020,124 |
Lehman Brothers Holdings, Inc. 6% 5/3/32 (i) | | 3,030,000 | | 2,653,532 |
Morgan Stanley 4.75% 4/1/14 | | 1,635,000 | | 1,528,432 |
| | 32,110,543 |
Commercial Banks - 0.3% |
Banco Nacional de Desenvolvimento Economico e Social 5.84% 6/16/08 (i) | | 3,027,000 | | 3,011,865 |
Bank of America NA: | | | | |
5.3% 3/15/17 | | 1,515,000 | | 1,459,548 |
6% 10/15/36 | | 5,040,000 | | 4,871,614 |
BB&T Capital Trust IV 6.82% 6/12/77 (i) | | 2,314,000 | | 2,182,433 |
Development Bank of Philippines 8.375% (i) | | 725,000 | | 746,750 |
KeyCorp Capital Trust VII 5.7% 6/15/35 | | 2,600,000 | | 2,219,337 |
Corporate Bonds - continued |
| Principal
Amount (b) | | Value |
Nonconvertible Bonds - continued |
FINANCIALS - continued |
Commercial Banks - continued |
Kyivstar GSM: | | | | |
7.75% 4/27/12 (Issued by Dresdner Bank AG for Kyivstar GSM) (f) | | $ 350,000 | | $ 344,750 |
10.375% 8/17/09 (Issued by Dresdner Bank AG for Kyivstar GSM) (f) | | 1,025,000 | | 1,078,813 |
Vimpel Communications: | | | | |
8% 2/11/10 (Issued by UBS Luxembourg SA for Vimpel Communications) | | 1,125,000 | | 1,143,281 |
10% 6/16/09 (Issued by UBS Luxembourg SA for Vimpel Communications) | | 320,000 | | 334,374 |
Wachovia Bank NA 5.85% 2/1/37 | | 3,200,000 | | 3,012,160 |
| | 20,404,925 |
Consumer Finance - 0.2% |
Ford Motor Credit Co. LLC: | | | | |
6.625% 6/16/08 | | 840,000 | | 814,797 |
7.8% 6/1/12 | | 980,000 | | 899,150 |
8.11% 1/13/12 (i) | | 170,000 | | 154,275 |
8.625% 11/1/10 | | 900,000 | | 859,795 |
General Motors Acceptance Corp.: | | | | |
6.75% 12/1/14 | | 565,000 | | 478,838 |
6.875% 9/15/11 | | 1,685,000 | | 1,482,800 |
GMAC LLC: | | | | |
6% 12/15/11 | | 530,000 | | 455,800 |
6.625% 5/15/12 | | 350,000 | | 302,750 |
SLM Corp.: | | | | |
4.5% 7/26/10 | | 2,235,000 | | 2,068,560 |
5.5% 7/27/09 (i) | | 1,827,000 | | 1,752,873 |
5.52% 7/26/10 (i) | | 6,515,000 | | 6,139,241 |
| | 15,408,879 |
Diversified Financial Services - 0.5% |
CCO Holdings LLC/CCO Holdings Capital Corp. 8.75% 11/15/13 | | 320,000 | | 313,600 |
Cerro Negro Finance Ltd.: | | | | |
(Reg. S) 7.33% 12/1/09 | | 414,100 | | 405,818 |
7.33% 12/1/09 (f) | | 176,300 | | 172,774 |
Citigroup, Inc.: | | | | |
5.875% 5/29/37 | | 2,700,000 | | 2,556,735 |
6.125% 8/25/36 | | 8,875,000 | | 8,669,109 |
Corporate Bonds - continued |
| Principal
Amount (b) | | Value |
Nonconvertible Bonds - continued |
FINANCIALS - continued |
Diversified Financial Services - continued |
Ex-Im Ukraine 7.65% 9/7/11 (Issued by Credit Suisse London Branch for Ex-Im Ukraine) | | $ 1,175,000 | | $ 1,165,582 |
Hilcorp Energy I LP/Hilcorp Finance Co. 7.75% 11/1/15 (f) | | 2,590,000 | | 2,486,400 |
JPMorgan Chase Capital XVII 5.85% 8/1/35 | | 7,405,000 | | 6,539,215 |
Leucadia National Corp.: | | | | |
7% 8/15/13 | | 500,000 | | 485,000 |
7.125% 3/15/17 (f) | | 880,000 | | 840,400 |
NSG Holdings II, LLC 7.75% 12/15/25 (f) | | 2,790,000 | | 2,776,050 |
OAO TMK 8.5% 9/29/09 (Issued by TMK Capital SA for OAO TMK) | | 2,200,000 | | 2,211,000 |
Pakistan International Sukuk Co. Ltd. 7.5703% 1/27/10 (i) | | 500,000 | | 491,250 |
Snoqualmie Entertainment Authority 9.125% 2/1/15 (f) | | 945,000 | | 930,825 |
Universal City Florida Holding Co. I/II 8.375% 5/1/10 | | 1,025,000 | | 1,004,500 |
ZFS Finance USA Trust V 6.5% 5/9/67 (f)(i) | | 2,400,000 | | 2,245,543 |
| | 33,293,801 |
Insurance - 0.0% |
AMBAC Financial Group, Inc. 6.15% 2/15/37 | | 1,525,000 | | 1,167,360 |
USI Holdings Corp. 9.75% 5/15/15 (f) | | 2,530,000 | | 2,302,300 |
| | 3,469,660 |
Real Estate Investment Trusts - 0.2% |
Archstone-Smith Operating Trust 5.25% 5/1/15 | | 2,080,000 | | 2,006,603 |
Crescent Real Estate Equities LP/Crescent Finance Co. 9.25% 4/15/09 | | 40,000 | | 40,400 |
Highwoods/Forsyth LP 5.85% 3/15/17 | | 80,000 | | 75,800 |
HMB Capital Trust V 8.99% 12/15/36 (f)(i) | | 270,000 | | 54,000 |
Host Hotels & Resorts LP 6.875% 11/1/14 | | 460,000 | | 451,950 |
iStar Financial, Inc. 5.95% 10/15/13 | | 300,000 | | 284,249 |
Omega Healthcare Investors, Inc.: | | | | |
7% 4/1/14 | | 2,225,000 | | 2,169,375 |
7% 1/15/16 | | 400,000 | | 386,000 |
Reckson Operating Partnership LP 6% 3/31/16 | | 4,021,000 | | 3,845,081 |
Rouse Co. 5.375% 11/26/13 | | 100,000 | | 91,701 |
Senior Housing Properties Trust: | | | | |
7.875% 4/15/15 | | 613,000 | | 634,455 |
8.625% 1/15/12 | | 750,000 | | 791,250 |
Thornburg Mortgage, Inc. 8% 5/15/13 | | 100,000 | | 88,000 |
Corporate Bonds - continued |
| Principal
Amount (b) | | Value |
Nonconvertible Bonds - continued |
FINANCIALS - continued |
Real Estate Investment Trusts - continued |
UDR, Inc. 5.5% 4/1/14 | | $ 2,755,000 | | $ 2,687,632 |
Ventas Realty LP: | | | | |
6.5% 6/1/16 | | 150,000 | | 144,000 |
6.625% 10/15/14 | | 1,350,000 | | 1,316,250 |
6.75% 4/1/17 | | 1,035,000 | | 1,003,950 |
| | 16,070,696 |
Real Estate Management & Development - 0.1% |
American Real Estate Partners/American Real Estate Finance Corp.: | | | | |
7.125% 2/15/13 | | 2,715,000 | | 2,538,525 |
7.125% 2/15/13 (f) | | 470,000 | | 444,150 |
8.125% 6/1/12 | | 1,485,000 | | 1,447,875 |
Forest City Enterprises, Inc. 7.625% 6/1/15 | | 100,000 | | 97,000 |
Inversiones y Representaciones SA 8.5% 2/2/17 (f) | | 1,135,000 | | 981,775 |
| | 5,509,325 |
Thrifts & Mortgage Finance - 0.0% |
Residential Capital Corp.: | | | | |
7.375% 6/30/10 | | 675,000 | | 519,750 |
7.5% 4/17/13 | | 495,000 | | 372,488 |
7.875% 6/30/15 | | 580,000 | | 437,900 |
| | 1,330,138 |
TOTAL FINANCIALS | | 127,597,967 |
HEALTH CARE - 0.2% |
Health Care Equipment & Supplies - 0.0% |
FMC Finance III SA 6.875% 7/15/17 (f) | | 1,685,000 | | 1,651,300 |
Health Care Providers & Services - 0.2% |
Community Health Systems, Inc. 8.875% 7/15/15 (f) | | 2,710,000 | | 2,693,198 |
DaVita, Inc.: | | | | |
6.625% 3/15/13 | | 290,000 | | 280,575 |
7.25% 3/15/15 | | 615,000 | | 601,163 |
HCA, Inc.: | | | | |
6.3% 10/1/12 | | 215,000 | | 187,588 |
6.5% 2/15/16 | | 1,420,000 | | 1,164,400 |
9.125% 11/15/14 (f) | | 600,000 | | 613,500 |
9.25% 11/15/16 (f) | | 2,010,000 | | 2,060,250 |
9.625% 11/15/16 pay-in-kind (f) | | 2,900,000 | | 2,972,500 |
Corporate Bonds - continued |
| Principal
Amount (b) | | Value |
Nonconvertible Bonds - continued |
HEALTH CARE - continued |
Health Care Providers & Services - continued |
HealthSouth Corp. 10.75% 6/15/16 | | $ 300,000 | | $ 309,000 |
IASIS Healthcare LLC/IASIS Capital Corp. 8.75% 6/15/14 | | 1,350,000 | | 1,312,875 |
Multiplan, Inc. 10.375% 4/15/16 (f) | | 735,000 | | 720,300 |
Rural/Metro Corp.: | | | | |
0% 3/15/16 (c) | | 150,000 | | 109,500 |
9.875% 3/15/15 | | 180,000 | | 169,200 |
Skilled Healthcare Group, Inc. 11% 1/15/14 | | 64,000 | | 68,480 |
Sun Healthcare Group, Inc. 9.125% 4/15/15 (f) | | 10,000 | | 9,925 |
Team Finance LLC/Health Finance Corp. 11.25% 12/1/13 | | 100,000 | | 108,000 |
United Surgical Partners International, Inc.: | | | | |
8.875% 5/1/17 | | 220,000 | | 209,000 |
9.25% 5/1/17 pay-in-kind | | 440,000 | | 422,400 |
Viant Holdings, Inc. 10.125% 7/15/17 (f) | | 71,000 | | 66,030 |
| | 14,077,884 |
TOTAL HEALTH CARE | | 15,729,184 |
INDUSTRIALS - 0.5% |
Aerospace & Defense - 0.0% |
Bombardier, Inc.: | | | | |
6.3% 5/1/14 (f) | | 1,410,000 | | 1,346,550 |
7.45% 5/1/34 (f) | | 750,000 | | 735,000 |
8% 11/15/14 (f) | | 160,000 | | 165,200 |
| | 2,246,750 |
Airlines - 0.2% |
American Airlines, Inc. pass thru trust certificates: | | | | |
6.817% 5/23/11 | | 50,000 | | 48,438 |
6.977% 11/23/22 | | 865,629 | | 802,871 |
7.377% 5/23/19 | | 94,884 | | 85,870 |
7.379% 11/23/17 | | 32,772 | | 29,495 |
AMR Corp. 9% 8/1/12 | | 485,000 | | 491,063 |
Continental Airlines, Inc.: | | | | |
7.875% 7/2/18 | | 1,164,084 | | 1,140,802 |
8.485% 6/2/13 (i) | | 100,000 | | 97,000 |
8.75% 12/1/11 | | 400,000 | | 366,000 |
9.558% 9/1/19 | | 264,626 | | 276,534 |
Corporate Bonds - continued |
| Principal
Amount (b) | | Value |
Nonconvertible Bonds - continued |
INDUSTRIALS - continued |
Airlines - continued |
Continental Airlines, Inc. pass thru trust certificates: | | | | |
7.566% 9/15/21 | | $ 82,946 | | $ 81,287 |
7.73% 9/15/12 | | 20,920 | | 20,240 |
8.499% 11/1/12 | | 21,521 | | 21,091 |
9.798% 4/1/21 | | 831,420 | | 872,991 |
Delta Air Lines, Inc. pass thru trust certificates 7.57% 11/18/10 | | 5,740,000 | | 5,811,750 |
United Air Lines, Inc. pass-thru trust certificates: | | | | |
7.032% 4/1/12 | | 1,080,884 | | 1,085,619 |
7.186% 10/1/12 | | 2,680,399 | | 2,707,203 |
| | 13,938,254 |
Commercial Services & Supplies - 0.1% |
ALH Finance LLC/ALH Finance Corp. 8.5% 1/15/13 | | 445,000 | | 429,425 |
Allied Waste North America, Inc.: | | | | |
5.75% 2/15/11 | | 370,000 | | 357,513 |
6.875% 6/1/17 | | 1,475,000 | | 1,438,125 |
7.125% 5/15/16 | | 400,000 | | 394,500 |
7.25% 3/15/15 | | 800,000 | | 800,000 |
7.875% 4/15/13 | | 120,000 | | 121,500 |
ARAMARK Corp.: | | | | |
8.5% 2/1/15 | | 1,110,000 | | 1,071,150 |
8.8563% 2/1/15 (i) | | 130,000 | | 129,350 |
FTI Consulting, Inc.: | | | | |
7.625% 6/15/13 | | 355,000 | | 347,900 |
7.75% 10/1/16 | | 605,000 | | 605,000 |
Rental Service Corp. 9.5% 12/1/14 | | 330,000 | | 316,800 |
| | 6,011,263 |
Electrical Equipment - 0.0% |
Belden, Inc. 7% 3/15/17 (f) | | 385,000 | | 377,300 |
Sensus Metering Systems, Inc. 8.625% 12/15/13 | | 2,220,000 | | 2,086,800 |
| | 2,464,100 |
Industrial Conglomerates - 0.0% |
Nell AF Sarl 8.375% 8/15/15 (f) | | 500,000 | | 445,000 |
Marine - 0.0% |
Britannia Bulk PLC 11% 12/1/11 | | 1,245,000 | | 1,226,325 |
Navios Maritime Holdings, Inc. 9.5% 12/15/14 | | 490,000 | | 497,350 |
| | 1,723,675 |
Corporate Bonds - continued |
| Principal
Amount (b) | | Value |
Nonconvertible Bonds - continued |
INDUSTRIALS - continued |
Road & Rail - 0.1% |
Avis Budget Car Rental LLC/Avis Budget Finance, Inc.: | | | | |
7.625% 5/15/14 | | $ 885,000 | | $ 856,238 |
7.75% 5/15/16 | | 665,000 | | 641,725 |
Hertz Corp.: | | | | |
8.875% 1/1/14 | | 700,000 | | 721,000 |
10.5% 1/1/16 | | 360,000 | | 387,000 |
Kansas City Southern de Mexico, SA de CV 7.375% 6/1/14 (f) | | 340,000 | | 326,400 |
Kansas City Southern Railway Co. 7.5% 6/15/09 | | 2,400,000 | | 2,400,000 |
| | 5,332,363 |
Trading Companies & Distributors - 0.1% |
Ahern Rentals, Inc. 9.25% 8/15/13 | | 400,000 | | 396,000 |
Ashtead Capital, Inc. 9% 8/15/16 (f) | | 300,000 | | 289,500 |
Ashtead Holdings PLC 8.625% 8/1/15 (f) | | 275,000 | | 259,875 |
Penhall International Corp. 12% 8/1/14 (f) | | 250,000 | | 256,250 |
VWR Funding, Inc. 10.25% 7/15/15 (f) | | 2,000,000 | | 1,860,000 |
| | 3,061,625 |
TOTAL INDUSTRIALS | | 35,223,030 |
INFORMATION TECHNOLOGY - 0.3% |
Communications Equipment - 0.1% |
L-3 Communications Corp. 6.375% 10/15/15 | | 125,000 | | 121,875 |
Lucent Technologies, Inc.: | | | | |
6.45% 3/15/29 | | 2,835,000 | | 2,395,575 |
6.5% 1/15/28 | | 1,050,000 | | 887,250 |
Nortel Networks Corp.: | | | | |
9.61% 7/15/11 (f)(i) | | 200,000 | | 202,000 |
10.125% 7/15/13 (f) | | 1,000,000 | | 1,032,500 |
| | 4,639,200 |
Computers & Peripherals - 0.0% |
Seagate Technology HDD Holdings 6.8% 10/1/16 | | 1,520,000 | | 1,459,200 |
Electronic Equipment & Instruments - 0.1% |
Celestica, Inc. 7.875% 7/1/11 | | 500,000 | | 475,000 |
Flextronics International Ltd.: | | | | |
6.25% 11/15/14 | | 300,000 | | 276,750 |
6.5% 5/15/13 | | 1,285,000 | | 1,217,538 |
Corporate Bonds - continued |
| Principal
Amount (b) | | Value |
Nonconvertible Bonds - continued |
INFORMATION TECHNOLOGY - continued |
Electronic Equipment & Instruments - continued |
NXP BV: | | | | |
7.875% 10/15/14 | | $ 490,000 | | $ 444,063 |
9.5% 10/15/15 | | 725,000 | | 627,125 |
| | 3,040,476 |
IT Services - 0.0% |
Iron Mountain, Inc.: | | | | |
6.625% 1/1/16 | | 1,670,000 | | 1,503,000 |
7.75% 1/15/15 | | 605,000 | | 588,363 |
8.625% 4/1/13 | | 210,000 | | 210,000 |
Telcordia Technologies, Inc. 9.11% 7/15/12 (f)(i) | | 430,000 | | 378,400 |
| | 2,679,763 |
Office Electronics - 0.0% |
Xerox Capital Trust I 8% 2/1/27 | | 1,630,000 | | 1,605,550 |
Semiconductors & Semiconductor Equipment - 0.1% |
Advanced Micro Devices, Inc. 7.75% 11/1/12 | | 1,085,000 | | 952,088 |
Amkor Technology, Inc.: | | | | |
7.75% 5/15/13 | | 235,000 | | 218,550 |
9.25% 6/1/16 | | 515,000 | | 499,550 |
Freescale Semiconductor, Inc.: | | | | |
8.875% 12/15/14 | | 1,510,000 | | 1,387,388 |
9.125% 12/15/14 pay-in-kind | | 800,000 | | 712,000 |
9.235% 12/15/14 (i) | | 290,000 | | 265,350 |
10.125% 12/15/16 | | 1,230,000 | | 1,065,549 |
Hynix Semiconductor, Inc. 7.875% 6/27/17 (f) | | 2,415,000 | | 2,312,363 |
| | 7,412,838 |
TOTAL INFORMATION TECHNOLOGY | | 20,837,027 |
MATERIALS - 0.5% |
Chemicals - 0.0% |
Equistar Chemicals LP 7.55% 2/15/26 | | 350,000 | | 297,500 |
Equistar Chemicals LP/Equistar Funding Corp. 10.625% 5/1/11 | | 226,000 | | 236,170 |
Lyondell Chemical Co.: | | | | |
6.875% 6/15/17 | | 400,000 | | 416,000 |
8% 9/15/14 | | 500,000 | | 543,125 |
Momentive Performance Materials, Inc. 9.75% 12/1/14 (f) | | 85,000 | | 80,750 |
Corporate Bonds - continued |
| Principal
Amount (b) | | Value |
Nonconvertible Bonds - continued |
MATERIALS - continued |
Chemicals - continued |
Nalco Co.: | | | | |
7.75% 11/15/11 | | $ 1,130,000 | | $ 1,135,650 |
8.875% 11/15/13 | | 270,000 | | 272,025 |
NOVA Chemicals Corp. 8.4838% 11/15/13 (i) | | 485,000 | | 471,663 |
Pliant Corp. 11.35% 6/15/09 (d) | | 60,119 | | 57,113 |
| | 3,509,996 |
Construction Materials - 0.0% |
U.S. Concrete, Inc. 8.375% 4/1/14 | | 110,000 | | 100,100 |
Containers & Packaging - 0.1% |
BWAY Corp. 10% 10/15/10 | | 1,105,000 | | 1,116,050 |
Crown Americas LLC/Crown Americas Capital Corp. 7.75% 11/15/15 | | 200,000 | | 202,000 |
Crown Cork & Seal, Inc. 8% 4/15/23 | | 105,000 | | 99,225 |
Greif, Inc. 6.75% 2/1/17 | | 485,000 | | 460,750 |
Jefferson Smurfit Corp. U.S.: | | | | |
7.5% 6/1/13 | | 15,000 | | 14,250 |
8.25% 10/1/12 | | 300,000 | | 292,500 |
Smurfit-Stone Container Enterprises, Inc. 8% 3/15/17 | | 2,000,000 | | 1,910,000 |
Vitro SAB de CV 8.625% 2/1/12 (f) | | 1,265,000 | | 1,220,725 |
| | 5,315,500 |
Metals & Mining - 0.3% |
CAP SA 7.375% 9/15/36 (f) | | 200,000 | | 192,896 |
Corporacion Nacional del Cobre (Codelco) 6.15% 10/24/36 (f) | | 1,370,000 | | 1,337,432 |
Evraz Group SA (Reg. S) 8.25% 11/10/15 | | 765,000 | | 758,306 |
Evraz Securities SA 10.875% 8/3/09 | | 900,000 | | 954,000 |
FMG Finance Property Ltd.: | | | | |
9.36% 9/1/11 (f)(i) | | 470,000 | | 486,450 |
10% 9/1/13 (f) | | 1,660,000 | | 1,776,200 |
10.625% 9/1/16 (f) | | 195,000 | | 223,763 |
Freeport-McMoRan Copper & Gold, Inc.: | | | | |
6.875% 2/1/14 | | 375,000 | | 383,438 |
8.25% 4/1/15 | | 880,000 | | 913,000 |
8.375% 4/1/17 | | 1,480,000 | | 1,568,800 |
8.5463% 4/1/15 (i) | | 870,000 | | 896,100 |
Noranda Aluminium Acquisition Corp. 9.36% 5/15/15 pay-in-kind (f)(i) | | 300,000 | | 276,000 |
PNA Group, Inc. 10.75% 9/1/16 (f) | | 130,000 | | 130,650 |
Corporate Bonds - continued |
| Principal
Amount (b) | | Value |
Nonconvertible Bonds - continued |
MATERIALS - continued |
Metals & Mining - continued |
RathGibson, Inc. 11.25% 2/15/14 | | $ 350,000 | | $ 350,000 |
Steel Dynamics, Inc. 6.75% 4/1/15 (f) | | 2,380,000 | | 2,284,800 |
United States Steel Corp. 6.65% 6/1/37 | | 3,395,000 | | 3,226,330 |
Vale Overseas Ltd. 6.25% 1/23/17 | | 2,685,000 | | 2,702,721 |
| | 18,460,886 |
Paper & Forest Products - 0.1% |
Georgia-Pacific Corp.: | | | | |
7% 1/15/15 (f) | | 2,350,000 | | 2,232,500 |
8.125% 5/15/11 | | 605,000 | | 609,538 |
Stone Container Corp. 8.375% 7/1/12 | | 700,000 | | 687,750 |
Stone Container Finance Co. 7.375% 7/15/14 | | 400,000 | | 378,000 |
| | 3,907,788 |
TOTAL MATERIALS | | 31,294,270 |
TELECOMMUNICATION SERVICES - 1.1% |
Diversified Telecommunication Services - 0.9% |
AT&T, Inc. 6.8% 5/15/36 | | 6,413,000 | | 6,696,108 |
BellSouth Capital Funding Corp. 7.875% 2/15/30 | | 1,060,000 | | 1,207,641 |
Cincinnati Bell, Inc. 8.375% 1/15/14 | | 1,710,000 | | 1,684,350 |
Eschelon Operating Co. 8.375% 3/15/10 | | 396,000 | | 382,635 |
Intelsat Bermuda Ltd. 8.886% 1/15/15 (i) | | 280,000 | | 282,100 |
Intelsat Ltd.: | | | | |
6.5% 11/1/13 | | 545,000 | | 400,575 |
7.625% 4/15/12 | | 960,000 | | 796,800 |
9.25% 6/15/16 | | 850,000 | | 875,500 |
11.25% 6/15/16 | | 1,400,000 | | 1,463,000 |
Level 3 Financing, Inc.: | | | | |
8.75% 2/15/17 | | 5,590,000 | | 5,226,650 |
9.25% 11/1/14 | | 1,430,000 | | 1,369,225 |
12.25% 3/15/13 | | 1,050,000 | | 1,144,500 |
NTL Cable PLC: | | | | |
8.75% 4/15/14 | | 1,300,000 | | 1,313,000 |
9.125% 8/15/16 | | 860,000 | | 879,350 |
Qwest Capital Funding, Inc. 7% 8/3/09 | | 50,000 | | 49,750 |
Qwest Communications International, Inc.: | | | | |
7.5% 2/15/14 | | 2,330,000 | | 2,330,000 |
7.5% 2/15/14 | | 60,000 | | 58,500 |
Corporate Bonds - continued |
| Principal
Amount (b) | | Value |
Nonconvertible Bonds - continued |
TELECOMMUNICATION SERVICES - continued |
Diversified Telecommunication Services - continued |
Qwest Communications International, Inc.: - continued | | | | |
9.0575% 2/15/09 (i) | | $ 226,000 | | $ 226,565 |
Qwest Corp.: | | | | |
7.5% 10/1/14 | | 500,000 | | 515,000 |
7.625% 6/15/15 | | 2,065,000 | | 2,121,788 |
8.61% 6/15/13 (i) | | 90,000 | | 95,400 |
SBC Communications, Inc.: | | | | |
6.15% 9/15/34 | | 500,000 | | 484,703 |
6.45% 6/15/34 | | 220,000 | | 218,889 |
Sprint Capital Corp. 8.75% 3/15/32 | | 9,313,000 | | 10,750,340 |
Telecom Italia Capital SA 7.2% 7/18/36 | | 2,225,000 | | 2,313,826 |
Telefonica de Argentina SA 9.125% 11/7/10 | | 404,000 | | 411,575 |
Telefonica Emisiones SAU 7.045% 6/20/36 | | 4,999,000 | | 5,204,654 |
Time Warner Telecom Holdings, Inc. 9.25% 2/15/14 | | 1,260,000 | | 1,297,800 |
U.S. West Capital Funding, Inc. 6.375% 7/15/08 | | 375,000 | | 375,938 |
U.S. West Communications: | | | | |
6.875% 9/15/33 | | 1,385,000 | | 1,267,275 |
7.5% 6/15/23 | | 300,000 | | 292,500 |
Verizon Communications, Inc. 6.25% 4/1/37 | | 2,348,000 | | 2,310,862 |
Verizon Global Funding Corp. 7.75% 12/1/30 | | 5,296,000 | | 6,000,813 |
Windstream Corp.: | | | | |
8.125% 8/1/13 | | 200,000 | | 206,000 |
8.625% 8/1/16 | | 835,000 | | 869,402 |
| | 61,123,014 |
Wireless Telecommunication Services - 0.2% |
Digicel Group Ltd.: | | | | |
8.875% 1/15/15 (f) | | 2,490,000 | | 2,272,125 |
9.25% 9/1/12 (f) | | 820,000 | | 828,200 |
DirecTV Holdings LLC/DirecTV Financing, Inc.: | | | | |
6.375% 6/15/15 | | 1,275,000 | | 1,198,500 |
8.375% 3/15/13 | | 1,000,000 | | 1,027,500 |
Intelsat Subsidiary Holding Co. Ltd. 8.625% 1/15/15 (i) | | 195,000 | | 196,463 |
MetroPCS Wireless, Inc.: | | | | |
9.25% 11/1/14 (f) | | 850,000 | | 837,250 |
9.25% 11/1/14 (f) | | 500,000 | | 492,500 |
Millicom International Cellular SA 10% 12/1/13 | | 860,000 | | 911,600 |
Mobile Telesystems Finance SA: | | | | |
8% 1/28/12 (f) | | 1,645,000 | | 1,661,450 |
Corporate Bonds - continued |
| Principal
Amount (b) | | Value |
Nonconvertible Bonds - continued |
TELECOMMUNICATION SERVICES - continued |
Wireless Telecommunication Services - continued |
Mobile Telesystems Finance SA: - continued | | | | |
8.375% 10/14/10 (f) | | $ 1,570,000 | | $ 1,601,400 |
9.75% 1/30/08 (Reg. S) | | 395,000 | | 397,963 |
Orascom Telecom Finance SCA 7.875% 2/8/14 (f) | | 1,375,000 | | 1,265,000 |
Pakistan Mobile Communications Ltd. 8.625% 11/13/13 (f) | | 500,000 | | 470,000 |
Rural Cellular Corp. 8.25% 3/15/12 | | 360,000 | | 370,800 |
Telecom Personal SA 9.25% 12/22/10 (f) | | 1,645,000 | | 1,653,225 |
| | 15,183,976 |
TOTAL TELECOMMUNICATION SERVICES | | 76,306,990 |
UTILITIES - 0.7% |
Electric Utilities - 0.2% |
AES Gener SA 7.5% 3/25/14 | | 30,000 | | 30,900 |
Chivor SA E.S.P. 9.75% 12/30/14 (f) | | 493,000 | | 536,138 |
Commonwealth Edison Co. 5.4% 12/15/11 | | 1,923,000 | | 1,911,331 |
Edison Mission Energy: | | | | |
7.2% 5/15/19 (f) | | 520,000 | | 485,550 |
7.625% 5/15/27 (f) | | 1,380,000 | | 1,290,300 |
Intergen NV 9% 6/30/17 (f) | | 2,280,000 | | 2,314,200 |
Mirant Americas Generation LLC 9.125% 5/1/31 | | 205,000 | | 198,850 |
National Power Corp. 6.875% 11/2/16 (f) | | 300,000 | | 283,500 |
Nevada Power Co. 6.5% 5/15/18 | | 790,000 | | 790,000 |
PPL Capital Funding, Inc. 6.7% 3/30/67 (i) | | 2,290,000 | | 2,212,719 |
Reliant Energy, Inc.: | | | | |
6.75% 12/15/14 | | 400,000 | | 396,000 |
7.875% 6/15/17 | | 2,595,000 | | 2,530,125 |
| | 12,979,613 |
Gas Utilities - 0.0% |
NiSource Finance Corp. 5.45% 9/15/20 | | 1,650,000 | | 1,491,216 |
Transportadora de Gas del Sur SA 7.875% 5/14/17 (f) | | 1,205,000 | | 1,045,338 |
| | 2,536,554 |
Independent Power Producers & Energy Traders - 0.3% |
AES Corp.: | | | | |
7.75% 3/1/14 | | 3,400,000 | | 3,400,000 |
8.875% 2/15/11 | | 982,000 | | 986,910 |
9% 5/15/15 (f) | | 625,000 | | 656,250 |
Corporate Bonds - continued |
| Principal
Amount (b) | | Value |
Nonconvertible Bonds - continued |
UTILITIES - continued |
Independent Power Producers & Energy Traders - continued |
AES Corp.: - continued | | | | |
9.375% 9/15/10 | | $ 7,000 | | $ 7,193 |
9.5% 6/1/09 | | 19,000 | | 19,428 |
Allegheny Energy Supply Co. LLC 7.8% 3/15/11 | | 9,060,000 | | 9,331,800 |
Mirant North America LLC 7.375% 12/31/13 | | 2,000,000 | | 1,985,000 |
NRG Energy, Inc.: | | | | |
7.25% 2/1/14 | | 1,300,000 | | 1,287,000 |
7.375% 2/1/16 | | 1,765,000 | | 1,747,350 |
7.375% 1/15/17 | | 2,000,000 | | 1,970,000 |
Tenaska Alabama Partners LP 7% 6/30/21 (f) | | 471,355 | | 461,928 |
TXU Corp. 5.55% 11/15/14 | | 3,140,000 | | 2,574,800 |
| | 24,427,659 |
Multi-Utilities - 0.2% |
CMS Energy Corp.: | | | | |
6.55% 7/17/17 | | 5,620,000 | | 5,386,281 |
9.875% 10/15/07 | | 135,000 | | 135,169 |
MidAmerican Energy Holdings, Co. 6.5% 9/15/37 (f) | | 5,765,000 | | 5,811,328 |
Utilicorp Canada Finance Corp. 7.75% 6/15/11 | | 105,000 | | 109,463 |
| | 11,442,241 |
TOTAL UTILITIES | | 51,386,067 |
TOTAL NONCONVERTIBLE BONDS | | 528,491,308 |
TOTAL CORPORATE BONDS (Cost $540,015,368) | 533,574,635 |
U.S. Government and Government Agency Obligations - 27.9% |
|
U.S. Government Agency Obligations - 1.7% |
Fannie Mae: | | | | |
4.375% 7/17/13 | | 8,745,000 | | 8,496,922 |
5% 2/16/12 | | 8,000,000 | | 8,071,304 |
Freddie Mac: | | | | |
5.25% 7/18/11 (e) | | 100,000,000 | | 101,804,700 |
U.S. Government and Government Agency Obligations - continued |
| Principal
Amount (b) | | Value |
U.S. Government Agency Obligations - continued |
Freddie Mac: - continued | | | | |
5.25% 11/5/12 | | $ 280,000 | | $ 279,830 |
Tennessee Valley Authority 5.375% 4/1/56 | | 385,000 | | 383,401 |
TOTAL U.S. GOVERNMENT AGENCY OBLIGATIONS | | 119,036,157 |
U.S. Treasury Inflation Protected Obligations - 4.6% |
U.S. Treasury Inflation-Indexed Notes: | | | | |
0.875% 4/15/10 | | 3,299,190 | | 3,155,373 |
2% 4/15/12 | | 20,534,000 | | 20,214,720 |
2% 1/15/14 | | 181,746,561 | | 177,479,394 |
2% 7/15/14 | | 16,579,050 | | 16,204,662 |
2.375% 4/15/11 | | 75,574,080 | | 75,432,175 |
3.5% 1/15/11 | | 23,940,800 | | 24,789,948 |
TOTAL U.S. TREASURY INFLATION PROTECTED OBLIGATIONS | | 317,276,272 |
U.S. Treasury Obligations - 21.6% |
U.S. Treasury Bonds: | | | | |
6.25% 5/15/30 (e) | | 253,489,000 | | 301,671,682 |
stripped principal: | | | | |
2/15/15 | | 78,530,000 | | 56,370,562 |
5/15/30 | | 35,870,000 | | 11,874,118 |
U.S. Treasury Notes: | | | | |
stripped principal 2/15/12 | | 75,970,000 | | 62,948,894 |
4.25% 8/15/13 (e) | | 37,179,000 | | 37,054,116 |
4.25% 8/15/14 (e) | | 400,000,000 | | 396,906,371 |
4.5% 9/30/11 (n) | | 91,855,000 | | 92,737,635 |
4.625% 7/31/12 (g) | | 208,834,000 | | 212,196,630 |
4.75% 1/31/12 (e) | | 130,000,000 | | 132,539,030 |
4.75% 5/15/14 (e) | | 185,157,000 | | 189,351,917 |
TOTAL U.S. TREASURY OBLIGATIONS | 1,493,650,955 |
TOTAL U.S. GOVERNMENT AND
GOVERNMENT AGENCY OBLIGATIONS (Cost $1,895,619,007) | 1,929,963,384 |
U.S. Government Agency - Mortgage Securities - 9.5% |
| Principal
Amount (b) | | Value |
Fannie Mae - 8.7% |
3.83% 10/1/33 (i) | | $ 2,786,774 | | $ 2,758,550 |
4.5% 4/1/20 | | 2,699,312 | | 2,605,952 |
4.678% 5/1/35 (i) | | 3,414,020 | | 3,398,145 |
5% 9/1/22 (g) | | 25,000,000 | | 24,434,208 |
5% 9/1/37 (g) | | 1,000,000 | | 951,071 |
5% 9/1/37 (g) | | 112,000,000 | | 106,519,907 |
5.101% 5/1/35 (i) | | 3,163,390 | | 3,175,180 |
5.302% 12/1/35 (i) | | 1,496,139 | | 1,495,489 |
5.304% 2/1/36 (i) | | 2,544,999 | | 2,544,596 |
5.5% 9/1/37 (g) | | 100,000,000 | | 97,715,640 |
5.5% 9/1/37 (g) | | 50,000,000 | | 48,857,820 |
5.5% 9/1/37 (g) | | 75,000,000 | | 73,286,730 |
5.5% 9/1/37 (g) | | 54,000,000 | | 52,766,446 |
5.651% 7/1/37 (i) | | 1,694,959 | | 1,704,962 |
6% 9/1/22 (g) | | 1,000,000 | | 1,010,683 |
6% 9/1/37 (g) | | 20,000,000 | | 19,993,814 |
6% 9/1/37 (g) | | 45,000,000 | | 44,986,082 |
6% 9/1/37 (g) | | 50,000,000 | | 49,984,535 |
6.061% 4/1/36 (i) | | 1,202,886 | | 1,217,460 |
6.256% 6/1/36 (i) | | 494,889 | | 499,490 |
6.319% 4/1/36 (i) | | 1,068,489 | | 1,085,171 |
6.5% 9/1/37 (g) | | 8,000,000 | | 8,122,630 |
6.5% 9/1/37 (g) | | 50,000,000 | | 50,766,440 |
TOTAL FANNIE MAE | | 599,881,001 |
Freddie Mac - 0.8% |
5.787% 10/1/35 (i) | | 915,204 | | 919,421 |
5.877% 6/1/36 (i) | | 1,355,088 | | 1,363,672 |
6% 9/1/37 (g) | | 40,000,000 | | 39,989,188 |
6.044% 6/1/36 (i) | | 1,322,750 | | 1,333,385 |
6.049% 7/1/37 (i) | | 6,875,000 | | 6,924,490 |
6.089% 4/1/36 (i) | | 2,232,134 | | 2,249,139 |
6.1% 6/1/36 (i) | | 1,249,753 | | 1,262,810 |
TOTAL FREDDIE MAC | | 54,042,105 |
TOTAL U.S. GOVERNMENT AGENCY - MORTGAGE SECURITIES (Cost $648,211,849) | 653,923,106 |
Asset-Backed Securities - 0.6% |
| Principal
Amount (b) | | Value |
ACE Securities Corp. Home Equity Loan Trust
Series 2005-SD1 Class A1, 5.905% 11/25/50 (i) | | $ 33,912 | | $ 32,667 |
Advanta Business Card Master Trust Series 2007-D1
Class D, 6.9375% 1/22/13 (f)(i) | | 2,590,000 | | 2,542,313 |
Airspeed Ltd. Series 2007-1A Class C1, 8.1113% 4/15/24 (f)(i) | | 4,930,405 | | 4,885,723 |
AmeriCredit Prime Automobile Receivables Trust
Series 2007-1 Class E, 6.96% 3/31/16 (f) | | 2,215,000 | | 2,166,713 |
Ameriquest Mortgage Securities, Inc. Series 2004-R8
Class M9, 8.255% 9/25/34 (i) | | 725,000 | | 531,969 |
Capital Auto Receivables Asset Trust: | | | | |
Series 2006-1: | | | | |
Class C, 5.55% 1/18/11 | | 1,500,000 | | 1,504,027 |
Class D, 7.16% 1/15/13 (f) | | 160,000 | | 159,613 |
Series 2006-SN1A: | | | | |
Class B, 5.5% 4/20/10 (f) | | 340,000 | | 338,764 |
Class C, 5.77% 5/20/10 (f) | | 325,000 | | 322,817 |
Class D, 6.15% 4/20/11 (f) | | 550,000 | | 549,686 |
Capmark VII Ltd. Series 2006-7A Class H, 7.1613% 8/20/36 (f)(i) | | 500,000 | | 357,105 |
Carrington Mortgage Loan Trust Series 2006-NC3 Class M10, 7.505% 8/25/36 (f)(i) | | 290,000 | | 63,438 |
Concord Real Estate CDO Ltd./LLC Series 2006-1A
Class F, 7.07% 12/25/46 (f)(i) | | 250,000 | | 191,250 |
Countrywide Home Loan Trust Series 2006-13N Class N, 7% 8/25/37 (f) | | 766,598 | | 559,616 |
DB Master Finance LLC Series 2006-1 Class M1, 8.285% 6/20/31 (f) | | 235,000 | | 241,545 |
Ford Credit Auto Owner Trust: | | | | |
Series 2006-B Class D, 7.26% 2/15/13 (f) | | 1,175,000 | | 1,169,271 |
Series 2006-C Class D, 6.89% 5/15/13 (f) | | 915,000 | | 910,346 |
Series 2007-A Class D, 7.05% 12/15/13 (f) | | 970,000 | | 921,500 |
GS Auto Loan Trust Series 2006-1 Class D, 6.25% 1/15/14 (f) | | 1,425,000 | | 1,394,135 |
GSAMP Trust Series 2004-AR1 Class B4, 5% 6/25/34 (f)(i) | | 856,000 | | 428,000 |
Guggenheim Structured Real Estate Funding Ltd. Series 2006-3 Class E, 6.97% 9/25/46 (f)(i) | | 250,000 | | 185,000 |
Home Equity Asset Trust Series 2006-3N Class B, 6.5% 8/27/36 (f) | | 250,000 | | 30,000 |
Kent Funding III Ltd. Series 2006-3A Class D, 8.455% 10/31/36 (i) | | 248,743 | | 74,623 |
Long Beach Mortgage Loan Trust Series 2006-6 Class M9, 7.405% 7/25/36 (i) | | 150,000 | | 22,500 |
Asset-Backed Securities - continued |
| Principal
Amount (b) | | Value |
Merna Reinsurance Ltd. Series 2007-1 Class B, 7.11% 6/30/12 (f)(i) | | $ 5,400,000 | | $ 5,400,000 |
Newcastle CDO VIII Series 2006-8A Class 10, 7.57% 11/1/52 (f)(i) | | 250,000 | | 178,297 |
Resource Real Estate Funding CDO Series 2007-1A
Class J, 8.27% 9/1/46 (f)(i) | | 250,000 | | 202,332 |
ROCK 1 CRE CDO LLC Series 2006-1A Class H, 6.66% 12/15/26 (f)(i) | | 185,000 | | 151,619 |
SIRENS B.V. Series 2007-2 Class A1, 7.16% 4/13/10 (f)(i) | | 10,000,000 | | 9,496,000 |
Structured Asset Securities Corp. Series 2006-BC1 Class B1, 8.005% 3/25/36 (f)(i) | | 100,000 | | 15,310 |
Swift Master Auto Receivables Trust Series 2007-1 Class B, 5.8313% 6/15/12 (i) | | 3,285,000 | | 3,279,767 |
TIAA Real Estate CDO Ltd./TIAA Real Estate CDO Corp. Series 2002-1A Class IV, 6.84% 5/22/37 (f) | | 235,000 | | 202,725 |
Wachovia Auto Loan Trust Series 2006-2A Class E, 7.05% 5/20/14 (f) | | 1,390,000 | | 1,336,714 |
WaMu Asset-Backed Certificates Series 2006-HE5
Class B1, 8.005% 10/25/36 (f)(i) | | 1,330,000 | | 266,000 |
TOTAL ASSET-BACKED SECURITIES (Cost $43,736,623) | 40,111,385 |
Collateralized Mortgage Obligations - 0.4% |
|
Private Sponsor - 0.2% |
ABN AMRO Mortgage Corp.: | | | | |
Series 2003-2 Class B4, 5.3302% 3/25/18 (i) | | 197,649 | | 152,943 |
Series 2003-9 Class B5, 4.5164% 8/25/18 (f) | | 327,216 | | 139,067 |
Banc of America Mortgage Securities, Inc. Series 2004-7 Class 15B4, 5.305% 8/25/19 (f)(i) | | 81,060 | | 57,235 |
Bayview Commercial Asset Trust Series 2006-3A Class IO, 1.1688% 10/25/36 (i)(k) | | 16,194,401 | | 1,910,939 |
Chase Mortgage Finance Trust Series 2007-A1 Class 1A5, 4.3588% 2/25/37 (i) | | 518,464 | | 511,072 |
Countrywide Alternative Loan Trust Series 2006-OC5N Class N, 7.25% 7/25/37 (f) | | 86,015 | | 43,260 |
Countrywide Home Loans pass-thru certificates
Series 2007-HY5 Class 3A1, 6.2335% 9/25/37 (i) | | 3,790,000 | | 3,733,150 |
Countrywide Home Loans, Inc.: | | | | |
Series 2003-28 Class B3, 5.5% 8/25/33 | | 94,077 | | 68,445 |
Series 2003-35 Class B, 4.639% 9/25/18 (i) | | 177,714 | | 141,190 |
Collateralized Mortgage Obligations - continued |
| Principal
Amount (b) | | Value |
Private Sponsor - continued |
Credit Suisse First Boston Mortgage Securities Corp.: | | | | |
Series 2003-17 Class B4, 5.389% 6/25/33 (f)(i) | | $ 394,470 | | $ 286,579 |
Series 2004-3 Class DB4, 5.8427% 4/25/34 (i) | | 118,919 | | 35,236 |
floater Series 2007-AR7 Class 2A1, 4.6454% 11/25/34 (i) | | 2,239,394 | | 2,200,150 |
Diversified REIT Trust Series 1999-1A: | | | | |
Class F, 6.78% 3/18/11 (f)(i) | | 250,000 | | 253,304 |
Class G, 6.78% 3/18/11 (f)(i) | | 250,000 | | 250,762 |
GMAC Commercial Mortgage Securities, Inc.
Series 1993-C3 Class L, 6.974% 8/15/36 (f) | | 324,000 | | 128,678 |
GMAC Mortgage Loan Trust Series 2003-J10 Class B2, 4.75% 1/25/19 (f) | | 167,483 | | 105,170 |
JPMorgan Mortgage Trust Series 2007-A1 Class 3A2, 5.0072% 7/25/35 (i) | | 2,345,046 | | 2,309,075 |
Nomura Home Equity Loan, Inc. floater Series 2006-FM2 Class B1, 7.805% 7/25/36 (f)(i) | | 4,165,000 | | 920,186 |
RESI Finance LP/RESI Finance DE Corp. floater
Series 2003-CB1: | | | | |
Class B4, 7% 6/10/35 (f)(i) | | 36,866 | | 37,050 |
Class B5, 7.6% 6/10/35 (f)(i) | | 27,649 | | 27,787 |
Class B6, 8.1% 6/10/35 (f)(i) | | 13,825 | | 13,963 |
RESIX Finance Ltd. floater Series 2007-A Class BB, 8.9613% 2/15/39 (f)(i) | | 498,366 | | 458,497 |
Structured Asset Securities Corp. floater: | | | | |
Series 2005-AR1 Class B1, 7.505% 9/25/35 (f)(i) | | 530,000 | | 132,500 |
Series 2006-BC5 Class B, 8.005% 12/25/36 (f)(i) | | 1,050,000 | | 374,010 |
Wells Fargo Mortgage Backed Securities Trust: | | | | |
Series 2003-12 Class B6, 4.75% 11/25/18 (f) | | 319,674 | | 135,861 |
Series 2005-AR12 Class 2A6, 4.3186% 7/25/35 (i) | | 660,131 | | 643,781 |
Series 2005-AR3 Class 2A1, 4.187% 3/25/35 (i) | | 1,295,238 | | 1,270,546 |
TOTAL PRIVATE SPONSOR | | 16,340,436 |
U.S. Government Agency - 0.2% |
Fannie Mae subordinate REMIC pass-thru certificates planned amortization class: | | | | |
Series 2001-68 Class QZ, 5.5% 12/25/16 | | 4,222,625 | | 4,230,956 |
Collateralized Mortgage Obligations - continued |
| Principal
Amount (b) | | Value |
U.S. Government Agency - continued |
Fannie Mae subordinate REMIC pass-thru certificates planned amortization class: - continued | | | | |
Series 2002-9 Class PC, 6% 3/25/17 | | $ 853,157 | | $ 861,562 |
Freddie Mac Multi-class participation certificates guaranteed sequential payer Series 2528 Class HN, 5% 11/15/17 | | 5,515,000 | | 5,417,799 |
TOTAL U.S. GOVERNMENT AGENCY | | 10,510,317 |
TOTAL COLLATERALIZED MORTGAGE OBLIGATIONS (Cost $30,951,247) | 26,850,753 |
Commercial Mortgage Securities - 0.3% |
|
Asset Securitization Corp.: | | | | |
Series 1996-D2 Class B1A, 8.6011% 2/14/29 (f)(i) | | 750,000 | | 806,279 |
Series 1997-D4: | | | | |
Class B2, 7.525% 4/14/29 | | 1,494,104 | | 1,603,687 |
Class B5, 7.525% 4/14/29 | | 129,000 | | 122,449 |
Banc of America Commercial Mortgage, Inc.
Series 2003-2 Class BWF, 7.55% 10/11/37 (f) | | 96,700 | | 107,331 |
Bear Stearns Commercial Mortgage Securities Trust
Series 2007-BBA8 Class L, 7.5113% 3/15/22 (f)(i) | | 100,000 | | 98,531 |
Chase Commercial Mortgage Securities Corp.
Series 1998-2 Class J, 6.39% 11/18/30 (f) | | 490,787 | | 182,205 |
Citigroup Commercial Mortgage Trust Series 2006-FL2 Class CNP3, 6.8113% 8/16/21 (f)(i) | | 5,182,308 | | 5,144,251 |
Claregold Trust Series 2007-2A: | | | | |
Class F, 5.01% 5/15/44 (f)(i) | CAD | 138,000 | | 116,437 |
Class G, 5.01% 5/15/44 (f)(i) | CAD | 30,000 | | 24,091 |
Class H, 5.01% 5/15/44 (f)(i) | CAD | 20,000 | | 14,110 |
Class J, 5.01% 5/15/44 (f)(i) | CAD | 20,000 | | 12,897 |
Class K, 5.01% 5/15/44 (f)(i) | CAD | 10,000 | | 5,907 |
Class L, 5.01% 5/15/44 (f)(i) | CAD | 36,000 | | 20,547 |
Class M, 5.01% 5/15/44 (f)(i) | CAD | 165,000 | | 67,856 |
Commercial Mortgage Acceptance Corp. Series 1998-C1 Class G, 6.21% 7/15/31 (f) | | 500,000 | | 489,536 |
Commercial Mortgage Asset Trust Series 1999-C1 Class F, 6.25% 1/17/32 (f) | | 550,000 | | 537,767 |
Credit Suisse First Boston Mortgage Securities Corp.: | | | | |
Series 1997-C2 Class F, 7.46% 1/17/35 (i) | | 500,000 | | 534,151 |
Series 1998-C1 Class H, 6% 5/17/40 (f) | | 130,000 | | 64,675 |
Series 2003-C3 Class J, 4.231% 5/15/38 (f) | | 300,000 | | 265,640 |
Commercial Mortgage Securities - continued |
| Principal
Amount (b) | | Value |
Credit Suisse Mortgage Capital Certificates floater
Series 2007-TFL1 Class L, 7.5113% 2/15/22 (f)(i) | | $ 100,000 | | $ 91,500 |
Crest Ltd. Series 2001-1A Class C, 9% 2/25/34 (f) | | 500,000 | | 566,738 |
First Chicago/Lennar Trust I weighted average coupon Series 1997-CHL1 Class E, 8.0609% 4/29/39 (f)(i) | | 195,462 | | 198,349 |
Ginnie Mae guaranteed REMIC pass-thru securities sequential payer Series 2003-47 Class C, 4.227% 10/16/27 | | 5,454,626 | | 5,346,368 |
Global Signal Trust III Series 2006-1 Class F, 7.036% 2/15/36 | | 200,000 | | 198,188 |
GMAC Commercial Mortgage Securities, Inc.: | | | | |
Series 1999-C1 Class F, 6.02% 5/15/33 (f) | | 500,000 | | 484,628 |
Series 1999-C2I Class K, 6.481% 9/15/33 (l) | | 285,000 | | 163,163 |
Series 1999-C3: | | | | |
Class J, 6.974% 8/15/36 (f) | | 226,000 | | 224,446 |
Class K, 6.974% 8/15/36 (f) | | 427,000 | | 355,678 |
Series 2000-C1 Class K, 7% 3/15/33 (f) | | 90,000 | | 84,516 |
Series 2003-J10 Class B2, 6.75% 4/15/29 (i) | | 500,000 | | 499,571 |
Greenwich Capital Commercial Funding Corp.
Series 2003-C2 Class J, 5.234% 11/5/13 (f)(i) | | 250,000 | | 223,464 |
GS Mortgage Securities Corp. II: | | | | |
floater: | | | | |
Series 2006-FL8A Class J, 7.08% 6/6/20 (f)(i) | | 250,000 | | 245,000 |
Series 2007-EOP Class L, 6.63% 3/1/20 (f)(i) | | 400,000 | | 388,000 |
Series 1998-GLII Class G, 6.9707% 4/13/31 (f)(i) | | 600,000 | | 631,599 |
Series 2006-RR2: | | | | |
Class M, 5.6876% 6/1/46 (f)(i) | | 100,000 | | 56,694 |
Class N, 5.6876% 6/1/46 (f)(i) | | 100,000 | | 51,851 |
LB Commercial Conduit Mortgage Trust Series 1998-C4 Class G, 5.6% 10/15/35 (f) | | 250,000 | | 250,477 |
LB-UBS Commercial Mortgage Trust sequential payer Series 2006-C7 Class A1, 5.279% 11/15/38 | | 1,011,490 | | 1,010,068 |
LNR CFL Series 2004-1: | | | | |
Class I10, 7.72% 7/26/08 (f) | | 180,000 | | 179,536 |
Class I11, 7.72% 7/26/08 (f) | | 100,000 | | 99,520 |
Class I12, 7.72% 7/26/08 (f) | | 100,000 | | 99,256 |
Class I9, 7.72% 7/26/08 (f) | | 153,200 | | 152,998 |
Merrill Lynch Mortgage Trust: | | | | |
Series 2004-KEY2 Class K, 5.091% 8/12/39 (f)(i) | | 100,000 | | 81,794 |
Series 2006-KEY2 Class L, 5.091% 8/12/39 (f) | | 300,000 | | 235,326 |
Providence Place Group Ltd. Partnership Series 2000-C1 Class A2, 7.75% 7/20/28 | | 381,076 | | 449,587 |
Commercial Mortgage Securities - continued |
| Principal
Amount (b) | | Value |
Real Estate Asset Liquidity Trust: | | | | |
Series 2006-2: | | | | |
Class F, 4.456% 9/12/38 (l) | CAD | 107,000 | | $ 83,708 |
Class G, 4.456% 9/12/38 (l) | CAD | 54,000 | | 41,084 |
Class H, 4.456% 9/12/38 (l) | CAD | 36,000 | | 24,127 |
Class J, 4.456% 9/12/38 (l) | CAD | 36,000 | | 22,460 |
Class K, 4.456% 9/12/38 (l) | CAD | 18,000 | | 9,951 |
Class L, 4.456% 9/12/38 (l) | CAD | 26,000 | | 13,867 |
Class M, 4.456% 9/12/38 (l) | CAD | 130,000 | | 46,060 |
Series 2007-1: | | | | |
Class F, 4.57% 4/12/23 | CAD | 126,000 | | 98,576 |
Class G, 4.57% 4/12/23 | CAD | 42,000 | | 31,570 |
Class H, 4.57% 4/12/23 | CAD | 42,000 | | 27,960 |
Class J, 4.57% 4/12/23 | CAD | 42,000 | | 25,632 |
Class K, 4.57% 4/12/23 | CAD | 21,000 | | 11,772 |
Class L, 4.57% 4/12/23 | CAD | 63,000 | | 34,154 |
Class M, 4.57% 4/12/23 | CAD | 185,000 | | 71,027 |
Salomon Brothers Mortgage Securities VII, Inc.
Series 2001-MMA: | | | | |
Class E6, 6.5% 2/18/34 (f)(i) | | $ 165,000 | | 157,539 |
Class F6, 6.5% 2/18/34 (f)(i) | | 37,000 | | 32,993 |
SBA CMBS Trust Series 2006-1A Class J, 7.825% 11/15/36 (f) | | 90,000 | | 83,162 |
Wachovia Ltd./Wachovia LLC Series 2006-1 Class 1ML, 10.86% 9/25/26 (f)(i) | | 400,000 | | 345,450 |
TOTAL COMMERCIAL MORTGAGE SECURITIES (Cost $23,960,249) | 23,747,754 |
Foreign Government and Government Agency Obligations - 1.1% |
|
Argentine Republic: | | | | |
discount (with partial capitalization through 12/31/13) 8.28% 12/31/33 | | 2,289,412 | | 1,974,618 |
par 1.33% 12/31/38 (i) | | 135,000 | | 50,625 |
5.389% 8/3/12 (i) | | 3,659,375 | | 3,209,356 |
7% 3/28/11 | | 2,810,000 | | 2,546,406 |
7% 9/12/13 | | 3,595,000 | | 2,959,684 |
Brazilian Federative Republic: | | | | |
7.125% 1/20/37 | | 1,085,000 | | 1,179,938 |
8.25% 1/20/34 | | 410,000 | | 503,685 |
8.75% 2/4/25 | | 280,000 | | 347,200 |
11% 8/17/40 | | 2,285,000 | | 3,020,770 |
Foreign Government and Government Agency Obligations - continued |
| Principal
Amount (b) | | Value |
Brazilian Federative Republic: - continued | | | | |
12.25% 3/6/30 | | $ 745,000 | | $ 1,238,563 |
12.75% 1/15/20 | | 490,000 | | 761,950 |
Central Bank of Nigeria promissory note 5.092% 1/5/10 | | 531,190 | | 506,913 |
Chilean Republic 5.5% 1/15/13 | | 105,000 | | 106,754 |
Colombian Republic: | | | | |
7.375% 9/18/37 | | 1,355,000 | | 1,436,300 |
11.75% 2/25/20 | | 557,000 | | 791,497 |
Dominican Republic: | | | | |
(Reg. S) 9.5% 9/27/11 | | 1,126,391 | | 1,185,527 |
Brady 6.3125% 8/30/09 (i) | | 51,655 | | 51,526 |
6.25% 8/30/24 (i) | | 2,000,000 | | 1,988,000 |
9.04% 1/23/18 (f) | | 1,289,713 | | 1,412,235 |
9.04% 1/23/18 (f) | | 81,973 | | 81,481 |
Ecuador Republic: | | | | |
10% 8/15/30 (Reg. S) | | 2,240,000 | | 1,971,200 |
euro par 5% 2/28/25 | | 153,000 | | 109,395 |
Indonesian Republic: | | | | |
(Reg. S) 6.75% 3/10/14 | | 1,175,000 | | 1,183,813 |
6.625% 2/17/37 (f) | | 1,550,000 | | 1,422,125 |
Islamic Republic of Pakistan: | | | | |
6.75% 2/19/09 | | 395,000 | | 383,150 |
6.875% 6/1/17 (f) | | 100,000 | | 85,500 |
7.125% 3/31/16 (f) | | 600,000 | | 526,500 |
Lebanese Republic: | | | | |
(Reg. S): | | | | |
8.625% 6/20/13 | | 150,000 | | 144,375 |
8.63% 11/30/09 (i) | | 1,400,000 | | 1,373,750 |
7.125% 3/5/10 | | 250,000 | | 239,375 |
7.75% 9/7/12 | | 400,000 | | 374,000 |
7.875% 5/20/11 (Reg. S) | | 1,040,000 | | 988,000 |
8.63% 11/30/09 (f)(i) | | 105,000 | | 103,031 |
10.25% 10/6/09 (Reg. S) | | 400,000 | | 405,000 |
Peruvian Republic: | | | | |
6.1425% 3/7/27 (i) | | 340,000 | | 339,150 |
euro Brady past due interest 6.125% 3/7/17 (i) | | 1,306,700 | | 1,303,433 |
Philippine Republic: | | | | |
8.25% 1/15/14 | | 1,580,000 | | 1,710,350 |
8.875% 3/17/15 | | 580,000 | | 653,950 |
9% 2/15/13 | | 630,000 | | 700,875 |
9.5% 2/2/30 | | 625,000 | | 789,063 |
9.875% 1/15/19 | | 1,035,000 | | 1,273,050 |
Foreign Government and Government Agency Obligations - continued |
| Principal
Amount (b) | | Value |
Philippine Republic: - continued | | | | |
10.625% 3/16/25 | | $ 715,000 | | $ 967,967 |
Republic of Fiji 6.875% 9/13/11 | | 400,000 | | 364,000 |
Republic of Serbia 3.75% 11/1/24 (d)(f) | | 540,000 | | 498,150 |
Russian Federation: | | | | |
7.5% 3/31/30 (Reg. S) | | 6,200,840 | | 6,882,932 |
12.75% 6/24/28 (Reg. S) | | 865,000 | | 1,524,563 |
Turkish Republic: | | | | |
6.875% 3/17/36 | | 1,275,000 | | 1,193,719 |
7% 9/26/16 | | 2,020,000 | | 2,045,250 |
7.375% 2/5/25 | | 855,000 | | 875,306 |
11% 1/14/13 | | 1,285,000 | | 1,542,000 |
11.5% 1/23/12 | | 1,025,000 | | 1,217,188 |
11.875% 1/15/30 | | 860,000 | | 1,309,350 |
Ukraine Cabinet of Ministers 6.58% 11/21/16 (f) | | 1,850,000 | | 1,830,982 |
Ukraine Government (Reg. S) 8.6881% 8/5/09 (i) | | 475,000 | | 499,320 |
United Mexican States: | | | | |
6.75% 9/27/34 | | 85,000 | | 93,203 |
7.5% 4/8/33 | | 575,000 | | 685,400 |
8.3% 8/15/31 | | 815,000 | | 1,050,372 |
Uruguay Republic 8% 11/18/22 | | 846,902 | | 912,537 |
Venezuelan Republic: | | | | |
5.375% 8/7/10 | | 850,000 | | 786,250 |
6.36% 4/20/11 (i) | | 1,990,000 | | 1,830,800 |
7.65% 4/21/25 | | 610,000 | | 523,075 |
8.5% 10/8/14 | | 565,000 | | 543,813 |
9.25% 9/15/27 | | 2,175,000 | | 2,158,688 |
9.375% 1/13/34 | | 685,000 | | 679,863 |
10.75% 9/19/13 | | 1,255,000 | | 1,342,850 |
13.625% 8/15/18 | | 1,168,000 | | 1,489,200 |
Vietnamese Socialist Republic Brady par 4% 3/12/28 (d) | | 90,000 | | 73,575 |
TOTAL FOREIGN GOVERNMENT AND
GOVERNMENT AGENCY OBLIGATIONS (Cost $75,673,898) | 74,352,466 |
Preferred Stocks - 0.1% |
| Shares | | Value |
Convertible Preferred Stocks - 0.1% |
ENERGY - 0.1% |
Oil, Gas & Consumable Fuels - 0.1% |
El Paso Corp. 4.99% | 1,566 | | $ 2,153,555 |
UTILITIES - 0.0% |
Electric Utilities - 0.0% |
AES Trust III 6.75% | 10,000 | | 461,500 |
TOTAL CONVERTIBLE PREFERRED STOCKS | | 2,615,055 |
Nonconvertible Preferred Stocks - 0.0% |
TELECOMMUNICATION SERVICES - 0.0% |
Wireless Telecommunication Services - 0.0% |
Rural Cellular Corp. 12.25% pay-in-kind | 520 | | 650,000 |
TOTAL PREFERRED STOCKS (Cost $3,200,260) | 3,265,055 |
Floating Rate Loans - 0.1% |
| Principal
Amount (b) | | |
CONSUMER DISCRETIONARY - 0.1% |
Hotels, Restaurants & Leisure - 0.0% |
Intrawest Resorts term loan 7.6225% 10/25/07 (i) | | $ 249,952 | | 243,703 |
Media - 0.1% |
CSC Holdings, Inc. Tranche B, term loan 7.07% 3/31/13 (i) | | 1,550,000 | | 1,488,000 |
Zuffa LLC term loan 7.5625% 6/19/15 (i) | | 1,350,000 | | 1,201,500 |
| | 2,689,500 |
Specialty Retail - 0.0% |
The Pep Boys - Manny, Moe & Jack term loan 7.54% 10/27/13 (i) | | 202,000 | | 197,455 |
Toys 'R' US, Inc. term loan 8.32% 12/9/08 (i) | | 500,000 | | 488,750 |
| | 686,205 |
TOTAL CONSUMER DISCRETIONARY | | 3,619,408 |
Floating Rate Loans - continued |
| Principal
Amount (b) | | Value |
ENERGY - 0.0% |
Oil, Gas & Consumable Fuels - 0.0% |
Kinder Morgan, Inc. Tranche B, term loan 7.0708% 5/30/14 (i) | | $ 1,970,000 | | $ 1,871,500 |
FINANCIALS - 0.0% |
Diversified Financial Services - 0.0% |
LandSource Communities Development LLC: | | | | |
Tranche 2LN, term loan 9.9988% 2/27/14 (i) | | 80,000 | | 71,600 |
Tranche B 1LN, term loan 8.2488% 2/27/13 (i) | | 109,600 | | 98,640 |
| | 170,240 |
Real Estate Investment Trusts - 0.0% |
Capital Automotive (REIT) Tranche B, term loan 7.07% 12/16/10 (i) | | 250,000 | | 240,000 |
General Growth Properties, Inc. Tranche A1, term loan 6.58% 2/24/10 (i) | | 209,211 | | 202,934 |
Spirit Finance Corp. term loan 8.3595% 8/1/13 (i) | | 134,000 | | 120,600 |
| | 563,534 |
Real Estate Management & Development - 0.0% |
Tishman Speyer Properties term loan 7.08%
12/27/12 (i) | | 143,000 | | 137,280 |
TOTAL FINANCIALS | | 871,054 |
HEALTH CARE - 0.0% |
Health Care Providers & Services - 0.0% |
Community Health Systems, Inc.: | | | | |
term loan 7.7563% 7/25/14 (i) | | 1,022,560 | | 986,770 |
Tranche DD, term loan 7/25/14 (m) | | 67,440 | | 65,080 |
| | 1,051,850 |
INDUSTRIALS - 0.0% |
Commercial Services & Supplies - 0.0% |
Adesa, Inc. term loan 7.61% 10/20/13 (i) | | 480,000 | | 448,800 |
INFORMATION TECHNOLOGY - 0.0% |
Software - 0.0% |
Kronos, Inc. Tranche 1LN, term loan 7.61%
6/11/14 (i) | | 1,680,000 | | 1,545,600 |
Floating Rate Loans - continued |
| Principal
Amount (b) | | Value |
TELECOMMUNICATION SERVICES - 0.0% |
Diversified Telecommunication Services - 0.0% |
Intelsat Ltd. Tranche B, term loan 7.36% 7/3/13 (i) | | $ 410,000 | | $ 400,775 |
Wireless Telecommunication Services - 0.0% |
Crown Castle International Corp. Tranche B, term loan 6.8385% 3/6/14 (i) | | 9,975 | | 9,476 |
TOTAL TELECOMMUNICATION SERVICES | | 410,251 |
TOTAL FLOATING RATE LOANS (Cost $9,964,709) | 9,818,463 |
Sovereign Loan Participations - 0.0% |
|
Indonesian Republic loan participation: | | | | |
- Citibank 6.25% 12/14/19 (i) | | 128,000 | | 122,879 |
- Credit Suisse First Boston 6.25% 3/28/13 (i) | | 98,751 | | 97,764 |
- Deutsche Bank 6.25% 3/28/13 (i) | | 11,623 | | 11,507 |
TOTAL SOVEREIGN LOAN PARTICIPATIONS (Cost $222,814) | 232,150 |
Fixed-Income Funds - 51.3% |
| Shares | | |
Fidelity 1-3 Year Duration Securitized Bond Central Fund (j) | 3,257,659 | | 310,910,980 |
Fidelity 2-5 Year Duration Securitized Bond Central Fund (j) | 4,113,459 | | 402,255,147 |
Fidelity Corporate Bond 1-10 Year Central Fund (j) | 7,711,107 | | 763,168,246 |
Fidelity Floating Rate Central Fund (j) | 2,379,674 | | 228,686,671 |
Fidelity Mortgage Backed Securities Central Fund (j) | 9,810,580 | | 964,085,734 |
Fidelity Ultra-Short Central Fund (j) | 9,260,420 | | 875,572,723 |
TOTAL FIXED-INCOME FUNDS (Cost $3,624,184,607) | 3,544,679,501 |
Preferred Securities - 0.1% |
| Principal
Amount (b) | | |
CONSUMER DISCRETIONARY - 0.1% |
Media - 0.1% |
Globo Comunicacoes e Participacoes SA 9.375% | $ 2,090,000 | | 2,122,796 |
Net Servicos de Comunicacao SA 9.25% (f) | 1,035,000 | | 1,050,272 |
| | 3,173,068 |
Preferred Securities - continued |
| Principal
Amount (b) | | Value |
ENERGY - 0.0% |
Oil, Gas & Consumable Fuels - 0.0% |
Pemex Project Funding Master Trust 7.75% | $ 3,034,000 | | $ 3,120,416 |
TOTAL PREFERRED SECURITIES (Cost $6,282,522) | 6,293,484 |
Cash Equivalents - 27.9% |
| Maturity
Amount | | |
Investments in repurchase agreements in a joint trading account at: | | | |
5.37%, dated 8/31/07 due 9/4/07 (Collateralized by U.S. Government Obligations) # | $ 837,988,965 | | 837,489,000 |
5.4%, dated 8/31/07 due 9/4/07 (Collateralized by U.S. Government Obligations) # (a) | 1,095,166,706 | | 1,094,510,000 |
TOTAL CASH EQUIVALENTS (Cost $1,931,999,000) | 1,931,999,000 |
TOTAL INVESTMENT PORTFOLIO - 127.0% (Cost $8,834,022,153) | | 8,778,811,136 |
NET OTHER ASSETS - (27.0)% | | (1,864,788,095) |
NET ASSETS - 100% | $ 6,914,023,041 |
Swap Agreements |
| Expiration Date | | Notional Amount | | |
Credit Default Swaps |
Pay monthly a fixed rate of .15% multiplied by the notional amount and receive from Credit Suisse First Boston upon each credit event of one of the issues of Dow Jones ABX AA 07-1 Index, par value of the proportional notional amount (g) | August 2037 | | $ 7,200,000 | | 1,728,000 |
Receive monthly notional amount multiplied by 3.35% and pay Morgan Stanley, Inc. upon credit event of Morgan Stanley ABS Capital I, Inc., par value of the notional amount of Morgan Stanley ABS Capital I, Inc. Series 2004-HE8 Class B3, 7.3913% 9/25/34 | Oct. 2034 | | 134,000 | | (23,527) |
Swap Agreements |
| Expiration Date | | Notional Amount | | Value |
Credit Default Swaps |
Receive monthly notional amount multiplied by 3.35% and pay Morgan Stanley, Inc. upon credit event of Morgan Stanley ABS Capital I, Inc., par value of the notional amount of Morgan Stanley ABS Capital I, Inc. Series 2004-HE7, Class B3, 9.01% 8/25/34 | Sept. 2034 | | $ 134,000 | | $ (33,139) |
Receive monthly notional amount multiplied by 3.35% and pay Morgan Stanley, Inc. upon credit event of Morgan Stanley ABS Capital I, Inc., par value of the notional amount of Morgan Stanley ABS Capital I, Inc. Series 2004-NC7, Class B3, 7.6913% 7/25/34 | August 2034 | | 134,000 | | (20,670) |
Receive from Bank of America upon credit event of Bristol-Myers Squibb Co., par value of the notional amount of Bristol-Myers Squibb Co. 5.25% 8/15/13, and pay quarterly notional amount multiplied by .30% | Sept. 2017 | | 3,700,000 | | 37,972 |
Receive from Bank of America upon credit event of Eli Lilly & Co., par value of the notional amount of Eli Lilly & Co. 6.57% 1/1/16, and pay quarterly notional amount multiplied by .22% | Sept. 2017 | | 2,995,000 | | 8,078 |
Receive from Citibank upon credit event of Bristol-Myers Squibb Co., par value of the notional amount of Bristol-Myers Squibb Co. 5.25% 8/15/13, and pay quarterly notional amount multiplied by .32% | Sept. 2017 | | 1,500,000 | | 12,951 |
Receive from Citibank upon credit event of Schering-Plough Corp., par value of the notional amount of Schering-Plough Corp. 5.55% 12/1/13, and pay quarterly notional amount multiplied by .4% | Sept. 2017 | | 2,500,000 | | 17,220 |
Receive from Citibank upon credit event of Schering-Plough Corp., par value of the notional amount of Schering-Plough Corp. 5.55% 12/1/13, and pay quarterly notional amount multiplied by .42% | Sept. 2017 | | 4,400,000 | | 23,344 |
Swap Agreements - continued |
| Expiration Date | | Notional Amount | | Value |
Credit Default Swaps - continued |
Receive from Deutsche Bank upon credit event of Household Finance Corp., par value of the notional amount of Household Finance Corp. 7% 5/15/12, and pay quarterly notional amount multiplied by .73% | Sept. 2012 | | $ 5,900,000 | | $ (100,076) |
Receive from Goldman Sachs upon credit event of CSX Corp., par value of the notional amount of CSX Corp. 5.30% 2/15/14, and pay quarterly notional amount multiplied by .77% | Sept. 2017 | | 5,000,000 | | 52,701 |
Receive from Goldman Sachs upon credit event of Eli Lilly & Co., par value of the notional amount of Eli Lilly & Co. 6.57% 1/1/16, and pay quarterly notional amount multiplied by .24% | Sept. 2017 | | 2,500,000 | | 3,639 |
Receive monthly a fixed rate of .15% multiplied by the notional amount and pay to Credit Suisse First Boston upon each credit event of one of the issues of Dow Jones ABX AA 07-1 Index, par value of the proportional notional amount (g) | August 2037 | | 4,000,000 | | (1,120,000) |
Receive monthly a fixed rate of .15% multiplied by the notional amount and pay to UBS upon each credit event of one of the issues of Dow Jones ABX AA 07-1 Index, par value of the proportional notional amount (g) | August 2037 | | 7,200,000 | | (2,016,000) |
Receive monthly a fixed rate of .15% multiplied by the notional amount and pay to UBS upon each credit event of one of the issues of Dow Jones ABX AA 07-1 Index, par value of the proportional notional amount (g) | August 2037 | | 2,600,000 | | (728,000) |
Receive monthly notional amount multiplied by .82% and pay UBS upon credit event of Morgan Stanley ABS Capital I, Inc., par value of the notional amount of Morgan Stanley ABS Capital I, Inc. Series 2004-NC6 Class M3, 5.6413% 7/25/34 | August 2034 | | 134,000 | | (14,889) |
Swap Agreements - continued |
| Expiration Date | | Notional Amount | | Value |
Credit Default Swaps - continued |
Receive monthly notional amount multiplied by .85% and pay UBS upon credit event of Ameriquest Mortgage Securities, Inc., par value of the notional amount of Ameriquest Mortgage Securities, Inc. Series 2004-R9 Class M5, 5.5913% 10/25/34 | Nov. 2034 | | $ 134,000 | | $ (22,366) |
Receive monthly notional amount multiplied by .85% and pay UBS upon credit event of Morgan Stanley ABS Capital I, Inc., par value of the notional amount of Morgan Stanley ABS Capital I, Inc. Series 2004-NC8 Class M6, 5.4413% 9/25/34 | Oct. 2034 | | 134,000 | | (18,954) |
Receive monthly notional amount multiplied by 1.6% and pay Morgan Stanley, Inc. upon credit event of Park Place Securities, Inc., par value of the notional amount of Park Place Securities, Inc. Series 2005-WHQ2 Class M7, 5.4413% 5/25/35 | June 2035 | | 100,000 | | (31,011) |
Receive monthly notional amount multiplied by 1.66% and pay Morgan Stanley, Inc. upon credit event of Park Place Securities, Inc., par value of the notional amount of Park Place Securities, Inc. Series 2005-WHQ2 Class M7, 5.4413% 5/25/35 | June 2035 | | 134,000 | | (41,373) |
Receive monthly notional amount multiplied by 2.22% and pay JPMorgan Chase, Inc. upon credit event of Morgan Stanley ABS Capital I, Inc., par value of the notional amount of Morgan Stanley ABS Capital I, Inc. Series 2005-HE3 Class B2, 6.87% 7/25/35 | August 2035 | | 5,325,000 | | (1,502,289) |
Receive monthly notional amount multiplied by 2.39% and pay UBS upon credit event of Fremont Home Loan Trust, par value of the notional amount of Fremont Home Loan Trust Series 2004-1 Class M9, 7.73% 2/25/34 | March 2034 | | 83,835 | | (12,139) |
Receive monthly notional amount multiplied by 2.4% and pay Deutsche Bank upon credit event of Fremont Home Loan Trust, par value of the notional amount of Fremont Home Loan Trust Series 2004-A Class B3, 7.2288% 1/25/34 | Feb. 2034 | | 38,810 | | (31,596) |
Swap Agreements - continued |
| Expiration Date | | Notional Amount | | Value |
Credit Default Swaps - continued |
Receive monthly notional amount multiplied by 2.54% and pay Merrill Lynch upon credit event of Countrywide Home Loans, Inc., par value of the notional amount of Countrywide Home Loans, Inc. Series 2003-BC1 Class B1, 7.6913% 3/25/32 | April 2032 | | $ 11,800 | | $ (362) |
Receive monthly notional amount multiplied by 3% and pay UBS upon credit event of Ameriquest Mortgage Securities, Inc., par value of the notional amount of Ameriquest Mortgage Securities, Inc. Series 2005-R4 Class M9, 7.07% 7/25/35 | August 2035 | | 1,200,000 | | (436,452) |
Receive monthly notional amount multiplied by 5% and pay Deutsche Bank upon credit event of MASTR Asset Backed Securities Trust, par value of the notional amount of MASTR Asset Backed Securities Trust Series 2003-NC1 Class M6, 8.1913% 4/25/33 | May 2033 | | 134,000 | | (38,715) |
Receive monthly notional amount multiplied by 5.55% and pay Deutsche Bank upon credit event of Carrington Mortgage Loan Trust, par value of the notional amount of Carrington Mortgage Loan Trust Series 2006-FRE1 Class M10, 7.74% 7/25/36 | August 2036 | | 1,200,000 | | (503,682) |
Receive monthly notional amount multiplied by 6.25% and pay Deutsche Bank upon credit event of Residential Asset Mortgage Products, Inc., par value of the notional amount of Residential Asset Mortgage Products, Inc. Series 2006-RS5, 7.17% 9/25/35 | Oct. 2036 | | 1,200,000 | | (840,651) |
Receive quarterly notional amount multiplied by .5% and pay Deutsche Bank upon credit event of Fannie Mae, par value of the notional amount of Fannie Mae 5.25% 8/1/12 | Sept. 2012 | | 3,600,000 | | 4,317 |
Receive quarterly notional amount multiplied by .54% and pay to Morgan Stanley, Inc. upon credit event of Fannie Mae, par value of the notional amount of Fannie Mae 5.25% 8/1/12 | Sept. 2012 | | 3,630,000 | | 11,021 |
Swap Agreements - continued |
| Expiration Date | | Notional Amount | | Value |
Credit Default Swaps - continued |
Receive quarterly notional amount multiplied by .72% and pay Bank of America upon credit event of Alleghany Energy Supply Co. LLC, par value of the notional amount of Alleghany Energy Supply Co. LLC 8.25% 4/15/12 | June 2012 | | $ 4,000,000 | | $ (81,914) |
Receive quarterly notional amount multiplied by .78% and pay Deutsche Bank upon credit event of Allegheny Energy Supply Co. LLC, par value of the notional amount of Allegheny Energy Supply Co. LLC 8.25% 4/15/12 | June 2012 | | 3,955,000 | | (72,155) |
Receive quarterly notional amount multiplied by 1.55% and pay Goldman Sachs upon credit event of Reynolds American, Inc., par value of the notional amount of Reynolds American, Inc. 7.625% 6/1/16 | Sept. 2017 | | 6,500,000 | | 76,749 |
TOTAL CREDIT DEFAULT SWAPS | | 81,411,445 | | (5,713,968) |
Interest Rate Swaps |
Receive quarterly a fixed rate equal to 4.3875% and pay quarterly a floating rate based on 3-month LIBOR with Credit Suisse First Boston | March 2010 | | 1,250,000 | | (16,696) |
Receive quarterly a fixed rate equal to 4.774% and pay quarterly a floating rate based on 3-month LIBOR with Credit Suisse First Boston | March 2015 | | 1,250,000 | | (26,171) |
Receive quarterly a fixed rate equal to 4.898% and pay quarterly a floating rate based on 3-month LIBOR with Lehman Brothers, Inc. | August 2014 | | 1,135,000 | | (10,282) |
Receive semi-annually a fixed rate equal to 5.015% and pay quarterly a floating rate based on 3-month LIBOR with Morgan Stanley, Inc. | April 2012 | | 50,000,000 | | 729,585 |
Receive semi-annually a fixed rate equal to 5.062% and pay quarterly a floating rate based on 3-month LIBOR with Credit Suisse First Boston | May 2012 | | 75,000,000 | | 1,267,898 |
Receive semi-annually a fixed rate equal to 5.09% and pay quarterly a floating rate based on 3-month LIBOR with Deutsche Bank | Jan. 2012 | | 75,000,000 | | 399,503 |
Swap Agreements - continued |
| Expiration Date | | Notional Amount | | Value |
Interest Rate Swaps - continued |
Receive semi-annually a fixed rate equal to 5.095% and pay quarterly a floating rate based on 3-month LIBOR with Bank of America | Feb. 2012 | | $ 15,000,000 | | $ 86,286 |
Receive semi-annually a fixed rate equal to 5.144% and pay quarterly a floating rate based on 3-month LIBOR with JPMorgan Chase, Inc. | April 2012 | | 100,000,000 | | 2,055,830 |
Receive semi-annually a fixed rate equal to 5.276% and pay quarterly a floating rate based on 3-month LIBOR with Deutsche Bank | April 2011 | | 20,000,000 | | 499,946 |
Receive semi-annually a fixed rate equal to 5.375% and pay quarterly a floating rate based on 3-month LIBOR with Deutsche Bank | April 2009 | | 30,000,000 | | 622,431 |
Receive semi-annually a fixed rate equal to 5.44% and pay quarterly a floating rate based on 3-month LIBOR with Morgan Stanley, Inc. | July 2012 | | 50,000,000 | | 1,048,405 |
Receive semi-annually a fixed rate equal to 5.556% and pay quarterly a floating rate based on 3-month LIBOR with JPMorgan Chase, Inc. | June 2012 | | 25,000,000 | | 632,030 |
Receive semi-annually a fixed rate equal to 5.636% and pay quarterly a floating rate based on 3-month LIBOR with Deutsche Bank | July 2009 | | 100,000,000 | | 1,374,470 |
Receive semi-annually a fixed rate equal to 5.6485% and pay quarterly a floating rate based on 3-month LIBOR with Deutsche Bank | July 2010 | | 100,000,000 | | 2,089,490 |
Receive semi-annually a fixed rate of 5.263% and pay quarterly a floating rate based on 3-month LIBOR with Credit Suisse First Boston | Feb. 2012 | | 50,000,000 | | 633,645 |
TOTAL INTEREST RATE SWAPS | | 693,635,000 | | 11,386,370 |
Total Return Swaps |
Receive monthly a return equal to Lehman Brothers CMBS U.S. Aggregate Index and pay monthly a floating rate based on 1-month LIBOR minus 17.5 basis points with Lehman Brothers, Inc. | Sept. 2007 | | 25,000,000 | | 213,037 |
| | $ 800,046,445 | | $ 5,885,439 |
Currency Abbreviation |
CAD | - | Canadian dollar |
Legend |
(a) Includes investment made with cash collateral received from securities on loan. |
(b) Principal amount is stated in United States dollars unless otherwise noted. |
(c) Security initially issued in zero coupon form which converts to coupon form at a specified rate and date. The rate shown is the rate at period end. |
(d) Security initially issued at one coupon which converts to a higher coupon at a specified date. The rate shown is the rate at period end. |
(e) Security or a portion of the security is on loan at period end. |
(f) Security exempt from registration under Rule 144A of the Securities Act of 1933. These securities may be resold in transactions exempt from registration, normally to qualified institutional buyers. At the end of the period, the value of these securities amounted to $167,313,939 or 2.4% of net assets. |
(g) Security or a portion of the security purchased on a delayed delivery or when-issued basis. |
(h) Represents a tradable index of credit default swaps on home equity asset-backed debt securities. |
(i) The coupon rate shown on floating or adjustable rate securities represents the rate at period end. |
(j) Affiliated fund that is available only to investment companies and other accounts managed by Fidelity Investments. A complete schedule of portfolio holdings for each Fidelity Central Fund is filed with the SEC for the first and third quarters of each fiscal year on Form N-Q and is available upon request or at the SEC's web site at www.sec.gov. A holdings listing for the Fund, which presents direct holdings as well as the pro rata share of securities and other investments held indirectly through its investment in underlying non-money market Fidelity Central Funds, is available at fidelity.com and/or advisor.fidelity.com, as applicable. In addition, each Fidelity Central Fund's financial statements, which are not covered by the Fund's Report of Independent Registered Public Accounting Firm, are available on the SEC's web site or upon request. |
(k) Security represents right to receive monthly interest payments on an underlying pool of mortgages or assets. Principal shown is the outstanding par amount of the pool held as of the end of the period. |
(l) Restricted securities - Investment in securities not registered under the Securities Act of 1933 (excluding 144A issues). At the end of the period, the value of restricted securities (excluding 144A issues) amounted to $404,420 or 0.0% of net assets. |
Additional information on each holding is as follows: |
Security | Acquisition Date | Acquisition Cost |
GMAC Commercial Mortgage Securities, Inc. Series 1999-C2I Class K, 6.481% 9/15/33 | 3/23/07 | $ 163,875 |
Real Estate Asset Liquidity Trust Series 2006-2: | | |
Class F, 4.456% 9/12/38 | 10/2/06 | $ 80,777 |
Class G, 4.456% 9/12/38 | 10/2/06 | $ 39,498 |
Class H, 4.456% 9/12/38 | 10/2/06 | $ 22,997 |
Class J, 4.456% 9/12/38 | 10/2/06 | $ 21,304 |
Class K, 4.456% 9/12/38 | 10/2/06 | $ 9,417 |
Class L, 4.456% 9/12/38 | 10/2/06 | $ 13,077 |
Class M, 4.456% 9/12/38 | 10/2/06 | $ 43,033 |
(m) Position represents an unfunded loan commitment. At period end, the total principal amount and market value of unfunded commitments totaled $67,440 and $65,080, respectively. The coupon rate will be determined at time of settlement. |
(n) Security or a portion of the security has been segregated as collateral for open swap agreements. At the period end, the value of securities pledged amounted to $2,322,101. |
# Additional Information on each counterparty to the repurchase agreement is as follows: |
Repurchase Agreement / Counterparty | Value |
$837,489,000 due 9/04/07 at 5.37% |
BNP Paribas Securities Corp. | $ 19,351,451 |
Banc of America Securities LLC | 296,559,731 |
Bank of America, NA | 133,293,735 |
Bear Stearns & Co., Inc. | 16,661,717 |
Citigroup Global Markets, Inc. | 52,550,488 |
Credit Suisse Securities (USA) LLC | 33,323,434 |
Greenwich Capital Markets, Inc. | 16,661,717 |
HSBC Securities (USA), Inc. | 33,323,434 |
ING Financial Markets LLC | 66,646,867 |
Societe Generale, New York Branch | 99,970,301 |
UBS Securities LLC | 32,490,348 |
WestLB AG | 36,655,777 |
| $ 837,489,000 |
| |
$1,094,510,000 due 9/04/07 at 5.40% |
Barclays Capital, Inc. | $ 701,415,186 |
Citigroup Global Markets, Inc. | 92,488,306 |
Countrywide Securities Corp. | 300,606,508 |
| $ 1,094,510,000 |
Affiliated Central Funds |
Information regarding fiscal year to date income earned by the Fund from investments in Fidelity Central Funds is as follows: |
Fund | Income earned |
Fidelity 1-3 Year Duration Securitized Bond Central Fund | $ 9,433,136 |
Fidelity 2-5 Year Duration Securitized Bond Central Fund | 10,921,434 |
Fidelity Corporate Bond 1-10 Year Central Fund | 22,886,151 |
Fidelity Floating Rate Central Fund | 10,658,722 |
Fidelity Mortgage Backed Securities Central Fund | 27,679,804 |
Fidelity Ultra-Short Central Fund | 37,981,161 |
Total | $ 119,560,408 |
Additional information regarding the Fund's fiscal year to date purchases and sales, including the ownership percentage, of the non Money Market Central Funds is as follows: |
Fund | Value, beginning
of period | Purchases | Sales
Proceeds | Value, end
of period | % ownership,
end of period |
Fidelity 1-3 Year Duration Securitized Bond Central Fund | $ - | $ 324,340,949* | $ - | $ 310,910,980 | 11.2% |
Fidelity 2-5 Year Duration Securitized Bond Central Fund | - | 408,884,453* | - | 402,255,147 | 10.6% |
Fidelity Corporate Bond 1-10 Year Central Fund | - | 771,624,458* | - | 763,168,246 | 10.7% |
Fidelity Floating Rate Central Fund | 66,958,885 | 169,996,782 | - | 228,686,671 | 9.8% |
Fidelity Mortgage Backed Securities Central Fund | - | 977,890,256* | - | 964,085,734 | 11.2% |
Fidelity Ultra-Short Central Fund | 414,088,852 | 709,578,811* | 194,768,516 | 875,572,723 | 7.0% |
Total | $ 481,047,737 | $ 3,362,315,709 | $ 194,768,516 | $ 3,544,679,501 | |
* Includes the value of shares received through in-kind contributions. See Note 6 of the Notes to
Financial Statements. |
See accompanying notes which are an integral part of the financial statements.
Annual Report
Financial Statements
Statement of Assets and Liabilities
| August 31, 2007 |
| | |
Assets | | |
Investment in securities, at value (including securities loaned of $1,065,421,563 and repurchase agreements of $1,931,999,000) -
See accompanying schedule: Unaffiliated issuers (cost $5,209,837,546) | $ 5,234,131,635 | |
Fidelity Central Funds (cost $3,624,184,607) | 3,544,679,501 | |
Total Investments (cost $8,834,022,153) | | $ 8,778,811,136 |
Cash | | 8,796,932 |
Receivable for investments sold | | 555,962 |
Receivable for swap agreements | | 30,594 |
Receivable for fund shares sold | | 35,451,678 |
Interest receivable | | 27,124,728 |
Distributions receivable from Fidelity Central Funds | | 17,762,000 |
Swap agreements, at value | | 5,885,439 |
Total assets | | 8,874,418,469 |
| | |
Liabilities | | |
Payable for investments purchased
Regular delivery | $ 31,629,273 | |
Delayed delivery | 826,128,255 | |
Payable for fund shares redeemed | 4,423,548 | |
Distributions payable | 999,688 | |
Accrued management fee | 1,751,324 | |
Distribution fees payable | 37,432 | |
Other affiliated payables | 759,523 | |
Other payables and accrued expenses | 156,385 | |
Collateral on securities loaned, at value | 1,094,510,000 | |
Total liabilities | | 1,960,395,428 |
| | |
Net Assets | | $ 6,914,023,041 |
Net Assets consist of: | | |
Paid in capital | | $ 6,957,656,017 |
Undistributed net investment income | | 4,530,397 |
Accumulated undistributed net realized gain (loss) on investments and foreign currency transactions | | 279,124 |
Net unrealized appreciation (depreciation) on investments and assets and liabilities in foreign currencies | | (48,442,497) |
Net Assets | | $ 6,914,023,041 |
See accompanying notes which are an integral part of the financial statements.
Annual Report
Statement of Assets and Liabilities - continued
| August 31, 2007 |
| | |
Calculation of Maximum Offering Price Class A:
Net Asset Value and redemption price per share ($48,075,763 ÷ 4,681,968 shares) | | $ 10.27 |
| | |
Maximum offering price per share (100/96.00 of $10.27) | | $ 10.70 |
Class T:
Net Asset Value and redemption price per share ($42,191,042 ÷ 4,112,625 shares) | | $ 10.26 |
| | |
Maximum offering price per share (100/96.00 of $10.26) | | $ 10.69 |
Class B:
Net Asset Value and offering price per share ($6,053,834 ÷ 589,436 shares)A | | $ 10.27 |
| | |
Class C:
Net Asset Value and offering price per share ($18,889,796 ÷ 1,839,636 shares)A | | $ 10.27 |
| | |
Total Bond:
Net Asset Value, offering price and redemption price per share ($6,450,176,834 ÷ 628,207,990 shares) | | $ 10.27 |
| | |
Institutional Class:
Net Asset Value, offering price and redemption price per share ($348,635,772 ÷ 33,986,027 shares) | | $ 10.26 |
A Redemption price per share is equal to net asset value less any applicable contingent deferred sales charge.
See accompanying notes which are an integral part of the financial statements.
Annual Report
Financial Statements - continued
Statement of Operations
| Year ended August 31, 2007 |
| | |
Investment Income | | |
Dividends | | $ 441,078 |
Interest | | 111,033,135 |
Income from Fidelity Central Funds | | 119,560,408 |
Total income | | 231,034,621 |
| | |
Expenses | | |
Management fee | $ 12,837,361 | |
Transfer agent fees | 4,159,017 | |
Distribution fees | 278,761 | |
Fund wide operations fee | 1,325,565 | |
Independent trustees' compensation | 11,741 | |
Miscellaneous | 9,476 | |
Total expenses before reductions | 18,621,921 | |
Expense reductions | (139,190) | 18,482,731 |
Net investment income | | 212,551,890 |
Realized and Unrealized Gain (Loss) Net realized gain (loss) on: | | |
Investment securities: | | |
Unaffiliated issuers | 7,720,985 | |
Fidelity Central Funds | (9,761,653) | |
Foreign currency transactions | (525) | |
Swap agreements | (4,037,675) | |
Capital gain distributions from Fidelity Central Funds | 58,264 | |
Total net realized gain (loss) | | (6,020,604) |
Change in net unrealized appreciation (depreciation) on: Investment securities: | | |
Unaffiliated issuers | 6,335,305 | |
Fidelity Central Funds | (94,146,335) | |
Assets and liabilities in foreign currencies | (2,128) | |
Swap agreements | 2,546,994 | |
Total change in net unrealized appreciation (depreciation) | | (85,266,164) |
Net gain (loss) | | (91,286,768) |
Net increase (decrease) in net assets resulting from operations | | $ 121,265,122 |
See accompanying notes which are an integral part of the financial statements.
Annual Report
Statement of Changes in Net Assets
| Year ended
August 31,
2007 | One month ended
August 31,
2006* | Year ended
July 31,
2006 |
Increase (Decrease) in Net Assets | | | |
Operations | | | |
Net investment income | $ 212,551,890 | $ 10,616,308 | $ 35,183,424 |
Net realized gain (loss) | (6,020,604) | 1,659,188 | (5,912,496) |
Change in net unrealized appreciation (depreciation) | (85,266,164) | 23,254,821 | 12,947,897 |
Net increase (decrease) in net assets resulting from operations | 121,265,122 | 35,530,317 | 42,218,825 |
Distributions to shareholders from net investment income | (198,338,706) | (9,317,974) | (31,840,595) |
Distributions to shareholders from net realized gain | (4,857,769) | - | (1,679,853) |
Total distributions | (203,196,475) | (9,317,974) | (33,520,448) |
Share transactions - net increase (decrease) | 4,556,920,613 | 92,507,042 | 1,879,857,353 |
Total increase (decrease) in net assets | 4,474,989,260 | 118,719,385 | 1,888,555,730 |
| | | |
Net Assets | | | |
Beginning of period | 2,439,033,781 | 2,320,314,396 | 431,758,666 |
End of period (including undistributed net investment income of $4,530,397, $5,573,349 and $2,168,613, respectively) | $ 6,914,023,041 | $ 2,439,033,781 | $ 2,320,314,396 |
* The Fund changed its fiscal year end from July 31 to August 31, effective August 31, 2006.
See accompanying notes which are an integral part of the financial statements.
Annual Report
Financial Highlights - Class A
Years ended August 31, | 2007 | 2006 I | 2006 M | 2005 M | 2004 J |
Selected Per-Share Data | | | | | |
Net asset value, beginning of period | $ 10.39 | $ 10.28 | $ 10.57 | $ 10.46 | $ 10.31 |
Income from Investment Operations | | | | | |
Net investment income E | .508 | .043 | .476 | .387 | .046 |
Net realized and unrealized gain (loss) | (.141) | .105 | (.294) H | .183 | .145 |
Total from investment operations | .367 | .148 | .182 | .570 | .191 |
Distributions from net investment income | (.470) | (.038) | (.432) | (.370) | (.041) |
Distributions from net realized gain | (.017) | - | (.040) | (.090) | - |
Total distributions | (.487) | (.038) | (.472) | (.460) | (.041) |
Net asset value, end of period | $ 10.27 | $ 10.39 | $ 10.28 | $ 10.57 | $ 10.46 |
Total Return B, C, D | 3.57% | 1.44% | 1.78% | 5.52% | 1.85% |
Ratios to Average Net Assets F, K | | | | |
Expenses before reductions | .77% | .73% A | .79% | .96% | .87% A |
Expenses net of fee waivers, if any | .77% | .73% A | .79% | .80% | .80% A |
Expenses net of all reductions | .77% | .73% A | .79% | .80% | .80% A |
Net investment income | 4.93% | 4.98% A | 4.61% | 3.69% | 3.51% A |
Supplemental Data | | | | | |
Net assets, end of period
(000 omitted) | $ 48,076 | $ 6,780 | $ 4,545 | $ 2,974 | $ 102 |
Portfolio turnover rate G | 116% L | 53% A | 99% | 193% | 251% |
A Annualized
B Total returns for periods of less than one year are not annualized.
C Total returns would have been lower had certain expenses not been reduced during the periods shown.
D Total returns do not include the effect of the sales charges.
E Calculated based on average shares outstanding during the period.
F Fees and expenses of the underlying Fidelity Central Funds are not included in the Fund's expense ratio. The Fund indirectly bears its proportionate share of the expenses of any underlying Fidelity Central Funds.
G Amount does not include the portfolio activity of any underlying Fidelity Central Funds.
H The amount shown for a share outstanding does not correspond with the aggregate net gain (loss) on investments for the period due to the timing of sales and repurchases of shares in relation to fluctuating market values of the investments of the Fund.
I For the one month period ended August 31. The Fund changed its fiscal year from July 31 to August 31, effective August 31, 2006.
J For the period June 16, 2004 (commencement of sale of shares) to July 31, 2004.
K Expense ratios reflect operating expenses of the class. Expenses before reductions do not reflect amounts reimbursed by the investment adviser or expense offset arrangements and do not represent the amount paid by the class during periods when reimbursements or reductions occur. Expense ratios before reductions for start-up periods may not be representative of longer-term operating periods. Expenses net of fee waivers reflect expenses after reimbursement by the investment adviser but prior to reductions from expense offset arrangements. Expenses net of all reductions represent the net expenses paid by the class.
L Portfolio turnover rate excludes securities received or delivered through non-taxable in-kind activity.
M For the period ended July 31.
See accompanying notes which are an integral part of the financial statements.
Annual Report
Financial Highlights - Class T
Years ended August 31, | 2007 | 2006 I | 2006 M | 2005 M | 2004 J |
Selected Per-Share Data | | | | | |
Net asset value, beginning of period | $ 10.38 | $ 10.27 | $ 10.56 | $ 10.46 | $ 10.31 |
Income from Investment Operations | | | | | |
Net investment income E | .508 | .042 | .466 | .377 | .045 |
Net realized and unrealized gain (loss) | (.143) | .105 | (.296) H | .173 | .144 |
Total from investment operations | .365 | .147 | .170 | .550 | .189 |
Distributions from net investment income | (.468) | (.037) | (.420) | (.360) | (.039) |
Distributions from net realized gain | (.017) | - | (.040) | (.090) | - |
Total distributions | (.485) | (.037) | (.460) | (.450) | (.039) |
Net asset value, end of period | $ 10.26 | $ 10.38 | $ 10.27 | $ 10.56 | $ 10.46 |
Total Return B, C, D | 3.55% | 1.43% | 1.66% | 5.33% | 1.84% |
Ratios to Average Net Assets F, K | | | | | |
Expenses before reductions | .78% | .87% A | .91% | 1.13% | .96% A |
Expenses net of fee waivers, if any | .78% | .87% A | .90% | .90% | .90% A |
Expenses net of all reductions | .78% | .87% A | .90% | .90% | .90% A |
Net investment income | 4.92% | 4.84% A | 4.50% | 3.59% | 3.41% A |
Supplemental Data | | | | | |
Net assets, end of period
(000 omitted) | $ 42,191 | $ 6,293 | $ 4,583 | $ 5,739 | $ 102 |
Portfolio turnover rate G | 116% L | 53% A | 99% | 193% | 251% |
A Annualized
B Total returns for periods of less than one year are not annualized.
C Total returns would have been lower had certain expenses not been reduced during the periods shown.
D Total returns do not include the effect of the sales charges.
E Calculated based on average shares outstanding during the period.
F Fees and expenses of the underlying Fidelity Central Funds are not included in the Fund's expense ratio. The Fund indirectly bears its proportionate share of the expenses of any underlying Fidelity Central Funds.
G Amount does not include the portfolio activity of any underlying Fidelity Central Funds.
H The amount shown for a share outstanding does not correspond with the aggregate net gain (loss) on investments for the period due to the timing of sales and repurchases of shares in relation to fluctuating market values of the investments of the Fund.
I For the one month period ended August 31. The Fund changed its fiscal year from July 31 to August 31, effective August 31, 2006.
J For the period June 16, 2004 (commencement of sale of shares) to July 31, 2004.
K Expense ratios reflect operating expenses of the class. Expenses before reductions do not reflect amounts reimbursed by the investment adviser or expense offset arrangements and do not represent the amount paid by the class during periods when reimbursements or reductions occur. Expense ratios before reductions for start-up periods may not be representative of longer-term operating periods. Expenses net of fee waivers reflect expenses after reimbursement by the investment adviser but prior to reductions from expense offset arrangements. Expenses net of all reductions represent the net expenses paid by the class.
L Portfolio turnover rate excludes securities received or delivered through non-taxable in-kind activity.
M For the period ended July 31.
See accompanying notes which are an integral part of the financial statements.
Annual Report
Financial Highlights - Class B
Years ended August 31, | 2007 | 2006 I | 2006 M | 2005 M | 2004 J |
Selected Per-Share Data | | | | | |
Net asset value, beginning of period | $ 10.39 | $ 10.28 | $ 10.57 | $ 10.46 | $ 10.31 |
Income from Investment Operations | | | | | |
Net investment income E | .432 | .037 | .399 | .309 | .036 |
Net realized and unrealized gain (loss) | (.145) | .104 | (.296) H | .182 | .145 |
Total from investment operations | .287 | .141 | .103 | .491 | .181 |
Distributions from net investment income | (.390) | (.031) | (.353) | (.291) | (.031) |
Distributions from net realized gain | (.017) | - | (.040) | (.090) | - |
Total distributions | (.407) | (.031) | (.393) | (.381) | (.031) |
Net asset value, end of period | $ 10.27 | $ 10.39 | $ 10.28 | $ 10.57 | $ 10.46 |
Total Return B, C, D | 2.77% | 1.38% | 1.01% | 4.74% | 1.76% |
Ratios to Average Net Assets F, K | | | | | |
Expenses before reductions | 1.53% | 1.51% A | 1.59% | 1.75% | 1.62% A |
Expenses net of fee waivers, if any | 1.53% | 1.51% A | 1.55% | 1.55% | 1.55% A |
Expenses net of all reductions | 1.53% | 1.51% A | 1.55% | 1.55% | 1.55% A |
Net investment income | 4.17% | 4.22% A | 3.85% | 2.94% | 2.76% A |
Supplemental Data | | | | | |
Net assets, end of period
(000 omitted) | $ 6,054 | $ 1,720 | $ 1,667 | $ 2,029 | $ 104 |
Portfolio turnover rate G | 116% L | 53% A | 99% | 193% | 251% |
A Annualized
B Total returns for periods of less than one year are not annualized.
C Total returns would have been lower had certain expenses not been reduced during the periods shown.
D Total returns do not include the effect of the contingent deferred sales charge.
E Calculated based on average shares outstanding during the period.
F Fees and expenses of the underlying Fidelity Central Funds are not included in the Fund's expense ratio. The Fund indirectly bears its proportionate share of the expenses of any underlying Fidelity Central Funds.
G Amount does not include the portfolio activity of any underlying Fidelity Central Funds.
H The amount shown for a share outstanding does not correspond with the aggregate net gain (loss) on investments for the period due to the timing of sales and repurchases of shares in relation to fluctuating market values of the investments of the Fund.
I For the one month period ended August 31. The Fund changed its fiscal year from July 31 to August 31, effective August 31, 2006.
J For the period June 16, 2004 (commencement of sale of shares) to July 31, 2004.
K Expense ratios reflect operating expenses of the class. Expenses before reductions do not reflect amounts reimbursed by the investment adviser or expense offset arrangements and do not represent the amount paid by the class during periods when reimbursements or reductions occur. Expense ratios before reductions for start-up periods may not be representative of longer-term operating periods. Expenses net of fee waivers reflect expenses after reimbursement by the investment adviser but prior to reductions from expense offset arrangements. Expenses net of all reductions represent the net expenses paid by the class.
L Portfolio turnover rate excludes securities received or delivered through non-taxable in-kind activity.
M For the period ended July 31.
See accompanying notes which are an integral part of the financial statements.
Annual Report
Financial Highlights - Class C
Years ended August 31, | 2007 | 2006 I | 2006 M | 2005 M | 2004 J |
Selected Per-Share Data | | | | | |
Net asset value, beginning of period | $ 10.39 | $ 10.28 | $ 10.57 | $ 10.46 | $ 10.31 |
Income from Investment Operations | | | | | |
Net investment income E | .429 | .036 | .389 | .299 | .035 |
Net realized and unrealized gain (loss) | (.145) | .105 | (.293) H | .181 | .145 |
Total from investment operations | .284 | .141 | .096 | .480 | .180 |
Distributions from net investment income | (.387) | (.031) | (.346) | (.280) | (.030) |
Distributions from net realized gain | (.017) | - | (.040) | (.090) | - |
Total distributions | (.404) | (.031) | (.386) | (.370) | (.030) |
Net asset value, end of period | $ 10.27 | $ 10.39 | $ 10.28 | $ 10.57 | $ 10.46 |
Total Return B, C, D | 2.75% | 1.37% | .94% | 4.63% | 1.74% |
Ratios to Average Net Assets F, K | | | | | |
Expenses before reductions | 1.55% | 1.60% A | 1.62% | 1.74% | 1.74% A |
Expenses net of fee waivers, if any | 1.55% | 1.60% A | 1.62% | 1.65% | 1.65% A |
Expenses net of all reductions | 1.55% | 1.60% A | 1.62% | 1.65% | 1.65% A |
Net investment income | 4.15% | 4.13% A | 3.78% | 2.84% | 2.66% A |
Supplemental Data | | | | | |
Net assets, end of period
(000 omitted) | $ 18,890 | $ 2,106 | $ 1,770 | $ 677 | $ 142 |
Portfolio turnover rate G | 116% L | 53% A | 99% | 193% | 251% |
A Annualized
B Total returns for periods of less than one year are not annualized.
C Total returns would have been lower had certain expenses not been reduced during the periods shown.
D Total returns do not include the effect of the contingent deferred sales charge.
E Calculated based on average shares outstanding during the period.
F Fees and expenses of the underlying Fidelity Central Funds are not included in the Fund's expense ratio. The Fund indirectly bears its proportionate share of the expenses of any underlying Fidelity Central Funds.
G Amount does not include the portfolio activity of any underlying Fidelity Central Funds.
H The amount shown for a share outstanding does not correspond with the aggregate net gain (loss) on investments for the period due to the timing of sales and repurchases of shares in relation to fluctuating market values of the investments of the Fund.
I For the one month period ended August 31. The Fund changed its fiscal year from July 31 to August 31, effective August 31, 2006.
J For the period June 16, 2004 (commencement of sale of shares) to July 31, 2004.
K Expense ratios reflect operating expenses of the class. Expenses before reductions do not reflect amounts reimbursed by the investment adviser or expense offset arrangements and do not represent the amount paid by the class during periods when reimbursements or reductions occur. Expense ratios before reductions for start-up periods may not be representative of longer-term operating periods. Expenses net of fee waivers reflect expenses after reimbursement by the investment adviser but prior to reductions from expense offset arrangements. Expenses net of all reductions represent the net expenses paid by the class.
L Portfolio turnover rate excludes securities received or delivered through non-taxable in-kind activity.
M For the period ended July 31.
See accompanying notes which are an integral part of the financial statements.
Annual Report
Financial Highlights - Total Bond
Years ended August 31, | 2007 | 2006 I | 2006 L | 2005 L | 2004 L | 2003 H |
Selected Per-Share Data | | | | | | |
Net asset value, beginning of period | $ 10.39 | $ 10.28 | $ 10.57 | $ 10.46 | $ 10.28 | $ 10.00 |
Income from Investment Operations | | | | | | |
Net investment income D | .543 | .046 | .506 | .411 | .340 | .232 |
Net realized and unrealized gain (loss) | (.143) | .105 | (.290) G | .182 | .237 | .269 |
Total from investment operations | .400 | .151 | .216 | .593 | .577 | .501 |
Distributions from net investment income | (.503) | (.041) | (.466) | (.393) | (.337) | (.221) |
Distributions from net realized gain | (.017) | - | (.040) | (.090) | (.060) | - |
Total distributions | (.520) | (.041) | (.506) | (.483) | (.397) | (.221) |
Net asset value, end of period | $ 10.27 | $ 10.39 | $ 10.28 | $ 10.57 | $ 10.46 | $ 10.28 |
Total Return B, C | 3.89% | 1.46% | 2.11% | 5.75% | 5.68% | 5.01% |
Ratios to Average Net Assets E, J | | | | | |
Expenses before reductions | .45% | .45% A | .45% | .64% | .75% | 1.01% A |
Expenses net of fee waivers, if any | .45% | .45% A | .45% | .61% | .65% | .65% A |
Expenses net of all reductions | .45% | .45% A | .45% | .61% | .65% | .65% A |
Net investment income | 5.25% | 5.26% A | 4.95% | 3.87% | 3.25% | 2.83% A |
Supplemental Data | | | | | | |
Net assets, end of period (000 omitted) | $ 6,450,177 | $ 2,421,077 | $ 2,306,817 | $ 420,225 | $ 373,699 | $ 80,816 |
Portfolio turnover rate F | 116% K | 53% A | 99% | 193% | 251% | 423% A |
A Annualized
B Total returns for periods of less than one year are not annualized.
C Total returns would have been lower had certain expenses not been reduced during the periods shown.
D Calculated based on average shares outstanding during the period.
E Fees and expenses of the underlying Fidelity Central Funds are not included in the Fund's expense ratio. The Fund indirectly bears its proportionate share of the expenses of any underlying Fidelity Central Funds.
F Amount does not include the portfolio activity of any underlying Fidelity Central Funds.
G The amount shown for a share outstanding does not correspond with the aggregate net gain (loss) on investments for the period due to the timing of sales and repurchases of shares in relation to fluctuating market values of the investments of the Fund.
H For the period October 15, 2002 (commencement of operations) to July 31, 2003.
I For the one month period ended August 31. The Fund changed its fiscal year from July 31 to August 31, effective August 31, 2006.
J Expense ratios reflect operating expenses of the class. Expenses before reductions do not reflect amounts reimbursed by the investment adviser or expense offset arrangements and do not represent the amount paid by the class during periods when reimbursements or reductions occur. Expense ratios before reductions for start-up periods may not be representative of longer-term operating periods. Expenses net of fee waivers reflect expenses after reimbursement by the investment adviser but prior to reductions from expense offset arrangements. Expenses net of all reductions represent the net expenses paid by the class.
K Portfolio turnover rate excludes securities received or delivered through non-taxable in-kind activity.
L For the period ended July 31.
See accompanying notes which are an integral part of the financial statements.
Annual Report
Financial Highlights - Institutional Class
Years ended August 31, | 2007 | 2006 H | 2006 L | 2005 L | 2004 I |
Selected Per-Share Data | | | | | |
Net asset value, beginning of period | $ 10.38 | $ 10.27 | $ 10.57 | $ 10.46 | $ 10.31 |
Income from Investment Operations | | | | | |
Net investment income D | .527 | .045 | .493 | .410 | .048 |
Net realized and unrealized gain (loss) | (.134) | .105 | (.294) G | .182 | .145 |
Total from investment operations | .393 | .150 | .199 | .592 | .193 |
Distributions from net investment income | (.496) | (.040) | (.459) | (.392) | (.043) |
Distributions from net realized gain | (.017) | - | (.040) | (.090) | - |
Total distributions | (.513) | (.040) | (.499) | (.482) | (.043) |
Net asset value, end of period | $ 10.26 | $ 10.38 | $ 10.27 | $ 10.57 | $ 10.46 |
Total Return B, C | 3.83% | 1.46% | 1.95% | 5.74% | 1.87% |
Ratios to Average Net Assets E, J | | | | | |
Expenses before reductions | .50% | .54% A | .56% | .62% | .71% A |
Expenses net of fee waivers, if any | .50% | .54% A | .56% | .62% | .65% A |
Expenses net of all reductions | .49% | .54% A | .56% | .61% | .65% A |
Net investment income | 5.21% | 5.16% A | 4.84% | 3.87% | 3.66% A |
Supplemental Data | | | | | |
Net assets, end of period
(000 omitted) | $ 348,636 | $ 1,058 | $ 933 | $ 114 | $ 102 |
Portfolio turnover rate F | 116% K | 53% A | 99% | 193% | 251% |
A Annualized
B Total returns for periods of less than one year are not annualized.
C Total returns would have been lower had certain expenses not been reduced during the periods shown.
D Calculated based on average shares outstanding during the period.
E Fees and expenses of the underlying Fidelity Central Funds are not included in the Fund's expense ratio. The Fund indirectly bears its proportionate share of the expenses of any underlying Fidelity Central Funds.
F Amount does not include the portfolio activity of any underlying Fidelity Central Funds.
G The amount shown for a share outstanding does not correspond with the aggregate net gain (loss) on investments for the period due to the timing of sales and repurchases of shares in relation to fluctuating market values of the investments of the Fund.
H For the one month period ended August 31. The Fund changed its fiscal year from July 31 to August 31, effective August 31, 2006.
I For the period June 16, 2004 (commencement of sale of shares) to July 31, 2004.
J Expense ratios reflect operating expenses of the class. Expenses before reductions do not reflect amounts reimbursed by the investment adviser or expense offset arrangements and do not represent the amount paid by the class during periods when reimbursements or reductions occur. Expense ratios before reductions for start-up periods may not be representative of longer-term operating periods. Expenses net of fee waivers reflect expenses after reimbursement by the investment adviser but prior to reductions from expense offset arrangements. Expenses net of all reductions represent the net expenses paid by the class.
K Portfolio turnover rate excludes securities received or delivered through non-taxable in-kind activity.
L For the period ended July 31.
See accompanying notes which are an integral part of the financial statements.
Annual Report
Notes to Financial Statements
For the period ended August 31, 2007
1. Organization.
Fidelity Total Bond Fund (the Fund) is a non-diversified fund of Fidelity Income Fund (the trust) and is authorized to issue an unlimited number of shares. The trust is registered under the Investment Company Act of 1940, as amended (the 1940 Act), as an open-end management investment company organized as a Massachusetts business trust.
The Fund offers Class A, Class T, Class B, Class C, Total Bond and Institutional Class shares, each of which has equal rights as to assets and voting privileges. Each class has exclusive voting rights with respect to matters that affect that class. Class B shares will automatically convert to Class A shares after a holding period of seven years from the initial date of purchase. Investment income, realized and unrealized capital gains and losses, the common expenses of the Fund, and certain fund-level expense reductions, if any, are allocated on a pro rata basis to each class based on the relative net assets of each class to the total net assets of the Fund. Each class differs with respect to transfer agent and distribution and service plan fees incurred. Certain expense reductions also differ by class.
2. Investments in Fidelity Central Funds.
The Fund may invest in Fidelity Central Funds which are open-end investment companies available only to other investment companies and accounts managed by Fidelity Management & Research Company (FMR) and its affiliates. The Fund's Schedule of Investments lists each of the Fidelity Central Funds as an investment of the Fund, but does not include the underlying holdings of each Fidelity Central Fund. As an Investing Fund, the Fund indirectly bears its proportionate share of the expenses of the underlying Fidelity Central Funds.
Based on their investment objective, each Fidelity Central Fund may invest or participate in various investment vehicles or strategies that are similar to those of the Fund. These strategies are consistent with the investment objectives of the Fund and may involve certain economic risks which may cause a decline in value of each of the Fidelity Central Funds and thus a decline in the value of the Fund. The following summarizes the Fund's investment in each Fidelity Central Fund.
Annual Report
2. Investments in Fidelity Central Funds - continued
Fidelity Central Fund | Investment Manager | Investment Objective | Investment Practices |
Fidelity 1-3 Year Duration Securitized Bond Central Fund | Fidelity Investment Money Management, Inc. (FIMM) | Seeks a high level of income by normally investing in investment-grade securitized debt securities and repurchase agreements for those securities. | Futures Repurchase Agreements Restricted Securities Swap Agreements |
Fidelity 2-5 Year Duration Securitized Bond Central Fund | FIMM | Seeks a high level of income by normally investing in investment-grade securitized debt securities and repurchase agreements for those securities. | Repurchase Agreements Restricted Securities Swap Agreements |
Fidelity Corporate Bond 1-10 Year Central Fund | FIMM | Seeks a high level of income by normally investing in investment-grade corporate bonds and other corporate debt securities and repurchase agreements for those securities. | Repurchase Agreements Restricted Securities Swap Agreements |
Fidelity Floating Rate Central Fund | Fidelity Management & Research Company, Inc. (FMRC) | Seeks a high level of income by normally investing in floating rate loans and other floating rate securities. | Loans & Direct Debt Instruments Repurchase Agreements Restricted Securities |
Fidelity Mortgage Backed Securities Central Fund | FIMM | Seeks a high level of income by normally investing in investment-grade mortgage-related securities and repurchase agreements for those securities. | Delayed Delivery & When Issued Securities Mortgage Dollar Rolls Repurchase Agreements Swap Agreements |
Fidelity Ultra-Short Central Fund | FIMM | Seeks to obtain a high level of current income consistent with preservation of capital by investing in U.S. dollar denominated money market and investment-grade debt securities. | Futures Mortgage Dollar Rolls Repurchase Agreements Restricted Securities Swap Agreements |
Annual Report
Notes to Financial Statements - continued
2. Investments in Fidelity Central Funds - continued
The Central Funds may invest a portion of their assets in securities of issuers that hold mortgage securities, including subprime mortgage securities. The value of these securities is sensitive to changes in economic conditions, including delinquencies and/or defaults, and may be adversely affected by shifts in the market's perception of the issuers and changes in interest rates.
A holdings listing for the Fund, which presents direct holdings as well as the pro rata share of any securities and other investments held indirectly through its investment in underlying non-money market Fidelity Central Funds, is available at fidelity.com and/or advisor.fidelity.com, as applicable. A complete list of holdings for each Fidelity Central Fund is available upon request or at the SEC's web site at www.sec.gov. In addition, the financial statements of the Fidelity Central Funds, which are not covered by the Fund's Report of Independent Registered Public Accounting Firm, are available on the SEC's web site or upon request.
3. Significant Accounting Policies.
The financial statements have been prepared in conformity with accounting principles generally accepted in the United States of America, which require management to make certain estimates and assumptions at the date of the financial statements. The following summarizes the significant accounting policies of the Fund:
Security Valuation. Investments are valued and net asset value per share is calculated (NAV calculation) as of the close of business of the New York Stock Exchange, normally 4:00 p.m. Eastern time. Wherever possible, the Fund uses independent pricing services approved by the Board of Trustees to value its investments. Debt securities, including restricted securities, for which quotations are readily available, are valued by independent pricing services or by dealers who make markets in such securities. Pricing services consider yield or price of bonds of comparable quality, coupon, maturity and type as well as available dealer supplied prices. Certain of the Fund's securities may be valued by a single source or dealer.
Equity securities, including restricted securities, for which market quotations are readily available, are valued at the last reported sale price or official closing price as reported by an independent pricing service on the primary market or exchange on which they are traded. In the event there were no sales during the day or closing prices are not available, securities are valued at the last quoted bid price.
When current market prices or quotations are not readily available or do not accurately reflect fair value, valuations may be determined in accordance with procedures adopted by the Board of Trustees. Factors used in the determination of fair value may include current market trading activity, interest rates, credit quality and default rates. The frequency of when fair value pricing is used is unpredictable. The value of securities used for NAV calculation under fair value pricing may differ from published prices for the same securities. Investments in open-end mutual funds, including the Fidelity Central Funds, are valued at their closing net asset value each business day. Short-term securities with remaining maturities of sixty days or less for which quotations are not readily available are valued at amortized cost, which approximates value.
Annual Report
3. Significant Accounting Policies -continued
Foreign Currency. The Fund uses foreign currency contracts to facilitate transactions in foreign-denominated securities. Losses from these transactions may arise from changes in the value of the foreign currency or if the counterparties do not perform under the contracts' terms.
Foreign-denominated assets, including investment securities, and liabilities are translated into U.S. dollars at the exchange rate at period end. Purchases and sales of investment securities, income and dividends received and expenses denominated in foreign currencies are translated into U.S. dollars at the exchange rate in effect on the transaction date.
The effects of exchange rate fluctuations on investments are included with the net realized and unrealized gain (loss) on investment securities. Other foreign currency transactions resulting in realized and unrealized gain (loss) are disclosed separately.
Investment Transactions and Income. For financial reporting purposes, the Fund's investment holdings and NAV include trades executed through the end of the last business day of the period. The NAV for processing shareholder transactions includes trades executed through the end of the prior business day. Gains and losses on securities sold are determined on the basis of identified cost. Dividend income is recorded on the ex-dividend date, except for certain dividends from foreign securities where the ex-dividend date may have passed, which are recorded as soon as the Fund is informed of the ex-dividend date. Non-cash dividends included in dividend income, if any, are recorded at the fair market value of the securities received. Interest income and income and capital gain distributions from the Fidelity Central Funds are accrued as earned. Interest income includes coupon interest and amortization of premium and accretion of discount on debt securities. Investment income is recorded net of foreign taxes withheld where recovery of such taxes is uncertain.
Expenses. Most expenses of the trust can be directly attributed to a fund. Expenses which cannot be directly attributed are apportioned among each Fund in the trust. Expense estimates are accrued in the period to which they relate and adjustments are made when actual amounts are known.
Income Tax Information and Distributions to Shareholders. Each year, the Fund intends to qualify as a regulated investment company by distributing all of its taxable income and realized gains under Subchapter M of the Internal Revenue Code. As a result, no provision for income taxes is required in the accompanying financial statements. Foreign taxes are provided for based on the Fund's understanding of the tax rules and rates that exist in the foreign markets in which it invests.
Annual Report
Notes to Financial Statements - continued
3. Significant Accounting Policies - continued
Income Tax Information and Distributions to Shareholders - continued
Dividends are declared daily and paid monthly from net investment income. Distributions from realized gains, if any, are recorded on the ex-dividend date. Income dividends and capital gain distributions are declared separately for each class. Income and capital gain distributions are determined in accordance with income tax regulations, which may differ from generally accepted accounting principles. In addition, the Fund will claim a portion of the payment made to redeeming shareholders as a distribution for income tax purposes.
Capital accounts within the financial statements are adjusted for permanent book-tax differences. Certain adjustments have been made to the accounts relating to prior periods. Collectively, these adjustments have no impact on net assets or the results of operations. Temporary book-tax differences will reverse in a subsequent period.
Book-tax differences are primarily due to swap agreements, foreign currency transactions, market discount, partnerships (including allocations from Fidelity Central Funds), financing transactions, capital loss carryforwards, the short-term gain distributions from the Fidelity Central Funds and losses deferred due to wash sales and excise tax regulations.
The tax-basis components of distributable earnings and the federal tax cost as of period end were as follows:
Unrealized appreciation | $ 70,358,198 |
Unrealized depreciation | (116,469,586) |
Net unrealized appreciation (depreciation) | (46,111,388) |
Undistributed ordinary income | 4,698,470 |
| |
Cost for federal income tax purposes | $ 8,824,922,524 |
The tax character of distributions paid was as follows:
| August 31,
2007 | One month ended
August 31,
2006 | July 31,
2006 |
| | | |
Ordinary Income | $ 203,196,475 | $ 9,317,974 | $ 32,890,503 |
Long-term Capital Gains | - | - | 629,945 |
Total | $ 203,196,475 | $ 9,317,974 | $ 33,520,448 |
Annual Report
3. Significant Accounting Policies -continued
New Accounting Pronouncements. In July 2006, Financial Accounting Standards Board Interpretation No. 48, Accounting for Uncertainty in Income Taxes - an interpretation of FASB Statement 109 (FIN 48), was issued and is effective on the last business day of the semiannual reporting period for fiscal years beginning after December 15, 2006. FIN 48 sets forth a threshold for financial statement recognition, measurement and disclosure of a tax position taken or expected to be taken on a tax return. Management has concluded that the adoption of FIN 48 will not result in a material impact on the Fund's net assets, results of operations and financial statement disclosures.
In addition, in September 2006, Statement of Financial Accounting Standards No. 157, Fair Value Measurements (SFAS 157), was issued and is effective for fiscal years beginning after November 15, 2007. SFAS 157 defines fair value, establishes a framework for measuring fair value and expands disclosures about fair value measurements. Management is currently evaluating the impact the adoption of SFAS 157 will have on the Fund's financial statement disclosures.
4. Operating Policies.
Repurchase Agreements. FMR has received an Exemptive Order from the Securities and Exchange Commission (the SEC) which permits the Fund and other affiliated entities of FMR to transfer uninvested cash balances into joint trading accounts which are then invested in repurchase agreements. The Fund may also invest directly with institutions in repurchase agreements. Repurchase agreements are collateralized by government or non-government securities. Upon settlement date, collateral is held in segregated accounts with custodian banks and may be obtained in the event of a default of the counterparty. The Fund monitors, on a daily basis, the value of the collateral to ensure it is at least equal to the principal amount of the repurchase agreement (including accrued interest). In the event of a default by the counterparty, realization of the collateral proceeds could be delayed, during which time the value of the collateral may decline.
Delayed Delivery Transactions and When-Issued Securities. The Fund may purchase or sell securities on a delayed delivery or when-issued basis. Payment and delivery may take place after the customary settlement period for that security. The price of the underlying securities and the date when the securities will be delivered and paid for are fixed at the time the transaction is negotiated. During the time a delayed delivery sell is outstanding, the contract is marked-to-market daily and equivalent deliverable securities are held for the transaction. The value of the securities purchased on a delayed delivery or when-issued basis are identified as such in the Fund's Schedule of Investments. The Fund may receive compensation for interest forgone in the purchase of a delayed delivery or when-issued security. With respect to purchase commitments, the
Annual Report
Notes to Financial Statements - continued
4. Operating Policies -continued
Delayed Delivery Transactions and When-Issued Securities - continued
Fund identifies securities as segregated in its records with a value at least equal to the amount of the commitment. Losses may arise due to changes in the value of the underlying securities or if the counterparty does not perform under the contract's terms, or if the issuer does not issue the securities due to political, economic, or other factors.
Restricted Securities. The Fund may invest in securities that are subject to legal or contractual restrictions on resale. These securities generally may be resold in transactions exempt from registration or to the public if the securities are registered. Disposal of these securities may involve time-consuming negotiations and expense, and prompt sale at an acceptable price may be difficult. Information regarding restricted securities is included at the end of the Fund's Schedule of Investments.
Loans and Other Direct Debt Instruments. The Fund may invest in loans and loan participations, trade claims or other receivables. These investments may include standby financing commitments, including revolving credit facilities, that obligate the Fund to supply additional cash to the borrower on demand. Loan participations involve a risk of insolvency of the lending bank or other financial intermediary. The Fund may be contractually obligated to receive approval from the agent bank and/or borrower prior to the sale of these investments. At the end of the period, the Fund had unfunded loan commitments of $67,440.
Swap Agreements. The Fund may invest in swaps for the purpose of managing its exposure to interest rate, credit or market risk.
Interest rate swaps are agreements to exchange cash flows periodically based on a notional principal amount, for example, the exchange of fixed rate interest payments for floating rate interest payments. The primary risk associated with interest rate swaps is that unfavorable changes in the fluctuation of interest rates could adversely impact a fund.
Total return swaps are agreements to exchange the return generated by one instrument or index for the return generated by another instrument, for example, the agreement to pay interest in exchange for a market-linked return based on a notional amount. To the extent the total return of the index exceeds the offsetting interest obligation, a fund will receive a payment from the counterparty. To the extent it is less, a fund will make a payment to the counterparty.
Credit default swaps involve the exchange of a fixed rate premium for protection against the loss in value of an underlying debt instrument in the event of a defined credit event (such as payment default or bankruptcy). Under the terms of the swap, one party acts as
Annual Report
4. Operating Policies -continued
Swap Agreements - continued
a "guarantor" receiving a periodic payment that is a fixed percentage applied to a notional principal amount. In return the party agrees to purchase the notional amount of the underlying instrument, at par, if a credit event occurs during the term of the swap. The Fund may enter into credit default swaps in which either it or its counterparty act as guarantors. By acting as the guarantor of a swap, a fund assumes the market and credit risk of the underlying instrument including liquidity and loss of value.
Swaps are marked-to-market daily based on dealer-supplied valuations and changes in value are recorded as unrealized appreciation (depreciation). Periodic payments and premiums received or made by the Fund are recorded in the accompanying Statement of Operations as realized gains or losses, respectively. Gains or losses are realized upon early termination of the swap agreement. Collateral, in the form of cash or securities, may be required to be held in segregated accounts with a fund's custodian in compliance with swap contracts. Risks may exceed amounts recognized on the Statement of Assets and Liabilities. These risks include changes in the returns of the underlying instruments, failure of the counterparties to perform under the contracts' terms and the possible lack of liquidity with respect to the swap agreements. Details of swap agreements open at period end are included in the Fund's Schedule of Investments under the caption "Swap Agreements."
Mortgage Dollar Rolls. To earn additional income, the Fund may employ trading strategies which involve the sale and simultaneous agreement to repurchase similar securities ("mortgage dollar rolls") or the purchase and simultaneous agreement to sell similar securities ("reverse mortgage dollar rolls"). The securities traded are mortgage securities and bear the same interest rate but may be collateralized by different pools of mortgages. During the period between the sale and repurchase in a mortgage dollar roll transaction, a fund will not be entitled to receive interest and principal payments on the securities sold but will invest the proceeds of the sale in other securities which may enhance the yield and total return. In addition, the difference between the sale price and the future purchase price is recorded as an adjustment to investment income. During the period between the purchase and subsequent sale in a reverse mortgage dollar roll transaction a fund is entitled to interest and principal payments on the securities purchased. The price differential between the purchase and sale is recorded as an adjustment to investment income. Losses may arise due to changes in the value of the securities or if the counterparty does not perform under the terms of the agreement. If the counterparty files for bankruptcy or becomes insolvent, a fund's right to repurchase or sell securities may be limited.
Annual Report
Notes to Financial Statements - continued
5. Purchases and Sales of Investments.
Purchases and sales of securities (including the Fixed-Income Central Funds), other than short-term securities, U.S. government securities and non-taxable in-kind transactions, aggregated $3,174,712,038 and $589,100,755, respectively.
6. Fees and Other Transactions with Affiliates.
Management Fee. FMR and its affiliates provide the Fund with investment management related services for which the Fund pays a monthly management fee. The management fee is the sum of an individual fund fee rate that is based on an annual rate of .20% of the Fund's average net assets and a group fee rate that averaged ..12% during the period. The group fee rate is based upon the average net assets of all the mutual funds advised by FMR. The group fee rate decreases as assets under management increase and increases as assets under management decrease. For the period, the total annualized management fee rate was .32% of the Fund's average net assets.
Distribution and Service Plan. In accordance with Rule 12b-1 of the 1940 Act, the Fund has adopted separate Distribution and Service Plans for each class of shares. Certain classes pay Fidelity Distributors Corporation (FDC), an affiliate of FMR, separate Distribution and Service Fees, each of which is based on an annual percentage of each class' average net assets. In addition, FDC may pay financial intermediaries for selling shares of the Fund and providing shareholder support services. For the period, the Distribution and Service Fee rates and the total amounts paid to and retained by FDC were as follows:
| Distribution
Fee | Service
Fee | Paid to
FDC | Retained
by FDC |
Class A | -% | .25% | $ 50,427 | $ 14,077 |
Class T | -% | .25% | 74,918 | 10,425 |
Class B | .65% | .25% | 32,409 | 23,635 |
Class C | .75% | .25% | 121,007 | 52,234 |
| | | $ 278,761 | $ 100,371 |
On January 18, 2007, the Board of Trustees approved an increase in Class A's Service fee from .15% to .25%, effective April 1, 2007.
Sales Load. FDC receives a front-end sales charge of up to 4.00% for selling Class A shares and Class T shares (4.75% for Class A and 3.50% for Class T prior to April 1, 2007), some of which is paid to financial intermediaries for selling shares of the Fund. FDC receives the proceeds of contingent deferred sales charges levied on Class A, Class T, Class B, and Class C redemptions. These charges depend on the holding period. The deferred sales charges range from 5% to 1% for Class B, 1% for Class C, ..75% to .50% for certain purchases of Class A shares and .25% for certain purchases of Class T shares.
Annual Report
6. Fees and Other Transactions with Affiliates - continued
Sales Load - continued
For the period, sales charge amounts retained by FDC were as follows:
| Retained
by FDC |
Class A | $ 46,259 |
Class T | 11,069 |
Class B* | 6,898 |
Class C* | 5,972 |
| $ 70,198 |
* When Class B and Class C shares are initially sold, FDC pays commissions from its own resources to financial intermediaries through which the sales are made.
Transfer Agent Fees. Fidelity Investments Institutional Operations Company, Inc. (FIIOC), an affiliate of FMR, is the transfer, dividend disbursing and shareholder servicing agent for each class of the Fund, except for Total Bond. Fidelity Service Company, Inc. (FSC), an affiliate of FMR, is the transfer agent for Total Bond shares. FIIOC receives account fees and asset-based fees that vary according to the account size and type of account of the shareholders of the respective classes of the Fund. FSC receives an asset-based fee of .10% of Total Bond's average net assets. FIIOC and FSC pay for typesetting, printing and mailing of shareholder reports, except proxy statements. For the period, the total transfer agent fees paid by each class to FIIOC or FSC, were as follows:
| Amount | % of
Average
Net Assets |
Class A | $ 51,776 | .22 |
Class T | 53,307 | .18 |
Class B | 10,172 | .28 |
Class C | 24,151 | .20 |
Total Bond | 3,898,554 | .10 |
Institutional Class | 121,057 | .15 |
| $ 4,159,017 | |
Fundwide Operations Fee. Pursuant to the Fundwide Operations and Expense Agreement (FWOE), FMR has agreed to provide for fund level expenses (which do not include transfer agent, Rule 12b-1 fees, compensation of the independent trustees, interest (including commitment fees), taxes or extraordinary expenses, if any) in return for a FWOE fee equal to .35% less the total amount of the management fee. The FWOE paid by the Fund is reduced by an amount equal to the fees and expenses paid to the independent trustees. For the period, the FWOE fee was equivalent to an annual rate of .03% of average net assets.
Annual Report
Notes to Financial Statements - continued
6. Fees and Other Transactions with Affiliates - continued
Exchange-In-Kind. During the period, the Fund exchanged securities for shares of four newly created Fidelity Fixed-Income Central Funds, all of which are affiliated investment companies managed by FIMM, an affiliate of FMR. The Fund delivered securities to each Fixed-Income Central Fund in exchange for shares of each respective Fixed-Income Central Fund, as presented in the accompanying table. Each exchange is considered a non-taxable exchange for federal income tax purposes, with no gain or loss recognized by the Fund or its shareholders.
Fidelity Fixed-Income Central Fund | Value of Securities
Delivered (including
accrued interest) | Unrealized
Appreciation/
(Depreciation) | Shares of Fixed-Income Central Fund Exchanged |
1-3 Year Duration Securitized Bond Central Fund | $ 103,444,744 | $ 297,067 | 1,034,447 |
2-5 Year Duration Securitized Bond Central Fund | 155,193,358 | 2,283,849 | 1,551,934 |
Corporate Bond 1-10 Year
Central Fund | 335,272,873 | 6,447,372 | 3,352,729 |
Mortgage Backed Securities
Central Fund | 365,968,286 | 5,495,809 | 3,659,683 |
Total | $ 959,879,261 | $ 14,524,097 | 9,598,793 |
On April 27, 2007, the Fund purchased 349,241 shares of Fidelity Ultra-Short Central Fund, an affiliated entity, valued at $34,588,841 by transferring securities of equal value, including accrued interest. This is considered taxable for federal income tax purposes, and the Fund recognized a loss of $15,234.
7. Committed Line of Credit.
The Fund participates with other funds managed by FMR in a $4.2 billion credit facility (the "line of credit") to be utilized for temporary or emergency purposes to fund shareholder redemptions or for other short-term liquidity purposes. The Fund has agreed to pay commitment fees on its pro rata portion of the line of credit, which amounted to $7,476 and is reflected in Miscellaneous Expense on the Statement of Operations. During the period, there were no borrowings on this line of credit.
8. Security Lending.
The Fund lends portfolio securities from time to time in order to earn additional income. On the settlement date of the loan, the Fund receives collateral (in the form of U.S. Treasury obligations, letters of credit and/or cash) against the loaned securities and maintains collateral in an amount not less than 100% of the market value of the loaned securities during the period of the loan. The market value of the loaned securities is determined at the close of business of the Fund and any additional required collateral is
Annual Report
8. Security Lending - continued
delivered to the Fund on the next business day. If the borrower defaults on its obligation to return the securities loaned because of insolvency or other reasons, a fund could experience delays and costs in recovering the securities loaned or in gaining access to the collateral. Any cash collateral received is invested in cash equivalents. The value of loaned securities and cash collateral at period end are disclosed on the Fund's Statement of Assets and Liabilities. Security lending income represents the income earned on investing cash collateral, less fees and expenses associated with the loan, plus any premium payments that may be received on the loan of certain types of securities. Security lending income is presented in the Statement of Operations as a component of interest income. Net income from lending portfolio securities during the period amounted to $1,272,622.
9. Expense Reductions.
Through arrangements with the Fund's custodian and each class' transfer agent, credits realized as a result of uninvested cash balances were used to reduce the Fund's expenses. During the period, these credits reduced the Fund's management fee by $75,968. During the period, credits reduced each class' transfer agent expense as noted in the table below.
| Transfer Agent
expense reduction | |
Total Bond | $ 60,056 | |
Institutional Class | 3,166 | |
| $ 63,222 | |
10. Other.
The Fund's organizational documents provide former and current trustees and officers with a limited indemnification against liabilities arising in connection with the performance of their duties to the Fund. In the normal course of business, the Fund may also enter into contracts that provide general indemnifications. The Fund's maximum exposure under these arrangements is unknown as this would be dependent on future claims that may be made against the Fund. The risk of material loss from such claims is considered remote.
In September 2006, FIIOC, a transfer agent of the Fund, notified the Fund that the Fund's books and records did not reflect a conversion of certain Class B to Class A shares upon their conversion date. In March 2007, FIIOC converted the relevant Class B shares to Class A shares and recorded the conversion in the books and records of the Fund which did not result in a material impact to the Fund's reported net assets or results of operations in the accompanying financial statements. FIIOC has remediated affected shareholders.
Annual Report
Notes to Financial Statements - continued
11. Distributions to Shareholders.
Distributions to shareholders of each class were as follows:
| Year ended
August 31,
2007 | One month ended
August 31,
2006 | Year ended
July 31,
2006 |
From net investment income | | | |
Class A | $ 1,100,606 | $ 18,886 | $ 180,734 |
Class T | 1,373,421 | 17,679 | 235,647 |
Class B | 136,878 | 5,122 | 75,406 |
Class C | 457,270 | 5,360 | 39,421 |
Total Bond | 191,143,423 | 9,267,073 | 31,294,037 |
Institutional Class | 4,127,108 | 3,854 | 15,350 |
Total | $ 198,338,706 | $ 9,317,974 | $ 31,840,595 |
| | | |
From net realized gain | | | |
Class A | $ 27,576 | $ - | $ 12,832 |
Class T | 34,295 | - | 23,014 |
Class B | 5,072 | - | 8,379 |
Class C | 16,001 | - | 2,940 |
Total Bond | 4,768,190 | - | 1,632,006 |
Institutional Class | 6,635 | - | 682 |
Total | $ 4,857,769 | $ - | $ 1,679,853 |
12. Share Transactions.
Transactions for each class of shares were as follows:
| Shares |
| Year ended
August 31,
2007 | One month ended
August 31,
2006 | Year ended
July 31,
2006 |
Class A | | | |
Shares sold | 5,058,526 | 220,612 | 390,963 |
Reinvestment of distributions | 89,369 | 1,550 | 16,805 |
Shares redeemed | (1,118,505) | (11,849) | (246,932) |
Net increase (decrease) | 4,029,390 | 210,313 | 160,836 |
Class T | | | |
Shares sold | 4,727,867 | 182,921 | 395,729 |
Reinvestment of distributions | 129,776 | 1,650 | 24,086 |
Shares redeemed | (1,351,158) | (24,758) | (517,046) |
Net increase (decrease) | 3,506,485 | 159,813 | (97,231) |
Class B | | | |
Shares sold | 539,386 | 15,160 | 117,578 |
Reinvestment of distributions | 9,450 | 396 | 6,955 |
Shares redeemed | (124,884) | (12,233) | (154,343) |
Net increase (decrease) | 423,952 | 3,323 | (29,810) |
Annual Report
12. Share Transactions - continued
| Shares |
| Year ended
August 31,
2007 | One month ended
August 31,
2006 | Year ended
July 31,
2006 |
Class C | | | |
Shares sold | 1,926,281 | 31,118 | 167,899 |
Reinvestment of distributions | 38,210 | 433 | 3,045 |
Shares redeemed | (327,493) | (1,096) | (62,848) |
Net increase (decrease) | 1,636,998 | 30,455 | 108,096 |
Total Bond | | | |
Shares sold | 449,525,248 | 13,049,555 | 196,541,228 |
Reinvestment of distributions | 18,043,057 | 844,577 | 2,948,119 |
Shares redeemed | (72,384,207) | (5,355,068) | (14,766,457) |
Net increase (decrease) | 395,184,098 | 8,539,064 | 184,722,890 |
Institutional Class | | | |
Shares sold | 34,101,050 | 12,269 | 87,064 |
Reinvestment of distributions | 377,910 | 202 | 888 |
Shares redeemed | (594,798) | (1,488) | (7,870) |
Net increase (decrease) | 33,884,162 | 10,983 | 80,082 |
| Dollars |
| Year ended
August 31,
2007 | One month ended
August 31,
2006 | Year ended
July 31,
2006 |
Class A | | | |
Shares sold | $ 52,475,077 | $ 2,282,175 | $ 4,048,068 |
Reinvestment of distributions | 927,501 | 16,100 | 174,112 |
Shares redeemed | (11,603,024) | (122,009) | (2,534,797) |
Net increase (decrease) | $ 41,799,554 | $ 2,176,266 | $ 1,687,383 |
Class T | | | |
Shares sold | $ 49,238,640 | $ 1,891,613 | $ 4,083,246 |
Reinvestment of distributions | 1,346,799 | 17,127 | 249,752 |
Shares redeemed | (13,923,481) | (254,833) | (5,305,428) |
Net increase (decrease) | $ 36,661,958 | $ 1,653,907 | $ (972,430) |
Class B | | | |
Shares sold | $ 5,591,610 | $ 156,534 | $ 1,220,621 |
Reinvestment of distributions | 98,229 | 4,113 | 72,205 |
Shares redeemed | (1,299,404) | (126,159) | (1,585,560) |
Net increase (decrease) | $ 4,390,435 | $ 34,488 | $ (292,734) |
Class C | | | |
Shares sold | $ 20,051,168 | $ 322,468 | $ 1,733,336 |
Reinvestment of distributions | 397,140 | 4,501 | 31,492 |
Shares redeemed | (3,406,204) | (11,362) | (646,689) |
Net increase (decrease) | $ 17,042,104 | $ 315,607 | $ 1,118,139 |
Annual Report
Notes to Financial Statements - continued
12. Share Transactions - continued
| Dollars |
| Year ended
August 31,
2007 | One month ended
August 31,
2006 | Year ended
July 31,
2006 |
Total Bond | | | |
Shares sold | $ 4,670,295,711 | $ 134,816,251 | $ 1,999,048,539 |
Reinvestment of distributions | 187,426,399 | 8,775,005 | 30,457,852 |
Shares redeemed | (750,709,047) | (55,377,801) | (152,010,033) |
Net increase (decrease) | $ 4,107,013,063 | $ 88,213,455 | $ 1,877,496,358 |
Institutional Class | | | |
Shares sold | $ 352,256,185 | $ 126,542 | $ 891,633 |
Reinvestment of distributions | 3,888,447 | 2,101 | 9,142 |
Shares redeemed | (6,131,133) | (15,324) | (80,138) |
Net increase (decrease) | $ 350,013,499 | $ 113,319 | $ 820,637 |
13. Credit Risk.
The Fund invests a portion of its assets in securities of issuers that hold mortgage securities, including subprime mortgage securities. The value of these securities is sensitive to changes in economic conditions, including delinquencies and/or defaults, and may be adversely affected by shifts in the market's perception of the issuers and changes in interest rates.
Annual Report
Report of Independent Registered Public Accounting Firm
To the Trustees of Fidelity Income Fund and the Shareholders of Fidelity Total Bond Fund:
In our opinion, the accompanying statement of assets and liabilities, including the schedule of investments, and the related statements of operations and of changes in net assets and the financial highlights present fairly, in all material respects, the financial position of Fidelity Total Bond Fund (a fund of Fidelity Income Fund) at August 31, 2007, the results of its operations for the year then ended, the changes in its net assets for each of the periods indicated and the financial highlights for each of the periods indicated, in conformity with accounting principles generally accepted in the United States of America. These financial statements and financial highlights (hereafter referred to as "financial statements") are the responsibility of the Fidelity Total Bond Fund's management. Our responsibility is to express an opinion on these financial statements based on our audits. We conducted our audits of these financial statements in accordance with the standards of the Public Company Accounting Oversight Board (United States). Those standards require that we plan and perform the audit to obtain reasonable assurance about whether the financial statements are free of material misstatement. An audit includes examining, on a test basis, evidence supporting the amounts and disclosures in the financial statements, assessing the accounting principles used and significant estimates made by management, and evaluating the overall financial statement presentation. We believe that our audits, which included confirmation of securities at August 31, 2007 by correspondence with the custodian and brokers, provide a reasonable basis for our opinion.
/s/ PricewaterhouseCoopers LLP
PricewaterhouseCoopers LLP
Boston, Massachusetts
October 30, 2007
Annual Report
Trustees and Officers
The Trustees, Members of the Advisory Board, and executive officers of the trust and fund, as applicable, are listed below. The Board of Trustees governs the fund and is responsible for protecting the interests of shareholders. The Trustees are experienced executives who meet periodically throughout the year to oversee the fund's activities, review contractual arrangements with companies that provide services to the fund, and review the fund's performance. Except for James C. Curvey, each of the Trustees oversees 369 funds advised by FMR or an affiliate. Mr. Curvey oversees 339 funds advised by FMR or an affiliate.
The Trustees hold office without limit in time except that (a) any Trustee may resign; (b) any Trustee may be removed by written instrument, signed by at least two-thirds of the number of Trustees prior to such removal; (c) any Trustee who requests to be retired or who has become incapacitated by illness or injury may be retired by written instrument signed by a majority of the other Trustees; and (d) any Trustee may be removed at any special meeting of shareholders by a two-thirds vote of the outstanding voting securities of the trust. Each Trustee who is not an interested person (as defined in the 1940 Act) (Independent Trustee), shall retire not later than the last day of the calendar year in which his or her 72nd birthday occurs. The Independent Trustees may waive this mandatory retirement age policy with respect to individual Trustees. The executive officers and Advisory Board Members hold office without limit in time, except that any officer and Advisory Board Member may resign or may be removed by a vote of a majority of the Trustees at any regular meeting or any special meeting of the Trustees. Except as indicated, each individual has held the office shown or other offices in the same company for the past five years.
The fund's Statement of Additional Information (SAI) includes more information about the Trustees. To request a free copy, call Fidelity at 1-800-544-8544.
Interested Trustees*:
Correspondence intended for each Trustee who is an interested person may be sent to Fidelity Investments, 82 Devonshire Street, Boston, Massachusetts 02109.
Name, Age; Principal Occupation |
Edward C. Johnson 3d (77) |
| Year of Election or Appointment: 1984 Mr. Johnson is Chairman of the Board of Trustees. Mr. Johnson serves as President (2006-present), Chief Executive Officer, Chairman, and a Director of FMR LLC; Chairman and a Director of FMR; Chairman and a Director of Fidelity Research & Analysis Company (FRAC); Chairman and a Director of Fidelity Investments Money Management, Inc.; and Chairman (2001-present) and a Director of FMR Co., Inc. In addition, Mr. Johnson serves as Chairman and Director of Fidelity International Limited (FIL). |
James C. Curvey (72) |
| Year of Election or Appointment: 2007 Mr. Curvey also serves as Trustee (2007-present) or Member of the Advisory Board (2007-present) of other investment companies advised by FMR. Mr. Curvey is a Director of FMR and FMR Co., Inc. (2007-present). Mr. Curvey is also Vice Chairman (2006-present) and Director of FMR LLC. Mr. Curvey joined Fidelity in 1982 and served in numerous senior management positions, including President and Chief Operating Officer of FMR LLC (1997-2000) and President of Fidelity Strategic Investments (2000-2002). In addition, he serves as a member of the Board of Directors of Geerlings & Wade, Inc. (wine distribution). |
* Trustees have been determined to be "Interested Trustees" by virtue of, among other things, their affiliation with the trust or various entities under common control with FMR. FMR Corp. merged with FMR LLC on October 1, 2007. Any references to FMR LLC for prior periods are deemed to be references to the prior entity.
Independent Trustees:
Correspondence intended for each Independent Trustee (that is, the Trustees other than the Interested Trustees) may be sent to Fidelity Investments, P.O. Box 55235, Boston, Massachusetts 02205-5235.
Name, Age; Principal Occupation |
Dennis J. Dirks (59) |
| Year of Election or Appointment: 2005 Prior to his retirement in May 2003, Mr. Dirks was Chief Operating Officer and a member of the Board of The Depository Trust & Clearing Corporation (DTCC) (1999-2003). He also served as President, Chief Operating Officer, and Board member of The Depository Trust Company (DTC) (1999-2003) and President and Board member of the National Securities Clearing Corporation (NSCC) (1999-2003). In addition, Mr. Dirks served as Chief Executive Officer and Board member of the Government Securities Clearing Corporation (2001-2003) and Chief Executive Officer and Board member of the Mortgage-Backed Securities Clearing Corporation (2001-2003). Mr. Dirks also serves as a Trustee and a member of the Finance Committee of Manhattan College (2005-present) and a Trustee and a member of the Finance Committee of AHRC of Nassau County (2006-present). |
Albert R. Gamper, Jr. (65) |
| Year of Election or Appointment: 2006 Prior to his retirement in December 2004, Mr. Gamper served as Chairman of the Board of CIT Group Inc. (commercial finance). During his tenure with CIT Group Inc. Mr. Gamper served in numerous senior management positions, including Chairman (1987-1989; 1999-2001; 2002-2004), Chief Executive Officer (1987-2004), and President (1989-2002). He currently serves as a member of the Board of Directors of Public Service Enterprise Group (utilities, 2001-present), Chairman of the Board of Governors, Rutgers University (2004-present), and Chairman of the Board of Saint Barnabas Health Care System. |
George H. Heilmeier (71) |
| Year of Election or Appointment: 2004 Dr. Heilmeier is Chairman Emeritus of Telcordia Technologies (communication software and systems), where prior to his retirement, he served as company Chairman and Chief Executive Officer. He currently serves on the Boards of Directors of The Mitre Corporation (systems engineering and information technology support for the government), and HRL Laboratories (private research and development, 2004-present). He is Chairman of the General Motors Science & Technology Advisory Board and a Life Fellow of the Institute of Electrical and Electronics Engineers (IEEE). Dr. Heilmeier is a member of the Defense Science Board and the National Security Agency Advisory Board. He is also a member of the National Academy of Engineering, the American Academy of Arts and Sciences, and the Board of Overseers of the School of Engineering and Applied Science of the University of Pennsylvania. Previously, Dr. Heilmeier served as a Director of TRW Inc. (automotive, space, defense, and information technology, 1992-2002), Compaq (1994-2002), Automatic Data Processing, Inc. (ADP) (technology-based business outsourcing, 1995-2002), INET Technologies Inc. (telecommunications network surveillance, 2001-2004), and Teletech Holdings (customer management services). He is the recipient of the 2005 Kyoto Prize in Advanced Technology for his invention of the liquid crystal display, and a member of the Consumer Electronics Hall of Fame. |
James H. Keyes (66) |
| Year of Election or Appointment: 2007 Prior to his retirement in 2003, Mr. Keyes was Chairman, President, and Chief Executive Officer of Johnson Controls, Inc. (automotive supplier, 1993-2003). He currently serves as a member of the boards of LSI Logic Corporation (semiconductor technologies), Navistar International Corporation (manufacture and sale of trucks, buses, and diesel engines, 2002-present), and Pitney Bowes, Inc. (integrated mail, messaging, and document management solutions). |
Marie L. Knowles (60) |
| Year of Election or Appointment: 2001 Prior to Ms. Knowles' retirement in June 2000, she served as Executive Vice President and Chief Financial Officer of Atlantic Richfield Company (ARCO) (diversified energy, 1996-2000). From 1993 to 1996, she was a Senior Vice President of ARCO and President of ARCO Transportation Company. She served as a Director of ARCO from 1996 to 1998. She currently serves as a Director of Phelps Dodge Corporation (copper mining and manufacturing) and McKesson Corporation (healthcare service, 2002-present). Ms. Knowles is a Trustee of the Brookings Institution and the Catalina Island Conservancy and also serves as a member of the Advisory Board for the School of Engineering of the University of Southern California. |
Ned C. Lautenbach (63) |
| Year of Election or Appointment: 2000 Mr. Lautenbach is Chairman of the Independent Trustees (2006-present). Mr. Lautenbach has been a partner of Clayton, Dubilier & Rice, Inc. (private equity investment firm) since September 1998. Previously, Mr. Lautenbach was with the International Business Machines Corporation (IBM) from 1968 until his retirement in 1998. Mr. Lautenbach serves as a Director of Sony Corporation (2006-present) and Eaton Corporation (diversified industrial) as well as the Philharmonic Center for the Arts in Naples, Florida. He also is a member of the Board of Trustees of Fairfield University (2005-present), as well as a member of the Council on Foreign Relations. |
Cornelia M. Small (63) |
| Year of Election or Appointment: 2005 Ms. Small is a member (2000-present) and Chairperson (2002-present) of the Investment Committee, and a member (2002-present) of the Board of Trustees of Smith College. Previously, she served as Chief Investment Officer (1999-2000), Director of Global Equity Investments (1996-1999), and a member of the Board of Directors of Scudder, Stevens & Clark (1990-1997) and Scudder Kemper Investments (1997-1999). In addition, Ms. Small served as Co-Chair (2000-2003) of the Annual Fund for the Fletcher School of Law and Diplomacy. |
William S. Stavropoulos (68) |
| Year of Election or Appointment: 2001 Mr. Stavropoulos is Chairman Emeritus of the Board of Directors of The Dow Chemical Company. Since joining The Dow Chemical Company in 1967, Mr. Stavropoulos served in numerous senior management positions, including President (1993-2000; 2002-2003), CEO (1995-2000; 2002-2004), and Chairman of the Executive Committee (2000-2004). Currently, he is a Director of NCR Corporation (data warehousing and technology solutions), Chemical Financial Corporation, Maersk Inc. (industrial conglomerate, 2002-present), Tyco International, Inc. (multinational manufacturing and services, 2007-present), and a member of the Advisory Board for Metalmark Capital (private equity investment firm, 2005-present). He is a special advisor to Clayton, Dubilier & Rice, Inc., a private equity investment firm. He also serves as a member of the Board of Trustees of the American Enterprise Institute for Public Policy Research. In addition, Mr. Stavropoulos is a member of The Business Council, J.P. Morgan International Council and the University of Notre Dame Advisory Council for the College of Science. |
Kenneth L. Wolfe (68) |
| Year of Election or Appointment: 2005 Prior to his retirement in 2001, Mr. Wolfe was Chairman and Chief Executive Officer of Hershey Foods Corporation (1993-2001). He currently serves as a member of the boards of Adelphia Communications Corporation (2003-present), Bausch & Lomb, Inc., and Revlon Inc. (2004-present). |
Advisory Board Members and Executive Officers**:
Correspondence intended for Mr. Mauriello and Mr. Wiley may be sent to Fidelity Investments, P.O. Box 55235, Boston, Massachusetts 02205-5235. Correspondence intended for each executive officer and Mr. Lynch may be sent to Fidelity Investments, 82 Devonshire Street, Boston, Massachusetts 02109.
Name, Age; Principal Occupation |
Peter S. Lynch (63) |
| Year of Election or Appointment: 2003 Member of the Advisory Board of Fidelity Income Fund. Mr. Lynch is Vice Chairman and a Director of FMR, and Vice Chairman (2001-present) and a Director of FMR Co., Inc. Previously, Mr. Lynch served as a Trustee of the Fidelity funds (1990-2003). In addition, he serves as a Trustee of Boston College and as the Chairman of the Inner-City Scholarship Fund. |
Joseph Mauriello (62) |
| Year of Election or Appointment: 2007 Member of the Advisory Board of Fidelity Income Fund. Prior to his retirement in January 2006, Mr. Mauriello served in numerous senior management positions including Deputy Chairman and Chief Operating Officer (2004-2005), and Vice Chairman of Financial Services (2002-2004) of KPMG LLP US (professional services firm, 1965-2005). Mr. Mauriello currently serves as a member of the Board of Directors of XL Capital Ltd., (global insurance and re-insurance company, 2006-present) and of Arcadia Resources Inc., (health care services and products, 2007-present). He also served as a Director of the Hamilton Funds of the Bank of New York (2006-2007). |
Michael E. Wiley (56) |
| Year of Election or Appointment: 2007 Member of the Advisory Board of Fidelity Income Fund. Mr. Wiley also serves as Sr. Energy Advisor of Katzenbach Partners, LLC (consulting firm, 2006-present) and a member of the Board of Trustees of the University of Tulsa (2000-2006; 2007-present). He serves as a Director of Tesoro Corporation (independent oil refiner and marketer, 2005-present), and a Director of Bill Barrett Corporation (exploration and production company, 2005-present). In addition, he also serves as a Director of Post Oak Bank (privately-held bank, 2004-present), and an Advisory Director of Riverstone Holdings (private investment firm). Previously, Mr. Wiley served as Chairman, President, and CEO of Baker Hughes, Inc. (oilfield services company, 2000-2004), and as Director of Spinnaker Exploration Company (exploration and production company, 2001-2005). |
Kimberley H. Monasterio (43) |
| Year of Election or Appointment: 2007 President and Treasurer of Total Bond. Ms. Monasterio also serves as President and Treasurer of other Fidelity funds (2007-present) and is an employee of FMR (2004-present). Previously, Ms. Monasterio served as Deputy Treasurer of the Fidelity funds (2004-2006). Before joining Fidelity Investments, Ms. Monasterio served as Treasurer (2000-2004) and Chief Financial Officer (2002-2004) of the Franklin Templeton Funds and Senior Vice President of Franklin Templeton Services, LLC (2000-2004). |
Walter C. Donovan (45) |
| Year of Election or Appointment: 2005 Vice President of Total Bond. Mr. Donovan also serves as Vice President of Fidelity's Equity Funds (2007-present). Mr. Donovan also serves as Executive Vice President of FMR (2005-present) and FMR Co., Inc. (2005-present). Previously, Mr. Donovan served as Vice President of Fidelity's High Income Funds (2005-2007), Fixed-Income Funds (2005-2006), certain Asset Allocation Funds (2005-2006), certain Balanced Funds (2005-2006), and as Vice President and Director of Fidelity's International Equity Trading group (1998-2005). |
Boyce I. Greer (51) |
| Year of Election or Appointment: 2006 Vice President of Total Bond. Mr. Greer also serves as Vice President of certain Asset Allocation Funds (2005-present), Fixed-Income Funds (2006-present), and Money Market Funds (2006-present). Mr. Greer is also a Trustee of other investment companies advised by FMR (2003-present). Mr. Greer is an Executive Vice President of FMR (2005-present) and FMR Co., Inc. (2005-present), and Senior Vice President of Fidelity Investments Money Management, Inc. (2006-present). Previously, Mr. Greer served as Vice President of certain Fidelity Equity Funds (2005-2007), a Director and Managing Director of Strategic Advisers, Inc. (2002-2005), and Executive Vice President (2000-2002) and Money Market Group Leader (1997-2002) of the Fidelity Investments Fixed Income Division. Mr. Greer also served as Vice President of Fidelity's Money Market Funds (1997-2002), Senior Vice President of FMR (1997-2002), and Vice President of FIMM (1998-2002). |
Robert A. Lawrence (54) |
| Year of Election or Appointment: 2006 Vice President of Total Bond. Mr. Lawrence also serves as Vice President of the High Income Funds. Mr. Lawrence is Senior Vice President of FMR (2006-present) and FMR Co., Inc. (2006-present). Previously, Mr. Lawrence served as President of Fidelity Strategic Investments (2002-2005). |
David L. Murphy (59) |
| Year of Election or Appointment: 2005 Vice President of Total Bond. Mr. Murphy also serves as Vice President of Fidelity's Money Market Funds (2002-present) and Fixed-Income Funds (2005-present). Mr. Murphy serves as Senior Vice President (2000-present) and Head (2004-present) of the Fidelity Investments Fixed Income Division. Mr. Murphy is also a Senior Vice President of Fidelity Investments Money Management, Inc. (2003-present) and an Executive Vice President of FMR (2005-present). Previously, Mr. Murphy served as Money Market Group Leader (2002-2004), Bond Group Leader (2000-2002), and Vice President of certain Asset Allocation Funds (2003-2007), Balanced Funds (2005-2007), Fidelity's Taxable Bond Funds (2000-2002) and Fidelity's Municipal Bond Funds (2001-2002). |
Thomas J. Silvia (46) |
| Year of Election or Appointment: 2005 Vice President of Total Bond. Mr. Silvia also serves as Vice President of Fidelity's Fixed-Income Funds (2005-present) and Senior Vice President and Bond Group Leader of the Fidelity Investments Fixed-Income Division (2005-present). Previously, Mr. Silvia served as Vice President of certain Balanced Funds (2005-2007), certain Asset Allocation Funds (2005-2007), a Director of Fidelity's Taxable Bond portfolio managers (2002-2004) and a portfolio manager in the Bond Group (1997-2004). |
Eric D. Roiter (58) |
| Year of Election or Appointment: 2002 Secretary of Total Bond. He also serves as Secretary of other Fidelity funds; Vice President, General Counsel, and Secretary of FMR Co., Inc. (2001-present) and FMR; Assistant Secretary of Fidelity Management & Research (U.K.) Inc. (2001-present), Fidelity Research & Analysis Company (2001-present), and Fidelity Investments Money Management, Inc. (2001-present). Mr. Roiter is an Adjunct Member, Faculty of Law, at Boston College Law School (2003-present). Previously, Mr. Roiter served as Vice President and Secretary of Fidelity Distributors Corporation (FDC) (1998-2005). |
Scott C. Goebel (39) |
| Year of Election or Appointment: 2007 Assistant Secretary of Total Bond. Mr. Goebel also serves as Assistant Secretary of other Fidelity funds (2007-present), and is an employee of FMR. |
R. Stephen Ganis (41) |
| Year of Election or Appointment: 2006 Anti-Money Laundering (AML) officer of Total Bond. Mr. Ganis also serves as AML officer of other Fidelity funds (2006-present) and FMR LLC (2003-present). Before joining Fidelity Investments, Mr. Ganis practiced law at Goodwin Procter, LLP (2000-2002). |
Joseph B. Hollis (59) |
| Year of Election or Appointment: 2006 Chief Financial Officer of Total Bond. Mr. Hollis also serves as Chief Financial Officer of other Fidelity funds. Mr. Hollis is President of Fidelity Pricing and Cash Management Services (FPCMS) (2005-present). Mr. Hollis also serves as President and Director of Fidelity Service Company, Inc. (2006-present). Previously, Mr. Hollis served as Senior Vice President of Cash Management Services (1999-2002) and Investment Management Operations (2002-2005). |
Kenneth A. Rathgeber (60) |
| Year of Election or Appointment: 2004 Chief Compliance Officer of Total Bond. Mr. Rathgeber also serves as Chief Compliance Officer of other Fidelity funds (2004-present) and Executive Vice President of Risk Oversight for Fidelity Investments (2002-present). He is Chief Compliance Officer of FMR (2005-present), FMR Co., Inc. (2005-present), Fidelity Management & Research (U.K.) Inc. (2005-present), Fidelity Research & Analysis Company (2005-present), Fidelity Investments Money Management, Inc. (2005-present), and Strategic Advisers, Inc. (2005-present). Previously, Mr. Rathgeber served as Executive Vice President and Chief Operating Officer for Fidelity Investments Institutional Services Company, Inc. (1998-2002). |
Bryan A. Mehrmann (46) |
| Year of Election or Appointment: 2005 Deputy Treasurer of Total Bond. Mr. Mehrmann also serves as Deputy Treasurer of other Fidelity funds (2005-present) and is an employee of FMR. Previously, Mr. Mehrmann served as Vice President of Fidelity Investments Institutional Services Group (FIIS)/Fidelity Investments Institutional Operations Corporation, Inc. (FIIOC) Client Services (1998-2004). |
Kenneth B. Robins (38) |
| Year of Election or Appointment: 2005 Deputy Treasurer of Total Bond. Mr. Robins also serves as Deputy Treasurer of other Fidelity funds (2005-present) and is an employee of FMR (2004-present). Before joining Fidelity Investments, Mr. Robins worked at KPMG LLP, where he was a partner in KPMG's department of professional practice (2002-2004) and a Senior Manager (1999-2000). In addition, Mr. Robins served as Assistant Chief Accountant, United States Securities and Exchange Commission (2000-2002). |
Robert G. Byrnes (40) |
| Year of Election or Appointment: 2005 Assistant Treasurer of Total Bond. Mr. Byrnes also serves as Assistant Treasurer of other Fidelity funds (2005-present) and is an employee of FMR (2005-present). Previously, Mr. Byrnes served as Vice President of FPCMS (2003-2005). Before joining Fidelity Investments, Mr. Byrnes worked at Deutsche Asset Management where he served as Vice President of the Investment Operations Group (2000-2003). |
Peter L. Lydecker (53) |
| Year of Election or Appointment: 2004 Assistant Treasurer of Total Bond. Mr. Lydecker also serves as Assistant Treasurer of other Fidelity funds (2004) and is an employee of FMR. |
Gary W. Ryan (49) |
| Year of Election or Appointment: 2005 Assistant Treasurer of Total Bond. Mr. Ryan also serves as Assistant Treasurer of other Fidelity funds (2005-present) and is an employee of FMR (2005-present). Previously, Mr. Ryan served as Vice President of Fund Reporting in FPCMS (1999-2005). |
** FMR Corp. merged with FMR LLC on October 1, 2007. Any references to FMR LLC for prior periods are deemed to be references to the prior entity.
Annual Report
Distributions
A total of 4.23% of the dividends distributed during the fiscal year was derived from interest on U.S. Government securities which is generally exempt from state income tax.
The fund designates $175,749,234 of distributions paid during the period January 1, 2007 to August 31, 2007 as qualifying to be taxed as interest-related dividends for nonresident alien shareholders.
The fund will notify shareholders in January 2008 of amounts for use in preparing 2007 income tax returns.
Annual Report
Board Approval of Investment Advisory Contracts and Management Fees
Fidelity Total Bond Fund
Each year, typically in June, the Board of Trustees, including the Independent Trustees (together, the Board), votes on the renewal of the management contract and sub-advisory agreements (together, the Advisory Contracts) for the fund. The Board, assisted by the advice of fund counsel and Independent Trustees' counsel, requests and considers a broad range of information throughout the year.
The Board meets regularly each month except August and takes into account throughout the year matters bearing on Advisory Contracts. The Board, acting directly and through its separate committees, considers at each of its meetings factors that are relevant to the annual renewal of the fund's Advisory Contracts, including the services and support provided to the fund and its shareholders. At the time of the renewal, the Board had 12 standing committees, each composed of Independent Trustees with varying backgrounds, to which the Board has assigned specific subject matter responsibilities in order to enhance effective decision-making by the Board. Each committee has adopted a written charter outlining the structure and purposes of the committee. One such committee, the Fixed-Income Contract Committee, meets periodically as needed throughout the year to consider matters specifically related to the annual renewal of Advisory Contracts. The committee requests and receives information on, and makes recommendations to the Independent Trustees concerning, the approval and annual review of the Advisory Contracts.
At its June 2007 meeting, the Board of Trustees, including the Independent Trustees, unanimously determined to renew the Advisory Contracts for the fund. In reaching its determination, the Board considered all factors it believed relevant, including (i) the nature, extent, and quality of the services to be provided to the fund and its shareholders (including the investment performance of the fund); (ii) the competitiveness of the management fee and total expenses of the fund; (iii) the total costs of the services to be provided by and the profits to be realized by the investment adviser and its affiliates from the relationship with the fund; (iv) the extent to which economies of scale would be realized as the fund grows; and (v) whether fee levels reflect these economies of scale, if any, for the benefit of fund shareholders. The Board also approved amendments to the fund's agreements with foreign sub-advisers to clarify that each sub-adviser provides services as an independent contractor.
In determining whether to renew the Advisory Contracts for the fund, the Board ultimately reached a determination, with the assistance of fund counsel and Independent Trustees' counsel, that the renewal of the Advisory Contracts and the compensation to be received by Fidelity under the management contract is consistent with Fidelity's fiduciary duty under applicable law. In addition to evaluating the specific factors noted above, the Board, in reaching its determination, is aware that shareholders in the fund have a broad range of investment choices available to them, including a wide choice among mutual funds offered by competitors to Fidelity, and that the fund's shareholders, with the opportunity to review and weigh the disclosure provided by the fund in its prospectus and other public disclosures, have chosen to invest in this fund, managed by Fidelity.
Annual Report
Board Approval of Investment Advisory Contracts and
Management Fees - continued
Nature, Extent, and Quality of Services Provided. The Board considered staffing within the investment adviser, FMR, and the sub-advisers (together, the Investment Advisers), including the background of the fund's portfolio manager and the fund's investment objective and discipline. The Independent Trustees also had discussions with senior management of Fidelity's investment operations and investment groups. The Board considered the structure of the portfolio manager compensation program and whether this structure provides appropriate incentives.
Resources Dedicated to Investment Management and Support Services. The Board reviewed the size, education, and experience of the Investment Advisers' investment staff, their use of technology, and the Investment Advisers' approach to recruiting, training, and retaining portfolio managers and other research, advisory, and management personnel. The Board considered Fidelity's extensive global research capabilities that enable the Investment Advisers to aggregate data from various sources in an effort to produce positive investment results. The Board noted that Fidelity's analysts have access to a variety of technological tools that enable them to perform both fundamental and quantitative analysis and to specialize in various disciplines. The Board also considered that Fidelity's portfolio managers and analysts have access to daily portfolio attribution that allows for monitoring of a fund's portfolio, as well as an electronic communication system that provides immediate real-time access to research concerning issuers and credit enhancers. In addition, the Board considered the trading resources that are an integrated part of the fixed-income portfolio management investment process.
Shareholder and Administrative Services. The Board considered (i) the nature, extent, quality, and cost of advisory, administrative, distribution, and shareholder services performed by the Investment Advisers and their affiliates under the Advisory Contracts and under separate agreements covering transfer agency, pricing and bookkeeping, and securities lending services for the fund; (ii) the nature and extent of the Investment Advisers' supervision of third party service providers, principally custodians and subcustodians; and (iii) the resources devoted to, and the record of compliance with, the fund's compliance policies and procedures.
The Board noted that the growth of fund assets across the complex allows Fidelity to reinvest in the development of services designed to enhance the value or convenience of the Fidelity funds as investment vehicles. These services include 24-hour access to account information and market information through phone representatives and over the Internet, and investor education materials and asset allocation tools.
Annual Report
Investment in a Large Fund Family. The Board considered the benefits to shareholders of investing in a Fidelity fund, including the benefits of investing in a fund that is part of a large family of funds offering a variety of investment disciplines and providing for a large variety of mutual fund investor services. For example, fund shareholders are offered the privilege of exchanging shares of the fund for shares of other Fidelity funds, as set forth in the fund's prospectus, without paying a sales charge. The Board noted that, since the last Advisory Contract renewals in June 2006, Fidelity has taken a number of actions that benefited particular funds, including (i) dedicating additional resources to investment research and to restructure the investment research teams; (ii) contractually agreeing to reduce the management fee on Fidelity Advisor Floating Rate High Income Fund; (iii) contractually agreeing to reduce the management fees on Fidelity's California, Massachusetts, New Jersey, and New York AMT Tax-Free Money Market Funds, launching new Institutional Classes and Service Classes of these funds, and contractually agreeing to impose expense limitations on these funds; (iv) eliminating the exchange fee on the Fidelity Select Portfolios and reducing the pricing and bookkeeping fee rates for these funds; (v) reducing the maximum transfer agency fee rates on high income funds and certain equity funds; (vi) proposing amended management contracts that, if approved by shareholders, will add a performance adjustment component to the management fees paid by 18 Fidelity Advisor equity funds; (vii) contractually agreeing to reduce fees for Ultra-Short Central Fund and the money market Central Funds; (viii) waiving the Fidelity Advisor funds' contingent deferred sales charge on certain redemptions made through systematic withdrawal programs; and (ix) amending the management contracts for equity and fixed-income funds whose management contracts incorporate a "group fee" structure by adding four new fee "breakpoints" to the group fee rate schedules.
Investment Performance. The Board considered whether the fund has operated within its investment objective, as well as its record of compliance with its investment restrictions. It also reviewed the fund's absolute investment performance for each class, as well as the fund's relative investment performance for each class measured against (i) a broad-based securities market index, and (ii) a peer group of mutual funds deemed appropriate by the Board over multiple periods. Because the fund had been in existence less than five calendar years, the following charts considered by the Board show, over the one- and three-year periods ended December 31, 2006, as available, the cumulative total returns of Fidelity Total Bond (retail class) and Class C, the cumulative total returns of a broad-based securities market index ("benchmark"), and a range of cumulative total returns of a peer group of mutual funds identified by Lipper Inc. as having an investment objective similar to that of the fund. The returns of Fidelity Total Bond (retail class) and Class C show the performance of the highest and lowest performing classes, respectively. The box within each chart shows the 25th percentile return (bottom of box) and the 75th percentile return (top of box) of the peer group. Returns shown above the box are in the first quartile and returns shown below the box are in the fourth quartile. The percentage beaten numbers noted below each chart correspond to the percentile box and represent the percentage of funds in the peer group whose performance was equal to or lower than that of the class indicated.
Annual Report
Board Approval of Investment Advisory Contracts and
Management Fees - continued
Fidelity Total Bond Fund

The Board reviewed the fund's relative investment performance against its peer group and stated that the performance of Fidelity Total Bond (retail class) was in the first quartile for all the periods shown. The Board also stated that the relative investment performance of Fidelity Total Bond (retail class) compared favorably to its benchmark for all periods shown. The Board considered that the variations in performance among the fund's classes reflect the variations in class expenses, which result in lower performance for higher expense classes.
Based on its review, and giving particular weight to the nature and quality of the resources dedicated by the Investment Advisers to maintain and improve relative performance, the Board concluded that the nature, extent, and quality of the services provided to the fund will benefit the fund's shareholders, particularly in light of the Board's view that the fund's shareholders benefit from investing in a fund that is part of a large family of funds offering a variety of investment disciplines and services.
Competitiveness of Management Fee and Total Fund Expenses. The Board considered the fund's management fee and total expenses compared to "mapped groups" of competitive funds and classes. Fidelity creates "mapped groups" by combining similar Lipper investment objective categories that have comparable management fee characteristics. Combining Lipper investment objective categories aids the Board's management fee and total expense comparisons by broadening the competitive group used for comparison and by reducing the number of universes to which various Fidelity funds are compared.
Annual Report
The Board considered two proprietary management fee comparisons for the 12-month (or shorter) periods shown in the chart below. The group of Lipper funds used by the Board for management fee comparisons is referred to below as the "Total Mapped Group" and, for the reasons explained above, is broader than the Lipper peer group used by the Board for performance comparisons. The Total Mapped Group comparison focuses on a fund's standing relative to the total universe of comparable funds available to investors, in terms of gross management fees before expense reimbursements or caps. "TMG %" represents the percentage of funds in the Total Mapped Group that had management fees that were lower than the fund's. For example, a TMG % of 8% means that 92% of the funds in the Total Mapped Group had higher management fees than the fund. The "Asset-Size Peer Group" (ASPG) comparison focuses on a fund's standing relative to non-Fidelity funds similar in size to the fund within the Total Mapped Group. The ASPG represents at least 15% of the funds in the Total Mapped Group with comparable asset size and management fee characteristics, subject to a minimum of 50 funds (or all funds in the Total Mapped Group if fewer than 50). Additional information, such as the ASPG quartile in which the fund's management fee ranked, is also included in the chart and considered by the Board.
Fidelity Total Bond Fund
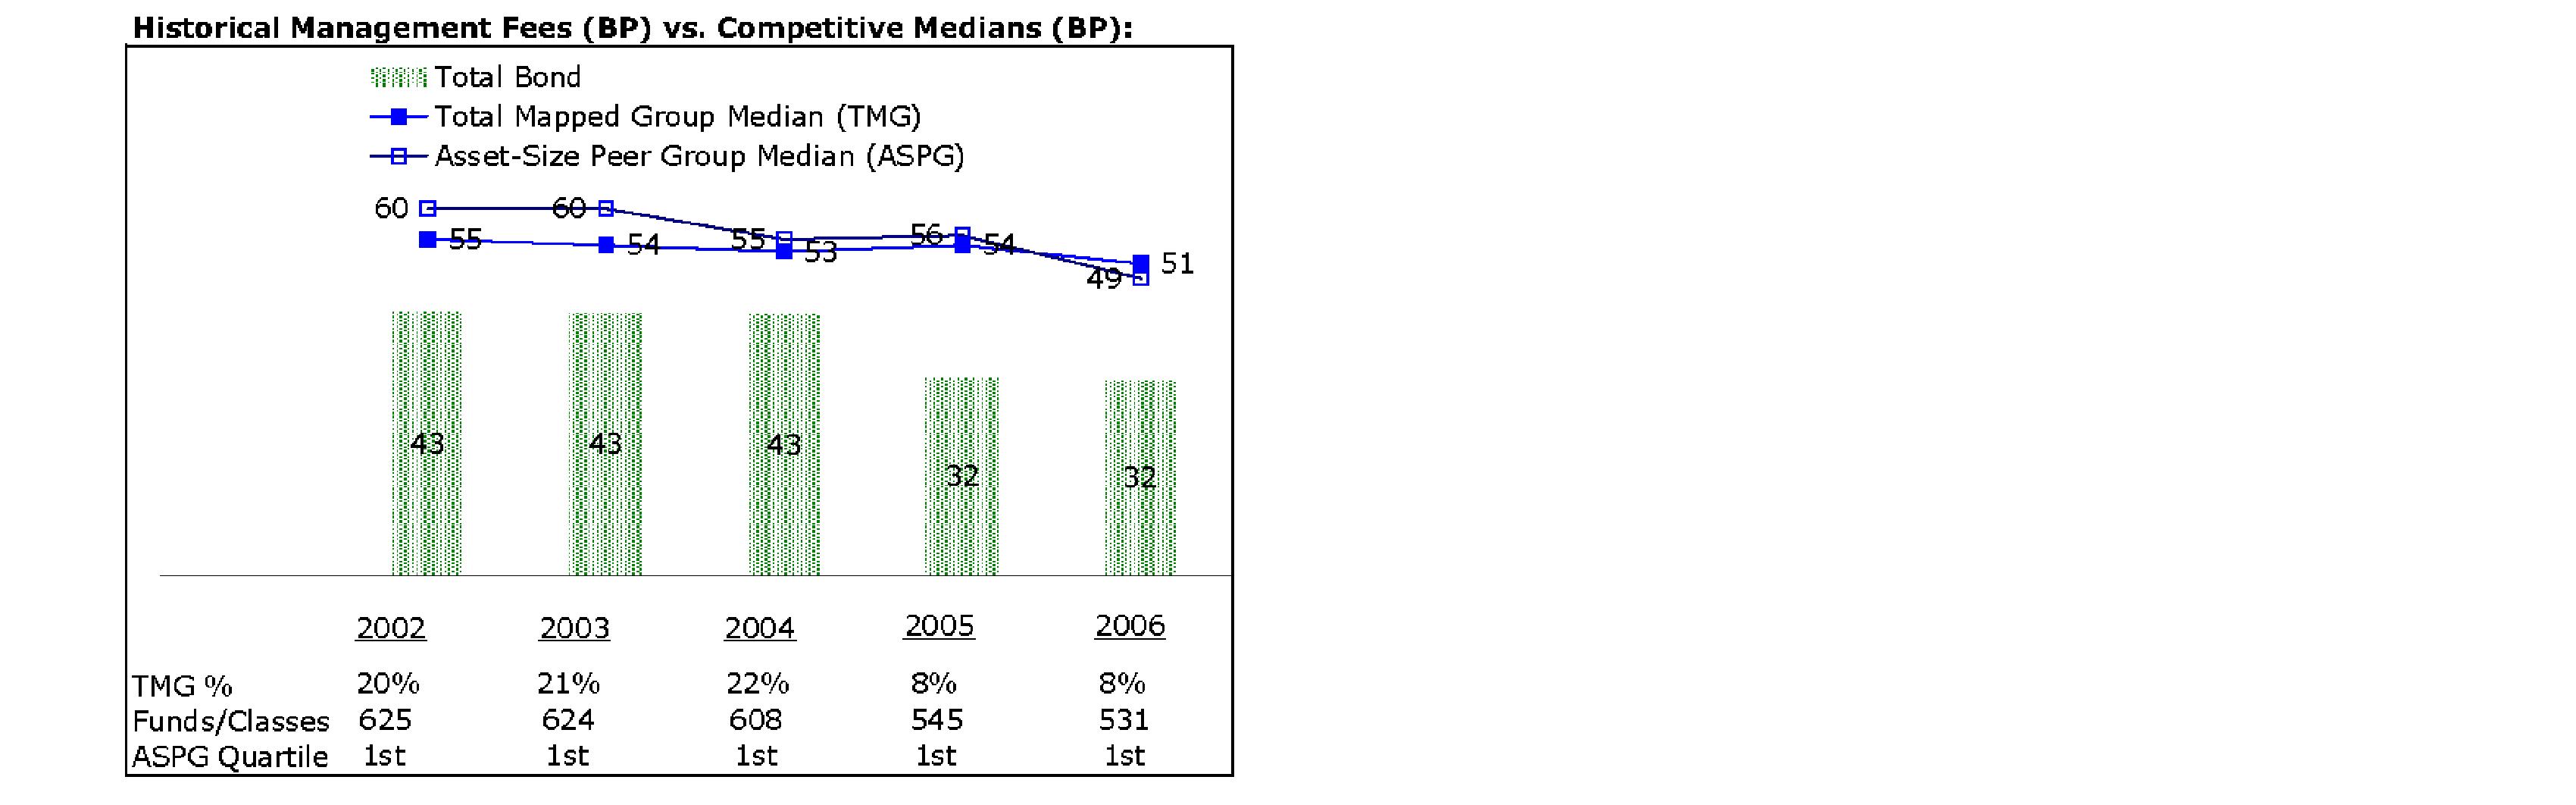
The Board noted that the fund's management fee ranked below the median of its Total Mapped Group and below the median of its ASPG for 2006.
Annual Report
Board Approval of Investment Advisory Contracts and
Management Fees - continued
Furthermore, the Board considered that it had approved an amendment (effective June 1, 2005) to the fund's management contract that lowered the fund's individual fund fee rate from 30 basis points to 20 basis points. The Board considered that the chart reflects the fund's lower management fee for 2005, as if the lower rate were in effect for the entire year.
Based on its review, the Board concluded that the fund's management fee was fair and reasonable in light of the services that the fund receives and the other factors considered.
In its review of each class's total expenses, the Board considered the fund's management fee as well as other fund or class expenses, as applicable, such as transfer agent fees, pricing and bookkeeping fees, fund-paid 12b-1 fees, and custodial, legal, and audit fees. The Board also noted the effects of any waivers and reimbursements on fees and expenses. As part of its review, the Board also considered current and historical total expenses of each class of the fund compared to competitive fund median expenses. Each class of the fund is compared to those funds and classes in the Total Mapped Group (used by the Board for management fee comparisons) that have a similar sales load structure.
The Board also considered that the current contractual arrangements for the fund (i) have the effect of setting the total "fund-level" expenses (including, among certain other expenses, the management fee) for each class at 35 basis points, (ii) lower and limit the "class-level" transfer agent fee for Fidelity Total Bond (retail class) to 10 basis points, and (iii) limit the total expenses for Fidelity Total Bond (retail class) to 45 basis points. These contractual arrangements may not be increased without the approval of the Board and the shareholders of the applicable class. The fund's Advisor classes are subject to different class-level expenses (transfer agent fees and 12b-1 fees).
The Board noted that each class's total expenses ranked below its competitive median for 2006.
The Board recognized that the fund's management contract incorporates a "group fee" structure, which provides for lower group fee rates as total fund assets under FMR's management increase, and for higher group fee rates as total fund assets under FMR's management decrease. FMR determines the group fee rates based on a tiered asset "breakpoint" schedule. In connection with the renewal of the fund's management contract, the Board approved amendments to the fund's management contract that added four new fee breakpoints to the group fee rate schedule for assets under FMR's management above $1,386 billion. The Board considered that the group fee rate declines under both the present and amended schedules, but that under the amended schedule, the group fee rate declines faster as assets under FMR's management exceed $1,386 billion. The Board noted, however, that because the current contractual arrangements set the total fund-level expenses for each class at 35 basis points, increases or decreases in the management fee due to changes in the group fee rate will not impact total expenses.
Annual Report
In its review of total expenses, the Board also considered Fidelity fee structures and other information on clients that FMR and its affiliates service in other competitive markets, such as other mutual funds advised or subadvised by FMR or its affiliates, pension plan clients, and other institutional clients.
Based on its review, the Board concluded that the total expenses of each class of the fund were reasonable in light of the services that the fund and its shareholders receive and the other factors considered.
Costs of the Services and Profitability. The Board considered the revenues earned and the expenses incurred by Fidelity in conducting the business of developing, marketing, distributing, managing, administering and servicing the fund and its shareholders. The Board also considered the level of Fidelity's profits in respect of all the Fidelity funds.
On an annual basis, FMR presents to the Board Fidelity's profitability for the fund. Fidelity calculates the profitability for each fund, as well as aggregate profitability for groups of Fidelity funds and all Fidelity funds, using a series of detailed revenue and cost allocation methodologies which originate with the audited books and records of Fidelity. The Audit Committee of the Board reviews any significant changes from the prior year's methodologies.
PricewaterhouseCoopers LLP (PwC), independent registered public accounting firm and auditor to Fidelity and certain Fidelity funds, has been engaged annually by the Board as part of the Board's assessment of the results of Fidelity's profitability analysis. PwC's engagement includes the review and assessment of Fidelity's methodologies used in determining the revenues and expenses attributable to Fidelity's mutual fund business, and completion of agreed-upon procedures surrounding the mathematical accuracy of fund profitability and its conformity to allocation methodologies. After considering PwC's reports issued under the engagement and information provided by Fidelity, the Board believes that while other allocation methods may also be reasonable, Fidelity's profitability methodologies are reasonable in all material respects.
The Board has also reviewed Fidelity's non-fund businesses and any fall-out benefits related to the mutual fund business as well as cases where Fidelity's affiliates may benefit from or be related to the fund's business.
The Board considered the costs of the services provided by and the profits realized by Fidelity in connection with the operation of the fund and determined that the amount of profit is a fair entrepreneurial profit for the management of the fund.
Annual Report
Board Approval of Investment Advisory Contracts and
Management Fees - continued
Economies of Scale. The Board considered whether there have been economies of scale in respect of the management of the Fidelity funds, whether the Fidelity funds (including the fund) have appropriately benefited from any such economies of scale, and whether there is potential for realization of any further economies of scale. The Board considered the extent to which the fund will benefit from economies of scale through increased services to the fund, through waivers or reimbursements, or through fee or expense reductions, including (Advisor classes only) reductions that occur through operation of the transfer agent agreement. The transfer agent fee varies in part based on the number of accounts in the fund. If the number of accounts decreases or the average account size increases, the overall transfer agent fee rate decreases. The Board concluded that any potential economies of scale are being shared between fund shareholders and Fidelity in an appropriate manner.
Additional Information Requested by the Board. In order to develop fully the factual basis for consideration of the Fidelity funds' Advisory Contracts, the Board requested and received additional information on several topics, including (i) Fidelity's fund profitability methodology, profitability by investment discipline, and profitability trends within certain funds; (ii) Fidelity's compensation structure relative to competitors and its effect on profitability; (iii) funds and accounts managed by Fidelity other than the Fidelity funds, including fee arrangements; (iv) the total expenses of certain funds and classes relative to competitors; (v) fund performance trends; (vi) fall-out benefits received by certain Fidelity affiliates; and (vii) Fidelity's fee structures.
Based on its evaluation of all of the conclusions noted above, and after considering all material factors, the Board ultimately concluded that the advisory fee structures are fair and reasonable, and that the fund's Advisory Contracts should be renewed.
Annual Report
Managing Your Investments
Fidelity offers several ways to conveniently manage your personal investments via your telephone or PC. You can access your account information, conduct trades and research your investments 24 hours a day.
By Phone
Fidelity Automated Service Telephone provides a single toll-free number to access account balances, positions, quotes and trading. It's easy to navigate the service, and on your first call, the system will help you create a personal identification number (PIN) for security.
(phone_graphic)
Fidelity Automated
Service Telephone (FAST®)
1-800-544-5555
Press
1 For mutual fund and brokerage trading.
2 For quotes.*
3 For account balances and holdings.
4 To review orders and mutual
fund activity.
5 To change your PIN.
*0 To speak to a Fidelity representative.
By PC
Fidelity's web site on the Internet provides a wide range of information, including daily financial news, fund performance, interactive planning tools and news about Fidelity products and services.
(computer_graphic)
Fidelity's Web Site
www.fidelity.com
* When you call the quotes line, please remember that a fund's yield and return will vary and, except for money market funds, share price will also vary. This means that you may have a gain or loss when you sell your shares. There is no assurance that money market funds will be able to maintain a stable $1 share price; an investment in a money market fund is not insured or guaranteed by the U.S. government. Total returns are historical and include changes in share price, reinvestment of dividends and capital gains, and the effects of any sales charges.
Annual Report
To Visit Fidelity
For directions and hours,
please call 1-800-544-9797.
Arizona
7001 West Ray Road
Chandler, AZ
15445 N. Scottsdale Road
Scottsdale, AZ
California
815 East Birch Street
Brea, CA
1411 Chapin Avenue
Burlingame, CA
851 East Hamilton Avenue
Campbell, CA
19200 Von Karman Avenue
Irvine, CA
601 Larkspur Landing Circle
Larkspur, CA
10100 Santa Monica Blvd.
Los Angeles, CA
27101 Puerta Real
Mission Viejo, CA
73-575 El Paseo
Palm Desert, CA
251 University Avenue
Palo Alto, CA
123 South Lake Avenue
Pasadena, CA
16995 Bernardo Ctr. Drive
Rancho Bernardo, CA
1220 Roseville Parkway
Roseville, CA
1740 Arden Way
Sacramento, CA
7676 Hazard Center Drive
San Diego, CA
11943 El Camino Real
San Diego, CA
8 Montgomery Street
San Francisco, CA
3793 State Street
Santa Barbara, CA
1200 Wilshire Boulevard
Santa Monica, CA
21701 Hawthorne Boulevard
Torrance, CA
2001 North Main Street
Walnut Creek, CA
6300 Canoga Avenue
Woodland Hills, CA
Colorado
1625 Broadway
Denver, CO
9185 Westview Road
Lone Tree, CO
Connecticut
48 West Putnam Avenue
Greenwich, CT
265 Church Street
New Haven, CT
300 Atlantic Street
Stamford, CT
29 South Main Street
West Hartford, CT
Delaware
400 Delaware Avenue
Wilmington, DE
Florida
4400 N. Federal Highway
Boca Raton, FL
121 Alhambra Plaza
Coral Gables, FL
2948 N. Federal Highway
Ft. Lauderdale, FL
4671 Town Center Parkway
Jacksonville, FL
1907 West State Road 434
Longwood, FL
8880 Tamiami Trail, North
Naples, FL
3501 PGA Boulevard
Palm Beach Gardens, FL
3550 Tamiami Trail, South
Sarasota, FL
1502 N. Westshore Blvd.
Tampa, FL
2465 State Road 7
Wellington, FL
Georgia
3445 Peachtree Road, N.E.
Atlanta, GA
1000 Abernathy Road
Atlanta, GA
Illinois
One North LaSalle Street
Chicago, IL
875 North Michigan Ave.
Chicago, IL
1415 West 22nd Street
Oak Brook, IL
1572 East Golf Road
Schaumburg, IL
3232 Lake Avenue
Wilmette, IL
Indiana
4729 East 82nd Street
Indianapolis, IN
Kansas
5400 College Boulevard
Overland Park, KS
Maine
Three Canal Plaza
Portland, ME
Maryland
7315 Wisconsin Avenue
Bethesda, MD
One W. Pennsylvania Ave.
Towson, MD
Massachusetts
801 Boylston Street
Boston, MA
155 Congress Street
Boston, MA
300 Granite Street
Braintree, MA
44 Mall Road
Burlington, MA
238 Main Street
Cambridge, MA
405 Cochituate Road
Framingham, MA
416 Belmont Street
Worcester, MA
Annual Report
Michigan
500 E. Eisenhower Pkwy.
Ann Arbor, MI
280 Old N. Woodward Ave.
Birmingham, MI
43420 Grand River Avenue
Novi, MI
29155 Northwestern Hwy.
Southfield, MI
Minnesota
7600 France Avenue South
Edina, MN
Missouri
1524 South Lindbergh Blvd.
St. Louis, MO
Nevada
2225 Village Walk Drive
Henderson, NV
New Jersey
150 Essex Street
Millburn, NJ
56 South Street
Morristown, NJ
396 Route 17, North
Paramus, NJ
3518 Route 1 North
Princeton, NJ
530 Broad Street
Shrewsbury, NJ
New York
1055 Franklin Avenue
Garden City, NY
37 West Jericho Turnpike
Huntington Station, NY
1271 Avenue of the Americas
New York, NY
980 Madison Avenue
New York, NY
61 Broadway
New York, NY
350 Park Avenue
New York, NY
200 Fifth Avenue
New York, NY
733 Third Avenue
New York, NY
11 Penn Plaza
New York, NY
2070 Broadway
New York, NY
1075 Northern Blvd.
Roslyn, NY
799 Central Park Avenue
Scarsdale, NY
North Carolina
4611 Sharon Road
Charlotte, NC
7011 Fayetteville Road
Durham, NC
Ohio
3805 Edwards Road
Cincinnati, OH
1324 Polaris Parkway
Columbus, OH
28699 Chagrin Boulevard
Woodmere Village, OH
Oregon
7493 SW Bridgeport Road
Tigard, OR
Pennsylvania
600 West DeKalb Pike
King of Prussia, PA
1735 Market Street
Philadelphia, PA
12001 Perry Highway
Wexford, PA
Rhode Island
47 Providence Place
Providence, RI
Tennessee
6150 Poplar Avenue
Memphis, TN
Texas
10000 Research Boulevard
Austin, TX
4001 Northwest Parkway
Dallas, TX
12532 Memorial Drive
Houston, TX
2701 Drexel Drive
Houston, TX
6560 Fannin Street
Houston, TX
6500 N. MacArthur Blvd.
Irving, TX
6005 West Park Boulevard
Plano, TX
14100 San Pedro
San Antonio, TX
1576 East Southlake Blvd.
Southlake, TX
19740 IH 45 North
Spring, TX
Utah
279 West South Temple
Salt Lake City, UT
Virginia
1861 International Drive
McLean, VA
Washington
411 108th Avenue, N.E.
Bellevue, WA
1518 6th Avenue
Seattle, WA
Washington, DC
1900 K Street, N.W.
Washington, DC
Wisconsin
595 North Barker Road
Brookfield, WI
Fidelity Brokerage Services, Inc., 100 Summer St., Boston, MA 02110 Member NYSE/SIPC
Annual Report
Investment Adviser
Fidelity Management & Research Company
Boston, MA
Investment Sub-Advisers
FMR Co., Inc.
Fidelity Research & Analysis Company
Fidelity Investments
Money Management, Inc.
Fidelity Investments Japan Limited
Fidelity International
Investment Advisors
Fidelity International
Investment Advisors (U.K.) Limited
General Distributor
Fidelity Distributors Corporation
Boston, MA
Transfer and Service Agent
Fidelity Service Company, Inc.
Boston, MA
Custodian
Citibank, N.A.
New York, NY
The Fidelity Telephone Connection
Mutual Fund 24-Hour Service
Exchanges/Redemptions
and Account Assistance 1-800-544-6666
Product Information 1-800-544-6666
Retirement Accounts 1-800-544-4774
(8 a.m. - 9 p.m.)
TDD Service 1-800-544-0118
for the deaf and hearing impaired
(9 a.m. - 9 p.m. Eastern time)
Fidelity Automated Service
Telephone (FAST®) (automated graphic) 1-800-544-5555
(automated graphic) Automated line for quickest service
TBD-UANN-1007
1.789712.104
(Fidelity Investment logo)(registered trademark)
Corporate Headquarters
82 Devonshire St., Boston, MA 02109
www.fidelity.com
(Fidelity Investment logo)(registered trademark)
Fidelity Advisor
Total Bond
Fund - Class A, Class T, Class B
and Class C
Annual Report
August 31, 2007
Class A, Class T, Class B,
and Class C are classes of
Fidelity Total Bond Fund
(2_fidelity_logos) (Registered_Trademark)
Contents
Notes to Shareholders | <Click Here> | An explanation of the changes to the fund. |
Chairman's Message | <Click Here> | Ned Johnson's message to shareholders. |
Performance | <Click Here> | How the fund has done over time. |
Management's Discussion | <Click Here> | The manager's review of fund performance, strategy and outlook |
Shareholder Expense Example | <Click Here> | An example of shareholder expenses. |
Investment Changes | <Click Here> | A summary of major shifts in the fund's investments over the past six months. |
Investments | <Click Here> | A complete list of the fund's investments with their market values. |
Financial Statements | <Click Here> | Statements of assets and liabilities, operations, and changes in net assets,
as well as financial highlights. |
Notes | <Click Here> | Notes to the financial statements. |
Report of Independent Registered Public Accounting Firm | <Click Here> | |
Trustees and Officers | <Click Here> | |
Distributions | <Click Here> | |
Board Approval of Investment Advisory Contracts and Management Fees | <Click Here> | |
To view a fund's proxy voting guidelines and proxy voting record for the 12-month period ended June 30, visit http://www.fidelity.com (search for "proxy voting guidelines") or visit the Securities and Exchange Commission's (SEC) web site at http://www.sec.gov. You may also call 1-800-544-8544 to request a free copy of the proxy voting guidelines.
Standard & Poor's, S&P and S&P 500 are registered service marks of The McGraw-Hill Companies, Inc. and have been licensed for use by Fidelity Distributors Corporation.
Other third party marks appearing herein are the property of their respective owners.
All other marks appearing herein are registered or unregistered trademarks or service marks of FMR LLC or an affiliated company.
Annual Report
This report and the financial statements contained herein are submitted for the general information of the shareholders of the fund. This report is not authorized for distribution to prospective investors in the fund unless preceded or accompanied by an effective prospectus.
A fund files its complete schedule of portfolio holdings with the SEC for the first and third quarters of each fiscal year on Form N-Q. Forms N-Q are available on the SEC's web site at http://www.sec.gov. A fund's Forms N-Q may be reviewed and copied at the SEC's Public Reference Room in Washington, DC. Information regarding the operation of the SEC's Public Reference Room may be obtained by calling 1-800-SEC-0330. For a complete list of a fund's portfolio holdings, view the most recent holdings listing, semiannual report, or annual report on Fidelity's web site at http://www.fidelity.com or http://www.advisor.fidelity.com, as applicable.
NOT FDIC INSURED · MAY LOSE VALUE · NO BANK GUARANTEE
Neither the fund nor Fidelity Distributors Corporation is a bank.
Annual Report
Notes to Shareholders:
As discussed in prior shareholder reports, the fund changed its investment approach in the way it invests in the investment-grade debt market, seeking exposure to various types of securities by investing in central funds as well as investing directly in individual investment-grade securities. Central funds are Fidelity mutual funds used by this fund and other Fidelity funds as an investment vehicle to gain pooled exposure to a particular core market sector, such as corporate bonds or mortgage-backed securities. Instead of multiple funds each investing in investment-grade debt securities individually, they can now take advantage of consolidating investments in a single, larger pool of investment-grade debt by investing directly in central funds. Shares of the central funds are offered only to other Fidelity mutual funds and accounts; investors cannot directly invest in them.
It's important to point out that investing in central funds does not impact the fund's investment objective or risk profile, only the mechanics of how we manage its investment portfolio. The portfolio managers continue to be responsible for choosing appropriate investments for their funds, whether they elect to purchase shares of a central fund or individual securities. Fidelity does not charge any additional management fees for central funds.
Investing in central funds does change the way this report presents the fund's holdings. The Investments section continues to list direct investments of the fund, including each central fund. However, many of the individual investment-grade debt securities previously held by the fund were transferred to the central funds, so they are no longer directly held and thus not listed. The financial statements and a complete schedule of portfolio holdings for each of the fixed-income central funds are available upon request or at the SEC's web site at www.sec.gov.
Annual Report
Chairman's Message
(photo_of_Edward_C_Johnson_3d)
Dear Shareholder:
Many stock and bond markets around the world have been unsettled of late; however, volatility can often lead to opportunity for patient investors. Financial markets are always unpredictable, but there are a number of time-tested principles that can put the historical odds in your favor.
One of the basic tenets is to invest for the long term. Over time, riding out the markets' inevitable ups and downs has proven much more effective than selling into panic or chasing the hottest trend. Even missing only a few of the markets' best days can significantly diminish investor returns. Patience also affords the benefits of compounding - of earning interest on additional income or reinvested dividends and capital gains. There are tax advantages and cost benefits to consider as well. The more you sell, the more taxes you pay, and the more you trade, the higher the costs. While staying the course doesn't eliminate risk, it can considerably lessen the effect of short-term declines.
You can further manage your investing risk through diversification. And today, more than ever, geographic diversification should be taken into account. Studies indicate that asset allocation is the single most important determinant of a portfolio's long-term success. The right mix of stocks, bonds and cash - aligned to your particular risk tolerance and investment objective - is very important. Age-appropriate rebalancing is also an essential aspect of asset allocation. For younger investors, an emphasis on equities - which historically have been the best-performing asset class over time - is encouraged. As investors near their specific goal, such as retirement or sending a child to college, consideration may be given to replacing volatile assets (e.g. common stocks) with more-stable fixed investments (bonds or savings plans).
A third investment principle - investing regularly - can help lower the average cost of your purchases. Investing a certain amount of money each month or quarter helps ensure you won't pay for all your shares at market highs. This strategy - known as dollar cost averaging - also reduces unconstructive "emotion" from investing, helping shareholders avoid selling weak performers just prior to an upswing, or chasing a hot performer just before a correction.
We invite you to contact us via the Internet, through our Investor Centers or over the phone. It is our privilege to provide you the information you need to make the investments that are right for you.
Sincerely,
/s/Edward C. Johnson 3d
Edward C. Johnson 3d
Annual Report
Performance: The Bottom Line
Average annual total return reflects the change in the value of an investment, assuming reinvestment of the class' dividend income and capital gains (the profits earned upon the sale of securities that have grown in value) and assuming a constant rate of performance each year. The $10,000 table and the fund's returns do not reflect the deduction of taxes that a shareholder would pay on fund distributions or the redemption of fund shares. During periods of reimbursement by Fidelity, a fund's total return will be greater than it would be had the reimbursement not occurred. How a fund did yesterday is no guarantee of how it will do tomorrow.
Average Annual Total Returns
Periods ended August 31, 2007 | Past 1
year | Life of
fund A |
Class A (incl. 4.00% sales charge) B(dagger) | -0.57% | 3.84% |
Class T (incl. 4.00% sales charge) C(dagger) | -0.59% | 3.77% |
Class B (incl. contingent deferred sales charge) D | -2.17% | 3.84% |
Class C (incl. contingent deferred sales charge) E | 1.76% | 4.15% |
A From October 15, 2002.
B As of April 1, 2007, Class A shares bear a 0.25% 12b-1 fee. The initial offering of Class A shares took place on June 16, 2004. Returns between June 16, 2004 and March 31, 2007 reflect a 0.15% 12b-1 fee. Returns prior to June 16, 2004 are those of Total Bond, the original retail class of the fund, which does not bear a 12b-1 fee. Had Class A shares' current 12b-1 fee been reflected, returns prior to April 1, 2007 would have been lower.
C Class T shares bear a 0.25% 12b-1 fee. The initial offering of Class T shares took place on June 16, 2004. Returns prior to June 16, 2004 are those of Total Bond, the original retail class of the fund, which does not bear a 12b-1 fee. Had Class T shares' 12b-1 fee been reflected, returns prior to June 16, 2004 would have been lower.
D Class B shares bear a 0.90% 12b-1 fee. The initial offering of Class B shares took place on June 16, 2004. Returns prior to June 16, 2004 are those of Total Bond, the original retail class of the fund, which does not bear a 12b-1 fee. Had Class B shares' 12b-1 fee been reflected, returns prior to June 16, 2004 would have been lower. Class B shares' contingent deferred sales charges included in past one year and life of fund total return figures are 5% and 2%, respectively.
E Class C shares bear a 1.00% 12b-1 fee. The initial offering of Class C shares took place on June 16, 2004. Returns prior to June 16, 2004 are those of Total Bond, the original retail class of the fund, which does not bear a 12b-1 fee. Had Class C shares' 12b-1 fee been reflected, returns prior to June 16, 2004 would have been lower. Class C shares' contingent deferred sales charges included in the past one year and life of fund total return figures are 1% and 0%, respectively.
8 The current sales charge is as of April 1, 2007. Prior to April 1, 2007, the sales charge was 4.75% for Class A and 3.50% for Class T.
Annual Report
$10,000 Over Life of Fund
Let's say hypothetically that $10,000 was invested in Fidelity Advisor Total Bond Fund - Class T on October 15, 2002, when the fund started, and the current 4.00% sales charge was paid. The chart shows how the value of your investment would have changed, and also shows how the Lehman Brothers® U.S. Aggregate Index performed over the same period. The initial offering of Class T took place on June 16, 2004. See the previous page for additional information regarding the performance of Class T.
Annual Report
Management's Discussion of Fund Performance
Comments from Ford O'Neil, Portfolio Manager of Fidelity Advisor Total Bond Fund
A subprime mortgage loan crisis and an emerging credit crunch contributed to subpar performance for some sectors of the investment-grade bond market during the 12-month period ending August 31, 2007. While returns for high-grade debt were fairly solid overall, they also were tempered to an extent by the Federal Reserve Board's decision not to lower interest rates as bond investors had hoped. The Lehman Brothers® U.S. Aggregate Index gained 5.26%. Within the index, Treasuries - the bond market's highest-quality debt instrument - fared best, as many investors fled riskier fixed-income securities. The asset-backed category - home to volatile subprime mortgages, as well as credit card debt and auto loans - had the weakest performance.
During the year, the fund's Class A, Class T, Class B and Class C shares returned 3.57%, 3.55%, 2.77% and 2.75%, respectively (excluding sales charges), lagging the Lehman Brothers Aggregate index and the 5.31% return of the Lehman Brothers U.S. Universal Index. I hold securities directly and indirectly through separately managed subportfolios and Fidelity fixed-income central funds, available only to other Fidelity funds and which allow me to gain exposure to particular segments of the bond market. I also invested in Fidelity® Ultra-Short Central Fund, a diversified pool of short-term assets. As I address performance, I'll be discussing direct investments and those of the subportfolios and central funds. Sector selection - with significant underweightings in plain-vanilla U.S. Treasury bonds and agency securities, as well as stakes in securitized bonds such as commercial mortgage-backed and asset-backed securities - proved to be the biggest detractor versus the Aggregate index. Treasuries and agencies were bolstered by a global flight to quality as the subprime mortgage market meltdown forced a repricing of risk, but securitized products were hurt by the same developments. Among securitized products, our exposure to subprime mortgage securities was especially detrimental to performance. Overweighted exposure to commercial mortgage-backed securities also hurt. They suffered from worries about what might have been lax lending standards in the commercial property market. Elsewhere, what we lost by owning emerging-markets holdings - which came under pressure as investors avoided riskier assets - we more than offset by holding high-yield corporate securities, which outpaced the benchmark. Within the high-yield allocation, a small exposure to floating-rate securities hurt because they, too, suffered as risk aversion escalated. My decision to modestly underweight investment-grade corporate bonds helped, as did favorable security selection within the sector.
The views expressed above reflect those of the portfolio manager(s) only through the end of the period as stated on the cover of this report and do not necessarily represent the views of Fidelity or any other person in the Fidelity organization. Any such views are subject to change at any time based upon market or other conditions and Fidelity disclaims any responsibility to update such views. These views may not be relied on as investment advice and, because investment decisions for a Fidelity fund are based on numerous factors, may not be relied on as an indication of trading intent on behalf of any Fidelity fund.
Annual Report
Shareholder Expense Example
As a shareholder of the Fund, you incur two types of costs: (1) transaction costs, including sales charges (loads) on purchase payments or redemption proceeds, and (2) ongoing costs, including management fees, distribution and/or service (12b-1) fees and other Fund expenses. This Example is intended to help you understand your ongoing costs (in dollars) of investing in the Fund and to compare these costs with the ongoing costs of investing in other mutual funds.
The Example is based on an investment of $1,000 invested at the beginning of the period and held for the entire period (March 1, 2007 to August 31, 2007).
Actual Expenses
The first line of the accompanying table for each class of the Fund provides information about actual account values and actual expenses. You may use the information in this line, together with the amount you invested, to estimate the expenses that you paid over the period. Simply divide your account value by $1,000.00 (for example, an $8,600 account value divided by $1,000.00 = 8.6), then multiply the result by the number in the first line for a class of the Fund under the heading entitled "Expenses Paid During Period" to estimate the expenses you paid on your account during this period. In addition, the Fund, as a shareholder in the underlying Fidelity Central Funds, will indirectly bear its pro rata share of the fees and expenses incurred by the underlying Fidelity Central Funds. These fees and expenses are not included in the Fund's annualized expense ratio used to calculate the expense estimate in the table below.
Hypothetical Example for Comparison Purposes
The second line of the accompanying table for each class of the Fund provides information about hypothetical account values and hypothetical expenses based on a Class' actual expense ratio and an assumed rate of return of 5% per year before expenses, which is not the Class' actual return. The hypothetical account values and expenses may not be used to estimate the actual ending account balance or expenses you paid for the period. You may use this information to compare the ongoing costs of investing in the Fund and other funds. To do so, compare this 5% hypothetical example with the 5% hypothetical examples that appear in the shareholder reports of the other funds. In addition, the Fund, as a shareholder in the underlying Fidelity Central Funds, will indirectly bear its pro rata share of the fees and expenses incurred by the underlying Fidelity Central Funds. These fees and expenses are not included in the Fund's annualized expense ratio used to calculate the expense estimate in the table below.
Please note that the expenses shown in the table are meant to highlight your ongoing costs only and do not reflect any transaction costs. Therefore, the second line of the table is useful in comparing ongoing costs only, and will not help you determine the relative total costs of owning different funds. In addition, if these transactional costs were included, your costs would have been higher.
Annual Report
Shareholder Expense Example - continued
| Beginning
Account Value
March 1, 2007 | Ending
Account Value
August 31, 2007 | Expenses Paid
During Period*
March 1, 2007
to August 31, 2007 |
Class A | | | |
Actual | $ 1,000.00 | $ 999.50 | $ 4.03 |
Hypothetical A | $ 1,000.00 | $ 1,021.17 | $ 4.08 |
Class T | | | |
Actual | $ 1,000.00 | $ 999.60 | $ 3.88 |
Hypothetical A | $ 1,000.00 | $ 1,021.32 | $ 3.92 |
Class B | | | |
Actual | $ 1,000.00 | $ 995.80 | $ 7.65 |
Hypothetical A | $ 1,000.00 | $ 1,017.54 | $ 7.73 |
Class C | | | |
Actual | $ 1,000.00 | $ 995.70 | $ 7.70 |
Hypothetical A | $ 1,000.00 | $ 1,017.49 | $ 7.78 |
Total Bond | | | |
Actual | $ 1,000.00 | $ 1,001.20 | $ 2.27 |
Hypothetical A | $ 1,000.00 | $ 1,022.94 | $ 2.29 |
Institutional Class | | | |
Actual | $ 1,000.00 | $ 1,001.00 | $ 2.52 |
Hypothetical A | $ 1,000.00 | $ 1,022.68 | $ 2.55 |
A 5% return per year before expenses
* Expenses are equal to each Class' annualized expense ratio (shown in the table below); multiplied by the average account value over the period, multiplied by 184/365 (to reflect the one-half year period). The fees and expenses of the underlying Fidelity Central Funds in which the Fund invests are not included in the Fund's annualized expense ratio.
| Annualized
Expense Ratio |
Class A | .80% |
Class T | .77% |
Class B | 1.52% |
Class C | 1.53% |
Total Bond | . .45% |
Institutional Class | .50% |
Annual Report
Investment Changes
The information in the following tables is based on the combined investments of the Fund and its pro rata share of its investments in each Fidelity Central Fund. |
Quality Diversification (% of fund's net assets) |
As of August 31, 2007 | As of February 28, 2007 |
| U.S. Government and
U.S. Government
Agency Obligations 55.2% | | | U.S. Government and
U.S. Government
Agency Obligations 52.5% | |
| AAA 13.8% | | | AAA 14.7% | |
| AA 5.0% | | | AA 4.5% | |
| A 3.8% | | | A 5.0% | |
| BBB 13.7% | | | BBB 12.9% | |
| BB and Below 8.4% | | | BB and Below 9.5% | |
| Not Rated 1.3% | | | Not Rated 2.0% | |
| Equities 0.1% | | | Equities 0.0% | |
| Short-Term
Investments and
Net Other Assets(dagger) (1.3)% | | | Short-Term
Investments and
Net Other Assets(dagger) (1.1)% | |

We have used ratings from Moody's ® Investors Services, Inc. Where Moody's ratings are not available, we have used S&P ® ratings. All ratings are as of the report date and do not reflect subsequent downgrades. |
Weighted Average Maturity as of August 31, 2007 |
| | 6 months ago |
Years | 5.0 | 5.7 |
The weighted average maturity is based on the dollar-weighted average length of time until principal payments are expected or until securities reach maturity, taking into account any maturity shortening feature such as a call, refunding or redemption provision. |
Duration as of August 31, 2007 |
| | 6 months ago |
Years | 4.4 | 4.1 |
Duration shows how much a bond fund's price fluctuates with changes in comparable interest rates. If rates rise 1%, for example, a fund with a five-year duration is likely to lose about 5% of its value. Other factors also can influence a bond fund's performance and share price. Accordingly, a bond fund's actual performance may differ from this example. |
Asset Allocation (% of fund's net assets) |
As of August 31, 2007* | As of February 28, 2007** |
| Corporate Bonds 20.2% | | | Corporate Bonds 21.8% | |
| U.S. Government and
U.S. Government
Agency Obligations 55.2% | | | U.S. Government and
U.S. Government
Agency Obligations 52.5% | |
| Asset-Backed
Securities 9.9% | | | Asset-Backed
Securities 10.7% | |
| CMOs and Other Mortgage Related Securities 11.5% | | | CMOs and Other Mortgage Related Securities 11.0% | |
| Stocks 0.1% | | | Stocks 0.0% | |
| Other Investments 4.4% | | | Other Investments 5.1% | |
| Short-Term
Investments and
Net Other Assets(dagger) (1.3)% | | | Short-Term
Investments and
Net Other Assets(dagger) (1.1)% | |
* Foreign investments | 9.2% | | ** Foreign investments | 9.3% | |
* Futures and Swaps | 13.0% | | ** Futures and Swaps | 16.1% | |

(dagger) Short-term Investments and Net Other Assets are not included in the pie chart. |
A holdings list for the Fund, which presents direct holdings as well as the pro rata share of any securities and other investments held indirectly through its investment in underlying non-money market Fidelity Central Funds, is available at fidelity.com and/or advisor.fidelity.com, as applicable. |
Annual Report
Investments August 31, 2007
Showing Percentage of Net Assets
Corporate Bonds - 7.7% |
| Principal Amount (b) | | Value |
Convertible Bonds - 0.1% |
ENERGY - 0.0% |
Oil, Gas & Consumable Fuels - 0.0% |
Chesapeake Energy Corp. 2.75% 11/15/35 | | $ 2,060,000 | | $ 2,115,414 |
FINANCIALS - 0.0% |
Real Estate Investment Trusts - 0.0% |
American Financial Realty Trust 4.375% 7/15/24 | | 50,000 | | 46,750 |
INFORMATION TECHNOLOGY - 0.1% |
Communications Equipment - 0.1% |
Nortel Networks Corp. 1.75% 4/15/12 (f) | | 3,160,000 | | 2,618,850 |
Semiconductors & Semiconductor Equipment - 0.0% |
Advanced Micro Devices, Inc. 6% 5/1/15 | | 350,000 | | 302,313 |
TOTAL INFORMATION TECHNOLOGY | | 2,921,163 |
TOTAL CONVERTIBLE BONDS | | 5,083,327 |
Nonconvertible Bonds - 7.6% |
CONSUMER DISCRETIONARY - 1.3% |
Auto Components - 0.0% |
ArvinMeritor, Inc.: | | | | |
8.125% 9/15/15 | | 305,000 | | 284,413 |
8.75% 3/1/12 | | 400,000 | | 392,000 |
Tenneco, Inc. 8.625% 11/15/14 | | 805,000 | | 784,875 |
| | 1,461,288 |
Diversified Consumer Services - 0.0% |
Affinion Group, Inc. 11.5% 10/15/15 | | 740,000 | | 741,850 |
Education Management LLC/Education Management Finance Corp.: | | | | |
8.75% 6/1/14 | | 300,000 | | 304,500 |
10.25% 6/1/16 | | 300,000 | | 307,500 |
Service Corp. International: | | | | |
6.75% 4/1/15 | | 970,000 | | 940,900 |
7.5% 4/1/27 | | 1,105,000 | | 1,005,550 |
| | 3,300,300 |
Hotels, Restaurants & Leisure - 0.4% |
Carrols Corp. 9% 1/15/13 | | 105,000 | | 98,700 |
Chukchansi Economic Development Authority 8% 11/15/13 (f) | | 565,000 | | 562,175 |
Corporate Bonds - continued |
| Principal
Amount (b) | | Value |
Nonconvertible Bonds - continued |
CONSUMER DISCRETIONARY - continued |
Hotels, Restaurants & Leisure - continued |
Fontainebleau Las Vegas Holdings LLC/Fontainebleau Las Vegas Capital Corp. 10.25% 6/15/15 (f) | | $ 565,000 | | $ 485,900 |
Host Marriott LP: | | | | |
6.375% 3/15/15 | | 250,000 | | 239,375 |
6.75% 6/1/16 | | 100,000 | | 97,250 |
7.125% 11/1/13 | | 2,870,000 | | 2,848,475 |
ITT Corp. 7.375% 11/15/15 | | 250,000 | | 255,000 |
Landry's Seafood Restaurants, Inc. 7.5% 12/15/14 | | 2,385,000 | | 2,379,038 |
MGM Mirage, Inc.: | | | | |
5.875% 2/27/14 | | 1,955,000 | | 1,805,931 |
6.625% 7/15/15 | | 300,000 | | 282,000 |
6.75% 9/1/12 | | 500,000 | | 487,500 |
6.875% 4/1/16 | | 1,635,000 | | 1,549,163 |
7.625% 1/15/17 | | 3,445,000 | | 3,410,550 |
8.375% 2/1/11 | | 180,000 | | 184,050 |
Mohegan Tribal Gaming Authority 7.125% 8/15/14 | | 540,000 | | 523,125 |
NCL Corp. Ltd. 10.625% 7/15/14 | | 1,000,000 | | 995,000 |
Park Place Entertainment Corp. 7% 4/15/13 | | 540,000 | | 554,850 |
Penn National Gaming, Inc.: | | | | |
6.75% 3/1/15 | | 350,000 | | 353,500 |
6.875% 12/1/11 | | 80,000 | | 79,800 |
Royal Caribbean Cruises Ltd. yankee: | | | | |
7.25% 6/15/16 | | 190,000 | | 182,400 |
7.5% 10/15/27 | | 125,000 | | 113,750 |
Seminole Hard Rock Entertainment, Inc. 7.86% 3/15/14 (f)(i) | | 1,040,000 | | 1,019,200 |
Seneca Gaming Corp.: | | | | |
Series B, 7.25% 5/1/12 | | 70,000 | | 70,000 |
7.25% 5/1/12 | | 350,000 | | 350,000 |
Shingle Springs Tribal Gaming Authority 9.375% 6/15/15 (f) | | 180,000 | | 177,300 |
Six Flags, Inc.: | | | | |
8.875% 2/1/10 | | 400,000 | | 348,000 |
9.625% 6/1/14 | | 1,090,000 | | 882,900 |
9.75% 4/15/13 | | 730,000 | | 605,900 |
Starwood Hotels & Resorts Worldwide, Inc. 7.875% 5/1/12 | | 250,000 | | 267,725 |
Station Casinos, Inc.: | | | | |
6.625% 3/15/18 | | 100,000 | | 80,625 |
Corporate Bonds - continued |
| Principal
Amount (b) | | Value |
Nonconvertible Bonds - continued |
CONSUMER DISCRETIONARY - continued |
Hotels, Restaurants & Leisure - continued |
Station Casinos, Inc.: - continued | | | | |
6.875% 3/1/16 | | $ 1,255,000 | | $ 1,044,788 |
7.75% 8/15/16 | | 365,000 | | 346,750 |
Town Sports International Holdings, Inc. 0% 2/1/14 (c) | | 1,000,000 | | 915,000 |
Virgin River Casino Corp./RBG LLC/B&BB, Inc.: | | | | |
0% 1/15/13 (c) | | 40,000 | | 29,600 |
9% 1/15/12 | | 280,000 | | 277,200 |
Wheeling Island Gaming, Inc. 10.125% 12/15/09 | | 1,000,000 | | 1,000,000 |
Wynn Las Vegas LLC/Wynn Las Vegas Capital Corp. 6.625% 12/1/14 | | 1,545,000 | | 1,494,788 |
| | 26,397,308 |
Household Durables - 0.0% |
Fortune Brands, Inc. 5.875% 1/15/36 | | 1,075,000 | | 969,211 |
Goodman Global Holdings, Inc. 7.875% 12/15/12 | | 430,000 | | 423,550 |
K. Hovnanian Enterprises, Inc.: | | | | |
6.25% 1/15/15 | | 245,000 | | 191,100 |
8.875% 4/1/12 | | 5,000 | | 3,950 |
KB Home 7.75% 2/1/10 | | 185,000 | | 179,450 |
Urbi, Desarrollos Urbanos, SA de CV 8.5% 4/19/16 (f) | | 260,000 | | 258,700 |
| | 2,025,961 |
Media - 0.7% |
AMC Entertainment, Inc. 8% 3/1/14 | | 1,700,000 | | 1,564,000 |
AOL Time Warner, Inc. 7.625% 4/15/31 | | 500,000 | | 541,952 |
Cablemas SA de CV (Reg. S) 9.375% 11/15/15 | | 700,000 | | 749,000 |
Cablevision Systems Corp.: | | | | |
8% 4/15/12 | | 555,000 | | 527,250 |
9.82% 4/1/09 (i) | | 340,000 | | 344,250 |
Charter Communications Holdings I LLC 9.92% 4/1/14 | | 495,000 | | 405,900 |
Charter Communications Holdings I LLC/Charter Communications Holdings I Capital Corp. 11% 10/1/15 | | 2,035,000 | | 1,973,950 |
Charter Communications Holdings II LLC/Charter Communications Holdings II Capital Corp.: | | | | |
Series B, 10.25% 9/15/10 | | 100,000 | | 99,750 |
10.25% 9/15/10 | | 615,000 | | 624,225 |
Charter Communications Operating LLC/Charter Communications Operating Capital Corp. 8.375% 4/30/14 (f) | | 370,000 | | 364,450 |
Cox Communications, Inc. 6.45% 12/1/36 (f) | | 1,365,000 | | 1,307,838 |
Corporate Bonds - continued |
| Principal
Amount (b) | | Value |
Nonconvertible Bonds - continued |
CONSUMER DISCRETIONARY - continued |
Media - continued |
CSC Holdings, Inc.: | | | | |
7.25% 4/15/12 | | $ 460,000 | | $ 437,000 |
7.625% 4/1/11 | | 1,000,000 | | 985,000 |
7.625% 7/15/18 | | 235,000 | | 215,613 |
8.125% 7/15/09 | | 365,000 | | 367,738 |
EchoStar Communications Corp.: | | | | |
6.375% 10/1/11 | | 1,630,000 | | 1,597,400 |
6.625% 10/1/14 | | 1,430,000 | | 1,376,375 |
7.125% 2/1/16 | | 750,000 | | 730,350 |
Insight Midwest LP/Insight Capital, Inc. 9.75% 10/1/09 | | 52,000 | | 52,455 |
Kabel Deutschland GmbH 10.625% 7/1/14 | | 2,000,000 | | 2,115,000 |
Liberty Media Corp.: | | | | |
5.7% 5/15/13 | | 450,000 | | 416,250 |
8.25% 2/1/30 | | 405,000 | | 392,850 |
8.5% 7/15/29 | | 630,000 | | 632,442 |
News America Holdings, Inc. 7.75% 12/1/45 | | 170,000 | | 186,075 |
News America, Inc.: | | | | |
6.15% 3/1/37 | | 2,970,000 | | 2,759,287 |
6.2% 12/15/34 | | 5,330,000 | | 4,949,150 |
Nexstar Broadcasting, Inc. 7% 1/15/14 | | 700,000 | | 661,500 |
Nielsen Finance LLC/Co.: | | | | |
0% 8/1/16 (c)(f) | | 2,300,000 | | 1,546,750 |
10% 8/1/14 (f) | | 400,000 | | 410,000 |
PanAmSat Corp.: | | | | |
6.375% 1/15/08 | | 200,000 | | 198,000 |
9% 8/15/14 | | 84,000 | | 85,369 |
Quebecor Media, Inc. 7.75% 3/15/16 | | 1,000,000 | | 945,000 |
Rainbow National LLC & RNS Co. Corp.: | | | | |
8.75% 9/1/12 (f) | | 280,000 | | 285,600 |
10.375% 9/1/14 (f) | | 20,000 | | 21,500 |
The Reader's Digest Association, Inc. 9% 2/15/17 (f) | | 1,700,000 | | 1,462,000 |
Time Warner Cable, Inc.: | | | | |
5.85% 5/1/17 (f) | | 2,607,000 | | 2,548,045 |
6.55% 5/1/37 (f) | | 3,118,000 | | 3,030,774 |
Time Warner, Inc. 6.625% 5/15/29 | | 4,415,000 | | 4,327,927 |
TL Acquisitions, Inc. 10.5% 1/15/15 (f) | | 1,115,000 | | 1,053,675 |
Umbrella Acquisition, Inc. 9.75% 3/15/15
pay-in-kind (f) | | 2,915,000 | | 2,812,975 |
Corporate Bonds - continued |
| Principal
Amount (b) | | Value |
Nonconvertible Bonds - continued |
CONSUMER DISCRETIONARY - continued |
Media - continued |
Valassis Communications, Inc. 8.25% 3/1/15 | | $ 1,475,000 | | $ 1,246,375 |
Visant Holding Corp. 8.75% 12/1/13 | | 450,000 | | 450,000 |
| | 46,801,040 |
Specialty Retail - 0.1% |
GSC Holdings Corp./Gamestop, Inc. 8% 10/1/12 | | 35,000 | | 36,050 |
Michaels Stores, Inc. 10% 11/1/14 (f) | | 300,000 | | 300,750 |
Nebraska Book Co., Inc. 8.625% 3/15/12 | | 1,090,000 | | 1,073,650 |
Toys 'R' US, Inc.: | | | | |
7.375% 10/15/18 | | 445,000 | | 347,100 |
7.625% 8/1/11 | | 755,000 | | 668,175 |
7.875% 4/15/13 | | 1,290,000 | | 1,086,825 |
| | 3,512,550 |
Textiles, Apparel & Luxury Goods - 0.1% |
Hanesbrands, Inc. 8.735% 12/15/14 (f)(i) | | 1,480,000 | | 1,465,200 |
Jostens IH Corp. 7.625% 10/1/12 | | 190,000 | | 190,000 |
Levi Strauss & Co.: | | | | |
8.875% 4/1/16 | | 2,100,000 | | 2,100,000 |
9.75% 1/15/15 | | 180,000 | | 185,400 |
12.25% 12/15/12 | | 315,000 | | 336,263 |
| | 4,276,863 |
TOTAL CONSUMER DISCRETIONARY | | 87,775,310 |
CONSUMER STAPLES - 0.3% |
Food & Staples Retailing - 0.1% |
Albertsons, Inc.: | | | | |
7.45% 8/1/29 | | 250,000 | | 237,372 |
7.75% 6/15/26 | | 210,000 | | 199,500 |
CVS Caremark Corp. 6.302% 6/1/37 (i) | | 8,615,000 | | 8,321,616 |
Rite Aid Corp. 7.5% 3/1/17 | | 1,000,000 | | 927,500 |
SUPERVALU, Inc. 7.5% 11/15/14 | | 785,000 | | 788,925 |
| | 10,474,913 |
Food Products - 0.1% |
Bertin Ltda 10.25% 10/5/16 (f) | | 205,000 | | 209,100 |
Dean Foods Co. 6.9% 10/15/17 | | 2,000,000 | | 1,805,000 |
Gruma SA de CV 7.75% | | 795,000 | | 791,025 |
Kraft Foods, Inc. 7% 8/11/37 | | 435,000 | | 447,739 |
Corporate Bonds - continued |
| Principal
Amount (b) | | Value |
Nonconvertible Bonds - continued |
CONSUMER STAPLES - continued |
Food Products - continued |
National Beef Packing Co. LLC/National Beef Finance Corp. 10.5% 8/1/11 | | $ 595,000 | | $ 609,875 |
Pierre Foods, Inc. 9.875% 7/15/12 | | 540,000 | | 523,800 |
Smithfield Foods, Inc. 7.75% 7/1/17 | | 725,000 | | 725,000 |
| | 5,111,539 |
Household Products - 0.0% |
Kimberly-Clark Corp. 6.625% 8/1/37 | | 2,207,000 | | 2,327,504 |
Tobacco - 0.1% |
Reynolds American, Inc.: | | | | |
7.25% 6/15/37 | | 4,865,000 | | 4,930,507 |
7.3% 7/15/15 | | 195,000 | | 200,850 |
| | 5,131,357 |
TOTAL CONSUMER STAPLES | | 23,045,313 |
ENERGY - 0.9% |
Energy Equipment & Services - 0.1% |
Compagnie Generale de Geophysique SA: | | | | |
7.5% 5/15/15 | | 535,000 | | 537,675 |
7.75% 5/15/17 | | 1,195,000 | | 1,209,938 |
Complete Production Services, Inc. 8% 12/15/16 | | 2,260,000 | | 2,175,250 |
Hanover Equipment Trust 8.75% 9/1/11 | | 50,000 | | 50,750 |
Seitel, Inc. 9.75% 2/15/14 (f) | | 1,000,000 | | 930,000 |
| | 4,903,613 |
Oil, Gas & Consumable Fuels - 0.8% |
Arch Western Finance LLC 6.75% 7/1/13 | | 1,350,000 | | 1,269,000 |
Atlas Pipeline Partners LP 8.125% 12/15/15 | | 2,290,000 | | 2,272,825 |
Chaparral Energy, Inc.: | | | | |
8.5% 12/1/15 | | 530,000 | | 473,025 |
8.875% 2/1/17 (f) | | 210,000 | | 189,000 |
Chesapeake Energy Corp.: | | | | |
6.5% 8/15/17 | | 1,625,000 | | 1,547,813 |
6.625% 1/15/16 | | 1,195,000 | | 1,156,163 |
6.875% 1/15/16 | | 1,020,000 | | 1,002,150 |
6.875% 11/15/20 | | 630,000 | | 604,800 |
7.5% 9/15/13 | | 300,000 | | 306,000 |
7.625% 7/15/13 | | 200,000 | | 203,500 |
7.75% 1/15/15 | | 430,000 | | 436,450 |
Corporate Bonds - continued |
| Principal
Amount (b) | | Value |
Nonconvertible Bonds - continued |
ENERGY - continued |
Oil, Gas & Consumable Fuels - continued |
Drummond Co., Inc. 7.375% 2/15/16 (f) | | $ 630,000 | | $ 567,000 |
Duke Capital LLC 6.75% 2/15/32 | | 1,195,000 | | 1,186,563 |
Duke Energy Field Services 6.45% 11/3/36 (f) | | 2,400,000 | | 2,372,069 |
Forest Oil Corp.: | | | | |
7.25% 6/15/19 (f) | | 500,000 | | 481,250 |
7.75% 5/1/14 | | 675,000 | | 676,688 |
Kinder Morgan Energy Partners LP 6.95% 1/15/38 | | 800,000 | | 804,874 |
Massey Energy Co.: | | | | |
6.625% 11/15/10 | | 40,000 | | 38,800 |
6.875% 12/15/13 | | 2,485,000 | | 2,248,925 |
Nakilat, Inc. 6.067% 12/31/33 (f) | | 2,885,000 | | 2,790,026 |
National Gas Co. of Trinidad & Tobago Ltd. 6.05% 1/15/36 (f) | | 240,000 | | 230,291 |
Nexen, Inc.: | | | | |
5.875% 3/10/35 | | 240,000 | | 217,518 |
6.4% 5/15/37 | | 3,645,000 | | 3,546,005 |
OPTI Canada, Inc.: | | | | |
7.875% 12/15/14 (f) | | 1,175,000 | | 1,177,938 |
8.25% 12/15/14 (f) | | 635,000 | | 642,938 |
Pan American Energy LLC 7.75% 2/9/12 (f) | | 2,475,000 | | 2,406,938 |
Peabody Energy Corp. 7.375% 11/1/16 | | 725,000 | | 731,344 |
Pemex Project Funding Master Trust 6.625% 6/15/35 | | 625,000 | | 640,625 |
Petrohawk Energy Corp. 9.125% 7/15/13 | | 1,270,000 | | 1,323,975 |
Petroleos de Venezuela SA: | | | | |
5.25% 4/12/17 | | 1,485,000 | | 1,028,363 |
5.375% 4/12/27 | | 1,270,000 | | 742,950 |
Petrozuata Finance, Inc.: | | | | |
7.63% 4/1/09 (f) | | 1,329,739 | | 1,319,766 |
8.22% 4/1/17 (f) | | 950,000 | | 950,000 |
Pioneer Natural Resources Co. 6.65% 3/15/17 | | 2,715,000 | | 2,511,375 |
Plains All American Pipeline LP: | | | | |
6.125% 1/15/17 | | 930,000 | | 932,867 |
6.65% 1/15/37 | | 1,740,000 | | 1,722,085 |
Plains Exploration & Production Co. 7% 3/15/17 | | 970,000 | | 887,550 |
Range Resources Corp.: | | | | |
6.375% 3/15/15 (Reg. S) | | 710,000 | | 678,050 |
7.375% 7/15/13 | | 440,000 | | 442,200 |
7.5% 5/15/16 | | 3,000,000 | | 3,052,500 |
Corporate Bonds - continued |
| Principal
Amount (b) | | Value |
Nonconvertible Bonds - continued |
ENERGY - continued |
Oil, Gas & Consumable Fuels - continued |
Ras Laffan Liquid Natural Gas Co. Ltd. III 6.332% 9/30/27 (f) | | $ 1,840,000 | | $ 1,838,381 |
Ship Finance International Ltd. 8.5% 12/15/13 | | 330,000 | | 335,775 |
Talisman Energy, Inc. yankee 6.25% 2/1/38 | | 2,290,000 | | 2,151,405 |
Teekay Corp. 8.875% 7/15/11 | | 115,000 | | 117,300 |
Valero Energy Corp. 6.625% 6/15/37 | | 1,510,000 | | 1,522,539 |
W&T Offshore, Inc. 8.25% 6/15/14 (f) | | 1,600,000 | | 1,520,000 |
Williams Companies, Inc. 8.75% 3/15/32 | | 165,000 | | 182,325 |
Williams Partners LP/Williams Partners Finance Corp. 7.25% 2/1/17 | | 485,000 | | 481,363 |
YPF SA 10% 11/2/28 | | 375,000 | | 431,250 |
| | 54,392,537 |
TOTAL ENERGY | | 59,296,150 |
FINANCIALS - 1.8% |
Capital Markets - 0.5% |
Bear Stearns Companies, Inc. 6.9% 8/15/12 | | 10,705,000 | | 10,777,591 |
Deutsche Bank AG London 6% 9/1/17 | | 4,440,000 | | 4,479,609 |
E*TRADE Financial Corp.: | | | | |
7.375% 9/15/13 | | 290,000 | | 246,500 |
7.875% 12/1/15 | | 400,000 | | 346,000 |
Goldman Sachs Group, Inc. 5.625% 1/15/17 | | 3,200,000 | | 3,058,755 |
JPMorgan Chase Capital XX 6.55% 9/29/36 | | 10,020,000 | | 9,020,124 |
Lehman Brothers Holdings, Inc. 6% 5/3/32 (i) | | 3,030,000 | | 2,653,532 |
Morgan Stanley 4.75% 4/1/14 | | 1,635,000 | | 1,528,432 |
| | 32,110,543 |
Commercial Banks - 0.3% |
Banco Nacional de Desenvolvimento Economico e Social 5.84% 6/16/08 (i) | | 3,027,000 | | 3,011,865 |
Bank of America NA: | | | | |
5.3% 3/15/17 | | 1,515,000 | | 1,459,548 |
6% 10/15/36 | | 5,040,000 | | 4,871,614 |
BB&T Capital Trust IV 6.82% 6/12/77 (i) | | 2,314,000 | | 2,182,433 |
Development Bank of Philippines 8.375% (i) | | 725,000 | | 746,750 |
KeyCorp Capital Trust VII 5.7% 6/15/35 | | 2,600,000 | | 2,219,337 |
Corporate Bonds - continued |
| Principal
Amount (b) | | Value |
Nonconvertible Bonds - continued |
FINANCIALS - continued |
Commercial Banks - continued |
Kyivstar GSM: | | | | |
7.75% 4/27/12 (Issued by Dresdner Bank AG for Kyivstar GSM) (f) | | $ 350,000 | | $ 344,750 |
10.375% 8/17/09 (Issued by Dresdner Bank AG for Kyivstar GSM) (f) | | 1,025,000 | | 1,078,813 |
Vimpel Communications: | | | | |
8% 2/11/10 (Issued by UBS Luxembourg SA for Vimpel Communications) | | 1,125,000 | | 1,143,281 |
10% 6/16/09 (Issued by UBS Luxembourg SA for Vimpel Communications) | | 320,000 | | 334,374 |
Wachovia Bank NA 5.85% 2/1/37 | | 3,200,000 | | 3,012,160 |
| | 20,404,925 |
Consumer Finance - 0.2% |
Ford Motor Credit Co. LLC: | | | | |
6.625% 6/16/08 | | 840,000 | | 814,797 |
7.8% 6/1/12 | | 980,000 | | 899,150 |
8.11% 1/13/12 (i) | | 170,000 | | 154,275 |
8.625% 11/1/10 | | 900,000 | | 859,795 |
General Motors Acceptance Corp.: | | | | |
6.75% 12/1/14 | | 565,000 | | 478,838 |
6.875% 9/15/11 | | 1,685,000 | | 1,482,800 |
GMAC LLC: | | | | |
6% 12/15/11 | | 530,000 | | 455,800 |
6.625% 5/15/12 | | 350,000 | | 302,750 |
SLM Corp.: | | | | |
4.5% 7/26/10 | | 2,235,000 | | 2,068,560 |
5.5% 7/27/09 (i) | | 1,827,000 | | 1,752,873 |
5.52% 7/26/10 (i) | | 6,515,000 | | 6,139,241 |
| | 15,408,879 |
Diversified Financial Services - 0.5% |
CCO Holdings LLC/CCO Holdings Capital Corp. 8.75% 11/15/13 | | 320,000 | | 313,600 |
Cerro Negro Finance Ltd.: | | | | |
(Reg. S) 7.33% 12/1/09 | | 414,100 | | 405,818 |
7.33% 12/1/09 (f) | | 176,300 | | 172,774 |
Citigroup, Inc.: | | | | |
5.875% 5/29/37 | | 2,700,000 | | 2,556,735 |
6.125% 8/25/36 | | 8,875,000 | | 8,669,109 |
Corporate Bonds - continued |
| Principal
Amount (b) | | Value |
Nonconvertible Bonds - continued |
FINANCIALS - continued |
Diversified Financial Services - continued |
Ex-Im Ukraine 7.65% 9/7/11 (Issued by Credit Suisse London Branch for Ex-Im Ukraine) | | $ 1,175,000 | | $ 1,165,582 |
Hilcorp Energy I LP/Hilcorp Finance Co. 7.75% 11/1/15 (f) | | 2,590,000 | | 2,486,400 |
JPMorgan Chase Capital XVII 5.85% 8/1/35 | | 7,405,000 | | 6,539,215 |
Leucadia National Corp.: | | | | |
7% 8/15/13 | | 500,000 | | 485,000 |
7.125% 3/15/17 (f) | | 880,000 | | 840,400 |
NSG Holdings II, LLC 7.75% 12/15/25 (f) | | 2,790,000 | | 2,776,050 |
OAO TMK 8.5% 9/29/09 (Issued by TMK Capital SA for OAO TMK) | | 2,200,000 | | 2,211,000 |
Pakistan International Sukuk Co. Ltd. 7.5703% 1/27/10 (i) | | 500,000 | | 491,250 |
Snoqualmie Entertainment Authority 9.125% 2/1/15 (f) | | 945,000 | | 930,825 |
Universal City Florida Holding Co. I/II 8.375% 5/1/10 | | 1,025,000 | | 1,004,500 |
ZFS Finance USA Trust V 6.5% 5/9/67 (f)(i) | | 2,400,000 | | 2,245,543 |
| | 33,293,801 |
Insurance - 0.0% |
AMBAC Financial Group, Inc. 6.15% 2/15/37 | | 1,525,000 | | 1,167,360 |
USI Holdings Corp. 9.75% 5/15/15 (f) | | 2,530,000 | | 2,302,300 |
| | 3,469,660 |
Real Estate Investment Trusts - 0.2% |
Archstone-Smith Operating Trust 5.25% 5/1/15 | | 2,080,000 | | 2,006,603 |
Crescent Real Estate Equities LP/Crescent Finance Co. 9.25% 4/15/09 | | 40,000 | | 40,400 |
Highwoods/Forsyth LP 5.85% 3/15/17 | | 80,000 | | 75,800 |
HMB Capital Trust V 8.99% 12/15/36 (f)(i) | | 270,000 | | 54,000 |
Host Hotels & Resorts LP 6.875% 11/1/14 | | 460,000 | | 451,950 |
iStar Financial, Inc. 5.95% 10/15/13 | | 300,000 | | 284,249 |
Omega Healthcare Investors, Inc.: | | | | |
7% 4/1/14 | | 2,225,000 | | 2,169,375 |
7% 1/15/16 | | 400,000 | | 386,000 |
Reckson Operating Partnership LP 6% 3/31/16 | | 4,021,000 | | 3,845,081 |
Rouse Co. 5.375% 11/26/13 | | 100,000 | | 91,701 |
Senior Housing Properties Trust: | | | | |
7.875% 4/15/15 | | 613,000 | | 634,455 |
8.625% 1/15/12 | | 750,000 | | 791,250 |
Thornburg Mortgage, Inc. 8% 5/15/13 | | 100,000 | | 88,000 |
Corporate Bonds - continued |
| Principal
Amount (b) | | Value |
Nonconvertible Bonds - continued |
FINANCIALS - continued |
Real Estate Investment Trusts - continued |
UDR, Inc. 5.5% 4/1/14 | | $ 2,755,000 | | $ 2,687,632 |
Ventas Realty LP: | | | | |
6.5% 6/1/16 | | 150,000 | | 144,000 |
6.625% 10/15/14 | | 1,350,000 | | 1,316,250 |
6.75% 4/1/17 | | 1,035,000 | | 1,003,950 |
| | 16,070,696 |
Real Estate Management & Development - 0.1% |
American Real Estate Partners/American Real Estate Finance Corp.: | | | | |
7.125% 2/15/13 | | 2,715,000 | | 2,538,525 |
7.125% 2/15/13 (f) | | 470,000 | | 444,150 |
8.125% 6/1/12 | | 1,485,000 | | 1,447,875 |
Forest City Enterprises, Inc. 7.625% 6/1/15 | | 100,000 | | 97,000 |
Inversiones y Representaciones SA 8.5% 2/2/17 (f) | | 1,135,000 | | 981,775 |
| | 5,509,325 |
Thrifts & Mortgage Finance - 0.0% |
Residential Capital Corp.: | | | | |
7.375% 6/30/10 | | 675,000 | | 519,750 |
7.5% 4/17/13 | | 495,000 | | 372,488 |
7.875% 6/30/15 | | 580,000 | | 437,900 |
| | 1,330,138 |
TOTAL FINANCIALS | | 127,597,967 |
HEALTH CARE - 0.2% |
Health Care Equipment & Supplies - 0.0% |
FMC Finance III SA 6.875% 7/15/17 (f) | | 1,685,000 | | 1,651,300 |
Health Care Providers & Services - 0.2% |
Community Health Systems, Inc. 8.875% 7/15/15 (f) | | 2,710,000 | | 2,693,198 |
DaVita, Inc.: | | | | |
6.625% 3/15/13 | | 290,000 | | 280,575 |
7.25% 3/15/15 | | 615,000 | | 601,163 |
HCA, Inc.: | | | | |
6.3% 10/1/12 | | 215,000 | | 187,588 |
6.5% 2/15/16 | | 1,420,000 | | 1,164,400 |
9.125% 11/15/14 (f) | | 600,000 | | 613,500 |
9.25% 11/15/16 (f) | | 2,010,000 | | 2,060,250 |
9.625% 11/15/16 pay-in-kind (f) | | 2,900,000 | | 2,972,500 |
Corporate Bonds - continued |
| Principal
Amount (b) | | Value |
Nonconvertible Bonds - continued |
HEALTH CARE - continued |
Health Care Providers & Services - continued |
HealthSouth Corp. 10.75% 6/15/16 | | $ 300,000 | | $ 309,000 |
IASIS Healthcare LLC/IASIS Capital Corp. 8.75% 6/15/14 | | 1,350,000 | | 1,312,875 |
Multiplan, Inc. 10.375% 4/15/16 (f) | | 735,000 | | 720,300 |
Rural/Metro Corp.: | | | | |
0% 3/15/16 (c) | | 150,000 | | 109,500 |
9.875% 3/15/15 | | 180,000 | | 169,200 |
Skilled Healthcare Group, Inc. 11% 1/15/14 | | 64,000 | | 68,480 |
Sun Healthcare Group, Inc. 9.125% 4/15/15 (f) | | 10,000 | | 9,925 |
Team Finance LLC/Health Finance Corp. 11.25% 12/1/13 | | 100,000 | | 108,000 |
United Surgical Partners International, Inc.: | | | | |
8.875% 5/1/17 | | 220,000 | | 209,000 |
9.25% 5/1/17 pay-in-kind | | 440,000 | | 422,400 |
Viant Holdings, Inc. 10.125% 7/15/17 (f) | | 71,000 | | 66,030 |
| | 14,077,884 |
TOTAL HEALTH CARE | | 15,729,184 |
INDUSTRIALS - 0.5% |
Aerospace & Defense - 0.0% |
Bombardier, Inc.: | | | | |
6.3% 5/1/14 (f) | | 1,410,000 | | 1,346,550 |
7.45% 5/1/34 (f) | | 750,000 | | 735,000 |
8% 11/15/14 (f) | | 160,000 | | 165,200 |
| | 2,246,750 |
Airlines - 0.2% |
American Airlines, Inc. pass thru trust certificates: | | | | |
6.817% 5/23/11 | | 50,000 | | 48,438 |
6.977% 11/23/22 | | 865,629 | | 802,871 |
7.377% 5/23/19 | | 94,884 | | 85,870 |
7.379% 11/23/17 | | 32,772 | | 29,495 |
AMR Corp. 9% 8/1/12 | | 485,000 | | 491,063 |
Continental Airlines, Inc.: | | | | |
7.875% 7/2/18 | | 1,164,084 | | 1,140,802 |
8.485% 6/2/13 (i) | | 100,000 | | 97,000 |
8.75% 12/1/11 | | 400,000 | | 366,000 |
9.558% 9/1/19 | | 264,626 | | 276,534 |
Corporate Bonds - continued |
| Principal
Amount (b) | | Value |
Nonconvertible Bonds - continued |
INDUSTRIALS - continued |
Airlines - continued |
Continental Airlines, Inc. pass thru trust certificates: | | | | |
7.566% 9/15/21 | | $ 82,946 | | $ 81,287 |
7.73% 9/15/12 | | 20,920 | | 20,240 |
8.499% 11/1/12 | | 21,521 | | 21,091 |
9.798% 4/1/21 | | 831,420 | | 872,991 |
Delta Air Lines, Inc. pass thru trust certificates 7.57% 11/18/10 | | 5,740,000 | | 5,811,750 |
United Air Lines, Inc. pass-thru trust certificates: | | | | |
7.032% 4/1/12 | | 1,080,884 | | 1,085,619 |
7.186% 10/1/12 | | 2,680,399 | | 2,707,203 |
| | 13,938,254 |
Commercial Services & Supplies - 0.1% |
ALH Finance LLC/ALH Finance Corp. 8.5% 1/15/13 | | 445,000 | | 429,425 |
Allied Waste North America, Inc.: | | | | |
5.75% 2/15/11 | | 370,000 | | 357,513 |
6.875% 6/1/17 | | 1,475,000 | | 1,438,125 |
7.125% 5/15/16 | | 400,000 | | 394,500 |
7.25% 3/15/15 | | 800,000 | | 800,000 |
7.875% 4/15/13 | | 120,000 | | 121,500 |
ARAMARK Corp.: | | | | |
8.5% 2/1/15 | | 1,110,000 | | 1,071,150 |
8.8563% 2/1/15 (i) | | 130,000 | | 129,350 |
FTI Consulting, Inc.: | | | | |
7.625% 6/15/13 | | 355,000 | | 347,900 |
7.75% 10/1/16 | | 605,000 | | 605,000 |
Rental Service Corp. 9.5% 12/1/14 | | 330,000 | | 316,800 |
| | 6,011,263 |
Electrical Equipment - 0.0% |
Belden, Inc. 7% 3/15/17 (f) | | 385,000 | | 377,300 |
Sensus Metering Systems, Inc. 8.625% 12/15/13 | | 2,220,000 | | 2,086,800 |
| | 2,464,100 |
Industrial Conglomerates - 0.0% |
Nell AF Sarl 8.375% 8/15/15 (f) | | 500,000 | | 445,000 |
Marine - 0.0% |
Britannia Bulk PLC 11% 12/1/11 | | 1,245,000 | | 1,226,325 |
Navios Maritime Holdings, Inc. 9.5% 12/15/14 | | 490,000 | | 497,350 |
| | 1,723,675 |
Corporate Bonds - continued |
| Principal
Amount (b) | | Value |
Nonconvertible Bonds - continued |
INDUSTRIALS - continued |
Road & Rail - 0.1% |
Avis Budget Car Rental LLC/Avis Budget Finance, Inc.: | | | | |
7.625% 5/15/14 | | $ 885,000 | | $ 856,238 |
7.75% 5/15/16 | | 665,000 | | 641,725 |
Hertz Corp.: | | | | |
8.875% 1/1/14 | | 700,000 | | 721,000 |
10.5% 1/1/16 | | 360,000 | | 387,000 |
Kansas City Southern de Mexico, SA de CV 7.375% 6/1/14 (f) | | 340,000 | | 326,400 |
Kansas City Southern Railway Co. 7.5% 6/15/09 | | 2,400,000 | | 2,400,000 |
| | 5,332,363 |
Trading Companies & Distributors - 0.1% |
Ahern Rentals, Inc. 9.25% 8/15/13 | | 400,000 | | 396,000 |
Ashtead Capital, Inc. 9% 8/15/16 (f) | | 300,000 | | 289,500 |
Ashtead Holdings PLC 8.625% 8/1/15 (f) | | 275,000 | | 259,875 |
Penhall International Corp. 12% 8/1/14 (f) | | 250,000 | | 256,250 |
VWR Funding, Inc. 10.25% 7/15/15 (f) | | 2,000,000 | | 1,860,000 |
| | 3,061,625 |
TOTAL INDUSTRIALS | | 35,223,030 |
INFORMATION TECHNOLOGY - 0.3% |
Communications Equipment - 0.1% |
L-3 Communications Corp. 6.375% 10/15/15 | | 125,000 | | 121,875 |
Lucent Technologies, Inc.: | | | | |
6.45% 3/15/29 | | 2,835,000 | | 2,395,575 |
6.5% 1/15/28 | | 1,050,000 | | 887,250 |
Nortel Networks Corp.: | | | | |
9.61% 7/15/11 (f)(i) | | 200,000 | | 202,000 |
10.125% 7/15/13 (f) | | 1,000,000 | | 1,032,500 |
| | 4,639,200 |
Computers & Peripherals - 0.0% |
Seagate Technology HDD Holdings 6.8% 10/1/16 | | 1,520,000 | | 1,459,200 |
Electronic Equipment & Instruments - 0.1% |
Celestica, Inc. 7.875% 7/1/11 | | 500,000 | | 475,000 |
Flextronics International Ltd.: | | | | |
6.25% 11/15/14 | | 300,000 | | 276,750 |
6.5% 5/15/13 | | 1,285,000 | | 1,217,538 |
Corporate Bonds - continued |
| Principal
Amount (b) | | Value |
Nonconvertible Bonds - continued |
INFORMATION TECHNOLOGY - continued |
Electronic Equipment & Instruments - continued |
NXP BV: | | | | |
7.875% 10/15/14 | | $ 490,000 | | $ 444,063 |
9.5% 10/15/15 | | 725,000 | | 627,125 |
| | 3,040,476 |
IT Services - 0.0% |
Iron Mountain, Inc.: | | | | |
6.625% 1/1/16 | | 1,670,000 | | 1,503,000 |
7.75% 1/15/15 | | 605,000 | | 588,363 |
8.625% 4/1/13 | | 210,000 | | 210,000 |
Telcordia Technologies, Inc. 9.11% 7/15/12 (f)(i) | | 430,000 | | 378,400 |
| | 2,679,763 |
Office Electronics - 0.0% |
Xerox Capital Trust I 8% 2/1/27 | | 1,630,000 | | 1,605,550 |
Semiconductors & Semiconductor Equipment - 0.1% |
Advanced Micro Devices, Inc. 7.75% 11/1/12 | | 1,085,000 | | 952,088 |
Amkor Technology, Inc.: | | | | |
7.75% 5/15/13 | | 235,000 | | 218,550 |
9.25% 6/1/16 | | 515,000 | | 499,550 |
Freescale Semiconductor, Inc.: | | | | |
8.875% 12/15/14 | | 1,510,000 | | 1,387,388 |
9.125% 12/15/14 pay-in-kind | | 800,000 | | 712,000 |
9.235% 12/15/14 (i) | | 290,000 | | 265,350 |
10.125% 12/15/16 | | 1,230,000 | | 1,065,549 |
Hynix Semiconductor, Inc. 7.875% 6/27/17 (f) | | 2,415,000 | | 2,312,363 |
| | 7,412,838 |
TOTAL INFORMATION TECHNOLOGY | | 20,837,027 |
MATERIALS - 0.5% |
Chemicals - 0.0% |
Equistar Chemicals LP 7.55% 2/15/26 | | 350,000 | | 297,500 |
Equistar Chemicals LP/Equistar Funding Corp. 10.625% 5/1/11 | | 226,000 | | 236,170 |
Lyondell Chemical Co.: | | | | |
6.875% 6/15/17 | | 400,000 | | 416,000 |
8% 9/15/14 | | 500,000 | | 543,125 |
Momentive Performance Materials, Inc. 9.75% 12/1/14 (f) | | 85,000 | | 80,750 |
Corporate Bonds - continued |
| Principal
Amount (b) | | Value |
Nonconvertible Bonds - continued |
MATERIALS - continued |
Chemicals - continued |
Nalco Co.: | | | | |
7.75% 11/15/11 | | $ 1,130,000 | | $ 1,135,650 |
8.875% 11/15/13 | | 270,000 | | 272,025 |
NOVA Chemicals Corp. 8.4838% 11/15/13 (i) | | 485,000 | | 471,663 |
Pliant Corp. 11.35% 6/15/09 (d) | | 60,119 | | 57,113 |
| | 3,509,996 |
Construction Materials - 0.0% |
U.S. Concrete, Inc. 8.375% 4/1/14 | | 110,000 | | 100,100 |
Containers & Packaging - 0.1% |
BWAY Corp. 10% 10/15/10 | | 1,105,000 | | 1,116,050 |
Crown Americas LLC/Crown Americas Capital Corp. 7.75% 11/15/15 | | 200,000 | | 202,000 |
Crown Cork & Seal, Inc. 8% 4/15/23 | | 105,000 | | 99,225 |
Greif, Inc. 6.75% 2/1/17 | | 485,000 | | 460,750 |
Jefferson Smurfit Corp. U.S.: | | | | |
7.5% 6/1/13 | | 15,000 | | 14,250 |
8.25% 10/1/12 | | 300,000 | | 292,500 |
Smurfit-Stone Container Enterprises, Inc. 8% 3/15/17 | | 2,000,000 | | 1,910,000 |
Vitro SAB de CV 8.625% 2/1/12 (f) | | 1,265,000 | | 1,220,725 |
| | 5,315,500 |
Metals & Mining - 0.3% |
CAP SA 7.375% 9/15/36 (f) | | 200,000 | | 192,896 |
Corporacion Nacional del Cobre (Codelco) 6.15% 10/24/36 (f) | | 1,370,000 | | 1,337,432 |
Evraz Group SA (Reg. S) 8.25% 11/10/15 | | 765,000 | | 758,306 |
Evraz Securities SA 10.875% 8/3/09 | | 900,000 | | 954,000 |
FMG Finance Property Ltd.: | | | | |
9.36% 9/1/11 (f)(i) | | 470,000 | | 486,450 |
10% 9/1/13 (f) | | 1,660,000 | | 1,776,200 |
10.625% 9/1/16 (f) | | 195,000 | | 223,763 |
Freeport-McMoRan Copper & Gold, Inc.: | | | | |
6.875% 2/1/14 | | 375,000 | | 383,438 |
8.25% 4/1/15 | | 880,000 | | 913,000 |
8.375% 4/1/17 | | 1,480,000 | | 1,568,800 |
8.5463% 4/1/15 (i) | | 870,000 | | 896,100 |
Noranda Aluminium Acquisition Corp. 9.36% 5/15/15 pay-in-kind (f)(i) | | 300,000 | | 276,000 |
PNA Group, Inc. 10.75% 9/1/16 (f) | | 130,000 | | 130,650 |
Corporate Bonds - continued |
| Principal
Amount (b) | | Value |
Nonconvertible Bonds - continued |
MATERIALS - continued |
Metals & Mining - continued |
RathGibson, Inc. 11.25% 2/15/14 | | $ 350,000 | | $ 350,000 |
Steel Dynamics, Inc. 6.75% 4/1/15 (f) | | 2,380,000 | | 2,284,800 |
United States Steel Corp. 6.65% 6/1/37 | | 3,395,000 | | 3,226,330 |
Vale Overseas Ltd. 6.25% 1/23/17 | | 2,685,000 | | 2,702,721 |
| | 18,460,886 |
Paper & Forest Products - 0.1% |
Georgia-Pacific Corp.: | | | | |
7% 1/15/15 (f) | | 2,350,000 | | 2,232,500 |
8.125% 5/15/11 | | 605,000 | | 609,538 |
Stone Container Corp. 8.375% 7/1/12 | | 700,000 | | 687,750 |
Stone Container Finance Co. 7.375% 7/15/14 | | 400,000 | | 378,000 |
| | 3,907,788 |
TOTAL MATERIALS | | 31,294,270 |
TELECOMMUNICATION SERVICES - 1.1% |
Diversified Telecommunication Services - 0.9% |
AT&T, Inc. 6.8% 5/15/36 | | 6,413,000 | | 6,696,108 |
BellSouth Capital Funding Corp. 7.875% 2/15/30 | | 1,060,000 | | 1,207,641 |
Cincinnati Bell, Inc. 8.375% 1/15/14 | | 1,710,000 | | 1,684,350 |
Eschelon Operating Co. 8.375% 3/15/10 | | 396,000 | | 382,635 |
Intelsat Bermuda Ltd. 8.886% 1/15/15 (i) | | 280,000 | | 282,100 |
Intelsat Ltd.: | | | | |
6.5% 11/1/13 | | 545,000 | | 400,575 |
7.625% 4/15/12 | | 960,000 | | 796,800 |
9.25% 6/15/16 | | 850,000 | | 875,500 |
11.25% 6/15/16 | | 1,400,000 | | 1,463,000 |
Level 3 Financing, Inc.: | | | | |
8.75% 2/15/17 | | 5,590,000 | | 5,226,650 |
9.25% 11/1/14 | | 1,430,000 | | 1,369,225 |
12.25% 3/15/13 | | 1,050,000 | | 1,144,500 |
NTL Cable PLC: | | | | |
8.75% 4/15/14 | | 1,300,000 | | 1,313,000 |
9.125% 8/15/16 | | 860,000 | | 879,350 |
Qwest Capital Funding, Inc. 7% 8/3/09 | | 50,000 | | 49,750 |
Qwest Communications International, Inc.: | | | | |
7.5% 2/15/14 | | 2,330,000 | | 2,330,000 |
7.5% 2/15/14 | | 60,000 | | 58,500 |
Corporate Bonds - continued |
| Principal
Amount (b) | | Value |
Nonconvertible Bonds - continued |
TELECOMMUNICATION SERVICES - continued |
Diversified Telecommunication Services - continued |
Qwest Communications International, Inc.: - continued | | | | |
9.0575% 2/15/09 (i) | | $ 226,000 | | $ 226,565 |
Qwest Corp.: | | | | |
7.5% 10/1/14 | | 500,000 | | 515,000 |
7.625% 6/15/15 | | 2,065,000 | | 2,121,788 |
8.61% 6/15/13 (i) | | 90,000 | | 95,400 |
SBC Communications, Inc.: | | | | |
6.15% 9/15/34 | | 500,000 | | 484,703 |
6.45% 6/15/34 | | 220,000 | | 218,889 |
Sprint Capital Corp. 8.75% 3/15/32 | | 9,313,000 | | 10,750,340 |
Telecom Italia Capital SA 7.2% 7/18/36 | | 2,225,000 | | 2,313,826 |
Telefonica de Argentina SA 9.125% 11/7/10 | | 404,000 | | 411,575 |
Telefonica Emisiones SAU 7.045% 6/20/36 | | 4,999,000 | | 5,204,654 |
Time Warner Telecom Holdings, Inc. 9.25% 2/15/14 | | 1,260,000 | | 1,297,800 |
U.S. West Capital Funding, Inc. 6.375% 7/15/08 | | 375,000 | | 375,938 |
U.S. West Communications: | | | | |
6.875% 9/15/33 | | 1,385,000 | | 1,267,275 |
7.5% 6/15/23 | | 300,000 | | 292,500 |
Verizon Communications, Inc. 6.25% 4/1/37 | | 2,348,000 | | 2,310,862 |
Verizon Global Funding Corp. 7.75% 12/1/30 | | 5,296,000 | | 6,000,813 |
Windstream Corp.: | | | | |
8.125% 8/1/13 | | 200,000 | | 206,000 |
8.625% 8/1/16 | | 835,000 | | 869,402 |
| | 61,123,014 |
Wireless Telecommunication Services - 0.2% |
Digicel Group Ltd.: | | | | |
8.875% 1/15/15 (f) | | 2,490,000 | | 2,272,125 |
9.25% 9/1/12 (f) | | 820,000 | | 828,200 |
DirecTV Holdings LLC/DirecTV Financing, Inc.: | | | | |
6.375% 6/15/15 | | 1,275,000 | | 1,198,500 |
8.375% 3/15/13 | | 1,000,000 | | 1,027,500 |
Intelsat Subsidiary Holding Co. Ltd. 8.625% 1/15/15 (i) | | 195,000 | | 196,463 |
MetroPCS Wireless, Inc.: | | | | |
9.25% 11/1/14 (f) | | 850,000 | | 837,250 |
9.25% 11/1/14 (f) | | 500,000 | | 492,500 |
Millicom International Cellular SA 10% 12/1/13 | | 860,000 | | 911,600 |
Mobile Telesystems Finance SA: | | | | |
8% 1/28/12 (f) | | 1,645,000 | | 1,661,450 |
Corporate Bonds - continued |
| Principal
Amount (b) | | Value |
Nonconvertible Bonds - continued |
TELECOMMUNICATION SERVICES - continued |
Wireless Telecommunication Services - continued |
Mobile Telesystems Finance SA: - continued | | | | |
8.375% 10/14/10 (f) | | $ 1,570,000 | | $ 1,601,400 |
9.75% 1/30/08 (Reg. S) | | 395,000 | | 397,963 |
Orascom Telecom Finance SCA 7.875% 2/8/14 (f) | | 1,375,000 | | 1,265,000 |
Pakistan Mobile Communications Ltd. 8.625% 11/13/13 (f) | | 500,000 | | 470,000 |
Rural Cellular Corp. 8.25% 3/15/12 | | 360,000 | | 370,800 |
Telecom Personal SA 9.25% 12/22/10 (f) | | 1,645,000 | | 1,653,225 |
| | 15,183,976 |
TOTAL TELECOMMUNICATION SERVICES | | 76,306,990 |
UTILITIES - 0.7% |
Electric Utilities - 0.2% |
AES Gener SA 7.5% 3/25/14 | | 30,000 | | 30,900 |
Chivor SA E.S.P. 9.75% 12/30/14 (f) | | 493,000 | | 536,138 |
Commonwealth Edison Co. 5.4% 12/15/11 | | 1,923,000 | | 1,911,331 |
Edison Mission Energy: | | | | |
7.2% 5/15/19 (f) | | 520,000 | | 485,550 |
7.625% 5/15/27 (f) | | 1,380,000 | | 1,290,300 |
Intergen NV 9% 6/30/17 (f) | | 2,280,000 | | 2,314,200 |
Mirant Americas Generation LLC 9.125% 5/1/31 | | 205,000 | | 198,850 |
National Power Corp. 6.875% 11/2/16 (f) | | 300,000 | | 283,500 |
Nevada Power Co. 6.5% 5/15/18 | | 790,000 | | 790,000 |
PPL Capital Funding, Inc. 6.7% 3/30/67 (i) | | 2,290,000 | | 2,212,719 |
Reliant Energy, Inc.: | | | | |
6.75% 12/15/14 | | 400,000 | | 396,000 |
7.875% 6/15/17 | | 2,595,000 | | 2,530,125 |
| | 12,979,613 |
Gas Utilities - 0.0% |
NiSource Finance Corp. 5.45% 9/15/20 | | 1,650,000 | | 1,491,216 |
Transportadora de Gas del Sur SA 7.875% 5/14/17 (f) | | 1,205,000 | | 1,045,338 |
| | 2,536,554 |
Independent Power Producers & Energy Traders - 0.3% |
AES Corp.: | | | | |
7.75% 3/1/14 | | 3,400,000 | | 3,400,000 |
8.875% 2/15/11 | | 982,000 | | 986,910 |
9% 5/15/15 (f) | | 625,000 | | 656,250 |
Corporate Bonds - continued |
| Principal
Amount (b) | | Value |
Nonconvertible Bonds - continued |
UTILITIES - continued |
Independent Power Producers & Energy Traders - continued |
AES Corp.: - continued | | | | |
9.375% 9/15/10 | | $ 7,000 | | $ 7,193 |
9.5% 6/1/09 | | 19,000 | | 19,428 |
Allegheny Energy Supply Co. LLC 7.8% 3/15/11 | | 9,060,000 | | 9,331,800 |
Mirant North America LLC 7.375% 12/31/13 | | 2,000,000 | | 1,985,000 |
NRG Energy, Inc.: | | | | |
7.25% 2/1/14 | | 1,300,000 | | 1,287,000 |
7.375% 2/1/16 | | 1,765,000 | | 1,747,350 |
7.375% 1/15/17 | | 2,000,000 | | 1,970,000 |
Tenaska Alabama Partners LP 7% 6/30/21 (f) | | 471,355 | | 461,928 |
TXU Corp. 5.55% 11/15/14 | | 3,140,000 | | 2,574,800 |
| | 24,427,659 |
Multi-Utilities - 0.2% |
CMS Energy Corp.: | | | | |
6.55% 7/17/17 | | 5,620,000 | | 5,386,281 |
9.875% 10/15/07 | | 135,000 | | 135,169 |
MidAmerican Energy Holdings, Co. 6.5% 9/15/37 (f) | | 5,765,000 | | 5,811,328 |
Utilicorp Canada Finance Corp. 7.75% 6/15/11 | | 105,000 | | 109,463 |
| | 11,442,241 |
TOTAL UTILITIES | | 51,386,067 |
TOTAL NONCONVERTIBLE BONDS | | 528,491,308 |
TOTAL CORPORATE BONDS (Cost $540,015,368) | 533,574,635 |
U.S. Government and Government Agency Obligations - 27.9% |
|
U.S. Government Agency Obligations - 1.7% |
Fannie Mae: | | | | |
4.375% 7/17/13 | | 8,745,000 | | 8,496,922 |
5% 2/16/12 | | 8,000,000 | | 8,071,304 |
Freddie Mac: | | | | |
5.25% 7/18/11 (e) | | 100,000,000 | | 101,804,700 |
U.S. Government and Government Agency Obligations - continued |
| Principal
Amount (b) | | Value |
U.S. Government Agency Obligations - continued |
Freddie Mac: - continued | | | | |
5.25% 11/5/12 | | $ 280,000 | | $ 279,830 |
Tennessee Valley Authority 5.375% 4/1/56 | | 385,000 | | 383,401 |
TOTAL U.S. GOVERNMENT AGENCY OBLIGATIONS | | 119,036,157 |
U.S. Treasury Inflation Protected Obligations - 4.6% |
U.S. Treasury Inflation-Indexed Notes: | | | | |
0.875% 4/15/10 | | 3,299,190 | | 3,155,373 |
2% 4/15/12 | | 20,534,000 | | 20,214,720 |
2% 1/15/14 | | 181,746,561 | | 177,479,394 |
2% 7/15/14 | | 16,579,050 | | 16,204,662 |
2.375% 4/15/11 | | 75,574,080 | | 75,432,175 |
3.5% 1/15/11 | | 23,940,800 | | 24,789,948 |
TOTAL U.S. TREASURY INFLATION PROTECTED OBLIGATIONS | | 317,276,272 |
U.S. Treasury Obligations - 21.6% |
U.S. Treasury Bonds: | | | | |
6.25% 5/15/30 (e) | | 253,489,000 | | 301,671,682 |
stripped principal: | | | | |
2/15/15 | | 78,530,000 | | 56,370,562 |
5/15/30 | | 35,870,000 | | 11,874,118 |
U.S. Treasury Notes: | | | | |
stripped principal 2/15/12 | | 75,970,000 | | 62,948,894 |
4.25% 8/15/13 (e) | | 37,179,000 | | 37,054,116 |
4.25% 8/15/14 (e) | | 400,000,000 | | 396,906,371 |
4.5% 9/30/11 (n) | | 91,855,000 | | 92,737,635 |
4.625% 7/31/12 (g) | | 208,834,000 | | 212,196,630 |
4.75% 1/31/12 (e) | | 130,000,000 | | 132,539,030 |
4.75% 5/15/14 (e) | | 185,157,000 | | 189,351,917 |
TOTAL U.S. TREASURY OBLIGATIONS | 1,493,650,955 |
TOTAL U.S. GOVERNMENT AND
GOVERNMENT AGENCY OBLIGATIONS (Cost $1,895,619,007) | 1,929,963,384 |
U.S. Government Agency - Mortgage Securities - 9.5% |
| Principal
Amount (b) | | Value |
Fannie Mae - 8.7% |
3.83% 10/1/33 (i) | | $ 2,786,774 | | $ 2,758,550 |
4.5% 4/1/20 | | 2,699,312 | | 2,605,952 |
4.678% 5/1/35 (i) | | 3,414,020 | | 3,398,145 |
5% 9/1/22 (g) | | 25,000,000 | | 24,434,208 |
5% 9/1/37 (g) | | 1,000,000 | | 951,071 |
5% 9/1/37 (g) | | 112,000,000 | | 106,519,907 |
5.101% 5/1/35 (i) | | 3,163,390 | | 3,175,180 |
5.302% 12/1/35 (i) | | 1,496,139 | | 1,495,489 |
5.304% 2/1/36 (i) | | 2,544,999 | | 2,544,596 |
5.5% 9/1/37 (g) | | 100,000,000 | | 97,715,640 |
5.5% 9/1/37 (g) | | 50,000,000 | | 48,857,820 |
5.5% 9/1/37 (g) | | 75,000,000 | | 73,286,730 |
5.5% 9/1/37 (g) | | 54,000,000 | | 52,766,446 |
5.651% 7/1/37 (i) | | 1,694,959 | | 1,704,962 |
6% 9/1/22 (g) | | 1,000,000 | | 1,010,683 |
6% 9/1/37 (g) | | 20,000,000 | | 19,993,814 |
6% 9/1/37 (g) | | 45,000,000 | | 44,986,082 |
6% 9/1/37 (g) | | 50,000,000 | | 49,984,535 |
6.061% 4/1/36 (i) | | 1,202,886 | | 1,217,460 |
6.256% 6/1/36 (i) | | 494,889 | | 499,490 |
6.319% 4/1/36 (i) | | 1,068,489 | | 1,085,171 |
6.5% 9/1/37 (g) | | 8,000,000 | | 8,122,630 |
6.5% 9/1/37 (g) | | 50,000,000 | | 50,766,440 |
TOTAL FANNIE MAE | | 599,881,001 |
Freddie Mac - 0.8% |
5.787% 10/1/35 (i) | | 915,204 | | 919,421 |
5.877% 6/1/36 (i) | | 1,355,088 | | 1,363,672 |
6% 9/1/37 (g) | | 40,000,000 | | 39,989,188 |
6.044% 6/1/36 (i) | | 1,322,750 | | 1,333,385 |
6.049% 7/1/37 (i) | | 6,875,000 | | 6,924,490 |
6.089% 4/1/36 (i) | | 2,232,134 | | 2,249,139 |
6.1% 6/1/36 (i) | | 1,249,753 | | 1,262,810 |
TOTAL FREDDIE MAC | | 54,042,105 |
TOTAL U.S. GOVERNMENT AGENCY - MORTGAGE SECURITIES (Cost $648,211,849) | 653,923,106 |
Asset-Backed Securities - 0.6% |
| Principal
Amount (b) | | Value |
ACE Securities Corp. Home Equity Loan Trust
Series 2005-SD1 Class A1, 5.905% 11/25/50 (i) | | $ 33,912 | | $ 32,667 |
Advanta Business Card Master Trust Series 2007-D1
Class D, 6.9375% 1/22/13 (f)(i) | | 2,590,000 | | 2,542,313 |
Airspeed Ltd. Series 2007-1A Class C1, 8.1113% 4/15/24 (f)(i) | | 4,930,405 | | 4,885,723 |
AmeriCredit Prime Automobile Receivables Trust
Series 2007-1 Class E, 6.96% 3/31/16 (f) | | 2,215,000 | | 2,166,713 |
Ameriquest Mortgage Securities, Inc. Series 2004-R8
Class M9, 8.255% 9/25/34 (i) | | 725,000 | | 531,969 |
Capital Auto Receivables Asset Trust: | | | | |
Series 2006-1: | | | | |
Class C, 5.55% 1/18/11 | | 1,500,000 | | 1,504,027 |
Class D, 7.16% 1/15/13 (f) | | 160,000 | | 159,613 |
Series 2006-SN1A: | | | | |
Class B, 5.5% 4/20/10 (f) | | 340,000 | | 338,764 |
Class C, 5.77% 5/20/10 (f) | | 325,000 | | 322,817 |
Class D, 6.15% 4/20/11 (f) | | 550,000 | | 549,686 |
Capmark VII Ltd. Series 2006-7A Class H, 7.1613% 8/20/36 (f)(i) | | 500,000 | | 357,105 |
Carrington Mortgage Loan Trust Series 2006-NC3 Class M10, 7.505% 8/25/36 (f)(i) | | 290,000 | | 63,438 |
Concord Real Estate CDO Ltd./LLC Series 2006-1A
Class F, 7.07% 12/25/46 (f)(i) | | 250,000 | | 191,250 |
Countrywide Home Loan Trust Series 2006-13N Class N, 7% 8/25/37 (f) | | 766,598 | | 559,616 |
DB Master Finance LLC Series 2006-1 Class M1, 8.285% 6/20/31 (f) | | 235,000 | | 241,545 |
Ford Credit Auto Owner Trust: | | | | |
Series 2006-B Class D, 7.26% 2/15/13 (f) | | 1,175,000 | | 1,169,271 |
Series 2006-C Class D, 6.89% 5/15/13 (f) | | 915,000 | | 910,346 |
Series 2007-A Class D, 7.05% 12/15/13 (f) | | 970,000 | | 921,500 |
GS Auto Loan Trust Series 2006-1 Class D, 6.25% 1/15/14 (f) | | 1,425,000 | | 1,394,135 |
GSAMP Trust Series 2004-AR1 Class B4, 5% 6/25/34 (f)(i) | | 856,000 | | 428,000 |
Guggenheim Structured Real Estate Funding Ltd. Series 2006-3 Class E, 6.97% 9/25/46 (f)(i) | | 250,000 | | 185,000 |
Home Equity Asset Trust Series 2006-3N Class B, 6.5% 8/27/36 (f) | | 250,000 | | 30,000 |
Kent Funding III Ltd. Series 2006-3A Class D, 8.455% 10/31/36 (i) | | 248,743 | | 74,623 |
Long Beach Mortgage Loan Trust Series 2006-6 Class M9, 7.405% 7/25/36 (i) | | 150,000 | | 22,500 |
Asset-Backed Securities - continued |
| Principal
Amount (b) | | Value |
Merna Reinsurance Ltd. Series 2007-1 Class B, 7.11% 6/30/12 (f)(i) | | $ 5,400,000 | | $ 5,400,000 |
Newcastle CDO VIII Series 2006-8A Class 10, 7.57% 11/1/52 (f)(i) | | 250,000 | | 178,297 |
Resource Real Estate Funding CDO Series 2007-1A
Class J, 8.27% 9/1/46 (f)(i) | | 250,000 | | 202,332 |
ROCK 1 CRE CDO LLC Series 2006-1A Class H, 6.66% 12/15/26 (f)(i) | | 185,000 | | 151,619 |
SIRENS B.V. Series 2007-2 Class A1, 7.16% 4/13/10 (f)(i) | | 10,000,000 | | 9,496,000 |
Structured Asset Securities Corp. Series 2006-BC1 Class B1, 8.005% 3/25/36 (f)(i) | | 100,000 | | 15,310 |
Swift Master Auto Receivables Trust Series 2007-1 Class B, 5.8313% 6/15/12 (i) | | 3,285,000 | | 3,279,767 |
TIAA Real Estate CDO Ltd./TIAA Real Estate CDO Corp. Series 2002-1A Class IV, 6.84% 5/22/37 (f) | | 235,000 | | 202,725 |
Wachovia Auto Loan Trust Series 2006-2A Class E, 7.05% 5/20/14 (f) | | 1,390,000 | | 1,336,714 |
WaMu Asset-Backed Certificates Series 2006-HE5
Class B1, 8.005% 10/25/36 (f)(i) | | 1,330,000 | | 266,000 |
TOTAL ASSET-BACKED SECURITIES (Cost $43,736,623) | 40,111,385 |
Collateralized Mortgage Obligations - 0.4% |
|
Private Sponsor - 0.2% |
ABN AMRO Mortgage Corp.: | | | | |
Series 2003-2 Class B4, 5.3302% 3/25/18 (i) | | 197,649 | | 152,943 |
Series 2003-9 Class B5, 4.5164% 8/25/18 (f) | | 327,216 | | 139,067 |
Banc of America Mortgage Securities, Inc. Series 2004-7 Class 15B4, 5.305% 8/25/19 (f)(i) | | 81,060 | | 57,235 |
Bayview Commercial Asset Trust Series 2006-3A Class IO, 1.1688% 10/25/36 (i)(k) | | 16,194,401 | | 1,910,939 |
Chase Mortgage Finance Trust Series 2007-A1 Class 1A5, 4.3588% 2/25/37 (i) | | 518,464 | | 511,072 |
Countrywide Alternative Loan Trust Series 2006-OC5N Class N, 7.25% 7/25/37 (f) | | 86,015 | | 43,260 |
Countrywide Home Loans pass-thru certificates
Series 2007-HY5 Class 3A1, 6.2335% 9/25/37 (i) | | 3,790,000 | | 3,733,150 |
Countrywide Home Loans, Inc.: | | | | |
Series 2003-28 Class B3, 5.5% 8/25/33 | | 94,077 | | 68,445 |
Series 2003-35 Class B, 4.639% 9/25/18 (i) | | 177,714 | | 141,190 |
Collateralized Mortgage Obligations - continued |
| Principal
Amount (b) | | Value |
Private Sponsor - continued |
Credit Suisse First Boston Mortgage Securities Corp.: | | | | |
Series 2003-17 Class B4, 5.389% 6/25/33 (f)(i) | | $ 394,470 | | $ 286,579 |
Series 2004-3 Class DB4, 5.8427% 4/25/34 (i) | | 118,919 | | 35,236 |
floater Series 2007-AR7 Class 2A1, 4.6454% 11/25/34 (i) | | 2,239,394 | | 2,200,150 |
Diversified REIT Trust Series 1999-1A: | | | | |
Class F, 6.78% 3/18/11 (f)(i) | | 250,000 | | 253,304 |
Class G, 6.78% 3/18/11 (f)(i) | | 250,000 | | 250,762 |
GMAC Commercial Mortgage Securities, Inc.
Series 1993-C3 Class L, 6.974% 8/15/36 (f) | | 324,000 | | 128,678 |
GMAC Mortgage Loan Trust Series 2003-J10 Class B2, 4.75% 1/25/19 (f) | | 167,483 | | 105,170 |
JPMorgan Mortgage Trust Series 2007-A1 Class 3A2, 5.0072% 7/25/35 (i) | | 2,345,046 | | 2,309,075 |
Nomura Home Equity Loan, Inc. floater Series 2006-FM2 Class B1, 7.805% 7/25/36 (f)(i) | | 4,165,000 | | 920,186 |
RESI Finance LP/RESI Finance DE Corp. floater
Series 2003-CB1: | | | | |
Class B4, 7% 6/10/35 (f)(i) | | 36,866 | | 37,050 |
Class B5, 7.6% 6/10/35 (f)(i) | | 27,649 | | 27,787 |
Class B6, 8.1% 6/10/35 (f)(i) | | 13,825 | | 13,963 |
RESIX Finance Ltd. floater Series 2007-A Class BB, 8.9613% 2/15/39 (f)(i) | | 498,366 | | 458,497 |
Structured Asset Securities Corp. floater: | | | | |
Series 2005-AR1 Class B1, 7.505% 9/25/35 (f)(i) | | 530,000 | | 132,500 |
Series 2006-BC5 Class B, 8.005% 12/25/36 (f)(i) | | 1,050,000 | | 374,010 |
Wells Fargo Mortgage Backed Securities Trust: | | | | |
Series 2003-12 Class B6, 4.75% 11/25/18 (f) | | 319,674 | | 135,861 |
Series 2005-AR12 Class 2A6, 4.3186% 7/25/35 (i) | | 660,131 | | 643,781 |
Series 2005-AR3 Class 2A1, 4.187% 3/25/35 (i) | | 1,295,238 | | 1,270,546 |
TOTAL PRIVATE SPONSOR | | 16,340,436 |
U.S. Government Agency - 0.2% |
Fannie Mae subordinate REMIC pass-thru certificates planned amortization class: | | | | |
Series 2001-68 Class QZ, 5.5% 12/25/16 | | 4,222,625 | | 4,230,956 |
Collateralized Mortgage Obligations - continued |
| Principal
Amount (b) | | Value |
U.S. Government Agency - continued |
Fannie Mae subordinate REMIC pass-thru certificates planned amortization class: - continued | | | | |
Series 2002-9 Class PC, 6% 3/25/17 | | $ 853,157 | | $ 861,562 |
Freddie Mac Multi-class participation certificates guaranteed sequential payer Series 2528 Class HN, 5% 11/15/17 | | 5,515,000 | | 5,417,799 |
TOTAL U.S. GOVERNMENT AGENCY | | 10,510,317 |
TOTAL COLLATERALIZED MORTGAGE OBLIGATIONS (Cost $30,951,247) | 26,850,753 |
Commercial Mortgage Securities - 0.3% |
|
Asset Securitization Corp.: | | | | |
Series 1996-D2 Class B1A, 8.6011% 2/14/29 (f)(i) | | 750,000 | | 806,279 |
Series 1997-D4: | | | | |
Class B2, 7.525% 4/14/29 | | 1,494,104 | | 1,603,687 |
Class B5, 7.525% 4/14/29 | | 129,000 | | 122,449 |
Banc of America Commercial Mortgage, Inc.
Series 2003-2 Class BWF, 7.55% 10/11/37 (f) | | 96,700 | | 107,331 |
Bear Stearns Commercial Mortgage Securities Trust
Series 2007-BBA8 Class L, 7.5113% 3/15/22 (f)(i) | | 100,000 | | 98,531 |
Chase Commercial Mortgage Securities Corp.
Series 1998-2 Class J, 6.39% 11/18/30 (f) | | 490,787 | | 182,205 |
Citigroup Commercial Mortgage Trust Series 2006-FL2 Class CNP3, 6.8113% 8/16/21 (f)(i) | | 5,182,308 | | 5,144,251 |
Claregold Trust Series 2007-2A: | | | | |
Class F, 5.01% 5/15/44 (f)(i) | CAD | 138,000 | | 116,437 |
Class G, 5.01% 5/15/44 (f)(i) | CAD | 30,000 | | 24,091 |
Class H, 5.01% 5/15/44 (f)(i) | CAD | 20,000 | | 14,110 |
Class J, 5.01% 5/15/44 (f)(i) | CAD | 20,000 | | 12,897 |
Class K, 5.01% 5/15/44 (f)(i) | CAD | 10,000 | | 5,907 |
Class L, 5.01% 5/15/44 (f)(i) | CAD | 36,000 | | 20,547 |
Class M, 5.01% 5/15/44 (f)(i) | CAD | 165,000 | | 67,856 |
Commercial Mortgage Acceptance Corp. Series 1998-C1 Class G, 6.21% 7/15/31 (f) | | 500,000 | | 489,536 |
Commercial Mortgage Asset Trust Series 1999-C1 Class F, 6.25% 1/17/32 (f) | | 550,000 | | 537,767 |
Credit Suisse First Boston Mortgage Securities Corp.: | | | | |
Series 1997-C2 Class F, 7.46% 1/17/35 (i) | | 500,000 | | 534,151 |
Series 1998-C1 Class H, 6% 5/17/40 (f) | | 130,000 | | 64,675 |
Series 2003-C3 Class J, 4.231% 5/15/38 (f) | | 300,000 | | 265,640 |
Commercial Mortgage Securities - continued |
| Principal
Amount (b) | | Value |
Credit Suisse Mortgage Capital Certificates floater
Series 2007-TFL1 Class L, 7.5113% 2/15/22 (f)(i) | | $ 100,000 | | $ 91,500 |
Crest Ltd. Series 2001-1A Class C, 9% 2/25/34 (f) | | 500,000 | | 566,738 |
First Chicago/Lennar Trust I weighted average coupon Series 1997-CHL1 Class E, 8.0609% 4/29/39 (f)(i) | | 195,462 | | 198,349 |
Ginnie Mae guaranteed REMIC pass-thru securities sequential payer Series 2003-47 Class C, 4.227% 10/16/27 | | 5,454,626 | | 5,346,368 |
Global Signal Trust III Series 2006-1 Class F, 7.036% 2/15/36 | | 200,000 | | 198,188 |
GMAC Commercial Mortgage Securities, Inc.: | | | | |
Series 1999-C1 Class F, 6.02% 5/15/33 (f) | | 500,000 | | 484,628 |
Series 1999-C2I Class K, 6.481% 9/15/33 (l) | | 285,000 | | 163,163 |
Series 1999-C3: | | | | |
Class J, 6.974% 8/15/36 (f) | | 226,000 | | 224,446 |
Class K, 6.974% 8/15/36 (f) | | 427,000 | | 355,678 |
Series 2000-C1 Class K, 7% 3/15/33 (f) | | 90,000 | | 84,516 |
Series 2003-J10 Class B2, 6.75% 4/15/29 (i) | | 500,000 | | 499,571 |
Greenwich Capital Commercial Funding Corp.
Series 2003-C2 Class J, 5.234% 11/5/13 (f)(i) | | 250,000 | | 223,464 |
GS Mortgage Securities Corp. II: | | | | |
floater: | | | | |
Series 2006-FL8A Class J, 7.08% 6/6/20 (f)(i) | | 250,000 | | 245,000 |
Series 2007-EOP Class L, 6.63% 3/1/20 (f)(i) | | 400,000 | | 388,000 |
Series 1998-GLII Class G, 6.9707% 4/13/31 (f)(i) | | 600,000 | | 631,599 |
Series 2006-RR2: | | | | |
Class M, 5.6876% 6/1/46 (f)(i) | | 100,000 | | 56,694 |
Class N, 5.6876% 6/1/46 (f)(i) | | 100,000 | | 51,851 |
LB Commercial Conduit Mortgage Trust Series 1998-C4 Class G, 5.6% 10/15/35 (f) | | 250,000 | | 250,477 |
LB-UBS Commercial Mortgage Trust sequential payer Series 2006-C7 Class A1, 5.279% 11/15/38 | | 1,011,490 | | 1,010,068 |
LNR CFL Series 2004-1: | | | | |
Class I10, 7.72% 7/26/08 (f) | | 180,000 | | 179,536 |
Class I11, 7.72% 7/26/08 (f) | | 100,000 | | 99,520 |
Class I12, 7.72% 7/26/08 (f) | | 100,000 | | 99,256 |
Class I9, 7.72% 7/26/08 (f) | | 153,200 | | 152,998 |
Merrill Lynch Mortgage Trust: | | | | |
Series 2004-KEY2 Class K, 5.091% 8/12/39 (f)(i) | | 100,000 | | 81,794 |
Series 2006-KEY2 Class L, 5.091% 8/12/39 (f) | | 300,000 | | 235,326 |
Providence Place Group Ltd. Partnership Series 2000-C1 Class A2, 7.75% 7/20/28 | | 381,076 | | 449,587 |
Commercial Mortgage Securities - continued |
| Principal
Amount (b) | | Value |
Real Estate Asset Liquidity Trust: | | | | |
Series 2006-2: | | | | |
Class F, 4.456% 9/12/38 (l) | CAD | 107,000 | | $ 83,708 |
Class G, 4.456% 9/12/38 (l) | CAD | 54,000 | | 41,084 |
Class H, 4.456% 9/12/38 (l) | CAD | 36,000 | | 24,127 |
Class J, 4.456% 9/12/38 (l) | CAD | 36,000 | | 22,460 |
Class K, 4.456% 9/12/38 (l) | CAD | 18,000 | | 9,951 |
Class L, 4.456% 9/12/38 (l) | CAD | 26,000 | | 13,867 |
Class M, 4.456% 9/12/38 (l) | CAD | 130,000 | | 46,060 |
Series 2007-1: | | | | |
Class F, 4.57% 4/12/23 | CAD | 126,000 | | 98,576 |
Class G, 4.57% 4/12/23 | CAD | 42,000 | | 31,570 |
Class H, 4.57% 4/12/23 | CAD | 42,000 | | 27,960 |
Class J, 4.57% 4/12/23 | CAD | 42,000 | | 25,632 |
Class K, 4.57% 4/12/23 | CAD | 21,000 | | 11,772 |
Class L, 4.57% 4/12/23 | CAD | 63,000 | | 34,154 |
Class M, 4.57% 4/12/23 | CAD | 185,000 | | 71,027 |
Salomon Brothers Mortgage Securities VII, Inc.
Series 2001-MMA: | | | | |
Class E6, 6.5% 2/18/34 (f)(i) | | $ 165,000 | | 157,539 |
Class F6, 6.5% 2/18/34 (f)(i) | | 37,000 | | 32,993 |
SBA CMBS Trust Series 2006-1A Class J, 7.825% 11/15/36 (f) | | 90,000 | | 83,162 |
Wachovia Ltd./Wachovia LLC Series 2006-1 Class 1ML, 10.86% 9/25/26 (f)(i) | | 400,000 | | 345,450 |
TOTAL COMMERCIAL MORTGAGE SECURITIES (Cost $23,960,249) | 23,747,754 |
Foreign Government and Government Agency Obligations - 1.1% |
|
Argentine Republic: | | | | |
discount (with partial capitalization through 12/31/13) 8.28% 12/31/33 | | 2,289,412 | | 1,974,618 |
par 1.33% 12/31/38 (i) | | 135,000 | | 50,625 |
5.389% 8/3/12 (i) | | 3,659,375 | | 3,209,356 |
7% 3/28/11 | | 2,810,000 | | 2,546,406 |
7% 9/12/13 | | 3,595,000 | | 2,959,684 |
Brazilian Federative Republic: | | | | |
7.125% 1/20/37 | | 1,085,000 | | 1,179,938 |
8.25% 1/20/34 | | 410,000 | | 503,685 |
8.75% 2/4/25 | | 280,000 | | 347,200 |
11% 8/17/40 | | 2,285,000 | | 3,020,770 |
Foreign Government and Government Agency Obligations - continued |
| Principal
Amount (b) | | Value |
Brazilian Federative Republic: - continued | | | | |
12.25% 3/6/30 | | $ 745,000 | | $ 1,238,563 |
12.75% 1/15/20 | | 490,000 | | 761,950 |
Central Bank of Nigeria promissory note 5.092% 1/5/10 | | 531,190 | | 506,913 |
Chilean Republic 5.5% 1/15/13 | | 105,000 | | 106,754 |
Colombian Republic: | | | | |
7.375% 9/18/37 | | 1,355,000 | | 1,436,300 |
11.75% 2/25/20 | | 557,000 | | 791,497 |
Dominican Republic: | | | | |
(Reg. S) 9.5% 9/27/11 | | 1,126,391 | | 1,185,527 |
Brady 6.3125% 8/30/09 (i) | | 51,655 | | 51,526 |
6.25% 8/30/24 (i) | | 2,000,000 | | 1,988,000 |
9.04% 1/23/18 (f) | | 1,289,713 | | 1,412,235 |
9.04% 1/23/18 (f) | | 81,973 | | 81,481 |
Ecuador Republic: | | | | |
10% 8/15/30 (Reg. S) | | 2,240,000 | | 1,971,200 |
euro par 5% 2/28/25 | | 153,000 | | 109,395 |
Indonesian Republic: | | | | |
(Reg. S) 6.75% 3/10/14 | | 1,175,000 | | 1,183,813 |
6.625% 2/17/37 (f) | | 1,550,000 | | 1,422,125 |
Islamic Republic of Pakistan: | | | | |
6.75% 2/19/09 | | 395,000 | | 383,150 |
6.875% 6/1/17 (f) | | 100,000 | | 85,500 |
7.125% 3/31/16 (f) | | 600,000 | | 526,500 |
Lebanese Republic: | | | | |
(Reg. S): | | | | |
8.625% 6/20/13 | | 150,000 | | 144,375 |
8.63% 11/30/09 (i) | | 1,400,000 | | 1,373,750 |
7.125% 3/5/10 | | 250,000 | | 239,375 |
7.75% 9/7/12 | | 400,000 | | 374,000 |
7.875% 5/20/11 (Reg. S) | | 1,040,000 | | 988,000 |
8.63% 11/30/09 (f)(i) | | 105,000 | | 103,031 |
10.25% 10/6/09 (Reg. S) | | 400,000 | | 405,000 |
Peruvian Republic: | | | | |
6.1425% 3/7/27 (i) | | 340,000 | | 339,150 |
euro Brady past due interest 6.125% 3/7/17 (i) | | 1,306,700 | | 1,303,433 |
Philippine Republic: | | | | |
8.25% 1/15/14 | | 1,580,000 | | 1,710,350 |
8.875% 3/17/15 | | 580,000 | | 653,950 |
9% 2/15/13 | | 630,000 | | 700,875 |
9.5% 2/2/30 | | 625,000 | | 789,063 |
9.875% 1/15/19 | | 1,035,000 | | 1,273,050 |
Foreign Government and Government Agency Obligations - continued |
| Principal
Amount (b) | | Value |
Philippine Republic: - continued | | | | |
10.625% 3/16/25 | | $ 715,000 | | $ 967,967 |
Republic of Fiji 6.875% 9/13/11 | | 400,000 | | 364,000 |
Republic of Serbia 3.75% 11/1/24 (d)(f) | | 540,000 | | 498,150 |
Russian Federation: | | | | |
7.5% 3/31/30 (Reg. S) | | 6,200,840 | | 6,882,932 |
12.75% 6/24/28 (Reg. S) | | 865,000 | | 1,524,563 |
Turkish Republic: | | | | |
6.875% 3/17/36 | | 1,275,000 | | 1,193,719 |
7% 9/26/16 | | 2,020,000 | | 2,045,250 |
7.375% 2/5/25 | | 855,000 | | 875,306 |
11% 1/14/13 | | 1,285,000 | | 1,542,000 |
11.5% 1/23/12 | | 1,025,000 | | 1,217,188 |
11.875% 1/15/30 | | 860,000 | | 1,309,350 |
Ukraine Cabinet of Ministers 6.58% 11/21/16 (f) | | 1,850,000 | | 1,830,982 |
Ukraine Government (Reg. S) 8.6881% 8/5/09 (i) | | 475,000 | | 499,320 |
United Mexican States: | | | | |
6.75% 9/27/34 | | 85,000 | | 93,203 |
7.5% 4/8/33 | | 575,000 | | 685,400 |
8.3% 8/15/31 | | 815,000 | | 1,050,372 |
Uruguay Republic 8% 11/18/22 | | 846,902 | | 912,537 |
Venezuelan Republic: | | | | |
5.375% 8/7/10 | | 850,000 | | 786,250 |
6.36% 4/20/11 (i) | | 1,990,000 | | 1,830,800 |
7.65% 4/21/25 | | 610,000 | | 523,075 |
8.5% 10/8/14 | | 565,000 | | 543,813 |
9.25% 9/15/27 | | 2,175,000 | | 2,158,688 |
9.375% 1/13/34 | | 685,000 | | 679,863 |
10.75% 9/19/13 | | 1,255,000 | | 1,342,850 |
13.625% 8/15/18 | | 1,168,000 | | 1,489,200 |
Vietnamese Socialist Republic Brady par 4% 3/12/28 (d) | | 90,000 | | 73,575 |
TOTAL FOREIGN GOVERNMENT AND
GOVERNMENT AGENCY OBLIGATIONS (Cost $75,673,898) | 74,352,466 |
Preferred Stocks - 0.1% |
| | Shares | | Value |
Convertible Preferred Stocks - 0.1% |
ENERGY - 0.1% |
Oil, Gas & Consumable Fuels - 0.1% |
El Paso Corp. 4.99% | | 1,566 | | $ 2,153,555 |
UTILITIES - 0.0% |
Electric Utilities - 0.0% |
AES Trust III 6.75% | | 10,000 | | 461,500 |
TOTAL CONVERTIBLE PREFERRED STOCKS | | | 2,615,055 |
Nonconvertible Preferred Stocks - 0.0% |
TELECOMMUNICATION SERVICES - 0.0% |
Wireless Telecommunication Services - 0.0% |
Rural Cellular Corp. 12.25% pay-in-kind | | 520 | | 650,000 |
TOTAL PREFERRED STOCKS (Cost $3,200,260) | | 3,265,055 |
Floating Rate Loans - 0.1% |
| Principal
Amount (b) | | |
CONSUMER DISCRETIONARY - 0.1% |
Hotels, Restaurants & Leisure - 0.0% |
Intrawest Resorts term loan 7.6225% 10/25/07 (i) | | $ 249,952 | | 243,703 |
Media - 0.1% |
CSC Holdings, Inc. Tranche B, term loan 7.07% 3/31/13 (i) | | 1,550,000 | | 1,488,000 |
Zuffa LLC term loan 7.5625% 6/19/15 (i) | | 1,350,000 | | 1,201,500 |
| | 2,689,500 |
Specialty Retail - 0.0% |
The Pep Boys - Manny, Moe & Jack term loan 7.54% 10/27/13 (i) | | 202,000 | | 197,455 |
Toys 'R' US, Inc. term loan 8.32% 12/9/08 (i) | | 500,000 | | 488,750 |
| | 686,205 |
TOTAL CONSUMER DISCRETIONARY | | 3,619,408 |
Floating Rate Loans - continued |
| Principal
Amount (b) | | Value |
ENERGY - 0.0% |
Oil, Gas & Consumable Fuels - 0.0% |
Kinder Morgan, Inc. Tranche B, term loan 7.0708% 5/30/14 (i) | | $ 1,970,000 | | $ 1,871,500 |
FINANCIALS - 0.0% |
Diversified Financial Services - 0.0% |
LandSource Communities Development LLC: | | | | |
Tranche 2LN, term loan 9.9988% 2/27/14 (i) | | 80,000 | | 71,600 |
Tranche B 1LN, term loan 8.2488% 2/27/13 (i) | | 109,600 | | 98,640 |
| | 170,240 |
Real Estate Investment Trusts - 0.0% |
Capital Automotive (REIT) Tranche B, term loan 7.07% 12/16/10 (i) | | 250,000 | | 240,000 |
General Growth Properties, Inc. Tranche A1, term loan 6.58% 2/24/10 (i) | | 209,211 | | 202,934 |
Spirit Finance Corp. term loan 8.3595% 8/1/13 (i) | | 134,000 | | 120,600 |
| | 563,534 |
Real Estate Management & Development - 0.0% |
Tishman Speyer Properties term loan 7.08%
12/27/12 (i) | | 143,000 | | 137,280 |
TOTAL FINANCIALS | | 871,054 |
HEALTH CARE - 0.0% |
Health Care Providers & Services - 0.0% |
Community Health Systems, Inc.: | | | | |
term loan 7.7563% 7/25/14 (i) | | 1,022,560 | | 986,770 |
Tranche DD, term loan 7/25/14 (m) | | 67,440 | | 65,080 |
| | 1,051,850 |
INDUSTRIALS - 0.0% |
Commercial Services & Supplies - 0.0% |
Adesa, Inc. term loan 7.61% 10/20/13 (i) | | 480,000 | | 448,800 |
INFORMATION TECHNOLOGY - 0.0% |
Software - 0.0% |
Kronos, Inc. Tranche 1LN, term loan 7.61%
6/11/14 (i) | | 1,680,000 | | 1,545,600 |
Floating Rate Loans - continued |
| Principal
Amount (b) | | Value |
TELECOMMUNICATION SERVICES - 0.0% |
Diversified Telecommunication Services - 0.0% |
Intelsat Ltd. Tranche B, term loan 7.36% 7/3/13 (i) | | $ 410,000 | | $ 400,775 |
Wireless Telecommunication Services - 0.0% |
Crown Castle International Corp. Tranche B, term loan 6.8385% 3/6/14 (i) | | 9,975 | | 9,476 |
TOTAL TELECOMMUNICATION SERVICES | | 410,251 |
TOTAL FLOATING RATE LOANS (Cost $9,964,709) | 9,818,463 |
Sovereign Loan Participations - 0.0% |
|
Indonesian Republic loan participation: | | | | |
- Citibank 6.25% 12/14/19 (i) | | 128,000 | | 122,879 |
- Credit Suisse First Boston 6.25% 3/28/13 (i) | | 98,751 | | 97,764 |
- Deutsche Bank 6.25% 3/28/13 (i) | | 11,623 | | 11,507 |
TOTAL SOVEREIGN LOAN PARTICIPATIONS (Cost $222,814) | 232,150 |
Fixed-Income Funds - 51.3% |
| Shares | | |
Fidelity 1-3 Year Duration Securitized Bond Central Fund (j) | 3,257,659 | | 310,910,980 |
Fidelity 2-5 Year Duration Securitized Bond Central Fund (j) | 4,113,459 | | 402,255,147 |
Fidelity Corporate Bond 1-10 Year Central Fund (j) | 7,711,107 | | 763,168,246 |
Fidelity Floating Rate Central Fund (j) | 2,379,674 | | 228,686,671 |
Fidelity Mortgage Backed Securities Central Fund (j) | 9,810,580 | | 964,085,734 |
Fidelity Ultra-Short Central Fund (j) | 9,260,420 | | 875,572,723 |
TOTAL FIXED-INCOME FUNDS (Cost $3,624,184,607) | 3,544,679,501 |
Preferred Securities - 0.1% |
| Principal
Amount (b) | | |
CONSUMER DISCRETIONARY - 0.1% |
Media - 0.1% |
Globo Comunicacoes e Participacoes SA 9.375% | $ 2,090,000 | | 2,122,796 |
Net Servicos de Comunicacao SA 9.25% (f) | 1,035,000 | | 1,050,272 |
| | 3,173,068 |
Preferred Securities - continued |
| Principal
Amount (b) | | Value |
ENERGY - 0.0% |
Oil, Gas & Consumable Fuels - 0.0% |
Pemex Project Funding Master Trust 7.75% | $ 3,034,000 | | $ 3,120,416 |
TOTAL PREFERRED SECURITIES (Cost $6,282,522) | 6,293,484 |
Cash Equivalents - 27.9% |
| Maturity
Amount | | |
Investments in repurchase agreements in a joint trading account at: | | | |
5.37%, dated 8/31/07 due 9/4/07 (Collateralized by U.S. Government Obligations) # | $ 837,988,965 | | 837,489,000 |
5.4%, dated 8/31/07 due 9/4/07 (Collateralized by U.S. Government Obligations) # (a) | 1,095,166,706 | | 1,094,510,000 |
TOTAL CASH EQUIVALENTS (Cost $1,931,999,000) | 1,931,999,000 |
TOTAL INVESTMENT PORTFOLIO - 127.0% (Cost $8,834,022,153) | | 8,778,811,136 |
NET OTHER ASSETS - (27.0)% | | (1,864,788,095) |
NET ASSETS - 100% | $ 6,914,023,041 |
Swap Agreements |
| Expiration Date | | Notional Amount | | |
Credit Default Swaps |
Pay monthly a fixed rate of .15% multiplied by the notional amount and receive from Credit Suisse First Boston upon each credit event of one of the issues of Dow Jones ABX AA 07-1 Index, par value of the proportional notional amount (g) | August 2037 | | $ 7,200,000 | | 1,728,000 |
Receive monthly notional amount multiplied by 3.35% and pay Morgan Stanley, Inc. upon credit event of Morgan Stanley ABS Capital I, Inc., par value of the notional amount of Morgan Stanley ABS Capital I, Inc. Series 2004-HE8 Class B3, 7.3913% 9/25/34 | Oct. 2034 | | 134,000 | | (23,527) |
Swap Agreements |
| Expiration Date | | Notional Amount | | Value |
Credit Default Swaps |
Receive monthly notional amount multiplied by 3.35% and pay Morgan Stanley, Inc. upon credit event of Morgan Stanley ABS Capital I, Inc., par value of the notional amount of Morgan Stanley ABS Capital I, Inc. Series 2004-HE7, Class B3, 9.01% 8/25/34 | Sept. 2034 | | $ 134,000 | | $ (33,139) |
Receive monthly notional amount multiplied by 3.35% and pay Morgan Stanley, Inc. upon credit event of Morgan Stanley ABS Capital I, Inc., par value of the notional amount of Morgan Stanley ABS Capital I, Inc. Series 2004-NC7, Class B3, 7.6913% 7/25/34 | August 2034 | | 134,000 | | (20,670) |
Receive from Bank of America upon credit event of Bristol-Myers Squibb Co., par value of the notional amount of Bristol-Myers Squibb Co. 5.25% 8/15/13, and pay quarterly notional amount multiplied by .30% | Sept. 2017 | | 3,700,000 | | 37,972 |
Receive from Bank of America upon credit event of Eli Lilly & Co., par value of the notional amount of Eli Lilly & Co. 6.57% 1/1/16, and pay quarterly notional amount multiplied by .22% | Sept. 2017 | | 2,995,000 | | 8,078 |
Receive from Citibank upon credit event of Bristol-Myers Squibb Co., par value of the notional amount of Bristol-Myers Squibb Co. 5.25% 8/15/13, and pay quarterly notional amount multiplied by .32% | Sept. 2017 | | 1,500,000 | | 12,951 |
Receive from Citibank upon credit event of Schering-Plough Corp., par value of the notional amount of Schering-Plough Corp. 5.55% 12/1/13, and pay quarterly notional amount multiplied by .4% | Sept. 2017 | | 2,500,000 | | 17,220 |
Receive from Citibank upon credit event of Schering-Plough Corp., par value of the notional amount of Schering-Plough Corp. 5.55% 12/1/13, and pay quarterly notional amount multiplied by .42% | Sept. 2017 | | 4,400,000 | | 23,344 |
Swap Agreements - continued |
| Expiration Date | | Notional Amount | | Value |
Credit Default Swaps - continued |
Receive from Deutsche Bank upon credit event of Household Finance Corp., par value of the notional amount of Household Finance Corp. 7% 5/15/12, and pay quarterly notional amount multiplied by .73% | Sept. 2012 | | $ 5,900,000 | | $ (100,076) |
Receive from Goldman Sachs upon credit event of CSX Corp., par value of the notional amount of CSX Corp. 5.30% 2/15/14, and pay quarterly notional amount multiplied by .77% | Sept. 2017 | | 5,000,000 | | 52,701 |
Receive from Goldman Sachs upon credit event of Eli Lilly & Co., par value of the notional amount of Eli Lilly & Co. 6.57% 1/1/16, and pay quarterly notional amount multiplied by .24% | Sept. 2017 | | 2,500,000 | | 3,639 |
Receive monthly a fixed rate of .15% multiplied by the notional amount and pay to Credit Suisse First Boston upon each credit event of one of the issues of Dow Jones ABX AA 07-1 Index, par value of the proportional notional amount (g) | August 2037 | | 4,000,000 | | (1,120,000) |
Receive monthly a fixed rate of .15% multiplied by the notional amount and pay to UBS upon each credit event of one of the issues of Dow Jones ABX AA 07-1 Index, par value of the proportional notional amount (g) | August 2037 | | 7,200,000 | | (2,016,000) |
Receive monthly a fixed rate of .15% multiplied by the notional amount and pay to UBS upon each credit event of one of the issues of Dow Jones ABX AA 07-1 Index, par value of the proportional notional amount (g) | August 2037 | | 2,600,000 | | (728,000) |
Receive monthly notional amount multiplied by .82% and pay UBS upon credit event of Morgan Stanley ABS Capital I, Inc., par value of the notional amount of Morgan Stanley ABS Capital I, Inc. Series 2004-NC6 Class M3, 5.6413% 7/25/34 | August 2034 | | 134,000 | | (14,889) |
Swap Agreements - continued |
| Expiration Date | | Notional Amount | | Value |
Credit Default Swaps - continued |
Receive monthly notional amount multiplied by .85% and pay UBS upon credit event of Ameriquest Mortgage Securities, Inc., par value of the notional amount of Ameriquest Mortgage Securities, Inc. Series 2004-R9 Class M5, 5.5913% 10/25/34 | Nov. 2034 | | $ 134,000 | | $ (22,366) |
Receive monthly notional amount multiplied by .85% and pay UBS upon credit event of Morgan Stanley ABS Capital I, Inc., par value of the notional amount of Morgan Stanley ABS Capital I, Inc. Series 2004-NC8 Class M6, 5.4413% 9/25/34 | Oct. 2034 | | 134,000 | | (18,954) |
Receive monthly notional amount multiplied by 1.6% and pay Morgan Stanley, Inc. upon credit event of Park Place Securities, Inc., par value of the notional amount of Park Place Securities, Inc. Series 2005-WHQ2 Class M7, 5.4413% 5/25/35 | June 2035 | | 100,000 | | (31,011) |
Receive monthly notional amount multiplied by 1.66% and pay Morgan Stanley, Inc. upon credit event of Park Place Securities, Inc., par value of the notional amount of Park Place Securities, Inc. Series 2005-WHQ2 Class M7, 5.4413% 5/25/35 | June 2035 | | 134,000 | | (41,373) |
Receive monthly notional amount multiplied by 2.22% and pay JPMorgan Chase, Inc. upon credit event of Morgan Stanley ABS Capital I, Inc., par value of the notional amount of Morgan Stanley ABS Capital I, Inc. Series 2005-HE3 Class B2, 6.87% 7/25/35 | August 2035 | | 5,325,000 | | (1,502,289) |
Receive monthly notional amount multiplied by 2.39% and pay UBS upon credit event of Fremont Home Loan Trust, par value of the notional amount of Fremont Home Loan Trust Series 2004-1 Class M9, 7.73% 2/25/34 | March 2034 | | 83,835 | | (12,139) |
Receive monthly notional amount multiplied by 2.4% and pay Deutsche Bank upon credit event of Fremont Home Loan Trust, par value of the notional amount of Fremont Home Loan Trust Series 2004-A Class B3, 7.2288% 1/25/34 | Feb. 2034 | | 38,810 | | (31,596) |
Swap Agreements - continued |
| Expiration Date | | Notional Amount | | Value |
Credit Default Swaps - continued |
Receive monthly notional amount multiplied by 2.54% and pay Merrill Lynch upon credit event of Countrywide Home Loans, Inc., par value of the notional amount of Countrywide Home Loans, Inc. Series 2003-BC1 Class B1, 7.6913% 3/25/32 | April 2032 | | $ 11,800 | | $ (362) |
Receive monthly notional amount multiplied by 3% and pay UBS upon credit event of Ameriquest Mortgage Securities, Inc., par value of the notional amount of Ameriquest Mortgage Securities, Inc. Series 2005-R4 Class M9, 7.07% 7/25/35 | August 2035 | | 1,200,000 | | (436,452) |
Receive monthly notional amount multiplied by 5% and pay Deutsche Bank upon credit event of MASTR Asset Backed Securities Trust, par value of the notional amount of MASTR Asset Backed Securities Trust Series 2003-NC1 Class M6, 8.1913% 4/25/33 | May 2033 | | 134,000 | | (38,715) |
Receive monthly notional amount multiplied by 5.55% and pay Deutsche Bank upon credit event of Carrington Mortgage Loan Trust, par value of the notional amount of Carrington Mortgage Loan Trust Series 2006-FRE1 Class M10, 7.74% 7/25/36 | August 2036 | | 1,200,000 | | (503,682) |
Receive monthly notional amount multiplied by 6.25% and pay Deutsche Bank upon credit event of Residential Asset Mortgage Products, Inc., par value of the notional amount of Residential Asset Mortgage Products, Inc. Series 2006-RS5, 7.17% 9/25/35 | Oct. 2036 | | 1,200,000 | | (840,651) |
Receive quarterly notional amount multiplied by .5% and pay Deutsche Bank upon credit event of Fannie Mae, par value of the notional amount of Fannie Mae 5.25% 8/1/12 | Sept. 2012 | | 3,600,000 | | 4,317 |
Receive quarterly notional amount multiplied by .54% and pay to Morgan Stanley, Inc. upon credit event of Fannie Mae, par value of the notional amount of Fannie Mae 5.25% 8/1/12 | Sept. 2012 | | 3,630,000 | | 11,021 |
Swap Agreements - continued |
| Expiration Date | | Notional Amount | | Value |
Credit Default Swaps - continued |
Receive quarterly notional amount multiplied by .72% and pay Bank of America upon credit event of Alleghany Energy Supply Co. LLC, par value of the notional amount of Alleghany Energy Supply Co. LLC 8.25% 4/15/12 | June 2012 | | $ 4,000,000 | | $ (81,914) |
Receive quarterly notional amount multiplied by .78% and pay Deutsche Bank upon credit event of Allegheny Energy Supply Co. LLC, par value of the notional amount of Allegheny Energy Supply Co. LLC 8.25% 4/15/12 | June 2012 | | 3,955,000 | | (72,155) |
Receive quarterly notional amount multiplied by 1.55% and pay Goldman Sachs upon credit event of Reynolds American, Inc., par value of the notional amount of Reynolds American, Inc. 7.625% 6/1/16 | Sept. 2017 | | 6,500,000 | | 76,749 |
TOTAL CREDIT DEFAULT SWAPS | | 81,411,445 | | (5,713,968) |
Interest Rate Swaps |
Receive quarterly a fixed rate equal to 4.3875% and pay quarterly a floating rate based on 3-month LIBOR with Credit Suisse First Boston | March 2010 | | 1,250,000 | | (16,696) |
Receive quarterly a fixed rate equal to 4.774% and pay quarterly a floating rate based on 3-month LIBOR with Credit Suisse First Boston | March 2015 | | 1,250,000 | | (26,171) |
Receive quarterly a fixed rate equal to 4.898% and pay quarterly a floating rate based on 3-month LIBOR with Lehman Brothers, Inc. | August 2014 | | 1,135,000 | | (10,282) |
Receive semi-annually a fixed rate equal to 5.015% and pay quarterly a floating rate based on 3-month LIBOR with Morgan Stanley, Inc. | April 2012 | | 50,000,000 | | 729,585 |
Receive semi-annually a fixed rate equal to 5.062% and pay quarterly a floating rate based on 3-month LIBOR with Credit Suisse First Boston | May 2012 | | 75,000,000 | | 1,267,898 |
Receive semi-annually a fixed rate equal to 5.09% and pay quarterly a floating rate based on 3-month LIBOR with Deutsche Bank | Jan. 2012 | | 75,000,000 | | 399,503 |
Swap Agreements - continued |
| Expiration Date | | Notional Amount | | Value |
Interest Rate Swaps - continued |
Receive semi-annually a fixed rate equal to 5.095% and pay quarterly a floating rate based on 3-month LIBOR with Bank of America | Feb. 2012 | | $ 15,000,000 | | $ 86,286 |
Receive semi-annually a fixed rate equal to 5.144% and pay quarterly a floating rate based on 3-month LIBOR with JPMorgan Chase, Inc. | April 2012 | | 100,000,000 | | 2,055,830 |
Receive semi-annually a fixed rate equal to 5.276% and pay quarterly a floating rate based on 3-month LIBOR with Deutsche Bank | April 2011 | | 20,000,000 | | 499,946 |
Receive semi-annually a fixed rate equal to 5.375% and pay quarterly a floating rate based on 3-month LIBOR with Deutsche Bank | April 2009 | | 30,000,000 | | 622,431 |
Receive semi-annually a fixed rate equal to 5.44% and pay quarterly a floating rate based on 3-month LIBOR with Morgan Stanley, Inc. | July 2012 | | 50,000,000 | | 1,048,405 |
Receive semi-annually a fixed rate equal to 5.556% and pay quarterly a floating rate based on 3-month LIBOR with JPMorgan Chase, Inc. | June 2012 | | 25,000,000 | | 632,030 |
Receive semi-annually a fixed rate equal to 5.636% and pay quarterly a floating rate based on 3-month LIBOR with Deutsche Bank | July 2009 | | 100,000,000 | | 1,374,470 |
Receive semi-annually a fixed rate equal to 5.6485% and pay quarterly a floating rate based on 3-month LIBOR with Deutsche Bank | July 2010 | | 100,000,000 | | 2,089,490 |
Receive semi-annually a fixed rate of 5.263% and pay quarterly a floating rate based on 3-month LIBOR with Credit Suisse First Boston | Feb. 2012 | | 50,000,000 | | 633,645 |
TOTAL INTEREST RATE SWAPS | | 693,635,000 | | 11,386,370 |
Total Return Swaps |
Receive monthly a return equal to Lehman Brothers CMBS U.S. Aggregate Index and pay monthly a floating rate based on 1-month LIBOR minus 17.5 basis points with Lehman Brothers, Inc. | Sept. 2007 | | 25,000,000 | | 213,037 |
| | $ 800,046,445 | | $ 5,885,439 |
Currency Abbreviation |
CAD | - | Canadian dollar |
Legend |
(a) Includes investment made with cash collateral received from securities on loan. |
(b) Principal amount is stated in United States dollars unless otherwise noted. |
(c) Security initially issued in zero coupon form which converts to coupon form at a specified rate and date. The rate shown is the rate at period end. |
(d) Security initially issued at one coupon which converts to a higher coupon at a specified date. The rate shown is the rate at period end. |
(e) Security or a portion of the security is on loan at period end. |
(f) Security exempt from registration under Rule 144A of the Securities Act of 1933. These securities may be resold in transactions exempt from registration, normally to qualified institutional buyers. At the end of the period, the value of these securities amounted to $167,313,939 or 2.4% of net assets. |
(g) Security or a portion of the security purchased on a delayed delivery or when-issued basis. |
(h) Represents a tradable index of credit default swaps on home equity asset-backed debt securities. |
(i) The coupon rate shown on floating or adjustable rate securities represents the rate at period end. |
(j) Affiliated fund that is available only to investment companies and other accounts managed by Fidelity Investments. A complete schedule of portfolio holdings for each Fidelity Central Fund is filed with the SEC for the first and third quarters of each fiscal year on Form N-Q and is available upon request or at the SEC's web site at www.sec.gov. A holdings listing for the Fund, which presents direct holdings as well as the pro rata share of securities and other investments held indirectly through its investment in underlying non-money market Fidelity Central Funds, is available at fidelity.com and/or advisor.fidelity.com, as applicable. In addition, each Fidelity Central Fund's financial statements, which are not covered by the Fund's Report of Independent Registered Public Accounting Firm, are available on the SEC's web site or upon request. |
(k) Security represents right to receive monthly interest payments on an underlying pool of mortgages or assets. Principal shown is the outstanding par amount of the pool held as of the end of the period. |
(l) Restricted securities - Investment in securities not registered under the Securities Act of 1933 (excluding 144A issues). At the end of the period, the value of restricted securities (excluding 144A issues) amounted to $404,420 or 0.0% of net assets. |
Additional information on each holding is as follows: |
Security | Acquisition Date | Acquisition Cost |
GMAC Commercial Mortgage Securities, Inc. Series 1999-C2I Class K, 6.481% 9/15/33 | 3/23/07 | $ 163,875 |
Real Estate Asset Liquidity Trust Series 2006-2: | | |
Class F, 4.456% 9/12/38 | 10/2/06 | $ 80,777 |
Class G, 4.456% 9/12/38 | 10/2/06 | $ 39,498 |
Class H, 4.456% 9/12/38 | 10/2/06 | $ 22,997 |
Class J, 4.456% 9/12/38 | 10/2/06 | $ 21,304 |
Class K, 4.456% 9/12/38 | 10/2/06 | $ 9,417 |
Class L, 4.456% 9/12/38 | 10/2/06 | $ 13,077 |
Class M, 4.456% 9/12/38 | 10/2/06 | $ 43,033 |
(m) Position represents an unfunded loan commitment. At period end, the total principal amount and market value of unfunded commitments totaled $67,440 and $65,080, respectively. The coupon rate will be determined at time of settlement. |
(n) Security or a portion of the security has been segregated as collateral for open swap agreements. At the period end, the value of securities pledged amounted to $2,322,101. |
# Additional Information on each counterparty to the repurchase agreement is as follows: |
Repurchase Agreement / Counterparty | Value |
$837,489,000 due 9/04/07 at 5.37% |
BNP Paribas Securities Corp. | $ 19,351,451 |
Banc of America Securities LLC | 296,559,731 |
Bank of America, NA | 133,293,735 |
Bear Stearns & Co., Inc. | 16,661,717 |
Citigroup Global Markets, Inc. | 52,550,488 |
Credit Suisse Securities (USA) LLC | 33,323,434 |
Greenwich Capital Markets, Inc. | 16,661,717 |
HSBC Securities (USA), Inc. | 33,323,434 |
ING Financial Markets LLC | 66,646,867 |
Societe Generale, New York Branch | 99,970,301 |
UBS Securities LLC | 32,490,348 |
WestLB AG | 36,655,777 |
| $ 837,489,000 |
| |
$1,094,510,000 due 9/04/07 at 5.40% |
Barclays Capital, Inc. | $ 701,415,186 |
Citigroup Global Markets, Inc. | 92,488,306 |
Countrywide Securities Corp. | 300,606,508 |
| $ 1,094,510,000 |
Affiliated Central Funds |
Information regarding fiscal year to date income earned by the Fund from investments in Fidelity Central Funds is as follows: |
Fund | Income earned |
Fidelity 1-3 Year Duration Securitized Bond Central Fund | $ 9,433,136 |
Fidelity 2-5 Year Duration Securitized Bond Central Fund | 10,921,434 |
Fidelity Corporate Bond 1-10 Year Central Fund | 22,886,151 |
Fidelity Floating Rate Central Fund | 10,658,722 |
Fidelity Mortgage Backed Securities Central Fund | 27,679,804 |
Fidelity Ultra-Short Central Fund | 37,981,161 |
Total | $ 119,560,408 |
Additional information regarding the Fund's fiscal year to date purchases and sales, including the ownership percentage, of the non Money Market Central Funds is as follows: |
Fund | Value, beginning
of period | Purchases | Sales
Proceeds | Value, end
of period | % ownership,
end of period |
Fidelity 1-3 Year Duration Securitized Bond Central Fund | $ - | $ 324,340,949* | $ - | $ 310,910,980 | 11.2% |
Fidelity 2-5 Year Duration Securitized Bond Central Fund | - | 408,884,453* | - | 402,255,147 | 10.6% |
Fidelity Corporate Bond 1-10 Year Central Fund | - | 771,624,458* | - | 763,168,246 | 10.7% |
Fidelity Floating Rate Central Fund | 66,958,885 | 169,996,782 | - | 228,686,671 | 9.8% |
Fidelity Mortgage Backed Securities Central Fund | - | 977,890,256* | - | 964,085,734 | 11.2% |
Fidelity Ultra-Short Central Fund | 414,088,852 | 709,578,811* | 194,768,516 | 875,572,723 | 7.0% |
Total | $ 481,047,737 | $ 3,362,315,709 | $ 194,768,516 | $ 3,544,679,501 | |
* Includes the value of shares received through in-kind contributions. See Note 6 of the Notes to
Financial Statements. |
See accompanying notes which are an integral part of the financial statements.
Annual Report
Financial Statements
Statement of Assets and Liabilities
| August 31, 2007 |
| | |
Assets | | |
Investment in securities, at value (including securities loaned of $1,065,421,563 and repurchase agreements of $1,931,999,000) -
See accompanying schedule: Unaffiliated issuers (cost $5,209,837,546) | $ 5,234,131,635 | |
Fidelity Central Funds (cost $3,624,184,607) | 3,544,679,501 | |
Total Investments (cost $8,834,022,153) | | $ 8,778,811,136 |
Cash | | 8,796,932 |
Receivable for investments sold | | 555,962 |
Receivable for swap agreements | | 30,594 |
Receivable for fund shares sold | | 35,451,678 |
Interest receivable | | 27,124,728 |
Distributions receivable from Fidelity Central Funds | | 17,762,000 |
Swap agreements, at value | | 5,885,439 |
Total assets | | 8,874,418,469 |
| | |
Liabilities | | |
Payable for investments purchased
Regular delivery | $ 31,629,273 | |
Delayed delivery | 826,128,255 | |
Payable for fund shares redeemed | 4,423,548 | |
Distributions payable | 999,688 | |
Accrued management fee | 1,751,324 | |
Distribution fees payable | 37,432 | |
Other affiliated payables | 759,523 | |
Other payables and accrued expenses | 156,385 | |
Collateral on securities loaned, at value | 1,094,510,000 | |
Total liabilities | | 1,960,395,428 |
| | |
Net Assets | | $ 6,914,023,041 |
Net Assets consist of: | | |
Paid in capital | | $ 6,957,656,017 |
Undistributed net investment income | | 4,530,397 |
Accumulated undistributed net realized gain (loss) on investments and foreign currency transactions | | 279,124 |
Net unrealized appreciation (depreciation) on investments and assets and liabilities in foreign currencies | | (48,442,497) |
Net Assets | | $ 6,914,023,041 |
See accompanying notes which are an integral part of the financial statements.
Annual Report
Financial Statements - continued
Statement of Assets and Liabilities - continued
| August 31, 2007 |
| | |
Calculation of Maximum Offering Price Class A:
Net Asset Value and redemption price per share ($48,075,763 ÷ 4,681,968 shares) | | $ 10.27 |
| | |
Maximum offering price per share (100/96.00 of $10.27) | | $ 10.70 |
Class T:
Net Asset Value and redemption price per share ($42,191,042 ÷ 4,112,625 shares) | | $ 10.26 |
| | |
Maximum offering price per share (100/96.00 of $10.26) | | $ 10.69 |
Class B:
Net Asset Value and offering price per share ($6,053,834 ÷ 589,436 shares)A | | $ 10.27 |
| | |
Class C:
Net Asset Value and offering price per share ($18,889,796 ÷ 1,839,636 shares)A | | $ 10.27 |
| | |
Total Bond:
Net Asset Value, offering price and redemption price per share ($6,450,176,834 ÷ 628,207,990 shares) | | $ 10.27 |
| | |
Institutional Class:
Net Asset Value, offering price and redemption price per share ($348,635,772 ÷ 33,986,027 shares) | | $ 10.26 |
A Redemption price per share is equal to net asset value less any applicable contingent deferred sales charge.
See accompanying notes which are an integral part of the financial statements.
Annual Report
Statement of Operations
| Year ended August 31, 2007 |
| | |
Investment Income | | |
Dividends | | $ 441,078 |
Interest | | 111,033,135 |
Income from Fidelity Central Funds | | 119,560,408 |
Total income | | 231,034,621 |
| | |
Expenses | | |
Management fee | $ 12,837,361 | |
Transfer agent fees | 4,159,017 | |
Distribution fees | 278,761 | |
Fund wide operations fee | 1,325,565 | |
Independent trustees' compensation | 11,741 | |
Miscellaneous | 9,476 | |
Total expenses before reductions | 18,621,921 | |
Expense reductions | (139,190) | 18,482,731 |
Net investment income | | 212,551,890 |
Realized and Unrealized Gain (Loss) Net realized gain (loss) on: | | |
Investment securities: | | |
Unaffiliated issuers | 7,720,985 | |
Fidelity Central Funds | (9,761,653) | |
Foreign currency transactions | (525) | |
Swap agreements | (4,037,675) | |
Capital gain distributions from Fidelity Central Funds | 58,264 | |
Total net realized gain (loss) | | (6,020,604) |
Change in net unrealized appreciation (depreciation) on: Investment securities: | | |
Unaffiliated issuers | 6,335,305 | |
Fidelity Central Funds | (94,146,335) | |
Assets and liabilities in foreign currencies | (2,128) | |
Swap agreements | 2,546,994 | |
Total change in net unrealized appreciation (depreciation) | | (85,266,164) |
Net gain (loss) | | (91,286,768) |
Net increase (decrease) in net assets resulting from operations | | $ 121,265,122 |
See accompanying notes which are an integral part of the financial statements.
Annual Report
Financial Statements - continued
Statement of Changes in Net Assets
| Year ended
August 31,
2007 | One month ended
August 31,
2006* | Year ended
July 31,
2006 |
Increase (Decrease) in Net Assets | | | |
Operations | | | |
Net investment income | $ 212,551,890 | $ 10,616,308 | $ 35,183,424 |
Net realized gain (loss) | (6,020,604) | 1,659,188 | (5,912,496) |
Change in net unrealized appreciation (depreciation) | (85,266,164) | 23,254,821 | 12,947,897 |
Net increase (decrease) in net assets resulting from operations | 121,265,122 | 35,530,317 | 42,218,825 |
Distributions to shareholders from net investment income | (198,338,706) | (9,317,974) | (31,840,595) |
Distributions to shareholders from net realized gain | (4,857,769) | - | (1,679,853) |
Total distributions | (203,196,475) | (9,317,974) | (33,520,448) |
Share transactions - net increase (decrease) | 4,556,920,613 | 92,507,042 | 1,879,857,353 |
Total increase (decrease) in net assets | 4,474,989,260 | 118,719,385 | 1,888,555,730 |
| | | |
Net Assets | | | |
Beginning of period | 2,439,033,781 | 2,320,314,396 | 431,758,666 |
End of period (including undistributed net investment income of $4,530,397, $5,573,349 and $2,168,613, respectively) | $ 6,914,023,041 | $ 2,439,033,781 | $ 2,320,314,396 |
* The Fund changed its fiscal year end from July 31 to August 31, effective August 31, 2006.
See accompanying notes which are an integral part of the financial statements.
Annual Report
Financial Highlights - Class A
Years ended August 31, | 2007 | 2006 I | 2006 M | 2005 M | 2004 J |
Selected Per-Share Data | | | | | |
Net asset value, beginning of period | $ 10.39 | $ 10.28 | $ 10.57 | $ 10.46 | $ 10.31 |
Income from Investment Operations | | | | | |
Net investment income E | .508 | .043 | .476 | .387 | .046 |
Net realized and unrealized gain (loss) | (.141) | .105 | (.294) H | .183 | .145 |
Total from investment operations | .367 | .148 | .182 | .570 | .191 |
Distributions from net investment income | (.470) | (.038) | (.432) | (.370) | (.041) |
Distributions from net realized gain | (.017) | - | (.040) | (.090) | - |
Total distributions | (.487) | (.038) | (.472) | (.460) | (.041) |
Net asset value, end of period | $ 10.27 | $ 10.39 | $ 10.28 | $ 10.57 | $ 10.46 |
Total Return B, C, D | 3.57% | 1.44% | 1.78% | 5.52% | 1.85% |
Ratios to Average Net Assets F, K | | | | |
Expenses before reductions | .77% | .73% A | .79% | .96% | .87% A |
Expenses net of fee waivers, if any | .77% | .73% A | .79% | .80% | .80% A |
Expenses net of all reductions | .77% | .73% A | .79% | .80% | .80% A |
Net investment income | 4.93% | 4.98% A | 4.61% | 3.69% | 3.51% A |
Supplemental Data | | | | | |
Net assets, end of period
(000 omitted) | $ 48,076 | $ 6,780 | $ 4,545 | $ 2,974 | $ 102 |
Portfolio turnover rate G | 116% L | 53% A | 99% | 193% | 251% |
A Annualized
B Total returns for periods of less than one year are not annualized.
C Total returns would have been lower had certain expenses not been reduced during the periods shown.
D Total returns do not include the effect of the sales charges.
E Calculated based on average shares outstanding during the period.
F Fees and expenses of the underlying Fidelity Central Funds are not included in the Fund's expense ratio. The Fund indirectly bears its proportionate share of the expenses of any underlying Fidelity Central Funds.
G Amount does not include the portfolio activity of any underlying Fidelity Central Funds.
H The amount shown for a share outstanding does not correspond with the aggregate net gain (loss) on investments for the period due to the timing of sales and repurchases of shares in relation to fluctuating market values of the investments of the Fund.
I For the one month period ended August 31. The Fund changed its fiscal year from July 31 to August 31, effective August 31, 2006.
J For the period June 16, 2004 (commencement of sale of shares) to July 31, 2004.
K Expense ratios reflect operating expenses of the class. Expenses before reductions do not reflect amounts reimbursed by the investment adviser or expense offset arrangements and do not represent the amount paid by the class during periods when reimbursements or reductions occur. Expense ratios before reductions for start-up periods may not be representative of longer-term operating periods. Expenses net of fee waivers reflect expenses after reimbursement by the investment adviser but prior to reductions from expense offset arrangements. Expenses net of all reductions represent the net expenses paid by the class.
L Portfolio turnover rate excludes securities received or delivered through non-taxable in-kind activity.
M For the period ended July 31.
See accompanying notes which are an integral part of the financial statements.
Annual Report
Financial Highlights - Class T
Years ended August 31, | 2007 | 2006 I | 2006 M | 2005 M | 2004 J |
Selected Per-Share Data | | | | | |
Net asset value, beginning of period | $ 10.38 | $ 10.27 | $ 10.56 | $ 10.46 | $ 10.31 |
Income from Investment Operations | | | | | |
Net investment income E | .508 | .042 | .466 | .377 | .045 |
Net realized and unrealized gain (loss) | (.143) | .105 | (.296) H | .173 | .144 |
Total from investment operations | .365 | .147 | .170 | .550 | .189 |
Distributions from net investment income | (.468) | (.037) | (.420) | (.360) | (.039) |
Distributions from net realized gain | (.017) | - | (.040) | (.090) | - |
Total distributions | (.485) | (.037) | (.460) | (.450) | (.039) |
Net asset value, end of period | $ 10.26 | $ 10.38 | $ 10.27 | $ 10.56 | $ 10.46 |
Total Return B, C, D | 3.55% | 1.43% | 1.66% | 5.33% | 1.84% |
Ratios to Average Net Assets F, K | | | | | |
Expenses before reductions | .78% | .87% A | .91% | 1.13% | .96% A |
Expenses net of fee waivers, if any | .78% | .87% A | .90% | .90% | .90% A |
Expenses net of all reductions | .78% | .87% A | .90% | .90% | .90% A |
Net investment income | 4.92% | 4.84% A | 4.50% | 3.59% | 3.41% A |
Supplemental Data | | | | | |
Net assets, end of period
(000 omitted) | $ 42,191 | $ 6,293 | $ 4,583 | $ 5,739 | $ 102 |
Portfolio turnover rate G | 116% L | 53% A | 99% | 193% | 251% |
A Annualized
B Total returns for periods of less than one year are not annualized.
C Total returns would have been lower had certain expenses not been reduced during the periods shown.
D Total returns do not include the effect of the sales charges.
E Calculated based on average shares outstanding during the period.
F Fees and expenses of the underlying Fidelity Central Funds are not included in the Fund's expense ratio. The Fund indirectly bears its proportionate share of the expenses of any underlying Fidelity Central Funds.
G Amount does not include the portfolio activity of any underlying Fidelity Central Funds.
H The amount shown for a share outstanding does not correspond with the aggregate net gain (loss) on investments for the period due to the timing of sales and repurchases of shares in relation to fluctuating market values of the investments of the Fund.
I For the one month period ended August 31. The Fund changed its fiscal year from July 31 to August 31, effective August 31, 2006.
J For the period June 16, 2004 (commencement of sale of shares) to July 31, 2004.
K Expense ratios reflect operating expenses of the class. Expenses before reductions do not reflect amounts reimbursed by the investment adviser or expense offset arrangements and do not represent the amount paid by the class during periods when reimbursements or reductions occur. Expense ratios before reductions for start-up periods may not be representative of longer-term operating periods. Expenses net of fee waivers reflect expenses after reimbursement by the investment adviser but prior to reductions from expense offset arrangements. Expenses net of all reductions represent the net expenses paid by the class.
L Portfolio turnover rate excludes securities received or delivered through non-taxable in-kind activity.
M For the period ended July 31.
See accompanying notes which are an integral part of the financial statements.
Annual Report
Financial Highlights - Class B
Years ended August 31, | 2007 | 2006 I | 2006 M | 2005 M | 2004 J |
Selected Per-Share Data | | | | | |
Net asset value, beginning of period | $ 10.39 | $ 10.28 | $ 10.57 | $ 10.46 | $ 10.31 |
Income from Investment Operations | | | | | |
Net investment income E | .432 | .037 | .399 | .309 | .036 |
Net realized and unrealized gain (loss) | (.145) | .104 | (.296) H | .182 | .145 |
Total from investment operations | .287 | .141 | .103 | .491 | .181 |
Distributions from net investment income | (.390) | (.031) | (.353) | (.291) | (.031) |
Distributions from net realized gain | (.017) | - | (.040) | (.090) | - |
Total distributions | (.407) | (.031) | (.393) | (.381) | (.031) |
Net asset value, end of period | $ 10.27 | $ 10.39 | $ 10.28 | $ 10.57 | $ 10.46 |
Total Return B, C, D | 2.77% | 1.38% | 1.01% | 4.74% | 1.76% |
Ratios to Average Net Assets F, K | | | | | |
Expenses before reductions | 1.53% | 1.51% A | 1.59% | 1.75% | 1.62% A |
Expenses net of fee waivers, if any | 1.53% | 1.51% A | 1.55% | 1.55% | 1.55% A |
Expenses net of all reductions | 1.53% | 1.51% A | 1.55% | 1.55% | 1.55% A |
Net investment income | 4.17% | 4.22% A | 3.85% | 2.94% | 2.76% A |
Supplemental Data | | | | | |
Net assets, end of period
(000 omitted) | $ 6,054 | $ 1,720 | $ 1,667 | $ 2,029 | $ 104 |
Portfolio turnover rate G | 116% L | 53% A | 99% | 193% | 251% |
A Annualized
B Total returns for periods of less than one year are not annualized.
C Total returns would have been lower had certain expenses not been reduced during the periods shown.
D Total returns do not include the effect of the contingent deferred sales charge.
E Calculated based on average shares outstanding during the period.
F Fees and expenses of the underlying Fidelity Central Funds are not included in the Fund's expense ratio. The Fund indirectly bears its proportionate share of the expenses of any underlying Fidelity Central Funds.
G Amount does not include the portfolio activity of any underlying Fidelity Central Funds.
H The amount shown for a share outstanding does not correspond with the aggregate net gain (loss) on investments for the period due to the timing of sales and repurchases of shares in relation to fluctuating market values of the investments of the Fund.
I For the one month period ended August 31. The Fund changed its fiscal year from July 31 to August 31, effective August 31, 2006.
J For the period June 16, 2004 (commencement of sale of shares) to July 31, 2004.
K Expense ratios reflect operating expenses of the class. Expenses before reductions do not reflect amounts reimbursed by the investment adviser or expense offset arrangements and do not represent the amount paid by the class during periods when reimbursements or reductions occur. Expense ratios before reductions for start-up periods may not be representative of longer-term operating periods. Expenses net of fee waivers reflect expenses after reimbursement by the investment adviser but prior to reductions from expense offset arrangements. Expenses net of all reductions represent the net expenses paid by the class.
L Portfolio turnover rate excludes securities received or delivered through non-taxable in-kind activity.
M For the period ended July 31.
See accompanying notes which are an integral part of the financial statements.
Annual Report
Financial Highlights - Class C
Years ended August 31, | 2007 | 2006 I | 2006 M | 2005 M | 2004 J |
Selected Per-Share Data | | | | | |
Net asset value, beginning of period | $ 10.39 | $ 10.28 | $ 10.57 | $ 10.46 | $ 10.31 |
Income from Investment Operations | | | | | |
Net investment income E | .429 | .036 | .389 | .299 | .035 |
Net realized and unrealized gain (loss) | (.145) | .105 | (.293) H | .181 | .145 |
Total from investment operations | .284 | .141 | .096 | .480 | .180 |
Distributions from net investment income | (.387) | (.031) | (.346) | (.280) | (.030) |
Distributions from net realized gain | (.017) | - | (.040) | (.090) | - |
Total distributions | (.404) | (.031) | (.386) | (.370) | (.030) |
Net asset value, end of period | $ 10.27 | $ 10.39 | $ 10.28 | $ 10.57 | $ 10.46 |
Total Return B, C, D | 2.75% | 1.37% | .94% | 4.63% | 1.74% |
Ratios to Average Net Assets F, K | | | | | |
Expenses before reductions | 1.55% | 1.60% A | 1.62% | 1.74% | 1.74% A |
Expenses net of fee waivers, if any | 1.55% | 1.60% A | 1.62% | 1.65% | 1.65% A |
Expenses net of all reductions | 1.55% | 1.60% A | 1.62% | 1.65% | 1.65% A |
Net investment income | 4.15% | 4.13% A | 3.78% | 2.84% | 2.66% A |
Supplemental Data | | | | | |
Net assets, end of period
(000 omitted) | $ 18,890 | $ 2,106 | $ 1,770 | $ 677 | $ 142 |
Portfolio turnover rate G | 116% L | 53% A | 99% | 193% | 251% |
A Annualized
B Total returns for periods of less than one year are not annualized.
C Total returns would have been lower had certain expenses not been reduced during the periods shown.
D Total returns do not include the effect of the contingent deferred sales charge.
E Calculated based on average shares outstanding during the period.
F Fees and expenses of the underlying Fidelity Central Funds are not included in the Fund's expense ratio. The Fund indirectly bears its proportionate share of the expenses of any underlying Fidelity Central Funds.
G Amount does not include the portfolio activity of any underlying Fidelity Central Funds.
H The amount shown for a share outstanding does not correspond with the aggregate net gain (loss) on investments for the period due to the timing of sales and repurchases of shares in relation to fluctuating market values of the investments of the Fund.
I For the one month period ended August 31. The Fund changed its fiscal year from July 31 to August 31, effective August 31, 2006.
J For the period June 16, 2004 (commencement of sale of shares) to July 31, 2004.
K Expense ratios reflect operating expenses of the class. Expenses before reductions do not reflect amounts reimbursed by the investment adviser or expense offset arrangements and do not represent the amount paid by the class during periods when reimbursements or reductions occur. Expense ratios before reductions for start-up periods may not be representative of longer-term operating periods. Expenses net of fee waivers reflect expenses after reimbursement by the investment adviser but prior to reductions from expense offset arrangements. Expenses net of all reductions represent the net expenses paid by the class.
L Portfolio turnover rate excludes securities received or delivered through non-taxable in-kind activity.
M For the period ended July 31.
See accompanying notes which are an integral part of the financial statements.
Annual Report
Financial Highlights - Total Bond
Years ended August 31, | 2007 | 2006 I | 2006 L | 2005 L | 2004 L | 2003 H |
Selected Per-Share Data | | | | | | |
Net asset value, beginning of period | $ 10.39 | $ 10.28 | $ 10.57 | $ 10.46 | $ 10.28 | $ 10.00 |
Income from Investment Operations | | | | | | |
Net investment income D | .543 | .046 | .506 | .411 | .340 | .232 |
Net realized and unrealized gain (loss) | (.143) | .105 | (.290) G | .182 | .237 | .269 |
Total from investment operations | .400 | .151 | .216 | .593 | .577 | .501 |
Distributions from net investment income | (.503) | (.041) | (.466) | (.393) | (.337) | (.221) |
Distributions from net realized gain | (.017) | - | (.040) | (.090) | (.060) | - |
Total distributions | (.520) | (.041) | (.506) | (.483) | (.397) | (.221) |
Net asset value, end of period | $ 10.27 | $ 10.39 | $ 10.28 | $ 10.57 | $ 10.46 | $ 10.28 |
Total Return B, C | 3.89% | 1.46% | 2.11% | 5.75% | 5.68% | 5.01% |
Ratios to Average Net Assets E, J | | | | | |
Expenses before reductions | .45% | .45% A | .45% | .64% | .75% | 1.01% A |
Expenses net of fee waivers, if any | .45% | .45% A | .45% | .61% | .65% | .65% A |
Expenses net of all reductions | .45% | .45% A | .45% | .61% | .65% | .65% A |
Net investment income | 5.25% | 5.26% A | 4.95% | 3.87% | 3.25% | 2.83% A |
Supplemental Data | | | | | | |
Net assets, end of period (000 omitted) | $ 6,450,177 | $ 2,421,077 | $ 2,306,817 | $ 420,225 | $ 373,699 | $ 80,816 |
Portfolio turnover rate F | 116% K | 53% A | 99% | 193% | 251% | 423% A |
A Annualized
B Total returns for periods of less than one year are not annualized.
C Total returns would have been lower had certain expenses not been reduced during the periods shown.
D Calculated based on average shares outstanding during the period.
E Fees and expenses of the underlying Fidelity Central Funds are not included in the Fund's expense ratio. The Fund indirectly bears its proportionate share of the expenses of any underlying Fidelity Central Funds.
F Amount does not include the portfolio activity of any underlying Fidelity Central Funds.
G The amount shown for a share outstanding does not correspond with the aggregate net gain (loss) on investments for the period due to the timing of sales and repurchases of shares in relation to fluctuating market values of the investments of the Fund.
H For the period October 15, 2002 (commencement of operations) to July 31, 2003.
I For the one month period ended August 31. The Fund changed its fiscal year from July 31 to August 31, effective August 31, 2006.
J Expense ratios reflect operating expenses of the class. Expenses before reductions do not reflect amounts reimbursed by the investment adviser or expense offset arrangements and do not represent the amount paid by the class during periods when reimbursements or reductions occur. Expense ratios before reductions for start-up periods may not be representative of longer-term operating periods. Expenses net of fee waivers reflect expenses after reimbursement by the investment adviser but prior to reductions from expense offset arrangements. Expenses net of all reductions represent the net expenses paid by the class.
K Portfolio turnover rate excludes securities received or delivered through non-taxable in-kind activity.
L For the period ended July 31.
See accompanying notes which are an integral part of the financial statements.
Annual Report
Financial Highlights - Institutional Class
Years ended August 31, | 2007 | 2006 H | 2006 L | 2005 L | 2004 I |
Selected Per-Share Data | | | | | |
Net asset value, beginning of period | $ 10.38 | $ 10.27 | $ 10.57 | $ 10.46 | $ 10.31 |
Income from Investment Operations | | | | | |
Net investment income D | .527 | .045 | .493 | .410 | .048 |
Net realized and unrealized gain (loss) | (.134) | .105 | (.294) G | .182 | .145 |
Total from investment operations | .393 | .150 | .199 | .592 | .193 |
Distributions from net investment income | (.496) | (.040) | (.459) | (.392) | (.043) |
Distributions from net realized gain | (.017) | - | (.040) | (.090) | - |
Total distributions | (.513) | (.040) | (.499) | (.482) | (.043) |
Net asset value, end of period | $ 10.26 | $ 10.38 | $ 10.27 | $ 10.57 | $ 10.46 |
Total Return B, C | 3.83% | 1.46% | 1.95% | 5.74% | 1.87% |
Ratios to Average Net Assets E, J | | | | | |
Expenses before reductions | .50% | .54% A | .56% | .62% | .71% A |
Expenses net of fee waivers, if any | .50% | .54% A | .56% | .62% | .65% A |
Expenses net of all reductions | .49% | .54% A | .56% | .61% | .65% A |
Net investment income | 5.21% | 5.16% A | 4.84% | 3.87% | 3.66% A |
Supplemental Data | | | | | |
Net assets, end of period
(000 omitted) | $ 348,636 | $ 1,058 | $ 933 | $ 114 | $ 102 |
Portfolio turnover rate F | 116% K | 53% A | 99% | 193% | 251% |
A Annualized
B Total returns for periods of less than one year are not annualized.
C Total returns would have been lower had certain expenses not been reduced during the periods shown.
D Calculated based on average shares outstanding during the period.
E Fees and expenses of the underlying Fidelity Central Funds are not included in the Fund's expense ratio. The Fund indirectly bears its proportionate share of the expenses of any underlying Fidelity Central Funds.
F Amount does not include the portfolio activity of any underlying Fidelity Central Funds.
G The amount shown for a share outstanding does not correspond with the aggregate net gain (loss) on investments for the period due to the timing of sales and repurchases of shares in relation to fluctuating market values of the investments of the Fund.
H For the one month period ended August 31. The Fund changed its fiscal year from July 31 to August 31, effective August 31, 2006.
I For the period June 16, 2004 (commencement of sale of shares) to July 31, 2004.
J Expense ratios reflect operating expenses of the class. Expenses before reductions do not reflect amounts reimbursed by the investment adviser or expense offset arrangements and do not represent the amount paid by the class during periods when reimbursements or reductions occur. Expense ratios before reductions for start-up periods may not be representative of longer-term operating periods. Expenses net of fee waivers reflect expenses after reimbursement by the investment adviser but prior to reductions from expense offset arrangements. Expenses net of all reductions represent the net expenses paid by the class.
K Portfolio turnover rate excludes securities received or delivered through non-taxable in-kind activity.
L For the period ended July 31.
See accompanying notes which are an integral part of the financial statements.
Annual Report
Notes to Financial Statements
For the period ended August 31, 2007
1. Organization.
Fidelity Total Bond Fund (the Fund) is a non-diversified fund of Fidelity Income Fund (the trust) and is authorized to issue an unlimited number of shares. The trust is registered under the Investment Company Act of 1940, as amended (the 1940 Act), as an open-end management investment company organized as a Massachusetts business trust.
The Fund offers Class A, Class T, Class B, Class C, Total Bond and Institutional Class shares, each of which has equal rights as to assets and voting privileges. Each class has exclusive voting rights with respect to matters that affect that class. Class B shares will automatically convert to Class A shares after a holding period of seven years from the initial date of purchase. Investment income, realized and unrealized capital gains and losses, the common expenses of the Fund, and certain fund-level expense reductions, if any, are allocated on a pro rata basis to each class based on the relative net assets of each class to the total net assets of the Fund. Each class differs with respect to transfer agent and distribution and service plan fees incurred. Certain expense reductions also differ by class.
2. Investments in Fidelity Central Funds.
The Fund may invest in Fidelity Central Funds which are open-end investment companies available only to other investment companies and accounts managed by Fidelity Management & Research Company (FMR) and its affiliates. The Fund's Schedule of Investments lists each of the Fidelity Central Funds as an investment of the Fund, but does not include the underlying holdings of each Fidelity Central Fund. As an Investing Fund, the Fund indirectly bears its proportionate share of the expenses of the underlying Fidelity Central Funds.
Based on their investment objective, each Fidelity Central Fund may invest or participate in various investment vehicles or strategies that are similar to those of the Fund. These strategies are consistent with the investment objectives of the Fund and may involve certain economic risks which may cause a decline in value of each of the Fidelity Central Funds and thus a decline in the value of the Fund. The following summarizes the Fund's investment in each Fidelity Central Fund.
Annual Report
Notes to Financial Statements - continued
2. Investments in Fidelity Central Funds - continued
Fidelity Central Fund | Investment Manager | Investment Objective | Investment Practices |
Fidelity 1-3 Year Duration Securitized Bond Central Fund | Fidelity Investment Money Management, Inc. (FIMM) | Seeks a high level of income by normally investing in investment-grade securitized debt securities and repurchase agreements for those securities. | Futures Repurchase Agreements Restricted Securities Swap Agreements |
Fidelity 2-5 Year Duration Securitized Bond Central Fund | FIMM | Seeks a high level of income by normally investing in investment-grade securitized debt securities and repurchase agreements for those securities. | Repurchase Agreements Restricted Securities Swap Agreements |
Fidelity Corporate Bond 1-10 Year Central Fund | FIMM | Seeks a high level of income by normally investing in investment-grade corporate bonds and other corporate debt securities and repurchase agreements for those securities. | Repurchase Agreements Restricted Securities Swap Agreements |
Fidelity Floating Rate Central Fund | Fidelity Management & Research Company, Inc. (FMRC) | Seeks a high level of income by normally investing in floating rate loans and other floating rate securities. | Loans & Direct Debt Instruments Repurchase Agreements Restricted Securities |
Fidelity Mortgage Backed Securities Central Fund | FIMM | Seeks a high level of income by normally investing in investment-grade mortgage-related securities and repurchase agreements for those securities. | Delayed Delivery & When Issued Securities Mortgage Dollar Rolls Repurchase Agreements Swap Agreements |
Fidelity Ultra-Short Central Fund | FIMM | Seeks to obtain a high level of current income consistent with preservation of capital by investing in U.S. dollar denominated money market and investment-grade debt securities. | Futures Mortgage Dollar Rolls Repurchase Agreements Restricted Securities Swap Agreements |
Annual Report
2. Investments in Fidelity Central Funds - continued
The Central Funds may invest a portion of their assets in securities of issuers that hold mortgage securities, including subprime mortgage securities. The value of these securities is sensitive to changes in economic conditions, including delinquencies and/or defaults, and may be adversely affected by shifts in the market's perception of the issuers and changes in interest rates.
A holdings listing for the Fund, which presents direct holdings as well as the pro rata share of any securities and other investments held indirectly through its investment in underlying non-money market Fidelity Central Funds, is available at fidelity.com and/or advisor.fidelity.com, as applicable. A complete list of holdings for each Fidelity Central Fund is available upon request or at the SEC's web site at www.sec.gov. In addition, the financial statements of the Fidelity Central Funds, which are not covered by the Fund's Report of Independent Registered Public Accounting Firm, are available on the SEC's web site or upon request.
3. Significant Accounting Policies.
The financial statements have been prepared in conformity with accounting principles generally accepted in the United States of America, which require management to make certain estimates and assumptions at the date of the financial statements. The following summarizes the significant accounting policies of the Fund:
Security Valuation. Investments are valued and net asset value per share is calculated (NAV calculation) as of the close of business of the New York Stock Exchange, normally 4:00 p.m. Eastern time. Wherever possible, the Fund uses independent pricing services approved by the Board of Trustees to value its investments. Debt securities, including restricted securities, for which quotations are readily available, are valued by independent pricing services or by dealers who make markets in such securities. Pricing services consider yield or price of bonds of comparable quality, coupon, maturity and type as well as available dealer supplied prices. Certain of the Fund's securities may be valued by a single source or dealer.
Equity securities, including restricted securities, for which market quotations are readily available, are valued at the last reported sale price or official closing price as reported by an independent pricing service on the primary market or exchange on which they are traded. In the event there were no sales during the day or closing prices are not available, securities are valued at the last quoted bid price.
When current market prices or quotations are not readily available or do not accurately reflect fair value, valuations may be determined in accordance with procedures adopted by the Board of Trustees. Factors used in the determination of fair value may include current market trading activity, interest rates, credit quality and default rates. The frequency of when fair value pricing is used is unpredictable. The value of securities used for NAV calculation under fair value pricing may differ from published prices for the same securities. Investments in open-end mutual funds, including the Fidelity Central Funds, are valued at their closing net asset value each business day. Short-term securities with remaining maturities of sixty days or less for which quotations are not readily available are valued at amortized cost, which approximates value.
Annual Report
Notes to Financial Statements - continued
3. Significant Accounting Policies -continued
Foreign Currency. The Fund uses foreign currency contracts to facilitate transactions in foreign-denominated securities. Losses from these transactions may arise from changes in the value of the foreign currency or if the counterparties do not perform under the contracts' terms.
Foreign-denominated assets, including investment securities, and liabilities are translated into U.S. dollars at the exchange rate at period end. Purchases and sales of investment securities, income and dividends received and expenses denominated in foreign currencies are translated into U.S. dollars at the exchange rate in effect on the transaction date.
The effects of exchange rate fluctuations on investments are included with the net realized and unrealized gain (loss) on investment securities. Other foreign currency transactions resulting in realized and unrealized gain (loss) are disclosed separately.
Investment Transactions and Income. For financial reporting purposes, the Fund's investment holdings and NAV include trades executed through the end of the last business day of the period. The NAV for processing shareholder transactions includes trades executed through the end of the prior business day. Gains and losses on securities sold are determined on the basis of identified cost. Dividend income is recorded on the ex-dividend date, except for certain dividends from foreign securities where the ex-dividend date may have passed, which are recorded as soon as the Fund is informed of the ex-dividend date. Non-cash dividends included in dividend income, if any, are recorded at the fair market value of the securities received. Interest income and income and capital gain distributions from the Fidelity Central Funds are accrued as earned. Interest income includes coupon interest and amortization of premium and accretion of discount on debt securities. Investment income is recorded net of foreign taxes withheld where recovery of such taxes is uncertain.
Expenses. Most expenses of the trust can be directly attributed to a fund. Expenses which cannot be directly attributed are apportioned among each Fund in the trust. Expense estimates are accrued in the period to which they relate and adjustments are made when actual amounts are known.
Income Tax Information and Distributions to Shareholders. Each year, the Fund intends to qualify as a regulated investment company by distributing all of its taxable income and realized gains under Subchapter M of the Internal Revenue Code. As a result, no provision for income taxes is required in the accompanying financial statements. Foreign taxes are provided for based on the Fund's understanding of the tax rules and rates that exist in the foreign markets in which it invests.
Annual Report
3. Significant Accounting Policies - continued
Income Tax Information and Distributions to Shareholders - continued
Dividends are declared daily and paid monthly from net investment income. Distributions from realized gains, if any, are recorded on the ex-dividend date. Income dividends and capital gain distributions are declared separately for each class. Income and capital gain distributions are determined in accordance with income tax regulations, which may differ from generally accepted accounting principles. In addition, the Fund will claim a portion of the payment made to redeeming shareholders as a distribution for income tax purposes.
Capital accounts within the financial statements are adjusted for permanent book-tax differences. Certain adjustments have been made to the accounts relating to prior periods. Collectively, these adjustments have no impact on net assets or the results of operations. Temporary book-tax differences will reverse in a subsequent period.
Book-tax differences are primarily due to swap agreements, foreign currency transactions, market discount, partnerships (including allocations from Fidelity Central Funds), financing transactions, capital loss carryforwards, the short-term gain distributions from the Fidelity Central Funds and losses deferred due to wash sales and excise tax regulations.
The tax-basis components of distributable earnings and the federal tax cost as of period end were as follows:
Unrealized appreciation | $ 70,358,198 |
Unrealized depreciation | (116,469,586) |
Net unrealized appreciation (depreciation) | (46,111,388) |
Undistributed ordinary income | 4,698,470 |
| |
Cost for federal income tax purposes | $ 8,824,922,524 |
The tax character of distributions paid was as follows:
| August 31,
2007 | One month ended
August 31,
2006 | July 31,
2006 |
| | | |
Ordinary Income | $ 203,196,475 | $ 9,317,974 | $ 32,890,503 |
Long-term Capital Gains | - | - | 629,945 |
Total | $ 203,196,475 | $ 9,317,974 | $ 33,520,448 |
Annual Report
Notes to Financial Statements - continued
3. Significant Accounting Policies -continued
New Accounting Pronouncements. In July 2006, Financial Accounting Standards Board Interpretation No. 48, Accounting for Uncertainty in Income Taxes - an interpretation of FASB Statement 109 (FIN 48), was issued and is effective on the last business day of the semiannual reporting period for fiscal years beginning after December 15, 2006. FIN 48 sets forth a threshold for financial statement recognition, measurement and disclosure of a tax position taken or expected to be taken on a tax return. Management has concluded that the adoption of FIN 48 will not result in a material impact on the Fund's net assets, results of operations and financial statement disclosures.
In addition, in September 2006, Statement of Financial Accounting Standards No. 157, Fair Value Measurements (SFAS 157), was issued and is effective for fiscal years beginning after November 15, 2007. SFAS 157 defines fair value, establishes a framework for measuring fair value and expands disclosures about fair value measurements. Management is currently evaluating the impact the adoption of SFAS 157 will have on the Fund's financial statement disclosures.
4. Operating Policies.
Repurchase Agreements. FMR has received an Exemptive Order from the Securities and Exchange Commission (the SEC) which permits the Fund and other affiliated entities of FMR to transfer uninvested cash balances into joint trading accounts which are then invested in repurchase agreements. The Fund may also invest directly with institutions in repurchase agreements. Repurchase agreements are collateralized by government or non-government securities. Upon settlement date, collateral is held in segregated accounts with custodian banks and may be obtained in the event of a default of the counterparty. The Fund monitors, on a daily basis, the value of the collateral to ensure it is at least equal to the principal amount of the repurchase agreement (including accrued interest). In the event of a default by the counterparty, realization of the collateral proceeds could be delayed, during which time the value of the collateral may decline.
Delayed Delivery Transactions and When-Issued Securities. The Fund may purchase or sell securities on a delayed delivery or when-issued basis. Payment and delivery may take place after the customary settlement period for that security. The price of the underlying securities and the date when the securities will be delivered and paid for are fixed at the time the transaction is negotiated. During the time a delayed delivery sell is outstanding, the contract is marked-to-market daily and equivalent deliverable securities are held for the transaction. The value of the securities purchased on a delayed delivery or when-issued basis are identified as such in the Fund's Schedule of Investments. The Fund may receive compensation for interest forgone in the purchase of a delayed delivery or when-issued security. With respect to purchase commitments, the
Annual Report
4. Operating Policies -continued
Delayed Delivery Transactions and When-Issued Securities - continued
Fund identifies securities as segregated in its records with a value at least equal to the amount of the commitment. Losses may arise due to changes in the value of the underlying securities or if the counterparty does not perform under the contract's terms, or if the issuer does not issue the securities due to political, economic, or other factors.
Restricted Securities. The Fund may invest in securities that are subject to legal or contractual restrictions on resale. These securities generally may be resold in transactions exempt from registration or to the public if the securities are registered. Disposal of these securities may involve time-consuming negotiations and expense, and prompt sale at an acceptable price may be difficult. Information regarding restricted securities is included at the end of the Fund's Schedule of Investments.
Loans and Other Direct Debt Instruments. The Fund may invest in loans and loan participations, trade claims or other receivables. These investments may include standby financing commitments, including revolving credit facilities, that obligate the Fund to supply additional cash to the borrower on demand. Loan participations involve a risk of insolvency of the lending bank or other financial intermediary. The Fund may be contractually obligated to receive approval from the agent bank and/or borrower prior to the sale of these investments. At the end of the period, the Fund had unfunded loan commitments of $67,440.
Swap Agreements. The Fund may invest in swaps for the purpose of managing its exposure to interest rate, credit or market risk.
Interest rate swaps are agreements to exchange cash flows periodically based on a notional principal amount, for example, the exchange of fixed rate interest payments for floating rate interest payments. The primary risk associated with interest rate swaps is that unfavorable changes in the fluctuation of interest rates could adversely impact a fund.
Total return swaps are agreements to exchange the return generated by one instrument or index for the return generated by another instrument, for example, the agreement to pay interest in exchange for a market-linked return based on a notional amount. To the extent the total return of the index exceeds the offsetting interest obligation, a fund will receive a payment from the counterparty. To the extent it is less, a fund will make a payment to the counterparty.
Credit default swaps involve the exchange of a fixed rate premium for protection against the loss in value of an underlying debt instrument in the event of a defined credit event (such as payment default or bankruptcy). Under the terms of the swap, one party acts as
Annual Report
Notes to Financial Statements - continued
4. Operating Policies -continued
Swap Agreements - continued
a "guarantor" receiving a periodic payment that is a fixed percentage applied to a notional principal amount. In return the party agrees to purchase the notional amount of the underlying instrument, at par, if a credit event occurs during the term of the swap. The Fund may enter into credit default swaps in which either it or its counterparty act as guarantors. By acting as the guarantor of a swap, a fund assumes the market and credit risk of the underlying instrument including liquidity and loss of value.
Swaps are marked-to-market daily based on dealer-supplied valuations and changes in value are recorded as unrealized appreciation (depreciation). Periodic payments and premiums received or made by the Fund are recorded in the accompanying Statement of Operations as realized gains or losses, respectively. Gains or losses are realized upon early termination of the swap agreement. Collateral, in the form of cash or securities, may be required to be held in segregated accounts with a fund's custodian in compliance with swap contracts. Risks may exceed amounts recognized on the Statement of Assets and Liabilities. These risks include changes in the returns of the underlying instruments, failure of the counterparties to perform under the contracts' terms and the possible lack of liquidity with respect to the swap agreements. Details of swap agreements open at period end are included in the Fund's Schedule of Investments under the caption "Swap Agreements."
Mortgage Dollar Rolls. To earn additional income, the Fund may employ trading strategies which involve the sale and simultaneous agreement to repurchase similar securities ("mortgage dollar rolls") or the purchase and simultaneous agreement to sell similar securities ("reverse mortgage dollar rolls"). The securities traded are mortgage securities and bear the same interest rate but may be collateralized by different pools of mortgages. During the period between the sale and repurchase in a mortgage dollar roll transaction, a fund will not be entitled to receive interest and principal payments on the securities sold but will invest the proceeds of the sale in other securities which may enhance the yield and total return. In addition, the difference between the sale price and the future purchase price is recorded as an adjustment to investment income. During the period between the purchase and subsequent sale in a reverse mortgage dollar roll transaction a fund is entitled to interest and principal payments on the securities purchased. The price differential between the purchase and sale is recorded as an adjustment to investment income. Losses may arise due to changes in the value of the securities or if the counterparty does not perform under the terms of the agreement. If the counterparty files for bankruptcy or becomes insolvent, a fund's right to repurchase or sell securities may be limited.
Annual Report
5. Purchases and Sales of Investments.
Purchases and sales of securities (including the Fixed-Income Central Funds), other than short-term securities, U.S. government securities and non-taxable in-kind transactions, aggregated $3,174,712,038 and $589,100,755, respectively.
6. Fees and Other Transactions with Affiliates.
Management Fee. FMR and its affiliates provide the Fund with investment management related services for which the Fund pays a monthly management fee. The management fee is the sum of an individual fund fee rate that is based on an annual rate of .20% of the Fund's average net assets and a group fee rate that averaged ..12% during the period. The group fee rate is based upon the average net assets of all the mutual funds advised by FMR. The group fee rate decreases as assets under management increase and increases as assets under management decrease. For the period, the total annualized management fee rate was .32% of the Fund's average net assets.
Distribution and Service Plan. In accordance with Rule 12b-1 of the 1940 Act, the Fund has adopted separate Distribution and Service Plans for each class of shares. Certain classes pay Fidelity Distributors Corporation (FDC), an affiliate of FMR, separate Distribution and Service Fees, each of which is based on an annual percentage of each class' average net assets. In addition, FDC may pay financial intermediaries for selling shares of the Fund and providing shareholder support services. For the period, the Distribution and Service Fee rates and the total amounts paid to and retained by FDC were as follows:
| Distribution
Fee | Service
Fee | Paid to
FDC | Retained
by FDC |
Class A | -% | .25% | $ 50,427 | $ 14,077 |
Class T | -% | .25% | 74,918 | 10,425 |
Class B | .65% | .25% | 32,409 | 23,635 |
Class C | .75% | .25% | 121,007 | 52,234 |
| | | $ 278,761 | $ 100,371 |
On January 18, 2007, the Board of Trustees approved an increase in Class A's Service fee from .15% to .25%, effective April 1, 2007.
Sales Load. FDC receives a front-end sales charge of up to 4.00% for selling Class A shares and Class T shares (4.75% for Class A and 3.50% for Class T prior to April 1, 2007), some of which is paid to financial intermediaries for selling shares of the Fund. FDC receives the proceeds of contingent deferred sales charges levied on Class A, Class T, Class B, and Class C redemptions. These charges depend on the holding period. The deferred sales charges range from 5% to 1% for Class B, 1% for Class C, ..75% to .50% for certain purchases of Class A shares and .25% for certain purchases of Class T shares.
Annual Report
Notes to Financial Statements - continued
6. Fees and Other Transactions with Affiliates - continued
Sales Load - continued
For the period, sales charge amounts retained by FDC were as follows:
| Retained
by FDC |
Class A | $ 46,259 |
Class T | 11,069 |
Class B* | 6,898 |
Class C* | 5,972 |
| $ 70,198 |
* When Class B and Class C shares are initially sold, FDC pays commissions from its own resources to financial intermediaries through which the sales
are made.
Transfer Agent Fees. Fidelity Investments Institutional Operations Company, Inc. (FIIOC), an affiliate of FMR, is the transfer, dividend disbursing and shareholder servicing agent for each class of the Fund, except for Total Bond. Fidelity Service Company, Inc. (FSC), an affiliate of FMR, is the transfer agent for Total Bond shares. FIIOC receives account fees and asset-based fees that vary according to the account size and type of account of the shareholders of the respective classes of the Fund. FSC receives an asset-based fee of .10% of Total Bond's average net assets. FIIOC and FSC pay for typesetting, printing and mailing of shareholder reports, except proxy statements. For the period, the total transfer agent fees paid by each class to FIIOC or FSC, were as follows:
| Amount | % of
Average
Net Assets |
Class A | $ 51,776 | .22 |
Class T | 53,307 | .18 |
Class B | 10,172 | .28 |
Class C | 24,151 | .20 |
Total Bond | 3,898,554 | .10 |
Institutional Class | 121,057 | .15 |
| $ 4,159,017 | |
Fundwide Operations Fee. Pursuant to the Fundwide Operations and Expense Agreement (FWOE), FMR has agreed to provide for fund level expenses (which do not include transfer agent, Rule 12b-1 fees, compensation of the independent trustees, interest (including commitment fees), taxes or extraordinary expenses, if any) in return for a FWOE fee equal to .35% less the total amount of the management fee. The FWOE paid by the Fund is reduced by an amount equal to the fees and expenses paid to the independent trustees. For the period, the FWOE fee was equivalent to an annual rate of .03% of average net assets.
Annual Report
6. Fees and Other Transactions with Affiliates - continued
Exchange-In-Kind. During the period, the Fund exchanged securities for shares of four newly created Fidelity Fixed-Income Central Funds, all of which are affiliated investment companies managed by FIMM, an affiliate of FMR. The Fund delivered securities to each Fixed-Income Central Fund in exchange for shares of each respective Fixed-Income Central Fund, as presented in the accompanying table. Each exchange is considered a non-taxable exchange for federal income tax purposes, with no gain or loss recognized by the Fund or its shareholders.
Fidelity Fixed-Income Central Fund | Value of Securities
Delivered (including
accrued interest) | Unrealized
Appreciation/
(Depreciation) | Shares of Fixed-Income Central Fund Exchanged |
1-3 Year Duration Securitized Bond Central Fund | $ 103,444,744 | $ 297,067 | 1,034,447 |
2-5 Year Duration Securitized Bond Central Fund | 155,193,358 | 2,283,849 | 1,551,934 |
Corporate Bond 1-10 Year
Central Fund | 335,272,873 | 6,447,372 | 3,352,729 |
Mortgage Backed Securities
Central Fund | 365,968,286 | 5,495,809 | 3,659,683 |
Total | $ 959,879,261 | $ 14,524,097 | 9,598,793 |
On April 27, 2007, the Fund purchased 349,241 shares of Fidelity Ultra-Short Central Fund, an affiliated entity, valued at $34,588,841 by transferring securities of equal value, including accrued interest. This is considered taxable for federal income tax purposes, and the Fund recognized a loss of $15,234.
7. Committed Line of Credit.
The Fund participates with other funds managed by FMR in a $4.2 billion credit facility (the "line of credit") to be utilized for temporary or emergency purposes to fund shareholder redemptions or for other short-term liquidity purposes. The Fund has agreed to pay commitment fees on its pro rata portion of the line of credit, which amounted to $7,476 and is reflected in Miscellaneous Expense on the Statement of Operations. During the period, there were no borrowings on this line of credit.
8. Security Lending.
The Fund lends portfolio securities from time to time in order to earn additional income. On the settlement date of the loan, the Fund receives collateral (in the form of U.S. Treasury obligations, letters of credit and/or cash) against the loaned securities and maintains collateral in an amount not less than 100% of the market value of the loaned securities during the period of the loan. The market value of the loaned securities is determined at the close of business of the Fund and any additional required collateral is
Annual Report
Notes to Financial Statements - continued
8. Security Lending - continued
delivered to the Fund on the next business day. If the borrower defaults on its obligation to return the securities loaned because of insolvency or other reasons, a fund could experience delays and costs in recovering the securities loaned or in gaining access to the collateral. Any cash collateral received is invested in cash equivalents. The value of loaned securities and cash collateral at period end are disclosed on the Fund's Statement of Assets and Liabilities. Security lending income represents the income earned on investing cash collateral, less fees and expenses associated with the loan, plus any premium payments that may be received on the loan of certain types of securities. Security lending income is presented in the Statement of Operations as a component of interest income. Net income from lending portfolio securities during the period amounted to $1,272,622.
9. Expense Reductions.
Through arrangements with the Fund's custodian and each class' transfer agent, credits realized as a result of uninvested cash balances were used to reduce the Fund's expenses. During the period, these credits reduced the Fund's management fee by $75,968. During the period, credits reduced each class' transfer agent expense as noted in the table below.
| Transfer Agent
expense reduction | |
Total Bond | $ 60,056 | |
Institutional Class | 3,166 | |
| $ 63,222 | |
10. Other.
The Fund's organizational documents provide former and current trustees and officers with a limited indemnification against liabilities arising in connection with the performance of their duties to the Fund. In the normal course of business, the Fund may also enter into contracts that provide general indemnifications. The Fund's maximum exposure under these arrangements is unknown as this would be dependent on future claims that may be made against the Fund. The risk of material loss from such claims is considered remote.
In September 2006, FIIOC, a transfer agent of the Fund, notified the Fund that the Fund's books and records did not reflect a conversion of certain Class B to Class A shares upon their conversion date. In March 2007, FIIOC converted the relevant Class B shares to Class A shares and recorded the conversion in the books and records of the Fund which did not result in a material impact to the Fund's reported net assets or results of operations in the accompanying financial statements. FIIOC has remediated affected shareholders.
Annual Report
11. Distributions to Shareholders.
Distributions to shareholders of each class were as follows:
| Year ended
August 31,
2007 | One month ended
August 31,
2006 | Year ended
July 31,
2006 |
From net investment income | | | |
Class A | $ 1,100,606 | $ 18,886 | $ 180,734 |
Class T | 1,373,421 | 17,679 | 235,647 |
Class B | 136,878 | 5,122 | 75,406 |
Class C | 457,270 | 5,360 | 39,421 |
Total Bond | 191,143,423 | 9,267,073 | 31,294,037 |
Institutional Class | 4,127,108 | 3,854 | 15,350 |
Total | $ 198,338,706 | $ 9,317,974 | $ 31,840,595 |
| | | |
From net realized gain | | | |
Class A | $ 27,576 | $ - | $ 12,832 |
Class T | 34,295 | - | 23,014 |
Class B | 5,072 | - | 8,379 |
Class C | 16,001 | - | 2,940 |
Total Bond | 4,768,190 | - | 1,632,006 |
Institutional Class | 6,635 | - | 682 |
Total | $ 4,857,769 | $ - | $ 1,679,853 |
12. Share Transactions.
Transactions for each class of shares were as follows:
| Shares |
| Year ended
August 31,
2007 | One month ended
August 31,
2006 | Year ended
July 31,
2006 |
Class A | | | |
Shares sold | 5,058,526 | 220,612 | 390,963 |
Reinvestment of distributions | 89,369 | 1,550 | 16,805 |
Shares redeemed | (1,118,505) | (11,849) | (246,932) |
Net increase (decrease) | 4,029,390 | 210,313 | 160,836 |
Class T | | | |
Shares sold | 4,727,867 | 182,921 | 395,729 |
Reinvestment of distributions | 129,776 | 1,650 | 24,086 |
Shares redeemed | (1,351,158) | (24,758) | (517,046) |
Net increase (decrease) | 3,506,485 | 159,813 | (97,231) |
Class B | | | |
Shares sold | 539,386 | 15,160 | 117,578 |
Reinvestment of distributions | 9,450 | 396 | 6,955 |
Shares redeemed | (124,884) | (12,233) | (154,343) |
Net increase (decrease) | 423,952 | 3,323 | (29,810) |
Annual Report
Notes to Financial Statements - continued
12. Share Transactions - continued
| Shares |
| Year ended
August 31,
2007 | One month ended
August 31,
2006 | Year ended
July 31,
2006 |
Class C | | | |
Shares sold | 1,926,281 | 31,118 | 167,899 |
Reinvestment of distributions | 38,210 | 433 | 3,045 |
Shares redeemed | (327,493) | (1,096) | (62,848) |
Net increase (decrease) | 1,636,998 | 30,455 | 108,096 |
Total Bond | | | |
Shares sold | 449,525,248 | 13,049,555 | 196,541,228 |
Reinvestment of distributions | 18,043,057 | 844,577 | 2,948,119 |
Shares redeemed | (72,384,207) | (5,355,068) | (14,766,457) |
Net increase (decrease) | 395,184,098 | 8,539,064 | 184,722,890 |
Institutional Class | | | |
Shares sold | 34,101,050 | 12,269 | 87,064 |
Reinvestment of distributions | 377,910 | 202 | 888 |
Shares redeemed | (594,798) | (1,488) | (7,870) |
Net increase (decrease) | 33,884,162 | 10,983 | 80,082 |
| Dollars |
| Year ended
August 31,
2007 | One month ended
August 31,
2006 | Year ended
July 31,
2006 |
Class A | | | |
Shares sold | $ 52,475,077 | $ 2,282,175 | $ 4,048,068 |
Reinvestment of distributions | 927,501 | 16,100 | 174,112 |
Shares redeemed | (11,603,024) | (122,009) | (2,534,797) |
Net increase (decrease) | $ 41,799,554 | $ 2,176,266 | $ 1,687,383 |
Class T | | | |
Shares sold | $ 49,238,640 | $ 1,891,613 | $ 4,083,246 |
Reinvestment of distributions | 1,346,799 | 17,127 | 249,752 |
Shares redeemed | (13,923,481) | (254,833) | (5,305,428) |
Net increase (decrease) | $ 36,661,958 | $ 1,653,907 | $ (972,430) |
Class B | | | |
Shares sold | $ 5,591,610 | $ 156,534 | $ 1,220,621 |
Reinvestment of distributions | 98,229 | 4,113 | 72,205 |
Shares redeemed | (1,299,404) | (126,159) | (1,585,560) |
Net increase (decrease) | $ 4,390,435 | $ 34,488 | $ (292,734) |
Class C | | | |
Shares sold | $ 20,051,168 | $ 322,468 | $ 1,733,336 |
Reinvestment of distributions | 397,140 | 4,501 | 31,492 |
Shares redeemed | (3,406,204) | (11,362) | (646,689) |
Net increase (decrease) | $ 17,042,104 | $ 315,607 | $ 1,118,139 |
Annual Report
12. Share Transactions - continued
| Dollars |
| Year ended
August 31,
2007 | One month ended
August 31,
2006 | Year ended
July 31,
2006 |
Total Bond | | | |
Shares sold | $ 4,670,295,711 | $ 134,816,251 | $ 1,999,048,539 |
Reinvestment of distributions | 187,426,399 | 8,775,005 | 30,457,852 |
Shares redeemed | (750,709,047) | (55,377,801) | (152,010,033) |
Net increase (decrease) | $ 4,107,013,063 | $ 88,213,455 | $ 1,877,496,358 |
Institutional Class | | | |
Shares sold | $ 352,256,185 | $ 126,542 | $ 891,633 |
Reinvestment of distributions | 3,888,447 | 2,101 | 9,142 |
Shares redeemed | (6,131,133) | (15,324) | (80,138) |
Net increase (decrease) | $ 350,013,499 | $ 113,319 | $ 820,637 |
13. Credit Risk.
The Fund invests a portion of its assets in securities of issuers that hold mortgage securities, including subprime mortgage securities. The value of these securities is sensitive to changes in economic conditions, including delinquencies and/or defaults, and may be adversely affected by shifts in the market's perception of the issuers and changes in interest rates.
Annual Report
Report of Independent Registered Public Accounting Firm
To the Trustees of Fidelity Income Fund and the Shareholders of Fidelity Total Bond Fund:
In our opinion, the accompanying statement of assets and liabilities, including the schedule of investments, and the related statements of operations and of changes in net assets and the financial highlights present fairly, in all material respects, the financial position of Fidelity Total Bond Fund (a fund of Fidelity Income Fund) at August 31, 2007, the results of its operations for the year then ended, the changes in its net assets for each of the periods indicated and the financial highlights for each of the periods indicated, in conformity with accounting principles generally accepted in the United States of America. These financial statements and financial highlights (hereafter referred to as "financial statements") are the responsibility of the Fidelity Total Bond Fund's management. Our responsibility is to express an opinion on these financial statements based on our audits. We conducted our audits of these financial statements in accordance with the standards of the Public Company Accounting Oversight Board (United States). Those standards require that we plan and perform the audit to obtain reasonable assurance about whether the financial statements are free of material misstatement. An audit includes examining, on a test basis, evidence supporting the amounts and disclosures in the financial statements, assessing the accounting principles used and significant estimates made by management, and evaluating the overall financial statement presentation. We believe that our audits, which included confirmation of securities at August 31, 2007 by correspondence with the custodian and brokers, provide a reasonable basis for our opinion.
/s/ PricewaterhouseCoopers LLP
PricewaterhouseCoopers LLP
Boston, Massachusetts
October 30, 2007
Annual Report
Trustees and Officers
The Trustees, Members of the Advisory Board, and executive officers of the trust and fund, as applicable, are listed below. The Board of Trustees governs the fund and is responsible for protecting the interests of shareholders. The Trustees are experienced executives who meet periodically throughout the year to oversee the fund's activities, review contractual arrangements with companies that provide services to the fund, and review the fund's performance. Except for James C. Curvey, each of the Trustees oversees 369 funds advised by FMR or an affiliate. Mr. Curvey oversees 339 funds advised by FMR or an affiliate.
The Trustees hold office without limit in time except that (a) any Trustee may resign; (b) any Trustee may be removed by written instrument, signed by at least two-thirds of the number of Trustees prior to such removal; (c) any Trustee who requests to be retired or who has become incapacitated by illness or injury may be retired by written instrument signed by a majority of the other Trustees; and (d) any Trustee may be removed at any special meeting of shareholders by a two-thirds vote of the outstanding voting securities of the trust. Each Trustee who is not an interested person (as defined in the 1940 Act) (Independent Trustee), shall retire not later than the last day of the calendar year in which his or her 72nd birthday occurs. The Independent Trustees may waive this mandatory retirement age policy with respect to individual Trustees. The executive officers and Advisory Board Members hold office without limit in time, except that any officer and Advisory Board Member may resign or may be removed by a vote of a majority of the Trustees at any regular meeting or any special meeting of the Trustees. Except as indicated, each individual has held the office shown or other offices in the same company for the past five years.
The fund's Statement of Additional Information (SAI) includes more information about the Trustees. To request a free copy, call Fidelity at 1-800-544-8544.
Interested Trustees*:
Correspondence intended for each Trustee who is an interested person may be sent to Fidelity Investments, 82 Devonshire Street, Boston, Massachusetts 02109.
Name, Age; Principal Occupation |
Edward C. Johnson 3d (77) |
| Year of Election or Appointment: 1984 Mr. Johnson is Chairman of the Board of Trustees. Mr. Johnson serves as President (2006-present), Chief Executive Officer, Chairman, and a Director of FMR LLC; Chairman and a Director of FMR; Chairman and a Director of Fidelity Research & Analysis Company (FRAC); Chairman and a Director of Fidelity Investments Money Management, Inc.; and Chairman (2001-present) and a Director of FMR Co., Inc. In addition, Mr. Johnson serves as Chairman and Director of Fidelity International Limited (FIL). |
James C. Curvey (72) |
| Year of Election or Appointment: 2007 Mr. Curvey also serves as Trustee (2007-present) or Member of the Advisory Board (2007-present) of other investment companies advised by FMR. Mr. Curvey is a Director of FMR and FMR Co., Inc. (2007-present). Mr. Curvey is also Vice Chairman (2006-present) and Director of FMR LLC. Mr. Curvey joined Fidelity in 1982 and served in numerous senior management positions, including President and Chief Operating Officer of FMR LLC (1997-2000) and President of Fidelity Strategic Investments (2000-2002). In addition, he serves as a member of the Board of Directors of Geerlings & Wade, Inc. (wine distribution). |
* Trustees have been determined to be "Interested Trustees" by virtue of, among other things, their affiliation with the trust or various entities under common control with FMR. FMR Corp. merged with FMR LLC on October 1, 2007. Any references to FMR LLC for prior periods are deemed to be references to the prior entity.
Independent Trustees:
Correspondence intended for each Independent Trustee (that is, the Trustees other than the Interested Trustees) may be sent to Fidelity Investments, P.O. Box 55235, Boston, Massachusetts 02205-5235.
Name, Age; Principal Occupation |
Dennis J. Dirks (59) |
| Year of Election or Appointment: 2005 Prior to his retirement in May 2003, Mr. Dirks was Chief Operating Officer and a member of the Board of The Depository Trust & Clearing Corporation (DTCC) (1999-2003). He also served as President, Chief Operating Officer, and Board member of The Depository Trust Company (DTC) (1999-2003) and President and Board member of the National Securities Clearing Corporation (NSCC) (1999-2003). In addition, Mr. Dirks served as Chief Executive Officer and Board member of the Government Securities Clearing Corporation (2001-2003) and Chief Executive Officer and Board member of the Mortgage-Backed Securities Clearing Corporation (2001-2003). Mr. Dirks also serves as a Trustee and a member of the Finance Committee of Manhattan College (2005-present) and a Trustee and a member of the Finance Committee of AHRC of Nassau County (2006-present). |
Albert R. Gamper, Jr. (65) |
| Year of Election or Appointment: 2006 Prior to his retirement in December 2004, Mr. Gamper served as Chairman of the Board of CIT Group Inc. (commercial finance). During his tenure with CIT Group Inc. Mr. Gamper served in numerous senior management positions, including Chairman (1987-1989; 1999-2001; 2002-2004), Chief Executive Officer (1987-2004), and President (1989-2002). He currently serves as a member of the Board of Directors of Public Service Enterprise Group (utilities, 2001-present), Chairman of the Board of Governors, Rutgers University (2004-present), and Chairman of the Board of Saint Barnabas Health Care System. |
George H. Heilmeier (71) |
| Year of Election or Appointment: 2004 Dr. Heilmeier is Chairman Emeritus of Telcordia Technologies (communication software and systems), where prior to his retirement, he served as company Chairman and Chief Executive Officer. He currently serves on the Boards of Directors of The Mitre Corporation (systems engineering and information technology support for the government), and HRL Laboratories (private research and development, 2004-present). He is Chairman of the General Motors Science & Technology Advisory Board and a Life Fellow of the Institute of Electrical and Electronics Engineers (IEEE). Dr. Heilmeier is a member of the Defense Science Board and the National Security Agency Advisory Board. He is also a member of the National Academy of Engineering, the American Academy of Arts and Sciences, and the Board of Overseers of the School of Engineering and Applied Science of the University of Pennsylvania. Previously, Dr. Heilmeier served as a Director of TRW Inc. (automotive, space, defense, and information technology, 1992-2002), Compaq (1994-2002), Automatic Data Processing, Inc. (ADP) (technology-based business outsourcing, 1995-2002), INET Technologies Inc. (telecommunications network surveillance, 2001-2004), and Teletech Holdings (customer management services). He is the recipient of the 2005 Kyoto Prize in Advanced Technology for his invention of the liquid crystal display, and a member of the Consumer Electronics Hall of Fame. |
James H. Keyes (66) |
| Year of Election or Appointment: 2007 Prior to his retirement in 2003, Mr. Keyes was Chairman, President, and Chief Executive Officer of Johnson Controls, Inc. (automotive supplier, 1993-2003). He currently serves as a member of the boards of LSI Logic Corporation (semiconductor technologies), Navistar International Corporation (manufacture and sale of trucks, buses, and diesel engines, 2002-present), and Pitney Bowes, Inc. (integrated mail, messaging, and document management solutions). |
Marie L. Knowles (60) |
| Year of Election or Appointment: 2001 Prior to Ms. Knowles' retirement in June 2000, she served as Executive Vice President and Chief Financial Officer of Atlantic Richfield Company (ARCO) (diversified energy, 1996-2000). From 1993 to 1996, she was a Senior Vice President of ARCO and President of ARCO Transportation Company. She served as a Director of ARCO from 1996 to 1998. She currently serves as a Director of Phelps Dodge Corporation (copper mining and manufacturing) and McKesson Corporation (healthcare service, 2002-present). Ms. Knowles is a Trustee of the Brookings Institution and the Catalina Island Conservancy and also serves as a member of the Advisory Board for the School of Engineering of the University of Southern California. |
Ned C. Lautenbach (63) |
| Year of Election or Appointment: 2000 Mr. Lautenbach is Chairman of the Independent Trustees (2006-present). Mr. Lautenbach has been a partner of Clayton, Dubilier & Rice, Inc. (private equity investment firm) since September 1998. Previously, Mr. Lautenbach was with the International Business Machines Corporation (IBM) from 1968 until his retirement in 1998. Mr. Lautenbach serves as a Director of Sony Corporation (2006-present) and Eaton Corporation (diversified industrial) as well as the Philharmonic Center for the Arts in Naples, Florida. He also is a member of the Board of Trustees of Fairfield University (2005-present), as well as a member of the Council on Foreign Relations. |
Cornelia M. Small (63) |
| Year of Election or Appointment: 2005 Ms. Small is a member (2000-present) and Chairperson (2002-present) of the Investment Committee, and a member (2002-present) of the Board of Trustees of Smith College. Previously, she served as Chief Investment Officer (1999-2000), Director of Global Equity Investments (1996-1999), and a member of the Board of Directors of Scudder, Stevens & Clark (1990-1997) and Scudder Kemper Investments (1997-1999). In addition, Ms. Small served as Co-Chair (2000-2003) of the Annual Fund for the Fletcher School of Law and Diplomacy. |
William S. Stavropoulos (68) |
| Year of Election or Appointment: 2001 Mr. Stavropoulos is Chairman Emeritus of the Board of Directors of The Dow Chemical Company. Since joining The Dow Chemical Company in 1967, Mr. Stavropoulos served in numerous senior management positions, including President (1993-2000; 2002-2003), CEO (1995-2000; 2002-2004), and Chairman of the Executive Committee (2000-2004). Currently, he is a Director of NCR Corporation (data warehousing and technology solutions), Chemical Financial Corporation, Maersk Inc. (industrial conglomerate, 2002-present), Tyco International, Inc. (multinational manufacturing and services, 2007-present), and a member of the Advisory Board for Metalmark Capital (private equity investment firm, 2005-present). He is a special advisor to Clayton, Dubilier & Rice, Inc., a private equity investment firm. He also serves as a member of the Board of Trustees of the American Enterprise Institute for Public Policy Research. In addition, Mr. Stavropoulos is a member of The Business Council, J.P. Morgan International Council and the University of Notre Dame Advisory Council for the College of Science. |
Kenneth L. Wolfe (68) |
| Year of Election or Appointment: 2005 Prior to his retirement in 2001, Mr. Wolfe was Chairman and Chief Executive Officer of Hershey Foods Corporation (1993-2001). He currently serves as a member of the boards of Adelphia Communications Corporation (2003-present), Bausch & Lomb, Inc., and Revlon Inc. (2004-present). |
Advisory Board Members and Executive Officers**:
Correspondence intended for Mr. Mauriello and Mr. Wiley may be sent to Fidelity Investments, P.O. Box 55235, Boston, Massachusetts 02205-5235. Correspondence intended for each executive officer and Mr. Lynch may be sent to Fidelity Investments, 82 Devonshire Street, Boston, Massachusetts 02109.
Name, Age; Principal Occupation |
Peter S. Lynch (63) |
| Year of Election or Appointment: 2003 Member of the Advisory Board of Fidelity Income Fund. Mr. Lynch is Vice Chairman and a Director of FMR, and Vice Chairman (2001-present) and a Director of FMR Co., Inc. Previously, Mr. Lynch served as a Trustee of the Fidelity funds (1990-2003). In addition, he serves as a Trustee of Boston College and as the Chairman of the Inner-City Scholarship Fund. |
Joseph Mauriello (62) |
| Year of Election or Appointment: 2007 Member of the Advisory Board of Fidelity Income Fund. Prior to his retirement in January 2006, Mr. Mauriello served in numerous senior management positions including Deputy Chairman and Chief Operating Officer (2004-2005), and Vice Chairman of Financial Services (2002-2004) of KPMG LLP US (professional services firm, 1965-2005). Mr. Mauriello currently serves as a member of the Board of Directors of XL Capital Ltd., (global insurance and re-insurance company, 2006-present) and of Arcadia Resources Inc., (health care services and products, 2007-present). He also served as a Director of the Hamilton Funds of the Bank of New York (2006-2007). |
Michael E. Wiley (56) |
| Year of Election or Appointment: 2007 Member of the Advisory Board of Fidelity Income Fund. Mr. Wiley also serves as Sr. Energy Advisor of Katzenbach Partners, LLC (consulting firm, 2006-present) and a member of the Board of Trustees of the University of Tulsa (2000-2006; 2007-present). He serves as a Director of Tesoro Corporation (independent oil refiner and marketer, 2005-present), and a Director of Bill Barrett Corporation (exploration and production company, 2005-present). In addition, he also serves as a Director of Post Oak Bank (privately-held bank, 2004-present), and an Advisory Director of Riverstone Holdings (private investment firm). Previously, Mr. Wiley served as Chairman, President, and CEO of Baker Hughes, Inc. (oilfield services company, 2000-2004), and as Director of Spinnaker Exploration Company (exploration and production company, 2001-2005). |
Kimberley H. Monasterio (43) |
| Year of Election or Appointment: 2007 President and Treasurer of the fund. Ms. Monasterio also serves as President and Treasurer of other Fidelity funds (2007-present) and is an employee of FMR (2004-present). Previously, Ms. Monasterio served as Deputy Treasurer of the Fidelity funds (2004-2006). Before joining Fidelity Investments, Ms. Monasterio served as Treasurer (2000-2004) and Chief Financial Officer (2002-2004) of the Franklin Templeton Funds and Senior Vice President of Franklin Templeton Services, LLC (2000-2004). |
Walter C. Donovan (45) |
| Year of Election or Appointment: 2005 Vice President of the fund. Mr. Donovan also serves as Vice President of Fidelity's Equity Funds (2007-present). Mr. Donovan also serves as Executive Vice President of FMR (2005-present) and FMR Co., Inc. (2005-present). Previously, Mr. Donovan served as Vice President of Fidelity's High Income Funds (2005-2007), Fixed-Income Funds (2005-2006), certain Asset Allocation Funds (2005-2006), certain Balanced Funds (2005-2006), and as Vice President and Director of Fidelity's International Equity Trading group (1998-2005). |
Boyce I. Greer (51) |
| Year of Election or Appointment: 2006 Vice President of the fund. Mr. Greer also serves as Vice President of certain Asset Allocation Funds (2005-present), Fixed-Income Funds (2006-present), and Money Market Funds (2006-present). Mr. Greer is also a Trustee of other investment companies advised by FMR (2003-present). Mr. Greer is an Executive Vice President of FMR (2005-present) and FMR Co., Inc. (2005-present), and Senior Vice President of Fidelity Investments Money Management, Inc. (2006-present). Previously, Mr. Greer served as Vice President of certain Fidelity Equity Funds (2005-2007), a Director and Managing Director of Strategic Advisers, Inc. (2002-2005), and Executive Vice President (2000-2002) and Money Market Group Leader (1997-2002) of the Fidelity Investments Fixed Income Division. Mr. Greer also served as Vice President of Fidelity's Money Market Funds (1997-2002), Senior Vice President of FMR (1997-2002), and Vice President of FIMM (1998-2002). |
Robert A. Lawrence (54) |
| Year of Election or Appointment: 2006 Vice President of the fund. Mr. Lawrence also serves as Vice President of the High Income Funds. Mr. Lawrence is Senior Vice President of FMR (2006-present) and FMR Co., Inc. (2006-present). Previously, Mr. Lawrence served as President of Fidelity Strategic Investments (2002-2005). |
David L. Murphy (59) |
| Year of Election or Appointment: 2005 Vice President of the fund. Mr. Murphy also serves as Vice President of Fidelity's Money Market Funds (2002-present) and Fixed-Income Funds (2005-present). Mr. Murphy serves as Senior Vice President (2000-present) and Head (2004-present) of the Fidelity Investments Fixed Income Division. Mr. Murphy is also a Senior Vice President of Fidelity Investments Money Management, Inc. (2003-present) and an Executive Vice President of FMR (2005-present). Previously, Mr. Murphy served as Money Market Group Leader (2002-2004), Bond Group Leader (2000-2002), and Vice President of certain Asset Allocation Funds (2003-2007), Balanced Funds (2005-2007), Fidelity's Taxable Bond Funds (2000-2002) and Fidelity's Municipal Bond Funds (2001-2002). |
Thomas J. Silvia (46) |
| Year of Election or Appointment: 2005 Vice President of the fund. Mr. Silvia also serves as Vice President of Fidelity's Fixed-Income Funds (2005-present) and Senior Vice President and Bond Group Leader of the Fidelity Investments Fixed-Income Division (2005-present). Previously, Mr. Silvia served as Vice President of certain Balanced Funds (2005-2007), certain Asset Allocation Funds (2005-2007), a Director of Fidelity's Taxable Bond portfolio managers (2002-2004) and a portfolio manager in the Bond Group (1997-2004). |
Eric D. Roiter (58) |
| Year of Election or Appointment: 2002 Secretary of the fund. He also serves as Secretary of other Fidelity funds; Vice President, General Counsel, and Secretary of FMR Co., Inc. (2001-present) and FMR; Assistant Secretary of Fidelity Management & Research (U.K.) Inc. (2001-present), Fidelity Research & Analysis Company (2001-present), and Fidelity Investments Money Management, Inc. (2001-present). Mr. Roiter is an Adjunct Member, Faculty of Law, at Boston College Law School (2003-present). Previously, Mr. Roiter served as Vice President and Secretary of Fidelity Distributors Corporation (FDC) (1998-2005). |
Scott C. Goebel (39) |
| Year of Election or Appointment: 2007 Assistant Secretary of the fund. Mr. Goebel also serves as Assistant Secretary of other Fidelity funds (2007-present), and is an employee of FMR. |
R. Stephen Ganis (41) |
| Year of Election or Appointment: 2006 Anti-Money Laundering (AML) officer of the fund. Mr. Ganis also serves as AML officer of other Fidelity funds (2006-present) and FMR LLC (2003-present). Before joining Fidelity Investments, Mr. Ganis practiced law at Goodwin Procter, LLP (2000-2002). |
Joseph B. Hollis (59) |
| Year of Election or Appointment: 2006 Chief Financial Officer of the fund. Mr. Hollis also serves as Chief Financial Officer of other Fidelity funds. Mr. Hollis is President of Fidelity Pricing and Cash Management Services (FPCMS) (2005-present). Mr. Hollis also serves as President and Director of Fidelity Service Company, Inc. (2006-present). Previously, Mr. Hollis served as Senior Vice President of Cash Management Services (1999-2002) and Investment Management Operations (2002-2005). |
Kenneth A. Rathgeber (60) |
| Year of Election or Appointment: 2004 Chief Compliance Officer of the fund. Mr. Rathgeber also serves as Chief Compliance Officer of other Fidelity funds (2004-present) and Executive Vice President of Risk Oversight for Fidelity Investments (2002-present). He is Chief Compliance Officer of FMR (2005-present), FMR Co., Inc. (2005-present), Fidelity Management & Research (U.K.) Inc. (2005-present), Fidelity Research & Analysis Company (2005-present), Fidelity Investments Money Management, Inc. (2005-present), and Strategic Advisers, Inc. (2005-present). Previously, Mr. Rathgeber served as Executive Vice President and Chief Operating Officer for Fidelity Investments Institutional Services Company, Inc. (1998-2002). |
Bryan A. Mehrmann (46) |
| Year of Election or Appointment: 2005 Deputy Treasurer of the fund. Mr. Mehrmann also serves as Deputy Treasurer of other Fidelity funds (2005-present) and is an employee of FMR. Previously, Mr. Mehrmann served as Vice President of Fidelity Investments Institutional Services Group (FIIS)/Fidelity Investments Institutional Operations Corporation, Inc. (FIIOC) Client Services (1998-2004). |
Kenneth B. Robins (38) |
| Year of Election or Appointment: 2005 Deputy Treasurer of the fund. Mr. Robins also serves as Deputy Treasurer of other Fidelity funds (2005-present) and is an employee of FMR (2004-present). Before joining Fidelity Investments, Mr. Robins worked at KPMG LLP, where he was a partner in KPMG's department of professional practice (2002-2004) and a Senior Manager (1999-2000). In addition, Mr. Robins served as Assistant Chief Accountant, United States Securities and Exchange Commission (2000-2002). |
Robert G. Byrnes (40) |
| Year of Election or Appointment: 2005 Assistant Treasurer of the fund. Mr. Byrnes also serves as Assistant Treasurer of other Fidelity funds (2005-present) and is an employee of FMR (2005-present). Previously, Mr. Byrnes served as Vice President of FPCMS (2003-2005). Before joining Fidelity Investments, Mr. Byrnes worked at Deutsche Asset Management where he served as Vice President of the Investment Operations Group (2000-2003). |
Peter L. Lydecker (53) |
| Year of Election or Appointment: 2004 Assistant Treasurer of the fund. Mr. Lydecker also serves as Assistant Treasurer of other Fidelity funds (2004) and is an employee of FMR. |
Gary W. Ryan (49) |
| Year of Election or Appointment: 2005 Assistant Treasurer of the fund. Mr. Ryan also serves as Assistant Treasurer of other Fidelity funds (2005-present) and is an employee of FMR (2005-present). Previously, Mr. Ryan served as Vice President of Fund Reporting in FPCMS (1999-2005). |
** FMR Corp. merged with FMR LLC on October 1, 2007. Any references to FMR LLC for prior periods are deemed to be references to the prior entity.
Annual Report
Distributions
A total of 4.23% of the dividends distributed during the fiscal year was derived from interest on U.S. Government securities which is generally exempt from state income tax.
The fund designates $175,749,234 of distributions paid during the period January 1, 2007 to August 31, 2007 as qualifying to be taxed as interest-related dividends for nonresident alien shareholders.
The fund will notify shareholders in January 2008 of amounts for use in preparing 2007 income tax returns.
Annual Report
Board Approval of Investment Advisory Contracts and Management Fees
Fidelity Total Bond Fund
Each year, typically in June, the Board of Trustees, including the Independent Trustees (together, the Board), votes on the renewal of the management contract and sub-advisory agreements (together, the Advisory Contracts) for the fund. The Board, assisted by the advice of fund counsel and Independent Trustees' counsel, requests and considers a broad range of information throughout the year.
The Board meets regularly each month except August and takes into account throughout the year matters bearing on Advisory Contracts. The Board, acting directly and through its separate committees, considers at each of its meetings factors that are relevant to the annual renewal of the fund's Advisory Contracts, including the services and support provided to the fund and its shareholders. At the time of the renewal, the Board had 12 standing committees, each composed of Independent Trustees with varying backgrounds, to which the Board has assigned specific subject matter responsibilities in order to enhance effective decision-making by the Board. Each committee has adopted a written charter outlining the structure and purposes of the committee. One such committee, the Fixed-Income Contract Committee, meets periodically as needed throughout the year to consider matters specifically related to the annual renewal of Advisory Contracts. The committee requests and receives information on, and makes recommendations to the Independent Trustees concerning, the approval and annual review of the Advisory Contracts.
At its June 2007 meeting, the Board of Trustees, including the Independent Trustees, unanimously determined to renew the Advisory Contracts for the fund. In reaching its determination, the Board considered all factors it believed relevant, including (i) the nature, extent, and quality of the services to be provided to the fund and its shareholders (including the investment performance of the fund); (ii) the competitiveness of the management fee and total expenses of the fund; (iii) the total costs of the services to be provided by and the profits to be realized by the investment adviser and its affiliates from the relationship with the fund; (iv) the extent to which economies of scale would be realized as the fund grows; and (v) whether fee levels reflect these economies of scale, if any, for the benefit of fund shareholders. The Board also approved amendments to the fund's agreements with foreign sub-advisers to clarify that each sub-adviser provides services as an independent contractor.
In determining whether to renew the Advisory Contracts for the fund, the Board ultimately reached a determination, with the assistance of fund counsel and Independent Trustees' counsel, that the renewal of the Advisory Contracts and the compensation to be received by Fidelity under the management contract is consistent with Fidelity's fiduciary duty under applicable law. In addition to evaluating the specific factors noted above, the Board, in reaching its determination, is aware that shareholders in the fund have a broad range of investment choices available to them, including a wide choice among mutual funds offered by competitors to Fidelity, and that the fund's shareholders, with the opportunity to review and weigh the disclosure provided by the fund in its prospectus and other public disclosures, have chosen to invest in this fund, managed by Fidelity.
Annual Report
Nature, Extent, and Quality of Services Provided. The Board considered staffing within the investment adviser, FMR, and the sub-advisers (together, the Investment Advisers), including the background of the fund's portfolio manager and the fund's investment objective and discipline. The Independent Trustees also had discussions with senior management of Fidelity's investment operations and investment groups. The Board considered the structure of the portfolio manager compensation program and whether this structure provides appropriate incentives.
Resources Dedicated to Investment Management and Support Services. The Board reviewed the size, education, and experience of the Investment Advisers' investment staff, their use of technology, and the Investment Advisers' approach to recruiting, training, and retaining portfolio managers and other research, advisory, and management personnel. The Board considered Fidelity's extensive global research capabilities that enable the Investment Advisers to aggregate data from various sources in an effort to produce positive investment results. The Board noted that Fidelity's analysts have access to a variety of technological tools that enable them to perform both fundamental and quantitative analysis and to specialize in various disciplines. The Board also considered that Fidelity's portfolio managers and analysts have access to daily portfolio attribution that allows for monitoring of a fund's portfolio, as well as an electronic communication system that provides immediate real-time access to research concerning issuers and credit enhancers. In addition, the Board considered the trading resources that are an integrated part of the fixed-income portfolio management investment process.
Shareholder and Administrative Services. The Board considered (i) the nature, extent, quality, and cost of advisory, administrative, distribution, and shareholder services performed by the Investment Advisers and their affiliates under the Advisory Contracts and under separate agreements covering transfer agency, pricing and bookkeeping, and securities lending services for the fund; (ii) the nature and extent of the Investment Advisers' supervision of third party service providers, principally custodians and subcustodians; and (iii) the resources devoted to, and the record of compliance with, the fund's compliance policies and procedures.
The Board noted that the growth of fund assets across the complex allows Fidelity to reinvest in the development of services designed to enhance the value or convenience of the Fidelity funds as investment vehicles. These services include 24-hour access to account information and market information through phone representatives and over the Internet, and investor education materials and asset allocation tools.
Annual Report
Board Approval of Investment Advisory Contracts and
Management Fees - continued
Investment in a Large Fund Family. The Board considered the benefits to shareholders of investing in a Fidelity fund, including the benefits of investing in a fund that is part of a large family of funds offering a variety of investment disciplines and providing for a large variety of mutual fund investor services. For example, fund shareholders are offered the privilege of exchanging shares of the fund for shares of other Fidelity funds, as set forth in the fund's prospectus, without paying a sales charge. The Board noted that, since the last Advisory Contract renewals in June 2006, Fidelity has taken a number of actions that benefited particular funds, including (i) dedicating additional resources to investment research and to restructure the investment research teams; (ii) contractually agreeing to reduce the management fee on Fidelity Advisor Floating Rate High Income Fund; (iii) contractually agreeing to reduce the management fees on Fidelity's California, Massachusetts, New Jersey, and New York AMT Tax-Free Money Market Funds, launching new Institutional Classes and Service Classes of these funds, and contractually agreeing to impose expense limitations on these funds; (iv) eliminating the exchange fee on the Fidelity Select Portfolios and reducing the pricing and bookkeeping fee rates for these funds; (v) reducing the maximum transfer agency fee rates on high income funds and certain equity funds; (vi) proposing amended management contracts that, if approved by shareholders, will add a performance adjustment component to the management fees paid by 18 Fidelity Advisor equity funds; (vii) contractually agreeing to reduce fees for Ultra-Short Central Fund and the money market Central Funds; (viii) waiving the Fidelity Advisor funds' contingent deferred sales charge on certain redemptions made through systematic withdrawal programs; and (ix) amending the management contracts for equity and fixed-income funds whose management contracts incorporate a "group fee" structure by adding four new fee "breakpoints" to the group fee rate schedules.
Investment Performance. The Board considered whether the fund has operated within its investment objective, as well as its record of compliance with its investment restrictions. It also reviewed the fund's absolute investment performance for each class, as well as the fund's relative investment performance for each class measured against (i) a broad-based securities market index, and (ii) a peer group of mutual funds deemed appropriate by the Board over multiple periods. Because the fund had been in existence less than five calendar years, the following charts considered by the Board show, over the one- and three-year periods ended December 31, 2006, as available, the cumulative total returns of Fidelity Total Bond (retail class) and Class C, the cumulative total returns of a broad-based securities market index ("benchmark"), and a range of cumulative total returns of a peer group of mutual funds identified by Lipper Inc. as having an investment objective similar to that of the fund. The returns of Fidelity Total Bond (retail class) and Class C show the performance of the highest and lowest performing classes, respectively. The box within each chart shows the 25th percentile return (bottom of box) and the 75th percentile return (top of box) of the peer group. Returns shown above the box are in the first quartile and returns shown below the box are in the fourth quartile. The percentage beaten numbers noted below each chart correspond to the percentile box and represent the percentage of funds in the peer group whose performance was equal to or lower than that of the class indicated.
Annual Report
Fidelity Total Bond Fund

The Board reviewed the fund's relative investment performance against its peer group and stated that the performance of Fidelity Total Bond (retail class) was in the first quartile for all the periods shown. The Board also stated that the relative investment performance of Fidelity Total Bond (retail class) compared favorably to its benchmark for all periods shown. The Board considered that the variations in performance among the fund's classes reflect the variations in class expenses, which result in lower performance for higher expense classes.
Based on its review, and giving particular weight to the nature and quality of the resources dedicated by the Investment Advisers to maintain and improve relative performance, the Board concluded that the nature, extent, and quality of the services provided to the fund will benefit the fund's shareholders, particularly in light of the Board's view that the fund's shareholders benefit from investing in a fund that is part of a large family of funds offering a variety of investment disciplines and services.
Competitiveness of Management Fee and Total Fund Expenses. The Board considered the fund's management fee and total expenses compared to "mapped groups" of competitive funds and classes. Fidelity creates "mapped groups" by combining similar Lipper investment objective categories that have comparable management fee characteristics. Combining Lipper investment objective categories aids the Board's management fee and total expense comparisons by broadening the competitive group used for comparison and by reducing the number of universes to which various Fidelity funds are compared.
Annual Report
Board Approval of Investment Advisory Contracts and
Management Fees - continued
The Board considered two proprietary management fee comparisons for the 12-month (or shorter) periods shown in the chart below. The group of Lipper funds used by the Board for management fee comparisons is referred to below as the "Total Mapped Group" and, for the reasons explained above, is broader than the Lipper peer group used by the Board for performance comparisons. The Total Mapped Group comparison focuses on a fund's standing relative to the total universe of comparable funds available to investors, in terms of gross management fees before expense reimbursements or caps. "TMG %" represents the percentage of funds in the Total Mapped Group that had management fees that were lower than the fund's. For example, a TMG % of 8% means that 92% of the funds in the Total Mapped Group had higher management fees than the fund. The "Asset-Size Peer Group" (ASPG) comparison focuses on a fund's standing relative to non-Fidelity funds similar in size to the fund within the Total Mapped Group. The ASPG represents at least 15% of the funds in the Total Mapped Group with comparable asset size and management fee characteristics, subject to a minimum of 50 funds (or all funds in the Total Mapped Group if fewer than 50). Additional information, such as the ASPG quartile in which the fund's management fee ranked, is also included in the chart and considered by the Board.
Fidelity Total Bond Fund

The Board noted that the fund's management fee ranked below the median of its Total Mapped Group and below the median of its ASPG for 2006.
Annual Report
Furthermore, the Board considered that it had approved an amendment (effective June 1, 2005) to the fund's management contract that lowered the fund's individual fund fee rate from 30 basis points to 20 basis points. The Board considered that the chart reflects the fund's lower management fee for 2005, as if the lower rate were in effect for the entire year.
Based on its review, the Board concluded that the fund's management fee was fair and reasonable in light of the services that the fund receives and the other factors considered.
In its review of each class's total expenses, the Board considered the fund's management fee as well as other fund or class expenses, as applicable, such as transfer agent fees, pricing and bookkeeping fees, fund-paid 12b-1 fees, and custodial, legal, and audit fees. The Board also noted the effects of any waivers and reimbursements on fees and expenses. As part of its review, the Board also considered current and historical total expenses of each class of the fund compared to competitive fund median expenses. Each class of the fund is compared to those funds and classes in the Total Mapped Group (used by the Board for management fee comparisons) that have a similar sales load structure.
The Board also considered that the current contractual arrangements for the fund (i) have the effect of setting the total "fund-level" expenses (including, among certain other expenses, the management fee) for each class at 35 basis points, (ii) lower and limit the "class-level" transfer agent fee for Fidelity Total Bond (retail class) to 10 basis points, and (iii) limit the total expenses for Fidelity Total Bond (retail class) to 45 basis points. These contractual arrangements may not be increased without the approval of the Board and the shareholders of the applicable class. The fund's Advisor classes are subject to different class-level expenses (transfer agent fees and 12b-1 fees).
The Board noted that each class's total expenses ranked below its competitive median for 2006.
The Board recognized that the fund's management contract incorporates a "group fee" structure, which provides for lower group fee rates as total fund assets under FMR's management increase, and for higher group fee rates as total fund assets under FMR's management decrease. FMR determines the group fee rates based on a tiered asset "breakpoint" schedule. In connection with the renewal of the fund's management contract, the Board approved amendments to the fund's management contract that added four new fee breakpoints to the group fee rate schedule for assets under FMR's management above $1,386 billion. The Board considered that the group fee rate declines under both the present and amended schedules, but that under the amended schedule, the group fee rate declines faster as assets under FMR's management exceed $1,386 billion. The Board noted, however, that because the current contractual arrangements set the total fund-level expenses for each class at 35 basis points, increases or decreases in the management fee due to changes in the group fee rate will not impact total expenses.
Annual Report
Board Approval of Investment Advisory Contracts and
Management Fees - continued
In its review of total expenses, the Board also considered Fidelity fee structures and other information on clients that FMR and its affiliates service in other competitive markets, such as other mutual funds advised or subadvised by FMR or its affiliates, pension plan clients, and other institutional clients.
Based on its review, the Board concluded that the total expenses of each class of the fund were reasonable in light of the services that the fund and its shareholders receive and the other factors considered.
Costs of the Services and Profitability. The Board considered the revenues earned and the expenses incurred by Fidelity in conducting the business of developing, marketing, distributing, managing, administering and servicing the fund and its shareholders. The Board also considered the level of Fidelity's profits in respect of all the Fidelity funds.
On an annual basis, FMR presents to the Board Fidelity's profitability for the fund. Fidelity calculates the profitability for each fund, as well as aggregate profitability for groups of Fidelity funds and all Fidelity funds, using a series of detailed revenue and cost allocation methodologies which originate with the audited books and records of Fidelity. The Audit Committee of the Board reviews any significant changes from the prior year's methodologies.
PricewaterhouseCoopers LLP (PwC), independent registered public accounting firm and auditor to Fidelity and certain Fidelity funds, has been engaged annually by the Board as part of the Board's assessment of the results of Fidelity's profitability analysis. PwC's engagement includes the review and assessment of Fidelity's methodologies used in determining the revenues and expenses attributable to Fidelity's mutual fund business, and completion of agreed-upon procedures surrounding the mathematical accuracy of fund profitability and its conformity to allocation methodologies. After considering PwC's reports issued under the engagement and information provided by Fidelity, the Board believes that while other allocation methods may also be reasonable, Fidelity's profitability methodologies are reasonable in all material respects.
The Board has also reviewed Fidelity's non-fund businesses and any fall-out benefits related to the mutual fund business as well as cases where Fidelity's affiliates may benefit from or be related to the fund's business.
The Board considered the costs of the services provided by and the profits realized by Fidelity in connection with the operation of the fund and determined that the amount of profit is a fair entrepreneurial profit for the management of the fund.
Annual Report
Economies of Scale. The Board considered whether there have been economies of scale in respect of the management of the Fidelity funds, whether the Fidelity funds (including the fund) have appropriately benefited from any such economies of scale, and whether there is potential for realization of any further economies of scale. The Board considered the extent to which the fund will benefit from economies of scale through increased services to the fund, through waivers or reimbursements, or through fee or expense reductions, including (Advisor classes only) reductions that occur through operation of the transfer agent agreement. The transfer agent fee varies in part based on the number of accounts in the fund. If the number of accounts decreases or the average account size increases, the overall transfer agent fee rate decreases. The Board concluded that any potential economies of scale are being shared between fund shareholders and Fidelity in an appropriate manner.
Additional Information Requested by the Board. In order to develop fully the factual basis for consideration of the Fidelity funds' Advisory Contracts, the Board requested and received additional information on several topics, including (i) Fidelity's fund profitability methodology, profitability by investment discipline, and profitability trends within certain funds; (ii) Fidelity's compensation structure relative to competitors and its effect on profitability; (iii) funds and accounts managed by Fidelity other than the Fidelity funds, including fee arrangements; (iv) the total expenses of certain funds and classes relative to competitors; (v) fund performance trends; (vi) fall-out benefits received by certain Fidelity affiliates; and (vii) Fidelity's fee structures.
Based on its evaluation of all of the conclusions noted above, and after considering all material factors, the Board ultimately concluded that the advisory fee structures are fair and reasonable, and that the fund's Advisory Contracts should be renewed.
Annual Report
Annual Report
Annual Report
Annual Report
Annual Report
Annual Report
Annual Report
Investment Adviser
Fidelity Management & Research Company
Boston, MA
Investment Sub-Advisers
FMR Co. Inc.
Fidelity Research & Analysis Company
Fidelity Investments
Money Management, Inc.
Fidelity Investments Japan Limited
Fidelity International Investment Advisors
Fidelity International Investment Advisors
(U.K.) Limited
General Distributor
Fidelity Distributors Corporation
Boston, MA
Transfer and Service Agents
Fidelity Investments Institutional Operations Company, Inc.
Boston, MA
Fidelity Service Company, Inc.
Boston, MA
Custodian
Citibank, N.A.
New York, NY
ATB-UANN-1007
1.804574.103
(Fidelity Investment logo)(registered trademark)
Corporate Headquarters
82 Devonshire St., Boston, MA 02109
www.fidelity.com
(Fidelity Investment logo)(registered trademark)
Fidelity Advisor
Total Bond
Fund - Institutional Class
Annual Report
August 31, 2007
Institutional Class is a class of Fidelity Total Bond Fund
(2_fidelity_logos) (Registered_Trademark)
Contents
Notes to Shareholders | <Click Here> | An explanation of the changes to the fund. |
Chairman's Message | <Click Here> | Ned Johnson's message to shareholders. |
Performance | <Click Here> | How the fund has done over time. |
Management's Discussion | <Click Here> | The manager's review of fund performance, strategy and outlook |
Shareholder Expense Example | <Click Here> | An example of shareholder expenses. |
Investment Changes | <Click Here> | A summary of major shifts in the fund's investments over the past six months. |
Investments | <Click Here> | A complete list of the fund's investments with their market values. |
Financial Statements | <Click Here> | Statements of assets and liabilities, operations, and changes in net assets,
as well as financial highlights. |
Notes | <Click Here> | Notes to the financial statements. |
Report of Independent Registered Public Accounting Firm | <Click Here> | |
Trustees and Officers | <Click Here> | |
Distributions | <Click Here> | |
Board Approval of Investment Advisory Contracts and Management Fees | <Click Here> | |
To view a fund's proxy voting guidelines and proxy voting record for the 12-month period ended June 30, visit http://www.fidelity.com (search for "proxy voting guidelines") or visit the Securities and Exchange Commission's (SEC) web site at http://www.sec.gov. You may also call 1-800-544-8544 to request a free copy of the proxy voting guidelines.
Standard & Poor's, S&P and S&P 500 are registered service marks of The McGraw-Hill Companies, Inc. and have been licensed for use by Fidelity Distributors Corporation.
Other third party marks appearing herein are the property of their respective owners.
All other marks appearing herein are registered or unregistered trademarks or service marks of FMR LLC or an affiliated company.
Annual Report
This report and the financial statements contained herein are submitted for the general information of the shareholders of the fund. This report is not authorized for distribution to prospective investors in the fund unless preceded or accompanied by an effective prospectus.
A fund files its complete schedule of portfolio holdings with the SEC for the first and third quarters of each fiscal year on Form N-Q. Forms N-Q are available on the SEC's web site at http://www.sec.gov. A fund's Forms N-Q may be reviewed and copied at the SEC's Public Reference Room in Washington, DC. Information regarding the operation of the SEC's Public Reference Room may be obtained by calling 1-800-SEC-0330. For a complete list of a fund's portfolio holdings, view the most recent holdings listing, semiannual report, or annual report on Fidelity's web site at http://www.fidelity.com or http://www.advisor.fidelity.com, as applicable.
NOT FDIC INSURED · MAY LOSE VALUE · NO BANK GUARANTEE
Neither the fund nor Fidelity Distributors Corporation is a bank.
Annual Report
Notes to Shareholders:
As discussed in prior shareholder reports, the fund changed its investment approach in the way it invests in the investment-grade debt market, seeking exposure to various types of securities by investing in central funds as well as investing directly in individual investment-grade securities. Central funds are Fidelity mutual funds used by this fund and other Fidelity funds as an investment vehicle to gain pooled exposure to a particular core market sector, such as corporate bonds or mortgage-backed securities. Instead of multiple funds each investing in investment-grade debt securities individually, they can now take advantage of consolidating investments in a single, larger pool of investment-grade debt by investing directly in central funds. Shares of the central funds are offered only to other Fidelity mutual funds and accounts; investors cannot directly invest in them.
It's important to point out that investing in central funds does not impact the fund's investment objective or risk profile, only the mechanics of how we manage its investment portfolio. The portfolio managers continue to be responsible for choosing appropriate investments for their funds, whether they elect to purchase shares of a central fund or individual securities. Fidelity does not charge any additional management fees for central funds.
Investing in central funds does change the way this report presents the fund's holdings. The Investments section continues to list direct investments of the fund, including each central fund. However, many of the individual investment-grade debt securities previously held by the fund were transferred to the central funds, so they are no longer directly held and thus not listed. The financial statements and a complete schedule of portfolio holdings for each of the fixed-income central funds are available upon request or at the SEC's web site at www.sec.gov.
Annual Report
Chairman's Message
(photo_of_Edward_C_Johnson_3d)
Dear Shareholder:
Many stock and bond markets around the world have been unsettled of late; however, volatility can often lead to opportunity for patient investors. Financial markets are always unpredictable, but there are a number of time-tested principles that can put the historical odds in your favor.
One of the basic tenets is to invest for the long term. Over time, riding out the markets' inevitable ups and downs has proven much more effective than selling into panic or chasing the hottest trend. Even missing only a few of the markets' best days can significantly diminish investor returns. Patience also affords the benefits of compounding - of earning interest on additional income or reinvested dividends and capital gains. There are tax advantages and cost benefits to consider as well. The more you sell, the more taxes you pay, and the more you trade, the higher the costs. While staying the course doesn't eliminate risk, it can considerably lessen the effect of short-term declines.
You can further manage your investing risk through diversification. And today, more than ever, geographic diversification should be taken into account. Studies indicate that asset allocation is the single most important determinant of a portfolio's long-term success. The right mix of stocks, bonds and cash - aligned to your particular risk tolerance and investment objective - is very important. Age-appropriate rebalancing is also an essential aspect of asset allocation. For younger investors, an emphasis on equities - which historically have been the best-performing asset class over time - is encouraged. As investors near their specific goal, such as retirement or sending a child to college, consideration may be given to replacing volatile assets (e.g. common stocks) with more-stable fixed investments (bonds or savings plans).
A third investment principle - investing regularly - can help lower the average cost of your purchases. Investing a certain amount of money each month or quarter helps ensure you won't pay for all your shares at market highs. This strategy - known as dollar cost averaging - also reduces unconstructive "emotion" from investing, helping shareholders avoid selling weak performers just prior to an upswing, or chasing a hot performer just before a correction.
We invite you to contact us via the Internet, through our Investor Centers or over the phone. It is our privilege to provide you the information you need to make the investments that are right for you.
Sincerely,
/s/Edward C. Johnson 3d
Edward C. Johnson 3d
Annual Report
Performance: The Bottom Line
Average annual total return reflects the change in the value of an investment, assuming reinvestment of the class' dividend income and capital gains (the profits earned upon the sale of securities that have grown in value) and assuming a constant rate of performance each year. The $10,000 table and the fund's returns do not reflect the deduction of taxes that a shareholder would pay on fund distributions or the redemption of fund shares. During periods of reimbursement by Fidelity, a fund's total return will be greater than it would be had the reimbursement not occurred. How a fund did yesterday is no guarantee of how it will do tomorrow.
Average Annual Total Returns
Periods ended August 31, 2007 | | Past 1
year | Life of
fundA |
Institutional Class B | | 3.83% | 4.85% |
A From October 15, 2002.
B The initial offering of Institutional Class shares took place on June 16, 2004. Returns prior to June 16, 2004 are those of Total Bond, the original retail class of the fund.
$10,000 Over Life of Fund
Let's say hypothetically that $10,000 was invested in Fidelity Advisor Total Bond Fund - Institutional Class on October 15, 2002, when the fund started. The chart shows how the value of your investment would have changed, and also shows how the Lehman Brothers® U.S. Aggregate Index performed over the same period. The initial offering of Institutional Class took place on June 16, 2004. See above for additional information regarding the performance of Institutional Class.
Annual Report
Management's Discussion of Fund Performance
Comments from Ford O'Neil, Portfolio Manager of Fidelity Advisor Total Bond Fund
A subprime mortgage loan crisis and an emerging credit crunch contributed to subpar performance for some sectors of the investment-grade bond market during the 12-month period ending August 31, 2007. While returns for high-grade debt were fairly solid overall, they also were tempered to an extent by the Federal Reserve Board's decision not to lower interest rates as bond investors had hoped. The Lehman Brothers® U.S. Aggregate Index gained 5.26%. Within the index, Treasuries - the bond market's highest-quality debt instrument - fared best, as many investors fled riskier fixed-income securities. The asset-backed category - home to volatile subprime mortgages, as well as credit card debt and auto loans - had the weakest performance.
During the year, the fund's Institutional Class shares returned 3.83%, lagging the Lehman Brothers Aggregate index and the 5.31% return of the Lehman Brothers U.S. Universal Index. I hold securities directly and indirectly through separately managed subportfolios and Fidelity fixed-income central funds, available only to other Fidelity funds and which allow me to gain exposure to particular segments of the bond market. I also invested in Fidelity® Ultra-Short Central Fund, a diversified pool of short-term assets. As I address performance, I'll be discussing direct investments and those of the subportfolios and central funds. Sector selection - with significant underweightings in plain-vanilla U.S. Treasury bonds and agency securities, as well as stakes in securitized bonds such as commercial mortgage-backed and asset-backed securities - proved to be the biggest detractor versus the Aggregate index. Treasuries and agencies were bolstered by a global flight to quality as the subprime mortgage market meltdown forced a repricing of risk, but securitized products were hurt by the same developments. Among securitized products, our exposure to subprime mortgage securities was especially detrimental to performance. Overweighted exposure to commercial mortgage-backed securities also hurt. They suffered from worries about what might have been lax lending standards in the commercial property market. Elsewhere, what we lost by owning emerging-markets holdings - which came under pressure as investors avoided riskier assets - we more than offset by holding high-yield corporate securities, which outpaced the benchmark. Within the high-yield allocation, a small exposure to floating-rate securities hurt because they, too, suffered as risk aversion escalated. My decision to modestly underweight investment-grade corporate bonds helped, as did favorable security selection within the sector.
The views expressed above reflect those of the portfolio manager(s) only through the end of the period as stated on the cover of this report and do not necessarily represent the views of Fidelity or any other person in the Fidelity organization. Any such views are subject to change at any time based upon market or other conditions and Fidelity disclaims any responsibility to update such views. These views may not be relied on as investment advice and, because investment decisions for a Fidelity fund are based on numerous factors, may not be relied on as an indication of trading intent on behalf of any Fidelity fund.
Annual Report
Shareholder Expense Example
As a shareholder of the Fund, you incur two types of costs: (1) transaction costs, including sales charges (loads) on purchase payments or redemption proceeds, and (2) ongoing costs, including management fees, distribution and/or service (12b-1) fees and other Fund expenses. This Example is intended to help you understand your ongoing costs (in dollars) of investing in the Fund and to compare these costs with the ongoing costs of investing in other mutual funds.
The Example is based on an investment of $1,000 invested at the beginning of the period and held for the entire period (March 1, 2007 to August 31, 2007).
Actual Expenses
The first line of the accompanying table for each class of the Fund provides information about actual account values and actual expenses. You may use the information in this line, together with the amount you invested, to estimate the expenses that you paid over the period. Simply divide your account value by $1,000.00 (for example, an $8,600 account value divided by $1,000.00 = 8.6), then multiply the result by the number in the first line for a class of the Fund under the heading entitled "Expenses Paid During Period" to estimate the expenses you paid on your account during this period. In addition, the Fund, as a shareholder in the underlying Fidelity Central Funds, will indirectly bear its pro rata share of the fees and expenses incurred by the underlying Fidelity Central Funds. These fees and expenses are not included in the Fund's annualized expense ratio used to calculate the expense estimate in the table below.
Hypothetical Example for Comparison Purposes
The second line of the accompanying table for each class of the Fund provides information about hypothetical account values and hypothetical expenses based on a Class' actual expense ratio and an assumed rate of return of 5% per year before expenses, which is not the Class' actual return. The hypothetical account values and expenses may not be used to estimate the actual ending account balance or expenses you paid for the period. You may use this information to compare the ongoing costs of investing in the Fund and other funds. To do so, compare this 5% hypothetical example with the 5% hypothetical examples that appear in the shareholder reports of the other funds. In addition, the Fund, as a shareholder in the underlying Fidelity Central Funds, will indirectly bear its pro rata share of the fees and expenses incurred by the underlying Fidelity Central Funds. These fees and expenses are not included in the Fund's annualized expense ratio used to calculate the expense estimate in the table below.
Please note that the expenses shown in the table are meant to highlight your ongoing costs only and do not reflect any transaction costs. Therefore, the second line of the table is useful in comparing ongoing costs only, and will not help you determine the relative total costs of owning different funds. In addition, if these transactional costs were included, your costs would have been higher.
Annual Report
| Beginning
Account Value
March 1, 2007 | Ending
Account Value
August 31, 2007 | Expenses Paid
During Period*
March 1, 2007
to August 31, 2007 |
Class A | | | |
Actual | $ 1,000.00 | $ 999.50 | $ 4.03 |
Hypothetical A | $ 1,000.00 | $ 1,021.17 | $ 4.08 |
Class T | | | |
Actual | $ 1,000.00 | $ 999.60 | $ 3.88 |
Hypothetical A | $ 1,000.00 | $ 1,021.32 | $ 3.92 |
Class B | | | |
Actual | $ 1,000.00 | $ 995.80 | $ 7.65 |
Hypothetical A | $ 1,000.00 | $ 1,017.54 | $ 7.73 |
Class C | | | |
Actual | $ 1,000.00 | $ 995.70 | $ 7.70 |
Hypothetical A | $ 1,000.00 | $ 1,017.49 | $ 7.78 |
Total Bond | | | |
Actual | $ 1,000.00 | $ 1,001.20 | $ 2.27 |
Hypothetical A | $ 1,000.00 | $ 1,022.94 | $ 2.29 |
Institutional Class | | | |
Actual | $ 1,000.00 | $ 1,001.00 | $ 2.52 |
Hypothetical A | $ 1,000.00 | $ 1,022.68 | $ 2.55 |
A 5% return per year before expenses
* Expenses are equal to each Class' annualized expense ratio (shown in the table below); multiplied by the average account value over the period, multiplied by 184/365 (to reflect the one-half year period). The fees and expenses of the underlying Fidelity Central Funds in which the Fund invests are not included in the Fund's annualized expense ratio.
| Annualized
Expense Ratio |
Class A | .80% |
Class T | .77% |
Class B | 1.52% |
Class C | 1.53% |
Total Bond | . .45% |
Institutional Class | .50% |
Annual Report
Investment Changes
The information in the following tables is based on the combined investments of the Fund and its pro rata share of its investments in each Fidelity Central Fund. |
Quality Diversification (% of fund's net assets) |
As of August 31, 2007 | As of February 28, 2007 |
| U.S. Government and
U.S. Government
Agency Obligations 55.2% | | | U.S. Government and
U.S. Government
Agency Obligations 52.5% | |
| AAA 13.8% | | | AAA 14.7% | |
| AA 5.0% | | | AA 4.5% | |
| A 3.8% | | | A 5.0% | |
| BBB 13.7% | | | BBB 12.9% | |
| BB and Below 8.4% | | | BB and Below 9.5% | |
| Not Rated 1.3% | | | Not Rated 2.0% | |
| Equities 0.1% | | | Equities 0.0% | |
| Short-Term
Investments and
Net Other Assets(dagger) (1.3)% | | | Short-Term
Investments and
Net Other Assets(dagger) (1.1)% | |

We have used ratings from Moody's ® Investors Services, Inc. Where Moody's ratings are not available, we have used S&P ® ratings. All ratings are as of the report date and do not reflect subsequent downgrades. |
Weighted Average Maturity as of August 31, 2007 |
| | 6 months ago |
Years | 5.0 | 5.7 |
The weighted average maturity is based on the dollar-weighted average length of time until principal payments are expected or until securities reach maturity, taking into account any maturity shortening feature such as a call, refunding or redemption provision. |
Duration as of August 31, 2007 |
| | 6 months ago |
Years | 4.4 | 4.1 |
Duration shows how much a bond fund's price fluctuates with changes in comparable interest rates. If rates rise 1%, for example, a fund with a five-year duration is likely to lose about 5% of its value. Other factors also can influence a bond fund's performance and share price. Accordingly, a bond fund's actual performance may differ from this example. |
Asset Allocation (% of fund's net assets) |
As of August 31, 2007* | As of February 28, 2007** |
| Corporate Bonds 20.2% | | | Corporate Bonds 21.8% | |
| U.S. Government and
U.S. Government
Agency Obligations 55.2% | | | U.S. Government and
U.S. Government
Agency Obligations 52.5% | |
| Asset-Backed
Securities 9.9% | | | Asset-Backed
Securities 10.7% | |
| CMOs and Other Mortgage Related Securities 11.5% | | | CMOs and Other Mortgage Related Securities 11.0% | |
| Stocks 0.1% | | | Stocks 0.0% | |
| Other Investments 4.4% | | | Other Investments 5.1% | |
| Short-Term
Investments and
Net Other Assets(dagger) (1.3)% | | | Short-Term
Investments and
Net Other Assets(dagger) (1.1)% | |
* Foreign investments | 9.2% | | ** Foreign investments | 9.3% | |
* Futures and Swaps | 13.0% | | ** Futures and Swaps | 16.1% | |

(dagger) Short-term Investments and Net Other Assets are not included in the pie chart. |
A holdings list for the Fund, which presents direct holdings as well as the pro rata share of any securities and other investments held indirectly through its investment in underlying non-money market Fidelity Central Funds, is available at fidelity.com and/or advisor.fidelity.com, as applicable. |
Annual Report
Investments August 31, 2007
Showing Percentage of Net Assets
Corporate Bonds - 7.7% |
| Principal Amount (b) | | Value |
Convertible Bonds - 0.1% |
ENERGY - 0.0% |
Oil, Gas & Consumable Fuels - 0.0% |
Chesapeake Energy Corp. 2.75% 11/15/35 | | $ 2,060,000 | | $ 2,115,414 |
FINANCIALS - 0.0% |
Real Estate Investment Trusts - 0.0% |
American Financial Realty Trust 4.375% 7/15/24 | | 50,000 | | 46,750 |
INFORMATION TECHNOLOGY - 0.1% |
Communications Equipment - 0.1% |
Nortel Networks Corp. 1.75% 4/15/12 (f) | | 3,160,000 | | 2,618,850 |
Semiconductors & Semiconductor Equipment - 0.0% |
Advanced Micro Devices, Inc. 6% 5/1/15 | | 350,000 | | 302,313 |
TOTAL INFORMATION TECHNOLOGY | | 2,921,163 |
TOTAL CONVERTIBLE BONDS | | 5,083,327 |
Nonconvertible Bonds - 7.6% |
CONSUMER DISCRETIONARY - 1.3% |
Auto Components - 0.0% |
ArvinMeritor, Inc.: | | | | |
8.125% 9/15/15 | | 305,000 | | 284,413 |
8.75% 3/1/12 | | 400,000 | | 392,000 |
Tenneco, Inc. 8.625% 11/15/14 | | 805,000 | | 784,875 |
| | 1,461,288 |
Diversified Consumer Services - 0.0% |
Affinion Group, Inc. 11.5% 10/15/15 | | 740,000 | | 741,850 |
Education Management LLC/Education Management Finance Corp.: | | | | |
8.75% 6/1/14 | | 300,000 | | 304,500 |
10.25% 6/1/16 | | 300,000 | | 307,500 |
Service Corp. International: | | | | |
6.75% 4/1/15 | | 970,000 | | 940,900 |
7.5% 4/1/27 | | 1,105,000 | | 1,005,550 |
| | 3,300,300 |
Hotels, Restaurants & Leisure - 0.4% |
Carrols Corp. 9% 1/15/13 | | 105,000 | | 98,700 |
Chukchansi Economic Development Authority 8% 11/15/13 (f) | | 565,000 | | 562,175 |
Corporate Bonds - continued |
| Principal
Amount (b) | | Value |
Nonconvertible Bonds - continued |
CONSUMER DISCRETIONARY - continued |
Hotels, Restaurants & Leisure - continued |
Fontainebleau Las Vegas Holdings LLC/Fontainebleau Las Vegas Capital Corp. 10.25% 6/15/15 (f) | | $ 565,000 | | $ 485,900 |
Host Marriott LP: | | | | |
6.375% 3/15/15 | | 250,000 | | 239,375 |
6.75% 6/1/16 | | 100,000 | | 97,250 |
7.125% 11/1/13 | | 2,870,000 | | 2,848,475 |
ITT Corp. 7.375% 11/15/15 | | 250,000 | | 255,000 |
Landry's Seafood Restaurants, Inc. 7.5% 12/15/14 | | 2,385,000 | | 2,379,038 |
MGM Mirage, Inc.: | | | | |
5.875% 2/27/14 | | 1,955,000 | | 1,805,931 |
6.625% 7/15/15 | | 300,000 | | 282,000 |
6.75% 9/1/12 | | 500,000 | | 487,500 |
6.875% 4/1/16 | | 1,635,000 | | 1,549,163 |
7.625% 1/15/17 | | 3,445,000 | | 3,410,550 |
8.375% 2/1/11 | | 180,000 | | 184,050 |
Mohegan Tribal Gaming Authority 7.125% 8/15/14 | | 540,000 | | 523,125 |
NCL Corp. Ltd. 10.625% 7/15/14 | | 1,000,000 | | 995,000 |
Park Place Entertainment Corp. 7% 4/15/13 | | 540,000 | | 554,850 |
Penn National Gaming, Inc.: | | | | |
6.75% 3/1/15 | | 350,000 | | 353,500 |
6.875% 12/1/11 | | 80,000 | | 79,800 |
Royal Caribbean Cruises Ltd. yankee: | | | | |
7.25% 6/15/16 | | 190,000 | | 182,400 |
7.5% 10/15/27 | | 125,000 | | 113,750 |
Seminole Hard Rock Entertainment, Inc. 7.86% 3/15/14 (f)(i) | | 1,040,000 | | 1,019,200 |
Seneca Gaming Corp.: | | | | |
Series B, 7.25% 5/1/12 | | 70,000 | | 70,000 |
7.25% 5/1/12 | | 350,000 | | 350,000 |
Shingle Springs Tribal Gaming Authority 9.375% 6/15/15 (f) | | 180,000 | | 177,300 |
Six Flags, Inc.: | | | | |
8.875% 2/1/10 | | 400,000 | | 348,000 |
9.625% 6/1/14 | | 1,090,000 | | 882,900 |
9.75% 4/15/13 | | 730,000 | | 605,900 |
Starwood Hotels & Resorts Worldwide, Inc. 7.875% 5/1/12 | | 250,000 | | 267,725 |
Station Casinos, Inc.: | | | | |
6.625% 3/15/18 | | 100,000 | | 80,625 |
Corporate Bonds - continued |
| Principal
Amount (b) | | Value |
Nonconvertible Bonds - continued |
CONSUMER DISCRETIONARY - continued |
Hotels, Restaurants & Leisure - continued |
Station Casinos, Inc.: - continued | | | | |
6.875% 3/1/16 | | $ 1,255,000 | | $ 1,044,788 |
7.75% 8/15/16 | | 365,000 | | 346,750 |
Town Sports International Holdings, Inc. 0% 2/1/14 (c) | | 1,000,000 | | 915,000 |
Virgin River Casino Corp./RBG LLC/B&BB, Inc.: | | | | |
0% 1/15/13 (c) | | 40,000 | | 29,600 |
9% 1/15/12 | | 280,000 | | 277,200 |
Wheeling Island Gaming, Inc. 10.125% 12/15/09 | | 1,000,000 | | 1,000,000 |
Wynn Las Vegas LLC/Wynn Las Vegas Capital Corp. 6.625% 12/1/14 | | 1,545,000 | | 1,494,788 |
| | 26,397,308 |
Household Durables - 0.0% |
Fortune Brands, Inc. 5.875% 1/15/36 | | 1,075,000 | | 969,211 |
Goodman Global Holdings, Inc. 7.875% 12/15/12 | | 430,000 | | 423,550 |
K. Hovnanian Enterprises, Inc.: | | | | |
6.25% 1/15/15 | | 245,000 | | 191,100 |
8.875% 4/1/12 | | 5,000 | | 3,950 |
KB Home 7.75% 2/1/10 | | 185,000 | | 179,450 |
Urbi, Desarrollos Urbanos, SA de CV 8.5% 4/19/16 (f) | | 260,000 | | 258,700 |
| | 2,025,961 |
Media - 0.7% |
AMC Entertainment, Inc. 8% 3/1/14 | | 1,700,000 | | 1,564,000 |
AOL Time Warner, Inc. 7.625% 4/15/31 | | 500,000 | | 541,952 |
Cablemas SA de CV (Reg. S) 9.375% 11/15/15 | | 700,000 | | 749,000 |
Cablevision Systems Corp.: | | | | |
8% 4/15/12 | | 555,000 | | 527,250 |
9.82% 4/1/09 (i) | | 340,000 | | 344,250 |
Charter Communications Holdings I LLC 9.92% 4/1/14 | | 495,000 | | 405,900 |
Charter Communications Holdings I LLC/Charter Communications Holdings I Capital Corp. 11% 10/1/15 | | 2,035,000 | | 1,973,950 |
Charter Communications Holdings II LLC/Charter Communications Holdings II Capital Corp.: | | | | |
Series B, 10.25% 9/15/10 | | 100,000 | | 99,750 |
10.25% 9/15/10 | | 615,000 | | 624,225 |
Charter Communications Operating LLC/Charter Communications Operating Capital Corp. 8.375% 4/30/14 (f) | | 370,000 | | 364,450 |
Cox Communications, Inc. 6.45% 12/1/36 (f) | | 1,365,000 | | 1,307,838 |
Corporate Bonds - continued |
| Principal
Amount (b) | | Value |
Nonconvertible Bonds - continued |
CONSUMER DISCRETIONARY - continued |
Media - continued |
CSC Holdings, Inc.: | | | | |
7.25% 4/15/12 | | $ 460,000 | | $ 437,000 |
7.625% 4/1/11 | | 1,000,000 | | 985,000 |
7.625% 7/15/18 | | 235,000 | | 215,613 |
8.125% 7/15/09 | | 365,000 | | 367,738 |
EchoStar Communications Corp.: | | | | |
6.375% 10/1/11 | | 1,630,000 | | 1,597,400 |
6.625% 10/1/14 | | 1,430,000 | | 1,376,375 |
7.125% 2/1/16 | | 750,000 | | 730,350 |
Insight Midwest LP/Insight Capital, Inc. 9.75% 10/1/09 | | 52,000 | | 52,455 |
Kabel Deutschland GmbH 10.625% 7/1/14 | | 2,000,000 | | 2,115,000 |
Liberty Media Corp.: | | | | |
5.7% 5/15/13 | | 450,000 | | 416,250 |
8.25% 2/1/30 | | 405,000 | | 392,850 |
8.5% 7/15/29 | | 630,000 | | 632,442 |
News America Holdings, Inc. 7.75% 12/1/45 | | 170,000 | | 186,075 |
News America, Inc.: | | | | |
6.15% 3/1/37 | | 2,970,000 | | 2,759,287 |
6.2% 12/15/34 | | 5,330,000 | | 4,949,150 |
Nexstar Broadcasting, Inc. 7% 1/15/14 | | 700,000 | | 661,500 |
Nielsen Finance LLC/Co.: | | | | |
0% 8/1/16 (c)(f) | | 2,300,000 | | 1,546,750 |
10% 8/1/14 (f) | | 400,000 | | 410,000 |
PanAmSat Corp.: | | | | |
6.375% 1/15/08 | | 200,000 | | 198,000 |
9% 8/15/14 | | 84,000 | | 85,369 |
Quebecor Media, Inc. 7.75% 3/15/16 | | 1,000,000 | | 945,000 |
Rainbow National LLC & RNS Co. Corp.: | | | | |
8.75% 9/1/12 (f) | | 280,000 | | 285,600 |
10.375% 9/1/14 (f) | | 20,000 | | 21,500 |
The Reader's Digest Association, Inc. 9% 2/15/17 (f) | | 1,700,000 | | 1,462,000 |
Time Warner Cable, Inc.: | | | | |
5.85% 5/1/17 (f) | | 2,607,000 | | 2,548,045 |
6.55% 5/1/37 (f) | | 3,118,000 | | 3,030,774 |
Time Warner, Inc. 6.625% 5/15/29 | | 4,415,000 | | 4,327,927 |
TL Acquisitions, Inc. 10.5% 1/15/15 (f) | | 1,115,000 | | 1,053,675 |
Umbrella Acquisition, Inc. 9.75% 3/15/15
pay-in-kind (f) | | 2,915,000 | | 2,812,975 |
Corporate Bonds - continued |
| Principal
Amount (b) | | Value |
Nonconvertible Bonds - continued |
CONSUMER DISCRETIONARY - continued |
Media - continued |
Valassis Communications, Inc. 8.25% 3/1/15 | | $ 1,475,000 | | $ 1,246,375 |
Visant Holding Corp. 8.75% 12/1/13 | | 450,000 | | 450,000 |
| | 46,801,040 |
Specialty Retail - 0.1% |
GSC Holdings Corp./Gamestop, Inc. 8% 10/1/12 | | 35,000 | | 36,050 |
Michaels Stores, Inc. 10% 11/1/14 (f) | | 300,000 | | 300,750 |
Nebraska Book Co., Inc. 8.625% 3/15/12 | | 1,090,000 | | 1,073,650 |
Toys 'R' US, Inc.: | | | | |
7.375% 10/15/18 | | 445,000 | | 347,100 |
7.625% 8/1/11 | | 755,000 | | 668,175 |
7.875% 4/15/13 | | 1,290,000 | | 1,086,825 |
| | 3,512,550 |
Textiles, Apparel & Luxury Goods - 0.1% |
Hanesbrands, Inc. 8.735% 12/15/14 (f)(i) | | 1,480,000 | | 1,465,200 |
Jostens IH Corp. 7.625% 10/1/12 | | 190,000 | | 190,000 |
Levi Strauss & Co.: | | | | |
8.875% 4/1/16 | | 2,100,000 | | 2,100,000 |
9.75% 1/15/15 | | 180,000 | | 185,400 |
12.25% 12/15/12 | | 315,000 | | 336,263 |
| | 4,276,863 |
TOTAL CONSUMER DISCRETIONARY | | 87,775,310 |
CONSUMER STAPLES - 0.3% |
Food & Staples Retailing - 0.1% |
Albertsons, Inc.: | | | | |
7.45% 8/1/29 | | 250,000 | | 237,372 |
7.75% 6/15/26 | | 210,000 | | 199,500 |
CVS Caremark Corp. 6.302% 6/1/37 (i) | | 8,615,000 | | 8,321,616 |
Rite Aid Corp. 7.5% 3/1/17 | | 1,000,000 | | 927,500 |
SUPERVALU, Inc. 7.5% 11/15/14 | | 785,000 | | 788,925 |
| | 10,474,913 |
Food Products - 0.1% |
Bertin Ltda 10.25% 10/5/16 (f) | | 205,000 | | 209,100 |
Dean Foods Co. 6.9% 10/15/17 | | 2,000,000 | | 1,805,000 |
Gruma SA de CV 7.75% | | 795,000 | | 791,025 |
Kraft Foods, Inc. 7% 8/11/37 | | 435,000 | | 447,739 |
Corporate Bonds - continued |
| Principal
Amount (b) | | Value |
Nonconvertible Bonds - continued |
CONSUMER STAPLES - continued |
Food Products - continued |
National Beef Packing Co. LLC/National Beef Finance Corp. 10.5% 8/1/11 | | $ 595,000 | | $ 609,875 |
Pierre Foods, Inc. 9.875% 7/15/12 | | 540,000 | | 523,800 |
Smithfield Foods, Inc. 7.75% 7/1/17 | | 725,000 | | 725,000 |
| | 5,111,539 |
Household Products - 0.0% |
Kimberly-Clark Corp. 6.625% 8/1/37 | | 2,207,000 | | 2,327,504 |
Tobacco - 0.1% |
Reynolds American, Inc.: | | | | |
7.25% 6/15/37 | | 4,865,000 | | 4,930,507 |
7.3% 7/15/15 | | 195,000 | | 200,850 |
| | 5,131,357 |
TOTAL CONSUMER STAPLES | | 23,045,313 |
ENERGY - 0.9% |
Energy Equipment & Services - 0.1% |
Compagnie Generale de Geophysique SA: | | | | |
7.5% 5/15/15 | | 535,000 | | 537,675 |
7.75% 5/15/17 | | 1,195,000 | | 1,209,938 |
Complete Production Services, Inc. 8% 12/15/16 | | 2,260,000 | | 2,175,250 |
Hanover Equipment Trust 8.75% 9/1/11 | | 50,000 | | 50,750 |
Seitel, Inc. 9.75% 2/15/14 (f) | | 1,000,000 | | 930,000 |
| | 4,903,613 |
Oil, Gas & Consumable Fuels - 0.8% |
Arch Western Finance LLC 6.75% 7/1/13 | | 1,350,000 | | 1,269,000 |
Atlas Pipeline Partners LP 8.125% 12/15/15 | | 2,290,000 | | 2,272,825 |
Chaparral Energy, Inc.: | | | | |
8.5% 12/1/15 | | 530,000 | | 473,025 |
8.875% 2/1/17 (f) | | 210,000 | | 189,000 |
Chesapeake Energy Corp.: | | | | |
6.5% 8/15/17 | | 1,625,000 | | 1,547,813 |
6.625% 1/15/16 | | 1,195,000 | | 1,156,163 |
6.875% 1/15/16 | | 1,020,000 | | 1,002,150 |
6.875% 11/15/20 | | 630,000 | | 604,800 |
7.5% 9/15/13 | | 300,000 | | 306,000 |
7.625% 7/15/13 | | 200,000 | | 203,500 |
7.75% 1/15/15 | | 430,000 | | 436,450 |
Corporate Bonds - continued |
| Principal
Amount (b) | | Value |
Nonconvertible Bonds - continued |
ENERGY - continued |
Oil, Gas & Consumable Fuels - continued |
Drummond Co., Inc. 7.375% 2/15/16 (f) | | $ 630,000 | | $ 567,000 |
Duke Capital LLC 6.75% 2/15/32 | | 1,195,000 | | 1,186,563 |
Duke Energy Field Services 6.45% 11/3/36 (f) | | 2,400,000 | | 2,372,069 |
Forest Oil Corp.: | | | | |
7.25% 6/15/19 (f) | | 500,000 | | 481,250 |
7.75% 5/1/14 | | 675,000 | | 676,688 |
Kinder Morgan Energy Partners LP 6.95% 1/15/38 | | 800,000 | | 804,874 |
Massey Energy Co.: | | | | |
6.625% 11/15/10 | | 40,000 | | 38,800 |
6.875% 12/15/13 | | 2,485,000 | | 2,248,925 |
Nakilat, Inc. 6.067% 12/31/33 (f) | | 2,885,000 | | 2,790,026 |
National Gas Co. of Trinidad & Tobago Ltd. 6.05% 1/15/36 (f) | | 240,000 | | 230,291 |
Nexen, Inc.: | | | | |
5.875% 3/10/35 | | 240,000 | | 217,518 |
6.4% 5/15/37 | | 3,645,000 | | 3,546,005 |
OPTI Canada, Inc.: | | | | |
7.875% 12/15/14 (f) | | 1,175,000 | | 1,177,938 |
8.25% 12/15/14 (f) | | 635,000 | | 642,938 |
Pan American Energy LLC 7.75% 2/9/12 (f) | | 2,475,000 | | 2,406,938 |
Peabody Energy Corp. 7.375% 11/1/16 | | 725,000 | | 731,344 |
Pemex Project Funding Master Trust 6.625% 6/15/35 | | 625,000 | | 640,625 |
Petrohawk Energy Corp. 9.125% 7/15/13 | | 1,270,000 | | 1,323,975 |
Petroleos de Venezuela SA: | | | | |
5.25% 4/12/17 | | 1,485,000 | | 1,028,363 |
5.375% 4/12/27 | | 1,270,000 | | 742,950 |
Petrozuata Finance, Inc.: | | | | |
7.63% 4/1/09 (f) | | 1,329,739 | | 1,319,766 |
8.22% 4/1/17 (f) | | 950,000 | | 950,000 |
Pioneer Natural Resources Co. 6.65% 3/15/17 | | 2,715,000 | | 2,511,375 |
Plains All American Pipeline LP: | | | | |
6.125% 1/15/17 | | 930,000 | | 932,867 |
6.65% 1/15/37 | | 1,740,000 | | 1,722,085 |
Plains Exploration & Production Co. 7% 3/15/17 | | 970,000 | | 887,550 |
Range Resources Corp.: | | | | |
6.375% 3/15/15 (Reg. S) | | 710,000 | | 678,050 |
7.375% 7/15/13 | | 440,000 | | 442,200 |
7.5% 5/15/16 | | 3,000,000 | | 3,052,500 |
Corporate Bonds - continued |
| Principal
Amount (b) | | Value |
Nonconvertible Bonds - continued |
ENERGY - continued |
Oil, Gas & Consumable Fuels - continued |
Ras Laffan Liquid Natural Gas Co. Ltd. III 6.332% 9/30/27 (f) | | $ 1,840,000 | | $ 1,838,381 |
Ship Finance International Ltd. 8.5% 12/15/13 | | 330,000 | | 335,775 |
Talisman Energy, Inc. yankee 6.25% 2/1/38 | | 2,290,000 | | 2,151,405 |
Teekay Corp. 8.875% 7/15/11 | | 115,000 | | 117,300 |
Valero Energy Corp. 6.625% 6/15/37 | | 1,510,000 | | 1,522,539 |
W&T Offshore, Inc. 8.25% 6/15/14 (f) | | 1,600,000 | | 1,520,000 |
Williams Companies, Inc. 8.75% 3/15/32 | | 165,000 | | 182,325 |
Williams Partners LP/Williams Partners Finance Corp. 7.25% 2/1/17 | | 485,000 | | 481,363 |
YPF SA 10% 11/2/28 | | 375,000 | | 431,250 |
| | 54,392,537 |
TOTAL ENERGY | | 59,296,150 |
FINANCIALS - 1.8% |
Capital Markets - 0.5% |
Bear Stearns Companies, Inc. 6.9% 8/15/12 | | 10,705,000 | | 10,777,591 |
Deutsche Bank AG London 6% 9/1/17 | | 4,440,000 | | 4,479,609 |
E*TRADE Financial Corp.: | | | | |
7.375% 9/15/13 | | 290,000 | | 246,500 |
7.875% 12/1/15 | | 400,000 | | 346,000 |
Goldman Sachs Group, Inc. 5.625% 1/15/17 | | 3,200,000 | | 3,058,755 |
JPMorgan Chase Capital XX 6.55% 9/29/36 | | 10,020,000 | | 9,020,124 |
Lehman Brothers Holdings, Inc. 6% 5/3/32 (i) | | 3,030,000 | | 2,653,532 |
Morgan Stanley 4.75% 4/1/14 | | 1,635,000 | | 1,528,432 |
| | 32,110,543 |
Commercial Banks - 0.3% |
Banco Nacional de Desenvolvimento Economico e Social 5.84% 6/16/08 (i) | | 3,027,000 | | 3,011,865 |
Bank of America NA: | | | | |
5.3% 3/15/17 | | 1,515,000 | | 1,459,548 |
6% 10/15/36 | | 5,040,000 | | 4,871,614 |
BB&T Capital Trust IV 6.82% 6/12/77 (i) | | 2,314,000 | | 2,182,433 |
Development Bank of Philippines 8.375% (i) | | 725,000 | | 746,750 |
KeyCorp Capital Trust VII 5.7% 6/15/35 | | 2,600,000 | | 2,219,337 |
Corporate Bonds - continued |
| Principal
Amount (b) | | Value |
Nonconvertible Bonds - continued |
FINANCIALS - continued |
Commercial Banks - continued |
Kyivstar GSM: | | | | |
7.75% 4/27/12 (Issued by Dresdner Bank AG for Kyivstar GSM) (f) | | $ 350,000 | | $ 344,750 |
10.375% 8/17/09 (Issued by Dresdner Bank AG for Kyivstar GSM) (f) | | 1,025,000 | | 1,078,813 |
Vimpel Communications: | | | | |
8% 2/11/10 (Issued by UBS Luxembourg SA for Vimpel Communications) | | 1,125,000 | | 1,143,281 |
10% 6/16/09 (Issued by UBS Luxembourg SA for Vimpel Communications) | | 320,000 | | 334,374 |
Wachovia Bank NA 5.85% 2/1/37 | | 3,200,000 | | 3,012,160 |
| | 20,404,925 |
Consumer Finance - 0.2% |
Ford Motor Credit Co. LLC: | | | | |
6.625% 6/16/08 | | 840,000 | | 814,797 |
7.8% 6/1/12 | | 980,000 | | 899,150 |
8.11% 1/13/12 (i) | | 170,000 | | 154,275 |
8.625% 11/1/10 | | 900,000 | | 859,795 |
General Motors Acceptance Corp.: | | | | |
6.75% 12/1/14 | | 565,000 | | 478,838 |
6.875% 9/15/11 | | 1,685,000 | | 1,482,800 |
GMAC LLC: | | | | |
6% 12/15/11 | | 530,000 | | 455,800 |
6.625% 5/15/12 | | 350,000 | | 302,750 |
SLM Corp.: | | | | |
4.5% 7/26/10 | | 2,235,000 | | 2,068,560 |
5.5% 7/27/09 (i) | | 1,827,000 | | 1,752,873 |
5.52% 7/26/10 (i) | | 6,515,000 | | 6,139,241 |
| | 15,408,879 |
Diversified Financial Services - 0.5% |
CCO Holdings LLC/CCO Holdings Capital Corp. 8.75% 11/15/13 | | 320,000 | | 313,600 |
Cerro Negro Finance Ltd.: | | | | |
(Reg. S) 7.33% 12/1/09 | | 414,100 | | 405,818 |
7.33% 12/1/09 (f) | | 176,300 | | 172,774 |
Citigroup, Inc.: | | | | |
5.875% 5/29/37 | | 2,700,000 | | 2,556,735 |
6.125% 8/25/36 | | 8,875,000 | | 8,669,109 |
Corporate Bonds - continued |
| Principal
Amount (b) | | Value |
Nonconvertible Bonds - continued |
FINANCIALS - continued |
Diversified Financial Services - continued |
Ex-Im Ukraine 7.65% 9/7/11 (Issued by Credit Suisse London Branch for Ex-Im Ukraine) | | $ 1,175,000 | | $ 1,165,582 |
Hilcorp Energy I LP/Hilcorp Finance Co. 7.75% 11/1/15 (f) | | 2,590,000 | | 2,486,400 |
JPMorgan Chase Capital XVII 5.85% 8/1/35 | | 7,405,000 | | 6,539,215 |
Leucadia National Corp.: | | | | |
7% 8/15/13 | | 500,000 | | 485,000 |
7.125% 3/15/17 (f) | | 880,000 | | 840,400 |
NSG Holdings II, LLC 7.75% 12/15/25 (f) | | 2,790,000 | | 2,776,050 |
OAO TMK 8.5% 9/29/09 (Issued by TMK Capital SA for OAO TMK) | | 2,200,000 | | 2,211,000 |
Pakistan International Sukuk Co. Ltd. 7.5703% 1/27/10 (i) | | 500,000 | | 491,250 |
Snoqualmie Entertainment Authority 9.125% 2/1/15 (f) | | 945,000 | | 930,825 |
Universal City Florida Holding Co. I/II 8.375% 5/1/10 | | 1,025,000 | | 1,004,500 |
ZFS Finance USA Trust V 6.5% 5/9/67 (f)(i) | | 2,400,000 | | 2,245,543 |
| | 33,293,801 |
Insurance - 0.0% |
AMBAC Financial Group, Inc. 6.15% 2/15/37 | | 1,525,000 | | 1,167,360 |
USI Holdings Corp. 9.75% 5/15/15 (f) | | 2,530,000 | | 2,302,300 |
| | 3,469,660 |
Real Estate Investment Trusts - 0.2% |
Archstone-Smith Operating Trust 5.25% 5/1/15 | | 2,080,000 | | 2,006,603 |
Crescent Real Estate Equities LP/Crescent Finance Co. 9.25% 4/15/09 | | 40,000 | | 40,400 |
Highwoods/Forsyth LP 5.85% 3/15/17 | | 80,000 | | 75,800 |
HMB Capital Trust V 8.99% 12/15/36 (f)(i) | | 270,000 | | 54,000 |
Host Hotels & Resorts LP 6.875% 11/1/14 | | 460,000 | | 451,950 |
iStar Financial, Inc. 5.95% 10/15/13 | | 300,000 | | 284,249 |
Omega Healthcare Investors, Inc.: | | | | |
7% 4/1/14 | | 2,225,000 | | 2,169,375 |
7% 1/15/16 | | 400,000 | | 386,000 |
Reckson Operating Partnership LP 6% 3/31/16 | | 4,021,000 | | 3,845,081 |
Rouse Co. 5.375% 11/26/13 | | 100,000 | | 91,701 |
Senior Housing Properties Trust: | | | | |
7.875% 4/15/15 | | 613,000 | | 634,455 |
8.625% 1/15/12 | | 750,000 | | 791,250 |
Thornburg Mortgage, Inc. 8% 5/15/13 | | 100,000 | | 88,000 |
Corporate Bonds - continued |
| Principal
Amount (b) | | Value |
Nonconvertible Bonds - continued |
FINANCIALS - continued |
Real Estate Investment Trusts - continued |
UDR, Inc. 5.5% 4/1/14 | | $ 2,755,000 | | $ 2,687,632 |
Ventas Realty LP: | | | | |
6.5% 6/1/16 | | 150,000 | | 144,000 |
6.625% 10/15/14 | | 1,350,000 | | 1,316,250 |
6.75% 4/1/17 | | 1,035,000 | | 1,003,950 |
| | 16,070,696 |
Real Estate Management & Development - 0.1% |
American Real Estate Partners/American Real Estate Finance Corp.: | | | | |
7.125% 2/15/13 | | 2,715,000 | | 2,538,525 |
7.125% 2/15/13 (f) | | 470,000 | | 444,150 |
8.125% 6/1/12 | | 1,485,000 | | 1,447,875 |
Forest City Enterprises, Inc. 7.625% 6/1/15 | | 100,000 | | 97,000 |
Inversiones y Representaciones SA 8.5% 2/2/17 (f) | | 1,135,000 | | 981,775 |
| | 5,509,325 |
Thrifts & Mortgage Finance - 0.0% |
Residential Capital Corp.: | | | | |
7.375% 6/30/10 | | 675,000 | | 519,750 |
7.5% 4/17/13 | | 495,000 | | 372,488 |
7.875% 6/30/15 | | 580,000 | | 437,900 |
| | 1,330,138 |
TOTAL FINANCIALS | | 127,597,967 |
HEALTH CARE - 0.2% |
Health Care Equipment & Supplies - 0.0% |
FMC Finance III SA 6.875% 7/15/17 (f) | | 1,685,000 | | 1,651,300 |
Health Care Providers & Services - 0.2% |
Community Health Systems, Inc. 8.875% 7/15/15 (f) | | 2,710,000 | | 2,693,198 |
DaVita, Inc.: | | | | |
6.625% 3/15/13 | | 290,000 | | 280,575 |
7.25% 3/15/15 | | 615,000 | | 601,163 |
HCA, Inc.: | | | | |
6.3% 10/1/12 | | 215,000 | | 187,588 |
6.5% 2/15/16 | | 1,420,000 | | 1,164,400 |
9.125% 11/15/14 (f) | | 600,000 | | 613,500 |
9.25% 11/15/16 (f) | | 2,010,000 | | 2,060,250 |
9.625% 11/15/16 pay-in-kind (f) | | 2,900,000 | | 2,972,500 |
Corporate Bonds - continued |
| Principal
Amount (b) | | Value |
Nonconvertible Bonds - continued |
HEALTH CARE - continued |
Health Care Providers & Services - continued |
HealthSouth Corp. 10.75% 6/15/16 | | $ 300,000 | | $ 309,000 |
IASIS Healthcare LLC/IASIS Capital Corp. 8.75% 6/15/14 | | 1,350,000 | | 1,312,875 |
Multiplan, Inc. 10.375% 4/15/16 (f) | | 735,000 | | 720,300 |
Rural/Metro Corp.: | | | | |
0% 3/15/16 (c) | | 150,000 | | 109,500 |
9.875% 3/15/15 | | 180,000 | | 169,200 |
Skilled Healthcare Group, Inc. 11% 1/15/14 | | 64,000 | | 68,480 |
Sun Healthcare Group, Inc. 9.125% 4/15/15 (f) | | 10,000 | | 9,925 |
Team Finance LLC/Health Finance Corp. 11.25% 12/1/13 | | 100,000 | | 108,000 |
United Surgical Partners International, Inc.: | | | | |
8.875% 5/1/17 | | 220,000 | | 209,000 |
9.25% 5/1/17 pay-in-kind | | 440,000 | | 422,400 |
Viant Holdings, Inc. 10.125% 7/15/17 (f) | | 71,000 | | 66,030 |
| | 14,077,884 |
TOTAL HEALTH CARE | | 15,729,184 |
INDUSTRIALS - 0.5% |
Aerospace & Defense - 0.0% |
Bombardier, Inc.: | | | | |
6.3% 5/1/14 (f) | | 1,410,000 | | 1,346,550 |
7.45% 5/1/34 (f) | | 750,000 | | 735,000 |
8% 11/15/14 (f) | | 160,000 | | 165,200 |
| | 2,246,750 |
Airlines - 0.2% |
American Airlines, Inc. pass thru trust certificates: | | | | |
6.817% 5/23/11 | | 50,000 | | 48,438 |
6.977% 11/23/22 | | 865,629 | | 802,871 |
7.377% 5/23/19 | | 94,884 | | 85,870 |
7.379% 11/23/17 | | 32,772 | | 29,495 |
AMR Corp. 9% 8/1/12 | | 485,000 | | 491,063 |
Continental Airlines, Inc.: | | | | |
7.875% 7/2/18 | | 1,164,084 | | 1,140,802 |
8.485% 6/2/13 (i) | | 100,000 | | 97,000 |
8.75% 12/1/11 | | 400,000 | | 366,000 |
9.558% 9/1/19 | | 264,626 | | 276,534 |
Corporate Bonds - continued |
| Principal
Amount (b) | | Value |
Nonconvertible Bonds - continued |
INDUSTRIALS - continued |
Airlines - continued |
Continental Airlines, Inc. pass thru trust certificates: | | | | |
7.566% 9/15/21 | | $ 82,946 | | $ 81,287 |
7.73% 9/15/12 | | 20,920 | | 20,240 |
8.499% 11/1/12 | | 21,521 | | 21,091 |
9.798% 4/1/21 | | 831,420 | | 872,991 |
Delta Air Lines, Inc. pass thru trust certificates 7.57% 11/18/10 | | 5,740,000 | | 5,811,750 |
United Air Lines, Inc. pass-thru trust certificates: | | | | |
7.032% 4/1/12 | | 1,080,884 | | 1,085,619 |
7.186% 10/1/12 | | 2,680,399 | | 2,707,203 |
| | 13,938,254 |
Commercial Services & Supplies - 0.1% |
ALH Finance LLC/ALH Finance Corp. 8.5% 1/15/13 | | 445,000 | | 429,425 |
Allied Waste North America, Inc.: | | | | |
5.75% 2/15/11 | | 370,000 | | 357,513 |
6.875% 6/1/17 | | 1,475,000 | | 1,438,125 |
7.125% 5/15/16 | | 400,000 | | 394,500 |
7.25% 3/15/15 | | 800,000 | | 800,000 |
7.875% 4/15/13 | | 120,000 | | 121,500 |
ARAMARK Corp.: | | | | |
8.5% 2/1/15 | | 1,110,000 | | 1,071,150 |
8.8563% 2/1/15 (i) | | 130,000 | | 129,350 |
FTI Consulting, Inc.: | | | | |
7.625% 6/15/13 | | 355,000 | | 347,900 |
7.75% 10/1/16 | | 605,000 | | 605,000 |
Rental Service Corp. 9.5% 12/1/14 | | 330,000 | | 316,800 |
| | 6,011,263 |
Electrical Equipment - 0.0% |
Belden, Inc. 7% 3/15/17 (f) | | 385,000 | | 377,300 |
Sensus Metering Systems, Inc. 8.625% 12/15/13 | | 2,220,000 | | 2,086,800 |
| | 2,464,100 |
Industrial Conglomerates - 0.0% |
Nell AF Sarl 8.375% 8/15/15 (f) | | 500,000 | | 445,000 |
Marine - 0.0% |
Britannia Bulk PLC 11% 12/1/11 | | 1,245,000 | | 1,226,325 |
Navios Maritime Holdings, Inc. 9.5% 12/15/14 | | 490,000 | | 497,350 |
| | 1,723,675 |
Corporate Bonds - continued |
| Principal
Amount (b) | | Value |
Nonconvertible Bonds - continued |
INDUSTRIALS - continued |
Road & Rail - 0.1% |
Avis Budget Car Rental LLC/Avis Budget Finance, Inc.: | | | | |
7.625% 5/15/14 | | $ 885,000 | | $ 856,238 |
7.75% 5/15/16 | | 665,000 | | 641,725 |
Hertz Corp.: | | | | |
8.875% 1/1/14 | | 700,000 | | 721,000 |
10.5% 1/1/16 | | 360,000 | | 387,000 |
Kansas City Southern de Mexico, SA de CV 7.375% 6/1/14 (f) | | 340,000 | | 326,400 |
Kansas City Southern Railway Co. 7.5% 6/15/09 | | 2,400,000 | | 2,400,000 |
| | 5,332,363 |
Trading Companies & Distributors - 0.1% |
Ahern Rentals, Inc. 9.25% 8/15/13 | | 400,000 | | 396,000 |
Ashtead Capital, Inc. 9% 8/15/16 (f) | | 300,000 | | 289,500 |
Ashtead Holdings PLC 8.625% 8/1/15 (f) | | 275,000 | | 259,875 |
Penhall International Corp. 12% 8/1/14 (f) | | 250,000 | | 256,250 |
VWR Funding, Inc. 10.25% 7/15/15 (f) | | 2,000,000 | | 1,860,000 |
| | 3,061,625 |
TOTAL INDUSTRIALS | | 35,223,030 |
INFORMATION TECHNOLOGY - 0.3% |
Communications Equipment - 0.1% |
L-3 Communications Corp. 6.375% 10/15/15 | | 125,000 | | 121,875 |
Lucent Technologies, Inc.: | | | | |
6.45% 3/15/29 | | 2,835,000 | | 2,395,575 |
6.5% 1/15/28 | | 1,050,000 | | 887,250 |
Nortel Networks Corp.: | | | | |
9.61% 7/15/11 (f)(i) | | 200,000 | | 202,000 |
10.125% 7/15/13 (f) | | 1,000,000 | | 1,032,500 |
| | 4,639,200 |
Computers & Peripherals - 0.0% |
Seagate Technology HDD Holdings 6.8% 10/1/16 | | 1,520,000 | | 1,459,200 |
Electronic Equipment & Instruments - 0.1% |
Celestica, Inc. 7.875% 7/1/11 | | 500,000 | | 475,000 |
Flextronics International Ltd.: | | | | |
6.25% 11/15/14 | | 300,000 | | 276,750 |
6.5% 5/15/13 | | 1,285,000 | | 1,217,538 |
Corporate Bonds - continued |
| Principal
Amount (b) | | Value |
Nonconvertible Bonds - continued |
INFORMATION TECHNOLOGY - continued |
Electronic Equipment & Instruments - continued |
NXP BV: | | | | |
7.875% 10/15/14 | | $ 490,000 | | $ 444,063 |
9.5% 10/15/15 | | 725,000 | | 627,125 |
| | 3,040,476 |
IT Services - 0.0% |
Iron Mountain, Inc.: | | | | |
6.625% 1/1/16 | | 1,670,000 | | 1,503,000 |
7.75% 1/15/15 | | 605,000 | | 588,363 |
8.625% 4/1/13 | | 210,000 | | 210,000 |
Telcordia Technologies, Inc. 9.11% 7/15/12 (f)(i) | | 430,000 | | 378,400 |
| | 2,679,763 |
Office Electronics - 0.0% |
Xerox Capital Trust I 8% 2/1/27 | | 1,630,000 | | 1,605,550 |
Semiconductors & Semiconductor Equipment - 0.1% |
Advanced Micro Devices, Inc. 7.75% 11/1/12 | | 1,085,000 | | 952,088 |
Amkor Technology, Inc.: | | | | |
7.75% 5/15/13 | | 235,000 | | 218,550 |
9.25% 6/1/16 | | 515,000 | | 499,550 |
Freescale Semiconductor, Inc.: | | | | |
8.875% 12/15/14 | | 1,510,000 | | 1,387,388 |
9.125% 12/15/14 pay-in-kind | | 800,000 | | 712,000 |
9.235% 12/15/14 (i) | | 290,000 | | 265,350 |
10.125% 12/15/16 | | 1,230,000 | | 1,065,549 |
Hynix Semiconductor, Inc. 7.875% 6/27/17 (f) | | 2,415,000 | | 2,312,363 |
| | 7,412,838 |
TOTAL INFORMATION TECHNOLOGY | | 20,837,027 |
MATERIALS - 0.5% |
Chemicals - 0.0% |
Equistar Chemicals LP 7.55% 2/15/26 | | 350,000 | | 297,500 |
Equistar Chemicals LP/Equistar Funding Corp. 10.625% 5/1/11 | | 226,000 | | 236,170 |
Lyondell Chemical Co.: | | | | |
6.875% 6/15/17 | | 400,000 | | 416,000 |
8% 9/15/14 | | 500,000 | | 543,125 |
Momentive Performance Materials, Inc. 9.75% 12/1/14 (f) | | 85,000 | | 80,750 |
Corporate Bonds - continued |
| Principal
Amount (b) | | Value |
Nonconvertible Bonds - continued |
MATERIALS - continued |
Chemicals - continued |
Nalco Co.: | | | | |
7.75% 11/15/11 | | $ 1,130,000 | | $ 1,135,650 |
8.875% 11/15/13 | | 270,000 | | 272,025 |
NOVA Chemicals Corp. 8.4838% 11/15/13 (i) | | 485,000 | | 471,663 |
Pliant Corp. 11.35% 6/15/09 (d) | | 60,119 | | 57,113 |
| | 3,509,996 |
Construction Materials - 0.0% |
U.S. Concrete, Inc. 8.375% 4/1/14 | | 110,000 | | 100,100 |
Containers & Packaging - 0.1% |
BWAY Corp. 10% 10/15/10 | | 1,105,000 | | 1,116,050 |
Crown Americas LLC/Crown Americas Capital Corp. 7.75% 11/15/15 | | 200,000 | | 202,000 |
Crown Cork & Seal, Inc. 8% 4/15/23 | | 105,000 | | 99,225 |
Greif, Inc. 6.75% 2/1/17 | | 485,000 | | 460,750 |
Jefferson Smurfit Corp. U.S.: | | | | |
7.5% 6/1/13 | | 15,000 | | 14,250 |
8.25% 10/1/12 | | 300,000 | | 292,500 |
Smurfit-Stone Container Enterprises, Inc. 8% 3/15/17 | | 2,000,000 | | 1,910,000 |
Vitro SAB de CV 8.625% 2/1/12 (f) | | 1,265,000 | | 1,220,725 |
| | 5,315,500 |
Metals & Mining - 0.3% |
CAP SA 7.375% 9/15/36 (f) | | 200,000 | | 192,896 |
Corporacion Nacional del Cobre (Codelco) 6.15% 10/24/36 (f) | | 1,370,000 | | 1,337,432 |
Evraz Group SA (Reg. S) 8.25% 11/10/15 | | 765,000 | | 758,306 |
Evraz Securities SA 10.875% 8/3/09 | | 900,000 | | 954,000 |
FMG Finance Property Ltd.: | | | | |
9.36% 9/1/11 (f)(i) | | 470,000 | | 486,450 |
10% 9/1/13 (f) | | 1,660,000 | | 1,776,200 |
10.625% 9/1/16 (f) | | 195,000 | | 223,763 |
Freeport-McMoRan Copper & Gold, Inc.: | | | | |
6.875% 2/1/14 | | 375,000 | | 383,438 |
8.25% 4/1/15 | | 880,000 | | 913,000 |
8.375% 4/1/17 | | 1,480,000 | | 1,568,800 |
8.5463% 4/1/15 (i) | | 870,000 | | 896,100 |
Noranda Aluminium Acquisition Corp. 9.36% 5/15/15 pay-in-kind (f)(i) | | 300,000 | | 276,000 |
PNA Group, Inc. 10.75% 9/1/16 (f) | | 130,000 | | 130,650 |
Corporate Bonds - continued |
| Principal
Amount (b) | | Value |
Nonconvertible Bonds - continued |
MATERIALS - continued |
Metals & Mining - continued |
RathGibson, Inc. 11.25% 2/15/14 | | $ 350,000 | | $ 350,000 |
Steel Dynamics, Inc. 6.75% 4/1/15 (f) | | 2,380,000 | | 2,284,800 |
United States Steel Corp. 6.65% 6/1/37 | | 3,395,000 | | 3,226,330 |
Vale Overseas Ltd. 6.25% 1/23/17 | | 2,685,000 | | 2,702,721 |
| | 18,460,886 |
Paper & Forest Products - 0.1% |
Georgia-Pacific Corp.: | | | | |
7% 1/15/15 (f) | | 2,350,000 | | 2,232,500 |
8.125% 5/15/11 | | 605,000 | | 609,538 |
Stone Container Corp. 8.375% 7/1/12 | | 700,000 | | 687,750 |
Stone Container Finance Co. 7.375% 7/15/14 | | 400,000 | | 378,000 |
| | 3,907,788 |
TOTAL MATERIALS | | 31,294,270 |
TELECOMMUNICATION SERVICES - 1.1% |
Diversified Telecommunication Services - 0.9% |
AT&T, Inc. 6.8% 5/15/36 | | 6,413,000 | | 6,696,108 |
BellSouth Capital Funding Corp. 7.875% 2/15/30 | | 1,060,000 | | 1,207,641 |
Cincinnati Bell, Inc. 8.375% 1/15/14 | | 1,710,000 | | 1,684,350 |
Eschelon Operating Co. 8.375% 3/15/10 | | 396,000 | | 382,635 |
Intelsat Bermuda Ltd. 8.886% 1/15/15 (i) | | 280,000 | | 282,100 |
Intelsat Ltd.: | | | | |
6.5% 11/1/13 | | 545,000 | | 400,575 |
7.625% 4/15/12 | | 960,000 | | 796,800 |
9.25% 6/15/16 | | 850,000 | | 875,500 |
11.25% 6/15/16 | | 1,400,000 | | 1,463,000 |
Level 3 Financing, Inc.: | | | | |
8.75% 2/15/17 | | 5,590,000 | | 5,226,650 |
9.25% 11/1/14 | | 1,430,000 | | 1,369,225 |
12.25% 3/15/13 | | 1,050,000 | | 1,144,500 |
NTL Cable PLC: | | | | |
8.75% 4/15/14 | | 1,300,000 | | 1,313,000 |
9.125% 8/15/16 | | 860,000 | | 879,350 |
Qwest Capital Funding, Inc. 7% 8/3/09 | | 50,000 | | 49,750 |
Qwest Communications International, Inc.: | | | | |
7.5% 2/15/14 | | 2,330,000 | | 2,330,000 |
7.5% 2/15/14 | | 60,000 | | 58,500 |
Corporate Bonds - continued |
| Principal
Amount (b) | | Value |
Nonconvertible Bonds - continued |
TELECOMMUNICATION SERVICES - continued |
Diversified Telecommunication Services - continued |
Qwest Communications International, Inc.: - continued | | | | |
9.0575% 2/15/09 (i) | | $ 226,000 | | $ 226,565 |
Qwest Corp.: | | | | |
7.5% 10/1/14 | | 500,000 | | 515,000 |
7.625% 6/15/15 | | 2,065,000 | | 2,121,788 |
8.61% 6/15/13 (i) | | 90,000 | | 95,400 |
SBC Communications, Inc.: | | | | |
6.15% 9/15/34 | | 500,000 | | 484,703 |
6.45% 6/15/34 | | 220,000 | | 218,889 |
Sprint Capital Corp. 8.75% 3/15/32 | | 9,313,000 | | 10,750,340 |
Telecom Italia Capital SA 7.2% 7/18/36 | | 2,225,000 | | 2,313,826 |
Telefonica de Argentina SA 9.125% 11/7/10 | | 404,000 | | 411,575 |
Telefonica Emisiones SAU 7.045% 6/20/36 | | 4,999,000 | | 5,204,654 |
Time Warner Telecom Holdings, Inc. 9.25% 2/15/14 | | 1,260,000 | | 1,297,800 |
U.S. West Capital Funding, Inc. 6.375% 7/15/08 | | 375,000 | | 375,938 |
U.S. West Communications: | | | | |
6.875% 9/15/33 | | 1,385,000 | | 1,267,275 |
7.5% 6/15/23 | | 300,000 | | 292,500 |
Verizon Communications, Inc. 6.25% 4/1/37 | | 2,348,000 | | 2,310,862 |
Verizon Global Funding Corp. 7.75% 12/1/30 | | 5,296,000 | | 6,000,813 |
Windstream Corp.: | | | | |
8.125% 8/1/13 | | 200,000 | | 206,000 |
8.625% 8/1/16 | | 835,000 | | 869,402 |
| | 61,123,014 |
Wireless Telecommunication Services - 0.2% |
Digicel Group Ltd.: | | | | |
8.875% 1/15/15 (f) | | 2,490,000 | | 2,272,125 |
9.25% 9/1/12 (f) | | 820,000 | | 828,200 |
DirecTV Holdings LLC/DirecTV Financing, Inc.: | | | | |
6.375% 6/15/15 | | 1,275,000 | | 1,198,500 |
8.375% 3/15/13 | | 1,000,000 | | 1,027,500 |
Intelsat Subsidiary Holding Co. Ltd. 8.625% 1/15/15 (i) | | 195,000 | | 196,463 |
MetroPCS Wireless, Inc.: | | | | |
9.25% 11/1/14 (f) | | 850,000 | | 837,250 |
9.25% 11/1/14 (f) | | 500,000 | | 492,500 |
Millicom International Cellular SA 10% 12/1/13 | | 860,000 | | 911,600 |
Mobile Telesystems Finance SA: | | | | |
8% 1/28/12 (f) | | 1,645,000 | | 1,661,450 |
Corporate Bonds - continued |
| Principal
Amount (b) | | Value |
Nonconvertible Bonds - continued |
TELECOMMUNICATION SERVICES - continued |
Wireless Telecommunication Services - continued |
Mobile Telesystems Finance SA: - continued | | | | |
8.375% 10/14/10 (f) | | $ 1,570,000 | | $ 1,601,400 |
9.75% 1/30/08 (Reg. S) | | 395,000 | | 397,963 |
Orascom Telecom Finance SCA 7.875% 2/8/14 (f) | | 1,375,000 | | 1,265,000 |
Pakistan Mobile Communications Ltd. 8.625% 11/13/13 (f) | | 500,000 | | 470,000 |
Rural Cellular Corp. 8.25% 3/15/12 | | 360,000 | | 370,800 |
Telecom Personal SA 9.25% 12/22/10 (f) | | 1,645,000 | | 1,653,225 |
| | 15,183,976 |
TOTAL TELECOMMUNICATION SERVICES | | 76,306,990 |
UTILITIES - 0.7% |
Electric Utilities - 0.2% |
AES Gener SA 7.5% 3/25/14 | | 30,000 | | 30,900 |
Chivor SA E.S.P. 9.75% 12/30/14 (f) | | 493,000 | | 536,138 |
Commonwealth Edison Co. 5.4% 12/15/11 | | 1,923,000 | | 1,911,331 |
Edison Mission Energy: | | | | |
7.2% 5/15/19 (f) | | 520,000 | | 485,550 |
7.625% 5/15/27 (f) | | 1,380,000 | | 1,290,300 |
Intergen NV 9% 6/30/17 (f) | | 2,280,000 | | 2,314,200 |
Mirant Americas Generation LLC 9.125% 5/1/31 | | 205,000 | | 198,850 |
National Power Corp. 6.875% 11/2/16 (f) | | 300,000 | | 283,500 |
Nevada Power Co. 6.5% 5/15/18 | | 790,000 | | 790,000 |
PPL Capital Funding, Inc. 6.7% 3/30/67 (i) | | 2,290,000 | | 2,212,719 |
Reliant Energy, Inc.: | | | | |
6.75% 12/15/14 | | 400,000 | | 396,000 |
7.875% 6/15/17 | | 2,595,000 | | 2,530,125 |
| | 12,979,613 |
Gas Utilities - 0.0% |
NiSource Finance Corp. 5.45% 9/15/20 | | 1,650,000 | | 1,491,216 |
Transportadora de Gas del Sur SA 7.875% 5/14/17 (f) | | 1,205,000 | | 1,045,338 |
| | 2,536,554 |
Independent Power Producers & Energy Traders - 0.3% |
AES Corp.: | | | | |
7.75% 3/1/14 | | 3,400,000 | | 3,400,000 |
8.875% 2/15/11 | | 982,000 | | 986,910 |
9% 5/15/15 (f) | | 625,000 | | 656,250 |
Corporate Bonds - continued |
| Principal
Amount (b) | | Value |
Nonconvertible Bonds - continued |
UTILITIES - continued |
Independent Power Producers & Energy Traders - continued |
AES Corp.: - continued | | | | |
9.375% 9/15/10 | | $ 7,000 | | $ 7,193 |
9.5% 6/1/09 | | 19,000 | | 19,428 |
Allegheny Energy Supply Co. LLC 7.8% 3/15/11 | | 9,060,000 | | 9,331,800 |
Mirant North America LLC 7.375% 12/31/13 | | 2,000,000 | | 1,985,000 |
NRG Energy, Inc.: | | | | |
7.25% 2/1/14 | | 1,300,000 | | 1,287,000 |
7.375% 2/1/16 | | 1,765,000 | | 1,747,350 |
7.375% 1/15/17 | | 2,000,000 | | 1,970,000 |
Tenaska Alabama Partners LP 7% 6/30/21 (f) | | 471,355 | | 461,928 |
TXU Corp. 5.55% 11/15/14 | | 3,140,000 | | 2,574,800 |
| | 24,427,659 |
Multi-Utilities - 0.2% |
CMS Energy Corp.: | | | | |
6.55% 7/17/17 | | 5,620,000 | | 5,386,281 |
9.875% 10/15/07 | | 135,000 | | 135,169 |
MidAmerican Energy Holdings, Co. 6.5% 9/15/37 (f) | | 5,765,000 | | 5,811,328 |
Utilicorp Canada Finance Corp. 7.75% 6/15/11 | | 105,000 | | 109,463 |
| | 11,442,241 |
TOTAL UTILITIES | | 51,386,067 |
TOTAL NONCONVERTIBLE BONDS | | 528,491,308 |
TOTAL CORPORATE BONDS (Cost $540,015,368) | 533,574,635 |
U.S. Government and Government Agency Obligations - 27.9% |
|
U.S. Government Agency Obligations - 1.7% |
Fannie Mae: | | | | |
4.375% 7/17/13 | | 8,745,000 | | 8,496,922 |
5% 2/16/12 | | 8,000,000 | | 8,071,304 |
Freddie Mac: | | | | |
5.25% 7/18/11 (e) | | 100,000,000 | | 101,804,700 |
U.S. Government and Government Agency Obligations - continued |
| Principal
Amount (b) | | Value |
U.S. Government Agency Obligations - continued |
Freddie Mac: - continued | | | | |
5.25% 11/5/12 | | $ 280,000 | | $ 279,830 |
Tennessee Valley Authority 5.375% 4/1/56 | | 385,000 | | 383,401 |
TOTAL U.S. GOVERNMENT AGENCY OBLIGATIONS | | 119,036,157 |
U.S. Treasury Inflation Protected Obligations - 4.6% |
U.S. Treasury Inflation-Indexed Notes: | | | | |
0.875% 4/15/10 | | 3,299,190 | | 3,155,373 |
2% 4/15/12 | | 20,534,000 | | 20,214,720 |
2% 1/15/14 | | 181,746,561 | | 177,479,394 |
2% 7/15/14 | | 16,579,050 | | 16,204,662 |
2.375% 4/15/11 | | 75,574,080 | | 75,432,175 |
3.5% 1/15/11 | | 23,940,800 | | 24,789,948 |
TOTAL U.S. TREASURY INFLATION PROTECTED OBLIGATIONS | | 317,276,272 |
U.S. Treasury Obligations - 21.6% |
U.S. Treasury Bonds: | | | | |
6.25% 5/15/30 (e) | | 253,489,000 | | 301,671,682 |
stripped principal: | | | | |
2/15/15 | | 78,530,000 | | 56,370,562 |
5/15/30 | | 35,870,000 | | 11,874,118 |
U.S. Treasury Notes: | | | | |
stripped principal 2/15/12 | | 75,970,000 | | 62,948,894 |
4.25% 8/15/13 (e) | | 37,179,000 | | 37,054,116 |
4.25% 8/15/14 (e) | | 400,000,000 | | 396,906,371 |
4.5% 9/30/11 (n) | | 91,855,000 | | 92,737,635 |
4.625% 7/31/12 (g) | | 208,834,000 | | 212,196,630 |
4.75% 1/31/12 (e) | | 130,000,000 | | 132,539,030 |
4.75% 5/15/14 (e) | | 185,157,000 | | 189,351,917 |
TOTAL U.S. TREASURY OBLIGATIONS | 1,493,650,955 |
TOTAL U.S. GOVERNMENT AND
GOVERNMENT AGENCY OBLIGATIONS (Cost $1,895,619,007) | 1,929,963,384 |
U.S. Government Agency - Mortgage Securities - 9.5% |
| Principal
Amount (b) | | Value |
Fannie Mae - 8.7% |
3.83% 10/1/33 (i) | | $ 2,786,774 | | $ 2,758,550 |
4.5% 4/1/20 | | 2,699,312 | | 2,605,952 |
4.678% 5/1/35 (i) | | 3,414,020 | | 3,398,145 |
5% 9/1/22 (g) | | 25,000,000 | | 24,434,208 |
5% 9/1/37 (g) | | 1,000,000 | | 951,071 |
5% 9/1/37 (g) | | 112,000,000 | | 106,519,907 |
5.101% 5/1/35 (i) | | 3,163,390 | | 3,175,180 |
5.302% 12/1/35 (i) | | 1,496,139 | | 1,495,489 |
5.304% 2/1/36 (i) | | 2,544,999 | | 2,544,596 |
5.5% 9/1/37 (g) | | 100,000,000 | | 97,715,640 |
5.5% 9/1/37 (g) | | 50,000,000 | | 48,857,820 |
5.5% 9/1/37 (g) | | 75,000,000 | | 73,286,730 |
5.5% 9/1/37 (g) | | 54,000,000 | | 52,766,446 |
5.651% 7/1/37 (i) | | 1,694,959 | | 1,704,962 |
6% 9/1/22 (g) | | 1,000,000 | | 1,010,683 |
6% 9/1/37 (g) | | 20,000,000 | | 19,993,814 |
6% 9/1/37 (g) | | 45,000,000 | | 44,986,082 |
6% 9/1/37 (g) | | 50,000,000 | | 49,984,535 |
6.061% 4/1/36 (i) | | 1,202,886 | | 1,217,460 |
6.256% 6/1/36 (i) | | 494,889 | | 499,490 |
6.319% 4/1/36 (i) | | 1,068,489 | | 1,085,171 |
6.5% 9/1/37 (g) | | 8,000,000 | | 8,122,630 |
6.5% 9/1/37 (g) | | 50,000,000 | | 50,766,440 |
TOTAL FANNIE MAE | | 599,881,001 |
Freddie Mac - 0.8% |
5.787% 10/1/35 (i) | | 915,204 | | 919,421 |
5.877% 6/1/36 (i) | | 1,355,088 | | 1,363,672 |
6% 9/1/37 (g) | | 40,000,000 | | 39,989,188 |
6.044% 6/1/36 (i) | | 1,322,750 | | 1,333,385 |
6.049% 7/1/37 (i) | | 6,875,000 | | 6,924,490 |
6.089% 4/1/36 (i) | | 2,232,134 | | 2,249,139 |
6.1% 6/1/36 (i) | | 1,249,753 | | 1,262,810 |
TOTAL FREDDIE MAC | | 54,042,105 |
TOTAL U.S. GOVERNMENT AGENCY - MORTGAGE SECURITIES (Cost $648,211,849) | 653,923,106 |
Asset-Backed Securities - 0.6% |
| Principal
Amount (b) | | Value |
ACE Securities Corp. Home Equity Loan Trust
Series 2005-SD1 Class A1, 5.905% 11/25/50 (i) | | $ 33,912 | | $ 32,667 |
Advanta Business Card Master Trust Series 2007-D1
Class D, 6.9375% 1/22/13 (f)(i) | | 2,590,000 | | 2,542,313 |
Airspeed Ltd. Series 2007-1A Class C1, 8.1113% 4/15/24 (f)(i) | | 4,930,405 | | 4,885,723 |
AmeriCredit Prime Automobile Receivables Trust
Series 2007-1 Class E, 6.96% 3/31/16 (f) | | 2,215,000 | | 2,166,713 |
Ameriquest Mortgage Securities, Inc. Series 2004-R8
Class M9, 8.255% 9/25/34 (i) | | 725,000 | | 531,969 |
Capital Auto Receivables Asset Trust: | | | | |
Series 2006-1: | | | | |
Class C, 5.55% 1/18/11 | | 1,500,000 | | 1,504,027 |
Class D, 7.16% 1/15/13 (f) | | 160,000 | | 159,613 |
Series 2006-SN1A: | | | | |
Class B, 5.5% 4/20/10 (f) | | 340,000 | | 338,764 |
Class C, 5.77% 5/20/10 (f) | | 325,000 | | 322,817 |
Class D, 6.15% 4/20/11 (f) | | 550,000 | | 549,686 |
Capmark VII Ltd. Series 2006-7A Class H, 7.1613% 8/20/36 (f)(i) | | 500,000 | | 357,105 |
Carrington Mortgage Loan Trust Series 2006-NC3 Class M10, 7.505% 8/25/36 (f)(i) | | 290,000 | | 63,438 |
Concord Real Estate CDO Ltd./LLC Series 2006-1A
Class F, 7.07% 12/25/46 (f)(i) | | 250,000 | | 191,250 |
Countrywide Home Loan Trust Series 2006-13N Class N, 7% 8/25/37 (f) | | 766,598 | | 559,616 |
DB Master Finance LLC Series 2006-1 Class M1, 8.285% 6/20/31 (f) | | 235,000 | | 241,545 |
Ford Credit Auto Owner Trust: | | | | |
Series 2006-B Class D, 7.26% 2/15/13 (f) | | 1,175,000 | | 1,169,271 |
Series 2006-C Class D, 6.89% 5/15/13 (f) | | 915,000 | | 910,346 |
Series 2007-A Class D, 7.05% 12/15/13 (f) | | 970,000 | | 921,500 |
GS Auto Loan Trust Series 2006-1 Class D, 6.25% 1/15/14 (f) | | 1,425,000 | | 1,394,135 |
GSAMP Trust Series 2004-AR1 Class B4, 5% 6/25/34 (f)(i) | | 856,000 | | 428,000 |
Guggenheim Structured Real Estate Funding Ltd. Series 2006-3 Class E, 6.97% 9/25/46 (f)(i) | | 250,000 | | 185,000 |
Home Equity Asset Trust Series 2006-3N Class B, 6.5% 8/27/36 (f) | | 250,000 | | 30,000 |
Kent Funding III Ltd. Series 2006-3A Class D, 8.455% 10/31/36 (i) | | 248,743 | | 74,623 |
Long Beach Mortgage Loan Trust Series 2006-6 Class M9, 7.405% 7/25/36 (i) | | 150,000 | | 22,500 |
Asset-Backed Securities - continued |
| Principal
Amount (b) | | Value |
Merna Reinsurance Ltd. Series 2007-1 Class B, 7.11% 6/30/12 (f)(i) | | $ 5,400,000 | | $ 5,400,000 |
Newcastle CDO VIII Series 2006-8A Class 10, 7.57% 11/1/52 (f)(i) | | 250,000 | | 178,297 |
Resource Real Estate Funding CDO Series 2007-1A
Class J, 8.27% 9/1/46 (f)(i) | | 250,000 | | 202,332 |
ROCK 1 CRE CDO LLC Series 2006-1A Class H, 6.66% 12/15/26 (f)(i) | | 185,000 | | 151,619 |
SIRENS B.V. Series 2007-2 Class A1, 7.16% 4/13/10 (f)(i) | | 10,000,000 | | 9,496,000 |
Structured Asset Securities Corp. Series 2006-BC1 Class B1, 8.005% 3/25/36 (f)(i) | | 100,000 | | 15,310 |
Swift Master Auto Receivables Trust Series 2007-1 Class B, 5.8313% 6/15/12 (i) | | 3,285,000 | | 3,279,767 |
TIAA Real Estate CDO Ltd./TIAA Real Estate CDO Corp. Series 2002-1A Class IV, 6.84% 5/22/37 (f) | | 235,000 | | 202,725 |
Wachovia Auto Loan Trust Series 2006-2A Class E, 7.05% 5/20/14 (f) | | 1,390,000 | | 1,336,714 |
WaMu Asset-Backed Certificates Series 2006-HE5
Class B1, 8.005% 10/25/36 (f)(i) | | 1,330,000 | | 266,000 |
TOTAL ASSET-BACKED SECURITIES (Cost $43,736,623) | 40,111,385 |
Collateralized Mortgage Obligations - 0.4% |
|
Private Sponsor - 0.2% |
ABN AMRO Mortgage Corp.: | | | | |
Series 2003-2 Class B4, 5.3302% 3/25/18 (i) | | 197,649 | | 152,943 |
Series 2003-9 Class B5, 4.5164% 8/25/18 (f) | | 327,216 | | 139,067 |
Banc of America Mortgage Securities, Inc. Series 2004-7 Class 15B4, 5.305% 8/25/19 (f)(i) | | 81,060 | | 57,235 |
Bayview Commercial Asset Trust Series 2006-3A Class IO, 1.1688% 10/25/36 (i)(k) | | 16,194,401 | | 1,910,939 |
Chase Mortgage Finance Trust Series 2007-A1 Class 1A5, 4.3588% 2/25/37 (i) | | 518,464 | | 511,072 |
Countrywide Alternative Loan Trust Series 2006-OC5N Class N, 7.25% 7/25/37 (f) | | 86,015 | | 43,260 |
Countrywide Home Loans pass-thru certificates
Series 2007-HY5 Class 3A1, 6.2335% 9/25/37 (i) | | 3,790,000 | | 3,733,150 |
Countrywide Home Loans, Inc.: | | | | |
Series 2003-28 Class B3, 5.5% 8/25/33 | | 94,077 | | 68,445 |
Series 2003-35 Class B, 4.639% 9/25/18 (i) | | 177,714 | | 141,190 |
Collateralized Mortgage Obligations - continued |
| Principal
Amount (b) | | Value |
Private Sponsor - continued |
Credit Suisse First Boston Mortgage Securities Corp.: | | | | |
Series 2003-17 Class B4, 5.389% 6/25/33 (f)(i) | | $ 394,470 | | $ 286,579 |
Series 2004-3 Class DB4, 5.8427% 4/25/34 (i) | | 118,919 | | 35,236 |
floater Series 2007-AR7 Class 2A1, 4.6454% 11/25/34 (i) | | 2,239,394 | | 2,200,150 |
Diversified REIT Trust Series 1999-1A: | | | | |
Class F, 6.78% 3/18/11 (f)(i) | | 250,000 | | 253,304 |
Class G, 6.78% 3/18/11 (f)(i) | | 250,000 | | 250,762 |
GMAC Commercial Mortgage Securities, Inc.
Series 1993-C3 Class L, 6.974% 8/15/36 (f) | | 324,000 | | 128,678 |
GMAC Mortgage Loan Trust Series 2003-J10 Class B2, 4.75% 1/25/19 (f) | | 167,483 | | 105,170 |
JPMorgan Mortgage Trust Series 2007-A1 Class 3A2, 5.0072% 7/25/35 (i) | | 2,345,046 | | 2,309,075 |
Nomura Home Equity Loan, Inc. floater Series 2006-FM2 Class B1, 7.805% 7/25/36 (f)(i) | | 4,165,000 | | 920,186 |
RESI Finance LP/RESI Finance DE Corp. floater
Series 2003-CB1: | | | | |
Class B4, 7% 6/10/35 (f)(i) | | 36,866 | | 37,050 |
Class B5, 7.6% 6/10/35 (f)(i) | | 27,649 | | 27,787 |
Class B6, 8.1% 6/10/35 (f)(i) | | 13,825 | | 13,963 |
RESIX Finance Ltd. floater Series 2007-A Class BB, 8.9613% 2/15/39 (f)(i) | | 498,366 | | 458,497 |
Structured Asset Securities Corp. floater: | | | | |
Series 2005-AR1 Class B1, 7.505% 9/25/35 (f)(i) | | 530,000 | | 132,500 |
Series 2006-BC5 Class B, 8.005% 12/25/36 (f)(i) | | 1,050,000 | | 374,010 |
Wells Fargo Mortgage Backed Securities Trust: | | | | |
Series 2003-12 Class B6, 4.75% 11/25/18 (f) | | 319,674 | | 135,861 |
Series 2005-AR12 Class 2A6, 4.3186% 7/25/35 (i) | | 660,131 | | 643,781 |
Series 2005-AR3 Class 2A1, 4.187% 3/25/35 (i) | | 1,295,238 | | 1,270,546 |
TOTAL PRIVATE SPONSOR | | 16,340,436 |
U.S. Government Agency - 0.2% |
Fannie Mae subordinate REMIC pass-thru certificates planned amortization class: | | | | |
Series 2001-68 Class QZ, 5.5% 12/25/16 | | 4,222,625 | | 4,230,956 |
Collateralized Mortgage Obligations - continued |
| Principal
Amount (b) | | Value |
U.S. Government Agency - continued |
Fannie Mae subordinate REMIC pass-thru certificates planned amortization class: - continued | | | | |
Series 2002-9 Class PC, 6% 3/25/17 | | $ 853,157 | | $ 861,562 |
Freddie Mac Multi-class participation certificates guaranteed sequential payer Series 2528 Class HN, 5% 11/15/17 | | 5,515,000 | | 5,417,799 |
TOTAL U.S. GOVERNMENT AGENCY | | 10,510,317 |
TOTAL COLLATERALIZED MORTGAGE OBLIGATIONS (Cost $30,951,247) | 26,850,753 |
Commercial Mortgage Securities - 0.3% |
|
Asset Securitization Corp.: | | | | |
Series 1996-D2 Class B1A, 8.6011% 2/14/29 (f)(i) | | 750,000 | | 806,279 |
Series 1997-D4: | | | | |
Class B2, 7.525% 4/14/29 | | 1,494,104 | | 1,603,687 |
Class B5, 7.525% 4/14/29 | | 129,000 | | 122,449 |
Banc of America Commercial Mortgage, Inc.
Series 2003-2 Class BWF, 7.55% 10/11/37 (f) | | 96,700 | | 107,331 |
Bear Stearns Commercial Mortgage Securities Trust
Series 2007-BBA8 Class L, 7.5113% 3/15/22 (f)(i) | | 100,000 | | 98,531 |
Chase Commercial Mortgage Securities Corp.
Series 1998-2 Class J, 6.39% 11/18/30 (f) | | 490,787 | | 182,205 |
Citigroup Commercial Mortgage Trust Series 2006-FL2 Class CNP3, 6.8113% 8/16/21 (f)(i) | | 5,182,308 | | 5,144,251 |
Claregold Trust Series 2007-2A: | | | | |
Class F, 5.01% 5/15/44 (f)(i) | CAD | 138,000 | | 116,437 |
Class G, 5.01% 5/15/44 (f)(i) | CAD | 30,000 | | 24,091 |
Class H, 5.01% 5/15/44 (f)(i) | CAD | 20,000 | | 14,110 |
Class J, 5.01% 5/15/44 (f)(i) | CAD | 20,000 | | 12,897 |
Class K, 5.01% 5/15/44 (f)(i) | CAD | 10,000 | | 5,907 |
Class L, 5.01% 5/15/44 (f)(i) | CAD | 36,000 | | 20,547 |
Class M, 5.01% 5/15/44 (f)(i) | CAD | 165,000 | | 67,856 |
Commercial Mortgage Acceptance Corp. Series 1998-C1 Class G, 6.21% 7/15/31 (f) | | 500,000 | | 489,536 |
Commercial Mortgage Asset Trust Series 1999-C1 Class F, 6.25% 1/17/32 (f) | | 550,000 | | 537,767 |
Credit Suisse First Boston Mortgage Securities Corp.: | | | | |
Series 1997-C2 Class F, 7.46% 1/17/35 (i) | | 500,000 | | 534,151 |
Series 1998-C1 Class H, 6% 5/17/40 (f) | | 130,000 | | 64,675 |
Series 2003-C3 Class J, 4.231% 5/15/38 (f) | | 300,000 | | 265,640 |
Commercial Mortgage Securities - continued |
| Principal
Amount (b) | | Value |
Credit Suisse Mortgage Capital Certificates floater
Series 2007-TFL1 Class L, 7.5113% 2/15/22 (f)(i) | | $ 100,000 | | $ 91,500 |
Crest Ltd. Series 2001-1A Class C, 9% 2/25/34 (f) | | 500,000 | | 566,738 |
First Chicago/Lennar Trust I weighted average coupon Series 1997-CHL1 Class E, 8.0609% 4/29/39 (f)(i) | | 195,462 | | 198,349 |
Ginnie Mae guaranteed REMIC pass-thru securities sequential payer Series 2003-47 Class C, 4.227% 10/16/27 | | 5,454,626 | | 5,346,368 |
Global Signal Trust III Series 2006-1 Class F, 7.036% 2/15/36 | | 200,000 | | 198,188 |
GMAC Commercial Mortgage Securities, Inc.: | | | | |
Series 1999-C1 Class F, 6.02% 5/15/33 (f) | | 500,000 | | 484,628 |
Series 1999-C2I Class K, 6.481% 9/15/33 (l) | | 285,000 | | 163,163 |
Series 1999-C3: | | | | |
Class J, 6.974% 8/15/36 (f) | | 226,000 | | 224,446 |
Class K, 6.974% 8/15/36 (f) | | 427,000 | | 355,678 |
Series 2000-C1 Class K, 7% 3/15/33 (f) | | 90,000 | | 84,516 |
Series 2003-J10 Class B2, 6.75% 4/15/29 (i) | | 500,000 | | 499,571 |
Greenwich Capital Commercial Funding Corp.
Series 2003-C2 Class J, 5.234% 11/5/13 (f)(i) | | 250,000 | | 223,464 |
GS Mortgage Securities Corp. II: | | | | |
floater: | | | | |
Series 2006-FL8A Class J, 7.08% 6/6/20 (f)(i) | | 250,000 | | 245,000 |
Series 2007-EOP Class L, 6.63% 3/1/20 (f)(i) | | 400,000 | | 388,000 |
Series 1998-GLII Class G, 6.9707% 4/13/31 (f)(i) | | 600,000 | | 631,599 |
Series 2006-RR2: | | | | |
Class M, 5.6876% 6/1/46 (f)(i) | | 100,000 | | 56,694 |
Class N, 5.6876% 6/1/46 (f)(i) | | 100,000 | | 51,851 |
LB Commercial Conduit Mortgage Trust Series 1998-C4 Class G, 5.6% 10/15/35 (f) | | 250,000 | | 250,477 |
LB-UBS Commercial Mortgage Trust sequential payer Series 2006-C7 Class A1, 5.279% 11/15/38 | | 1,011,490 | | 1,010,068 |
LNR CFL Series 2004-1: | | | | |
Class I10, 7.72% 7/26/08 (f) | | 180,000 | | 179,536 |
Class I11, 7.72% 7/26/08 (f) | | 100,000 | | 99,520 |
Class I12, 7.72% 7/26/08 (f) | | 100,000 | | 99,256 |
Class I9, 7.72% 7/26/08 (f) | | 153,200 | | 152,998 |
Merrill Lynch Mortgage Trust: | | | | |
Series 2004-KEY2 Class K, 5.091% 8/12/39 (f)(i) | | 100,000 | | 81,794 |
Series 2006-KEY2 Class L, 5.091% 8/12/39 (f) | | 300,000 | | 235,326 |
Providence Place Group Ltd. Partnership Series 2000-C1 Class A2, 7.75% 7/20/28 | | 381,076 | | 449,587 |
Commercial Mortgage Securities - continued |
| Principal
Amount (b) | | Value |
Real Estate Asset Liquidity Trust: | | | | |
Series 2006-2: | | | | |
Class F, 4.456% 9/12/38 (l) | CAD | 107,000 | | $ 83,708 |
Class G, 4.456% 9/12/38 (l) | CAD | 54,000 | | 41,084 |
Class H, 4.456% 9/12/38 (l) | CAD | 36,000 | | 24,127 |
Class J, 4.456% 9/12/38 (l) | CAD | 36,000 | | 22,460 |
Class K, 4.456% 9/12/38 (l) | CAD | 18,000 | | 9,951 |
Class L, 4.456% 9/12/38 (l) | CAD | 26,000 | | 13,867 |
Class M, 4.456% 9/12/38 (l) | CAD | 130,000 | | 46,060 |
Series 2007-1: | | | | |
Class F, 4.57% 4/12/23 | CAD | 126,000 | | 98,576 |
Class G, 4.57% 4/12/23 | CAD | 42,000 | | 31,570 |
Class H, 4.57% 4/12/23 | CAD | 42,000 | | 27,960 |
Class J, 4.57% 4/12/23 | CAD | 42,000 | | 25,632 |
Class K, 4.57% 4/12/23 | CAD | 21,000 | | 11,772 |
Class L, 4.57% 4/12/23 | CAD | 63,000 | | 34,154 |
Class M, 4.57% 4/12/23 | CAD | 185,000 | | 71,027 |
Salomon Brothers Mortgage Securities VII, Inc.
Series 2001-MMA: | | | | |
Class E6, 6.5% 2/18/34 (f)(i) | | $ 165,000 | | 157,539 |
Class F6, 6.5% 2/18/34 (f)(i) | | 37,000 | | 32,993 |
SBA CMBS Trust Series 2006-1A Class J, 7.825% 11/15/36 (f) | | 90,000 | | 83,162 |
Wachovia Ltd./Wachovia LLC Series 2006-1 Class 1ML, 10.86% 9/25/26 (f)(i) | | 400,000 | | 345,450 |
TOTAL COMMERCIAL MORTGAGE SECURITIES (Cost $23,960,249) | 23,747,754 |
Foreign Government and Government Agency Obligations - 1.1% |
|
Argentine Republic: | | | | |
discount (with partial capitalization through 12/31/13) 8.28% 12/31/33 | | 2,289,412 | | 1,974,618 |
par 1.33% 12/31/38 (i) | | 135,000 | | 50,625 |
5.389% 8/3/12 (i) | | 3,659,375 | | 3,209,356 |
7% 3/28/11 | | 2,810,000 | | 2,546,406 |
7% 9/12/13 | | 3,595,000 | | 2,959,684 |
Brazilian Federative Republic: | | | | |
7.125% 1/20/37 | | 1,085,000 | | 1,179,938 |
8.25% 1/20/34 | | 410,000 | | 503,685 |
8.75% 2/4/25 | | 280,000 | | 347,200 |
11% 8/17/40 | | 2,285,000 | | 3,020,770 |
Foreign Government and Government Agency Obligations - continued |
| Principal
Amount (b) | | Value |
Brazilian Federative Republic: - continued | | | | |
12.25% 3/6/30 | | $ 745,000 | | $ 1,238,563 |
12.75% 1/15/20 | | 490,000 | | 761,950 |
Central Bank of Nigeria promissory note 5.092% 1/5/10 | | 531,190 | | 506,913 |
Chilean Republic 5.5% 1/15/13 | | 105,000 | | 106,754 |
Colombian Republic: | | | | |
7.375% 9/18/37 | | 1,355,000 | | 1,436,300 |
11.75% 2/25/20 | | 557,000 | | 791,497 |
Dominican Republic: | | | | |
(Reg. S) 9.5% 9/27/11 | | 1,126,391 | | 1,185,527 |
Brady 6.3125% 8/30/09 (i) | | 51,655 | | 51,526 |
6.25% 8/30/24 (i) | | 2,000,000 | | 1,988,000 |
9.04% 1/23/18 (f) | | 1,289,713 | | 1,412,235 |
9.04% 1/23/18 (f) | | 81,973 | | 81,481 |
Ecuador Republic: | | | | |
10% 8/15/30 (Reg. S) | | 2,240,000 | | 1,971,200 |
euro par 5% 2/28/25 | | 153,000 | | 109,395 |
Indonesian Republic: | | | | |
(Reg. S) 6.75% 3/10/14 | | 1,175,000 | | 1,183,813 |
6.625% 2/17/37 (f) | | 1,550,000 | | 1,422,125 |
Islamic Republic of Pakistan: | | | | |
6.75% 2/19/09 | | 395,000 | | 383,150 |
6.875% 6/1/17 (f) | | 100,000 | | 85,500 |
7.125% 3/31/16 (f) | | 600,000 | | 526,500 |
Lebanese Republic: | | | | |
(Reg. S): | | | | |
8.625% 6/20/13 | | 150,000 | | 144,375 |
8.63% 11/30/09 (i) | | 1,400,000 | | 1,373,750 |
7.125% 3/5/10 | | 250,000 | | 239,375 |
7.75% 9/7/12 | | 400,000 | | 374,000 |
7.875% 5/20/11 (Reg. S) | | 1,040,000 | | 988,000 |
8.63% 11/30/09 (f)(i) | | 105,000 | | 103,031 |
10.25% 10/6/09 (Reg. S) | | 400,000 | | 405,000 |
Peruvian Republic: | | | | |
6.1425% 3/7/27 (i) | | 340,000 | | 339,150 |
euro Brady past due interest 6.125% 3/7/17 (i) | | 1,306,700 | | 1,303,433 |
Philippine Republic: | | | | |
8.25% 1/15/14 | | 1,580,000 | | 1,710,350 |
8.875% 3/17/15 | | 580,000 | | 653,950 |
9% 2/15/13 | | 630,000 | | 700,875 |
9.5% 2/2/30 | | 625,000 | | 789,063 |
9.875% 1/15/19 | | 1,035,000 | | 1,273,050 |
Foreign Government and Government Agency Obligations - continued |
| Principal
Amount (b) | | Value |
Philippine Republic: - continued | | | | |
10.625% 3/16/25 | | $ 715,000 | | $ 967,967 |
Republic of Fiji 6.875% 9/13/11 | | 400,000 | | 364,000 |
Republic of Serbia 3.75% 11/1/24 (d)(f) | | 540,000 | | 498,150 |
Russian Federation: | | | | |
7.5% 3/31/30 (Reg. S) | | 6,200,840 | | 6,882,932 |
12.75% 6/24/28 (Reg. S) | | 865,000 | | 1,524,563 |
Turkish Republic: | | | | |
6.875% 3/17/36 | | 1,275,000 | | 1,193,719 |
7% 9/26/16 | | 2,020,000 | | 2,045,250 |
7.375% 2/5/25 | | 855,000 | | 875,306 |
11% 1/14/13 | | 1,285,000 | | 1,542,000 |
11.5% 1/23/12 | | 1,025,000 | | 1,217,188 |
11.875% 1/15/30 | | 860,000 | | 1,309,350 |
Ukraine Cabinet of Ministers 6.58% 11/21/16 (f) | | 1,850,000 | | 1,830,982 |
Ukraine Government (Reg. S) 8.6881% 8/5/09 (i) | | 475,000 | | 499,320 |
United Mexican States: | | | | |
6.75% 9/27/34 | | 85,000 | | 93,203 |
7.5% 4/8/33 | | 575,000 | | 685,400 |
8.3% 8/15/31 | | 815,000 | | 1,050,372 |
Uruguay Republic 8% 11/18/22 | | 846,902 | | 912,537 |
Venezuelan Republic: | | | | |
5.375% 8/7/10 | | 850,000 | | 786,250 |
6.36% 4/20/11 (i) | | 1,990,000 | | 1,830,800 |
7.65% 4/21/25 | | 610,000 | | 523,075 |
8.5% 10/8/14 | | 565,000 | | 543,813 |
9.25% 9/15/27 | | 2,175,000 | | 2,158,688 |
9.375% 1/13/34 | | 685,000 | | 679,863 |
10.75% 9/19/13 | | 1,255,000 | | 1,342,850 |
13.625% 8/15/18 | | 1,168,000 | | 1,489,200 |
Vietnamese Socialist Republic Brady par 4% 3/12/28 (d) | | 90,000 | | 73,575 |
TOTAL FOREIGN GOVERNMENT AND
GOVERNMENT AGENCY OBLIGATIONS (Cost $75,673,898) | 74,352,466 |
Preferred Stocks - 0.1% |
| | Shares | | Value |
Convertible Preferred Stocks - 0.1% |
ENERGY - 0.1% |
Oil, Gas & Consumable Fuels - 0.1% |
El Paso Corp. 4.99% | | 1,566 | | $ 2,153,555 |
UTILITIES - 0.0% |
Electric Utilities - 0.0% |
AES Trust III 6.75% | | 10,000 | | 461,500 |
TOTAL CONVERTIBLE PREFERRED STOCKS | | | 2,615,055 |
Nonconvertible Preferred Stocks - 0.0% |
TELECOMMUNICATION SERVICES - 0.0% |
Wireless Telecommunication Services - 0.0% |
Rural Cellular Corp. 12.25% pay-in-kind | | 520 | | 650,000 |
TOTAL PREFERRED STOCKS (Cost $3,200,260) | | 3,265,055 |
Floating Rate Loans - 0.1% |
| Principal
Amount (b) | | |
CONSUMER DISCRETIONARY - 0.1% |
Hotels, Restaurants & Leisure - 0.0% |
Intrawest Resorts term loan 7.6225% 10/25/07 (i) | | $ 249,952 | | 243,703 |
Media - 0.1% |
CSC Holdings, Inc. Tranche B, term loan 7.07% 3/31/13 (i) | | 1,550,000 | | 1,488,000 |
Zuffa LLC term loan 7.5625% 6/19/15 (i) | | 1,350,000 | | 1,201,500 |
| | 2,689,500 |
Specialty Retail - 0.0% |
The Pep Boys - Manny, Moe & Jack term loan 7.54% 10/27/13 (i) | | 202,000 | | 197,455 |
Toys 'R' US, Inc. term loan 8.32% 12/9/08 (i) | | 500,000 | | 488,750 |
| | 686,205 |
TOTAL CONSUMER DISCRETIONARY | | 3,619,408 |
Floating Rate Loans - continued |
| Principal
Amount (b) | | Value |
ENERGY - 0.0% |
Oil, Gas & Consumable Fuels - 0.0% |
Kinder Morgan, Inc. Tranche B, term loan 7.0708% 5/30/14 (i) | | $ 1,970,000 | | $ 1,871,500 |
FINANCIALS - 0.0% |
Diversified Financial Services - 0.0% |
LandSource Communities Development LLC: | | | | |
Tranche 2LN, term loan 9.9988% 2/27/14 (i) | | 80,000 | | 71,600 |
Tranche B 1LN, term loan 8.2488% 2/27/13 (i) | | 109,600 | | 98,640 |
| | 170,240 |
Real Estate Investment Trusts - 0.0% |
Capital Automotive (REIT) Tranche B, term loan 7.07% 12/16/10 (i) | | 250,000 | | 240,000 |
General Growth Properties, Inc. Tranche A1, term loan 6.58% 2/24/10 (i) | | 209,211 | | 202,934 |
Spirit Finance Corp. term loan 8.3595% 8/1/13 (i) | | 134,000 | | 120,600 |
| | 563,534 |
Real Estate Management & Development - 0.0% |
Tishman Speyer Properties term loan 7.08%
12/27/12 (i) | | 143,000 | | 137,280 |
TOTAL FINANCIALS | | 871,054 |
HEALTH CARE - 0.0% |
Health Care Providers & Services - 0.0% |
Community Health Systems, Inc.: | | | | |
term loan 7.7563% 7/25/14 (i) | | 1,022,560 | | 986,770 |
Tranche DD, term loan 7/25/14 (m) | | 67,440 | | 65,080 |
| | 1,051,850 |
INDUSTRIALS - 0.0% |
Commercial Services & Supplies - 0.0% |
Adesa, Inc. term loan 7.61% 10/20/13 (i) | | 480,000 | | 448,800 |
INFORMATION TECHNOLOGY - 0.0% |
Software - 0.0% |
Kronos, Inc. Tranche 1LN, term loan 7.61%
6/11/14 (i) | | 1,680,000 | | 1,545,600 |
Floating Rate Loans - continued |
| Principal
Amount (b) | | Value |
TELECOMMUNICATION SERVICES - 0.0% |
Diversified Telecommunication Services - 0.0% |
Intelsat Ltd. Tranche B, term loan 7.36% 7/3/13 (i) | | $ 410,000 | | $ 400,775 |
Wireless Telecommunication Services - 0.0% |
Crown Castle International Corp. Tranche B, term loan 6.8385% 3/6/14 (i) | | 9,975 | | 9,476 |
TOTAL TELECOMMUNICATION SERVICES | | 410,251 |
TOTAL FLOATING RATE LOANS (Cost $9,964,709) | 9,818,463 |
Sovereign Loan Participations - 0.0% |
|
Indonesian Republic loan participation: | | | | |
- Citibank 6.25% 12/14/19 (i) | | 128,000 | | 122,879 |
- Credit Suisse First Boston 6.25% 3/28/13 (i) | | 98,751 | | 97,764 |
- Deutsche Bank 6.25% 3/28/13 (i) | | 11,623 | | 11,507 |
TOTAL SOVEREIGN LOAN PARTICIPATIONS (Cost $222,814) | 232,150 |
Fixed-Income Funds - 51.3% |
| Shares | | |
Fidelity 1-3 Year Duration Securitized Bond Central Fund (j) | 3,257,659 | | 310,910,980 |
Fidelity 2-5 Year Duration Securitized Bond Central Fund (j) | 4,113,459 | | 402,255,147 |
Fidelity Corporate Bond 1-10 Year Central Fund (j) | 7,711,107 | | 763,168,246 |
Fidelity Floating Rate Central Fund (j) | 2,379,674 | | 228,686,671 |
Fidelity Mortgage Backed Securities Central Fund (j) | 9,810,580 | | 964,085,734 |
Fidelity Ultra-Short Central Fund (j) | 9,260,420 | | 875,572,723 |
TOTAL FIXED-INCOME FUNDS (Cost $3,624,184,607) | 3,544,679,501 |
Preferred Securities - 0.1% |
| Principal
Amount (b) | | |
CONSUMER DISCRETIONARY - 0.1% |
Media - 0.1% |
Globo Comunicacoes e Participacoes SA 9.375% | $ 2,090,000 | | 2,122,796 |
Net Servicos de Comunicacao SA 9.25% (f) | 1,035,000 | | 1,050,272 |
| | 3,173,068 |
Preferred Securities - continued |
| Principal
Amount (b) | | Value |
ENERGY - 0.0% |
Oil, Gas & Consumable Fuels - 0.0% |
Pemex Project Funding Master Trust 7.75% | $ 3,034,000 | | $ 3,120,416 |
TOTAL PREFERRED SECURITIES (Cost $6,282,522) | 6,293,484 |
Cash Equivalents - 27.9% |
| Maturity
Amount | | |
Investments in repurchase agreements in a joint trading account at: | | | |
5.37%, dated 8/31/07 due 9/4/07 (Collateralized by U.S. Government Obligations) # | $ 837,988,965 | | 837,489,000 |
5.4%, dated 8/31/07 due 9/4/07 (Collateralized by U.S. Government Obligations) # (a) | 1,095,166,706 | | 1,094,510,000 |
TOTAL CASH EQUIVALENTS (Cost $1,931,999,000) | 1,931,999,000 |
TOTAL INVESTMENT PORTFOLIO - 127.0% (Cost $8,834,022,153) | | 8,778,811,136 |
NET OTHER ASSETS - (27.0)% | | (1,864,788,095) |
NET ASSETS - 100% | $ 6,914,023,041 |
Swap Agreements |
| Expiration Date | | Notional Amount | | |
Credit Default Swaps |
Pay monthly a fixed rate of .15% multiplied by the notional amount and receive from Credit Suisse First Boston upon each credit event of one of the issues of Dow Jones ABX AA 07-1 Index, par value of the proportional notional amount (g) | August 2037 | | $ 7,200,000 | | 1,728,000 |
Receive monthly notional amount multiplied by 3.35% and pay Morgan Stanley, Inc. upon credit event of Morgan Stanley ABS Capital I, Inc., par value of the notional amount of Morgan Stanley ABS Capital I, Inc. Series 2004-HE8 Class B3, 7.3913% 9/25/34 | Oct. 2034 | | 134,000 | | (23,527) |
Swap Agreements |
| Expiration Date | | Notional Amount | | Value |
Credit Default Swaps |
Receive monthly notional amount multiplied by 3.35% and pay Morgan Stanley, Inc. upon credit event of Morgan Stanley ABS Capital I, Inc., par value of the notional amount of Morgan Stanley ABS Capital I, Inc. Series 2004-HE7, Class B3, 9.01% 8/25/34 | Sept. 2034 | | $ 134,000 | | $ (33,139) |
Receive monthly notional amount multiplied by 3.35% and pay Morgan Stanley, Inc. upon credit event of Morgan Stanley ABS Capital I, Inc., par value of the notional amount of Morgan Stanley ABS Capital I, Inc. Series 2004-NC7, Class B3, 7.6913% 7/25/34 | August 2034 | | 134,000 | | (20,670) |
Receive from Bank of America upon credit event of Bristol-Myers Squibb Co., par value of the notional amount of Bristol-Myers Squibb Co. 5.25% 8/15/13, and pay quarterly notional amount multiplied by .30% | Sept. 2017 | | 3,700,000 | | 37,972 |
Receive from Bank of America upon credit event of Eli Lilly & Co., par value of the notional amount of Eli Lilly & Co. 6.57% 1/1/16, and pay quarterly notional amount multiplied by .22% | Sept. 2017 | | 2,995,000 | | 8,078 |
Receive from Citibank upon credit event of Bristol-Myers Squibb Co., par value of the notional amount of Bristol-Myers Squibb Co. 5.25% 8/15/13, and pay quarterly notional amount multiplied by .32% | Sept. 2017 | | 1,500,000 | | 12,951 |
Receive from Citibank upon credit event of Schering-Plough Corp., par value of the notional amount of Schering-Plough Corp. 5.55% 12/1/13, and pay quarterly notional amount multiplied by .4% | Sept. 2017 | | 2,500,000 | | 17,220 |
Receive from Citibank upon credit event of Schering-Plough Corp., par value of the notional amount of Schering-Plough Corp. 5.55% 12/1/13, and pay quarterly notional amount multiplied by .42% | Sept. 2017 | | 4,400,000 | | 23,344 |
Swap Agreements - continued |
| Expiration Date | | Notional Amount | | Value |
Credit Default Swaps - continued |
Receive from Deutsche Bank upon credit event of Household Finance Corp., par value of the notional amount of Household Finance Corp. 7% 5/15/12, and pay quarterly notional amount multiplied by .73% | Sept. 2012 | | $ 5,900,000 | | $ (100,076) |
Receive from Goldman Sachs upon credit event of CSX Corp., par value of the notional amount of CSX Corp. 5.30% 2/15/14, and pay quarterly notional amount multiplied by .77% | Sept. 2017 | | 5,000,000 | | 52,701 |
Receive from Goldman Sachs upon credit event of Eli Lilly & Co., par value of the notional amount of Eli Lilly & Co. 6.57% 1/1/16, and pay quarterly notional amount multiplied by .24% | Sept. 2017 | | 2,500,000 | | 3,639 |
Receive monthly a fixed rate of .15% multiplied by the notional amount and pay to Credit Suisse First Boston upon each credit event of one of the issues of Dow Jones ABX AA 07-1 Index, par value of the proportional notional amount (g) | August 2037 | | 4,000,000 | | (1,120,000) |
Receive monthly a fixed rate of .15% multiplied by the notional amount and pay to UBS upon each credit event of one of the issues of Dow Jones ABX AA 07-1 Index, par value of the proportional notional amount (g) | August 2037 | | 7,200,000 | | (2,016,000) |
Receive monthly a fixed rate of .15% multiplied by the notional amount and pay to UBS upon each credit event of one of the issues of Dow Jones ABX AA 07-1 Index, par value of the proportional notional amount (g) | August 2037 | | 2,600,000 | | (728,000) |
Receive monthly notional amount multiplied by .82% and pay UBS upon credit event of Morgan Stanley ABS Capital I, Inc., par value of the notional amount of Morgan Stanley ABS Capital I, Inc. Series 2004-NC6 Class M3, 5.6413% 7/25/34 | August 2034 | | 134,000 | | (14,889) |
Swap Agreements - continued |
| Expiration Date | | Notional Amount | | Value |
Credit Default Swaps - continued |
Receive monthly notional amount multiplied by .85% and pay UBS upon credit event of Ameriquest Mortgage Securities, Inc., par value of the notional amount of Ameriquest Mortgage Securities, Inc. Series 2004-R9 Class M5, 5.5913% 10/25/34 | Nov. 2034 | | $ 134,000 | | $ (22,366) |
Receive monthly notional amount multiplied by .85% and pay UBS upon credit event of Morgan Stanley ABS Capital I, Inc., par value of the notional amount of Morgan Stanley ABS Capital I, Inc. Series 2004-NC8 Class M6, 5.4413% 9/25/34 | Oct. 2034 | | 134,000 | | (18,954) |
Receive monthly notional amount multiplied by 1.6% and pay Morgan Stanley, Inc. upon credit event of Park Place Securities, Inc., par value of the notional amount of Park Place Securities, Inc. Series 2005-WHQ2 Class M7, 5.4413% 5/25/35 | June 2035 | | 100,000 | | (31,011) |
Receive monthly notional amount multiplied by 1.66% and pay Morgan Stanley, Inc. upon credit event of Park Place Securities, Inc., par value of the notional amount of Park Place Securities, Inc. Series 2005-WHQ2 Class M7, 5.4413% 5/25/35 | June 2035 | | 134,000 | | (41,373) |
Receive monthly notional amount multiplied by 2.22% and pay JPMorgan Chase, Inc. upon credit event of Morgan Stanley ABS Capital I, Inc., par value of the notional amount of Morgan Stanley ABS Capital I, Inc. Series 2005-HE3 Class B2, 6.87% 7/25/35 | August 2035 | | 5,325,000 | | (1,502,289) |
Receive monthly notional amount multiplied by 2.39% and pay UBS upon credit event of Fremont Home Loan Trust, par value of the notional amount of Fremont Home Loan Trust Series 2004-1 Class M9, 7.73% 2/25/34 | March 2034 | | 83,835 | | (12,139) |
Receive monthly notional amount multiplied by 2.4% and pay Deutsche Bank upon credit event of Fremont Home Loan Trust, par value of the notional amount of Fremont Home Loan Trust Series 2004-A Class B3, 7.2288% 1/25/34 | Feb. 2034 | | 38,810 | | (31,596) |
Swap Agreements - continued |
| Expiration Date | | Notional Amount | | Value |
Credit Default Swaps - continued |
Receive monthly notional amount multiplied by 2.54% and pay Merrill Lynch upon credit event of Countrywide Home Loans, Inc., par value of the notional amount of Countrywide Home Loans, Inc. Series 2003-BC1 Class B1, 7.6913% 3/25/32 | April 2032 | | $ 11,800 | | $ (362) |
Receive monthly notional amount multiplied by 3% and pay UBS upon credit event of Ameriquest Mortgage Securities, Inc., par value of the notional amount of Ameriquest Mortgage Securities, Inc. Series 2005-R4 Class M9, 7.07% 7/25/35 | August 2035 | | 1,200,000 | | (436,452) |
Receive monthly notional amount multiplied by 5% and pay Deutsche Bank upon credit event of MASTR Asset Backed Securities Trust, par value of the notional amount of MASTR Asset Backed Securities Trust Series 2003-NC1 Class M6, 8.1913% 4/25/33 | May 2033 | | 134,000 | | (38,715) |
Receive monthly notional amount multiplied by 5.55% and pay Deutsche Bank upon credit event of Carrington Mortgage Loan Trust, par value of the notional amount of Carrington Mortgage Loan Trust Series 2006-FRE1 Class M10, 7.74% 7/25/36 | August 2036 | | 1,200,000 | | (503,682) |
Receive monthly notional amount multiplied by 6.25% and pay Deutsche Bank upon credit event of Residential Asset Mortgage Products, Inc., par value of the notional amount of Residential Asset Mortgage Products, Inc. Series 2006-RS5, 7.17% 9/25/35 | Oct. 2036 | | 1,200,000 | | (840,651) |
Receive quarterly notional amount multiplied by .5% and pay Deutsche Bank upon credit event of Fannie Mae, par value of the notional amount of Fannie Mae 5.25% 8/1/12 | Sept. 2012 | | 3,600,000 | | 4,317 |
Receive quarterly notional amount multiplied by .54% and pay to Morgan Stanley, Inc. upon credit event of Fannie Mae, par value of the notional amount of Fannie Mae 5.25% 8/1/12 | Sept. 2012 | | 3,630,000 | | 11,021 |
Swap Agreements - continued |
| Expiration Date | | Notional Amount | | Value |
Credit Default Swaps - continued |
Receive quarterly notional amount multiplied by .72% and pay Bank of America upon credit event of Alleghany Energy Supply Co. LLC, par value of the notional amount of Alleghany Energy Supply Co. LLC 8.25% 4/15/12 | June 2012 | | $ 4,000,000 | | $ (81,914) |
Receive quarterly notional amount multiplied by .78% and pay Deutsche Bank upon credit event of Allegheny Energy Supply Co. LLC, par value of the notional amount of Allegheny Energy Supply Co. LLC 8.25% 4/15/12 | June 2012 | | 3,955,000 | | (72,155) |
Receive quarterly notional amount multiplied by 1.55% and pay Goldman Sachs upon credit event of Reynolds American, Inc., par value of the notional amount of Reynolds American, Inc. 7.625% 6/1/16 | Sept. 2017 | | 6,500,000 | | 76,749 |
TOTAL CREDIT DEFAULT SWAPS | | 81,411,445 | | (5,713,968) |
Interest Rate Swaps |
Receive quarterly a fixed rate equal to 4.3875% and pay quarterly a floating rate based on 3-month LIBOR with Credit Suisse First Boston | March 2010 | | 1,250,000 | | (16,696) |
Receive quarterly a fixed rate equal to 4.774% and pay quarterly a floating rate based on 3-month LIBOR with Credit Suisse First Boston | March 2015 | | 1,250,000 | | (26,171) |
Receive quarterly a fixed rate equal to 4.898% and pay quarterly a floating rate based on 3-month LIBOR with Lehman Brothers, Inc. | August 2014 | | 1,135,000 | | (10,282) |
Receive semi-annually a fixed rate equal to 5.015% and pay quarterly a floating rate based on 3-month LIBOR with Morgan Stanley, Inc. | April 2012 | | 50,000,000 | | 729,585 |
Receive semi-annually a fixed rate equal to 5.062% and pay quarterly a floating rate based on 3-month LIBOR with Credit Suisse First Boston | May 2012 | | 75,000,000 | | 1,267,898 |
Receive semi-annually a fixed rate equal to 5.09% and pay quarterly a floating rate based on 3-month LIBOR with Deutsche Bank | Jan. 2012 | | 75,000,000 | | 399,503 |
Swap Agreements - continued |
| Expiration Date | | Notional Amount | | Value |
Interest Rate Swaps - continued |
Receive semi-annually a fixed rate equal to 5.095% and pay quarterly a floating rate based on 3-month LIBOR with Bank of America | Feb. 2012 | | $ 15,000,000 | | $ 86,286 |
Receive semi-annually a fixed rate equal to 5.144% and pay quarterly a floating rate based on 3-month LIBOR with JPMorgan Chase, Inc. | April 2012 | | 100,000,000 | | 2,055,830 |
Receive semi-annually a fixed rate equal to 5.276% and pay quarterly a floating rate based on 3-month LIBOR with Deutsche Bank | April 2011 | | 20,000,000 | | 499,946 |
Receive semi-annually a fixed rate equal to 5.375% and pay quarterly a floating rate based on 3-month LIBOR with Deutsche Bank | April 2009 | | 30,000,000 | | 622,431 |
Receive semi-annually a fixed rate equal to 5.44% and pay quarterly a floating rate based on 3-month LIBOR with Morgan Stanley, Inc. | July 2012 | | 50,000,000 | | 1,048,405 |
Receive semi-annually a fixed rate equal to 5.556% and pay quarterly a floating rate based on 3-month LIBOR with JPMorgan Chase, Inc. | June 2012 | | 25,000,000 | | 632,030 |
Receive semi-annually a fixed rate equal to 5.636% and pay quarterly a floating rate based on 3-month LIBOR with Deutsche Bank | July 2009 | | 100,000,000 | | 1,374,470 |
Receive semi-annually a fixed rate equal to 5.6485% and pay quarterly a floating rate based on 3-month LIBOR with Deutsche Bank | July 2010 | | 100,000,000 | | 2,089,490 |
Receive semi-annually a fixed rate of 5.263% and pay quarterly a floating rate based on 3-month LIBOR with Credit Suisse First Boston | Feb. 2012 | | 50,000,000 | | 633,645 |
TOTAL INTEREST RATE SWAPS | | 693,635,000 | | 11,386,370 |
Total Return Swaps |
Receive monthly a return equal to Lehman Brothers CMBS U.S. Aggregate Index and pay monthly a floating rate based on 1-month LIBOR minus 17.5 basis points with Lehman Brothers, Inc. | Sept. 2007 | | 25,000,000 | | 213,037 |
| | $ 800,046,445 | | $ 5,885,439 |
Currency Abbreviation |
CAD | - | Canadian dollar |
Legend |
(a) Includes investment made with cash collateral received from securities on loan. |
(b) Principal amount is stated in United States dollars unless otherwise noted. |
(c) Security initially issued in zero coupon form which converts to coupon form at a specified rate and date. The rate shown is the rate at period end. |
(d) Security initially issued at one coupon which converts to a higher coupon at a specified date. The rate shown is the rate at period end. |
(e) Security or a portion of the security is on loan at period end. |
(f) Security exempt from registration under Rule 144A of the Securities Act of 1933. These securities may be resold in transactions exempt from registration, normally to qualified institutional buyers. At the end of the period, the value of these securities amounted to $167,313,939 or 2.4% of net assets. |
(g) Security or a portion of the security purchased on a delayed delivery or when-issued basis. |
(h) Represents a tradable index of credit default swaps on home equity asset-backed debt securities. |
(i) The coupon rate shown on floating or adjustable rate securities represents the rate at period end. |
(j) Affiliated fund that is available only to investment companies and other accounts managed by Fidelity Investments. A complete schedule of portfolio holdings for each Fidelity Central Fund is filed with the SEC for the first and third quarters of each fiscal year on Form N-Q and is available upon request or at the SEC's web site at www.sec.gov. A holdings listing for the Fund, which presents direct holdings as well as the pro rata share of securities and other investments held indirectly through its investment in underlying non-money market Fidelity Central Funds, is available at fidelity.com and/or advisor.fidelity.com, as applicable. In addition, each Fidelity Central Fund's financial statements, which are not covered by the Fund's Report of Independent Registered Public Accounting Firm, are available on the SEC's web site or upon request. |
(k) Security represents right to receive monthly interest payments on an underlying pool of mortgages or assets. Principal shown is the outstanding par amount of the pool held as of the end of the period. |
(l) Restricted securities - Investment in securities not registered under the Securities Act of 1933 (excluding 144A issues). At the end of the period, the value of restricted securities (excluding 144A issues) amounted to $404,420 or 0.0% of net assets. |
Additional information on each holding is as follows: |
Security | Acquisition Date | Acquisition Cost |
GMAC Commercial Mortgage Securities, Inc. Series 1999-C2I Class K, 6.481% 9/15/33 | 3/23/07 | $ 163,875 |
Real Estate Asset Liquidity Trust Series 2006-2: | | |
Class F, 4.456% 9/12/38 | 10/2/06 | $ 80,777 |
Class G, 4.456% 9/12/38 | 10/2/06 | $ 39,498 |
Class H, 4.456% 9/12/38 | 10/2/06 | $ 22,997 |
Class J, 4.456% 9/12/38 | 10/2/06 | $ 21,304 |
Class K, 4.456% 9/12/38 | 10/2/06 | $ 9,417 |
Class L, 4.456% 9/12/38 | 10/2/06 | $ 13,077 |
Class M, 4.456% 9/12/38 | 10/2/06 | $ 43,033 |
(m) Position represents an unfunded loan commitment. At period end, the total principal amount and market value of unfunded commitments totaled $67,440 and $65,080, respectively. The coupon rate will be determined at time of settlement. |
(n) Security or a portion of the security has been segregated as collateral for open swap agreements. At the period end, the value of securities pledged amounted to $2,322,101. |
# Additional Information on each counterparty to the repurchase agreement is as follows: |
Repurchase Agreement / Counterparty | Value |
$837,489,000 due 9/04/07 at 5.37% |
BNP Paribas Securities Corp. | $ 19,351,451 |
Banc of America Securities LLC | 296,559,731 |
Bank of America, NA | 133,293,735 |
Bear Stearns & Co., Inc. | 16,661,717 |
Citigroup Global Markets, Inc. | 52,550,488 |
Credit Suisse Securities (USA) LLC | 33,323,434 |
Greenwich Capital Markets, Inc. | 16,661,717 |
HSBC Securities (USA), Inc. | 33,323,434 |
ING Financial Markets LLC | 66,646,867 |
Societe Generale, New York Branch | 99,970,301 |
UBS Securities LLC | 32,490,348 |
WestLB AG | 36,655,777 |
| $ 837,489,000 |
| |
$1,094,510,000 due 9/04/07 at 5.40% |
Barclays Capital, Inc. | $ 701,415,186 |
Citigroup Global Markets, Inc. | 92,488,306 |
Countrywide Securities Corp. | 300,606,508 |
| $ 1,094,510,000 |
Affiliated Central Funds |
Information regarding fiscal year to date income earned by the Fund from investments in Fidelity Central Funds is as follows: |
Fund | Income earned |
Fidelity 1-3 Year Duration Securitized Bond Central Fund | $ 9,433,136 |
Fidelity 2-5 Year Duration Securitized Bond Central Fund | 10,921,434 |
Fidelity Corporate Bond 1-10 Year Central Fund | 22,886,151 |
Fidelity Floating Rate Central Fund | 10,658,722 |
Fidelity Mortgage Backed Securities Central Fund | 27,679,804 |
Fidelity Ultra-Short Central Fund | 37,981,161 |
Total | $ 119,560,408 |
Additional information regarding the Fund's fiscal year to date purchases and sales, including the ownership percentage, of the non Money Market Central Funds is as follows: |
Fund | Value, beginning
of period | Purchases | Sales
Proceeds | Value, end
of period | % ownership,
end of period |
Fidelity 1-3 Year Duration Securitized Bond Central Fund | $ - | $ 324,340,949* | $ - | $ 310,910,980 | 11.2% |
Fidelity 2-5 Year Duration Securitized Bond Central Fund | - | 408,884,453* | - | 402,255,147 | 10.6% |
Fidelity Corporate Bond 1-10 Year Central Fund | - | 771,624,458* | - | 763,168,246 | 10.7% |
Fidelity Floating Rate Central Fund | 66,958,885 | 169,996,782 | - | 228,686,671 | 9.8% |
Fidelity Mortgage Backed Securities Central Fund | - | 977,890,256* | - | 964,085,734 | 11.2% |
Fidelity Ultra-Short Central Fund | 414,088,852 | 709,578,811* | 194,768,516 | 875,572,723 | 7.0% |
Total | $ 481,047,737 | $ 3,362,315,709 | $ 194,768,516 | $ 3,544,679,501 | |
* Includes the value of shares received through in-kind contributions. See Note 6 of the Notes to
Financial Statements. |
See accompanying notes which are an integral part of the financial statements.
Annual Report
Financial Statements
Statement of Assets and Liabilities
| August 31, 2007 |
| | |
Assets | | |
Investment in securities, at value (including securities loaned of $1,065,421,563 and repurchase agreements of $1,931,999,000) -
See accompanying schedule: Unaffiliated issuers (cost $5,209,837,546) | $ 5,234,131,635 | |
Fidelity Central Funds (cost $3,624,184,607) | 3,544,679,501 | |
Total Investments (cost $8,834,022,153) | | $ 8,778,811,136 |
Cash | | 8,796,932 |
Receivable for investments sold | | 555,962 |
Receivable for swap agreements | | 30,594 |
Receivable for fund shares sold | | 35,451,678 |
Interest receivable | | 27,124,728 |
Distributions receivable from Fidelity Central Funds | | 17,762,000 |
Swap agreements, at value | | 5,885,439 |
Total assets | | 8,874,418,469 |
| | |
Liabilities | | |
Payable for investments purchased
Regular delivery | $ 31,629,273 | |
Delayed delivery | 826,128,255 | |
Payable for fund shares redeemed | 4,423,548 | |
Distributions payable | 999,688 | |
Accrued management fee | 1,751,324 | |
Distribution fees payable | 37,432 | |
Other affiliated payables | 759,523 | |
Other payables and accrued expenses | 156,385 | |
Collateral on securities loaned, at value | 1,094,510,000 | |
Total liabilities | | 1,960,395,428 |
| | |
Net Assets | | $ 6,914,023,041 |
Net Assets consist of: | | |
Paid in capital | | $ 6,957,656,017 |
Undistributed net investment income | | 4,530,397 |
Accumulated undistributed net realized gain (loss) on investments and foreign currency transactions | | 279,124 |
Net unrealized appreciation (depreciation) on investments and assets and liabilities in foreign currencies | | (48,442,497) |
Net Assets | | $ 6,914,023,041 |
See accompanying notes which are an integral part of the financial statements.
Annual Report
Statement of Assets and Liabilities - continued
| August 31, 2007 |
| | |
Calculation of Maximum Offering Price Class A:
Net Asset Value and redemption price per share ($48,075,763 ÷ 4,681,968 shares) | | $ 10.27 |
| | |
Maximum offering price per share (100/96.00 of $10.27) | | $ 10.70 |
Class T:
Net Asset Value and redemption price per share ($42,191,042 ÷ 4,112,625 shares) | | $ 10.26 |
| | |
Maximum offering price per share (100/96.00 of $10.26) | | $ 10.69 |
Class B:
Net Asset Value and offering price per share ($6,053,834 ÷ 589,436 shares)A | | $ 10.27 |
| | |
Class C:
Net Asset Value and offering price per share ($18,889,796 ÷ 1,839,636 shares)A | | $ 10.27 |
| | |
Total Bond:
Net Asset Value, offering price and redemption price per share ($6,450,176,834 ÷ 628,207,990 shares) | | $ 10.27 |
| | |
Institutional Class:
Net Asset Value, offering price and redemption price per share ($348,635,772 ÷ 33,986,027 shares) | | $ 10.26 |
A Redemption price per share is equal to net asset value less any applicable contingent deferred sales charge.
See accompanying notes which are an integral part of the financial statements.
Annual Report
Financial Statements - continued
Statement of Operations
| Year ended August 31, 2007 |
| | |
Investment Income | | |
Dividends | | $ 441,078 |
Interest | | 111,033,135 |
Income from Fidelity Central Funds | | 119,560,408 |
Total income | | 231,034,621 |
| | |
Expenses | | |
Management fee | $ 12,837,361 | |
Transfer agent fees | 4,159,017 | |
Distribution fees | 278,761 | |
Fund wide operations fee | 1,325,565 | |
Independent trustees' compensation | 11,741 | |
Miscellaneous | 9,476 | |
Total expenses before reductions | 18,621,921 | |
Expense reductions | (139,190) | 18,482,731 |
Net investment income | | 212,551,890 |
Realized and Unrealized Gain (Loss) Net realized gain (loss) on: | | |
Investment securities: | | |
Unaffiliated issuers | 7,720,985 | |
Fidelity Central Funds | (9,761,653) | |
Foreign currency transactions | (525) | |
Swap agreements | (4,037,675) | |
Capital gain distributions from Fidelity Central Funds | 58,264 | |
Total net realized gain (loss) | | (6,020,604) |
Change in net unrealized appreciation (depreciation) on: Investment securities: | | |
Unaffiliated issuers | 6,335,305 | |
Fidelity Central Funds | (94,146,335) | |
Assets and liabilities in foreign currencies | (2,128) | |
Swap agreements | 2,546,994 | |
Total change in net unrealized appreciation (depreciation) | | (85,266,164) |
Net gain (loss) | | (91,286,768) |
Net increase (decrease) in net assets resulting from operations | | $ 121,265,122 |
See accompanying notes which are an integral part of the financial statements.
Annual Report
Statement of Changes in Net Assets
| Year ended
August 31,
2007 | One month ended
August 31,
2006* | Year ended
July 31,
2006 |
Increase (Decrease) in Net Assets | | | |
Operations | | | |
Net investment income | $ 212,551,890 | $ 10,616,308 | $ 35,183,424 |
Net realized gain (loss) | (6,020,604) | 1,659,188 | (5,912,496) |
Change in net unrealized appreciation (depreciation) | (85,266,164) | 23,254,821 | 12,947,897 |
Net increase (decrease) in net assets resulting from operations | 121,265,122 | 35,530,317 | 42,218,825 |
Distributions to shareholders from net investment income | (198,338,706) | (9,317,974) | (31,840,595) |
Distributions to shareholders from net realized gain | (4,857,769) | - | (1,679,853) |
Total distributions | (203,196,475) | (9,317,974) | (33,520,448) |
Share transactions - net increase (decrease) | 4,556,920,613 | 92,507,042 | 1,879,857,353 |
Total increase (decrease) in net assets | 4,474,989,260 | 118,719,385 | 1,888,555,730 |
| | | |
Net Assets | | | |
Beginning of period | 2,439,033,781 | 2,320,314,396 | 431,758,666 |
End of period (including undistributed net investment income of $4,530,397, $5,573,349 and $2,168,613, respectively) | $ 6,914,023,041 | $ 2,439,033,781 | $ 2,320,314,396 |
* The Fund changed its fiscal year end from July 31 to August 31, effective August 31, 2006.
See accompanying notes which are an integral part of the financial statements.
Annual Report
Financial Highlights - Class A
Years ended August 31, | 2007 | 2006 I | 2006 M | 2005 M | 2004 J |
Selected Per-Share Data | | | | | |
Net asset value, beginning of period | $ 10.39 | $ 10.28 | $ 10.57 | $ 10.46 | $ 10.31 |
Income from Investment Operations | | | | | |
Net investment income E | .508 | .043 | .476 | .387 | .046 |
Net realized and unrealized gain (loss) | (.141) | .105 | (.294) H | .183 | .145 |
Total from investment operations | .367 | .148 | .182 | .570 | .191 |
Distributions from net investment income | (.470) | (.038) | (.432) | (.370) | (.041) |
Distributions from net realized gain | (.017) | - | (.040) | (.090) | - |
Total distributions | (.487) | (.038) | (.472) | (.460) | (.041) |
Net asset value, end of period | $ 10.27 | $ 10.39 | $ 10.28 | $ 10.57 | $ 10.46 |
Total Return B, C, D | 3.57% | 1.44% | 1.78% | 5.52% | 1.85% |
Ratios to Average Net Assets F, K | | | | |
Expenses before reductions | .77% | .73% A | .79% | .96% | .87% A |
Expenses net of fee waivers, if any | .77% | .73% A | .79% | .80% | .80% A |
Expenses net of all reductions | .77% | .73% A | .79% | .80% | .80% A |
Net investment income | 4.93% | 4.98% A | 4.61% | 3.69% | 3.51% A |
Supplemental Data | | | | | |
Net assets, end of period
(000 omitted) | $ 48,076 | $ 6,780 | $ 4,545 | $ 2,974 | $ 102 |
Portfolio turnover rate G | 116% L | 53% A | 99% | 193% | 251% |
A Annualized
B Total returns for periods of less than one year are not annualized.
C Total returns would have been lower had certain expenses not been reduced during the periods shown.
D Total returns do not include the effect of the sales charges.
E Calculated based on average shares outstanding during the period.
F Fees and expenses of the underlying Fidelity Central Funds are not included in the Fund's expense ratio. The Fund indirectly bears its proportionate share of the expenses of any underlying Fidelity Central Funds.
G Amount does not include the portfolio activity of any underlying Fidelity Central Funds.
H The amount shown for a share outstanding does not correspond with the aggregate net gain (loss) on investments for the period due to the timing of sales and repurchases of shares in relation to fluctuating market values of the investments of the Fund.
I For the one month period ended August 31. The Fund changed its fiscal year from July 31 to August 31, effective August 31, 2006.
J For the period June 16, 2004 (commencement of sale of shares) to July 31, 2004.
K Expense ratios reflect operating expenses of the class. Expenses before reductions do not reflect amounts reimbursed by the investment adviser or expense offset arrangements and do not represent the amount paid by the class during periods when reimbursements or reductions occur. Expense ratios before reductions for start-up periods may not be representative of longer-term operating periods. Expenses net of fee waivers reflect expenses after reimbursement by the investment adviser but prior to reductions from expense offset arrangements. Expenses net of all reductions represent the net expenses paid by the class.
L Portfolio turnover rate excludes securities received or delivered through non-taxable in-kind activity.
M For the period ended July 31.
See accompanying notes which are an integral part of the financial statements.
Annual Report
Financial Highlights - Class T
Years ended August 31, | 2007 | 2006 I | 2006 M | 2005 M | 2004 J |
Selected Per-Share Data | | | | | |
Net asset value, beginning of period | $ 10.38 | $ 10.27 | $ 10.56 | $ 10.46 | $ 10.31 |
Income from Investment Operations | | | | | |
Net investment income E | .508 | .042 | .466 | .377 | .045 |
Net realized and unrealized gain (loss) | (.143) | .105 | (.296) H | .173 | .144 |
Total from investment operations | .365 | .147 | .170 | .550 | .189 |
Distributions from net investment income | (.468) | (.037) | (.420) | (.360) | (.039) |
Distributions from net realized gain | (.017) | - | (.040) | (.090) | - |
Total distributions | (.485) | (.037) | (.460) | (.450) | (.039) |
Net asset value, end of period | $ 10.26 | $ 10.38 | $ 10.27 | $ 10.56 | $ 10.46 |
Total Return B, C, D | 3.55% | 1.43% | 1.66% | 5.33% | 1.84% |
Ratios to Average Net Assets F, K | | | | | |
Expenses before reductions | .78% | .87% A | .91% | 1.13% | .96% A |
Expenses net of fee waivers, if any | .78% | .87% A | .90% | .90% | .90% A |
Expenses net of all reductions | .78% | .87% A | .90% | .90% | .90% A |
Net investment income | 4.92% | 4.84% A | 4.50% | 3.59% | 3.41% A |
Supplemental Data | | | | | |
Net assets, end of period
(000 omitted) | $ 42,191 | $ 6,293 | $ 4,583 | $ 5,739 | $ 102 |
Portfolio turnover rate G | 116% L | 53% A | 99% | 193% | 251% |
A Annualized
B Total returns for periods of less than one year are not annualized.
C Total returns would have been lower had certain expenses not been reduced during the periods shown.
D Total returns do not include the effect of the sales charges.
E Calculated based on average shares outstanding during the period.
F Fees and expenses of the underlying Fidelity Central Funds are not included in the Fund's expense ratio. The Fund indirectly bears its proportionate share of the expenses of any underlying Fidelity Central Funds.
G Amount does not include the portfolio activity of any underlying Fidelity Central Funds.
H The amount shown for a share outstanding does not correspond with the aggregate net gain (loss) on investments for the period due to the timing of sales and repurchases of shares in relation to fluctuating market values of the investments of the Fund.
I For the one month period ended August 31. The Fund changed its fiscal year from July 31 to August 31, effective August 31, 2006.
J For the period June 16, 2004 (commencement of sale of shares) to July 31, 2004.
K Expense ratios reflect operating expenses of the class. Expenses before reductions do not reflect amounts reimbursed by the investment adviser or expense offset arrangements and do not represent the amount paid by the class during periods when reimbursements or reductions occur. Expense ratios before reductions for start-up periods may not be representative of longer-term operating periods. Expenses net of fee waivers reflect expenses after reimbursement by the investment adviser but prior to reductions from expense offset arrangements. Expenses net of all reductions represent the net expenses paid by the class.
L Portfolio turnover rate excludes securities received or delivered through non-taxable in-kind activity.
M For the period ended July 31.
See accompanying notes which are an integral part of the financial statements.
Annual Report
Financial Highlights - Class B
Years ended August 31, | 2007 | 2006 I | 2006 M | 2005 M | 2004 J |
Selected Per-Share Data | | | | | |
Net asset value, beginning of period | $ 10.39 | $ 10.28 | $ 10.57 | $ 10.46 | $ 10.31 |
Income from Investment Operations | | | | | |
Net investment income E | .432 | .037 | .399 | .309 | .036 |
Net realized and unrealized gain (loss) | (.145) | .104 | (.296) H | .182 | .145 |
Total from investment operations | .287 | .141 | .103 | .491 | .181 |
Distributions from net investment income | (.390) | (.031) | (.353) | (.291) | (.031) |
Distributions from net realized gain | (.017) | - | (.040) | (.090) | - |
Total distributions | (.407) | (.031) | (.393) | (.381) | (.031) |
Net asset value, end of period | $ 10.27 | $ 10.39 | $ 10.28 | $ 10.57 | $ 10.46 |
Total Return B, C, D | 2.77% | 1.38% | 1.01% | 4.74% | 1.76% |
Ratios to Average Net Assets F, K | | | | | |
Expenses before reductions | 1.53% | 1.51% A | 1.59% | 1.75% | 1.62% A |
Expenses net of fee waivers, if any | 1.53% | 1.51% A | 1.55% | 1.55% | 1.55% A |
Expenses net of all reductions | 1.53% | 1.51% A | 1.55% | 1.55% | 1.55% A |
Net investment income | 4.17% | 4.22% A | 3.85% | 2.94% | 2.76% A |
Supplemental Data | | | | | |
Net assets, end of period
(000 omitted) | $ 6,054 | $ 1,720 | $ 1,667 | $ 2,029 | $ 104 |
Portfolio turnover rate G | 116% L | 53% A | 99% | 193% | 251% |
A Annualized
B Total returns for periods of less than one year are not annualized.
C Total returns would have been lower had certain expenses not been reduced during the periods shown.
D Total returns do not include the effect of the contingent deferred sales charge.
E Calculated based on average shares outstanding during the period.
F Fees and expenses of the underlying Fidelity Central Funds are not included in the Fund's expense ratio. The Fund indirectly bears its proportionate share of the expenses of any underlying Fidelity Central Funds.
G Amount does not include the portfolio activity of any underlying Fidelity Central Funds.
H The amount shown for a share outstanding does not correspond with the aggregate net gain (loss) on investments for the period due to the timing of sales and repurchases of shares in relation to fluctuating market values of the investments of the Fund.
I For the one month period ended August 31. The Fund changed its fiscal year from July 31 to August 31, effective August 31, 2006.
J For the period June 16, 2004 (commencement of sale of shares) to July 31, 2004.
K Expense ratios reflect operating expenses of the class. Expenses before reductions do not reflect amounts reimbursed by the investment adviser or expense offset arrangements and do not represent the amount paid by the class during periods when reimbursements or reductions occur. Expense ratios before reductions for start-up periods may not be representative of longer-term operating periods. Expenses net of fee waivers reflect expenses after reimbursement by the investment adviser but prior to reductions from expense offset arrangements. Expenses net of all reductions represent the net expenses paid by the class.
L Portfolio turnover rate excludes securities received or delivered through non-taxable in-kind activity.
M For the period ended July 31.
See accompanying notes which are an integral part of the financial statements.
Annual Report
Financial Highlights - Class C
Years ended August 31, | 2007 | 2006 I | 2006 M | 2005 M | 2004 J |
Selected Per-Share Data | | | | | |
Net asset value, beginning of period | $ 10.39 | $ 10.28 | $ 10.57 | $ 10.46 | $ 10.31 |
Income from Investment Operations | | | | | |
Net investment income E | .429 | .036 | .389 | .299 | .035 |
Net realized and unrealized gain (loss) | (.145) | .105 | (.293) H | .181 | .145 |
Total from investment operations | .284 | .141 | .096 | .480 | .180 |
Distributions from net investment income | (.387) | (.031) | (.346) | (.280) | (.030) |
Distributions from net realized gain | (.017) | - | (.040) | (.090) | - |
Total distributions | (.404) | (.031) | (.386) | (.370) | (.030) |
Net asset value, end of period | $ 10.27 | $ 10.39 | $ 10.28 | $ 10.57 | $ 10.46 |
Total Return B, C, D | 2.75% | 1.37% | .94% | 4.63% | 1.74% |
Ratios to Average Net Assets F, K | | | | | |
Expenses before reductions | 1.55% | 1.60% A | 1.62% | 1.74% | 1.74% A |
Expenses net of fee waivers, if any | 1.55% | 1.60% A | 1.62% | 1.65% | 1.65% A |
Expenses net of all reductions | 1.55% | 1.60% A | 1.62% | 1.65% | 1.65% A |
Net investment income | 4.15% | 4.13% A | 3.78% | 2.84% | 2.66% A |
Supplemental Data | | | | | |
Net assets, end of period
(000 omitted) | $ 18,890 | $ 2,106 | $ 1,770 | $ 677 | $ 142 |
Portfolio turnover rate G | 116% L | 53% A | 99% | 193% | 251% |
A Annualized
B Total returns for periods of less than one year are not annualized.
C Total returns would have been lower had certain expenses not been reduced during the periods shown.
D Total returns do not include the effect of the contingent deferred sales charge.
E Calculated based on average shares outstanding during the period.
F Fees and expenses of the underlying Fidelity Central Funds are not included in the Fund's expense ratio. The Fund indirectly bears its proportionate share of the expenses of any underlying Fidelity Central Funds.
G Amount does not include the portfolio activity of any underlying Fidelity Central Funds.
H The amount shown for a share outstanding does not correspond with the aggregate net gain (loss) on investments for the period due to the timing of sales and repurchases of shares in relation to fluctuating market values of the investments of the Fund.
I For the one month period ended August 31. The Fund changed its fiscal year from July 31 to August 31, effective August 31, 2006.
J For the period June 16, 2004 (commencement of sale of shares) to July 31, 2004.
K Expense ratios reflect operating expenses of the class. Expenses before reductions do not reflect amounts reimbursed by the investment adviser or expense offset arrangements and do not represent the amount paid by the class during periods when reimbursements or reductions occur. Expense ratios before reductions for start-up periods may not be representative of longer-term operating periods. Expenses net of fee waivers reflect expenses after reimbursement by the investment adviser but prior to reductions from expense offset arrangements. Expenses net of all reductions represent the net expenses paid by the class.
L Portfolio turnover rate excludes securities received or delivered through non-taxable in-kind activity.
M For the period ended July 31.
See accompanying notes which are an integral part of the financial statements.
Annual Report
Financial Highlights - Total Bond
Years ended August 31, | 2007 | 2006 I | 2006 L | 2005 L | 2004 L | 2003 H |
Selected Per-Share Data | | | | | | |
Net asset value, beginning of period | $ 10.39 | $ 10.28 | $ 10.57 | $ 10.46 | $ 10.28 | $ 10.00 |
Income from Investment Operations | | | | | | |
Net investment income D | .543 | .046 | .506 | .411 | .340 | .232 |
Net realized and unrealized gain (loss) | (.143) | .105 | (.290) G | .182 | .237 | .269 |
Total from investment operations | .400 | .151 | .216 | .593 | .577 | .501 |
Distributions from net investment income | (.503) | (.041) | (.466) | (.393) | (.337) | (.221) |
Distributions from net realized gain | (.017) | - | (.040) | (.090) | (.060) | - |
Total distributions | (.520) | (.041) | (.506) | (.483) | (.397) | (.221) |
Net asset value, end of period | $ 10.27 | $ 10.39 | $ 10.28 | $ 10.57 | $ 10.46 | $ 10.28 |
Total Return B, C | 3.89% | 1.46% | 2.11% | 5.75% | 5.68% | 5.01% |
Ratios to Average Net Assets E, J | | | | | |
Expenses before reductions | .45% | .45% A | .45% | .64% | .75% | 1.01% A |
Expenses net of fee waivers, if any | .45% | .45% A | .45% | .61% | .65% | .65% A |
Expenses net of all reductions | .45% | .45% A | .45% | .61% | .65% | .65% A |
Net investment income | 5.25% | 5.26% A | 4.95% | 3.87% | 3.25% | 2.83% A |
Supplemental Data | | | | | | |
Net assets, end of period (000 omitted) | $ 6,450,177 | $ 2,421,077 | $ 2,306,817 | $ 420,225 | $ 373,699 | $ 80,816 |
Portfolio turnover rate F | 116% K | 53% A | 99% | 193% | 251% | 423% A |
A Annualized
B Total returns for periods of less than one year are not annualized.
C Total returns would have been lower had certain expenses not been reduced during the periods shown.
D Calculated based on average shares outstanding during the period.
E Fees and expenses of the underlying Fidelity Central Funds are not included in the Fund's expense ratio. The Fund indirectly bears its proportionate share of the expenses of any underlying Fidelity Central Funds.
F Amount does not include the portfolio activity of any underlying Fidelity Central Funds.
G The amount shown for a share outstanding does not correspond with the aggregate net gain (loss) on investments for the period due to the timing of sales and repurchases of shares in relation to fluctuating market values of the investments of the Fund.
H For the period October 15, 2002 (commencement of operations) to July 31, 2003.
I For the one month period ended August 31. The Fund changed its fiscal year from July 31 to August 31, effective August 31, 2006.
J Expense ratios reflect operating expenses of the class. Expenses before reductions do not reflect amounts reimbursed by the investment adviser or expense offset arrangements and do not represent the amount paid by the class during periods when reimbursements or reductions occur. Expense ratios before reductions for start-up periods may not be representative of longer-term operating periods. Expenses net of fee waivers reflect expenses after reimbursement by the investment adviser but prior to reductions from expense offset arrangements. Expenses net of all reductions represent the net expenses paid by the class.
K Portfolio turnover rate excludes securities received or delivered through non-taxable in-kind activity.
L For the period ended July 31.
See accompanying notes which are an integral part of the financial statements.
Annual Report
Financial Highlights - Institutional Class
Years ended August 31, | 2007 | 2006 H | 2006 L | 2005 L | 2004 I |
Selected Per-Share Data | | | | | |
Net asset value, beginning of period | $ 10.38 | $ 10.27 | $ 10.57 | $ 10.46 | $ 10.31 |
Income from Investment Operations | | | | | |
Net investment income D | .527 | .045 | .493 | .410 | .048 |
Net realized and unrealized gain (loss) | (.134) | .105 | (.294) G | .182 | .145 |
Total from investment operations | .393 | .150 | .199 | .592 | .193 |
Distributions from net investment income | (.496) | (.040) | (.459) | (.392) | (.043) |
Distributions from net realized gain | (.017) | - | (.040) | (.090) | - |
Total distributions | (.513) | (.040) | (.499) | (.482) | (.043) |
Net asset value, end of period | $ 10.26 | $ 10.38 | $ 10.27 | $ 10.57 | $ 10.46 |
Total Return B, C | 3.83% | 1.46% | 1.95% | 5.74% | 1.87% |
Ratios to Average Net Assets E, J | | | | | |
Expenses before reductions | .50% | .54% A | .56% | .62% | .71% A |
Expenses net of fee waivers, if any | .50% | .54% A | .56% | .62% | .65% A |
Expenses net of all reductions | .49% | .54% A | .56% | .61% | .65% A |
Net investment income | 5.21% | 5.16% A | 4.84% | 3.87% | 3.66% A |
Supplemental Data | | | | | |
Net assets, end of period
(000 omitted) | $ 348,636 | $ 1,058 | $ 933 | $ 114 | $ 102 |
Portfolio turnover rate F | 116% K | 53% A | 99% | 193% | 251% |
A Annualized
B Total returns for periods of less than one year are not annualized.
C Total returns would have been lower had certain expenses not been reduced during the periods shown.
D Calculated based on average shares outstanding during the period.
E Fees and expenses of the underlying Fidelity Central Funds are not included in the Fund's expense ratio. The Fund indirectly bears its proportionate share of the expenses of any underlying Fidelity Central Funds.
F Amount does not include the portfolio activity of any underlying Fidelity Central Funds.
G The amount shown for a share outstanding does not correspond with the aggregate net gain (loss) on investments for the period due to the timing of sales and repurchases of shares in relation to fluctuating market values of the investments of the Fund.
H For the one month period ended August 31. The Fund changed its fiscal year from July 31 to August 31, effective August 31, 2006.
I For the period June 16, 2004 (commencement of sale of shares) to July 31, 2004.
J Expense ratios reflect operating expenses of the class. Expenses before reductions do not reflect amounts reimbursed by the investment adviser or expense offset arrangements and do not represent the amount paid by the class during periods when reimbursements or reductions occur. Expense ratios before reductions for start-up periods may not be representative of longer-term operating periods. Expenses net of fee waivers reflect expenses after reimbursement by the investment adviser but prior to reductions from expense offset arrangements. Expenses net of all reductions represent the net expenses paid by the class.
K Portfolio turnover rate excludes securities received or delivered through non-taxable in-kind activity.
L For the period ended July 31.
See accompanying notes which are an integral part of the financial statements.
Annual Report
Notes to Financial Statements
For the period ended August 31, 2007
1. Organization.
Fidelity Total Bond Fund (the Fund) is a non-diversified fund of Fidelity Income Fund (the trust) and is authorized to issue an unlimited number of shares. The trust is registered under the Investment Company Act of 1940, as amended (the 1940 Act), as an open-end management investment company organized as a Massachusetts business trust.
The Fund offers Class A, Class T, Class B, Class C, Total Bond and Institutional Class shares, each of which has equal rights as to assets and voting privileges. Each class has exclusive voting rights with respect to matters that affect that class. Class B shares will automatically convert to Class A shares after a holding period of seven years from the initial date of purchase. Investment income, realized and unrealized capital gains and losses, the common expenses of the Fund, and certain fund-level expense reductions, if any, are allocated on a pro rata basis to each class based on the relative net assets of each class to the total net assets of the Fund. Each class differs with respect to transfer agent and distribution and service plan fees incurred. Certain expense reductions also differ by class.
2. Investments in Fidelity Central Funds.
The Fund may invest in Fidelity Central Funds which are open-end investment companies available only to other investment companies and accounts managed by Fidelity Management & Research Company (FMR) and its affiliates. The Fund's Schedule of Investments lists each of the Fidelity Central Funds as an investment of the Fund, but does not include the underlying holdings of each Fidelity Central Fund. As an Investing Fund, the Fund indirectly bears its proportionate share of the expenses of the underlying Fidelity Central Funds.
Based on their investment objective, each Fidelity Central Fund may invest or participate in various investment vehicles or strategies that are similar to those of the Fund. These strategies are consistent with the investment objectives of the Fund and may involve certain economic risks which may cause a decline in value of each of the Fidelity Central Funds and thus a decline in the value of the Fund. The following summarizes the Fund's investment in each Fidelity Central Fund.
Annual Report
2. Investments in Fidelity Central Funds - continued
Fidelity Central Fund | Investment Manager | Investment Objective | Investment Practices |
Fidelity 1-3 Year Duration Securitized Bond Central Fund | Fidelity Investment Money Management, Inc. (FIMM) | Seeks a high level of income by normally investing in investment-grade securitized debt securities and repurchase agreements for those securities. | Futures Repurchase Agreements Restricted Securities Swap Agreements |
Fidelity 2-5 Year Duration Securitized Bond Central Fund | FIMM | Seeks a high level of income by normally investing in investment-grade securitized debt securities and repurchase agreements for those securities. | Repurchase Agreements Restricted Securities Swap Agreements |
Fidelity Corporate Bond 1-10 Year Central Fund | FIMM | Seeks a high level of income by normally investing in investment-grade corporate bonds and other corporate debt securities and repurchase agreements for those securities. | Repurchase Agreements Restricted Securities Swap Agreements |
Fidelity Floating Rate Central Fund | Fidelity Management & Research Company, Inc. (FMRC) | Seeks a high level of income by normally investing in floating rate loans and other floating rate securities. | Loans & Direct Debt Instruments Repurchase Agreements Restricted Securities |
Fidelity Mortgage Backed Securities Central Fund | FIMM | Seeks a high level of income by normally investing in investment-grade mortgage-related securities and repurchase agreements for those securities. | Delayed Delivery & When Issued Securities Mortgage Dollar Rolls Repurchase Agreements Swap Agreements |
Fidelity Ultra-Short Central Fund | FIMM | Seeks to obtain a high level of current income consistent with preservation of capital by investing in U.S. dollar denominated money market and investment-grade debt securities. | Futures Mortgage Dollar Rolls Repurchase Agreements Restricted Securities Swap Agreements |
Annual Report
Notes to Financial Statements - continued
2. Investments in Fidelity Central Funds - continued
The Central Funds may invest a portion of their assets in securities of issuers that hold mortgage securities, including subprime mortgage securities. The value of these securities is sensitive to changes in economic conditions, including delinquencies and/or defaults, and may be adversely affected by shifts in the market's perception of the issuers and changes in interest rates.
A holdings listing for the Fund, which presents direct holdings as well as the pro rata share of any securities and other investments held indirectly through its investment in underlying non-money market Fidelity Central Funds, is available at fidelity.com and/or advisor.fidelity.com, as applicable. A complete list of holdings for each Fidelity Central Fund is available upon request or at the SEC's web site at www.sec.gov. In addition, the financial statements of the Fidelity Central Funds, which are not covered by the Fund's Report of Independent Registered Public Accounting Firm, are available on the SEC's web site or upon request.
3. Significant Accounting Policies.
The financial statements have been prepared in conformity with accounting principles generally accepted in the United States of America, which require management to make certain estimates and assumptions at the date of the financial statements. The following summarizes the significant accounting policies of the Fund:
Security Valuation. Investments are valued and net asset value per share is calculated (NAV calculation) as of the close of business of the New York Stock Exchange, normally 4:00 p.m. Eastern time. Wherever possible, the Fund uses independent pricing services approved by the Board of Trustees to value its investments. Debt securities, including restricted securities, for which quotations are readily available, are valued by independent pricing services or by dealers who make markets in such securities. Pricing services consider yield or price of bonds of comparable quality, coupon, maturity and type as well as available dealer supplied prices. Certain of the Fund's securities may be valued by a single source or dealer.
Equity securities, including restricted securities, for which market quotations are readily available, are valued at the last reported sale price or official closing price as reported by an independent pricing service on the primary market or exchange on which they are traded. In the event there were no sales during the day or closing prices are not available, securities are valued at the last quoted bid price.
When current market prices or quotations are not readily available or do not accurately reflect fair value, valuations may be determined in accordance with procedures adopted by the Board of Trustees. Factors used in the determination of fair value may include current market trading activity, interest rates, credit quality and default rates. The frequency of when fair value pricing is used is unpredictable. The value of securities used for NAV calculation under fair value pricing may differ from published prices for the same securities. Investments in open-end mutual funds, including the Fidelity Central Funds, are valued at their closing net asset value each business day. Short-term securities with remaining maturities of sixty days or less for which quotations are not readily available are valued at amortized cost, which approximates value.
Annual Report
3. Significant Accounting Policies -continued
Foreign Currency. The Fund uses foreign currency contracts to facilitate transactions in foreign-denominated securities. Losses from these transactions may arise from changes in the value of the foreign currency or if the counterparties do not perform under the contracts' terms.
Foreign-denominated assets, including investment securities, and liabilities are translated into U.S. dollars at the exchange rate at period end. Purchases and sales of investment securities, income and dividends received and expenses denominated in foreign currencies are translated into U.S. dollars at the exchange rate in effect on the transaction date.
The effects of exchange rate fluctuations on investments are included with the net realized and unrealized gain (loss) on investment securities. Other foreign currency transactions resulting in realized and unrealized gain (loss) are disclosed separately.
Investment Transactions and Income. For financial reporting purposes, the Fund's investment holdings and NAV include trades executed through the end of the last business day of the period. The NAV for processing shareholder transactions includes trades executed through the end of the prior business day. Gains and losses on securities sold are determined on the basis of identified cost. Dividend income is recorded on the ex-dividend date, except for certain dividends from foreign securities where the ex-dividend date may have passed, which are recorded as soon as the Fund is informed of the ex-dividend date. Non-cash dividends included in dividend income, if any, are recorded at the fair market value of the securities received. Interest income and income and capital gain distributions from the Fidelity Central Funds are accrued as earned. Interest income includes coupon interest and amortization of premium and accretion of discount on debt securities. Investment income is recorded net of foreign taxes withheld where recovery of such taxes is uncertain.
Expenses. Most expenses of the trust can be directly attributed to a fund. Expenses which cannot be directly attributed are apportioned among each Fund in the trust. Expense estimates are accrued in the period to which they relate and adjustments are made when actual amounts are known.
Income Tax Information and Distributions to Shareholders. Each year, the Fund intends to qualify as a regulated investment company by distributing all of its taxable income and realized gains under Subchapter M of the Internal Revenue Code. As a result, no provision for income taxes is required in the accompanying financial statements. Foreign taxes are provided for based on the Fund's understanding of the tax rules and rates that exist in the foreign markets in which it invests.
Annual Report
Notes to Financial Statements - continued
3. Significant Accounting Policies - continued
Income Tax Information and Distributions to Shareholders - continued
Dividends are declared daily and paid monthly from net investment income. Distributions from realized gains, if any, are recorded on the ex-dividend date. Income dividends and capital gain distributions are declared separately for each class. Income and capital gain distributions are determined in accordance with income tax regulations, which may differ from generally accepted accounting principles. In addition, the Fund will claim a portion of the payment made to redeeming shareholders as a distribution for income tax purposes.
Capital accounts within the financial statements are adjusted for permanent book-tax differences. Certain adjustments have been made to the accounts relating to prior periods. Collectively, these adjustments have no impact on net assets or the results of operations. Temporary book-tax differences will reverse in a subsequent period.
Book-tax differences are primarily due to swap agreements, foreign currency transactions, market discount, partnerships (including allocations from Fidelity Central Funds), financing transactions, capital loss carryforwards, the short-term gain distributions from the Fidelity Central Funds and losses deferred due to wash sales and excise tax regulations.
The tax-basis components of distributable earnings and the federal tax cost as of period end were as follows:
Unrealized appreciation | $ 70,358,198 |
Unrealized depreciation | (116,469,586) |
Net unrealized appreciation (depreciation) | (46,111,388) |
Undistributed ordinary income | 4,698,470 |
| |
Cost for federal income tax purposes | $ 8,824,922,524 |
The tax character of distributions paid was as follows:
| August 31,
2007 | One month ended
August 31,
2006 | July 31,
2006 |
| | | |
Ordinary Income | $ 203,196,475 | $ 9,317,974 | $ 32,890,503 |
Long-term Capital Gains | - | - | 629,945 |
Total | $ 203,196,475 | $ 9,317,974 | $ 33,520,448 |
Annual Report
3. Significant Accounting Policies -continued
New Accounting Pronouncements. In July 2006, Financial Accounting Standards Board Interpretation No. 48, Accounting for Uncertainty in Income Taxes - an interpretation of FASB Statement 109 (FIN 48), was issued and is effective on the last business day of the semiannual reporting period for fiscal years beginning after December 15, 2006. FIN 48 sets forth a threshold for financial statement recognition, measurement and disclosure of a tax position taken or expected to be taken on a tax return. Management has concluded that the adoption of FIN 48 will not result in a material impact on the Fund's net assets, results of operations and financial statement disclosures.
In addition, in September 2006, Statement of Financial Accounting Standards No. 157, Fair Value Measurements (SFAS 157), was issued and is effective for fiscal years beginning after November 15, 2007. SFAS 157 defines fair value, establishes a framework for measuring fair value and expands disclosures about fair value measurements. Management is currently evaluating the impact the adoption of SFAS 157 will have on the Fund's financial statement disclosures.
4. Operating Policies.
Repurchase Agreements. FMR has received an Exemptive Order from the Securities and Exchange Commission (the SEC) which permits the Fund and other affiliated entities of FMR to transfer uninvested cash balances into joint trading accounts which are then invested in repurchase agreements. The Fund may also invest directly with institutions in repurchase agreements. Repurchase agreements are collateralized by government or non-government securities. Upon settlement date, collateral is held in segregated accounts with custodian banks and may be obtained in the event of a default of the counterparty. The Fund monitors, on a daily basis, the value of the collateral to ensure it is at least equal to the principal amount of the repurchase agreement (including accrued interest). In the event of a default by the counterparty, realization of the collateral proceeds could be delayed, during which time the value of the collateral may decline.
Delayed Delivery Transactions and When-Issued Securities. The Fund may purchase or sell securities on a delayed delivery or when-issued basis. Payment and delivery may take place after the customary settlement period for that security. The price of the underlying securities and the date when the securities will be delivered and paid for are fixed at the time the transaction is negotiated. During the time a delayed delivery sell is outstanding, the contract is marked-to-market daily and equivalent deliverable securities are held for the transaction. The value of the securities purchased on a delayed delivery or when-issued basis are identified as such in the Fund's Schedule of Investments. The Fund may receive compensation for interest forgone in the purchase of a delayed delivery or when-issued security. With respect to purchase commitments, the
Annual Report
Notes to Financial Statements - continued
4. Operating Policies -continued
Delayed Delivery Transactions and When-Issued Securities - continued
Fund identifies securities as segregated in its records with a value at least equal to the amount of the commitment. Losses may arise due to changes in the value of the underlying securities or if the counterparty does not perform under the contract's terms, or if the issuer does not issue the securities due to political, economic, or other factors.
Restricted Securities. The Fund may invest in securities that are subject to legal or contractual restrictions on resale. These securities generally may be resold in transactions exempt from registration or to the public if the securities are registered. Disposal of these securities may involve time-consuming negotiations and expense, and prompt sale at an acceptable price may be difficult. Information regarding restricted securities is included at the end of the Fund's Schedule of Investments.
Loans and Other Direct Debt Instruments. The Fund may invest in loans and loan participations, trade claims or other receivables. These investments may include standby financing commitments, including revolving credit facilities, that obligate the Fund to supply additional cash to the borrower on demand. Loan participations involve a risk of insolvency of the lending bank or other financial intermediary. The Fund may be contractually obligated to receive approval from the agent bank and/or borrower prior to the sale of these investments. At the end of the period, the Fund had unfunded loan commitments of $67,440.
Swap Agreements. The Fund may invest in swaps for the purpose of managing its exposure to interest rate, credit or market risk.
Interest rate swaps are agreements to exchange cash flows periodically based on a notional principal amount, for example, the exchange of fixed rate interest payments for floating rate interest payments. The primary risk associated with interest rate swaps is that unfavorable changes in the fluctuation of interest rates could adversely impact a fund.
Total return swaps are agreements to exchange the return generated by one instrument or index for the return generated by another instrument, for example, the agreement to pay interest in exchange for a market-linked return based on a notional amount. To the extent the total return of the index exceeds the offsetting interest obligation, a fund will receive a payment from the counterparty. To the extent it is less, a fund will make a payment to the counterparty.
Credit default swaps involve the exchange of a fixed rate premium for protection against the loss in value of an underlying debt instrument in the event of a defined credit event (such as payment default or bankruptcy). Under the terms of the swap, one party acts as
Annual Report
4. Operating Policies -continued
Swap Agreements - continued
a "guarantor" receiving a periodic payment that is a fixed percentage applied to a notional principal amount. In return the party agrees to purchase the notional amount of the underlying instrument, at par, if a credit event occurs during the term of the swap. The Fund may enter into credit default swaps in which either it or its counterparty act as guarantors. By acting as the guarantor of a swap, a fund assumes the market and credit risk of the underlying instrument including liquidity and loss of value.
Swaps are marked-to-market daily based on dealer-supplied valuations and changes in value are recorded as unrealized appreciation (depreciation). Periodic payments and premiums received or made by the Fund are recorded in the accompanying Statement of Operations as realized gains or losses, respectively. Gains or losses are realized upon early termination of the swap agreement. Collateral, in the form of cash or securities, may be required to be held in segregated accounts with a fund's custodian in compliance with swap contracts. Risks may exceed amounts recognized on the Statement of Assets and Liabilities. These risks include changes in the returns of the underlying instruments, failure of the counterparties to perform under the contracts' terms and the possible lack of liquidity with respect to the swap agreements. Details of swap agreements open at period end are included in the Fund's Schedule of Investments under the caption "Swap Agreements."
Mortgage Dollar Rolls. To earn additional income, the Fund may employ trading strategies which involve the sale and simultaneous agreement to repurchase similar securities ("mortgage dollar rolls") or the purchase and simultaneous agreement to sell similar securities ("reverse mortgage dollar rolls"). The securities traded are mortgage securities and bear the same interest rate but may be collateralized by different pools of mortgages. During the period between the sale and repurchase in a mortgage dollar roll transaction, a fund will not be entitled to receive interest and principal payments on the securities sold but will invest the proceeds of the sale in other securities which may enhance the yield and total return. In addition, the difference between the sale price and the future purchase price is recorded as an adjustment to investment income. During the period between the purchase and subsequent sale in a reverse mortgage dollar roll transaction a fund is entitled to interest and principal payments on the securities purchased. The price differential between the purchase and sale is recorded as an adjustment to investment income. Losses may arise due to changes in the value of the securities or if the counterparty does not perform under the terms of the agreement. If the counterparty files for bankruptcy or becomes insolvent, a fund's right to repurchase or sell securities may be limited.
Annual Report
Notes to Financial Statements - continued
5. Purchases and Sales of Investments.
Purchases and sales of securities (including the Fixed-Income Central Funds), other than short-term securities, U.S. government securities and non-taxable in-kind transactions, aggregated $3,174,712,038 and $589,100,755, respectively.
6. Fees and Other Transactions with Affiliates.
Management Fee. FMR and its affiliates provide the Fund with investment management related services for which the Fund pays a monthly management fee. The management fee is the sum of an individual fund fee rate that is based on an annual rate of .20% of the Fund's average net assets and a group fee rate that averaged ..12% during the period. The group fee rate is based upon the average net assets of all the mutual funds advised by FMR. The group fee rate decreases as assets under management increase and increases as assets under management decrease. For the period, the total annualized management fee rate was .32% of the Fund's average net assets.
Distribution and Service Plan. In accordance with Rule 12b-1 of the 1940 Act, the Fund has adopted separate Distribution and Service Plans for each class of shares. Certain classes pay Fidelity Distributors Corporation (FDC), an affiliate of FMR, separate Distribution and Service Fees, each of which is based on an annual percentage of each class' average net assets. In addition, FDC may pay financial intermediaries for selling shares of the Fund and providing shareholder support services. For the period, the Distribution and Service Fee rates and the total amounts paid to and retained by FDC were as follows:
| Distribution
Fee | Service
Fee | Paid to
FDC | Retained
by FDC |
Class A | -% | .25% | $ 50,427 | $ 14,077 |
Class T | -% | .25% | 74,918 | 10,425 |
Class B | .65% | .25% | 32,409 | 23,635 |
Class C | .75% | .25% | 121,007 | 52,234 |
| | | $ 278,761 | $ 100,371 |
On January 18, 2007, the Board of Trustees approved an increase in Class A's Service fee from .15% to .25%, effective April 1, 2007.
Sales Load. FDC receives a front-end sales charge of up to 4.00% for selling Class A shares and Class T shares (4.75% for Class A and 3.50% for Class T prior to April 1, 2007), some of which is paid to financial intermediaries for selling shares of the Fund. FDC receives the proceeds of contingent deferred sales charges levied on Class A, Class T, Class B, and Class C redemptions. These charges depend on the holding period. The deferred sales charges range from 5% to 1% for Class B, 1% for Class C, ..75% to .50% for certain purchases of Class A shares and .25% for certain purchases of Class T shares.
Annual Report
6. Fees and Other Transactions with Affiliates - continued
Sales Load - continued
For the period, sales charge amounts retained by FDC were as follows:
| Retained
by FDC |
Class A | $ 46,259 |
Class T | 11,069 |
Class B* | 6,898 |
Class C* | 5,972 |
| $ 70,198 |
* When Class B and Class C shares are initially sold, FDC pays commissions from its own resources to financial intermediaries through which the sales are made.
Transfer Agent Fees. Fidelity Investments Institutional Operations Company, Inc. (FIIOC), an affiliate of FMR, is the transfer, dividend disbursing and shareholder servicing agent for each class of the Fund, except for Total Bond. Fidelity Service Company, Inc. (FSC), an affiliate of FMR, is the transfer agent for Total Bond shares. FIIOC receives account fees and asset-based fees that vary according to the account size and type of account of the shareholders of the respective classes of the Fund. FSC receives an asset-based fee of .10% of Total Bond's average net assets. FIIOC and FSC pay for typesetting, printing and mailing of shareholder reports, except proxy statements. For the period, the total transfer agent fees paid by each class to FIIOC or FSC, were as follows:
| Amount | % of
Average
Net Assets |
Class A | $ 51,776 | .22 |
Class T | 53,307 | .18 |
Class B | 10,172 | .28 |
Class C | 24,151 | .20 |
Total Bond | 3,898,554 | .10 |
Institutional Class | 121,057 | .15 |
| $ 4,159,017 | |
Fundwide Operations Fee. Pursuant to the Fundwide Operations and Expense Agreement (FWOE), FMR has agreed to provide for fund level expenses (which do not include transfer agent, Rule 12b-1 fees, compensation of the independent trustees, interest (including commitment fees), taxes or extraordinary expenses, if any) in return for a FWOE fee equal to .35% less the total amount of the management fee. The FWOE paid by the Fund is reduced by an amount equal to the fees and expenses paid to the independent trustees. For the period, the FWOE fee was equivalent to an annual rate of .03% of average net assets.
Annual Report
Notes to Financial Statements - continued
6. Fees and Other Transactions with Affiliates - continued
Exchange-In-Kind. During the period, the Fund exchanged securities for shares of four newly created Fidelity Fixed-Income Central Funds, all of which are affiliated investment companies managed by FIMM, an affiliate of FMR. The Fund delivered securities to each Fixed-Income Central Fund in exchange for shares of each respective Fixed-Income Central Fund, as presented in the accompanying table. Each exchange is considered a non-taxable exchange for federal income tax purposes, with no gain or loss recognized by the Fund or its shareholders.
Fidelity Fixed-Income Central Fund | Value of Securities
Delivered (including
accrued interest) | Unrealized
Appreciation/
(Depreciation) | Shares of Fixed-Income Central Fund Exchanged |
1-3 Year Duration Securitized Bond Central Fund | $ 103,444,744 | $ 297,067 | 1,034,447 |
2-5 Year Duration Securitized Bond Central Fund | 155,193,358 | 2,283,849 | 1,551,934 |
Corporate Bond 1-10 Year
Central Fund | 335,272,873 | 6,447,372 | 3,352,729 |
Mortgage Backed Securities
Central Fund | 365,968,286 | 5,495,809 | 3,659,683 |
Total | $ 959,879,261 | $ 14,524,097 | 9,598,793 |
On April 27, 2007, the Fund purchased 349,241 shares of Fidelity Ultra-Short Central Fund, an affiliated entity, valued at $34,588,841 by transferring securities of equal value, including accrued interest. This is considered taxable for federal income tax purposes, and the Fund recognized a loss of $15,234.
7. Committed Line of Credit.
The Fund participates with other funds managed by FMR in a $4.2 billion credit facility (the "line of credit") to be utilized for temporary or emergency purposes to fund shareholder redemptions or for other short-term liquidity purposes. The Fund has agreed to pay commitment fees on its pro rata portion of the line of credit, which amounted to $7,476 and is reflected in Miscellaneous Expense on the Statement of Operations. During the period, there were no borrowings on this line of credit.
8. Security Lending.
The Fund lends portfolio securities from time to time in order to earn additional income. On the settlement date of the loan, the Fund receives collateral (in the form of U.S. Treasury obligations, letters of credit and/or cash) against the loaned securities and maintains collateral in an amount not less than 100% of the market value of the loaned securities during the period of the loan. The market value of the loaned securities is determined at the close of business of the Fund and any additional required collateral is
Annual Report
8. Security Lending - continued
delivered to the Fund on the next business day. If the borrower defaults on its obligation to return the securities loaned because of insolvency or other reasons, a fund could experience delays and costs in recovering the securities loaned or in gaining access to the collateral. Any cash collateral received is invested in cash equivalents. The value of loaned securities and cash collateral at period end are disclosed on the Fund's Statement of Assets and Liabilities. Security lending income represents the income earned on investing cash collateral, less fees and expenses associated with the loan, plus any premium payments that may be received on the loan of certain types of securities. Security lending income is presented in the Statement of Operations as a component of interest income. Net income from lending portfolio securities during the period amounted to $1,272,622.
9. Expense Reductions.
Through arrangements with the Fund's custodian and each class' transfer agent, credits realized as a result of uninvested cash balances were used to reduce the Fund's expenses. During the period, these credits reduced the Fund's management fee by $75,968. During the period, credits reduced each class' transfer agent expense as noted in the table below.
| Transfer Agent
expense reduction | |
Total Bond | $ 60,056 | |
Institutional Class | 3,166 | |
| $ 63,222 | |
10. Other.
The Fund's organizational documents provide former and current trustees and officers with a limited indemnification against liabilities arising in connection with the performance of their duties to the Fund. In the normal course of business, the Fund may also enter into contracts that provide general indemnifications. The Fund's maximum exposure under these arrangements is unknown as this would be dependent on future claims that may be made against the Fund. The risk of material loss from such claims is considered remote.
In September 2006, FIIOC, a transfer agent of the Fund, notified the Fund that the Fund's books and records did not reflect a conversion of certain Class B to Class A shares upon their conversion date. In March 2007, FIIOC converted the relevant Class B shares to Class A shares and recorded the conversion in the books and records of the Fund which did not result in a material impact to the Fund's reported net assets or results of operations in the accompanying financial statements. FIIOC has remediated affected shareholders.
Annual Report
Notes to Financial Statements - continued
11. Distributions to Shareholders.
Distributions to shareholders of each class were as follows:
| Year ended
August 31,
2007 | One month ended
August 31,
2006 | Year ended
July 31,
2006 |
From net investment income | | | |
Class A | $ 1,100,606 | $ 18,886 | $ 180,734 |
Class T | 1,373,421 | 17,679 | 235,647 |
Class B | 136,878 | 5,122 | 75,406 |
Class C | 457,270 | 5,360 | 39,421 |
Total Bond | 191,143,423 | 9,267,073 | 31,294,037 |
Institutional Class | 4,127,108 | 3,854 | 15,350 |
Total | $ 198,338,706 | $ 9,317,974 | $ 31,840,595 |
| | | |
From net realized gain | | | |
Class A | $ 27,576 | $ - | $ 12,832 |
Class T | 34,295 | - | 23,014 |
Class B | 5,072 | - | 8,379 |
Class C | 16,001 | - | 2,940 |
Total Bond | 4,768,190 | - | 1,632,006 |
Institutional Class | 6,635 | - | 682 |
Total | $ 4,857,769 | $ - | $ 1,679,853 |
12. Share Transactions.
Transactions for each class of shares were as follows:
| Shares |
| Year ended
August 31,
2007 | One month ended
August 31,
2006 | Year ended
July 31,
2006 |
Class A | | | |
Shares sold | 5,058,526 | 220,612 | 390,963 |
Reinvestment of distributions | 89,369 | 1,550 | 16,805 |
Shares redeemed | (1,118,505) | (11,849) | (246,932) |
Net increase (decrease) | 4,029,390 | 210,313 | 160,836 |
Class T | | | |
Shares sold | 4,727,867 | 182,921 | 395,729 |
Reinvestment of distributions | 129,776 | 1,650 | 24,086 |
Shares redeemed | (1,351,158) | (24,758) | (517,046) |
Net increase (decrease) | 3,506,485 | 159,813 | (97,231) |
Class B | | | |
Shares sold | 539,386 | 15,160 | 117,578 |
Reinvestment of distributions | 9,450 | 396 | 6,955 |
Shares redeemed | (124,884) | (12,233) | (154,343) |
Net increase (decrease) | 423,952 | 3,323 | (29,810) |
Annual Report
12. Share Transactions - continued
| Shares |
| Year ended
August 31,
2007 | One month ended
August 31,
2006 | Year ended
July 31,
2006 |
Class C | | | |
Shares sold | 1,926,281 | 31,118 | 167,899 |
Reinvestment of distributions | 38,210 | 433 | 3,045 |
Shares redeemed | (327,493) | (1,096) | (62,848) |
Net increase (decrease) | 1,636,998 | 30,455 | 108,096 |
Total Bond | | | |
Shares sold | 449,525,248 | 13,049,555 | 196,541,228 |
Reinvestment of distributions | 18,043,057 | 844,577 | 2,948,119 |
Shares redeemed | (72,384,207) | (5,355,068) | (14,766,457) |
Net increase (decrease) | 395,184,098 | 8,539,064 | 184,722,890 |
Institutional Class | | | |
Shares sold | 34,101,050 | 12,269 | 87,064 |
Reinvestment of distributions | 377,910 | 202 | 888 |
Shares redeemed | (594,798) | (1,488) | (7,870) |
Net increase (decrease) | 33,884,162 | 10,983 | 80,082 |
| Dollars |
| Year ended
August 31,
2007 | One month ended
August 31,
2006 | Year ended
July 31,
2006 |
Class A | | | |
Shares sold | $ 52,475,077 | $ 2,282,175 | $ 4,048,068 |
Reinvestment of distributions | 927,501 | 16,100 | 174,112 |
Shares redeemed | (11,603,024) | (122,009) | (2,534,797) |
Net increase (decrease) | $ 41,799,554 | $ 2,176,266 | $ 1,687,383 |
Class T | | | |
Shares sold | $ 49,238,640 | $ 1,891,613 | $ 4,083,246 |
Reinvestment of distributions | 1,346,799 | 17,127 | 249,752 |
Shares redeemed | (13,923,481) | (254,833) | (5,305,428) |
Net increase (decrease) | $ 36,661,958 | $ 1,653,907 | $ (972,430) |
Class B | | | |
Shares sold | $ 5,591,610 | $ 156,534 | $ 1,220,621 |
Reinvestment of distributions | 98,229 | 4,113 | 72,205 |
Shares redeemed | (1,299,404) | (126,159) | (1,585,560) |
Net increase (decrease) | $ 4,390,435 | $ 34,488 | $ (292,734) |
Class C | | | |
Shares sold | $ 20,051,168 | $ 322,468 | $ 1,733,336 |
Reinvestment of distributions | 397,140 | 4,501 | 31,492 |
Shares redeemed | (3,406,204) | (11,362) | (646,689) |
Net increase (decrease) | $ 17,042,104 | $ 315,607 | $ 1,118,139 |
Annual Report
Notes to Financial Statements - continued
12. Share Transactions - continued
| Dollars |
| Year ended
August 31,
2007 | One month ended
August 31,
2006 | Year ended
July 31,
2006 |
Total Bond | | | |
Shares sold | $ 4,670,295,711 | $ 134,816,251 | $ 1,999,048,539 |
Reinvestment of distributions | 187,426,399 | 8,775,005 | 30,457,852 |
Shares redeemed | (750,709,047) | (55,377,801) | (152,010,033) |
Net increase (decrease) | $ 4,107,013,063 | $ 88,213,455 | $ 1,877,496,358 |
Institutional Class | | | |
Shares sold | $ 352,256,185 | $ 126,542 | $ 891,633 |
Reinvestment of distributions | 3,888,447 | 2,101 | 9,142 |
Shares redeemed | (6,131,133) | (15,324) | (80,138) |
Net increase (decrease) | $ 350,013,499 | $ 113,319 | $ 820,637 |
13. Credit Risk.
The Fund invests a portion of its assets in securities of issuers that hold mortgage securities, including subprime mortgage securities. The value of these securities is sensitive to changes in economic conditions, including delinquencies and/or defaults, and may be adversely affected by shifts in the market's perception of the issuers and changes in interest rates.
Annual Report
Report of Independent Registered Public Accounting Firm
To the Trustees of Fidelity Income Fund and the Shareholders of Fidelity Total Bond Fund:
In our opinion, the accompanying statement of assets and liabilities, including the schedule of investments, and the related statements of operations and of changes in net assets and the financial highlights present fairly, in all material respects, the financial position of Fidelity Total Bond Fund (a fund of Fidelity Income Fund) at August 31, 2007, the results of its operations for the year then ended, the changes in its net assets for each of the periods indicated and the financial highlights for each of the periods indicated, in conformity with accounting principles generally accepted in the United States of America. These financial statements and financial highlights (hereafter referred to as "financial statements") are the responsibility of the Fidelity Total Bond Fund's management. Our responsibility is to express an opinion on these financial statements based on our audits. We conducted our audits of these financial statements in accordance with the standards of the Public Company Accounting Oversight Board (United States). Those standards require that we plan and perform the audit to obtain reasonable assurance about whether the financial statements are free of material misstatement. An audit includes examining, on a test basis, evidence supporting the amounts and disclosures in the financial statements, assessing the accounting principles used and significant estimates made by management, and evaluating the overall financial statement presentation. We believe that our audits, which included confirmation of securities at August 31, 2007 by correspondence with the custodian and brokers, provide a reasonable basis for our opinion.
/s/ PricewaterhouseCoopers LLP
PricewaterhouseCoopers LLP
Boston, Massachusetts
October 30, 2007
Annual Report
Trustees and Officers
The Trustees, Members of the Advisory Board, and executive officers of the trust and fund, as applicable, are listed below. The Board of Trustees governs the fund and is responsible for protecting the interests of shareholders. The Trustees are experienced executives who meet periodically throughout the year to oversee the fund's activities, review contractual arrangements with companies that provide services to the fund, and review the fund's performance. Except for James C. Curvey, each of the Trustees oversees 369 funds advised by FMR or an affiliate. Mr. Curvey oversees 339 funds advised by FMR or an affiliate.
The Trustees hold office without limit in time except that (a) any Trustee may resign; (b) any Trustee may be removed by written instrument, signed by at least two-thirds of the number of Trustees prior to such removal; (c) any Trustee who requests to be retired or who has become incapacitated by illness or injury may be retired by written instrument signed by a majority of the other Trustees; and (d) any Trustee may be removed at any special meeting of shareholders by a two-thirds vote of the outstanding voting securities of the trust. Each Trustee who is not an interested person (as defined in the 1940 Act) (Independent Trustee), shall retire not later than the last day of the calendar year in which his or her 72nd birthday occurs. The Independent Trustees may waive this mandatory retirement age policy with respect to individual Trustees. The executive officers and Advisory Board Members hold office without limit in time, except that any officer and Advisory Board Member may resign or may be removed by a vote of a majority of the Trustees at any regular meeting or any special meeting of the Trustees. Except as indicated, each individual has held the office shown or other offices in the same company for the past five years.
The fund's Statement of Additional Information (SAI) includes more information about the Trustees. To request a free copy, call Fidelity at 1-800-544-8544.
Interested Trustees*:
Correspondence intended for each Trustee who is an interested person may be sent to Fidelity Investments, 82 Devonshire Street, Boston, Massachusetts 02109.
Name, Age; Principal Occupation |
Edward C. Johnson 3d (77) |
| Year of Election or Appointment: 1984 Mr. Johnson is Chairman of the Board of Trustees. Mr. Johnson serves as President (2006-present), Chief Executive Officer, Chairman, and a Director of FMR LLC; Chairman and a Director of FMR; Chairman and a Director of Fidelity Research & Analysis Company (FRAC); Chairman and a Director of Fidelity Investments Money Management, Inc.; and Chairman (2001-present) and a Director of FMR Co., Inc. In addition, Mr. Johnson serves as Chairman and Director of Fidelity International Limited (FIL). |
James C. Curvey (72) |
| Year of Election or Appointment: 2007 Mr. Curvey also serves as Trustee (2007-present) or Member of the Advisory Board (2007-present) of other investment companies advised by FMR. Mr. Curvey is a Director of FMR and FMR Co., Inc. (2007-present). Mr. Curvey is also Vice Chairman (2006-present) and Director of FMR LLC. Mr. Curvey joined Fidelity in 1982 and served in numerous senior management positions, including President and Chief Operating Officer of FMR LLC (1997-2000) and President of Fidelity Strategic Investments (2000-2002). In addition, he serves as a member of the Board of Directors of Geerlings & Wade, Inc. (wine distribution). |
* Trustees have been determined to be "Interested Trustees" by virtue of, among other things, their affiliation with the trust or various entities under common control with FMR. FMR Corp. merged with FMR LLC on October 1, 2007. Any references to FMR LLC for prior periods are deemed to be references to the prior entity.
Independent Trustees:
Correspondence intended for each Independent Trustee (that is, the Trustees other than the Interested Trustees) may be sent to Fidelity Investments, P.O. Box 55235, Boston, Massachusetts 02205-5235.
Name, Age; Principal Occupation |
Dennis J. Dirks (59) |
| Year of Election or Appointment: 2005 Prior to his retirement in May 2003, Mr. Dirks was Chief Operating Officer and a member of the Board of The Depository Trust & Clearing Corporation (DTCC) (1999-2003). He also served as President, Chief Operating Officer, and Board member of The Depository Trust Company (DTC) (1999-2003) and President and Board member of the National Securities Clearing Corporation (NSCC) (1999-2003). In addition, Mr. Dirks served as Chief Executive Officer and Board member of the Government Securities Clearing Corporation (2001-2003) and Chief Executive Officer and Board member of the Mortgage-Backed Securities Clearing Corporation (2001-2003). Mr. Dirks also serves as a Trustee and a member of the Finance Committee of Manhattan College (2005-present) and a Trustee and a member of the Finance Committee of AHRC of Nassau County (2006-present). |
Albert R. Gamper, Jr. (65) |
| Year of Election or Appointment: 2006 Prior to his retirement in December 2004, Mr. Gamper served as Chairman of the Board of CIT Group Inc. (commercial finance). During his tenure with CIT Group Inc. Mr. Gamper served in numerous senior management positions, including Chairman (1987-1989; 1999-2001; 2002-2004), Chief Executive Officer (1987-2004), and President (1989-2002). He currently serves as a member of the Board of Directors of Public Service Enterprise Group (utilities, 2001-present), Chairman of the Board of Governors, Rutgers University (2004-present), and Chairman of the Board of Saint Barnabas Health Care System. |
George H. Heilmeier (71) |
| Year of Election or Appointment: 2004 Dr. Heilmeier is Chairman Emeritus of Telcordia Technologies (communication software and systems), where prior to his retirement, he served as company Chairman and Chief Executive Officer. He currently serves on the Boards of Directors of The Mitre Corporation (systems engineering and information technology support for the government), and HRL Laboratories (private research and development, 2004-present). He is Chairman of the General Motors Science & Technology Advisory Board and a Life Fellow of the Institute of Electrical and Electronics Engineers (IEEE). Dr. Heilmeier is a member of the Defense Science Board and the National Security Agency Advisory Board. He is also a member of the National Academy of Engineering, the American Academy of Arts and Sciences, and the Board of Overseers of the School of Engineering and Applied Science of the University of Pennsylvania. Previously, Dr. Heilmeier served as a Director of TRW Inc. (automotive, space, defense, and information technology, 1992-2002), Compaq (1994-2002), Automatic Data Processing, Inc. (ADP) (technology-based business outsourcing, 1995-2002), INET Technologies Inc. (telecommunications network surveillance, 2001-2004), and Teletech Holdings (customer management services). He is the recipient of the 2005 Kyoto Prize in Advanced Technology for his invention of the liquid crystal display, and a member of the Consumer Electronics Hall of Fame. |
James H. Keyes (66) |
| Year of Election or Appointment: 2007 Prior to his retirement in 2003, Mr. Keyes was Chairman, President, and Chief Executive Officer of Johnson Controls, Inc. (automotive supplier, 1993-2003). He currently serves as a member of the boards of LSI Logic Corporation (semiconductor technologies), Navistar International Corporation (manufacture and sale of trucks, buses, and diesel engines, 2002-present), and Pitney Bowes, Inc. (integrated mail, messaging, and document management solutions). |
Marie L. Knowles (60) |
| Year of Election or Appointment: 2001 Prior to Ms. Knowles' retirement in June 2000, she served as Executive Vice President and Chief Financial Officer of Atlantic Richfield Company (ARCO) (diversified energy, 1996-2000). From 1993 to 1996, she was a Senior Vice President of ARCO and President of ARCO Transportation Company. She served as a Director of ARCO from 1996 to 1998. She currently serves as a Director of Phelps Dodge Corporation (copper mining and manufacturing) and McKesson Corporation (healthcare service, 2002-present). Ms. Knowles is a Trustee of the Brookings Institution and the Catalina Island Conservancy and also serves as a member of the Advisory Board for the School of Engineering of the University of Southern California. |
Ned C. Lautenbach (63) |
| Year of Election or Appointment: 2000 Mr. Lautenbach is Chairman of the Independent Trustees (2006-present). Mr. Lautenbach has been a partner of Clayton, Dubilier & Rice, Inc. (private equity investment firm) since September 1998. Previously, Mr. Lautenbach was with the International Business Machines Corporation (IBM) from 1968 until his retirement in 1998. Mr. Lautenbach serves as a Director of Sony Corporation (2006-present) and Eaton Corporation (diversified industrial) as well as the Philharmonic Center for the Arts in Naples, Florida. He also is a member of the Board of Trustees of Fairfield University (2005-present), as well as a member of the Council on Foreign Relations. |
Cornelia M. Small (63) |
| Year of Election or Appointment: 2005 Ms. Small is a member (2000-present) and Chairperson (2002-present) of the Investment Committee, and a member (2002-present) of the Board of Trustees of Smith College. Previously, she served as Chief Investment Officer (1999-2000), Director of Global Equity Investments (1996-1999), and a member of the Board of Directors of Scudder, Stevens & Clark (1990-1997) and Scudder Kemper Investments (1997-1999). In addition, Ms. Small served as Co-Chair (2000-2003) of the Annual Fund for the Fletcher School of Law and Diplomacy. |
William S. Stavropoulos (68) |
| Year of Election or Appointment: 2001 Mr. Stavropoulos is Chairman Emeritus of the Board of Directors of The Dow Chemical Company. Since joining The Dow Chemical Company in 1967, Mr. Stavropoulos served in numerous senior management positions, including President (1993-2000; 2002-2003), CEO (1995-2000; 2002-2004), and Chairman of the Executive Committee (2000-2004). Currently, he is a Director of NCR Corporation (data warehousing and technology solutions), Chemical Financial Corporation, Maersk Inc. (industrial conglomerate, 2002-present), Tyco International, Inc. (multinational manufacturing and services, 2007-present), and a member of the Advisory Board for Metalmark Capital (private equity investment firm, 2005-present). He is a special advisor to Clayton, Dubilier & Rice, Inc., a private equity investment firm. He also serves as a member of the Board of Trustees of the American Enterprise Institute for Public Policy Research. In addition, Mr. Stavropoulos is a member of The Business Council, J.P. Morgan International Council and the University of Notre Dame Advisory Council for the College of Science. |
Kenneth L. Wolfe (68) |
| Year of Election or Appointment: 2005 Prior to his retirement in 2001, Mr. Wolfe was Chairman and Chief Executive Officer of Hershey Foods Corporation (1993-2001). He currently serves as a member of the boards of Adelphia Communications Corporation (2003-present), Bausch & Lomb, Inc., and Revlon Inc. (2004-present). |
Advisory Board Members and Executive Officers**:
Correspondence intended for Mr. Mauriello and Mr. Wiley may be sent to Fidelity Investments, P.O. Box 55235, Boston, Massachusetts 02205-5235. Correspondence intended for each executive officer and Mr. Lynch may be sent to Fidelity Investments, 82 Devonshire Street, Boston, Massachusetts 02109.
Name, Age; Principal Occupation |
Peter S. Lynch (63) |
| Year of Election or Appointment: 2003 Member of the Advisory Board of Fidelity Income Fund. Mr. Lynch is Vice Chairman and a Director of FMR, and Vice Chairman (2001-present) and a Director of FMR Co., Inc. Previously, Mr. Lynch served as a Trustee of the Fidelity funds (1990-2003). In addition, he serves as a Trustee of Boston College and as the Chairman of the Inner-City Scholarship Fund. |
Joseph Mauriello (62) |
| Year of Election or Appointment: 2007 Member of the Advisory Board of Fidelity Income Fund. Prior to his retirement in January 2006, Mr. Mauriello served in numerous senior management positions including Deputy Chairman and Chief Operating Officer (2004-2005), and Vice Chairman of Financial Services (2002-2004) of KPMG LLP US (professional services firm, 1965-2005). Mr. Mauriello currently serves as a member of the Board of Directors of XL Capital Ltd., (global insurance and re-insurance company, 2006-present) and of Arcadia Resources Inc., (health care services and products, 2007-present). He also served as a Director of the Hamilton Funds of the Bank of New York (2006-2007). |
Michael E. Wiley (56) |
| Year of Election or Appointment: 2007 Member of the Advisory Board of Fidelity Income Fund. Mr. Wiley also serves as Sr. Energy Advisor of Katzenbach Partners, LLC (consulting firm, 2006-present) and a member of the Board of Trustees of the University of Tulsa (2000-2006; 2007-present). He serves as a Director of Tesoro Corporation (independent oil refiner and marketer, 2005-present), and a Director of Bill Barrett Corporation (exploration and production company, 2005-present). In addition, he also serves as a Director of Post Oak Bank (privately-held bank, 2004-present), and an Advisory Director of Riverstone Holdings (private investment firm). Previously, Mr. Wiley served as Chairman, President, and CEO of Baker Hughes, Inc. (oilfield services company, 2000-2004), and as Director of Spinnaker Exploration Company (exploration and production company, 2001-2005). |
Kimberley H. Monasterio (43) |
| Year of Election or Appointment: 2007 President and Treasurer of the fund. Ms. Monasterio also serves as President and Treasurer of other Fidelity funds (2007-present) and is an employee of FMR (2004-present). Previously, Ms. Monasterio served as Deputy Treasurer of the Fidelity funds (2004-2006). Before joining Fidelity Investments, Ms. Monasterio served as Treasurer (2000-2004) and Chief Financial Officer (2002-2004) of the Franklin Templeton Funds and Senior Vice President of Franklin Templeton Services, LLC (2000-2004). |
Walter C. Donovan (45) |
| Year of Election or Appointment: 2005 Vice President of the fund. Mr. Donovan also serves as Vice President of Fidelity's Equity Funds (2007-present). Mr. Donovan also serves as Executive Vice President of FMR (2005-present) and FMR Co., Inc. (2005-present). Previously, Mr. Donovan served as Vice President of Fidelity's High Income Funds (2005-2007), Fixed-Income Funds (2005-2006), certain Asset Allocation Funds (2005-2006), certain Balanced Funds (2005-2006), and as Vice President and Director of Fidelity's International Equity Trading group (1998-2005). |
Boyce I. Greer (51) |
| Year of Election or Appointment: 2006 Vice President of the fund. Mr. Greer also serves as Vice President of certain Asset Allocation Funds (2005-present), Fixed-Income Funds (2006-present), and Money Market Funds (2006-present). Mr. Greer is also a Trustee of other investment companies advised by FMR (2003-present). Mr. Greer is an Executive Vice President of FMR (2005-present) and FMR Co., Inc. (2005-present), and Senior Vice President of Fidelity Investments Money Management, Inc. (2006-present). Previously, Mr. Greer served as Vice President of certain Fidelity Equity Funds (2005-2007), a Director and Managing Director of Strategic Advisers, Inc. (2002-2005), and Executive Vice President (2000-2002) and Money Market Group Leader (1997-2002) of the Fidelity Investments Fixed Income Division. Mr. Greer also served as Vice President of Fidelity's Money Market Funds (1997-2002), Senior Vice President of FMR (1997-2002), and Vice President of FIMM (1998-2002). |
Robert A. Lawrence (54) |
| Year of Election or Appointment: 2006 Vice President of the fund. Mr. Lawrence also serves as Vice President of the High Income Funds. Mr. Lawrence is Senior Vice President of FMR (2006-present) and FMR Co., Inc. (2006-present). Previously, Mr. Lawrence served as President of Fidelity Strategic Investments (2002-2005). |
David L. Murphy (59) |
| Year of Election or Appointment: 2005 Vice President of the fund. Mr. Murphy also serves as Vice President of Fidelity's Money Market Funds (2002-present) and Fixed-Income Funds (2005-present). Mr. Murphy serves as Senior Vice President (2000-present) and Head (2004-present) of the Fidelity Investments Fixed Income Division. Mr. Murphy is also a Senior Vice President of Fidelity Investments Money Management, Inc. (2003-present) and an Executive Vice President of FMR (2005-present). Previously, Mr. Murphy served as Money Market Group Leader (2002-2004), Bond Group Leader (2000-2002), and Vice President of certain Asset Allocation Funds (2003-2007), Balanced Funds (2005-2007), Fidelity's Taxable Bond Funds (2000-2002) and Fidelity's Municipal Bond Funds (2001-2002). |
Thomas J. Silvia (46) |
| Year of Election or Appointment: 2005 Vice President of the fund. Mr. Silvia also serves as Vice President of Fidelity's Fixed-Income Funds (2005-present) and Senior Vice President and Bond Group Leader of the Fidelity Investments Fixed-Income Division (2005-present). Previously, Mr. Silvia served as Vice President of certain Balanced Funds (2005-2007), certain Asset Allocation Funds (2005-2007), a Director of Fidelity's Taxable Bond portfolio managers (2002-2004) and a portfolio manager in the Bond Group (1997-2004). |
Eric D. Roiter (58) |
| Year of Election or Appointment: 2002 Secretary of the fund. He also serves as Secretary of other Fidelity funds; Vice President, General Counsel, and Secretary of FMR Co., Inc. (2001-present) and FMR; Assistant Secretary of Fidelity Management & Research (U.K.) Inc. (2001-present), Fidelity Research & Analysis Company (2001-present), and Fidelity Investments Money Management, Inc. (2001-present). Mr. Roiter is an Adjunct Member, Faculty of Law, at Boston College Law School (2003-present). Previously, Mr. Roiter served as Vice President and Secretary of Fidelity Distributors Corporation (FDC) (1998-2005). |
Scott C. Goebel (39) |
| Year of Election or Appointment: 2007 Assistant Secretary of the fund. Mr. Goebel also serves as Assistant Secretary of other Fidelity funds (2007-present), and is an employee of FMR. |
R. Stephen Ganis (41) |
| Year of Election or Appointment: 2006 Anti-Money Laundering (AML) officer of the fund. Mr. Ganis also serves as AML officer of other Fidelity funds (2006-present) and FMR LLC (2003-present). Before joining Fidelity Investments, Mr. Ganis practiced law at Goodwin Procter, LLP (2000-2002). |
Joseph B. Hollis (59) |
| Year of Election or Appointment: 2006 Chief Financial Officer of the fund. Mr. Hollis also serves as Chief Financial Officer of other Fidelity funds. Mr. Hollis is President of Fidelity Pricing and Cash Management Services (FPCMS) (2005-present). Mr. Hollis also serves as President and Director of Fidelity Service Company, Inc. (2006-present). Previously, Mr. Hollis served as Senior Vice President of Cash Management Services (1999-2002) and Investment Management Operations (2002-2005). |
Kenneth A. Rathgeber (60) |
| Year of Election or Appointment: 2004 Chief Compliance Officer of the fund. Mr. Rathgeber also serves as Chief Compliance Officer of other Fidelity funds (2004-present) and Executive Vice President of Risk Oversight for Fidelity Investments (2002-present). He is Chief Compliance Officer of FMR (2005-present), FMR Co., Inc. (2005-present), Fidelity Management & Research (U.K.) Inc. (2005-present), Fidelity Research & Analysis Company (2005-present), Fidelity Investments Money Management, Inc. (2005-present), and Strategic Advisers, Inc. (2005-present). Previously, Mr. Rathgeber served as Executive Vice President and Chief Operating Officer for Fidelity Investments Institutional Services Company, Inc. (1998-2002). |
Bryan A. Mehrmann (46) |
| Year of Election or Appointment: 2005 Deputy Treasurer of the fund. Mr. Mehrmann also serves as Deputy Treasurer of other Fidelity funds (2005-present) and is an employee of FMR. Previously, Mr. Mehrmann served as Vice President of Fidelity Investments Institutional Services Group (FIIS)/Fidelity Investments Institutional Operations Corporation, Inc. (FIIOC) Client Services (1998-2004). |
Kenneth B. Robins (38) |
| Year of Election or Appointment: 2005 Deputy Treasurer of the fund. Mr. Robins also serves as Deputy Treasurer of other Fidelity funds (2005-present) and is an employee of FMR (2004-present). Before joining Fidelity Investments, Mr. Robins worked at KPMG LLP, where he was a partner in KPMG's department of professional practice (2002-2004) and a Senior Manager (1999-2000). In addition, Mr. Robins served as Assistant Chief Accountant, United States Securities and Exchange Commission (2000-2002). |
Robert G. Byrnes (40) |
| Year of Election or Appointment: 2005 Assistant Treasurer of the fund. Mr. Byrnes also serves as Assistant Treasurer of other Fidelity funds (2005-present) and is an employee of FMR (2005-present). Previously, Mr. Byrnes served as Vice President of FPCMS (2003-2005). Before joining Fidelity Investments, Mr. Byrnes worked at Deutsche Asset Management where he served as Vice President of the Investment Operations Group (2000-2003). |
Peter L. Lydecker (53) |
| Year of Election or Appointment: 2004 Assistant Treasurer of the fund. Mr. Lydecker also serves as Assistant Treasurer of other Fidelity funds (2004) and is an employee of FMR. |
Gary W. Ryan (49) |
| Year of Election or Appointment: 2005 Assistant Treasurer of the fund. Mr. Ryan also serves as Assistant Treasurer of other Fidelity funds (2005-present) and is an employee of FMR (2005-present). Previously, Mr. Ryan served as Vice President of Fund Reporting in FPCMS (1999-2005). |
** FMR Corp. merged with FMR LLC on October 1, 2007. Any references to FMR LLC for prior periods are deemed to be references to the prior entity.
Annual Report
Distributions
A total of 4.23% of the dividends distributed during the fiscal year was derived from interest on U.S. Government securities which is generally exempt from state income tax.
The fund designates $175,749,234 of distributions paid during the period January 1, 2007 to August 31, 2007 as qualifying to be taxed as interest-related dividends for nonresident alien shareholders.
The fund will notify shareholders in January 2008 of amounts for use in preparing 2007 income tax returns.
Annual Report
Board Approval of Investment Advisory Contracts and Management Fees
Fidelity Total Bond Fund
Each year, typically in June, the Board of Trustees, including the Independent Trustees (together, the Board), votes on the renewal of the management contract and sub-advisory agreements (together, the Advisory Contracts) for the fund. The Board, assisted by the advice of fund counsel and Independent Trustees' counsel, requests and considers a broad range of information throughout the year.
The Board meets regularly each month except August and takes into account throughout the year matters bearing on Advisory Contracts. The Board, acting directly and through its separate committees, considers at each of its meetings factors that are relevant to the annual renewal of the fund's Advisory Contracts, including the services and support provided to the fund and its shareholders. At the time of the renewal, the Board had 12 standing committees, each composed of Independent Trustees with varying backgrounds, to which the Board has assigned specific subject matter responsibilities in order to enhance effective decision-making by the Board. Each committee has adopted a written charter outlining the structure and purposes of the committee. One such committee, the Fixed-Income Contract Committee, meets periodically as needed throughout the year to consider matters specifically related to the annual renewal of Advisory Contracts. The committee requests and receives information on, and makes recommendations to the Independent Trustees concerning, the approval and annual review of the Advisory Contracts.
At its June 2007 meeting, the Board of Trustees, including the Independent Trustees, unanimously determined to renew the Advisory Contracts for the fund. In reaching its determination, the Board considered all factors it believed relevant, including (i) the nature, extent, and quality of the services to be provided to the fund and its shareholders (including the investment performance of the fund); (ii) the competitiveness of the management fee and total expenses of the fund; (iii) the total costs of the services to be provided by and the profits to be realized by the investment adviser and its affiliates from the relationship with the fund; (iv) the extent to which economies of scale would be realized as the fund grows; and (v) whether fee levels reflect these economies of scale, if any, for the benefit of fund shareholders. The Board also approved amendments to the fund's agreements with foreign sub-advisers to clarify that each sub-adviser provides services as an independent contractor.
In determining whether to renew the Advisory Contracts for the fund, the Board ultimately reached a determination, with the assistance of fund counsel and Independent Trustees' counsel, that the renewal of the Advisory Contracts and the compensation to be received by Fidelity under the management contract is consistent with Fidelity's fiduciary duty under applicable law. In addition to evaluating the specific factors noted above, the Board, in reaching its determination, is aware that shareholders in the fund have a broad range of investment choices available to them, including a wide choice among mutual funds offered by competitors to Fidelity, and that the fund's shareholders, with the opportunity to review and weigh the disclosure provided by the fund in its prospectus and other public disclosures, have chosen to invest in this fund, managed by Fidelity.
Annual Report
Board Approval of Investment Advisory Contracts and
Management Fees - continued
Nature, Extent, and Quality of Services Provided. The Board considered staffing within the investment adviser, FMR, and the sub-advisers (together, the Investment Advisers), including the background of the fund's portfolio manager and the fund's investment objective and discipline. The Independent Trustees also had discussions with senior management of Fidelity's investment operations and investment groups. The Board considered the structure of the portfolio manager compensation program and whether this structure provides appropriate incentives.
Resources Dedicated to Investment Management and Support Services. The Board reviewed the size, education, and experience of the Investment Advisers' investment staff, their use of technology, and the Investment Advisers' approach to recruiting, training, and retaining portfolio managers and other research, advisory, and management personnel. The Board considered Fidelity's extensive global research capabilities that enable the Investment Advisers to aggregate data from various sources in an effort to produce positive investment results. The Board noted that Fidelity's analysts have access to a variety of technological tools that enable them to perform both fundamental and quantitative analysis and to specialize in various disciplines. The Board also considered that Fidelity's portfolio managers and analysts have access to daily portfolio attribution that allows for monitoring of a fund's portfolio, as well as an electronic communication system that provides immediate real-time access to research concerning issuers and credit enhancers. In addition, the Board considered the trading resources that are an integrated part of the fixed-income portfolio management investment process.
Shareholder and Administrative Services. The Board considered (i) the nature, extent, quality, and cost of advisory, administrative, distribution, and shareholder services performed by the Investment Advisers and their affiliates under the Advisory Contracts and under separate agreements covering transfer agency, pricing and bookkeeping, and securities lending services for the fund; (ii) the nature and extent of the Investment Advisers' supervision of third party service providers, principally custodians and subcustodians; and (iii) the resources devoted to, and the record of compliance with, the fund's compliance policies and procedures.
The Board noted that the growth of fund assets across the complex allows Fidelity to reinvest in the development of services designed to enhance the value or convenience of the Fidelity funds as investment vehicles. These services include 24-hour access to account information and market information through phone representatives and over the Internet, and investor education materials and asset allocation tools.
Annual Report
Investment in a Large Fund Family. The Board considered the benefits to shareholders of investing in a Fidelity fund, including the benefits of investing in a fund that is part of a large family of funds offering a variety of investment disciplines and providing for a large variety of mutual fund investor services. For example, fund shareholders are offered the privilege of exchanging shares of the fund for shares of other Fidelity funds, as set forth in the fund's prospectus, without paying a sales charge. The Board noted that, since the last Advisory Contract renewals in June 2006, Fidelity has taken a number of actions that benefited particular funds, including (i) dedicating additional resources to investment research and to restructure the investment research teams; (ii) contractually agreeing to reduce the management fee on Fidelity Advisor Floating Rate High Income Fund; (iii) contractually agreeing to reduce the management fees on Fidelity's California, Massachusetts, New Jersey, and New York AMT Tax-Free Money Market Funds, launching new Institutional Classes and Service Classes of these funds, and contractually agreeing to impose expense limitations on these funds; (iv) eliminating the exchange fee on the Fidelity Select Portfolios and reducing the pricing and bookkeeping fee rates for these funds; (v) reducing the maximum transfer agency fee rates on high income funds and certain equity funds; (vi) proposing amended management contracts that, if approved by shareholders, will add a performance adjustment component to the management fees paid by 18 Fidelity Advisor equity funds; (vii) contractually agreeing to reduce fees for Ultra-Short Central Fund and the money market Central Funds; (viii) waiving the Fidelity Advisor funds' contingent deferred sales charge on certain redemptions made through systematic withdrawal programs; and (ix) amending the management contracts for equity and fixed-income funds whose management contracts incorporate a "group fee" structure by adding four new fee "breakpoints" to the group fee rate schedules.
Investment Performance. The Board considered whether the fund has operated within its investment objective, as well as its record of compliance with its investment restrictions. It also reviewed the fund's absolute investment performance for each class, as well as the fund's relative investment performance for each class measured against (i) a broad-based securities market index, and (ii) a peer group of mutual funds deemed appropriate by the Board over multiple periods. Because the fund had been in existence less than five calendar years, the following charts considered by the Board show, over the one- and three-year periods ended December 31, 2006, as available, the cumulative total returns of Fidelity Total Bond (retail class) and Class C, the cumulative total returns of a broad-based securities market index ("benchmark"), and a range of cumulative total returns of a peer group of mutual funds identified by Lipper Inc. as having an investment objective similar to that of the fund. The returns of Fidelity Total Bond (retail class) and Class C show the performance of the highest and lowest performing classes, respectively. The box within each chart shows the 25th percentile return (bottom of box) and the 75th percentile return (top of box) of the peer group. Returns shown above the box are in the first quartile and returns shown below the box are in the fourth quartile. The percentage beaten numbers noted below each chart correspond to the percentile box and represent the percentage of funds in the peer group whose performance was equal to or lower than that of the class indicated.
Annual Report
Board Approval of Investment Advisory Contracts and
Management Fees - continued
Fidelity Total Bond Fund
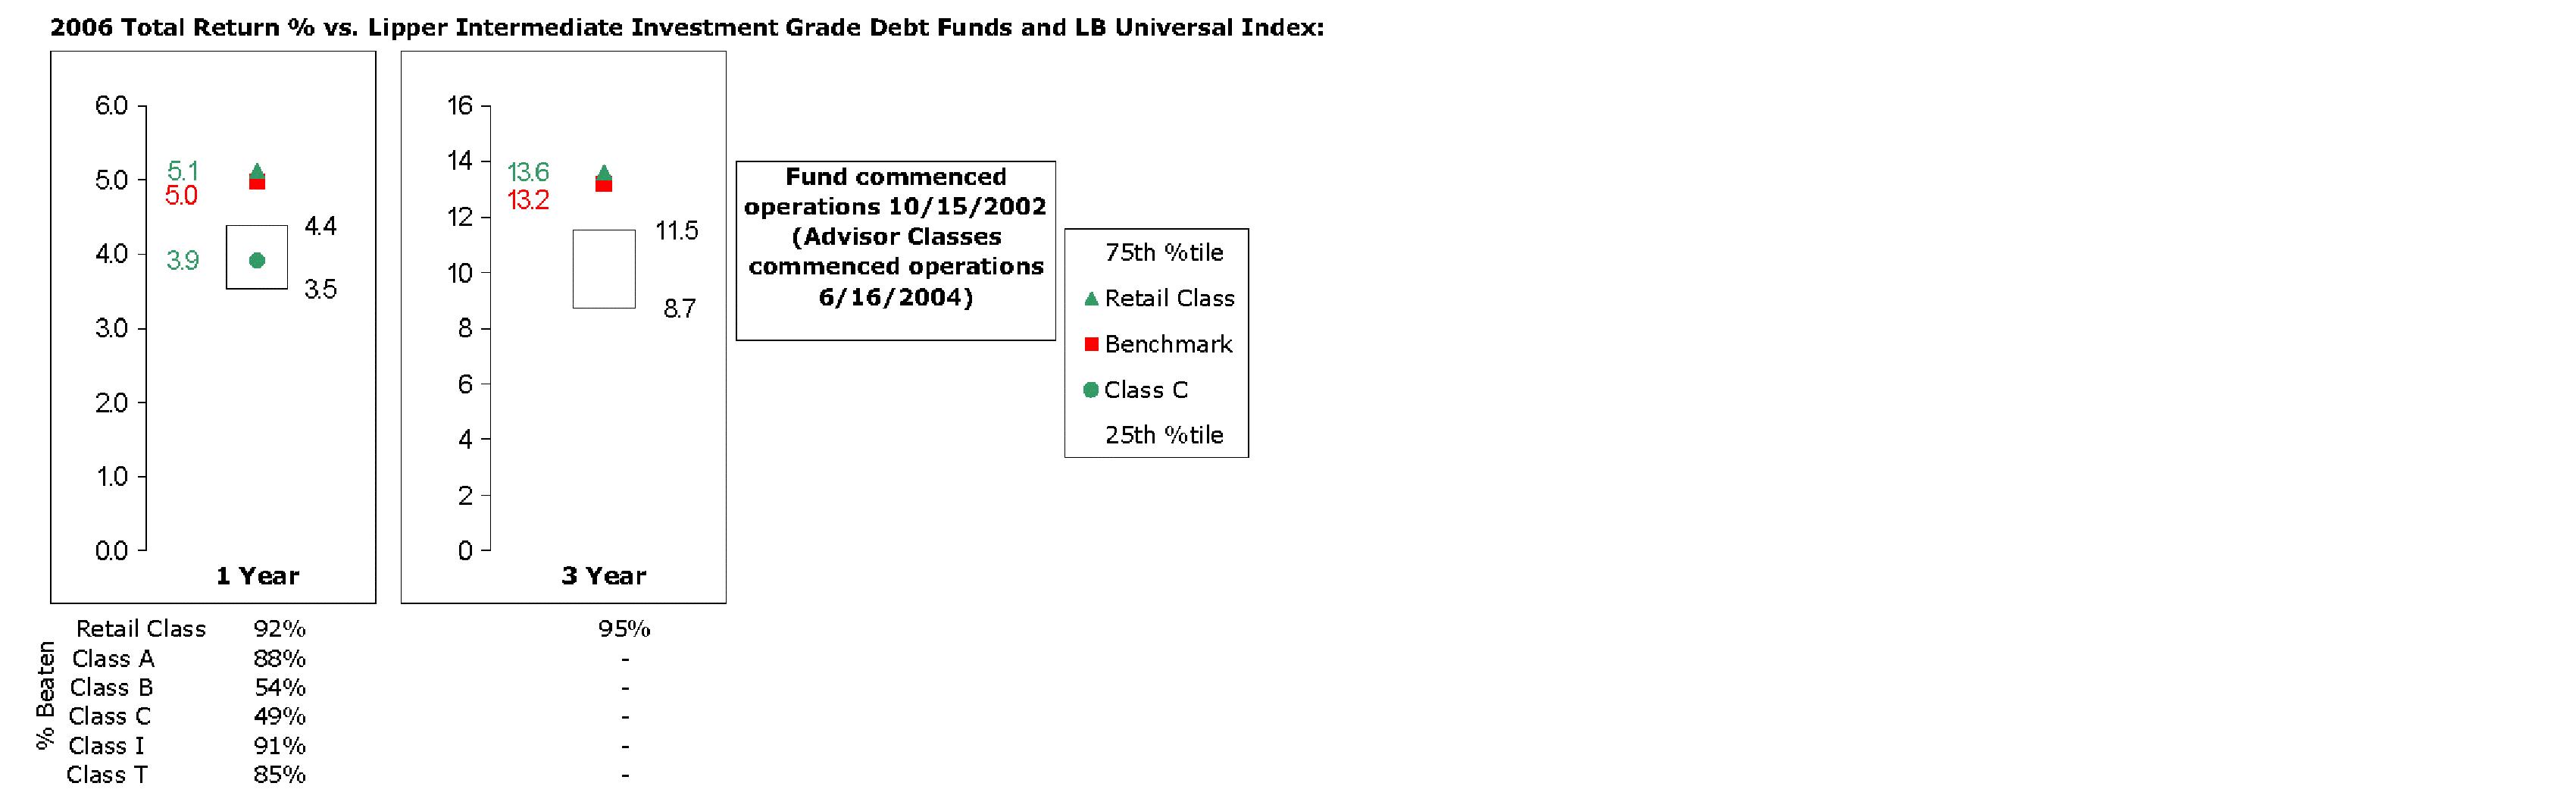
The Board reviewed the fund's relative investment performance against its peer group and stated that the performance of Fidelity Total Bond (retail class) was in the first quartile for all the periods shown. The Board also stated that the relative investment performance of Fidelity Total Bond (retail class) compared favorably to its benchmark for all periods shown. The Board considered that the variations in performance among the fund's classes reflect the variations in class expenses, which result in lower performance for higher expense classes.
Based on its review, and giving particular weight to the nature and quality of the resources dedicated by the Investment Advisers to maintain and improve relative performance, the Board concluded that the nature, extent, and quality of the services provided to the fund will benefit the fund's shareholders, particularly in light of the Board's view that the fund's shareholders benefit from investing in a fund that is part of a large family of funds offering a variety of investment disciplines and services.
Competitiveness of Management Fee and Total Fund Expenses. The Board considered the fund's management fee and total expenses compared to "mapped groups" of competitive funds and classes. Fidelity creates "mapped groups" by combining similar Lipper investment objective categories that have comparable management fee characteristics. Combining Lipper investment objective categories aids the Board's management fee and total expense comparisons by broadening the competitive group used for comparison and by reducing the number of universes to which various Fidelity funds are compared.
Annual Report
The Board considered two proprietary management fee comparisons for the 12-month (or shorter) periods shown in the chart below. The group of Lipper funds used by the Board for management fee comparisons is referred to below as the "Total Mapped Group" and, for the reasons explained above, is broader than the Lipper peer group used by the Board for performance comparisons. The Total Mapped Group comparison focuses on a fund's standing relative to the total universe of comparable funds available to investors, in terms of gross management fees before expense reimbursements or caps. "TMG %" represents the percentage of funds in the Total Mapped Group that had management fees that were lower than the fund's. For example, a TMG % of 8% means that 92% of the funds in the Total Mapped Group had higher management fees than the fund. The "Asset-Size Peer Group" (ASPG) comparison focuses on a fund's standing relative to non-Fidelity funds similar in size to the fund within the Total Mapped Group. The ASPG represents at least 15% of the funds in the Total Mapped Group with comparable asset size and management fee characteristics, subject to a minimum of 50 funds (or all funds in the Total Mapped Group if fewer than 50). Additional information, such as the ASPG quartile in which the fund's management fee ranked, is also included in the chart and considered by the Board.
Fidelity Total Bond Fund

The Board noted that the fund's management fee ranked below the median of its Total Mapped Group and below the median of its ASPG for 2006.
Annual Report
Board Approval of Investment Advisory Contracts and
Management Fees - continued
Furthermore, the Board considered that it had approved an amendment (effective June 1, 2005) to the fund's management contract that lowered the fund's individual fund fee rate from 30 basis points to 20 basis points. The Board considered that the chart reflects the fund's lower management fee for 2005, as if the lower rate were in effect for the entire year.
Based on its review, the Board concluded that the fund's management fee was fair and reasonable in light of the services that the fund receives and the other factors considered.
In its review of each class's total expenses, the Board considered the fund's management fee as well as other fund or class expenses, as applicable, such as transfer agent fees, pricing and bookkeeping fees, fund-paid 12b-1 fees, and custodial, legal, and audit fees. The Board also noted the effects of any waivers and reimbursements on fees and expenses. As part of its review, the Board also considered current and historical total expenses of each class of the fund compared to competitive fund median expenses. Each class of the fund is compared to those funds and classes in the Total Mapped Group (used by the Board for management fee comparisons) that have a similar sales load structure.
The Board also considered that the current contractual arrangements for the fund (i) have the effect of setting the total "fund-level" expenses (including, among certain other expenses, the management fee) for each class at 35 basis points, (ii) lower and limit the "class-level" transfer agent fee for Fidelity Total Bond (retail class) to 10 basis points, and (iii) limit the total expenses for Fidelity Total Bond (retail class) to 45 basis points. These contractual arrangements may not be increased without the approval of the Board and the shareholders of the applicable class. The fund's Advisor classes are subject to different class-level expenses (transfer agent fees and 12b-1 fees).
The Board noted that each class's total expenses ranked below its competitive median for 2006.
The Board recognized that the fund's management contract incorporates a "group fee" structure, which provides for lower group fee rates as total fund assets under FMR's management increase, and for higher group fee rates as total fund assets under FMR's management decrease. FMR determines the group fee rates based on a tiered asset "breakpoint" schedule. In connection with the renewal of the fund's management contract, the Board approved amendments to the fund's management contract that added four new fee breakpoints to the group fee rate schedule for assets under FMR's management above $1,386 billion. The Board considered that the group fee rate declines under both the present and amended schedules, but that under the amended schedule, the group fee rate declines faster as assets under FMR's management exceed $1,386 billion. The Board noted, however, that because the current contractual arrangements set the total fund-level expenses for each class at 35 basis points, increases or decreases in the management fee due to changes in the group fee rate will not impact total expenses.
Annual Report
In its review of total expenses, the Board also considered Fidelity fee structures and other information on clients that FMR and its affiliates service in other competitive markets, such as other mutual funds advised or subadvised by FMR or its affiliates, pension plan clients, and other institutional clients.
Based on its review, the Board concluded that the total expenses of each class of the fund were reasonable in light of the services that the fund and its shareholders receive and the other factors considered.
Costs of the Services and Profitability. The Board considered the revenues earned and the expenses incurred by Fidelity in conducting the business of developing, marketing, distributing, managing, administering and servicing the fund and its shareholders. The Board also considered the level of Fidelity's profits in respect of all the Fidelity funds.
On an annual basis, FMR presents to the Board Fidelity's profitability for the fund. Fidelity calculates the profitability for each fund, as well as aggregate profitability for groups of Fidelity funds and all Fidelity funds, using a series of detailed revenue and cost allocation methodologies which originate with the audited books and records of Fidelity. The Audit Committee of the Board reviews any significant changes from the prior year's methodologies.
PricewaterhouseCoopers LLP (PwC), independent registered public accounting firm and auditor to Fidelity and certain Fidelity funds, has been engaged annually by the Board as part of the Board's assessment of the results of Fidelity's profitability analysis. PwC's engagement includes the review and assessment of Fidelity's methodologies used in determining the revenues and expenses attributable to Fidelity's mutual fund business, and completion of agreed-upon procedures surrounding the mathematical accuracy of fund profitability and its conformity to allocation methodologies. After considering PwC's reports issued under the engagement and information provided by Fidelity, the Board believes that while other allocation methods may also be reasonable, Fidelity's profitability methodologies are reasonable in all material respects.
The Board has also reviewed Fidelity's non-fund businesses and any fall-out benefits related to the mutual fund business as well as cases where Fidelity's affiliates may benefit from or be related to the fund's business.
The Board considered the costs of the services provided by and the profits realized by Fidelity in connection with the operation of the fund and determined that the amount of profit is a fair entrepreneurial profit for the management of the fund.
Annual Report
Board Approval of Investment Advisory Contracts and
Management Fees - continued
Economies of Scale. The Board considered whether there have been economies of scale in respect of the management of the Fidelity funds, whether the Fidelity funds (including the fund) have appropriately benefited from any such economies of scale, and whether there is potential for realization of any further economies of scale. The Board considered the extent to which the fund will benefit from economies of scale through increased services to the fund, through waivers or reimbursements, or through fee or expense reductions, including (Advisor classes only) reductions that occur through operation of the transfer agent agreement. The transfer agent fee varies in part based on the number of accounts in the fund. If the number of accounts decreases or the average account size increases, the overall transfer agent fee rate decreases. The Board concluded that any potential economies of scale are being shared between fund shareholders and Fidelity in an appropriate manner.
Additional Information Requested by the Board. In order to develop fully the factual basis for consideration of the Fidelity funds' Advisory Contracts, the Board requested and received additional information on several topics, including (i) Fidelity's fund profitability methodology, profitability by investment discipline, and profitability trends within certain funds; (ii) Fidelity's compensation structure relative to competitors and its effect on profitability; (iii) funds and accounts managed by Fidelity other than the Fidelity funds, including fee arrangements; (iv) the total expenses of certain funds and classes relative to competitors; (v) fund performance trends; (vi) fall-out benefits received by certain Fidelity affiliates; and (vii) Fidelity's fee structures.
Based on its evaluation of all of the conclusions noted above, and after considering all material factors, the Board ultimately concluded that the advisory fee structures are fair and reasonable, and that the fund's Advisory Contracts should be renewed.
Annual Report
Annual Report
Annual Report
Annual Report
Investment Adviser
Fidelity Management & Research Company
Boston, MA
Investment Sub-Advisers
FMR Co. Inc.
Fidelity Research & Analysis Company
Fidelity Investments
Money Management, Inc.
Fidelity Investments Japan Limited
Fidelity International Investment Advisors
Fidelity International Investment Advisors
(U.K.) Limited
General Distributor
Fidelity Distributors Corporation
Boston, MA
Transfer and Service Agents
Fidelity Investments Institutional Operations Company, Inc.
Boston, MA
Fidelity Service Company, Inc.
Boston, MA
Custodian
Citibank, N.A.
New York, NY
ATBI-UANN-1007
1.804580.103
(Fidelity Investment logo)(registered trademark)
Corporate Headquarters
82 Devonshire St., Boston, MA 02109
www.fidelity.com
Item 2. Code of Ethics
As of the end of the period, August 31, 2007, Fidelity Income Fund (the trust) has adopted a code of ethics, as defined in Item 2 of Form N-CSR, that applies to its President and Treasurer and its Chief Financial Officer. A copy of the code of ethics is filed as an exhibit to this Form N-CSR.
Item 3. Audit Committee Financial Expert
The Board of Trustees of the trust has determined that Marie L. Knowles is an audit committee financial expert, as defined in Item 3 of Form N-CSR. Ms. Knowles is independent for purposes of Item 3 of Form N-CSR.
Item 4. Principal Accountant Fees and Services
(a) Audit Fees.
For the fiscal year ended August 31, 2007, the one month period ended August 31, 2006 and the fiscal year ended July 31, 2006, the aggregate Audit Fees billed by PricewaterhouseCoopers LLP (PwC) for professional services rendered for the audits of the financial statements, or services that are normally provided in connection with statutory and regulatory filings or engagements for those fiscal years, for the Fidelity Total Bond Fund (the fund) and for all funds in the Fidelity Group of Funds are shown in the table below.
Fund | 2007A | 2006A | 2006A |
Fidelity Total Bond Fund | $119,000 | $48,000 B | $59,000 |
All funds in the Fidelity Group of Funds audited by PwC | $14,300,000 | $13,300,000 C | $12,800,000 |
A | Aggregate amounts may reflect rounding. |
B | For the one month period ended August 31, 2006. |
C | For the twelve month period ended August 31, 2006. |
(b) Audit-Related Fees.
For the fiscal year ended August 31, 2007, the one month period ended August 31, 2006 and the fiscal year ended July 31, 2006, the aggregate Audit-Related Fees billed by PwC for services rendered for assurance and related services to the fund that are reasonably related to the performance of the audit or review of the fund's financial statements, but not reported as Audit Fees, are shown in the table below.
Fund | 2007A | 2006A,B | 2006A |
Fidelity Total Bond Fund | $0 | $0 | $0 |
A | Aggregate amounts may reflect rounding. |
B | For the one month period ended August 31, 2006. |
For the fiscal year ended August 31, 2007, the one month period ended August 31, 2006 and the fiscal year ended July 31, 2006, the aggregate Audit-Related Fees that were billed by PwC that were required to be approved by the Audit Committee for services rendered on behalf of Fidelity Management & Research Company (FMR) and entities controlling, controlled by, or under common control with FMR (not including any sub-adviser whose role is primarily portfolio management and is subcontracted with or overseen by another investment adviser) that provide ongoing services to the fund ("Fund Service Providers") for assurance and related services that relate directly to the operations and financial reporting of the fund that are reasonably related to the performance of the audit or review of the fund's financial statements, but not reported as Audit Fees, are shown in the table below.
Billed By | 2007A | 2006A,B | 2006A |
PwC | $0 | $0 | $0 |
A | Aggregate amounts may reflect rounding. |
B | For the one month period ended August 31, 2006. |
Fees included in the audit-related category comprise assurance and related services (e.g., due diligence services) that are traditionally performed by the independent registered public accounting firm. These audit-related services include due diligence related to mergers and acquisitions, accounting consultations and audits in connection with acquisitions, internal control reviews, attest services that are not required by statute or regulation and consultation concerning financial accounting and reporting standards.
(c) Tax Fees.
For the fiscal year ended August 31, 2007, the one month period ended August 31, 2006 and the fiscal year ended July 31, 2006, the aggregate Tax Fees billed by PwC for professional services rendered for tax compliance, tax advice, and tax planning for the fund is shown in the table below.
Fund | 2007A | 2006A,B | 2006A |
Fidelity Total Bond Fund | $2,900 | $2,500 | $2,700 |
A | Aggregate amounts may reflect rounding. |
B | For the one month period ended August 31, 2006. |
For the fiscal year ended August 31, 2007, the one month period ended August 31, 2006 and the fiscal year ended July 31, 2006, the aggregate Tax Fees billed by PwC that were required to be approved by the Audit Committee for professional services rendered on behalf of the Fund Service Providers for tax compliance, tax advice, and tax planning that relate directly to the operations and financial reporting of the fund is shown in the table below.
Billed By | 2007A | 2006A,B | 2006A |
PwC | $0 | $0 | $0 |
A | Aggregate amounts may reflect rounding. |
B | For the one month period ended August 31, 2006. |
Fees included in the Tax Fees category comprise all services performed by professional staff in the independent registered public accounting firm's tax division except those services related to the audit. Typically, this category would include fees for tax compliance, tax planning, and tax advice. Tax compliance, tax advice, and tax planning services include preparation of original and amended tax returns, claims for refund and tax payment-planning services, assistance with tax audits and appeals, tax advice related to mergers and acquisitions and requests for rulings or technical advice from taxing authorities.
(d) All Other Fees.
For the fiscal year ended August 31, 2007, the one month period ended August 31, 2006 and the fiscal year ended July 31, 2006, the aggregate Other Fees billed by PwC for all other non-audit services rendered to the fund is shown in the table below.
Fund | 2007A | 2006A,B | 2006A |
Fidelity Total Bond Fund | $3,600 | $300 | $1,800 |
A | Aggregate amounts may reflect rounding. |
B | For the one month period ended August 31, 2006. |
For the fiscal year ended August 31, 2007, the one month ended August 31, 2006 and the fiscal year ended July 31, 2006, the aggregate Other Fees billed by PwC that were required to be approved by the Audit Committee for all other non-audit services rendered on behalf of the Fund Service Providers that relate directly to the operations and financial reporting of the fund is shown in the table below.
Billed By | 2007A | 2006A,B | 2006A |
PwC | $275,000 | $0 | $155,000 |
A | Aggregate amounts may reflect rounding. |
B | For the one month period ended August 31, 2006. |
Fees included in the All Other Fees category include services related to internal control reviews, strategy and other consulting, financial information systems design and implementation, consulting on other information systems, and other tax services unrelated to the fund.
(e) (1) | Audit Committee Pre-Approval Policies and Procedures: |
The trust's Audit Committee must pre-approve all audit and non-audit services provided by the independent registered public accounting firm relating to the operations or financial reporting of the fund. Prior to the commencement of any audit or non-audit services to a fund, the Audit Committee reviews the services to determine whether they are appropriate and permissible under applicable law.
The trust's Audit Committee has adopted policies and procedures to, among other purposes, provide a framework for the Committee's consideration of non-audit services by the audit firms that audit the Fidelity funds. The policies and procedures require that any non-audit service provided by a fund audit firm to a Fidelity Fund and any non-audit service provided by a fund auditor to a Fund Service Provider that relates directly to the operations and financial reporting of a Fidelity fund (Covered Service) are subject to approval by the Audit Committee before such service is provided. Non-audit services provided by a fund audit firm for a Fund Service Provider that do not relate directly to the operations and financial reporting of a Fidelity fund (Non-Covered Service) but that are expected to exceed $50,000 are also subject to pre-approval by the Audit Committee.
All Covered Services, as well as Non-Covered Services that are expected to exceed $50,000, must be approved in advance of provision of the service either: (i) by formal resolution of the Audit Committee, or (ii) by oral or written approval of the service by the Chair of the Audit Committee (or if the Chair is unavailable, such other member of the Audit Committee as may be designated by the Chair to act in the Chair's absence). The approval contemplated by (ii) above is permitted where the Treasurer determines that action on such an engagement is necessary before the next meeting of the Audit Committee. Neither pre-approval nor advance notice of Non-Covered Service engagements for which fees are not expected to exceed $50,000 is required; such engagements are to be reported to the Audit Committee monthly.
(e) (2) | Services approved pursuant to paragraph (c)(7)(i)(C) of Rule 2-01 of Regulation S-X: |
Audit-Related Fees:
There were no amounts that were approved by the Audit Committee pursuant to the de minimis exception for the periods ended August 31, 2007, August 31, 2006, and July 31, 2006 on behalf of the fund.
There were no amounts that were required to be approved by the Audit Committee pursuant to the de minimis exception for the periods ended August 31, 2007, August 31, 2006 and July 31, 2006 on behalf of the Fund Service Providers that relate directly to the operations and financial reporting of the fund.
Tax Fees:
There were no amounts that were approved by the Audit Committee pursuant to the de minimis exception for the periods ended August 31, 2007, August 31, 2006, and July 31, 2006 on behalf of the fund.
There were no amounts that were required to be approved by the Audit Committee pursuant to the de minimis exception for the periods ended August 31, 2007, August 31, 2006 and July 31, 2006 on behalf of the Fund Service Providers that relate directly to the operations and financial reporting of the fund.
All Other Fees:
There were no amounts that were approved by the Audit Committee pursuant to the de minimis exception for the periods ended August 31, 2007, August 31, 2006 and July 31, 2006 on behalf of the fund.
There were no amounts that were required to be approved by the Audit Committee pursuant to the de minimis exception for the periods ended August 31, 2007, August 31, 2006 and July 31, 2006 on behalf of the Fund Service Providers that relate directly to the operations and financial reporting of the fund.
(f) Not applicable.
(g) For the fiscal year ended August 31, 2007, the one month period ended August 31, 2006 and the fiscal year ended July 31, 2006, the aggregate fees billed by PwC of $1,390,000A, $3,000 A,B and $1,160,000A for non-audit services rendered on behalf of the fund, FMR (not including any sub-adviser whose role is primarily portfolio management and is subcontracted with or overseen by another investment adviser) and Fund Service Providers relating to Covered Services and Non-Covered Services are shown in the table below.
| 2007A | 2006A,B | 2006A |
Covered Services | $280,000 | $3,000 | $160,000 |
Non-Covered Services | $1,110,000 | $0 | $1,000,000 |
A | Aggregate amounts may reflect rounding. |
B | For the one month period ended August 31, 2006. |
(h) The trust's Audit Committee has considered Non-Covered Services that were not pre-approved that were provided by PwC to Fund Service Providers to be compatible with maintaining the independence of PwC in its audit of the fund, taking into account representations from PwC, in accordance with Independence Standards Board Standard No.1, regarding its independence from the fund and its related entities.
Item 5. Audit Committee of Listed Registrants
Not applicable.
Item 6. Schedule of Investments
Not applicable.
Item 7. Disclosure of Proxy Voting Policies and Procedures for Closed-End Management Investment Companies
Not applicable.
Item 8. Portfolio Managers of Closed-End Management Investment Companies
Not applicable.
Item 9. Purchase of Equity Securities by Closed-End Management Investment Company and Affiliated Purchasers
Not applicable.
Item 10. Submission of Matters to a Vote of Security Holders
There were no material changes to the procedures by which shareholders may recommend nominees to the trust's Board of Trustees.
Item 11. Controls and Procedures
(a)(i) The President and Treasurer and the Chief Financial Officer have concluded that the trust's disclosure controls and procedures (as defined in Rule 30a-3(c) under the Investment Company Act) provide reasonable assurances that material information relating to the trust is made known to them by the appropriate persons, based on their evaluation of these controls and procedures as of a date within 90 days of the filing date of this report.
(a)(ii) There was no change in the trust's internal control over financial reporting (as defined in Rule 30a-3(d) under the Investment Company Act) that occurred during the second fiscal quarter of the period covered by this report that has materially affected, or is reasonably likely to materially affect, the trust's internal control over financial reporting.
Item 12. Exhibits
(a) | (1) | Code of Ethics pursuant to Item 2 of Form N-CSR is filed and attached hereto as EX-99.CODE ETH. |
(a) | (2) | Certification pursuant to Rule 30a-2(a) under the Investment Company Act of 1940 (17 CFR 270.30a-2(a)) is filed and attached hereto as Exhibit 99.CERT. |
(a) | (3) | Not applicable. |
(b) | | Certification pursuant to Rule 30a-2(b) under the Investment Company Act of 1940 (17 CFR 270.30a-2(b)) is furnished and attached hereto as Exhibit 99.906CERT. |
SIGNATURES
Pursuant to the requirements of the Securities Exchange Act of 1934 and the Investment Company Act of 1940, the registrant has duly caused this report to be signed on its behalf by the undersigned, thereunto duly authorized.
Fidelity Income Fund
By: | /s/Kimberley Monasterio |
| Kimberley Monasterio |
| President and Treasurer |
| |
Date: | November 7, 2007 |
Pursuant to the requirements of the Securities Exchange Act of 1934 and the Investment Company Act of 1940, this report has been signed below by the following persons on behalf of the registrant and in the capacities and on the dates indicated.
By: | /s/Kimberley Monasterio |
| Kimberley Monasterio |
| President and Treasurer |
| |
Date: | November 7, 2007 |
By: | /s/Joseph B. Hollis |
| Joseph B. Hollis |
| Chief Financial Officer |
| |
Date: | November 7, 2007 |