UNITED STATES
SECURITIES AND EXCHANGE COMMISSION
Washington, D.C. 20549
FORM N-CSR
CERTIFIED SHAREHOLDER REPORT OF REGISTERED
MANAGEMENT INVESTMENT COMPANIES
Investment Company Act file number 811-4085
Fidelity Income Fund
(Exact name of registrant as specified in charter)
82 Devonshire St., Boston, Massachusetts 02109
(Address of principal executive offices) (Zip code)
Eric D. Roiter, Secretary
82 Devonshire St.
Boston, Massachusetts 02109
(Name and address of agent for service)
Registrant's telephone number, including area code: 617-563-7000
Date of fiscal year end: | July 31 |
| |
Date of reporting period: | July 31, 2007 |
Item 1. Reports to Stockholders
Fidelity® Ginnie Mae Fund
Fidelity Intermediate
Government Income Fund
Annual Report
July 31, 2007
(2_fidelity_logos) (Registered_Trademark)
Contents
To view a fund's proxy voting guidelines and proxy voting record for the 12-month period ended June 30, visit http://www.fidelity.com (search for "proxy voting guidelines") or visit the Securities and Exchange Commission's (SEC) web site at http://www.sec.gov. You may also call 1-800-544-8544 to request a free copy of the proxy voting guidelines.
Standard & Poor's, S&P and S&P 500 are registered service marks of The McGraw-Hill Companies, Inc. and have been licensed for use by Fidelity Distributors Corporation.
Other third party marks appearing herein are the property of their respective owners.
All other marks appearing herein are registered or unregistered trademarks or service marks of FMR Corp. or an affiliated company.
Annual Report
This report and the financial statements contained herein are submitted for the general information of the shareholders of the funds. This report is not authorized for distribution to prospective investors in the funds unless preceded or accompanied by an effective prospectus.
A fund files its complete schedule of portfolio holdings with the SEC for the first and third quarters of each fiscal year on Form N-Q. Forms N-Q are available on the SEC's web site at http://www.sec.gov. A fund's Forms N-Q may be reviewed and copied at the SEC's Public Reference Room in Washington, DC. Information regarding the operation of the SEC's Public Reference Room may be obtained by calling 1-800-SEC-0330. For a complete list of a fund's portfolio holdings, view the most recent holdings listing, semiannual report, or annual report on Fidelity's web site at http://www.fidelity.com or http://www.advisor.fidelity.com, as applicable.
NOT FDIC INSURED · MAY LOSE VALUE · NO BANK GUARANTEE
Neither the funds nor Fidelity Distributors Corporation is a bank.
Annual Report
Chairman's Message
(photo_of_Edward_C_Johnson_3d)
Dear Shareholder:
Stocks are currently on pace to register their fifth straight year of positive returns, although gains could be trimmed if the U.S. economy continues to slow. While financial markets are always unpredictable, there are a number of time-tested principles that can put the historical odds in your favor.
One of the basic tenets is to invest for the long term. Over time, riding out the markets' inevitable ups and downs has proven much more effective than selling into panic or chasing the hottest trend. Even missing only a few of the markets' best days can significantly diminish investor returns. Patience also affords the benefits of compounding - of earning interest on additional income or reinvested dividends and capital gains. There are tax advantages and cost benefits to consider as well. The more you sell, the more taxes you pay, and the more you trade, the higher the costs. While staying the course doesn't eliminate risk, it can considerably lessen the effect of short-term declines.
You can further manage your investing risk through diversification. And today, more than ever, geographic diversification should be taken into account. Studies indicate that asset allocation is the single most important determinant of a portfolio's long-term success. The right mix of stocks, bonds and cash - aligned to your particular risk tolerance and investment objective - is very important. Age-appropriate rebalancing is also an essential aspect of asset allocation. For younger investors, an emphasis on equities - which historically have been the best-performing asset class over time - is encouraged. As investors near their specific goal, such as retirement or sending a child to college, consideration may be given to replacing volatile assets (e.g. common stocks) with more-stable fixed investments (bonds or savings plans).
A third investment principle - investing regularly - can help lower the average cost of your purchases. Investing a certain amount of money each month or quarter helps ensure you won't pay for all your shares at market highs. This strategy - known as dollar cost averaging - also reduces unconstructive "emotion" from investing, helping shareholders avoid selling weak performers just prior to an upswing, or chasing a hot performer just before a correction.
We invite you to contact us via the Internet, through our Investor Centers or over the phone. It is our privilege to provide you the information you need to make the investments that are right for you.
Sincerely,
/s/Edward C. Johnson 3d
Edward C. Johnson 3d
Annual Report
Shareholder Expense Example
As a shareholder of a Fund, you incur two types of costs: (1) transaction costs, and (2) ongoing costs, including management fees and other Fund expenses. This Example is intended to help you understand your ongoing costs (in dollars) of investing in the Funds and to compare these costs with the ongoing costs of investing in other mutual funds.
The Example is based on an investment of $1,000 invested at the beginning of the period and held for the entire period (February 1, 2007 to July 31, 2007).
Actual Expenses
The first line of the accompanying table for each fund provides information about actual account values and actual expenses. You may use the information in this line, together with the amount you invested, to estimate the expenses that you paid over the period. Simply divide your account value by $1,000.00 (for example, an $8,600 account value divided by $1,000.00 = 8.6), then multiply the result by the number in the first line for a fund under the heading entitled "Expenses Paid During Period" to estimate the expenses you paid on your account during this period. A small balance maintenance fee of $12.00 that is charged once a year may apply for certain accounts with a value of less than $2,000. This fee is not included in the table below. If it was, the estimate of expenses you paid during the period would be higher, and your ending account value lower, by this amount.
Hypothetical Example for Comparison Purposes
The second line of the accompanying table for each fund provides information about hypothetical account values and hypothetical expenses based on a fund's actual expense ratio and an assumed rate of return of 5% per year before expenses, which is not the Fund's actual return. The hypothetical account values and expenses may not be used to estimate the actual ending account balance or expenses you paid for the period. You may use this information to compare the ongoing costs of investing in the Fund and other funds. To do so, compare this 5% hypothetical example with the 5% hypothetical examples that appear in the shareholder reports of the other funds. A small balance maintenance fee of $12.00 that is charged once a year may apply for certain accounts with a value of less than $2,000. This fee is not included in the table below. If it was, the estimate of expenses you paid during the period would be higher, and your ending account value lower, by this amount.
Please note that the expenses shown in the table are meant to highlight your ongoing costs only and do not reflect any transaction costs. Therefore, the second line of the table is useful in comparing ongoing costs only, and will not help you determine the relative total costs of owning different funds.
Annual Report
Shareholder Expense Example - continued
| Beginning
Account Value
February 1, 2007 | Ending
Account Value
July 31, 2007 | Expenses Paid
During Period*
February 1, 2007
to July 31, 2007 |
Ginnie Mae Fund | | | |
Actual | $ 1,000.00 | $ 1,017.80 | $ 2.25 |
HypotheticalA | $ 1,000.00 | $ 1,022.56 | $ 2.26 |
Intermediate Government Income Fund | | | |
Actual | $ 1,000.00 | $ 1,026.00 | $ 2.26 |
HypotheticalA | $ 1,000.00 | $ 1,022.56 | $ 2.26 |
A 5% return per year before expenses
* Expenses are equal to each Fund's annualized expense ratio (shown in the table below); multiplied by the average account value over the period, multiplied by 181/365 (to reflect the one-half year period).
| Annualized
Expense Ratio |
Ginnie Mae Fund | .45% |
Intermediate Government Income Fund | .45% |
Annual Report
Fidelity Ginnie Mae Fund
Performance: The Bottom Line
Average annual total return reflects the change in the value of an investment, assuming reinvestment of the fund's dividend income and capital gains (the profits earned upon the sale of securities that have grown in value) and assuming a constant rate of performance each year. The $10,000 table and the fund's returns do not reflect the deduction of taxes that a shareholder would pay on fund distributions or the redemption of fund shares. During periods of reimbursement by Fidelity, a fund's total return will be greater than it would be had the reimbursement not occurred. How a fund did yesterday is no guarantee of how it will do tomorrow.
Average Annual Total Returns
Periods ended July 31, 2007 | Past 1
year | Past 5
years | Past 10
years |
Fidelity® Ginnie Mae Fund | 5.29% | 3.61% | 5.20% |
$10,000 Over 10 Years
Let's say hypothetically that $10,000 was invested in Fidelity® Ginnie Mae Fund on July 31, 1997. The chart shows how the value of your investment would have changed, and also shows how the Lehman Brothers® GNMA Index performed over the same period.
Annual Report
Fidelity Ginnie Mae Fund
Management's Discussion of Fund Performance
Comments from William Irving, Portfolio Manager of Fidelity® Ginnie Mae Fund
The investment-grade bond market posted a reasonably solid advance for the 12 months ending July 31, 2007. In that time, the Lehman Brothers® U.S. Aggregate Index - a performance gauge of taxable, high-quality debt - gained 5.58%. A sizable percentage of that increase came in the first four months of the period. The index returned a cumulative 4.30% from August through November, as investors responded favorably to the end of the Federal Reserve Board's two-year campaign of interest rate hikes. In fact, the central bank left rates unchanged through the entire 12-month period. Bonds turned negative in December and January, but had their best month of the past year in February, rising 1.54% as extreme volatility in the stock markets led to a flight to safety in high-quality debt. Performance was lackluster thereafter, however. Inflation concerns and dwindling hopes for a near-term Fed rate cut pressured bond prices for much of the remainder of the period, as did the meltdown of the subprime mortgage sector. Against that backdrop, the index gained only 0.32% over the final five months of the period.
For the 12 months ending July 31, 2007, the fund returned 5.29%, while the Lehman Brothers GNMA Index gained 5.46%. The fund's performance was aided by its out-of-benchmark stake in hybrid adjustable-rate mortgages (ARMs), which outpaced the fixed-rate mortgages that constitute the benchmark due to strong demand from institutional investors. Many institutional investors added to their holdings in hybrid ARM securities in response to their April 1, 2007, inclusion into two commonly employed Lehman Brothers benchmarks. Security selection among fixed-rate mortgage securities also was beneficial, with higher-coupon and "seasoned" mortgages performing well due to their lower prepayment risk. Some of the fund's seasoned and higher-coupon holdings were in the form of collateralized mortgage obligations (CMOs), whose cash flows are carved into classes - each with its own expected maturity and cash flow. On the flip side, the fund's modest out-of-index holdings in interest-only project loans issued by Ginnie Mae detracted from performance as they were hurt by fears of faster-than-expected prepayments.
The views expressed above reflect those of the portfolio manager(s) only through the end of the period as stated on the cover of this report and do not necessarily represent the views of Fidelity or any other person in the Fidelity organization. Any such views are subject to change at any time based upon market or other conditions and Fidelity disclaims any responsibility to update such views. These views may not be relied on as investment advice and, because investment decisions for a Fidelity fund are based on numerous factors, may not be relied on as an indication of trading intent on behalf of any Fidelity fund.
Annual Report
Fidelity Ginnie Mae Fund
Investment Changes
Coupon Distribution as of July 31, 2007 |
| % of fund's
investments | % of fund's investments
6 months ago |
Less than 4% | 4.5 | 4.1 |
4 - 4.99% | 11.3 | 6.6 |
5 - 5.99% | 42.3 | 46.4 |
6 - 6.99% | 28.3 | 30.9 |
7 - 7.99% | 4.7 | 7.8 |
8% and over | 1.2 | 0.8 |
Coupon distribution shows the range of stated interest rates on the fund's investments, excluding short-term investments. |
Weighted Average Maturity as of July 31, 2007 |
| | 6 months ago |
Years | 5.8 | 5.6 |
The weighted average maturity is based on the dollar-weighted average length of time until principal payments are expected or until securities reach maturity, taking into account any maturity shortening feature such as a call, refunding or redemption provision. |
Duration as of July 31, 2007 |
| | 6 months ago |
Years | 4.3 | 3.4 |
Duration shows how much a bond fund's price fluctuates with changes in comparable interest rates. If rates rise 1%, for example, a fund with a five-year duration is likely to lose about 5% of its value. Other factors also can influence a bond fund's performance and share price. Accordingly, a bond fund's actual performance may differ from this example. |
Asset Allocation (% of fund's net assets) |
As of July 31, 2007*A | As of January 31, 2007**B |
 | Mortgage
Securities 91.7% | | | Mortgage
Securities 87.6% | |
 | CMOs and Other Mortgage Related Securities 17.7% | | | CMOs and Other Mortgage Related Securities 14.5% | |
 | Asset-Backed
Securities 0.7% | | | Asset-Backed
Securities 0.9% | |
 | Short-Term
Investments and
Net Other Assets (10.1)%(dagger) | |  | Short-Term
Investments and
Net Other Assets (3.0)%(dagger) | |
* GNMA Securities | 94.5% | | ** GNMA Securities | 95.2% | |
A Futures and Swaps | (7.1)% | | B Futures and Swaps | 0.0% | |

(dagger) Short-Term Investments and Net Other Assets are not included in the pie chart. |
Annual Report
Fidelity Ginnie Mae Fund
Investments July 31, 2007
Showing Percentage of Net Assets
U.S. Government Agency - Mortgage Securities - 91.7% |
| Principal Amount (000s) | | Value
(000s) |
Fannie Mae - 8.7% |
3.585% 9/1/33 (b) | | $ 1,542 | | $ 1,515 |
3.718% 6/1/33 (b) | | 4,807 | | 4,793 |
3.757% 10/1/33 (b) | | 437 | | 436 |
3.784% 6/1/33 (b) | | 5,736 | | 5,745 |
3.809% 10/1/33 (b) | | 3,778 | | 3,719 |
3.825% 4/1/33 (b) | | 1,191 | | 1,196 |
3.991% 4/1/34 (b) | | 4,876 | | 4,807 |
3.999% 12/1/33 (b) | | 24,889 | | 24,615 |
4.004% 8/1/33 (b) | | 2,149 | | 2,122 |
4.027% 3/1/34 (b) | | 8,711 | | 8,591 |
4.034% 6/1/34 (b) | | 9,056 | | 8,919 |
4.115% 4/1/34 (b) | | 5,786 | | 5,713 |
4.124% 5/1/34 (b) | | 4,709 | | 4,652 |
4.128% 2/1/35 (b) | | 15,112 | | 14,905 |
4.178% 8/1/34 (b) | | 2,529 | | 2,500 |
4.191% 9/1/33 (b) | | 2,800 | | 2,790 |
4.226% 5/1/34 (b) | | 6,622 | | 6,602 |
4.249% 1/1/34 (b) | | 1,092 | | 1,082 |
4.28% 10/1/33 (b) | | 178 | | 177 |
4.282% 3/1/33 (b) | | 443 | | 445 |
4.3% 3/1/33 (b) | | 198 | | 195 |
4.302% 6/1/33 (b) | | 226 | | 228 |
4.321% 4/1/35 (b) | | 226 | | 227 |
4.386% 10/1/34 (b) | | 2,101 | | 2,076 |
4.406% 8/1/34 (b) | | 10,123 | | 10,169 |
4.419% 5/1/35 (b) | | 1,267 | | 1,263 |
4.502% 2/1/35 (b) | | 22,484 | | 22,644 |
4.524% 7/1/35 (b) | | 1,478 | | 1,472 |
4.53% 10/1/35 (b) | | 139 | | 138 |
4.56% 1/1/34 (b) | | 11,057 | | 10,984 |
4.575% 2/1/35 (b) | | 1,831 | | 1,810 |
4.649% 8/1/35 (b) | | 2,480 | | 2,472 |
4.723% 3/1/35 (b) | | 134 | | 135 |
4.756% 1/1/35 (b) | | 1,470 | | 1,458 |
4.781% 12/1/34 (b) | | 409 | | 406 |
4.808% 2/1/33 (b) | | 579 | | 585 |
4.829% 1/1/35 (b) | | 9,830 | | 9,837 |
4.832% 10/1/35 (b) | | 1,015 | | 1,009 |
4.87% 5/1/33 (b) | | 18 | | 18 |
4.892% 9/1/34 (b) | | 721 | | 718 |
4.968% 9/1/34 (b) | | 625 | | 623 |
5.016% 7/1/34 (b) | | 187 | | 187 |
U.S. Government Agency - Mortgage Securities - continued |
| Principal Amount (000s) | | Value
(000s) |
Fannie Mae - continued |
5.04% 10/1/36 (b) | | $ 10,728 | | $ 10,753 |
5.052% 5/1/35 (b) | | 2,442 | | 2,460 |
5.084% 9/1/34 (b) | | 367 | | 366 |
5.087% 8/1/34 (b) | | 335 | | 334 |
5.123% 3/1/34 (b) | | 7,121 | | 7,114 |
5.17% 6/1/35 (b) | | 1,737 | | 1,749 |
5.176% 8/1/33 (b) | | 557 | | 557 |
5.176% 3/1/35 (b) | | 194 | | 194 |
5.25% 7/1/35 (b) | | 1,794 | | 1,794 |
5.258% 11/1/36 (b) | | 1,309 | | 1,310 |
5.297% 7/1/35 (b) | | 213 | | 214 |
5.324% 12/1/34 (b) | | 543 | | 543 |
5.483% 6/1/47 (b) | | 1,049 | | 1,052 |
5.499% 11/1/36 (b) | | 5,184 | | 5,195 |
5.5% 11/1/13 to 3/1/20 | | 16,877 | | 16,797 |
5.526% 2/1/37 (b) | | 11,118 | | 11,144 |
5.688% 4/1/37 (b) | | 5,600 | | 5,626 |
5.831% 3/1/36 (b) | | 3,975 | | 4,006 |
5.872% 3/1/36 (b) | | 3,771 | | 3,784 |
5.95% 5/1/36 (b) | | 3,478 | | 3,506 |
6.352% 8/1/36 (b) | | 3,460 | | 3,502 |
6.5% 10/1/17 to 7/1/32 | | 15,515 | | 15,847 |
7% 11/1/16 to 3/1/17 | | 1,836 | | 1,907 |
7.5% 10/1/07 to 4/1/17 | | 2,074 | | 2,134 |
8.5% 12/1/27 | | 250 | | 269 |
9.5% 9/1/30 | | 468 | | 519 |
10.25% 10/1/18 | | 12 | | 13 |
11.5% 5/1/14 to 9/1/15 | | 32 | | 35 |
12.5% 11/1/13 to 7/1/16 | | 66 | | 74 |
13.25% 9/1/11 | | 39 | | 43 |
| | 276,819 |
Freddie Mac - 5.0% |
3.754% 10/1/33 (b) | | 5,131 | | 5,048 |
3.911% 6/1/33 (b) | | 7,076 | | 7,033 |
4.179% 1/1/35 (b) | | 6,872 | | 6,794 |
4.362% 6/1/35 (b) | | 13,873 | | 13,742 |
4.382% 9/1/36 (b) | | 19,798 | | 19,598 |
4.569% 6/1/33 (b) | | 2,240 | | 2,240 |
4.576% 7/1/36 (b) | | 5,298 | | 5,323 |
4.669% 6/1/35 (b) | | 10,644 | | 10,624 |
4.784% 3/1/33 (b) | | 192 | | 194 |
U.S. Government Agency - Mortgage Securities - continued |
| Principal Amount (000s) | | Value
(000s) |
Freddie Mac - continued |
4.873% 10/1/35 (b) | | $ 2,819 | | $ 2,812 |
5.106% 3/1/36 (b) | | 12,018 | | 11,969 |
5.272% 11/1/35 (b) | | 2,426 | | 2,418 |
5.352% 10/1/35 (b) | | 8,150 | | 8,127 |
5.362% 3/1/37 (b) | | 912 | | 910 |
5.5% 11/1/17 to 1/1/25 | | 13,169 | | 12,902 |
5.776% 6/1/37 (b) | | 13,556 | | 13,604 |
5.858% 5/1/37 (b) | | 1,048 | | 1,053 |
6.6% 10/1/36 (b) | | 12,178 | | 12,334 |
6.752% 9/1/36 (b) | | 21,947 | | 22,248 |
8.5% 2/1/09 to 6/1/25 | | 60 | | 63 |
9% 7/1/08 to 4/1/21 | | 91 | | 94 |
9.5% 7/1/30 to 8/1/30 | | 98 | | 110 |
9.75% 12/1/08 to 4/1/13 | | 6 | | 7 |
10% 1/1/09 to 11/1/20 | | 276 | | 299 |
10.25% 2/1/09 to 11/1/16 | | 93 | | 97 |
10.5% 5/1/10 | | 3 | | 3 |
11.25% 2/1/10 | | 10 | | 11 |
11.75% 11/1/11 | | 8 | | 9 |
12% 5/1/10 to 2/1/17 | | 61 | | 68 |
12.5% 11/1/12 to 5/1/15 | | 83 | | 93 |
13% 5/1/14 to 11/1/14 | | 11 | | 12 |
13.5% 1/1/13 to 12/1/14 | | 6 | | 6 |
| | 159,845 |
Government National Mortgage Association - 78.0% |
3.5% 3/20/34 | | 1,237 | | 1,057 |
3.5% 5/20/34 (b) | | 1,326 | | 1,317 |
3.5% 5/20/35 (b) | | 1,795 | | 1,766 |
3.5% 6/20/35 (b) | | 1,733 | | 1,704 |
3.75% 4/20/34 (b) | | 20,066 | | 19,972 |
3.75% 6/20/34 (b) | | 15,527 | | 15,453 |
3.75% 4/20/35 (b) | | 635 | | 626 |
4% 11/20/33 | | 1,475 | | 1,322 |
4% 4/20/35 (b) | | 2,838 | | 2,835 |
4% 4/20/35 (b) | | 10,047 | | 9,929 |
4% 5/20/35 (b) | | 11,374 | | 11,240 |
4.25% 7/20/34 (b) | | 1,091 | | 1,085 |
4.5% 4/15/18 to 4/20/34 | | 139,505 | | 131,244 |
4.5% 9/20/34 (b) | | 5,101 | | 5,080 |
4.5% 3/20/35 (b) | | 1,089 | | 1,081 |
4.5% 6/20/35 (b) | | 3,996 | | 4,023 |
U.S. Government Agency - Mortgage Securities - continued |
| Principal Amount (000s) | | Value
(000s) |
Government National Mortgage Association - continued |
4.5% 12/20/36 (b) | | $ 11,713 | | $ 11,503 |
4.75% 12/20/33 (b) | | 12,872 | | 12,808 |
5% 8/15/18 to 4/20/36 | | 368,172 | | 350,803 |
5% 4/20/37 (b) | | 43,309 | | 42,883 |
5.5% 12/20/18 to 4/15/35 | | 388,686 | | 380,129 |
5.5% 8/1/37 (a) | | 26,000 | | 25,354 |
5.5% 8/1/37 (a) | | 50,000 | | 48,758 |
5.5% 8/1/37 (a) | | 50,000 | | 48,551 |
5.5% 8/1/37 (a) | | 135,000 | | 131,646 |
5.5% 8/1/37 (a) | | 71,200 | | 69,431 |
5.5% 8/1/37 (a) | | 67,000 | | 65,058 |
5.5% 9/1/37 (a) | | 46,000 | | 44,828 |
5.75% 8/20/35 (b) | | 746 | | 747 |
6% 8/15/17 to 2/15/37 | | 541,738 | | 543,169 |
6% 8/1/37 (a) | | 20,000 | | 19,953 |
6% 8/1/37 (a) | | 72,000 | | 71,958 |
6% 8/1/37 (a) | | 26,000 | | 25,939 |
6.5% 4/15/23 to 12/15/36 | | 124,519 | | 127,694 |
6.5% 8/1/37 (a) | | 16,000 | | 16,295 |
6.5% 8/1/37 (a) | | 10,000 | | 10,185 |
6.5% 8/1/37 (a) | | 37,000 | | 37,683 |
7% 10/20/16 to 9/20/34 | | 107,009 | | 111,053 |
7.25% 9/15/27 | | 259 | | 271 |
7.395% 6/20/25 to 11/20/27 | | 1,942 | | 2,025 |
7.5% 9/15/07 to 9/20/32 | | 44,404 | | 46,657 |
8% 9/15/07 to 7/15/32 | | 10,474 | | 11,095 |
8.5% 7/15/08 to 2/15/31 | | 4,031 | | 4,317 |
9% 2/15/09 to 5/15/30 | | 1,672 | | 1,822 |
9.5% 12/20/15 to 4/20/17 | | 599 | | 658 |
10.5% 1/15/14 to 5/15/19 | | 633 | | 708 |
13% 2/15/11 to 1/15/15 | | 125 | | 143 |
13.5% 7/15/10 to 1/15/15 | | 20 | | 23 |
| | 2,473,881 |
TOTAL U.S. GOVERNMENT AGENCY - MORTGAGE SECURITIES (Cost $2,937,435) | 2,910,545 |
Asset-Backed Securities - 0.7% |
|
Fannie Mae Grantor Trust Series 2005-T4 Class A1C, 5.47% 9/25/35 (b)
(Cost $21,795) | | 21,795 | | 21,941 |
Collateralized Mortgage Obligations - 17.1% |
| Principal Amount (000s) | | Value
(000s) |
U.S. Government Agency - 17.1% |
Fannie Mae: | | | | |
Series 2003-39 Class IA, 5.5% 10/25/22 (b)(c) | | $ 4,420 | | $ 749 |
Series 2006-48 Class LF, 0% 8/25/34 (b) | | 747 | | 759 |
target amortization class Series G94-2 Class D, 6.45% 1/25/24 | | 3,252 | | 3,321 |
Fannie Mae STRIP: | | | | |
Series 331 Class 12, 6.5% 2/1/33 (c) | | 2,883 | | 708 |
Series 339 Class 5, 5.5% 7/1/33 (c) | | 4,453 | | 1,063 |
Series 343 Class 16, 5.5% 5/1/34 (c) | | 3,170 | | 760 |
Freddie Mac Multi-class participation certificates guaranteed: | | | | |
floater: | | | | |
Series 2861 Class JF, 5.62% 4/15/17 (b) | | 2,881 | | 2,896 |
Series 3094 Class UF, 0% 9/15/34 (b) | | 499 | | 489 |
planned amortization class: | | | | |
Series 2220 Class PD, 8% 3/15/30 | | 4,367 | | 4,554 |
Series 2787 Class OI, 5.5% 10/15/24 (c) | | 3,296 | | 139 |
Series 40 Class K, 6.5% 8/17/24 | | 1,790 | | 1,842 |
sequential payer: | | | | |
Series 2204 Class N, 7.5% 12/20/29 | | 7,590 | | 7,855 |
Series 2601 Class TI, 5.5% 10/15/22 (c) | | 18,572 | | 3,215 |
Series 2750 Class ZT, 5% 2/15/34 | | 6,072 | | 5,232 |
Series 2866 Class CY, 4.5% 10/15/19 | | 4,491 | | 4,142 |
Series 2957 Class SW, 0.68% 4/15/35 (b)(c) | | 13,034 | | 359 |
Ginnie Mae guaranteed Multi-family pass-thru securities sequential payer Series 2002-71: | | | | |
Class Z, 5.5% 10/20/32 | | 45,636 | | 44,098 |
Class ZJ, 6% 10/20/32 | | 23,254 | | 22,997 |
Ginnie Mae guaranteed REMIC pass-thru securities: | | | | |
floater: | | | | |
Series 2001-22 Class FM, 5.67% 5/20/31 (b) | | 726 | | 730 |
Series 2002-41 Class HF, 5.72% 6/16/32 (b) | | 789 | | 796 |
Series 2007-22 Class TC, 0% 4/20/37 (b) | | 2,721 | | 3,246 |
planned amortization class: | | | | |
Series 1993-13 Class PD, 6% 5/20/29 | | 18,000 | | 18,116 |
Series 1994-4 Class KQ, 7.9875% 7/16/24 | | 1,163 | | 1,248 |
Series 2000-26 Class PK, 7.5% 9/20/30 | | 3,135 | | 3,256 |
Series 2001-65 Class PH, 6% 11/20/28 | | 6,323 | | 6,348 |
Series 2002-5 Class PD, 6.5% 5/16/31 | | 10,072 | | 10,117 |
Series 2002-50 Class PE, 6% 7/20/32 | | 17,485 | | 17,457 |
Series 2003-31 Class PI, 5.5% 4/16/30 (c) | | 4,598 | | 367 |
Series 2003-34 Class IO, 5.5% 4/16/28 (c) | | 2,800 | | 33 |
Collateralized Mortgage Obligations - continued |
| Principal Amount (000s) | | Value
(000s) |
U.S. Government Agency - continued |
Ginnie Mae guaranteed REMIC pass-thru securities: - continued | | | | |
planned amortization class: | | | | |
Series 2003-4 Class LI, 5.5% 7/16/27 (c) | | $ 723 | | $ 4 |
Series 2003-7 Class IN, 5.5% 1/16/28 (c) | | 5,228 | | 151 |
Series 2003-70 Class LE, 5% 7/20/32 | | 44,000 | | 41,774 |
Series 2004-19: | | | | |
Class DJ, 4.5% 3/20/34 | | 2,890 | | 2,834 |
Class DP, 5.5% 3/20/34 | | 3,895 | | 3,870 |
Series 2004-30: | | | | |
Class PC, 5% 11/20/30 | | 19,736 | | 19,272 |
Class UA, 3.5% 2/20/32 | | 5,669 | | 5,486 |
Series 2004-64 Class KE, 5.5% 12/20/33 | | 22,978 | | 22,313 |
Series 2004-98 Class IG, 5.5% 2/20/30 (c) | | 2,581 | | 392 |
Series 2005-17 Class IA, 5.5% 8/20/33 (c) | | 7,905 | | 1,268 |
Series 2005-24 Class TC, 5.5% 3/20/35 | | 5,403 | | 5,084 |
Series 2005-54 Class BM, 5% 7/20/35 | | 9,658 | | 9,330 |
Series 2005-57 Class PB, 5.5% 7/20/35 | | 5,673 | | 5,354 |
Series 2005-58 Class NJ, 4.5% 8/20/35 | | 41,635 | | 40,822 |
Series 2006-50 Class JC, 5% 6/20/36 | | 11,780 | | 11,139 |
Series 2008-28 Class PC, 5.5% 4/20/34 | | 18,652 | | 18,297 |
sequential payer: | | | | |
Series 1995-4 Class CQ, 8% 6/20/25 | | 841 | | 903 |
Series 2001-40 Class Z, 6% 8/20/31 | | 8,550 | | 8,550 |
Series 2002-18 Class ZB, 6% 3/20/32 | | 8,857 | | 8,910 |
Series 2002-29 Class SK, 8.25% 5/20/32 (b) | | 403 | | 419 |
Series 2002-67 Class ZA, 6% 9/20/32 | | 50,896 | | 50,492 |
Series 2003-7 Class VP, 6% 11/20/13 | | 5,000 | | 5,036 |
Series 2004-65 Class VE, 5.5% 7/20/15 | | 4,677 | | 4,674 |
Series 2004-86 Class G, 6% 10/20/34 | | 6,273 | | 6,129 |
Series 2005-28 Class AJ, 5.5% 4/20/35 | | 32,523 | | 32,431 |
Series 2005-47 Class ZY, 6% 6/20/35 | | 4,531 | | 4,301 |
Series 2005-6 Class EX, 5.5% 11/20/34 | | 1,001 | | 941 |
Series 2005-82 Class JV, 5% 6/20/35 | | 3,500 | | 3,118 |
Series 1995-6 Class Z, 7% 9/20/25 | | 2,436 | | 2,561 |
Series 2003-11 Class S, 1.23% 2/16/33 (b)(c) | | 10,580 | | 454 |
Series 2003-92 Class SN, 1.11% 10/16/33 (b)(c) | | 32,856 | | 1,437 |
Series 2004-32 Class GS, 1.18% 5/16/34 (b)(c) | | 3,136 | | 131 |
Series 2005-6 Class EY, 5.5% 11/20/33 | | 1,016 | | 950 |
Series 2006-13 Class DS, 3.12% 3/20/36 (b) | | 45,360 | | 37,432 |
Collateralized Mortgage Obligations - continued |
| Principal Amount (000s) | | Value
(000s) |
U.S. Government Agency - continued |
Ginnie Mae guaranteed REMIC pass-thru securities: - continued | | | | |
Series 2007-18 Class S, 1.48% 4/16/37 (b)(c) | | $ 50,528 | | $ 2,493 |
Series 2007-35 Class SC, 8.28% 6/16/37 (b) | | 17,096 | | 18,296 |
TOTAL COLLATERALIZED MORTGAGE OBLIGATIONS (Cost $557,473) | 543,940 |
Commercial Mortgage Securities - 0.6% |
|
Fannie Mae Series 1997-M1 Class N, 0.445% 10/17/36 (b)(c) | | 7,488 | | 63 |
Fannie Mae subordinate REMIC pass-thru certificates: | | | | |
Series 1998-M3 Class IB, 0.831% 1/17/38 (b)(c) | | 33,446 | | 581 |
Series 1998-M4 Class N, 1.1496% 2/25/35 (b)(c) | | 13,988 | | 181 |
Ginnie Mae guaranteed Multi-family pass-thru securities: | | | | |
sequential payer Series 2001-58 Class X, 1.1724% 9/16/41 (b)(c) | | 157,655 | | 3,941 |
Series 2001-12 Class X, 0.862% 7/16/40 (b)(c) | | 45,009 | | 788 |
Ginnie Mae guaranteed REMIC pass-thru securities: | | | | |
sequential payer Series 2002-81 Class IO, 1.8581% 9/16/42 (b)(c) | | 120,475 | | 5,120 |
Series 2002-62 Class IO, 1.4307% 8/16/42 (b)(c) | | 87,347 | | 3,276 |
Series 2002-85 Class X, 1.7456% 3/16/42 (b)(c) | | 65,556 | | 3,817 |
TOTAL COMMERCIAL MORTGAGE SECURITIES (Cost $40,664) | 17,767 |
Cash Equivalents - 9.2% |
| Maturity Amount (000s) | | |
Investments in repurchase agreements in a joint trading account at 5.3%, dated 7/31/07 due 8/1/07 (Collateralized by U.S. Government Obligations) #
(Cost $290,292) | $ 290,335 | | 290,292 |
TOTAL INVESTMENT PORTFOLIO - 119.3% (Cost $3,847,659) | | 3,784,485 |
NET OTHER ASSETS - (19.3)% | | (612,184) |
NET ASSETS - 100% | $ 3,172,301 |
Swap Agreements |
| Expiration Date | | Notional Amount (000s) | | Value
(000s) |
Interest Rate Swaps |
Receive quarterly a floating rate based on 3-month LIBOR and pay semi-annually a fixed rate equal to 5.32% with Morgan Stanley, Inc. | July 2010 | | $ 40,000 | | $ (200) |
Receive quarterly a floating rate based on 3-month LIBOR and pay semi-annually a fixed rate equal to 5.43% with Credit Suisse First Boston | June 2009 | | 65,000 | | (376) |
Receive quarterly a floating rate based on 3-month LIBOR and pay semi-annually a fixed rate equal to 5.524% with Credit Suisse First Boston | June 2009 | | 121,000 | | (904) |
| | $ 226,000 | | $ (1,480) |
Legend |
(a) Security or a portion of the security purchased on a delayed delivery or when-issued basis. |
(b) The coupon rate shown on floating or adjustable rate securities represents the rate at period end. |
(c) Security represents right to receive monthly interest payments on an underlying pool of mortgages or assets. Principal shown is the outstanding par amount of the pool held as of the end of the period. |
# Additional Information on each counterparty to the repurchase agreement is as follows: |
Repurchase Agreement / Counterparty | Value
(Amounts in thousands) |
$290,292,000 due 8/01/07 at 5.30% |
ABN AMRO Bank N.V., New York Branch | $ 7,039 |
Banc of America Securities LLC | 62,643 |
Bank of America, NA | 17,676 |
Barclays Capital, Inc. | 32,421 |
Repurchase Agreement / Counterparty | Value
(Amounts in thousands) |
Bear Stearns & Co., Inc. | $ 30,970 |
Countrywide Securities Corp. | 22,700 |
ING Financial Markets LLC | 28,155 |
Societe Generale, New York Branch | 28,155 |
UBS Securities LLC | 49,271 |
WestLB AG | 11,262 |
| $ 290,292 |
Income Tax Information |
At July 31, 2007, the fund had a capital loss carryforward of approximately $55,811,000 of which $9,594,000 and $46,217,000 will expire on July 31, 2014 and 2015, respectively. |
See accompanying notes which are an integral part of the financial statements.
Annual Report
Fidelity Ginnie Mae Fund
Financial Statements
Statement of Assets and Liabilities
Amounts in thousands (except per-share amount) | July 31, 2007 |
| | |
Assets | | |
Investment in securities, at value (including repurchase agreements of $290,292) - See accompanying schedule: Unaffiliated issuers (cost $3,847,659) | | $ 3,784,485 |
Cash | | 658 |
Receivable for investments sold
Regular delivery | | 2,255 |
Delayed delivery | | 6,667 |
Receivable for fund shares sold | | 1,188 |
Interest receivable | | 15,964 |
Other receivables | | 59 |
Total assets | | 3,811,276 |
| | |
Liabilities | | |
Payable for investments purchased
Regular delivery | $ 17,086 | |
Delayed delivery | 613,216 | |
Payable for fund shares redeemed | 4,424 | |
Distributions payable | 1,501 | |
Swap agreements, at value | 1,480 | |
Accrued management fee | 834 | |
Other affiliated payables | 359 | |
Other payables and accrued expenses | 75 | |
Total liabilities | | 638,975 |
| | |
Net Assets | | $ 3,172,301 |
Net Assets consist of: | | |
Paid in capital | | $ 3,307,492 |
Distributions in excess of net investment income | | (4,664) |
Accumulated undistributed net realized gain (loss) on investments | | (65,873) |
Net unrealized appreciation (depreciation) on investments | | (64,654) |
Net Assets, for 298,134 shares outstanding | | $ 3,172,301 |
Net Asset Value, offering price and redemption price per share ($3,172,301 ÷ 298,134 shares) | | $ 10.64 |
See accompanying notes which are an integral part of the financial statements.
Annual Report
Statement of Operations
Amounts in thousands | Year ended July 31, 2007 |
| | |
Investment Income | | |
Interest | | $ 180,164 |
| | |
Expenses | | |
Management fee | $ 10,497 | |
Transfer agent fees | 3,300 | |
Fund wide operations fee | 1,050 | |
Independent trustees' compensation | 11 | |
Miscellaneous | 6 | |
Total expenses before reductions | 14,864 | |
Expense reductions | (63) | 14,801 |
Net investment income | | 165,363 |
Realized and Unrealized Gain (Loss) Net realized gain (loss) on: | | |
Investment securities: | | |
Unaffiliated issuers | (27,956) | |
Swap agreements | 1,526 | |
Total net realized gain (loss) | | (26,430) |
Change in net unrealized appreciation (depreciation) on: Investment securities | 35,141 | |
Swap agreements | (2,980) | |
Delayed delivery commitments | 1,063 | |
Total change in net unrealized appreciation (depreciation) | | 33,224 |
Net gain (loss) | | 6,794 |
Net increase (decrease) in net assets resulting from operations | | $ 172,157 |
See accompanying notes which are an integral part of the financial statements.
Annual Report
Fidelity Ginnie Mae Fund
Financial Statements - continued
Statement of Changes in Net Assets
Amounts in thousands | Year ended
July 31,
2007 | Year ended
July 31,
2006 |
Increase (Decrease) in Net Assets | | |
Operations | | |
Net investment income | $ 165,363 | $ 171,119 |
Net realized gain (loss) | (26,430) | (34,126) |
Change in net unrealized appreciation (depreciation) | 33,224 | (76,350) |
Net increase (decrease) in net assets resulting
from operations | 172,157 | 60,643 |
Distributions to shareholders from net investment income | (164,399) | (186,731) |
Distributions to shareholders from net realized gain | - | (7,297) |
Total distributions | (164,399) | (194,028) |
Share transactions
Proceeds from sales of shares | 321,666 | 426,203 |
Reinvestment of distributions | 145,593 | 172,335 |
Cost of shares redeemed | (667,711) | (1,133,635) |
Net increase (decrease) in net assets resulting from share transactions | (200,452) | (535,097) |
Total increase (decrease) in net assets | (192,694) | (668,482) |
| | |
Net Assets | | |
Beginning of period | 3,364,995 | 4,033,477 |
End of period (including distributions in excess of net investment income of $4,664 and distributions in excess of net investment income of $10,001, respectively) | $ 3,172,301 | $ 3,364,995 |
Other Information Shares | | |
Sold | 29,988 | 39,460 |
Issued in reinvestment of distributions | 13,559 | 15,990 |
Redeemed | (62,274) | (105,330) |
Net increase (decrease) | (18,727) | (49,880) |
See accompanying notes which are an integral part of the financial statements.
Annual Report
Financial Highlights
Years ended July 31, | 2007 | 2006 | 2005 | 2004 | 2003 |
Selected Per-Share Data | | | | | |
Net asset value, beginning of period | $ 10.62 | $ 11.00 | $ 11.00 | $ 11.05 | $ 11.11 |
Income from Investment Operations | | | | | |
Net investment incomeB | .537 | .497 | .443 | .404 | .364 |
Net realized and unrealized gain (loss) | .017 | (.315) | .004 | .027 | (.029) |
Total from investment
operations | .554 | .182 | .447 | .431 | .335 |
Distributions from net investment income | (.534) | (.542) | (.447) | (.391) | (.395) |
Distributions from net realized gain | - | (.020) | - | (.090) | - |
Total distributions | (.534) | (.562) | (.447) | (.481) | (.395) |
Net asset value, end of period | $ 10.64 | $ 10.62 | $ 11.00 | $ 11.00 | $ 11.05 |
Total ReturnA | 5.29% | 1.70% | 4.11% | 3.96% | 3.02% |
Ratios to Average Net Assets C | | | | | |
Expenses before reductions | .45% | .45% | .57% | .60% | .57% |
Expenses net of fee waivers, if any | .45% | .45% | .57% | .60% | .57% |
Expenses net of all reductions | .45% | .45% | .57% | .60% | .57% |
Net investment income | 5.01% | 4.61% | 4.00% | 3.64% | 3.25% |
Supplemental Data | | | | | |
Net assets, end of period
(in millions) | $ 3,172 | $ 3,365 | $ 4,033 | $ 3,977 | $ 5,606 |
Portfolio turnover rate | 165% | 183% | 160% | 155% | 262% |
A Total returns would have been lower had certain expenses not been reduced during the periods shown.
B Calculated based on average shares outstanding during the period.
C Expense ratios reflect operating expenses of the Fund. Expenses before reductions do not reflect amounts reimbursed by the investment adviser or expense offset arrangements and do not represent the amount paid by the Fund during periods when reimbursements or reductions occur. Expenses net of fee waivers reflect expenses after reimbursement by the investment adviser but prior to reductions from expense offset arrangements. Expenses net of all reductions represent the net expenses paid by the Fund.
See accompanying notes which are an integral part of the financial statements.
Annual Report
Fidelity Intermediate Government Income Fund
Performance: The Bottom Line
Average annual total return reflects the change in the value of an investment, assuming reinvestment of the fund's dividend income and capital gains (the profits earned upon the sale of securities that have grown in value) and assuming a constant rate of performance each year. The $10,000 table and the fund's returns do not reflect the deduction of taxes that a shareholder would pay on fund distributions or the redemption of fund shares. During periods of reimbursement by Fidelity, a fund's total return will be greater than it would be had the reimbursement not occurred. How a fund did yesterday is no guarantee of how it will do tomorrow.
Average Annual Total Returns
Periods ended July 31, 2007 | Past 1
year | Past 5
years | Past 10
years |
Fidelity Intermediate Govt Income Fund | 5.14% | 3.23% | 5.11% |
$10,000 Over 10 Years
Let's say hypothetically that $10,000 was invested in Fidelity Intermediate Government Income Fund on July 31, 1997. The chart shows how the value of your investment would have changed, and also shows how the Lehman Brothers Intermediate U.S. Government Index performed over the same period.
Annual Report
Fidelity Intermediate Government Income Fund
Management's Discussion of Fund Performance
Comments from Brett Kozlowski, Portfolio Manager of Fidelity® Intermediate Government Income Fund
The investment-grade bond market posted a reasonably solid advance for the 12 months ending July 31, 2007. In that time, the Lehman Brothers® U.S. Aggregate Index - a performance gauge of taxable, high-quality debt - gained 5.58%. A sizable percentage of that increase came in the first four months of the period. The index returned a cumulative 4.30% from August through November, as investors responded favorably to the end of the Federal Reserve Board's two-year campaign of interest rate hikes. In fact, the central bank left rates unchanged through the entire 12-month period. Bonds turned negative in December and January, but had their best month of the past year in February, rising 1.54% as extreme volatility in the stock markets led to a flight to safety in high-quality debt. Performance was lackluster thereafter, however. Inflation concerns and dwindling hopes for a near-term Fed rate cut pressured bond prices for much of the remainder of the period, as did the meltdown of the subprime mortgage sector. Against that backdrop, the index gained only 0.32% over the final five months of the period.
The fund returned 5.14% during the past year, while its benchmark, the Lehman Brothers Intermediate U.S. Government Index, returned 5.62%. Given increased uncertainty related to subprime mortgages, and the potential impact on liquidity within the mortgage-backed securities market, bond-market volatility intensified during the final months of the period. Yields on interest rate swap contracts rose as investors reduced their exposure to swaps in favor of the relative safety of U.S. Treasuries, causing swaps to underperform. Fluctuations in the swap market are significant for the fund because the fund's government-sponsored enterprise (GSE) securities, as well as its out-of-index allocations to mortgage pass-throughs, collateralized mortgage obligations (CMOs) and hybrid adjustable-rate mortgage (ARM) securities, are highly correlated to swap yields. When swap prices decline relative to Treasuries, the prices of GSEs, CMOs and hybrid ARM bonds also tend to decline relative to Treasuries. So, while security selection among GSEs, CMOs, hybrid ARMs and mortgage pass-throughs contributed to the fund's results, returns from these holdings were dampened by weakness in the swap market. At the same time, however, I used interest rate swaps to help manage the fund's duration, or its sensitivity to interest rate changes. The strategy I employed helped the fund to benefit from a steeper yield curve and, by so doing, offset most of the negative impact of rising swap yields.
The views expressed above reflect those of the portfolio manager(s) only through the end of the period as stated on the cover of this report and do not necessarily represent the views of Fidelity or any other person in the Fidelity organization. Any such views are subject to change at any time based upon market or other conditions and Fidelity disclaims any responsibility to update such views. These views may not be relied on as investment advice and, because investment decisions for a Fidelity fund are based on numerous factors, may not be relied on as an indication of trading intent on behalf of any Fidelity fund.
Annual Report
Fidelity Intermediate Government Income Fund
Investment Changes
Coupon Distribution as of July 31, 2007 |
| % of fund's investments | % of fund's investments
6 months ago |
Less than 3% | 1.7 | 2.4 |
3 - 3.99% | 3.6 | 9.5 |
4 - 4.99% | 41.2 | 42.1 |
5 - 5.99% | 23.3 | 30.0 |
6 - 6.99% | 5.9 | 8.0 |
7% and over | 1.1 | 1.5 |
Coupon distribution shows the range of stated interest rates on the fund's investments, excluding short-term investments. |
Weighted Average Maturity as of July 31, 2007 |
| | 6 months ago |
Years | 3.3 | 3.9 |
The weighted average maturity is based on the dollar-weighted average length of time until principal payments are expected or until securities reach maturity, taking into account any maturity shortening feature such as a call, refunding or redemption provision. |
Duration as of July 31, 2007 |
| | 6 months ago |
Years | 3.4 | 3.2 |
Duration shows how much a bond fund's price fluctuates with changes in comparable interest rates. If rates rise 1%, for example, a fund with a five-year duration is likely to lose about 5% of its value. Other factors also can influence a bond fund's performance and share price. Accordingly, a bond fund's actual performance may differ from this example. |
Asset Allocation (% of fund's net assets) |
As of July 31, 2007* | As of January 31, 2007** |
 | Mortgage
Securities 28.3% | | | Mortgage
Securities 12.1% | |
 | CMOs and Other Mortgage Related Securities 8.6% | | | CMOs and Other Mortgage Related Securities 11.6% | |
 | U.S. Treasury
Obligations 43.4% | |  | U.S. Treasury
Obligations 32.8% | |
 | U.S. Government
Agency Obligations 25.4% | | | U.S. Government
Agency Obligations 41.6% | |
 | Asset-Backed
Securities 0.7% | |  | Asset-Backed
Securities 0.9% | |
 | Short-Term
Investments and
Net Other Assets (6.4)%(dagger) | |  | Short-Term
Investments and
Net Other Assets 1.0% | |
* Futures and Swaps | 4.8% | | ** Futures and Swaps | 0.0% | |

(dagger) Short-Term Investments and Net Other Assets are not included in the pie chart. |
Annual Report
Fidelity Intermediate Government Income Fund
Investments July 31, 2007
Showing Percentage of Net Assets
U.S. Government and Government Agency Obligations - 68.8% |
| Principal Amount (000s) | | Value
(000s) |
U.S. Government Agency Obligations - 25.4% |
Fannie Mae: | | | | |
3.25% 1/15/08 | | $ 370 | | $ 367 |
3.25% 2/15/09 | | 745 | | 727 |
4.125% 5/15/10 | | 11,700 | | 11,438 |
4.5% 10/15/08 | | 2,905 | | 2,889 |
4.75% 12/15/10 (b) | | 28,500 | | 28,265 |
4.875% 4/15/09 | | 1,391 | | 1,390 |
5.125% 9/2/08 | | 10,635 | | 10,643 |
6.375% 6/15/09 | | 3,770 | | 3,866 |
7.25% 1/15/10 | | 1,779 | | 1,872 |
Federal Home Loan Bank: | | | | |
4.5% 10/14/08 | | 1,850 | | 1,839 |
5.375% 8/19/11 | | 16,960 | | 17,140 |
5.8% 9/2/08 | | 5,845 | | 5,891 |
Freddie Mac: | | | | |
3.625% 9/15/08 | | 2,285 | | 2,250 |
4.75% 3/5/09 | | 12,047 | | 12,013 |
5.125% 8/23/10 | | 13,500 | | 13,541 |
5.125% 4/18/11 | | 2,360 | | 2,363 |
5.25% 7/18/11 | | 58 | | 58 |
5.5% 8/23/17 | | 15,500 | | 15,629 |
5.625% 3/15/11 | | 1,000 | | 1,018 |
5.75% 3/15/09 | | 4,000 | | 4,050 |
Israeli State (guaranteed by U.S. Government through Agency for International Development): | | | | |
6.6% 2/15/08 | | 5,681 | | 5,691 |
6.8% 2/15/12 | | 7,500 | | 7,817 |
Private Export Funding Corp.: | | | | |
secured: | | | | |
5.66% 9/15/11 (c) | | 9,000 | | 9,166 |
5.685% 5/15/12 | | 3,915 | | 4,004 |
4.974% 8/15/13 | | 3,435 | | 3,410 |
Small Business Administration guaranteed development participation certificates Series 2004-20H Class 1, 5.17% 8/1/24 | | 779 | | 769 |
U.S. Department of Housing and Urban Development Government guaranteed participation certificates Series 1999-A, 6.06% 8/1/10 | | 10,000 | | 10,051 |
TOTAL U.S. GOVERNMENT AGENCY OBLIGATIONS | | 178,157 |
U.S. Government and Government Agency Obligations - continued |
| Principal Amount (000s) | | Value
(000s) |
U.S. Treasury Inflation Protected Obligations - 2.4% |
U.S. Treasury Inflation-Indexed Notes: | | | | |
2.375% 4/15/11 | | $ 15,345 | | $ 15,255 |
2.5% 7/15/16 | | 1,287 | | 1,293 |
TOTAL U.S. TREASURY INFLATION PROTECTED OBLIGATIONS | | 16,548 |
U.S. Treasury Obligations - 41.0% |
U.S. Treasury Notes: | | | | |
3.375% 9/15/09 | | 23,002 | | 22,457 |
4.25% 11/15/14 (b) | | 31,500 | | 30,589 |
4.5% 5/15/10 (d) | | 44,000 | | 43,963 |
4.625% 11/15/16 | | 3,000 | | 2,963 |
4.75% 5/31/12 | | 18,000 | | 18,110 |
4.75% 5/15/14 (b) | | 14,058 | | 14,100 |
4.875% 4/30/08 (b) | | 52,596 | | 52,585 |
4.875% 6/30/09 (d) | | 30,007 | | 30,170 |
4.875% 6/30/12 (d) | | 40,847 | | 41,320 |
4.875% 8/15/16 (d) | | 8,897 | | 8,952 |
5.125% 5/15/16 (b) | | 21,000 | | 21,499 |
TOTAL U.S. TREASURY OBLIGATIONS | | 286,708 |
TOTAL U.S. GOVERNMENT AND GOVERNMENT AGENCY OBLIGATIONS (Cost $481,231) | 481,413 |
U.S. Government Agency - Mortgage Securities - 28.3% |
|
Fannie Mae - 18.9% |
3.585% 9/1/33 (e) | | 336 | | 330 |
3.718% 6/1/33 (e) | | 1,048 | | 1,045 |
3.757% 10/1/33 (e) | | 90 | | 90 |
3.784% 6/1/33 (e) | | 1,252 | | 1,254 |
3.802% 6/1/33 (e) | | 86 | | 86 |
3.877% 6/1/33 (e) | | 418 | | 420 |
3.902% 5/1/34 (e) | | 666 | | 656 |
3.91% 5/1/33 (e) | | 496 | | 499 |
3.944% 5/1/34 (e) | | 542 | | 534 |
3.947% 5/1/33 (e) | | 30 | | 30 |
3.967% 9/1/33 (e) | | 943 | | 931 |
3.998% 4/1/34 (e) | | 998 | | 984 |
3.999% 10/1/18 (e) | | 71 | | 70 |
U.S. Government Agency - Mortgage Securities - continued |
| Principal Amount (000s) | | Value
(000s) |
Fannie Mae - continued |
4% 9/1/13 to 5/1/20 | | $ 2,901 | | $ 2,727 |
4.004% 8/1/33 (e) | | 468 | | 462 |
4.013% 4/1/33 (e) | | 29 | | 29 |
4.027% 3/1/34 (e) | | 1,892 | | 1,866 |
4.045% 6/1/33 (e) | | 1,182 | | 1,178 |
4.063% 3/1/35 (e) | | 1,813 | | 1,794 |
4.076% 2/1/35 (e) | | 48 | | 48 |
4.115% 4/1/34 (e) | | 1,256 | | 1,241 |
4.124% 5/1/34 (e) | | 1,024 | | 1,011 |
4.166% 1/1/35 (e) | | 222 | | 218 |
4.187% 11/1/34 (e) | | 1,271 | | 1,274 |
4.249% 1/1/34 (e) | | 240 | | 237 |
4.25% 2/1/35 (e) | | 100 | | 98 |
4.264% 5/1/35 (e) | | 106 | | 107 |
4.28% 10/1/33 (e) | | 39 | | 38 |
4.282% 3/1/33 (e) | | 97 | | 97 |
4.294% 8/1/33 (e) | | 184 | | 184 |
4.295% 3/1/35 (e) | | 86 | | 86 |
4.302% 6/1/33 (e) | | 51 | | 51 |
4.304% 3/1/33 (e) | | 54 | | 54 |
4.321% 4/1/35 (e) | | 48 | | 48 |
4.343% 1/1/35 (e) | | 109 | | 107 |
4.355% 10/1/19 (e) | | 114 | | 112 |
4.36% 2/1/34 (e) | | 217 | | 215 |
4.386% 10/1/34 (e) | | 473 | | 467 |
4.396% 2/1/35 (e) | | 169 | | 166 |
4.406% 8/1/34 (e) | | 2,213 | | 2,223 |
4.411% 7/1/35 (e) | | 1,866 | | 1,838 |
4.419% 5/1/35 (e) | | 281 | | 280 |
4.429% 5/1/35 (e) | | 112 | | 112 |
4.432% 3/1/35 (e) | | 165 | | 163 |
4.441% 5/1/35 (e) | | 1,460 | | 1,457 |
4.444% 8/1/34 (e) | | 2,426 | | 2,400 |
4.445% 8/1/34 (e) | | 305 | | 303 |
4.46% 8/1/35 (e) | | 1,514 | | 1,511 |
4.481% 1/1/35 (e) | | 523 | | 516 |
4.484% 11/1/33 (e) | | 174 | | 172 |
4.494% 12/1/34 (e) | | 42 | | 41 |
4.5% 5/1/18 to 10/1/18 | | 973 | | 932 |
4.503% 2/1/35 (e) | | 86 | | 87 |
4.504% 2/1/35 (e) | | 49 | | 49 |
4.512% 1/1/35 (e) | | 115 | | 114 |
U.S. Government Agency - Mortgage Securities - continued |
| Principal Amount (000s) | | Value
(000s) |
Fannie Mae - continued |
4.519% 2/1/35 (e) | | $ 1,268 | | $ 1,259 |
4.524% 7/1/35 (e) | | 320 | | 319 |
4.53% 10/1/35 (e) | | 69 | | 69 |
4.554% 9/1/34 (e) | | 2,211 | | 2,190 |
4.569% 1/1/35 (e) | | 807 | | 798 |
4.57% 7/1/35 (e) | | 319 | | 320 |
4.575% 2/1/35 (e) | | 403 | | 398 |
4.649% 8/1/35 (e) | | 541 | | 539 |
4.651% 10/1/34 (e) | | 320 | | 318 |
4.653% 3/1/35 (e) | | 693 | | 698 |
4.687% 2/1/35 (e) | | 1,482 | | 1,468 |
4.702% 10/1/34 (e) | | 301 | | 299 |
4.719% 7/1/34 (e) | | 280 | | 278 |
4.723% 3/1/35 (e) | | 29 | | 29 |
4.733% 12/1/35 (e) | | 4,291 | | 4,263 |
4.772% 1/1/35 (e) | | 464 | | 460 |
4.781% 12/1/34 (e) | | 84 | | 84 |
4.794% 4/1/35 (e) | | 1,273 | | 1,270 |
4.8% 7/1/35 (e) | | 445 | | 441 |
4.8% 7/1/36 (e) | | 534 | | 535 |
4.801% 11/1/34 (e) | | 250 | | 248 |
4.803% 6/1/35 (e) | | 368 | | 369 |
4.803% 11/1/35 (e) | | 1,061 | | 1,062 |
4.808% 2/1/33 (e) | | 119 | | 120 |
4.808% 1/1/36 (e) | | 2,565 | | 2,544 |
4.832% 10/1/35 (e) | | 209 | | 208 |
4.849% 7/1/35 (e) | | 703 | | 697 |
4.857% 10/1/34 (e) | | 983 | | 977 |
4.87% 5/1/33 (e) | | 6 | | 6 |
4.882% 10/1/35 (e) | | 160 | | 160 |
4.894% 5/1/35 (e) | | 180 | | 178 |
4.951% 8/1/34 (e) | | 745 | | 742 |
5% 2/1/16 to 1/1/19 | | 12,566 | | 12,276 |
5.005% 2/1/34 (e) | | 781 | | 774 |
5.016% 7/1/34 (e) | | 41 | | 41 |
5.038% 12/1/32 (e) | | 1,015 | | 1,012 |
5.052% 5/1/35 (e) | | 541 | | 545 |
5.069% 9/1/34 (e) | | 702 | | 700 |
5.084% 9/1/34 (e) | | 73 | | 73 |
5.087% 8/1/34 (e) | | 72 | | 72 |
5.093% 5/1/35 (e) | | 234 | | 235 |
5.101% 10/1/35 (e) | | 663 | | 660 |
U.S. Government Agency - Mortgage Securities - continued |
| Principal Amount (000s) | | Value
(000s) |
Fannie Mae - continued |
5.108% 10/1/35 (e) | | $ 462 | | $ 459 |
5.165% 3/1/36 (e) | | 1,405 | | 1,402 |
5.17% 6/1/35 (e) | | 380 | | 383 |
5.176% 8/1/33 (e) | | 121 | | 121 |
5.176% 3/1/35 (e) | | 49 | | 48 |
5.258% 11/1/36 (e) | | 284 | | 284 |
5.277% 4/1/36 (e) | | 547 | | 552 |
5.294% 7/1/35 (e) | | 2,689 | | 2,687 |
5.297% 7/1/35 (e) | | 46 | | 47 |
5.324% 12/1/34 (e) | | 109 | | 109 |
5.342% 2/1/36 (e) | | 103 | | 103 |
5.356% 12/1/36 (e) | | 352 | | 352 |
5.365% 2/1/36 (e) | | 812 | | 812 |
5.387% 3/1/37 (e) | | 2,136 | | 2,140 |
5.407% 2/1/37 (e) | | 295 | | 296 |
5.449% 2/1/37 (e) | | 1,339 | | 1,341 |
5.483% 6/1/47 (e) | | 230 | | 231 |
5.488% 2/1/37 (e) | | 1,790 | | 1,796 |
5.5% 1/1/09 to 3/1/20 | | 11,786 | | 11,718 |
5.533% 11/1/36 (e) | | 575 | | 576 |
5.612% 2/1/36 (e) | | 321 | | 323 |
5.67% 4/1/36 (e) | | 1,186 | | 1,192 |
5.67% 6/1/36 (e) | | 775 | | 779 |
5.688% 4/1/37 (e) | | 1,224 | | 1,230 |
5.757% 4/1/36 (e) | | 628 | | 632 |
5.804% 3/1/36 (e) | | 2,398 | | 2,416 |
5.818% 1/1/36 (e) | | 298 | | 298 |
5.831% 3/1/36 (e) | | 875 | | 881 |
5.831% 5/1/36 (e) | | 1,859 | | 1,874 |
5.897% 12/1/36 (e) | | 442 | | 446 |
5.925% 6/1/36 (e) | | 6,627 | | 6,688 |
5.934% 6/1/36 (e) | | 1,559 | | 1,570 |
5.95% 5/1/36 (e) | | 760 | | 767 |
6% 5/1/12 to 9/1/19 | | 2,519 | | 2,546 |
6.038% 4/1/36 (e) | | 4,959 | | 5,013 |
6.226% 3/1/37 (e) | | 140 | | 141 |
6.5% 6/1/16 to 3/1/35 | | 5,238 | | 5,336 |
7% 12/1/08 to 9/1/31 | | 387 | | 396 |
7.5% 5/1/37 | | 424 | | 440 |
9% 2/1/13 | | 102 | | 107 |
9.5% 11/15/09 | | 118 | | 122 |
10.25% 10/1/09 to 10/1/18 | | 8 | | 9 |
U.S. Government Agency - Mortgage Securities - continued |
| Principal Amount (000s) | | Value
(000s) |
Fannie Mae - continued |
11% 8/1/10 to 1/1/16 | | $ 312 | | $ 331 |
11.25% 5/1/14 to 1/1/16 | | 56 | | 63 |
11.5% 9/1/11 to 6/15/19 | | 196 | | 215 |
12.25% 7/1/12 to 8/1/13 | | 10 | | 11 |
12.5% 9/1/12 to 7/1/16 | | 155 | | 177 |
12.75% 10/1/11 to 6/1/15 | | 108 | | 117 |
13% 7/1/13 to 7/1/15 | | 67 | | 77 |
13.25% 9/1/11 | | 63 | | 70 |
13.5% 11/1/14 to 12/1/14 | | 15 | | 18 |
15% 4/1/12 | | 3 | | 3 |
| | 132,521 |
Freddie Mac - 9.2% |
3.377% 7/1/33 (e) | | 916 | | 907 |
4% 1/1/19 to 11/1/20 | | 4,437 | | 4,140 |
4.004% 5/1/33 (e) | | 1,564 | | 1,561 |
4.179% 1/1/35 (e) | | 1,497 | | 1,480 |
4.283% 2/1/35 (e) | | 258 | | 259 |
4.288% 3/1/35 (e) | | 120 | | 120 |
4.301% 12/1/34 (e) | | 163 | | 160 |
4.424% 6/1/35 (e) | | 167 | | 167 |
4.426% 2/1/34 (e) | | 127 | | 126 |
4.426% 3/1/35 (e) | | 145 | | 143 |
4.444% 3/1/35 (e) | | 158 | | 156 |
4.5% 2/1/18 to 11/1/20 | | 674 | | 646 |
4.539% 2/1/35 (e) | | 270 | | 266 |
4.569% 6/1/33 (e) | | 490 | | 490 |
4.661% 2/1/35 (e) | | 3,721 | | 3,673 |
4.701% 9/1/36 (e) | | 329 | | 327 |
4.704% 9/1/35 (e) | | 3,901 | | 3,882 |
4.784% 3/1/33 (e) | | 42 | | 42 |
4.789% 2/1/36 (e) | | 136 | | 134 |
4.837% 5/1/35 (e) | | 2,519 | | 2,491 |
4.873% 10/1/35 (e) | | 617 | | 615 |
4.922% 10/1/36 (e) | | 1,895 | | 1,887 |
4.988% 4/1/35 (e) | | 640 | | 643 |
5% 3/1/18 to 9/1/35 | | 3,236 | | 3,151 |
5.013% 7/1/35 (e) | | 1,545 | | 1,535 |
5.128% 7/1/35 (e) | | 519 | | 516 |
5.132% 4/1/35 (e) | | 543 | | 540 |
5.272% 11/1/35 (e) | | 527 | | 526 |
5.278% 2/1/36 (e) | | 41 | | 41 |
U.S. Government Agency - Mortgage Securities - continued |
| Principal Amount (000s) | | Value
(000s) |
Freddie Mac - continued |
5.362% 3/1/37 (e) | | $ 202 | | $ 202 |
5.489% 2/1/37 (e) | | 1,154 | | 1,149 |
5.498% 1/1/36 (e) | | 449 | | 448 |
5.5% 8/1/14 to 11/1/20 | | 3,576 | | 3,545 |
5.536% 1/1/36 (e) | | 680 | | 680 |
5.553% 4/1/37 (e) | | 298 | | 298 |
5.586% 3/1/36 (e) | | 1,975 | | 1,977 |
5.673% 8/1/36 (e) | | 1,978 | | 1,981 |
5.732% 4/1/36 (e) | | 4,650 | | 4,658 |
5.779% 3/1/37 (e) | | 1,020 | | 1,023 |
5.806% 5/1/37 (e) | | 2,349 | | 2,358 |
5.809% 4/1/37 (e) | | 940 | | 944 |
5.828% 6/1/37 (e) | | 765 | | 769 |
5.858% 5/1/37 (e) | | 230 | | 231 |
5.863% 5/1/37 (e) | | 1,330 | | 1,336 |
5.963% 4/1/36 (e) | | 2,611 | | 2,627 |
6% 7/1/16 to 2/1/19 | | 852 | | 861 |
6.084% 2/1/37 (e) | | 2,101 | | 2,116 |
6.157% 12/1/36 (e) | | 2,386 | | 2,400 |
6.5% 5/1/08 | | 20 | | 20 |
6.525% 9/1/36 (e) | | 1,866 | | 1,884 |
8.5% 6/1/14 to 6/1/17 | | 31 | | 32 |
9% 11/1/09 to 8/1/16 | | 37 | | 39 |
9.5% 7/1/16 to 8/1/21 | | 283 | | 308 |
10% 7/1/09 to 3/1/21 | | 609 | | 666 |
10.5% 9/1/09 to 5/1/21 | | 46 | | 48 |
11% 2/1/11 to 9/1/20 | | 35 | | 39 |
11.25% 2/1/10 to 6/1/14 | | 69 | | 76 |
11.5% 10/1/15 to 8/1/19 | | 51 | | 56 |
11.75% 11/1/11 to 7/1/15 | | 10 | | 11 |
12% 10/1/09 to 11/1/19 | | 133 | | 146 |
12.25% 12/1/11 to 8/1/15 | | 59 | | 66 |
12.5% 10/1/09 to 6/1/19 | | 653 | | 730 |
12.75% 2/1/10 to 10/1/10 | | 7 | | 7 |
13% 9/1/10 to 5/1/17 | | 101 | | 115 |
13.25% 11/1/10 to 10/1/13 | | 30 | | 34 |
13.5% 11/1/10 to 8/1/11 | | 33 | | 37 |
14% 11/1/12 to 4/1/16 | | 5 | | 6 |
14.5% 12/1/10 | | 1 | | 1 |
U.S. Government Agency - Mortgage Securities - continued |
| Principal Amount (000s) | | Value
(000s) |
Freddie Mac - continued |
14.75% 3/1/10 | | $ 1 | | $ 1 |
| | 64,549 |
Government National Mortgage Association - 0.2% |
8% 11/15/07 to 12/15/23 | | 431 | | 456 |
8.5% 6/15/16 to 2/15/17 | | 8 | | 8 |
10.5% 9/15/15 to 10/15/21 | | 689 | | 785 |
10.75% 12/15/09 to 3/15/10 | | 8 | | 8 |
11% 5/20/16 to 1/20/21 | | 41 | | 47 |
12.5% 12/15/10 | | 2 | | 2 |
13% 1/15/11 to 10/15/13 | | 47 | | 52 |
13.25% 8/15/14 | | 10 | | 11 |
13.5% 7/15/11 to 12/15/14 | | 11 | | 12 |
14% 6/15/11 | | 6 | | 7 |
| | 1,388 |
TOTAL U.S. GOVERNMENT AGENCY - MORTGAGE SECURITIES (Cost $198,714) | 198,458 |
Asset-Backed Securities - 0.7% |
|
Fannie Mae Grantor Trust Series 2005-T4 Class A1C, 5.47% 9/25/35 (e)
(Cost $4,763) | | 4,763 | | 4,796 |
Collateralized Mortgage Obligations - 8.6% |
|
U.S. Government Agency - 8.6% |
Fannie Mae: | | | | |
floater Series 1994-42 Class FK, 4.34% 4/25/24 (e) | | 3,603 | | 3,431 |
planned amortization class: | | | | |
Series 1988-21 Class G, 9.5% 8/25/18 | | 88 | | 95 |
Series 1994-12 Class PH, 6.25% 1/25/09 | | 483 | | 484 |
Series 2002-83 Class ME, 5% 12/25/17 | | 5,150 | | 5,004 |
Series 2003-28 Class KG, 5.5% 4/25/23 | | 725 | | 707 |
sequential payer Series 1993-238 Class C, 6.5% 12/25/08 | | 2,141 | | 2,142 |
Fannie Mae Grantor Trust sequential payer Series 2005-93 Class HD, 4.5% 11/25/19 | | 152 | | 148 |
Fannie Mae subordinate REMIC pass-thru certificates: | | | | |
floater: | | | | |
Series 2001-38 Class QF, 6.3% 8/25/31 (e) | | 712 | | 729 |
Collateralized Mortgage Obligations - continued |
| Principal Amount (000s) | | Value
(000s) |
U.S. Government Agency - continued |
Fannie Mae subordinate REMIC pass-thru certificates: - continued | | | | |
floater: | | | | |
Series 2002-60 Class FV, 6.32% 4/25/32 (e) | | $ 251 | | $ 258 |
Series 2002-74 Class FV, 5.77% 11/25/32 (e) | | 3,550 | | 3,576 |
Series 2002-75 Class FA, 6.32% 11/25/32 (e) | | 514 | | 529 |
planned amortization class: | | | | |
Series 2002-11 Class UC, 6% 3/25/17 | | 1,214 | | 1,227 |
Series 2002-16 Class PG, 6% 4/25/17 | | 1,273 | | 1,287 |
Series 2002-18 Class PC, 5.5% 4/25/17 | | 1,045 | | 1,045 |
Series 2002-71 Class UC, 5% 11/25/17 | | 3,155 | | 3,070 |
Series 2003-128 Class NE, 4% 12/25/16 | | 1,260 | | 1,197 |
Series 2003-85 Class GD, 4.5% 9/25/18 | | 610 | | 581 |
Series 2004-80 Class LD, 4% 1/25/19 | | 980 | | 923 |
Series 2004-81: | | | | |
Class KC, 4.5% 4/25/17 | | 690 | | 676 |
Class KD, 4.5% 7/25/18 | | 1,315 | | 1,262 |
sequential payer: | | | | |
Series 2002-56 Class MC, 5.5% 9/25/17 | | 438 | | 438 |
Series 2003-18 Class EY, 5% 6/25/17 | | 2,084 | | 2,059 |
Series 2002-50 Class LE, 7% 12/25/29 | | 1 | | 1 |
Freddie Mac planned amortization class Series 2356 Class GD, 6% 9/15/16 | | 482 | | 488 |
Freddie Mac Multi-class participation certificates guaranteed: | | | | |
floater: | | | | |
Series 2526 Class FC, 5.72% 11/15/32 (e) | | 857 | | 863 |
Series 2630 Class FL, 5.82% 6/15/18 (e) | | 58 | | 59 |
planned amortization class: | | | | |
Series 2640 Class GE, 4.5% 7/15/18 | | 3,690 | | 3,521 |
Series 2695 Class DG, 4% 10/15/18 | | 1,635 | | 1,507 |
Series 2752 Class PW, 4% 4/15/22 | | 2,000 | | 1,975 |
Series 2802 Class OB, 6% 5/15/34 | | 1,355 | | 1,350 |
Series 2810 Class PD, 6% 6/15/33 | | 1,020 | | 1,018 |
Series 2831 Class PB, 5% 7/15/19 | | 1,975 | | 1,905 |
Series 2866 Class XE, 4% 12/15/18 | | 1,875 | | 1,768 |
sequential payer: | | | | |
Series 1929 Class EZ, 7.5% 2/17/27 | | 2,311 | | 2,400 |
Series 2570 Class CU, 4.5% 7/15/17 | | 219 | | 213 |
Series 2572 Class HK, 4% 2/15/17 | | 319 | | 309 |
Series 2617 Class GW, 3.5% 6/15/16 | | 1,697 | | 1,667 |
Series 2860 Class CP, 4% 10/15/17 | | 236 | | 229 |
Series 2866 Class N, 4.5% 12/15/18 | | 1,340 | | 1,321 |
Collateralized Mortgage Obligations - continued |
| Principal Amount (000s) | | Value
(000s) |
U.S. Government Agency - continued |
Freddie Mac Multi-class participation certificates guaranteed: - continued | | | | |
sequential payer: | | | | |
Series 2937 Class HJ, 5% 10/15/19 | | $ 1,015 | | $ 999 |
Series 2998 Class LY, 5.5% 7/15/25 | | 295 | | 280 |
Series 3007 Class EW, 5.5% 7/15/25 | | 1,125 | | 1,067 |
Series 3013 Class VJ, 5% 1/15/14 | | 1,987 | | 1,962 |
Series 2769 Class BU, 5% 3/15/34 | | 1,020 | | 922 |
Ginnie Mae guaranteed REMIC pass-thru securities planned amortization class Series 2005-58 Class NJ, 4.5% 8/20/35 | | 3,465 | | 3,397 |
TOTAL COLLATERALIZED MORTGAGE OBLIGATIONS (Cost $60,794) | 60,089 |
Cash Equivalents - 32.2% |
| Maturity Amount (000s) | | |
Investments in repurchase agreements in a joint trading account at 5.3%, dated 7/31/07 due 8/1/07: | | | |
(Collateralized by U.S. Government Obligations) # | $ 78,861 | | 78,849 |
(Collateralized by U.S. Government Obligations) # (a) | 146,519 | | 146,497 |
TOTAL CASH EQUIVALENTS (Cost $225,346) | 225,346 |
TOTAL INVESTMENT PORTFOLIO - 138.6% (Cost $970,848) | | 970,102 |
NET OTHER ASSETS - (38.6)% | | (270,047) |
NET ASSETS - 100% | $ 700,055 |
Swap Agreements |
| Expiration Date | | Notional Amount (000s) | | Value
(000s) |
Interest Rate Swaps |
Receive quarterly a floating rate based on 3-month LIBOR and pay semi-annually a fixed equal to 5.484% with Deutsche Bank | June 2010 | | $ 4,000 | | $ (38) |
Receive quarterly a floating rate based on 3-month LIBOR and pay semi-annually a fixed rate equal to 5.35% with Bank of America | March 2037 | | 1,800 | | 66 |
Receive semi-annually a fixed rate equal to 5.44% and pay quarterly a floating rate based on 3-month LIBOR with JPMorgan Chase, Inc. | July 2010 | | 7,000 | | 57 |
Receive semi-annually a fixed rate equal to 5.467% and pay quarterly a floating rate based on 3-month LIBOR with JPMorgan Chase, Inc. | July 2011 | | 1,500 | | 14 |
Receive semi-annually a fixed rate equal to 5.505% and pay quarterly a floating rate based on 3-month LIBOR with Credit Suisse First Boston | July 2012 | | 11,000 | | 114 |
Receive semi-annually a fixed rate equal to 5.6025% and pay quarterly a floating rate based on 3-month LIBOR with Bank of America | June 2011 | | 11,000 | | 158 |
Receive semi-annually a fixed rate equal to 5.706% and pay quarterly a floating rate based on 3-month LIBOR with Deutsche Bank | June 2017 | | 3,000 | | 46 |
Receive semi-annually a fixed rate equal to 5.76% and pay quarterly a floating rate based on 3-month LIBOR with Credit Suisse First Boston | June 2016 | | 2,500 | | 52 |
Receive semi-annually a fixed rate equal to 5.79% and pay quarterly a floating rate based on 3-month LIBOR with Goldman Sachs | July 2016 | | 3,100 | | 71 |
| | $ 44,900 | | $ 540 |
Legend |
(a) Includes investment made with cash collateral received from securities on loan. |
(b) Security or a portion of the security is on loan at period end. |
(c) Security exempt from registration under Rule 144A of the Securities Act of 1933. These securities may be resold in transactions exempt from registration, normally to qualified institutional buyers. At the end of the period, the value of these securities amounted to $9,166,000 or 1.3% of net assets. |
(d) Security or a portion of the security purchased on a delayed delivery or when-issued basis. |
(e) The coupon rate shown on floating or adjustable rate securities represents the rate at period end. |
# Additional Information on each counterparty to the repurchase agreement is as follows: |
Repurchase Agreement / Counterparty | Value
(Amounts in thousands) |
$78,849,000 due 8/01/07 at 5.30% |
ABN AMRO Bank N.V., New York Branch | $ 1,912 |
Banc of America Securities LLC | 17,016 |
Bank of America, NA | 4,801 |
Barclays Capital, Inc. | 8,806 |
Bear Stearns & Co., Inc. | 8,412 |
Countrywide Securities Corp. | 6,166 |
ING Financial Markets LLC | 7,647 |
Societe Generale, New York Branch | 7,647 |
UBS Securities LLC | 13,383 |
WestLB AG | 3,059 |
| $ 78,849 |
$146,497,000 due 8/01/07 at 5.30% |
Bank of America, NA | $ 44,486 |
Barclays Capital, Inc. | 102,011 |
| $ 146,497 |
Income Tax Information |
At July 31, 2007, the fund had a capital loss carryforward of approximately $40,571,000 of which $11,911,000, $7,507,000, $3,266,000, $414,000, $6,019,000 and $11,454,000 will expire on July 31, 2008, 2009, 2012, 2013, 2014 and 2015, respectively. |
See accompanying notes which are an integral part of the financial statements.
Annual Report
Fidelity Intermediate Government Income Fund
Financial Statements
Statement of Assets and Liabilities
Amounts in thousands (except per-share amount) | July 31, 2007 |
| | |
Assets | | |
Investment in securities, at value (including securities loaned of $142,374 and repurchase agreements of $225,346) - See accompanying schedule: Unaffiliated issuers (cost $970,848) | | $ 970,102 |
Cash | | 1 |
Receivable for investments sold | | 1,396 |
Receivable for fund shares sold | | 283 |
Interest receivable | | 7,062 |
Swap agreements, at value | | 540 |
Total assets | | 979,384 |
| | |
Liabilities | | |
Payable for investments purchased
Regular delivery | $ 7,312 | |
Delayed delivery | 124,411 | |
Payable for fund shares redeemed | 512 | |
Distributions payable | 331 | |
Accrued management fee | 183 | |
Other affiliated payables | 83 | |
Collateral on securities loaned, at value | 146,497 | |
Total liabilities | | 279,329 |
| | |
Net Assets | | $ 700,055 |
Net Assets consist of: | | |
Paid in capital | | $ 742,449 |
Undistributed net investment income | | 1,908 |
Accumulated undistributed net realized gain (loss) on investments | | (44,096) |
Net unrealized appreciation (depreciation) on investments | | (206) |
Net Assets, for 70,231 shares outstanding | | $ 700,055 |
Net Asset Value, offering price and redemption price per share ($700,055 ÷ 70,231 shares) | | $ 9.97 |
See accompanying notes which are an integral part of the financial statements.
Annual Report
Fidelity Intermediate Government Income Fund
Financial Statements - continued
Statement of Operations
Amounts in thousands | Year ended July 31, 2007 |
| | |
Investment Income | | |
Interest | | $ 34,779 |
| | |
Expenses | | |
Management fee | $ 2,302 | |
Transfer agent fees | 722 | |
Fund wide operations fee | 230 | |
Independent trustees' compensation | 3 | |
Miscellaneous | 1 | |
Total expenses before reductions | 3,258 | |
Expense reductions | (21) | 3,237 |
Net investment income | | 31,542 |
Realized and Unrealized Gain (Loss) Net realized gain (loss) on: | | |
Investment securities: | | |
Unaffiliated issuers | (5,294) | |
Swap agreements | 189 | |
Total net realized gain (loss) | | (5,105) |
Change in net unrealized appreciation (depreciation) on: Investment securities | 9,371 | |
Swap agreements | 540 | |
Total change in net unrealized appreciation (depreciation) | | 9,911 |
Net gain (loss) | | 4,806 |
Net increase (decrease) in net assets resulting from operations | | $ 36,348 |
See accompanying notes which are an integral part of the financial statements.
Annual Report
Statement of Changes in Net Assets
Amounts in thousands | Year ended
July 31,
2007 | Year ended
July 31,
2006 |
Increase (Decrease) in Net Assets | | |
Operations | | |
Net investment income | $ 31,542 | $ 33,845 |
Net realized gain (loss) | (5,105) | (12,088) |
Change in net unrealized appreciation (depreciation) | 9,911 | (5,860) |
Net increase (decrease) in net assets resulting
from operations | 36,348 | 15,897 |
Distributions to shareholders from net investment income | (32,742) | (31,447) |
Share transactions
Proceeds from sales of shares | 66,477 | 83,463 |
Reinvestment of distributions | 28,271 | 26,830 |
Cost of shares redeemed | (157,163) | (219,836) |
Net increase (decrease) in net assets resulting from share transactions | (62,415) | (109,543) |
Total increase (decrease) in net assets | (58,809) | (125,093) |
| | |
Net Assets | | |
Beginning of period | 758,864 | 883,957 |
End of period (including undistributed net investment income of $1,908 and undistributed net investment income of $3,867, respectively) | $ 700,055 | $ 758,864 |
Other Information Shares | | |
Sold | 6,665 | 8,353 |
Issued in reinvestment of distributions | 2,831 | 2,687 |
Redeemed | (15,756) | (22,008) |
Net increase (decrease) | (6,260) | (10,968) |
See accompanying notes which are an integral part of the financial statements.
Annual Report
Financial Highlights
Years ended July 31, | 2007 | 2006 | 2005 | 2004 | 2003 |
Selected Per-Share Data | | | | | |
Net asset value, beginning of period | $ 9.92 | $ 10.11 | $ 10.18 | $ 10.17 | $ 10.11 |
Income from Investment Operations | | | | | |
Net investment incomeB | .435 | .414 | .330 | .274 | .329 |
Net realized and unrealized gain (loss) | .067 | (.219) | (.084) | .014 | .056 |
Total from investment operations | .502 | .195 | .246 | .288 | .385 |
Distributions from net investment income | (.452) | (.385) | (.316) | (.278) | (.325) |
Net asset value, end of period | $ 9.97 | $ 9.92 | $ 10.11 | $ 10.18 | $ 10.17 |
Total ReturnA | 5.14% | 1.97% | 2.43% | 2.84% | 3.80% |
Ratios to Average Net AssetsC | | | | | |
Expenses before reductions | .45% | .45% | .57% | .60% | .60% |
Expenses net of fee waivers, if any | .45% | .45% | .57% | .60% | .60% |
Expenses net of all reductions | .45% | .45% | .57% | .60% | .60% |
Net investment income | 4.36% | 4.14% | 3.23% | 2.67% | 3.18% |
Supplemental Data | | | | | |
Net assets, end of period (in millions) | $ 700 | $ 759 | $ 884 | $ 963 | $ 1,283 |
Portfolio turnover rate | 121% | 97% | 90% | 152% | 229% |
A Total returns would have been lower had certain expenses not been reduced during the periods shown.
B Calculated based on average shares outstanding during the period.
C Expense ratios reflect operating expenses of the Fund. Expenses before reductions do not reflect amounts reimbursed by the investment adviser or expense offset arrangements and do not represent the amount paid by the Fund during periods when reimbursements or reductions occur. Expenses net of fee waivers reflect expenses after reimbursement by the investment adviser but prior to reductions from expense offset arrangements. Expenses net of all reductions represent the net expenses paid by the Fund.
See accompanying notes which are an integral part of the financial statements.
Annual Report
Notes to Financial Statements
For the period ended July 31, 2007
(Amounts in thousands except ratios)
1. Organization.
Fidelity Ginnie Mae Fund and Fidelity Intermediate Government Income Fund (the Funds) are funds of Fidelity Income Fund (the trust). The trust is registered under the Investment Company Act of 1940, as amended (the 1940 Act), as an open-end management investment company organized as a Massachusetts business trust. Each Fund is authorized to issue an unlimited number of shares.
2. Significant Accounting Policies.
The financial statements have been prepared in conformity with accounting principles generally accepted in the United States of America, which require management to make certain estimates and assumptions at the date of the financial statements. The following summarizes the significant accounting policies of the Funds:
Security Valuation. Investments are valued and net asset value per share is calculated (NAV calculation) as of the close of business of the New York Stock Exchange, normally 4:00 p.m. Eastern time. Wherever possible, each Fund uses independent pricing services approved by the Board of Trustees to value their investments. Debt securities, including restricted securities, for which quotes are readily available, are valued by independent pricing services or by dealers who make markets in such securities. Pricing services consider yield or price of bonds of comparable quality, coupon, maturity and type as well as dealer supplied prices.
When current market prices or quotations are not readily available or do not accurately reflect fair value, valuations may be determined in accordance with procedures adopted by the Board of Trustees. The frequency of when fair value pricing is used is unpredictable. The value of securities used for NAV calculation under fair value pricing may differ from published prices for the same securities. Investments in open-end mutual funds are valued at their closing net asset value each business day. Short-term securities with remaining maturities of sixty days or less for which quotations are not readily available are valued at amortized cost, which approximates value.
Investment Transactions and Income. For financial reporting purposes, the Funds' investment holdings and NAV include trades executed through the end of the last business day of the period. The NAV for processing shareholder transactions includes trades executed through the end of the prior business day. Gains and losses on securities sold are determined on the basis of identified cost. Interest income is accrued as earned. Interest income includes coupon interest and amortization of premium and accretion of discount on debt securities.
Annual Report
Notes to Financial Statements - continued
(Amounts in thousands except ratios)
2. Significant Accounting Policies - continued
Expenses. Most expenses of the trust can be directly attributed to a fund. Expenses which cannot be directly attributed are apportioned among each Fund in the trust. Expense estimates are accrued in the period to which they relate and adjustments are made when actual amounts are known.
Deferred Trustee Compensation. Under a Deferred Compensation Plan (the Plan) for Fidelity Ginnie Mae Fund, Independent Trustees must defer receipt of a portion of, and may elect to defer receipt of an additional portion of, their annual compensation. Deferred amounts are invested in a cross-section of Fidelity funds, are marked-to-market and remain in the Fund until distributed in accordance with the Plan. The investment of deferred amounts and the offsetting payable to the Trustees are included in the accompanying Statement of Assets and Liabilities.
Income Tax Information and Distributions to Shareholders. Each year, each Fund intends to qualify as a regulated investment company by distributing all of its taxable income and realized gains under Subchapter M of the Internal Revenue Code. As a result, no provision for income taxes is required in the accompanying financial statements.
Dividends are declared daily and paid monthly from net investment income. Distributions from realized gains, if any, are recorded on the ex-dividend date. Income and capital gain distributions are determined in accordance with income tax regulations, which may differ from generally accepted accounting principles.
Capital accounts within the financial statements are adjusted for permanent book-tax differences. These adjustments have no impact on net assets or the results of operations. Temporary book-tax differences will reverse in a subsequent period.
Book-tax differences are primarily due to swap agreements, prior period premium and discount on debt securities, market discount, deferred trustees compensation, financing transactions, capital loss carryforwards, losses deferred due to wash sales and excise tax regulations.
The tax-basis components of distributable earnings and the federal tax cost as of period end were as follows for each Fund:
| Cost for Federal Income Tax
Purposes | Unrealized
Appreciation | Unrealized
Depreciation | Net Unrealized
Appreciation/
(Depreciation) |
Ginnie Mae Fund | $ 3,858,765 | $ 12,577 | $ (86,857) | $ (74,280) |
Intermediate Government Income Fund | 969,583 | 4,006 | (3,487) | 519 |
Annual Report
2. Significant Accounting Policies - continued
Income Tax Information and Distributions to Shareholders - continued
| Undistributed
Ordinary
Income | Undistributed
Long-term
Capital Gain | Capital Loss Carryforward |
Ginnie Mae Fund | $ 2,996 | $ - | $ (55,811) |
Intermediate Government Income Fund | 1,082 | - | (40,571) |
The tax character of distributions paid was as follows:
July 31, 2007 | Ordinary
Income | Long-term
Capital Gains | Total |
Ginnie Mae Fund | $ 164,399 | $ - | $ 164,399 |
Intermediate Government Income Fund | 32,742 | - | 32,742 |
July 31, 2006 | Ordinary
Income | Long-term
Capital Gains | Total |
Ginnie Mae Fund | $ 186,731 | $ 7,297 | $ 194,028 |
Intermediate Government Income Fund | 31,447 | - | 31,447 |
New Accounting Pronouncements. In July 2006, Financial Accounting Standards Board Interpretation No. 48, Accounting for Uncertainty in Income Taxes - an interpretation of FASB Statement 109 (FIN 48), was issued and is effective on the last business day of the semiannual reporting period for fiscal years beginning after December 15, 2006. FIN 48 sets forth a threshold for financial statement recognition, measurement and disclosure of a tax position taken or expected to be taken on a tax return. Management has concluded that the adoption of FIN 48 will not result in a material impact on the Funds' net assets, results of operations and financial statement disclosures.
In addition, in September 2006, Statement of Financial Accounting Standards No. 157, Fair Value Measurements (SFAS 157), was issued and is effective for fiscal years beginning after November 15, 2007. SFAS 157 defines fair value, establishes a framework for measuring fair value and expands disclosures about fair value measurements. Management is currently evaluating the impact the adoption of SFAS 157 will have on the Funds' financial statement disclosures.
3. Operating Policies.
Repurchase Agreements. Fidelity Management & Research Company (FMR) has received an Exemptive Order from the Securities and Exchange Commission (the SEC) which permits certain Funds and other affiliated entities of FMR to transfer uninvested cash balances into joint trading accounts which are then invested in repurchase agreements. Certain Funds may also invest directly with institutions in repurchase agreements. Repurchase agreements are collateralized by government or non-government
Annual Report
Notes to Financial Statements - continued
(Amounts in thousands except ratios)
3. Operating Policies - continued
Repurchase Agreements - continued
securities. Upon settlement date, collateral is held in segregated accounts with custodian banks and may be obtained in the event of a default of the counterparty. Each applicable Fund monitors, on a daily basis, the value of the collateral to ensure it is at least equal to the principal amount of the repurchase agreement (including accrued interest). In the event of a default by the counterparty, realization of the collateral proceeds could be delayed, during which time the value of the collateral may decline.
Delayed Delivery Transactions and When-Issued Securities. Certain Funds may purchase or sell securities on a delayed delivery or when-issued basis. Payment and delivery may take place after the customary settlement period for that security. The price of the underlying securities and the date when the securities will be delivered and paid for are fixed at the time the transaction is negotiated. During the time a delayed delivery sell is outstanding, the contract is marked-to-market daily and equivalent deliverable securities are held for the transaction. The value of the securities purchased on a delayed delivery or when-issued basis are identified as such in each applicable Fund's Schedule of Investments. Certain Funds may receive compensation for interest forgone in the purchase of a delayed delivery or when-issued security. With respect to purchase commitments, each applicable Fund identifies securities as segregated in its records with a value at least equal to the amount of the commitment. The payables and receivables associated with the purchases and sales of delayed delivery securities having the same coupon, settlement date and broker are offset. Delayed delivery or when-issued securities that have been purchased from and sold to different brokers are reflected as both payables and receivables in each applicable fund's Statement of Assets and Liabilities under the caption "Delayed delivery." Losses may arise due to changes in the value of the underlying securities or if the counterparty does not perform under the contract's terms, or if the issuer does not issue the securities due to political, economic, or other factors.
Restricted Securities. Certain Funds may invest in securities that are subject to legal or contractual restrictions on resale. These securities generally may be resold in transactions exempt from registration or to the public if the securities are registered. Disposal of these securities may involve time-consuming negotiations and expense, and prompt sale at an acceptable price may be difficult. Information regarding restricted securities is included at the end of each applicable Fund's Schedule of Investments.
Swap Agreements. Certain Funds may invest in swaps for the purpose of managing their exposure to interest rate, credit or market risk.
Annual Report
3. Operating Policies - continued
Swap Agreements - continued
Interest rate swaps are agreements to exchange cash flows periodically based on a notional principal amount, for example, the exchange of fixed rate interest payments for floating rate interest payments. Periodic payments received or made by each applicable Fund are recorded in the accompanying Statement of Operations as realized gains or losses, respectively. The primary risk associated with interest rate swaps is that unfavorable changes in the fluctuation of interest rates could adversely impact a fund.
Swaps are marked-to-market daily based on dealer-supplied valuations and changes in value are recorded as unrealized appreciation (depreciation). Gains or losses are realized upon early termination of the swap agreement. Collateral, in the form of cash or securities, may be required to be held in segregated accounts with a fund's custodian in compliance with swap contracts. Risks may exceed amounts recognized on each applicable Fund's Statement of Assets and Liabilities. These risks include changes in the returns of the underlying instruments, failure of the counterparties to perform under the contracts' terms and the possible lack of liquidity with respect to the swap agreements. Details of swap agreements open at period end are included in each applicable Fund's Schedule of Investments under the caption "Swap Agreements."
Mortgage Dollar Rolls. To earn additional income, certain Funds may employ trading strategies which involve the sale and simultaneous agreement to repurchase similar securities ("mortgage dollar rolls") or the purchase and simultaneous agreement to sell similar securities ("reverse mortgage dollar rolls"). The securities traded are mortgage securities and bear the same interest rate but may be collateralized by different pools of mortgages. During the period between the sale and repurchase in a mortgage dollar roll transaction, a fund will not be entitled to receive interest and principal payments on the securities sold but will invest the proceeds of the sale in other securities which may enhance the yield and total return. In addition, the difference between the sale price and the future purchase price is recorded as an adjustment to investment income. During the period between the purchase and subsequent sale in a reverse mortgage dollar roll transaction a fund is entitled to interest and principal payments on the securities purchased. The price differential between the purchase and sale is recorded as an adjustment to investment income. Losses may arise due to changes in the value of the securities or if the counterparty does not perform under the terms of the agreement. If the counterparty files for bankruptcy or becomes insolvent, a fund's right to repurchase or sell securities may be limited.
Annual Report
Notes to Financial Statements - continued
(Amounts in thousands except ratios)
4. Fees and Other Transactions with Affiliates.
Management Fee. FMR and its affiliates provide the Funds with investment management related services for which the Funds pay a monthly management fee. The management fee is the sum of an individual fund fee rate and a group fee rate. The individual fund fee rate is applied to each Fund's average net assets. The group fee rate is based upon the average net assets of all the mutual funds advised by FMR. The group fee rate decreases as assets under management increase and increases as assets under management decrease. For the period, each Fund's annual management fee rate expressed as a percentage of each Fund's average net assets was as follows:
| Individual Rate | Group Rate | Total |
Ginnie Mae Fund | .20% | .12% | .32% |
Intermediate Government Income Fund | .20% | .12% | .32% |
Transfer Agent Fees. Fidelity Service Company, Inc. (FSC), an affiliate of FMR, is the Funds' transfer, dividend disbursing and shareholder servicing agent. FSC receives an asset-based fee of .10% of each Fund's average net assets. FSC pays for typesetting, printing and mailing of shareholder reports, except proxy statements.
Fundwide Operations Fee. Pursuant to the Fundwide Operations and Expense Agreement (FWOE), FMR has agreed to provide for fund level expenses (which do not include transfer agent, the compensation of the independent trustees, interest (including commitment fees), taxes or extraordinary expenses, if any) in return for a FWOE fee equal to .35% less the total amount of the management fee. The FWOE paid by the Fund is reduced by an amount equal to the fees and expenses paid to the independent trustees. For the period, the FWOE fees were equivalent to the following annual rates expressed as a percentage of average net assets:
Ginnie Mae Fund | .03% |
Intermediate Government Income Fund | .03% |
5. Committed Line of Credit.
Certain Funds participate with other funds managed by FMR in a $4.2 billion credit facility (the "line of credit") to be utilized for temporary or emergency purposes to fund shareholder redemptions or for other short-term liquidity purposes. The participating funds have agreed to pay commitment fees on their pro rata portion of the line of credit, which is reflected in Miscellaneous Expense on the Statement of Operations, and is as follows:
Ginnie Mae Fund | 6 |
Intermediate Government Income Fund | 1 |
During the period, there were no borrowings on this line of credit.
Annual Report
6. Security Lending.
Certain Funds lend portfolio securities from time to time in order to earn additional income. On the settlement date of the loan, each applicable Fund receives collateral (in the form of U.S. Treasury obligations, letters of credit and/or cash) against the loaned securities and maintains collateral in an amount not less than 100% of the market value of the loaned securities during the period of the loan. The market value of the loaned securities is determined at the close of business of the Funds and any additional required collateral is delivered to the Funds on the next business day. If the borrower defaults on its obligation to return the securities loaned because of insolvency or other reasons, a fund could experience delays and costs in recovering the securities loaned or in gaining access to the collateral. Any cash collateral received is invested in cash equivalents. The value of loaned securities and cash collateral at period end are disclosed on each applicable Fund's Statement of Assets and Liabilities. Security lending income represents the income earned on investing cash collateral, less fees and expenses associated with the loan, plus any premium payments that may be received on the loan of certain types of securities. Security lending income is presented on each applicable Fund's Statement of Operations as a component of interest income. Net income from lending portfolio securities during the period amounted to:
Intermediate Government Income Fund | $ 197 | |
7. Expense Reductions.
Through arrangements with each applicable Fund's custodian and transfer agent, credits realized as a result of uninvested cash balances were used to reduce each applicable Fund's expenses. All of the applicable expense reductions are noted in the table below.
| Management Fee
expense
reduction | Transfer
Agent
expense
reduction |
| | |
Ginnie Mae Fund | $ 2 | $ 61 |
Intermediate Government Income Fund | 2 | 19 |
8. Other.
The Funds' organizational documents provide former and current trustees and officers with a limited indemnification against liabilities arising in connection with the performance of their duties to the Funds. In the normal course of business, the Funds may also enter into contracts that provide general indemnifications. The Funds' maximum exposure under these arrangements is unknown as this would be dependent on future claims that may be made against the Funds. The risk of material loss from such claims is considered remote.
Annual Report
Report of Independent Registered Public Accounting Firm
To the Trustees of Fidelity Income Fund and the Shareholders of Fidelity Ginnie Mae Fund and Fidelity Intermediate Government Income Fund:
In our opinion, the accompanying statements of assets and liabilities, including the schedules of investments, and the related statements of operations and of changes in net assets and the financial highlights present fairly, in all material respects, the financial position of Fidelity Ginnie Mae Fund and Fidelity Intermediate Government Income Fund (funds of Fidelity Income Fund) at July 31, 2007, the results of each of their operations for the year then ended, the changes in each of their net assets for each of the two years in the period then ended and the financial highlights for each of the five years in the period then ended, in conformity with accounting principles generally accepted in the United States of America. These financial statements and financial highlights (hereafter referred to as "financial statements") are the responsibility of the Fidelity Income Fund's management. Our responsibility is to express an opinion on these financial statements based on our audits. We conducted our audits of these financial statements in accordance with the standards of the Public Company Accounting Oversight Board (United States). Those standards require that we plan and perform the audit to obtain reasonable assurance about whether the financial statements are free of material misstatement. An audit includes examining, on a test basis, evidence supporting the amounts and disclosures in the financial statements, assessing the accounting principles used and significant estimates made by management, and evaluating the overall financial statement presentation. We believe that our audits, which included confirmation of securities at July 31, 2007 by correspondence with the custodian and brokers, provide a reasonable basis for our opinion.
/s/ PricewaterhouseCoopers LLP
PricewaterhouseCoopers LLP
Boston, Massachusetts
September 21, 2007
Annual Report
Trustees and Officers
The Trustees, Members of the Advisory Board, and executive officers of the trust and funds, as applicable, are listed below. The Board of Trustees governs each fund and is responsible for protecting the interests of shareholders. The Trustees are experienced executives who meet periodically throughout the year to oversee each fund's activities, review contractual arrangements with companies that provide services to each fund, and review each fund's performance. Except for James C. Curvey, each of the Trustees oversees 353 funds advised by FMR or an affiliate. Mr. Curvey oversees 317 funds advised by FMR or an affiliate.
The Trustees hold office without limit in time except that (a) any Trustee may resign; (b) any Trustee may be removed by written instrument, signed by at least two-thirds of the number of Trustees prior to such removal; (c) any Trustee who requests to be retired or who has become incapacitated by illness or injury may be retired by written instrument signed by a majority of the other Trustees; and (d) any Trustee may be removed at any special meeting of shareholders by a two-thirds vote of the outstanding voting securities of the trust. Each Trustee who is not an interested person (as defined in the 1940 Act) (Independent Trustee), shall retire not later than the last day of the calendar year in which his or her 72nd birthday occurs. The Independent Trustees may waive this mandatory retirement age policy with respect to individual Trustees. The executive officers and Advisory Board Members hold office without limit in time, except that any officer and Advisory Board Member may resign or may be removed by a vote of a majority of the Trustees at any regular meeting or any special meeting of the Trustees. Except as indicated, each individual has held the office shown or other offices in the same company for the past five years.
The fund's Statement of Additional Information (SAI) includes more information about the Trustees. To request a free copy, call Fidelity at 1-800-544-8544.
Interested Trustees*:
Correspondence intended for each Trustee who is an interested person may be sent to Fidelity Investments, 82 Devonshire Street, Boston, Massachusetts 02109.
Name, Age; Principal Occupation |
Edward C. Johnson 3d (77) |
| Year of Election or Appointment:1984 Mr. Johnson is Chairman of the Board of Trustees. Mr. Johnson serves as President (2006-present), Chief Executive Officer, Chairman, and a Director of FMR Corp.; Chairman and a Director of FMR; Chairman and a Director of Fidelity Research & Analysis Company (FRAC); Chairman and a Director of Fidelity Investments Money Management, Inc.; and Chairman (2001-present) and a Director of FMR Co., Inc. In addition, Mr. Johnson serves as Chairman and Director of Fidelity International Limited (FIL). |
James C. Curvey (72) |
| Year of Election or Appointment: 2007 Mr. Curvey also serves as Trustee (2007-present) or Member of the Advisory Board (2007-present) of other investment companies advised by FMR. Mr. Curvey is Vice Chairman (2006-present) and Director of FMR Corp. Mr. Curvey joined Fidelity in 1982 and served in numerous senior management positions, including President and Chief Operating Officer of FMR Corp. (1997-2000) and President of Fidelity Strategic Investments (2000-2002). In addition, he serves as a member of the Board of Directors of Geerlings & Wade, Inc. (wine distribution). |
* Trustees have been determined to be "Interested Trustees" by virtue of, among other things, their affiliation with the trusts or various entities under common control with FMR.
Independent Trustees:
Correspondence intended for each Independent Trustee (that is, the Trustees other than the Interested Trustees) may be sent to Fidelity Investments, P.O. Box 55235, Boston, Massachusetts 02205-5235.
Name, Age; Principal Occupation |
Dennis J. Dirks (59) |
| Year of Election or Appointment: 2005 Prior to his retirement in May 2003, Mr. Dirks was Chief Operating Officer and a member of the Board of The Depository Trust & Clearing Corporation (DTCC) (1999-2003). He also served as President, Chief Operating Officer, and Board member of The Depository Trust Company (DTC) (1999-2003) and President and Board member of the National Securities Clearing Corporation (NSCC) (1999-2003). In addition, Mr. Dirks served as Chief Executive Officer and Board member of the Government Securities Clearing Corporation (2001-2003) and Chief Executive Officer and Board member of the Mortgage-Backed Securities Clearing Corporation (2001-2003). Mr. Dirks also serves as a Trustee and a member of the Finance Committee of Manhattan College (2005-present) and a Trustee and a member of the Finance Committee of AHRC of Nassau County (2006-present). |
Albert R. Gamper, Jr. (65) |
| Year of Election or Appointment: 2006 Prior to his retirement in December 2004, Mr. Gamper served as Chairman of the Board of CIT Group Inc. (commercial finance). During his tenure with CIT Group Inc. Mr. Gamper served in numerous senior management positions, including Chairman (1987-1989; 1999-2001; 2002-2004), Chief Executive Officer (1987-2004), and President (1989-2002). He currently serves as a member of the Board of Directors of Public Service Enterprise Group (utilities, 2001-present), Chairman of the Board of Governors, Rutgers University (2004-present), and Chairman of the Board of Saint Barnabas Health Care System. |
George H. Heilmeier (71) |
| Year of Election or Appointment: 2004 Dr. Heilmeier is Chairman Emeritus of Telcordia Technologies (communication software and systems), where prior to his retirement, he served as company Chairman and Chief Executive Officer. He currently serves on the Boards of Directors of The Mitre Corporation (systems engineering and information technology support for the government), and HRL Laboratories (private research and development, 2004-present). He is Chairman of the General Motors Science & Technology Advisory Board and a Life Fellow of the Institute of Electrical and Electronics Engineers (IEEE). Dr. Heilmeier is a member of the Defense Science Board and the National Security Agency Advisory Board. He is also a member of the National Academy of Engineering, the American Academy of Arts and Sciences, and the Board of Overseers of the School of Engineering and Applied Science of the University of Pennsylvania. Previously, Dr. Heilmeier served as a Director of TRW Inc. (automotive, space, defense, and information technology, 1992-2002), Compaq (1994-2002), Automatic Data Processing, Inc. (ADP) (technology-based business outsourcing, 1995-2002), INET Technologies Inc. (telecommunications network surveillance, 2001-2004), and Teletech Holdings (customer management services). He is the recipient of the 2005 Kyoto Prize in Advanced Technology for his invention of the liquid crystal display, and a member of the Consumer Electronics Hall of Fame. |
James H. Keyes (66) |
| Year of Election or Appointment: 2007 Prior to his retirement in 2003, Mr. Keyes was Chairman, President, and Chief Executive Officer of Johnson Controls, Inc. (automotive supplier, 1993-2003). He currently serves as a member of the boards of LSI Logic Corporation (semiconductor technologies), Navistar International Corporation (manufacture and sale of trucks, buses, and diesel engines, 2002-present), and Pitney Bowes, Inc. (integrated mail, messaging, and document management solutions). |
Marie L. Knowles (60) |
| Year of Election or Appointment: 2001 Prior to Ms. Knowles' retirement in June 2000, she served as Executive Vice President and Chief Financial Officer of Atlantic Richfield Company (ARCO) (diversified energy, 1996-2000). From 1993 to 1996, she was a Senior Vice President of ARCO and President of ARCO Transportation Company. She served as a Director of ARCO from 1996 to 1998. She currently serves as a Director of Phelps Dodge Corporation (copper mining and manufacturing) and McKesson Corporation (healthcare service, 2002-present). Ms. Knowles is a Trustee of the Brookings Institution and the Catalina Island Conservancy and also serves as a member of the Advisory Board for the School of Engineering of the University of Southern California. |
Ned C. Lautenbach (63) |
| Year of Election or Appointment: 2000 Mr. Lautenbach is Chairman of the Independent Trustees (2006-present). Mr. Lautenbach has been a partner of Clayton, Dubilier & Rice, Inc. (private equity investment firm) since September 1998. Previously, Mr. Lautenbach was with the International Business Machines Corporation (IBM) from 1968 until his retirement in 1998. Mr. Lautenbach serves as a Director of Sony Corporation (2006-present) and Eaton Corporation (diversified industrial) as well as the Philharmonic Center for the Arts in Naples, Florida. He also is a member of the Board of Trustees of Fairfield University (2005-present), as well as a member of the Council on Foreign Relations. |
Cornelia M. Small (63) |
| Year of Election or Appointment: 2005 Ms. Small is a member (2000-present) and Chairperson (2002-present) of the Investment Committee, and a member (2002-present) of the Board of Trustees of Smith College. Previously, she served as Chief Investment Officer (1999-2000), Director of Global Equity Investments (1996-1999), and a member of the Board of Directors of Scudder, Stevens & Clark (1990-1997) and Scudder Kemper Investments (1997-1999). In addition, Ms. Small served as Co-Chair (2000-2003) of the Annual Fund for the Fletcher School of Law and Diplomacy. |
William S. Stavropoulos (68) |
| Year of Election or Appointment: 2001 Mr. Stavropoulos is Chairman Emeritus of the Board of Directors of The Dow Chemical Company. Since joining The Dow Chemical Company in 1967, Mr. Stavropoulos served in numerous senior management positions, including President (1993-2000; 2002-2003), CEO (1995-2000; 2002-2004), and Chairman of the Executive Committee (2000-2004). Currently, he is a Director of NCR Corporation (data warehousing and technology solutions), Chemical Financial Corporation, Maersk Inc. (industrial conglomerate, 2002-present), Tyco International, Inc. (multinational manufacturing and services, 2007-present), and a member of the Advisory Board for Metalmark Capital (private equity investment firm, 2005-present). He is a special advisor to Clayton, Dubilier & Rice, Inc., a private equity investment firm. He also serves as a member of the Board of Trustees of the American Enterprise Institute for Public Policy Research. In addition, Mr. Stavropoulos is a member of The Business Council, J.P. Morgan International Council and the University of Notre Dame Advisory Council for the College of Science. |
Kenneth L. Wolfe (68) |
| Year of Election or Appointment: 2005 Prior to his retirement in 2001, Mr. Wolfe was Chairman and Chief Executive Officer of Hershey Foods Corporation (1993-2001). He currently serves as a member of the boards of Adelphia Communications Corporation (2003-present), Bausch & Lomb, Inc., and Revlon Inc. (2004-present). |
Advisory Board Members and Executive Officers:
Correspondence intended for Mr. Mauriello may be sent to Fidelity Investments, P.O. Box 55235, Boston, Massachusetts 02205-5235. Correspondence intended for each executive officer and Mr. Lynch may be sent to Fidelity Investments, 82 Devonshire Street, Boston, Massachusetts 02109.
Name, Age; Principal Occupation |
Peter S. Lynch (63) |
| Year of Election or Appointment: 2003 Member of the Advisory Board of Fidelity Income Fund. Mr. Lynch is Vice Chairman and a Director of FMR, and Vice Chairman (2001-present) and a Director of FMR Co., Inc. Previously, Mr. Lynch served as a Trustee of the Fidelity funds (1990-2003). In addition, he serves as a Trustee of Boston College and as the Chairman of the Inner-City Scholarship Fund. |
Joseph Mauriello (62) |
| Year of Election or Appointment: 2007 Member of the Advisory Board of Fidelity Income Fund. Prior to his retirement in January 2006, Mr. Mauriello served in numerous senior management positions including Deputy Chairman and Chief Operating Officer (2004-2005), and Vice Chairman of Financial Services (2002-2004) of KPMG LLP US (professional services firm, 1965-2005). Mr. Mauriello currently serves as a member of the Board of Directors of XL Capital Ltd., (global insurance and re-insurance company, 2006-present) and of Arcadia Resources Inc., (health care services and products, 2007-present). He also served as a Director of the Hamilton Funds of the Bank of New York (2006-2007). |
Kimberley H. Monasterio (43) |
| Year of Election or Appointment: 2007 President and Treasurer of Ginnie Mae and Intermediate Government Income. Ms. Monasterio also serves as President and Treasurer of other Fidelity funds (2007-present) and is an employee of FMR (2004-present). Previously, Ms. Monasterio served as Deputy Treasurer of the Fidelity funds (2004-2006). Before joining Fidelity Investments, Ms. Monasterio served as Treasurer (2000-2004) and Chief Financial Officer (2002-2004) of the Franklin Templeton Funds and Senior Vice President of Franklin Templeton Services, LLC (2000-2004). |
Boyce I. Greer (51) |
| Year of Election or Appointment: 2006 Vice President of Ginnie Mae and Intermediate Government Income. Mr. Greer also serves as Vice President of certain Equity Funds (2005-present), certain Asset Allocation Funds (2005-present), Fixed-Income Funds (2006-present), and Money Market Funds (2006-present). Mr. Greer is also a Trustee of other investment companies advised by FMR (2003-present). He is an Executive Vice President of FMR (2005-present) and FMR Co., Inc. (2005-present), and Senior Vice President of Fidelity Investments Money Management, Inc. (2006-present). Previously, Mr. Greer served as a Director and Managing Director of Strategic Advisers, Inc. (2002-2005), and Executive Vice President (2000-2002) and Money Market Group Leader (1997-2002) of the Fidelity Investments Fixed Income Division. He also served as Vice President of Fidelity's Money Market Funds (1997-2002), Senior Vice President of FMR (1997-2002), and Vice President of FIMM (1998-2002). |
David L. Murphy (59) |
| Year of Election or Appointment: 2005 Vice President of Ginnie Mae and Intermediate Government Income. Mr. Murphy also serves as Vice President of Fidelity's Money Market Funds (2002-present), certain Asset Allocation Funds (2003-present), Fixed-Income Funds (2005-present), and Balanced Funds (2005-present). He serves as Senior Vice President (2000-present) and Head (2004-present) of the Fidelity Investments Fixed Income Division. Mr. Murphy is also a Senior Vice President of Fidelity Investments Money Management, Inc. (2003-present) and an Executive Vice President of FMR (2005-present). Previously, Mr. Murphy served as Money Market Group Leader (2002-2004), Bond Group Leader (2000-2002), and Vice President of Fidelity's Taxable Bond Funds (2000-2002) and Fidelity's Municipal Bond Funds (2001-2002). |
Thomas J. Silvia (46) |
| Year of Election or Appointment: 2005 Vice President of Ginnie Mae and Intermediate Government Income. Mr. Silvia also serves as Vice President of Fidelity's Fixed-Income Funds (2005-present), certain Balanced Funds (2005-present), certain Asset Allocation Funds (2005-present), and Senior Vice President and Bond Group Leader of the Fidelity Investments Fixed-Income Division (2005-present). Previously, Mr. Silvia served as Director of Fidelity's Taxable Bond portfolio managers (2002-2004) and a portfolio manager in the Bond Group (1997-2004). |
William Irving (43) |
| Year of Election or Appointment: 2004
Vice President of Ginnie Mae. Dr. Irving also serves as Vice President of other funds advised by FMR. Prior to assuming his current responsibilities, Dr. Irving worked as a quantitative analyst and portfolio manager. |
Brett Kozlowski (32) |
| Year of Election or Appointment: 2006
Vice President of Intermediate Government Income. Mr. Kozlowski also serves as Vice President of other funds advised by FMR. Prior to assuming his current responsibilities, Mr. Kozlowski worked as an analyst and a trader in the Fixed-Income Group. |
Eric D. Roiter (58) |
| Year of Election or Appointment: 1998 Secretary of Ginnie Mae and Intermediate Government Income. Mr. Roiter also serves as Secretary of other Fidelity funds; Vice President, General Counsel, and Secretary of FMR Co., Inc. (2001-present) and FMR; Assistant Secretary of Fidelity Management & Research (U.K.) Inc. (2001-present), Fidelity Research & Analysis Company (2001-present), and Fidelity Investments Money Management, Inc. (2001-present). Mr. Roiter is an Adjunct Member, Faculty of Law, at Boston College Law School (2003-present). Previously, Mr. Roiter served as Vice President and Secretary of Fidelity Distributors Corporation (FDC) (1998-2005). |
Scott C. Goebel (39) |
| Year of Election or Appointment: 2007 Assistant Secretary of Ginnie Mae and Intermediate Government Income. Mr. Goebel also serves as Assistant Secretary of other Fidelity funds (2007-present), Vice President and Secretary of FDC (2006-present), and is an employee of FMR. |
R. Stephen Ganis (41) |
| Year of Election or Appointment: 2006 Anti-Money Laundering (AML) officer of Ginnie Mae and Intermediate Government Income. Mr. Ganis also serves as AML officer of other Fidelity funds (2006-present) and FMR Corp. (2003-present). Before joining Fidelity Investments, Mr. Ganis practiced law at Goodwin Procter, LLP (2000-2002). |
Joseph B. Hollis (59) |
| Year of Election or Appointment: 2006 Chief Financial Officer of Ginnie Mae and Intermediate Government Income. Mr. Hollis also serves as Chief Financial Officer of other Fidelity funds. Mr. Hollis is President of Fidelity Pricing and Cash Management Services (FPCMS) (2005-present). Mr. Hollis also serves as President and Director of Fidelity Service Company, Inc. (2006-present). Previously, Mr. Hollis served as Senior Vice President of Cash Management Services (1999-2002) and Investment Management Operations (2002-2005). |
Kenneth A. Rathgeber (60) |
| Year of Election or Appointment: 2004 Chief Compliance Officer of Ginnie Mae and Intermediate Government Income. Mr. Rathgeber also serves as Chief Compliance Officer of other Fidelity funds (2004-present) and Executive Vice President of Risk Oversight for Fidelity Investments (2002-present). He is Chief Compliance Officer of FMR (2005-present), FMR Co., Inc. (2005-present), Fidelity Management & Research (U.K.) Inc. (2005-present), Fidelity Research & Analysis Company (2005-present), Fidelity Investments Money Management, Inc. (2005-present), and Strategic Advisers, Inc. (2005-present). Previously, Mr. Rathgeber served as Executive Vice President and Chief Operating Officer for Fidelity Investments Institutional Services Company, Inc. (1998-2002). |
Bryan A. Mehrmann (46) |
| Year of Election or Appointment: 2005 Deputy Treasurer of Ginnie Mae and Intermediate Government Income. Mr. Mehrmann also serves as Deputy Treasurer of other Fidelity funds (2005-present) and is an employee of FMR. Previously, Mr. Mehrmann served as Vice President of Fidelity Investments Institutional Services Group (FIIS)/Fidelity Investments Institutional Operations Corporation, Inc. (FIIOC) Client Services (1998-2004). |
Kenneth B. Robins (37) |
| Year of Election or Appointment: 2005 Deputy Treasurer of Ginnie Mae and Intermediate Government Income. Mr. Robins also serves as Deputy Treasurer of other Fidelity funds (2005-present) and is an employee of FMR (2004-present). Before joining Fidelity Investments, Mr. Robins worked at KPMG LLP, where he was a partner in KPMG's department of professional practice (2002-2004) and a Senior Manager (1999-2000). In addition, Mr. Robins served as Assistant Chief Accountant, United States Securities and Exchange Commission (2000-2002). |
Robert G. Byrnes (40) |
| Year of Election or Appointment: 2005 Assistant Treasurer of Ginnie Mae and Intermediate Government Income. Mr. Byrnes also serves as Assistant Treasurer of other Fidelity funds (2005-present) and is an employee of FMR (2005-present). Previously, Mr. Byrnes served as Vice President of FPCMS (2003-2005). Before joining Fidelity Investments, Mr. Byrnes worked at Deutsche Asset Management where he served as Vice President of the Investment Operations Group (2000-2003). |
Peter L. Lydecker (53) |
| Year of Election or Appointment: 2004 Assistant Treasurer of Ginnie Mae and Intermediate Government Income. Mr. Lydecker also serves as Assistant Treasurer of other Fidelity funds (2004) and is an employee of FMR. |
Gary W. Ryan (48) |
| Year of Election or Appointment: 2005 Assistant Treasurer of Ginnie Mae and Intermediate Government Income. Mr. Ryan also serves as Assistant Treasurer of other Fidelity funds (2005-present) and is an employee of FMR (2005-present). Previously, Mr. Ryan served as Vice President of Fund Reporting in FPCMS (1999-2005). |
Annual Report
Distributions
A percentage of the dividends distributed during the fiscal year for the following funds was derived from interest on U.S. Government securities which is generally exempt from state income tax:
Intermediate Government Income | 24.83% |
The funds hereby designates the amounts noted below as distributions paid during the period January 1, 2007 to July 31, 2007, as qualifying to be taxed as interest-related dividends for nonresident alien shareholders:
Fund | |
Ginnie Mae | $95,971,830 |
Intermediate Government Income | $21,223,374 |
The fund will notify shareholders in January 2008 of amounts for use in preparing 2007 income tax returns.
Annual Report
Board Approval of Investment Advisory Contracts and Management Fees
Fidelity Ginnie Mae Fund / Fidelity Intermediate Government Income Fund
Each year, typically in June, the Board of Trustees, including the Independent Trustees (together, the Board), votes on the renewal of the management contract and sub-advisory agreements (together, the Advisory Contracts) for each fund. The Board, assisted by the advice of fund counsel and Independent Trustees' counsel, requests and considers a broad range of information throughout the year.
The Board meets regularly each month except August and takes into account throughout the year matters bearing on Advisory Contracts. The Board, acting directly and through its separate committees, considers at each of its meetings factors that are relevant to the annual renewal of each fund's Advisory Contracts, including the services and support provided to each fund and its shareholders. At the time of the renewal, the Board had 12 standing committees, each composed of Independent Trustees with varying backgrounds, to which the Board has assigned specific subject matter responsibilities in order to enhance effective decision-making by the Board. Each committee has adopted a written charter outlining the structure and purposes of the committee. One such committee, the Fixed-Income Contract Committee, meets periodically as needed throughout the year to consider matters specifically related to the annual renewal of Advisory Contracts. The committee requests and receives information on, and makes recommendations to the Independent Trustees concerning, the approval and annual review of the Advisory Contracts.
At its June 2007 meeting, the Board of Trustees, including the Independent Trustees, unanimously determined to renew the Advisory Contracts for each fund. In reaching its determination, the Board considered all factors it believed relevant, including (i) the nature, extent, and quality of the services to be provided to each fund and its shareholders (including the investment performance of each fund); (ii) the competitiveness of the management fee and total expenses of each fund; (iii) the total costs of the services to be provided by and the profits to be realized by the investment adviser and its affiliates from the relationship with each fund; (iv) the extent to which economies of scale would be realized as each fund grows; and (v) whether fee levels reflect these economies of scale, if any, for the benefit of fund shareholders. The Board also approved amendments to each fund's agreements with foreign sub-advisers to clarify that each sub-adviser provides services as an independent contractor.
In determining whether to renew the Advisory Contracts for each fund, the Board ultimately reached a determination, with the assistance of fund counsel and Independent Trustees' counsel, that the renewal of the Advisory Contracts and the compensation to be received by Fidelity under the management contracts is consistent with Fidelity's fiduciary duty under applicable law. In addition to evaluating the specific factors noted above, the Board, in reaching its determination, is aware that shareholders in each fund have a broad range of investment choices available to them, including a wide choice among mutual funds offered by competitors to Fidelity, and that each fund's shareholders, with the opportunity to review and weigh the disclosure provided by the fund in its prospectus and other public disclosures, have chosen to invest in that fund, managed by Fidelity.
Annual Report
Nature, Extent, and Quality of Services Provided. The Board considered staffing within the investment adviser, FMR, and the sub-advisers (together, the Investment Advisers), including the backgrounds of the funds' portfolio managers and the funds' investment objectives and disciplines. The Independent Trustees also had discussions with senior management of Fidelity's investment operations and investment groups. The Board considered the structure of the portfolio manager compensation program and whether this structure provides appropriate incentives.
Resources Dedicated to Investment Management and Support Services. The Board reviewed the size, education, and experience of the Investment Advisers' investment staff, their use of technology, and the Investment Advisers' approach to recruiting, training, and retaining portfolio managers and other research, advisory, and management personnel. The Board considered Fidelity's extensive global research capabilities that enable the Investment Advisers to aggregate data from various sources in an effort to produce positive investment results. The Board noted that Fidelity's analysts have access to a variety of technological tools that enable them to perform both fundamental and quantitative analysis and to specialize in various disciplines. The Board also considered that Fidelity's portfolio managers and analysts have access to daily portfolio attribution that allows for monitoring of a fund's portfolio, as well as an electronic communication system that provides immediate real-time access to research concerning issuers and credit enhancers. In addition, the Board considered the trading resources that are an integrated part of the fixed-income portfolio management investment process.
Shareholder and Administrative Services. The Board considered (i) the nature, extent, quality, and cost of advisory, administrative, distribution, and shareholder services performed by the Investment Advisers and their affiliates under the Advisory Contracts and under separate agreements covering transfer agency, pricing and bookkeeping, and securities lending services for each fund; (ii) the nature and extent of the Investment Advisers' supervision of third party service providers, principally custodians and subcustodians; and (iii) the resources devoted to, and the record of compliance with, each fund's compliance policies and procedures.
The Board noted that the growth of fund assets across the complex allows Fidelity to reinvest in the development of services designed to enhance the value or convenience of the Fidelity funds as investment vehicles. These services include 24-hour access to account information and market information through phone representatives and over the Internet, and investor education materials and asset allocation tools.
Annual Report
Board Approval of Investment Advisory Contracts and
Management Fees - continued
Investment in a Large Fund Family. The Board considered the benefits to shareholders of investing in a Fidelity fund, including the benefits of investing in a fund that is part of a large family of funds offering a variety of investment disciplines and providing for a large variety of mutual fund investor services. For example, fund shareholders are offered the privilege of exchanging shares of a fund for shares of other Fidelity funds, as set forth in the fund's prospectus, without paying a sales charge. The Board noted that, since the last Advisory Contract renewals in June 2006, Fidelity has taken a number of actions that benefited particular funds, including (i) dedicating additional resources to investment research and to restructure the investment research teams; (ii) contractually agreeing to reduce the management fee on Fidelity Advisor Floating Rate High Income Fund; (iii) contractually agreeing to reduce the management fees on Fidelity's California, Massachusetts, New Jersey, and New York AMT Tax-Free Money Market Funds, launching new Institutional Classes and Service Classes of these funds, and contractually agreeing to impose expense limitations on these funds; (iv) eliminating the exchange fee on the Fidelity Select Portfolios and reducing the pricing and bookkeeping fee rates for these funds; (v) reducing the maximum transfer agency fee rates on high income funds and certain equity funds; (vi) proposing amended management contracts that, if approved by shareholders, will add a performance adjustment component to the management fees paid by 18 Fidelity Advisor equity funds; (vii) contractually agreeing to reduce fees for Ultra-Short Central Fund and the money market Central Funds; (viii) waiving the Fidelity Advisor funds' contingent deferred sales charge on certain redemptions made through systematic withdrawal programs; and (ix) amending the management contracts for equity and fixed-income funds whose management contracts incorporate a "group fee" structure by adding four new fee "breakpoints" to the group fee rate schedules.
Investment Performance. The Board considered whether each fund has operated within its investment objective, as well as its record of compliance with its investment restrictions. It also reviewed each fund's absolute investment performance, as well as each fund's relative investment performance measured against (i) a broad-based securities market index, and (ii) a peer group of mutual funds deemed appropriate by the Board over multiple periods. For each fund, the following charts considered by the Board show, over the one-, three-, and five-year periods ended December 31, 2006, the fund's cumulative total returns, the cumulative total returns of a broad-based securities market index ("benchmark"), and a range of cumulative total returns of a peer group of mutual funds identified by Lipper Inc. as having an investment objective similar to that of the fund. The box within each chart shows the 25th percentile return (bottom of box) and the 75th percentile return (top of box) of the peer group. Returns shown above the box are in the first quartile and returns shown below the box are in the fourth quartile. The percentage beaten number noted below each chart corresponds to the percentile box and represents the percentage of funds in the peer group whose performance was equal to or lower than that of the fund.
Annual Report
Fidelity Ginnie Mae Fund
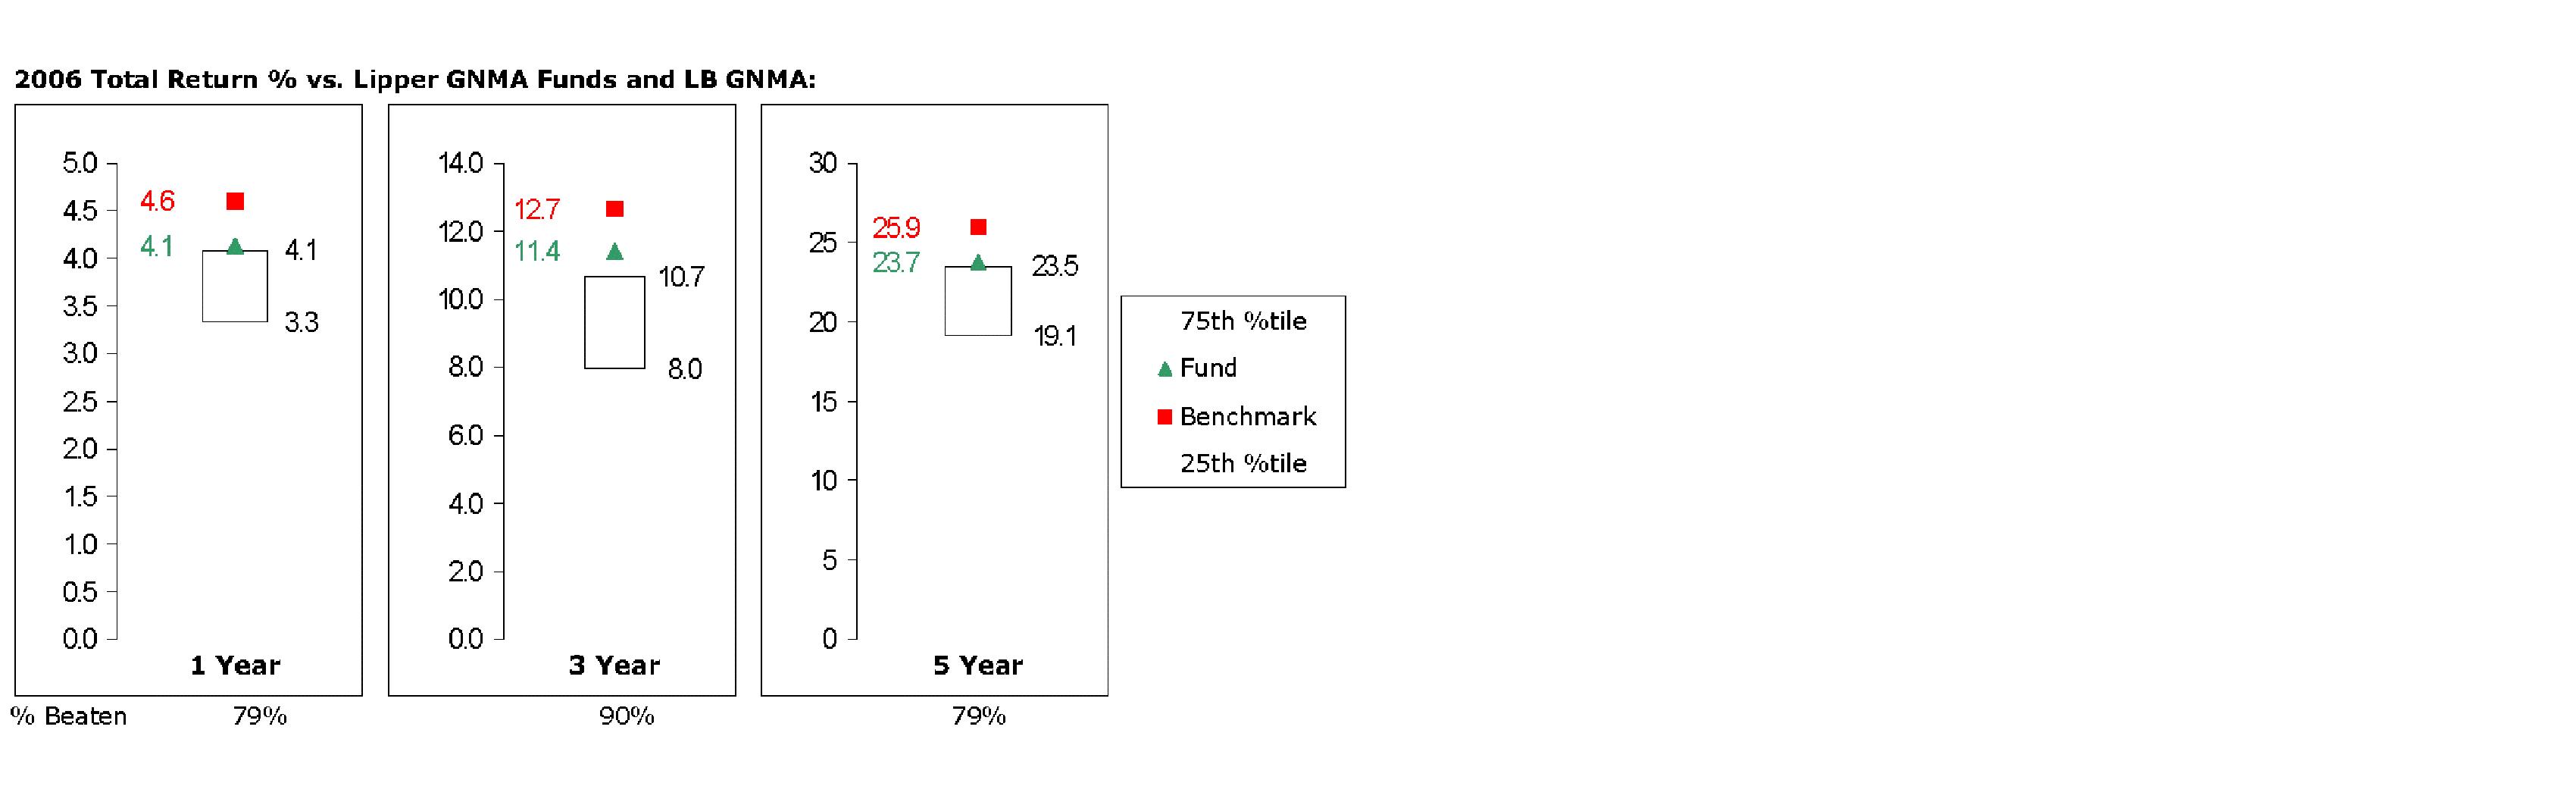
The Board reviewed the fund's relative investment performance against its peer group and stated that the performance of the fund was in the first quartile for all the periods shown. The Board also stated that the relative investment performance of the fund was lower than its benchmark for all the periods shown. The Board discussed with FMR actions to be taken by FMR to improve the fund's below-benchmark performance.
Fidelity Intermediate Government Income Fund
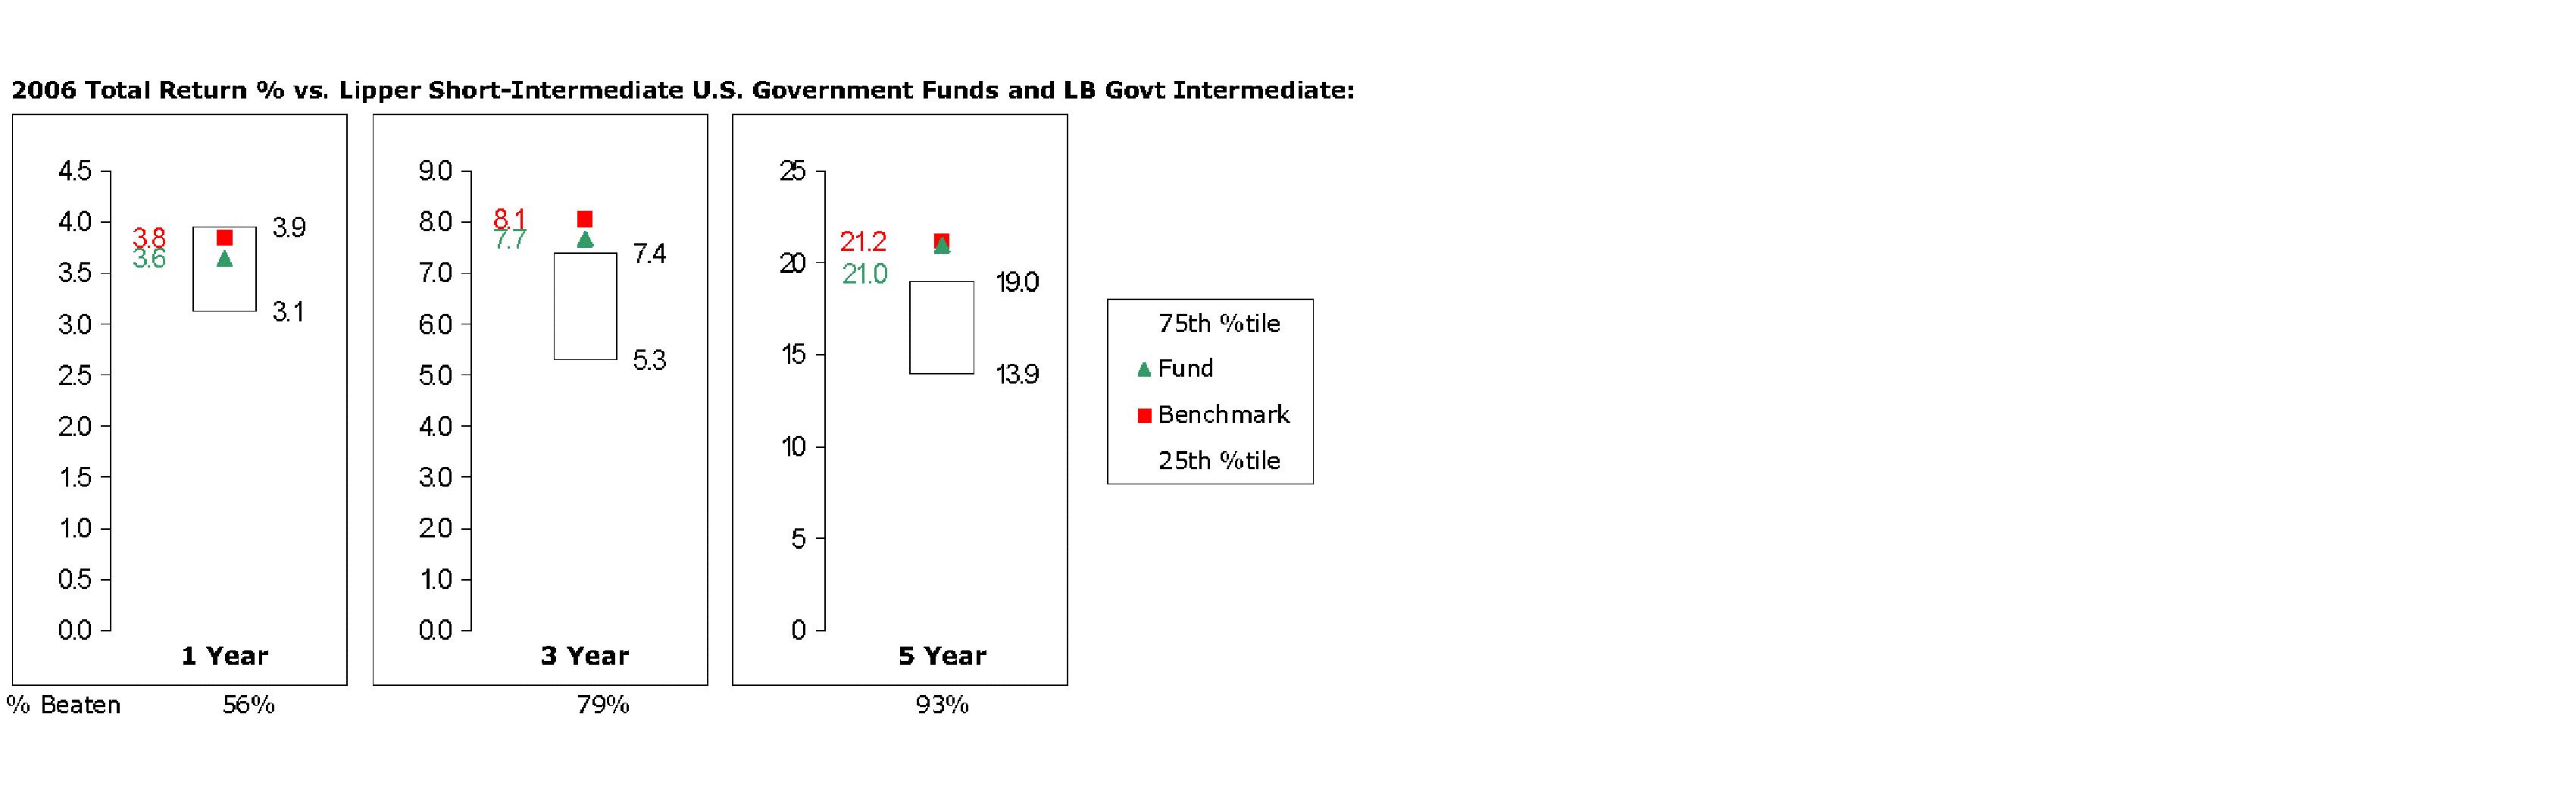
Annual Report
Board Approval of Investment Advisory Contracts and
Management Fees - continued
The Board reviewed the fund's relative investment performance against its peer group and stated that the performance of the fund was in the second quartile for the one-year period and the first quartile for the three- and five-year periods. The Board also stated that the relative investment performance of the fund was lower than its benchmark for all the periods shown.
Based on its review, and giving particular weight to the nature and quality of the resources dedicated by the Investment Advisers to maintain and improve relative performance, the Board concluded that the nature, extent, and quality of the services provided to each fund will benefit each fund's shareholders, particularly in light of the Board's view that each fund's shareholders benefit from investing in a fund that is part of a large family of funds offering a variety of investment disciplines and services.
Competitiveness of Management Fee and Total Fund Expenses. The Board considered each fund's management fee and total expenses compared to "mapped groups" of competitive funds and classes. Fidelity creates "mapped groups" by combining similar Lipper investment objective categories that have comparable management fee characteristics. Combining Lipper investment objective categories aids the Board's management fee and total expense comparisons by broadening the competitive group used for comparison and by reducing the number of universes to which various Fidelity funds are compared.
The Board considered two proprietary management fee comparisons for the 12-month periods shown in the charts below. The group of Lipper funds used by the Board for management fee comparisons is referred to below as the "Total Mapped Group" and, for the reasons explained above, is broader than the Lipper peer group used by the Board for performance comparisons. The Total Mapped Group comparison focuses on a fund's standing relative to the total universe of comparable funds available to investors, in terms of gross management fees before expense reimbursements or caps. "TMG %" represents the percentage of funds in the Total Mapped Group that had management fees that were lower than a fund's. For example, a TMG % of 8% means that 92% of the funds in the Total Mapped Group had higher management fees than a fund. The "Asset-Size Peer Group" (ASPG) comparison focuses on a fund's standing relative to non-Fidelity funds similar in size to the fund within the Total Mapped Group. The ASPG represents at least 15% of the funds in the Total Mapped Group with comparable asset size and management fee characteristics, subject to a minimum of 50 funds (or all funds in the Total Mapped Group if fewer than 50). Additional information, such as the ASPG quartile in which a fund's management fee ranked, is also included in the charts and considered by the Board.
Annual Report
Fidelity Ginnie Mae Fund
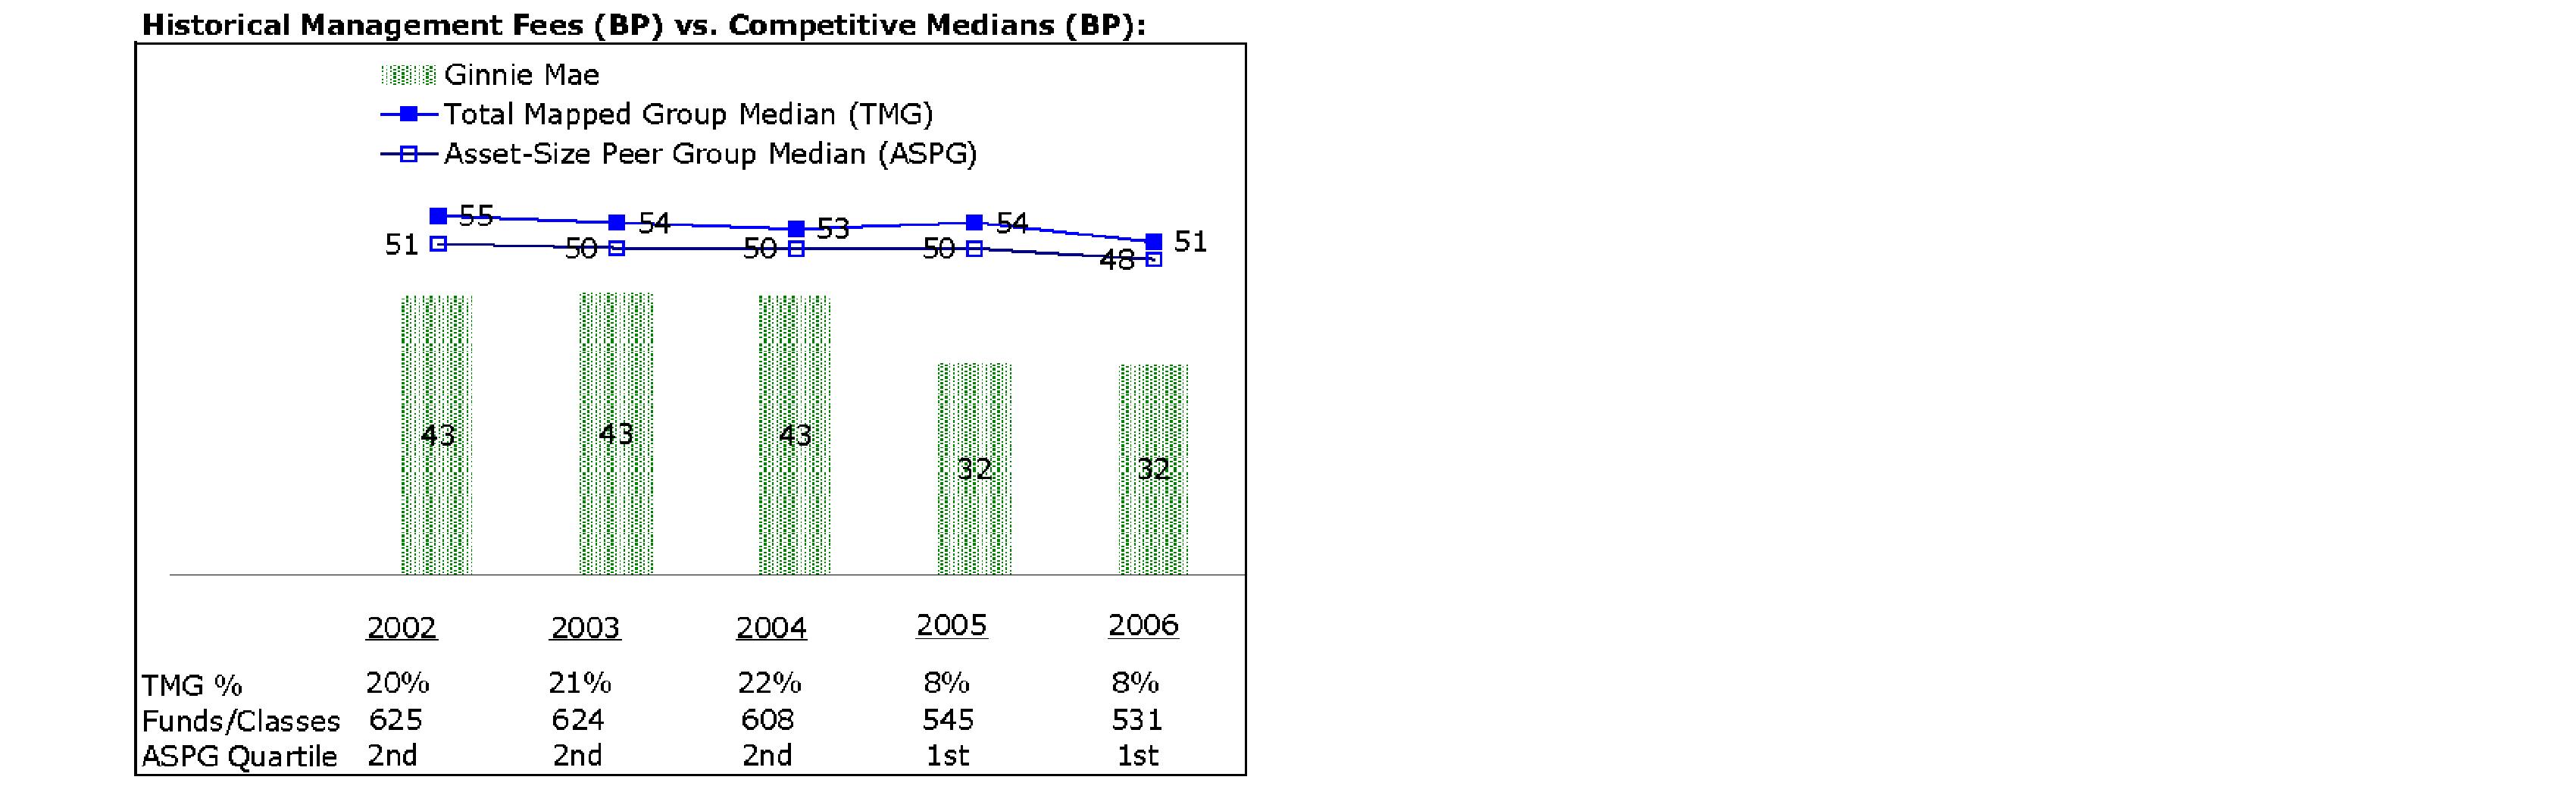
Fidelity Intermediate Government Income Fund
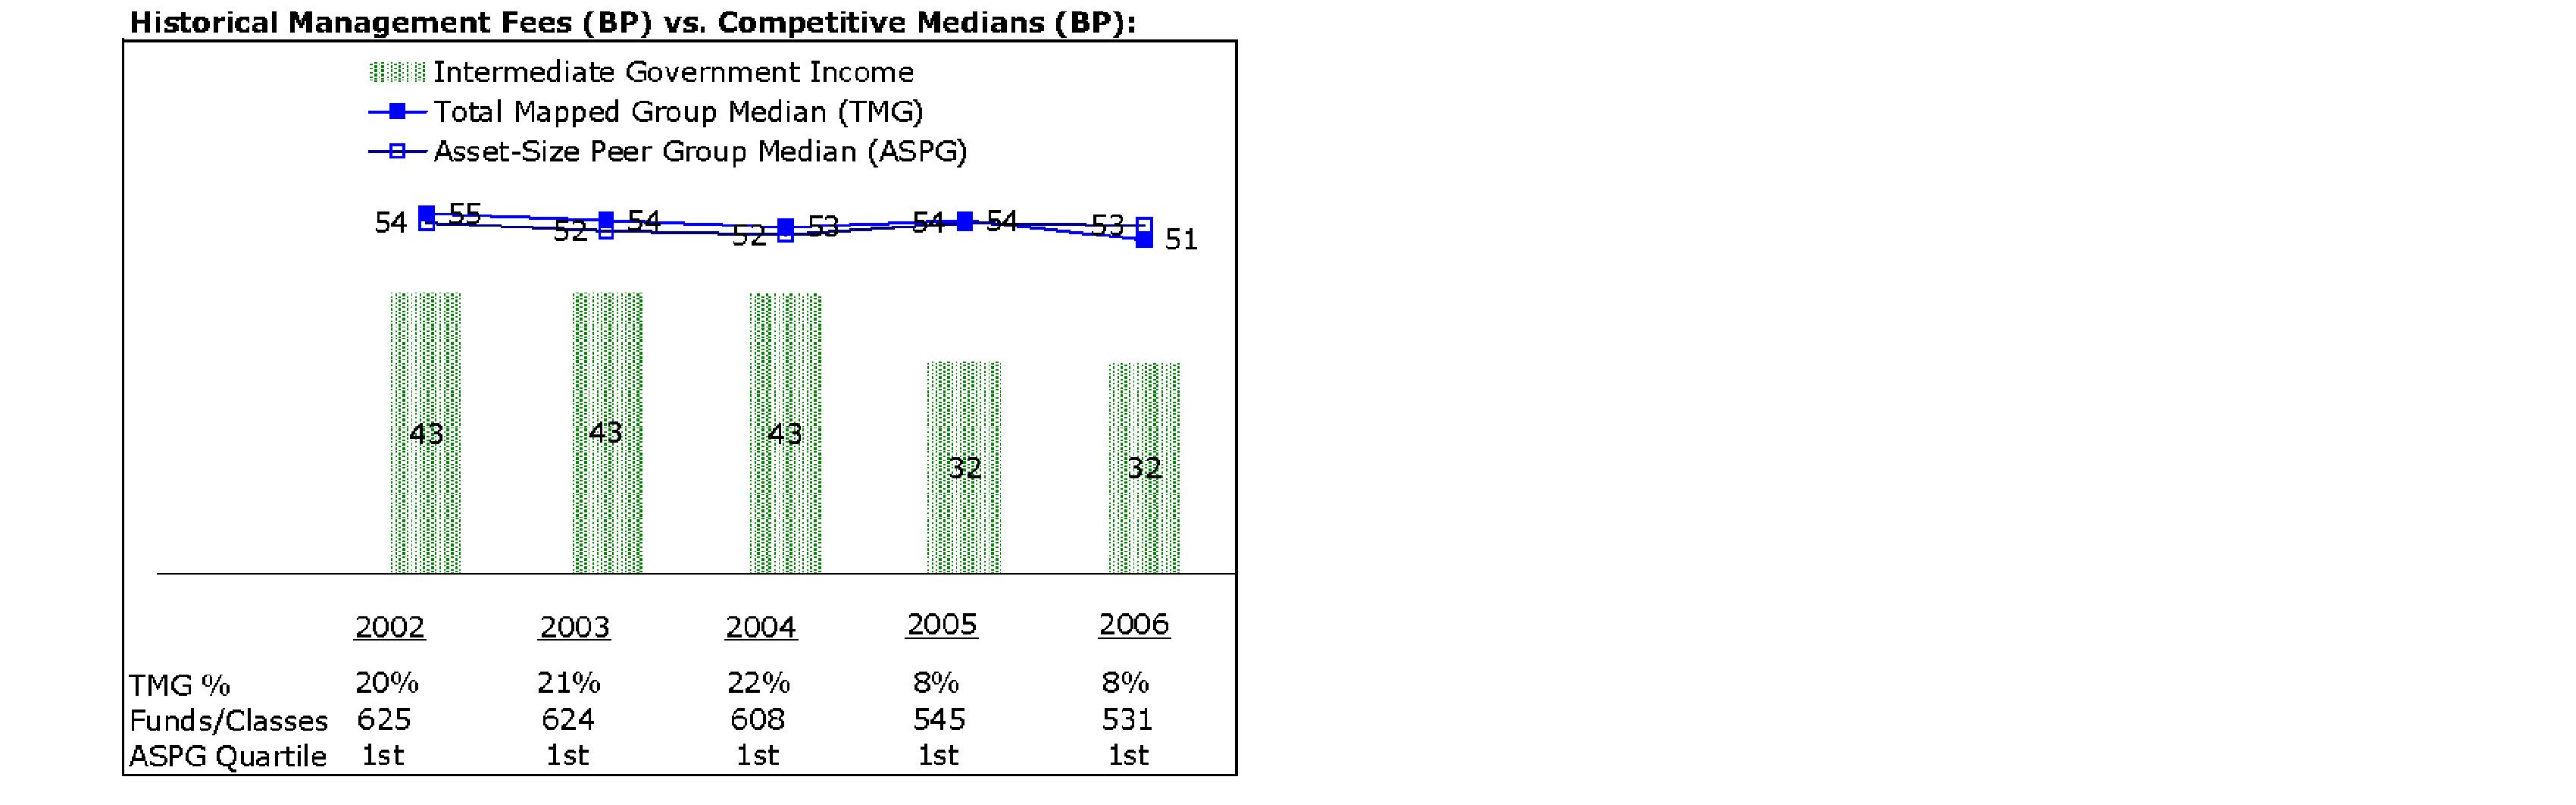
The Board noted that each fund's management fee ranked below the median of its Total Mapped Group and below the median of its ASPG for 2006.
Furthermore, the Board considered that it had approved an amendment (effective June 1, 2005) to each fund's management contract that lowered the fund's individual fund fee rate from 30 basis points to 20 basis points. The Board considered that each fund's chart reflects the fund's lower management fee for 2005, as if the lower rate were in effect for the entire year.
Annual Report
Board Approval of Investment Advisory Contracts and
Management Fees - continued
Based on its review, the Board concluded that each fund's management fee was fair and reasonable in light of the services that the fund receives and the other factors considered.
In its review of each fund's total expenses, the Board considered the fund's management fee as well as other fund expenses, such as transfer agent fees, pricing and bookkeeping fees, and custodial, legal, and audit fees. The Board also noted the effects of any waivers and reimbursements on fees and expenses. As part of its review, the Board also considered current and historical total expenses of each fund compared to competitive fund median expenses. Each fund is compared to those funds and classes in the Total Mapped Group (used by the Board for management fee comparisons) that have a similar sales load structure.
The Board also considered that the current contractual arrangements for each fund (i) have the effect of setting the total "fund-level" expenses (including, among certain other expenses, the management fee) at 35 basis points, (ii) lower and limit the "class-level" transfer agent fee to 10 basis points, and (iii) limit each fund's total expenses to 45 basis points. These contractual arrangements may not be increased without Board and shareholder approval.
The Board noted that each fund's total expenses ranked below its competitive median for 2006.
The Board recognized that each fund's management contract incorporates a "group fee" structure, which provides for lower group fee rates as total fund assets under FMR's management increase, and for higher group fee rates as total fund assets under FMR's management decrease. FMR determines the group fee rates based on a tiered asset "breakpoint" schedule. In connection with the renewal of each fund's management contract, the Board approved amendments to each fund's management contract that added four new fee breakpoints to the group fee rate schedule for assets under FMR's management above $1,386 billion. The Board considered that the group fee rate declines under both the present and amended schedules, but that under the amended schedule, the group fee rate declines faster as assets under FMR's management exceed $1,386 billion. The Board noted, however, that because the current contractual arrangements set the total fund-level expenses at 35 basis points, increases or decreases in the management fee due to changes in the group fee rate will not impact total expenses.
In its review of total expenses, the Board also considered Fidelity fee structures and other information on clients that FMR and its affiliates service in other competitive markets, such as other mutual funds advised or subadvised by FMR or its affiliates, pension plan clients, and other institutional clients.
Annual Report
Based on its review, the Board concluded that each fund's total expenses were reasonable in light of the services that the fund and its shareholders receive and the other factors considered.
Costs of the Services and Profitability. The Board considered the revenues earned and the expenses incurred by Fidelity in conducting the business of developing, marketing, distributing, managing, administering and servicing each fund and its shareholders. The Board also considered the level of Fidelity's profits in respect of all the Fidelity funds.
On an annual basis, FMR presents to the Board Fidelity's profitability for each fund. Fidelity calculates the profitability for each fund, as well as aggregate profitability for groups of Fidelity funds and all Fidelity funds, using a series of detailed revenue and cost allocation methodologies which originate with the audited books and records of Fidelity. The Audit Committee of the Board reviews any significant changes from the prior year's methodologies.
PricewaterhouseCoopers LLP (PwC), independent registered public accounting firm and auditor to Fidelity and certain Fidelity funds, has been engaged annually by the Board as part of the Board's assessment of the results of Fidelity's profitability analysis. PwC's engagement includes the review and assessment of Fidelity's methodologies used in determining the revenues and expenses attributable to Fidelity's mutual fund business, and completion of agreed-upon procedures surrounding the mathematical accuracy of fund profitability and its conformity to allocation methodologies. After considering PwC's reports issued under the engagement and information provided by Fidelity, the Board believes that while other allocation methods may also be reasonable, Fidelity's profitability methodologies are reasonable in all material respects.
The Board has also reviewed Fidelity's non-fund businesses and any fall-out benefits related to the mutual fund business as well as cases where Fidelity's affiliates may benefit from or be related to the funds' business.
The Board considered the costs of the services provided by and the profits realized by Fidelity in connection with the operation of each fund and determined that the amount of profit is a fair entrepreneurial profit for the management of each fund.
Economies of Scale. The Board considered whether there have been economies of scale in respect of the management of the Fidelity funds, whether the Fidelity funds (including each fund) have appropriately benefited from any such economies of scale, and whether there is potential for realization of any further economies of scale. The Board considered the extent to which each fund will benefit from economies of scale through increased services to the fund, through waivers or reimbursements, or through fee or expense reductions. The Board concluded that any potential economies of scale are being shared between fund shareholders and Fidelity in an appropriate manner.
Annual Report
Board Approval of Investment Advisory Contracts and
Management Fees - continued
Additional Information Requested by the Board. In order to develop fully the factual basis for consideration of the Fidelity funds' Advisory Contracts, the Board requested and received additional information on several topics, including (i) Fidelity's fund profitability methodology, profitability by investment discipline, and profitability trends within certain funds; (ii) Fidelity's compensation structure relative to competitors and its effect on profitability; (iii) funds and accounts managed by Fidelity other than the Fidelity funds, including fee arrangements; (iv) the total expenses of certain funds and classes relative to competitors; (v) fund performance trends; (vi) fall-out benefits received by certain Fidelity affiliates; and (vii) Fidelity's fee structures.
Based on its evaluation of all of the conclusions noted above, and after considering all material factors, the Board ultimately concluded that the advisory fee structures are fair and reasonable, and that each fund's Advisory Contracts should be renewed.
Annual Report
Managing Your Investments
Fidelity offers several ways to conveniently manage your personal investments via your telephone or PC. You can access your account information, conduct trades and research your investments 24 hours a day.
By Phone
Fidelity Automated Service Telephone provides a single toll-free number to access account balances, positions, quotes and trading. It's easy to navigate the service, and on your first call, the system will help you create a personal identification number (PIN) for security.
(phone_graphic)
Fidelity Automated
Service Telephone (FAST®)
1-800-544-5555
Press
1 For mutual fund and brokerage trading.
2 For quotes.*
3 For account balances and holdings.
4 To review orders and mutual
fund activity.
5 To change your PIN.
*0 To speak to a Fidelity representative.
By PC
Fidelity's web site on the Internet provides a wide range of information, including daily financial news, fund performance, interactive planning tools and news about Fidelity products and services.
(computer_graphic)
Fidelity's Web Site
www.fidelity.com
* When you call the quotes line, please remember that a fund's yield and return will vary and, except for money market funds, share price will also vary. This means that you may have a gain or loss when you sell your shares. There is no assurance that money market funds will be able to maintain a stable $1 share price; an investment in a money market fund is not insured or guaranteed by the U.S. government. Total returns are historical and include changes in share price, reinvestment of dividends and capital gains, and the effects of any sales charges.
Annual Report
To Visit Fidelity
For directions and hours,
please call 1-800-544-9797.
Arizona
7001 West Ray Road
Chandler, AZ
15445 N. Scottsdale Road
Scottsdale, AZ
California
815 East Birch Street
Brea, CA
1411 Chapin Avenue
Burlingame, CA
851 East Hamilton Avenue
Campbell, CA
19200 Von Karman Avenue
Irvine, CA
601 Larkspur Landing Circle
Larkspur, CA
10100 Santa Monica Blvd.
Los Angeles, CA
27101 Puerta Real
Mission Viejo, CA
73-575 El Paseo
Palm Desert, CA
251 University Avenue
Palo Alto, CA
123 South Lake Avenue
Pasadena, CA
16995 Bernardo Ctr. Drive
Rancho Bernardo, CA
1220 Roseville Parkway
Roseville, CA
1740 Arden Way
Sacramento, CA
7676 Hazard Center Drive
San Diego, CA
11943 El Camino Real
San Diego, CA
8 Montgomery Street
San Francisco, CA
3793 State Street
Santa Barbara, CA
1200 Wilshire Boulevard
Santa Monica, CA
21701 Hawthorne Boulevard
Torrance, CA
2001 North Main Street
Walnut Creek, CA
6300 Canoga Avenue
Woodland Hills, CA
Colorado
1625 Broadway
Denver, CO
9185 Westview Road
Lone Tree, CO
Connecticut
48 West Putnam Avenue
Greenwich, CT
265 Church Street
New Haven, CT
300 Atlantic Street
Stamford, CT
29 South Main Street
West Hartford, CT
Delaware
400 Delaware Avenue
Wilmington, DE
Florida
4400 N. Federal Highway
Boca Raton, FL
121 Alhambra Plaza
Coral Gables, FL
2948 N. Federal Highway
Ft. Lauderdale, FL
4671 Town Center Parkway
Jacksonville, FL
1907 West State Road 434
Longwood, FL
8880 Tamiami Trail, North
Naples, FL
3501 PGA Boulevard
Palm Beach Gardens, FL
3550 Tamiami Trail, South
Sarasota, FL
1502 N. Westshore Blvd.
Tampa, FL
2465 State Road 7
Wellington, FL
Georgia
3445 Peachtree Road, N.E.
Atlanta, GA
1000 Abernathy Road
Atlanta, GA
Illinois
One North LaSalle Street
Chicago, IL
875 North Michigan Ave.
Chicago, IL
1415 West 22nd Street
Oak Brook, IL
1572 East Golf Road
Schaumburg, IL
3232 Lake Avenue
Wilmette, IL
Indiana
4729 East 82nd Street
Indianapolis, IN
Kansas
5400 College Boulevard
Overland Park, KS
Maine
Three Canal Plaza
Portland, ME
Maryland
7315 Wisconsin Avenue
Bethesda, MD
One W. Pennsylvania Ave.
Towson, MD
Massachusetts
801 Boylston Street
Boston, MA
155 Congress Street
Boston, MA
300 Granite Street
Braintree, MA
44 Mall Road
Burlington, MA
238 Main Street
Cambridge, MA
405 Cochituate Road
Framingham, MA
416 Belmont Street
Worcester, MA
Annual Report
Michigan
500 E. Eisenhower Pkwy.
Ann Arbor, MI
280 Old N. Woodward Ave.
Birmingham, MI
43420 Grand River Avenue
Novi, MI
29155 Northwestern Hwy.
Southfield, MI
Minnesota
7600 France Avenue South
Edina, MN
Missouri
1524 South Lindbergh Blvd.
St. Louis, MO
Nevada
2225 Village Walk Drive
Henderson, NV
New Jersey
150 Essex Street
Millburn, NJ
56 South Street
Morristown, NJ
396 Route 17, North
Paramus, NJ
3518 Route 1 North
Princeton, NJ
530 Broad Street
Shrewsbury, NJ
New York
1055 Franklin Avenue
Garden City, NY
37 West Jericho Turnpike
Huntington Station, NY
1271 Avenue of the Americas
New York, NY
980 Madison Avenue
New York, NY
61 Broadway
New York, NY
350 Park Avenue
New York, NY
200 Fifth Avenue
New York, NY
733 Third Avenue
New York, NY
11 Penn Plaza
New York, NY
2070 Broadway
New York, NY
1075 Northern Blvd.
Roslyn, NY
799 Central Park Avenue
Scarsdale, NY
North Carolina
4611 Sharon Road
Charlotte, NC
7011 Fayetteville Road
Durham, NC
Ohio
3805 Edwards Road
Cincinnati, OH
1324 Polaris Parkway
Columbus, OH
28699 Chagrin Boulevard
Woodmere Village, OH
Oregon
7493 SW Bridgeport Road
Tigard, OR
Pennsylvania
600 West DeKalb Pike
King of Prussia, PA
1735 Market Street
Philadelphia, PA
12001 Perry Highway
Wexford, PA
Rhode Island
47 Providence Place
Providence, RI
Tennessee
6150 Poplar Avenue
Memphis, TN
Texas
10000 Research Boulevard
Austin, TX
4001 Northwest Parkway
Dallas, TX
12532 Memorial Drive
Houston, TX
2701 Drexel Drive
Houston, TX
6560 Fannin Street
Houston, TX
6500 N. MacArthur Blvd.
Irving, TX
6005 West Park Boulevard
Plano, TX
14100 San Pedro
San Antonio, TX
1576 East Southlake Blvd.
Southlake, TX
19740 IH 45 North
Spring, TX
Utah
279 West South Temple
Salt Lake City, UT
Virginia
1861 International Drive
McLean, VA
Washington
411 108th Avenue, N.E.
Bellevue, WA
1518 6th Avenue
Seattle, WA
Washington, DC
1900 K Street, N.W.
Washington, DC
Wisconsin
595 North Barker Road
Brookfield, WI
Fidelity Brokerage Services, Inc., 100 Summer St., Boston, MA 02110 Member NYSE/SIPC
Annual Report
Investment Adviser
Fidelity Management & Research Company
Boston, MA
Investment Sub-Advisers
Fidelity Research & Analysis Company
Fidelity Investments
Money Management, Inc.
Fidelity Investments Japan Limited
Fidelity International Investment Advisors
Fidelity International Investment Advisors
(U.K.) Limited
General Distributor
Fidelity Distributors Corporation
Boston, MA
Transfer and Service Agent
Fidelity Service Company, Inc.
Boston, MA
Custodian
The Bank of New York
New York, NY
The Fidelity Telephone Connection
Mutual Fund 24-Hour Service
Exchanges/Redemptions
and Account Assistance 1-800-544-6666
Product Information 1-800-544-6666
Retirement Accounts 1-800-544-4774
(8 a.m. - 9 p.m.)
TDD Service 1-800-544-0118
for the deaf and hearing impaired
(9 a.m. - 9 p.m. Eastern time)
Fidelity Automated Service
Telephone (FAST®) (automated graphic) 1-800-544-5555
(automated graphic) Automated line for quickest service
GMIG-UANN-0907
1.844592.100
(Fidelity Investment logo)(registered trademark)
Corporate Headquarters
82 Devonshire St., Boston, MA 02109
www.fidelity.com
Fidelity®
Government Income
Fund
Annual Report
July 31, 2007
(2_fidelity_logos) (Registered_Trademark)
Contents
Chairman's Message | <Click Here> | Ned Johnson's message to shareholders. |
Performance | <Click Here> | How the fund has done over time. |
Management's Discussion | <Click Here> | The manager's review of fund performance, strategy and outlook. |
Shareholder Expense Example | <Click Here> | An example of shareholder expenses. |
Investment Changes | <Click Here> | A summary of major shifts in the fund's investments over the past six months. |
Investments | <Click Here> | A complete list of the fund's investments with their market values. |
Financial Statements | <Click Here> | Statements of assets and liabilities, operations, and changes in net assets,
as well as financial highlights. |
Notes | <Click Here> | Notes to the financial statements. |
Report of Independent Registered Public Accounting Firm | <Click Here> | |
Trustees and Officers | <Click Here> | |
Distributions | <Click Here> | |
Board Approval of Investment Advisory Contracts and Management Fees | <Click Here> | |
| | |
To view a fund's proxy voting guidelines and proxy voting record for the 12-month period ended June 30, visit http://www.fidelity.com (search for "proxy voting guidelines") or visit the Securities and Exchange Commission's (SEC) web site at http://www.sec.gov. You may also call 1-800-544-8544 to request a free copy of the proxy voting guidelines.
Standard & Poor's, S&P and S&P 500 are registered service marks of The McGraw-Hill Companies, Inc. and have been licensed for use by Fidelity Distributors Corporation.
Other third party marks appearing herein are the property of their respective owners.
All other marks appearing herein are registered or unregistered trademarks or service marks of FMR Corp. or an affiliated company.
Annual Report
This report and the financial statements contained herein are submitted for the general information of the shareholders of the fund. This report is not authorized for distribution to prospective investors in the fund unless preceded or accompanied by an effective prospectus.
A fund files its complete schedule of portfolio holdings with the SEC for the first and third quarters of each fiscal year on Form N-Q. Forms N-Q are available on the SEC's web site at http://www.sec.gov. A fund's Forms N-Q may be reviewed and copied at the SEC's Public Reference Room in Washington, DC. Information regarding the operation of the SEC's Public Reference Room may be obtained by calling 1-800-SEC-0330. For a complete list of a fund's portfolio holdings, view the most recent holdings listing, semiannual report, or annual report on Fidelity's web site at http://www.fidelity.com or http://www.advisor.fidelity.com, as applicable.
NOT FDIC INSURED · MAY LOSE VALUE · NO BANK GUARANTEE
Neither the fund nor Fidelity Distributors Corporation is a bank.
Annual Report
Chairman's Message
(photo_of_Edward_C_Johnson_3d)
Dear Shareholder:
Stocks are currently on pace to register their fifth straight year of positive returns, although gains could be trimmed if the U.S. economy continues to slow. While financial markets are always unpredictable, there are a number of time-tested principles that can put the historical odds in your favor.
One of the basic tenets is to invest for the long term. Over time, riding out the markets' inevitable ups and downs has proven much more effective than selling into panic or chasing the hottest trend. Even missing only a few of the markets' best days can significantly diminish investor returns. Patience also affords the benefits of compounding - of earning interest on additional income or reinvested dividends and capital gains. There are tax advantages and cost benefits to consider as well. The more you sell, the more taxes you pay, and the more you trade, the higher the costs. While staying the course doesn't eliminate risk, it can considerably lessen the effect of short-term declines.
You can further manage your investing risk through diversification. And today, more than ever, geographic diversification should be taken into account. Studies indicate that asset allocation is the single most important determinant of a portfolio's long-term success. The right mix of stocks, bonds and cash - aligned to your particular risk tolerance and investment objective - is very important. Age-appropriate rebalancing is also an essential aspect of asset allocation. For younger investors, an emphasis on equities - which historically have been the best-performing asset class over time - is encouraged. As investors near their specific goal, such as retirement or sending a child to college, consideration may be given to replacing volatile assets (e.g. common stocks) with more-stable fixed investments (bonds or savings plans).
A third investment principle - investing regularly - can help lower the average cost of your purchases. Investing a certain amount of money each month or quarter helps ensure you won't pay for all your shares at market highs. This strategy - known as dollar cost averaging - also reduces unconstructive "emotion" from investing, helping shareholders avoid selling weak performers just prior to an upswing, or chasing a hot performer just before a correction.
We invite you to contact us via the Internet, through our Investor Centers or over the phone. It is our privilege to provide you the information you need to make the investments that are right for you.
Sincerely,
/s/Edward C. Johnson 3d
Edward C. Johnson 3d
Annual Report
Performance: The Bottom Line
Average annual total return reflects the change in the value of an investment, assuming reinvestment of Government Income's dividend income and capital gains (the profits earned upon the sale of securities that have grown in value) and assuming a constant rate of performance each year. The $10,000 table and the fund's returns do not reflect the deduction of taxes that a shareholder would pay on fund distributions or the redemption of fund shares. During periods of reimbursement by Fidelity, a fund's total return will be greater than it would be had the reimbursement not occurred. How a fund did yesterday is no guarantee of how it will do tomorrow.
Average Annual Total Returns
Periods ended July 31, 2007 | Past 1
year | Past 5
years | Past 10
years |
Government Income | 5.22% | 3.75% | 5.33% |
$10,000 Over 10 Years
Let's say hypothetically that $10,000 was invested in Government Income on July 31, 1997. The chart shows how the value of your investment would have changed, and also shows how the Lehman Brothers® U.S. Government Index performed over the same period.
Annual Report
Management's Discussion of Fund Performance
Comments from William Irving, Portfolio Manager of Fidelity® Government Income Fund
The investment-grade bond market posted a reasonably solid advance for the 12 months ending July 31, 2007. In that time, the Lehman Brothers® U.S. Aggregate Index - a performance gauge of taxable, high-quality debt - gained 5.58%. A sizable percentage of that increase came in the first four months of the period. The index returned a cumulative 4.30% from August through November, as investors responded favorably to the end of the Federal Reserve Board's two-year campaign of interest rate hikes. In fact, the central bank left rates unchanged through the entire 12-month period. Bonds turned negative in December and January, but had their best month of the past year in February, rising 1.54% as extreme volatility in the stock markets led to a flight to safety in high-quality debt. Performance was lackluster thereafter, however. Inflation concerns and dwindling hopes for a near-term Fed rate cut pressured bond prices for much of the remainder of the period, as did the meltdown of the subprime mortgage sector. Against that backdrop, the index gained only 0.32% over the final five months of the period.
For the 12 months ending July 31, 2007, Government Income returned 5.22%, while the Lehman Brothers 75% U.S. Government/25% U.S. Mortgage-Backed Securities Index gained 5.75%. The fund's performance relative to the index was helped by its yield-curve positioning, which refers to how we allocated investments across a range of bond maturities. In particular, our overweighting in better-performing intermediate bonds in the two- to five-year range and our underweighting in lagging 10- to 20-year bonds worked in our favor. In the mortgage sector, our overweighted position in hybrid adjustable-rate mortgages (ARMs) helped because they generally outpaced the fixed-rate mortgages that dominate the benchmark, due to strong demand from institutional investors, who recently bought the bonds prior to their inclusion in the Lehman Brothers U.S. Aggregate Index and the Lehman Brothers U.S. Mortgage-Backed Securities Index. On the flip side, sector selection generally worked against us. An out-of-index position in Treasury Inflation-Protected Securities hurt because they lagged the index. Elsewhere, the fund also suffered from its underweighting in plain-vanilla Treasury securities, which outpaced mortgage-backed securities, in which we were overweighted. Our slightly larger-than-index weighting in agency securities had little effect on the fund's relative performance, as they generally kept pace with the index.
The views expressed above reflect those of the portfolio manager(s) only through the end of the period as stated on the cover of this report and do not necessarily represent the views of Fidelity or any other person in the Fidelity organization. Any such views are subject to change at any time based upon market or other conditions and Fidelity disclaims any responsibility to update such views. These views may not be relied on as investment advice and, because investment decisions for a Fidelity fund are based on numerous factors, may not be relied on as an indication of trading intent on behalf of any Fidelity fund.
Annual Report
Shareholder Expense Example
As a shareholder of the Fund, you incur two types of costs: (1) transaction costs, including sales charges (loads) on purchase payments or redemption proceeds, and (2) ongoing costs, including management fees, distribution and/or service (12b-1) fees and other Fund expenses. This Example is intended to help you understand your ongoing costs (in dollars) of investing in the Fund and to compare these costs with the ongoing costs of investing in other mutual funds.
The Example is based on an investment of $1,000 invested at the beginning of the period and held for the entire period (February 1, 2007 to July 31, 2007).
Actual Expenses
The first line of the accompanying table for each class of the Fund provides information about actual account values and actual expenses. You may use the information in this line, together with the amount you invested, to estimate the expenses that you paid over the period. Simply divide your account value by $1,000.00 (for example, an $8,600 account value divided by $1,000.00 = 8.6), then multiply the result by the number in the first line for a class of the Fund under the heading entitled "Expenses Paid During Period" to estimate the expenses you paid on your account during this period. A small balance maintenance fee of $12.00 that is charged once a year may apply for certain accounts with a value of less than $2,000. This fee is not included in the table below. If it was, the estimate of expenses you paid during the period would be higher, and your ending account value lower, by this amount.
Hypothetical Example for Comparison Purposes
The second line of the accompanying table for each class of the Fund provides information about hypothetical account values and hypothetical expenses based on a Class' actual expense ratio and an assumed rate of return of 5% per year before expenses, which is not the Class' actual return. The hypothetical account values and expenses may not be used to estimate the actual ending account balance or expenses you paid for the period. You may use this information to compare the ongoing costs of investing in the Fund and other funds. To do so, compare this 5% hypothetical example with the 5% hypothetical examples that appear in the shareholder reports of the other funds. A small balance maintenance fee of $12.00 that is charged once a year may apply for certain accounts with a value of less than $2,000. This fee is not included in the table below. If it was, the estimate of expenses you paid during the period would be higher, and your ending account value lower, by this amount.
Please note that the expenses shown in the table are meant to highlight your ongoing costs only and do not reflect any transaction costs. Therefore, the second line of the table is useful in comparing ongoing costs only, and will not help you determine the relative total costs of owning different funds. In addition, if these transactional costs were included, your costs would have been higher.
Annual Report
Shareholder Expense Example - continued
| Beginning
Account Value
February 1, 2007 | Ending
Account Value
July 31, 2007 | Expenses Paid
During Period*
February 1, 2007
to July 31, 2007 |
Class A | | | |
Actual | $ 1,000.00 | $ 1,021.70 | $ 4.01 |
HypotheticalA | $ 1,000.00 | $ 1,020.83 | $ 4.01 |
Class T | | | |
Actual | $ 1,000.00 | $ 1,021.70 | $ 4.01 |
HypotheticalA | $ 1,000.00 | $ 1,020.83 | $ 4.01 |
Class B | | | |
Actual | $ 1,000.00 | $ 1,018.10 | $ 7.56 |
HypotheticalA | $ 1,000.00 | $ 1,017.31 | $ 7.55 |
Class C | | | |
Actual | $ 1,000.00 | $ 1,017.80 | $ 7.80 |
HypotheticalA | $ 1,000.00 | $ 1,017.06 | $ 7.80 |
Government Income | | | |
Actual | $ 1,000.00 | $ 1,023.50 | $ 2.26 |
HypotheticalA | $ 1,000.00 | $ 1,022.56 | $ 2.26 |
Institutional Class | | | |
Actual | $ 1,000.00 | $ 1,023.10 | $ 2.66 |
HypotheticalA | $ 1,000.00 | $ 1,022.17 | $ 2.66 |
A 5% return per year before expenses
* Expenses are equal to each Class' annualized expense ratio (shown in the table below); multiplied by the average account value over the period, multiplied by 181/365 (to reflect the one-half year period).
| Annualized
Expense Ratio |
Class A | .80% |
Class T | .80% |
Class B | 1.51% |
Class C | 1.56% |
Government Income | .45% |
Institutional Class | .53% |
Annual Report
Investment Changes
Coupon Distribution as of July 31, 2007 |
| % of fund's investments | % of fund's investments
6 months ago |
Less than 2% | 1.7 | 2.5 |
2 - 2.99% | 0.0 | 1.2 |
3 - 3.99% | 2.8 | 3.0 |
4 - 4.99% | 34.2 | 31.0 |
5 - 5.99% | 21.7 | 24.3 |
6 - 6.99% | 15.6 | 15.8 |
7% and over | 2.8 | 3.0 |
Coupon distribution shows the range of stated interest rates on the fund's investments, excluding short-term investments. |
Weighted Average Maturity as of July 31, 2007 |
| | 6 months ago |
Years | 4.9 | 4.9 |
The weighted average maturity is based on the dollar-weighted average length of time until principal payments are expected or until securities reach maturity, taking into account any maturity shortening feature such as a call, refunding or redemption provision. |
Duration as of July 31, 2007 |
| | 6 months ago |
Years | 4.7 | 4.1 |
Duration shows how much a bond fund's price fluctuates with changes in comparable interest rates. If rates rise 1%, for example, a fund with a five-year duration is likely to lose about 5% of its value. Other factors also can influence a bond fund's performance and share price. Accordingly, a bond fund's actual performance may differ from this example. |
Asset Allocation (% of fund's net assets) |
As of July 31, 2007* | As of January 31, 2007** |
 | Mortgage
Securities 32.0% | | | Mortgage
Securities 29.2% | |
 | CMOs and Other Mortgage Related Securities 7.9% | | | CMOs and Other Mortgage Related Securities 11.4% | |
 | U.S. Treasury
Obligations 34.7% | | | U.S. Treasury
Obligations 29.8% | |
 | U.S. Government
Agency Obligations 27.5% | | | U.S. Government
Agency Obligations 32.1% | |
 | Asset-Backed
Securities 0.5% | | | Asset-Backed
Securities 0.7% | |
 | Short-Term
Investments and
Net Other Assets(dagger) (2.6)% | | | Short-Term
Investments and
Net Other Assets(dagger) (3.2)% | |
* Futures and Swaps | 4.4% | | ** Futures and Swaps | 0.3% | |

(dagger) Short-Term Investments and Net Other Assets are not included in the pie chart. |
Annual Report
Investments July 31, 2007
Showing Percentage of Net Assets
U.S. Government and Government Agency Obligations - 62.2% |
| Principal Amount (000s) | | Value
(000s) |
U.S. Government Agency Obligations - 27.5% |
Fannie Mae: | | | |
3.25% 8/15/08 | $ 4,812 | | $ 4,725 |
3.25% 2/15/09 (b) | 143,050 | | 139,526 |
4.25% 5/15/09 | 11,235 | | 11,108 |
4.5% 10/15/08 | 81,560 | | 81,101 |
4.75% 12/15/10 | 233,801 | | 231,870 |
4.875% 4/15/09 | 43,350 | | 43,305 |
5.125% 9/2/08 | 78,770 | | 78,833 |
5.125% 4/15/11 | 187,000 | | 187,460 |
5.375% 6/12/17 | 124,591 | | 124,477 |
6.375% 6/15/09 | 55,710 | | 57,121 |
6.625% 9/15/09 | 36,820 | | 38,047 |
7.25% 1/15/10 | 25,086 | | 26,393 |
Federal Home Loan Bank: | | | |
4.5% 10/14/08 | 56,475 | | 56,140 |
5.375% 8/19/11 | 35,350 | | 35,724 |
5.8% 9/2/08 | 26,570 | | 26,779 |
Freddie Mac: | | | |
3.875% 6/15/08 | 2,791 | | 2,761 |
4.75% 3/5/09 | 113,806 | | 113,487 |
4.75% 3/5/12 | 10,000 | | 9,851 |
5% 1/30/14 | 25,000 | | 24,700 |
5.125% 4/18/11 | 31,220 | | 31,266 |
5.25% 7/18/11 | 29,000 | | 29,129 |
5.5% 8/23/17 | 100,000 | | 100,832 |
5.625% 3/15/11 | 48,555 | | 49,446 |
5.75% 1/15/12 | 1,686 | | 1,727 |
6.625% 9/15/09 | 155,000 | | 160,166 |
Israeli State (guaranteed by U.S. Government through Agency for International Development): | | | |
5.5% 9/18/23 | 110,500 | | 111,982 |
6.6% 2/15/08 | 20,957 | | 20,995 |
6.8% 2/15/12 | 30,000 | | 31,268 |
Overseas Private Investment Corp. U.S. Government guaranteed participation certificates: | | | |
6.77% 11/15/13 | 6,650 | | 6,716 |
6.99% 5/21/16 | 21,433 | | 22,966 |
Private Export Funding Corp.: | | | |
secured: | | | |
5.66% 9/15/11 (c) | 18,000 | | 18,332 |
5.685% 5/15/12 | 24,035 | | 24,581 |
6.67% 9/15/09 | 3,500 | | 3,624 |
U.S. Government and Government Agency Obligations - continued |
| Principal Amount (000s) | | Value
(000s) |
U.S. Government Agency Obligations - continued |
Private Export Funding Corp.: - continued | | | |
4.974% 8/15/13 | $ 22,940 | | $ 22,775 |
Small Business Administration guaranteed development participation certificates: | | | |
Series 2002-20J Class 1, 4.75% 10/1/22 | 6,759 | | 6,559 |
Series 2002-20K Class 1, 5.08% 11/1/22 | 14,321 | | 14,131 |
Series 2003 P10B, 5.136% 8/10/13 | 11,281 | | 11,165 |
Series 2004-20H Class 1, 5.17% 8/1/24 | 4,033 | | 3,981 |
Tennessee Valley Authority 5.375% 4/1/56 | 8,429 | | 8,064 |
U.S. Department of Housing and Urban Development Government guaranteed participation certificates Series 1999-A, 5.96% 8/1/09 | 18,380 | | 18,434 |
TOTAL U.S. GOVERNMENT AGENCY OBLIGATIONS | | 1,991,547 |
U.S. Treasury Obligations - 34.7% |
U.S. Treasury Bonds: | | | |
6.125% 8/15/29 (b) | 293,102 | | 337,365 |
6.25% 8/15/23 | 1,500 | | 1,701 |
8% 11/15/21 | 146,794 | | 191,406 |
U.S. Treasury Notes: | | | |
4.25% 8/15/13 (b) | 20,010 | | 19,605 |
4.25% 11/15/13 | 37,610 | | 36,778 |
4.25% 8/15/14 (b)(f) | 161,550 | | 157,070 |
4.25% 11/15/14 (b) | 77,185 | | 74,954 |
4.25% 8/15/15 (b) | 84,500 | | 81,608 |
4.375% 12/15/10 | 5,230 | | 5,201 |
4.5% 4/30/09 (b) | 100,000 | | 99,813 |
4.5% 4/30/12 | 86,000 | | 85,604 |
4.5% 11/15/15 (b) | 111,800 | | 109,739 |
4.5% 5/15/17 (b) | 72,000 | | 70,464 |
4.625% 11/15/09 | 81,000 | | 81,095 |
4.625% 10/31/11 | 11,000 | | 11,015 |
4.625% 2/29/12 | 4,500 | | 4,505 |
4.625% 11/15/16 (b) | 224,000 | | 221,270 |
4.75% 1/31/12 (b) | 188,250 | | 189,485 |
4.75% 5/31/12 | 35,000 | | 35,213 |
4.75% 5/15/14 (b) | 167,723 | | 168,221 |
4.875% 10/31/08 (b) | 180,000 | | 180,281 |
4.875% 5/15/09 (b) | 113,432 | | 113,964 |
4.875% 6/30/09 | 128,000 | | 128,690 |
U.S. Government and Government Agency Obligations - continued |
| Principal Amount (000s) | | Value
(000s) |
U.S. Treasury Obligations - continued |
U.S. Treasury Notes: - continued | | | |
4.875% 5/31/11 | $ 20,740 | | $ 20,951 |
4.875% 6/30/12 (b) | 61,471 | | 62,182 |
5.125% 6/30/11 | 23,214 | | 23,666 |
TOTAL U.S. TREASURY OBLIGATIONS | | 2,511,846 |
TOTAL U.S. GOVERNMENT AND GOVERNMENT AGENCY OBLIGATIONS (Cost $4,494,382) | 4,503,393 |
U.S. Government Agency - Mortgage Securities - 32.0% |
|
Fannie Mae - 26.4% |
3.729% 10/1/33 (g) | 704 | | 695 |
3.75% 1/1/34 (g) | 657 | | 648 |
3.75% 4/1/34 (g) | 11,938 | | 11,739 |
3.757% 10/1/33 (g) | 720 | | 717 |
3.802% 6/1/33 (g) | 549 | | 551 |
3.825% 4/1/33 (g) | 1,988 | | 1,996 |
3.847% 10/1/33 (g) | 30,880 | | 30,833 |
3.877% 6/1/33 (g) | 2,681 | | 2,690 |
3.902% 5/1/34 (g) | 6,663 | | 6,565 |
3.91% 5/1/33 (g) | 4,715 | | 4,742 |
3.913% 9/1/33 (g) | 11,186 | | 11,086 |
3.944% 5/1/34 (g) | 5,281 | | 5,200 |
3.947% 5/1/33 (g) | 230 | | 229 |
3.967% 9/1/33 (g) | 9,140 | | 9,031 |
3.998% 4/1/34 (g) | 10,531 | | 10,379 |
3.999% 10/1/18 (g) | 508 | | 502 |
4% 9/1/13 to 6/1/20 | 27,020 | | 25,401 |
4.013% 4/1/33 (g) | 187 | | 188 |
4.033% 6/1/34 (g) | 9,627 | | 9,485 |
4.063% 3/1/35 (g) | 17,948 | | 17,760 |
4.076% 2/1/35 (g) | 372 | | 373 |
4.114% 5/1/33 (g) | 8,396 | | 8,412 |
4.166% 1/1/35 (g) | 1,571 | | 1,544 |
4.187% 11/1/34 (g) | 12,876 | | 12,913 |
4.205% 6/1/34 (g) | 10,741 | | 10,600 |
4.249% 1/1/34 (g) | 2,105 | | 2,084 |
4.25% 2/1/35 (g) | 767 | | 755 |
U.S. Government Agency - Mortgage Securities - continued |
| Principal Amount (000s) | | Value
(000s) |
Fannie Mae - continued |
4.264% 5/1/35 (g) | $ 773 | | $ 774 |
4.28% 10/1/33 (g) | 332 | | 330 |
4.282% 3/1/33 (g) | 831 | | 835 |
4.283% 6/1/34 (g) | 11,653 | | 11,534 |
4.294% 8/1/33 (g) | 1,342 | | 1,344 |
4.295% 3/1/35 (g) | 656 | | 660 |
4.3% 3/1/33 (g) | 276 | | 272 |
4.302% 6/1/33 (g) | 430 | | 433 |
4.304% 3/1/33 (g) | 370 | | 364 |
4.321% 4/1/35 (g) | 381 | | 382 |
4.343% 1/1/35 (g) | 832 | | 820 |
4.355% 10/1/19 (g) | 1,207 | | 1,192 |
4.36% 2/1/34 (g) | 1,313 | | 1,301 |
4.386% 10/1/34 (g) | 4,044 | | 3,996 |
4.396% 2/1/35 (g) | 1,047 | | 1,031 |
4.411% 7/1/35 (g) | 19,301 | | 19,009 |
4.419% 5/1/35 (g) | 2,123 | | 2,117 |
4.429% 5/1/35 (g) | 616 | | 617 |
4.432% 3/1/35 (g) | 1,101 | | 1,085 |
4.445% 8/1/34 (g) | 2,165 | | 2,148 |
4.481% 1/1/35 (g) | 5,530 | | 5,460 |
4.484% 11/1/33 (g) | 1,650 | | 1,638 |
4.494% 12/1/34 (g) | 458 | | 452 |
4.5% 2/1/18 to 4/1/20 | 16,046 | | 15,376 |
4.503% 2/1/35 (g) | 635 | | 639 |
4.504% 2/1/35 (g) | 333 | | 336 |
4.512% 1/1/35 (g) | 876 | | 867 |
4.519% 2/1/35 (g) | 11,901 | | 11,819 |
4.524% 7/1/35 (g) | 2,513 | | 2,504 |
4.53% 10/1/35 (g) | 416 | | 415 |
4.554% 9/1/34 (g) | 19,342 | | 19,158 |
4.57% 7/1/35 (g) | 3,098 | | 3,108 |
4.575% 2/1/35 (g) | 3,589 | | 3,548 |
4.614% 7/1/34 (g) | 26,137 | | 26,045 |
4.651% 10/1/34 (g) | 3,356 | | 3,327 |
4.653% 3/1/35 (g) | 614 | | 619 |
4.702% 10/1/34 (g) | 2,776 | | 2,755 |
4.719% 7/1/34 (g) | 1,970 | | 1,957 |
4.723% 3/1/35 (g) | 253 | | 255 |
4.733% 12/1/35 (g) | 64,285 | | 63,872 |
4.772% 1/1/35 (g) | 4,800 | | 4,761 |
4.779% 12/1/35 (g) | 4,486 | | 4,465 |
U.S. Government Agency - Mortgage Securities - continued |
| Principal Amount (000s) | | Value
(000s) |
Fannie Mae - continued |
4.781% 12/1/34 (g) | $ 686 | | $ 681 |
4.794% 4/1/35 (g) | 12,356 | | 12,330 |
4.8% 7/1/35 (g) | 4,715 | | 4,669 |
4.801% 11/1/34 (g) | 2,315 | | 2,299 |
4.803% 6/1/35 (g) | 3,587 | | 3,597 |
4.803% 11/1/35 (g) | 10,309 | | 10,315 |
4.808% 2/1/33 (g) | 1,141 | | 1,152 |
4.808% 1/1/36 (g) | 25,970 | | 25,762 |
4.832% 10/1/35 (g) | 2,001 | | 1,988 |
4.849% 7/1/35 (g) | 10,016 | | 9,930 |
4.857% 10/1/34 (g) | 8,122 | | 8,076 |
4.86% 7/1/34 (g) | 6,286 | | 6,256 |
4.87% 5/1/33 (g) | 36 | | 36 |
4.894% 5/1/35 (g) | 1,781 | | 1,768 |
4.899% 8/1/34 (g) | 5,359 | | 5,333 |
5% 12/1/15 to 12/1/35 (e) | 228,426 | | 218,572 |
5.005% 2/1/34 (g) | 8,241 | | 8,166 |
5.016% 7/1/34 (g) | 355 | | 353 |
5.052% 5/1/35 (g) | 4,154 | | 4,184 |
5.069% 9/1/34 (g) | 5,765 | | 5,750 |
5.084% 9/1/34 (g) | 735 | | 733 |
5.087% 8/1/34 (g) | 626 | | 625 |
5.108% 10/1/35 (g) | 4,553 | | 4,531 |
5.135% 7/1/34 (g) | 2,204 | | 2,200 |
5.137% 8/1/36 (g) | 31,468 | | 31,432 |
5.162% 1/1/37 (g) | 5,998 | | 5,975 |
5.165% 3/1/36 (g) | 14,153 | | 14,126 |
5.17% 6/1/35 (g) | 2,942 | | 2,961 |
5.176% 8/1/33 (g) | 1,042 | | 1,043 |
5.176% 3/1/35 (g) | 388 | | 388 |
5.242% 5/1/35 (g) | 5,794 | | 5,790 |
5.277% 4/1/36 (g) | 5,513 | | 5,562 |
5.297% 7/1/35 (g) | 396 | | 399 |
5.31% 3/1/36 (g) | 38,095 | | 38,087 |
5.324% 12/1/34 (g) | 1,042 | | 1,042 |
5.356% 12/1/36 (g) | 3,536 | | 3,530 |
5.365% 2/1/36 (g) | 8,514 | | 8,518 |
5.394% 7/1/35 (g) | 2,589 | | 2,590 |
5.407% 2/1/37 (g) | 3,127 | | 3,130 |
5.449% 2/1/37 (g) | 14,139 | | 14,163 |
5.5% 4/1/09 to 12/1/35 | 404,307 | | 395,248 |
5.5% 8/20/22 (d) | 13,000 | | 12,857 |
5.518% 1/1/34 (g) | 77 | | 77 |
U.S. Government Agency - Mortgage Securities - continued |
| Principal Amount (000s) | | Value
(000s) |
Fannie Mae - continued |
5.612% 2/1/36 (g) | $ 3,401 | | $ 3,417 |
5.67% 4/1/36 (g) | 12,513 | | 12,576 |
5.67% 6/1/36 (g) | 8,147 | | 8,191 |
5.757% 4/1/36 (g) | 6,620 | | 6,664 |
5.804% 3/1/36 (g) | 8,634 | | 8,698 |
5.807% 5/1/36 (g) | 3,745 | | 3,775 |
5.818% 1/1/36 (g) | 2,679 | | 2,686 |
5.831% 5/1/36 (g) | 19,628 | | 19,791 |
5.854% 6/1/35 (g) | 2,147 | | 2,164 |
5.872% 3/1/36 (g) | 8,089 | | 8,116 |
5.897% 12/1/36 (g) | 4,655 | | 4,689 |
5.9% 3/1/36 (g) | 7,602 | | 7,671 |
5.925% 6/1/36 (g) | 14,806 | | 14,942 |
5.94% 5/1/36 (g) | 5,459 | | 5,511 |
6% 5/1/12 to 7/1/33 (e) | 104,928 | | 104,948 |
6% 8/1/22 (d) | 23,000 | | 23,160 |
6% 8/1/37 (d) | 65,000 | | 64,465 |
6% 8/1/37 (d) | 107,000 | | 106,119 |
6% 8/14/37 (d) | 48,000 | | 47,605 |
6.038% 4/1/36 (g) | 52,142 | | 52,707 |
6.106% 4/1/36 (g) | 28,823 | | 29,145 |
6.226% 3/1/37 (g) | 1,495 | | 1,508 |
6.314% 10/1/36 (g) | 23,129 | | 23,379 |
6.352% 8/1/36 (g) | 7,422 | | 7,512 |
6.5% 2/1/12 to 1/1/35 | 25,718 | | 26,177 |
6.58% 9/1/36 (g) | 10,877 | | 11,031 |
7% 7/1/13 to 7/1/32 | 5,688 | | 5,916 |
7.5% 8/1/10 to 4/1/29 | 155 | | 160 |
8% 1/1/22 | 9 | | 9 |
8.5% 1/1/15 to 7/1/31 | 617 | | 651 |
9% 11/1/11 to 5/1/14 | 646 | | 649 |
9.5% 11/15/09 to 10/1/20 | 893 | | 968 |
10% 8/1/10 | 2 | | 2 |
11% 8/1/10 | 14 | | 15 |
11.25% 5/1/14 | 9 | | 10 |
11.5% 6/15/19 to 1/15/21 | 1,428 | | 1,593 |
12.5% 8/1/15 to 3/1/16 | 3 | | 3 |
| | 1,913,585 |
Freddie Mac - 5.0% |
3.377% 7/1/33 (g) | 9,295 | | 9,201 |
4% 5/1/19 to 11/1/20 | 26,657 | | 24,871 |
U.S. Government Agency - Mortgage Securities - continued |
| Principal Amount (000s) | | Value
(000s) |
Freddie Mac - continued |
4.283% 2/1/35 (g) | $ 1,796 | | $ 1,799 |
4.288% 3/1/35 (g) | 842 | | 842 |
4.301% 12/1/34 (g) | 1,107 | | 1,087 |
4.424% 6/1/35 (g) | 1,284 | | 1,278 |
4.426% 2/1/34 (g) | 780 | | 771 |
4.426% 3/1/35 (g) | 1,054 | | 1,035 |
4.444% 3/1/35 (g) | 1,076 | | 1,059 |
4.5% 2/1/18 to 8/1/33 | 17,105 | | 16,227 |
4.539% 2/1/35 (g) | 1,585 | | 1,560 |
4.701% 9/1/36 (g) | 3,473 | | 3,449 |
4.704% 9/1/35 (g) | 26,676 | | 26,548 |
4.737% 2/1/34 (g) | 8,503 | | 8,358 |
4.784% 3/1/33 (g) | 361 | | 366 |
4.789% 2/1/36 (g) | 1,410 | | 1,392 |
4.922% 10/1/36 (g) | 19,855 | | 19,768 |
4.988% 4/1/35 (g) | 4,699 | | 4,722 |
5% 1/1/09 to 9/1/35 | 13,435 | | 12,779 |
5.021% 4/1/35 (g) | 527 | | 517 |
5.128% 7/1/35 (g) | 5,138 | | 5,103 |
5.132% 4/1/35 (g) | 4,463 | | 4,439 |
5.278% 2/1/36 (g) | 313 | | 311 |
5.489% 2/1/37 (g) | 12,155 | | 12,106 |
5.498% 1/1/36 (g) | 4,438 | | 4,433 |
5.5% 8/1/14 to 11/1/36 | 56,405 | | 55,704 |
5.536% 1/1/36 (g) | 6,600 | | 6,597 |
6% 7/1/16 to 11/1/33 | 31,292 | | 31,441 |
6.489% 10/1/36 (g) | 10,873 | | 11,010 |
6.5% 11/1/10 to 10/1/36 | 48,678 | | 49,550 |
6.538% 2/1/37 (g) | 18,692 | | 18,820 |
6.618% 12/1/36 (g) | 18,478 | | 18,674 |
7% 4/1/11 | 4 | | 4 |
7.5% 5/1/11 to 7/1/16 | 2,286 | | 2,384 |
8% 1/1/10 to 6/1/11 | 1 | | 1 |
8.5% 8/1/08 to 9/1/29 | 232 | | 248 |
9% 8/1/08 to 10/1/20 | 110 | | 116 |
9.5% 6/1/09 to 8/1/21 | 358 | | 388 |
9.75% 8/1/14 | 153 | | 162 |
10% 7/1/09 to 8/1/21 | 37 | | 40 |
11% 7/1/13 to 5/1/14 | 70 | | 77 |
12% 8/1/13 to 3/1/15 | 3 | | 3 |
12.25% 4/1/11 to 9/1/13 | 3 | | 4 |
U.S. Government Agency - Mortgage Securities - continued |
| Principal Amount (000s) | | Value
(000s) |
Freddie Mac - continued |
12.5% 2/1/10 to 6/1/19 | $ 35 | | $ 38 |
13% 8/1/10 to 6/1/15 | 9 | | 10 |
| | 359,292 |
Government National Mortgage Association - 0.6% |
4.25% 7/20/34 (g) | 1,091 | | 1,085 |
6% 7/15/08 to 12/15/10 | 1,510 | | 1,523 |
6.5% 2/15/24 to 10/15/35 | 23,880 | | 24,483 |
6.5% 8/1/37 (d) | 10,000 | | 10,185 |
6.5% 8/1/37 (d) | 2,000 | | 2,037 |
6.5% 8/1/37 (d) | 4,000 | | 4,074 |
7% 10/15/26 to 8/15/32 | 113 | | 117 |
7.5% 1/15/08 to 8/15/29 | 137 | | 144 |
8% 11/15/07 to 12/15/23 | 1,465 | | 1,553 |
8.5% 10/15/08 to 1/15/25 | 14 | | 14 |
9% 12/15/09 | 1 | | 1 |
9.5% 2/15/25 | 1 | | 1 |
10.5% 4/15/14 to 1/20/18 | 105 | | 118 |
13.5% 7/15/11 | 8 | | 9 |
| | 45,344 |
TOTAL U.S. GOVERNMENT AGENCY - MORTGAGE SECURITIES (Cost $2,338,955) | 2,318,221 |
Asset-Backed Securities - 0.5% |
|
Fannie Mae Grantor Trust Series 2005-T4 Class A1C, 5.47% 9/25/35 (g)
(Cost $37,634) | 37,634 | | 37,887 |
Collateralized Mortgage Obligations - 7.9% |
|
U.S. Government Agency - 7.9% |
Fannie Mae: | | | |
planned amortization class: | | | |
Series 1992-168 Class KB, 7% 10/25/22 | 1,537 | | 1,591 |
Series 1993-109 Class NZ, 6% 7/25/08 | 938 | | 937 |
Series 1993-207 Class H, 6.5% 11/25/23 | 18,360 | | 18,860 |
Series 1993-240 Class PD, 6.25% 12/25/13 | 6,432 | | 6,520 |
Series 1994-23: | | | |
Class PG, 6% 4/25/23 | 5,761 | | 5,763 |
Class PZ, 6% 2/25/24 | 10,056 | | 10,038 |
Series 1994-27 Class PJ, 6.5% 6/25/23 | 319 | | 318 |
Collateralized Mortgage Obligations - continued |
| Principal Amount (000s) | | Value
(000s) |
U.S. Government Agency - continued |
Fannie Mae: - continued | | | |
planned amortization class: | | | |
Series 1996-28 Class PK, 6.5% 7/25/25 | $ 4,114 | | $ 4,220 |
Series 2003-28 Class KG, 5.5% 4/25/23 | 4,940 | | 4,816 |
Series 2006-45 Class OP, 6/25/36 (i) | 6,641 | | 4,880 |
Series 2006-62 Class KP, 4/25/36 (i) | 13,648 | | 9,648 |
sequential payer Series 1997-41 Class J, 7.5% 6/18/27 | 3,010 | | 3,189 |
Series 2003-22 6% 4/25/33 (h) | 20,731 | | 4,920 |
Fannie Mae Grantor Trust: | | | |
planned amortization class Series 2005-81 Class PC, 5.5% 9/25/35 | 2,150 | | 2,056 |
sequential payer Series 2005-93 Class HD, 4.5% 11/25/19 | 1,428 | | 1,391 |
Fannie Mae subordinate REMIC pass-thru certificates: | | | |
floater: | | | |
Series 2001-38 Class QF, 6.3% 8/25/31 (g) | 762 | | 780 |
Series 2002-49 Class FB, 5.92% 11/18/31 (g) | 1,203 | | 1,224 |
Series 2002-60 Class FV, 6.32% 4/25/32 (g) | 502 | | 516 |
Series 2002-75 Class FA, 6.32% 11/25/32 (g) | 1,028 | | 1,058 |
Series 2004-54 Class FE, 6.47% 2/25/33 (g) | 522 | | 524 |
planned amortization class: | | | |
Series 2002-18 Class PC, 5.5% 4/25/17 | 1,170 | | 1,170 |
Series 2003-113: | | | |
Class PD, 4% 2/25/17 | 23,515 | | 22,334 |
Class PE, 4% 11/25/18 | 7,545 | | 6,815 |
Series 2003-128 Class NE, 4% 12/25/16 | 13,100 | | 12,442 |
Series 2004-21 Class QE, 4.5% 11/25/32 | 1,500 | | 1,394 |
Series 2004-80 Class LD, 4% 1/25/19 | 10,160 | | 9,569 |
Series 2005-102 Class CO, 11/25/35 (i) | 6,783 | | 5,005 |
Series 2006-12 Class BO, 10/25/35 (i) | 31,149 | | 22,967 |
Series 2006-37 Class OW, 5/25/36 (i) | 7,297 | | 5,413 |
sequential payer: | | | |
Series 2001-20 Class Z, 6% 5/25/31 | 24,462 | | 24,478 |
Series 2001-46 Class ZG, 6% 9/25/31 | 8,550 | | 8,560 |
Series 2004-3 Class BA, 4% 7/25/17 | 723 | | 696 |
Series 2004-86 Class KC, 4.5% 5/25/19 | 3,213 | | 3,122 |
Series 2004-91 Class AH, 4.5% 5/25/29 | 6,395 | | 6,220 |
Series 2005-117, Class JN, 4.5% 1/25/36 | 645 | | 564 |
Series 2002-50 Class LE, 7% 12/25/29 | 5 | | 5 |
Series 2005-14 Class SE, 0.73% 3/25/35 (g)(h) | 21,743 | | 677 |
Series 2007-36: | | | |
Class GO, 4/25/37 (i) | 1,469 | | 1,102 |
Collateralized Mortgage Obligations - continued |
| Principal Amount (000s) | | Value
(000s) |
U.S. Government Agency - continued |
Fannie Mae subordinate REMIC pass-thru certificates: - continued | | | |
Series 2007-36: | | | |
Class PO, 4/25/37 (i) | $ 3,261 | | $ 2,427 |
Class SB, 1.28% 4/25/37 (g)(h) | 42,342 | | 2,114 |
Class SG, 1.28% 4/25/37 (g)(h) | 19,112 | | 971 |
Series 2007-66 Class SA, 7.68% 7/25/37 (g) | 5,575 | | 5,775 |
Freddie Mac: | | | |
planned amortization class: | | | |
Series 1413 Class J, 4% 11/15/07 | 100 | | 99 |
Series 2115 Class PE, 6% 1/15/14 | 1,037 | | 1,039 |
Series 2356 Class GD, 6% 9/15/16 | 636 | | 643 |
Series 3149 Class OD, 5/15/36 (i) | 35,541 | | 25,496 |
sequential payer Series 2114 Class ZM, 6% 1/15/29 | 2,704 | | 2,729 |
Freddie Mac Manufactured Housing participation certificates guaranteed: | | | |
floater Series 1686 Class FA, 6.275% 2/15/24 (g) | 1,017 | | 1,036 |
planned amortization class Series 1681 Class PJ, 7% 12/15/23 | 8,867 | | 9,097 |
Series 1560 Class PN, 7% 12/15/12 | 6,638 | | 6,661 |
Freddie Mac Multi-class participation certificates guaranteed: | | | |
floater: | | | |
Series 2389 Class DA, 6.22% 11/15/30 (g) | 765 | | 767 |
Series 2448 Class FT, 6.32% 3/15/32 (g) | 1,182 | | 1,212 |
Series 2530 Class FE, 5.92% 2/15/32 (g) | 697 | | 705 |
Series 2630 Class FL, 5.82% 6/15/18 (g) | 550 | | 556 |
Series 3008 Class SM, 0% 7/15/35 (g) | 377 | | 381 |
planned amortization class: | | | |
Series 1141 Class G, 9% 9/15/21 | 435 | | 461 |
Series 1614 Class L, 6.5% 7/15/23 | 5,333 | | 5,412 |
Series 1671 Class G, 6.5% 8/15/23 | 1,191 | | 1,196 |
Series 2006-15 Class OP, 3/25/36 (i) | 8,127 | | 5,738 |
Series 2543 Class PM, 5.5% 8/15/18 | 250 | | 250 |
Series 2625 Class QX, 2.25% 3/15/22 | 72 | | 72 |
Series 2640: | | | |
Class GE, 4.5% 7/15/18 | 7,310 | | 6,975 |
Class QG, 2% 4/15/22 | 86 | | 85 |
Series 2660 Class ML, 3.5% 7/15/22 | 6,346 | | 6,289 |
Series 2682 Class LD, 4.5% 10/15/33 | 777 | | 676 |
Series 2752 Class PW, 4% 4/15/22 | 2,515 | | 2,484 |
Series 2802 Class OB, 6% 5/15/34 | 10,455 | | 10,415 |
Collateralized Mortgage Obligations - continued |
| Principal Amount (000s) | | Value
(000s) |
U.S. Government Agency - continued |
Freddie Mac Multi-class participation certificates guaranteed: - continued | | | |
planned amortization class: | | | |
Series 2810 Class PD, 6% 6/15/33 | $ 995 | | $ 993 |
Series 2866 Class XE, 4% 12/15/18 | 19,350 | | 18,246 |
Series 2937 Class KC, 4.5% 2/15/20 | 19,686 | | 18,524 |
Series 2966 Class XC, 5.5% 1/15/31 | 25,111 | | 24,877 |
Series 3077 Class TO, 4/15/35 (i) | 17,855 | | 12,817 |
Series 3110 Class OP, 9/15/35 (i) | 16,826 | | 12,131 |
Series 3119, 2/15/36 (i) | 20,299 | | 14,338 |
Series 3121 Class KO, 3/15/36 (i) | 7,162 | | 5,453 |
Series 3123 Class LO, 3/15/36 (i) | 13,128 | | 9,225 |
Series 3145 Class GO, 4/15/36 (i) | 11,854 | | 8,368 |
Series 3151 5/15/36 (i) | 12,724 | | 8,910 |
sequential payer: | | | |
Series 2546 Class MJ, 5.5% 3/15/23 | 2,861 | | 2,741 |
Series 2570 Class CU, 4.5% 7/15/17 | 2,060 | | 2,013 |
Series 2587 Class AD, 4.71% 3/15/33 | 5,785 | | 4,891 |
Series 2601 Class TB, 5.5% 4/15/23 | 869 | | 831 |
Series 2617 Class GW, 3.5% 6/15/16 | 4,132 | | 4,057 |
Series 2675 Class CB, 4% 5/15/16 | 2,018 | | 1,958 |
Series 2677 Class HG, 3% 8/15/12 | 1,169 | | 1,158 |
Series 2683 Class JA, 4% 10/15/16 | 2,104 | | 2,036 |
Series 2685 Class ND, 4% 10/15/18 | 9,064 | | 8,147 |
Series 2750 Class ZT, 5% 2/15/34 | 1,020 | | 879 |
Series 2773 Class HC, 4.5% 4/15/19 | 704 | | 644 |
Series 2809 Class UA, 4% 12/15/14 | 3,028 | | 2,980 |
Series 2849 Class AL, 5% 5/15/18 | 7,819 | | 7,684 |
Series 2860 Class CP, 4% 10/15/17 | 2,474 | | 2,403 |
Series 2866 Class N, 4.5% 12/15/18 | 7,093 | | 6,991 |
Series 2937 Class HJ, 5% 10/15/19 | 9,618 | | 9,472 |
Series 2998 Class LY, 5.5% 7/15/25 | 2,011 | | 1,908 |
Series 3007 Class EW, 5.5% 7/15/25 | 8,875 | | 8,421 |
Series 3013 Class VJ, 5% 1/15/14 | 1,981 | | 1,957 |
Series 2769 Class BU, 5% 3/15/34 | 5,744 | | 5,191 |
Series 2863 Class DB, 4% 9/15/14 | 1,319 | | 1,251 |
Series 2957 Class SW, 0.68% 4/15/35 (g)(h) | 29,878 | | 823 |
Series 3002 Class SN, 1.18% 7/15/35 (g)(h) | 29,958 | | 1,283 |
target amortization class: | | | |
Series 2156 Class TC, 6.25% 5/15/29 | 9,895 | | 10,184 |
Series 2877 Class JC, 5% 10/15/34 | 1,413 | | 1,382 |
Collateralized Mortgage Obligations - continued |
| Principal Amount (000s) | | Value
(000s) |
U.S. Government Agency - continued |
Ginnie Mae guaranteed REMIC pass-thru securities planned amortization class: | | | |
Series 1997-8 Class PE, 7.5% 5/16/27 | $ 4,821 | | $ 5,135 |
Series 2005-58 Class NJ, 4.5% 8/20/35 | 21,605 | | 21,183 |
TOTAL COLLATERALIZED MORTGAGE OBLIGATIONS (Cost $575,569) | 569,028 |
Cash Equivalents - 27.6% |
| Maturity Amount (000s) | | |
Investments in repurchase agreements in a joint trading account at 5.3%, dated 7/31/07 due 8/1/07: | | | |
(Collateralized by U.S. Government Obligations) # | $ 13,512 | | 13,510 |
(Collateralized by U.S. Government Obligations) # (a) | 1,985,314 | | 1,985,022 |
TOTAL CASH EQUIVALENTS (Cost $1,998,532) | 1,998,532 |
TOTAL INVESTMENT PORTFOLIO - 130.2% (Cost $9,445,072) | | 9,427,061 |
NET OTHER ASSETS - (30.2)% | | (2,185,321) |
NET ASSETS - 100% | $ 7,241,740 |
Swap Agreements |
| Expiration Date | | Notional Amount (000s) | | Value
(000s) |
Interest Rate Swaps |
Receive quarterly a floating rate based on 3-month LIBOR and pay semi-annually a fixed rate equal to 5.57% with Goldman Sachs | August 2017 | | $ 100,000 | | $ (443) |
Receive quarterly a floating rate based on 3-month LIBOR and pay semi-annually a fixed rate equal to 5.96% with Morgan Stanley, Inc. | July 2037 | | 27,500 | | (1,027) |
Receive semi-annually a fixed rate equal to 5.035% and pay quarterly a floating rate based on 3-month LIBOR with Deutsche Bank | April 2010 | | 225,000 | | (723) |
Receive semi-annually a fixed rate equal to 5.51% and pay quarterly a floating rate based on 3-month LIBOR with Morgan Stanley, Inc. | July 2010 | | 140,000 | | 1,409 |
Receive semi-annually a fixed rate equal to 5.706% and pay quarterly a floating rate based on 3-month LIBOR with Deutsche Bank | June 2017 | | 75,000 | | 1,148 |
| | $ 567,500 | | $ 364 |
Legend |
(a) Includes investment made with cash collateral received from securities on loan. |
(b) Security or a portion of the security is on loan at period end. |
(c) Security exempt from registration under Rule 144A of the Securities Act of 1933. These securities may be resold in transactions exempt from registration, normally to qualified institutional buyers. At the end of the period, the value of these securities amounted to $18,332,000 or 0.3% of net assets. |
(d) Security or a portion of the security purchased on a delayed delivery or when-issued basis. |
(e) A portion of the security is subject to a forward commitment to sell. |
(f) Security or a portion of the security has been segregated as collateral for open swap agreements. At the period end, the value of securities pledged amounted to $2,382,000. |
(g) The coupon rate shown on floating or adjustable rate securities represents the rate at period end. |
(h) Security represents right to receive monthly interest payments on an underlying pool of mortgages or assets. Principal shown is the outstanding par amount of the pool held as of the end of the period. |
(i) Principal Only Strips represent the right to receive the monthly principal payments on an underlying pool of mortgage loans. |
# Additional Information on each counterparty to the repurchase agreement is as follows: |
Repurchase Agreement / Counterparty | Value
(Amounts in thousands) |
$13,510,000 due 8/01/07 at 5.30% |
ABN AMRO Bank N.V., New York Branch | $ 328 |
Banc of America Securities LLC | 2,916 |
Bank of America, NA | 823 |
Barclays Capital, Inc. | 1,509 |
Bear Stearns & Co., Inc. | 1,441 |
Countrywide Securities Corp. | 1,056 |
ING Financial Markets LLC | 1,310 |
Societe Generale, New York Branch | 1,310 |
UBS Securities LLC | 2,293 |
WestLB AG | 524 |
| $ 13,510 |
$1,985,022,000 due 8/01/07 at 5.30% |
Bank of America, NA | $ 602,780 |
Barclays Capital, Inc. | 1,382,242 |
| $ 1,985,022 |
Income Tax Information |
At July 31, 2007, the fund had a capital loss carryforward of approximately $93,664,000 of which $831,000, $561,000, $1,882,000, $28,692,000, and $61,698,000 will expire on July 31, 2011, 2012, 2013, 2014 and 2015, respectively. |
Of the loss carryforwards expiring July 31, 2011, 2012, 2013, and 2014, $831,000, $561,000, $1,882,000, and $17,977,000, respectively, was acquired in the merger and is available to offset future capital gains of the fund to the extent provided by regulations. |
See accompanying notes which are an integral part of the financial statements.
Annual Report
Financial Statements
Statement of Assets and Liabilities
Amounts in thousands (except per-share amounts) | July 31, 2007 |
| | |
Assets | | |
Investment in securities, at value (including securities loaned of $1,920,947 and repurchase agreements of $1,998,532) - See accompanying schedule: Unaffiliated issuers (cost $9,445,072) | | $ 9,427,061 |
Commitment to sell securities on a delayed delivery basis | $ (238,522) | |
Receivable for securities sold on a delayed delivery basis | 237,005 | (1,517) |
Receivable for investments sold, regular delivery | | 5,988 |
Cash | | 8,931 |
Receivable for fund shares sold | | 4,128 |
Interest receivable | | 71,447 |
Swap agreements, at value | | 364 |
Total assets | | 9,516,402 |
| | |
Liabilities | | |
Payable for investments purchased
Regular delivery | $ 6,703 | |
Delayed delivery | 269,464 | |
Payable for fund shares redeemed | 4,894 | |
Distributions payable | 664 | |
Accrued management fee | 1,888 | |
Distribution fees payable | 131 | |
Other affiliated payables | 888 | |
Other payables and accrued expenses | 5,008 | |
Collateral on securities loaned, at value | 1,985,022 | |
Total liabilities | | 2,274,662 |
| | |
Net Assets | | $ 7,241,740 |
Net Assets consist of: | | |
Paid in capital | | $ 7,382,737 |
Undistributed net investment income | | 1,411 |
Accumulated undistributed net realized gain (loss) on investments | | (123,244) |
Net unrealized appreciation (depreciation) on investments | | (19,164) |
Net Assets | | $ 7,241,740 |
See accompanying notes which are an integral part of the financial statements.
Annual Report
Statement of Assets and Liabilities - continued
Amounts in thousands (except per-share amounts) | July 31, 2007 |
| | |
Calculation of Maximum Offering Price
Class A:
Net Asset Value and redemption price per share
($145,299 ÷ 14,516 shares) | | $ 10.01 |
| | |
Maximum offering price per share (100/96.00 of $10.01) | | $ 10.43 |
Class T:
Net Asset Value and redemption price per share ($180,781 ÷ 18,060 shares) | | $ 10.01 |
| | |
Maximum offering price per share (100/96.00 of $10.01) | | $ 10.43 |
Class B:
Net Asset Value and offering price per share
($43,307 ÷ 4,326 shares)A | | $ 10.01 |
| | |
Class C:
Net Asset Value and offering price per share
($39,391 ÷ 3,935 shares)A | | $ 10.01 |
| | |
Government Income:
Net Asset Value, offering price and redemption price per share ($6,117,821 ÷ 611,879 shares) | | $ 10.00 |
| | |
Institutional Class:
Net Asset Value, offering price and redemption price per share ($715,141 ÷ 71,448 shares) | | $ 10.01 |
A Redemption price per share is equal to net asset value less any applicable contingent deferred sales charge.
See accompanying notes which are an integral part of the financial statements.
Annual Report
Financial Statements - continued
Statement of Operations
Amounts in thousands | Year ended July 31, 2007 |
| | |
Investment Income | | |
Interest | | $ 328,118 |
| | |
Expenses | | |
Management fee | $ 21,463 | |
Transfer agent fees | 7,506 | |
Distribution fees | 1,223 | |
Fund wide operations fee | 2,122 | |
Independent trustees' compensation | 22 | |
Miscellaneous | 13 | |
Total expenses before reductions | 32,349 | |
Expense reductions | (545) | 31,804 |
Net investment income | | 296,314 |
Realized and Unrealized Gain (Loss) Net realized gain (loss) on: | | |
Investment securities: | | |
Unaffiliated issuers | (41,739) | |
Futures contracts | 1,498 | |
Swap agreements | 492 | |
Total net realized gain (loss) | | (39,749) |
Change in net unrealized appreciation (depreciation) on: Investment securities | 69,326 | |
Swap agreements | (3,916) | |
Delayed delivery commitments | (1,455) | |
Total change in net unrealized appreciation (depreciation) | | 63,955 |
Net gain (loss) | | 24,206 |
Net increase (decrease) in net assets resulting from operations | | $ 320,520 |
See accompanying notes which are an integral part of the financial statements.
Annual Report
Statement of Changes in Net Assets
Amounts in thousands | Year ended
July 31,
2007 | Year ended
July 31,
2006 |
Increase (Decrease) in Net Assets | | |
Operations | | |
Net investment income | $ 296,314 | $ 235,825 |
Net realized gain (loss) | (39,749) | (63,122) |
Change in net unrealized appreciation (depreciation) | 63,955 | (93,536) |
Net increase (decrease) in net assets resulting
from operations | 320,520 | 79,167 |
Distributions to shareholders from net investment income | (303,351) | (223,332) |
Distributions to shareholders from net realized gain | (2,616) | - |
Total distributions | (305,967) | (223,332) |
Share transactions - net increase (decrease) | 1,895,812 | 348,165 |
Total increase (decrease) in net assets | 1,910,365 | 204,000 |
| | |
Net Assets | | |
Beginning of period | 5,331,375 | 5,127,375 |
End of period (including undistributed net investment income of $1,411 and undistributed net investment income of $11,750, respectively) | $ 7,241,740 | $ 5,331,375 |
See accompanying notes which are an integral part of the financial statements.
Annual Report
Financial Highlights - Class A
Period ended July 31, | 2007 E |
Selected Per-Share Data | |
Net asset value, beginning of period | $ 9.98 |
Income from Investment Operations | |
Net investment income D | .311 |
Net realized and unrealized gain (loss) | .033 |
Total from investment operations | .344 |
Distributions from net investment income | (.314) |
Net asset value, end of period | $ 10.01 |
Total Return A, B, C | 3.49% |
Ratios to Average Net Assets F | |
Expenses before reductions | .78% H |
Expenses net of fee waivers, if any | .78% H |
Expenses net of all reductions | .77% H |
Net investment income | 4.08% H |
Supplemental Data | |
Net assets, end of period (in millions) | $ 145 |
Portfolio turnover rate | 164% G |
A Total returns for periods of less than one year are not annualized.
B Total returns would have been lower had certain expenses not been reduced during the periods shown.
C Total returns do not include the effect of the sales charges.
D Calculated based on average shares outstanding during the period.
E For the period October 24, 2006 (commencement of sale of shares) to July 31, 2007.
F Expense ratios reflect operating expenses of the class. Expenses before reductions do not reflect amounts reimbursed by the investment adviser or reductions from brokerage service arrangements or other expense offset arrangements and do not represent the amount paid by the class during periods when reimbursements or reductions occur. Expense ratios before reductions for start-up periods may not be representative of longer-term operating periods. Expenses net of fee waivers reflect expenses after reimbursement by the investment adviser but prior to reductions from brokerage service arrangements or other expense offset arrangements. Expenses net of all reductions represent the net expenses paid by the class.
G The portfolio turnover rate does not include the assets acquired in the merger.
H Annualized
See accompanying notes which are an integral part of the financial statements.
Annual Report
Financial Highlights - Class T
Period ended July 31, | 2007 E |
Selected Per-Share Data | |
Net asset value, beginning of period | $ 9.98 |
Income from Investment Operations | |
Net investment income D | .306 |
Net realized and unrealized gain (loss) | .036 |
Total from investment operations | .342 |
Distributions from net investment income | (.312) |
Net asset value, end of period | $ 10.01 |
Total Return A, B, C | 3.46% |
Ratios to Average Net Assets F | |
Expenses before reductions | .79% H |
Expenses net of fee waivers, if any | .79% H |
Expenses net of all reductions | .79% H |
Net investment income | 4.02% H |
Supplemental Data | |
Net assets, end of period (in millions) | $ 181 |
Portfolio turnover rate | 164% G |
A Total returns for periods of less than one year are not annualized.
B Total returns would have been lower had certain expenses not been reduced during the periods shown.
C Total returns do not include the effect of the sales charges.
D Calculated based on average shares outstanding during the period.
E For the period October 24, 2006 (commencement of sale of shares) to July 31, 2007.
F Expense ratios reflect operating expenses of the class. Expenses before reductions do not reflect amounts reimbursed by the investment adviser or reductions from brokerage service arrangements or other expense offset arrangements and do not represent the amount paid by the class during periods when reimbursements or reductions occur. Expense ratios before reductions for start-up periods may not be representative of longer-term operating periods. Expenses net of fee waivers reflect expenses after reimbursement by the investment adviser but prior to reductions from brokerage service arrangements or other expense offset arrangements. Expenses net of all reductions represent the net expenses paid by the class.
G The portfolio turnover rate does not include the assets acquired in the merger.
H Annualized
See accompanying notes which are an integral part of the financial statements.
Annual Report
Financial Highlights - Class B
Period ended July 31, | 2007 E |
Selected Per-Share Data | |
Net asset value, beginning of period | $ 9.98 |
Income from Investment Operations | |
Net investment income D | .251 |
Net realized and unrealized gain (loss) | .037 |
Total from investment operations | .288 |
Distributions from net investment income | (.258) |
Net asset value, end of period | $ 10.01 |
Total Return A, B, C | 2.91% |
Ratios to Average Net Assets F | |
Expenses before reductions | 1.50% H |
Expenses net of fee waivers, if any | 1.50% H |
Expenses net of all reductions | 1.50% H |
Net investment income | 3.30% H |
Supplemental Data | |
Net assets, end of period (in millions) | $ 43 |
Portfolio turnover rate | 164% G |
A Total returns for periods of less than one year are not annualized.
B Total returns would have been lower had certain expenses not been reduced during the periods shown.
C Total returns do not include the effect of the contingent deferred sales charge.
D Calculated based on average shares outstanding during the period.
E For the period October 24, 2006 (commencement of sale of shares) to July 31, 2007.
F Expense ratios reflect operating expenses of the class. Expenses before reductions do not reflect amounts reimbursed by the investment adviser or reductions from brokerage service arrangements or other expense offset arrangements and do not represent the amount paid by the class during periods when reimbursements or reductions occur. Expense ratios before reductions for start-up periods may not be representative of longer-term operating periods. Expenses net of fee waivers reflect expenses after reimbursement by the investment adviser but prior to reductions from brokerage service arrangements or other expense offset arrangements. Expenses net of all reductions represent the net expenses paid by the class.
G The portfolio turnover rate does not include the assets acquired in the merger.
H Annualized
See accompanying notes which are an integral part of the financial statements.
Annual Report
Financial Highlights - Class C
Period ended July 31, | 2007 E |
Selected Per-Share Data | |
Net asset value, beginning of period | $ 9.98 |
Income from Investment Operations | |
Net investment income D | .249 |
Net realized and unrealized gain (loss) | .033 |
Total from investment operations | .282 |
Distributions from net investment income | (.252) |
Net asset value, end of period | $ 10.01 |
Total Return A, B, C | 2.85% |
Ratios to Average Net Assets F | |
Expenses before reductions | 1.55% H |
Expenses net of fee waivers, if any | 1.55% H |
Expenses net of all reductions | 1.55% H |
Net investment income | 3.26% H |
Supplemental Data | |
Net assets, end of period (in millions) | $ 39 |
Portfolio turnover rate | 164% G |
A Total returns for periods of less than one year are not annualized.
B Total returns would have been lower had certain expenses not been reduced during the periods shown.
C Total returns do not include the effect of the contingent deferred sales charge.
D Calculated based on average shares outstanding during the period.
E For the period October 24, 2006 (commencement of sale of shares) to July 31, 2007.
F Expense ratios reflect operating expenses of the class. Expenses before reductions do not reflect amounts reimbursed by the investment adviser or reductions from brokerage service arrangements or other expense offset arrangements and do not represent the amount paid by the class during periods when reimbursements or reductions occur. Expense ratios before reductions for start-up periods may not be representative of longer-term operating periods. Expenses net of fee waivers reflect expenses after reimbursement by the investment adviser but prior to reductions from brokerage service arrangements or other expense offset arrangements. Expenses net of all reductions represent the net expenses paid by the class.
G The portfolio turnover rate does not include the assets acquired in the merger.
H Annualized
See accompanying notes which are an integral part of the financial statements.
Annual Report
Financial Highlights - Government Income
Years ended July 31, | 2007 | 2006 | 2005 | 2004 | 2003 |
Selected Per-Share Data | | | | | |
Net asset value,
beginning of period | $ 9.95 | $ 10.20 | $ 10.13 | $ 10.16 | $ 10.30 |
Income from Investment Operations | | | | | |
Net investment income B | .443 | .429 | .329 | .307 | .374 |
Net realized and unrealized gain (loss) | .068 | (.274) | .097 | .124 | (.014) |
Total from investment operations | .511 | .155 | .426 | .431 | .360 |
Distributions from net investment income | (.456) | (.405) | (.321) | (.301) | (.370) |
Distributions from net realized gain | (.005) | - | (.035) | (.160) | (.130) |
Total distributions | (.461) | (.405) | (.356) | (.461) | (.500) |
Net asset value, end of period | $ 10.00 | $ 9.95 | $ 10.20 | $ 10.13 | $ 10.16 |
Total Return A | 5.22% | 1.56% | 4.24% | 4.30% | 3.45% |
Ratios to Average Net Assets C | | | | | |
Expenses before reductions | .45% | .45% | .58% | .63% | .65% |
Expenses net of fee waivers,
if any | .45% | .45% | .58% | .63% | .65% |
Expenses net of all reductions | .44% | .44% | .58% | .63% | .65% |
Net investment income | 4.42% | 4.27% | 3.21% | 3.01% | 3.56% |
Supplemental Data | | | | | |
Net assets, end of period
(in millions) | $ 6,118 | $ 5,331 | $ 5,127 | $ 4,168 | $ 3,622 |
Portfolio turnover rate | 164% D | 108% | 114% | 224% | 253% |
A Total returns would have been lower had certain expenses not been reduced during the periods shown.
B Calculated based on average shares outstanding during the period.
C Expense ratios reflect operating expenses of the class. Expenses before reductions do not reflect amounts reimbursed by the investment adviser or reductions from brokerage service arrangements or other expense offset arrangements and do not represent the amount paid by the class during periods when reimbursements or reductions occur. Expenses net of fee waivers reflect expenses after reimbursement by the investment adviser but prior to reductions from brokerage service arrangements or other expense offset arrangements. Expenses net of all reductions represent the net expenses paid by the class.
D The portfolio turnover rate does not include the assets acquired in the merger.
See accompanying notes which are an integral part of the financial statements.
Annual Report
Financial Highlights - Institutional Class
Period ended July 31, | 2007 D |
Selected Per-Share Data | |
Net asset value, beginning of period | $ 9.98 |
Income from Investment Operations | |
Net investment income C | .329 |
Net realized and unrealized gain (loss) | .034 |
Total from investment operations | .363 |
Distributions from net investment income | (.333) |
Net asset value, end of period | $ 10.01 |
Total Return A, B | 3.67% |
Ratios to Average Net Assets E | |
Expenses before reductions | .53% G |
Expenses net of fee waivers, if any | .53% G |
Expenses net of all reductions | .53% G |
Net investment income | 4.32% G |
Supplemental Data | |
Net assets, end of period (in millions) | $ 715 |
Portfolio turnover rate | 164%F |
A Total returns for periods of less than one year are not annualized.
B Total returns would have been lower had certain expenses not been reduced during the periods shown.
C Calculated based on average shares outstanding during the period.
D For the period October 24, 2006 (commencement of sale of shares) to July 31, 2007.
E Expense ratios reflect operating expenses of the class. Expenses before reductions do not reflect amounts reimbursed by the investment adviser or reductions from brokerage service arrangements or other expense offset arrangements and do not represent the amount paid by the class during periods when reimbursements or reductions occur. Expense ratios before reductions for start-up periods may not be representative of longer-term operating periods. Expenses net of fee waivers reflect expenses after reimbursement by the investment adviser but prior to reductions from brokerage service arrangements or other expense offset arrangements. Expenses net of all reductions represent the net expenses paid by the class.
F The portfolio turnover rate does not include the assets acquired in the merger.
G Annualized
See accompanying notes which are an integral part of the financial statements.
Annual Report
Notes to Financial Statements
For the period ended July 31, 2007
(Amounts in thousands except ratios)
1. Organization.
Fidelity Government Income Fund (the Fund) is a fund of Fidelity Income Fund (the trust) and is authorized to issue an unlimited number of shares. The trust is registered under the Investment Company Act of 1940, as amended (the 1940 Act), as an open-end management investment company organized as a Massachusetts business trust.
The Fund offers Class A, Class T, Class B, Class C, Government Income, and Institutional Class shares, each of which has equal rights as to assets and voting privileges. Each class has exclusive voting rights with respect to matters that affect that class. The Fund commenced sales of Class A, Class T, Class B, Class C and Institutional Class shares and the existing class was designated Government Income on October 24, 2006. Class B shares will automatically convert to Class A shares after a holding period of seven years from the initial date of purchase. Investment income, realized and unrealized capital gains and losses, the common expenses of the Fund, and certain fund-level expense reductions, if any, are allocated on a pro rata basis to each class based on the relative net assets of each class to the total net assets of the Fund. Each class differs with respect to transfer agent and distribution and service plan fees incurred. Certain expense reductions also differ by class.
2. Significant Accounting Policies.
The financial statements have been prepared in conformity with accounting principles generally accepted in the United States of America, which require management to make certain estimates and assumptions at the date of the financial statements. The following summarizes the significant accounting policies of the Fund:
Security Valuation. Investments are valued and net asset value per share is calculated (NAV calculation) as of the close of business of the New York Stock Exchange, normally 4:00 p.m. Eastern time. Wherever possible, the Fund uses independent pricing services approved by the Board of Trustees to value its investments. Debt securities, including restricted securities, for which quotes are readily available, are valued by independent pricing services or by dealers who make markets in such securities. Pricing services consider yield or price of bonds of comparable quality, coupon, maturity and type as well as dealer supplied prices.
When current market prices or quotations are not readily available or do not accurately reflect fair value, valuations may be determined in accordance with procedures adopted by the Board of Trustees. The frequency of when fair value pricing is used is unpredictable. The value of securities used for NAV calculation under fair value pricing may differ from published prices for the same securities. Investments in open-end mutual funds are valued at their closing net asset value each business day. Short-term securities with remaining maturities of sixty days or less for which quotations are not readily available are valued at amortized cost, which approximates value.
Annual Report
2. Significant Accounting Policies - continued
Investment Transactions and Income. For financial reporting purposes, the Fund's investment holdings and NAV include trades executed through the end of the last business day of the period. The NAV for processing shareholder transactions includes trades executed through the end of the prior business day. Gains and losses on securities sold are determined on the basis of identified cost. Interest income is accrued as earned. Interest income includes coupon interest and amortization of premium and accretion of discount on debt securities.
Expenses. Most expenses of the trust can be directly attributed to a fund. Expenses which cannot be directly attributed are apportioned among each Fund in the trust. Expense estimates are accrued in the period to which they relate and adjustments are made when actual amounts are known.
Income Tax Information and Distributions to Shareholders. Each year, the Fund intends to qualify as a regulated investment company by distributing all of its taxable income and realized gains under Subchapter M of the Internal Revenue Code. As a result, no provision for income taxes is required in the accompanying financial statements.
Dividends are declared daily and paid monthly from net investment income. Distributions from realized gains, if any, are recorded on the ex-dividend date. Income dividends and capital gain distributions are declared separately for each class. Income and capital gain distributions are determined in accordance with income tax regulations, which may differ from generally accepted accounting principles.
Capital accounts within the financial statements are adjusted for permanent book-tax differences. These adjustments have no impact on net assets or the results of operations. Temporary book-tax differences will reverse in a subsequent period.
Book-tax differences are primarily due to swap agreements, prior period premium and discount on debt securities, market discount, deferred trustees compensation, financing transactions, capital loss carryforwards, and losses deferred due to wash sales and excise tax regulations.
The tax-basis components of distributable earnings and the federal tax cost as of period end were as follows:
Unrealized appreciation | $ 41,525 | |
Unrealized depreciation | (59,427) | |
Net unrealized appreciation (depreciation) | (17,902) | |
Undistributed ordinary income | 257 | |
Capital loss carryforward | (93,664) | |
| | |
Cost for federal income tax purposes | $ 9,444,963 | |
Annual Report
Notes to Financial Statements - continued
(Amounts in thousands except ratios)
2. Significant Accounting Policies - continued
Income Tax Information and Distributions to Shareholders - continued
The tax character of distributions paid was as follows:
| July 31, 2007 | July 31, 2006 |
Ordinary Income | $ 305,967 | $ 223,332 |
New Accounting Pronouncements. In July 2006, Financial Accounting Standards Board Interpretation No. 48, Accounting for Uncertainty in Income Taxes - an interpretation of FASB Statement 109 (FIN 48), was issued and is effective on the last business day of the semiannual reporting period for fiscal years beginning after December 15, 2006. FIN 48 sets forth a threshold for financial statement recognition, measurement and disclosure of a tax position taken or expected to be taken on a tax return. Management has concluded that the adoption of FIN 48 will not result in a material impact on the Fund's net assets, results of operations and financial statement disclosures.
In addition, in September 2006, Statement of Financial Accounting Standards No. 157, Fair Value Measurements (SFAS 157), was issued and is effective for fiscal years beginning after November 15, 2007. SFAS 157 defines fair value, establishes a framework for measuring fair value and expands disclosures about fair value measurements. Management is currently evaluating the impact the adoption of SFAS 157 will have on the Fund's financial statement disclosures.
3. Operating Policies.
Repurchase Agreements. Fidelity Management & Research Company (FMR) has received an Exemptive Order from the Securities and Exchange Commission (the SEC) which permits the Fund and other affiliated entities of FMR to transfer uninvested cash balances into joint trading accounts which are then invested in repurchase agreements. The Fund may also invest directly with institutions in repurchase agreements. Repurchase agreements are collateralized by government or non-government securities. Upon settlement date, collateral is held in segregated accounts with custodian banks and may be obtained in the event of a default of the counterparty. The Fund monitors, on a daily basis, the value of the collateral to ensure it is at least equal to the principal amount of the repurchase agreement (including accrued interest). In the event of a default by the counterparty, realization of the collateral proceeds could be delayed, during which time the value of the collateral may decline.
Delayed Delivery Transactions and When-Issued Securities. The Fund may purchase or sell securities on a delayed delivery or when-issued basis. Payment and delivery may take place after the customary settlement period for that security. The price of the underlying securities and the date when the securities will be delivered and paid
Annual Report
3. Operating Policies - continued
Delayed Delivery Transactions and When-Issued Securities - continued
for are fixed at the time the transaction is negotiated. During the time a delayed delivery sell is outstanding, the contract is marked-to-market daily and equivalent deliverable securities are held for the transaction. The value of the securities purchased on a delayed delivery or when-issued basis are identified as such in the Fund's Schedule of Investments. The Fund may receive compensation for interest forgone in the purchase of a delayed delivery or when-issued security. With respect to purchase commitments, the Fund identifies securities as segregated in its records with a value at least equal to the amount of the commitment. The payables and receivables associated with the purchases and sales of delayed delivery securities having the same coupon, settlement date and broker are offset. Delayed delivery or when-issued securities that have been purchased from and sold to different brokers are reflected as both payables and receivables in the fund's Statement of Assets and Liabilities under the caption "Delayed delivery." Losses may arise due to changes in the value of the underlying securities or if the counterparty does not perform under the contract's terms, or if the issuer does not issue the securities due to political, economic, or other factors.
Futures Contracts. The Fund may use futures contracts to manage its exposure to the bond market and to fluctuations in interest rates. Buying futures tends to increase a fund's exposure to the underlying instrument, while selling futures tends to decrease a fund's exposure to the underlying instrument or hedge other fund investments. Upon entering into a futures contract, a fund is required to deposit with a clearing broker, no later than the following business day, an amount ("initial margin") equal to a certain percentage of the face value of the contract. The initial margin may be in the form of cash or securities and is transferred to a segregated account on settlement date. Subsequent payments ("variation margin") are made or received by a fund depending on the daily fluctuations in the value of the futures contract and are accounted for as unrealized gains or losses. Realized gains (losses) are recorded upon the expiration or closing of the futures contract. Securities deposited to meet margin requirements are identified in the Schedule of Investments. Losses may arise from changes in the value of the underlying instruments or if the counterparties do not perform under the contract's terms. Futures contracts are valued at the settlement price established each day by the board of trade or exchange on which they are traded.
Restricted Securities. The Fund may invest in securities that are subject to legal or contractual restrictions on resale. These securities generally may be resold in transactions exempt from registration or to the public if the securities are registered. Disposal of these securities may involve time-consuming negotiations and expense, and prompt sale at an acceptable price may be difficult. Information regarding restricted securities is included at the end of the Fund's Schedule of Investments.
Annual Report
Notes to Financial Statements - continued
(Amounts in thousands except ratios)
3. Operating Policies - continued
Swap Agreements. The Fund may invest in swaps for the purpose of managing its exposure to interest rate, credit or market risk.
Interest rate swaps are agreements to exchange cash flows periodically based on a notional principal amount, for example, the exchange of fixed rate interest payments for floating rate interest payments. Periodic payments received or made by the Fund are recorded in the accompanying Statement of Operations as realized gains or losses, respectively. The primary risk associated with interest rate swaps is that unfavorable changes in the fluctuation of interest rates could adversely impact a fund.
Swaps are marked-to-market daily based on dealer-supplied valuations and changes in value are recorded as unrealized appreciation (depreciation). Gains or losses are realized upon early termination of the swap agreement. Collateral, in the form of cash or securities, may be required to be held in segregated accounts with a fund's custodian in compliance with swap contracts. Risks may exceed amounts recognized on the Statement of Assets and Liabilities. These risks include changes in the returns of the underlying instruments, failure of the counterparties to perform under the contracts' terms and the possible lack of liquidity with respect to the swap agreements. Details of swap agreements open at period end are included in the Fund's Schedule of Investments under the caption "Swap Agreements."
Mortgage Dollar Rolls. To earn additional income, the Fund may employ trading strategies which involve the sale and simultaneous agreement to repurchase similar securities ("mortgage dollar rolls") or the purchase and simultaneous agreement to sell similar securities ("reverse mortgage dollar rolls"). The securities traded are mortgage securities and bear the same interest rate but may be collateralized by different pools of mortgages. During the period between the sale and repurchase in a mortgage dollar roll transaction, a fund will not be entitled to receive interest and principal payments on the securities sold but will invest the proceeds of the sale in other securities which may enhance the yield and total return. In addition, the difference between the sale price and the future purchase price is recorded as an adjustment to investment income. During the period between the purchase and subsequent sale in a reverse mortgage dollar roll transaction a fund is entitled to interest and principal payments on the securities purchased. The price differential between the purchase and sale is recorded as an adjustment to investment income. Losses may arise due to changes in the value of the securities or if the counterparty does not perform under the terms of the agreement. If the counterparty files for bankruptcy or becomes insolvent, a fund's right to repurchase or sell securities may be limited.
Annual Report
4. Fees and Other Transactions with Affiliates.
Management Fee and Expense Contract. FMR and its affiliates provide the Fund with investment management related services for which the Fund pays a monthly management fee. The management fee is the sum of an individual fund fee rate that is based on an annual rate of .20% of the Fund's average net assets and a group fee rate that averaged .12% during the period. The group fee rate is based upon the average net assets of all the mutual funds advised by FMR. The group fee rate decreases as assets under management increase and increases as assets under management decrease. For the period, the total annual management fee rate was .32% of the Fund's average net assets.
In addition, effective October 27, 2006 under a new expense contract, FMR pays all class-level expenses for Government Income class, so that the total expense, except the compensation of the independent Trustees and certain other expenses such as interest expense, including commitment fees, do not exceed .45% of the Class' average net assets. This agreement does not apply to any of the other classes and any change or modification that would increase expenses can only be made with shareholder approval.
Distribution and Service Plan. In accordance with Rule 12b-1 of the 1940 Act, the Fund has adopted separate Distribution and Service Plans for each class of shares. Certain classes pay Fidelity Distributors Corporation (FDC), an affiliate of FMR, separate Distribution and Service Fees, each of which is based on an annual percentage of each class' average net assets. In addition, FDC may pay financial intermediaries for selling shares of the Fund and providing shareholder support services. For the period, the Distribution and Service Fee rates and the total amounts paid to and retained by FDC were as follows:
| Distribution
Fee | Service
Fee | Paid to
FDC | Retained
by FDC |
Class A | 0% | .25% | $ 199 | $ 34 |
Class T | 0% | .25% | 355 | - |
Class B | .65% | .25% | 350 | 253 |
Class C | .75% | .25% | 319 | - |
| | | $ 1,223 | $ 287 |
On January 18, 2007, the Board of Trustees approved an increase in Class A's Service fee from .15% to .25%, effective April 1, 2007.
Sales Load. FDC receives a front-end sales charge of up to 4.00% for selling Class A and Class T shares, (4.75% for Class A and 3.50% for Class T shares prior to April 1, 2007), some of which is paid to financial intermediaries for selling shares of the Fund. FDC receives the proceeds of contingent deferred sales charges levied on Class A, Class T, Class B, and Class C redemptions. These charges depend on the holding period. The deferred sales charges range from 5% to 1% for Class B, 1% for Class C,.75% to .50% for certain purchases of Class A shares and .25% for certain purchases of Class T shares.
Annual Report
Notes to Financial Statements - continued
(Amounts in thousands except ratios)
4. Fees and Other Transactions with Affiliates - continued
Sales Load - continued
For the period, sales charge amounts retained by FDC were as follows:
| Retained
by FDC |
Class A | $ 12 |
Class T | 5 |
Class B* | 90 |
Class C* | 2 |
| $ 109 |
* When Class B and Class C shares are initially sold, FDC pays commissions from its own resources to financial intermediaries through which the sales are made.
Transfer Agent Fees. Fidelity Investments Institutional Operations Company, Inc. (FIIOC), an affiliate of FMR, is the transfer, dividend disbursing and shareholder servicing agent for each class of the Fund, except for Government Income. Fidelity Service Company, Inc. (FSC), an affiliate of FMR, is the transfer agent for Government Income shares. FIIOC and FSC receive account fees and asset-based fees that vary according to the account size and type of account of the shareholders of the respective classes of the Fund. FIIOC and FSC pay for typesetting, printing and mailing of shareholder reports, except proxy statements. For the period, the total transfer agent fees paid by each class to FIIOC or FSC, were as follows:
| Amount | % of
Average
Net Assets |
Class A | $ 232 | .23* |
Class T | 275 | .19* |
Class B | 97 | .25* |
Class C | 64 | .20* |
Government Income | 5,931 | .10 |
Institutional Class | 907 | .18* |
| $ 7,506 | |
* Annualized
Fundwide Operations Fee. Pursuant to the Fundwide Operations and Expense Agreement (FWOE), FMR has agreed to provide for fund level expenses (which do not include transfer agent, Rule 12b-1 fees, compensation of the independent trustees, interest (including commitment fees), taxes or extraordinary expenses, if any) in return for a FWOE fee equal to .35% less the total amount of the management fee. The FWOE paid by the Fund is reduced by an amount equal to the fees and expenses paid to the independent trustees. For the period, the FWOE fee was equivalent to an annual rate of .03% of average net assets.
Annual Report
5. Committed Line of Credit.
The Fund participates with other funds managed by FMR in a $4.2 billion credit facility (the "line of credit") to be utilized for temporary or emergency purposes to fund shareholder redemptions or for other short-term liquidity purposes. The Fund has agreed to pay commitment fees on its pro rata portion of the line of credit, which amounted to $12 and is reflected in Miscellaneous Expense on the Statement of Operations. During the period, there were no borrowings on this line of credit.
6. Security Lending.
The Fund lends portfolio securities from time to time in order to earn additional income. On the settlement date of the loan, the Fund receives collateral (in the form of U.S. Treasury obligations, letters of credit and/or cash) against the loaned securities and maintains collateral in an amount not less than 100% of the market value of the loaned securities during the period of the loan. The market value of the loaned securities is determined at the close of business of the Fund and any additional required collateral is delivered to the Fund on the next business day. If the borrower defaults on its obligation to return the securities loaned because of insolvency or other reasons, a fund could experience delays and costs in recovering the securities loaned or in gaining access to the collateral. Any cash collateral received is invested in cash equivalents. The value of loaned securities and cash collateral at period end are disclosed on the Fund's Statement of Assets and Liabilities. Security lending income represents the income earned on investing cash collateral, less fees and expenses associated with the loan, plus any premium payments that may be received on the loan of certain types of securities. Security lending income is presented in the Statement of Operations as a component of interest income. Net income from lending portfolio securities during the period amounted to $2,400.
7. Expense Reductions.
Through arrangements with the Fund's custodian and each class' transfer agent, credits realized as a result of uninvested cash balances were used to reduce the Fund's expenses. During the period, these credits reduced the Fund's management fee by $11. During the period, credits reduced each class' transfer agent expense as noted in the table below.
| Transfer Agent
expense reduction | |
Class A | $ 9 | |
Class T | 1 | |
Government Income | 509 | |
Institutional Class | 15 | |
| $ 534 | |
Annual Report
Notes to Financial Statements - continued
(Amounts in thousands except ratios)
8. Other.
The Fund's organizational documents provide former and current trustees and officers with a limited indemnification against liabilities arising in connection with the performance of their duties to the Fund. In the normal course of business, the Fund may also enter into contracts that provide general indemnifications. The Fund's maximum exposure under these arrangements is unknown as this would be dependent on future claims that may be made against the Fund. The risk of material loss from such claims is considered remote.
FIIOC, a transfer agent of the Fund, notified the Fund that the Fund's books and records did not reflect a conversion of certain Class B to Class A shares upon their conversion date. In March 2007, FIIOC converted the relevant Class B shares to Class A shares and recorded the conversion in the books and records of the Fund which did not result in a material impact to the Fund's reported net assets or results of operations in the accompanying financial statements. FIIOC has remediated affected shareholders.
At the end of the period, Fidelity Freedom 2010 and Fidelity Freedom 2020 were the owners of record of approximately 14% and 14% of the total outstanding shares of Fidelity Government Income Fund. The Fidelity Freedom Funds were the owners of record, in aggregate, of approximately 44% of the total outstanding shares of Fidelity Government Income Fund.
9. Distributions to Shareholders.
Distributions to shareholders of each class were as follows:
| Year ended
July 31, 2007 A | Year ended
July 31, 2006 |
From net investment income | | |
Class A | $ 4,138 | $ - |
Class T | 5,771 | - |
Class B | 1,298 | - |
Class C | 1,042 | - |
Government Income | 269,231 | 223,332 |
Institutional Class | 21,871 | - |
Total | $ 303,351 | $ 233,332 |
From net realized gain | | |
Government Income | $ 2,616 | $ - |
A Distributions for Class A, Class T, Class B, Class C and Institutional Class are for the period October 24, 2006 (commencement of sale of shares) to July 31, 2007.
Annual Report
10. Share Transactions.
Transactions for each class of shares were as follows:
| Shares | Dollars |
| Years ended July 31, | Years ended July 31, |
| 2007 A | 2006 | 2007 A | 2006 |
Class A | | | | |
Shares sold | 5,668 | - | $ 56,865 | $ - |
Issued in exchange for shares of Fidelity Advisor Government Investment Fund | 11,639 | - | 116,974 | - |
Reinvestment of distributions | 374 | - | 3,759 | - |
Shares redeemed | (3,165) | - | (31,770) | - |
Net increase (decrease) | 14,516 | - | $ 145,828 | $ - |
Class T | | | | |
Shares sold | 3,593 | - | $ 36,101 | $ - |
Issued in exchange for shares of Fidelity Advisor Government Investment Fund | 19,997 | - | 200,973 | - |
Reinvestment of distributions | 549 | - | 5,508 | - |
Shares redeemed | (6,079) | - | (60,985) | - |
Net increase (decrease) | 18,060 | - | $ 181,597 | $ - |
Class B | | | | |
Shares sold | 524 | - | $ 5,289 | $ - |
Issued in exchange for shares of Fidelity Advisor Government Investment Fund | 5,890 | - | 59,191 | - |
Reinvestment of distributions | 104 | - | 1,045 | - |
Shares redeemed | (2,192) | - | (22,000) | - |
Net increase (decrease) | 4,326 | - | $ 43,525 | $ - |
Class C | | | | |
Shares sold | 517 | - | $ 5,201 | $ - |
Issued in exchange for shares of Fidelity Advisor Government Investment Fund | 4,449 | - | 44,717 | - |
Reinvestment of distributions | 64 | - | 643 | - |
Shares redeemed | (1,095) | - | (10,981) | - |
Net increase (decrease) | 3,935 | - | $ 39,580 | $ - |
Government Income | | | | |
Shares sold | 105,528 | 127,904 | $ 1,058,863 | $ 1,289,378 |
Issued in exchange for shares of Spartan Government Income Fund | 71,077 | - | 713,611 | - |
Reinvestment of distributions | 26,531 | 21,894 | 266,315 | 219,740 |
Shares redeemed | (127,164) | (116,476) | (1,271,926) | (1,160,953) |
Net increase (decrease) | 75,972 | 33,322 | $ 766,863 | $ 348,165 |
A Share transactions for Class A, Class T, Class B, Class C and Institutional Class are for the period October 24, 2006 (commencement of sale of shares) to July 31, 2007.
Annual Report
Notes to Financial Statements - continued
(Amounts in thousands except ratios)
10. Share Transactions - continued
| Shares | Dollars |
| Years ended July 31, | Years ended July 31, |
| 2007 A | 2006 | 2007 A | 2006 |
Institutional Class | | | | |
Shares sold | 16,978 | - | $ 170,642 | $ - |
Issued in exchange for shares of Fidelity Advisor Government Investment Fund | 57,200 | - | 574,860 | - |
Reinvestment of distributions | 2,169 | - | 21,772 | - |
Shares redeemed | (4,899) | - | (48,855) | - |
Net increase (decrease) | 71,448 | - | $ 718,419 | $ - |
A Share transactions for Class A, Class T, Class B, Class C and Institutional Class are for the period October 24, 2006 (commencement of sale of shares) to July 31, 2007.
11. Merger Information.
On October 27, 2006, the Fund acquired all of the assets and assumed all of the liabilities of Fidelity Advisor Government Investment Fund and Spartan Government Income Fund pursuant to an agreement and plan of reorganization approved by the shareholders on September 20, 2006. The acquisition was accomplished by an exchange of 11,639, 19,997, 5,890, 4,449, and 57,200 shares of Class A, Class T, Class B, Class C and Institutional Class of the Fund, respectively, for 11,840, 20,358, 6,003, 4,531, and 58,535 shares then outstanding of Class A, Class T, Class B, Class C and Institutional Class (valued at $9.88, $9.87, $9.86, $9.87, and $9.82, per share for Class A, Class T, Class B, Class C and Institutional Class, respectively) of Fidelity Advisor Government Investment Fund. Further, the acquisition was accomplished by an exchange of 71,077 shares of Government Income class for the 66,115 shares then outstanding (valued at $10.79 per share) of Spartan Government Income Fund. The reorganization qualified as a tax-free reorganization for federal income tax purposes with no gain or loss recognized to the funds or their shareholders. Fidelity Advisor Government Investment Fund's net assets, including $1,514 of unrealized depreciation, and Spartan Government Income Fund's net assets, including $3,295 of unrealized depreciation, were combined with the Fund's net assets of $5,214,485 for total net assets after the acquisition of $6,924,811.
Annual Report
Report of Independent Registered Public Accounting Firm
To the Trustees of Fidelity Income Fund and the Shareholders of Fidelity Government Income Fund:
In our opinion, the accompanying statement of assets and liabilities, including the schedule of investments, and the related statements of operations and of changes in net assets and the financial highlights present fairly, in all material respects, the financial position of Fidelity Government Income Fund (a fund of Fidelity Income Fund) at July 31, 2007, the results of its operations for the year then ended, the changes in its net assets for each of the two years in the period then ended and the financial highlights for each of the five years in the period then ended, in conformity with accounting principles generally accepted in the United States of America. These financial statements and financial highlights (hereafter referred to as "financial statements") are the responsibility of the Fidelity Government Income Fund's management. Our responsibility is to express an opinion on these financial statements based on our audits. We conducted our audits of these financial statements in accordance with the standards of the Public Company Accounting Oversight Board (United States). Those standards require that we plan and perform the audit to obtain reasonable assurance about whether the financial statements are free of material misstatement. An audit includes examining, on a test basis, evidence supporting the amounts and disclosures in the financial statements, assessing the accounting principles used and significant estimates made by management, and evaluating the overall financial statement presentation. We believe that our audits, which included confirmation of securities at July 31, 2007 by correspondence with the custodian and brokers, provide a reasonable basis for our opinion.
/s/ PricewaterhouseCoopers LLP
PricewaterhouseCoopers LLP
Boston, Massachusetts
September 17, 2007
Annual Report
Trustees and Officers
The Trustees, Members of the Advisory Board, and executive officers of the trust and fund, as applicable, are listed below. The Board of Trustees governs th fund and is responsible for protecting the interests of shareholders. The Trustees are experienced executives who meet periodically throughout the year to oversee the fund's activities, review contractual arrangements with companies that provide services to the fund, and review the fund's performance. Except for James C. Curvey, each of the Trustees oversees 353 funds advised by FMR or an affiliate. Mr. Curvey oversees 317 funds advised by FMR or an affiliate.
The Trustees hold office without limit in time except that (a) any Trustee may resign; (b) any Trustee may be removed by written instrument, signed by at least two-thirds of the number of Trustees prior to such removal; (c) any Trustee who requests to be retired or who has become incapacitated by illness or injury may be retired by written instrument signed by a majority of the other Trustees; and (d) any Trustee may be removed at any special meeting of shareholders by a two-thirds vote of the outstanding voting securities of the trust. Each Trustee who is not an interested person (as defined in the 1940 Act) (Independent Trustee), shall retire not later than the last day of the calendar year in which his or her 72nd birthday occurs. The Independent Trustees may waive this mandatory retirement age policy with respect to individual Trustees. The executive officers and Advisory Board Members hold office without limit in time, except that any officer and Advisory Board Member may resign or may be removed by a vote of a majority of the Trustees at any regular meeting or any special meeting of the Trustees. Except as indicated, each individual has held the office shown or other offices in the same company for the past five years.
The fund's Statement of Additional Information (SAI) includes more information about the Trustees. To request a free copy, call Fidelity at 1-800-544-8544.
Interested Trustees*:
Correspondence intended for each Trustee who is an interested person may be sent to Fidelity Investments, 82 Devonshire Street, Boston, Massachusetts 02109.
Name, Age; Principal Occupation |
Edward C. Johnson 3d (77) |
| Year of Election or Appointment:1984 Mr. Johnson is Chairman of the Board of Trustees. Mr. Johnson serves as President (2006-present), Chief Executive Officer, Chairman, and a Director of FMR Corp.; Chairman and a Director of FMR; Chairman and a Director of Fidelity Research & Analysis Company (FRAC); Chairman and a Director of Fidelity Investments Money Management, Inc.; and Chairman (2001-present) and a Director of FMR Co., Inc. In addition, Mr. Johnson serves as Chairman and Director of Fidelity International Limited (FIL). |
James C. Curvey (72) |
| Year of Election or Appointment: 2007 Mr. Curvey also serves as Trustee (2007-present) or Member of the Advisory Board (2007-present) of other investment companies advised by FMR. Mr. Curvey is Vice Chairman (2006-present) and Director of FMR Corp. Mr. Curvey joined Fidelity in 1982 and served in numerous senior management positions, including President and Chief Operating Officer of FMR Corp. (1997-2000) and President of Fidelity Strategic Investments (2000-2002). In addition, he serves as a member of the Board of Directors of Geerlings & Wade, Inc. (wine distribution). |
* Trustees have been determined to be "Interested Trustees" by virtue of, among other things, their affiliation with the trusts or various entities under common control with FMR.
Independent Trustees:
Correspondence intended for each Independent Trustee (that is, the Trustees other than the Interested Trustees) may be sent to Fidelity Investments, P.O. Box 55235, Boston, Massachusetts 02205-5235.
Name, Age; Principal Occupation |
Dennis J. Dirks (59) |
| Year of Election or Appointment: 2005 Prior to his retirement in May 2003, Mr. Dirks was Chief Operating Officer and a member of the Board of The Depository Trust & Clearing Corporation (DTCC) (1999-2003). He also served as President, Chief Operating Officer, and Board member of The Depository Trust Company (DTC) (1999-2003) and President and Board member of the National Securities Clearing Corporation (NSCC) (1999-2003). In addition, Mr. Dirks served as Chief Executive Officer and Board member of the Government Securities Clearing Corporation (2001-2003) and Chief Executive Officer and Board member of the Mortgage-Backed Securities Clearing Corporation (2001-2003). Mr. Dirks also serves as a Trustee and a member of the Finance Committee of Manhattan College (2005-present) and a Trustee and a member of the Finance Committee of AHRC of Nassau County (2006-present). |
Albert R. Gamper, Jr. (65) |
| Year of Election or Appointment: 2006 Prior to his retirement in December 2004, Mr. Gamper served as Chairman of the Board of CIT Group Inc. (commercial finance). During his tenure with CIT Group Inc. Mr. Gamper served in numerous senior management positions, including Chairman (1987-1989; 1999-2001; 2002-2004), Chief Executive Officer (1987-2004), and President (1989-2002). He currently serves as a member of the Board of Directors of Public Service Enterprise Group (utilities, 2001-present), Chairman of the Board of Governors, Rutgers University (2004-present), and Chairman of the Board of Saint Barnabas Health Care System. |
George H. Heilmeier (71) |
| Year of Election or Appointment: 2004 Dr. Heilmeier is Chairman Emeritus of Telcordia Technologies (communication software and systems), where prior to his retirement, he served as company Chairman and Chief Executive Officer. He currently serves on the Boards of Directors of The Mitre Corporation (systems engineering and information technology support for the government), and HRL Laboratories (private research and development, 2004-present). He is Chairman of the General Motors Science & Technology Advisory Board and a Life Fellow of the Institute of Electrical and Electronics Engineers (IEEE). Dr. Heilmeier is a member of the Defense Science Board and the National Security Agency Advisory Board. He is also a member of the National Academy of Engineering, the American Academy of Arts and Sciences, and the Board of Overseers of the School of Engineering and Applied Science of the University of Pennsylvania. Previously, Dr. Heilmeier served as a Director of TRW Inc. (automotive, space, defense, and information technology, 1992-2002), Compaq (1994-2002), Automatic Data Processing, Inc. (ADP) (technology-based business outsourcing, 1995-2002), INET Technologies Inc. (telecommunications network surveillance, 2001-2004), and Teletech Holdings (customer management services). He is the recipient of the 2005 Kyoto Prize in Advanced Technology for his invention of the liquid crystal display, and a member of the Consumer Electronics Hall of Fame. |
James H. Keyes (66) |
| Year of Election or Appointment: 2007 Prior to his retirement in 2003, Mr. Keyes was Chairman, President, and Chief Executive Officer of Johnson Controls, Inc. (automotive supplier, 1993-2003). He currently serves as a member of the boards of LSI Logic Corporation (semiconductor technologies), Navistar International Corporation (manufacture and sale of trucks, buses, and diesel engines, 2002-present), and Pitney Bowes, Inc. (integrated mail, messaging, and document management solutions). |
Marie L. Knowles (60) |
| Year of Election or Appointment: 2001 Prior to Ms. Knowles' retirement in June 2000, she served as Executive Vice President and Chief Financial Officer of Atlantic Richfield Company (ARCO) (diversified energy, 1996-2000). From 1993 to 1996, she was a Senior Vice President of ARCO and President of ARCO Transportation Company. She served as a Director of ARCO from 1996 to 1998. She currently serves as a Director of Phelps Dodge Corporation (copper mining and manufacturing) and McKesson Corporation (healthcare service, 2002-present). Ms. Knowles is a Trustee of the Brookings Institution and the Catalina Island Conservancy and also serves as a member of the Advisory Board for the School of Engineering of the University of Southern California. |
Ned C. Lautenbach (63) |
| Year of Election or Appointment: 2000 Mr. Lautenbach is Chairman of the Independent Trustees (2006-present). Mr. Lautenbach has been a partner of Clayton, Dubilier & Rice, Inc. (private equity investment firm) since September 1998. Previously, Mr. Lautenbach was with the International Business Machines Corporation (IBM) from 1968 until his retirement in 1998. Mr. Lautenbach serves as a Director of Sony Corporation (2006-present) and Eaton Corporation (diversified industrial) as well as the Philharmonic Center for the Arts in Naples, Florida. He also is a member of the Board of Trustees of Fairfield University (2005-present), as well as a member of the Council on Foreign Relations. |
Cornelia M. Small (63) |
| Year of Election or Appointment: 2005 Ms. Small is a member (2000-present) and Chairperson (2002-present) of the Investment Committee, and a member (2002-present) of the Board of Trustees of Smith College. Previously, she served as Chief Investment Officer (1999-2000), Director of Global Equity Investments (1996-1999), and a member of the Board of Directors of Scudder, Stevens & Clark (1990-1997) and Scudder Kemper Investments (1997-1999). In addition, Ms. Small served as Co-Chair (2000-2003) of the Annual Fund for the Fletcher School of Law and Diplomacy. |
William S. Stavropoulos (68) |
| Year of Election or Appointment: 2001 Mr. Stavropoulos is Chairman Emeritus of the Board of Directors of The Dow Chemical Company. Since joining The Dow Chemical Company in 1967, Mr. Stavropoulos served in numerous senior management positions, including President (1993-2000; 2002-2003), CEO (1995-2000; 2002-2004), and Chairman of the Executive Committee (2000-2004). Currently, he is a Director of NCR Corporation (data warehousing and technology solutions), Chemical Financial Corporation, Maersk Inc. (industrial conglomerate, 2002-present), Tyco International, Inc. (multinational manufacturing and services, 2007-present), and a member of the Advisory Board for Metalmark Capital (private equity investment firm, 2005-present). He is a special advisor to Clayton, Dubilier & Rice, Inc., a private equity investment firm. He also serves as a member of the Board of Trustees of the American Enterprise Institute for Public Policy Research. In addition, Mr. Stavropoulos is a member of The Business Council, J.P. Morgan International Council and the University of Notre Dame Advisory Council for the College of Science. |
Kenneth L. Wolfe (68) |
| Year of Election or Appointment: 2005 Prior to his retirement in 2001, Mr. Wolfe was Chairman and Chief Executive Officer of Hershey Foods Corporation (1993-2001). He currently serves as a member of the boards of Adelphia Communications Corporation (2003-present), Bausch & Lomb, Inc., and Revlon Inc. (2004-present). |
Advisory Board Members and Executive Officers:
Correspondence intended for Mr. Mauriello may be sent to Fidelity Investments, P.O. Box 55235, Boston, Massachusetts 02205-5235. Correspondence intended for each executive officer and Mr. Lynch may be sent to Fidelity Investments, 82 Devonshire Street, Boston, Massachusetts 02109.
Name, Age; Principal Occupation |
Peter S. Lynch (63) |
| Year of Election or Appointment: 2003 Member of the Advisory Board of Fidelity Income Fund. Mr. Lynch is Vice Chairman and a Director of FMR, and Vice Chairman (2001-present) and a Director of FMR Co., Inc. Previously, Mr. Lynch served as a Trustee of the Fidelity funds (1990-2003). In addition, he serves as a Trustee of Boston College and as the Chairman of the Inner-City Scholarship Fund. |
Joseph Mauriello (62) |
| Year of Election or Appointment: 2007 Member of the Advisory Board of Fidelity Income Fund. Prior to his retirement in January 2006, Mr. Mauriello served in numerous senior management positions including Deputy Chairman and Chief Operating Officer (2004-2005), and Vice Chairman of Financial Services (2002-2004) of KPMG LLP US (professional services firm, 1965-2005). Mr. Mauriello currently serves as a member of the Board of Directors of XL Capital Ltd., (global insurance and re-insurance company, 2006-present) and of Arcadia Resources Inc., (health care services and products, 2007-present). He also served as a Director of the Hamilton Funds of the Bank of New York (2006-2007). |
Kimberley H. Monasterio (43) |
| Year of Election or Appointment: 2007 President and Treasurer of Government Income. Ms. Monasterio also serves as President and Treasurer of other Fidelity funds (2007-present) and is an employee of FMR (2004-present). Previously, Ms. Monasterio served as Deputy Treasurer of the Fidelity funds (2004-2006). Before joining Fidelity Investments, Ms. Monasterio served as Treasurer (2000-2004) and Chief Financial Officer (2002-2004) of the Franklin Templeton Funds and Senior Vice President of Franklin Templeton Services, LLC (2000-2004). |
Boyce I. Greer (51) |
| Year of Election or Appointment: 2006 Vice President of Government Income. Mr. Greer also serves as Vice President of certain Equity Funds (2005-present), certain Asset Allocation Funds (2005-present), Fixed-Income Funds (2006-present), and Money Market Funds (2006-present). Mr. Greer is also a Trustee of other investment companies advised by FMR (2003-present). He is an Executive Vice President of FMR (2005-present) and FMR Co., Inc. (2005-present), and Senior Vice President of Fidelity Investments Money Management, Inc. (2006-present). Previously, Mr. Greer served as a Director and Managing Director of Strategic Advisers, Inc. (2002-2005), and Executive Vice President (2000-2002) and Money Market Group Leader (1997-2002) of the Fidelity Investments Fixed Income Division. He also served as Vice President of Fidelity's Money Market Funds (1997-2002), Senior Vice President of FMR (1997-2002), and Vice President of FIMM (1998-2002). |
David L. Murphy (59) |
| Year of Election or Appointment: 2005 Vice President of Government Income. Mr. Murphy also serves as Vice President of Fidelity's Money Market Funds (2002-present), certain Asset Allocation Funds (2003-present), Fixed-Income Funds (2005-present), and Balanced Funds (2005-present). He serves as Senior Vice President (2000-present) and Head (2004-present) of the Fidelity Investments Fixed Income Division. Mr. Murphy is also a Senior Vice President of Fidelity Investments Money Management, Inc. (2003-present) and an Executive Vice President of FMR (2005-present). Previously, Mr. Murphy served as Money Market Group Leader (2002-2004), Bond Group Leader (2000-2002), and Vice President of Fidelity's Taxable Bond Funds (2000-2002) and Fidelity's Municipal Bond Funds (2001-2002). |
Thomas J. Silvia (46) |
| Year of Election or Appointment: 2005 Vice President of Government Income. Mr. Silvia also serves as Vice President of Fidelity's Fixed-Income Funds (2005-present), certain Balanced Funds (2005-present), certain Asset Allocation Funds (2005-present), and Senior Vice President and Bond Group Leader of the Fidelity Investments Fixed-Income Division (2005-present). Previously, Mr. Silvia served as Director of Fidelity's Taxable Bond portfolio managers (2002-2004) and a portfolio manager in the Bond Group (1997-2004). |
William Irving (43) |
| Year of Election or Appointment: 2007 Vice President of Government Income. Dr. Irving also serves as Vice President of other funds advised by FMR. Prior to assuming his current responsibilities, Dr. Irving worked as a quantitative analyst and portfolio manager. |
Eric D. Roiter (58) |
| Year of Election or Appointment: 1998 Secretary of Government Income. Mr. Roiter also serves as Secretary of other Fidelity funds; Vice President, General Counsel, and Secretary of FMR Co., Inc. (2001-present) and FMR; Assistant Secretary of Fidelity Management & Research (U.K.) Inc. (2001-present), Fidelity Research & Analysis Company (2001-present), and Fidelity Investments Money Management, Inc. (2001-present). Mr. Roiter is an Adjunct Member, Faculty of Law, at Boston College Law School (2003-present). Previously, Mr. Roiter served as Vice President and Secretary of Fidelity Distributors Corporation (FDC) (1998-2005). |
Scott C. Goebel (39) |
| Year of Election or Appointment: 2007 Assistant Secretary of Government Income. Mr. Goebel also serves as Assistant Secretary of other Fidelity funds (2007-present), Vice President and Secretary of FDC (2006-present), and is an employee of FMR. |
R. Stephen Ganis (41) |
| Year of Election or Appointment: 2006 Anti-Money Laundering (AML) officer of Government Income. Mr. Ganis also serves as AML officer of other Fidelity funds (2006-present) and FMR Corp. (2003-present). Before joining Fidelity Investments, Mr. Ganis practiced law at Goodwin Procter, LLP (2000-2002). |
Joseph B. Hollis (59) |
| Year of Election or Appointment: 2006 Chief Financial Officer of Government Income. Mr. Hollis also serves as Chief Financial Officer of other Fidelity funds. Mr. Hollis is President of Fidelity Pricing and Cash Management Services (FPCMS) (2005-present). Mr. Hollis also serves as President and Director of Fidelity Service Company, Inc. (2006-present). Previously, Mr. Hollis served as Senior Vice President of Cash Management Services (1999-2002) and Investment Management Operations (2002-2005). |
Kenneth A. Rathgeber (60) |
| Year of Election or Appointment: 2004 Chief Compliance Officer of Government Income. Mr. Rathgeber also serves as Chief Compliance Officer of other Fidelity funds (2004-present) and Executive Vice President of Risk Oversight for Fidelity Investments (2002-present). He is Chief Compliance Officer of FMR (2005-present), FMR Co., Inc. (2005-present), Fidelity Management & Research (U.K.) Inc. (2005-present), Fidelity Research & Analysis Company (2005-present), Fidelity Investments Money Management, Inc. (2005-present), and Strategic Advisers, Inc. (2005-present). Previously, Mr. Rathgeber served as Executive Vice President and Chief Operating Officer for Fidelity Investments Institutional Services Company, Inc. (1998-2002). |
Bryan A. Mehrmann (46) |
| Year of Election or Appointment: 2005 Deputy Treasurer of Government Income. Mr. Mehrmann also serves as Deputy Treasurer of other Fidelity funds (2005-present) and is an employee of FMR. Previously, Mr. Mehrmann served as Vice President of Fidelity Investments Institutional Services Group (FIIS)/Fidelity Investments Institutional Operations Corporation, Inc. (FIIOC) Client Services (1998-2004). |
Kenneth B. Robins (37) |
| Year of Election or Appointment: 2005 Deputy Treasurer of Government Income. Mr. Robins also serves as Deputy Treasurer of other Fidelity funds (2005-present) and is an employee of FMR (2004-present). Before joining Fidelity Investments, Mr. Robins worked at KPMG LLP, where he was a partner in KPMG's department of professional practice (2002-2004) and a Senior Manager (1999-2000). In addition, Mr. Robins served as Assistant Chief Accountant, United States Securities and Exchange Commission (2000-2002). |
Robert G. Byrnes (40) |
| Year of Election or Appointment: 2005 Assistant Treasurer of Government Income. Mr. Byrnes also serves as Assistant Treasurer of other Fidelity funds (2005-present) and is an employee of FMR (2005-present). Previously, Mr. Byrnes served as Vice President of FPCMS (2003-2005). Before joining Fidelity Investments, Mr. Byrnes worked at Deutsche Asset Management where he served as Vice President of the Investment Operations Group (2000-2003). |
Peter L. Lydecker (53) |
| Year of Election or Appointment: 2004 Assistant Treasurer of Government Income. Mr. Lydecker also serves as Assistant Treasurer of other Fidelity funds (2004) and is an employee of FMR. |
Gary W. Ryan (48) |
| Year of Election or Appointment: 2005 Assistant Treasurer of Government Income. Mr. Ryan also serves as Assistant Treasurer of other Fidelity funds (2005-present) and is an employee of FMR (2005-present). Previously, Mr. Ryan served as Vice President of Fund Reporting in FPCMS (1999-2005). |
Annual Report
Distributions
A total of 15.00% of the dividends distributed during the fiscal year was derived from interest on U.S. Government securities which is generally exempt from state income tax.
The fund designates $231,780,564 of distributions paid during the period January 1, 2007 to July 31, 2007 as qualifying to be taxed as interest-related dividends for nonresident alien shareholders.
The fund will notify shareholders in January 2008 of amounts for use in preparing 2007 income tax returns.
Annual Report
Board Approval of Investment Advisory Contracts and Management Fees
Fidelity Government Income Fund
Each year, typically in June, the Board of Trustees, including the Independent Trustees (together, the Board), votes on the renewal of the management contract and sub-advisory agreements (together, the Advisory Contracts) for the fund. The Board, assisted by the advice of fund counsel and Independent Trustees' counsel, requests and considers a broad range of information throughout the year.
The Board meets regularly each month except August and takes into account throughout the year matters bearing on Advisory Contracts. The Board, acting directly and through its separate committees, considers at each of its meetings factors that are relevant to the annual renewal of the fund's Advisory Contracts, including the services and support provided to the fund and its shareholders. At the time of the renewal, the Board had 12 standing committees, each composed of Independent Trustees with varying backgrounds, to which the Board has assigned specific subject matter responsibilities in order to enhance effective decision-making by the Board. Each committee has adopted a written charter outlining the structure and purposes of the committee. One such committee, the Fixed-Income Contract Committee, meets periodically as needed throughout the year to consider matters specifically related to the annual renewal of Advisory Contracts. The committee requests and receives information on, and makes recommendations to the Independent Trustees concerning, the approval and annual review of the Advisory Contracts.
At its June 2007 meeting, the Board of Trustees, including the Independent Trustees, unanimously determined to renew the Advisory Contracts for the fund. In reaching its determination, the Board considered all factors it believed relevant, including (i) the nature, extent, and quality of the services to be provided to the fund and its shareholders (including the investment performance of the fund); (ii) the competitiveness of the management fee and total expenses of the fund; (iii) the total costs of the services to be provided by and the profits to be realized by the investment adviser and its affiliates from the relationship with the fund; (iv) the extent to which economies of scale would be realized as the fund grows; and (v) whether fee levels reflect these economies of scale, if any, for the benefit of fund shareholders. The Board also approved amendments to the fund's agreements with foreign sub-advisers to clarify that each sub-adviser provides services as an independent contractor.
In determining whether to renew the Advisory Contracts for the fund, the Board ultimately reached a determination, with the assistance of fund counsel and Independent Trustees' counsel, that the renewal of the Advisory Contracts and the compensation to be received by Fidelity under the management contract is consistent with Fidelity's fiduciary duty under applicable law. In addition to evaluating the specific factors noted above, the Board, in reaching its determination, is aware that shareholders in the fund have a broad range of investment choices available to them, including a wide choice among mutual funds offered by competitors to Fidelity, and that the fund's shareholders, with the opportunity to review and weigh the disclosure provided by the fund in its prospectus and other public disclosures, have chosen to invest in this fund, managed by Fidelity.
Annual Report
Nature, Extent, and Quality of Services Provided. The Board considered staffing within the investment adviser, FMR, and the sub-advisers (together, the Investment Advisers), including the background of the fund's portfolio manager and the fund's investment objective and discipline. The Independent Trustees also had discussions with senior management of Fidelity's investment operations and investment groups. The Board considered the structure of the portfolio manager compensation program and whether this structure provides appropriate incentives.
Resources Dedicated to Investment Management and Support Services. The Board reviewed the size, education, and experience of the Investment Advisers' investment staff, their use of technology, and the Investment Advisers' approach to recruiting, training, and retaining portfolio managers and other research, advisory, and management personnel. The Board considered Fidelity's extensive global research capabilities that enable the Investment Advisers to aggregate data from various sources in an effort to produce positive investment results. The Board noted that Fidelity's analysts have access to a variety of technological tools that enable them to perform both fundamental and quantitative analysis and to specialize in various disciplines. The Board also considered that Fidelity's portfolio managers and analysts have access to daily portfolio attribution that allows for monitoring of a fund's portfolio, as well as an electronic communication system that provides immediate real-time access to research concerning issuers and credit enhancers. In addition, the Board considered the trading resources that are an integrated part of the fixed-income portfolio management investment process.
Shareholder and Administrative Services. The Board considered (i) the nature, extent, quality, and cost of advisory, administrative, distribution, and shareholder services performed by the Investment Advisers and their affiliates under the Advisory Contracts and under separate agreements covering transfer agency, pricing and bookkeeping, and securities lending services for the fund; (ii) the nature and extent of the Investment Advisers' supervision of third party service providers, principally custodians and subcustodians; and (iii) the resources devoted to, and the record of compliance with, the fund's compliance policies and procedures.
The Board noted that the growth of fund assets across the complex allows Fidelity to reinvest in the development of services designed to enhance the value or convenience of the Fidelity funds as investment vehicles. These services include 24-hour access to account information and market information through phone representatives and over the Internet, and investor education materials and asset allocation tools.
Annual Report
Board Approval of Investment Advisory Contracts and
Management Fees - continued
Investment in a Large Fund Family. The Board considered the benefits to shareholders of investing in a Fidelity fund, including the benefits of investing in a fund that is part of a large family of funds offering a variety of investment disciplines and providing for a large variety of mutual fund investor services. For example, fund shareholders are offered the privilege of exchanging shares of the fund for shares of other Fidelity funds, as set forth in the fund's prospectus, without paying a sales charge. The Board noted that, since the last Advisory Contract renewals in June 2006, Fidelity has taken a number of actions that benefited particular funds, including (i) dedicating additional resources to investment research and to restructure the investment research teams; (ii) contractually agreeing to reduce the management fee on Fidelity Advisor Floating Rate High Income Fund; (iii) contractually agreeing to reduce the management fees on Fidelity's California, Massachusetts, New Jersey, and New York AMT Tax-Free Money Market Funds, launching new Institutional Classes and Service Classes of these funds, and contractually agreeing to impose expense limitations on these funds; (iv) eliminating the exchange fee on the Fidelity Select Portfolios and reducing the pricing and bookkeeping fee rates for these funds; (v) reducing the maximum transfer agency fee rates on high income funds and certain equity funds; (vi) proposing amended management contracts that, if approved by shareholders, will add a performance adjustment component to the management fees paid by 18 Fidelity Advisor equity funds; (vii) contractually agreeing to reduce fees for Ultra-Short Central Fund and the money market Central Funds; (viii) waiving the Fidelity Advisor funds' contingent deferred sales charge on certain redemptions made through systematic withdrawal programs; and (ix) amending the management contracts for equity and fixed-income funds whose management contracts incorporate a "group fee" structure by adding four new fee "breakpoints" to the group fee rate schedules.
Investment Performance. The Board considered whether the fund has operated within its investment objective, as well as its record of compliance with its investment restrictions. It also reviewed the fund's absolute investment performance for Fidelity Government Income (retail class), as well as the fund's relative investment performance for Fidelity Government Income (retail class) measured against (i) a proprietary custom index, and (ii) a peer group of mutual funds deemed appropriate by the Board over multiple periods. The following charts considered by the Board show, over the one-, three-, and five-year periods ended December 31, 2006, the cumulative total returns of Fidelity Government Income (retail class), the cumulative total returns of a proprietary custom index ("benchmark"), and a range of cumulative total returns of a peer group of mutual funds identified by Lipper Inc. as having an investment objective similar to that of the fund. (The Advisor classes of the fund had less than one year of performance as of December 31, 2006.) The box within each chart shows the 25th percentile return (bottom of box) and the 75th percentile return (top of box) of the peer group. Returns shown above the box are in the first quartile and returns shown below the box are in the fourth quartile. The percentage beaten number noted below each chart corresponds to the percentile box and represents the percentage of funds in the peer group whose performance was equal to or lower than that of Fidelity Government Income (retail class). The fund's proprietary custom index is an index developed by FMR that represents the performance of the fund's general investment categories.
Annual Report
Fidelity Government Income Fund

The Board reviewed the fund's relative investment performance against its peer group and stated that the performance of Fidelity Government Income (retail class) was in the first quartile for all the periods shown. The Board also stated that the relative investment performance of the fund was lower than its benchmark for all the periods shown. The Board discussed with FMR actions to be taken by FMR to improve the fund's below-benchmark performance.
Based on its review, and giving particular weight to the nature and quality of the resources dedicated by the Investment Advisers to maintain and improve relative performance, the Board concluded that the nature, extent, and quality of the services provided to the fund will benefit the fund's shareholders, particularly in light of the Board's view that the fund's shareholders benefit from investing in a fund that is part of a large family of funds offering a variety of investment disciplines and services.
Competitiveness of Management Fee and Total Fund Expenses. The Board considered the fund's management fee and total expenses compared to "mapped groups" of competitive funds and classes. Fidelity creates "mapped groups" by combining similar Lipper investment objective categories that have comparable management fee characteristics. Combining Lipper investment objective categories aids the Board's management fee and total expense comparisons by broadening the competitive group used for comparison and by reducing the number of universes to which various Fidelity funds are compared.
Annual Report
Board Approval of Investment Advisory Contracts and
Management Fees - continued
The Board considered two proprietary management fee comparisons for the 12-month periods shown in the chart below. The group of Lipper funds used by the Board for management fee comparisons is referred to below as the "Total Mapped Group" and, for the reasons explained above, is broader than the Lipper peer group used by the Board for performance comparisons. The Total Mapped Group comparison focuses on a fund's standing relative to the total universe of comparable funds available to investors, in terms of gross management fees before expense reimbursements or caps. "TMG %" represents the percentage of funds in the Total Mapped Group that had management fees that were lower than the fund's. For example, a TMG % of 8% means that 92% of the funds in the Total Mapped Group had higher management fees than the fund. The "Asset-Size Peer Group" (ASPG) comparison focuses on a fund's standing relative to non-Fidelity funds similar in size to the fund within the Total Mapped Group. The ASPG represents at least 15% of the funds in the Total Mapped Group with comparable asset size and management fee characteristics, subject to a minimum of 50 funds (or all funds in the Total Mapped Group if fewer than 50). Additional information, such as the ASPG quartile in which the fund's management fee ranked, is also included in the chart and considered by the Board.
Fidelity Government Income Fund
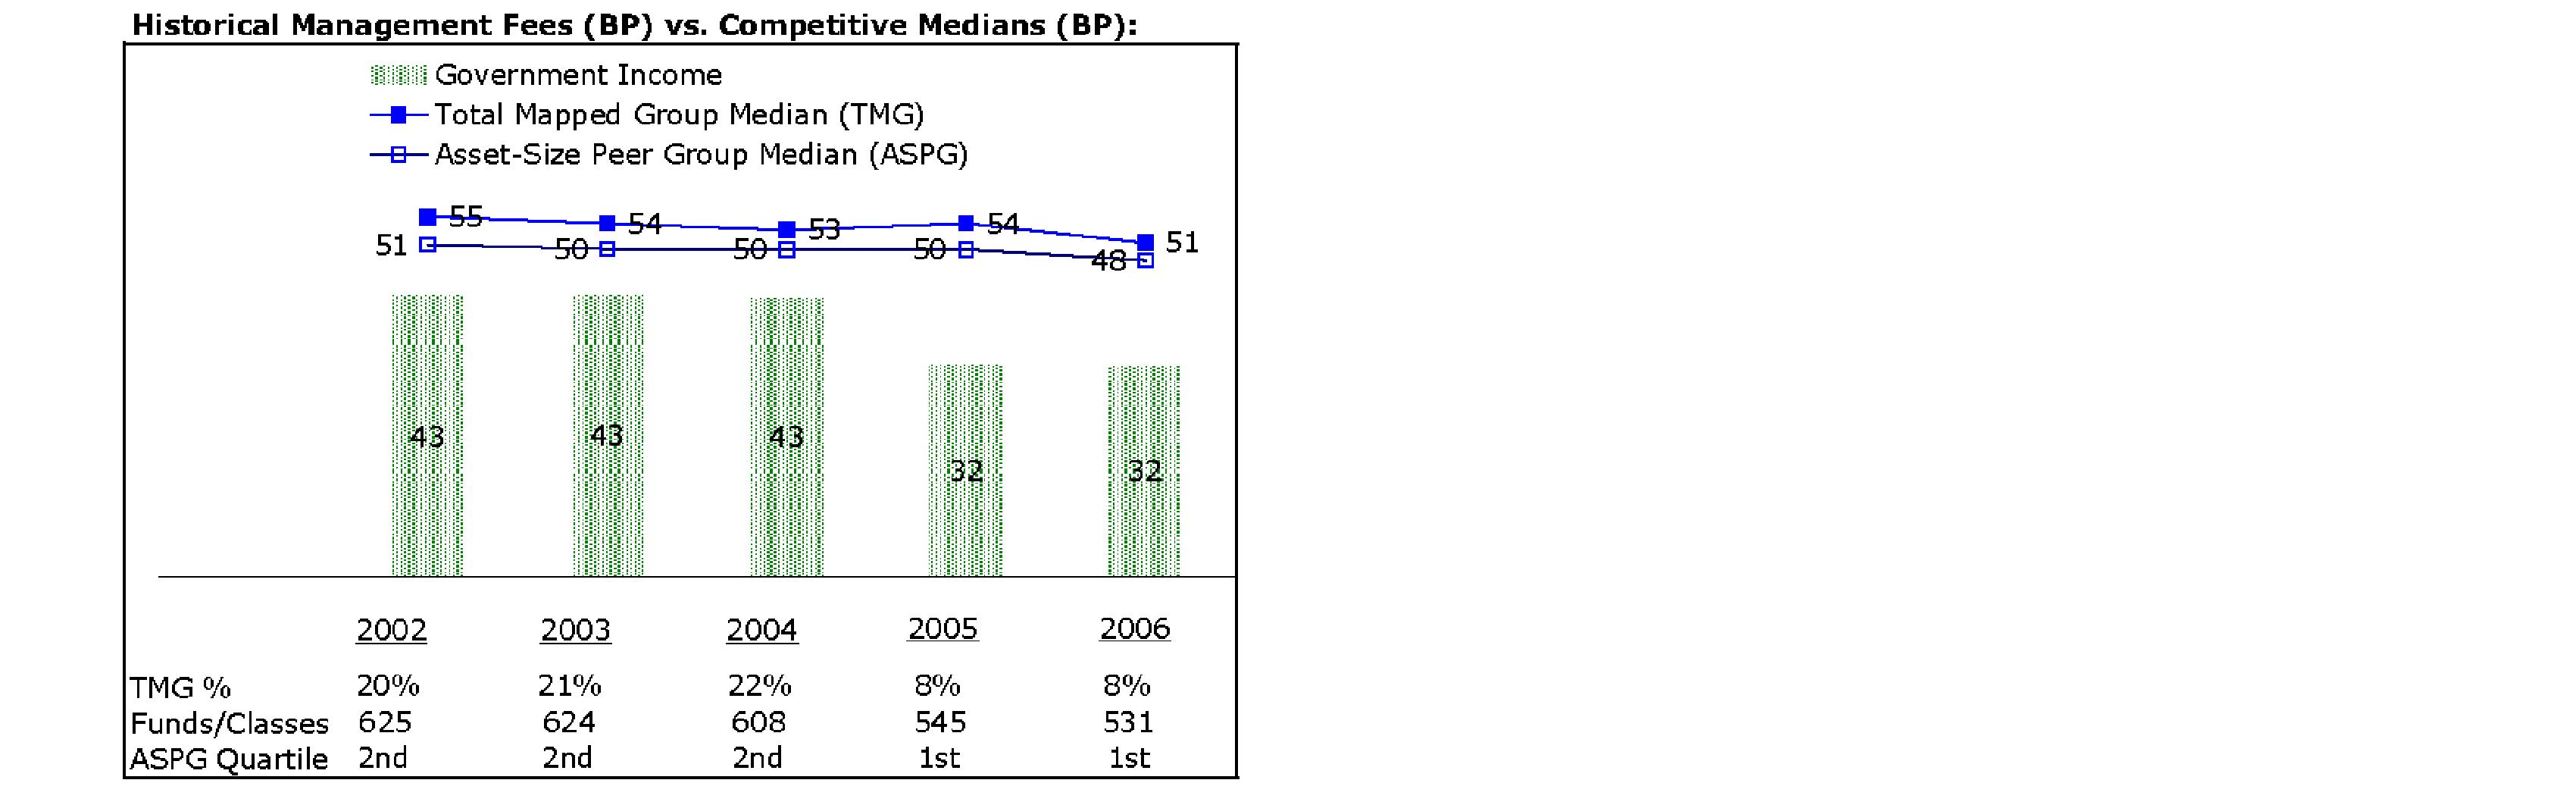
The Board noted that the fund's management fee ranked below the median of its Total Mapped Group and below the median of its ASPG for 2006.
Annual Report
Furthermore, the Board considered that it had approved an amendment (effective June 1, 2005) to the fund's management contract that lowered the fund's individual fund fee rate from 30 basis points to 20 basis points. The Board considered that the fund's chart reflects the fund's lower management fee for 2005, as if the lower rate were in effect for the entire year.
Based on its review, the Board concluded that the fund's management fee was fair and reasonable in light of the services that the fund receives and the other factors considered.
In its review of each class's total expenses, the Board considered the fund's management fee as well as other fund or class expenses, as applicable, such as transfer agent fees, pricing and bookkeeping fees, fund-paid 12b-1 fees, and custodial, legal, and audit fees. The Board also noted the effects of any waivers and reimbursements on fees and expenses. As part of its review, the Board also considered current and historical total expenses of each class of the fund compared to competitive fund median expenses. Each class of the fund is compared to those funds and classes in the Total Mapped Group (used by the Board for management fee comparisons) that have a similar sales load structure.
The Board also considered that the current contractual arrangements for the fund (i) have the effect of setting the total "fund-level" expenses (including, among certain other expenses, the management fee) for each class at 35 basis points, (ii) lower and limit the "class-level" transfer agent fee for Fidelity Government Income (retail class) to 10 basis points, and (iii) limit the total expenses for Fidelity Government Income (retail class) to 45 basis points. These contractual arrangements may not be increased without the approval of the Board and the shareholders of the applicable class. The fund's Advisor classes are subject to different "class-level" expenses (transfer agent fees and 12b-1 fees).
The Board noted that the total expenses of each class ranked below its competitive median for 2006.
The Board recognized that the fund's management contract incorporates a "group fee" structure, which provides for lower group fee rates as total fund assets under FMR's management increase, and for higher group fee rates as total fund assets under FMR's management decrease. FMR determines the group fee rates based on a tiered asset "breakpoint" schedule. In connection with the renewal of the fund's management contract, the Board approved amendments to the fund's management contract that added four new fee breakpoints to the group fee rate schedule for assets under FMR's management above $1,386 billion. The Board considered that the group fee rate declines under both the present and amended schedules, but that under the amended schedule, the group fee rate declines faster as assets under FMR's management exceed $1,386 billion. The Board noted, however, that because the current contractual arrangements set the total fund-level expenses for each class at 35 basis points, increases or decreases in the management fee due to changes in the group fee rate will not impact total expenses.
Annual Report
Board Approval of Investment Advisory Contracts and
Management Fees - continued
In its review of total expenses, the Board also considered Fidelity fee structures and other information on clients that FMR and its affiliates service in other competitive markets, such as other mutual funds advised or subadvised by FMR or its affiliates, pension plan clients, and other institutional clients.
Based on its review, the Board concluded that the total expenses of each class of the fund were reasonable in light of the services that the fund and its shareholders receive and the other factors considered.
Costs of the Services and Profitability. The Board considered the revenues earned and the expenses incurred by Fidelity in conducting the business of developing, marketing, distributing, managing, administering and servicing the fund and its shareholders. The Board also considered the level of Fidelity's profits in respect of all the Fidelity funds.
On an annual basis, FMR presents to the Board Fidelity's profitability for the fund. Fidelity calculates the profitability for each fund, as well as aggregate profitability for groups of Fidelity funds and all Fidelity funds, using a series of detailed revenue and cost allocation methodologies which originate with the audited books and records of Fidelity. The Audit Committee of the Board reviews any significant changes from the prior year's methodologies.
PricewaterhouseCoopers LLP (PwC), independent registered public accounting firm and auditor to Fidelity and certain Fidelity funds, has been engaged annually by the Board as part of the Board's assessment of the results of Fidelity's profitability analysis. PwC's engagement includes the review and assessment of Fidelity's methodologies used in determining the revenues and expenses attributable to Fidelity's mutual fund business, and completion of agreed-upon procedures surrounding the mathematical accuracy of fund profitability and its conformity to allocation methodologies. After considering PwC's reports issued under the engagement and information provided by Fidelity, the Board believes that while other allocation methods may also be reasonable, Fidelity's profitability methodologies are reasonable in all material respects.
The Board has also reviewed Fidelity's non-fund businesses and any fall-out benefits related to the mutual fund business as well as cases where Fidelity's affiliates may benefit from or be related to the fund's business.
The Board considered the costs of the services provided by and the profits realized by Fidelity in connection with the operation of the fund and determined that the amount of profit is a fair entrepreneurial profit for the management of the fund.
Annual Report
Economies of Scale. The Board considered whether there have been economies of scale in respect of the management of the Fidelity funds, whether the Fidelity funds (including the fund) have appropriately benefited from any such economies of scale, and whether there is potential for realization of any further economies of scale. The Board considered the extent to which the fund will benefit from economies of scale through increased services to the fund, through waivers or reimbursements, or through fee or expense reductions, including (Advisor classes only) reductions that occur through operation of the transfer agent agreement. The transfer agent fee varies in part based on the number of accounts in the fund. If the number of accounts decreases or the average account size increases, the overall transfer agent fee rate decreases. The Board concluded that any potential economies of scale are being shared between fund shareholders and Fidelity in an appropriate manner.
Additional Information Requested by the Board. In order to develop fully the factual basis for consideration of the Fidelity funds' Advisory Contracts, the Board requested and received additional information on several topics, including (i) Fidelity's fund profitability methodology, profitability by investment discipline, and profitability trends within certain funds; (ii) Fidelity's compensation structure relative to competitors and its effect on profitability; (iii) funds and accounts managed by Fidelity other than the Fidelity funds, including fee arrangements; (iv) the total expenses of certain funds and classes relative to competitors; (v) fund performance trends; (vi) fall-out benefits received by certain Fidelity affiliates; and (vii) Fidelity's fee structures.
Based on its evaluation of all of the conclusions noted above, and after considering all material factors, the Board ultimately concluded that the advisory fee structures are fair and reasonable, and that the fund's Advisory Contracts should be renewed.
Annual Report
Managing Your Investments
Fidelity offers several ways to conveniently manage your personal investments via your telephone or PC. You can access your account information, conduct trades and research your investments 24 hours a day.
By Phone
Fidelity Automated Service Telephone provides a single toll-free number to access account balances, positions, quotes and trading. It's easy to navigate the service, and on your first call, the system will help you create a personal identification number (PIN) for security.
(phone_graphic)
Fidelity Automated
Service Telephone (FAST®)
1-800-544-5555
Press
1 For mutual fund and brokerage trading.
2 For quotes.*
3 For account balances and holdings.
4 To review orders and mutual
fund activity.
5 To change your PIN.
*0 To speak to a Fidelity representative.
By PC
Fidelity's web site on the Internet provides a wide range of information, including daily financial news, fund performance, interactive planning tools and news about Fidelity products and services.
(computer_graphic)
Fidelity's Web Site
www.fidelity.com
* When you call the quotes line, please remember that a fund's yield and return will vary and, except for money market funds, share price will also vary. This means that you may have a gain or loss when you sell your shares. There is no assurance that money market funds will be able to maintain a stable $1 share price; an investment in a money market fund is not insured or guaranteed by the U.S. government. Total returns are historical and include changes in share price, reinvestment of dividends and capital gains, and the effects of any sales charges.
Annual Report
To Write Fidelity
We'll give your correspondence immediate attention and send you written confirmation upon completion of your request.
(letter_graphic)
Making Changes
To Your Account
(such as changing name, address, bank, etc.)
Fidelity Investments
P.O. Box 770001
Cincinnati, OH 45277-0002
(letter_graphic)
For Non-Retirement
Accounts
Buying shares
Fidelity Investments
P.O. Box 770001
Cincinnati, OH 45277-0003
Overnight Express
Fidelity Investments
Attn: Distribution Services
100 Crosby Parkway - KC1H
Covington, KY 41015
Selling shares
Fidelity Investments
P.O. Box 770001
Cincinnati, OH 45277-0035
Overnight Express
Fidelity Investments
Attn: Distribution Services
100 Crosby Parkway - KC1H
Covington, KY 41015
General Correspondence
Fidelity Investments
P.O. Box 500
Merrimack, NH 03054-0500
(letter_graphic)
For Retirement
Accounts
Buying shares
Fidelity Investments
P.O. Box 770001
Cincinnati, OH 45277-0003
Selling shares
Fidelity Investments
P.O. Box 770001
Cincinnati, OH 45277-0035
Overnight Express
Fidelity Investments
Attn: Distribution Services
100 Crosby Parkway - KC1H
Covington, KY 41015
General Correspondence
Fidelity Investments
P.O. Box 500
Merrimack, NH 03054-0500
Annual Report
To Visit Fidelity
For directions and hours,
please call 1-800-544-9797.
Arizona
7001 West Ray Road
Chandler, AZ
15445 N. Scottsdale Road
Scottsdale, AZ
California
815 East Birch Street
Brea, CA
1411 Chapin Avenue
Burlingame, CA
851 East Hamilton Avenue
Campbell, CA
19200 Von Karman Avenue
Irvine, CA
601 Larkspur Landing Circle
Larkspur, CA
10100 Santa Monica Blvd.
Los Angeles, CA
27101 Puerta Real
Mission Viejo, CA
73-575 El Paseo
Palm Desert, CA
251 University Avenue
Palo Alto, CA
123 South Lake Avenue
Pasadena, CA
16995 Bernardo Ctr. Drive
Rancho Bernardo, CA
1220 Roseville Parkway
Roseville, CA
1740 Arden Way
Sacramento, CA
7676 Hazard Center Drive
San Diego, CA
11943 El Camino Real
San Diego, CA
8 Montgomery Street
San Francisco, CA
3793 State Street
Santa Barbara, CA
1200 Wilshire Boulevard
Santa Monica, CA
21701 Hawthorne Boulevard
Torrance, CA
2001 North Main Street
Walnut Creek, CA
6300 Canoga Avenue
Woodland Hills, CA
Colorado
1625 Broadway
Denver, CO
9185 Westview Road
Lone Tree, CO
Connecticut
48 West Putnam Avenue
Greenwich, CT
265 Church Street
New Haven, CT
300 Atlantic Street
Stamford, CT
29 South Main Street
West Hartford, CT
Delaware
400 Delaware Avenue
Wilmington, DE
Florida
4400 N. Federal Highway
Boca Raton, FL
121 Alhambra Plaza
Coral Gables, FL
2948 N. Federal Highway
Ft. Lauderdale, FL
4671 Town Center Parkway
Jacksonville, FL
1907 West State Road 434
Longwood, FL
8880 Tamiami Trail, North
Naples, FL
3501 PGA Boulevard
Palm Beach Gardens, FL
3550 Tamiami Trail, South
Sarasota, FL
1502 N. Westshore Blvd.
Tampa, FL
2465 State Road 7
Wellington, FL
Georgia
3445 Peachtree Road, N.E.
Atlanta, GA
1000 Abernathy Road
Atlanta, GA
Illinois
One North LaSalle Street
Chicago, IL
875 North Michigan Ave.
Chicago, IL
1415 West 22nd Street
Oak Brook, IL
1572 East Golf Road
Schaumburg, IL
3232 Lake Avenue
Wilmette, IL
Indiana
4729 East 82nd Street
Indianapolis, IN
Kansas
5400 College Boulevard
Overland Park, KS
Maine
Three Canal Plaza
Portland, ME
Maryland
7315 Wisconsin Avenue
Bethesda, MD
One W. Pennsylvania Ave.
Towson, MD
Massachusetts
801 Boylston Street
Boston, MA
155 Congress Street
Boston, MA
300 Granite Street
Braintree, MA
44 Mall Road
Burlington, MA
238 Main Street
Cambridge, MA
405 Cochituate Road
Framingham, MA
416 Belmont Street
Worcester, MA
Annual Report
Michigan
500 E. Eisenhower Pkwy.
Ann Arbor, MI
280 Old N. Woodward Ave.
Birmingham, MI
43420 Grand River Avenue
Novi, MI
29155 Northwestern Hwy.
Southfield, MI
Minnesota
7600 France Avenue South
Edina, MN
Missouri
1524 South Lindbergh Blvd.
St. Louis, MO
Nevada
2225 Village Walk Drive
Henderson, NV
New Jersey
150 Essex Street
Millburn, NJ
56 South Street
Morristown, NJ
396 Route 17, North
Paramus, NJ
3518 Route 1 North
Princeton, NJ
530 Broad Street
Shrewsbury, NJ
New York
1055 Franklin Avenue
Garden City, NY
37 West Jericho Turnpike
Huntington Station, NY
1271 Avenue of the Americas
New York, NY
980 Madison Avenue
New York, NY
61 Broadway
New York, NY
350 Park Avenue
New York, NY
200 Fifth Avenue
New York, NY
733 Third Avenue
New York, NY
11 Penn Plaza
New York, NY
2070 Broadway
New York, NY
1075 Northern Blvd.
Roslyn, NY
799 Central Park Avenue
Scarsdale, NY
North Carolina
4611 Sharon Road
Charlotte, NC
7011 Fayetteville Road
Durham, NC
Ohio
3805 Edwards Road
Cincinnati, OH
1324 Polaris Parkway
Columbus, OH
28699 Chagrin Boulevard
Woodmere Village, OH
Oregon
7493 SW Bridgeport Road
Tigard, OR
Pennsylvania
600 West DeKalb Pike
King of Prussia, PA
1735 Market Street
Philadelphia, PA
12001 Perry Highway
Wexford, PA
Rhode Island
47 Providence Place
Providence, RI
Tennessee
6150 Poplar Avenue
Memphis, TN
Texas
10000 Research Boulevard
Austin, TX
4001 Northwest Parkway
Dallas, TX
12532 Memorial Drive
Houston, TX
2701 Drexel Drive
Houston, TX
6560 Fannin Street
Houston, TX
6500 N. MacArthur Blvd.
Irving, TX
6005 West Park Boulevard
Plano, TX
14100 San Pedro
San Antonio, TX
1576 East Southlake Blvd.
Southlake, TX
19740 IH 45 North
Spring, TX
Utah
279 West South Temple
Salt Lake City, UT
Virginia
1861 International Drive
McLean, VA
Washington
411 108th Avenue, N.E.
Bellevue, WA
1518 6th Avenue
Seattle, WA
Washington, DC
1900 K Street, N.W.
Washington, DC
Wisconsin
595 North Barker Road
Brookfield, WI
Fidelity Brokerage Services, Inc., 100 Summer St., Boston, MA 02110 Member NYSE/SIPC
Annual Report
Annual Report
Annual Report
Investment Adviser
Fidelity Management & Research Company
Boston, MA
Investment Sub-Advisers
Fidelity Research & Analysis Company
Fidelity Investments
Money Management, Inc.
Fidelity International Investment Advisors
Fidelity International Investment Advisors
(U.K.) Limited
General Distributor
Fidelity Distributors Corporation
Boston, MA
Transfer and Service Agent
Fidelity Service Company, Inc.
Boston, MA
Custodian
The Bank of New York
New York, NY
The Fidelity Telephone Connection
Mutual Fund 24-Hour Service
Exchanges/Redemptions
and Account Assistance 1-800-544-6666
Product Information 1-800-544-6666
Retirement Accounts 1-800-544-4774
(8 a.m. - 9 p.m.)
TDD Service 1-800-544-0118
for the deaf and hearing impaired
(9 a.m. - 9 p.m. Eastern time)
Fidelity Automated Service
Telephone (FAST®)(automated graphic) 1-800-544-5555
(automated graphic) Automated line for quickest service
GVT-UANN-0907
1.789246.104
(Fidelity Investment logo)(registered trademark)
Corporate Headquarters
82 Devonshire St., Boston, MA 02109
www.fidelity.com
(Fidelity Investment logo)(registered trademark)
Fidelity Advisor
Government Income
Fund - Class A, Class T, Class B
and Class C
Annual Report
July 31, 2007
Class A, Class T, Class B, and Class C are classes of Fidelity® Government Income Fund
(2_fidelity_logos) (Registered_Trademark)
Contents
Chairman's Message | <Click Here> | Ned Johnson's message to shareholders. |
Performance | <Click Here> | How the fund has done over time. |
Management's Discussion | <Click Here> | The manager's review of fund performance, strategy and outlook. |
Shareholder Expense Example | <Click Here> | An example of shareholder expenses. |
Investment Changes | <Click Here> | A summary of major shifts in the fund's investments over the past six months. |
Investments | <Click Here> | A complete list of the fund's investments with their market values. |
Financial Statements | <Click Here> | Statements of assets and liabilities, operations, and changes in net assets, as well as financial highlights. |
Notes | <Click Here> | Notes to the financial statements. |
Report of Independent Registered Public Accounting Firm | <Click Here> | |
Trustees and Officers | <Click Here> | |
Distributions | <Click Here> | |
Board Approval of Investment Advisory Contracts and Management Fees | <Click Here> | |
To view a fund's proxy voting guidelines and proxy voting record for the 12-month period ended June 30, visit http://www.fidelity.com (search for "proxy voting guidelines") or visit the Securities and Exchange Commission's (SEC) web site at http://www.sec.gov. You may also call 1-877-208-0098 to request a free copy of the proxy voting guidelines.
Standard & Poor's, S&P and S&P 500 are registered service marks of The McGraw-Hill Companies, Inc. and have been licensed for use by Fidelity Distributors Corporation.
Other third party marks appearing herein are the property of their respective owners.
All other marks appearing herein are registered or unregistered trademarks or service marks of FMR Corp. or an affiliated company.
Annual Report
This report and the financial statements contained herein are submitted for the general information of the shareholders of the fund. This report is not authorized for distribution to prospective investors in the fund unless preceded or accompanied by an effective prospectus.
A fund files its complete schedule of portfolio holdings with the SEC for the first and third quarters of each fiscal year on Form N-Q. Forms N-Q are available on the SEC's web site at http://www.sec.gov. A fund's Forms N-Q may be reviewed and copied at the SEC's Public Reference Room in Washington, DC. Information regarding the operation of the SEC's Public Reference Room may be obtained by calling 1-800-SEC-0330. For a complete list of a fund's portfolio holdings, view the most recent holdings listing, semiannual report, or annual report on Fidelity's web site at http://www.fidelity.com or http://www.advisor.fidelity.com, as applicable.
NOT FDIC INSURED · MAY LOSE VALUE · NO BANK GUARANTEE
Neither the fund nor Fidelity Distributors Corporation is a bank.
Annual Report
Chairman's Message
(photo_of_Edward_C_Johnson_3d)
Dear Shareholder:
Stocks are currently on pace to register their fifth straight year of positive returns, although gains could be trimmed if the U.S. economy continues to slow. While financial markets are always unpredictable, there are a number of time-tested principles that can put the historical odds in your favor.
One of the basic tenets is to invest for the long term. Over time, riding out the markets' inevitable ups and downs has proven much more effective than selling into panic or chasing the hottest trend. Even missing only a few of the markets' best days can significantly diminish investor returns. Patience also affords the benefits of compounding - of earning interest on additional income or reinvested dividends and capital gains. There are tax advantages and cost benefits to consider as well. The more you sell, the more taxes you pay, and the more you trade, the higher the costs. While staying the course doesn't eliminate risk, it can considerably lessen the effect of short-term declines.
You can further manage your investing risk through diversification. And today, more than ever, geographic diversification should be taken into account. Studies indicate that asset allocation is the single most important determinant of a portfolio's long-term success. The right mix of stocks, bonds and cash - aligned to your particular risk tolerance and investment objective - is very important. Age-appropriate rebalancing is also an essential aspect of asset allocation. For younger investors, an emphasis on equities - which historically have been the best-performing asset class over time - is encouraged. As investors near their specific goal, such as retirement or sending a child to college, consideration may be given to replacing volatile assets (e.g. common stocks) with more-stable fixed investments (bonds or savings plans).
A third investment principle - investing regularly - can help lower the average cost of your purchases. Investing a certain amount of money each month or quarter helps ensure you won't pay for all your shares at market highs. This strategy - known as dollar cost averaging - also reduces unconstructive "emotion" from investing, helping shareholders avoid selling weak performers just prior to an upswing, or chasing a hot performer just before a correction.
We invite you to contact us via the Internet, through our Investor Centers or over the phone. It is our privilege to provide you the information you need to make the investments that are right for you.
Sincerely,
/s/Edward C. Johnson 3d
Edward C. Johnson 3d
Annual Report
Fidelity Advisor Government Income Fund - Class A, T, B, and C
Performance: The Bottom Line
Average annual total return reflects the change in the value of an investment, assuming reinvestment of the fund's dividend income and capital gains (the profits earned upon the sale of securities that have grown in value) and assuming a constant rate of performance each year. The $10,000 table and the fund's returns do not reflect the deduction of taxes that a shareholder would pay on fund distributions or the redemption of fund shares. During periods of reimbursement by Fidelity, a fund's total return will be greater than it would be had the reimbursement not occurred. How a fund did yesterday is no guarantee of how it will do tomorrow.
Average Annual Total Returns
Periods ended July 31, 2007 | Past 1
year | Past 5
years | Past 10
years |
Class A (incl. 4.00% sales charge) A (dagger) | 0.85% | 2.87% | 4.89% |
Class T (incl. 4.00% sales charge) B (dagger) | 0.83% | 2.87% | 4.88% |
Class B (incl. contingent deferred sales charge) C | -0.53% | 3.26% | 5.26% |
Class C (incl. contingent deferred sales charge) D | 3.41% | 3.59% | 5.25% |
A As of April 1, 2007, Class A shares bear a 0.25% 12b-1 fee. The initial offering of Class A shares took place on October 24, 2006. Returns between October 24, 2006 and March 31, 2007 reflect a 0.15% 12b-1 fee. Returns prior to October 24, 2006 are those of Government Income, the original retail class of the fund, which does not bear a 12b-1 fee. Had Class A shares' current 12b-1 fee been reflected, returns prior to April 1, 2007 would have been lower.
B Class T shares bear a 0.25% 12b-1 fee. The initial offering of Class T shares took place on October 24, 2006. Returns prior to October 24, 2006 are those of Government Income, the original retail class of the fund, which does not bear a 12b-1 fee. Had Class T shares' 12b-1 fee been reflected, returns prior to October 24, 2006 would have been lower.
C Class B shares bear a 0.90% 12b-1 fee. The initial offering of Class B shares took place on October 24, 2006. Returns prior to October 24, 2006 are those of Government Income, the original retail class of the fund, which does not bear a 12b-1 fee. Had Class B shares' 12b-1 fee been reflected, returns prior to October 24, 2006 would have been lower. Class B shares' contingent deferred sales charges included in the past one year, past five years, and past ten years total return figures are 5%, 2%, and 0%, respectively.
D Class C shares bear a 1.00% 12b-1 fee. The initial offering of Class C shares took place on October 24, 2006. Returns prior to October 24, 2006 are those of Government Income, the original retail class of the fund, which does not bear a 12b-1 fee. Had Class C shares' 12b-1 fee been reflected, returns prior to October 24, 2006 would have been lower. Class C shares' contingent deferred sales charges included in the past one year, past five years, and past ten years total return figures are 1%, 0%, and 0%, respectively.
* The current sales charge is as of April 1, 2007. Prior to April 1, 2007, the sales charge was 4.75% for Class A and 3.50% for Class T.
Annual Report
$10,000 Over 10 Years
Let's say hypothetically that $10,000 was invested in Fidelity Advisor Government Income Fund - Class T on July 31, 1997, and the current 4.00% sales charge was paid. The chart shows how the value of your investment would have changed, and also shows how the Lehman Brothers U.S. Government Index performed over the same period. The initial offering of Class T took place on October 24, 2006. See the previous page for additional information regarding the performance of Class T.
Annual Report
Management's Discussion of Fund Performance
Comments from William Irving, Portfolio Manager of Fidelity Advisor Government Income Fund
The investment-grade bond market posted a reasonably solid advance for the 12 months ending July 31, 2007. In that time, the Lehman Brothers® U.S. Aggregate Index - a performance gauge of taxable, high-quality debt - gained 5.58%. A sizable percentage of that increase came in the first four months of the period. The index returned a cumulative 4.30% from August through November, as investors responded favorably to the end of the Federal Reserve Board's two-year campaign of interest rate hikes. In fact, the central bank left rates unchanged through the entire 12-month period. Bonds turned negative in December and January, but had their best month of the past year in February, rising 1.54% as extreme volatility in the stock markets led to a flight to safety in high-quality debt. Performance was lackluster thereafter, however. Inflation concerns and dwindling hopes for a near-term Fed rate cut pressured bond prices for much of the remainder of the period, as did the meltdown of the subprime mortgage sector. Against that backdrop, the index gained only 0.32% over the final five months of the period.
During the past year, the fund (excluding sales charges) lagged the 5.75% return of the Lehman Brothers 75% U.S. Government/25% U.S. Mortgage-Backed Securities Index. (For specific performance information on the fund's Class A, Class T, Class B and Class C shares, please refer to the performance section of this report.) The fund's return relative to the index was helped by its yield-curve positioning, which refers to how we allocated investments across a range of bond maturities. In particular, our overweighting in better-performing intermediate bonds in the two- to five-year range and our underweighting in lagging 10- to 20-year bonds worked in our favor. In the mortgage sector, our overweighted position in hybrid adjustable-rate mortgages (ARMs) helped because they generally outpaced the fixed-rate mortgages that dominate the benchmark, due to strong demand from institutional investors, who recently bought the bonds prior to their inclusion in the Lehman Brothers U.S. Aggregate Index and the Lehman Brothers U.S. Mortgage-Backed Securities Index. On the flip side, sector selection generally worked against us. An out-of-index position in Treasury Inflation-Protected Securities hurt because they lagged the index. Elsewhere, the fund also suffered from its underweighting in plain-vanilla Treasury securities, which outpaced mortgage-backed securities, in which we were overweighted. Our slightly larger-than-index weighting in agency securities had little effect on the fund's relative performance, as they generally kept pace with the index.
The views expressed above reflect those of the portfolio manager(s) only through the end of the period as stated on the cover of this report and do not necessarily represent the views of Fidelity or any other person in the Fidelity organization. Any such views are subject to change at any time based upon market or other conditions and Fidelity disclaims any responsibility to update such views. These views may not be relied on as investment advice and, because investment decisions for a Fidelity fund are based on numerous factors, may not be relied on as an indication of trading intent on behalf of any Fidelity fund.
Annual Report
Shareholder Expense Example
As a shareholder of the Fund, you incur two types of costs: (1) transaction costs, including sales charges (loads) on purchase payments or redemption proceeds, and (2) ongoing costs, including management fees, distribution and/or service (12b-1) fees and other Fund expenses. This Example is intended to help you understand your ongoing costs (in dollars) of investing in the Fund and to compare these costs with the ongoing costs of investing in other mutual funds.
The Example is based on an investment of $1,000 invested at the beginning of the period and held for the entire period (February 1, 2007 to July 31, 2007).
Actual Expenses
The first line of the accompanying table for each class of the Fund provides information about actual account values and actual expenses. You may use the information in this line, together with the amount you invested, to estimate the expenses that you paid over the period. Simply divide your account value by $1,000.00 (for example, an $8,600 account value divided by $1,000.00 = 8.6), then multiply the result by the number in the first line for a class of the Fund under the heading entitled "Expenses Paid During Period" to estimate the expenses you paid on your account during this period. A small balance maintenance fee of $12.00 that is charged once a year may apply for certain accounts with a value of less than $2,000. This fee is not included in the table below. If it was, the estimate of expenses you paid during the period would be higher, and your ending account value lower, by this amount.
Hypothetical Example for Comparison Purposes
The second line of the accompanying table for each class of the Fund provides information about hypothetical account values and hypothetical expenses based on a Class' actual expense ratio and an assumed rate of return of 5% per year before expenses, which is not the Class' actual return. The hypothetical account values and expenses may not be used to estimate the actual ending account balance or expenses you paid for the period. You may use this information to compare the ongoing costs of investing in the Fund and other funds. To do so, compare this 5% hypothetical example with the 5% hypothetical examples that appear in the shareholder reports of the other funds. A small balance maintenance fee of $12.00 that is charged once a year may apply for certain accounts with a value of less than $2,000. This fee is not included in the table below. If it was, the estimate of expenses you paid during the period would be higher, and your ending account value lower, by this amount.
Please note that the expenses shown in the table are meant to highlight your ongoing costs only and do not reflect any transaction costs. Therefore, the second line of the table is useful in comparing ongoing costs only, and will not help you determine the relative total costs of owning different funds. In addition, if these transactional costs were included, your costs would have been higher.
Annual Report
| Beginning
Account Value
February 1, 2007 | Ending
Account Value
July 31, 2007 | Expenses Paid
During Period*
February 1, 2007
to July 31, 2007 |
Class A | | | |
Actual | $ 1,000.00 | $ 1,021.70 | $ 4.01 |
HypotheticalA | $ 1,000.00 | $ 1,020.83 | $ 4.01 |
Class T | | | |
Actual | $ 1,000.00 | $ 1,021.70 | $ 4.01 |
HypotheticalA | $ 1,000.00 | $ 1,020.83 | $ 4.01 |
Class B | | | |
Actual | $ 1,000.00 | $ 1,018.10 | $ 7.56 |
HypotheticalA | $ 1,000.00 | $ 1,017.31 | $ 7.55 |
Class C | | | |
Actual | $ 1,000.00 | $ 1,017.80 | $ 7.80 |
HypotheticalA | $ 1,000.00 | $ 1,017.06 | $ 7.80 |
Government Income | | | |
Actual | $ 1,000.00 | $ 1,023.50 | $ 2.26 |
HypotheticalA | $ 1,000.00 | $ 1,022.56 | $ 2.26 |
Institutional Class | | | |
Actual | $ 1,000.00 | $ 1,023.10 | $ 2.66 |
HypotheticalA | $ 1,000.00 | $ 1,022.17 | $ 2.66 |
A 5% return per year before expenses
* Expenses are equal to each Class' annualized expense ratio (shown in the table below); multiplied by the average account value over the period, multiplied by 181/365 (to reflect the one-half year period).
| Annualized
Expense Ratio |
Class A | .80% |
Class T | .80% |
Class B | 1.51% |
Class C | 1.56% |
Government Income | .45% |
Institutional Class | .53% |
Annual Report
Investment Changes
Coupon Distribution as of July 31, 2007 |
| % of fund's investments | % of fund's investments
6 months ago |
Less than 2% | 1.7 | 2.5 |
2 - 2.99% | 0.0 | 1.2 |
3 - 3.99% | 2.8 | 3.0 |
4 - 4.99% | 34.2 | 31.0 |
5 - 5.99% | 21.7 | 24.3 |
6 - 6.99% | 15.6 | 15.8 |
7% and over | 2.8 | 3.0 |
Coupon distribution shows the range of stated interest rates on the fund's investments, excluding short-term investments. |
Weighted Average Maturity as of July 31, 2007 |
| | 6 months ago |
Years | 4.9 | 4.9 |
The weighted average maturity is based on the dollar-weighted average length of time until principal payments are expected or until securities reach maturity, taking into account any maturity shortening feature such as a call, refunding or redemption provision. |
Duration as of July 31, 2007 |
| | 6 months ago |
Years | 4.7 | 4.1 |
Duration shows how much a bond fund's price fluctuates with changes in comparable interest rates. If rates rise 1%, for example, a fund with a five-year duration is likely to lose about 5% of its value. Other factors also can influence a bond fund's performance and share price. Accordingly, a bond fund's actual performance may differ from this example. |
Asset Allocation (% of fund's net assets) |
As of July 31, 2007* | As of January 31, 2007** |
| Mortgage
Securities 32.0% | | | Mortgage
Securities 29.2% | |
| CMOs and Other Mortgage Related Securities 7.9% | | | CMOs and Other Mortgage Related Securities 11.4% | |
| U.S. Treasury
Obligations 34.7% | | | U.S. Treasury
Obligations 29.8% | |
| U.S. Government
Agency Obligations 27.5% | | | U.S. Government
Agency Obligations 32.1% | |
| Asset-Backed
Securities 0.5% | | | Asset-Backed
Securities 0.7% | |
| Short-Term
Investments and
Net Other Assets(dagger) (2.6)% | | | Short-Term
Investments and
Net Other Assets(dagger) (3.2)% | |
* Futures and Swaps | 4.4% | | ** Futures and Swaps | 0.3% | |

(dagger) Short-Term Investments and Net Other Assets are not included in the pie chart. |
Annual Report
Investments July 31, 2007
Showing Percentage of Net Assets
U.S. Government and Government Agency Obligations - 62.2% |
| Principal Amount (000s) | | Value
(000s) |
U.S. Government Agency Obligations - 27.5% |
Fannie Mae: | | | |
3.25% 8/15/08 | $ 4,812 | | $ 4,725 |
3.25% 2/15/09 (b) | 143,050 | | 139,526 |
4.25% 5/15/09 | 11,235 | | 11,108 |
4.5% 10/15/08 | 81,560 | | 81,101 |
4.75% 12/15/10 | 233,801 | | 231,870 |
4.875% 4/15/09 | 43,350 | | 43,305 |
5.125% 9/2/08 | 78,770 | | 78,833 |
5.125% 4/15/11 | 187,000 | | 187,460 |
5.375% 6/12/17 | 124,591 | | 124,477 |
6.375% 6/15/09 | 55,710 | | 57,121 |
6.625% 9/15/09 | 36,820 | | 38,047 |
7.25% 1/15/10 | 25,086 | | 26,393 |
Federal Home Loan Bank: | | | |
4.5% 10/14/08 | 56,475 | | 56,140 |
5.375% 8/19/11 | 35,350 | | 35,724 |
5.8% 9/2/08 | 26,570 | | 26,779 |
Freddie Mac: | | | |
3.875% 6/15/08 | 2,791 | | 2,761 |
4.75% 3/5/09 | 113,806 | | 113,487 |
4.75% 3/5/12 | 10,000 | | 9,851 |
5% 1/30/14 | 25,000 | | 24,700 |
5.125% 4/18/11 | 31,220 | | 31,266 |
5.25% 7/18/11 | 29,000 | | 29,129 |
5.5% 8/23/17 | 100,000 | | 100,832 |
5.625% 3/15/11 | 48,555 | | 49,446 |
5.75% 1/15/12 | 1,686 | | 1,727 |
6.625% 9/15/09 | 155,000 | | 160,166 |
Israeli State (guaranteed by U.S. Government through Agency for International Development): | | | |
5.5% 9/18/23 | 110,500 | | 111,982 |
6.6% 2/15/08 | 20,957 | | 20,995 |
6.8% 2/15/12 | 30,000 | | 31,268 |
Overseas Private Investment Corp. U.S. Government guaranteed participation certificates: | | | |
6.77% 11/15/13 | 6,650 | | 6,716 |
6.99% 5/21/16 | 21,433 | | 22,966 |
Private Export Funding Corp.: | | | |
secured: | | | |
5.66% 9/15/11 (c) | 18,000 | | 18,332 |
5.685% 5/15/12 | 24,035 | | 24,581 |
6.67% 9/15/09 | 3,500 | | 3,624 |
U.S. Government and Government Agency Obligations - continued |
| Principal Amount (000s) | | Value
(000s) |
U.S. Government Agency Obligations - continued |
Private Export Funding Corp.: - continued | | | |
4.974% 8/15/13 | $ 22,940 | | $ 22,775 |
Small Business Administration guaranteed development participation certificates: | | | |
Series 2002-20J Class 1, 4.75% 10/1/22 | 6,759 | | 6,559 |
Series 2002-20K Class 1, 5.08% 11/1/22 | 14,321 | | 14,131 |
Series 2003 P10B, 5.136% 8/10/13 | 11,281 | | 11,165 |
Series 2004-20H Class 1, 5.17% 8/1/24 | 4,033 | | 3,981 |
Tennessee Valley Authority 5.375% 4/1/56 | 8,429 | | 8,064 |
U.S. Department of Housing and Urban Development Government guaranteed participation certificates Series 1999-A, 5.96% 8/1/09 | 18,380 | | 18,434 |
TOTAL U.S. GOVERNMENT AGENCY OBLIGATIONS | | 1,991,547 |
U.S. Treasury Obligations - 34.7% |
U.S. Treasury Bonds: | | | |
6.125% 8/15/29 (b) | 293,102 | | 337,365 |
6.25% 8/15/23 | 1,500 | | 1,701 |
8% 11/15/21 | 146,794 | | 191,406 |
U.S. Treasury Notes: | | | |
4.25% 8/15/13 (b) | 20,010 | | 19,605 |
4.25% 11/15/13 | 37,610 | | 36,778 |
4.25% 8/15/14 (b)(f) | 161,550 | | 157,070 |
4.25% 11/15/14 (b) | 77,185 | | 74,954 |
4.25% 8/15/15 (b) | 84,500 | | 81,608 |
4.375% 12/15/10 | 5,230 | | 5,201 |
4.5% 4/30/09 (b) | 100,000 | | 99,813 |
4.5% 4/30/12 | 86,000 | | 85,604 |
4.5% 11/15/15 (b) | 111,800 | | 109,739 |
4.5% 5/15/17 (b) | 72,000 | | 70,464 |
4.625% 11/15/09 | 81,000 | | 81,095 |
4.625% 10/31/11 | 11,000 | | 11,015 |
4.625% 2/29/12 | 4,500 | | 4,505 |
4.625% 11/15/16 (b) | 224,000 | | 221,270 |
4.75% 1/31/12 (b) | 188,250 | | 189,485 |
4.75% 5/31/12 | 35,000 | | 35,213 |
4.75% 5/15/14 (b) | 167,723 | | 168,221 |
4.875% 10/31/08 (b) | 180,000 | | 180,281 |
4.875% 5/15/09 (b) | 113,432 | | 113,964 |
4.875% 6/30/09 | 128,000 | | 128,690 |
U.S. Government and Government Agency Obligations - continued |
| Principal Amount (000s) | | Value
(000s) |
U.S. Treasury Obligations - continued |
U.S. Treasury Notes: - continued | | | |
4.875% 5/31/11 | $ 20,740 | | $ 20,951 |
4.875% 6/30/12 (b) | 61,471 | | 62,182 |
5.125% 6/30/11 | 23,214 | | 23,666 |
TOTAL U.S. TREASURY OBLIGATIONS | | 2,511,846 |
TOTAL U.S. GOVERNMENT AND GOVERNMENT AGENCY OBLIGATIONS (Cost $4,494,382) | 4,503,393 |
U.S. Government Agency - Mortgage Securities - 32.0% |
|
Fannie Mae - 26.4% |
3.729% 10/1/33 (g) | 704 | | 695 |
3.75% 1/1/34 (g) | 657 | | 648 |
3.75% 4/1/34 (g) | 11,938 | | 11,739 |
3.757% 10/1/33 (g) | 720 | | 717 |
3.802% 6/1/33 (g) | 549 | | 551 |
3.825% 4/1/33 (g) | 1,988 | | 1,996 |
3.847% 10/1/33 (g) | 30,880 | | 30,833 |
3.877% 6/1/33 (g) | 2,681 | | 2,690 |
3.902% 5/1/34 (g) | 6,663 | | 6,565 |
3.91% 5/1/33 (g) | 4,715 | | 4,742 |
3.913% 9/1/33 (g) | 11,186 | | 11,086 |
3.944% 5/1/34 (g) | 5,281 | | 5,200 |
3.947% 5/1/33 (g) | 230 | | 229 |
3.967% 9/1/33 (g) | 9,140 | | 9,031 |
3.998% 4/1/34 (g) | 10,531 | | 10,379 |
3.999% 10/1/18 (g) | 508 | | 502 |
4% 9/1/13 to 6/1/20 | 27,020 | | 25,401 |
4.013% 4/1/33 (g) | 187 | | 188 |
4.033% 6/1/34 (g) | 9,627 | | 9,485 |
4.063% 3/1/35 (g) | 17,948 | | 17,760 |
4.076% 2/1/35 (g) | 372 | | 373 |
4.114% 5/1/33 (g) | 8,396 | | 8,412 |
4.166% 1/1/35 (g) | 1,571 | | 1,544 |
4.187% 11/1/34 (g) | 12,876 | | 12,913 |
4.205% 6/1/34 (g) | 10,741 | | 10,600 |
4.249% 1/1/34 (g) | 2,105 | | 2,084 |
4.25% 2/1/35 (g) | 767 | | 755 |
U.S. Government Agency - Mortgage Securities - continued |
| Principal Amount (000s) | | Value
(000s) |
Fannie Mae - continued |
4.264% 5/1/35 (g) | $ 773 | | $ 774 |
4.28% 10/1/33 (g) | 332 | | 330 |
4.282% 3/1/33 (g) | 831 | | 835 |
4.283% 6/1/34 (g) | 11,653 | | 11,534 |
4.294% 8/1/33 (g) | 1,342 | | 1,344 |
4.295% 3/1/35 (g) | 656 | | 660 |
4.3% 3/1/33 (g) | 276 | | 272 |
4.302% 6/1/33 (g) | 430 | | 433 |
4.304% 3/1/33 (g) | 370 | | 364 |
4.321% 4/1/35 (g) | 381 | | 382 |
4.343% 1/1/35 (g) | 832 | | 820 |
4.355% 10/1/19 (g) | 1,207 | | 1,192 |
4.36% 2/1/34 (g) | 1,313 | | 1,301 |
4.386% 10/1/34 (g) | 4,044 | | 3,996 |
4.396% 2/1/35 (g) | 1,047 | | 1,031 |
4.411% 7/1/35 (g) | 19,301 | | 19,009 |
4.419% 5/1/35 (g) | 2,123 | | 2,117 |
4.429% 5/1/35 (g) | 616 | | 617 |
4.432% 3/1/35 (g) | 1,101 | | 1,085 |
4.445% 8/1/34 (g) | 2,165 | | 2,148 |
4.481% 1/1/35 (g) | 5,530 | | 5,460 |
4.484% 11/1/33 (g) | 1,650 | | 1,638 |
4.494% 12/1/34 (g) | 458 | | 452 |
4.5% 2/1/18 to 4/1/20 | 16,046 | | 15,376 |
4.503% 2/1/35 (g) | 635 | | 639 |
4.504% 2/1/35 (g) | 333 | | 336 |
4.512% 1/1/35 (g) | 876 | | 867 |
4.519% 2/1/35 (g) | 11,901 | | 11,819 |
4.524% 7/1/35 (g) | 2,513 | | 2,504 |
4.53% 10/1/35 (g) | 416 | | 415 |
4.554% 9/1/34 (g) | 19,342 | | 19,158 |
4.57% 7/1/35 (g) | 3,098 | | 3,108 |
4.575% 2/1/35 (g) | 3,589 | | 3,548 |
4.614% 7/1/34 (g) | 26,137 | | 26,045 |
4.651% 10/1/34 (g) | 3,356 | | 3,327 |
4.653% 3/1/35 (g) | 614 | | 619 |
4.702% 10/1/34 (g) | 2,776 | | 2,755 |
4.719% 7/1/34 (g) | 1,970 | | 1,957 |
4.723% 3/1/35 (g) | 253 | | 255 |
4.733% 12/1/35 (g) | 64,285 | | 63,872 |
4.772% 1/1/35 (g) | 4,800 | | 4,761 |
4.779% 12/1/35 (g) | 4,486 | | 4,465 |
U.S. Government Agency - Mortgage Securities - continued |
| Principal Amount (000s) | | Value
(000s) |
Fannie Mae - continued |
4.781% 12/1/34 (g) | $ 686 | | $ 681 |
4.794% 4/1/35 (g) | 12,356 | | 12,330 |
4.8% 7/1/35 (g) | 4,715 | | 4,669 |
4.801% 11/1/34 (g) | 2,315 | | 2,299 |
4.803% 6/1/35 (g) | 3,587 | | 3,597 |
4.803% 11/1/35 (g) | 10,309 | | 10,315 |
4.808% 2/1/33 (g) | 1,141 | | 1,152 |
4.808% 1/1/36 (g) | 25,970 | | 25,762 |
4.832% 10/1/35 (g) | 2,001 | | 1,988 |
4.849% 7/1/35 (g) | 10,016 | | 9,930 |
4.857% 10/1/34 (g) | 8,122 | | 8,076 |
4.86% 7/1/34 (g) | 6,286 | | 6,256 |
4.87% 5/1/33 (g) | 36 | | 36 |
4.894% 5/1/35 (g) | 1,781 | | 1,768 |
4.899% 8/1/34 (g) | 5,359 | | 5,333 |
5% 12/1/15 to 12/1/35 (e) | 228,426 | | 218,572 |
5.005% 2/1/34 (g) | 8,241 | | 8,166 |
5.016% 7/1/34 (g) | 355 | | 353 |
5.052% 5/1/35 (g) | 4,154 | | 4,184 |
5.069% 9/1/34 (g) | 5,765 | | 5,750 |
5.084% 9/1/34 (g) | 735 | | 733 |
5.087% 8/1/34 (g) | 626 | | 625 |
5.108% 10/1/35 (g) | 4,553 | | 4,531 |
5.135% 7/1/34 (g) | 2,204 | | 2,200 |
5.137% 8/1/36 (g) | 31,468 | | 31,432 |
5.162% 1/1/37 (g) | 5,998 | | 5,975 |
5.165% 3/1/36 (g) | 14,153 | | 14,126 |
5.17% 6/1/35 (g) | 2,942 | | 2,961 |
5.176% 8/1/33 (g) | 1,042 | | 1,043 |
5.176% 3/1/35 (g) | 388 | | 388 |
5.242% 5/1/35 (g) | 5,794 | | 5,790 |
5.277% 4/1/36 (g) | 5,513 | | 5,562 |
5.297% 7/1/35 (g) | 396 | | 399 |
5.31% 3/1/36 (g) | 38,095 | | 38,087 |
5.324% 12/1/34 (g) | 1,042 | | 1,042 |
5.356% 12/1/36 (g) | 3,536 | | 3,530 |
5.365% 2/1/36 (g) | 8,514 | | 8,518 |
5.394% 7/1/35 (g) | 2,589 | | 2,590 |
5.407% 2/1/37 (g) | 3,127 | | 3,130 |
5.449% 2/1/37 (g) | 14,139 | | 14,163 |
5.5% 4/1/09 to 12/1/35 | 404,307 | | 395,248 |
5.5% 8/20/22 (d) | 13,000 | | 12,857 |
5.518% 1/1/34 (g) | 77 | | 77 |
U.S. Government Agency - Mortgage Securities - continued |
| Principal Amount (000s) | | Value
(000s) |
Fannie Mae - continued |
5.612% 2/1/36 (g) | $ 3,401 | | $ 3,417 |
5.67% 4/1/36 (g) | 12,513 | | 12,576 |
5.67% 6/1/36 (g) | 8,147 | | 8,191 |
5.757% 4/1/36 (g) | 6,620 | | 6,664 |
5.804% 3/1/36 (g) | 8,634 | | 8,698 |
5.807% 5/1/36 (g) | 3,745 | | 3,775 |
5.818% 1/1/36 (g) | 2,679 | | 2,686 |
5.831% 5/1/36 (g) | 19,628 | | 19,791 |
5.854% 6/1/35 (g) | 2,147 | | 2,164 |
5.872% 3/1/36 (g) | 8,089 | | 8,116 |
5.897% 12/1/36 (g) | 4,655 | | 4,689 |
5.9% 3/1/36 (g) | 7,602 | | 7,671 |
5.925% 6/1/36 (g) | 14,806 | | 14,942 |
5.94% 5/1/36 (g) | 5,459 | | 5,511 |
6% 5/1/12 to 7/1/33 (e) | 104,928 | | 104,948 |
6% 8/1/22 (d) | 23,000 | | 23,160 |
6% 8/1/37 (d) | 65,000 | | 64,465 |
6% 8/1/37 (d) | 107,000 | | 106,119 |
6% 8/14/37 (d) | 48,000 | | 47,605 |
6.038% 4/1/36 (g) | 52,142 | | 52,707 |
6.106% 4/1/36 (g) | 28,823 | | 29,145 |
6.226% 3/1/37 (g) | 1,495 | | 1,508 |
6.314% 10/1/36 (g) | 23,129 | | 23,379 |
6.352% 8/1/36 (g) | 7,422 | | 7,512 |
6.5% 2/1/12 to 1/1/35 | 25,718 | | 26,177 |
6.58% 9/1/36 (g) | 10,877 | | 11,031 |
7% 7/1/13 to 7/1/32 | 5,688 | | 5,916 |
7.5% 8/1/10 to 4/1/29 | 155 | | 160 |
8% 1/1/22 | 9 | | 9 |
8.5% 1/1/15 to 7/1/31 | 617 | | 651 |
9% 11/1/11 to 5/1/14 | 646 | | 649 |
9.5% 11/15/09 to 10/1/20 | 893 | | 968 |
10% 8/1/10 | 2 | | 2 |
11% 8/1/10 | 14 | | 15 |
11.25% 5/1/14 | 9 | | 10 |
11.5% 6/15/19 to 1/15/21 | 1,428 | | 1,593 |
12.5% 8/1/15 to 3/1/16 | 3 | | 3 |
| | 1,913,585 |
Freddie Mac - 5.0% |
3.377% 7/1/33 (g) | 9,295 | | 9,201 |
4% 5/1/19 to 11/1/20 | 26,657 | | 24,871 |
U.S. Government Agency - Mortgage Securities - continued |
| Principal Amount (000s) | | Value
(000s) |
Freddie Mac - continued |
4.283% 2/1/35 (g) | $ 1,796 | | $ 1,799 |
4.288% 3/1/35 (g) | 842 | | 842 |
4.301% 12/1/34 (g) | 1,107 | | 1,087 |
4.424% 6/1/35 (g) | 1,284 | | 1,278 |
4.426% 2/1/34 (g) | 780 | | 771 |
4.426% 3/1/35 (g) | 1,054 | | 1,035 |
4.444% 3/1/35 (g) | 1,076 | | 1,059 |
4.5% 2/1/18 to 8/1/33 | 17,105 | | 16,227 |
4.539% 2/1/35 (g) | 1,585 | | 1,560 |
4.701% 9/1/36 (g) | 3,473 | | 3,449 |
4.704% 9/1/35 (g) | 26,676 | | 26,548 |
4.737% 2/1/34 (g) | 8,503 | | 8,358 |
4.784% 3/1/33 (g) | 361 | | 366 |
4.789% 2/1/36 (g) | 1,410 | | 1,392 |
4.922% 10/1/36 (g) | 19,855 | | 19,768 |
4.988% 4/1/35 (g) | 4,699 | | 4,722 |
5% 1/1/09 to 9/1/35 | 13,435 | | 12,779 |
5.021% 4/1/35 (g) | 527 | | 517 |
5.128% 7/1/35 (g) | 5,138 | | 5,103 |
5.132% 4/1/35 (g) | 4,463 | | 4,439 |
5.278% 2/1/36 (g) | 313 | | 311 |
5.489% 2/1/37 (g) | 12,155 | | 12,106 |
5.498% 1/1/36 (g) | 4,438 | | 4,433 |
5.5% 8/1/14 to 11/1/36 | 56,405 | | 55,704 |
5.536% 1/1/36 (g) | 6,600 | | 6,597 |
6% 7/1/16 to 11/1/33 | 31,292 | | 31,441 |
6.489% 10/1/36 (g) | 10,873 | | 11,010 |
6.5% 11/1/10 to 10/1/36 | 48,678 | | 49,550 |
6.538% 2/1/37 (g) | 18,692 | | 18,820 |
6.618% 12/1/36 (g) | 18,478 | | 18,674 |
7% 4/1/11 | 4 | | 4 |
7.5% 5/1/11 to 7/1/16 | 2,286 | | 2,384 |
8% 1/1/10 to 6/1/11 | 1 | | 1 |
8.5% 8/1/08 to 9/1/29 | 232 | | 248 |
9% 8/1/08 to 10/1/20 | 110 | | 116 |
9.5% 6/1/09 to 8/1/21 | 358 | | 388 |
9.75% 8/1/14 | 153 | | 162 |
10% 7/1/09 to 8/1/21 | 37 | | 40 |
11% 7/1/13 to 5/1/14 | 70 | | 77 |
12% 8/1/13 to 3/1/15 | 3 | | 3 |
12.25% 4/1/11 to 9/1/13 | 3 | | 4 |
U.S. Government Agency - Mortgage Securities - continued |
| Principal Amount (000s) | | Value
(000s) |
Freddie Mac - continued |
12.5% 2/1/10 to 6/1/19 | $ 35 | | $ 38 |
13% 8/1/10 to 6/1/15 | 9 | | 10 |
| | 359,292 |
Government National Mortgage Association - 0.6% |
4.25% 7/20/34 (g) | 1,091 | | 1,085 |
6% 7/15/08 to 12/15/10 | 1,510 | | 1,523 |
6.5% 2/15/24 to 10/15/35 | 23,880 | | 24,483 |
6.5% 8/1/37 (d) | 10,000 | | 10,185 |
6.5% 8/1/37 (d) | 2,000 | | 2,037 |
6.5% 8/1/37 (d) | 4,000 | | 4,074 |
7% 10/15/26 to 8/15/32 | 113 | | 117 |
7.5% 1/15/08 to 8/15/29 | 137 | | 144 |
8% 11/15/07 to 12/15/23 | 1,465 | | 1,553 |
8.5% 10/15/08 to 1/15/25 | 14 | | 14 |
9% 12/15/09 | 1 | | 1 |
9.5% 2/15/25 | 1 | | 1 |
10.5% 4/15/14 to 1/20/18 | 105 | | 118 |
13.5% 7/15/11 | 8 | | 9 |
| | 45,344 |
TOTAL U.S. GOVERNMENT AGENCY - MORTGAGE SECURITIES (Cost $2,338,955) | 2,318,221 |
Asset-Backed Securities - 0.5% |
|
Fannie Mae Grantor Trust Series 2005-T4 Class A1C, 5.47% 9/25/35 (g)
(Cost $37,634) | 37,634 | | 37,887 |
Collateralized Mortgage Obligations - 7.9% |
|
U.S. Government Agency - 7.9% |
Fannie Mae: | | | |
planned amortization class: | | | |
Series 1992-168 Class KB, 7% 10/25/22 | 1,537 | | 1,591 |
Series 1993-109 Class NZ, 6% 7/25/08 | 938 | | 937 |
Series 1993-207 Class H, 6.5% 11/25/23 | 18,360 | | 18,860 |
Series 1993-240 Class PD, 6.25% 12/25/13 | 6,432 | | 6,520 |
Series 1994-23: | | | |
Class PG, 6% 4/25/23 | 5,761 | | 5,763 |
Class PZ, 6% 2/25/24 | 10,056 | | 10,038 |
Series 1994-27 Class PJ, 6.5% 6/25/23 | 319 | | 318 |
Collateralized Mortgage Obligations - continued |
| Principal Amount (000s) | | Value
(000s) |
U.S. Government Agency - continued |
Fannie Mae: - continued | | | |
planned amortization class: | | | |
Series 1996-28 Class PK, 6.5% 7/25/25 | $ 4,114 | | $ 4,220 |
Series 2003-28 Class KG, 5.5% 4/25/23 | 4,940 | | 4,816 |
Series 2006-45 Class OP, 6/25/36 (i) | 6,641 | | 4,880 |
Series 2006-62 Class KP, 4/25/36 (i) | 13,648 | | 9,648 |
sequential payer Series 1997-41 Class J, 7.5% 6/18/27 | 3,010 | | 3,189 |
Series 2003-22 6% 4/25/33 (h) | 20,731 | | 4,920 |
Fannie Mae Grantor Trust: | | | |
planned amortization class Series 2005-81 Class PC, 5.5% 9/25/35 | 2,150 | | 2,056 |
sequential payer Series 2005-93 Class HD, 4.5% 11/25/19 | 1,428 | | 1,391 |
Fannie Mae subordinate REMIC pass-thru certificates: | | | |
floater: | | | |
Series 2001-38 Class QF, 6.3% 8/25/31 (g) | 762 | | 780 |
Series 2002-49 Class FB, 5.92% 11/18/31 (g) | 1,203 | | 1,224 |
Series 2002-60 Class FV, 6.32% 4/25/32 (g) | 502 | | 516 |
Series 2002-75 Class FA, 6.32% 11/25/32 (g) | 1,028 | | 1,058 |
Series 2004-54 Class FE, 6.47% 2/25/33 (g) | 522 | | 524 |
planned amortization class: | | | |
Series 2002-18 Class PC, 5.5% 4/25/17 | 1,170 | | 1,170 |
Series 2003-113: | | | |
Class PD, 4% 2/25/17 | 23,515 | | 22,334 |
Class PE, 4% 11/25/18 | 7,545 | | 6,815 |
Series 2003-128 Class NE, 4% 12/25/16 | 13,100 | | 12,442 |
Series 2004-21 Class QE, 4.5% 11/25/32 | 1,500 | | 1,394 |
Series 2004-80 Class LD, 4% 1/25/19 | 10,160 | | 9,569 |
Series 2005-102 Class CO, 11/25/35 (i) | 6,783 | | 5,005 |
Series 2006-12 Class BO, 10/25/35 (i) | 31,149 | | 22,967 |
Series 2006-37 Class OW, 5/25/36 (i) | 7,297 | | 5,413 |
sequential payer: | | | |
Series 2001-20 Class Z, 6% 5/25/31 | 24,462 | | 24,478 |
Series 2001-46 Class ZG, 6% 9/25/31 | 8,550 | | 8,560 |
Series 2004-3 Class BA, 4% 7/25/17 | 723 | | 696 |
Series 2004-86 Class KC, 4.5% 5/25/19 | 3,213 | | 3,122 |
Series 2004-91 Class AH, 4.5% 5/25/29 | 6,395 | | 6,220 |
Series 2005-117, Class JN, 4.5% 1/25/36 | 645 | | 564 |
Series 2002-50 Class LE, 7% 12/25/29 | 5 | | 5 |
Series 2005-14 Class SE, 0.73% 3/25/35 (g)(h) | 21,743 | | 677 |
Series 2007-36: | | | |
Class GO, 4/25/37 (i) | 1,469 | | 1,102 |
Collateralized Mortgage Obligations - continued |
| Principal Amount (000s) | | Value
(000s) |
U.S. Government Agency - continued |
Fannie Mae subordinate REMIC pass-thru certificates: - continued | | | |
Series 2007-36: | | | |
Class PO, 4/25/37 (i) | $ 3,261 | | $ 2,427 |
Class SB, 1.28% 4/25/37 (g)(h) | 42,342 | | 2,114 |
Class SG, 1.28% 4/25/37 (g)(h) | 19,112 | | 971 |
Series 2007-66 Class SA, 7.68% 7/25/37 (g) | 5,575 | | 5,775 |
Freddie Mac: | | | |
planned amortization class: | | | |
Series 1413 Class J, 4% 11/15/07 | 100 | | 99 |
Series 2115 Class PE, 6% 1/15/14 | 1,037 | | 1,039 |
Series 2356 Class GD, 6% 9/15/16 | 636 | | 643 |
Series 3149 Class OD, 5/15/36 (i) | 35,541 | | 25,496 |
sequential payer Series 2114 Class ZM, 6% 1/15/29 | 2,704 | | 2,729 |
Freddie Mac Manufactured Housing participation certificates guaranteed: | | | |
floater Series 1686 Class FA, 6.275% 2/15/24 (g) | 1,017 | | 1,036 |
planned amortization class Series 1681 Class PJ, 7% 12/15/23 | 8,867 | | 9,097 |
Series 1560 Class PN, 7% 12/15/12 | 6,638 | | 6,661 |
Freddie Mac Multi-class participation certificates guaranteed: | | | |
floater: | | | |
Series 2389 Class DA, 6.22% 11/15/30 (g) | 765 | | 767 |
Series 2448 Class FT, 6.32% 3/15/32 (g) | 1,182 | | 1,212 |
Series 2530 Class FE, 5.92% 2/15/32 (g) | 697 | | 705 |
Series 2630 Class FL, 5.82% 6/15/18 (g) | 550 | | 556 |
Series 3008 Class SM, 0% 7/15/35 (g) | 377 | | 381 |
planned amortization class: | | | |
Series 1141 Class G, 9% 9/15/21 | 435 | | 461 |
Series 1614 Class L, 6.5% 7/15/23 | 5,333 | | 5,412 |
Series 1671 Class G, 6.5% 8/15/23 | 1,191 | | 1,196 |
Series 2006-15 Class OP, 3/25/36 (i) | 8,127 | | 5,738 |
Series 2543 Class PM, 5.5% 8/15/18 | 250 | | 250 |
Series 2625 Class QX, 2.25% 3/15/22 | 72 | | 72 |
Series 2640: | | | |
Class GE, 4.5% 7/15/18 | 7,310 | | 6,975 |
Class QG, 2% 4/15/22 | 86 | | 85 |
Series 2660 Class ML, 3.5% 7/15/22 | 6,346 | | 6,289 |
Series 2682 Class LD, 4.5% 10/15/33 | 777 | | 676 |
Series 2752 Class PW, 4% 4/15/22 | 2,515 | | 2,484 |
Series 2802 Class OB, 6% 5/15/34 | 10,455 | | 10,415 |
Collateralized Mortgage Obligations - continued |
| Principal Amount (000s) | | Value
(000s) |
U.S. Government Agency - continued |
Freddie Mac Multi-class participation certificates guaranteed: - continued | | | |
planned amortization class: | | | |
Series 2810 Class PD, 6% 6/15/33 | $ 995 | | $ 993 |
Series 2866 Class XE, 4% 12/15/18 | 19,350 | | 18,246 |
Series 2937 Class KC, 4.5% 2/15/20 | 19,686 | | 18,524 |
Series 2966 Class XC, 5.5% 1/15/31 | 25,111 | | 24,877 |
Series 3077 Class TO, 4/15/35 (i) | 17,855 | | 12,817 |
Series 3110 Class OP, 9/15/35 (i) | 16,826 | | 12,131 |
Series 3119, 2/15/36 (i) | 20,299 | | 14,338 |
Series 3121 Class KO, 3/15/36 (i) | 7,162 | | 5,453 |
Series 3123 Class LO, 3/15/36 (i) | 13,128 | | 9,225 |
Series 3145 Class GO, 4/15/36 (i) | 11,854 | | 8,368 |
Series 3151 5/15/36 (i) | 12,724 | | 8,910 |
sequential payer: | | | |
Series 2546 Class MJ, 5.5% 3/15/23 | 2,861 | | 2,741 |
Series 2570 Class CU, 4.5% 7/15/17 | 2,060 | | 2,013 |
Series 2587 Class AD, 4.71% 3/15/33 | 5,785 | | 4,891 |
Series 2601 Class TB, 5.5% 4/15/23 | 869 | | 831 |
Series 2617 Class GW, 3.5% 6/15/16 | 4,132 | | 4,057 |
Series 2675 Class CB, 4% 5/15/16 | 2,018 | | 1,958 |
Series 2677 Class HG, 3% 8/15/12 | 1,169 | | 1,158 |
Series 2683 Class JA, 4% 10/15/16 | 2,104 | | 2,036 |
Series 2685 Class ND, 4% 10/15/18 | 9,064 | | 8,147 |
Series 2750 Class ZT, 5% 2/15/34 | 1,020 | | 879 |
Series 2773 Class HC, 4.5% 4/15/19 | 704 | | 644 |
Series 2809 Class UA, 4% 12/15/14 | 3,028 | | 2,980 |
Series 2849 Class AL, 5% 5/15/18 | 7,819 | | 7,684 |
Series 2860 Class CP, 4% 10/15/17 | 2,474 | | 2,403 |
Series 2866 Class N, 4.5% 12/15/18 | 7,093 | | 6,991 |
Series 2937 Class HJ, 5% 10/15/19 | 9,618 | | 9,472 |
Series 2998 Class LY, 5.5% 7/15/25 | 2,011 | | 1,908 |
Series 3007 Class EW, 5.5% 7/15/25 | 8,875 | | 8,421 |
Series 3013 Class VJ, 5% 1/15/14 | 1,981 | | 1,957 |
Series 2769 Class BU, 5% 3/15/34 | 5,744 | | 5,191 |
Series 2863 Class DB, 4% 9/15/14 | 1,319 | | 1,251 |
Series 2957 Class SW, 0.68% 4/15/35 (g)(h) | 29,878 | | 823 |
Series 3002 Class SN, 1.18% 7/15/35 (g)(h) | 29,958 | | 1,283 |
target amortization class: | | | |
Series 2156 Class TC, 6.25% 5/15/29 | 9,895 | | 10,184 |
Series 2877 Class JC, 5% 10/15/34 | 1,413 | | 1,382 |
Collateralized Mortgage Obligations - continued |
| Principal Amount (000s) | | Value
(000s) |
U.S. Government Agency - continued |
Ginnie Mae guaranteed REMIC pass-thru securities planned amortization class: | | | |
Series 1997-8 Class PE, 7.5% 5/16/27 | $ 4,821 | | $ 5,135 |
Series 2005-58 Class NJ, 4.5% 8/20/35 | 21,605 | | 21,183 |
TOTAL COLLATERALIZED MORTGAGE OBLIGATIONS (Cost $575,569) | 569,028 |
Cash Equivalents - 27.6% |
| Maturity Amount (000s) | | |
Investments in repurchase agreements in a joint trading account at 5.3%, dated 7/31/07 due 8/1/07: | | | |
(Collateralized by U.S. Government Obligations) # | $ 13,512 | | 13,510 |
(Collateralized by U.S. Government Obligations) # (a) | 1,985,314 | | 1,985,022 |
TOTAL CASH EQUIVALENTS (Cost $1,998,532) | 1,998,532 |
TOTAL INVESTMENT PORTFOLIO - 130.2% (Cost $9,445,072) | | 9,427,061 |
NET OTHER ASSETS - (30.2)% | | (2,185,321) |
NET ASSETS - 100% | $ 7,241,740 |
Swap Agreements |
| Expiration Date | | Notional Amount (000s) | | Value
(000s) |
Interest Rate Swaps |
Receive quarterly a floating rate based on 3-month LIBOR and pay semi-annually a fixed rate equal to 5.57% with Goldman Sachs | August 2017 | | $ 100,000 | | $ (443) |
Receive quarterly a floating rate based on 3-month LIBOR and pay semi-annually a fixed rate equal to 5.96% with Morgan Stanley, Inc. | July 2037 | | 27,500 | | (1,027) |
Receive semi-annually a fixed rate equal to 5.035% and pay quarterly a floating rate based on 3-month LIBOR with Deutsche Bank | April 2010 | | 225,000 | | (723) |
Receive semi-annually a fixed rate equal to 5.51% and pay quarterly a floating rate based on 3-month LIBOR with Morgan Stanley, Inc. | July 2010 | | 140,000 | | 1,409 |
Receive semi-annually a fixed rate equal to 5.706% and pay quarterly a floating rate based on 3-month LIBOR with Deutsche Bank | June 2017 | | 75,000 | | 1,148 |
| | $ 567,500 | | $ 364 |
Legend |
(a) Includes investment made with cash collateral received from securities on loan. |
(b) Security or a portion of the security is on loan at period end. |
(c) Security exempt from registration under Rule 144A of the Securities Act of 1933. These securities may be resold in transactions exempt from registration, normally to qualified institutional buyers. At the end of the period, the value of these securities amounted to $18,332,000 or 0.3% of net assets. |
(d) Security or a portion of the security purchased on a delayed delivery or when-issued basis. |
(e) A portion of the security is subject to a forward commitment to sell. |
(f) Security or a portion of the security has been segregated as collateral for open swap agreements. At the period end, the value of securities pledged amounted to $2,382,000. |
(g) The coupon rate shown on floating or adjustable rate securities represents the rate at period end. |
(h) Security represents right to receive monthly interest payments on an underlying pool of mortgages or assets. Principal shown is the outstanding par amount of the pool held as of the end of the period. |
(i) Principal Only Strips represent the right to receive the monthly principal payments on an underlying pool of mortgage loans. |
# Additional Information on each counterparty to the repurchase agreement is as follows: |
Repurchase Agreement / Counterparty | Value
(Amounts in thousands) |
$13,510,000 due 8/01/07 at 5.30% |
ABN AMRO Bank N.V., New York Branch | $ 328 |
Banc of America Securities LLC | 2,916 |
Bank of America, NA | 823 |
Barclays Capital, Inc. | 1,509 |
Bear Stearns & Co., Inc. | 1,441 |
Countrywide Securities Corp. | 1,056 |
ING Financial Markets LLC | 1,310 |
Societe Generale, New York Branch | 1,310 |
UBS Securities LLC | 2,293 |
WestLB AG | 524 |
| $ 13,510 |
$1,985,022,000 due 8/01/07 at 5.30% |
Bank of America, NA | $ 602,780 |
Barclays Capital, Inc. | 1,382,242 |
| $ 1,985,022 |
Income Tax Information |
At July 31, 2007, the fund had a capital loss carryforward of approximately $93,664,000 of which $831,000, $561,000, $1,882,000, $28,692,000, and $61,698,000 will expire on July 31, 2011, 2012, 2013, 2014 and 2015, respectively. |
Of the loss carryforwards expiring July 31, 2011, 2012, 2013, and 2014, $831,000, $561,000, $1,882,000, and $17,977,000, respectively, was acquired in the merger and is available to offset future capital gains of the fund to the extent provided by regulations. |
See accompanying notes which are an integral part of the financial statements.
Annual Report
Financial Statements
Statement of Assets and Liabilities
Amounts in thousands (except per-share amounts) | July 31, 2007 |
| | |
Assets | | |
Investment in securities, at value (including securities loaned of $1,920,947 and repurchase agreements of $1,998,532) - See accompanying schedule: Unaffiliated issuers (cost $9,445,072) | | $ 9,427,061 |
Commitment to sell securities on a delayed delivery basis | $ (238,522) | |
Receivable for securities sold on a delayed delivery basis | 237,005 | (1,517) |
Receivable for investments sold, regular delivery | | 5,988 |
Cash | | 8,931 |
Receivable for fund shares sold | | 4,128 |
Interest receivable | | 71,447 |
Swap agreements, at value | | 364 |
Total assets | | 9,516,402 |
| | |
Liabilities | | |
Payable for investments purchased
Regular delivery | $ 6,703 | |
Delayed delivery | 269,464 | |
Payable for fund shares redeemed | 4,894 | |
Distributions payable | 664 | |
Accrued management fee | 1,888 | |
Distribution fees payable | 131 | |
Other affiliated payables | 888 | |
Other payables and accrued expenses | 5,008 | |
Collateral on securities loaned, at value | 1,985,022 | |
Total liabilities | | 2,274,662 |
| | |
Net Assets | | $ 7,241,740 |
Net Assets consist of: | | |
Paid in capital | | $ 7,382,737 |
Undistributed net investment income | | 1,411 |
Accumulated undistributed net realized gain (loss) on investments | | (123,244) |
Net unrealized appreciation (depreciation) on investments | | (19,164) |
Net Assets | | $ 7,241,740 |
See accompanying notes which are an integral part of the financial statements.
Annual Report
Financial Statements - continued
Statement of Assets and Liabilities - continued
Amounts in thousands (except per-share amounts) | July 31, 2007 |
| | |
Calculation of Maximum Offering Price
Class A:
Net Asset Value and redemption price per share
($145,299 ÷ 14,516 shares) | | $ 10.01 |
| | |
Maximum offering price per share (100/96.00 of $10.01) | | $ 10.43 |
Class T:
Net Asset Value and redemption price per share ($180,781 ÷ 18,060 shares) | | $ 10.01 |
| | |
Maximum offering price per share (100/96.00 of $10.01) | | $ 10.43 |
Class B:
Net Asset Value and offering price per share
($43,307 ÷ 4,326 shares)A | | $ 10.01 |
| | |
Class C:
Net Asset Value and offering price per share
($39,391 ÷ 3,935 shares)A | | $ 10.01 |
| | |
Government Income:
Net Asset Value, offering price and redemption price per share ($6,117,821 ÷ 611,879 shares) | | $ 10.00 |
| | |
Institutional Class:
Net Asset Value, offering price and redemption price per share ($715,141 ÷ 71,448 shares) | | $ 10.01 |
A Redemption price per share is equal to net asset value less any applicable contingent deferred sales charge.
See accompanying notes which are an integral part of the financial statements.
Annual Report
Statement of Operations
Amounts in thousands | Year ended July 31, 2007 |
| | |
Investment Income | | |
Interest | | $ 328,118 |
| | |
Expenses | | |
Management fee | $ 21,463 | |
Transfer agent fees | 7,506 | |
Distribution fees | 1,223 | |
Fund wide operations fee | 2,122 | |
Independent trustees' compensation | 22 | |
Miscellaneous | 13 | |
Total expenses before reductions | 32,349 | |
Expense reductions | (545) | 31,804 |
Net investment income | | 296,314 |
Realized and Unrealized Gain (Loss) Net realized gain (loss) on: | | |
Investment securities: | | |
Unaffiliated issuers | (41,739) | |
Futures contracts | 1,498 | |
Swap agreements | 492 | |
Total net realized gain (loss) | | (39,749) |
Change in net unrealized appreciation (depreciation) on: Investment securities | 69,326 | |
Swap agreements | (3,916) | |
Delayed delivery commitments | (1,455) | |
Total change in net unrealized appreciation (depreciation) | | 63,955 |
Net gain (loss) | | 24,206 |
Net increase (decrease) in net assets resulting from operations | | $ 320,520 |
See accompanying notes which are an integral part of the financial statements.
Annual Report
Financial Statements - continued
Statement of Changes in Net Assets
Amounts in thousands | Year ended
July 31,
2007 | Year ended
July 31,
2006 |
Increase (Decrease) in Net Assets | | |
Operations | | |
Net investment income | $ 296,314 | $ 235,825 |
Net realized gain (loss) | (39,749) | (63,122) |
Change in net unrealized appreciation (depreciation) | 63,955 | (93,536) |
Net increase (decrease) in net assets resulting
from operations | 320,520 | 79,167 |
Distributions to shareholders from net investment income | (303,351) | (223,332) |
Distributions to shareholders from net realized gain | (2,616) | - |
Total distributions | (305,967) | (223,332) |
Share transactions - net increase (decrease) | 1,895,812 | 348,165 |
Total increase (decrease) in net assets | 1,910,365 | 204,000 |
| | |
Net Assets | | |
Beginning of period | 5,331,375 | 5,127,375 |
End of period (including undistributed net investment income of $1,411 and undistributed net investment income of $11,750, respectively) | $ 7,241,740 | $ 5,331,375 |
See accompanying notes which are an integral part of the financial statements.
Annual Report
Financial Highlights - Class A
Period ended July 31, | 2007 E |
Selected Per-Share Data | |
Net asset value, beginning of period | $ 9.98 |
Income from Investment Operations | |
Net investment income D | .311 |
Net realized and unrealized gain (loss) | .033 |
Total from investment operations | .344 |
Distributions from net investment income | (.314) |
Net asset value, end of period | $ 10.01 |
Total Return A, B, C | 3.49% |
Ratios to Average Net Assets F | |
Expenses before reductions | .78% H |
Expenses net of fee waivers, if any | .78% H |
Expenses net of all reductions | .77% H |
Net investment income | 4.08% H |
Supplemental Data | |
Net assets, end of period (in millions) | $ 145 |
Portfolio turnover rate | 164% G |
A Total returns for periods of less than one year are not annualized.
B Total returns would have been lower had certain expenses not been reduced during the periods shown.
C Total returns do not include the effect of the sales charges.
D Calculated based on average shares outstanding during the period.
E For the period October 24, 2006 (commencement of sale of shares) to July 31, 2007.
F Expense ratios reflect operating expenses of the class. Expenses before reductions do not reflect amounts reimbursed by the investment adviser or reductions from brokerage service arrangements or other expense offset arrangements and do not represent the amount paid by the class during periods when reimbursements or reductions occur. Expense ratios before reductions for start-up periods may not be representative of longer-term operating periods. Expenses net of fee waivers reflect expenses after reimbursement by the investment adviser but prior to reductions from brokerage service arrangements or other expense offset arrangements. Expenses net of all reductions represent the net expenses paid by the class.
G The portfolio turnover rate does not include the assets acquired in the merger.
H Annualized
See accompanying notes which are an integral part of the financial statements.
Annual Report
Financial Highlights - Class T
Period ended July 31, | 2007 E |
Selected Per-Share Data | |
Net asset value, beginning of period | $ 9.98 |
Income from Investment Operations | |
Net investment income D | .306 |
Net realized and unrealized gain (loss) | .036 |
Total from investment operations | .342 |
Distributions from net investment income | (.312) |
Net asset value, end of period | $ 10.01 |
Total Return A, B, C | 3.46% |
Ratios to Average Net Assets F | |
Expenses before reductions | .79% H |
Expenses net of fee waivers, if any | .79% H |
Expenses net of all reductions | .79% H |
Net investment income | 4.02% H |
Supplemental Data | |
Net assets, end of period (in millions) | $ 181 |
Portfolio turnover rate | 164% G |
A Total returns for periods of less than one year are not annualized.
B Total returns would have been lower had certain expenses not been reduced during the periods shown.
C Total returns do not include the effect of the sales charges.
D Calculated based on average shares outstanding during the period.
E For the period October 24, 2006 (commencement of sale of shares) to July 31, 2007.
F Expense ratios reflect operating expenses of the class. Expenses before reductions do not reflect amounts reimbursed by the investment adviser or reductions from brokerage service arrangements or other expense offset arrangements and do not represent the amount paid by the class during periods when reimbursements or reductions occur. Expense ratios before reductions for start-up periods may not be representative of longer-term operating periods. Expenses net of fee waivers reflect expenses after reimbursement by the investment adviser but prior to reductions from brokerage service arrangements or other expense offset arrangements. Expenses net of all reductions represent the net expenses paid by the class.
G The portfolio turnover rate does not include the assets acquired in the merger.
H Annualized
See accompanying notes which are an integral part of the financial statements.
Annual Report
Financial Highlights - Class B
Period ended July 31, | 2007 E |
Selected Per-Share Data | |
Net asset value, beginning of period | $ 9.98 |
Income from Investment Operations | |
Net investment income D | .251 |
Net realized and unrealized gain (loss) | .037 |
Total from investment operations | .288 |
Distributions from net investment income | (.258) |
Net asset value, end of period | $ 10.01 |
Total Return A, B, C | 2.91% |
Ratios to Average Net Assets F | |
Expenses before reductions | 1.50% H |
Expenses net of fee waivers, if any | 1.50% H |
Expenses net of all reductions | 1.50% H |
Net investment income | 3.30% H |
Supplemental Data | |
Net assets, end of period (in millions) | $ 43 |
Portfolio turnover rate | 164% G |
A Total returns for periods of less than one year are not annualized.
B Total returns would have been lower had certain expenses not been reduced during the periods shown.
C Total returns do not include the effect of the contingent deferred sales charge.
D Calculated based on average shares outstanding during the period.
E For the period October 24, 2006 (commencement of sale of shares) to July 31, 2007.
F Expense ratios reflect operating expenses of the class. Expenses before reductions do not reflect amounts reimbursed by the investment adviser or reductions from brokerage service arrangements or other expense offset arrangements and do not represent the amount paid by the class during periods when reimbursements or reductions occur. Expense ratios before reductions for start-up periods may not be representative of longer-term operating periods. Expenses net of fee waivers reflect expenses after reimbursement by the investment adviser but prior to reductions from brokerage service arrangements or other expense offset arrangements. Expenses net of all reductions represent the net expenses paid by the class.
G The portfolio turnover rate does not include the assets acquired in the merger.
H Annualized
See accompanying notes which are an integral part of the financial statements.
Annual Report
Financial Highlights - Class C
Period ended July 31, | 2007 E |
Selected Per-Share Data | |
Net asset value, beginning of period | $ 9.98 |
Income from Investment Operations | |
Net investment income D | .249 |
Net realized and unrealized gain (loss) | .033 |
Total from investment operations | .282 |
Distributions from net investment income | (.252) |
Net asset value, end of period | $ 10.01 |
Total Return A, B, C | 2.85% |
Ratios to Average Net Assets F | |
Expenses before reductions | 1.55% H |
Expenses net of fee waivers, if any | 1.55% H |
Expenses net of all reductions | 1.55% H |
Net investment income | 3.26% H |
Supplemental Data | |
Net assets, end of period (in millions) | $ 39 |
Portfolio turnover rate | 164% G |
A Total returns for periods of less than one year are not annualized.
B Total returns would have been lower had certain expenses not been reduced during the periods shown.
C Total returns do not include the effect of the contingent deferred sales charge.
D Calculated based on average shares outstanding during the period.
E For the period October 24, 2006 (commencement of sale of shares) to July 31, 2007.
F Expense ratios reflect operating expenses of the class. Expenses before reductions do not reflect amounts reimbursed by the investment adviser or reductions from brokerage service arrangements or other expense offset arrangements and do not represent the amount paid by the class during periods when reimbursements or reductions occur. Expense ratios before reductions for start-up periods may not be representative of longer-term operating periods. Expenses net of fee waivers reflect expenses after reimbursement by the investment adviser but prior to reductions from brokerage service arrangements or other expense offset arrangements. Expenses net of all reductions represent the net expenses paid by the class.
G The portfolio turnover rate does not include the assets acquired in the merger.
H Annualized
See accompanying notes which are an integral part of the financial statements.
Annual Report
Financial Highlights - Government Income
Years ended July 31, | 2007 | 2006 | 2005 | 2004 | 2003 |
Selected Per-Share Data | | | | | |
Net asset value,
beginning of period | $ 9.95 | $ 10.20 | $ 10.13 | $ 10.16 | $ 10.30 |
Income from Investment Operations | | | | | |
Net investment income B | .443 | .429 | .329 | .307 | .374 |
Net realized and unrealized gain (loss) | .068 | (.274) | .097 | .124 | (.014) |
Total from investment operations | .511 | .155 | .426 | .431 | .360 |
Distributions from net investment income | (.456) | (.405) | (.321) | (.301) | (.370) |
Distributions from net realized gain | (.005) | - | (.035) | (.160) | (.130) |
Total distributions | (.461) | (.405) | (.356) | (.461) | (.500) |
Net asset value, end of period | $ 10.00 | $ 9.95 | $ 10.20 | $ 10.13 | $ 10.16 |
Total Return A | 5.22% | 1.56% | 4.24% | 4.30% | 3.45% |
Ratios to Average Net Assets C | | | | | |
Expenses before reductions | .45% | .45% | .58% | .63% | .65% |
Expenses net of fee waivers,
if any | .45% | .45% | .58% | .63% | .65% |
Expenses net of all reductions | .44% | .44% | .58% | .63% | .65% |
Net investment income | 4.42% | 4.27% | 3.21% | 3.01% | 3.56% |
Supplemental Data | | | | | |
Net assets, end of period
(in millions) | $ 6,118 | $ 5,331 | $ 5,127 | $ 4,168 | $ 3,622 |
Portfolio turnover rate | 164% D | 108% | 114% | 224% | 253% |
A Total returns would have been lower had certain expenses not been reduced during the periods shown.
B Calculated based on average shares outstanding during the period.
C Expense ratios reflect operating expenses of the class. Expenses before reductions do not reflect amounts reimbursed by the investment adviser or reductions from brokerage service arrangements or other expense offset arrangements and do not represent the amount paid by the class during periods when reimbursements or reductions occur. Expenses net of fee waivers reflect expenses after reimbursement by the investment adviser but prior to reductions from brokerage service arrangements or other expense offset arrangements. Expenses net of all reductions represent the net expenses paid by the class.
D The portfolio turnover rate does not include the assets acquired in the merger.
See accompanying notes which are an integral part of the financial statements.
Annual Report
Financial Highlights - Institutional Class
Period ended July 31, | 2007 D |
Selected Per-Share Data | |
Net asset value, beginning of period | $ 9.98 |
Income from Investment Operations | |
Net investment income C | .329 |
Net realized and unrealized gain (loss) | .034 |
Total from investment operations | .363 |
Distributions from net investment income | (.333) |
Net asset value, end of period | $ 10.01 |
Total Return A, B | 3.67% |
Ratios to Average Net Assets E | |
Expenses before reductions | .53% G |
Expenses net of fee waivers, if any | .53% G |
Expenses net of all reductions | .53% G |
Net investment income | 4.32% G |
Supplemental Data | |
Net assets, end of period (in millions) | $ 715 |
Portfolio turnover rate | 164%F |
A Total returns for periods of less than one year are not annualized.
B Total returns would have been lower had certain expenses not been reduced during the periods shown.
C Calculated based on average shares outstanding during the period.
D For the period October 24, 2006 (commencement of sale of shares) to July 31, 2007.
E Expense ratios reflect operating expenses of the class. Expenses before reductions do not reflect amounts reimbursed by the investment adviser or reductions from brokerage service arrangements or other expense offset arrangements and do not represent the amount paid by the class during periods when reimbursements or reductions occur. Expense ratios before reductions for start-up periods may not be representative of longer-term operating periods. Expenses net of fee waivers reflect expenses after reimbursement by the investment adviser but prior to reductions from brokerage service arrangements or other expense offset arrangements. Expenses net of all reductions represent the net expenses paid by the class.
F The portfolio turnover rate does not include the assets acquired in the merger.
G Annualized
See accompanying notes which are an integral part of the financial statements.
Annual Report
Notes to Financial Statements
For the period ended July 31, 2007
(Amounts in thousands except ratios)
1. Organization.
Fidelity Government Income Fund (the Fund) is a fund of Fidelity Income Fund (the trust) and is authorized to issue an unlimited number of shares. The trust is registered under the Investment Company Act of 1940, as amended (the 1940 Act), as an open-end management investment company organized as a Massachusetts business trust.
The Fund offers Class A, Class T, Class B, Class C, Government Income, and Institutional Class shares, each of which has equal rights as to assets and voting privileges. Each class has exclusive voting rights with respect to matters that affect that class. The Fund commenced sales of Class A, Class T, Class B, Class C and Institutional Class shares and the existing class was designated Government Income on October 24, 2006. Class B shares will automatically convert to Class A shares after a holding period of seven years from the initial date of purchase. Investment income, realized and unrealized capital gains and losses, the common expenses of the Fund, and certain fund-level expense reductions, if any, are allocated on a pro rata basis to each class based on the relative net assets of each class to the total net assets of the Fund. Each class differs with respect to transfer agent and distribution and service plan fees incurred. Certain expense reductions also differ by class.
2. Significant Accounting Policies.
The financial statements have been prepared in conformity with accounting principles generally accepted in the United States of America, which require management to make certain estimates and assumptions at the date of the financial statements. The following summarizes the significant accounting policies of the Fund:
Security Valuation. Investments are valued and net asset value per share is calculated (NAV calculation) as of the close of business of the New York Stock Exchange, normally 4:00 p.m. Eastern time. Wherever possible, the Fund uses independent pricing services approved by the Board of Trustees to value its investments. Debt securities, including restricted securities, for which quotes are readily available, are valued by independent pricing services or by dealers who make markets in such securities. Pricing services consider yield or price of bonds of comparable quality, coupon, maturity and type as well as dealer supplied prices.
When current market prices or quotations are not readily available or do not accurately reflect fair value, valuations may be determined in accordance with procedures adopted by the Board of Trustees. The frequency of when fair value pricing is used is unpredictable. The value of securities used for NAV calculation under fair value pricing may differ from published prices for the same securities. Investments in open-end mutual funds are valued at their closing net asset value each business day. Short-term securities with remaining maturities of sixty days or less for which quotations are not readily available are valued at amortized cost, which approximates value.
Annual Report
Notes to Financial Statements - continued
(Amounts in thousands except ratios)
2. Significant Accounting Policies - continued
Investment Transactions and Income. For financial reporting purposes, the Fund's investment holdings and NAV include trades executed through the end of the last business day of the period. The NAV for processing shareholder transactions includes trades executed through the end of the prior business day. Gains and losses on securities sold are determined on the basis of identified cost. Interest income is accrued as earned. Interest income includes coupon interest and amortization of premium and accretion of discount on debt securities.
Expenses. Most expenses of the trust can be directly attributed to a fund. Expenses which cannot be directly attributed are apportioned among each Fund in the trust. Expense estimates are accrued in the period to which they relate and adjustments are made when actual amounts are known.
Income Tax Information and Distributions to Shareholders. Each year, the Fund intends to qualify as a regulated investment company by distributing all of its taxable income and realized gains under Subchapter M of the Internal Revenue Code. As a result, no provision for income taxes is required in the accompanying financial statements.
Dividends are declared daily and paid monthly from net investment income. Distributions from realized gains, if any, are recorded on the ex-dividend date. Income dividends and capital gain distributions are declared separately for each class. Income and capital gain distributions are determined in accordance with income tax regulations, which may differ from generally accepted accounting principles.
Capital accounts within the financial statements are adjusted for permanent book-tax differences. These adjustments have no impact on net assets or the results of operations. Temporary book-tax differences will reverse in a subsequent period.
Book-tax differences are primarily due to swap agreements, prior period premium and discount on debt securities, market discount, deferred trustees compensation, financing transactions, capital loss carryforwards, and losses deferred due to wash sales and excise tax regulations.
The tax-basis components of distributable earnings and the federal tax cost as of period end were as follows:
Unrealized appreciation | $ 41,525 | |
Unrealized depreciation | (59,427) | |
Net unrealized appreciation (depreciation) | (17,902) | |
Undistributed ordinary income | 257 | |
Capital loss carryforward | (93,664) | |
| | |
Cost for federal income tax purposes | $ 9,444,963 | |
Annual Report
2. Significant Accounting Policies - continued
Income Tax Information and Distributions to Shareholders - continued
The tax character of distributions paid was as follows:
| July 31, 2007 | July 31, 2006 |
Ordinary Income | $ 305,967 | $ 223,332 |
New Accounting Pronouncements. In July 2006, Financial Accounting Standards Board Interpretation No. 48, Accounting for Uncertainty in Income Taxes - an interpretation of FASB Statement 109 (FIN 48), was issued and is effective on the last business day of the semiannual reporting period for fiscal years beginning after December 15, 2006. FIN 48 sets forth a threshold for financial statement recognition, measurement and disclosure of a tax position taken or expected to be taken on a tax return. Management has concluded that the adoption of FIN 48 will not result in a material impact on the Fund's net assets, results of operations and financial statement disclosures.
In addition, in September 2006, Statement of Financial Accounting Standards No. 157, Fair Value Measurements (SFAS 157), was issued and is effective for fiscal years beginning after November 15, 2007. SFAS 157 defines fair value, establishes a framework for measuring fair value and expands disclosures about fair value measurements. Management is currently evaluating the impact the adoption of SFAS 157 will have on the Fund's financial statement disclosures.
3. Operating Policies.
Repurchase Agreements. Fidelity Management & Research Company (FMR) has received an Exemptive Order from the Securities and Exchange Commission (the SEC) which permits the Fund and other affiliated entities of FMR to transfer uninvested cash balances into joint trading accounts which are then invested in repurchase agreements. The Fund may also invest directly with institutions in repurchase agreements. Repurchase agreements are collateralized by government or non-government securities. Upon settlement date, collateral is held in segregated accounts with custodian banks and may be obtained in the event of a default of the counterparty. The Fund monitors, on a daily basis, the value of the collateral to ensure it is at least equal to the principal amount of the repurchase agreement (including accrued interest). In the event of a default by the counterparty, realization of the collateral proceeds could be delayed, during which time the value of the collateral may decline.
Delayed Delivery Transactions and When-Issued Securities. The Fund may purchase or sell securities on a delayed delivery or when-issued basis. Payment and delivery may take place after the customary settlement period for that security. The price of the underlying securities and the date when the securities will be delivered and paid
Annual Report
Notes to Financial Statements - continued
(Amounts in thousands except ratios)
3. Operating Policies - continued
Delayed Delivery Transactions and When-Issued Securities - continued
for are fixed at the time the transaction is negotiated. During the time a delayed delivery sell is outstanding, the contract is marked-to-market daily and equivalent deliverable securities are held for the transaction. The value of the securities purchased on a delayed delivery or when-issued basis are identified as such in the Fund's Schedule of Investments. The Fund may receive compensation for interest forgone in the purchase of a delayed delivery or when-issued security. With respect to purchase commitments, the Fund identifies securities as segregated in its records with a value at least equal to the amount of the commitment. The payables and receivables associated with the purchases and sales of delayed delivery securities having the same coupon, settlement date and broker are offset. Delayed delivery or when-issued securities that have been purchased from and sold to different brokers are reflected as both payables and receivables in the fund's Statement of Assets and Liabilities under the caption "Delayed delivery." Losses may arise due to changes in the value of the underlying securities or if the counterparty does not perform under the contract's terms, or if the issuer does not issue the securities due to political, economic, or other factors.
Futures Contracts. The Fund may use futures contracts to manage its exposure to the bond market and to fluctuations in interest rates. Buying futures tends to increase a fund's exposure to the underlying instrument, while selling futures tends to decrease a fund's exposure to the underlying instrument or hedge other fund investments. Upon entering into a futures contract, a fund is required to deposit with a clearing broker, no later than the following business day, an amount ("initial margin") equal to a certain percentage of the face value of the contract. The initial margin may be in the form of cash or securities and is transferred to a segregated account on settlement date. Subsequent payments ("variation margin") are made or received by a fund depending on the daily fluctuations in the value of the futures contract and are accounted for as unrealized gains or losses. Realized gains (losses) are recorded upon the expiration or closing of the futures contract. Securities deposited to meet margin requirements are identified in the Schedule of Investments. Losses may arise from changes in the value of the underlying instruments or if the counterparties do not perform under the contract's terms. Futures contracts are valued at the settlement price established each day by the board of trade or exchange on which they are traded.
Restricted Securities. The Fund may invest in securities that are subject to legal or contractual restrictions on resale. These securities generally may be resold in transactions exempt from registration or to the public if the securities are registered. Disposal of these securities may involve time-consuming negotiations and expense, and prompt sale at an acceptable price may be difficult. Information regarding restricted securities is included at the end of the Fund's Schedule of Investments.
Annual Report
3. Operating Policies - continued
Swap Agreements. The Fund may invest in swaps for the purpose of managing its exposure to interest rate, credit or market risk.
Interest rate swaps are agreements to exchange cash flows periodically based on a notional principal amount, for example, the exchange of fixed rate interest payments for floating rate interest payments. Periodic payments received or made by the Fund are recorded in the accompanying Statement of Operations as realized gains or losses, respectively. The primary risk associated with interest rate swaps is that unfavorable changes in the fluctuation of interest rates could adversely impact a fund.
Swaps are marked-to-market daily based on dealer-supplied valuations and changes in value are recorded as unrealized appreciation (depreciation). Gains or losses are realized upon early termination of the swap agreement. Collateral, in the form of cash or securities, may be required to be held in segregated accounts with a fund's custodian in compliance with swap contracts. Risks may exceed amounts recognized on the Statement of Assets and Liabilities. These risks include changes in the returns of the underlying instruments, failure of the counterparties to perform under the contracts' terms and the possible lack of liquidity with respect to the swap agreements. Details of swap agreements open at period end are included in the Fund's Schedule of Investments under the caption "Swap Agreements."
Mortgage Dollar Rolls. To earn additional income, the Fund may employ trading strategies which involve the sale and simultaneous agreement to repurchase similar securities ("mortgage dollar rolls") or the purchase and simultaneous agreement to sell similar securities ("reverse mortgage dollar rolls"). The securities traded are mortgage securities and bear the same interest rate but may be collateralized by different pools of mortgages. During the period between the sale and repurchase in a mortgage dollar roll transaction, a fund will not be entitled to receive interest and principal payments on the securities sold but will invest the proceeds of the sale in other securities which may enhance the yield and total return. In addition, the difference between the sale price and the future purchase price is recorded as an adjustment to investment income. During the period between the purchase and subsequent sale in a reverse mortgage dollar roll transaction a fund is entitled to interest and principal payments on the securities purchased. The price differential between the purchase and sale is recorded as an adjustment to investment income. Losses may arise due to changes in the value of the securities or if the counterparty does not perform under the terms of the agreement. If the counterparty files for bankruptcy or becomes insolvent, a fund's right to repurchase or sell securities may be limited.
Annual Report
Notes to Financial Statements - continued
(Amounts in thousands except ratios)
4. Fees and Other Transactions with Affiliates.
Management Fee and Expense Contract. FMR and its affiliates provide the Fund with investment management related services for which the Fund pays a monthly management fee. The management fee is the sum of an individual fund fee rate that is based on an annual rate of .20% of the Fund's average net assets and a group fee rate that averaged .12% during the period. The group fee rate is based upon the average net assets of all the mutual funds advised by FMR. The group fee rate decreases as assets under management increase and increases as assets under management decrease. For the period, the total annual management fee rate was .32% of the Fund's average net assets.
In addition, effective October 27, 2006 under a new expense contract, FMR pays all class-level expenses for Government Income class, so that the total expense, except the compensation of the independent Trustees and certain other expenses such as interest expense, including commitment fees, do not exceed .45% of the Class' average net assets. This agreement does not apply to any of the other classes and any change or modification that would increase expenses can only be made with shareholder approval.
Distribution and Service Plan. In accordance with Rule 12b-1 of the 1940 Act, the Fund has adopted separate Distribution and Service Plans for each class of shares. Certain classes pay Fidelity Distributors Corporation (FDC), an affiliate of FMR, separate Distribution and Service Fees, each of which is based on an annual percentage of each class' average net assets. In addition, FDC may pay financial intermediaries for selling shares of the Fund and providing shareholder support services. For the period, the Distribution and Service Fee rates and the total amounts paid to and retained by FDC were as follows:
| Distribution
Fee | Service
Fee | Paid to
FDC | Retained
by FDC |
Class A | 0% | .25% | $ 199 | $ 34 |
Class T | 0% | .25% | 355 | - |
Class B | .65% | .25% | 350 | 253 |
Class C | .75% | .25% | 319 | - |
| | | $ 1,223 | $ 287 |
On January 18, 2007, the Board of Trustees approved an increase in Class A's Service fee from .15% to .25%, effective April 1, 2007.
Sales Load. FDC receives a front-end sales charge of up to 4.00% for selling Class A and Class T shares, (4.75% for Class A and 3.50% for Class T shares prior to April 1, 2007), some of which is paid to financial intermediaries for selling shares of the Fund. FDC receives the proceeds of contingent deferred sales charges levied on Class A, Class T, Class B, and Class C redemptions. These charges depend on the holding period. The deferred sales charges range from 5% to 1% for Class B, 1% for Class C,.75% to .50% for certain purchases of Class A shares and .25% for certain purchases of Class T shares.
Annual Report
4. Fees and Other Transactions with Affiliates - continued
Sales Load - continued
For the period, sales charge amounts retained by FDC were as follows:
| Retained
by FDC |
Class A | $ 12 |
Class T | 5 |
Class B* | 90 |
Class C* | 2 |
| $ 109 |
* When Class B and Class C shares are initially sold, FDC pays commissions from its own resources to financial intermediaries through which the sales are made.
Transfer Agent Fees. Fidelity Investments Institutional Operations Company, Inc. (FIIOC), an affiliate of FMR, is the transfer, dividend disbursing and shareholder servicing agent for each class of the Fund, except for Government Income. Fidelity Service Company, Inc. (FSC), an affiliate of FMR, is the transfer agent for Government Income shares. FIIOC and FSC receive account fees and asset-based fees that vary according to the account size and type of account of the shareholders of the respective classes of the Fund. FIIOC and FSC pay for typesetting, printing and mailing of shareholder reports, except proxy statements. For the period, the total transfer agent fees paid by each class to FIIOC or FSC, were as follows:
| Amount | % of
Average
Net Assets |
Class A | $ 232 | .23* |
Class T | 275 | .19* |
Class B | 97 | .25* |
Class C | 64 | .20* |
Government Income | 5,931 | .10 |
Institutional Class | 907 | .18* |
| $ 7,506 | |
* Annualized
Fundwide Operations Fee. Pursuant to the Fundwide Operations and Expense Agreement (FWOE), FMR has agreed to provide for fund level expenses (which do not include transfer agent, Rule 12b-1 fees, compensation of the independent trustees, interest (including commitment fees), taxes or extraordinary expenses, if any) in return for a FWOE fee equal to .35% less the total amount of the management fee. The FWOE paid by the Fund is reduced by an amount equal to the fees and expenses paid to the independent trustees. For the period, the FWOE fee was equivalent to an annual rate of .03% of average net assets.
Annual Report
Notes to Financial Statements - continued
(Amounts in thousands except ratios)
5. Committed Line of Credit.
The Fund participates with other funds managed by FMR in a $4.2 billion credit facility (the "line of credit") to be utilized for temporary or emergency purposes to fund shareholder redemptions or for other short-term liquidity purposes. The Fund has agreed to pay commitment fees on its pro rata portion of the line of credit, which amounted to $12 and is reflected in Miscellaneous Expense on the Statement of Operations. During the period, there were no borrowings on this line of credit.
6. Security Lending.
The Fund lends portfolio securities from time to time in order to earn additional income. On the settlement date of the loan, the Fund receives collateral (in the form of U.S. Treasury obligations, letters of credit and/or cash) against the loaned securities and maintains collateral in an amount not less than 100% of the market value of the loaned securities during the period of the loan. The market value of the loaned securities is determined at the close of business of the Fund and any additional required collateral is delivered to the Fund on the next business day. If the borrower defaults on its obligation to return the securities loaned because of insolvency or other reasons, a fund could experience delays and costs in recovering the securities loaned or in gaining access to the collateral. Any cash collateral received is invested in cash equivalents. The value of loaned securities and cash collateral at period end are disclosed on the Fund's Statement of Assets and Liabilities. Security lending income represents the income earned on investing cash collateral, less fees and expenses associated with the loan, plus any premium payments that may be received on the loan of certain types of securities. Security lending income is presented in the Statement of Operations as a component of interest income. Net income from lending portfolio securities during the period amounted to $2,400.
7. Expense Reductions.
Through arrangements with the Fund's custodian and each class' transfer agent, credits realized as a result of uninvested cash balances were used to reduce the Fund's expenses. During the period, these credits reduced the Fund's management fee by $11. During the period, credits reduced each class' transfer agent expense as noted in the table below.
| Transfer Agent
expense reduction | |
Class A | $ 9 | |
Class T | 1 | |
Government Income | 509 | |
Institutional Class | 15 | |
| $ 534 | |
Annual Report
8. Other.
The Fund's organizational documents provide former and current trustees and officers with a limited indemnification against liabilities arising in connection with the performance of their duties to the Fund. In the normal course of business, the Fund may also enter into contracts that provide general indemnifications. The Fund's maximum exposure under these arrangements is unknown as this would be dependent on future claims that may be made against the Fund. The risk of material loss from such claims is considered remote.
FIIOC, a transfer agent of the Fund, notified the Fund that the Fund's books and records did not reflect a conversion of certain Class B to Class A shares upon their conversion date. In March 2007, FIIOC converted the relevant Class B shares to Class A shares and recorded the conversion in the books and records of the Fund which did not result in a material impact to the Fund's reported net assets or results of operations in the accompanying financial statements. FIIOC has remediated affected shareholders.
At the end of the period, Fidelity Freedom 2010 and Fidelity Freedom 2020 were the owners of record of approximately 14% and 14% of the total outstanding shares of Fidelity Government Income Fund. The Fidelity Freedom Funds were the owners of record, in aggregate, of approximately 44% of the total outstanding shares of Fidelity Government Income Fund.
9. Distributions to Shareholders.
Distributions to shareholders of each class were as follows:
| Year ended
July 31, 2007 A | Year ended
July 31, 2006 |
From net investment income | | |
Class A | $ 4,138 | $ - |
Class T | 5,771 | - |
Class B | 1,298 | - |
Class C | 1,042 | - |
Government Income | 269,231 | 223,332 |
Institutional Class | 21,871 | - |
Total | $ 303,351 | $ 233,332 |
From net realized gain | | |
Government Income | $ 2,616 | $ - |
A Distributions for Class A, Class T, Class B, Class C and Institutional Class are for the period October 24, 2006 (commencement of sale of shares) to July 31, 2007.
Annual Report
Notes to Financial Statements - continued
(Amounts in thousands except ratios)
10. Share Transactions.
Transactions for each class of shares were as follows:
| Shares | Dollars |
| Years ended July 31, | Years ended July 31, |
| 2007 A | 2006 | 2007 A | 2006 |
Class A | | | | |
Shares sold | 5,668 | - | $ 56,865 | $ - |
Issued in exchange for shares of Fidelity Advisor Government Investment Fund | 11,639 | - | 116,974 | - |
Reinvestment of distributions | 374 | - | 3,759 | - |
Shares redeemed | (3,165) | - | (31,770) | - |
Net increase (decrease) | 14,516 | - | $ 145,828 | $ - |
Class T | | | | |
Shares sold | 3,593 | - | $ 36,101 | $ - |
Issued in exchange for shares of Fidelity Advisor Government Investment Fund | 19,997 | - | 200,973 | - |
Reinvestment of distributions | 549 | - | 5,508 | - |
Shares redeemed | (6,079) | - | (60,985) | - |
Net increase (decrease) | 18,060 | - | $ 181,597 | $ - |
Class B | | | | |
Shares sold | 524 | - | $ 5,289 | $ - |
Issued in exchange for shares of Fidelity Advisor Government Investment Fund | 5,890 | - | 59,191 | - |
Reinvestment of distributions | 104 | - | 1,045 | - |
Shares redeemed | (2,192) | - | (22,000) | - |
Net increase (decrease) | 4,326 | - | $ 43,525 | $ - |
Class C | | | | |
Shares sold | 517 | - | $ 5,201 | $ - |
Issued in exchange for shares of Fidelity Advisor Government Investment Fund | 4,449 | - | 44,717 | - |
Reinvestment of distributions | 64 | - | 643 | - |
Shares redeemed | (1,095) | - | (10,981) | - |
Net increase (decrease) | 3,935 | - | $ 39,580 | $ - |
Government Income | | | | |
Shares sold | 105,528 | 127,904 | $ 1,058,863 | $ 1,289,378 |
Issued in exchange for shares of Spartan Government Income Fund | 71,077 | - | 713,611 | - |
Reinvestment of distributions | 26,531 | 21,894 | 266,315 | 219,740 |
Shares redeemed | (127,164) | (116,476) | (1,271,926) | (1,160,953) |
Net increase (decrease) | 75,972 | 33,322 | $ 766,863 | $ 348,165 |
A Share transactions for Class A, Class T, Class B, Class C and Institutional Class are for the period October 24, 2006 (commencement of sale of shares) to July 31, 2007.
Annual Report
10. Share Transactions - continued
| Shares | Dollars |
| Years ended July 31, | Years ended July 31, |
| 2007 A | 2006 | 2007 A | 2006 |
Institutional Class | | | | |
Shares sold | 16,978 | - | $ 170,642 | $ - |
Issued in exchange for shares of Fidelity Advisor Government Investment Fund | 57,200 | - | 574,860 | - |
Reinvestment of distributions | 2,169 | - | 21,772 | - |
Shares redeemed | (4,899) | - | (48,855) | - |
Net increase (decrease) | 71,448 | - | $ 718,419 | $ - |
A Share transactions for Class A, Class T, Class B, Class C and Institutional Class are for the period October 24, 2006 (commencement of sale of shares) to July 31, 2007.
11. Merger Information.
On October 27, 2006, the Fund acquired all of the assets and assumed all of the liabilities of Fidelity Advisor Government Investment Fund and Spartan Government Income Fund pursuant to an agreement and plan of reorganization approved by the shareholders on September 20, 2006. The acquisition was accomplished by an exchange of 11,639, 19,997, 5,890, 4,449, and 57,200 shares of Class A, Class T, Class B, Class C and Institutional Class of the Fund, respectively, for 11,840, 20,358, 6,003, 4,531, and 58,535 shares then outstanding of Class A, Class T, Class B, Class C and Institutional Class (valued at $9.88, $9.87, $9.86, $9.87, and $9.82, per share for Class A, Class T, Class B, Class C and Institutional Class, respectively) of Fidelity Advisor Government Investment Fund. Further, the acquisition was accomplished by an exchange of 71,077 shares of Government Income class for the 66,115 shares then outstanding (valued at $10.79 per share) of Spartan Government Income Fund. The reorganization qualified as a tax-free reorganization for federal income tax purposes with no gain or loss recognized to the funds or their shareholders. Fidelity Advisor Government Investment Fund's net assets, including $1,514 of unrealized depreciation, and Spartan Government Income Fund's net assets, including $3,295 of unrealized depreciation, were combined with the Fund's net assets of $5,214,485 for total net assets after the acquisition of $6,924,811.
Annual Report
Report of Independent Registered Public Accounting Firm
To the Trustees of Fidelity Income Fund and the Shareholders of Fidelity Government Income Fund:
In our opinion, the accompanying statement of assets and liabilities, including the schedule of investments, and the related statements of operations and of changes in net assets and the financial highlights present fairly, in all material respects, the financial position of Fidelity Government Income Fund (a fund of Fidelity Income Fund) at July 31, 2007, the results of its operations for the year then ended, the changes in its net assets for each of the two years in the period then ended and the financial highlights for each of the five years in the period then ended, in conformity with accounting principles generally accepted in the United States of America. These financial statements and financial highlights (hereafter referred to as "financial statements") are the responsibility of the Fidelity Government Income Fund's management. Our responsibility is to express an opinion on these financial statements based on our audits. We conducted our audits of these financial statements in accordance with the standards of the Public Company Accounting Oversight Board (United States). Those standards require that we plan and perform the audit to obtain reasonable assurance about whether the financial statements are free of material misstatement. An audit includes examining, on a test basis, evidence supporting the amounts and disclosures in the financial statements, assessing the accounting principles used and significant estimates made by management, and evaluating the overall financial statement presentation. We believe that our audits, which included confirmation of securities at July 31, 2007 by correspondence with the custodian and brokers, provide a reasonable basis for our opinion.
/s/ PricewaterhouseCoopers LLP
PricewaterhouseCoopers LLP
Boston, Massachusetts
September 17, 2007
Annual Report
Trustees and Officers
The Trustees, Members of the Advisory Board, and executive officers of the trust and fund, as applicable, are listed below. The Board of Trustees governs the fund and is responsible for protecting the interests of shareholders. The Trustees are experienced executives who meet periodically throughout the year to oversee the fund's activities, review contractual arrangements with companies that provide services to the fund, and review the fund's performance. Except for James C. Curvey, each of the Trustees oversees 353 funds advised by FMR or an affiliate. Mr. Curvey oversees 317 funds advised by FMR or an affiliate.
The Trustees hold office without limit in time except that (a) any Trustee may resign; (b) any Trustee may be removed by written instrument, signed by at least two-thirds of the number of Trustees prior to such removal; (c) any Trustee who requests to be retired or who has become incapacitated by illness or injury may be retired by written instrument signed by a majority of the other Trustees; and (d) any Trustee may be removed at any special meeting of shareholders by a two-thirds vote of the outstanding voting securities of the trust. Each Trustee who is not an interested person (as defined in the 1940 Act) (Independent Trustee), shall retire not later than the last day of the calendar year in which his or her 72nd birthday occurs. The Independent Trustees may waive this mandatory retirement age policy with respect to individual Trustees. The executive officers and Advisory Board Members hold office without limit in time, except that any officer and Advisory Board Member may resign or may be removed by a vote of a majority of the Trustees at any regular meeting or any special meeting of the Trustees. Except as indicated, each individual has held the office shown or other offices in the same company for the past five years.
The fund's Statement of Additional Information (SAI) includes more information about the Trustees. To request a free copy, call Fidelity at 1-877-208-0098.
Interested Trustees*:
Correspondence intended for each Trustee who is an interested person may be sent to Fidelity Investments, 82 Devonshire Street, Boston, Massachusetts 02109.
Name, Age; Principal Occupation |
Edward C. Johnson 3d (77) |
| Year of Election or Appointment: 1984 Mr. Johnson is Chairman of the Board of Trustees. Mr. Johnson serves as President (2006-present), Chief Executive Officer, Chairman, and a Director of FMR Corp.; Chairman and a Director of FMR; Chairman and a Director of Fidelity Research & Analysis Company (FRAC); Chairman and a Director of Fidelity Investments Money Management, Inc.; and Chairman (2001-present) and a Director of FMR Co., Inc. In addition, Mr. Johnson serves as Chairman and Director of Fidelity International Limited (FIL). |
James C. Curvey (72) |
| Year of Election or Appointment: 2007 Mr. Curvey also serves as Trustee (2007-present) or Member of the Advisory Board (2007-present) of other investment companies advised by FMR. Mr. Curvey is Vice Chairman (2006-present) and Director of FMR Corp. Mr. Curvey joined Fidelity in 1982 and served in numerous senior management positions, including President and Chief Operating Officer of FMR Corp. (1997-2000) and President of Fidelity Strategic Investments (2000-2002). In addition, he serves as a member of the Board of Directors of Geerlings & Wade, Inc. (wine distribution). |
* Trustees have been determined to be "Interested Trustees" by virtue of, among other things, their affiliation with the trust or various entities under common control with FMR.
Independent Trustees:
Correspondence intended for each Independent Trustee (that is, the Trustees other than the Interested Trustees) may be sent to Fidelity Investments, P.O. Box 55235, Boston, Massachusetts 02205-5235.
Name, Age; Principal Occupation |
Dennis J. Dirks (59) |
| Year of Election or Appointment: 2005 Prior to his retirement in May 2003, Mr. Dirks was Chief Operating Officer and a member of the Board of The Depository Trust & Clearing Corporation (DTCC) (1999-2003). He also served as President, Chief Operating Officer, and Board member of The Depository Trust Company (DTC) (1999-2003) and President and Board member of the National Securities Clearing Corporation (NSCC) (1999-2003). In addition, Mr. Dirks served as Chief Executive Officer and Board member of the Government Securities Clearing Corporation (2001-2003) and Chief Executive Officer and Board member of the Mortgage-Backed Securities Clearing Corporation (2001-2003). Mr. Dirks also serves as a Trustee and a member of the Finance Committee of Manhattan College (2005-present) and a Trustee and a member of the Finance Committee of AHRC of Nassau County (2006-present). |
Albert R. Gamper, Jr. (65) |
| Year of Election or Appointment: 2006 Prior to his retirement in December 2004, Mr. Gamper served as Chairman of the Board of CIT Group Inc. (commercial finance). During his tenure with CIT Group Inc. Mr. Gamper served in numerous senior management positions, including Chairman (1987-1989; 1999-2001; 2002-2004), Chief Executive Officer (1987-2004), and President (1989-2002). He currently serves as a member of the Board of Directors of Public Service Enterprise Group (utilities, 2001-present), Chairman of the Board of Governors, Rutgers University (2004-present), and Chairman of the Board of Saint Barnabas Health Care System. |
George H. Heilmeier (71) |
| Year of Election or Appointment: 2004 Dr. Heilmeier is Chairman Emeritus of Telcordia Technologies (communication software and systems), where prior to his retirement, he served as company Chairman and Chief Executive Officer. He currently serves on the Boards of Directors of The Mitre Corporation (systems engineering and information technology support for the government), and HRL Laboratories (private research and development, 2004-present). He is Chairman of the General Motors Science & Technology Advisory Board and a Life Fellow of the Institute of Electrical and Electronics Engineers (IEEE). Dr. Heilmeier is a member of the Defense Science Board and the National Security Agency Advisory Board. He is also a member of the National Academy of Engineering, the American Academy of Arts and Sciences, and the Board of Overseers of the School of Engineering and Applied Science of the University of Pennsylvania. Previously, Dr. Heilmeier served as a Director of TRW Inc. (automotive, space, defense, and information technology, 1992-2002), Compaq (1994-2002), Automatic Data Processing, Inc. (ADP) (technology-based business outsourcing, 1995-2002), INET Technologies Inc. (telecommunications network surveillance, 2001-2004), and Teletech Holdings (customer management services). He is the recipient of the 2005 Kyoto Prize in Advanced Technology for his invention of the liquid crystal display, and a member of the Consumer Electronics Hall of Fame. |
James H. Keyes (66) |
| Year of Election or Appointment: 2007 Prior to his retirement in 2003, Mr. Keyes was Chairman, President, and Chief Executive Officer of Johnson Controls, Inc. (automotive supplier, 1993-2003). He currently serves as a member of the boards of LSI Logic Corporation (semiconductor technologies), Navistar International Corporation (manufacture and sale of trucks, buses, and diesel engines, 2002-present), and Pitney Bowes, Inc. (integrated mail, messaging, and document management solutions). |
Marie L. Knowles (60) |
| Year of Election or Appointment: 2001 Prior to Ms. Knowles' retirement in June 2000, she served as Executive Vice President and Chief Financial Officer of Atlantic Richfield Company (ARCO) (diversified energy, 1996-2000). From 1993 to 1996, she was a Senior Vice President of ARCO and President of ARCO Transportation Company. She served as a Director of ARCO from 1996 to 1998. She currently serves as a Director of Phelps Dodge Corporation (copper mining and manufacturing) and McKesson Corporation (healthcare service, 2002-present). Ms. Knowles is a Trustee of the Brookings Institution and the Catalina Island Conservancy and also serves as a member of the Advisory Board for the School of Engineering of the University of Southern California. |
Ned C. Lautenbach (63) |
| Year of Election or Appointment: 2000 Mr. Lautenbach is Chairman of the Independent Trustees (2006-present). Mr. Lautenbach has been a partner of Clayton, Dubilier & Rice, Inc. (private equity investment firm) since September 1998. Previously, Mr. Lautenbach was with the International Business Machines Corporation (IBM) from 1968 until his retirement in 1998. Mr. Lautenbach serves as a Director of Sony Corporation (2006-present) and Eaton Corporation (diversified industrial) as well as the Philharmonic Center for the Arts in Naples, Florida. He also is a member of the Board of Trustees of Fairfield University (2005-present), as well as a member of the Council on Foreign Relations. |
Cornelia M. Small (63) |
| Year of Election or Appointment: 2005 Ms. Small is a member (2000-present) and Chairperson (2002-present) of the Investment Committee, and a member (2002-present) of the Board of Trustees of Smith College. Previously, she served as Chief Investment Officer (1999-2000), Director of Global Equity Investments (1996-1999), and a member of the Board of Directors of Scudder, Stevens & Clark (1990-1997) and Scudder Kemper Investments (1997-1999). In addition, Ms. Small served as Co-Chair (2000-2003) of the Annual Fund for the Fletcher School of Law and Diplomacy. |
William S. Stavropoulos (68) |
| Year of Election or Appointment: 2001 Mr. Stavropoulos is Chairman Emeritus of the Board of Directors of The Dow Chemical Company. Since joining The Dow Chemical Company in 1967, Mr. Stavropoulos served in numerous senior management positions, including President (1993-2000; 2002-2003), CEO (1995-2000; 2002-2004), and Chairman of the Executive Committee (2000-2004). Currently, he is a Director of NCR Corporation (data warehousing and technology solutions), Chemical Financial Corporation, Maersk Inc. (industrial conglomerate, 2002-present), Tyco International, Inc. (multinational manufacturing and services, 2007-present), and a member of the Advisory Board for Metalmark Capital (private equity investment firm, 2005-present). He is a special advisor to Clayton, Dubilier & Rice, Inc., a private equity investment firm. He also serves as a member of the Board of Trustees of the American Enterprise Institute for Public Policy Research. In addition, Mr. Stavropoulos is a member of The Business Council, J.P. Morgan International Council and the University of Notre Dame Advisory Council for the College of Science. |
Kenneth L. Wolfe (68) |
| Year of Election or Appointment: 2005 Prior to his retirement in 2001, Mr. Wolfe was Chairman and Chief Executive Officer of Hershey Foods Corporation (1993-2001). He currently serves as a member of the boards of Adelphia Communications Corporation (2003-present), Bausch & Lomb, Inc., and Revlon Inc. (2004-present). |
Advisory Board Members and Executive Officers:
Correspondence intended for Mr. Mauriello may be sent to Fidelity Investments, P.O. Box 55235, Boston, Massachusetts 02205-5235. Correspondence intended for each executive officer and Mr. Lynch may be sent to Fidelity Investments, 82 Devonshire Street, Boston, Massachusetts 02109.
Name, Age; Principal Occupation |
Peter S. Lynch (63) |
| Year of Election or Appointment: 2003 Member of the Advisory Board of Fidelity Income Fund. Mr. Lynch is Vice Chairman and a Director of FMR, and Vice Chairman (2001-present) and a Director of FMR Co., Inc. Previously, Mr. Lynch served as a Trustee of the Fidelity funds (1990-2003). In addition, he serves as a Trustee of Boston College and as the Chairman of the Inner-City Scholarship Fund. |
Joseph Mauriello (62) |
| Year of Election or Appointment: 2007 Member of the Advisory Board of Fidelity Income Fund. Prior to his retirement in January 2006, Mr. Mauriello served in numerous senior management positions including Deputy Chairman and Chief Operating Officer (2004-2005), and Vice Chairman of Financial Services (2002-2004) of KPMG LLP US (professional services firm, 1965-2005). Mr. Mauriello currently serves as a member of the Board of Directors of XL Capital Ltd., (global insurance and re-insurance company, 2006-present) and of Arcadia Resources Inc., (health care services and products, 2007-present). He also served as a Director of the Hamilton Funds of the Bank of New York (2006-2007). |
Kimberley H. Monasterio (43) |
| Year of Election or Appointment: 2007 President and Treasurer of the fund. Ms. Monasterio also serves as President and Treasurer of other Fidelity funds (2007-present) and is an employee of FMR (2004-present). Previously, Ms. Monasterio served as Deputy Treasurer of the Fidelity funds (2004-2006). Before joining Fidelity Investments, Ms. Monasterio served as Treasurer (2000-2004) and Chief Financial Officer (2002-2004) of the Franklin Templeton Funds and Senior Vice President of Franklin Templeton Services, LLC (2000-2004). |
Boyce I. Greer (51) |
| Year of Election or Appointment: 2005 Vice President of the fund. Mr. Greer also serves as Vice President of certain Equity Funds (2005-present), certain Asset Allocation Funds (2005-present), Fixed-Income Funds (2006-present), and Money Market Funds (2006-present). Mr. Greer is also a Trustee of other investment companies advised by FMR (2003-present). He is an Executive Vice President of FMR (2005-present) and FMR Co., Inc. (2005-present), and Senior Vice President of Fidelity Investments Money Management, Inc. (2006-present). Previously, Mr. Greer served as a Director and Managing Director of Strategic Advisers, Inc. (2002-2005), and Executive Vice President (2000-2002) and Money Market Group Leader (1997-2002) of the Fidelity Investments Fixed Income Division. He also served as Vice President of Fidelity's Money Market Funds (1997-2002), Senior Vice President of FMR (1997-2002), and Vice President of FIMM (1998-2002). |
David L. Murphy (59) |
| Year of Election or Appointment: 2005 Vice President of the fund. Mr. Murphy also serves as Vice President of Fidelity's Money Market Funds (2002-present), certain Asset Allocation Funds (2003-present), Fixed-Income Funds (2005-present), and Balanced Funds (2005-present). He serves as Senior Vice President (2000-present) and Head (2004-present) of the Fidelity Investments Fixed Income Division. Mr. Murphy is also a Senior Vice President of Fidelity Investments Money Management, Inc. (2003-present) and an Executive Vice President of FMR (2005-present). Previously, Mr. Murphy served as Money Market Group Leader (2002-2004), Bond Group Leader (2000-2002), and Vice President of Fidelity's Taxable Bond Funds (2000-2002) and Fidelity's Municipal Bond Funds (2001-2002). |
Thomas J. Silvia (46) |
| Year of Election or Appointment: 2005 Vice President of the fund. Mr. Silvia also serves as Vice President of Fidelity's Fixed-Income Funds (2005-present), certain Balanced Funds (2005-present), certain Asset Allocation Funds (2005-present), and Senior Vice President and Bond Group Leader of the Fidelity Investments Fixed-Income Division (2005-present). Previously, Mr. Silvia served as Director of Fidelity's Taxable Bond portfolio managers (2002-2004) and a portfolio manager in the Bond Group (1997-2004). |
William Irving (43) |
| Year of Election or Appointment: 2007 Vice President of the fund. Dr. Irving also serves as Vice President of other funds advised by FMR. Prior to assuming his current responsibilities, Dr. Irving worked as a quantitative analyst and portfolio manager. |
Eric D. Roiter (58) |
| Year of Election or Appointment: 1998 Secretary of the fund. He also serves as Secretary of other Fidelity funds; Vice President, General Counsel, and Secretary of FMR Co., Inc. (2001-present) and FMR; Assistant Secretary of Fidelity Management & Research (U.K.) Inc. (2001-present), Fidelity Research & Analysis Company (2001-present), and Fidelity Investments Money Management, Inc. (2001-present). Mr. Roiter is an Adjunct Member, Faculty of Law, at Boston College Law School (2003-present). Previously, Mr. Roiter served as Vice President and Secretary of Fidelity Distributors Corporation (FDC) (1998-2005). |
Scott C. Goebel (39) |
| Year of Election or Appointment: 2007 Assistant Secretary of the fund. Mr. Goebel also serves as Assistant Secretary of other Fidelity funds (2007-present), Vice President and Secretary of FDC (2006-present), and is an employee of FMR. |
R. Stephen Ganis (41) |
| Year of Election or Appointment: 2006 Anti-Money Laundering (AML) officer of the fund. Mr. Ganis also serves as AML officer of other Fidelity funds (2006-present) and FMR Corp. (2003-present). Before joining Fidelity Investments, Mr. Ganis practiced law at Goodwin Procter, LLP (2000-2002). |
Joseph B. Hollis (59) |
| Year of Election or Appointment: 2006 Chief Financial Officer of the fund. Mr. Hollis also serves as Chief Financial Officer of other Fidelity funds. Mr. Hollis is President of Fidelity Pricing and Cash Management Services (FPCMS) (2005-present). Mr. Hollis also serves as President and Director of Fidelity Service Company, Inc. (2006-present). Previously, Mr. Hollis served as Senior Vice President of Cash Management Services (1999-2002) and Investment Management Operations (2002-2005). |
Kenneth A. Rathgeber (60) |
| Year of Election or Appointment: 2004 Chief Compliance Officer of the fund. Mr. Rathgeber also serves as Chief Compliance Officer of other Fidelity funds (2004-present) and Executive Vice President of Risk Oversight for Fidelity Investments (2002-present). He is Chief Compliance Officer of FMR (2005-present), FMR Co., Inc. (2005-present), Fidelity Management & Research (U.K.) Inc. (2005-present), Fidelity Research & Analysis Company (2005-present), Fidelity Investments Money Management, Inc. (2005-present), and Strategic Advisers, Inc. (2005-present). Previously, Mr. Rathgeber served as Executive Vice President and Chief Operating Officer for Fidelity Investments Institutional Services Company, Inc. (1998-2002). |
Bryan A. Mehrmann (46) |
| Year of Election or Appointment: 2005 Deputy Treasurer of the fund. Mr. Mehrmann also serves as Deputy Treasurer of other Fidelity funds (2005-present) and is an employee of FMR. Previously, Mr. Mehrmann served as Vice President of Fidelity Investments Institutional Services Group (FIIS)/Fidelity Investments Institutional Operations Corporation, Inc. (FIIOC) Client Services (1998-2004). |
Kenneth B. Robins (37) |
| Year of Election or Appointment: 2005 Deputy Treasurer of the fund. Mr. Robins also serves as Deputy Treasurer of other Fidelity funds (2005-present) and is an employee of FMR (2004-present). Before joining Fidelity Investments, Mr. Robins worked at KPMG LLP, where he was a partner in KPMG's department of professional practice (2002-2004) and a Senior Manager (1999-2000). In addition, Mr. Robins served as Assistant Chief Accountant, United States Securities and Exchange Commission (2000-2002). |
Robert G. Byrnes (40) |
| Year of Election or Appointment: 2005 Assistant Treasurer of the fund. Mr. Byrnes also serves as Assistant Treasurer of other Fidelity funds (2005-present) and is an employee of FMR (2005-present). Previously, Mr. Byrnes served as Vice President of FPCMS (2003-2005). Before joining Fidelity Investments, Mr. Byrnes worked at Deutsche Asset Management where he served as Vice President of the Investment Operations Group (2000-2003). |
Peter L. Lydecker (53) |
| Year of Election or Appointment: 2004 Assistant Treasurer of the fund. Mr. Lydecker also serves as Assistant Treasurer of other Fidelity funds (2004) and is an employee of FMR. |
Gary W. Ryan (48) |
| Year of Election or Appointment: 2005 Assistant Treasurer of the fund. Mr. Ryan also serves as Assistant Treasurer of other Fidelity funds (2005-present) and is an employee of FMR (2005-present). Previously, Mr. Ryan served as Vice President of Fund Reporting in FPCMS (1999-2005). |
Annual Report
Distributions
A total of 15.00% of the dividends distributed during the fiscal year was derived from interest on U.S. Government securities which is generally exempt from state income tax.
The fund designates $231,780,564 of distributions paid during the period January 1, 2007 to July 31, 2007 as qualifying to be taxed as interest-related dividends for nonresident alien shareholders.
The fund will notify shareholders in January 2008 of amounts for use in preparing 2007 income tax returns.
Annual Report
Board Approval of Investment Advisory Contracts and Management Fees
Fidelity Government Income Fund
Each year, typically in June, the Board of Trustees, including the Independent Trustees (together, the Board), votes on the renewal of the management contract and sub-advisory agreements (together, the Advisory Contracts) for the fund. The Board, assisted by the advice of fund counsel and Independent Trustees' counsel, requests and considers a broad range of information throughout the year.
The Board meets regularly each month except August and takes into account throughout the year matters bearing on Advisory Contracts. The Board, acting directly and through its separate committees, considers at each of its meetings factors that are relevant to the annual renewal of the fund's Advisory Contracts, including the services and support provided to the fund and its shareholders. At the time of the renewal, the Board had 12 standing committees, each composed of Independent Trustees with varying backgrounds, to which the Board has assigned specific subject matter responsibilities in order to enhance effective decision-making by the Board. Each committee has adopted a written charter outlining the structure and purposes of the committee. One such committee, the Fixed-Income Contract Committee, meets periodically as needed throughout the year to consider matters specifically related to the annual renewal of Advisory Contracts. The committee requests and receives information on, and makes recommendations to the Independent Trustees concerning, the approval and annual review of the Advisory Contracts.
At its June 2007 meeting, the Board of Trustees, including the Independent Trustees, unanimously determined to renew the Advisory Contracts for the fund. In reaching its determination, the Board considered all factors it believed relevant, including (i) the nature, extent, and quality of the services to be provided to the fund and its shareholders (including the investment performance of the fund); (ii) the competitiveness of the management fee and total expenses of the fund; (iii) the total costs of the services to be provided by and the profits to be realized by the investment adviser and its affiliates from the relationship with the fund; (iv) the extent to which economies of scale would be realized as the fund grows; and (v) whether fee levels reflect these economies of scale, if any, for the benefit of fund shareholders. The Board also approved amendments to the fund's agreements with foreign sub-advisers to clarify that each sub-adviser provides services as an independent contractor.
In determining whether to renew the Advisory Contracts for the fund, the Board ultimately reached a determination, with the assistance of fund counsel and Independent Trustees' counsel, that the renewal of the Advisory Contracts and the compensation to be received by Fidelity under the management contract is consistent with Fidelity's fiduciary duty under applicable law. In addition to evaluating the specific factors noted above, the Board, in reaching its determination, is aware that shareholders in the fund have a broad range of investment choices available to them, including a wide choice among mutual funds offered by competitors to Fidelity, and that the fund's shareholders, with the opportunity to review and weigh the disclosure provided by the fund in its prospectus and other public disclosures, have chosen to invest in this fund, managed by Fidelity.
Annual Report
Board Approval of Investment Advisory Contracts and
Management Fees - continued
Nature, Extent, and Quality of Services Provided. The Board considered staffing within the investment adviser, FMR, and the sub-advisers (together, the Investment Advisers), including the background of the fund's portfolio manager and the fund's investment objective and discipline. The Independent Trustees also had discussions with senior management of Fidelity's investment operations and investment groups. The Board considered the structure of the portfolio manager compensation program and whether this structure provides appropriate incentives.
Resources Dedicated to Investment Management and Support Services. The Board reviewed the size, education, and experience of the Investment Advisers' investment staff, their use of technology, and the Investment Advisers' approach to recruiting, training, and retaining portfolio managers and other research, advisory, and management personnel. The Board considered Fidelity's extensive global research capabilities that enable the Investment Advisers to aggregate data from various sources in an effort to produce positive investment results. The Board noted that Fidelity's analysts have access to a variety of technological tools that enable them to perform both fundamental and quantitative analysis and to specialize in various disciplines. The Board also considered that Fidelity's portfolio managers and analysts have access to daily portfolio attribution that allows for monitoring of a fund's portfolio, as well as an electronic communication system that provides immediate real-time access to research concerning issuers and credit enhancers. In addition, the Board considered the trading resources that are an integrated part of the fixed-income portfolio management investment process.
Shareholder and Administrative Services. The Board considered (i) the nature, extent, quality, and cost of advisory, administrative, distribution, and shareholder services performed by the Investment Advisers and their affiliates under the Advisory Contracts and under separate agreements covering transfer agency, pricing and bookkeeping, and securities lending services for the fund; (ii) the nature and extent of the Investment Advisers' supervision of third party service providers, principally custodians and subcustodians; and (iii) the resources devoted to, and the record of compliance with, the fund's compliance policies and procedures.
The Board noted that the growth of fund assets across the complex allows Fidelity to reinvest in the development of services designed to enhance the value or convenience of the Fidelity funds as investment vehicles. These services include 24-hour access to account information and market information through phone representatives and over the Internet, and investor education materials and asset allocation tools.
Annual Report
Investment in a Large Fund Family. The Board considered the benefits to shareholders of investing in a Fidelity fund, including the benefits of investing in a fund that is part of a large family of funds offering a variety of investment disciplines and providing for a large variety of mutual fund investor services. For example, fund shareholders are offered the privilege of exchanging shares of the fund for shares of other Fidelity funds, as set forth in the fund's prospectus, without paying a sales charge. The Board noted that, since the last Advisory Contract renewals in June 2006, Fidelity has taken a number of actions that benefited particular funds, including (i) dedicating additional resources to investment research and to restructure the investment research teams; (ii) contractually agreeing to reduce the management fee on Fidelity Advisor Floating Rate High Income Fund; (iii) contractually agreeing to reduce the management fees on Fidelity's California, Massachusetts, New Jersey, and New York AMT Tax-Free Money Market Funds, launching new Institutional Classes and Service Classes of these funds, and contractually agreeing to impose expense limitations on these funds; (iv) eliminating the exchange fee on the Fidelity Select Portfolios and reducing the pricing and bookkeeping fee rates for these funds; (v) reducing the maximum transfer agency fee rates on high income funds and certain equity funds; (vi) proposing amended management contracts that, if approved by shareholders, will add a performance adjustment component to the management fees paid by 18 Fidelity Advisor equity funds; (vii) contractually agreeing to reduce fees for Ultra-Short Central Fund and the money market Central Funds; (viii) waiving the Fidelity Advisor funds' contingent deferred sales charge on certain redemptions made through systematic withdrawal programs; and (ix) amending the management contracts for equity and fixed-income funds whose management contracts incorporate a "group fee" structure by adding four new fee "breakpoints" to the group fee rate schedules.
Investment Performance. The Board considered whether the fund has operated within its investment objective, as well as its record of compliance with its investment restrictions. It also reviewed the fund's absolute investment performance for Fidelity Government Income (retail class), as well as the fund's relative investment performance for Fidelity Government Income (retail class) measured against (i) a proprietary custom index, and (ii) a peer group of mutual funds deemed appropriate by the Board over multiple periods. The following charts considered by the Board show, over the one-, three-, and five-year periods ended December 31, 2006, the cumulative total returns of Fidelity Government Income (retail class), the cumulative total returns of a proprietary custom index ("benchmark"), and a range of cumulative total returns of a peer group of mutual funds identified by Lipper Inc. as having an investment objective similar to that of the fund. (The Advisor classes of the fund had less than one year of performance as of December 31, 2006.) The box within each chart shows the 25th percentile return (bottom of box) and the 75th percentile return (top of box) of the peer group. Returns shown above the box are in the first quartile and returns shown below the box are in the fourth quartile. The percentage beaten number noted below each chart corresponds to the percentile box and represents the percentage of funds in the peer group whose performance was equal to or lower than that of Fidelity Government Income (retail class). The fund's proprietary custom index is an index developed by FMR that represents the performance of the fund's general investment categories.
Annual Report
Board Approval of Investment Advisory Contracts and
Management Fees - continued
Fidelity Government Income Fund

The Board reviewed the fund's relative investment performance against its peer group and stated that the performance of Fidelity Government Income (retail class) was in the first quartile for all the periods shown. The Board also stated that the relative investment performance of the fund was lower than its benchmark for all the periods shown. The Board discussed with FMR actions to be taken by FMR to improve the fund's below-benchmark performance.
Based on its review, and giving particular weight to the nature and quality of the resources dedicated by the Investment Advisers to maintain and improve relative performance, the Board concluded that the nature, extent, and quality of the services provided to the fund will benefit the fund's shareholders, particularly in light of the Board's view that the fund's shareholders benefit from investing in a fund that is part of a large family of funds offering a variety of investment disciplines and services.
Competitiveness of Management Fee and Total Fund Expenses. The Board considered the fund's management fee and total expenses compared to "mapped groups" of competitive funds and classes. Fidelity creates "mapped groups" by combining similar Lipper investment objective categories that have comparable management fee characteristics. Combining Lipper investment objective categories aids the Board's management fee and total expense comparisons by broadening the competitive group used for comparison and by reducing the number of universes to which various Fidelity funds are compared.
Annual Report
The Board considered two proprietary management fee comparisons for the 12-month periods shown in the chart below. The group of Lipper funds used by the Board for management fee comparisons is referred to below as the "Total Mapped Group" and, for the reasons explained above, is broader than the Lipper peer group used by the Board for performance comparisons. The Total Mapped Group comparison focuses on a fund's standing relative to the total universe of comparable funds available to investors, in terms of gross management fees before expense reimbursements or caps. "TMG %" represents the percentage of funds in the Total Mapped Group that had management fees that were lower than the fund's. For example, a TMG % of 8% means that 92% of the funds in the Total Mapped Group had higher management fees than the fund. The "Asset-Size Peer Group" (ASPG) comparison focuses on a fund's standing relative to non-Fidelity funds similar in size to the fund within the Total Mapped Group. The ASPG represents at least 15% of the funds in the Total Mapped Group with comparable asset size and management fee characteristics, subject to a minimum of 50 funds (or all funds in the Total Mapped Group if fewer than 50). Additional information, such as the ASPG quartile in which the fund's management fee ranked, is also included in the chart and considered by the Board.
Fidelity Government Income Fund

The Board noted that the fund's management fee ranked below the median of its Total Mapped Group and below the median of its ASPG for 2006.
Annual Report
Board Approval of Investment Advisory Contracts and
Management Fees - continued
Furthermore, the Board considered that it had approved an amendment (effective June 1, 2005) to the fund's management contract that lowered the fund's individual fund fee rate from 30 basis points to 20 basis points. The Board considered that the fund's chart reflects the fund's lower management fee for 2005, as if the lower rate were in effect for the entire year.
Based on its review, the Board concluded that the fund's management fee was fair and reasonable in light of the services that the fund receives and the other factors considered.
In its review of each class's total expenses, the Board considered the fund's management fee as well as other fund or class expenses, as applicable, such as transfer agent fees, pricing and bookkeeping fees, fund-paid 12b-1 fees, and custodial, legal, and audit fees. The Board also noted the effects of any waivers and reimbursements on fees and expenses. As part of its review, the Board also considered current and historical total expenses of each class of the fund compared to competitive fund median expenses. Each class of the fund is compared to those funds and classes in the Total Mapped Group (used by the Board for management fee comparisons) that have a similar sales load structure.
The Board also considered that the current contractual arrangements for the fund (i) have the effect of setting the total "fund-level" expenses (including, among certain other expenses, the management fee) for each class at 35 basis points, (ii) lower and limit the "class-level" transfer agent fee for Fidelity Government Income (retail class) to 10 basis points, and (iii) limit the total expenses for Fidelity Government Income (retail class) to 45 basis points. These contractual arrangements may not be increased without the approval of the Board and the shareholders of the applicable class. The fund's Advisor classes are subject to different "class-level" expenses (transfer agent fees and 12b-1 fees).
The Board noted that the total expenses of each class ranked below its competitive median for 2006.
The Board recognized that the fund's management contract incorporates a "group fee" structure, which provides for lower group fee rates as total fund assets under FMR's management increase, and for higher group fee rates as total fund assets under FMR's management decrease. FMR determines the group fee rates based on a tiered asset "breakpoint" schedule. In connection with the renewal of the fund's management contract, the Board approved amendments to the fund's management contract that added four new fee breakpoints to the group fee rate schedule for assets under FMR's management above $1,386 billion. The Board considered that the group fee rate declines under both the present and amended schedules, but that under the amended schedule, the group fee rate declines faster as assets under FMR's management exceed $1,386 billion. The Board noted, however, that because the current contractual arrangements set the total fund-level expenses for each class at 35 basis points, increases or decreases in the management fee due to changes in the group fee rate will not impact total expenses.
Annual Report
In its review of total expenses, the Board also considered Fidelity fee structures and other information on clients that FMR and its affiliates service in other competitive markets, such as other mutual funds advised or subadvised by FMR or its affiliates, pension plan clients, and other institutional clients.
Based on its review, the Board concluded that the total expenses of each class of the fund were reasonable in light of the services that the fund and its shareholders receive and the other factors considered.
Costs of the Services and Profitability. The Board considered the revenues earned and the expenses incurred by Fidelity in conducting the business of developing, marketing, distributing, managing, administering and servicing the fund and its shareholders. The Board also considered the level of Fidelity's profits in respect of all the Fidelity funds.
On an annual basis, FMR presents to the Board Fidelity's profitability for the fund. Fidelity calculates the profitability for each fund, as well as aggregate profitability for groups of Fidelity funds and all Fidelity funds, using a series of detailed revenue and cost allocation methodologies which originate with the audited books and records of Fidelity. The Audit Committee of the Board reviews any significant changes from the prior year's methodologies.
PricewaterhouseCoopers LLP (PwC), independent registered public accounting firm and auditor to Fidelity and certain Fidelity funds, has been engaged annually by the Board as part of the Board's assessment of the results of Fidelity's profitability analysis. PwC's engagement includes the review and assessment of Fidelity's methodologies used in determining the revenues and expenses attributable to Fidelity's mutual fund business, and completion of agreed-upon procedures surrounding the mathematical accuracy of fund profitability and its conformity to allocation methodologies. After considering PwC's reports issued under the engagement and information provided by Fidelity, the Board believes that while other allocation methods may also be reasonable, Fidelity's profitability methodologies are reasonable in all material respects.
The Board has also reviewed Fidelity's non-fund businesses and any fall-out benefits related to the mutual fund business as well as cases where Fidelity's affiliates may benefit from or be related to the fund's business.
The Board considered the costs of the services provided by and the profits realized by Fidelity in connection with the operation of the fund and determined that the amount of profit is a fair entrepreneurial profit for the management of the fund.
Annual Report
Board Approval of Investment Advisory Contracts and
Management Fees - continued
Economies of Scale. The Board considered whether there have been economies of scale in respect of the management of the Fidelity funds, whether the Fidelity funds (including the fund) have appropriately benefited from any such economies of scale, and whether there is potential for realization of any further economies of scale. The Board considered the extent to which the fund will benefit from economies of scale through increased services to the fund, through waivers or reimbursements, or through fee or expense reductions, including (Advisor classes only) reductions that occur through operation of the transfer agent agreement. The transfer agent fee varies in part based on the number of accounts in the fund. If the number of accounts decreases or the average account size increases, the overall transfer agent fee rate decreases. The Board concluded that any potential economies of scale are being shared between fund shareholders and Fidelity in an appropriate manner.
Additional Information Requested by the Board. In order to develop fully the factual basis for consideration of the Fidelity funds' Advisory Contracts, the Board requested and received additional information on several topics, including (i) Fidelity's fund profitability methodology, profitability by investment discipline, and profitability trends within certain funds; (ii) Fidelity's compensation structure relative to competitors and its effect on profitability; (iii) funds and accounts managed by Fidelity other than the Fidelity funds, including fee arrangements; (iv) the total expenses of certain funds and classes relative to competitors; (v) fund performance trends; (vi) fall-out benefits received by certain Fidelity affiliates; and (vii) Fidelity's fee structures.
Based on its evaluation of all of the conclusions noted above, and after considering all material factors, the Board ultimately concluded that the advisory fee structures are fair and reasonable, and that the fund's Advisory Contracts should be renewed.
Annual Report
Annual Report
Annual Report
Annual Report
Investment Adviser
Fidelity Management & Research Company
Boston, MA
Investment Sub-Advisers
Fidelity Investments Money
Management, Inc.
Fidelity Research & Analysis Company
Fidelity International
Investment Advisors
Fidelity International
Investment Advisors (U.K.) Limited
General Distributor
Fidelity Distributors Corporation
Boston, MA
Transfer and Service Agents
Fidelity Investments Institutional Operations Company, Inc.
Boston, MA
Fidelity Service Company, Inc.
Boston, MA
Custodian
The Bank of New York
New York, NY
AGVT-UANN-0907
1.834241.100
(Fidelity Investment logo)(registered trademark)
(Fidelity Investment logo)(registered trademark)
Fidelity Advisor
Government Income
Fund - Institutional Class
Annual Report
July 31, 2007
Institutional Class is a class of
Fidelity® Government Income Fund
(2_fidelity_logos) (Registered_Trademark)
Contents
Chairman's Message | <Click Here> | Ned Johnson's message to shareholders. |
Performance | <Click Here> | How the fund has done over time. |
Management's Discussion | <Click Here> | The manager's review of fund performance, strategy and outlook. |
Shareholder Expense Example | <Click Here> | An example of shareholder expenses. |
Investment Changes | <Click Here> | A summary of major shifts in the fund's investments over the past six months. |
Investments | <Click Here> | A complete list of the fund's investments with their market values. |
Financial Statements | <Click Here> | Statements of assets and liabilities, operations, and changes in net assets, as well as financial highlights. |
Notes | <Click Here> | Notes to the financial statements. |
Report of Independent Registered Public Accounting Firm | <Click Here> | |
Trustees and Officers | <Click Here> | |
Distributions | <Click Here> | |
Board Approval of Investment Advisory Contracts and Management Fees | <Click Here> | |
To view a fund's proxy voting guidelines and proxy voting record for the 12-month period ended June 30, visit http://www.fidelity.com (search for "proxy voting guidelines") or visit the Securities and Exchange Commission's (SEC) web site at http://www.sec.gov. You may also call 1-877-208-0098 to request a free copy of the proxy voting guidelines.
Standard & Poor's, S&P and S&P 500 are registered service marks of The McGraw-Hill Companies, Inc. and have been licensed for use by Fidelity Distributors Corporation.
Other third party marks appearing herein are the property of their respective owners.
All other marks appearing herein are registered or unregistered trademarks or service marks of FMR Corp. or an affiliated company.
Annual Report
This report and the financial statements contained herein are submitted for the general information of the shareholders of the fund. This report is not authorized for distribution to prospective investors in the fund unless preceded or accompanied by an effective prospectus.
A fund files its complete schedule of portfolio holdings with the SEC for the first and third quarters of each fiscal year on Form N-Q. Forms N-Q are available on the SEC's web site at http://www.sec.gov. A fund's Forms N-Q may be reviewed and copied at the SEC's Public Reference Room in Washington, DC. Information regarding the operation of the SEC's Public Reference Room may be obtained by calling 1-800-SEC-0330. For a complete list of a fund's portfolio holdings, view the most recent holdings listing, semiannual report, or annual report on Fidelity's web site at http://www.fidelity.com or http://www.advisor.fidelity.com, as applicable.
NOT FDIC INSURED · MAY LOSE VALUE · NO BANK GUARANTEE
Neither the fund nor Fidelity Distributors Corporation is a bank.
Annual Report
Chairman's Message
(photo_of_Edward_C_Johnson_3d)
Dear Shareholder:
Stocks are currently on pace to register their fifth straight year of positive returns, although gains could be trimmed if the U.S. economy continues to slow. While financial markets are always unpredictable, there are a number of time-tested principles that can put the historical odds in your favor.
One of the basic tenets is to invest for the long term. Over time, riding out the markets' inevitable ups and downs has proven much more effective than selling into panic or chasing the hottest trend. Even missing only a few of the markets' best days can significantly diminish investor returns. Patience also affords the benefits of compounding - of earning interest on additional income or reinvested dividends and capital gains. There are tax advantages and cost benefits to consider as well. The more you sell, the more taxes you pay, and the more you trade, the higher the costs. While staying the course doesn't eliminate risk, it can considerably lessen the effect of short-term declines.
You can further manage your investing risk through diversification. And today, more than ever, geographic diversification should be taken into account. Studies indicate that asset allocation is the single most important determinant of a portfolio's long-term success. The right mix of stocks, bonds and cash - aligned to your particular risk tolerance and investment objective - is very important. Age-appropriate rebalancing is also an essential aspect of asset allocation. For younger investors, an emphasis on equities - which historically have been the best-performing asset class over time - is encouraged. As investors near their specific goal, such as retirement or sending a child to college, consideration may be given to replacing volatile assets (e.g. common stocks) with more-stable fixed investments (bonds or savings plans).
A third investment principle - investing regularly - can help lower the average cost of your purchases. Investing a certain amount of money each month or quarter helps ensure you won't pay for all your shares at market highs. This strategy - known as dollar cost averaging - also reduces unconstructive "emotion" from investing, helping shareholders avoid selling weak performers just prior to an upswing, or chasing a hot performer just before a correction.
We invite you to contact us via the Internet, through our Investor Centers or over the phone. It is our privilege to provide you the information you need to make the investments that are right for you.
Sincerely,
/s/Edward C. Johnson 3d
Edward C. Johnson 3d
Annual Report
Fidelity Advisor Government Income Fund - Institutional Class
Performance: The Bottom Line
Average annual total return reflects the change in the value of an investment, assuming reinvestment of the class' dividend income and capital gains (the profits earned upon the sale of securities that have grown in value) and assuming a constant rate of performance each year. The $10,000 table and the fund's returns do not reflect the deduction of taxes that a shareholder would pay on fund distributions or the redemption of fund shares. During periods of reimbursement by Fidelity, a fund's total return will be greater than it would be had the reimbursement not occurred. How a fund did yesterday is no guarantee of how it will do tomorrow.
Average Annual Total Returns
Periods ended July 31, 2007 | Past 1
year | Past 5
years | Past 10
years |
Institutional Class A | 5.25% | 3.75% | 5.33% |
A The initial offering of Institutional Class shares took place on October 24, 2006. Returns prior to October 24, 2006 are those of Government Income, the original retail class of the fund.
$10,000 Over 10 Years
Let's say hypothetically that $10,000 was invested in Fidelity Advisor Government Income Fund - Institutional Class on July 31, 1997. The chart shows how the value of your investment would have changed, and also shows how the Lehman Brothers U.S. Government Index performed over the same period. The initial offering of Institutional Class took place on October 24, 2006. See above for additional information regarding the performance of Institutional Class.
Annual Report
Management's Discussion of Fund Performance
Comments from William Irving, Portfolio Manager of Fidelity Advisor Government Income Fund
The investment-grade bond market posted a reasonably solid advance for the 12 months ending July 31, 2007. In that time, the Lehman Brothers® U.S. Aggregate Index - a performance gauge of taxable, high-quality debt - gained 5.58%. A sizable percentage of that increase came in the first four months of the period. The index returned a cumulative 4.30% from August through November, as investors responded favorably to the end of the Federal Reserve Board's two-year campaign of interest rate hikes. In fact, the central bank left rates unchanged through the entire 12-month period. Bonds turned negative in December and January, but had their best month of the past year in February, rising 1.54% as extreme volatility in the stock markets led to a flight to safety in high-quality debt. Performance was lackluster thereafter, however. Inflation concerns and dwindling hopes for a near-term Fed rate cut pressured bond prices for much of the remainder of the period, as did the meltdown of the subprime mortgage sector. Against that backdrop, the index gained only 0.32% over the final five months of the period.
During the past year, the fund lagged the 5.75% return of the Lehman Brothers 75% U.S. Government/25% U.S. Mortgage-Backed Securities Index. (For specific performance information on the fund's Institutional Class shares, please refer to the performance section of this report.) The fund's return relative to the index was helped by its yield-curve positioning, which refers to how we allocated investments across a range of bond maturities. In particular, our overweighting in better-performing intermediate bonds in the two- to five-year range and our underweighting in lagging 10- to 20-year bonds worked in our favor. In the mortgage sector, our overweighted position in hybrid adjustable-rate mortgages (ARMs) helped because they generally outpaced the fixed-rate mortgages that dominate the benchmark, due to strong demand from institutional investors, who recently bought the bonds prior to their inclusion in the Lehman Brothers U.S. Aggregate Index and the Lehman Brothers U.S. Mortgage-Backed Securities Index. On the flip side, sector selection generally worked against us. An out-of-index position in Treasury Inflation-Protected Securities hurt because they lagged the index. Elsewhere, the fund also suffered from its underweighting in plain-vanilla Treasury securities, which outpaced mortgage-backed securities, in which we were overweighted. Our slightly larger-than-index weighting in agency securities had little effect on the fund's relative performance, as they generally kept pace with the index.
The views expressed above reflect those of the portfolio manager(s) only through the end of the period as stated on the cover of this report and do not necessarily represent the views of Fidelity or any other person in the Fidelity organization. Any such views are subject to change at any time based upon market or other conditions and Fidelity disclaims any responsibility to update such views. These views may not be relied on as investment advice and, because investment decisions for a Fidelity fund are based on numerous factors, may not be relied on as an indication of trading intent on behalf of any Fidelity fund.
Annual Report
Shareholder Expense Example
As a shareholder of the Fund, you incur two types of costs: (1) transaction costs, including sales charges (loads) on purchase payments or redemption proceeds, and (2) ongoing costs, including management fees, distribution and/or service (12b-1) fees and other Fund expenses. This Example is intended to help you understand your ongoing costs (in dollars) of investing in the Fund and to compare these costs with the ongoing costs of investing in other mutual funds.
The Example is based on an investment of $1,000 invested at the beginning of the period and held for the entire period (February 1, 2007 to July 31, 2007).
Actual Expenses
The first line of the accompanying table for each class of the Fund provides information about actual account values and actual expenses. You may use the information in this line, together with the amount you invested, to estimate the expenses that you paid over the period. Simply divide your account value by $1,000.00 (for example, an $8,600 account value divided by $1,000.00 = 8.6), then multiply the result by the number in the first line for a class of the Fund under the heading entitled "Expenses Paid During Period" to estimate the expenses you paid on your account during this period. A small balance maintenance fee of $12.00 that is charged once a year may apply for certain accounts with a value of less than $2,000. This fee is not included in the table below. If it was, the estimate of expenses you paid during the period would be higher, and your ending account value lower, by this amount.
Hypothetical Example for Comparison Purposes
The second line of the accompanying table for each class of the Fund provides information about hypothetical account values and hypothetical expenses based on a Class' actual expense ratio and an assumed rate of return of 5% per year before expenses, which is not the Class' actual return. The hypothetical account values and expenses may not be used to estimate the actual ending account balance or expenses you paid for the period. You may use this information to compare the ongoing costs of investing in the Fund and other funds. To do so, compare this 5% hypothetical example with the 5% hypothetical examples that appear in the shareholder reports of the other funds. A small balance maintenance fee of $12.00 that is charged once a year may apply for certain accounts with a value of less than $2,000. This fee is not included in the table below. If it was, the estimate of expenses you paid during the period would be higher, and your ending account value lower, by this amount.
Please note that the expenses shown in the table are meant to highlight your ongoing costs only and do not reflect any transaction costs. Therefore, the second line of the table is useful in comparing ongoing costs only, and will not help you determine the relative total costs of owning different funds. In addition, if these transactional costs were included, your costs would have been higher.
Annual Report
Shareholder Expense Example - continued
| Beginning
Account Value
February 1, 2007 | Ending
Account Value
July 31, 2007 | Expenses Paid
During Period*
February 1, 2007
to July 31, 2007 |
Class A | | | |
Actual | $ 1,000.00 | $ 1,021.70 | $ 4.01 |
HypotheticalA | $ 1,000.00 | $ 1,020.83 | $ 4.01 |
Class T | | | |
Actual | $ 1,000.00 | $ 1,021.70 | $ 4.01 |
HypotheticalA | $ 1,000.00 | $ 1,020.83 | $ 4.01 |
Class B | | | |
Actual | $ 1,000.00 | $ 1,018.10 | $ 7.56 |
HypotheticalA | $ 1,000.00 | $ 1,017.31 | $ 7.55 |
Class C | | | |
Actual | $ 1,000.00 | $ 1,017.80 | $ 7.80 |
HypotheticalA | $ 1,000.00 | $ 1,017.06 | $ 7.80 |
Government Income | | | |
Actual | $ 1,000.00 | $ 1,023.50 | $ 2.26 |
HypotheticalA | $ 1,000.00 | $ 1,022.56 | $ 2.26 |
Institutional Class | | | |
Actual | $ 1,000.00 | $ 1,023.10 | $ 2.66 |
HypotheticalA | $ 1,000.00 | $ 1,022.17 | $ 2.66 |
A 5% return per year before expenses
* Expenses are equal to each Class' annualized expense ratio (shown in the table below); multiplied by the average account value over the period, multiplied by 181/365 (to reflect the one-half year period).
| Annualized
Expense Ratio |
Class A | .80% |
Class T | .80% |
Class B | 1.51% |
Class C | 1.56% |
Government Income | .45% |
Institutional Class | .53% |
Annual Report
Investment Changes
Coupon Distribution as of July 31, 2007 |
| % of fund's investments | % of fund's investments
6 months ago |
Less than 2% | 1.7 | 2.5 |
2 - 2.99% | 0.0 | 1.2 |
3 - 3.99% | 2.8 | 3.0 |
4 - 4.99% | 34.2 | 31.0 |
5 - 5.99% | 21.7 | 24.3 |
6 - 6.99% | 15.6 | 15.8 |
7% and over | 2.8 | 3.0 |
Coupon distribution shows the range of stated interest rates on the fund's investments, excluding short-term investments. |
Weighted Average Maturity as of July 31, 2007 |
| | 6 months ago |
Years | 4.9 | 4.9 |
The weighted average maturity is based on the dollar-weighted average length of time until principal payments are expected or until securities reach maturity, taking into account any maturity shortening feature such as a call, refunding or redemption provision. |
Duration as of July 31, 2007 |
| | 6 months ago |
Years | 4.7 | 4.1 |
Duration shows how much a bond fund's price fluctuates with changes in comparable interest rates. If rates rise 1%, for example, a fund with a five-year duration is likely to lose about 5% of its value. Other factors also can influence a bond fund's performance and share price. Accordingly, a bond fund's actual performance may differ from this example. |
Asset Allocation (% of fund's net assets) |
As of July 31, 2007* | As of January 31, 2007** |
| Mortgage
Securities 32.0% | | | Mortgage
Securities 29.2% | |
| CMOs and Other Mortgage Related Securities 7.9% | | | CMOs and Other Mortgage Related Securities 11.4% | |
| U.S. Treasury
Obligations 34.7% | | | U.S. Treasury
Obligations 29.8% | |
| U.S. Government
Agency Obligations 27.5% | | | U.S. Government
Agency Obligations 32.1% | |
| Asset-Backed
Securities 0.5% | | | Asset-Backed
Securities 0.7% | |
| Short-Term
Investments and
Net Other Assets(dagger) (2.6)% | | | Short-Term
Investments and
Net Other Assets(dagger) (3.2)% | |
* Futures and Swaps | 4.4% | | ** Futures and Swaps | 0.3% | |

(dagger) Short-Term Investments and Net Other Assets are not included in the pie chart. |
Annual Report
Investments July 31, 2007
Showing Percentage of Net Assets
U.S. Government and Government Agency Obligations - 62.2% |
| Principal Amount (000s) | | Value
(000s) |
U.S. Government Agency Obligations - 27.5% |
Fannie Mae: | | | |
3.25% 8/15/08 | $ 4,812 | | $ 4,725 |
3.25% 2/15/09 (b) | 143,050 | | 139,526 |
4.25% 5/15/09 | 11,235 | | 11,108 |
4.5% 10/15/08 | 81,560 | | 81,101 |
4.75% 12/15/10 | 233,801 | | 231,870 |
4.875% 4/15/09 | 43,350 | | 43,305 |
5.125% 9/2/08 | 78,770 | | 78,833 |
5.125% 4/15/11 | 187,000 | | 187,460 |
5.375% 6/12/17 | 124,591 | | 124,477 |
6.375% 6/15/09 | 55,710 | | 57,121 |
6.625% 9/15/09 | 36,820 | | 38,047 |
7.25% 1/15/10 | 25,086 | | 26,393 |
Federal Home Loan Bank: | | | |
4.5% 10/14/08 | 56,475 | | 56,140 |
5.375% 8/19/11 | 35,350 | | 35,724 |
5.8% 9/2/08 | 26,570 | | 26,779 |
Freddie Mac: | | | |
3.875% 6/15/08 | 2,791 | | 2,761 |
4.75% 3/5/09 | 113,806 | | 113,487 |
4.75% 3/5/12 | 10,000 | | 9,851 |
5% 1/30/14 | 25,000 | | 24,700 |
5.125% 4/18/11 | 31,220 | | 31,266 |
5.25% 7/18/11 | 29,000 | | 29,129 |
5.5% 8/23/17 | 100,000 | | 100,832 |
5.625% 3/15/11 | 48,555 | | 49,446 |
5.75% 1/15/12 | 1,686 | | 1,727 |
6.625% 9/15/09 | 155,000 | | 160,166 |
Israeli State (guaranteed by U.S. Government through Agency for International Development): | | | |
5.5% 9/18/23 | 110,500 | | 111,982 |
6.6% 2/15/08 | 20,957 | | 20,995 |
6.8% 2/15/12 | 30,000 | | 31,268 |
Overseas Private Investment Corp. U.S. Government guaranteed participation certificates: | | | |
6.77% 11/15/13 | 6,650 | | 6,716 |
6.99% 5/21/16 | 21,433 | | 22,966 |
Private Export Funding Corp.: | | | |
secured: | | | |
5.66% 9/15/11 (c) | 18,000 | | 18,332 |
5.685% 5/15/12 | 24,035 | | 24,581 |
6.67% 9/15/09 | 3,500 | | 3,624 |
U.S. Government and Government Agency Obligations - continued |
| Principal Amount (000s) | | Value
(000s) |
U.S. Government Agency Obligations - continued |
Private Export Funding Corp.: - continued | | | |
4.974% 8/15/13 | $ 22,940 | | $ 22,775 |
Small Business Administration guaranteed development participation certificates: | | | |
Series 2002-20J Class 1, 4.75% 10/1/22 | 6,759 | | 6,559 |
Series 2002-20K Class 1, 5.08% 11/1/22 | 14,321 | | 14,131 |
Series 2003 P10B, 5.136% 8/10/13 | 11,281 | | 11,165 |
Series 2004-20H Class 1, 5.17% 8/1/24 | 4,033 | | 3,981 |
Tennessee Valley Authority 5.375% 4/1/56 | 8,429 | | 8,064 |
U.S. Department of Housing and Urban Development Government guaranteed participation certificates Series 1999-A, 5.96% 8/1/09 | 18,380 | | 18,434 |
TOTAL U.S. GOVERNMENT AGENCY OBLIGATIONS | | 1,991,547 |
U.S. Treasury Obligations - 34.7% |
U.S. Treasury Bonds: | | | |
6.125% 8/15/29 (b) | 293,102 | | 337,365 |
6.25% 8/15/23 | 1,500 | | 1,701 |
8% 11/15/21 | 146,794 | | 191,406 |
U.S. Treasury Notes: | | | |
4.25% 8/15/13 (b) | 20,010 | | 19,605 |
4.25% 11/15/13 | 37,610 | | 36,778 |
4.25% 8/15/14 (b)(f) | 161,550 | | 157,070 |
4.25% 11/15/14 (b) | 77,185 | | 74,954 |
4.25% 8/15/15 (b) | 84,500 | | 81,608 |
4.375% 12/15/10 | 5,230 | | 5,201 |
4.5% 4/30/09 (b) | 100,000 | | 99,813 |
4.5% 4/30/12 | 86,000 | | 85,604 |
4.5% 11/15/15 (b) | 111,800 | | 109,739 |
4.5% 5/15/17 (b) | 72,000 | | 70,464 |
4.625% 11/15/09 | 81,000 | | 81,095 |
4.625% 10/31/11 | 11,000 | | 11,015 |
4.625% 2/29/12 | 4,500 | | 4,505 |
4.625% 11/15/16 (b) | 224,000 | | 221,270 |
4.75% 1/31/12 (b) | 188,250 | | 189,485 |
4.75% 5/31/12 | 35,000 | | 35,213 |
4.75% 5/15/14 (b) | 167,723 | | 168,221 |
4.875% 10/31/08 (b) | 180,000 | | 180,281 |
4.875% 5/15/09 (b) | 113,432 | | 113,964 |
4.875% 6/30/09 | 128,000 | | 128,690 |
U.S. Government and Government Agency Obligations - continued |
| Principal Amount (000s) | | Value
(000s) |
U.S. Treasury Obligations - continued |
U.S. Treasury Notes: - continued | | | |
4.875% 5/31/11 | $ 20,740 | | $ 20,951 |
4.875% 6/30/12 (b) | 61,471 | | 62,182 |
5.125% 6/30/11 | 23,214 | | 23,666 |
TOTAL U.S. TREASURY OBLIGATIONS | | 2,511,846 |
TOTAL U.S. GOVERNMENT AND GOVERNMENT AGENCY OBLIGATIONS (Cost $4,494,382) | 4,503,393 |
U.S. Government Agency - Mortgage Securities - 32.0% |
|
Fannie Mae - 26.4% |
3.729% 10/1/33 (g) | 704 | | 695 |
3.75% 1/1/34 (g) | 657 | | 648 |
3.75% 4/1/34 (g) | 11,938 | | 11,739 |
3.757% 10/1/33 (g) | 720 | | 717 |
3.802% 6/1/33 (g) | 549 | | 551 |
3.825% 4/1/33 (g) | 1,988 | | 1,996 |
3.847% 10/1/33 (g) | 30,880 | | 30,833 |
3.877% 6/1/33 (g) | 2,681 | | 2,690 |
3.902% 5/1/34 (g) | 6,663 | | 6,565 |
3.91% 5/1/33 (g) | 4,715 | | 4,742 |
3.913% 9/1/33 (g) | 11,186 | | 11,086 |
3.944% 5/1/34 (g) | 5,281 | | 5,200 |
3.947% 5/1/33 (g) | 230 | | 229 |
3.967% 9/1/33 (g) | 9,140 | | 9,031 |
3.998% 4/1/34 (g) | 10,531 | | 10,379 |
3.999% 10/1/18 (g) | 508 | | 502 |
4% 9/1/13 to 6/1/20 | 27,020 | | 25,401 |
4.013% 4/1/33 (g) | 187 | | 188 |
4.033% 6/1/34 (g) | 9,627 | | 9,485 |
4.063% 3/1/35 (g) | 17,948 | | 17,760 |
4.076% 2/1/35 (g) | 372 | | 373 |
4.114% 5/1/33 (g) | 8,396 | | 8,412 |
4.166% 1/1/35 (g) | 1,571 | | 1,544 |
4.187% 11/1/34 (g) | 12,876 | | 12,913 |
4.205% 6/1/34 (g) | 10,741 | | 10,600 |
4.249% 1/1/34 (g) | 2,105 | | 2,084 |
4.25% 2/1/35 (g) | 767 | | 755 |
U.S. Government Agency - Mortgage Securities - continued |
| Principal Amount (000s) | | Value
(000s) |
Fannie Mae - continued |
4.264% 5/1/35 (g) | $ 773 | | $ 774 |
4.28% 10/1/33 (g) | 332 | | 330 |
4.282% 3/1/33 (g) | 831 | | 835 |
4.283% 6/1/34 (g) | 11,653 | | 11,534 |
4.294% 8/1/33 (g) | 1,342 | | 1,344 |
4.295% 3/1/35 (g) | 656 | | 660 |
4.3% 3/1/33 (g) | 276 | | 272 |
4.302% 6/1/33 (g) | 430 | | 433 |
4.304% 3/1/33 (g) | 370 | | 364 |
4.321% 4/1/35 (g) | 381 | | 382 |
4.343% 1/1/35 (g) | 832 | | 820 |
4.355% 10/1/19 (g) | 1,207 | | 1,192 |
4.36% 2/1/34 (g) | 1,313 | | 1,301 |
4.386% 10/1/34 (g) | 4,044 | | 3,996 |
4.396% 2/1/35 (g) | 1,047 | | 1,031 |
4.411% 7/1/35 (g) | 19,301 | | 19,009 |
4.419% 5/1/35 (g) | 2,123 | | 2,117 |
4.429% 5/1/35 (g) | 616 | | 617 |
4.432% 3/1/35 (g) | 1,101 | | 1,085 |
4.445% 8/1/34 (g) | 2,165 | | 2,148 |
4.481% 1/1/35 (g) | 5,530 | | 5,460 |
4.484% 11/1/33 (g) | 1,650 | | 1,638 |
4.494% 12/1/34 (g) | 458 | | 452 |
4.5% 2/1/18 to 4/1/20 | 16,046 | | 15,376 |
4.503% 2/1/35 (g) | 635 | | 639 |
4.504% 2/1/35 (g) | 333 | | 336 |
4.512% 1/1/35 (g) | 876 | | 867 |
4.519% 2/1/35 (g) | 11,901 | | 11,819 |
4.524% 7/1/35 (g) | 2,513 | | 2,504 |
4.53% 10/1/35 (g) | 416 | | 415 |
4.554% 9/1/34 (g) | 19,342 | | 19,158 |
4.57% 7/1/35 (g) | 3,098 | | 3,108 |
4.575% 2/1/35 (g) | 3,589 | | 3,548 |
4.614% 7/1/34 (g) | 26,137 | | 26,045 |
4.651% 10/1/34 (g) | 3,356 | | 3,327 |
4.653% 3/1/35 (g) | 614 | | 619 |
4.702% 10/1/34 (g) | 2,776 | | 2,755 |
4.719% 7/1/34 (g) | 1,970 | | 1,957 |
4.723% 3/1/35 (g) | 253 | | 255 |
4.733% 12/1/35 (g) | 64,285 | | 63,872 |
4.772% 1/1/35 (g) | 4,800 | | 4,761 |
4.779% 12/1/35 (g) | 4,486 | | 4,465 |
U.S. Government Agency - Mortgage Securities - continued |
| Principal Amount (000s) | | Value
(000s) |
Fannie Mae - continued |
4.781% 12/1/34 (g) | $ 686 | | $ 681 |
4.794% 4/1/35 (g) | 12,356 | | 12,330 |
4.8% 7/1/35 (g) | 4,715 | | 4,669 |
4.801% 11/1/34 (g) | 2,315 | | 2,299 |
4.803% 6/1/35 (g) | 3,587 | | 3,597 |
4.803% 11/1/35 (g) | 10,309 | | 10,315 |
4.808% 2/1/33 (g) | 1,141 | | 1,152 |
4.808% 1/1/36 (g) | 25,970 | | 25,762 |
4.832% 10/1/35 (g) | 2,001 | | 1,988 |
4.849% 7/1/35 (g) | 10,016 | | 9,930 |
4.857% 10/1/34 (g) | 8,122 | | 8,076 |
4.86% 7/1/34 (g) | 6,286 | | 6,256 |
4.87% 5/1/33 (g) | 36 | | 36 |
4.894% 5/1/35 (g) | 1,781 | | 1,768 |
4.899% 8/1/34 (g) | 5,359 | | 5,333 |
5% 12/1/15 to 12/1/35 (e) | 228,426 | | 218,572 |
5.005% 2/1/34 (g) | 8,241 | | 8,166 |
5.016% 7/1/34 (g) | 355 | | 353 |
5.052% 5/1/35 (g) | 4,154 | | 4,184 |
5.069% 9/1/34 (g) | 5,765 | | 5,750 |
5.084% 9/1/34 (g) | 735 | | 733 |
5.087% 8/1/34 (g) | 626 | | 625 |
5.108% 10/1/35 (g) | 4,553 | | 4,531 |
5.135% 7/1/34 (g) | 2,204 | | 2,200 |
5.137% 8/1/36 (g) | 31,468 | | 31,432 |
5.162% 1/1/37 (g) | 5,998 | | 5,975 |
5.165% 3/1/36 (g) | 14,153 | | 14,126 |
5.17% 6/1/35 (g) | 2,942 | | 2,961 |
5.176% 8/1/33 (g) | 1,042 | | 1,043 |
5.176% 3/1/35 (g) | 388 | | 388 |
5.242% 5/1/35 (g) | 5,794 | | 5,790 |
5.277% 4/1/36 (g) | 5,513 | | 5,562 |
5.297% 7/1/35 (g) | 396 | | 399 |
5.31% 3/1/36 (g) | 38,095 | | 38,087 |
5.324% 12/1/34 (g) | 1,042 | | 1,042 |
5.356% 12/1/36 (g) | 3,536 | | 3,530 |
5.365% 2/1/36 (g) | 8,514 | | 8,518 |
5.394% 7/1/35 (g) | 2,589 | | 2,590 |
5.407% 2/1/37 (g) | 3,127 | | 3,130 |
5.449% 2/1/37 (g) | 14,139 | | 14,163 |
5.5% 4/1/09 to 12/1/35 | 404,307 | | 395,248 |
5.5% 8/20/22 (d) | 13,000 | | 12,857 |
5.518% 1/1/34 (g) | 77 | | 77 |
U.S. Government Agency - Mortgage Securities - continued |
| Principal Amount (000s) | | Value
(000s) |
Fannie Mae - continued |
5.612% 2/1/36 (g) | $ 3,401 | | $ 3,417 |
5.67% 4/1/36 (g) | 12,513 | | 12,576 |
5.67% 6/1/36 (g) | 8,147 | | 8,191 |
5.757% 4/1/36 (g) | 6,620 | | 6,664 |
5.804% 3/1/36 (g) | 8,634 | | 8,698 |
5.807% 5/1/36 (g) | 3,745 | | 3,775 |
5.818% 1/1/36 (g) | 2,679 | | 2,686 |
5.831% 5/1/36 (g) | 19,628 | | 19,791 |
5.854% 6/1/35 (g) | 2,147 | | 2,164 |
5.872% 3/1/36 (g) | 8,089 | | 8,116 |
5.897% 12/1/36 (g) | 4,655 | | 4,689 |
5.9% 3/1/36 (g) | 7,602 | | 7,671 |
5.925% 6/1/36 (g) | 14,806 | | 14,942 |
5.94% 5/1/36 (g) | 5,459 | | 5,511 |
6% 5/1/12 to 7/1/33 (e) | 104,928 | | 104,948 |
6% 8/1/22 (d) | 23,000 | | 23,160 |
6% 8/1/37 (d) | 65,000 | | 64,465 |
6% 8/1/37 (d) | 107,000 | | 106,119 |
6% 8/14/37 (d) | 48,000 | | 47,605 |
6.038% 4/1/36 (g) | 52,142 | | 52,707 |
6.106% 4/1/36 (g) | 28,823 | | 29,145 |
6.226% 3/1/37 (g) | 1,495 | | 1,508 |
6.314% 10/1/36 (g) | 23,129 | | 23,379 |
6.352% 8/1/36 (g) | 7,422 | | 7,512 |
6.5% 2/1/12 to 1/1/35 | 25,718 | | 26,177 |
6.58% 9/1/36 (g) | 10,877 | | 11,031 |
7% 7/1/13 to 7/1/32 | 5,688 | | 5,916 |
7.5% 8/1/10 to 4/1/29 | 155 | | 160 |
8% 1/1/22 | 9 | | 9 |
8.5% 1/1/15 to 7/1/31 | 617 | | 651 |
9% 11/1/11 to 5/1/14 | 646 | | 649 |
9.5% 11/15/09 to 10/1/20 | 893 | | 968 |
10% 8/1/10 | 2 | | 2 |
11% 8/1/10 | 14 | | 15 |
11.25% 5/1/14 | 9 | | 10 |
11.5% 6/15/19 to 1/15/21 | 1,428 | | 1,593 |
12.5% 8/1/15 to 3/1/16 | 3 | | 3 |
| | 1,913,585 |
Freddie Mac - 5.0% |
3.377% 7/1/33 (g) | 9,295 | | 9,201 |
4% 5/1/19 to 11/1/20 | 26,657 | | 24,871 |
U.S. Government Agency - Mortgage Securities - continued |
| Principal Amount (000s) | | Value
(000s) |
Freddie Mac - continued |
4.283% 2/1/35 (g) | $ 1,796 | | $ 1,799 |
4.288% 3/1/35 (g) | 842 | | 842 |
4.301% 12/1/34 (g) | 1,107 | | 1,087 |
4.424% 6/1/35 (g) | 1,284 | | 1,278 |
4.426% 2/1/34 (g) | 780 | | 771 |
4.426% 3/1/35 (g) | 1,054 | | 1,035 |
4.444% 3/1/35 (g) | 1,076 | | 1,059 |
4.5% 2/1/18 to 8/1/33 | 17,105 | | 16,227 |
4.539% 2/1/35 (g) | 1,585 | | 1,560 |
4.701% 9/1/36 (g) | 3,473 | | 3,449 |
4.704% 9/1/35 (g) | 26,676 | | 26,548 |
4.737% 2/1/34 (g) | 8,503 | | 8,358 |
4.784% 3/1/33 (g) | 361 | | 366 |
4.789% 2/1/36 (g) | 1,410 | | 1,392 |
4.922% 10/1/36 (g) | 19,855 | | 19,768 |
4.988% 4/1/35 (g) | 4,699 | | 4,722 |
5% 1/1/09 to 9/1/35 | 13,435 | | 12,779 |
5.021% 4/1/35 (g) | 527 | | 517 |
5.128% 7/1/35 (g) | 5,138 | | 5,103 |
5.132% 4/1/35 (g) | 4,463 | | 4,439 |
5.278% 2/1/36 (g) | 313 | | 311 |
5.489% 2/1/37 (g) | 12,155 | | 12,106 |
5.498% 1/1/36 (g) | 4,438 | | 4,433 |
5.5% 8/1/14 to 11/1/36 | 56,405 | | 55,704 |
5.536% 1/1/36 (g) | 6,600 | | 6,597 |
6% 7/1/16 to 11/1/33 | 31,292 | | 31,441 |
6.489% 10/1/36 (g) | 10,873 | | 11,010 |
6.5% 11/1/10 to 10/1/36 | 48,678 | | 49,550 |
6.538% 2/1/37 (g) | 18,692 | | 18,820 |
6.618% 12/1/36 (g) | 18,478 | | 18,674 |
7% 4/1/11 | 4 | | 4 |
7.5% 5/1/11 to 7/1/16 | 2,286 | | 2,384 |
8% 1/1/10 to 6/1/11 | 1 | | 1 |
8.5% 8/1/08 to 9/1/29 | 232 | | 248 |
9% 8/1/08 to 10/1/20 | 110 | | 116 |
9.5% 6/1/09 to 8/1/21 | 358 | | 388 |
9.75% 8/1/14 | 153 | | 162 |
10% 7/1/09 to 8/1/21 | 37 | | 40 |
11% 7/1/13 to 5/1/14 | 70 | | 77 |
12% 8/1/13 to 3/1/15 | 3 | | 3 |
12.25% 4/1/11 to 9/1/13 | 3 | | 4 |
U.S. Government Agency - Mortgage Securities - continued |
| Principal Amount (000s) | | Value
(000s) |
Freddie Mac - continued |
12.5% 2/1/10 to 6/1/19 | $ 35 | | $ 38 |
13% 8/1/10 to 6/1/15 | 9 | | 10 |
| | 359,292 |
Government National Mortgage Association - 0.6% |
4.25% 7/20/34 (g) | 1,091 | | 1,085 |
6% 7/15/08 to 12/15/10 | 1,510 | | 1,523 |
6.5% 2/15/24 to 10/15/35 | 23,880 | | 24,483 |
6.5% 8/1/37 (d) | 10,000 | | 10,185 |
6.5% 8/1/37 (d) | 2,000 | | 2,037 |
6.5% 8/1/37 (d) | 4,000 | | 4,074 |
7% 10/15/26 to 8/15/32 | 113 | | 117 |
7.5% 1/15/08 to 8/15/29 | 137 | | 144 |
8% 11/15/07 to 12/15/23 | 1,465 | | 1,553 |
8.5% 10/15/08 to 1/15/25 | 14 | | 14 |
9% 12/15/09 | 1 | | 1 |
9.5% 2/15/25 | 1 | | 1 |
10.5% 4/15/14 to 1/20/18 | 105 | | 118 |
13.5% 7/15/11 | 8 | | 9 |
| | 45,344 |
TOTAL U.S. GOVERNMENT AGENCY - MORTGAGE SECURITIES (Cost $2,338,955) | 2,318,221 |
Asset-Backed Securities - 0.5% |
|
Fannie Mae Grantor Trust Series 2005-T4 Class A1C, 5.47% 9/25/35 (g)
(Cost $37,634) | 37,634 | | 37,887 |
Collateralized Mortgage Obligations - 7.9% |
|
U.S. Government Agency - 7.9% |
Fannie Mae: | | | |
planned amortization class: | | | |
Series 1992-168 Class KB, 7% 10/25/22 | 1,537 | | 1,591 |
Series 1993-109 Class NZ, 6% 7/25/08 | 938 | | 937 |
Series 1993-207 Class H, 6.5% 11/25/23 | 18,360 | | 18,860 |
Series 1993-240 Class PD, 6.25% 12/25/13 | 6,432 | | 6,520 |
Series 1994-23: | | | |
Class PG, 6% 4/25/23 | 5,761 | | 5,763 |
Class PZ, 6% 2/25/24 | 10,056 | | 10,038 |
Series 1994-27 Class PJ, 6.5% 6/25/23 | 319 | | 318 |
Collateralized Mortgage Obligations - continued |
| Principal Amount (000s) | | Value
(000s) |
U.S. Government Agency - continued |
Fannie Mae: - continued | | | |
planned amortization class: | | | |
Series 1996-28 Class PK, 6.5% 7/25/25 | $ 4,114 | | $ 4,220 |
Series 2003-28 Class KG, 5.5% 4/25/23 | 4,940 | | 4,816 |
Series 2006-45 Class OP, 6/25/36 (i) | 6,641 | | 4,880 |
Series 2006-62 Class KP, 4/25/36 (i) | 13,648 | | 9,648 |
sequential payer Series 1997-41 Class J, 7.5% 6/18/27 | 3,010 | | 3,189 |
Series 2003-22 6% 4/25/33 (h) | 20,731 | | 4,920 |
Fannie Mae Grantor Trust: | | | |
planned amortization class Series 2005-81 Class PC, 5.5% 9/25/35 | 2,150 | | 2,056 |
sequential payer Series 2005-93 Class HD, 4.5% 11/25/19 | 1,428 | | 1,391 |
Fannie Mae subordinate REMIC pass-thru certificates: | | | |
floater: | | | |
Series 2001-38 Class QF, 6.3% 8/25/31 (g) | 762 | | 780 |
Series 2002-49 Class FB, 5.92% 11/18/31 (g) | 1,203 | | 1,224 |
Series 2002-60 Class FV, 6.32% 4/25/32 (g) | 502 | | 516 |
Series 2002-75 Class FA, 6.32% 11/25/32 (g) | 1,028 | | 1,058 |
Series 2004-54 Class FE, 6.47% 2/25/33 (g) | 522 | | 524 |
planned amortization class: | | | |
Series 2002-18 Class PC, 5.5% 4/25/17 | 1,170 | | 1,170 |
Series 2003-113: | | | |
Class PD, 4% 2/25/17 | 23,515 | | 22,334 |
Class PE, 4% 11/25/18 | 7,545 | | 6,815 |
Series 2003-128 Class NE, 4% 12/25/16 | 13,100 | | 12,442 |
Series 2004-21 Class QE, 4.5% 11/25/32 | 1,500 | | 1,394 |
Series 2004-80 Class LD, 4% 1/25/19 | 10,160 | | 9,569 |
Series 2005-102 Class CO, 11/25/35 (i) | 6,783 | | 5,005 |
Series 2006-12 Class BO, 10/25/35 (i) | 31,149 | | 22,967 |
Series 2006-37 Class OW, 5/25/36 (i) | 7,297 | | 5,413 |
sequential payer: | | | |
Series 2001-20 Class Z, 6% 5/25/31 | 24,462 | | 24,478 |
Series 2001-46 Class ZG, 6% 9/25/31 | 8,550 | | 8,560 |
Series 2004-3 Class BA, 4% 7/25/17 | 723 | | 696 |
Series 2004-86 Class KC, 4.5% 5/25/19 | 3,213 | | 3,122 |
Series 2004-91 Class AH, 4.5% 5/25/29 | 6,395 | | 6,220 |
Series 2005-117, Class JN, 4.5% 1/25/36 | 645 | | 564 |
Series 2002-50 Class LE, 7% 12/25/29 | 5 | | 5 |
Series 2005-14 Class SE, 0.73% 3/25/35 (g)(h) | 21,743 | | 677 |
Series 2007-36: | | | |
Class GO, 4/25/37 (i) | 1,469 | | 1,102 |
Collateralized Mortgage Obligations - continued |
| Principal Amount (000s) | | Value
(000s) |
U.S. Government Agency - continued |
Fannie Mae subordinate REMIC pass-thru certificates: - continued | | | |
Series 2007-36: | | | |
Class PO, 4/25/37 (i) | $ 3,261 | | $ 2,427 |
Class SB, 1.28% 4/25/37 (g)(h) | 42,342 | | 2,114 |
Class SG, 1.28% 4/25/37 (g)(h) | 19,112 | | 971 |
Series 2007-66 Class SA, 7.68% 7/25/37 (g) | 5,575 | | 5,775 |
Freddie Mac: | | | |
planned amortization class: | | | |
Series 1413 Class J, 4% 11/15/07 | 100 | | 99 |
Series 2115 Class PE, 6% 1/15/14 | 1,037 | | 1,039 |
Series 2356 Class GD, 6% 9/15/16 | 636 | | 643 |
Series 3149 Class OD, 5/15/36 (i) | 35,541 | | 25,496 |
sequential payer Series 2114 Class ZM, 6% 1/15/29 | 2,704 | | 2,729 |
Freddie Mac Manufactured Housing participation certificates guaranteed: | | | |
floater Series 1686 Class FA, 6.275% 2/15/24 (g) | 1,017 | | 1,036 |
planned amortization class Series 1681 Class PJ, 7% 12/15/23 | 8,867 | | 9,097 |
Series 1560 Class PN, 7% 12/15/12 | 6,638 | | 6,661 |
Freddie Mac Multi-class participation certificates guaranteed: | | | |
floater: | | | |
Series 2389 Class DA, 6.22% 11/15/30 (g) | 765 | | 767 |
Series 2448 Class FT, 6.32% 3/15/32 (g) | 1,182 | | 1,212 |
Series 2530 Class FE, 5.92% 2/15/32 (g) | 697 | | 705 |
Series 2630 Class FL, 5.82% 6/15/18 (g) | 550 | | 556 |
Series 3008 Class SM, 0% 7/15/35 (g) | 377 | | 381 |
planned amortization class: | | | |
Series 1141 Class G, 9% 9/15/21 | 435 | | 461 |
Series 1614 Class L, 6.5% 7/15/23 | 5,333 | | 5,412 |
Series 1671 Class G, 6.5% 8/15/23 | 1,191 | | 1,196 |
Series 2006-15 Class OP, 3/25/36 (i) | 8,127 | | 5,738 |
Series 2543 Class PM, 5.5% 8/15/18 | 250 | | 250 |
Series 2625 Class QX, 2.25% 3/15/22 | 72 | | 72 |
Series 2640: | | | |
Class GE, 4.5% 7/15/18 | 7,310 | | 6,975 |
Class QG, 2% 4/15/22 | 86 | | 85 |
Series 2660 Class ML, 3.5% 7/15/22 | 6,346 | | 6,289 |
Series 2682 Class LD, 4.5% 10/15/33 | 777 | | 676 |
Series 2752 Class PW, 4% 4/15/22 | 2,515 | | 2,484 |
Series 2802 Class OB, 6% 5/15/34 | 10,455 | | 10,415 |
Collateralized Mortgage Obligations - continued |
| Principal Amount (000s) | | Value
(000s) |
U.S. Government Agency - continued |
Freddie Mac Multi-class participation certificates guaranteed: - continued | | | |
planned amortization class: | | | |
Series 2810 Class PD, 6% 6/15/33 | $ 995 | | $ 993 |
Series 2866 Class XE, 4% 12/15/18 | 19,350 | | 18,246 |
Series 2937 Class KC, 4.5% 2/15/20 | 19,686 | | 18,524 |
Series 2966 Class XC, 5.5% 1/15/31 | 25,111 | | 24,877 |
Series 3077 Class TO, 4/15/35 (i) | 17,855 | | 12,817 |
Series 3110 Class OP, 9/15/35 (i) | 16,826 | | 12,131 |
Series 3119, 2/15/36 (i) | 20,299 | | 14,338 |
Series 3121 Class KO, 3/15/36 (i) | 7,162 | | 5,453 |
Series 3123 Class LO, 3/15/36 (i) | 13,128 | | 9,225 |
Series 3145 Class GO, 4/15/36 (i) | 11,854 | | 8,368 |
Series 3151 5/15/36 (i) | 12,724 | | 8,910 |
sequential payer: | | | |
Series 2546 Class MJ, 5.5% 3/15/23 | 2,861 | | 2,741 |
Series 2570 Class CU, 4.5% 7/15/17 | 2,060 | | 2,013 |
Series 2587 Class AD, 4.71% 3/15/33 | 5,785 | | 4,891 |
Series 2601 Class TB, 5.5% 4/15/23 | 869 | | 831 |
Series 2617 Class GW, 3.5% 6/15/16 | 4,132 | | 4,057 |
Series 2675 Class CB, 4% 5/15/16 | 2,018 | | 1,958 |
Series 2677 Class HG, 3% 8/15/12 | 1,169 | | 1,158 |
Series 2683 Class JA, 4% 10/15/16 | 2,104 | | 2,036 |
Series 2685 Class ND, 4% 10/15/18 | 9,064 | | 8,147 |
Series 2750 Class ZT, 5% 2/15/34 | 1,020 | | 879 |
Series 2773 Class HC, 4.5% 4/15/19 | 704 | | 644 |
Series 2809 Class UA, 4% 12/15/14 | 3,028 | | 2,980 |
Series 2849 Class AL, 5% 5/15/18 | 7,819 | | 7,684 |
Series 2860 Class CP, 4% 10/15/17 | 2,474 | | 2,403 |
Series 2866 Class N, 4.5% 12/15/18 | 7,093 | | 6,991 |
Series 2937 Class HJ, 5% 10/15/19 | 9,618 | | 9,472 |
Series 2998 Class LY, 5.5% 7/15/25 | 2,011 | | 1,908 |
Series 3007 Class EW, 5.5% 7/15/25 | 8,875 | | 8,421 |
Series 3013 Class VJ, 5% 1/15/14 | 1,981 | | 1,957 |
Series 2769 Class BU, 5% 3/15/34 | 5,744 | | 5,191 |
Series 2863 Class DB, 4% 9/15/14 | 1,319 | | 1,251 |
Series 2957 Class SW, 0.68% 4/15/35 (g)(h) | 29,878 | | 823 |
Series 3002 Class SN, 1.18% 7/15/35 (g)(h) | 29,958 | | 1,283 |
target amortization class: | | | |
Series 2156 Class TC, 6.25% 5/15/29 | 9,895 | | 10,184 |
Series 2877 Class JC, 5% 10/15/34 | 1,413 | | 1,382 |
Collateralized Mortgage Obligations - continued |
| Principal Amount (000s) | | Value
(000s) |
U.S. Government Agency - continued |
Ginnie Mae guaranteed REMIC pass-thru securities planned amortization class: | | | |
Series 1997-8 Class PE, 7.5% 5/16/27 | $ 4,821 | | $ 5,135 |
Series 2005-58 Class NJ, 4.5% 8/20/35 | 21,605 | | 21,183 |
TOTAL COLLATERALIZED MORTGAGE OBLIGATIONS (Cost $575,569) | 569,028 |
Cash Equivalents - 27.6% |
| Maturity Amount (000s) | | |
Investments in repurchase agreements in a joint trading account at 5.3%, dated 7/31/07 due 8/1/07: | | | |
(Collateralized by U.S. Government Obligations) # | $ 13,512 | | 13,510 |
(Collateralized by U.S. Government Obligations) # (a) | 1,985,314 | | 1,985,022 |
TOTAL CASH EQUIVALENTS (Cost $1,998,532) | 1,998,532 |
TOTAL INVESTMENT PORTFOLIO - 130.2% (Cost $9,445,072) | | 9,427,061 |
NET OTHER ASSETS - (30.2)% | | (2,185,321) |
NET ASSETS - 100% | $ 7,241,740 |
Swap Agreements |
| Expiration Date | | Notional Amount (000s) | | Value
(000s) |
Interest Rate Swaps |
Receive quarterly a floating rate based on 3-month LIBOR and pay semi-annually a fixed rate equal to 5.57% with Goldman Sachs | August 2017 | | $ 100,000 | | $ (443) |
Receive quarterly a floating rate based on 3-month LIBOR and pay semi-annually a fixed rate equal to 5.96% with Morgan Stanley, Inc. | July 2037 | | 27,500 | | (1,027) |
Receive semi-annually a fixed rate equal to 5.035% and pay quarterly a floating rate based on 3-month LIBOR with Deutsche Bank | April 2010 | | 225,000 | | (723) |
Receive semi-annually a fixed rate equal to 5.51% and pay quarterly a floating rate based on 3-month LIBOR with Morgan Stanley, Inc. | July 2010 | | 140,000 | | 1,409 |
Receive semi-annually a fixed rate equal to 5.706% and pay quarterly a floating rate based on 3-month LIBOR with Deutsche Bank | June 2017 | | 75,000 | | 1,148 |
| | $ 567,500 | | $ 364 |
Legend |
(a) Includes investment made with cash collateral received from securities on loan. |
(b) Security or a portion of the security is on loan at period end. |
(c) Security exempt from registration under Rule 144A of the Securities Act of 1933. These securities may be resold in transactions exempt from registration, normally to qualified institutional buyers. At the end of the period, the value of these securities amounted to $18,332,000 or 0.3% of net assets. |
(d) Security or a portion of the security purchased on a delayed delivery or when-issued basis. |
(e) A portion of the security is subject to a forward commitment to sell. |
(f) Security or a portion of the security has been segregated as collateral for open swap agreements. At the period end, the value of securities pledged amounted to $2,382,000. |
(g) The coupon rate shown on floating or adjustable rate securities represents the rate at period end. |
(h) Security represents right to receive monthly interest payments on an underlying pool of mortgages or assets. Principal shown is the outstanding par amount of the pool held as of the end of the period. |
(i) Principal Only Strips represent the right to receive the monthly principal payments on an underlying pool of mortgage loans. |
# Additional Information on each counterparty to the repurchase agreement is as follows: |
Repurchase Agreement / Counterparty | Value
(Amounts in thousands) |
$13,510,000 due 8/01/07 at 5.30% |
ABN AMRO Bank N.V., New York Branch | $ 328 |
Banc of America Securities LLC | 2,916 |
Bank of America, NA | 823 |
Barclays Capital, Inc. | 1,509 |
Bear Stearns & Co., Inc. | 1,441 |
Countrywide Securities Corp. | 1,056 |
ING Financial Markets LLC | 1,310 |
Societe Generale, New York Branch | 1,310 |
UBS Securities LLC | 2,293 |
WestLB AG | 524 |
| $ 13,510 |
$1,985,022,000 due 8/01/07 at 5.30% |
Bank of America, NA | $ 602,780 |
Barclays Capital, Inc. | 1,382,242 |
| $ 1,985,022 |
Income Tax Information |
At July 31, 2007, the fund had a capital loss carryforward of approximately $93,664,000 of which $831,000, $561,000, $1,882,000, $28,692,000, and $61,698,000 will expire on July 31, 2011, 2012, 2013, 2014 and 2015, respectively. |
Of the loss carryforwards expiring July 31, 2011, 2012, 2013, and 2014, $831,000, $561,000, $1,882,000, and $17,977,000, respectively, was acquired in the merger and is available to offset future capital gains of the fund to the extent provided by regulations. |
See accompanying notes which are an integral part of the financial statements.
Annual Report
Financial Statements
Statement of Assets and Liabilities
Amounts in thousands (except per-share amounts) | July 31, 2007 |
| | |
Assets | | |
Investment in securities, at value (including securities loaned of $1,920,947 and repurchase agreements of $1,998,532) - See accompanying schedule: Unaffiliated issuers (cost $9,445,072) | | $ 9,427,061 |
Commitment to sell securities on a delayed delivery basis | $ (238,522) | |
Receivable for securities sold on a delayed delivery basis | 237,005 | (1,517) |
Receivable for investments sold, regular delivery | | 5,988 |
Cash | | 8,931 |
Receivable for fund shares sold | | 4,128 |
Interest receivable | | 71,447 |
Swap agreements, at value | | 364 |
Total assets | | 9,516,402 |
| | |
Liabilities | | |
Payable for investments purchased
Regular delivery | $ 6,703 | |
Delayed delivery | 269,464 | |
Payable for fund shares redeemed | 4,894 | |
Distributions payable | 664 | |
Accrued management fee | 1,888 | |
Distribution fees payable | 131 | |
Other affiliated payables | 888 | |
Other payables and accrued expenses | 5,008 | |
Collateral on securities loaned, at value | 1,985,022 | |
Total liabilities | | 2,274,662 |
| | |
Net Assets | | $ 7,241,740 |
Net Assets consist of: | | |
Paid in capital | | $ 7,382,737 |
Undistributed net investment income | | 1,411 |
Accumulated undistributed net realized gain (loss) on investments | | (123,244) |
Net unrealized appreciation (depreciation) on investments | | (19,164) |
Net Assets | | $ 7,241,740 |
See accompanying notes which are an integral part of the financial statements.
Annual Report
Statement of Assets and Liabilities - continued
Amounts in thousands (except per-share amounts) | July 31, 2007 |
| | |
Calculation of Maximum Offering Price
Class A:
Net Asset Value and redemption price per share
($145,299 ÷ 14,516 shares) | | $ 10.01 |
| | |
Maximum offering price per share (100/96.00 of $10.01) | | $ 10.43 |
Class T:
Net Asset Value and redemption price per share ($180,781 ÷ 18,060 shares) | | $ 10.01 |
| | |
Maximum offering price per share (100/96.00 of $10.01) | | $ 10.43 |
Class B:
Net Asset Value and offering price per share
($43,307 ÷ 4,326 shares)A | | $ 10.01 |
| | |
Class C:
Net Asset Value and offering price per share
($39,391 ÷ 3,935 shares)A | | $ 10.01 |
| | |
Government Income:
Net Asset Value, offering price and redemption price per share ($6,117,821 ÷ 611,879 shares) | | $ 10.00 |
| | |
Institutional Class:
Net Asset Value, offering price and redemption price per share ($715,141 ÷ 71,448 shares) | | $ 10.01 |
A Redemption price per share is equal to net asset value less any applicable contingent deferred sales charge.
See accompanying notes which are an integral part of the financial statements.
Annual Report
Financial Statements - continued
Statement of Operations
Amounts in thousands | Year ended July 31, 2007 |
| | |
Investment Income | | |
Interest | | $ 328,118 |
| | |
Expenses | | |
Management fee | $ 21,463 | |
Transfer agent fees | 7,506 | |
Distribution fees | 1,223 | |
Fund wide operations fee | 2,122 | |
Independent trustees' compensation | 22 | |
Miscellaneous | 13 | |
Total expenses before reductions | 32,349 | |
Expense reductions | (545) | 31,804 |
Net investment income | | 296,314 |
Realized and Unrealized Gain (Loss) Net realized gain (loss) on: | | |
Investment securities: | | |
Unaffiliated issuers | (41,739) | |
Futures contracts | 1,498 | |
Swap agreements | 492 | |
Total net realized gain (loss) | | (39,749) |
Change in net unrealized appreciation (depreciation) on: Investment securities | 69,326 | |
Swap agreements | (3,916) | |
Delayed delivery commitments | (1,455) | |
Total change in net unrealized appreciation (depreciation) | | 63,955 |
Net gain (loss) | | 24,206 |
Net increase (decrease) in net assets resulting from operations | | $ 320,520 |
See accompanying notes which are an integral part of the financial statements.
Annual Report
Statement of Changes in Net Assets
Amounts in thousands | Year ended
July 31,
2007 | Year ended
July 31,
2006 |
Increase (Decrease) in Net Assets | | |
Operations | | |
Net investment income | $ 296,314 | $ 235,825 |
Net realized gain (loss) | (39,749) | (63,122) |
Change in net unrealized appreciation (depreciation) | 63,955 | (93,536) |
Net increase (decrease) in net assets resulting
from operations | 320,520 | 79,167 |
Distributions to shareholders from net investment income | (303,351) | (223,332) |
Distributions to shareholders from net realized gain | (2,616) | - |
Total distributions | (305,967) | (223,332) |
Share transactions - net increase (decrease) | 1,895,812 | 348,165 |
Total increase (decrease) in net assets | 1,910,365 | 204,000 |
| | |
Net Assets | | |
Beginning of period | 5,331,375 | 5,127,375 |
End of period (including undistributed net investment income of $1,411 and undistributed net investment income of $11,750, respectively) | $ 7,241,740 | $ 5,331,375 |
See accompanying notes which are an integral part of the financial statements.
Annual Report
Financial Highlights - Class A
Period ended July 31, | 2007 E |
Selected Per-Share Data | |
Net asset value, beginning of period | $ 9.98 |
Income from Investment Operations | |
Net investment income D | .311 |
Net realized and unrealized gain (loss) | .033 |
Total from investment operations | .344 |
Distributions from net investment income | (.314) |
Net asset value, end of period | $ 10.01 |
Total Return A, B, C | 3.49% |
Ratios to Average Net Assets F | |
Expenses before reductions | .78% H |
Expenses net of fee waivers, if any | .78% H |
Expenses net of all reductions | .77% H |
Net investment income | 4.08% H |
Supplemental Data | |
Net assets, end of period (in millions) | $ 145 |
Portfolio turnover rate | 164% G |
A Total returns for periods of less than one year are not annualized.
B Total returns would have been lower had certain expenses not been reduced during the periods shown.
C Total returns do not include the effect of the sales charges.
D Calculated based on average shares outstanding during the period.
E For the period October 24, 2006 (commencement of sale of shares) to July 31, 2007.
F Expense ratios reflect operating expenses of the class. Expenses before reductions do not reflect amounts reimbursed by the investment adviser or reductions from brokerage service arrangements or other expense offset arrangements and do not represent the amount paid by the class during periods when reimbursements or reductions occur. Expense ratios before reductions for start-up periods may not be representative of longer-term operating periods. Expenses net of fee waivers reflect expenses after reimbursement by the investment adviser but prior to reductions from brokerage service arrangements or other expense offset arrangements. Expenses net of all reductions represent the net expenses paid by the class.
G The portfolio turnover rate does not include the assets acquired in the merger.
H Annualized
See accompanying notes which are an integral part of the financial statements.
Annual Report
Financial Highlights - Class T
Period ended July 31, | 2007 E |
Selected Per-Share Data | |
Net asset value, beginning of period | $ 9.98 |
Income from Investment Operations | |
Net investment income D | .306 |
Net realized and unrealized gain (loss) | .036 |
Total from investment operations | .342 |
Distributions from net investment income | (.312) |
Net asset value, end of period | $ 10.01 |
Total Return A, B, C | 3.46% |
Ratios to Average Net Assets F | |
Expenses before reductions | .79% H |
Expenses net of fee waivers, if any | .79% H |
Expenses net of all reductions | .79% H |
Net investment income | 4.02% H |
Supplemental Data | |
Net assets, end of period (in millions) | $ 181 |
Portfolio turnover rate | 164% G |
A Total returns for periods of less than one year are not annualized.
B Total returns would have been lower had certain expenses not been reduced during the periods shown.
C Total returns do not include the effect of the sales charges.
D Calculated based on average shares outstanding during the period.
E For the period October 24, 2006 (commencement of sale of shares) to July 31, 2007.
F Expense ratios reflect operating expenses of the class. Expenses before reductions do not reflect amounts reimbursed by the investment adviser or reductions from brokerage service arrangements or other expense offset arrangements and do not represent the amount paid by the class during periods when reimbursements or reductions occur. Expense ratios before reductions for start-up periods may not be representative of longer-term operating periods. Expenses net of fee waivers reflect expenses after reimbursement by the investment adviser but prior to reductions from brokerage service arrangements or other expense offset arrangements. Expenses net of all reductions represent the net expenses paid by the class.
G The portfolio turnover rate does not include the assets acquired in the merger.
H Annualized
See accompanying notes which are an integral part of the financial statements.
Annual Report
Financial Highlights - Class B
Period ended July 31, | 2007 E |
Selected Per-Share Data | |
Net asset value, beginning of period | $ 9.98 |
Income from Investment Operations | |
Net investment income D | .251 |
Net realized and unrealized gain (loss) | .037 |
Total from investment operations | .288 |
Distributions from net investment income | (.258) |
Net asset value, end of period | $ 10.01 |
Total Return A, B, C | 2.91% |
Ratios to Average Net Assets F | |
Expenses before reductions | 1.50% H |
Expenses net of fee waivers, if any | 1.50% H |
Expenses net of all reductions | 1.50% H |
Net investment income | 3.30% H |
Supplemental Data | |
Net assets, end of period (in millions) | $ 43 |
Portfolio turnover rate | 164% G |
A Total returns for periods of less than one year are not annualized.
B Total returns would have been lower had certain expenses not been reduced during the periods shown.
C Total returns do not include the effect of the contingent deferred sales charge.
D Calculated based on average shares outstanding during the period.
E For the period October 24, 2006 (commencement of sale of shares) to July 31, 2007.
F Expense ratios reflect operating expenses of the class. Expenses before reductions do not reflect amounts reimbursed by the investment adviser or reductions from brokerage service arrangements or other expense offset arrangements and do not represent the amount paid by the class during periods when reimbursements or reductions occur. Expense ratios before reductions for start-up periods may not be representative of longer-term operating periods. Expenses net of fee waivers reflect expenses after reimbursement by the investment adviser but prior to reductions from brokerage service arrangements or other expense offset arrangements. Expenses net of all reductions represent the net expenses paid by the class.
G The portfolio turnover rate does not include the assets acquired in the merger.
H Annualized
See accompanying notes which are an integral part of the financial statements.
Annual Report
Financial Highlights - Class C
Period ended July 31, | 2007 E |
Selected Per-Share Data | |
Net asset value, beginning of period | $ 9.98 |
Income from Investment Operations | |
Net investment income D | .249 |
Net realized and unrealized gain (loss) | .033 |
Total from investment operations | .282 |
Distributions from net investment income | (.252) |
Net asset value, end of period | $ 10.01 |
Total Return A, B, C | 2.85% |
Ratios to Average Net Assets F | |
Expenses before reductions | 1.55% H |
Expenses net of fee waivers, if any | 1.55% H |
Expenses net of all reductions | 1.55% H |
Net investment income | 3.26% H |
Supplemental Data | |
Net assets, end of period (in millions) | $ 39 |
Portfolio turnover rate | 164% G |
A Total returns for periods of less than one year are not annualized.
B Total returns would have been lower had certain expenses not been reduced during the periods shown.
C Total returns do not include the effect of the contingent deferred sales charge.
D Calculated based on average shares outstanding during the period.
E For the period October 24, 2006 (commencement of sale of shares) to July 31, 2007.
F Expense ratios reflect operating expenses of the class. Expenses before reductions do not reflect amounts reimbursed by the investment adviser or reductions from brokerage service arrangements or other expense offset arrangements and do not represent the amount paid by the class during periods when reimbursements or reductions occur. Expense ratios before reductions for start-up periods may not be representative of longer-term operating periods. Expenses net of fee waivers reflect expenses after reimbursement by the investment adviser but prior to reductions from brokerage service arrangements or other expense offset arrangements. Expenses net of all reductions represent the net expenses paid by the class.
G The portfolio turnover rate does not include the assets acquired in the merger.
H Annualized
See accompanying notes which are an integral part of the financial statements.
Annual Report
Financial Highlights - Government Income
Years ended July 31, | 2007 | 2006 | 2005 | 2004 | 2003 |
Selected Per-Share Data | | | | | |
Net asset value,
beginning of period | $ 9.95 | $ 10.20 | $ 10.13 | $ 10.16 | $ 10.30 |
Income from Investment Operations | | | | | |
Net investment income B | .443 | .429 | .329 | .307 | .374 |
Net realized and unrealized gain (loss) | .068 | (.274) | .097 | .124 | (.014) |
Total from investment operations | .511 | .155 | .426 | .431 | .360 |
Distributions from net investment income | (.456) | (.405) | (.321) | (.301) | (.370) |
Distributions from net realized gain | (.005) | - | (.035) | (.160) | (.130) |
Total distributions | (.461) | (.405) | (.356) | (.461) | (.500) |
Net asset value, end of period | $ 10.00 | $ 9.95 | $ 10.20 | $ 10.13 | $ 10.16 |
Total Return A | 5.22% | 1.56% | 4.24% | 4.30% | 3.45% |
Ratios to Average Net Assets C | | | | | |
Expenses before reductions | .45% | .45% | .58% | .63% | .65% |
Expenses net of fee waivers,
if any | .45% | .45% | .58% | .63% | .65% |
Expenses net of all reductions | .44% | .44% | .58% | .63% | .65% |
Net investment income | 4.42% | 4.27% | 3.21% | 3.01% | 3.56% |
Supplemental Data | | | | | |
Net assets, end of period
(in millions) | $ 6,118 | $ 5,331 | $ 5,127 | $ 4,168 | $ 3,622 |
Portfolio turnover rate | 164% D | 108% | 114% | 224% | 253% |
A Total returns would have been lower had certain expenses not been reduced during the periods shown.
B Calculated based on average shares outstanding during the period.
C Expense ratios reflect operating expenses of the class. Expenses before reductions do not reflect amounts reimbursed by the investment adviser or reductions from brokerage service arrangements or other expense offset arrangements and do not represent the amount paid by the class during periods when reimbursements or reductions occur. Expenses net of fee waivers reflect expenses after reimbursement by the investment adviser but prior to reductions from brokerage service arrangements or other expense offset arrangements. Expenses net of all reductions represent the net expenses paid by the class.
D The portfolio turnover rate does not include the assets acquired in the merger.
See accompanying notes which are an integral part of the financial statements.
Annual Report
Financial Highlights - Institutional Class
Period ended July 31, | 2007 D |
Selected Per-Share Data | |
Net asset value, beginning of period | $ 9.98 |
Income from Investment Operations | |
Net investment income C | .329 |
Net realized and unrealized gain (loss) | .034 |
Total from investment operations | .363 |
Distributions from net investment income | (.333) |
Net asset value, end of period | $ 10.01 |
Total Return A, B | 3.67% |
Ratios to Average Net Assets E | |
Expenses before reductions | .53% G |
Expenses net of fee waivers, if any | .53% G |
Expenses net of all reductions | .53% G |
Net investment income | 4.32% G |
Supplemental Data | |
Net assets, end of period (in millions) | $ 715 |
Portfolio turnover rate | 164%F |
A Total returns for periods of less than one year are not annualized.
B Total returns would have been lower had certain expenses not been reduced during the periods shown.
C Calculated based on average shares outstanding during the period.
D For the period October 24, 2006 (commencement of sale of shares) to July 31, 2007.
E Expense ratios reflect operating expenses of the class. Expenses before reductions do not reflect amounts reimbursed by the investment adviser or reductions from brokerage service arrangements or other expense offset arrangements and do not represent the amount paid by the class during periods when reimbursements or reductions occur. Expense ratios before reductions for start-up periods may not be representative of longer-term operating periods. Expenses net of fee waivers reflect expenses after reimbursement by the investment adviser but prior to reductions from brokerage service arrangements or other expense offset arrangements. Expenses net of all reductions represent the net expenses paid by the class.
F The portfolio turnover rate does not include the assets acquired in the merger.
G Annualized
See accompanying notes which are an integral part of the financial statements.
Annual Report
Notes to Financial Statements
For the period ended July 31, 2007
(Amounts in thousands except ratios)
1. Organization.
Fidelity Government Income Fund (the Fund) is a fund of Fidelity Income Fund (the trust) and is authorized to issue an unlimited number of shares. The trust is registered under the Investment Company Act of 1940, as amended (the 1940 Act), as an open-end management investment company organized as a Massachusetts business trust.
The Fund offers Class A, Class T, Class B, Class C, Government Income, and Institutional Class shares, each of which has equal rights as to assets and voting privileges. Each class has exclusive voting rights with respect to matters that affect that class. The Fund commenced sales of Class A, Class T, Class B, Class C and Institutional Class shares and the existing class was designated Government Income on October 24, 2006. Class B shares will automatically convert to Class A shares after a holding period of seven years from the initial date of purchase. Investment income, realized and unrealized capital gains and losses, the common expenses of the Fund, and certain fund-level expense reductions, if any, are allocated on a pro rata basis to each class based on the relative net assets of each class to the total net assets of the Fund. Each class differs with respect to transfer agent and distribution and service plan fees incurred. Certain expense reductions also differ by class.
2. Significant Accounting Policies.
The financial statements have been prepared in conformity with accounting principles generally accepted in the United States of America, which require management to make certain estimates and assumptions at the date of the financial statements. The following summarizes the significant accounting policies of the Fund:
Security Valuation. Investments are valued and net asset value per share is calculated (NAV calculation) as of the close of business of the New York Stock Exchange, normally 4:00 p.m. Eastern time. Wherever possible, the Fund uses independent pricing services approved by the Board of Trustees to value its investments. Debt securities, including restricted securities, for which quotes are readily available, are valued by independent pricing services or by dealers who make markets in such securities. Pricing services consider yield or price of bonds of comparable quality, coupon, maturity and type as well as dealer supplied prices.
When current market prices or quotations are not readily available or do not accurately reflect fair value, valuations may be determined in accordance with procedures adopted by the Board of Trustees. The frequency of when fair value pricing is used is unpredictable. The value of securities used for NAV calculation under fair value pricing may differ from published prices for the same securities. Investments in open-end mutual funds are valued at their closing net asset value each business day. Short-term securities with remaining maturities of sixty days or less for which quotations are not readily available are valued at amortized cost, which approximates value.
Annual Report
2. Significant Accounting Policies - continued
Investment Transactions and Income. For financial reporting purposes, the Fund's investment holdings and NAV include trades executed through the end of the last business day of the period. The NAV for processing shareholder transactions includes trades executed through the end of the prior business day. Gains and losses on securities sold are determined on the basis of identified cost. Interest income is accrued as earned. Interest income includes coupon interest and amortization of premium and accretion of discount on debt securities.
Expenses. Most expenses of the trust can be directly attributed to a fund. Expenses which cannot be directly attributed are apportioned among each Fund in the trust. Expense estimates are accrued in the period to which they relate and adjustments are made when actual amounts are known.
Income Tax Information and Distributions to Shareholders. Each year, the Fund intends to qualify as a regulated investment company by distributing all of its taxable income and realized gains under Subchapter M of the Internal Revenue Code. As a result, no provision for income taxes is required in the accompanying financial statements.
Dividends are declared daily and paid monthly from net investment income. Distributions from realized gains, if any, are recorded on the ex-dividend date. Income dividends and capital gain distributions are declared separately for each class. Income and capital gain distributions are determined in accordance with income tax regulations, which may differ from generally accepted accounting principles.
Capital accounts within the financial statements are adjusted for permanent book-tax differences. These adjustments have no impact on net assets or the results of operations. Temporary book-tax differences will reverse in a subsequent period.
Book-tax differences are primarily due to swap agreements, prior period premium and discount on debt securities, market discount, deferred trustees compensation, financing transactions, capital loss carryforwards, and losses deferred due to wash sales and excise tax regulations.
The tax-basis components of distributable earnings and the federal tax cost as of period end were as follows:
Unrealized appreciation | $ 41,525 | |
Unrealized depreciation | (59,427) | |
Net unrealized appreciation (depreciation) | (17,902) | |
Undistributed ordinary income | 257 | |
Capital loss carryforward | (93,664) | |
| | |
Cost for federal income tax purposes | $ 9,444,963 | |
Annual Report
Notes to Financial Statements - continued
(Amounts in thousands except ratios)
2. Significant Accounting Policies - continued
Income Tax Information and Distributions to Shareholders - continued
The tax character of distributions paid was as follows:
| July 31, 2007 | July 31, 2006 |
Ordinary Income | $ 305,967 | $ 223,332 |
New Accounting Pronouncements. In July 2006, Financial Accounting Standards Board Interpretation No. 48, Accounting for Uncertainty in Income Taxes - an interpretation of FASB Statement 109 (FIN 48), was issued and is effective on the last business day of the semiannual reporting period for fiscal years beginning after December 15, 2006. FIN 48 sets forth a threshold for financial statement recognition, measurement and disclosure of a tax position taken or expected to be taken on a tax return. Management has concluded that the adoption of FIN 48 will not result in a material impact on the Fund's net assets, results of operations and financial statement disclosures.
In addition, in September 2006, Statement of Financial Accounting Standards No. 157, Fair Value Measurements (SFAS 157), was issued and is effective for fiscal years beginning after November 15, 2007. SFAS 157 defines fair value, establishes a framework for measuring fair value and expands disclosures about fair value measurements. Management is currently evaluating the impact the adoption of SFAS 157 will have on the Fund's financial statement disclosures.
3. Operating Policies.
Repurchase Agreements. Fidelity Management & Research Company (FMR) has received an Exemptive Order from the Securities and Exchange Commission (the SEC) which permits the Fund and other affiliated entities of FMR to transfer uninvested cash balances into joint trading accounts which are then invested in repurchase agreements. The Fund may also invest directly with institutions in repurchase agreements. Repurchase agreements are collateralized by government or non-government securities. Upon settlement date, collateral is held in segregated accounts with custodian banks and may be obtained in the event of a default of the counterparty. The Fund monitors, on a daily basis, the value of the collateral to ensure it is at least equal to the principal amount of the repurchase agreement (including accrued interest). In the event of a default by the counterparty, realization of the collateral proceeds could be delayed, during which time the value of the collateral may decline.
Delayed Delivery Transactions and When-Issued Securities. The Fund may purchase or sell securities on a delayed delivery or when-issued basis. Payment and delivery may take place after the customary settlement period for that security. The price of the underlying securities and the date when the securities will be delivered and paid
Annual Report
3. Operating Policies - continued
Delayed Delivery Transactions and When-Issued Securities - continued
for are fixed at the time the transaction is negotiated. During the time a delayed delivery sell is outstanding, the contract is marked-to-market daily and equivalent deliverable securities are held for the transaction. The value of the securities purchased on a delayed delivery or when-issued basis are identified as such in the Fund's Schedule of Investments. The Fund may receive compensation for interest forgone in the purchase of a delayed delivery or when-issued security. With respect to purchase commitments, the Fund identifies securities as segregated in its records with a value at least equal to the amount of the commitment. The payables and receivables associated with the purchases and sales of delayed delivery securities having the same coupon, settlement date and broker are offset. Delayed delivery or when-issued securities that have been purchased from and sold to different brokers are reflected as both payables and receivables in the fund's Statement of Assets and Liabilities under the caption "Delayed delivery." Losses may arise due to changes in the value of the underlying securities or if the counterparty does not perform under the contract's terms, or if the issuer does not issue the securities due to political, economic, or other factors.
Futures Contracts. The Fund may use futures contracts to manage its exposure to the bond market and to fluctuations in interest rates. Buying futures tends to increase a fund's exposure to the underlying instrument, while selling futures tends to decrease a fund's exposure to the underlying instrument or hedge other fund investments. Upon entering into a futures contract, a fund is required to deposit with a clearing broker, no later than the following business day, an amount ("initial margin") equal to a certain percentage of the face value of the contract. The initial margin may be in the form of cash or securities and is transferred to a segregated account on settlement date. Subsequent payments ("variation margin") are made or received by a fund depending on the daily fluctuations in the value of the futures contract and are accounted for as unrealized gains or losses. Realized gains (losses) are recorded upon the expiration or closing of the futures contract. Securities deposited to meet margin requirements are identified in the Schedule of Investments. Losses may arise from changes in the value of the underlying instruments or if the counterparties do not perform under the contract's terms. Futures contracts are valued at the settlement price established each day by the board of trade or exchange on which they are traded.
Restricted Securities. The Fund may invest in securities that are subject to legal or contractual restrictions on resale. These securities generally may be resold in transactions exempt from registration or to the public if the securities are registered. Disposal of these securities may involve time-consuming negotiations and expense, and prompt sale at an acceptable price may be difficult. Information regarding restricted securities is included at the end of the Fund's Schedule of Investments.
Annual Report
Notes to Financial Statements - continued
(Amounts in thousands except ratios)
3. Operating Policies - continued
Swap Agreements. The Fund may invest in swaps for the purpose of managing its exposure to interest rate, credit or market risk.
Interest rate swaps are agreements to exchange cash flows periodically based on a notional principal amount, for example, the exchange of fixed rate interest payments for floating rate interest payments. Periodic payments received or made by the Fund are recorded in the accompanying Statement of Operations as realized gains or losses, respectively. The primary risk associated with interest rate swaps is that unfavorable changes in the fluctuation of interest rates could adversely impact a fund.
Swaps are marked-to-market daily based on dealer-supplied valuations and changes in value are recorded as unrealized appreciation (depreciation). Gains or losses are realized upon early termination of the swap agreement. Collateral, in the form of cash or securities, may be required to be held in segregated accounts with a fund's custodian in compliance with swap contracts. Risks may exceed amounts recognized on the Statement of Assets and Liabilities. These risks include changes in the returns of the underlying instruments, failure of the counterparties to perform under the contracts' terms and the possible lack of liquidity with respect to the swap agreements. Details of swap agreements open at period end are included in the Fund's Schedule of Investments under the caption "Swap Agreements."
Mortgage Dollar Rolls. To earn additional income, the Fund may employ trading strategies which involve the sale and simultaneous agreement to repurchase similar securities ("mortgage dollar rolls") or the purchase and simultaneous agreement to sell similar securities ("reverse mortgage dollar rolls"). The securities traded are mortgage securities and bear the same interest rate but may be collateralized by different pools of mortgages. During the period between the sale and repurchase in a mortgage dollar roll transaction, a fund will not be entitled to receive interest and principal payments on the securities sold but will invest the proceeds of the sale in other securities which may enhance the yield and total return. In addition, the difference between the sale price and the future purchase price is recorded as an adjustment to investment income. During the period between the purchase and subsequent sale in a reverse mortgage dollar roll transaction a fund is entitled to interest and principal payments on the securities purchased. The price differential between the purchase and sale is recorded as an adjustment to investment income. Losses may arise due to changes in the value of the securities or if the counterparty does not perform under the terms of the agreement. If the counterparty files for bankruptcy or becomes insolvent, a fund's right to repurchase or sell securities may be limited.
Annual Report
4. Fees and Other Transactions with Affiliates.
Management Fee and Expense Contract. FMR and its affiliates provide the Fund with investment management related services for which the Fund pays a monthly management fee. The management fee is the sum of an individual fund fee rate that is based on an annual rate of .20% of the Fund's average net assets and a group fee rate that averaged .12% during the period. The group fee rate is based upon the average net assets of all the mutual funds advised by FMR. The group fee rate decreases as assets under management increase and increases as assets under management decrease. For the period, the total annual management fee rate was .32% of the Fund's average net assets.
In addition, effective October 27, 2006 under a new expense contract, FMR pays all class-level expenses for Government Income class, so that the total expense, except the compensation of the independent Trustees and certain other expenses such as interest expense, including commitment fees, do not exceed .45% of the Class' average net assets. This agreement does not apply to any of the other classes and any change or modification that would increase expenses can only be made with shareholder approval.
Distribution and Service Plan. In accordance with Rule 12b-1 of the 1940 Act, the Fund has adopted separate Distribution and Service Plans for each class of shares. Certain classes pay Fidelity Distributors Corporation (FDC), an affiliate of FMR, separate Distribution and Service Fees, each of which is based on an annual percentage of each class' average net assets. In addition, FDC may pay financial intermediaries for selling shares of the Fund and providing shareholder support services. For the period, the Distribution and Service Fee rates and the total amounts paid to and retained by FDC were as follows:
| Distribution
Fee | Service
Fee | Paid to
FDC | Retained
by FDC |
Class A | 0% | .25% | $ 199 | $ 34 |
Class T | 0% | .25% | 355 | - |
Class B | .65% | .25% | 350 | 253 |
Class C | .75% | .25% | 319 | - |
| | | $ 1,223 | $ 287 |
On January 18, 2007, the Board of Trustees approved an increase in Class A's Service fee from .15% to .25%, effective April 1, 2007.
Sales Load. FDC receives a front-end sales charge of up to 4.00% for selling Class A and Class T shares, (4.75% for Class A and 3.50% for Class T shares prior to April 1, 2007), some of which is paid to financial intermediaries for selling shares of the Fund. FDC receives the proceeds of contingent deferred sales charges levied on Class A, Class T, Class B, and Class C redemptions. These charges depend on the holding period. The deferred sales charges range from 5% to 1% for Class B, 1% for Class C,.75% to .50% for certain purchases of Class A shares and .25% for certain purchases of Class T shares.
Annual Report
Notes to Financial Statements - continued
(Amounts in thousands except ratios)
4. Fees and Other Transactions with Affiliates - continued
Sales Load - continued
For the period, sales charge amounts retained by FDC were as follows:
| Retained
by FDC |
Class A | $ 12 |
Class T | 5 |
Class B* | 90 |
Class C* | 2 |
| $ 109 |
* When Class B and Class C shares are initially sold, FDC pays commissions from its own resources to financial intermediaries through which the sales are made.
Transfer Agent Fees. Fidelity Investments Institutional Operations Company, Inc. (FIIOC), an affiliate of FMR, is the transfer, dividend disbursing and shareholder servicing agent for each class of the Fund, except for Government Income. Fidelity Service Company, Inc. (FSC), an affiliate of FMR, is the transfer agent for Government Income shares. FIIOC and FSC receive account fees and asset-based fees that vary according to the account size and type of account of the shareholders of the respective classes of the Fund. FIIOC and FSC pay for typesetting, printing and mailing of shareholder reports, except proxy statements. For the period, the total transfer agent fees paid by each class to FIIOC or FSC, were as follows:
| Amount | % of
Average
Net Assets |
Class A | $ 232 | .23* |
Class T | 275 | .19* |
Class B | 97 | .25* |
Class C | 64 | .20* |
Government Income | 5,931 | .10 |
Institutional Class | 907 | .18* |
| $ 7,506 | |
* Annualized
Fundwide Operations Fee. Pursuant to the Fundwide Operations and Expense Agreement (FWOE), FMR has agreed to provide for fund level expenses (which do not include transfer agent, Rule 12b-1 fees, compensation of the independent trustees, interest (including commitment fees), taxes or extraordinary expenses, if any) in return for a FWOE fee equal to .35% less the total amount of the management fee. The FWOE paid by the Fund is reduced by an amount equal to the fees and expenses paid to the independent trustees. For the period, the FWOE fee was equivalent to an annual rate of .03% of average net assets.
Annual Report
5. Committed Line of Credit.
The Fund participates with other funds managed by FMR in a $4.2 billion credit facility (the "line of credit") to be utilized for temporary or emergency purposes to fund shareholder redemptions or for other short-term liquidity purposes. The Fund has agreed to pay commitment fees on its pro rata portion of the line of credit, which amounted to $12 and is reflected in Miscellaneous Expense on the Statement of Operations. During the period, there were no borrowings on this line of credit.
6. Security Lending.
The Fund lends portfolio securities from time to time in order to earn additional income. On the settlement date of the loan, the Fund receives collateral (in the form of U.S. Treasury obligations, letters of credit and/or cash) against the loaned securities and maintains collateral in an amount not less than 100% of the market value of the loaned securities during the period of the loan. The market value of the loaned securities is determined at the close of business of the Fund and any additional required collateral is delivered to the Fund on the next business day. If the borrower defaults on its obligation to return the securities loaned because of insolvency or other reasons, a fund could experience delays and costs in recovering the securities loaned or in gaining access to the collateral. Any cash collateral received is invested in cash equivalents. The value of loaned securities and cash collateral at period end are disclosed on the Fund's Statement of Assets and Liabilities. Security lending income represents the income earned on investing cash collateral, less fees and expenses associated with the loan, plus any premium payments that may be received on the loan of certain types of securities. Security lending income is presented in the Statement of Operations as a component of interest income. Net income from lending portfolio securities during the period amounted to $2,400.
7. Expense Reductions.
Through arrangements with the Fund's custodian and each class' transfer agent, credits realized as a result of uninvested cash balances were used to reduce the Fund's expenses. During the period, these credits reduced the Fund's management fee by $11. During the period, credits reduced each class' transfer agent expense as noted in the table below.
| Transfer Agent
expense reduction | |
Class A | $ 9 | |
Class T | 1 | |
Government Income | 509 | |
Institutional Class | 15 | |
| $ 534 | |
Annual Report
Notes to Financial Statements - continued
(Amounts in thousands except ratios)
8. Other.
The Fund's organizational documents provide former and current trustees and officers with a limited indemnification against liabilities arising in connection with the performance of their duties to the Fund. In the normal course of business, the Fund may also enter into contracts that provide general indemnifications. The Fund's maximum exposure under these arrangements is unknown as this would be dependent on future claims that may be made against the Fund. The risk of material loss from such claims is considered remote.
FIIOC, a transfer agent of the Fund, notified the Fund that the Fund's books and records did not reflect a conversion of certain Class B to Class A shares upon their conversion date. In March 2007, FIIOC converted the relevant Class B shares to Class A shares and recorded the conversion in the books and records of the Fund which did not result in a material impact to the Fund's reported net assets or results of operations in the accompanying financial statements. FIIOC has remediated affected shareholders.
At the end of the period, Fidelity Freedom 2010 and Fidelity Freedom 2020 were the owners of record of approximately 14% and 14% of the total outstanding shares of Fidelity Government Income Fund. The Fidelity Freedom Funds were the owners of record, in aggregate, of approximately 44% of the total outstanding shares of Fidelity Government Income Fund.
9. Distributions to Shareholders.
Distributions to shareholders of each class were as follows:
| Year ended
July 31, 2007 A | Year ended
July 31, 2006 |
From net investment income | | |
Class A | $ 4,138 | $ - |
Class T | 5,771 | - |
Class B | 1,298 | - |
Class C | 1,042 | - |
Government Income | 269,231 | 223,332 |
Institutional Class | 21,871 | - |
Total | $ 303,351 | $ 233,332 |
From net realized gain | | |
Government Income | $ 2,616 | $ - |
A Distributions for Class A, Class T, Class B, Class C and Institutional Class are for the period October 24, 2006 (commencement of sale of shares) to July 31, 2007.
Annual Report
10. Share Transactions.
Transactions for each class of shares were as follows:
| Shares | Dollars |
| Years ended July 31, | Years ended July 31, |
| 2007 A | 2006 | 2007 A | 2006 |
Class A | | | | |
Shares sold | 5,668 | - | $ 56,865 | $ - |
Issued in exchange for shares of Fidelity Advisor Government Investment Fund | 11,639 | - | 116,974 | - |
Reinvestment of distributions | 374 | - | 3,759 | - |
Shares redeemed | (3,165) | - | (31,770) | - |
Net increase (decrease) | 14,516 | - | $ 145,828 | $ - |
Class T | | | | |
Shares sold | 3,593 | - | $ 36,101 | $ - |
Issued in exchange for shares of Fidelity Advisor Government Investment Fund | 19,997 | - | 200,973 | - |
Reinvestment of distributions | 549 | - | 5,508 | - |
Shares redeemed | (6,079) | - | (60,985) | - |
Net increase (decrease) | 18,060 | - | $ 181,597 | $ - |
Class B | | | | |
Shares sold | 524 | - | $ 5,289 | $ - |
Issued in exchange for shares of Fidelity Advisor Government Investment Fund | 5,890 | - | 59,191 | - |
Reinvestment of distributions | 104 | - | 1,045 | - |
Shares redeemed | (2,192) | - | (22,000) | - |
Net increase (decrease) | 4,326 | - | $ 43,525 | $ - |
Class C | | | | |
Shares sold | 517 | - | $ 5,201 | $ - |
Issued in exchange for shares of Fidelity Advisor Government Investment Fund | 4,449 | - | 44,717 | - |
Reinvestment of distributions | 64 | - | 643 | - |
Shares redeemed | (1,095) | - | (10,981) | - |
Net increase (decrease) | 3,935 | - | $ 39,580 | $ - |
Government Income | | | | |
Shares sold | 105,528 | 127,904 | $ 1,058,863 | $ 1,289,378 |
Issued in exchange for shares of Spartan Government Income Fund | 71,077 | - | 713,611 | - |
Reinvestment of distributions | 26,531 | 21,894 | 266,315 | 219,740 |
Shares redeemed | (127,164) | (116,476) | (1,271,926) | (1,160,953) |
Net increase (decrease) | 75,972 | 33,322 | $ 766,863 | $ 348,165 |
A Share transactions for Class A, Class T, Class B, Class C and Institutional Class are for the period October 24, 2006 (commencement of sale of shares) to July 31, 2007.
Annual Report
Notes to Financial Statements - continued
(Amounts in thousands except ratios)
10. Share Transactions - continued
| Shares | Dollars |
| Years ended July 31, | Years ended July 31, |
| 2007 A | 2006 | 2007 A | 2006 |
Institutional Class | | | | |
Shares sold | 16,978 | - | $ 170,642 | $ - |
Issued in exchange for shares of Fidelity Advisor Government Investment Fund | 57,200 | - | 574,860 | - |
Reinvestment of distributions | 2,169 | - | 21,772 | - |
Shares redeemed | (4,899) | - | (48,855) | - |
Net increase (decrease) | 71,448 | - | $ 718,419 | $ - |
A Share transactions for Class A, Class T, Class B, Class C and Institutional Class are for the period October 24, 2006 (commencement of sale of shares) to July 31, 2007.
11. Merger Information.
On October 27, 2006, the Fund acquired all of the assets and assumed all of the liabilities of Fidelity Advisor Government Investment Fund and Spartan Government Income Fund pursuant to an agreement and plan of reorganization approved by the shareholders on September 20, 2006. The acquisition was accomplished by an exchange of 11,639, 19,997, 5,890, 4,449, and 57,200 shares of Class A, Class T, Class B, Class C and Institutional Class of the Fund, respectively, for 11,840, 20,358, 6,003, 4,531, and 58,535 shares then outstanding of Class A, Class T, Class B, Class C and Institutional Class (valued at $9.88, $9.87, $9.86, $9.87, and $9.82, per share for Class A, Class T, Class B, Class C and Institutional Class, respectively) of Fidelity Advisor Government Investment Fund. Further, the acquisition was accomplished by an exchange of 71,077 shares of Government Income class for the 66,115 shares then outstanding (valued at $10.79 per share) of Spartan Government Income Fund. The reorganization qualified as a tax-free reorganization for federal income tax purposes with no gain or loss recognized to the funds or their shareholders. Fidelity Advisor Government Investment Fund's net assets, including $1,514 of unrealized depreciation, and Spartan Government Income Fund's net assets, including $3,295 of unrealized depreciation, were combined with the Fund's net assets of $5,214,485 for total net assets after the acquisition of $6,924,811.
Annual Report
Report of Independent Registered Public Accounting Firm
To the Trustees of Fidelity Income Fund and the Shareholders of Fidelity Government Income Fund:
In our opinion, the accompanying statement of assets and liabilities, including the schedule of investments, and the related statements of operations and of changes in net assets and the financial highlights present fairly, in all material respects, the financial position of Fidelity Government Income Fund (a fund of Fidelity Income Fund) at July 31, 2007, the results of its operations for the year then ended, the changes in its net assets for each of the two years in the period then ended and the financial highlights for each of the five years in the period then ended, in conformity with accounting principles generally accepted in the United States of America. These financial statements and financial highlights (hereafter referred to as "financial statements") are the responsibility of the Fidelity Government Income Fund's management. Our responsibility is to express an opinion on these financial statements based on our audits. We conducted our audits of these financial statements in accordance with the standards of the Public Company Accounting Oversight Board (United States). Those standards require that we plan and perform the audit to obtain reasonable assurance about whether the financial statements are free of material misstatement. An audit includes examining, on a test basis, evidence supporting the amounts and disclosures in the financial statements, assessing the accounting principles used and significant estimates made by management, and evaluating the overall financial statement presentation. We believe that our audits, which included confirmation of securities at July 31, 2007 by correspondence with the custodian and brokers, provide a reasonable basis for our opinion.
/s/ PricewaterhouseCoopers LLP
PricewaterhouseCoopers LLP
Boston, Massachusetts
September 17, 2007
Annual Report
Trustees and Officers
The Trustees, Members of the Advisory Board, and executive officers of the trust and fund, as applicable, are listed below. The Board of Trustees governs the fund and is responsible for protecting the interests of shareholders. The Trustees are experienced executives who meet periodically throughout the year to oversee the fund's activities, review contractual arrangements with companies that provide services to the fund, and review the fund's performance. Except for James C. Curvey, each of the Trustees oversees 353 funds advised by FMR or an affiliate. Mr. Curvey oversees 317 funds advised by FMR or an affiliate.
The Trustees hold office without limit in time except that (a) any Trustee may resign; (b) any Trustee may be removed by written instrument, signed by at least two-thirds of the number of Trustees prior to such removal; (c) any Trustee who requests to be retired or who has become incapacitated by illness or injury may be retired by written instrument signed by a majority of the other Trustees; and (d) any Trustee may be removed at any special meeting of shareholders by a two-thirds vote of the outstanding voting securities of the trust. Each Trustee who is not an interested person (as defined in the 1940 Act) (Independent Trustee), shall retire not later than the last day of the calendar year in which his or her 72nd birthday occurs. The Independent Trustees may waive this mandatory retirement age policy with respect to individual Trustees. The executive officers and Advisory Board Members hold office without limit in time, except that any officer and Advisory Board Member may resign or may be removed by a vote of a majority of the Trustees at any regular meeting or any special meeting of the Trustees. Except as indicated, each individual has held the office shown or other offices in the same company for the past five years.
The fund's Statement of Additional Information (SAI) includes more information about the Trustees. To request a free copy, call Fidelity at 1-877-208-0098.
Interested Trustees*:
Correspondence intended for each Trustee who is an interested person may be sent to Fidelity Investments, 82 Devonshire Street, Boston, Massachusetts 02109.
Name, Age; Principal Occupation |
Edward C. Johnson 3d (77) |
| Year of Election or Appointment: 1984 Mr. Johnson is Chairman of the Board of Trustees. Mr. Johnson serves as President (2006-present), Chief Executive Officer, Chairman, and a Director of FMR Corp.; Chairman and a Director of FMR; Chairman and a Director of Fidelity Research & Analysis Company (FRAC); Chairman and a Director of Fidelity Investments Money Management, Inc.; and Chairman (2001-present) and a Director of FMR Co., Inc. In addition, Mr. Johnson serves as Chairman and Director of Fidelity International Limited (FIL). |
James C. Curvey (72) |
| Year of Election or Appointment: 2007 Mr. Curvey also serves as Trustee (2007-present) or Member of the Advisory Board (2007-present) of other investment companies advised by FMR. Mr. Curvey is Vice Chairman (2006-present) and Director of FMR Corp. Mr. Curvey joined Fidelity in 1982 and served in numerous senior management positions, including President and Chief Operating Officer of FMR Corp. (1997-2000) and President of Fidelity Strategic Investments (2000-2002). In addition, he serves as a member of the Board of Directors of Geerlings & Wade, Inc. (wine distribution). |
* Trustees have been determined to be "Interested Trustees" by virtue of, among other things, their affiliation with the trust or various entities under common control with FMR.
Independent Trustees:
Correspondence intended for each Independent Trustee (that is, the Trustees other than the Interested Trustees) may be sent to Fidelity Investments, P.O. Box 55235, Boston, Massachusetts 02205-5235.
Name, Age; Principal Occupation |
Dennis J. Dirks (59) |
| Year of Election or Appointment: 2005 Prior to his retirement in May 2003, Mr. Dirks was Chief Operating Officer and a member of the Board of The Depository Trust & Clearing Corporation (DTCC) (1999-2003). He also served as President, Chief Operating Officer, and Board member of The Depository Trust Company (DTC) (1999-2003) and President and Board member of the National Securities Clearing Corporation (NSCC) (1999-2003). In addition, Mr. Dirks served as Chief Executive Officer and Board member of the Government Securities Clearing Corporation (2001-2003) and Chief Executive Officer and Board member of the Mortgage-Backed Securities Clearing Corporation (2001-2003). Mr. Dirks also serves as a Trustee and a member of the Finance Committee of Manhattan College (2005-present) and a Trustee and a member of the Finance Committee of AHRC of Nassau County (2006-present). |
Albert R. Gamper, Jr. (65) |
| Year of Election or Appointment: 2006 Prior to his retirement in December 2004, Mr. Gamper served as Chairman of the Board of CIT Group Inc. (commercial finance). During his tenure with CIT Group Inc. Mr. Gamper served in numerous senior management positions, including Chairman (1987-1989; 1999-2001; 2002-2004), Chief Executive Officer (1987-2004), and President (1989-2002). He currently serves as a member of the Board of Directors of Public Service Enterprise Group (utilities, 2001-present), Chairman of the Board of Governors, Rutgers University (2004-present), and Chairman of the Board of Saint Barnabas Health Care System. |
George H. Heilmeier (71) |
| Year of Election or Appointment: 2004 Dr. Heilmeier is Chairman Emeritus of Telcordia Technologies (communication software and systems), where prior to his retirement, he served as company Chairman and Chief Executive Officer. He currently serves on the Boards of Directors of The Mitre Corporation (systems engineering and information technology support for the government), and HRL Laboratories (private research and development, 2004-present). He is Chairman of the General Motors Science & Technology Advisory Board and a Life Fellow of the Institute of Electrical and Electronics Engineers (IEEE). Dr. Heilmeier is a member of the Defense Science Board and the National Security Agency Advisory Board. He is also a member of the National Academy of Engineering, the American Academy of Arts and Sciences, and the Board of Overseers of the School of Engineering and Applied Science of the University of Pennsylvania. Previously, Dr. Heilmeier served as a Director of TRW Inc. (automotive, space, defense, and information technology, 1992-2002), Compaq (1994-2002), Automatic Data Processing, Inc. (ADP) (technology-based business outsourcing, 1995-2002), INET Technologies Inc. (telecommunications network surveillance, 2001-2004), and Teletech Holdings (customer management services). He is the recipient of the 2005 Kyoto Prize in Advanced Technology for his invention of the liquid crystal display, and a member of the Consumer Electronics Hall of Fame. |
James H. Keyes (66) |
| Year of Election or Appointment: 2007 Prior to his retirement in 2003, Mr. Keyes was Chairman, President, and Chief Executive Officer of Johnson Controls, Inc. (automotive supplier, 1993-2003). He currently serves as a member of the boards of LSI Logic Corporation (semiconductor technologies), Navistar International Corporation (manufacture and sale of trucks, buses, and diesel engines, 2002-present), and Pitney Bowes, Inc. (integrated mail, messaging, and document management solutions). |
Marie L. Knowles (60) |
| Year of Election or Appointment: 2001 Prior to Ms. Knowles' retirement in June 2000, she served as Executive Vice President and Chief Financial Officer of Atlantic Richfield Company (ARCO) (diversified energy, 1996-2000). From 1993 to 1996, she was a Senior Vice President of ARCO and President of ARCO Transportation Company. She served as a Director of ARCO from 1996 to 1998. She currently serves as a Director of Phelps Dodge Corporation (copper mining and manufacturing) and McKesson Corporation (healthcare service, 2002-present). Ms. Knowles is a Trustee of the Brookings Institution and the Catalina Island Conservancy and also serves as a member of the Advisory Board for the School of Engineering of the University of Southern California. |
Ned C. Lautenbach (63) |
| Year of Election or Appointment: 2000 Mr. Lautenbach is Chairman of the Independent Trustees (2006-present). Mr. Lautenbach has been a partner of Clayton, Dubilier & Rice, Inc. (private equity investment firm) since September 1998. Previously, Mr. Lautenbach was with the International Business Machines Corporation (IBM) from 1968 until his retirement in 1998. Mr. Lautenbach serves as a Director of Sony Corporation (2006-present) and Eaton Corporation (diversified industrial) as well as the Philharmonic Center for the Arts in Naples, Florida. He also is a member of the Board of Trustees of Fairfield University (2005-present), as well as a member of the Council on Foreign Relations. |
Cornelia M. Small (63) |
| Year of Election or Appointment: 2005 Ms. Small is a member (2000-present) and Chairperson (2002-present) of the Investment Committee, and a member (2002-present) of the Board of Trustees of Smith College. Previously, she served as Chief Investment Officer (1999-2000), Director of Global Equity Investments (1996-1999), and a member of the Board of Directors of Scudder, Stevens & Clark (1990-1997) and Scudder Kemper Investments (1997-1999). In addition, Ms. Small served as Co-Chair (2000-2003) of the Annual Fund for the Fletcher School of Law and Diplomacy. |
William S. Stavropoulos (68) |
| Year of Election or Appointment: 2001 Mr. Stavropoulos is Chairman Emeritus of the Board of Directors of The Dow Chemical Company. Since joining The Dow Chemical Company in 1967, Mr. Stavropoulos served in numerous senior management positions, including President (1993-2000; 2002-2003), CEO (1995-2000; 2002-2004), and Chairman of the Executive Committee (2000-2004). Currently, he is a Director of NCR Corporation (data warehousing and technology solutions), Chemical Financial Corporation, Maersk Inc. (industrial conglomerate, 2002-present), Tyco International, Inc. (multinational manufacturing and services, 2007-present), and a member of the Advisory Board for Metalmark Capital (private equity investment firm, 2005-present). He is a special advisor to Clayton, Dubilier & Rice, Inc., a private equity investment firm. He also serves as a member of the Board of Trustees of the American Enterprise Institute for Public Policy Research. In addition, Mr. Stavropoulos is a member of The Business Council, J.P. Morgan International Council and the University of Notre Dame Advisory Council for the College of Science. |
Kenneth L. Wolfe (68) |
| Year of Election or Appointment: 2005 Prior to his retirement in 2001, Mr. Wolfe was Chairman and Chief Executive Officer of Hershey Foods Corporation (1993-2001). He currently serves as a member of the boards of Adelphia Communications Corporation (2003-present), Bausch & Lomb, Inc., and Revlon Inc. (2004-present). |
Advisory Board Members and Executive Officers:
Correspondence intended for Mr. Mauriello may be sent to Fidelity Investments, P.O. Box 55235, Boston, Massachusetts 02205-5235. Correspondence intended for each executive officer and Mr. Lynch may be sent to Fidelity Investments, 82 Devonshire Street, Boston, Massachusetts 02109.
Name, Age; Principal Occupation |
Peter S. Lynch (63) |
| Year of Election or Appointment: 2003 Member of the Advisory Board of Fidelity Income Fund. Mr. Lynch is Vice Chairman and a Director of FMR, and Vice Chairman (2001-present) and a Director of FMR Co., Inc. Previously, Mr. Lynch served as a Trustee of the Fidelity funds (1990-2003). In addition, he serves as a Trustee of Boston College and as the Chairman of the Inner-City Scholarship Fund. |
Joseph Mauriello (62) |
| Year of Election or Appointment: 2007 Member of the Advisory Board of Fidelity Income Fund. Prior to his retirement in January 2006, Mr. Mauriello served in numerous senior management positions including Deputy Chairman and Chief Operating Officer (2004-2005), and Vice Chairman of Financial Services (2002-2004) of KPMG LLP US (professional services firm, 1965-2005). Mr. Mauriello currently serves as a member of the Board of Directors of XL Capital Ltd., (global insurance and re-insurance company, 2006-present) and of Arcadia Resources Inc., (health care services and products, 2007-present). He also served as a Director of the Hamilton Funds of the Bank of New York (2006-2007). |
Kimberley H. Monasterio (43) |
| Year of Election or Appointment: 2007 President and Treasurer of the fund. Ms. Monasterio also serves as President and Treasurer of other Fidelity funds (2007-present) and is an employee of FMR (2004-present). Previously, Ms. Monasterio served as Deputy Treasurer of the Fidelity funds (2004-2006). Before joining Fidelity Investments, Ms. Monasterio served as Treasurer (2000-2004) and Chief Financial Officer (2002-2004) of the Franklin Templeton Funds and Senior Vice President of Franklin Templeton Services, LLC (2000-2004). |
Boyce I. Greer (51) |
| Year of Election or Appointment: 2005 Vice President of the fund. Mr. Greer also serves as Vice President of certain Equity Funds (2005-present), certain Asset Allocation Funds (2005-present), Fixed-Income Funds (2006-present), and Money Market Funds (2006-present). Mr. Greer is also a Trustee of other investment companies advised by FMR (2003-present). He is an Executive Vice President of FMR (2005-present) and FMR Co., Inc. (2005-present), and Senior Vice President of Fidelity Investments Money Management, Inc. (2006-present). Previously, Mr. Greer served as a Director and Managing Director of Strategic Advisers, Inc. (2002-2005), and Executive Vice President (2000-2002) and Money Market Group Leader (1997-2002) of the Fidelity Investments Fixed Income Division. He also served as Vice President of Fidelity's Money Market Funds (1997-2002), Senior Vice President of FMR (1997-2002), and Vice President of FIMM (1998-2002). |
David L. Murphy (59) |
| Year of Election or Appointment: 2005 Vice President of the fund. Mr. Murphy also serves as Vice President of Fidelity's Money Market Funds (2002-present), certain Asset Allocation Funds (2003-present), Fixed-Income Funds (2005-present), and Balanced Funds (2005-present). He serves as Senior Vice President (2000-present) and Head (2004-present) of the Fidelity Investments Fixed Income Division. Mr. Murphy is also a Senior Vice President of Fidelity Investments Money Management, Inc. (2003-present) and an Executive Vice President of FMR (2005-present). Previously, Mr. Murphy served as Money Market Group Leader (2002-2004), Bond Group Leader (2000-2002), and Vice President of Fidelity's Taxable Bond Funds (2000-2002) and Fidelity's Municipal Bond Funds (2001-2002). |
Thomas J. Silvia (46) |
| Year of Election or Appointment: 2005 Vice President of the fund. Mr. Silvia also serves as Vice President of Fidelity's Fixed-Income Funds (2005-present), certain Balanced Funds (2005-present), certain Asset Allocation Funds (2005-present), and Senior Vice President and Bond Group Leader of the Fidelity Investments Fixed-Income Division (2005-present). Previously, Mr. Silvia served as Director of Fidelity's Taxable Bond portfolio managers (2002-2004) and a portfolio manager in the Bond Group (1997-2004). |
William Irving (43) |
| Year of Election or Appointment: 2007 Vice President of the fund. Dr. Irving also serves as Vice President of other funds advised by FMR. Prior to assuming his current responsibilities, Dr. Irving worked as a quantitative analyst and portfolio manager. |
Eric D. Roiter (58) |
| Year of Election or Appointment: 1998 Secretary of the fund. He also serves as Secretary of other Fidelity funds; Vice President, General Counsel, and Secretary of FMR Co., Inc. (2001-present) and FMR; Assistant Secretary of Fidelity Management & Research (U.K.) Inc. (2001-present), Fidelity Research & Analysis Company (2001-present), and Fidelity Investments Money Management, Inc. (2001-present). Mr. Roiter is an Adjunct Member, Faculty of Law, at Boston College Law School (2003-present). Previously, Mr. Roiter served as Vice President and Secretary of Fidelity Distributors Corporation (FDC) (1998-2005). |
Scott C. Goebel (39) |
| Year of Election or Appointment: 2007 Assistant Secretary of the fund. Mr. Goebel also serves as Assistant Secretary of other Fidelity funds (2007-present), Vice President and Secretary of FDC (2006-present), and is an employee of FMR. |
R. Stephen Ganis (41) |
| Year of Election or Appointment: 2006 Anti-Money Laundering (AML) officer of the fund. Mr. Ganis also serves as AML officer of other Fidelity funds (2006-present) and FMR Corp. (2003-present). Before joining Fidelity Investments, Mr. Ganis practiced law at Goodwin Procter, LLP (2000-2002). |
Joseph B. Hollis (59) |
| Year of Election or Appointment: 2006 Chief Financial Officer of the fund. Mr. Hollis also serves as Chief Financial Officer of other Fidelity funds. Mr. Hollis is President of Fidelity Pricing and Cash Management Services (FPCMS) (2005-present). Mr. Hollis also serves as President and Director of Fidelity Service Company, Inc. (2006-present). Previously, Mr. Hollis served as Senior Vice President of Cash Management Services (1999-2002) and Investment Management Operations (2002-2005). |
Kenneth A. Rathgeber (60) |
| Year of Election or Appointment: 2004 Chief Compliance Officer of the fund. Mr. Rathgeber also serves as Chief Compliance Officer of other Fidelity funds (2004-present) and Executive Vice President of Risk Oversight for Fidelity Investments (2002-present). He is Chief Compliance Officer of FMR (2005-present), FMR Co., Inc. (2005-present), Fidelity Management & Research (U.K.) Inc. (2005-present), Fidelity Research & Analysis Company (2005-present), Fidelity Investments Money Management, Inc. (2005-present), and Strategic Advisers, Inc. (2005-present). Previously, Mr. Rathgeber served as Executive Vice President and Chief Operating Officer for Fidelity Investments Institutional Services Company, Inc. (1998-2002). |
Bryan A. Mehrmann (46) |
| Year of Election or Appointment: 2005 Deputy Treasurer of the fund. Mr. Mehrmann also serves as Deputy Treasurer of other Fidelity funds (2005-present) and is an employee of FMR. Previously, Mr. Mehrmann served as Vice President of Fidelity Investments Institutional Services Group (FIIS)/Fidelity Investments Institutional Operations Corporation, Inc. (FIIOC) Client Services (1998-2004). |
Kenneth B. Robins (37) |
| Year of Election or Appointment: 2005 Deputy Treasurer of the fund. Mr. Robins also serves as Deputy Treasurer of other Fidelity funds (2005-present) and is an employee of FMR (2004-present). Before joining Fidelity Investments, Mr. Robins worked at KPMG LLP, where he was a partner in KPMG's department of professional practice (2002-2004) and a Senior Manager (1999-2000). In addition, Mr. Robins served as Assistant Chief Accountant, United States Securities and Exchange Commission (2000-2002). |
Robert G. Byrnes (40) |
| Year of Election or Appointment: 2005 Assistant Treasurer of the fund. Mr. Byrnes also serves as Assistant Treasurer of other Fidelity funds (2005-present) and is an employee of FMR (2005-present). Previously, Mr. Byrnes served as Vice President of FPCMS (2003-2005). Before joining Fidelity Investments, Mr. Byrnes worked at Deutsche Asset Management where he served as Vice President of the Investment Operations Group (2000-2003). |
Peter L. Lydecker (53) |
| Year of Election or Appointment: 2004 Assistant Treasurer of the fund. Mr. Lydecker also serves as Assistant Treasurer of other Fidelity funds (2004) and is an employee of FMR. |
Gary W. Ryan (48) |
| Year of Election or Appointment: 2005 Assistant Treasurer of the fund. Mr. Ryan also serves as Assistant Treasurer of other Fidelity funds (2005-present) and is an employee of FMR (2005-present). Previously, Mr. Ryan served as Vice President of Fund Reporting in FPCMS (1999-2005). |
Annual Report
Distributions
A total of 15.00% of the dividends distributed during the fiscal year was derived from interest on U.S. Government securities which is generally exempt from state income tax.
The fund designates $231,780,564 of distributions paid during the period January 1, 2007 to July 31, 2007 as qualifying to be taxed as interest-related dividends for nonresident alien shareholders.
The fund will notify shareholders in January 2008 of amounts for use in preparing 2007 income tax returns.
Annual Report
Board Approval of Investment Advisory Contracts and Management Fees
Fidelity Government Income Fund
Each year, typically in June, the Board of Trustees, including the Independent Trustees (together, the Board), votes on the renewal of the management contract and sub-advisory agreements (together, the Advisory Contracts) for the fund. The Board, assisted by the advice of fund counsel and Independent Trustees' counsel, requests and considers a broad range of information throughout the year.
The Board meets regularly each month except August and takes into account throughout the year matters bearing on Advisory Contracts. The Board, acting directly and through its separate committees, considers at each of its meetings factors that are relevant to the annual renewal of the fund's Advisory Contracts, including the services and support provided to the fund and its shareholders. At the time of the renewal, the Board had 12 standing committees, each composed of Independent Trustees with varying backgrounds, to which the Board has assigned specific subject matter responsibilities in order to enhance effective decision-making by the Board. Each committee has adopted a written charter outlining the structure and purposes of the committee. One such committee, the Fixed-Income Contract Committee, meets periodically as needed throughout the year to consider matters specifically related to the annual renewal of Advisory Contracts. The committee requests and receives information on, and makes recommendations to the Independent Trustees concerning, the approval and annual review of the Advisory Contracts.
At its June 2007 meeting, the Board of Trustees, including the Independent Trustees, unanimously determined to renew the Advisory Contracts for the fund. In reaching its determination, the Board considered all factors it believed relevant, including (i) the nature, extent, and quality of the services to be provided to the fund and its shareholders (including the investment performance of the fund); (ii) the competitiveness of the management fee and total expenses of the fund; (iii) the total costs of the services to be provided by and the profits to be realized by the investment adviser and its affiliates from the relationship with the fund; (iv) the extent to which economies of scale would be realized as the fund grows; and (v) whether fee levels reflect these economies of scale, if any, for the benefit of fund shareholders. The Board also approved amendments to the fund's agreements with foreign sub-advisers to clarify that each sub-adviser provides services as an independent contractor.
In determining whether to renew the Advisory Contracts for the fund, the Board ultimately reached a determination, with the assistance of fund counsel and Independent Trustees' counsel, that the renewal of the Advisory Contracts and the compensation to be received by Fidelity under the management contract is consistent with Fidelity's fiduciary duty under applicable law. In addition to evaluating the specific factors noted above, the Board, in reaching its determination, is aware that shareholders in the fund have a broad range of investment choices available to them, including a wide choice among mutual funds offered by competitors to Fidelity, and that the fund's shareholders, with the opportunity to review and weigh the disclosure provided by the fund in its prospectus and other public disclosures, have chosen to invest in this fund, managed by Fidelity.
Annual Report
Nature, Extent, and Quality of Services Provided. The Board considered staffing within the investment adviser, FMR, and the sub-advisers (together, the Investment Advisers), including the background of the fund's portfolio manager and the fund's investment objective and discipline. The Independent Trustees also had discussions with senior management of Fidelity's investment operations and investment groups. The Board considered the structure of the portfolio manager compensation program and whether this structure provides appropriate incentives.
Resources Dedicated to Investment Management and Support Services. The Board reviewed the size, education, and experience of the Investment Advisers' investment staff, their use of technology, and the Investment Advisers' approach to recruiting, training, and retaining portfolio managers and other research, advisory, and management personnel. The Board considered Fidelity's extensive global research capabilities that enable the Investment Advisers to aggregate data from various sources in an effort to produce positive investment results. The Board noted that Fidelity's analysts have access to a variety of technological tools that enable them to perform both fundamental and quantitative analysis and to specialize in various disciplines. The Board also considered that Fidelity's portfolio managers and analysts have access to daily portfolio attribution that allows for monitoring of a fund's portfolio, as well as an electronic communication system that provides immediate real-time access to research concerning issuers and credit enhancers. In addition, the Board considered the trading resources that are an integrated part of the fixed-income portfolio management investment process.
Shareholder and Administrative Services. The Board considered (i) the nature, extent, quality, and cost of advisory, administrative, distribution, and shareholder services performed by the Investment Advisers and their affiliates under the Advisory Contracts and under separate agreements covering transfer agency, pricing and bookkeeping, and securities lending services for the fund; (ii) the nature and extent of the Investment Advisers' supervision of third party service providers, principally custodians and subcustodians; and (iii) the resources devoted to, and the record of compliance with, the fund's compliance policies and procedures.
The Board noted that the growth of fund assets across the complex allows Fidelity to reinvest in the development of services designed to enhance the value or convenience of the Fidelity funds as investment vehicles. These services include 24-hour access to account information and market information through phone representatives and over the Internet, and investor education materials and asset allocation tools.
Annual Report
Board Approval of Investment Advisory Contracts and
Management Fees - continued
Investment in a Large Fund Family. The Board considered the benefits to shareholders of investing in a Fidelity fund, including the benefits of investing in a fund that is part of a large family of funds offering a variety of investment disciplines and providing for a large variety of mutual fund investor services. For example, fund shareholders are offered the privilege of exchanging shares of the fund for shares of other Fidelity funds, as set forth in the fund's prospectus, without paying a sales charge. The Board noted that, since the last Advisory Contract renewals in June 2006, Fidelity has taken a number of actions that benefited particular funds, including (i) dedicating additional resources to investment research and to restructure the investment research teams; (ii) contractually agreeing to reduce the management fee on Fidelity Advisor Floating Rate High Income Fund; (iii) contractually agreeing to reduce the management fees on Fidelity's California, Massachusetts, New Jersey, and New York AMT Tax-Free Money Market Funds, launching new Institutional Classes and Service Classes of these funds, and contractually agreeing to impose expense limitations on these funds; (iv) eliminating the exchange fee on the Fidelity Select Portfolios and reducing the pricing and bookkeeping fee rates for these funds; (v) reducing the maximum transfer agency fee rates on high income funds and certain equity funds; (vi) proposing amended management contracts that, if approved by shareholders, will add a performance adjustment component to the management fees paid by 18 Fidelity Advisor equity funds; (vii) contractually agreeing to reduce fees for Ultra-Short Central Fund and the money market Central Funds; (viii) waiving the Fidelity Advisor funds' contingent deferred sales charge on certain redemptions made through systematic withdrawal programs; and (ix) amending the management contracts for equity and fixed-income funds whose management contracts incorporate a "group fee" structure by adding four new fee "breakpoints" to the group fee rate schedules.
Investment Performance. The Board considered whether the fund has operated within its investment objective, as well as its record of compliance with its investment restrictions. It also reviewed the fund's absolute investment performance for Fidelity Government Income (retail class), as well as the fund's relative investment performance for Fidelity Government Income (retail class) measured against (i) a proprietary custom index, and (ii) a peer group of mutual funds deemed appropriate by the Board over multiple periods. The following charts considered by the Board show, over the one-, three-, and five-year periods ended December 31, 2006, the cumulative total returns of Fidelity Government Income (retail class), the cumulative total returns of a proprietary custom index ("benchmark"), and a range of cumulative total returns of a peer group of mutual funds identified by Lipper Inc. as having an investment objective similar to that of the fund. (The Advisor classes of the fund had less than one year of performance as of December 31, 2006.) The box within each chart shows the 25th percentile return (bottom of box) and the 75th percentile return (top of box) of the peer group. Returns shown above the box are in the first quartile and returns shown below the box are in the fourth quartile. The percentage beaten number noted below each chart corresponds to the percentile box and represents the percentage of funds in the peer group whose performance was equal to or lower than that of Fidelity Government Income (retail class). The fund's proprietary custom index is an index developed by FMR that represents the performance of the fund's general investment categories.
Annual Report
Fidelity Government Income Fund
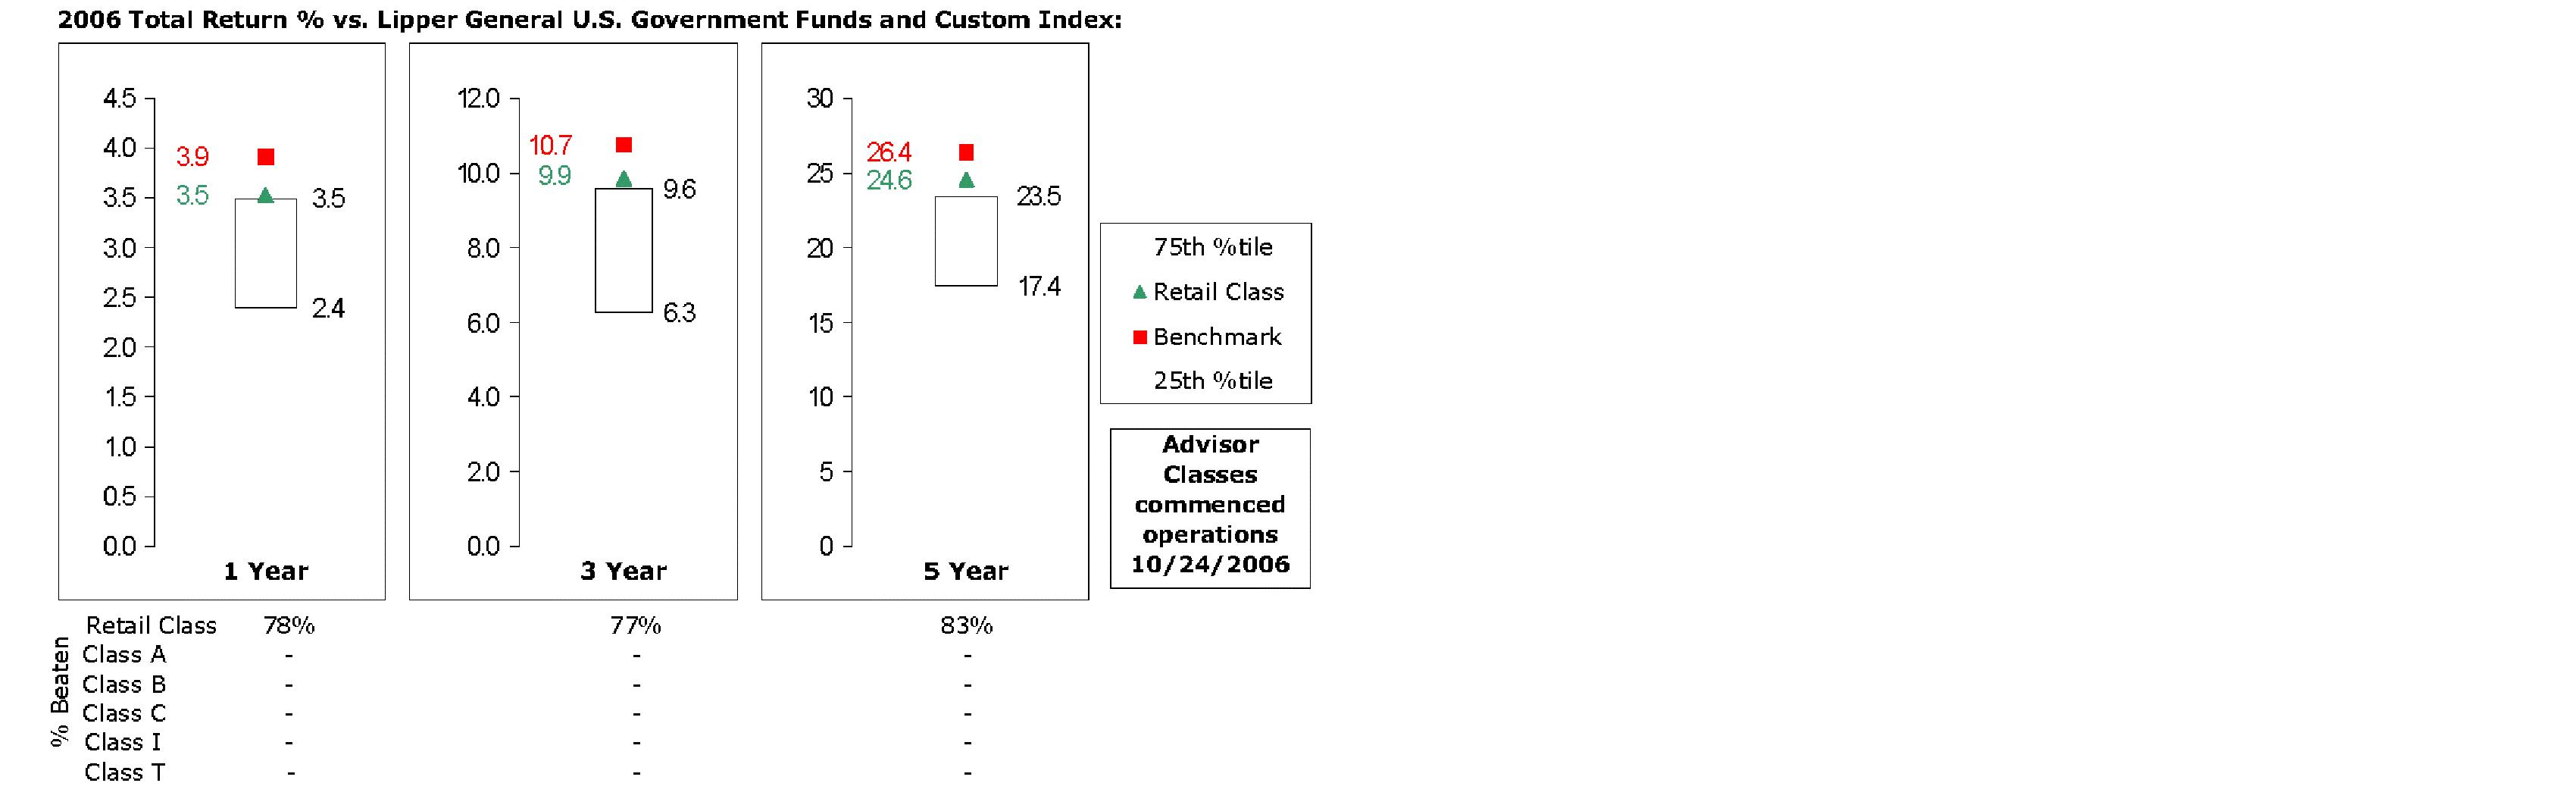
The Board reviewed the fund's relative investment performance against its peer group and stated that the performance of Fidelity Government Income (retail class) was in the first quartile for all the periods shown. The Board also stated that the relative investment performance of the fund was lower than its benchmark for all the periods shown. The Board discussed with FMR actions to be taken by FMR to improve the fund's below-benchmark performance.
Based on its review, and giving particular weight to the nature and quality of the resources dedicated by the Investment Advisers to maintain and improve relative performance, the Board concluded that the nature, extent, and quality of the services provided to the fund will benefit the fund's shareholders, particularly in light of the Board's view that the fund's shareholders benefit from investing in a fund that is part of a large family of funds offering a variety of investment disciplines and services.
Competitiveness of Management Fee and Total Fund Expenses. The Board considered the fund's management fee and total expenses compared to "mapped groups" of competitive funds and classes. Fidelity creates "mapped groups" by combining similar Lipper investment objective categories that have comparable management fee characteristics. Combining Lipper investment objective categories aids the Board's management fee and total expense comparisons by broadening the competitive group used for comparison and by reducing the number of universes to which various Fidelity funds are compared.
Annual Report
Board Approval of Investment Advisory Contracts and
Management Fees - continued
The Board considered two proprietary management fee comparisons for the 12-month periods shown in the chart below. The group of Lipper funds used by the Board for management fee comparisons is referred to below as the "Total Mapped Group" and, for the reasons explained above, is broader than the Lipper peer group used by the Board for performance comparisons. The Total Mapped Group comparison focuses on a fund's standing relative to the total universe of comparable funds available to investors, in terms of gross management fees before expense reimbursements or caps. "TMG %" represents the percentage of funds in the Total Mapped Group that had management fees that were lower than the fund's. For example, a TMG % of 8% means that 92% of the funds in the Total Mapped Group had higher management fees than the fund. The "Asset-Size Peer Group" (ASPG) comparison focuses on a fund's standing relative to non-Fidelity funds similar in size to the fund within the Total Mapped Group. The ASPG represents at least 15% of the funds in the Total Mapped Group with comparable asset size and management fee characteristics, subject to a minimum of 50 funds (or all funds in the Total Mapped Group if fewer than 50). Additional information, such as the ASPG quartile in which the fund's management fee ranked, is also included in the chart and considered by the Board.
Fidelity Government Income Fund

The Board noted that the fund's management fee ranked below the median of its Total Mapped Group and below the median of its ASPG for 2006.
Annual Report
Furthermore, the Board considered that it had approved an amendment (effective June 1, 2005) to the fund's management contract that lowered the fund's individual fund fee rate from 30 basis points to 20 basis points. The Board considered that the fund's chart reflects the fund's lower management fee for 2005, as if the lower rate were in effect for the entire year.
Based on its review, the Board concluded that the fund's management fee was fair and reasonable in light of the services that the fund receives and the other factors considered.
In its review of each class's total expenses, the Board considered the fund's management fee as well as other fund or class expenses, as applicable, such as transfer agent fees, pricing and bookkeeping fees, fund-paid 12b-1 fees, and custodial, legal, and audit fees. The Board also noted the effects of any waivers and reimbursements on fees and expenses. As part of its review, the Board also considered current and historical total expenses of each class of the fund compared to competitive fund median expenses. Each class of the fund is compared to those funds and classes in the Total Mapped Group (used by the Board for management fee comparisons) that have a similar sales load structure.
The Board also considered that the current contractual arrangements for the fund (i) have the effect of setting the total "fund-level" expenses (including, among certain other expenses, the management fee) for each class at 35 basis points, (ii) lower and limit the "class-level" transfer agent fee for Fidelity Government Income (retail class) to 10 basis points, and (iii) limit the total expenses for Fidelity Government Income (retail class) to 45 basis points. These contractual arrangements may not be increased without the approval of the Board and the shareholders of the applicable class. The fund's Advisor classes are subject to different "class-level" expenses (transfer agent fees and 12b-1 fees).
The Board noted that the total expenses of each class ranked below its competitive median for 2006.
The Board recognized that the fund's management contract incorporates a "group fee" structure, which provides for lower group fee rates as total fund assets under FMR's management increase, and for higher group fee rates as total fund assets under FMR's management decrease. FMR determines the group fee rates based on a tiered asset "breakpoint" schedule. In connection with the renewal of the fund's management contract, the Board approved amendments to the fund's management contract that added four new fee breakpoints to the group fee rate schedule for assets under FMR's management above $1,386 billion. The Board considered that the group fee rate declines under both the present and amended schedules, but that under the amended schedule, the group fee rate declines faster as assets under FMR's management exceed $1,386 billion. The Board noted, however, that because the current contractual arrangements set the total fund-level expenses for each class at 35 basis points, increases or decreases in the management fee due to changes in the group fee rate will not impact total expenses.
Annual Report
Board Approval of Investment Advisory Contracts and
Management Fees - continued
In its review of total expenses, the Board also considered Fidelity fee structures and other information on clients that FMR and its affiliates service in other competitive markets, such as other mutual funds advised or subadvised by FMR or its affiliates, pension plan clients, and other institutional clients.
Based on its review, the Board concluded that the total expenses of each class of the fund were reasonable in light of the services that the fund and its shareholders receive and the other factors considered.
Costs of the Services and Profitability. The Board considered the revenues earned and the expenses incurred by Fidelity in conducting the business of developing, marketing, distributing, managing, administering and servicing the fund and its shareholders. The Board also considered the level of Fidelity's profits in respect of all the Fidelity funds.
On an annual basis, FMR presents to the Board Fidelity's profitability for the fund. Fidelity calculates the profitability for each fund, as well as aggregate profitability for groups of Fidelity funds and all Fidelity funds, using a series of detailed revenue and cost allocation methodologies which originate with the audited books and records of Fidelity. The Audit Committee of the Board reviews any significant changes from the prior year's methodologies.
PricewaterhouseCoopers LLP (PwC), independent registered public accounting firm and auditor to Fidelity and certain Fidelity funds, has been engaged annually by the Board as part of the Board's assessment of the results of Fidelity's profitability analysis. PwC's engagement includes the review and assessment of Fidelity's methodologies used in determining the revenues and expenses attributable to Fidelity's mutual fund business, and completion of agreed-upon procedures surrounding the mathematical accuracy of fund profitability and its conformity to allocation methodologies. After considering PwC's reports issued under the engagement and information provided by Fidelity, the Board believes that while other allocation methods may also be reasonable, Fidelity's profitability methodologies are reasonable in all material respects.
The Board has also reviewed Fidelity's non-fund businesses and any fall-out benefits related to the mutual fund business as well as cases where Fidelity's affiliates may benefit from or be related to the fund's business.
The Board considered the costs of the services provided by and the profits realized by Fidelity in connection with the operation of the fund and determined that the amount of profit is a fair entrepreneurial profit for the management of the fund.
Annual Report
Economies of Scale. The Board considered whether there have been economies of scale in respect of the management of the Fidelity funds, whether the Fidelity funds (including the fund) have appropriately benefited from any such economies of scale, and whether there is potential for realization of any further economies of scale. The Board considered the extent to which the fund will benefit from economies of scale through increased services to the fund, through waivers or reimbursements, or through fee or expense reductions, including (Advisor classes only) reductions that occur through operation of the transfer agent agreement. The transfer agent fee varies in part based on the number of accounts in the fund. If the number of accounts decreases or the average account size increases, the overall transfer agent fee rate decreases. The Board concluded that any potential economies of scale are being shared between fund shareholders and Fidelity in an appropriate manner.
Additional Information Requested by the Board. In order to develop fully the factual basis for consideration of the Fidelity funds' Advisory Contracts, the Board requested and received additional information on several topics, including (i) Fidelity's fund profitability methodology, profitability by investment discipline, and profitability trends within certain funds; (ii) Fidelity's compensation structure relative to competitors and its effect on profitability; (iii) funds and accounts managed by Fidelity other than the Fidelity funds, including fee arrangements; (iv) the total expenses of certain funds and classes relative to competitors; (v) fund performance trends; (vi) fall-out benefits received by certain Fidelity affiliates; and (vii) Fidelity's fee structures.
Based on its evaluation of all of the conclusions noted above, and after considering all material factors, the Board ultimately concluded that the advisory fee structures are fair and reasonable, and that the fund's Advisory Contracts should be renewed.
Annual Report
Annual Report
Annual Report
Annual Report
Annual Report
Annual Report
Annual Report
Investment Adviser
Fidelity Management & Research Company
Boston, MA
Investment Sub-Advisers
Fidelity Investments Money
Management, Inc.
Fidelity Research & Analysis Company
Fidelity International
Investment Advisors
Fidelity International
Investment Advisors (U.K.) Limited
General Distributor
Fidelity Distributors Corporation
Boston, MA
Transfer and Service Agents
Fidelity Investments Institutional Operations Company, Inc.
Boston, MA
Fidelity Service Company, Inc.
Boston, MA
Custodian
The Bank of New York
New York, NY
AGVTI-UANN-0907
1.834231.100
(Fidelity Investment logo)(registered trademark)
Fidelity®
Ultra-Short Bond
Fund
Annual Report
July 31, 2007
(2_fidelity_logos) (Registered_Trademark)
Contents
Chairman's Message | <Click Here> | Ned Johnson's message to shareholders. |
Performance | <Click Here> | How the fund has done over time. |
Management's Discussion | <Click Here> | The managers' review of fund performance, strategy and outlook. |
Shareholder Expense Example | <Click Here> | An example of shareholder expenses. |
Investment Changes | <Click Here> | A summary of major shifts in the fund's investments over the past six months. |
Investments | <Click Here> | A complete list of the fund's investments with their market values. |
Financial Statements | <Click Here> | Statements of assets and liabilities, operations, and changes in net assets,
as well as financial highlights. |
Notes | <Click Here> | Notes to the financial statements. |
Report of Independent Registered Public Accounting Firm | <Click Here> | |
Trustees and Officers | <Click Here> | |
Distributions | <Click Here> | |
Board Approval of Investment Advisory Contracts and Management Fees | <Click Here> | |
| | |
To view a fund's proxy voting guidelines and proxy voting record for the 12-month period ended June 30, visit http://www.fidelity.com (search for "proxy voting guidelines") or visit the Securities and Exchange Commission's (SEC) web site at http://www.sec.gov. You may also call 1-800-544-8544 to request a free copy of the proxy voting guidelines.
Standard & Poor's, S&P and S&P 500 are registered service marks of The McGraw-Hill Companies, Inc. and have been licensed for use by Fidelity Distributors Corporation.
Other third party marks appearing herein are the property of their respective owners.
All other marks appearing herein are registered or unregistered trademarks or service marks of FMR Corp. or an affiliated company.
Annual Report
This report and the financial statements contained herein are submitted for the general information of the shareholders of the fund. This report is not authorized for distribution to prospective investors in the fund unless preceded or accompanied by an effective prospectus.
A fund files its complete schedule of portfolio holdings with the SEC for the first and third quarters of each fiscal year on Form N-Q. Forms N-Q are available on the SEC's web site at http://www.sec.gov. A fund's Forms N-Q may be reviewed and copied at the SEC's Public Reference Room in Washington, DC. Information regarding the operation of the SEC's Public Reference Room may be obtained by calling 1-800-SEC-0330. For a complete list of a fund's portfolio holdings, view the most recent holdings listing, semiannual report, or annual report on Fidelity's web site at http://www.fidelity.com or http://www.advisor.fidelity.com, as applicable.
NOT FDIC INSURED · MAY LOSE VALUE · NO BANK GUARANTEE
Neither the fund nor Fidelity Distributors Corporation is a bank.
Annual Report
Chairman's Message
(photo_of_Edward_C_Johnson_3d)
Dear Shareholder:
Stocks are currently on pace to register their fifth straight year of positive returns, although gains could be trimmed if the U.S. economy continues to slow. While financial markets are always unpredictable, there are a number of time-tested principles that can put the historical odds in your favor.
One of the basic tenets is to invest for the long term. Over time, riding out the markets' inevitable ups and downs has proven much more effective than selling into panic or chasing the hottest trend. Even missing only a few of the markets' best days can significantly diminish investor returns. Patience also affords the benefits of compounding - of earning interest on additional income or reinvested dividends and capital gains. There are tax advantages and cost benefits to consider as well. The more you sell, the more taxes you pay, and the more you trade, the higher the costs. While staying the course doesn't eliminate risk, it can considerably lessen the effect of short-term declines.
You can further manage your investing risk through diversification. And today, more than ever, geographic diversification should be taken into account. Studies indicate that asset allocation is the single most important determinant of a portfolio's long-term success. The right mix of stocks, bonds and cash - aligned to your particular risk tolerance and investment objective - is very important. Age-appropriate rebalancing is also an essential aspect of asset allocation. For younger investors, an emphasis on equities - which historically have been the best-performing asset class over time - is encouraged. As investors near their specific goal, such as retirement or sending a child to college, consideration may be given to replacing volatile assets (e.g. common stocks) with more-stable fixed investments (bonds or savings plans).
A third investment principle - investing regularly - can help lower the average cost of your purchases. Investing a certain amount of money each month or quarter helps ensure you won't pay for all your shares at market highs. This strategy - known as dollar cost averaging - also reduces unconstructive "emotion" from investing, helping shareholders avoid selling weak performers just prior to an upswing, or chasing a hot performer just before a correction.
We invite you to contact us via the Internet, through our Investor Centers or over the phone. It is our privilege to provide you the information you need to make the investments that are right for you.
Sincerely,
/s/Edward C. Johnson 3d
Edward C. Johnson 3d
Annual Report
Performance: The Bottom Line
Average annual total return reflects the change in the value of an investment, assuming reinvestment of Ultra-Short Bond's dividend income and capital gains (the profits earned upon the sale of securities that have grown in value) and assuming a constant rate of performance each year. The $10,000 table and the fund's returns do not reflect the deduction of taxes that a shareholder would pay on fund distributions or the redemption of fund shares. During periods of reimbursement by Fidelity, a fund's total return will be greater than it would be had the reimbursement not occurred. How a fund did yesterday is no guarantee of how it will do tomorrow.
Average Annual Total Returns
Periods ended July 31, 2007 | Past 1
year | Life of
fund A |
Ultra-Short Bond | 3.09% | 2.63% |
A From August 29, 2002.
$10,000 Over Life of Fund
Let's say hypothetically that $10,000 was invested in Fidelity Ultra-Short Bond Fund on August 29, 2002, when the fund started. The chart shows how the value of your investment would have changed, and also shows how the Lehman Brothers® 6 Month Swap Index performed over the same period.
Annual Report
Management's Discussion of Fund Performance
Comments from Andrew Dudley, Portfolio Manager of Fidelity® Ultra-Short Bond Fund during the period covered by this report, and Robert Galusza, who became Lead Portfolio Manager of the fund on July 1, 2007. Dudley remained on the fund as Co-Manager.
The investment-grade bond market posted a reasonably solid advance for the 12 months ending July 31, 2007. In that time, the Lehman Brothers® U.S. Aggregate Index - a performance gauge of taxable, high-quality debt - gained 5.58%. A sizable percentage of that increase came in the first four months of the period. The index returned a cumulative 4.30% from August through November, as investors responded favorably to the end of the Federal Reserve Board's two-year campaign of interest rate hikes. Bonds turned negative in December and January, but had their best month of the past year in February, rising 1.54% as extreme volatility in the stock markets led to a flight to safety in high-quality debt. Performance was lackluster thereafter, however. Inflation concerns and dwindling hopes for a near-term Fed rate cut pressured bond prices for much of the remainder of the period, as did the meltdown of the subprime mortgage sector. Against that backdrop, the index gained only 0.32% over the final five months of the period.
During the past year, Ultra-Short Bond gained 3.09%, while the Lehman Brothers 6 Month Swap Index returned 5.41%. The fund's significant underperformance stemmed largely from its sizable exposure to subprime mortgage securities. I held these securities - and others - both directly and indirectly through Fidelity Ultra-Short Central Fund, a diversified pool of short-term assets I also manage and which is designed to outperform cash-like instruments with similar risk characteristics. Early on, the fund's modest stake in lower-quality subprime holdings faltered, reflecting weakness in the housing market. Recently, technical factors caused higher-quality securities - which made up the bulk of the fund's subprime stake - to join their lower-quality counterparts in a major sell-off amid a massive unwinding of leverage by investors. Also detracting were commercial mortgage-backed securities, which came under pressure as investors repriced risk. In contrast, our position in collateralized mortgage obligations served us well, as they outpaced the index. And while the fund's stake in corporate bonds cost us some ground because it lagged the index, select holdings in the sector performed well.
The views expressed above reflect those of the portfolio manager(s) only through the end of the period as stated on the cover of this report and do not necessarily represent the views of Fidelity or any other person in the Fidelity organization. Any such views are subject to change at any time based upon market or other conditions and Fidelity disclaims any responsibility to update such views. These views may not be relied on as investment advice and, because investment decisions for a Fidelity fund are based on numerous factors, may not be relied on as an indication of trading intent on behalf of any Fidelity fund.
Annual Report
Shareholder Expense Example
As a shareholder of the Fund, you incur two types of costs: (1) transaction costs, including redemption fees, and (2) ongoing costs, including management fees, distribution and/or service (12b-1) fees and other Fund expenses. This Example is intended to help you understand your ongoing costs (in dollars) of investing in the Fund and to compare these costs with the ongoing costs of investing in other mutual funds.
The Example is based on an investment of $1,000 invested at the beginning of the period and held for the entire period (February 1, 2007 to July 31, 2007).
Actual Expenses
The first line of the accompanying table for each class of the Fund provides information about actual account values and actual expenses. You may use the information in this line, together with the amount you invested, to estimate the expenses that you paid over the period. Simply divide your account value by $1,000.00 (for example, an $8,600 account value divided by $1,000.00 = 8.6), then multiply the result by the number in the first line for a class of the Fund under the heading entitled "Expenses Paid During Period" to estimate the expenses you paid on your account during this period. In addition, the Fund, as a shareholder in the underlying Fidelity Central Funds, will indirectly bear its pro rata share of the fees and expenses incurred by the underlying Fidelity Central Funds. These fees and expenses are not included in the Fund's annualized expense ratio used to calculate the expense estimate in the table below.
Hypothetical Example for Comparison Purposes
The second line of the accompanying table for each class of the Fund provides information about hypothetical account values and hypothetical expenses based on a Class' actual expense ratio and an assumed rate of return of 5% per year before expenses, which is not the Class' actual return. The hypothetical account values and expenses may not be used to estimate the actual ending account balance or expenses you paid for the period. You may use this information to compare the ongoing costs of investing in the Fund and other funds. To do so, compare this 5% hypothetical example with the 5% hypothetical examples that appear in the shareholder reports of the other funds. In addition, the Fund, as a shareholder in the underlying Fidelity Central Funds, will indirectly bear its pro rata share of the fees and expenses incurred by the underlying Fidelity Central Funds. These fees and expenses are not included in the Fund's annualized expense ratio used to calculate the expense estimate in the table below.
Please note that the expenses shown in the table are meant to highlight your ongoing costs only and do not reflect any transaction costs. Therefore, the second line of the table is useful in comparing ongoing costs only, and will not help you determine the relative total costs of owning different funds. In addition, if these transactional costs were included, your costs would have been higher.
Annual Report
Shareholder Expense Example - continued
| Beginning
Account Value
February 1, 2007 | Ending
Account Value
July 31, 2007 | Expenses Paid
During Period*
February 1, 2007
to July 31, 2007 |
Class A | | | |
Actual | $ 1,000.00 | $ 1,005.40 | $ 3.23 |
HypotheticalA | $ 1,000.00 | $ 1,021.57 | $ 3.26 |
Class T | | | |
Actual | $ 1,000.00 | $ 1,005.10 | $ 3.48 |
HypotheticalA | $ 1,000.00 | $ 1,021.32 | $ 3.51 |
Ultra-Short Bond | | | |
Actual | $ 1,000.00 | $ 1,005.30 | $ 2.24 |
HypotheticalA | $ 1,000.00 | $ 1,022.56 | $ 2.26 |
Institutional Class | | | |
Actual | $ 1,000.00 | $ 1,005.20 | $ 2.39 |
HypotheticalA | $ 1,000.00 | $ 1,022.41 | $ 2.41 |
A 5% return per year before expenses
* Expenses are equal to each Class' annualized expense ratio (shown in the table below); multiplied by the average account value over the period, multiplied by 181/365 (to reflect the one-half year period). The fees and expenses of the underlying Fidelity Central Funds in which the Fund invests are not included in the Fund's annualized expense ratio.
| Annualized
Expense Ratio |
Class A | .65% |
Class T | .70% |
Ultra-Short Bond | .45% |
Institutional Class | .48% |
Annual Report
Investment Changes
The information in the following tables is based on the combined investments of the Fund and its pro-rata share of its investments in each Fidelity Central Fund. |
Quality Diversification (% of fund's net assets) |
As of July 31, 2007* | As of January 31, 2007** |
 | U.S. Government and
U.S. Government
Agency Obligations 11.7% | |  | U.S. Government and
U.S. Government
Agency Obligations 9.9% | |
 | AAA 30.3% | |  | AAA 25.6% | |
 | AA 13.9% | |  | AA 11.4% | |
 | A 12.2% | |  | A 12.0% | |
 | BBB 22.4% | |  | BBB 19.0% | |
 | BB and Below 0.3% | |  | BB and Below 0.6% | |
 | Not Rated 2.1% | |  | Not Rated 4.2% | |
 | Short-Term
Investments and
Net Other Assets 7.1% | |  | Short-Term
Investments and
Net Other Assets 17.3% | |

We have used ratings from Moody's® Investors Services, Inc. Where Moody's ratings are not available, we have used S&P® ratings. Securities rated BB or below were rated investment grade at the time of acquisition. |
Weighted Average Maturity as of July 31, 2007 |
| | 6 months ago |
Years | 2.0 | 1.7 |
The weighted average maturity is based on the dollar-weighted average length of time until principal payments are expected or until securities reach maturity, taking into account any maturity shortening feature such as a call, refunding or redemption provision. |
Duration as of July 31, 2007 |
| | 6 months ago |
Years | 0.4 | 0.3 |
Duration shows how much a bond fund's price fluctuates with changes in comparable interest rates. If rates rise 1%, for example, a fund with a five-year duration is likely to lose about 5% of its value. Other factors also can influence a bond fund's performance and share price. Accordingly, a bond fund's actual performance may differ from this example. |
Asset Allocation (% of fund's net assets) |
As of July 31, 2007* | As of January 31, 2007** |
| Corporate Bonds 15.8% | | | Corporate Bonds 14.9% | |
| U.S. Government and
U.S. Government
Agency Obligations 11.7% | | | U.S. Government and
U.S. Government
Agency Obligations 9.9% | |
 | Asset-Backed
Securities 39.3% | |  | Asset-Backed
Securities 37.3% | |
| CMOs and Other Mortgage Related Securities 26.0% | | | CMOs and Other Mortgage Related Securities 20.6% | |
| Other Investments 0.1% | | | Other Investments 0.0% | |
| Short-Term
Investments and
Net Other Assets 7.1% | | | Short-Term
Investments and
Net Other Assets 17.3% | |
* Foreign investments | 16.0% | | ** Foreign investments | 14.8% | |
* Futures and Swaps | 16.6% | | ** Futures and Swaps | 15.7% | |

A holdings listing for the Fund, which presents direct holdings as well as the pro rata share of any securities and other investments held indirectly through its investment in underlying non-money market Fidelity Central Funds is available at fidelity.com and/or advisor.fidelity.com, as applicable. |
Annual Report
Investments July 31, 2007
Showing Percentage of Net Assets
Nonconvertible Bonds - 12.5% |
| Principal Amount | | Value |
CONSUMER DISCRETIONARY - 1.8% |
Auto Components - 0.7% |
DaimlerChrysler NA Holding Corp.: | | | | |
5.71% 3/13/09 (d) | | $ 3,685,000 | | $ 3,684,985 |
5.79% 3/13/09 (d) | | 1,800,000 | | 1,803,742 |
5.84% 9/10/07 (d) | | 1,230,000 | | 1,230,540 |
| | 6,719,267 |
Media - 1.1% |
Continental Cablevision, Inc. 9% 9/1/08 | | 1,100,000 | | 1,139,520 |
Cox Communications, Inc.: | | | | |
(Reg. S) 5.91% 12/14/07 (d) | | 2,330,000 | | 2,334,126 |
5.61% 8/15/07 (a)(d) | | 4,000,000 | | 4,000,040 |
Time Warner, Inc. 8.18% 8/15/07 | | 2,000,000 | | 2,001,600 |
Viacom, Inc. 5.71% 6/16/09 (d) | | 2,000,000 | | 2,006,296 |
| | 11,481,582 |
TOTAL CONSUMER DISCRETIONARY | | 18,200,849 |
CONSUMER STAPLES - 0.2% |
Food & Staples Retailing - 0.2% |
CVS Caremark Corp. 5.66% 6/1/10 (d) | | 2,200,000 | | 2,200,988 |
ENERGY - 1.1% |
Energy Equipment & Services - 0.2% |
Transocean, Inc. 5.56% 9/5/08 (d) | | 2,400,000 | | 2,399,299 |
Oil, Gas & Consumable Fuels - 0.9% |
Anadarko Petroleum Corp.: | | | | |
3.25% 5/1/08 | | 850,000 | | 835,041 |
5.76% 9/15/09 (d) | | 2,200,000 | | 2,202,339 |
Enterprise Products Operating LP 4% 10/15/07 | | 2,670,000 | | 2,660,930 |
Kinder Morgan Energy Partners LP 5.35% 8/15/07 | | 615,000 | | 614,891 |
Ocean Energy, Inc. 4.375% 10/1/07 | | 2,310,000 | | 2,304,837 |
| | 8,618,038 |
TOTAL ENERGY | | 11,017,337 |
FINANCIALS - 6.0% |
Capital Markets - 1.2% |
Bear Stearns Companies, Inc.: | | | | |
5.5463% 2/1/12 (d) | | 745,000 | | 727,985 |
5.76% 7/19/10 (d) | | 2,000,000 | | 1,993,092 |
Nonconvertible Bonds - continued |
| Principal Amount | | Value |
FINANCIALS - continued |
Capital Markets - continued |
Lehman Brothers Holdings E-Capital Trust I 6.14% 8/19/65 (d) | | $ 1,205,000 | | $ 1,201,988 |
Lehman Brothers Holdings, Inc. 5.5% 5/25/10 (d) | | 1,500,000 | | 1,494,345 |
Merrill Lynch & Co., Inc. 5.59% 6/5/12 (d) | | 2,600,000 | | 2,547,012 |
Morgan Stanley 5.61% 1/18/11 (d) | | 1,900,000 | | 1,894,729 |
Royal Bank of Scotland PLC 5.66% 7/24/14 (d) | | 2,590,000 | | 2,596,993 |
| | 12,456,144 |
Commercial Banks - 1.3% |
Barclays Bank PLC: | | | | |
5.56% 5/25/15 (d) | | 825,000 | | 825,760 |
5.81% 9/11/13 (d) | | 3,500,000 | | 3,516,037 |
DBS Bank Ltd. (Singapore) 5.58% 5/16/17 (a)(d) | | 2,000,000 | | 1,991,780 |
HBOS plc 5.6306% 2/6/14 (d) | | 305,000 | | 305,753 |
HSBC Holdings PLC 5.56% 10/6/16 (d) | | 500,000 | | 500,613 |
ING Bank NV 5.61% 10/14/14 (d) | | 440,000 | | 441,188 |
Manufacturers & Traders Trust Co. 3.85% 4/1/13 (a)(d) | | 520,000 | | 514,831 |
PNC Funding Corp. 5.4975% 1/31/12 (d) | | 2,400,000 | | 2,399,035 |
Santander Issuances SA Unipersonal 5.72% 6/20/16 (a)(d) | | 1,900,000 | | 1,909,411 |
Sovereign Bank 4.375% 8/1/13 (d) | | 500,000 | | 494,350 |
| | 12,898,758 |
Consumer Finance - 1.4% |
Capital One Financial Corp. 5.64% 9/10/09 (d) | | 2,260,000 | | 2,261,180 |
General Electric Capital Corp. 5.4169% 5/10/10 (d) | | 2,845,000 | | 2,848,144 |
MBNA Capital I 8.278% 12/1/26 | | 810,000 | | 843,553 |
MBNA Europe Funding PLC 5.46% 9/7/07 (a)(d) | | 2,720,000 | | 2,720,359 |
SLM Corp.: | | | | |
5.33% 4/18/08 (a)(d) | | 2,500,000 | | 2,482,003 |
5.52% 7/26/10 (d) | | 2,770,000 | | 2,609,911 |
| | 13,765,150 |
Insurance - 0.2% |
Monumental Global Funding III 5.53% 1/25/13 (a)(d) | | 1,745,000 | | 1,745,002 |
Real Estate Investment Trusts - 0.7% |
iStar Financial, Inc.: | | | | |
5.47% 3/16/09 (d) | | 2,505,000 | | 2,517,655 |
5.69% 3/9/10 (d) | | 2,000,000 | | 2,002,710 |
Simon Property Group LP 6.375% 11/15/07 | | 2,310,000 | | 2,313,188 |
| | 6,833,553 |
Nonconvertible Bonds - continued |
| Principal Amount | | Value |
FINANCIALS - continued |
Real Estate Management & Development - 0.1% |
Chelsea GCA Realty Partnership LP 7.25% 10/21/07 | | $ 880,000 | | $ 882,526 |
Thrifts & Mortgage Finance - 1.1% |
Capmark Financial Group, Inc. 6.0069% 5/10/10 (a)(d) | | 2,000,000 | | 2,003,884 |
Independence Community Bank Corp. 3.5% 6/20/13 (d) | | 735,000 | | 722,056 |
Residential Capital Corp. 7.19% 4/17/09 (a)(d) | | 2,085,000 | | 2,064,150 |
Residential Capital LLC 6.46% 5/22/09 (d) | | 1,500,000 | | 1,426,176 |
Washington Mutual Bank 5.4463% 5/1/09 (d) | | 3,000,000 | | 2,998,989 |
Washington Mutual, Inc. 5.5% 8/24/09 (d) | | 2,250,000 | | 2,250,981 |
| | 11,466,236 |
TOTAL FINANCIALS | | 60,047,369 |
INFORMATION TECHNOLOGY - 0.4% |
Communications Equipment - 0.2% |
Motorola, Inc. 4.608% 11/16/07 | | 1,700,000 | | 1,695,789 |
Semiconductors & Semiconductor Equipment - 0.2% |
National Semiconductor Corp. 5.61% 6/15/10 (d) | | 1,710,000 | | 1,710,193 |
TOTAL INFORMATION TECHNOLOGY | | 3,405,982 |
TELECOMMUNICATION SERVICES - 2.1% |
Diversified Telecommunication Services - 2.0% |
AT&T, Inc. 5.45% 5/15/08 (d) | | 3,000,000 | | 3,002,184 |
BellSouth Corp. 5.46% 8/15/08 (d) | | 2,000,000 | | 2,001,668 |
Deutsche Telekom International Finance BV 5.54% 3/23/09 (d) | | 1,725,000 | | 1,727,743 |
Telecom Italia Capital SA 5.97% 7/18/11 (d) | | 3,750,000 | | 3,764,689 |
Telefonica Emisiones SAU: | | | | |
5.66% 6/19/09 (d) | | 4,775,000 | | 4,766,314 |
5.69% 2/4/13 (d) | | 3,000,000 | | 2,956,114 |
Telefonos de Mexico SA de CV 4.5% 11/19/08 | | 1,605,000 | | 1,581,110 |
| | 19,799,822 |
Wireless Telecommunication Services - 0.1% |
America Movil SAB de CV 5.46% 6/27/08 (a)(d) | | 1,506,000 | | 1,504,419 |
TOTAL TELECOMMUNICATION SERVICES | | 21,304,241 |
Nonconvertible Bonds - continued |
| Principal Amount | | Value |
UTILITIES - 0.9% |
Electric Utilities - 0.4% |
Commonwealth Edison Co. 3.7% 2/1/08 | | $ 1,125,000 | | $ 1,114,909 |
Pepco Holdings, Inc. 5.5% 8/15/07 | | 1,626,000 | | 1,628,715 |
TXU Electric Delivery Co. 5.735% 9/16/08 (a)(d) | | 1,085,000 | | 1,085,493 |
| | 3,829,117 |
Gas Utilities - 0.1% |
NiSource Finance Corp. 5.93% 11/23/09 (d) | | 845,000 | | 845,204 |
Multi-Utilities - 0.4% |
Dominion Resources, Inc. 5.66% 9/28/07 (d) | | 2,470,000 | | 2,470,326 |
Sempra Energy 4.75% 5/15/09 | | 2,000,000 | | 1,980,928 |
| | 4,451,254 |
TOTAL UTILITIES | | 9,125,575 |
TOTAL NONCONVERTIBLE BONDS (Cost $125,701,400) | 125,302,341 |
U.S. Government Agency Obligations - 5.0% |
|
Freddie Mac 4.75% 3/5/09 (c)
(Cost $49,927,296) | | 50,000,000 | 49,859,826 |
U.S. Government Agency - Mortgage Securities - 2.1% |
|
Fannie Mae - 1.8% |
3.236% 9/1/33 (d) | | 468,295 | | 460,158 |
3.668% 7/1/33 (d) | | 402,880 | | 398,752 |
3.955% 5/1/34 (d) | | 528,720 | | 522,998 |
4.239% 3/1/34 (d) | | 526,002 | | 520,619 |
4.28% 10/1/33 (d) | | 40,238 | | 40,039 |
4.282% 3/1/33 (d) | | 100,634 | | 101,087 |
4.283% 6/1/34 (d) | | 1,276,866 | | 1,263,769 |
4.302% 6/1/33 (d) | | 51,011 | | 51,379 |
4.53% 10/1/35 (d) | | 69,282 | | 69,129 |
4.555% 8/1/34 (d) | | 86,065 | | 87,345 |
4.723% 3/1/35 (d) | | 30,174 | | 30,305 |
4.87% 5/1/33 (d) | | 5,969 | | 6,027 |
4.882% 10/1/35 (d) | | 213,765 | | 212,980 |
4.889% 7/1/35 (d) | | 529,060 | | 528,238 |
5.016% 7/1/34 (d) | | 42,975 | | 42,845 |
U.S. Government Agency - Mortgage Securities - continued |
| Principal Amount | | Value |
Fannie Mae - continued |
5.087% 8/1/34 (d) | | $ 75,908 | | $ 75,809 |
5.149% 9/1/35 (d) | | 3,008,199 | | 2,997,358 |
5.176% 8/1/33 (d) | | 125,661 | | 125,740 |
5.233% 5/1/36 (d) | | 212,825 | | 212,764 |
5.258% 11/1/36 (d) | | 349,068 | | 349,220 |
5.277% 4/1/36 (d) | | 596,355 | | 601,712 |
5.294% 8/1/36 (d) | | 653,629 | | 654,204 |
5.297% 7/1/35 (d) | | 48,851 | | 49,215 |
5.342% 2/1/36 (d) | | 137,136 | | 137,197 |
5.5% 11/1/16 to 2/1/19 | | 3,285,144 | | 3,263,340 |
5.533% 11/1/36 (d) | | 723,634 | | 725,342 |
5.611% 10/1/35 (d) | | 272,108 | | 273,269 |
5.831% 3/1/36 (d) | | 1,093,360 | | 1,101,755 |
6.5% 7/1/16 to 3/1/35 | | 1,806,234 | | 1,843,891 |
7% 8/1/17 to 5/1/32 | | 968,410 | | 1,006,494 |
TOTAL FANNIE MAE | | 17,752,980 |
Freddie Mac - 0.3% |
3.377% 7/1/33 (d) | | 1,002,476 | | 992,278 |
4.043% 4/1/34 (d) | | 802,261 | | 788,941 |
4.784% 3/1/33 (d) | | 43,326 | | 43,858 |
4.922% 10/1/36 (d) | | 1,737,350 | | 1,729,682 |
TOTAL FREDDIE MAC | | 3,554,759 |
TOTAL U.S. GOVERNMENT AGENCY - MORTGAGE SECURITIES (Cost $21,453,593) | 21,307,739 |
Asset-Backed Securities - 29.4% |
|
Accredited Mortgage Loan Trust: | | | | |
Series 2004-2 Class A2, 5.62% 7/25/34 (d) | | 241,836 | | 241,685 |
Series 2004-4 Class A2D, 5.67% 1/25/35 (d) | | 89,039 | | 88,747 |
Series 2005-1 Class M1, 5.79% 4/25/35 (d) | | 1,545,000 | | 1,519,481 |
Series 2007-1 Class A3, 5.45% 2/25/37 (d) | | 1,000,000 | | 988,906 |
ACE Securities Corp.: | | | | |
Series 2002-HE2 Class M1, 6.595% 8/25/32 (d) | | 150,838 | | 150,938 |
Series 2003-HE1: | | | | |
Class M1, 5.97% 11/25/33 (d) | | 113,099 | | 110,613 |
Class M2, 7.02% 11/25/33 (d) | | 56,558 | | 55,160 |
Asset-Backed Securities - continued |
| Principal Amount | | Value |
ACE Securities Corp.: - continued | | | | |
Series 2003-HS1: | | | | |
Class M1, 6.07% 6/25/33 (d) | | $ 27,542 | | $ 27,591 |
Class M2, 7.07% 6/25/33 (d) | | 50,000 | | 50,304 |
Series 2003-NC1 Class M1, 6.1% 7/25/33 (d) | | 100,000 | | 98,192 |
Series 2004-HE1: | | | | |
Class M1, 5.82% 2/25/34 (d) | | 107,488 | | 103,490 |
Class M2, 6.42% 2/25/34 (d) | | 175,000 | | 161,894 |
Series 2005-HE2: | | | | |
Class M2, 5.77% 4/25/35 (d) | | 250,000 | | 246,416 |
Class M3, 5.8% 4/25/35 (d) | | 145,000 | | 141,815 |
Series 2005-HE3 Class A2B, 5.53% 5/25/35 (d) | | 34,211 | | 34,222 |
Series 2005-SD1 Class A1, 5.72% 11/25/50 (d) | | 84,033 | | 83,560 |
Series 2006-HE2: | | | | |
Class A2C, 5.48% 5/25/36 (d) | | 995,000 | | 978,831 |
Class M1, 5.62% 5/25/36 (d) | | 915,000 | | 868,417 |
Class M2, 5.64% 5/25/36 (d) | | 305,000 | | 288,504 |
Class M3, 5.66% 5/25/36 (d) | | 240,000 | | 217,893 |
Class M4, 5.72% 5/25/36 (d) | | 200,000 | | 174,411 |
Class M5, 5.76% 5/25/36 (d) | | 295,000 | | 247,140 |
ACE Securities Corp. Home Equity Loan Trust
Series 2007-HE1: | | | | |
Class A2C, 5.49% 1/25/37 (d) | | 1,000,000 | | 990,788 |
Class M1, 5.58% 1/25/37 (d) | | 755,000 | | 719,062 |
Advanta Business Card Master Trust: | | | | |
Series 2004-C1 Class C, 6.37% 9/20/13 (d) | | 340,000 | | 343,292 |
Series 2006-C1 Class C1, 5.8% 10/20/14 (d) | | 770,000 | | 769,996 |
Series 2007-B1 Class B, 5.57% 12/22/14 (d) | | 1,725,000 | | 1,727,744 |
Aesop Funding II LLC Series 2005-1A Class A2, 5.38% 4/20/09 (a)(d) | | 1,200,000 | | 1,199,872 |
American Express Credit Account Master Trust: | | | | |
Series 2004-1 Class B, 5.57% 9/15/11 (d) | | 410,000 | | 411,223 |
Series 2004-5 Class B, 5.57% 4/16/12 (d) | | 2,150,000 | | 2,150,136 |
Series 2004-C Class C, 5.82% 2/15/12 (a)(d) | | 368,551 | | 369,236 |
Series 2005-1 Class A, 5.35% 10/15/12 (d) | | 2,185,000 | | 2,184,959 |
Series 2005-6 Class C, 5.57% 3/15/11 (a)(d) | | 2,680,000 | | 2,681,367 |
AmeriCredit Automobile Receivables Trust: | | | | |
Series 2005-1 Class C, 4.73% 7/6/10 | | 2,500,000 | | 2,488,918 |
Series 2006-RM Class A1, 5.37% 10/6/09 | | 1,541,881 | | 1,542,136 |
Series 2007-BF Class A2, 5.31% 1/6/11 | | 1,230,000 | | 1,230,625 |
Series 2007-CM Class A2, 5.43% 11/8/10 | | 3,000,000 | | 3,001,464 |
Ameriquest Mortgage Securities, Inc.: | | | | |
Series 2003-1 Class M1, 6.67% 2/25/33 (d) | | 474,619 | | 473,993 |
Asset-Backed Securities - continued |
| Principal Amount | | Value |
Ameriquest Mortgage Securities, Inc.: - continued | | | | |
Series 2004-R11 Class M1, 5.98% 11/25/34 (d) | | $ 560,000 | | $ 553,764 |
Series 2004-R2: | | | | |
Class M1, 5.75% 4/25/34 (d) | | 85,000 | | 83,831 |
Class M2, 5.8% 4/25/34 (d) | | 75,000 | | 74,119 |
Series 2004-R8 Class M9, 8.07% 9/25/34 (d) | | 1,525,000 | | 1,255,202 |
Series 2004-R9 Class M2, 5.97% 10/25/34 (d) | | 720,000 | | 711,024 |
Series 2005-R1: | | | | |
Class M1, 5.77% 3/25/35 (d) | | 770,000 | | 753,102 |
Class M2, 5.8% 3/25/35 (d) | | 260,000 | | 251,345 |
Series 2005-R2 Class M1, 5.77% 4/25/35 (d) | | 1,700,000 | | 1,660,813 |
Series 2006-M3: | | | | |
Class M7, 6.17% 10/25/36 (d) | | 705,000 | | 615,113 |
Class M9, 7.32% 10/25/36 (d) | | 450,000 | | 291,094 |
Amortizing Residential Collateral Trust Series 2002-BC1 Class M2, 6.42% 1/25/32 (d) | | 21,053 | | 16,534 |
ARG Funding Corp.: | | | | |
Series 2005-1A Class A2, 5.42% 4/20/09 (a)(d) | | 1,500,000 | | 1,500,766 |
Series 2005-2A Class A2, 5.43% 5/20/09 (a)(d) | | 800,000 | | 800,521 |
Argent Securities, Inc.: | | | | |
Series 2003-W3 Class M2, 6.8739% 9/25/33 (d) | | 800,000 | | 790,358 |
Series 2004-W5 Class M1, 5.92% 4/25/34 (d) | | 1,420,000 | | 1,396,718 |
Series 2004-W7: | | | | |
Class M1, 5.87% 5/25/34 (d) | | 305,000 | | 298,830 |
Class M2, 5.92% 5/25/34 (d) | | 250,000 | | 246,596 |
Series 2006-W4: | | | | |
Class A2C, 5.48% 5/25/36 (d) | | 1,200,000 | | 1,180,313 |
Class M2, 5.64% 5/25/36 (d) | | 1,265,000 | | 1,196,599 |
Class M3, 5.66% 5/25/36 (d) | | 1,010,000 | | 947,370 |
Arran Funding Ltd. Series 2005-A Class C, 5.64% 12/15/10 (d) | | 3,235,000 | | 3,234,353 |
Asset Backed Funding Certificates Series 2004-HE1 Class M2, 6.47% 1/25/34 (d) | | 230,000 | | 226,248 |
Asset Backed Funding Corp. Series 2006-OPT2
Class C7, 5.47% 10/25/36 (d) | | 780,000 | | 757,575 |
Asset Backed Securities Corp. Home Equity Loan Trust: | | | | |
Series 2003-HE2 Class M1, 6.67% 4/15/33 (d) | | 1,165,025 | | 1,165,511 |
Series 2003-HE6 Class M1, 5.97% 11/25/33 (d) | | 215,000 | | 212,310 |
Series 2004-HE6 Class A2, 5.68% 6/25/34 (d) | | 305,093 | | 301,661 |
Series 2005-HE1 Class M1, 5.82% 3/25/35 (d) | | 540,000 | | 530,943 |
Series 2005-HE2: | | | | |
Class M1, 5.77% 3/25/35 (d) | | 1,105,000 | | 1,088,705 |
Class M2, 5.82% 3/25/35 (d) | | 275,000 | | 270,529 |
Asset-Backed Securities - continued |
| Principal Amount | | Value |
Asset Backed Securities Corp. Home Equity Loan Trust: - continued | | | | |
Series 2007-HE1 Class A4, 5.46% 12/25/36 (d) | | $ 1,000,000 | | $ 994,688 |
Bank of America Credit Card Master Trust: | | | | |
Series 2006-C7 Class C7, 5.55% 3/15/12 (d) | | 3,165,000 | | 3,161,669 |
Series 2007-C2 Class C2, 5.59% 9/17/12 (d) | | 2,050,000 | | 2,050,504 |
Bank One Issuance Trust: | | | | |
Series 2003-C4 Class C4, 6.35% 2/15/11 (d) | | 2,010,000 | | 2,024,296 |
Series 2004-C1 Class C1, 5.82% 11/15/11 (d) | | 25,000 | | 25,114 |
Bayview Financial Acquisition Trust Series 2004-C
Class A1, 5.74% 5/28/44 (d) | | 369,809 | | 369,925 |
Bayview Financial Mortgage Loan Trust Series 2004-A Class A, 5.77% 2/28/44 (d) | | 177,675 | | 177,758 |
Bear Stearns Asset Backed Securities Trust: | | | | |
Series 2004-BO1: | | | | |
Class M2, 6.07% 9/25/34 (d) | | 390,000 | | 369,203 |
Class M3, 6.37% 9/25/34 (d) | | 265,000 | | 245,890 |
Class M4, 6.52% 9/25/34 (d) | | 225,000 | | 203,957 |
Series 2004-HE9 Class M2, 6.52% 11/25/34 (d) | | 490,000 | | 461,770 |
Series 2005-HE2: | | | | |
Class M1, 5.82% 2/25/35 (d) | | 840,950 | | 832,470 |
Class M2, 6.07% 2/25/35 (d) | | 330,000 | | 305,394 |
Brazos Higher Education Authority, Inc. Series 2006-2 Class A9, 5.37% 12/26/24 (d) | | 2,375,570 | | 2,375,477 |
C-Bass Trust Series 2007-CB1 Class M1, 5.55% 1/25/37 (d) | | 215,000 | | 204,508 |
Capital Auto Receivables Asset Trust: | | | | |
Series 2005-1 Class B, 5.695% 6/15/10 (d) | | 850,000 | | 853,621 |
Series 2006-SN1A Class A4B, 5.43% 3/20/10 (a)(d) | | 2,700,000 | | 2,700,360 |
Capital One Auto Finance Trust: | | | | |
Series 2004-B Class A4, 5.43% 8/15/11 (d) | | 1,260,082 | | 1,260,400 |
Series 2006-B Class A2, 5.53% 4/15/09 | | 444,204 | | 444,190 |
Series 2007-A Class A2, 5.33% 5/17/10 | | 930,000 | | 930,409 |
Capital One Master Trust: | | | | |
Series 2001-1 Class B, 5.83% 12/15/10 (d) | | 500,000 | | 500,813 |
Series 2001-6 Class C, 6.7% 6/15/11 (a) | | 2,200,000 | | 2,228,875 |
Capital One Multi-Asset Execution Trust: | | | | |
Series 2003-B6 Class B6, 5.85% 9/15/11 (d) | | 1,125,000 | | 1,130,709 |
Series 2004-B1 Class B1, 5.76% 11/15/11 (d) | | 1,180,000 | | 1,186,372 |
Capital Trust Ltd. Series 2004-1: | | | | |
Class A2, 5.77% 7/20/39 (a)(d) | | 265,000 | | 265,374 |
Class B, 6.07% 7/20/39 (a)(d) | | 140,000 | | 140,981 |
Class C, 6.42% 7/20/39 (a)(d) | | 180,000 | | 181,136 |
Asset-Backed Securities - continued |
| Principal Amount | | Value |
Carrington Mortgage Loan Trust: | | | | |
Series 2006-FRE1: | | | | |
Class M7, 6.27% 7/25/36 (d) | | $ 445,000 | | $ 287,637 |
Class M9, 7.22% 7/25/36 (d) | | 285,000 | | 176,921 |
Series 2006-NC3 Class M10, 7.32% 8/25/36 (a)(d) | | 125,000 | | 41,250 |
Series 2007-RFC1 Class A3, 5.46% 12/25/36 (d) | | 1,000,000 | | 992,390 |
CDC Mortgage Capital Trust Series 2003-HE3 Class M1, 6.02% 11/25/33 (d) | | 91,792 | | 90,713 |
Cendant Timeshare Receivables Funding LLC
Series 2005 1A Class 2A2, 5.5% 5/20/17 (a)(d) | | 460,711 | | 458,075 |
Chase Credit Card Owner Trust Series 2003-6 Class C, 6.12% 2/15/11 (d) | | 2,210,000 | | 2,228,794 |
Chase Issuance Trust: | | | | |
Series 2004-C3 Class C3, 5.79% 6/15/12 (d) | | 1,645,000 | | 1,651,557 |
Series 2006-C3 Class C3, 5.55% 6/15/11 (d) | | 1,975,000 | | 1,975,639 |
CIT Equipment Collateral Trust Series 2005-VT1: | | | | |
Class C, 4.18% 11/20/12 | | 274,590 | | 272,705 |
Class D, 4.51% 11/20/12 | | 209,796 | | 208,174 |
Citibank Credit Card Issuance Trust: | | | | |
Series 2003-C1 Class C1, 6.46% 4/7/10 (d) | | 1,685,000 | | 1,695,590 |
Series 2006-C4 Class C4, 5.54% 1/9/12 (d) | | 2,365,000 | | 2,364,437 |
Series 2006-C6 Class C6, 5.65% 11/15/12 (d) | | 1,595,000 | | 1,598,381 |
CNH Equipment Trust Series 2007-A Class A2, 5.09% 10/15/09 | | 2,500,000 | | 2,498,562 |
College Loan Corp. Trust I Series 2006-1 Class A7B, 5.37% 4/25/46 (a)(d) | | 3,195,000 | | 3,195,000 |
Countrywide Home Loan Trust Series 2006-13N
Class N, 7% 8/25/37 (a) | | 353,273 | | 290,567 |
Countrywide Home Loans, Inc.: | | | | |
Series 2002-6 Class AV1, 5.75% 5/25/33 (d) | | 22,398 | | 22,409 |
Series 2003-BC1 Class M2, 8.0286% 9/25/32 (d) | | 196,139 | | 189,970 |
Series 2004-2 Class M1, 5.82% 5/25/34 (d) | | 375,000 | | 369,554 |
Series 2004-3: | | | | |
Class 3A4, 5.57% 8/25/34 (d) | | 1,273,720 | | 1,262,774 |
Class M1, 5.82% 6/25/34 (d) | | 100,000 | | 98,432 |
Series 2004-4 Class M2, 5.85% 6/25/34 (d) | | 315,000 | | 312,441 |
Series 2005-1: | | | | |
Class 1AV2, 5.52% 7/25/35 (d) | | 369,922 | | 369,806 |
Class MV1, 5.72% 7/25/35 (d) | | 435,000 | | 422,375 |
Class MV2, 5.76% 7/25/35 (d) | | 525,000 | | 513,170 |
Series 2005-AB1 Class A2, 5.53% 8/25/35 (d) | | 1,322,142 | | 1,319,043 |
CPS Auto Receivables Trust: | | | | |
Series 2006-B Class A2, 5.71% 6/15/16 (a) | | 2,042,199 | | 2,044,432 |
Asset-Backed Securities - continued |
| Principal Amount | | Value |
CPS Auto Receivables Trust: - continued | | | | |
Series 2006-C Class A2, 5.31% 3/15/10 (a) | | $ 1,447,703 | | $ 1,447,842 |
Series 2007-A Class A1, 5.332% 3/17/08 (a) | | 438,603 | | 438,572 |
Discover Card Master Trust I: | | | | |
Series 2003-4 Class B1, 5.65% 5/16/11 (d) | | 550,000 | | 552,065 |
Series 2005-1 Class B, 5.47% 9/16/10 (d) | | 1,580,000 | | 1,580,884 |
Series 2005-3 Class B, 5.51% 5/15/11 (d) | | 2,000,000 | | 2,005,520 |
Series 2006-1 Class B1, 5.47% 8/16/11 (d) | | 1,845,000 | | 1,847,023 |
Series 2006-2 Class B1, 5.44% 1/17/12 (d) | | 2,000,000 | | 2,001,947 |
DriveTime Auto Owner Trust Series 2006-B Class A2, 5.32% 3/15/10 (a) | | 1,281,600 | | 1,279,998 |
Fannie Mae subordinate REMIC pass-thru certificates Series 2004-T5: | | | | |
Class AB1, 5.57% 5/28/35 (d) | | 80,751 | | 79,754 |
Class AB3, 5.712% 5/28/35 (d) | | 32,052 | | 31,577 |
Fieldstone Mortgage Investment Corp.: | | | | |
Series 2004-3 Class M5, 6.77% 8/25/34 (d) | | 1,500,000 | | 1,438,710 |
Series 2006-2: | | | | |
Class 2A2, 5.49% 7/25/36 (d) | | 880,000 | | 862,537 |
Class M1, 5.63% 7/25/36 (d) | | 1,765,000 | | 1,642,941 |
First Franklin Mortgage Loan Trust: | | | | |
Series 2004-FF2: | | | | |
Class M3, 5.87% 3/25/34 (d) | | 25,000 | | 24,696 |
Class M4, 6.22% 3/25/34 (d) | | 24,349 | | 24,147 |
Series 2004-FF8 Class M3, 6.27% 10/25/34 (d) | | 1,760,000 | | 1,648,520 |
Series 2006-FF14: | | | | |
Class A5, 5.48% 10/25/36 (d) | | 990,000 | | 951,329 |
Class M1, 5.58% 10/25/36 (d) | | 880,000 | | 837,688 |
Series 2006-FF18 Class M1, 5.55% 12/25/37 (d) | | 3,500,000 | | 3,321,115 |
Series 2007-FF1 Class M1, 5.55% 1/25/38 (d) | | 375,000 | | 355,691 |
First Investors Auto Owner Trust Series 2006-A Class A3, 4.93% 2/15/11 (a) | | 683,986 | | 682,047 |
Ford Credit Floorplan Master Owner Trust: | | | | |
Series 2005-1: | | | | |
Class A, 5.47% 5/15/10 (d) | | 1,375,000 | | 1,375,102 |
Class B, 5.76% 5/15/10 (d) | | 1,110,000 | | 1,111,647 |
Series 2006-3: | | | | |
Class A, 5.5% 6/15/11 (d) | | 990,000 | | 990,223 |
Class B, 5.77% 6/15/11 (d) | | 1,405,000 | | 1,406,464 |
Fosse Master Issuer PLC Series 2007-1A Class C2, 0% 10/18/54 (a)(b)(d) | | 460,000 | | 460,000 |
Franklin Auto Trust Series 2006-1 Class A2, 5.2% 10/20/09 | | 888,410 | | 888,032 |
Asset-Backed Securities - continued |
| Principal Amount | | Value |
Fremont Home Loan Trust: | | | | |
Series 2003-B Class M6, 9.82% 12/25/33 (d) | | $ 236,627 | | $ 82,819 |
Series 2004-B Class M1, 5.9% 5/25/34 (d) | | 205,000 | | 200,976 |
Series 2004-C Class M1, 5.97% 8/25/34 (d) | | 540,000 | | 528,572 |
Series 2005-A: | | | | |
Class M1, 5.75% 1/25/35 (d) | | 225,000 | | 219,768 |
Class M2, 5.78% 1/25/35 (d) | | 325,000 | | 320,555 |
Class M3, 5.81% 1/25/35 (d) | | 175,000 | | 171,704 |
Class M4, 6% 1/25/35 (d) | | 125,000 | | 122,150 |
Series 2006-A: | | | | |
Class M3, 5.7% 5/25/36 (d) | | 455,000 | | 404,754 |
Class M4, 5.72% 5/25/36 (d) | | 685,000 | | 588,587 |
Class M5, 5.82% 5/25/36 (d) | | 365,000 | | 279,827 |
Series 2006-E Class M1, 5.58% 1/25/37 (d) | | 1,725,000 | | 1,635,441 |
GCO Education Loan Funding Master Trust II
Series 2007-1A Class C1L, 5.76% 9/25/30 (a)(d) | | 960,000 | | 957,220 |
GE Business Loan Trust Series 2003-1 Class A, 5.75% 4/15/31 (a)(d) | | 156,758 | | 156,758 |
GE Capital Credit Card Master Note Trust: | | | | |
Series 2005-2 Class B, 5.52% 6/15/11 (d) | | 925,000 | | 925,649 |
Series 2006-1: | | | | |
Class B, 5.43% 9/17/12 (d) | | 585,000 | | 585,472 |
Class C, 5.56% 9/17/12 (d) | | 455,000 | | 455,274 |
GE Equipment Midticket LLC Series 2006-1 Class A2, 5.1% 5/15/09 | | 1,325,000 | | 1,323,470 |
Gracechurch Card Funding PLC: | | | | |
Series 11 Class C, 5.6% 11/15/10 (d) | | 2,490,000 | | 2,490,000 |
Series 8 Class C, 5.65% 6/15/10 (d) | | 2,650,000 | | 2,648,384 |
Series 9: | | | | |
Class B, 5.47% 9/15/10 (d) | | 485,000 | | 485,000 |
Class C, 5.63% 9/15/10 (d) | | 1,800,000 | | 1,800,000 |
Granite Master Issuer PLC Series 2006-1A Class A4, 5.36% 12/20/30 (a)(d) | | 196,173 | | 196,175 |
GSAMP Trust: | | | | |
Series 2002-NC1 Class A2, 5.96% 7/25/32 (d) | | 2,606 | | 2,597 |
Series 2003-FM1 Class M1, 6.55% 3/20/33 (d) | | 565,268 | | 565,564 |
Series 2004-FM1: | | | | |
Class M1, 5.97% 11/25/33 (d) | | 168,544 | | 166,143 |
Class M2, 6.72% 11/25/33 (d) | | 76,057 | | 74,520 |
Series 2004-FM2 Class M1, 6.07% 1/25/34 (d) | | 232,499 | | 228,978 |
Series 2004-HE1: | | | | |
Class M1, 5.87% 5/25/34 (d) | | 289,483 | | 285,263 |
Class M2, 6.47% 5/25/34 (d) | | 150,000 | | 148,880 |
Asset-Backed Securities - continued |
| Principal Amount | | Value |
GSAMP Trust: - continued | | | | |
Series 2006-FM3 Class ABS, 5.52% 11/25/36 (d) | | $ 2,045,000 | | $ 2,025,993 |
Series 2006-HE5 Class M7, 6.15% 8/25/36 (d) | | 1,495,000 | | 1,018,526 |
Series 2006-NC2 Class M4, 5.67% 6/25/36 (d) | | 1,541,000 | | 1,284,980 |
Series 2007-FM1 Class M1, 5.59% 12/25/36 (d) | | 1,000,000 | | 961,070 |
Series 2007-FM2 Class M1, 5.6% 1/25/37 (d) | | 1,615,000 | | 1,552,629 |
Series 2007-HE1 Class M1, 5.57% 3/25/47 (d) | | 335,000 | | 317,593 |
Series 2007-NC1 Class M7, 6.27% 12/25/46 (d) | | 3,390,000 | | 1,695,000 |
GSR Mortgage Loan Trust: | | | | |
Series 2004-AHL Class A2D, 5.68% 8/25/34 (d) | | 178,621 | | 178,649 |
Series 2005-6 Class A2, 5.53% 6/25/35 (d) | | 1,800,000 | | 1,799,617 |
Series 2005-9 Class 2A1, 5.44% 8/25/35 (d) | | 395,292 | | 395,007 |
Series 2005-HE2 Class M, 5.75% 3/25/35 (d) | | 1,220,000 | | 1,187,492 |
Series 2005-MTR1 Class A1, 5.46% 10/25/35 (d) | | 653,910 | | 653,608 |
Series 2005-NC1 Class M1, 5.77% 2/25/35 (d) | | 1,205,000 | | 1,177,671 |
Guggenheim Structured Real Estate Funding Ltd.: | | | | |
Series 2005-1 Class C, 6.4% 5/25/30 (a)(d) | | 651,189 | | 605,606 |
Series 2006-3: | | | | |
Class B, 5.72% 9/25/46 (a)(d) | | 450,000 | | 441,000 |
Class C, 5.87% 9/25/46 (a)(d) | | 1,150,000 | | 1,104,000 |
Harwood Street Funding I LLC Series 2004-1A
Class CTFS, 7.32% 9/20/09 (a)(d) | | 1,700,000 | | 1,683,092 |
Holmes Master Issuer PLC Series 2007-2A Class 1C, 5.59% 7/15/21 (d) | | 1,640,000 | | 1,640,000 |
Home Equity Asset Trust: | | | | |
Series 2002-3 Class A5, 6.2% 2/25/33 (d) | | 14 | | 14 |
Series 2002-5 Class M1, 7.02% 5/25/33 (d) | | 165,576 | | 165,742 |
Series 2003-1 Class M1, 6.82% 6/25/33 (d) | | 524,845 | | 525,274 |
Series 2003-2 Class M1, 6.64% 8/25/33 (d) | | 66,323 | | 65,951 |
Series 2003-3 Class M1, 6.61% 8/25/33 (d) | | 320,568 | | 318,068 |
Series 2003-4 Class M1, 6.52% 10/25/33 (d) | | 96,601 | | 96,678 |
Series 2003-5: | | | | |
Class A2, 5.67% 12/25/33 (d) | | 10,566 | | 10,545 |
Class M1, 6.02% 12/25/33 (d) | | 160,000 | | 158,438 |
Class M2, 7.05% 12/25/33 (d) | | 30,927 | | 30,074 |
Series 2003-7: | | | | |
Class A2, 5.7% 3/25/34 (d) | | 2,079 | | 2,081 |
Class M1, 5.97% 3/25/34 (d) | | 795,000 | | 790,362 |
Series 2003-8 Class M1, 6.04% 4/25/34 (d) | | 192,210 | | 189,696 |
Series 2004-6 Class A2, 5.67% 12/25/34 (d) | | 18,234 | | 18,243 |
Series 2005-1 Class M1, 5.75% 5/25/35 (d) | | 1,270,000 | | 1,230,997 |
Series 2005-2: | | | | |
Class 2A2, 5.52% 7/25/35 (d) | | 259,937 | | 259,937 |
Asset-Backed Securities - continued |
| Principal Amount | | Value |
Home Equity Asset Trust: - continued | | | | |
Series 2005-2: | | | | |
Class M1, 5.77% 7/25/35 (d) | | $ 890,000 | | $ 878,330 |
Series 2007-1 Class M1, 5.56% 5/25/37 (d) | | 1,940,000 | | 1,875,175 |
Series 2007-3 Class 2A3, 5.56% 8/25/37 (d) | | 2,015,000 | | 2,000,202 |
Household Home Equity Loan Trust Series 2004-1
Class M, 5.84% 9/20/33 (d) | | 86,560 | | 84,970 |
HSBC Automotive Trust: | | | | |
Series 2006-1 Class A2, 5.4% 6/17/09 | | 597,362 | | 597,289 |
Series 2006-2 Class A2, 5.61% 6/17/09 | | 412,534 | | 412,590 |
Series 2007-1 Class A2, 5.32% 5/17/10 | | 1,070,000 | | 1,070,006 |
HSBC Home Equity Loan Trust: | | | | |
Series 2005-2: | | | | |
Class M1, 5.78% 1/20/35 (d) | | 181,046 | | 178,386 |
Class M2, 5.81% 1/20/35 (d) | | 134,778 | | 132,755 |
Series 2005-3: | | | | |
Class A1, 5.58% 1/20/35 (d) | | 412,581 | | 409,744 |
Class M1, 5.74% 1/20/35 (d) | | 242,271 | | 238,526 |
Series 2006-2: | | | | |
Class M1, 5.59% 3/20/36 (d) | | 600,432 | | 587,292 |
Class M2, 5.61% 3/20/36 (d) | | 991,246 | | 968,972 |
HSI Asset Securitization Corp. Trust Series 2007-HE1 Class M1, 5.62% 1/25/37 (d) | | 1,025,000 | | 978,073 |
IXIS Real Estate Capital Trust Series 2005-HE1 Class M1, 5.79% 6/25/35 (d) | | 492,536 | | 484,104 |
John Deere Owner Trust Series 2006-A Class A2, 5.41% 11/17/08 | | 139,583 | | 139,560 |
JPMorgan Auto Receivables Trust Series 2007-A
Class A2, 5.3% 12/15/09 (a) | | 1,665,000 | | 1,665,513 |
JPMorgan Mortgage Acquisition Trust Series 2006-WMC4 Class A4, 5.47% 12/25/36 (d) | | 3,000,000 | | 2,921,250 |
Keycorp Student Loan Trust Series 1999-A Class A2, 5.69% 12/27/09 (d) | | 178,335 | | 178,745 |
Long Beach Auto Receivables Trust: | | | | |
Series 2006-B Class A2, 5.34% 11/15/09 | | 1,000,226 | | 1,000,171 |
Series 2007-A Class A1, 5.335% 4/15/08 | | 657,235 | | 657,189 |
Long Beach Mortgage Loan Trust: | | | | |
Series 2003-2 Class M1, 6.55% 6/25/33 (d) | | 462,597 | | 461,883 |
Series 2003-3 Class M1, 6.07% 7/25/33 (d) | | 337,423 | | 337,270 |
Series 2005-1 Class M2, 5.85% 2/25/35 (d) | | 1,410,000 | | 1,386,824 |
Series 2005-WL1 Class M2, 5.87% 6/25/35 (d) | | 660,000 | | 660,462 |
Asset-Backed Securities - continued |
| Principal Amount | | Value |
Long Beach Mortgage Loan Trust: - continued | | | | |
Series 2006-6: | | | | |
Class 2A3, 5.47% 7/25/36 (d) | | $ 1,435,000 | | $ 1,385,448 |
Class M4, 5.68% 7/25/36 (d) | | 425,000 | | 357,647 |
Class M5, 5.71% 7/25/36 (d) | | 265,000 | | 212,595 |
Series 2006-7 Class M10, 7.82% 8/25/36 (d) | | 675,000 | | 202,500 |
MASTR Asset Backed Securities Trust: | | | | |
Series 2004-HE1 Class M1, 5.97% 9/25/34 (d) | | 685,000 | | 676,037 |
Series 2006-HE3 Class A2, 5.42% 8/25/36 (d) | | 1,140,000 | | 1,125,572 |
Series 2007-WMC1 Class A4, 5.48% 1/25/37 (d) | | 1,380,000 | | 1,365,985 |
MBNA Credit Card Master Note Trust: | | | | |
Series 2002-B4 Class B4, 5.82% 3/15/10 (d) | | 630,000 | | 630,526 |
Series 2003-B1 Class B1, 5.76% 7/15/10 (d) | | 1,510,000 | | 1,513,112 |
Series 2003-B2 Class B2, 5.71% 10/15/10 (d) | | 125,000 | | 125,333 |
Series 2003-B3 Class B3, 5.695% 1/18/11 (d) | | 1,550,000 | | 1,555,642 |
Series 2003-B5 Class B5, 5.69% 2/15/11 (d) | | 2,000,000 | | 2,007,078 |
Series 2003-C2 Class C2, 6.92% 6/15/10 (d) | | 2,000,000 | | 2,013,322 |
Series 2005-C1 Class C, 5.73% 10/15/12 (d) | | 2,505,000 | | 2,522,051 |
Series 2005-C2 Class C, 5.67% 2/15/13 (d) | | 2,505,000 | | 2,516,617 |
Series 2005-C3 Class C, 5.59% 3/15/11 (d) | | 2,830,000 | | 2,835,016 |
MBNA Master Credit Card Trust II Series 1998-E Class B, 5.69% 9/15/10 (d) | | 200,000 | | 200,387 |
Meritage Mortgage Loan Trust Series 2004-1: | | | | |
Class M1, 6.07% 7/25/34 (d) | | 141,466 | | 140,510 |
Class M2, 6.145% 7/25/34 (d) | | 11,233 | | 11,173 |
Merrill Lynch First Franklin Mortgage Loan Trust Series 2007-1: | | | |
Class A2C, 5.57% 4/25/37 (d) | | 1,035,000 | | 1,023,033 |
Class M1, 5.7% 4/25/37 (d) | | 1,355,000 | | 1,315,927 |
Merrill Lynch Mortgage Investors, Inc.: | | | | |
Series 2004-FM1 Class M2, 6.47% 1/25/35 (d) | | 57,263 | | 53,004 |
Series 2004-HE2 Class A1B, 5.79% 8/25/35 (d) | | 70,891 | | 70,991 |
Series 2006-FM1 Class A2B, 5.43% 4/25/37 (d) | | 1,055,000 | | 1,051,208 |
Morgan Stanley ABS Capital I, Inc.: | | | | |
Series 2002-HE3 Class M1, 6.42% 12/27/32 (d) | | 114,935 | | 114,935 |
Series 2003-NC10 Class M1, 6% 10/25/33 (d) | | 792,708 | | 782,417 |
Series 2003-NC8 Class M1, 6.02% 9/25/33 (d) | | 119,992 | | 119,931 |
Series 2004-HE6 Class A2, 5.66% 8/25/34 (d) | | 79,986 | | 79,999 |
Series 2004-NC2 Class M1, 5.87% 12/25/33 (d) | | 347,703 | | 340,993 |
Series 2005-1 Class M2, 5.79% 12/25/34 (d) | | 570,000 | | 557,500 |
Series 2005-HE1: | | | | |
Class M1, 5.77% 12/25/34 (d) | | 150,000 | | 145,263 |
Class M2, 5.79% 12/25/34 (d) | | 385,000 | | 376,051 |
Asset-Backed Securities - continued |
| Principal Amount | | Value |
Morgan Stanley ABS Capital I, Inc.: - continued | | | | |
Series 2005-HE2: | | | | |
Class M1, 5.72% 1/25/35 (d) | | $ 370,000 | | $ 358,201 |
Class M2, 5.76% 1/25/35 (d) | | 265,000 | | 258,631 |
Series 2005-NC1: | | | | |
Class M1, 5.76% 1/25/35 (d) | | 325,000 | | 314,750 |
Class M2, 5.79% 1/25/35 (d) | | 325,000 | | 317,322 |
Class M3, 5.83% 1/25/35 (d) | | 325,000 | | 312,167 |
Series 2006-HE4: | | | | |
Class M1, 5.6% 6/25/36 (d) | | 440,000 | | 417,969 |
Class M2: | | | | |
5.62% 6/25/36 (d) | | 770,000 | | 730,507 |
5.63% 6/25/36 (d) | | 550,000 | | 501,576 |
Class M4, 5.67% 6/25/36 (d) | | 1,160,000 | | 1,017,047 |
Series 2006-HE5 Class B1, 6.29% 8/25/36 (d) | | 2,415,000 | | 1,409,100 |
Morgan Stanley Dean Witter Capital I Trust: | | | | |
Series 2001-AM1 Class M1, 6.595% 2/25/32 (d) | | 279,043 | | 279,218 |
Series 2001-NC1 Class M2, 6.925% 10/25/31 (d) | | 8,084 | | 7,546 |
Series 2001-NC4 Class M1, 6.82% 1/25/32 (d) | | 20,819 | | 20,839 |
Series 2002-AM3 Class A3, 6.3% 2/25/33 (d) | | 14,114 | | 14,121 |
Series 2002-HE1 Class M1, 6.22% 7/25/32 (d) | | 572,410 | | 560,060 |
Series 2002-NC3 Class M1, 6.4% 8/25/32 (d) | | 100,000 | | 99,947 |
Series 2002-OP1 Class M1, 6.445% 9/25/32 (d) | | 289,725 | | 287,805 |
Navistar Financial Dealer Note Master Trust
Series 2005-1 Class A, 5.43% 2/25/13 (d) | | 2,050,000 | | 2,045,011 |
New Century Home Equity Loan Trust Series 2005-1: | | | | |
Class M1, 5.77% 3/25/35 (d) | | 595,000 | | 584,077 |
Class M2, 5.8% 3/25/35 (d) | | 595,000 | | 586,093 |
Class M3, 5.84% 3/25/35 (d) | | 290,000 | | 283,310 |
Nissan Auto Lease Trust: | | | | |
Series 2004-A Class A4A, 5.39% 6/15/10 (d) | | 157,665 | | 157,679 |
Series 2005-A Class A4, 5.37% 8/15/11 (d) | | 2,210,000 | | 2,210,196 |
Nomura Home Equity Loan Trust: | | | | |
Series 2006-HE3: | | | | |
Class M7, 6.12% 7/25/36 (d) | | 485,000 | | 350,682 |
Class M8, 6.27% 7/25/36 (d) | | 340,000 | | 218,322 |
Class M9, 7.17% 7/25/36 (d) | | 490,000 | | 255,876 |
Series 2007-2 Class 2A3, 5.51% 2/25/37 (d) | | 947,000 | | 938,562 |
NovaStar Home Equity Loan Series 2004-1: | | | | |
Class M1, 5.77% 6/25/34 (d) | | 100,000 | | 98,093 |
Class M4, 6.295% 6/25/34 (d) | | 170,000 | | 167,975 |
Asset-Backed Securities - continued |
| Principal Amount | | Value |
NovaStar Mortgage Funding Trust: | | | | |
Series 2003-3 Class A3, 5.77% 12/25/33 (d) | | $ 42,010 | | $ 42,226 |
Series 2007-1 Class A2C, 5.5% 3/25/37 (d) | | 805,000 | | 761,480 |
Ocala Funding LLC Series 2006-1A Class A, 6.72% 3/20/11 (a)(d) | | 965,000 | | 928,813 |
Option One Mortgage Loan Trust Series 2003-6
Class M1, 5.97% 11/25/33 (d) | | 1,025,000 | | 1,028,943 |
Park Place Securities, Inc.: | | | | |
Series 2004-WCW1: | | | | |
Class M1, 5.95% 9/25/34 (d) | | 815,000 | | 789,548 |
Class M2, 6% 9/25/34 (d) | | 160,000 | | 153,524 |
Class M3, 6.57% 9/25/34 (d) | | 310,000 | | 293,060 |
Class M4, 6.77% 9/25/34 (d) | | 435,000 | | 403,061 |
Series 2004-WWF1: | | | | |
Class A5, 5.79% 1/25/35 (d) | | 6,172 | | 6,094 |
Class M4, 6.42% 1/25/35 (d) | | 945,000 | | 904,102 |
Series 2005-WCH1: | | | | |
Class A3B, 5.54% 1/25/35 (d) | | 9,352 | | 9,354 |
Class M2, 5.84% 1/25/35 (d) | | 1,130,000 | | 1,102,828 |
Class M3, 5.88% 1/25/35 (d) | | 425,000 | | 409,727 |
Class M5, 6.2% 1/25/35 (d) | | 400,000 | | 377,995 |
Series 2005-WHQ1 Class M7, 6.57% 3/25/35 (d) | | 910,000 | | 761,657 |
Providian Master Note Trust: | | | | |
Series 2005-2 Class C2, 5.82% 11/15/12 (a)(d) | | 2,160,000 | | 2,164,082 |
Series 2006-C1A Class C1, 5.87% 3/16/15 (a)(d) | | 2,465,000 | | 2,465,000 |
Residential Asset Mortgage Products, Inc.: | | | | |
Series 2004-RS10 Class MII2, 6.57% 10/25/34 (d) | | 1,300,000 | | 1,237,425 |
Series 2004-RS6: | | | | |
Class 2M2, 6.62% 6/25/34 (d) | | 250,000 | | 246,312 |
Class 2M3, 6.77% 6/25/34 (d) | | 250,000 | | 221,402 |
Series 2005-SP2 Class 1A1, 5.47% 5/25/44 (d) | | 128,322 | | 128,302 |
Series 2007-RZ1 Class A2, 5.48% 2/25/37 (d) | | 1,200,000 | | 1,194,039 |
Residential Asset Securities Corp. Series 2004-KS10 Class AI2, 5.64% 3/25/29 (d) | | 1,118 | | 1,118 |
Salomon Brothers Mortgage Securities VII, Inc.
Series 2003-HE1 Class A, 5.72% 4/25/33 (d) | | 1,451 | | 1,435 |
Saxon Asset Securities Trust: | | | | |
Series 2004-1 Class M1, 6.115% 3/25/35 (d) | | 640,000 | | 631,197 |
Series 2004-2 Class MV1, 5.9% 8/25/35 (d) | | 327,280 | | 324,762 |
Series 2007-1 Class A2C, 5.47% 2/25/37 (d) | | 1,000,000 | | 984,375 |
Asset-Backed Securities - continued |
| Principal Amount | | Value |
Securitized Asset Backed Receivables LLC Trust: | | | | |
Series 2006-WM4 Class M1, 5.56% 11/25/36 (d) | | $ 890,000 | | $ 846,390 |
Series 2007-HE1 Class M1, 5.57% 12/25/36 (d) | | 955,000 | | 903,589 |
Series 2007-NC1 Class M1, 5.56% 12/25/36 (d) | | 2,035,000 | | 1,934,483 |
Series 2007-NC2 Class M1, 5.55% 1/25/37 (d) | | 385,000 | | 365,442 |
Sierra Timeshare Receivables Fund LLC Series 2006-1A Class A2, 5.47% 5/20/18 (a)(d) | | 2,213,840 | | 2,213,829 |
Sovereign Dealer Floor Plan Master LLC Series 2006-1: | | | | |
Class B, 5.5% 8/15/11 (a)(d) | | 1,140,000 | | 1,139,772 |
Class C, 5.7% 8/15/11 (a)(d) | | 520,000 | | 519,896 |
Specialty Underwriting & Residential Finance Trust: | | | | |
Series 2003-BC3 Class M1, 5.97% 8/25/34 (d) | | 1,000,000 | | 998,544 |
Series 2003-BC4 Class M1, 5.92% 11/25/34 (d) | | 260,000 | | 251,673 |
Structured Asset Corp. Trust Series 2006-BC6: | | | | |
Class A4, 5.49% 1/25/37 (d) | | 1,215,000 | | 1,188,698 |
Class M1, 5.59% 1/25/37 (d) | | 1,180,000 | | 1,116,230 |
Structured Asset Investment Loan Trust: | | | | |
Series 2003-BC9 Class M1, 6.02% 8/25/33 (d) | | 1,135,000 | | 1,128,890 |
Series 2004-8 Class M5, 6.47% 9/25/34 (d) | | 290,000 | | 278,867 |
Series 2005-1 Class M4, 6.08% 2/25/35 (a)(d) | | 485,000 | | 470,312 |
Structured Asset Securities Corp.: | | | | |
Series 2004-GEL1 Class A, 5.68% 2/25/34 (d) | | 25,222 | | 24,871 |
Series 2007-BC1 Class M1, 5.55% 2/25/37 (d) | | 3,195,000 | | 3,071,293 |
Superior Wholesale Inventory Financing Trust: | | | | |
Series 2004-A10: | | | | |
Class A, 5.42% 9/15/11 (d) | | 2,735,000 | | 2,731,647 |
Class B, 5.6% 9/15/11 (d) | | 1,625,000 | | 1,627,627 |
Series 2007-AE1: | | | | |
Class A, 5.42% 1/15/12 (d) | | 400,000 | | 399,889 |
Class B, 5.62% 1/15/12 (d) | | 335,000 | | 334,907 |
Class C, 5.92% 1/15/12 (d) | | 420,000 | | 419,996 |
Superior Wholesale Inventory Financing Trust VII
Series 2003-A8 Class CTFS, 5.77% 3/15/11 (a)(d) | | 675,000 | | 678,077 |
Superior Wholesale Inventory Financing Trust XII
Series 2005-A12 Class C, 6.52% 6/15/10 (d) | | 980,000 | | 987,813 |
Swift Master Auto Receivables Trust Series 2007-1: | | | | |
Class A, 5.42% 6/15/12 (d) | | 1,015,000 | | 1,015,000 |
Class B, 5.54% 6/15/12 (d) | | 790,000 | | 790,000 |
Class C, 5.82% 6/15/12 (d) | | 470,000 | | 470,000 |
Terwin Mortgage Trust: | | | | |
Series 2003-4HE Class A1, 5.75% 9/25/34 (d) | | 21,802 | | 21,564 |
Series 2003-6HE Class A1, 5.79% 11/25/33 (d) | | 17,086 | | 17,145 |
Series 2005-14HE Class AF1, 5.46% 8/25/36 (d) | | 90,678 | | 90,678 |
Asset-Backed Securities - continued |
| Principal Amount | | Value |
Triad Auto Receivables Owner Trust Series 2006-B
Class A2, 5.36% 11/12/09 | | $ 643,062 | | $ 642,957 |
Turquoise Card Backed Securities PLC Series 2006-1A Class C, 5.65% 5/16/11 (a)(d) | | 2,165,000 | | 2,160,518 |
UPFC Auto Receivables Trust: | | | | |
Series 2006-A Class A2, 5.46% 6/15/09 | | 278,277 | | 278,321 |
Series 2007-A Class A2, 5.46% 6/15/10 | | 1,245,000 | | 1,247,110 |
Wachovia Auto Loan Owner Trust Series 2006-1
Class A2, 5.28% 4/20/10 (a) | | 1,743,721 | | 1,743,405 |
WaMu Master Note Trust: | | | | |
Series 2006-A3A Class A3, 5.35% 9/16/13 (a)(d) | | 3,025,000 | | 3,024,364 |
Series 2007-C1 Class C1, 5.72% 5/15/14 (a)(d) | | 1,595,000 | | 1,594,984 |
WFS Financial Owner Trust: | | | | |
Series 2004-3 Class D, 4.07% 2/17/12 | | 165,867 | | 165,048 |
Series 2004-4 Class D, 3.58% 5/17/12 | | 154,808 | | 153,664 |
Series 2005-1 Class D, 4.09% 8/15/12 | | 165,032 | | 163,758 |
Whinstone Capital Management Ltd. Series 1A Class B3, 6.255% 10/25/44 (a)(d) | | 1,696,801 | | 1,696,801 |
TOTAL ASSET-BACKED SECURITIES (Cost $303,720,753) | 294,087,412 |
Collateralized Mortgage Obligations - 15.4% |
|
Private Sponsor - 12.4% |
ACE Securities Corp. Home Equity Loan Trust floater Series 2007-WM1: | | | | |
Class A2C, 5.49% 11/25/36 (d) | | 1,000,000 | | 943,438 |
Class M1, 5.57% 11/25/36 (d) | | 530,000 | | 501,913 |
American Home Mortgage Assets Trust floater Series 2006-1 Class 2A1, 5.51% 5/25/46 (d) | | 977,142 | | 977,766 |
Arkle Master Issuer PLC floater Series 2007-1A
Class 1C, 5.62% 2/17/52 (a)(d) | | 1,625,000 | | 1,625,000 |
Banc of America Mortgage Securities, Inc. Series 2003-I Class 2A6, 4.1485% 10/25/33 (d) | | 4,245,000 | | 4,262,385 |
Bear Stearns Adjustable Rate Mortgage Trust floater Series 2005-6 Class 1A1, 5.0828% 8/25/35 (d) | | 1,509,004 | | 1,510,420 |
Bear Stearns Alt-A Trust floater: | | | | |
Series 2005-1 Class A1, 5.6% 1/25/35 (d) | | 1,134,983 | | 1,137,045 |
Series 2005-2 Class 1A1, 5.57% 3/25/35 (d) | | 589,020 | | 589,618 |
Collateralized Mortgage Obligations - continued |
| Principal Amount | | Value |
Private Sponsor - continued |
Citigroup Mortgage Loan Trust, Inc.: | | | | |
floater Series 2006-NC1: | | | | |
Class M4, 5.71% 8/25/36 (d) | | $ 1,205,000 | | 1,027,142 |
Class M5, 5.74% 8/25/36 (d) | | 860,000 | | 701,048 |
Series 2004-UST1 Class A3, 4.228% 8/25/34 (d) | | 2,269,042 | | 2,241,000 |
Credit Suisse First Boston Adjustable Rate Mortgage Trust floater: | | | | |
Series 2004-2 Class 7A3, 5.72% 2/25/35 (d) | | 292,760 | | 294,060 |
Series 2004-4 Class 5A2, 5.72% 3/25/35 (d) | | 79,492 | | 79,774 |
Series 2005-1 Class 5A2, 5.65% 5/25/35 (d) | | 183,523 | | 184,187 |
Series 2005-10 Class 5A2, 5.64% 1/25/36 (d) | | 997,528 | | 999,153 |
Series 2005-2: | | | | |
Class 6A2, 5.6% 6/25/35 (d) | | 66,012 | | 66,077 |
Class 6M2, 5.8% 6/25/35 (d) | | 1,375,000 | | 1,376,813 |
Series 2005-3 Class 8A2, 5.56% 7/25/35 (d) | | 745,192 | | 746,745 |
Series 2005-5 Class 6A2, 5.55% 9/25/35 (d) | | 615,233 | | 616,920 |
Series 2005-8 Class 7A2, 5.6% 11/25/35 (d) | | 460,426 | | 461,861 |
Credit Suisse First Boston Mortgage Securities Corp. floater: | | | | |
Series 2004-AR2 Class 6A1, 5.72% 3/25/34 (d) | | 22,081 | | 22,098 |
Series 2004-AR3 Class 6A2, 5.69% 4/25/34 (d) | | 8,817 | | 8,820 |
Series 2004-AR5 Class 11A2, 5.69% 6/25/34 (d) | | 37,397 | | 37,410 |
Series 2004-AR6 Class 9A2, 5.69% 10/25/34 (d) | | 54,114 | | 54,141 |
Series 2004-AR7 Class 6A2, 5.7% 8/25/34 (d) | | 77,944 | | 78,060 |
Series 2004-AR8 Class 8A2, 5.7% 9/25/34 (d) | | 41,239 | | 41,323 |
CWALT, Inc. floater Series 2005-56 Class 3A1, 5.61% 11/25/35 (d) | | 360,336 | | 361,367 |
Deutsche Alt-A Securities Mortgage Loan Trust floater Series 2007-BAR1 Class A3, 5.48% 3/25/37 (d) | | 1,375,000 | | 1,374,907 |
First Franklin Mortgage Loan Trust floater Series 2006-FF13: | | | | |
Class M7, 6.07% 10/25/36 (d) | | 1,205,000 | | 781,161 |
Class M8, 6.27% 10/25/36 (d) | | 525,000 | | 236,250 |
First Horizon Mortgage pass-thru Trust floater Series 2004-FL1 Class 2A1, 5.67% 12/25/34 (d) | | 71,259 | | 71,235 |
Gracechurch Mortgage Funding PLC floater Series 1A: | | | | |
Class A2B, 5.42% 10/11/41 (a)(d) | | 2,060,293 | | 2,060,231 |
Class CB, 5.63% 10/11/41 (a)(d) | | 260,000 | | 259,992 |
Class DB, 5.82% 10/11/41 (a)(d) | | 1,060,000 | | 1,059,968 |
Collateralized Mortgage Obligations - continued |
| Principal Amount | | Value |
Private Sponsor - continued |
Granite Master Issuer PLC floater: | | | | |
Series 2005-1 Class A3, 5.44% 12/21/24 (d) | | $ 350,000 | | $ 350,056 |
Series 2005-2 Class C1, 5.86% 12/20/54 (d) | | 3,110,000 | | 3,104,169 |
Series 2005-4: | | | | |
Class A3, 5.43% 12/20/54 (d) | | 2,230,000 | | 2,230,290 |
Class C1, 5.79% 12/20/54 (d) | | 5,580,616 | | 5,580,616 |
Class M2, 5.64% 12/20/54 (d) | | 1,830,000 | | 1,830,997 |
Series 2006-1A: | | | | |
Class A5, 5.43% 12/20/54 (a)(d) | | 1,000,000 | | 1,000,313 |
Class C2, 5.96% 12/20/54 (a)(d) | | 1,545,000 | | 1,544,954 |
Series 2006-3 Class C2, 5.86% 12/20/54 (d) | | 1,230,000 | | 1,230,000 |
Series 2006-4: | | | | |
Class B1, 5.45% 12/20/54 (d) | | 1,250,000 | | 1,249,938 |
Class C1, 5.74% 12/20/54 (d) | | 765,000 | | 764,962 |
Class M1, 5.53% 12/20/54 (d) | | 330,000 | | 329,984 |
Series 2007-1: | | | | |
Class 1C1, 5.66% 12/20/54 (d) | | 555,000 | | 555,195 |
Class 1M1, 5.51% 12/20/54 (d) | | 500,000 | | 499,785 |
Class 2B1, 5.48% 12/20/54 (d) | | 535,000 | | 535,000 |
Class 2C1, 5.79% 12/20/54 (d) | | 295,000 | | 294,124 |
Class 2M1, 5.61% 12/20/54 (d) | | 645,000 | | 643,060 |
GSR Mortgage Loan Trust: | | | | |
floater Series 2004-11 Class 2A1, 5.65% 12/20/34 (d) | | 661,761 | | 664,229 |
Series 2006-AR2 Class 4A1, 5.8544% 4/25/36 (d) | | 3,176,771 | | 3,182,351 |
Holmes Financing No. 10 PLC floater Series 10A: | | | | |
Class 2A, 5.39% 7/15/40 (a)(d) | | 1,040,000 | | 1,040,284 |
Class 2C, 5.71% 7/15/40 (a)(d) | | 975,000 | | 974,971 |
Holmes Financing No. 9 PLC floater Class 2A, 5.42% 7/15/13 (d) | | 2,780,000 | | 2,780,612 |
Homestar Mortgage Acceptance Corp. floater
Series 2004-5 Class A1, 5.77% 10/25/34 (d) | | 376,180 | | 377,903 |
HSI Asset Securitization Corp. Trust floater
Series 2007-OPT1 Class M1, 5.55% 12/25/36 (d) | | 670,000 | | 636,655 |
Impac CMB Trust floater: | | | | |
Series 2004-11 Class 2A2, 5.69% 3/25/35 (d) | | 302,025 | | 302,318 |
Series 2004-6 Class 1A2, 5.71% 10/25/34 (d) | | 91,912 | | 91,946 |
Series 2005-1: | | | | |
Class M1, 5.78% 4/25/35 (d) | | 156,285 | | 156,368 |
Class M2, 5.82% 4/25/35 (d) | | 276,378 | | 276,451 |
Class M3, 5.85% 4/25/35 (d) | | 67,449 | | 67,425 |
Collateralized Mortgage Obligations - continued |
| Principal Amount | | Value |
Private Sponsor - continued |
Impac CMB Trust floater: - continued | | | | |
Series 2005-1: | | | | |
Class M4, 6.07% 4/25/35 (d) | | $ 41,128 | | $ 32,080 |
Class M5, 6.09% 4/25/35 (d) | | 41,128 | | 30,846 |
Class M6, 6.14% 4/25/35 (d) | | 64,159 | | 45,232 |
Series 2005-2 Class 1A2, 5.63% 4/25/35 (d) | | 675,603 | | 676,186 |
Series 2005-4 Class 1B1, 6.62% 5/25/35 (d) | | 278,394 | | 267,867 |
Series 2005-7: | | | | |
Class M1, 5.8% 11/25/35 (d) | | 152,297 | | 149,944 |
Class M2, 5.84% 11/25/35 (d) | | 114,222 | | 113,849 |
Class M3, 5.94% 11/25/35 (d) | | 571,112 | | 445,468 |
Class M4, 5.98% 11/25/35 (d) | | 272,865 | | 204,649 |
JPMorgan Mortgage Trust Series 2006-A2 Class 5A1, 3.7544% 11/25/33 (d) | | 3,081,435 | | 3,059,600 |
Kildare Securities Ltd. floater Series 2007-1 Class A2, 5.42% 12/10/43 (a)(d) | | 865,000 | | 865,979 |
Lehman Structured Securities Corp. floater Series 2005-1 Class A2, 5.71% 9/26/45 (a)(d) | | 564,894 | | 567,252 |
Lehman XS Trust floater: | | | | |
Series 2006-12N Class A1A1, 5.4% 8/25/46 (d) | | 1,347,069 | | 1,347,281 |
Series 2006-GP1 Class A1, 5.41% 5/25/46 (d) | | 1,004,198 | | 1,003,868 |
MASTR Adjustable Rate Mortgages Trust floater: | | | | |
Series 2004-11: | | | | |
Class 1A4, 5.81% 11/25/34 (d) | | 40,960 | | 41,268 |
Class 2A1, 5.7% 11/25/34 (d) | | 81,477 | | 81,726 |
Class 2A2, 5.76% 11/25/34 (d) | | 17,937 | | 18,005 |
Series 2005-1 Class 1A1, 5.59% 3/25/35 (d) | | 107,784 | | 107,994 |
MASTR Seasoned Securitization Trust Series 2004-1 Class 1A1, 6.2347% 8/25/17 (d) | | 407,329 | | 411,646 |
Merrill Lynch Mortgage Investors Trust floater
Series 2006-MLN1 Class M4, 5.68% 7/25/37 (d) | | 1,015,000 | | 848,168 |
Merrill Lynch Mortgage Investors, Inc.: | | | | |
floater: | | | | |
Series 2003-A: | | | | |
Class 2A1, 5.71% 3/25/28 (d) | | 84,711 | | 84,806 |
Class 2A2, 5.7981% 3/25/28 (d) | | 30,254 | | 30,223 |
Series 2003-B Class A1, 5.66% 4/25/28 (d) | | 87,875 | | 87,295 |
Series 2003-D Class A, 5.63% 8/25/28 (d) | | 405,555 | | 405,711 |
Series 2003-E Class A2, 5.7181% 10/25/28 (d) | | 161,077 | | 161,340 |
Series 2003-F Class A2, 5.6538% 10/25/28 (d) | | 158,952 | | 159,370 |
Collateralized Mortgage Obligations - continued |
| Principal Amount | | Value |
Private Sponsor - continued |
Merrill Lynch Mortgage Investors, Inc.: - continued | | | | |
floater: | | | | |
Series 2004-A Class A2, 5.5638% 4/25/29 (d) | | $ 222,820 | | $ 222,707 |
Series 2004-B Class A2, 5.65% 6/25/29 (d) | | 202,304 | | 202,383 |
Series 2004-C Class A2, 5.68% 7/25/29 (d) | | 254,631 | | 254,934 |
Series 2004-D Class A2, 5.6738% 9/25/29 (d) | | 277,953 | | 278,129 |
Series 2004-E Class A2D, 5.8638% 11/25/29 (d) | | 299,520 | | 300,987 |
Series 2004-G Class A2, 5.6934% 11/25/29 (d) | | 104,516 | | 104,557 |
Series 2005-A Class A2, 5.6381% 2/25/30 (d) | | 316,223 | | 316,843 |
Series 2005-B Class A2, 5.61% 7/25/30 (d) | | 277,842 | | 277,994 |
Series 2003-G Class XA1, 1% 1/25/29 (f) | | 976,747 | | 2,250 |
MortgageIT Trust floater Series 2004-2: | | | | |
Class A1, 5.69% 12/25/34 (d) | | 352,567 | | 353,992 |
Class A2, 5.77% 12/25/34 (d) | | 476,229 | | 479,056 |
Opteum Mortgage Acceptance Corp. floater: | | | | |
Series 2005-3 Class APT, 5.61% 7/25/35 (d) | | 1,343,846 | | 1,346,464 |
Series 2005-5 Class 1A1B, 5.52% 12/25/35 (d) | | 920,000 | | 919,922 |
Option One Mortgage Loan Trust floater Series 2007-CP1 Class M1, 5.62% 3/25/37 (d) | | 980,000 | | 936,629 |
Permanent Financing No. 3 PLC floater Series 2006-3 Class 3A, 5.54% 9/10/33 (d) | | 2,495,000 | | 2,498,371 |
Permanent Financing No. 5 PLC floater: | | | | |
Series 2: | | | | |
Class A, 5.47% 6/10/11 (d) | | 1,250,000 | | 1,250,013 |
Class C, 6.01% 6/10/42 (d) | | 390,000 | | 389,756 |
Series 3 Class C, 6.16% 6/10/42 (d) | | 1,030,000 | | 1,030,000 |
Permanent Financing No. 6 PLC floater Series 6
Class 2C, 5.81% 6/10/42 (d) | | 1,600,000 | | 1,600,480 |
Permanent Financing No. 7 PLC floater Series 7
Class 2C, 5.69% 6/10/42 (d) | | 1,685,000 | | 1,684,142 |
Permanent Financing No. 8 PLC floater: | | | | |
Series 8: | | | | |
Class 2A, 5.43% 6/10/14 (d) | | 2,945,000 | | 2,945,669 |
Class 2C, 5.76% 6/10/42 (d) | | 2,350,000 | | 2,348,383 |
Class 3C, 5.88% 6/10/42 (d) | | 910,000 | | 910,451 |
Permanent Master Issuer PLC floater: | | | | |
Series 2006-1 Class 2C, 5.76% 7/17/42 (d) | | 2,645,000 | | 2,643,863 |
Series 2007-1 Class 4A, 5.44% 10/15/33 (d) | | 3,450,000 | | 3,449,897 |
Residential Accredit Loans, Inc. floater Series 2006-QO7 Class 3A1, 5.42% 9/25/46 (d) | | 2,127,992 | | 2,125,997 |
Collateralized Mortgage Obligations - continued |
| Principal Amount | | Value |
Private Sponsor - continued |
Residential Asset Mortgage Products, Inc.: | | | | |
sequential payer: | | | | |
Series 2003-SL1 Class A31, 7.125% 4/25/31 | | $ 157,003 | | $ 158,348 |
Series 2004-SL2 Class A1, 6.5% 10/25/16 | | 53,437 | | 54,049 |
Series 2005-AR5 Class 1A1, 4.81% 9/19/35 (d) | | 416,572 | | 421,631 |
Residential Funding Securities Corp. floater
Series 2003-RP2 Class A1, 5.77% 6/25/33 (a)(d) | | 76,837 | | 76,224 |
Sequoia Mortgage Funding Trust Series 2003-A
Class AX1, 0.8% 10/21/08 (a)(f) | | 924,634 | | 1,137 |
Sequoia Mortgage Trust floater: | | | | |
Series 2003-5 Class A2, 5.72% 9/20/33 (d) | | 154,284 | | 154,281 |
Series 2004-1 Class A, 5.6906% 2/20/34 (d) | | 104,194 | | 104,192 |
Series 2004-10 Class A4, 5.7006% 11/20/34 (d) | | 296,941 | | 297,624 |
Series 2004-12 Class 1A2, 5.69% 1/20/35 (d) | | 506,415 | | 507,610 |
Series 2004-4 Class A, 5.6206% 5/20/34 (d) | | 330,288 | | 330,273 |
Series 2004-5 Class A3, 5.6409% 6/20/34 (d) | | 132,319 | | 132,332 |
Series 2004-6: | | | | |
Class A3A, 5.6975% 6/20/35 (d) | | 143,696 | | 143,818 |
Class A3B, 5.84% 7/20/34 (d) | | 287,393 | | 287,501 |
Series 2004-7: | | | | |
Class A3A, 5.71% 8/20/34 (d) | | 179,635 | | 179,897 |
Class A3B, 5.935% 7/20/34 (d) | | 348,806 | | 349,626 |
Series 2004-8 Class A2, 5.755% 9/20/34 (d) | | 539,834 | | 541,239 |
Series 2005-1 Class A2, 5.6406% 2/20/35 (d) | | 286,115 | | 286,671 |
Series 2005-2 Class A2, 5.6406% 3/20/35 (d) | | 477,252 | | 477,944 |
Soundview Home Equity Loan Trust floater Series 2006-EQ1: | | | |
Class M2, 5.64% 9/25/36 (d) | | 640,000 | | 603,967 |
Class M4, 5.69% 9/25/36 (d) | | 960,000 | | 833,844 |
Class M7, 6.12% 9/25/36 (d) | | 330,000 | | 213,433 |
Structured Asset Securities Corp. floater: | | | | |
Series 2004-NP1 Class A, 5.72% 9/25/33 (a)(d) | | 81,699 | | 81,540 |
Series 2005-AR1 Class B1, 7.32% 9/25/35 (a)(d) | | 1,155,000 | | 323,400 |
Series 2007-GEL1 Class A2, 5.51% 1/25/37 (a)(d) | | 1,000,000 | | 960,313 |
TBW Mortgage-Backed pass-thru certificates floater Series 2006-4 Class A3, 5.34% 9/25/36 (d) | | 2,255,000 | | 2,252,634 |
Thornburg Mortgage Securities Trust floater: | | | | |
Series 2004-3 Class A, 5.69% 9/25/34 (d) | | 1,323,390 | | 1,324,477 |
Series 2005-3 Class A4, 5.59% 10/25/35 (d) | | 2,004,718 | | 2,002,847 |
WaMu Mortgage pass-thru certificates: | | | | |
floater Series 2006-AR11 Class C1B1, 5.4% 9/25/46 (d) | | 1,053,008 | | 1,053,539 |
sequential payer Series 2002-S6 Class A25, 6% 10/25/32 | | 90,725 | | 90,405 |
Collateralized Mortgage Obligations - continued |
| Principal Amount | | Value |
Private Sponsor - continued |
WaMu Mortgage pass-thru certificates: - continued | | | | |
Series 2003-AR10 Class A7, 4.0583% 10/25/33 (d) | | $ 690,000 | | $ 695,355 |
Series 2007-HY1 Class 4A1, 5.4807% 2/25/37 (d) | | 1,686,102 | | 1,682,269 |
WaMu Mortgage Securities Corp. sequential payer Series 2003-MS9 Class 2A1, 7.5% 12/25/33 | | 46,276 | | 47,505 |
Wells Fargo Mortgage Backed Securities Trust: | | | | |
sequential payer Series 2006-AR10 Class 5A5, 5.599% 7/25/36 (d) | | 1,930,000 | | 1,940,347 |
Series 2004-M Class A3, 4.6649% 8/25/34 (d) | | 138,021 | | 137,478 |
Series 2005-AR10 Class 2A2, 4.1098%
6/25/35 (d) | | 4,028,993 | | 3,995,863 |
Series 2005-AR12 Class 2A1, 4.319%
7/25/35 (d) | | 1,754,453 | | 1,741,846 |
TOTAL PRIVATE SPONSOR | | 123,691,265 |
U.S. Government Agency - 3.0% |
Fannie Mae: | | | | |
floater Series 2002-89 Class F, 5.62% 1/25/33 (d) | | 81,642 | | 82,103 |
planned amortization class: | | | | |
Series 1993-207 Class G, 6.15% 4/25/23 | | 230,283 | | 229,894 |
Series 2003-24 Class PB, 4.5% 12/25/12 | | 504,999 | | 502,723 |
Fannie Mae subordinate REMIC pass-thru
certificates: | | | | |
floater: | | | | |
Series 2001-38 Class QF, 6.3% 8/25/31 (d) | | 724,506 | | 741,892 |
Series 2002-11 Class QF, 5.82% 3/25/32 (d) | | 112,190 | | 113,463 |
Series 2002-36 Class FT, 5.82% 6/25/32 (d) | | 112,420 | | 113,330 |
Series 2002-49 Class FB, 5.92% 11/18/31 (d) | | 1,186,700 | | 1,206,919 |
Series 2002-60 Class FV, 6.32% 4/25/32 (d) | | 260,037 | | 267,713 |
Series 2002-64 Class FE, 5.67% 10/18/32 (d) | | 53,548 | | 53,850 |
Series 2002-68 Class FH, 5.82% 10/18/32 (d) | | 2,229,504 | | 2,256,736 |
Series 2002-74 Class FV, 5.77% 11/25/32 (d) | | 72,310 | | 72,842 |
Series 2002-75 Class FA, 6.32% 11/25/32 (d) | | 532,684 | | 548,407 |
Series 2003-11: | | | | |
Class DF, 5.77% 2/25/33 (d) | | 54,285 | | 54,687 |
Class EF, 5.77% 2/25/33 (d) | | 26,066 | | 26,263 |
Series 2003-122 Class FL, 5.67% 7/25/29 (d) | | 412,273 | | 413,888 |
Series 2004-33 Class FW, 5.72% 8/25/25 (d) | | 683,138 | | 687,732 |
Series 2004-54 Class FE, 6.47% 2/25/33 (d) | | 508,219 | | 509,714 |
Series 2005-72 Class FG, 5.57% 5/25/35 (d) | | 5,870,871 | | 5,862,766 |
Collateralized Mortgage Obligations - continued |
| Principal Amount | | Value |
U.S. Government Agency - continued |
Fannie Mae subordinate REMIC pass-thru
certificates: - continued | | | | |
planned amortization class Series 2002-52 Class PA, 6% 4/25/31 | | $ 2,847 | | $ 2,843 |
Series 2002-50 Class LE, 7% 12/25/29 | | 486 | | 484 |
Freddie Mac planned amortization class Series 2162 Class PH, 6% 6/15/29 | | 1,162,628 | | 1,171,659 |
Freddie Mac Multi-class participation certificates guaranteed: | | | | |
floater: | | | | |
Series 2389 Class DA, 6.22% 11/15/30 (d) | | 760,170 | | 762,291 |
Series 2406: | | | | |
Class FP, 6.3% 1/15/32 (d) | | 1,790,439 | | 1,834,606 |
Class PF, 6.3% 12/15/31 (d) | | 1,727,481 | | 1,770,013 |
Series 2410 Class PF, 6.3% 2/15/32 (d) | | 2,570,011 | | 2,633,375 |
Series 2448 Class FT, 6.32% 3/15/32 (d) | | 1,166,063 | | 1,195,487 |
Series 2526 Class FC, 5.72% 11/15/32 (d) | | 14,291 | | 14,387 |
Series 2538 Class FB, 5.72% 12/15/32 (d) | | 142,341 | | 143,578 |
Series 2551 Class FH, 5.77% 1/15/33 (d) | | 50,613 | | 50,995 |
Series 2553 Class FB, 5.82% 3/15/29 (d) | | 2,173,163 | | 2,185,954 |
Series 2577 Class FW, 5.82% 1/15/30 (d) | | 1,487,209 | | 1,496,953 |
Series 2650 Class FV, 5.72% 12/15/32 (d) | | 1,481,099 | | 1,490,950 |
Series 2861 Class JF, 5.62% 4/15/17 (d) | | 651,895 | | 655,198 |
Series 2994 Class FB, 5.47% 6/15/20 (d) | | 520,690 | | 520,909 |
Series 3066 Class HF, 0% 1/15/34 (d) | | 45,825 | | 51,239 |
planned amortization class: | | | | |
Series 2543 Class PM, 5.5% 8/15/18 | | 229,694 | | 229,750 |
Series 2676 Class KN, 3% 12/15/13 | | 151,708 | | 151,119 |
Series 2776 Class UJ, 4.5% 5/15/20 (f) | | 96,151 | | 808 |
Series 1803 Class A, 6% 12/15/08 | | 156,865 | | 157,053 |
Ginnie Mae guaranteed REMIC pass-thru securities: | | | | |
floater Series 2001-21 Class FB, 5.72% 1/16/27 (d) | | 84,420 | | 84,951 |
planned amortization class Series 2002-5 Class PD, 6.5% 5/16/31 | | 109,122 | | 109,605 |
TOTAL U.S. GOVERNMENT AGENCY | | 30,459,129 |
TOTAL COLLATERALIZED MORTGAGE OBLIGATIONS (Cost $156,702,501) | 154,150,394 |
Commercial Mortgage Securities - 7.3% |
| Principal Amount | | Value |
Banc of America Large Loan, Inc. floater: | | | | |
Series 2003-BBA2 Class K, 7.92% 11/15/15 (a)(d) | | $ 61,614 | | $ 62,009 |
Series 2005-BBA6 Class G, 5.74% 1/15/19 (a)(d) | | 87,320 | | 87,328 |
Series 2005-MIB1: | | | | |
Class B, 5.58% 3/15/22 (a)(d) | | 475,000 | | 475,152 |
Class C, 5.63% 3/15/22 (a)(d) | | 200,000 | | 200,069 |
Class D, 5.68% 3/15/22 (a)(d) | | 205,000 | | 205,107 |
Class E, 5.72% 3/15/22 (a)(d) | | 390,000 | | 389,570 |
Class F, 5.79% 3/15/22 (a)(d) | | 200,000 | | 199,905 |
Class G, 5.85% 3/15/22 (a)(d) | | 130,000 | | 129,857 |
Series 2006-BIX1: | | | | |
Class E, 5.56% 10/15/19 (a)(d) | | 170,000 | | 169,720 |
Class F, 5.63% 10/15/19 (a)(d) | | 325,000 | | 324,250 |
Class G, 5.65% 10/15/19 (a)(d) | | 125,000 | | 124,628 |
Class JCP, 5.82% 10/15/19 (a)(d) | | 10,882 | | 10,738 |
Bayview Commercial Asset Trust floater: | | | | |
Series 2003-2 Class A, 5.9% 12/25/33 (a)(d) | | 421,687 | | 421,828 |
Series 2004-1: | | | | |
Class A, 5.68% 4/25/34 (a)(d) | | 260,940 | | 261,103 |
Class B, 7.22% 4/25/34 (a)(d) | | 43,490 | | 43,599 |
Series 2004-2: | | | | |
Class A, 5.75% 8/25/34 (a)(d) | | 343,650 | | 344,241 |
Class M1, 5.9% 8/25/34 (a)(d) | | 110,075 | | 110,351 |
Series 2004-3: | | | | |
Class A1, 5.69% 1/25/35 (a)(d) | | 504,486 | | 505,274 |
Class A2, 5.74% 1/25/35 (a)(d) | | 59,351 | | 59,444 |
Class M1, 5.82% 1/25/35 (a)(d) | | 89,027 | | 89,236 |
Class M2, 6.32% 1/25/35 (a)(d) | | 59,351 | | 59,657 |
Series 2005-2A: | | | | |
Class A1, 5.63% 8/25/35 (a)(d) | | 788,641 | | 782,019 |
Class M1, 5.75% 8/25/35 (a)(d) | | 142,340 | | 141,225 |
Class M2, 5.8% 8/25/35 (a)(d) | | 238,516 | | 239,243 |
Class M3, 5.82% 8/25/35 (a)(d) | | 130,799 | | 128,852 |
Class M4, 5.93% 8/25/35 (a)(d) | | 119,258 | | 117,606 |
Series 2005-3A: | | | | |
Class A1, 5.64% 11/25/35 (a)(d) | | 669,570 | | 672,126 |
Class A2, 5.72% 11/25/35 (a)(d) | | 275,002 | | 275,964 |
Class M1, 5.76% 11/25/35 (a)(d) | | 95,653 | | 95,300 |
Class M2, 5.81% 11/25/35 (a)(d) | | 131,523 | | 130,931 |
Class M3, 5.83% 11/25/35 (a)(d) | | 119,566 | | 117,963 |
Class M4, 5.92% 11/25/35 (a)(d) | | 147,465 | | 144,403 |
Commercial Mortgage Securities - continued |
| Principal Amount | | Value |
Bayview Commercial Asset Trust floater: - continued | | | | |
Series 2005-4A: | | | | |
Class A2, 5.71% 1/25/36 (a)(d) | | $ 935,469 | | $ 937,807 |
Class B1, 6.72% 1/25/36 (a)(d) | | 85,043 | | 85,986 |
Class M1, 5.77% 1/25/36 (a)(d) | | 340,170 | | 341,393 |
Class M2, 5.79% 1/25/36 (a)(d) | | 85,043 | | 85,348 |
Class M3, 5.82% 1/25/36 (a)(d) | | 170,085 | | 170,696 |
Class M4, 5.93% 1/25/36 (a)(d) | | 85,043 | | 85,308 |
Class M5, 5.97% 1/25/36 (a)(d) | | 85,043 | | 85,109 |
Class M6, 6.02% 1/25/36 (a)(d) | | 85,043 | | 84,803 |
Series 2006-2A: | | | | |
Class A1, 5.55% 7/25/36 (a)(d) | | 1,540,397 | | 1,540,396 |
Class A2, 5.6% 7/25/36 (a)(d) | | 259,617 | | 259,814 |
Class B1, 6.19% 7/25/36 (a)(d) | | 95,193 | | 91,582 |
Class B3, 8.02% 7/25/36 (a)(d) | | 155,770 | | 142,694 |
Class M1, 5.63% 7/25/36 (a)(d) | | 272,598 | | 267,572 |
Class M2, 5.65% 7/25/36 (a)(d) | | 194,713 | | 195,068 |
Class M3, 5.67% 7/25/36 (a)(d) | | 151,443 | | 148,318 |
Class M4, 5.74% 7/25/36 (a)(d) | | 103,847 | | 100,454 |
Class M5, 5.79% 7/25/36 (a)(d) | | 125,482 | | 121,161 |
Class M6, 5.86% 7/25/36 (a)(d) | | 199,040 | | 184,328 |
Series 2006-3A: | | | | |
Class A1, 5.57% 10/25/36 (a)(d) | | 1,224,987 | | 1,224,987 |
Class B1, 6.12% 10/25/36 (a)(d) | | 144,941 | | 143,582 |
Class B2, 6.67% 10/25/36 (a)(d) | | 93,510 | | 92,648 |
Class B3, 7.92% 10/25/36 (a)(d) | | 168,319 | | 161,849 |
Class M4, 5.75% 10/25/36 (a)(d) | | 144,941 | | 144,443 |
Class M5, 5.8% 10/25/36 (a)(d) | | 182,345 | | 181,120 |
Class M6, 5.88% 10/25/36 (a)(d) | | 360,015 | | 355,909 |
Series 2007-1: | | | | |
Class A2, 5.59% 3/25/37 (a)(d) | | 339,787 | | 339,310 |
Class B1, 5.99% 3/25/37 (a)(d) | | 110,072 | | 108,421 |
Class B2, 6.47% 3/25/37 (a)(d) | | 76,572 | | 75,208 |
Class B3, 8.67% 3/25/37 (a)(d) | | 224,930 | | 219,025 |
Class M1, 5.59% 3/25/37 (a)(d) | | 90,929 | | 90,716 |
Class M2, 5.61% 3/25/37 (a)(d) | | 67,000 | | 66,843 |
Class M3, 5.64% 3/27/37 (a)(d) | | 62,215 | | 62,069 |
Class M4, 5.69% 3/25/37 (a)(d) | | 47,857 | | 47,566 |
Class M5, 5.74% 3/25/37 (a)(d) | | 76,572 | | 75,866 |
Class M6, 5.82% 3/25/37 (a)(d) | | 105,286 | | 103,839 |
Commercial Mortgage Securities - continued |
| Principal Amount | | Value |
Bayview Commercial Asset Trust floater: - continued | | | | |
Series 2007-3: | | | | |
Class B1, 6.27% 7/25/37 (a)(d) | | $ 73,707 | | $ 72,601 |
Class B2, 6.92% 7/25/37 (a)(d) | | 186,723 | | 183,922 |
Class B3, 9.32% 7/25/37 (a)(d) | | 98,275 | | 96,801 |
Class M1, 5.63% 7/25/37 (a)(d) | | 63,879 | | 63,520 |
Class M2, 5.66% 7/25/37 (a)(d) | | 68,793 | | 68,406 |
Class M3, 5.69% 7/25/37 (a)(d) | | 108,103 | | 107,360 |
Class M4, 5.82% 7/25/37 (a)(d) | | 171,982 | | 170,477 |
Class M5, 5.92% 7/25/37 (a)(d) | | 83,534 | | 82,699 |
Class M6, 6.12% 7/25/37 (a)(d) | | 63,879 | | 63,240 |
Bear Stearns Commercial Mortgage Securities Trust floater Series 2007-BBA8: | | | | |
Class D, 5.57% 3/15/22 (a)(d) | | 165,000 | | 165,000 |
Class E, 5.62% 3/15/22 (a)(d) | | 870,000 | | 870,000 |
Class F, 5.67% 5/15/22 (a)(d) | | 535,000 | | 535,000 |
Class G, 5.72% 3/15/22 (a)(d) | | 135,000 | | 135,000 |
Class H, 5.87% 3/15/22 (a)(d) | | 165,000 | | 165,000 |
Class J, 6.02% 3/15/22 (a)(d) | | 165,000 | | 165,000 |
Class MS-6, 6.22% 3/15/22 (a)(d) | | 335,000 | | 335,000 |
Class MS5, 5.97% 3/15/22 (a)(d) | | 600,000 | | 600,000 |
Class X-1M, 1.12% 3/15/22 (a)(f) | | 18,625,725 | | 174,616 |
COMM floater Series 2002-FL7: | | | | |
Class F, 6.62% 11/15/14 (a)(d) | | 1,000,000 | | 1,000,757 |
Class H, 7.57% 11/15/14 (a)(d) | | 150,000 | | 150,018 |
Commercial Mortgage pass-thru certificates floater: | | | | |
Series 2005-F10A: | | | | |
Class B, 5.55% 4/15/17 (a)(d) | | 1,005,000 | | 1,004,586 |
Class C, 5.59% 4/15/17 (a)(d) | | 425,000 | | 424,721 |
Class D, 5.63% 4/15/17 (a)(d) | | 345,000 | | 344,718 |
Class E, 5.69% 4/15/17 (a)(d) | | 260,000 | | 259,692 |
Class F, 5.73% 4/15/17 (a)(d) | | 145,000 | | 144,757 |
Class G, 5.87% 4/15/17 (a)(d) | | 145,000 | | 144,757 |
Class H, 5.94% 4/15/17 (a)(d) | | 145,000 | | 144,318 |
Class J, 6.17% 4/15/17 (a)(d) | | 50,000 | | 49,614 |
Series 2005-FL11: | | | | |
Class B, 5.57% 11/15/17 (a)(d) | | 286,269 | | 286,289 |
Class C, 5.62% 11/15/17 (a)(d) | | 572,538 | | 572,641 |
Class D, 5.66% 11/15/17 (a)(d) | | 99,240 | | 99,218 |
Class E, 5.71% 11/15/17 (a)(d) | | 152,677 | | 152,587 |
Class F, 5.77% 11/15/17 (a)(d) | | 137,409 | | 137,167 |
Class G, 5.82% 11/15/17 (a)(d) | | 217,565 | | 217,532 |
Commercial Mortgage Securities - continued |
| Principal Amount | | Value |
Commercial Mortgage pass-thru certificates floater: - continued | | | | |
Series 2006-CN2A Class AJFL, 5.58% 2/5/19 (d) | | $ 1,135,000 | | $ 1,137,194 |
Series 2007-FL14: | | | | |
Class F, 5.82% 6/15/22 (a)(d) | | 1,312,702 | | 1,311,061 |
Class G, 5.87% 6/15/22 (a)(d) | | 209,633 | | 209,371 |
Class H, 6.02% 6/15/22 (a)(d) | | 209,633 | | 209,371 |
Class MLK1, 6.12% 6/15/22 (a)(d) | | 565,000 | | 564,294 |
Class MLK2, 6.32% 6/15/22 (a)(d) | | 315,000 | | 314,606 |
Class MLK3, 6.52% 6/15/22 (a)(d) | | 380,000 | | 379,525 |
Credit Suisse First Boston Mortgage Capital
Certificates floater Series 2007-TF2A Class B, 5.67% 4/15/22 (d) | | 1,775,000 | | 1,772,227 |
Credit Suisse First Boston Mortgage Securities Corp. floater Series 2005-TF3A Class A2, 5.6% 11/15/20 (d) | | 2,606,767 | | 2,606,874 |
Credit Suisse Mortgage Capital Certificates floater: | | | | |
Series 200-TFL1 Class B, 5.47% 2/15/22 (a)(d) | | 685,000 | | 684,144 |
Series 2007-TFL1: | | | | |
Class C: | | | | |
5.49% 2/15/22 (a)(d) | | 740,000 | | 738,616 |
5.59% 2/15/22 (a)(d) | | 265,000 | | 264,173 |
Class F, 5.64% 2/15/22 (a)(d) | | 530,000 | | 528,013 |
Crown Castle Towers LLC/Crown Atlantic Holdings Sub LLC/Crown Communication, Inc. Series 2006-1A Class AFL, 5.49% 11/15/36 (a)(d) | | 540,000 | | 537,287 |
CSMC Commercial Mortgage Trust floater
Series 2006-TFLA: | | | | |
Class D, 5.6% 4/15/21 (a)(d) | | 300,000 | | 299,809 |
Class E, 5.65% 4/15/21 (a)(d) | | 300,000 | | 299,809 |
Class G, 5.74% 4/15/21 (a)(d) | | 300,000 | | 299,566 |
Class H, 6.05% 4/15/21 (a)(d) | | 300,000 | | 298,590 |
Class J, 6.12% 4/15/21 (a)(d) | | 200,000 | | 198,461 |
Class K, 6.52% 4/15/21 (a)(d) | | 1,005,000 | | 994,627 |
Greenwich Capital Commercial Funding Corp.
floater: | | | | |
Series 2005-FL3A: | | | | |
Class H-AON: | | | | |
6.32% 10/5/20 (a)(d) | | 180,000 | | 180,000 |
6.57% 10/5/20 (a)(d) | | 220,000 | | 220,000 |
Class M-AON, 6.82% 10/5/20 (a)(d) | | 215,000 | | 215,000 |
Class N-AON, 7.17% 10/5/20 (a)(d) | | 550,000 | | 550,000 |
Commercial Mortgage Securities - continued |
| Principal Amount | | Value |
Greenwich Capital Commercial Funding Corp.
floater: - continued | | | | |
Series 2006-FL4: | | | | |
Class A2, 5.46% 11/5/21 (a)(d) | | $ 1,815,000 | | $ 1,814,398 |
Class B, 5.51% 11/5/21 (a)(d) | | 670,000 | | 669,301 |
GS Mortgage Securities Corp. II floater: | | | | |
Series 2006-FL8A: | | | | |
Class C, 5.56% 6/6/20 (a)(d) | | 145,000 | | 144,988 |
Class D, 5.6% 6/6/20 (a)(d) | | 1,400,000 | | 1,398,037 |
Class E, 5.69% 6/6/20 (a)(d) | | 800,000 | | 797,719 |
Class F, 5.76% 6/6/20 (a)(d) | | 575,000 | | 562,908 |
Series 2007-EOP: | | | | |
Class C, 5.64% 3/1/20 (a)(d) | | 440,000 | | 437,250 |
Class D, 5.69% 3/1/20 (a)(d) | | 130,000 | | 129,188 |
Class E, 5.76% 3/1/20 (a)(d) | | 220,000 | | 218,625 |
Class F, 5.8% 3/1/20 (a)(d) | | 110,000 | | 109,313 |
Class G, 5.84% 3/1/20 (a)(d) | | 55,000 | | 54,656 |
Class H, 5.97% 3/1/20 (a)(d) | | 90,000 | | 89,100 |
Class J: | | | | |
6.17% 3/1/20 (a)(d) | | 130,000 | | 128,700 |
6.37% 3/1/20 (a)(d) | | 90,000 | | 89,100 |
Hilton Hotel Pool Trust floater Series 2000-HLTA
Class A2, 5.72% 10/3/15 (a)(d) | | 3,000,000 | | 3,010,580 |
JPMorgan Chase Commercial Securities Trust floater Series 2006-FLA2: | | | | |
Class A2, 5.45% 11/15/18 (a)(d) | | 1,535,000 | | 1,534,366 |
Class B, 5.49% 11/15/18 (a)(d) | | 414,371 | | 413,959 |
Class C, 5.53% 11/15/18 (a)(d) | | 294,319 | | 293,845 |
Class D, 5.55% 11/15/18 (a)(d) | | 104,561 | | 104,354 |
Class E, 5.6% 11/15/18 (a)(d) | | 154,905 | | 154,398 |
Class F, 5.65% 11/15/18 (a)(d) | | 232,357 | | 231,171 |
Class G, 5.68% 11/15/18 (a)(d) | | 201,376 | | 198,492 |
Class H, 5.82% 11/15/18 (a)(d) | | 154,905 | | 151,290 |
LB-UBS Commercial Mortgage Trust sequential payer Series 2003-C3 Class A2, 3.086% 5/15/27 | | 875,000 | | 859,226 |
Lehman Brothers Floating Rate Commercial Mortgage Trust floater: | | | | |
Series 2003-LLFA Class K1, 7.87% 12/16/14 (a)(d) | | 435,000 | | 425,876 |
Series 2006-LLFA: | | | | |
Class F, 5.66% 9/15/21 (a)(d) | | 291,191 | | 290,011 |
Class G, 5.68% 9/15/21 (a)(d) | | 648,135 | | 644,202 |
Merrill Lynch Mortgage Trust Series 2005-GGP1 Class X, 0.1416% 11/15/10 (a)(d)(f) | | 417,400,000 | | 121,422 |
Commercial Mortgage Securities - continued |
| Principal Amount | | Value |
ML-CFC Commercial Mortgage Trust floater
Series 2006-4 Class A2FL, 5.44% 12/12/49 (d) | | $ 1,180,000 | | $ 1,178,634 |
Morgan Stanley Capital I Trust: | | | | |
floater: | | | | |
Series 2007-XCLA Class A1, 5.52% 7/17/17 (a)(d) | | 1,319,592 | | 1,319,585 |
Series 2007-XLFA: | | | | |
Class A2, 5.42% 10/15/20 (a)(d) | | 1,225,000 | | 1,224,993 |
Class B, 5.45% 10/15/20 (a)(d) | | 440,000 | | 439,998 |
Class C, 5.48% 10/15/20 (a)(d) | | 330,000 | | 329,998 |
Class D, 5.51% 10/15/20 (a)(d) | | 265,000 | | 264,999 |
Class E, 5.57% 10/15/20 (a)(d) | | 330,000 | | 329,998 |
Class F, 5.62% 10/15/20 (a)(d) | | 195,000 | | 194,999 |
Class G, 5.66% 10/15/20 (a)(d) | | 245,000 | | 244,999 |
Class H, 5.75% 10/15/20 (a)(d) | | 155,000 | | 154,999 |
Class J, 6.32% 10/15/20 (a)(d) | | 175,000 | | 174,059 |
Class MHRO, 6.01% 10/15/20 (a)(d) | | 474,674 | | 474,671 |
Class MJPM, 6.32% 10/15/20 (a)(d) | | 167,951 | | 167,950 |
Class MSTR, 6.02% 10/15/20 (a)(d) | | 260,000 | | 259,998 |
Class NHRO, 6.21% 10/15/20 (a)(d) | | 730,268 | | 710,673 |
Class NSTR, 6.17% 10/15/20 (a)(d) | | 240,000 | | 234,240 |
Series 2007-XLC1: | | | | |
Class C, 5.92% 7/17/17 (a)(d) | | 1,092,247 | | 1,051,958 |
Class D, 6.02% 7/17/17 (a)(d) | | 513,998 | | 494,782 |
Class E, 6.12% 7/17/17 (a)(d) | | 415,153 | | 397,847 |
Morgan Stanley Capital I, Inc. floater: | | | | |
Series 2005-XLF: | | | | |
Class D, 5.58% 8/15/19 (a)(d) | | 149,863 | | 149,894 |
Class E, 5.6% 8/15/19 (a)(d) | | 245,000 | | 245,239 |
Class F, 5.64% 8/15/19 (a)(d) | | 170,000 | | 170,202 |
Class G, 5.69% 8/15/19 (a)(d) | | 120,000 | | 120,149 |
Class H, 5.71% 8/15/19 (a)(d) | | 100,000 | | 100,078 |
Class J, 5.78% 8/15/19 (a)(d) | | 75,000 | | 74,975 |
Class K, 5.97% 8/15/19 (a)(d) | | 420,000 | | 415,103 |
Series 2006-XLF: | | | | |
Class C, 6.52% 7/15/19 (a)(d) | | 570,000 | | 569,996 |
Class D, 5.57% 7/15/19 (a)(d) | | 1,345,000 | | 1,345,666 |
Class E, 5.61% 7/15/19 (a)(d) | | 1,450,000 | | 1,449,030 |
Class F, 5.64% 7/15/19 (a)(d) | | 535,000 | | 533,166 |
Class G, 5.68% 7/15/19 (a)(d) | | 385,000 | | 383,766 |
STRIPS III Ltd./STRIPS III Corp. floater Series 2004-1A Class A, 5.8% 3/24/18 (a)(d) | | 270,958 | | 271,297 |
Commercial Mortgage Securities - continued |
| Principal Amount | | Value |
Wachovia Bank Commercial Mortgage Trust floater: | | | | |
Series 2005-WL6A Class D, 5.75% 10/15/17 (a)(d) | | $ 295,951 | | $ 295,952 |
Series 2006-WL7A: | | | | |
Class F, 5.66% 8/11/18 (a)(d) | | 1,235,000 | | 1,231,707 |
Class G, 5.68% 8/11/18 (a)(d) | | 1,170,000 | | 1,166,044 |
Class J, 5.92% 8/11/18 (a)(d) | | 260,000 | | 253,883 |
TOTAL COMMERCIAL MORTGAGE SECURITIES (Cost $73,397,323) | 73,041,570 |
Foreign Government and Government Agency Obligations - 0.1% |
|
United Mexican States 4.83% 1/13/09 (d)
(Cost $1,320,222) | 1,313,000 | | 1,320,222 |
Commercial Paper - 0.2% |
|
Sprint Nextel Corp. 5.6066% 11/9/07 (d)
(Cost $2,000,000) | 2,000,000 | | 2,000,282 |
Fixed-Income Funds - 25.4% |
| Shares | | |
Fidelity Ultra-Short Central Fund (e)
(Cost $259,817,448) | 2,613,124 | | 255,014,810 |
Cash Equivalents - 3.1% |
| Maturity Amount | | |
Investments in repurchase agreements in a joint trading account at 5.3%, dated 7/31/07 due 8/1/07 (Collateralized by U.S. Government Obligations) #
(Cost $30,832,000) | $ 30,836,536 | | 30,832,000 |
TOTAL INVESTMENT PORTFOLIO - 100.5% (Cost $1,024,872,536) | | 1,006,916,596 |
NET OTHER ASSETS - (0.5)% | | (5,450,599) |
NET ASSETS - 100% | $ 1,001,465,997 |
Futures Contracts |
| Expiration Date | | Underlying
Face Amount
at Value | | Unrealized
Appreciation/
(Depreciation) |
Purchased |
Eurodollar Contracts |
113 Eurodollar 90 Day Index Contracts | Sept. 2007 | | $ 111,509,813 | | $ 38,290 |
113 Eurodollar 90 Day Index Contracts | Dec. 2007 | | 111,560,663 | | (102,616) |
113 Eurodollar 90 Day Index Contracts | March 2008 | | 111,604,450 | | (68,252) |
TOTAL EURODOLLAR CONTRACTS | | | | $ (132,578) |
Sold |
Eurodollar Contracts |
4 Eurodollar 90 Day Index Contracts | June 2008 | | 3,951,450 | | 4,609 |
3 Eurodollar 90 Day Index Contracts | Sept. 2008 | | 2,963,738 | | 3,151 |
2 Eurodollar 90 Day Index Contracts | Dec. 2008 | | 1,975,725 | | 1,417 |
1 Eurodollar 90 Day Index Contracts | March 2009 | | 987,750 | | 771 |
TOTAL EURODOLLAR CONTRACTS | | | | 9,948 |
| | | | $ (122,630) |
Swap Agreements |
| | | Notional Amount | | Value |
Credit Default Swaps |
Receive monthly notional amount multiplied by 3.86% and pay Morgan Stanley, Inc. upon credit event of Merrill Lynch Mortgage Investors Trust, Inc., par value of the notional amount of Merrill Lynch Mortgage Investors Trust, Inc. Series 2006 HE5,
Class B3, 7.32% 8/25/37 | Sept. 2037 | | $ 600,000 | | $ (366,220) |
Receive monthly notional amount multiplied by 3.3% and pay to Morgan Stanley, Inc. upon credit event of Ameriquest Mortgage Securities, Inc., par value of the notional amount of Ameriquest Mortgage Securities, Inc. Series 2004-R11 Class M9, 7.2253% 11/25/34 | Dec. 2034 | | 275,000 | | (70,814) |
Receive monthly notional amount multiplied by 2.7% and pay Lehman Brothers, Inc. upon credit event of Morgan Stanley ABS Capital I, Inc., par value of the notional amount of Morgan Stanley ABS Capital I, Inc. Series 2006 WMC1, Class B3, 7.5% 12/25/35 | Jan. 2036 | | 600,000 | | (265,230) |
Swap Agreements - continued |
| Expiration Date | | Notional Amount | | Value |
Credit Default Swaps - continued |
Receive monthly notional amount multiplied by 1.9% and pay Morgan Stanley, Inc., upon credit event of Morgan Stanley ABS Capital I, Inc., par value of the notional amount of Morgan Stanley ABS Capital I, Inc. Series 2006-HE3 Class B3, 7.2225% 4/25/36 | May 2036 | | $ 500,000 | | $ (404,714) |
Receive monthly notional amount multiplied by 2.39% and pay UBS upon credit event of Fremont Home Loan Trust, par value of the notional amount of Fremont Home Loan Trust Series 2004-1 Class M9, 7.73% 2/25/34 | March 2034 | | 183,497 | | (70,846) |
Receive monthly notional amount multiplied by 2.4% and pay Deutsche Bank upon credit event of Fremont Home Loan Trust, par value of the notional amount of Fremont Home Loan Trust Series 2004-A Class B3, 7.2288% 1/25/34 | Feb. 2034 | | 109,274 | | (87,178) |
Receive monthly notional amount multiplied by 2.7% and pay Morgan Stanley, Inc. upon credit event of Park Place Securities, Inc., par value of the notional amount of Park Place Securities, Inc. Series 2005-WHQ2 Class M9, 6.41% 5/25/35 | June 2035 | | 845,000 | | (360,061) |
Receive monthly notional amount multiplied by 2.79% and pay Merrill Lynch, Inc. upon credit event of New Century Home Equity Loan Trust, par value of the notional amount of New Century Home Equity Loan Trust Series 2004-4 Class M9, 7.0788% 2/25/35 | March 2035 | | 610,000 | | (106,671) |
Receive quarterly notional amount multiplied by .48% and pay Goldman Sachs upon credit event of TXU Energy Co. LLC, par value of the notional amount of TXU Energy Co. LLC 7% 3/15/13 | Sept. 2008 | | 1,840,000 | | (15,789) |
Receive quarterly notional amount multiplied by .55% and pay Deutsche Bank upon credit event of MBIA, Inc., par value of the notional amount of MBIA, Inc. 6.625% 10/1/28 | Sept. 2010 | | 900,000 | | (15,157) |
Receive quarterly notional amount multiplied by .58% and pay Deutsche Bank upon credit event of MBIA, Inc., par value of the notional amount of MBIA, Inc. 6.625% 10/1/28 | Sept. 2010 | | 200,000 | | (3,201) |
Swap Agreements - continued |
| Expiration Date | | Notional Amount | | Value |
Credit Default Swaps - continued |
Receive quarterly notional amount multiplied by .59% and pay Bank of America upon credit event of MBIA, Inc., par value of the notional amount of MBIA, Inc. 6.625% 10/1/28 | Sept. 2010 | | $ 200,000 | | $ (3,143) |
Receive quarterly notional amount multiplied by .76% and pay Merrill Lynch, Inc. upon credit event of MBIA, Inc., par value of the notional amount of MBIA, Inc. 6.625% 10/1/28 | Sept. 2010 | | 500,000 | | (7,857) |
Receive quarterly notional amount multiplied by .78% and pay Goldman Sachs upon credit event of TXU Energy Co. LLC, par value of the notional amount of TXU Energy Co. LLC 7% 3/15/13 | Dec. 2008 | | 1,750,000 | | (16,528) |
TOTAL CREDIT DEFAULT SWAPS | | 9,112,771 | | (1,793,409) |
Total Return Swaps |
Receive monthly notional amount multiplied by the nominal spread appreciation of the Lehman Brothers CMBS U.S. Aggregate Index adjusted by a modified duration factor plus 25 basis points and pay monthly notional amount multiplied by the nominal spread depreciation of the Lehman Brothers CMBS U.S. Aggregate Index adjusted by a modified duration factor with Lehman Brothers, Inc. | April 2008 | | 4,000,000 | | (43,127) |
Receive monthly notional amount multiplied by the nominal spread appreciation of the Lehman Brothers CMBS U.S. Aggregate Index adjusted by a modified duration factor plus 15 basis points and pay monthly notional amount multiplied by the nominal spread depreciation of the Lehman Brothers CMBS U.S. Aggregate Index adjusted by a modified duration factor with Lehman Brothers, Inc. | May 2008 | | 5,655,000 | | (61,442) |
Receive monthly notional amount multiplied by the nominal spread appreciation of the Lehman Brothers CMBS U.S. Aggregate Index adjusted by a modified duration factor and pay monthly notional amount multiplied by the nominal spread depreciation of the Lehman Brothers CMBS U.S. Aggregate Index adjusted by a modified duration factor with Lehman Brothers, Inc. | Dec. 2007 | | 4,450,000 | | (48,906) |
Swap Agreements - continued |
| Expiration Date | | Notional Amount | | Value |
Total Return Swaps - continued |
Receive monthly notional amount multiplied by the nominal spread appreciation of the Lehman Brothers CMBS AAA 8.5+ Index adjusted by a modified duration factor plus 25 basis points and pay monthly notional amount multiplied by the nominal spread depreciation of the Lehman Brothers CMBS AAA 8.5+ Index adjusted by a modified duration factor with Lehman Brothers, Inc. | March 2008 | | $ 10,000,000 | | $ (186,475) |
Receive monthly a return equal to Lehman Brothers U.S. ABS AA Floating Home Equities Index and pay monthly a floating rate based on 1-month LIBOR minus 10 basis points with Lehman Brothers, Inc. | Sept. 2007 | | 10,000,000 | | (461,861) |
Receive monthly a return equal to Lehman Brothers U.S. ABS AA Floating Home Equities Index and pay monthly a floating rate based on 1-month LIBOR minus 15 basis points with Lehman Brothers, Inc. | Oct. 2007 | | 10,000,000 | | (461,431) |
TOTAL TOTAL RETURN SWAPS | | 44,105,000 | | (1,263,242) |
| | $ 53,217,771 | | $ (3,056,651) |
Legend |
(a) Security exempt from registration under Rule 144A of the Securities Act of 1933. These securities may be resold in transactions exempt from registration, normally to qualified institutional buyers. At the end of the period, the value of these securities amounted to $149,965,833 or 15.0% of net assets. |
(b) Security or a portion of the security purchased on a delayed delivery or when-issued basis. |
(c) Security or a portion of the security was pledged to cover margin requirements for futures contracts. At the period end, the value of securities pledged amounted to $349,019. |
(d) The coupon rate shown on floating or adjustable rate securities represents the rate at period end. |
(e) Affiliated fund that is available only to investment companies and other accounts managed by Fidelity Investments. A complete schedule of portfolio holdings for each Fidelity Central Fund is filed with the SEC for the first and third quarters of each fiscal year on Form N-Q and is available upon request or at the SEC's web site at www.sec.gov. A holdings listing for the Fund, which presents direct holdings as well as the pro rata share of securities and other investments held indirectly through its investment in underlying non-money market Fidelity Central Funds, is available at fidelity.com and/or advisor.fidelity.com, as applicable. In addition, each Fidelity Central Fund's financial statements, which are not covered by the Fund's Report of Independent Registered Public Accounting Firm, are available on the SEC's web site, or upon request. |
(f) Security represents right to receive monthly interest payments on an underlying pool of mortgages or assets. Principal shown is the outstanding par amount of the pool held as of the end of the period. |
# Additional Information on each counterparty to the repurchase agreement is as follows: |
Repurchase Agreement / Counterparty | Value |
$30,832,000 due 8/01/07 at 5.30% |
ABN AMRO Bank N.V., New York Branch | $ 747,585 |
Banc of America Securities LLC | 6,653,351 |
Bank of America, NA | 1,877,404 |
Barclays Capital, Inc. | 3,443,405 |
Bear Stearns & Co., Inc. | 3,289,376 |
Countrywide Securities Corp. | 2,410,963 |
Ing Financial Markets Llc | 2,990,341 |
Societe Generale, New York Branch | 2,990,341 |
UBS Securities LLC | 5,233,097 |
WestLB AG | 1,196,137 |
| $ 30,832,000 |
Affiliated Central Funds |
Information regarding fiscal year to date income earned by the Fund from investments in Fidelity Central Funds is as follows: |
Fund | Income earned |
Fidelity Ultra-Short Central Fund | $ 14,678,690 |
|
Additional information regarding the Fund's fiscal year to date purchases and sales, including the ownership percentage, of the non Money Market Central Funds is as follows: |
Fund | Value, beginning of period | Purchases | Sales
Proceeds | Value, end of period | % ownership, end of period |
Fidelity Ultra-Short Central Fund | $ 237,764,502 | $ 50,000,041 | $ 27,465,319 | $ 255,014,810 | 1.7% |
Other Information |
Distribution of investments by country of issue, as a percentage of total net assets, is as follows: |
United States of America | 84.0% |
United Kingdom | 11.8% |
Cayman Islands | 1.4% |
Spain | 1.2% |
Others (individually less than 1%) | 1.6% |
| 100.0% |
Income Tax Information |
At July 31, 2007, the fund had a capital loss carryforward of approximately $2,436,121 of which $1,917,431 and $518,690 will expire on July 31, 2014 and 2015, respectively. |
See accompanying notes which are an integral part of the financial statements.
Annual Report
Financial Statements
Statement of Assets and Liabilities
| July 31, 2007 |
| | |
Assets | | |
Investment in securities, at value (including repurchase agreements of $30,832,000) -
See accompanying schedule: Unaffiliated issuers (cost $765,055,088) | $ 751,901,786 | |
Fidelity Central Funds (cost $259,817,448) | 255,014,810 | |
Total Investments (cost $1,024,872,536) | | $ 1,006,916,596 |
Cash | | 91 |
Receivable for investments sold | | 117,697 |
Receivable for swap agreements | | 7,894 |
Receivable for fund shares sold | | 1,247,297 |
Interest receivable | | 3,600,400 |
Distributions receivable from Fidelity Central Funds | | 1,333,888 |
Receivable for daily variation on futures contracts | | 3,750 |
Other receivables | | 24,679 |
Total assets | | 1,013,252,292 |
| | |
Liabilities | | |
Payable for investments purchased
Regular delivery | $ 3,102,401 | |
Delayed delivery | 460,000 | |
Payable for fund shares redeemed | 4,373,362 | |
Distributions payable | 396,327 | |
Swap agreements, at value | 3,056,651 | |
Accrued management fee | 276,854 | |
Distribution fees payable | 2,309 | |
Other affiliated payables | 118,391 | |
Total liabilities | | 11,786,295 |
| | |
Net Assets | | $ 1,001,465,997 |
Net Assets consist of: | | |
Paid in capital | | $ 1,025,316,779 |
Undistributed net investment income | | 539,837 |
Accumulated undistributed net realized gain (loss) on investments | | (3,255,398) |
Net unrealized appreciation (depreciation) on investments | | (21,135,221) |
Net Assets | | $ 1,001,465,997 |
See accompanying notes which are an integral part of the financial statements.
Annual Report
Statement of Assets and Liabilities - continued
| July 31, 2007 |
| | |
Calculation of Maximum Offering Price
Class A:
Net Asset Value and redemption price per share
($13,734,615 ÷ 1,399,083 shares) | | $ 9.82 |
| | |
Maximum offering price per share (100/98.50 of $9.82) | | $ 9.97 |
Class T:
Net Asset Value and redemption price per share ($4,817,531 ÷ 490,826 shares) | | $ 9.82 |
| | |
Maximum offering price per share (100/98.50 of $9.82) | | $ 9.97 |
Ultra-Short Bond:
Net Asset Value, offering price and redemption price per share ($974,601,626 ÷ 99,298,589 shares) | | $ 9.81 |
| | |
Institutional Class:
Net Asset Value, offering price and redemption price per share ($8,312,225 ÷ 847,021 shares) | | $ 9.81 |
See accompanying notes which are an integral part of the financial statements.
Annual Report
Financial Statements - continued
Statement of Operations
| Year ended July 31, 2007 |
| | |
Investment Income | | |
Interest | | $ 41,462,873 |
Income from Fidelity Central Funds | | 14,678,690 |
Total income | | 56,141,563 |
| | |
Expenses | | |
Management fee | $ 3,177,740 | |
Transfer agent fees | 1,011,190 | |
Distribution fees | 20,733 | |
Fund wide operations fee | 319,407 | |
Independent trustees' compensation | 3,214 | |
Miscellaneous | 1,798 | |
Total expenses before reductions | 4,534,082 | |
Expense reductions | (19,809) | 4,514,273 |
Net investment income | | 51,627,290 |
Realized and Unrealized Gain (Loss) Net realized gain (loss) on: | | |
Investment securities: | | |
Unaffiliated issuers | (290,068) | |
Fidelity Central Funds | (248,412) | |
Futures contracts | (703,239) | |
Swap agreements | 171,901 | |
Capital gain distributions from Fidelity Central Funds | 32,406 | |
Total net realized gain (loss) | | (1,037,412) |
Change in net unrealized appreciation (depreciation) on: Investment securities | (18,018,278) | |
Futures contracts | 491,969 | |
Swap agreements | (3,108,720) | |
Total change in net unrealized appreciation (depreciation) | | (20,635,029) |
Net gain (loss) | | (21,672,441) |
Net increase (decrease) in net assets resulting from operations | | $ 29,954,849 |
See accompanying notes which are an integral part of the financial statements.
Annual Report
Statement of Changes in Net Assets
| Year ended
July 31,
2007 | Year ended
July 31,
2006 |
Increase (Decrease) in Net Assets | | |
Operations | | |
Net investment income | $ 51,627,290 | $ 38,252,086 |
Net realized gain (loss) | (1,037,412) | (1,106,422) |
Change in net unrealized appreciation (depreciation) | (20,635,029) | 76,542 |
Net increase (decrease) in net assets resulting
from operations | 29,954,849 | 37,222,206 |
Distributions to shareholders from net investment income | (51,625,727) | (38,283,502) |
Share transactions - net increase (decrease) | 161,604,013 | (51,227,531) |
Redemption fees | 39,619 | 28,307 |
Total increase (decrease) in net assets | 139,972,754 | (52,260,520) |
| | |
Net Assets | | |
Beginning of period | 861,493,243 | 913,753,763 |
End of period (including undistributed net investment income of $539,837 and undistributed net investment income of $106,939, respectively) | $ 1,001,465,997 | $ 861,493,243 |
See accompanying notes which are an integral part of the financial statements.
Annual Report
Financial Highlights - Class A
Years ended July 31, | 2007 | 2006 | 2005 | 2004 H |
Selected Per-Share Data | | | | |
Net asset value, beginning of period | $ 10.02 | $ 10.03 | $ 10.05 | $ 10.04 |
Income from Investment Operations | | | | |
Net investment income E | .493 | .400 | .223 | .013 |
Net realized and unrealized gain (loss) | (.198) | (.009) | (.026) | .011 |
Total from investment operations | .295 | .391 | .197 | .024 |
Distributions from net investment income | (.495) | (.401) | (.214) | (.014) |
Distributions from net realized gain | - | - | (.003) | - |
Total distributions | (.495) | (.401) | (.217) | (.014) |
Redemption fees added to paid in capitalE, J | - | - | - | - |
Net asset value, end of period | $ 9.82 | $ 10.02 | $ 10.03 | $ 10.05 |
Total Return B, C, D | 2.97% | 3.97% | 1.98% | .24% |
Ratios to Average Net Assets, F, I | | | | |
Expenses before reductions | .66% | .70% | .78% | .85% A |
Expenses net of fee waivers, if any | .66% | .70% | .70% | .70% A |
Expenses net of all reductions | .66% | .70% | .70% | .70% A |
Net investment income | 4.96% | 4.00% | 2.23% | 1.11% A |
Supplemental Data | | | | |
Net assets, end of period (000 omitted) | $ 13,735 | $ 4,553 | $ 2,557 | $ 316 |
Portfolio turnover rate G | 29% | 39% | 33% | 53% |
A Annualized
B Total returns for periods of less than one year are not annualized.
C Total returns would have been lower had certain expenses not been reduced during the periods shown.
D Total returns do not include the effect of the sales charges.
E Calculated based on average shares outstanding during the period.
F Fees and expenses of the underlying Fidelity Central Funds are not included in the Fund's expense ratio. The Fund indirectly bears its proportionate share of the expenses of any underlying Fidelity Central Funds.
G Amount does not include the portfolio activity of any underlying Fidelity Central Funds.
H For the period June 16, 2004 (commencement of sale of shares) to July 31, 2004.
I Expense ratios reflect operating expenses of the class. Expenses before reductions do not reflect amounts reimbursed by the investment adviser or expense offset arrangements and do not represent the amount paid by the class during periods when reimbursements or reductions occur. Expense ratios before reductions for start-up periods may not be representative of longer-term operating periods. Expenses net of fee waivers reflect expenses after reimbursement by the investment adviser but prior to reductions from expense offset arrangements. Expenses net of all reductions represent the net expenses paid by the class.
J Amount represents less than $.001 per share.
See accompanying notes which are an integral part of the financial statements.
Annual Report
Financial Highlights - Class T
Years ended July 31, | 2007 | 2006 | 2005 | 2004 H |
Selected Per-Share Data | | | | |
Net asset value, beginning of period | $ 10.02 | $ 10.03 | $ 10.05 | $ 10.04 |
Income from Investment Operations | | | | |
Net investment income E | .491 | .404 | .222 | .013 |
Net realized and unrealized gain (loss) | (.199) | (.011) | (.025) | .010 |
Total from investment operations | .292 | .393 | .197 | .023 |
Distributions from net investment income | (.492) | (.403) | (.214) | (.013) |
Distributions from net realized gain | - | - | (.003) | - |
Total distributions | (.492) | (.403) | (.217) | (.013) |
Redemption fees added to paid in capital E, J | - | - | - | - |
Net asset value, end of period | $ 9.82 | $ 10.02 | $ 10.03 | $ 10.05 |
Total Return B, C, D | 2.95% | 4.00% | 1.98% | .23% |
Ratios to Average Net Assets F, I | | | | |
Expenses before reductions | .69% | .68% | .77% | .86% A |
Expenses net of fee waivers, if any | .69% | .68% | .70% | .70% A |
Expenses net of all reductions | .69% | .68% | .70% | .70% A |
Net investment income | 4.93% | 4.03% | 2.23% | 1.11% A |
Supplemental Data | | | | |
Net assets, end of period (000 omitted) | $ 4,818 | $ 4,624 | $ 4,044 | $ 356 |
Portfolio turnover rate G | 29% | 39% | 33% | 53% |
A Annualized
B Total returns for periods of less than one year are not annualized.
C Total returns would have been lower had certain expenses not been reduced during the periods shown.
D Total returns do not include the effect of the sales charges.
E Calculated based on average shares outstanding during the period.
F Fees and expenses of the underlying Fidelity Central Funds are not included in the Fund's expense ratio. The Fund indirectly bears its proportionate share of the expenses of any underlying Fidelity Central Funds.
G Amount does not include the portfolio activity of any underlying Fidelity Central Funds.
H For the period June 16, 2004 (commencement of sale of shares) to July 31, 2004.
I Expense ratios reflect operating expenses of the class. Expenses before reductions do not reflect amounts reimbursed by the investment adviser or expense offset arrangements and do not represent the amount paid by the class during periods when reimbursements or reductions occur. Expense ratios before reductions for start-up periods may not be representative of longer-term operating periods. Expenses net of fee waivers reflect expenses after reimbursement by the investment adviser but prior to reductions from expense offset arrangements. Expenses net of all reductions represent the net expenses paid by the class.
J Amount represents less than $.001 per share.
See accompanying notes which are an integral part of the financial statements.
Annual Report
Financial Highlights - Ultra-Short Bond
Years ended July 31, | 2007 | 2006 | 2005 | 2004 | 2003 G |
Selected Per-Share Data | | | | | |
Net asset value,
beginning of period | $ 10.02 | $ 10.03 | $ 10.05 | $ 10.02 | $ 10.00 |
Income from Investment Operations | | | | | |
Net investment income D | .516 | .427 | .241 | .122 | .137 |
Net realized and unrealized gain (loss) | (.210) | (.011) | (.026) | .029 | .052 |
Total from investment operations | .306 | .416 | .215 | .151 | .189 |
Distributions from net investment income | (.516) | (.426) | (.232) | (.122) | (.173) |
Distributions from net realized gain | - | - | (.003) | - | - |
Total distributions | (.516) | (.426) | (.235) | (.122) | (.173) |
Redemption fees added to paid in capital D | - I | - I | - I | .001 | .004 |
Net asset value, end of period | $ 9.81 | $ 10.02 | $ 10.03 | $ 10.05 | $ 10.02 |
Total Return B, C | 3.09% | 4.23% | 2.16% | 1.52% | 1.94% |
Ratios to Average Net Assets E, H | | | | |
Expenses before reductions | .45% | .45% | .58% | .62% | .70% A |
Expenses net of fee waivers,
if any | .45% | .45% | .53% | .55% | .55% A |
Expenses net of all reductions | .45% | .45% | .53% | .55% | .55% A |
Net investment income | 5.17% | 4.26% | 2.41% | 1.21% | 1.50% A |
Supplemental Data | | | | | |
Net assets, end of period (000 omitted) | $ 974,602 | $ 850,329 | $ 906,644 | $ 580,174 | $ 225,203 |
Portfolio turnover rate F | 29% | 39% | 33% | 53% | 39% A |
A Annualized
B Total returns for periods of less than one year are not annualized.
C Total returns would have been lower had certain expenses not been reduced during the periods shown.
D Calculated based on average shares outstanding during the period.
E Fees and expenses of the underlying Fidelity Central Funds are not included in the Fund's expense ratio. The Fund indirectly bears its proportionate share of the expenses of any underlying Fidelity Central Funds.
F Amount does not include the portfolio activity of any underlying Fidelity Central Funds.
G For the period August 29, 2002 (commencement of operations) to July 31, 2003.
H Expense ratios reflect operating expenses of the class. Expenses before reductions do not reflect amounts reimbursed by the investment adviser or expense offset arrangements and do not represent the amount paid by the class during periods when reimbursements or reductions occur. Expense ratios before reductions for start-up periods may not be representative of longer-term operating periods. Expenses net of fee waivers reflect expenses after reimbursement by the investment adviser but prior to reductions from expense offset arrangements. Expenses net of all reductions represent the net expenses paid by the class.
I Amount represents less than $.001 per share.
See accompanying notes which are an integral part of the financial statements.
Annual Report
Financial Highlights - Institutional Class
Years ended July 31, | 2007 | 2006 | 2005 | 2004 G |
Selected Per-Share Data | | | | |
Net asset value, beginning of period | $ 10.02 | $ 10.03 | $ 10.05 | $ 10.04 |
Income from Investment Operations | | | | |
Net investment income D | .510 | .420 | .240 | .015 |
Net realized and unrealized gain (loss) | (.206) | (.008) | (.026) | .010 |
Total from investment operations | .304 | .412 | .214 | .025 |
Distributions from net investment income | (.514) | (.422) | (.231) | (.015) |
Distributions from net realized gain | - | - | (.003) | - |
Total distributions | (.514) | (.422) | (.234) | (.015) |
Redemption fees added to paid in capital D, I | - | - | - | - |
Net asset value, end of period | $ 9.81 | $ 10.02 | $ 10.03 | $ 10.05 |
Total Return B, C | 3.06% | 4.19% | 2.15% | .25% |
Ratios to Average Net Assets E, H | | | | |
Expenses before reductions | .48% | .49% | .58% | .67% A |
Expenses net of fee waivers, if any | .48% | .49% | .55% | .55% A |
Expenses net of all reductions | .48% | .49% | .55% | .55% A |
Net investment income | 5.14% | 4.22% | 2.38% | 1.26% A |
Supplemental Data | | | | |
Net assets, end of period (000 omitted) | $ 8,312 | $ 1,987 | $ 509 | $ 376 |
Portfolio turnover rate F | 29% | 39% | 33% | 53% |
A Annualized
B Total returns for periods of less than one year are not annualized.
C Total returns would have been lower had certain expenses not been reduced during the periods shown.
D Calculated based on average shares outstanding during the period.
E Fees and expenses of the underlying Fidelity Central Funds are not included in the Fund's expense ratio. The Fund indirectly bears its proportionate share of the expenses of any underlying Fidelity Central Funds.
F Amount does not include the portfolio activity of any underlying Fidelity Central Funds.
G For the period June 16, 2004 (commencement of sale of shares) to July 31, 2004.
H Expense ratios reflect operating expenses of the class. Expenses before reductions do not reflect amounts reimbursed by the investment adviser or expense offset arrangements and do not represent the amount paid by the class during periods when reimbursements or reductions occur. Expense ratios before reductions for start-up periods may not be representative of longer-term operating periods. Expenses net of fee waivers reflect expenses after reimbursement by the investment adviser but prior to reductions from expense offset arrangements. Expenses net of all reductions represent the net expenses paid by the class.
I Amount represents less than $.001 per share.
See accompanying notes which are an integral part of the financial statements.
Annual Report
Notes to Financial Statements
For the period ended July 31, 2007
1. Organization.
Fidelity Ultra-Short Bond Fund (the Fund) is a non-diversified fund of Fidelity Income Fund (the trust) and is authorized to issue an unlimited number of shares. The trust is registered under the Investment Company Act of 1940, as amended (the 1940 Act), as an open-end management investment company organized as a Massachusetts business trust.
The Fund offers Class A, Class T, Ultra-Short Bond, and Institutional Class shares, each of which has equal rights as to assets and voting privileges. Each class has exclusive voting rights with respect to matters that affect that class. Investment income, realized and unrealized capital gains and losses, the common expenses of the Fund, and certain fund-level expense reductions, if any, are allocated on a pro rata basis to each class based on the relative net assets of each class to the total net assets of the Fund. Each class differs with respect to transfer agent and distribution and service plan fees incurred. Certain expense reductions also differ by class.
2. Investments in Fidelity Central Funds.
The Fund may invest in Fidelity Central Funds which are open-end investment companies available only to other investment companies and accounts managed by Fidelity Management & Research Company (FMR) and its affiliates. The Fund's Schedule of Investments lists each of the Fidelity Central Funds as an investment of the Fund, but does not include the underlying holdings of each Fidelity Central Fund. As an Investing Fund, the Fund indirectly bears its proportionate share of the expenses of the underlying Fidelity Central Funds.
Based on their investment objective, each Fidelity Central Fund may invest or participate in various investment vehicles or strategies that are similar to those of the Fund. These strategies are consistent with the investment objectives of the Fund and may involve certain economic risks which may cause a decline in value of each of the Fidelity Central Funds and thus a decline in the value of the Fund. The following summarizes the Fund's investment in each Fidelity Central Fund.
Fidelity Central Fund | Investment Manager | Investment Objective | Investment Practices |
Fidelity Ultra-Short Central Fund | Fidelity Investments Money Management, Inc. (FIMM) | Seeks to obtain a high level of current income consistent with preservation of capital by investing in U.S. dollar denominated money market and investment-grade debt securities. | Delayed Delivery & When Issued Securities Futures Mortgage Dollar Rolls Repurchase Agreements Restricted Securities Swap Agreements |
Annual Report
2. Investments in Fidelity Central Funds - continued
A holdings listing for the Fund, which presents direct holdings as well as the pro rata share of any securities and other investments held indirectly through its investment in underlying non-money market Fidelity Central Funds is available at fidelity.com and/or advisor.fidelity.com, as applicable. A complete list of holdings for each Fidelity Central Fund is available upon request or at the SEC's web site at www.sec.gov. In addition, the financial statements of the Fidelity Central Funds, which are not covered by the Fund's Report of Independent Registered Public Accounting Firm, are available on the SEC's web site or upon request.
3. Significant Accounting Policies.
The financial statements have been prepared in conformity with accounting principles generally accepted in the United States of America, which require management to make certain estimates and assumptions at the date of the financial statements. The following summarizes the significant accounting policies of the Fund:
Security Valuation. Investments are valued and net asset value per share is calculated (NAV calculation) as of the close of business of the New York Stock Exchange, normally 4:00 p.m. Eastern time. Wherever possible, the Fund uses independent pricing services approved by the Board of Trustees to value its investments. Debt securities, including restricted securities, for which quotations are readily available, are valued by independent pricing services or by dealers who make markets in such securities. Pricing services consider yield or price of bonds of comparable quality, coupon, maturity and type as well as available dealer prices.
When current market prices or quotations are not readily available or do not accurately reflect fair value, valuations may be determined in accordance with procedures adopted by the Board of Trustees. Factors used in the determination of fair value may include current market trading activity, interest rates, credit quality and default rates. The frequency of when fair value pricing is used is unpredictable. The value of securities used for NAV calculation under fair value pricing may differ from published prices for the same securities. Investments in open-end mutual funds, including the Fidelity Central Funds, are valued at their closing net asset value each business day. Short-term securities with remaining maturities of sixty days or less for which quotations are not readily available are valued at amortized cost, which approximates value.
Investment Transactions and Income. For financial reporting purposes, the Fund's investment holdings and NAV include trades executed through the end of the last business day of the period. The NAV for processing shareholder transactions includes trades executed through the end of the prior business day. Gains and losses on securities sold are determined on the basis of identified cost. Interest income and income and capital gain distributions from the Fidelity Central Funds are accrued as earned. Interest income includes coupon interest and amortization of premium and accretion of discount on debt securities.
Annual Report
Notes to Financial Statements - continued
3. Significant Accounting Policies - continued
Expenses. Most expenses of the trust can be directly attributed to a fund. Expenses which cannot be directly attributed are apportioned among each Fund in the trust. Expense estimates are accrued in the period to which they relate and adjustments are made when actual amounts are known.
Income Tax Information and Distributions to Shareholders. Each year, the Fund intends to qualify as a regulated investment company by distributing all of its taxable income and realized gains under Subchapter M of the Internal Revenue Code. As a result, no provision for income taxes is required in the accompanying financial statements.
Dividends are declared daily and paid monthly from net investment income. Distributions from realized gains, if any, are recorded on the ex-dividend date. Income dividends and capital gain distributions are declared separately for each class. Income and capital gain distributions are determined in accordance with income tax regulations, which may differ from generally accepted accounting principles.
Capital accounts within the financial statements are adjusted for permanent book-tax differences. These adjustments have no impact on net assets or the results of operations. Temporary book-tax differences will reverse in a subsequent period.
Book-tax differences are primarily due to futures transactions, swap agreements, market discount, capital loss carryforwards and losses deferred due to excise tax regulations.
The tax-basis components of distributable earnings and the federal tax cost as of period end were as follows:
Unrealized appreciation | $ 632,219 | |
Unrealized depreciation | (20,350,264) | |
Net unrealized appreciation (depreciation) | (19,718,045) | |
Capital loss carryforward | (2,436,121) | |
| | |
Cost for federal income tax purposes | $ 1,026,634,641 | |
The tax character of distributions paid was as follows:
| July 31, 2007 | July 31, 2006 |
Ordinary Income | $ 51,625,727 | $ 38,283,502 |
Short-Term Trading (Redemption) Fees. Shares held in the Fund less than 60 days are subject to a redemption fee equal to .25% of the proceeds of the redeemed shares. All redemption fees, including any estimated redemption fees paid by FMR, are retained by the Fund and accounted for as an addition to paid in capital.
Annual Report
3. Significant Accounting Policies - continued
New Accounting Pronouncements. In July 2006, Financial Accounting Standards Board Interpretation No. 48, Accounting for Uncertainty in Income Taxes - an interpretation of FASB Statement 109 (FIN 48), was issued and is effective on the last business day of the semiannual reporting period for fiscal years beginning after December 15, 2006. FIN 48 sets forth a threshold for financial statement recognition, measurement and disclosure of a tax position taken or expected to be taken on a tax return. Management has concluded that the adoption of FIN 48 will not result in a material impact on the Fund's net assets, results of operations and financial statement disclosures.
In addition, in September 2006, Statement of Financial Accounting Standards No. 157, Fair Value Measurements (SFAS 157), was issued and is effective for fiscal years beginning after November 15, 2007. SFAS 157 defines fair value, establishes a framework for measuring fair value and expands disclosures about fair value measurements. Management is currently evaluating the impact the adoption of SFAS 157 will have on the Fund's financial statement disclosures.
4. Operating Policies.
Repurchase Agreements. FMR has received an Exemptive Order from the Securities and Exchange Commission (the SEC) which permits the Fund and other affiliated entities of FMR to transfer uninvested cash balances into joint trading accounts which are then invested in repurchase agreements. The Fund may also invest directly with institutions in repurchase agreements. Repurchase agreements are collateralized by government or non-government securities. Upon settlement date, collateral is held in segregated accounts with custodian banks and may be obtained in the event of a default of the counterparty. The Fund monitors, on a daily basis, the value of the collateral to ensure it is at least equal to the principal amount of the repurchase agreement (including accrued interest). In the event of a default by the counterparty, realization of the collateral proceeds could be delayed, during which time the value of the collateral may decline.
Delayed Delivery Transactions and When-Issued Securities. The Fund may purchase or sell securities on a delayed delivery or when-issued basis. Payment and delivery may take place after the customary settlement period for that security. The price of the underlying securities and the date when the securities will be delivered and paid for are fixed at the time the transaction is negotiated. During the time a delayed delivery sell is outstanding, the contract is marked-to-market daily and equivalent deliverable securities are held for the transaction. The value of the securities purchased on a delayed delivery or when-issued basis are identified as such in the Fund's Schedule of Investments. The Fund may receive compensation for interest forgone in the purchase of a delayed delivery or when-issued security. With respect to purchase commitments,
Annual Report
Notes to Financial Statements - continued
4. Operating Policies - continued
Delayed Delivery Transactions and When-Issued Securities - continued
the Fund identifies securities as segregated in its records with a value at least equal to the amount of the commitment. Losses may arise due to changes in the value of the underlying securities or if the counterparty does not perform under the contract's terms, or if the issuer does not issue the securities due to political, economic, or other factors.
Futures Contracts. The Fund may use futures contracts to manage its exposure to the bond market and to fluctuations in interest rates. Buying futures tends to increase a fund's exposure to the underlying instrument, while selling futures tends to decrease a fund's exposure to the underlying instrument or hedge other fund investments. Upon entering into a futures contract, a fund is required to deposit with a clearing broker, no later than the following business day, an amount ("initial margin") equal to a certain percentage of the face value of the contract. The initial margin may be in the form of cash or securities and is transferred to a segregated account on settlement date. Subsequent payments ("variation margin") are made or received by a fund depending on the daily fluctuations in the value of the futures contract and are accounted for as unrealized gains or losses. Realized gains (losses) are recorded upon the expiration or closing of the futures contract. Securities deposited to meet margin requirements are identified in the Schedule of Investments. Futures contracts involve, to varying degrees, risk of loss in excess of any futures variation margin reflected in the Statement of Assets and Liabilities. The underlying face amount at value of any open futures contracts at period end is shown in the Schedule of Investments under the caption "Futures Contracts." This amount reflects each contract's exposure to the underlying instrument at period end. Losses may arise from changes in the value of the underlying instruments or if the counterparties do not perform under the contract's terms. Futures contracts are valued at the settlement price established each day by the board of trade or exchange on which they are traded.
Restricted Securities. The Fund may invest in securities that are subject to legal or contractual restrictions on resale. These securities generally may be resold in transactions exempt from registration or to the public if the securities are registered. Disposal of these securities may involve time-consuming negotiations and expense, and prompt sale at an acceptable price may be difficult. Information regarding restricted securities is included at the end of the Fund's Schedule of Investments.
Swap Agreements. The Fund may invest in swaps for the purpose of managing its exposure to interest rate, credit or market risk.
Total return swaps are agreements to exchange the return generated by one instrument or index for the return generated by another instrument, for example, the agreement to pay interest in exchange for a market-linked return based on a notional amount. To the
Annual Report
4. Operating Policies - continued
Swap Agreements - continued
extent the total return of the index exceeds the offsetting interest obligation, a fund will receive a payment from the counterparty. To the extent it is less, a fund will make a payment to the counterparty. Periodic payments received or made by the Fund are recorded in the accompanying Statement of Operations as realized gains or losses, respectively.
Credit default swaps involve the exchange of a fixed rate premium for protection against the loss in value of an underlying debt instrument in the event of a defined credit event (such as payment default or bankruptcy). Under the terms of the swap, one party acts as a "guarantor" receiving a periodic payment that is a fixed percentage applied to a notional principal amount. In return the party agrees to purchase the notional amount of the underlying instrument, at par, if a credit event occurs during the term of the swap. The Fund may enter into credit default swaps in which either it or its counterparty act as guarantors. By acting as the guarantor of a swap, a fund assumes the market and credit risk of the underlying instrument including liquidity and loss of value. Periodic payments and premiums received or made by the Fund are recorded in the accompanying Statement of Operations as realized gains or losses, respectively.
Swaps are marked-to-market daily based on dealer-supplied valuations and changes in value are recorded as unrealized appreciation (depreciation). Gains or losses are realized upon early termination of the swap agreement. Collateral, in the form of cash or securities, may be required to be held in segregated accounts with a fund's custodian in compliance with swap contracts. Risks may exceed amounts recognized on the Statement of Assets and Liabilities. These risks include changes in the returns of the underlying instruments, failure of the counterparties to perform under the contracts' terms and the possible lack of liquidity with respect to the swap agreements. Details of swap agreements open at period end are included in the Fund's Schedule of Investments under the caption "Swap Agreements."
5. Purchases and Sales of Investments.
Purchases and sales of securities (including the Fixed-Income Central Funds), other than short-term securities and U.S. government securities, aggregated $399,912,272 and $239,443,351, respectively.
6. Fees and Other Transactions with Affiliates.
Management Fee. FMR and its affiliates provide the Fund with investment management related services for which the Fund pays a monthly management fee. The management fee is the sum of an individual fund fee rate that is based on an annual rate of .20% of the Fund's average net assets and a group fee rate that averaged ..12% during the
Annual Report
Notes to Financial Statements - continued
6. Fees and Other Transactions with Affiliates - continued
Management Fee - continued
period. The group fee rate is based upon the average net assets of all the mutual funds advised by FMR. The group fee rate decreases as assets under management increase and increases as assets under management decrease. For the period, the total annual management fee rate was .32% of the Fund's average net assets.
Distribution and Service Plan. In accordance with Rule 12b-1 of the 1940 Act, the Fund has adopted separate Distribution and Service Plans for each class of shares. Certain classes pay Fidelity Distributors Corporation (FDC), an affiliate of FMR, separate Distribution and Service Fees, each of which is based on an annual percentage of each class' average net assets. In addition, FDC may pay financial intermediaries for selling shares of the Fund and providing shareholder support services. For the period, the Distribution and Service Fee rates and the total amounts paid to and retained by FDC were as follows:
| Distribution
Fee | Service
Fee | Paid to
FDC | Retained
by FDC |
Class A | 0 % | .15% | $ 14,333 | $ 6,971 |
Class T | 0 % | .15% | 6,400 | 157 |
| | | $ 20,733 | $ 7,128 |
Sales Load. FDC receives a front-end sales charge of up to 1.50% for selling Class A and Class T shares, some of which is paid to financial intermediaries for selling shares of the Fund. FDC receives the proceeds of a contingent deferred sales charges levied on Class A and Class T redemptions. These charges depend on the holding period. The deferred sales charges range from .75% to .50% for certain purchases of Class A shares and .25% for certain purchases of Class T shares.
For the period, sales charge amounts retained by FDC were as follows:
| Retained
by FDC |
Class A | $ 9,720 |
Class T | 1,413 |
| $ 11,133 |
Transfer Agent Fees. Fidelity Investments Institutional Operations Company, Inc. (FIIOC), an affiliate of FMR, is the transfer, dividend disbursing and shareholder servicing agent for each class of the Fund, except for Ultra-Short Bond. Fidelity Service Company, Inc. (FSC), an affiliate of FMR, is the transfer agent for Ultra-Short Bond shares. FIIOC receives account fees and asset-based fees that vary according to the account size and type of account of the shareholders of the respective classes of the Fund. FSC receives an asset-based fee of .10% of Ultra-Short Bond's average net assets.
Annual Report
6. Fees and Other Transactions with Affiliates - continued
Transfer Agent Fees - continued
FIIOC and FSC pay for typesetting, printing and mailing of shareholder reports, except proxy statements. For the period, the total transfer agent fees paid by each class to FIIOC or FSC, were as follows:
| Amount | % of
Average
Net Assets |
Class A | $ 15,125 | .16 |
Class T | 8,066 | .19 |
Ultra-Short Bond | 980,311 | .10 |
Institutional Class | 7,688 | .13 |
| $ 1,011,190 | |
Fundwide Operations Fee. Pursuant to the Fundwide Operations and Expense Agreement (FWOE), FMR has agreed to provide for fund level expenses (which do not include transfer agent, Rule 12b-1 fees, compensation of the independent trustees, interest (including commitment fees), taxes or extraordinary expenses, if any) in return for a FWOE fee equal to .35% less the total amount of the management fee. The FWOE paid by the Fund is reduced by an amount equal to the fees and expenses paid to the independent trustees. For the period, the FWOE fee was equivalent to an annual rate of .03% of average net assets.
7. Committed Line of Credit.
The Fund participates with other funds managed by FMR in a $4.2 billion credit facility (the "line of credit") to be utilized for temporary or emergency purposes to fund shareholder redemptions or for other short-term liquidity purposes. The Fund has agreed to pay commitment fees on its pro rata portion of the line of credit, which amounted to $1,798 and is reflected in Miscellaneous Expense on the Statement of Operations. During the period, there were no borrowings on this line of credit.
8. Expense Reductions.
Through arrangements with the Fund's custodian and each class' transfer agent, credits realized as a result of uninvested cash balances were used to reduce the Fund's expenses. During the period, these credits reduced the Fund's expenses by $14,119. During the period, credits reduced each class' transfer agent expense as noted in the table below.
| Transfer Agent
expense reduction | |
Ultra-Short Bond | $ 5,690 | |
Annual Report
Notes to Financial Statements - continued
9. Credit Risk.
The Fund invests a significant portion of its assets in securities of issuers that hold mortgage securities, including subprime mortgage securities. The value of these securities is sensitive to changes in economic conditions, including delinquencies and/or defaults, and may be adversely affected by shifts in the market's perception of the issuers and changes in interest rates.
10. Other.
The Fund's organizational documents provide former and current trustees and officers with a limited indemnification against liabilities arising in connection with the performance of their duties to the Fund. In the normal course of business, the Fund may also enter into contracts that provide general indemnifications. The Fund's maximum exposure under these arrangements is unknown as this would be dependent on future claims that may be made against the Fund. The risk of material loss from such claims is considered remote.
11. Distributions to Shareholders.
Distributions to shareholders of each class were as follows:
| Years ended July 31, |
| 2007 | 2006 |
From net investment income | | |
Class A | $ 470,241 | $ 126,997 |
Class T | 210,443 | 141,086 |
Ultra-Short Bond | 50,639,843 | 37,977,353 |
Institutional Class | 305,200 | 38,066 |
Total | $ 51,625,727 | $ 38,283,502 |
12. Share Transactions.
Transactions for each class of shares were as follows:
| Shares | Dollars |
| Years ended July 31, | Years ended July 31, |
| 2007 | 2006 | 2007 | 2006 |
Class A | | | | |
Shares sold | 1,247,732 | 574,958 | $ 12,475,671 | $ 5,763,274 |
Reinvestment of distributions | 37,250 | 10,043 | 371,847 | 100,637 |
Shares redeemed | (340,215) | (385,505) | (3,395,610) | (3,863,258) |
Net increase (decrease) | 944,767 | 199,496 | $ 9,451,908 | $ 2,000,653 |
Annual Report
12. Share Transactions - continued
| Shares | Dollars |
| Years ended July 31, | Years ended July 31, |
| 2007 | 2006 | 2007 | 2006 |
Class T | | | | |
Shares sold | 388,444 | 357,260 | $ 3,878,571 | $ 3,579,216 |
Reinvestment of distributions | 19,812 | 13,205 | 197,787 | 132,333 |
Shares redeemed | (378,796) | (312,176) | (3,788,237) | (3,129,874) |
Net increase (decrease) | 29,460 | 58,289 | $ 288,121 | $ 581,675 |
Ultra-Short Bond | | | | |
Shares sold | 59,380,876 | 39,226,057 | $ 593,653,669 | $ 393,000,678 |
Reinvestment of distributions | 4,599,590 | 3,400,651 | 45,902,034 | 34,072,273 |
Shares redeemed | (49,556,665) | (48,147,604) | (494,187,803) | (482,361,462) |
Net increase (decrease) | 14,423,801 | (5,520,896) | $ 145,367,900 | $ (55,288,511) |
Institutional Class | | | | |
Shares sold | 970,636 | 190,577 | $ 9,707,468 | $ 1,908,425 |
Reinvestment of distributions | 8,301 | 756 | 82,674 | 7,577 |
Shares redeemed | (330,344) | (43,621) | (3,294,058) | (437,350) |
Net increase (decrease) | 648,593 | 147,712 | $ 6,496,084 | $ 1,478,652 |
Annual Report
Report of Independent Registered Public Accounting Firm
To the Trustees of Fidelity Income Fund and the Shareholders of Fidelity Ultra-Short Bond Fund:
In our opinion, the accompanying statement of assets and liabilities, including the schedule of investments, and the related statements of operations and of changes in net assets and the financial highlights present fairly, in all material respects, the financial position of Fidelity Ultra-Short Bond Fund (a fund of Fidelity Income Fund) at July 31, 2007, the results of its operations for the year then ended, the changes in its net assets for each of the two years in the period then ended and the financial highlights for each of the periods indicated, in conformity with accounting principles generally accepted in the United States of America. These financial statements and financial highlights (hereafter referred to as "financial statements") are the responsibility of the Fidelity Ultra-Short Bond Fund's management. Our responsibility is to express an opinion on these financial statements based on our audits. We conducted our audits of these financial statements in accordance with the standards of the Public Company Accounting Oversight Board (United States). Those standards require that we plan and perform the audit to obtain reasonable assurance about whether the financial statements are free of material misstatement. An audit includes examining, on a test basis, evidence supporting the amounts and disclosures in the financial statements, assessing the accounting principles used and significant estimates made by management, and evaluating the overall financial statement presentation. We believe that our audits, which included confirmation of securities at July 31, 2007 by correspondence with the custodian and brokers, provide a reasonable basis for our opinion.
/s/ PricewaterhouseCoopers LLP
PricewaterhouseCoopers LLP
Boston, Massachusetts
September 25, 2007
Annual Report
Trustees and Officers
The Trustees, Members of the Advisory Board, and executive officers of the trust and fund, as applicable, are listed below. The Board of Trustees governs the fund and is responsible for protecting the interests of shareholders. The Trustees are experienced executives who meet periodically throughout the year to oversee the fund's activities, review contractual arrangements with companies that provide services to the fund, and review the fund's performance. Except for James C. Curvey, each of the Trustees oversees 353 funds advised by FMR or an affiliate. Mr. Curvey oversees 317 funds advised by FMR or an affiliate.
The Trustees hold office without limit in time except that (a) any Trustee may resign; (b) any Trustee may be removed by written instrument, signed by at least two-thirds of the number of Trustees prior to such removal; (c) any Trustee who requests to be retired or who has become incapacitated by illness or injury may be retired by written instrument signed by a majority of the other Trustees; and (d) any Trustee may be removed at any special meeting of shareholders by a two-thirds vote of the outstanding voting securities of the trust. Each Trustee who is not an interested person (as defined in the 1940 Act) (Independent Trustee), shall retire not later than the last day of the calendar year in which his or her 72nd birthday occurs. The Independent Trustees may waive this mandatory retirement age policy with respect to individual Trustees. The executive officers and Advisory Board Members hold office without limit in time, except that any officer and Advisory Board Member may resign or may be removed by a vote of a majority of the Trustees at any regular meeting or any special meeting of the Trustees. Except as indicated, each individual has held the office shown or other offices in the same company for the past five years.
The fund's Statement of Additional Information (SAI) includes more information about the Trustees. To request a free copy, call Fidelity at 1-877-208-0098.
Interested Trustees*:
Correspondence intended for each Trustee who is an interested person may be sent to Fidelity Investments, 82 Devonshire Street, Boston, Massachusetts 02109.
Name, Age; Principal Occupation |
Edward C. Johnson 3d (77) |
| Year of Election or Appointment: 1984 Mr. Johnson is Chairman of the Board of Trustees. Mr. Johnson serves as President (2006-present), Chief Executive Officer, Chairman, and a Director of FMR Corp.; Chairman and a Director of FMR; Chairman and a Director of Fidelity Research & Analysis Company (FRAC); Chairman and a Director of Fidelity Investments Money Management, Inc.; and Chairman (2001-present) and a Director of FMR Co., Inc. In addition, Mr. Johnson serves as Chairman and Director of Fidelity International Limited (FIL). |
James C. Curvey (72) |
| Year of Election or Appointment: 2007 Mr. Curvey also serves as Trustee (2007-present) or Member of the Advisory Board (2007-present) of other investment companies advised by FMR. Mr. Curvey is Vice Chairman (2006-present) and Director of FMR Corp. Mr. Curvey joined Fidelity in 1982 and served in numerous senior management positions, including President and Chief Operating Officer of FMR Corp. (1997-2000) and President of Fidelity Strategic Investments (2000-2002). In addition, he serves as a member of the Board of Directors of Geerlings & Wade, Inc. (wine distribution). |
* Trustees have been determined to be "Interested Trustees" by virtue of, among other things, their affiliation with the trust or various entities under common control with FMR.
Independent Trustees:
Correspondence intended for each Independent Trustee (that is, the Trustees other than the Interested Trustees) may be sent to Fidelity Investments, P.O. Box 55235, Boston, Massachusetts 02205-5235.
Name, Age; Principal Occupation |
Dennis J. Dirks (59) |
| Year of Election or Appointment: 2005 Prior to his retirement in May 2003, Mr. Dirks was Chief Operating Officer and a member of the Board of The Depository Trust & Clearing Corporation (DTCC) (1999-2003). He also served as President, Chief Operating Officer, and Board member of The Depository Trust Company (DTC) (1999-2003) and President and Board member of the National Securities Clearing Corporation (NSCC) (1999-2003). In addition, Mr. Dirks served as Chief Executive Officer and Board member of the Government Securities Clearing Corporation (2001-2003) and Chief Executive Officer and Board member of the Mortgage-Backed Securities Clearing Corporation (2001-2003). Mr. Dirks also serves as a Trustee and a member of the Finance Committee of Manhattan College (2005-present) and a Trustee and a member of the Finance Committee of AHRC of Nassau County (2006-present). |
Albert R. Gamper, Jr. (65) |
| Year of Election or Appointment: 2006 Prior to his retirement in December 2004, Mr. Gamper served as Chairman of the Board of CIT Group Inc. (commercial finance). During his tenure with CIT Group Inc. Mr. Gamper served in numerous senior management positions, including Chairman (1987-1989; 1999-2001; 2002-2004), Chief Executive Officer (1987-2004), and President (1989-2002). He currently serves as a member of the Board of Directors of Public Service Enterprise Group (utilities, 2001-present), Chairman of the Board of Governors, Rutgers University (2004-present), and Chairman of the Board of Saint Barnabas Health Care System. |
George H. Heilmeier (71) |
| Year of Election or Appointment: 2004 Dr. Heilmeier is Chairman Emeritus of Telcordia Technologies (communication software and systems), where prior to his retirement, he served as company Chairman and Chief Executive Officer. He currently serves on the Boards of Directors of The Mitre Corporation (systems engineering and information technology support for the government), and HRL Laboratories (private research and development, 2004-present). He is Chairman of the General Motors Science & Technology Advisory Board and a Life Fellow of the Institute of Electrical and Electronics Engineers (IEEE). Dr. Heilmeier is a member of the Defense Science Board and the National Security Agency Advisory Board. He is also a member of the National Academy of Engineering, the American Academy of Arts and Sciences, and the Board of Overseers of the School of Engineering and Applied Science of the University of Pennsylvania. Previously, Dr. Heilmeier served as a Director of TRW Inc. (automotive, space, defense, and information technology, 1992-2002), Compaq (1994-2002), Automatic Data Processing, Inc. (ADP) (technology-based business outsourcing, 1995-2002), INET Technologies Inc. (telecommunications network surveillance, 2001-2004), and Teletech Holdings (customer management services). He is the recipient of the 2005 Kyoto Prize in Advanced Technology for his invention of the liquid crystal display, and a member of the Consumer Electronics Hall of Fame. |
James H. Keyes (66) |
| Year of Election or Appointment: 2007 Prior to his retirement in 2003, Mr. Keyes was Chairman, President, and Chief Executive Officer of Johnson Controls, Inc. (automotive supplier, 1993-2003). He currently serves as a member of the boards of LSI Logic Corporation (semiconductor technologies), Navistar International Corporation (manufacture and sale of trucks, buses, and diesel engines, 2002-present), and Pitney Bowes, Inc. (integrated mail, messaging, and document management solutions). |
Marie L. Knowles (60) |
| Year of Election or Appointment: 2001 Prior to Ms. Knowles' retirement in June 2000, she served as Executive Vice President and Chief Financial Officer of Atlantic Richfield Company (ARCO) (diversified energy, 1996-2000). From 1993 to 1996, she was a Senior Vice President of ARCO and President of ARCO Transportation Company. She served as a Director of ARCO from 1996 to 1998. She currently serves as a Director of Phelps Dodge Corporation (copper mining and manufacturing) and McKesson Corporation (healthcare service, 2002-present). Ms. Knowles is a Trustee of the Brookings Institution and the Catalina Island Conservancy and also serves as a member of the Advisory Board for the School of Engineering of the University of Southern California. |
Ned C. Lautenbach (63) |
| Year of Election or Appointment: 2000 Mr. Lautenbach is Chairman of the Independent Trustees (2006-present). Mr. Lautenbach has been a partner of Clayton, Dubilier & Rice, Inc. (private equity investment firm) since September 1998. Previously, Mr. Lautenbach was with the International Business Machines Corporation (IBM) from 1968 until his retirement in 1998. Mr. Lautenbach serves as a Director of Sony Corporation (2006-present) and Eaton Corporation (diversified industrial) as well as the Philharmonic Center for the Arts in Naples, Florida. He also is a member of the Board of Trustees of Fairfield University (2005-present), as well as a member of the Council on Foreign Relations. |
Cornelia M. Small (63) |
| Year of Election or Appointment: 2005 Ms. Small is a member (2000-present) and Chairperson (2002-present) of the Investment Committee, and a member (2002-present) of the Board of Trustees of Smith College. Previously, she served as Chief Investment Officer (1999-2000), Director of Global Equity Investments (1996-1999), and a member of the Board of Directors of Scudder, Stevens & Clark (1990-1997) and Scudder Kemper Investments (1997-1999). In addition, Ms. Small served as Co-Chair (2000-2003) of the Annual Fund for the Fletcher School of Law and Diplomacy. |
William S. Stavropoulos (68) |
| Year of Election or Appointment: 2001 Mr. Stavropoulos is Chairman Emeritus of the Board of Directors of The Dow Chemical Company. Since joining The Dow Chemical Company in 1967, Mr. Stavropoulos served in numerous senior management positions, including President (1993-2000; 2002-2003), CEO (1995-2000; 2002-2004), and Chairman of the Executive Committee (2000-2004). Currently, he is a Director of NCR Corporation (data warehousing and technology solutions), Chemical Financial Corporation, Maersk Inc. (industrial conglomerate, 2002-present), Tyco International, Inc. (multinational manufacturing and services, 2007-present), and a member of the Advisory Board for Metalmark Capital (private equity investment firm, 2005-present). He is a special advisor to Clayton, Dubilier & Rice, Inc., a private equity investment firm. He also serves as a member of the Board of Trustees of the American Enterprise Institute for Public Policy Research. In addition, Mr. Stavropoulos is a member of The Business Council, J.P. Morgan International Council and the University of Notre Dame Advisory Council for the College of Science. |
Kenneth L. Wolfe (68) |
| Year of Election or Appointment: 2005 Prior to his retirement in 2001, Mr. Wolfe was Chairman and Chief Executive Officer of Hershey Foods Corporation (1993-2001). He currently serves as a member of the boards of Adelphia Communications Corporation (2003-present), Bausch & Lomb, Inc., and Revlon Inc. (2004-present). |
Advisory Board Members and Executive Officers:
Correspondence intended for Mr. Mauriello may be sent to Fidelity Investments, P.O. Box 55235, Boston, Massachusetts 02205-5235. Correspondence intended for each executive officer and Mr. Lynch may be sent to Fidelity Investments, 82 Devonshire Street, Boston, Massachusetts 02109.
Name, Age; Principal Occupation |
Peter S. Lynch (63) |
| Year of Election or Appointment: 2003 Member of the Advisory Board of Fidelity Income Fund. Mr. Lynch is Vice Chairman and a Director of FMR, and Vice Chairman (2001-present) and a Director of FMR Co., Inc. Previously, Mr. Lynch served as a Trustee of the Fidelity funds (1990-2003). In addition, he serves as a Trustee of Boston College and as the Chairman of the Inner-City Scholarship Fund. |
Joseph Mauriello (62) |
| Year of Election or Appointment: 2007 Member of the Advisory Board of Fidelity Income Fund. Prior to his retirement in January 2006, Mr. Mauriello served in numerous senior management positions including Deputy Chairman and Chief Operating Officer (2004-2005), and Vice Chairman of Financial Services (2002-2004) of KPMG LLP US (professional services firm, 1965-2005). Mr. Mauriello currently serves as a member of the Board of Directors of XL Capital Ltd., (global insurance and re-insurance company, 2006-present) and of Arcadia Resources Inc., (health care services and products, 2007-present). He also served as a Director of the Hamilton Funds of the Bank of New York (2006-2007). |
Kimberley H. Monasterio (43) |
| Year of Election or Appointment: 2007 President and Treasurer of Ultra-Short Bond. Ms. Monasterio also serves as President and Treasurer of other Fidelity funds (2007-present) and is an employee of FMR (2004-present). Previously, Ms. Monasterio served as Deputy Treasurer of the Fidelity funds (2004-2006). Before joining Fidelity Investments, Ms. Monasterio served as Treasurer (2000-2004) and Chief Financial Officer (2002-2004) of the Franklin Templeton Funds and Senior Vice President of Franklin Templeton Services, LLC (2000-2004). |
Boyce I. Greer (51) |
| Year of Election or Appointment: 2006 Vice President of Ultra-Short Bond. Mr. Greer also serves as Vice President of certain Equity Funds (2005-present), certain Asset Allocation Funds (2005-present), Fixed-Income Funds (2006-present), and Money Market Funds (2006-present). Mr. Greer is also a Trustee of other investment companies advised by FMR (2003-present). He is an Executive Vice President of FMR (2005-present) and FMR Co., Inc. (2005-present), and Senior Vice President of Fidelity Investments Money Management, Inc. (2006-present). Previously, Mr. Greer served as a Director and Managing Director of Strategic Advisers, Inc. (2002-2005), and Executive Vice President (2000-2002) and Money Market Group Leader (1997-2002) of the Fidelity Investments Fixed Income Division. He also served as Vice President of Fidelity's Money Market Funds (1997-2002), Senior Vice President of FMR (1997-2002), and Vice President of FIMM (1998-2002). |
David L. Murphy (59) |
| Year of Election or Appointment: 2005 Vice President of Ultra-Short Bond. Mr. Murphy also serves as Vice President of Fidelity's Money Market Funds (2002-present), certain Asset Allocation Funds (2003-present), Fixed-Income Funds (2005-present), and Balanced Funds (2005-present). He serves as Senior Vice President (2000-present) and Head (2004-present) of the Fidelity Investments Fixed Income Division. Mr. Murphy is also a Senior Vice President of Fidelity Investments Money Management, Inc. (2003-present) and an Executive Vice President of FMR (2005-present). Previously, Mr. Murphy served as Money Market Group Leader (2002-2004), Bond Group Leader (2000-2002), and Vice President of Fidelity's Taxable Bond Funds (2000-2002) and Fidelity's Municipal Bond Funds (2001-2002). |
Thomas J. Silvia (46) |
| Year of Election or Appointment: 2005 Vice President of Ultra-Short Bond. Mr. Silvia also serves as Vice President of Fidelity's Fixed-Income Funds (2005-present), certain Balanced Funds (2005-present), certain Asset Allocation Funds (2005-present), and Senior Vice President and Bond Group Leader of the Fidelity Investments Fixed-Income Division (2005-present). Previously, Mr. Silvia served as Director of Fidelity's Taxable Bond portfolio managers (2002-2004) and a portfolio manager in the Bond Group (1997-2004). |
Andrew Dudley (42) |
| Year of Election or Appointment: 2002 Vice President of Ultra-Short Bond. Mr. Dudley also serves as Vice President of other funds advised by FMR. Prior to assuming his current responsibilities, Mr. Dudley worked as a portfolio manager. |
Robert Galusza (43) |
| Year of Election or Appointment: 2007 Vice President of Ultra-Short Bond. Mr. Galusza also serves as Vice President of other funds advised by FMR. Prior to assuming his current responsibilities, Mr. Galusza worked as an analyst and a portfolio manager. |
Eric D. Roiter (58) |
| Year of Election or Appointment: 2002 Secretary of Ultra-Short Bond. He also serves as Secretary of other Fidelity funds; Vice President, General Counsel, and Secretary of FMR Co., Inc. (2001-present) and FMR; Assistant Secretary of Fidelity Management & Research (U.K.) Inc. (2001-present), Fidelity Research & Analysis Company (2001-present), and Fidelity Investments Money Management, Inc. (2001-present). Mr. Roiter is an Adjunct Member, Faculty of Law, at Boston College Law School (2003-present). Previously, Mr. Roiter served as Vice President and Secretary of Fidelity Distributors Corporation (FDC) (1998-2005). |
Scott C. Goebel (39) |
| Year of Election or Appointment: 2007 Assistant Secretary of Ultra-Short Bond. Mr. Goebel also serves as Assistant Secretary of other Fidelity funds (2007-present), Vice President and Secretary of FDC (2006-present), and is an employee of FMR. |
R. Stephen Ganis (41) |
| Year of Election or Appointment: 2006 Anti-Money Laundering (AML) officer of Ultra-Short Bond. Mr. Ganis also serves as AML officer of other Fidelity funds (2006-present) and FMR Corp. (2003-present). Before joining Fidelity Investments, Mr. Ganis practiced law at Goodwin Procter, LLP (2000-2002). |
Joseph B. Hollis (59) |
| Year of Election or Appointment: 2006 Chief Financial Officer of Ultra-Short Bond. Mr. Hollis also serves as Chief Financial Officer of other Fidelity funds. Mr. Hollis is President of Fidelity Pricing and Cash Management Services (FPCMS) (2005-present). Mr. Hollis also serves as President and Director of Fidelity Service Company, Inc. (2006-present). Previously, Mr. Hollis served as Senior Vice President of Cash Management Services (1999-2002) and Investment Management Operations (2002-2005). |
Kenneth A. Rathgeber (60) |
| Year of Election or Appointment: 2004 Chief Compliance Officer of Ultra-Short Bond. Mr. Rathgeber also serves as Chief Compliance Officer of other Fidelity funds (2004-present) and Executive Vice President of Risk Oversight for Fidelity Investments (2002-present). He is Chief Compliance Officer of FMR (2005-present), FMR Co., Inc. (2005-present), Fidelity Management & Research (U.K.) Inc. (2005-present), Fidelity Research & Analysis Company (2005-present), Fidelity Investments Money Management, Inc. (2005-present), and Strategic Advisers, Inc. (2005-present). Previously, Mr. Rathgeber served as Executive Vice President and Chief Operating Officer for Fidelity Investments Institutional Services Company, Inc. (1998-2002). |
Bryan A. Mehrmann (46) |
| Year of Election or Appointment: 2005 Deputy Treasurer of Ultra-Short Bond. Mr. Mehrmann also serves as Deputy Treasurer of other Fidelity funds (2005-present) and is an employee of FMR. Previously, Mr. Mehrmann served as Vice President of Fidelity Investments Institutional Services Group (FIIS)/Fidelity Investments Institutional Operations Corporation, Inc. (FIIOC) Client Services (1998-2004). |
Kenneth B. Robins (37) |
| Year of Election or Appointment: 2005 Deputy Treasurer of Ultra-Short Bond. Mr. Robins also serves as Deputy Treasurer of other Fidelity funds (2005-present) and is an employee of FMR (2004-present). Before joining Fidelity Investments, Mr. Robins worked at KPMG LLP, where he was a partner in KPMG's department of professional practice (2002-2004) and a Senior Manager (1999-2000). In addition, Mr. Robins served as Assistant Chief Accountant, United States Securities and Exchange Commission (2000-2002). |
Robert G. Byrnes (40) |
| Year of Election or Appointment: 2005 Assistant Treasurer of Ultra-Short Bond. Mr. Byrnes also serves as Assistant Treasurer of other Fidelity funds (2005-present) and is an employee of FMR (2005-present). Previously, Mr. Byrnes served as Vice President of FPCMS (2003-2005). Before joining Fidelity Investments, Mr. Byrnes worked at Deutsche Asset Management where he served as Vice President of the Investment Operations Group (2000-2003). |
Peter L. Lydecker (53) |
| Year of Election or Appointment: 2004 Assistant Treasurer of Ultra-Short Bond. Mr. Lydecker also serves as Assistant Treasurer of other Fidelity funds (2004) and is an employee of FMR. |
Gary W. Ryan (48) |
| Year of Election or Appointment: 2005 Assistant Treasurer of Ultra-Short Bond. Mr. Ryan also serves as Assistant Treasurer of other Fidelity funds (2005-present) and is an employee of FMR (2005-present). Previously, Mr. Ryan served as Vice President of Fund Reporting in FPCMS (1999-2005). |
Annual Report
Distributions
A total of 0.01% of the dividends distributed during the fiscal year was derived from interest on U.S. Government securities which is generally exempt from state income tax.
The fund designates $28,899,333 of distributions paid during the period January 1, 2007 to July 31, 2007 as qualifying to be taxed as interest-related dividends for nonresident alien shareholders.
The fund will notify shareholders in January 2008 of amounts for use in preparing 2007 income tax returns.
Annual Report
Board Approval of Investment Advisory Contracts and Management Fees
Fidelity Ultra-Short Bond Fund
Each year, typically in June, the Board of Trustees, including the Independent Trustees (together, the Board), votes on the renewal of the management contract and sub-advisory agreements (together, the Advisory Contracts) for the fund. The Board, assisted by the advice of fund counsel and Independent Trustees' counsel, requests and considers a broad range of information throughout the year.
The Board meets regularly each month except August and takes into account throughout the year matters bearing on Advisory Contracts. The Board, acting directly and through its separate committees, considers at each of its meetings factors that are relevant to the annual renewal of the fund's Advisory Contracts, including the services and support provided to the fund and its shareholders. At the time of the renewal, the Board had 12 standing committees, each composed of Independent Trustees with varying backgrounds, to which the Board has assigned specific subject matter responsibilities in order to enhance effective decision-making by the Board. Each committee has adopted a written charter outlining the structure and purposes of the committee. One such committee, the Fixed-Income Contract Committee, meets periodically as needed throughout the year to consider matters specifically related to the annual renewal of Advisory Contracts. The committee requests and receives information on, and makes recommendations to the Independent Trustees concerning, the approval and annual review of the Advisory Contracts.
At its June 2007 meeting, the Board of Trustees, including the Independent Trustees, unanimously determined to renew the Advisory Contracts for the fund. In reaching its determination, the Board considered all factors it believed relevant, including (i) the nature, extent, and quality of the services to be provided to the fund and its shareholders (including the investment performance of the fund); (ii) the competitiveness of the management fee and total expenses of the fund; (iii) the total costs of the services to be provided by and the profits to be realized by the investment adviser and its affiliates from the relationship with the fund; (iv) the extent to which economies of scale would be realized as the fund grows; and (v) whether fee levels reflect these economies of scale, if any, for the benefit of fund shareholders. The Board also approved amendments to the fund's agreements with foreign sub-advisers to clarify that each sub-adviser provides services as an independent contractor.
In determining whether to renew the Advisory Contracts for the fund, the Board ultimately reached a determination, with the assistance of fund counsel and Independent Trustees' counsel, that the renewal of the Advisory Contracts and the compensation to be received by Fidelity under the management contract is consistent with Fidelity's fiduciary duty under applicable law. In addition to evaluating the specific factors noted above, the Board, in reaching its determination, is aware that shareholders in the fund have a broad range of investment choices available to them, including a wide choice among mutual funds offered by competitors to Fidelity, and that the fund's shareholders, with the opportunity to review and weigh the disclosure provided by the fund in its prospectus and other public disclosures, have chosen to invest in this fund, managed by Fidelity.
Annual Report
Nature, Extent, and Quality of Services Provided. The Board considered staffing within the investment adviser, FMR, and the sub-advisers (together, the Investment Advisers), including the background of the fund's portfolio manager and the fund's investment objective and discipline. The Independent Trustees also had discussions with senior management of Fidelity's investment operations and investment groups. The Board considered the structure of the portfolio manager compensation program and whether this structure provides appropriate incentives.
Resources Dedicated to Investment Management and Support Services. The Board reviewed the size, education, and experience of the Investment Advisers' investment staff, their use of technology, and the Investment Advisers' approach to recruiting, training, and retaining portfolio managers and other research, advisory, and management personnel. The Board considered Fidelity's extensive global research capabilities that enable the Investment Advisers to aggregate data from various sources in an effort to produce positive investment results. The Board noted that Fidelity's analysts have access to a variety of technological tools that enable them to perform both fundamental and quantitative analysis and to specialize in various disciplines. The Board also considered that Fidelity's portfolio managers and analysts have access to daily portfolio attribution that allows for monitoring of a fund's portfolio, as well as an electronic communication system that provides immediate real-time access to research concerning issuers and credit enhancers. In addition, the Board considered the trading resources that are an integrated part of the fixed-income portfolio management investment process.
Shareholder and Administrative Services. The Board considered (i) the nature, extent, quality, and cost of advisory, administrative, distribution, and shareholder services performed by the Investment Advisers and their affiliates under the Advisory Contracts and under separate agreements covering transfer agency, pricing and bookkeeping, and securities lending services for the fund; (ii) the nature and extent of the Investment Advisers' supervision of third party service providers, principally custodians and subcustodians; and (iii) the resources devoted to, and the record of compliance with, the fund's compliance policies and procedures.
The Board noted that the growth of fund assets across the complex allows Fidelity to reinvest in the development of services designed to enhance the value or convenience of the Fidelity funds as investment vehicles. These services include 24-hour access to account information and market information through phone representatives and over the Internet, and investor education materials and asset allocation tools.
Annual Report
Board Approval of Investment Advisory Contracts and
Management Fees - continued
Investment in a Large Fund Family. The Board considered the benefits to shareholders of investing in a Fidelity fund, including the benefits of investing in a fund that is part of a large family of funds offering a variety of investment disciplines and providing for a large variety of mutual fund investor services. For example, fund shareholders are offered the privilege of exchanging shares of the fund for shares of other Fidelity funds, as set forth in the fund's prospectus, without paying a sales charge. The Board noted that, since the last Advisory Contract renewals in June 2006, Fidelity has taken a number of actions that benefited particular funds, including (i) dedicating additional resources to investment research and to restructure the investment research teams; (ii) contractually agreeing to reduce the management fee on Fidelity Advisor Floating Rate High Income Fund; (iii) contractually agreeing to reduce the management fees on Fidelity's California, Massachusetts, New Jersey, and New York AMT Tax-Free Money Market Funds, launching new Institutional Classes and Service Classes of these funds, and contractually agreeing to impose expense limitations on these funds; (iv) eliminating the exchange fee on the Fidelity Select Portfolios and reducing the pricing and bookkeeping fee rates for these funds; (v) reducing the maximum transfer agency fee rates on high income funds and certain equity funds; (vi) proposing amended management contracts that, if approved by shareholders, will add a performance adjustment component to the management fees paid by 18 Fidelity Advisor equity funds; (vii) contractually agreeing to reduce fees for Ultra-Short Central Fund and the money market Central Funds; (viii) waiving the Fidelity Advisor funds' contingent deferred sales charge on certain redemptions made through systematic withdrawal programs; and (ix) amending the management contracts for equity and fixed-income funds whose management contracts incorporate a "group fee" structure by adding four new fee "breakpoints" to the group fee rate schedules.
Investment Performance. The Board considered whether the fund has operated within its investment objective, as well as its record of compliance with its investment restrictions. It also reviewed the fund's absolute investment performance for each class, as well as the fund's relative investment performance for each class measured against (i) a broad-based securities market index, and (ii) a peer group of mutual funds deemed appropriate by the Board over multiple periods. Because the fund had been in existence less than five calendar years, the following charts considered by the Board show, over the one- and three-year periods ended December 31, 2006, as available, the cumulative total returns of Fidelity Ultra-Short Bond (retail class) and Class A, the cumulative total returns of a broad-based securities market index ("benchmark"), and a range of cumulative total returns of a peer group of mutual funds identified by Lipper Inc. as having an investment objective similar to that of the fund. The returns of Fidelity Ultra-Short Bond (retail class) and Class A show the performance of the highest and lowest performing classes, respectively. The box within each chart shows the 25th percentile return (bottom of box) and the 75th percentile return (top of box) of the peer group. Returns shown above the box are in the first quartile and returns shown below the box are in the fourth quartile. The percentage beaten numbers noted below each chart correspond to the percentile box and represent the percentage of funds in the peer group whose performance was equal to or lower than that of the class indicated.
Annual Report
Fidelity Ultra-Short Bond Fund
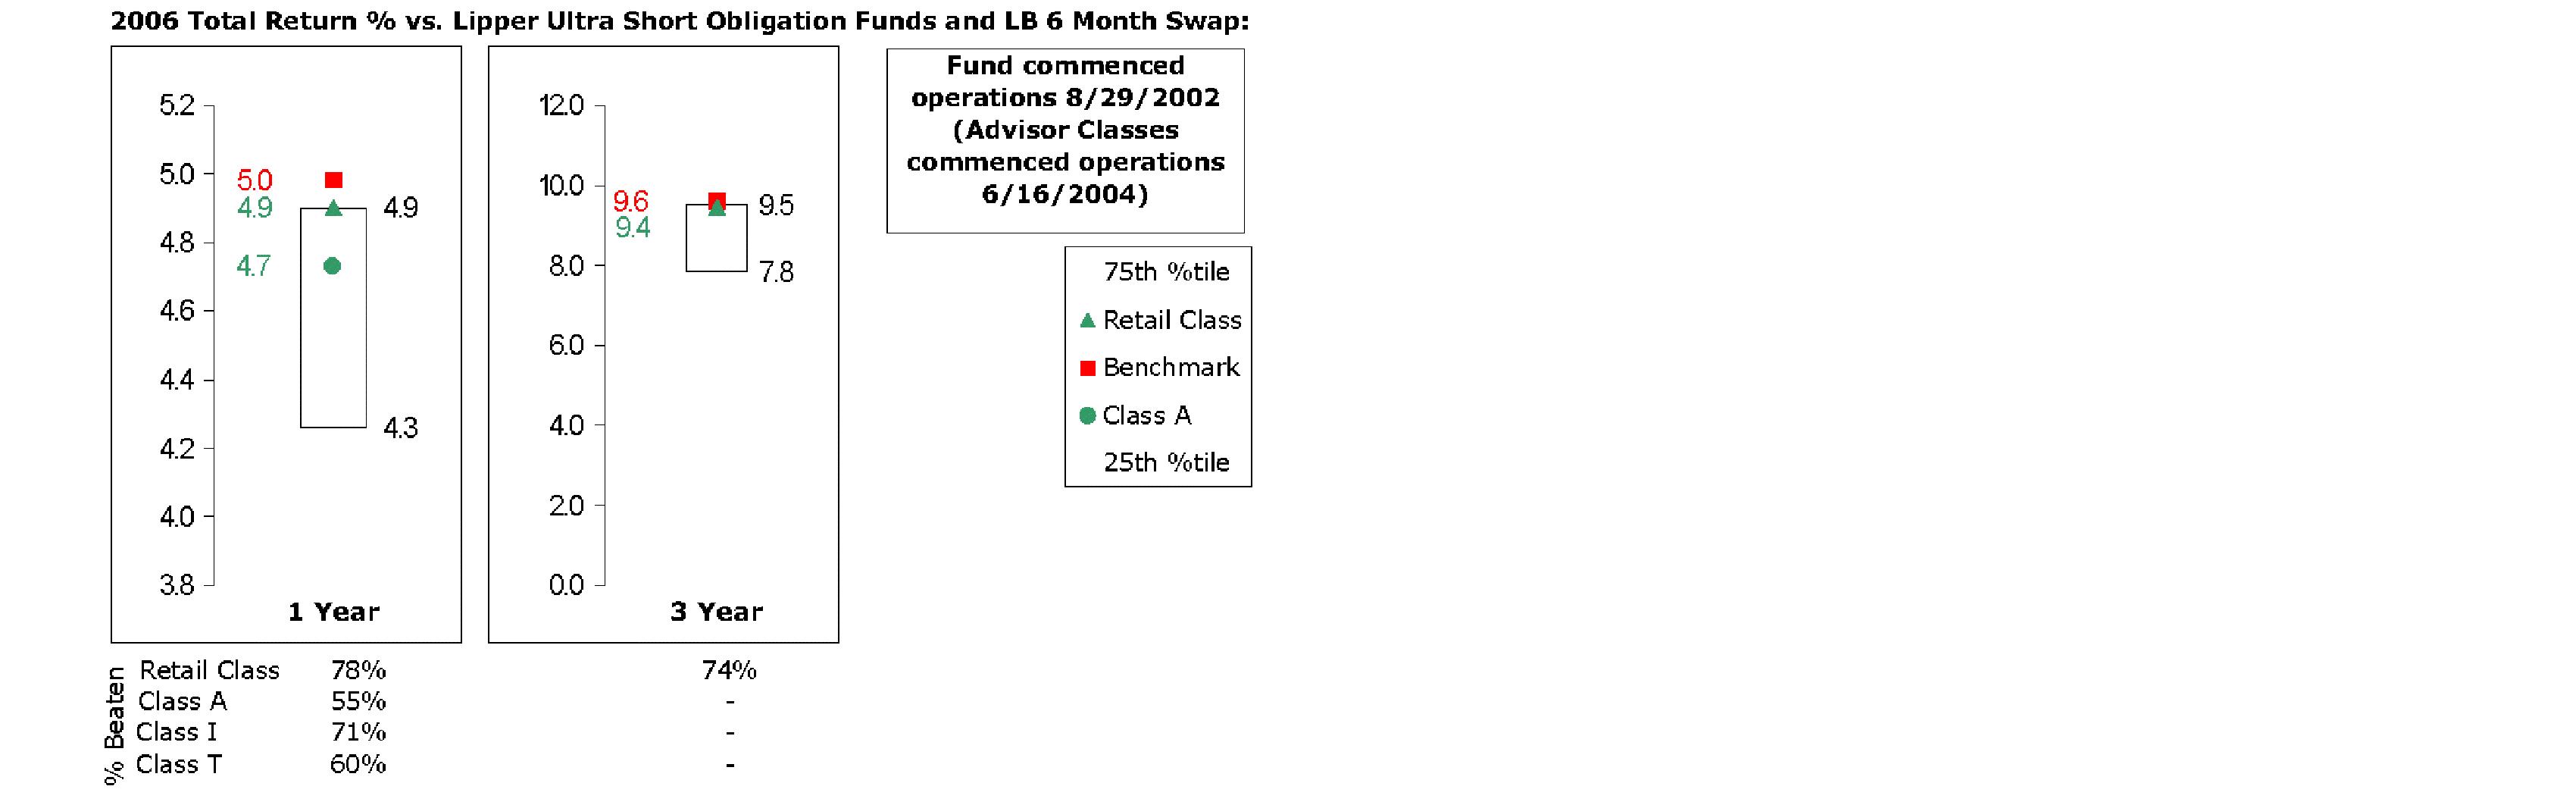
The Board reviewed the fund's relative investment performance against its peer group and stated that the performance of Fidelity Ultra-Short Bond (retail class) was in the first quartile for the one-year period and the second quartile for the three-year period. The Board also stated that the relative investment performance of the fund was lower than its benchmark for all the periods shown. The Board considered that the variations in performance among the fund's classes reflect the variations in class expenses, which result in lower performance for higher expense classes.
Based on its review, and giving particular weight to the nature and quality of the resources dedicated by the Investment Advisers to maintain and improve relative performance, the Board concluded that the nature, extent, and quality of the services provided to the fund will benefit the fund's shareholders, particularly in light of the Board's view that the fund's shareholders benefit from investing in a fund that is part of a large family of funds offering a variety of investment disciplines and services.
Competitiveness of Management Fee and Total Fund Expenses. The Board considered the fund's management fee and total expenses compared to "mapped groups" of competitive funds and classes. Fidelity creates "mapped groups" by combining similar Lipper investment objective categories that have comparable management fee characteristics. Combining Lipper investment objective categories aids the Board's management fee and total expense comparisons by broadening the competitive group used for comparison and by reducing the number of universes to which various Fidelity funds are compared.
Annual Report
Board Approval of Investment Advisory Contracts and
Management Fees - continued
The Board considered two proprietary management fee comparisons for the 12-month (or shorter) periods shown in the chart below. The group of Lipper funds used by the Board for management fee comparisons is referred to below as the "Total Mapped Group" and, for the reasons explained above, is broader than the Lipper peer group used by the Board for performance comparisons. The Total Mapped Group comparison focuses on a fund's standing relative to the total universe of comparable funds available to investors, in terms of gross management fees before expense reimbursements or caps. "TMG %" represents the percentage of funds in the Total Mapped Group that had management fees that were lower than the fund's. For example, a TMG % of 18% means that 82% of the funds in the Total Mapped Group had higher management fees than the fund. The "Asset-Size Peer Group" (ASPG) comparison focuses on a fund's standing relative to non-Fidelity funds similar in size to the fund within the Total Mapped Group. The ASPG represents at least 15% of the funds in the Total Mapped Group with comparable asset size and management fee characteristics, subject to a minimum of 50 funds (or all funds in the Total Mapped Group if fewer than 50). Additional information, such as the ASPG quartile in which the fund's management fee ranked, is also included in the chart and considered by the Board.
Fidelity Ultra-Short Bond Fund
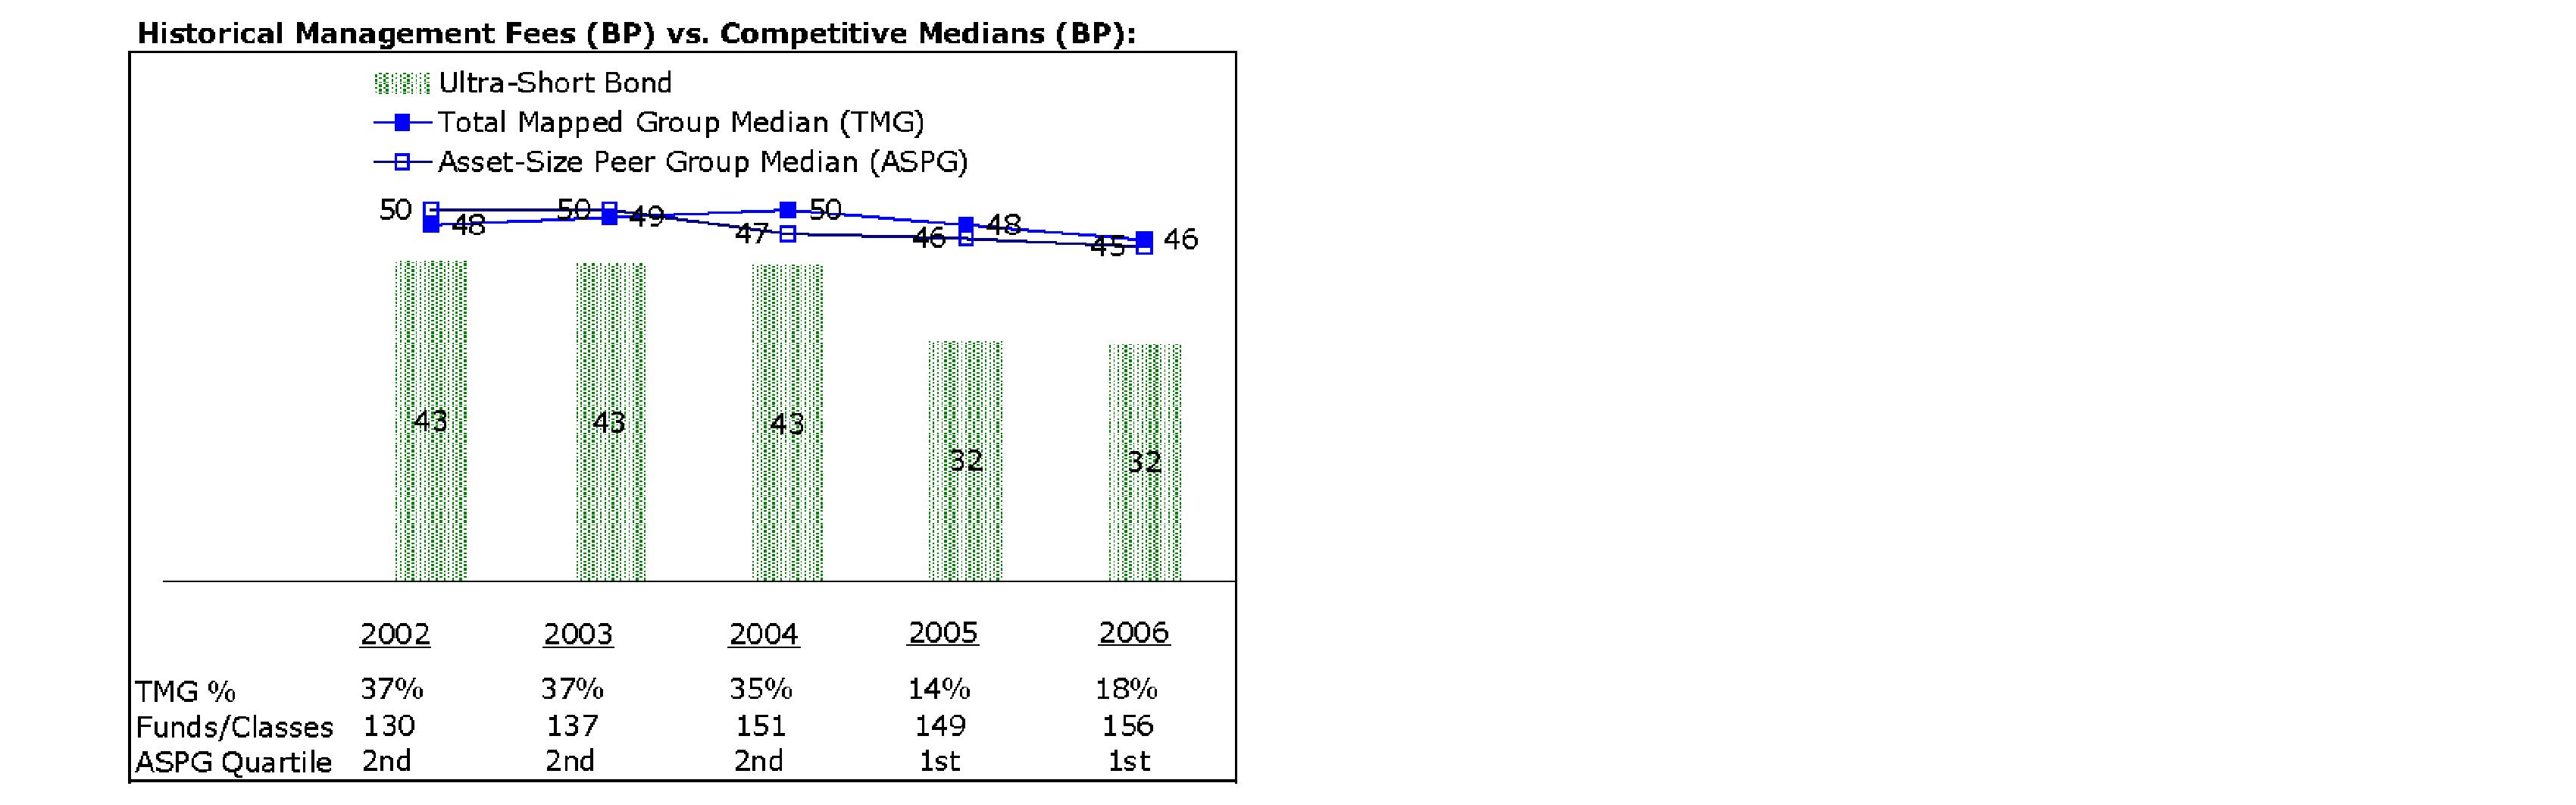
The Board noted that the fund's management fee ranked below the median of its Total Mapped Group and below the median of its ASPG for 2006.
Annual Report
Furthermore, the Board considered that it had approved an amendment (effective June 1, 2005) to the fund's management contract that lowered the fund's individual fund fee rate from 30 basis points to 20 basis points. The Board considered that the chart reflects the fund's lower management fee for 2005, as if the lower rate were in effect for the entire year.
Based on its review, the Board concluded that the fund's management fee was fair and reasonable in light of the services that the fund receives and the other factors considered.
In its review of each class's total expenses, the Board considered the fund's management fee as well as other fund or class expenses, as applicable, such as transfer agent fees, pricing and bookkeeping fees, fund-paid 12b-1 fees, and custodial, legal, and audit fees. The Board also noted the effects of any waivers and reimbursements on fees and expenses. As part of its review, the Board also considered current and historical total expenses of each class of the fund compared to competitive fund median expenses. Each class of the fund is compared to those funds and classes in the Total Mapped Group (used by the Board for management fee comparisons) that have a similar sales load structure.
The Board also considered that the current contractual arrangements for the fund (i) have the effect of setting the total "fund-level" expenses (including, among certain other expenses, the management fee) for each class at 35 basis points, (ii) lower and limit the "class-level" transfer agent fee for Fidelity Ultra-Short Bond (retail class) to 10 basis points, and (iii) limit the total expenses for Fidelity Ultra-Short Bond (retail class) to 45 basis points. These contractual arrangements may not be increased without the approval of the Board and the shareholders of the applicable class. The fund's Advisor classes are subject to different class-level expenses (transfer agent fees and 12b-1 fees).
The Board noted that each class's total expenses ranked below its competitive median for 2006.
The Board recognized that the fund's management contract incorporates a "group fee" structure, which provides for lower group fee rates as total fund assets under FMR's management increase, and for higher group fee rates as total fund assets under FMR's management decrease. FMR determines the group fee rates based on a tiered asset "breakpoint" schedule. In connection with the renewal of the fund's management contract, the Board approved amendments to the fund's management contract that added four new fee breakpoints to the group fee rate schedule for assets under FMR's management above $1,386 billion. The Board considered that the group fee rate declines under both the present and amended schedules, but that under the amended schedule, the group fee rate declines faster as assets under FMR's management exceed $1,386 billion. The Board noted, however, that because the current contractual arrangements set the total fund-level expenses for each class at 35 basis points, increases or decreases in the management fee due to changes in the group fee rate will not impact total expenses.
Annual Report
Board Approval of Investment Advisory Contracts and
Management Fees - continued
In its review of total expenses, the Board also considered Fidelity fee structures and other information on clients that FMR and its affiliates service in other competitive markets, such as other mutual funds advised or subadvised by FMR or its affiliates, pension plan clients, and other institutional clients.
Based on its review, the Board concluded that the total expenses of each class of the fund were reasonable in light of the services that the fund and its shareholders receive and the other factors considered.
Costs of the Services and Profitability. The Board considered the revenues earned and the expenses incurred by Fidelity in conducting the business of developing, marketing, distributing, managing, administering and servicing the fund and its shareholders. The Board also considered the level of Fidelity's profits in respect of all the Fidelity funds.
On an annual basis, FMR presents to the Board Fidelity's profitability for the fund. Fidelity calculates the profitability for each fund, as well as aggregate profitability for groups of Fidelity funds and all Fidelity funds, using a series of detailed revenue and cost allocation methodologies which originate with the audited books and records of Fidelity. The Audit Committee of the Board reviews any significant changes from the prior year's methodologies.
PricewaterhouseCoopers LLP (PwC), independent registered public accounting firm and auditor to Fidelity and certain Fidelity funds, has been engaged annually by the Board as part of the Board's assessment of the results of Fidelity's profitability analysis. PwC's engagement includes the review and assessment of Fidelity's methodologies used in determining the revenues and expenses attributable to Fidelity's mutual fund business, and completion of agreed-upon procedures surrounding the mathematical accuracy of fund profitability and its conformity to allocation methodologies. After considering PwC's reports issued under the engagement and information provided by Fidelity, the Board believes that while other allocation methods may also be reasonable, Fidelity's profitability methodologies are reasonable in all material respects.
The Board has also reviewed Fidelity's non-fund businesses and any fall-out benefits related to the mutual fund business as well as cases where Fidelity's affiliates may benefit from or be related to the fund's business.
The Board considered the costs of the services provided by and the profits realized by Fidelity in connection with the operation of the fund and determined that the amount of profit is a fair entrepreneurial profit for the management of the fund.
Annual Report
Economies of Scale. The Board considered whether there have been economies of scale in respect of the management of the Fidelity funds, whether the Fidelity funds (including the fund) have appropriately benefited from any such economies of scale, and whether there is potential for realization of any further economies of scale. The Board considered the extent to which the fund will benefit from economies of scale through increased services to the fund, through waivers or reimbursements, or through fee or expense reductions, including (Advisor classes only) reductions that occur through operation of the transfer agent agreement. The transfer agent fee varies in part based on the number of accounts in the fund. If the number of accounts decreases or the average account size increases, the overall transfer agent fee rate decreases. The Board concluded that any potential economies of scale are being shared between fund shareholders and Fidelity in an appropriate manner.
Additional Information Requested by the Board. In order to develop fully the factual basis for consideration of the Fidelity funds' Advisory Contracts, the Board requested and received additional information on several topics, including (i) Fidelity's fund profitability methodology, profitability by investment discipline, and profitability trends within certain funds; (ii) Fidelity's compensation structure relative to competitors and its effect on profitability; (iii) funds and accounts managed by Fidelity other than the Fidelity funds, including fee arrangements; (iv) the total expenses of certain funds and classes relative to competitors; (v) fund performance trends; (vi) fall-out benefits received by certain Fidelity affiliates; and (vii) Fidelity's fee structures.
Based on its evaluation of all of the conclusions noted above, and after considering all material factors, the Board ultimately concluded that the advisory fee structures are fair and reasonable, and that the fund's Advisory Contracts should be renewed.
Annual Report
Investment Adviser
Fidelity Management & Research Company
Boston, MA
Investment Sub-Advisers
Fidelity Investments
Money Management, Inc.
Fidelity International Investment Advisors
Fidelity International Investment Advisors
(U.K.) Limited
Fidelity Research & Analysis Company
General Distributor
Fidelity Distributors Corporation
Boston, MA
Transfer and Service Agent
Fidelity Service Company, Inc.
Boston, MA
Custodian
Citibank, N.A.
New York, NY
The Fidelity Telephone Connection
Mutual Fund 24-Hour Service
Exchanges/Redemptions
and Account Assistance 1-800-544-6666
Product Information 1-800-544-6666
Retirement Accounts 1-800-544-4774
(8 a.m. - 9 p.m.)
TDD Service 1-800-544-0118
for the deaf and hearing impaired
(9 a.m. - 9 p.m. Eastern time)
Fidelity Automated Service
Telephone (FAST®) (automated graphic) 1-800-544-5555
(automated graphic) Automated line for quickest service
ULB-UANN-0907
1.789713.104
(Fidelity Investment logo)(registered trademark)
Corporate Headquarters
82 Devonshire St., Boston, MA 02109
www.fidelity.com
(Fidelity Investment logo)(registered trademark)
Fidelity Advisor
Ultra-Short Bond
Fund - Class A and Class T
Annual Report
July 31, 2007
Class A and Class T
are classes of
Fidelity® Ultra-Short Bond Fund
(2_fidelity_logos) (Registered_Trademark)
Contents
Chairman's Message | <Click Here> | Ned Johnson's message to shareholders. |
Performance | <Click Here> | How the fund has done over time. |
Management's Discussion | <Click Here> | The managers' review of fund performance, strategy and outlook. |
Shareholder Expense Example | <Click Here> | An example of shareholder expenses. |
Investment Changes | <Click Here> | A summary of major shifts in the fund's investments over the past six months. |
Investments | <Click Here> | A complete list of the fund's investments with their market values. |
Financial Statements | <Click Here> | Statements of assets and liabilities, operations, and changes in net assets,
as well as financial highlights. |
Notes | <Click Here> | Notes to the financial statements. |
Report of Independent Registered Public Accounting Firm | <Click Here> | |
Trustees and Officers | <Click Here> | |
Distributions | <Click Here> | |
Board Approval of Investment Advisory Contracts and Management Fees | <Click Here> | |
| | |
To view a fund's proxy voting guidelines and proxy voting record for the 12-month period ended June 30, visit http://www.fidelity.com (search for "proxy voting guidelines") or visit the Securities and Exchange Commission's (SEC) web site at http://www.sec.gov. You may also call 1-800-544-8544 to request a free copy of the proxy voting guidelines.
Standard & Poor's, S&P and S&P 500 are registered service marks of The McGraw-Hill Companies, Inc. and have been licensed for use by Fidelity Distributors Corporation.
Other third party marks appearing herein are the property of their respective owners.
All other marks appearing herein are registered or unregistered trademarks or service marks of FMR Corp. or an affiliated company.
Annual Report
This report and the financial statements contained herein are submitted for the general information of the shareholders of the fund. This report is not authorized for distribution to prospective investors in the fund unless preceded or accompanied by an effective prospectus.
A fund files its complete schedule of portfolio holdings with the SEC for the first and third quarters of each fiscal year on Form N-Q. Forms N-Q are available on the SEC's web site at http://www.sec.gov. A fund's Forms N-Q may be reviewed and copied at the SEC's Public Reference Room in Washington, DC. Information regarding the operation of the SEC's Public Reference Room may be obtained by calling 1-800-SEC-0330. For a complete list of a fund's portfolio holdings, view the most recent holdings listing, semiannual report, or annual report on Fidelity's web site at http://www.fidelity.com or http://www.advisor.fidelity.com, as applicable.
NOT FDIC INSURED · MAY LOSE VALUE · NO BANK GUARANTEE
Neither the fund nor Fidelity Distributors Corporation is a bank.
Annual Report
Chairman's Message
(photo_of_Edward_C_Johnson_3d)
Dear Shareholder:
Stocks are currently on pace to register their fifth straight year of positive returns, although gains could be trimmed if the U.S. economy continues to slow. While financial markets are always unpredictable, there are a number of time-tested principles that can put the historical odds in your favor.
One of the basic tenets is to invest for the long term. Over time, riding out the markets' inevitable ups and downs has proven much more effective than selling into panic or chasing the hottest trend. Even missing only a few of the markets' best days can significantly diminish investor returns. Patience also affords the benefits of compounding - of earning interest on additional income or reinvested dividends and capital gains. There are tax advantages and cost benefits to consider as well. The more you sell, the more taxes you pay, and the more you trade, the higher the costs. While staying the course doesn't eliminate risk, it can considerably lessen the effect of short-term declines.
You can further manage your investing risk through diversification. And today, more than ever, geographic diversification should be taken into account. Studies indicate that asset allocation is the single most important determinant of a portfolio's long-term success. The right mix of stocks, bonds and cash - aligned to your particular risk tolerance and investment objective - is very important. Age-appropriate rebalancing is also an essential aspect of asset allocation. For younger investors, an emphasis on equities - which historically have been the best-performing asset class over time - is encouraged. As investors near their specific goal, such as retirement or sending a child to college, consideration may be given to replacing volatile assets (e.g. common stocks) with more-stable fixed investments (bonds or savings plans).
A third investment principle - investing regularly - can help lower the average cost of your purchases. Investing a certain amount of money each month or quarter helps ensure you won't pay for all your shares at market highs. This strategy - known as dollar cost averaging - also reduces unconstructive "emotion" from investing, helping shareholders avoid selling weak performers just prior to an upswing, or chasing a hot performer just before a correction.
We invite you to contact us via the Internet, through our Investor Centers or over the phone. It is our privilege to provide you the information you need to make the investments that are right for you.
Sincerely,
/s/Edward C. Johnson 3d
Edward C. Johnson 3d
Annual Report
Performance: The Bottom Line
Average annual total return reflects the change in the value of an investment, assuming reinvestment of the class' dividend income and capital gains (the profits earned upon the sale of securities that have grown in value) and assuming a constant rate of performance each year. The $10,000 table and the fund's returns do not reflect the deduction of taxes that a shareholder would pay on fund distributions or the redemption of fund shares. During periods of reimbursement by Fidelity, a fund's total return will be greater than it would be had the reimbursement not occurred. How a fund did yesterday is no guarantee of how it will do tomorrow.
Average Annual Total Returns
Periods ended July 31, 2007 | | Past 1
year | Life of
fund A |
Class A (incl. 1.50% sales charge) B | | 1.43% | 2.19% |
Class T (incl. 1.50% sales charge) C | | 1.40% | 2.19% |
A Since August 29, 2002
B Class A shares bear a 0.15% 12b-1 fee. The initial offering of Class A shares took place on June 16, 2004. Returns prior to June 16, 2004 are those of Ultra-Short Bond, the original retail class of the fund, which does not bear a 12b-1 fee. Had Class A shares' 12b-1 fee been reflected, returns prior to June 16, 2004 would have been lower.
C Class T shares bear a 0.15% 12b-1 fee. The initial offering of Class T shares took place on June 16, 2004. Returns prior to June 16, 2004 are those of Ultra-Short Bond, the original retail class of the fund, which does not bear a 12b-1 fee. Had Class T shares' 12b-1 fee been reflected, returns prior to June 16, 2004 would have been lower.
Annual Report
Performance - continued
$10,000 Over Life of Fund
Let's say hypothetically that $10,000 was invested in Fidelity Advisor Ultra-Short Bond Fund - Class T on August 29, 2002, when the fund started, and the current 1.50% sales charge was paid. The chart shows how the value of your investment would have changed, and also shows how the Lehman Brothers® 6 Month Swap Index performed over the same period.
Annual Report
Management's Discussion of Fund Performance
Comments from Andrew Dudley, Portfolio Manager of Fidelity Advisor Ultra-Short Bond Fund during the period covered by this report, and Robert Galusza, who became Lead Portfolio Manager of the fund on July 1, 2007. Dudley remained on the fund as Co-Manager.
The investment-grade bond market posted a reasonably solid advance for the 12 months ending July 31, 2007. In that time, the Lehman Brothers® U.S. Aggregate Index - a performance gauge of taxable, high-quality debt - gained 5.58%. A sizable percentage of that increase came in the first four months of the period. The index returned a cumulative 4.30% from August through November, as investors responded favorably to the end of the Federal Reserve Board's two-year campaign of interest rate hikes. Bonds turned negative in December and January, but had their best month of the past year in February, rising 1.54% as extreme volatility in the stock markets led to a flight to safety in high-quality debt. Performance was lackluster thereafter, however. Inflation concerns and dwindling hopes for a near-term Fed rate cut pressured bond prices for much of the remainder of the period, as did the meltdown of the subprime mortgage sector. Against that backdrop, the index gained only 0.32% over the final five months of the period.
During the past year, the fund's Class A and Class T shares gained 2.97% and 2.95%, respectively (excluding sales charges), while the Lehman Brothers 6 Month Swap Index returned 5.41%. The fund's significant underperformance stemmed largely from its sizable exposure to subprime mortgage securities. I held these securities - and others - - both directly and indirectly through Fidelity® Ultra-Short Central Fund, a diversified pool of short-term assets I also manage and which is designed to outperform cash-like instruments with similar risk characteristics. Early on, the fund's modest stake in lower-quality subprime holdings faltered, reflecting weakness in the housing market. Recently, technical factors caused higher-quality securities - which made up the bulk of the fund's subprime stake - to join their lower-quality counterparts in a major sell-off amid a massive unwinding of leverage by investors. Also detracting were commercial mortgage-backed securities, which came under pressure as investors repriced risk. In contrast, our position in collateralized mortgage obligations served us well, as they outpaced the index. And while the fund's stake in corporate bonds cost us some ground because it lagged the index, select holdings in the sector performed well.
The views expressed above reflect those of the portfolio manager(s) only through the end of the period as stated on the cover of this report and do not necessarily represent the views of Fidelity or any other person in the Fidelity organization. Any such views are subject to change at any time based upon market or other conditions and Fidelity disclaims any responsibility to update such views. These views may not be relied on as investment advice and, because investment decisions for a Fidelity fund are based on numerous factors, may not be relied on as an indication of trading intent on behalf of any Fidelity fund.
Annual Report
Shareholder Expense Example
As a shareholder of the Fund, you incur two types of costs: (1) transaction costs, including redemption fees, and (2) ongoing costs, including management fees, distribution and/or service (12b-1) fees and other Fund expenses. This Example is intended to help you understand your ongoing costs (in dollars) of investing in the Fund and to compare these costs with the ongoing costs of investing in other mutual funds.
The Example is based on an investment of $1,000 invested at the beginning of the period and held for the entire period (February 1, 2007 to July 31, 2007).
Actual Expenses
The first line of the accompanying table for each class of the Fund provides information about actual account values and actual expenses. You may use the information in this line, together with the amount you invested, to estimate the expenses that you paid over the period. Simply divide your account value by $1,000.00 (for example, an $8,600 account value divided by $1,000.00 = 8.6), then multiply the result by the number in the first line for a class of the Fund under the heading entitled "Expenses Paid During Period" to estimate the expenses you paid on your account during this period. In addition, the Fund, as a shareholder in the underlying Fidelity Central Funds, will indirectly bear its pro rata share of the fees and expenses incurred by the underlying Fidelity Central Funds. These fees and expenses are not included in the Fund's annualized expense ratio used to calculate the expense estimate in the table below.
Hypothetical Example for Comparison Purposes
The second line of the accompanying table for each class of the Fund provides information about hypothetical account values and hypothetical expenses based on a Class' actual expense ratio and an assumed rate of return of 5% per year before expenses, which is not the Class' actual return. The hypothetical account values and expenses may not be used to estimate the actual ending account balance or expenses you paid for the period. You may use this information to compare the ongoing costs of investing in the Fund and other funds. To do so, compare this 5% hypothetical example with the 5% hypothetical examples that appear in the shareholder reports of the other funds. In addition, the Fund, as a shareholder in the underlying Fidelity Central Funds, will indirectly bear its pro rata share of the fees and expenses incurred by the underlying Fidelity Central Funds. These fees and expenses are not included in the Fund's annualized expense ratio used to calculate the expense estimate in the table below.
Please note that the expenses shown in the table are meant to highlight your ongoing costs only and do not reflect any transaction costs. Therefore, the second line of the table is useful in comparing ongoing costs only, and will not help you determine the relative total costs of owning different funds. In addition, if these transactional costs were included, your costs would have been higher.
Annual Report
| Beginning
Account Value
February 1, 2007 | Ending
Account Value
July 31, 2007 | Expenses Paid
During Period*
February 1, 2007
to July 31, 2007 |
Class A | | | |
Actual | $ 1,000.00 | $ 1,005.40 | $ 3.23 |
HypotheticalA | $ 1,000.00 | $ 1,021.57 | $ 3.26 |
Class T | | | |
Actual | $ 1,000.00 | $ 1,005.10 | $ 3.48 |
HypotheticalA | $ 1,000.00 | $ 1,021.32 | $ 3.51 |
Ultra-Short Bond | | | |
Actual | $ 1,000.00 | $ 1,005.30 | $ 2.24 |
HypotheticalA | $ 1,000.00 | $ 1,022.56 | $ 2.26 |
Institutional Class | | | |
Actual | $ 1,000.00 | $ 1,005.20 | $ 2.39 |
HypotheticalA | $ 1,000.00 | $ 1,022.41 | $ 2.41 |
A 5% return per year before expenses
* Expenses are equal to each Class' annualized expense ratio (shown in the table below); multiplied by the average account value over the period, multiplied by 181/365 (to reflect the one-half year period). The fees and expenses of the underlying Fidelity Central Funds in which the Fund invests are not included in the Fund's annualized expense ratio.
| Annualized
Expense Ratio |
Class A | .65% |
Class T | .70% |
Ultra-Short Bond | .45% |
Institutional Class | .48% |
Annual Report
Investment Changes
The information in the following tables is based on the combined investments of the Fund and its pro-rata share of its investments in each Fidelity Central Fund. |
Quality Diversification (% of fund's net assets) |
As of July 31, 2007* | As of January 31, 2007** |
| U.S. Government and
U.S. Government
Agency Obligations 11.7% | | | U.S. Government and
U.S. Government
Agency Obligations 9.9% | |
| AAA 30.3% | | | AAA 25.6% | |
| AA 13.9% | | | AA 11.4% | |
| A 12.2% | | | A 12.0% | |
| BBB 22.4% | | | BBB 19.0% | |
| BB and Below 0.3% | | | BB and Below 0.6% | |
| Not Rated 2.1% | | | Not Rated 4.2% | |
| Short-Term
Investments and
Net Other Assets 7.1% | | | Short-Term
Investments and
Net Other Assets 17.3% | |

We have used ratings from Moody's® Investors Services, Inc. Where Moody's ratings are not available, we have used S&P® ratings. Securities rated BB or below were rated investment grade at the time of acquisition. |
Weighted Average Maturity as of July 31, 2007 |
| | 6 months ago |
Years | 2.0 | 1.7 |
The weighted average maturity is based on the dollar-weighted average length of time until principal payments are expected or until securities reach maturity, taking into account any maturity shortening feature such as a call, refunding or redemption provision. |
Duration as of July 31, 2007 |
| | 6 months ago |
Years | 0.4 | 0.3 |
Duration shows how much a bond fund's price fluctuates with changes in comparable interest rates. If rates rise 1%, for example, a fund with a five-year duration is likely to lose about 5% of its value. Other factors also can influence a bond fund's performance and share price. Accordingly, a bond fund's actual performance may differ from this example. |
Asset Allocation (% of fund's net assets) |
As of July 31, 2007* | As of January 31, 2007** |
| Corporate Bonds 15.8% | | | Corporate Bonds 14.9% | |
| U.S. Government and
U.S. Government
Agency Obligations 11.7% | | | U.S. Government and
U.S. Government
Agency Obligations 9.9% | |
| Asset-Backed
Securities 39.3% | | | Asset-Backed
Securities 37.3% | |
| CMOs and Other Mortgage Related Securities 26.0% | | | CMOs and Other Mortgage Related Securities 20.6% | |
| Other Investments 0.1% | | | Other Investments 0.0% | |
| Short-Term
Investments and
Net Other Assets 7.1% | | | Short-Term
Investments and
Net Other Assets 17.3% | |
* Foreign investments | 16.0% | | ** Foreign investments | 14.8% | |
* Futures and Swaps | 16.6% | | ** Futures and Swaps | 15.7% | |

A holdings listing for the Fund, which presents direct holdings as well as the pro rata share of any securities and other investments held indirectly through its investment in underlying non-money market Fidelity Central Funds is available at fidelity.com and/or advisor.fidelity.com, as applicable. |
Annual Report
Investments July 31, 2007
Showing Percentage of Net Assets
Nonconvertible Bonds - 12.5% |
| Principal Amount | | Value |
CONSUMER DISCRETIONARY - 1.8% |
Auto Components - 0.7% |
DaimlerChrysler NA Holding Corp.: | | | | |
5.71% 3/13/09 (d) | | $ 3,685,000 | | $ 3,684,985 |
5.79% 3/13/09 (d) | | 1,800,000 | | 1,803,742 |
5.84% 9/10/07 (d) | | 1,230,000 | | 1,230,540 |
| | 6,719,267 |
Media - 1.1% |
Continental Cablevision, Inc. 9% 9/1/08 | | 1,100,000 | | 1,139,520 |
Cox Communications, Inc.: | | | | |
(Reg. S) 5.91% 12/14/07 (d) | | 2,330,000 | | 2,334,126 |
5.61% 8/15/07 (a)(d) | | 4,000,000 | | 4,000,040 |
Time Warner, Inc. 8.18% 8/15/07 | | 2,000,000 | | 2,001,600 |
Viacom, Inc. 5.71% 6/16/09 (d) | | 2,000,000 | | 2,006,296 |
| | 11,481,582 |
TOTAL CONSUMER DISCRETIONARY | | 18,200,849 |
CONSUMER STAPLES - 0.2% |
Food & Staples Retailing - 0.2% |
CVS Caremark Corp. 5.66% 6/1/10 (d) | | 2,200,000 | | 2,200,988 |
ENERGY - 1.1% |
Energy Equipment & Services - 0.2% |
Transocean, Inc. 5.56% 9/5/08 (d) | | 2,400,000 | | 2,399,299 |
Oil, Gas & Consumable Fuels - 0.9% |
Anadarko Petroleum Corp.: | | | | |
3.25% 5/1/08 | | 850,000 | | 835,041 |
5.76% 9/15/09 (d) | | 2,200,000 | | 2,202,339 |
Enterprise Products Operating LP 4% 10/15/07 | | 2,670,000 | | 2,660,930 |
Kinder Morgan Energy Partners LP 5.35% 8/15/07 | | 615,000 | | 614,891 |
Ocean Energy, Inc. 4.375% 10/1/07 | | 2,310,000 | | 2,304,837 |
| | 8,618,038 |
TOTAL ENERGY | | 11,017,337 |
FINANCIALS - 6.0% |
Capital Markets - 1.2% |
Bear Stearns Companies, Inc.: | | | | |
5.5463% 2/1/12 (d) | | 745,000 | | 727,985 |
5.76% 7/19/10 (d) | | 2,000,000 | | 1,993,092 |
Nonconvertible Bonds - continued |
| Principal Amount | | Value |
FINANCIALS - continued |
Capital Markets - continued |
Lehman Brothers Holdings E-Capital Trust I 6.14% 8/19/65 (d) | | $ 1,205,000 | | $ 1,201,988 |
Lehman Brothers Holdings, Inc. 5.5% 5/25/10 (d) | | 1,500,000 | | 1,494,345 |
Merrill Lynch & Co., Inc. 5.59% 6/5/12 (d) | | 2,600,000 | | 2,547,012 |
Morgan Stanley 5.61% 1/18/11 (d) | | 1,900,000 | | 1,894,729 |
Royal Bank of Scotland PLC 5.66% 7/24/14 (d) | | 2,590,000 | | 2,596,993 |
| | 12,456,144 |
Commercial Banks - 1.3% |
Barclays Bank PLC: | | | | |
5.56% 5/25/15 (d) | | 825,000 | | 825,760 |
5.81% 9/11/13 (d) | | 3,500,000 | | 3,516,037 |
DBS Bank Ltd. (Singapore) 5.58% 5/16/17 (a)(d) | | 2,000,000 | | 1,991,780 |
HBOS plc 5.6306% 2/6/14 (d) | | 305,000 | | 305,753 |
HSBC Holdings PLC 5.56% 10/6/16 (d) | | 500,000 | | 500,613 |
ING Bank NV 5.61% 10/14/14 (d) | | 440,000 | | 441,188 |
Manufacturers & Traders Trust Co. 3.85% 4/1/13 (a)(d) | | 520,000 | | 514,831 |
PNC Funding Corp. 5.4975% 1/31/12 (d) | | 2,400,000 | | 2,399,035 |
Santander Issuances SA Unipersonal 5.72% 6/20/16 (a)(d) | | 1,900,000 | | 1,909,411 |
Sovereign Bank 4.375% 8/1/13 (d) | | 500,000 | | 494,350 |
| | 12,898,758 |
Consumer Finance - 1.4% |
Capital One Financial Corp. 5.64% 9/10/09 (d) | | 2,260,000 | | 2,261,180 |
General Electric Capital Corp. 5.4169% 5/10/10 (d) | | 2,845,000 | | 2,848,144 |
MBNA Capital I 8.278% 12/1/26 | | 810,000 | | 843,553 |
MBNA Europe Funding PLC 5.46% 9/7/07 (a)(d) | | 2,720,000 | | 2,720,359 |
SLM Corp.: | | | | |
5.33% 4/18/08 (a)(d) | | 2,500,000 | | 2,482,003 |
5.52% 7/26/10 (d) | | 2,770,000 | | 2,609,911 |
| | 13,765,150 |
Insurance - 0.2% |
Monumental Global Funding III 5.53% 1/25/13 (a)(d) | | 1,745,000 | | 1,745,002 |
Real Estate Investment Trusts - 0.7% |
iStar Financial, Inc.: | | | | |
5.47% 3/16/09 (d) | | 2,505,000 | | 2,517,655 |
5.69% 3/9/10 (d) | | 2,000,000 | | 2,002,710 |
Simon Property Group LP 6.375% 11/15/07 | | 2,310,000 | | 2,313,188 |
| | 6,833,553 |
Nonconvertible Bonds - continued |
| Principal Amount | | Value |
FINANCIALS - continued |
Real Estate Management & Development - 0.1% |
Chelsea GCA Realty Partnership LP 7.25% 10/21/07 | | $ 880,000 | | $ 882,526 |
Thrifts & Mortgage Finance - 1.1% |
Capmark Financial Group, Inc. 6.0069% 5/10/10 (a)(d) | | 2,000,000 | | 2,003,884 |
Independence Community Bank Corp. 3.5% 6/20/13 (d) | | 735,000 | | 722,056 |
Residential Capital Corp. 7.19% 4/17/09 (a)(d) | | 2,085,000 | | 2,064,150 |
Residential Capital LLC 6.46% 5/22/09 (d) | | 1,500,000 | | 1,426,176 |
Washington Mutual Bank 5.4463% 5/1/09 (d) | | 3,000,000 | | 2,998,989 |
Washington Mutual, Inc. 5.5% 8/24/09 (d) | | 2,250,000 | | 2,250,981 |
| | 11,466,236 |
TOTAL FINANCIALS | | 60,047,369 |
INFORMATION TECHNOLOGY - 0.4% |
Communications Equipment - 0.2% |
Motorola, Inc. 4.608% 11/16/07 | | 1,700,000 | | 1,695,789 |
Semiconductors & Semiconductor Equipment - 0.2% |
National Semiconductor Corp. 5.61% 6/15/10 (d) | | 1,710,000 | | 1,710,193 |
TOTAL INFORMATION TECHNOLOGY | | 3,405,982 |
TELECOMMUNICATION SERVICES - 2.1% |
Diversified Telecommunication Services - 2.0% |
AT&T, Inc. 5.45% 5/15/08 (d) | | 3,000,000 | | 3,002,184 |
BellSouth Corp. 5.46% 8/15/08 (d) | | 2,000,000 | | 2,001,668 |
Deutsche Telekom International Finance BV 5.54% 3/23/09 (d) | | 1,725,000 | | 1,727,743 |
Telecom Italia Capital SA 5.97% 7/18/11 (d) | | 3,750,000 | | 3,764,689 |
Telefonica Emisiones SAU: | | | | |
5.66% 6/19/09 (d) | | 4,775,000 | | 4,766,314 |
5.69% 2/4/13 (d) | | 3,000,000 | | 2,956,114 |
Telefonos de Mexico SA de CV 4.5% 11/19/08 | | 1,605,000 | | 1,581,110 |
| | 19,799,822 |
Wireless Telecommunication Services - 0.1% |
America Movil SAB de CV 5.46% 6/27/08 (a)(d) | | 1,506,000 | | 1,504,419 |
TOTAL TELECOMMUNICATION SERVICES | | 21,304,241 |
Nonconvertible Bonds - continued |
| Principal Amount | | Value |
UTILITIES - 0.9% |
Electric Utilities - 0.4% |
Commonwealth Edison Co. 3.7% 2/1/08 | | $ 1,125,000 | | $ 1,114,909 |
Pepco Holdings, Inc. 5.5% 8/15/07 | | 1,626,000 | | 1,628,715 |
TXU Electric Delivery Co. 5.735% 9/16/08 (a)(d) | | 1,085,000 | | 1,085,493 |
| | 3,829,117 |
Gas Utilities - 0.1% |
NiSource Finance Corp. 5.93% 11/23/09 (d) | | 845,000 | | 845,204 |
Multi-Utilities - 0.4% |
Dominion Resources, Inc. 5.66% 9/28/07 (d) | | 2,470,000 | | 2,470,326 |
Sempra Energy 4.75% 5/15/09 | | 2,000,000 | | 1,980,928 |
| | 4,451,254 |
TOTAL UTILITIES | | 9,125,575 |
TOTAL NONCONVERTIBLE BONDS (Cost $125,701,400) | 125,302,341 |
U.S. Government Agency Obligations - 5.0% |
|
Freddie Mac 4.75% 3/5/09 (c)
(Cost $49,927,296) | | 50,000,000 | 49,859,826 |
U.S. Government Agency - Mortgage Securities - 2.1% |
|
Fannie Mae - 1.8% |
3.236% 9/1/33 (d) | | 468,295 | | 460,158 |
3.668% 7/1/33 (d) | | 402,880 | | 398,752 |
3.955% 5/1/34 (d) | | 528,720 | | 522,998 |
4.239% 3/1/34 (d) | | 526,002 | | 520,619 |
4.28% 10/1/33 (d) | | 40,238 | | 40,039 |
4.282% 3/1/33 (d) | | 100,634 | | 101,087 |
4.283% 6/1/34 (d) | | 1,276,866 | | 1,263,769 |
4.302% 6/1/33 (d) | | 51,011 | | 51,379 |
4.53% 10/1/35 (d) | | 69,282 | | 69,129 |
4.555% 8/1/34 (d) | | 86,065 | | 87,345 |
4.723% 3/1/35 (d) | | 30,174 | | 30,305 |
4.87% 5/1/33 (d) | | 5,969 | | 6,027 |
4.882% 10/1/35 (d) | | 213,765 | | 212,980 |
4.889% 7/1/35 (d) | | 529,060 | | 528,238 |
5.016% 7/1/34 (d) | | 42,975 | | 42,845 |
U.S. Government Agency - Mortgage Securities - continued |
| Principal Amount | | Value |
Fannie Mae - continued |
5.087% 8/1/34 (d) | | $ 75,908 | | $ 75,809 |
5.149% 9/1/35 (d) | | 3,008,199 | | 2,997,358 |
5.176% 8/1/33 (d) | | 125,661 | | 125,740 |
5.233% 5/1/36 (d) | | 212,825 | | 212,764 |
5.258% 11/1/36 (d) | | 349,068 | | 349,220 |
5.277% 4/1/36 (d) | | 596,355 | | 601,712 |
5.294% 8/1/36 (d) | | 653,629 | | 654,204 |
5.297% 7/1/35 (d) | | 48,851 | | 49,215 |
5.342% 2/1/36 (d) | | 137,136 | | 137,197 |
5.5% 11/1/16 to 2/1/19 | | 3,285,144 | | 3,263,340 |
5.533% 11/1/36 (d) | | 723,634 | | 725,342 |
5.611% 10/1/35 (d) | | 272,108 | | 273,269 |
5.831% 3/1/36 (d) | | 1,093,360 | | 1,101,755 |
6.5% 7/1/16 to 3/1/35 | | 1,806,234 | | 1,843,891 |
7% 8/1/17 to 5/1/32 | | 968,410 | | 1,006,494 |
TOTAL FANNIE MAE | | 17,752,980 |
Freddie Mac - 0.3% |
3.377% 7/1/33 (d) | | 1,002,476 | | 992,278 |
4.043% 4/1/34 (d) | | 802,261 | | 788,941 |
4.784% 3/1/33 (d) | | 43,326 | | 43,858 |
4.922% 10/1/36 (d) | | 1,737,350 | | 1,729,682 |
TOTAL FREDDIE MAC | | 3,554,759 |
TOTAL U.S. GOVERNMENT AGENCY - MORTGAGE SECURITIES (Cost $21,453,593) | 21,307,739 |
Asset-Backed Securities - 29.4% |
|
Accredited Mortgage Loan Trust: | | | | |
Series 2004-2 Class A2, 5.62% 7/25/34 (d) | | 241,836 | | 241,685 |
Series 2004-4 Class A2D, 5.67% 1/25/35 (d) | | 89,039 | | 88,747 |
Series 2005-1 Class M1, 5.79% 4/25/35 (d) | | 1,545,000 | | 1,519,481 |
Series 2007-1 Class A3, 5.45% 2/25/37 (d) | | 1,000,000 | | 988,906 |
ACE Securities Corp.: | | | | |
Series 2002-HE2 Class M1, 6.595% 8/25/32 (d) | | 150,838 | | 150,938 |
Series 2003-HE1: | | | | |
Class M1, 5.97% 11/25/33 (d) | | 113,099 | | 110,613 |
Class M2, 7.02% 11/25/33 (d) | | 56,558 | | 55,160 |
Asset-Backed Securities - continued |
| Principal Amount | | Value |
ACE Securities Corp.: - continued | | | | |
Series 2003-HS1: | | | | |
Class M1, 6.07% 6/25/33 (d) | | $ 27,542 | | $ 27,591 |
Class M2, 7.07% 6/25/33 (d) | | 50,000 | | 50,304 |
Series 2003-NC1 Class M1, 6.1% 7/25/33 (d) | | 100,000 | | 98,192 |
Series 2004-HE1: | | | | |
Class M1, 5.82% 2/25/34 (d) | | 107,488 | | 103,490 |
Class M2, 6.42% 2/25/34 (d) | | 175,000 | | 161,894 |
Series 2005-HE2: | | | | |
Class M2, 5.77% 4/25/35 (d) | | 250,000 | | 246,416 |
Class M3, 5.8% 4/25/35 (d) | | 145,000 | | 141,815 |
Series 2005-HE3 Class A2B, 5.53% 5/25/35 (d) | | 34,211 | | 34,222 |
Series 2005-SD1 Class A1, 5.72% 11/25/50 (d) | | 84,033 | | 83,560 |
Series 2006-HE2: | | | | |
Class A2C, 5.48% 5/25/36 (d) | | 995,000 | | 978,831 |
Class M1, 5.62% 5/25/36 (d) | | 915,000 | | 868,417 |
Class M2, 5.64% 5/25/36 (d) | | 305,000 | | 288,504 |
Class M3, 5.66% 5/25/36 (d) | | 240,000 | | 217,893 |
Class M4, 5.72% 5/25/36 (d) | | 200,000 | | 174,411 |
Class M5, 5.76% 5/25/36 (d) | | 295,000 | | 247,140 |
ACE Securities Corp. Home Equity Loan Trust
Series 2007-HE1: | | | | |
Class A2C, 5.49% 1/25/37 (d) | | 1,000,000 | | 990,788 |
Class M1, 5.58% 1/25/37 (d) | | 755,000 | | 719,062 |
Advanta Business Card Master Trust: | | | | |
Series 2004-C1 Class C, 6.37% 9/20/13 (d) | | 340,000 | | 343,292 |
Series 2006-C1 Class C1, 5.8% 10/20/14 (d) | | 770,000 | | 769,996 |
Series 2007-B1 Class B, 5.57% 12/22/14 (d) | | 1,725,000 | | 1,727,744 |
Aesop Funding II LLC Series 2005-1A Class A2, 5.38% 4/20/09 (a)(d) | | 1,200,000 | | 1,199,872 |
American Express Credit Account Master Trust: | | | | |
Series 2004-1 Class B, 5.57% 9/15/11 (d) | | 410,000 | | 411,223 |
Series 2004-5 Class B, 5.57% 4/16/12 (d) | | 2,150,000 | | 2,150,136 |
Series 2004-C Class C, 5.82% 2/15/12 (a)(d) | | 368,551 | | 369,236 |
Series 2005-1 Class A, 5.35% 10/15/12 (d) | | 2,185,000 | | 2,184,959 |
Series 2005-6 Class C, 5.57% 3/15/11 (a)(d) | | 2,680,000 | | 2,681,367 |
AmeriCredit Automobile Receivables Trust: | | | | |
Series 2005-1 Class C, 4.73% 7/6/10 | | 2,500,000 | | 2,488,918 |
Series 2006-RM Class A1, 5.37% 10/6/09 | | 1,541,881 | | 1,542,136 |
Series 2007-BF Class A2, 5.31% 1/6/11 | | 1,230,000 | | 1,230,625 |
Series 2007-CM Class A2, 5.43% 11/8/10 | | 3,000,000 | | 3,001,464 |
Ameriquest Mortgage Securities, Inc.: | | | | |
Series 2003-1 Class M1, 6.67% 2/25/33 (d) | | 474,619 | | 473,993 |
Asset-Backed Securities - continued |
| Principal Amount | | Value |
Ameriquest Mortgage Securities, Inc.: - continued | | | | |
Series 2004-R11 Class M1, 5.98% 11/25/34 (d) | | $ 560,000 | | $ 553,764 |
Series 2004-R2: | | | | |
Class M1, 5.75% 4/25/34 (d) | | 85,000 | | 83,831 |
Class M2, 5.8% 4/25/34 (d) | | 75,000 | | 74,119 |
Series 2004-R8 Class M9, 8.07% 9/25/34 (d) | | 1,525,000 | | 1,255,202 |
Series 2004-R9 Class M2, 5.97% 10/25/34 (d) | | 720,000 | | 711,024 |
Series 2005-R1: | | | | |
Class M1, 5.77% 3/25/35 (d) | | 770,000 | | 753,102 |
Class M2, 5.8% 3/25/35 (d) | | 260,000 | | 251,345 |
Series 2005-R2 Class M1, 5.77% 4/25/35 (d) | | 1,700,000 | | 1,660,813 |
Series 2006-M3: | | | | |
Class M7, 6.17% 10/25/36 (d) | | 705,000 | | 615,113 |
Class M9, 7.32% 10/25/36 (d) | | 450,000 | | 291,094 |
Amortizing Residential Collateral Trust Series 2002-BC1 Class M2, 6.42% 1/25/32 (d) | | 21,053 | | 16,534 |
ARG Funding Corp.: | | | | |
Series 2005-1A Class A2, 5.42% 4/20/09 (a)(d) | | 1,500,000 | | 1,500,766 |
Series 2005-2A Class A2, 5.43% 5/20/09 (a)(d) | | 800,000 | | 800,521 |
Argent Securities, Inc.: | | | | |
Series 2003-W3 Class M2, 6.8739% 9/25/33 (d) | | 800,000 | | 790,358 |
Series 2004-W5 Class M1, 5.92% 4/25/34 (d) | | 1,420,000 | | 1,396,718 |
Series 2004-W7: | | | | |
Class M1, 5.87% 5/25/34 (d) | | 305,000 | | 298,830 |
Class M2, 5.92% 5/25/34 (d) | | 250,000 | | 246,596 |
Series 2006-W4: | | | | |
Class A2C, 5.48% 5/25/36 (d) | | 1,200,000 | | 1,180,313 |
Class M2, 5.64% 5/25/36 (d) | | 1,265,000 | | 1,196,599 |
Class M3, 5.66% 5/25/36 (d) | | 1,010,000 | | 947,370 |
Arran Funding Ltd. Series 2005-A Class C, 5.64% 12/15/10 (d) | | 3,235,000 | | 3,234,353 |
Asset Backed Funding Certificates Series 2004-HE1 Class M2, 6.47% 1/25/34 (d) | | 230,000 | | 226,248 |
Asset Backed Funding Corp. Series 2006-OPT2
Class C7, 5.47% 10/25/36 (d) | | 780,000 | | 757,575 |
Asset Backed Securities Corp. Home Equity Loan Trust: | | | | |
Series 2003-HE2 Class M1, 6.67% 4/15/33 (d) | | 1,165,025 | | 1,165,511 |
Series 2003-HE6 Class M1, 5.97% 11/25/33 (d) | | 215,000 | | 212,310 |
Series 2004-HE6 Class A2, 5.68% 6/25/34 (d) | | 305,093 | | 301,661 |
Series 2005-HE1 Class M1, 5.82% 3/25/35 (d) | | 540,000 | | 530,943 |
Series 2005-HE2: | | | | |
Class M1, 5.77% 3/25/35 (d) | | 1,105,000 | | 1,088,705 |
Class M2, 5.82% 3/25/35 (d) | | 275,000 | | 270,529 |
Asset-Backed Securities - continued |
| Principal Amount | | Value |
Asset Backed Securities Corp. Home Equity Loan Trust: - continued | | | | |
Series 2007-HE1 Class A4, 5.46% 12/25/36 (d) | | $ 1,000,000 | | $ 994,688 |
Bank of America Credit Card Master Trust: | | | | |
Series 2006-C7 Class C7, 5.55% 3/15/12 (d) | | 3,165,000 | | 3,161,669 |
Series 2007-C2 Class C2, 5.59% 9/17/12 (d) | | 2,050,000 | | 2,050,504 |
Bank One Issuance Trust: | | | | |
Series 2003-C4 Class C4, 6.35% 2/15/11 (d) | | 2,010,000 | | 2,024,296 |
Series 2004-C1 Class C1, 5.82% 11/15/11 (d) | | 25,000 | | 25,114 |
Bayview Financial Acquisition Trust Series 2004-C
Class A1, 5.74% 5/28/44 (d) | | 369,809 | | 369,925 |
Bayview Financial Mortgage Loan Trust Series 2004-A Class A, 5.77% 2/28/44 (d) | | 177,675 | | 177,758 |
Bear Stearns Asset Backed Securities Trust: | | | | |
Series 2004-BO1: | | | | |
Class M2, 6.07% 9/25/34 (d) | | 390,000 | | 369,203 |
Class M3, 6.37% 9/25/34 (d) | | 265,000 | | 245,890 |
Class M4, 6.52% 9/25/34 (d) | | 225,000 | | 203,957 |
Series 2004-HE9 Class M2, 6.52% 11/25/34 (d) | | 490,000 | | 461,770 |
Series 2005-HE2: | | | | |
Class M1, 5.82% 2/25/35 (d) | | 840,950 | | 832,470 |
Class M2, 6.07% 2/25/35 (d) | | 330,000 | | 305,394 |
Brazos Higher Education Authority, Inc. Series 2006-2 Class A9, 5.37% 12/26/24 (d) | | 2,375,570 | | 2,375,477 |
C-Bass Trust Series 2007-CB1 Class M1, 5.55% 1/25/37 (d) | | 215,000 | | 204,508 |
Capital Auto Receivables Asset Trust: | | | | |
Series 2005-1 Class B, 5.695% 6/15/10 (d) | | 850,000 | | 853,621 |
Series 2006-SN1A Class A4B, 5.43% 3/20/10 (a)(d) | | 2,700,000 | | 2,700,360 |
Capital One Auto Finance Trust: | | | | |
Series 2004-B Class A4, 5.43% 8/15/11 (d) | | 1,260,082 | | 1,260,400 |
Series 2006-B Class A2, 5.53% 4/15/09 | | 444,204 | | 444,190 |
Series 2007-A Class A2, 5.33% 5/17/10 | | 930,000 | | 930,409 |
Capital One Master Trust: | | | | |
Series 2001-1 Class B, 5.83% 12/15/10 (d) | | 500,000 | | 500,813 |
Series 2001-6 Class C, 6.7% 6/15/11 (a) | | 2,200,000 | | 2,228,875 |
Capital One Multi-Asset Execution Trust: | | | | |
Series 2003-B6 Class B6, 5.85% 9/15/11 (d) | | 1,125,000 | | 1,130,709 |
Series 2004-B1 Class B1, 5.76% 11/15/11 (d) | | 1,180,000 | | 1,186,372 |
Capital Trust Ltd. Series 2004-1: | | | | |
Class A2, 5.77% 7/20/39 (a)(d) | | 265,000 | | 265,374 |
Class B, 6.07% 7/20/39 (a)(d) | | 140,000 | | 140,981 |
Class C, 6.42% 7/20/39 (a)(d) | | 180,000 | | 181,136 |
Asset-Backed Securities - continued |
| Principal Amount | | Value |
Carrington Mortgage Loan Trust: | | | | |
Series 2006-FRE1: | | | | |
Class M7, 6.27% 7/25/36 (d) | | $ 445,000 | | $ 287,637 |
Class M9, 7.22% 7/25/36 (d) | | 285,000 | | 176,921 |
Series 2006-NC3 Class M10, 7.32% 8/25/36 (a)(d) | | 125,000 | | 41,250 |
Series 2007-RFC1 Class A3, 5.46% 12/25/36 (d) | | 1,000,000 | | 992,390 |
CDC Mortgage Capital Trust Series 2003-HE3 Class M1, 6.02% 11/25/33 (d) | | 91,792 | | 90,713 |
Cendant Timeshare Receivables Funding LLC
Series 2005 1A Class 2A2, 5.5% 5/20/17 (a)(d) | | 460,711 | | 458,075 |
Chase Credit Card Owner Trust Series 2003-6 Class C, 6.12% 2/15/11 (d) | | 2,210,000 | | 2,228,794 |
Chase Issuance Trust: | | | | |
Series 2004-C3 Class C3, 5.79% 6/15/12 (d) | | 1,645,000 | | 1,651,557 |
Series 2006-C3 Class C3, 5.55% 6/15/11 (d) | | 1,975,000 | | 1,975,639 |
CIT Equipment Collateral Trust Series 2005-VT1: | | | | |
Class C, 4.18% 11/20/12 | | 274,590 | | 272,705 |
Class D, 4.51% 11/20/12 | | 209,796 | | 208,174 |
Citibank Credit Card Issuance Trust: | | | | |
Series 2003-C1 Class C1, 6.46% 4/7/10 (d) | | 1,685,000 | | 1,695,590 |
Series 2006-C4 Class C4, 5.54% 1/9/12 (d) | | 2,365,000 | | 2,364,437 |
Series 2006-C6 Class C6, 5.65% 11/15/12 (d) | | 1,595,000 | | 1,598,381 |
CNH Equipment Trust Series 2007-A Class A2, 5.09% 10/15/09 | | 2,500,000 | | 2,498,562 |
College Loan Corp. Trust I Series 2006-1 Class A7B, 5.37% 4/25/46 (a)(d) | | 3,195,000 | | 3,195,000 |
Countrywide Home Loan Trust Series 2006-13N
Class N, 7% 8/25/37 (a) | | 353,273 | | 290,567 |
Countrywide Home Loans, Inc.: | | | | |
Series 2002-6 Class AV1, 5.75% 5/25/33 (d) | | 22,398 | | 22,409 |
Series 2003-BC1 Class M2, 8.0286% 9/25/32 (d) | | 196,139 | | 189,970 |
Series 2004-2 Class M1, 5.82% 5/25/34 (d) | | 375,000 | | 369,554 |
Series 2004-3: | | | | |
Class 3A4, 5.57% 8/25/34 (d) | | 1,273,720 | | 1,262,774 |
Class M1, 5.82% 6/25/34 (d) | | 100,000 | | 98,432 |
Series 2004-4 Class M2, 5.85% 6/25/34 (d) | | 315,000 | | 312,441 |
Series 2005-1: | | | | |
Class 1AV2, 5.52% 7/25/35 (d) | | 369,922 | | 369,806 |
Class MV1, 5.72% 7/25/35 (d) | | 435,000 | | 422,375 |
Class MV2, 5.76% 7/25/35 (d) | | 525,000 | | 513,170 |
Series 2005-AB1 Class A2, 5.53% 8/25/35 (d) | | 1,322,142 | | 1,319,043 |
CPS Auto Receivables Trust: | | | | |
Series 2006-B Class A2, 5.71% 6/15/16 (a) | | 2,042,199 | | 2,044,432 |
Asset-Backed Securities - continued |
| Principal Amount | | Value |
CPS Auto Receivables Trust: - continued | | | | |
Series 2006-C Class A2, 5.31% 3/15/10 (a) | | $ 1,447,703 | | $ 1,447,842 |
Series 2007-A Class A1, 5.332% 3/17/08 (a) | | 438,603 | | 438,572 |
Discover Card Master Trust I: | | | | |
Series 2003-4 Class B1, 5.65% 5/16/11 (d) | | 550,000 | | 552,065 |
Series 2005-1 Class B, 5.47% 9/16/10 (d) | | 1,580,000 | | 1,580,884 |
Series 2005-3 Class B, 5.51% 5/15/11 (d) | | 2,000,000 | | 2,005,520 |
Series 2006-1 Class B1, 5.47% 8/16/11 (d) | | 1,845,000 | | 1,847,023 |
Series 2006-2 Class B1, 5.44% 1/17/12 (d) | | 2,000,000 | | 2,001,947 |
DriveTime Auto Owner Trust Series 2006-B Class A2, 5.32% 3/15/10 (a) | | 1,281,600 | | 1,279,998 |
Fannie Mae subordinate REMIC pass-thru certificates Series 2004-T5: | | | | |
Class AB1, 5.57% 5/28/35 (d) | | 80,751 | | 79,754 |
Class AB3, 5.712% 5/28/35 (d) | | 32,052 | | 31,577 |
Fieldstone Mortgage Investment Corp.: | | | | |
Series 2004-3 Class M5, 6.77% 8/25/34 (d) | | 1,500,000 | | 1,438,710 |
Series 2006-2: | | | | |
Class 2A2, 5.49% 7/25/36 (d) | | 880,000 | | 862,537 |
Class M1, 5.63% 7/25/36 (d) | | 1,765,000 | | 1,642,941 |
First Franklin Mortgage Loan Trust: | | | | |
Series 2004-FF2: | | | | |
Class M3, 5.87% 3/25/34 (d) | | 25,000 | | 24,696 |
Class M4, 6.22% 3/25/34 (d) | | 24,349 | | 24,147 |
Series 2004-FF8 Class M3, 6.27% 10/25/34 (d) | | 1,760,000 | | 1,648,520 |
Series 2006-FF14: | | | | |
Class A5, 5.48% 10/25/36 (d) | | 990,000 | | 951,329 |
Class M1, 5.58% 10/25/36 (d) | | 880,000 | | 837,688 |
Series 2006-FF18 Class M1, 5.55% 12/25/37 (d) | | 3,500,000 | | 3,321,115 |
Series 2007-FF1 Class M1, 5.55% 1/25/38 (d) | | 375,000 | | 355,691 |
First Investors Auto Owner Trust Series 2006-A Class A3, 4.93% 2/15/11 (a) | | 683,986 | | 682,047 |
Ford Credit Floorplan Master Owner Trust: | | | | |
Series 2005-1: | | | | |
Class A, 5.47% 5/15/10 (d) | | 1,375,000 | | 1,375,102 |
Class B, 5.76% 5/15/10 (d) | | 1,110,000 | | 1,111,647 |
Series 2006-3: | | | | |
Class A, 5.5% 6/15/11 (d) | | 990,000 | | 990,223 |
Class B, 5.77% 6/15/11 (d) | | 1,405,000 | | 1,406,464 |
Fosse Master Issuer PLC Series 2007-1A Class C2, 0% 10/18/54 (a)(b)(d) | | 460,000 | | 460,000 |
Franklin Auto Trust Series 2006-1 Class A2, 5.2% 10/20/09 | | 888,410 | | 888,032 |
Asset-Backed Securities - continued |
| Principal Amount | | Value |
Fremont Home Loan Trust: | | | | |
Series 2003-B Class M6, 9.82% 12/25/33 (d) | | $ 236,627 | | $ 82,819 |
Series 2004-B Class M1, 5.9% 5/25/34 (d) | | 205,000 | | 200,976 |
Series 2004-C Class M1, 5.97% 8/25/34 (d) | | 540,000 | | 528,572 |
Series 2005-A: | | | | |
Class M1, 5.75% 1/25/35 (d) | | 225,000 | | 219,768 |
Class M2, 5.78% 1/25/35 (d) | | 325,000 | | 320,555 |
Class M3, 5.81% 1/25/35 (d) | | 175,000 | | 171,704 |
Class M4, 6% 1/25/35 (d) | | 125,000 | | 122,150 |
Series 2006-A: | | | | |
Class M3, 5.7% 5/25/36 (d) | | 455,000 | | 404,754 |
Class M4, 5.72% 5/25/36 (d) | | 685,000 | | 588,587 |
Class M5, 5.82% 5/25/36 (d) | | 365,000 | | 279,827 |
Series 2006-E Class M1, 5.58% 1/25/37 (d) | | 1,725,000 | | 1,635,441 |
GCO Education Loan Funding Master Trust II
Series 2007-1A Class C1L, 5.76% 9/25/30 (a)(d) | | 960,000 | | 957,220 |
GE Business Loan Trust Series 2003-1 Class A, 5.75% 4/15/31 (a)(d) | | 156,758 | | 156,758 |
GE Capital Credit Card Master Note Trust: | | | | |
Series 2005-2 Class B, 5.52% 6/15/11 (d) | | 925,000 | | 925,649 |
Series 2006-1: | | | | |
Class B, 5.43% 9/17/12 (d) | | 585,000 | | 585,472 |
Class C, 5.56% 9/17/12 (d) | | 455,000 | | 455,274 |
GE Equipment Midticket LLC Series 2006-1 Class A2, 5.1% 5/15/09 | | 1,325,000 | | 1,323,470 |
Gracechurch Card Funding PLC: | | | | |
Series 11 Class C, 5.6% 11/15/10 (d) | | 2,490,000 | | 2,490,000 |
Series 8 Class C, 5.65% 6/15/10 (d) | | 2,650,000 | | 2,648,384 |
Series 9: | | | | |
Class B, 5.47% 9/15/10 (d) | | 485,000 | | 485,000 |
Class C, 5.63% 9/15/10 (d) | | 1,800,000 | | 1,800,000 |
Granite Master Issuer PLC Series 2006-1A Class A4, 5.36% 12/20/30 (a)(d) | | 196,173 | | 196,175 |
GSAMP Trust: | | | | |
Series 2002-NC1 Class A2, 5.96% 7/25/32 (d) | | 2,606 | | 2,597 |
Series 2003-FM1 Class M1, 6.55% 3/20/33 (d) | | 565,268 | | 565,564 |
Series 2004-FM1: | | | | |
Class M1, 5.97% 11/25/33 (d) | | 168,544 | | 166,143 |
Class M2, 6.72% 11/25/33 (d) | | 76,057 | | 74,520 |
Series 2004-FM2 Class M1, 6.07% 1/25/34 (d) | | 232,499 | | 228,978 |
Series 2004-HE1: | | | | |
Class M1, 5.87% 5/25/34 (d) | | 289,483 | | 285,263 |
Class M2, 6.47% 5/25/34 (d) | | 150,000 | | 148,880 |
Asset-Backed Securities - continued |
| Principal Amount | | Value |
GSAMP Trust: - continued | | | | |
Series 2006-FM3 Class ABS, 5.52% 11/25/36 (d) | | $ 2,045,000 | | $ 2,025,993 |
Series 2006-HE5 Class M7, 6.15% 8/25/36 (d) | | 1,495,000 | | 1,018,526 |
Series 2006-NC2 Class M4, 5.67% 6/25/36 (d) | | 1,541,000 | | 1,284,980 |
Series 2007-FM1 Class M1, 5.59% 12/25/36 (d) | | 1,000,000 | | 961,070 |
Series 2007-FM2 Class M1, 5.6% 1/25/37 (d) | | 1,615,000 | | 1,552,629 |
Series 2007-HE1 Class M1, 5.57% 3/25/47 (d) | | 335,000 | | 317,593 |
Series 2007-NC1 Class M7, 6.27% 12/25/46 (d) | | 3,390,000 | | 1,695,000 |
GSR Mortgage Loan Trust: | | | | |
Series 2004-AHL Class A2D, 5.68% 8/25/34 (d) | | 178,621 | | 178,649 |
Series 2005-6 Class A2, 5.53% 6/25/35 (d) | | 1,800,000 | | 1,799,617 |
Series 2005-9 Class 2A1, 5.44% 8/25/35 (d) | | 395,292 | | 395,007 |
Series 2005-HE2 Class M, 5.75% 3/25/35 (d) | | 1,220,000 | | 1,187,492 |
Series 2005-MTR1 Class A1, 5.46% 10/25/35 (d) | | 653,910 | | 653,608 |
Series 2005-NC1 Class M1, 5.77% 2/25/35 (d) | | 1,205,000 | | 1,177,671 |
Guggenheim Structured Real Estate Funding Ltd.: | | | | |
Series 2005-1 Class C, 6.4% 5/25/30 (a)(d) | | 651,189 | | 605,606 |
Series 2006-3: | | | | |
Class B, 5.72% 9/25/46 (a)(d) | | 450,000 | | 441,000 |
Class C, 5.87% 9/25/46 (a)(d) | | 1,150,000 | | 1,104,000 |
Harwood Street Funding I LLC Series 2004-1A
Class CTFS, 7.32% 9/20/09 (a)(d) | | 1,700,000 | | 1,683,092 |
Holmes Master Issuer PLC Series 2007-2A Class 1C, 5.59% 7/15/21 (d) | | 1,640,000 | | 1,640,000 |
Home Equity Asset Trust: | | | | |
Series 2002-3 Class A5, 6.2% 2/25/33 (d) | | 14 | | 14 |
Series 2002-5 Class M1, 7.02% 5/25/33 (d) | | 165,576 | | 165,742 |
Series 2003-1 Class M1, 6.82% 6/25/33 (d) | | 524,845 | | 525,274 |
Series 2003-2 Class M1, 6.64% 8/25/33 (d) | | 66,323 | | 65,951 |
Series 2003-3 Class M1, 6.61% 8/25/33 (d) | | 320,568 | | 318,068 |
Series 2003-4 Class M1, 6.52% 10/25/33 (d) | | 96,601 | | 96,678 |
Series 2003-5: | | | | |
Class A2, 5.67% 12/25/33 (d) | | 10,566 | | 10,545 |
Class M1, 6.02% 12/25/33 (d) | | 160,000 | | 158,438 |
Class M2, 7.05% 12/25/33 (d) | | 30,927 | | 30,074 |
Series 2003-7: | | | | |
Class A2, 5.7% 3/25/34 (d) | | 2,079 | | 2,081 |
Class M1, 5.97% 3/25/34 (d) | | 795,000 | | 790,362 |
Series 2003-8 Class M1, 6.04% 4/25/34 (d) | | 192,210 | | 189,696 |
Series 2004-6 Class A2, 5.67% 12/25/34 (d) | | 18,234 | | 18,243 |
Series 2005-1 Class M1, 5.75% 5/25/35 (d) | | 1,270,000 | | 1,230,997 |
Series 2005-2: | | | | |
Class 2A2, 5.52% 7/25/35 (d) | | 259,937 | | 259,937 |
Asset-Backed Securities - continued |
| Principal Amount | | Value |
Home Equity Asset Trust: - continued | | | | |
Series 2005-2: | | | | |
Class M1, 5.77% 7/25/35 (d) | | $ 890,000 | | $ 878,330 |
Series 2007-1 Class M1, 5.56% 5/25/37 (d) | | 1,940,000 | | 1,875,175 |
Series 2007-3 Class 2A3, 5.56% 8/25/37 (d) | | 2,015,000 | | 2,000,202 |
Household Home Equity Loan Trust Series 2004-1
Class M, 5.84% 9/20/33 (d) | | 86,560 | | 84,970 |
HSBC Automotive Trust: | | | | |
Series 2006-1 Class A2, 5.4% 6/17/09 | | 597,362 | | 597,289 |
Series 2006-2 Class A2, 5.61% 6/17/09 | | 412,534 | | 412,590 |
Series 2007-1 Class A2, 5.32% 5/17/10 | | 1,070,000 | | 1,070,006 |
HSBC Home Equity Loan Trust: | | | | |
Series 2005-2: | | | | |
Class M1, 5.78% 1/20/35 (d) | | 181,046 | | 178,386 |
Class M2, 5.81% 1/20/35 (d) | | 134,778 | | 132,755 |
Series 2005-3: | | | | |
Class A1, 5.58% 1/20/35 (d) | | 412,581 | | 409,744 |
Class M1, 5.74% 1/20/35 (d) | | 242,271 | | 238,526 |
Series 2006-2: | | | | |
Class M1, 5.59% 3/20/36 (d) | | 600,432 | | 587,292 |
Class M2, 5.61% 3/20/36 (d) | | 991,246 | | 968,972 |
HSI Asset Securitization Corp. Trust Series 2007-HE1 Class M1, 5.62% 1/25/37 (d) | | 1,025,000 | | 978,073 |
IXIS Real Estate Capital Trust Series 2005-HE1 Class M1, 5.79% 6/25/35 (d) | | 492,536 | | 484,104 |
John Deere Owner Trust Series 2006-A Class A2, 5.41% 11/17/08 | | 139,583 | | 139,560 |
JPMorgan Auto Receivables Trust Series 2007-A
Class A2, 5.3% 12/15/09 (a) | | 1,665,000 | | 1,665,513 |
JPMorgan Mortgage Acquisition Trust Series 2006-WMC4 Class A4, 5.47% 12/25/36 (d) | | 3,000,000 | | 2,921,250 |
Keycorp Student Loan Trust Series 1999-A Class A2, 5.69% 12/27/09 (d) | | 178,335 | | 178,745 |
Long Beach Auto Receivables Trust: | | | | |
Series 2006-B Class A2, 5.34% 11/15/09 | | 1,000,226 | | 1,000,171 |
Series 2007-A Class A1, 5.335% 4/15/08 | | 657,235 | | 657,189 |
Long Beach Mortgage Loan Trust: | | | | |
Series 2003-2 Class M1, 6.55% 6/25/33 (d) | | 462,597 | | 461,883 |
Series 2003-3 Class M1, 6.07% 7/25/33 (d) | | 337,423 | | 337,270 |
Series 2005-1 Class M2, 5.85% 2/25/35 (d) | | 1,410,000 | | 1,386,824 |
Series 2005-WL1 Class M2, 5.87% 6/25/35 (d) | | 660,000 | | 660,462 |
Asset-Backed Securities - continued |
| Principal Amount | | Value |
Long Beach Mortgage Loan Trust: - continued | | | | |
Series 2006-6: | | | | |
Class 2A3, 5.47% 7/25/36 (d) | | $ 1,435,000 | | $ 1,385,448 |
Class M4, 5.68% 7/25/36 (d) | | 425,000 | | 357,647 |
Class M5, 5.71% 7/25/36 (d) | | 265,000 | | 212,595 |
Series 2006-7 Class M10, 7.82% 8/25/36 (d) | | 675,000 | | 202,500 |
MASTR Asset Backed Securities Trust: | | | | |
Series 2004-HE1 Class M1, 5.97% 9/25/34 (d) | | 685,000 | | 676,037 |
Series 2006-HE3 Class A2, 5.42% 8/25/36 (d) | | 1,140,000 | | 1,125,572 |
Series 2007-WMC1 Class A4, 5.48% 1/25/37 (d) | | 1,380,000 | | 1,365,985 |
MBNA Credit Card Master Note Trust: | | | | |
Series 2002-B4 Class B4, 5.82% 3/15/10 (d) | | 630,000 | | 630,526 |
Series 2003-B1 Class B1, 5.76% 7/15/10 (d) | | 1,510,000 | | 1,513,112 |
Series 2003-B2 Class B2, 5.71% 10/15/10 (d) | | 125,000 | | 125,333 |
Series 2003-B3 Class B3, 5.695% 1/18/11 (d) | | 1,550,000 | | 1,555,642 |
Series 2003-B5 Class B5, 5.69% 2/15/11 (d) | | 2,000,000 | | 2,007,078 |
Series 2003-C2 Class C2, 6.92% 6/15/10 (d) | | 2,000,000 | | 2,013,322 |
Series 2005-C1 Class C, 5.73% 10/15/12 (d) | | 2,505,000 | | 2,522,051 |
Series 2005-C2 Class C, 5.67% 2/15/13 (d) | | 2,505,000 | | 2,516,617 |
Series 2005-C3 Class C, 5.59% 3/15/11 (d) | | 2,830,000 | | 2,835,016 |
MBNA Master Credit Card Trust II Series 1998-E Class B, 5.69% 9/15/10 (d) | | 200,000 | | 200,387 |
Meritage Mortgage Loan Trust Series 2004-1: | | | | |
Class M1, 6.07% 7/25/34 (d) | | 141,466 | | 140,510 |
Class M2, 6.145% 7/25/34 (d) | | 11,233 | | 11,173 |
Merrill Lynch First Franklin Mortgage Loan Trust Series 2007-1: | | | |
Class A2C, 5.57% 4/25/37 (d) | | 1,035,000 | | 1,023,033 |
Class M1, 5.7% 4/25/37 (d) | | 1,355,000 | | 1,315,927 |
Merrill Lynch Mortgage Investors, Inc.: | | | | |
Series 2004-FM1 Class M2, 6.47% 1/25/35 (d) | | 57,263 | | 53,004 |
Series 2004-HE2 Class A1B, 5.79% 8/25/35 (d) | | 70,891 | | 70,991 |
Series 2006-FM1 Class A2B, 5.43% 4/25/37 (d) | | 1,055,000 | | 1,051,208 |
Morgan Stanley ABS Capital I, Inc.: | | | | |
Series 2002-HE3 Class M1, 6.42% 12/27/32 (d) | | 114,935 | | 114,935 |
Series 2003-NC10 Class M1, 6% 10/25/33 (d) | | 792,708 | | 782,417 |
Series 2003-NC8 Class M1, 6.02% 9/25/33 (d) | | 119,992 | | 119,931 |
Series 2004-HE6 Class A2, 5.66% 8/25/34 (d) | | 79,986 | | 79,999 |
Series 2004-NC2 Class M1, 5.87% 12/25/33 (d) | | 347,703 | | 340,993 |
Series 2005-1 Class M2, 5.79% 12/25/34 (d) | | 570,000 | | 557,500 |
Series 2005-HE1: | | | | |
Class M1, 5.77% 12/25/34 (d) | | 150,000 | | 145,263 |
Class M2, 5.79% 12/25/34 (d) | | 385,000 | | 376,051 |
Asset-Backed Securities - continued |
| Principal Amount | | Value |
Morgan Stanley ABS Capital I, Inc.: - continued | | | | |
Series 2005-HE2: | | | | |
Class M1, 5.72% 1/25/35 (d) | | $ 370,000 | | $ 358,201 |
Class M2, 5.76% 1/25/35 (d) | | 265,000 | | 258,631 |
Series 2005-NC1: | | | | |
Class M1, 5.76% 1/25/35 (d) | | 325,000 | | 314,750 |
Class M2, 5.79% 1/25/35 (d) | | 325,000 | | 317,322 |
Class M3, 5.83% 1/25/35 (d) | | 325,000 | | 312,167 |
Series 2006-HE4: | | | | |
Class M1, 5.6% 6/25/36 (d) | | 440,000 | | 417,969 |
Class M2: | | | | |
5.62% 6/25/36 (d) | | 770,000 | | 730,507 |
5.63% 6/25/36 (d) | | 550,000 | | 501,576 |
Class M4, 5.67% 6/25/36 (d) | | 1,160,000 | | 1,017,047 |
Series 2006-HE5 Class B1, 6.29% 8/25/36 (d) | | 2,415,000 | | 1,409,100 |
Morgan Stanley Dean Witter Capital I Trust: | | | | |
Series 2001-AM1 Class M1, 6.595% 2/25/32 (d) | | 279,043 | | 279,218 |
Series 2001-NC1 Class M2, 6.925% 10/25/31 (d) | | 8,084 | | 7,546 |
Series 2001-NC4 Class M1, 6.82% 1/25/32 (d) | | 20,819 | | 20,839 |
Series 2002-AM3 Class A3, 6.3% 2/25/33 (d) | | 14,114 | | 14,121 |
Series 2002-HE1 Class M1, 6.22% 7/25/32 (d) | | 572,410 | | 560,060 |
Series 2002-NC3 Class M1, 6.4% 8/25/32 (d) | | 100,000 | | 99,947 |
Series 2002-OP1 Class M1, 6.445% 9/25/32 (d) | | 289,725 | | 287,805 |
Navistar Financial Dealer Note Master Trust
Series 2005-1 Class A, 5.43% 2/25/13 (d) | | 2,050,000 | | 2,045,011 |
New Century Home Equity Loan Trust Series 2005-1: | | | | |
Class M1, 5.77% 3/25/35 (d) | | 595,000 | | 584,077 |
Class M2, 5.8% 3/25/35 (d) | | 595,000 | | 586,093 |
Class M3, 5.84% 3/25/35 (d) | | 290,000 | | 283,310 |
Nissan Auto Lease Trust: | | | | |
Series 2004-A Class A4A, 5.39% 6/15/10 (d) | | 157,665 | | 157,679 |
Series 2005-A Class A4, 5.37% 8/15/11 (d) | | 2,210,000 | | 2,210,196 |
Nomura Home Equity Loan Trust: | | | | |
Series 2006-HE3: | | | | |
Class M7, 6.12% 7/25/36 (d) | | 485,000 | | 350,682 |
Class M8, 6.27% 7/25/36 (d) | | 340,000 | | 218,322 |
Class M9, 7.17% 7/25/36 (d) | | 490,000 | | 255,876 |
Series 2007-2 Class 2A3, 5.51% 2/25/37 (d) | | 947,000 | | 938,562 |
NovaStar Home Equity Loan Series 2004-1: | | | | |
Class M1, 5.77% 6/25/34 (d) | | 100,000 | | 98,093 |
Class M4, 6.295% 6/25/34 (d) | | 170,000 | | 167,975 |
Asset-Backed Securities - continued |
| Principal Amount | | Value |
NovaStar Mortgage Funding Trust: | | | | |
Series 2003-3 Class A3, 5.77% 12/25/33 (d) | | $ 42,010 | | $ 42,226 |
Series 2007-1 Class A2C, 5.5% 3/25/37 (d) | | 805,000 | | 761,480 |
Ocala Funding LLC Series 2006-1A Class A, 6.72% 3/20/11 (a)(d) | | 965,000 | | 928,813 |
Option One Mortgage Loan Trust Series 2003-6
Class M1, 5.97% 11/25/33 (d) | | 1,025,000 | | 1,028,943 |
Park Place Securities, Inc.: | | | | |
Series 2004-WCW1: | | | | |
Class M1, 5.95% 9/25/34 (d) | | 815,000 | | 789,548 |
Class M2, 6% 9/25/34 (d) | | 160,000 | | 153,524 |
Class M3, 6.57% 9/25/34 (d) | | 310,000 | | 293,060 |
Class M4, 6.77% 9/25/34 (d) | | 435,000 | | 403,061 |
Series 2004-WWF1: | | | | |
Class A5, 5.79% 1/25/35 (d) | | 6,172 | | 6,094 |
Class M4, 6.42% 1/25/35 (d) | | 945,000 | | 904,102 |
Series 2005-WCH1: | | | | |
Class A3B, 5.54% 1/25/35 (d) | | 9,352 | | 9,354 |
Class M2, 5.84% 1/25/35 (d) | | 1,130,000 | | 1,102,828 |
Class M3, 5.88% 1/25/35 (d) | | 425,000 | | 409,727 |
Class M5, 6.2% 1/25/35 (d) | | 400,000 | | 377,995 |
Series 2005-WHQ1 Class M7, 6.57% 3/25/35 (d) | | 910,000 | | 761,657 |
Providian Master Note Trust: | | | | |
Series 2005-2 Class C2, 5.82% 11/15/12 (a)(d) | | 2,160,000 | | 2,164,082 |
Series 2006-C1A Class C1, 5.87% 3/16/15 (a)(d) | | 2,465,000 | | 2,465,000 |
Residential Asset Mortgage Products, Inc.: | | | | |
Series 2004-RS10 Class MII2, 6.57% 10/25/34 (d) | | 1,300,000 | | 1,237,425 |
Series 2004-RS6: | | | | |
Class 2M2, 6.62% 6/25/34 (d) | | 250,000 | | 246,312 |
Class 2M3, 6.77% 6/25/34 (d) | | 250,000 | | 221,402 |
Series 2005-SP2 Class 1A1, 5.47% 5/25/44 (d) | | 128,322 | | 128,302 |
Series 2007-RZ1 Class A2, 5.48% 2/25/37 (d) | | 1,200,000 | | 1,194,039 |
Residential Asset Securities Corp. Series 2004-KS10 Class AI2, 5.64% 3/25/29 (d) | | 1,118 | | 1,118 |
Salomon Brothers Mortgage Securities VII, Inc.
Series 2003-HE1 Class A, 5.72% 4/25/33 (d) | | 1,451 | | 1,435 |
Saxon Asset Securities Trust: | | | | |
Series 2004-1 Class M1, 6.115% 3/25/35 (d) | | 640,000 | | 631,197 |
Series 2004-2 Class MV1, 5.9% 8/25/35 (d) | | 327,280 | | 324,762 |
Series 2007-1 Class A2C, 5.47% 2/25/37 (d) | | 1,000,000 | | 984,375 |
Asset-Backed Securities - continued |
| Principal Amount | | Value |
Securitized Asset Backed Receivables LLC Trust: | | | | |
Series 2006-WM4 Class M1, 5.56% 11/25/36 (d) | | $ 890,000 | | $ 846,390 |
Series 2007-HE1 Class M1, 5.57% 12/25/36 (d) | | 955,000 | | 903,589 |
Series 2007-NC1 Class M1, 5.56% 12/25/36 (d) | | 2,035,000 | | 1,934,483 |
Series 2007-NC2 Class M1, 5.55% 1/25/37 (d) | | 385,000 | | 365,442 |
Sierra Timeshare Receivables Fund LLC Series 2006-1A Class A2, 5.47% 5/20/18 (a)(d) | | 2,213,840 | | 2,213,829 |
Sovereign Dealer Floor Plan Master LLC Series 2006-1: | | | | |
Class B, 5.5% 8/15/11 (a)(d) | | 1,140,000 | | 1,139,772 |
Class C, 5.7% 8/15/11 (a)(d) | | 520,000 | | 519,896 |
Specialty Underwriting & Residential Finance Trust: | | | | |
Series 2003-BC3 Class M1, 5.97% 8/25/34 (d) | | 1,000,000 | | 998,544 |
Series 2003-BC4 Class M1, 5.92% 11/25/34 (d) | | 260,000 | | 251,673 |
Structured Asset Corp. Trust Series 2006-BC6: | | | | |
Class A4, 5.49% 1/25/37 (d) | | 1,215,000 | | 1,188,698 |
Class M1, 5.59% 1/25/37 (d) | | 1,180,000 | | 1,116,230 |
Structured Asset Investment Loan Trust: | | | | |
Series 2003-BC9 Class M1, 6.02% 8/25/33 (d) | | 1,135,000 | | 1,128,890 |
Series 2004-8 Class M5, 6.47% 9/25/34 (d) | | 290,000 | | 278,867 |
Series 2005-1 Class M4, 6.08% 2/25/35 (a)(d) | | 485,000 | | 470,312 |
Structured Asset Securities Corp.: | | | | |
Series 2004-GEL1 Class A, 5.68% 2/25/34 (d) | | 25,222 | | 24,871 |
Series 2007-BC1 Class M1, 5.55% 2/25/37 (d) | | 3,195,000 | | 3,071,293 |
Superior Wholesale Inventory Financing Trust: | | | | |
Series 2004-A10: | | | | |
Class A, 5.42% 9/15/11 (d) | | 2,735,000 | | 2,731,647 |
Class B, 5.6% 9/15/11 (d) | | 1,625,000 | | 1,627,627 |
Series 2007-AE1: | | | | |
Class A, 5.42% 1/15/12 (d) | | 400,000 | | 399,889 |
Class B, 5.62% 1/15/12 (d) | | 335,000 | | 334,907 |
Class C, 5.92% 1/15/12 (d) | | 420,000 | | 419,996 |
Superior Wholesale Inventory Financing Trust VII
Series 2003-A8 Class CTFS, 5.77% 3/15/11 (a)(d) | | 675,000 | | 678,077 |
Superior Wholesale Inventory Financing Trust XII
Series 2005-A12 Class C, 6.52% 6/15/10 (d) | | 980,000 | | 987,813 |
Swift Master Auto Receivables Trust Series 2007-1: | | | | |
Class A, 5.42% 6/15/12 (d) | | 1,015,000 | | 1,015,000 |
Class B, 5.54% 6/15/12 (d) | | 790,000 | | 790,000 |
Class C, 5.82% 6/15/12 (d) | | 470,000 | | 470,000 |
Terwin Mortgage Trust: | | | | |
Series 2003-4HE Class A1, 5.75% 9/25/34 (d) | | 21,802 | | 21,564 |
Series 2003-6HE Class A1, 5.79% 11/25/33 (d) | | 17,086 | | 17,145 |
Series 2005-14HE Class AF1, 5.46% 8/25/36 (d) | | 90,678 | | 90,678 |
Asset-Backed Securities - continued |
| Principal Amount | | Value |
Triad Auto Receivables Owner Trust Series 2006-B
Class A2, 5.36% 11/12/09 | | $ 643,062 | | $ 642,957 |
Turquoise Card Backed Securities PLC Series 2006-1A Class C, 5.65% 5/16/11 (a)(d) | | 2,165,000 | | 2,160,518 |
UPFC Auto Receivables Trust: | | | | |
Series 2006-A Class A2, 5.46% 6/15/09 | | 278,277 | | 278,321 |
Series 2007-A Class A2, 5.46% 6/15/10 | | 1,245,000 | | 1,247,110 |
Wachovia Auto Loan Owner Trust Series 2006-1
Class A2, 5.28% 4/20/10 (a) | | 1,743,721 | | 1,743,405 |
WaMu Master Note Trust: | | | | |
Series 2006-A3A Class A3, 5.35% 9/16/13 (a)(d) | | 3,025,000 | | 3,024,364 |
Series 2007-C1 Class C1, 5.72% 5/15/14 (a)(d) | | 1,595,000 | | 1,594,984 |
WFS Financial Owner Trust: | | | | |
Series 2004-3 Class D, 4.07% 2/17/12 | | 165,867 | | 165,048 |
Series 2004-4 Class D, 3.58% 5/17/12 | | 154,808 | | 153,664 |
Series 2005-1 Class D, 4.09% 8/15/12 | | 165,032 | | 163,758 |
Whinstone Capital Management Ltd. Series 1A Class B3, 6.255% 10/25/44 (a)(d) | | 1,696,801 | | 1,696,801 |
TOTAL ASSET-BACKED SECURITIES (Cost $303,720,753) | 294,087,412 |
Collateralized Mortgage Obligations - 15.4% |
|
Private Sponsor - 12.4% |
ACE Securities Corp. Home Equity Loan Trust floater Series 2007-WM1: | | | | |
Class A2C, 5.49% 11/25/36 (d) | | 1,000,000 | | 943,438 |
Class M1, 5.57% 11/25/36 (d) | | 530,000 | | 501,913 |
American Home Mortgage Assets Trust floater Series 2006-1 Class 2A1, 5.51% 5/25/46 (d) | | 977,142 | | 977,766 |
Arkle Master Issuer PLC floater Series 2007-1A
Class 1C, 5.62% 2/17/52 (a)(d) | | 1,625,000 | | 1,625,000 |
Banc of America Mortgage Securities, Inc. Series 2003-I Class 2A6, 4.1485% 10/25/33 (d) | | 4,245,000 | | 4,262,385 |
Bear Stearns Adjustable Rate Mortgage Trust floater Series 2005-6 Class 1A1, 5.0828% 8/25/35 (d) | | 1,509,004 | | 1,510,420 |
Bear Stearns Alt-A Trust floater: | | | | |
Series 2005-1 Class A1, 5.6% 1/25/35 (d) | | 1,134,983 | | 1,137,045 |
Series 2005-2 Class 1A1, 5.57% 3/25/35 (d) | | 589,020 | | 589,618 |
Collateralized Mortgage Obligations - continued |
| Principal Amount | | Value |
Private Sponsor - continued |
Citigroup Mortgage Loan Trust, Inc.: | | | | |
floater Series 2006-NC1: | | | | |
Class M4, 5.71% 8/25/36 (d) | | $ 1,205,000 | | 1,027,142 |
Class M5, 5.74% 8/25/36 (d) | | 860,000 | | 701,048 |
Series 2004-UST1 Class A3, 4.228% 8/25/34 (d) | | 2,269,042 | | 2,241,000 |
Credit Suisse First Boston Adjustable Rate Mortgage Trust floater: | | | | |
Series 2004-2 Class 7A3, 5.72% 2/25/35 (d) | | 292,760 | | 294,060 |
Series 2004-4 Class 5A2, 5.72% 3/25/35 (d) | | 79,492 | | 79,774 |
Series 2005-1 Class 5A2, 5.65% 5/25/35 (d) | | 183,523 | | 184,187 |
Series 2005-10 Class 5A2, 5.64% 1/25/36 (d) | | 997,528 | | 999,153 |
Series 2005-2: | | | | |
Class 6A2, 5.6% 6/25/35 (d) | | 66,012 | | 66,077 |
Class 6M2, 5.8% 6/25/35 (d) | | 1,375,000 | | 1,376,813 |
Series 2005-3 Class 8A2, 5.56% 7/25/35 (d) | | 745,192 | | 746,745 |
Series 2005-5 Class 6A2, 5.55% 9/25/35 (d) | | 615,233 | | 616,920 |
Series 2005-8 Class 7A2, 5.6% 11/25/35 (d) | | 460,426 | | 461,861 |
Credit Suisse First Boston Mortgage Securities Corp. floater: | | | | |
Series 2004-AR2 Class 6A1, 5.72% 3/25/34 (d) | | 22,081 | | 22,098 |
Series 2004-AR3 Class 6A2, 5.69% 4/25/34 (d) | | 8,817 | | 8,820 |
Series 2004-AR5 Class 11A2, 5.69% 6/25/34 (d) | | 37,397 | | 37,410 |
Series 2004-AR6 Class 9A2, 5.69% 10/25/34 (d) | | 54,114 | | 54,141 |
Series 2004-AR7 Class 6A2, 5.7% 8/25/34 (d) | | 77,944 | | 78,060 |
Series 2004-AR8 Class 8A2, 5.7% 9/25/34 (d) | | 41,239 | | 41,323 |
CWALT, Inc. floater Series 2005-56 Class 3A1, 5.61% 11/25/35 (d) | | 360,336 | | 361,367 |
Deutsche Alt-A Securities Mortgage Loan Trust floater Series 2007-BAR1 Class A3, 5.48% 3/25/37 (d) | | 1,375,000 | | 1,374,907 |
First Franklin Mortgage Loan Trust floater Series 2006-FF13: | | | | |
Class M7, 6.07% 10/25/36 (d) | | 1,205,000 | | 781,161 |
Class M8, 6.27% 10/25/36 (d) | | 525,000 | | 236,250 |
First Horizon Mortgage pass-thru Trust floater Series 2004-FL1 Class 2A1, 5.67% 12/25/34 (d) | | 71,259 | | 71,235 |
Gracechurch Mortgage Funding PLC floater Series 1A: | | | | |
Class A2B, 5.42% 10/11/41 (a)(d) | | 2,060,293 | | 2,060,231 |
Class CB, 5.63% 10/11/41 (a)(d) | | 260,000 | | 259,992 |
Class DB, 5.82% 10/11/41 (a)(d) | | 1,060,000 | | 1,059,968 |
Collateralized Mortgage Obligations - continued |
| Principal Amount | | Value |
Private Sponsor - continued |
Granite Master Issuer PLC floater: | | | | |
Series 2005-1 Class A3, 5.44% 12/21/24 (d) | | $ 350,000 | | $ 350,056 |
Series 2005-2 Class C1, 5.86% 12/20/54 (d) | | 3,110,000 | | 3,104,169 |
Series 2005-4: | | | | |
Class A3, 5.43% 12/20/54 (d) | | 2,230,000 | | 2,230,290 |
Class C1, 5.79% 12/20/54 (d) | | 5,580,616 | | 5,580,616 |
Class M2, 5.64% 12/20/54 (d) | | 1,830,000 | | 1,830,997 |
Series 2006-1A: | | | | |
Class A5, 5.43% 12/20/54 (a)(d) | | 1,000,000 | | 1,000,313 |
Class C2, 5.96% 12/20/54 (a)(d) | | 1,545,000 | | 1,544,954 |
Series 2006-3 Class C2, 5.86% 12/20/54 (d) | | 1,230,000 | | 1,230,000 |
Series 2006-4: | | | | |
Class B1, 5.45% 12/20/54 (d) | | 1,250,000 | | 1,249,938 |
Class C1, 5.74% 12/20/54 (d) | | 765,000 | | 764,962 |
Class M1, 5.53% 12/20/54 (d) | | 330,000 | | 329,984 |
Series 2007-1: | | | | |
Class 1C1, 5.66% 12/20/54 (d) | | 555,000 | | 555,195 |
Class 1M1, 5.51% 12/20/54 (d) | | 500,000 | | 499,785 |
Class 2B1, 5.48% 12/20/54 (d) | | 535,000 | | 535,000 |
Class 2C1, 5.79% 12/20/54 (d) | | 295,000 | | 294,124 |
Class 2M1, 5.61% 12/20/54 (d) | | 645,000 | | 643,060 |
GSR Mortgage Loan Trust: | | | | |
floater Series 2004-11 Class 2A1, 5.65% 12/20/34 (d) | | 661,761 | | 664,229 |
Series 2006-AR2 Class 4A1, 5.8544% 4/25/36 (d) | | 3,176,771 | | 3,182,351 |
Holmes Financing No. 10 PLC floater Series 10A: | | | | |
Class 2A, 5.39% 7/15/40 (a)(d) | | 1,040,000 | | 1,040,284 |
Class 2C, 5.71% 7/15/40 (a)(d) | | 975,000 | | 974,971 |
Holmes Financing No. 9 PLC floater Class 2A, 5.42% 7/15/13 (d) | | 2,780,000 | | 2,780,612 |
Homestar Mortgage Acceptance Corp. floater
Series 2004-5 Class A1, 5.77% 10/25/34 (d) | | 376,180 | | 377,903 |
HSI Asset Securitization Corp. Trust floater
Series 2007-OPT1 Class M1, 5.55% 12/25/36 (d) | | 670,000 | | 636,655 |
Impac CMB Trust floater: | | | | |
Series 2004-11 Class 2A2, 5.69% 3/25/35 (d) | | 302,025 | | 302,318 |
Series 2004-6 Class 1A2, 5.71% 10/25/34 (d) | | 91,912 | | 91,946 |
Series 2005-1: | | | | |
Class M1, 5.78% 4/25/35 (d) | | 156,285 | | 156,368 |
Class M2, 5.82% 4/25/35 (d) | | 276,378 | | 276,451 |
Class M3, 5.85% 4/25/35 (d) | | 67,449 | | 67,425 |
Collateralized Mortgage Obligations - continued |
| Principal Amount | | Value |
Private Sponsor - continued |
Impac CMB Trust floater: - continued | | | | |
Series 2005-1: | | | | |
Class M4, 6.07% 4/25/35 (d) | | $ 41,128 | | $ 32,080 |
Class M5, 6.09% 4/25/35 (d) | | 41,128 | | 30,846 |
Class M6, 6.14% 4/25/35 (d) | | 64,159 | | 45,232 |
Series 2005-2 Class 1A2, 5.63% 4/25/35 (d) | | 675,603 | | 676,186 |
Series 2005-4 Class 1B1, 6.62% 5/25/35 (d) | | 278,394 | | 267,867 |
Series 2005-7: | | | | |
Class M1, 5.8% 11/25/35 (d) | | 152,297 | | 149,944 |
Class M2, 5.84% 11/25/35 (d) | | 114,222 | | 113,849 |
Class M3, 5.94% 11/25/35 (d) | | 571,112 | | 445,468 |
Class M4, 5.98% 11/25/35 (d) | | 272,865 | | 204,649 |
JPMorgan Mortgage Trust Series 2006-A2 Class 5A1, 3.7544% 11/25/33 (d) | | 3,081,435 | | 3,059,600 |
Kildare Securities Ltd. floater Series 2007-1 Class A2, 5.42% 12/10/43 (a)(d) | | 865,000 | | 865,979 |
Lehman Structured Securities Corp. floater Series 2005-1 Class A2, 5.71% 9/26/45 (a)(d) | | 564,894 | | 567,252 |
Lehman XS Trust floater: | | | | |
Series 2006-12N Class A1A1, 5.4% 8/25/46 (d) | | 1,347,069 | | 1,347,281 |
Series 2006-GP1 Class A1, 5.41% 5/25/46 (d) | | 1,004,198 | | 1,003,868 |
MASTR Adjustable Rate Mortgages Trust floater: | | | | |
Series 2004-11: | | | | |
Class 1A4, 5.81% 11/25/34 (d) | | 40,960 | | 41,268 |
Class 2A1, 5.7% 11/25/34 (d) | | 81,477 | | 81,726 |
Class 2A2, 5.76% 11/25/34 (d) | | 17,937 | | 18,005 |
Series 2005-1 Class 1A1, 5.59% 3/25/35 (d) | | 107,784 | | 107,994 |
MASTR Seasoned Securitization Trust Series 2004-1 Class 1A1, 6.2347% 8/25/17 (d) | | 407,329 | | 411,646 |
Merrill Lynch Mortgage Investors Trust floater
Series 2006-MLN1 Class M4, 5.68% 7/25/37 (d) | | 1,015,000 | | 848,168 |
Merrill Lynch Mortgage Investors, Inc.: | | | | |
floater: | | | | |
Series 2003-A: | | | | |
Class 2A1, 5.71% 3/25/28 (d) | | 84,711 | | 84,806 |
Class 2A2, 5.7981% 3/25/28 (d) | | 30,254 | | 30,223 |
Series 2003-B Class A1, 5.66% 4/25/28 (d) | | 87,875 | | 87,295 |
Series 2003-D Class A, 5.63% 8/25/28 (d) | | 405,555 | | 405,711 |
Series 2003-E Class A2, 5.7181% 10/25/28 (d) | | 161,077 | | 161,340 |
Series 2003-F Class A2, 5.6538% 10/25/28 (d) | | 158,952 | | 159,370 |
Collateralized Mortgage Obligations - continued |
| Principal Amount | | Value |
Private Sponsor - continued |
Merrill Lynch Mortgage Investors, Inc.: - continued | | | | |
floater: | | | | |
Series 2004-A Class A2, 5.5638% 4/25/29 (d) | | $ 222,820 | | $ 222,707 |
Series 2004-B Class A2, 5.65% 6/25/29 (d) | | 202,304 | | 202,383 |
Series 2004-C Class A2, 5.68% 7/25/29 (d) | | 254,631 | | 254,934 |
Series 2004-D Class A2, 5.6738% 9/25/29 (d) | | 277,953 | | 278,129 |
Series 2004-E Class A2D, 5.8638% 11/25/29 (d) | | 299,520 | | 300,987 |
Series 2004-G Class A2, 5.6934% 11/25/29 (d) | | 104,516 | | 104,557 |
Series 2005-A Class A2, 5.6381% 2/25/30 (d) | | 316,223 | | 316,843 |
Series 2005-B Class A2, 5.61% 7/25/30 (d) | | 277,842 | | 277,994 |
Series 2003-G Class XA1, 1% 1/25/29 (f) | | 976,747 | | 2,250 |
MortgageIT Trust floater Series 2004-2: | | | | |
Class A1, 5.69% 12/25/34 (d) | | 352,567 | | 353,992 |
Class A2, 5.77% 12/25/34 (d) | | 476,229 | | 479,056 |
Opteum Mortgage Acceptance Corp. floater: | | | | |
Series 2005-3 Class APT, 5.61% 7/25/35 (d) | | 1,343,846 | | 1,346,464 |
Series 2005-5 Class 1A1B, 5.52% 12/25/35 (d) | | 920,000 | | 919,922 |
Option One Mortgage Loan Trust floater Series 2007-CP1 Class M1, 5.62% 3/25/37 (d) | | 980,000 | | 936,629 |
Permanent Financing No. 3 PLC floater Series 2006-3 Class 3A, 5.54% 9/10/33 (d) | | 2,495,000 | | 2,498,371 |
Permanent Financing No. 5 PLC floater: | | | | |
Series 2: | | | | |
Class A, 5.47% 6/10/11 (d) | | 1,250,000 | | 1,250,013 |
Class C, 6.01% 6/10/42 (d) | | 390,000 | | 389,756 |
Series 3 Class C, 6.16% 6/10/42 (d) | | 1,030,000 | | 1,030,000 |
Permanent Financing No. 6 PLC floater Series 6
Class 2C, 5.81% 6/10/42 (d) | | 1,600,000 | | 1,600,480 |
Permanent Financing No. 7 PLC floater Series 7
Class 2C, 5.69% 6/10/42 (d) | | 1,685,000 | | 1,684,142 |
Permanent Financing No. 8 PLC floater: | | | | |
Series 8: | | | | |
Class 2A, 5.43% 6/10/14 (d) | | 2,945,000 | | 2,945,669 |
Class 2C, 5.76% 6/10/42 (d) | | 2,350,000 | | 2,348,383 |
Class 3C, 5.88% 6/10/42 (d) | | 910,000 | | 910,451 |
Permanent Master Issuer PLC floater: | | | | |
Series 2006-1 Class 2C, 5.76% 7/17/42 (d) | | 2,645,000 | | 2,643,863 |
Series 2007-1 Class 4A, 5.44% 10/15/33 (d) | | 3,450,000 | | 3,449,897 |
Residential Accredit Loans, Inc. floater Series 2006-QO7 Class 3A1, 5.42% 9/25/46 (d) | | 2,127,992 | | 2,125,997 |
Collateralized Mortgage Obligations - continued |
| Principal Amount | | Value |
Private Sponsor - continued |
Residential Asset Mortgage Products, Inc.: | | | | |
sequential payer: | | | | |
Series 2003-SL1 Class A31, 7.125% 4/25/31 | | $ 157,003 | | $ 158,348 |
Series 2004-SL2 Class A1, 6.5% 10/25/16 | | 53,437 | | 54,049 |
Series 2005-AR5 Class 1A1, 4.81% 9/19/35 (d) | | 416,572 | | 421,631 |
Residential Funding Securities Corp. floater
Series 2003-RP2 Class A1, 5.77% 6/25/33 (a)(d) | | 76,837 | | 76,224 |
Sequoia Mortgage Funding Trust Series 2003-A
Class AX1, 0.8% 10/21/08 (a)(f) | | 924,634 | | 1,137 |
Sequoia Mortgage Trust floater: | | | | |
Series 2003-5 Class A2, 5.72% 9/20/33 (d) | | 154,284 | | 154,281 |
Series 2004-1 Class A, 5.6906% 2/20/34 (d) | | 104,194 | | 104,192 |
Series 2004-10 Class A4, 5.7006% 11/20/34 (d) | | 296,941 | | 297,624 |
Series 2004-12 Class 1A2, 5.69% 1/20/35 (d) | | 506,415 | | 507,610 |
Series 2004-4 Class A, 5.6206% 5/20/34 (d) | | 330,288 | | 330,273 |
Series 2004-5 Class A3, 5.6409% 6/20/34 (d) | | 132,319 | | 132,332 |
Series 2004-6: | | | | |
Class A3A, 5.6975% 6/20/35 (d) | | 143,696 | | 143,818 |
Class A3B, 5.84% 7/20/34 (d) | | 287,393 | | 287,501 |
Series 2004-7: | | | | |
Class A3A, 5.71% 8/20/34 (d) | | 179,635 | | 179,897 |
Class A3B, 5.935% 7/20/34 (d) | | 348,806 | | 349,626 |
Series 2004-8 Class A2, 5.755% 9/20/34 (d) | | 539,834 | | 541,239 |
Series 2005-1 Class A2, 5.6406% 2/20/35 (d) | | 286,115 | | 286,671 |
Series 2005-2 Class A2, 5.6406% 3/20/35 (d) | | 477,252 | | 477,944 |
Soundview Home Equity Loan Trust floater Series 2006-EQ1: | | | |
Class M2, 5.64% 9/25/36 (d) | | 640,000 | | 603,967 |
Class M4, 5.69% 9/25/36 (d) | | 960,000 | | 833,844 |
Class M7, 6.12% 9/25/36 (d) | | 330,000 | | 213,433 |
Structured Asset Securities Corp. floater: | | | | |
Series 2004-NP1 Class A, 5.72% 9/25/33 (a)(d) | | 81,699 | | 81,540 |
Series 2005-AR1 Class B1, 7.32% 9/25/35 (a)(d) | | 1,155,000 | | 323,400 |
Series 2007-GEL1 Class A2, 5.51% 1/25/37 (a)(d) | | 1,000,000 | | 960,313 |
TBW Mortgage-Backed pass-thru certificates floater Series 2006-4 Class A3, 5.34% 9/25/36 (d) | | 2,255,000 | | 2,252,634 |
Thornburg Mortgage Securities Trust floater: | | | | |
Series 2004-3 Class A, 5.69% 9/25/34 (d) | | 1,323,390 | | 1,324,477 |
Series 2005-3 Class A4, 5.59% 10/25/35 (d) | | 2,004,718 | | 2,002,847 |
WaMu Mortgage pass-thru certificates: | | | | |
floater Series 2006-AR11 Class C1B1, 5.4% 9/25/46 (d) | | 1,053,008 | | 1,053,539 |
sequential payer Series 2002-S6 Class A25, 6% 10/25/32 | | 90,725 | | 90,405 |
Collateralized Mortgage Obligations - continued |
| Principal Amount | | Value |
Private Sponsor - continued |
WaMu Mortgage pass-thru certificates: - continued | | | | |
Series 2003-AR10 Class A7, 4.0583% 10/25/33 (d) | | $ 690,000 | | $ 695,355 |
Series 2007-HY1 Class 4A1, 5.4807% 2/25/37 (d) | | 1,686,102 | | 1,682,269 |
WaMu Mortgage Securities Corp. sequential payer Series 2003-MS9 Class 2A1, 7.5% 12/25/33 | | 46,276 | | 47,505 |
Wells Fargo Mortgage Backed Securities Trust: | | | | |
sequential payer Series 2006-AR10 Class 5A5, 5.599% 7/25/36 (d) | | 1,930,000 | | 1,940,347 |
Series 2004-M Class A3, 4.6649% 8/25/34 (d) | | 138,021 | | 137,478 |
Series 2005-AR10 Class 2A2, 4.1098%
6/25/35 (d) | | 4,028,993 | | 3,995,863 |
Series 2005-AR12 Class 2A1, 4.319%
7/25/35 (d) | | 1,754,453 | | 1,741,846 |
TOTAL PRIVATE SPONSOR | | 123,691,265 |
U.S. Government Agency - 3.0% |
Fannie Mae: | | | | |
floater Series 2002-89 Class F, 5.62% 1/25/33 (d) | | 81,642 | | 82,103 |
planned amortization class: | | | | |
Series 1993-207 Class G, 6.15% 4/25/23 | | 230,283 | | 229,894 |
Series 2003-24 Class PB, 4.5% 12/25/12 | | 504,999 | | 502,723 |
Fannie Mae subordinate REMIC pass-thru
certificates: | | | | |
floater: | | | | |
Series 2001-38 Class QF, 6.3% 8/25/31 (d) | | 724,506 | | 741,892 |
Series 2002-11 Class QF, 5.82% 3/25/32 (d) | | 112,190 | | 113,463 |
Series 2002-36 Class FT, 5.82% 6/25/32 (d) | | 112,420 | | 113,330 |
Series 2002-49 Class FB, 5.92% 11/18/31 (d) | | 1,186,700 | | 1,206,919 |
Series 2002-60 Class FV, 6.32% 4/25/32 (d) | | 260,037 | | 267,713 |
Series 2002-64 Class FE, 5.67% 10/18/32 (d) | | 53,548 | | 53,850 |
Series 2002-68 Class FH, 5.82% 10/18/32 (d) | | 2,229,504 | | 2,256,736 |
Series 2002-74 Class FV, 5.77% 11/25/32 (d) | | 72,310 | | 72,842 |
Series 2002-75 Class FA, 6.32% 11/25/32 (d) | | 532,684 | | 548,407 |
Series 2003-11: | | | | |
Class DF, 5.77% 2/25/33 (d) | | 54,285 | | 54,687 |
Class EF, 5.77% 2/25/33 (d) | | 26,066 | | 26,263 |
Series 2003-122 Class FL, 5.67% 7/25/29 (d) | | 412,273 | | 413,888 |
Series 2004-33 Class FW, 5.72% 8/25/25 (d) | | 683,138 | | 687,732 |
Series 2004-54 Class FE, 6.47% 2/25/33 (d) | | 508,219 | | 509,714 |
Series 2005-72 Class FG, 5.57% 5/25/35 (d) | | 5,870,871 | | 5,862,766 |
Collateralized Mortgage Obligations - continued |
| Principal Amount | | Value |
U.S. Government Agency - continued |
Fannie Mae subordinate REMIC pass-thru
certificates: - continued | | | | |
planned amortization class Series 2002-52 Class PA, 6% 4/25/31 | | $ 2,847 | | $ 2,843 |
Series 2002-50 Class LE, 7% 12/25/29 | | 486 | | 484 |
Freddie Mac planned amortization class Series 2162 Class PH, 6% 6/15/29 | | 1,162,628 | | 1,171,659 |
Freddie Mac Multi-class participation certificates guaranteed: | | | | |
floater: | | | | |
Series 2389 Class DA, 6.22% 11/15/30 (d) | | 760,170 | | 762,291 |
Series 2406: | | | | |
Class FP, 6.3% 1/15/32 (d) | | 1,790,439 | | 1,834,606 |
Class PF, 6.3% 12/15/31 (d) | | 1,727,481 | | 1,770,013 |
Series 2410 Class PF, 6.3% 2/15/32 (d) | | 2,570,011 | | 2,633,375 |
Series 2448 Class FT, 6.32% 3/15/32 (d) | | 1,166,063 | | 1,195,487 |
Series 2526 Class FC, 5.72% 11/15/32 (d) | | 14,291 | | 14,387 |
Series 2538 Class FB, 5.72% 12/15/32 (d) | | 142,341 | | 143,578 |
Series 2551 Class FH, 5.77% 1/15/33 (d) | | 50,613 | | 50,995 |
Series 2553 Class FB, 5.82% 3/15/29 (d) | | 2,173,163 | | 2,185,954 |
Series 2577 Class FW, 5.82% 1/15/30 (d) | | 1,487,209 | | 1,496,953 |
Series 2650 Class FV, 5.72% 12/15/32 (d) | | 1,481,099 | | 1,490,950 |
Series 2861 Class JF, 5.62% 4/15/17 (d) | | 651,895 | | 655,198 |
Series 2994 Class FB, 5.47% 6/15/20 (d) | | 520,690 | | 520,909 |
Series 3066 Class HF, 0% 1/15/34 (d) | | 45,825 | | 51,239 |
planned amortization class: | | | | |
Series 2543 Class PM, 5.5% 8/15/18 | | 229,694 | | 229,750 |
Series 2676 Class KN, 3% 12/15/13 | | 151,708 | | 151,119 |
Series 2776 Class UJ, 4.5% 5/15/20 (f) | | 96,151 | | 808 |
Series 1803 Class A, 6% 12/15/08 | | 156,865 | | 157,053 |
Ginnie Mae guaranteed REMIC pass-thru securities: | | | | |
floater Series 2001-21 Class FB, 5.72% 1/16/27 (d) | | 84,420 | | 84,951 |
planned amortization class Series 2002-5 Class PD, 6.5% 5/16/31 | | 109,122 | | 109,605 |
TOTAL U.S. GOVERNMENT AGENCY | | 30,459,129 |
TOTAL COLLATERALIZED MORTGAGE OBLIGATIONS (Cost $156,702,501) | 154,150,394 |
Commercial Mortgage Securities - 7.3% |
| Principal Amount | | Value |
Banc of America Large Loan, Inc. floater: | | | | |
Series 2003-BBA2 Class K, 7.92% 11/15/15 (a)(d) | | $ 61,614 | | $ 62,009 |
Series 2005-BBA6 Class G, 5.74% 1/15/19 (a)(d) | | 87,320 | | 87,328 |
Series 2005-MIB1: | | | | |
Class B, 5.58% 3/15/22 (a)(d) | | 475,000 | | 475,152 |
Class C, 5.63% 3/15/22 (a)(d) | | 200,000 | | 200,069 |
Class D, 5.68% 3/15/22 (a)(d) | | 205,000 | | 205,107 |
Class E, 5.72% 3/15/22 (a)(d) | | 390,000 | | 389,570 |
Class F, 5.79% 3/15/22 (a)(d) | | 200,000 | | 199,905 |
Class G, 5.85% 3/15/22 (a)(d) | | 130,000 | | 129,857 |
Series 2006-BIX1: | | | | |
Class E, 5.56% 10/15/19 (a)(d) | | 170,000 | | 169,720 |
Class F, 5.63% 10/15/19 (a)(d) | | 325,000 | | 324,250 |
Class G, 5.65% 10/15/19 (a)(d) | | 125,000 | | 124,628 |
Class JCP, 5.82% 10/15/19 (a)(d) | | 10,882 | | 10,738 |
Bayview Commercial Asset Trust floater: | | | | |
Series 2003-2 Class A, 5.9% 12/25/33 (a)(d) | | 421,687 | | 421,828 |
Series 2004-1: | | | | |
Class A, 5.68% 4/25/34 (a)(d) | | 260,940 | | 261,103 |
Class B, 7.22% 4/25/34 (a)(d) | | 43,490 | | 43,599 |
Series 2004-2: | | | | |
Class A, 5.75% 8/25/34 (a)(d) | | 343,650 | | 344,241 |
Class M1, 5.9% 8/25/34 (a)(d) | | 110,075 | | 110,351 |
Series 2004-3: | | | | |
Class A1, 5.69% 1/25/35 (a)(d) | | 504,486 | | 505,274 |
Class A2, 5.74% 1/25/35 (a)(d) | | 59,351 | | 59,444 |
Class M1, 5.82% 1/25/35 (a)(d) | | 89,027 | | 89,236 |
Class M2, 6.32% 1/25/35 (a)(d) | | 59,351 | | 59,657 |
Series 2005-2A: | | | | |
Class A1, 5.63% 8/25/35 (a)(d) | | 788,641 | | 782,019 |
Class M1, 5.75% 8/25/35 (a)(d) | | 142,340 | | 141,225 |
Class M2, 5.8% 8/25/35 (a)(d) | | 238,516 | | 239,243 |
Class M3, 5.82% 8/25/35 (a)(d) | | 130,799 | | 128,852 |
Class M4, 5.93% 8/25/35 (a)(d) | | 119,258 | | 117,606 |
Series 2005-3A: | | | | |
Class A1, 5.64% 11/25/35 (a)(d) | | 669,570 | | 672,126 |
Class A2, 5.72% 11/25/35 (a)(d) | | 275,002 | | 275,964 |
Class M1, 5.76% 11/25/35 (a)(d) | | 95,653 | | 95,300 |
Class M2, 5.81% 11/25/35 (a)(d) | | 131,523 | | 130,931 |
Class M3, 5.83% 11/25/35 (a)(d) | | 119,566 | | 117,963 |
Class M4, 5.92% 11/25/35 (a)(d) | | 147,465 | | 144,403 |
Commercial Mortgage Securities - continued |
| Principal Amount | | Value |
Bayview Commercial Asset Trust floater: - continued | | | | |
Series 2005-4A: | | | | |
Class A2, 5.71% 1/25/36 (a)(d) | | $ 935,469 | | $ 937,807 |
Class B1, 6.72% 1/25/36 (a)(d) | | 85,043 | | 85,986 |
Class M1, 5.77% 1/25/36 (a)(d) | | 340,170 | | 341,393 |
Class M2, 5.79% 1/25/36 (a)(d) | | 85,043 | | 85,348 |
Class M3, 5.82% 1/25/36 (a)(d) | | 170,085 | | 170,696 |
Class M4, 5.93% 1/25/36 (a)(d) | | 85,043 | | 85,308 |
Class M5, 5.97% 1/25/36 (a)(d) | | 85,043 | | 85,109 |
Class M6, 6.02% 1/25/36 (a)(d) | | 85,043 | | 84,803 |
Series 2006-2A: | | | | |
Class A1, 5.55% 7/25/36 (a)(d) | | 1,540,397 | | 1,540,396 |
Class A2, 5.6% 7/25/36 (a)(d) | | 259,617 | | 259,814 |
Class B1, 6.19% 7/25/36 (a)(d) | | 95,193 | | 91,582 |
Class B3, 8.02% 7/25/36 (a)(d) | | 155,770 | | 142,694 |
Class M1, 5.63% 7/25/36 (a)(d) | | 272,598 | | 267,572 |
Class M2, 5.65% 7/25/36 (a)(d) | | 194,713 | | 195,068 |
Class M3, 5.67% 7/25/36 (a)(d) | | 151,443 | | 148,318 |
Class M4, 5.74% 7/25/36 (a)(d) | | 103,847 | | 100,454 |
Class M5, 5.79% 7/25/36 (a)(d) | | 125,482 | | 121,161 |
Class M6, 5.86% 7/25/36 (a)(d) | | 199,040 | | 184,328 |
Series 2006-3A: | | | | |
Class A1, 5.57% 10/25/36 (a)(d) | | 1,224,987 | | 1,224,987 |
Class B1, 6.12% 10/25/36 (a)(d) | | 144,941 | | 143,582 |
Class B2, 6.67% 10/25/36 (a)(d) | | 93,510 | | 92,648 |
Class B3, 7.92% 10/25/36 (a)(d) | | 168,319 | | 161,849 |
Class M4, 5.75% 10/25/36 (a)(d) | | 144,941 | | 144,443 |
Class M5, 5.8% 10/25/36 (a)(d) | | 182,345 | | 181,120 |
Class M6, 5.88% 10/25/36 (a)(d) | | 360,015 | | 355,909 |
Series 2007-1: | | | | |
Class A2, 5.59% 3/25/37 (a)(d) | | 339,787 | | 339,310 |
Class B1, 5.99% 3/25/37 (a)(d) | | 110,072 | | 108,421 |
Class B2, 6.47% 3/25/37 (a)(d) | | 76,572 | | 75,208 |
Class B3, 8.67% 3/25/37 (a)(d) | | 224,930 | | 219,025 |
Class M1, 5.59% 3/25/37 (a)(d) | | 90,929 | | 90,716 |
Class M2, 5.61% 3/25/37 (a)(d) | | 67,000 | | 66,843 |
Class M3, 5.64% 3/27/37 (a)(d) | | 62,215 | | 62,069 |
Class M4, 5.69% 3/25/37 (a)(d) | | 47,857 | | 47,566 |
Class M5, 5.74% 3/25/37 (a)(d) | | 76,572 | | 75,866 |
Class M6, 5.82% 3/25/37 (a)(d) | | 105,286 | | 103,839 |
Commercial Mortgage Securities - continued |
| Principal Amount | | Value |
Bayview Commercial Asset Trust floater: - continued | | | | |
Series 2007-3: | | | | |
Class B1, 6.27% 7/25/37 (a)(d) | | $ 73,707 | | $ 72,601 |
Class B2, 6.92% 7/25/37 (a)(d) | | 186,723 | | 183,922 |
Class B3, 9.32% 7/25/37 (a)(d) | | 98,275 | | 96,801 |
Class M1, 5.63% 7/25/37 (a)(d) | | 63,879 | | 63,520 |
Class M2, 5.66% 7/25/37 (a)(d) | | 68,793 | | 68,406 |
Class M3, 5.69% 7/25/37 (a)(d) | | 108,103 | | 107,360 |
Class M4, 5.82% 7/25/37 (a)(d) | | 171,982 | | 170,477 |
Class M5, 5.92% 7/25/37 (a)(d) | | 83,534 | | 82,699 |
Class M6, 6.12% 7/25/37 (a)(d) | | 63,879 | | 63,240 |
Bear Stearns Commercial Mortgage Securities Trust floater Series 2007-BBA8: | | | | |
Class D, 5.57% 3/15/22 (a)(d) | | 165,000 | | 165,000 |
Class E, 5.62% 3/15/22 (a)(d) | | 870,000 | | 870,000 |
Class F, 5.67% 5/15/22 (a)(d) | | 535,000 | | 535,000 |
Class G, 5.72% 3/15/22 (a)(d) | | 135,000 | | 135,000 |
Class H, 5.87% 3/15/22 (a)(d) | | 165,000 | | 165,000 |
Class J, 6.02% 3/15/22 (a)(d) | | 165,000 | | 165,000 |
Class MS-6, 6.22% 3/15/22 (a)(d) | | 335,000 | | 335,000 |
Class MS5, 5.97% 3/15/22 (a)(d) | | 600,000 | | 600,000 |
Class X-1M, 1.12% 3/15/22 (a)(f) | | 18,625,725 | | 174,616 |
COMM floater Series 2002-FL7: | | | | |
Class F, 6.62% 11/15/14 (a)(d) | | 1,000,000 | | 1,000,757 |
Class H, 7.57% 11/15/14 (a)(d) | | 150,000 | | 150,018 |
Commercial Mortgage pass-thru certificates floater: | | | | |
Series 2005-F10A: | | | | |
Class B, 5.55% 4/15/17 (a)(d) | | 1,005,000 | | 1,004,586 |
Class C, 5.59% 4/15/17 (a)(d) | | 425,000 | | 424,721 |
Class D, 5.63% 4/15/17 (a)(d) | | 345,000 | | 344,718 |
Class E, 5.69% 4/15/17 (a)(d) | | 260,000 | | 259,692 |
Class F, 5.73% 4/15/17 (a)(d) | | 145,000 | | 144,757 |
Class G, 5.87% 4/15/17 (a)(d) | | 145,000 | | 144,757 |
Class H, 5.94% 4/15/17 (a)(d) | | 145,000 | | 144,318 |
Class J, 6.17% 4/15/17 (a)(d) | | 50,000 | | 49,614 |
Series 2005-FL11: | | | | |
Class B, 5.57% 11/15/17 (a)(d) | | 286,269 | | 286,289 |
Class C, 5.62% 11/15/17 (a)(d) | | 572,538 | | 572,641 |
Class D, 5.66% 11/15/17 (a)(d) | | 99,240 | | 99,218 |
Class E, 5.71% 11/15/17 (a)(d) | | 152,677 | | 152,587 |
Class F, 5.77% 11/15/17 (a)(d) | | 137,409 | | 137,167 |
Class G, 5.82% 11/15/17 (a)(d) | | 217,565 | | 217,532 |
Commercial Mortgage Securities - continued |
| Principal Amount | | Value |
Commercial Mortgage pass-thru certificates floater: - continued | | | | |
Series 2006-CN2A Class AJFL, 5.58% 2/5/19 (d) | | $ 1,135,000 | | $ 1,137,194 |
Series 2007-FL14: | | | | |
Class F, 5.82% 6/15/22 (a)(d) | | 1,312,702 | | 1,311,061 |
Class G, 5.87% 6/15/22 (a)(d) | | 209,633 | | 209,371 |
Class H, 6.02% 6/15/22 (a)(d) | | 209,633 | | 209,371 |
Class MLK1, 6.12% 6/15/22 (a)(d) | | 565,000 | | 564,294 |
Class MLK2, 6.32% 6/15/22 (a)(d) | | 315,000 | | 314,606 |
Class MLK3, 6.52% 6/15/22 (a)(d) | | 380,000 | | 379,525 |
Credit Suisse First Boston Mortgage Capital
Certificates floater Series 2007-TF2A Class B, 5.67% 4/15/22 (d) | | 1,775,000 | | 1,772,227 |
Credit Suisse First Boston Mortgage Securities Corp. floater Series 2005-TF3A Class A2, 5.6% 11/15/20 (d) | | 2,606,767 | | 2,606,874 |
Credit Suisse Mortgage Capital Certificates floater: | | | | |
Series 200-TFL1 Class B, 5.47% 2/15/22 (a)(d) | | 685,000 | | 684,144 |
Series 2007-TFL1: | | | | |
Class C: | | | | |
5.49% 2/15/22 (a)(d) | | 740,000 | | 738,616 |
5.59% 2/15/22 (a)(d) | | 265,000 | | 264,173 |
Class F, 5.64% 2/15/22 (a)(d) | | 530,000 | | 528,013 |
Crown Castle Towers LLC/Crown Atlantic Holdings Sub LLC/Crown Communication, Inc. Series 2006-1A Class AFL, 5.49% 11/15/36 (a)(d) | | 540,000 | | 537,287 |
CSMC Commercial Mortgage Trust floater
Series 2006-TFLA: | | | | |
Class D, 5.6% 4/15/21 (a)(d) | | 300,000 | | 299,809 |
Class E, 5.65% 4/15/21 (a)(d) | | 300,000 | | 299,809 |
Class G, 5.74% 4/15/21 (a)(d) | | 300,000 | | 299,566 |
Class H, 6.05% 4/15/21 (a)(d) | | 300,000 | | 298,590 |
Class J, 6.12% 4/15/21 (a)(d) | | 200,000 | | 198,461 |
Class K, 6.52% 4/15/21 (a)(d) | | 1,005,000 | | 994,627 |
Greenwich Capital Commercial Funding Corp.
floater: | | | | |
Series 2005-FL3A: | | | | |
Class H-AON: | | | | |
6.32% 10/5/20 (a)(d) | | 180,000 | | 180,000 |
6.57% 10/5/20 (a)(d) | | 220,000 | | 220,000 |
Class M-AON, 6.82% 10/5/20 (a)(d) | | 215,000 | | 215,000 |
Class N-AON, 7.17% 10/5/20 (a)(d) | | 550,000 | | 550,000 |
Commercial Mortgage Securities - continued |
| Principal Amount | | Value |
Greenwich Capital Commercial Funding Corp.
floater: - continued | | | | |
Series 2006-FL4: | | | | |
Class A2, 5.46% 11/5/21 (a)(d) | | $ 1,815,000 | | $ 1,814,398 |
Class B, 5.51% 11/5/21 (a)(d) | | 670,000 | | 669,301 |
GS Mortgage Securities Corp. II floater: | | | | |
Series 2006-FL8A: | | | | |
Class C, 5.56% 6/6/20 (a)(d) | | 145,000 | | 144,988 |
Class D, 5.6% 6/6/20 (a)(d) | | 1,400,000 | | 1,398,037 |
Class E, 5.69% 6/6/20 (a)(d) | | 800,000 | | 797,719 |
Class F, 5.76% 6/6/20 (a)(d) | | 575,000 | | 562,908 |
Series 2007-EOP: | | | | |
Class C, 5.64% 3/1/20 (a)(d) | | 440,000 | | 437,250 |
Class D, 5.69% 3/1/20 (a)(d) | | 130,000 | | 129,188 |
Class E, 5.76% 3/1/20 (a)(d) | | 220,000 | | 218,625 |
Class F, 5.8% 3/1/20 (a)(d) | | 110,000 | | 109,313 |
Class G, 5.84% 3/1/20 (a)(d) | | 55,000 | | 54,656 |
Class H, 5.97% 3/1/20 (a)(d) | | 90,000 | | 89,100 |
Class J: | | | | |
6.17% 3/1/20 (a)(d) | | 130,000 | | 128,700 |
6.37% 3/1/20 (a)(d) | | 90,000 | | 89,100 |
Hilton Hotel Pool Trust floater Series 2000-HLTA
Class A2, 5.72% 10/3/15 (a)(d) | | 3,000,000 | | 3,010,580 |
JPMorgan Chase Commercial Securities Trust floater Series 2006-FLA2: | | | | |
Class A2, 5.45% 11/15/18 (a)(d) | | 1,535,000 | | 1,534,366 |
Class B, 5.49% 11/15/18 (a)(d) | | 414,371 | | 413,959 |
Class C, 5.53% 11/15/18 (a)(d) | | 294,319 | | 293,845 |
Class D, 5.55% 11/15/18 (a)(d) | | 104,561 | | 104,354 |
Class E, 5.6% 11/15/18 (a)(d) | | 154,905 | | 154,398 |
Class F, 5.65% 11/15/18 (a)(d) | | 232,357 | | 231,171 |
Class G, 5.68% 11/15/18 (a)(d) | | 201,376 | | 198,492 |
Class H, 5.82% 11/15/18 (a)(d) | | 154,905 | | 151,290 |
LB-UBS Commercial Mortgage Trust sequential payer Series 2003-C3 Class A2, 3.086% 5/15/27 | | 875,000 | | 859,226 |
Lehman Brothers Floating Rate Commercial Mortgage Trust floater: | | | | |
Series 2003-LLFA Class K1, 7.87% 12/16/14 (a)(d) | | 435,000 | | 425,876 |
Series 2006-LLFA: | | | | |
Class F, 5.66% 9/15/21 (a)(d) | | 291,191 | | 290,011 |
Class G, 5.68% 9/15/21 (a)(d) | | 648,135 | | 644,202 |
Merrill Lynch Mortgage Trust Series 2005-GGP1 Class X, 0.1416% 11/15/10 (a)(d)(f) | | 417,400,000 | | 121,422 |
Commercial Mortgage Securities - continued |
| Principal Amount | | Value |
ML-CFC Commercial Mortgage Trust floater
Series 2006-4 Class A2FL, 5.44% 12/12/49 (d) | | $ 1,180,000 | | $ 1,178,634 |
Morgan Stanley Capital I Trust: | | | | |
floater: | | | | |
Series 2007-XCLA Class A1, 5.52% 7/17/17 (a)(d) | | 1,319,592 | | 1,319,585 |
Series 2007-XLFA: | | | | |
Class A2, 5.42% 10/15/20 (a)(d) | | 1,225,000 | | 1,224,993 |
Class B, 5.45% 10/15/20 (a)(d) | | 440,000 | | 439,998 |
Class C, 5.48% 10/15/20 (a)(d) | | 330,000 | | 329,998 |
Class D, 5.51% 10/15/20 (a)(d) | | 265,000 | | 264,999 |
Class E, 5.57% 10/15/20 (a)(d) | | 330,000 | | 329,998 |
Class F, 5.62% 10/15/20 (a)(d) | | 195,000 | | 194,999 |
Class G, 5.66% 10/15/20 (a)(d) | | 245,000 | | 244,999 |
Class H, 5.75% 10/15/20 (a)(d) | | 155,000 | | 154,999 |
Class J, 6.32% 10/15/20 (a)(d) | | 175,000 | | 174,059 |
Class MHRO, 6.01% 10/15/20 (a)(d) | | 474,674 | | 474,671 |
Class MJPM, 6.32% 10/15/20 (a)(d) | | 167,951 | | 167,950 |
Class MSTR, 6.02% 10/15/20 (a)(d) | | 260,000 | | 259,998 |
Class NHRO, 6.21% 10/15/20 (a)(d) | | 730,268 | | 710,673 |
Class NSTR, 6.17% 10/15/20 (a)(d) | | 240,000 | | 234,240 |
Series 2007-XLC1: | | | | |
Class C, 5.92% 7/17/17 (a)(d) | | 1,092,247 | | 1,051,958 |
Class D, 6.02% 7/17/17 (a)(d) | | 513,998 | | 494,782 |
Class E, 6.12% 7/17/17 (a)(d) | | 415,153 | | 397,847 |
Morgan Stanley Capital I, Inc. floater: | | | | |
Series 2005-XLF: | | | | |
Class D, 5.58% 8/15/19 (a)(d) | | 149,863 | | 149,894 |
Class E, 5.6% 8/15/19 (a)(d) | | 245,000 | | 245,239 |
Class F, 5.64% 8/15/19 (a)(d) | | 170,000 | | 170,202 |
Class G, 5.69% 8/15/19 (a)(d) | | 120,000 | | 120,149 |
Class H, 5.71% 8/15/19 (a)(d) | | 100,000 | | 100,078 |
Class J, 5.78% 8/15/19 (a)(d) | | 75,000 | | 74,975 |
Class K, 5.97% 8/15/19 (a)(d) | | 420,000 | | 415,103 |
Series 2006-XLF: | | | | |
Class C, 6.52% 7/15/19 (a)(d) | | 570,000 | | 569,996 |
Class D, 5.57% 7/15/19 (a)(d) | | 1,345,000 | | 1,345,666 |
Class E, 5.61% 7/15/19 (a)(d) | | 1,450,000 | | 1,449,030 |
Class F, 5.64% 7/15/19 (a)(d) | | 535,000 | | 533,166 |
Class G, 5.68% 7/15/19 (a)(d) | | 385,000 | | 383,766 |
STRIPS III Ltd./STRIPS III Corp. floater Series 2004-1A Class A, 5.8% 3/24/18 (a)(d) | | 270,958 | | 271,297 |
Commercial Mortgage Securities - continued |
| Principal Amount | | Value |
Wachovia Bank Commercial Mortgage Trust floater: | | | | |
Series 2005-WL6A Class D, 5.75% 10/15/17 (a)(d) | | $ 295,951 | | $ 295,952 |
Series 2006-WL7A: | | | | |
Class F, 5.66% 8/11/18 (a)(d) | | 1,235,000 | | 1,231,707 |
Class G, 5.68% 8/11/18 (a)(d) | | 1,170,000 | | 1,166,044 |
Class J, 5.92% 8/11/18 (a)(d) | | 260,000 | | 253,883 |
TOTAL COMMERCIAL MORTGAGE SECURITIES (Cost $73,397,323) | 73,041,570 |
Foreign Government and Government Agency Obligations - 0.1% |
|
United Mexican States 4.83% 1/13/09 (d)
(Cost $1,320,222) | 1,313,000 | | 1,320,222 |
Commercial Paper - 0.2% |
|
Sprint Nextel Corp. 5.6066% 11/9/07 (d)
(Cost $2,000,000) | 2,000,000 | | 2,000,282 |
Fixed-Income Funds - 25.4% |
| Shares | | |
Fidelity Ultra-Short Central Fund (e)
(Cost $259,817,448) | 2,613,124 | | 255,014,810 |
Cash Equivalents - 3.1% |
| Maturity Amount | | |
Investments in repurchase agreements in a joint trading account at 5.3%, dated 7/31/07 due 8/1/07 (Collateralized by U.S. Government Obligations) #
(Cost $30,832,000) | $ 30,836,536 | | 30,832,000 |
TOTAL INVESTMENT PORTFOLIO - 100.5% (Cost $1,024,872,536) | | 1,006,916,596 |
NET OTHER ASSETS - (0.5)% | | (5,450,599) |
NET ASSETS - 100% | $ 1,001,465,997 |
Futures Contracts |
| Expiration Date | | Underlying
Face Amount
at Value | | Unrealized
Appreciation/
(Depreciation) |
Purchased |
Eurodollar Contracts |
113 Eurodollar 90 Day Index Contracts | Sept. 2007 | | $ 111,509,813 | | $ 38,290 |
113 Eurodollar 90 Day Index Contracts | Dec. 2007 | | 111,560,663 | | (102,616) |
113 Eurodollar 90 Day Index Contracts | March 2008 | | 111,604,450 | | (68,252) |
TOTAL EURODOLLAR CONTRACTS | | | | $ (132,578) |
Sold |
Eurodollar Contracts |
4 Eurodollar 90 Day Index Contracts | June 2008 | | 3,951,450 | | 4,609 |
3 Eurodollar 90 Day Index Contracts | Sept. 2008 | | 2,963,738 | | 3,151 |
2 Eurodollar 90 Day Index Contracts | Dec. 2008 | | 1,975,725 | | 1,417 |
1 Eurodollar 90 Day Index Contracts | March 2009 | | 987,750 | | 771 |
TOTAL EURODOLLAR CONTRACTS | | | | 9,948 |
| | | | $ (122,630) |
Swap Agreements |
| | | Notional Amount | | Value |
Credit Default Swaps |
Receive monthly notional amount multiplied by 3.86% and pay Morgan Stanley, Inc. upon credit event of Merrill Lynch Mortgage Investors Trust, Inc., par value of the notional amount of Merrill Lynch Mortgage Investors Trust, Inc. Series 2006 HE5,
Class B3, 7.32% 8/25/37 | Sept. 2037 | | $ 600,000 | | $ (366,220) |
Receive monthly notional amount multiplied by 3.3% and pay to Morgan Stanley, Inc. upon credit event of Ameriquest Mortgage Securities, Inc., par value of the notional amount of Ameriquest Mortgage Securities, Inc. Series 2004-R11 Class M9, 7.2253% 11/25/34 | Dec. 2034 | | 275,000 | | (70,814) |
Receive monthly notional amount multiplied by 2.7% and pay Lehman Brothers, Inc. upon credit event of Morgan Stanley ABS Capital I, Inc., par value of the notional amount of Morgan Stanley ABS Capital I, Inc. Series 2006 WMC1, Class B3, 7.5% 12/25/35 | Jan. 2036 | | 600,000 | | (265,230) |
Swap Agreements - continued |
| Expiration Date | | Notional Amount | | Value |
Credit Default Swaps - continued |
Receive monthly notional amount multiplied by 1.9% and pay Morgan Stanley, Inc., upon credit event of Morgan Stanley ABS Capital I, Inc., par value of the notional amount of Morgan Stanley ABS Capital I, Inc. Series 2006-HE3 Class B3, 7.2225% 4/25/36 | May 2036 | | $ 500,000 | | $ (404,714) |
Receive monthly notional amount multiplied by 2.39% and pay UBS upon credit event of Fremont Home Loan Trust, par value of the notional amount of Fremont Home Loan Trust Series 2004-1 Class M9, 7.73% 2/25/34 | March 2034 | | 183,497 | | (70,846) |
Receive monthly notional amount multiplied by 2.4% and pay Deutsche Bank upon credit event of Fremont Home Loan Trust, par value of the notional amount of Fremont Home Loan Trust Series 2004-A Class B3, 7.2288% 1/25/34 | Feb. 2034 | | 109,274 | | (87,178) |
Receive monthly notional amount multiplied by 2.7% and pay Morgan Stanley, Inc. upon credit event of Park Place Securities, Inc., par value of the notional amount of Park Place Securities, Inc. Series 2005-WHQ2 Class M9, 6.41% 5/25/35 | June 2035 | | 845,000 | | (360,061) |
Receive monthly notional amount multiplied by 2.79% and pay Merrill Lynch, Inc. upon credit event of New Century Home Equity Loan Trust, par value of the notional amount of New Century Home Equity Loan Trust Series 2004-4 Class M9, 7.0788% 2/25/35 | March 2035 | | 610,000 | | (106,671) |
Receive quarterly notional amount multiplied by .48% and pay Goldman Sachs upon credit event of TXU Energy Co. LLC, par value of the notional amount of TXU Energy Co. LLC 7% 3/15/13 | Sept. 2008 | | 1,840,000 | | (15,789) |
Receive quarterly notional amount multiplied by .55% and pay Deutsche Bank upon credit event of MBIA, Inc., par value of the notional amount of MBIA, Inc. 6.625% 10/1/28 | Sept. 2010 | | 900,000 | | (15,157) |
Receive quarterly notional amount multiplied by .58% and pay Deutsche Bank upon credit event of MBIA, Inc., par value of the notional amount of MBIA, Inc. 6.625% 10/1/28 | Sept. 2010 | | 200,000 | | (3,201) |
Swap Agreements - continued |
| Expiration Date | | Notional Amount | | Value |
Credit Default Swaps - continued |
Receive quarterly notional amount multiplied by .59% and pay Bank of America upon credit event of MBIA, Inc., par value of the notional amount of MBIA, Inc. 6.625% 10/1/28 | Sept. 2010 | | $ 200,000 | | $ (3,143) |
Receive quarterly notional amount multiplied by .76% and pay Merrill Lynch, Inc. upon credit event of MBIA, Inc., par value of the notional amount of MBIA, Inc. 6.625% 10/1/28 | Sept. 2010 | | 500,000 | | (7,857) |
Receive quarterly notional amount multiplied by .78% and pay Goldman Sachs upon credit event of TXU Energy Co. LLC, par value of the notional amount of TXU Energy Co. LLC 7% 3/15/13 | Dec. 2008 | | 1,750,000 | | (16,528) |
TOTAL CREDIT DEFAULT SWAPS | | 9,112,771 | | (1,793,409) |
Total Return Swaps |
Receive monthly notional amount multiplied by the nominal spread appreciation of the Lehman Brothers CMBS U.S. Aggregate Index adjusted by a modified duration factor plus 25 basis points and pay monthly notional amount multiplied by the nominal spread depreciation of the Lehman Brothers CMBS U.S. Aggregate Index adjusted by a modified duration factor with Lehman Brothers, Inc. | April 2008 | | 4,000,000 | | (43,127) |
Receive monthly notional amount multiplied by the nominal spread appreciation of the Lehman Brothers CMBS U.S. Aggregate Index adjusted by a modified duration factor plus 15 basis points and pay monthly notional amount multiplied by the nominal spread depreciation of the Lehman Brothers CMBS U.S. Aggregate Index adjusted by a modified duration factor with Lehman Brothers, Inc. | May 2008 | | 5,655,000 | | (61,442) |
Receive monthly notional amount multiplied by the nominal spread appreciation of the Lehman Brothers CMBS U.S. Aggregate Index adjusted by a modified duration factor and pay monthly notional amount multiplied by the nominal spread depreciation of the Lehman Brothers CMBS U.S. Aggregate Index adjusted by a modified duration factor with Lehman Brothers, Inc. | Dec. 2007 | | 4,450,000 | | (48,906) |
Swap Agreements - continued |
| Expiration Date | | Notional Amount | | Value |
Total Return Swaps - continued |
Receive monthly notional amount multiplied by the nominal spread appreciation of the Lehman Brothers CMBS AAA 8.5+ Index adjusted by a modified duration factor plus 25 basis points and pay monthly notional amount multiplied by the nominal spread depreciation of the Lehman Brothers CMBS AAA 8.5+ Index adjusted by a modified duration factor with Lehman Brothers, Inc. | March 2008 | | $ 10,000,000 | | $ (186,475) |
Receive monthly a return equal to Lehman Brothers U.S. ABS AA Floating Home Equities Index and pay monthly a floating rate based on 1-month LIBOR minus 10 basis points with Lehman Brothers, Inc. | Sept. 2007 | | 10,000,000 | | (461,861) |
Receive monthly a return equal to Lehman Brothers U.S. ABS AA Floating Home Equities Index and pay monthly a floating rate based on 1-month LIBOR minus 15 basis points with Lehman Brothers, Inc. | Oct. 2007 | | 10,000,000 | | (461,431) |
TOTAL TOTAL RETURN SWAPS | | 44,105,000 | | (1,263,242) |
| | $ 53,217,771 | | $ (3,056,651) |
Legend |
(a) Security exempt from registration under Rule 144A of the Securities Act of 1933. These securities may be resold in transactions exempt from registration, normally to qualified institutional buyers. At the end of the period, the value of these securities amounted to $149,965,833 or 15.0% of net assets. |
(b) Security or a portion of the security purchased on a delayed delivery or when-issued basis. |
(c) Security or a portion of the security was pledged to cover margin requirements for futures contracts. At the period end, the value of securities pledged amounted to $349,019. |
(d) The coupon rate shown on floating or adjustable rate securities represents the rate at period end. |
(e) Affiliated fund that is available only to investment companies and other accounts managed by Fidelity Investments. A complete schedule of portfolio holdings for each Fidelity Central Fund is filed with the SEC for the first and third quarters of each fiscal year on Form N-Q and is available upon request or at the SEC's web site at www.sec.gov. A holdings listing for the Fund, which presents direct holdings as well as the pro rata share of securities and other investments held indirectly through its investment in underlying non-money market Fidelity Central Funds, is available at fidelity.com and/or advisor.fidelity.com, as applicable. In addition, each Fidelity Central Fund's financial statements, which are not covered by the Fund's Report of Independent Registered Public Accounting Firm, are available on the SEC's web site, or upon request. |
(f) Security represents right to receive monthly interest payments on an underlying pool of mortgages or assets. Principal shown is the outstanding par amount of the pool held as of the end of the period. |
# Additional Information on each counterparty to the repurchase agreement is as follows: |
Repurchase Agreement / Counterparty | Value |
$30,832,000 due 8/01/07 at 5.30% |
ABN AMRO Bank N.V., New York Branch | $ 747,585 |
Banc of America Securities LLC | 6,653,351 |
Bank of America, NA | 1,877,404 |
Barclays Capital, Inc. | 3,443,405 |
Bear Stearns & Co., Inc. | 3,289,376 |
Countrywide Securities Corp. | 2,410,963 |
Ing Financial Markets Llc | 2,990,341 |
Societe Generale, New York Branch | 2,990,341 |
UBS Securities LLC | 5,233,097 |
WestLB AG | 1,196,137 |
| $ 30,832,000 |
Affiliated Central Funds |
Information regarding fiscal year to date income earned by the Fund from investments in Fidelity Central Funds is as follows: |
Fund | Income earned |
Fidelity Ultra-Short Central Fund | $ 14,678,690 |
|
Additional information regarding the Fund's fiscal year to date purchases and sales, including the ownership percentage, of the non Money Market Central Funds is as follows: |
Fund | Value, beginning of period | Purchases | Sales
Proceeds | Value, end of period | % ownership, end of period |
Fidelity Ultra-Short Central Fund | $ 237,764,502 | $ 50,000,041 | $ 27,465,319 | $ 255,014,810 | 1.7% |
Other Information |
Distribution of investments by country of issue, as a percentage of total net assets, is as follows: |
United States of America | 84.0% |
United Kingdom | 11.8% |
Cayman Islands | 1.4% |
Spain | 1.2% |
Others (individually less than 1%) | 1.6% |
| 100.0% |
Income Tax Information |
At July 31, 2007, the fund had a capital loss carryforward of approximately $2,436,121 of which $1,917,431 and $518,690 will expire on July 31, 2014 and 2015, respectively. |
See accompanying notes which are an integral part of the financial statements.
Annual Report
Financial Statements
Statement of Assets and Liabilities
| July 31, 2007 |
| | |
Assets | | |
Investment in securities, at value (including repurchase agreements of $30,832,000) -
See accompanying schedule: Unaffiliated issuers (cost $765,055,088) | $ 751,901,786 | |
Fidelity Central Funds (cost $259,817,448) | 255,014,810 | |
Total Investments (cost $1,024,872,536) | | $ 1,006,916,596 |
Cash | | 91 |
Receivable for investments sold | | 117,697 |
Receivable for swap agreements | | 7,894 |
Receivable for fund shares sold | | 1,247,297 |
Interest receivable | | 3,600,400 |
Distributions receivable from Fidelity Central Funds | | 1,333,888 |
Receivable for daily variation on futures contracts | | 3,750 |
Other receivables | | 24,679 |
Total assets | | 1,013,252,292 |
| | |
Liabilities | | |
Payable for investments purchased
Regular delivery | $ 3,102,401 | |
Delayed delivery | 460,000 | |
Payable for fund shares redeemed | 4,373,362 | |
Distributions payable | 396,327 | |
Swap agreements, at value | 3,056,651 | |
Accrued management fee | 276,854 | |
Distribution fees payable | 2,309 | |
Other affiliated payables | 118,391 | |
Total liabilities | | 11,786,295 |
| | |
Net Assets | | $ 1,001,465,997 |
Net Assets consist of: | | |
Paid in capital | | $ 1,025,316,779 |
Undistributed net investment income | | 539,837 |
Accumulated undistributed net realized gain (loss) on investments | | (3,255,398) |
Net unrealized appreciation (depreciation) on investments | | (21,135,221) |
Net Assets | | $ 1,001,465,997 |
See accompanying notes which are an integral part of the financial statements.
Annual Report
Financial Statements - continued
Statement of Assets and Liabilities - continued
| July 31, 2007 |
| | |
Calculation of Maximum Offering Price
Class A:
Net Asset Value and redemption price per share
($13,734,615 ÷ 1,399,083 shares) | | $ 9.82 |
| | |
Maximum offering price per share (100/98.50 of $9.82) | | $ 9.97 |
Class T:
Net Asset Value and redemption price per share ($4,817,531 ÷ 490,826 shares) | | $ 9.82 |
| | |
Maximum offering price per share (100/98.50 of $9.82) | | $ 9.97 |
Ultra-Short Bond:
Net Asset Value, offering price and redemption price per share ($974,601,626 ÷ 99,298,589 shares) | | $ 9.81 |
| | |
Institutional Class:
Net Asset Value, offering price and redemption price per share ($8,312,225 ÷ 847,021 shares) | | $ 9.81 |
See accompanying notes which are an integral part of the financial statements.
Annual Report
Statement of Operations
| Year ended July 31, 2007 |
| | |
Investment Income | | |
Interest | | $ 41,462,873 |
Income from Fidelity Central Funds | | 14,678,690 |
Total income | | 56,141,563 |
| | |
Expenses | | |
Management fee | $ 3,177,740 | |
Transfer agent fees | 1,011,190 | |
Distribution fees | 20,733 | |
Fund wide operations fee | 319,407 | |
Independent trustees' compensation | 3,214 | |
Miscellaneous | 1,798 | |
Total expenses before reductions | 4,534,082 | |
Expense reductions | (19,809) | 4,514,273 |
Net investment income | | 51,627,290 |
Realized and Unrealized Gain (Loss) Net realized gain (loss) on: | | |
Investment securities: | | |
Unaffiliated issuers | (290,068) | |
Fidelity Central Funds | (248,412) | |
Futures contracts | (703,239) | |
Swap agreements | 171,901 | |
Capital gain distributions from Fidelity Central Funds | 32,406 | |
Total net realized gain (loss) | | (1,037,412) |
Change in net unrealized appreciation (depreciation) on: Investment securities | (18,018,278) | |
Futures contracts | 491,969 | |
Swap agreements | (3,108,720) | |
Total change in net unrealized appreciation (depreciation) | | (20,635,029) |
Net gain (loss) | | (21,672,441) |
Net increase (decrease) in net assets resulting from operations | | $ 29,954,849 |
See accompanying notes which are an integral part of the financial statements.
Annual Report
Financial Statements - continued
Statement of Changes in Net Assets
| Year ended
July 31,
2007 | Year ended
July 31,
2006 |
Increase (Decrease) in Net Assets | | |
Operations | | |
Net investment income | $ 51,627,290 | $ 38,252,086 |
Net realized gain (loss) | (1,037,412) | (1,106,422) |
Change in net unrealized appreciation (depreciation) | (20,635,029) | 76,542 |
Net increase (decrease) in net assets resulting
from operations | 29,954,849 | 37,222,206 |
Distributions to shareholders from net investment income | (51,625,727) | (38,283,502) |
Share transactions - net increase (decrease) | 161,604,013 | (51,227,531) |
Redemption fees | 39,619 | 28,307 |
Total increase (decrease) in net assets | 139,972,754 | (52,260,520) |
| | |
Net Assets | | |
Beginning of period | 861,493,243 | 913,753,763 |
End of period (including undistributed net investment income of $539,837 and undistributed net investment income of $106,939, respectively) | $ 1,001,465,997 | $ 861,493,243 |
See accompanying notes which are an integral part of the financial statements.
Annual Report
Financial Highlights - Class A
Years ended July 31, | 2007 | 2006 | 2005 | 2004 H |
Selected Per-Share Data | | | | |
Net asset value, beginning of period | $ 10.02 | $ 10.03 | $ 10.05 | $ 10.04 |
Income from Investment Operations | | | | |
Net investment income E | .493 | .400 | .223 | .013 |
Net realized and unrealized gain (loss) | (.198) | (.009) | (.026) | .011 |
Total from investment operations | .295 | .391 | .197 | .024 |
Distributions from net investment income | (.495) | (.401) | (.214) | (.014) |
Distributions from net realized gain | - | - | (.003) | - |
Total distributions | (.495) | (.401) | (.217) | (.014) |
Redemption fees added to paid in capitalE, J | - | - | - | - |
Net asset value, end of period | $ 9.82 | $ 10.02 | $ 10.03 | $ 10.05 |
Total Return B, C, D | 2.97% | 3.97% | 1.98% | .24% |
Ratios to Average Net Assets, F, I | | | | |
Expenses before reductions | .66% | .70% | .78% | .85% A |
Expenses net of fee waivers, if any | .66% | .70% | .70% | .70% A |
Expenses net of all reductions | .66% | .70% | .70% | .70% A |
Net investment income | 4.96% | 4.00% | 2.23% | 1.11% A |
Supplemental Data | | | | |
Net assets, end of period (000 omitted) | $ 13,735 | $ 4,553 | $ 2,557 | $ 316 |
Portfolio turnover rate G | 29% | 39% | 33% | 53% |
A Annualized
B Total returns for periods of less than one year are not annualized.
C Total returns would have been lower had certain expenses not been reduced during the periods shown.
D Total returns do not include the effect of the sales charges.
E Calculated based on average shares outstanding during the period.
F Fees and expenses of the underlying Fidelity Central Funds are not included in the Fund's expense ratio. The Fund indirectly bears its proportionate share of the expenses of any underlying Fidelity Central Funds.
G Amount does not include the portfolio activity of any underlying Fidelity Central Funds.
H For the period June 16, 2004 (commencement of sale of shares) to July 31, 2004.
I Expense ratios reflect operating expenses of the class. Expenses before reductions do not reflect amounts reimbursed by the investment adviser or expense offset arrangements and do not represent the amount paid by the class during periods when reimbursements or reductions occur. Expense ratios before reductions for start-up periods may not be representative of longer-term operating periods. Expenses net of fee waivers reflect expenses after reimbursement by the investment adviser but prior to reductions from expense offset arrangements. Expenses net of all reductions represent the net expenses paid by the class.
J Amount represents less than $.001 per share.
See accompanying notes which are an integral part of the financial statements.
Annual Report
Financial Highlights - Class T
Years ended July 31, | 2007 | 2006 | 2005 | 2004 H |
Selected Per-Share Data | | | | |
Net asset value, beginning of period | $ 10.02 | $ 10.03 | $ 10.05 | $ 10.04 |
Income from Investment Operations | | | | |
Net investment income E | .491 | .404 | .222 | .013 |
Net realized and unrealized gain (loss) | (.199) | (.011) | (.025) | .010 |
Total from investment operations | .292 | .393 | .197 | .023 |
Distributions from net investment income | (.492) | (.403) | (.214) | (.013) |
Distributions from net realized gain | - | - | (.003) | - |
Total distributions | (.492) | (.403) | (.217) | (.013) |
Redemption fees added to paid in capital E, J | - | - | - | - |
Net asset value, end of period | $ 9.82 | $ 10.02 | $ 10.03 | $ 10.05 |
Total Return B, C, D | 2.95% | 4.00% | 1.98% | .23% |
Ratios to Average Net Assets F, I | | | | |
Expenses before reductions | .69% | .68% | .77% | .86% A |
Expenses net of fee waivers, if any | .69% | .68% | .70% | .70% A |
Expenses net of all reductions | .69% | .68% | .70% | .70% A |
Net investment income | 4.93% | 4.03% | 2.23% | 1.11% A |
Supplemental Data | | | | |
Net assets, end of period (000 omitted) | $ 4,818 | $ 4,624 | $ 4,044 | $ 356 |
Portfolio turnover rate G | 29% | 39% | 33% | 53% |
A Annualized
B Total returns for periods of less than one year are not annualized.
C Total returns would have been lower had certain expenses not been reduced during the periods shown.
D Total returns do not include the effect of the sales charges.
E Calculated based on average shares outstanding during the period.
F Fees and expenses of the underlying Fidelity Central Funds are not included in the Fund's expense ratio. The Fund indirectly bears its proportionate share of the expenses of any underlying Fidelity Central Funds.
G Amount does not include the portfolio activity of any underlying Fidelity Central Funds.
H For the period June 16, 2004 (commencement of sale of shares) to July 31, 2004.
I Expense ratios reflect operating expenses of the class. Expenses before reductions do not reflect amounts reimbursed by the investment adviser or expense offset arrangements and do not represent the amount paid by the class during periods when reimbursements or reductions occur. Expense ratios before reductions for start-up periods may not be representative of longer-term operating periods. Expenses net of fee waivers reflect expenses after reimbursement by the investment adviser but prior to reductions from expense offset arrangements. Expenses net of all reductions represent the net expenses paid by the class.
J Amount represents less than $.001 per share.
See accompanying notes which are an integral part of the financial statements.
Annual Report
Financial Highlights - Ultra-Short Bond
Years ended July 31, | 2007 | 2006 | 2005 | 2004 | 2003 G |
Selected Per-Share Data | | | | | |
Net asset value,
beginning of period | $ 10.02 | $ 10.03 | $ 10.05 | $ 10.02 | $ 10.00 |
Income from Investment Operations | | | | | |
Net investment income D | .516 | .427 | .241 | .122 | .137 |
Net realized and unrealized gain (loss) | (.210) | (.011) | (.026) | .029 | .052 |
Total from investment operations | .306 | .416 | .215 | .151 | .189 |
Distributions from net investment income | (.516) | (.426) | (.232) | (.122) | (.173) |
Distributions from net realized gain | - | - | (.003) | - | - |
Total distributions | (.516) | (.426) | (.235) | (.122) | (.173) |
Redemption fees added to paid in capital D | - I | - I | - I | .001 | .004 |
Net asset value, end of period | $ 9.81 | $ 10.02 | $ 10.03 | $ 10.05 | $ 10.02 |
Total Return B, C | 3.09% | 4.23% | 2.16% | 1.52% | 1.94% |
Ratios to Average Net Assets E, H | | | | |
Expenses before reductions | .45% | .45% | .58% | .62% | .70% A |
Expenses net of fee waivers,
if any | .45% | .45% | .53% | .55% | .55% A |
Expenses net of all reductions | .45% | .45% | .53% | .55% | .55% A |
Net investment income | 5.17% | 4.26% | 2.41% | 1.21% | 1.50% A |
Supplemental Data | | | | | |
Net assets, end of period (000 omitted) | $ 974,602 | $ 850,329 | $ 906,644 | $ 580,174 | $ 225,203 |
Portfolio turnover rate F | 29% | 39% | 33% | 53% | 39% A |
A Annualized
B Total returns for periods of less than one year are not annualized.
C Total returns would have been lower had certain expenses not been reduced during the periods shown.
D Calculated based on average shares outstanding during the period.
E Fees and expenses of the underlying Fidelity Central Funds are not included in the Fund's expense ratio. The Fund indirectly bears its proportionate share of the expenses of any underlying Fidelity Central Funds.
F Amount does not include the portfolio activity of any underlying Fidelity Central Funds.
G For the period August 29, 2002 (commencement of operations) to July 31, 2003.
H Expense ratios reflect operating expenses of the class. Expenses before reductions do not reflect amounts reimbursed by the investment adviser or expense offset arrangements and do not represent the amount paid by the class during periods when reimbursements or reductions occur. Expense ratios before reductions for start-up periods may not be representative of longer-term operating periods. Expenses net of fee waivers reflect expenses after reimbursement by the investment adviser but prior to reductions from expense offset arrangements. Expenses net of all reductions represent the net expenses paid by the class.
I Amount represents less than $.001 per share.
See accompanying notes which are an integral part of the financial statements.
Annual Report
Financial Highlights - Institutional Class
Years ended July 31, | 2007 | 2006 | 2005 | 2004 G |
Selected Per-Share Data | | | | |
Net asset value, beginning of period | $ 10.02 | $ 10.03 | $ 10.05 | $ 10.04 |
Income from Investment Operations | | | | |
Net investment income D | .510 | .420 | .240 | .015 |
Net realized and unrealized gain (loss) | (.206) | (.008) | (.026) | .010 |
Total from investment operations | .304 | .412 | .214 | .025 |
Distributions from net investment income | (.514) | (.422) | (.231) | (.015) |
Distributions from net realized gain | - | - | (.003) | - |
Total distributions | (.514) | (.422) | (.234) | (.015) |
Redemption fees added to paid in capital D, I | - | - | - | - |
Net asset value, end of period | $ 9.81 | $ 10.02 | $ 10.03 | $ 10.05 |
Total Return B, C | 3.06% | 4.19% | 2.15% | .25% |
Ratios to Average Net Assets E, H | | | | |
Expenses before reductions | .48% | .49% | .58% | .67% A |
Expenses net of fee waivers, if any | .48% | .49% | .55% | .55% A |
Expenses net of all reductions | .48% | .49% | .55% | .55% A |
Net investment income | 5.14% | 4.22% | 2.38% | 1.26% A |
Supplemental Data | | | | |
Net assets, end of period (000 omitted) | $ 8,312 | $ 1,987 | $ 509 | $ 376 |
Portfolio turnover rate F | 29% | 39% | 33% | 53% |
A Annualized
B Total returns for periods of less than one year are not annualized.
C Total returns would have been lower had certain expenses not been reduced during the periods shown.
D Calculated based on average shares outstanding during the period.
E Fees and expenses of the underlying Fidelity Central Funds are not included in the Fund's expense ratio. The Fund indirectly bears its proportionate share of the expenses of any underlying Fidelity Central Funds.
F Amount does not include the portfolio activity of any underlying Fidelity Central Funds.
G For the period June 16, 2004 (commencement of sale of shares) to July 31, 2004.
H Expense ratios reflect operating expenses of the class. Expenses before reductions do not reflect amounts reimbursed by the investment adviser or expense offset arrangements and do not represent the amount paid by the class during periods when reimbursements or reductions occur. Expense ratios before reductions for start-up periods may not be representative of longer-term operating periods. Expenses net of fee waivers reflect expenses after reimbursement by the investment adviser but prior to reductions from expense offset arrangements. Expenses net of all reductions represent the net expenses paid by the class.
I Amount represents less than $.001 per share.
See accompanying notes which are an integral part of the financial statements.
Annual Report
Notes to Financial Statements
For the period ended July 31, 2007
1. Organization.
Fidelity Ultra-Short Bond Fund (the Fund) is a non-diversified fund of Fidelity Income Fund (the trust) and is authorized to issue an unlimited number of shares. The trust is registered under the Investment Company Act of 1940, as amended (the 1940 Act), as an open-end management investment company organized as a Massachusetts business trust.
The Fund offers Class A, Class T, Ultra-Short Bond, and Institutional Class shares, each of which has equal rights as to assets and voting privileges. Each class has exclusive voting rights with respect to matters that affect that class. Investment income, realized and unrealized capital gains and losses, the common expenses of the Fund, and certain fund-level expense reductions, if any, are allocated on a pro rata basis to each class based on the relative net assets of each class to the total net assets of the Fund. Each class differs with respect to transfer agent and distribution and service plan fees incurred. Certain expense reductions also differ by class.
2. Investments in Fidelity Central Funds.
The Fund may invest in Fidelity Central Funds which are open-end investment companies available only to other investment companies and accounts managed by Fidelity Management & Research Company (FMR) and its affiliates. The Fund's Schedule of Investments lists each of the Fidelity Central Funds as an investment of the Fund, but does not include the underlying holdings of each Fidelity Central Fund. As an Investing Fund, the Fund indirectly bears its proportionate share of the expenses of the underlying Fidelity Central Funds.
Based on their investment objective, each Fidelity Central Fund may invest or participate in various investment vehicles or strategies that are similar to those of the Fund. These strategies are consistent with the investment objectives of the Fund and may involve certain economic risks which may cause a decline in value of each of the Fidelity Central Funds and thus a decline in the value of the Fund. The following summarizes the Fund's investment in each Fidelity Central Fund.
Fidelity Central Fund | Investment Manager | Investment Objective | Investment Practices |
Fidelity Ultra-Short Central Fund | Fidelity Investments Money Management, Inc. (FIMM) | Seeks to obtain a high level of current income consistent with preservation of capital by investing in U.S. dollar denominated money market and investment-grade debt securities. | Delayed Delivery & When Issued Securities Futures Mortgage Dollar Rolls Repurchase Agreements Restricted Securities Swap Agreements |
Annual Report
Notes to Financial Statements - continued
2. Investments in Fidelity Central Funds - continued
A holdings listing for the Fund, which presents direct holdings as well as the pro rata share of any securities and other investments held indirectly through its investment in underlying non-money market Fidelity Central Funds is available at fidelity.com and/or advisor.fidelity.com, as applicable. A complete list of holdings for each Fidelity Central Fund is available upon request or at the SEC's web site at www.sec.gov. In addition, the financial statements of the Fidelity Central Funds, which are not covered by the Fund's Report of Independent Registered Public Accounting Firm, are available on the SEC's web site or upon request.
3. Significant Accounting Policies.
The financial statements have been prepared in conformity with accounting principles generally accepted in the United States of America, which require management to make certain estimates and assumptions at the date of the financial statements. The following summarizes the significant accounting policies of the Fund:
Security Valuation. Investments are valued and net asset value per share is calculated (NAV calculation) as of the close of business of the New York Stock Exchange, normally 4:00 p.m. Eastern time. Wherever possible, the Fund uses independent pricing services approved by the Board of Trustees to value its investments. Debt securities, including restricted securities, for which quotations are readily available, are valued by independent pricing services or by dealers who make markets in such securities. Pricing services consider yield or price of bonds of comparable quality, coupon, maturity and type as well as available dealer prices.
When current market prices or quotations are not readily available or do not accurately reflect fair value, valuations may be determined in accordance with procedures adopted by the Board of Trustees. Factors used in the determination of fair value may include current market trading activity, interest rates, credit quality and default rates. The frequency of when fair value pricing is used is unpredictable. The value of securities used for NAV calculation under fair value pricing may differ from published prices for the same securities. Investments in open-end mutual funds, including the Fidelity Central Funds, are valued at their closing net asset value each business day. Short-term securities with remaining maturities of sixty days or less for which quotations are not readily available are valued at amortized cost, which approximates value.
Investment Transactions and Income. For financial reporting purposes, the Fund's investment holdings and NAV include trades executed through the end of the last business day of the period. The NAV for processing shareholder transactions includes trades executed through the end of the prior business day. Gains and losses on securities sold are determined on the basis of identified cost. Interest income and income and capital gain distributions from the Fidelity Central Funds are accrued as earned. Interest income includes coupon interest and amortization of premium and accretion of discount on debt securities.
Annual Report
3. Significant Accounting Policies - continued
Expenses. Most expenses of the trust can be directly attributed to a fund. Expenses which cannot be directly attributed are apportioned among each Fund in the trust. Expense estimates are accrued in the period to which they relate and adjustments are made when actual amounts are known.
Income Tax Information and Distributions to Shareholders. Each year, the Fund intends to qualify as a regulated investment company by distributing all of its taxable income and realized gains under Subchapter M of the Internal Revenue Code. As a result, no provision for income taxes is required in the accompanying financial statements.
Dividends are declared daily and paid monthly from net investment income. Distributions from realized gains, if any, are recorded on the ex-dividend date. Income dividends and capital gain distributions are declared separately for each class. Income and capital gain distributions are determined in accordance with income tax regulations, which may differ from generally accepted accounting principles.
Capital accounts within the financial statements are adjusted for permanent book-tax differences. These adjustments have no impact on net assets or the results of operations. Temporary book-tax differences will reverse in a subsequent period.
Book-tax differences are primarily due to futures transactions, swap agreements, market discount, capital loss carryforwards and losses deferred due to excise tax regulations.
The tax-basis components of distributable earnings and the federal tax cost as of period end were as follows:
Unrealized appreciation | $ 632,219 | |
Unrealized depreciation | (20,350,264) | |
Net unrealized appreciation (depreciation) | (19,718,045) | |
Capital loss carryforward | (2,436,121) | |
| | |
Cost for federal income tax purposes | $ 1,026,634,641 | |
The tax character of distributions paid was as follows:
| July 31, 2007 | July 31, 2006 |
Ordinary Income | $ 51,625,727 | $ 38,283,502 |
Short-Term Trading (Redemption) Fees. Shares held in the Fund less than 60 days are subject to a redemption fee equal to .25% of the proceeds of the redeemed shares. All redemption fees, including any estimated redemption fees paid by FMR, are retained by the Fund and accounted for as an addition to paid in capital.
Annual Report
Notes to Financial Statements - continued
3. Significant Accounting Policies - continued
New Accounting Pronouncements. In July 2006, Financial Accounting Standards Board Interpretation No. 48, Accounting for Uncertainty in Income Taxes - an interpretation of FASB Statement 109 (FIN 48), was issued and is effective on the last business day of the semiannual reporting period for fiscal years beginning after December 15, 2006. FIN 48 sets forth a threshold for financial statement recognition, measurement and disclosure of a tax position taken or expected to be taken on a tax return. Management has concluded that the adoption of FIN 48 will not result in a material impact on the Fund's net assets, results of operations and financial statement disclosures.
In addition, in September 2006, Statement of Financial Accounting Standards No. 157, Fair Value Measurements (SFAS 157), was issued and is effective for fiscal years beginning after November 15, 2007. SFAS 157 defines fair value, establishes a framework for measuring fair value and expands disclosures about fair value measurements. Management is currently evaluating the impact the adoption of SFAS 157 will have on the Fund's financial statement disclosures.
4. Operating Policies.
Repurchase Agreements. FMR has received an Exemptive Order from the Securities and Exchange Commission (the SEC) which permits the Fund and other affiliated entities of FMR to transfer uninvested cash balances into joint trading accounts which are then invested in repurchase agreements. The Fund may also invest directly with institutions in repurchase agreements. Repurchase agreements are collateralized by government or non-government securities. Upon settlement date, collateral is held in segregated accounts with custodian banks and may be obtained in the event of a default of the counterparty. The Fund monitors, on a daily basis, the value of the collateral to ensure it is at least equal to the principal amount of the repurchase agreement (including accrued interest). In the event of a default by the counterparty, realization of the collateral proceeds could be delayed, during which time the value of the collateral may decline.
Delayed Delivery Transactions and When-Issued Securities. The Fund may purchase or sell securities on a delayed delivery or when-issued basis. Payment and delivery may take place after the customary settlement period for that security. The price of the underlying securities and the date when the securities will be delivered and paid for are fixed at the time the transaction is negotiated. During the time a delayed delivery sell is outstanding, the contract is marked-to-market daily and equivalent deliverable securities are held for the transaction. The value of the securities purchased on a delayed delivery or when-issued basis are identified as such in the Fund's Schedule of Investments. The Fund may receive compensation for interest forgone in the purchase of a delayed delivery or when-issued security. With respect to purchase commitments,
Annual Report
4. Operating Policies - continued
Delayed Delivery Transactions and When-Issued Securities - continued
the Fund identifies securities as segregated in its records with a value at least equal to the amount of the commitment. Losses may arise due to changes in the value of the underlying securities or if the counterparty does not perform under the contract's terms, or if the issuer does not issue the securities due to political, economic, or other factors.
Futures Contracts. The Fund may use futures contracts to manage its exposure to the bond market and to fluctuations in interest rates. Buying futures tends to increase a fund's exposure to the underlying instrument, while selling futures tends to decrease a fund's exposure to the underlying instrument or hedge other fund investments. Upon entering into a futures contract, a fund is required to deposit with a clearing broker, no later than the following business day, an amount ("initial margin") equal to a certain percentage of the face value of the contract. The initial margin may be in the form of cash or securities and is transferred to a segregated account on settlement date. Subsequent payments ("variation margin") are made or received by a fund depending on the daily fluctuations in the value of the futures contract and are accounted for as unrealized gains or losses. Realized gains (losses) are recorded upon the expiration or closing of the futures contract. Securities deposited to meet margin requirements are identified in the Schedule of Investments. Futures contracts involve, to varying degrees, risk of loss in excess of any futures variation margin reflected in the Statement of Assets and Liabilities. The underlying face amount at value of any open futures contracts at period end is shown in the Schedule of Investments under the caption "Futures Contracts." This amount reflects each contract's exposure to the underlying instrument at period end. Losses may arise from changes in the value of the underlying instruments or if the counterparties do not perform under the contract's terms. Futures contracts are valued at the settlement price established each day by the board of trade or exchange on which they are traded.
Restricted Securities. The Fund may invest in securities that are subject to legal or contractual restrictions on resale. These securities generally may be resold in transactions exempt from registration or to the public if the securities are registered. Disposal of these securities may involve time-consuming negotiations and expense, and prompt sale at an acceptable price may be difficult. Information regarding restricted securities is included at the end of the Fund's Schedule of Investments.
Swap Agreements. The Fund may invest in swaps for the purpose of managing its exposure to interest rate, credit or market risk.
Total return swaps are agreements to exchange the return generated by one instrument or index for the return generated by another instrument, for example, the agreement to pay interest in exchange for a market-linked return based on a notional amount. To the
Annual Report
Notes to Financial Statements - continued
4. Operating Policies - continued
Swap Agreements - continued
extent the total return of the index exceeds the offsetting interest obligation, a fund will receive a payment from the counterparty. To the extent it is less, a fund will make a payment to the counterparty. Periodic payments received or made by the Fund are recorded in the accompanying Statement of Operations as realized gains or losses, respectively.
Credit default swaps involve the exchange of a fixed rate premium for protection against the loss in value of an underlying debt instrument in the event of a defined credit event (such as payment default or bankruptcy). Under the terms of the swap, one party acts as a "guarantor" receiving a periodic payment that is a fixed percentage applied to a notional principal amount. In return the party agrees to purchase the notional amount of the underlying instrument, at par, if a credit event occurs during the term of the swap. The Fund may enter into credit default swaps in which either it or its counterparty act as guarantors. By acting as the guarantor of a swap, a fund assumes the market and credit risk of the underlying instrument including liquidity and loss of value. Periodic payments and premiums received or made by the Fund are recorded in the accompanying Statement of Operations as realized gains or losses, respectively.
Swaps are marked-to-market daily based on dealer-supplied valuations and changes in value are recorded as unrealized appreciation (depreciation). Gains or losses are realized upon early termination of the swap agreement. Collateral, in the form of cash or securities, may be required to be held in segregated accounts with a fund's custodian in compliance with swap contracts. Risks may exceed amounts recognized on the Statement of Assets and Liabilities. These risks include changes in the returns of the underlying instruments, failure of the counterparties to perform under the contracts' terms and the possible lack of liquidity with respect to the swap agreements. Details of swap agreements open at period end are included in the Fund's Schedule of Investments under the caption "Swap Agreements."
5. Purchases and Sales of Investments.
Purchases and sales of securities (including the Fixed-Income Central Funds), other than short-term securities and U.S. government securities, aggregated $399,912,272 and $239,443,351, respectively.
6. Fees and Other Transactions with Affiliates.
Management Fee. FMR and its affiliates provide the Fund with investment management related services for which the Fund pays a monthly management fee. The management fee is the sum of an individual fund fee rate that is based on an annual rate of .20% of the Fund's average net assets and a group fee rate that averaged ..12% during the
Annual Report
6. Fees and Other Transactions with Affiliates - continued
Management Fee - continued
period. The group fee rate is based upon the average net assets of all the mutual funds advised by FMR. The group fee rate decreases as assets under management increase and increases as assets under management decrease. For the period, the total annual management fee rate was .32% of the Fund's average net assets.
Distribution and Service Plan. In accordance with Rule 12b-1 of the 1940 Act, the Fund has adopted separate Distribution and Service Plans for each class of shares. Certain classes pay Fidelity Distributors Corporation (FDC), an affiliate of FMR, separate Distribution and Service Fees, each of which is based on an annual percentage of each class' average net assets. In addition, FDC may pay financial intermediaries for selling shares of the Fund and providing shareholder support services. For the period, the Distribution and Service Fee rates and the total amounts paid to and retained by FDC were as follows:
| Distribution
Fee | Service
Fee | Paid to
FDC | Retained
by FDC |
Class A | 0 % | .15% | $ 14,333 | $ 6,971 |
Class T | 0 % | .15% | 6,400 | 157 |
| | | $ 20,733 | $ 7,128 |
Sales Load. FDC receives a front-end sales charge of up to 1.50% for selling Class A and Class T shares, some of which is paid to financial intermediaries for selling shares of the Fund. FDC receives the proceeds of a contingent deferred sales charges levied on Class A and Class T redemptions. These charges depend on the holding period. The deferred sales charges range from .75% to .50% for certain purchases of Class A shares and .25% for certain purchases of Class T shares.
For the period, sales charge amounts retained by FDC were as follows:
| Retained
by FDC |
Class A | $ 9,720 |
Class T | 1,413 |
| $ 11,133 |
Transfer Agent Fees. Fidelity Investments Institutional Operations Company, Inc. (FIIOC), an affiliate of FMR, is the transfer, dividend disbursing and shareholder servicing agent for each class of the Fund, except for Ultra-Short Bond. Fidelity Service Company, Inc. (FSC), an affiliate of FMR, is the transfer agent for Ultra-Short Bond shares. FIIOC receives account fees and asset-based fees that vary according to the account size and type of account of the shareholders of the respective classes of the Fund. FSC receives an asset-based fee of .10% of Ultra-Short Bond's average net assets.
Annual Report
Notes to Financial Statements - continued
6. Fees and Other Transactions with Affiliates - continued
Transfer Agent Fees - continued
FIIOC and FSC pay for typesetting, printing and mailing of shareholder reports, except proxy statements. For the period, the total transfer agent fees paid by each class to FIIOC or FSC, were as follows:
| Amount | % of
Average
Net Assets |
Class A | $ 15,125 | .16 |
Class T | 8,066 | .19 |
Ultra-Short Bond | 980,311 | .10 |
Institutional Class | 7,688 | .13 |
| $ 1,011,190 | |
Fundwide Operations Fee. Pursuant to the Fundwide Operations and Expense Agreement (FWOE), FMR has agreed to provide for fund level expenses (which do not include transfer agent, Rule 12b-1 fees, compensation of the independent trustees, interest (including commitment fees), taxes or extraordinary expenses, if any) in return for a FWOE fee equal to .35% less the total amount of the management fee. The FWOE paid by the Fund is reduced by an amount equal to the fees and expenses paid to the independent trustees. For the period, the FWOE fee was equivalent to an annual rate of .03% of average net assets.
7. Committed Line of Credit.
The Fund participates with other funds managed by FMR in a $4.2 billion credit facility (the "line of credit") to be utilized for temporary or emergency purposes to fund shareholder redemptions or for other short-term liquidity purposes. The Fund has agreed to pay commitment fees on its pro rata portion of the line of credit, which amounted to $1,798 and is reflected in Miscellaneous Expense on the Statement of Operations. During the period, there were no borrowings on this line of credit.
8. Expense Reductions.
Through arrangements with the Fund's custodian and each class' transfer agent, credits realized as a result of uninvested cash balances were used to reduce the Fund's expenses. During the period, these credits reduced the Fund's expenses by $14,119. During the period, credits reduced each class' transfer agent expense as noted in the table below.
| Transfer Agent
expense reduction | |
Ultra-Short Bond | $ 5,690 | |
Annual Report
9. Credit Risk.
The Fund invests a significant portion of its assets in securities of issuers that hold mortgage securities, including subprime mortgage securities. The value of these securities is sensitive to changes in economic conditions, including delinquencies and/or defaults, and may be adversely affected by shifts in the market's perception of the issuers and changes in interest rates.
10. Other.
The Fund's organizational documents provide former and current trustees and officers with a limited indemnification against liabilities arising in connection with the performance of their duties to the Fund. In the normal course of business, the Fund may also enter into contracts that provide general indemnifications. The Fund's maximum exposure under these arrangements is unknown as this would be dependent on future claims that may be made against the Fund. The risk of material loss from such claims is considered remote.
11. Distributions to Shareholders.
Distributions to shareholders of each class were as follows:
| Years ended July 31, |
| 2007 | 2006 |
From net investment income | | |
Class A | $ 470,241 | $ 126,997 |
Class T | 210,443 | 141,086 |
Ultra-Short Bond | 50,639,843 | 37,977,353 |
Institutional Class | 305,200 | 38,066 |
Total | $ 51,625,727 | $ 38,283,502 |
12. Share Transactions.
Transactions for each class of shares were as follows:
| Shares | Dollars |
| Years ended July 31, | Years ended July 31, |
| 2007 | 2006 | 2007 | 2006 |
Class A | | | | |
Shares sold | 1,247,732 | 574,958 | $ 12,475,671 | $ 5,763,274 |
Reinvestment of distributions | 37,250 | 10,043 | 371,847 | 100,637 |
Shares redeemed | (340,215) | (385,505) | (3,395,610) | (3,863,258) |
Net increase (decrease) | 944,767 | 199,496 | $ 9,451,908 | $ 2,000,653 |
Annual Report
Notes to Financial Statements - continued
12. Share Transactions - continued
| Shares | Dollars |
| Years ended July 31, | Years ended July 31, |
| 2007 | 2006 | 2007 | 2006 |
Class T | | | | |
Shares sold | 388,444 | 357,260 | $ 3,878,571 | $ 3,579,216 |
Reinvestment of distributions | 19,812 | 13,205 | 197,787 | 132,333 |
Shares redeemed | (378,796) | (312,176) | (3,788,237) | (3,129,874) |
Net increase (decrease) | 29,460 | 58,289 | $ 288,121 | $ 581,675 |
Ultra-Short Bond | | | | |
Shares sold | 59,380,876 | 39,226,057 | $ 593,653,669 | $ 393,000,678 |
Reinvestment of distributions | 4,599,590 | 3,400,651 | 45,902,034 | 34,072,273 |
Shares redeemed | (49,556,665) | (48,147,604) | (494,187,803) | (482,361,462) |
Net increase (decrease) | 14,423,801 | (5,520,896) | $ 145,367,900 | $ (55,288,511) |
Institutional Class | | | | |
Shares sold | 970,636 | 190,577 | $ 9,707,468 | $ 1,908,425 |
Reinvestment of distributions | 8,301 | 756 | 82,674 | 7,577 |
Shares redeemed | (330,344) | (43,621) | (3,294,058) | (437,350) |
Net increase (decrease) | 648,593 | 147,712 | $ 6,496,084 | $ 1,478,652 |
Annual Report
Report of Independent Registered Public Accounting Firm
To the Trustees of Fidelity Income Fund and the Shareholders of Fidelity Ultra-Short Bond Fund:
In our opinion, the accompanying statement of assets and liabilities, including the schedule of investments, and the related statements of operations and of changes in net assets and the financial highlights present fairly, in all material respects, the financial position of Fidelity Ultra-Short Bond Fund (a fund of Fidelity Income Fund) at July 31, 2007, the results of its operations for the year then ended, the changes in its net assets for each of the two years in the period then ended and the financial highlights for each of the periods indicated, in conformity with accounting principles generally accepted in the United States of America. These financial statements and financial highlights (hereafter referred to as "financial statements") are the responsibility of the Fidelity Ultra-Short Bond Fund's management. Our responsibility is to express an opinion on these financial statements based on our audits. We conducted our audits of these financial statements in accordance with the standards of the Public Company Accounting Oversight Board (United States). Those standards require that we plan and perform the audit to obtain reasonable assurance about whether the financial statements are free of material misstatement. An audit includes examining, on a test basis, evidence supporting the amounts and disclosures in the financial statements, assessing the accounting principles used and significant estimates made by management, and evaluating the overall financial statement presentation. We believe that our audits, which included confirmation of securities at July 31, 2007 by correspondence with the custodian and brokers, provide a reasonable basis for our opinion.
/s/ PricewaterhouseCoopers LLP
PricewaterhouseCoopers LLP
Boston, Massachusetts
September 25, 2007
Annual Report
Trustees and Officers
The Trustees, Members of the Advisory Board, and executive officers of the trust and fund, as applicable, are listed below. The Board of Trustees governs the fund and is responsible for protecting the interests of shareholders. The Trustees are experienced executives who meet periodically throughout the year to oversee the fund's activities, review contractual arrangements with companies that provide services to the fund, and review the fund's performance. Except for James C. Curvey, each of the Trustees oversees 353 funds advised by FMR or an affiliate. Mr. Curvey oversees 317 funds advised by FMR or an affiliate.
The Trustees hold office without limit in time except that (a) any Trustee may resign; (b) any Trustee may be removed by written instrument, signed by at least two-thirds of the number of Trustees prior to such removal; (c) any Trustee who requests to be retired or who has become incapacitated by illness or injury may be retired by written instrument signed by a majority of the other Trustees; and (d) any Trustee may be removed at any special meeting of shareholders by a two-thirds vote of the outstanding voting securities of the trust. Each Trustee who is not an interested person (as defined in the 1940 Act) (Independent Trustee), shall retire not later than the last day of the calendar year in which his or her 72nd birthday occurs. The Independent Trustees may waive this mandatory retirement age policy with respect to individual Trustees. The executive officers and Advisory Board Members hold office without limit in time, except that any officer and Advisory Board Member may resign or may be removed by a vote of a majority of the Trustees at any regular meeting or any special meeting of the Trustees. Except as indicated, each individual has held the office shown or other offices in the same company for the past five years.
The fund's Statement of Additional Information (SAI) includes more information about the Trustees. To request a free copy, call Fidelity at 1-877-208-0098.
Interested Trustees*:
Correspondence intended for each Trustee who is an interested person may be sent to Fidelity Investments, 82 Devonshire Street, Boston, Massachusetts 02109.
Name, Age; Principal Occupation |
Edward C. Johnson 3d (77) |
| Year of Election or Appointment: 1984 Mr. Johnson is Chairman of the Board of Trustees. Mr. Johnson serves as President (2006-present), Chief Executive Officer, Chairman, and a Director of FMR Corp.; Chairman and a Director of FMR; Chairman and a Director of Fidelity Research & Analysis Company (FRAC); Chairman and a Director of Fidelity Investments Money Management, Inc.; and Chairman (2001-present) and a Director of FMR Co., Inc. In addition, Mr. Johnson serves as Chairman and Director of Fidelity International Limited (FIL). |
James C. Curvey (72) |
| Year of Election or Appointment: 2007 Mr. Curvey also serves as Trustee (2007-present) or Member of the Advisory Board (2007-present) of other investment companies advised by FMR. Mr. Curvey is Vice Chairman (2006-present) and Director of FMR Corp. Mr. Curvey joined Fidelity in 1982 and served in numerous senior management positions, including President and Chief Operating Officer of FMR Corp. (1997-2000) and President of Fidelity Strategic Investments (2000-2002). In addition, he serves as a member of the Board of Directors of Geerlings & Wade, Inc. (wine distribution). |
* Trustees have been determined to be "Interested Trustees" by virtue of, among other things, their affiliation with the trust or various entities under common control with FMR.
Independent Trustees:
Correspondence intended for each Independent Trustee (that is, the Trustees other than the Interested Trustees) may be sent to Fidelity Investments, P.O. Box 55235, Boston, Massachusetts 02205-5235.
Name, Age; Principal Occupation |
Dennis J. Dirks (59) |
| Year of Election or Appointment: 2005 Prior to his retirement in May 2003, Mr. Dirks was Chief Operating Officer and a member of the Board of The Depository Trust & Clearing Corporation (DTCC) (1999-2003). He also served as President, Chief Operating Officer, and Board member of The Depository Trust Company (DTC) (1999-2003) and President and Board member of the National Securities Clearing Corporation (NSCC) (1999-2003). In addition, Mr. Dirks served as Chief Executive Officer and Board member of the Government Securities Clearing Corporation (2001-2003) and Chief Executive Officer and Board member of the Mortgage-Backed Securities Clearing Corporation (2001-2003). Mr. Dirks also serves as a Trustee and a member of the Finance Committee of Manhattan College (2005-present) and a Trustee and a member of the Finance Committee of AHRC of Nassau County (2006-present). |
Albert R. Gamper, Jr. (65) |
| Year of Election or Appointment: 2006 Prior to his retirement in December 2004, Mr. Gamper served as Chairman of the Board of CIT Group Inc. (commercial finance). During his tenure with CIT Group Inc. Mr. Gamper served in numerous senior management positions, including Chairman (1987-1989; 1999-2001; 2002-2004), Chief Executive Officer (1987-2004), and President (1989-2002). He currently serves as a member of the Board of Directors of Public Service Enterprise Group (utilities, 2001-present), Chairman of the Board of Governors, Rutgers University (2004-present), and Chairman of the Board of Saint Barnabas Health Care System. |
George H. Heilmeier (71) |
| Year of Election or Appointment: 2004 Dr. Heilmeier is Chairman Emeritus of Telcordia Technologies (communication software and systems), where prior to his retirement, he served as company Chairman and Chief Executive Officer. He currently serves on the Boards of Directors of The Mitre Corporation (systems engineering and information technology support for the government), and HRL Laboratories (private research and development, 2004-present). He is Chairman of the General Motors Science & Technology Advisory Board and a Life Fellow of the Institute of Electrical and Electronics Engineers (IEEE). Dr. Heilmeier is a member of the Defense Science Board and the National Security Agency Advisory Board. He is also a member of the National Academy of Engineering, the American Academy of Arts and Sciences, and the Board of Overseers of the School of Engineering and Applied Science of the University of Pennsylvania. Previously, Dr. Heilmeier served as a Director of TRW Inc. (automotive, space, defense, and information technology, 1992-2002), Compaq (1994-2002), Automatic Data Processing, Inc. (ADP) (technology-based business outsourcing, 1995-2002), INET Technologies Inc. (telecommunications network surveillance, 2001-2004), and Teletech Holdings (customer management services). He is the recipient of the 2005 Kyoto Prize in Advanced Technology for his invention of the liquid crystal display, and a member of the Consumer Electronics Hall of Fame. |
James H. Keyes (66) |
| Year of Election or Appointment: 2007 Prior to his retirement in 2003, Mr. Keyes was Chairman, President, and Chief Executive Officer of Johnson Controls, Inc. (automotive supplier, 1993-2003). He currently serves as a member of the boards of LSI Logic Corporation (semiconductor technologies), Navistar International Corporation (manufacture and sale of trucks, buses, and diesel engines, 2002-present), and Pitney Bowes, Inc. (integrated mail, messaging, and document management solutions). |
Marie L. Knowles (60) |
| Year of Election or Appointment: 2001 Prior to Ms. Knowles' retirement in June 2000, she served as Executive Vice President and Chief Financial Officer of Atlantic Richfield Company (ARCO) (diversified energy, 1996-2000). From 1993 to 1996, she was a Senior Vice President of ARCO and President of ARCO Transportation Company. She served as a Director of ARCO from 1996 to 1998. She currently serves as a Director of Phelps Dodge Corporation (copper mining and manufacturing) and McKesson Corporation (healthcare service, 2002-present). Ms. Knowles is a Trustee of the Brookings Institution and the Catalina Island Conservancy and also serves as a member of the Advisory Board for the School of Engineering of the University of Southern California. |
Ned C. Lautenbach (63) |
| Year of Election or Appointment: 2000 Mr. Lautenbach is Chairman of the Independent Trustees (2006-present). Mr. Lautenbach has been a partner of Clayton, Dubilier & Rice, Inc. (private equity investment firm) since September 1998. Previously, Mr. Lautenbach was with the International Business Machines Corporation (IBM) from 1968 until his retirement in 1998. Mr. Lautenbach serves as a Director of Sony Corporation (2006-present) and Eaton Corporation (diversified industrial) as well as the Philharmonic Center for the Arts in Naples, Florida. He also is a member of the Board of Trustees of Fairfield University (2005-present), as well as a member of the Council on Foreign Relations. |
Cornelia M. Small (63) |
| Year of Election or Appointment: 2005 Ms. Small is a member (2000-present) and Chairperson (2002-present) of the Investment Committee, and a member (2002-present) of the Board of Trustees of Smith College. Previously, she served as Chief Investment Officer (1999-2000), Director of Global Equity Investments (1996-1999), and a member of the Board of Directors of Scudder, Stevens & Clark (1990-1997) and Scudder Kemper Investments (1997-1999). In addition, Ms. Small served as Co-Chair (2000-2003) of the Annual Fund for the Fletcher School of Law and Diplomacy. |
William S. Stavropoulos (68) |
| Year of Election or Appointment: 2001 Mr. Stavropoulos is Chairman Emeritus of the Board of Directors of The Dow Chemical Company. Since joining The Dow Chemical Company in 1967, Mr. Stavropoulos served in numerous senior management positions, including President (1993-2000; 2002-2003), CEO (1995-2000; 2002-2004), and Chairman of the Executive Committee (2000-2004). Currently, he is a Director of NCR Corporation (data warehousing and technology solutions), Chemical Financial Corporation, Maersk Inc. (industrial conglomerate, 2002-present), Tyco International, Inc. (multinational manufacturing and services, 2007-present), and a member of the Advisory Board for Metalmark Capital (private equity investment firm, 2005-present). He is a special advisor to Clayton, Dubilier & Rice, Inc., a private equity investment firm. He also serves as a member of the Board of Trustees of the American Enterprise Institute for Public Policy Research. In addition, Mr. Stavropoulos is a member of The Business Council, J.P. Morgan International Council and the University of Notre Dame Advisory Council for the College of Science. |
Kenneth L. Wolfe (68) |
| Year of Election or Appointment: 2005 Prior to his retirement in 2001, Mr. Wolfe was Chairman and Chief Executive Officer of Hershey Foods Corporation (1993-2001). He currently serves as a member of the boards of Adelphia Communications Corporation (2003-present), Bausch & Lomb, Inc., and Revlon Inc. (2004-present). |
Advisory Board Members and Executive Officers:
Correspondence intended for Mr. Mauriello may be sent to Fidelity Investments, P.O. Box 55235, Boston, Massachusetts 02205-5235. Correspondence intended for each executive officer and Mr. Lynch may be sent to Fidelity Investments, 82 Devonshire Street, Boston, Massachusetts 02109.
Name, Age; Principal Occupation |
Peter S. Lynch (63) |
| Year of Election or Appointment: 2003 Member of the Advisory Board of Fidelity Income Fund. Mr. Lynch is Vice Chairman and a Director of FMR, and Vice Chairman (2001-present) and a Director of FMR Co., Inc. Previously, Mr. Lynch served as a Trustee of the Fidelity funds (1990-2003). In addition, he serves as a Trustee of Boston College and as the Chairman of the Inner-City Scholarship Fund. |
Joseph Mauriello (62) |
| Year of Election or Appointment: 2007 Member of the Advisory Board of Fidelity Income Fund. Prior to his retirement in January 2006, Mr. Mauriello served in numerous senior management positions including Deputy Chairman and Chief Operating Officer (2004-2005), and Vice Chairman of Financial Services (2002-2004) of KPMG LLP US (professional services firm, 1965-2005). Mr. Mauriello currently serves as a member of the Board of Directors of XL Capital Ltd., (global insurance and re-insurance company, 2006-present) and of Arcadia Resources Inc., (health care services and products, 2007-present). He also served as a Director of the Hamilton Funds of the Bank of New York (2006-2007). |
Kimberley H. Monasterio (43) |
| Year of Election or Appointment: 2007 President and Treasurer of the fund. Ms. Monasterio also serves as President and Treasurer of other Fidelity funds (2007-present) and is an employee of FMR (2004-present). Previously, Ms. Monasterio served as Deputy Treasurer of the Fidelity funds (2004-2006). Before joining Fidelity Investments, Ms. Monasterio served as Treasurer (2000-2004) and Chief Financial Officer (2002-2004) of the Franklin Templeton Funds and Senior Vice President of Franklin Templeton Services, LLC (2000-2004). |
Boyce I. Greer (51) |
| Year of Election or Appointment: 2006 Vice President of the fund. Mr. Greer also serves as Vice President of certain Equity Funds (2005-present), certain Asset Allocation Funds (2005-present), Fixed-Income Funds (2006-present), and Money Market Funds (2006-present). Mr. Greer is also a Trustee of other investment companies advised by FMR (2003-present). He is an Executive Vice President of FMR (2005-present) and FMR Co., Inc. (2005-present), and Senior Vice President of Fidelity Investments Money Management, Inc. (2006-present). Previously, Mr. Greer served as a Director and Managing Director of Strategic Advisers, Inc. (2002-2005), and Executive Vice President (2000-2002) and Money Market Group Leader (1997-2002) of the Fidelity Investments Fixed Income Division. He also served as Vice President of Fidelity's Money Market Funds (1997-2002), Senior Vice President of FMR (1997-2002), and Vice President of FIMM (1998-2002). |
David L. Murphy (59) |
| Year of Election or Appointment: 2005 Vice President of the fund. Mr. Murphy also serves as Vice President of Fidelity's Money Market Funds (2002-present), certain Asset Allocation Funds (2003-present), Fixed-Income Funds (2005-present), and Balanced Funds (2005-present). He serves as Senior Vice President (2000-present) and Head (2004-present) of the Fidelity Investments Fixed Income Division. Mr. Murphy is also a Senior Vice President of Fidelity Investments Money Management, Inc. (2003-present) and an Executive Vice President of FMR (2005-present). Previously, Mr. Murphy served as Money Market Group Leader (2002-2004), Bond Group Leader (2000-2002), and Vice President of Fidelity's Taxable Bond Funds (2000-2002) and Fidelity's Municipal Bond Funds (2001-2002). |
Thomas J. Silvia (46) |
| Year of Election or Appointment: 2005 Vice President of the fund. Mr. Silvia also serves as Vice President of Fidelity's Fixed-Income Funds (2005-present), certain Balanced Funds (2005-present), certain Asset Allocation Funds (2005-present), and Senior Vice President and Bond Group Leader of the Fidelity Investments Fixed-Income Division (2005-present). Previously, Mr. Silvia served as Director of Fidelity's Taxable Bond portfolio managers (2002-2004) and a portfolio manager in the Bond Group (1997-2004). |
Andrew Dudley (42) |
| Year of Election or Appointment: 2002 Vice President of the fund. Mr. Dudley also serves as Vice President of other funds advised by FMR. Prior to assuming his current responsibilities, Mr. Dudley worked as a portfolio manager. |
Robert Galusza (43) |
| Year of Election or Appointment: 2007 Vice President of the fund. Mr. Galusza also serves as Vice President of other funds advised by FMR. Prior to assuming his current responsibilities, Mr. Galusza worked as an analyst and a portfolio manager. |
Eric D. Roiter (58) |
| Year of Election or Appointment: 2002 Secretary of the fund. He also serves as Secretary of other Fidelity funds; Vice President, General Counsel, and Secretary of FMR Co., Inc. (2001-present) and FMR; Assistant Secretary of Fidelity Management & Research (U.K.) Inc. (2001-present), Fidelity Research & Analysis Company (2001-present), and Fidelity Investments Money Management, Inc. (2001-present). Mr. Roiter is an Adjunct Member, Faculty of Law, at Boston College Law School (2003-present). Previously, Mr. Roiter served as Vice President and Secretary of Fidelity Distributors Corporation (FDC) (1998-2005). |
Scott C. Goebel (39) |
| Year of Election or Appointment: 2007 Assistant Secretary of the fund. Mr. Goebel also serves as Assistant Secretary of other Fidelity funds (2007-present), Vice President and Secretary of FDC (2006-present), and is an employee of FMR. |
R. Stephen Ganis (41) |
| Year of Election or Appointment: 2006 Anti-Money Laundering (AML) officer of the fund. Mr. Ganis also serves as AML officer of other Fidelity funds (2006-present) and FMR Corp. (2003-present). Before joining Fidelity Investments, Mr. Ganis practiced law at Goodwin Procter, LLP (2000-2002). |
Joseph B. Hollis (59) |
| Year of Election or Appointment: 2006 Chief Financial Officer of the fund. Mr. Hollis also serves as Chief Financial Officer of other Fidelity funds. Mr. Hollis is President of Fidelity Pricing and Cash Management Services (FPCMS) (2005-present). Mr. Hollis also serves as President and Director of Fidelity Service Company, Inc. (2006-present). Previously, Mr. Hollis served as Senior Vice President of Cash Management Services (1999-2002) and Investment Management Operations (2002-2005). |
Kenneth A. Rathgeber (60) |
| Year of Election or Appointment: 2004 Chief Compliance Officer of the fund. Mr. Rathgeber also serves as Chief Compliance Officer of other Fidelity funds (2004-present) and Executive Vice President of Risk Oversight for Fidelity Investments (2002-present). He is Chief Compliance Officer of FMR (2005-present), FMR Co., Inc. (2005-present), Fidelity Management & Research (U.K.) Inc. (2005-present), Fidelity Research & Analysis Company (2005-present), Fidelity Investments Money Management, Inc. (2005-present), and Strategic Advisers, Inc. (2005-present). Previously, Mr. Rathgeber served as Executive Vice President and Chief Operating Officer for Fidelity Investments Institutional Services Company, Inc. (1998-2002). |
Bryan A. Mehrmann (46) |
| Year of Election or Appointment: 2005 Deputy Treasurer of the fund. Mr. Mehrmann also serves as Deputy Treasurer of other Fidelity funds (2005-present) and is an employee of FMR. Previously, Mr. Mehrmann served as Vice President of Fidelity Investments Institutional Services Group (FIIS)/Fidelity Investments Institutional Operations Corporation, Inc. (FIIOC) Client Services (1998-2004). |
Kenneth B. Robins (37) |
| Year of Election or Appointment: 2005 Deputy Treasurer of the fund. Mr. Robins also serves as Deputy Treasurer of other Fidelity funds (2005-present) and is an employee of FMR (2004-present). Before joining Fidelity Investments, Mr. Robins worked at KPMG LLP, where he was a partner in KPMG's department of professional practice (2002-2004) and a Senior Manager (1999-2000). In addition, Mr. Robins served as Assistant Chief Accountant, United States Securities and Exchange Commission (2000-2002). |
Robert G. Byrnes (40) |
| Year of Election or Appointment: 2005 Assistant Treasurer of the fund. Mr. Byrnes also serves as Assistant Treasurer of other Fidelity funds (2005-present) and is an employee of FMR (2005-present). Previously, Mr. Byrnes served as Vice President of FPCMS (2003-2005). Before joining Fidelity Investments, Mr. Byrnes worked at Deutsche Asset Management where he served as Vice President of the Investment Operations Group (2000-2003). |
Peter L. Lydecker (53) |
| Year of Election or Appointment: 2004 Assistant Treasurer of the fund. Mr. Lydecker also serves as Assistant Treasurer of other Fidelity funds (2004) and is an employee of FMR. |
Gary W. Ryan (48) |
| Year of Election or Appointment: 2005 Assistant Treasurer of the fund. Mr. Ryan also serves as Assistant Treasurer of other Fidelity funds (2005-present) and is an employee of FMR (2005-present). Previously, Mr. Ryan served as Vice President of Fund Reporting in FPCMS (1999-2005). |
Annual Report
Distributions
A total of 0.01% of the dividends distributed during the fiscal year was derived from interest on U.S. Government securities which is generally exempt from state income tax.
The fund designates $28,899,333 of distributions paid during the period January 1, 2007 to July 31, 2007 as qualifying to be taxed as interest-related dividends for nonresident alien shareholders.
The fund will notify shareholders in January 2008 of amounts for use in preparing 2007 income tax returns.
Annual Report
Board Approval of Investment Advisory Contracts and Management Fees
Fidelity Ultra-Short Bond Fund
Each year, typically in June, the Board of Trustees, including the Independent Trustees (together, the Board), votes on the renewal of the management contract and sub-advisory agreements (together, the Advisory Contracts) for the fund. The Board, assisted by the advice of fund counsel and Independent Trustees' counsel, requests and considers a broad range of information throughout the year.
The Board meets regularly each month except August and takes into account throughout the year matters bearing on Advisory Contracts. The Board, acting directly and through its separate committees, considers at each of its meetings factors that are relevant to the annual renewal of the fund's Advisory Contracts, including the services and support provided to the fund and its shareholders. At the time of the renewal, the Board had 12 standing committees, each composed of Independent Trustees with varying backgrounds, to which the Board has assigned specific subject matter responsibilities in order to enhance effective decision-making by the Board. Each committee has adopted a written charter outlining the structure and purposes of the committee. One such committee, the Fixed-Income Contract Committee, meets periodically as needed throughout the year to consider matters specifically related to the annual renewal of Advisory Contracts. The committee requests and receives information on, and makes recommendations to the Independent Trustees concerning, the approval and annual review of the Advisory Contracts.
At its June 2007 meeting, the Board of Trustees, including the Independent Trustees, unanimously determined to renew the Advisory Contracts for the fund. In reaching its determination, the Board considered all factors it believed relevant, including (i) the nature, extent, and quality of the services to be provided to the fund and its shareholders (including the investment performance of the fund); (ii) the competitiveness of the management fee and total expenses of the fund; (iii) the total costs of the services to be provided by and the profits to be realized by the investment adviser and its affiliates from the relationship with the fund; (iv) the extent to which economies of scale would be realized as the fund grows; and (v) whether fee levels reflect these economies of scale, if any, for the benefit of fund shareholders. The Board also approved amendments to the fund's agreements with foreign sub-advisers to clarify that each sub-adviser provides services as an independent contractor.
In determining whether to renew the Advisory Contracts for the fund, the Board ultimately reached a determination, with the assistance of fund counsel and Independent Trustees' counsel, that the renewal of the Advisory Contracts and the compensation to be received by Fidelity under the management contract is consistent with Fidelity's fiduciary duty under applicable law. In addition to evaluating the specific factors noted above, the Board, in reaching its determination, is aware that shareholders in the fund have a broad range of investment choices available to them, including a wide choice among mutual funds offered by competitors to Fidelity, and that the fund's shareholders, with the opportunity to review and weigh the disclosure provided by the fund in its prospectus and other public disclosures, have chosen to invest in this fund, managed by Fidelity.
Annual Report
Board Approval of Investment Advisory Contracts and
Management Fees - continued
Nature, Extent, and Quality of Services Provided. The Board considered staffing within the investment adviser, FMR, and the sub-advisers (together, the Investment Advisers), including the background of the fund's portfolio manager and the fund's investment objective and discipline. The Independent Trustees also had discussions with senior management of Fidelity's investment operations and investment groups. The Board considered the structure of the portfolio manager compensation program and whether this structure provides appropriate incentives.
Resources Dedicated to Investment Management and Support Services. The Board reviewed the size, education, and experience of the Investment Advisers' investment staff, their use of technology, and the Investment Advisers' approach to recruiting, training, and retaining portfolio managers and other research, advisory, and management personnel. The Board considered Fidelity's extensive global research capabilities that enable the Investment Advisers to aggregate data from various sources in an effort to produce positive investment results. The Board noted that Fidelity's analysts have access to a variety of technological tools that enable them to perform both fundamental and quantitative analysis and to specialize in various disciplines. The Board also considered that Fidelity's portfolio managers and analysts have access to daily portfolio attribution that allows for monitoring of a fund's portfolio, as well as an electronic communication system that provides immediate real-time access to research concerning issuers and credit enhancers. In addition, the Board considered the trading resources that are an integrated part of the fixed-income portfolio management investment process.
Shareholder and Administrative Services. The Board considered (i) the nature, extent, quality, and cost of advisory, administrative, distribution, and shareholder services performed by the Investment Advisers and their affiliates under the Advisory Contracts and under separate agreements covering transfer agency, pricing and bookkeeping, and securities lending services for the fund; (ii) the nature and extent of the Investment Advisers' supervision of third party service providers, principally custodians and subcustodians; and (iii) the resources devoted to, and the record of compliance with, the fund's compliance policies and procedures.
The Board noted that the growth of fund assets across the complex allows Fidelity to reinvest in the development of services designed to enhance the value or convenience of the Fidelity funds as investment vehicles. These services include 24-hour access to account information and market information through phone representatives and over the Internet, and investor education materials and asset allocation tools.
Annual Report
Investment in a Large Fund Family. The Board considered the benefits to shareholders of investing in a Fidelity fund, including the benefits of investing in a fund that is part of a large family of funds offering a variety of investment disciplines and providing for a large variety of mutual fund investor services. For example, fund shareholders are offered the privilege of exchanging shares of the fund for shares of other Fidelity funds, as set forth in the fund's prospectus, without paying a sales charge. The Board noted that, since the last Advisory Contract renewals in June 2006, Fidelity has taken a number of actions that benefited particular funds, including (i) dedicating additional resources to investment research and to restructure the investment research teams; (ii) contractually agreeing to reduce the management fee on Fidelity Advisor Floating Rate High Income Fund; (iii) contractually agreeing to reduce the management fees on Fidelity's California, Massachusetts, New Jersey, and New York AMT Tax-Free Money Market Funds, launching new Institutional Classes and Service Classes of these funds, and contractually agreeing to impose expense limitations on these funds; (iv) eliminating the exchange fee on the Fidelity Select Portfolios and reducing the pricing and bookkeeping fee rates for these funds; (v) reducing the maximum transfer agency fee rates on high income funds and certain equity funds; (vi) proposing amended management contracts that, if approved by shareholders, will add a performance adjustment component to the management fees paid by 18 Fidelity Advisor equity funds; (vii) contractually agreeing to reduce fees for Ultra-Short Central Fund and the money market Central Funds; (viii) waiving the Fidelity Advisor funds' contingent deferred sales charge on certain redemptions made through systematic withdrawal programs; and (ix) amending the management contracts for equity and fixed-income funds whose management contracts incorporate a "group fee" structure by adding four new fee "breakpoints" to the group fee rate schedules.
Investment Performance. The Board considered whether the fund has operated within its investment objective, as well as its record of compliance with its investment restrictions. It also reviewed the fund's absolute investment performance for each class, as well as the fund's relative investment performance for each class measured against (i) a broad-based securities market index, and (ii) a peer group of mutual funds deemed appropriate by the Board over multiple periods. Because the fund had been in existence less than five calendar years, the following charts considered by the Board show, over the one- and three-year periods ended December 31, 2006, as available, the cumulative total returns of Fidelity Ultra-Short Bond (retail class) and Class A, the cumulative total returns of a broad-based securities market index ("benchmark"), and a range of cumulative total returns of a peer group of mutual funds identified by Lipper Inc. as having an investment objective similar to that of the fund. The returns of Fidelity Ultra-Short Bond (retail class) and Class A show the performance of the highest and lowest performing classes, respectively. The box within each chart shows the 25th percentile return (bottom of box) and the 75th percentile return (top of box) of the peer group. Returns shown above the box are in the first quartile and returns shown below the box are in the fourth quartile. The percentage beaten numbers noted below each chart correspond to the percentile box and represent the percentage of funds in the peer group whose performance was equal to or lower than that of the class indicated.
Annual Report
Board Approval of Investment Advisory Contracts and
Management Fees - continued
Fidelity Ultra-Short Bond Fund

The Board reviewed the fund's relative investment performance against its peer group and stated that the performance of Fidelity Ultra-Short Bond (retail class) was in the first quartile for the one-year period and the second quartile for the three-year period. The Board also stated that the relative investment performance of the fund was lower than its benchmark for all the periods shown. The Board considered that the variations in performance among the fund's classes reflect the variations in class expenses, which result in lower performance for higher expense classes.
Based on its review, and giving particular weight to the nature and quality of the resources dedicated by the Investment Advisers to maintain and improve relative performance, the Board concluded that the nature, extent, and quality of the services provided to the fund will benefit the fund's shareholders, particularly in light of the Board's view that the fund's shareholders benefit from investing in a fund that is part of a large family of funds offering a variety of investment disciplines and services.
Competitiveness of Management Fee and Total Fund Expenses. The Board considered the fund's management fee and total expenses compared to "mapped groups" of competitive funds and classes. Fidelity creates "mapped groups" by combining similar Lipper investment objective categories that have comparable management fee characteristics. Combining Lipper investment objective categories aids the Board's management fee and total expense comparisons by broadening the competitive group used for comparison and by reducing the number of universes to which various Fidelity funds are compared.
Annual Report
The Board considered two proprietary management fee comparisons for the 12-month (or shorter) periods shown in the chart below. The group of Lipper funds used by the Board for management fee comparisons is referred to below as the "Total Mapped Group" and, for the reasons explained above, is broader than the Lipper peer group used by the Board for performance comparisons. The Total Mapped Group comparison focuses on a fund's standing relative to the total universe of comparable funds available to investors, in terms of gross management fees before expense reimbursements or caps. "TMG %" represents the percentage of funds in the Total Mapped Group that had management fees that were lower than the fund's. For example, a TMG % of 18% means that 82% of the funds in the Total Mapped Group had higher management fees than the fund. The "Asset-Size Peer Group" (ASPG) comparison focuses on a fund's standing relative to non-Fidelity funds similar in size to the fund within the Total Mapped Group. The ASPG represents at least 15% of the funds in the Total Mapped Group with comparable asset size and management fee characteristics, subject to a minimum of 50 funds (or all funds in the Total Mapped Group if fewer than 50). Additional information, such as the ASPG quartile in which the fund's management fee ranked, is also included in the chart and considered by the Board.
Fidelity Ultra-Short Bond Fund

The Board noted that the fund's management fee ranked below the median of its Total Mapped Group and below the median of its ASPG for 2006.
Annual Report
Board Approval of Investment Advisory Contracts and
Management Fees - continued
Furthermore, the Board considered that it had approved an amendment (effective June 1, 2005) to the fund's management contract that lowered the fund's individual fund fee rate from 30 basis points to 20 basis points. The Board considered that the chart reflects the fund's lower management fee for 2005, as if the lower rate were in effect for the entire year.
Based on its review, the Board concluded that the fund's management fee was fair and reasonable in light of the services that the fund receives and the other factors considered.
In its review of each class's total expenses, the Board considered the fund's management fee as well as other fund or class expenses, as applicable, such as transfer agent fees, pricing and bookkeeping fees, fund-paid 12b-1 fees, and custodial, legal, and audit fees. The Board also noted the effects of any waivers and reimbursements on fees and expenses. As part of its review, the Board also considered current and historical total expenses of each class of the fund compared to competitive fund median expenses. Each class of the fund is compared to those funds and classes in the Total Mapped Group (used by the Board for management fee comparisons) that have a similar sales load structure.
The Board also considered that the current contractual arrangements for the fund (i) have the effect of setting the total "fund-level" expenses (including, among certain other expenses, the management fee) for each class at 35 basis points, (ii) lower and limit the "class-level" transfer agent fee for Fidelity Ultra-Short Bond (retail class) to 10 basis points, and (iii) limit the total expenses for Fidelity Ultra-Short Bond (retail class) to 45 basis points. These contractual arrangements may not be increased without the approval of the Board and the shareholders of the applicable class. The fund's Advisor classes are subject to different class-level expenses (transfer agent fees and 12b-1 fees).
The Board noted that each class's total expenses ranked below its competitive median for 2006.
The Board recognized that the fund's management contract incorporates a "group fee" structure, which provides for lower group fee rates as total fund assets under FMR's management increase, and for higher group fee rates as total fund assets under FMR's management decrease. FMR determines the group fee rates based on a tiered asset "breakpoint" schedule. In connection with the renewal of the fund's management contract, the Board approved amendments to the fund's management contract that added four new fee breakpoints to the group fee rate schedule for assets under FMR's management above $1,386 billion. The Board considered that the group fee rate declines under both the present and amended schedules, but that under the amended schedule, the group fee rate declines faster as assets under FMR's management exceed $1,386 billion. The Board noted, however, that because the current contractual arrangements set the total fund-level expenses for each class at 35 basis points, increases or decreases in the management fee due to changes in the group fee rate will not impact total expenses.
Annual Report
In its review of total expenses, the Board also considered Fidelity fee structures and other information on clients that FMR and its affiliates service in other competitive markets, such as other mutual funds advised or subadvised by FMR or its affiliates, pension plan clients, and other institutional clients.
Based on its review, the Board concluded that the total expenses of each class of the fund were reasonable in light of the services that the fund and its shareholders receive and the other factors considered.
Costs of the Services and Profitability. The Board considered the revenues earned and the expenses incurred by Fidelity in conducting the business of developing, marketing, distributing, managing, administering and servicing the fund and its shareholders. The Board also considered the level of Fidelity's profits in respect of all the Fidelity funds.
On an annual basis, FMR presents to the Board Fidelity's profitability for the fund. Fidelity calculates the profitability for each fund, as well as aggregate profitability for groups of Fidelity funds and all Fidelity funds, using a series of detailed revenue and cost allocation methodologies which originate with the audited books and records of Fidelity. The Audit Committee of the Board reviews any significant changes from the prior year's methodologies.
PricewaterhouseCoopers LLP (PwC), independent registered public accounting firm and auditor to Fidelity and certain Fidelity funds, has been engaged annually by the Board as part of the Board's assessment of the results of Fidelity's profitability analysis. PwC's engagement includes the review and assessment of Fidelity's methodologies used in determining the revenues and expenses attributable to Fidelity's mutual fund business, and completion of agreed-upon procedures surrounding the mathematical accuracy of fund profitability and its conformity to allocation methodologies. After considering PwC's reports issued under the engagement and information provided by Fidelity, the Board believes that while other allocation methods may also be reasonable, Fidelity's profitability methodologies are reasonable in all material respects.
The Board has also reviewed Fidelity's non-fund businesses and any fall-out benefits related to the mutual fund business as well as cases where Fidelity's affiliates may benefit from or be related to the fund's business.
The Board considered the costs of the services provided by and the profits realized by Fidelity in connection with the operation of the fund and determined that the amount of profit is a fair entrepreneurial profit for the management of the fund.
Annual Report
Board Approval of Investment Advisory Contracts and
Management Fees - continued
Economies of Scale. The Board considered whether there have been economies of scale in respect of the management of the Fidelity funds, whether the Fidelity funds (including the fund) have appropriately benefited from any such economies of scale, and whether there is potential for realization of any further economies of scale. The Board considered the extent to which the fund will benefit from economies of scale through increased services to the fund, through waivers or reimbursements, or through fee or expense reductions, including (Advisor classes only) reductions that occur through operation of the transfer agent agreement. The transfer agent fee varies in part based on the number of accounts in the fund. If the number of accounts decreases or the average account size increases, the overall transfer agent fee rate decreases. The Board concluded that any potential economies of scale are being shared between fund shareholders and Fidelity in an appropriate manner.
Additional Information Requested by the Board. In order to develop fully the factual basis for consideration of the Fidelity funds' Advisory Contracts, the Board requested and received additional information on several topics, including (i) Fidelity's fund profitability methodology, profitability by investment discipline, and profitability trends within certain funds; (ii) Fidelity's compensation structure relative to competitors and its effect on profitability; (iii) funds and accounts managed by Fidelity other than the Fidelity funds, including fee arrangements; (iv) the total expenses of certain funds and classes relative to competitors; (v) fund performance trends; (vi) fall-out benefits received by certain Fidelity affiliates; and (vii) Fidelity's fee structures.
Based on its evaluation of all of the conclusions noted above, and after considering all material factors, the Board ultimately concluded that the advisory fee structures are fair and reasonable, and that the fund's Advisory Contracts should be renewed.
Annual Report
Annual Report
Annual Report
Annual Report
Annual Report
Annual Report
Investment Adviser
Fidelity Management & Research Company
Boston, MA
Investment Sub-Advisers
Fidelity Investments
Money Management, Inc.
Fidelity International Investment Advisors
Fidelity International Investment Advisors
(U.K.) Limited
Fidelity Research & Analysis Company
General Distributor
Fidelity Distributors Corporation
Boston, MA
Transfer and Service Agent
Fidelity Investments Institutional
Operations Company, Inc.
Boston, MA
Fidelity Service Company, Inc.
Boston, MA
Custodian
Citibank, N.A.
New York, NY
AUSB-UANN-0907
1.804587.103
(Fidelity Investment logo)(registered trademark)
(Fidelity Investment logo)(registered trademark)
Fidelity Advisor
Ultra-Short Bond
Fund - Institutional Class
Annual Report
July 31, 2007
Institutional Class
is a class of
Fidelity® Ultra-Short Bond Fund
(2_fidelity_logos) (Registered_Trademark)
Contents
Chairman's Message | <Click Here> | Ned Johnson's message to shareholders. |
Performance | <Click Here> | How the fund has done over time. |
Management's Discussion | <Click Here> | The managers' review of fund performance, strategy and outlook. |
Shareholder Expense Example | <Click Here> | An example of shareholder expenses. |
Investment Changes | <Click Here> | A summary of major shifts in the fund's investments over the past six months. |
Investments | <Click Here> | A complete list of the fund's investments with their market values. |
Financial Statements | <Click Here> | Statements of assets and liabilities, operations, and changes in net assets,
as well as financial highlights. |
Notes | <Click Here> | Notes to the financial statements. |
Report of Independent Registered Public Accounting Firm | <Click Here> | |
Trustees and Officers | <Click Here> | |
Distributions | <Click Here> | |
Board Approval of Investment Advisory Contracts and Management Fees | <Click Here> | |
| | |
To view a fund's proxy voting guidelines and proxy voting record for the 12-month period ended June 30, visit http://www.fidelity.com (search for "proxy voting guidelines") or visit the Securities and Exchange Commission's (SEC) web site at http://www.sec.gov. You may also call 1-800-544-8544 to request a free copy of the proxy voting guidelines.
Standard & Poor's, S&P and S&P 500 are registered service marks of The McGraw-Hill Companies, Inc. and have been licensed for use by Fidelity Distributors Corporation.
Other third party marks appearing herein are the property of their respective owners.
All other marks appearing herein are registered or unregistered trademarks or service marks of FMR Corp. or an affiliated company.
Annual Report
This report and the financial statements contained herein are submitted for the general information of the shareholders of the fund. This report is not authorized for distribution to prospective investors in the fund unless preceded or accompanied by an effective prospectus.
A fund files its complete schedule of portfolio holdings with the SEC for the first and third quarters of each fiscal year on Form N-Q. Forms N-Q are available on the SEC's web site at http://www.sec.gov. A fund's Forms N-Q may be reviewed and copied at the SEC's Public Reference Room in Washington, DC. Information regarding the operation of the SEC's Public Reference Room may be obtained by calling 1-800-SEC-0330. For a complete list of a fund's portfolio holdings, view the most recent holdings listing, semiannual report, or annual report on Fidelity's web site at http://www.fidelity.com or http://www.advisor.fidelity.com, as applicable.
NOT FDIC INSURED · MAY LOSE VALUE · NO BANK GUARANTEE
Neither the fund nor Fidelity Distributors Corporation is a bank.
Annual Report
Chairman's Message
(photo_of_Edward_C_Johnson_3d)
Dear Shareholder:
Stocks are currently on pace to register their fifth straight year of positive returns, although gains could be trimmed if the U.S. economy continues to slow. While financial markets are always unpredictable, there are a number of time-tested principles that can put the historical odds in your favor.
One of the basic tenets is to invest for the long term. Over time, riding out the markets' inevitable ups and downs has proven much more effective than selling into panic or chasing the hottest trend. Even missing only a few of the markets' best days can significantly diminish investor returns. Patience also affords the benefits of compounding - of earning interest on additional income or reinvested dividends and capital gains. There are tax advantages and cost benefits to consider as well. The more you sell, the more taxes you pay, and the more you trade, the higher the costs. While staying the course doesn't eliminate risk, it can considerably lessen the effect of short-term declines.
You can further manage your investing risk through diversification. And today, more than ever, geographic diversification should be taken into account. Studies indicate that asset allocation is the single most important determinant of a portfolio's long-term success. The right mix of stocks, bonds and cash - aligned to your particular risk tolerance and investment objective - is very important. Age-appropriate rebalancing is also an essential aspect of asset allocation. For younger investors, an emphasis on equities - which historically have been the best-performing asset class over time - is encouraged. As investors near their specific goal, such as retirement or sending a child to college, consideration may be given to replacing volatile assets (e.g. common stocks) with more-stable fixed investments (bonds or savings plans).
A third investment principle - investing regularly - can help lower the average cost of your purchases. Investing a certain amount of money each month or quarter helps ensure you won't pay for all your shares at market highs. This strategy - known as dollar cost averaging - also reduces unconstructive "emotion" from investing, helping shareholders avoid selling weak performers just prior to an upswing, or chasing a hot performer just before a correction.
We invite you to contact us via the Internet, through our Investor Centers or over the phone. It is our privilege to provide you the information you need to make the investments that are right for you.
Sincerely,
/s/Edward C. Johnson 3d
Edward C. Johnson 3d
Annual Report
Performance: The Bottom Line
Average annual total return reflects the change in the value of an investment, assuming reinvestment of the class' dividend income and capital gains (the profits earned upon the sale of securities that have grown in value) and assuming a constant rate of performance each year. The $10,000 table and the fund's returns do not reflect the deduction of taxes that a shareholder would pay on fund distributions or the redemption of fund shares. During periods of reimbursement by Fidelity, a fund's total return will be greater than it would be had the reimbursement not occurred. How a fund did yesterday is no guarantee of how it will do tomorrow.
Average Annual Total Returns
Periods ended July 31, 2007 | | Past 1
year | Life of
fund A |
Institutional Class B | | 3.06% | 2.61% |
A From August 29, 2002
B Institutional Class shares are sold to eligible investors without a sales load or 12b-1 fee. The initial offering of Institutional Class shares took place on June 16, 2004. Returns prior to June 16, 2004 are those of Ultra-Short Bond, the original retail class of the fund.
$10,000 Over Life of Fund
Let's say hypothetically that $10,000 was invested in Fidelity Advisor Ultra-Short Bond Fund - Institutional Class on August 29, 2002, when the fund started. The chart shows how the value of your investment would have changed, and also shows how the Lehman Brothers® 6 Month Swap Index performed over the same period.
Annual Report
Management's Discussion of Fund Performance
Comments from Andrew Dudley, Portfolio Manager of Fidelity Advisor Ultra-Short Bond Fund during the period covered by this report, and Robert Galusza, who became Lead Portfolio Manager of the fund on July 1, 2007. Dudley remained on the fund as Co-Manager.
The investment-grade bond market posted a reasonably solid advance for the 12 months ending July 31, 2007. In that time, the Lehman Brothers® U.S. Aggregate Index - a performance gauge of taxable, high-quality debt - gained 5.58%. A sizable percentage of that increase came in the first four months of the period. The index returned a cumulative 4.30% from August through November, as investors responded favorably to the end of the Federal Reserve Board's two-year campaign of interest rate hikes. Bonds turned negative in December and January, but had their best month of the past year in February, rising 1.54% as extreme volatility in the stock markets led to a flight to safety in high-quality debt. Performance was lackluster thereafter, however. Inflation concerns and dwindling hopes for a near-term Fed rate cut pressured bond prices for much of the remainder of the period, as did the meltdown of the subprime mortgage sector. Against that backdrop, the index gained only 0.32% over the final five months of the period.
During the past year, the fund's Institutional Class shares gained 3.06%, while the Lehman Brothers 6 Month Swap Index returned 5.41%. The fund's significant underperformance stemmed largely from its sizable exposure to subprime mortgage securities. I held these securities - and others - both directly and indirectly through Fidelity® Ultra-Short Central Fund, a diversified pool of short-term assets I also manage and which is designed to outperform cash-like instruments with similar risk characteristics. Early on, the fund's modest stake in lower-quality subprime holdings faltered, reflecting weakness in the housing market. Recently, technical factors caused higher-quality securities - which made up the bulk of the fund's subprime stake - to join their lower-quality counterparts in a major sell-off amid a massive unwinding of leverage by investors. Also detracting were commercial mortgage-backed securities, which came under pressure as investors repriced risk. In contrast, our position in collateralized mortgage obligations served us well, as they outpaced the index. And while the fund's stake in corporate bonds cost us some ground because it lagged the index, select holdings in the sector performed well.
The views expressed above reflect those of the portfolio manager(s) only through the end of the period as stated on the cover of this report and do not necessarily represent the views of Fidelity or any other person in the Fidelity organization. Any such views are subject to change at any time based upon market or other conditions and Fidelity disclaims any responsibility to update such views. These views may not be relied on as investment advice and, because investment decisions for a Fidelity fund are based on numerous factors, may not be relied on as an indication of trading intent on behalf of any Fidelity fund.
Annual Report
Shareholder Expense Example
As a shareholder of the Fund, you incur two types of costs: (1) transaction costs, including redemption fees, and (2) ongoing costs, including management fees, distribution and/or service (12b-1) fees and other Fund expenses. This Example is intended to help you understand your ongoing costs (in dollars) of investing in the Fund and to compare these costs with the ongoing costs of investing in other mutual funds.
The Example is based on an investment of $1,000 invested at the beginning of the period and held for the entire period (February 1, 2007 to July 31, 2007).
Actual Expenses
The first line of the accompanying table for each class of the Fund provides information about actual account values and actual expenses. You may use the information in this line, together with the amount you invested, to estimate the expenses that you paid over the period. Simply divide your account value by $1,000.00 (for example, an $8,600 account value divided by $1,000.00 = 8.6), then multiply the result by the number in the first line for a class of the Fund under the heading entitled "Expenses Paid During Period" to estimate the expenses you paid on your account during this period. In addition, the Fund, as a shareholder in the underlying Fidelity Central Funds, will indirectly bear its pro rata share of the fees and expenses incurred by the underlying Fidelity Central Funds. These fees and expenses are not included in the Fund's annualized expense ratio used to calculate the expense estimate in the table below.
Hypothetical Example for Comparison Purposes
The second line of the accompanying table for each class of the Fund provides information about hypothetical account values and hypothetical expenses based on a Class' actual expense ratio and an assumed rate of return of 5% per year before expenses, which is not the Class' actual return. The hypothetical account values and expenses may not be used to estimate the actual ending account balance or expenses you paid for the period. You may use this information to compare the ongoing costs of investing in the Fund and other funds. To do so, compare this 5% hypothetical example with the 5% hypothetical examples that appear in the shareholder reports of the other funds. In addition, the Fund, as a shareholder in the underlying Fidelity Central Funds, will indirectly bear its pro rata share of the fees and expenses incurred by the underlying Fidelity Central Funds. These fees and expenses are not included in the Fund's annualized expense ratio used to calculate the expense estimate in the table below.
Please note that the expenses shown in the table are meant to highlight your ongoing costs only and do not reflect any transaction costs. Therefore, the second line of the table is useful in comparing ongoing costs only, and will not help you determine the relative total costs of owning different funds. In addition, if these transactional costs were included, your costs would have been higher.
Annual Report
Shareholder Expense Example - continued
| Beginning
Account Value
February 1, 2007 | Ending
Account Value
July 31, 2007 | Expenses Paid
During Period*
February 1, 2007
to July 31, 2007 |
Class A | | | |
Actual | $ 1,000.00 | $ 1,005.40 | $ 3.23 |
HypotheticalA | $ 1,000.00 | $ 1,021.57 | $ 3.26 |
Class T | | | |
Actual | $ 1,000.00 | $ 1,005.10 | $ 3.48 |
HypotheticalA | $ 1,000.00 | $ 1,021.32 | $ 3.51 |
Ultra-Short Bond | | | |
Actual | $ 1,000.00 | $ 1,005.30 | $ 2.24 |
HypotheticalA | $ 1,000.00 | $ 1,022.56 | $ 2.26 |
Institutional Class | | | |
Actual | $ 1,000.00 | $ 1,005.20 | $ 2.39 |
HypotheticalA | $ 1,000.00 | $ 1,022.41 | $ 2.41 |
A 5% return per year before expenses
* Expenses are equal to each Class' annualized expense ratio (shown in the table below); multiplied by the average account value over the period, multiplied by 181/365 (to reflect the one-half year period). The fees and expenses of the underlying Fidelity Central Funds in which the Fund invests are not included in the Fund's annualized expense ratio.
| Annualized
Expense Ratio |
Class A | .65% |
Class T | .70% |
Ultra-Short Bond | .45% |
Institutional Class | .48% |
Annual Report
Investment Changes
The information in the following tables is based on the combined investments of the Fund and its pro-rata share of its investments in each Fidelity Central Fund. |
Quality Diversification (% of fund's net assets) |
As of July 31, 2007* | As of January 31, 2007** |
| U.S. Government and
U.S. Government
Agency Obligations 11.7% | | | U.S. Government and
U.S. Government
Agency Obligations 9.9% | |
| AAA 30.3% | | | AAA 25.6% | |
| AA 13.9% | | | AA 11.4% | |
| A 12.2% | | | A 12.0% | |
| BBB 22.4% | | | BBB 19.0% | |
| BB and Below 0.3% | | | BB and Below 0.6% | |
| Not Rated 2.1% | | | Not Rated 4.2% | |
| Short-Term
Investments and
Net Other Assets 7.1% | | | Short-Term
Investments and
Net Other Assets 17.3% | |

We have used ratings from Moody's® Investors Services, Inc. Where Moody's ratings are not available, we have used S&P® ratings. Securities rated BB or below were rated investment grade at the time of acquisition. |
Weighted Average Maturity as of July 31, 2007 |
| | 6 months ago |
Years | 2.0 | 1.7 |
The weighted average maturity is based on the dollar-weighted average length of time until principal payments are expected or until securities reach maturity, taking into account any maturity shortening feature such as a call, refunding or redemption provision. |
Duration as of July 31, 2007 |
| | 6 months ago |
Years | 0.4 | 0.3 |
Duration shows how much a bond fund's price fluctuates with changes in comparable interest rates. If rates rise 1%, for example, a fund with a five-year duration is likely to lose about 5% of its value. Other factors also can influence a bond fund's performance and share price. Accordingly, a bond fund's actual performance may differ from this example. |
Asset Allocation (% of fund's net assets) |
As of July 31, 2007* | As of January 31, 2007** |
| Corporate Bonds 15.8% | | | Corporate Bonds 14.9% | |
| U.S. Government and
U.S. Government
Agency Obligations 11.7% | | | U.S. Government and
U.S. Government
Agency Obligations 9.9% | |
| Asset-Backed
Securities 39.3% | | | Asset-Backed
Securities 37.3% | |
| CMOs and Other Mortgage Related Securities 26.0% | | | CMOs and Other Mortgage Related Securities 20.6% | |
| Other Investments 0.1% | | | Other Investments 0.0% | |
| Short-Term
Investments and
Net Other Assets 7.1% | | | Short-Term
Investments and
Net Other Assets 17.3% | |
* Foreign investments | 16.0% | | ** Foreign investments | 14.8% | |
* Futures and Swaps | 16.6% | | ** Futures and Swaps | 15.7% | |

A holdings listing for the Fund, which presents direct holdings as well as the pro rata share of any securities and other investments held indirectly through its investment in underlying non-money market Fidelity Central Funds is available at fidelity.com and/or advisor.fidelity.com, as applicable. |
Annual Report
Investments July 31, 2007
Showing Percentage of Net Assets
Nonconvertible Bonds - 12.5% |
| Principal Amount | | Value |
CONSUMER DISCRETIONARY - 1.8% |
Auto Components - 0.7% |
DaimlerChrysler NA Holding Corp.: | | | | |
5.71% 3/13/09 (d) | | $ 3,685,000 | | $ 3,684,985 |
5.79% 3/13/09 (d) | | 1,800,000 | | 1,803,742 |
5.84% 9/10/07 (d) | | 1,230,000 | | 1,230,540 |
| | 6,719,267 |
Media - 1.1% |
Continental Cablevision, Inc. 9% 9/1/08 | | 1,100,000 | | 1,139,520 |
Cox Communications, Inc.: | | | | |
(Reg. S) 5.91% 12/14/07 (d) | | 2,330,000 | | 2,334,126 |
5.61% 8/15/07 (a)(d) | | 4,000,000 | | 4,000,040 |
Time Warner, Inc. 8.18% 8/15/07 | | 2,000,000 | | 2,001,600 |
Viacom, Inc. 5.71% 6/16/09 (d) | | 2,000,000 | | 2,006,296 |
| | 11,481,582 |
TOTAL CONSUMER DISCRETIONARY | | 18,200,849 |
CONSUMER STAPLES - 0.2% |
Food & Staples Retailing - 0.2% |
CVS Caremark Corp. 5.66% 6/1/10 (d) | | 2,200,000 | | 2,200,988 |
ENERGY - 1.1% |
Energy Equipment & Services - 0.2% |
Transocean, Inc. 5.56% 9/5/08 (d) | | 2,400,000 | | 2,399,299 |
Oil, Gas & Consumable Fuels - 0.9% |
Anadarko Petroleum Corp.: | | | | |
3.25% 5/1/08 | | 850,000 | | 835,041 |
5.76% 9/15/09 (d) | | 2,200,000 | | 2,202,339 |
Enterprise Products Operating LP 4% 10/15/07 | | 2,670,000 | | 2,660,930 |
Kinder Morgan Energy Partners LP 5.35% 8/15/07 | | 615,000 | | 614,891 |
Ocean Energy, Inc. 4.375% 10/1/07 | | 2,310,000 | | 2,304,837 |
| | 8,618,038 |
TOTAL ENERGY | | 11,017,337 |
FINANCIALS - 6.0% |
Capital Markets - 1.2% |
Bear Stearns Companies, Inc.: | | | | |
5.5463% 2/1/12 (d) | | 745,000 | | 727,985 |
5.76% 7/19/10 (d) | | 2,000,000 | | 1,993,092 |
Nonconvertible Bonds - continued |
| Principal Amount | | Value |
FINANCIALS - continued |
Capital Markets - continued |
Lehman Brothers Holdings E-Capital Trust I 6.14% 8/19/65 (d) | | $ 1,205,000 | | $ 1,201,988 |
Lehman Brothers Holdings, Inc. 5.5% 5/25/10 (d) | | 1,500,000 | | 1,494,345 |
Merrill Lynch & Co., Inc. 5.59% 6/5/12 (d) | | 2,600,000 | | 2,547,012 |
Morgan Stanley 5.61% 1/18/11 (d) | | 1,900,000 | | 1,894,729 |
Royal Bank of Scotland PLC 5.66% 7/24/14 (d) | | 2,590,000 | | 2,596,993 |
| | 12,456,144 |
Commercial Banks - 1.3% |
Barclays Bank PLC: | | | | |
5.56% 5/25/15 (d) | | 825,000 | | 825,760 |
5.81% 9/11/13 (d) | | 3,500,000 | | 3,516,037 |
DBS Bank Ltd. (Singapore) 5.58% 5/16/17 (a)(d) | | 2,000,000 | | 1,991,780 |
HBOS plc 5.6306% 2/6/14 (d) | | 305,000 | | 305,753 |
HSBC Holdings PLC 5.56% 10/6/16 (d) | | 500,000 | | 500,613 |
ING Bank NV 5.61% 10/14/14 (d) | | 440,000 | | 441,188 |
Manufacturers & Traders Trust Co. 3.85% 4/1/13 (a)(d) | | 520,000 | | 514,831 |
PNC Funding Corp. 5.4975% 1/31/12 (d) | | 2,400,000 | | 2,399,035 |
Santander Issuances SA Unipersonal 5.72% 6/20/16 (a)(d) | | 1,900,000 | | 1,909,411 |
Sovereign Bank 4.375% 8/1/13 (d) | | 500,000 | | 494,350 |
| | 12,898,758 |
Consumer Finance - 1.4% |
Capital One Financial Corp. 5.64% 9/10/09 (d) | | 2,260,000 | | 2,261,180 |
General Electric Capital Corp. 5.4169% 5/10/10 (d) | | 2,845,000 | | 2,848,144 |
MBNA Capital I 8.278% 12/1/26 | | 810,000 | | 843,553 |
MBNA Europe Funding PLC 5.46% 9/7/07 (a)(d) | | 2,720,000 | | 2,720,359 |
SLM Corp.: | | | | |
5.33% 4/18/08 (a)(d) | | 2,500,000 | | 2,482,003 |
5.52% 7/26/10 (d) | | 2,770,000 | | 2,609,911 |
| | 13,765,150 |
Insurance - 0.2% |
Monumental Global Funding III 5.53% 1/25/13 (a)(d) | | 1,745,000 | | 1,745,002 |
Real Estate Investment Trusts - 0.7% |
iStar Financial, Inc.: | | | | |
5.47% 3/16/09 (d) | | 2,505,000 | | 2,517,655 |
5.69% 3/9/10 (d) | | 2,000,000 | | 2,002,710 |
Simon Property Group LP 6.375% 11/15/07 | | 2,310,000 | | 2,313,188 |
| | 6,833,553 |
Nonconvertible Bonds - continued |
| Principal Amount | | Value |
FINANCIALS - continued |
Real Estate Management & Development - 0.1% |
Chelsea GCA Realty Partnership LP 7.25% 10/21/07 | | $ 880,000 | | $ 882,526 |
Thrifts & Mortgage Finance - 1.1% |
Capmark Financial Group, Inc. 6.0069% 5/10/10 (a)(d) | | 2,000,000 | | 2,003,884 |
Independence Community Bank Corp. 3.5% 6/20/13 (d) | | 735,000 | | 722,056 |
Residential Capital Corp. 7.19% 4/17/09 (a)(d) | | 2,085,000 | | 2,064,150 |
Residential Capital LLC 6.46% 5/22/09 (d) | | 1,500,000 | | 1,426,176 |
Washington Mutual Bank 5.4463% 5/1/09 (d) | | 3,000,000 | | 2,998,989 |
Washington Mutual, Inc. 5.5% 8/24/09 (d) | | 2,250,000 | | 2,250,981 |
| | 11,466,236 |
TOTAL FINANCIALS | | 60,047,369 |
INFORMATION TECHNOLOGY - 0.4% |
Communications Equipment - 0.2% |
Motorola, Inc. 4.608% 11/16/07 | | 1,700,000 | | 1,695,789 |
Semiconductors & Semiconductor Equipment - 0.2% |
National Semiconductor Corp. 5.61% 6/15/10 (d) | | 1,710,000 | | 1,710,193 |
TOTAL INFORMATION TECHNOLOGY | | 3,405,982 |
TELECOMMUNICATION SERVICES - 2.1% |
Diversified Telecommunication Services - 2.0% |
AT&T, Inc. 5.45% 5/15/08 (d) | | 3,000,000 | | 3,002,184 |
BellSouth Corp. 5.46% 8/15/08 (d) | | 2,000,000 | | 2,001,668 |
Deutsche Telekom International Finance BV 5.54% 3/23/09 (d) | | 1,725,000 | | 1,727,743 |
Telecom Italia Capital SA 5.97% 7/18/11 (d) | | 3,750,000 | | 3,764,689 |
Telefonica Emisiones SAU: | | | | |
5.66% 6/19/09 (d) | | 4,775,000 | | 4,766,314 |
5.69% 2/4/13 (d) | | 3,000,000 | | 2,956,114 |
Telefonos de Mexico SA de CV 4.5% 11/19/08 | | 1,605,000 | | 1,581,110 |
| | 19,799,822 |
Wireless Telecommunication Services - 0.1% |
America Movil SAB de CV 5.46% 6/27/08 (a)(d) | | 1,506,000 | | 1,504,419 |
TOTAL TELECOMMUNICATION SERVICES | | 21,304,241 |
Nonconvertible Bonds - continued |
| Principal Amount | | Value |
UTILITIES - 0.9% |
Electric Utilities - 0.4% |
Commonwealth Edison Co. 3.7% 2/1/08 | | $ 1,125,000 | | $ 1,114,909 |
Pepco Holdings, Inc. 5.5% 8/15/07 | | 1,626,000 | | 1,628,715 |
TXU Electric Delivery Co. 5.735% 9/16/08 (a)(d) | | 1,085,000 | | 1,085,493 |
| | 3,829,117 |
Gas Utilities - 0.1% |
NiSource Finance Corp. 5.93% 11/23/09 (d) | | 845,000 | | 845,204 |
Multi-Utilities - 0.4% |
Dominion Resources, Inc. 5.66% 9/28/07 (d) | | 2,470,000 | | 2,470,326 |
Sempra Energy 4.75% 5/15/09 | | 2,000,000 | | 1,980,928 |
| | 4,451,254 |
TOTAL UTILITIES | | 9,125,575 |
TOTAL NONCONVERTIBLE BONDS (Cost $125,701,400) | 125,302,341 |
U.S. Government Agency Obligations - 5.0% |
|
Freddie Mac 4.75% 3/5/09 (c)
(Cost $49,927,296) | | 50,000,000 | 49,859,826 |
U.S. Government Agency - Mortgage Securities - 2.1% |
|
Fannie Mae - 1.8% |
3.236% 9/1/33 (d) | | 468,295 | | 460,158 |
3.668% 7/1/33 (d) | | 402,880 | | 398,752 |
3.955% 5/1/34 (d) | | 528,720 | | 522,998 |
4.239% 3/1/34 (d) | | 526,002 | | 520,619 |
4.28% 10/1/33 (d) | | 40,238 | | 40,039 |
4.282% 3/1/33 (d) | | 100,634 | | 101,087 |
4.283% 6/1/34 (d) | | 1,276,866 | | 1,263,769 |
4.302% 6/1/33 (d) | | 51,011 | | 51,379 |
4.53% 10/1/35 (d) | | 69,282 | | 69,129 |
4.555% 8/1/34 (d) | | 86,065 | | 87,345 |
4.723% 3/1/35 (d) | | 30,174 | | 30,305 |
4.87% 5/1/33 (d) | | 5,969 | | 6,027 |
4.882% 10/1/35 (d) | | 213,765 | | 212,980 |
4.889% 7/1/35 (d) | | 529,060 | | 528,238 |
5.016% 7/1/34 (d) | | 42,975 | | 42,845 |
U.S. Government Agency - Mortgage Securities - continued |
| Principal Amount | | Value |
Fannie Mae - continued |
5.087% 8/1/34 (d) | | $ 75,908 | | $ 75,809 |
5.149% 9/1/35 (d) | | 3,008,199 | | 2,997,358 |
5.176% 8/1/33 (d) | | 125,661 | | 125,740 |
5.233% 5/1/36 (d) | | 212,825 | | 212,764 |
5.258% 11/1/36 (d) | | 349,068 | | 349,220 |
5.277% 4/1/36 (d) | | 596,355 | | 601,712 |
5.294% 8/1/36 (d) | | 653,629 | | 654,204 |
5.297% 7/1/35 (d) | | 48,851 | | 49,215 |
5.342% 2/1/36 (d) | | 137,136 | | 137,197 |
5.5% 11/1/16 to 2/1/19 | | 3,285,144 | | 3,263,340 |
5.533% 11/1/36 (d) | | 723,634 | | 725,342 |
5.611% 10/1/35 (d) | | 272,108 | | 273,269 |
5.831% 3/1/36 (d) | | 1,093,360 | | 1,101,755 |
6.5% 7/1/16 to 3/1/35 | | 1,806,234 | | 1,843,891 |
7% 8/1/17 to 5/1/32 | | 968,410 | | 1,006,494 |
TOTAL FANNIE MAE | | 17,752,980 |
Freddie Mac - 0.3% |
3.377% 7/1/33 (d) | | 1,002,476 | | 992,278 |
4.043% 4/1/34 (d) | | 802,261 | | 788,941 |
4.784% 3/1/33 (d) | | 43,326 | | 43,858 |
4.922% 10/1/36 (d) | | 1,737,350 | | 1,729,682 |
TOTAL FREDDIE MAC | | 3,554,759 |
TOTAL U.S. GOVERNMENT AGENCY - MORTGAGE SECURITIES (Cost $21,453,593) | 21,307,739 |
Asset-Backed Securities - 29.4% |
|
Accredited Mortgage Loan Trust: | | | | |
Series 2004-2 Class A2, 5.62% 7/25/34 (d) | | 241,836 | | 241,685 |
Series 2004-4 Class A2D, 5.67% 1/25/35 (d) | | 89,039 | | 88,747 |
Series 2005-1 Class M1, 5.79% 4/25/35 (d) | | 1,545,000 | | 1,519,481 |
Series 2007-1 Class A3, 5.45% 2/25/37 (d) | | 1,000,000 | | 988,906 |
ACE Securities Corp.: | | | | |
Series 2002-HE2 Class M1, 6.595% 8/25/32 (d) | | 150,838 | | 150,938 |
Series 2003-HE1: | | | | |
Class M1, 5.97% 11/25/33 (d) | | 113,099 | | 110,613 |
Class M2, 7.02% 11/25/33 (d) | | 56,558 | | 55,160 |
Asset-Backed Securities - continued |
| Principal Amount | | Value |
ACE Securities Corp.: - continued | | | | |
Series 2003-HS1: | | | | |
Class M1, 6.07% 6/25/33 (d) | | $ 27,542 | | $ 27,591 |
Class M2, 7.07% 6/25/33 (d) | | 50,000 | | 50,304 |
Series 2003-NC1 Class M1, 6.1% 7/25/33 (d) | | 100,000 | | 98,192 |
Series 2004-HE1: | | | | |
Class M1, 5.82% 2/25/34 (d) | | 107,488 | | 103,490 |
Class M2, 6.42% 2/25/34 (d) | | 175,000 | | 161,894 |
Series 2005-HE2: | | | | |
Class M2, 5.77% 4/25/35 (d) | | 250,000 | | 246,416 |
Class M3, 5.8% 4/25/35 (d) | | 145,000 | | 141,815 |
Series 2005-HE3 Class A2B, 5.53% 5/25/35 (d) | | 34,211 | | 34,222 |
Series 2005-SD1 Class A1, 5.72% 11/25/50 (d) | | 84,033 | | 83,560 |
Series 2006-HE2: | | | | |
Class A2C, 5.48% 5/25/36 (d) | | 995,000 | | 978,831 |
Class M1, 5.62% 5/25/36 (d) | | 915,000 | | 868,417 |
Class M2, 5.64% 5/25/36 (d) | | 305,000 | | 288,504 |
Class M3, 5.66% 5/25/36 (d) | | 240,000 | | 217,893 |
Class M4, 5.72% 5/25/36 (d) | | 200,000 | | 174,411 |
Class M5, 5.76% 5/25/36 (d) | | 295,000 | | 247,140 |
ACE Securities Corp. Home Equity Loan Trust
Series 2007-HE1: | | | | |
Class A2C, 5.49% 1/25/37 (d) | | 1,000,000 | | 990,788 |
Class M1, 5.58% 1/25/37 (d) | | 755,000 | | 719,062 |
Advanta Business Card Master Trust: | | | | |
Series 2004-C1 Class C, 6.37% 9/20/13 (d) | | 340,000 | | 343,292 |
Series 2006-C1 Class C1, 5.8% 10/20/14 (d) | | 770,000 | | 769,996 |
Series 2007-B1 Class B, 5.57% 12/22/14 (d) | | 1,725,000 | | 1,727,744 |
Aesop Funding II LLC Series 2005-1A Class A2, 5.38% 4/20/09 (a)(d) | | 1,200,000 | | 1,199,872 |
American Express Credit Account Master Trust: | | | | |
Series 2004-1 Class B, 5.57% 9/15/11 (d) | | 410,000 | | 411,223 |
Series 2004-5 Class B, 5.57% 4/16/12 (d) | | 2,150,000 | | 2,150,136 |
Series 2004-C Class C, 5.82% 2/15/12 (a)(d) | | 368,551 | | 369,236 |
Series 2005-1 Class A, 5.35% 10/15/12 (d) | | 2,185,000 | | 2,184,959 |
Series 2005-6 Class C, 5.57% 3/15/11 (a)(d) | | 2,680,000 | | 2,681,367 |
AmeriCredit Automobile Receivables Trust: | | | | |
Series 2005-1 Class C, 4.73% 7/6/10 | | 2,500,000 | | 2,488,918 |
Series 2006-RM Class A1, 5.37% 10/6/09 | | 1,541,881 | | 1,542,136 |
Series 2007-BF Class A2, 5.31% 1/6/11 | | 1,230,000 | | 1,230,625 |
Series 2007-CM Class A2, 5.43% 11/8/10 | | 3,000,000 | | 3,001,464 |
Ameriquest Mortgage Securities, Inc.: | | | | |
Series 2003-1 Class M1, 6.67% 2/25/33 (d) | | 474,619 | | 473,993 |
Asset-Backed Securities - continued |
| Principal Amount | | Value |
Ameriquest Mortgage Securities, Inc.: - continued | | | | |
Series 2004-R11 Class M1, 5.98% 11/25/34 (d) | | $ 560,000 | | $ 553,764 |
Series 2004-R2: | | | | |
Class M1, 5.75% 4/25/34 (d) | | 85,000 | | 83,831 |
Class M2, 5.8% 4/25/34 (d) | | 75,000 | | 74,119 |
Series 2004-R8 Class M9, 8.07% 9/25/34 (d) | | 1,525,000 | | 1,255,202 |
Series 2004-R9 Class M2, 5.97% 10/25/34 (d) | | 720,000 | | 711,024 |
Series 2005-R1: | | | | |
Class M1, 5.77% 3/25/35 (d) | | 770,000 | | 753,102 |
Class M2, 5.8% 3/25/35 (d) | | 260,000 | | 251,345 |
Series 2005-R2 Class M1, 5.77% 4/25/35 (d) | | 1,700,000 | | 1,660,813 |
Series 2006-M3: | | | | |
Class M7, 6.17% 10/25/36 (d) | | 705,000 | | 615,113 |
Class M9, 7.32% 10/25/36 (d) | | 450,000 | | 291,094 |
Amortizing Residential Collateral Trust Series 2002-BC1 Class M2, 6.42% 1/25/32 (d) | | 21,053 | | 16,534 |
ARG Funding Corp.: | | | | |
Series 2005-1A Class A2, 5.42% 4/20/09 (a)(d) | | 1,500,000 | | 1,500,766 |
Series 2005-2A Class A2, 5.43% 5/20/09 (a)(d) | | 800,000 | | 800,521 |
Argent Securities, Inc.: | | | | |
Series 2003-W3 Class M2, 6.8739% 9/25/33 (d) | | 800,000 | | 790,358 |
Series 2004-W5 Class M1, 5.92% 4/25/34 (d) | | 1,420,000 | | 1,396,718 |
Series 2004-W7: | | | | |
Class M1, 5.87% 5/25/34 (d) | | 305,000 | | 298,830 |
Class M2, 5.92% 5/25/34 (d) | | 250,000 | | 246,596 |
Series 2006-W4: | | | | |
Class A2C, 5.48% 5/25/36 (d) | | 1,200,000 | | 1,180,313 |
Class M2, 5.64% 5/25/36 (d) | | 1,265,000 | | 1,196,599 |
Class M3, 5.66% 5/25/36 (d) | | 1,010,000 | | 947,370 |
Arran Funding Ltd. Series 2005-A Class C, 5.64% 12/15/10 (d) | | 3,235,000 | | 3,234,353 |
Asset Backed Funding Certificates Series 2004-HE1 Class M2, 6.47% 1/25/34 (d) | | 230,000 | | 226,248 |
Asset Backed Funding Corp. Series 2006-OPT2
Class C7, 5.47% 10/25/36 (d) | | 780,000 | | 757,575 |
Asset Backed Securities Corp. Home Equity Loan Trust: | | | | |
Series 2003-HE2 Class M1, 6.67% 4/15/33 (d) | | 1,165,025 | | 1,165,511 |
Series 2003-HE6 Class M1, 5.97% 11/25/33 (d) | | 215,000 | | 212,310 |
Series 2004-HE6 Class A2, 5.68% 6/25/34 (d) | | 305,093 | | 301,661 |
Series 2005-HE1 Class M1, 5.82% 3/25/35 (d) | | 540,000 | | 530,943 |
Series 2005-HE2: | | | | |
Class M1, 5.77% 3/25/35 (d) | | 1,105,000 | | 1,088,705 |
Class M2, 5.82% 3/25/35 (d) | | 275,000 | | 270,529 |
Asset-Backed Securities - continued |
| Principal Amount | | Value |
Asset Backed Securities Corp. Home Equity Loan Trust: - continued | | | | |
Series 2007-HE1 Class A4, 5.46% 12/25/36 (d) | | $ 1,000,000 | | $ 994,688 |
Bank of America Credit Card Master Trust: | | | | |
Series 2006-C7 Class C7, 5.55% 3/15/12 (d) | | 3,165,000 | | 3,161,669 |
Series 2007-C2 Class C2, 5.59% 9/17/12 (d) | | 2,050,000 | | 2,050,504 |
Bank One Issuance Trust: | | | | |
Series 2003-C4 Class C4, 6.35% 2/15/11 (d) | | 2,010,000 | | 2,024,296 |
Series 2004-C1 Class C1, 5.82% 11/15/11 (d) | | 25,000 | | 25,114 |
Bayview Financial Acquisition Trust Series 2004-C
Class A1, 5.74% 5/28/44 (d) | | 369,809 | | 369,925 |
Bayview Financial Mortgage Loan Trust Series 2004-A Class A, 5.77% 2/28/44 (d) | | 177,675 | | 177,758 |
Bear Stearns Asset Backed Securities Trust: | | | | |
Series 2004-BO1: | | | | |
Class M2, 6.07% 9/25/34 (d) | | 390,000 | | 369,203 |
Class M3, 6.37% 9/25/34 (d) | | 265,000 | | 245,890 |
Class M4, 6.52% 9/25/34 (d) | | 225,000 | | 203,957 |
Series 2004-HE9 Class M2, 6.52% 11/25/34 (d) | | 490,000 | | 461,770 |
Series 2005-HE2: | | | | |
Class M1, 5.82% 2/25/35 (d) | | 840,950 | | 832,470 |
Class M2, 6.07% 2/25/35 (d) | | 330,000 | | 305,394 |
Brazos Higher Education Authority, Inc. Series 2006-2 Class A9, 5.37% 12/26/24 (d) | | 2,375,570 | | 2,375,477 |
C-Bass Trust Series 2007-CB1 Class M1, 5.55% 1/25/37 (d) | | 215,000 | | 204,508 |
Capital Auto Receivables Asset Trust: | | | | |
Series 2005-1 Class B, 5.695% 6/15/10 (d) | | 850,000 | | 853,621 |
Series 2006-SN1A Class A4B, 5.43% 3/20/10 (a)(d) | | 2,700,000 | | 2,700,360 |
Capital One Auto Finance Trust: | | | | |
Series 2004-B Class A4, 5.43% 8/15/11 (d) | | 1,260,082 | | 1,260,400 |
Series 2006-B Class A2, 5.53% 4/15/09 | | 444,204 | | 444,190 |
Series 2007-A Class A2, 5.33% 5/17/10 | | 930,000 | | 930,409 |
Capital One Master Trust: | | | | |
Series 2001-1 Class B, 5.83% 12/15/10 (d) | | 500,000 | | 500,813 |
Series 2001-6 Class C, 6.7% 6/15/11 (a) | | 2,200,000 | | 2,228,875 |
Capital One Multi-Asset Execution Trust: | | | | |
Series 2003-B6 Class B6, 5.85% 9/15/11 (d) | | 1,125,000 | | 1,130,709 |
Series 2004-B1 Class B1, 5.76% 11/15/11 (d) | | 1,180,000 | | 1,186,372 |
Capital Trust Ltd. Series 2004-1: | | | | |
Class A2, 5.77% 7/20/39 (a)(d) | | 265,000 | | 265,374 |
Class B, 6.07% 7/20/39 (a)(d) | | 140,000 | | 140,981 |
Class C, 6.42% 7/20/39 (a)(d) | | 180,000 | | 181,136 |
Asset-Backed Securities - continued |
| Principal Amount | | Value |
Carrington Mortgage Loan Trust: | | | | |
Series 2006-FRE1: | | | | |
Class M7, 6.27% 7/25/36 (d) | | $ 445,000 | | $ 287,637 |
Class M9, 7.22% 7/25/36 (d) | | 285,000 | | 176,921 |
Series 2006-NC3 Class M10, 7.32% 8/25/36 (a)(d) | | 125,000 | | 41,250 |
Series 2007-RFC1 Class A3, 5.46% 12/25/36 (d) | | 1,000,000 | | 992,390 |
CDC Mortgage Capital Trust Series 2003-HE3 Class M1, 6.02% 11/25/33 (d) | | 91,792 | | 90,713 |
Cendant Timeshare Receivables Funding LLC
Series 2005 1A Class 2A2, 5.5% 5/20/17 (a)(d) | | 460,711 | | 458,075 |
Chase Credit Card Owner Trust Series 2003-6 Class C, 6.12% 2/15/11 (d) | | 2,210,000 | | 2,228,794 |
Chase Issuance Trust: | | | | |
Series 2004-C3 Class C3, 5.79% 6/15/12 (d) | | 1,645,000 | | 1,651,557 |
Series 2006-C3 Class C3, 5.55% 6/15/11 (d) | | 1,975,000 | | 1,975,639 |
CIT Equipment Collateral Trust Series 2005-VT1: | | | | |
Class C, 4.18% 11/20/12 | | 274,590 | | 272,705 |
Class D, 4.51% 11/20/12 | | 209,796 | | 208,174 |
Citibank Credit Card Issuance Trust: | | | | |
Series 2003-C1 Class C1, 6.46% 4/7/10 (d) | | 1,685,000 | | 1,695,590 |
Series 2006-C4 Class C4, 5.54% 1/9/12 (d) | | 2,365,000 | | 2,364,437 |
Series 2006-C6 Class C6, 5.65% 11/15/12 (d) | | 1,595,000 | | 1,598,381 |
CNH Equipment Trust Series 2007-A Class A2, 5.09% 10/15/09 | | 2,500,000 | | 2,498,562 |
College Loan Corp. Trust I Series 2006-1 Class A7B, 5.37% 4/25/46 (a)(d) | | 3,195,000 | | 3,195,000 |
Countrywide Home Loan Trust Series 2006-13N
Class N, 7% 8/25/37 (a) | | 353,273 | | 290,567 |
Countrywide Home Loans, Inc.: | | | | |
Series 2002-6 Class AV1, 5.75% 5/25/33 (d) | | 22,398 | | 22,409 |
Series 2003-BC1 Class M2, 8.0286% 9/25/32 (d) | | 196,139 | | 189,970 |
Series 2004-2 Class M1, 5.82% 5/25/34 (d) | | 375,000 | | 369,554 |
Series 2004-3: | | | | |
Class 3A4, 5.57% 8/25/34 (d) | | 1,273,720 | | 1,262,774 |
Class M1, 5.82% 6/25/34 (d) | | 100,000 | | 98,432 |
Series 2004-4 Class M2, 5.85% 6/25/34 (d) | | 315,000 | | 312,441 |
Series 2005-1: | | | | |
Class 1AV2, 5.52% 7/25/35 (d) | | 369,922 | | 369,806 |
Class MV1, 5.72% 7/25/35 (d) | | 435,000 | | 422,375 |
Class MV2, 5.76% 7/25/35 (d) | | 525,000 | | 513,170 |
Series 2005-AB1 Class A2, 5.53% 8/25/35 (d) | | 1,322,142 | | 1,319,043 |
CPS Auto Receivables Trust: | | | | |
Series 2006-B Class A2, 5.71% 6/15/16 (a) | | 2,042,199 | | 2,044,432 |
Asset-Backed Securities - continued |
| Principal Amount | | Value |
CPS Auto Receivables Trust: - continued | | | | |
Series 2006-C Class A2, 5.31% 3/15/10 (a) | | $ 1,447,703 | | $ 1,447,842 |
Series 2007-A Class A1, 5.332% 3/17/08 (a) | | 438,603 | | 438,572 |
Discover Card Master Trust I: | | | | |
Series 2003-4 Class B1, 5.65% 5/16/11 (d) | | 550,000 | | 552,065 |
Series 2005-1 Class B, 5.47% 9/16/10 (d) | | 1,580,000 | | 1,580,884 |
Series 2005-3 Class B, 5.51% 5/15/11 (d) | | 2,000,000 | | 2,005,520 |
Series 2006-1 Class B1, 5.47% 8/16/11 (d) | | 1,845,000 | | 1,847,023 |
Series 2006-2 Class B1, 5.44% 1/17/12 (d) | | 2,000,000 | | 2,001,947 |
DriveTime Auto Owner Trust Series 2006-B Class A2, 5.32% 3/15/10 (a) | | 1,281,600 | | 1,279,998 |
Fannie Mae subordinate REMIC pass-thru certificates Series 2004-T5: | | | | |
Class AB1, 5.57% 5/28/35 (d) | | 80,751 | | 79,754 |
Class AB3, 5.712% 5/28/35 (d) | | 32,052 | | 31,577 |
Fieldstone Mortgage Investment Corp.: | | | | |
Series 2004-3 Class M5, 6.77% 8/25/34 (d) | | 1,500,000 | | 1,438,710 |
Series 2006-2: | | | | |
Class 2A2, 5.49% 7/25/36 (d) | | 880,000 | | 862,537 |
Class M1, 5.63% 7/25/36 (d) | | 1,765,000 | | 1,642,941 |
First Franklin Mortgage Loan Trust: | | | | |
Series 2004-FF2: | | | | |
Class M3, 5.87% 3/25/34 (d) | | 25,000 | | 24,696 |
Class M4, 6.22% 3/25/34 (d) | | 24,349 | | 24,147 |
Series 2004-FF8 Class M3, 6.27% 10/25/34 (d) | | 1,760,000 | | 1,648,520 |
Series 2006-FF14: | | | | |
Class A5, 5.48% 10/25/36 (d) | | 990,000 | | 951,329 |
Class M1, 5.58% 10/25/36 (d) | | 880,000 | | 837,688 |
Series 2006-FF18 Class M1, 5.55% 12/25/37 (d) | | 3,500,000 | | 3,321,115 |
Series 2007-FF1 Class M1, 5.55% 1/25/38 (d) | | 375,000 | | 355,691 |
First Investors Auto Owner Trust Series 2006-A Class A3, 4.93% 2/15/11 (a) | | 683,986 | | 682,047 |
Ford Credit Floorplan Master Owner Trust: | | | | |
Series 2005-1: | | | | |
Class A, 5.47% 5/15/10 (d) | | 1,375,000 | | 1,375,102 |
Class B, 5.76% 5/15/10 (d) | | 1,110,000 | | 1,111,647 |
Series 2006-3: | | | | |
Class A, 5.5% 6/15/11 (d) | | 990,000 | | 990,223 |
Class B, 5.77% 6/15/11 (d) | | 1,405,000 | | 1,406,464 |
Fosse Master Issuer PLC Series 2007-1A Class C2, 0% 10/18/54 (a)(b)(d) | | 460,000 | | 460,000 |
Franklin Auto Trust Series 2006-1 Class A2, 5.2% 10/20/09 | | 888,410 | | 888,032 |
Asset-Backed Securities - continued |
| Principal Amount | | Value |
Fremont Home Loan Trust: | | | | |
Series 2003-B Class M6, 9.82% 12/25/33 (d) | | $ 236,627 | | $ 82,819 |
Series 2004-B Class M1, 5.9% 5/25/34 (d) | | 205,000 | | 200,976 |
Series 2004-C Class M1, 5.97% 8/25/34 (d) | | 540,000 | | 528,572 |
Series 2005-A: | | | | |
Class M1, 5.75% 1/25/35 (d) | | 225,000 | | 219,768 |
Class M2, 5.78% 1/25/35 (d) | | 325,000 | | 320,555 |
Class M3, 5.81% 1/25/35 (d) | | 175,000 | | 171,704 |
Class M4, 6% 1/25/35 (d) | | 125,000 | | 122,150 |
Series 2006-A: | | | | |
Class M3, 5.7% 5/25/36 (d) | | 455,000 | | 404,754 |
Class M4, 5.72% 5/25/36 (d) | | 685,000 | | 588,587 |
Class M5, 5.82% 5/25/36 (d) | | 365,000 | | 279,827 |
Series 2006-E Class M1, 5.58% 1/25/37 (d) | | 1,725,000 | | 1,635,441 |
GCO Education Loan Funding Master Trust II
Series 2007-1A Class C1L, 5.76% 9/25/30 (a)(d) | | 960,000 | | 957,220 |
GE Business Loan Trust Series 2003-1 Class A, 5.75% 4/15/31 (a)(d) | | 156,758 | | 156,758 |
GE Capital Credit Card Master Note Trust: | | | | |
Series 2005-2 Class B, 5.52% 6/15/11 (d) | | 925,000 | | 925,649 |
Series 2006-1: | | | | |
Class B, 5.43% 9/17/12 (d) | | 585,000 | | 585,472 |
Class C, 5.56% 9/17/12 (d) | | 455,000 | | 455,274 |
GE Equipment Midticket LLC Series 2006-1 Class A2, 5.1% 5/15/09 | | 1,325,000 | | 1,323,470 |
Gracechurch Card Funding PLC: | | | | |
Series 11 Class C, 5.6% 11/15/10 (d) | | 2,490,000 | | 2,490,000 |
Series 8 Class C, 5.65% 6/15/10 (d) | | 2,650,000 | | 2,648,384 |
Series 9: | | | | |
Class B, 5.47% 9/15/10 (d) | | 485,000 | | 485,000 |
Class C, 5.63% 9/15/10 (d) | | 1,800,000 | | 1,800,000 |
Granite Master Issuer PLC Series 2006-1A Class A4, 5.36% 12/20/30 (a)(d) | | 196,173 | | 196,175 |
GSAMP Trust: | | | | |
Series 2002-NC1 Class A2, 5.96% 7/25/32 (d) | | 2,606 | | 2,597 |
Series 2003-FM1 Class M1, 6.55% 3/20/33 (d) | | 565,268 | | 565,564 |
Series 2004-FM1: | | | | |
Class M1, 5.97% 11/25/33 (d) | | 168,544 | | 166,143 |
Class M2, 6.72% 11/25/33 (d) | | 76,057 | | 74,520 |
Series 2004-FM2 Class M1, 6.07% 1/25/34 (d) | | 232,499 | | 228,978 |
Series 2004-HE1: | | | | |
Class M1, 5.87% 5/25/34 (d) | | 289,483 | | 285,263 |
Class M2, 6.47% 5/25/34 (d) | | 150,000 | | 148,880 |
Asset-Backed Securities - continued |
| Principal Amount | | Value |
GSAMP Trust: - continued | | | | |
Series 2006-FM3 Class ABS, 5.52% 11/25/36 (d) | | $ 2,045,000 | | $ 2,025,993 |
Series 2006-HE5 Class M7, 6.15% 8/25/36 (d) | | 1,495,000 | | 1,018,526 |
Series 2006-NC2 Class M4, 5.67% 6/25/36 (d) | | 1,541,000 | | 1,284,980 |
Series 2007-FM1 Class M1, 5.59% 12/25/36 (d) | | 1,000,000 | | 961,070 |
Series 2007-FM2 Class M1, 5.6% 1/25/37 (d) | | 1,615,000 | | 1,552,629 |
Series 2007-HE1 Class M1, 5.57% 3/25/47 (d) | | 335,000 | | 317,593 |
Series 2007-NC1 Class M7, 6.27% 12/25/46 (d) | | 3,390,000 | | 1,695,000 |
GSR Mortgage Loan Trust: | | | | |
Series 2004-AHL Class A2D, 5.68% 8/25/34 (d) | | 178,621 | | 178,649 |
Series 2005-6 Class A2, 5.53% 6/25/35 (d) | | 1,800,000 | | 1,799,617 |
Series 2005-9 Class 2A1, 5.44% 8/25/35 (d) | | 395,292 | | 395,007 |
Series 2005-HE2 Class M, 5.75% 3/25/35 (d) | | 1,220,000 | | 1,187,492 |
Series 2005-MTR1 Class A1, 5.46% 10/25/35 (d) | | 653,910 | | 653,608 |
Series 2005-NC1 Class M1, 5.77% 2/25/35 (d) | | 1,205,000 | | 1,177,671 |
Guggenheim Structured Real Estate Funding Ltd.: | | | | |
Series 2005-1 Class C, 6.4% 5/25/30 (a)(d) | | 651,189 | | 605,606 |
Series 2006-3: | | | | |
Class B, 5.72% 9/25/46 (a)(d) | | 450,000 | | 441,000 |
Class C, 5.87% 9/25/46 (a)(d) | | 1,150,000 | | 1,104,000 |
Harwood Street Funding I LLC Series 2004-1A
Class CTFS, 7.32% 9/20/09 (a)(d) | | 1,700,000 | | 1,683,092 |
Holmes Master Issuer PLC Series 2007-2A Class 1C, 5.59% 7/15/21 (d) | | 1,640,000 | | 1,640,000 |
Home Equity Asset Trust: | | | | |
Series 2002-3 Class A5, 6.2% 2/25/33 (d) | | 14 | | 14 |
Series 2002-5 Class M1, 7.02% 5/25/33 (d) | | 165,576 | | 165,742 |
Series 2003-1 Class M1, 6.82% 6/25/33 (d) | | 524,845 | | 525,274 |
Series 2003-2 Class M1, 6.64% 8/25/33 (d) | | 66,323 | | 65,951 |
Series 2003-3 Class M1, 6.61% 8/25/33 (d) | | 320,568 | | 318,068 |
Series 2003-4 Class M1, 6.52% 10/25/33 (d) | | 96,601 | | 96,678 |
Series 2003-5: | | | | |
Class A2, 5.67% 12/25/33 (d) | | 10,566 | | 10,545 |
Class M1, 6.02% 12/25/33 (d) | | 160,000 | | 158,438 |
Class M2, 7.05% 12/25/33 (d) | | 30,927 | | 30,074 |
Series 2003-7: | | | | |
Class A2, 5.7% 3/25/34 (d) | | 2,079 | | 2,081 |
Class M1, 5.97% 3/25/34 (d) | | 795,000 | | 790,362 |
Series 2003-8 Class M1, 6.04% 4/25/34 (d) | | 192,210 | | 189,696 |
Series 2004-6 Class A2, 5.67% 12/25/34 (d) | | 18,234 | | 18,243 |
Series 2005-1 Class M1, 5.75% 5/25/35 (d) | | 1,270,000 | | 1,230,997 |
Series 2005-2: | | | | |
Class 2A2, 5.52% 7/25/35 (d) | | 259,937 | | 259,937 |
Asset-Backed Securities - continued |
| Principal Amount | | Value |
Home Equity Asset Trust: - continued | | | | |
Series 2005-2: | | | | |
Class M1, 5.77% 7/25/35 (d) | | $ 890,000 | | $ 878,330 |
Series 2007-1 Class M1, 5.56% 5/25/37 (d) | | 1,940,000 | | 1,875,175 |
Series 2007-3 Class 2A3, 5.56% 8/25/37 (d) | | 2,015,000 | | 2,000,202 |
Household Home Equity Loan Trust Series 2004-1
Class M, 5.84% 9/20/33 (d) | | 86,560 | | 84,970 |
HSBC Automotive Trust: | | | | |
Series 2006-1 Class A2, 5.4% 6/17/09 | | 597,362 | | 597,289 |
Series 2006-2 Class A2, 5.61% 6/17/09 | | 412,534 | | 412,590 |
Series 2007-1 Class A2, 5.32% 5/17/10 | | 1,070,000 | | 1,070,006 |
HSBC Home Equity Loan Trust: | | | | |
Series 2005-2: | | | | |
Class M1, 5.78% 1/20/35 (d) | | 181,046 | | 178,386 |
Class M2, 5.81% 1/20/35 (d) | | 134,778 | | 132,755 |
Series 2005-3: | | | | |
Class A1, 5.58% 1/20/35 (d) | | 412,581 | | 409,744 |
Class M1, 5.74% 1/20/35 (d) | | 242,271 | | 238,526 |
Series 2006-2: | | | | |
Class M1, 5.59% 3/20/36 (d) | | 600,432 | | 587,292 |
Class M2, 5.61% 3/20/36 (d) | | 991,246 | | 968,972 |
HSI Asset Securitization Corp. Trust Series 2007-HE1 Class M1, 5.62% 1/25/37 (d) | | 1,025,000 | | 978,073 |
IXIS Real Estate Capital Trust Series 2005-HE1 Class M1, 5.79% 6/25/35 (d) | | 492,536 | | 484,104 |
John Deere Owner Trust Series 2006-A Class A2, 5.41% 11/17/08 | | 139,583 | | 139,560 |
JPMorgan Auto Receivables Trust Series 2007-A
Class A2, 5.3% 12/15/09 (a) | | 1,665,000 | | 1,665,513 |
JPMorgan Mortgage Acquisition Trust Series 2006-WMC4 Class A4, 5.47% 12/25/36 (d) | | 3,000,000 | | 2,921,250 |
Keycorp Student Loan Trust Series 1999-A Class A2, 5.69% 12/27/09 (d) | | 178,335 | | 178,745 |
Long Beach Auto Receivables Trust: | | | | |
Series 2006-B Class A2, 5.34% 11/15/09 | | 1,000,226 | | 1,000,171 |
Series 2007-A Class A1, 5.335% 4/15/08 | | 657,235 | | 657,189 |
Long Beach Mortgage Loan Trust: | | | | |
Series 2003-2 Class M1, 6.55% 6/25/33 (d) | | 462,597 | | 461,883 |
Series 2003-3 Class M1, 6.07% 7/25/33 (d) | | 337,423 | | 337,270 |
Series 2005-1 Class M2, 5.85% 2/25/35 (d) | | 1,410,000 | | 1,386,824 |
Series 2005-WL1 Class M2, 5.87% 6/25/35 (d) | | 660,000 | | 660,462 |
Asset-Backed Securities - continued |
| Principal Amount | | Value |
Long Beach Mortgage Loan Trust: - continued | | | | |
Series 2006-6: | | | | |
Class 2A3, 5.47% 7/25/36 (d) | | $ 1,435,000 | | $ 1,385,448 |
Class M4, 5.68% 7/25/36 (d) | | 425,000 | | 357,647 |
Class M5, 5.71% 7/25/36 (d) | | 265,000 | | 212,595 |
Series 2006-7 Class M10, 7.82% 8/25/36 (d) | | 675,000 | | 202,500 |
MASTR Asset Backed Securities Trust: | | | | |
Series 2004-HE1 Class M1, 5.97% 9/25/34 (d) | | 685,000 | | 676,037 |
Series 2006-HE3 Class A2, 5.42% 8/25/36 (d) | | 1,140,000 | | 1,125,572 |
Series 2007-WMC1 Class A4, 5.48% 1/25/37 (d) | | 1,380,000 | | 1,365,985 |
MBNA Credit Card Master Note Trust: | | | | |
Series 2002-B4 Class B4, 5.82% 3/15/10 (d) | | 630,000 | | 630,526 |
Series 2003-B1 Class B1, 5.76% 7/15/10 (d) | | 1,510,000 | | 1,513,112 |
Series 2003-B2 Class B2, 5.71% 10/15/10 (d) | | 125,000 | | 125,333 |
Series 2003-B3 Class B3, 5.695% 1/18/11 (d) | | 1,550,000 | | 1,555,642 |
Series 2003-B5 Class B5, 5.69% 2/15/11 (d) | | 2,000,000 | | 2,007,078 |
Series 2003-C2 Class C2, 6.92% 6/15/10 (d) | | 2,000,000 | | 2,013,322 |
Series 2005-C1 Class C, 5.73% 10/15/12 (d) | | 2,505,000 | | 2,522,051 |
Series 2005-C2 Class C, 5.67% 2/15/13 (d) | | 2,505,000 | | 2,516,617 |
Series 2005-C3 Class C, 5.59% 3/15/11 (d) | | 2,830,000 | | 2,835,016 |
MBNA Master Credit Card Trust II Series 1998-E Class B, 5.69% 9/15/10 (d) | | 200,000 | | 200,387 |
Meritage Mortgage Loan Trust Series 2004-1: | | | | |
Class M1, 6.07% 7/25/34 (d) | | 141,466 | | 140,510 |
Class M2, 6.145% 7/25/34 (d) | | 11,233 | | 11,173 |
Merrill Lynch First Franklin Mortgage Loan Trust Series 2007-1: | | | |
Class A2C, 5.57% 4/25/37 (d) | | 1,035,000 | | 1,023,033 |
Class M1, 5.7% 4/25/37 (d) | | 1,355,000 | | 1,315,927 |
Merrill Lynch Mortgage Investors, Inc.: | | | | |
Series 2004-FM1 Class M2, 6.47% 1/25/35 (d) | | 57,263 | | 53,004 |
Series 2004-HE2 Class A1B, 5.79% 8/25/35 (d) | | 70,891 | | 70,991 |
Series 2006-FM1 Class A2B, 5.43% 4/25/37 (d) | | 1,055,000 | | 1,051,208 |
Morgan Stanley ABS Capital I, Inc.: | | | | |
Series 2002-HE3 Class M1, 6.42% 12/27/32 (d) | | 114,935 | | 114,935 |
Series 2003-NC10 Class M1, 6% 10/25/33 (d) | | 792,708 | | 782,417 |
Series 2003-NC8 Class M1, 6.02% 9/25/33 (d) | | 119,992 | | 119,931 |
Series 2004-HE6 Class A2, 5.66% 8/25/34 (d) | | 79,986 | | 79,999 |
Series 2004-NC2 Class M1, 5.87% 12/25/33 (d) | | 347,703 | | 340,993 |
Series 2005-1 Class M2, 5.79% 12/25/34 (d) | | 570,000 | | 557,500 |
Series 2005-HE1: | | | | |
Class M1, 5.77% 12/25/34 (d) | | 150,000 | | 145,263 |
Class M2, 5.79% 12/25/34 (d) | | 385,000 | | 376,051 |
Asset-Backed Securities - continued |
| Principal Amount | | Value |
Morgan Stanley ABS Capital I, Inc.: - continued | | | | |
Series 2005-HE2: | | | | |
Class M1, 5.72% 1/25/35 (d) | | $ 370,000 | | $ 358,201 |
Class M2, 5.76% 1/25/35 (d) | | 265,000 | | 258,631 |
Series 2005-NC1: | | | | |
Class M1, 5.76% 1/25/35 (d) | | 325,000 | | 314,750 |
Class M2, 5.79% 1/25/35 (d) | | 325,000 | | 317,322 |
Class M3, 5.83% 1/25/35 (d) | | 325,000 | | 312,167 |
Series 2006-HE4: | | | | |
Class M1, 5.6% 6/25/36 (d) | | 440,000 | | 417,969 |
Class M2: | | | | |
5.62% 6/25/36 (d) | | 770,000 | | 730,507 |
5.63% 6/25/36 (d) | | 550,000 | | 501,576 |
Class M4, 5.67% 6/25/36 (d) | | 1,160,000 | | 1,017,047 |
Series 2006-HE5 Class B1, 6.29% 8/25/36 (d) | | 2,415,000 | | 1,409,100 |
Morgan Stanley Dean Witter Capital I Trust: | | | | |
Series 2001-AM1 Class M1, 6.595% 2/25/32 (d) | | 279,043 | | 279,218 |
Series 2001-NC1 Class M2, 6.925% 10/25/31 (d) | | 8,084 | | 7,546 |
Series 2001-NC4 Class M1, 6.82% 1/25/32 (d) | | 20,819 | | 20,839 |
Series 2002-AM3 Class A3, 6.3% 2/25/33 (d) | | 14,114 | | 14,121 |
Series 2002-HE1 Class M1, 6.22% 7/25/32 (d) | | 572,410 | | 560,060 |
Series 2002-NC3 Class M1, 6.4% 8/25/32 (d) | | 100,000 | | 99,947 |
Series 2002-OP1 Class M1, 6.445% 9/25/32 (d) | | 289,725 | | 287,805 |
Navistar Financial Dealer Note Master Trust
Series 2005-1 Class A, 5.43% 2/25/13 (d) | | 2,050,000 | | 2,045,011 |
New Century Home Equity Loan Trust Series 2005-1: | | | | |
Class M1, 5.77% 3/25/35 (d) | | 595,000 | | 584,077 |
Class M2, 5.8% 3/25/35 (d) | | 595,000 | | 586,093 |
Class M3, 5.84% 3/25/35 (d) | | 290,000 | | 283,310 |
Nissan Auto Lease Trust: | | | | |
Series 2004-A Class A4A, 5.39% 6/15/10 (d) | | 157,665 | | 157,679 |
Series 2005-A Class A4, 5.37% 8/15/11 (d) | | 2,210,000 | | 2,210,196 |
Nomura Home Equity Loan Trust: | | | | |
Series 2006-HE3: | | | | |
Class M7, 6.12% 7/25/36 (d) | | 485,000 | | 350,682 |
Class M8, 6.27% 7/25/36 (d) | | 340,000 | | 218,322 |
Class M9, 7.17% 7/25/36 (d) | | 490,000 | | 255,876 |
Series 2007-2 Class 2A3, 5.51% 2/25/37 (d) | | 947,000 | | 938,562 |
NovaStar Home Equity Loan Series 2004-1: | | | | |
Class M1, 5.77% 6/25/34 (d) | | 100,000 | | 98,093 |
Class M4, 6.295% 6/25/34 (d) | | 170,000 | | 167,975 |
Asset-Backed Securities - continued |
| Principal Amount | | Value |
NovaStar Mortgage Funding Trust: | | | | |
Series 2003-3 Class A3, 5.77% 12/25/33 (d) | | $ 42,010 | | $ 42,226 |
Series 2007-1 Class A2C, 5.5% 3/25/37 (d) | | 805,000 | | 761,480 |
Ocala Funding LLC Series 2006-1A Class A, 6.72% 3/20/11 (a)(d) | | 965,000 | | 928,813 |
Option One Mortgage Loan Trust Series 2003-6
Class M1, 5.97% 11/25/33 (d) | | 1,025,000 | | 1,028,943 |
Park Place Securities, Inc.: | | | | |
Series 2004-WCW1: | | | | |
Class M1, 5.95% 9/25/34 (d) | | 815,000 | | 789,548 |
Class M2, 6% 9/25/34 (d) | | 160,000 | | 153,524 |
Class M3, 6.57% 9/25/34 (d) | | 310,000 | | 293,060 |
Class M4, 6.77% 9/25/34 (d) | | 435,000 | | 403,061 |
Series 2004-WWF1: | | | | |
Class A5, 5.79% 1/25/35 (d) | | 6,172 | | 6,094 |
Class M4, 6.42% 1/25/35 (d) | | 945,000 | | 904,102 |
Series 2005-WCH1: | | | | |
Class A3B, 5.54% 1/25/35 (d) | | 9,352 | | 9,354 |
Class M2, 5.84% 1/25/35 (d) | | 1,130,000 | | 1,102,828 |
Class M3, 5.88% 1/25/35 (d) | | 425,000 | | 409,727 |
Class M5, 6.2% 1/25/35 (d) | | 400,000 | | 377,995 |
Series 2005-WHQ1 Class M7, 6.57% 3/25/35 (d) | | 910,000 | | 761,657 |
Providian Master Note Trust: | | | | |
Series 2005-2 Class C2, 5.82% 11/15/12 (a)(d) | | 2,160,000 | | 2,164,082 |
Series 2006-C1A Class C1, 5.87% 3/16/15 (a)(d) | | 2,465,000 | | 2,465,000 |
Residential Asset Mortgage Products, Inc.: | | | | |
Series 2004-RS10 Class MII2, 6.57% 10/25/34 (d) | | 1,300,000 | | 1,237,425 |
Series 2004-RS6: | | | | |
Class 2M2, 6.62% 6/25/34 (d) | | 250,000 | | 246,312 |
Class 2M3, 6.77% 6/25/34 (d) | | 250,000 | | 221,402 |
Series 2005-SP2 Class 1A1, 5.47% 5/25/44 (d) | | 128,322 | | 128,302 |
Series 2007-RZ1 Class A2, 5.48% 2/25/37 (d) | | 1,200,000 | | 1,194,039 |
Residential Asset Securities Corp. Series 2004-KS10 Class AI2, 5.64% 3/25/29 (d) | | 1,118 | | 1,118 |
Salomon Brothers Mortgage Securities VII, Inc.
Series 2003-HE1 Class A, 5.72% 4/25/33 (d) | | 1,451 | | 1,435 |
Saxon Asset Securities Trust: | | | | |
Series 2004-1 Class M1, 6.115% 3/25/35 (d) | | 640,000 | | 631,197 |
Series 2004-2 Class MV1, 5.9% 8/25/35 (d) | | 327,280 | | 324,762 |
Series 2007-1 Class A2C, 5.47% 2/25/37 (d) | | 1,000,000 | | 984,375 |
Asset-Backed Securities - continued |
| Principal Amount | | Value |
Securitized Asset Backed Receivables LLC Trust: | | | | |
Series 2006-WM4 Class M1, 5.56% 11/25/36 (d) | | $ 890,000 | | $ 846,390 |
Series 2007-HE1 Class M1, 5.57% 12/25/36 (d) | | 955,000 | | 903,589 |
Series 2007-NC1 Class M1, 5.56% 12/25/36 (d) | | 2,035,000 | | 1,934,483 |
Series 2007-NC2 Class M1, 5.55% 1/25/37 (d) | | 385,000 | | 365,442 |
Sierra Timeshare Receivables Fund LLC Series 2006-1A Class A2, 5.47% 5/20/18 (a)(d) | | 2,213,840 | | 2,213,829 |
Sovereign Dealer Floor Plan Master LLC Series 2006-1: | | | | |
Class B, 5.5% 8/15/11 (a)(d) | | 1,140,000 | | 1,139,772 |
Class C, 5.7% 8/15/11 (a)(d) | | 520,000 | | 519,896 |
Specialty Underwriting & Residential Finance Trust: | | | | |
Series 2003-BC3 Class M1, 5.97% 8/25/34 (d) | | 1,000,000 | | 998,544 |
Series 2003-BC4 Class M1, 5.92% 11/25/34 (d) | | 260,000 | | 251,673 |
Structured Asset Corp. Trust Series 2006-BC6: | | | | |
Class A4, 5.49% 1/25/37 (d) | | 1,215,000 | | 1,188,698 |
Class M1, 5.59% 1/25/37 (d) | | 1,180,000 | | 1,116,230 |
Structured Asset Investment Loan Trust: | | | | |
Series 2003-BC9 Class M1, 6.02% 8/25/33 (d) | | 1,135,000 | | 1,128,890 |
Series 2004-8 Class M5, 6.47% 9/25/34 (d) | | 290,000 | | 278,867 |
Series 2005-1 Class M4, 6.08% 2/25/35 (a)(d) | | 485,000 | | 470,312 |
Structured Asset Securities Corp.: | | | | |
Series 2004-GEL1 Class A, 5.68% 2/25/34 (d) | | 25,222 | | 24,871 |
Series 2007-BC1 Class M1, 5.55% 2/25/37 (d) | | 3,195,000 | | 3,071,293 |
Superior Wholesale Inventory Financing Trust: | | | | |
Series 2004-A10: | | | | |
Class A, 5.42% 9/15/11 (d) | | 2,735,000 | | 2,731,647 |
Class B, 5.6% 9/15/11 (d) | | 1,625,000 | | 1,627,627 |
Series 2007-AE1: | | | | |
Class A, 5.42% 1/15/12 (d) | | 400,000 | | 399,889 |
Class B, 5.62% 1/15/12 (d) | | 335,000 | | 334,907 |
Class C, 5.92% 1/15/12 (d) | | 420,000 | | 419,996 |
Superior Wholesale Inventory Financing Trust VII
Series 2003-A8 Class CTFS, 5.77% 3/15/11 (a)(d) | | 675,000 | | 678,077 |
Superior Wholesale Inventory Financing Trust XII
Series 2005-A12 Class C, 6.52% 6/15/10 (d) | | 980,000 | | 987,813 |
Swift Master Auto Receivables Trust Series 2007-1: | | | | |
Class A, 5.42% 6/15/12 (d) | | 1,015,000 | | 1,015,000 |
Class B, 5.54% 6/15/12 (d) | | 790,000 | | 790,000 |
Class C, 5.82% 6/15/12 (d) | | 470,000 | | 470,000 |
Terwin Mortgage Trust: | | | | |
Series 2003-4HE Class A1, 5.75% 9/25/34 (d) | | 21,802 | | 21,564 |
Series 2003-6HE Class A1, 5.79% 11/25/33 (d) | | 17,086 | | 17,145 |
Series 2005-14HE Class AF1, 5.46% 8/25/36 (d) | | 90,678 | | 90,678 |
Asset-Backed Securities - continued |
| Principal Amount | | Value |
Triad Auto Receivables Owner Trust Series 2006-B
Class A2, 5.36% 11/12/09 | | $ 643,062 | | $ 642,957 |
Turquoise Card Backed Securities PLC Series 2006-1A Class C, 5.65% 5/16/11 (a)(d) | | 2,165,000 | | 2,160,518 |
UPFC Auto Receivables Trust: | | | | |
Series 2006-A Class A2, 5.46% 6/15/09 | | 278,277 | | 278,321 |
Series 2007-A Class A2, 5.46% 6/15/10 | | 1,245,000 | | 1,247,110 |
Wachovia Auto Loan Owner Trust Series 2006-1
Class A2, 5.28% 4/20/10 (a) | | 1,743,721 | | 1,743,405 |
WaMu Master Note Trust: | | | | |
Series 2006-A3A Class A3, 5.35% 9/16/13 (a)(d) | | 3,025,000 | | 3,024,364 |
Series 2007-C1 Class C1, 5.72% 5/15/14 (a)(d) | | 1,595,000 | | 1,594,984 |
WFS Financial Owner Trust: | | | | |
Series 2004-3 Class D, 4.07% 2/17/12 | | 165,867 | | 165,048 |
Series 2004-4 Class D, 3.58% 5/17/12 | | 154,808 | | 153,664 |
Series 2005-1 Class D, 4.09% 8/15/12 | | 165,032 | | 163,758 |
Whinstone Capital Management Ltd. Series 1A Class B3, 6.255% 10/25/44 (a)(d) | | 1,696,801 | | 1,696,801 |
TOTAL ASSET-BACKED SECURITIES (Cost $303,720,753) | 294,087,412 |
Collateralized Mortgage Obligations - 15.4% |
|
Private Sponsor - 12.4% |
ACE Securities Corp. Home Equity Loan Trust floater Series 2007-WM1: | | | | |
Class A2C, 5.49% 11/25/36 (d) | | 1,000,000 | | 943,438 |
Class M1, 5.57% 11/25/36 (d) | | 530,000 | | 501,913 |
American Home Mortgage Assets Trust floater Series 2006-1 Class 2A1, 5.51% 5/25/46 (d) | | 977,142 | | 977,766 |
Arkle Master Issuer PLC floater Series 2007-1A
Class 1C, 5.62% 2/17/52 (a)(d) | | 1,625,000 | | 1,625,000 |
Banc of America Mortgage Securities, Inc. Series 2003-I Class 2A6, 4.1485% 10/25/33 (d) | | 4,245,000 | | 4,262,385 |
Bear Stearns Adjustable Rate Mortgage Trust floater Series 2005-6 Class 1A1, 5.0828% 8/25/35 (d) | | 1,509,004 | | 1,510,420 |
Bear Stearns Alt-A Trust floater: | | | | |
Series 2005-1 Class A1, 5.6% 1/25/35 (d) | | 1,134,983 | | 1,137,045 |
Series 2005-2 Class 1A1, 5.57% 3/25/35 (d) | | 589,020 | | 589,618 |
Collateralized Mortgage Obligations - continued |
| Principal Amount | | Value |
Private Sponsor - continued |
Citigroup Mortgage Loan Trust, Inc.: | | | | |
floater Series 2006-NC1: | | | | |
Class M4, 5.71% 8/25/36 (d) | | $ 1,205,000 | | 1,027,142 |
Class M5, 5.74% 8/25/36 (d) | | 860,000 | | 701,048 |
Series 2004-UST1 Class A3, 4.228% 8/25/34 (d) | | 2,269,042 | | 2,241,000 |
Credit Suisse First Boston Adjustable Rate Mortgage Trust floater: | | | | |
Series 2004-2 Class 7A3, 5.72% 2/25/35 (d) | | 292,760 | | 294,060 |
Series 2004-4 Class 5A2, 5.72% 3/25/35 (d) | | 79,492 | | 79,774 |
Series 2005-1 Class 5A2, 5.65% 5/25/35 (d) | | 183,523 | | 184,187 |
Series 2005-10 Class 5A2, 5.64% 1/25/36 (d) | | 997,528 | | 999,153 |
Series 2005-2: | | | | |
Class 6A2, 5.6% 6/25/35 (d) | | 66,012 | | 66,077 |
Class 6M2, 5.8% 6/25/35 (d) | | 1,375,000 | | 1,376,813 |
Series 2005-3 Class 8A2, 5.56% 7/25/35 (d) | | 745,192 | | 746,745 |
Series 2005-5 Class 6A2, 5.55% 9/25/35 (d) | | 615,233 | | 616,920 |
Series 2005-8 Class 7A2, 5.6% 11/25/35 (d) | | 460,426 | | 461,861 |
Credit Suisse First Boston Mortgage Securities Corp. floater: | | | | |
Series 2004-AR2 Class 6A1, 5.72% 3/25/34 (d) | | 22,081 | | 22,098 |
Series 2004-AR3 Class 6A2, 5.69% 4/25/34 (d) | | 8,817 | | 8,820 |
Series 2004-AR5 Class 11A2, 5.69% 6/25/34 (d) | | 37,397 | | 37,410 |
Series 2004-AR6 Class 9A2, 5.69% 10/25/34 (d) | | 54,114 | | 54,141 |
Series 2004-AR7 Class 6A2, 5.7% 8/25/34 (d) | | 77,944 | | 78,060 |
Series 2004-AR8 Class 8A2, 5.7% 9/25/34 (d) | | 41,239 | | 41,323 |
CWALT, Inc. floater Series 2005-56 Class 3A1, 5.61% 11/25/35 (d) | | 360,336 | | 361,367 |
Deutsche Alt-A Securities Mortgage Loan Trust floater Series 2007-BAR1 Class A3, 5.48% 3/25/37 (d) | | 1,375,000 | | 1,374,907 |
First Franklin Mortgage Loan Trust floater Series 2006-FF13: | | | | |
Class M7, 6.07% 10/25/36 (d) | | 1,205,000 | | 781,161 |
Class M8, 6.27% 10/25/36 (d) | | 525,000 | | 236,250 |
First Horizon Mortgage pass-thru Trust floater Series 2004-FL1 Class 2A1, 5.67% 12/25/34 (d) | | 71,259 | | 71,235 |
Gracechurch Mortgage Funding PLC floater Series 1A: | | | | |
Class A2B, 5.42% 10/11/41 (a)(d) | | 2,060,293 | | 2,060,231 |
Class CB, 5.63% 10/11/41 (a)(d) | | 260,000 | | 259,992 |
Class DB, 5.82% 10/11/41 (a)(d) | | 1,060,000 | | 1,059,968 |
Collateralized Mortgage Obligations - continued |
| Principal Amount | | Value |
Private Sponsor - continued |
Granite Master Issuer PLC floater: | | | | |
Series 2005-1 Class A3, 5.44% 12/21/24 (d) | | $ 350,000 | | $ 350,056 |
Series 2005-2 Class C1, 5.86% 12/20/54 (d) | | 3,110,000 | | 3,104,169 |
Series 2005-4: | | | | |
Class A3, 5.43% 12/20/54 (d) | | 2,230,000 | | 2,230,290 |
Class C1, 5.79% 12/20/54 (d) | | 5,580,616 | | 5,580,616 |
Class M2, 5.64% 12/20/54 (d) | | 1,830,000 | | 1,830,997 |
Series 2006-1A: | | | | |
Class A5, 5.43% 12/20/54 (a)(d) | | 1,000,000 | | 1,000,313 |
Class C2, 5.96% 12/20/54 (a)(d) | | 1,545,000 | | 1,544,954 |
Series 2006-3 Class C2, 5.86% 12/20/54 (d) | | 1,230,000 | | 1,230,000 |
Series 2006-4: | | | | |
Class B1, 5.45% 12/20/54 (d) | | 1,250,000 | | 1,249,938 |
Class C1, 5.74% 12/20/54 (d) | | 765,000 | | 764,962 |
Class M1, 5.53% 12/20/54 (d) | | 330,000 | | 329,984 |
Series 2007-1: | | | | |
Class 1C1, 5.66% 12/20/54 (d) | | 555,000 | | 555,195 |
Class 1M1, 5.51% 12/20/54 (d) | | 500,000 | | 499,785 |
Class 2B1, 5.48% 12/20/54 (d) | | 535,000 | | 535,000 |
Class 2C1, 5.79% 12/20/54 (d) | | 295,000 | | 294,124 |
Class 2M1, 5.61% 12/20/54 (d) | | 645,000 | | 643,060 |
GSR Mortgage Loan Trust: | | | | |
floater Series 2004-11 Class 2A1, 5.65% 12/20/34 (d) | | 661,761 | | 664,229 |
Series 2006-AR2 Class 4A1, 5.8544% 4/25/36 (d) | | 3,176,771 | | 3,182,351 |
Holmes Financing No. 10 PLC floater Series 10A: | | | | |
Class 2A, 5.39% 7/15/40 (a)(d) | | 1,040,000 | | 1,040,284 |
Class 2C, 5.71% 7/15/40 (a)(d) | | 975,000 | | 974,971 |
Holmes Financing No. 9 PLC floater Class 2A, 5.42% 7/15/13 (d) | | 2,780,000 | | 2,780,612 |
Homestar Mortgage Acceptance Corp. floater
Series 2004-5 Class A1, 5.77% 10/25/34 (d) | | 376,180 | | 377,903 |
HSI Asset Securitization Corp. Trust floater
Series 2007-OPT1 Class M1, 5.55% 12/25/36 (d) | | 670,000 | | 636,655 |
Impac CMB Trust floater: | | | | |
Series 2004-11 Class 2A2, 5.69% 3/25/35 (d) | | 302,025 | | 302,318 |
Series 2004-6 Class 1A2, 5.71% 10/25/34 (d) | | 91,912 | | 91,946 |
Series 2005-1: | | | | |
Class M1, 5.78% 4/25/35 (d) | | 156,285 | | 156,368 |
Class M2, 5.82% 4/25/35 (d) | | 276,378 | | 276,451 |
Class M3, 5.85% 4/25/35 (d) | | 67,449 | | 67,425 |
Collateralized Mortgage Obligations - continued |
| Principal Amount | | Value |
Private Sponsor - continued |
Impac CMB Trust floater: - continued | | | | |
Series 2005-1: | | | | |
Class M4, 6.07% 4/25/35 (d) | | $ 41,128 | | $ 32,080 |
Class M5, 6.09% 4/25/35 (d) | | 41,128 | | 30,846 |
Class M6, 6.14% 4/25/35 (d) | | 64,159 | | 45,232 |
Series 2005-2 Class 1A2, 5.63% 4/25/35 (d) | | 675,603 | | 676,186 |
Series 2005-4 Class 1B1, 6.62% 5/25/35 (d) | | 278,394 | | 267,867 |
Series 2005-7: | | | | |
Class M1, 5.8% 11/25/35 (d) | | 152,297 | | 149,944 |
Class M2, 5.84% 11/25/35 (d) | | 114,222 | | 113,849 |
Class M3, 5.94% 11/25/35 (d) | | 571,112 | | 445,468 |
Class M4, 5.98% 11/25/35 (d) | | 272,865 | | 204,649 |
JPMorgan Mortgage Trust Series 2006-A2 Class 5A1, 3.7544% 11/25/33 (d) | | 3,081,435 | | 3,059,600 |
Kildare Securities Ltd. floater Series 2007-1 Class A2, 5.42% 12/10/43 (a)(d) | | 865,000 | | 865,979 |
Lehman Structured Securities Corp. floater Series 2005-1 Class A2, 5.71% 9/26/45 (a)(d) | | 564,894 | | 567,252 |
Lehman XS Trust floater: | | | | |
Series 2006-12N Class A1A1, 5.4% 8/25/46 (d) | | 1,347,069 | | 1,347,281 |
Series 2006-GP1 Class A1, 5.41% 5/25/46 (d) | | 1,004,198 | | 1,003,868 |
MASTR Adjustable Rate Mortgages Trust floater: | | | | |
Series 2004-11: | | | | |
Class 1A4, 5.81% 11/25/34 (d) | | 40,960 | | 41,268 |
Class 2A1, 5.7% 11/25/34 (d) | | 81,477 | | 81,726 |
Class 2A2, 5.76% 11/25/34 (d) | | 17,937 | | 18,005 |
Series 2005-1 Class 1A1, 5.59% 3/25/35 (d) | | 107,784 | | 107,994 |
MASTR Seasoned Securitization Trust Series 2004-1 Class 1A1, 6.2347% 8/25/17 (d) | | 407,329 | | 411,646 |
Merrill Lynch Mortgage Investors Trust floater
Series 2006-MLN1 Class M4, 5.68% 7/25/37 (d) | | 1,015,000 | | 848,168 |
Merrill Lynch Mortgage Investors, Inc.: | | | | |
floater: | | | | |
Series 2003-A: | | | | |
Class 2A1, 5.71% 3/25/28 (d) | | 84,711 | | 84,806 |
Class 2A2, 5.7981% 3/25/28 (d) | | 30,254 | | 30,223 |
Series 2003-B Class A1, 5.66% 4/25/28 (d) | | 87,875 | | 87,295 |
Series 2003-D Class A, 5.63% 8/25/28 (d) | | 405,555 | | 405,711 |
Series 2003-E Class A2, 5.7181% 10/25/28 (d) | | 161,077 | | 161,340 |
Series 2003-F Class A2, 5.6538% 10/25/28 (d) | | 158,952 | | 159,370 |
Collateralized Mortgage Obligations - continued |
| Principal Amount | | Value |
Private Sponsor - continued |
Merrill Lynch Mortgage Investors, Inc.: - continued | | | | |
floater: | | | | |
Series 2004-A Class A2, 5.5638% 4/25/29 (d) | | $ 222,820 | | $ 222,707 |
Series 2004-B Class A2, 5.65% 6/25/29 (d) | | 202,304 | | 202,383 |
Series 2004-C Class A2, 5.68% 7/25/29 (d) | | 254,631 | | 254,934 |
Series 2004-D Class A2, 5.6738% 9/25/29 (d) | | 277,953 | | 278,129 |
Series 2004-E Class A2D, 5.8638% 11/25/29 (d) | | 299,520 | | 300,987 |
Series 2004-G Class A2, 5.6934% 11/25/29 (d) | | 104,516 | | 104,557 |
Series 2005-A Class A2, 5.6381% 2/25/30 (d) | | 316,223 | | 316,843 |
Series 2005-B Class A2, 5.61% 7/25/30 (d) | | 277,842 | | 277,994 |
Series 2003-G Class XA1, 1% 1/25/29 (f) | | 976,747 | | 2,250 |
MortgageIT Trust floater Series 2004-2: | | | | |
Class A1, 5.69% 12/25/34 (d) | | 352,567 | | 353,992 |
Class A2, 5.77% 12/25/34 (d) | | 476,229 | | 479,056 |
Opteum Mortgage Acceptance Corp. floater: | | | | |
Series 2005-3 Class APT, 5.61% 7/25/35 (d) | | 1,343,846 | | 1,346,464 |
Series 2005-5 Class 1A1B, 5.52% 12/25/35 (d) | | 920,000 | | 919,922 |
Option One Mortgage Loan Trust floater Series 2007-CP1 Class M1, 5.62% 3/25/37 (d) | | 980,000 | | 936,629 |
Permanent Financing No. 3 PLC floater Series 2006-3 Class 3A, 5.54% 9/10/33 (d) | | 2,495,000 | | 2,498,371 |
Permanent Financing No. 5 PLC floater: | | | | |
Series 2: | | | | |
Class A, 5.47% 6/10/11 (d) | | 1,250,000 | | 1,250,013 |
Class C, 6.01% 6/10/42 (d) | | 390,000 | | 389,756 |
Series 3 Class C, 6.16% 6/10/42 (d) | | 1,030,000 | | 1,030,000 |
Permanent Financing No. 6 PLC floater Series 6
Class 2C, 5.81% 6/10/42 (d) | | 1,600,000 | | 1,600,480 |
Permanent Financing No. 7 PLC floater Series 7
Class 2C, 5.69% 6/10/42 (d) | | 1,685,000 | | 1,684,142 |
Permanent Financing No. 8 PLC floater: | | | | |
Series 8: | | | | |
Class 2A, 5.43% 6/10/14 (d) | | 2,945,000 | | 2,945,669 |
Class 2C, 5.76% 6/10/42 (d) | | 2,350,000 | | 2,348,383 |
Class 3C, 5.88% 6/10/42 (d) | | 910,000 | | 910,451 |
Permanent Master Issuer PLC floater: | | | | |
Series 2006-1 Class 2C, 5.76% 7/17/42 (d) | | 2,645,000 | | 2,643,863 |
Series 2007-1 Class 4A, 5.44% 10/15/33 (d) | | 3,450,000 | | 3,449,897 |
Residential Accredit Loans, Inc. floater Series 2006-QO7 Class 3A1, 5.42% 9/25/46 (d) | | 2,127,992 | | 2,125,997 |
Collateralized Mortgage Obligations - continued |
| Principal Amount | | Value |
Private Sponsor - continued |
Residential Asset Mortgage Products, Inc.: | | | | |
sequential payer: | | | | |
Series 2003-SL1 Class A31, 7.125% 4/25/31 | | $ 157,003 | | $ 158,348 |
Series 2004-SL2 Class A1, 6.5% 10/25/16 | | 53,437 | | 54,049 |
Series 2005-AR5 Class 1A1, 4.81% 9/19/35 (d) | | 416,572 | | 421,631 |
Residential Funding Securities Corp. floater
Series 2003-RP2 Class A1, 5.77% 6/25/33 (a)(d) | | 76,837 | | 76,224 |
Sequoia Mortgage Funding Trust Series 2003-A
Class AX1, 0.8% 10/21/08 (a)(f) | | 924,634 | | 1,137 |
Sequoia Mortgage Trust floater: | | | | |
Series 2003-5 Class A2, 5.72% 9/20/33 (d) | | 154,284 | | 154,281 |
Series 2004-1 Class A, 5.6906% 2/20/34 (d) | | 104,194 | | 104,192 |
Series 2004-10 Class A4, 5.7006% 11/20/34 (d) | | 296,941 | | 297,624 |
Series 2004-12 Class 1A2, 5.69% 1/20/35 (d) | | 506,415 | | 507,610 |
Series 2004-4 Class A, 5.6206% 5/20/34 (d) | | 330,288 | | 330,273 |
Series 2004-5 Class A3, 5.6409% 6/20/34 (d) | | 132,319 | | 132,332 |
Series 2004-6: | | | | |
Class A3A, 5.6975% 6/20/35 (d) | | 143,696 | | 143,818 |
Class A3B, 5.84% 7/20/34 (d) | | 287,393 | | 287,501 |
Series 2004-7: | | | | |
Class A3A, 5.71% 8/20/34 (d) | | 179,635 | | 179,897 |
Class A3B, 5.935% 7/20/34 (d) | | 348,806 | | 349,626 |
Series 2004-8 Class A2, 5.755% 9/20/34 (d) | | 539,834 | | 541,239 |
Series 2005-1 Class A2, 5.6406% 2/20/35 (d) | | 286,115 | | 286,671 |
Series 2005-2 Class A2, 5.6406% 3/20/35 (d) | | 477,252 | | 477,944 |
Soundview Home Equity Loan Trust floater Series 2006-EQ1: | | | |
Class M2, 5.64% 9/25/36 (d) | | 640,000 | | 603,967 |
Class M4, 5.69% 9/25/36 (d) | | 960,000 | | 833,844 |
Class M7, 6.12% 9/25/36 (d) | | 330,000 | | 213,433 |
Structured Asset Securities Corp. floater: | | | | |
Series 2004-NP1 Class A, 5.72% 9/25/33 (a)(d) | | 81,699 | | 81,540 |
Series 2005-AR1 Class B1, 7.32% 9/25/35 (a)(d) | | 1,155,000 | | 323,400 |
Series 2007-GEL1 Class A2, 5.51% 1/25/37 (a)(d) | | 1,000,000 | | 960,313 |
TBW Mortgage-Backed pass-thru certificates floater Series 2006-4 Class A3, 5.34% 9/25/36 (d) | | 2,255,000 | | 2,252,634 |
Thornburg Mortgage Securities Trust floater: | | | | |
Series 2004-3 Class A, 5.69% 9/25/34 (d) | | 1,323,390 | | 1,324,477 |
Series 2005-3 Class A4, 5.59% 10/25/35 (d) | | 2,004,718 | | 2,002,847 |
WaMu Mortgage pass-thru certificates: | | | | |
floater Series 2006-AR11 Class C1B1, 5.4% 9/25/46 (d) | | 1,053,008 | | 1,053,539 |
sequential payer Series 2002-S6 Class A25, 6% 10/25/32 | | 90,725 | | 90,405 |
Collateralized Mortgage Obligations - continued |
| Principal Amount | | Value |
Private Sponsor - continued |
WaMu Mortgage pass-thru certificates: - continued | | | | |
Series 2003-AR10 Class A7, 4.0583% 10/25/33 (d) | | $ 690,000 | | $ 695,355 |
Series 2007-HY1 Class 4A1, 5.4807% 2/25/37 (d) | | 1,686,102 | | 1,682,269 |
WaMu Mortgage Securities Corp. sequential payer Series 2003-MS9 Class 2A1, 7.5% 12/25/33 | | 46,276 | | 47,505 |
Wells Fargo Mortgage Backed Securities Trust: | | | | |
sequential payer Series 2006-AR10 Class 5A5, 5.599% 7/25/36 (d) | | 1,930,000 | | 1,940,347 |
Series 2004-M Class A3, 4.6649% 8/25/34 (d) | | 138,021 | | 137,478 |
Series 2005-AR10 Class 2A2, 4.1098%
6/25/35 (d) | | 4,028,993 | | 3,995,863 |
Series 2005-AR12 Class 2A1, 4.319%
7/25/35 (d) | | 1,754,453 | | 1,741,846 |
TOTAL PRIVATE SPONSOR | | 123,691,265 |
U.S. Government Agency - 3.0% |
Fannie Mae: | | | | |
floater Series 2002-89 Class F, 5.62% 1/25/33 (d) | | 81,642 | | 82,103 |
planned amortization class: | | | | |
Series 1993-207 Class G, 6.15% 4/25/23 | | 230,283 | | 229,894 |
Series 2003-24 Class PB, 4.5% 12/25/12 | | 504,999 | | 502,723 |
Fannie Mae subordinate REMIC pass-thru
certificates: | | | | |
floater: | | | | |
Series 2001-38 Class QF, 6.3% 8/25/31 (d) | | 724,506 | | 741,892 |
Series 2002-11 Class QF, 5.82% 3/25/32 (d) | | 112,190 | | 113,463 |
Series 2002-36 Class FT, 5.82% 6/25/32 (d) | | 112,420 | | 113,330 |
Series 2002-49 Class FB, 5.92% 11/18/31 (d) | | 1,186,700 | | 1,206,919 |
Series 2002-60 Class FV, 6.32% 4/25/32 (d) | | 260,037 | | 267,713 |
Series 2002-64 Class FE, 5.67% 10/18/32 (d) | | 53,548 | | 53,850 |
Series 2002-68 Class FH, 5.82% 10/18/32 (d) | | 2,229,504 | | 2,256,736 |
Series 2002-74 Class FV, 5.77% 11/25/32 (d) | | 72,310 | | 72,842 |
Series 2002-75 Class FA, 6.32% 11/25/32 (d) | | 532,684 | | 548,407 |
Series 2003-11: | | | | |
Class DF, 5.77% 2/25/33 (d) | | 54,285 | | 54,687 |
Class EF, 5.77% 2/25/33 (d) | | 26,066 | | 26,263 |
Series 2003-122 Class FL, 5.67% 7/25/29 (d) | | 412,273 | | 413,888 |
Series 2004-33 Class FW, 5.72% 8/25/25 (d) | | 683,138 | | 687,732 |
Series 2004-54 Class FE, 6.47% 2/25/33 (d) | | 508,219 | | 509,714 |
Series 2005-72 Class FG, 5.57% 5/25/35 (d) | | 5,870,871 | | 5,862,766 |
Collateralized Mortgage Obligations - continued |
| Principal Amount | | Value |
U.S. Government Agency - continued |
Fannie Mae subordinate REMIC pass-thru
certificates: - continued | | | | |
planned amortization class Series 2002-52 Class PA, 6% 4/25/31 | | $ 2,847 | | $ 2,843 |
Series 2002-50 Class LE, 7% 12/25/29 | | 486 | | 484 |
Freddie Mac planned amortization class Series 2162 Class PH, 6% 6/15/29 | | 1,162,628 | | 1,171,659 |
Freddie Mac Multi-class participation certificates guaranteed: | | | | |
floater: | | | | |
Series 2389 Class DA, 6.22% 11/15/30 (d) | | 760,170 | | 762,291 |
Series 2406: | | | | |
Class FP, 6.3% 1/15/32 (d) | | 1,790,439 | | 1,834,606 |
Class PF, 6.3% 12/15/31 (d) | | 1,727,481 | | 1,770,013 |
Series 2410 Class PF, 6.3% 2/15/32 (d) | | 2,570,011 | | 2,633,375 |
Series 2448 Class FT, 6.32% 3/15/32 (d) | | 1,166,063 | | 1,195,487 |
Series 2526 Class FC, 5.72% 11/15/32 (d) | | 14,291 | | 14,387 |
Series 2538 Class FB, 5.72% 12/15/32 (d) | | 142,341 | | 143,578 |
Series 2551 Class FH, 5.77% 1/15/33 (d) | | 50,613 | | 50,995 |
Series 2553 Class FB, 5.82% 3/15/29 (d) | | 2,173,163 | | 2,185,954 |
Series 2577 Class FW, 5.82% 1/15/30 (d) | | 1,487,209 | | 1,496,953 |
Series 2650 Class FV, 5.72% 12/15/32 (d) | | 1,481,099 | | 1,490,950 |
Series 2861 Class JF, 5.62% 4/15/17 (d) | | 651,895 | | 655,198 |
Series 2994 Class FB, 5.47% 6/15/20 (d) | | 520,690 | | 520,909 |
Series 3066 Class HF, 0% 1/15/34 (d) | | 45,825 | | 51,239 |
planned amortization class: | | | | |
Series 2543 Class PM, 5.5% 8/15/18 | | 229,694 | | 229,750 |
Series 2676 Class KN, 3% 12/15/13 | | 151,708 | | 151,119 |
Series 2776 Class UJ, 4.5% 5/15/20 (f) | | 96,151 | | 808 |
Series 1803 Class A, 6% 12/15/08 | | 156,865 | | 157,053 |
Ginnie Mae guaranteed REMIC pass-thru securities: | | | | |
floater Series 2001-21 Class FB, 5.72% 1/16/27 (d) | | 84,420 | | 84,951 |
planned amortization class Series 2002-5 Class PD, 6.5% 5/16/31 | | 109,122 | | 109,605 |
TOTAL U.S. GOVERNMENT AGENCY | | 30,459,129 |
TOTAL COLLATERALIZED MORTGAGE OBLIGATIONS (Cost $156,702,501) | 154,150,394 |
Commercial Mortgage Securities - 7.3% |
| Principal Amount | | Value |
Banc of America Large Loan, Inc. floater: | | | | |
Series 2003-BBA2 Class K, 7.92% 11/15/15 (a)(d) | | $ 61,614 | | $ 62,009 |
Series 2005-BBA6 Class G, 5.74% 1/15/19 (a)(d) | | 87,320 | | 87,328 |
Series 2005-MIB1: | | | | |
Class B, 5.58% 3/15/22 (a)(d) | | 475,000 | | 475,152 |
Class C, 5.63% 3/15/22 (a)(d) | | 200,000 | | 200,069 |
Class D, 5.68% 3/15/22 (a)(d) | | 205,000 | | 205,107 |
Class E, 5.72% 3/15/22 (a)(d) | | 390,000 | | 389,570 |
Class F, 5.79% 3/15/22 (a)(d) | | 200,000 | | 199,905 |
Class G, 5.85% 3/15/22 (a)(d) | | 130,000 | | 129,857 |
Series 2006-BIX1: | | | | |
Class E, 5.56% 10/15/19 (a)(d) | | 170,000 | | 169,720 |
Class F, 5.63% 10/15/19 (a)(d) | | 325,000 | | 324,250 |
Class G, 5.65% 10/15/19 (a)(d) | | 125,000 | | 124,628 |
Class JCP, 5.82% 10/15/19 (a)(d) | | 10,882 | | 10,738 |
Bayview Commercial Asset Trust floater: | | | | |
Series 2003-2 Class A, 5.9% 12/25/33 (a)(d) | | 421,687 | | 421,828 |
Series 2004-1: | | | | |
Class A, 5.68% 4/25/34 (a)(d) | | 260,940 | | 261,103 |
Class B, 7.22% 4/25/34 (a)(d) | | 43,490 | | 43,599 |
Series 2004-2: | | | | |
Class A, 5.75% 8/25/34 (a)(d) | | 343,650 | | 344,241 |
Class M1, 5.9% 8/25/34 (a)(d) | | 110,075 | | 110,351 |
Series 2004-3: | | | | |
Class A1, 5.69% 1/25/35 (a)(d) | | 504,486 | | 505,274 |
Class A2, 5.74% 1/25/35 (a)(d) | | 59,351 | | 59,444 |
Class M1, 5.82% 1/25/35 (a)(d) | | 89,027 | | 89,236 |
Class M2, 6.32% 1/25/35 (a)(d) | | 59,351 | | 59,657 |
Series 2005-2A: | | | | |
Class A1, 5.63% 8/25/35 (a)(d) | | 788,641 | | 782,019 |
Class M1, 5.75% 8/25/35 (a)(d) | | 142,340 | | 141,225 |
Class M2, 5.8% 8/25/35 (a)(d) | | 238,516 | | 239,243 |
Class M3, 5.82% 8/25/35 (a)(d) | | 130,799 | | 128,852 |
Class M4, 5.93% 8/25/35 (a)(d) | | 119,258 | | 117,606 |
Series 2005-3A: | | | | |
Class A1, 5.64% 11/25/35 (a)(d) | | 669,570 | | 672,126 |
Class A2, 5.72% 11/25/35 (a)(d) | | 275,002 | | 275,964 |
Class M1, 5.76% 11/25/35 (a)(d) | | 95,653 | | 95,300 |
Class M2, 5.81% 11/25/35 (a)(d) | | 131,523 | | 130,931 |
Class M3, 5.83% 11/25/35 (a)(d) | | 119,566 | | 117,963 |
Class M4, 5.92% 11/25/35 (a)(d) | | 147,465 | | 144,403 |
Commercial Mortgage Securities - continued |
| Principal Amount | | Value |
Bayview Commercial Asset Trust floater: - continued | | | | |
Series 2005-4A: | | | | |
Class A2, 5.71% 1/25/36 (a)(d) | | $ 935,469 | | $ 937,807 |
Class B1, 6.72% 1/25/36 (a)(d) | | 85,043 | | 85,986 |
Class M1, 5.77% 1/25/36 (a)(d) | | 340,170 | | 341,393 |
Class M2, 5.79% 1/25/36 (a)(d) | | 85,043 | | 85,348 |
Class M3, 5.82% 1/25/36 (a)(d) | | 170,085 | | 170,696 |
Class M4, 5.93% 1/25/36 (a)(d) | | 85,043 | | 85,308 |
Class M5, 5.97% 1/25/36 (a)(d) | | 85,043 | | 85,109 |
Class M6, 6.02% 1/25/36 (a)(d) | | 85,043 | | 84,803 |
Series 2006-2A: | | | | |
Class A1, 5.55% 7/25/36 (a)(d) | | 1,540,397 | | 1,540,396 |
Class A2, 5.6% 7/25/36 (a)(d) | | 259,617 | | 259,814 |
Class B1, 6.19% 7/25/36 (a)(d) | | 95,193 | | 91,582 |
Class B3, 8.02% 7/25/36 (a)(d) | | 155,770 | | 142,694 |
Class M1, 5.63% 7/25/36 (a)(d) | | 272,598 | | 267,572 |
Class M2, 5.65% 7/25/36 (a)(d) | | 194,713 | | 195,068 |
Class M3, 5.67% 7/25/36 (a)(d) | | 151,443 | | 148,318 |
Class M4, 5.74% 7/25/36 (a)(d) | | 103,847 | | 100,454 |
Class M5, 5.79% 7/25/36 (a)(d) | | 125,482 | | 121,161 |
Class M6, 5.86% 7/25/36 (a)(d) | | 199,040 | | 184,328 |
Series 2006-3A: | | | | |
Class A1, 5.57% 10/25/36 (a)(d) | | 1,224,987 | | 1,224,987 |
Class B1, 6.12% 10/25/36 (a)(d) | | 144,941 | | 143,582 |
Class B2, 6.67% 10/25/36 (a)(d) | | 93,510 | | 92,648 |
Class B3, 7.92% 10/25/36 (a)(d) | | 168,319 | | 161,849 |
Class M4, 5.75% 10/25/36 (a)(d) | | 144,941 | | 144,443 |
Class M5, 5.8% 10/25/36 (a)(d) | | 182,345 | | 181,120 |
Class M6, 5.88% 10/25/36 (a)(d) | | 360,015 | | 355,909 |
Series 2007-1: | | | | |
Class A2, 5.59% 3/25/37 (a)(d) | | 339,787 | | 339,310 |
Class B1, 5.99% 3/25/37 (a)(d) | | 110,072 | | 108,421 |
Class B2, 6.47% 3/25/37 (a)(d) | | 76,572 | | 75,208 |
Class B3, 8.67% 3/25/37 (a)(d) | | 224,930 | | 219,025 |
Class M1, 5.59% 3/25/37 (a)(d) | | 90,929 | | 90,716 |
Class M2, 5.61% 3/25/37 (a)(d) | | 67,000 | | 66,843 |
Class M3, 5.64% 3/27/37 (a)(d) | | 62,215 | | 62,069 |
Class M4, 5.69% 3/25/37 (a)(d) | | 47,857 | | 47,566 |
Class M5, 5.74% 3/25/37 (a)(d) | | 76,572 | | 75,866 |
Class M6, 5.82% 3/25/37 (a)(d) | | 105,286 | | 103,839 |
Commercial Mortgage Securities - continued |
| Principal Amount | | Value |
Bayview Commercial Asset Trust floater: - continued | | | | |
Series 2007-3: | | | | |
Class B1, 6.27% 7/25/37 (a)(d) | | $ 73,707 | | $ 72,601 |
Class B2, 6.92% 7/25/37 (a)(d) | | 186,723 | | 183,922 |
Class B3, 9.32% 7/25/37 (a)(d) | | 98,275 | | 96,801 |
Class M1, 5.63% 7/25/37 (a)(d) | | 63,879 | | 63,520 |
Class M2, 5.66% 7/25/37 (a)(d) | | 68,793 | | 68,406 |
Class M3, 5.69% 7/25/37 (a)(d) | | 108,103 | | 107,360 |
Class M4, 5.82% 7/25/37 (a)(d) | | 171,982 | | 170,477 |
Class M5, 5.92% 7/25/37 (a)(d) | | 83,534 | | 82,699 |
Class M6, 6.12% 7/25/37 (a)(d) | | 63,879 | | 63,240 |
Bear Stearns Commercial Mortgage Securities Trust floater Series 2007-BBA8: | | | | |
Class D, 5.57% 3/15/22 (a)(d) | | 165,000 | | 165,000 |
Class E, 5.62% 3/15/22 (a)(d) | | 870,000 | | 870,000 |
Class F, 5.67% 5/15/22 (a)(d) | | 535,000 | | 535,000 |
Class G, 5.72% 3/15/22 (a)(d) | | 135,000 | | 135,000 |
Class H, 5.87% 3/15/22 (a)(d) | | 165,000 | | 165,000 |
Class J, 6.02% 3/15/22 (a)(d) | | 165,000 | | 165,000 |
Class MS-6, 6.22% 3/15/22 (a)(d) | | 335,000 | | 335,000 |
Class MS5, 5.97% 3/15/22 (a)(d) | | 600,000 | | 600,000 |
Class X-1M, 1.12% 3/15/22 (a)(f) | | 18,625,725 | | 174,616 |
COMM floater Series 2002-FL7: | | | | |
Class F, 6.62% 11/15/14 (a)(d) | | 1,000,000 | | 1,000,757 |
Class H, 7.57% 11/15/14 (a)(d) | | 150,000 | | 150,018 |
Commercial Mortgage pass-thru certificates floater: | | | | |
Series 2005-F10A: | | | | |
Class B, 5.55% 4/15/17 (a)(d) | | 1,005,000 | | 1,004,586 |
Class C, 5.59% 4/15/17 (a)(d) | | 425,000 | | 424,721 |
Class D, 5.63% 4/15/17 (a)(d) | | 345,000 | | 344,718 |
Class E, 5.69% 4/15/17 (a)(d) | | 260,000 | | 259,692 |
Class F, 5.73% 4/15/17 (a)(d) | | 145,000 | | 144,757 |
Class G, 5.87% 4/15/17 (a)(d) | | 145,000 | | 144,757 |
Class H, 5.94% 4/15/17 (a)(d) | | 145,000 | | 144,318 |
Class J, 6.17% 4/15/17 (a)(d) | | 50,000 | | 49,614 |
Series 2005-FL11: | | | | |
Class B, 5.57% 11/15/17 (a)(d) | | 286,269 | | 286,289 |
Class C, 5.62% 11/15/17 (a)(d) | | 572,538 | | 572,641 |
Class D, 5.66% 11/15/17 (a)(d) | | 99,240 | | 99,218 |
Class E, 5.71% 11/15/17 (a)(d) | | 152,677 | | 152,587 |
Class F, 5.77% 11/15/17 (a)(d) | | 137,409 | | 137,167 |
Class G, 5.82% 11/15/17 (a)(d) | | 217,565 | | 217,532 |
Commercial Mortgage Securities - continued |
| Principal Amount | | Value |
Commercial Mortgage pass-thru certificates floater: - continued | | | | |
Series 2006-CN2A Class AJFL, 5.58% 2/5/19 (d) | | $ 1,135,000 | | $ 1,137,194 |
Series 2007-FL14: | | | | |
Class F, 5.82% 6/15/22 (a)(d) | | 1,312,702 | | 1,311,061 |
Class G, 5.87% 6/15/22 (a)(d) | | 209,633 | | 209,371 |
Class H, 6.02% 6/15/22 (a)(d) | | 209,633 | | 209,371 |
Class MLK1, 6.12% 6/15/22 (a)(d) | | 565,000 | | 564,294 |
Class MLK2, 6.32% 6/15/22 (a)(d) | | 315,000 | | 314,606 |
Class MLK3, 6.52% 6/15/22 (a)(d) | | 380,000 | | 379,525 |
Credit Suisse First Boston Mortgage Capital
Certificates floater Series 2007-TF2A Class B, 5.67% 4/15/22 (d) | | 1,775,000 | | 1,772,227 |
Credit Suisse First Boston Mortgage Securities Corp. floater Series 2005-TF3A Class A2, 5.6% 11/15/20 (d) | | 2,606,767 | | 2,606,874 |
Credit Suisse Mortgage Capital Certificates floater: | | | | |
Series 200-TFL1 Class B, 5.47% 2/15/22 (a)(d) | | 685,000 | | 684,144 |
Series 2007-TFL1: | | | | |
Class C: | | | | |
5.49% 2/15/22 (a)(d) | | 740,000 | | 738,616 |
5.59% 2/15/22 (a)(d) | | 265,000 | | 264,173 |
Class F, 5.64% 2/15/22 (a)(d) | | 530,000 | | 528,013 |
Crown Castle Towers LLC/Crown Atlantic Holdings Sub LLC/Crown Communication, Inc. Series 2006-1A Class AFL, 5.49% 11/15/36 (a)(d) | | 540,000 | | 537,287 |
CSMC Commercial Mortgage Trust floater
Series 2006-TFLA: | | | | |
Class D, 5.6% 4/15/21 (a)(d) | | 300,000 | | 299,809 |
Class E, 5.65% 4/15/21 (a)(d) | | 300,000 | | 299,809 |
Class G, 5.74% 4/15/21 (a)(d) | | 300,000 | | 299,566 |
Class H, 6.05% 4/15/21 (a)(d) | | 300,000 | | 298,590 |
Class J, 6.12% 4/15/21 (a)(d) | | 200,000 | | 198,461 |
Class K, 6.52% 4/15/21 (a)(d) | | 1,005,000 | | 994,627 |
Greenwich Capital Commercial Funding Corp.
floater: | | | | |
Series 2005-FL3A: | | | | |
Class H-AON: | | | | |
6.32% 10/5/20 (a)(d) | | 180,000 | | 180,000 |
6.57% 10/5/20 (a)(d) | | 220,000 | | 220,000 |
Class M-AON, 6.82% 10/5/20 (a)(d) | | 215,000 | | 215,000 |
Class N-AON, 7.17% 10/5/20 (a)(d) | | 550,000 | | 550,000 |
Commercial Mortgage Securities - continued |
| Principal Amount | | Value |
Greenwich Capital Commercial Funding Corp.
floater: - continued | | | | |
Series 2006-FL4: | | | | |
Class A2, 5.46% 11/5/21 (a)(d) | | $ 1,815,000 | | $ 1,814,398 |
Class B, 5.51% 11/5/21 (a)(d) | | 670,000 | | 669,301 |
GS Mortgage Securities Corp. II floater: | | | | |
Series 2006-FL8A: | | | | |
Class C, 5.56% 6/6/20 (a)(d) | | 145,000 | | 144,988 |
Class D, 5.6% 6/6/20 (a)(d) | | 1,400,000 | | 1,398,037 |
Class E, 5.69% 6/6/20 (a)(d) | | 800,000 | | 797,719 |
Class F, 5.76% 6/6/20 (a)(d) | | 575,000 | | 562,908 |
Series 2007-EOP: | | | | |
Class C, 5.64% 3/1/20 (a)(d) | | 440,000 | | 437,250 |
Class D, 5.69% 3/1/20 (a)(d) | | 130,000 | | 129,188 |
Class E, 5.76% 3/1/20 (a)(d) | | 220,000 | | 218,625 |
Class F, 5.8% 3/1/20 (a)(d) | | 110,000 | | 109,313 |
Class G, 5.84% 3/1/20 (a)(d) | | 55,000 | | 54,656 |
Class H, 5.97% 3/1/20 (a)(d) | | 90,000 | | 89,100 |
Class J: | | | | |
6.17% 3/1/20 (a)(d) | | 130,000 | | 128,700 |
6.37% 3/1/20 (a)(d) | | 90,000 | | 89,100 |
Hilton Hotel Pool Trust floater Series 2000-HLTA
Class A2, 5.72% 10/3/15 (a)(d) | | 3,000,000 | | 3,010,580 |
JPMorgan Chase Commercial Securities Trust floater Series 2006-FLA2: | | | | |
Class A2, 5.45% 11/15/18 (a)(d) | | 1,535,000 | | 1,534,366 |
Class B, 5.49% 11/15/18 (a)(d) | | 414,371 | | 413,959 |
Class C, 5.53% 11/15/18 (a)(d) | | 294,319 | | 293,845 |
Class D, 5.55% 11/15/18 (a)(d) | | 104,561 | | 104,354 |
Class E, 5.6% 11/15/18 (a)(d) | | 154,905 | | 154,398 |
Class F, 5.65% 11/15/18 (a)(d) | | 232,357 | | 231,171 |
Class G, 5.68% 11/15/18 (a)(d) | | 201,376 | | 198,492 |
Class H, 5.82% 11/15/18 (a)(d) | | 154,905 | | 151,290 |
LB-UBS Commercial Mortgage Trust sequential payer Series 2003-C3 Class A2, 3.086% 5/15/27 | | 875,000 | | 859,226 |
Lehman Brothers Floating Rate Commercial Mortgage Trust floater: | | | | |
Series 2003-LLFA Class K1, 7.87% 12/16/14 (a)(d) | | 435,000 | | 425,876 |
Series 2006-LLFA: | | | | |
Class F, 5.66% 9/15/21 (a)(d) | | 291,191 | | 290,011 |
Class G, 5.68% 9/15/21 (a)(d) | | 648,135 | | 644,202 |
Merrill Lynch Mortgage Trust Series 2005-GGP1 Class X, 0.1416% 11/15/10 (a)(d)(f) | | 417,400,000 | | 121,422 |
Commercial Mortgage Securities - continued |
| Principal Amount | | Value |
ML-CFC Commercial Mortgage Trust floater
Series 2006-4 Class A2FL, 5.44% 12/12/49 (d) | | $ 1,180,000 | | $ 1,178,634 |
Morgan Stanley Capital I Trust: | | | | |
floater: | | | | |
Series 2007-XCLA Class A1, 5.52% 7/17/17 (a)(d) | | 1,319,592 | | 1,319,585 |
Series 2007-XLFA: | | | | |
Class A2, 5.42% 10/15/20 (a)(d) | | 1,225,000 | | 1,224,993 |
Class B, 5.45% 10/15/20 (a)(d) | | 440,000 | | 439,998 |
Class C, 5.48% 10/15/20 (a)(d) | | 330,000 | | 329,998 |
Class D, 5.51% 10/15/20 (a)(d) | | 265,000 | | 264,999 |
Class E, 5.57% 10/15/20 (a)(d) | | 330,000 | | 329,998 |
Class F, 5.62% 10/15/20 (a)(d) | | 195,000 | | 194,999 |
Class G, 5.66% 10/15/20 (a)(d) | | 245,000 | | 244,999 |
Class H, 5.75% 10/15/20 (a)(d) | | 155,000 | | 154,999 |
Class J, 6.32% 10/15/20 (a)(d) | | 175,000 | | 174,059 |
Class MHRO, 6.01% 10/15/20 (a)(d) | | 474,674 | | 474,671 |
Class MJPM, 6.32% 10/15/20 (a)(d) | | 167,951 | | 167,950 |
Class MSTR, 6.02% 10/15/20 (a)(d) | | 260,000 | | 259,998 |
Class NHRO, 6.21% 10/15/20 (a)(d) | | 730,268 | | 710,673 |
Class NSTR, 6.17% 10/15/20 (a)(d) | | 240,000 | | 234,240 |
Series 2007-XLC1: | | | | |
Class C, 5.92% 7/17/17 (a)(d) | | 1,092,247 | | 1,051,958 |
Class D, 6.02% 7/17/17 (a)(d) | | 513,998 | | 494,782 |
Class E, 6.12% 7/17/17 (a)(d) | | 415,153 | | 397,847 |
Morgan Stanley Capital I, Inc. floater: | | | | |
Series 2005-XLF: | | | | |
Class D, 5.58% 8/15/19 (a)(d) | | 149,863 | | 149,894 |
Class E, 5.6% 8/15/19 (a)(d) | | 245,000 | | 245,239 |
Class F, 5.64% 8/15/19 (a)(d) | | 170,000 | | 170,202 |
Class G, 5.69% 8/15/19 (a)(d) | | 120,000 | | 120,149 |
Class H, 5.71% 8/15/19 (a)(d) | | 100,000 | | 100,078 |
Class J, 5.78% 8/15/19 (a)(d) | | 75,000 | | 74,975 |
Class K, 5.97% 8/15/19 (a)(d) | | 420,000 | | 415,103 |
Series 2006-XLF: | | | | |
Class C, 6.52% 7/15/19 (a)(d) | | 570,000 | | 569,996 |
Class D, 5.57% 7/15/19 (a)(d) | | 1,345,000 | | 1,345,666 |
Class E, 5.61% 7/15/19 (a)(d) | | 1,450,000 | | 1,449,030 |
Class F, 5.64% 7/15/19 (a)(d) | | 535,000 | | 533,166 |
Class G, 5.68% 7/15/19 (a)(d) | | 385,000 | | 383,766 |
STRIPS III Ltd./STRIPS III Corp. floater Series 2004-1A Class A, 5.8% 3/24/18 (a)(d) | | 270,958 | | 271,297 |
Commercial Mortgage Securities - continued |
| Principal Amount | | Value |
Wachovia Bank Commercial Mortgage Trust floater: | | | | |
Series 2005-WL6A Class D, 5.75% 10/15/17 (a)(d) | | $ 295,951 | | $ 295,952 |
Series 2006-WL7A: | | | | |
Class F, 5.66% 8/11/18 (a)(d) | | 1,235,000 | | 1,231,707 |
Class G, 5.68% 8/11/18 (a)(d) | | 1,170,000 | | 1,166,044 |
Class J, 5.92% 8/11/18 (a)(d) | | 260,000 | | 253,883 |
TOTAL COMMERCIAL MORTGAGE SECURITIES (Cost $73,397,323) | 73,041,570 |
Foreign Government and Government Agency Obligations - 0.1% |
|
United Mexican States 4.83% 1/13/09 (d)
(Cost $1,320,222) | 1,313,000 | | 1,320,222 |
Commercial Paper - 0.2% |
|
Sprint Nextel Corp. 5.6066% 11/9/07 (d)
(Cost $2,000,000) | 2,000,000 | | 2,000,282 |
Fixed-Income Funds - 25.4% |
| Shares | | |
Fidelity Ultra-Short Central Fund (e)
(Cost $259,817,448) | 2,613,124 | | 255,014,810 |
Cash Equivalents - 3.1% |
| Maturity Amount | | |
Investments in repurchase agreements in a joint trading account at 5.3%, dated 7/31/07 due 8/1/07 (Collateralized by U.S. Government Obligations) #
(Cost $30,832,000) | $ 30,836,536 | | 30,832,000 |
TOTAL INVESTMENT PORTFOLIO - 100.5% (Cost $1,024,872,536) | | 1,006,916,596 |
NET OTHER ASSETS - (0.5)% | | (5,450,599) |
NET ASSETS - 100% | $ 1,001,465,997 |
Futures Contracts |
| Expiration Date | | Underlying
Face Amount
at Value | | Unrealized
Appreciation/
(Depreciation) |
Purchased |
Eurodollar Contracts |
113 Eurodollar 90 Day Index Contracts | Sept. 2007 | | $ 111,509,813 | | $ 38,290 |
113 Eurodollar 90 Day Index Contracts | Dec. 2007 | | 111,560,663 | | (102,616) |
113 Eurodollar 90 Day Index Contracts | March 2008 | | 111,604,450 | | (68,252) |
TOTAL EURODOLLAR CONTRACTS | | | | $ (132,578) |
Sold |
Eurodollar Contracts |
4 Eurodollar 90 Day Index Contracts | June 2008 | | 3,951,450 | | 4,609 |
3 Eurodollar 90 Day Index Contracts | Sept. 2008 | | 2,963,738 | | 3,151 |
2 Eurodollar 90 Day Index Contracts | Dec. 2008 | | 1,975,725 | | 1,417 |
1 Eurodollar 90 Day Index Contracts | March 2009 | | 987,750 | | 771 |
TOTAL EURODOLLAR CONTRACTS | | | | 9,948 |
| | | | $ (122,630) |
Swap Agreements |
| | | Notional Amount | | Value |
Credit Default Swaps |
Receive monthly notional amount multiplied by 3.86% and pay Morgan Stanley, Inc. upon credit event of Merrill Lynch Mortgage Investors Trust, Inc., par value of the notional amount of Merrill Lynch Mortgage Investors Trust, Inc. Series 2006 HE5,
Class B3, 7.32% 8/25/37 | Sept. 2037 | | $ 600,000 | | $ (366,220) |
Receive monthly notional amount multiplied by 3.3% and pay to Morgan Stanley, Inc. upon credit event of Ameriquest Mortgage Securities, Inc., par value of the notional amount of Ameriquest Mortgage Securities, Inc. Series 2004-R11 Class M9, 7.2253% 11/25/34 | Dec. 2034 | | 275,000 | | (70,814) |
Receive monthly notional amount multiplied by 2.7% and pay Lehman Brothers, Inc. upon credit event of Morgan Stanley ABS Capital I, Inc., par value of the notional amount of Morgan Stanley ABS Capital I, Inc. Series 2006 WMC1, Class B3, 7.5% 12/25/35 | Jan. 2036 | | 600,000 | | (265,230) |
Swap Agreements - continued |
| Expiration Date | | Notional Amount | | Value |
Credit Default Swaps - continued |
Receive monthly notional amount multiplied by 1.9% and pay Morgan Stanley, Inc., upon credit event of Morgan Stanley ABS Capital I, Inc., par value of the notional amount of Morgan Stanley ABS Capital I, Inc. Series 2006-HE3 Class B3, 7.2225% 4/25/36 | May 2036 | | $ 500,000 | | $ (404,714) |
Receive monthly notional amount multiplied by 2.39% and pay UBS upon credit event of Fremont Home Loan Trust, par value of the notional amount of Fremont Home Loan Trust Series 2004-1 Class M9, 7.73% 2/25/34 | March 2034 | | 183,497 | | (70,846) |
Receive monthly notional amount multiplied by 2.4% and pay Deutsche Bank upon credit event of Fremont Home Loan Trust, par value of the notional amount of Fremont Home Loan Trust Series 2004-A Class B3, 7.2288% 1/25/34 | Feb. 2034 | | 109,274 | | (87,178) |
Receive monthly notional amount multiplied by 2.7% and pay Morgan Stanley, Inc. upon credit event of Park Place Securities, Inc., par value of the notional amount of Park Place Securities, Inc. Series 2005-WHQ2 Class M9, 6.41% 5/25/35 | June 2035 | | 845,000 | | (360,061) |
Receive monthly notional amount multiplied by 2.79% and pay Merrill Lynch, Inc. upon credit event of New Century Home Equity Loan Trust, par value of the notional amount of New Century Home Equity Loan Trust Series 2004-4 Class M9, 7.0788% 2/25/35 | March 2035 | | 610,000 | | (106,671) |
Receive quarterly notional amount multiplied by .48% and pay Goldman Sachs upon credit event of TXU Energy Co. LLC, par value of the notional amount of TXU Energy Co. LLC 7% 3/15/13 | Sept. 2008 | | 1,840,000 | | (15,789) |
Receive quarterly notional amount multiplied by .55% and pay Deutsche Bank upon credit event of MBIA, Inc., par value of the notional amount of MBIA, Inc. 6.625% 10/1/28 | Sept. 2010 | | 900,000 | | (15,157) |
Receive quarterly notional amount multiplied by .58% and pay Deutsche Bank upon credit event of MBIA, Inc., par value of the notional amount of MBIA, Inc. 6.625% 10/1/28 | Sept. 2010 | | 200,000 | | (3,201) |
Swap Agreements - continued |
| Expiration Date | | Notional Amount | | Value |
Credit Default Swaps - continued |
Receive quarterly notional amount multiplied by .59% and pay Bank of America upon credit event of MBIA, Inc., par value of the notional amount of MBIA, Inc. 6.625% 10/1/28 | Sept. 2010 | | $ 200,000 | | $ (3,143) |
Receive quarterly notional amount multiplied by .76% and pay Merrill Lynch, Inc. upon credit event of MBIA, Inc., par value of the notional amount of MBIA, Inc. 6.625% 10/1/28 | Sept. 2010 | | 500,000 | | (7,857) |
Receive quarterly notional amount multiplied by .78% and pay Goldman Sachs upon credit event of TXU Energy Co. LLC, par value of the notional amount of TXU Energy Co. LLC 7% 3/15/13 | Dec. 2008 | | 1,750,000 | | (16,528) |
TOTAL CREDIT DEFAULT SWAPS | | 9,112,771 | | (1,793,409) |
Total Return Swaps |
Receive monthly notional amount multiplied by the nominal spread appreciation of the Lehman Brothers CMBS U.S. Aggregate Index adjusted by a modified duration factor plus 25 basis points and pay monthly notional amount multiplied by the nominal spread depreciation of the Lehman Brothers CMBS U.S. Aggregate Index adjusted by a modified duration factor with Lehman Brothers, Inc. | April 2008 | | 4,000,000 | | (43,127) |
Receive monthly notional amount multiplied by the nominal spread appreciation of the Lehman Brothers CMBS U.S. Aggregate Index adjusted by a modified duration factor plus 15 basis points and pay monthly notional amount multiplied by the nominal spread depreciation of the Lehman Brothers CMBS U.S. Aggregate Index adjusted by a modified duration factor with Lehman Brothers, Inc. | May 2008 | | 5,655,000 | | (61,442) |
Receive monthly notional amount multiplied by the nominal spread appreciation of the Lehman Brothers CMBS U.S. Aggregate Index adjusted by a modified duration factor and pay monthly notional amount multiplied by the nominal spread depreciation of the Lehman Brothers CMBS U.S. Aggregate Index adjusted by a modified duration factor with Lehman Brothers, Inc. | Dec. 2007 | | 4,450,000 | | (48,906) |
Swap Agreements - continued |
| Expiration Date | | Notional Amount | | Value |
Total Return Swaps - continued |
Receive monthly notional amount multiplied by the nominal spread appreciation of the Lehman Brothers CMBS AAA 8.5+ Index adjusted by a modified duration factor plus 25 basis points and pay monthly notional amount multiplied by the nominal spread depreciation of the Lehman Brothers CMBS AAA 8.5+ Index adjusted by a modified duration factor with Lehman Brothers, Inc. | March 2008 | | $ 10,000,000 | | $ (186,475) |
Receive monthly a return equal to Lehman Brothers U.S. ABS AA Floating Home Equities Index and pay monthly a floating rate based on 1-month LIBOR minus 10 basis points with Lehman Brothers, Inc. | Sept. 2007 | | 10,000,000 | | (461,861) |
Receive monthly a return equal to Lehman Brothers U.S. ABS AA Floating Home Equities Index and pay monthly a floating rate based on 1-month LIBOR minus 15 basis points with Lehman Brothers, Inc. | Oct. 2007 | | 10,000,000 | | (461,431) |
TOTAL TOTAL RETURN SWAPS | | 44,105,000 | | (1,263,242) |
| | $ 53,217,771 | | $ (3,056,651) |
Legend |
(a) Security exempt from registration under Rule 144A of the Securities Act of 1933. These securities may be resold in transactions exempt from registration, normally to qualified institutional buyers. At the end of the period, the value of these securities amounted to $149,965,833 or 15.0% of net assets. |
(b) Security or a portion of the security purchased on a delayed delivery or when-issued basis. |
(c) Security or a portion of the security was pledged to cover margin requirements for futures contracts. At the period end, the value of securities pledged amounted to $349,019. |
(d) The coupon rate shown on floating or adjustable rate securities represents the rate at period end. |
(e) Affiliated fund that is available only to investment companies and other accounts managed by Fidelity Investments. A complete schedule of portfolio holdings for each Fidelity Central Fund is filed with the SEC for the first and third quarters of each fiscal year on Form N-Q and is available upon request or at the SEC's web site at www.sec.gov. A holdings listing for the Fund, which presents direct holdings as well as the pro rata share of securities and other investments held indirectly through its investment in underlying non-money market Fidelity Central Funds, is available at fidelity.com and/or advisor.fidelity.com, as applicable. In addition, each Fidelity Central Fund's financial statements, which are not covered by the Fund's Report of Independent Registered Public Accounting Firm, are available on the SEC's web site, or upon request. |
(f) Security represents right to receive monthly interest payments on an underlying pool of mortgages or assets. Principal shown is the outstanding par amount of the pool held as of the end of the period. |
# Additional Information on each counterparty to the repurchase agreement is as follows: |
Repurchase Agreement / Counterparty | Value |
$30,832,000 due 8/01/07 at 5.30% |
ABN AMRO Bank N.V., New York Branch | $ 747,585 |
Banc of America Securities LLC | 6,653,351 |
Bank of America, NA | 1,877,404 |
Barclays Capital, Inc. | 3,443,405 |
Bear Stearns & Co., Inc. | 3,289,376 |
Countrywide Securities Corp. | 2,410,963 |
Ing Financial Markets Llc | 2,990,341 |
Societe Generale, New York Branch | 2,990,341 |
UBS Securities LLC | 5,233,097 |
WestLB AG | 1,196,137 |
| $ 30,832,000 |
Affiliated Central Funds |
Information regarding fiscal year to date income earned by the Fund from investments in Fidelity Central Funds is as follows: |
Fund | Income earned |
Fidelity Ultra-Short Central Fund | $ 14,678,690 |
|
Additional information regarding the Fund's fiscal year to date purchases and sales, including the ownership percentage, of the non Money Market Central Funds is as follows: |
Fund | Value, beginning of period | Purchases | Sales
Proceeds | Value, end of period | % ownership, end of period |
Fidelity Ultra-Short Central Fund | $ 237,764,502 | $ 50,000,041 | $ 27,465,319 | $ 255,014,810 | 1.7% |
Other Information |
Distribution of investments by country of issue, as a percentage of total net assets, is as follows: |
United States of America | 84.0% |
United Kingdom | 11.8% |
Cayman Islands | 1.4% |
Spain | 1.2% |
Others (individually less than 1%) | 1.6% |
| 100.0% |
Income Tax Information |
At July 31, 2007, the fund had a capital loss carryforward of approximately $2,436,121 of which $1,917,431 and $518,690 will expire on July 31, 2014 and 2015, respectively. |
See accompanying notes which are an integral part of the financial statements.
Annual Report
Financial Statements
Statement of Assets and Liabilities
| July 31, 2007 |
| | |
Assets | | |
Investment in securities, at value (including repurchase agreements of $30,832,000) -
See accompanying schedule: Unaffiliated issuers (cost $765,055,088) | $ 751,901,786 | |
Fidelity Central Funds (cost $259,817,448) | 255,014,810 | |
Total Investments (cost $1,024,872,536) | | $ 1,006,916,596 |
Cash | | 91 |
Receivable for investments sold | | 117,697 |
Receivable for swap agreements | | 7,894 |
Receivable for fund shares sold | | 1,247,297 |
Interest receivable | | 3,600,400 |
Distributions receivable from Fidelity Central Funds | | 1,333,888 |
Receivable for daily variation on futures contracts | | 3,750 |
Other receivables | | 24,679 |
Total assets | | 1,013,252,292 |
| | |
Liabilities | | |
Payable for investments purchased
Regular delivery | $ 3,102,401 | |
Delayed delivery | 460,000 | |
Payable for fund shares redeemed | 4,373,362 | |
Distributions payable | 396,327 | |
Swap agreements, at value | 3,056,651 | |
Accrued management fee | 276,854 | |
Distribution fees payable | 2,309 | |
Other affiliated payables | 118,391 | |
Total liabilities | | 11,786,295 |
| | |
Net Assets | | $ 1,001,465,997 |
Net Assets consist of: | | |
Paid in capital | | $ 1,025,316,779 |
Undistributed net investment income | | 539,837 |
Accumulated undistributed net realized gain (loss) on investments | | (3,255,398) |
Net unrealized appreciation (depreciation) on investments | | (21,135,221) |
Net Assets | | $ 1,001,465,997 |
See accompanying notes which are an integral part of the financial statements.
Annual Report
Statement of Assets and Liabilities - continued
| July 31, 2007 |
| | |
Calculation of Maximum Offering Price
Class A:
Net Asset Value and redemption price per share
($13,734,615 ÷ 1,399,083 shares) | | $ 9.82 |
| | |
Maximum offering price per share (100/98.50 of $9.82) | | $ 9.97 |
Class T:
Net Asset Value and redemption price per share ($4,817,531 ÷ 490,826 shares) | | $ 9.82 |
| | |
Maximum offering price per share (100/98.50 of $9.82) | | $ 9.97 |
Ultra-Short Bond:
Net Asset Value, offering price and redemption price per share ($974,601,626 ÷ 99,298,589 shares) | | $ 9.81 |
| | |
Institutional Class:
Net Asset Value, offering price and redemption price per share ($8,312,225 ÷ 847,021 shares) | | $ 9.81 |
See accompanying notes which are an integral part of the financial statements.
Annual Report
Financial Statements - continued
Statement of Operations
| Year ended July 31, 2007 |
| | |
Investment Income | | |
Interest | | $ 41,462,873 |
Income from Fidelity Central Funds | | 14,678,690 |
Total income | | 56,141,563 |
| | |
Expenses | | |
Management fee | $ 3,177,740 | |
Transfer agent fees | 1,011,190 | |
Distribution fees | 20,733 | |
Fund wide operations fee | 319,407 | |
Independent trustees' compensation | 3,214 | |
Miscellaneous | 1,798 | |
Total expenses before reductions | 4,534,082 | |
Expense reductions | (19,809) | 4,514,273 |
Net investment income | | 51,627,290 |
Realized and Unrealized Gain (Loss) Net realized gain (loss) on: | | |
Investment securities: | | |
Unaffiliated issuers | (290,068) | |
Fidelity Central Funds | (248,412) | |
Futures contracts | (703,239) | |
Swap agreements | 171,901 | |
Capital gain distributions from Fidelity Central Funds | 32,406 | |
Total net realized gain (loss) | | (1,037,412) |
Change in net unrealized appreciation (depreciation) on: Investment securities | (18,018,278) | |
Futures contracts | 491,969 | |
Swap agreements | (3,108,720) | |
Total change in net unrealized appreciation (depreciation) | | (20,635,029) |
Net gain (loss) | | (21,672,441) |
Net increase (decrease) in net assets resulting from operations | | $ 29,954,849 |
See accompanying notes which are an integral part of the financial statements.
Annual Report
Statement of Changes in Net Assets
| Year ended
July 31,
2007 | Year ended
July 31,
2006 |
Increase (Decrease) in Net Assets | | |
Operations | | |
Net investment income | $ 51,627,290 | $ 38,252,086 |
Net realized gain (loss) | (1,037,412) | (1,106,422) |
Change in net unrealized appreciation (depreciation) | (20,635,029) | 76,542 |
Net increase (decrease) in net assets resulting
from operations | 29,954,849 | 37,222,206 |
Distributions to shareholders from net investment income | (51,625,727) | (38,283,502) |
Share transactions - net increase (decrease) | 161,604,013 | (51,227,531) |
Redemption fees | 39,619 | 28,307 |
Total increase (decrease) in net assets | 139,972,754 | (52,260,520) |
| | |
Net Assets | | |
Beginning of period | 861,493,243 | 913,753,763 |
End of period (including undistributed net investment income of $539,837 and undistributed net investment income of $106,939, respectively) | $ 1,001,465,997 | $ 861,493,243 |
See accompanying notes which are an integral part of the financial statements.
Annual Report
Financial Highlights - Class A
Years ended July 31, | 2007 | 2006 | 2005 | 2004 H |
Selected Per-Share Data | | | | |
Net asset value, beginning of period | $ 10.02 | $ 10.03 | $ 10.05 | $ 10.04 |
Income from Investment Operations | | | | |
Net investment income E | .493 | .400 | .223 | .013 |
Net realized and unrealized gain (loss) | (.198) | (.009) | (.026) | .011 |
Total from investment operations | .295 | .391 | .197 | .024 |
Distributions from net investment income | (.495) | (.401) | (.214) | (.014) |
Distributions from net realized gain | - | - | (.003) | - |
Total distributions | (.495) | (.401) | (.217) | (.014) |
Redemption fees added to paid in capitalE, J | - | - | - | - |
Net asset value, end of period | $ 9.82 | $ 10.02 | $ 10.03 | $ 10.05 |
Total Return B, C, D | 2.97% | 3.97% | 1.98% | .24% |
Ratios to Average Net Assets, F, I | | | | |
Expenses before reductions | .66% | .70% | .78% | .85% A |
Expenses net of fee waivers, if any | .66% | .70% | .70% | .70% A |
Expenses net of all reductions | .66% | .70% | .70% | .70% A |
Net investment income | 4.96% | 4.00% | 2.23% | 1.11% A |
Supplemental Data | | | | |
Net assets, end of period (000 omitted) | $ 13,735 | $ 4,553 | $ 2,557 | $ 316 |
Portfolio turnover rate G | 29% | 39% | 33% | 53% |
A Annualized
B Total returns for periods of less than one year are not annualized.
C Total returns would have been lower had certain expenses not been reduced during the periods shown.
D Total returns do not include the effect of the sales charges.
E Calculated based on average shares outstanding during the period.
F Fees and expenses of the underlying Fidelity Central Funds are not included in the Fund's expense ratio. The Fund indirectly bears its proportionate share of the expenses of any underlying Fidelity Central Funds.
G Amount does not include the portfolio activity of any underlying Fidelity Central Funds.
H For the period June 16, 2004 (commencement of sale of shares) to July 31, 2004.
I Expense ratios reflect operating expenses of the class. Expenses before reductions do not reflect amounts reimbursed by the investment adviser or expense offset arrangements and do not represent the amount paid by the class during periods when reimbursements or reductions occur. Expense ratios before reductions for start-up periods may not be representative of longer-term operating periods. Expenses net of fee waivers reflect expenses after reimbursement by the investment adviser but prior to reductions from expense offset arrangements. Expenses net of all reductions represent the net expenses paid by the class.
J Amount represents less than $.001 per share.
See accompanying notes which are an integral part of the financial statements.
Annual Report
Financial Highlights - Class T
Years ended July 31, | 2007 | 2006 | 2005 | 2004 H |
Selected Per-Share Data | | | | |
Net asset value, beginning of period | $ 10.02 | $ 10.03 | $ 10.05 | $ 10.04 |
Income from Investment Operations | | | | |
Net investment income E | .491 | .404 | .222 | .013 |
Net realized and unrealized gain (loss) | (.199) | (.011) | (.025) | .010 |
Total from investment operations | .292 | .393 | .197 | .023 |
Distributions from net investment income | (.492) | (.403) | (.214) | (.013) |
Distributions from net realized gain | - | - | (.003) | - |
Total distributions | (.492) | (.403) | (.217) | (.013) |
Redemption fees added to paid in capital E, J | - | - | - | - |
Net asset value, end of period | $ 9.82 | $ 10.02 | $ 10.03 | $ 10.05 |
Total Return B, C, D | 2.95% | 4.00% | 1.98% | .23% |
Ratios to Average Net Assets F, I | | | | |
Expenses before reductions | .69% | .68% | .77% | .86% A |
Expenses net of fee waivers, if any | .69% | .68% | .70% | .70% A |
Expenses net of all reductions | .69% | .68% | .70% | .70% A |
Net investment income | 4.93% | 4.03% | 2.23% | 1.11% A |
Supplemental Data | | | | |
Net assets, end of period (000 omitted) | $ 4,818 | $ 4,624 | $ 4,044 | $ 356 |
Portfolio turnover rate G | 29% | 39% | 33% | 53% |
A Annualized
B Total returns for periods of less than one year are not annualized.
C Total returns would have been lower had certain expenses not been reduced during the periods shown.
D Total returns do not include the effect of the sales charges.
E Calculated based on average shares outstanding during the period.
F Fees and expenses of the underlying Fidelity Central Funds are not included in the Fund's expense ratio. The Fund indirectly bears its proportionate share of the expenses of any underlying Fidelity Central Funds.
G Amount does not include the portfolio activity of any underlying Fidelity Central Funds.
H For the period June 16, 2004 (commencement of sale of shares) to July 31, 2004.
I Expense ratios reflect operating expenses of the class. Expenses before reductions do not reflect amounts reimbursed by the investment adviser or expense offset arrangements and do not represent the amount paid by the class during periods when reimbursements or reductions occur. Expense ratios before reductions for start-up periods may not be representative of longer-term operating periods. Expenses net of fee waivers reflect expenses after reimbursement by the investment adviser but prior to reductions from expense offset arrangements. Expenses net of all reductions represent the net expenses paid by the class.
J Amount represents less than $.001 per share.
See accompanying notes which are an integral part of the financial statements.
Annual Report
Financial Highlights - Ultra-Short Bond
Years ended July 31, | 2007 | 2006 | 2005 | 2004 | 2003 G |
Selected Per-Share Data | | | | | |
Net asset value,
beginning of period | $ 10.02 | $ 10.03 | $ 10.05 | $ 10.02 | $ 10.00 |
Income from Investment Operations | | | | | |
Net investment income D | .516 | .427 | .241 | .122 | .137 |
Net realized and unrealized gain (loss) | (.210) | (.011) | (.026) | .029 | .052 |
Total from investment operations | .306 | .416 | .215 | .151 | .189 |
Distributions from net investment income | (.516) | (.426) | (.232) | (.122) | (.173) |
Distributions from net realized gain | - | - | (.003) | - | - |
Total distributions | (.516) | (.426) | (.235) | (.122) | (.173) |
Redemption fees added to paid in capital D | - I | - I | - I | .001 | .004 |
Net asset value, end of period | $ 9.81 | $ 10.02 | $ 10.03 | $ 10.05 | $ 10.02 |
Total Return B, C | 3.09% | 4.23% | 2.16% | 1.52% | 1.94% |
Ratios to Average Net Assets E, H | | | | |
Expenses before reductions | .45% | .45% | .58% | .62% | .70% A |
Expenses net of fee waivers,
if any | .45% | .45% | .53% | .55% | .55% A |
Expenses net of all reductions | .45% | .45% | .53% | .55% | .55% A |
Net investment income | 5.17% | 4.26% | 2.41% | 1.21% | 1.50% A |
Supplemental Data | | | | | |
Net assets, end of period (000 omitted) | $ 974,602 | $ 850,329 | $ 906,644 | $ 580,174 | $ 225,203 |
Portfolio turnover rate F | 29% | 39% | 33% | 53% | 39% A |
A Annualized
B Total returns for periods of less than one year are not annualized.
C Total returns would have been lower had certain expenses not been reduced during the periods shown.
D Calculated based on average shares outstanding during the period.
E Fees and expenses of the underlying Fidelity Central Funds are not included in the Fund's expense ratio. The Fund indirectly bears its proportionate share of the expenses of any underlying Fidelity Central Funds.
F Amount does not include the portfolio activity of any underlying Fidelity Central Funds.
G For the period August 29, 2002 (commencement of operations) to July 31, 2003.
H Expense ratios reflect operating expenses of the class. Expenses before reductions do not reflect amounts reimbursed by the investment adviser or expense offset arrangements and do not represent the amount paid by the class during periods when reimbursements or reductions occur. Expense ratios before reductions for start-up periods may not be representative of longer-term operating periods. Expenses net of fee waivers reflect expenses after reimbursement by the investment adviser but prior to reductions from expense offset arrangements. Expenses net of all reductions represent the net expenses paid by the class.
I Amount represents less than $.001 per share.
See accompanying notes which are an integral part of the financial statements.
Annual Report
Financial Highlights - Institutional Class
Years ended July 31, | 2007 | 2006 | 2005 | 2004 G |
Selected Per-Share Data | | | | |
Net asset value, beginning of period | $ 10.02 | $ 10.03 | $ 10.05 | $ 10.04 |
Income from Investment Operations | | | | |
Net investment income D | .510 | .420 | .240 | .015 |
Net realized and unrealized gain (loss) | (.206) | (.008) | (.026) | .010 |
Total from investment operations | .304 | .412 | .214 | .025 |
Distributions from net investment income | (.514) | (.422) | (.231) | (.015) |
Distributions from net realized gain | - | - | (.003) | - |
Total distributions | (.514) | (.422) | (.234) | (.015) |
Redemption fees added to paid in capital D, I | - | - | - | - |
Net asset value, end of period | $ 9.81 | $ 10.02 | $ 10.03 | $ 10.05 |
Total Return B, C | 3.06% | 4.19% | 2.15% | .25% |
Ratios to Average Net Assets E, H | | | | |
Expenses before reductions | .48% | .49% | .58% | .67% A |
Expenses net of fee waivers, if any | .48% | .49% | .55% | .55% A |
Expenses net of all reductions | .48% | .49% | .55% | .55% A |
Net investment income | 5.14% | 4.22% | 2.38% | 1.26% A |
Supplemental Data | | | | |
Net assets, end of period (000 omitted) | $ 8,312 | $ 1,987 | $ 509 | $ 376 |
Portfolio turnover rate F | 29% | 39% | 33% | 53% |
A Annualized
B Total returns for periods of less than one year are not annualized.
C Total returns would have been lower had certain expenses not been reduced during the periods shown.
D Calculated based on average shares outstanding during the period.
E Fees and expenses of the underlying Fidelity Central Funds are not included in the Fund's expense ratio. The Fund indirectly bears its proportionate share of the expenses of any underlying Fidelity Central Funds.
F Amount does not include the portfolio activity of any underlying Fidelity Central Funds.
G For the period June 16, 2004 (commencement of sale of shares) to July 31, 2004.
H Expense ratios reflect operating expenses of the class. Expenses before reductions do not reflect amounts reimbursed by the investment adviser or expense offset arrangements and do not represent the amount paid by the class during periods when reimbursements or reductions occur. Expense ratios before reductions for start-up periods may not be representative of longer-term operating periods. Expenses net of fee waivers reflect expenses after reimbursement by the investment adviser but prior to reductions from expense offset arrangements. Expenses net of all reductions represent the net expenses paid by the class.
I Amount represents less than $.001 per share.
See accompanying notes which are an integral part of the financial statements.
Annual Report
Notes to Financial Statements
For the period ended July 31, 2007
1. Organization.
Fidelity Ultra-Short Bond Fund (the Fund) is a non-diversified fund of Fidelity Income Fund (the trust) and is authorized to issue an unlimited number of shares. The trust is registered under the Investment Company Act of 1940, as amended (the 1940 Act), as an open-end management investment company organized as a Massachusetts business trust.
The Fund offers Class A, Class T, Ultra-Short Bond, and Institutional Class shares, each of which has equal rights as to assets and voting privileges. Each class has exclusive voting rights with respect to matters that affect that class. Investment income, realized and unrealized capital gains and losses, the common expenses of the Fund, and certain fund-level expense reductions, if any, are allocated on a pro rata basis to each class based on the relative net assets of each class to the total net assets of the Fund. Each class differs with respect to transfer agent and distribution and service plan fees incurred. Certain expense reductions also differ by class.
2. Investments in Fidelity Central Funds.
The Fund may invest in Fidelity Central Funds which are open-end investment companies available only to other investment companies and accounts managed by Fidelity Management & Research Company (FMR) and its affiliates. The Fund's Schedule of Investments lists each of the Fidelity Central Funds as an investment of the Fund, but does not include the underlying holdings of each Fidelity Central Fund. As an Investing Fund, the Fund indirectly bears its proportionate share of the expenses of the underlying Fidelity Central Funds.
Based on their investment objective, each Fidelity Central Fund may invest or participate in various investment vehicles or strategies that are similar to those of the Fund. These strategies are consistent with the investment objectives of the Fund and may involve certain economic risks which may cause a decline in value of each of the Fidelity Central Funds and thus a decline in the value of the Fund. The following summarizes the Fund's investment in each Fidelity Central Fund.
Fidelity Central Fund | Investment Manager | Investment Objective | Investment Practices |
Fidelity Ultra-Short Central Fund | Fidelity Investments Money Management, Inc. (FIMM) | Seeks to obtain a high level of current income consistent with preservation of capital by investing in U.S. dollar denominated money market and investment-grade debt securities. | Delayed Delivery & When Issued Securities Futures Mortgage Dollar Rolls Repurchase Agreements Restricted Securities Swap Agreements |
Annual Report
2. Investments in Fidelity Central Funds - continued
A holdings listing for the Fund, which presents direct holdings as well as the pro rata share of any securities and other investments held indirectly through its investment in underlying non-money market Fidelity Central Funds is available at fidelity.com and/or advisor.fidelity.com, as applicable. A complete list of holdings for each Fidelity Central Fund is available upon request or at the SEC's web site at www.sec.gov. In addition, the financial statements of the Fidelity Central Funds, which are not covered by the Fund's Report of Independent Registered Public Accounting Firm, are available on the SEC's web site or upon request.
3. Significant Accounting Policies.
The financial statements have been prepared in conformity with accounting principles generally accepted in the United States of America, which require management to make certain estimates and assumptions at the date of the financial statements. The following summarizes the significant accounting policies of the Fund:
Security Valuation. Investments are valued and net asset value per share is calculated (NAV calculation) as of the close of business of the New York Stock Exchange, normally 4:00 p.m. Eastern time. Wherever possible, the Fund uses independent pricing services approved by the Board of Trustees to value its investments. Debt securities, including restricted securities, for which quotations are readily available, are valued by independent pricing services or by dealers who make markets in such securities. Pricing services consider yield or price of bonds of comparable quality, coupon, maturity and type as well as available dealer prices.
When current market prices or quotations are not readily available or do not accurately reflect fair value, valuations may be determined in accordance with procedures adopted by the Board of Trustees. Factors used in the determination of fair value may include current market trading activity, interest rates, credit quality and default rates. The frequency of when fair value pricing is used is unpredictable. The value of securities used for NAV calculation under fair value pricing may differ from published prices for the same securities. Investments in open-end mutual funds, including the Fidelity Central Funds, are valued at their closing net asset value each business day. Short-term securities with remaining maturities of sixty days or less for which quotations are not readily available are valued at amortized cost, which approximates value.
Investment Transactions and Income. For financial reporting purposes, the Fund's investment holdings and NAV include trades executed through the end of the last business day of the period. The NAV for processing shareholder transactions includes trades executed through the end of the prior business day. Gains and losses on securities sold are determined on the basis of identified cost. Interest income and income and capital gain distributions from the Fidelity Central Funds are accrued as earned. Interest income includes coupon interest and amortization of premium and accretion of discount on debt securities.
Annual Report
Notes to Financial Statements - continued
3. Significant Accounting Policies - continued
Expenses. Most expenses of the trust can be directly attributed to a fund. Expenses which cannot be directly attributed are apportioned among each Fund in the trust. Expense estimates are accrued in the period to which they relate and adjustments are made when actual amounts are known.
Income Tax Information and Distributions to Shareholders. Each year, the Fund intends to qualify as a regulated investment company by distributing all of its taxable income and realized gains under Subchapter M of the Internal Revenue Code. As a result, no provision for income taxes is required in the accompanying financial statements.
Dividends are declared daily and paid monthly from net investment income. Distributions from realized gains, if any, are recorded on the ex-dividend date. Income dividends and capital gain distributions are declared separately for each class. Income and capital gain distributions are determined in accordance with income tax regulations, which may differ from generally accepted accounting principles.
Capital accounts within the financial statements are adjusted for permanent book-tax differences. These adjustments have no impact on net assets or the results of operations. Temporary book-tax differences will reverse in a subsequent period.
Book-tax differences are primarily due to futures transactions, swap agreements, market discount, capital loss carryforwards and losses deferred due to excise tax regulations.
The tax-basis components of distributable earnings and the federal tax cost as of period end were as follows:
Unrealized appreciation | $ 632,219 | |
Unrealized depreciation | (20,350,264) | |
Net unrealized appreciation (depreciation) | (19,718,045) | |
Capital loss carryforward | (2,436,121) | |
| | |
Cost for federal income tax purposes | $ 1,026,634,641 | |
The tax character of distributions paid was as follows:
| July 31, 2007 | July 31, 2006 |
Ordinary Income | $ 51,625,727 | $ 38,283,502 |
Short-Term Trading (Redemption) Fees. Shares held in the Fund less than 60 days are subject to a redemption fee equal to .25% of the proceeds of the redeemed shares. All redemption fees, including any estimated redemption fees paid by FMR, are retained by the Fund and accounted for as an addition to paid in capital.
Annual Report
3. Significant Accounting Policies - continued
New Accounting Pronouncements. In July 2006, Financial Accounting Standards Board Interpretation No. 48, Accounting for Uncertainty in Income Taxes - an interpretation of FASB Statement 109 (FIN 48), was issued and is effective on the last business day of the semiannual reporting period for fiscal years beginning after December 15, 2006. FIN 48 sets forth a threshold for financial statement recognition, measurement and disclosure of a tax position taken or expected to be taken on a tax return. Management has concluded that the adoption of FIN 48 will not result in a material impact on the Fund's net assets, results of operations and financial statement disclosures.
In addition, in September 2006, Statement of Financial Accounting Standards No. 157, Fair Value Measurements (SFAS 157), was issued and is effective for fiscal years beginning after November 15, 2007. SFAS 157 defines fair value, establishes a framework for measuring fair value and expands disclosures about fair value measurements. Management is currently evaluating the impact the adoption of SFAS 157 will have on the Fund's financial statement disclosures.
4. Operating Policies.
Repurchase Agreements. FMR has received an Exemptive Order from the Securities and Exchange Commission (the SEC) which permits the Fund and other affiliated entities of FMR to transfer uninvested cash balances into joint trading accounts which are then invested in repurchase agreements. The Fund may also invest directly with institutions in repurchase agreements. Repurchase agreements are collateralized by government or non-government securities. Upon settlement date, collateral is held in segregated accounts with custodian banks and may be obtained in the event of a default of the counterparty. The Fund monitors, on a daily basis, the value of the collateral to ensure it is at least equal to the principal amount of the repurchase agreement (including accrued interest). In the event of a default by the counterparty, realization of the collateral proceeds could be delayed, during which time the value of the collateral may decline.
Delayed Delivery Transactions and When-Issued Securities. The Fund may purchase or sell securities on a delayed delivery or when-issued basis. Payment and delivery may take place after the customary settlement period for that security. The price of the underlying securities and the date when the securities will be delivered and paid for are fixed at the time the transaction is negotiated. During the time a delayed delivery sell is outstanding, the contract is marked-to-market daily and equivalent deliverable securities are held for the transaction. The value of the securities purchased on a delayed delivery or when-issued basis are identified as such in the Fund's Schedule of Investments. The Fund may receive compensation for interest forgone in the purchase of a delayed delivery or when-issued security. With respect to purchase commitments,
Annual Report
Notes to Financial Statements - continued
4. Operating Policies - continued
Delayed Delivery Transactions and When-Issued Securities - continued
the Fund identifies securities as segregated in its records with a value at least equal to the amount of the commitment. Losses may arise due to changes in the value of the underlying securities or if the counterparty does not perform under the contract's terms, or if the issuer does not issue the securities due to political, economic, or other factors.
Futures Contracts. The Fund may use futures contracts to manage its exposure to the bond market and to fluctuations in interest rates. Buying futures tends to increase a fund's exposure to the underlying instrument, while selling futures tends to decrease a fund's exposure to the underlying instrument or hedge other fund investments. Upon entering into a futures contract, a fund is required to deposit with a clearing broker, no later than the following business day, an amount ("initial margin") equal to a certain percentage of the face value of the contract. The initial margin may be in the form of cash or securities and is transferred to a segregated account on settlement date. Subsequent payments ("variation margin") are made or received by a fund depending on the daily fluctuations in the value of the futures contract and are accounted for as unrealized gains or losses. Realized gains (losses) are recorded upon the expiration or closing of the futures contract. Securities deposited to meet margin requirements are identified in the Schedule of Investments. Futures contracts involve, to varying degrees, risk of loss in excess of any futures variation margin reflected in the Statement of Assets and Liabilities. The underlying face amount at value of any open futures contracts at period end is shown in the Schedule of Investments under the caption "Futures Contracts." This amount reflects each contract's exposure to the underlying instrument at period end. Losses may arise from changes in the value of the underlying instruments or if the counterparties do not perform under the contract's terms. Futures contracts are valued at the settlement price established each day by the board of trade or exchange on which they are traded.
Restricted Securities. The Fund may invest in securities that are subject to legal or contractual restrictions on resale. These securities generally may be resold in transactions exempt from registration or to the public if the securities are registered. Disposal of these securities may involve time-consuming negotiations and expense, and prompt sale at an acceptable price may be difficult. Information regarding restricted securities is included at the end of the Fund's Schedule of Investments.
Swap Agreements. The Fund may invest in swaps for the purpose of managing its exposure to interest rate, credit or market risk.
Total return swaps are agreements to exchange the return generated by one instrument or index for the return generated by another instrument, for example, the agreement to pay interest in exchange for a market-linked return based on a notional amount. To the
Annual Report
4. Operating Policies - continued
Swap Agreements - continued
extent the total return of the index exceeds the offsetting interest obligation, a fund will receive a payment from the counterparty. To the extent it is less, a fund will make a payment to the counterparty. Periodic payments received or made by the Fund are recorded in the accompanying Statement of Operations as realized gains or losses, respectively.
Credit default swaps involve the exchange of a fixed rate premium for protection against the loss in value of an underlying debt instrument in the event of a defined credit event (such as payment default or bankruptcy). Under the terms of the swap, one party acts as a "guarantor" receiving a periodic payment that is a fixed percentage applied to a notional principal amount. In return the party agrees to purchase the notional amount of the underlying instrument, at par, if a credit event occurs during the term of the swap. The Fund may enter into credit default swaps in which either it or its counterparty act as guarantors. By acting as the guarantor of a swap, a fund assumes the market and credit risk of the underlying instrument including liquidity and loss of value. Periodic payments and premiums received or made by the Fund are recorded in the accompanying Statement of Operations as realized gains or losses, respectively.
Swaps are marked-to-market daily based on dealer-supplied valuations and changes in value are recorded as unrealized appreciation (depreciation). Gains or losses are realized upon early termination of the swap agreement. Collateral, in the form of cash or securities, may be required to be held in segregated accounts with a fund's custodian in compliance with swap contracts. Risks may exceed amounts recognized on the Statement of Assets and Liabilities. These risks include changes in the returns of the underlying instruments, failure of the counterparties to perform under the contracts' terms and the possible lack of liquidity with respect to the swap agreements. Details of swap agreements open at period end are included in the Fund's Schedule of Investments under the caption "Swap Agreements."
5. Purchases and Sales of Investments.
Purchases and sales of securities (including the Fixed-Income Central Funds), other than short-term securities and U.S. government securities, aggregated $399,912,272 and $239,443,351, respectively.
6. Fees and Other Transactions with Affiliates.
Management Fee. FMR and its affiliates provide the Fund with investment management related services for which the Fund pays a monthly management fee. The management fee is the sum of an individual fund fee rate that is based on an annual rate of .20% of the Fund's average net assets and a group fee rate that averaged ..12% during the
Annual Report
Notes to Financial Statements - continued
6. Fees and Other Transactions with Affiliates - continued
Management Fee - continued
period. The group fee rate is based upon the average net assets of all the mutual funds advised by FMR. The group fee rate decreases as assets under management increase and increases as assets under management decrease. For the period, the total annual management fee rate was .32% of the Fund's average net assets.
Distribution and Service Plan. In accordance with Rule 12b-1 of the 1940 Act, the Fund has adopted separate Distribution and Service Plans for each class of shares. Certain classes pay Fidelity Distributors Corporation (FDC), an affiliate of FMR, separate Distribution and Service Fees, each of which is based on an annual percentage of each class' average net assets. In addition, FDC may pay financial intermediaries for selling shares of the Fund and providing shareholder support services. For the period, the Distribution and Service Fee rates and the total amounts paid to and retained by FDC were as follows:
| Distribution
Fee | Service
Fee | Paid to
FDC | Retained
by FDC |
Class A | 0 % | .15% | $ 14,333 | $ 6,971 |
Class T | 0 % | .15% | 6,400 | 157 |
| | | $ 20,733 | $ 7,128 |
Sales Load. FDC receives a front-end sales charge of up to 1.50% for selling Class A and Class T shares, some of which is paid to financial intermediaries for selling shares of the Fund. FDC receives the proceeds of a contingent deferred sales charges levied on Class A and Class T redemptions. These charges depend on the holding period. The deferred sales charges range from .75% to .50% for certain purchases of Class A shares and .25% for certain purchases of Class T shares.
For the period, sales charge amounts retained by FDC were as follows:
| Retained
by FDC |
Class A | $ 9,720 |
Class T | 1,413 |
| $ 11,133 |
Transfer Agent Fees. Fidelity Investments Institutional Operations Company, Inc. (FIIOC), an affiliate of FMR, is the transfer, dividend disbursing and shareholder servicing agent for each class of the Fund, except for Ultra-Short Bond. Fidelity Service Company, Inc. (FSC), an affiliate of FMR, is the transfer agent for Ultra-Short Bond shares. FIIOC receives account fees and asset-based fees that vary according to the account size and type of account of the shareholders of the respective classes of the Fund. FSC receives an asset-based fee of .10% of Ultra-Short Bond's average net assets.
Annual Report
6. Fees and Other Transactions with Affiliates - continued
Transfer Agent Fees - continued
FIIOC and FSC pay for typesetting, printing and mailing of shareholder reports, except proxy statements. For the period, the total transfer agent fees paid by each class to FIIOC or FSC, were as follows:
| Amount | % of
Average
Net Assets |
Class A | $ 15,125 | .16 |
Class T | 8,066 | .19 |
Ultra-Short Bond | 980,311 | .10 |
Institutional Class | 7,688 | .13 |
| $ 1,011,190 | |
Fundwide Operations Fee. Pursuant to the Fundwide Operations and Expense Agreement (FWOE), FMR has agreed to provide for fund level expenses (which do not include transfer agent, Rule 12b-1 fees, compensation of the independent trustees, interest (including commitment fees), taxes or extraordinary expenses, if any) in return for a FWOE fee equal to .35% less the total amount of the management fee. The FWOE paid by the Fund is reduced by an amount equal to the fees and expenses paid to the independent trustees. For the period, the FWOE fee was equivalent to an annual rate of .03% of average net assets.
7. Committed Line of Credit.
The Fund participates with other funds managed by FMR in a $4.2 billion credit facility (the "line of credit") to be utilized for temporary or emergency purposes to fund shareholder redemptions or for other short-term liquidity purposes. The Fund has agreed to pay commitment fees on its pro rata portion of the line of credit, which amounted to $1,798 and is reflected in Miscellaneous Expense on the Statement of Operations. During the period, there were no borrowings on this line of credit.
8. Expense Reductions.
Through arrangements with the Fund's custodian and each class' transfer agent, credits realized as a result of uninvested cash balances were used to reduce the Fund's expenses. During the period, these credits reduced the Fund's expenses by $14,119. During the period, credits reduced each class' transfer agent expense as noted in the table below.
| Transfer Agent
expense reduction | |
Ultra-Short Bond | $ 5,690 | |
Annual Report
Notes to Financial Statements - continued
9. Credit Risk.
The Fund invests a significant portion of its assets in securities of issuers that hold mortgage securities, including subprime mortgage securities. The value of these securities is sensitive to changes in economic conditions, including delinquencies and/or defaults, and may be adversely affected by shifts in the market's perception of the issuers and changes in interest rates.
10. Other.
The Fund's organizational documents provide former and current trustees and officers with a limited indemnification against liabilities arising in connection with the performance of their duties to the Fund. In the normal course of business, the Fund may also enter into contracts that provide general indemnifications. The Fund's maximum exposure under these arrangements is unknown as this would be dependent on future claims that may be made against the Fund. The risk of material loss from such claims is considered remote.
11. Distributions to Shareholders.
Distributions to shareholders of each class were as follows:
| Years ended July 31, |
| 2007 | 2006 |
From net investment income | | |
Class A | $ 470,241 | $ 126,997 |
Class T | 210,443 | 141,086 |
Ultra-Short Bond | 50,639,843 | 37,977,353 |
Institutional Class | 305,200 | 38,066 |
Total | $ 51,625,727 | $ 38,283,502 |
12. Share Transactions.
Transactions for each class of shares were as follows:
| Shares | Dollars |
| Years ended July 31, | Years ended July 31, |
| 2007 | 2006 | 2007 | 2006 |
Class A | | | | |
Shares sold | 1,247,732 | 574,958 | $ 12,475,671 | $ 5,763,274 |
Reinvestment of distributions | 37,250 | 10,043 | 371,847 | 100,637 |
Shares redeemed | (340,215) | (385,505) | (3,395,610) | (3,863,258) |
Net increase (decrease) | 944,767 | 199,496 | $ 9,451,908 | $ 2,000,653 |
Annual Report
12. Share Transactions - continued
| Shares | Dollars |
| Years ended July 31, | Years ended July 31, |
| 2007 | 2006 | 2007 | 2006 |
Class T | | | | |
Shares sold | 388,444 | 357,260 | $ 3,878,571 | $ 3,579,216 |
Reinvestment of distributions | 19,812 | 13,205 | 197,787 | 132,333 |
Shares redeemed | (378,796) | (312,176) | (3,788,237) | (3,129,874) |
Net increase (decrease) | 29,460 | 58,289 | $ 288,121 | $ 581,675 |
Ultra-Short Bond | | | | |
Shares sold | 59,380,876 | 39,226,057 | $ 593,653,669 | $ 393,000,678 |
Reinvestment of distributions | 4,599,590 | 3,400,651 | 45,902,034 | 34,072,273 |
Shares redeemed | (49,556,665) | (48,147,604) | (494,187,803) | (482,361,462) |
Net increase (decrease) | 14,423,801 | (5,520,896) | $ 145,367,900 | $ (55,288,511) |
Institutional Class | | | | |
Shares sold | 970,636 | 190,577 | $ 9,707,468 | $ 1,908,425 |
Reinvestment of distributions | 8,301 | 756 | 82,674 | 7,577 |
Shares redeemed | (330,344) | (43,621) | (3,294,058) | (437,350) |
Net increase (decrease) | 648,593 | 147,712 | $ 6,496,084 | $ 1,478,652 |
Annual Report
Report of Independent Registered Public Accounting Firm
To the Trustees of Fidelity Income Fund and the Shareholders of Fidelity Ultra-Short Bond Fund:
In our opinion, the accompanying statement of assets and liabilities, including the schedule of investments, and the related statements of operations and of changes in net assets and the financial highlights present fairly, in all material respects, the financial position of Fidelity Ultra-Short Bond Fund (a fund of Fidelity Income Fund) at July 31, 2007, the results of its operations for the year then ended, the changes in its net assets for each of the two years in the period then ended and the financial highlights for each of the periods indicated, in conformity with accounting principles generally accepted in the United States of America. These financial statements and financial highlights (hereafter referred to as "financial statements") are the responsibility of the Fidelity Ultra-Short Bond Fund's management. Our responsibility is to express an opinion on these financial statements based on our audits. We conducted our audits of these financial statements in accordance with the standards of the Public Company Accounting Oversight Board (United States). Those standards require that we plan and perform the audit to obtain reasonable assurance about whether the financial statements are free of material misstatement. An audit includes examining, on a test basis, evidence supporting the amounts and disclosures in the financial statements, assessing the accounting principles used and significant estimates made by management, and evaluating the overall financial statement presentation. We believe that our audits, which included confirmation of securities at July 31, 2007 by correspondence with the custodian and brokers, provide a reasonable basis for our opinion.
/s/ PricewaterhouseCoopers LLP
PricewaterhouseCoopers LLP
Boston, Massachusetts
September 25, 2007
Annual Report
Trustees and Officers
The Trustees, Members of the Advisory Board, and executive officers of the trust and fund, as applicable, are listed below. The Board of Trustees governs the fund and is responsible for protecting the interests of shareholders. The Trustees are experienced executives who meet periodically throughout the year to oversee the fund's activities, review contractual arrangements with companies that provide services to the fund, and review the fund's performance. Except for James C. Curvey, each of the Trustees oversees 353 funds advised by FMR or an affiliate. Mr. Curvey oversees 317 funds advised by FMR or an affiliate.
The Trustees hold office without limit in time except that (a) any Trustee may resign; (b) any Trustee may be removed by written instrument, signed by at least two-thirds of the number of Trustees prior to such removal; (c) any Trustee who requests to be retired or who has become incapacitated by illness or injury may be retired by written instrument signed by a majority of the other Trustees; and (d) any Trustee may be removed at any special meeting of shareholders by a two-thirds vote of the outstanding voting securities of the trust. Each Trustee who is not an interested person (as defined in the 1940 Act) (Independent Trustee), shall retire not later than the last day of the calendar year in which his or her 72nd birthday occurs. The Independent Trustees may waive this mandatory retirement age policy with respect to individual Trustees. The executive officers and Advisory Board Members hold office without limit in time, except that any officer and Advisory Board Member may resign or may be removed by a vote of a majority of the Trustees at any regular meeting or any special meeting of the Trustees. Except as indicated, each individual has held the office shown or other offices in the same company for the past five years.
The fund's Statement of Additional Information (SAI) includes more information about the Trustees. To request a free copy, call Fidelity at 1-877-208-0098.
Interested Trustees*:
Correspondence intended for each Trustee who is an interested person may be sent to Fidelity Investments, 82 Devonshire Street, Boston, Massachusetts 02109.
Name, Age; Principal Occupation |
Edward C. Johnson 3d (77) |
| Year of Election or Appointment: 1984 Mr. Johnson is Chairman of the Board of Trustees. Mr. Johnson serves as President (2006-present), Chief Executive Officer, Chairman, and a Director of FMR Corp.; Chairman and a Director of FMR; Chairman and a Director of Fidelity Research & Analysis Company (FRAC); Chairman and a Director of Fidelity Investments Money Management, Inc.; and Chairman (2001-present) and a Director of FMR Co., Inc. In addition, Mr. Johnson serves as Chairman and Director of Fidelity International Limited (FIL). |
James C. Curvey (72) |
| Year of Election or Appointment: 2007 Mr. Curvey also serves as Trustee (2007-present) or Member of the Advisory Board (2007-present) of other investment companies advised by FMR. Mr. Curvey is Vice Chairman (2006-present) and Director of FMR Corp. Mr. Curvey joined Fidelity in 1982 and served in numerous senior management positions, including President and Chief Operating Officer of FMR Corp. (1997-2000) and President of Fidelity Strategic Investments (2000-2002). In addition, he serves as a member of the Board of Directors of Geerlings & Wade, Inc. (wine distribution). |
* Trustees have been determined to be "Interested Trustees" by virtue of, among other things, their affiliation with the trust or various entities under common control with FMR.
Independent Trustees:
Correspondence intended for each Independent Trustee (that is, the Trustees other than the Interested Trustees) may be sent to Fidelity Investments, P.O. Box 55235, Boston, Massachusetts 02205-5235.
Name, Age; Principal Occupation |
Dennis J. Dirks (59) |
| Year of Election or Appointment: 2005 Prior to his retirement in May 2003, Mr. Dirks was Chief Operating Officer and a member of the Board of The Depository Trust & Clearing Corporation (DTCC) (1999-2003). He also served as President, Chief Operating Officer, and Board member of The Depository Trust Company (DTC) (1999-2003) and President and Board member of the National Securities Clearing Corporation (NSCC) (1999-2003). In addition, Mr. Dirks served as Chief Executive Officer and Board member of the Government Securities Clearing Corporation (2001-2003) and Chief Executive Officer and Board member of the Mortgage-Backed Securities Clearing Corporation (2001-2003). Mr. Dirks also serves as a Trustee and a member of the Finance Committee of Manhattan College (2005-present) and a Trustee and a member of the Finance Committee of AHRC of Nassau County (2006-present). |
Albert R. Gamper, Jr. (65) |
| Year of Election or Appointment: 2006 Prior to his retirement in December 2004, Mr. Gamper served as Chairman of the Board of CIT Group Inc. (commercial finance). During his tenure with CIT Group Inc. Mr. Gamper served in numerous senior management positions, including Chairman (1987-1989; 1999-2001; 2002-2004), Chief Executive Officer (1987-2004), and President (1989-2002). He currently serves as a member of the Board of Directors of Public Service Enterprise Group (utilities, 2001-present), Chairman of the Board of Governors, Rutgers University (2004-present), and Chairman of the Board of Saint Barnabas Health Care System. |
George H. Heilmeier (71) |
| Year of Election or Appointment: 2004 Dr. Heilmeier is Chairman Emeritus of Telcordia Technologies (communication software and systems), where prior to his retirement, he served as company Chairman and Chief Executive Officer. He currently serves on the Boards of Directors of The Mitre Corporation (systems engineering and information technology support for the government), and HRL Laboratories (private research and development, 2004-present). He is Chairman of the General Motors Science & Technology Advisory Board and a Life Fellow of the Institute of Electrical and Electronics Engineers (IEEE). Dr. Heilmeier is a member of the Defense Science Board and the National Security Agency Advisory Board. He is also a member of the National Academy of Engineering, the American Academy of Arts and Sciences, and the Board of Overseers of the School of Engineering and Applied Science of the University of Pennsylvania. Previously, Dr. Heilmeier served as a Director of TRW Inc. (automotive, space, defense, and information technology, 1992-2002), Compaq (1994-2002), Automatic Data Processing, Inc. (ADP) (technology-based business outsourcing, 1995-2002), INET Technologies Inc. (telecommunications network surveillance, 2001-2004), and Teletech Holdings (customer management services). He is the recipient of the 2005 Kyoto Prize in Advanced Technology for his invention of the liquid crystal display, and a member of the Consumer Electronics Hall of Fame. |
James H. Keyes (66) |
| Year of Election or Appointment: 2007 Prior to his retirement in 2003, Mr. Keyes was Chairman, President, and Chief Executive Officer of Johnson Controls, Inc. (automotive supplier, 1993-2003). He currently serves as a member of the boards of LSI Logic Corporation (semiconductor technologies), Navistar International Corporation (manufacture and sale of trucks, buses, and diesel engines, 2002-present), and Pitney Bowes, Inc. (integrated mail, messaging, and document management solutions). |
Marie L. Knowles (60) |
| Year of Election or Appointment: 2001 Prior to Ms. Knowles' retirement in June 2000, she served as Executive Vice President and Chief Financial Officer of Atlantic Richfield Company (ARCO) (diversified energy, 1996-2000). From 1993 to 1996, she was a Senior Vice President of ARCO and President of ARCO Transportation Company. She served as a Director of ARCO from 1996 to 1998. She currently serves as a Director of Phelps Dodge Corporation (copper mining and manufacturing) and McKesson Corporation (healthcare service, 2002-present). Ms. Knowles is a Trustee of the Brookings Institution and the Catalina Island Conservancy and also serves as a member of the Advisory Board for the School of Engineering of the University of Southern California. |
Ned C. Lautenbach (63) |
| Year of Election or Appointment: 2000 Mr. Lautenbach is Chairman of the Independent Trustees (2006-present). Mr. Lautenbach has been a partner of Clayton, Dubilier & Rice, Inc. (private equity investment firm) since September 1998. Previously, Mr. Lautenbach was with the International Business Machines Corporation (IBM) from 1968 until his retirement in 1998. Mr. Lautenbach serves as a Director of Sony Corporation (2006-present) and Eaton Corporation (diversified industrial) as well as the Philharmonic Center for the Arts in Naples, Florida. He also is a member of the Board of Trustees of Fairfield University (2005-present), as well as a member of the Council on Foreign Relations. |
Cornelia M. Small (63) |
| Year of Election or Appointment: 2005 Ms. Small is a member (2000-present) and Chairperson (2002-present) of the Investment Committee, and a member (2002-present) of the Board of Trustees of Smith College. Previously, she served as Chief Investment Officer (1999-2000), Director of Global Equity Investments (1996-1999), and a member of the Board of Directors of Scudder, Stevens & Clark (1990-1997) and Scudder Kemper Investments (1997-1999). In addition, Ms. Small served as Co-Chair (2000-2003) of the Annual Fund for the Fletcher School of Law and Diplomacy. |
William S. Stavropoulos (68) |
| Year of Election or Appointment: 2001 Mr. Stavropoulos is Chairman Emeritus of the Board of Directors of The Dow Chemical Company. Since joining The Dow Chemical Company in 1967, Mr. Stavropoulos served in numerous senior management positions, including President (1993-2000; 2002-2003), CEO (1995-2000; 2002-2004), and Chairman of the Executive Committee (2000-2004). Currently, he is a Director of NCR Corporation (data warehousing and technology solutions), Chemical Financial Corporation, Maersk Inc. (industrial conglomerate, 2002-present), Tyco International, Inc. (multinational manufacturing and services, 2007-present), and a member of the Advisory Board for Metalmark Capital (private equity investment firm, 2005-present). He is a special advisor to Clayton, Dubilier & Rice, Inc., a private equity investment firm. He also serves as a member of the Board of Trustees of the American Enterprise Institute for Public Policy Research. In addition, Mr. Stavropoulos is a member of The Business Council, J.P. Morgan International Council and the University of Notre Dame Advisory Council for the College of Science. |
Kenneth L. Wolfe (68) |
| Year of Election or Appointment: 2005 Prior to his retirement in 2001, Mr. Wolfe was Chairman and Chief Executive Officer of Hershey Foods Corporation (1993-2001). He currently serves as a member of the boards of Adelphia Communications Corporation (2003-present), Bausch & Lomb, Inc., and Revlon Inc. (2004-present). |
Advisory Board Members and Executive Officers:
Correspondence intended for Mr. Mauriello may be sent to Fidelity Investments, P.O. Box 55235, Boston, Massachusetts 02205-5235. Correspondence intended for each executive officer and Mr. Lynch may be sent to Fidelity Investments, 82 Devonshire Street, Boston, Massachusetts 02109.
Name, Age; Principal Occupation |
Peter S. Lynch (63) |
| Year of Election or Appointment: 2003 Member of the Advisory Board of Fidelity Income Fund. Mr. Lynch is Vice Chairman and a Director of FMR, and Vice Chairman (2001-present) and a Director of FMR Co., Inc. Previously, Mr. Lynch served as a Trustee of the Fidelity funds (1990-2003). In addition, he serves as a Trustee of Boston College and as the Chairman of the Inner-City Scholarship Fund. |
Joseph Mauriello (62) |
| Year of Election or Appointment: 2007 Member of the Advisory Board of Fidelity Income Fund. Prior to his retirement in January 2006, Mr. Mauriello served in numerous senior management positions including Deputy Chairman and Chief Operating Officer (2004-2005), and Vice Chairman of Financial Services (2002-2004) of KPMG LLP US (professional services firm, 1965-2005). Mr. Mauriello currently serves as a member of the Board of Directors of XL Capital Ltd., (global insurance and re-insurance company, 2006-present) and of Arcadia Resources Inc., (health care services and products, 2007-present). He also served as a Director of the Hamilton Funds of the Bank of New York (2006-2007). |
Kimberley H. Monasterio (43) |
| Year of Election or Appointment: 2007 President and Treasurer of the fund. Ms. Monasterio also serves as President and Treasurer of other Fidelity funds (2007-present) and is an employee of FMR (2004-present). Previously, Ms. Monasterio served as Deputy Treasurer of the Fidelity funds (2004-2006). Before joining Fidelity Investments, Ms. Monasterio served as Treasurer (2000-2004) and Chief Financial Officer (2002-2004) of the Franklin Templeton Funds and Senior Vice President of Franklin Templeton Services, LLC (2000-2004). |
Boyce I. Greer (51) |
| Year of Election or Appointment: 2006 Vice President of the fund. Mr. Greer also serves as Vice President of certain Equity Funds (2005-present), certain Asset Allocation Funds (2005-present), Fixed-Income Funds (2006-present), and Money Market Funds (2006-present). Mr. Greer is also a Trustee of other investment companies advised by FMR (2003-present). He is an Executive Vice President of FMR (2005-present) and FMR Co., Inc. (2005-present), and Senior Vice President of Fidelity Investments Money Management, Inc. (2006-present). Previously, Mr. Greer served as a Director and Managing Director of Strategic Advisers, Inc. (2002-2005), and Executive Vice President (2000-2002) and Money Market Group Leader (1997-2002) of the Fidelity Investments Fixed Income Division. He also served as Vice President of Fidelity's Money Market Funds (1997-2002), Senior Vice President of FMR (1997-2002), and Vice President of FIMM (1998-2002). |
David L. Murphy (59) |
| Year of Election or Appointment: 2005 Vice President of the fund. Mr. Murphy also serves as Vice President of Fidelity's Money Market Funds (2002-present), certain Asset Allocation Funds (2003-present), Fixed-Income Funds (2005-present), and Balanced Funds (2005-present). He serves as Senior Vice President (2000-present) and Head (2004-present) of the Fidelity Investments Fixed Income Division. Mr. Murphy is also a Senior Vice President of Fidelity Investments Money Management, Inc. (2003-present) and an Executive Vice President of FMR (2005-present). Previously, Mr. Murphy served as Money Market Group Leader (2002-2004), Bond Group Leader (2000-2002), and Vice President of Fidelity's Taxable Bond Funds (2000-2002) and Fidelity's Municipal Bond Funds (2001-2002). |
Thomas J. Silvia (46) |
| Year of Election or Appointment: 2005 Vice President of the fund. Mr. Silvia also serves as Vice President of Fidelity's Fixed-Income Funds (2005-present), certain Balanced Funds (2005-present), certain Asset Allocation Funds (2005-present), and Senior Vice President and Bond Group Leader of the Fidelity Investments Fixed-Income Division (2005-present). Previously, Mr. Silvia served as Director of Fidelity's Taxable Bond portfolio managers (2002-2004) and a portfolio manager in the Bond Group (1997-2004). |
Andrew Dudley (42) |
| Year of Election or Appointment: 2002 Vice President of the fund. Mr. Dudley also serves as Vice President of other funds advised by FMR. Prior to assuming his current responsibilities, Mr. Dudley worked as a portfolio manager. |
Robert Galusza (43) |
| Year of Election or Appointment: 2007 Vice President of the fund. Mr. Galusza also serves as Vice President of other funds advised by FMR. Prior to assuming his current responsibilities, Mr. Galusza worked as an analyst and a portfolio manager. |
Eric D. Roiter (58) |
| Year of Election or Appointment: 2002 Secretary of the fund. He also serves as Secretary of other Fidelity funds; Vice President, General Counsel, and Secretary of FMR Co., Inc. (2001-present) and FMR; Assistant Secretary of Fidelity Management & Research (U.K.) Inc. (2001-present), Fidelity Research & Analysis Company (2001-present), and Fidelity Investments Money Management, Inc. (2001-present). Mr. Roiter is an Adjunct Member, Faculty of Law, at Boston College Law School (2003-present). Previously, Mr. Roiter served as Vice President and Secretary of Fidelity Distributors Corporation (FDC) (1998-2005). |
Scott C. Goebel (39) |
| Year of Election or Appointment: 2007 Assistant Secretary of the fund. Mr. Goebel also serves as Assistant Secretary of other Fidelity funds (2007-present), Vice President and Secretary of FDC (2006-present), and is an employee of FMR. |
R. Stephen Ganis (41) |
| Year of Election or Appointment: 2006 Anti-Money Laundering (AML) officer of the fund. Mr. Ganis also serves as AML officer of other Fidelity funds (2006-present) and FMR Corp. (2003-present). Before joining Fidelity Investments, Mr. Ganis practiced law at Goodwin Procter, LLP (2000-2002). |
Joseph B. Hollis (59) |
| Year of Election or Appointment: 2006 Chief Financial Officer of the fund. Mr. Hollis also serves as Chief Financial Officer of other Fidelity funds. Mr. Hollis is President of Fidelity Pricing and Cash Management Services (FPCMS) (2005-present). Mr. Hollis also serves as President and Director of Fidelity Service Company, Inc. (2006-present). Previously, Mr. Hollis served as Senior Vice President of Cash Management Services (1999-2002) and Investment Management Operations (2002-2005). |
Kenneth A. Rathgeber (60) |
| Year of Election or Appointment: 2004 Chief Compliance Officer of the fund. Mr. Rathgeber also serves as Chief Compliance Officer of other Fidelity funds (2004-present) and Executive Vice President of Risk Oversight for Fidelity Investments (2002-present). He is Chief Compliance Officer of FMR (2005-present), FMR Co., Inc. (2005-present), Fidelity Management & Research (U.K.) Inc. (2005-present), Fidelity Research & Analysis Company (2005-present), Fidelity Investments Money Management, Inc. (2005-present), and Strategic Advisers, Inc. (2005-present). Previously, Mr. Rathgeber served as Executive Vice President and Chief Operating Officer for Fidelity Investments Institutional Services Company, Inc. (1998-2002). |
Bryan A. Mehrmann (46) |
| Year of Election or Appointment: 2005 Deputy Treasurer of the fund. Mr. Mehrmann also serves as Deputy Treasurer of other Fidelity funds (2005-present) and is an employee of FMR. Previously, Mr. Mehrmann served as Vice President of Fidelity Investments Institutional Services Group (FIIS)/Fidelity Investments Institutional Operations Corporation, Inc. (FIIOC) Client Services (1998-2004). |
Kenneth B. Robins (37) |
| Year of Election or Appointment: 2005 Deputy Treasurer of the fund. Mr. Robins also serves as Deputy Treasurer of other Fidelity funds (2005-present) and is an employee of FMR (2004-present). Before joining Fidelity Investments, Mr. Robins worked at KPMG LLP, where he was a partner in KPMG's department of professional practice (2002-2004) and a Senior Manager (1999-2000). In addition, Mr. Robins served as Assistant Chief Accountant, United States Securities and Exchange Commission (2000-2002). |
Robert G. Byrnes (40) |
| Year of Election or Appointment: 2005 Assistant Treasurer of the fund. Mr. Byrnes also serves as Assistant Treasurer of other Fidelity funds (2005-present) and is an employee of FMR (2005-present). Previously, Mr. Byrnes served as Vice President of FPCMS (2003-2005). Before joining Fidelity Investments, Mr. Byrnes worked at Deutsche Asset Management where he served as Vice President of the Investment Operations Group (2000-2003). |
Peter L. Lydecker (53) |
| Year of Election or Appointment: 2004 Assistant Treasurer of the fund. Mr. Lydecker also serves as Assistant Treasurer of other Fidelity funds (2004) and is an employee of FMR. |
Gary W. Ryan (48) |
| Year of Election or Appointment: 2005 Assistant Treasurer of the fund. Mr. Ryan also serves as Assistant Treasurer of other Fidelity funds (2005-present) and is an employee of FMR (2005-present). Previously, Mr. Ryan served as Vice President of Fund Reporting in FPCMS (1999-2005). |
Annual Report
Distributions
A total of 0.01% of the dividends distributed during the fiscal year was derived from interest on U.S. Government securities which is generally exempt from state income tax.
The fund designates $28,899,333 of distributions paid during the period January 1, 2007 to July 31, 2007 as qualifying to be taxed as interest-related dividends for nonresident alien shareholders.
The fund will notify shareholders in January 2008 of amounts for use in preparing 2007 income tax returns.
Annual Report
Board Approval of Investment Advisory Contracts and Management Fees
Fidelity Ultra-Short Bond Fund
Each year, typically in June, the Board of Trustees, including the Independent Trustees (together, the Board), votes on the renewal of the management contract and sub-advisory agreements (together, the Advisory Contracts) for the fund. The Board, assisted by the advice of fund counsel and Independent Trustees' counsel, requests and considers a broad range of information throughout the year.
The Board meets regularly each month except August and takes into account throughout the year matters bearing on Advisory Contracts. The Board, acting directly and through its separate committees, considers at each of its meetings factors that are relevant to the annual renewal of the fund's Advisory Contracts, including the services and support provided to the fund and its shareholders. At the time of the renewal, the Board had 12 standing committees, each composed of Independent Trustees with varying backgrounds, to which the Board has assigned specific subject matter responsibilities in order to enhance effective decision-making by the Board. Each committee has adopted a written charter outlining the structure and purposes of the committee. One such committee, the Fixed-Income Contract Committee, meets periodically as needed throughout the year to consider matters specifically related to the annual renewal of Advisory Contracts. The committee requests and receives information on, and makes recommendations to the Independent Trustees concerning, the approval and annual review of the Advisory Contracts.
At its June 2007 meeting, the Board of Trustees, including the Independent Trustees, unanimously determined to renew the Advisory Contracts for the fund. In reaching its determination, the Board considered all factors it believed relevant, including (i) the nature, extent, and quality of the services to be provided to the fund and its shareholders (including the investment performance of the fund); (ii) the competitiveness of the management fee and total expenses of the fund; (iii) the total costs of the services to be provided by and the profits to be realized by the investment adviser and its affiliates from the relationship with the fund; (iv) the extent to which economies of scale would be realized as the fund grows; and (v) whether fee levels reflect these economies of scale, if any, for the benefit of fund shareholders. The Board also approved amendments to the fund's agreements with foreign sub-advisers to clarify that each sub-adviser provides services as an independent contractor.
In determining whether to renew the Advisory Contracts for the fund, the Board ultimately reached a determination, with the assistance of fund counsel and Independent Trustees' counsel, that the renewal of the Advisory Contracts and the compensation to be received by Fidelity under the management contract is consistent with Fidelity's fiduciary duty under applicable law. In addition to evaluating the specific factors noted above, the Board, in reaching its determination, is aware that shareholders in the fund have a broad range of investment choices available to them, including a wide choice among mutual funds offered by competitors to Fidelity, and that the fund's shareholders, with the opportunity to review and weigh the disclosure provided by the fund in its prospectus and other public disclosures, have chosen to invest in this fund, managed by Fidelity.
Annual Report
Nature, Extent, and Quality of Services Provided. The Board considered staffing within the investment adviser, FMR, and the sub-advisers (together, the Investment Advisers), including the background of the fund's portfolio manager and the fund's investment objective and discipline. The Independent Trustees also had discussions with senior management of Fidelity's investment operations and investment groups. The Board considered the structure of the portfolio manager compensation program and whether this structure provides appropriate incentives.
Resources Dedicated to Investment Management and Support Services. The Board reviewed the size, education, and experience of the Investment Advisers' investment staff, their use of technology, and the Investment Advisers' approach to recruiting, training, and retaining portfolio managers and other research, advisory, and management personnel. The Board considered Fidelity's extensive global research capabilities that enable the Investment Advisers to aggregate data from various sources in an effort to produce positive investment results. The Board noted that Fidelity's analysts have access to a variety of technological tools that enable them to perform both fundamental and quantitative analysis and to specialize in various disciplines. The Board also considered that Fidelity's portfolio managers and analysts have access to daily portfolio attribution that allows for monitoring of a fund's portfolio, as well as an electronic communication system that provides immediate real-time access to research concerning issuers and credit enhancers. In addition, the Board considered the trading resources that are an integrated part of the fixed-income portfolio management investment process.
Shareholder and Administrative Services. The Board considered (i) the nature, extent, quality, and cost of advisory, administrative, distribution, and shareholder services performed by the Investment Advisers and their affiliates under the Advisory Contracts and under separate agreements covering transfer agency, pricing and bookkeeping, and securities lending services for the fund; (ii) the nature and extent of the Investment Advisers' supervision of third party service providers, principally custodians and subcustodians; and (iii) the resources devoted to, and the record of compliance with, the fund's compliance policies and procedures.
The Board noted that the growth of fund assets across the complex allows Fidelity to reinvest in the development of services designed to enhance the value or convenience of the Fidelity funds as investment vehicles. These services include 24-hour access to account information and market information through phone representatives and over the Internet, and investor education materials and asset allocation tools.
Annual Report
Board Approval of Investment Advisory Contracts and
Management Fees - continued
Investment in a Large Fund Family. The Board considered the benefits to shareholders of investing in a Fidelity fund, including the benefits of investing in a fund that is part of a large family of funds offering a variety of investment disciplines and providing for a large variety of mutual fund investor services. For example, fund shareholders are offered the privilege of exchanging shares of the fund for shares of other Fidelity funds, as set forth in the fund's prospectus, without paying a sales charge. The Board noted that, since the last Advisory Contract renewals in June 2006, Fidelity has taken a number of actions that benefited particular funds, including (i) dedicating additional resources to investment research and to restructure the investment research teams; (ii) contractually agreeing to reduce the management fee on Fidelity Advisor Floating Rate High Income Fund; (iii) contractually agreeing to reduce the management fees on Fidelity's California, Massachusetts, New Jersey, and New York AMT Tax-Free Money Market Funds, launching new Institutional Classes and Service Classes of these funds, and contractually agreeing to impose expense limitations on these funds; (iv) eliminating the exchange fee on the Fidelity Select Portfolios and reducing the pricing and bookkeeping fee rates for these funds; (v) reducing the maximum transfer agency fee rates on high income funds and certain equity funds; (vi) proposing amended management contracts that, if approved by shareholders, will add a performance adjustment component to the management fees paid by 18 Fidelity Advisor equity funds; (vii) contractually agreeing to reduce fees for Ultra-Short Central Fund and the money market Central Funds; (viii) waiving the Fidelity Advisor funds' contingent deferred sales charge on certain redemptions made through systematic withdrawal programs; and (ix) amending the management contracts for equity and fixed-income funds whose management contracts incorporate a "group fee" structure by adding four new fee "breakpoints" to the group fee rate schedules.
Investment Performance. The Board considered whether the fund has operated within its investment objective, as well as its record of compliance with its investment restrictions. It also reviewed the fund's absolute investment performance for each class, as well as the fund's relative investment performance for each class measured against (i) a broad-based securities market index, and (ii) a peer group of mutual funds deemed appropriate by the Board over multiple periods. Because the fund had been in existence less than five calendar years, the following charts considered by the Board show, over the one- and three-year periods ended December 31, 2006, as available, the cumulative total returns of Fidelity Ultra-Short Bond (retail class) and Class A, the cumulative total returns of a broad-based securities market index ("benchmark"), and a range of cumulative total returns of a peer group of mutual funds identified by Lipper Inc. as having an investment objective similar to that of the fund. The returns of Fidelity Ultra-Short Bond (retail class) and Class A show the performance of the highest and lowest performing classes, respectively. The box within each chart shows the 25th percentile return (bottom of box) and the 75th percentile return (top of box) of the peer group. Returns shown above the box are in the first quartile and returns shown below the box are in the fourth quartile. The percentage beaten numbers noted below each chart correspond to the percentile box and represent the percentage of funds in the peer group whose performance was equal to or lower than that of the class indicated.
Annual Report
Fidelity Ultra-Short Bond Fund

The Board reviewed the fund's relative investment performance against its peer group and stated that the performance of Fidelity Ultra-Short Bond (retail class) was in the first quartile for the one-year period and the second quartile for the three-year period. The Board also stated that the relative investment performance of the fund was lower than its benchmark for all the periods shown. The Board considered that the variations in performance among the fund's classes reflect the variations in class expenses, which result in lower performance for higher expense classes.
Based on its review, and giving particular weight to the nature and quality of the resources dedicated by the Investment Advisers to maintain and improve relative performance, the Board concluded that the nature, extent, and quality of the services provided to the fund will benefit the fund's shareholders, particularly in light of the Board's view that the fund's shareholders benefit from investing in a fund that is part of a large family of funds offering a variety of investment disciplines and services.
Competitiveness of Management Fee and Total Fund Expenses. The Board considered the fund's management fee and total expenses compared to "mapped groups" of competitive funds and classes. Fidelity creates "mapped groups" by combining similar Lipper investment objective categories that have comparable management fee characteristics. Combining Lipper investment objective categories aids the Board's management fee and total expense comparisons by broadening the competitive group used for comparison and by reducing the number of universes to which various Fidelity funds are compared.
Annual Report
Board Approval of Investment Advisory Contracts and
Management Fees - continued
The Board considered two proprietary management fee comparisons for the 12-month (or shorter) periods shown in the chart below. The group of Lipper funds used by the Board for management fee comparisons is referred to below as the "Total Mapped Group" and, for the reasons explained above, is broader than the Lipper peer group used by the Board for performance comparisons. The Total Mapped Group comparison focuses on a fund's standing relative to the total universe of comparable funds available to investors, in terms of gross management fees before expense reimbursements or caps. "TMG %" represents the percentage of funds in the Total Mapped Group that had management fees that were lower than the fund's. For example, a TMG % of 18% means that 82% of the funds in the Total Mapped Group had higher management fees than the fund. The "Asset-Size Peer Group" (ASPG) comparison focuses on a fund's standing relative to non-Fidelity funds similar in size to the fund within the Total Mapped Group. The ASPG represents at least 15% of the funds in the Total Mapped Group with comparable asset size and management fee characteristics, subject to a minimum of 50 funds (or all funds in the Total Mapped Group if fewer than 50). Additional information, such as the ASPG quartile in which the fund's management fee ranked, is also included in the chart and considered by the Board.
Fidelity Ultra-Short Bond Fund

The Board noted that the fund's management fee ranked below the median of its Total Mapped Group and below the median of its ASPG for 2006.
Annual Report
Furthermore, the Board considered that it had approved an amendment (effective June 1, 2005) to the fund's management contract that lowered the fund's individual fund fee rate from 30 basis points to 20 basis points. The Board considered that the chart reflects the fund's lower management fee for 2005, as if the lower rate were in effect for the entire year.
Based on its review, the Board concluded that the fund's management fee was fair and reasonable in light of the services that the fund receives and the other factors considered.
In its review of each class's total expenses, the Board considered the fund's management fee as well as other fund or class expenses, as applicable, such as transfer agent fees, pricing and bookkeeping fees, fund-paid 12b-1 fees, and custodial, legal, and audit fees. The Board also noted the effects of any waivers and reimbursements on fees and expenses. As part of its review, the Board also considered current and historical total expenses of each class of the fund compared to competitive fund median expenses. Each class of the fund is compared to those funds and classes in the Total Mapped Group (used by the Board for management fee comparisons) that have a similar sales load structure.
The Board also considered that the current contractual arrangements for the fund (i) have the effect of setting the total "fund-level" expenses (including, among certain other expenses, the management fee) for each class at 35 basis points, (ii) lower and limit the "class-level" transfer agent fee for Fidelity Ultra-Short Bond (retail class) to 10 basis points, and (iii) limit the total expenses for Fidelity Ultra-Short Bond (retail class) to 45 basis points. These contractual arrangements may not be increased without the approval of the Board and the shareholders of the applicable class. The fund's Advisor classes are subject to different class-level expenses (transfer agent fees and 12b-1 fees).
The Board noted that each class's total expenses ranked below its competitive median for 2006.
The Board recognized that the fund's management contract incorporates a "group fee" structure, which provides for lower group fee rates as total fund assets under FMR's management increase, and for higher group fee rates as total fund assets under FMR's management decrease. FMR determines the group fee rates based on a tiered asset "breakpoint" schedule. In connection with the renewal of the fund's management contract, the Board approved amendments to the fund's management contract that added four new fee breakpoints to the group fee rate schedule for assets under FMR's management above $1,386 billion. The Board considered that the group fee rate declines under both the present and amended schedules, but that under the amended schedule, the group fee rate declines faster as assets under FMR's management exceed $1,386 billion. The Board noted, however, that because the current contractual arrangements set the total fund-level expenses for each class at 35 basis points, increases or decreases in the management fee due to changes in the group fee rate will not impact total expenses.
Annual Report
Board Approval of Investment Advisory Contracts and
Management Fees - continued
In its review of total expenses, the Board also considered Fidelity fee structures and other information on clients that FMR and its affiliates service in other competitive markets, such as other mutual funds advised or subadvised by FMR or its affiliates, pension plan clients, and other institutional clients.
Based on its review, the Board concluded that the total expenses of each class of the fund were reasonable in light of the services that the fund and its shareholders receive and the other factors considered.
Costs of the Services and Profitability. The Board considered the revenues earned and the expenses incurred by Fidelity in conducting the business of developing, marketing, distributing, managing, administering and servicing the fund and its shareholders. The Board also considered the level of Fidelity's profits in respect of all the Fidelity funds.
On an annual basis, FMR presents to the Board Fidelity's profitability for the fund. Fidelity calculates the profitability for each fund, as well as aggregate profitability for groups of Fidelity funds and all Fidelity funds, using a series of detailed revenue and cost allocation methodologies which originate with the audited books and records of Fidelity. The Audit Committee of the Board reviews any significant changes from the prior year's methodologies.
PricewaterhouseCoopers LLP (PwC), independent registered public accounting firm and auditor to Fidelity and certain Fidelity funds, has been engaged annually by the Board as part of the Board's assessment of the results of Fidelity's profitability analysis. PwC's engagement includes the review and assessment of Fidelity's methodologies used in determining the revenues and expenses attributable to Fidelity's mutual fund business, and completion of agreed-upon procedures surrounding the mathematical accuracy of fund profitability and its conformity to allocation methodologies. After considering PwC's reports issued under the engagement and information provided by Fidelity, the Board believes that while other allocation methods may also be reasonable, Fidelity's profitability methodologies are reasonable in all material respects.
The Board has also reviewed Fidelity's non-fund businesses and any fall-out benefits related to the mutual fund business as well as cases where Fidelity's affiliates may benefit from or be related to the fund's business.
The Board considered the costs of the services provided by and the profits realized by Fidelity in connection with the operation of the fund and determined that the amount of profit is a fair entrepreneurial profit for the management of the fund.
Annual Report
Economies of Scale. The Board considered whether there have been economies of scale in respect of the management of the Fidelity funds, whether the Fidelity funds (including the fund) have appropriately benefited from any such economies of scale, and whether there is potential for realization of any further economies of scale. The Board considered the extent to which the fund will benefit from economies of scale through increased services to the fund, through waivers or reimbursements, or through fee or expense reductions, including (Advisor classes only) reductions that occur through operation of the transfer agent agreement. The transfer agent fee varies in part based on the number of accounts in the fund. If the number of accounts decreases or the average account size increases, the overall transfer agent fee rate decreases. The Board concluded that any potential economies of scale are being shared between fund shareholders and Fidelity in an appropriate manner.
Additional Information Requested by the Board. In order to develop fully the factual basis for consideration of the Fidelity funds' Advisory Contracts, the Board requested and received additional information on several topics, including (i) Fidelity's fund profitability methodology, profitability by investment discipline, and profitability trends within certain funds; (ii) Fidelity's compensation structure relative to competitors and its effect on profitability; (iii) funds and accounts managed by Fidelity other than the Fidelity funds, including fee arrangements; (iv) the total expenses of certain funds and classes relative to competitors; (v) fund performance trends; (vi) fall-out benefits received by certain Fidelity affiliates; and (vii) Fidelity's fee structures.
Based on its evaluation of all of the conclusions noted above, and after considering all material factors, the Board ultimately concluded that the advisory fee structures are fair and reasonable, and that the fund's Advisory Contracts should be renewed.
Annual Report
Investment Adviser
Fidelity Management & Research Company
Boston, MA
Investment Sub-Advisers
Fidelity Investments
Money Management, Inc.
Fidelity International Investment Advisors
Fidelity International Investment Advisors
(U.K.) Limited
Fidelity Research & Analysis Company
General Distributor
Fidelity Distributors Corporation
Boston, MA
Transfer and Service Agent
Fidelity Investments Institutional
Operations Company, Inc.
Boston, MA
Fidelity Service Company, Inc.
Boston, MA
Custodian
Citibank, N.A.
New York, NY
AUSBI-UANN-0907
1.804593.103
(Fidelity Investment logo)(registered trademark)
Item 2. Code of Ethics
As of the end of the period, July 31, 2007, Fidelity Income Fund (the trust) has adopted a code of ethics, as defined in Item 2 of Form N-CSR, that applies to its President and Treasurer and its Chief Financial Officer. A copy of the code of ethics is filed as an exhibit to this Form N-CSR.
Item 3. Audit Committee Financial Expert
The Board of Trustees of the trust has determined that Marie L. Knowles is an audit committee financial expert, as defined in Item 3 of Form N-CSR. Ms. Knowles is independent for purposes of Item 3 of Form N-CSR.
Item 4. Principal Accountant Fees and Services
(a) Audit Fees.
For the fiscal years ended July 31, 2007 and July 31, 2006, the aggregate Audit Fees billed by PricewaterhouseCoopers LLP (PwC) for professional services rendered for the audits of the financial statements, or services that are normally provided in connection with statutory and regulatory filings or engagements for those fiscal years, for the Fidelity Ginnie Mae Fund, Fidelity Government Income Fund, Fidelity Intermediate Government Income Fund, and Fidelity Ultra-Short Bond Fund (the funds) and for all funds in the Fidelity Group of Funds are shown in the table below.
Fund | 2007A | 2006A |
Fidelity Ginnie Mae Fund | $93,000 | $112,000 |
Fidelity Government Income Fund | $73,000 | $70,000 |
Fidelity Intermediate Government Income Fund | $64,000 | $63,000 |
Fidelity Ultra-Short Bond Fund | $68,000 | $54,000 |
All funds in the Fidelity Group of Funds audited by PwC | $13,800,000 | $12,800,000 |
A | Aggregate amounts may reflect rounding. |
(b) Audit-Related Fees.
In each of the fiscal years ended July 31, 2007 and July 31, 2006 the aggregate Audit-Related Fees billed by PwC for services rendered for assurance and related services to each fund that are reasonably related to the performance of the audit or review of the fund's financial statements, but not reported as Audit Fees, are shown in the table below.
Fund | 2007A | 2006A |
Fidelity Ginnie Mae Fund | $0 | $0 |
Fidelity Government Income Fund | $0 | $0 |
Fidelity Intermediate Government Income Fund | $0 | $0 |
Fidelity Ultra-Short Bond Fund | $0 | $0 |
A | Aggregate amounts may reflect rounding. |
In each of the fiscal years ended July 31, 2007 and July 31, 2006, the aggregate Audit-Related Fees that were billed by PwC that were required to be approved by the Audit Committee for services rendered on behalf of Fidelity Management & Research Company (FMR) and entities controlling, controlled by, or under common control with FMR (not including any sub-adviser whose role is primarily portfolio management and is subcontracted with or overseen by another investment adviser) that provide ongoing services to the funds ("Fund Service Providers") for assurance and related services that relate directly to the operations and financial reporting of each fund that are reasonably related to the performance of the audit or review of the fund's financial statements, but not reported as Audit Fees, are shown in the table below.
Billed By | 2007A | 2006A |
PwC | $0 | $0 |
A | Aggregate amounts may reflect rounding. |
Fees included in the audit-related category comprise assurance and related services (e.g., due diligence services) that are traditionally performed by the independent registered public accounting firm. These audit-related services include due diligence related to mergers and acquisitions, accounting consultations and audits in connection with acquisitions, internal control reviews, attest services that are not required by statute or regulation and consultation concerning financial accounting and reporting standards.
(c) Tax Fees.
In each of the fiscal years ended July 31, 2007 and July 31, 2006, the aggregate Tax Fees billed by PwC for professional services rendered for tax compliance, tax advice, and tax planning for each fund is shown in the table below.
Fund | 2007A | 2006A |
Fidelity Ginnie Mae Fund | $2,900 | $2,700 |
Fidelity Government Income Fund | $2,900 | $2,700 |
Fidelity Intermediate Government Income Fund | $2,900 | $2,700 |
Fidelity Ultra-Short Bond Fund | $2,900 | $2,700 |
A | Aggregate amounts may reflect rounding. |
In each of the fiscal years ended July 31, 2007 and July 31, 2006, the aggregate Tax Fees billed by PwC that were required to be approved by the Audit Committee for professional services rendered on behalf of the Fund Service Providers for tax compliance, tax advice, and tax planning that relate directly to the operations and financial reporting of each fund is shown in the table below.
Billed By | 2007A | 2006A |
PwC | $0 | $0 |
A | Aggregate amounts may reflect rounding. |
Fees included in the Tax Fees category comprise all services performed by professional staff in the independent registered public accounting firm's tax division except those services related to the audit. Typically, this category would include fees for tax compliance, tax planning, and tax advice. Tax compliance, tax advice, and tax planning services include preparation of original and amended tax returns, claims for refund and tax payment-planning services, assistance with tax audits and appeals, tax advice related to mergers and acquisitions and requests for rulings or technical advice from taxing authorities.
(d) All Other Fees.
In each of the fiscal years ended July 31, 2007 and July 31, 2006, the aggregate Other Fees billed by PwC for all other non-audit services rendered to the funds is shown in the table below.
Fund | 2007A | 2006A |
Fidelity Ginnie Mae Fund | $3,200 | $4,600 |
Fidelity Government Income Fund | $5,500 | $6,100 |
Fidelity Intermediate Government Income Fund | $1,600 | $2,100 |
Fidelity Ultra-Short Bond Fund | $1,800 | $2,100 |
A | Aggregate amounts may reflect rounding. |
In each of the fiscal years ended July 31, 2007 and July 31, 2006, the aggregate Other Fees billed by PwC that were required to be approved by the Audit Committee for all other non-audit services rendered on behalf of the Fund Service Providers that relate directly to the operations and financial reporting of each fund is shown in the table below.
Billed By | 2007A | 2006A |
PwC | $225,000 | $155,000 |
A | Aggregate amounts may reflect rounding. |
Fees included in the All Other Fees category include services related to internal control reviews, strategy and other consulting, financial information systems design and implementation, consulting on other information systems, and other tax services unrelated to the fund.
(e) (1) | Audit Committee Pre-Approval Policies and Procedures: |
The trust's Audit Committee must pre-approve all audit and non-audit services provided by the independent registered public accounting firm relating to the operations or financial reporting of the funds. Prior to the commencement of any audit or non-audit services to a fund, the Audit Committee reviews the services to determine whether they are appropriate and permissible under applicable law.
The trust's Audit Committee has adopted policies and procedures to, among other purposes, provide a framework for the Committee's consideration of non-audit services by the audit firms that audit the Fidelity funds. The policies and procedures require that any non-audit service provided by a fund audit firm to a Fidelity Fund and any non-audit service provided by a fund auditor to a Fund Service Provider that relates directly to the operations and financial reporting of a Fidelity fund (Covered Service) are subject to approval by the Audit Committee before such service is provided. Non-audit services provided by a fund audit firm for a Fund Service Provider that do not relate directly to the operations and financial reporting of a Fidelity fund (Non-Covered Service) but that are expected to exceed $50,000 are also subject to pre-approval by the Audit Committee.
All Covered Services, as well as Non-Covered Services that are expected to exceed $50,000, must be approved in advance of provision of the service either: (i) by formal resolution of the Audit Committee, or (ii) by oral or written approval of the service by the Chair of the Audit Committee (or if the Chair is unavailable, such other member of the Audit Committee as may be designated by the Chair to act in the Chair's absence). The approval contemplated by (ii) above is permitted where the Treasurer determines that action on such an engagement is necessary before the next meeting of the Audit Committee. Neither pre-approval nor advance notice of Non-Covered Service engagements for which fees are not expected to exceed $50,000 is required; such engagements are to be reported to the Audit Committee monthly.
(e) (2) | Services approved pursuant to paragraph (c)(7)(i)(C) of Rule 2-01 of Regulation S-X: |
Audit-Related Fees:
There were no amounts that were approved by the Audit Committee pursuant to the de minimis exception for the fiscal years ended July 31, 2007 and July 31, 2006 on behalf of each fund.
There were no amounts that were required to be approved by the Audit Committee pursuant to the de minimis exception for the fiscal years ended July 31, 2007 and July 31, 2006 on behalf of the Fund Service Providers that relate directly to the operations and financial reporting of each fund.
Tax Fees:
There were no amounts that were approved by the Audit Committee pursuant to the de minimis exception for the fiscal years ended July 31, 2007 and July 31, 2006 on behalf of each fund.
There were no amounts that were required to be approved by the Audit Committee pursuant to the de minimis exception for the fiscal years ended July 31, 2007 and July 31, 2006 on behalf of the Fund Service Providers that relate directly to the operations and financial reporting of each fund.
All Other Fees:
There were no amounts that were approved by the Audit Committee pursuant to the de minimis exception for the fiscal years ended July 31, 2007 and July 31, 2006 on behalf of each fund.
There were no amounts that were required to be approved by the Audit Committee pursuant to the de minimis exception for the fiscal years ended July 31, 2007 and July 31, 2006 on behalf of the Fund Service Providers that relate directly to the operations and financial reporting of each fund.
(f) Not applicable.
(g) For the fiscal years ended July 31, 2007 and July 31, 2006, the aggregate fees billed by PwC of $1,350,000A and $1,180,000A for non-audit services rendered on behalf of the funds, FMR (not including any sub-adviser whose role is primarily portfolio management and is subcontracted with or overseen by another investment adviser) and Fund Service Providers relating to Covered Services and Non-Covered Services are shown in the table below.
| 2007A | 2006A |
Covered Services | $250,000 | $180,000 |
Non-Covered Services | $1,100,000 | $1,000,000 |
A | Aggregate amounts may reflect rounding. |
(h) The trust's Audit Committee has considered Non-Covered Services that were not pre-approved that were provided by PwC to Fund Service Providers to be compatible with maintaining the independence of PwC in its audit of the funds, taking into account representations from PwC, in accordance with Independence Standards Board Standard No.1, regarding its independence from the funds and their related entities.
Item 5. Audit Committee of Listed Registrants
Not applicable.
Item 6. Schedule of Investments
Not applicable.
Item 7. Disclosure of Proxy Voting Policies and Procedures for Closed-End Management Investment Companies
Not applicable.
Item 8. Portfolio Managers of Closed-End Management Investment Companies
Not applicable.
Item 9. Purchase of Equity Securities by Closed-End Management Investment Company and Affiliated Purchasers
Not applicable.
Item 10. Submission of Matters to a Vote of Security Holders
There were no material changes to the procedures by which shareholders may recommend nominees to the trust's Board of Trustees.
Item 11. Controls and Procedures
(a)(i) The President and Treasurer and the Chief Financial Officer have concluded that the trust's disclosure controls and procedures (as defined in Rule 30a-3(c) under the Investment Company Act) provide reasonable assurances that material information relating to the trust is made known to them by the appropriate persons, based on their evaluation of these controls and procedures as of a date within 90 days of the filing date of this report.
(a)(ii) There was no change in the trust's internal control over financial reporting (as defined in Rule 30a-3(d) under the Investment Company Act) that occurred during the second fiscal quarter of the period covered by this report that has materially affected, or is reasonably likely to materially affect, the trust's internal control over financial reporting.
Item 12. Exhibits
(a) | (1) | Code of Ethics pursuant to Item 2 of Form N-CSR is filed and attached hereto as EX-99.CODE ETH. |
(a) | (2) | Certification pursuant to Rule 30a-2(a) under the Investment Company Act of 1940 (17 CFR 270.30a-2(a)) is filed and attached hereto as Exhibit 99.CERT. |
(a) | (3) | Not applicable. |
(b) | | Certification pursuant to Rule 30a-2(b) under the Investment Company Act of 1940 (17 CFR 270.30a-2(b)) is furnished and attached hereto as Exhibit 99.906CERT. |
SIGNATURES
Pursuant to the requirements of the Securities Exchange Act of 1934 and the Investment Company Act of 1940, the registrant has duly caused this report to be signed on its behalf by the undersigned, thereunto duly authorized.
Fidelity Income Fund
By: | /s/Kimberley Monasterio |
| Kimberley Monasterio |
| President and Treasurer |
| |
Date: | September 27, 2007 |
Pursuant to the requirements of the Securities Exchange Act of 1934 and the Investment Company Act of 1940, this report has been signed below by the following persons on behalf of the registrant and in the capacities and on the dates indicated.
By: | /s/Kimberley Monasterio |
| Kimberley Monasterio |
| President and Treasurer |
| |
Date: | September 27, 2007 |
By: | /s/Joseph B. Hollis |
| Joseph B. Hollis |
| Chief Financial Officer |
| |
Date: | September 27, 2007 |