UNITED STATES
SECURITIES AND EXCHANGE COMMISSION
Washington, D.C. 20549
FORM N-CSR
CERTIFIED SHAREHOLDER REPORT OF REGISTERED
MANAGEMENT INVESTMENT COMPANIES
Investment Company Act file number 811-4085
Fidelity Income Fund
(Exact name of registrant as specified in charter)
245 Summer St., Boston, MA 02210
(Address of principal executive offices) (Zip code)
Marc Bryant, Secretary
245 Summer St.
Boston, Massachusetts 02210
(Name and address of agent for service)
Registrant's telephone number, including area code:
617-563-7000
| |
Date of fiscal year end: | August 31 |
|
|
Date of reporting period: | February 28, 2018 |
Item 1.
Reports to Stockholders
Fidelity Advisor® Government Income Fund -
Class A, Class M, Class C and Class I
Semi-Annual Report February 28, 2018 Class A, Class M, Class C and Class I are classes of Fidelity® Government Income Fund |
 |
Contents
To view a fund's proxy voting guidelines and proxy voting record for the 12-month period ended June 30, visit http://www.fidelity.com/proxyvotingresults or visit the Securities and Exchange Commission's (SEC) web site at http://www.sec.gov.
You may also call 1-877-208-0098 to request a free copy of the proxy voting guidelines.
Standard & Poor's, S&P and S&P 500 are registered service marks of The McGraw-Hill Companies, Inc. and have been licensed for use by Fidelity Distributors Corporation.
Other third-party marks appearing herein are the property of their respective owners.
All other marks appearing herein are registered or unregistered trademarks or service marks of FMR LLC or an affiliated company. © 2018 FMR LLC. All rights reserved.
This report and the financial statements contained herein are submitted for the general information of the shareholders of the Fund. This report is not authorized for distribution to prospective investors in the Fund unless preceded or accompanied by an effective prospectus.
A fund files its complete schedule of portfolio holdings with the SEC for the first and third quarters of each fiscal year on Form N-Q. Forms N-Q are available on the SEC’s web site at http://www.sec.gov. A fund's Forms N-Q may be reviewed and copied at the SEC’s Public Reference Room in Washington, DC. Information regarding the operation of the SEC's Public Reference Room may be obtained by calling 1-800-SEC-0330.
For a complete list of a fund's portfolio holdings, view the most recent holdings listing, semiannual report, or annual report on Fidelity's web site at http://www.fidelity.com, http://www.institutional.fidelity.com, or http://www.401k.com, as applicable.
NOT FDIC INSURED •MAY LOSE VALUE •NO BANK GUARANTEE
Neither the Fund nor Fidelity Distributors Corporation is a bank.
Investment Summary (Unaudited)
The information in the following tables is based on the combined investments of the Fund and its pro-rata share of the investments of Fidelity's Fixed-Income Central Funds.
Coupon Distribution as of February 28, 2018
| | % of fund's investments |
| Zero coupon bonds | 0.3 |
| 0.01 - 0.99% | 0.0 |
| 1 - 1.99% | 19.7 |
| 2 - 2.99% | 27.7 |
| 3 - 3.99% | 24.3 |
| 4 - 4.99% | 14.0 |
| 5 - 5.99% | 7.8 |
| 6 - 6.99% | 0.9 |
| 7% and above | 0.0 |
Coupon distribution shows the range of stated interest rates on the fund's investments, excluding short-term investments.
Asset Allocation (% of fund's net assets)
| As of February 28, 2018*,**,*** |
| | Mortgage Securities | 26.4% |
| | CMOs and Other Mortgage Related Securities | 29.6% |
| | U.S. Treasury Obligations | 36.0% |
| | U.S. Government Agency Obligations† | 2.2% |
| | Foreign Government & Government Agency Obligations | 3.6% |
| | Asset-Backed Securities | 3.9% |
| | Short-Term Investments and Net Other Assets (Liabilities)†† | (1.7)% |

* Foreign investments – 3.6%
** Futures and Swaps – 10.6%
*** Written options - (3.0)%
† Includes NCUA Guaranteed Notes
†† Short-Term Investments and Net Other Assets (Liabilities) are not included in the pie chart
An unaudited holdings listing for the Fund, which presents direct holdings as well as the pro-rata share of any securities and other investments held indirectly through its investment in underlying non-money market Fidelity Central Funds, is available at fidelity.com and/or institutional.fidelity.com, as applicable.
Percentages in the above tables are adjusted for the effect of TBA Sale Commitments.
Percentages shown as 0.0% may reflect amounts less than 0.05%.
Schedule of Investments February 28, 2018 (Unaudited)
Showing Percentage of Net Assets
| U.S. Government and Government Agency Obligations - 38.2% | | | |
| | | Principal Amount (000s) | Value (000s) |
| U.S. Government Agency Obligations - 0.2% | | | |
| Fannie Mae: | | | |
| 0.875% 8/2/19 | | $131 | $129 |
| 1% 2/26/19 | | 326 | 322 |
| 1.125% 12/14/18 | | 240 | 238 |
| Tennessee Valley Authority: | | | |
| 5.25% 9/15/39 | | 2,807 | 3,607 |
| 5.375% 4/1/56 | | 3,438 | 4,559 |
| | | | 8,855 |
| U.S. Treasury Obligations - 36.0% | | | |
| U.S. Treasury Bonds: | | | |
| stripped coupon 2/15/34 | | 23,210 | 14,118 |
| 2.5% 2/15/46 | | 28,232 | 24,909 |
| 2.75% 8/15/47 | | 49,596 | 45,946 |
| 2.75% 11/15/47 | | 4,400 | 4,077 |
| 2.875% 8/15/45 | | 112,441 | 107,188 |
| 3% 11/15/44 | | 29,032 | 28,380 |
| 3% 11/15/45 | | 40,000 | 39,056 |
| 3% 5/15/47 | | 15,900 | 15,498 |
| 3% 2/15/48 | | 4,500 | 4,389 |
| 3.625% 2/15/44 | | 43,531 | 47,450 |
| 4.75% 2/15/37 (a)(b) | | 52,044 | 65,285 |
| 5% 5/15/37 (a)(b)(c) | | 32,242 | 41,648 |
| U.S. Treasury Notes: | | | |
| 1.125% 9/30/21 | | 60,467 | 57,578 |
| 1.375% 4/30/20 | | 29,895 | 29,303 |
| 1.375% 8/31/20 | | 5,000 | 4,881 |
| 1.375% 1/31/21 | | 22,500 | 21,835 |
| 1.375% 4/30/21 | | 15,000 | 14,504 |
| 1.375% 5/31/21 | | 20,000 | 19,313 |
| 1.5% 4/15/20 | | 653 | 642 |
| 1.5% 7/15/20 | | 20,725 | 20,325 |
| 1.5% 8/15/26 | | 9,629 | 8,642 |
| 1.625% 6/30/20 | | 4,710 | 4,633 |
| 1.625% 7/31/20 | | 30,000 | 29,495 |
| 1.625% 8/31/22 | | 17,293 | 16,565 |
| 1.75% 10/31/20 | | 2,405 | 2,366 |
| 1.75% 12/31/20 | | 31,701 | 31,134 |
| 1.75% 6/30/22 | | 34,052 | 32,859 |
| 1.875% 1/31/22 | | 45,770 | 44,592 |
| 1.875% 3/31/22 | | 56,661 | 55,107 |
| 1.875% 7/31/22 | | 85,036 | 82,405 |
| 1.875% 9/30/22(b) | | 28,814 | 27,876 |
| 2% 9/30/20 | | 15,143 | 15,001 |
| 2% 12/31/21 | | 78,894 | 77,291 |
| 2% 7/31/22 | | 18,845 | 18,375 |
| 2% 10/31/22 | | 10,000 | 9,720 |
| 2% 8/15/25 (a) | | 38,778 | 36,632 |
| 2% 11/15/26 | | 12,579 | 11,732 |
| 2.125% 6/30/21 | | 22,000 | 21,746 |
| 2.125% 12/31/21 | | 2,000 | 1,969 |
| 2.125% 6/30/22 | | 146 | 143 |
| 2.125% 7/31/24 | | 77,525 | 74,585 |
| 2.125% 11/30/24 | | 51,557 | 49,440 |
| 2.125% 5/15/25 | | 18,702 | 17,860 |
| 2.25% 2/29/20 | | 22,000 | 21,996 |
| 2.25% 7/31/21 | | 26,021 | 25,801 |
| 2.25% 12/31/24 | | 47,409 | 45,800 |
| 2.25% 2/15/27 | | 3,000 | 2,850 |
| 2.25% 11/15/27 | | 13,251 | 12,538 |
| 2.375% 1/31/23 | | 8,710 | 8,600 |
| 2.375% 5/15/27 | | 2,200 | 2,110 |
| 2.625% 2/28/23 | | 25,000 | 24,973 |
| 2.75% 2/15/28 | | 9,000 | 8,909 |
| | | | 1,430,070 |
| Other Government Related - 2.0% | | | |
| National Credit Union Administration Guaranteed Notes Series 2010-A1 Class A, 1 month U.S. LIBOR + 0.350% 1.9293% 12/7/20 (NCUA Guaranteed) (d)(e) | | 2,394 | 2,397 |
| National Credit Union Administration Guaranteed Notes Master Trust 3.45% 6/12/21 (NCUA Guaranteed) | | 74,000 | 75,522 |
| | | | 77,919 |
| TOTAL U.S. GOVERNMENT AND GOVERNMENT AGENCY OBLIGATIONS | | | |
| (Cost $1,565,589) | | | 1,516,844 |
|
| U.S. Government Agency - Mortgage Securities - 12.0% | | | |
| Fannie Mae - 5.3% | | | |
| 12 month U.S. LIBOR + 1.415% 3.165% 11/1/33 (d)(e) | | 77 | 79 |
| 12 month U.S. LIBOR + 1.480% 3.312% 7/1/34 (d)(e) | | 88 | 91 |
| 12 month U.S. LIBOR + 1.523% 3.218% 3/1/36 (d)(e) | | 340 | 352 |
| 12 month U.S. LIBOR + 1.551% 2.488% 2/1/44 (d)(e) | | 308 | 317 |
| 12 month U.S. LIBOR + 1.553% 2.611% 5/1/44 (d)(e) | | 972 | 997 |
| 12 month U.S. LIBOR + 1.553% 3.326% 6/1/36 (d)(e) | | 81 | 84 |
| 12 month U.S. LIBOR + 1.558% 2.449% 2/1/44 (d)(e) | | 393 | 405 |
| 12 month U.S. LIBOR + 1.565% 3.315% 3/1/37 (d)(e) | | 111 | 116 |
| 12 month U.S. LIBOR + 1.570% 2.559% 5/1/44 (d)(e) | | 528 | 542 |
| 12 month U.S. LIBOR + 1.574% 2.656% 4/1/44 (d)(e) | | 1,396 | 1,436 |
| 12 month U.S. LIBOR + 1.580% 2.44% 4/1/44 (d)(e) | | 555 | 570 |
| 12 month U.S. LIBOR + 1.580% 2.519% 1/1/44 (d)(e) | | 576 | 593 |
| 12 month U.S. LIBOR + 1.725% 2.592% 6/1/42 (d)(e) | | 236 | 243 |
| 12 month U.S. LIBOR + 1.728% 3.445% 11/1/36 (d)(e) | | 54 | 57 |
| 12 month U.S. LIBOR + 1.741% 3.477% 3/1/40 (d)(e) | | 1,055 | 1,087 |
| 12 month U.S. LIBOR + 1.745% 3.448% 7/1/35 (d)(e) | | 124 | 128 |
| 12 month U.S. LIBOR + 1.800% 2.747% 1/1/42 (d)(e) | | 804 | 834 |
| 12 month U.S. LIBOR + 1.800% 3.573% 7/1/41 (d)(e) | | 210 | 221 |
| 12 month U.S. LIBOR + 1.818% 2.689% 2/1/42 (d)(e) | | 1,145 | 1,187 |
| 12 month U.S. LIBOR + 1.818% 3.016% 9/1/41 (d)(e) | | 120 | 124 |
| 12 month U.S. LIBOR + 1.818% 3.266% 7/1/41 (d)(e) | | 161 | 169 |
| 12 month U.S. LIBOR + 1.830% 3.337% 10/1/41 (d)(e) | | 110 | 116 |
| 12 month U.S. LIBOR + 1.851% 3.518% 5/1/36 (d)(e) | | 66 | 68 |
| 6 month U.S. LIBOR + 1.475% 2.975% 10/1/33 (d)(e) | | 70 | 72 |
| 6 month U.S. LIBOR + 1.510% 3.043% 2/1/33 (d)(e) | | 47 | 48 |
| 6 month U.S. LIBOR + 1.535% 2.938% 12/1/34 (d)(e) | | 105 | 108 |
| 6 month U.S. LIBOR + 1.535% 2.958% 3/1/35 (d)(e) | | 53 | 55 |
| 6 month U.S. LIBOR + 1.556% 3.046% 10/1/33 (d)(e) | | 39 | 40 |
| 6 month U.S. LIBOR + 1.565% 2.999% 7/1/35 (d)(e) | | 46 | 47 |
| U.S. TREASURY 1 YEAR INDEX + 1.965% 2.84% 2/1/36 (d)(e) | | 46 | 48 |
| U.S. TREASURY 1 YEAR INDEX + 2.208% 3.083% 3/1/35 (d)(e) | | 49 | 52 |
| U.S. TREASURY 1 YEAR INDEX + 2.295% 3.54% 10/1/33 (d)(e) | | 83 | 87 |
| 3.5% 3/1/48 (f) | | 98,100 | 97,921 |
| 4% 5/1/29 to 1/1/47 | | 42,827 | 44,165 |
| 4% 3/1/48 (f) | | 7,000 | 7,171 |
| 4% 4/1/48 (f) | | 7,000 | 7,159 |
| 4.5% 11/1/25 to 6/1/41 | | 7,358 | 7,715 |
| 5.5% 12/1/39 to 5/1/44 | | 29,060 | 31,974 |
| 6% 1/1/34 to 6/1/36 | | 4,437 | 4,948 |
| 6.5% 3/1/22 to 5/1/27 | | 226 | 247 |
| 9.5% 10/1/20 | | 3 | 3 |
| 11.5% 1/15/21 | | 0 | 0 |
| | | | 211,676 |
| Freddie Mac - 0.6% | | | |
| 12 month U.S. LIBOR + 1.754% 3.067% 9/1/41 (d)(e) | | 1,164 | 1,218 |
| 12 month U.S. LIBOR + 1.874% 3.634% 10/1/42 (d)(e) | | 639 | 668 |
| 12 month U.S. LIBOR + 1.877% 3.213% 4/1/41 (d)(e) | | 107 | 110 |
| 12 month U.S. LIBOR + 1.880% 3.055% 10/1/41 (d)(e) | | 1,785 | 1,859 |
| 12 month U.S. LIBOR + 1.880% 3.206% 9/1/41 (d)(e) | | 126 | 130 |
| 12 month U.S. LIBOR + 1.910% 3.278% 6/1/41 (d)(e) | | 129 | 135 |
| 12 month U.S. LIBOR + 1.910% 3.417% 5/1/41 (d)(e) | | 129 | 136 |
| 12 month U.S. LIBOR + 1.910% 3.579% 5/1/41 (d)(e) | | 174 | 183 |
| 12 month U.S. LIBOR + 1.910% 3.677% 6/1/41 (d)(e) | | 163 | 171 |
| 12 month U.S. LIBOR + 2.045% 3.811% 7/1/36 (d)(e) | | 241 | 255 |
| 12 month U.S. LIBOR + 2.197% 3.771% 3/1/33 (d)(e) | | 6 | 7 |
| 6 month U.S. LIBOR + 1.445% 2.945% 3/1/35 (d)(e) | | 154 | 158 |
| 6 month U.S. LIBOR + 1.746% 3.092% 5/1/37 (d)(e) | | 110 | 114 |
| 6 month U.S. LIBOR + 2.755% 4.273% 10/1/35 (d)(e) | | 118 | 125 |
| U.S. TREASURY 1 YEAR INDEX + 2.383% 3.441% 2/1/36 (d)(e) | | 10 | 11 |
| U.S. TREASURY 1 YEAR INDEX + 2.548% 3.548% 7/1/35 (d)(e) | | 485 | 506 |
| 3% 2/1/31 | | 9,474 | 9,470 |
| 4% 5/1/47 to 7/1/47 | | 4,245 | 4,353 |
| 4.5% 5/1/39 to 10/1/41 | | 2,334 | 2,470 |
| 5.5% 7/1/29 | | 17 | 18 |
| 6% 1/1/24 | | 807 | 853 |
| 9.5% 11/1/19 to 8/1/21 | | 2 | 2 |
| | | | 22,952 |
| Ginnie Mae - 6.1% | | | |
| 6% 6/15/36 | | 3,610 | 4,145 |
| 4.312% 8/20/61 (d)(g) | | 1,468 | 1,480 |
| 4.5% 3/1/48 (f) | | 12,800 | 13,314 |
| 4.5% 3/1/48 (f) | | 10,950 | 11,389 |
| 4.5% 3/1/48 (f) | | 10,950 | 11,389 |
| 4.5% 3/1/48 (f) | | 11,400 | 11,858 |
| 4.5% 3/1/48 (f) | | 17,050 | 17,734 |
| 4.5% 3/1/48 (f) | | 42,650 | 44,362 |
| 4.5% 4/1/48 (f) | | 49,400 | 51,323 |
| 4.5% 4/1/48 (f) | | 56,400 | 58,595 |
| 4.642% 2/20/62 (d)(g) | | 1,905 | 1,938 |
| 4.674% 2/20/62 (d)(g) | | 2,328 | 2,362 |
| 4.698% 1/20/62 (d)(g) | | 12,873 | 13,054 |
| 5.47% 8/20/59 (d)(g) | | 14 | 14 |
| | | | 242,957 |
| TOTAL U.S. GOVERNMENT AGENCY - MORTGAGE SECURITIES | | | |
| (Cost $479,703) | | | 477,585 |
|
| Asset-Backed Securities - 3.9% | | | |
| GCO Education Loan Funding Trust Series 2006-1 Class A8L, 3 month U.S. LIBOR + 0.130% 2.0736% 5/25/25 (d)(e) | | $7,233 | $7,226 |
| Goal Capital Funding Trust Series 2005-2 Class A3, 3 month U.S. LIBOR + 0.170% 2.1136% 5/28/30 (d)(e) | | 3,496 | 3,492 |
| Illinois Student Assistance Commission Student Loan Rev. Series 2010-1 Class A2, 3 month U.S. LIBOR + 1.050% 2.4174% 4/25/22 (d)(e) | | 993 | 994 |
| Navient Student Loan Trust: | | | |
| Series 2017-3A: | | | |
| Class A1, 1 month U.S. LIBOR + 0.300% 1.9207% 7/26/66 (d)(e)(h) | | 9,737 | 9,742 |
| Class A2, 1 month U.S. LIBOR + 0.600% 2.2207% 7/26/66 (d)(e)(h) | | 14,550 | 14,642 |
| Series 2018-1A Class A1, 1 month U.S. LIBOR + 0.250% 1.7514% 3/25/67 (d)(e)(h) | | 16,267 | 16,261 |
| Nelnet Student Loan Trust 3 month U.S. LIBOR + 0.100% 1.8452% 1/25/30 (d)(e) | | 8,717 | 8,703 |
| Northstar Education Finance, Inc., Delaware Series 2004-2 Class A4, 3 month U.S. LIBOR + 0.230% 1.608% 7/28/21 (d)(e) | | 26,023 | 26,002 |
| SLM Student Loan Trust Series 2007-8 Class A4, 3 month U.S. LIBOR + 0.470% 2.2152% 1/26/26 (d)(e) | | 64,752 | 64,921 |
| Small Business Administration guaranteed development participation certificates: | | | |
| Series 2002-20J Class 1, 4.75% 10/1/22 | | 558 | 568 |
| Series 2002-20K Class 1, 5.08% 11/1/22 | | 834 | 861 |
| Series 2004-20H Class 1, 5.17% 8/1/24 | | 342 | 357 |
| TOTAL ASSET-BACKED SECURITIES | | | |
| (Cost $153,633) | | | 153,769 |
|
| Collateralized Mortgage Obligations - 16.7% | | | |
| U.S. Government Agency - 16.7% | | | |
| Fannie Mae: | | | |
| floater: | | $ | $ |
| Series 2001-38 Class QF, 1 month U.S. LIBOR + 0.980% 2.6007% 8/25/31 (d)(e) | | 78 | 80 |
| Series 2002-49 Class FB, 1 month U.S. LIBOR + 0.600% 2.19% 11/18/31 (d)(e) | | 72 | 73 |
| Series 2002-60 Class FV, 1 month U.S. LIBOR + 1.000% 2.6207% 4/25/32 (d)(e) | | 31 | 32 |
| Series 2002-75 Class FA, 1 month U.S. LIBOR + 1.000% 2.6207% 11/25/32 (d)(e) | | 63 | 65 |
| Series 2010-15 Class FJ, 1 month U.S. LIBOR + 0.930% 2.5507% 6/25/36 (d)(e) | | 4,730 | 4,803 |
| planned amortization class: | | | |
| Series 2005-19 Class PA, 5.5% 7/25/34 | | 972 | 999 |
| Series 2005-64 Class PX, 5.5% 6/25/35 | | 1,264 | 1,337 |
| Series 2005-68 Class CZ, 5.5% 8/25/35 | | 3,778 | 4,126 |
| Series 2006-45 Class OP 6/25/36 (i) | | 649 | 550 |
| Series 2010-118 Class PB, 4.5% 10/25/40 | | 5,382 | 5,554 |
| Series 2012-149: | | | |
| Class DA, 1.75% 1/25/43 | | 970 | 928 |
| Class GA, 1.75% 6/25/42 | | 954 | 911 |
| sequential payer: | | | |
| Series 2003-117 Class MD, 5% 12/25/23 | | 660 | 688 |
| Series 2004-91 Class Z, 5% 12/25/34 | | 4,427 | 4,725 |
| Series 2005-117 Class JN, 4.5% 1/25/36 | | 322 | 335 |
| Series 2005-14 Class ZB, 5% 3/25/35 | | 1,379 | 1,475 |
| Series 2006-72 Class CY, 6% 8/25/26 | | 2,734 | 2,909 |
| Series 2009-59 Class HB, 5% 8/25/39 | | 2,046 | 2,188 |
| Series 201-75 Class AL, 3.5% 8/25/26 | | 11,851 | 12,087 |
| Series 2010-97 Class CX, 4.5% 9/25/25 | | 10,927 | 11,406 |
| Series 2011-80: | | | |
| Class HE, 3.5% 8/25/26 | | 4,160 | 4,254 |
| Class KB, 3.5% 8/25/26 | | 6,462 | 6,598 |
| Series 2009-85 Class IB, 4.5% 8/25/24 (j) | | 160 | 6 |
| Series 2009-93 Class IC, 4.5% 9/25/24 (j) | | 219 | 7 |
| Series 2010-139 Class NI, 4.5% 2/25/40 (j) | | 2,898 | 296 |
| Series 2010-39 Class FG, 1 month U.S. LIBOR + 0.920% 2.5407% 3/25/36 (d)(e) | | 2,958 | 3,023 |
| Series 2010-97 Class CI, 4.5% 8/25/25 (j) | | 636 | 30 |
| Series 2012-27 Class EZ, 4.25% 3/25/42 | | 6,806 | 7,047 |
| Series 2016-26 Class CG, 3% 5/25/46 | | 18,866 | 18,773 |
| Freddie Mac: | | | |
| floater: | | | |
| Series 2530 Class FE, 1 month U.S. LIBOR + 0.600% 2.1875% 2/15/32 (d)(e) | | 42 | 42 |
| Series 2630 Class FL, 1 month U.S. LIBOR + 0.500% 2.0875% 6/15/18 (d)(e) | | 2 | 2 |
| Series 2682 Class FB, 1 month U.S. LIBOR + 0.900% 2.4875% 10/15/33 (d)(e) | | 2,203 | 2,235 |
| Series 2711 Class FC, 1 month U.S. LIBOR + 0.900% 2.4875% 2/15/33 (d)(e) | | 1,347 | 1,373 |
| planned amortization class: | | | |
| Series 1141 Class G, 9% 9/15/21 | | 26 | 28 |
| Series 2682 Class LD, 4.5% 10/15/33 | | 591 | 617 |
| Series 3415 Class PC, 5% 12/15/37 | | 405 | 431 |
| Series 3840 Class VA, 4.5% 9/15/27 | | 3,465 | 3,502 |
| Series 3857 Class ZP, 5% 5/15/41 | | 3,067 | 3,457 |
| Series 4135 Class AB, 1.75% 6/15/42 | | 713 | 681 |
| sequential payer: | | | |
| Series 2004-2802 Class ZG, 5.5% 5/15/34 | | 6,664 | 7,274 |
| Series 2587 Class AD, 4.71% 3/15/33 | | 2,368 | 2,462 |
| Series 2773 Class HC, 4.5% 4/15/19 | | 46 | 46 |
| Series 2877 Class ZD, 5% 10/15/34 | | 5,452 | 5,823 |
| Series 3007 Class EW, 5.5% 7/15/25 | | 4,333 | 4,580 |
| Series 3745 Class KV, 4.5% 12/15/26 | | 6,018 | 6,310 |
| Series 3806 Class L, 3.5% 2/15/26 | | 8,900 | 9,102 |
| Series 3862 Class MB, 3.5% 5/15/26 | | 6,893 | 7,039 |
| Series 3871 Class KB, 5.5% 6/15/41 | | 13,870 | 15,553 |
| Series 3889 Class DZ, 4% 1/15/41 | | 35,497 | 36,351 |
| Series 3843 Class PZ, 5% 4/15/41 | | 2,623 | 2,927 |
| Freddie Mac Multi-family Structured pass-thru certificates sequential payer: | | | |
| Series 4335 Class AL, 4.25% 3/15/40 | | 6,078 | 6,268 |
| Series 4341 Class ML, 3.5% 11/15/31 | | 8,800 | 8,954 |
| Ginnie Mae guaranteed REMIC pass-thru certificates: | | | |
| floater: | | | |
| Series 2008-2 Class FD, 1 month U.S. LIBOR + 0.480% 2.0412% 1/20/38 (d)(e) | | 216 | 217 |
| Series 2008-73 Class FA, 1 month U.S. LIBOR + 0.860% 2.4212% 8/20/38 (d)(e) | | 1,663 | 1,692 |
| Series 2008-83 Class FB, 1 month U.S. LIBOR + 0.900% 2.4612% 9/20/38 (d)(e) | | 1,416 | 1,446 |
| Series 2009-108 Class CF, 1 month U.S. LIBOR + 0.600% 2.1881% 11/16/39 (d)(e) | | 881 | 887 |
| Series 2011-H20 Class FA, 1 month U.S. LIBOR + 0.550% 1.9294% 9/20/61 (d)(e)(g) | | 8,184 | 8,215 |
| Series 2011-H21 Class FA, 1 month U.S. LIBOR + 0.600% 1.9794% 10/20/61 (d)(e)(g) | | 5,344 | 5,368 |
| Series 2012-H01 Class FA, 1 month U.S. LIBOR + 0.700% 2.0794% 11/20/61 (d)(e)(g) | | 4,547 | 4,582 |
| Series 2012-H03 Class FA, 1 month U.S. LIBOR + 0.700% 2.0794% 1/20/62 (d)(e)(g) | | 2,991 | 3,013 |
| Series 2012-H06 Class FA, 1 month U.S. LIBOR + 0.630% 2.0094% 1/20/62 (d)(e)(g) | | 4,282 | 4,306 |
| Series 2012-H07 Class FA, 1 month U.S. LIBOR + 0.630% 2.0094% 3/20/62 (d)(e)(g) | | 2,638 | 2,653 |
| Series 2012-H21 Class DF, 1 month U.S. LIBOR + 0.650% 2.0294% 5/20/61 (d)(e)(g) | | 2,264 | 2,268 |
| Series 2013-H19: | | | |
| Class FC, 1 month U.S. LIBOR + 0.600% 1.9794% 8/20/63 (d)(e)(g) | | 1,091 | 1,096 |
| Class FD, 1 month U.S. LIBOR + 0.600% 1.9794% 8/20/63 (d)(e)(g) | | 2,838 | 2,849 |
| Series 2014-H02 Class FB, 1 month U.S. LIBOR + 0.650% 2.2118% 12/20/63 (d)(e)(g) | | 35,584 | 35,830 |
| Series 2014-H03 Class FA, 1 month U.S. LIBOR + 0.600% 2.1618% 1/20/64 (d)(e)(g) | | 13,245 | 13,307 |
| Series 2015-H07 Class FA, 1 month U.S. LIBOR + 0.300% 1.8618% 3/20/65 (d)(e)(g) | | 6,465 | 6,466 |
| Series 2015-H13 Class FL, 1 month U.S. LIBOR + 0.280% 1.8418% 5/20/63 (d)(e)(g) | | 8,210 | 8,212 |
| Series 2015-H19 Class FA, 1 month U.S. LIBOR + 0.200% 1.7618% 4/20/63 (d)(e)(g) | | 9,484 | 9,481 |
| Series 2016-H20 Class FM, 1 month U.S. LIBOR + 0.400% 1.9618% 12/20/62 (d)(e)(g) | | 10,209 | 10,219 |
| planned amortization class Series 2010-31 Class BP, 5% 3/20/40 | | 11,191 | 12,122 |
| sequential payer: | | | |
| Series 2011-69 Class GX, 4.5% 5/16/40 | | 10,205 | 10,741 |
| Series 2013-H06 Class HA, 1.65% 1/20/63 (g) | | 4,122 | 4,072 |
| Series 2013-H26 Class HA, 3.5% 9/20/63 (g) | | 35,666 | 35,998 |
| Series 2014-H04 Class HA, 2.75% 2/20/64 (g) | | 8,623 | 8,595 |
| Series 2014-H12 Class KA, 2.75% 5/20/64 (g) | | 4,728 | 4,682 |
| Series 2016-H02 Class FM, 1 month U.S. LIBOR + 0.500% 2.0618% 9/20/62 (d)(e)(g) | | 17,875 | 17,924 |
| Series 2016-H04 Class FE, 1 month U.S. LIBOR + 0.650% 2.2118% 11/20/65 (d)(e)(g) | | 3,183 | 3,194 |
| Series 2004-22 Class M1, 5.5% 4/20/34 | | 600 | 717 |
| Series 2010-169 Class Z, 4.5% 12/20/40 | | 6,980 | 7,347 |
| Series 2010-H15 Class TP, 5.15% 8/20/60 (g) | | 10,915 | 11,139 |
| Series 2010-H17 Class XP, 5.2946% 7/20/60 (d)(g) | | 10,751 | 11,011 |
| Series 2010-H18 Class PL, 5.01% 9/20/60 (d)(g) | | 9,679 | 9,862 |
| Series 2012-64 Class KI, 3.5% 11/20/36 (j) | | 978 | 77 |
| Series 2013-124: | | | |
| Class ES, 8.667% - 1 month U.S. LIBOR 6.5851% 4/20/39 (d)(k) | | 3,530 | 3,617 |
| Class ST, 8.800% - 1 month U.S. LIBOR 6.7184% 8/20/39 (d)(k) | | 9,799 | 10,156 |
| Series 2013-H07 Class JA, 1.75% 3/20/63 (g) | | 23,116 | 22,782 |
| Series 2015-H17 Class HA, 2.5% 5/20/65 (g) | | 12,428 | 12,391 |
| Series 2015-H21: | | | |
| Class HA, 2.5% 6/20/63 (g) | | 34,918 | 34,841 |
| Class JA, 2.5% 6/20/65 (g) | | 4,043 | 4,032 |
| Series 2015-H30 Class HA, 1.75% 9/20/62 (d)(g) | | 36,646 | 36,236 |
| Series 2016-H13 Class FB, U.S. TREASURY 1 YEAR INDEX + 0.500% 1.65% 5/20/66 (d)(e)(g) | | 23,600 | 23,730 |
| Series 2017-H06 Class FA, U.S. TREASURY 1 YEAR INDEX + 0.350% 2.11% 8/20/66 (d)(e)(g) | | 20,958 | 21,014 |
| Series 2090-118 Class XZ, 5% 12/20/39 | | 14,448 | 15,777 |
| | | | 664,526 |
| TOTAL COLLATERALIZED MORTGAGE OBLIGATIONS | | | |
| (Cost $676,388) | | | 664,526 |
|
| Commercial Mortgage Securities - 10.4% | | | |
| Fannie Mae Series 2017-T1 Class A, 2.898% 6/25/27 | | 46,890 | 45,022 |
| FHLMC Multi-Family Structured Pass-Through Certificates sequential payer: | | | |
| Series K071 Class A2, 3.289% 11/25/27 | | 8,900 | 8,884 |
| Series K072 Class A2, 3.444% 12/25/50 | | 21,029 | 21,263 |
| Freddie Mac: | | | |
| floater: | | | |
| Series KP04 Class AG1, 1 month U.S. LIBOR + 0.220% 1.7997% 7/25/20 (d)(e) | | 10,600 | 10,610 |
| Series KP04, Class AG2, 1 month U.S. LIBOR + 0.200% 1.7797% 10/25/19 (d)(e) | | 21,200 | 21,210 |
| pass-thru certificates sequential payer Series K011 Class A2, 4.084% 11/25/20 | | 3,740 | 3,860 |
| sequential payer: | | | |
| Series 2017-SR01 Class A2, 2.75% 11/25/22 | | 19,000 | 18,780 |
| Series K009 Class A2, 3.808% 8/25/20 | | 5,591 | 5,728 |
| Series K034 Class A1, 2.669% 2/25/23 | | 10,896 | 10,824 |
| Series K073 Class A2, 3.35% 1/25/28 | | 33,000 | 33,081 |
| Series K708 Class A2, 2.13% 1/25/19 | | 23,574 | 23,502 |
| Series K709 Class A2, 2.086% 3/25/19 | | 17,210 | 17,143 |
| Series K710 Class A2, 1.883% 5/25/19 | | 16,814 | 16,719 |
| Series K713 Class A2, 2.313% 3/25/20 | | 5,437 | 5,399 |
| Series K717 Class A2, 2.991% 9/25/21 | | 12,968 | 13,012 |
| Series K729 Class A1, 2.9184% 2/25/24 | | 24,304 | 24,288 |
| Series K032 Class A1, 3.016% 2/25/23 | | 18,386 | 18,497 |
| Series K504 Class A2, 2.566% 9/25/20 | | 15,428 | 15,409 |
| Series K704 Class A2, 2.412% 8/25/18 | | 4,481 | 4,479 |
| Series K706 Class A2, 2.323% 10/25/18 | | 9,365 | 9,360 |
| Series K724 Class A1, 2.776% 3/25/23 | | 15,830 | 15,770 |
| Series K726 Class A1, 2.596% 8/25/23 | | 4,796 | 4,748 |
| Series K730 Class A1, 3.447% 9/24/24 | | 22,600 | 23,051 |
| Freddie Mac Multi-family floater Series 2017-KT01 Class A, 1 month U.S. LIBOR + 0.320% 1.8814% 2/25/20 (d)(e) | | 43,722 | 43,884 |
| TOTAL COMMERCIAL MORTGAGE SECURITIES | | | |
| (Cost $419,760) | | | 414,523 |
|
| Foreign Government and Government Agency Obligations - 3.6% | | | |
| Israeli State: | | | |
| (guaranteed by U.S. Government through Agency for International Development): | | | |
| 5.5% 9/18/23 | | 72,266 | 82,037 |
| 5.5% 12/4/23 | | 48 | 55 |
| 5.5% 4/26/24 | | 6,065 | 6,936 |
| Jordanian Kingdom 3% 6/30/25 | | 19,267 | 19,336 |
| Ukraine Government 1.471% 9/29/21 | | 34,809 | 33,458 |
| TOTAL FOREIGN GOVERNMENT AND GOVERNMENT AGENCY OBLIGATIONS | | | |
| (Cost $135,746) | | | 141,822 |
| | | Shares | Value (000s) |
|
| Fixed-Income Funds - 21.6% | | | |
| Fidelity Mortgage Backed Securities Central Fund (l) | | | |
| (Cost $852,107) | | 8,146,148 | 858,767 |
|
| Money Market Funds - 3.1% | | | |
| Fidelity Cash Central Fund, 1.41% (m) | | | |
| (Cost $122,981) | | 122,956,009 | 122,981 |
| Purchased Swaptions - 0.2% | | | | |
| | | Expiration Date | Notional Amount (000s) | Value (000s) |
| Put Options - 0.1% | | | | |
| Option on an interest rate swap with Goldman Sachs Bank U.S.A. to pay semi-annually a fixed rate of 2.495% and receive quarterly a floating rate based on 3-month LIBOR, expiring October 2027 | | 10/5/20 | 13,400 | $624 |
| Option on an interest rate swap with Goldman Sachs Bank U.S.A. to pay semi-annually a fixed rate of 2.7875% and receive quarterly a floating rate based on 3-month LIBOR, expiring January 2028 | | 1/25/21 | 77,100 | 2,894 |
| Option on an interest rate swap with JPMorgan Chase Bank NA to pay semi-annually a fixed rate of 2.5340% and receive quarterly a floating rate based on 3-month LIBOR, expiring December 2027 | | 12/8/20 | 44,800 | 2,057 |
|
| TOTAL PUT OPTIONS | | | | 5,575 |
|
| Call Options - 0.1% | | | | |
| Option on an interest rate swap with Goldman Sachs Bank U.S.A. to receive semi-annually a fixed rate of 2.495% and pay quarterly a floating rate based on 3-month LIBOR, expiring October 2027 | | 10/5/20 | 13,400 | 235 |
| Option on an interest rate swap with Goldman Sachs Bank U.S.A. to receive semi-annually a fixed rate of 2.7875% and pay quarterly a floating rate based on 3-month LIBOR, expiring January 2028 | | 1/25/21 | 77,100 | 1,965 |
| Option on an interest rate swap with JPMorgan Chase Bank NA to receive semi-annually a fixed rate of 2.5340% and pay quarterly a floating rate based on 3-month LIBOR, expiring December 2027 | | 12/8/20 | 44,800 | 849 |
|
| TOTAL CALL OPTIONS | | | | 3,049 |
|
| TOTAL PURCHASED SWAPTIONS | | | | |
| (Cost $8,178) | | | | 8,624 |
| TOTAL INVESTMENT IN SECURITIES - 109.7% | | | | |
| (Cost $4,414,085) | | | | 4,359,441 |
| NET OTHER ASSETS (LIABILITIES) - (9.7)% | | | | (384,188) |
| NET ASSETS - 100% | | | | $3,975,253 |
| TBA Sale Commitments | | |
| | Principal Amount (000s) | Value (000s) |
| Fannie Mae | | |
| 3.5% 3/1/48 | $(98,100) | $(97,922) |
| 4% 3/1/48 | (7,000) | (7,170) |
|
| TOTAL FANNIE MAE | | (105,092) |
|
| Ginnie Mae | | |
| 4.5% 3/1/48 | (49,400) | (51,383) |
| 4.5% 3/1/48 | (56,400) | (58,663) |
|
| TOTAL GINNIE MAE | | (110,046) |
|
| TOTAL TBA SALE COMMITMENTS | | |
| (Proceeds $215,065) | | $(215,138) |
| Written Swaptions | | | |
| | Expiration Date | Notional Amount | Value (000s) |
| Put Swaptions | | | |
| Option on an interest rate swap with Goldman Sachs Bank U.S.A. to pay semi-annually a fixed rate of 3.065% and receive quarterly a floating rate based on 3-month LIBOR, expiring January 2028 | 2/5/21 | 57,570 | $(1,702) |
| Call Swaptions | | | |
| Option on an interest rate swap with Goldman Sachs Bank U.S.A. to receive semi-annually a fixed rate of 3.065% and pay quarterly a floating rate based on 3-month LIBOR, expiring January 2028 | 2/5/21 | 57,570 | (1,955) |
| TOTAL WRITTEN SWAPTIONS | | | $(3,657) |
| Futures Contracts | | | | | |
| | Number of contracts | Expiration Date | Notional Amount (000s) | Value (000s) | Unrealized Appreciation/(Depreciation) (000s) |
| Purchased | | | | | |
| Treasury Contracts | | | | | |
| CBOT 10-Year U.S. Treasury Note Contracts (United States) | 730 | June 2018 | $87,634 | $141 | $141 |
| CBOT 2-Year U.S. Treasury Note Contracts (United States) | 872 | June 2018 | 185,273 | (2) | (2) |
| CBOT 5-Year U.S. Treasury Note Contracts (United States) | 636 | June 2018 | 72,459 | (255) | (255) |
| CBOT Long Term U.S. Treasury Bond Contracts (United States) | 238 | June 2018 | 34,138 | 416 | 416 |
| CBOT Ultra 10-Year U.S. Treasury Note Contracts (United States) | 75 | June 2018 | 9,605 | 29 | 29 |
| TOTAL FUTURES CONTRACTS | | | | | $329 |
The notional amount of futures purchased as a percentage of Net Assets is 9.8%
For the period, the average monthly underlying face amount at value for futures contracts in the aggregate was $385,714.
Swaps
| Payment Received | Payment Frequency | Payment Paid | Payment Frequency | Clearinghouse / Counterparty(1) | Maturity Date | Notional Amount (000s) | Value (000s) | Upfront Premium Received/(Paid) (000s)(2) | Unrealized Appreciation/(Depreciation) (000s) |
| Interest Rate Swaps | | | | | | | | | |
| 2% | Semi - annual | 3-month LIBOR(3) | Quarterly | LCH | Mar. 2025 | $19,866 | $(289) | $0 | $(289) |
(1) Swaps with LCH Clearnet Group (LCH) are centrally cleared over-the-counter (OTC) swaps.
(2) Any premiums for centrally cleared over-the-counter (OTC) swaps are recorded periodically throughout the term of the swap to variation margin and included in unrealized appreciation (depreciation).
(3) Represents floating rate.
Values shown as $0 may reflect amounts less than $500.
Legend
(a) Security or a portion of the security was pledged to cover margin requirements for futures contracts. At period end, the value of securities pledged amounted to $2,189,000.
(b) Security or a portion of the security has been segregated as collateral for mortgage-backed or asset-backed securities purchased on a delayed delivery or when-issued basis. At period end, the value of securities pledged amounted to $170,000.
(c) Security or a portion of the security was pledged to cover margin requirements for centrally cleared OTC swaps. At period end, the value of securities pledged amounted to $674,000.
(d) Coupon rates for floating and adjustable rate securities reflect the rates in effect at period end.
(e) Coupon is indexed to a floating interest rate which may be multiplied by a specified factor and/or subject to caps or floors.
(f) Security or a portion of the security purchased on a delayed delivery or when-issued basis.
(g) Represents an investment in an underlying pool of reverse mortgages which typically do not require regular principal and interest payments as repayment is deferred until a maturity event.
(h) Security exempt from registration under Rule 144A of the Securities Act of 1933. These securities may be resold in transactions exempt from registration, normally to qualified institutional buyers. At the end of the period, the value of these securities amounted to $40,645,000 or 1.0% of net assets.
(i) Principal Only Strips represent the right to receive the monthly principal payments on an underlying pool of mortgage loans.
(j) Security represents right to receive monthly interest payments on an underlying pool of mortgages or assets. Principal shown is the outstanding par amount of the pool as of the end of the period.
(k) Coupon is inversely indexed to a floating interest rate multiplied by a specified factor. The price may be considerably more volatile than the price of a comparable fixed rate security.
(l) Affiliated fund that is generally available only to investment companies and other accounts managed by Fidelity Investments. A complete unaudited schedule of portfolio holdings for each Fidelity Central Fund is filed with the SEC for the first and third quarters of each fiscal year on Form N-Q and is available upon request or at the SEC's website at www.sec.gov. An unaudited holdings listing for the Fund, which presents direct holdings as well as the pro-rata share of securities and other investments held indirectly through its investment in underlying non-money market Fidelity Central Funds, is available at fidelity.com and/or institutional.fidelity.com, as applicable. In addition, each Fidelity Central Fund's financial statements are available on the SEC's website or upon request.
(m) Affiliated fund that is generally available only to investment companies and other accounts managed by Fidelity Investments. The rate quoted is the annualized seven-day yield of the fund at period end. A complete unaudited listing of the fund's holdings as of its most recent quarter end is available upon request. In addition, each Fidelity Central Fund's financial statements are available on the SEC's website or upon request.
Affiliated Central Funds
Information regarding fiscal year to date income earned by the Fund from investments in Fidelity Central Funds is as follows:
| Fund | Income earned |
| | (Amounts in thousands) |
| Fidelity Cash Central Fund | $226 |
| Fidelity Mortgage Backed Securities Central Fund | 12,490 |
| Total | $12,716 |
Amounts in the income column in the above table include any capital gain distributions from underlying funds, which are presented in the corresponding line-item in the Statement of Operations if applicable.
Additional information regarding the Fund's fiscal year to date purchases and sales, including the ownership percentage, of the non Money Market Central Funds is as follows:
| Fund (Amounts in thousands) | Value, beginning of period | Purchases | Sales Proceeds | Realized Gain/Loss | Change in Unrealized appreciation (depreciation) | Value, end of period | % ownership, end of period |
| Fidelity Mortgage Backed Securities Central Fund | $939,005 | $100,490 | $152,000 | $3,913 | $(32,641) | $858,767 | 12.0% |
| Total | $939,005 | $100,490 | $152,000 | $3,913 | $(32,641) | $858,767 | |
Investment Valuation
The following is a summary of the inputs used, as of February 28, 2018, involving the Fund's assets and liabilities carried at fair value. The inputs or methodology used for valuing securities may not be an indication of the risk associated with investing in those securities. For more information on valuation inputs, and their aggregation into the levels used below, please refer to the Investment Valuation section in the accompanying Notes to Financial Statements.
| | Valuation Inputs at Reporting Date: |
| Description | Total | Level 1 | Level 2 | Level 3 |
| (Amounts in thousands) | | | | |
| Investments in Securities: | | | | |
| U.S. Government and Government Agency Obligations | $1,516,844 | $-- | $1,516,844 | $-- |
| U.S. Government Agency - Mortgage Securities | 477,585 | -- | 477,585 | -- |
| Asset-Backed Securities | 153,769 | -- | 153,769 | -- |
| Collateralized Mortgage Obligations | 664,526 | -- | 664,526 | -- |
| Commercial Mortgage Securities | 414,523 | -- | 414,523 | -- |
| Foreign Government and Government Agency Obligations | 141,822 | -- | 141,822 | -- |
| Fixed-Income Funds | 858,767 | 858,767 | -- | -- |
| Money Market Funds | 122,981 | 122,981 | -- | -- |
| Purchased Swaptions | 8,624 | -- | 8,624 | -- |
| Total Investments in Securities: | $4,359,441 | $981,748 | $3,377,693 | $-- |
| Derivative Instruments: | | | | |
| Assets | | | | |
| Futures Contracts | $586 | $586 | $-- | $-- |
| Total Assets | $586 | $586 | $-- | $-- |
| Liabilities | | | | |
| Futures Contracts | $(257) | $(257) | $-- | $-- |
| Swaps | (289) | -- | (289) | -- |
| Written Swaptions | (3,657) | -- | (3,657) | -- |
| Total Liabilities | $(4,203) | $(257) | $(3,946) | $-- |
| Total Derivative Instruments: | $(3,617) | $329 | $(3,946) | $-- |
| Other Financial Instruments: | | | | |
| TBA Sale Commitments | $(215,138) | $-- | $(215,138) | $-- |
| Total Other Financial Instruments: | $(215,138) | $-- | $(215,138) | $-- |
Value of Derivative Instruments
The following table is a summary of the Fund's value of derivative instruments by primary risk exposure as of February 28, 2018. For additional information on derivative instruments, please refer to the Derivative Instruments section in the accompanying Notes to Financial Statements.
| Primary Risk Exposure / Derivative Type | Value |
| | Asset | Liability |
| (Amounts in thousands) | | |
| Interest Rate Risk | | |
| Futures Contracts(a) | $586 | $(257) |
| Purchased Swaptions(b) | 8,624 | 0 |
| Swaps(c) | 0 | (289) |
| Written Swaptions(d) | 0 | (3,657) |
| Total Interest Rate Risk | 9,210 | (4,203) |
| Total Value of Derivatives | $9,210 | $(4,203) |
(a) Reflects gross cumulative appreciation (depreciation) on futures contracts as presented in the Schedule of Investments. In the Statement of Assets and Liabilities, the period end daily variation margin is included in receivable or payable for daily variation margin on futures contracts, and the net cumulative appreciation (depreciation) is included in net unrealized appreciation (depreciation).
(b) Gross value is included in the Statement of Assets and Liabilities in the investments, at value line-item.
(c) For centrally cleared over-the-counter (OTC) swaps, reflects gross cumulative appreciation (depreciation) as presented in the Schedule of Investments. In the Statement of Assets and Liabilities, the period end daily variation margin for centrally cleared OTC swaps is included in receivable or payable for daily variation margin on centrally cleared OTC swaps, and the net cumulative appreciation (depreciation) for centrally cleared OTC swaps is included in net unrealized appreciation (depreciation).
(d) Gross value is presented in the Statement of Assets and Liabilities in the written options, at value line-item.
See accompanying notes which are an integral part of the financial statements.
Financial Statements
Statement of Assets and Liabilities
| Amounts in thousands (except per-share amounts) | | February 28, 2018 (Unaudited) |
| Assets | | |
Investment in securities, at value — See accompanying schedule:
Unaffiliated issuers (cost $3,438,997) | $3,377,693 | |
| Fidelity Central Funds (cost $975,088) | 981,748 | |
| Total Investment in Securities (cost $4,414,085) | | $4,359,441 |
| Receivable for investments sold | | 35,041 |
| Receivable for TBA sale commitments | | 215,065 |
| Receivable for fund shares sold | | 2,440 |
| Interest receivable | | 11,082 |
| Distributions receivable from Fidelity Central Funds | | 110 |
| Receivable for daily variation margin for on futures contracts | | 484 |
| Receivable for daily variation margin on centrally cleared OTC swaps | | 46 |
| Other receivables | | 68 |
| Total assets | | 4,623,777 |
| Liabilities | | |
| Payable for investments purchased | | |
| Regular delivery | $91,488 | |
| Delayed delivery | 332,375 | |
| TBA sale commitments, at value | 215,138 | |
| Payable for fund shares redeemed | 3,914 | |
| Distributions payable | 235 | |
| Accrued management fee | 1,017 | |
| Distribution and service plan fees payable | 112 | |
| Written options, at value (premium received $3,748) | 3,657 | |
| Other affiliated payables | 520 | |
| Other payables and accrued expenses | 68 | |
| Total liabilities | | 648,524 |
| Net Assets | | $3,975,253 |
| Net Assets consist of: | | |
| Paid in capital | | $4,119,944 |
| Distributions in excess of net investment income | | (7,437) |
| Accumulated undistributed net realized gain (loss) on investments | | (82,668) |
| Net unrealized appreciation (depreciation) on investments | | (54,586) |
| Net Assets | | $3,975,253 |
| Calculation of Maximum Offering Price | | |
| Class A: | | |
| Net Asset Value and redemption price per share ($152,293 ÷ 15,242 shares) | | $9.99 |
| Maximum offering price per share (100/96.00 of $9.99) | | $10.41 |
| Class M: | | |
| Net Asset Value and redemption price per share ($140,278 ÷ 14,041 shares) | | $9.99 |
| Maximum offering price per share (100/96.00 of $9.99) | | $10.41 |
| Class C: | | |
| Net Asset Value and offering price per share ($59,188 ÷ 5,925 shares)(a) | | $9.99 |
| Government Income: | | |
| Net Asset Value, offering price and redemption price per share ($3,172,355 ÷ 318,009 shares) | | $9.98 |
| Class I: | | |
| Net Asset Value, offering price and redemption price per share ($451,139 ÷ 45,154 shares) | | $9.99 |
(a) Redemption price per share is equal to net asset value less any applicable contingent deferred sales charge.
See accompanying notes which are an integral part of the financial statements.
Statement of Operations
| Amounts in thousands | | Six months ended February 28, 2018 (Unaudited) |
| Investment Income | | |
| Interest | | $36,272 |
| Income from Fidelity Central Funds | | 12,716 |
| Total income | | 48,988 |
| Expenses | | |
| Management fee | $6,427 | |
| Transfer agent fees | 2,334 | |
| Distribution and service plan fees | 717 | |
| Fund wide operations fee | 908 | |
| Independent trustees' fees and expenses | 8 | |
| Miscellaneous | 7 | |
| Total expenses before reductions | 10,401 | |
| Expense reductions | (2) | 10,399 |
| Net investment income (loss) | | 38,589 |
| Realized and Unrealized Gain (Loss) | | |
| Net realized gain (loss) on: | | |
| Investment securities: | | |
| Unaffiliated issuers | (12,143) | |
| Fidelity Central Funds | 3,913 | |
| Futures contracts | (11,097) | |
| Swaps | (131) | |
| Total net realized gain (loss) | | (19,458) |
| Change in net unrealized appreciation (depreciation) on: | | |
| Investment securities: | | |
| Unaffiliated issuers | (99,739) | |
| Fidelity Central Funds | (32,643) | |
| Futures contracts | (225) | |
| Swaps | (305) | |
| Written options | 91 | |
| Delayed delivery commitments | 799 | |
| Total change in net unrealized appreciation (depreciation) | | (132,022) |
| Net gain (loss) | | (151,480) |
| Net increase (decrease) in net assets resulting from operations | | $(112,891) |
See accompanying notes which are an integral part of the financial statements.
Statement of Changes in Net Assets
| Amounts in thousands | Six months ended February 28, 2018 (Unaudited) | Year ended August 31, 2017 |
| Increase (Decrease) in Net Assets | | |
| Operations | | |
| Net investment income (loss) | $38,589 | $76,961 |
| Net realized gain (loss) | (19,458) | 1,723 |
| Change in net unrealized appreciation (depreciation) | (132,022) | (115,167) |
| Net increase (decrease) in net assets resulting from operations | (112,891) | (36,483) |
| Distributions to shareholders from net investment income | (38,482) | (74,479) |
| Distributions to shareholders from net realized gain | – | (34,956) |
| Total distributions | (38,482) | (109,435) |
| Share transactions - net increase (decrease) | (238,658) | (430,132) |
| Total increase (decrease) in net assets | (390,031) | (576,050) |
| Net Assets | | |
| Beginning of period | 4,365,284 | 4,941,334 |
| End of period | $3,975,253 | $4,365,284 |
| Other Information | | |
| Distributions in excess of net investment income end of period | $(7,437) | $(7,544) |
See accompanying notes which are an integral part of the financial statements.
Financial Highlights
Fidelity Government Income Fund Class A
| | Six months ended (Unaudited) February 28, | Years endedAugust 31, | | | | |
| | 2018 | 2017 | 2016 | 2015 | 2014 | 2013 |
| Selected Per–Share Data | | | | | | |
| Net asset value, beginning of period | $10.36 | $10.66 | $10.50 | $10.47 | $10.20 | $10.97 |
| Income from Investment Operations | | | | | | |
| Net investment income (loss)A | .080 | .149 | .135 | .126 | .138 | .105 |
| Net realized and unrealized gain (loss) | (.370) | (.230) | .270 | .048 | .278 | (.454) |
| Total from investment operations | (.290) | (.081) | .405 | .174 | .416 | (.349) |
| Distributions from net investment income | (.080) | (.143) | (.150) | (.116) | (.139) | (.099) |
| Distributions from net realized gain | – | (.076) | (.095) | (.028) | (.007) | (.322) |
| Total distributions | (.080) | (.219) | (.245) | (.144) | (.146) | (.421) |
| Net asset value, end of period | $9.99 | $10.36 | $10.66 | $10.50 | $10.47 | $10.20 |
| Total ReturnB,C,D | (2.81)% | (.73)% | 3.92% | 1.67% | 4.10% | (3.29)% |
| Ratios to Average Net AssetsE,F | | | | | | |
| Expenses before reductions | .77%G | .77% | .76% | .77% | .77% | .77% |
| Expenses net of fee waivers, if any | .77%G | .77% | .76% | .77% | .77% | .77% |
| Expenses net of all reductions | .77%G | .77% | .76% | .77% | .77% | .77% |
| Net investment income (loss) | 1.58%G | 1.44% | 1.28% | 1.20% | 1.34% | .99% |
| Supplemental Data | | | | | | |
| Net assets, end of period (in millions) | $152 | $174 | $261 | $222 | $246 | $291 |
| Portfolio turnover rateH | 146%G | 157% | 93% | 83% | 131% | 192% |
A Calculated based on average shares outstanding during the period.
B Total returns for periods of less than one year are not annualized.
C Total returns would have been lower if certain expenses had not been reduced during the applicable periods shown.
D Total returns do not include the effect of the sales charges.
E Fees and expenses of any underlying Fidelity Central Funds are not included in the Fund's expense ratio. The Fund indirectly bears its proportionate share of the expenses of any underlying Fidelity Central Funds. Based on their most recent shareholder report date, the expenses of any underlying non-money market Fidelity Central Funds were less than .005%.
F Expense ratios reflect operating expenses of the class. Expenses before reductions do not reflect amounts reimbursed by the investment adviser or reductions from expense offset arrangements and do not represent the amount paid by the class during periods when reimbursements or reductions occur. Expenses net of fee waivers reflect expenses after reimbursement by the investment adviser but prior to reductions from expense offset arrangements. Expenses net of all reductions represent the net expenses paid by the class.
G Annualized
H Amount does not include the portfolio activity of any underlying Fidelity Central Funds.
See accompanying notes which are an integral part of the financial statements.
Fidelity Government Income Fund Class M
| | Six months ended (Unaudited) February 28, | Years endedAugust 31, | | | | |
| | 2018 | 2017 | 2016 | 2015 | 2014 | 2013 |
| Selected Per–Share Data | | | | | | |
| Net asset value, beginning of period | $10.36 | $10.66 | $10.50 | $10.47 | $10.20 | $10.97 |
| Income from Investment Operations | | | | | | |
| Net investment income (loss)A | .080 | .149 | .135 | .127 | .140 | .107 |
| Net realized and unrealized gain (loss) | (.370) | (.229) | .270 | .048 | .277 | (.454) |
| Total from investment operations | (.290) | (.080) | .405 | .175 | .417 | (.347) |
| Distributions from net investment income | (.080) | (.144) | (.150) | (.117) | (.140) | (.101) |
| Distributions from net realized gain | – | (.076) | (.095) | (.028) | (.007) | (.322) |
| Total distributions | (.080) | (.220) | (.245) | (.145) | (.147) | (.423) |
| Net asset value, end of period | $9.99 | $10.36 | $10.66 | $10.50 | $10.47 | $10.20 |
| Total ReturnB,C,D | (2.81)% | (.73)% | 3.92% | 1.68% | 4.12% | (3.27)% |
| Ratios to Average Net AssetsE,F | | | | | | |
| Expenses before reductions | .77%G | .76% | .76% | .76% | .76% | .75% |
| Expenses net of fee waivers, if any | .77%G | .76% | .76% | .76% | .76% | .75% |
| Expenses net of all reductions | .77%G | .76% | .76% | .76% | .76% | .75% |
| Net investment income (loss) | 1.58%G | 1.44% | 1.28% | 1.20% | 1.36% | 1.01% |
| Supplemental Data | | | | | | |
| Net assets, end of period (in millions) | $140 | $157 | $197 | $181 | $196 | $228 |
| Portfolio turnover rateH | 146%G | 157% | 93% | 83% | 131% | 192% |
A Calculated based on average shares outstanding during the period.
B Total returns for periods of less than one year are not annualized.
C Total returns would have been lower if certain expenses had not been reduced during the applicable periods shown.
D Total returns do not include the effect of the sales charges.
E Fees and expenses of any underlying Fidelity Central Funds are not included in the Fund's expense ratio. The Fund indirectly bears its proportionate share of the expenses of any underlying Fidelity Central Funds. Based on their most recent shareholder report date, the expenses of any underlying non-money market Fidelity Central Funds were less than .005%.
F Expense ratios reflect operating expenses of the class. Expenses before reductions do not reflect amounts reimbursed by the investment adviser or reductions from expense offset arrangements and do not represent the amount paid by the class during periods when reimbursements or reductions occur. Expenses net of fee waivers reflect expenses after reimbursement by the investment adviser but prior to reductions from expense offset arrangements. Expenses net of all reductions represent the net expenses paid by the class.
G Annualized
H Amount does not include the portfolio activity of any underlying Fidelity Central Funds.
See accompanying notes which are an integral part of the financial statements.
Fidelity Government Income Fund Class C
| | Six months ended (Unaudited) February 28, | Years endedAugust 31, | | | | |
| | 2018 | 2017 | 2016 | 2015 | 2014 | 2013 |
| Selected Per–Share Data | | | | | | |
| Net asset value, beginning of period | $10.36 | $10.66 | $10.50 | $10.47 | $10.20 | $10.96 |
| Income from Investment Operations | | | | | | |
| Net investment income (loss)A | .041 | .069 | .053 | .044 | .059 | .025 |
| Net realized and unrealized gain (loss) | (.371) | (.229) | .270 | .048 | .278 | (.443) |
| Total from investment operations | (.330) | (.160) | .323 | .092 | .337 | (.418) |
| Distributions from net investment income | (.040) | (.064) | (.068) | (.034) | (.060) | (.020) |
| Distributions from net realized gain | – | (.076) | (.095) | (.028) | (.007) | (.322) |
| Total distributions | (.040) | (.140) | (.163) | (.062) | (.067) | (.342) |
| Net asset value, end of period | $9.99 | $10.36 | $10.66 | $10.50 | $10.47 | $10.20 |
| Total ReturnB,C,D | (3.19)% | (1.49)% | 3.12% | .88% | 3.32% | (3.93)% |
| Ratios to Average Net AssetsE,F | | | | | | |
| Expenses before reductions | 1.55%G | 1.54% | 1.54% | 1.55% | 1.54% | 1.52% |
| Expenses net of fee waivers, if any | 1.55%G | 1.54% | 1.54% | 1.55% | 1.54% | 1.52% |
| Expenses net of all reductions | 1.55%G | 1.54% | 1.54% | 1.55% | 1.54% | 1.52% |
| Net investment income (loss) | .80%G | .67% | .50% | .42% | .57% | .24% |
| Supplemental Data | | | | | | |
| Net assets, end of period (in millions) | $59 | $72 | $94 | $54 | $58 | $73 |
| Portfolio turnover rateH | 146%G | 157% | 93% | 83% | 131% | 192% |
A Calculated based on average shares outstanding during the period.
B Total returns for periods of less than one year are not annualized.
C Total returns would have been lower if certain expenses had not been reduced during the applicable periods shown.
D Total returns do not include the effect of the contingent deferred sales charge.
E Fees and expenses of any underlying Fidelity Central Funds are not included in the Fund's expense ratio. The Fund indirectly bears its proportionate share of the expenses of any underlying Fidelity Central Funds. Based on their most recent shareholder report date, the expenses of any underlying non-money market Fidelity Central Funds were less than .005%.
F Expense ratios reflect operating expenses of the class. Expenses before reductions do not reflect amounts reimbursed by the investment adviser or reductions from expense offset arrangements and do not represent the amount paid by the class during periods when reimbursements or reductions occur. Expenses net of fee waivers reflect expenses after reimbursement by the investment adviser but prior to reductions from expense offset arrangements. Expenses net of all reductions represent the net expenses paid by the class.
G Annualized
H Amount does not include the portfolio activity of any underlying Fidelity Central Funds.
See accompanying notes which are an integral part of the financial statements.
Fidelity Government Income Fund
| | Six months ended (Unaudited) February 28, | Years endedAugust 31, | | | | |
| | 2018 | 2017 | 2016 | 2015 | 2014 | 2013 |
| Selected Per–Share Data | | | | | | |
| Net asset value, beginning of period | $10.35 | $10.65 | $10.48 | $10.45 | $10.18 | $10.95 |
| Income from Investment Operations | | | | | | |
| Net investment income (loss)A | .096 | .181 | .167 | .159 | .171 | .138 |
| Net realized and unrealized gain (loss) | (.370) | (.229) | .281 | .048 | .278 | (.453) |
| Total from investment operations | (.274) | (.048) | .448 | .207 | .449 | (.315) |
| Distributions from net investment income | (.096) | (.176) | (.183) | (.149) | (.172) | (.133) |
| Distributions from net realized gain | – | (.076) | (.095) | (.028) | (.007) | (.322) |
| Total distributions | (.096) | (.252) | (.278) | (.177) | (.179) | (.455) |
| Net asset value, end of period | $9.98 | $10.35 | $10.65 | $10.48 | $10.45 | $10.18 |
| Total ReturnB,C | (2.66)% | (.42)% | 4.35% | 1.99% | 4.45% | (2.99)% |
| Ratios to Average Net AssetsD,E | | | | | | |
| Expenses before reductions | .45%F | .45% | .45% | .45% | .45% | .45% |
| Expenses net of fee waivers, if any | .45%F | .45% | .45% | .45% | .45% | .45% |
| Expenses net of all reductions | .45%F | .45% | .45% | .45% | .45% | .45% |
| Net investment income (loss) | 1.90%F | 1.76% | 1.59% | 1.51% | 1.66% | 1.31% |
| Supplemental Data | | | | | | |
| Net assets, end of period (in millions) | $3,172 | $3,467 | $3,896 | $3,489 | $3,157 | $3,412 |
| Portfolio turnover rateG | 146%F | 157% | 93% | 83% | 131% | 192% |
A Calculated based on average shares outstanding during the period.
B Total returns for periods of less than one year are not annualized.
C Total returns would have been lower if certain expenses had not been reduced during the applicable periods shown.
D Fees and expenses of any underlying Fidelity Central Funds are not included in the Fund's expense ratio. The Fund indirectly bears its proportionate share of the expenses of any underlying Fidelity Central Funds. Based on their most recent shareholder report date, the expenses of any underlying non-money market Fidelity Central Funds were less than .005%.
E Expense ratios reflect operating expenses of the class. Expenses before reductions do not reflect amounts reimbursed by the investment adviser or reductions from expense offset arrangements and do not represent the amount paid by the class during periods when reimbursements or reductions occur. Expenses net of fee waivers reflect expenses after reimbursement by the investment adviser but prior to reductions from expense offset arrangements. Expenses net of all reductions represent the net expenses paid by the class.
F Annualized
G Amount does not include the portfolio activity of any underlying Fidelity Central Funds.
See accompanying notes which are an integral part of the financial statements.
Fidelity Government Income Fund Class I
| | Six months ended (Unaudited) February 28, | Years endedAugust 31, | | | | |
| | 2018 | 2017 | 2016 | 2015 | 2014 | 2013 |
| Selected Per–Share Data | | | | | | |
| Net asset value, beginning of period | $10.36 | $10.66 | $10.50 | $10.47 | $10.20 | $10.97 |
| Income from Investment Operations | | | | | | |
| Net investment income (loss)A | .094 | .177 | .162 | .154 | .166 | .133 |
| Net realized and unrealized gain (loss) | (.370) | (.230) | .271 | .048 | .277 | (.454) |
| Total from investment operations | (.276) | (.053) | .433 | .202 | .443 | (.321) |
| Distributions from net investment income | (.094) | (.171) | (.178) | (.144) | (.166) | (.127) |
| Distributions from net realized gain | – | (.076) | (.095) | (.028) | (.007) | (.322) |
| Total distributions | (.094) | (.247) | (.273) | (.172) | (.173) | (.449) |
| Net asset value, end of period | $9.99 | $10.36 | $10.66 | $10.50 | $10.47 | $10.20 |
| Total ReturnB,C | (2.68)% | (.46)% | 4.19% | 1.94% | 4.38% | (3.03)% |
| Ratios to Average Net AssetsD,E | | | | | | |
| Expenses before reductions | .50%F | .49% | .50% | .50% | .51% | .51% |
| Expenses net of fee waivers, if any | .50%F | .49% | .50% | .50% | .51% | .51% |
| Expenses net of all reductions | .50%F | .49% | .50% | .50% | .51% | .51% |
| Net investment income (loss) | 1.86%F | 1.71% | 1.54% | 1.46% | 1.61% | 1.26% |
| Supplemental Data | | | | | | |
| Net assets, end of period (in millions) | $451 | $496 | $494 | $412 | $298 | $296 |
| Portfolio turnover rateG | 146%F | 157% | 93% | 83% | 131% | 192% |
A Calculated based on average shares outstanding during the period.
B Total returns for periods of less than one year are not annualized.
C Total returns would have been lower if certain expenses had not been reduced during the applicable periods shown.
D Fees and expenses of any underlying Fidelity Central Funds are not included in the Fund's expense ratio. The Fund indirectly bears its proportionate share of the expenses of any underlying Fidelity Central Funds. Based on their most recent shareholder report date, the expenses of any underlying non-money market Fidelity Central Funds were less than .005%.
E Expense ratios reflect operating expenses of the class. Expenses before reductions do not reflect amounts reimbursed by the investment adviser or reductions from expense offset arrangements and do not represent the amount paid by the class during periods when reimbursements or reductions occur. Expenses net of fee waivers reflect expenses after reimbursement by the investment adviser but prior to reductions from expense offset arrangements. Expenses net of all reductions represent the net expenses paid by the class.
F Annualized
G Amount does not include the portfolio activity of any underlying Fidelity Central Funds.
See accompanying notes which are an integral part of the financial statements.
Notes to Financial Statements (Unaudited)
For the period ended February 28, 2018
(Amounts in thousands except percentages)
1. Organization.
Fidelity Government Income Fund (the Fund) is a fund of Fidelity Income Fund (the Trust) and is authorized to issue an unlimited number of shares. The Trust is registered under the Investment Company Act of 1940, as amended (the 1940 Act), as an open-end management investment company organized as a Massachusetts business trust. The Fund offers Class A, Class M, Class C, Government Income and Class I shares, each of which has equal rights as to assets and voting privileges. Each class has exclusive voting rights with respect to matters that affect that class.
2. Investments in Fidelity Central Funds.
The Fund invests in Fidelity Central Funds, which are open-end investment companies generally available only to other investment companies and accounts managed by the investment adviser and its affiliates. The Fund's Schedule of Investments lists each of the Fidelity Central Funds held as of period end, if any, as an investment of the Fund, but does not include the underlying holdings of each Fidelity Central Fund. As an Investing Fund, the Fund indirectly bears its proportionate share of the expenses of the underlying Fidelity Central Funds.
Based on its investment objective, each Fidelity Central Fund may invest or participate in various investment vehicles or strategies that are similar to those of the Fund. These strategies are consistent with the investment objectives of the Fund and may involve certain economic risks which may cause a decline in value of each of the Fidelity Central Funds and thus a decline in the value of the Fund. The Money Market Central Funds seek preservation of capital and current income and are managed by Fidelity Investments Money Management, Inc. (FIMM), an affiliate of the investment adviser. Annualized expenses of the Money Market Central Funds as of their most recent shareholder report date are less than .005%. The following summarizes the Fund's investment in each non-money market Fidelity Central Fund.
| Fidelity Central Fund | Investment Manager | Investment Objective | Investment Practices | Expense Ratio(a) |
| Fidelity Mortgage Backed Securities Central Fund | FIMM | Seeks a high level of income by normally investing in investment-grade mortgage-related securities and repurchase agreements for those securities. | Delayed Delivery & When Issued Securities
Futures
Swaps | Less Than .005% |
(a) Expenses expressed as a percentage of average net assets and are as of each underlying Central Fund's most recent annual or semi-annual shareholder report.
An unaudited holdings listing for the Fund, which presents direct holdings as well as the pro-rata share of any securities and other investments held indirectly through its investment in underlying non-money market Fidelity Central Funds, is available at fidelity.com and/or institutional.fidelity.com, as applicable. A complete unaudited list of holdings for each Fidelity Central Fund is available upon request or at the Securities and Exchange Commission (the SEC) website at www.sec.gov. In addition, the financial statements of the Fidelity Central Funds which contain the significant accounting policies (including investment valuation policies) of those funds are available on the SEC website or upon request.
3. Significant Accounting Policies.
The Fund is an investment company and applies the accounting and reporting guidance of the Financial Accounting Standards Board (FASB) Accounting Standards Codification Topic 946 Financial Services – Investments Companies. The financial statements have been prepared in conformity with accounting principles generally accepted in the United States of America (GAAP), which require management to make certain estimates and assumptions at the date of the financial statements. Actual results could differ from those estimates. Subsequent events, if any, through the date that the financial statements were issued have been evaluated in the preparation of the financial statements. The following summarizes the significant accounting policies of the Fund:
Investment Valuation. Investments are valued as of 4:00 p.m. Eastern time on the last calendar day of the period. The Board of Trustees (the Board) has delegated the day to day responsibility for the valuation of the Fund's investments to the Fair Value Committee (the Committee) established by the Fund's investment adviser. In accordance with valuation policies and procedures approved by the Board, the Fund attempts to obtain prices from one or more third party pricing vendors or brokers to value its investments. When current market prices, quotations or currency exchange rates are not readily available or reliable, investments will be fair valued in good faith by the Committee, in accordance with procedures adopted by the Board. Factors used in determining fair value vary by investment type and may include market or investment specific events, changes in interest rates and credit quality. The frequency with which these procedures are used cannot be predicted and they may be utilized to a significant extent. The Committee oversees the Fund's valuation policies and procedures and reports to the Board on the Committee's activities and fair value determinations. The Board monitors the appropriateness of the procedures used in valuing the Fund's investments and ratifies the fair value determinations of the Committee.
The Fund categorizes the inputs to valuation techniques used to value its investments into a disclosure hierarchy consisting of three levels as shown below:
- Level 1 – quoted prices in active markets for identical investments
- Level 2 – other significant observable inputs (including quoted prices for similar investments, interest rates, prepayment speeds, etc.)
- Level 3 – unobservable inputs (including the Fund's own assumptions based on the best information available)
Valuation techniques used to value the Fund's investments by major category are as follows:
Debt securities, including restricted securities, are valued based on evaluated prices received from third party pricing vendors or from brokers who make markets in such securities. Foreign government and government agency obligations and U.S. government and government agency obligations are valued by pricing vendors who utilize matrix pricing which considers yield or price of bonds of comparable quality, coupon, maturity and type or by broker-supplied prices. Asset backed securities, collateralized mortgage obligations, commercial mortgage securities and U.S. government agency mortgage securities are valued by pricing vendors who utilize matrix pricing which considers prepayment speed assumptions, attributes of the collateral, yield or price of bonds of comparable quality, coupon, maturity and type or by broker-supplied prices. Swaps are marked-to-market daily based on valuations from third party pricing vendors, registered derivatives clearing organizations (clearinghouses) or broker-supplied valuations. These pricing sources may utilize inputs such as interest rate curves, credit spread curves, default possibilities and recovery rates. When independent prices are unavailable or unreliable, debt securities and swaps may be valued utilizing pricing methodologies which consider similar factors that would be used by third party pricing vendors. Debt securities and swaps are generally categorized as Level 2 in the hierarchy but may be Level 3 depending on the circumstances.
Futures contracts are valued at the settlement price established each day by the board of trade or exchange on which they are traded and are categorized as Level 1 in the hierarchy. Options traded over-the-counter are valued using vendor or broker-supplied valuations and are categorized as Level 2 in the hierarchy. Investments in open-end mutual funds, including the Fidelity Central Funds, are valued at their closing net asset value (NAV) each business day and are categorized as Level 1 in the hierarchy.
Changes in valuation techniques may result in transfers in or out of an assigned level within the disclosure hierarchy. The aggregate value of investments by input level as of February 28, 2018, is included at the end of the Fund's Schedule of Investments.
Investment Transactions and Income. For financial reporting purposes, the Fund's investment holdings and NAV include trades executed through the end of the last business day of the period. The NAV per share for processing shareholder transactions is calculated as of the close of business of the New York Stock Exchange (NYSE), normally 4:00 p.m. Eastern time and includes trades executed through the end of the prior business day. Gains and losses on securities sold are determined on the basis of identified cost. Income and capital gain distributions from Fidelity Central Funds, if any, are recorded on the ex-dividend date. Interest income is accrued as earned and includes coupon interest and amortization of premium and accretion of discount on debt securities as applicable. The principal amount on inflation-indexed securities is periodically adjusted to the rate of inflation and interest is accrued based on the principal amount. The adjustments to principal due to inflation are reflected as increases or decreases to Interest in the accompanying Statement of Operations.
Class Allocations and Expenses. Investment income, realized and unrealized capital gains and losses, common expenses of the Fund, and certain fund-level expense reductions, if any, are allocated daily on a pro-rata basis to each class based on the relative net assets of each class to the total net assets of the Fund. Each class differs with respect to transfer agent and distribution and service plan fees incurred. Certain expense reductions may also differ by class. For the reporting period, the allocated portion of income and expenses to each class as a percent of its average net assets may vary due to the timing of recording these transactions in relation to fluctuating net assets of the classes. Expenses directly attributable to a fund are charged to that fund. Expenses attributable to more than one fund are allocated among the respective funds on the basis of relative net assets or other appropriate methods. Expense estimates are accrued in the period to which they relate and adjustments are made when actual amounts are known.
Deferred Trustee Compensation. Under a Deferred Compensation Plan (the Plan), independent Trustees may elect to defer receipt of a portion of their annual compensation. Deferred amounts are invested in a cross-section of Fidelity funds, are marked-to-market and remain in the Fund until distributed in accordance with the Plan. The investment of deferred amounts and the offsetting payable to the Trustees are included in the accompanying Statement of Assets and Liabilities.
Income Tax Information and Distributions to Shareholders. Each year, the Fund intends to qualify as a regulated investment company under Subchapter M of the Internal Revenue Code, including distributing substantially all of its taxable income and realized gains. As a result, no provision for U.S. Federal income taxes is required. The Fund files a U.S. federal tax return, in addition to state and local tax returns as required. The Fund's federal income tax returns are subject to examination by the Internal Revenue Service (IRS) for a period of three fiscal years after they are filed. State and local tax returns may be subject to examination for an additional fiscal year depending on the jurisdiction.
Dividends are declared and recorded daily and paid monthly from net investment income. Distributions from realized gains, if any, are declared and recorded on the ex-dividend date. Income dividends and capital gain distributions are declared separately for each class. Income and capital gain distributions are determined in accordance with income tax regulations, which may differ from GAAP.
Capital accounts within the financial statements are adjusted for permanent book-tax differences. These adjustments have no impact on net assets or the results of operations. Capital accounts are not adjusted for temporary book-tax differences which will reverse in a subsequent period.
Book-tax differences are primarily due to the short-term gain distributions from the Fidelity Central Funds, futures contracts, swaps, market discount, partnerships (including allocations from Fidelity Central Funds), deferred trustees compensation and losses deferred due to wash sales and excise tax regulations.
As of period end, the cost and unrealized appreciation (depreciation) in securities, and derivatives if applicable, for federal income tax purposes were as follows:
| Gross unrealized appreciation | $22,537 |
| Gross unrealized depreciation | (119,552) |
| Net unrealized appreciation (depreciation) | $(97,015) |
| Tax cost | $4,456,514 |
The Fund elected to defer to its next fiscal year approximately $14,932 of capital losses recognized during the period November 1, 2016 to August 31, 2017.
Delayed Delivery Transactions and When-Issued Securities. During the period, the Fund transacted in securities on a delayed delivery or when-issued basis. Payment and delivery may take place after the customary settlement period for that security. The price of the underlying securities and the date when the securities will be delivered and paid for are fixed at the time the transaction is negotiated. The securities purchased on a delayed delivery or when-issued basis are identified as such in the Fund's Schedule of Investments. The Fund may receive compensation for interest forgone in the purchase of a delayed delivery or when-issued security. With respect to purchase commitments, the Fund identifies securities as segregated in its records with a value at least equal to the amount of the commitment. Losses may arise due to changes in the value of the underlying securities or if the counterparty does not perform under the contract's terms, or if the issuer does not issue the securities due to political, economic, or other factors.
To-Be-Announced (TBA) Securities and Mortgage Dollar Rolls. During the period, the Fund transacted in TBA securities that involved buying or selling mortgage-backed securities (MBS) on a forward commitment basis. A TBA transaction typically does not designate the actual security to be delivered and only includes an approximate principal amount; however delivered securities must meet specified terms defined by industry guidelines, including issuer, rate and current principal amount outstanding on underlying mortgage pools. The Fund may enter into a TBA transaction with the intent to take possession of or deliver the underlying MBS, or the Fund may elect to extend the settlement by entering into either a mortgage or reverse mortgage dollar roll. Mortgage dollar rolls are transactions where a fund sells TBA securities and simultaneously agrees to repurchase MBS on a later date at a lower price and with the same counterparty. Reverse mortgage dollar rolls involve the purchase and simultaneous agreement to sell TBA securities on a later date at a lower price. Transactions in mortgage dollar rolls and reverse mortgage dollar rolls are accounted for as purchases and sales and may result in an increase to the Fund's portfolio turnover rate.
Purchases and sales of TBA securities involve risks similar to those discussed above for delayed delivery and when-issued securities. Also, if the counterparty in a mortgage dollar roll or a reverse mortgage dollar roll transaction files for bankruptcy or becomes insolvent, the Fund's right to repurchase or sell securities may be limited. Additionally, when a fund sells TBA securities without already owning or having the right to obtain the deliverable securities (an uncovered forward commitment to sell), it incurs a risk of loss because it could have to purchase the securities at a price that is higher than the price at which it sold them. A fund may be unable to purchase the deliverable securities if the corresponding market is illiquid.
TBA securities subject to a forward commitment to sell at period end are included at the end of the Fund's Schedule of Investments under the caption "TBA Sale Commitments." The proceeds and value of these commitments are reflected in the Fund's Statement of Assets and Liabilities as Receivable for TBA sale commitments and TBA sale commitments, at value, respectively.
Restricted Securities. The Fund may invest in securities that are subject to legal or contractual restrictions on resale. These securities generally may be resold in transactions exempt from registration or to the public if the securities are registered. Disposal of these securities may involve time-consuming negotiations and expense, and prompt sale at an acceptable price may be difficult. Information regarding restricted securities is included at the end of the Fund's Schedule of Investments.
New Accounting Pronouncement. In March 2017, the Financial Accounting Standards Board (FASB) issued an Accounting Standards Update (ASU), ASU 2017-08, which amends the amortization period for certain callable debt securities that are held at a premium. The amendment requires the premium to be amortized to the earliest call date. The amendments do not require an accounting change for securities held at a discount. The ASU is effective for annual periods beginning after December 15, 2018. Management is currently evaluating the potential impact of these changes to the financial statements.
4. Derivative Instruments.
Risk Exposures and the Use of Derivative Instruments. The Fund's investment objective allows the Fund to enter into various types of derivative contracts, including futures contracts, options and swaps. Derivatives are investments whose value is primarily derived from underlying assets, indices or reference rates and may be transacted on an exchange or over-the-counter (OTC). Derivatives may involve a future commitment to buy or sell a specified asset based on specified terms, to exchange future cash flows at periodic intervals based on a notional principal amount, or for one party to make one or more payments upon the occurrence of specified events in exchange for periodic payments from the other party.
The Fund used derivatives to increase returns, to gain exposure to certain types of assets and to manage exposure to certain risks as defined below. The success of any strategy involving derivatives depends on analysis of numerous economic factors, and if the strategies for investment do not work as intended, the Fund may not achieve its objectives.
The Fund's use of derivatives increased or decreased its exposure to the following risk:
| Interest Rate Risk | Interest rate risk relates to the fluctuations in the value of interest-bearing securities due to changes in the prevailing levels of market interest rates. |
The Fund is also exposed to additional risks from investing in derivatives, such as liquidity risk and counterparty credit risk. Liquidity risk is the risk that the Fund will be unable to close out the derivative in the open market in a timely manner. Counterparty credit risk is the risk that the counterparty will not be able to fulfill its obligation to the Fund. Derivative counterparty credit risk is managed through formal evaluation of the creditworthiness of all potential counterparties. On certain OTC derivatives such as options, , the Fund attempts to reduce its exposure to counterparty credit risk by entering into an International Swaps and Derivatives Association, Inc. (ISDA) Master Agreement with each of its counterparties. The ISDA Master Agreement gives the Fund the right to terminate all transactions traded under such agreement upon the deterioration in the credit quality of the counterparty beyond specified levels. The ISDA Master Agreement gives each party the right, upon an event of default by the other party or a termination of the agreement, to close out all transactions traded under such agreement and to net amounts owed under each transaction to one net payable by one party to the other. To mitigate counterparty credit risk on bi-lateral OTC derivatives, the Fund receives collateral in the form of cash or securities once the Fund's net unrealized appreciation on outstanding derivative contracts under an ISDA Master Agreement exceeds certain applicable thresholds, subject to certain minimum transfer provisions. The collateral received is held in segregated accounts with the Fund's custodian bank in accordance with the collateral agreements entered into between the Fund, the counterparty and the Fund's custodian bank. The Fund could experience delays and costs in gaining access to the collateral even though it is held by the Fund's custodian bank. The Fund's maximum risk of loss from counterparty credit risk related to bi-lateral OTC derivatives is generally the aggregate unrealized appreciation and unpaid counterparty payments in excess of any collateral pledged by the counterparty to the Fund. For OTC written options with upfront premiums received, the Fund is obligated to perform and therefore does not have counterparty risk. For OTC written options with premiums to be received at a future date, the maximum risk of loss from counterparty credit risk is the amount of the premium in excess of any collateral pledged by the counterparty. The Fund may be required to pledge collateral for the benefit of the counterparties on bi-lateral OTC derivatives in an amount not less than each counterparty's unrealized appreciation on outstanding derivative contracts, subject to certain minimum transfer provisions, and any such pledged collateral is identified in the Schedule of Investments. Exchange-traded futures contracts are not covered by the ISDA Master Agreement; however counterparty credit risk related to exchange-traded futures contracts may be mitigated by the protection provided by the exchange on which they trade. Counterparty credit risk related to centrally cleared OTC swaps may be mitigated by the protection provided by the clearinghouse.
Investing in derivatives may involve greater risks than investing in the underlying assets directly and, to varying degrees, may involve risk of loss in excess of any initial investment and collateral received and amounts recognized in the Statement of Assets and Liabilities. In addition, there may be the risk that the change in value of the derivative contract does not correspond to the change in value of the underlying instrument.
Net Realized Gain (Loss) and Change in Net Unrealized Appreciation (Depreciation) on Derivatives. The table below, which reflects the impacts of derivatives on the financial performance of the Fund, summarizes the net realized gain (loss) and change in net unrealized appreciation (depreciation) for derivatives during the period as presented in the Statement of Operations.
| Primary Risk Exposure / Derivative Type | Net Realized Gain (Loss) | Change in Net Unrealized Appreciation (Depreciation) |
| Interest Rate Risk | | |
| Futures Contracts | $(11,097) | $(225) |
| Purchased Options | 66 | 446 |
| Swaps | (131) | (305) |
| Written Options | – | 91 |
| Totals | $(11,162) | $7 |
A summary of the value of derivatives by primary risk exposure as of period end is included at the end of the Schedule of Investments.
Futures Contracts. A futures contract is an agreement between two parties to buy or sell a specified underlying instrument for a fixed price at a specified future date. The Fund used futures contracts to manage its exposure to the bond market and fluctuations in interest rates.
Upon entering into a futures contract, a fund is required to deposit either cash or securities (initial margin) with a clearing broker in an amount equal to a certain percentage of the face value of the contract. Futures contracts are marked-to-market daily and subsequent daily payments (variation margin) are made or received by a fund depending on the daily fluctuations in the value of the futures contracts and are recorded as unrealized appreciation or (depreciation). This receivable and/or payable, if any, is included in daily variation margin on futures contracts in the Statement of Assets and Liabilities. Realized gain or (loss) is recorded upon the expiration or closing of a futures contract. The net realized gain (loss) and change in net unrealized appreciation (depreciation) on futures contracts during the period is presented in the Statement of Operations.
Any open futures contracts at period end are presented in the Schedule of Investments under the caption "Futures Contracts". The notional amount at value reflects each contract's exposure to the underlying instrument or index at period end. Securities deposited to meet initial margin requirements are identified in the Schedule of Investments.
Options. Options give the purchaser the right, but not the obligation, to buy (call) or sell (put) an underlying security or financial instrument at an agreed exercise or strike price between or on certain dates. Options obligate the seller (writer) to buy (put) or sell (call) an underlying instrument at the exercise or strike price or cash settle an underlying derivative instrument if the holder exercises the option on or before the expiration date. The Fund uses OTC options, such as swaptions, which are options where the underlying instrument is a swap, to manage its exposure to fluctuations in interest rates.
Upon entering into an options contract, a fund will pay or receive a premium. Premiums paid on purchased options are reflected as cost of investments and premiums received on written options are reflected as a liability on the Statement of Assets and Liabilities. Certain options may be purchased or written with premiums to be paid or received on a future date. Options are valued daily and any unrealized appreciation (depreciation) is reflected on the Statement of Assets and Liabilities. When an option is exercised, the cost or proceeds of the underlying instrument purchased or sold is adjusted by the amount of the premium. When an option is closed the Fund will realize a gain or loss depending on whether the proceeds or amount paid for the closing sale transaction is greater or less than the premium received or paid. When an option expires, gains and losses are realized to the extent of premiums received and paid, respectively. The net realized and unrealized gains (losses) on purchased options are included in the Statement of Operations in net realized gain (loss) and change in net unrealized appreciation (depreciation) on investment securities. The net realized gain (loss) and change in net unrealized appreciation (depreciation) on written options are presented in the Statement of Operations.
Any open options at period end are presented in the Schedule of Investments under the captions "Purchased Options," "Purchased Swaptions," "Written Options" and "Written Swaptions," as applicable, and are representative of volume of activity during the period.
Writing puts and buying calls tend to increase exposure to the underlying instrument while buying puts and writing calls tend to decrease exposure to the underlying instrument. For purchased options, risk of loss is limited to the premium paid, and for written options, risk of loss is the change in value in excess of the premium received.
Swaps. A swap is a contract between two parties to exchange future cash flows at periodic intervals based on a notional principal amount. A centrally cleared OTC swap is a transaction executed between a fund and a dealer counterparty, then cleared by a futures commission merchant (FCM) through a clearinghouse. Once cleared, the clearinghouse serves as a central counterparty, with whom a fund exchanges cash flows for the life of the transaction, similar to transactions in futures contracts.
Centrally cleared OTC swaps require a fund to deposit either cash or securities (initial margin) with the FCM, at the instruction of and for the benefit of the clearinghouse. Securities deposited to meet initial margin requirements are identified in the Schedule of Investments Centrally cleared OTC swaps are marked-to-market daily and subsequent payments (variation margin) are made or received depending on the daily fluctuations in the value of the swaps and are recorded as unrealized appreciation or (depreciation). These daily payments, if any, are included in receivable or payable for daily variation margin on centrally cleared OTC swaps in the Statement of Assets and Liabilities. Any premiums for centrally cleared OTC swaps are recorded periodically throughout the term of the swap to variation margin and included in unrealized appreciation (depreciation) in the Statement of Assets and Liabilities. Any premiums are recognized as realized gain (loss) upon termination or maturity of the swap.
Payments are exchanged at specified intervals, accrued daily commencing with the effective date of the contract and recorded as realized gain or (loss). Some swaps may be terminated prior to the effective date and realize a gain or loss upon termination. The net realized gain (loss) and change in net unrealized appreciation (depreciation) on swaps during the period is presented in the Statement of Operations.
Any open swaps at period end are included in the Schedule of Investments under the caption "Swaps" and are representative of volume of activity during the period.
Interest Rate Swaps. Interest rate swaps are agreements between counterparties to exchange cash flows, one based on a fixed rate, and the other on a floating rate. The Fund entered into interest rate swaps to manage its exposure to interest rate changes. Changes in interest rates can have an effect on both the value of bond holdings as well as the amount of interest income earned. In general, the value of bonds can fall when interest rates rise and can rise when interest rates fall.
5. Purchases and Sales of Investments.
Purchases and sales of securities (including the Fixed-Income Central Funds), other than short-term securities and U.S. government securities, aggregated $239,830 and $189,317, respectively.
6. Fees and Other Transactions with Affiliates.
Management Fee and Expense Contract. Fidelity Management & Research Company (the investment adviser) and its affiliates provide the Fund with investment management related services for which the Fund pays a monthly management fee. The management fee is the sum of an individual fund fee rate that is based on an annual rate of .20% of the Fund's average net assets and an annualized group fee rate that averaged .11% during the period. The group fee rate is based upon the average net assets of all the mutual funds advised by the investment adviser, including any mutual funds previously advised by the investment adviser that are currently advised by Fidelity SelectCo, LLC, an affiliate of the investment adviser. The group fee rate decreases as assets under management increase and increases as assets under management decrease. For the reporting period, the total annualized management fee rate was .31% of the Fund's average net assets.
In addition, under the expense contract, the investment adviser pays class-level expenses for Government Income, so that the total expenses, except the compensation of the independent Trustees and certain other expenses such as interest expense, including commitment fees, do not exceed .45% of the Class' average net assets. This agreement does not apply to any of the other classes and any change or modification that would increase expenses can only be made with shareholder approval.
Distribution and Service Plan Fees. In accordance with Rule 12b-1 of the 1940 Act, the Fund has adopted separate Distribution and Service Plans for each class of shares. Certain classes pay Fidelity Distributors Corporation (FDC), an affiliate of the investment adviser, separate Distribution and Service Fees, each of which is based on an annual percentage of each class' average net assets. In addition, FDC may pay financial intermediaries for selling shares of the Fund and providing shareholder support services. For the period, the Distribution and Service Fee rates, total fees and amounts retained by FDC were as follows:
| | Distribution Fee | Service Fee | Total Fees | Retained by FDC |
| Class A | -% | .25% | $203 | $37 |
| Class M | -% | .25% | 186 | 41 |
| Class C | .75% | .25% | 328 | 11 |
| | | | $717 | $89 |
Sales Load. FDC may receive a front-end sales charge of up to 4.00% for selling Class A shares and Class M shares, some of which is paid to financial intermediaries for selling shares of the Fund. Depending on the holding period, FDC may receive contingent deferred sales charges levied on Class A, Class M and Class C redemptions. The deferred sales charges are 1.00% for Class C shares, .75% for certain purchases of Class A shares and .25% for certain purchases of Class M shares.
For the period, sales charge amounts retained by FDC were as follows:
| | Retained by FDC |
| Class A | $2 |
| Class M | 1 |
| Class C(a) | 1 |
| | $4 |
(a) When Class C shares are initially sold, FDC pays commissions from its own resources to financial intermediaries through which the sales are made.
Transfer Agent Fees. Fidelity Investments Institutional Operations Company, Inc., (FIIOC), an affiliate of the investment adviser, is the transfer, dividend disbursing and shareholder servicing agent for each class of the Fund. FIIOC receives account fees and asset-based fees that vary according to the account size and type of account of the shareholders of each respective class of the Fund, with the exception of Government Income. FIIOC receives an asset-based fee of .10% of Government Income average net assets. FIIOC pays for typesetting, printing and mailing of shareholder reports, except proxy statements. For the period, transfer agent fees for each class were as follows:
| | Amount | % of Class-Level Average Net Assets(a) |
| Class A | $137 | .17 |
| Class M | 120 | .16 |
| Class C | 63 | .19 |
| Government Income | 1,668 | .10 |
| Class I | 346 | .14 |
| | $2,334 | |
(a) Annualized
Fund Wide Operations Fee. Pursuant to the Fund Wide Operations and Expense Agreement (FWOE), the investment adviser has agreed to provide for fund level expenses (which do not include transfer agent, Rule 12b-1 fees, compensation of the independent Trustees, interest (including commitment fees), taxes or extraordinary expenses, if any) in return for a FWOE fee equal to .35% of the Fund's average net assets less the total amount of the management fee. The FWOE paid by the Fund is reduced by an amount equal to the fees and expenses paid to the independent Trustees. For the period, the FWOE fee was equivalent to an annualized rate of .04% of average net assets.
Interfund Trades. The Fund may purchase from or sell securities to other Fidelity Funds under procedures adopted by the Board. The procedures have been designed to ensure these interfund trades are executed in accordance with Rule 17a-7 of the 1940 Act. Interfund trades are included within the respective purchases and sales amounts shown in the Purchases and Sales of Investments note.
7. Committed Line of Credit.
The Fund participates with other funds managed by the investment adviser or an affiliate in a $4.25 billion credit facility (the "line of credit") to be utilized for temporary or emergency purposes to fund shareholder redemptions or for other short-term liquidity purposes. The Fund has agreed to pay commitment fees on its pro-rata portion of the line of credit, which amounted to $6 and is reflected in Miscellaneous expenses on the Statement of Operations. During the period, the Fund did not borrow on this line of credit.
8. Security Lending.
The Fund lends portfolio securities from time to time in order to earn additional income. On the settlement date of the loan, the Fund receives collateral (in the form of U.S. Treasury obligations, letters of credit and/or cash) against the loaned securities and maintains collateral in an amount not less than 100% of the market value of the loaned securities during the period of the loan. The market value of the loaned securities is determined at the close of business of the Fund and any additional required collateral is delivered to the Fund on the next business day. The Fund or borrower may terminate the loan at any time, and if the borrower defaults on its obligation to return the securities loaned because of insolvency or other reasons, the Fund may apply collateral received from the borrower against the obligation. The Fund may experience delays and costs in recovering the securities loaned. Any cash collateral received is maintained at the Fund's custodian and/or invested in cash equivalents. At period end, there were no security loans outstanding. Security lending income represents the income earned on investing cash collateral, less rebates paid to borrowers, plus any premium payments received for lending certain types of securities. Security lending income is presented in the Statement of Operations as a component of interest income. Total security lending income during the period amounted to $18.
9. Expense Reductions.
Through arrangements with the Fund's custodian, credits realized as a result of certain uninvested cash balances were used to reduce the Fund's expenses. During the period, these credits reduced the Fund's expenses $2.
10. Distributions to Shareholders.
Distributions to shareholders of each class were as follows:
| | Six months ended February 28, 2018 | Year ended
August 31, 2017 |
| From net investment income | | |
| Class A | $1,265 | $3,003 |
| Class M | 1,165 | 2,353 |
| Class C | 258 | 492 |
| Government Income | 31,372 | 60,593 |
| Class I | 4,422 | 8,038 |
| Total | $38,482 | $74,479 |
| From net realized gain | | |
| Class A | $– | $1,831 |
| Class M | – | 1,339 |
| Class C | – | 658 |
| Government Income | – | 27,600 |
| Class I | – | 3,528 |
| Total | $– | $34,956 |
11. Share Transactions.
Share transactions for each class were as follows and may contain automatic conversions between classes or exchanges between affiliated funds:
| | Shares | Shares | Dollars | Dollars |
| | Six months ended February 28, 2018 | Year ended August 31, 2017 | Six months ended February 28, 2018 | Year ended August 31, 2017 |
| Class A | | | | |
| Shares sold | 1,470 | 4,084 | $14,931 | $42,226 |
| Reinvestment of distributions | 120 | 450 | 1,225 | 4,652 |
| Shares redeemed | (3,158) | (12,230) | (32,227) | (125,628) |
| Net increase (decrease) | (1,568) | (7,696) | $(16,071) | $(78,750) |
| Class M | | | | |
| Shares sold | 1,871 | 3,752 | $19,034 | $38,695 |
| Reinvestment of distributions | 106 | 338 | 1,076 | 3,499 |
| Shares redeemed | (3,042) | (7,416) | (30,989) | (76,589) |
| Net increase (decrease) | (1,065) | (3,326) | $(10,879) | $(34,395) |
| Class C | | | | |
| Shares sold | 517 | 1,245 | $5,274 | $12,880 |
| Reinvestment of distributions | 24 | 102 | 244 | 1,056 |
| Shares redeemed | (1,520) | (3,261) | (15,467) | (33,484) |
| Net increase (decrease) | (979) | (1,914) | $(9,949) | $(19,548) |
| Government Income | | | | |
| Shares sold | 26,130 | 78,457 | $265,748 | $805,428 |
| Reinvestment of distributions | 2,963 | 8,206 | 30,085 | 84,659 |
| Shares redeemed | (46,215) | (117,437) | (470,136) | (1,203,566) |
| Net increase (decrease) | (17,122) | (30,774) | $(174,303) | $(313,479) |
| Class I | | | | |
| Shares sold | 11,075 | 13,696 | $113,239 | $140,776 |
| Reinvestment of distributions | 418 | 1,085 | 4,245 | 11,211 |
| Shares redeemed | (14,199) | (13,214) | (144,940) | (135,947) |
| Net increase (decrease) | (2,706) | 1,567 | $(27,456) | $16,040 |
12. Other.
The Fund's organizational documents provide former and current trustees and officers with a limited indemnification against liabilities arising in connection with the performance of their duties to the Fund. In the normal course of business, the Fund may also enter into contracts that provide general indemnifications. The Fund's maximum exposure under these arrangements is unknown as this would be dependent on future claims that may be made against the Fund. The risk of material loss from such claims is considered remote.
Shareholder Expense Example
As a shareholder of the Fund, you incur two types of costs: (1) transaction costs, including sales charges (loads) on purchase payments or redemption proceeds, and (2) ongoing costs, including management fees, distribution and/or service (12b-1) fees and other Fund expenses. This Example is intended to help you understand your ongoing costs (in dollars) of investing in the Fund and to compare these costs with the ongoing costs of investing in other mutual funds.
The Example is based on an investment of $1,000 invested at the beginning of the period and held for the entire period (September 1, 2017 to February 28, 2018).
Actual Expenses
The first line of the accompanying table for each class of the Fund provides information about actual account values and actual expenses. You may use the information in this line, together with the amount you invested, to estimate the expenses that you paid over the period. Simply divide your account value by $1,000.00 (for example, an $8,600 account value divided by $1,000.00 = 8.6), then multiply the result by the number in the first line for a class of the Fund under the heading entitled "Expenses Paid During Period" to estimate the expenses you paid on your account during this period. A small balance maintenance fee of $12.00 that is charged once a year may apply for certain accounts with a value of less than $2,000. This fee is not included in the table below. If it was, the estimate of expenses you paid during the period would be higher, and your ending account value lower, by this amount. In addition, the Fund, as a shareholder in the underlying Fidelity Central Funds, will indirectly bear its pro-rata share of the fees and expenses incurred by the underlying Fidelity Central Funds. These fees and expenses are not included in the Fund's annualized expense ratio used to calculate the expense estimate in the table below.
Hypothetical Example for Comparison Purposes
The second line of the accompanying table for each class of the Fund provides information about hypothetical account values and hypothetical expenses based on a Class' actual expense ratio and an assumed rate of return of 5% per year before expenses, which is not the Class' actual return. The hypothetical account values and expenses may not be used to estimate the actual ending account balance or expenses you paid for the period. You may use this information to compare the ongoing costs of investing in the Fund and other funds. To do so, compare this 5% hypothetical example with the 5% hypothetical examples that appear in the shareholder reports of the other funds. A small balance maintenance fee of $12.00 that is charged once a year may apply for certain accounts with a value of less than $2,000. This fee is not included in the table below. If it was, the estimate of expenses you paid during the period would be higher, and your ending account value lower, by this amount. In addition, the Fund, as a shareholder in the underlying Fidelity Central Funds, will indirectly bear its pro-rata share of the fees and expenses incurred by the underlying Fidelity Central Funds. These fees and expenses are not included in the Fund's annualized expense ratio used to calculate the expense estimate in the table below.
Please note that the expenses shown in the table are meant to highlight your ongoing costs only and do not reflect any transaction costs. Therefore, the second line of the table is useful in comparing ongoing costs only, and will not help you determine the relative total costs of owning different funds. In addition, if these transactional costs were included, your costs would have been higher.
| | Annualized Expense Ratio-A | Beginning
Account Value
September 1, 2017 | Ending
Account Value
February 28, 2018 | Expenses Paid
During Period-B
September 1, 2017
to February 28, 2018 |
| Class A | .77% | | | |
| Actual | | $1,000.00 | $971.90 | $3.76 |
| Hypothetical-C | | $1,000.00 | $1,020.98 | $3.86 |
| Class M | .77% | | | |
| Actual | | $1,000.00 | $971.90 | $3.76 |
| Hypothetical-C | | $1,000.00 | $1,020.98 | $3.86 |
| Class C | 1.55% | | | |
| Actual | | $1,000.00 | $968.10 | $7.56 |
| Hypothetical-C | | $1,000.00 | $1,017.11 | $7.75 |
| Government Income | .45% | | | |
| Actual | | $1,000.00 | $973.40 | $2.20 |
| Hypothetical-C | | $1,000.00 | $1,022.56 | $2.26 |
| Class I | .50% | | | |
| Actual | | $1,000.00 | $973.20 | $2.45 |
| Hypothetical-C | | $1,000.00 | $1,022.32 | $2.51 |
A Annualized expense ratio reflects expenses net of applicable fee waivers.
B Expenses are equal to each Class' annualized expense ratio, multiplied by the average account value over the period, multiplied by 181/365 (to reflect the one-half year period). The fees and expenses of the underlying Fidelity Central Funds in which the Fund invests are not included in each Class' annualized expense ratio. In addition to the expenses noted above, the Fund also indirectly bears its proportional share of the expenses of the underlying Fidelity Central Funds. Annualized expenses of the underlying non-money market Fidelity Central Funds as of their most recent fiscal half year were less than .005%.
C 5% return per year before expenses
Board Approval of Investment Advisory Contracts and Management Fees
Fidelity Government Income Fund
Each year, the Board of Trustees, including the Independent Trustees (together, the Board), votes on the renewal of the management contract with Fidelity Management & Research Company (FMR) and the sub-advisory agreements (together, the Advisory Contracts) for the fund. FMR and the sub-advisers are referred to herein as the Investment Advisers. The Board, assisted by the advice of fund counsel and Independent Trustees' counsel, requests and considers a broad range of information relevant to the renewal of the Advisory Contracts throughout the year.
The Board meets regularly and, at each of its meetings, covers an extensive agenda of topics and materials and considers factors that are relevant to its annual consideration of the renewal of the fund's Advisory Contracts, including the services and support provided to the fund and its shareholders. The Board has established four standing committees (Committees) — Operations, Audit, Fair Valuation, and Governance and Nominating — each composed of and chaired by Independent Trustees with varying backgrounds, to which the Board has assigned specific subject matter responsibilities in order to enhance effective decision-making by the Board. The Operations Committee, of which all of the Independent Trustees are members, meets regularly throughout the year and considers, among other matters, information specifically related to the annual consideration of the renewal of the fund's Advisory Contracts. The Board, acting directly and through its Committees, requests and receives information concerning the annual consideration of the renewal of the fund's Advisory Contracts. The Board also meets as needed to review matters specifically related to the Board's annual consideration of the renewal of the Advisory Contracts. Members of the Board may also meet with trustees of other Fidelity funds through ad hoc joint committees to discuss certain matters relevant to all of the Fidelity funds.
At its September 2017 meeting, the Board unanimously determined to renew the fund's Advisory Contracts. In reaching its determination, the Board considered all factors it believed relevant, including (i) the nature, extent, and quality of the services to be provided to the fund and its shareholders (including the investment performance of the fund); (ii) the competitiveness of the fund's management fee and total expense ratio relative to peer funds; (iii) the total costs of the services to be provided by and the profits to be realized by Fidelity from its relationships with the fund; and (iv) the extent to which, if any, economies of scale exist and would be realized as the fund grows, and whether any economies of scale are appropriately shared with fund shareholders.
In considering whether to renew the Advisory Contracts for the fund, the Board reached a determination, with the assistance of fund counsel and Independent Trustees' counsel and through the exercise of its business judgment, that the renewal of the Advisory Contracts was in the best interests of the fund and its shareholders and that the compensation payable under the Advisory Contracts was fair and reasonable. The Board's decision to renew the Advisory Contracts was not based on any single factor, but rather was based on a comprehensive consideration of all the information provided to the Board at its meetings throughout the year. The Board, in reaching its determination to renew the Advisory Contracts, was aware that shareholders of the fund have a broad range of investment choices available to them, including a wide choice among funds offered by Fidelity's competitors, and that the fund's shareholders, who have the opportunity to review and weigh the disclosure provided by the fund in its prospectus and other public disclosures, have chosen to invest in this fund, which is part of the Fidelity family of funds.
Amendment to Group Fee Rate. The Board also approved an amendment to the management contract for the fund to add an additional breakpoint to the group fee schedule, effective October 1, 2017. The Board noted that the additional breakpoint would result in lower management fee rates as Fidelity's assets under management increase above the new breakpoint.
Nature, Extent, and Quality of Services Provided. The Board considered Fidelity's staffing as it relates to the fund, including the backgrounds of investment personnel of Fidelity, and also considered the fund's investment objective, strategies, and related investment philosophy. The Independent Trustees also had discussions with senior management of Fidelity's investment operations and investment groups. The Board considered the structure of the investment personnel compensation program and whether this structure provides appropriate incentives to act in the best interests of the fund. Additionally, the Board considered the portfolio managers' investments, if any, in the funds that they manage.
Resources Dedicated to Investment Management and Support Services. The Board reviewed the general qualifications and capabilities of Fidelity's investment staff, including its size, education, experience, and resources, as well as Fidelity's approach to recruiting, managing, and compensating investment personnel. The Board noted that Fidelity has continued to increase the resources devoted to non-U.S. offices, including expansion of Fidelity's global investment organization. The Board also noted that Fidelity's analysts have extensive resources, tools and capabilities that allow them to conduct sophisticated quantitative and fundamental analysis, as well as credit analysis of issuers, counterparties and guarantors. Further, the Board considered that Fidelity's investment professionals have sufficient access to global information and data so as to provide competitive investment results over time, and that those professionals also have access to sophisticated tools that permit them to assess portfolio construction and risk and performance attribution characteristics continuously, as well as to transmit new information and research conclusions rapidly around the world. Additionally, in its deliberations, the Board considered Fidelity's trading, risk management, compliance, and technology and operations capabilities and resources, which are integral parts of the investment management process.
Shareholder and Administrative Services. The Board considered (i) the nature, extent, quality, and cost of advisory, administrative, and shareholder services performed by the Investment Advisers and their affiliates under the Advisory Contracts and under separate agreements covering transfer agency, pricing and bookkeeping, and securities lending services for the fund; (ii) the nature and extent of the supervision of third party service providers, principally custodians, subcustodians, and pricing vendors; and (iii) the resources devoted to, and the record of compliance with, the fund's compliance policies and procedures.
The Board noted that the growth of fund assets over time across the complex allows Fidelity to reinvest in the development of services designed to enhance the value or convenience of the Fidelity funds as investment vehicles. These services include 24-hour access to account information and market information through telephone representatives and over the Internet, investor education materials and asset allocation tools, and the expanded availability of Fidelity Investor Centers.
Investment in a Large Fund Family. The Board considered the benefits to shareholders of investing in a Fidelity fund, including the benefits of investing in a fund that is part of a large family of funds offering a variety of investment disciplines and providing a large variety of mutual fund investor services. The Board noted that Fidelity had taken, or had made recommendations that resulted in the Fidelity funds taking, a number of actions over the previous year that benefited particular funds, including: (i) continuing to dedicate additional resources to Fidelity's investment research process, which includes meetings with management of issuers in which the funds invest, and to the support of the senior management team that oversees asset management; (ii) continuing efforts to enhance Fidelity's global research capabilities; (iii) launching new funds and making other enhancements to meet client needs; (iv) launching new share classes of existing funds; (v) eliminating purchase minimums and broadening eligibility requirements for certain lower-priced share classes; (vi) reducing management fees and total expenses for certain growth equity funds and index funds; (vii) lowering expense caps for certain existing funds and classes to reduce expenses borne by shareholders; (viii) eliminating short-term redemption fees for certain funds; (ix) introducing a new pricing structure for certain funds of funds that is expected to reduce overall expenses paid by shareholders; (x) rationalizing product lines and gaining increased efficiencies through proposals for fund mergers and share class consolidations; (xi) continuing to develop, acquire and implement systems and technology to improve services to the funds and shareholders, strengthen information security, and increase efficiency; and (xii) implementing enhancements to further strengthen Fidelity's product line to increase investors' probability of success in achieving their investment goals, including retirement income goals.
Investment Performance. The Board considered whether the fund has operated in accordance with its investment objective, as well as its record of compliance with its investment restrictions and its performance history.
The Board took into account discussions with representatives of the Investment Advisers about fund investment performance that occur at Board meetings throughout the year. In this regard the Board noted that as part of regularly scheduled fund reviews and other reports to the Board on fund performance, the Board considers annualized return information for the fund for different time periods, measured against a securities market index ("benchmark index") and a peer group of funds with similar objectives ("peer group"), if any. In its evaluation of fund investment performance at meetings throughout the year, the Board gave particular attention to information indicating underperformance of certain Fidelity funds for specific time periods and discussed with the Investment Advisers the reasons for such underperformance.
In addition to reviewing absolute and relative fund performance, the Independent Trustees periodically consider the appropriateness of fund performance metrics in evaluating the results achieved. In general, the Independent Trustees believe that fund performance should be evaluated based on gross performance (before fees and expenses but after transaction costs) compared to appropriate benchmark indices, over appropriate time periods that may include full market cycles, and on net performance (after fees and expenses) compared to peer groups, as applicable, over the same periods, taking into account relevant factors including the following: general market conditions; expectations for interest rate levels and credit conditions; issuer-specific information including credit quality; the potential for incremental return versus the fund's benchmark index weighed against the risks involved in obtaining that incremental return, including the risk of diminished or negative total returns; and fund cash flows and other factors. Depending on the circumstances, the Independent Trustees may be satisfied with a fund's performance notwithstanding that it lags its benchmark index or peer group for certain periods.
The Independent Trustees recognize that shareholders evaluate performance on a net basis over their own holding periods, for which one-, three-, and five-year periods are often used as a proxy. For this reason, the performance information reviewed by the Board also included net cumulative calendar year total return information for the fund and an appropriate benchmark index and peer group for the most recent one-, three-, and five-year periods.
Based on its review, the Board concluded that the nature, extent, and quality of services provided to the fund under the Advisory Contracts should continue to benefit the shareholders of the fund.
Competitiveness of Management Fee and Total Expense Ratio. The Board considered the fund's management fee and total expense ratio compared to "mapped groups" of competitive funds and classes created for the purpose of facilitating the Trustees' competitive analysis of management fees and total expenses. Fidelity creates "mapped groups" by combining similar Lipper investment objective categories that have comparable investment mandates. Combining Lipper investment objective categories aids the Board's management fee and total expense ratio comparisons by broadening the competitive group used for comparison.
Management Fee. The Board considered two proprietary management fee comparisons for the 12-month periods shown in basis points (BP) in the chart below. The group of Lipper funds used by the Board for management fee comparisons is referred to below as the "Total Mapped Group" and, for the reasons explained above, is broader than the Lipper peer group used by the Board for performance comparisons. The Total Mapped Group comparison focuses on a fund's standing in terms of gross management fees before expense reimbursements or caps relative to the total universe of funds with comparable investment mandates, regardless of whether their management fee structures also are comparable. Funds with comparable investment mandates offer exposure to similar types of securities. Funds with comparable management fee structures have similar management fee contractual arrangements (
e.g., flat rate charged for advisory services, all-inclusive fee rate,
etc.). "TMG %" represents the percentage of funds in the Total Mapped Group that had management fees that were lower than the fund's. For example, a hypothetical TMG % of 20% would mean that 80% of the funds in the Total Mapped Group had higher, and 20% had lower, management fees than the fund. The fund's actual TMG %s and the number of funds in the Total Mapped Group are in the chart below. The "Asset-Size Peer Group" (ASPG) comparison focuses on a fund's standing relative to a subset of non-Fidelity funds within the Total Mapped Group that are similar in size and management fee structure. For example, if a fund is in the first quartile of the ASPG, the fund's management fee ranks in the least expensive or lowest 25% of funds in the ASPG. The ASPG represents at least 15% of the funds in the Total Mapped Group with comparable asset size and management fee structures, subject to a minimum of 50 funds (or all funds in the Total Mapped Group if fewer than 50). Additional information, such as the ASPG quartile in which the fund's management fee rate ranked, is also included in the chart and considered by the Board.
Fidelity Government Income Fund

The Board noted that the fund's management fee rate ranked below the median of its Total Mapped Group and below the median of its ASPG for 2016.
The Board noted that it and the boards of other Fidelity funds formed an ad hoc Committee on Group Fee, which meets periodically, to conduct an in-depth review of the "group fee" component of the management fee of funds with such management fee structures. The Committee's focus included the mechanics of the group fee, the competitive landscape of group fee structures, Fidelity funds with no group fee component and investment products not included in group fee assets. The Board also considered that, for funds subject to the group fee, FMR agreed to voluntarily waive fees over a specified period of time in amounts designed to account for assets converted from certain funds to certain collective investment trusts.
Based on its review, the Board concluded that the fund's management fee is fair and reasonable in light of the services that the fund receives and the other factors considered.
Total Expense Ratio. In its review of each class's total expense ratio, the Board considered the fund's management fee rate as well as other fund or class expenses, as applicable, such as transfer agent fees, pricing and bookkeeping fees, fund-paid 12b-1 fees, and custodial, legal, and audit fees. The Board also noted that Fidelity may agree to waive fees and expenses from time to time, and the extent to which, if any, it has done so for the fund. As part of its review, the Board also considered the current and historical total expense ratios of each class of the fund compared to competitive fund median expenses. Each class of the fund is compared to those funds and classes in the Total Mapped Group (used by the Board for management fee comparisons) that have a similar sales load structure.
The Board noted that the total expense ratio of each class ranked below the competitive median for 2016.
The Board considered that the current contractual arrangements for the fund have the effect of setting the total "fund-level" (but not "class-level") expenses (including, among certain other "fund-level" expenses, the management fee) for each class at 0.35%. The Board also considered that current contractual arrangements oblige FMR to pay all "class-level" expenses of the retail class of the fund to the extent necessary to limit total operating expenses, with certain exceptions, to 0.45%. These contractual arrangements may not be amended to increase the fees or expenses payable except by a vote of a majority of the Board and by a vote of a majority of the outstanding voting securities of the fund or class, as applicable.
The Board recognized that the fund's management contract incorporates a "group fee" structure, which provides for lower group fee rates as total group assets increase, and for higher group fee rates as total group assets decrease (with "group assets" defined to include fund assets under FMR's management plus the assets of sector funds previously under FMR's management). FMR calculates the group fee rates based on a tiered asset "breakpoint" schedule that varies based on asset class. The Board noted, however, that because the current contractual arrangements set the total "fund-level" expenses for each class at 0.35%, increases or decreases in the management fee due to changes in the group fee rate will not impact the total expense ratio.
Fees Charged to Other Fidelity Clients. The Board also considered Fidelity fee structures and other information with respect to clients of Fidelity, such as other funds advised or subadvised by Fidelity, pension plan clients, and other institutional clients with similar mandates. The Board noted that an ad hoc joint committee created by it and the boards of other Fidelity funds periodically reviews and compares Fidelity's institutional investment advisory business with its business of providing services to the Fidelity funds, including the differences in services provided, fees charged, and costs incurred, as well as competition in their respective marketplaces.
Based on its review of total expense ratios and fees charged to other Fidelity clients, the Board concluded that the total expense ratio of each class of the fund was reasonable in light of the services that the fund and its shareholders receive and the other factors considered.
Costs of the Services and Profitability. The Board considered the revenues earned and the expenses incurred by Fidelity in conducting the business of developing, marketing, distributing, managing, administering and servicing the fund and servicing the fund's shareholders. The Board also considered the level of Fidelity's profits in respect of all the Fidelity funds.
On an annual basis, Fidelity presents to the Board information about the profitability of its relationships with the fund. Fidelity calculates profitability information for each fund, as well as aggregate profitability information for groups of Fidelity funds and all Fidelity funds, using a series of detailed revenue and cost allocation methodologies which originate with the books and records of Fidelity on which Fidelity's audited financial statements are based. The Audit Committee of the Board reviews any significant changes from the prior year's methodologies.
PricewaterhouseCoopers LLP (PwC), independent registered public accounting firm and auditor to Fidelity and certain Fidelity funds, has been engaged annually by the Board as part of the Board's assessment of Fidelity's profitability analysis. PwC's engagement includes the review and assessment of the methodologies used by Fidelity in determining the revenues and expenses attributable to Fidelity's mutual fund business, and completion of agreed-upon procedures in respect of the mathematical accuracy of the fund profitability information and its conformity to established allocation methodologies. After considering PwC's reports issued under the engagement and information provided by Fidelity, the Board concluded that while other allocation methods may also be reasonable, Fidelity's profitability methodologies are reasonable in all material respects.
The Board also reviewed Fidelity's non-fund businesses and potential fall-out benefits related to the mutual fund business as well as cases where Fidelity's affiliates may benefit from or be related to the fund's business.
The Board considered the costs of the services provided by and the profits realized by Fidelity in connection with the operation of the fund and was satisfied that the profitability was not excessive.
Economies of Scale. The Board considered whether there have been economies of scale in respect of the management of the Fidelity funds, whether the Fidelity funds (including the fund) have appropriately benefited from any such economies of scale, and whether there is potential for realization of any further economies of scale. The Board considered the extent to which the fund will benefit from economies of scale as assets grow through increased services to the fund, through waivers or reimbursements, or through fee or expense ratio reductions. The Board also noted that a committee (the Economies of Scale Committee) created by it and the boards of other Fidelity funds periodically analyzes whether Fidelity attains economies of scale in respect of the management and servicing of the Fidelity funds, whether the Fidelity funds have appropriately benefited from such economies of scale, and whether there is potential for realization of any further economies of scale.
The Board concluded, taking into account the analysis of the Economies of Scale Committee, that economies of scale, if any, are being appropriately shared between fund shareholders and Fidelity.
Additional Information Requested by the Board. In order to develop fully the factual basis for consideration of the Fidelity funds' advisory contracts, the Board requested and received additional information on certain topics, including: (i) Fidelity's fund profitability methodology, profitability trends for certain funds, and the impact of certain factors on fund profitability results; (ii) portfolio manager changes that have occurred during the past year and the amount of the investment that each portfolio manager has made in the Fidelity fund(s) that he or she manages; (iii) Fidelity's compensation structure for portfolio managers, research analysts, and other key personnel, including its effects on fund profitability, the rationale for the compensation structure, and the extent to which current market conditions have affected retention and recruitment; (iv) the arrangements with and compensation paid to certain fund sub-advisers on behalf of the Fidelity funds; (v) the terms of Fidelity's contractual and voluntary expense cap and waiver arrangements with the funds; (vi) the methodology with respect to competitive fund data and peer group classifications; (vii) Fidelity's transfer agent fee, expense, and service structures for different funds and classes relative to competitive trends, and the impact of the increased use of omnibus accounts; (viii) Fidelity's long-term expectations for its offerings in the workplace investing channel; (ix) new developments in the retail and institutional marketplaces and the competitive positioning of the funds relative to other investment products and services; (x) the approach to considering "fall-out" benefits; (xi) the impact of money market reform on Fidelity's money market funds, including with respect to costs and profitability; (xii) the funds' share class structures and distribution channels, including the impact of the Department of Labor's new fiduciary rule on the funds' distribution arrangements; and (xiii) explanations regarding the relative total expense ratios of certain funds and classes, total expense competitive trends and methodologies for total expense competitive comparisons, and actions that might be taken by Fidelity to reduce total expense ratios for certain classes. In addition, the Board considered its discussions with Fidelity throughout the year regarding enhanced information security initiatives and the funds' fair valuation policies.
Based on its evaluation of all of the conclusions noted above, and after considering all factors it believed relevant, the Board concluded that the advisory fee structures are fair and reasonable, and that the fund's Advisory Contracts should be renewed.

AGVT-SANN-0418
1.834245.111
Fidelity® Government Income Fund
Semi-Annual Report February 28, 2018 |
|
Contents
To view a fund's proxy voting guidelines and proxy voting record for the 12-month period ended June 30, visit http://www.fidelity.com/proxyvotingresults or visit the Securities and Exchange Commission's (SEC) web site at http://www.sec.gov.
You may also call 1-800-544-8544 to request a free copy of the proxy voting guidelines.
Standard & Poor's, S&P and S&P 500 are registered service marks of The McGraw-Hill Companies, Inc. and have been licensed for use by Fidelity Distributors Corporation.
Other third-party marks appearing herein are the property of their respective owners.
All other marks appearing herein are registered or unregistered trademarks or service marks of FMR LLC or an affiliated company. © 2018 FMR LLC. All rights reserved.
This report and the financial statements contained herein are submitted for the general information of the shareholders of the Fund. This report is not authorized for distribution to prospective investors in the Fund unless preceded or accompanied by an effective prospectus.
A fund files its complete schedule of portfolio holdings with the SEC for the first and third quarters of each fiscal year on Form N-Q. Forms N-Q are available on the SEC’s web site at http://www.sec.gov. A fund's Forms N-Q may be reviewed and copied at the SEC’s Public Reference Room in Washington, DC. Information regarding the operation of the SEC's Public Reference Room may be obtained by calling 1-800-SEC-0330.
For a complete list of a fund's portfolio holdings, view the most recent holdings listing, semiannual report, or annual report on Fidelity's web site at http://www.fidelity.com, http://www.institutional.fidelity.com, or http://www.401k.com, as applicable.
NOT FDIC INSURED •MAY LOSE VALUE •NO BANK GUARANTEE
Neither the Fund nor Fidelity Distributors Corporation is a bank.
Investment Summary (Unaudited)
The information in the following tables is based on the combined investments of the Fund and its pro-rata share of the investments of Fidelity's Fixed-Income Central Funds.
Coupon Distribution as of February 28, 2018
| | % of fund's investments |
| Zero coupon bonds | 0.3 |
| 0.01 - 0.99% | 0.0 |
| 1 - 1.99% | 19.7 |
| 2 - 2.99% | 27.7 |
| 3 - 3.99% | 24.3 |
| 4 - 4.99% | 14.0 |
| 5 - 5.99% | 7.8 |
| 6 - 6.99% | 0.9 |
| 7% and above | 0.0 |
Coupon distribution shows the range of stated interest rates on the fund's investments, excluding short-term investments.
Asset Allocation (% of fund's net assets)
| As of February 28, 2018*,**,*** |
| | Mortgage Securities | 26.4% |
| | CMOs and Other Mortgage Related Securities | 29.6% |
| | U.S. Treasury Obligations | 36.0% |
| | U.S. Government Agency Obligations† | 2.2% |
| | Foreign Government & Government Agency Obligations | 3.6% |
| | Asset-Backed Securities | 3.9% |
| | Short-Term Investments and Net Other Assets (Liabilities)†† | (1.7)% |
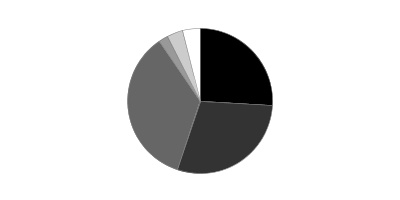
* Foreign investments – 3.6%
** Futures and Swaps – 10.6%
*** Written options - (3.0)%
† Includes NCUA Guaranteed Notes
†† Short-Term Investments and Net Other Assets (Liabilities) are not included in the pie chart
An unaudited holdings listing for the Fund, which presents direct holdings as well as the pro-rata share of any securities and other investments held indirectly through its investment in underlying non-money market Fidelity Central Funds, is available at fidelity.com and/or institutional.fidelity.com, as applicable.
Percentages in the above tables are adjusted for the effect of TBA Sale Commitments.
Percentages shown as 0.0% may reflect amounts less than 0.05%.
Schedule of Investments February 28, 2018 (Unaudited)
Showing Percentage of Net Assets
| U.S. Government and Government Agency Obligations - 38.2% | | | |
| | | Principal Amount (000s) | Value (000s) |
| U.S. Government Agency Obligations - 0.2% | | | |
| Fannie Mae: | | | |
| 0.875% 8/2/19 | | $131 | $129 |
| 1% 2/26/19 | | 326 | 322 |
| 1.125% 12/14/18 | | 240 | 238 |
| Tennessee Valley Authority: | | | |
| 5.25% 9/15/39 | | 2,807 | 3,607 |
| 5.375% 4/1/56 | | 3,438 | 4,559 |
| | | | 8,855 |
| U.S. Treasury Obligations - 36.0% | | | |
| U.S. Treasury Bonds: | | | |
| stripped coupon 2/15/34 | | 23,210 | 14,118 |
| 2.5% 2/15/46 | | 28,232 | 24,909 |
| 2.75% 8/15/47 | | 49,596 | 45,946 |
| 2.75% 11/15/47 | | 4,400 | 4,077 |
| 2.875% 8/15/45 | | 112,441 | 107,188 |
| 3% 11/15/44 | | 29,032 | 28,380 |
| 3% 11/15/45 | | 40,000 | 39,056 |
| 3% 5/15/47 | | 15,900 | 15,498 |
| 3% 2/15/48 | | 4,500 | 4,389 |
| 3.625% 2/15/44 | | 43,531 | 47,450 |
| 4.75% 2/15/37 (a)(b) | | 52,044 | 65,285 |
| 5% 5/15/37 (a)(b)(c) | | 32,242 | 41,648 |
| U.S. Treasury Notes: | | | |
| 1.125% 9/30/21 | | 60,467 | 57,578 |
| 1.375% 4/30/20 | | 29,895 | 29,303 |
| 1.375% 8/31/20 | | 5,000 | 4,881 |
| 1.375% 1/31/21 | | 22,500 | 21,835 |
| 1.375% 4/30/21 | | 15,000 | 14,504 |
| 1.375% 5/31/21 | | 20,000 | 19,313 |
| 1.5% 4/15/20 | | 653 | 642 |
| 1.5% 7/15/20 | | 20,725 | 20,325 |
| 1.5% 8/15/26 | | 9,629 | 8,642 |
| 1.625% 6/30/20 | | 4,710 | 4,633 |
| 1.625% 7/31/20 | | 30,000 | 29,495 |
| 1.625% 8/31/22 | | 17,293 | 16,565 |
| 1.75% 10/31/20 | | 2,405 | 2,366 |
| 1.75% 12/31/20 | | 31,701 | 31,134 |
| 1.75% 6/30/22 | | 34,052 | 32,859 |
| 1.875% 1/31/22 | | 45,770 | 44,592 |
| 1.875% 3/31/22 | | 56,661 | 55,107 |
| 1.875% 7/31/22 | | 85,036 | 82,405 |
| 1.875% 9/30/22(b) | | 28,814 | 27,876 |
| 2% 9/30/20 | | 15,143 | 15,001 |
| 2% 12/31/21 | | 78,894 | 77,291 |
| 2% 7/31/22 | | 18,845 | 18,375 |
| 2% 10/31/22 | | 10,000 | 9,720 |
| 2% 8/15/25 (a) | | 38,778 | 36,632 |
| 2% 11/15/26 | | 12,579 | 11,732 |
| 2.125% 6/30/21 | | 22,000 | 21,746 |
| 2.125% 12/31/21 | | 2,000 | 1,969 |
| 2.125% 6/30/22 | | 146 | 143 |
| 2.125% 7/31/24 | | 77,525 | 74,585 |
| 2.125% 11/30/24 | | 51,557 | 49,440 |
| 2.125% 5/15/25 | | 18,702 | 17,860 |
| 2.25% 2/29/20 | | 22,000 | 21,996 |
| 2.25% 7/31/21 | | 26,021 | 25,801 |
| 2.25% 12/31/24 | | 47,409 | 45,800 |
| 2.25% 2/15/27 | | 3,000 | 2,850 |
| 2.25% 11/15/27 | | 13,251 | 12,538 |
| 2.375% 1/31/23 | | 8,710 | 8,600 |
| 2.375% 5/15/27 | | 2,200 | 2,110 |
| 2.625% 2/28/23 | | 25,000 | 24,973 |
| 2.75% 2/15/28 | | 9,000 | 8,909 |
| | | | 1,430,070 |
| Other Government Related - 2.0% | | | |
| National Credit Union Administration Guaranteed Notes Series 2010-A1 Class A, 1 month U.S. LIBOR + 0.350% 1.9293% 12/7/20 (NCUA Guaranteed) (d)(e) | | 2,394 | 2,397 |
| National Credit Union Administration Guaranteed Notes Master Trust 3.45% 6/12/21 (NCUA Guaranteed) | | 74,000 | 75,522 |
| | | | 77,919 |
| TOTAL U.S. GOVERNMENT AND GOVERNMENT AGENCY OBLIGATIONS | | | |
| (Cost $1,565,589) | | | 1,516,844 |
|
| U.S. Government Agency - Mortgage Securities - 12.0% | | | |
| Fannie Mae - 5.3% | | | |
| 12 month U.S. LIBOR + 1.415% 3.165% 11/1/33 (d)(e) | | 77 | 79 |
| 12 month U.S. LIBOR + 1.480% 3.312% 7/1/34 (d)(e) | | 88 | 91 |
| 12 month U.S. LIBOR + 1.523% 3.218% 3/1/36 (d)(e) | | 340 | 352 |
| 12 month U.S. LIBOR + 1.551% 2.488% 2/1/44 (d)(e) | | 308 | 317 |
| 12 month U.S. LIBOR + 1.553% 2.611% 5/1/44 (d)(e) | | 972 | 997 |
| 12 month U.S. LIBOR + 1.553% 3.326% 6/1/36 (d)(e) | | 81 | 84 |
| 12 month U.S. LIBOR + 1.558% 2.449% 2/1/44 (d)(e) | | 393 | 405 |
| 12 month U.S. LIBOR + 1.565% 3.315% 3/1/37 (d)(e) | | 111 | 116 |
| 12 month U.S. LIBOR + 1.570% 2.559% 5/1/44 (d)(e) | | 528 | 542 |
| 12 month U.S. LIBOR + 1.574% 2.656% 4/1/44 (d)(e) | | 1,396 | 1,436 |
| 12 month U.S. LIBOR + 1.580% 2.44% 4/1/44 (d)(e) | | 555 | 570 |
| 12 month U.S. LIBOR + 1.580% 2.519% 1/1/44 (d)(e) | | 576 | 593 |
| 12 month U.S. LIBOR + 1.725% 2.592% 6/1/42 (d)(e) | | 236 | 243 |
| 12 month U.S. LIBOR + 1.728% 3.445% 11/1/36 (d)(e) | | 54 | 57 |
| 12 month U.S. LIBOR + 1.741% 3.477% 3/1/40 (d)(e) | | 1,055 | 1,087 |
| 12 month U.S. LIBOR + 1.745% 3.448% 7/1/35 (d)(e) | | 124 | 128 |
| 12 month U.S. LIBOR + 1.800% 2.747% 1/1/42 (d)(e) | | 804 | 834 |
| 12 month U.S. LIBOR + 1.800% 3.573% 7/1/41 (d)(e) | | 210 | 221 |
| 12 month U.S. LIBOR + 1.818% 2.689% 2/1/42 (d)(e) | | 1,145 | 1,187 |
| 12 month U.S. LIBOR + 1.818% 3.016% 9/1/41 (d)(e) | | 120 | 124 |
| 12 month U.S. LIBOR + 1.818% 3.266% 7/1/41 (d)(e) | | 161 | 169 |
| 12 month U.S. LIBOR + 1.830% 3.337% 10/1/41 (d)(e) | | 110 | 116 |
| 12 month U.S. LIBOR + 1.851% 3.518% 5/1/36 (d)(e) | | 66 | 68 |
| 6 month U.S. LIBOR + 1.475% 2.975% 10/1/33 (d)(e) | | 70 | 72 |
| 6 month U.S. LIBOR + 1.510% 3.043% 2/1/33 (d)(e) | | 47 | 48 |
| 6 month U.S. LIBOR + 1.535% 2.938% 12/1/34 (d)(e) | | 105 | 108 |
| 6 month U.S. LIBOR + 1.535% 2.958% 3/1/35 (d)(e) | | 53 | 55 |
| 6 month U.S. LIBOR + 1.556% 3.046% 10/1/33 (d)(e) | | 39 | 40 |
| 6 month U.S. LIBOR + 1.565% 2.999% 7/1/35 (d)(e) | | 46 | 47 |
| U.S. TREASURY 1 YEAR INDEX + 1.965% 2.84% 2/1/36 (d)(e) | | 46 | 48 |
| U.S. TREASURY 1 YEAR INDEX + 2.208% 3.083% 3/1/35 (d)(e) | | 49 | 52 |
| U.S. TREASURY 1 YEAR INDEX + 2.295% 3.54% 10/1/33 (d)(e) | | 83 | 87 |
| 3.5% 3/1/48 (f) | | 98,100 | 97,921 |
| 4% 5/1/29 to 1/1/47 | | 42,827 | 44,165 |
| 4% 3/1/48 (f) | | 7,000 | 7,171 |
| 4% 4/1/48 (f) | | 7,000 | 7,159 |
| 4.5% 11/1/25 to 6/1/41 | | 7,358 | 7,715 |
| 5.5% 12/1/39 to 5/1/44 | | 29,060 | 31,974 |
| 6% 1/1/34 to 6/1/36 | | 4,437 | 4,948 |
| 6.5% 3/1/22 to 5/1/27 | | 226 | 247 |
| 9.5% 10/1/20 | | 3 | 3 |
| 11.5% 1/15/21 | | 0 | 0 |
| | | | 211,676 |
| Freddie Mac - 0.6% | | | |
| 12 month U.S. LIBOR + 1.754% 3.067% 9/1/41 (d)(e) | | 1,164 | 1,218 |
| 12 month U.S. LIBOR + 1.874% 3.634% 10/1/42 (d)(e) | | 639 | 668 |
| 12 month U.S. LIBOR + 1.877% 3.213% 4/1/41 (d)(e) | | 107 | 110 |
| 12 month U.S. LIBOR + 1.880% 3.055% 10/1/41 (d)(e) | | 1,785 | 1,859 |
| 12 month U.S. LIBOR + 1.880% 3.206% 9/1/41 (d)(e) | | 126 | 130 |
| 12 month U.S. LIBOR + 1.910% 3.278% 6/1/41 (d)(e) | | 129 | 135 |
| 12 month U.S. LIBOR + 1.910% 3.417% 5/1/41 (d)(e) | | 129 | 136 |
| 12 month U.S. LIBOR + 1.910% 3.579% 5/1/41 (d)(e) | | 174 | 183 |
| 12 month U.S. LIBOR + 1.910% 3.677% 6/1/41 (d)(e) | | 163 | 171 |
| 12 month U.S. LIBOR + 2.045% 3.811% 7/1/36 (d)(e) | | 241 | 255 |
| 12 month U.S. LIBOR + 2.197% 3.771% 3/1/33 (d)(e) | | 6 | 7 |
| 6 month U.S. LIBOR + 1.445% 2.945% 3/1/35 (d)(e) | | 154 | 158 |
| 6 month U.S. LIBOR + 1.746% 3.092% 5/1/37 (d)(e) | | 110 | 114 |
| 6 month U.S. LIBOR + 2.755% 4.273% 10/1/35 (d)(e) | | 118 | 125 |
| U.S. TREASURY 1 YEAR INDEX + 2.383% 3.441% 2/1/36 (d)(e) | | 10 | 11 |
| U.S. TREASURY 1 YEAR INDEX + 2.548% 3.548% 7/1/35 (d)(e) | | 485 | 506 |
| 3% 2/1/31 | | 9,474 | 9,470 |
| 4% 5/1/47 to 7/1/47 | | 4,245 | 4,353 |
| 4.5% 5/1/39 to 10/1/41 | | 2,334 | 2,470 |
| 5.5% 7/1/29 | | 17 | 18 |
| 6% 1/1/24 | | 807 | 853 |
| 9.5% 11/1/19 to 8/1/21 | | 2 | 2 |
| | | | 22,952 |
| Ginnie Mae - 6.1% | | | |
| 6% 6/15/36 | | 3,610 | 4,145 |
| 4.312% 8/20/61 (d)(g) | | 1,468 | 1,480 |
| 4.5% 3/1/48 (f) | | 12,800 | 13,314 |
| 4.5% 3/1/48 (f) | | 10,950 | 11,389 |
| 4.5% 3/1/48 (f) | | 10,950 | 11,389 |
| 4.5% 3/1/48 (f) | | 11,400 | 11,858 |
| 4.5% 3/1/48 (f) | | 17,050 | 17,734 |
| 4.5% 3/1/48 (f) | | 42,650 | 44,362 |
| 4.5% 4/1/48 (f) | | 49,400 | 51,323 |
| 4.5% 4/1/48 (f) | | 56,400 | 58,595 |
| 4.642% 2/20/62 (d)(g) | | 1,905 | 1,938 |
| 4.674% 2/20/62 (d)(g) | | 2,328 | 2,362 |
| 4.698% 1/20/62 (d)(g) | | 12,873 | 13,054 |
| 5.47% 8/20/59 (d)(g) | | 14 | 14 |
| | | | 242,957 |
| TOTAL U.S. GOVERNMENT AGENCY - MORTGAGE SECURITIES | | | |
| (Cost $479,703) | | | 477,585 |
|
| Asset-Backed Securities - 3.9% | | | |
| GCO Education Loan Funding Trust Series 2006-1 Class A8L, 3 month U.S. LIBOR + 0.130% 2.0736% 5/25/25 (d)(e) | | $7,233 | $7,226 |
| Goal Capital Funding Trust Series 2005-2 Class A3, 3 month U.S. LIBOR + 0.170% 2.1136% 5/28/30 (d)(e) | | 3,496 | 3,492 |
| Illinois Student Assistance Commission Student Loan Rev. Series 2010-1 Class A2, 3 month U.S. LIBOR + 1.050% 2.4174% 4/25/22 (d)(e) | | 993 | 994 |
| Navient Student Loan Trust: | | | |
| Series 2017-3A: | | | |
| Class A1, 1 month U.S. LIBOR + 0.300% 1.9207% 7/26/66 (d)(e)(h) | | 9,737 | 9,742 |
| Class A2, 1 month U.S. LIBOR + 0.600% 2.2207% 7/26/66 (d)(e)(h) | | 14,550 | 14,642 |
| Series 2018-1A Class A1, 1 month U.S. LIBOR + 0.250% 1.7514% 3/25/67 (d)(e)(h) | | 16,267 | 16,261 |
| Nelnet Student Loan Trust 3 month U.S. LIBOR + 0.100% 1.8452% 1/25/30 (d)(e) | | 8,717 | 8,703 |
| Northstar Education Finance, Inc., Delaware Series 2004-2 Class A4, 3 month U.S. LIBOR + 0.230% 1.608% 7/28/21 (d)(e) | | 26,023 | 26,002 |
| SLM Student Loan Trust Series 2007-8 Class A4, 3 month U.S. LIBOR + 0.470% 2.2152% 1/26/26 (d)(e) | | 64,752 | 64,921 |
| Small Business Administration guaranteed development participation certificates: | | | |
| Series 2002-20J Class 1, 4.75% 10/1/22 | | 558 | 568 |
| Series 2002-20K Class 1, 5.08% 11/1/22 | | 834 | 861 |
| Series 2004-20H Class 1, 5.17% 8/1/24 | | 342 | 357 |
| TOTAL ASSET-BACKED SECURITIES | | | |
| (Cost $153,633) | | | 153,769 |
|
| Collateralized Mortgage Obligations - 16.7% | | | |
| U.S. Government Agency - 16.7% | | | |
| Fannie Mae: | | | |
| floater: | | $ | $ |
| Series 2001-38 Class QF, 1 month U.S. LIBOR + 0.980% 2.6007% 8/25/31 (d)(e) | | 78 | 80 |
| Series 2002-49 Class FB, 1 month U.S. LIBOR + 0.600% 2.19% 11/18/31 (d)(e) | | 72 | 73 |
| Series 2002-60 Class FV, 1 month U.S. LIBOR + 1.000% 2.6207% 4/25/32 (d)(e) | | 31 | 32 |
| Series 2002-75 Class FA, 1 month U.S. LIBOR + 1.000% 2.6207% 11/25/32 (d)(e) | | 63 | 65 |
| Series 2010-15 Class FJ, 1 month U.S. LIBOR + 0.930% 2.5507% 6/25/36 (d)(e) | | 4,730 | 4,803 |
| planned amortization class: | | | |
| Series 2005-19 Class PA, 5.5% 7/25/34 | | 972 | 999 |
| Series 2005-64 Class PX, 5.5% 6/25/35 | | 1,264 | 1,337 |
| Series 2005-68 Class CZ, 5.5% 8/25/35 | | 3,778 | 4,126 |
| Series 2006-45 Class OP 6/25/36 (i) | | 649 | 550 |
| Series 2010-118 Class PB, 4.5% 10/25/40 | | 5,382 | 5,554 |
| Series 2012-149: | | | |
| Class DA, 1.75% 1/25/43 | | 970 | 928 |
| Class GA, 1.75% 6/25/42 | | 954 | 911 |
| sequential payer: | | | |
| Series 2003-117 Class MD, 5% 12/25/23 | | 660 | 688 |
| Series 2004-91 Class Z, 5% 12/25/34 | | 4,427 | 4,725 |
| Series 2005-117 Class JN, 4.5% 1/25/36 | | 322 | 335 |
| Series 2005-14 Class ZB, 5% 3/25/35 | | 1,379 | 1,475 |
| Series 2006-72 Class CY, 6% 8/25/26 | | 2,734 | 2,909 |
| Series 2009-59 Class HB, 5% 8/25/39 | | 2,046 | 2,188 |
| Series 201-75 Class AL, 3.5% 8/25/26 | | 11,851 | 12,087 |
| Series 2010-97 Class CX, 4.5% 9/25/25 | | 10,927 | 11,406 |
| Series 2011-80: | | | |
| Class HE, 3.5% 8/25/26 | | 4,160 | 4,254 |
| Class KB, 3.5% 8/25/26 | | 6,462 | 6,598 |
| Series 2009-85 Class IB, 4.5% 8/25/24 (j) | | 160 | 6 |
| Series 2009-93 Class IC, 4.5% 9/25/24 (j) | | 219 | 7 |
| Series 2010-139 Class NI, 4.5% 2/25/40 (j) | | 2,898 | 296 |
| Series 2010-39 Class FG, 1 month U.S. LIBOR + 0.920% 2.5407% 3/25/36 (d)(e) | | 2,958 | 3,023 |
| Series 2010-97 Class CI, 4.5% 8/25/25 (j) | | 636 | 30 |
| Series 2012-27 Class EZ, 4.25% 3/25/42 | | 6,806 | 7,047 |
| Series 2016-26 Class CG, 3% 5/25/46 | | 18,866 | 18,773 |
| Freddie Mac: | | | |
| floater: | | | |
| Series 2530 Class FE, 1 month U.S. LIBOR + 0.600% 2.1875% 2/15/32 (d)(e) | | 42 | 42 |
| Series 2630 Class FL, 1 month U.S. LIBOR + 0.500% 2.0875% 6/15/18 (d)(e) | | 2 | 2 |
| Series 2682 Class FB, 1 month U.S. LIBOR + 0.900% 2.4875% 10/15/33 (d)(e) | | 2,203 | 2,235 |
| Series 2711 Class FC, 1 month U.S. LIBOR + 0.900% 2.4875% 2/15/33 (d)(e) | | 1,347 | 1,373 |
| planned amortization class: | | | |
| Series 1141 Class G, 9% 9/15/21 | | 26 | 28 |
| Series 2682 Class LD, 4.5% 10/15/33 | | 591 | 617 |
| Series 3415 Class PC, 5% 12/15/37 | | 405 | 431 |
| Series 3840 Class VA, 4.5% 9/15/27 | | 3,465 | 3,502 |
| Series 3857 Class ZP, 5% 5/15/41 | | 3,067 | 3,457 |
| Series 4135 Class AB, 1.75% 6/15/42 | | 713 | 681 |
| sequential payer: | | | |
| Series 2004-2802 Class ZG, 5.5% 5/15/34 | | 6,664 | 7,274 |
| Series 2587 Class AD, 4.71% 3/15/33 | | 2,368 | 2,462 |
| Series 2773 Class HC, 4.5% 4/15/19 | | 46 | 46 |
| Series 2877 Class ZD, 5% 10/15/34 | | 5,452 | 5,823 |
| Series 3007 Class EW, 5.5% 7/15/25 | | 4,333 | 4,580 |
| Series 3745 Class KV, 4.5% 12/15/26 | | 6,018 | 6,310 |
| Series 3806 Class L, 3.5% 2/15/26 | | 8,900 | 9,102 |
| Series 3862 Class MB, 3.5% 5/15/26 | | 6,893 | 7,039 |
| Series 3871 Class KB, 5.5% 6/15/41 | | 13,870 | 15,553 |
| Series 3889 Class DZ, 4% 1/15/41 | | 35,497 | 36,351 |
| Series 3843 Class PZ, 5% 4/15/41 | | 2,623 | 2,927 |
| Freddie Mac Multi-family Structured pass-thru certificates sequential payer: | | | |
| Series 4335 Class AL, 4.25% 3/15/40 | | 6,078 | 6,268 |
| Series 4341 Class ML, 3.5% 11/15/31 | | 8,800 | 8,954 |
| Ginnie Mae guaranteed REMIC pass-thru certificates: | | | |
| floater: | | | |
| Series 2008-2 Class FD, 1 month U.S. LIBOR + 0.480% 2.0412% 1/20/38 (d)(e) | | 216 | 217 |
| Series 2008-73 Class FA, 1 month U.S. LIBOR + 0.860% 2.4212% 8/20/38 (d)(e) | | 1,663 | 1,692 |
| Series 2008-83 Class FB, 1 month U.S. LIBOR + 0.900% 2.4612% 9/20/38 (d)(e) | | 1,416 | 1,446 |
| Series 2009-108 Class CF, 1 month U.S. LIBOR + 0.600% 2.1881% 11/16/39 (d)(e) | | 881 | 887 |
| Series 2011-H20 Class FA, 1 month U.S. LIBOR + 0.550% 1.9294% 9/20/61 (d)(e)(g) | | 8,184 | 8,215 |
| Series 2011-H21 Class FA, 1 month U.S. LIBOR + 0.600% 1.9794% 10/20/61 (d)(e)(g) | | 5,344 | 5,368 |
| Series 2012-H01 Class FA, 1 month U.S. LIBOR + 0.700% 2.0794% 11/20/61 (d)(e)(g) | | 4,547 | 4,582 |
| Series 2012-H03 Class FA, 1 month U.S. LIBOR + 0.700% 2.0794% 1/20/62 (d)(e)(g) | | 2,991 | 3,013 |
| Series 2012-H06 Class FA, 1 month U.S. LIBOR + 0.630% 2.0094% 1/20/62 (d)(e)(g) | | 4,282 | 4,306 |
| Series 2012-H07 Class FA, 1 month U.S. LIBOR + 0.630% 2.0094% 3/20/62 (d)(e)(g) | | 2,638 | 2,653 |
| Series 2012-H21 Class DF, 1 month U.S. LIBOR + 0.650% 2.0294% 5/20/61 (d)(e)(g) | | 2,264 | 2,268 |
| Series 2013-H19: | | | |
| Class FC, 1 month U.S. LIBOR + 0.600% 1.9794% 8/20/63 (d)(e)(g) | | 1,091 | 1,096 |
| Class FD, 1 month U.S. LIBOR + 0.600% 1.9794% 8/20/63 (d)(e)(g) | | 2,838 | 2,849 |
| Series 2014-H02 Class FB, 1 month U.S. LIBOR + 0.650% 2.2118% 12/20/63 (d)(e)(g) | | 35,584 | 35,830 |
| Series 2014-H03 Class FA, 1 month U.S. LIBOR + 0.600% 2.1618% 1/20/64 (d)(e)(g) | | 13,245 | 13,307 |
| Series 2015-H07 Class FA, 1 month U.S. LIBOR + 0.300% 1.8618% 3/20/65 (d)(e)(g) | | 6,465 | 6,466 |
| Series 2015-H13 Class FL, 1 month U.S. LIBOR + 0.280% 1.8418% 5/20/63 (d)(e)(g) | | 8,210 | 8,212 |
| Series 2015-H19 Class FA, 1 month U.S. LIBOR + 0.200% 1.7618% 4/20/63 (d)(e)(g) | | 9,484 | 9,481 |
| Series 2016-H20 Class FM, 1 month U.S. LIBOR + 0.400% 1.9618% 12/20/62 (d)(e)(g) | | 10,209 | 10,219 |
| planned amortization class Series 2010-31 Class BP, 5% 3/20/40 | | 11,191 | 12,122 |
| sequential payer: | | | |
| Series 2011-69 Class GX, 4.5% 5/16/40 | | 10,205 | 10,741 |
| Series 2013-H06 Class HA, 1.65% 1/20/63 (g) | | 4,122 | 4,072 |
| Series 2013-H26 Class HA, 3.5% 9/20/63 (g) | | 35,666 | 35,998 |
| Series 2014-H04 Class HA, 2.75% 2/20/64 (g) | | 8,623 | 8,595 |
| Series 2014-H12 Class KA, 2.75% 5/20/64 (g) | | 4,728 | 4,682 |
| Series 2016-H02 Class FM, 1 month U.S. LIBOR + 0.500% 2.0618% 9/20/62 (d)(e)(g) | | 17,875 | 17,924 |
| Series 2016-H04 Class FE, 1 month U.S. LIBOR + 0.650% 2.2118% 11/20/65 (d)(e)(g) | | 3,183 | 3,194 |
| Series 2004-22 Class M1, 5.5% 4/20/34 | | 600 | 717 |
| Series 2010-169 Class Z, 4.5% 12/20/40 | | 6,980 | 7,347 |
| Series 2010-H15 Class TP, 5.15% 8/20/60 (g) | | 10,915 | 11,139 |
| Series 2010-H17 Class XP, 5.2946% 7/20/60 (d)(g) | | 10,751 | 11,011 |
| Series 2010-H18 Class PL, 5.01% 9/20/60 (d)(g) | | 9,679 | 9,862 |
| Series 2012-64 Class KI, 3.5% 11/20/36 (j) | | 978 | 77 |
| Series 2013-124: | | | |
| Class ES, 8.667% - 1 month U.S. LIBOR 6.5851% 4/20/39 (d)(k) | | 3,530 | 3,617 |
| Class ST, 8.800% - 1 month U.S. LIBOR 6.7184% 8/20/39 (d)(k) | | 9,799 | 10,156 |
| Series 2013-H07 Class JA, 1.75% 3/20/63 (g) | | 23,116 | 22,782 |
| Series 2015-H17 Class HA, 2.5% 5/20/65 (g) | | 12,428 | 12,391 |
| Series 2015-H21: | | | |
| Class HA, 2.5% 6/20/63 (g) | | 34,918 | 34,841 |
| Class JA, 2.5% 6/20/65 (g) | | 4,043 | 4,032 |
| Series 2015-H30 Class HA, 1.75% 9/20/62 (d)(g) | | 36,646 | 36,236 |
| Series 2016-H13 Class FB, U.S. TREASURY 1 YEAR INDEX + 0.500% 1.65% 5/20/66 (d)(e)(g) | | 23,600 | 23,730 |
| Series 2017-H06 Class FA, U.S. TREASURY 1 YEAR INDEX + 0.350% 2.11% 8/20/66 (d)(e)(g) | | 20,958 | 21,014 |
| Series 2090-118 Class XZ, 5% 12/20/39 | | 14,448 | 15,777 |
| | | | 664,526 |
| TOTAL COLLATERALIZED MORTGAGE OBLIGATIONS | | | |
| (Cost $676,388) | | | 664,526 |
|
| Commercial Mortgage Securities - 10.4% | | | |
| Fannie Mae Series 2017-T1 Class A, 2.898% 6/25/27 | | 46,890 | 45,022 |
| FHLMC Multi-Family Structured Pass-Through Certificates sequential payer: | | | |
| Series K071 Class A2, 3.289% 11/25/27 | | 8,900 | 8,884 |
| Series K072 Class A2, 3.444% 12/25/50 | | 21,029 | 21,263 |
| Freddie Mac: | | | |
| floater: | | | |
| Series KP04 Class AG1, 1 month U.S. LIBOR + 0.220% 1.7997% 7/25/20 (d)(e) | | 10,600 | 10,610 |
| Series KP04, Class AG2, 1 month U.S. LIBOR + 0.200% 1.7797% 10/25/19 (d)(e) | | 21,200 | 21,210 |
| pass-thru certificates sequential payer Series K011 Class A2, 4.084% 11/25/20 | | 3,740 | 3,860 |
| sequential payer: | | | |
| Series 2017-SR01 Class A2, 2.75% 11/25/22 | | 19,000 | 18,780 |
| Series K009 Class A2, 3.808% 8/25/20 | | 5,591 | 5,728 |
| Series K034 Class A1, 2.669% 2/25/23 | | 10,896 | 10,824 |
| Series K073 Class A2, 3.35% 1/25/28 | | 33,000 | 33,081 |
| Series K708 Class A2, 2.13% 1/25/19 | | 23,574 | 23,502 |
| Series K709 Class A2, 2.086% 3/25/19 | | 17,210 | 17,143 |
| Series K710 Class A2, 1.883% 5/25/19 | | 16,814 | 16,719 |
| Series K713 Class A2, 2.313% 3/25/20 | | 5,437 | 5,399 |
| Series K717 Class A2, 2.991% 9/25/21 | | 12,968 | 13,012 |
| Series K729 Class A1, 2.9184% 2/25/24 | | 24,304 | 24,288 |
| Series K032 Class A1, 3.016% 2/25/23 | | 18,386 | 18,497 |
| Series K504 Class A2, 2.566% 9/25/20 | | 15,428 | 15,409 |
| Series K704 Class A2, 2.412% 8/25/18 | | 4,481 | 4,479 |
| Series K706 Class A2, 2.323% 10/25/18 | | 9,365 | 9,360 |
| Series K724 Class A1, 2.776% 3/25/23 | | 15,830 | 15,770 |
| Series K726 Class A1, 2.596% 8/25/23 | | 4,796 | 4,748 |
| Series K730 Class A1, 3.447% 9/24/24 | | 22,600 | 23,051 |
| Freddie Mac Multi-family floater Series 2017-KT01 Class A, 1 month U.S. LIBOR + 0.320% 1.8814% 2/25/20 (d)(e) | | 43,722 | 43,884 |
| TOTAL COMMERCIAL MORTGAGE SECURITIES | | | |
| (Cost $419,760) | | | 414,523 |
|
| Foreign Government and Government Agency Obligations - 3.6% | | | |
| Israeli State: | | | |
| (guaranteed by U.S. Government through Agency for International Development): | | | |
| 5.5% 9/18/23 | | 72,266 | 82,037 |
| 5.5% 12/4/23 | | 48 | 55 |
| 5.5% 4/26/24 | | 6,065 | 6,936 |
| Jordanian Kingdom 3% 6/30/25 | | 19,267 | 19,336 |
| Ukraine Government 1.471% 9/29/21 | | 34,809 | 33,458 |
| TOTAL FOREIGN GOVERNMENT AND GOVERNMENT AGENCY OBLIGATIONS | | | |
| (Cost $135,746) | | | 141,822 |
| | | Shares | Value (000s) |
|
| Fixed-Income Funds - 21.6% | | | |
| Fidelity Mortgage Backed Securities Central Fund (l) | | | |
| (Cost $852,107) | | 8,146,148 | 858,767 |
|
| Money Market Funds - 3.1% | | | |
| Fidelity Cash Central Fund, 1.41% (m) | | | |
| (Cost $122,981) | | 122,956,009 | 122,981 |
| Purchased Swaptions - 0.2% | | | | |
| | | Expiration Date | Notional Amount (000s) | Value (000s) |
| Put Options - 0.1% | | | | |
| Option on an interest rate swap with Goldman Sachs Bank U.S.A. to pay semi-annually a fixed rate of 2.495% and receive quarterly a floating rate based on 3-month LIBOR, expiring October 2027 | | 10/5/20 | 13,400 | $624 |
| Option on an interest rate swap with Goldman Sachs Bank U.S.A. to pay semi-annually a fixed rate of 2.7875% and receive quarterly a floating rate based on 3-month LIBOR, expiring January 2028 | | 1/25/21 | 77,100 | 2,894 |
| Option on an interest rate swap with JPMorgan Chase Bank NA to pay semi-annually a fixed rate of 2.5340% and receive quarterly a floating rate based on 3-month LIBOR, expiring December 2027 | | 12/8/20 | 44,800 | 2,057 |
|
| TOTAL PUT OPTIONS | | | | 5,575 |
|
| Call Options - 0.1% | | | | |
| Option on an interest rate swap with Goldman Sachs Bank U.S.A. to receive semi-annually a fixed rate of 2.495% and pay quarterly a floating rate based on 3-month LIBOR, expiring October 2027 | | 10/5/20 | 13,400 | 235 |
| Option on an interest rate swap with Goldman Sachs Bank U.S.A. to receive semi-annually a fixed rate of 2.7875% and pay quarterly a floating rate based on 3-month LIBOR, expiring January 2028 | | 1/25/21 | 77,100 | 1,965 |
| Option on an interest rate swap with JPMorgan Chase Bank NA to receive semi-annually a fixed rate of 2.5340% and pay quarterly a floating rate based on 3-month LIBOR, expiring December 2027 | | 12/8/20 | 44,800 | 849 |
|
| TOTAL CALL OPTIONS | | | | 3,049 |
|
| TOTAL PURCHASED SWAPTIONS | | | | |
| (Cost $8,178) | | | | 8,624 |
| TOTAL INVESTMENT IN SECURITIES - 109.7% | | | | |
| (Cost $4,414,085) | | | | 4,359,441 |
| NET OTHER ASSETS (LIABILITIES) - (9.7)% | | | | (384,188) |
| NET ASSETS - 100% | | | | $3,975,253 |
| TBA Sale Commitments | | |
| | Principal Amount (000s) | Value (000s) |
| Fannie Mae | | |
| 3.5% 3/1/48 | $(98,100) | $(97,922) |
| 4% 3/1/48 | (7,000) | (7,170) |
|
| TOTAL FANNIE MAE | | (105,092) |
|
| Ginnie Mae | | |
| 4.5% 3/1/48 | (49,400) | (51,383) |
| 4.5% 3/1/48 | (56,400) | (58,663) |
|
| TOTAL GINNIE MAE | | (110,046) |
|
| TOTAL TBA SALE COMMITMENTS | | |
| (Proceeds $215,065) | | $(215,138) |
| Written Swaptions | | | |
| | Expiration Date | Notional Amount | Value (000s) |
| Put Swaptions | | | |
| Option on an interest rate swap with Goldman Sachs Bank U.S.A. to pay semi-annually a fixed rate of 3.065% and receive quarterly a floating rate based on 3-month LIBOR, expiring January 2028 | 2/5/21 | 57,570 | $(1,702) |
| Call Swaptions | | | |
| Option on an interest rate swap with Goldman Sachs Bank U.S.A. to receive semi-annually a fixed rate of 3.065% and pay quarterly a floating rate based on 3-month LIBOR, expiring January 2028 | 2/5/21 | 57,570 | (1,955) |
| TOTAL WRITTEN SWAPTIONS | | | $(3,657) |
| Futures Contracts | | | | | |
| | Number of contracts | Expiration Date | Notional Amount (000s) | Value (000s) | Unrealized Appreciation/(Depreciation) (000s) |
| Purchased | | | | | |
| Treasury Contracts | | | | | |
| CBOT 10-Year U.S. Treasury Note Contracts (United States) | 730 | June 2018 | $87,634 | $141 | $141 |
| CBOT 2-Year U.S. Treasury Note Contracts (United States) | 872 | June 2018 | 185,273 | (2) | (2) |
| CBOT 5-Year U.S. Treasury Note Contracts (United States) | 636 | June 2018 | 72,459 | (255) | (255) |
| CBOT Long Term U.S. Treasury Bond Contracts (United States) | 238 | June 2018 | 34,138 | 416 | 416 |
| CBOT Ultra 10-Year U.S. Treasury Note Contracts (United States) | 75 | June 2018 | 9,605 | 29 | 29 |
| TOTAL FUTURES CONTRACTS | | | | | $329 |
The notional amount of futures purchased as a percentage of Net Assets is 9.8%
For the period, the average monthly underlying face amount at value for futures contracts in the aggregate was $385,714.
Swaps
| Payment Received | Payment Frequency | Payment Paid | Payment Frequency | Clearinghouse / Counterparty(1) | Maturity Date | Notional Amount (000s) | Value (000s) | Upfront Premium Received/(Paid) (000s)(2) | Unrealized Appreciation/(Depreciation) (000s) |
| Interest Rate Swaps | | | | | | | | | |
| 2% | Semi - annual | 3-month LIBOR(3) | Quarterly | LCH | Mar. 2025 | $19,866 | $(289) | $0 | $(289) |
(1) Swaps with LCH Clearnet Group (LCH) are centrally cleared over-the-counter (OTC) swaps.
(2) Any premiums for centrally cleared over-the-counter (OTC) swaps are recorded periodically throughout the term of the swap to variation margin and included in unrealized appreciation (depreciation).
(3) Represents floating rate.
Values shown as $0 may reflect amounts less than $500.
Legend
(a) Security or a portion of the security was pledged to cover margin requirements for futures contracts. At period end, the value of securities pledged amounted to $2,189,000.
(b) Security or a portion of the security has been segregated as collateral for mortgage-backed or asset-backed securities purchased on a delayed delivery or when-issued basis. At period end, the value of securities pledged amounted to $170,000.
(c) Security or a portion of the security was pledged to cover margin requirements for centrally cleared OTC swaps. At period end, the value of securities pledged amounted to $674,000.
(d) Coupon rates for floating and adjustable rate securities reflect the rates in effect at period end.
(e) Coupon is indexed to a floating interest rate which may be multiplied by a specified factor and/or subject to caps or floors.
(f) Security or a portion of the security purchased on a delayed delivery or when-issued basis.
(g) Represents an investment in an underlying pool of reverse mortgages which typically do not require regular principal and interest payments as repayment is deferred until a maturity event.
(h) Security exempt from registration under Rule 144A of the Securities Act of 1933. These securities may be resold in transactions exempt from registration, normally to qualified institutional buyers. At the end of the period, the value of these securities amounted to $40,645,000 or 1.0% of net assets.
(i) Principal Only Strips represent the right to receive the monthly principal payments on an underlying pool of mortgage loans.
(j) Security represents right to receive monthly interest payments on an underlying pool of mortgages or assets. Principal shown is the outstanding par amount of the pool as of the end of the period.
(k) Coupon is inversely indexed to a floating interest rate multiplied by a specified factor. The price may be considerably more volatile than the price of a comparable fixed rate security.
(l) Affiliated fund that is generally available only to investment companies and other accounts managed by Fidelity Investments. A complete unaudited schedule of portfolio holdings for each Fidelity Central Fund is filed with the SEC for the first and third quarters of each fiscal year on Form N-Q and is available upon request or at the SEC's website at www.sec.gov. An unaudited holdings listing for the Fund, which presents direct holdings as well as the pro-rata share of securities and other investments held indirectly through its investment in underlying non-money market Fidelity Central Funds, is available at fidelity.com and/or institutional.fidelity.com, as applicable. In addition, each Fidelity Central Fund's financial statements are available on the SEC's website or upon request.
(m) Affiliated fund that is generally available only to investment companies and other accounts managed by Fidelity Investments. The rate quoted is the annualized seven-day yield of the fund at period end. A complete unaudited listing of the fund's holdings as of its most recent quarter end is available upon request. In addition, each Fidelity Central Fund's financial statements are available on the SEC's website or upon request.
Affiliated Central Funds
Information regarding fiscal year to date income earned by the Fund from investments in Fidelity Central Funds is as follows:
| Fund | Income earned |
| | (Amounts in thousands) |
| Fidelity Cash Central Fund | $226 |
| Fidelity Mortgage Backed Securities Central Fund | 12,490 |
| Total | $12,716 |
Amounts in the income column in the above table include any capital gain distributions from underlying funds, which are presented in the corresponding line-item in the Statement of Operations if applicable.
Additional information regarding the Fund's fiscal year to date purchases and sales, including the ownership percentage, of the non Money Market Central Funds is as follows:
| Fund (Amounts in thousands) | Value, beginning of period | Purchases | Sales Proceeds | Realized Gain/Loss | Change in Unrealized appreciation (depreciation) | Value, end of period | % ownership, end of period |
| Fidelity Mortgage Backed Securities Central Fund | $939,005 | $100,490 | $152,000 | $3,913 | $(32,641) | $858,767 | 12.0% |
| Total | $939,005 | $100,490 | $152,000 | $3,913 | $(32,641) | $858,767 | |
Investment Valuation
The following is a summary of the inputs used, as of February 28, 2018, involving the Fund's assets and liabilities carried at fair value. The inputs or methodology used for valuing securities may not be an indication of the risk associated with investing in those securities. For more information on valuation inputs, and their aggregation into the levels used below, please refer to the Investment Valuation section in the accompanying Notes to Financial Statements.
| | Valuation Inputs at Reporting Date: |
| Description | Total | Level 1 | Level 2 | Level 3 |
| (Amounts in thousands) | | | | |
| Investments in Securities: | | | | |
| U.S. Government and Government Agency Obligations | $1,516,844 | $-- | $1,516,844 | $-- |
| U.S. Government Agency - Mortgage Securities | 477,585 | -- | 477,585 | -- |
| Asset-Backed Securities | 153,769 | -- | 153,769 | -- |
| Collateralized Mortgage Obligations | 664,526 | -- | 664,526 | -- |
| Commercial Mortgage Securities | 414,523 | -- | 414,523 | -- |
| Foreign Government and Government Agency Obligations | 141,822 | -- | 141,822 | -- |
| Fixed-Income Funds | 858,767 | 858,767 | -- | -- |
| Money Market Funds | 122,981 | 122,981 | -- | -- |
| Purchased Swaptions | 8,624 | -- | 8,624 | -- |
| Total Investments in Securities: | $4,359,441 | $981,748 | $3,377,693 | $-- |
| Derivative Instruments: | | | | |
| Assets | | | | |
| Futures Contracts | $586 | $586�� | $-- | $-- |
| Total Assets | $586 | $586 | $-- | $-- |
| Liabilities | | | | |
| Futures Contracts | $(257) | $(257) | $-- | $-- |
| Swaps | (289) | -- | (289) | -- |
| Written Swaptions | (3,657) | -- | (3,657) | -- |
| Total Liabilities | $(4,203) | $(257) | $(3,946) | $-- |
| Total Derivative Instruments: | $(3,617) | $329 | $(3,946) | $-- |
| Other Financial Instruments: | | | | |
| TBA Sale Commitments | $(215,138) | $-- | $(215,138) | $-- |
| Total Other Financial Instruments: | $(215,138) | $-- | $(215,138) | $-- |
Value of Derivative Instruments
The following table is a summary of the Fund's value of derivative instruments by primary risk exposure as of February 28, 2018. For additional information on derivative instruments, please refer to the Derivative Instruments section in the accompanying Notes to Financial Statements.
| Primary Risk Exposure / Derivative Type | Value |
| | Asset | Liability |
| (Amounts in thousands) | | |
| Interest Rate Risk | | |
| Futures Contracts(a) | $586 | $(257) |
| Purchased Swaptions(b) | 8,624 | 0 |
| Swaps(c) | 0 | (289) |
| Written Swaptions(d) | 0 | (3,657) |
| Total Interest Rate Risk | 9,210 | (4,203) |
| Total Value of Derivatives | $9,210 | $(4,203) |
(a) Reflects gross cumulative appreciation (depreciation) on futures contracts as presented in the Schedule of Investments. In the Statement of Assets and Liabilities, the period end daily variation margin is included in receivable or payable for daily variation margin on futures contracts, and the net cumulative appreciation (depreciation) is included in net unrealized appreciation (depreciation).
(b) Gross value is included in the Statement of Assets and Liabilities in the investments, at value line-item.
(c) For centrally cleared over-the-counter (OTC) swaps, reflects gross cumulative appreciation (depreciation) as presented in the Schedule of Investments. In the Statement of Assets and Liabilities, the period end daily variation margin for centrally cleared OTC swaps is included in receivable or payable for daily variation margin on centrally cleared OTC swaps, and the net cumulative appreciation (depreciation) for centrally cleared OTC swaps is included in net unrealized appreciation (depreciation).
(d) Gross value is presented in the Statement of Assets and Liabilities in the written options, at value line-item.
See accompanying notes which are an integral part of the financial statements.
Financial Statements
Statement of Assets and Liabilities
| Amounts in thousands (except per-share amounts) | | February 28, 2018 (Unaudited) |
| Assets | | |
Investment in securities, at value — See accompanying schedule:
Unaffiliated issuers (cost $3,438,997) | $3,377,693 | |
| Fidelity Central Funds (cost $975,088) | 981,748 | |
| Total Investment in Securities (cost $4,414,085) | | $4,359,441 |
| Receivable for investments sold | | 35,041 |
| Receivable for TBA sale commitments | | 215,065 |
| Receivable for fund shares sold | | 2,440 |
| Interest receivable | | 11,082 |
| Distributions receivable from Fidelity Central Funds | | 110 |
| Receivable for daily variation margin for on futures contracts | | 484 |
| Receivable for daily variation margin on centrally cleared OTC swaps | | 46 |
| Other receivables | | 68 |
| Total assets | | 4,623,777 |
| Liabilities | | |
| Payable for investments purchased | | |
| Regular delivery | $91,488 | |
| Delayed delivery | 332,375 | |
| TBA sale commitments, at value | 215,138 | |
| Payable for fund shares redeemed | 3,914 | |
| Distributions payable | 235 | |
| Accrued management fee | 1,017 | |
| Distribution and service plan fees payable | 112 | |
| Written options, at value (premium received $3,748) | 3,657 | |
| Other affiliated payables | 520 | |
| Other payables and accrued expenses | 68 | |
| Total liabilities | | 648,524 |
| Net Assets | | $3,975,253 |
| Net Assets consist of: | | |
| Paid in capital | | $4,119,944 |
| Distributions in excess of net investment income | | (7,437) |
| Accumulated undistributed net realized gain (loss) on investments | | (82,668) |
| Net unrealized appreciation (depreciation) on investments | | (54,586) |
| Net Assets | | $3,975,253 |
| Calculation of Maximum Offering Price | | |
| Class A: | | |
| Net Asset Value and redemption price per share ($152,293 ÷ 15,242 shares) | | $9.99 |
| Maximum offering price per share (100/96.00 of $9.99) | | $10.41 |
| Class M: | | |
| Net Asset Value and redemption price per share ($140,278 ÷ 14,041 shares) | | $9.99 |
| Maximum offering price per share (100/96.00 of $9.99) | | $10.41 |
| Class C: | | |
| Net Asset Value and offering price per share ($59,188 ÷ 5,925 shares)(a) | | $9.99 |
| Government Income: | | |
| Net Asset Value, offering price and redemption price per share ($3,172,355 ÷ 318,009 shares) | | $9.98 |
| Class I: | | |
| Net Asset Value, offering price and redemption price per share ($451,139 ÷ 45,154 shares) | | $9.99 |
(a) Redemption price per share is equal to net asset value less any applicable contingent deferred sales charge.
See accompanying notes which are an integral part of the financial statements.
Statement of Operations
| Amounts in thousands | | Six months ended February 28, 2018 (Unaudited) |
| Investment Income | | |
| Interest | | $36,272 |
| Income from Fidelity Central Funds | | 12,716 |
| Total income | | 48,988 |
| Expenses | | |
| Management fee | $6,427 | |
| Transfer agent fees | 2,334 | |
| Distribution and service plan fees | 717 | |
| Fund wide operations fee | 908 | |
| Independent trustees' fees and expenses | 8 | |
| Miscellaneous | 7 | |
| Total expenses before reductions | 10,401 | |
| Expense reductions | (2) | 10,399 |
| Net investment income (loss) | | 38,589 |
| Realized and Unrealized Gain (Loss) | | |
| Net realized gain (loss) on: | | |
| Investment securities: | | |
| Unaffiliated issuers | (12,143) | |
| Fidelity Central Funds | 3,913 | |
| Futures contracts | (11,097) | |
| Swaps | (131) | |
| Total net realized gain (loss) | | (19,458) |
| Change in net unrealized appreciation (depreciation) on: | | |
| Investment securities: | | |
| Unaffiliated issuers | (99,739) | |
| Fidelity Central Funds | (32,643) | |
| Futures contracts | (225) | |
| Swaps | (305) | |
| Written options | 91 | |
| Delayed delivery commitments | 799 | |
| Total change in net unrealized appreciation (depreciation) | | (132,022) |
| Net gain (loss) | | (151,480) |
| Net increase (decrease) in net assets resulting from operations | | $(112,891) |
See accompanying notes which are an integral part of the financial statements.
Statement of Changes in Net Assets
| Amounts in thousands | Six months ended February 28, 2018 (Unaudited) | Year ended August 31, 2017 |
| Increase (Decrease) in Net Assets | | |
| Operations | | |
| Net investment income (loss) | $38,589 | $76,961 |
| Net realized gain (loss) | (19,458) | 1,723 |
| Change in net unrealized appreciation (depreciation) | (132,022) | (115,167) |
| Net increase (decrease) in net assets resulting from operations | (112,891) | (36,483) |
| Distributions to shareholders from net investment income | (38,482) | (74,479) |
| Distributions to shareholders from net realized gain | – | (34,956) |
| Total distributions | (38,482) | (109,435) |
| Share transactions - net increase (decrease) | (238,658) | (430,132) |
| Total increase (decrease) in net assets | (390,031) | (576,050) |
| Net Assets | | |
| Beginning of period | 4,365,284 | 4,941,334 |
| End of period | $3,975,253 | $4,365,284 |
| Other Information | | |
| Distributions in excess of net investment income end of period | $(7,437) | $(7,544) |
See accompanying notes which are an integral part of the financial statements.
Financial Highlights
Fidelity Government Income Fund Class A
| | Six months ended (Unaudited) February 28, | Years endedAugust 31, | | | | |
| | 2018 | 2017 | 2016 | 2015 | 2014 | 2013 |
| Selected Per–Share Data | | | | | | |
| Net asset value, beginning of period | $10.36 | $10.66 | $10.50 | $10.47 | $10.20 | $10.97 |
| Income from Investment Operations | | | | | | |
| Net investment income (loss)A | .080 | .149 | .135 | .126 | .138 | .105 |
| Net realized and unrealized gain (loss) | (.370) | (.230) | .270 | .048 | .278 | (.454) |
| Total from investment operations | (.290) | (.081) | .405 | .174 | .416 | (.349) |
| Distributions from net investment income | (.080) | (.143) | (.150) | (.116) | (.139) | (.099) |
| Distributions from net realized gain | – | (.076) | (.095) | (.028) | (.007) | (.322) |
| Total distributions | (.080) | (.219) | (.245) | (.144) | (.146) | (.421) |
| Net asset value, end of period | $9.99 | $10.36 | $10.66 | $10.50 | $10.47 | $10.20 |
| Total ReturnB,C,D | (2.81)% | (.73)% | 3.92% | 1.67% | 4.10% | (3.29)% |
| Ratios to Average Net AssetsE,F | | | | | | |
| Expenses before reductions | .77%G | .77% | .76% | .77% | .77% | .77% |
| Expenses net of fee waivers, if any | .77%G | .77% | .76% | .77% | .77% | .77% |
| Expenses net of all reductions | .77%G | .77% | .76% | .77% | .77% | .77% |
| Net investment income (loss) | 1.58%G | 1.44% | 1.28% | 1.20% | 1.34% | .99% |
| Supplemental Data | | | | | | |
| Net assets, end of period (in millions) | $152 | $174 | $261 | $222 | $246 | $291 |
| Portfolio turnover rateH | 146%G | 157% | 93% | 83% | 131% | 192% |
A Calculated based on average shares outstanding during the period.
B Total returns for periods of less than one year are not annualized.
C Total returns would have been lower if certain expenses had not been reduced during the applicable periods shown.
D Total returns do not include the effect of the sales charges.
E Fees and expenses of any underlying Fidelity Central Funds are not included in the Fund's expense ratio. The Fund indirectly bears its proportionate share of the expenses of any underlying Fidelity Central Funds. Based on their most recent shareholder report date, the expenses of any underlying non-money market Fidelity Central Funds were less than .005%.
F Expense ratios reflect operating expenses of the class. Expenses before reductions do not reflect amounts reimbursed by the investment adviser or reductions from expense offset arrangements and do not represent the amount paid by the class during periods when reimbursements or reductions occur. Expenses net of fee waivers reflect expenses after reimbursement by the investment adviser but prior to reductions from expense offset arrangements. Expenses net of all reductions represent the net expenses paid by the class.
G Annualized
H Amount does not include the portfolio activity of any underlying Fidelity Central Funds.
See accompanying notes which are an integral part of the financial statements.
Fidelity Government Income Fund Class M
| | Six months ended (Unaudited) February 28, | Years endedAugust 31, | | | | |
| | 2018 | 2017 | 2016 | 2015 | 2014 | 2013 |
| Selected Per–Share Data | | | | | | |
| Net asset value, beginning of period | $10.36 | $10.66 | $10.50 | $10.47 | $10.20 | $10.97 |
| Income from Investment Operations | | | | | | |
| Net investment income (loss)A | .080 | .149 | .135 | .127 | .140 | .107 |
| Net realized and unrealized gain (loss) | (.370) | (.229) | .270 | .048 | .277 | (.454) |
| Total from investment operations | (.290) | (.080) | .405 | .175 | .417 | (.347) |
| Distributions from net investment income | (.080) | (.144) | (.150) | (.117) | (.140) | (.101) |
| Distributions from net realized gain | – | (.076) | (.095) | (.028) | (.007) | (.322) |
| Total distributions | (.080) | (.220) | (.245) | (.145) | (.147) | (.423) |
| Net asset value, end of period | $9.99 | $10.36 | $10.66 | $10.50 | $10.47 | $10.20 |
| Total ReturnB,C,D | (2.81)% | (.73)% | 3.92% | 1.68% | 4.12% | (3.27)% |
| Ratios to Average Net AssetsE,F | | | | | | |
| Expenses before reductions | .77%G | .76% | .76% | .76% | .76% | .75% |
| Expenses net of fee waivers, if any | .77%G | .76% | .76% | .76% | .76% | .75% |
| Expenses net of all reductions | .77%G | .76% | .76% | .76% | .76% | .75% |
| Net investment income (loss) | 1.58%G | 1.44% | 1.28% | 1.20% | 1.36% | 1.01% |
| Supplemental Data | | | | | | |
| Net assets, end of period (in millions) | $140 | $157 | $197 | $181 | $196 | $228 |
| Portfolio turnover rateH | 146%G | 157% | 93% | 83% | 131% | 192% |
A Calculated based on average shares outstanding during the period.
B Total returns for periods of less than one year are not annualized.
C Total returns would have been lower if certain expenses had not been reduced during the applicable periods shown.
D Total returns do not include the effect of the sales charges.
E Fees and expenses of any underlying Fidelity Central Funds are not included in the Fund's expense ratio. The Fund indirectly bears its proportionate share of the expenses of any underlying Fidelity Central Funds. Based on their most recent shareholder report date, the expenses of any underlying non-money market Fidelity Central Funds were less than .005%.
F Expense ratios reflect operating expenses of the class. Expenses before reductions do not reflect amounts reimbursed by the investment adviser or reductions from expense offset arrangements and do not represent the amount paid by the class during periods when reimbursements or reductions occur. Expenses net of fee waivers reflect expenses after reimbursement by the investment adviser but prior to reductions from expense offset arrangements. Expenses net of all reductions represent the net expenses paid by the class.
G Annualized
H Amount does not include the portfolio activity of any underlying Fidelity Central Funds.
See accompanying notes which are an integral part of the financial statements.
Fidelity Government Income Fund Class C
| | Six months ended (Unaudited) February 28, | Years endedAugust 31, | | | | |
| | 2018 | 2017 | 2016 | 2015 | 2014 | 2013 |
| Selected Per–Share Data | | | | | | |
| Net asset value, beginning of period | $10.36 | $10.66 | $10.50 | $10.47 | $10.20 | $10.96 |
| Income from Investment Operations | | | | | | |
| Net investment income (loss)A | .041 | .069 | .053 | .044 | .059 | .025 |
| Net realized and unrealized gain (loss) | (.371) | (.229) | .270 | .048 | .278 | (.443) |
| Total from investment operations | (.330) | (.160) | .323 | .092 | .337 | (.418) |
| Distributions from net investment income | (.040) | (.064) | (.068) | (.034) | (.060) | (.020) |
| Distributions from net realized gain | – | (.076) | (.095) | (.028) | (.007) | (.322) |
| Total distributions | (.040) | (.140) | (.163) | (.062) | (.067) | (.342) |
| Net asset value, end of period | $9.99 | $10.36 | $10.66 | $10.50 | $10.47 | $10.20 |
| Total ReturnB,C,D | (3.19)% | (1.49)% | 3.12% | .88% | 3.32% | (3.93)% |
| Ratios to Average Net AssetsE,F | | | | | | |
| Expenses before reductions | 1.55%G | 1.54% | 1.54% | 1.55% | 1.54% | 1.52% |
| Expenses net of fee waivers, if any | 1.55%G | 1.54% | 1.54% | 1.55% | 1.54% | 1.52% |
| Expenses net of all reductions | 1.55%G | 1.54% | 1.54% | 1.55% | 1.54% | 1.52% |
| Net investment income (loss) | .80%G | .67% | .50% | .42% | .57% | .24% |
| Supplemental Data | | | | | | |
| Net assets, end of period (in millions) | $59 | $72 | $94 | $54 | $58 | $73 |
| Portfolio turnover rateH | 146%G | 157% | 93% | 83% | 131% | 192% |
A Calculated based on average shares outstanding during the period.
B Total returns for periods of less than one year are not annualized.
C Total returns would have been lower if certain expenses had not been reduced during the applicable periods shown.
D Total returns do not include the effect of the contingent deferred sales charge.
E Fees and expenses of any underlying Fidelity Central Funds are not included in the Fund's expense ratio. The Fund indirectly bears its proportionate share of the expenses of any underlying Fidelity Central Funds. Based on their most recent shareholder report date, the expenses of any underlying non-money market Fidelity Central Funds were less than .005%.
F Expense ratios reflect operating expenses of the class. Expenses before reductions do not reflect amounts reimbursed by the investment adviser or reductions from expense offset arrangements and do not represent the amount paid by the class during periods when reimbursements or reductions occur. Expenses net of fee waivers reflect expenses after reimbursement by the investment adviser but prior to reductions from expense offset arrangements. Expenses net of all reductions represent the net expenses paid by the class.
G Annualized
H Amount does not include the portfolio activity of any underlying Fidelity Central Funds.
See accompanying notes which are an integral part of the financial statements.
Fidelity Government Income Fund
| | Six months ended (Unaudited) February 28, | Years endedAugust 31, | | | | |
| | 2018 | 2017 | 2016 | 2015 | 2014 | 2013 |
| Selected Per–Share Data | | | | | | |
| Net asset value, beginning of period | $10.35 | $10.65 | $10.48 | $10.45 | $10.18 | $10.95 |
| Income from Investment Operations | | | | | | |
| Net investment income (loss)A | .096 | .181 | .167 | .159 | .171 | .138 |
| Net realized and unrealized gain (loss) | (.370) | (.229) | .281 | .048 | .278 | (.453) |
| Total from investment operations | (.274) | (.048) | .448 | .207 | .449 | (.315) |
| Distributions from net investment income | (.096) | (.176) | (.183) | (.149) | (.172) | (.133) |
| Distributions from net realized gain | – | (.076) | (.095) | (.028) | (.007) | (.322) |
| Total distributions | (.096) | (.252) | (.278) | (.177) | (.179) | (.455) |
| Net asset value, end of period | $9.98 | $10.35 | $10.65 | $10.48 | $10.45 | $10.18 |
| Total ReturnB,C | (2.66)% | (.42)% | 4.35% | 1.99% | 4.45% | (2.99)% |
| Ratios to Average Net AssetsD,E | | | | | | |
| Expenses before reductions | .45%F | .45% | .45% | .45% | .45% | .45% |
| Expenses net of fee waivers, if any | .45%F | .45% | .45% | .45% | .45% | .45% |
| Expenses net of all reductions | .45%F | .45% | .45% | .45% | .45% | .45% |
| Net investment income (loss) | 1.90%F | 1.76% | 1.59% | 1.51% | 1.66% | 1.31% |
| Supplemental Data | | | | | | |
| Net assets, end of period (in millions) | $3,172 | $3,467 | $3,896 | $3,489 | $3,157 | $3,412 |
| Portfolio turnover rateG | 146%F | 157% | 93% | 83% | 131% | 192% |
A Calculated based on average shares outstanding during the period.
B Total returns for periods of less than one year are not annualized.
C Total returns would have been lower if certain expenses had not been reduced during the applicable periods shown.
D Fees and expenses of any underlying Fidelity Central Funds are not included in the Fund's expense ratio. The Fund indirectly bears its proportionate share of the expenses of any underlying Fidelity Central Funds. Based on their most recent shareholder report date, the expenses of any underlying non-money market Fidelity Central Funds were less than .005%.
E Expense ratios reflect operating expenses of the class. Expenses before reductions do not reflect amounts reimbursed by the investment adviser or reductions from expense offset arrangements and do not represent the amount paid by the class during periods when reimbursements or reductions occur. Expenses net of fee waivers reflect expenses after reimbursement by the investment adviser but prior to reductions from expense offset arrangements. Expenses net of all reductions represent the net expenses paid by the class.
F Annualized
G Amount does not include the portfolio activity of any underlying Fidelity Central Funds.
See accompanying notes which are an integral part of the financial statements.
Fidelity Government Income Fund Class I
| | Six months ended (Unaudited) February 28, | Years endedAugust 31, | | | | |
| | 2018 | 2017 | 2016 | 2015 | 2014 | 2013 |
| Selected Per–Share Data | | | | | | |
| Net asset value, beginning of period | $10.36 | $10.66 | $10.50 | $10.47 | $10.20 | $10.97 |
| Income from Investment Operations | | | | | | |
| Net investment income (loss)A | .094 | .177 | .162 | .154 | .166 | .133 |
| Net realized and unrealized gain (loss) | (.370) | (.230) | .271 | .048 | .277 | (.454) |
| Total from investment operations | (.276) | (.053) | .433 | .202 | .443 | (.321) |
| Distributions from net investment income | (.094) | (.171) | (.178) | (.144) | (.166) | (.127) |
| Distributions from net realized gain | – | (.076) | (.095) | (.028) | (.007) | (.322) |
| Total distributions | (.094) | (.247) | (.273) | (.172) | (.173) | (.449) |
| Net asset value, end of period | $9.99 | $10.36 | $10.66 | $10.50 | $10.47 | $10.20 |
| Total ReturnB,C | (2.68)% | (.46)% | 4.19% | 1.94% | 4.38% | (3.03)% |
| Ratios to Average Net AssetsD,E | | | | | | |
| Expenses before reductions | .50%F | .49% | .50% | .50% | .51% | .51% |
| Expenses net of fee waivers, if any | .50%F | .49% | .50% | .50% | .51% | .51% |
| Expenses net of all reductions | .50%F | .49% | .50% | .50% | .51% | .51% |
| Net investment income (loss) | 1.86%F | 1.71% | 1.54% | 1.46% | 1.61% | 1.26% |
| Supplemental Data | | | | | | |
| Net assets, end of period (in millions) | $451 | $496 | $494 | $412 | $298 | $296 |
| Portfolio turnover rateG | 146%F | 157% | 93% | 83% | 131% | 192% |
A Calculated based on average shares outstanding during the period.
B Total returns for periods of less than one year are not annualized.
C Total returns would have been lower if certain expenses had not been reduced during the applicable periods shown.
D Fees and expenses of any underlying Fidelity Central Funds are not included in the Fund's expense ratio. The Fund indirectly bears its proportionate share of the expenses of any underlying Fidelity Central Funds. Based on their most recent shareholder report date, the expenses of any underlying non-money market Fidelity Central Funds were less than .005%.
E Expense ratios reflect operating expenses of the class. Expenses before reductions do not reflect amounts reimbursed by the investment adviser or reductions from expense offset arrangements and do not represent the amount paid by the class during periods when reimbursements or reductions occur. Expenses net of fee waivers reflect expenses after reimbursement by the investment adviser but prior to reductions from expense offset arrangements. Expenses net of all reductions represent the net expenses paid by the class.
F Annualized
G Amount does not include the portfolio activity of any underlying Fidelity Central Funds.
See accompanying notes which are an integral part of the financial statements.
Notes to Financial Statements (Unaudited)
For the period ended February 28, 2018
(Amounts in thousands except percentages)
1. Organization.
Fidelity Government Income Fund (the Fund) is a fund of Fidelity Income Fund (the Trust) and is authorized to issue an unlimited number of shares. The Trust is registered under the Investment Company Act of 1940, as amended (the 1940 Act), as an open-end management investment company organized as a Massachusetts business trust. The Fund offers Class A, Class M, Class C, Government Income and Class I shares, each of which has equal rights as to assets and voting privileges. Each class has exclusive voting rights with respect to matters that affect that class.
2. Investments in Fidelity Central Funds.
The Fund invests in Fidelity Central Funds, which are open-end investment companies generally available only to other investment companies and accounts managed by the investment adviser and its affiliates. The Fund's Schedule of Investments lists each of the Fidelity Central Funds held as of period end, if any, as an investment of the Fund, but does not include the underlying holdings of each Fidelity Central Fund. As an Investing Fund, the Fund indirectly bears its proportionate share of the expenses of the underlying Fidelity Central Funds.
Based on its investment objective, each Fidelity Central Fund may invest or participate in various investment vehicles or strategies that are similar to those of the Fund. These strategies are consistent with the investment objectives of the Fund and may involve certain economic risks which may cause a decline in value of each of the Fidelity Central Funds and thus a decline in the value of the Fund. The Money Market Central Funds seek preservation of capital and current income and are managed by Fidelity Investments Money Management, Inc. (FIMM), an affiliate of the investment adviser. Annualized expenses of the Money Market Central Funds as of their most recent shareholder report date are less than .005%. The following summarizes the Fund's investment in each non-money market Fidelity Central Fund.
| Fidelity Central Fund | Investment Manager | Investment Objective | Investment Practices | Expense Ratio(a) |
| Fidelity Mortgage Backed Securities Central Fund | FIMM | Seeks a high level of income by normally investing in investment-grade mortgage-related securities and repurchase agreements for those securities. | Delayed Delivery & When Issued Securities
Futures
Swaps | Less Than .005% |
(a) Expenses expressed as a percentage of average net assets and are as of each underlying Central Fund's most recent annual or semi-annual shareholder report.
An unaudited holdings listing for the Fund, which presents direct holdings as well as the pro-rata share of any securities and other investments held indirectly through its investment in underlying non-money market Fidelity Central Funds, is available at fidelity.com and/or institutional.fidelity.com, as applicable. A complete unaudited list of holdings for each Fidelity Central Fund is available upon request or at the Securities and Exchange Commission (the SEC) website at www.sec.gov. In addition, the financial statements of the Fidelity Central Funds which contain the significant accounting policies (including investment valuation policies) of those funds are available on the SEC website or upon request.
3. Significant Accounting Policies.
The Fund is an investment company and applies the accounting and reporting guidance of the Financial Accounting Standards Board (FASB) Accounting Standards Codification Topic 946 Financial Services – Investments Companies. The financial statements have been prepared in conformity with accounting principles generally accepted in the United States of America (GAAP), which require management to make certain estimates and assumptions at the date of the financial statements. Actual results could differ from those estimates. Subsequent events, if any, through the date that the financial statements were issued have been evaluated in the preparation of the financial statements. The following summarizes the significant accounting policies of the Fund:
Investment Valuation. Investments are valued as of 4:00 p.m. Eastern time on the last calendar day of the period. The Board of Trustees (the Board) has delegated the day to day responsibility for the valuation of the Fund's investments to the Fair Value Committee (the Committee) established by the Fund's investment adviser. In accordance with valuation policies and procedures approved by the Board, the Fund attempts to obtain prices from one or more third party pricing vendors or brokers to value its investments. When current market prices, quotations or currency exchange rates are not readily available or reliable, investments will be fair valued in good faith by the Committee, in accordance with procedures adopted by the Board. Factors used in determining fair value vary by investment type and may include market or investment specific events, changes in interest rates and credit quality. The frequency with which these procedures are used cannot be predicted and they may be utilized to a significant extent. The Committee oversees the Fund's valuation policies and procedures and reports to the Board on the Committee's activities and fair value determinations. The Board monitors the appropriateness of the procedures used in valuing the Fund's investments and ratifies the fair value determinations of the Committee.
The Fund categorizes the inputs to valuation techniques used to value its investments into a disclosure hierarchy consisting of three levels as shown below:
- Level 1 – quoted prices in active markets for identical investments
- Level 2 – other significant observable inputs (including quoted prices for similar investments, interest rates, prepayment speeds, etc.)
- Level 3 – unobservable inputs (including the Fund's own assumptions based on the best information available)
Valuation techniques used to value the Fund's investments by major category are as follows:
Debt securities, including restricted securities, are valued based on evaluated prices received from third party pricing vendors or from brokers who make markets in such securities. Foreign government and government agency obligations and U.S. government and government agency obligations are valued by pricing vendors who utilize matrix pricing which considers yield or price of bonds of comparable quality, coupon, maturity and type or by broker-supplied prices. Asset backed securities, collateralized mortgage obligations, commercial mortgage securities and U.S. government agency mortgage securities are valued by pricing vendors who utilize matrix pricing which considers prepayment speed assumptions, attributes of the collateral, yield or price of bonds of comparable quality, coupon, maturity and type or by broker-supplied prices. Swaps are marked-to-market daily based on valuations from third party pricing vendors, registered derivatives clearing organizations (clearinghouses) or broker-supplied valuations. These pricing sources may utilize inputs such as interest rate curves, credit spread curves, default possibilities and recovery rates. When independent prices are unavailable or unreliable, debt securities and swaps may be valued utilizing pricing methodologies which consider similar factors that would be used by third party pricing vendors. Debt securities and swaps are generally categorized as Level 2 in the hierarchy but may be Level 3 depending on the circumstances.
Futures contracts are valued at the settlement price established each day by the board of trade or exchange on which they are traded and are categorized as Level 1 in the hierarchy. Options traded over-the-counter are valued using vendor or broker-supplied valuations and are categorized as Level 2 in the hierarchy. Investments in open-end mutual funds, including the Fidelity Central Funds, are valued at their closing net asset value (NAV) each business day and are categorized as Level 1 in the hierarchy.
Changes in valuation techniques may result in transfers in or out of an assigned level within the disclosure hierarchy. The aggregate value of investments by input level as of February 28, 2018, is included at the end of the Fund's Schedule of Investments.
Investment Transactions and Income. For financial reporting purposes, the Fund's investment holdings and NAV include trades executed through the end of the last business day of the period. The NAV per share for processing shareholder transactions is calculated as of the close of business of the New York Stock Exchange (NYSE), normally 4:00 p.m. Eastern time and includes trades executed through the end of the prior business day. Gains and losses on securities sold are determined on the basis of identified cost. Income and capital gain distributions from Fidelity Central Funds, if any, are recorded on the ex-dividend date. Interest income is accrued as earned and includes coupon interest and amortization of premium and accretion of discount on debt securities as applicable. The principal amount on inflation-indexed securities is periodically adjusted to the rate of inflation and interest is accrued based on the principal amount. The adjustments to principal due to inflation are reflected as increases or decreases to Interest in the accompanying Statement of Operations.
Class Allocations and Expenses. Investment income, realized and unrealized capital gains and losses, common expenses of the Fund, and certain fund-level expense reductions, if any, are allocated daily on a pro-rata basis to each class based on the relative net assets of each class to the total net assets of the Fund. Each class differs with respect to transfer agent and distribution and service plan fees incurred. Certain expense reductions may also differ by class. For the reporting period, the allocated portion of income and expenses to each class as a percent of its average net assets may vary due to the timing of recording these transactions in relation to fluctuating net assets of the classes. Expenses directly attributable to a fund are charged to that fund. Expenses attributable to more than one fund are allocated among the respective funds on the basis of relative net assets or other appropriate methods. Expense estimates are accrued in the period to which they relate and adjustments are made when actual amounts are known.
Deferred Trustee Compensation. Under a Deferred Compensation Plan (the Plan), independent Trustees may elect to defer receipt of a portion of their annual compensation. Deferred amounts are invested in a cross-section of Fidelity funds, are marked-to-market and remain in the Fund until distributed in accordance with the Plan. The investment of deferred amounts and the offsetting payable to the Trustees are included in the accompanying Statement of Assets and Liabilities.
Income Tax Information and Distributions to Shareholders. Each year, the Fund intends to qualify as a regulated investment company under Subchapter M of the Internal Revenue Code, including distributing substantially all of its taxable income and realized gains. As a result, no provision for U.S. Federal income taxes is required. The Fund files a U.S. federal tax return, in addition to state and local tax returns as required. The Fund's federal income tax returns are subject to examination by the Internal Revenue Service (IRS) for a period of three fiscal years after they are filed. State and local tax returns may be subject to examination for an additional fiscal year depending on the jurisdiction.
Dividends are declared and recorded daily and paid monthly from net investment income. Distributions from realized gains, if any, are declared and recorded on the ex-dividend date. Income dividends and capital gain distributions are declared separately for each class. Income and capital gain distributions are determined in accordance with income tax regulations, which may differ from GAAP.
Capital accounts within the financial statements are adjusted for permanent book-tax differences. These adjustments have no impact on net assets or the results of operations. Capital accounts are not adjusted for temporary book-tax differences which will reverse in a subsequent period.
Book-tax differences are primarily due to the short-term gain distributions from the Fidelity Central Funds, futures contracts, swaps, market discount, partnerships (including allocations from Fidelity Central Funds), deferred trustees compensation and losses deferred due to wash sales and excise tax regulations.
As of period end, the cost and unrealized appreciation (depreciation) in securities, and derivatives if applicable, for federal income tax purposes were as follows:
| Gross unrealized appreciation | $22,537 |
| Gross unrealized depreciation | (119,552) |
| Net unrealized appreciation (depreciation) | $(97,015) |
| Tax cost | $4,456,514 |
The Fund elected to defer to its next fiscal year approximately $14,932 of capital losses recognized during the period November 1, 2016 to August 31, 2017.
Delayed Delivery Transactions and When-Issued Securities. During the period, the Fund transacted in securities on a delayed delivery or when-issued basis. Payment and delivery may take place after the customary settlement period for that security. The price of the underlying securities and the date when the securities will be delivered and paid for are fixed at the time the transaction is negotiated. The securities purchased on a delayed delivery or when-issued basis are identified as such in the Fund's Schedule of Investments. The Fund may receive compensation for interest forgone in the purchase of a delayed delivery or when-issued security. With respect to purchase commitments, the Fund identifies securities as segregated in its records with a value at least equal to the amount of the commitment. Losses may arise due to changes in the value of the underlying securities or if the counterparty does not perform under the contract's terms, or if the issuer does not issue the securities due to political, economic, or other factors.
To-Be-Announced (TBA) Securities and Mortgage Dollar Rolls. During the period, the Fund transacted in TBA securities that involved buying or selling mortgage-backed securities (MBS) on a forward commitment basis. A TBA transaction typically does not designate the actual security to be delivered and only includes an approximate principal amount; however delivered securities must meet specified terms defined by industry guidelines, including issuer, rate and current principal amount outstanding on underlying mortgage pools. The Fund may enter into a TBA transaction with the intent to take possession of or deliver the underlying MBS, or the Fund may elect to extend the settlement by entering into either a mortgage or reverse mortgage dollar roll. Mortgage dollar rolls are transactions where a fund sells TBA securities and simultaneously agrees to repurchase MBS on a later date at a lower price and with the same counterparty. Reverse mortgage dollar rolls involve the purchase and simultaneous agreement to sell TBA securities on a later date at a lower price. Transactions in mortgage dollar rolls and reverse mortgage dollar rolls are accounted for as purchases and sales and may result in an increase to the Fund's portfolio turnover rate.
Purchases and sales of TBA securities involve risks similar to those discussed above for delayed delivery and when-issued securities. Also, if the counterparty in a mortgage dollar roll or a reverse mortgage dollar roll transaction files for bankruptcy or becomes insolvent, the Fund's right to repurchase or sell securities may be limited. Additionally, when a fund sells TBA securities without already owning or having the right to obtain the deliverable securities (an uncovered forward commitment to sell), it incurs a risk of loss because it could have to purchase the securities at a price that is higher than the price at which it sold them. A fund may be unable to purchase the deliverable securities if the corresponding market is illiquid.
TBA securities subject to a forward commitment to sell at period end are included at the end of the Fund's Schedule of Investments under the caption "TBA Sale Commitments." The proceeds and value of these commitments are reflected in the Fund's Statement of Assets and Liabilities as Receivable for TBA sale commitments and TBA sale commitments, at value, respectively.
Restricted Securities. The Fund may invest in securities that are subject to legal or contractual restrictions on resale. These securities generally may be resold in transactions exempt from registration or to the public if the securities are registered. Disposal of these securities may involve time-consuming negotiations and expense, and prompt sale at an acceptable price may be difficult. Information regarding restricted securities is included at the end of the Fund's Schedule of Investments.
New Accounting Pronouncement. In March 2017, the Financial Accounting Standards Board (FASB) issued an Accounting Standards Update (ASU), ASU 2017-08, which amends the amortization period for certain callable debt securities that are held at a premium. The amendment requires the premium to be amortized to the earliest call date. The amendments do not require an accounting change for securities held at a discount. The ASU is effective for annual periods beginning after December 15, 2018. Management is currently evaluating the potential impact of these changes to the financial statements.
4. Derivative Instruments.
Risk Exposures and the Use of Derivative Instruments. The Fund's investment objective allows the Fund to enter into various types of derivative contracts, including futures contracts, options and swaps. Derivatives are investments whose value is primarily derived from underlying assets, indices or reference rates and may be transacted on an exchange or over-the-counter (OTC). Derivatives may involve a future commitment to buy or sell a specified asset based on specified terms, to exchange future cash flows at periodic intervals based on a notional principal amount, or for one party to make one or more payments upon the occurrence of specified events in exchange for periodic payments from the other party.
The Fund used derivatives to increase returns, to gain exposure to certain types of assets and to manage exposure to certain risks as defined below. The success of any strategy involving derivatives depends on analysis of numerous economic factors, and if the strategies for investment do not work as intended, the Fund may not achieve its objectives.
The Fund's use of derivatives increased or decreased its exposure to the following risk:
| Interest Rate Risk | Interest rate risk relates to the fluctuations in the value of interest-bearing securities due to changes in the prevailing levels of market interest rates. |
The Fund is also exposed to additional risks from investing in derivatives, such as liquidity risk and counterparty credit risk. Liquidity risk is the risk that the Fund will be unable to close out the derivative in the open market in a timely manner. Counterparty credit risk is the risk that the counterparty will not be able to fulfill its obligation to the Fund. Derivative counterparty credit risk is managed through formal evaluation of the creditworthiness of all potential counterparties. On certain OTC derivatives such as options, , the Fund attempts to reduce its exposure to counterparty credit risk by entering into an International Swaps and Derivatives Association, Inc. (ISDA) Master Agreement with each of its counterparties. The ISDA Master Agreement gives the Fund the right to terminate all transactions traded under such agreement upon the deterioration in the credit quality of the counterparty beyond specified levels. The ISDA Master Agreement gives each party the right, upon an event of default by the other party or a termination of the agreement, to close out all transactions traded under such agreement and to net amounts owed under each transaction to one net payable by one party to the other. To mitigate counterparty credit risk on bi-lateral OTC derivatives, the Fund receives collateral in the form of cash or securities once the Fund's net unrealized appreciation on outstanding derivative contracts under an ISDA Master Agreement exceeds certain applicable thresholds, subject to certain minimum transfer provisions. The collateral received is held in segregated accounts with the Fund's custodian bank in accordance with the collateral agreements entered into between the Fund, the counterparty and the Fund's custodian bank. The Fund could experience delays and costs in gaining access to the collateral even though it is held by the Fund's custodian bank. The Fund's maximum risk of loss from counterparty credit risk related to bi-lateral OTC derivatives is generally the aggregate unrealized appreciation and unpaid counterparty payments in excess of any collateral pledged by the counterparty to the Fund. For OTC written options with upfront premiums received, the Fund is obligated to perform and therefore does not have counterparty risk. For OTC written options with premiums to be received at a future date, the maximum risk of loss from counterparty credit risk is the amount of the premium in excess of any collateral pledged by the counterparty. The Fund may be required to pledge collateral for the benefit of the counterparties on bi-lateral OTC derivatives in an amount not less than each counterparty's unrealized appreciation on outstanding derivative contracts, subject to certain minimum transfer provisions, and any such pledged collateral is identified in the Schedule of Investments. Exchange-traded futures contracts are not covered by the ISDA Master Agreement; however counterparty credit risk related to exchange-traded futures contracts may be mitigated by the protection provided by the exchange on which they trade. Counterparty credit risk related to centrally cleared OTC swaps may be mitigated by the protection provided by the clearinghouse.
Investing in derivatives may involve greater risks than investing in the underlying assets directly and, to varying degrees, may involve risk of loss in excess of any initial investment and collateral received and amounts recognized in the Statement of Assets and Liabilities. In addition, there may be the risk that the change in value of the derivative contract does not correspond to the change in value of the underlying instrument.
Net Realized Gain (Loss) and Change in Net Unrealized Appreciation (Depreciation) on Derivatives. The table below, which reflects the impacts of derivatives on the financial performance of the Fund, summarizes the net realized gain (loss) and change in net unrealized appreciation (depreciation) for derivatives during the period as presented in the Statement of Operations.
| Primary Risk Exposure / Derivative Type | Net Realized Gain (Loss) | Change in Net Unrealized Appreciation (Depreciation) |
| Interest Rate Risk | | |
| Futures Contracts | $(11,097) | $(225) |
| Purchased Options | 66 | 446 |
| Swaps | (131) | (305) |
| Written Options | – | 91 |
| Totals | $(11,162) | $7 |
A summary of the value of derivatives by primary risk exposure as of period end is included at the end of the Schedule of Investments.
Futures Contracts. A futures contract is an agreement between two parties to buy or sell a specified underlying instrument for a fixed price at a specified future date. The Fund used futures contracts to manage its exposure to the bond market and fluctuations in interest rates.
Upon entering into a futures contract, a fund is required to deposit either cash or securities (initial margin) with a clearing broker in an amount equal to a certain percentage of the face value of the contract. Futures contracts are marked-to-market daily and subsequent daily payments (variation margin) are made or received by a fund depending on the daily fluctuations in the value of the futures contracts and are recorded as unrealized appreciation or (depreciation). This receivable and/or payable, if any, is included in daily variation margin on futures contracts in the Statement of Assets and Liabilities. Realized gain or (loss) is recorded upon the expiration or closing of a futures contract. The net realized gain (loss) and change in net unrealized appreciation (depreciation) on futures contracts during the period is presented in the Statement of Operations.
Any open futures contracts at period end are presented in the Schedule of Investments under the caption "Futures Contracts". The notional amount at value reflects each contract's exposure to the underlying instrument or index at period end. Securities deposited to meet initial margin requirements are identified in the Schedule of Investments.
Options. Options give the purchaser the right, but not the obligation, to buy (call) or sell (put) an underlying security or financial instrument at an agreed exercise or strike price between or on certain dates. Options obligate the seller (writer) to buy (put) or sell (call) an underlying instrument at the exercise or strike price or cash settle an underlying derivative instrument if the holder exercises the option on or before the expiration date. The Fund uses OTC options, such as swaptions, which are options where the underlying instrument is a swap, to manage its exposure to fluctuations in interest rates.
Upon entering into an options contract, a fund will pay or receive a premium. Premiums paid on purchased options are reflected as cost of investments and premiums received on written options are reflected as a liability on the Statement of Assets and Liabilities. Certain options may be purchased or written with premiums to be paid or received on a future date. Options are valued daily and any unrealized appreciation (depreciation) is reflected on the Statement of Assets and Liabilities. When an option is exercised, the cost or proceeds of the underlying instrument purchased or sold is adjusted by the amount of the premium. When an option is closed the Fund will realize a gain or loss depending on whether the proceeds or amount paid for the closing sale transaction is greater or less than the premium received or paid. When an option expires, gains and losses are realized to the extent of premiums received and paid, respectively. The net realized and unrealized gains (losses) on purchased options are included in the Statement of Operations in net realized gain (loss) and change in net unrealized appreciation (depreciation) on investment securities. The net realized gain (loss) and change in net unrealized appreciation (depreciation) on written options are presented in the Statement of Operations.
Any open options at period end are presented in the Schedule of Investments under the captions "Purchased Options," "Purchased Swaptions," "Written Options" and "Written Swaptions," as applicable, and are representative of volume of activity during the period.
Writing puts and buying calls tend to increase exposure to the underlying instrument while buying puts and writing calls tend to decrease exposure to the underlying instrument. For purchased options, risk of loss is limited to the premium paid, and for written options, risk of loss is the change in value in excess of the premium received.
Swaps. A swap is a contract between two parties to exchange future cash flows at periodic intervals based on a notional principal amount. A centrally cleared OTC swap is a transaction executed between a fund and a dealer counterparty, then cleared by a futures commission merchant (FCM) through a clearinghouse. Once cleared, the clearinghouse serves as a central counterparty, with whom a fund exchanges cash flows for the life of the transaction, similar to transactions in futures contracts.
Centrally cleared OTC swaps require a fund to deposit either cash or securities (initial margin) with the FCM, at the instruction of and for the benefit of the clearinghouse. Securities deposited to meet initial margin requirements are identified in the Schedule of Investments Centrally cleared OTC swaps are marked-to-market daily and subsequent payments (variation margin) are made or received depending on the daily fluctuations in the value of the swaps and are recorded as unrealized appreciation or (depreciation). These daily payments, if any, are included in receivable or payable for daily variation margin on centrally cleared OTC swaps in the Statement of Assets and Liabilities. Any premiums for centrally cleared OTC swaps are recorded periodically throughout the term of the swap to variation margin and included in unrealized appreciation (depreciation) in the Statement of Assets and Liabilities. Any premiums are recognized as realized gain (loss) upon termination or maturity of the swap.
Payments are exchanged at specified intervals, accrued daily commencing with the effective date of the contract and recorded as realized gain or (loss). Some swaps may be terminated prior to the effective date and realize a gain or loss upon termination. The net realized gain (loss) and change in net unrealized appreciation (depreciation) on swaps during the period is presented in the Statement of Operations.
Any open swaps at period end are included in the Schedule of Investments under the caption "Swaps" and are representative of volume of activity during the period.
Interest Rate Swaps. Interest rate swaps are agreements between counterparties to exchange cash flows, one based on a fixed rate, and the other on a floating rate. The Fund entered into interest rate swaps to manage its exposure to interest rate changes. Changes in interest rates can have an effect on both the value of bond holdings as well as the amount of interest income earned. In general, the value of bonds can fall when interest rates rise and can rise when interest rates fall.
5. Purchases and Sales of Investments.
Purchases and sales of securities (including the Fixed-Income Central Funds), other than short-term securities and U.S. government securities, aggregated $239,830 and $189,317, respectively.
6. Fees and Other Transactions with Affiliates.
Management Fee and Expense Contract. Fidelity Management & Research Company (the investment adviser) and its affiliates provide the Fund with investment management related services for which the Fund pays a monthly management fee. The management fee is the sum of an individual fund fee rate that is based on an annual rate of .20% of the Fund's average net assets and an annualized group fee rate that averaged .11% during the period. The group fee rate is based upon the average net assets of all the mutual funds advised by the investment adviser, including any mutual funds previously advised by the investment adviser that are currently advised by Fidelity SelectCo, LLC, an affiliate of the investment adviser. The group fee rate decreases as assets under management increase and increases as assets under management decrease. For the reporting period, the total annualized management fee rate was .31% of the Fund's average net assets.
In addition, under the expense contract, the investment adviser pays class-level expenses for Government Income, so that the total expenses, except the compensation of the independent Trustees and certain other expenses such as interest expense, including commitment fees, do not exceed .45% of the Class' average net assets. This agreement does not apply to any of the other classes and any change or modification that would increase expenses can only be made with shareholder approval.
Distribution and Service Plan Fees. In accordance with Rule 12b-1 of the 1940 Act, the Fund has adopted separate Distribution and Service Plans for each class of shares. Certain classes pay Fidelity Distributors Corporation (FDC), an affiliate of the investment adviser, separate Distribution and Service Fees, each of which is based on an annual percentage of each class' average net assets. In addition, FDC may pay financial intermediaries for selling shares of the Fund and providing shareholder support services. For the period, the Distribution and Service Fee rates, total fees and amounts retained by FDC were as follows:
| | Distribution Fee | Service Fee | Total Fees | Retained by FDC |
| Class A | -% | .25% | $203 | $37 |
| Class M | -% | .25% | 186 | 41 |
| Class C | .75% | .25% | 328 | 11 |
| | | | $717 | $89 |
Sales Load. FDC may receive a front-end sales charge of up to 4.00% for selling Class A shares and Class M shares, some of which is paid to financial intermediaries for selling shares of the Fund. Depending on the holding period, FDC may receive contingent deferred sales charges levied on Class A, Class M and Class C redemptions. The deferred sales charges are 1.00% for Class C shares, .75% for certain purchases of Class A shares and .25% for certain purchases of Class M shares.
For the period, sales charge amounts retained by FDC were as follows:
| | Retained by FDC |
| Class A | $2 |
| Class M | 1 |
| Class C(a) | 1 |
| | $4 |
(a) When Class C shares are initially sold, FDC pays commissions from its own resources to financial intermediaries through which the sales are made.
Transfer Agent Fees. Fidelity Investments Institutional Operations Company, Inc., (FIIOC), an affiliate of the investment adviser, is the transfer, dividend disbursing and shareholder servicing agent for each class of the Fund. FIIOC receives account fees and asset-based fees that vary according to the account size and type of account of the shareholders of each respective class of the Fund, with the exception of Government Income. FIIOC receives an asset-based fee of .10% of Government Income average net assets. FIIOC pays for typesetting, printing and mailing of shareholder reports, except proxy statements. For the period, transfer agent fees for each class were as follows:
| | Amount | % of Class-Level Average Net Assets(a) |
| Class A | $137 | .17 |
| Class M | 120 | .16 |
| Class C | 63 | .19 |
| Government Income | 1,668 | .10 |
| Class I | 346 | .14 |
| | $2,334 | |
(a) Annualized
Fund Wide Operations Fee. Pursuant to the Fund Wide Operations and Expense Agreement (FWOE), the investment adviser has agreed to provide for fund level expenses (which do not include transfer agent, Rule 12b-1 fees, compensation of the independent Trustees, interest (including commitment fees), taxes or extraordinary expenses, if any) in return for a FWOE fee equal to .35% of the Fund's average net assets less the total amount of the management fee. The FWOE paid by the Fund is reduced by an amount equal to the fees and expenses paid to the independent Trustees. For the period, the FWOE fee was equivalent to an annualized rate of .04% of average net assets.
Interfund Trades. The Fund may purchase from or sell securities to other Fidelity Funds under procedures adopted by the Board. The procedures have been designed to ensure these interfund trades are executed in accordance with Rule 17a-7 of the 1940 Act. Interfund trades are included within the respective purchases and sales amounts shown in the Purchases and Sales of Investments note.
7. Committed Line of Credit.
The Fund participates with other funds managed by the investment adviser or an affiliate in a $4.25 billion credit facility (the "line of credit") to be utilized for temporary or emergency purposes to fund shareholder redemptions or for other short-term liquidity purposes. The Fund has agreed to pay commitment fees on its pro-rata portion of the line of credit, which amounted to $6 and is reflected in Miscellaneous expenses on the Statement of Operations. During the period, the Fund did not borrow on this line of credit.
8. Security Lending.
The Fund lends portfolio securities from time to time in order to earn additional income. On the settlement date of the loan, the Fund receives collateral (in the form of U.S. Treasury obligations, letters of credit and/or cash) against the loaned securities and maintains collateral in an amount not less than 100% of the market value of the loaned securities during the period of the loan. The market value of the loaned securities is determined at the close of business of the Fund and any additional required collateral is delivered to the Fund on the next business day. The Fund or borrower may terminate the loan at any time, and if the borrower defaults on its obligation to return the securities loaned because of insolvency or other reasons, the Fund may apply collateral received from the borrower against the obligation. The Fund may experience delays and costs in recovering the securities loaned. Any cash collateral received is maintained at the Fund's custodian and/or invested in cash equivalents. At period end, there were no security loans outstanding. Security lending income represents the income earned on investing cash collateral, less rebates paid to borrowers, plus any premium payments received for lending certain types of securities. Security lending income is presented in the Statement of Operations as a component of interest income. Total security lending income during the period amounted to $18.
9. Expense Reductions.
Through arrangements with the Fund's custodian, credits realized as a result of certain uninvested cash balances were used to reduce the Fund's expenses. During the period, these credits reduced the Fund's expenses $2.
10. Distributions to Shareholders.
Distributions to shareholders of each class were as follows:
| | Six months ended February 28, 2018 | Year ended
August 31, 2017 |
| From net investment income | | |
| Class A | $1,265 | $3,003 |
| Class M | 1,165 | 2,353 |
| Class C | 258 | 492 |
| Government Income | 31,372 | 60,593 |
| Class I | 4,422 | 8,038 |
| Total | $38,482 | $74,479 |
| From net realized gain | | |
| Class A | $– | $1,831 |
| Class M | – | 1,339 |
| Class C | – | 658 |
| Government Income | – | 27,600 |
| Class I | – | 3,528 |
| Total | $– | $34,956 |
11. Share Transactions.
Share transactions for each class were as follows and may contain automatic conversions between classes or exchanges between affiliated funds:
| | Shares | Shares | Dollars | Dollars |
| | Six months ended February 28, 2018 | Year ended August 31, 2017 | Six months ended February 28, 2018 | Year ended August 31, 2017 |
| Class A | | | | |
| Shares sold | 1,470 | 4,084 | $14,931 | $42,226 |
| Reinvestment of distributions | 120 | 450 | 1,225 | 4,652 |
| Shares redeemed | (3,158) | (12,230) | (32,227) | (125,628) |
| Net increase (decrease) | (1,568) | (7,696) | $(16,071) | $(78,750) |
| Class M | | | | |
| Shares sold | 1,871 | 3,752 | $19,034 | $38,695 |
| Reinvestment of distributions | 106 | 338 | 1,076 | 3,499 |
| Shares redeemed | (3,042) | (7,416) | (30,989) | (76,589) |
| Net increase (decrease) | (1,065) | (3,326) | $(10,879) | $(34,395) |
| Class C | | | | |
| Shares sold | 517 | 1,245 | $5,274 | $12,880 |
| Reinvestment of distributions | 24 | 102 | 244 | 1,056 |
| Shares redeemed | (1,520) | (3,261) | (15,467) | (33,484) |
| Net increase (decrease) | (979) | (1,914) | $(9,949) | $(19,548) |
| Government Income | | | | |
| Shares sold | 26,130 | 78,457 | $265,748 | $805,428 |
| Reinvestment of distributions | 2,963 | 8,206 | 30,085 | 84,659 |
| Shares redeemed | (46,215) | (117,437) | (470,136) | (1,203,566) |
| Net increase (decrease) | (17,122) | (30,774) | $(174,303) | $(313,479) |
| Class I | | | | |
| Shares sold | 11,075 | 13,696 | $113,239 | $140,776 |
| Reinvestment of distributions | 418 | 1,085 | 4,245 | 11,211 |
| Shares redeemed | (14,199) | (13,214) | (144,940) | (135,947) |
| Net increase (decrease) | (2,706) | 1,567 | $(27,456) | $16,040 |
12. Other.
The Fund's organizational documents provide former and current trustees and officers with a limited indemnification against liabilities arising in connection with the performance of their duties to the Fund. In the normal course of business, the Fund may also enter into contracts that provide general indemnifications. The Fund's maximum exposure under these arrangements is unknown as this would be dependent on future claims that may be made against the Fund. The risk of material loss from such claims is considered remote.
Shareholder Expense Example
As a shareholder of the Fund, you incur two types of costs: (1) transaction costs, including sales charges (loads) on purchase payments or redemption proceeds, and (2) ongoing costs, including management fees, distribution and/or service (12b-1) fees and other Fund expenses. This Example is intended to help you understand your ongoing costs (in dollars) of investing in the Fund and to compare these costs with the ongoing costs of investing in other mutual funds.
The Example is based on an investment of $1,000 invested at the beginning of the period and held for the entire period (September 1, 2017 to February 28, 2018).
Actual Expenses
The first line of the accompanying table for each class of the Fund provides information about actual account values and actual expenses. You may use the information in this line, together with the amount you invested, to estimate the expenses that you paid over the period. Simply divide your account value by $1,000.00 (for example, an $8,600 account value divided by $1,000.00 = 8.6), then multiply the result by the number in the first line for a class of the Fund under the heading entitled "Expenses Paid During Period" to estimate the expenses you paid on your account during this period. A small balance maintenance fee of $12.00 that is charged once a year may apply for certain accounts with a value of less than $2,000. This fee is not included in the table below. If it was, the estimate of expenses you paid during the period would be higher, and your ending account value lower, by this amount. In addition, the Fund, as a shareholder in the underlying Fidelity Central Funds, will indirectly bear its pro-rata share of the fees and expenses incurred by the underlying Fidelity Central Funds. These fees and expenses are not included in the Fund's annualized expense ratio used to calculate the expense estimate in the table below.
Hypothetical Example for Comparison Purposes
The second line of the accompanying table for each class of the Fund provides information about hypothetical account values and hypothetical expenses based on a Class' actual expense ratio and an assumed rate of return of 5% per year before expenses, which is not the Class' actual return. The hypothetical account values and expenses may not be used to estimate the actual ending account balance or expenses you paid for the period. You may use this information to compare the ongoing costs of investing in the Fund and other funds. To do so, compare this 5% hypothetical example with the 5% hypothetical examples that appear in the shareholder reports of the other funds. A small balance maintenance fee of $12.00 that is charged once a year may apply for certain accounts with a value of less than $2,000. This fee is not included in the table below. If it was, the estimate of expenses you paid during the period would be higher, and your ending account value lower, by this amount. In addition, the Fund, as a shareholder in the underlying Fidelity Central Funds, will indirectly bear its pro-rata share of the fees and expenses incurred by the underlying Fidelity Central Funds. These fees and expenses are not included in the Fund's annualized expense ratio used to calculate the expense estimate in the table below.
Please note that the expenses shown in the table are meant to highlight your ongoing costs only and do not reflect any transaction costs. Therefore, the second line of the table is useful in comparing ongoing costs only, and will not help you determine the relative total costs of owning different funds. In addition, if these transactional costs were included, your costs would have been higher.
| | Annualized Expense Ratio-A | Beginning
Account Value
September 1, 2017 | Ending
Account Value
February 28, 2018 | Expenses Paid
During Period-B
September 1, 2017
to February 28, 2018 |
| Class A | .77% | | | |
| Actual | | $1,000.00 | $971.90 | $3.76 |
| Hypothetical-C | | $1,000.00 | $1,020.98 | $3.86 |
| Class M | .77% | | | |
| Actual | | $1,000.00 | $971.90 | $3.76 |
| Hypothetical-C | | $1,000.00 | $1,020.98 | $3.86 |
| Class C | 1.55% | | | |
| Actual | | $1,000.00 | $968.10 | $7.56 |
| Hypothetical-C | | $1,000.00 | $1,017.11 | $7.75 |
| Government Income | .45% | | | |
| Actual | | $1,000.00 | $973.40 | $2.20 |
| Hypothetical-C | | $1,000.00 | $1,022.56 | $2.26 |
| Class I | .50% | | | |
| Actual | | $1,000.00 | $973.20 | $2.45 |
| Hypothetical-C | | $1,000.00 | $1,022.32 | $2.51 |
A Annualized expense ratio reflects expenses net of applicable fee waivers.
B Expenses are equal to each Class' annualized expense ratio, multiplied by the average account value over the period, multiplied by 181/365 (to reflect the one-half year period). The fees and expenses of the underlying Fidelity Central Funds in which the Fund invests are not included in each Class' annualized expense ratio. In addition to the expenses noted above, the Fund also indirectly bears its proportional share of the expenses of the underlying Fidelity Central Funds. Annualized expenses of the underlying non-money market Fidelity Central Funds as of their most recent fiscal half year were less than .005%.
C 5% return per year before expenses
Board Approval of Investment Advisory Contracts and Management Fees
Fidelity Government Income Fund
Each year, the Board of Trustees, including the Independent Trustees (together, the Board), votes on the renewal of the management contract with Fidelity Management & Research Company (FMR) and the sub-advisory agreements (together, the Advisory Contracts) for the fund. FMR and the sub-advisers are referred to herein as the Investment Advisers. The Board, assisted by the advice of fund counsel and Independent Trustees' counsel, requests and considers a broad range of information relevant to the renewal of the Advisory Contracts throughout the year.
The Board meets regularly and, at each of its meetings, covers an extensive agenda of topics and materials and considers factors that are relevant to its annual consideration of the renewal of the fund's Advisory Contracts, including the services and support provided to the fund and its shareholders. The Board has established four standing committees (Committees) — Operations, Audit, Fair Valuation, and Governance and Nominating — each composed of and chaired by Independent Trustees with varying backgrounds, to which the Board has assigned specific subject matter responsibilities in order to enhance effective decision-making by the Board. The Operations Committee, of which all of the Independent Trustees are members, meets regularly throughout the year and considers, among other matters, information specifically related to the annual consideration of the renewal of the fund's Advisory Contracts. The Board, acting directly and through its Committees, requests and receives information concerning the annual consideration of the renewal of the fund's Advisory Contracts. The Board also meets as needed to review matters specifically related to the Board's annual consideration of the renewal of the Advisory Contracts. Members of the Board may also meet with trustees of other Fidelity funds through ad hoc joint committees to discuss certain matters relevant to all of the Fidelity funds.
At its September 2017 meeting, the Board unanimously determined to renew the fund's Advisory Contracts. In reaching its determination, the Board considered all factors it believed relevant, including (i) the nature, extent, and quality of the services to be provided to the fund and its shareholders (including the investment performance of the fund); (ii) the competitiveness of the fund's management fee and total expense ratio relative to peer funds; (iii) the total costs of the services to be provided by and the profits to be realized by Fidelity from its relationships with the fund; and (iv) the extent to which, if any, economies of scale exist and would be realized as the fund grows, and whether any economies of scale are appropriately shared with fund shareholders.
In considering whether to renew the Advisory Contracts for the fund, the Board reached a determination, with the assistance of fund counsel and Independent Trustees' counsel and through the exercise of its business judgment, that the renewal of the Advisory Contracts was in the best interests of the fund and its shareholders and that the compensation payable under the Advisory Contracts was fair and reasonable. The Board's decision to renew the Advisory Contracts was not based on any single factor, but rather was based on a comprehensive consideration of all the information provided to the Board at its meetings throughout the year. The Board, in reaching its determination to renew the Advisory Contracts, was aware that shareholders of the fund have a broad range of investment choices available to them, including a wide choice among funds offered by Fidelity's competitors, and that the fund's shareholders, who have the opportunity to review and weigh the disclosure provided by the fund in its prospectus and other public disclosures, have chosen to invest in this fund, which is part of the Fidelity family of funds.
Amendment to Group Fee Rate. The Board also approved an amendment to the management contract for the fund to add an additional breakpoint to the group fee schedule, effective October 1, 2017. The Board noted that the additional breakpoint would result in lower management fee rates as Fidelity's assets under management increase above the new breakpoint.
Nature, Extent, and Quality of Services Provided. The Board considered Fidelity's staffing as it relates to the fund, including the backgrounds of investment personnel of Fidelity, and also considered the fund's investment objective, strategies, and related investment philosophy. The Independent Trustees also had discussions with senior management of Fidelity's investment operations and investment groups. The Board considered the structure of the investment personnel compensation program and whether this structure provides appropriate incentives to act in the best interests of the fund. Additionally, the Board considered the portfolio managers' investments, if any, in the funds that they manage.
Resources Dedicated to Investment Management and Support Services. The Board reviewed the general qualifications and capabilities of Fidelity's investment staff, including its size, education, experience, and resources, as well as Fidelity's approach to recruiting, managing, and compensating investment personnel. The Board noted that Fidelity has continued to increase the resources devoted to non-U.S. offices, including expansion of Fidelity's global investment organization. The Board also noted that Fidelity's analysts have extensive resources, tools and capabilities that allow them to conduct sophisticated quantitative and fundamental analysis, as well as credit analysis of issuers, counterparties and guarantors. Further, the Board considered that Fidelity's investment professionals have sufficient access to global information and data so as to provide competitive investment results over time, and that those professionals also have access to sophisticated tools that permit them to assess portfolio construction and risk and performance attribution characteristics continuously, as well as to transmit new information and research conclusions rapidly around the world. Additionally, in its deliberations, the Board considered Fidelity's trading, risk management, compliance, and technology and operations capabilities and resources, which are integral parts of the investment management process.
Shareholder and Administrative Services. The Board considered (i) the nature, extent, quality, and cost of advisory, administrative, and shareholder services performed by the Investment Advisers and their affiliates under the Advisory Contracts and under separate agreements covering transfer agency, pricing and bookkeeping, and securities lending services for the fund; (ii) the nature and extent of the supervision of third party service providers, principally custodians, subcustodians, and pricing vendors; and (iii) the resources devoted to, and the record of compliance with, the fund's compliance policies and procedures.
The Board noted that the growth of fund assets over time across the complex allows Fidelity to reinvest in the development of services designed to enhance the value or convenience of the Fidelity funds as investment vehicles. These services include 24-hour access to account information and market information through telephone representatives and over the Internet, investor education materials and asset allocation tools, and the expanded availability of Fidelity Investor Centers.
Investment in a Large Fund Family. The Board considered the benefits to shareholders of investing in a Fidelity fund, including the benefits of investing in a fund that is part of a large family of funds offering a variety of investment disciplines and providing a large variety of mutual fund investor services. The Board noted that Fidelity had taken, or had made recommendations that resulted in the Fidelity funds taking, a number of actions over the previous year that benefited particular funds, including: (i) continuing to dedicate additional resources to Fidelity's investment research process, which includes meetings with management of issuers in which the funds invest, and to the support of the senior management team that oversees asset management; (ii) continuing efforts to enhance Fidelity's global research capabilities; (iii) launching new funds and making other enhancements to meet client needs; (iv) launching new share classes of existing funds; (v) eliminating purchase minimums and broadening eligibility requirements for certain lower-priced share classes; (vi) reducing management fees and total expenses for certain growth equity funds and index funds; (vii) lowering expense caps for certain existing funds and classes to reduce expenses borne by shareholders; (viii) eliminating short-term redemption fees for certain funds; (ix) introducing a new pricing structure for certain funds of funds that is expected to reduce overall expenses paid by shareholders; (x) rationalizing product lines and gaining increased efficiencies through proposals for fund mergers and share class consolidations; (xi) continuing to develop, acquire and implement systems and technology to improve services to the funds and shareholders, strengthen information security, and increase efficiency; and (xii) implementing enhancements to further strengthen Fidelity's product line to increase investors' probability of success in achieving their investment goals, including retirement income goals.
Investment Performance. The Board considered whether the fund has operated in accordance with its investment objective, as well as its record of compliance with its investment restrictions and its performance history.
The Board took into account discussions with representatives of the Investment Advisers about fund investment performance that occur at Board meetings throughout the year. In this regard the Board noted that as part of regularly scheduled fund reviews and other reports to the Board on fund performance, the Board considers annualized return information for the fund for different time periods, measured against a securities market index ("benchmark index") and a peer group of funds with similar objectives ("peer group"), if any. In its evaluation of fund investment performance at meetings throughout the year, the Board gave particular attention to information indicating underperformance of certain Fidelity funds for specific time periods and discussed with the Investment Advisers the reasons for such underperformance.
In addition to reviewing absolute and relative fund performance, the Independent Trustees periodically consider the appropriateness of fund performance metrics in evaluating the results achieved. In general, the Independent Trustees believe that fund performance should be evaluated based on gross performance (before fees and expenses but after transaction costs) compared to appropriate benchmark indices, over appropriate time periods that may include full market cycles, and on net performance (after fees and expenses) compared to peer groups, as applicable, over the same periods, taking into account relevant factors including the following: general market conditions; expectations for interest rate levels and credit conditions; issuer-specific information including credit quality; the potential for incremental return versus the fund's benchmark index weighed against the risks involved in obtaining that incremental return, including the risk of diminished or negative total returns; and fund cash flows and other factors. Depending on the circumstances, the Independent Trustees may be satisfied with a fund's performance notwithstanding that it lags its benchmark index or peer group for certain periods.
The Independent Trustees recognize that shareholders evaluate performance on a net basis over their own holding periods, for which one-, three-, and five-year periods are often used as a proxy. For this reason, the performance information reviewed by the Board also included net cumulative calendar year total return information for the fund and an appropriate benchmark index and peer group for the most recent one-, three-, and five-year periods.
Based on its review, the Board concluded that the nature, extent, and quality of services provided to the fund under the Advisory Contracts should continue to benefit the shareholders of the fund.
Competitiveness of Management Fee and Total Expense Ratio. The Board considered the fund's management fee and total expense ratio compared to "mapped groups" of competitive funds and classes created for the purpose of facilitating the Trustees' competitive analysis of management fees and total expenses. Fidelity creates "mapped groups" by combining similar Lipper investment objective categories that have comparable investment mandates. Combining Lipper investment objective categories aids the Board's management fee and total expense ratio comparisons by broadening the competitive group used for comparison.
Management Fee. The Board considered two proprietary management fee comparisons for the 12-month periods shown in basis points (BP) in the chart below. The group of Lipper funds used by the Board for management fee comparisons is referred to below as the "Total Mapped Group" and, for the reasons explained above, is broader than the Lipper peer group used by the Board for performance comparisons. The Total Mapped Group comparison focuses on a fund's standing in terms of gross management fees before expense reimbursements or caps relative to the total universe of funds with comparable investment mandates, regardless of whether their management fee structures also are comparable. Funds with comparable investment mandates offer exposure to similar types of securities. Funds with comparable management fee structures have similar management fee contractual arrangements (
e.g., flat rate charged for advisory services, all-inclusive fee rate,
etc.). "TMG %" represents the percentage of funds in the Total Mapped Group that had management fees that were lower than the fund's. For example, a hypothetical TMG % of 20% would mean that 80% of the funds in the Total Mapped Group had higher, and 20% had lower, management fees than the fund. The fund's actual TMG %s and the number of funds in the Total Mapped Group are in the chart below. The "Asset-Size Peer Group" (ASPG) comparison focuses on a fund's standing relative to a subset of non-Fidelity funds within the Total Mapped Group that are similar in size and management fee structure. For example, if a fund is in the first quartile of the ASPG, the fund's management fee ranks in the least expensive or lowest 25% of funds in the ASPG. The ASPG represents at least 15% of the funds in the Total Mapped Group with comparable asset size and management fee structures, subject to a minimum of 50 funds (or all funds in the Total Mapped Group if fewer than 50). Additional information, such as the ASPG quartile in which the fund's management fee rate ranked, is also included in the chart and considered by the Board.
Fidelity Government Income Fund
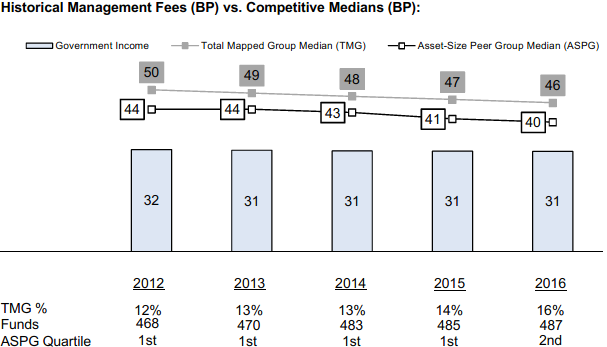
The Board noted that the fund's management fee rate ranked below the median of its Total Mapped Group and below the median of its ASPG for 2016.
The Board noted that it and the boards of other Fidelity funds formed an ad hoc Committee on Group Fee, which meets periodically, to conduct an in-depth review of the "group fee" component of the management fee of funds with such management fee structures. The Committee's focus included the mechanics of the group fee, the competitive landscape of group fee structures, Fidelity funds with no group fee component and investment products not included in group fee assets. The Board also considered that, for funds subject to the group fee, FMR agreed to voluntarily waive fees over a specified period of time in amounts designed to account for assets converted from certain funds to certain collective investment trusts.
Based on its review, the Board concluded that the fund's management fee is fair and reasonable in light of the services that the fund receives and the other factors considered.
Total Expense Ratio. In its review of each class's total expense ratio, the Board considered the fund's management fee rate as well as other fund or class expenses, as applicable, such as transfer agent fees, pricing and bookkeeping fees, fund-paid 12b-1 fees, and custodial, legal, and audit fees. The Board also noted that Fidelity may agree to waive fees and expenses from time to time, and the extent to which, if any, it has done so for the fund. As part of its review, the Board also considered the current and historical total expense ratios of each class of the fund compared to competitive fund median expenses. Each class of the fund is compared to those funds and classes in the Total Mapped Group (used by the Board for management fee comparisons) that have a similar sales load structure.
The Board noted that the total expense ratio of each class ranked below the competitive median for 2016.
The Board considered that the current contractual arrangements for the fund have the effect of setting the total "fund-level" (but not "class-level") expenses (including, among certain other "fund-level" expenses, the management fee) for each class at 0.35%. The Board also considered that current contractual arrangements oblige FMR to pay all "class-level" expenses of the retail class of the fund to the extent necessary to limit total operating expenses, with certain exceptions, to 0.45%. These contractual arrangements may not be amended to increase the fees or expenses payable except by a vote of a majority of the Board and by a vote of a majority of the outstanding voting securities of the fund or class, as applicable.
The Board recognized that the fund's management contract incorporates a "group fee" structure, which provides for lower group fee rates as total group assets increase, and for higher group fee rates as total group assets decrease (with "group assets" defined to include fund assets under FMR's management plus the assets of sector funds previously under FMR's management). FMR calculates the group fee rates based on a tiered asset "breakpoint" schedule that varies based on asset class. The Board noted, however, that because the current contractual arrangements set the total "fund-level" expenses for each class at 0.35%, increases or decreases in the management fee due to changes in the group fee rate will not impact the total expense ratio.
Fees Charged to Other Fidelity Clients. The Board also considered Fidelity fee structures and other information with respect to clients of Fidelity, such as other funds advised or subadvised by Fidelity, pension plan clients, and other institutional clients with similar mandates. The Board noted that an ad hoc joint committee created by it and the boards of other Fidelity funds periodically reviews and compares Fidelity's institutional investment advisory business with its business of providing services to the Fidelity funds, including the differences in services provided, fees charged, and costs incurred, as well as competition in their respective marketplaces.
Based on its review of total expense ratios and fees charged to other Fidelity clients, the Board concluded that the total expense ratio of each class of the fund was reasonable in light of the services that the fund and its shareholders receive and the other factors considered.
Costs of the Services and Profitability. The Board considered the revenues earned and the expenses incurred by Fidelity in conducting the business of developing, marketing, distributing, managing, administering and servicing the fund and servicing the fund's shareholders. The Board also considered the level of Fidelity's profits in respect of all the Fidelity funds.
On an annual basis, Fidelity presents to the Board information about the profitability of its relationships with the fund. Fidelity calculates profitability information for each fund, as well as aggregate profitability information for groups of Fidelity funds and all Fidelity funds, using a series of detailed revenue and cost allocation methodologies which originate with the books and records of Fidelity on which Fidelity's audited financial statements are based. The Audit Committee of the Board reviews any significant changes from the prior year's methodologies.
PricewaterhouseCoopers LLP (PwC), independent registered public accounting firm and auditor to Fidelity and certain Fidelity funds, has been engaged annually by the Board as part of the Board's assessment of Fidelity's profitability analysis. PwC's engagement includes the review and assessment of the methodologies used by Fidelity in determining the revenues and expenses attributable to Fidelity's mutual fund business, and completion of agreed-upon procedures in respect of the mathematical accuracy of the fund profitability information and its conformity to established allocation methodologies. After considering PwC's reports issued under the engagement and information provided by Fidelity, the Board concluded that while other allocation methods may also be reasonable, Fidelity's profitability methodologies are reasonable in all material respects.
The Board also reviewed Fidelity's non-fund businesses and potential fall-out benefits related to the mutual fund business as well as cases where Fidelity's affiliates may benefit from or be related to the fund's business.
The Board considered the costs of the services provided by and the profits realized by Fidelity in connection with the operation of the fund and was satisfied that the profitability was not excessive.
Economies of Scale. The Board considered whether there have been economies of scale in respect of the management of the Fidelity funds, whether the Fidelity funds (including the fund) have appropriately benefited from any such economies of scale, and whether there is potential for realization of any further economies of scale. The Board considered the extent to which the fund will benefit from economies of scale as assets grow through increased services to the fund, through waivers or reimbursements, or through fee or expense ratio reductions. The Board also noted that a committee (the Economies of Scale Committee) created by it and the boards of other Fidelity funds periodically analyzes whether Fidelity attains economies of scale in respect of the management and servicing of the Fidelity funds, whether the Fidelity funds have appropriately benefited from such economies of scale, and whether there is potential for realization of any further economies of scale.
The Board concluded, taking into account the analysis of the Economies of Scale Committee, that economies of scale, if any, are being appropriately shared between fund shareholders and Fidelity.
Additional Information Requested by the Board. In order to develop fully the factual basis for consideration of the Fidelity funds' advisory contracts, the Board requested and received additional information on certain topics, including: (i) Fidelity's fund profitability methodology, profitability trends for certain funds, and the impact of certain factors on fund profitability results; (ii) portfolio manager changes that have occurred during the past year and the amount of the investment that each portfolio manager has made in the Fidelity fund(s) that he or she manages; (iii) Fidelity's compensation structure for portfolio managers, research analysts, and other key personnel, including its effects on fund profitability, the rationale for the compensation structure, and the extent to which current market conditions have affected retention and recruitment; (iv) the arrangements with and compensation paid to certain fund sub-advisers on behalf of the Fidelity funds; (v) the terms of Fidelity's contractual and voluntary expense cap and waiver arrangements with the funds; (vi) the methodology with respect to competitive fund data and peer group classifications; (vii) Fidelity's transfer agent fee, expense, and service structures for different funds and classes relative to competitive trends, and the impact of the increased use of omnibus accounts; (viii) Fidelity's long-term expectations for its offerings in the workplace investing channel; (ix) new developments in the retail and institutional marketplaces and the competitive positioning of the funds relative to other investment products and services; (x) the approach to considering "fall-out" benefits; (xi) the impact of money market reform on Fidelity's money market funds, including with respect to costs and profitability; (xii) the funds' share class structures and distribution channels, including the impact of the Department of Labor's new fiduciary rule on the funds' distribution arrangements; and (xiii) explanations regarding the relative total expense ratios of certain funds and classes, total expense competitive trends and methodologies for total expense competitive comparisons, and actions that might be taken by Fidelity to reduce total expense ratios for certain classes. In addition, the Board considered its discussions with Fidelity throughout the year regarding enhanced information security initiatives and the funds' fair valuation policies.
Based on its evaluation of all of the conclusions noted above, and after considering all factors it believed relevant, the Board concluded that the advisory fee structures are fair and reasonable, and that the fund's Advisory Contracts should be renewed.
Corporate Headquarters
245 Summer St.
Boston, MA 02210
www.fidelity.com
GOV-SANN-0418
1.700523.120
Fidelity® Intermediate Government Income Fund
Semi-Annual Report February 28, 2018 |
|
Contents
To view a fund's proxy voting guidelines and proxy voting record for the 12-month period ended June 30, visit http://www.fidelity.com/proxyvotingresults or visit the Securities and Exchange Commission's (SEC) web site at http://www.sec.gov.
You may also call 1-800-544-8544 to request a free copy of the proxy voting guidelines.
Standard & Poor's, S&P and S&P 500 are registered service marks of The McGraw-Hill Companies, Inc. and have been licensed for use by Fidelity Distributors Corporation.
Other third-party marks appearing herein are the property of their respective owners.
All other marks appearing herein are registered or unregistered trademarks or service marks of FMR LLC or an affiliated company. © 2018 FMR LLC. All rights reserved.
This report and the financial statements contained herein are submitted for the general information of the shareholders of the Fund. This report is not authorized for distribution to prospective investors in the Fund unless preceded or accompanied by an effective prospectus.
A fund files its complete schedule of portfolio holdings with the SEC for the first and third quarters of each fiscal year on Form N-Q. Forms N-Q are available on the SEC’s web site at http://www.sec.gov. A fund's Forms N-Q may be reviewed and copied at the SEC’s Public Reference Room in Washington, DC. Information regarding the operation of the SEC's Public Reference Room may be obtained by calling 1-800-SEC-0330.
For a complete list of a fund's portfolio holdings, view the most recent holdings listing, semiannual report, or annual report on Fidelity's web site at http://www.fidelity.com, http://www.institutional.fidelity.com, or http://www.401k.com, as applicable.
NOT FDIC INSURED •MAY LOSE VALUE •NO BANK GUARANTEE
Neither the Fund nor Fidelity Distributors Corporation is a bank.
Investment Summary (Unaudited)
Coupon Distribution as of February 28, 2018
| | % of fund's investments |
| 1 - 1.99% | 33.8 |
| 2 - 2.99% | 39.0 |
| 3 - 3.99% | 7.2 |
| 4 - 4.99% | 6.1 |
| 5 - 5.99% | 8.1 |
| 6 - 6.99% | 1.2 |
| 7 - 7.99% | 0.1 |
| 8% and above | 0.0 |
Coupon distribution shows the range of stated interest rates on the fund's investments, excluding short-term investments.
Asset Allocation (% of fund's net assets)
| As of February 28, 2018*,**,*** |
| | Mortgage Securities | 7.7% |
| | CMOs and Other Mortgage Related Securities | 31.5% |
| | U.S. Treasury Obligations | 52.9% |
| | U.S. Government Agency Obligations† | 2.7% |
| | Foreign Government & Government Agency Obligations | 4.5% |
| | Asset-Backed Securities | 3.9% |
| | Short-Term Investments and Net Other Assets (Liabilities)†† | (3.2)% |
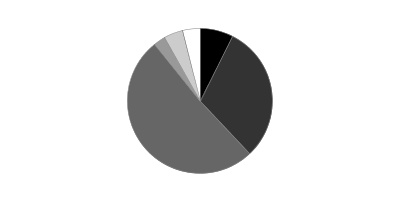
* Foreign investments – 4.5%
** Futures and Swaps – 11.1%
*** Written options - (4.0)%
† Includes NCUA Guaranteed Notes
†† Short-Term Investments and Net Other Assets (Liabilities) are not included in the pie chart
Percentages in the above tables are adjusted for the effect of TBA Sale Commitments.
Percentages shown as 0.0% may reflect amounts less than 0.05%.
Schedule of Investments February 28, 2018 (Unaudited)
Showing Percentage of Net Assets
| U.S. Government and Government Agency Obligations - 55.6% | | | |
| | | Principal Amount (000s) | Value (000s) |
| U.S. Treasury Obligations - 52.9% | | | |
| U.S. Treasury Notes: | | | |
| 1.125% 9/30/21 | | $11,060 | $10,532 |
| 1.375% 1/31/21 | | 10,000 | 9,704 |
| 1.5% 4/15/20 | | 11,267 | 11,080 |
| 1.5% 7/15/20 | | 12,288 | 12,051 |
| 1.5% 8/15/26 | | 174 | 156 |
| 1.625% 7/31/20 | | 3,000 | 2,949 |
| 1.625% 8/31/22 | | 3,459 | 3,313 |
| 1.75% 10/31/20 | | 5,000 | 4,918 |
| 1.75% 12/31/20 | | 11,330 | 11,127 |
| 1.75% 4/30/22 | | 2,240 | 2,166 |
| 1.75% 6/30/22 | | 24 | 23 |
| 1.875% 1/31/22 | | 29,140 | 28,390 |
| 1.875% 3/31/22 | | 20,608 | 20,043 |
| 1.875% 7/31/22 | | 16,612 | 16,098 |
| 2% 12/31/21 | | 1,226 | 1,201 |
| 2% 10/31/22 | | 3,250 | 3,159 |
| 2% 8/15/25 (a)(b)(c) | | 41,631 | 39,340 |
| 2.125% 6/30/22 | | 327 | 321 |
| 2.125% 12/31/22 | | 6,399 | 6,248 |
| 2.125% 7/31/24 | | 18,117 | 17,430 |
| 2.125% 11/30/24 | | 11,730 | 11,248 |
| 2.125% 5/15/25 | | 1,053 | 1,006 |
| 2.25% 7/31/21 | | 35,982 | 35,678 |
| 2.25% 12/31/24 | | 11,877 | 11,474 |
| 2.25% 2/15/27 | | 1,920 | 1,824 |
| 2.25% 8/15/27 | | 8,155 | 7,726 |
| 2.25% 11/15/27 | | 1,563 | 1,479 |
| 2.375% 1/31/23 | | 1,140 | 1,126 |
| 2.375% 5/15/27 (c) | | 2,764 | 2,651 |
| 2.75% 2/15/28 | | 2,500 | 2,475 |
| | | | 276,936 |
| Other Government Related - 2.7% | | | |
| National Credit Union Administration Guaranteed Notes: | | | |
| Series 2010-A1 Class A, 1 month U.S. LIBOR + 0.350% 1.9293% 12/7/20 (NCUA Guaranteed) (d)(e) | | 564 | 565 |
| Series 2011-R1 Class 1A, 1 month U.S. LIBOR + 0.450% 2.0295% 1/8/20 (NCUA Guaranteed) (d)(e) | | 1,181 | 1,184 |
| National Credit Union Administration Guaranteed Notes Master Trust 3.45% 6/12/21 (NCUA Guaranteed) | | 12,000 | 12,247 |
| | | | 13,996 |
| TOTAL U.S. GOVERNMENT AND GOVERNMENT AGENCY OBLIGATIONS | | | |
| (Cost $299,416) | | | 290,932 |
|
| U.S. Government Agency - Mortgage Securities - 11.3% | | | |
| Fannie Mae - 2.7% | | | |
| 12 month U.S. LIBOR + 1.365% 3.115% 10/1/35 (d)(e) | | 7 | 7 |
| 12 month U.S. LIBOR + 1.415% 3.165% 11/1/33 (d)(e) | | 8 | 8 |
| 12 month U.S. LIBOR + 1.480% 3.312% 7/1/34 (d)(e) | | 10 | 11 |
| 12 month U.S. LIBOR + 1.495% 3.19% 1/1/35 (d)(e) | | 39 | 40 |
| 12 month U.S. LIBOR + 1.551% 2.488% 2/1/44 (d)(e) | | 50 | 51 |
| 12 month U.S. LIBOR + 1.553% 2.611% 5/1/44 (d)(e) | | 158 | 162 |
| 12 month U.S. LIBOR + 1.553% 3.326% 6/1/36 (d)(e) | | 8 | 8 |
| 12 month U.S. LIBOR + 1.558% 2.449% 2/1/44 (d)(e) | | 64 | 66 |
| 12 month U.S. LIBOR + 1.565% 3.315% 3/1/37 (d)(e) | | 10 | 11 |
| 12 month U.S. LIBOR + 1.570% 2.559% 5/1/44 (d)(e) | | 86 | 88 |
| 12 month U.S. LIBOR + 1.574% 2.656% 4/1/44 (d)(e) | | 227 | 233 |
| 12 month U.S. LIBOR + 1.580% 2.44% 4/1/44 (d)(e) | | 90 | 93 |
| 12 month U.S. LIBOR + 1.580% 2.519% 1/1/44 (d)(e) | | 93 | 96 |
| 12 month U.S. LIBOR + 1.617% 3.327% 3/1/33 (d)(e) | | 25 | 25 |
| 12 month U.S. LIBOR + 1.643% 3.315% 9/1/36 (d)(e) | | 13 | 14 |
| 12 month U.S. LIBOR + 1.645% 3.395% 6/1/47 (d)(e) | | 21 | 22 |
| 12 month U.S. LIBOR + 1.728% 3.445% 11/1/36 (d)(e) | | 55 | 57 |
| 12 month U.S. LIBOR + 1.741% 3.477% 3/1/40 (d)(e) | | 244 | 252 |
| 12 month U.S. LIBOR + 1.745% 3.448% 7/1/35 (d)(e) | | 10 | 10 |
| 12 month U.S. LIBOR + 1.760% 3.414% 2/1/37 (d)(e) | | 115 | 120 |
| 12 month U.S. LIBOR + 1.800% 2.747% 1/1/42 (d)(e) | | 213 | 221 |
| 12 month U.S. LIBOR + 1.818% 2.689% 2/1/42 (d)(e) | | 310 | 322 |
| 12 month U.S. LIBOR + 1.851% 3.518% 5/1/36 (d)(e) | | 6 | 7 |
| 12 month U.S. LIBOR + 1.885% 3.637% 4/1/36 (d)(e) | | 65 | 68 |
| 12 month U.S. LIBOR + 2.176% 3.768% 8/1/35 (d)(e) | | 76 | 79 |
| 6 month U.S. LIBOR + 1.510% 3.043% 2/1/33 (d)(e) | | 5 | 5 |
| 6 month U.S. LIBOR + 1.535% 2.938% 12/1/34 (d)(e) | | 10 | 11 |
| 6 month U.S. LIBOR + 1.535% 2.958% 3/1/35 (d)(e) | | 7 | 7 |
| 6 month U.S. LIBOR + 1.556% 3.046% 10/1/33 (d)(e) | | 4 | 5 |
| 6 month U.S. LIBOR + 1.565% 2.999% 7/1/35 (d)(e) | | 5 | 6 |
| U.S. TREASURY 1 YEAR INDEX + 1.965% 2.84% 2/1/36 (d)(e) | | 4 | 4 |
| U.S. TREASURY 1 YEAR INDEX + 2.146% 3.213% 7/1/36 (d)(e) | | 47 | 49 |
| U.S. TREASURY 1 YEAR INDEX + 2.208% 3.083% 3/1/35 (d)(e) | | 6 | 6 |
| U.S. TREASURY 1 YEAR INDEX + 2.295% 3.54% 10/1/33 (d)(e) | | 10 | 11 |
| 4% 5/1/29 | | 3,365 | 3,473 |
| 4.5% 11/1/25 to 6/1/41 | | 1,541 | 1,623 |
| 5% 1/1/22 to 4/1/22 | | 14 | 15 |
| 5.5% 10/1/20 to 5/1/44 | | 4,300 | 4,699 |
| 6% 1/1/34 to 6/1/36 | | 882 | 982 |
| 6.5% 2/1/22 to 8/1/36 | | 901 | 1,009 |
| | | | 13,976 |
| Freddie Mac - 0.4% | | | |
| 12 month U.S. LIBOR + 1.325% 3.075% 3/1/37 (d)(e) | | 7 | 7 |
| 12 month U.S. LIBOR + 1.515% 3.265% 11/1/35 (d)(e) | | 21 | 21 |
| 12 month U.S. LIBOR + 1.600% 3.35% 7/1/35 (d)(e) | | 43 | 44 |
| 12 month U.S. LIBOR + 1.754% 3.067% 9/1/41 (d)(e) | | 328 | 343 |
| 12 month U.S. LIBOR + 1.793% 3.543% 4/1/37 (d)(e) | | 15 | 15 |
| 12 month U.S. LIBOR + 1.874% 3.634% 10/1/42 (d)(e) | | 172 | 180 |
| 12 month U.S. LIBOR + 1.880% 3.055% 10/1/41 (d)(e) | | 289 | 301 |
| 12 month U.S. LIBOR + 2.045% 3.811% 7/1/36 (d)(e) | | 24 | 25 |
| 12 month U.S. LIBOR + 2.197% 3.771% 3/1/33 (d)(e) | | 1 | 1 |
| 6 month U.S. LIBOR + 1.445% 2.945% 3/1/35 (d)(e) | | 15 | 15 |
| 6 month U.S. LIBOR + 1.647% 3.221% 2/1/37 (d)(e) | | 16 | 17 |
| 6 month U.S. LIBOR + 1.665% 3.136% 7/1/35 (d)(e) | | 272 | 280 |
| 6 month U.S. LIBOR + 1.675% 3.175% 6/1/37 (d)(e) | | 11 | 12 |
| 6 month U.S. LIBOR + 1.720% 3.15% 8/1/37 (d)(e) | | 21 | 22 |
| 6 month U.S. LIBOR + 1.746% 3.092% 5/1/37 (d)(e) | | 11 | 11 |
| 6 month U.S. LIBOR + 1.932% 3.297% 10/1/36 (d)(e) | | 70 | 71 |
| 6 month U.S. LIBOR + 1.976% 3.448% 10/1/35 (d)(e) | | 49 | 51 |
| 6 month U.S. LIBOR + 2.010% 3.51% 5/1/37 (d)(e) | | 73 | 76 |
| 6 month U.S. LIBOR + 2.010% 3.51% 5/1/37 (d)(e) | | 125 | 128 |
| 6 month U.S. LIBOR + 2.040% 3.629% 6/1/37 (d)(e) | | 24 | 25 |
| 6 month U.S. LIBOR + 2.755% 4.273% 10/1/35 (d)(e) | | 11 | 12 |
| U.S. TREASURY 1 YEAR INDEX + 2.035% 2.913% 6/1/33 (d)(e) | | 67 | 69 |
| U.S. TREASURY 1 YEAR INDEX + 2.230% 2.988% 4/1/34 (d)(e) | | 213 | 223 |
| U.S. TREASURY 1 YEAR INDEX + 2.383% 3.441% 2/1/36 (d)(e) | | 1 | 1 |
| U.S. TREASURY 1 YEAR INDEX + 2.548% 3.548% 7/1/35 (d)(e) | | 49 | 51 |
| 6% 1/1/24 | | 171 | 181 |
| 6.5% 12/1/21 | | 45 | 47 |
| 9.5% 5/1/20 to 6/1/21 | | 5 | 5 |
| 10% 11/1/18 to 3/1/21 | | 1 | 1 |
| 10.5% 1/1/21 | | 0 | 0 |
| 11% 9/1/20 | | 0 | 0 |
| | | | 2,235 |
| Ginnie Mae - 8.2% | | | |
| 6% 6/15/36 | | 750 | 861 |
| 8% 12/15/23 | | 49 | 54 |
| 10.5% 11/15/18 to 10/15/21 | | 11 | 12 |
| 4.312% 8/20/61 (d)(f) | | 307 | 309 |
| 4.5% 3/1/48 (g) | | 2,200 | 2,288 |
| 4.5% 3/1/48 (g) | | 1,900 | 1,976 |
| 4.5% 3/1/48 (g) | | 1,900 | 1,976 |
| 4.5% 3/1/48 (g) | | 1,950 | 2,028 |
| 4.5% 3/1/48 (g) | | 3,000 | 3,120 |
| 4.5% 3/1/48 (g) | | 7,450 | 7,749 |
| 4.5% 4/1/48 (g) | | 8,600 | 8,935 |
| 4.5% 4/1/48 (g) | | 9,800 | 10,181 |
| 4.642% 2/20/62 (d)(f) | | 401 | 408 |
| 4.674% 2/20/62 (d)(f) | | 487 | 494 |
| 4.698% 1/20/62 (d)(f) | | 2,771 | 2,810 |
| 5.47% 8/20/59 (d)(f) | | 3 | 3 |
| 11% 7/20/18 to 1/20/21 | | 3 | 3 |
| | | | 43,207 |
| TOTAL U.S. GOVERNMENT AGENCY - MORTGAGE SECURITIES | | | |
| (Cost $59,455) | | | 59,418 |
|
| Asset-Backed Securities - 3.9% | | | |
| GCO Education Loan Funding Trust Series 2006-1 Class A8L, 3 month U.S. LIBOR + 0.130% 2.0736% 5/25/25 (d)(e) | | $941 | $941 |
| Goal Capital Funding Trust Series 2005-2 Class A3, 3 month U.S. LIBOR + 0.170% 2.1136% 5/28/30 (d)(e) | | 483 | 482 |
| Illinois Student Assistance Commission Student Loan Rev. Series 2010-1 Class A2, 3 month U.S. LIBOR + 1.050% 2.4174% 4/25/22 (d)(e) | | 135 | 135 |
| Navient Student Loan Trust: | | | |
| Series 2017-3A: | | | |
| Class A1, 1 month U.S. LIBOR + 0.300% 1.9207% 7/26/66 (d)(e)(h) | | 1,347 | 1,348 |
| Class A2, 1 month U.S. LIBOR + 0.600% 2.2207% 7/26/66 (d)(e)(h) | | 2,013 | 2,026 |
| Series 2018-1A Class A1, 1 month U.S. LIBOR + 0.250% 1.7514% 3/25/67 (d)(e)(h) | | 2,130 | 2,129 |
| Nelnet Student Loan Trust 3 month U.S. LIBOR + 0.100% 1.8452% 1/25/30 (d)(e) | | 1,144 | 1,142 |
| Northstar Education Finance, Inc., Delaware Series 2004-2 Class A4, 3 month U.S. LIBOR + 0.230% 1.608% 7/28/21 (d)(e) | | 3,387 | 3,384 |
| SLM Student Loan Trust Series 2007-8 Class A4, 3 month U.S. LIBOR + 0.470% 2.2152% 1/26/26 (d)(e) | | 8,731 | 8,753 |
| Small Business Administration guaranteed development participation certificates Series 2004-20H Class 1, 5.17% 8/1/24 | | 66 | 69 |
| TOTAL ASSET-BACKED SECURITIES | | | |
| (Cost $20,395) | | | 20,409 |
|
| Collateralized Mortgage Obligations - 21.2% | | | |
| U.S. Government Agency - 21.2% | | | |
| Fannie Mae: | | | |
| floater: | | $ | $ |
| Series 1994-42 Class FK, 10-Year Treasury Constant Maturity Rate - 0.500% 1.96% 4/25/24 (d)(e) | | 332 | 333 |
| Series 2001-38 Class QF, 1 month U.S. LIBOR + 0.980% 2.6007% 8/25/31 (d)(e) | | 73 | 74 |
| Series 2002-60 Class FV, 1 month U.S. LIBOR + 1.000% 2.6207% 4/25/32 (d)(e) | | 15 | 16 |
| Series 2002-74 Class FV, 1 month U.S. LIBOR + 0.450% 2.0707% 11/25/32 (d)(e) | | 810 | 813 |
| Series 2002-75 Class FA, 1 month U.S. LIBOR + 1.000% 2.6207% 11/25/32 (d)(e) | | 32 | 32 |
| Series 2010-15 Class FJ, 1 month U.S. LIBOR + 0.930% 2.5507% 6/25/36 (d)(e) | | 1,024 | 1,039 |
| planned amortization class: | | | |
| Series 1988-21 Class G, 9.5% 8/25/18 | | 0 | 0 |
| Series 2003-28 Class KG, 5.5% 4/25/23 | | 137 | 143 |
| Series 2005-19 Class PA, 5.5% 7/25/34 | | 209 | 215 |
| Series 2005-64 Class PX, 5.5% 6/25/35 | | 273 | 288 |
| Series 2005-68 Class CZ, 5.5% 8/25/35 | | 771 | 842 |
| Series 2012-149: | | | |
| Class DA, 1.75% 1/25/43 | | 162 | 155 |
| Class GA, 1.75% 6/25/42 | | 160 | 152 |
| sequential payer: | | | |
| Series 2003-117 Class MD, 5% 12/25/23 | | 139 | 145 |
| Series 2004-52 Class KZ, 5.5% 7/25/34 | | 1,747 | 1,900 |
| Series 2004-91 Class Z, 5% 12/25/34 | | 979 | 1,045 |
| Series 2009-59 Class HB, 5% 8/25/39 | | 428 | 458 |
| Series 201-75 Class AL, 3.5% 8/25/26 | | 1,561 | 1,592 |
| Series 2010-97 Class CX, 4.5% 9/25/25 | | 1,693 | 1,767 |
| Series 2011-80: | | | |
| Class HE, 3.5% 8/25/26 | | 548 | 560 |
| Class KB, 3.5% 8/25/26 | | 851 | 869 |
| Series 2010-139 Class NI, 4.5% 2/25/40 (i) | | 668 | 68 |
| Series 2010-39 Class FG, 1 month U.S. LIBOR + 0.920% 2.5407% 3/25/36 (d)(e) | | 637 | 651 |
| Series 2011-67 Class AI, 4% 7/25/26 (i) | | 176 | 16 |
| Series 2016-26 Class CG, 3% 5/25/46 | | 2,410 | 2,398 |
| Freddie Mac: | | | |
| floater: | | | |
| Series 2526 Class FC, 1 month U.S. LIBOR + 0.400% 1.9875% 11/15/32 (d)(e) | | 137 | 137 |
| Series 2630 Class FL, 1 month U.S. LIBOR + 0.500% 2.0875% 6/15/18 (d)(e) | | 0 | 0 |
| Series 2711 Class FC, 1 month U.S. LIBOR + 0.900% 2.4875% 2/15/33 (d)(e) | | 291 | 296 |
| floater planned amortization class Series 2770 Class FH, 1 month U.S. LIBOR + 0.400% 1.9875% 3/15/34 (d)(e) | | 313 | 315 |
| planned amortization class: | | | |
| Series 2802 Class OB, 6% 5/15/34 | | 351 | 376 |
| Series 3415 Class PC, 5% 12/15/37 | | 114 | 121 |
| Series 3840 Class VA, 4.5% 9/15/27 | | 580 | 586 |
| Series 4135 Class AB, 1.75% 6/15/42 | | 119 | 114 |
| sequential payer: | | | |
| Series 1929 Class EZ, 7.5% 2/17/27 | | 385 | 415 |
| Series 2004-2802 Class ZG, 5.5% 5/15/34 | | 1,397 | 1,525 |
| Series 2004-2862 Class NE, 5% 9/15/24 | | 2,493 | 2,592 |
| Series 2145 Class MZ, 6.5% 4/15/29 | | 424 | 469 |
| Series 2357 Class ZB, 6.5% 9/15/31 | | 246 | 275 |
| Series 2877 Class ZD, 5% 10/15/34 | | 1,202 | 1,283 |
| Series 2998 Class LY, 5.5% 7/15/25 | | 122 | 129 |
| Series 3007 Class EW, 5.5% 7/15/25 | | 549 | 581 |
| Series 3745 Class KV, 4.5% 12/15/26 | | 1,029 | 1,079 |
| Series 3806 Class L, 3.5% 2/15/26 | | 1,400 | 1,432 |
| Series 3862 Class MB, 3.5% 5/15/26 | | 908 | 927 |
| Freddie Mac Multi-family Structured pass-thru certificates sequential payer: | | | |
| Series 4335 Class AL, 4.25% 3/15/40 | | 921 | 949 |
| Series 4341 Class ML, 3.5% 11/15/31 | | 1,285 | 1,308 |
| Ginnie Mae guaranteed REMIC pass-thru certificates: | | | |
| floater: | | | |
| Series 2007-59 Class FC, 1 month U.S. LIBOR + 0.500% 2.0612% 7/20/37 (d)(e) | | 182 | 183 |
| Series 2008-2 Class FD, 1 month U.S. LIBOR + 0.480% 2.0412% 1/20/38 (d)(e) | | 45 | 46 |
| Series 2009-108 Class CF, 1 month U.S. LIBOR + 0.600% 2.1881% 11/16/39 (d)(e) | | 182 | 184 |
| Series 2009-116 Class KF, 1 month U.S. LIBOR + 0.530% 2.1181% 12/16/39 (d)(e) | | 139 | 140 |
| Series 2010-H17 Class FA, 1 month U.S. LIBOR + 0.330% 1.8938% 7/20/60 (d)(e)(f) | | 2,209 | 2,203 |
| Series 2010-H18 Class AF, 1 month U.S. LIBOR + 0.300% 1.6794% 9/20/60 (d)(e)(f) | | 2,609 | 2,600 |
| Series 2010-H19 Class FG, 1 month U.S. LIBOR + 0.300% 1.6794% 8/20/60 (d)(e)(f) | | 2,982 | 2,972 |
| Series 2010-H27 Series FA, 1 month U.S. LIBOR + 0.380% 1.7594% 12/20/60 (d)(e)(f) | | 792 | 791 |
| Series 2011-H05 Class FA, 1 month U.S. LIBOR + 0.500% 1.8794% 12/20/60 (d)(e)(f) | | 1,499 | 1,502 |
| Series 2011-H07 Class FA, 1 month U.S. LIBOR + 0.500% 2.0618% 2/20/61 (d)(e)(f) | | 2,981 | 2,986 |
| Series 2011-H12 Class FA, 1 month U.S. LIBOR + 0.490% 2.0518% 2/20/61 (d)(e)(f) | | 3,382 | 3,387 |
| Series 2011-H13 Class FA, 1 month U.S. LIBOR + 0.500% 1.8794% 4/20/61 (d)(e)(f) | | 1,137 | 1,139 |
| Series 2011-H14: | | | |
| Class FB, 1 month U.S. LIBOR + 0.500% 1.8794% 5/20/61 (d)(e)(f) | | 1,316 | 1,319 |
| Class FC, 1 month U.S. LIBOR + 0.500% 1.8794% 5/20/61 (d)(e)(f) | | 1,235 | 1,237 |
| Series 2011-H17 Class FA, 1 month U.S. LIBOR + 0.530% 1.9094% 6/20/61 (d)(e)(f) | | 1,539 | 1,543 |
| Series 2011-H21 Class FA, 1 month U.S. LIBOR + 0.600% 1.9794% 10/20/61 (d)(e)(f) | | 1,534 | 1,541 |
| Series 2012-H01 Class FA, 1 month U.S. LIBOR + 0.700% 2.0794% 11/20/61 (d)(e)(f) | | 1,305 | 1,315 |
| Series 2012-H03 Class FA, 1 month U.S. LIBOR + 0.700% 2.0794% 1/20/62 (d)(e)(f) | | 861 | 868 |
| Series 2012-H06 Class FA, 1 month U.S. LIBOR + 0.630% 2.0094% 1/20/62 (d)(e)(f) | | 1,227 | 1,234 |
| Series 2012-H07 Class FA, 1 month U.S. LIBOR + 0.630% 2.0094% 3/20/62 (d)(e)(f) | | 760 | 764 |
| Series 2012-H21 Class DF, 1 month U.S. LIBOR + 0.650% 2.0294% 5/20/61 (d)(e)(f) | | 333 | 334 |
| Series 2015-H13 Class FL, 1 month U.S. LIBOR + 0.280% 1.8418% 5/20/63 (d)(e)(f) | | 1,415 | 1,416 |
| Series 2015-H19 Class FA, 1 month U.S. LIBOR + 0.200% 1.7618% 4/20/63 (d)(e)(f) | | 1,625 | 1,624 |
| planned amortization class: | | | |
| Series 2010-31 Class BP, 5% 3/20/40 | | 1,810 | 1,960 |
| Series 2011-136 Class WI, 4.5% 5/20/40 (i) | | 376 | 45 |
| Series 2011-68 Class EC, 3.5% 4/20/41 | | 863 | 877 |
| sequential payer: | | | |
| Series 2013-H06 Class HA, 1.65% 1/20/63 (f) | | 667 | 659 |
| Series 2014-H12 Class KA, 2.75% 5/20/64 (f) | | 793 | 785 |
| Series 2016-H02 Class FM, 1 month U.S. LIBOR + 0.500% 2.0618% 9/20/62 (d)(e)(f) | | 2,714 | 2,721 |
| Series 2016-H04 Class FE, 1 month U.S. LIBOR + 0.650% 2.2118% 11/20/65 (d)(e)(f) | | 616 | 618 |
| Series 2010-169 Class Z, 4.5% 12/20/40 | | 1,019 | 1,072 |
| Series 2010-H15 Class TP, 5.15% 8/20/60 (f) | | 2,360 | 2,409 |
| Series 2010-H17 Class XP, 5.2946% 7/20/60 (d)(f) | | 2,276 | 2,330 |
| Series 2010-H18 Class PL, 5.01% 9/20/60 (d)(f) | | 2,037 | 2,076 |
| Series 2012-64 Class KI, 3.5% 11/20/36 (i) | | 210 | 16 |
| Series 2013-124: | | | |
| Class ES, 8.667% - 1 month U.S. LIBOR 6.5851% 4/20/39 (d)(j) | | 720 | 738 |
| Class ST, 8.800% - 1 month U.S. LIBOR 6.7184% 8/20/39 (d)(j) | | 2,000 | 2,072 |
| Series 2013-H04 Class BA, 1.65% 2/20/63 (f) | | 1,236 | 1,217 |
| Series 2013-H07 Class JA, 1.75% 3/20/63 (f) | | 3,212 | 3,166 |
| Series 2015-H17 Class HA, 2.5% 5/20/65 (f) | | 2,809 | 2,800 |
| Series 2015-H21: | | | |
| Class HA, 2.5% 6/20/63 (f) | | 7,555 | 7,538 |
| Class JA, 2.5% 6/20/65 (f) | | 685 | 683 |
| Series 2015-H30 Class HA, 1.75% 9/20/62 (d)(f) | | 6,127 | 6,059 |
| Series 2016-H13 Class FB, U.S. TREASURY 1 YEAR INDEX + 0.500% 1.65% 5/20/66 (d)(e)(f) | | 3,607 | 3,627 |
| Series 2017-H06 Class FA, U.S. TREASURY 1 YEAR INDEX + 0.350% 2.11% 8/20/66 (d)(e)(f) | | 3,300 | 3,309 |
| Series 2090-118 Class XZ, 5% 12/20/39 | | 2,289 | 2,500 |
| | | | 111,085 |
| TOTAL COLLATERALIZED MORTGAGE OBLIGATIONS | | | |
| (Cost $112,344) | | | 111,085 |
|
| Commercial Mortgage Securities - 10.3% | | | |
| Fannie Mae Series 2017-T1 Class A, 2.898% 6/25/27 | | 6,499 | 6,240 |
| FHLMC Multi-Family Structured Pass-Through Certificates sequential payer: | | | |
| Series K071 Class A2, 3.289% 11/25/27 | | 1,200 | 1,198 |
| Series K072 Class A2, 3.444% 12/25/50 | | 2,753 | 2,784 |
| Freddie Mac: | | | |
| floater: | | | |
| Series KP04 Class AG1, 1 month U.S. LIBOR + 0.220% 1.7997% 7/25/20 (d)(e) | | 1,400 | 1,401 |
| Series KP04, Class AG2, 1 month U.S. LIBOR + 0.200% 1.7797% 10/25/19 (d)(e) | | 2,800 | 2,801 |
| pass-thru certificates sequential payer Series K011 Class A2, 4.084% 11/25/20 | | 780 | 805 |
| sequential payer: | | | |
| Series 2017-SR01 Class A2, 2.75% 11/25/22 | | 2,500 | 2,471 |
| Series K034 Class A1, 2.669% 2/25/23 | | 2,320 | 2,305 |
| Series K073 Class A2, 3.35% 1/25/28 | | 4,400 | 4,411 |
| Series K708 Class A2, 2.13% 1/25/19 | | 3,092 | 3,082 |
| Series K709 Class A2, 2.086% 3/25/19 | | 2,390 | 2,381 |
| Series K710 Class A2, 1.883% 5/25/19 | | 2,438 | 2,424 |
| Series K713 Class A2, 2.313% 3/25/20 | | 804 | 798 |
| Series K717 Class A2, 2.991% 9/25/21 | | 670 | 672 |
| Series K729 Class A1, 2.9184% 2/25/24 | | 3,163 | 3,161 |
| Series K032 Class A1, 3.016% 2/25/23 | | 3,914 | 3,937 |
| Series K504 Class A2, 2.566% 9/25/20 | | 1,912 | 1,910 |
| Series K704 Class A2, 2.412% 8/25/18 | | 615 | 615 |
| Series K706 Class A2, 2.323% 10/25/18 | | 1,280 | 1,279 |
| Series K724 Class A1, 2.776% 3/25/23 | | 2,328 | 2,319 |
| Series K726 Class A1, 2.596% 8/25/23 | | 655 | 648 |
| Freddie Mac Multi-family floater Series 2017-KT01 Class A, 1 month U.S. LIBOR + 0.320% 1.8814% 2/25/20 (d)(e) | | 6,130 | 6,153 |
| TOTAL COMMERCIAL MORTGAGE SECURITIES | | | |
| (Cost $54,500) | | | 53,795 |
|
| Foreign Government and Government Agency Obligations - 4.5% | | | |
| Israeli State: | | | |
| (guaranteed by U.S. Government through Agency for International Development): | | | |
| 5.5% 9/18/23 | | 4,551 | 5,166 |
| 5.5% 12/4/23 | | 10,710 | 12,221 |
| 5.5% 4/26/24 | | 1,100 | 1,258 |
| Jordanian Kingdom 3% 6/30/25 | | 3,329 | 3,341 |
| Ukraine Government 1.471% 9/29/21 | | 1,400 | 1,346 |
| TOTAL FOREIGN GOVERNMENT AND GOVERNMENT AGENCY OBLIGATIONS | | | |
| (Cost $22,600) | | | 23,332 |
| | | Shares | Value (000s) |
|
| Money Market Funds - 0.7% | | | |
| Fidelity Cash Central Fund, 1.41% (k) | | | |
| (Cost $3,910) | | 3,909,685 | 3,910 |
| Purchased Swaptions - 0.4%(l) | | | | |
| | | Expiration Date | Notional Amount (000s) | Value (000s) |
| Put Options - 0.3% | | | | |
| Option on an interest rate swap with Goldman Sachs Bank U.S.A. to pay semi-annually a fixed rate of 2.495% and receive quarterly a floating rate based on 3-month LIBOR, expiring October 2027 | | 10/5/20 | 5,300 | $247 |
| Option on an interest rate swap with Goldman Sachs Bank U.S.A. to pay semi-annually a fixed rate of 2.7875% and receive quarterly a floating rate based on 3-month LIBOR, expiring January 2028 | | 1/25/21 | 2,800 | 105 |
| Option on an interest rate swap with JPMorgan Chase Bank NA to pay semi-annually a fixed rate of 2.5340% and receive quarterly a floating rate based on 3-month LIBOR, expiring December 2027 | | 12/8/20 | 17,500 | 804 |
| Option on an interest rate swap with JPMorgan Chase Bank NA to pay semi-annually a fixed rate of 2.5575% and receive quarterly a floating rate based on 3-month LIBOR, expiring October 2027 | | 10/6/20 | 3,600 | 159 |
|
| TOTAL PUT OPTIONS | | | | 1,315 |
|
| Call Options - 0.1% | | | | |
| Option on an interest rate swap with Goldman Sachs Bank U.S.A. to receive semi-annually a fixed rate of 2.495% and pay quarterly a floating rate based on 3-month LIBOR, expiring October 2027 | | 10/5/20 | 5,300 | 93 |
| Option on an interest rate swap with Goldman Sachs Bank U.S.A. to receive semi-annually a fixed rate of 2.7875% and pay quarterly a floating rate based on 3-month LIBOR, expiring January 2028 | | 1/25/21 | 2,800 | 71 |
| Option on an interest rate swap with JPMorgan Chase Bank NA to receive semi-annually a fixed rate of 2.5340% and pay quarterly a floating rate based on 3-month LIBOR, expiring December 2027 | | 12/8/20 | 17,500 | 332 |
| Option on an interest rate swap with JPMorgan Chase Bank NA to receive semi-annually a fixed rate of 2.5575% and pay quarterly a floating rate based on 3-month LIBOR, expiring October 2027 | | 10/6/20 | 3,600 | 68 |
|
| TOTAL CALL OPTIONS | | | | 564 |
|
| TOTAL PURCHASED SWAPTIONS | | | | |
| (Cost $1,828) | | | | 1,879 |
| TOTAL INVESTMENT IN SECURITIES - 107.9% | | | | |
| (Cost $574,448) | | | | 564,760 |
| NET OTHER ASSETS (LIABILITIES) - (7.9)% | | | | (41,243) |
| NET ASSETS - 100% | | | | $523,517 |
| TBA Sale Commitments | | |
| | Principal Amount (000s) | Value (000s) |
| Ginnie Mae | | |
| 4.5% 3/1/48 | $(8,600) | $(8,945) |
| 4.5% 3/1/48 | (9,800) | (10,194) |
| TOTAL TBA SALE COMMITMENTS | | |
| (Proceeds $19,103) | | $(19,139) |
| Written Swaptions | | | |
| | Expiration Date | Notional Amount | Value (000s) |
| Put Swaptions | | | |
| Option on an interest rate swap with Goldman Sachs Bank U.S.A. to pay semi-annually a fixed rate of 3.065% and receive quarterly a floating rate based on 3-month LIBOR, expiring January 2028 | 2/5/21 | $10,060 | $(297) |
| Call Swaptions | | | |
| Option on an interest rate swap with Goldman Sachs Bank U.S.A. to receive semi-annually a fixed rate of 3.065% and pay quarterly a floating rate based on 3-month LIBOR, expiring January 2028 | 2/5/21 | 10,060 | (342) |
| TOTAL WRITTEN SWAPTIONS | | | $(639) |
| Futures Contracts | | | | | |
| | Number of contracts | Expiration Date | Notional Amount (000s) | Value (000s) | Unrealized Appreciation/(Depreciation) (000s) |
| Purchased | | | | | |
| Treasury Contracts | | | | | |
| CBOT 2-Year U.S. Treasury Note Contracts (United States) | 187 | June 2018 | $39,732 | $0 | $0 |
| CBOT 5-Year U.S. Treasury Note Contracts (United States) | 162 | June 2018 | 18,457 | (45) | (45) |
| TOTAL PURCHASED FUTURES | | | | | (45) |
| Sold | | | | | |
| Treasury Contracts | | | | | |
| CBOT Long Term U.S. Treasury Bond Contracts (United States) | 4 | June 2018 | 574 | (2) | (2) |
| TOTAL FUTURES CONTRACTS | | | | | $(47) |
The notional amount of futures purchased as a percentage of Net Assets is 11.1%
The notional amount of futures sold as a percentage of Net Assets is 0.1%
For the period, the average monthly underlying face amount at value for futures contracts in the aggregate was $58,318.
Swaps
| Payment Received | Payment Frequency | Payment Paid | Payment Frequency | Clearinghouse / Counterparty(1) | Maturity Date | Notional Amount (000s) | Value (000s) | Upfront Premium Received/(Paid) (000s)(2) | Unrealized Appreciation/(Depreciation) (000s) |
| Interest Rate Swaps | | | | | | | | | |
| 2% | Semi - annual | 3-month LIBOR(3) | Quarterly | LCH | Mar. 2025 | $474 | $(6) | $0 | $(6) |
(1) Swaps with LCH Clearnet Group (LCH) are centrally cleared over-the-counter (OTC) swaps.
(2) Any premiums for centrally cleared over-the-counter (OTC) swaps are recorded periodically throughout the term of the swap to variation margin and included in unrealized appreciation (depreciation).
(3) Represents floating rate.
Values shown as $0 may reflect amounts less than $500.
Legend
(a) Security or a portion of the security was pledged to cover margin requirements for futures contracts. At period end, the value of securities pledged amounted to $151,000.
(b) Security or a portion of the security was pledged to cover margin requirements for centrally cleared OTC swaps. At period end, the value of securities pledged amounted to $18,000.
(c) Security or a portion of the security has been segregated as collateral for mortgage-backed or asset-backed securities purchased on a delayed delivery or when-issued basis. At period end, the value of securities pledged amounted to $20,000.
(d) Coupon rates for floating and adjustable rate securities reflect the rates in effect at period end.
(e) Coupon is indexed to a floating interest rate which may be multiplied by a specified factor and/or subject to caps or floors.
(f) Represents an investment in an underlying pool of reverse mortgages which typically do not require regular principal and interest payments as repayment is deferred until a maturity event.
(g) Security or a portion of the security purchased on a delayed delivery or when-issued basis.
(h) Security exempt from registration under Rule 144A of the Securities Act of 1933. These securities may be resold in transactions exempt from registration, normally to qualified institutional buyers. At the end of the period, the value of these securities amounted to $5,503,000 or 1.1% of net assets.
(i) Security represents right to receive monthly interest payments on an underlying pool of mortgages or assets. Principal shown is the outstanding par amount of the pool as of the end of the period.
(j) Coupon is inversely indexed to a floating interest rate multiplied by a specified factor. The price may be considerably more volatile than the price of a comparable fixed rate security.
(k) Affiliated fund that is generally available only to investment companies and other accounts managed by Fidelity Investments. The rate quoted is the annualized seven-day yield of the fund at period end. A complete unaudited listing of the fund's holdings as of its most recent quarter end is available upon request. In addition, each Fidelity Central Fund's financial statements are available on the SEC's website or upon request.
(l) For the period, the average monthly notional amount for purchased swaptions was $39,783,000.
Affiliated Central Funds
Information regarding fiscal year to date income earned by the Fund from investments in Fidelity Central Funds is as follows:
| Fund | Income earned |
| | (Amounts in thousands) |
| Fidelity Cash Central Fund | $39 |
| Total | $39 |
Amounts in the income column in the above table include any capital gain distributions from underlying funds, which are presented in the corresponding line-item in the Statement of Operations if applicable.
Investment Valuation
The following is a summary of the inputs used, as of February 28, 2018, involving the Fund's assets and liabilities carried at fair value. The inputs or methodology used for valuing securities may not be an indication of the risk associated with investing in those securities. For more information on valuation inputs, and their aggregation into the levels used below, please refer to the Investment Valuation section in the accompanying Notes to Financial Statements.
| | Valuation Inputs at Reporting Date: |
| Description | Total | Level 1 | Level 2 | Level 3 |
| (Amounts in thousands) | | | | |
| Investments in Securities: | | | | |
| U.S. Government and Government Agency Obligations | $290,932 | $-- | $290,932 | $-- |
| U.S. Government Agency - Mortgage Securities | 59,418 | -- | 59,418 | -- |
| Asset-Backed Securities | 20,409 | -- | 20,409 | -- |
| Collateralized Mortgage Obligations | 111,085 | -- | 111,085 | -- |
| Commercial Mortgage Securities | 53,795 | -- | 53,795 | -- |
| Foreign Government and Government Agency Obligations | 23,332 | -- | 23,332 | -- |
| Money Market Funds | 3,910 | 3,910 | -- | -- |
| Purchased Swaptions | 1,879 | -- | 1,879 | -- |
| Total Investments in Securities: | $564,760 | $3,910 | $560,850 | $-- |
| Derivative Instruments: | | | | |
| Liabilities | | | | |
| Futures Contracts | $(47) | $(47) | $-- | $-- |
| Swaps | (6) | -- | (6) | -- |
| Written Swaptions | (639) | -- | (639) | -- |
| Total Liabilities | $(692) | $(47) | $(645) | $-- |
| Total Derivative Instruments: | $(692) | $(47) | $(645) | $-- |
| Other Financial Instruments: | | | | |
| TBA Sale Commitments | $(19,139) | $-- | $(19,139) | $-- |
| Total Other Financial Instruments: | $(19,139) | $-- | $(19,139) | $-- |
Value of Derivative Instruments
The following table is a summary of the Fund's value of derivative instruments by primary risk exposure as of February 28, 2018. For additional information on derivative instruments, please refer to the Derivative Instruments section in the accompanying Notes to Financial Statements.
| Primary Risk Exposure / Derivative Type | Value |
| | Asset | Liability |
| (Amounts in thousands) | | |
| Interest Rate Risk | | |
| Futures Contracts(a) | $0 | $(47) |
| Purchased Swaptions(b) | 1,879 | 0 |
| Swaps(c) | 0 | (6) |
| Written Swaptions(d) | 0 | (639) |
| Total Interest Rate Risk | 1,879 | (692) |
| Total Value of Derivatives | $1,879 | $(692) |
(a) Reflects gross cumulative appreciation (depreciation) on futures contracts as presented in the Schedule of Investments. In the Statement of Assets and Liabilities, the period end daily variation margin is included in receivable or payable for daily variation margin on futures contracts, and the net cumulative appreciation (depreciation) is included in net unrealized appreciation (depreciation).
(b) Gross value is included in the Statement of Assets and Liabilities in the investments, at value line-item.
(c) For centrally cleared over-the-counter (OTC) swaps, reflects gross cumulative appreciation (depreciation) as presented in the Schedule of Investments. In the Statement of Assets and Liabilities, the period end daily variation margin for centrally cleared OTC swaps is included in receivable or payable for daily variation margin on centrally cleared OTC swaps, and the net cumulative appreciation (depreciation) for centrally cleared OTC swaps is included in net unrealized appreciation (depreciation).
(d) Gross value is presented in the Statement of Assets and Liabilities in the written options, at value line-item.
See accompanying notes which are an integral part of the financial statements.
Financial Statements
Statement of Assets and Liabilities
| Amounts in thousands (except per-share amount) | | February 28, 2018 (Unaudited) |
| Assets | | |
Investment in securities, at value — See accompanying schedule:
Unaffiliated issuers (cost $570,538) | $560,850 | |
| Fidelity Central Funds (cost $3,910) | 3,910 | |
| Total Investment in Securities (cost $574,448) | | $564,760 |
| Receivable for investments sold | | 716 |
| Receivable for TBA sale commitments | | 19,103 |
| Receivable for fund shares sold | | 189 |
| Interest receivable | | 1,619 |
| Distributions receivable from Fidelity Central Funds | | 7 |
| Receivable for daily variation margin for on futures contracts | | 7 |
| Receivable for daily variation margin on centrally cleared OTC swaps | | 1 |
| Total assets | | 586,402 |
| Liabilities | | |
| Payable for investments purchased | | |
| Regular delivery | $4,304 | |
| Delayed delivery | 38,253 | |
| TBA sale commitments, at value | 19,139 | |
| Payable for fund shares redeemed | 297 | |
| Distributions payable | 57 | |
| Accrued management fee | 134 | |
| Written options, at value (premium received $655) | 639 | |
| Other affiliated payables | 62 | |
| Total liabilities | | 62,885 |
| Net Assets | | $523,517 |
| Net Assets consist of: | | |
| Paid in capital | | $540,047 |
| Distributions in excess of net investment income | | (370) |
| Accumulated undistributed net realized gain (loss) on investments | | (6,399) |
| Net unrealized appreciation (depreciation) on investments | | (9,761) |
| Net Assets, for 51,092 shares outstanding | | $523,517 |
| Net Asset Value, offering price and redemption price per share ($523,517 ÷ 51,092 shares) | | $10.25 |
See accompanying notes which are an integral part of the financial statements.
Statement of Operations
| Amounts in thousands | | Six months ended February 28, 2018 (Unaudited) |
| Investment Income | | |
| Interest | | $5,594 |
| Income from Fidelity Central Funds | | 39 |
| Total income | | 5,633 |
| Expenses | | |
| Management fee | $843 | |
| Transfer agent fees | 275 | |
| Fund wide operations fee | 119 | |
| Independent trustees' fees and expenses | 1 | |
| Total expenses before reductions | 1,238 | |
| Expense reductions | – | 1,238 |
| Net investment income (loss) | | 4,395 |
| Realized and Unrealized Gain (Loss) | | |
| Net realized gain (loss) on: | | |
| Investment securities: | | |
| Unaffiliated issuers | (1,883) | |
| Futures contracts | (885) | |
| Swaps | (5) | |
| Total net realized gain (loss) | | (2,773) |
| Change in net unrealized appreciation (depreciation) on: | | |
| Investment securities: | | |
| Unaffiliated issuers | (14,046) | |
| Futures contracts | (55) | |
| Swaps | (6) | |
| Written options | 16 | |
| Delayed delivery commitments | (4) | |
| Total change in net unrealized appreciation (depreciation) | | (14,095) |
| Net gain (loss) | | (16,868) |
| Net increase (decrease) in net assets resulting from operations | | $(12,473) |
See accompanying notes which are an integral part of the financial statements.
Statement of Changes in Net Assets
| Amounts in thousands | Six months ended February 28, 2018 (Unaudited) | Year ended August 31, 2017 |
| Increase (Decrease) in Net Assets | | |
| Operations | | |
| Net investment income (loss) | $4,395 | $8,623 |
| Net realized gain (loss) | (2,773) | (3,078) |
| Change in net unrealized appreciation (depreciation) | (14,095) | (7,228) |
| Net increase (decrease) in net assets resulting from operations | (12,473) | (1,683) |
| Distributions to shareholders from net investment income | (4,508) | (8,262) |
| Distributions to shareholders from net realized gain | – | (5,795) |
| Total distributions | (4,508) | (14,057) |
| Share transactions | | |
| Proceeds from sales of shares | 25,662 | 41,033 |
| Reinvestment of distributions | 4,143 | 13,123 |
| Cost of shares redeemed | (65,054) | (183,806) |
| Net increase (decrease) in net assets resulting from share transactions | (35,249) | (129,650) |
| Total increase (decrease) in net assets | (52,230) | (145,390) |
| Net Assets | | |
| Beginning of period | 575,747 | 721,137 |
| End of period | $523,517 | $575,747 |
| Other Information | | |
| Distributions in excess of net investment income end of period | $(370) | $(257) |
| Shares | | |
| Sold | 2,471 | 3,886 |
| Issued in reinvestment of distributions | 399 | 1,240 |
| Redeemed | (6,255) | (17,480) |
| Net increase (decrease) | (3,385) | (12,354) |
See accompanying notes which are an integral part of the financial statements.
Financial Highlights
Fidelity Intermediate Government Income Fund
| | Six months ended (Unaudited) February 28, | Years endedAugust 31, | | | | |
| | 2018 | 2017 | 2016 | 2015 | 2014 | 2013 |
| Selected Per–Share Data | | | | | | |
| Net asset value, beginning of period | $10.57 | $10.79 | $10.71 | $10.68 | $10.58 | $11.09 |
| Income from Investment Operations | | | | | | |
| Net investment income (loss)A | .083 | .144 | .130 | .144 | .133 | .116 |
| Net realized and unrealized gain (loss) | (.318) | (.138) | .148 | .016 | .153 | (.294) |
| Total from investment operations | (.235) | .006 | .278 | .160 | .286 | (.178) |
| Distributions from net investment income | (.085) | (.138) | (.135) | (.130) | (.130) | (.116) |
| Distributions from net realized gain | – | (.088) | (.063) | – | (.056) | (.216) |
| Total distributions | (.085) | (.226) | (.198) | (.130) | (.186) | (.332) |
| Net asset value, end of period | $10.25 | $10.57 | $10.79 | $10.71 | $10.68 | $10.58 |
| Total ReturnB,C | (2.23)% | .08% | 2.62% | 1.50% | 2.72% | (1.66)% |
| Ratios to Average Net AssetsD,E | | | | | | |
| Expenses before reductions | .45%F | .45% | .45% | .45% | .45% | .45% |
| Expenses net of fee waivers, if any | .45%F | .45% | .45% | .45% | .45% | .45% |
| Expenses net of all reductions | .45%F | .45% | .45% | .45% | .45% | .45% |
| Net investment income (loss) | 1.61%F | 1.36% | 1.21% | 1.34% | 1.25% | 1.07% |
| Supplemental Data | | | | | | |
| Net assets, end of period (in millions) | $524 | $576 | $721 | $740 | $823 | $916 |
| Portfolio turnover rateG | 128%F | 149% | 117% | 71% | 153% | 179% |
A Calculated based on average shares outstanding during the period.
B Total returns for periods of less than one year are not annualized.
C Total returns would have been lower if certain expenses had not been reduced during the applicable periods shown.
D Fees and expenses of any underlying Fidelity Central Funds are not included in the Fund's expense ratio. The Fund indirectly bears its proportionate share of the expenses of any underlying Fidelity Central Funds.
E Expense ratios reflect operating expenses of the Fund. Expenses before reductions do not reflect amounts reimbursed by the investment adviser or reductions from expense offset arrangements and do not represent the amount paid by the Fund during periods when reimbursements or reductions occur. Expenses net of fee waivers reflect expenses after reimbursement by the investment adviser but prior to reductions from expense offset arrangements. Expenses net of all reductions represent the net expenses paid by the Fund.
F Annualized
G Amount does not include the portfolio activity of any underlying Fidelity Central Funds.
See accompanying notes which are an integral part of the financial statements.
Notes to Financial Statements (Unaudited)
For the period ended February 28, 2018
(Amounts in thousands except percentages)
1. Organization.
Fidelity Intermediate Government Income Fund (the Fund) is a fund of Fidelity Income Fund (the Trust) and is authorized to issue an unlimited number of shares. Share transactions on the Statement of Changes in Net Assets may contain exchanges between affiliated funds. The Trust is registered under the Investment Company Act of 1940, as amended (the 1940 Act), as an open-end management investment company organized as a Massachusetts business trust.
2. Investments in Fidelity Central Funds.
The Fund invests in Fidelity Central Funds, which are open-end investment companies generally available only to other investment companies and accounts managed by the investment adviser and its affiliates. The Fund's Schedule of Investments lists each of the Fidelity Central Funds held as of period end, if any, as an investment of the Fund, but does not include the underlying holdings of each Fidelity Central Fund. As an Investing Fund, the Fund indirectly bears its proportionate share of the expenses of the underlying Fidelity Central Funds.
The Money Market Central Funds seek preservation of capital and current income and are managed by Fidelity Investments Money Management, Inc. (FIMM), an affiliate of the investment adviser. Annualized expenses of the Money Market Central Funds as of their most recent shareholder report date are less than .005%.
A complete unaudited list of holdings for each Fidelity Central Fund is available upon request or at the Securities and Exchange Commission (the SEC) website at www.sec.gov. In addition, the financial statements of the Fidelity Central Funds are available on the SEC website or upon request.
3. Significant Accounting Policies.
The Fund is an investment company and applies the accounting and reporting guidance of the Financial Accounting Standards Board (FASB) Accounting Standards Codification Topic 946 Financial Services – Investments Companies. The financial statements have been prepared in conformity with accounting principles generally accepted in the United States of America (GAAP), which require management to make certain estimates and assumptions at the date of the financial statements. Actual results could differ from those estimates. Subsequent events, if any, through the date that the financial statements were issued have been evaluated in the preparation of the financial statements. The following summarizes the significant accounting policies of the Fund:
Investment Valuation. Investments are valued as of 4:00 p.m. Eastern time on the last calendar day of the period. The Board of Trustees (the Board) has delegated the day to day responsibility for the valuation of the Fund's investments to the Fair Value Committee (the Committee) established by the Fund's investment adviser. In accordance with valuation policies and procedures approved by the Board, the Fund attempts to obtain prices from one or more third party pricing vendors or brokers to value its investments. When current market prices, quotations or currency exchange rates are not readily available or reliable, investments will be fair valued in good faith by the Committee, in accordance with procedures adopted by the Board. Factors used in determining fair value vary by investment type and may include market or investment specific events, changes in interest rates and credit quality. The frequency with which these procedures are used cannot be predicted and they may be utilized to a significant extent. The Committee oversees the Fund's valuation policies and procedures and reports to the Board on the Committee's activities and fair value determinations. The Board monitors the appropriateness of the procedures used in valuing the Fund's investments and ratifies the fair value determinations of the Committee.
The Fund categorizes the inputs to valuation techniques used to value its investments into a disclosure hierarchy consisting of three levels as shown below:
- Level 1 – quoted prices in active markets for identical investments
- Level 2 – other significant observable inputs (including quoted prices for similar investments, interest rates, prepayment speeds, etc.)
- Level 3 – unobservable inputs (including the Fund's own assumptions based on the best information available)
Valuation techniques used to value the Fund's investments by major category are as follows:
Debt securities, including restricted securities, are valued based on evaluated prices received from third party pricing vendors or from brokers who make markets in such securities. Foreign government and government agency obligations and U.S. government and government agency obligations are valued by pricing vendors who utilize matrix pricing which considers yield or price of bonds of comparable quality, coupon, maturity and type or by broker-supplied prices. Asset backed securities, collateralized mortgage obligations, commercial mortgage securities and U.S. government agency mortgage securities are valued by pricing vendors who utilize matrix pricing which considers prepayment speed assumptions, attributes of the collateral, yield or price of bonds of comparable quality, coupon, maturity and type or by broker-supplied prices. Swaps are marked-to-market daily based on valuations from third party pricing vendors, registered derivatives clearing organizations (clearinghouses) or broker-supplied valuations. These pricing sources may utilize inputs such as interest rate curves, credit spread curves, default possibilities and recovery rates. When independent prices are unavailable or unreliable, debt securities and swaps may be valued utilizing pricing methodologies which consider similar factors that would be used by third party pricing vendors. Debt securities and swaps are generally categorized as Level 2 in the hierarchy but may be Level 3 depending on the circumstances.
Futures contracts are valued at the settlement price established each day by the board of trade or exchange on which they are traded and are categorized as Level 1 in the hierarchy. Options traded over-the-counter are valued using vendor or broker-supplied valuations and are categorized as Level 2 in the hierarchy. Investments in open-end mutual funds, including the Fidelity Central Funds, are valued at their closing net asset value (NAV) each business day and are categorized as Level 1 in the hierarchy.
Changes in valuation techniques may result in transfers in or out of an assigned level within the disclosure hierarchy. The aggregate value of investments by input level as of February 28, 2018 is included at the end of the Fund's Schedule of Investments.
Investment Transactions and Income. For financial reporting purposes, the Fund's investment holdings and NAV include trades executed through the end of the last business day of the period. The NAV per share for processing shareholder transactions is calculated as of the close of business of the New York Stock Exchange (NYSE), normally 4:00 p.m. Eastern time and includes trades executed through the end of the prior business day. Gains and losses on securities sold are determined on the basis of identified cost. Income and capital gain distributions from Fidelity Central Funds, if any, are recorded on the ex-dividend date. Interest income is accrued as earned and includes coupon interest and amortization of premium and accretion of discount on debt securities as applicable. The principal amount on inflation-indexed securities is periodically adjusted to the rate of inflation and interest is accrued based on the principal amount. The adjustments to principal due to inflation are reflected as increases or decreases to Interest in the accompanying Statement of Operations.
Expenses. Expenses directly attributable to a fund are charged to that fund. Expenses attributable to more than one fund are allocated among the respective funds on the basis of relative net assets or other appropriate methods. Expense estimates are accrued in the period to which they relate and adjustments are made when actual amounts are known.
Income Tax Information and Distributions to Shareholders. Each year, the Fund intends to qualify as a regulated investment company under Subchapter M of the Internal Revenue Code, including distributing substantially all of its taxable income and realized gains. As a result, no provision for U.S. Federal income taxes is required. The Fund files a U.S. federal tax return, in addition to state and local tax returns as required. The Fund's federal income tax returns are subject to examination by the Internal Revenue Service (IRS) for a period of three fiscal years after they are filed. State and local tax returns may be subject to examination for an additional fiscal year depending on the jurisdiction.
Dividends are declared and recorded daily and paid monthly from net investment income. Distributions from realized gains, if any, are declared and recorded on the ex-dividend date. Income and capital gain distributions are determined in accordance with income tax regulations, which may differ from GAAP.
Capital accounts within the financial statements are adjusted for permanent book-tax differences. These adjustments have no impact on net assets or the results of operations. Capital accounts are not adjusted for temporary book-tax differences which will reverse in a subsequent period.
Book-tax differences are primarily due to futures contracts, market discount, deferred trustees compensation and losses deferred due to wash sales, futures contracts and excise tax regulations.
As of period end, the cost and unrealized appreciation (depreciation) in securities, and derivatives if applicable, for federal income tax purposes were as follows:
| Gross unrealized appreciation | $2,188 |
| Gross unrealized depreciation | (11,960) |
| Net unrealized appreciation (depreciation) | $(9,772) |
| Tax cost | $574,459 |
The Fund elected to defer to its next fiscal year approximately $3,614 of capital losses recognized during the period November 1, 2016 to August 31, 2017.
Delayed Delivery Transactions and When-Issued Securities. During the period, the Fund transacted in securities on a delayed delivery or when-issued basis. Payment and delivery may take place after the customary settlement period for that security. The price of the underlying securities and the date when the securities will be delivered and paid for are fixed at the time the transaction is negotiated. The securities purchased on a delayed delivery or when-issued basis are identified as such in the Fund's Schedule of Investments. The Fund may receive compensation for interest forgone in the purchase of a delayed delivery or when-issued security. With respect to purchase commitments, the Fund identifies securities as segregated in its records with a value at least equal to the amount of the commitment. Losses may arise due to changes in the value of the underlying securities or if the counterparty does not perform under the contract's terms, or if the issuer does not issue the securities due to political, economic, or other factors.
To-Be-Announced (TBA) Securities and Mortgage Dollar Rolls. During the period, the Fund transacted in TBA securities that involved buying or selling mortgage-backed securities (MBS) on a forward commitment basis. A TBA transaction typically does not designate the actual security to be delivered and only includes an approximate principal amount; however delivered securities must meet specified terms defined by industry guidelines, including issuer, rate and current principal amount outstanding on underlying mortgage pools. The Fund may enter into a TBA transaction with the intent to take possession of or deliver the underlying MBS, or the Fund may elect to extend the settlement by entering into either a mortgage or reverse mortgage dollar roll. Mortgage dollar rolls are transactions where a fund sells TBA securities and simultaneously agrees to repurchase MBS on a later date at a lower price and with the same counterparty. Reverse mortgage dollar rolls involve the purchase and simultaneous agreement to sell TBA securities on a later date at a lower price. Transactions in mortgage dollar rolls and reverse mortgage dollar rolls are accounted for as purchases and sales and may result in an increase to the Fund's portfolio turnover rate.
Purchases and sales of TBA securities involve risks similar to those discussed above for delayed delivery and when-issued securities. Also, if the counterparty in a mortgage dollar roll or a reverse mortgage dollar roll transaction files for bankruptcy or becomes insolvent, the Fund's right to repurchase or sell securities may be limited. Additionally, when a fund sells TBA securities without already owning or having the right to obtain the deliverable securities (an uncovered forward commitment to sell), it incurs a risk of loss because it could have to purchase the securities at a price that is higher than the price at which it sold them. A fund may be unable to purchase the deliverable securities if the corresponding market is illiquid.
TBA securities subject to a forward commitment to sell at period end are included at the end of the Fund's Schedule of Investments under the caption "TBA Sale Commitments." The proceeds and value of these commitments are reflected in the Fund's Statement of Assets and Liabilities as Receivable for TBA sale commitments and TBA sale commitments, at value, respectively.
Restricted Securities. The Fund may invest in securities that are subject to legal or contractual restrictions on resale. These securities generally may be resold in transactions exempt from registration or to the public if the securities are registered. Disposal of these securities may involve time-consuming negotiations and expense, and prompt sale at an acceptable price may be difficult. Information regarding restricted securities is included at the end of the Fund's Schedule of Investments.
New Accounting Pronouncement. In March 2017, the Financial Accounting Standards Board (FASB) issued an Accounting Standards Update (ASU), ASU 2017-08, which amends the amortization period for certain callable debt securities that are held at a premium. The amendment requires the premium to be amortized to the earliest call date. The amendments do not require an accounting change for securities held at a discount. The ASU is effective for annual periods beginning after December 15, 2018. Management is currently evaluating the potential impact of these changes to the financial statements.
4. Derivative Instruments.
Risk Exposures and the Use of Derivative Instruments. The Fund's investment objective allows the Fund to enter into various types of derivative contracts, including futures contracts, options and swaps. Derivatives are investments whose value is primarily derived from underlying assets, indices or reference rates and may be transacted on an exchange or over-the-counter (OTC). Derivatives may involve a future commitment to buy or sell a specified asset based on specified terms, to exchange future cash flows at periodic intervals based on a notional principal amount, or for one party to make one or more payments upon the occurrence of specified events in exchange for periodic payments from the other party.
The Fund used derivatives to increase returns, to gain exposure to certain types of assets and to manage exposure to certain risks as defined below. The success of any strategy involving derivatives depends on analysis of numerous economic factors, and if the strategies for investment do not work as intended, the Fund may not achieve its objectives.
The Fund's use of derivatives increased or decreased its exposure to the following risk:
| Interest Rate Risk | Interest rate risk relates to the fluctuations in the value of interest-bearing securities due to changes in the prevailing levels of market interest rates. |
The Fund is also exposed to additional risks from investing in derivatives, such as liquidity risk and counterparty credit risk. Liquidity risk is the risk that the Fund will be unable to close out the derivative in the open market in a timely manner. Counterparty credit risk is the risk that the counterparty will not be able to fulfill its obligation to the Fund. Derivative counterparty credit risk is managed through formal evaluation of the creditworthiness of all potential counterparties. On certain OTC derivatives such as options, the Fund attempts to reduce its exposure to counterparty credit risk by entering into an International Swaps and Derivatives Association, Inc. (ISDA) Master Agreement with each of its counterparties. The ISDA Master Agreement gives the Fund the right to terminate all transactions traded under such agreement upon the deterioration in the credit quality of the counterparty beyond specified levels. The ISDA Master Agreement gives each party the right, upon an event of default by the other party or a termination of the agreement, to close out all transactions traded under such agreement and to net amounts owed under each transaction to one net payable by one party to the other. To mitigate counterparty credit risk on bi-lateral OTC derivatives, the Fund receives collateral in the form of cash or securities once the Fund's net unrealized appreciation on outstanding derivative contracts under an ISDA Master Agreement exceeds certain applicable thresholds, subject to certain minimum transfer provisions. The collateral received is held in segregated accounts with the Fund's custodian bank in accordance with the collateral agreements entered into between the Fund, the counterparty and the Fund's custodian bank. The Fund could experience delays and costs in gaining access to the collateral even though it is held by the Fund's custodian bank. The Fund's maximum risk of loss from counterparty credit risk related to bi-lateral OTC derivatives is generally the aggregate unrealized appreciation and unpaid counterparty payments in excess of any collateral pledged by the counterparty to the Fund. For OTC written options with upfront premiums received, the Fund is obligated to perform and therefore does not have counterparty risk. For OTC written options with premiums to be received at a future date, the maximum risk of loss from counterparty credit risk is the amount of the premium in excess of any collateral pledged by the counterparty. The Fund may be required to pledge collateral for the benefit of the counterparties on bi-lateral OTC derivatives in an amount not less than each counterparty's unrealized appreciation on outstanding derivative contracts, subject to certain minimum transfer provisions, and any such pledged collateral is identified in the Schedule of Investments. Exchange-traded futures contracts are not covered by the ISDA Master Agreement; however counterparty credit risk related to exchange-traded futures contracts may be mitigated by the protection provided by the exchange on which they trade. Counterparty credit risk related to centrally cleared OTC swaps may be mitigated by the protection provided by the clearinghouse.
Investing in derivatives may involve greater risks than investing in the underlying assets directly and, to varying degrees, may involve risk of loss in excess of any initial investment and collateral received and amounts recognized in the Statement of Assets and Liabilities. In addition, there may be the risk that the change in value of the derivative contract does not correspond to the change in value of the underlying instrument.
Net Realized Gain (Loss) and Change in Net Unrealized Appreciation (Depreciation) on Derivatives. The table below, which reflects the impacts of derivatives on the financial performance of the Fund, summarizes the net realized gain (loss) and change in net unrealized appreciation (depreciation) for derivatives during the period as presented in the Statement of Operations.
| Primary Risk Exposure / Derivative Type | Net Realized Gain (Loss) | Change in Net Unrealized Appreciation (Depreciation) |
| Interest Rate Risk | | |
| Futures Contracts | $(885) | $(55) |
| Purchased Options | 29 | 51 |
| Swaps | (5) | (6) |
| Written Options | – | 16 |
| Totals | $(861) | $6 |
A summary of the value of derivatives by primary risk exposure as of period end is included at the end of the Schedule of Investments.
Futures Contracts. A futures contract is an agreement between two parties to buy or sell a specified underlying instrument for a fixed price at a specified future date. The Fund used futures contracts to manage its exposure to the bond market and fluctuations in interest rates.
Upon entering into a futures contract, a fund is required to deposit either cash or securities (initial margin) with a clearing broker in an amount equal to a certain percentage of the face value of the contract. Futures contracts are marked-to-market daily and subsequent daily payments (variation margin) are made or received by a fund depending on the daily fluctuations in the value of the futures contracts and are recorded as unrealized appreciation or (depreciation). This receivable and/or payable, if any, is included in daily variation margin on futures contracts in the Statement of Assets and Liabilities. Realized gain or (loss) is recorded upon the expiration or closing of a futures contract. The net realized gain (loss) and change in net unrealized appreciation (depreciation) on futures contracts during the period is presented in the Statement of Operations.
Any open futures contracts at period end are presented in the Schedule of Investments under the caption "Futures Contracts". The notional amount at value reflects each contract's exposure to the underlying instrument or index at period end. Securities deposited to meet initial margin requirements are identified in the Schedule of Investments.
Options. Options give the purchaser the right, but not the obligation, to buy (call) or sell (put) an underlying security or financial instrument at an agreed exercise or strike price between or on certain dates. Options obligate the seller (writer) to buy (put) or sell (call) an underlying instrument at the exercise or strike price or cash settle an underlying derivative instrument if the holder exercises the option on or before the expiration date. The Fund uses OTC options, such as swaptions, which are options where the underlying instrument is a swap, to manage its exposure to fluctuations in interest rates.
Upon entering into an options contract, a fund will pay or receive a premium. Premiums paid on purchased options are reflected as cost of investments and premiums received on written options are reflected as a liability on the Statement of Assets and Liabilities. Certain options may be purchased or written with premiums to be paid or received on a future date. Options are valued daily and any unrealized appreciation (depreciation) is reflected on the Statement of Assets and Liabilities. When an option is exercised, the cost or proceeds of the underlying instrument purchased or sold is adjusted by the amount of the premium. When an option is closed the Fund will realize a gain or loss depending on whether the proceeds or amount paid for the closing sale transaction is greater or less than the premium received or paid. When an option expires, gains and losses are realized to the extent of premiums received and paid, respectively. The net realized and unrealized gains (losses) on purchased options are included in the Statement of Operations in net realized gain (loss) and change in net unrealized appreciation (depreciation) on investment securities. The net realized gain (loss) and change in net unrealized appreciation (depreciation) on written options are presented in the Statement of Operations.
Any open options at period end are presented in the Schedule of Investments under the captions "Purchased Options," "Purchased Swaptions," "Written Options" and "Written Swaptions," as applicable, and are representative of volume of activity during the period.
Writing puts and buying calls tend to increase exposure to the underlying instrument while buying puts and writing calls tend to decrease exposure to the underlying instrument. For purchased options, risk of loss is limited to the premium paid, and for written options, risk of loss is the change in value in excess of the premium received.
Swaps. A swap is a contract between two parties to exchange future cash flows at periodic intervals based on a notional principal amount. A centrally cleared OTC swap is a transaction executed between a fund and a dealer counterparty, then cleared by a futures commission merchant (FCM) through a clearinghouse. Once cleared, the clearinghouse serves as a central counterparty, with whom a fund exchanges cash flows for the life of the transaction, similar to transactions in futures contracts.
Centrally cleared OTC swaps require a fund to deposit either cash or securities (initial margin) with the FCM, at the instruction of and for the benefit of the clearinghouse. Securities deposited to meet initial margin requirements are identified in the Schedule of Investments. Centrally cleared OTC swaps are marked-to-market daily and subsequent payments (variation margin) are made or received depending on the daily fluctuations in the value of the swaps and are recorded as unrealized appreciation or (depreciation). These daily payments, if any, are included in receivable or payable for daily variation margin on centrally cleared OTC swaps in the Statement of Assets and Liabilities. Any premiums for centrally cleared OTC swaps are recorded periodically throughout the term of the swap to variation margin and included in unrealized appreciation (depreciation) in the Statement of Assets and Liabilities. Any premiums are recognized as realized gain (loss) upon termination or maturity of the swap.
Payments are exchanged at specified intervals, accrued daily commencing with the effective date of the contract and recorded as realized gain or (loss). Some swaps may be terminated prior to the effective date and realize a gain or loss upon termination. The net realized gain (loss) and change in net unrealized appreciation (depreciation) on swaps during the period is presented in the Statement of Operations.
Any open swaps at period end are included in the Schedule of Investments under the caption "Swaps" and are representative of volume of activity during the period.
Interest Rate Swaps. Interest rate swaps are agreements between counterparties to exchange cash flows, one based on a fixed rate, and the other on a floating rate. The Fund entered into interest rate swaps to manage its exposure to interest rate changes. Changes in interest rates can have an effect on both the value of bond holdings as well as the amount of interest income earned. In general, the value of bonds can fall when interest rates rise and can rise when interest rates fall.
5. Purchases and Sales of Investments.
Purchases and sales of securities, other than short-term securities and U.S. government securities, aggregated $19,229 and $6,689, respectively.
6. Fees and Other Transactions with Affiliates.
Management Fee. Fidelity Management & Research Company (the investment adviser) and its affiliates provide the Fund with investment management related services for which the Fund pays a monthly management fee. The management fee is the sum of an individual fund fee rate that is based on an annual rate of .20% of the Fund's average net assets and an annualized group fee rate that averaged .11% during the period. The group fee rate is based upon the average net assets of all the mutual funds advised by the investment adviser, including any mutual funds previously advised by the investment adviser that are currently advised by Fidelity SelectCo, LLC, an affiliate of the investment adviser. The group fee rate decreases as assets under management increase and increases as assets under management decrease. For the reporting period, the total annualized management fee rate was .31% of the Fund's average net assets.
Transfer Agent Fees. Fidelity Investments Institutional Operations Company, Inc. (FIIOC), an affiliate of the investment adviser, is the Fund's transfer, dividend disbursing and shareholder servicing agent. FIIOC receives an asset-based fee of .10% of the Fund's average net assets. FIIOC pays for typesetting, printing and mailing of shareholder reports, except proxy statements.
Fund Wide Operations Fee. Pursuant to the Fund Wide Operations and Expense Agreement (FWOE), the investment adviser has agreed to provide for fund level expenses (which do not include transfer agent, compensation of the independent Trustees, interest (including commitment fees), taxes or extraordinary expenses, if any) in return for a FWOE fee equal to .35% of the Fund's average net assets less the total amount of the management fee. The FWOE paid by the Fund is reduced by an amount equal to the fees and expenses paid to the independent Trustees. For the period, the FWOE fee was equivalent to an annualized rate of .04% of average net assets.
Interfund Trades. The Fund may purchase from or sell securities to other Fidelity Funds under procedures adopted by the Board. The procedures have been designed to ensure these interfund trades are executed in accordance with Rule 17a-7 of the 1940 Act. Interfund trades are included within the respective purchases and sales amounts shown in the Purchases and Sales of Investments note.
7. Committed Line of Credit.
The Fund participates with other funds managed by the investment adviser or an affiliate in a $4.25 billion credit facility (the "line of credit") to be utilized for temporary or emergency purposes to fund shareholder redemptions or for other short-term liquidity purposes. The Fund has agreed to pay commitment fees on its pro-rata portion of the line of credit, which amounted to $1 and is reflected in Miscellaneous expenses on the Statement of Operations. During the period, the Fund did not borrow on this line of credit.
8. Expense Reductions.
Through arrangements with the Fund's custodian, credits realized as a result of certain uninvested cash balances were used to reduce the Fund's expenses. During the period, these credits reduced the Fund's expenses in the amount of less than five hundred dollars.
9. Other.
The Fund's organizational documents provide former and current trustees and officers with a limited indemnification against liabilities arising in connection with the performance of their duties to the Fund. In the normal course of business, the Fund may also enter into contracts that provide general indemnifications. The Fund's maximum exposure under these arrangements is unknown as this would be dependent on future claims that may be made against the Fund. The risk of material loss from such claims is considered remote.
Shareholder Expense Example
As a shareholder of the Fund, you incur two types of costs: (1) transaction costs, and (2) ongoing costs, including management fees and other Fund expenses. This Example is intended to help you understand your ongoing costs (in dollars) of investing in the Fund and to compare these costs with the ongoing costs of investing in other mutual funds.
The Example is based on an investment of $1,000 invested at the beginning of the period and held for the entire period (September 1, 2017 to February 28, 2018).
Actual Expenses
The first line of the accompanying table provides information about actual account values and actual expenses. You may use the information in this line, together with the amount you invested, to estimate the expenses that you paid over the period. Simply divide your account value by $1,000.00 (for example, an $8,600 account value divided by $1,000.00 = 8.6), then multiply the result by the number in the first line under the heading entitled "Expenses Paid During Period" to estimate the expenses you paid on your account during this period. A small balance maintenance fee of $12.00 that is charged once a year may apply for certain accounts with a value of less than $2,000. This fee is not included in the table below. If it was, the estimate of expenses you paid during the period would be higher, and your ending account value lower, by this amount. In addition, the Fund, as a shareholder in the underlying Fidelity Central Funds, will indirectly bear its pro-rata share of the fees and expenses incurred by the underlying Fidelity Central Funds. These fees and expenses are not included in the Fund's annualized expense ratio used to calculate the expense estimate in the table below.
Hypothetical Example for Comparison Purposes
The second line of the accompanying table provides information about hypothetical account values and hypothetical expenses based on the Fund's actual expense ratio and an assumed rate of return of 5% per year before expenses, which is not the Fund's actual return. The hypothetical account values and expenses may not be used to estimate the actual ending account balance or expenses you paid for the period. You may use this information to compare the ongoing costs of investing in the Fund and other funds. To do so, compare this 5% hypothetical example with the 5% hypothetical examples that appear in the shareholder reports of the other funds. A small balance maintenance fee of $12.00 that is charged once a year may apply for certain accounts with a value of less than $2,000. This fee is not included in the table below. If it was, the estimate of expenses you paid during the period would be higher, and your ending account value lower, by this amount. In addition, the Fund, as a shareholder in the underlying Fidelity Central Funds, will indirectly bear its pro-rata share of the fees and expenses incurred by the underlying Fidelity Central Funds. These fees and expenses are not included in the Fund's annualized expense ratio used to calculate the expense estimate in the table below.
Please note that the expenses shown in the table are meant to highlight your ongoing costs only and do not reflect any transaction costs. Therefore, the second line of the table is useful in comparing ongoing costs only, and will not help you determine the relative total costs of owning different funds.
| | Annualized Expense Ratio-A | Beginning
Account Value
September 1, 2017 | Ending
Account Value
February 28, 2018 | Expenses Paid
During Period-B
September 1, 2017
to February 28, 2018 |
| Actual | .45% | $1,000.00 | $977.70 | $2.21 |
| Hypothetical-C | | $1,000.00 | $1,022.56 | $2.26 |
A Annualized expense ratio reflects expenses net of applicable fee waivers.
B Expenses are equal to the Fund's annualized expense ratio, multiplied by the average account value over the period, multiplied by 181/365 (to reflect the one-half year period).
C 5% return per year before expenses
Board Approval of Investment Advisory Contracts and Management Fees
Fidelity Intermediate Government Income Fund
Each year, the Board of Trustees, including the Independent Trustees (together, the Board), votes on the renewal of the management contract with Fidelity Management & Research Company (FMR) and the sub-advisory agreements (together, the Advisory Contracts) for the fund. FMR and the sub-advisers are referred to herein as the Investment Advisers. The Board, assisted by the advice of fund counsel and Independent Trustees' counsel, requests and considers a broad range of information relevant to the renewal of the Advisory Contracts throughout the year.
The Board meets regularly and, at each of its meetings, covers an extensive agenda of topics and materials and considers factors that are relevant to its annual consideration of the renewal of the fund's Advisory Contracts, including the services and support provided to the fund and its shareholders. The Board has established four standing committees (Committees) — Operations, Audit, Fair Valuation, and Governance and Nominating — each composed of and chaired by Independent Trustees with varying backgrounds, to which the Board has assigned specific subject matter responsibilities in order to enhance effective decision-making by the Board. The Operations Committee, of which all of the Independent Trustees are members, meets regularly throughout the year and considers, among other matters, information specifically related to the annual consideration of the renewal of the fund's Advisory Contracts. The Board, acting directly and through its Committees, requests and receives information concerning the annual consideration of the renewal of the fund's Advisory Contracts. The Board also meets as needed to review matters specifically related to the Board's annual consideration of the renewal of the Advisory Contracts. Members of the Board may also meet with trustees of other Fidelity funds through ad hoc joint committees to discuss certain matters relevant to all of the Fidelity funds.
At its September 2017 meeting, the Board unanimously determined to renew the fund's Advisory Contracts. In reaching its determination, the Board considered all factors it believed relevant, including (i) the nature, extent, and quality of the services to be provided to the fund and its shareholders (including the investment performance of the fund); (ii) the competitiveness of the fund's management fee and total expense ratio relative to peer funds; (iii) the total costs of the services to be provided by and the profits to be realized by Fidelity from its relationships with the fund; and (iv) the extent to which, if any, economies of scale exist and would be realized as the fund grows, and whether any economies of scale are appropriately shared with fund shareholders.
In considering whether to renew the Advisory Contracts for the fund, the Board reached a determination, with the assistance of fund counsel and Independent Trustees' counsel and through the exercise of its business judgment, that the renewal of the Advisory Contracts was in the best interests of the fund and its shareholders and that the compensation payable under the Advisory Contracts was fair and reasonable. The Board's decision to renew the Advisory Contracts was not based on any single factor, but rather was based on a comprehensive consideration of all the information provided to the Board at its meetings throughout the year. The Board, in reaching its determination to renew the Advisory Contracts, was aware that shareholders of the fund have a broad range of investment choices available to them, including a wide choice among funds offered by Fidelity's competitors, and that the fund's shareholders, who have the opportunity to review and weigh the disclosure provided by the fund in its prospectus and other public disclosures, have chosen to invest in this fund, which is part of the Fidelity family of funds.
Amendment to Group Fee Rate. The Board also approved an amendment to the management contract for the fund to add an additional breakpoint to the group fee schedule, effective October 1, 2017. The Board noted that the additional breakpoint would result in lower management fee rates as Fidelity's assets under management increase above the new breakpoint.
Nature, Extent, and Quality of Services Provided. The Board considered Fidelity's staffing as it relates to the fund, including the backgrounds of investment personnel of Fidelity, and also considered the fund's investment objective, strategies, and related investment philosophy. The Independent Trustees also had discussions with senior management of Fidelity's investment operations and investment groups. The Board considered the structure of the investment personnel compensation program and whether this structure provides appropriate incentives to act in the best interests of the fund. Additionally, the Board considered the portfolio managers' investments, if any, in the funds that they manage.
Resources Dedicated to Investment Management and Support Services. The Board reviewed the general qualifications and capabilities of Fidelity's investment staff, including its size, education, experience, and resources, as well as Fidelity's approach to recruiting, managing, and compensating investment personnel. The Board noted that Fidelity has continued to increase the resources devoted to non-U.S. offices, including expansion of Fidelity's global investment organization. The Board also noted that Fidelity's analysts have extensive resources, tools and capabilities that allow them to conduct sophisticated quantitative and fundamental analysis, as well as credit analysis of issuers, counterparties and guarantors. Further, the Board considered that Fidelity's investment professionals have sufficient access to global information and data so as to provide competitive investment results over time, and that those professionals also have access to sophisticated tools that permit them to assess portfolio construction and risk and performance attribution characteristics continuously, as well as to transmit new information and research conclusions rapidly around the world. Additionally, in its deliberations, the Board considered Fidelity's trading, risk management, compliance, and technology and operations capabilities and resources, which are integral parts of the investment management process.
Shareholder and Administrative Services. The Board considered (i) the nature, extent, quality, and cost of advisory, administrative, and shareholder services performed by the Investment Advisers and their affiliates under the Advisory Contracts and under separate agreements covering transfer agency, pricing and bookkeeping, and securities lending services for the fund; (ii) the nature and extent of the supervision of third party service providers, principally custodians, subcustodians, and pricing vendors; and (iii) the resources devoted to, and the record of compliance with, the fund's compliance policies and procedures.
The Board noted that the growth of fund assets over time across the complex allows Fidelity to reinvest in the development of services designed to enhance the value or convenience of the Fidelity funds as investment vehicles. These services include 24-hour access to account information and market information through telephone representatives and over the Internet, investor education materials and asset allocation tools, and the expanded availability of Fidelity Investor Centers.
Investment in a Large Fund Family. The Board considered the benefits to shareholders of investing in a Fidelity fund, including the benefits of investing in a fund that is part of a large family of funds offering a variety of investment disciplines and providing a large variety of mutual fund investor services. The Board noted that Fidelity had taken, or had made recommendations that resulted in the Fidelity funds taking, a number of actions over the previous year that benefited particular funds, including: (i) continuing to dedicate additional resources to Fidelity's investment research process, which includes meetings with management of issuers in which the funds invest, and to the support of the senior management team that oversees asset management; (ii) continuing efforts to enhance Fidelity's global research capabilities; (iii) launching new funds and making other enhancements to meet client needs; (iv) launching new share classes of existing funds; (v) eliminating purchase minimums and broadening eligibility requirements for certain lower-priced share classes; (vi) reducing management fees and total expenses for certain growth equity funds and index funds; (vii) lowering expense caps for certain existing funds and classes to reduce expenses borne by shareholders; (viii) eliminating short-term redemption fees for certain funds; (ix) introducing a new pricing structure for certain funds of funds that is expected to reduce overall expenses paid by shareholders; (x) rationalizing product lines and gaining increased efficiencies through proposals for fund mergers and share class consolidations; (xi) continuing to develop, acquire and implement systems and technology to improve services to the funds and shareholders, strengthen information security, and increase efficiency; and (xii) implementing enhancements to further strengthen Fidelity's product line to increase investors' probability of success in achieving their investment goals, including retirement income goals.
Investment Performance. The Board considered whether the fund has operated in accordance with its investment objective, as well as its record of compliance with its investment restrictions and its performance history.
The Board took into account discussions with representatives of the Investment Advisers about fund investment performance that occur at Board meetings throughout the year. In this regard the Board noted that as part of regularly scheduled fund reviews and other reports to the Board on fund performance, the Board considers annualized return information for the fund for different time periods, measured against a securities market index ("benchmark index") and a peer group of funds with similar objectives ("peer group"), if any. In its evaluation of fund investment performance at meetings throughout the year, the Board gave particular attention to information indicating underperformance of certain Fidelity funds for specific time periods and discussed with the Investment Advisers the reasons for such underperformance.
In addition to reviewing absolute and relative fund performance, the Independent Trustees periodically consider the appropriateness of fund performance metrics in evaluating the results achieved. In general, the Independent Trustees believe that fund performance should be evaluated based on gross performance (before fees and expenses but after transaction costs) compared to appropriate benchmark indices, over appropriate time periods that may include full market cycles, and on net performance (after fees and expenses) compared to peer groups, as applicable, over the same periods, taking into account relevant factors including the following: general market conditions; expectations for interest rate levels and credit conditions; issuer-specific information including credit quality; the potential for incremental return versus the fund's benchmark index weighed against the risks involved in obtaining that incremental return, including the risk of diminished or negative total returns; and fund cash flows and other factors. Depending on the circumstances, the Independent Trustees may be satisfied with a fund's performance notwithstanding that it lags its benchmark index or peer group for certain periods.
The Independent Trustees recognize that shareholders evaluate performance on a net basis over their own holding periods, for which one-, three-, and five-year periods are often used as a proxy. For this reason, the performance information reviewed by the Board also included net cumulative calendar year total return information for the fund and an appropriate benchmark index and peer group for the most recent one-, three-, and five-year periods.
Based on its review, the Board concluded that the nature, extent, and quality of services provided to the fund under the Advisory Contracts should continue to benefit the shareholders of the fund.
Competitiveness of Management Fee and Total Expense Ratio. The Board considered the fund's management fee and total expense ratio compared to "mapped groups" of competitive funds and classes created for the purpose of facilitating the Trustees' competitive analysis of management fees and total expenses. Fidelity creates "mapped groups" by combining similar Lipper investment objective categories that have comparable investment mandates. Combining Lipper investment objective categories aids the Board's management fee and total expense ratio comparisons by broadening the competitive group used for comparison.
Management Fee. The Board considered two proprietary management fee comparisons for the 12-month periods shown in basis points (BP) in the chart below. The group of Lipper funds used by the Board for management fee comparisons is referred to below as the "Total Mapped Group" and, for the reasons explained above, is broader than the Lipper peer group used by the Board for performance comparisons. The Total Mapped Group comparison focuses on a fund's standing in terms of gross management fees before expense reimbursements or caps relative to the total universe of funds with comparable investment mandates, regardless of whether their management fee structures also are comparable. Funds with comparable investment mandates offer exposure to similar types of securities. Funds with comparable management fee structures have similar management fee contractual arrangements (
e.g., flat rate charged for advisory services, all-inclusive fee rate,
etc.). "TMG %" represents the percentage of funds in the Total Mapped Group that had management fees that were lower than the fund's. For example, a hypothetical TMG % of 20% would mean that 80% of the funds in the Total Mapped Group had higher, and 20% had lower, management fees than the fund. The fund's actual TMG %s and the number of funds in the Total Mapped Group are in the chart below. The "Asset-Size Peer Group" (ASPG) comparison focuses on a fund's standing relative to a subset of non-Fidelity funds within the Total Mapped Group that are similar in size and management fee structure. For example, if a fund is in the first quartile of the ASPG, the fund's management fee ranks in the least expensive or lowest 25% of funds in the ASPG. The ASPG represents at least 15% of the funds in the Total Mapped Group with comparable asset size and management fee structures, subject to a minimum of 50 funds (or all funds in the Total Mapped Group if fewer than 50). Additional information, such as the ASPG quartile in which the fund's management fee rate ranked, is also included in the chart and considered by the Board.
Fidelity Intermediate Government Income Fund
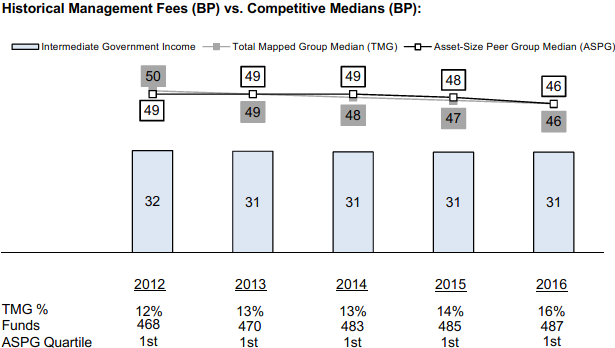
The Board noted that the fund's management fee rate ranked below the median of its Total Mapped Group and below the median of its ASPG for 2016.
The Board noted that it and the boards of other Fidelity funds formed an ad hoc Committee on Group Fee, which meets periodically, to conduct an in-depth review of the "group fee" component of the management fee of funds with such management fee structures. The Committee's focus included the mechanics of the group fee, the competitive landscape of group fee structures, Fidelity funds with no group fee component and investment products not included in group fee assets. The Board also considered that, for funds subject to the group fee, FMR agreed to voluntarily waive fees over a specified period of time in amounts designed to account for assets converted from certain funds to certain collective investment trusts.
Based on its review, the Board concluded that the fund's management fee is fair and reasonable in light of the services that the fund receives and the other factors considered.
Total Expense Ratio. In its review of the fund's total expense ratio, the Board considered the fund's management fee rate as well as other fund expenses, such as transfer agent fees, pricing and bookkeeping fees, and custodial, legal, and audit fees. The Board also noted that Fidelity may agree to waive fees and expenses from time to time, and the extent to which, if any, it has done so for the fund. As part of its review, the Board also considered the current and historical total expense ratios of the fund compared to competitive fund median expenses. The fund is compared to those funds and classes in the Total Mapped Group (used by the Board for management fee comparisons) that have a similar sales load structure.
The Board noted that the fund's total expense ratio ranked below the competitive median for 2016.
The Board considered that the current contractual arrangements for the fund have the effect of setting the total "fund-level" expenses (including, among certain other "fund-level" expenses, the management fee) at 0.35%. These contractual arrangements may not be amended to increase the fees or expenses payable except by a vote of a majority of the Board.
The Board recognized that the fund's management contract incorporates a "group fee" structure, which provides for lower group fee rates as total group assets increase, and for higher group fee rates as total group assets decrease (with "group assets" defined to include fund assets under FMR's management plus the assets of sector funds previously under FMR's management). FMR calculates the group fee rates based on a tiered asset "breakpoint" schedule that varies based on asset class. The Board noted, however, that because the current contractual arrangements set the total "fund-level" expenses at 0.35%, increases or decreases in the management fee due to changes in the group fee rate will not impact the total expense ratio.
Fees Charged to Other Fidelity Clients. The Board also considered Fidelity fee structures and other information with respect to clients of Fidelity, such as other funds advised or subadvised by Fidelity, pension plan clients, and other institutional clients with similar mandates. The Board noted that an ad hoc joint committee created by it and the boards of other Fidelity funds periodically reviews and compares Fidelity's institutional investment advisory business with its business of providing services to the Fidelity funds, including the differences in services provided, fees charged, and costs incurred, as well as competition in their respective marketplaces.
Based on its review of total expense ratios and fees charged to other Fidelity clients, the Board concluded that the fund's total expense ratio was reasonable in light of the services that the fund and its shareholders receive and the other factors considered.
Costs of the Services and Profitability. The Board considered the revenues earned and the expenses incurred by Fidelity in conducting the business of developing, marketing, distributing, managing, administering and servicing the fund and servicing the fund's shareholders. The Board also considered the level of Fidelity's profits in respect of all the Fidelity funds.
On an annual basis, Fidelity presents to the Board information about the profitability of its relationships with the fund. Fidelity calculates profitability information for each fund, as well as aggregate profitability information for groups of Fidelity funds and all Fidelity funds, using a series of detailed revenue and cost allocation methodologies which originate with the books and records of Fidelity on which Fidelity's audited financial statements are based. The Audit Committee of the Board reviews any significant changes from the prior year's methodologies.
PricewaterhouseCoopers LLP (PwC), independent registered public accounting firm and auditor to Fidelity and certain Fidelity funds, has been engaged annually by the Board as part of the Board's assessment of Fidelity's profitability analysis. PwC's engagement includes the review and assessment of the methodologies used by Fidelity in determining the revenues and expenses attributable to Fidelity's mutual fund business, and completion of agreed-upon procedures in respect of the mathematical accuracy of the fund profitability information and its conformity to established allocation methodologies. After considering PwC's reports issued under the engagement and information provided by Fidelity, the Board concluded that while other allocation methods may also be reasonable, Fidelity's profitability methodologies are reasonable in all material respects.
The Board also reviewed Fidelity's non-fund businesses and potential fall-out benefits related to the mutual fund business as well as cases where Fidelity's affiliates may benefit from or be related to the fund's business.
The Board considered the costs of the services provided by and the profits realized by Fidelity in connection with the operation of the fund and was satisfied that the profitability was not excessive.
Economies of Scale. The Board considered whether there have been economies of scale in respect of the management of the Fidelity funds, whether the Fidelity funds (including the fund) have appropriately benefited from any such economies of scale, and whether there is potential for realization of any further economies of scale. The Board considered the extent to which the fund will benefit from economies of scale as assets grow through increased services to the fund, through waivers or reimbursements, or through fee or expense ratio reductions. The Board also noted that a committee (the Economies of Scale Committee) created by it and the boards of other Fidelity funds periodically analyzes whether Fidelity attains economies of scale in respect of the management and servicing of the Fidelity funds, whether the Fidelity funds have appropriately benefited from such economies of scale, and whether there is potential for realization of any further economies of scale.
The Board concluded, taking into account the analysis of the Economies of Scale Committee, that economies of scale, if any, are being appropriately shared between fund shareholders and Fidelity.
Additional Information Requested by the Board. In order to develop fully the factual basis for consideration of the Fidelity funds' advisory contracts, the Board requested and received additional information on certain topics, including: (i) Fidelity's fund profitability methodology, profitability trends for certain funds, and the impact of certain factors on fund profitability results; (ii) portfolio manager changes that have occurred during the past year and the amount of the investment that each portfolio manager has made in the Fidelity fund(s) that he or she manages; (iii) Fidelity's compensation structure for portfolio managers, research analysts, and other key personnel, including its effects on fund profitability, the rationale for the compensation structure, and the extent to which current market conditions have affected retention and recruitment; (iv) the arrangements with and compensation paid to certain fund sub-advisers on behalf of the Fidelity funds; (v) the terms of Fidelity's contractual and voluntary expense cap and waiver arrangements with the funds; (vi) the methodology with respect to competitive fund data and peer group classifications; (vii) Fidelity's transfer agent fee, expense, and service structures for different funds and classes relative to competitive trends, and the impact of the increased use of omnibus accounts; (viii) Fidelity's long-term expectations for its offerings in the workplace investing channel; (ix) new developments in the retail and institutional marketplaces and the competitive positioning of the funds relative to other investment products and services; (x) the approach to considering "fall-out" benefits; (xi) the impact of money market reform on Fidelity's money market funds, including with respect to costs and profitability; (xii) the funds' share class structures and distribution channels, including the impact of the Department of Labor's new fiduciary rule on the funds' distribution arrangements; and (xiii) explanations regarding the relative total expense ratios of certain funds and classes, total expense competitive trends and methodologies for total expense competitive comparisons, and actions that might be taken by Fidelity to reduce total expense ratios for certain classes. In addition, the Board considered its discussions with Fidelity throughout the year regarding enhanced information security initiatives and the funds' fair valuation policies.
Based on its evaluation of all of the conclusions noted above, and after considering all factors it believed relevant, the Board concluded that the advisory fee structures are fair and reasonable, and that the fund's Advisory Contracts should be renewed.
Corporate Headquarters
245 Summer St.
Boston, MA 02210
www.fidelity.com
SLM-SANN-0418
1.844597.112
Fidelity Advisor® Total Bond Fund -
Class A, Class M, Class C, Class I and Class Z
Semi-Annual Report February 28, 2018 Class A, Class M, Class C, Class I and Class Z are classes of Fidelity® Total Bond Fund |
|
Contents
To view a fund's proxy voting guidelines and proxy voting record for the 12-month period ended June 30, visit http://www.fidelity.com/proxyvotingresults or visit the Securities and Exchange Commission's (SEC) web site at http://www.sec.gov.
You may also call 1-800-835-5095 (plan accounts) or 1-877-208-0098 (all other accounts) to request a free copy of the proxy voting guidelines.
Standard & Poor's, S&P and S&P 500 are registered service marks of The McGraw-Hill Companies, Inc. and have been licensed for use by Fidelity Distributors Corporation.
Other third-party marks appearing herein are the property of their respective owners.
All other marks appearing herein are registered or unregistered trademarks or service marks of FMR LLC or an affiliated company. © 2018 FMR LLC. All rights reserved.
This report and the financial statements contained herein are submitted for the general information of the shareholders of the Fund. This report is not authorized for distribution to prospective investors in the Fund unless preceded or accompanied by an effective prospectus.
A fund files its complete schedule of portfolio holdings with the SEC for the first and third quarters of each fiscal year on Form N-Q. Forms N-Q are available on the SEC’s web site at http://www.sec.gov. A fund's Forms N-Q may be reviewed and copied at the SEC’s Public Reference Room in Washington, DC. Information regarding the operation of the SEC's Public Reference Room may be obtained by calling 1-800-SEC-0330.
For a complete list of a fund's portfolio holdings, view the most recent holdings listing, semiannual report, or annual report on Fidelity's web site at http://www.fidelity.com, http://www.institutional.fidelity.com, or http://www.401k.com, as applicable.
NOT FDIC INSURED •MAY LOSE VALUE •NO BANK GUARANTEE
Neither the Fund nor Fidelity Distributors Corporation is a bank.
Investment Summary (Unaudited)
Quality Diversification (% of fund's net assets)
| As of February 28, 2018 |
| | U.S. Government and U.S. Government Agency Obligations | 58.3% |
| | AAA | 0.9% |
| | AA | 0.6% |
| | A | 5.0% |
| | BBB | 17.3% |
| | BB and Below | 15.9% |
| | Not Rated | 1.4% |
| | Equities | 0.1% |
| | Short-Term Investments and Net Other Assets | 0.5% |

We have used ratings from Moody's Investors Service, Inc. Where Moody's® ratings are not available, we have used S&P® ratings. All ratings are as of the date indicated and do not reflect subsequent changes. Securities rated BB or below were rated investment grade at the time of acquisition.
Asset Allocation (% of fund's net assets)
| As of February 28, 2018*,** |
| | Corporate Bonds | 30.2% |
| | U.S. Government and U.S. Government Agency Obligations | 58.3% |
| | Asset-Backed Securities | 1.0% |
| | CMOs and Other Mortgage Related Securities | 1.8% |
| | Municipal Bonds | 1.2% |
| | Stocks | 0.1% |
| | Other Investments | 6.9% |
| | Short-Term Investments and Net Other Assets (Liabilities) | 0.5% |

* Foreign investments - 10.4%
** Futures and Swaps - 0.5%
Percentages in the above tables are adjusted for the effect of TBA Sale Commitments.
Schedule of Investments February 28, 2018 (Unaudited)
Showing Percentage of Net Assets
| Corporate Bonds - 30.2% | | | |
| | | Principal Amount(a) | Value |
| Convertible Bonds - 0.0% | | | |
| CONSUMER DISCRETIONARY - 0.0% | | | |
| Media - 0.0% | | | |
| DISH Network Corp.: | | | |
| 2.375% 3/15/24 (b) | | $5,710,000 | $5,145,350 |
| 3.375% 8/15/26 | | 3,010,000 | 3,028,256 |
| | | | 8,173,606 |
| INDUSTRIALS - 0.0% | | | |
| Electrical Equipment - 0.0% | | | |
| SolarCity Corp. 1.625% 11/1/19 | | 7,900,000 | 7,385,457 |
|
| TOTAL CONVERTIBLE BONDS | | | 15,559,063 |
|
| Nonconvertible Bonds - 30.2% | | | |
| CONSUMER DISCRETIONARY - 3.2% | | | |
| Auto Components - 0.0% | | | |
| Delphi Technologies PLC 5% 10/1/25 (b) | | 2,215,000 | 2,196,283 |
| J.B. Poindexter & Co., Inc. 9% 4/1/22 (b) | | 2,442,000 | 2,521,365 |
| Metalsa SA de CV 4.9% 4/24/23 (b) | | 4,550,000 | 4,498,813 |
| Samvardhana Motherson Automotive Systems Group BV 1.8% 7/6/24 (Reg. S) | EUR | 3,500,000 | 4,119,440 |
| Tenedora Nemak SA de CV 4.75% 1/23/25 (b) | | 1,215,000 | 1,205,888 |
| Tupy Overseas SA 6.625% 7/17/24 (b) | | 290,000 | 303,848 |
| | | | 14,845,637 |
| Automobiles - 0.6% | | | |
| General Motors Co. 3.5% 10/2/18 | | 9,215,000 | 9,261,759 |
| General Motors Financial Co., Inc.: | | | |
| 3.15% 1/15/20 | | 27,252,000 | 27,293,938 |
| 3.2% 7/13/20 | | 20,200,000 | 20,199,504 |
| 3.25% 5/15/18 | | 4,810,000 | 4,817,037 |
| 3.5% 7/10/19 | | 10,761,000 | 10,824,701 |
| 4% 1/15/25 | | 18,085,000 | 17,928,467 |
| 4.2% 3/1/21 | | 26,269,000 | 26,884,555 |
| 4.25% 5/15/23 | | 5,420,000 | 5,526,111 |
| 4.375% 9/25/21 | | 47,963,000 | 49,339,917 |
| Volkswagen International Finance NV 2.7%(Reg. S) (c)(d) | EUR | 1,800,000 | 2,255,762 |
| | | | 174,331,751 |
| Distributors - 0.0% | | | |
| American Tire Distributors, Inc. 10.25% 3/1/22 (b) | | 1,740,000 | 1,811,984 |
| Diversified Consumer Services - 0.1% | | | |
| Ingersoll-Rand Global Holding Co. Ltd.: | | | |
| 2.875% 1/15/19 | | 1,206,000 | 1,210,683 |
| 4.25% 6/15/23 | | 8,466,000 | 8,820,705 |
| Laureate Education, Inc. 8.25% 5/1/25 (b) | | 4,615,000 | 4,914,975 |
| Service Corp. International 4.625% 12/15/27 | | 4,045,000 | 3,953,988 |
| | | | 18,900,351 |
| Hotels, Restaurants & Leisure - 0.4% | | | |
| 1011778 BC Unlimited Liability Co./New Red Finance, Inc.: | | | |
| 4.25% 5/15/24 (b) | | 2,935,000 | 2,802,925 |
| 5% 10/15/25 (b) | | 5,275,000 | 5,139,828 |
| Aramark Services, Inc.: | | | |
| 4.75% 6/1/26 | | 7,225,000 | 7,125,656 |
| 5% 2/1/28 (b) | | 3,410,000 | 3,397,213 |
| 5.125% 1/15/24 | | 2,520,000 | 2,570,400 |
| ESH Hospitality, Inc. 5.25% 5/1/25 (b) | | 1,100,000 | 1,097,250 |
| FelCor Lodging LP 5.625% 3/1/23 | | 135,000 | 137,531 |
| Golden Nugget, Inc. 6.75% 10/15/24 (b) | | 13,075,000 | 13,401,875 |
| Hilton Escrow Issuer LLC 4.25% 9/1/24 | | 7,280,000 | 7,152,600 |
| Hilton Worldwide Finance LLC/Hilton Worldwide Finance Corp.: | | | |
| 4.625% 4/1/25 | | 2,580,000 | 2,589,675 |
| 4.875% 4/1/27 | | 1,530,000 | 1,530,000 |
| KFC Holding Co./Pizza Hut Holding LLC: | | | |
| 4.75% 6/1/27 (b) | | 1,580,000 | 1,544,450 |
| 5% 6/1/24 (b) | | 4,515,000 | 4,560,150 |
| 5.25% 6/1/26 (b) | | 1,790,000 | 1,812,375 |
| McDonald's Corp. 2.75% 12/9/20 | | 3,638,000 | 3,633,195 |
| MCE Finance Ltd. 4.875% 6/6/25 (b) | | 12,515,000 | 12,243,723 |
| MGM Growth Properties Operating Partnership LP: | | | |
| 4.5% 9/1/26 | | 14,045,000 | 13,377,863 |
| 4.5% 1/15/28 | | 6,215,000 | 5,888,713 |
| RHP Hotel Properties LP/RHP Finance Corp. 5% 4/15/23 | | 540,000 | 542,700 |
| Scientific Games Corp.: | | | |
| 5% 10/15/25 (b) | | 5,100,000 | 5,042,625 |
| 6.625% 5/15/21 | | 6,270,000 | 6,473,148 |
| 7% 1/1/22 (b) | | 567,000 | 596,768 |
| Station Casinos LLC 5% 10/1/25 (b) | | 4,290,000 | 4,182,750 |
| Studio City Co. Ltd.: | | | |
| 5.875% 11/30/19 (b) | | 2,555,000 | 2,618,875 |
| 7.25% 11/30/21 (b) | | 4,925,000 | 5,177,406 |
| Sugarhouse HSP Gaming Prop Mezz LP/Sugarhouse HSP Gaming Finance Corp. 5.875% 5/15/25 (b) | | 840,000 | 789,600 |
| Times Square Hotel Trust 8.528% 8/1/26 (b) | | 985,159 | 1,125,864 |
| Viking Cruises Ltd. 5.875% 9/15/27 (b) | | 3,530,000 | 3,441,750 |
| Voc Escrow Ltd. 5% 2/15/28 (b) | | 1,780,000 | 1,731,050 |
| Wynn Las Vegas LLC/Wynn Las Vegas Capital Corp. 5.25% 5/15/27 (b) | | 4,730,000 | 4,647,225 |
| Wynn Macau Ltd.: | | | |
| 4.875% 10/1/24 (b) | | 1,475,000 | 1,445,500 |
| 5.5% 10/1/27 (b) | | 4,440,000 | 4,372,068 |
| Yum! Brands, Inc. 5.35% 11/1/43 | | 3,280,000 | 2,984,800 |
| | | | 135,177,551 |
| Household Durables - 0.2% | | | |
| Beazer Homes U.S.A., Inc. 5.875% 10/15/27 | | 3,770,000 | 3,581,500 |
| Lennar Corp.: | | | |
| 4.75% 11/29/27 (b) | | 2,660,000 | 2,573,550 |
| 5% 6/15/27 (b) | | 3,810,000 | 3,800,856 |
| 5.25% 6/1/26 (b) | | 4,285,000 | 4,370,700 |
| 5.875% 11/15/24 (b) | | 1,775,000 | 1,885,938 |
| M.D.C. Holdings, Inc. 6% 1/15/43 | | 1,300,000 | 1,235,000 |
| M/I Homes, Inc.: | | | |
| 5.625% 8/1/25 | | 1,055,000 | 1,059,928 |
| 6.75% 1/15/21 | | 4,265,000 | 4,392,950 |
| PulteGroup, Inc. 5% 1/15/27 | | 2,625,000 | 2,608,594 |
| Reynolds Group Issuer, Inc./Reynolds Group Issuer LLC/Reynolds Group Issuer (Luxembourg) SA: | | | |
| 3 month U.S. LIBOR + 3.500% 5.2215% 7/15/21 (b)(d)(e) | | 6,520,000 | 6,593,350 |
| 5.125% 7/15/23 (b) | | 5,170,000 | 5,272,625 |
| 5.75% 10/15/20 | | 2,844,331 | 2,883,441 |
| Taylor Morrison Communities, Inc./Monarch Communities, Inc. 5.875% 4/15/23 (b) | | 1,495,000 | 1,555,249 |
| Toll Brothers Finance Corp. 4.875% 3/15/27 | | 683,000 | 679,585 |
| TRI Pointe Homes, Inc. 5.25% 6/1/27 | | 2,800,000 | 2,768,500 |
| William Lyon Homes, Inc.: | | | |
| 5.75% 4/15/19 | | 4,175,000 | 4,185,438 |
| 7% 8/15/22 | | 4,250,000 | 4,356,250 |
| | | | 53,803,454 |
| Internet & Direct Marketing Retail - 0.1% | | | |
| Netflix, Inc.: | | | |
| 4.375% 11/15/26 | | 5,750,000 | 5,520,000 |
| 4.875% 4/15/28 (b) | | 4,690,000 | 4,607,925 |
| Zayo Group LLC/Zayo Capital, Inc.: | | | |
| 5.75% 1/15/27 (b) | | 5,975,000 | 6,004,875 |
| 6.375% 5/15/25 | | 8,115,000 | 8,490,319 |
| | | | 24,623,119 |
| Media - 1.8% | | | |
| 21st Century Fox America, Inc.: | | | |
| 6.15% 3/1/37 | | 4,759,000 | 5,876,770 |
| 7.75% 12/1/45 | | 3,932,000 | 5,976,292 |
| Altice SA: | | | |
| 7.25% 5/15/22 (Reg. S) | EUR | 700,000 | 823,435 |
| 7.625% 2/15/25 (b) | | 2,235,000 | 1,966,800 |
| 7.75% 5/15/22 (b) | | 28,085,000 | 26,189,263 |
| Altice U.S. Finance SA: | | | |
| 5.375% 7/15/23 (b) | | 2,560,000 | 2,601,600 |
| 5.5% 5/15/26 (b) | | 5,035,000 | 4,984,650 |
| Cablevision SA 6.5% 6/15/21 (b) | | 1,185,000 | 1,239,000 |
| Cablevision Systems Corp. 5.875% 9/15/22 | | 3,120,000 | 3,120,000 |
| CCO Holdings LLC/CCO Holdings Capital Corp.: | | | |
| 4% 3/1/23 (b) | | 6,395,000 | 6,227,131 |
| 5% 2/1/28 (b) | | 19,150,000 | 18,084,877 |
| 5.125% 2/15/23 | | 1,130,000 | 1,148,363 |
| 5.125% 5/1/23 (b) | | 7,520,000 | 7,661,000 |
| 5.125% 5/1/27 (b) | | 11,140,000 | 10,708,325 |
| 5.5% 5/1/26 (b) | | 9,005,000 | 9,005,000 |
| 5.75% 2/15/26 (b) | | 3,370,000 | 3,416,338 |
| Charter Communications Operating LLC/Charter Communications Operating Capital Corp.: | | | |
| 4.464% 7/23/22 | | 20,419,000 | 20,904,803 |
| 4.908% 7/23/25 | | 20,419,000 | 21,027,558 |
| 5.375% 5/1/47 | | 51,316,000 | 50,794,396 |
| 6.484% 10/23/45 | | 8,199,000 | 9,236,253 |
| Comcast Corp. 6.45% 3/15/37 | | 2,196,000 | 2,811,634 |
| CSC Holdings LLC: | | | |
| 5.25% 6/1/24 | | 4,283,000 | 4,122,388 |
| 5.375% 2/1/28 (b) | | 2,850,000 | 2,785,875 |
| 6.75% 11/15/21 | | 8,225,000 | 8,651,672 |
| CSC Holdings, Inc. 5.5% 4/15/27 (b) | | 4,045,000 | 3,984,325 |
| DISH DBS Corp.: | | | |
| 5.875% 7/15/22 | | 4,000,000 | 3,900,000 |
| 5.875% 11/15/24 | | 6,795,000 | 6,370,313 |
| 7.75% 7/1/26 | | 1,355,000 | 1,334,675 |
| E.W. Scripps Co. 5.125% 5/15/25 (b) | | 3,120,000 | 2,995,200 |
| Globo Comunicacao e Participacoes SA: | | | |
| 4.843% 6/8/25 (b) | | 1,820,000 | 1,801,800 |
| 4.875% 4/11/22 (b) | | 565,000 | 577,713 |
| 5.125% 3/31/27 (b) | | 580,000 | 578,840 |
| Lagardere S.C.A.: | | | |
| 1.625% 6/21/24 (Reg. S) | EUR | 4,900,000 | 5,876,093 |
| 2.75% 4/13/23 (Reg. S) | EUR | 1,300,000 | 1,669,064 |
| MDC Partners, Inc. 6.5% 5/1/24 (b) | | 12,090,000 | 12,059,775 |
| MHGE Parent LLC/MHGE Parent Finance, Inc. 8.5% 8/1/19 pay-in-kind (b)(d) | | 8,405,000 | 8,362,975 |
| Myriad International Holding BV 5.5% 7/21/25 (b) | | 1,040,000 | 1,109,794 |
| NBCUniversal, Inc. 5.15% 4/30/20 | | 11,614,000 | 12,190,751 |
| New Cotai LLC/New Cotai Capital Corp. 10.625% 5/1/19 pay-in-kind (b)(d) | | 4,958,504 | 4,908,919 |
| Sirius XM Radio, Inc.: | | | |
| 3.875% 8/1/22 (b) | | 6,090,000 | 5,968,200 |
| 5% 8/1/27 (b) | | 8,290,000 | 8,059,538 |
| SKY PLC 2.25% 11/17/25 (Reg. S) | EUR | 2,650,000 | 3,463,804 |
| Time Warner Cable, Inc.: | | | |
| 4% 9/1/21 | | 20,277,000 | 20,472,581 |
| 4.5% 9/15/42 | | 30,539,000 | 27,587,080 |
| 5.5% 9/1/41 | | 12,973,000 | 13,169,293 |
| 5.875% 11/15/40 | | 16,544,000 | 17,459,460 |
| 6.55% 5/1/37 | | 38,302,000 | 43,563,146 |
| 6.75% 7/1/18 | | 13,763,000 | 13,946,861 |
| 7.3% 7/1/38 | | 38,728,000 | 46,441,712 |
| 8.25% 4/1/19 | | 24,391,000 | 25,749,335 |
| Time Warner, Inc.: | | | |
| 3.6% 7/15/25 | | 6,406,000 | 6,223,739 |
| 6.2% 3/15/40 | | 11,792,000 | 13,790,223 |
| TV Azteca SA de CV 8.25% 8/9/24 (Reg. S) | | 4,289,000 | 4,535,618 |
| Virgin Media Secured Finance PLC: | | | |
| 5.5% 1/15/25 (b) | | 2,500,000 | 2,518,750 |
| 5.5% 8/15/26 (b) | | 4,335,000 | 4,291,217 |
| VTR Finance BV 6.875% 1/15/24 (b) | | 2,955,000 | 3,080,588 |
| Ziggo Bond Finance BV: | | | |
| 5.875% 1/15/25 (b) | | 3,100,000 | 2,983,750 |
| 6% 1/15/27 (b) | | 5,605,000 | 5,310,738 |
| Ziggo Secured Finance BV 5.5% 1/15/27 (b) | | 4,540,000 | 4,352,725 |
| | | | 570,052,018 |
| Multiline Retail - 0.0% | | | |
| JC Penney Corp., Inc. 5.875% 7/1/23 (b) | | 980,000 | 940,800 |
| Specialty Retail - 0.0% | | | |
| Jaguar Land Rover PLC 4.5% 10/1/27 (b) | | 3,915,000 | 3,719,250 |
| PetSmart, Inc. 5.875% 6/1/25 (b) | | 1,000,000 | 780,000 |
| | | | 4,499,250 |
| Textiles, Apparel & Luxury Goods - 0.0% | | | |
| Tecpetrol SA 4.875% 12/12/22 (b) | | 725,000 | 705,425 |
| TOTAL CONSUMER DISCRETIONARY | | | 999,691,340 |
| CONSUMER STAPLES - 1.5% | | | |
| Beverages - 0.6% | | | |
| Anheuser-Busch InBev Finance, Inc.: | | | |
| 2.65% 2/1/21 | | 38,614,000 | 38,255,584 |
| 3.3% 2/1/23 | | 41,589,000 | 41,411,733 |
| 4.7% 2/1/36 | | 39,376,000 | 41,378,582 |
| 4.9% 2/1/46 | | 45,032,000 | 48,012,699 |
| Anheuser-Busch InBev SA NV 1.75% 3/7/25 (Reg. S) | GBP | 3,600,000 | 4,806,638 |
| Anheuser-Busch InBev Worldwide, Inc. 3.75% 1/15/22 | | 10,217,000 | 10,421,679 |
| Central American Bottling Corp. 5.75% 1/31/27 (b) | | 450,000 | 463,500 |
| Constellation Brands, Inc.: | | | |
| 3.875% 11/15/19 | | 2,360,000 | 2,400,615 |
| 4.25% 5/1/23 | | 5,205,000 | 5,386,016 |
| | | | 192,537,046 |
| Food & Staples Retailing - 0.2% | | | |
| Albertsons Companies LLC/Safeway, Inc./New Albertson's, Inc./Albertson's LLC: | | | |
| 5.75% 3/15/25 | | 2,915,000 | 2,536,050 |
| 6.625% 6/15/24 | | 2,215,000 | 2,040,569 |
| Albertsons, Inc.: | | | |
| 6.625% 6/1/28 | | 705,000 | 546,375 |
| 7.75% 6/15/26 | | 765,000 | 669,375 |
| 8% 5/1/31 | | 2,220,000 | 1,903,650 |
| 8.7% 5/1/30 | | 560,000 | 506,800 |
| C&S Group Enterprises LLC 5.375% 7/15/22 (b) | | 4,725,000 | 4,488,750 |
| CVS Health Corp.: | | | |
| 2.8% 7/20/20 | | 15,202,000 | 15,095,019 |
| 3.5% 7/20/22 | | 8,944,000 | 8,910,268 |
| 4% 12/5/23 | | 8,525,000 | 8,643,345 |
| FAGE International SA/FAGE U.S.A. Dairy Industry, Inc. 5.625% 8/15/26 (b) | | 80,000 | 75,150 |
| Minerva Luxembourg SA 6.5% 9/20/26 (b) | | 1,525,000 | 1,513,563 |
| Tesco PLC: | | | |
| 5% 3/24/23 | GBP | 1,100,000 | 1,664,682 |
| 6.125% 2/24/22 | GBP | 550,000 | 856,960 |
| Tops Holding LLC/Tops Markets II Corp. 8% 6/15/22 (b)(f) | | 5,155,000 | 2,706,375 |
| Walgreens Boots Alliance, Inc.: | | | |
| 2.7% 11/18/19 | | 8,473,000 | 8,442,207 |
| 3.3% 11/18/21 | | 10,050,000 | 10,065,061 |
| | | | 70,664,199 |
| Food Products - 0.1% | | | |
| CF Industries Holdings, Inc.: | | | |
| 3.4% 12/1/21 (b) | | 1,915,000 | 1,900,492 |
| 3.45% 6/1/23 | | 3,115,000 | 3,017,656 |
| 4.5% 12/1/26 (b) | | 1,380,000 | 1,404,393 |
| 5.15% 3/15/34 | | 280,000 | 274,400 |
| Gruma S.A.B. de CV 4.875% 12/1/24 (Reg. S) | | 800,000 | 838,000 |
| Lamb Weston Holdings, Inc.: | | | |
| 4.625% 11/1/24 (b) | | 2,145,000 | 2,155,725 |
| 4.875% 11/1/26 (b) | | 1,555,000 | 1,555,000 |
| Post Holdings, Inc.: | | | |
| 5% 8/15/26 (b) | | 3,240,000 | 3,078,000 |
| 5.625% 1/15/28 (b) | | 3,245,000 | 3,159,819 |
| 5.75% 3/1/27 (b) | | 2,690,000 | 2,656,375 |
| | | | 20,039,860 |
| Tobacco - 0.6% | | | |
| Altria Group, Inc.: | | | |
| 2.85% 8/9/22 | | 9,573,000 | 9,412,047 |
| 4% 1/31/24 | | 6,408,000 | 6,593,754 |
| Bat Capital Corp. 2.125% 8/15/25 | GBP | 2,470,000 | 3,302,836 |
| Imperial Tobacco Finance PLC: | | | |
| 2.05% 7/20/18 (b) | | 8,743,000 | 8,726,687 |
| 2.95% 7/21/20 (b) | | 20,000,000 | 19,966,794 |
| 3.75% 7/21/22 (b) | | 20,300,000 | 20,553,705 |
| 4.25% 7/21/25 (b) | | 18,467,000 | 18,829,228 |
| 8.125% 3/15/24 | GBP | 1,850,000 | 3,335,424 |
| Reynolds American, Inc.: | | | |
| 2.3% 6/12/18 | | 7,358,000 | 7,355,523 |
| 3.25% 6/12/20 | | 3,274,000 | 3,283,751 |
| 4% 6/12/22 | | 11,386,000 | 11,623,674 |
| 4.45% 6/12/25 | | 14,753,000 | 15,188,141 |
| 5.7% 8/15/35 | | 4,237,000 | 4,825,554 |
| 5.85% 8/15/45 | | 35,690,000 | 41,337,325 |
| 6.15% 9/15/43 | | 4,511,000 | 5,449,496 |
| 7.25% 6/15/37 | | 5,056,000 | 6,664,878 |
| Vector Group Ltd. 6.125% 2/1/25 (b) | | 7,705,000 | 7,868,731 |
| | | | 194,317,548 |
| TOTAL CONSUMER STAPLES | | | 477,558,653 |
| ENERGY - 6.4% | | | |
| Energy Equipment & Services - 0.5% | | | |
| Borets Finance DAC 6.5% 4/7/22 (b) | | 1,345,000 | 1,403,884 |
| Calfrac Holdings LP 7.5% 12/1/20 (b) | | 3,560,000 | 3,543,268 |
| Diamond Offshore Drilling, Inc. 7.875% 8/15/25 | | 2,910,000 | 2,953,650 |
| El Paso Pipeline Partners Operating Co. LLC: | | | |
| 5% 10/1/21 | | 18,884,000 | 19,857,483 |
| 6.5% 4/1/20 | | 738,000 | 786,995 |
| Ensco PLC: | | | |
| 4.5% 10/1/24 | | 9,325,000 | 7,599,875 |
| 5.2% 3/15/25 | | 16,510,000 | 13,703,300 |
| 5.75% 10/1/44 | | 7,801,000 | 5,392,441 |
| 7.75% 2/1/26 | | 2,200,000 | 2,081,750 |
| 8% 1/31/24 | | 3,943,000 | 3,873,998 |
| Exterran Energy Solutions LP 8.125% 5/1/25 (b) | | 1,920,000 | 2,064,000 |
| Exterran Partners LP/EXLP Finance Corp.: | | | |
| 6% 4/1/21 | | 3,210,000 | 3,218,025 |
| 6% 10/1/22 | | 995,000 | 997,488 |
| Forum Energy Technologies, Inc. 6.25% 10/1/21 | | 3,780,000 | 3,756,375 |
| FTS International, Inc. 6.25% 5/1/22 | | 1,780,000 | 1,780,000 |
| Halliburton Co.: | | | |
| 3.8% 11/15/25 | | 9,790,000 | 9,784,715 |
| 4.85% 11/15/35 | | 8,550,000 | 9,157,167 |
| Jonah Energy LLC 7.25% 10/15/25 (b) | | 2,755,000 | 2,617,250 |
| Nabors Industries, Inc.: | | | |
| 5.5% 1/15/23 | | 3,322,000 | 3,297,085 |
| 5.75% 2/1/25 (b) | | 5,305,000 | 5,062,959 |
| Noble Holding International Ltd.: | | | |
| 5.25% 3/15/42 | | 1,890,000 | 1,200,150 |
| 7.7% 4/1/25 (d) | | 10,335,000 | 9,249,825 |
| 7.75% 1/15/24 | | 3,019,000 | 2,758,611 |
| 7.875% 2/1/26 (b) | | 1,930,000 | 1,939,650 |
| 8.7% 4/1/45 (d) | | 7,307,000 | 6,174,415 |
| NuStar Logistics LP 5.625% 4/28/27 | | 3,335,000 | 3,301,650 |
| Precision Drilling Corp.: | | | |
| 5.25% 11/15/24 | | 1,290,000 | 1,228,725 |
| 6.5% 12/15/21 | | 838,000 | 852,665 |
| 7.125% 1/15/26 (b) | | 1,620,000 | 1,634,175 |
| 7.75% 12/15/23 | | 4,985,000 | 5,259,175 |
| Southern Gas Corridor CJSC 6.875% 3/24/26 (b) | | 2,555,000 | 2,832,008 |
| Summit Midstream Holdings LLC: | | | |
| 5.5% 8/15/22 | | 2,135,000 | 2,153,681 |
| 5.75% 4/15/25 | | 3,385,000 | 3,385,000 |
| The Oil and Gas Holding Co. 7.5% 10/25/27 (b) | | 870,000 | 878,296 |
| Weatherford International, Inc. 9.875% 3/1/25 (b) | | 5,400,000 | 5,319,000 |
| | | | 151,098,734 |
| Oil, Gas & Consumable Fuels - 5.9% | | | |
| Afren PLC: | | | |
| 6.625% 12/9/20 (b)(f)(g) | | 770,910 | 278 |
| 10.25% 4/8/19 (Reg. S) (f)(g) | | 2,024,860 | 729 |
| Anadarko Finance Co. 7.5% 5/1/31 | | 29,585,000 | 37,420,859 |
| Anadarko Petroleum Corp.: | | | |
| 4.85% 3/15/21 | | 6,730,000 | 7,022,344 |
| 5.55% 3/15/26 | | 13,807,000 | 15,078,820 |
| 6.45% 9/15/36 | | 4,370,000 | 5,205,728 |
| 6.6% 3/15/46 | | 22,460,000 | 28,000,661 |
| Antero Resources Corp.: | | | |
| 5% 3/1/25 | | 7,605,000 | 7,662,038 |
| 5.125% 12/1/22 | | 8,335,000 | 8,407,931 |
| 5.625% 6/1/23 (Reg. S) | | 4,310,000 | 4,417,750 |
| Antero Resources Finance Corp. 5.375% 11/1/21 | | 3,675,000 | 3,757,688 |
| California Resources Corp. 8% 12/15/22 (b) | | 5,050,000 | 3,995,813 |
| Canadian Natural Resources Ltd.: | | | |
| 3.9% 2/1/25 | | 24,997,000 | 24,865,428 |
| 5.85% 2/1/35 | | 10,897,000 | 12,344,998 |
| Cenovus Energy, Inc. 4.25% 4/15/27 | | 31,079,000 | 30,371,925 |
| Cheniere Corpus Christi Holdings LLC: | | | |
| 5.125% 6/30/27 | | 3,595,000 | 3,635,444 |
| 5.875% 3/31/25 | | 5,295,000 | 5,599,463 |
| 7% 6/30/24 | | 4,155,000 | 4,649,445 |
| Chesapeake Energy Corp.: | | | |
| 4.875% 4/15/22 | | 3,735,000 | 3,501,563 |
| 5.75% 3/15/23 | | 5,580,000 | 5,105,700 |
| 6.125% 2/15/21 | | 3,783,000 | 3,820,830 |
| 8% 12/15/22 (b) | | 7,485,000 | 7,962,169 |
| 8% 1/15/25 (b) | | 2,890,000 | 2,853,875 |
| 8% 6/15/27 (b) | | 3,295,000 | 3,159,081 |
| Citgo Holding, Inc. 10.75% 2/15/20 (b) | | 820,000 | 879,450 |
| Columbia Pipeline Group, Inc.: | | | |
| 2.45% 6/1/18 | | 3,149,000 | 3,148,721 |
| 3.3% 6/1/20 | | 15,490,000 | 15,548,242 |
| 4.5% 6/1/25 | | 4,707,000 | 4,829,857 |
| Consolidated Energy Finance SA: | | | |
| 3 month U.S. LIBOR + 3.750% 5.3385% 6/15/22 (b)(d)(e) | | 12,775,000 | 12,744,134 |
| 6.875% 6/15/25 (b) | | 4,700,000 | 4,935,000 |
| Continental Resources, Inc.: | | | |
| 3.8% 6/1/24 | | 4,150,000 | 4,030,688 |
| 4.375% 1/15/28 (b) | | 4,675,000 | 4,543,516 |
| 4.5% 4/15/23 | | 8,290,000 | 8,393,625 |
| 4.9% 6/1/44 | | 1,255,000 | 1,207,938 |
| Covey Park Energy LLC 7.5% 5/15/25 (b) | | 3,225,000 | 3,273,375 |
| CVR Refining LLC/Coffeyville Finance, Inc. 6.5% 11/1/22 | | 8,710,000 | 8,916,863 |
| DCP Midstream LLC: | | | |
| 4.75% 9/30/21 (b) | | 11,333,000 | 11,531,328 |
| 5.85% 5/21/43 (b)(d) | | 7,143,000 | 6,767,993 |
| DCP Midstream Operating LP 3.875% 3/15/23 | | 5,532,000 | 5,393,700 |
| Denbury Resources, Inc. 9% 5/15/21 (b) | | 4,000,000 | 4,090,000 |
| DTEK Finance PLC 10.75% 12/31/24 pay-in-kind (d) | | 1,985,000 | 2,106,085 |
| Duke Energy Field Services 6.45% 11/3/36 (b) | | 13,741,000 | 15,115,100 |
| El Paso Corp. 6.5% 9/15/20 | | 16,140,000 | 17,368,419 |
| Empresa Nacional de Petroleo 4.375% 10/30/24 (b) | | 9,045,000 | 9,268,610 |
| Enable Midstream Partners LP: | | | |
| 2.4% 5/15/19 (d) | | 4,028,000 | 3,990,272 |
| 3.9% 5/15/24 (d) | | 4,249,000 | 4,187,656 |
| Enbridge Energy Partners LP: | | | |
| 4.2% 9/15/21 | | 13,331,000 | 13,655,772 |
| 4.375% 10/15/20 | | 11,319,000 | 11,639,867 |
| Enbridge, Inc.: | | | |
| 4.25% 12/1/26 | | 7,730,000 | 7,780,677 |
| 5.5% 12/1/46 | | 8,922,000 | 10,043,413 |
| Endeavor Energy Resources LP/EER Finance, Inc.: | | | |
| 5.5% 1/30/26 (b) | | 860,000 | 853,550 |
| 5.75% 1/30/28 (b) | | 865,000 | 865,000 |
| Energy Transfer Equity LP 4.25% 3/15/23 | | 3,880,000 | 3,806,047 |
| Enterprise Products Operating LP: | | | |
| 2.55% 10/15/19 | | 2,971,000 | 2,957,384 |
| 3.75% 2/15/25 | | 9,982,000 | 10,026,076 |
| EP Energy LLC/Everest Acquisition Finance, Inc. 8% 11/29/24 (b) | | 6,325,000 | 6,514,750 |
| Extraction Oil & Gas, Inc. 5.625% 2/1/26 (b) | | 3,980,000 | 3,900,400 |
| Georgian Oil & Gas Corp. 6.75% 4/26/21 (b) | | 1,500,000 | 1,587,731 |
| Global Partners LP/GLP Finance Corp.: | | | |
| 6.25% 7/15/22 | | 5,165,000 | 5,158,544 |
| 7% 6/15/23 | | 9,970,000 | 10,156,938 |
| Gran Tierra Energy International Holdings 6.25% 2/15/25 (b) | | 650,000 | 632,125 |
| Hess Infrastructure Partners LP 5.625% 2/15/26 (b) | | 2,575,000 | 2,575,000 |
| Hilcorp Energy I LP/Hilcorp Finance Co.: | | | |
| 5% 12/1/24 (b) | | 7,510,000 | 7,547,550 |
| 5.75% 10/1/25 (b) | | 2,135,000 | 2,172,363 |
| Indigo Natural Resources LLC 6.875% 2/15/26 (b) | | 4,810,000 | 4,702,833 |
| Indika Energy Capital II Pte. Ltd. 6.875% 4/10/22 (b) | | 2,030,000 | 2,096,994 |
| KazMunaiGaz Finance Sub BV 4.875% 5/7/25 (b) | | 700,000 | 722,666 |
| Kinder Morgan Energy Partners LP: | | | |
| 3.5% 3/1/21 | | 11,339,000 | 11,385,122 |
| 5.5% 3/1/44 | | 42,953,000 | 44,328,567 |
| 6.55% 9/15/40 | | 1,889,000 | 2,178,669 |
| Kinder Morgan, Inc.: | | | |
| 5% 2/15/21 (b) | | 10,606,000 | 11,066,857 |
| 5.05% 2/15/46 | | 4,854,000 | 4,758,968 |
| Kosmos Energy Ltd.: | | | |
| 7.875% 8/1/21 (b) | | 1,910,000 | 1,952,975 |
| 7.875% 8/1/21 (b) | | 2,325,000 | 2,377,313 |
| Marathon Petroleum Corp. 5.125% 3/1/21 | | 10,178,000 | 10,780,142 |
| MPLX LP 4.875% 12/1/24 | | 10,070,000 | 10,594,395 |
| Nakilat, Inc. 6.067% 12/31/33 (b) | | 1,975,000 | 2,202,520 |
| Newfield Exploration Co. 5.375% 1/1/26 | | 1,260,000 | 1,300,950 |
| NGL Energy Partners LP/NGL Energy Finance Corp. 6.125% 3/1/25 | | 925,000 | 894,938 |
| NGPL PipeCo LLC: | | | |
| 4.375% 8/15/22 (b) | | 505,000 | 503,738 |
| 4.875% 8/15/27 (b) | | 505,000 | 509,419 |
| Nostrum Oil & Gas Finance BV: | | | |
| 7% 2/16/25 (b) | | 835,000 | 817,465 |
| 8% 7/25/22 (b) | | 4,990,000 | 5,153,902 |
| Pacific Exploration and Production Corp.: | | | |
| 10% 11/2/21 pay-in-kind (d) | | 1,204,000 | 1,352,995 |
| 10% 11/2/21 pay-in-kind (b)(d) | | 1,040,000 | 1,168,700 |
| Pan American Energy LLC 7.875% 5/7/21 (b) | | 2,858,000 | 3,034,882 |
| Parsley Energy LLC/Parsley: | | | |
| 5.25% 8/15/25 (b) | | 715,000 | 704,275 |
| 5.375% 1/15/25 (b) | | 1,170,000 | 1,158,300 |
| PBF Logistics LP/PBF Logistics Finance, Inc.: | | | |
| 6.875% 5/15/23 | | 4,365,000 | 4,468,669 |
| 6.875% 5/15/23 (b) | | 3,080,000 | 3,153,150 |
| Pemex Project Funding Master Trust 6.625% 6/15/35 | | 4,705,000 | 4,866,146 |
| Petrobras Energia SA 7.375% 7/21/23 (b) | | 1,715,000 | 1,811,126 |
| Petrobras Global Finance BV: | | | |
| 4.375% 5/20/23 | | 20,096,000 | 19,553,408 |
| 4.75% 1/14/25 | EUR | 450,000 | 598,161 |
| 5.625% 5/20/43 | | 18,504,000 | 15,820,920 |
| 5.75% 2/1/29 | | 40,170,000 | 38,663,625 |
| 5.999% 1/27/28 (b) | | 59,620,000 | 58,725,700 |
| 6.125% 1/17/22 | | 11,055,000 | 11,633,729 |
| 6.25% 3/17/24 | | 21,380,000 | 22,288,650 |
| 7.25% 3/17/44 | | 45,050,000 | 45,725,750 |
| 7.375% 1/17/27 | | 41,110,000 | 44,563,240 |
| 8.75% 5/23/26 | | 56,815,000 | 66,686,606 |
| Petrobras International Finance Co. Ltd.: | | | |
| 5.375% 1/27/21 | | 44,755,000 | 46,097,650 |
| 5.875% 3/7/22 | EUR | 200,000 | 277,674 |
| 6.875% 1/20/40 | | 1,220,000 | 1,189,195 |
| Petroleos de Venezuela SA: | | | |
| 5.375% 4/12/27 (f) | | 975,000 | 242,775 |
| 6% 5/16/24 (b)(f) | | 2,355,000 | 596,262 |
| 6% 11/15/26 (b)(f) | | 2,810,000 | 705,310 |
| 9.75% 5/17/35 (b)(f) | | 3,210,000 | 876,330 |
| 12.75% 2/17/22 (b)(f) | | 270,000 | 79,866 |
| Petroleos Mexicanos: | | | |
| 2.5% 8/21/21 (Reg. S) | EUR | 6,200,000 | 7,878,284 |
| 3.5% 1/30/23 | | 11,169,000 | 10,755,747 |
| 4.5% 1/23/26 | | 46,043,000 | 44,546,603 |
| 4.625% 9/21/23 | | 80,090,000 | 80,498,459 |
| 4.875% 1/24/22 | | 11,642,000 | 11,938,172 |
| 4.875% 1/18/24 | | 13,597,000 | 13,800,955 |
| 5.5% 1/21/21 | | 11,789,000 | 12,337,189 |
| 5.5% 6/27/44 | | 10,807,000 | 9,683,180 |
| 5.625% 1/23/46 | | 35,710,000 | 31,974,734 |
| 6% 3/5/20 | | 3,910,000 | 4,097,680 |
| 6.35% 2/12/48 (b) | | 17,325,000 | 16,890,143 |
| 6.375% 2/4/21 | | 785,000 | 838,773 |
| 6.375% 1/23/45 | | 29,907,000 | 29,009,790 |
| 6.5% 3/13/27 (b) | | 33,960,000 | 36,298,825 |
| 6.5% 3/13/27 (b) | | 57,927,000 | 61,916,432 |
| 6.5% 6/2/41 | | 29,057,000 | 29,049,736 |
| 6.625% (b)(c) | | 2,510,000 | 2,527,570 |
| 6.75% 9/21/47 | | 25,666,000 | 26,098,985 |
| 6.75% 9/21/47 (b) | | 24,580,000 | 24,994,665 |
| 6.875% 8/4/26 | | 41,150,000 | 45,158,010 |
| 8% 5/3/19 | | 7,261,000 | 7,664,712 |
| Phillips 66 Co. 4.3% 4/1/22 | | 12,618,000 | 13,102,006 |
| Phillips 66 Partners LP 2.646% 2/15/20 | | 1,316,000 | 1,307,709 |
| Plains All American Pipeline LP/PAA Finance Corp. 3.65% 6/1/22 | | 5,217,000 | 5,153,052 |
| PT Pertamina Persero 6.5% 5/27/41 (b) | | 510,000 | 582,985 |
| Range Resources Corp.: | | | |
| 4.875% 5/15/25 | | 5,395,000 | 5,169,084 |
| 5% 8/15/22 | | 1,725,000 | 1,699,125 |
| 5% 3/15/23 | | 9,650,000 | 9,432,875 |
| Sanchez Energy Corp. 7.25% 2/15/23 (b) | | 6,470,000 | 6,544,729 |
| SemGroup Corp. 7.25% 3/15/26 | | 1,885,000 | 1,927,413 |
| Sinopec Group Overseas Development 2.5% 9/13/22 (Reg. S) | | 10,300,000 | 9,853,876 |
| Southwestern Energy Co.: | | | |
| 4.1% 3/15/22 | | 1,540,000 | 1,443,750 |
| 6.7% 1/23/25 (d) | | 34,312,000 | 33,625,760 |
| 7.75% 10/1/27 | | 3,760,000 | 3,835,200 |
| Sunoco Logistics Partner Operations LP 5.4% 10/1/47 | | 43,401,000 | 42,433,077 |
| Targa Resources Partners LP/Targa Resources Partners Finance Corp.: | | | |
| 4.25% 11/15/23 | | 2,990,000 | 2,915,250 |
| 5% 1/15/28 (b) | | 5,175,000 | 5,026,219 |
| 5.125% 2/1/25 | | 1,210,000 | 1,205,463 |
| 5.25% 5/1/23 | | 685,000 | 694,850 |
| 6.75% 3/15/24 | | 4,420,000 | 4,690,725 |
| The Williams Companies, Inc.: | | | |
| 3.7% 1/15/23 | | 3,730,000 | 3,622,763 |
| 4.55% 6/24/24 | | 41,276,000 | 41,585,570 |
| 5.75% 6/24/44 | | 19,187,000 | 20,386,188 |
| Transportadora de Gas del Sur SA 9.625% 5/14/20 (b) | | 3,316,317 | 3,490,457 |
| Tullow Oil PLC 6% 11/1/20 (b) | | 810,000 | 818,100 |
| Western Gas Partners LP: | | | |
| 4.65% 7/1/26 | | 4,876,000 | 4,952,315 |
| 5.375% 6/1/21 | | 44,065,000 | 46,123,474 |
| Whiting Petroleum Corp.: | | | |
| 5.75% 3/15/21 | | 1,350,000 | 1,380,375 |
| 6.625% 1/15/26 (b) | | 2,895,000 | 2,934,806 |
| Williams Partners LP: | | | |
| 3.6% 3/15/22 | | 10,817,000 | 10,849,451 |
| 3.9% 1/15/25 | | 26,667,000 | 26,471,734 |
| 4% 11/15/21 | | 6,716,000 | 6,848,752 |
| 4% 9/15/25 | | 3,000,000 | 2,990,802 |
| 4.125% 11/15/20 | | 2,399,000 | 2,454,931 |
| 4.3% 3/4/24 | | 40,932,000 | 41,962,669 |
| 4.5% 11/15/23 | | 7,325,000 | 7,575,880 |
| YPF SA: | | | |
| 7% 12/15/47 (b) | | 2,090,000 | 1,914,963 |
| 8.5% 3/23/21 (b) | | 1,235,000 | 1,352,943 |
| 8.5% 3/23/21 (Reg. S) | | 2,250,000 | 2,464,875 |
| 8.75% 4/4/24 (b) | | 5,160,000 | 5,766,300 |
| | | | 1,891,904,986 |
| TOTAL ENERGY | | | 2,043,003,720 |
| FINANCIALS - 9.9% | | | |
| Banks - 4.3% | | | |
| ABN AMRO Bank NV 4.4% 3/27/28 (Reg. S) (d) | | 3,400,000 | 3,425,976 |
| Access Bank PLC 10.5% 10/19/21 (b) | | 585,000 | 654,884 |
| Akbank TAS/Ak Finansal Kiralama A/S 7.2% 3/16/27 (b)(d) | | 945,000 | 979,313 |
| Allied Irish Banks PLC 4.125% 11/26/25 (Reg. S) (d) | EUR | 3,450,000 | 4,543,902 |
| Banca Monte dei Paschi di Siena SpA 5.375% 1/18/28 (d) | EUR | 1,300,000 | 1,562,857 |
| Banco de Bogota SA 6.25% 5/12/26 (b) | | 690,000 | 731,883 |
| Banco de Reservas de La Republica Dominicana 7% 2/1/23 (b) | | 1,455,000 | 1,524,113 |
| Banco Do Brasil SA 4.625% 1/15/25 (b) | | 2,490,000 | 2,430,863 |
| Banco Espirito Santo SA 4% 1/21/19 (Reg. S) (f) | EUR | 1,300,000 | 475,800 |
| Banco Hipotecario SA 9.75% 11/30/20 (b) | | 5,160,000 | 5,762,585 |
| Banco Macro SA 6.75% 11/4/26 (b)(d) | | 2,775,000 | 2,820,344 |
| Banco Nacional de Desenvolvimento Economico e Social: | | | |
| 4% 4/14/19 (b) | | 500,000 | 504,500 |
| 6.369% 6/16/18 (b) | | 1,125,000 | 1,133,044 |
| Bank of America Corp.: | | | |
| 1.776% 5/4/27 (Reg. S) (d) | EUR | 3,300,000 | 4,129,428 |
| 2.25% 4/21/20 | | 66,694,000 | 65,888,186 |
| 2.6% 1/15/19 | | 1,164,000 | 1,164,326 |
| 3.004% 12/20/23 (b)(d) | | 14,176,000 | 13,870,586 |
| 3.3% 1/11/23 | | 901,000 | 897,909 |
| 3.419% 12/20/28 (b)(d) | | 23,300,000 | 22,308,513 |
| 3.5% 4/19/26 | | 20,559,000 | 20,247,211 |
| 3.705% 4/24/28 (d) | | 32,549,000 | 31,946,251 |
| 3.95% 4/21/25 | | 17,156,000 | 17,129,848 |
| 4.1% 7/24/23 | | 11,481,000 | 11,869,949 |
| 4.2% 8/26/24 | | 40,532,000 | 41,342,351 |
| 4.25% 10/22/26 | | 14,724,000 | 14,865,815 |
| 5.65% 5/1/18 | | 8,780,000 | 8,830,834 |
| Banque Centrale de Tunisie 5.75% 1/30/25 (b) | | 905,000 | 855,225 |
| Barclays PLC: | | | |
| 2.75% 11/8/19 | | 12,249,000 | 12,175,628 |
| 3.25% 1/12/21 | | 21,116,000 | 20,967,681 |
| 4.375% 1/12/26 | | 25,086,000 | 25,112,491 |
| BBVA Bancomer SA: | | | |
| 7.25% 4/22/20 (b) | | 1,475,000 | 1,568,663 |
| 7.25% 4/22/20 (Reg. S) | | 3,300,000 | 3,509,550 |
| BTA Bank JSC 5.5% 12/21/22 (b) | | 650,000 | 645,983 |
| CaixaBank SA: | | | |
| 2.75% 7/14/28 (Reg. S) (d) | EUR | 1,400,000 | 1,763,104 |
| 5% 11/14/23 (Reg. S) (d) | EUR | 2,700,000 | 3,401,029 |
| CBOM Finance PLC 7.5% 10/5/27 (b)(d) | | 2,650,000 | 2,521,210 |
| Citigroup, Inc.: | | | |
| 2.4% 2/18/20 | | 35,902,000 | 35,559,833 |
| 2.65% 10/26/20 | | 20,000,000 | 19,798,822 |
| 2.75% 4/25/22 | | 25,000,000 | 24,468,638 |
| 3.142% 1/24/23 (d) | | 22,807,000 | 22,641,029 |
| 4.05% 7/30/22 | | 5,303,000 | 5,425,066 |
| 4.3% 11/20/26 | | 3,788,000 | 3,829,719 |
| 4.4% 6/10/25 | | 40,790,000 | 41,867,919 |
| 4.45% 9/29/27 | | 10,000,000 | 10,204,829 |
| 5.125% 12/12/18 | GBP | 1,875,000 | 2,661,333 |
| 5.5% 9/13/25 | | 21,906,000 | 23,961,291 |
| Citizens Bank NA 2.55% 5/13/21 | | 6,564,000 | 6,434,171 |
| Citizens Financial Group, Inc. 4.15% 9/28/22 (b) | | 15,987,000 | 16,254,036 |
| Credit Suisse Group Funding Guernsey Ltd.: | | | |
| 2.75% 3/26/20 | | 19,455,000 | 19,309,470 |
| 3.75% 3/26/25 | | 19,450,000 | 19,200,661 |
| 3.8% 9/15/22 | | 30,700,000 | 30,997,349 |
| 3.8% 6/9/23 | | 36,648,000 | 36,876,275 |
| CYBG PLC 3.125% 6/22/25 (Reg. S) (d) | GBP | 1,300,000 | 1,803,734 |
| Discover Bank: | | | |
| 4.2% 8/8/23 | | 17,852,000 | 18,335,302 |
| 7% 4/15/20 | | 2,030,000 | 2,184,899 |
| Fidelity Bank PLC: | | | |
| 6.875% 5/9/18 (b) | | 200,000 | 199,407 |
| 10.5% 10/16/22 (b) | | 1,435,000 | 1,493,720 |
| Fifth Third Bancorp: | | | |
| 4.5% 6/1/18 | | 798,000 | 802,652 |
| 8.25% 3/1/38 | | 4,667,000 | 6,778,776 |
| HBOS PLC 6.75% 5/21/18 (b) | | 6,067,000 | 6,120,557 |
| HSBC Holdings PLC: | | | |
| 2.256% 11/13/26 (Reg. S) (d) | GBP | 3,250,000 | 4,368,011 |
| 4.25% 3/14/24 | | 6,192,000 | 6,271,315 |
| Huntington Bancshares, Inc. 7% 12/15/20 | | 2,851,000 | 3,140,732 |
| Intesa Sanpaolo SpA 5.71% 1/15/26 (b) | | 28,396,000 | 28,992,929 |
| Itau Unibanco Holding SA: | | | |
| 5.125% 5/13/23 (Reg. S) | | 1,650,000 | 1,666,005 |
| 5.5% 8/6/22 (b) | | 1,155,000 | 1,188,495 |
| 6.2% 12/21/21 (Reg. S) | | 980,000 | 1,038,310 |
| JPMorgan Chase & Co.: | | | |
| 1.625% 5/15/18 | | 12,580,000 | 12,567,856 |
| 2.2% 10/22/19 | | 7,268,000 | 7,204,354 |
| 2.25% 1/23/20 | | 40,000,000 | 39,624,394 |
| 2.35% 1/28/19 | | 6,857,000 | 6,849,580 |
| 2.95% 10/1/26 | | 18,480,000 | 17,367,905 |
| 3.25% 9/23/22 | | 18,423,000 | 18,429,511 |
| 3.875% 9/10/24 | | 35,791,000 | 36,033,791 |
| 4.125% 12/15/26 | | 32,416,000 | 32,770,350 |
| 4.25% 10/15/20 | | 6,995,000 | 7,233,865 |
| 4.35% 8/15/21 | | 20,267,000 | 21,071,760 |
| 4.5% 1/24/22 | | 22,046,000 | 23,054,483 |
| 4.625% 5/10/21 | | 6,879,000 | 7,209,297 |
| 4.95% 3/25/20 | | 22,079,000 | 23,004,159 |
| JSC BGEO Group 6% 7/26/23 (b) | | 2,360,000 | 2,433,632 |
| Kazkommertsbank Jsc Mtn Bank Ent 8.5% 5/11/18 (b) | | 2,845,000 | 2,865,973 |
| Nykredit Realkredit A/S 4% 6/3/36 (Reg. S) (d) | EUR | 4,092,000 | 5,429,910 |
| PSB Finance SA 5.25% 10/19/19 | | 1,000,000 | 986,850 |
| Rabobank Nederland 4.375% 8/4/25 | | 25,937,000 | 26,350,460 |
| Regions Bank 6.45% 6/26/37 | | 24,618,000 | 29,786,344 |
| Regions Financial Corp. 3.2% 2/8/21 | | 11,916,000 | 11,956,299 |
| Royal Bank of Canada 2.77% 12/11/18 | CAD | 12,507,000 | 9,810,568 |
| Royal Bank of Scotland Group PLC: | | | |
| 4.8% 4/5/26 | | 50,452,000 | 52,260,812 |
| 5.125% 5/28/24 | | 64,006,000 | 65,577,415 |
| 6% 12/19/23 | | 36,682,000 | 39,164,692 |
| 6.1% 6/10/23 | | 31,961,000 | 34,137,404 |
| 6.125% 12/15/22 | | 42,557,000 | 45,385,825 |
| SB Capital SA 5.5% 2/26/24 (b)(d) | | 1,160,000 | 1,176,240 |
| Trade and Development Bank of Mongolia LLC 9.375% 5/19/20 (b) | | 1,905,000 | 2,069,230 |
| Turkiye Garanti Bankasi A/S 6.125% 5/24/27 (b)(d) | | 1,145,000 | 1,134,271 |
| Turkiye Is Bankasi A/S: | | | |
| 5.5% 4/21/19 (b) | | 415,000 | 421,018 |
| 5.5% 4/21/22 (b) | | 1,415,000 | 1,406,657 |
| Turkiye Vakiflar Bankasi TAO: | | | |
| 5.75% 1/30/23 (b) | | 825,000 | 810,563 |
| 6.875% 2/3/25 (Reg. S) (d) | | 2,665,000 | 2,689,593 |
| UniCredit SpA 6.375% 5/2/23 (Reg. S) (d) | | 1,350,000 | 1,355,913 |
| Zenith Bank PLC: | | | |
| 6.25% 4/22/19 (b) | | 4,330,000 | 4,417,120 |
| 7.375% 5/30/22 (b) | | 3,495,000 | 3,648,605 |
| | | | 1,355,133,819 |
| Capital Markets - 3.1% | | | |
| Affiliated Managers Group, Inc.: | | | |
| 3.5% 8/1/25 | | 21,008,000 | 20,584,752 |
| 4.25% 2/15/24 | | 14,661,000 | 15,105,050 |
| Credit Suisse Group AG: | | | |
| 3.869% 1/12/29 (b)(d) | | 18,512,000 | 17,981,564 |
| 5.75% 9/18/25 (Reg. S) (d) | EUR | 5,950,000 | 8,130,080 |
| Deutsche Bank AG 4.5% 4/1/25 | | 80,571,000 | 78,933,000 |
| Deutsche Bank AG New York Branch: | | | |
| 3.15% 1/22/21 | | 28,709,000 | 28,446,345 |
| 3.3% 11/16/22 | | 47,595,000 | 46,410,407 |
| Goldman Sachs Group, Inc.: | | | |
| 2.876% 10/31/22 (d) | | 100,974,000 | 98,998,940 |
| 3.2% 2/23/23 | | 17,000,000 | 16,739,012 |
| 3.691% 6/5/28 (d) | | 200,926,000 | 195,514,508 |
| 3.75% 5/22/25 | | 20,000,000 | 19,923,065 |
| 4.25% 10/21/25 | | 6,650,000 | 6,702,996 |
| IntercontinentalExchange, Inc. 2.75% 12/1/20 | | 6,489,000 | 6,457,408 |
| Lazard Group LLC 4.25% 11/14/20 | | 10,151,000 | 10,472,251 |
| Merrill Lynch & Co., Inc. 5.5% 11/22/21 | GBP | 1,100,000 | 1,706,631 |
| Moody's Corp.: | | | |
| 3.25% 1/15/28 (b) | | 11,520,000 | 10,958,929 |
| 4.875% 2/15/24 | | 10,818,000 | 11,519,048 |
| Morgan Stanley: | | | |
| 2.125% 4/25/18 | | 12,586,000 | 12,585,371 |
| 2.8% 6/16/20 | | 30,000,000 | 29,907,622 |
| 3.125% 1/23/23 | | 13,000,000 | 12,789,995 |
| 3.125% 7/27/26 | | 108,849,000 | 103,243,346 |
| 3.7% 10/23/24 | | 37,479,000 | 37,459,099 |
| 3.95% 4/23/27 | | 3,150,000 | 3,099,387 |
| 4.875% 11/1/22 | | 26,240,000 | 27,665,938 |
| 5% 11/24/25 | | 3,189,000 | 3,395,280 |
| 5.5% 1/26/20 | | 88,000,000 | 92,150,080 |
| 5.625% 9/23/19 | | 12,714,000 | 13,251,597 |
| 5.75% 1/25/21 | | 19,879,000 | 21,318,362 |
| MSCI, Inc.: | | | |
| 4.75% 8/1/26 (b) | | 4,145,000 | 4,113,913 |
| 5.25% 11/15/24 (b) | | 4,420,000 | 4,516,356 |
| Thomson Reuters Corp. 3.85% 9/29/24 | | 11,394,000 | 11,430,674 |
| UBS AG 4.75% 2/12/26 (Reg. S) (d) | EUR | 6,185,000 | 8,347,431 |
| UBS Group Funding Ltd. 4.125% 9/24/25 (b) | | 18,881,000 | 19,182,709 |
| | | | 999,041,146 |
| Consumer Finance - 0.8% | | �� | |
| AerCap Ireland Capital Ltd./AerCap Global Aviation Trust 3.5% 5/26/22 | | 7,478,000 | 7,451,208 |
| Capital One Financial Corp.: | | | |
| 2.45% 4/24/19 | | 10,550,000 | 10,510,744 |
| 3.8% 1/31/28 | | 22,294,000 | 21,644,317 |
| Credito Real S.A.B. de CV 7.5% 3/13/19 (b) | | 1,465,000 | 1,486,975 |
| Discover Financial Services: | | | |
| 3.85% 11/21/22 | | 34,849,000 | 35,081,984 |
| 3.95% 11/6/24 | | 14,738,000 | 14,715,814 |
| 4.1% 2/9/27 | | 24,223,000 | 23,958,255 |
| 5.2% 4/27/22 | | 12,545,000 | 13,247,629 |
| Ford Motor Credit Co. LLC: | | | |
| 2.24% 6/15/18 | | 19,162,000 | 19,152,387 |
| 2.597% 11/4/19 | | 52,209,000 | 51,871,295 |
| 2.875% 10/1/18 | | 13,000,000 | 13,026,733 |
| Hyundai Capital America 2.875% 8/9/18 (b) | | 5,276,000 | 5,281,037 |
| SLM Corp.: | | | |
| 5.5% 1/15/19 | | 725,000 | 735,658 |
| 5.5% 1/25/23 | | 2,640,000 | 2,613,600 |
| Synchrony Financial: | | | |
| 3% 8/15/19 | | 4,907,000 | 4,909,843 |
| 3.75% 8/15/21 | | 7,409,000 | 7,502,836 |
| 4.25% 8/15/24 | | 7,458,000 | 7,511,380 |
| | | | 240,701,695 |
| Diversified Financial Services - 0.6% | | | |
| 1MDB Global Investments Ltd. 4.4% 3/9/23 | | 2,000,000 | 1,932,070 |
| Annington Funding PLC 2.646% 7/12/25 (Reg. S) | GBP | 1,789,000 | 2,437,972 |
| Brixmor Operating Partnership LP: | | | |
| 3.25% 9/15/23 | | 25,518,000 | 24,705,687 |
| 3.85% 2/1/25 | | 14,325,000 | 13,969,835 |
| 3.875% 8/15/22 | | 21,027,000 | 21,192,364 |
| 4.125% 6/15/26 | | 8,647,000 | 8,512,801 |
| Chobani LLC/Finance Corp., Inc. 7.5% 4/15/25 (b) | | 2,700,000 | 2,814,750 |
| Cimpor Financial Operations BV 5.75% 7/17/24 (b) | | 1,965,000 | 1,886,400 |
| CRC Escrow Issuer LLC/CRC Finance LLC 5.25% 10/15/25 (b) | | 10,500,000 | 10,263,750 |
| Crown Americas LLC / Crown Americas Capital Corp. IV 4.75% 2/1/26 (b) | | 3,660,000 | 3,605,100 |
| Icahn Enterprises LP/Icahn Enterprises Finance Corp.: | | | |
| 5.875% 2/1/22 | | 24,766,000 | 24,766,000 |
| 6% 8/1/20 | | 2,810,000 | 2,864,795 |
| 6.25% 2/1/22 | | 7,435,000 | 7,546,525 |
| 6.375% 12/15/25 | | 7,050,000 | 7,076,438 |
| 6.75% 2/1/24 | | 2,000,000 | 2,040,000 |
| ILFC E-Capital Trust I 3 month U.S. LIBOR + 1.550% 4.37% 12/21/65 (b)(d)(e) | | 11,760,000 | 11,613,000 |
| ILFC E-Capital Trust II 3 month U.S. LIBOR + 1.800% 4.62% 12/21/65 (b)(d)(e) | | 6,710,000 | 6,592,575 |
| PT Bukit Makmur Mandiri Utama 7.75% 2/13/22 (b) | | 1,695,000 | 1,786,266 |
| Radiate Holdco LLC/Radiate Financial Service Ltd.: | | | |
| 6.625% 2/15/25 (b) | | 2,080,000 | 1,991,600 |
| 6.875% 2/15/23 (b) | | 705,000 | 703,238 |
| Sistema International Funding SA 6.95% 5/17/19 (b) | | 2,975,000 | 3,005,345 |
| Solera LLC/Solera Finance, Inc. 10.5% 3/1/24 (b) | | 6,270,000 | 7,039,956 |
| Sparc Em Spc 0% 12/5/22 (b) | | 205,000 | 186,806 |
| Tempo Acquisition LLC 6.75% 6/1/25 (b) | | 5,020,000 | 5,057,650 |
| TMK Capital SA 6.75% 4/3/20 (Reg. S) | | 560,000 | 584,098 |
| Valvoline, Inc. 4.375% 8/15/25 | | 3,845,000 | 3,758,488 |
| Voya Financial, Inc. 3.125% 7/15/24 | | 13,804,000 | 13,437,203 |
| | | | 191,370,712 |
| Insurance - 1.1% | | | |
| Acrisure LLC 7% 11/15/25 (b) | | 2,970,000 | 2,903,175 |
| AIA Group Ltd. 2.25% 3/11/19 (b) | | 2,566,000 | 2,544,292 |
| American International Group, Inc.: | | | |
| 2.3% 7/16/19 | | 6,461,000 | 6,415,985 |
| 3.3% 3/1/21 | | 9,614,000 | 9,636,158 |
| 3.875% 1/15/35 | | 19,041,000 | 17,999,460 |
| 4.875% 6/1/22 | | 18,193,000 | 19,274,821 |
| Aon Corp. 5% 9/30/20 | | 3,854,000 | 4,039,620 |
| Aquarius + Investments PLC for Swiss Reinsurance Co. Ltd. 6.375% 9/1/24 (d) | | 4,650,000 | 4,816,238 |
| AXA SA: | | | |
| 3.941% (c)(d) | EUR | 1,238,000 | 1,680,276 |
| 6.6862% (c)(d) | GBP | 100,000 | 164,168 |
| Demeter Investments BV 5.625% 8/15/52 (Reg. S) (d) | | 2,250,000 | 2,336,877 |
| Great-West Life & Annuity Insurance Co. 3 month U.S. LIBOR + 2.538% 4.388% 5/16/46 (b)(d)(e) | | 1,859,000 | 1,854,353 |
| Hartford Financial Services Group, Inc. 5.125% 4/15/22 | | 14,787,000 | 15,797,371 |
| Liberty Mutual Group, Inc. 5% 6/1/21 (b) | | 12,644,000 | 13,327,879 |
| Marsh & McLennan Companies, Inc. 4.8% 7/15/21 | | 7,090,000 | 7,456,564 |
| Massachusetts Mutual Life Insurance Co. 4.5% 4/15/65 (b) | | 30,523,000 | 29,639,318 |
| MetLife, Inc.: | | | |
| 3.048% 12/15/22 (d) | | 12,433,000 | 12,359,066 |
| 4.75% 2/8/21 | | 4,032,000 | 4,225,796 |
| Metropolitan Life Global Funding I 3% 1/10/23 (b) | | 7,896,000 | 7,791,423 |
| Pacific LifeCorp 5.125% 1/30/43 (b) | | 33,774,000 | 35,687,125 |
| Pricoa Global Funding I 5.375% 5/15/45 (d) | | 17,492,000 | 18,191,680 |
| Prudential Financial, Inc.: | | | |
| 2.3% 8/15/18 | | 1,622,000 | 1,621,531 |
| 7.375% 6/15/19 | | 3,230,000 | 3,422,443 |
| QBE Insurance Group Ltd. 5.25% (Reg. S) (c)(d) | | 1,750,000 | 1,724,667 |
| Teachers Insurance & Annuity Association of America 4.9% 9/15/44 (b) | | 18,083,000 | 19,698,231 |
| TIAA Asset Management Finance LLC: | | | |
| 2.95% 11/1/19 (b) | | 4,172,000 | 4,173,940 |
| 4.125% 11/1/24 (b) | | 6,048,000 | 6,228,795 |
| Unum Group: | | | |
| 3.875% 11/5/25 | | 21,587,000 | 21,481,726 |
| 4% 3/15/24 | | 20,000,000 | 20,302,281 |
| 5.625% 9/15/20 | | 8,386,000 | 8,905,688 |
| 5.75% 8/15/42 | | 25,545,000 | 30,115,329 |
| | | | 335,816,276 |
| Mortgage Real Estate Investment Trusts - 0.0% | | | |
| Starwood Property Trust, Inc. 4.75% 3/15/25 (b) | | 1,925,000 | 1,867,250 |
| Thrifts & Mortgage Finance - 0.0% | | | |
| Cassa Depositi e Prestiti SpA 1.875% 2/7/26 | EUR | 1,000,000 | 1,217,462 |
| Prime Securities Services Borrower LLC/Prime Finance, Inc. 9.25% 5/15/23 (b) | | 3,760,000 | 4,093,700 |
| Quicken Loans, Inc. 5.25% 1/15/28 (b) | | 4,045,000 | 3,903,425 |
| | | | 9,214,587 |
| TOTAL FINANCIALS | | | 3,133,145,485 |
| HEALTH CARE - 1.5% | | | |
| Biotechnology - 0.1% | | | |
| AbbVie, Inc.: | | | |
| 2.9% 11/6/22 | | 24,855,000 | 24,346,781 |
| 4.5% 5/14/35 | | 23,238,000 | 23,938,558 |
| | | | 48,285,339 |
| Health Care Equipment & Supplies - 0.1% | | | |
| Becton, Dickinson & Co. 2.675% 12/15/19 | | 3,954,000 | 3,938,519 |
| Hologic, Inc.: | | | |
| 4.375% 10/15/25 (b) | | 3,735,000 | 3,646,294 |
| 4.625% 2/1/28 (b) | | 695,000 | 670,675 |
| Ortho-Clinical Diagnostics, Inc. 6.625% 5/15/22 (b) | | 4,425,000 | 4,391,813 |
| Teleflex, Inc.: | | | |
| 4.625% 11/15/27 | | 825,000 | 805,109 |
| 4.875% 6/1/26 | | 6,975,000 | 6,905,250 |
| | | | 20,357,660 |
| Health Care Providers & Services - 0.5% | | | |
| Aetna, Inc. 2.75% 11/15/22 | | 2,010,000 | 1,947,489 |
| Community Health Systems, Inc.: | | | |
| 6.25% 3/31/23 | | 4,705,000 | 4,281,550 |
| 6.875% 2/1/22 | | 7,715,000 | 5,014,750 |
| HCA Holdings, Inc.: | | | |
| 3.75% 3/15/19 | | 18,722,000 | 18,839,574 |
| 4.25% 10/15/19 | | 7,590,000 | 7,684,875 |
| 4.5% 2/15/27 | | 5,270,000 | 5,144,838 |
| 4.75% 5/1/23 | | 595,000 | 605,413 |
| 5% 3/15/24 | | 6,375,000 | 6,494,531 |
| 5.25% 6/15/26 | | 11,470,000 | 11,756,750 |
| 5.875% 3/15/22 | | 715,000 | 757,900 |
| 5.875% 2/15/26 | | 3,820,000 | 3,953,700 |
| 6.5% 2/15/20 | | 30,303,000 | 31,893,908 |
| HealthSouth Corp. 5.125% 3/15/23 | | 4,745,000 | 4,828,038 |
| Kindred Healthcare, Inc.: | | | |
| 8% 1/15/20 | | 1,145,000 | 1,223,719 |
| 8.75% 1/15/23 | | 1,565,000 | 1,674,550 |
| Medco Health Solutions, Inc. 4.125% 9/15/20 | | 7,486,000 | 7,689,436 |
| Rede D Oregon Finance Sarl 4.95% 1/17/28 (b) | | 525,000 | 508,594 |
| Sabra Health Care LP/Sabra Capital Corp.: | | | |
| 5.375% 6/1/23 | | 500,000 | 502,500 |
| 5.5% 2/1/21 | | 1,555,000 | 1,589,988 |
| SP Finco LLC 6.75% 7/1/25 (b) | | 1,795,000 | 1,687,300 |
| Tenet Healthcare Corp.: | | | |
| 4.375% 10/1/21 | | 3,825,000 | 3,805,875 |
| 4.625% 7/15/24 (b) | | 5,540,000 | 5,301,088 |
| 6.75% 6/15/23 | | 3,555,000 | 3,555,000 |
| 7.5% 1/1/22 (b) | | 775,000 | 818,594 |
| THC Escrow Corp. III 5.125% 5/1/25 (b) | | 4,400,000 | 4,268,000 |
| Wellcare Health Plans, Inc. 5.25% 4/1/25 | | 3,335,000 | 3,375,420 |
| WellPoint, Inc. 3.3% 1/15/23 | | 6,442,000 | 6,391,013 |
| | | | 145,594,393 |
| Life Sciences Tools & Services - 0.0% | | | |
| Thermo Fisher Scientific, Inc.: | | | |
| 2.4% 2/1/19 | | 1,959,000 | 1,955,780 |
| 4.15% 2/1/24 | | 3,010,000 | 3,097,406 |
| | | | 5,053,186 |
| Pharmaceuticals - 0.8% | | | |
| Actavis Funding SCS: | | | |
| 3% 3/12/20 | | 13,777,000 | 13,768,535 |
| 3.45% 3/15/22 | | 48,347,000 | 48,127,265 |
| Catalent Pharma Solutions 4.875% 1/15/26 (b) | | 5,125,000 | 5,073,750 |
| Mylan NV: | | | |
| 2.25% 11/22/24 (Reg. S) | EUR | 1,650,000 | 2,063,110 |
| 2.5% 6/7/19 | | 16,423,000 | 16,324,215 |
| 3.15% 6/15/21 | | 21,235,000 | 21,044,252 |
| 3.95% 6/15/26 | | 11,126,000 | 10,761,417 |
| Perrigo Finance PLC: | | | |
| 3.5% 12/15/21 | | 1,541,000 | 1,546,684 |
| 3.9% 12/15/24 | | 5,449,000 | 5,432,422 |
| Teva Pharmaceutical Finance IV BV 3.65% 11/10/21 | | 1,630,000 | 1,560,871 |
| Teva Pharmaceutical Finance Netherlands III BV: | | | |
| 0.375% 7/25/20 (Reg. S) | EUR | 800,000 | 943,022 |
| 1.25% 3/31/23 (Reg. S) | EUR | 1,500,000 | 1,628,689 |
| 2.2% 7/21/21 | | 14,999,000 | 13,899,577 |
| 2.8% 7/21/23 | | 38,972,000 | 34,111,902 |
| 3.15% 10/1/26 | | 12,782,000 | 10,424,852 |
| Valeant Pharmaceuticals International, Inc.: | | | |
| 5.375% 3/15/20 (b) | | 4,690,000 | 4,678,275 |
| 5.5% 11/1/25 (b) | | 3,645,000 | 3,606,272 |
| 5.625% 12/1/21 (b) | | 8,980,000 | 8,519,775 |
| 5.875% 5/15/23 (b) | | 16,770,000 | 14,904,338 |
| 6.125% 4/15/25 (b) | | 14,175,000 | 12,429,703 |
| 6.5% 3/15/22 (b) | | 2,500,000 | 2,600,000 |
| 7% 3/15/24 (b) | | 4,905,000 | 5,168,644 |
| 9% 12/15/25 (b) | | 3,170,000 | 3,175,944 |
| Zoetis, Inc.: | | | |
| 3.25% 2/1/23 | | 4,892,000 | 4,854,254 |
| 3.45% 11/13/20 | | 5,179,000 | 5,236,662 |
| | | | 251,884,430 |
| TOTAL HEALTH CARE | | | 471,175,008 |
| INDUSTRIALS - 1.0% | | | |
| Aerospace & Defense - 0.2% | | | |
| BAE Systems Holdings, Inc.: | | | |
| 3.8% 10/7/24 (b) | | 9,122,000 | 9,213,550 |
| 6.375% 6/1/19 (b) | | 8,071,000 | 8,430,722 |
| Bombardier, Inc.: | | | |
| 6.125% 1/15/23 (b) | | 8,980,000 | 9,002,450 |
| 7.5% 12/1/24 (b) | | 10,695,000 | 11,109,431 |
| 7.5% 3/15/25 (b) | | 3,005,000 | 3,083,881 |
| DAE Funding LLC: | | | |
| 4% 8/1/20 (b) | | 250,000 | 245,625 |
| 4.5% 8/1/22 (b) | | 1,470,000 | 1,425,900 |
| TransDigm, Inc.: | | | |
| 5.5% 10/15/20 | | 3,580,000 | 3,611,325 |
| 6% 7/15/22 | | 4,010,000 | 4,105,238 |
| 6.375% 6/15/26 | | 2,060,000 | 2,106,350 |
| 6.5% 5/15/25 | | 8,300,000 | 8,507,500 |
| | | | 60,841,972 |
| Air Freight & Logistics - 0.0% | | | |
| Rumo Luxembourg Sarl 7.375% 2/9/24 (b) | | 2,485,000 | 2,663,672 |
| Airlines - 0.1% | | | |
| Air Canada 7.75% 4/15/21 (b) | | 945,000 | 1,043,044 |
| Allegiant Travel Co. 5.5% 7/15/19 | | 4,985,000 | 5,090,931 |
| American Airlines Group, Inc. 4.625% 3/1/20 (b) | | 1,650,000 | 1,666,500 |
| Azul Investments LLP 5.875% 10/26/24 (b) | | 900,000 | 883,125 |
| U.S. Airways Group, Inc. 6.125% 6/1/18 | | 895,000 | 901,713 |
| U.S. Airways pass-thru certificates: | | | |
| Series 2012-2C, 5.45% 6/3/18 | | 1,690,000 | 1,702,506 |
| Series 2013-1 Class B, 5.375% 11/15/21 | | 273,209 | 284,137 |
| U.S. Airways pass-thru trust certificates 8.36% 1/20/19 | | 37,788 | 38,544 |
| United Air Lines, Inc. pass-thru trust certificates Class B, 7.336% 7/2/19 | | 485,736 | 505,165 |
| United Continental Holdings, Inc.: | | | |
| 4.25% 10/1/22 | | 7,680,000 | 7,656,000 |
| 6% 12/1/20 | | 605,000 | 641,300 |
| | | | 20,412,965 |
| Building Products - 0.0% | | | |
| Building Materials Corp. of America 4.75% 1/15/28 (b) | | 4,105,000 | 3,940,800 |
| Commercial Services & Supplies - 0.2% | | | |
| APX Group, Inc.: | | | |
| 6.375% 12/1/19 | | 5,657,000 | 5,741,855 |
| 7.625% 9/1/23 | | 3,860,000 | 4,106,075 |
| 7.875% 12/1/22 | | 1,150,000 | 1,211,813 |
| 8.75% 12/1/20 | | 10,732,000 | 10,812,490 |
| Brand Energy & Infrastructure Services, Inc. 8.5% 7/15/25 (b) | | 4,110,000 | 4,243,575 |
| Cenveo Corp. 6% 8/1/19 (b)(f) | | 270,000 | 130,950 |
| LBC Tank Terminals Holding Netherlands BV 6.875% 5/15/23 (b) | | 3,420,000 | 3,526,875 |
| Multi-Color Corp. 4.875% 11/1/25 (b) | | 4,685,000 | 4,497,600 |
| Prime Security One MS, Inc. 4.875% 7/15/32 (b) | | 4,170,000 | 3,794,700 |
| Securitas AB 1.125% 2/20/24 (Reg. S) | EUR | 3,750,000 | 4,575,183 |
| | | | 42,641,116 |
| Construction & Engineering - 0.0% | | | |
| Cementos Progreso Trust 7.125% 11/6/23 (b) | | 920,000 | 954,500 |
| Odebrecht Finance Ltd.: | | | |
| 4.375% 4/25/25 (b) | | 2,575,000 | 540,750 |
| 7.125% 6/26/42 (b) | | 1,940,000 | 446,200 |
| | | | 1,941,450 |
| Electrical Equipment - 0.0% | | | |
| Sensata Technologies BV 5% 10/1/25 (b) | | 4,285,000 | 4,317,138 |
| Vestas Wind Systems A/S 2.75% 3/11/22 (Reg. S) | EUR | 3,840,000 | 4,966,211 |
| | | | 9,283,349 |
| Industrial Conglomerates - 0.0% | | | |
| Alfa SA de CV 5.25% 3/25/24 (b) | | 450,000 | 469,125 |
| Machinery - 0.0% | | | |
| Xerium Technologies, Inc. 9.5% 8/15/21 | | 2,500,000 | 2,518,750 |
| Marine - 0.1% | | | |
| Navios Maritime Acquisition Corp./Navios Acquisition Finance U.S., Inc. 8.125% 11/15/21 (b) | | 12,785,000 | 10,451,738 |
| Navios Maritime Holdings, Inc.: | | | |
| 7.375% 1/15/22 (b) | | 1,520,000 | 1,241,650 |
| 11.25% 8/15/22 (b) | | 3,190,000 | 3,233,863 |
| | | | 14,927,251 |
| Professional Services - 0.0% | | | |
| IHS Markit Ltd. 4% 3/1/26 (b) | | 890,000 | 863,300 |
| Road & Rail - 0.0% | | | |
| Alpha Trains Finance SA 2.064% 6/30/25 | EUR | 2,726,000 | 3,380,162 |
| Hertz Corp. 7.625% 6/1/22 (b) | | 4,020,000 | 4,140,600 |
| JSC Georgian Railway 7.75% 7/11/22 (b) | | 650,000 | 716,560 |
| | | | 8,237,322 |
| Trading Companies & Distributors - 0.4% | | | |
| Air Lease Corp.: | | | |
| 2.625% 9/4/18 | | 16,438,000 | 16,446,536 |
| 3% 9/15/23 | | 3,204,000 | 3,116,515 |
| 3.375% 6/1/21 | | 10,493,000 | 10,562,914 |
| 3.75% 2/1/22 | | 26,396,000 | 26,757,613 |
| 3.875% 4/1/21 | | 11,610,000 | 11,822,541 |
| 4.25% 9/15/24 | | 12,030,000 | 12,327,112 |
| 4.75% 3/1/20 | | 11,796,000 | 12,204,430 |
| Ashtead Capital, Inc.: | | | |
| 4.125% 8/15/25 (b) | | 1,490,000 | 1,458,338 |
| 4.375% 8/15/27 (b) | | 1,575,000 | 1,519,875 |
| Avantor, Inc.: | | | |
| 6% 10/1/24 (b) | | 2,925,000 | 2,925,000 |
| 9% 10/1/25 (b) | | 5,300,000 | 5,313,250 |
| Brenntag Finance BV 1.125% 9/27/25 (Reg. S) | EUR | 2,880,000 | 3,489,356 |
| FLY Leasing Ltd.: | | | |
| 5.25% 10/15/24 | | 3,280,000 | 3,239,000 |
| 6.375% 10/15/21 | | 6,000,000 | 6,240,000 |
| Travis Perkins PLC: | | | |
| 4.375% 9/15/21 (Reg. S) | GBP | 1,253,000 | 1,799,325 |
| 4.5% 9/7/23 (Reg. S) | GBP | 1,950,000 | 2,787,513 |
| | | | 122,009,318 |
| Transportation Infrastructure - 0.0% | | | |
| Aeropuertos Argentina 2000 SA 6.875% 2/1/27 (b) | | 1,960,000 | 2,044,006 |
| Global Ports Finance PLC 6.872% 1/25/22 (b) | | 1,410,000 | 1,498,689 |
| Heathrow Funding Ltd. 6% 3/20/20 | GBP | 3,800,000 | 5,694,931 |
| | | | 9,237,626 |
| TOTAL INDUSTRIALS | | | 299,988,016 |
| INFORMATION TECHNOLOGY - 0.2% | | | |
| Communications Equipment - 0.0% | | | |
| Banglalink Digital Communications Ltd.: | | | |
| 8.625% 5/6/19 (b) | | 4,415,000 | 4,523,168 |
| 8.625% 5/6/19 (Reg. S) | | 500,000 | 512,250 |
| Proven Glory Capital Ltd. 3.25% 2/21/22 (Reg. S) | | 3,300,000 | 3,235,406 |
| | | | 8,270,824 |
| Electronic Equipment & Components - 0.0% | | | |
| Diamond 1 Finance Corp./Diamond 2 Finance Corp.: | | | |
| 3.48% 6/1/19 (b) | | 796,000 | 800,597 |
| 4.42% 6/15/21 (b) | | 2,400,000 | 2,449,338 |
| Tyco Electronics Group SA 2.375% 12/17/18 | | 2,244,000 | 2,241,843 |
| | | | 5,491,778 |
| Internet Software & Services - 0.0% | | | |
| Gogo Intermediate Holdings LLC/Gogo Finance Co., Inc. 12.5% 7/1/22 (b) | | 5,620,000 | 6,294,400 |
| IT Services - 0.0% | | | |
| Ceridian HCM Holding, Inc. 11% 3/15/21 (b) | | 440,000 | 454,665 |
| Gartner, Inc. 5.125% 4/1/25 (b) | | 1,335,000 | 1,368,375 |
| | | | 1,823,040 |
| Semiconductors & Semiconductor Equipment - 0.1% | | | |
| Micron Technology, Inc.: | | | |
| 5.25% 1/15/24 (b) | | 2,650,000 | 2,716,250 |
| 5.5% 2/1/25 | | 3,845,000 | 3,989,188 |
| 5.625% 1/15/26 (b) | | 1,285,000 | 1,329,975 |
| NXP BV/NXP Funding LLC: | | | |
| 3.875% 9/1/22 (b) | | 6,305,000 | 6,320,763 |
| 4.125% 6/1/21 (b) | | 5,555,000 | 5,653,324 |
| 4.625% 6/15/22 (b) | | 2,875,000 | 2,961,566 |
| Qorvo, Inc. 7% 12/1/25 | | 5,885,000 | 6,399,938 |
| Sensata Technologies UK Financing Co. PLC 6.25% 2/15/26 (b) | | 3,025,000 | 3,206,500 |
| Versum Materials, Inc. 5.5% 9/30/24 (b) | | 2,715,000 | 2,837,175 |
| | | | 35,414,679 |
| Software - 0.1% | | | |
| CDK Global, Inc. 4.875% 6/1/27 (b) | | 1,820,000 | 1,805,804 |
| Nuance Communications, Inc. 5.375% 8/15/20 (b) | | 1,939,000 | 1,955,966 |
| Open Text Corp. 5.875% 6/1/26 (b) | | 11,080,000 | 11,523,200 |
| SS&C Technologies Holdings, Inc. 5.875% 7/15/23 | | 1,745,000 | 1,834,431 |
| Symantec Corp. 5% 4/15/25 (b) | | 1,520,000 | 1,550,557 |
| | | | 18,669,958 |
| TOTAL INFORMATION TECHNOLOGY | | | 75,964,679 |
| MATERIALS - 1.0% | | | |
| Chemicals - 0.3% | | | |
| Braskem Finance Ltd.: | | | |
| 5.375% 5/2/22 (b) | | 1,560,000 | 1,624,350 |
| 5.75% 4/15/21 (b) | | 830,000 | 869,508 |
| 6.45% 2/3/24 | | 680,000 | 744,090 |
| Evolution Escrow Issuer LLC 7.5% 3/15/22 (b) | | 3,730,000 | 3,869,875 |
| Kraton Polymers LLC/Kraton Polymers Capital Corp. 7% 4/15/25 (b) | | 5,185,000 | 5,353,513 |
| NOVA Chemicals Corp.: | | | |
| 4.875% 6/1/24 (b) | | 5,820,000 | 5,747,250 |
| 5.25% 6/1/27 (b) | | 3,505,000 | 3,426,138 |
| Nufarm Australia Ltd. 6.375% 10/15/19 (b) | | 2,175,000 | 2,196,750 |
| OCP SA 5.625% 4/25/24 (b) | | 390,000 | 410,576 |
| Olin Corp.: | | | |
| 5% 2/1/30 | | 1,670,000 | 1,611,550 |
| 5.125% 9/15/27 | | 5,750,000 | 5,660,156 |
| Petkim Petrokimya Holding A/S 5.875% 1/26/23 (b) | | 925,000 | 926,856 |
| Platform Specialty Products Corp. 5.875% 12/1/25 (b) | | 5,315,000 | 5,288,425 |
| SunCoke Energy Partners LP/SunCoke Energy Partners Finance Corp. 7.5% 6/15/25 (b) | | 10,155,000 | 10,586,588 |
| The Dow Chemical Co.: | | | |
| 4.125% 11/15/21 | | 10,888,000 | 11,271,076 |
| 4.25% 11/15/20 | | 3,653,000 | 3,763,811 |
| TPC Group, Inc. 8.75% 12/15/20 (b) | | 13,345,000 | 13,411,725 |
| Trinseo Materials Operating SCA/Trinseo Materials Finance, Inc. 5.375% 9/1/25 (b) | | 4,650,000 | 4,702,313 |
| Tronox Finance PLC 5.75% 10/1/25 (b) | | 925,000 | 918,063 |
| | | | 82,382,613 |
| Construction Materials - 0.1% | | | |
| CEMEX Finance LLC: | | | |
| 4.625% 6/15/24 | EUR | 200,000 | 261,592 |
| 6% 4/1/24 (b) | | 5,665,000 | 5,919,925 |
| CEMEX S.A.B. de CV: | | | |
| 4.375% 3/5/23 (Reg. S) | EUR | 250,000 | 319,366 |
| 5.7% 1/11/25 (b) | | 1,960,000 | 2,043,006 |
| 7.75% 4/16/26 (b) | | 4,100,000 | 4,583,800 |
| Union Andina de Cementos SAA 5.875% 10/30/21 (b) | | 1,135,000 | 1,169,050 |
| | | | 14,296,739 |
| Containers & Packaging - 0.1% | | | |
| Ard Securities Finance Sarl 8.75% 1/31/23 pay-in-kind (b)(d) | | 3,840,000 | 3,993,600 |
| Ardagh Packaging Finance PLC/Ardagh MP Holdings U.S.A., Inc.: | | | |
| 4.25% 9/15/22 (b) | | 3,145,000 | 3,133,206 |
| 4.625% 5/15/23 (b) | | 6,305,000 | 6,297,119 |
| 6% 2/15/25 (b) | | 11,455,000 | 11,741,375 |
| Crown Americas LLC/Crown Americas Capital Corp. V 4.25% 9/30/26 | | 5,350,000 | 5,069,125 |
| OI European Group BV 4% 3/15/23 (b) | | 5,400,000 | 5,224,500 |
| Owens-Brockway Glass Container, Inc. 5.375% 1/15/25 (b) | | 3,930,000 | 4,008,600 |
| Silgan Holdings, Inc. 4.75% 3/15/25 | | 2,945,000 | 2,922,913 |
| | | | 42,390,438 |
| Metals & Mining - 0.5% | | | |
| ArcelorMittal SA: | | | |
| 6.125% 6/1/25 | | 1,900,000 | 2,092,945 |
| 7.25% 10/15/39 (d) | | 1,893,000 | 2,337,287 |
| BHP Billiton Financial (U.S.A.) Ltd.: | | | |
| 6.25% 10/19/75 (b)(d) | | 7,018,000 | 7,460,485 |
| 6.75% 10/19/75 (b)(d) | | 17,432,000 | 19,785,320 |
| Cliffs Natural Resources, Inc.: | | | |
| 4.875% 1/15/24 (b) | | 4,045,000 | 3,974,213 |
| 5.75% 3/1/25 (b) | | 4,720,000 | 4,581,350 |
| Commercial Metals Co. 5.375% 7/15/27 | | 8,490,000 | 8,548,369 |
| Constellium NV 5.875% 2/15/26 (b) | | 2,975,000 | 3,004,750 |
| Corporacion Nacional del Cobre de Chile (Codelco): | | | |
| 3.625% 8/1/27 (b) | | 8,277,000 | 7,996,492 |
| 4.5% 8/1/47 (b) | | 6,545,000 | 6,529,030 |
| CSN Resources SA 6.5% 7/21/20 (b) | | 1,880,000 | 1,851,424 |
| EVRAZ Group SA: | | | |
| 5.375% 3/20/23 (b) | | 1,195,000 | 1,224,875 |
| 8.25% 1/28/21 (Reg. S) | | 1,135,000 | 1,257,013 |
| Ferrexpo Finance PLC: | | | |
| 10.375% 4/7/19 (b) | | 90,000 | 92,819 |
| 10.375% 4/7/19 (b) | | 367,000 | 378,496 |
| 10.375% 4/7/19 (Reg. S) | | 655,000 | 675,518 |
| 10.375% 4/7/19 (Reg. S) | | 985,000 | 1,015,855 |
| First Quantum Minerals Ltd.: | | | |
| 6.5% 3/1/24 (b) | | 3,455,000 | 3,433,406 |
| 6.875% 3/1/26 (b) | | 3,525,000 | 3,511,781 |
| 7.25% 5/15/22 (b) | | 2,220,000 | 2,286,600 |
| 7.25% 4/1/23 (b) | | 12,885,000 | 13,368,188 |
| 7.5% 4/1/25 (b) | | 3,325,000 | 3,424,750 |
| FMG Resources (August 2006) Pty Ltd.: | | | |
| 4.75% 5/15/22 (b) | | 4,230,000 | 4,226,828 |
| 5.125% 5/15/24 (b) | | 3,895,000 | 3,884,055 |
| Freeport-McMoRan, Inc.: | | | |
| 3.55% 3/1/22 | | 10,100,000 | 9,825,280 |
| 3.875% 3/15/23 | | 3,080,000 | 2,987,600 |
| 4.55% 11/14/24 | | 9,320,000 | 9,110,300 |
| 5.4% 11/14/34 | | 1,289,000 | 1,253,553 |
| 5.45% 3/15/43 | | 4,539,000 | 4,357,440 |
| Gold Fields Orogen Holding BVI Ltd. 4.875% 10/7/20 (b) | | 580,000 | 587,250 |
| GTL Trade Finance, Inc. 5.893% 4/29/24 (b) | | 850,000 | 907,885 |
| Metinvest BV: | | | |
| 9.3725% 12/31/21 pay-in-kind(Reg. S) (d) | | 262,763 | 268,036 |
| 9.3725% 12/31/21 pay-in-kind (d) | | 4,591,285 | 4,683,432 |
| Polyus Finance PLC 5.25% 2/7/23 (b) | | 590,000 | 604,234 |
| Steel Dynamics, Inc.: | | | |
| 4.125% 9/15/25 | | 4,225,000 | 4,087,688 |
| 5.125% 10/1/21 | | 2,205,000 | 2,232,563 |
| Stillwater Mining Co.: | | | |
| 6.125% 6/27/22 (b) | | 2,585,000 | 2,603,147 |
| 7.125% 6/27/25 (b) | | 1,185,000 | 1,212,611 |
| Vale Overseas Ltd. 4.375% 1/11/22 | | 12,930,000 | 13,246,785 |
| Vedanta Resources PLC: | | | |
| 6.375% 7/30/22 (b) | | 2,510,000 | 2,578,774 |
| 8.25% 6/7/21 (b) | | 1,275,000 | 1,392,938 |
| VM Holding SA 5.375% 5/4/27 (b) | | 565,000 | 583,080 |
| | | | 169,464,445 |
| TOTAL MATERIALS | | | 308,534,235 |
| REAL ESTATE - 2.5% | | | |
| Equity Real Estate Investment Trusts (REITs) - 1.3% | | | |
| Alexandria Real Estate Equities, Inc.: | | | |
| 2.75% 1/15/20 | | 2,884,000 | 2,873,678 |
| 4.6% 4/1/22 | | 4,896,000 | 5,114,669 |
| alstria office REIT-AG 1.5% 11/15/27 (Reg. S) | EUR | 5,200,000 | 6,129,021 |
| American Campus Communities Operating Partnership LP 3.75% 4/15/23 | | 3,491,000 | 3,499,391 |
| American Homes 4 Rent 4.25% 2/15/28 | | 1,025,000 | 1,008,922 |
| AvalonBay Communities, Inc. 3.625% 10/1/20 | | 5,005,000 | 5,089,902 |
| Boston Properties, Inc. 3.85% 2/1/23 | | 5,829,000 | 5,967,832 |
| Camden Property Trust: | | | |
| 2.95% 12/15/22 | | 6,621,000 | 6,511,585 |
| 4.25% 1/15/24 | | 9,191,000 | 9,447,549 |
| CBL & Associates LP 4.6% 10/15/24 | | 272,000 | 223,288 |
| CommonWealth REIT 5.875% 9/15/20 | | 2,130,000 | 2,224,024 |
| Corporate Office Properties LP 5% 7/1/25 | | 12,377,000 | 12,841,270 |
| CTR Partnership LP/CareTrust Capital Corp. 5.25% 6/1/25 | | 4,820,000 | 4,844,100 |
| DDR Corp.: | | | |
| 3.625% 2/1/25 | | 8,557,000 | 8,265,715 |
| 4.25% 2/1/26 | | 22,796,000 | 22,602,331 |
| 4.625% 7/15/22 | | 20,268,000 | 21,094,198 |
| 4.7% 6/1/27 | | 840,000 | 857,068 |
| Duke Realty LP: | | | |
| 3.625% 4/15/23 | | 6,287,000 | 6,358,896 |
| 3.75% 12/1/24 | | 5,408,000 | 5,471,609 |
| 3.875% 10/15/22 | | 17,388,000 | 17,798,327 |
| Equinix, Inc. 5.375% 5/15/27 | | 1,680,000 | 1,713,600 |
| Equity One, Inc. 3.75% 11/15/22 | | 18,100,000 | 18,213,985 |
| ERP Operating LP: | | | |
| 2.375% 7/1/19 | | 8,777,000 | 8,744,544 |
| 4.75% 7/15/20 | | 7,700,000 | 8,020,546 |
| Health Care REIT, Inc. 2.25% 3/15/18 | | 5,151,000 | 5,150,983 |
| iStar Financial, Inc. 6% 4/1/22 | | 775,000 | 780,813 |
| Lexington Corporate Properties Trust 4.4% 6/15/24 | | 4,608,000 | 4,546,593 |
| MPT Operating Partnership LP/MPT Finance Corp.: | | | |
| 5% 10/15/27 | | 2,235,000 | 2,183,595 |
| 5.25% 8/1/26 | | 4,930,000 | 4,899,188 |
| 6.375% 3/1/24 | | 2,250,000 | 2,368,125 |
| Omega Healthcare Investors, Inc.: | | | |
| 4.375% 8/1/23 | | 42,087,000 | 41,923,832 |
| 4.5% 1/15/25 | | 10,686,000 | 10,401,176 |
| 4.5% 4/1/27 | | 50,980,000 | 48,714,708 |
| 4.75% 1/15/28 | | 29,482,000 | 28,538,192 |
| 4.95% 4/1/24 | | 17,495,000 | 17,857,455 |
| 5.25% 1/15/26 | | 29,233,000 | 29,474,936 |
| Retail Opportunity Investments Partnership LP: | | | |
| 4% 12/15/24 | | 3,376,000 | 3,243,930 |
| 5% 12/15/23 | | 2,030,000 | 2,069,410 |
| SBA Communications Corp. 4.875% 9/1/24 | | 2,205,000 | 2,177,438 |
| Senior Housing Properties Trust 6.75% 4/15/20 | | 250,000 | 262,948 |
| Weingarten Realty Investors 3.375% 10/15/22 | | 2,729,000 | 2,709,010 |
| WP Carey, Inc. 4% 2/1/25 | | 34,017,000 | 33,636,729 |
| | | | 425,855,111 |
| Real Estate Management & Development - 1.2% | | | |
| Brandywine Operating Partnership LP: | | | |
| 3.95% 2/15/23 | | 29,103,000 | 29,179,931 |
| 3.95% 11/15/27 | | 18,049,000 | 17,388,202 |
| 4.1% 10/1/24 | | 15,881,000 | 15,863,764 |
| 4.55% 10/1/29 | | 17,155,000 | 17,127,788 |
| Carmila 2.125% 3/7/28 | EUR | 2,300,000 | 2,796,516 |
| CBRE Group, Inc. 5% 3/15/23 | | 465,000 | 476,928 |
| Deutsche Annington Finance BV 5% 10/2/23 (b) | | 5,800,000 | 6,024,780 |
| Digital Realty Trust LP: | | | |
| 3.4% 10/1/20 | | 17,707,000 | 17,904,302 |
| 3.625% 10/1/22 | | 9,206,000 | 9,308,056 |
| 3.95% 7/1/22 | | 11,840,000 | 12,162,320 |
| 4.75% 10/1/25 | | 30,612,000 | 32,308,281 |
| 5.25% 3/15/21 | | 5,708,000 | 6,042,204 |
| Essex Portfolio LP 3.875% 5/1/24 | | 8,802,000 | 8,869,842 |
| Greystar Real Estate Partners 5.75% 12/1/25 (b) | | 720,000 | 729,000 |
| Host Hotels & Resorts LP 4.75% 3/1/23 | | 150,000 | 156,573 |
| Howard Hughes Corp. 5.375% 3/15/25 (b) | | 4,440,000 | 4,378,950 |
| Hunt Companies, Inc. 9.625% 3/1/21 (b) | | 870,000 | 912,195 |
| Inversiones y Representaciones SA 11.5% 7/20/20 (Reg. S) | | 5,000 | 5,693 |
| IRSA Propiedades Comerciales SA 8.75% 3/23/23 (b) | | 1,930,000 | 2,126,320 |
| Liberty Property LP: | | | |
| 3.375% 6/15/23 | | 8,174,000 | 8,187,025 |
| 4.125% 6/15/22 | | 14,880,000 | 15,357,082 |
| 4.4% 2/15/24 | | 13,017,000 | 13,580,382 |
| 4.75% 10/1/20 | | 11,282,000 | 11,761,358 |
| Mack-Cali Realty LP: | | | |
| 3.15% 5/15/23 | | 14,735,000 | 13,410,025 |
| 4.5% 4/18/22 | | 17,365,000 | 17,044,327 |
| Mattamy Group Corp.: | | | |
| 6.5% 10/1/25 (b) | | 570,000 | 595,650 |
| 6.875% 12/15/23 (b) | | 700,000 | 734,125 |
| Post Apartment Homes LP 3.375% 12/1/22 | | 2,570,000 | 2,566,481 |
| Realogy Group LLC/Realogy Co.-Issuer Corp. 4.5% 4/15/19 (b) | | 235,000 | 238,231 |
| SELP Finance SARL 1.25% 10/25/23 (Reg. S) | EUR | 3,485,000 | 4,257,027 |
| Shimao Property Holdings Ltd. 4.75% 7/3/22 | | 660,000 | 651,815 |
| Tanger Properties LP: | | | |
| 3.125% 9/1/26 | | 11,019,000 | 10,098,939 |
| 3.75% 12/1/24 | | 21,455,000 | 21,045,418 |
| 3.875% 12/1/23 | | 4,812,000 | 4,780,552 |
| TLG Immobilien AG 1.375% 11/27/24 (Reg. S) | EUR | 2,900,000 | 3,510,025 |
| Ventas Realty LP: | | | |
| 3.125% 6/15/23 | | 5,458,000 | 5,347,294 |
| 3.5% 2/1/25 | | 5,961,000 | 5,845,557 |
| 3.75% 5/1/24 | | 25,000,000 | 25,111,397 |
| 4% 3/1/28 | | 10,982,000 | 10,869,419 |
| 4.125% 1/15/26 | | 5,557,000 | 5,610,225 |
| Ventas Realty LP/Ventas Capital Corp. 4.25% 3/1/22 | | 300,000 | 309,066 |
| | | | 364,673,065 |
| TOTAL REAL ESTATE | | | 790,528,176 |
| TELECOMMUNICATION SERVICES - 1.1% | | | |
| Diversified Telecommunication Services - 0.9% | | | |
| Altice Financing SA: | | | |
| 6.625% 2/15/23 (b) | | 2,780,000 | 2,776,525 |
| 7.5% 5/15/26 (b) | | 3,905,000 | 3,934,288 |
| Altice Finco SA 7.625% 2/15/25 (b) | | 5,335,000 | 5,254,975 |
| AT&T, Inc.: | | | |
| 2.45% 6/30/20 | | 11,294,000 | 11,173,598 |
| 3% 6/30/22 | | 12,546,000 | 12,335,501 |
| 3.4% 5/15/25 | | 39,520,000 | 38,048,206 |
| 3.6% 2/17/23 | | 44,557,000 | 44,657,309 |
| 5.875% 10/1/19 | | 5,944,000 | 6,216,057 |
| 6.3% 1/15/38 | | 16,665,000 | 19,214,992 |
| Axtel S.A.B. de CV 6.375% 11/14/24 (b) | | 1,650,000 | 1,680,938 |
| BellSouth Capital Funding Corp. 7.875% 2/15/30 | | 40,000 | 50,158 |
| C&W Senior Financing Designated Activity Co. 6.875% 9/15/27 (b) | | 820,000 | 846,650 |
| Colombia Telecomunicaciones SA 5.375% 9/27/22 (b) | | 415,000 | 420,814 |
| Frontier Communications Corp.: | | | |
| 10.5% 9/15/22 | | 3,770,000 | 3,218,638 |
| 11% 9/15/25 | | 6,400,000 | 5,016,000 |
| GTH Finance BV: | | | |
| 6.25% 4/26/20 (b) | | 765,000 | 795,297 |
| 7.25% 4/26/23 (b) | | 3,985,000 | 4,356,514 |
| Sable International Finance Ltd. 6.875% 8/1/22 (b) | | 4,575,000 | 4,849,500 |
| SFR Group SA: | | | |
| 6% 5/15/22 (b) | | 4,550,000 | 4,419,188 |
| 6.25% 5/15/24 (b) | | 3,140,000 | 2,924,125 |
| 7.375% 5/1/26 (b) | | 2,380,000 | 2,297,414 |
| TalkTalk Telecom Group PLC 5.375% 1/15/22 (Reg. S) | GBP | 560,000 | 759,326 |
| TDC A/S 3.5% 2/26/3015 (Reg. S) (d) | EUR | 2,546,000 | 3,124,757 |
| Telecom Italia Capital SA: | | | |
| 6% 9/30/34 | | 3,775,000 | 3,954,313 |
| 6.375% 11/15/33 | | 3,785,000 | 4,144,575 |
| Telefonica Celular del Paraguay SA 6.75% 12/13/22 (b) | | 1,650,000 | 1,688,313 |
| Telenet Finance Luxembourg Notes SARL 5.5% 3/1/28 (b) | | 4,400,000 | 4,246,000 |
| Verizon Communications, Inc.: | | | |
| 2.625% 2/21/20 | | 12,550,000 | 12,524,355 |
| 5.012% 4/15/49 | | 2,831,000 | 2,872,802 |
| 5.012% 8/21/54 | | 55,038,000 | 54,518,791 |
| 5.5% 3/16/47 | | 36,099,000 | 39,437,400 |
| | | | 301,757,319 |
| Wireless Telecommunication Services - 0.2% | | | |
| America Movil S.A.B. de CV 3.125% 7/16/22 | | 9,218,000 | 9,126,244 |
| Comcel Trust 6.875% 2/6/24 (b) | | 2,525,000 | 2,641,781 |
| Digicel Group Ltd. 6.75% 3/1/23 (b) | | 560,000 | 521,500 |
| Millicom International Cellular SA 6% 3/15/25 (b) | | 1,375,000 | 1,445,469 |
| MTN (Mauritius) Investments Ltd. 6.5% 10/13/26 (b) | | 1,095,000 | 1,164,095 |
| Sprint Communications, Inc.: | | | |
| 6% 11/15/22 | | 3,685,000 | 3,638,938 |
| 9% 11/15/18 (b) | | 2,225,000 | 2,308,438 |
| Sprint Corp.: | | | |
| 7.25% 9/15/21 | | 4,240,000 | 4,425,500 |
| 7.875% 9/15/23 | | 3,925,000 | 4,062,375 |
| T-Mobile U.S.A., Inc.: | | | |
| 4% 4/15/22 | | 5,110,000 | 5,110,000 |
| 4.5% 2/1/26 | | 4,055,000 | 3,978,969 |
| 4.75% 2/1/28 | | 2,705,000 | 2,638,403 |
| 6.375% 3/1/25 | | 4,860,000 | 5,127,300 |
| 6.5% 1/15/24 | | 6,085,000 | 6,374,038 |
| 6.625% 4/1/23 | | 6,440,000 | 6,667,976 |
| TBG Global Pte. Ltd. 5.25% 2/10/22 (Reg. S) | | 485,000 | 491,173 |
| | | | 59,722,199 |
| TOTAL TELECOMMUNICATION SERVICES | | | 361,479,518 |
| UTILITIES - 1.9% | | | |
| Electric Utilities - 1.0% | | | |
| American Electric Power Co., Inc. 2.95% 12/15/22 | | 4,935,000 | 4,873,965 |
| DPL, Inc. 6.75% 10/1/19 | | 2,490,000 | 2,614,500 |
| Duquesne Light Holdings, Inc.: | | | |
| 5.9% 12/1/21 (b) | | 29,344,000 | 31,933,444 |
| 6.4% 9/15/20 (b) | | 25,897,000 | 27,907,767 |
| Eversource Energy: | | | |
| 1.45% 5/1/18 | | 3,325,000 | 3,320,549 |
| 2.8% 5/1/23 | | 15,104,000 | 14,654,761 |
| Exelon Corp. 2.85% 6/15/20 | | 4,888,000 | 4,867,506 |
| FirstEnergy Corp.: | | | |
| 4.25% 3/15/23 | | 31,243,000 | 32,155,907 |
| 7.375% 11/15/31 | | 64,123,000 | 84,546,095 |
| FirstEnergy Solutions Corp. 6.05% 8/15/21 | | 20,194,000 | 7,269,840 |
| InterGen NV 7% 6/30/23 (b) | | 3,595,000 | 3,586,013 |
| IPALCO Enterprises, Inc.: | | | |
| 3.45% 7/15/20 | | 27,495,000 | 27,566,762 |
| 3.7% 9/1/24 | | 10,462,000 | 10,230,945 |
| Israel Electric Corp. Ltd.: | | | |
| 4.25% 8/14/28 (b) | | 650,000 | 639,444 |
| 7.75% 12/15/27 (Reg. S) | | 600,000 | 750,588 |
| LG&E and KU Energy LLC 3.75% 11/15/20 | | 1,450,000 | 1,475,957 |
| Monongahela Power Co. 4.1% 4/15/24 (b) | | 3,982,000 | 4,148,208 |
| Nevada Power Co. 6.5% 5/15/18 | | 790,000 | 796,981 |
| NRG Yield Operating LLC 5% 9/15/26 | | 3,945,000 | 3,875,489 |
| NSG Holdings II LLC/NSG Holdings, Inc. 7.75% 12/15/25 (b) | | 8,306,803 | 9,095,950 |
| NV Energy, Inc. 6.25% 11/15/20 | | 3,500,000 | 3,797,990 |
| Pampa Holding SA 7.5% 1/24/27 (b) | | 885,000 | 927,038 |
| PG&E Corp. 2.4% 3/1/19 | | 1,683,000 | 1,673,096 |
| PPL Capital Funding, Inc. 3.4% 6/1/23 | | 7,184,000 | 7,174,954 |
| Progress Energy, Inc. 4.4% 1/15/21 | | 12,059,000 | 12,455,957 |
| TECO Finance, Inc. 5.15% 3/15/20 | | 3,761,000 | 3,911,278 |
| | | | 306,250,984 |
| Gas Utilities - 0.0% | | | |
| Southern Natural Gas Co./Southern Natural Issuing Corp. 4.4% 6/15/21 | | 3,646,000 | 3,777,809 |
| Independent Power and Renewable Electricity Producers - 0.4% | | | |
| Dolphin Subsidiary II, Inc. 7.25% 10/15/21 | | 67,644,000 | 73,731,960 |
| Dynegy, Inc.: | | | |
| 7.625% 11/1/24 | | 5,590,000 | 6,009,250 |
| 8.125% 1/30/26 (b) | | 3,095,000 | 3,389,025 |
| Emera U.S. Finance LP: | | | |
| 2.15% 6/15/19 | | 5,136,000 | 5,086,774 |
| 2.7% 6/15/21 | | 5,055,000 | 4,959,612 |
| 3.55% 6/15/26 | | 8,087,000 | 7,785,420 |
| Listrindo Capital BV 4.95% 9/14/26 (b) | | 620,000 | 600,656 |
| NextEra Energy Partners LP: | | | |
| 4.25% 9/15/24 (b) | | 1,345,000 | 1,326,506 |
| 4.5% 9/15/27 (b) | | 935,000 | 899,938 |
| NRG Energy, Inc.: | | | |
| 5.75% 1/15/28 (b) | | 2,250,000 | 2,221,425 |
| 6.25% 5/1/24 | | 4,510,000 | 4,667,850 |
| 6.625% 1/15/27 | | 1,695,000 | 1,750,088 |
| TerraForm Power Operating LLC: | | | |
| 4.25% 1/31/23 (b) | | 1,040,000 | 1,019,200 |
| 5% 1/31/28 (b) | | 1,040,000 | 1,006,512 |
| The AES Corp.: | | | |
| 4.875% 5/15/23 | | 9,515,000 | 9,598,256 |
| 5.125% 9/1/27 | | 7,280,000 | 7,371,000 |
| 6% 5/15/26 | | 1,545,000 | 1,622,250 |
| Three Gorges Finance II (Cayman Islands) Ltd. 1.3% 6/21/24 (Reg. S) | EUR | 2,500,000 | 3,056,527 |
| | | | 136,102,249 |
| Multi-Utilities - 0.5% | | | |
| Berkshire Hathaway Energy Co. 2% 11/15/18 | | 12,172,000 | 12,143,958 |
| Dominion Resources, Inc.: | | | |
| 3 month U.S. LIBOR + 2.300% 3.9934% 9/30/66 (d)(e) | | 35,229,000 | 33,203,333 |
| 3 month U.S. LIBOR + 2.825% 4.5197% 6/30/66 (d)(e) | | 10,345,000 | 10,241,550 |
| NiSource Finance Corp.: | | | |
| 5.25% 2/15/43 | | 12,739,000 | 14,367,445 |
| 5.8% 2/1/42 | | 6,336,000 | 7,447,128 |
| 5.95% 6/15/41 | | 11,832,000 | 14,391,344 |
| 6.8% 1/15/19 | | 1,039,000 | 1,074,693 |
| Puget Energy, Inc.: | | | |
| 6% 9/1/21 | | 15,565,000 | 16,946,165 |
| 6.5% 12/15/20 | | 5,125,000 | 5,609,213 |
| Sempra Energy: | | | |
| 2.875% 10/1/22 | | 5,760,000 | 5,661,800 |
| 6% 10/15/39 | | 15,009,000 | 18,503,866 |
| Wind Tre SpA: | | | |
| 3.125% 1/20/25 (Reg. S) | EUR | 1,177,000 | 1,281,576 |
| 5% 1/20/26 (b) | | 6,960,000 | 5,988,384 |
| Wisconsin Energy Corp. 3 month U.S. LIBOR + 2.113% 3.9513% 5/15/67 (d)(e) | | 3,860,000 | 3,763,500 |
| | | | 150,623,955 |
| Water Utilities - 0.0% | | | |
| Pennon Group PLC 2.875% (Reg. S) (c)(d) | GBP | 2,375,000 | 3,281,924 |
| TOTAL UTILITIES | | | 600,036,921 |
|
| TOTAL NONCONVERTIBLE BONDS | | | 9,561,105,751 |
|
| TOTAL CORPORATE BONDS | | | |
| (Cost $9,434,844,883) | | | 9,576,664,814 |
|
| U.S. Government and Government Agency Obligations - 41.1% | | | |
| U.S. Treasury Inflation-Protected Obligations - 7.2% | | | |
| U.S. Treasury Inflation-Indexed Bonds: | | | |
| 0.75% 2/15/45 | | $235,550,250 | $222,752,230 |
| 0.875% 2/15/47 | | 170,775,097 | 166,030,818 |
| 1% 2/15/46 | | 147,095,993 | 147,775,144 |
| 1.375% 2/15/44 | | 140,134,694 | 153,090,944 |
| U.S. Treasury Inflation-Indexed Notes: | | | |
| 0.125% 7/15/24 | | 171,581,004 | 166,981,046 |
| 0.125% 7/15/26 | | 197,567,166 | 188,704,094 |
| 0.25% 1/15/25 | | 78,062,250 | 75,975,464 |
| 0.375% 7/15/25 | | 412,385,136 | 404,947,621 |
| 0.375% 1/15/27 | | 404,607,253 | 391,944,500 |
| 0.375% 7/15/27 | | 151,168,500 | 146,554,982 |
| 0.625% 1/15/26 | | 207,502,000 | 206,393,581 |
|
| TOTAL U.S. TREASURY INFLATION-PROTECTED OBLIGATIONS | | | 2,271,150,424 |
|
| U.S. Treasury Obligations - 33.9% | | | |
| U.S. Treasury Bonds: | | | |
| 2.5% 2/15/45 | | 2,580,000 | 2,284,812 |
| 2.5% 2/15/46 | | 2,072,000 | 1,828,135 |
| 2.75% 11/15/47 | | 286,780,000 | 265,697,191 |
| 3% 5/15/45 | | 145,382,000 | 142,048,436 |
| 3% 11/15/45 | | 207,323,000 | 202,431,473 |
| 3% 2/15/47 | | 658,626,000 | 642,237,534 |
| 3% 5/15/47 | | 103,797,000 | 101,169,638 |
| 3% 2/15/48 | | 6,295,000 | 6,139,838 |
| 5% 5/15/37 | | 620,000 | 800,866 |
| U.S. Treasury Notes: | | | |
| 0.75% 8/31/18 | | 5,500,000 | 5,468,203 |
| 1.125% 6/30/21 | | 1,125,000 | 1,076,045 |
| 1.25% 3/31/21 | | 1,180,775,000 | 1,138,894,387 |
| 1.25% 10/31/21 | | 453,470,000 | 433,187,847 |
| 1.375% 4/30/21 | | 334,800,000 | 323,735,905 |
| 1.5% 5/15/20 | | 308,760,000 | 303,368,760 |
| 1.5% 8/15/26 | | 218,742,000 | 196,320,945 |
| 1.625% 7/31/20 | | 7,093,000 | 6,973,583 |
| 1.625% 5/15/26 | | 25,000,000 | 22,750,000 |
| 1.75% 12/31/20 | | 600,000,000 | 589,265,628 |
| 1.75% 6/30/22 | | 952,845,000 | 919,458,207 |
| 1.875% 3/31/22 | | 1,455,761,000 | 1,415,841,204 |
| 1.875% 7/31/22 | | 903,426,000 | 875,476,258 |
| 1.875% 9/30/22 | | 67,650,000 | 65,448,733 |
| 2% 12/31/21 | | 906,934,000 | 888,511,903 |
| 2% 4/30/24 | | 25,000,000 | 23,928,711 |
| 2% 11/15/26 | | 11,480,000 | 10,706,894 |
| 2.125% 12/31/22 | | 368,686,000 | 360,001,716 |
| 2.125% 7/31/24 | | 649,329,000 | 624,700,152 |
| 2.125% 11/30/24 | | 424,340,000 | 406,918,853 |
| 2.25% 12/31/24 | | 618,783,000 | 597,778,219 |
| 2.25% 11/15/27 | | 192,640,000 | 182,278,075 |
|
| TOTAL U.S. TREASURY OBLIGATIONS | | | 10,756,728,151 |
|
| TOTAL U.S. GOVERNMENT AND GOVERNMENT AGENCY OBLIGATIONS | | | |
| (Cost $13,434,640,595) | | | 13,027,878,575 |
|
| U.S. Government Agency - Mortgage Securities - 17.3% | | | |
| Fannie Mae - 9.3% | | | |
| 12 month U.S. LIBOR + 1.445% 3.195% 4/1/37 (d)(e) | | 57,322 | 59,348 |
| 12 month U.S. LIBOR + 1.480% 3.312% 7/1/34 (d)(e) | | 26,487 | 27,427 |
| 12 month U.S. LIBOR + 1.495% 3.19% 1/1/35 (d)(e) | | 91,196 | 94,246 |
| 12 month U.S. LIBOR + 1.507% 3.2% 7/1/37 (d)(e) | | 16,188 | 16,790 |
| 12 month U.S. LIBOR + 1.553% 3.326% 6/1/36 (d)(e) | | 71,760 | 74,659 |
| 12 month U.S. LIBOR + 1.565% 3.315% 3/1/37 (d)(e) | | 24,859 | 25,827 |
| 12 month U.S. LIBOR + 1.594% 3.448% 5/1/36 (d)(e) | | 118,256 | 124,151 |
| 12 month U.S. LIBOR + 1.617% 3.327% 3/1/33 (d)(e) | | 62,037 | 64,355 |
| 12 month U.S. LIBOR + 1.641% 3.366% 9/1/36 (d)(e) | | 47,641 | 49,611 |
| 12 month U.S. LIBOR + 1.643% 3.315% 9/1/36 (d)(e) | | 32,237 | 33,517 |
| 12 month U.S. LIBOR + 1.645% 3.395% 6/1/47 (d)(e) | | 50,199 | 51,651 |
| 12 month U.S. LIBOR + 1.718% 3.429% 5/1/35 (d)(e) | | 147,194 | 153,272 |
| 12 month U.S. LIBOR + 1.725% 2.592% 6/1/42 (d)(e) | | 192,623 | 198,344 |
| 12 month U.S. LIBOR + 1.728% 3.445% 11/1/36 (d)(e) | | 48,021 | 50,608 |
| 12 month U.S. LIBOR + 1.741% 3.477% 3/1/40 (d)(e) | | 232,578 | 239,535 |
| 12 month U.S. LIBOR + 1.745% 3.448% 7/1/35 (d)(e) | | 59,048 | 60,719 |
| 12 month U.S. LIBOR + 1.750% 3.008% 8/1/41 (d)(e) | | 530,575 | 553,037 |
| 12 month U.S. LIBOR + 1.788% 3.444% 2/1/36 (d)(e) | | 180,231 | 185,591 |
| 12 month U.S. LIBOR + 1.800% 2.747% 1/1/42 (d)(e) | | 867,076 | 900,051 |
| 12 month U.S. LIBOR + 1.800% 3.573% 7/1/41 (d)(e) | | 173,614 | 182,989 |
| 12 month U.S. LIBOR + 1.810% 3.56% 12/1/39 (d)(e) | | 102,932 | 106,164 |
| 12 month U.S. LIBOR + 1.812% 3.562% 12/1/40 (d)(e) | | 5,892,241 | 6,164,575 |
| 12 month U.S. LIBOR + 1.818% 2.689% 2/1/42 (d)(e) | | 960,348 | 995,460 |
| 12 month U.S. LIBOR + 1.818% 3.016% 9/1/41 (d)(e) | | 100,102 | 103,184 |
| 12 month U.S. LIBOR + 1.818% 3.266% 7/1/41 (d)(e) | | 133,064 | 139,676 |
| 12 month U.S. LIBOR + 1.820% 3.695% 12/1/35 (d)(e) | | 193,062 | 202,327 |
| 12 month U.S. LIBOR + 1.830% 3.337% 10/1/41 (d)(e) | | 92,702 | 97,541 |
| 12 month U.S. LIBOR + 1.851% 3.518% 5/1/36 (d)(e) | | 68,918 | 71,209 |
| 12 month U.S. LIBOR + 1.900% 3.745% 7/1/37 (d)(e) | | 65,866 | 69,503 |
| 6 month U.S. LIBOR + 1.375% 2.875% 10/1/34 (d)(e) | | 1,269 | 1,310 |
| 6 month U.S. LIBOR + 1.475% 2.975% 10/1/33 (d)(e) | | 1,193 | 1,220 |
| 6 month U.S. LIBOR + 1.505% 3.031% 1/1/35 (d)(e) | | 172,936 | 177,592 |
| 6 month U.S. LIBOR + 1.510% 3.043% 2/1/33 (d)(e) | | 754 | 773 |
| 6 month U.S. LIBOR + 1.535% 2.938% 12/1/34 (d)(e) | | 30,703 | 31,548 |
| 6 month U.S. LIBOR + 1.535% 2.958% 3/1/35 (d)(e) | | 15,249 | 15,675 |
| 6 month U.S. LIBOR + 1.556% 3.046% 10/1/33 (d)(e) | | 11,644 | 11,981 |
| 6 month U.S. LIBOR + 1.565% 2.999% 7/1/35 (d)(e) | | 13,963 | 14,229 |
| 6 month U.S. LIBOR + 1.740% 3.316% 12/1/34 (d)(e) | | 3,625 | 3,781 |
| 6 month U.S. LIBOR + 1.960% 3.46% 9/1/35 (d)(e) | | 25,281 | 26,425 |
| U.S. TREASURY 1 YEAR INDEX + 1.945% 3.078% 10/1/33 (d)(e) | | 266,874 | 277,548 |
| U.S. TREASURY 1 YEAR INDEX + 2.208% 3.083% 3/1/35 (d)(e) | | 36,397 | 38,425 |
| U.S. TREASURY 1 YEAR INDEX + 2.270% 3.417% 6/1/36 (d)(e) | | 198,941 | 210,123 |
| U.S. TREASURY 1 YEAR INDEX + 2.295% 3.54% 10/1/33 (d)(e) | | 65,978 | 69,171 |
| U.S. TREASURY 1 YEAR INDEX + 2.447% 3.537% 7/1/34 (d)(e) | | 146,287 | 155,040 |
| 2.5% 10/1/30 to 8/1/43 | | 16,402,207 | 15,519,614 |
| 3% 3/1/25 to 2/1/47 | | 516,078,142 | 505,824,549 |
| 3% 3/1/33 (h) | | 53,050,000 | 52,820,294 |
| 3% 3/1/33 (h) | | 300,000 | 298,701 |
| 3% 3/1/33 (h) | | 14,900,000 | 14,835,483 |
| 3% 3/1/33 (h) | | 5,950,000 | 5,924,237 |
| 3% 3/1/33 (h) | | 22,600,000 | 22,502,142 |
| 3% 3/1/33 (h) | | 19,150,000 | 19,067,081 |
| 3% 3/1/33 (h) | | 113,700,000 | 113,207,679 |
| 3% 3/1/48 (h) | | 104,500,000 | 101,264,262 |
| 3% 3/1/48 (h) | | 61,600,000 | 59,692,618 |
| 3% 3/1/48 (h) | | 20,650,000 | 20,010,593 |
| 3.5% 3/1/25 to 10/1/56 | | 561,317,484 | 564,176,613 |
| 3.5% 3/1/48 (h) | | 160,000,000 | 159,707,536 |
| 3.5% 3/1/48 (h) | | 65,000,000 | 64,881,187 |
| 3.5% 3/1/48 (h) | | 28,200,000 | 28,148,453 |
| 3.5% 3/1/48 (h) | | 28,300,000 | 28,248,270 |
| 4% 9/1/24 to 10/1/46 | | 287,421,828 | 296,615,672 |
| 4% 3/1/48 (h) | | 50,400,000 | 51,628,500 |
| 4% 3/1/48 (h) | | 35,900,000 | 36,775,063 |
| 4% 3/1/48 (h) | | 38,500,000 | 39,438,438 |
| 4% 3/1/48 (h) | | 48,800,000 | 49,989,500 |
| 4% 3/1/48 (h) | | 46,950,000 | 48,094,406 |
| 4% 4/1/48 (h) | | 209,550,000 | 214,313,994 |
| 4.5% 6/1/33 to 8/1/56 | | 100,514,826 | 106,184,227 |
| 5% 3/1/18 to 8/1/56 | | 191,611,636 | 206,461,512 |
| 5.255% 8/1/41 | | 2,143,800 | 2,288,457 |
| 5.5% 3/1/18 to 5/1/44 | | 47,510,497 | 52,238,933 |
| 6% 7/1/19 to 1/1/42 | | 14,941,359 | 16,603,106 |
| 6.309% 2/1/39 | | 3,384,349 | 3,666,765 |
| 6.5% 4/1/18 to 8/1/39 | | 24,608,047 | 27,513,965 |
| 7% 9/1/21 to 7/1/37 | | 1,112,620 | 1,251,831 |
| 7.5% 6/1/25 to 2/1/32 | | 494,154 | 560,331 |
| 8% 7/1/29 to 3/1/37 | | 11,952 | 14,060 |
| 8.5% 12/1/19 to 6/1/22 | | 238 | 256 |
| 9.5% 6/1/18 to 9/1/21 | | 1,963 | 2,015 |
|
| TOTAL FANNIE MAE | | | 2,941,900,551 |
|
| Freddie Mac - 3.5% | | | |
| 12 month U.S. LIBOR + 1.325% 3.075% 1/1/36 (d)(e) | | 50,771 | 52,078 |
| 12 month U.S. LIBOR + 1.325% 3.075% 3/1/37 (d)(e) | | 16,145 | 16,560 |
| 12 month U.S. LIBOR + 1.375% 3.117% 3/1/36 (d)(e) | | 133,564 | 137,343 |
| 12 month U.S. LIBOR + 1.500% 3.208% 3/1/36 (d)(e) | | 111,865 | 114,281 |
| 12 month U.S. LIBOR + 1.515% 3.265% 11/1/35 (d)(e) | | 40,692 | 41,531 |
| 12 month U.S. LIBOR + 1.750% 3.25% 7/1/41 (d)(e) | | 727,883 | 763,143 |
| 12 month U.S. LIBOR + 1.750% 3.497% 12/1/40 (d)(e) | | 3,090,034 | 3,213,591 |
| 12 month U.S. LIBOR + 1.754% 3.067% 9/1/41 (d)(e) | | 980,120 | 1,025,593 |
| 12 month U.S. LIBOR + 1.793% 3.543% 4/1/37 (d)(e) | | 35,447 | 37,051 |
| 12 month U.S. LIBOR + 1.864% 3.614% 4/1/36 (d)(e) | | 79,634 | 83,578 |
| 12 month U.S. LIBOR + 1.874% 3.634% 10/1/42 (d)(e) | | 878,243 | 918,355 |
| 12 month U.S. LIBOR + 1.877% 3.213% 4/1/41 (d)(e) | | 87,546 | 90,486 |
| 12 month U.S. LIBOR + 1.880% 3.206% 9/1/41 (d)(e) | | 105,106 | 108,231 |
| 12 month U.S. LIBOR + 1.910% 3.278% 6/1/41 (d)(e) | | 107,222 | 112,599 |
| 12 month U.S. LIBOR + 1.910% 3.417% 5/1/41 (d)(e) | | 105,912 | 111,701 |
| 12 month U.S. LIBOR + 1.910% 3.579% 5/1/41 (d)(e) | | 145,204 | 152,789 |
| 12 month U.S. LIBOR + 1.910% 3.677% 6/1/41 (d)(e) | | 133,770 | 140,688 |
| 12 month U.S. LIBOR + 1.920% 3.67% 6/1/36 (d)(e) | | 20,217 | 21,243 |
| 12 month U.S. LIBOR + 1.993% 5.14% 4/1/38 (d)(e) | | 108,684 | 113,821 |
| 12 month U.S. LIBOR + 2.045% 3.811% 7/1/36 (d)(e) | | 56,271 | 59,437 |
| 12 month U.S. LIBOR + 2.197% 3.771% 3/1/33 (d)(e) | | 1,763 | 1,845 |
| 12 month U.S. LIBOR + 2.200% 3.95% 12/1/36 (d)(e) | | 109,608 | 115,874 |
| 6 month U.S. LIBOR + 1.125% 2.7% 8/1/37 (d)(e) | | 33,351 | 33,672 |
| 6 month U.S. LIBOR + 1.445% 2.945% 3/1/35 (d)(e) | | 35,982 | 36,725 |
| 6 month U.S. LIBOR + 1.608% 3.08% 12/1/35 (d)(e) | | 51,068 | 51,997 |
| 6 month U.S. LIBOR + 1.647% 3.221% 2/1/37 (d)(e) | | 135,025 | 139,367 |
| 6 month U.S. LIBOR + 1.675% 3.175% 6/1/37 (d)(e) | | 27,891 | 28,844 |
| 6 month U.S. LIBOR + 1.720% 3.15% 8/1/37 (d)(e) | | 51,577 | 53,386 |
| 6 month U.S. LIBOR + 1.746% 3.092% 5/1/37 (d)(e) | | 25,712 | 26,505 |
| 6 month U.S. LIBOR + 1.932% 3.297% 10/1/36 (d)(e) | | 176,456 | 180,869 |
| 6 month U.S. LIBOR + 1.976% 3.448% 10/1/35 (d)(e) | | 115,732 | 120,480 |
| 6 month U.S. LIBOR + 2.010% 3.51% 6/1/37 (d)(e) | | 23,362 | 24,416 |
| 6 month U.S. LIBOR + 2.040% 3.629% 6/1/37 (d)(e) | | 59,218 | 60,987 |
| 6 month U.S. LIBOR + 2.066% 3.544% 6/1/37 (d)(e) | | 38,687 | 40,521 |
| 6 month U.S. LIBOR + 2.755% 4.273% 10/1/35 (d)(e) | | 104,174 | 110,535 |
| U.S. TREASURY 1 YEAR INDEX + 2.035% 2.913% 6/1/33 (d)(e) | | 158,203 | 164,375 |
| U.S. TREASURY 1 YEAR INDEX + 2.267% 3.206% 6/1/33 (d)(e) | | 385,186 | 405,829 |
| U.S. TREASURY 1 YEAR INDEX + 2.418% 3.504% 3/1/35 (d)(e) | | 682,639 | 722,353 |
| 2.5% 7/1/31 | | 5,924,413 | 5,797,870 |
| 3% 2/1/32 to 2/1/47 | | 338,275,274 | 329,521,047 |
| 3.5% 1/1/32 to 12/1/47 (i)(j) | | 436,480,964 | 439,772,691 |
| 4% 7/1/31 to 6/1/47 | | 258,301,031 | 266,777,186 |
| 4% 3/1/48 (h) | | 2,600,000 | 2,663,883 |
| 4% 4/1/48 (h) | | 2,600,000 | 2,659,516 |
| 4.5% 6/1/25 to 1/1/45 | | 19,604,402 | 20,724,478 |
| 5% 6/1/20 to 7/1/41 | | 20,258,374 | 21,993,052 |
| 5.5% 5/1/18 to 3/1/41 | | 7,251,310 | 7,944,920 |
| 6% 2/1/19 to 12/1/37 | | 2,148,459 | 2,390,234 |
| 6.5% 7/1/21 to 9/1/39 | | 2,857,924 | 3,186,375 |
| 7% 6/1/21 to 9/1/36 | | 1,024,971 | 1,158,406 |
| 7.5% 1/1/27 to 4/1/32 | | 20,753 | 23,687 |
| 8% 7/1/24 to 1/1/37 | | 32,544 | 37,693 |
| 8.5% 9/1/19 to 1/1/28 | | 26,254 | 29,697 |
| 9% 10/1/20 | | 15 | 15 |
| 9.5% 5/1/21 to 7/1/21 | | 49 | 50 |
| 10% 2/1/20 to 11/1/20 | | 37 | 38 |
| 11% 7/1/19 to 9/1/20 | | 9 | 9 |
|
| TOTAL FREDDIE MAC | | | 1,114,313,526 |
|
| Ginnie Mae - 4.5% | | | |
| 3.5% 11/15/40 to 1/20/48 (i) | | 484,398,444 | 488,569,302 |
| 4% 5/20/33 to 1/20/48 | | 224,931,348 | 232,269,709 |
| 4.5% 6/20/33 to 8/15/41 | | 49,492,705 | 52,345,120 |
| 5% 12/15/32 to 9/15/41 | | 21,398,365 | 23,176,185 |
| 5.5% 7/15/33 to 9/15/39 | | 1,717,440 | 1,899,194 |
| 6% 10/15/30 to 11/15/39 | | 506,328 | 566,281 |
| 7% 10/15/22 to 3/15/33 | | 1,028,721 | 1,176,827 |
| 7.5% 11/15/21 to 9/15/31 | | 445,573 | 500,838 |
| 8% 11/15/21 to 11/15/29 | | 137,933 | 153,708 |
| 8.5% 10/15/21 to 1/15/31 | | 27,151 | 31,283 |
| 9% 9/15/19 to 1/15/23 | | 619 | 655 |
| 9.5% 12/15/20 to 3/15/23 | | 240 | 254 |
| 3% 5/20/42 to 4/20/47 | | 286,127,066 | 280,452,210 |
| 3% 3/1/48 (h) | | 79,550,000 | 77,783,330 |
| 3.5% 3/1/48 (h) | | 60,000,000 | 60,344,262 |
| 3.5% 3/1/48 (h) | | 50,350,000 | 50,638,893 |
| 4.5% 3/1/48 (h) | | 73,700,000 | 76,658,016 |
| 4.5% 4/1/48 (h) | | 34,500,000 | 35,842,913 |
| 4.5% 4/1/48 (h) | | 39,200,000 | 40,725,860 |
| 6.5% 3/20/31 to 6/15/37 | | 308,162 | 349,598 |
| 11% 9/20/19 | | 211 | 220 |
|
| TOTAL GINNIE MAE | | | 1,423,484,658 |
|
| TOTAL U.S. GOVERNMENT AGENCY - MORTGAGE SECURITIES | | | |
| (Cost $5,596,425,522) | | | 5,479,698,735 |
|
| Asset-Backed Securities - 1.0% | | | |
| AASET Trust Series 2018-1A Class A, 3.844% 1/16/38 (b) | | $23,934,703 | $23,934,667 |
| Accredited Mortgage Loan Trust Series 2005-1 Class M1, 1 month U.S. LIBOR + 0.705% 2.3257% 4/25/35 (d)(e) | | 664,344 | 669,584 |
| ACE Securities Corp. Home Equity Loan Trust Series 2004-HE1 Class M2, 1 month U.S. LIBOR + 1.650% 3.2707% 3/25/34 (d)(e) | | 183,174 | 187,121 |
| Airspeed Ltd. Series 2007-1A Class C1, 1 month U.S. LIBOR + 2.500% 4.0875% 6/15/32 (b)(d)(e)(g) | | 2,769,731 | 1,693,181 |
| American Homes 4 Rent: | | | |
| Series 2014-SFR2 Class E, 6.231% 10/17/36 (b) | | 147,000 | 163,015 |
| Series 2014-SFR3 Class E, 6.418% 12/17/36 (b) | | 428,000 | 481,091 |
| Series 2015-SFR1 Class E, 5.639% 4/17/52 (b) | | 599,438 | 646,295 |
| Series 2015-SFR2: | | | |
| Class E, 6.07% 10/17/45 (b) | | 981,000 | 1,086,515 |
| Class XS, 0% 10/17/45 (b)(d)(g)(k) | | 683,519 | 7 |
| Ameriquest Mortgage Securities, Inc. pass-thru certificates: | | | |
| Series 2003-10 Class M1, 1 month U.S. LIBOR + 1.050% 2.6707% 12/25/33 (d)(e) | | 31,366 | 31,126 |
| Series 2004-R2 Class M3, 1 month U.S. LIBOR + 0.825% 2.4457% 4/25/34 (d)(e) | | 89,819 | 84,198 |
| Argent Securities, Inc. pass-thru certificates: | | | |
| Series 2003-W7 Class A2, 1 month U.S. LIBOR + 0.780% 2.4007% 3/25/34 (d)(e) | | 46,970 | 45,958 |
| Series 2004-W11 Class M2, 1 month U.S. LIBOR + 1.050% 2.6707% 11/25/34 (d)(e) | | 410,612 | 417,519 |
| Series 2004-W7 Class M1, 1 month U.S. LIBOR + 0.825% 2.4457% 5/25/34 (d)(e) | | 1,122,875 | 1,152,384 |
| Series 2006-W4 Class A2C, 1 month U.S. LIBOR + 0.160% 1.7807% 5/25/36 (d)(e) | | 1,071,115 | 411,785 |
| Asset Backed Securities Corp. Home Equity Loan Trust: | | | |
| Series 2004-HE2 Class M1, 1 month U.S. LIBOR + 0.825% 2.3864% 4/25/34 (d)(e) | | 1,297,829 | 1,270,811 |
| Series 2006-HE2 Class M1, 1 month U.S. LIBOR + 0.370% 1.9907% 3/25/36 (d)(e) | | 18,318 | 7,512 |
| Avis Budget Rental Car Funding (AESOP) LLC Series 2012-3A Class A, 2.1% 3/20/19 (b) | | 1,533,333 | 1,533,339 |
| Blackbird Capital Aircraft Series 2016-1A: | | | |
| Class A, 4.213% 12/16/41 (b) | | 43,010,344 | 43,867,153 |
| Class AA, 4.213% 12/16/41 (b) | | 9,591,688 | 9,398,289 |
| CAM Mortgage Trust Series 2017-1 Class A1, 3.22% 8/1/57 (b) | | 13,098,454 | 13,041,169 |
| Carrington Mortgage Loan Trust Series 2007-RFC1 Class A3, 1 month U.S. LIBOR + 0.140% 1.7607% 12/25/36 (d)(e) | | 1,802,588 | 1,520,964 |
| Citi Mortgage Loan Trust Series 2007-1 Class 1A, 1 month U.S. LIBOR + 1.350% 2.9707% 10/25/37 (b)(d)(e) | | 18,204,215 | 18,294,648 |
| CLUB Credit Trust: | | | |
| Series 2017-NP1 Class A, 2.39% 4/17/23 (b) | | 1,344,227 | 1,344,431 |
| Series 2017-P1 Class A, 2.54% 9/15/23 (b) | | 3,746,443 | 3,740,405 |
| Consumer Loan Underlying Bond Credit Trust Series 2017-NP2 Class A, 2.55% 1/16/24 (b) | | 13,362,853 | 13,359,476 |
| Countrywide Home Loans, Inc.: | | | |
| Series 2003-BC1 Class B1, 1 month U.S. LIBOR + 5.250% 6.8707% 3/25/32 (d)(e) | | 3,192 | 3,334 |
| Series 2004-3 Class M4, 1 month U.S. LIBOR + 1.455% 3.0757% 4/25/34 (d)(e) | | 51,103 | 49,095 |
| Series 2004-4 Class M2, 1 month U.S. LIBOR + 0.795% 2.4157% 6/25/34 (d)(e) | | 73,864 | 74,749 |
| Series 2004-7 Class AF5, 5.868% 1/25/35 | | 962,875 | 973,246 |
| Series 2005-3 Class MV4, 1 month U.S. LIBOR + 0.620% 2.5507% 8/25/35 (d)(e) | | 1,781,294 | 1,786,150 |
| Credit Suisse First Boston Mortgage Securities Corp. Series 2003-5 Class A2, 1 month U.S. LIBOR + 0.700% 2.3207% 12/25/33 (d)(e) | | 32,929 | 32,411 |
| DB Master Finance LLC Series 2017-1A: | | | |
| Class A2I, 3.629% 11/20/47 (b) | | 17,324,580 | 17,138,329 |
| Class A2II, 4.03% 11/20/47 (b) | | 29,350,440 | 29,387,788 |
| Deutsche Financial Capital Securitization LLC Series 1997-I Class M, 7.275% 9/15/27 | | 141,639 | 145,054 |
| Exeter Automobile Receivables Trust Series 2017-2A Class A, 2.11% 6/15/21 (b) | | 9,680,635 | 9,657,838 |
| Fannie Mae Series 2004-T5 Class AB3, 1 month U.S. LIBOR + 0.392% 2.5147% 5/28/35 (d)(e) | | 38,916 | 37,768 |
| First Franklin Mortgage Loan Trust Series 2004-FF2 Class M3, 1 month U.S. LIBOR + 0.825% 2.4457% 3/25/34 (d)(e) | | 2,512 | 2,251 |
| Flagship Credit Auto Trust Series 2015-3 Class A, 2.38% 10/15/20 (b) | | 2,239,933 | 2,240,390 |
| Fremont Home Loan Trust Series 2005-A: | | | |
| Class M3, 1 month U.S. LIBOR + 0.735% 2.3557% 1/25/35 (d)(e) | | 948,695 | 941,524 |
| Class M4, 1 month U.S. LIBOR + 1.020% 2.6407% 1/25/35 (d)(e) | | 347,133 | 296,634 |
| GCO Education Loan Funding Master Trust II Series 2007-1A Class C1L, 3 month U.S. LIBOR + 0.380% 2.3236% 2/25/47 (b)(d)(e) | | 252,874 | 244,539 |
| GE Business Loan Trust Series 2006-2A: | | | |
| Class A, 1 month U.S. LIBOR + 0.180% 1.7675% 11/15/34 (b)(d)(e) | | 368,753 | 361,715 |
| Class B, 1 month U.S. LIBOR + 0.280% 1.8675% 11/15/34 (b)(d)(e) | | 133,205 | 130,477 |
| Class C, 1 month U.S. LIBOR + 0.380% 1.9675% 11/15/34 (b)(d)(e) | | 221,381 | 206,853 |
| Class D, 1 month U.S. LIBOR + 0.750% 2.3375% 11/15/34 (b)(d)(e) | | 84,065 | 77,373 |
| GSAMP Trust Series 2004-AR1 Class B4, 5.5% 6/25/34 (b) | | 75,390 | 6,715 |
| Home Equity Asset Trust: | | | |
| Series 2003-2 Class M1, 1 month U.S. LIBOR + 1.320% 2.9407% 8/25/33 (d)(e) | | 200,975 | 203,267 |
| Series 2003-3 Class M1, 1 month U.S. LIBOR + 1.290% 2.9107% 8/25/33 (d)(e) | | 311,943 | 314,423 |
| Home Partners of America Credit Trust Series 2017-1: | | | |
| Class E, 1 month U.S. LIBOR + 2.650% 4.24% 7/17/34 (b)(d)(e) | | 229,000 | 233,615 |
| Class F, 1 month U.S. LIBOR + 3.539% 5.129% 7/17/34 (b)(d)(e) | | 332,000 | 339,226 |
| HSI Asset Securitization Corp. Trust Series 2007-HE1 Class 2A3, 1 month U.S. LIBOR + 0.190% 1.8107% 1/25/37 (d)(e) | | 1,403,095 | 1,035,202 |
| Invitation Homes Trust: | | | |
| Series 2015-SFR2 Class E, 1 month U.S. LIBOR + 3.150% 4.74% 6/17/32 (b)(d)(e) | | 485,000 | 487,219 |
| Series 2015-SRF1 Class E, 1 month U.S. LIBOR + 4.300% 5.7832% 3/17/32 (b)(d)(e) | | 624,000 | 625,816 |
| Series 2017-SFR2: | | | |
| Class E, 1 month U.S. LIBOR + 2.250% 3.84% 12/17/36 (b)(d)(e) | | 525,000 | 534,967 |
| Class F, 1 month U.S. LIBOR + 3.000% 4.59% 12/17/36 (b)(d)(e) | | 441,000 | 449,967 |
| Series 2018-SFR1 Class F, 1 month U.S. LIBOR + 3.100% 4.611% 3/17/37 (b)(d)(e) | | 672,000 | 679,278 |
| Keycorp Student Loan Trust Series 2006-A Class 2C, 3 month U.S. LIBOR + 1.150% 2.8246% 3/27/42 (d)(e) | | 3,243,000 | 2,397,843 |
| Long Beach Mortgage Loan Trust Series 2006-10 Class 2A3, 1 month U.S. LIBOR + 0.160% 1.7807% 11/25/36 (d)(e) | | 3,853,089 | 1,779,838 |
| MASTR Asset Backed Securities Trust Series 2007-HE1 Class M1, 1 month U.S. LIBOR + 0.300% 1.9207% 5/25/37 (d)(e) | | 271,000 | 82,095 |
| Meritage Mortgage Loan Trust Series 2004-1 Class M1, 1 month U.S. LIBOR + 0.750% 2.3707% 7/25/34 (d)(e) | | 81,623 | 78,766 |
| Merrill Lynch Mortgage Investors Trust: | | | |
| Series 2003-OPT1 Class M1, 1 month U.S. LIBOR + 0.975% 2.5957% 7/25/34 (d)(e) | | 124,390 | 123,952 |
| Series 2006-FF1 Class M2, 1 month U.S. LIBOR + 0.290% 1.9107% 8/25/36 (d)(e) | | 12,490,396 | 12,489,083 |
| Series 2006-FM1 Class A2B, 1 month U.S. LIBOR + 0.110% 1.7307% 4/25/37 (d)(e) | | 2,687 | 1,658 |
| Series 2006-OPT1 Class A1A, 1 month U.S. LIBOR + 0.520% 2.1407% 6/25/35 (d)(e) | | 1,052,436 | 1,021,554 |
| Morgan Stanley ABS Capital I Trust: | | | |
| Series 2004-HE6 Class A2, 1 month U.S. LIBOR + 0.680% 2.3007% 8/25/34 (d)(e) | | 57,368 | 55,685 |
| Series 2004-NC6 Class M3, 1 month U.S. LIBOR + 2.175% 3.7957% 7/25/34 (d)(e) | | 11,965 | 11,842 |
| Series 2004-NC8 Class M6, 1 month U.S. LIBOR + 1.875% 3.4957% 9/25/34 (d)(e) | | 13,754 | 13,637 |
| Series 2005-NC1 Class M1, 1 month U.S. LIBOR + 0.660% 2.2807% 1/25/35 (d)(e) | | 101,204 | 97,345 |
| Series 2005-NC2 Class B1, 1 month U.S. LIBOR + 1.755% 3.3757% 3/25/35 (d)(e) | | 98,943 | 3,629 |
| Nationstar HECM Loan Trust: | | | |
| Series 2017-1A Class A, 1.9679% 5/25/27 (b) | | 15,338,071 | 15,274,709 |
| Series 2017-2A Class A1, 2.12% 9/25/27 (b) | | 24,276,718 | 24,186,700 |
| Navient Student Loan Trust Series 2017-3A Class A2, 1 month U.S. LIBOR + 0.600% 2.2207% 7/26/66 (b)(d)(e) | | 3,513,000 | 3,535,106 |
| New Century Home Equity Loan Trust Series 2005-4 Class M2, 1 month U.S. LIBOR + 0.510% 2.1307% 9/25/35 (d)(e) | | 1,426,957 | 1,418,001 |
| Park Place Securities, Inc.: | | | |
| Series 2004-WCW1: | | | |
| Class M3, 1 month U.S. LIBOR + 1.875% 3.4957% 9/25/34 (d)(e) | | 450,894 | 457,768 |
| Class M4, 1 month U.S. LIBOR + 2.175% 3.7957% 9/25/34 (d)(e) | | 683,353 | 616,422 |
| Series 2005-WCH1 Class M4, 1 month U.S. LIBOR + 1.245% 2.8657% 1/25/36 (d)(e) | | 1,475,804 | 1,473,958 |
| Progress Residential Trust: | | | |
| Series 2015-SFR3 Class F, 6.643% 11/12/32 (b) | | 168,000 | 176,632 |
| Series 2017-SFR1 Class F, 5.35% 8/17/34 (b) | | 160,000 | 164,401 |
| Series 2017-SFR2 Class F, 1 month U.S. LIBOR + 2.750% 4.836% 12/17/34 (b)(e) | | 134,000 | 134,893 |
| Series 2018-SFR1 Class F, 4.778% 3/17/35 (b) | | 384,000 | 383,880 |
| SLM Private Credit Student Loan Trust Series 2004-A Class C, 3 month U.S. LIBOR + 0.950% 2.5385% 6/15/33 (d)(e) | | 60,269 | 60,247 |
| Starwood Waypoint Homes Trust Series 2017-1: | | | |
| Class E, 1 month U.S. LIBOR + 2.600% 4.19% 1/17/35 (b)(d)(e) | | 1,040,000 | 1,056,046 |
| Class F, 1 month U.S. LIBOR + 3.400% 4.99% 1/17/35 (b)(d)(e) | | 903,000 | 902,975 |
| Structured Asset Investment Loan Trust Series 2004-8 Class M5, 1 month U.S. LIBOR + 1.725% 3.3457% 9/25/34 (d)(e) | | 31,675 | 31,138 |
| Terwin Mortgage Trust Series 2003-4HE Class A1, 1 month U.S. LIBOR + 0.860% 2.4214% 9/25/34 (d)(e) | | 28,819 | 27,765 |
| Thunderbolt Aircraft Lease Ltd. Series 2017-A Class A, 4.212% 5/17/32 (b) | | 24,454,768 | 24,649,452 |
| Trapeza CDO XII Ltd./Trapeza CDO XII, Inc. Series 2007-12A Class B, 3 month U.S. LIBOR + 0.560% 1.7978% 4/6/42 (b)(d)(e)(g) | | 2,573,000 | 1,358,639 |
| Tricon American Homes: | | | |
| Series 2017-SFR1 Class F, 5.151% 9/17/34 (b) | | 1,092,000 | 1,107,881 |
| Series 2017-SFR2 Class F, 5.16% 1/17/36 (b) | | 198,000 | 199,538 |
| Tricon American Homes Trust Series 2016-SFR1: | | | |
| Class B, 2.989% 11/17/33 (b) | | 517,000 | 507,580 |
| Class F, 5.769% 11/17/33 (b) | | 456,000 | 472,205 |
| VB-S1 Issuer LLC Series 2018-1A Class F, 5.25% 2/15/48 (b) | | 574,000 | 574,000 |
| Wrightwood Capital Real Estate CDO Ltd. Series 2005-1A Class D, 3 month U.S. LIBOR + 0.850% 2.1664% 11/21/40 (b)(d)(e) | | 305,000 | 283,803 |
| TOTAL ASSET-BACKED SECURITIES | | | |
| (Cost $295,195,553) | | | 304,290,522 |
|
| Collateralized Mortgage Obligations - 1.9% | | | |
| Private Sponsor - 0.4% | | | |
| Banc of America Funding Corp. Series 2015-R3 Class 10A1, 1 month U.S. LIBOR + 0.140% 1.6921% 6/27/36 (b)(d)(e) | | 8,874,710 | 8,736,871 |
| Banc of America Funding Trust sequential payer Series 2010-R3 Class 1A1, 3.6731% 12/26/35 (b)(d) | | 988,831 | 990,016 |
| BCAP LLC Trust sequential payer: | | | |
| Series 2012-RR5 Class 8A5, 1.7011% 7/26/36 (b)(d) | | 1,499,327 | 1,464,472 |
| Series 2013-RR4 Class 2A1, 3.761% 5/26/47 (b)(d) | | 1,865,700 | 1,872,777 |
| Bear Stearns ALT-A Trust floater Series 2005-1 Class A1, 1 month U.S. LIBOR + 0.560% 2.1807% 1/25/35 (d)(e) | | 408,345 | 410,125 |
| Citigroup Mortgage Loan Trust sequential payer Series 2014-8 Class 2A1, 3.45% 6/27/37 (b)(d) | | 6,785,380 | 6,729,330 |
| Citigroup Mortgage Loan Trust, Inc. sequential payer Series 2009-5 Class 5A1, 3.7416% 1/25/37 (b)(d) | | 2,038,877 | 2,078,100 |
| Credit Suisse Mortgage Trust Series 2010-9R Class 2A5, 4% 2/27/38 (b) | | 5,998,848 | 6,019,281 |
| CSMC: | | | |
| floater Series 2015-1R Class 6A1, 1 month U.S. LIBOR + 0.280% 1.8321% 5/27/37 (b)(d)(e) | | 7,422,975 | 7,202,517 |
| Series 2014-3R Class 2A1, 1 month U.S. LIBOR + 0.700% 2.2521% 5/27/37 (b)(d)(e) | | 700,952 | 685,706 |
| CSMC Trust Series 2009-5R Class 2A2, 3.3536% 7/26/49 (b)(d) | | 933,731 | 933,623 |
| First Horizon Mortgage pass-thru Trust Series 2004-AR5 Class 2A1, 3.5992% 10/25/34 (d) | | 303,912 | 311,382 |
| FirstKey Mortgage Trust sequential payer Series 2015-1 Class A9, 3% 3/25/45 (b)(d) | | 14,766,734 | 14,667,593 |
| Freddie Mac Seasoned Credit Risk Transfer Series sequential payer Series 2017-1 Class MA, 3% 1/25/56 | | 17,338,351 | 16,756,620 |
| FREMF Mortgage Trust: | | | |
| Series 2010-K6 Class B, 5.3637% 12/25/46 (b)(d) | | 910,000 | 943,959 |
| Series 2010-K7 Class B, 5.6853% 4/25/20 (b)(d) | | 1,000,000 | 1,046,686 |
| GSR Mortgage Loan Trust floater Series 2007-AR1 Class 6A1, 3.1565% 3/25/37 (d) | | 512,815 | 512,707 |
| JP Morgan Resecuritization Trust floater Series 2012-2 Class 6A1, 1 month U.S. LIBOR + 0.210% 1.7672% 6/21/36 (b)(d)(e) | | 4,814,911 | 4,753,528 |
| JPMorgan Mortgage Trust sequential payer Series 2006-A5 Class 3A5, 3.461% 8/25/36 (d) | | 696,686 | 674,556 |
| Merrill Lynch Alternative Note Asset Trust floater Series 2007-OAR1 Class A1, 1 month U.S. LIBOR + 0.170% 1.7221% 2/25/37 (d)(e) | | 1,340,405 | 1,315,496 |
| Nomura Resecuritization Trust sequential payer Series 2011-3RA Class 2A1, 3.5335% 3/26/37 (b)(d) | | 751,813 | 750,588 |
| Opteum Mortgage Acceptance Corp. floater Series 2005-3 Class APT, 1 month U.S. LIBOR + 0.290% 1.8514% 7/25/35 (d)(e) | | 362,020 | 358,413 |
| RBSSP Resecuritization Trust sequential payer Series 2010-1 Class 2A1, 3.3328% 7/26/45 (b)(d) | | 7,794,860 | 7,881,444 |
| RESI Finance LP/RESI Finance DE Corp. floater Series 2003-B: | | | |
| Class B5, 1 month U.S. LIBOR + 2.350% 3.9038% 6/10/35 (b)(d)(e) | | 184,397 | 146,896 |
| Class B6, 1 month U.S. LIBOR + 2.850% 4.4038% 6/10/35 (b)(d)(e) | | 41,114 | 27,535 |
| Sequoia Mortgage Trust floater Series 2004-6 Class A3B, 6 month U.S. LIBOR + 0.880% 2.6617% 7/20/34 (d)(e) | | 16,752 | 16,561 |
| Structured Asset Securities Corp. Series 2003-15A Class 4A, 3.493% 4/25/33 (d) | | 52,321 | 52,688 |
| Thornburg Mortgage Securities Trust floater Series 2003-4 Class A1, 1 month U.S. LIBOR + 0.640% 2.2607% 9/25/43 (d)(e) | | 7,143,954 | 6,906,200 |
| Wells Fargo Mortgage Backed Securities Trust: | | | |
| Series 2004-BB Class A2, 3.7231% 1/25/35 (d) | | 1,498,048 | 1,512,043 |
| Series 2005-AR10 Class 2A15, 3.5661% 6/25/35 (d) | | 8,197,246 | 8,376,803 |
| Series 2005-AR2: | | | |
| Class 1A2, 3.5392% 3/25/35 (d) | | 1,015,637 | 1,017,767 |
| Class 3A1, 3.6387% 3/25/35 (d) | | 13,400,547 | 13,624,618 |
| Wells Fargo Mortgage Loan Trust sequential payer Series 2011-RR4: | | | |
| Class 1A1, 3.5053% 6/27/36 (b)(d) | | 717,298 | 717,630 |
| Class 2A1, 3.4585% 6/27/36 (b)(d) | | 1,088,949 | 1,084,753 |
|
| TOTAL PRIVATE SPONSOR | | | 120,579,284 |
|
| U.S. Government Agency - 1.5% | | | |
| Fannie Mae: | | | |
| floater: | | | |
| Series 2002-18 Class FD, 1 month U.S. LIBOR + 0.800% 2.4207% 2/25/32 (d)(e) | | 20,139 | 20,474 |
| Series 2002-39 Class FD, 1 month U.S. LIBOR + 1.000% 2.59% 3/18/32 (d)(e) | | 35,625 | 36,285 |
| Series 2002-60 Class FV, 1 month U.S. LIBOR + 1.000% 2.6207% 4/25/32 (d)(e) | | 43,539 | 44,480 |
| Series 2002-63 Class FN, 1 month U.S. LIBOR + 1.000% 2.6207% 10/25/32 (d)(e) | | 56,889 | 58,102 |
| Series 2002-7 Class FC, 1 month U.S. LIBOR + 0.750% 2.3707% 1/25/32 (d)(e) | | 20,183 | 20,503 |
| Series 2003-118 Class S, 8.100% - 1 month U.S. LIBOR 6.4793% 12/25/33 (d)(k)(l) | | 664,863 | 141,082 |
| Series 2006-104 Class GI, 6.680% - 1 month U.S. LIBOR 5.0593% 11/25/36 (d)(k)(l) | | 503,477 | 79,058 |
| planned amortization class: | | | |
| Series 1992-168 Class KB, 7% 10/25/22 | | 22,719 | 23,924 |
| Series 1993-207 Class H, 6.5% 11/25/23 | | 327,187 | 349,763 |
| Series 1996-28 Class PK, 6.5% 7/25/25 | | 107,122 | 114,819 |
| Series 1999-17 Class PG, 6% 4/25/29 | | 314,161 | 339,533 |
| Series 1999-32 Class PL, 6% 7/25/29 | | 290,227 | 314,010 |
| Series 1999-33 Class PK, 6% 7/25/29 | | 217,332 | 235,415 |
| Series 2001-52 Class YZ, 6.5% 10/25/31 | | 25,558 | 28,555 |
| Series 2003-28 Class KG, 5.5% 4/25/23 | | 185,536 | 194,060 |
| Series 2005-102 Class CO 11/25/35 (m) | | 165,549 | 145,140 |
| Series 2005-73 Class SA, 17.500% - 1 month U.S. LIBOR 13.3362% 8/25/35 (d)(l) | | 55,574 | 64,818 |
| Series 2005-81 Class PC, 5.5% 9/25/35 | | 401,639 | 428,406 |
| Series 2006-12 Class BO 10/25/35 (m) | | 743,102 | 652,094 |
| Series 2006-37 Class OW 5/25/36 (m) | | 70,102 | 59,282 |
| Series 2006-45 Class OP 6/25/36 (m) | | 226,630 | 192,210 |
| Series 2006-62 Class KP 4/25/36 (m) | | 357,258 | 303,103 |
| Series 2012-149: | | | |
| Class DA, 1.75% 1/25/43 | | 8,300,032 | 7,937,781 |
| Class GA, 1.75% 6/25/42 | | 8,177,246 | 7,805,516 |
| sequential payer: | | | |
| Series 1997-41 Class J, 7.5% 6/18/27 | | 66,122 | 74,245 |
| Series 1999-25 Class Z, 6% 6/25/29 | | 227,851 | 248,150 |
| Series 2001-20 Class Z, 6% 5/25/31 | | 332,996 | 363,308 |
| Series 2001-31 Class ZC, 6.5% 7/25/31 | | 169,737 | 187,966 |
| Series 2002-16 Class ZD, 6.5% 4/25/32 | | 89,265 | 99,791 |
| Series 2002-74 Class SV, 7.550% - 1 month U.S. LIBOR 5.9293% 11/25/32 (d)(k)(l) | | 434,785 | 58,957 |
| Series 2012-67 Class AI, 4.5% 7/25/27 (k) | | 2,022,012 | 206,382 |
| Series 06-116 Class SG, 6.640% - 1 month U.S. LIBOR 5.0193% 12/25/36 (d)(k)(l) | | 319,774 | 58,127 |
| Series 07-40 Class SE, 6.440% - 1 month U.S. LIBOR 4.8193% 5/25/37 (d)(k)(l) | | 194,859 | 30,567 |
| Series 1993-165 Class SH, 19.800% - 1 month U.S. LIBOR 15.2156% 9/25/23 (d)(l) | | 14,087 | 16,504 |
| Series 2003-21 Class SK, 8.100% - 1 month U.S. LIBOR 6.4793% 3/25/33 (d)(k)(l) | | 47,374 | 8,426 |
| Series 2003-35 Class TQ, 7.500% - 1 month U.S. LIBOR 5.8793% 5/25/18 (d)(k)(l) | | 333 | 1 |
| Series 2005-72 Class ZC, 5.5% 8/25/35 | | 2,462,559 | 2,628,791 |
| Series 2005-79 Class ZC, 5.9% 9/25/35 | | 1,559,500 | 1,733,201 |
| Series 2007-57 Class SA, 40.600% - 1 month U.S. LIBOR 30.8958% 6/25/37 (d)(l) | | 161,875 | 294,642 |
| Series 2007-66: | | | |
| Class SA, 39.600% - 1 month U.S. LIBOR 29.8758% 7/25/37 (d)(l) | | 243,132 | 437,363 |
| Class SB, 39.600% - 1 month U.S. LIBOR 29.8758% 7/25/37 (d)(l) | | 100,974 | 162,845 |
| Series 2007-75 Class JI, 6.545% - 1 month U.S. LIBOR 4.9243% 8/25/37 (d)(k)(l) | | 7,247,543 | 1,112,027 |
| Series 2008-12 Class SG, 6.350% - 1 month U.S. LIBOR 4.7293% 3/25/38 (d)(k)(l) | | 1,298,528 | 186,663 |
| Series 2009-16 Class SA, 6.250% - 1 month U.S. LIBOR 4.6293% 3/25/24 (d)(k)(l) | | 20 | 0 |
| Series 2009-76 Class MI, 5.5% 9/25/24 (k) | | 6,089 | 151 |
| Series 2009-85 Class IB, 4.5% 8/25/24 (k) | | 67,578 | 2,359 |
| Series 2009-93 Class IC, 4.5% 9/25/24 (k) | | 92,776 | 2,993 |
| Series 2010-112 Class SG, 6.360% - 1 month U.S. LIBOR 4.7393% 6/25/21 (d)(k)(l) | | 50,797 | 1,179 |
| Series 2010-12 Class AI, 5% 12/25/18 (k) | | 33,729 | 164 |
| Series 2010-135 Class LS, 6.050% - 1 month U.S. LIBOR 4.4293% 12/25/40 (d)(k)(l) | | 1,206,807 | 160,531 |
| Series 2010-139 Class NI, 4.5% 2/25/40 (k) | | 1,086,899 | 110,902 |
| Series 2010-150 Class ZC, 4.75% 1/25/41 | | 5,407,537 | 5,785,605 |
| Series 2010-17 Class DI, 4.5% 6/25/21 (k) | | 38,649 | 962 |
| Series 2010-23: | | | |
| Class AI, 5% 12/25/18 (k) | | 8,216 | 60 |
| Class HI, 4.5% 10/25/18 (k) | | 18,874 | 149 |
| Series 2010-29 Class LI, 4.5% 6/25/19 (k) | | 40,179 | 271 |
| Series 2010-95 Class ZC, 5% 9/25/40 | | 10,952,982 | 11,858,980 |
| Series 2010-97 Class CI, 4.5% 8/25/25 (k) | | 270,230 | 12,757 |
| Series 2011-110 Class SA, 6.610% - 1 month U.S. LIBOR 4.9893% 4/25/41 (d)(k)(l) | | 3,152,311 | 438,431 |
| Series 2011-112 Class SA, 6.550% - 1 month U.S. LIBOR 4.9293% 11/25/41 (d)(k)(l) | | 3,257,728 | 507,197 |
| Series 2011-123 Class SD, 6.600% - 1 month U.S. LIBOR 4.9793% 8/25/39 (d)(k)(l) | | 2,691,703 | 332,837 |
| Series 2011-39 Class ZA, 6% 11/25/32 | | 874,098 | 965,640 |
| Series 2011-4 Class PZ, 5% 2/25/41 | | 2,309,122 | 2,571,532 |
| Series 2011-67 Class AI, 4% 7/25/26 (k) | | 339,899 | 31,267 |
| Series 2011-83 Class DI, 6% 9/25/26 (k) | | 443,591 | 39,272 |
| Series 2012-100 Class WI, 3% 9/25/27 (k) | | 5,427,503 | 517,635 |
| Series 2012-14 Class JS, 6.650% - 1 month U.S. LIBOR 5.0293% 12/25/30 (d)(k)(l) | | 1,788,022 | 210,598 |
| Series 2012-47 Class SD, 6.450% - 1 month U.S. LIBOR 4.8293% 5/25/42 (d)(k)(l) | | 8,106,114 | 1,467,255 |
| Series 2012-9 Class SH, 6.550% - 1 month U.S. LIBOR 4.9293% 6/25/41 (d)(k)(l) | | 2,375,384 | 323,701 |
| Series 2013-133 Class IB, 3% 4/25/32 (k) | | 3,436,343 | 328,584 |
| Series 2013-134 Class SA, 6.050% - 1 month U.S. LIBOR 4.4293% 1/25/44 (d)(k)(l) | | 1,798,340 | 272,351 |
| Series 2013-51 Class GI, 3% 10/25/32 (k) | | 5,119,640 | 514,299 |
| Series 2013-N1 Class A, 6.720% - 1 month U.S. LIBOR 5.0993% 6/25/35 (d)(k)(l) | | 1,041,615 | 166,131 |
| Series 2015-42: | | | |
| Class IL, 6% 6/25/45 (k) | | 7,733,022 | 1,852,838 |
| Class LS, 6.200% - 1 month U.S. LIBOR 4.5793% 6/25/45 (d)(k)(l) | | 12,901,063 | 1,745,851 |
| Series 2015-70 Class JC, 3% 10/25/45 | | 6,656,986 | 6,618,951 |
| Series 2016-78 Class CS, 6.100% - 1 month U.S. LIBOR 4.4793% 5/25/39 (d)(k)(l) | | 15,036,610 | 2,171,356 |
| Series 2017-30 Class AI, 5.5% 5/25/47 | | 4,031,994 | 943,163 |
| Fannie Mae Stripped Mortgage-Backed Securities: | | | |
| Series 339: | | | |
| Class 29, 5.5% 8/25/18 (k) | | 256 | 1 |
| Class 5, 5.5% 7/25/33 (k) | | 185,214 | 40,799 |
| Series 343 Class 16, 5.5% 5/25/34 (k) | | 159,587 | 28,416 |
| Series 348 Class 14, 6.5% 8/25/34 (d)(k) | | 114,418 | 26,353 |
| Series 351: | | | |
| Class 12, 5.5% 4/25/34 (d)(k) | | 72,605 | 14,178 |
| Class 13, 6% 3/25/34 (k) | | 99,395 | 19,504 |
| Series 359 Class 19, 6% 7/25/35 (d)(k) | | 61,469 | 11,570 |
| Series 384 Class 6, 5% 7/25/37 (k) | | 792,467 | 156,178 |
| Freddie Mac: | | | |
| floater: | | | |
| Series 2412 Class FK, 1 month U.S. LIBOR + 0.800% 2.3875% 1/15/32 (d)(e) | | 16,122 | 16,389 |
| Series 2423 Class FA, 1 month U.S. LIBOR + 0.900% 2.4875% 3/15/32 (d)(e) | | 21,872 | 22,290 |
| Series 2424 Class FM, 1 month U.S. LIBOR + 1.000% 2.5875% 3/15/32 (d)(e) | | 23,527 | 24,017 |
| Series 2432: | | | |
| Class FE, 1 month U.S. LIBOR + 0.900% 2.4875% 6/15/31 (d)(e) | | 41,776 | 42,532 |
| Class FG, 1 month U.S. LIBOR + 0.900% 2.4875% 3/15/32 (d)(e) | | 12,732 | 12,970 |
| floater target amortization class Series 3366 Class FD, 1 month U.S. LIBOR + 0.250% 1.8375% 5/15/37 (d)(e) | | 934,808 | 933,591 |
| planned amortization class: | | | |
| Series 2006-15 Class OP 3/25/36 (m) | | 666,785 | 566,416 |
| Series 2095 Class PE, 6% 11/15/28 | | 347,240 | 376,484 |
| Series 2101 Class PD, 6% 11/15/28 | | 31,284 | 33,112 |
| Series 2121 Class MG, 6% 2/15/29 | | 142,915 | 154,959 |
| Series 2131 Class BG, 6% 3/15/29 | | 974,477 | 1,058,194 |
| Series 2137 Class PG, 6% 3/15/29 | | 155,121 | 167,350 |
| Series 2154 Class PT, 6% 5/15/29 | | 247,377 | 268,754 |
| Series 2162 Class PH, 6% 6/15/29 | | 58,378 | 62,603 |
| Series 2520 Class BE, 6% 11/15/32 | | 321,050 | 354,872 |
| Series 2585 Class KS, 7.600% - 1 month U.S. LIBOR 6.0125% 3/15/23 (d)(k)(l) | | 15,004 | 974 |
| Series 2693 Class MD, 5.5% 10/15/33 | | 3,735,598 | 4,070,238 |
| Series 2802 Class OB, 6% 5/15/34 | | 539,070 | 577,903 |
| Series 2937 Class KC, 4.5% 2/15/20 | | 226,290 | 228,064 |
| Series 2962 Class BE, 4.5% 4/15/20 | | 376,650 | 382,270 |
| Series 3002 Class NE, 5% 7/15/35 | | 885,206 | 937,425 |
| Series 3110 Class OP 9/15/35 (m) | | 412,118 | 370,788 |
| Series 3119 Class PO 2/15/36 (m) | | 779,948 | 660,211 |
| Series 3121 Class KO 3/15/36 (m) | | 137,369 | 117,308 |
| Series 3123 Class LO 3/15/36 (m) | | 430,684 | 365,771 |
| Series 3145 Class GO 4/15/36 (m) | | 417,447 | 355,001 |
| Series 3189 Class PD, 6% 7/15/36 | | 801,755 | 892,596 |
| Series 3225 Class EO 10/15/36 (m) | | 244,781 | 207,656 |
| Series 3258 Class PM, 5.5% 12/15/36 | | 407,850 | 436,283 |
| Series 3415 Class PC, 5% 12/15/37 | | 310,898 | 330,846 |
| Series 3786 Class HI, 4% 3/15/38 (k) | | 1,017,996 | 82,748 |
| Series 3806 Class UP, 4.5% 2/15/41 | | 2,414,467 | 2,505,362 |
| Series 3832 Class PE, 5% 3/15/41 | | 2,375,210 | 2,542,509 |
| Series 4135 Class AB, 1.75% 6/15/42 | | 6,111,850 | 5,839,288 |
| sequential payer: | | | |
| Series 2135 Class JE, 6% 3/15/29 | | 71,321 | 77,479 |
| Series 2274 Class ZM, 6.5% 1/15/31 | | 81,760 | 90,363 |
| Series 2281 Class ZB, 6% 3/15/30 | | 193,435 | 204,311 |
| Series 2303 Class ZV, 6% 4/15/31 | | 80,823 | 87,984 |
| Series 2357 Class ZB, 6.5% 9/15/31 | | 598,312 | 668,782 |
| Series 2502 Class ZC, 6% 9/15/32 | | 163,249 | 179,822 |
| Series 2519 Class ZD, 5.5% 11/15/32 | | 262,096 | 275,495 |
| Series 2546 Class MJ, 5.5% 3/15/23 | | 113,978 | 118,036 |
| Series 2601 Class TB, 5.5% 4/15/23 | | 54,477 | 57,224 |
| Series 2998 Class LY, 5.5% 7/15/25 | | 165,607 | 174,868 |
| Series 3871 Class KB, 5.5% 6/15/41 | | 4,329,000 | 4,854,365 |
| Series 06-3115 Class SM, 6.600% - 1 month U.S. LIBOR 5.0125% 2/15/36 (d)(k)(l) | | 284,773 | 48,821 |
| Series 2013-4281 Class AI, 4% 12/15/28 (k) | | 3,411,752 | 289,957 |
| Series 2017-4683 Class LM, 3% 5/15/47 | | 8,972,578 | 8,938,714 |
| Series 2844: | | | |
| Class SC, 46.800% - 1 month U.S. LIBOR 36.4813% 8/15/24 (d)(l) | | 6,335 | 8,551 |
| Class SD, 86.400% - 1 month U.S. LIBOR 65.8125% 8/15/24 (d)(l) | | 9,320 | 15,519 |
| Series 2933 Class ZM, 5.75% 2/15/35 | | 2,921,423 | 3,297,204 |
| Series 2935 Class ZK, 5.5% 2/15/35 | | 3,643,269 | 3,982,631 |
| Series 2947 Class XZ, 6% 3/15/35 | | 1,063,809 | 1,158,373 |
| Series 2996 Class ZD, 5.5% 6/15/35 | | 2,366,776 | 2,628,966 |
| Series 3055 Class CS, 6.590% - 1 month U.S. LIBOR 5.0025% 10/15/35 (d)(k)(l) | | 402,196 | 66,712 |
| Series 3237 Class C, 5.5% 11/15/36 | | 3,318,748 | 3,639,754 |
| Series 3244 Class SG, 6.660% - 1 month U.S. LIBOR 5.0725% 11/15/36 (d)(k)(l) | | 962,470 | 157,515 |
| Series 3284 Class CI, 6.120% - 1 month U.S. LIBOR 4.5325% 3/15/37 (d)(k)(l) | | 2,262,661 | 341,550 |
| Series 3287 Class SD, 6.750% - 1 month U.S. LIBOR 5.1625% 3/15/37 (d)(k)(l) | | 1,426,247 | 248,544 |
| Series 3297 Class BI, 6.760% - 1 month U.S. LIBOR 5.1725% 4/15/37 (d)(k)(l) | | 2,175,728 | 389,324 |
| Series 3336 Class LI, 6.580% - 1 month U.S. LIBOR 4.9925% 6/15/37 (d)(k)(l) | | 689,534 | 102,702 |
| Series 3772 Class BI, 4.5% 10/15/18 (k) | | 63,345 | 496 |
| Series 3949 Class MK, 4.5% 10/15/34 | | 631,458 | 658,068 |
| Series 3955: | | | |
| Class GS, 5.950% - 1 month U.S. LIBOR 4.3625% 9/15/41 (d)(k)(l) | | 3,494,968 | 469,912 |
| Class YI, 3% 11/15/21 (k) | | 1,502,936 | 58,774 |
| Series 4055 Class BI, 3.5% 5/15/31 (k) | | 3,150,990 | 345,781 |
| Series 4149 Class IO, 3% 1/15/33 (k) | | 2,223,201 | 282,975 |
| Series 4314 Class AI, 5% 3/15/34 (k) | | 1,098,584 | 115,287 |
| Series 4427 Class LI, 3.5% 2/15/34 (k) | | 5,804,485 | 780,666 |
| Series 4471 Class PA 4% 12/15/40 | | 7,463,955 | 7,643,210 |
| target amortization class Series 2156 Class TC, 6.25% 5/15/29 | | 183,294 | 194,641 |
| Freddie Mac Manufactured Housing participation certificates guaranteed: | | | |
| floater Series 1686 Class FA, 1 month U.S. LIBOR + 0.900% 2.4875% 2/15/24 (d)(e) | | 73,743 | 74,530 |
| sequential payer: | | | |
| Series 2043 Class ZH, 6% 4/15/28 | | 125,565 | 136,196 |
| Series 2056 Class Z, 6% 5/15/28 | | 275,622 | 298,619 |
| Freddie Mac Multi-family Structured pass-thru certificates Series 4386 Class AZ, 4.5% 11/15/40 | | 7,467,209 | 7,728,682 |
| Ginnie Mae guaranteed REMIC pass-thru certificates: | | | |
| floater: | | | |
| Series 2007-37 Class TS, 6.690% - 1 month U.S. LIBOR 5.1019% 6/16/37 (d)(k)(l) | | 422,624 | 74,103 |
| Series 2010-H03 Class FA, 1 month U.S. LIBOR + 0.550% 2.1138% 3/20/60 (d)(e)(n) | | 5,451,488 | 5,469,234 |
| Series 2010-H17 Class FA, 1 month U.S. LIBOR + 0.330% 1.8938% 7/20/60 (d)(e)(n) | | 623,537 | 621,839 |
| Series 2010-H18 Class AF, 1 month U.S. LIBOR + 0.300% 1.6794% 9/20/60 (d)(e)(n) | | 754,119 | 751,572 |
| Series 2010-H19 Class FG, 1 month U.S. LIBOR + 0.300% 1.6794% 8/20/60 (d)(e)(n) | | 860,357 | 857,416 |
| Series 2010-H27 Series FA, 1 month U.S. LIBOR + 0.380% 1.7594% 12/20/60 (d)(e)(n) | | 1,539,467 | 1,537,702 |
| Series 2011-H05 Class FA, 1 month U.S. LIBOR + 0.500% 1.8794% 12/20/60 (d)(e)(n) | | 2,401,332 | 2,406,208 |
| Series 2011-H07 Class FA, 1 month U.S. LIBOR + 0.500% 2.0618% 2/20/61 (d)(e)(n) | | 4,832,731 | 4,840,817 |
| Series 2011-H12 Class FA, 1 month U.S. LIBOR + 0.490% 2.0518% 2/20/61 (d)(e)(n) | | 6,345,020 | 6,354,321 |
| Series 2011-H13 Class FA, 1 month U.S. LIBOR + 0.500% 1.8794% 4/20/61 (d)(e)(n) | | 2,121,639 | 2,125,999 |
| Series 2011-H14: | | | |
| Class FB, 1 month U.S. LIBOR + 0.500% 1.8794% 5/20/61 (d)(e)(n) | | 2,485,580 | 2,491,585 |
| Class FC, 1 month U.S. LIBOR + 0.500% 1.8794% 5/20/61 (d)(e)(n) | | 2,329,356 | 2,334,464 |
| Series 2011-H17 Class FA, 1 month U.S. LIBOR + 0.530% 1.9094% 6/20/61 (d)(e)(n) | | 2,964,997 | 2,972,871 |
| Series 2011-H21 Class FA, 1 month U.S. LIBOR + 0.600% 1.9794% 10/20/61 (d)(e)(n) | | 5,809,923 | 5,836,881 |
| Series 2012-H01 Class FA, 1 month U.S. LIBOR + 0.700% 2.0794% 11/20/61 (d)(e)(n) | | 2,852,489 | 2,874,380 |
| Series 2012-H03 Class FA, 1 month U.S. LIBOR + 0.700% 2.0794% 1/20/62 (d)(e)(n) | | 1,897,259 | 1,911,164 |
| Series 2012-H06 Class FA, 1 month U.S. LIBOR + 0.630% 2.0094% 1/20/62 (d)(e)(n) | | 2,733,255 | 2,748,778 |
| Series 2012-H07 Class FA, 1 month U.S. LIBOR + 0.630% 2.0094% 3/20/62 (d)(e)(n) | | 1,689,787 | 1,699,034 |
| Series 2012-H21 Class DF, 1 month U.S. LIBOR + 0.650% 2.0294% 5/20/61 (d)(e)(n) | | 2,289,349 | 2,293,787 |
| Series 2012-H23 Class WA, 1 month U.S. LIBOR + 0.520% 1.8994% 10/20/62 (d)(e)(n) | | 1,503,629 | 1,507,742 |
| Series 2012-H26, Class CA, 1 month U.S. LIBOR + 0.530% 1.9094% 7/20/60 (d)(e)(n) | | 4,432,296 | 4,442,138 |
| Series 2013-H07 Class BA, 1 month U.S. LIBOR + 0.360% 1.7394% 3/20/63 (d)(e)(n) | | 2,392,037 | 2,387,815 |
| Series 2014-H03 Class FA, 1 month U.S. LIBOR + 0.600% 2.1618% 1/20/64 (d)(e)(n) | | 2,750,755 | 2,763,574 |
| Series 2014-H05 Class FB, 1 month U.S. LIBOR + 0.600% 2.1618% 12/20/63 (d)(e)(n) | | 7,397,477 | 7,437,162 |
| Series 2014-H11 Class BA, 1 month U.S. LIBOR + 0.500% 2.0618% 6/20/64 (d)(e)(n) | | 10,961,021 | 10,986,273 |
| Series 2014-H20 Class BF, 1 month U.S. LIBOR + 0.500% 2.0618% 9/20/64 (d)(e)(n) | | 34,539,316 | 34,622,269 |
| Series 2016-H20 Class FM, 1 month U.S. LIBOR + 0.400% 1.9618% 12/20/62 (d)(e)(n) | | 10,122,466 | 10,132,472 |
| planned amortization class: | | | |
| Series 1993-13 Class PD, 6% 5/20/29 | | 351,326 | 384,008 |
| Series 1997-8 Class PE, 7.5% 5/16/27 | | 151,327 | 171,591 |
| Series 2010-158 Class MS, 10.000% - 1 month U.S. LIBOR 6.8776% 12/20/40 (d)(l) | | 5,680,000 | 5,868,770 |
| Series 2011-136 Class WI, 4.5% 5/20/40 (k) | | 714,509 | 85,509 |
| sequential payer: | | | |
| Series 2004-24 Class ZM, 5% 4/20/34 | | 1,352,609 | 1,447,489 |
| Series 2010-160 Class DY, 4% 12/20/40 | | 16,137,413 | 16,683,336 |
| Series 2010-170 Class B, 4% 12/20/40 | | 3,649,890 | 3,773,333 |
| Series 2004-32 Class GS, 6.500% - 1 month U.S. LIBOR 4.9119% 5/16/34 (d)(k)(l) | | 229,664 | 34,482 |
| Series 2004-73 Class AL, 7.200% - 1 month U.S. LIBOR 5.6119% 8/17/34 (d)(k)(l) | | 277,608 | 52,313 |
| Series 2007-35 Class SC, 40.200% - 1 month U.S. LIBOR 30.6712% 6/16/37 (d)(l) | | 16,996 | 28,118 |
| Series 2010-116 Class QB, 4% 9/16/40 | | 34,128,659 | 35,233,438 |
| Series 2010-H10 Class FA, 1 month U.S. LIBOR + 0.330% 1.8938% 5/20/60 (d)(e)(n) | | 2,018,300 | 2,012,968 |
| Series 2011-94 Class SA, 6.100% - 1 month U.S. LIBOR 4.5388% 7/20/41 (d)(k)(l) | | 1,409,888 | 210,515 |
| Series 2012-76 Class GS, 6.700% - 1 month U.S. LIBOR 5.1119% 6/16/42 (d)(k)(l) | | 882,626 | 139,978 |
| Series 2013-124: | | | |
| Class ES, 8.667% - 1 month U.S. LIBOR 6.5851% 4/20/39 (d)(l) | | 2,294,538 | 2,351,217 |
| Class ST, 8.800% - 1 month U.S. LIBOR 6.7184% 8/20/39 (d)(l) | | 6,369,770 | 6,601,525 |
| Series 2013-149 Class MA, 2.5% 5/20/40 | | 19,602,395 | 19,119,731 |
| Series 2014-2 Class BA, 3% 1/20/44 | | 15,998,622 | 15,809,006 |
| Series 2014-21 Class HA, 3% 2/20/44 | | 7,304,331 | 7,225,986 |
| Series 2014-25 Class HC, 3% 2/20/44 | | 10,349,933 | 10,203,901 |
| Series 2014-5 Class A, 3% 1/20/44 | | 9,689,540 | 9,575,476 |
| Series 2015-H13 Class HA, 2.5% 8/20/64 (n) | | 22,184,094 | 22,119,429 |
| Series 2015-H17 Class HA, 2.5% 5/20/65 (n) | | 20,412,281 | 20,350,411 |
| Series 2015-H21: | | | |
| Class HA, 2.5% 6/20/63 (n) | | 4,163,611 | 4,154,344 |
| Class JA, 2.5% 6/20/65 (n) | | 18,985,862 | 18,932,595 |
| Series 2017-H06 Class FA, U.S. TREASURY 1 YEAR INDEX + 0.350% 2.11% 8/20/66 (d)(e)(n) | | 24,063,842 | 24,127,662 |
|
| TOTAL U.S. GOVERNMENT AGENCY | | | 494,817,228 |
|
| TOTAL COLLATERALIZED MORTGAGE OBLIGATIONS | | | |
| (Cost $623,560,526) | | | 615,396,512 |
|
| Commercial Mortgage Securities - 1.8% | | | |
| 280 Park Avenue Mortgage Trust floater Series 2017-280P Class F, 1 month U.S. LIBOR + 3.150% 4.3865% 9/15/34 (b)(d)(e) | | 1,242,000 | 1,235,762 |
| Americold LLC Trust Series 2010-ARTA Class D, 7.443% 1/14/29 (b) | | 180,000 | 194,913 |
| Asset Securitization Corp.: | | | |
| Series 1997-D4 Class B5, 7.525% 4/14/29 | | 129,000 | 129,004 |
| Series 1997-D5 Class PS1, 1.8371% 2/14/43 (d)(k) | | 44,756 | 383 |
| Aventura Mall Trust Series 2013-AVM Class E, 3.7427% 12/5/32 (b)(d) | | 1,340,110 | 1,340,774 |
| BAMLL Trust Series 2015-200P Class F, 3.5958% 4/14/33 (b)(d) | | 767,000 | 716,487 |
| BANK: | | | |
| Series 2017-BNK4 Class D, 3.357% 5/15/50 (b) | | 1,323,000 | 1,058,831 |
| Series 2017-BNK6 Class D, 3.1% 7/15/60 (b) | | 765,000 | 594,129 |
| Series 2017-BNK8 Class D, 2.6% 11/15/50 (b) | | 965,000 | 717,243 |
| Bank of America Commercial Mortgage Securities Trust Series 2017-BNK3: | | | |
| Class C, 4.352% 2/15/50 (d) | | 957,000 | 948,941 |
| Class D, 3.25% 2/15/50 (b) | | 667,000 | 527,269 |
| Bank of America Commercial Mortgage Trust Series 2016-UB10 Class XA, 1.9953% 7/15/49 (d)(k) | | 45,866,901 | 4,769,681 |
| Barclays Commercial Mortgage Securities LLC Series 2015-STP: | | | |
| Class A, 3.3228% 9/10/28 (b) | | 4,201,978 | 4,219,549 |
| Class E, 4.2844% 9/10/28 (b)(d) | | 1,786,000 | 1,714,102 |
| Bayview Commercial Asset Trust: | | | |
| floater: | | | |
| Series 2003-2 Class M1, 1 month U.S. LIBOR + 0.850% 2.8957% 12/25/33 (b)(d)(e) | | 18,755 | 18,695 |
| Series 2005-4A: | | | |
| Class A2, 1 month U.S. LIBOR + 0.390% 2.0107% 1/25/36 (b)(d)(e) | | 533,873 | 500,491 |
| Class B1, 1 month U.S. LIBOR + 1.400% 3.0207% 1/25/36 (b)(d)(e) | | 23,977 | 18,663 |
| Class M1, 1 month U.S. LIBOR + 0.450% 2.0707% 1/25/36 (b)(d)(e) | | 172,217 | 160,357 |
| Class M2, 1 month U.S. LIBOR + 0.470% 2.0907% 1/25/36 (b)(d)(e) | | 51,665 | 47,708 |
| Class M3, 1 month U.S. LIBOR + 0.500% 2.1207% 1/25/36 (b)(d)(e) | | 75,453 | 69,060 |
| Class M4, 1 month U.S. LIBOR + 0.610% 2.2307% 1/25/36 (b)(d)(e) | | 41,730 | 38,297 |
| Class M5, 1 month U.S. LIBOR + 0.650% 2.2707% 1/25/36 (b)(d)(e) | | 41,730 | 31,798 |
| Class M6, 1 month U.S. LIBOR + 0.700% 2.3207% 1/25/36 (b)(d)(e) | | 44,321 | 34,002 |
| Series 2006-3A Class M4, 1 month U.S. LIBOR + 0.430% 2.0507% 10/25/36 (b)(d)(e) | | 23,330 | 18,782 |
| Series 2007-1 Class A2, 1 month U.S. LIBOR + 0.270% 1.8907% 3/25/37 (b)(d)(e) | | 343,368 | 319,394 |
| Series 2007-2A: | | | |
| Class A1, 1 month U.S. LIBOR + 0.270% 1.8221% 7/25/37 (b)(d)(e) | | 360,230 | 344,112 |
| Class A2, 1 month U.S. LIBOR + 0.320% 1.8721% 7/25/37 (b)(d)(e) | | 336,586 | 318,419 |
| Class M1, 1 month U.S. LIBOR + 0.370% 1.9221% 7/25/37 (b)(d)(e) | | 118,190 | 106,655 |
| Class M2, 1 month U.S. LIBOR + 0.410% 1.9621% 7/25/37 (b)(d)(e) | | 64,584 | 56,672 |
| Class M3, 1 month U.S. LIBOR + 0.490% 2.0421% 7/25/37 (b)(d)(e) | | 52,526 | 41,607 |
| Series 2007-3: | | | |
| Class A2, 1 month U.S. LIBOR + 0.290% 1.8421% 7/25/37 (b)(d)(e) | | 323,618 | 302,168 |
| Class M1, 1 month U.S. LIBOR + 0.310% 1.8621% 7/25/37 (b)(d)(e) | | 70,287 | 66,591 |
| Class M2, 1 month U.S. LIBOR + 0.340% 1.8921% 7/25/37 (b)(d)(e) | | 75,335 | 70,601 |
| Class M3, 1 month U.S. LIBOR + 0.370% 1.9221% 7/25/37 (b)(d)(e) | | 118,709 | 102,178 |
| Class M4, 1 month U.S. LIBOR + 0.500% 2.0521% 7/25/37 (b)(d)(e) | | 186,391 | 155,577 |
| Class M5, 1 month U.S. LIBOR + 0.600% 2.1521% 7/25/37 (b)(d)(e) | | 71,541 | 55,725 |
| Series 2006-3A, Class IO, 0% 10/25/36 (b)(d)(g)(k) | | 3,584,120 | 0 |
| BBCMS Mortgage Trust Series 2016-ETC: | | | |
| Class D, 3.6089% 8/14/36 (b)(d) | | 1,000,000 | 917,757 |
| Class E, 3.6089% 8/14/36 (b)(d) | | 1,000,000 | 871,624 |
| Beckman Coulter, Inc. sequential payer Series 2000-A Class A, 7.4975% 12/15/18 (b) | | 546,250 | 546,987 |
| BWAY Mortgage Trust Series 2015-1740 Class E, 4.4499% 1/10/35 (b)(d) | | 1,000,000 | 969,822 |
| BX Trust Series 2017-IMC Class F, 1 month U.S. LIBOR + 4.250% 5.8095% 10/15/32 (b)(d)(e) | | 1,253,000 | 1,259,648 |
| BXMT Ltd. floater Series 2017-FL1 Class D, 1 month U.S. LIBOR + 2.700% 4.061% 6/15/35 (b)(e) | | 836,000 | 838,592 |
| CCRESG Commercial Mortgage Trust Series 2016-HEAT Class E, 5.4883% 4/10/29 (b)(d) | | 606,000 | 581,009 |
| CD Mortgage Trust Series 2017-CD3: | | | |
| Class C, 4.563% 2/10/50 | | 1,360,000 | 1,380,272 |
| Class D, 3.25% 2/10/50 (b) | | 1,259,000 | 1,004,920 |
| CFCRE Commercial Mortgage Trust Series 2011-C2 Class B, 5.7537% 12/15/47 (b)(d) | | 750,000 | 808,648 |
| CG-CCRE Commercial Mortgage Trust: | | | |
| Series 2014-FL1: | | | |
| Class YTC2, 1 month U.S. LIBOR + 2.489% 4.0485% 6/15/31 (b)(d)(e) | | 435,090 | 413,963 |
| Class YTC3, 1 month U.S. LIBOR + 2.489% 4.0485% 6/15/31 (b)(d)(e) | | 156,667 | 147,845 |
| Series 2014-FL1, 1 month U.S. LIBOR + 2.489% 4.0485% 6/15/31 (b)(d)(e) | | 435,090 | 416,523 |
| CGBAM Commercial Mortgage Trust Series 2015-SMRT: | | | |
| Class E, 3.7859% 4/10/28 (b)(d) | | 162,000 | 161,307 |
| Class F, 3.7859% 4/10/28 (b)(d) | | 1,133,000 | 1,116,990 |
| CGDB Commercial Mortgage Trust: | | | |
| 1 month U.S. LIBOR + 2.500% 4.0595% 5/15/30 (b)(d)(e) | | 260,000 | 261,457 |
| Series 2017-BIO Class F, 1 month U.S. LIBOR + 3.250% 4.8095% 5/15/30 (b)(d)(e) | | 134,000 | 133,825 |
| Chase Commercial Mortgage Securities Corp.: | | | |
| Series 1998-1 Class H, 6.34% 5/18/30 (b) | | 57,754 | 58,753 |
| Series 1998-2 Class J, 6.39% 11/18/30 (b) | | 186,544 | 183,345 |
| Citigroup Commercial Mortgage Trust: | | | |
| Series 2013-375P Class E, 3.5176% 5/10/35 (b)(d) | | 1,205,000 | 1,136,261 |
| Series 2013-GC15 Class D, 5.0987% 9/10/46 (b)(d) | | 1,927,000 | 1,826,260 |
| Series 2015-GC29 Class XA, 1.1526% 4/10/48 (d)(k) | | 66,339,943 | 3,746,475 |
| Series 2015-GC33 Class XA, 0.9596% 9/10/58 (d)(k) | | 92,077,832 | 5,134,131 |
| Series 2015-SHP2 Class E, 1 month U.S. LIBOR + 4.100% 5.9095% 7/15/27 (b)(d)(e) | | 693,000 | 696,491 |
| Series 2016-C3 Class D, 3% 11/15/49 (b) | | 1,451,000 | 1,085,790 |
| Series 2016-P6 Class XA, 0.8303% 12/10/49 (d)(k) | | 83,087,022 | 3,812,431 |
| Series 2016-SMPL Class E, 4.509% 9/10/31 (b) | | 1,406,000 | 1,396,656 |
| COMM Mortgage Trust: | | | |
| floater Series 2014-PAT Class E, 1 month U.S. LIBOR + 3.150% 4.7025% 8/13/27 (b)(d)(e) | | 735,000 | 744,011 |
| sequential payer Series 2013-LC6 Class E, 3.5% 1/10/46 (b) | | 1,410,000 | 1,055,531 |
| Series 2012-CR1: | | | |
| Class C, 5.3197% 5/15/45 (d) | | 850,000 | 882,968 |
| Class D, 5.3197% 5/15/45 (b)(d) | | 1,510,000 | 1,458,645 |
| Class G, 2.462% 5/15/45 (b) | | 231,000 | 140,118 |
| Series 2012-CR5 Class D, 4.3253% 12/10/45 (b)(d) | | 740,000 | 699,027 |
| Series 2012-LC4: | | | |
| Class C, 5.6047% 12/10/44 (d) | | 260,000 | 264,214 |
| Class D, 5.6047% 12/10/44 (b)(d) | | 1,437,000 | 1,281,389 |
| Series 2013-CCRE6 Class E, 4.0668% 3/10/46 (b)(d) | | 42,000 | 33,372 |
| Series 2013-CR10: | | | |
| Class C, 4.7886% 8/10/46 (b)(d) | | 270,000 | 271,893 |
| Class D, 4.7886% 8/10/46 (b)(d) | | 1,578,000 | 1,366,364 |
| Series 2013-CR12 Class D, 5.0786% 10/10/46 (b)(d) | | 1,680,000 | 1,396,259 |
| Series 2013-CR6 Class F, 4.0668% 3/10/46 (b)(d) | | 418,000 | 267,555 |
| Series 2013-CR9: | | | |
| Class C, 4.2539% 7/10/45 (b)(d) | | 525,000 | 511,543 |
| Class D, 4.2539% 7/10/45 (b)(d) | | 252,000 | 214,154 |
| Series 2013-LC6 Class D, 4.3062% 1/10/46 (b)(d) | | 1,441,000 | 1,316,050 |
| Series 2014-CR15 Class D, 4.769% 2/10/47 (b)(d) | | 258,000 | 234,395 |
| Series 2014-CR17: | | | |
| Class D, 4.7985% 5/10/47 (b)(d) | | 1,292,000 | 1,087,115 |
| Class E, 4.7985% 5/10/47 (b)(d) | | 182,000 | 140,666 |
| Series 2014-CR19 Class XA, 1.22% 8/10/47 (d)(k) | | 154,962,614 | 7,449,146 |
| Series 2014-CR20 Class XA, 1.1559% 11/10/47 (d)(k) | | 125,328,396 | 6,564,965 |
| Series 2014-LC17 Class XA, 0.9465% 10/10/47 (d)(k) | | 108,231,032 | 3,737,564 |
| Series 2014-UBS2 Class D, 5.0145% 3/10/47 (b)(d) | | 844,000 | 734,001 |
| Series 2014-UBS4 Class XA, 1.2174% 8/10/47 (d)(k) | | 112,531,975 | 5,704,797 |
| Series 2014-UBS6 Class XA, 1.0169% 12/10/47 (d)(k) | | 152,033,333 | 6,866,525 |
| Series 2015-3BP Class F, 3.2384% 2/10/35 (b)(d) | | 1,500,000 | 1,344,707 |
| Series 2015-CR23 Class CME, 3.6845% 5/10/48 (b)(d) | | 483,000 | 471,517 |
| Series 2015-DC1 Class XA, 1.1593% 2/10/48 (d)(k) | | 154,253,411 | 8,027,255 |
| Series 2016-CD1 Class D, 2.771% 8/10/49 (b)(d) | | 1,006,000 | 770,490 |
| Series 2017-CD4 Class D, 3.3% 5/10/50 (b) | | 1,024,000 | 826,644 |
| COMM Mortgage Trust pass-thru certificates Series 2005-LP5 Class F, 4.5947% 5/10/43 (b)(d) | | 1,206,747 | 1,200,849 |
| COMM Trust Series 2017-COR2 Class D, 3% 9/10/50 (b) | | 340,000 | 274,312 |
| Commercial Mortgage Asset Trust Series 1999-C2 Class H, 6% 11/17/32 (b) | | 704,842 | 706,970 |
| Commercial Mortgage Trust Series 2016-CD2: | | | |
| Class C, 4.0306% 11/10/49 (d) | | 971,000 | 946,084 |
| Class D, 2.7806% 11/10/49 (d) | | 508,000 | 389,247 |
| Commercial Mortgage Trust pass-thru certificates: | | | |
| Series 2012-CR2: | | | |
| Class E, 4.832% 8/15/45 (b)(d) | | 1,727,000 | 1,655,692 |
| Class F, 4.25% 8/15/45 (b) | | 1,418,000 | 1,142,344 |
| Series 2014-CR2 Class G, 4.25% 8/15/45 (b) | | 496,000 | 315,430 |
| Core Industrial Trust: | | | |
| Series 2015-CALW Class G, 3.8504% 2/10/34 (b)(d) | | 625,000 | 600,708 |
| Series 2015-TEXW Class F, 3.8487% 2/10/34 (b)(d) | | 493,000 | 475,867 |
| Series 2015-WEST Class F, 4.2268% 2/10/37 (b)(d) | | 1,566,000 | 1,492,866 |
| Credit Suisse First Boston Mortgage Securities Corp.: | | | |
| Series 1998-C1 Class H, 6% 5/17/40 (b) | | 90,060 | 73,478 |
| Series 1998-C2 Class G, 6.75% 11/15/30 (b) | | 55,002 | 55,121 |
| CSAIL Commercial Mortgage Trust: | | | |
| Series 2017-C8 Class D, 4.47% 6/15/50 (b) | | 1,196,000 | 1,068,976 |
| Series 2017-CX10 Class UESD, 4.2366% 11/15/27 (b)(d) | | 588,000 | 558,639 |
| Series 2017-CX9 Class D, 4.161% 9/15/50 (b) | | 479,000 | 399,649 |
| CSMC Trust: | | | |
| floater Series 2015-DEAL: | | | |
| Class E, 1 month U.S. LIBOR + 4.000% 5.588% 4/15/29 (b)(d)(e) | | 1,109,000 | 1,108,999 |
| Class F, 1 month U.S. LIBOR + 4.750% 6.338% 4/15/29 (b)(d)(e) | | 989,000 | 987,576 |
| Series 2016-MFF Class F, 1 month U.S. LIBOR + 7.250% 8.8095% 11/15/33 (b)(d)(e) | | 968,000 | 977,272 |
| Series 2017-MOON Class E, 3.1965% 7/10/34 (b)(d) | | 377,000 | 360,155 |
| DBCCRE Mortgage Trust Series 2014-ARCP Class E, 4.9345% 1/10/34 (b)(d) | | 1,449,000 | 1,280,878 |
| DBUBS Mortgage Trust: | | | |
| Series 2011-LC1A: | | | |
| Class E, 5.6978% 11/10/46 (b)(d) | | 1,810,000 | 1,872,435 |
| Class F, 5.6978% 11/10/46 (b)(d) | | 1,560,000 | 1,504,611 |
| Class G, 4.652% 11/10/46 (b) | | 1,948,000 | 1,712,943 |
| Class XB, 0.306% 11/10/46 (b)(d)(k) | | 20,920,000 | 172,590 |
| Series 2011-LC3A Class D, 5.3405% 8/10/44 (b)(d) | | 812,000 | 836,884 |
| Deutsche Bank Commercial Mortgage Trust Series 2016-C3 Class C, 3.4938% 9/10/49 (d) | | 600,000 | 563,789 |
| Fannie Mae Series 2017-T1 Class A, 2.898% 6/25/27 | | 52,088,846 | 50,013,319 |
| Freddie Mac: | | | |
| floater: | | | |
| Series KP04 Class AG1, 1 month U.S. LIBOR + 0.220% 1.7997% 7/25/20 (d)(e) | | 12,900,000 | 12,912,193 |
| Series KP04, Class AG2, 1 month U.S. LIBOR + 0.200% 1.7797% 10/25/19 (d)(e) | | 26,000,000 | 26,012,815 |
| pass-thru certificates: | | | |
| Series K011 Class X3, 2.577% 12/25/43 (d)(k) | | 1,640,000 | 109,202 |
| Series K012 Class X3, 2.252% 1/25/41 (d)(k) | | 1,770,270 | 105,614 |
| Series K013 Class X3, 2.9089% 1/25/43 (d)(k) | | 820,000 | 62,863 |
| Series KAIV Class X2, 3.6147% 6/25/46 (d)(k) | | 420,000 | 43,498 |
| FREMF Mortgage Trust: | | | |
| Series 2010-K9 Class B, 5.2061% 9/25/45 (b)(d) | | 1,815,000 | 1,901,302 |
| Series 2011-K10 Class B, 4.6216% 11/25/49 (b)(d) | | 500,000 | 516,230 |
| Series 2011-K11 Class B, 4.4238% 12/25/48 (b)(d) | | 750,000 | 772,994 |
| GAHR Commercial Mortgage Trust Series 2015-NRF: | | | |
| Class BFX, 3.3822% 12/15/34 (b)(d) | | 18,910,000 | 18,960,616 |
| Class CFX, 3.3822% 12/15/34 (b)(d) | | 14,152,000 | 14,141,331 |
| Class DFX, 3.3822% 12/15/34 (b)(d) | | 27,804,000 | 27,711,780 |
| Class EFX, 3.3822% 12/15/34 (b)(d) | | 1,750,000 | 1,729,353 |
| Class FFX, 3.3822% 12/15/34 (b)(d) | | 1,967,000 | 1,933,872 |
| Class GFX, 3.3822% 12/15/34 (b)(d) | | 2,314,000 | 2,268,063 |
| GE Capital Commercial Mortgage Corp. Series 2007-C1 Class A1A, 5.483% 12/10/49 | | 1,111,667 | 1,115,802 |
| GMAC Commercial Mortgage Securities, Inc.: | | | |
| Series 1997-C1 Class H, 6.6% 7/15/29 | | 147,453 | 141,363 |
| Series 1997-C2 Class G, 6.75% 4/15/29 (d) | | 17,873 | 17,874 |
| Series 1999-C2I Class K, 6.481% 9/15/33 | | 835,000 | 757,645 |
| GP Portfolio Trust Series 2014-GPP: | | | |
| Class A, 1 month U.S. LIBOR + 1.200% 2.7595% 2/15/27 (b)(d)(e) | | 7,427,286 | 7,428,763 |
| Class D, 1 month U.S. LIBOR + 3.000% 4.5595% 2/15/27 (b)(d)(e) | | 291,000 | 291,064 |
| Class E, 1 month U.S. LIBOR + 4.100% 5.6595% 2/15/27 (b)(d)(e) | | 378,000 | 372,315 |
| Grace Mortgage Trust Series 2014-GRCE Class F, 3.5901% 6/10/28 (b)(d) | | 1,323,000 | 1,298,060 |
| GS Mortgage Securities Corp. II Series 2010-C1: | | | |
| Class D, 6.051% 8/10/43 (b)(d) | | 617,000 | 626,735 |
| Class F, 4% 8/10/43 (b) | | 327,000 | 234,405 |
| Class X, 1.377% 8/10/43 (b)(d)(k) | | 4,746,027 | 125,093 |
| GS Mortgage Securities Trust: | | | |
| Series 2010-C2: | | | |
| Class D, 5.1826% 12/10/43 (b)(d) | | 720,000 | 723,650 |
| Class XA, 0.1177% 12/10/43 (b)(d)(k) | | 3,170,775 | 10,891 |
| Series 2011-GC3 Class D, 5.6416% 3/10/44 (b)(d) | | 294,000 | 302,102 |
| Series 2011-GC5: | | | |
| Class C, 5.3983% 8/10/44 (b)(d) | | 1,050,000 | 1,099,642 |
| Class D, 5.3983% 8/10/44 (b)(d) | | 1,500,000 | 1,443,624 |
| Class E, 5.3983% 8/10/44 (b)(d) | | 711,000 | 576,023 |
| Class F, 4.5% 8/10/44 (b) | | 1,209,000 | 617,579 |
| Series 2012-GC6: | | | |
| Class D, 5.6521% 1/10/45 (b)(d) | | 1,156,000 | 1,096,984 |
| Class E, 5% 1/10/45 (b)(d) | | 412,000 | 351,121 |
| Series 2012-GC6I Class F, 5% 1/10/45 (d) | | 390,000 | 260,823 |
| Series 2012-GCJ7: | | | |
| Class C, 5.6977% 5/10/45 (d) | | 630,000 | 651,438 |
| Class D, 5.6977% 5/10/45 (b)(d) | | 2,204,000 | 2,123,212 |
| Class E, 5% 5/10/45 (b) | | 1,311,000 | 1,063,776 |
| Class F, 5% 5/10/45 (b) | | 2,079,000 | 1,146,462 |
| Series 2012-GCJ9: | | | |
| Class D, 4.7489% 11/10/45 (b)(d) | | 2,119,000 | 2,023,570 |
| Class E, 4.7489% 11/10/45 (b)(d) | | 1,290,000 | 1,132,939 |
| Series 2013-GC10 Class D, 4.4112% 2/10/46 (b)(d) | | 920,000 | 865,382 |
| Series 2013-GC12: | | | |
| Class D, 4.4423% 6/10/46 (b)(d) | | 219,000 | 186,801 |
| Class XA, 1.5229% 6/10/46 (d)(k) | | 29,591,814 | 1,615,503 |
| Series 2013-GC13 Class D, 4.0897% 7/10/46 (b)(d) | | 1,858,000 | 1,697,189 |
| Series 2013-GC16: | | | |
| Class C, 5.3272% 11/10/46 (d) | | 662,844 | 669,562 |
| Class D, 5.3272% 11/10/46 (b)(d) | | 1,009,000 | 948,605 |
| Class F, 3.5% 11/10/46 (b) | | 999,000 | 707,730 |
| Series 2014-GC20 Class XA, 1.0046% 4/10/47 (d)(k) | | 180,321,462 | 8,582,652 |
| Series 2015-GC34 Class XA, 1.3559% 10/10/48 (d)(k) | | 29,147,286 | 2,194,490 |
| Series 2016-GS2 Class C, 4.5293% 5/10/49 (d) | | 699,000 | 718,259 |
| Series 2016-GS3 Class D, 2.728% 10/10/49 (b) | | 1,776,000 | 1,363,738 |
| Series 2016-GS4 Class C, 3.8041% 11/10/49 | | 728,000 | 704,552 |
| Series 2016-REMZ Class MZB, 7.727% 2/10/21 (b) | | 1,113,000 | 1,091,007 |
| Series 2016-RENT: | | | |
| Class E, 4.0667% 2/10/29 (b)(d) | | 1,452,000 | 1,433,938 |
| Class F, 4.0667% 2/10/29 (b)(d) | | 1,520,000 | 1,407,769 |
| Series 2017-GS6 Class D, 3.331% 5/10/50 (b) | | 1,113,000 | 868,571 |
| Hilton U.S.A. Trust: | | | |
| Series 2016-HHV Class F, 4.1935% 11/5/38 (b)(d) | | 1,702,000 | 1,479,666 |
| Series 2016-SFP Class F, 6.0801% 11/5/35 (b) | | 1,344,000 | 1,342,045 |
| IMT Trust Series 2017-APTS: | | | |
| Class EFL, 1 month U.S. LIBOR + 2.150% 3.7095% 6/15/34 (b)(d)(e) | | 564,000 | 564,886 |
| Class FFL, 1 month U.S. LIBOR + 2.850% 4.4095% 6/15/34 (b)(d)(e) | | 226,000 | 226,479 |
| JPMBB Commercial Mortgage Securities Trust: | | | |
| Series 2014-C19 Class XA, 1.1383% 4/15/47 (d)(k) | | 23,349,322 | 586,920 |
| Series 2014-C22 Class D, 4.5589% 9/15/47 (b)(d) | | 525,000 | 424,178 |
| Series 2014-C23 Class UH5, 4.7094% 9/15/47 (b) | | 179,000 | 151,012 |
| Series 2014-C26 Class D, 3.924% 1/15/48 (b)(d) | | 707,000 | 601,010 |
| Series 2015-C30 Class XA, 0.683% 7/15/48 (d)(k) | | 82,989,433 | 2,529,452 |
| Series 2015-C32 Class C, 4.6675% 11/15/48 (d) | | 1,907,000 | 1,896,148 |
| JPMCC Commercial Mortgage Securities Trust Series 2016-JP4 Class D, 3.4619% 12/15/49 (b) | | 1,462,000 | 1,183,353 |
| JPMDB Commercial Mortgage Securities Trust: | | | |
| Series 2016-C4: | | | |
| Class C, 3.0971% 12/15/49 | | 946,000 | 863,294 |
| Class D, 3.0954% 12/15/49 (b)(d) | | 1,148,000 | 904,260 |
| Series 2017-C7: | | | |
| Class C, 4.1854% 10/15/50 (d) | | 545,000 | 538,089 |
| Class D, 3% 10/15/50 (b) | | 569,000 | 445,979 |
| JPMorgan Chase Commercial Mortgage Securities Corp.: | | | |
| sequential payer Series 2010-CNTR Class A2, 4.311% 8/5/32 (b) | | 319,521 | 326,224 |
| Series 2003-C1 Class F, 5.4825% 1/12/37 (b)(d) | | 182,122 | 187,834 |
| Series 2009-IWST: | | | |
| Class C, 7.4453% 12/5/27 (b)(d) | | 380,000 | 409,182 |
| Class D, 7.4453% 12/5/27 (b)(d) | | 1,885,000 | 2,025,778 |
| Series 2010-CNTR Class D, 6.1838% 8/5/32 (b)(d) | | 695,000 | 733,440 |
| Series 2012-CBX: | | | |
| Class C, 5.2137% 6/15/45 (d) | | 250,000 | 254,753 |
| Class D, 5.2137% 6/16/45 (b)(d) | | 690,000 | 689,720 |
| Class E, 5.2137% 6/15/45 (b)(d) | | 1,043,000 | 1,019,720 |
| Class F, 4% 6/15/45 (b) | | 988,000 | 790,939 |
| Class G 4% 6/15/45 (b) | | 1,079,000 | 600,425 |
| JPMorgan Chase Commercial Mortgage Securities Trust: | | | |
| Series 2004-CBX Class D, 5.097% 1/12/37 (d) | | 170,000 | 173,030 |
| Series 2005-LDP2: | | | |
| Class E, 4.981% 7/15/42 (d) | | 69,065 | 70,066 |
| Class F, 5.01% 7/15/42 (d) | | 189,000 | 187,551 |
| Series 2011-C3: | | | |
| Class E, 5.6301% 2/15/46 (b)(d) | | 700,000 | 690,242 |
| Class H, 4.409% 2/15/46 (b)(d) | | 756,000 | 554,419 |
| Class J, 4.409% 2/15/46 (b)(d) | | 106,000 | 67,575 |
| Series 2011-C4: | | | |
| Class E, 5.5344% 7/15/46 (b)(d) | | 1,130,000 | 1,139,338 |
| Class F, 3.873% 7/15/46 (b) | | 105,000 | 96,405 |
| Class H, 3.873% 7/15/46 (b) | | 674,250 | 483,661 |
| Class NR, 3.873% 7/15/46 (b) | | 385,000 | 243,513 |
| Class TAC1, 7.99% 7/15/46 (b) | | 715,915 | 713,665 |
| Class TAC2, 7.99% 7/15/46 (b) | | 671,000 | 667,892 |
| Series 2011-C5: | | | |
| Class B. 5.4078% 8/15/46 (b)(d) | | 1,140,000 | 1,205,854 |
| Class C, 5.4078% 8/15/46 (b)(d) | | 650,648 | 673,967 |
| Series 2013-LC11: | | | |
| Class C, 3.9582% 4/15/46 (d) | | 1,163,000 | 1,146,982 |
| Class D, 4.1949% 4/15/46 (d) | | 1,800,000 | 1,651,478 |
| Class F, 3.25% 4/15/46 (b)(d) | | 1,682,000 | 972,449 |
| Series 2014-DSTY: | | | |
| Class D, 3.8046% 6/10/27 (b)(d) | | 816,000 | 772,757 |
| Class E, 3.8046% 6/10/27 (b)(d) | | 1,169,000 | 1,089,984 |
| Series 2015-UES Class F, 3.621% 9/5/32 (b)(d) | | 1,155,000 | 1,122,801 |
| Series 2016-WP Class TA, 1 month U.S. LIBOR + 1.450% 3.0095% 10/15/33 (b)(d)(e) | | 15,063,000 | 15,086,421 |
| Ladder Capital Commercial Mortgage Securities Trust Series 2014-909 Class E, 3.8979% 5/15/31 (b)(d) | | 1,218,000 | 1,167,396 |
| Liberty Street Trust Series 2016-225L: | | | |
| Class D, 4.6485% 2/10/36 (b)(d) | | 588,000 | 606,135 |
| Class E, 4.6485% 2/10/36 (b)(d) | | 1,050,000 | 1,011,101 |
| Lone Star Portfolio Trust floater Series 2015-LSP Class A1A2, 1 month U.S. LIBOR + 1.800% 3.3595% 9/15/28 (b)(d)(e) | | 7,113,426 | 7,126,899 |
| LSTAR Commercial Mortgage Trust Series 2014-2: | | | |
| Class D, 5.1239% 1/20/41 (b)(d) | | 256,000 | 254,749 |
| Class E, 5.1239% 1/20/41 (b)(d) | | 400,000 | 369,524 |
| Merrill Lynch Mortgage Trust Series 2006-C1 Class AJ, 5.677% 5/12/39 (d) | | 282,634 | 284,802 |
| Morgan Stanley BAML Trust: | | | |
| sequential payer Series 2014-C18 Class 300E, 4.6896% 8/15/31 (b) | | 750,000 | 715,789 |
| Series 2012-C5 Class E, 4.6873% 8/15/45 (b)(d) | | 269,000 | 263,137 |
| Series 2012-C6 Class D, 4.5751% 11/15/45 (b)(d) | | 1,357,000 | 1,354,704 |
| Series 2013-C12 Class D, 4.7636% 10/15/46 (b)(d) | | 1,210,000 | 1,135,645 |
| Series 2013-C13: | | | |
| Class D, 4.8893% 11/15/46 (b)(d) | | 1,074,000 | 998,057 |
| Class E, 4.8893% 11/15/46 (b)(d) | | 887,000 | 697,348 |
| Series 2013-C7: | | | |
| Class D, 4.2502% 2/15/46 (b)(d) | | 1,111,000 | 1,004,072 |
| Class E, 4.2502% 2/15/46 (b)(d) | | 340,000 | 261,781 |
| Series 2013-C8 Class D, 4.0593% 12/15/48 (b)(d) | | 400,000 | 360,247 |
| Series 2013-C9: | | | |
| Class C, 4.0468% 5/15/46 (d) | | 790,000 | 774,157 |
| Class D, 4.1348% 5/15/46 (b)(d) | | 1,747,000 | 1,588,367 |
| Series 2014-C17 Class XA, 1.2301% 8/15/47 (d)(k) | | 172,274,284 | 7,811,691 |
| Series 2015-C25 Class XA, 1.1336% 10/15/48 (d)(k) | | 47,277,848 | 2,953,017 |
| Series 2016-C30: | | | |
| Class C, 4.1312% 9/15/49 (d) | | 417,000 | 407,285 |
| Class D, 3% 9/15/49 (b) | | 452,000 | 338,242 |
| Series 2016-C31: | | | |
| Class C, 4.3193% 11/15/49 (d) | | 946,000 | 925,319 |
| Class D, 3% 11/15/49 (b)(d) | | 703,000 | 522,860 |
| Series 2016-C32: | | | |
| Class C, 4.296% 12/15/49 | | 651,000 | 645,463 |
| Class D, 3.396% 12/15/49 (b) | | 924,000 | 681,861 |
| Series 2017-C33 Class D, 3.25% 5/15/50 (b) | | 879,000 | 703,726 |
| Morgan Stanley Capital I Trust: | | | |
| sequential payer Series 2012-C4 Class E, 5.4205% 3/15/45 (b)(d) | | 1,483,000 | 1,239,106 |
| Series 1997-RR Class F, 7.51% 4/30/39 (b)(d) | | 19,357 | 19,318 |
| Series 1998-CF1 Class G, 7.35% 7/15/32 (b) | | 83,471 | 80,800 |
| Series 1999-WF1: | | | |
| Class N, 5.91% 11/15/31 (b) | | 52,812 | 52,671 |
| Class O, 5.91% 11/15/31 (b) | | 160,287 | 154,600 |
| Series 2011-C1: | | | |
| Class D, 5.4264% 9/15/47 (b)(d) | | 1,760,000 | 1,833,956 |
| Class E, 5.4264% 9/15/47 (b)(d) | | 573,100 | 595,858 |
| Series 2011-C2: | | | |
| Class D, 5.4831% 6/15/44 (b)(d) | | 1,272,000 | 1,253,006 |
| Class E, 5.4831% 6/15/44 (b)(d) | | 600,000 | 563,788 |
| Class F, 5.4831% 6/15/44 (b)(d) | | 550,000 | 464,716 |
| Class XB, 0.5345% 6/15/44 (b)(d)(k) | | 9,001,008 | 141,729 |
| Series 2011-C3: | | | |
| Class C, 5.1549% 7/15/49 (b)(d) | | 1,000,000 | 1,043,815 |
| Class D, 5.1549% 7/15/49 (b)(d) | | 1,130,000 | 1,168,167 |
| Class E, 5.1549% 7/15/49 (b)(d) | | 532,000 | 512,965 |
| Class F, 5.1549% 7/15/49 (b)(d) | | 181,000 | 166,274 |
| Class G, 5.1549% 7/15/49 (b)(d) | | 957,000 | 795,462 |
| Series 2012-C4: | | | |
| Class D, 5.4205% 3/15/45 (b)(d) | | 330,000 | 313,469 |
| Class F, 3.07% 3/15/45 (b) | | 623,000 | 349,971 |
| Series 2014-150E: | | | |
| Class C, 4.295% 9/9/32 (b)(d) | | 656,000 | 671,444 |
| Class F, 4.295% 9/9/32 (b)(d) | | 651,000 | 624,335 |
| Series 2014-CPT Class F, 3.4455% 7/13/29 (b)(d) | | 1,436,000 | 1,405,329 |
| Series 2015-MS1: | | | |
| Class C, 4.0301% 5/15/48 (d) | | 734,000 | 708,708 |
| Class D, 4.0301% 5/15/48 (b)(d) | | 1,260,000 | 1,065,393 |
| Series 2015-UBS8 Class D, 3.18% 12/15/48 (b) | | 798,000 | 668,023 |
| Series 2016-BNK2: | | | |
| Class C, 3% 11/15/49 (b) | | 1,350,000 | 1,052,836 |
| Class D, 3.9101% 11/15/49 (d) | | 946,000 | 908,053 |
| Series 2017-CLS Class F, 1 month U.S. LIBOR + 2.600% 4.1595% 11/15/34 (b)(d)(e) | | 1,100,000 | 1,103,792 |
| Morgan Stanley Dean Witter Capital I Trust Series 2001-TOP3 Class E, 7.5867% 7/15/33 (b)(d) | | 91,000 | 97,060 |
| Motel 6 Trust floater: | | | |
| Series 2017-M6MZ, Class M, 1 month U.S. LIBOR + 6.927% 8.486% 8/15/19 (b)(d)(e) | | 494,792 | 497,855 |
| Series 2017-MTL6, Class F, 1 month U.S. LIBOR + 4.250% 5.8095% 8/15/34 (b)(d)(e) | | 3,179,551 | 3,200,386 |
| MSCG Trust Series 2016-SNR: | | | |
| Class A, 3.348% 11/15/34 (b)(d) | | 23,867,000 | 23,363,442 |
| Class B, 4.181% 11/15/34 (b) | | 8,435,000 | 8,324,624 |
| Class C, 5.205% 11/15/34 (b) | | 5,900,000 | 5,905,506 |
| Class D, 6.55% 11/15/34 (b) | | 2,222,000 | 2,218,115 |
| Class E, 6.8087% 11/15/34 (b) | | 615,000 | 583,817 |
| MSJP Commercial Securities Mortgage Trust Series 2015-HAUL Class E, 4.851% 9/5/47 (b)(d) | | 278,000 | 255,202 |
| NationsLink Funding Corp. Series 1999-LTL1 Class D, 6.45% 1/22/26 (b) | | 237,026 | 242,405 |
| Natixis Commercial Mortgage Securities Trust: | | | |
| Series 2018-285M Class F, 3.7904% 11/15/32 (b)(d) | | 294,000 | 273,124 |
| Series 2018-TECH Class F, 4.5595% 11/15/34 (b) | | 364,000 | 364,678 |
| Providence Place Group Ltd. Partnership Series 2000-C1 Class A2, 7.75% 7/20/28 (b) | | 943,493 | 1,152,948 |
| Real Estate Asset Liquidity Trust Series 2006-2: | | | |
| Class J, 4.456% 9/12/38 (b) | CAD | 20,949 | 16,245 |
| Class K, 4.456% 9/12/38 (b) | CAD | 18,000 | 13,970 |
| Class L, 4.456% 9/12/38 (b) | CAD | 26,000 | 20,146 |
| Class M, 4.456% 9/12/38 (b) | CAD | 104,391 | 79,401 |
| SCG Trust Series 2013-SRP1: | | | |
| Class A, 1 month U.S. LIBOR + 1.400% 3.2095% 11/15/26 (b)(d)(e) | | 19,989,000 | 19,988,996 |
| Class D, 1 month U.S. LIBOR + 3.344% 5.1532% 11/15/26 (b)(d)(e) | | 249,000 | 243,600 |
| Starwood Retail Property Trust Series 2014-STAR Class D, 1 month U.S. LIBOR + 3.250% 4.8095% 11/15/27 (b)(d)(e) | | 663,000 | 639,802 |
| TIAA Seasoned Commercial Mortgage Trust: | | | |
| sequential payer Series 2007-C4 Class AJ, 5.4762% 8/15/39 (d) | | 21,299 | 21,347 |
| Series 2007-C4 Class F, 5.4762% 8/15/39 (d) | | 820,000 | 757,344 |
| TPG Real Estate Finance floater Series 2018-FL1 Class D, 1 month U.S. LIBOR + 2.700% 4.261% 4/15/35 (b)(d)(e) | | 314,000 | 315,382 |
| UBS Commercial Mortgage Trust: | | | |
| Series 2012-C1: | | | |
| Class D, 5.5444% 5/10/45 (b)(d) | | 1,197,000 | 1,182,908 |
| Class E, 5% 5/10/45 (b)(d) | | 537,000 | 453,112 |
| Class F, 5% 5/10/45 (b)(d) | | 682,700 | 465,166 |
| Series 2017-C7 Class XA, 1.047% 12/15/50 (d)(k) | | 85,605,137 | 6,513,721 |
| UBS-BAMLL Trust: | | | |
| Series 12-WRM Class D, 4.238% 6/10/30 (b)(d) | | 310,000 | 299,808 |
| Series 2012-WRM Class E, 4.238% 6/10/30 (b)(d) | | 970,000 | 914,166 |
| VNO Mortgage Trust Series 2012-6AVE Class D, 3.3372% 11/15/30 (b)(d) | | 1,299,000 | 1,254,627 |
| Vornado DP LLC Series 2010-VNO Class D, 6.3555% 9/13/28 (b) | | 180,000 | 193,189 |
| Wells Fargo Commercial Mortgage Trust: | | | |
| Series 2010-C1 Class XB, 0.5836% 11/15/43 (b)(d)(k) | | 20,343,927 | 291,130 |
| Series 2012-LC5: | | | |
| Class C, 4.693% 10/15/45 (d) | | 569,000 | 573,619 |
| Class D, 4.7646% 10/15/45 (b)(d) | | 1,776,000 | 1,592,110 |
| Class E, 4.7646% 10/15/45 (b)(d) | | 284,000 | 227,837 |
| Series 2013-LC12 Class C, 4.2908% 7/15/46 (d) | | 760,000 | 749,864 |
| Series 2015-C31 Class XA, 1.0929% 11/15/48 (d)(k) | | 38,043,061 | 2,327,463 |
| Series 2015-NXS4 Class E, 3.6003% 12/15/48 (b)(d) | | 588,000 | 462,178 |
| Series 2016-BNK1: | | | |
| Class C, 3.071% 8/15/49 | | 700,000 | 629,655 |
| Class D, 3% 8/15/49 (b) | | 447,000 | 356,586 |
| Series 2016-C34 Class XA, 2.1737% 6/15/49 (d)(k) | | 34,252,998 | 4,056,363 |
| Series 2016-C35 Class D, 3.142% 7/15/48 (b) | | 1,596,000 | 1,169,329 |
| Series 2016-LC25 Class C, 4.4362% 12/15/59 (d) | | 903,000 | 863,345 |
| Series 2016-NXS6 Class D, 3.059% 11/15/49 (b) | | 1,218,000 | 874,827 |
| Series 2017-C38 Class D, 3% 7/15/50 (b)(d) | | 1,364,000 | 1,051,918 |
| Series 2017-RB1 Class D, 3.401% 3/15/50 (b) | | 556,000 | 446,808 |
| WF-RBS Commercial Mortgage Trust: | | | |
| sequential payer Series 2011-C4I Class G, 5% 6/15/44 (b) | | 325,000 | 218,039 |
| Series 2011-C3: | | | |
| Class C, 5.335% 3/15/44 (b) | | 360,000 | 371,978 |
| Class D, 5.6398% 3/15/44 (b)(d) | | 800,000 | 697,936 |
| Class E, 5% 3/15/44 (b) | | 890,000 | 717,744 |
| Class F, 5% 3/15/44 (b) | | 693,000 | 400,109 |
| Series 2011-C4: | | | |
| Class D, 5.2468% 6/15/44 (b)(d) | | 408,000 | 395,801 |
| Class E, 5.2468% 6/15/44 (b)(d) | | 263,432 | 230,739 |
| Series 2011-C5: | | | |
| Class C, 5.6706% 11/15/44 (b)(d) | | 260,000 | 277,151 |
| Class D, 5.6706% 11/15/44 (b)(d) | | 600,000 | 609,010 |
| Class E, 5.6706% 11/15/44 (b)(d) | | 1,853,000 | 1,856,924 |
| Class F, 5.25% 11/15/44 (b)(d) | | 933,000 | 806,436 |
| Class G, 5.25% 11/15/44 (b)(d) | | 329,000 | 266,676 |
| Class XA, 1.7517% 11/15/44 (b)(d)(k) | | 3,933,167 | 195,225 |
| Series 2012-C10: | | | |
| Class E, 4.4474% 12/15/45 (b)(d) | | 1,190,000 | 894,991 |
| Class F, 4.4474% 12/15/45 (b)(d) | | 1,726,000 | 955,698 |
| Series 2012-C6 Class D, 5.5799% 4/15/45 (b)(d) | | 540,000 | 525,137 |
| Series 2012-C7: | | | |
| Class C, 4.8252% 6/15/45 (d) | | 1,270,000 | 1,282,684 |
| Class E, 4.8252% 6/15/45 (b)(d) | | 2,501,000 | 2,023,762 |
| Class F, 4.5% 6/15/45 (b) | | 357,000 | 237,299 |
| Class G, 4.5% 6/15/45 (b) | | 1,076,000 | 635,315 |
| Series 2012-C8: | | | |
| Class D, 4.8934% 8/15/45 (b)(d) | | 650,000 | 632,976 |
| Class E, 4.8934% 8/15/45 (b)(d) | | 335,000 | 319,069 |
| Series 2013-C11: | | | |
| Class D, 4.2718% 3/15/45 (b)(d) | | 870,000 | 813,557 |
| Class E, 4.2718% 3/15/45 (b)(d) | | 1,750,000 | 1,354,369 |
| Series 2013-C13 Class D, 4.1386% 5/15/45 (b)(d) | | 600,000 | 547,839 |
| Series 2013-C16 Class D, 5.0284% 9/15/46 (b)(d) | | 193,000 | 181,279 |
| Series 2013-UBS1 Class D, 4.6234% 3/15/46 (b)(d) | | 756,000 | 694,486 |
| Series 2014-C21 Class XA, 1.1255% 8/15/47 (d)(k) | | 104,518,922 | 5,170,321 |
| Series 2014-C24 Class XA, 0.9498% 11/15/47 (d)(k) | | 34,595,625 | 1,531,268 |
| WFCG Commercial Mortgage Trust floater Series 2015-BXRP: | | | |
| Class F, 1 month U.S. LIBOR + 3.721% 5.2798% 11/15/29 (b)(d)(e) | | 1,054,900 | 1,056,228 |
| Class G, 1 month U.S. LIBOR + 3.001% 4.5795% 11/15/29 (b)(d)(e) | | 456,347 | 450,391 |
| Worldwide Plaza Trust Series 2017-WWP Class F, 3.5955% 11/10/36 (b)(d) | | 830,000 | 707,897 |
| WP Glimcher Mall Trust Series 2015-WPG: | | | |
| Class PR1, 3.516% 6/5/35 (b)(d) | | 489,000 | 375,529 |
| Class PR2, 3.516% 6/5/35 (b)(d) | | 1,260,000 | 897,936 |
| TOTAL COMMERCIAL MORTGAGE SECURITIES | | | |
| (Cost $574,795,283) | | | 569,196,111 |
|
| Municipal Securities - 1.2% | | | |
| California Gen. Oblig.: | | | |
| Series 2009, 7.35% 11/1/39 | | $2,650,000 | $3,846,820 |
| 7.3% 10/1/39 | | 27,595,000 | 39,775,433 |
| 7.5% 4/1/34 | | 9,105,000 | 12,999,573 |
| 7.55% 4/1/39 | | 18,745,000 | 28,223,409 |
| 7.6% 11/1/40 | | 14,220,000 | 21,842,773 |
| 7.625% 3/1/40 | | 10,110,000 | 15,188,657 |
| Chicago Gen. Oblig. (Taxable Proj.): | | | |
| Series 2008 B, 5.63% 1/1/22 | | 2,410,000 | 2,423,255 |
| Series 2010 C1, 7.781% 1/1/35 | | 13,950,000 | 16,074,864 |
| Series 2012 B, 5.432% 1/1/42 | | 3,285,000 | 3,026,175 |
| Illinois Gen. Oblig.: | | | |
| Series 2003: | | | |
| 4.35% 6/1/18 | | 3,508,000 | 3,521,190 |
| 4.95% 6/1/23 | | 24,240,000 | 24,996,530 |
| 5.1% 6/1/33 | | 63,045,000 | 59,440,717 |
| Series 2010-1, 6.63% 2/1/35 | | 11,945,000 | 12,642,707 |
| Series 2010-3: | | | |
| 5.547% 4/1/19 | | 330,000 | 336,815 |
| 6.725% 4/1/35 | | 17,810,000 | 18,713,679 |
| 7.35% 7/1/35 | | 8,165,000 | 8,956,842 |
| Series 2010-5, 6.2% 7/1/21 | | 6,528,000 | 6,812,033 |
| Series 2011: | | | |
| 5.665% 3/1/18 | | 21,275,000 | 21,275,000 |
| 5.877% 3/1/19 | | 77,850,000 | 79,734,749 |
| Series 2013, 3.14% 12/1/18 | | 3,490,000 | 3,485,219 |
| TOTAL MUNICIPAL SECURITIES | | | |
| (Cost $373,165,624) | | | 383,316,440 |
|
| Foreign Government and Government Agency Obligations - 0.9% | | | |
| Arab Republic of Egypt: | | | |
| 5.577% 2/21/23 (b) | | $1,675,000 | $1,703,358 |
| 5.875% 6/11/25 | | 765,000 | 769,529 |
| 5.875% 6/11/25 (b) | | 535,000 | 538,167 |
| 6.125% 1/31/22 (b) | | 5,720,000 | 5,926,606 |
| 7.5% 1/31/27 (b) | | 600,000 | 648,853 |
| 7.903% 2/21/48 (b) | | 1,265,000 | 1,327,752 |
| 8.5% 1/31/47 (b) | | 1,990,000 | 2,227,881 |
| Argentine Republic: | | | |
| 5.625% 1/26/22 | | 6,680,000 | 6,803,580 |
| 6.875% 4/22/21 | | 15,050,000 | 15,930,425 |
| 7.125% 6/28/2117 (b) | | 1,355,000 | 1,270,990 |
| 7.5% 4/22/26 | | 6,830,000 | 7,294,440 |
| Bahamian Republic 6% 11/21/28 (b) | | 785,000 | 816,400 |
| Barbados Government: | | | |
| 7% 8/4/22 (b) | | 825,000 | 682,374 |
| 7.25% 12/15/21 (b) | | 90,000 | 77,288 |
| Belarus Republic: | | | |
| 6.875% 2/28/23 (b) | | 1,910,000 | 2,041,706 |
| 7.625% 6/29/27 (b) | | 955,000 | 1,078,405 |
| Brazilian Federative Republic: | | | |
| 4.25% 1/7/25 | | 10,005,000 | 9,974,985 |
| 5.625% 1/7/41 | | 13,210,000 | 12,747,650 |
| 7.125% 1/20/37 | | 4,575,000 | 5,352,750 |
| 8.25% 1/20/34 | | 5,360,000 | 6,834,000 |
| Buenos Aires Province: | | | |
| 6.5% 2/15/23 (b) | | 1,350,000 | 1,377,270 |
| 9.95% 6/9/21 (b) | | 3,625,000 | 4,032,813 |
| 10.875% 1/26/21 (b) | | 1,360,000 | 1,502,800 |
| 10.875% 1/26/21 (Reg. S) | | 5,590,000 | 6,176,950 |
| Cameroon Republic 9.5% 11/19/25 (b) | | 1,260,000 | 1,445,850 |
| City of Buenos Aires 8.95% 2/19/21 (b) | | 525,000 | 561,750 |
| Colombian Republic: | | | |
| 6.125% 1/18/41 | | 5,000 | 5,695 |
| 7.375% 9/18/37 | | 1,320,000 | 1,684,980 |
| 10.375% 1/28/33 | | 1,875,000 | 2,990,625 |
| Croatia Republic 5.5% 4/4/23 (b) | | 560,000 | 598,102 |
| Democratic Socialist Republic of Sri Lanka: | | | |
| 6.2% 5/11/27 (b) | | 355,000 | 352,346 |
| 6.25% 10/4/20 (b) | | 430,000 | 446,211 |
| 6.25% 7/27/21 (b) | | 360,000 | 373,157 |
| Dominican Republic: | | | |
| 5.95% 1/25/27 (b) | | 1,355,000 | 1,434,268 |
| 6.6% 1/28/24 (b) | | 520,000 | 568,620 |
| 6.85% 1/27/45 (b) | | 745,000 | 810,188 |
| 6.875% 1/29/26 (b) | | 1,220,000 | 1,366,400 |
| 7.45% 4/30/44 (b) | | 1,265,000 | 1,454,750 |
| Ecuador Republic: | | | |
| 7.875% 1/23/28 (b) | | 610,000 | 610,000 |
| 8.875% 10/23/27 (b) | | 1,870,000 | 1,972,850 |
| 9.65% 12/13/26 (b) | | 1,000,000 | 1,100,700 |
| El Salvador Republic 7.375% 12/1/19 (b) | | 1,940,000 | 2,007,900 |
| German Federal Republic 0% 8/15/26(Reg. S) | EUR | 300,000 | 351,228 |
| Ghana Republic 10.75% 10/14/30 (b) | | 185,000 | 248,011 |
| Indonesian Republic: | | | |
| 2.625% 6/14/23 | EUR | 7,700,000 | 9,988,387 |
| 7.75% 1/17/38 (b) | | 2,300,000 | 3,116,001 |
| 8.5% 10/12/35 (Reg. S) | | 2,160,000 | 3,074,499 |
| Islamic Republic of Pakistan: | | | |
| 6.75% 12/3/19 (b) | | 1,605,000 | 1,647,455 |
| 7.25% 4/15/19 (b) | | 2,720,000 | 2,788,207 |
| 8.25% 4/15/24 (b) | | 975,000 | 1,050,914 |
| Jordanian Kingdom 7.375% 10/10/47 (b) | | 765,000 | 807,259 |
| Kingdom of Saudi Arabia 3.625% 3/4/28 (b) | | 790,000 | 751,685 |
| Lebanese Republic: | | | |
| 5.15% 6/12/18 | | 5,555,000 | 5,545,968 |
| 5.15% 11/12/18 | | 4,905,000 | 4,885,723 |
| 5.45% 11/28/19 | | 2,415,000 | 2,372,738 |
| 6% 5/20/19 | | 2,735,000 | 2,721,325 |
| Mongolian People's Republic 8.75% 3/9/24 (b) | | 2,255,000 | 2,563,297 |
| Panamanian Republic 9.375% 4/1/29 | | 365,000 | 538,193 |
| Peruvian Republic 4% 3/7/27 (g)(o) | | 1,360,000 | 1,308,344 |
| Plurinational State of Bolivia 5.95% 8/22/23 (b) | | 275,000 | 292,738 |
| Province of Santa Fe 7% 3/23/23 (b) | | 2,780,000 | 2,875,104 |
| Provincia de Cordoba: | | | |
| 7.125% 6/10/21 (b) | | 3,880,000 | 4,057,743 |
| 7.45% 9/1/24 (b) | | 1,920,000 | 2,009,818 |
| Republic of Angola 7% 8/17/19 (Issued by Northern Lights III BV for Republic of Angola) (Reg. S) | | 262,500 | 268,543 |
| Republic of Armenia: | | | |
| 6% 9/30/20 (b) | | 1,996,000 | 2,064,543 |
| 7.15% 3/26/25 (b) | | 995,000 | 1,098,540 |
| Republic of Iraq: | | | |
| 5.8% 1/15/28 (Reg. S) | | 5,350,000 | 5,160,011 |
| 6.752% 3/9/23 (b) | | 1,370,000 | 1,404,072 |
| Republic of Kenya 7.25% 2/28/28 (b) | | 620,000 | 627,440 |
| Republic of Nigeria: | | | |
| 6.5% 11/28/27 (b) | | 770,000 | 778,532 |
| 6.75% 1/28/21 (b) | | 240,000 | 252,442 |
| 7.625% 11/28/47 (b) | | 1,085,000 | 1,113,785 |
| 7.696% 2/23/38 (b) | | 780,000 | 809,250 |
| Republic of Serbia: | | | |
| 6.75% 11/1/24 (b) | | 1,070,575 | 1,076,600 |
| 7.25% 9/28/21 (b) | | 310,000 | 344,060 |
| Russian Federation: | | | |
| 5.25% 6/23/47 (b) | | 2,600,000 | 2,702,497 |
| 5.625% 4/4/42 (b) | | 850,000 | 937,094 |
| 5.875% 9/16/43 (b) | | 755,000 | 861,549 |
| 12.75% 6/24/28 (Reg. S) | | 5,155,000 | 8,736,343 |
| Rwanda Republic 6.625% 5/2/23 (b) | | 985,000 | 1,019,445 |
| South African Republic 5.875% 9/16/25 | | 575,000 | 616,285 |
| State of Qatar 9.75% 6/15/30 (b) | | 565,000 | 846,201 |
| Sultanate of Oman 6.75% 1/17/48 (b) | | 1,625,000 | 1,614,438 |
| Turkish Republic: | | | |
| 4.875% 10/9/26 | | 605,000 | 577,747 |
| 5.125% 3/25/22 | | 1,590,000 | 1,628,160 |
| 5.625% 3/30/21 | | 1,770,000 | 1,839,812 |
| 6% 3/25/27 | | 975,000 | 998,790 |
| 6.25% 9/26/22 | | 7,275,000 | 7,760,592 |
| 6.75% 5/30/40 | | 725,000 | 753,603 |
| 6.875% 3/17/36 | | 1,795,000 | 1,893,725 |
| 7% 6/5/20 | | 1,140,000 | 1,212,436 |
| 7.25% 3/5/38 | | 1,150,000 | 1,262,700 |
| 7.375% 2/5/25 | | 1,495,000 | 1,675,895 |
| 8% 2/14/34 | | 760,000 | 889,200 |
| 11.875% 1/15/30 | | 1,455,000 | 2,196,075 |
| Turkiye Ihracat Kredi Bankasi A/S 5.375% 2/8/21 (b) | | 895,000 | 910,491 |
| Ukraine Government: | | | |
| 7.75% 9/1/19 (b) | | 800,000 | 833,680 |
| 7.75% 9/1/20 (b) | | 4,780,000 | 5,027,317 |
| 7.75% 9/1/21 (b) | | 13,454,000 | 14,236,754 |
| 7.75% 9/1/22 (b) | | 12,474,000 | 13,158,573 |
| United Kingdom, Great Britain and Northern Ireland: | | | |
| 1.5% 7/22/26(Reg. S) | GBP | 200,000 | 277,266 |
| 1.5% 7/22/47 | GBP | 1,465,000 | 1,834,956 |
| 2% 9/7/25(Reg. S) | GBP | 1,285,000 | 1,856,333 |
| 4.25% 3/7/36 | GBP | 1,495,000 | 2,812,546 |
| 4.5% 9/7/34 (i)(p) | GBP | 2,135,000 | 4,058,540 |
| United Mexican States 6.05% 1/11/40 | | 1,135,000 | 1,276,875 |
| Uruguay Republic 7.875% 1/15/33 pay-in-kind | | 725,000 | 1,005,032 |
| Venezuelan Republic: | | | |
| 9.25% 9/15/27 (f) | | 4,770,000 | 1,335,600 |
| 11.95% 8/5/31 (Reg. S) (f) | | 2,420,000 | 695,750 |
| 12.75% 8/23/22 (f) | | 550,000 | 160,875 |
| Vietnamese Socialist Republic: | | | |
| 6 month U.S. LIBOR + 0.813% 2.25% 3/13/28 (d)(e)(g) | | 195,000 | 173,663 |
| 4% 3/12/28 (g)(o) | | 6,029,167 | 5,983,586 |
| 4.8% 11/19/24 (b) | | 550,000 | 564,424 |
| TOTAL FOREIGN GOVERNMENT AND GOVERNMENT AGENCY OBLIGATIONS | | | |
| (Cost $270,213,612) | | | 281,138,667 |
| | | Shares | Value |
|
| Common Stocks - 0.1% | | | |
| CONSUMER DISCRETIONARY - 0.0% | | | |
| Media - 0.0% | | | |
| Tribune Media Co. Class A | | 21,200 | 883,404 |
| ENERGY - 0.1% | | | |
| Energy Equipment & Services - 0.1% | | | |
| Expro Holdings U.S., Inc. (g) | | 179,923 | 4,264,175 |
| Expro Holdings U.S., Inc. (b)(g) | | 66,030 | 825,375 |
| Forbes Energy Services Ltd. | | 154,325 | 1,564,856 |
| | | | 6,654,406 |
| Oil, Gas & Consumable Fuels - 0.0% | | | |
| Pacific Exploration and Production Corp. (q) | | 59,896 | 2,007,580 |
| Warrior Metropolitan Coal, Inc. | | 31,922 | 996,286 |
| | | | 3,003,866 |
|
| TOTAL ENERGY | | | 9,658,272 |
|
| MATERIALS - 0.0% | | | |
| Chemicals - 0.0% | | | |
| LyondellBasell Industries NV Class A | | 31,400 | 3,398,108 |
| TELECOMMUNICATION SERVICES - 0.0% | | | |
| Diversified Telecommunication Services - 0.0% | | | |
| Consolidated Communications Holdings, Inc. | | 14,162 | 163,713 |
| Wireless Telecommunication Services - 0.0% | | | |
| CUI Acquisition Corp. Class E (g)(q) | | 1 | 34,600 |
|
| TOTAL TELECOMMUNICATION SERVICES | | | 198,313 |
|
| TOTAL COMMON STOCKS | | | |
| (Cost $26,130,974) | | | 14,138,097 |
|
| Preferred Stocks - 0.0% | | | |
| Convertible Preferred Stocks - 0.0% | | | |
| REAL ESTATE - 0.0% | | | |
| Equity Real Estate Investment Trusts (REITs) - 0.0% | | | |
| Alexandria Real Estate Equities, Inc. Series D, 7.00% (q) | | 9,000 | 323,801 |
| RLJ Lodging Trust Series A, 1.95% | | 17,900 | 465,042 |
| | | | 788,843 |
| Nonconvertible Preferred Stocks - 0.0% | | | |
| FINANCIALS - 0.0% | | | |
| Mortgage Real Estate Investment Trusts - 0.0% | | | |
| Annaly Capital Management, Inc. Series C, 7.625% | | 16,052 | 406,276 |
| CYS Investments, Inc. Series B, 7.50% | | 17,000 | 409,360 |
| MFA Financial, Inc. Series B, 7.50% | | 22,500 | 573,750 |
| | | | 1,389,386 |
| Thrifts & Mortgage Finance - 0.0% | | | |
| Nationwide Building Society 10.25% (q) | | 9,106 | 1,996,395 |
| TOTAL FINANCIALS | | | 3,385,781 |
| REAL ESTATE - 0.0% | | | |
| Equity Real Estate Investment Trusts (REITs) - 0.0% | | | |
| American Homes 4 Rent Series D, 6.50% | | 24,500 | 626,710 |
| Boston Properties, Inc. 5.25% | | 17,500 | 434,875 |
| Cedar Realty Trust, Inc.: | | | |
| Series B, 7.25% | | 1,816 | 44,238 |
| Series C, 6.50% | | 24,400 | 530,700 |
| DDR Corp. Series K, 6.25% | | 17,823 | 406,186 |
| National Storage Affiliates Trust Series A, 6.00% | | 11,900 | 293,325 |
| PS Business Parks, Inc. Series W, 5.20% | | 100 | 2,394 |
| Public Storage Series F, 5.15% | | 37,000 | 888,000 |
| Rexford Industrial Realty, Inc. Series B, 5.875% | | 28,300 | 661,937 |
| Sabra Health Care REIT, Inc. Series A, 7.125% | | 18,495 | 464,243 |
| Taubman Centers, Inc. Series J, 6.50% | | 11,338 | 280,616 |
| | | | 4,633,224 |
|
| TOTAL NONCONVERTIBLE PREFERRED STOCKS | | | 8,019,005 |
|
| TOTAL PREFERRED STOCKS | | | |
| (Cost $8,752,504) | | | 8,807,848 |
| | | Principal Amount(a) | Value |
|
| Bank Loan Obligations - 4.9% | | | |
| CONSUMER DISCRETIONARY - 1.4% | | | |
| Auto Components - 0.0% | | | |
| North American Lifting Holdings, Inc.: | | | |
| Tranche 1LN, term loan 3 month U.S. LIBOR + 4.500% 6.1934% 11/27/20 (d)(e) | | 4,517,977 | 4,242,381 |
| Tranche 2LN, term loan 3 month U.S. LIBOR + 9.000% 10.6934% 11/27/21 (d)(e) | | 1,594,000 | 1,325,013 |
| | | | 5,567,394 |
| Automobiles - 0.0% | | | |
| Caliber Holdings Corp.: | | | |
| Tranche 1LN, term loan 3 month U.S. LIBOR + 3.000% 4.648% 2/1/24 (d)(e) | | 1,401,110 | 1,408,115 |
| Tranche 2LN, term loan 3 month U.S. LIBOR + 7.250% 8.898% 2/1/25 (d)(e) | | 385,000 | 389,813 |
| Chrysler Group LLC term loan 3 month U.S. LIBOR + 2.000% 3.6% 12/31/18 (d)(e) | | 750,577 | 751,830 |
| UOS LLC Tranche B 1LN, term loan 3 month U.S. LIBOR + 5.500% 7.148% 4/18/23 (d)(e) | | 1,935,886 | 1,989,123 |
| | | | 4,538,881 |
| Diversified Consumer Services - 0.2% | | | |
| Bright Horizons Family Solutions Tranche B, term loan 3 month U.S. LIBOR + 2.000% 3.648% 11/7/23 (d)(e) | | 1,496,851 | 1,506,206 |
| Coinmach Service Corp. Tranche B, term loan 3 month U.S. LIBOR + 3.250% 5.0834% 11/14/22 (d)(e) | | 5,751,557 | 5,782,731 |
| CSM Bakery Supplies Tranche B 1LN, term loan 3 month U.S. LIBOR + 4.000% 5.7% 7/3/20 (d)(e) | | 2,428,725 | 2,398,366 |
| EAB Global, Inc. Tranche B, term loan 3 month U.S. LIBOR + 3.500% 5.4841% 11/17/24 (d)(e) | | 1,000,000 | 1,002,500 |
| KUEHG Corp.: | | | |
| Tranche B 1LN, term loan 3 month U.S. LIBOR + 3.750% 5.4434% 8/13/22 (d)(e) | | 4,420,294 | 4,442,395 |
| Tranche B, term loan 3 month U.S. LIBOR + 8.250% 9.9434% 8/22/25 (d)(e) | | 1,000,000 | 1,010,000 |
| Laureate Education, Inc. Tranche B 1LN, term loan 3 month U.S. LIBOR + 3.500% 5.148% 4/26/24 (d)(e) | | 18,210,206 | 18,309,816 |
| Seminole Tribe Florida Tranche B, term loan 3 month U.S. LIBOR + 2.000% 3.648% 7/6/24 (d)(e) | | 2,493,750 | 2,502,578 |
| The ServiceMaster Co. Tranche B, term loan 3 month U.S. LIBOR + 2.500% 4.148% 11/8/23 (d)(e) | | 2,970,000 | 2,983,365 |
| Wash Multifamily Acquisition, Inc.: | | | |
| Tranche B 1LN, term loan 3 month U.S. LIBOR + 3.250% 4.898% 5/14/22 (d)(e) | | 4,753,389 | 4,777,156 |
| Tranche B 2LN, term loan 3 month U.S. LIBOR + 7.000% 8.648% 5/14/23 (d)(e)(g) | | 360,000 | 356,400 |
| Weight Watchers International, Inc. Tranche B, term loan 3 month U.S. LIBOR + 4.750% 6.4274% 11/29/24 (d)(e) | | 8,000,000 | 8,090,000 |
| | | | 53,161,513 |
| Hotels, Restaurants & Leisure - 0.6% | | | |
| 24 Hour Fitness Worldwide, Inc. Tranche B, term loan 3 month U.S. LIBOR + 3.750% 5.4434% 5/30/21 (d)(e) | | 2,920,837 | 2,946,394 |
| Affinity Gaming LLC Tranche B, term loan 3 month U.S. LIBOR + 3.500% 5.1934% 7/1/23 (d)(e) | | 1,917,903 | 1,922,218 |
| AP Gaming I LLC Tranche B, term loan 3 month U.S. LIBOR + 4.250% 5.898% 2/15/24 (d)(e) | | 1,787,747 | 1,804,516 |
| Aramark Services, Inc. Tranche B-1, term loan 3 month U.S. LIBOR + 2.000% 3.648% 3/11/25 (d)(e) | | 7,255,000 | 7,298,095 |
| Aristocrat Technologies, Inc. Tranche B 2LN, term loan 3 month U.S. LIBOR + 2.000% 3.7447% 10/20/21 (d)(e) | | 4,125,923 | 4,145,274 |
| Boyd Gaming Corp. Tranche B 1LN, term loan 3 month U.S. LIBOR + 2.500% 3.9738% 9/15/23 (d)(e) | | 2,076,254 | 2,086,117 |
| Burger King Worldwide, Inc. Tranche B, term loan 3 month U.S. LIBOR + 2.250% 3.9158% 2/17/24 (d)(e) | | 3,459,185 | 3,463,509 |
| Caesars Resort Collection LLC Tranche B 1LN, term loan 3 month U.S. LIBOR + 2.750% 4.398% 12/22/24 (d)(e) | | 28,000,000 | 28,171,640 |
| CCM Merger, Inc. Tranche B, term loan 3 month U.S. LIBOR + 2.750% 4.398% 8/8/21 (d)(e) | | 2,613,493 | 2,631,474 |
| CEC Entertainment, Inc. Tranche B, term loan 3 month U.S. LIBOR + 3.250% 4.898% 2/14/21 (d)(e) | | 3,012,960 | 2,910,519 |
| Churchill Downs, Inc. Tranche B, term loan 3 month U.S. LIBOR + 2.000% 3.65% 12/27/24 (d)(e) | | 1,025,000 | 1,027,563 |
| CityCenter Holdings LLC Tranche B, term loan 3 month U.S. LIBOR + 2.500% 4.148% 4/18/24 (d)(e) | | 3,129,275 | 3,142,199 |
| Cyan Blue Holdco 3 Ltd. Tranche B, term loan 3 month U.S. LIBOR + 3.500% 5.1934% 8/25/24 (d)(e) | | 1,636,775 | 1,639,852 |
| Delta 2 SARL Tranche B, term loan 3 month U.S. LIBOR + 2.500% 4.148% 2/1/24 (d)(e) | | 10,480,709 | 10,451,258 |
| Eldorado Resorts, Inc. Tranche B, term loan 3 month U.S. LIBOR + 2.250% 3.9532% 4/17/24 (d)(e) | | 3,206,762 | 3,210,771 |
| Equinox Holdings, Inc.: | | | |
| Tranche 2LN, term loan 3 month U.S. LIBOR + 7.000% 8.648% 9/8/24 (d)(e) | | 940,000 | 967,025 |
| Tranche B-1, term loan 3 month U.S. LIBOR + 3.000% 4.648% 3/8/24 (d)(e) | | 2,233,153 | 2,247,579 |
| ESH Hospitality, Inc. Tranche B, term loan 3 month U.S. LIBOR + 2.250% 3.898% 8/30/23 (d)(e) | | 2,849,098 | 2,862,688 |
| Fitness International LLC Tranche B, term loan 3 month U.S. LIBOR + 3.500% 5.1934% 7/1/20 (d)(e) | | 1,086,193 | 1,096,512 |
| Four Seasons Holdings, Inc. Tranche B, term loan 3 month U.S. LIBOR + 2.500% 4.148% 11/30/23 (d)(e) | | 6,422,842 | 6,462,985 |
| Gateway Casinos & Entertainment Ltd. term loan 3 month U.S. LIBOR + 3.750% 5.4434% 2/22/23 (d)(e) | | 2,989,975 | 3,016,137 |
| Golden Entertainment, Inc. Tranche B, term loan: | | | |
| 3 month U.S. LIBOR + 3.000% 4.59% 10/20/24 (d)(e) | | 10,600,000 | 10,653,000 |
| 3 month U.S. LIBOR + 7.000% 8.6% 10/20/25 (d)(e) | | 2,700,000 | 2,706,750 |
| Golden Nugget, Inc. Tranche B 1LN, term loan 3 month U.S. LIBOR + 3.250% 4.9786% 10/4/23 (d)(e) | | 14,806,132 | 14,919,103 |
| Greektown Holdings LLC Tranche B, term loan 3 month U.S. LIBOR + 2.750% 4.398% 4/25/24 (d)(e) | | 1,104,450 | 1,102,385 |
| Hilton Worldwide Finance LLC Tranche B 2LN, term loan 3 month U.S. LIBOR + 2.000% 3.6207% 10/25/23 (d)(e) | | 4,955,651 | 4,981,965 |
| Intrawest Resorts Holdings, Inc. Tranche B 1LN, term loan 3 month U.S. LIBOR + 3.250% 4.898% 7/31/24 (d)(e) | | 3,415,000 | 3,425,689 |
| La Quinta Intermediate Holdings LLC Tranche B LN, term loan 3 month U.S. LIBOR + 2.750% 4.4702% 4/14/21 (d)(e) | | 3,521,201 | 3,536,624 |
| LTF Merger Sub, Inc. Tranche B, term loan 3 month U.S. LIBOR + 2.750% 4.7334% 6/10/22 (d)(e) | | 3,534,531 | 3,550,437 |
| MGM Mirage, Inc. Tranche A, term loan 3 month U.S. LIBOR + 2.250% 3.898% 4/25/21 (d)(e) | | 1,748,000 | 1,752,370 |
| Mohegan Tribal Gaming Authority Tranche B, term loan 3 month U.S. LIBOR + 4.000% 5.648% 10/14/23 (d)(e) | | 1,375,392 | 1,384,965 |
| NVA Holdings, Inc. Tranche B 3LN, term loan 3 month U.S. LIBOR + 2.750% 4.4089% 2/2/25 (d)(e) | | 975,000 | 974,269 |
| Penn National Gaming, Inc. Tranche B, term loan 3 month U.S. LIBOR + 2.500% 4.148% 1/19/24 (d)(e) | | 711,588 | 714,035 |
| Playa Resorts Holding BV Tranche B, term loan 3 month U.S. LIBOR + 3.250% 4.9997% 4/27/24 (d)(e) | | 5,705,465 | 5,738,728 |
| Red Lobster Hospitality LLC Tranche B, term loan 3 month U.S. LIBOR + 5.250% 6.898% 7/28/21 (d)(e) | | 2,041,160 | 2,044,998 |
| Ryman Hospitality Properties, Inc. Tranche B, term loan 3 month U.S. LIBOR + 2.250% 4.07% 5/11/24 (d)(e) | | 292,788 | 294,070 |
| Scientific Games Corp. Tranche B 5LN, term loan 3 month U.S. LIBOR + 2.750% 4.4488% 8/14/24 (d)(e) | | 13,847,400 | 13,908,052 |
| SMG: | | | |
| Tranche B 1LN, term loan 3 month U.S. LIBOR + 3.250% 4.8895% 1/12/25 (d)(e) | | 1,395,000 | 1,405,463 |
| Tranche B 2LN, term loan 3 month U.S. LIBOR + 7.000% 8.6439% 1/12/26 (d)(e) | | 85,000 | 86,700 |
| Station Casinos LLC Tranche B, term loan 3 month U.S. LIBOR + 2.500% 4.15% 6/8/23 (d)(e) | | 5,975,863 | 5,984,408 |
| Tacala Investment Corp. term loan 3 month U.S. LIBOR + 3.250% 4.8247% 2/1/25 (d)(e) | | 1,720,000 | 1,728,600 |
| Tropicana Entertainment, Inc. Tranche B, term loan 3 month U.S. LIBOR + 3.000% 4.648% 11/27/20 (d)(e) | | 708,051 | 711,591 |
| Wynn America LLC Tranche A 1LN, term loan 3 month U.S. LIBOR + 1.750% 3.4% 12/31/21 (d)(e) | | 2,540,000 | 2,533,650 |
| Yonkers Racing Corp. Tranche B 1LN, term loan 3 month U.S. LIBOR + 3.250% 4.9% 5/31/24 (d)(e) | | 1,958,600 | 1,970,841 |
| | | | 179,613,018 |
| Internet & Direct Marketing Retail - 0.1% | | | |
| Bass Pro Shops LLC. Tranche B, term loan 3 month U.S. LIBOR + 5.000% 6.648% 9/25/24 (d)(e) | | 22,523,796 | 22,439,332 |
| Harbor Freight Tools U.S.A., Inc. Tranche B, term loan 3 month U.S. LIBOR + 2.500% 4.148% 8/19/23 (d)(e) | | 3,877,781 | 3,883,249 |
| Red Ventures LLC Tranche B 1LN, term loan 3 month U.S. LIBOR + 4.000% 5.648% 11/8/24 (d)(e) | | 2,992,500 | 3,009,946 |
| | | | 29,332,527 |
| Leisure Products - 0.0% | | | |
| Varsity Brands Holding Co., Inc. Tranche B 1LN, term loan 3 month U.S. LIBOR + 3.500% 5.0735% 12/15/24 (d)(e) | | 5,000,000 | 5,053,150 |
| Media - 0.4% | | | |
| Acosta, Inc. Tranche B, term loan 3 month U.S. LIBOR + 3.250% 4.898% 9/26/21 (d)(e) | | 1,746,611 | 1,537,017 |
| Altice U.S. Finance SA Tranche B, term loan 3 month U.S. LIBOR + 2.250% 3.898% 7/28/25 (d)(e) | | 1,985,025 | 1,981,710 |
| AMC Entertainment Holdings, Inc. Tranche B, term loan 3 month U.S. LIBOR + 2.250% 3.8375% 12/15/23 (d)(e) | | 1,736,231 | 1,740,034 |
| AMC Entertainment, Inc. Tranche B, term loan 3 month U.S. LIBOR + 2.250% 3.8375% 12/15/22 (d)(e) | | 4,999,427 | 5,010,876 |
| Cable One, Inc. Tranche B, term loan 3 month U.S. LIBOR + 2.250% 3.95% 5/1/24 (d)(e) | | 1,014,900 | 1,017,437 |
| CBS Radio, Inc. Tranche B 1LN, term loan 3 month U.S. LIBOR + 2.750% 4.6225% 11/18/24 (d)(e) | | 4,987,500 | 5,010,343 |
| CDS U.S. Intermediate Holdings, Inc.: | | | |
| Tranche B 1LN, term loan 3 month U.S. LIBOR + 3.750% 5.4434% 7/8/22 (d)(e) | | 3,546,460 | 3,536,707 |
| Tranche B 2LN, term loan 3 month U.S. LIBOR + 8.250% 9.9434% 7/8/23 (d)(e) | | 465,000 | 462,387 |
| Cengage Learning, Inc. Tranche B, term loan 3 month U.S. LIBOR + 4.250% 5.8381% 6/7/23 (d)(e) | | 6,067,375 | 5,568,516 |
| Charter Communication Operating LLC Tranche B, term loan 3 month U.S. LIBOR + 2.000% 3.65% 4/30/25 (d)(e) | | 16,500,000 | 16,531,020 |
| Cineworld Finance U.S., Inc. Tranche B 1LN, term loan 3 month U.S. LIBOR + 2.500% 4.148% 2/5/25 (d)(e) | | 6,000,000 | 5,991,000 |
| Clear Channel Communications, Inc. Tranche D, term loan 3 month U.S. LIBOR + 6.750% 8.4434% 1/30/19 (d)(e) | | 8,600,000 | 6,826,250 |
| CSC Holdings LLC Tranche B, term loan 3 month U.S. LIBOR + 2.500% 4.1393% 1/25/26 (d)(e) | | 5,100,000 | 5,104,233 |
| Getty Images, Inc. Tranche B, term loan 3 month U.S. LIBOR + 3.500% 5.1934% 10/18/19 (d)(e) | | 3,916,422 | 3,742,807 |
| Houghton Mifflin Harcourt Publishing, Inc. Tranche B, term loan 3 month U.S. LIBOR + 3.000% 4.648% 5/29/21 (d)(e) | | 4,572,159 | 4,295,909 |
| ION Media Networks, Inc. Tranche B, term loan 3 month U.S. LIBOR + 2.750% 4.54% 12/18/20 (d)(e) | | 1,938,474 | 1,947,352 |
| Lamar Media Corp. Tranche B, term loan 3 month U.S. LIBOR + 1.750% 2/15/25 (e)(r) | | 2,130,000 | 2,140,650 |
| MCC Iowa LLC Tranche M, term loan 3 month U.S. LIBOR + 2.000% 3.48% 1/15/25 (d)(e) | | 827,925 | 829,217 |
| McGraw-Hill Global Education Holdings, LLC term loan 3 month U.S. LIBOR + 4.000% 5.648% 5/4/22 (d)(e) | | 7,779,193 | 7,652,781 |
| Neptune Finco Corp. Tranche B, term loan 3 month U.S. LIBOR + 2.250% 3.8381% 7/17/25 (d)(e) | | 2,631,639 | 2,623,744 |
| Numericable LLC Tranche B 12LN, term loan 3 month U.S. LIBOR + 3.000% 4.7202% 1/31/26 (d)(e) | | 3,416,438 | 3,279,780 |
| Proquest LLC Tranche B, term loan 3 month U.S. LIBOR + 3.750% 5.398% 10/24/21 (d)(e) | | 3,897,119 | 3,944,624 |
| Raycom Media, Inc. Tranche B, term loan 3 month U.S. LIBOR + 2.250% 3.8707% 8/23/24 (d)(e) | | 2,054,850 | 2,054,850 |
| Sinclair Television Group, Inc. Tranche B-1, term loan 3 month U.S. LIBOR + 2.500% 12/7/24 (e)(r) | | 3,000,000 | 3,003,750 |
| Springer Science+Business Media Deutschland GmbH Tranche B 13LN, term loan 3 month U.S. LIBOR + 3.500% 5.148% 8/24/22 (d)(e) | | 9,918,307 | 9,951,335 |
| Unitymedia Finance LLC Tranche B, term loan 3 month U.S. LIBOR + 2.250% 3.8375% 9/30/25 (d)(e) | | 4,130,000 | 4,122,277 |
| Virgin Media Bristol LLC Tranche B, term loan 3 month U.S. LIBOR + 2.500% 4.0875% 1/15/26 (d)(e) | | 5,000,000 | 5,015,950 |
| WideOpenWest Finance LLC Tranche B, term loan 3 month U.S. LIBOR + 3.250% 4.8456% 8/19/23 (d)(e) | | 10,962,313 | 10,914,407 |
| Ziggo Secured Finance Partnership Tranche E, term loan 3 month U.S. LIBOR + 2.500% 4.0875% 4/15/25 (d)(e) | | 4,610,000 | 4,565,928 |
| | | | 130,402,891 |
| Multiline Retail - 0.0% | | | |
| JC Penney Corp., Inc. Tranche B, term loan 3 month U.S. LIBOR + 4.250% 6.2342% 6/23/23 (d)(e) | | 6,502,598 | 6,217,199 |
| Specialty Retail - 0.1% | | | |
| ABB Optical Group LLC Tranche B, term loan 3 month U.S. LIBOR + 5.000% 6.5795% 6/15/23 (d)(e) | | 1,328,188 | 1,331,508 |
| Academy Ltd. Tranche B, term loan 3 month U.S. LIBOR + 4.000% 5.5529% 7/2/22 (d)(e) | | 5,122,076 | 4,083,268 |
| Burlington Coat Factory Warehouse Corp. Tranche B, term loan 3 month U.S. LIBOR + 2.500% 4.09% 11/17/24 (d)(e) | | 4,257,500 | 4,264,142 |
| Davids Bridal, Inc. Tranche B, term loan 3 month U.S. LIBOR + 4.000% 5.7% 10/11/19 (d)(e) | | 1,860,847 | 1,578,389 |
| Party City Holdings, Inc. term loan 3 month U.S. LIBOR + 2.750% 4.4694% 8/19/22 (d)(e) | | 4,662,903 | 4,671,669 |
| PETCO Animal Supplies, Inc. Tranche B 1LN, term loan 3 month U.S. LIBOR + 3.000% 4.7723% 1/26/23 (d)(e) | | 4,754,676 | 3,298,556 |
| PetSmart, Inc. term loan 3 month U.S. LIBOR + 3.000% 4.57% 3/11/22 (d)(e) | | 3,255,376 | 2,652,318 |
| Sports Authority, Inc. Tranche B, term loan 3 month U.S. LIBOR + 6.000% 0% 11/16/17 (d)(e)(f) | | 1,931,590 | 5,312 |
| | | | 21,885,162 |
|
| TOTAL CONSUMER DISCRETIONARY | | | 435,771,735 |
|
| CONSUMER STAPLES - 0.3% | | | |
| Beverages - 0.0% | | | |
| Arterra Wines Canada, Inc. Tranche B, term loan 3 month U.S. LIBOR + 2.750% 4.3755% 12/16/23 (d)(e) | | 1,980,000 | 1,989,900 |
| Food & Staples Retailing - 0.2% | | | |
| Agro Merchants Intermediate Ho Tranche B, term loan 3 month U.S. LIBOR + 3.750% 5.398% 12/6/24 (d)(e) | | 2,235,000 | 2,251,763 |
| Albertson's LLC Tranche B, term loan: | | | |
| 3 month U.S. LIBOR + 2.750% 4.398% 8/25/21 (d)(e) | | 21,457,564 | 21,159,519 |
| 3 month U.S. LIBOR + 3.000% 4.6746% 12/21/22 (d)(e) | | 4,569,456 | 4,509,231 |
| 3 month U.S. LIBOR + 3.000% 4.9563% 6/22/23 (d)(e) | | 8,069,606 | 7,943,559 |
| BJ's Wholesale Club, Inc.: | | | |
| Tranche 2LN, term loan 3 month U.S. LIBOR + 7.500% 9.0795% 2/3/25 (d)(e) | | 2,000,000 | 2,003,220 |
| Tranche B 1LN, term loan 3 month U.S. LIBOR + 3.500% 5.0796% 2/3/24 (d)(e) | | 9,643,478 | 9,618,309 |
| CTI Foods Holdings Co. LLC Tranche 1LN, term loan 3 month U.S. LIBOR + 3.500% 5.15% 6/28/20 (d)(e) | | 1,072,224 | 966,342 |
| Eg Finco Ltd. Tranche B, term loan 3 month U.S. LIBOR + 4.000% 2/1/25 (e)(r) | | 1,015,000 | 1,014,493 |
| GOBP Holdings, Inc. Tranche B, term loan 3 month U.S. LIBOR + 3.500% 5.1934% 10/21/21 (d)(e) | | 3,834,554 | 3,848,933 |
| Pizza Hut Holdings LLC Tranche B, term loan 3 month U.S. LIBOR + 2.000% 3.59% 6/16/23 (d)(e) | | 2,962,613 | 2,976,803 |
| Shearer's Foods, Inc.: | | | |
| Tranche 2LN, term loan 3 month U.S. LIBOR + 6.750% 8.4434% 6/30/22 (d)(e) | | 2,913,000 | 2,709,090 |
| Tranche B 1LN, term loan 3 month U.S. LIBOR + 3.938% 5.6309% 6/30/21 (d)(e) | | 3,315,203 | 3,333,868 |
| Smart & Final, Inc. Tranche B, term loan 3 month U.S. LIBOR + 3.500% 5.1934% 11/15/22 (d)(e) | | 4,033,000 | 3,977,546 |
| Tops Markets LLC term loan: | | | |
| 3 month U.S. LIBOR + 9.500% 2/23/19 (e)(r) | | 1,016,089 | 1,016,089 |
| 3 month U.S. LIBOR + 9.500% 11.125% 2/23/19 (d)(e) | | 1,016,089 | 1,016,089 |
| U.S. Foods, Inc. Tranche B, term loan 3 month U.S. LIBOR + 2.500% 4.148% 6/27/23 (d)(e) | | 3,447,500 | 3,472,563 |
| | | | 71,817,417 |
| Food Products - 0.1% | | | |
| Arctic Glacier Group Holdings, Inc. Tranche B, term loan 3 month U.S. LIBOR + 4.250% 5.898% 3/20/24 (d)(e) | | 803,925 | 805,268 |
| Chobani LLC Tranche B, term loan 3 month U.S. LIBOR + 3.500% 5.148% 10/7/23 (d)(e) | | 4,313,653 | 4,341,951 |
| Hostess Brands LLC Tranche B, term loan 3 month U.S. LIBOR + 2.250% 3.898% 8/3/22 (d)(e) | | 1,054,010 | 1,056,835 |
| JBS USA Lux SA Tranche B, term loan 3 month U.S. LIBOR + 2.500% 4.1004% 10/30/22 (d)(e) | | 6,423,782 | 6,391,663 |
| Post Holdings, Inc. Tranche B, term loan 3 month U.S. LIBOR + 2.250% 3.9% 5/24/24 (d)(e) | | 6,263,525 | 6,270,039 |
| | | | 18,865,756 |
| Personal Products - 0.0% | | | |
| Prestige Brands, Inc. term loan 3 month U.S. LIBOR + 2.750% 4.398% 1/26/24 (d)(e) | | 1,956,741 | 1,967,582 |
|
| TOTAL CONSUMER STAPLES | | | 94,640,655 |
|
| ENERGY - 0.3% | | | |
| Energy Equipment & Services - 0.1% | | | |
| Forbes Energy Services LLC Tranche B, term loan 12% 4/13/21 (d)(g) | | 1,547,508 | 1,559,114 |
| FTS International, Inc. Tranche B, term loan 3 month U.S. LIBOR + 4.750% 6.4142% 4/16/21 (d)(e) | | 4,070,798 | 4,070,798 |
| Lucid Energy Group Ii LLC Tranche B 1LN, term loan 3 month U.S. LIBOR + 3.000% 4.5881% 1/31/25 (d)(e) | | 3,000,000 | 3,001,890 |
| Seadrill Operating LP Tranche B, term loan 3 month U.S. LIBOR + 3.000% 4.6934% 2/21/21 (d)(e) | | 3,055,291 | 2,644,355 |
| | | | 11,276,157 |
| Oil, Gas & Consumable Fuels - 0.2% | | | |
| Alon U.S.A. Partners LP term loan 3 month U.S. LIBOR + 8.000% 9.648% 11/26/18 (d)(e) | | 2,116,383 | 2,116,383 |
| Arctic LNG Carriers Ltd. Tranche B 1LN, term loan 3 month U.S. LIBOR + 4.500% 6.148% 5/18/23 (d)(e) | | 2,275,000 | 2,297,750 |
| Bcp Raptor LLC Tranche B, term loan 3 month U.S. LIBOR + 4.250% 6.0386% 6/22/24 (d)(e) | | 2,668,458 | 2,687,137 |
| California Resources Corp.: | | | |
| Tranche 1LN, term loan 3 month U.S. LIBOR + 10.375% 11.9706% 12/31/21 (d)(e) | | 6,470,000 | 7,294,925 |
| Tranche B, term loan 3 month U.S. LIBOR + 4.750% 6.34% 12/31/22 (d)(e) | | 8,050,000 | 8,140,563 |
| Chesapeake Energy Corp. Tranche 1LN, term loan 3 month U.S. LIBOR + 7.500% 9.4436% 8/23/21 (d)(e) | | 13,630,000 | 14,512,543 |
| Chief Exploration & Development, LLC. Tranche 2LN, term loan 3 month U.S. LIBOR + 6.500% 7.9586% 5/16/21 (d)(e) | | 2,832,000 | 2,813,111 |
| Citgo Petroleum Corp. Tranche B, term loan 3 month U.S. LIBOR + 3.500% 5.1947% 7/29/21 (d)(e) | | 5,583,157 | 5,558,759 |
| Crestwood Holdings Partners LLC Tranche B, term loan 3 month U.S. LIBOR + 8.000% 9.4357% 6/19/19 (d)(e) | | 2,702,721 | 2,700,477 |
| Foresight Energy LLC Tranche B 1LN, term loan 3 month U.S. LIBOR + 5.750% 7.4434% 3/28/22 (d)(e) | | 1,985,000 | 1,905,600 |
| Gavilan Resources LLC Tranche 2LN, term loan 3 month U.S. LIBOR + 6.000% 7.5881% 3/1/24 (d)(e) | | 3,500,000 | 3,511,655 |
| Houston Fuel Oil Terminal Co. Tranche B, term loan 3 month U.S. LIBOR + 3.500% 5.19% 8/19/21 (d)(e) | | 7,171,061 | 7,233,808 |
| Limetree Bay Terminals LLC term loan 3 month U.S. LIBOR + 4.000% 5.5956% 2/15/24 (d)(e) | | 2,843,514 | 2,836,406 |
| Medallion Midland Acquisition Tranche B, term loan 3 month U.S. LIBOR + 3.250% 4.898% 10/30/24 (d)(e) | | 3,295,000 | 3,303,238 |
| Moxie Patriot LLC Tranche B, term loan 3 month U.S. LIBOR + 5.750% 7.4434% 12/19/20 (d)(e) | | 5,703,811 | 5,646,773 |
| | | | 72,559,128 |
|
| TOTAL ENERGY | | | 83,835,285 |
|
| FINANCIALS - 0.3% | | | |
| Capital Markets - 0.0% | | | |
| Cypress Intermediate Holdings, Inc. Tranche B 1LN, term loan 3 month U.S. LIBOR + 3.000% 4.65% 4/27/24 (d)(e) | | 3,029,775 | 3,037,349 |
| HarbourVest Partners LLC: | | | |
| Tranche B 1LN, term loan 3 month U.S. LIBOR + 2.250% 3.9142% 2/21/25 (d)(e) | | 3,370,000 | 3,365,788 |
| Tranche B, term loan 3 month U.S. LIBOR + 2.500% 4.0808% 2/4/21 (d)(e) | | 663,819 | 663,540 |
| IBC Capital U.S. LLC: | | | |
| Tranche 2LN, term loan 3 month U.S. LIBOR + 7.000% 8.5361% 9/9/22 (d)(e) | | 2,505,000 | 2,479,950 |
| Tranche B 1LN, term loan 3 month U.S. LIBOR + 3.750% 5.2861% 9/10/21 (d)(e) | | 1,402,661 | 1,407,051 |
| Recess Holdings, Inc. Tranche B, term loan: | | | |
| 3 month U.S. LIBOR + 3.750% 9/29/24 (e)(s) | | 205,357 | 206,513 |
| 3 month U.S. LIBOR + 3.750% 5.2539% 9/29/24 (d)(e) | | 1,515,844 | 1,524,378 |
| | | | 12,684,569 |
| Diversified Financial Services - 0.1% | | | |
| Bcp Renaissance Parent LLC Tranche B, term loan 3 month U.S. LIBOR + 4.000% 5.7723% 10/31/24 (d)(e) | | 3,415,000 | 3,443,174 |
| Deerfield Holdings Corp. Tranche B, term loan 3 month U.S. LIBOR + 3.250% 4.8332% 2/13/25 (d)(e) | | 1,705,000 | 1,717,310 |
| Delos Finance SARL Tranche B, term loan 3 month U.S. LIBOR + 2.000% 3.6934% 10/6/23 (d)(e) | | 4,118,000 | 4,126,813 |
| Extell Boston 5.154% 8/31/21 (d) | | 1,014,845 | 1,014,845 |
| Finco I LLC Tranche B, term loan 3 month U.S. LIBOR + 2.750% 4.398% 7/14/22 (d)(e) | | 3,000,000 | 3,027,000 |
| Flying Fortress Holdings, Inc. term loan 3 month U.S. LIBOR + 1.750% 3.4434% 10/30/22 (e) | | 2,000,000 | 2,003,220 |
| Focus Financial Partners LLC Tranche B 1LN, term loan 3 month U.S. LIBOR + 2.750% 4.4434% 7/3/24 (d)(e) | | 1,381,538 | 1,387,589 |
| Kingpin Intermediate Holdings LLC Tranche B, term loan 3 month U.S. LIBOR + 4.250% 5.73% 7/3/24 (d)(e) | | 995,000 | 1,011,169 |
| NAB Holdings LLC Tranche B, term loan 3 month U.S. LIBOR + 3.000% 4.6943% 6/30/24 (d)(e) | | 1,746,225 | 1,755,690 |
| Onvoy LLC Tranche B 1LN, term loan 3 month U.S. LIBOR + 4.500% 6.1934% 2/10/24 (d)(e) | | 2,729,375 | 2,592,906 |
| The Edelman Financial Center L Tranche B, term loan 3 month U.S. LIBOR + 4.250% 5.9702% 11/9/24 (d)(e) | | 2,500,000 | 2,534,375 |
| TransUnion LLC Tranche B, term loan 3 month U.S. LIBOR + 2.000% 3.648% 4/9/23 (d)(e) | | 4,881,683 | 4,895,547 |
| UFC Holdings LLC Tranche B 1LN, term loan 3 month U.S. LIBOR + 3.250% 4.9% 8/18/23 (d)(e) | | 2,958,788 | 2,972,191 |
| VF Holdings Corp. term loan 3 month U.S. LIBOR + 3.250% 4.898% 6/30/23(d)(e) | | 1,481,250 | 1,494,211 |
| | | | 33,976,040 |
| Insurance - 0.1% | | | |
| Acrisure LLC Tranche B, term loan 3 month U.S. LIBOR + 4.250% 5.9913% 11/22/23 (d)(e) | | 5,956,422 | 6,047,614 |
| Alliant Holdings Intermediate LLC Tranche B, term loan 3 month U.S. LIBOR + 3.250% 4.898% 8/14/22 (d)(e) | | 4,914,843 | 4,934,502 |
| AmWINS Group, Inc.: | | | |
| Tranche 2LN, term loan 3 month U.S. LIBOR + 6.750% 8.398% 1/25/25 (d)(e) | | 275,000 | 276,947 |
| Tranche B 1LN, term loan 3 month U.S. LIBOR + 2.750% 4.3786% 1/25/24 (d)(e) | | 1,485,000 | 1,492,425 |
| Asurion LLC: | | | |
| term loan 3 month U.S. LIBOR + 2.750% 4.398% 11/3/23 (e) | | 7,602,325 | 7,640,336 |
| Tranche B, term loan: | | | |
| 3 month U.S. LIBOR + 2.750% 4.398% 8/4/22 (d)(e) | | 4,669,242 | 4,689,694 |
| 3 month U.S. LIBOR + 6.000% 7.648% 8/4/25 (d)(e) | | 3,935,000 | 4,030,424 |
| HUB International Ltd. Tranche B 1LN, term loan 3 month U.S. LIBOR + 3.000% 4.8384% 10/2/20 (d)(e) | | 4,775,796 | 4,793,705 |
| USI, Inc. Tranche B, term loan 3 month U.S. LIBOR + 3.000% 4.6934% 5/16/24 (d)(e) | | 5,625,900 | 5,615,830 |
| | | | 39,521,477 |
| Real Estate Management & Development - 0.1% | | | |
| DTZ U.S. Borrower LLC Tranche B 1LN, term loan 3 month U.S. LIBOR + 3.250% 5.1598% 11/4/21 (d)(e) | | 9,982,335 | 9,961,572 |
| MGM Growth Properties Operating Partner LP Tranche B, term loan 3 month U.S. LIBOR + 2.250% 3.898% 4/25/23 (d)(e) | | 4,786,029 | 4,805,460 |
| | | | 14,767,032 |
| Thrifts & Mortgage Finance - 0.0% | | | |
| Ocwen Loan Servicing LLC Tranche B, term loan 3 month U.S. LIBOR + 5.000% 6.5881% 12/5/20 (d)(e) | | 1,167,531 | 1,169,959 |
|
| TOTAL FINANCIALS | | | 102,119,077 |
|
| HEALTH CARE - 0.3% | | | |
| Health Care Equipment & Supplies - 0.0% | | | |
| American Renal Holdings, Inc. Tranche B, term loan 3 month U.S. LIBOR + 3.250% 4.898% 6/22/24 (d)(e) | | 2,810,875 | 2,810,875 |
| CPI Holdco LLC Tranche B 1LN, term loan 3 month U.S. LIBOR + 3.500% 5.1934% 3/21/24 (d)(e) | | 1,900,641 | 1,917,272 |
| Ortho-Clinical Diagnostics, Inc. Tranche B, term loan 3 month U.S. LIBOR + 3.750% 5.4434% 6/30/21 (d)(e) | | 8,913,831 | 8,980,685 |
| | | | 13,708,832 |
| Health Care Providers & Services - 0.2% | | | |
| Community Health Systems, Inc.: | | | |
| Tranche G, term loan 3 month U.S. LIBOR + 2.750% 4.7342% 12/31/19 (d)(e) | | 1,209,624 | 1,198,386 |
| Tranche H, term loan 3 month U.S. LIBOR + 3.000% 4.9842% 1/27/21 (d)(e) | | 7,364,915 | 7,189,188 |
| Concentra, Inc. Tranche B 1LN, term loan 3 month U.S. LIBOR + 2.750% 4.53% 6/1/22 (d)(e) | | 1,220,000 | 1,227,625 |
| CVS Holdings I LP: | | | |
| Tranche 2LN, term loan 3 month U.S. LIBOR + 6.750% 8.54% 2/6/26 (d)(e) | | 750,000 | 748,125 |
| Tranche B 1LN, term loan 3 month U.S. LIBOR + 3.000% 4.79% 2/6/25 (d)(e) | | 1,225,000 | 1,220,406 |
| Envision Healthcare Corp. Tranche B, term loan 3 month U.S. LIBOR + 3.000% 4.65% 12/1/23 (d)(e) | | 5,447,481 | 5,459,411 |
| Equian Buyer Corp. Tranche B, term loan 3 month U.S. LIBOR + 3.250% 5.1539% 5/19/24 (d)(e) | | 2,000,000 | 2,008,760 |
| Ghx Ultimate Parent Corp. Tranche B, term loan 3 month U.S. LIBOR + 3.000% 4.6934% 6/30/24 (d)(e) | | 1,253,700 | 1,256,834 |
| HCA Holdings, Inc.: | | | |
| Tranche B 8LN, term loan 3 month U.S. LIBOR + 2.250% 3.898% 2/15/24 (d)(e) | | 2,970,056 | 2,991,084 |
| Tranche B 9LN, term loan 3 month U.S. LIBOR + 2.000% 3.648% 3/18/23 (d)(e) | | 7,880,450 | 7,920,956 |
| Kindred Healthcare, Inc. Tranche B, term loan 3 month U.S. LIBOR + 3.500% 5.25% 4/9/21 (d)(e) | | 1,554,448 | 1,557,370 |
| MPH Acquisition Holdings LLC Tranche B, term loan 3 month U.S. LIBOR + 3.000% 4.6934% 6/7/23 (d)(e) | | 2,201,009 | 2,210,913 |
| Onex Schumacher Finance LP Tranche B 1LN, term loan 3 month U.S. LIBOR + 4.000% 5.648% 7/31/22 (d)(e) | | 1,163,083 | 1,157,267 |
| Prospect Medical Holdings, Inc. Tranche 1LN, term loan 3 month U.S. LIBOR + 5.500% 7% 2/16/24 (d)(e) | | 2,130,000 | 2,140,650 |
| U.S. Anesthesia Partners, Inc. Tranche B, term loan 3 month U.S. LIBOR + 3.000% 4.648% 6/23/24 (d)(e) | | 1,495,000 | 1,502,101 |
| U.S. Renal Care, Inc.: | | | |
| Tranche 2LN, term loan 3 month U.S. LIBOR + 8.000% 9.6934% 12/31/23 (d)(e) | | 3,000,000 | 3,007,500 |
| Tranche B 1LN, term loan 3 month U.S. LIBOR + 4.250% 5.9434% 12/31/22 (d)(e) | | 7,373,742 | 7,397,706 |
| Vizient, Inc. Tranche B 3LN, term loan 3 month U.S. LIBOR + 3.500% 4.398% 2/11/23 (d)(e) | | 1,254,902 | 1,262,745 |
| Wink Holdco, Inc. Tranche B, term loan 3 month U.S. LIBOR + 3.000% 4.49% 12/1/24 (d)(e) | | 2,500,000 | 2,487,500 |
| | | | 53,944,527 |
| Health Care Technology - 0.0% | | | |
| Press Ganey Holdings, Inc.: | | | |
| Tranche 2LN, term loan 3 month U.S. LIBOR + 6.500% 8.148% 10/21/24 (d)(e) | | 673,321 | 680,896 |
| Tranche B 1LN, term loan 3 month U.S. LIBOR + 3.000% 4.648% 10/21/23 (d)(e) | | 3,867,733 | 3,891,906 |
| | | | 4,572,802 |
| Life Sciences Tools & Services - 0.0% | | | |
| Albany Molecular Research, Inc. Tranche B, term loan: | | | |
| 3 month U.S. LIBOR + 3.250% 4.898% 8/30/24 (d)(e) | | 1,602,238 | 1,608,246 |
| 3 month U.S. LIBOR + 7.000% 8.648% 8/30/25 (d)(e) | | 580,000 | 580,365 |
| PAREXEL International Corp. Tranche B, term loan 3 month U.S. LIBOR + 2.750% 4.398% 8/11/24 (d)(e) | | 4,568,550 | 4,564,256 |
| | | | 6,752,867 |
| Pharmaceuticals - 0.1% | | | |
| HLF Financing U.S. LLC Tranche B, term loan 3 month U.S. LIBOR + 5.500% 7.148% 2/15/23 (d)(e) | | 5,676,805 | 5,708,766 |
| Innoviva, Inc. Tranche B, term loan 3 month U.S. LIBOR + 4.500% 6.3725% 8/18/22 (d)(e) | | 1,257,300 | 1,271,445 |
| Lannett Co., Inc.: | | | |
| Tranche B, term loan 3 month U.S. LIBOR + 4.750% 6.398% 11/25/20 (d)(e) | | 244,928 | 243,245 |
| Tranche B, term loan 3 month U.S. LIBOR + 5.375% 7.023% 11/25/22 (d)(e) | | 9,197,077 | 9,174,084 |
| RPI Finance Trust Tranche B 6LN, term loan 3 month U.S. LIBOR + 2.000% 3.6934% 3/27/23 (d)(e) | | 3,935,757 | 3,955,436 |
| Valeant Pharmaceuticals International, Inc. Tranche B, term loan 3 month U.S. LIBOR + 3.500% 5.0808% 4/1/22 (d)(e) | | 8,359,184 | 8,455,315 |
| | | | 28,808,291 |
|
| TOTAL HEALTH CARE | | | 107,787,319 |
|
| INDUSTRIALS - 0.5% | | | |
| Aerospace & Defense - 0.1% | | | |
| TransDigm, Inc.: | | | |
| term loan 3 month U.S. LIBOR + 2.750% 4.398% 5/14/22 (d)(e) | | 978,418 | 984,348 |
| Tranche B, term loan 3 month U.S. LIBOR + 2.750% 4.4136% 6/9/23 (d)(e) | | 19,247,417 | 19,356,550 |
| Tranche G, term loan 3 month U.S. LIBOR + 2.500% 4.0956% 8/22/24 (d)(e) | | 7,801,150 | 7,830,404 |
| Wesco Aircraft Hardware Corp. Tranche B, term loan 3 month U.S. LIBOR + 2.500% 4.2% 2/28/21 (d)(e) | | 1,005,000 | 992,438 |
| | | | 29,163,740 |
| Air Freight & Logistics - 0.0% | | | |
| Hanjin International Corp. Tranche B, term loan 3 month U.S. LIBOR + 2.500% 4.2341% 10/18/20 (d)(e) | | 1,625,000 | 1,630,086 |
| Transplace Holding, Inc. Tranche B 1LN, term loan 3 month U.S. LIBOR + 4.250% 5.8293% 10/5/24 (d)(e) | | 3,000,000 | 3,028,140 |
| XPO Logistics, Inc. Tranche B, term loan 3 month U.S. LIBOR + 2.000% 3.9198% 2/23/25 (d)(e) | | 1,475,000 | 1,478,157 |
| | | | 6,136,383 |
| Airlines - 0.1% | | | |
| American Airlines, Inc. Tranche B, term loan: | | | |
| 3 month U.S. LIBOR + 2.000% 3.5808% 10/10/21 (d)(e) | | 6,177,773 | 6,190,314 |
| 3 month U.S. LIBOR + 2.000% 3.5875% 12/14/23 (d)(e) | | 4,400,550 | 4,399,934 |
| | | | 10,590,248 |
| Building Products - 0.0% | | | |
| GYP Holdings III Corp. Tranche B, term loan 3 month U.S. LIBOR + 3.000% 4.7723% 4/1/23 (d)(e) | | 3,786,268 | 3,805,200 |
| HD Supply, Inc. Tranche B 4LN, term loan 3 month U.S. LIBOR + 2.500% 4.1934% 10/17/23 (d)(e) | | 990,019 | 996,206 |
| Jeld-Wen, Inc. Tranche B, term loan 3 month U.S. LIBOR + 2.000% 3.6934% 12/14/24 (d)(e) | | 1,195,000 | 1,200,676 |
| | | | 6,002,082 |
| Commercial Services & Supplies - 0.2% | | | |
| ABG Intermediate Holdings 2 LLC Tranche B, term loan 3 month U.S. LIBOR + 3.500% 5.1934% 9/29/24 (d)(e) | | 452,563 | 455,676 |
| Brand Energy & Infrastructure Services, Inc. Tranche B, term loan 3 month U.S. LIBOR + 4.250% 5.9959% 6/21/24 (d)(e) | | 9,029,625 | 9,092,652 |
| Harland Clarke Holdings Corp. Tranche B 7LN, term loan 3 month U.S. LIBOR + 4.750% 6.4434% 11/3/23 (d)(e) | | 4,855,865 | 4,899,228 |
| Hd Supply Waterworks Ltd. Tranche B, term loan 3 month U.S. LIBOR + 3.000% 4.5747% 8/1/24 (d)(e) | | 798,000 | 799,333 |
| KAR Auction Services, Inc. Tranche B, term loan 3 month U.S. LIBOR + 2.500% 4.25% 3/9/23 (d)(e) | | 1,114,356 | 1,119,928 |
| Lineage Logistics Holdings, LLC. Tranche B, term loan 3 month U.S. LIBOR + 3.000% 4.6312% 2/16/25 (d)(e) | | 5,950,000 | 5,961,186 |
| Merrill Communications LLC Tranche B, term loan 3 month U.S. LIBOR + 5.250% 7.0223% 6/1/22 (d)(e) | | 1,631,466 | 1,633,505 |
| Metal Services LLC Tranche B, term loan 3 month U.S. LIBOR + 7.500% 9.1934% 6/30/19 (d)(e) | | 1,083,421 | 1,085,231 |
| Multi-Color Corp. Tranche B, term loan 3 month U.S. LIBOR + 2.250% 3.898% 10/31/24 (d)(e) | | 1,280,000 | 1,284,262 |
| Optiv Security, Inc. Tranche B 1LN, term loan 3 month U.S. LIBOR + 3.250% 4.8125% 2/1/24 (d)(e) | | 1,343,595 | 1,278,095 |
| Prime Security Services Borrower LLC Tranche B 1LN, term loan 3 month U.S. LIBOR + 2.750% 4.398% 5/2/22 (d)(e) | | 11,224,497 | 11,313,732 |
| Prometric Holdings, Inc. Tranche B 1LN, term loan 3 month U.S. LIBOR + 3.000% 4.77% 1/29/25 (d)(e) | | 1,010,000 | 1,016,313 |
| SAI Global GP Tranche B, term loan 3 month U.S. LIBOR + 4.500% 6.1934% 12/8/23 (d)(e)(g) | | 2,475,000 | 2,462,625 |
| The Brickman Group, Ltd. Tranche B 1LN, term loan 3 month U.S. LIBOR + 3.000% 4.622% 12/18/20 (d)(e) | | 2,673,614 | 2,687,811 |
| Thomson Reuters IP&S Tranche B, term loan 1 month U.S. LIBOR + 3.250% 4.898% 10/3/23 (d)(e) | | 3,767,503 | 3,792,406 |
| TMK Hawk Parent Corp. Tranche B, term loan: | | | |
| 3 month U.S. LIBOR + 3.500% 5.07% 9/26/24 (d)(e) | | 1,241,333 | 1,248,161 |
| 3 month U.S. LIBOR + 3.500% 5.15% 9/26/24 (d)(e) | | 55,556 | 55,861 |
| Wrangler Buyer Corp. Tranche B, term loan 3 month U.S. LIBOR + 3.000% 4.648% 9/28/24 (d)(e) | | 1,425,000 | 1,431,826 |
| WTG Holdings III Corp. Tranche B 1LN, term loan 3 month U.S. LIBOR + 3.000% 4.6934% 12/20/24 (d)(e) | | 2,206,886 | 2,227,587 |
| | | | 53,845,418 |
| Construction & Engineering - 0.1% | | | |
| AECOM Tranche B, term loan 3 month U.S. LIBOR + 1.750% 3/16/25 (e)(r) | | 2,040,000 | 2,041,693 |
| Traverse Midstream Partners Ll Tranche B, term loan 3 month U.S. LIBOR + 4.000% 5.85% 9/27/24 (d)(e) | | 3,515,000 | 3,538,445 |
| Ventia Deco LLC Tranche B, term loan 3 month U.S. LIBOR + 3.500% 5.1934% 5/21/22 (d)(e) | | 3,154,810 | 3,194,245 |
| | | | 8,774,383 |
| Electrical Equipment - 0.0% | | | |
| Cortes NP Acquisition Corp. Tranche B, term loan 3 month U.S. LIBOR + 4.000% 5.5797% 11/30/23 (d)(e) | | 3,257,499 | 3,273,787 |
| Machinery - 0.0% | | | |
| Doosan Bobcat Tranche B, term loan 3 month U.S. LIBOR + 2.500% 4.1934% 5/18/24 (d)(e) | | 1,597,582 | 1,600,250 |
| Gardner Denver, Inc. Tranche B, term loan 3 month U.S. LIBOR + 2.750% 4.4434% 7/30/24 (d)(e) | | 1,027,425 | 1,030,343 |
| Onex Wizard U.S. Acquisition, Inc. Tranche B, term loan 3 month U.S. LIBOR + 3.000% 4.4738% 3/13/22 (d)(e) | | 3,585,835 | 3,593,293 |
| The Gates Corp. Tranche B 1LN, term loan 3 month U.S. LIBOR + 3.000% 4.3883% 3/31/24 (d)(e) | | 391,039 | 393,483 |
| | | | 6,617,369 |
| Marine - 0.0% | | | |
| International Seaways Operating Corp. Tranche B, term loan 3 month U.S. LIBOR + 5.500% 7.15% 6/22/22 (d)(e) | | 2,893,375 | 2,889,758 |
| Navios Maritime Partners LP Tranche B, term loan 3 month U.S. LIBOR + 5.000% 6.54% 9/14/20 (d)(e) | | 2,887,501 | 2,898,329 |
| | | | 5,788,087 |
| Professional Services - 0.0% | | | |
| AlixPartners LLP Tranche B, term loan 3 month U.S. LIBOR + 2.750% 4.4434% 4/4/24 (d)(e) | | 3,349,688 | 3,367,843 |
| On Assignment, Inc. Tranche B, term loan 3 month U.S. LIBOR + 2.000% 2/20/25 (e)(r) | | 1,200,000 | 1,204,500 |
| Science Applications International Corp. Tranche B, term loan 3 month U.S. LIBOR + 2.000% 3.8125% 5/4/22 (d)(e) | | 1,405,732 | 1,415,108 |
| | | | 5,987,451 |
| Road & Rail - 0.0% | | | |
| Hertz Corp. Tranche B 1LN, term loan 3 month U.S. LIBOR + 2.750% 6/30/23 (e)(r) | | 1,255,000 | 1,254,410 |
| Trading Companies & Distributors - 0.0% | | | |
| Beacon Roofing Supply, Inc. Tranche B, term loan 3 month U.S. LIBOR + 2.250% 3.8297% 1/2/25 (d)(e) | | 1,000,000 | 1,004,170 |
| Fly Funding II SARL Tranche B, term loan 3 month U.S. LIBOR + 2.000% 3.8% 2/9/23 (d)(e) | | 3,529,769 | 3,531,993 |
| | | | 4,536,163 |
| Transportation Infrastructure - 0.0% | | | |
| American Commercial Barge Line Tranche B 1LN, term loan 3 month U.S. LIBOR + 8.750% 10.398% 11/12/20 (d)(e) | | 1,124,536 | 656,920 |
| DAE Aviation Holdings, Inc. Tranche B, term loan 3 month U.S. LIBOR + 3.750% 5.4% 7/7/22 (d)(e) | | 3,271,481 | 3,298,078 |
| | | | 3,954,998 |
|
| TOTAL INDUSTRIALS | | | 145,924,519 |
|
| INFORMATION TECHNOLOGY - 0.9% | | | |
| Communications Equipment - 0.0% | | | |
| Radiate Holdco LLC Tranche B, term loan 3 month U.S. LIBOR + 3.000% 4.5735% 2/1/24 (d)(e) | | 9,973,638 | 9,955,486 |
| Zayo Group LLC term loan 3 month U.S. LIBOR + 2.000% 3.648% 1/19/21 (d)(e) | | 1,950,263 | 1,956,230 |
| | | | 11,911,716 |
| Electronic Equipment & Components - 0.1% | | | |
| Atkore International, Inc. Tranche B 1LN, term loan 3 month U.S. LIBOR + 3.000% 4.45% 12/22/23 (d)(e) | | 1,300,000 | 1,307,579 |
| ATS Consolidated, Inc. Tranche B 1LN, term loan 3 month U.S. LIBOR + 3.750% 5.398% 2/23/25 (d)(e) | | 1,590,000 | 1,597,950 |
| DG Investment Intermediate Holdings, Inc. Tranche B 1LN, term loan 3 month U.S. LIBOR + 3.000% 1/26/25 (e)(s) | | 111,774 | 111,565 |
| Electro Rent Corp. Tranche B 1LN, term loan 3 month U.S. LIBOR + 5.000% 6.9833% 1/31/24 (d)(e) | | 1,281,763 | 1,286,570 |
| EPV Merger Sub, Inc.: | | | |
| Tranche 2LN, term loan 3 month U.S. LIBOR + 7.250% 2/27/26 (e)(r) | | 355,000 | 354,113 |
| Tranche B 1LN, term loan 3 month U.S. LIBOR + 3.250% 2/27/25 (e)(r) | | 810,000 | 810,510 |
| EXC Holdings III Corp. Tranche B, term loan: | | | |
| 3 month U.S. LIBOR + 3.500% 5.1605% 12/2/24 (d)(e) | | 1,210,000 | 1,219,450 |
| 3 month U.S. LIBOR + 7.500% 9.1605% 11/16/25 (d)(e) | | 750,000 | 758,910 |
| Go Daddy Operating Co. LLC Tranche B, term loan 3 month U.S. LIBOR + 2.250% 3.898% 2/15/24 (d)(e) | | 10,362,312 | 10,380,446 |
| Gopher Sub, Inc.: | | | |
| Tranche B 1LN, term loan 3 month U.S. LIBOR + 3.000% 4.6576% 2/1/25 (d)(e) | | 1,043,226 | 1,041,275 |
| Tranche B 2LN, term loan 3 month U.S. LIBOR + 6.750% 8.4076% 2/1/26 (d)(e) | | 435,000 | 437,175 |
| Infor U.S., Inc. Tranche B 6LN, term loan 3 month U.S. LIBOR + 2.750% 4.4434% 2/1/22 (d)(e) | | 2,191,859 | 2,193,613 |
| Lux FinCo U.S. SPV Tranche B 3LN, term loan 3 month U.S. LIBOR + 3.500% 5.1207% 10/16/22 (d)(e) | | 1,903,387 | 1,902,207 |
| TTM Technologies, Inc. Tranche B, term loan: | | | |
| 3 month U.S. LIBOR + 2.500% 9/28/24 (e)(r) | | 2,500,000 | 2,509,375 |
| 3 month U.S. LIBOR + 2.500% 4.0735% 9/28/24 (d)(e) | | 1,995,000 | 1,997,494 |
| | | | 27,908,232 |
| Internet Software & Services - 0.2% | | | |
| Abacus Innovations Corp. Tranche B, term loan 3 month U.S. LIBOR + 2.000% 3.6875% 8/16/23 (d)(e) | | 1,811,278 | 1,818,070 |
| Ancestry.Com Operations, Inc. Tranche B 1LN, term loan 3 month U.S. LIBOR + 3.250% 4.9% 10/19/23 (d)(e) | | 4,912,500 | 4,933,378 |
| Autodata, Inc. Tranche B 1LN, term loan 3 month U.S. LIBOR + 3.250% 4.8235% 12/14/24 (d)(e) | | 1,835,000 | 1,830,413 |
| Cvent, Inc. Tranche B, term loan 3 month U.S. LIBOR + 3.750% 5.3235% 11/29/24 (d)(e) | | 2,500,000 | 2,517,700 |
| EIG Investors Corp. Tranche B, term loan 3 month U.S. LIBOR + 4.000% 5.9545% 2/9/23 (d)(e) | | 5,180,707 | 5,208,476 |
| I-Logic Technologies Bidco Ltd. Tranche B, term loan 3 month U.S. LIBOR + 4.000% 5.642% 12/21/24 (d)(e) | | 2,500,000 | 2,512,500 |
| Marketo, Inc. Tranche B 1LN, term loan 3 month U.S. LIBOR + 3.250% 5.0434% 2/7/25 (d)(e) | | 2,675,000 | 2,668,313 |
| Mcafee LLC Tranche B, term loan: | | | |
| 3 month U.S. LIBOR + 4.500% 6.148% 9/29/24 (d)(e) | | 7,410,988 | 7,445,374 |
| 3 month U.S. LIBOR + 8.500% 10.148% 9/29/25 (d)(e) | | 2,000,000 | 2,005,000 |
| MH Sub I LLC Tranche B, term loan 3 month U.S. LIBOR + 3.750% 5.3385% 9/15/24 (d)(e) | | 1,995,000 | 1,994,501 |
| Rackspace Hosting, Inc. Tranche B, term loan 3 month U.S. LIBOR + 3.000% 4.7867% 11/3/23 (d)(e) | | 7,950,505 | 7,970,382 |
| Travelclick, Inc. Tranche B 1LN, term loan 3 month U.S. LIBOR + 4.000% 5.648% 5/12/21 (d)(e) | | 923,067 | 932,685 |
| Uber Technologies, Inc. Tranche B, term loan 3 month U.S. LIBOR + 4.000% 5.648% 7/13/23 (d)(e) | | 12,798,133 | 12,868,523 |
| VFH Parent LLC Tranche B 1LN, term loan 3 month U.S. LIBOR + 3.250% 4.9447% 12/30/21 (d)(e) | | 936,000 | 946,530 |
| | | | 55,651,845 |
| IT Services - 0.2% | | | |
| Ceridian HCM Holding, Inc. Tranche B 2LN, term loan 3 month U.S. LIBOR + 3.500% 5.148% 9/15/20 (d)(e) | | 7,301,067 | 7,326,183 |
| Cologix Holdings, Inc. Tranche B 1LN, term loan 3 month U.S. LIBOR + 3.000% 4.6025% 3/20/24 (d)(e) | | 1,985,000 | 1,984,385 |
| First Data Corp. Tranche B, term loan 3 month U.S. LIBOR + 2.250% 3.8707% 7/10/22 (d)(e) | | 16,093,329 | 16,118,918 |
| Global Payments, Inc. Tranche B 2LN, term loan 3 month U.S. LIBOR + 2.000% 3.648% 4/22/23 (d)(e) | | 1,235,276 | 1,240,427 |
| Mitchell International, Inc. Tranche B, term loan: | | | |
| 3 month U.S. LIBOR + 3.250% 11/20/24 (e)(s) | | 141,791 | 142,120 |
| 3 month U.S. LIBOR + 3.250% 4.9434% 12/1/24 (d)(e) | | 1,758,209 | 1,762,288 |
| 3 month U.S. LIBOR + 7.250% 8.9434% 12/1/25 (d)(e) | | 750,000 | 754,500 |
| Neustar, Inc.: | | | |
| Tranche 2LN, term loan 3 month U.S. LIBOR + 8.000% 9.6715% 8/8/25 (d)(e) | | 700,000 | 704,375 |
| Tranche B1 1LN, term loan 3 month U.S. LIBOR + 3.250% 4.9215% 1/8/20 (d)(e) | | 368,653 | 368,808 |
| Tranche B2 1LN, term loan 3 month U.S. LIBOR + 3.750% 5.4215% 8/8/24 (d)(e) | | 2,433,900 | 2,434,922 |
| Tempo Acquisition LLC Tranche B, term loan 3 month U.S. LIBOR + 3.000% 4.648% 5/1/24 (d)(e) | | 5,343,150 | 5,354,264 |
| Vantiv LLC Tranche B, term loan 3 month U.S. LIBOR + 2.000% 3.5875% 8/7/24 (d)(e) | | 3,750,000 | 3,771,413 |
| WEX, Inc. Tranche B, term loan 3 month U.S. LIBOR + 2.250% 3.898% 7/1/23 (d)(e) | | 3,194,427 | 3,214,392 |
| Xerox Business Services LLC Tranche B, term loan 3 month U.S. LIBOR + 3.000% 4.648% 12/7/23 (d)(e) | | 3,489,750 | 3,515,923 |
| | | | 48,692,918 |
| Semiconductors & Semiconductor Equipment - 0.0% | | | |
| Cavium, Inc. Tranche B 1LN, term loan 3 month U.S. LIBOR + 2.250% 3.8169% 8/16/22 (d)(e) | | 1,562,134 | 1,564,087 |
| Microsemi Corp. Tranche B, term loan 3 month U.S. LIBOR + 2.000% 3.7422% 1/15/23 (d)(e) | | 1,386,841 | 1,389,726 |
| | | | 2,953,813 |
| Software - 0.4% | | | |
| Almonde, Inc.: | | | |
| Tranche 2LN, term loan 3 month U.S. LIBOR + 7.250% 9.2342% 6/13/25 (d)(e) | | 2,365,000 | 2,345,938 |
| Tranche B 1LN, term loan 3 month U.S. LIBOR + 3.500% 5.4842% 6/13/24 (d)(e) | | 7,875,425 | 7,869,676 |
| Aptean, Inc.: | | | |
| Tranche 2LN, term loan 3 month U.S. LIBOR + 9.500% 11.2% 12/20/23 (d)(e) | | 685,000 | 687,856 |
| Tranche B 1LN, term loan 3 month U.S. LIBOR + 4.250% 5.95% 12/20/22 (d)(e) | | 1,915,525 | 1,924,298 |
| Compuware Corp. Tranche B 3LN, term loan 3 month U.S. LIBOR + 3.500% 5.15% 12/15/21 (d)(e) | | 6,088,297 | 6,161,844 |
| Digicert Holdings, Inc. Tranche B, term loan 3 month U.S. LIBOR + 4.750% 6.5223% 10/31/24 (d)(e) | | 4,580,000 | 4,628,685 |
| Epicor Software Corp. Tranche B, term loan 3 month U.S. LIBOR + 3.250% 4.9% 6/1/22 (d)(e) | | 9,771,568 | 9,811,241 |
| Evo Payments International LLC Tranche B 1LN, term loan 3 month U.S. LIBOR + 4.000% 5.64% 12/22/23 (d)(e) | | 2,481,250 | 2,507,105 |
| Flexera Software LLC: | | | |
| Tranche B 1LN, term loan 3 month U.S. LIBOR + 3.250% 4.87% 1/24/25 (d)(e) | | 975,000 | 977,135 |
| Tranche B 2LN, term loan 3 month U.S. LIBOR + 7.250% 8.87% 1/24/26 (d)(e) | | 85,000 | 85,425 |
| Hyland Software, Inc. Tranche B 1LN, term loan 3 month U.S. LIBOR + 3.250% 4.898% 7/1/22 (d)(e) | | 1,353,183 | 1,362,209 |
| ION Trading Technologies Ltd. Tranche B, term loan 3 month U.S. LIBOR + 2.750% 4.4036% 11/21/24 (d)(e) | | 4,500,000 | 4,455,000 |
| Kronos, Inc.: | | | |
| term loan 3 month U.S. LIBOR + 8.250% 10.0234% 11/1/24 (d)(e) | | 5,095,000 | 5,226,604 |
| Tranche B 1LN, term loan 3 month U.S. LIBOR + 3.500% 5.2995% 11/1/23 (d)(e) | | 14,469,124 | 14,557,964 |
| Landesk Group, Inc. term loan: | | | |
| 3 month U.S. LIBOR + 4.250% 5.9% 1/20/24 (d)(e) | | 7,341,092 | 7,208,658 |
| 3 month U.S. LIBOR + 9.000% 10.65% 1/20/25 (d)(e) | | 2,445,000 | 2,347,200 |
| MA FinanceCo. LLC Tranche B 3LN, term loan: | | | |
| 3 month U.S. LIBOR + 2.750% 4.398% 6/21/24 (d)(e) | | 7,012,898 | 7,026,082 |
| 3 month U.S. LIBOR + 2.750% 4.398% 6/21/24 (d)(e) | | 1,052,102 | 1,054,080 |
| Quest Software U.S. Holdings, Inc. Tranche B, term loan 3 month U.S. LIBOR + 5.500% 7.2723% 10/31/22 (d)(e) | | 4,087,236 | 4,152,182 |
| Renaissance Learning, Inc.: | | | |
| Tranche 1LN, term loan 3 month U.S. LIBOR + 3.750% 5.4434% 4/9/21 (d)(e) | | 6,379,949 | 6,411,849 |
| Tranche 2LN, term loan 3 month U.S. LIBOR + 7.000% 8.6934% 4/9/22 (d)(e) | | 2,813,000 | 2,817,698 |
| SolarWinds Holdings, Inc. Tranche B, term loan 3 month U.S. LIBOR + 3.500% 5.148% 2/5/23 (d)(e) | | 2,955,150 | 2,962,538 |
| Solera LLC: | | | |
| Tranche B, term loan 3 month U.S. LIBOR + 2.750% 3/3/23 (e)(r) | | 1,210,000 | 1,212,517 |
| Tranche B, term loan 3 month U.S. LIBOR + 3.250% 4.898% 3/3/23 (d)(e) | | 4,890,845 | 4,901,018 |
| Sophia L.P. term loan 3 month U.S. LIBOR + 3.250% 4.9434% 9/30/22 (d)(e) | | 4,813,193 | 4,817,862 |
| SS&C Technologies, Inc.: | | | |
| Tranche B 1LN, term loan 3 month U.S. LIBOR + 2.250% 3.898% 7/8/22 (d)(e) | | 1,516,380 | 1,523,583 |
| Tranche B 2LN, term loan 3 month U.S. LIBOR + 2.250% 3.898% 7/8/22 (d)(e) | | 23,746 | 23,858 |
| Tranche B 3LN, term loan 3 month U.S. LIBOR + 2.500% 2/27/25 (e)(r) | | 7,370,649 | 7,404,406 |
| Tranche B 4LN, term loan 3 month U.S. LIBOR + 2.500% 2/27/25 (e)(r) | | 2,629,351 | 2,641,394 |
| Sybil Software LLC. Tranche B, term loan 3 month U.S. LIBOR + 2.750% 4.4434% 9/30/23 (d)(e) | | 3,691,454 | 3,712,422 |
| TIBCO Software, Inc. Tranche B, term loan 3 month U.S. LIBOR + 3.500% 5.15% 12/4/20 (d)(e) | | 773,200 | 774,808 |
| | | | 123,593,135 |
| Technology Hardware, Storage & Peripherals - 0.0% | | | |
| Dell International LLC Tranche B, term loan 3 month U.S. LIBOR + 2.000% 3.65% 9/7/23 (d)(e) | | 1,604,180 | 1,603,843 |
|
| TOTAL INFORMATION TECHNOLOGY | | | 272,315,502 |
|
| MATERIALS - 0.3% | | | |
| Chemicals - 0.2% | | | |
| American Rock Salt Co. LLC Tranche B 1LN, term loan 3 month U.S. LIBOR + 3.750% 5.2288% 5/20/21 (d)(e) | | 3,716,414 | 3,716,414 |
| Ashland LLC Tranche B, term loan 3 month U.S. LIBOR + 2.000% 3.5981% 5/17/24 (d)(e) | | 1,990,000 | 2,000,786 |
| ASP Chromaflo Intermediate Holdings, Inc. Tranche B 1LN, term loan 3 month U.S. LIBOR + 3.500% 5.148% 11/18/23 (d)(e) | | 1,801,800 | 1,810,809 |
| Ineos Styrolution U.S. Holding LLC Tranche B, term loan 3 month U.S. LIBOR + 2.000% 3.6934% 3/29/24 (d)(e) | | 1,240,854 | 1,243,957 |
| Invictus U.S. Newco LLC: | | | |
| Tranche 1LN, term loan 3 month U.S. LIBOR + 3.000% 2/13/25 (e)(r) | | 1,365,000 | 1,374,105 |
| Tranche 2LN, term loan 3 month U.S. LIBOR + 6.750% 2/13/26 (e)(r) | | 750,000 | 755,160 |
| Jade Germany GmbH Tranche B, term loan 3 month U.S. LIBOR + 5.500% 7.1934% 5/31/23 (d)(e) | | 2,985,000 | 2,992,463 |
| Kraton Polymers LLC Tranche B, term loan 3 month U.S. LIBOR + 3.000% 4.648% 1/6/22 (d)(e) | | 1,508,509 | 1,512,597 |
| MacDermid, Inc.: | | | |
| Tranche B 6LN, term loan 3 month U.S. LIBOR + 3.000% 4% 6/7/23 (d)(e) | | 3,078,767 | 3,097,239 |
| Tranche B 7LN, term loan 3 month U.S. LIBOR + 2.500% 4.148% 6/7/20 (d)(e) | | 2,412,413 | 2,421,893 |
| Methanol Holdings (TRINIDAD) Ltd. Tranche B, term loan 3 month U.S. LIBOR + 3.500% 5.148% 6/30/22 (d)(e) | | 2,570,229 | 2,570,229 |
| OCI Beaumont, LLC Tranche B, term loan 3 month U.S. LIBOR + 4.250% 3/9/25 (e)(r) | | 2,500,000 | 2,509,375 |
| Oxea Corp. Tranche B, term loan 3 month U.S. LIBOR + 3.500% 5.25% 10/12/24 (d)(e) | | 4,099,725 | 4,120,224 |
| PQ Corp. Tranche B, term loan 3 month U.S. LIBOR + 2.500% 4.2907% 2/8/25 (d)(e) | | 950,000 | 954,456 |
| The Chemours Co. LLC Tranche B, term loan 3 month U.S. LIBOR + 2.500% 4.15% 5/12/22 (d)(e) | | 2,363,156 | 2,373,199 |
| Trinseo Materials Operating SCA/Trinseo Materials Finance, Inc. Tranche B, term loan 3 month U.S. LIBOR + 2.500% 4.148% 9/6/24 (d)(e) | | 1,995,000 | 2,009,344 |
| Tronox Blocked Borrower LLC Tranche B, term loan 3 month U.S. LIBOR + 3.000% 4.6934% 9/22/24 (d)(e) | | 1,900,116 | 1,911,403 |
| Tronox Finance LLC Tranche B, term loan 3 month U.S. LIBOR + 3.000% 4.6934% 9/22/24 (d)(e) | | 4,384,884 | 4,410,930 |
| U.S. Coatings Acquisition, Inc. Tranche B, term loan 3 month U.S. LIBOR + 2.000% 3.6934% 6/1/24 (d)(e) | | 1,960,000 | 1,970,212 |
| Univar, Inc. Tranche B, term loan 3 month U.S. LIBOR + 2.500% 4.148% 7/1/24 (d)(e) | | 1,212,572 | 1,218,416 |
| Venator Materials LLC Tranche B, term loan 3 month U.S. LIBOR + 3.000% 4.648% 8/8/24 (d)(e) | | 1,256,850 | 1,261,563 |
| W. R. Grace & Co.-Conn.: | | | |
| Tranche B 1LN, term loan 3 month U.S. LIBOR + 1.750% 2/23/25 (e)(r) | | 744,211 | 744,828 |
| Tranche B 2LN, term loan 3 month U.S. LIBOR + 1.750% 2/23/25 (e)(r) | | 1,275,789 | 1,276,848 |
| | | | 48,256,450 |
| Containers & Packaging - 0.1% | | | |
| Berlin Packaging, LLC: | | | |
| Tranche 2LN, term loan 3 month U.S. LIBOR + 6.750% 8.33% 10/1/22 (d)(e) | | 1,129,000 | 1,135,706 |
| Tranche B, term loan 3 month U.S. LIBOR + 3.250% 4.8855% 10/1/21 (d)(e) | | 5,325,858 | 5,350,837 |
| Berry Global, Inc.: | | | |
| Tranche P, term loan 3 month U.S. LIBOR + 2.000% 3.5808% 1/6/21 (d)(e) | | 3,552,000 | 3,563,828 |
| Tranche Q, term loan 3 month U.S. LIBOR + 2.000% 3.6216% 10/1/22 (d)(e) | | 4,956,562 | 4,971,183 |
| BWAY Holding Co. Tranche B, term loan 3 month U.S. LIBOR + 3.250% 4.9578% 4/3/24 (d)(e) | | 995,000 | 998,731 |
| Caraustar Industries, Inc. Tranche B, term loan 3 month U.S. LIBOR + 5.500% 7.1934% 3/14/22 (d)(e) | | 3,483,675 | 3,491,757 |
| Charter Nex U.S., Inc. Tranche B 1LN, term loan 3 month U.S. LIBOR + 3.250% 4.5735% 5/16/24 (d)(e) | | 1,228,825 | 1,230,668 |
| Consolidated Container Co. Tranche B 1LN, term loan 3 month U.S. LIBOR + 3.000% 4.648% 5/22/24 (d)(e) | | 2,284,275 | 2,295,696 |
| Crown Americas LLC Tranche B 1LN, term loan 3 month U.S. LIBOR + 2.000% 1/29/25 (e)(r) | | 2,690,000 | 2,712,408 |
| Flex Acquisition Co., Inc. Tranche B 1LN, term loan 3 month U.S. LIBOR + 3.000% 4.6947% 12/29/23 (d)(e) | | 4,515,875 | 4,535,655 |
| Plastipak Packaging, Inc. Tranche B, term loan 3 month U.S. LIBOR + 2.750% 4.45% 10/14/24 (d)(e) | | 817,950 | 822,449 |
| Printpack Holdings, Inc. Tranche B, term loan 3 month U.S. LIBOR + 3.000% 4.6875% 7/26/23 (d)(e) | | 1,066,500 | 1,072,504 |
| Reynolds Group Holdings, Inc. Tranche B, term loan 3 month U.S. LIBOR + 2.750% 4.398% 2/5/23 (d)(e) | | 12,994,202 | 13,051,117 |
| | | | 45,232,539 |
| Metals & Mining - 0.0% | | | |
| Gulf Finance LLC Tranche B 1LN, term loan 3 month U.S. LIBOR + 5.250% 6.95% 8/25/23 (d)(e) | | 7,184,864 | 6,538,226 |
| JMC Steel Group, Inc. Tranche B, term loan 3 month U.S. LIBOR + 2.750% 4.408% 6/14/21 (d)(e) | | 2,851,318 | 2,864,862 |
| Murray Energy Corp. Tranche B 2LN, term loan 3 month U.S. LIBOR + 7.250% 8.9434% 4/16/20 (d)(e) | | 5,948,904 | 5,208,266 |
| | | | 14,611,354 |
|
| TOTAL MATERIALS | | | 108,100,343 |
|
| REAL ESTATE - 0.0% | | | |
| Equity Real Estate Investment Trusts (REITs) - 0.0% | | | |
| iStar Financial, Inc. Tranche B, term loan 3 month U.S. LIBOR + 3.000% 4.5863% 10/1/21 (d)(e) | | 925,471 | 932,412 |
| The GEO Group, Inc. Tranche B, term loan 3 month U.S. LIBOR + 2.250% 3.95% 3/23/24 (d)(e) | | 1,463,938 | 1,468,329 |
| | | | 2,400,741 |
| Real Estate Management & Development - 0.0% | | | |
| Capital Automotive LP: | | | |
| Tranche 2LN, term loan 3 month U.S. LIBOR + 6.000% 7.65% 3/24/25 (d)(e) | | 922,111 | 936,708 |
| Tranche B 1LN, term loan 3 month U.S. LIBOR + 2.500% 4.15% 3/24/24 (d)(e) | | 170,730 | 171,478 |
| Realogy Group LLC Tranche B, term loan 3 month U.S. LIBOR + 2.250% 3.8293% 2/8/25 (d)(e) | | 4,963,817 | 4,986,849 |
| Simply Storage Management LLC 8.2375% 9/6/21 (d)(g) | | 1,305,000 | 1,305,000 |
| VICI Properties, LLC Tranche B 1LN, term loan 3 month U.S. LIBOR + 2.250% 3.5956% 12/22/24 (d)(e) | | 8,590,909 | 8,631,200 |
| | | | 16,031,235 |
|
| TOTAL REAL ESTATE | | | 18,431,976 |
|
| TELECOMMUNICATION SERVICES - 0.4% | | | |
| Diversified Telecommunication Services - 0.2% | | | |
| Altice Financing SA Tranche B, term loan: | | | |
| 3 month U.S. LIBOR + 2.750% 4.4702% 7/15/25 (d)(e) | | 3,126,375 | 3,082,825 |
| 3 month U.S. LIBOR + 2.750% 4.4702% 1/31/26 (d)(e) | | 5,486,250 | 5,408,071 |
| Frontier Communications Corp.: | | | |
| Tranche A, term loan 3 month U.S. LIBOR + 2.750% 4.4% 3/31/21 (d)(e) | | 5,598,851 | 5,535,864 |
| Tranche B 1LN, term loan 3 month U.S. LIBOR + 3.750% 5.4% 6/15/24 (d)(e) | | 11,057,444 | 10,877,760 |
| Level 3 Financing, Inc. Tranche B, term loan 3 month U.S. LIBOR + 2.250% 3.8456% 2/22/24 (d)(e) | | 11,805,000 | 11,823,062 |
| Sable International Finance Ltd. Tranche B 4LN, term loan 3 month U.S. LIBOR + 3.250% 4.8894% 1/31/26 (d)(e) | | 10,790,000 | 10,769,067 |
| Securus Technologies, Inc. Tranche B, term loan: | | | |
| 3 month U.S. LIBOR + 4.500% 6.148% 11/1/24 (d)(e) | | 9,580,000 | 9,681,835 |
| 3 month U.S. LIBOR + 8.250% 9.898% 11/1/25 (d)(e) | | 3,360,000 | 3,400,320 |
| SFR Group SA Tranche B 11LN, term loan 3 month U.S. LIBOR + 2.750% 4.5223% 7/31/25 (d)(e) | | 8,770,683 | 8,380,387 |
| | | | 68,959,191 |
| Wireless Telecommunication Services - 0.2% | | | |
| Digicel International Finance Ltd. Tranche B, term loan 3 month U.S. LIBOR + 3.750% 5.02% 5/25/24 (d)(e) | | 4,699,800 | 4,707,649 |
| Intelsat Jackson Holdings SA: | | | |
| Tranche B, term loan 3 month U.S. LIBOR + 3.750% 5.7063% 11/27/23 (d)(e) | | 20,300,000 | 20,144,096 |
| Tranche B-4, term loan 3 month U.S. LIBOR + 4.500% 6.4563% 1/2/24 (d)(e) | | 3,500,000 | 3,563,735 |
| Tranche B-5, term loan 6.625% 1/2/24 | | 4,735,000 | 4,749,063 |
| Syniverse Holdings, Inc.: | | | |
| Tranche B 2LN, term loan 3 month U.S. LIBOR + 9.000% 2/9/24 (e)(r) | | 1,740,000 | 1,763,925 |
| Tranche B, term loan 3 month U.S. LIBOR + 5.000% 2/9/23 (e)(r) | | 11,460,000 | 11,549,503 |
| Telesat LLC Tranche B 4LN, term loan 3 month U.S. LIBOR + 3.000% 4.7% 11/17/23 (d)(e) | | 3,148,742 | 3,161,873 |
| | | | 49,639,844 |
|
| TOTAL TELECOMMUNICATION SERVICES | | | 118,599,035 |
|
| UTILITIES - 0.2% | | | |
| Electric Utilities - 0.1% | | | |
| Empire Generating Co. LLC: | | | |
| Tranche B, term loan 3 month U.S. LIBOR + 4.250% 6.03% 3/14/21 (d)(e) | | 884,825 | 732,193 |
| Tranche C, term loan 3 month U.S. LIBOR + 4.250% 6.03% 3/14/21 (d)(e) | | 87,227 | 71,962 |
| Exgen Renewables Iv LLC Tranche B, term loan 3 month U.S. LIBOR + 3.000% 4.4676% 11/28/24 (d)(e) | | 2,992,500 | 3,018,684 |
| Exgen Texas Power LLC Tranche B, term loan 3 month U.S. LIBOR + 4.750% 0% 9/18/21 (e)(f) | | 4,473,483 | 2,721,354 |
| Green Energy Partners/Stonewall LLC Tranche B 1LN, term loan 3 month U.S. LIBOR + 5.500% 7.1934% 11/13/21 (d)(e) | | 3,034,395 | 3,004,051 |
| InterGen NV Tranche B, term loan 3 month U.S. LIBOR + 4.500% 6.15% 6/13/20 (d)(e) | | 6,245,489 | 6,245,489 |
| Lightstone Holdco LLC: | | | |
| Tranche B 1LN, term loan 3 month U.S. LIBOR + 3.750% 5.398% 1/30/24 (d)(e) | | 2,495,327 | 2,509,201 |
| Tranche C 1LN, term loan 3 month U.S. LIBOR + 3.750% 5.398% 1/30/24 (d)(e) | | 158,446 | 159,327 |
| Tex Operations Co. LLC: | | | |
| Tranche B, term loan 3 month U.S. LIBOR + 2.500% 4.148% 8/4/23 (d)(e) | | 7,182,358 | 7,219,563 |
| Tranche C, term loan 3 month U.S. LIBOR + 2.500% 4.148% 8/4/23 (d)(e) | | 1,272,791 | 1,279,384 |
| USIC Holdings, Inc. Tranche B, term loan 3 month U.S. LIBOR + 3.500% 5.0039% 12/9/23 (d)(e) | | 1,485,000 | 1,493,658 |
| Vistra Operations Co. LLC Tranche B 2LN, term loan 3 month U.S. LIBOR + 2.250% 3.8541% 12/14/23 (d)(e) | | 1,485,000 | 1,492,217 |
| | | | 29,947,083 |
| Independent Power and Renewable Electricity Producers - 0.1% | | | |
| Dynegy, Inc. Tranche C-2, term loan 3 month U.S. LIBOR + 2.750% 4.3456% 2/7/24 (d)(e) | | 6,806,790 | 6,845,792 |
| Energy Future Holdings Corp. Tranche B, term loan 3 month U.S. LIBOR + 3.000% 4.4737% 6/30/18 (d)(e) | | 13,500,000 | 13,498,380 |
| Terra-Gen Finance Co. LLC Tranche B, term loan 3 month U.S. LIBOR + 4.250% 5.9% 12/9/21 (d)(e) | | 2,689,367 | 2,433,877 |
| TerraForm AP Acquisition Holdings LLC Tranche B, term loan 3 month U.S. LIBOR + 4.250% 5.9434% 6/26/22 (d)(e) | | 2,403,186 | 2,415,201 |
| TerraForm Power Operating LLC Tranche B, term loan 3 month U.S. LIBOR + 2.750% 4.3293% 11/8/22 (d)(e) | | 810,000 | 814,390 |
| The AES Corp. Tranche B, term loan 3 month U.S. LIBOR + 2.000% 3.9436% 5/24/22 (d)(e) | | 4,039,475 | 4,041,495 |
| | | | 30,049,135 |
|
| TOTAL UTILITIES | | | 59,996,218 |
|
| TOTAL BANK LOAN OBLIGATIONS | | | |
| (Cost $1,545,110,198) | | | 1,547,521,664 |
|
| Bank Notes - 0.4% | | | |
| Capital One NA 2.95% 7/23/21 | | 18,827,000 | 18,629,865 |
| Discover Bank: | | | |
| (Delaware) 3.2% 8/9/21 | | $25,781,000 | $25,623,829 |
| 3.1% 6/4/20 | | 22,584,000 | 22,553,138 |
| 8.7% 11/18/19 | | 2,958,000 | 3,216,737 |
| KeyBank NA 6.95% 2/1/28 | | 1,977,000 | 2,434,607 |
| RBS Citizens NA 2.5% 3/14/19 | | 11,319,000 | 11,302,220 |
| Regions Bank 7.5% 5/15/18 | | 24,647,000 | 24,903,822 |
| UBS AG Stamford Branch 1.8% 3/26/18 | | 24,142,000 | 24,138,379 |
| TOTAL BANK NOTES | | | |
| (Cost $132,366,169) | | | 132,802,597 |
|
| Preferred Securities - 0.7% | | | |
| CONSUMER DISCRETIONARY - 0.0% | | | |
| Automobiles - 0.0% | | | |
| Volkswagen International Finance NV 2.5%(Reg. S) (c)(d) | EUR | $1,525,000 | $1,950,099 |
| CONSUMER STAPLES - 0.0% | | | |
| Food Products - 0.0% | | | |
| Cosan Overseas Ltd. 8.25% (c) | | 4,402,000 | 4,543,179 |
| Danone SA 1.75% (Reg. S) (c)(d) | EUR | 1,500,000 | 1,826,064 |
| | | | 6,369,243 |
| ENERGY - 0.1% | | | |
| Oil, Gas & Consumable Fuels - 0.1% | | | |
| Andeavor Logistics LP 6.875% (c)(d) | | 7,770,000 | 7,929,313 |
| Sunoco Logistics Partners LP 6.25% (c)(d) | | 11,264,000 | 10,949,083 |
| Total SA 2.625% (Reg. S) (c)(d) | EUR | 2,150,000 | 2,708,105 |
| | | | 21,586,501 |
| FINANCIALS - 0.5% | | | |
| Banks - 0.5% | | | |
| Alfa Bond Issuance PLC 8% (Reg. S) (c)(d) | | 1,860,000 | 1,938,906 |
| Banco Bilbao Vizcaya Argentaria SA 7% (c)(d) | EUR | 2,800,000 | 3,599,596 |
| Banco Do Brasil SA 9% (b)(c)(d) | | 3,445,000 | 3,782,780 |
| Banco Mercantil del Norte SA 7.625% (b)(c)(d) | | 1,930,000 | 2,121,335 |
| Bank of America Corp.: | | | |
| 6.1% (c)(d) | | 8,141,000 | 8,855,811 |
| 6.25% (c)(d) | | 5,325,000 | 5,888,169 |
| 6.5% (c)(d) | | 3,000,000 | 3,358,457 |
| Bank of Nova Scotia 4.65% (c)(d) | | 1,700,000 | 1,679,404 |
| Barclays Bank PLC 7.625% 11/21/22 | | 31,295,000 | 35,494,350 |
| Barclays PLC: | | | |
| 6.625% (c)(d) | | 15,585,000 | 16,252,071 |
| 7.875% (Reg. S) (c)(d) | GBP | 2,000,000 | 3,107,149 |
| BNP Paribas SA 6.75% (Reg. S) (c)(d) | | 1,500,000 | 1,648,239 |
| Citigroup, Inc.: | | | |
| 5.875% (c)(d) | | 4,305,000 | 4,569,350 |
| 5.95% (c)(d) | | 5,290,000 | 5,591,121 |
| 5.95% (c)(d) | | 2,285,000 | 2,372,061 |
| Credit Agricole SA: | | | |
| 6.625% (b)(c)(d) | | 10,445,000 | 10,967,395 |
| 7.875% (b)(c)(d) | | 4,250,000 | 4,807,281 |
| 8.125% 9/19/33 (Reg. S) (d) | | 2,500,000 | 2,656,537 |
| HSBC Holdings PLC 5.25% (c)(d) | EUR | 2,000,000 | 2,788,380 |
| Itau Unibanco Holding SA 6.125% (b)(c)(d) | | 2,510,000 | 2,568,442 |
| KBC Groep NV 5.625% (c)(d) | EUR | 800,000 | 1,029,530 |
| Royal Bank of Scotland Group PLC: | | | |
| 7.5% (c)(d) | | 9,170,000 | 9,730,363 |
| 8.625% (c)(d) | | 3,665,000 | 4,103,387 |
| Stichting AK Rabobank Certificaten 6.5% (Reg. S) (c) | EUR | 2,050,000 | 3,144,869 |
| | | | 142,054,983 |
| Capital Markets - 0.0% | | | |
| Goldman Sachs Group, Inc. 5% (c)(d) | | 7,500,000 | 7,418,992 |
| Diversified Financial Services - 0.0% | | | |
| Magnesita Finance Ltd.: | | | |
| 8.625% (b)(c) | | 1,018,800 | 1,037,319 |
| 8.625% (Reg. S) (c) | | 144,000 | 146,618 |
| | | | 1,183,937 |
| Insurance - 0.0% | | | |
| Assicurazioni Generali SpA 6.416% (c)(d) | GBP | 2,900,000 | 4,324,566 |
| Aviva PLC 6.125% (c)(d) | GBP | 3,270,000 | 5,140,601 |
| AXA SA 6.463% (c)(d) | | 1,012,000 | 1,035,956 |
| Credit Agricole Assurances SA 4.25% (Reg. S) (c)(d) | EUR | 2,600,000 | 3,518,930 |
| | | | 14,020,053 |
|
| TOTAL FINANCIALS | | | 164,677,965 |
|
| INDUSTRIALS - 0.0% | | | |
| Construction & Engineering - 0.0% | | | |
| Odebrecht Finance Ltd.: | | | |
| 7.5% (b)(c) | | 6,805,000 | 1,674,442 |
| 7.5% (Reg. S) (c) | | 100,000 | 24,604 |
| | | | 1,699,046 |
| MATERIALS - 0.0% | | | |
| Metals & Mining - 0.0% | | | |
| CSN Islands XII Corp. 7% (Reg. S) (c) | | 1,170,000 | 1,004,184 |
| REAL ESTATE - 0.0% | | | |
| Real Estate Management & Development - 0.0% | | | |
| Grand City Properties SA 3.75% (c)(d) | EUR | 2,500,000 | 3,248,403 |
| TELECOMMUNICATION SERVICES - 0.1% | | | |
| Diversified Telecommunication Services - 0.1% | | | |
| Colombia Telecomunicaciones SA 8.5% (b)(c)(d) | | 830,000 | 907,348 |
| Telefonica Europe BV 6.5% (Reg. S) (c)(d) | EUR | 5,500,000 | 7,127,801 |
| | | | 8,035,149 |
| TOTAL PREFERRED SECURITIES | | | |
| (Cost $201,315,366) | | | 208,570,590 |
| | | Shares | Value |
|
| Money Market Funds - 2.2% | | | |
| Fidelity Cash Central Fund, 1.41% (t) | | | |
| (Cost $700,075,650) | | 700,012,139 | 700,152,141 |
| Purchased Swaptions - 0.0% | | | | |
| | | Expiration Date | Notional Amount | Value |
| Put Options - 0.0% | | | | |
| Option with an exercise rate of 2.500% on a credit default swap with BNP Paribas to buy protection on the 5-Year iTraxx Europe Crossover Series 28 Index expiring December 2022, paying 5% quarterly | | 6/20/18 | EUR 29,000,000 | $734,533 |
| TOTAL PURCHASED SWAPTIONS | | | | |
| (Cost $472,991) | | | | 734,533 |
| TOTAL INVESTMENT IN SECURITIES - 103.7% | | | | |
| (Cost $33,217,065,450) | | | | 32,850,307,846 |
| NET OTHER ASSETS (LIABILITIES) - (3.7)% | | | | (1,158,730,663) |
| NET ASSETS - 100% | | | | $31,691,577,183 |
| TBA Sale Commitments | | |
| | Principal Amount | Value |
| Fannie Mae | | |
| 3% 3/1/33 | $(52,150,000) | $(51,924,191) |
| 3% 3/1/33 | (37,150,000) | (36,989,141) |
| 3% 3/1/33 | (39,850,000) | (39,677,450) |
| 3% 3/1/33 | (51,700,000) | (51,476,139) |
| 3% 3/1/33 | (24,400,000) | (24,294,348) |
| 3% 3/1/33 | (24,400,000) | (24,294,348) |
| 3% 3/1/48 | (5,600,000) | (5,426,602) |
| 3% 3/1/48 | (9,400,000) | (9,108,938) |
| 3% 3/1/48 | (68,100,000) | (65,991,352) |
| 3.5% 3/1/48 | (41,300,000) | (41,224,508) |
| 4% 3/1/48 | (11,000,000) | (11,268,125) |
| 4% 3/1/48 | (209,550,000) | (214,657,781) |
|
| TOTAL FANNIE MAE | | (576,332,923) |
|
| Freddie Mac | | |
| 4% 3/1/48 | (2,600,000) | (2,663,883) |
| Ginnie Mae | | |
| 4.5% 3/1/48 | (34,500,000) | (35,884,689) |
| 4.5% 3/1/48 | (39,200,000) | (40,773,325) |
|
| TOTAL GINNIE MAE | | (76,658,014) |
|
| TOTAL TBA SALE COMMITMENTS | | |
| (Proceeds $655,325,636) | | $(655,654,820) |
| Futures Contracts | | | | | |
| | Number of contracts | Expiration Date | Notional Amount | Value | Unrealized Appreciation/(Depreciation) |
| Purchased | | | | | |
| Bond Index Contracts | | | | | |
| ASX 10 Year Treasury Bond Index Contracts (Australia) | 29 | March 2018 | $2,878,442 | $(52,660) | $(52,660) |
| Eurex Euro-Buxl 30 Year Bond Contracts (Germany) | 38 | March 2018 | 7,488,994 | (261,518) | (261,518) |
| TOTAL BOND INDEX CONTRACTS | | | | | (314,178) |
| Treasury Contracts | | | | | |
| CBOT 10-Year U.S. Treasury Note Contracts (United States) | 143 | June 2018 | 17,166,703 | 27,628 | 27,628 |
| CBOT 2-Year U.S. Treasury Note Contracts (United States) | 111 | June 2018 | 23,584,031 | (218) | (218) |
| CBOT 5-Year U.S. Treasury Note Contracts (United States) | 147 | June 2018 | 16,747,664 | (44,124) | (44,124) |
| CBOT Long Term U.S. Treasury Bond Contracts (United States) | 18 | June 2018 | 2,581,875 | 31,461 | 31,461 |
| CBOT Ultra 10-Year U.S. Treasury Note Contracts (United States) | 40 | June 2018 | 5,122,500 | 9,955 | 9,955 |
| CBOT Ultra Long Term U.S. Treasury Bond Contracts (United States) | 23 | June 2018 | 3,585,125 | 13,809 | 13,809 |
| TME 10 Year Canadian Note Contracts (Canada) | 77 | June 2018 | 7,901,621 | 60,448 | 60,448 |
| TOTAL TREASURY CONTRACTS | | | | | 98,959 |
|
| TOTAL PURCHASED | | | | | (215,219) |
|
| Sold | | | | | |
| Bond Index Contracts | | | | | |
| Eurex Euro-Bobl Contracts (Germany) | 153 | March 2018 | 24,459,926 | 34,574 | 34,574 |
| Eurex Euro-Bund Contracts (Germany) | 9 | March 2018 | 1,750,651 | (7,116) | (7,116) |
| Eurex Euro-Bund Contracts (Germany) | 15 | June 2018 | 2,868,891 | (14) | (14) |
| ICE Long Gilt Contracts (United Kingdom) | 9 | June 2018 | 1,500,218 | (4,228) | (4,228) |
| ICE Medium Gilt Contracts (United Kingdom) | 25 | June 2018 | 3,876,099 | (2,323) | (2,323) |
| TOTAL BOND INDEX CONTRACTS | | | | | 20,893 |
| Treasury Contracts | | | | | |
| CBOT 10-Year U.S. Treasury Note Contracts (United States) | 372 | June 2018 | 44,657,438 | 127,148 | 127,148 |
| CBOT 2-Year U.S. Treasury Note Contracts (United States) | 515 | June 2018 | 109,421,406 | 146,881 | 146,881 |
| CBOT Long Term U.S. Treasury Bond Contracts (United States) | 61 | June 2018 | 8,749,688 | (27,772) | (27,772) |
| CBOT Ultra 10-Year U.S. Treasury Note Contracts (United States) | 519 | June 2018 | 66,464,438 | (203,834) | (203,834) |
| TOTAL TREASURY CONTRACTS | | | | | 42,423 |
|
| TOTAL SOLD | | | | | 63,316 |
|
| TOTAL FUTURES CONTRACTS | | | | | $(151,903) |
The notional amount of futures purchased as a percentage of Net Assets is 0.3%
The notional amount of futures sold as a percentage of Net Assets is 0.8%
| Forward Foreign Currency Contracts | | | | | | |
| Currency Purchased | Currency Sold | Counterparty | Settlement Date | Unrealized Appreciation/(Depreciation) |
| USD | 1,212,503 | EUR | 993,000 | JPMorgan Chase Bank | 3/2/18 | $1,043 |
| EUR | 229,000 | USD | 282,501 | Citibank, N.A. | 5/18/18 | (1,454) |
| EUR | 3,080,000 | USD | 3,808,174 | Goldman Sachs Bank USA | 5/18/18 | (28,154) |
| EUR | 11,840,228 | USD | 14,669,439 | JPMorgan Chase Bank | 5/18/18 | (138,175) |
| EUR | 1,056,000 | USD | 1,296,865 | JPMorgan Chase Bank | 5/18/18 | (859) |
| GBP | 341,000 | USD | 471,526 | JPMorgan Chase Bank | 5/18/18 | (428) |
| USD | 197,598 | AUD | 250,000 | JPMorgan Chase Bank | 5/18/18 | 3,387 |
| USD | 10,204,114 | CAD | 12,863,000 | BNP Paribas | 5/18/18 | 165,444 |
| USD | 167,241,046 | EUR | 134,653,000 | JPMorgan Chase Bank | 5/18/18 | 1,984,247 |
| USD | 7,253,187 | EUR | 5,788,180 | State Street Bank and Trust Co. | 5/18/18 | 149,475 |
| USD | 680,754 | EUR | 548,000 | State Street Bank and Trust Co. | 5/18/18 | 8,205 |
| USD | 68,573,788 | GBP | 48,787,000 | Goldman Sachs Bank USA | 5/18/18 | 1,173,563 |
| USD | 1,553,432 | GBP | 1,105,000 | State Street Bank and Trust Co. | 5/18/18 | 26,852 |
| USD | 29,553 | JPY | 3,150,000 | JPMorgan Chase Bank | 5/18/18 | (132) |
| TOTAL FORWARD FOREIGN CURRENCY CONTRACTS | | | | | | $3,343,014 |
| | | | | | Unrealized Appreciation | 3,512,216 |
| | | | | | Unrealized Depreciation | (169,202) |
Swaps
| Underlying Reference | Rating(1) | Maturity Date | Clearinghouse / Counterparty(2) | Fixed Payment Received/(Paid) | Payment Frequency | Notional Amount(3) | Value(1) | Upfront Premium Received/(Paid)(4) | Unrealized Appreciation/(Depreciation) |
| Credit Default Swaps | | | | | | | | | |
| Buy Protection | | | | | | | | | |
| 5-Year iTraxx Europe Series 25 Index | | Jun. 2021 | ICE | (1%) | Quarterly | EUR 8,300,000 | $(122,409) | $0 | $(122,409) |
| Accor SA | | Jun. 2022 | Citibank, N.A. | (1%) | Quarterly | EUR 4,200,000 | (120,580) | 80,071 | (40,509) |
| Carlsberg Breweries A/S | | Jun. 2022 | BNP Paribas SA | (1%) | Quarterly | EUR 4,150,000 | (152,423) | 137,049 | (15,374) |
| Energias De Portugal SA | | Jun. 2022 | JPMorgan Chase Bank, N.A. | (5%) | Quarterly | EUR 3,550,000 | (871,416) | 791,667 | (79,749) |
| Gas Natural Capital Markets SA | | Jun. 2022 | BNP Paribas SA | (1%) | Quarterly | EUR 4,200,000 | (107,836) | 104,014 | (3,822) |
| Kering SA | | Sep. 2018 | Morgan Stanley Capital Group, Inc. | (1%) | Quarterly | EUR 3,500,000 | (31,181) | 2,671 | (28,510) |
| Royal Bank Of Scotland Grp PLC (Ungtd) | | Jun. 2022 | BNP Paribas SA | (1%) | Quarterly | EUR 4,600,000 | (95,778) | (107,285) | (203,063) |
| Santander Issuances SA Unipersonal | | Jun. 2022 | BNP Paribas SA | (1%) | Quarterly | EUR 4,350,000 | (24,363) | (95,897) | (120,260) |
| Standard Chartered PLC | | Jun. 2021 | Goldman Sachs Bank USA | (1%) | Quarterly | EUR 1,550,000 | (35,435) | (105,808) | (141,243) |
| TOTAL BUY PROTECTION | | | | | | | (1,561,421) | 806,482 | (754,939) |
| Sell Protection | | | | | | | | | |
| 5-Year iTraxx Europe Senior Financials Series 25 Index | NR | Jun. 2021 | ICE | 1% | Quarterly | EUR 8,300,000 | 266,396 | 0 | 266,396 |
| Intesa Sanpaolo Spa | Ba1 | Jun. 2022 | BNP Paribas SA | 1% | Quarterly | EUR 1,850,000 | (42,895) | 163,034 | 120,139 |
| TOTAL SELL PROTECTION | | | | | | | 223,501 | 163,034 | 386,535 |
|
| TOTAL CREDIT DEFAULT SWAPS | | | | | | | $(1,337,920) | $969,516 | $(368,404) |
|
(1) Ratings are presented for credit default swaps in which the Fund has sold protection on the underlying referenced debt. Ratings for an underlying index represent a weighted average of the ratings of all securities included in the index. The credit rating or value can be measures of the current payment/performance risk. Ratings are from Moody's Investors Service, Inc. Where Moody's® ratings are not available, S&P® ratings are disclosed and are indicated as such. All ratings are as of the report date and do not reflect subsequent changes.
(2) Swaps with Intercontinental Exchange (ICE) are centrally cleared over-the-counter (OTC) swaps.
(3) The notional amount of each credit default swap where the Fund has sold protection approximates the maximum potential amount of future payments that the Fund could be required to make if a credit event were to occur.
(4) Any premiums for centrally cleared over-the-counter (OTC) swaps are recorded periodically throughout the term of the swap to variation margin and included in unrealized appreciation (depreciation).
Currency Abbreviations
AUD – Australian dollar
CAD – Canadian dollar
EUR – European Monetary Unit
GBP – British pound
JPY – Japanese yen
USD – U.S. dollar
Legend
(a) Amount is stated in United States dollars unless otherwise noted.
(b) Security exempt from registration under Rule 144A of the Securities Act of 1933. These securities may be resold in transactions exempt from registration, normally to qualified institutional buyers. At the end of the period, the value of these securities amounted to $2,674,654,323 or 8.4% of net assets.
(c) Security is perpetual in nature with no stated maturity date.
(d) Coupon rates for floating and adjustable rate securities reflect the rates in effect at period end.
(e) Coupon is indexed to a floating interest rate which may be multiplied by a specified factor and/or subject to caps or floors.
(f) Non-income producing - Security is in default.
(g) Level 3 security
(h) Security or a portion of the security purchased on a delayed delivery or when-issued basis.
(i) Security or a portion of the security was pledged to cover margin requirements for futures contracts. At period end, the value of securities pledged amounted to $2,248,587.
(j) Security or a portion of the security has been segregated as collateral for mortgage-backed or asset-backed securities purchased on a delayed delivery or when-issued basis. At period end, the value of securities pledged amounted to $3,740,484.
(k) Security represents right to receive monthly interest payments on an underlying pool of mortgages or assets. Principal shown is the outstanding par amount of the pool as of the end of the period.
(l) Coupon is inversely indexed to a floating interest rate multiplied by a specified factor. The price may be considerably more volatile than the price of a comparable fixed rate security.
(m) Principal Only Strips represent the right to receive the monthly principal payments on an underlying pool of mortgage loans.
(n) Represents an investment in an underlying pool of reverse mortgages which typically do not require regular principal and interest payments as repayment is deferred until a maturity event.
(o) Security initially issued at one coupon which converts to a higher coupon at a specified date. The rate shown is the rate at period end.
(p) Security or a portion of the security was pledged to cover margin requirements for centrally cleared OTC swaps. At period end, the value of securities pledged amounted to $264,233.
(q) Non-income producing
(r) The coupon rate will be determined upon settlement of the loan after period end.
(s) Position represents an unfunded loan commitment. At period end, the total principal amount and market value of unfunded commitments totaled $458,922 and $460,198, respectively.
(t) Affiliated fund that is generally available only to investment companies and other accounts managed by Fidelity Investments. The rate quoted is the annualized seven-day yield of the fund at period end. A complete unaudited listing of the fund's holdings as of its most recent quarter end is available upon request. In addition, each Fidelity Central Fund's financial statements are available on the SEC's website or upon request.
Affiliated Central Funds
Information regarding fiscal year to date income earned by the Fund from investments in Fidelity Central Funds is as follows:
| Fund | Income earned |
| Fidelity Cash Central Fund | $5,092,511 |
| Total | $5,092,511 |
Amounts in the income column in the above table include any capital gain distributions from underlying funds, which are presented in the corresponding line-item in the Statement of Operations if applicable.
Investment Valuation
The following is a summary of the inputs used, as of February 28, 2018, involving the Fund's assets and liabilities carried at fair value. The inputs or methodology used for valuing securities may not be an indication of the risk associated with investing in those securities. For more information on valuation inputs, and their aggregation into the levels used below, please refer to the Investment Valuation section in the accompanying Notes to Financial Statements.
| | Valuation Inputs at Reporting Date: |
| Description | Total | Level 1 | Level 2 | Level 3 |
| Investments in Securities: | | | | |
| Equities: | | | | |
| Consumer Discretionary | $883,404 | $883,404 | $-- | $-- |
| Energy | 9,658,272 | 4,568,722 | -- | 5,089,550 |
| Financials | 3,385,781 | 1,389,386 | 1,996,395 | -- |
| Materials | 3,398,108 | 3,398,108 | -- | -- |
| Real Estate | 5,422,067 | 4,633,224 | 788,843 | -- |
| Telecommunication Services | 198,313 | 163,713 | -- | 34,600 |
| Corporate Bonds | 9,576,664,814 | -- | 9,576,663,807 | 1,007 |
| U.S. Government and Government Agency Obligations | 13,027,878,575 | -- | 13,027,878,575 | -- |
| U.S. Government Agency - Mortgage Securities | 5,479,698,735 | -- | 5,479,698,735 | -- |
| Asset-Backed Securities | 304,290,522 | -- | 301,238,695 | 3,051,827 |
| Collateralized Mortgage Obligations | 615,396,512 | -- | 615,396,512 | -- |
| Commercial Mortgage Securities | 569,196,111 | -- | 569,196,111 | -- |
| Municipal Securities | 383,316,440 | -- | 383,316,440 | -- |
| Foreign Government and Government Agency Obligations | 281,138,667 | -- | 273,673,074 | 7,465,593 |
| Bank Loan Obligations | 1,547,521,664 | -- | 1,541,838,525 | 5,683,139 |
| Bank Notes | 132,802,597 | -- | 132,802,597 | -- |
| Preferred Securities | 208,570,590 | -- | 208,570,590 | -- |
| Money Market Funds | 700,152,141 | 700,152,141 | -- | -- |
| Purchased Swaptions | 734,533 | -- | 734,533 | -- |
| Total Investments in Securities: | $32,850,307,846 | $715,188,698 | $32,113,793,432 | $21,325,716 |
| Derivative Instruments: | | | | |
| Assets | | | | |
| Futures Contracts | $451,904 | $451,904 | $-- | $-- |
| Forward Foreign Currency Contracts | 3,512,216 | -- | 3,512,216 | -- |
| Swaps | 266,396 | -- | 266,396 | -- |
| Total Assets | $4,230,516 | $451,904 | $3,778,612 | $-- |
| Liabilities | | | | |
| Futures Contracts | $(603,807) | $(603,807) | $-- | $-- |
| Forward Foreign Currency Contracts | (169,202) | -- | (169,202) | -- |
| Swaps | (1,604,316) | -- | (1,604,316) | -- |
| Total Liabilities | $(2,377,325) | $(603,807) | $(1,773,518) | $-- |
| Total Derivative Instruments: | $1,853,191 | $(151,903) | $2,005,094 | $-- |
| Other Financial Instruments: | | | | |
| TBA Sale Commitments | $(655,654,820) | $-- | $(655,654,820) | $-- |
| Total Other Financial Instruments: | $(655,654,820) | $-- | $(655,654,820) | $-- |
Value of Derivative Instruments
The following table is a summary of the Fund's value of derivative instruments by primary risk exposure as of February 28, 2018. For additional information on derivative instruments, please refer to the Derivative Instruments section in the accompanying Notes to Financial Statements.
| Primary Risk Exposure / Derivative Type | Value |
| | Asset | Liability |
| Credit Risk | | |
| Purchased Swaptions(a) | $734,533 | $0 |
| Swaps(b) | 266,396 | (1,604,316) |
| Total Credit Risk | 1,000,929 | (1,604,316) |
| Foreign Exchange Risk | | |
| Forward Foreign Currency Contracts(c) | 3,512,216 | (169,202) |
| Total Foreign Exchange Risk | 3,512,216 | (169,202) |
| Interest Rate Risk | | |
| Futures Contracts(d) | 451,904 | (603,807) |
| Total Interest Rate Risk | 451,904 | (603,807) |
| Total Value of Derivatives | $4,965,049 | $(2,377,325) |
(a) Gross value is included in the Statement of Assets and Liabilities in the investments, at value line-item.
(b) For bi-lateral over-the-counter (OTC) swaps, reflects gross value which is presented in the Statement of Assets and Liabilities in the bi-lateral OTC swaps, at value line-items. For centrally cleared OTC swaps, reflects gross cumulative appreciation (depreciation) as presented in the Schedule of Investments. In the Statement of Assets and Liabilities, the period end daily variation margin for centrally cleared OTC swaps is included in receivable or payable for daily variation margin on centrally cleared OTC swaps, and the net cumulative appreciation (depreciation) for centrally cleared OTC swaps is included in net unrealized appreciation (depreciation).
(c) Gross value is presented in the Statement of Assets and Liabilities in the unrealized appreciation/depreciation on forward foreign currency contracts line-items.
(d) Reflects gross cumulative appreciation (depreciation) on futures contracts as presented in the Schedule of Investments. In the Statement of Assets and Liabilities, the period end daily variation margin is included in receivable or payable for daily variation margin on futures contracts, and the net cumulative appreciation (depreciation) is included in net unrealized appreciation (depreciation).
Other Information
Distribution of investments by country or territory of incorporation, as a percentage of Total Net Assets, is as follows (Unaudited):
| United States of America | 89.6% |
| Mexico | 2.0% |
| Netherlands | 1.9% |
| United Kingdom | 1.7% |
| Luxembourg | 1.0% |
| Others (Individually Less Than 1%) | 3.8% |
| | 100.0% |
See accompanying notes which are an integral part of the financial statements.
Financial Statements
Statement of Assets and Liabilities
| | | February 28, 2018 (Unaudited) |
| Assets | | |
Investment in securities, at value — See accompanying schedule:
Unaffiliated issuers (cost $32,516,989,800) | $32,150,155,705 | |
| Fidelity Central Funds (cost $700,075,650) | 700,152,141 | |
| Total Investment in Securities (cost $33,217,065,450) | | $32,850,307,846 |
| Cash | | 47,069,975 |
| Foreign currency held at value (cost $1,160,458) | | 1,147,868 |
| Receivable for investments sold | | 206,424,557 |
| Receivable for TBA sale commitments | | 655,325,636 |
| Unrealized appreciation on forward foreign currency contracts | | 3,512,216 |
| Receivable for fund shares sold | | 41,714,689 |
| Dividends receivable | | 146,447 |
| Interest receivable | | 204,719,910 |
| Distributions receivable from Fidelity Central Funds | | 732,736 |
| Receivable for daily variation margin on centrally cleared OTC swaps | | 811 |
| Other receivables | | 206,047 |
| Total assets | | 34,011,308,738 |
| Liabilities | | |
| Payable for investments purchased | | |
| Regular delivery | $118,666,725 | |
| Delayed delivery | 1,480,080,094 | |
| TBA sale commitments, at value | 655,654,820 | |
| Unrealized depreciation on forward foreign currency contracts | 169,202 | |
| Payable for fund shares redeemed | 48,039,325 | |
| Distributions payable | 2,764,249 | |
| Bi-lateral OTC swaps, at value | 1,481,907 | |
| Accrued management fee | 8,118,928 | |
| Distribution and service plan fees payable | 322,332 | |
| Payable for daily variation margin on futures contracts | 292,601 | |
| Other affiliated payables | 3,935,310 | |
| Other payables and accrued expenses | 206,062 | |
| Total liabilities | | 2,319,731,555 |
| Net Assets | | $31,691,577,183 |
| Net Assets consist of: | | |
| Paid in capital | | $32,094,442,060 |
| Undistributed net investment income | | 40,032,337 |
| Accumulated undistributed net realized gain (loss) on investments and foreign currency transactions | | (78,690,162) |
| Net unrealized appreciation (depreciation) on investments and assets and liabilities in foreign currencies | | (364,207,052) |
| Net Assets | | $31,691,577,183 |
| Calculation of Maximum Offering Price | | |
| Class A: | | |
| Net Asset Value and redemption price per share ($504,369,578 ÷ 48,398,404 shares) | | $10.42 |
| Maximum offering price per share (100/96.00 of $10.42) | | $10.85 |
| Class M: | | |
| Net Asset Value and redemption price per share ($301,987,901 ÷ 29,029,524 shares) | | $10.40 |
| Maximum offering price per share (100/96.00 of $10.40) | | $10.83 |
| Class C: | | |
| Net Asset Value and offering price per share ($183,067,903 ÷ 17,561,009 shares)(a) | | $10.42 |
| Total Bond: | | |
| Net Asset Value, offering price and redemption price per share ($23,808,092,252 ÷ 2,285,471,243 shares) | | $10.42 |
| Class I: | | |
| Net Asset Value, offering price and redemption price per share ($4,821,249,070 ÷ 463,536,932 shares) | | $10.40 |
| Class Z: | | |
| Net Asset Value, offering price and redemption price per share ($2,072,810,479 ÷ 199,275,788 shares) | | $10.40 |
(a) Redemption price per share is equal to net asset value less any applicable contingent deferred sales charge.
See accompanying notes which are an integral part of the financial statements.
Statement of Operations
| | | Six months ended February 28, 2018 (Unaudited) |
| Investment Income | | |
| Dividends | | $6,827,441 |
| Interest | | 475,672,800 |
| Income from Fidelity Central Funds | | 5,092,511 |
| Total income | | 487,592,752 |
| Expenses | | |
| Management fee | $48,363,852 | |
| Transfer agent fees | 16,446,345 | |
| Distribution and service plan fees | 1,957,268 | |
| Fund wide operations fee | 6,837,094 | |
| Independent trustees' fees and expenses | 59,065 | |
| Miscellaneous | 44,490 | |
| Total expenses before reductions | 73,708,114 | |
| Expense reductions | (48,555) | 73,659,559 |
| Net investment income (loss) | | 413,933,193 |
| Realized and Unrealized Gain (Loss) | | |
| Net realized gain (loss) on: | | |
| Investment securities: | | |
| Unaffiliated issuers | (3,982,221) | |
| Fidelity Central Funds | 3,792 | |
| Forward foreign currency contracts | (11,264,823) | |
| Foreign currency transactions | 16,466,381 | |
| Futures contracts | 5,209,636 | |
| Swaps | 352,421 | |
| Total net realized gain (loss) | | 6,785,186 |
| Change in net unrealized appreciation (depreciation) on: | | |
| Investment securities: | | |
| Unaffiliated issuers | (942,406,816) | |
| Fidelity Central Funds | (3,792) | |
| Forward foreign currency contracts | 4,610,970 | |
| Assets and liabilities in foreign currencies | (71,438) | |
| Futures contracts | 359,036 | |
| Swaps | 272,008 | |
| Delayed delivery commitments | 357,181 | |
| Total change in net unrealized appreciation (depreciation) | | (936,882,851) |
| Net gain (loss) | | (930,097,665) |
| Net increase (decrease) in net assets resulting from operations | | $(516,164,472) |
See accompanying notes which are an integral part of the financial statements.
Statement of Changes in Net Assets
| | Six months ended February 28, 2018 (Unaudited) | Year ended August 31, 2017 |
| Increase (Decrease) in Net Assets | | |
| Operations | | |
| Net investment income (loss) | $413,933,193 | $775,303,535 |
| Net realized gain (loss) | 6,785,186 | 36,180,617 |
| Change in net unrealized appreciation (depreciation) | (936,882,851) | (187,045,805) |
| Net increase (decrease) in net assets resulting from operations | (516,164,472) | 624,438,347 |
| Distributions to shareholders from net investment income | (449,309,447) | (739,976,289) |
| Distributions to shareholders from net realized gain | (72,496,766) | (67,918,257) |
| Total distributions | (521,806,213) | (807,894,546) |
| Share transactions - net increase (decrease) | 2,042,733,161 | 5,166,571,919 |
| Total increase (decrease) in net assets | 1,004,762,476 | 4,983,115,720 |
| Net Assets | | |
| Beginning of period | 30,686,814,707 | 25,703,698,987 |
| End of period | $31,691,577,183 | $30,686,814,707 |
| Other Information | | |
| Undistributed net investment income end of period | $40,032,337 | $75,408,591 |
See accompanying notes which are an integral part of the financial statements.
Financial Highlights
Fidelity Total Bond Fund Class A
| | Six months ended (Unaudited) February 28, | Years endedAugust 31, | | | | |
| | 2018 | 2017 | 2016 | 2015 | 2014 | 2013 |
| Selected Per–Share Data | | | | | | |
| Net asset value, beginning of period | $10.77 | $10.87 | $10.53 | $10.77 | $10.48 | $11.29 |
| Income from Investment Operations | | | | | | |
| Net investment income (loss)A | .124 | .272 | .312 | .287 | .292 | .263 |
| Net realized and unrealized gain (loss) | (.313) | (.086) | .377 | (.224) | .382 | (.468) |
| Total from investment operations | (.189) | .186 | .689 | .063 | .674 | (.205) |
| Distributions from net investment income | (.136) | (.258) | (.290) | (.270) | (.275) | (.250) |
| Distributions from net realized gain | (.025) | (.028) | (.059) | (.033) | (.109) | (.355) |
| Total distributions | (.161) | (.286) | (.349) | (.303) | (.384) | (.605) |
| Net asset value, end of period | $10.42 | $10.77 | $10.87 | $10.53 | $10.77 | $10.48 |
| Total ReturnB,C,D | (1.78)% | 1.77% | 6.71% | .58% | 6.56% | (1.94)% |
| Ratios to Average Net AssetsE,F | | | | | | |
| Expenses before reductions | .76%G | .75% | .75% | .75% | .76% | .79% |
| Expenses net of fee waivers, if any | .76%G | .75% | .75% | .75% | .76% | .79% |
| Expenses net of all reductions | .76%G | .75% | .75% | .75% | .76% | .79% |
| Net investment income (loss) | 2.35%G | 2.53% | 2.95% | 2.69% | 2.76% | 2.41% |
| Supplemental Data | | | | | | |
| Net assets, end of period (000 omitted) | $504,370 | $521,557 | $1,233,806 | $852,243 | $639,235 | $517,259 |
| Portfolio turnover rateH | 102%G | 137% | 134% | 140%I | 108% | 201% |
A Calculated based on average shares outstanding during the period.
B Total returns for periods of less than one year are not annualized.
C Total returns would have been lower if certain expenses had not been reduced during the applicable periods shown.
D Total returns do not include the effect of the sales charges.
E Fees and expenses of any underlying Fidelity Central Funds are not included in the Fund's expense ratio. The Fund indirectly bears its proportionate share of the expenses of any underlying Fidelity Central Funds.
F Expense ratios reflect operating expenses of the class. Expenses before reductions do not reflect amounts reimbursed by the investment adviser or reductions from brokerage service arrangements or reductions from other expense offset arrangements and do not represent the amount paid by the class during periods when reimbursements or reductions occur. Expenses net of fee waivers reflect expenses after reimbursement by the investment adviser but prior to reductions from brokerage service arrangements or other expense offset arrangements. Expenses net of all reductions represent the net expenses paid by the class.
G Annualized
H Amount does not include the portfolio activity of any underlying Fidelity Central Funds.
I Portfolio turnover rate excludes securities received or delivered in-kind.
See accompanying notes which are an integral part of the financial statements.
Fidelity Total Bond Fund Class M
| | Six months ended (Unaudited) February 28, | Years endedAugust 31, | | | | |
| | 2018 | 2017 | 2016 | 2015 | 2014 | 2013 |
| Selected Per–Share Data | | | | | | |
| Net asset value, beginning of period | $10.75 | $10.85 | $10.51 | $10.76 | $10.46 | $11.28 |
| Income from Investment Operations | | | | | | |
| Net investment income (loss)A | .124 | .267 | .309 | .285 | .290 | .265 |
| Net realized and unrealized gain (loss) | (.314) | (.083) | .378 | (.234) | .392 | (.477) |
| Total from investment operations | (.190) | .184 | .687 | .051 | .682 | (.212) |
| Distributions from net investment income | (.135) | (.256) | (.288) | (.268) | (.273) | (.253) |
| Distributions from net realized gain | (.025) | (.028) | (.059) | (.033) | (.109) | (.355) |
| Total distributions | (.160) | (.284) | (.347) | (.301) | (.382) | (.608) |
| Net asset value, end of period | $10.40 | $10.75 | $10.85 | $10.51 | $10.76 | $10.46 |
| Total ReturnB,C,D | (1.78)% | 1.76% | 6.71% | .47% | 6.65% | (2.01)% |
| Ratios to Average Net AssetsE,F | | | | | | |
| Expenses before reductions | .77%G | .76% | .77% | .77% | .78% | .76% |
| Expenses net of fee waivers, if any | .77%G | .76% | .77% | .77% | .78% | .76% |
| Expenses net of all reductions | .77%G | .76% | .77% | .77% | .78% | .76% |
| Net investment income (loss) | 2.35%G | 2.53% | 2.94% | 2.67% | 2.74% | 2.44% |
| Supplemental Data | | | | | | |
| Net assets, end of period (000 omitted) | $301,988 | $287,111 | $155,518 | $101,673 | $57,972 | $52,848 |
| Portfolio turnover rateH | 102%G | 137% | 134% | 140%I | 108% | 201% |
A Calculated based on average shares outstanding during the period.
B Total returns for periods of less than one year are not annualized.
C Total returns would have been lower if certain expenses had not been reduced during the applicable periods shown.
D Total returns do not include the effect of the sales charges.
E Fees and expenses of any underlying Fidelity Central Funds are not included in the Fund's expense ratio. The Fund indirectly bears its proportionate share of the expenses of any underlying Fidelity Central Funds.
F Expense ratios reflect operating expenses of the class. Expenses before reductions do not reflect amounts reimbursed by the investment adviser or reductions from brokerage service arrangements or reductions from other expense offset arrangements and do not represent the amount paid by the class during periods when reimbursements or reductions occur. Expenses net of fee waivers reflect expenses after reimbursement by the investment adviser but prior to reductions from brokerage service arrangements or other expense offset arrangements. Expenses net of all reductions represent the net expenses paid by the class.
G Annualized
H Amount does not include the portfolio activity of any underlying Fidelity Central Funds.
I Portfolio turnover rate excludes securities received or delivered in-kind.
See accompanying notes which are an integral part of the financial statements.
Fidelity Total Bond Fund Class C
| | Six months ended (Unaudited) February 28, | Years endedAugust 31, | | | | |
| | 2018 | 2017 | 2016 | 2015 | 2014 | 2013 |
| Selected Per–Share Data | | | | | | |
| Net asset value, beginning of period | $10.77 | $10.87 | $10.53 | $10.77 | $10.48 | $11.29 |
| Income from Investment Operations | | | | | | |
| Net investment income (loss)A | .084 | .188 | .231 | .205 | .211 | .185 |
| Net realized and unrealized gain (loss) | (.314) | (.084) | .378 | (.225) | .382 | (.469) |
| Total from investment operations | (.230) | .104 | .609 | (.020) | .593 | (.284) |
| Distributions from net investment income | (.095) | (.176) | (.210) | (.187) | (.194) | (.171) |
| Distributions from net realized gain | (.025) | (.028) | (.059) | (.033) | (.109) | (.355) |
| Total distributions | (.120) | (.204) | (.269) | (.220) | (.303) | (.526) |
| Net asset value, end of period | $10.42 | $10.77 | $10.87 | $10.53 | $10.77 | $10.48 |
| Total ReturnB,C,D | (2.15)% | .99% | 5.90% | (.20)% | 5.75% | (2.65)% |
| Ratios to Average Net AssetsE,F | | | | | | |
| Expenses before reductions | 1.53%G | 1.52% | 1.52% | 1.53% | 1.53% | 1.51% |
| Expenses net of fee waivers, if any | 1.53%G | 1.52% | 1.52% | 1.53% | 1.53% | 1.51% |
| Expenses net of all reductions | 1.53%G | 1.52% | 1.52% | 1.53% | 1.53% | 1.51% |
| Net investment income (loss) | 1.58%G | 1.77% | 2.19% | 1.92% | 1.99% | 1.69% |
| Supplemental Data | | | | | | |
| Net assets, end of period (000 omitted) | $183,068 | $190,273 | $186,380 | $139,264 | $83,818 | $79,711 |
| Portfolio turnover rateH | 102%G | 137% | 134% | 140%I | 108% | 201% |
A Calculated based on average shares outstanding during the period.
B Total returns for periods of less than one year are not annualized.
C Total returns would have been lower if certain expenses had not been reduced during the applicable periods shown.
D Total returns do not include the effect of the contingent deferred sales charge.
E Fees and expenses of any underlying Fidelity Central Funds are not included in the Fund's expense ratio. The Fund indirectly bears its proportionate share of the expenses of any underlying Fidelity Central Funds.
F Expense ratios reflect operating expenses of the class. Expenses before reductions do not reflect amounts reimbursed by the investment adviser or reductions from brokerage service arrangements or reductions from other expense offset arrangements and do not represent the amount paid by the class during periods when reimbursements or reductions occur. Expenses net of fee waivers reflect expenses after reimbursement by the investment adviser but prior to reductions from brokerage service arrangements or other expense offset arrangements. Expenses net of all reductions represent the net expenses paid by the class.
G Annualized
H Amount does not include the portfolio activity of any underlying Fidelity Central Funds.
I Portfolio turnover rate excludes securities received or delivered in-kind.
See accompanying notes which are an integral part of the financial statements.
Fidelity Total Bond Fund
| | Six months ended (Unaudited) February 28, | Years endedAugust 31, | | | | |
| | 2018 | 2017 | 2016 | 2015 | 2014 | 2013 |
| Selected Per–Share Data | | | | | | |
| Net asset value, beginning of period | $10.76 | $10.86 | $10.53 | $10.77 | $10.47 | $11.29 |
| Income from Investment Operations | | | | | | |
| Net investment income (loss)A | .140 | .302 | .343 | .320 | .326 | .300 |
| Net realized and unrealized gain (loss) | (.303) | (.085) | .368 | (.224) | .392 | (.478) |
| Total from investment operations | (.163) | .217 | .711 | .096 | .718 | (.178) |
| Distributions from net investment income | (.152) | (.289) | (.322) | (.303) | (.309) | (.287) |
| Distributions from net realized gain | (.025) | (.028) | (.059) | (.033) | (.109) | (.355) |
| Total distributions | (.177) | (.317) | (.381) | (.336) | (.418) | (.642) |
| Net asset value, end of period | $10.42 | $10.76 | $10.86 | $10.53 | $10.77 | $10.47 |
| Total ReturnB,C | (1.53)% | 2.07% | 6.94% | .88% | 7.00% | (1.70)% |
| Ratios to Average Net AssetsD,E | | | | | | |
| Expenses before reductions | .45%F | .45% | .45% | .45% | .45% | .45% |
| Expenses net of fee waivers, if any | .45%F | .45% | .45% | .45% | .45% | .45% |
| Expenses net of all reductions | .45%F | .45% | .45% | .45% | .45% | .45% |
| Net investment income (loss) | 2.66%F | 2.84% | 3.25% | 2.99% | 3.07% | 2.75% |
| Supplemental Data | | | | | | |
| Net assets, end of period (000 omitted) | $23,808,092 | $23,732,156 | $20,469,677 | $17,359,294 | $14,547,801 | $11,526,014 |
| Portfolio turnover rateG | 102%F | 137% | 134% | 140%H | 108% | 201% |
A Calculated based on average shares outstanding during the period.
B Total returns for periods of less than one year are not annualized.
C Total returns would have been lower if certain expenses had not been reduced during the applicable periods shown.
D Fees and expenses of any underlying Fidelity Central Funds are not included in the Fund's expense ratio. The Fund indirectly bears its proportionate share of the expenses of any underlying Fidelity Central Funds.
E Expense ratios reflect operating expenses of the class. Expenses before reductions do not reflect amounts reimbursed by the investment adviser or reductions from brokerage service arrangements or reductions from other expense offset arrangements and do not represent the amount paid by the class during periods when reimbursements or reductions occur. Expenses net of fee waivers reflect expenses after reimbursement by the investment adviser but prior to reductions from brokerage service arrangements or other expense offset arrangements. Expenses net of all reductions represent the net expenses paid by the class.
F Annualized
G Amount does not include the portfolio activity of any underlying Fidelity Central Funds.
H Portfolio turnover rate excludes securities received or delivered in-kind.
See accompanying notes which are an integral part of the financial statements.
Fidelity Total Bond Fund Class I
| | Six months ended (Unaudited) February 28, | Years endedAugust 31, | | | | |
| | 2018 | 2017 | 2016 | 2015 | 2014 | 2013 |
| Selected Per–Share Data | | | | | | |
| Net asset value, beginning of period | $10.75 | $10.85 | $10.51 | $10.76 | $10.46 | $11.27 |
| Income from Investment Operations | | | | | | |
| Net investment income (loss)A | .137 | .295 | .337 | .313 | .319 | .295 |
| Net realized and unrealized gain (loss) | (.313) | (.083) | .378 | (.233) | .393 | (.469) |
| Total from investment operations | (.176) | .212 | .715 | .080 | .712 | (.174) |
| Distributions from net investment income | (.149) | (.284) | (.316) | (.297) | (.303) | (.281) |
| Distributions from net realized gain | (.025) | (.028) | (.059) | (.033) | (.109) | (.355) |
| Total distributions | (.174) | (.312) | (.375) | (.330) | (.412) | (.636) |
| Net asset value, end of period | $10.40 | $10.75 | $10.85 | $10.51 | $10.76 | $10.46 |
| Total ReturnB,C | (1.66)% | 2.02% | 6.99% | .73% | 6.95% | (1.67)% |
| Ratios to Average Net AssetsD,E | | | | | | |
| Expenses before reductions | .50%F | .50% | .50% | .50% | .51% | .51% |
| Expenses net of fee waivers, if any | .50%F | .50% | .50% | .50% | .51% | .51% |
| Expenses net of all reductions | .50%F | .50% | .50% | .50% | .51% | .51% |
| Net investment income (loss) | 2.61%F | 2.79% | 3.20% | 2.94% | 3.02% | 2.69% |
| Supplemental Data | | | | | | |
| Net assets, end of period (000 omitted) | $4,821,249 | $4,481,725 | $2,846,878 | $1,266,870 | $573,410 | $244,911 |
| Portfolio turnover rateG | 102%F | 137% | 134% | 140%H | 108% | 201% |
A Calculated based on average shares outstanding during the period.
B Total returns for periods of less than one year are not annualized.
C Total returns would have been lower if certain expenses had not been reduced during the applicable periods shown.
D Fees and expenses of any underlying Fidelity Central Funds are not included in the Fund's expense ratio. The Fund indirectly bears its proportionate share of the expenses of any underlying Fidelity Central Funds.
E Expense ratios reflect operating expenses of the class. Expenses before reductions do not reflect amounts reimbursed by the investment adviser or reductions from brokerage service arrangements or reductions from other expense offset arrangements and do not represent the amount paid by the class during periods when reimbursements or reductions occur. Expenses net of fee waivers reflect expenses after reimbursement by the investment adviser but prior to reductions from brokerage service arrangements or other expense offset arrangements. Expenses net of all reductions represent the net expenses paid by the class.
F Annualized
G Amount does not include the portfolio activity of any underlying Fidelity Central Funds.
H Portfolio turnover rate excludes securities received or delivered in-kind.
See accompanying notes which are an integral part of the financial statements.
Fidelity Total Bond Fund Class Z
| | Six months ended (Unaudited) February 28, | Years endedAugust 31, | | |
| | 2018 | 2017 | 2016 | 2015 A |
| Selected Per–Share Data | | | | |
| Net asset value, beginning of period | $10.75 | $10.85 | $10.51 | $10.66 |
| Income from Investment Operations | | | | |
| Net investment income (loss)B | .144 | .310 | .352 | .234 |
| Net realized and unrealized gain (loss) | (.312) | (.083) | .378 | (.167) |
| Total from investment operations | (.168) | .227 | .730 | .067 |
| Distributions from net investment income | (.157) | (.299) | (.331) | (.217) |
| Distributions from net realized gain | (.025) | (.028) | (.059) | – |
| Total distributions | (.182) | (.327) | (.390) | (.217) |
| Net asset value, end of period | $10.40 | $10.75 | $10.85 | $10.51 |
| Total ReturnC,D | (1.59)% | 2.16% | 7.14% | .59% |
| Ratios to Average Net AssetsE,F | | | | |
| Expenses before reductions | .36%G | .36% | .36% | .36%G |
| Expenses net of fee waivers, if any | .36%G | .36% | .36% | .36%G |
| Expenses net of all reductions | .36%G | .36% | .36% | .36%G |
| Net investment income (loss) | 2.75%G | 2.93% | 3.34% | 3.29%G |
| Supplemental Data | | | | |
| Net assets, end of period (000 omitted) | $2,072,810 | $1,473,993 | $811,440 | $546,968 |
| Portfolio turnover rateH | 102%G | 137% | 134% | 140%I |
A For the period December 22, 2014 (commencement of sale of shares) to August 31, 2015.
B Calculated based on average shares outstanding during the period.
C Total returns for periods of less than one year are not annualized.
D Total returns would have been lower if certain expenses had not been reduced during the applicable periods shown.
E Fees and expenses of any underlying Fidelity Central Funds are not included in the Fund's expense ratio. The Fund indirectly bears its proportionate share of the expenses of any underlying Fidelity Central Funds.
F Expense ratios reflect operating expenses of the class. Expenses before reductions do not reflect amounts reimbursed by the investment adviser or reductions from brokerage service arrangements or reductions from other expense offset arrangements and do not represent the amount paid by the class during periods when reimbursements or reductions occur. Expense ratios before reductions for start-up periods may not be representative of longer-term operating periods. Expenses net of fee waivers reflect expenses after reimbursement by the investment adviser but prior to reductions from brokerage service arrangements or other expense offset arrangements. Expenses net of all reductions represent the net expenses paid by the class.
G Annualized
H Amount does not include the portfolio activity of any underlying Fidelity Central Funds.
I Portfolio turnover rate excludes securities received or delivered in-kind.
See accompanying notes which are an integral part of the financial statements.
Notes to Financial Statements (Unaudited)
For the period ended February 28, 2018
1. Organization.
Fidelity Total Bond Fund (the Fund) is a fund of Fidelity Income Fund (the Trust) and is authorized to issue an unlimited number of shares. The Trust is registered under the Investment Company Act of 1940, as amended (the 1940 Act), as an open-end management investment company organized as a Massachusetts business trust. The Fund offers Class A, Class M, Class C, Total Bond, Class I and Class Z shares, each of which has equal rights as to assets and voting privileges. Each class has exclusive voting rights with respect to matters that affect that class.
2. Investments in Fidelity Central Funds.
The Fund invests in Fidelity Central Funds, which are open-end investment companies generally available only to other investment companies and accounts managed by the investment adviser and its affiliates. The Fund's Schedule of Investments lists each of the Fidelity Central Funds held as of period end, if any, as an investment of the Fund, but does not include the underlying holdings of each Fidelity Central Fund. As an Investing Fund, the Fund indirectly bears its proportionate share of the expenses of the underlying Fidelity Central Funds.
The Money Market Central Funds seek preservation of capital and current income and are managed by Fidelity Investments Money Management, Inc. (FIMM), an affiliate of the investment adviser. Annualized expenses of the Money Market Central Funds as of their most recent shareholder report date are less than .005%.
A complete unaudited list of holdings for each Fidelity Central Fund is available upon request or at the Securities and Exchange Commission (the SEC) website at www.sec.gov. In addition, the financial statements of the Fidelity Central Funds are available on the SEC website or upon request.
3. Significant Accounting Policies.
The Fund is an investment company and applies the accounting and reporting guidance of the Financial Accounting Standards Board (FASB) Accounting Standards Codification Topic 946 Financial Services – Investments Companies. The financial statements have been prepared in conformity with accounting principles generally accepted in the United States of America (GAAP), which require management to make certain estimates and assumptions at the date of the financial statements. Actual results could differ from those estimates. Subsequent events, if any, through the date that the financial statements were issued have been evaluated in the preparation of the financial statements. The following summarizes the significant accounting policies of the Fund:
Investment Valuation. Investments are valued as of 4:00 p.m. Eastern time on the last calendar day of the period. The Board of Trustees (the Board) has delegated the day to day responsibility for the valuation of the Fund's investments to the Fair Value Committee (the Committee) established by the Fund's investment adviser. In accordance with valuation policies and procedures approved by the Board, the Fund attempts to obtain prices from one or more third party pricing vendors or brokers to value its investments. When current market prices, quotations or currency exchange rates are not readily available or reliable, investments will be fair valued in good faith by the Committee, in accordance with procedures adopted by the Board. Factors used in determining fair value vary by investment type and may include market or investment specific events, changes in interest rates and credit quality. The frequency with which these procedures are used cannot be predicted and they may be utilized to a significant extent. The Committee oversees the Fund's valuation policies and procedures and reports to the Board on the Committee's activities and fair value determinations. The Board monitors the appropriateness of the procedures used in valuing the Fund's investments and ratifies the fair value determinations of the Committee.
The Fund categorizes the inputs to valuation techniques used to value its investments into a disclosure hierarchy consisting of three levels as shown below:
- Level 1 – quoted prices in active markets for identical investments
- Level 2 – other significant observable inputs (including quoted prices for similar investments, interest rates, prepayment speeds, etc.)
- Level 3 – unobservable inputs (including the Fund's own assumptions based on the best information available)
Valuation techniques used to value the Fund's investments by major category are as follows:
Debt securities, including restricted securities, are valued based on evaluated prices received from third party pricing vendors or from brokers who make markets in such securities. Corporate bonds, bank notes, bank loan obligations, foreign government and government agency obligations, municipal securities, preferred securities and U.S. government and government agency obligations are valued by pricing vendors who utilize matrix pricing which considers yield or price of bonds of comparable quality, coupon, maturity and type or by broker-supplied prices. Asset backed securities, collateralized mortgage obligations, commercial mortgage securities and U.S. government agency mortgage securities are valued by pricing vendors who utilize matrix pricing which considers prepayment speed assumptions, attributes of the collateral, yield or price of bonds of comparable quality, coupon, maturity and type or by broker-supplied prices. Swaps are marked-to-market daily based on valuations from third party pricing vendors, registered derivatives clearing organizations (clearinghouses) or broker-supplied valuations. These pricing sources may utilize inputs such as interest rate curves, credit spread curves, default possibilities and recovery rates. When independent prices are unavailable or unreliable, debt securities and swaps may be valued utilizing pricing methodologies which consider similar factors that would be used by third party pricing vendors. For foreign debt securities, when significant market or security specific events arise, valuations may be determined in good faith in accordance with procedures adopted by the Board. Debt securities and swaps are generally categorized as Level 2 in the hierarchy but may be Level 3 depending on the circumstances.
Equity securities, including restricted securities, for which market quotations are readily available, are valued at the last reported sale price or official closing price as reported by a third party pricing vendor on the primary market or exchange on which they are traded and are categorized as Level 1 in the hierarchy. In the event there were no sales during the day or closing prices are not available, securities are valued at the last quoted bid price or may be valued using the last available price and are generally categorized as Level 2 in the hierarchy. For foreign equity securities, when market or security specific events arise, comparisons to the valuation of American Depositary Receipts (ADRs), futures contracts, Exchange-Traded Funds (ETFs) and certain indexes as well as quoted prices for similar securities may be used and would be categorized as Level 2 in the hierarchy. Utilizing these techniques may result in transfers between Level 1 and Level 2. For equity securities, including restricted securities, where observable inputs are limited, assumptions about market activity and risk are used and these securities may be categorized as Level 3 in the hierarchy.
The U.S. dollar value of foreign currency contracts is determined using currency exchange rates supplied by a pricing service and are categorized as Level 2 in the hierarchy. Futures contracts are valued at the settlement price established each day by the board of trade or exchange on which they are traded and are categorized as Level 1 in the hierarchy. Options traded over-the-counter are valued using broker-supplied valuations and are categorized as Level 2 in the hierarchy. Investments in open-end mutual funds, including the Fidelity Central Funds, are valued at their closing net asset value (NAV) each business day and are categorized as Level 1 in the hierarchy.
Changes in valuation techniques may result in transfers in or out of an assigned level within the disclosure hierarchy. The aggregate value of investments by input level as of February 28, 2018 is included at the end of the Fund's Schedule of Investments.
Foreign Currency. Foreign-denominated assets, including investment securities, and liabilities are translated into U.S. dollars at the exchange rates at period end. Purchases and sales of investment securities, income and dividends received and expenses denominated in foreign currencies are translated into U.S. dollars at the exchange rate in effect on the transaction date.
The effects of exchange rate fluctuations on investments are included with the net realized and unrealized gain (loss) on investment securities. Other foreign currency transactions resulting in realized and unrealized gain (loss) are disclosed separately.
Realized gains and losses on foreign currency transactions arise from the disposition of foreign currency, realized changes in the value of foreign currency between the trade and settlement dates on security transactions, and the difference between the amounts of dividends, interest and foreign withholding taxes recorded on transaction date and the U.S. dollar equivalent of the amounts actually received or paid. Unrealized gains and losses on assets and liabilities in foreign currencies arise from changes in the value of foreign currency, and from assets and liabilities denominated in foreign currencies, other than investments, which are held at period end.
Investment Transactions and Income. For financial reporting purposes, the Fund's investment holdings and NAV include trades executed through the end of the last business day of the period. The NAV per share for processing shareholder transactions is calculated as of the close of business of the New York Stock Exchange (NYSE), normally 4:00 p.m. Eastern time and includes trades executed through the end of the prior business day. Gains and losses on securities sold are determined on the basis of identified cost and includes proceeds received from litigation. Dividend income is recorded on the ex-dividend date, except for certain dividends from foreign securities where the ex-dividend date may have passed, which are recorded as soon as the Fund is informed of the ex-dividend date. Non-cash dividends included in dividend income, if any, are recorded at the fair market value of the securities received. Income and capital gain distributions from Fidelity Central Funds, if any, are recorded on the ex-dividend date. Certain distributions received by the Fund represent a return of capital or capital gain. The Fund determines the components of these distributions subsequent to the ex-dividend date, based upon receipt of tax filings or other correspondence relating to the underlying investment. These distributions are recorded as a reduction of cost of investments and/or as a realized gain. Interest income is accrued as earned and includes coupon interest and amortization of premium and accretion of discount on debt securities as applicable. Paid in Kind (PIK) income is recorded at the fair market value of the securities received. The principal amount on inflation-indexed securities is periodically adjusted to the rate of inflation and interest is accrued based on the principal amount. The adjustments to principal due to inflation are reflected as increases or decreases to Interest in the accompanying Statement of Operations. Investment income is recorded net of foreign taxes withheld where recovery of such taxes is uncertain. Debt obligations may be placed on non-accrual status and related interest income may be reduced by ceasing current accruals and writing off interest receivables when the collection of all or a portion of interest has become doubtful based on consistently applied procedures. A debt obligation is removed from non-accrual status when the issuer resumes interest payments or when collectability of interest is reasonably assured.
Class Allocations and Expenses. Investment income, realized and unrealized capital gains and losses, common expenses of the Fund, and certain fund-level expense reductions, if any, are allocated daily on a pro-rata basis to each class based on the relative net assets of each class to the total net assets of the Fund. Each class differs with respect to transfer agent and distribution and service plan fees incurred. Certain expense reductions may also differ by class. For the reporting period, the allocated portion of income and expenses to each class as a percent of its average net assets may vary due to the timing of recording these transactions in relation to fluctuating net assets of the classes. Expenses directly attributable to a fund are charged to that fund. Expenses attributable to more than one fund are allocated among the respective funds on the basis of relative net assets or other appropriate methods. Expense estimates are accrued in the period to which they relate and adjustments are made when actual amounts are known.
Deferred Trustee Compensation. Under a Deferred Compensation Plan (the Plan), independent Trustees may elect to defer receipt of a portion of their annual compensation. Deferred amounts are invested in a cross-section of Fidelity funds, are marked-to-market and remain in the Fund until distributed in accordance with the Plan. The investment of deferred amounts and the offsetting payable to the Trustees are included in the accompanying Statement of Assets and Liabilities.
Income Tax Information and Distributions to Shareholders. Each year, the Fund intends to qualify as a regulated investment company under Subchapter M of the Internal Revenue Code, including distributing substantially all of its taxable income and realized gains. As a result, no provision for U.S. Federal income taxes is required. The Fund files a U.S. federal tax return, in addition to state and local tax returns as required. The Fund's federal income tax returns are subject to examination by the Internal Revenue Service (IRS) for a period of three fiscal years after they are filed. State and local tax returns may be subject to examination for an additional fiscal year depending on the jurisdiction. Foreign taxes are provided for based on the Fund's understanding of the tax rules and rates that exist in the foreign markets in which it invests.
Dividends are declared and recorded daily and paid monthly from net investment income. Distributions from realized gains, if any, are declared and recorded on the ex-dividend date. Income dividends and capital gain distributions are declared separately for each class. Income and capital gain distributions are determined in accordance with income tax regulations, which may differ from GAAP.
Capital accounts within the financial statements are adjusted for permanent book-tax differences. These adjustments have no impact on net assets or the results of operations. Capital accounts are not adjusted for temporary book-tax differences which will reverse in a subsequent period.
Book-tax differences are primarily due to futures contracts, swaps, foreign currency transactions, defaulted bonds, certain conversion ratio adjustments, market discount, deferred trustees compensation and losses deferred due to wash sales and excise tax regulations.
As of period end, the cost and unrealized appreciation (depreciation) in securities, and derivatives if applicable, for federal income tax purposes were as follows:
| Gross unrealized appreciation | $393,286,506 |
| Gross unrealized depreciation | (722,483,134) |
| Net unrealized appreciation (depreciation) | $(329,196,628) |
| Tax cost | $33,182,685,369 |
The Fund elected to defer to its next fiscal year approximately $49,045,791 of capital losses recognized during the period November 1, 2016 to August 31, 2017.
Delayed Delivery Transactions and When-Issued Securities. During the period, the Fund transacted in securities on a delayed delivery or when-issued basis. Payment and delivery may take place after the customary settlement period for that security. The price of the underlying securities and the date when the securities will be delivered and paid for are fixed at the time the transaction is negotiated. The securities purchased on a delayed delivery or when-issued basis are identified as such in the Fund's Schedule of Investments. The Fund may receive compensation for interest forgone in the purchase of a delayed delivery or when-issued security. With respect to purchase commitments, the Fund identifies securities as segregated in its records with a value at least equal to the amount of the commitment. Losses may arise due to changes in the value of the underlying securities or if the counterparty does not perform under the contract's terms, or if the issuer does not issue the securities due to political, economic, or other factors.
To-Be-Announced (TBA) Securities and Mortgage Dollar Rolls. During the period, the Fund transacted in TBA securities that involved buying or selling mortgage-backed securities (MBS) on a forward commitment basis. A TBA transaction typically does not designate the actual security to be delivered and only includes an approximate principal amount; however delivered securities must meet specified terms defined by industry guidelines, including issuer, rate and current principal amount outstanding on underlying mortgage pools. The Fund may enter into a TBA transaction with the intent to take possession of or deliver the underlying MBS, or the Fund may elect to extend the settlement by entering into either a mortgage or reverse mortgage dollar roll. Mortgage dollar rolls are transactions where a fund sells TBA securities and simultaneously agrees to repurchase MBS on a later date at a lower price and with the same counterparty. Reverse mortgage dollar rolls involve the purchase and simultaneous agreement to sell TBA securities on a later date at a lower price. Transactions in mortgage dollar rolls and reverse mortgage dollar rolls are accounted for as purchases and sales and may result in an increase to the Fund's portfolio turnover rate.
Purchases and sales of TBA securities involve risks similar to those discussed above for delayed delivery and when-issued securities. Also, if the counterparty in a mortgage dollar roll or a reverse mortgage dollar roll transaction files for bankruptcy or becomes insolvent, the Fund's right to repurchase or sell securities may be limited. Additionally, when a fund sells TBA securities without already owning or having the right to obtain the deliverable securities (an uncovered forward commitment to sell), it incurs a risk of loss because it could have to purchase the securities at a price that is higher than the price at which it sold them. A fund may be unable to purchase the deliverable securities if the corresponding market is illiquid.
TBA securities subject to a forward commitment to sell at period end are included at the end of the Fund's Schedule of Investments under the caption "TBA Sale Commitments." The proceeds and value of these commitments are reflected in the Fund's Statement of Assets and Liabilities as Receivable for TBA sale commitments and TBA sale commitments, at value, respectively.
Restricted Securities. The Fund may invest in securities that are subject to legal or contractual restrictions on resale. These securities generally may be resold in transactions exempt from registration or to the public if the securities are registered. Disposal of these securities may involve time-consuming negotiations and expense, and prompt sale at an acceptable price may be difficult. Information regarding restricted securities is included at the end of the Fund's Schedule of Investments.
Loans and Other Direct Debt Instruments. The Fund invests in direct debt instruments which are interests in amounts owed to lenders by corporate or other borrowers. These instruments may be in the form of loans, trade claims or other receivables and may include standby financing commitments such as revolving credit facilities that obligate the Fund to supply additional cash to the borrower on demand. Loans may be acquired through assignment or participation. The Fund also invests in unfunded loan commitments, which are contractual obligations for future funding. Information regarding unfunded commitments is included at the end of the Fund's Schedule of Investments.
New Accounting Pronouncement. In March 2017, the Financial Accounting Standards Board (FASB) issued an Accounting Standards Update (ASU), ASU 2017-08, which amends the amortization period for certain callable debt securities that are held at a premium. The amendment requires the premium to be amortized to the earliest call date. The amendments do not require an accounting change for securities held at a discount. The ASU is effective for annual periods beginning after December 15, 2018. Management is currently evaluating the potential impact of these changes to the financial statements.
4. Derivative Instruments.
Risk Exposures and the Use of Derivative Instruments. The Fund's investment objective allows the Fund to enter into various types of derivative contracts, including futures contracts, forward foreign currency contracts, options and swaps. Derivatives are investments whose value is primarily derived from underlying assets, indices or reference rates and may be transacted on an exchange or over-the-counter (OTC). Derivatives may involve a future commitment to buy or sell a specified asset based on specified terms, to exchange future cash flows at periodic intervals based on a notional principal amount, or for one party to make one or more payments upon the occurrence of specified events in exchange for periodic payments from the other party.
The Fund used derivatives to increase returns, to gain exposure to certain types of assets, to facilitate transactions in foreign-denominated securities and to manage exposure to certain risks as defined below. The success of any strategy involving derivatives depends on analysis of numerous economic factors, and if the strategies for investment do not work as intended, the Fund may not achieve its objectives.
The Fund's use of derivatives increased or decreased its exposure to the following risks:
| Credit Risk | Credit risk relates to the ability of the issuer of a financial instrument to make further principal or interest payments on an obligation or commitment that it has to the Fund.
|
| Foreign Exchange Risk | Foreign exchange rate risk relates to fluctuations in the value of an asset or liability due to changes in currency exchange rates.
|
| Interest Rate Risk | Interest rate risk relates to the fluctuations in the value of interest-bearing securities due to changes in the prevailing levels of market interest rates. |
The Fund is also exposed to additional risks from investing in derivatives, such as liquidity risk and counterparty credit risk. Liquidity risk is the risk that the Fund will be unable to close out the derivative in the open market in a timely manner. Counterparty credit risk is the risk that the counterparty will not be able to fulfill its obligation to the Fund. Derivative counterparty credit risk is managed through formal evaluation of the creditworthiness of all potential counterparties. On certain OTC derivatives such as forward foreign currency contracts, options and bi-lateral swaps, the Fund attempts to reduce its exposure to counterparty credit risk by entering into an International Swaps and Derivatives Association, Inc. (ISDA) Master Agreement with each of its counterparties. The ISDA Master Agreement gives the Fund the right to terminate all transactions traded under such agreement upon the deterioration in the credit quality of the counterparty beyond specified levels. The ISDA Master Agreement gives each party the right, upon an event of default by the other party or a termination of the agreement, to close out all transactions traded under such agreement and to net amounts owed under each transaction to one net payable by one party to the other. To mitigate counterparty credit risk on bi-lateral OTC derivatives, the Fund receives collateral in the form of cash or securities once the Fund's net unrealized appreciation on outstanding derivative contracts under an ISDA Master Agreement exceeds certain applicable thresholds, subject to certain minimum transfer provisions. The collateral received is held in segregated accounts with the Fund's custodian bank in accordance with the collateral agreements entered into between the Fund, the counterparty and the Fund's custodian bank. The Fund could experience delays and costs in gaining access to the collateral even though it is held by the Fund's custodian bank. The Fund's maximum risk of loss from counterparty credit risk related to bi-lateral OTC derivatives is generally the aggregate unrealized appreciation and unpaid counterparty payments in excess of any collateral pledged by the counterparty to the Fund. The Fund may be required to pledge collateral for the benefit of the counterparties on bi-lateral OTC derivatives in an amount not less than each counterparty's unrealized appreciation on outstanding derivative contracts, subject to certain minimum transfer provisions, and any such pledged collateral is identified in the Schedule of Investments. Exchange-traded futures contracts are not covered by the ISDA Master Agreement; however counterparty credit risk related to exchange-traded futures contracts may be mitigated by the protection provided by the exchange on which they trade. Counterparty credit risk related to centrally cleared OTC swaps may be mitigated by the protection provided by the clearinghouse.
Investing in derivatives may involve greater risks than investing in the underlying assets directly and, to varying degrees, may involve risk of loss in excess of any initial investment and collateral received and amounts recognized in the Statement of Assets and Liabilities. In addition, there may be the risk that the change in value of the derivative contract does not correspond to the change in value of the underlying instrument.
Net Realized Gain (Loss) and Change in Net Unrealized Appreciation (Depreciation) on Derivatives. The table below, which reflects the impacts of derivatives on the financial performance of the Fund, summarizes the net realized gain (loss) and change in net unrealized appreciation (depreciation) for derivatives during the period as presented in the Statement of Operations.
| Primary Risk Exposure / Derivative Type | Net Realized Gain (Loss) | Change in Net Unrealized Appreciation (Depreciation) |
| Credit Risk | | |
| Purchased options | $(749,571) | $ 327,491 |
| Swaps | (53,903) | 66,782 |
| Total Credit Risk | (803,474) | 394,273 |
| Foreign Exchange Risk | | |
| Forward Foreign Currency Contracts | (11,264,823) | 4,610,970 |
| Interest Rate Risk | | |
| Futures Contracts | 5,209,636 | 359,036 |
| Swaps | 406,324 | 205,226 |
| Total Interest Rate Risk | 5,615,960 | 564,262 |
| Totals | $(6,452,337) | $5,569,505 |
A summary of the value of derivatives by primary risk exposure as of period end is included at the end of the Schedule of Investments.
Forward Foreign Currency Contracts. Forward foreign currency contracts represent obligations to purchase or sell foreign currency on a specified future date at a price fixed at the time the contracts are entered into. The Fund used forward foreign currency contracts to facilitate transactions in foreign-denominated securities and to manage exposure to certain foreign currencies.
Forward foreign currency contracts are valued daily and fluctuations in exchange rates on open contracts are recorded as unrealized appreciation or (depreciation) and reflected in the Statement of Assets and Liabilities. When the contract is closed, the Fund realizes a gain or loss equal to the difference between the closing value and the value at the time it was opened. Non-deliverable forward foreign currency exchange contracts are settled with the counterparty in cash without the delivery of foreign currency. The net realized gain (loss) and change in net unrealized appreciation (depreciation) on forward foreign currency contracts during the period is presented in the Statement of Operations.
Any open forward foreign currency contracts at period end are presented in the Schedule of Investments under the caption "Forward Foreign Currency Contracts." The contract amount and unrealized appreciation (depreciation) reflects each contract's exposure to the underlying currency at period end and is representative of volume of activity during the period.
Futures Contracts. A futures contract is an agreement between two parties to buy or sell a specified underlying instrument for a fixed price at a specified future date. The Fund used futures contracts to manage its exposure to the bond market and fluctuations in interest rates.
Upon entering into a futures contract, a fund is required to deposit either cash or securities (initial margin) with a clearing broker in an amount equal to a certain percentage of the face value of the contract. Futures contracts are marked-to-market daily and subsequent daily payments (variation margin) are made or received by a fund depending on the daily fluctuations in the value of the futures contracts and are recorded as unrealized appreciation or (depreciation). This receivable and/or payable, if any, is included in daily variation margin on futures contracts in the Statement of Assets and Liabilities. Realized gain or (loss) is recorded upon the expiration or closing of a futures contract. The net realized gain (loss) and change in net unrealized appreciation (depreciation) on futures contracts during the period is presented in the Statement of Operations.
Any open futures contracts at period end are presented in the Schedule of Investments under the caption "Futures Contracts". The notional amount at value reflects each contract's exposure to the underlying instrument or index at period end and is representative of volume of activity during the period. Securities deposited to meet initial margin requirements are identified in the Schedule of Investments.
Options. Options give the purchaser the right, but not the obligation, to buy (call) or sell (put) an underlying security or financial instrument at an agreed exercise or strike price between or on certain dates. Options obligate the seller (writer) to buy (put) or sell (call) an underlying instrument at the exercise or strike price or cash settle an underlying derivative instrument if the holder exercises the option on or before the expiration date. The Fund uses OTC options, such as swaptions, which are options where the underlying instrument is a swap, to manage its exposure to potential credit events.
Upon entering into an options contract, a fund will pay or receive a premium. Premiums paid on purchased options are reflected as cost of investments and premiums received on written options are reflected as a liability on the Statement of Assets and Liabilities. Certain options may be purchased or written with premiums to be paid or received on a future date. Options are valued daily and any unrealized appreciation (depreciation) is reflected on the Statement of Assets and Liabilities. When an option is exercised, the cost or proceeds of the underlying instrument purchased or sold is adjusted by the amount of the premium. When an option is closed the Fund will realize a gain or loss depending on whether the proceeds or amount paid for the closing sale transaction is greater or less than the premium received or paid. When an option expires, gains and losses are realized to the extent of premiums received and paid, respectively. The net realized and unrealized gains (losses) on purchased options are included in the Statement of Operations in net realized gain (loss) and change in net unrealized appreciation (depreciation) on investment securities. The net realized gain (loss) and change in net unrealized appreciation (depreciation) on written options are presented in the Statement of Operations.
Any open options at period end are presented in the Schedule of Investments under the captions "Purchased Options," "Purchased Swaptions," "Written Options" and "Written Swaptions," as applicable, and are representative of volume of activity during the period.
Writing puts and buying calls tend to increase exposure to the underlying instrument while buying puts and writing calls tend to decrease exposure to the underlying instrument. For purchased options, risk of loss is limited to the premium paid, and for written options, risk of loss is the change in value in excess of the premium received.
Swaps. A swap is a contract between two parties to exchange future cash flows at periodic intervals based on a notional principal amount. A bi-lateral OTC swap is a transaction between a fund and a dealer counterparty where cash flows are exchanged between the two parties for the life of the swap. A centrally cleared OTC swap is a transaction executed between a fund and a dealer counterparty, then cleared by a futures commission merchant (FCM) through a clearinghouse. Once cleared, the clearinghouse serves as a central counterparty, with whom a fund exchanges cash flows for the life of the transaction, similar to transactions in futures contracts.
Bi-lateral OTC swaps are marked-to-market daily and changes in value are reflected in the Statement of Assets and Liabilities in the bi-lateral OTC swaps at value line items. Any upfront premiums paid or received upon entering a bi-lateral OTC swap to compensate for differences between stated terms of the swap and prevailing market conditions (e.g. credit spreads, interest rates or other factors) are recorded in net unrealized appreciation (depreciation) in the Statement of Assets and Liabilities and amortized to realized gain or (loss) ratably over the term of the swap. Any unamortized upfront premiums are presented in the Schedule of Investments.
Centrally cleared OTC swaps require a fund to deposit either cash or securities (initial margin) with the FCM, at the instruction of and for the benefit of the clearinghouse. Securities deposited to meet initial margin requirements are identified in the Schedule of Investments. Centrally cleared OTC swaps are marked-to-market daily and subsequent payments (variation margin) are made or received depending on the daily fluctuations in the value of the swaps and are recorded as unrealized appreciation or (depreciation). These daily payments, if any, are included in receivable or payable for daily variation margin on centrally cleared OTC swaps in the Statement of Assets and Liabilities. Any premiums for centrally cleared OTC swaps are recorded periodically throughout the term of the swap to variation margin and included in unrealized appreciation (depreciation) in the Statement of Assets and Liabilities. Any premiums are recognized as realized gain (loss) upon termination or maturity of the swap.
For both bi-lateral and centrally cleared OTC swaps, payments are exchanged at specified intervals, accrued daily commencing with the effective date of the contract and recorded as realized gain or (loss). Some swaps may be terminated prior to the effective date and realize a gain or loss upon termination. The net realized gain (loss) and change in net unrealized appreciation (depreciation) on swaps during the period is presented in the Statement of Operations.
Any open swaps at period end are included in the Schedule of Investments under the caption "Swaps" and are representative of volume of activity during the period.
Credit Default Swaps. Credit default swaps enable the Fund to buy or sell protection against specified credit events on a single-name issuer or a traded credit index. Under the terms of a credit default swap the buyer of protection (buyer) receives credit protection in exchange for making periodic payments to the seller of protection (seller) based on a fixed percentage applied to a notional principal amount. In return for these payments, the seller will be required to make a payment upon the occurrence of one or more specified credit events. The Fund enters into credit default swaps as a seller to gain credit exposure to an issuer and/or as a buyer to obtain a measure of protection against defaults of an issuer. Periodic payments are made over the life of the contract by the buyer provided that no credit event occurs.
For credit default swaps on most corporate and sovereign issuers, credit events include bankruptcy, failure to pay or repudiation/moratorium. For credit default swaps on corporate or sovereign issuers, the obligation that may be put to the seller is not limited to the specific reference obligation described in the Schedule of Investments. For credit default swaps on asset-backed securities, a credit event may be triggered by events such as failure to pay principal, maturity extension, rating downgrade or write-down. For credit default swaps on asset-backed securities, the reference obligation described represents the security that may be put to the seller. For credit default swaps on a traded credit index, a specified credit event may affect all or individual underlying securities included in the index.
As a seller, if an underlying credit event occurs, the Fund will pay a net settlement amount of cash equal to the notional amount of the swap less the recovery value of the reference obligation or underlying securities comprising an index. Only in the event of the industry's inability to value the underlying asset will the Fund be required to take delivery of the reference obligation or underlying securities comprising an index and pay an amount equal to the notional amount of the swap.
As a buyer, if an underlying credit event occurs, the Fund will receive a net settlement amount of cash equal to the notional amount of the swap less the recovery value of the reference obligation or underlying securities comprising an index. Only in the event of the industry's inability to value the underlying asset will the Fund be required to deliver the reference obligation or underlying securities comprising an index in exchange for payment of an amount equal to the notional amount of the swap.
Typically, the value of each credit default swap and credit rating disclosed for each reference obligation in the Schedule of Investments, where the Fund is the seller, can be used as measures of the current payment/performance risk of the swap. As the value of the swap changes as a positive or negative percentage of the total notional amount, the payment/performance risk may decrease or increase, respectively. In addition to these measures, the investment adviser monitors a variety of factors including cash flow assumptions, market activity and market sentiment as part of its ongoing process of assessing payment/performance risk.
Interest Rate Swaps. Interest rate swaps are agreements between counterparties to exchange cash flows, one based on a fixed rate, and the other on a floating rate. The Fund entered into interest rate swaps to manage its exposure to interest rate changes. Changes in interest rates can have an effect on both the value of bond holdings as well as the amount of interest income earned. In general, the value of bonds can fall when interest rates rise and can rise when interest rates fall.
5. Purchases and Sales of Investments.
Purchases and sales of securities, other than short-term securities and U.S. government securities, aggregated $2,529,945,675 and $2,651,784,633, respectively.
6. Fees and Other Transactions with Affiliates.
Management Fee. Fidelity Management & Research Company (the investment adviser) and its affiliates provide the Fund with investment management related services for which the Fund pays a monthly management fee. The management fee is the sum of an individual fund fee rate that is based on an annual rate of .20% of the Fund's average net assets and an annualized group fee rate that averaged .11% during the period. The group fee rate is based upon the average net assets of all the mutual funds advised by the investment adviser, including any mutual funds previously advised by the investment adviser that are currently advised by Fidelity SelectCo, LLC, an affiliate of the investment adviser. The group fee rate decreases as assets under management increase and increases as assets under management decrease. For the reporting period, the total annualized management fee rate was .31% of the Fund's average net assets.
Distribution and Service Plan Fees. In accordance with Rule 12b-1 of the 1940 Act, the Fund has adopted separate Distribution and Service Plans for each class of shares. Certain classes pay Fidelity Distributors Corporation (FDC), an affiliate of the investment adviser, separate Distribution and Service Fees, each of which is based on an annual percentage of each class' average net assets. In addition, FDC may pay financial intermediaries for selling shares of the Fund and providing shareholder support services. For the period, the Distribution and Service Fee rates, total fees and amounts retained by FDC were as follows:
| | Distribution Fee | Service Fee | Total Fees | Retained by FDC |
| Class A | -% | .25% | $647,613 | $3,030 |
| Class M | -% | .25% | 374,919 | 98,226 |
| Class C | .75% | .25% | 934,736 | 134,223 |
| | | | $1,957,268 | $235,479 |
Sales Load. FDC may receive a front-end sales charge of up to 4.00% for selling Class A shares and Class M shares, some of which is paid to financial intermediaries for selling shares of the Fund. Depending on the holding period, FDC may receive contingent deferred sales charges levied on Class A, Class M and Class C redemptions. The deferred sales charges are 1.00% for Class C shares, .75% for certain purchases of Class A shares and .25% for certain purchases of Class M shares.
For the period, sales charge amounts retained by FDC were as follows:
| | Retained by FDC |
| Class A | $44,429 |
| Class M | 5,263 |
| Class C(a) | 11,995 |
| | $61,687 |
(a) When Class C shares are initially sold, FDC pays commissions from its own resources to financial intermediaries through which the sales are made.
Transfer Agent Fees. Fidelity Investments Institutional Operations Company, Inc., (FIIOC), an affiliate of the investment adviser, is the transfer, dividend disbursing and shareholder servicing agent for each class of the Fund. FIIOC receives an asset-based fee of .10% of Total Bond's average net assets. FIIOC pays for typesetting, printing and mailing of shareholder reports, except proxy statements. For the period, transfer agent fees for each class were as follows:
| | Amount | % of Class-Level Average Net Assets(a) |
| Class A | $398,784 | .16 |
| Class M | 239,340 | .16 |
| Class C | 156,517 | .17 |
| Total Bond | 12,087,968 | .10 |
| Class I | 3,477,687 | .15 |
| Class Z | 86,049 | .01 |
| | $16,446,345 | |
(a) Annualized
Fund Wide Operations Fee. Pursuant to the Fund Wide Operations and Expense Agreement (FWOE), the investment adviser has agreed to provide for fund level expenses (which do not include transfer agent, Rule 12b-1 fees, compensation of the independent Trustees, interest (including commitment fees), taxes or extraordinary expenses, if any) in return for a FWOE fee equal to .35% of the Fund's average net assets less the total amount of the management fee. The FWOE paid by the Fund is reduced by an amount equal to the fees and expenses paid to the independent Trustees. For the period, the FWOE fee was equivalent to an annualized rate of .04% of average net assets.
Interfund Trades. The Fund may purchase from or sell securities to other Fidelity Funds under procedures adopted by the Board. The procedures have been designed to ensure these interfund trades are executed in accordance with Rule 17a-7 of the 1940 Act. Interfund trades are included within the respective purchases and sales amounts shown in the Purchases and Sales of Investments note.
Other. During the period, the investment adviser reimbursed the Fund for certain losses in the amount of $8,400.
7. Committed Line of Credit.
The Fund participates with other funds managed by the investment adviser or an affiliate in a $4.25 billion credit facility (the "line of credit") to be utilized for temporary or emergency purposes to fund shareholder redemptions or for other short-term liquidity purposes. The Fund has agreed to pay commitment fees on its pro-rata portion of the line of credit, which amounted to $44,490 and is reflected in Miscellaneous expenses on the Statement of Operations. During the period, the Fund did not borrow on this line of credit.
8. Security Lending.
The Fund lends portfolio securities from time to time in order to earn additional income. On the settlement date of the loan, the Fund receives collateral (in the form of U.S. Treasury obligations, letters of credit and/or cash) against the loaned securities and maintains collateral in an amount not less than 100% of the market value of the loaned securities during the period of the loan. The market value of the loaned securities is determined at the close of business of the Fund and any additional required collateral is delivered to the Fund on the next business day. The Fund or borrower may terminate the loan at any time, and if the borrower defaults on its obligation to return the securities loaned because of insolvency or other reasons, the Fund may apply collateral received from the borrower against the obligation. The Fund may experience delays and costs in recovering the securities loaned. Any cash collateral received is maintained at the Fund's custodian and/or invested in cash equivalents. At period end, there were no security loans outstanding. Security lending income represents the income earned on investing cash collateral, less rebates paid to borrowers, plus any premium payments received for lending certain types of securities. Security lending income is presented in the Statement of Operations as a component of interest income. Total security lending income during the period amounted to $54,402.
9. Expense Reductions.
Through arrangements with the Fund's custodian, credits realized as a result of certain uninvested cash balances were used to reduce the Fund's expenses. During the period, these credits reduced the Fund's expenses by $48,555.
10. Distributions to Shareholders.
Distributions to shareholders of each class were as follows:
| | Six months ended
February 28, 2018 | Year ended
August 31, 2017 |
| From net investment income | | |
| Class A | $6,636,770 | $21,656,972 |
| Class M | 3,831,041 | 4,370,911 |
| Class C | 1,675,287 | 3,033,896 |
| Total Bond | 345,790,129 | 586,137,135 |
| Class I | 65,856,367 | 93,037,515 |
| Class Z | 25,519,853 | 31,739,860 |
| Total | $449,309,447 | $739,976,289 |
| From net realized gain | | |
| Class A | $1,217,520 | $3,152,995 |
| Class M | 687,881 | 416,240 |
| Class C | 431,234 | 491,517 |
| Total Bond | 55,742,692 | 54,284,285 |
| Class I | 10,651,705 | 7,617,861 |
| Class Z | 3,765,734 | 1,955,359 |
| Total | $72,496,766 | $67,918,257 |
11. Share Transactions.
Share transactions for each class were as follows and may contain automatic conversions between classes or exchanges between affiliated funds:
| | Shares | Shares | Dollars | Dollars |
| | Six months ended February 28, 2018 | Year ended August 31, 2017 | Six months ended February 28, 2018 | Year ended August 31, 2017 |
| Class A | | | | |
| Shares sold | 9,149,263 | 35,580,281 | $97,219,607 | $378,631,170 |
| Reinvestment of distributions | 724,842 | 2,271,068 | 7,705,261 | 24,175,284 |
| Shares redeemed | (9,912,451) | (102,937,028) | (105,299,107) | (1,089,228,226) |
| Net increase (decrease) | (38,346) | (65,085,679) | $(374,239) | $(686,421,772) |
| Class M | | | | |
| Shares sold | 5,489,771 | 17,161,400 | $58,318,822 | $182,620,103 |
| Reinvestment of distributions | 424,062 | 442,288 | 4,498,626 | 4,706,740 |
| Shares redeemed | (3,595,194) | (5,227,159) | (38,122,704) | (55,482,738) |
| Net increase (decrease) | 2,318,639 | 12,376,529 | $24,694,744 | $131,844,105 |
| Class C | | | | |
| Shares sold | 2,748,168 | 5,742,872 | $29,244,325 | $61,343,735 |
| Reinvestment of distributions | 191,889 | 311,520 | 2,041,252 | 3,319,847 |
| Shares redeemed | (3,043,819) | (5,532,987) | (32,364,386) | (58,835,524) |
| Net increase (decrease) | (103,762) | 521,405 | $(1,078,809) | $5,828,058 |
| Total Bond | | | | |
| Shares sold | 344,459,784 | 715,776,478 | $3,658,187,908 | $7,613,246,265 |
| Reinvestment of distributions | 36,367,309 | 57,507,306 | 386,286,653 | 612,532,396 |
| Shares redeemed | (300,207,835) | (452,613,004) | (3,174,971,426) | (4,806,739,429) |
| Net increase (decrease) | 80,619,258 | 320,670,780 | $869,503,135 | $3,419,039,232 |
| Class I | | | | |
| Shares sold | 95,336,215 | 245,139,592 | $1,010,770,765 | $2,596,745,220 |
| Reinvestment of distributions | 6,877,200 | 8,911,840 | 72,930,992 | 94,805,632 |
| Shares redeemed | (55,696,794) | (99,475,433) | (589,727,932) | (1,055,508,510) |
| Net increase (decrease) | 46,516,621 | 154,575,999 | $493,973,825 | $1,636,042,342 |
| Class Z | | | | |
| Shares sold | 91,489,578 | 155,922,153 | $965,955,052 | $1,656,237,293 |
| Reinvestment of distributions | 2,282,632 | 2,946,230 | 24,197,067 | 31,368,596 |
| Shares redeemed | (31,639,822) | (96,526,329) | (334,137,614) | (1,027,365,935) |
| Net increase (decrease) | 62,132,388 | 62,342,054 | $656,014,505 | $660,239,954 |
12. Other.
The Fund's organizational documents provide former and current trustees and officers with a limited indemnification against liabilities arising in connection with the performance of their duties to the Fund. In the normal course of business, the Fund may also enter into contracts that provide general indemnifications. The Fund's maximum exposure under these arrangements is unknown as this would be dependent on future claims that may be made against the Fund. The risk of material loss from such claims is considered remote.
At the end of the period, Strategic Advisers Core Income Fund was the owner of record of approximately 20% of the total outstanding shares of the Fund.
13. Credit Risk.
The Fund invests a portion of its assets in structured securities of issuers backed by commercial and residential mortgage loans, credit card receivables and automotive loans. The value and related income of these securities is sensitive to changes in economic conditions, including delinquencies and/or defaults.
Shareholder Expense Example
As a shareholder of the Fund, you incur two types of costs: (1) transaction costs, including sales charges (loads) on purchase payments or redemption proceeds, and (2) ongoing costs, including management fees, distribution and/or service (12b-1) fees and other Fund expenses. This Example is intended to help you understand your ongoing costs (in dollars) of investing in the Fund and to compare these costs with the ongoing costs of investing in other mutual funds.
The Example is based on an investment of $1,000 invested at the beginning of the period and held for the entire period (September 1, 2017 to February 28, 2018).
Actual Expenses
The first line of the accompanying table for each class of the Fund provides information about actual account values and actual expenses. You may use the information in this line, together with the amount you invested, to estimate the expenses that you paid over the period. Simply divide your account value by $1,000.00 (for example, an $8,600 account value divided by $1,000.00 = 8.6), then multiply the result by the number in the first line for a class of the Fund under the heading entitled "Expenses Paid During Period" to estimate the expenses you paid on your account during this period. A small balance maintenance fee of $12.00 that is charged once a year may apply for certain accounts with a value of less than $2,000. This fee is not included in the table below. If it was, the estimate of expenses you paid during the period would be higher, and your ending account value lower, by this amount. In addition, the Fund, as a shareholder in the underlying Fidelity Central Funds, will indirectly bear its pro-rata share of the fees and expenses incurred by the underlying Fidelity Central Funds. These fees and expenses are not included in the Fund's annualized expense ratio used to calculate the expense estimate in the table below.
Hypothetical Example for Comparison Purposes
The second line of the accompanying table for each class of the Fund provides information about hypothetical account values and hypothetical expenses based on a Class' actual expense ratio and an assumed rate of return of 5% per year before expenses, which is not the Class' actual return. The hypothetical account values and expenses may not be used to estimate the actual ending account balance or expenses you paid for the period. You may use this information to compare the ongoing costs of investing in the Fund and other funds. To do so, compare this 5% hypothetical example with the 5% hypothetical examples that appear in the shareholder reports of the other funds. A small balance maintenance fee of $12.00 that is charged once a year may apply for certain accounts with a value of less than $2,000. This fee is not included in the table below. If it was, the estimate of expenses you paid during the period would be higher, and your ending account value lower, by this amount. In addition, the Fund, as a shareholder in the underlying Fidelity Central Funds, will indirectly bear its pro-rata share of the fees and expenses incurred by the underlying Fidelity Central Funds. These fees and expenses are not included in the Fund's annualized expense ratio used to calculate the expense estimate in the table below.
Please note that the expenses shown in the table are meant to highlight your ongoing costs only and do not reflect any transaction costs. Therefore, the second line of the table is useful in comparing ongoing costs only, and will not help you determine the relative total costs of owning different funds. In addition, if these transactional costs were included, your costs would have been higher.
| | Annualized Expense Ratio-A | Beginning
Account Value
September 1, 2017 | Ending
Account Value
February 28, 2018 | Expenses Paid
During Period-B
September 1, 2017
to February 28, 2018 |
| Class A | .76% | | | |
| Actual | | $1,000.00 | $982.20 | $3.74 |
| Hypothetical-C | | $1,000.00 | $1,021.03 | $3.81 |
| Class M | .77% | | | |
| Actual | | $1,000.00 | $982.20 | $3.78 |
| Hypothetical-C | | $1,000.00 | $1,020.98 | $3.86 |
| Class C | 1.53% | | | |
| Actual | | $1,000.00 | $978.50 | $7.51 |
| Hypothetical-C | | $1,000.00 | $1,017.21 | $7.65 |
| Total Bond | .45% | | | |
| Actual | | $1,000.00 | $984.70 | $2.21 |
| Hypothetical-C | | $1,000.00 | $1,022.56 | $2.26 |
| Class I | .50% | | | |
| Actual | | $1,000.00 | $983.40 | $2.46 |
| Hypothetical-C | | $1,000.00 | $1,022.32 | $2.51 |
| Class Z | .36% | | | |
| Actual | | $1,000.00 | $984.10 | $1.77 |
| Hypothetical-C | | $1,000.00 | $1,023.01 | $1.81 |
A Annualized expense ratio reflects expenses net of applicable fee waivers.
B Expenses are equal to each Class' annualized expense ratio, multiplied by the average account value over the period, multiplied by 181/365 (to reflect the one-half year period).
C 5% return per year before expenses
Board Approval of Investment Advisory Contracts and Management Fees
Fidelity Total Bond Fund
Each year, the Board of Trustees, including the Independent Trustees (together, the Board), votes on the renewal of the management contract with Fidelity Management & Research Company (FMR) and the sub-advisory agreements (together, the Advisory Contracts) for the fund. FMR and the sub-advisers are referred to herein as the Investment Advisers. The Board, assisted by the advice of fund counsel and Independent Trustees' counsel, requests and considers a broad range of information relevant to the renewal of the Advisory Contracts throughout the year.
The Board meets regularly and, at each of its meetings, covers an extensive agenda of topics and materials and considers factors that are relevant to its annual consideration of the renewal of the fund's Advisory Contracts, including the services and support provided to the fund and its shareholders. The Board has established four standing committees (Committees) — Operations, Audit, Fair Valuation, and Governance and Nominating — each composed of and chaired by Independent Trustees with varying backgrounds, to which the Board has assigned specific subject matter responsibilities in order to enhance effective decision-making by the Board. The Operations Committee, of which all of the Independent Trustees are members, meets regularly throughout the year and considers, among other matters, information specifically related to the annual consideration of the renewal of the fund's Advisory Contracts. The Board, acting directly and through its Committees, requests and receives information concerning the annual consideration of the renewal of the fund's Advisory Contracts. The Board also meets as needed to review matters specifically related to the Board's annual consideration of the renewal of the Advisory Contracts. Members of the Board may also meet with trustees of other Fidelity funds through ad hoc joint committees to discuss certain matters relevant to all of the Fidelity funds.
At its September 2017 meeting, the Board unanimously determined to renew the fund's Advisory Contracts. In reaching its determination, the Board considered all factors it believed relevant, including (i) the nature, extent, and quality of the services to be provided to the fund and its shareholders (including the investment performance of the fund); (ii) the competitiveness of the fund's management fee and total expense ratio relative to peer funds; (iii) the total costs of the services to be provided by and the profits to be realized by Fidelity from its relationships with the fund; and (iv) the extent to which, if any, economies of scale exist and would be realized as the fund grows, and whether any economies of scale are appropriately shared with fund shareholders.
In considering whether to renew the Advisory Contracts for the fund, the Board reached a determination, with the assistance of fund counsel and Independent Trustees' counsel and through the exercise of its business judgment, that the renewal of the Advisory Contracts was in the best interests of the fund and its shareholders and that the compensation payable under the Advisory Contracts was fair and reasonable. The Board's decision to renew the Advisory Contracts was not based on any single factor, but rather was based on a comprehensive consideration of all the information provided to the Board at its meetings throughout the year. The Board, in reaching its determination to renew the Advisory Contracts, was aware that shareholders of the fund have a broad range of investment choices available to them, including a wide choice among funds offered by Fidelity's competitors, and that the fund's shareholders, who have the opportunity to review and weigh the disclosure provided by the fund in its prospectus and other public disclosures, have chosen to invest in this fund, which is part of the Fidelity family of funds.
Amendment to Group Fee Rate. The Board also approved an amendment to the management contract for the fund to add an additional breakpoint to the group fee schedule, effective October 1, 2017. The Board noted that the additional breakpoint would result in lower management fee rates as Fidelity's assets under management increase above the new breakpoint.
Nature, Extent, and Quality of Services Provided. The Board considered Fidelity's staffing as it relates to the fund, including the backgrounds of investment personnel of Fidelity, and also considered the fund's investment objective, strategies, and related investment philosophy. The Independent Trustees also had discussions with senior management of Fidelity's investment operations and investment groups. The Board considered the structure of the investment personnel compensation program and whether this structure provides appropriate incentives to act in the best interests of the fund. Additionally, the Board considered the portfolio managers' investments, if any, in the funds that they manage.
Resources Dedicated to Investment Management and Support Services. The Board reviewed the general qualifications and capabilities of Fidelity's investment staff, including its size, education, experience, and resources, as well as Fidelity's approach to recruiting, managing, and compensating investment personnel. The Board noted that Fidelity has continued to increase the resources devoted to non-U.S. offices, including expansion of Fidelity's global investment organization. The Board also noted that Fidelity's analysts have extensive resources, tools and capabilities that allow them to conduct sophisticated quantitative and fundamental analysis, as well as credit analysis of issuers, counterparties and guarantors. Further, the Board considered that Fidelity's investment professionals have sufficient access to global information and data so as to provide competitive investment results over time, and that those professionals also have access to sophisticated tools that permit them to assess portfolio construction and risk and performance attribution characteristics continuously, as well as to transmit new information and research conclusions rapidly around the world. Additionally, in its deliberations, the Board considered Fidelity's trading, risk management, compliance, and technology and operations capabilities and resources, which are integral parts of the investment management process.
Shareholder and Administrative Services. The Board considered (i) the nature, extent, quality, and cost of advisory, administrative, and shareholder services performed by the Investment Advisers and their affiliates under the Advisory Contracts and under separate agreements covering transfer agency, pricing and bookkeeping, and securities lending services for the fund; (ii) the nature and extent of the supervision of third party service providers, principally custodians, subcustodians, and pricing vendors; and (iii) the resources devoted to, and the record of compliance with, the fund's compliance policies and procedures.
The Board noted that the growth of fund assets over time across the complex allows Fidelity to reinvest in the development of services designed to enhance the value or convenience of the Fidelity funds as investment vehicles. These services include 24-hour access to account information and market information through telephone representatives and over the Internet, investor education materials and asset allocation tools, and the expanded availability of Fidelity Investor Centers.
Investment in a Large Fund Family. The Board considered the benefits to shareholders of investing in a Fidelity fund, including the benefits of investing in a fund that is part of a large family of funds offering a variety of investment disciplines and providing a large variety of mutual fund investor services. The Board noted that Fidelity had taken, or had made recommendations that resulted in the Fidelity funds taking, a number of actions over the previous year that benefited particular funds, including: (i) continuing to dedicate additional resources to Fidelity's investment research process, which includes meetings with management of issuers in which the funds invest, and to the support of the senior management team that oversees asset management; (ii) continuing efforts to enhance Fidelity's global research capabilities; (iii) launching new funds and making other enhancements to meet client needs; (iv) launching new share classes of existing funds; (v) eliminating purchase minimums and broadening eligibility requirements for certain lower-priced share classes; (vi) reducing management fees and total expenses for certain growth equity funds and index funds; (vii) lowering expense caps for certain existing funds and classes to reduce expenses borne by shareholders; (viii) eliminating short-term redemption fees for certain funds; (ix) introducing a new pricing structure for certain funds of funds that is expected to reduce overall expenses paid by shareholders; (x) rationalizing product lines and gaining increased efficiencies through proposals for fund mergers and share class consolidations; (xi) continuing to develop, acquire and implement systems and technology to improve services to the funds and shareholders, strengthen information security, and increase efficiency; and (xii) implementing enhancements to further strengthen Fidelity's product line to increase investors' probability of success in achieving their investment goals, including retirement income goals.
Investment Performance. The Board considered whether the fund has operated in accordance with its investment objective, as well as its record of compliance with its investment restrictions and its performance history. The Board noted that there was a portfolio management change for the fund in September 2017.
The Board took into account discussions with representatives of the Investment Advisers about fund investment performance that occur at Board meetings throughout the year. In this regard the Board noted that as part of regularly scheduled fund reviews and other reports to the Board on fund performance, the Board considers annualized return information for the fund for different time periods, measured against a securities market index ("benchmark index") and a peer group of funds with similar objectives ("peer group"), if any. In its evaluation of fund investment performance at meetings throughout the year, the Board gave particular attention to information indicating underperformance of certain Fidelity funds for specific time periods and discussed with the Investment Advisers the reasons for such underperformance.
In addition to reviewing absolute and relative fund performance, the Independent Trustees periodically consider the appropriateness of fund performance metrics in evaluating the results achieved. In general, the Independent Trustees believe that fund performance should be evaluated based on gross performance (before fees and expenses but after transaction costs) compared to appropriate benchmark indices, over appropriate time periods that may include full market cycles, and on net performance (after fees and expenses) compared to peer groups, as applicable, over the same periods, taking into account relevant factors including the following: general market conditions; expectations for interest rate levels and credit conditions; issuer-specific information including credit quality; the potential for incremental return versus the fund's benchmark index weighed against the risks involved in obtaining that incremental return, including the risk of diminished or negative total returns; and fund cash flows and other factors. Depending on the circumstances, the Independent Trustees may be satisfied with a fund's performance notwithstanding that it lags its benchmark index or peer group for certain periods.
The Independent Trustees recognize that shareholders evaluate performance on a net basis over their own holding periods, for which one-, three-, and five-year periods are often used as a proxy. For this reason, the performance information reviewed by the Board also included net cumulative calendar year total return information for the fund and an appropriate benchmark index and peer group for the most recent one-, three-, and five-year periods.
Based on its review, the Board concluded that the nature, extent, and quality of services provided to the fund under the Advisory Contracts should continue to benefit the shareholders of the fund.
Competitiveness of Management Fee and Total Expense Ratio. The Board considered the fund's management fee and total expense ratio compared to "mapped groups" of competitive funds and classes created for the purpose of facilitating the Trustees' competitive analysis of management fees and total expenses. Fidelity creates "mapped groups" by combining similar Lipper investment objective categories that have comparable investment mandates. Combining Lipper investment objective categories aids the Board's management fee and total expense ratio comparisons by broadening the competitive group used for comparison.
Management Fee. The Board considered two proprietary management fee comparisons for the 12-month periods shown in basis points (BP) in the chart below. The group of Lipper funds used by the Board for management fee comparisons is referred to below as the "Total Mapped Group" and, for the reasons explained above, is broader than the Lipper peer group used by the Board for performance comparisons. The Total Mapped Group comparison focuses on a fund's standing in terms of gross management fees before expense reimbursements or caps relative to the total universe of funds with comparable investment mandates, regardless of whether their management fee structures also are comparable. Funds with comparable investment mandates offer exposure to similar types of securities. Funds with comparable management fee structures have similar management fee contractual arrangements (
e.g., flat rate charged for advisory services, all-inclusive fee rate,
etc.). "TMG %" represents the percentage of funds in the Total Mapped Group that had management fees that were lower than the fund's. For example, a hypothetical TMG % of 20% would mean that 80% of the funds in the Total Mapped Group had higher, and 20% had lower, management fees than the fund. The fund's actual TMG %s and the number of funds in the Total Mapped Group are in the chart below. The "Asset-Size Peer Group" (ASPG) comparison focuses on a fund's standing relative to a subset of non-Fidelity funds within the Total Mapped Group that are similar in size and management fee structure. For example, if a fund is in the first quartile of the ASPG, the fund's management fee ranks in the least expensive or lowest 25% of funds in the ASPG. The ASPG represents at least 15% of the funds in the Total Mapped Group with comparable asset size and management fee structures, subject to a minimum of 50 funds (or all funds in the Total Mapped Group if fewer than 50). Additional information, such as the ASPG quartile in which the fund's management fee rate ranked, is also included in the chart and considered by the Board.
Fidelity Total Bond Fund
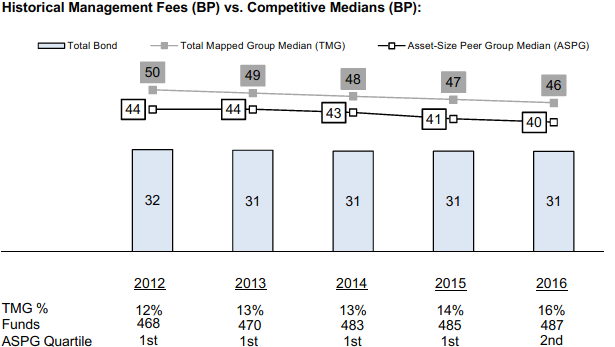
The Board noted that the fund's management fee rate ranked below the median of its Total Mapped Group and below the median of its ASPG for 2016.
The Board noted that it and the boards of other Fidelity funds formed an ad hoc Committee on Group Fee, which meets periodically, to conduct an in-depth review of the "group fee" component of the management fee of funds with such management fee structures. The Committee's focus included the mechanics of the group fee, the competitive landscape of group fee structures, Fidelity funds with no group fee component and investment products not included in group fee assets. The Board also considered that, for funds subject to the group fee, FMR agreed to voluntarily waive fees over a specified period of time in amounts designed to account for assets converted from certain funds to certain collective investment trusts.
Based on its review, the Board concluded that the fund's management fee is fair and reasonable in light of the services that the fund receives and the other factors considered.
Total Expense Ratio. In its review of each class's total expense ratio, the Board considered the fund's management fee rate as well as other fund or class expenses, as applicable, such as transfer agent fees, pricing and bookkeeping fees, fund-paid 12b-1 fees, and custodial, legal, and audit fees. The Board also noted that Fidelity may agree to waive fees and expenses from time to time, and the extent to which, if any, it has done so for the fund. As part of its review, the Board also considered the current and historical total expense ratios of each class of the fund compared to competitive fund median expenses. Each class of the fund is compared to those funds and classes in the Total Mapped Group (used by the Board for management fee comparisons) that have a similar sales load structure.
The Board noted that the total expense ratio of each class ranked below the competitive median for 2016.
The Board considered that the current contractual arrangements for the fund have the effect of setting the total "fund-level" (but not "class-level") expenses (including, among certain other "fund-level" expenses, the management fee) for each class at 0.35%. These contractual arrangements may not be amended to increase the fees or expenses payable except by a vote of a majority of the Board.
The Board recognized that the fund's management contract incorporates a "group fee" structure, which provides for lower group fee rates as total group assets increase, and for higher group fee rates as total group assets decrease (with "group assets" defined to include fund assets under FMR's management plus the assets of sector funds previously under FMR's management). FMR calculates the group fee rates based on a tiered asset "breakpoint" schedule that varies based on asset class. The Board noted, however, that because the current contractual arrangements set the total "fund-level" expenses for each class at 0.35%, increases or decreases in the management fee due to changes in the group fee rate will not impact the total expense ratio.
Fees Charged to Other Fidelity Clients. The Board also considered Fidelity fee structures and other information with respect to clients of Fidelity, such as other funds advised or subadvised by Fidelity, pension plan clients, and other institutional clients with similar mandates. The Board noted that an ad hoc joint committee created by it and the boards of other Fidelity funds periodically reviews and compares Fidelity's institutional investment advisory business with its business of providing services to the Fidelity funds, including the differences in services provided, fees charged, and costs incurred, as well as competition in their respective marketplaces.
Based on its review of total expense ratios and fees charged to other Fidelity clients, the Board concluded that the total expense ratio of each class of the fund was reasonable in light of the services that the fund and its shareholders receive and the other factors considered.
Costs of the Services and Profitability. The Board considered the revenues earned and the expenses incurred by Fidelity in conducting the business of developing, marketing, distributing, managing, administering and servicing the fund and servicing the fund's shareholders. The Board also considered the level of Fidelity's profits in respect of all the Fidelity funds.
On an annual basis, Fidelity presents to the Board information about the profitability of its relationships with the fund. Fidelity calculates profitability information for each fund, as well as aggregate profitability information for groups of Fidelity funds and all Fidelity funds, using a series of detailed revenue and cost allocation methodologies which originate with the books and records of Fidelity on which Fidelity's audited financial statements are based. The Audit Committee of the Board reviews any significant changes from the prior year's methodologies.
PricewaterhouseCoopers LLP (PwC), independent registered public accounting firm and auditor to Fidelity and certain Fidelity funds, has been engaged annually by the Board as part of the Board's assessment of Fidelity's profitability analysis. PwC's engagement includes the review and assessment of the methodologies used by Fidelity in determining the revenues and expenses attributable to Fidelity's mutual fund business, and completion of agreed-upon procedures in respect of the mathematical accuracy of the fund profitability information and its conformity to established allocation methodologies. After considering PwC's reports issued under the engagement and information provided by Fidelity, the Board concluded that while other allocation methods may also be reasonable, Fidelity's profitability methodologies are reasonable in all material respects.
The Board also reviewed Fidelity's non-fund businesses and potential fall-out benefits related to the mutual fund business as well as cases where Fidelity's affiliates may benefit from or be related to the fund's business.
The Board considered the costs of the services provided by and the profits realized by Fidelity in connection with the operation of the fund and was satisfied that the profitability was not excessive.
Economies of Scale. The Board considered whether there have been economies of scale in respect of the management of the Fidelity funds, whether the Fidelity funds (including the fund) have appropriately benefited from any such economies of scale, and whether there is potential for realization of any further economies of scale. The Board considered the extent to which the fund will benefit from economies of scale as assets grow through increased services to the fund, through waivers or reimbursements, or through fee or expense ratio reductions. The Board also noted that a committee (the Economies of Scale Committee) created by it and the boards of other Fidelity funds periodically analyzes whether Fidelity attains economies of scale in respect of the management and servicing of the Fidelity funds, whether the Fidelity funds have appropriately benefited from such economies of scale, and whether there is potential for realization of any further economies of scale.
The Board concluded, taking into account the analysis of the Economies of Scale Committee, that economies of scale, if any, are being appropriately shared between fund shareholders and Fidelity.
Additional Information Requested by the Board. In order to develop fully the factual basis for consideration of the Fidelity funds' advisory contracts, the Board requested and received additional information on certain topics, including: (i) Fidelity's fund profitability methodology, profitability trends for certain funds, and the impact of certain factors on fund profitability results; (ii) portfolio manager changes that have occurred during the past year and the amount of the investment that each portfolio manager has made in the Fidelity fund(s) that he or she manages; (iii) Fidelity's compensation structure for portfolio managers, research analysts, and other key personnel, including its effects on fund profitability, the rationale for the compensation structure, and the extent to which current market conditions have affected retention and recruitment; (iv) the arrangements with and compensation paid to certain fund sub-advisers on behalf of the Fidelity funds; (v) the terms of Fidelity's contractual and voluntary expense cap and waiver arrangements with the funds; (vi) the methodology with respect to competitive fund data and peer group classifications; (vii) Fidelity's transfer agent fee, expense, and service structures for different funds and classes relative to competitive trends, and the impact of the increased use of omnibus accounts; (viii) Fidelity's long-term expectations for its offerings in the workplace investing channel; (ix) new developments in the retail and institutional marketplaces and the competitive positioning of the funds relative to other investment products and services; (x) the approach to considering "fall-out" benefits; (xi) the impact of money market reform on Fidelity's money market funds, including with respect to costs and profitability; (xii) the funds' share class structures and distribution channels, including the impact of the Department of Labor's new fiduciary rule on the funds' distribution arrangements; and (xiii) explanations regarding the relative total expense ratios of certain funds and classes, total expense competitive trends and methodologies for total expense competitive comparisons, and actions that might be taken by Fidelity to reduce total expense ratios for certain classes. In addition, the Board considered its discussions with Fidelity throughout the year regarding enhanced information security initiatives and the funds' fair valuation policies.
Based on its evaluation of all of the conclusions noted above, and after considering all factors it believed relevant, the Board concluded that the advisory fee structures are fair and reasonable, and that the fund's Advisory Contracts should be renewed.
ATB-SANN-0418
1.804578.113
Fidelity® Total Bond Fund
Semi-Annual Report February 28, 2018 |
|
Contents
To view a fund's proxy voting guidelines and proxy voting record for the 12-month period ended June 30, visit http://www.fidelity.com/proxyvotingresults or visit the Securities and Exchange Commission's (SEC) web site at http://www.sec.gov.
You may also call 1-800-544-8544 to request a free copy of the proxy voting guidelines.
Standard & Poor's, S&P and S&P 500 are registered service marks of The McGraw-Hill Companies, Inc. and have been licensed for use by Fidelity Distributors Corporation.
Other third-party marks appearing herein are the property of their respective owners.
All other marks appearing herein are registered or unregistered trademarks or service marks of FMR LLC or an affiliated company. © 2018 FMR LLC. All rights reserved.
This report and the financial statements contained herein are submitted for the general information of the shareholders of the Fund. This report is not authorized for distribution to prospective investors in the Fund unless preceded or accompanied by an effective prospectus.
A fund files its complete schedule of portfolio holdings with the SEC for the first and third quarters of each fiscal year on Form N-Q. Forms N-Q are available on the SEC’s web site at http://www.sec.gov. A fund's Forms N-Q may be reviewed and copied at the SEC’s Public Reference Room in Washington, DC. Information regarding the operation of the SEC's Public Reference Room may be obtained by calling 1-800-SEC-0330.
For a complete list of a fund's portfolio holdings, view the most recent holdings listing, semiannual report, or annual report on Fidelity's web site at http://www.fidelity.com, http://www.institutional.fidelity.com, or http://www.401k.com, as applicable.
NOT FDIC INSURED •MAY LOSE VALUE •NO BANK GUARANTEE
Neither the Fund nor Fidelity Distributors Corporation is a bank.
Investment Summary (Unaudited)
Quality Diversification (% of fund's net assets)
| As of February 28, 2018 |
| | U.S. Government and U.S. Government Agency Obligations | 58.3% |
| | AAA | 0.9% |
| | AA | 0.6% |
| | A | 5.0% |
| | BBB | 17.3% |
| | BB and Below | 15.9% |
| | Not Rated | 1.4% |
| | Equities | 0.1% |
| | Short-Term Investments and Net Other Assets | 0.5% |

We have used ratings from Moody's Investors Service, Inc. Where Moody's® ratings are not available, we have used S&P® ratings. All ratings are as of the date indicated and do not reflect subsequent changes. Securities rated BB or below were rated investment grade at the time of acquisition.
Asset Allocation (% of fund's net assets)
| As of February 28, 2018*,** |
| | Corporate Bonds | 30.2% |
| | U.S. Government and U.S. Government Agency Obligations | 58.3% |
| | Asset-Backed Securities | 1.0% |
| | CMOs and Other Mortgage Related Securities | 1.8% |
| | Municipal Bonds | 1.2% |
| | Stocks | 0.1% |
| | Other Investments | 6.9% |
| | Short-Term Investments and Net Other Assets (Liabilities) | 0.5% |
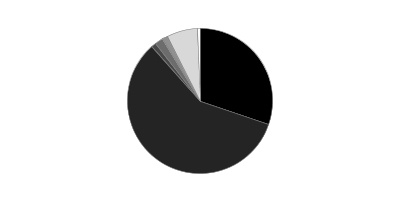
* Foreign investments - 10.4%
** Futures and Swaps - 0.5%
Percentages in the above tables are adjusted for the effect of TBA Sale Commitments.
Schedule of Investments February 28, 2018 (Unaudited)
Showing Percentage of Net Assets
| Corporate Bonds - 30.2% | | | |
| | | Principal Amount(a) | Value |
| Convertible Bonds - 0.0% | | | |
| CONSUMER DISCRETIONARY - 0.0% | | | |
| Media - 0.0% | | | |
| DISH Network Corp.: | | | |
| 2.375% 3/15/24 (b) | | $5,710,000 | $5,145,350 |
| 3.375% 8/15/26 | | 3,010,000 | 3,028,256 |
| | | | 8,173,606 |
| INDUSTRIALS - 0.0% | | | |
| Electrical Equipment - 0.0% | | | |
| SolarCity Corp. 1.625% 11/1/19 | | 7,900,000 | 7,385,457 |
|
| TOTAL CONVERTIBLE BONDS | | | 15,559,063 |
|
| Nonconvertible Bonds - 30.2% | | | |
| CONSUMER DISCRETIONARY - 3.2% | | | |
| Auto Components - 0.0% | | | |
| Delphi Technologies PLC 5% 10/1/25 (b) | | 2,215,000 | 2,196,283 |
| J.B. Poindexter & Co., Inc. 9% 4/1/22 (b) | | 2,442,000 | 2,521,365 |
| Metalsa SA de CV 4.9% 4/24/23 (b) | | 4,550,000 | 4,498,813 |
| Samvardhana Motherson Automotive Systems Group BV 1.8% 7/6/24 (Reg. S) | EUR | 3,500,000 | 4,119,440 |
| Tenedora Nemak SA de CV 4.75% 1/23/25 (b) | | 1,215,000 | 1,205,888 |
| Tupy Overseas SA 6.625% 7/17/24 (b) | | 290,000 | 303,848 |
| | | | 14,845,637 |
| Automobiles - 0.6% | | | |
| General Motors Co. 3.5% 10/2/18 | | 9,215,000 | 9,261,759 |
| General Motors Financial Co., Inc.: | | | |
| 3.15% 1/15/20 | | 27,252,000 | 27,293,938 |
| 3.2% 7/13/20 | | 20,200,000 | 20,199,504 |
| 3.25% 5/15/18 | | 4,810,000 | 4,817,037 |
| 3.5% 7/10/19 | | 10,761,000 | 10,824,701 |
| 4% 1/15/25 | | 18,085,000 | 17,928,467 |
| 4.2% 3/1/21 | | 26,269,000 | 26,884,555 |
| 4.25% 5/15/23 | | 5,420,000 | 5,526,111 |
| 4.375% 9/25/21 | | 47,963,000 | 49,339,917 |
| Volkswagen International Finance NV 2.7%(Reg. S) (c)(d) | EUR | 1,800,000 | 2,255,762 |
| | | | 174,331,751 |
| Distributors - 0.0% | | | |
| American Tire Distributors, Inc. 10.25% 3/1/22 (b) | | 1,740,000 | 1,811,984 |
| Diversified Consumer Services - 0.1% | | | |
| Ingersoll-Rand Global Holding Co. Ltd.: | | | |
| 2.875% 1/15/19 | | 1,206,000 | 1,210,683 |
| 4.25% 6/15/23 | | 8,466,000 | 8,820,705 |
| Laureate Education, Inc. 8.25% 5/1/25 (b) | | 4,615,000 | 4,914,975 |
| Service Corp. International 4.625% 12/15/27 | | 4,045,000 | 3,953,988 |
| | | | 18,900,351 |
| Hotels, Restaurants & Leisure - 0.4% | | | |
| 1011778 BC Unlimited Liability Co./New Red Finance, Inc.: | | | |
| 4.25% 5/15/24 (b) | | 2,935,000 | 2,802,925 |
| 5% 10/15/25 (b) | | 5,275,000 | 5,139,828 |
| Aramark Services, Inc.: | | | |
| 4.75% 6/1/26 | | 7,225,000 | 7,125,656 |
| 5% 2/1/28 (b) | | 3,410,000 | 3,397,213 |
| 5.125% 1/15/24 | | 2,520,000 | 2,570,400 |
| ESH Hospitality, Inc. 5.25% 5/1/25 (b) | | 1,100,000 | 1,097,250 |
| FelCor Lodging LP 5.625% 3/1/23 | | 135,000 | 137,531 |
| Golden Nugget, Inc. 6.75% 10/15/24 (b) | | 13,075,000 | 13,401,875 |
| Hilton Escrow Issuer LLC 4.25% 9/1/24 | | 7,280,000 | 7,152,600 |
| Hilton Worldwide Finance LLC/Hilton Worldwide Finance Corp.: | | | |
| 4.625% 4/1/25 | | 2,580,000 | 2,589,675 |
| 4.875% 4/1/27 | | 1,530,000 | 1,530,000 |
| KFC Holding Co./Pizza Hut Holding LLC: | | | |
| 4.75% 6/1/27 (b) | | 1,580,000 | 1,544,450 |
| 5% 6/1/24 (b) | | 4,515,000 | 4,560,150 |
| 5.25% 6/1/26 (b) | | 1,790,000 | 1,812,375 |
| McDonald's Corp. 2.75% 12/9/20 | | 3,638,000 | 3,633,195 |
| MCE Finance Ltd. 4.875% 6/6/25 (b) | | 12,515,000 | 12,243,723 |
| MGM Growth Properties Operating Partnership LP: | | | |
| 4.5% 9/1/26 | | 14,045,000 | 13,377,863 |
| 4.5% 1/15/28 | | 6,215,000 | 5,888,713 |
| RHP Hotel Properties LP/RHP Finance Corp. 5% 4/15/23 | | 540,000 | 542,700 |
| Scientific Games Corp.: | | | |
| 5% 10/15/25 (b) | | 5,100,000 | 5,042,625 |
| 6.625% 5/15/21 | | 6,270,000 | 6,473,148 |
| 7% 1/1/22 (b) | | 567,000 | 596,768 |
| Station Casinos LLC 5% 10/1/25 (b) | | 4,290,000 | 4,182,750 |
| Studio City Co. Ltd.: | | | |
| 5.875% 11/30/19 (b) | | 2,555,000 | 2,618,875 |
| 7.25% 11/30/21 (b) | | 4,925,000 | 5,177,406 |
| Sugarhouse HSP Gaming Prop Mezz LP/Sugarhouse HSP Gaming Finance Corp. 5.875% 5/15/25 (b) | | 840,000 | 789,600 |
| Times Square Hotel Trust 8.528% 8/1/26 (b) | | 985,159 | 1,125,864 |
| Viking Cruises Ltd. 5.875% 9/15/27 (b) | | 3,530,000 | 3,441,750 |
| Voc Escrow Ltd. 5% 2/15/28 (b) | | 1,780,000 | 1,731,050 |
| Wynn Las Vegas LLC/Wynn Las Vegas Capital Corp. 5.25% 5/15/27 (b) | | 4,730,000 | 4,647,225 |
| Wynn Macau Ltd.: | | | |
| 4.875% 10/1/24 (b) | | 1,475,000 | 1,445,500 |
| 5.5% 10/1/27 (b) | | 4,440,000 | 4,372,068 |
| Yum! Brands, Inc. 5.35% 11/1/43 | | 3,280,000 | 2,984,800 |
| | | | 135,177,551 |
| Household Durables - 0.2% | | | |
| Beazer Homes U.S.A., Inc. 5.875% 10/15/27 | | 3,770,000 | 3,581,500 |
| Lennar Corp.: | | | |
| 4.75% 11/29/27 (b) | | 2,660,000 | 2,573,550 |
| 5% 6/15/27 (b) | | 3,810,000 | 3,800,856 |
| 5.25% 6/1/26 (b) | | 4,285,000 | 4,370,700 |
| 5.875% 11/15/24 (b) | | 1,775,000 | 1,885,938 |
| M.D.C. Holdings, Inc. 6% 1/15/43 | | 1,300,000 | 1,235,000 |
| M/I Homes, Inc.: | | | |
| 5.625% 8/1/25 | | 1,055,000 | 1,059,928 |
| 6.75% 1/15/21 | | 4,265,000 | 4,392,950 |
| PulteGroup, Inc. 5% 1/15/27 | | 2,625,000 | 2,608,594 |
| Reynolds Group Issuer, Inc./Reynolds Group Issuer LLC/Reynolds Group Issuer (Luxembourg) SA: | | | |
| 3 month U.S. LIBOR + 3.500% 5.2215% 7/15/21 (b)(d)(e) | | 6,520,000 | 6,593,350 |
| 5.125% 7/15/23 (b) | | 5,170,000 | 5,272,625 |
| 5.75% 10/15/20 | | 2,844,331 | 2,883,441 |
| Taylor Morrison Communities, Inc./Monarch Communities, Inc. 5.875% 4/15/23 (b) | | 1,495,000 | 1,555,249 |
| Toll Brothers Finance Corp. 4.875% 3/15/27 | | 683,000 | 679,585 |
| TRI Pointe Homes, Inc. 5.25% 6/1/27 | | 2,800,000 | 2,768,500 |
| William Lyon Homes, Inc.: | | | |
| 5.75% 4/15/19 | | 4,175,000 | 4,185,438 |
| 7% 8/15/22 | | 4,250,000 | 4,356,250 |
| | | | 53,803,454 |
| Internet & Direct Marketing Retail - 0.1% | | | |
| Netflix, Inc.: | | | |
| 4.375% 11/15/26 | | 5,750,000 | 5,520,000 |
| 4.875% 4/15/28 (b) | | 4,690,000 | 4,607,925 |
| Zayo Group LLC/Zayo Capital, Inc.: | | | |
| 5.75% 1/15/27 (b) | | 5,975,000 | 6,004,875 |
| 6.375% 5/15/25 | | 8,115,000 | 8,490,319 |
| | | | 24,623,119 |
| Media - 1.8% | | | |
| 21st Century Fox America, Inc.: | | | |
| 6.15% 3/1/37 | | 4,759,000 | 5,876,770 |
| 7.75% 12/1/45 | | 3,932,000 | 5,976,292 |
| Altice SA: | | | |
| 7.25% 5/15/22 (Reg. S) | EUR | 700,000 | 823,435 |
| 7.625% 2/15/25 (b) | | 2,235,000 | 1,966,800 |
| 7.75% 5/15/22 (b) | | 28,085,000 | 26,189,263 |
| Altice U.S. Finance SA: | | | |
| 5.375% 7/15/23 (b) | | 2,560,000 | 2,601,600 |
| 5.5% 5/15/26 (b) | | 5,035,000 | 4,984,650 |
| Cablevision SA 6.5% 6/15/21 (b) | | 1,185,000 | 1,239,000 |
| Cablevision Systems Corp. 5.875% 9/15/22 | | 3,120,000 | 3,120,000 |
| CCO Holdings LLC/CCO Holdings Capital Corp.: | | | |
| 4% 3/1/23 (b) | | 6,395,000 | 6,227,131 |
| 5% 2/1/28 (b) | | 19,150,000 | 18,084,877 |
| 5.125% 2/15/23 | | 1,130,000 | 1,148,363 |
| 5.125% 5/1/23 (b) | | 7,520,000 | 7,661,000 |
| 5.125% 5/1/27 (b) | | 11,140,000 | 10,708,325 |
| 5.5% 5/1/26 (b) | | 9,005,000 | 9,005,000 |
| 5.75% 2/15/26 (b) | | 3,370,000 | 3,416,338 |
| Charter Communications Operating LLC/Charter Communications Operating Capital Corp.: | | | |
| 4.464% 7/23/22 | | 20,419,000 | 20,904,803 |
| 4.908% 7/23/25 | | 20,419,000 | 21,027,558 |
| 5.375% 5/1/47 | | 51,316,000 | 50,794,396 |
| 6.484% 10/23/45 | | 8,199,000 | 9,236,253 |
| Comcast Corp. 6.45% 3/15/37 | | 2,196,000 | 2,811,634 |
| CSC Holdings LLC: | | | |
| 5.25% 6/1/24 | | 4,283,000 | 4,122,388 |
| 5.375% 2/1/28 (b) | | 2,850,000 | 2,785,875 |
| 6.75% 11/15/21 | | 8,225,000 | 8,651,672 |
| CSC Holdings, Inc. 5.5% 4/15/27 (b) | | 4,045,000 | 3,984,325 |
| DISH DBS Corp.: | | | |
| 5.875% 7/15/22 | | 4,000,000 | 3,900,000 |
| 5.875% 11/15/24 | | 6,795,000 | 6,370,313 |
| 7.75% 7/1/26 | | 1,355,000 | 1,334,675 |
| E.W. Scripps Co. 5.125% 5/15/25 (b) | | 3,120,000 | 2,995,200 |
| Globo Comunicacao e Participacoes SA: | | | |
| 4.843% 6/8/25 (b) | | 1,820,000 | 1,801,800 |
| 4.875% 4/11/22 (b) | | 565,000 | 577,713 |
| 5.125% 3/31/27 (b) | | 580,000 | 578,840 |
| Lagardere S.C.A.: | | | |
| 1.625% 6/21/24 (Reg. S) | EUR | 4,900,000 | 5,876,093 |
| 2.75% 4/13/23 (Reg. S) | EUR | 1,300,000 | 1,669,064 |
| MDC Partners, Inc. 6.5% 5/1/24 (b) | | 12,090,000 | 12,059,775 |
| MHGE Parent LLC/MHGE Parent Finance, Inc. 8.5% 8/1/19 pay-in-kind (b)(d) | | 8,405,000 | 8,362,975 |
| Myriad International Holding BV 5.5% 7/21/25 (b) | | 1,040,000 | 1,109,794 |
| NBCUniversal, Inc. 5.15% 4/30/20 | | 11,614,000 | 12,190,751 |
| New Cotai LLC/New Cotai Capital Corp. 10.625% 5/1/19 pay-in-kind (b)(d) | | 4,958,504 | 4,908,919 |
| Sirius XM Radio, Inc.: | | | |
| 3.875% 8/1/22 (b) | | 6,090,000 | 5,968,200 |
| 5% 8/1/27 (b) | | 8,290,000 | 8,059,538 |
| SKY PLC 2.25% 11/17/25 (Reg. S) | EUR | 2,650,000 | 3,463,804 |
| Time Warner Cable, Inc.: | | | |
| 4% 9/1/21 | | 20,277,000 | 20,472,581 |
| 4.5% 9/15/42 | | 30,539,000 | 27,587,080 |
| 5.5% 9/1/41 | | 12,973,000 | 13,169,293 |
| 5.875% 11/15/40 | | 16,544,000 | 17,459,460 |
| 6.55% 5/1/37 | | 38,302,000 | 43,563,146 |
| 6.75% 7/1/18 | | 13,763,000 | 13,946,861 |
| 7.3% 7/1/38 | | 38,728,000 | 46,441,712 |
| 8.25% 4/1/19 | | 24,391,000 | 25,749,335 |
| Time Warner, Inc.: | | | |
| 3.6% 7/15/25 | | 6,406,000 | 6,223,739 |
| 6.2% 3/15/40 | | 11,792,000 | 13,790,223 |
| TV Azteca SA de CV 8.25% 8/9/24 (Reg. S) | | 4,289,000 | 4,535,618 |
| Virgin Media Secured Finance PLC: | | | |
| 5.5% 1/15/25 (b) | | 2,500,000 | 2,518,750 |
| 5.5% 8/15/26 (b) | | 4,335,000 | 4,291,217 |
| VTR Finance BV 6.875% 1/15/24 (b) | | 2,955,000 | 3,080,588 |
| Ziggo Bond Finance BV: | | | |
| 5.875% 1/15/25 (b) | | 3,100,000 | 2,983,750 |
| 6% 1/15/27 (b) | | 5,605,000 | 5,310,738 |
| Ziggo Secured Finance BV 5.5% 1/15/27 (b) | | 4,540,000 | 4,352,725 |
| | | | 570,052,018 |
| Multiline Retail - 0.0% | | | |
| JC Penney Corp., Inc. 5.875% 7/1/23 (b) | | 980,000 | 940,800 |
| Specialty Retail - 0.0% | | | |
| Jaguar Land Rover PLC 4.5% 10/1/27 (b) | | 3,915,000 | 3,719,250 |
| PetSmart, Inc. 5.875% 6/1/25 (b) | | 1,000,000 | 780,000 |
| | | | 4,499,250 |
| Textiles, Apparel & Luxury Goods - 0.0% | | | |
| Tecpetrol SA 4.875% 12/12/22 (b) | | 725,000 | 705,425 |
| TOTAL CONSUMER DISCRETIONARY | | | 999,691,340 |
| CONSUMER STAPLES - 1.5% | | | |
| Beverages - 0.6% | | | |
| Anheuser-Busch InBev Finance, Inc.: | | | |
| 2.65% 2/1/21 | | 38,614,000 | 38,255,584 |
| 3.3% 2/1/23 | | 41,589,000 | 41,411,733 |
| 4.7% 2/1/36 | | 39,376,000 | 41,378,582 |
| 4.9% 2/1/46 | | 45,032,000 | 48,012,699 |
| Anheuser-Busch InBev SA NV 1.75% 3/7/25 (Reg. S) | GBP | 3,600,000 | 4,806,638 |
| Anheuser-Busch InBev Worldwide, Inc. 3.75% 1/15/22 | | 10,217,000 | 10,421,679 |
| Central American Bottling Corp. 5.75% 1/31/27 (b) | | 450,000 | 463,500 |
| Constellation Brands, Inc.: | | | |
| 3.875% 11/15/19 | | 2,360,000 | 2,400,615 |
| 4.25% 5/1/23 | | 5,205,000 | 5,386,016 |
| | | | 192,537,046 |
| Food & Staples Retailing - 0.2% | | | |
| Albertsons Companies LLC/Safeway, Inc./New Albertson's, Inc./Albertson's LLC: | | | |
| 5.75% 3/15/25 | | 2,915,000 | 2,536,050 |
| 6.625% 6/15/24 | | 2,215,000 | 2,040,569 |
| Albertsons, Inc.: | | | |
| 6.625% 6/1/28 | | 705,000 | 546,375 |
| 7.75% 6/15/26 | | 765,000 | 669,375 |
| 8% 5/1/31 | | 2,220,000 | 1,903,650 |
| 8.7% 5/1/30 | | 560,000 | 506,800 |
| C&S Group Enterprises LLC 5.375% 7/15/22 (b) | | 4,725,000 | 4,488,750 |
| CVS Health Corp.: | | | |
| 2.8% 7/20/20 | | 15,202,000 | 15,095,019 |
| 3.5% 7/20/22 | | 8,944,000 | 8,910,268 |
| 4% 12/5/23 | | 8,525,000 | 8,643,345 |
| FAGE International SA/FAGE U.S.A. Dairy Industry, Inc. 5.625% 8/15/26 (b) | | 80,000 | 75,150 |
| Minerva Luxembourg SA 6.5% 9/20/26 (b) | | 1,525,000 | 1,513,563 |
| Tesco PLC: | | | |
| 5% 3/24/23 | GBP | 1,100,000 | 1,664,682 |
| 6.125% 2/24/22 | GBP | 550,000 | 856,960 |
| Tops Holding LLC/Tops Markets II Corp. 8% 6/15/22 (b)(f) | | 5,155,000 | 2,706,375 |
| Walgreens Boots Alliance, Inc.: | | | |
| 2.7% 11/18/19 | | 8,473,000 | 8,442,207 |
| 3.3% 11/18/21 | | 10,050,000 | 10,065,061 |
| | | | 70,664,199 |
| Food Products - 0.1% | | | |
| CF Industries Holdings, Inc.: | | | |
| 3.4% 12/1/21 (b) | | 1,915,000 | 1,900,492 |
| 3.45% 6/1/23 | | 3,115,000 | 3,017,656 |
| 4.5% 12/1/26 (b) | | 1,380,000 | 1,404,393 |
| 5.15% 3/15/34 | | 280,000 | 274,400 |
| Gruma S.A.B. de CV 4.875% 12/1/24 (Reg. S) | | 800,000 | 838,000 |
| Lamb Weston Holdings, Inc.: | | | |
| 4.625% 11/1/24 (b) | | 2,145,000 | 2,155,725 |
| 4.875% 11/1/26 (b) | | 1,555,000 | 1,555,000 |
| Post Holdings, Inc.: | | | |
| 5% 8/15/26 (b) | | 3,240,000 | 3,078,000 |
| 5.625% 1/15/28 (b) | | 3,245,000 | 3,159,819 |
| 5.75% 3/1/27 (b) | | 2,690,000 | 2,656,375 |
| | | | 20,039,860 |
| Tobacco - 0.6% | | | |
| Altria Group, Inc.: | | | |
| 2.85% 8/9/22 | | 9,573,000 | 9,412,047 |
| 4% 1/31/24 | | 6,408,000 | 6,593,754 |
| Bat Capital Corp. 2.125% 8/15/25 | GBP | 2,470,000 | 3,302,836 |
| Imperial Tobacco Finance PLC: | | | |
| 2.05% 7/20/18 (b) | | 8,743,000 | 8,726,687 |
| 2.95% 7/21/20 (b) | | 20,000,000 | 19,966,794 |
| 3.75% 7/21/22 (b) | | 20,300,000 | 20,553,705 |
| 4.25% 7/21/25 (b) | | 18,467,000 | 18,829,228 |
| 8.125% 3/15/24 | GBP | 1,850,000 | 3,335,424 |
| Reynolds American, Inc.: | | | |
| 2.3% 6/12/18 | | 7,358,000 | 7,355,523 |
| 3.25% 6/12/20 | | 3,274,000 | 3,283,751 |
| 4% 6/12/22 | | 11,386,000 | 11,623,674 |
| 4.45% 6/12/25 | | 14,753,000 | 15,188,141 |
| 5.7% 8/15/35 | | 4,237,000 | 4,825,554 |
| 5.85% 8/15/45 | | 35,690,000 | 41,337,325 |
| 6.15% 9/15/43 | | 4,511,000 | 5,449,496 |
| 7.25% 6/15/37 | | 5,056,000 | 6,664,878 |
| Vector Group Ltd. 6.125% 2/1/25 (b) | | 7,705,000 | 7,868,731 |
| | | | 194,317,548 |
| TOTAL CONSUMER STAPLES | | | 477,558,653 |
| ENERGY - 6.4% | | | |
| Energy Equipment & Services - 0.5% | | | |
| Borets Finance DAC 6.5% 4/7/22 (b) | | 1,345,000 | 1,403,884 |
| Calfrac Holdings LP 7.5% 12/1/20 (b) | | 3,560,000 | 3,543,268 |
| Diamond Offshore Drilling, Inc. 7.875% 8/15/25 | | 2,910,000 | 2,953,650 |
| El Paso Pipeline Partners Operating Co. LLC: | | | |
| 5% 10/1/21 | | 18,884,000 | 19,857,483 |
| 6.5% 4/1/20 | | 738,000 | 786,995 |
| Ensco PLC: | | | |
| 4.5% 10/1/24 | | 9,325,000 | 7,599,875 |
| 5.2% 3/15/25 | | 16,510,000 | 13,703,300 |
| 5.75% 10/1/44 | | 7,801,000 | 5,392,441 |
| 7.75% 2/1/26 | | 2,200,000 | 2,081,750 |
| 8% 1/31/24 | | 3,943,000 | 3,873,998 |
| Exterran Energy Solutions LP 8.125% 5/1/25 (b) | | 1,920,000 | 2,064,000 |
| Exterran Partners LP/EXLP Finance Corp.: | | | |
| 6% 4/1/21 | | 3,210,000 | 3,218,025 |
| 6% 10/1/22 | | 995,000 | 997,488 |
| Forum Energy Technologies, Inc. 6.25% 10/1/21 | | 3,780,000 | 3,756,375 |
| FTS International, Inc. 6.25% 5/1/22 | | 1,780,000 | 1,780,000 |
| Halliburton Co.: | | | |
| 3.8% 11/15/25 | | 9,790,000 | 9,784,715 |
| 4.85% 11/15/35 | | 8,550,000 | 9,157,167 |
| Jonah Energy LLC 7.25% 10/15/25 (b) | | 2,755,000 | 2,617,250 |
| Nabors Industries, Inc.: | | | |
| 5.5% 1/15/23 | | 3,322,000 | 3,297,085 |
| 5.75% 2/1/25 (b) | | 5,305,000 | 5,062,959 |
| Noble Holding International Ltd.: | | | |
| 5.25% 3/15/42 | | 1,890,000 | 1,200,150 |
| 7.7% 4/1/25 (d) | | 10,335,000 | 9,249,825 |
| 7.75% 1/15/24 | | 3,019,000 | 2,758,611 |
| 7.875% 2/1/26 (b) | | 1,930,000 | 1,939,650 |
| 8.7% 4/1/45 (d) | | 7,307,000 | 6,174,415 |
| NuStar Logistics LP 5.625% 4/28/27 | | 3,335,000 | 3,301,650 |
| Precision Drilling Corp.: | | | |
| 5.25% 11/15/24 | | 1,290,000 | 1,228,725 |
| 6.5% 12/15/21 | | 838,000 | 852,665 |
| 7.125% 1/15/26 (b) | | 1,620,000 | 1,634,175 |
| 7.75% 12/15/23 | | 4,985,000 | 5,259,175 |
| Southern Gas Corridor CJSC 6.875% 3/24/26 (b) | | 2,555,000 | 2,832,008 |
| Summit Midstream Holdings LLC: | | | |
| 5.5% 8/15/22 | | 2,135,000 | 2,153,681 |
| 5.75% 4/15/25 | | 3,385,000 | 3,385,000 |
| The Oil and Gas Holding Co. 7.5% 10/25/27 (b) | | 870,000 | 878,296 |
| Weatherford International, Inc. 9.875% 3/1/25 (b) | | 5,400,000 | 5,319,000 |
| | | | 151,098,734 |
| Oil, Gas & Consumable Fuels - 5.9% | | | |
| Afren PLC: | | | |
| 6.625% 12/9/20 (b)(f)(g) | | 770,910 | 278 |
| 10.25% 4/8/19 (Reg. S) (f)(g) | | 2,024,860 | 729 |
| Anadarko Finance Co. 7.5% 5/1/31 | | 29,585,000 | 37,420,859 |
| Anadarko Petroleum Corp.: | | | |
| 4.85% 3/15/21 | | 6,730,000 | 7,022,344 |
| 5.55% 3/15/26 | | 13,807,000 | 15,078,820 |
| 6.45% 9/15/36 | | 4,370,000 | 5,205,728 |
| 6.6% 3/15/46 | | 22,460,000 | 28,000,661 |
| Antero Resources Corp.: | | | |
| 5% 3/1/25 | | 7,605,000 | 7,662,038 |
| 5.125% 12/1/22 | | 8,335,000 | 8,407,931 |
| 5.625% 6/1/23 (Reg. S) | | 4,310,000 | 4,417,750 |
| Antero Resources Finance Corp. 5.375% 11/1/21 | | 3,675,000 | 3,757,688 |
| California Resources Corp. 8% 12/15/22 (b) | | 5,050,000 | 3,995,813 |
| Canadian Natural Resources Ltd.: | | | |
| 3.9% 2/1/25 | | 24,997,000 | 24,865,428 |
| 5.85% 2/1/35 | | 10,897,000 | 12,344,998 |
| Cenovus Energy, Inc. 4.25% 4/15/27 | | 31,079,000 | 30,371,925 |
| Cheniere Corpus Christi Holdings LLC: | | | |
| 5.125% 6/30/27 | | 3,595,000 | 3,635,444 |
| 5.875% 3/31/25 | | 5,295,000 | 5,599,463 |
| 7% 6/30/24 | | 4,155,000 | 4,649,445 |
| Chesapeake Energy Corp.: | | | |
| 4.875% 4/15/22 | | 3,735,000 | 3,501,563 |
| 5.75% 3/15/23 | | 5,580,000 | 5,105,700 |
| 6.125% 2/15/21 | | 3,783,000 | 3,820,830 |
| 8% 12/15/22 (b) | | 7,485,000 | 7,962,169 |
| 8% 1/15/25 (b) | | 2,890,000 | 2,853,875 |
| 8% 6/15/27 (b) | | 3,295,000 | 3,159,081 |
| Citgo Holding, Inc. 10.75% 2/15/20 (b) | | 820,000 | 879,450 |
| Columbia Pipeline Group, Inc.: | | | |
| 2.45% 6/1/18 | | 3,149,000 | 3,148,721 |
| 3.3% 6/1/20 | | 15,490,000 | 15,548,242 |
| 4.5% 6/1/25 | | 4,707,000 | 4,829,857 |
| Consolidated Energy Finance SA: | | | |
| 3 month U.S. LIBOR + 3.750% 5.3385% 6/15/22 (b)(d)(e) | | 12,775,000 | 12,744,134 |
| 6.875% 6/15/25 (b) | | 4,700,000 | 4,935,000 |
| Continental Resources, Inc.: | | | |
| 3.8% 6/1/24 | | 4,150,000 | 4,030,688 |
| 4.375% 1/15/28 (b) | | 4,675,000 | 4,543,516 |
| 4.5% 4/15/23 | | 8,290,000 | 8,393,625 |
| 4.9% 6/1/44 | | 1,255,000 | 1,207,938 |
| Covey Park Energy LLC 7.5% 5/15/25 (b) | | 3,225,000 | 3,273,375 |
| CVR Refining LLC/Coffeyville Finance, Inc. 6.5% 11/1/22 | | 8,710,000 | 8,916,863 |
| DCP Midstream LLC: | | | |
| 4.75% 9/30/21 (b) | | 11,333,000 | 11,531,328 |
| 5.85% 5/21/43 (b)(d) | | 7,143,000 | 6,767,993 |
| DCP Midstream Operating LP 3.875% 3/15/23 | | 5,532,000 | 5,393,700 |
| Denbury Resources, Inc. 9% 5/15/21 (b) | | 4,000,000 | 4,090,000 |
| DTEK Finance PLC 10.75% 12/31/24 pay-in-kind (d) | | 1,985,000 | 2,106,085 |
| Duke Energy Field Services 6.45% 11/3/36 (b) | | 13,741,000 | 15,115,100 |
| El Paso Corp. 6.5% 9/15/20 | | 16,140,000 | 17,368,419 |
| Empresa Nacional de Petroleo 4.375% 10/30/24 (b) | | 9,045,000 | 9,268,610 |
| Enable Midstream Partners LP: | | | |
| 2.4% 5/15/19 (d) | | 4,028,000 | 3,990,272 |
| 3.9% 5/15/24 (d) | | 4,249,000 | 4,187,656 |
| Enbridge Energy Partners LP: | | | |
| 4.2% 9/15/21 | | 13,331,000 | 13,655,772 |
| 4.375% 10/15/20 | | 11,319,000 | 11,639,867 |
| Enbridge, Inc.: | | | |
| 4.25% 12/1/26 | | 7,730,000 | 7,780,677 |
| 5.5% 12/1/46 | | 8,922,000 | 10,043,413 |
| Endeavor Energy Resources LP/EER Finance, Inc.: | | | |
| 5.5% 1/30/26 (b) | | 860,000 | 853,550 |
| 5.75% 1/30/28 (b) | | 865,000 | 865,000 |
| Energy Transfer Equity LP 4.25% 3/15/23 | | 3,880,000 | 3,806,047 |
| Enterprise Products Operating LP: | | | |
| 2.55% 10/15/19 | | 2,971,000 | 2,957,384 |
| 3.75% 2/15/25 | | 9,982,000 | 10,026,076 |
| EP Energy LLC/Everest Acquisition Finance, Inc. 8% 11/29/24 (b) | | 6,325,000 | 6,514,750 |
| Extraction Oil & Gas, Inc. 5.625% 2/1/26 (b) | | 3,980,000 | 3,900,400 |
| Georgian Oil & Gas Corp. 6.75% 4/26/21 (b) | | 1,500,000 | 1,587,731 |
| Global Partners LP/GLP Finance Corp.: | | | |
| 6.25% 7/15/22 | | 5,165,000 | 5,158,544 |
| 7% 6/15/23 | | 9,970,000 | 10,156,938 |
| Gran Tierra Energy International Holdings 6.25% 2/15/25 (b) | | 650,000 | 632,125 |
| Hess Infrastructure Partners LP 5.625% 2/15/26 (b) | | 2,575,000 | 2,575,000 |
| Hilcorp Energy I LP/Hilcorp Finance Co.: | | | |
| 5% 12/1/24 (b) | | 7,510,000 | 7,547,550 |
| 5.75% 10/1/25 (b) | | 2,135,000 | 2,172,363 |
| Indigo Natural Resources LLC 6.875% 2/15/26 (b) | | 4,810,000 | 4,702,833 |
| Indika Energy Capital II Pte. Ltd. 6.875% 4/10/22 (b) | | 2,030,000 | 2,096,994 |
| KazMunaiGaz Finance Sub BV 4.875% 5/7/25 (b) | | 700,000 | 722,666 |
| Kinder Morgan Energy Partners LP: | | | |
| 3.5% 3/1/21 | | 11,339,000 | 11,385,122 |
| 5.5% 3/1/44 | | 42,953,000 | 44,328,567 |
| 6.55% 9/15/40 | | 1,889,000 | 2,178,669 |
| Kinder Morgan, Inc.: | | | |
| 5% 2/15/21 (b) | | 10,606,000 | 11,066,857 |
| 5.05% 2/15/46 | | 4,854,000 | 4,758,968 |
| Kosmos Energy Ltd.: | | | |
| 7.875% 8/1/21 (b) | | 1,910,000 | 1,952,975 |
| 7.875% 8/1/21 (b) | | 2,325,000 | 2,377,313 |
| Marathon Petroleum Corp. 5.125% 3/1/21 | | 10,178,000 | 10,780,142 |
| MPLX LP 4.875% 12/1/24 | | 10,070,000 | 10,594,395 |
| Nakilat, Inc. 6.067% 12/31/33 (b) | | 1,975,000 | 2,202,520 |
| Newfield Exploration Co. 5.375% 1/1/26 | | 1,260,000 | 1,300,950 |
| NGL Energy Partners LP/NGL Energy Finance Corp. 6.125% 3/1/25 | | 925,000 | 894,938 |
| NGPL PipeCo LLC: | | | |
| 4.375% 8/15/22 (b) | | 505,000 | 503,738 |
| 4.875% 8/15/27 (b) | | 505,000 | 509,419 |
| Nostrum Oil & Gas Finance BV: | | | |
| 7% 2/16/25 (b) | | 835,000 | 817,465 |
| 8% 7/25/22 (b) | | 4,990,000 | 5,153,902 |
| Pacific Exploration and Production Corp.: | | | |
| 10% 11/2/21 pay-in-kind (d) | | 1,204,000 | 1,352,995 |
| 10% 11/2/21 pay-in-kind (b)(d) | | 1,040,000 | 1,168,700 |
| Pan American Energy LLC 7.875% 5/7/21 (b) | | 2,858,000 | 3,034,882 |
| Parsley Energy LLC/Parsley: | | | |
| 5.25% 8/15/25 (b) | | 715,000 | 704,275 |
| 5.375% 1/15/25 (b) | | 1,170,000 | 1,158,300 |
| PBF Logistics LP/PBF Logistics Finance, Inc.: | | | |
| 6.875% 5/15/23 | | 4,365,000 | 4,468,669 |
| 6.875% 5/15/23 (b) | | 3,080,000 | 3,153,150 |
| Pemex Project Funding Master Trust 6.625% 6/15/35 | | 4,705,000 | 4,866,146 |
| Petrobras Energia SA 7.375% 7/21/23 (b) | | 1,715,000 | 1,811,126 |
| Petrobras Global Finance BV: | | | |
| 4.375% 5/20/23 | | 20,096,000 | 19,553,408 |
| 4.75% 1/14/25 | EUR | 450,000 | 598,161 |
| 5.625% 5/20/43 | | 18,504,000 | 15,820,920 |
| 5.75% 2/1/29 | | 40,170,000 | 38,663,625 |
| 5.999% 1/27/28 (b) | | 59,620,000 | 58,725,700 |
| 6.125% 1/17/22 | | 11,055,000 | 11,633,729 |
| 6.25% 3/17/24 | | 21,380,000 | 22,288,650 |
| 7.25% 3/17/44 | | 45,050,000 | 45,725,750 |
| 7.375% 1/17/27 | | 41,110,000 | 44,563,240 |
| 8.75% 5/23/26 | | 56,815,000 | 66,686,606 |
| Petrobras International Finance Co. Ltd.: | | | |
| 5.375% 1/27/21 | | 44,755,000 | 46,097,650 |
| 5.875% 3/7/22 | EUR | 200,000 | 277,674 |
| 6.875% 1/20/40 | | 1,220,000 | 1,189,195 |
| Petroleos de Venezuela SA: | | | |
| 5.375% 4/12/27 (f) | | 975,000 | 242,775 |
| 6% 5/16/24 (b)(f) | | 2,355,000 | 596,262 |
| 6% 11/15/26 (b)(f) | | 2,810,000 | 705,310 |
| 9.75% 5/17/35 (b)(f) | | 3,210,000 | 876,330 |
| 12.75% 2/17/22 (b)(f) | | 270,000 | 79,866 |
| Petroleos Mexicanos: | | | |
| 2.5% 8/21/21 (Reg. S) | EUR | 6,200,000 | 7,878,284 |
| 3.5% 1/30/23 | | 11,169,000 | 10,755,747 |
| 4.5% 1/23/26 | | 46,043,000 | 44,546,603 |
| 4.625% 9/21/23 | | 80,090,000 | 80,498,459 |
| 4.875% 1/24/22 | | 11,642,000 | 11,938,172 |
| 4.875% 1/18/24 | | 13,597,000 | 13,800,955 |
| 5.5% 1/21/21 | | 11,789,000 | 12,337,189 |
| 5.5% 6/27/44 | | 10,807,000 | 9,683,180 |
| 5.625% 1/23/46 | | 35,710,000 | 31,974,734 |
| 6% 3/5/20 | | 3,910,000 | 4,097,680 |
| 6.35% 2/12/48 (b) | | 17,325,000 | 16,890,143 |
| 6.375% 2/4/21 | | 785,000 | 838,773 |
| 6.375% 1/23/45 | | 29,907,000 | 29,009,790 |
| 6.5% 3/13/27 (b) | | 33,960,000 | 36,298,825 |
| 6.5% 3/13/27 (b) | | 57,927,000 | 61,916,432 |
| 6.5% 6/2/41 | | 29,057,000 | 29,049,736 |
| 6.625% (b)(c) | | 2,510,000 | 2,527,570 |
| 6.75% 9/21/47 | | 25,666,000 | 26,098,985 |
| 6.75% 9/21/47 (b) | | 24,580,000 | 24,994,665 |
| 6.875% 8/4/26 | | 41,150,000 | 45,158,010 |
| 8% 5/3/19 | | 7,261,000 | 7,664,712 |
| Phillips 66 Co. 4.3% 4/1/22 | | 12,618,000 | 13,102,006 |
| Phillips 66 Partners LP 2.646% 2/15/20 | | 1,316,000 | 1,307,709 |
| Plains All American Pipeline LP/PAA Finance Corp. 3.65% 6/1/22 | | 5,217,000 | 5,153,052 |
| PT Pertamina Persero 6.5% 5/27/41 (b) | | 510,000 | 582,985 |
| Range Resources Corp.: | | | |
| 4.875% 5/15/25 | | 5,395,000 | 5,169,084 |
| 5% 8/15/22 | | 1,725,000 | 1,699,125 |
| 5% 3/15/23 | | 9,650,000 | 9,432,875 |
| Sanchez Energy Corp. 7.25% 2/15/23 (b) | | 6,470,000 | 6,544,729 |
| SemGroup Corp. 7.25% 3/15/26 | | 1,885,000 | 1,927,413 |
| Sinopec Group Overseas Development 2.5% 9/13/22 (Reg. S) | | 10,300,000 | 9,853,876 |
| Southwestern Energy Co.: | | | |
| 4.1% 3/15/22 | | 1,540,000 | 1,443,750 |
| 6.7% 1/23/25 (d) | | 34,312,000 | 33,625,760 |
| 7.75% 10/1/27 | | 3,760,000 | 3,835,200 |
| Sunoco Logistics Partner Operations LP 5.4% 10/1/47 | | 43,401,000 | 42,433,077 |
| Targa Resources Partners LP/Targa Resources Partners Finance Corp.: | | | |
| 4.25% 11/15/23 | | 2,990,000 | 2,915,250 |
| 5% 1/15/28 (b) | | 5,175,000 | 5,026,219 |
| 5.125% 2/1/25 | | 1,210,000 | 1,205,463 |
| 5.25% 5/1/23 | | 685,000 | 694,850 |
| 6.75% 3/15/24 | | 4,420,000 | 4,690,725 |
| The Williams Companies, Inc.: | | | |
| 3.7% 1/15/23 | | 3,730,000 | 3,622,763 |
| 4.55% 6/24/24 | | 41,276,000 | 41,585,570 |
| 5.75% 6/24/44 | | 19,187,000 | 20,386,188 |
| Transportadora de Gas del Sur SA 9.625% 5/14/20 (b) | | 3,316,317 | 3,490,457 |
| Tullow Oil PLC 6% 11/1/20 (b) | | 810,000 | 818,100 |
| Western Gas Partners LP: | | | |
| 4.65% 7/1/26 | | 4,876,000 | 4,952,315 |
| 5.375% 6/1/21 | | 44,065,000 | 46,123,474 |
| Whiting Petroleum Corp.: | | | |
| 5.75% 3/15/21 | | 1,350,000 | 1,380,375 |
| 6.625% 1/15/26 (b) | | 2,895,000 | 2,934,806 |
| Williams Partners LP: | | | |
| 3.6% 3/15/22 | | 10,817,000 | 10,849,451 |
| 3.9% 1/15/25 | | 26,667,000 | 26,471,734 |
| 4% 11/15/21 | | 6,716,000 | 6,848,752 |
| 4% 9/15/25 | | 3,000,000 | 2,990,802 |
| 4.125% 11/15/20 | | 2,399,000 | 2,454,931 |
| 4.3% 3/4/24 | | 40,932,000 | 41,962,669 |
| 4.5% 11/15/23 | | 7,325,000 | 7,575,880 |
| YPF SA: | | | |
| 7% 12/15/47 (b) | | 2,090,000 | 1,914,963 |
| 8.5% 3/23/21 (b) | | 1,235,000 | 1,352,943 |
| 8.5% 3/23/21 (Reg. S) | | 2,250,000 | 2,464,875 |
| 8.75% 4/4/24 (b) | | 5,160,000 | 5,766,300 |
| | | | 1,891,904,986 |
| TOTAL ENERGY | | | 2,043,003,720 |
| FINANCIALS - 9.9% | | | |
| Banks - 4.3% | | | |
| ABN AMRO Bank NV 4.4% 3/27/28 (Reg. S) (d) | | 3,400,000 | 3,425,976 |
| Access Bank PLC 10.5% 10/19/21 (b) | | 585,000 | 654,884 |
| Akbank TAS/Ak Finansal Kiralama A/S 7.2% 3/16/27 (b)(d) | | 945,000 | 979,313 |
| Allied Irish Banks PLC 4.125% 11/26/25 (Reg. S) (d) | EUR | 3,450,000 | 4,543,902 |
| Banca Monte dei Paschi di Siena SpA 5.375% 1/18/28 (d) | EUR | 1,300,000 | 1,562,857 |
| Banco de Bogota SA 6.25% 5/12/26 (b) | | 690,000 | 731,883 |
| Banco de Reservas de La Republica Dominicana 7% 2/1/23 (b) | | 1,455,000 | 1,524,113 |
| Banco Do Brasil SA 4.625% 1/15/25 (b) | | 2,490,000 | 2,430,863 |
| Banco Espirito Santo SA 4% 1/21/19 (Reg. S) (f) | EUR | 1,300,000 | 475,800 |
| Banco Hipotecario SA 9.75% 11/30/20 (b) | | 5,160,000 | 5,762,585 |
| Banco Macro SA 6.75% 11/4/26 (b)(d) | | 2,775,000 | 2,820,344 |
| Banco Nacional de Desenvolvimento Economico e Social: | | | |
| 4% 4/14/19 (b) | | 500,000 | 504,500 |
| 6.369% 6/16/18 (b) | | 1,125,000 | 1,133,044 |
| Bank of America Corp.: | | | |
| 1.776% 5/4/27 (Reg. S) (d) | EUR | 3,300,000 | 4,129,428 |
| 2.25% 4/21/20 | | 66,694,000 | 65,888,186 |
| 2.6% 1/15/19 | | 1,164,000 | 1,164,326 |
| 3.004% 12/20/23 (b)(d) | | 14,176,000 | 13,870,586 |
| 3.3% 1/11/23 | | 901,000 | 897,909 |
| 3.419% 12/20/28 (b)(d) | | 23,300,000 | 22,308,513 |
| 3.5% 4/19/26 | | 20,559,000 | 20,247,211 |
| 3.705% 4/24/28 (d) | | 32,549,000 | 31,946,251 |
| 3.95% 4/21/25 | | 17,156,000 | 17,129,848 |
| 4.1% 7/24/23 | | 11,481,000 | 11,869,949 |
| 4.2% 8/26/24 | | 40,532,000 | 41,342,351 |
| 4.25% 10/22/26 | | 14,724,000 | 14,865,815 |
| 5.65% 5/1/18 | | 8,780,000 | 8,830,834 |
| Banque Centrale de Tunisie 5.75% 1/30/25 (b) | | 905,000 | 855,225 |
| Barclays PLC: | | | |
| 2.75% 11/8/19 | | 12,249,000 | 12,175,628 |
| 3.25% 1/12/21 | | 21,116,000 | 20,967,681 |
| 4.375% 1/12/26 | | 25,086,000 | 25,112,491 |
| BBVA Bancomer SA: | | | |
| 7.25% 4/22/20 (b) | | 1,475,000 | 1,568,663 |
| 7.25% 4/22/20 (Reg. S) | | 3,300,000 | 3,509,550 |
| BTA Bank JSC 5.5% 12/21/22 (b) | | 650,000 | 645,983 |
| CaixaBank SA: | | | |
| 2.75% 7/14/28 (Reg. S) (d) | EUR | 1,400,000 | 1,763,104 |
| 5% 11/14/23 (Reg. S) (d) | EUR | 2,700,000 | 3,401,029 |
| CBOM Finance PLC 7.5% 10/5/27 (b)(d) | | 2,650,000 | 2,521,210 |
| Citigroup, Inc.: | | | |
| 2.4% 2/18/20 | | 35,902,000 | 35,559,833 |
| 2.65% 10/26/20 | | 20,000,000 | 19,798,822 |
| 2.75% 4/25/22 | | 25,000,000 | 24,468,638 |
| 3.142% 1/24/23 (d) | | 22,807,000 | 22,641,029 |
| 4.05% 7/30/22 | | 5,303,000 | 5,425,066 |
| 4.3% 11/20/26 | | 3,788,000 | 3,829,719 |
| 4.4% 6/10/25 | | 40,790,000 | 41,867,919 |
| 4.45% 9/29/27 | | 10,000,000 | 10,204,829 |
| 5.125% 12/12/18 | GBP | 1,875,000 | 2,661,333 |
| 5.5% 9/13/25 | | 21,906,000 | 23,961,291 |
| Citizens Bank NA 2.55% 5/13/21 | | 6,564,000 | 6,434,171 |
| Citizens Financial Group, Inc. 4.15% 9/28/22 (b) | | 15,987,000 | 16,254,036 |
| Credit Suisse Group Funding Guernsey Ltd.: | | | |
| 2.75% 3/26/20 | | 19,455,000 | 19,309,470 |
| 3.75% 3/26/25 | | 19,450,000 | 19,200,661 |
| 3.8% 9/15/22 | | 30,700,000 | 30,997,349 |
| 3.8% 6/9/23 | | 36,648,000 | 36,876,275 |
| CYBG PLC 3.125% 6/22/25 (Reg. S) (d) | GBP | 1,300,000 | 1,803,734 |
| Discover Bank: | | | |
| 4.2% 8/8/23 | | 17,852,000 | 18,335,302 |
| 7% 4/15/20 | | 2,030,000 | 2,184,899 |
| Fidelity Bank PLC: | | | |
| 6.875% 5/9/18 (b) | | 200,000 | 199,407 |
| 10.5% 10/16/22 (b) | | 1,435,000 | 1,493,720 |
| Fifth Third Bancorp: | | | |
| 4.5% 6/1/18 | | 798,000 | 802,652 |
| 8.25% 3/1/38 | | 4,667,000 | 6,778,776 |
| HBOS PLC 6.75% 5/21/18 (b) | | 6,067,000 | 6,120,557 |
| HSBC Holdings PLC: | | | |
| 2.256% 11/13/26 (Reg. S) (d) | GBP | 3,250,000 | 4,368,011 |
| 4.25% 3/14/24 | | 6,192,000 | 6,271,315 |
| Huntington Bancshares, Inc. 7% 12/15/20 | | 2,851,000 | 3,140,732 |
| Intesa Sanpaolo SpA 5.71% 1/15/26 (b) | | 28,396,000 | 28,992,929 |
| Itau Unibanco Holding SA: | | | |
| 5.125% 5/13/23 (Reg. S) | | 1,650,000 | 1,666,005 |
| 5.5% 8/6/22 (b) | | 1,155,000 | 1,188,495 |
| 6.2% 12/21/21 (Reg. S) | | 980,000 | 1,038,310 |
| JPMorgan Chase & Co.: | | | |
| 1.625% 5/15/18 | | 12,580,000 | 12,567,856 |
| 2.2% 10/22/19 | | 7,268,000 | 7,204,354 |
| 2.25% 1/23/20 | | 40,000,000 | 39,624,394 |
| 2.35% 1/28/19 | | 6,857,000 | 6,849,580 |
| 2.95% 10/1/26 | | 18,480,000 | 17,367,905 |
| 3.25% 9/23/22 | | 18,423,000 | 18,429,511 |
| 3.875% 9/10/24 | | 35,791,000 | 36,033,791 |
| 4.125% 12/15/26 | | 32,416,000 | 32,770,350 |
| 4.25% 10/15/20 | | 6,995,000 | 7,233,865 |
| 4.35% 8/15/21 | | 20,267,000 | 21,071,760 |
| 4.5% 1/24/22 | | 22,046,000 | 23,054,483 |
| 4.625% 5/10/21 | | 6,879,000 | 7,209,297 |
| 4.95% 3/25/20 | | 22,079,000 | 23,004,159 |
| JSC BGEO Group 6% 7/26/23 (b) | | 2,360,000 | 2,433,632 |
| Kazkommertsbank Jsc Mtn Bank Ent 8.5% 5/11/18 (b) | | 2,845,000 | 2,865,973 |
| Nykredit Realkredit A/S 4% 6/3/36 (Reg. S) (d) | EUR | 4,092,000 | 5,429,910 |
| PSB Finance SA 5.25% 10/19/19 | | 1,000,000 | 986,850 |
| Rabobank Nederland 4.375% 8/4/25 | | 25,937,000 | 26,350,460 |
| Regions Bank 6.45% 6/26/37 | | 24,618,000 | 29,786,344 |
| Regions Financial Corp. 3.2% 2/8/21 | | 11,916,000 | 11,956,299 |
| Royal Bank of Canada 2.77% 12/11/18 | CAD | 12,507,000 | 9,810,568 |
| Royal Bank of Scotland Group PLC: | | | |
| 4.8% 4/5/26 | | 50,452,000 | 52,260,812 |
| 5.125% 5/28/24 | | 64,006,000 | 65,577,415 |
| 6% 12/19/23 | | 36,682,000 | 39,164,692 |
| 6.1% 6/10/23 | | 31,961,000 | 34,137,404 |
| 6.125% 12/15/22 | | 42,557,000 | 45,385,825 |
| SB Capital SA 5.5% 2/26/24 (b)(d) | | 1,160,000 | 1,176,240 |
| Trade and Development Bank of Mongolia LLC 9.375% 5/19/20 (b) | | 1,905,000 | 2,069,230 |
| Turkiye Garanti Bankasi A/S 6.125% 5/24/27 (b)(d) | | 1,145,000 | 1,134,271 |
| Turkiye Is Bankasi A/S: | | | |
| 5.5% 4/21/19 (b) | | 415,000 | 421,018 |
| 5.5% 4/21/22 (b) | | 1,415,000 | 1,406,657 |
| Turkiye Vakiflar Bankasi TAO: | | | |
| 5.75% 1/30/23 (b) | | 825,000 | 810,563 |
| 6.875% 2/3/25 (Reg. S) (d) | | 2,665,000 | 2,689,593 |
| UniCredit SpA 6.375% 5/2/23 (Reg. S) (d) | | 1,350,000 | 1,355,913 |
| Zenith Bank PLC: | | | |
| 6.25% 4/22/19 (b) | | 4,330,000 | 4,417,120 |
| 7.375% 5/30/22 (b) | | 3,495,000 | 3,648,605 |
| | | | 1,355,133,819 |
| Capital Markets - 3.1% | | | |
| Affiliated Managers Group, Inc.: | | | |
| 3.5% 8/1/25 | | 21,008,000 | 20,584,752 |
| 4.25% 2/15/24 | | 14,661,000 | 15,105,050 |
| Credit Suisse Group AG: | | | |
| 3.869% 1/12/29 (b)(d) | | 18,512,000 | 17,981,564 |
| 5.75% 9/18/25 (Reg. S) (d) | EUR | 5,950,000 | 8,130,080 |
| Deutsche Bank AG 4.5% 4/1/25 | | 80,571,000 | 78,933,000 |
| Deutsche Bank AG New York Branch: | | | |
| 3.15% 1/22/21 | | 28,709,000 | 28,446,345 |
| 3.3% 11/16/22 | | 47,595,000 | 46,410,407 |
| Goldman Sachs Group, Inc.: | | | |
| 2.876% 10/31/22 (d) | | 100,974,000 | 98,998,940 |
| 3.2% 2/23/23 | | 17,000,000 | 16,739,012 |
| 3.691% 6/5/28 (d) | | 200,926,000 | 195,514,508 |
| 3.75% 5/22/25 | | 20,000,000 | 19,923,065 |
| 4.25% 10/21/25 | | 6,650,000 | 6,702,996 |
| IntercontinentalExchange, Inc. 2.75% 12/1/20 | | 6,489,000 | 6,457,408 |
| Lazard Group LLC 4.25% 11/14/20 | | 10,151,000 | 10,472,251 |
| Merrill Lynch & Co., Inc. 5.5% 11/22/21 | GBP | 1,100,000 | 1,706,631 |
| Moody's Corp.: | | | |
| 3.25% 1/15/28 (b) | | 11,520,000 | 10,958,929 |
| 4.875% 2/15/24 | | 10,818,000 | 11,519,048 |
| Morgan Stanley: | | | |
| 2.125% 4/25/18 | | 12,586,000 | 12,585,371 |
| 2.8% 6/16/20 | | 30,000,000 | 29,907,622 |
| 3.125% 1/23/23 | | 13,000,000 | 12,789,995 |
| 3.125% 7/27/26 | | 108,849,000 | 103,243,346 |
| 3.7% 10/23/24 | | 37,479,000 | 37,459,099 |
| 3.95% 4/23/27 | | 3,150,000 | 3,099,387 |
| 4.875% 11/1/22 | | 26,240,000 | 27,665,938 |
| 5% 11/24/25 | | 3,189,000 | 3,395,280 |
| 5.5% 1/26/20 | | 88,000,000 | 92,150,080 |
| 5.625% 9/23/19 | | 12,714,000 | 13,251,597 |
| 5.75% 1/25/21 | | 19,879,000 | 21,318,362 |
| MSCI, Inc.: | | | |
| 4.75% 8/1/26 (b) | | 4,145,000 | 4,113,913 |
| 5.25% 11/15/24 (b) | | 4,420,000 | 4,516,356 |
| Thomson Reuters Corp. 3.85% 9/29/24 | | 11,394,000 | 11,430,674 |
| UBS AG 4.75% 2/12/26 (Reg. S) (d) | EUR | 6,185,000 | 8,347,431 |
| UBS Group Funding Ltd. 4.125% 9/24/25 (b) | | 18,881,000 | 19,182,709 |
| | | | 999,041,146 |
| Consumer Finance - 0.8% | | | |
| AerCap Ireland Capital Ltd./AerCap Global Aviation Trust 3.5% 5/26/22 | | 7,478,000 | 7,451,208 |
| Capital One Financial Corp.: | | | |
| 2.45% 4/24/19 | | 10,550,000 | 10,510,744 |
| 3.8% 1/31/28 | | 22,294,000 | 21,644,317 |
| Credito Real S.A.B. de CV 7.5% 3/13/19 (b) | | 1,465,000 | 1,486,975 |
| Discover Financial Services: | | | |
| 3.85% 11/21/22 | | 34,849,000 | 35,081,984 |
| 3.95% 11/6/24 | | 14,738,000 | 14,715,814 |
| 4.1% 2/9/27 | | 24,223,000 | 23,958,255 |
| 5.2% 4/27/22 | | 12,545,000 | 13,247,629 |
| Ford Motor Credit Co. LLC: | | | |
| 2.24% 6/15/18 | | 19,162,000 | 19,152,387 |
| 2.597% 11/4/19 | | 52,209,000 | 51,871,295 |
| 2.875% 10/1/18 | | 13,000,000 | 13,026,733 |
| Hyundai Capital America 2.875% 8/9/18 (b) | | 5,276,000 | 5,281,037 |
| SLM Corp.: | | | |
| 5.5% 1/15/19 | | 725,000 | 735,658 |
| 5.5% 1/25/23 | | 2,640,000 | 2,613,600 |
| Synchrony Financial: | | | |
| 3% 8/15/19 | | 4,907,000 | 4,909,843 |
| 3.75% 8/15/21 | | 7,409,000 | 7,502,836 |
| 4.25% 8/15/24 | | 7,458,000 | 7,511,380 |
| | | | 240,701,695 |
| Diversified Financial Services - 0.6% | | | |
| 1MDB Global Investments Ltd. 4.4% 3/9/23 | | 2,000,000 | 1,932,070 |
| Annington Funding PLC 2.646% 7/12/25 (Reg. S) | GBP | 1,789,000 | 2,437,972 |
| Brixmor Operating Partnership LP: | | | |
| 3.25% 9/15/23 | | 25,518,000 | 24,705,687 |
| 3.85% 2/1/25 | | 14,325,000 | 13,969,835 |
| 3.875% 8/15/22 | | 21,027,000 | 21,192,364 |
| 4.125% 6/15/26 | | 8,647,000 | 8,512,801 |
| Chobani LLC/Finance Corp., Inc. 7.5% 4/15/25 (b) | | 2,700,000 | 2,814,750 |
| Cimpor Financial Operations BV 5.75% 7/17/24 (b) | | 1,965,000 | 1,886,400 |
| CRC Escrow Issuer LLC/CRC Finance LLC 5.25% 10/15/25 (b) | | 10,500,000 | 10,263,750 |
| Crown Americas LLC / Crown Americas Capital Corp. IV 4.75% 2/1/26 (b) | | 3,660,000 | 3,605,100 |
| Icahn Enterprises LP/Icahn Enterprises Finance Corp.: | | | |
| 5.875% 2/1/22 | | 24,766,000 | 24,766,000 |
| 6% 8/1/20 | | 2,810,000 | 2,864,795 |
| 6.25% 2/1/22 | | 7,435,000 | 7,546,525 |
| 6.375% 12/15/25 | | 7,050,000 | 7,076,438 |
| 6.75% 2/1/24 | | 2,000,000 | 2,040,000 |
| ILFC E-Capital Trust I 3 month U.S. LIBOR + 1.550% 4.37% 12/21/65 (b)(d)(e) | | 11,760,000 | 11,613,000 |
| ILFC E-Capital Trust II 3 month U.S. LIBOR + 1.800% 4.62% 12/21/65 (b)(d)(e) | | 6,710,000 | 6,592,575 |
| PT Bukit Makmur Mandiri Utama 7.75% 2/13/22 (b) | | 1,695,000 | 1,786,266 |
| Radiate Holdco LLC/Radiate Financial Service Ltd.: | | | |
| 6.625% 2/15/25 (b) | | 2,080,000 | 1,991,600 |
| 6.875% 2/15/23 (b) | | 705,000 | 703,238 |
| Sistema International Funding SA 6.95% 5/17/19 (b) | | 2,975,000 | 3,005,345 |
| Solera LLC/Solera Finance, Inc. 10.5% 3/1/24 (b) | | 6,270,000 | 7,039,956 |
| Sparc Em Spc 0% 12/5/22 (b) | | 205,000 | 186,806 |
| Tempo Acquisition LLC 6.75% 6/1/25 (b) | | 5,020,000 | 5,057,650 |
| TMK Capital SA 6.75% 4/3/20 (Reg. S) | | 560,000 | 584,098 |
| Valvoline, Inc. 4.375% 8/15/25 | | 3,845,000 | 3,758,488 |
| Voya Financial, Inc. 3.125% 7/15/24 | | 13,804,000 | 13,437,203 |
| | | | 191,370,712 |
| Insurance - 1.1% | | | |
| Acrisure LLC 7% 11/15/25 (b) | | 2,970,000 | 2,903,175 |
| AIA Group Ltd. 2.25% 3/11/19 (b) | | 2,566,000 | 2,544,292 |
| American International Group, Inc.: | | | |
| 2.3% 7/16/19 | | 6,461,000 | 6,415,985 |
| 3.3% 3/1/21 | | 9,614,000 | 9,636,158 |
| 3.875% 1/15/35 | | 19,041,000 | 17,999,460 |
| 4.875% 6/1/22 | | 18,193,000 | 19,274,821 |
| Aon Corp. 5% 9/30/20 | | 3,854,000 | 4,039,620 |
| Aquarius + Investments PLC for Swiss Reinsurance Co. Ltd. 6.375% 9/1/24 (d) | | 4,650,000 | 4,816,238 |
| AXA SA: | | | |
| 3.941% (c)(d) | EUR | 1,238,000 | 1,680,276 |
| 6.6862% (c)(d) | GBP | 100,000 | 164,168 |
| Demeter Investments BV 5.625% 8/15/52 (Reg. S) (d) | | 2,250,000 | 2,336,877 |
| Great-West Life & Annuity Insurance Co. 3 month U.S. LIBOR + 2.538% 4.388% 5/16/46 (b)(d)(e) | | 1,859,000 | 1,854,353 |
| Hartford Financial Services Group, Inc. 5.125% 4/15/22 | | 14,787,000 | 15,797,371 |
| Liberty Mutual Group, Inc. 5% 6/1/21 (b) | | 12,644,000 | 13,327,879 |
| Marsh & McLennan Companies, Inc. 4.8% 7/15/21 | | 7,090,000 | 7,456,564 |
| Massachusetts Mutual Life Insurance Co. 4.5% 4/15/65 (b) | | 30,523,000 | 29,639,318 |
| MetLife, Inc.: | | | |
| 3.048% 12/15/22 (d) | | 12,433,000 | 12,359,066 |
| 4.75% 2/8/21 | | 4,032,000 | 4,225,796 |
| Metropolitan Life Global Funding I 3% 1/10/23 (b) | | 7,896,000 | 7,791,423 |
| Pacific LifeCorp 5.125% 1/30/43 (b) | | 33,774,000 | 35,687,125 |
| Pricoa Global Funding I 5.375% 5/15/45 (d) | | 17,492,000 | 18,191,680 |
| Prudential Financial, Inc.: | | | |
| 2.3% 8/15/18 | | 1,622,000 | 1,621,531 |
| 7.375% 6/15/19 | | 3,230,000 | 3,422,443 |
| QBE Insurance Group Ltd. 5.25% (Reg. S) (c)(d) | | 1,750,000 | 1,724,667 |
| Teachers Insurance & Annuity Association of America 4.9% 9/15/44 (b) | | 18,083,000 | 19,698,231 |
| TIAA Asset Management Finance LLC: | | | |
| 2.95% 11/1/19 (b) | | 4,172,000 | 4,173,940 |
| 4.125% 11/1/24 (b) | | 6,048,000 | 6,228,795 |
| Unum Group: | | | |
| 3.875% 11/5/25 | | 21,587,000 | 21,481,726 |
| 4% 3/15/24 | | 20,000,000 | 20,302,281 |
| 5.625% 9/15/20 | | 8,386,000 | 8,905,688 |
| 5.75% 8/15/42 | | 25,545,000 | 30,115,329 |
| | | | 335,816,276 |
| Mortgage Real Estate Investment Trusts - 0.0% | | | |
| Starwood Property Trust, Inc. 4.75% 3/15/25 (b) | | 1,925,000 | 1,867,250 |
| Thrifts & Mortgage Finance - 0.0% | | | |
| Cassa Depositi e Prestiti SpA 1.875% 2/7/26 | EUR | 1,000,000 | 1,217,462 |
| Prime Securities Services Borrower LLC/Prime Finance, Inc. 9.25% 5/15/23 (b) | | 3,760,000 | 4,093,700 |
| Quicken Loans, Inc. 5.25% 1/15/28 (b) | | 4,045,000 | 3,903,425 |
| | | | 9,214,587 |
| TOTAL FINANCIALS | | | 3,133,145,485 |
| HEALTH CARE - 1.5% | | | |
| Biotechnology - 0.1% | | | |
| AbbVie, Inc.: | | | |
| 2.9% 11/6/22 | | 24,855,000 | 24,346,781 |
| 4.5% 5/14/35 | | 23,238,000 | 23,938,558 |
| | | | 48,285,339 |
| Health Care Equipment & Supplies - 0.1% | | | |
| Becton, Dickinson & Co. 2.675% 12/15/19 | | 3,954,000 | 3,938,519 |
| Hologic, Inc.: | | | |
| 4.375% 10/15/25 (b) | | 3,735,000 | 3,646,294 |
| 4.625% 2/1/28 (b) | | 695,000 | 670,675 |
| Ortho-Clinical Diagnostics, Inc. 6.625% 5/15/22 (b) | | 4,425,000 | 4,391,813 |
| Teleflex, Inc.: | | | |
| 4.625% 11/15/27 | | 825,000 | 805,109 |
| 4.875% 6/1/26 | | 6,975,000 | 6,905,250 |
| | | | 20,357,660 |
| Health Care Providers & Services - 0.5% | | | |
| Aetna, Inc. 2.75% 11/15/22 | | 2,010,000 | 1,947,489 |
| Community Health Systems, Inc.: | | | |
| 6.25% 3/31/23 | | 4,705,000 | 4,281,550 |
| 6.875% 2/1/22 | | 7,715,000 | 5,014,750 |
| HCA Holdings, Inc.: | | | |
| 3.75% 3/15/19 | | 18,722,000 | 18,839,574 |
| 4.25% 10/15/19 | | 7,590,000 | 7,684,875 |
| 4.5% 2/15/27 | | 5,270,000 | 5,144,838 |
| 4.75% 5/1/23 | | 595,000 | 605,413 |
| 5% 3/15/24 | | 6,375,000 | 6,494,531 |
| 5.25% 6/15/26 | | 11,470,000 | 11,756,750 |
| 5.875% 3/15/22 | | 715,000 | 757,900 |
| 5.875% 2/15/26 | | 3,820,000 | 3,953,700 |
| 6.5% 2/15/20 | | 30,303,000 | 31,893,908 |
| HealthSouth Corp. 5.125% 3/15/23 | | 4,745,000 | 4,828,038 |
| Kindred Healthcare, Inc.: | | | |
| 8% 1/15/20 | | 1,145,000 | 1,223,719 |
| 8.75% 1/15/23 | | 1,565,000 | 1,674,550 |
| Medco Health Solutions, Inc. 4.125% 9/15/20 | | 7,486,000 | 7,689,436 |
| Rede D Oregon Finance Sarl 4.95% 1/17/28 (b) | | 525,000 | 508,594 |
| Sabra Health Care LP/Sabra Capital Corp.: | | | |
| 5.375% 6/1/23 | | 500,000 | 502,500 |
| 5.5% 2/1/21 | | 1,555,000 | 1,589,988 |
| SP Finco LLC 6.75% 7/1/25 (b) | | 1,795,000 | 1,687,300 |
| Tenet Healthcare Corp.: | | | |
| 4.375% 10/1/21 | | 3,825,000 | 3,805,875 |
| 4.625% 7/15/24 (b) | | 5,540,000 | 5,301,088 |
| 6.75% 6/15/23 | | 3,555,000 | 3,555,000 |
| 7.5% 1/1/22 (b) | | 775,000 | 818,594 |
| THC Escrow Corp. III 5.125% 5/1/25 (b) | | 4,400,000 | 4,268,000 |
| Wellcare Health Plans, Inc. 5.25% 4/1/25 | | 3,335,000 | 3,375,420 |
| WellPoint, Inc. 3.3% 1/15/23 | | 6,442,000 | 6,391,013 |
| | | | 145,594,393 |
| Life Sciences Tools & Services - 0.0% | | | |
| Thermo Fisher Scientific, Inc.: | | | |
| 2.4% 2/1/19 | | 1,959,000 | 1,955,780 |
| 4.15% 2/1/24 | | 3,010,000 | 3,097,406 |
| | | | 5,053,186 |
| Pharmaceuticals - 0.8% | | | |
| Actavis Funding SCS: | | | |
| 3% 3/12/20 | | 13,777,000 | 13,768,535 |
| 3.45% 3/15/22 | | 48,347,000 | 48,127,265 |
| Catalent Pharma Solutions 4.875% 1/15/26 (b) | | 5,125,000 | 5,073,750 |
| Mylan NV: | | | |
| 2.25% 11/22/24 (Reg. S) | EUR | 1,650,000 | 2,063,110 |
| 2.5% 6/7/19 | | 16,423,000 | 16,324,215 |
| 3.15% 6/15/21 | | 21,235,000 | 21,044,252 |
| 3.95% 6/15/26 | | 11,126,000 | 10,761,417 |
| Perrigo Finance PLC: | | | |
| 3.5% 12/15/21 | | 1,541,000 | 1,546,684 |
| 3.9% 12/15/24 | | 5,449,000 | 5,432,422 |
| Teva Pharmaceutical Finance IV BV 3.65% 11/10/21 | | 1,630,000 | 1,560,871 |
| Teva Pharmaceutical Finance Netherlands III BV: | | | |
| 0.375% 7/25/20 (Reg. S) | EUR | 800,000 | 943,022 |
| 1.25% 3/31/23 (Reg. S) | EUR | 1,500,000 | 1,628,689 |
| 2.2% 7/21/21 | | 14,999,000 | 13,899,577 |
| 2.8% 7/21/23 | | 38,972,000 | 34,111,902 |
| 3.15% 10/1/26 | | 12,782,000 | 10,424,852 |
| Valeant Pharmaceuticals International, Inc.: | | | |
| 5.375% 3/15/20 (b) | | 4,690,000 | 4,678,275 |
| 5.5% 11/1/25 (b) | | 3,645,000 | 3,606,272 |
| 5.625% 12/1/21 (b) | | 8,980,000 | 8,519,775 |
| 5.875% 5/15/23 (b) | | 16,770,000 | 14,904,338 |
| 6.125% 4/15/25 (b) | | 14,175,000 | 12,429,703 |
| 6.5% 3/15/22 (b) | | 2,500,000 | 2,600,000 |
| 7% 3/15/24 (b) | | 4,905,000 | 5,168,644 |
| 9% 12/15/25 (b) | | 3,170,000 | 3,175,944 |
| Zoetis, Inc.: | | | |
| 3.25% 2/1/23 | | 4,892,000 | 4,854,254 |
| 3.45% 11/13/20 | | 5,179,000 | 5,236,662 |
| | | | 251,884,430 |
| TOTAL HEALTH CARE | | | 471,175,008 |
| INDUSTRIALS - 1.0% | | | |
| Aerospace & Defense - 0.2% | | | |
| BAE Systems Holdings, Inc.: | | | |
| 3.8% 10/7/24 (b) | | 9,122,000 | 9,213,550 |
| 6.375% 6/1/19 (b) | | 8,071,000 | 8,430,722 |
| Bombardier, Inc.: | | | |
| 6.125% 1/15/23 (b) | | 8,980,000 | 9,002,450 |
| 7.5% 12/1/24 (b) | | 10,695,000 | 11,109,431 |
| 7.5% 3/15/25 (b) | | 3,005,000 | 3,083,881 |
| DAE Funding LLC: | | | |
| 4% 8/1/20 (b) | | 250,000 | 245,625 |
| 4.5% 8/1/22 (b) | | 1,470,000 | 1,425,900 |
| TransDigm, Inc.: | | | |
| 5.5% 10/15/20 | | 3,580,000 | 3,611,325 |
| 6% 7/15/22 | | 4,010,000 | 4,105,238 |
| 6.375% 6/15/26 | | 2,060,000 | 2,106,350 |
| 6.5% 5/15/25 | | 8,300,000 | 8,507,500 |
| | | | 60,841,972 |
| Air Freight & Logistics - 0.0% | | | |
| Rumo Luxembourg Sarl 7.375% 2/9/24 (b) | | 2,485,000 | 2,663,672 |
| Airlines - 0.1% | | | |
| Air Canada 7.75% 4/15/21 (b) | | 945,000 | 1,043,044 |
| Allegiant Travel Co. 5.5% 7/15/19 | | 4,985,000 | 5,090,931 |
| American Airlines Group, Inc. 4.625% 3/1/20 (b) | | 1,650,000 | 1,666,500 |
| Azul Investments LLP 5.875% 10/26/24 (b) | | 900,000 | 883,125 |
| U.S. Airways Group, Inc. 6.125% 6/1/18 | | 895,000 | 901,713 |
| U.S. Airways pass-thru certificates: | | | |
| Series 2012-2C, 5.45% 6/3/18 | | 1,690,000 | 1,702,506 |
| Series 2013-1 Class B, 5.375% 11/15/21 | | 273,209 | 284,137 |
| U.S. Airways pass-thru trust certificates 8.36% 1/20/19 | | 37,788 | 38,544 |
| United Air Lines, Inc. pass-thru trust certificates Class B, 7.336% 7/2/19 | | 485,736 | 505,165 |
| United Continental Holdings, Inc.: | | | |
| 4.25% 10/1/22 | | 7,680,000 | 7,656,000 |
| 6% 12/1/20 | | 605,000 | 641,300 |
| | | | 20,412,965 |
| Building Products - 0.0% | | | |
| Building Materials Corp. of America 4.75% 1/15/28 (b) | | 4,105,000 | 3,940,800 |
| Commercial Services & Supplies - 0.2% | | | |
| APX Group, Inc.: | | | |
| 6.375% 12/1/19 | | 5,657,000 | 5,741,855 |
| 7.625% 9/1/23 | | 3,860,000 | 4,106,075 |
| 7.875% 12/1/22 | | 1,150,000 | 1,211,813 |
| 8.75% 12/1/20 | | 10,732,000 | 10,812,490 |
| Brand Energy & Infrastructure Services, Inc. 8.5% 7/15/25 (b) | | 4,110,000 | 4,243,575 |
| Cenveo Corp. 6% 8/1/19 (b)(f) | | 270,000 | 130,950 |
| LBC Tank Terminals Holding Netherlands BV 6.875% 5/15/23 (b) | | 3,420,000 | 3,526,875 |
| Multi-Color Corp. 4.875% 11/1/25 (b) | | 4,685,000 | 4,497,600 |
| Prime Security One MS, Inc. 4.875% 7/15/32 (b) | | 4,170,000 | 3,794,700 |
| Securitas AB 1.125% 2/20/24 (Reg. S) | EUR | 3,750,000 | 4,575,183 |
| | | | 42,641,116 |
| Construction & Engineering - 0.0% | | | |
| Cementos Progreso Trust 7.125% 11/6/23 (b) | | 920,000 | 954,500 |
| Odebrecht Finance Ltd.: | | | |
| 4.375% 4/25/25 (b) | | 2,575,000 | 540,750 |
| 7.125% 6/26/42 (b) | | 1,940,000 | 446,200 |
| | | | 1,941,450 |
| Electrical Equipment - 0.0% | | | |
| Sensata Technologies BV 5% 10/1/25 (b) | | 4,285,000 | 4,317,138 |
| Vestas Wind Systems A/S 2.75% 3/11/22 (Reg. S) | EUR | 3,840,000 | 4,966,211 |
| | | | 9,283,349 |
| Industrial Conglomerates - 0.0% | | | |
| Alfa SA de CV 5.25% 3/25/24 (b) | | 450,000 | 469,125 |
| Machinery - 0.0% | | | |
| Xerium Technologies, Inc. 9.5% 8/15/21 | | 2,500,000 | 2,518,750 |
| Marine - 0.1% | | | |
| Navios Maritime Acquisition Corp./Navios Acquisition Finance U.S., Inc. 8.125% 11/15/21 (b) | | 12,785,000 | 10,451,738 |
| Navios Maritime Holdings, Inc.: | | | |
| 7.375% 1/15/22 (b) | | 1,520,000 | 1,241,650 |
| 11.25% 8/15/22 (b) | | 3,190,000 | 3,233,863 |
| | | | 14,927,251 |
| Professional Services - 0.0% | | | |
| IHS Markit Ltd. 4% 3/1/26 (b) | | 890,000 | 863,300 |
| Road & Rail - 0.0% | | | |
| Alpha Trains Finance SA 2.064% 6/30/25 | EUR | 2,726,000 | 3,380,162 |
| Hertz Corp. 7.625% 6/1/22 (b) | | 4,020,000 | 4,140,600 |
| JSC Georgian Railway 7.75% 7/11/22 (b) | | 650,000 | 716,560 |
| | | | 8,237,322 |
| Trading Companies & Distributors - 0.4% | | | |
| Air Lease Corp.: | | | |
| 2.625% 9/4/18 | | 16,438,000 | 16,446,536 |
| 3% 9/15/23 | | 3,204,000 | 3,116,515 |
| 3.375% 6/1/21 | | 10,493,000 | 10,562,914 |
| 3.75% 2/1/22 | | 26,396,000 | 26,757,613 |
| 3.875% 4/1/21 | | 11,610,000 | 11,822,541 |
| 4.25% 9/15/24 | | 12,030,000 | 12,327,112 |
| 4.75% 3/1/20 | | 11,796,000 | 12,204,430 |
| Ashtead Capital, Inc.: | | | |
| 4.125% 8/15/25 (b) | | 1,490,000 | 1,458,338 |
| 4.375% 8/15/27 (b) | | 1,575,000 | 1,519,875 |
| Avantor, Inc.: | | | |
| 6% 10/1/24 (b) | | 2,925,000 | 2,925,000 |
| 9% 10/1/25 (b) | | 5,300,000 | 5,313,250 |
| Brenntag Finance BV 1.125% 9/27/25 (Reg. S) | EUR | 2,880,000 | 3,489,356 |
| FLY Leasing Ltd.: | | | |
| 5.25% 10/15/24 | | 3,280,000 | 3,239,000 |
| 6.375% 10/15/21 | | 6,000,000 | 6,240,000 |
| Travis Perkins PLC: | | | |
| 4.375% 9/15/21 (Reg. S) | GBP | 1,253,000 | 1,799,325 |
| 4.5% 9/7/23 (Reg. S) | GBP | 1,950,000 | 2,787,513 |
| | | | 122,009,318 |
| Transportation Infrastructure - 0.0% | | | |
| Aeropuertos Argentina 2000 SA 6.875% 2/1/27 (b) | | 1,960,000 | 2,044,006 |
| Global Ports Finance PLC 6.872% 1/25/22 (b) | | 1,410,000 | 1,498,689 |
| Heathrow Funding Ltd. 6% 3/20/20 | GBP | 3,800,000 | 5,694,931 |
| | | | 9,237,626 |
| TOTAL INDUSTRIALS | | | 299,988,016 |
| INFORMATION TECHNOLOGY - 0.2% | | | |
| Communications Equipment - 0.0% | | | |
| Banglalink Digital Communications Ltd.: | | | |
| 8.625% 5/6/19 (b) | | 4,415,000 | 4,523,168 |
| 8.625% 5/6/19 (Reg. S) | | 500,000 | 512,250 |
| Proven Glory Capital Ltd. 3.25% 2/21/22 (Reg. S) | | 3,300,000 | 3,235,406 |
| | | | 8,270,824 |
| Electronic Equipment & Components - 0.0% | | | |
| Diamond 1 Finance Corp./Diamond 2 Finance Corp.: | | | |
| 3.48% 6/1/19 (b) | | 796,000 | 800,597 |
| 4.42% 6/15/21 (b) | | 2,400,000 | 2,449,338 |
| Tyco Electronics Group SA 2.375% 12/17/18 | | 2,244,000 | 2,241,843 |
| | | | 5,491,778 |
| Internet Software & Services - 0.0% | | | |
| Gogo Intermediate Holdings LLC/Gogo Finance Co., Inc. 12.5% 7/1/22 (b) | | 5,620,000 | 6,294,400 |
| IT Services - 0.0% | | | |
| Ceridian HCM Holding, Inc. 11% 3/15/21 (b) | | 440,000 | 454,665 |
| Gartner, Inc. 5.125% 4/1/25 (b) | | 1,335,000 | 1,368,375 |
| | | | 1,823,040 |
| Semiconductors & Semiconductor Equipment - 0.1% | | | |
| Micron Technology, Inc.: | | | |
| 5.25% 1/15/24 (b) | | 2,650,000 | 2,716,250 |
| 5.5% 2/1/25 | | 3,845,000 | 3,989,188 |
| 5.625% 1/15/26 (b) | | 1,285,000 | 1,329,975 |
| NXP BV/NXP Funding LLC: | | | |
| 3.875% 9/1/22 (b) | | 6,305,000 | 6,320,763 |
| 4.125% 6/1/21 (b) | | 5,555,000 | 5,653,324 |
| 4.625% 6/15/22 (b) | | 2,875,000 | 2,961,566 |
| Qorvo, Inc. 7% 12/1/25 | | 5,885,000 | 6,399,938 |
| Sensata Technologies UK Financing Co. PLC 6.25% 2/15/26 (b) | | 3,025,000 | 3,206,500 |
| Versum Materials, Inc. 5.5% 9/30/24 (b) | | 2,715,000 | 2,837,175 |
| | | | 35,414,679 |
| Software - 0.1% | | | |
| CDK Global, Inc. 4.875% 6/1/27 (b) | | 1,820,000 | 1,805,804 |
| Nuance Communications, Inc. 5.375% 8/15/20 (b) | | 1,939,000 | 1,955,966 |
| Open Text Corp. 5.875% 6/1/26 (b) | | 11,080,000 | 11,523,200 |
| SS&C Technologies Holdings, Inc. 5.875% 7/15/23 | | 1,745,000 | 1,834,431 |
| Symantec Corp. 5% 4/15/25 (b) | | 1,520,000 | 1,550,557 |
| | | | 18,669,958 |
| TOTAL INFORMATION TECHNOLOGY | | | 75,964,679 |
| MATERIALS - 1.0% | | | |
| Chemicals - 0.3% | | | |
| Braskem Finance Ltd.: | | | |
| 5.375% 5/2/22 (b) | | 1,560,000 | 1,624,350 |
| 5.75% 4/15/21 (b) | | 830,000 | 869,508 |
| 6.45% 2/3/24 | | 680,000 | 744,090 |
| Evolution Escrow Issuer LLC 7.5% 3/15/22 (b) | | 3,730,000 | 3,869,875 |
| Kraton Polymers LLC/Kraton Polymers Capital Corp. 7% 4/15/25 (b) | | 5,185,000 | 5,353,513 |
| NOVA Chemicals Corp.: | | | |
| 4.875% 6/1/24 (b) | | 5,820,000 | 5,747,250 |
| 5.25% 6/1/27 (b) | | 3,505,000 | 3,426,138 |
| Nufarm Australia Ltd. 6.375% 10/15/19 (b) | | 2,175,000 | 2,196,750 |
| OCP SA 5.625% 4/25/24 (b) | | 390,000 | 410,576 |
| Olin Corp.: | | | |
| 5% 2/1/30 | | 1,670,000 | 1,611,550 |
| 5.125% 9/15/27 | | 5,750,000 | 5,660,156 |
| Petkim Petrokimya Holding A/S 5.875% 1/26/23 (b) | | 925,000 | 926,856 |
| Platform Specialty Products Corp. 5.875% 12/1/25 (b) | | 5,315,000 | 5,288,425 |
| SunCoke Energy Partners LP/SunCoke Energy Partners Finance Corp. 7.5% 6/15/25 (b) | | 10,155,000 | 10,586,588 |
| The Dow Chemical Co.: | | | |
| 4.125% 11/15/21 | | 10,888,000 | 11,271,076 |
| 4.25% 11/15/20 | | 3,653,000 | 3,763,811 |
| TPC Group, Inc. 8.75% 12/15/20 (b) | | 13,345,000 | 13,411,725 |
| Trinseo Materials Operating SCA/Trinseo Materials Finance, Inc. 5.375% 9/1/25 (b) | | 4,650,000 | 4,702,313 |
| Tronox Finance PLC 5.75% 10/1/25 (b) | | 925,000 | 918,063 |
| | | | 82,382,613 |
| Construction Materials - 0.1% | | | |
| CEMEX Finance LLC: | | | |
| 4.625% 6/15/24 | EUR | 200,000 | 261,592 |
| 6% 4/1/24 (b) | | 5,665,000 | 5,919,925 |
| CEMEX S.A.B. de CV: | | | |
| 4.375% 3/5/23 (Reg. S) | EUR | 250,000 | 319,366 |
| 5.7% 1/11/25 (b) | | 1,960,000 | 2,043,006 |
| 7.75% 4/16/26 (b) | | 4,100,000 | 4,583,800 |
| Union Andina de Cementos SAA 5.875% 10/30/21 (b) | | 1,135,000 | 1,169,050 |
| | | | 14,296,739 |
| Containers & Packaging - 0.1% | | | |
| Ard Securities Finance Sarl 8.75% 1/31/23 pay-in-kind (b)(d) | | 3,840,000 | 3,993,600 |
| Ardagh Packaging Finance PLC/Ardagh MP Holdings U.S.A., Inc.: | | | |
| 4.25% 9/15/22 (b) | | 3,145,000 | 3,133,206 |
| 4.625% 5/15/23 (b) | | 6,305,000 | 6,297,119 |
| 6% 2/15/25 (b) | | 11,455,000 | 11,741,375 |
| Crown Americas LLC/Crown Americas Capital Corp. V 4.25% 9/30/26 | | 5,350,000 | 5,069,125 |
| OI European Group BV 4% 3/15/23 (b) | | 5,400,000 | 5,224,500 |
| Owens-Brockway Glass Container, Inc. 5.375% 1/15/25 (b) | | 3,930,000 | 4,008,600 |
| Silgan Holdings, Inc. 4.75% 3/15/25 | | 2,945,000 | 2,922,913 |
| | | | 42,390,438 |
| Metals & Mining - 0.5% | | | |
| ArcelorMittal SA: | | | |
| 6.125% 6/1/25 | | 1,900,000 | 2,092,945 |
| 7.25% 10/15/39 (d) | | 1,893,000 | 2,337,287 |
| BHP Billiton Financial (U.S.A.) Ltd.: | | | |
| 6.25% 10/19/75 (b)(d) | | 7,018,000 | 7,460,485 |
| 6.75% 10/19/75 (b)(d) | | 17,432,000 | 19,785,320 |
| Cliffs Natural Resources, Inc.: | | | |
| 4.875% 1/15/24 (b) | | 4,045,000 | 3,974,213 |
| 5.75% 3/1/25 (b) | | 4,720,000 | 4,581,350 |
| Commercial Metals Co. 5.375% 7/15/27 | | 8,490,000 | 8,548,369 |
| Constellium NV 5.875% 2/15/26 (b) | | 2,975,000 | 3,004,750 |
| Corporacion Nacional del Cobre de Chile (Codelco): | | | |
| 3.625% 8/1/27 (b) | | 8,277,000 | 7,996,492 |
| 4.5% 8/1/47 (b) | | 6,545,000 | 6,529,030 |
| CSN Resources SA 6.5% 7/21/20 (b) | | 1,880,000 | 1,851,424 |
| EVRAZ Group SA: | | | |
| 5.375% 3/20/23 (b) | | 1,195,000 | 1,224,875 |
| 8.25% 1/28/21 (Reg. S) | | 1,135,000 | 1,257,013 |
| Ferrexpo Finance PLC: | | | |
| 10.375% 4/7/19 (b) | | 90,000 | 92,819 |
| 10.375% 4/7/19 (b) | | 367,000 | 378,496 |
| 10.375% 4/7/19 (Reg. S) | | 655,000 | 675,518 |
| 10.375% 4/7/19 (Reg. S) | | 985,000 | 1,015,855 |
| First Quantum Minerals Ltd.: | | | |
| 6.5% 3/1/24 (b) | | 3,455,000 | 3,433,406 |
| 6.875% 3/1/26 (b) | | 3,525,000 | 3,511,781 |
| 7.25% 5/15/22 (b) | | 2,220,000 | 2,286,600 |
| 7.25% 4/1/23 (b) | | 12,885,000 | 13,368,188 |
| 7.5% 4/1/25 (b) | | 3,325,000 | 3,424,750 |
| FMG Resources (August 2006) Pty Ltd.: | | | |
| 4.75% 5/15/22 (b) | | 4,230,000 | 4,226,828 |
| 5.125% 5/15/24 (b) | | 3,895,000 | 3,884,055 |
| Freeport-McMoRan, Inc.: | | | |
| 3.55% 3/1/22 | | 10,100,000 | 9,825,280 |
| 3.875% 3/15/23 | | 3,080,000 | 2,987,600 |
| 4.55% 11/14/24 | | 9,320,000 | 9,110,300 |
| 5.4% 11/14/34 | | 1,289,000 | 1,253,553 |
| 5.45% 3/15/43 | | 4,539,000 | 4,357,440 |
| Gold Fields Orogen Holding BVI Ltd. 4.875% 10/7/20 (b) | | 580,000 | 587,250 |
| GTL Trade Finance, Inc. 5.893% 4/29/24 (b) | | 850,000 | 907,885 |
| Metinvest BV: | | | |
| 9.3725% 12/31/21 pay-in-kind(Reg. S) (d) | | 262,763 | 268,036 |
| 9.3725% 12/31/21 pay-in-kind (d) | | 4,591,285 | 4,683,432 |
| Polyus Finance PLC 5.25% 2/7/23 (b) | | 590,000 | 604,234 |
| Steel Dynamics, Inc.: | | | |
| 4.125% 9/15/25 | | 4,225,000 | 4,087,688 |
| 5.125% 10/1/21 | | 2,205,000 | 2,232,563 |
| Stillwater Mining Co.: | | | |
| 6.125% 6/27/22 (b) | | 2,585,000 | 2,603,147 |
| 7.125% 6/27/25 (b) | | 1,185,000 | 1,212,611 |
| Vale Overseas Ltd. 4.375% 1/11/22 | | 12,930,000 | 13,246,785 |
| Vedanta Resources PLC: | | | |
| 6.375% 7/30/22 (b) | | 2,510,000 | 2,578,774 |
| 8.25% 6/7/21 (b) | | 1,275,000 | 1,392,938 |
| VM Holding SA 5.375% 5/4/27 (b) | | 565,000 | 583,080 |
| | | | 169,464,445 |
| TOTAL MATERIALS | | | 308,534,235 |
| REAL ESTATE - 2.5% | | | |
| Equity Real Estate Investment Trusts (REITs) - 1.3% | | | |
| Alexandria Real Estate Equities, Inc.: | | | |
| 2.75% 1/15/20 | | 2,884,000 | 2,873,678 |
| 4.6% 4/1/22 | | 4,896,000 | 5,114,669 |
| alstria office REIT-AG 1.5% 11/15/27 (Reg. S) | EUR | 5,200,000 | 6,129,021 |
| American Campus Communities Operating Partnership LP 3.75% 4/15/23 | | 3,491,000 | 3,499,391 |
| American Homes 4 Rent 4.25% 2/15/28 | | 1,025,000 | 1,008,922 |
| AvalonBay Communities, Inc. 3.625% 10/1/20 | | 5,005,000 | 5,089,902 |
| Boston Properties, Inc. 3.85% 2/1/23 | | 5,829,000 | 5,967,832 |
| Camden Property Trust: | | | |
| 2.95% 12/15/22 | | 6,621,000 | 6,511,585 |
| 4.25% 1/15/24 | | 9,191,000 | 9,447,549 |
| CBL & Associates LP 4.6% 10/15/24 | | 272,000 | 223,288 |
| CommonWealth REIT 5.875% 9/15/20 | | 2,130,000 | 2,224,024 |
| Corporate Office Properties LP 5% 7/1/25 | | 12,377,000 | 12,841,270 |
| CTR Partnership LP/CareTrust Capital Corp. 5.25% 6/1/25 | | 4,820,000 | 4,844,100 |
| DDR Corp.: | | | |
| 3.625% 2/1/25 | | 8,557,000 | 8,265,715 |
| 4.25% 2/1/26 | | 22,796,000 | 22,602,331 |
| 4.625% 7/15/22 | | 20,268,000 | 21,094,198 |
| 4.7% 6/1/27 | | 840,000 | 857,068 |
| Duke Realty LP: | | | |
| 3.625% 4/15/23 | | 6,287,000 | 6,358,896 |
| 3.75% 12/1/24 | | 5,408,000 | 5,471,609 |
| 3.875% 10/15/22 | | 17,388,000 | 17,798,327 |
| Equinix, Inc. 5.375% 5/15/27 | | 1,680,000 | 1,713,600 |
| Equity One, Inc. 3.75% 11/15/22 | | 18,100,000 | 18,213,985 |
| ERP Operating LP: | | | |
| 2.375% 7/1/19 | | 8,777,000 | 8,744,544 |
| 4.75% 7/15/20 | | 7,700,000 | 8,020,546 |
| Health Care REIT, Inc. 2.25% 3/15/18 | | 5,151,000 | 5,150,983 |
| iStar Financial, Inc. 6% 4/1/22 | | 775,000 | 780,813 |
| Lexington Corporate Properties Trust 4.4% 6/15/24 | | 4,608,000 | 4,546,593 |
| MPT Operating Partnership LP/MPT Finance Corp.: | | | |
| 5% 10/15/27 | | 2,235,000 | 2,183,595 |
| 5.25% 8/1/26 | | 4,930,000 | 4,899,188 |
| 6.375% 3/1/24 | | 2,250,000 | 2,368,125 |
| Omega Healthcare Investors, Inc.: | | | |
| 4.375% 8/1/23 | | 42,087,000 | 41,923,832 |
| 4.5% 1/15/25 | | 10,686,000 | 10,401,176 |
| 4.5% 4/1/27 | | 50,980,000 | 48,714,708 |
| 4.75% 1/15/28 | | 29,482,000 | 28,538,192 |
| 4.95% 4/1/24 | | 17,495,000 | 17,857,455 |
| 5.25% 1/15/26 | | 29,233,000 | 29,474,936 |
| Retail Opportunity Investments Partnership LP: | | | |
| 4% 12/15/24 | | 3,376,000 | 3,243,930 |
| 5% 12/15/23 | | 2,030,000 | 2,069,410 |
| SBA Communications Corp. 4.875% 9/1/24 | | 2,205,000 | 2,177,438 |
| Senior Housing Properties Trust 6.75% 4/15/20 | | 250,000 | 262,948 |
| Weingarten Realty Investors 3.375% 10/15/22 | | 2,729,000 | 2,709,010 |
| WP Carey, Inc. 4% 2/1/25 | | 34,017,000 | 33,636,729 |
| | | | 425,855,111 |
| Real Estate Management & Development - 1.2% | | | |
| Brandywine Operating Partnership LP: | | | |
| 3.95% 2/15/23 | | 29,103,000 | 29,179,931 |
| 3.95% 11/15/27 | | 18,049,000 | 17,388,202 |
| 4.1% 10/1/24 | | 15,881,000 | 15,863,764 |
| 4.55% 10/1/29 | | 17,155,000 | 17,127,788 |
| Carmila 2.125% 3/7/28 | EUR | 2,300,000 | 2,796,516 |
| CBRE Group, Inc. 5% 3/15/23 | | 465,000 | 476,928 |
| Deutsche Annington Finance BV 5% 10/2/23 (b) | | 5,800,000 | 6,024,780 |
| Digital Realty Trust LP: | | | |
| 3.4% 10/1/20 | | 17,707,000 | 17,904,302 |
| 3.625% 10/1/22 | | 9,206,000 | 9,308,056 |
| 3.95% 7/1/22 | | 11,840,000 | 12,162,320 |
| 4.75% 10/1/25 | | 30,612,000 | 32,308,281 |
| 5.25% 3/15/21 | | 5,708,000 | 6,042,204 |
| Essex Portfolio LP 3.875% 5/1/24 | | 8,802,000 | 8,869,842 |
| Greystar Real Estate Partners 5.75% 12/1/25 (b) | | 720,000 | 729,000 |
| Host Hotels & Resorts LP 4.75% 3/1/23 | | 150,000 | 156,573 |
| Howard Hughes Corp. 5.375% 3/15/25 (b) | | 4,440,000 | 4,378,950 |
| Hunt Companies, Inc. 9.625% 3/1/21 (b) | | 870,000 | 912,195 |
| Inversiones y Representaciones SA 11.5% 7/20/20 (Reg. S) | | 5,000 | 5,693 |
| IRSA Propiedades Comerciales SA 8.75% 3/23/23 (b) | | 1,930,000 | 2,126,320 |
| Liberty Property LP: | | | |
| 3.375% 6/15/23 | | 8,174,000 | 8,187,025 |
| 4.125% 6/15/22 | | 14,880,000 | 15,357,082 |
| 4.4% 2/15/24 | | 13,017,000 | 13,580,382 |
| 4.75% 10/1/20 | | 11,282,000 | 11,761,358 |
| Mack-Cali Realty LP: | | | |
| 3.15% 5/15/23 | | 14,735,000 | 13,410,025 |
| 4.5% 4/18/22 | | 17,365,000 | 17,044,327 |
| Mattamy Group Corp.: | | | |
| 6.5% 10/1/25 (b) | | 570,000 | 595,650 |
| 6.875% 12/15/23 (b) | | 700,000 | 734,125 |
| Post Apartment Homes LP 3.375% 12/1/22 | | 2,570,000 | 2,566,481 |
| Realogy Group LLC/Realogy Co.-Issuer Corp. 4.5% 4/15/19 (b) | | 235,000 | 238,231 |
| SELP Finance SARL 1.25% 10/25/23 (Reg. S) | EUR | 3,485,000 | 4,257,027 |
| Shimao Property Holdings Ltd. 4.75% 7/3/22 | | 660,000 | 651,815 |
| Tanger Properties LP: | | | |
| 3.125% 9/1/26 | | 11,019,000 | 10,098,939 |
| 3.75% 12/1/24 | | 21,455,000 | 21,045,418 |
| 3.875% 12/1/23 | | 4,812,000 | 4,780,552 |
| TLG Immobilien AG 1.375% 11/27/24 (Reg. S) | EUR | 2,900,000 | 3,510,025 |
| Ventas Realty LP: | | | |
| 3.125% 6/15/23 | | 5,458,000 | 5,347,294 |
| 3.5% 2/1/25 | | 5,961,000 | 5,845,557 |
| 3.75% 5/1/24 | | 25,000,000 | 25,111,397 |
| 4% 3/1/28 | | 10,982,000 | 10,869,419 |
| 4.125% 1/15/26 | | 5,557,000 | 5,610,225 |
| Ventas Realty LP/Ventas Capital Corp. 4.25% 3/1/22 | | 300,000 | 309,066 |
| | | | 364,673,065 |
| TOTAL REAL ESTATE | | | 790,528,176 |
| TELECOMMUNICATION SERVICES - 1.1% | | | |
| Diversified Telecommunication Services - 0.9% | | | |
| Altice Financing SA: | | | |
| 6.625% 2/15/23 (b) | | 2,780,000 | 2,776,525 |
| 7.5% 5/15/26 (b) | | 3,905,000 | 3,934,288 |
| Altice Finco SA 7.625% 2/15/25 (b) | | 5,335,000 | 5,254,975 |
| AT&T, Inc.: | | | |
| 2.45% 6/30/20 | | 11,294,000 | 11,173,598 |
| 3% 6/30/22 | | 12,546,000 | 12,335,501 |
| 3.4% 5/15/25 | | 39,520,000 | 38,048,206 |
| 3.6% 2/17/23 | | 44,557,000 | 44,657,309 |
| 5.875% 10/1/19 | | 5,944,000 | 6,216,057 |
| 6.3% 1/15/38 | | 16,665,000 | 19,214,992 |
| Axtel S.A.B. de CV 6.375% 11/14/24 (b) | | 1,650,000 | 1,680,938 |
| BellSouth Capital Funding Corp. 7.875% 2/15/30 | | 40,000 | 50,158 |
| C&W Senior Financing Designated Activity Co. 6.875% 9/15/27 (b) | | 820,000 | 846,650 |
| Colombia Telecomunicaciones SA 5.375% 9/27/22 (b) | | 415,000 | 420,814 |
| Frontier Communications Corp.: | | | |
| 10.5% 9/15/22 | | 3,770,000 | 3,218,638 |
| 11% 9/15/25 | | 6,400,000 | 5,016,000 |
| GTH Finance BV: | | | |
| 6.25% 4/26/20 (b) | | 765,000 | 795,297 |
| 7.25% 4/26/23 (b) | | 3,985,000 | 4,356,514 |
| Sable International Finance Ltd. 6.875% 8/1/22 (b) | | 4,575,000 | 4,849,500 |
| SFR Group SA: | | | |
| 6% 5/15/22 (b) | | 4,550,000 | 4,419,188 |
| 6.25% 5/15/24 (b) | | 3,140,000 | 2,924,125 |
| 7.375% 5/1/26 (b) | | 2,380,000 | 2,297,414 |
| TalkTalk Telecom Group PLC 5.375% 1/15/22 (Reg. S) | GBP | 560,000 | 759,326 |
| TDC A/S 3.5% 2/26/3015 (Reg. S) (d) | EUR | 2,546,000 | 3,124,757 |
| Telecom Italia Capital SA: | | | |
| 6% 9/30/34 | | 3,775,000 | 3,954,313 |
| 6.375% 11/15/33 | | 3,785,000 | 4,144,575 |
| Telefonica Celular del Paraguay SA 6.75% 12/13/22 (b) | | 1,650,000 | 1,688,313 |
| Telenet Finance Luxembourg Notes SARL 5.5% 3/1/28 (b) | | 4,400,000 | 4,246,000 |
| Verizon Communications, Inc.: | | | |
| 2.625% 2/21/20 | | 12,550,000 | 12,524,355 |
| 5.012% 4/15/49 | | 2,831,000 | 2,872,802 |
| 5.012% 8/21/54 | | 55,038,000 | 54,518,791 |
| 5.5% 3/16/47 | | 36,099,000 | 39,437,400 |
| | | | 301,757,319 |
| Wireless Telecommunication Services - 0.2% | | | |
| America Movil S.A.B. de CV 3.125% 7/16/22 | | 9,218,000 | 9,126,244 |
| Comcel Trust 6.875% 2/6/24 (b) | | 2,525,000 | 2,641,781 |
| Digicel Group Ltd. 6.75% 3/1/23 (b) | | 560,000 | 521,500 |
| Millicom International Cellular SA 6% 3/15/25 (b) | | 1,375,000 | 1,445,469 |
| MTN (Mauritius) Investments Ltd. 6.5% 10/13/26 (b) | | 1,095,000 | 1,164,095 |
| Sprint Communications, Inc.: | | | |
| 6% 11/15/22 | | 3,685,000 | 3,638,938 |
| 9% 11/15/18 (b) | | 2,225,000 | 2,308,438 |
| Sprint Corp.: | | | |
| 7.25% 9/15/21 | | 4,240,000 | 4,425,500 |
| 7.875% 9/15/23 | | 3,925,000 | 4,062,375 |
| T-Mobile U.S.A., Inc.: | | | |
| 4% 4/15/22 | | 5,110,000 | 5,110,000 |
| 4.5% 2/1/26 | | 4,055,000 | 3,978,969 |
| 4.75% 2/1/28 | | 2,705,000 | 2,638,403 |
| 6.375% 3/1/25 | | 4,860,000 | 5,127,300 |
| 6.5% 1/15/24 | | 6,085,000 | 6,374,038 |
| 6.625% 4/1/23 | | 6,440,000 | 6,667,976 |
| TBG Global Pte. Ltd. 5.25% 2/10/22 (Reg. S) | | 485,000 | 491,173 |
| | | | 59,722,199 |
| TOTAL TELECOMMUNICATION SERVICES | | | 361,479,518 |
| UTILITIES - 1.9% | | | |
| Electric Utilities - 1.0% | | | |
| American Electric Power Co., Inc. 2.95% 12/15/22 | | 4,935,000 | 4,873,965 |
| DPL, Inc. 6.75% 10/1/19 | | 2,490,000 | 2,614,500 |
| Duquesne Light Holdings, Inc.: | | | |
| 5.9% 12/1/21 (b) | | 29,344,000 | 31,933,444 |
| 6.4% 9/15/20 (b) | | 25,897,000 | 27,907,767 |
| Eversource Energy: | | | |
| 1.45% 5/1/18 | | 3,325,000 | 3,320,549 |
| 2.8% 5/1/23 | | 15,104,000 | 14,654,761 |
| Exelon Corp. 2.85% 6/15/20 | | 4,888,000 | 4,867,506 |
| FirstEnergy Corp.: | | | |
| 4.25% 3/15/23 | | 31,243,000 | 32,155,907 |
| 7.375% 11/15/31 | | 64,123,000 | 84,546,095 |
| FirstEnergy Solutions Corp. 6.05% 8/15/21 | | 20,194,000 | 7,269,840 |
| InterGen NV 7% 6/30/23 (b) | | 3,595,000 | 3,586,013 |
| IPALCO Enterprises, Inc.: | | | |
| 3.45% 7/15/20 | | 27,495,000 | 27,566,762 |
| 3.7% 9/1/24 | | 10,462,000 | 10,230,945 |
| Israel Electric Corp. Ltd.: | | | |
| 4.25% 8/14/28 (b) | | 650,000 | 639,444 |
| 7.75% 12/15/27 (Reg. S) | | 600,000 | 750,588 |
| LG&E and KU Energy LLC 3.75% 11/15/20 | | 1,450,000 | 1,475,957 |
| Monongahela Power Co. 4.1% 4/15/24 (b) | | 3,982,000 | 4,148,208 |
| Nevada Power Co. 6.5% 5/15/18 | | 790,000 | 796,981 |
| NRG Yield Operating LLC 5% 9/15/26 | | 3,945,000 | 3,875,489 |
| NSG Holdings II LLC/NSG Holdings, Inc. 7.75% 12/15/25 (b) | | 8,306,803 | 9,095,950 |
| NV Energy, Inc. 6.25% 11/15/20 | | 3,500,000 | 3,797,990 |
| Pampa Holding SA 7.5% 1/24/27 (b) | | 885,000 | 927,038 |
| PG&E Corp. 2.4% 3/1/19 | | 1,683,000 | 1,673,096 |
| PPL Capital Funding, Inc. 3.4% 6/1/23 | | 7,184,000 | 7,174,954 |
| Progress Energy, Inc. 4.4% 1/15/21 | | 12,059,000 | 12,455,957 |
| TECO Finance, Inc. 5.15% 3/15/20 | | 3,761,000 | 3,911,278 |
| | | | 306,250,984 |
| Gas Utilities - 0.0% | | | |
| Southern Natural Gas Co./Southern Natural Issuing Corp. 4.4% 6/15/21 | | 3,646,000 | 3,777,809 |
| Independent Power and Renewable Electricity Producers - 0.4% | | | |
| Dolphin Subsidiary II, Inc. 7.25% 10/15/21 | | 67,644,000 | 73,731,960 |
| Dynegy, Inc.: | | | |
| 7.625% 11/1/24 | | 5,590,000 | 6,009,250 |
| 8.125% 1/30/26 (b) | | 3,095,000 | 3,389,025 |
| Emera U.S. Finance LP: | | | |
| 2.15% 6/15/19 | | 5,136,000 | 5,086,774 |
| 2.7% 6/15/21 | | 5,055,000 | 4,959,612 |
| 3.55% 6/15/26 | | 8,087,000 | 7,785,420 |
| Listrindo Capital BV 4.95% 9/14/26 (b) | | 620,000 | 600,656 |
| NextEra Energy Partners LP: | | | |
| 4.25% 9/15/24 (b) | | 1,345,000 | 1,326,506 |
| 4.5% 9/15/27 (b) | | 935,000 | 899,938 |
| NRG Energy, Inc.: | | | |
| 5.75% 1/15/28 (b) | | 2,250,000 | 2,221,425 |
| 6.25% 5/1/24 | | 4,510,000 | 4,667,850 |
| 6.625% 1/15/27 | | 1,695,000 | 1,750,088 |
| TerraForm Power Operating LLC: | | | |
| 4.25% 1/31/23 (b) | | 1,040,000 | 1,019,200 |
| 5% 1/31/28 (b) | | 1,040,000 | 1,006,512 |
| The AES Corp.: | | | |
| 4.875% 5/15/23 | | 9,515,000 | 9,598,256 |
| 5.125% 9/1/27 | | 7,280,000 | 7,371,000 |
| 6% 5/15/26 | | 1,545,000 | 1,622,250 |
| Three Gorges Finance II (Cayman Islands) Ltd. 1.3% 6/21/24 (Reg. S) | EUR | 2,500,000 | 3,056,527 |
| | | | 136,102,249 |
| Multi-Utilities - 0.5% | | | |
| Berkshire Hathaway Energy Co. 2% 11/15/18 | | 12,172,000 | 12,143,958 |
| Dominion Resources, Inc.: | | | |
| 3 month U.S. LIBOR + 2.300% 3.9934% 9/30/66 (d)(e) | | 35,229,000 | 33,203,333 |
| 3 month U.S. LIBOR + 2.825% 4.5197% 6/30/66 (d)(e) | | 10,345,000 | 10,241,550 |
| NiSource Finance Corp.: | | | |
| 5.25% 2/15/43 | | 12,739,000 | 14,367,445 |
| 5.8% 2/1/42 | | 6,336,000 | 7,447,128 |
| 5.95% 6/15/41 | | 11,832,000 | 14,391,344 |
| 6.8% 1/15/19 | | 1,039,000 | 1,074,693 |
| Puget Energy, Inc.: | | | |
| 6% 9/1/21 | | 15,565,000 | 16,946,165 |
| 6.5% 12/15/20 | | 5,125,000 | 5,609,213 |
| Sempra Energy: | | | |
| 2.875% 10/1/22 | | 5,760,000 | 5,661,800 |
| 6% 10/15/39 | | 15,009,000 | 18,503,866 |
| Wind Tre SpA: | | | |
| 3.125% 1/20/25 (Reg. S) | EUR | 1,177,000 | 1,281,576 |
| 5% 1/20/26 (b) | | 6,960,000 | 5,988,384 |
| Wisconsin Energy Corp. 3 month U.S. LIBOR + 2.113% 3.9513% 5/15/67 (d)(e) | | 3,860,000 | 3,763,500 |
| | | | 150,623,955 |
| Water Utilities - 0.0% | | | |
| Pennon Group PLC 2.875% (Reg. S) (c)(d) | GBP | 2,375,000 | 3,281,924 |
| TOTAL UTILITIES | | | 600,036,921 |
|
| TOTAL NONCONVERTIBLE BONDS | | | 9,561,105,751 |
|
| TOTAL CORPORATE BONDS | | | |
| (Cost $9,434,844,883) | | | 9,576,664,814 |
|
| U.S. Government and Government Agency Obligations - 41.1% | | | |
| U.S. Treasury Inflation-Protected Obligations - 7.2% | | | |
| U.S. Treasury Inflation-Indexed Bonds: | | | |
| 0.75% 2/15/45 | | $235,550,250 | $222,752,230 |
| 0.875% 2/15/47 | | 170,775,097 | 166,030,818 |
| 1% 2/15/46 | | 147,095,993 | 147,775,144 |
| 1.375% 2/15/44 | | 140,134,694 | 153,090,944 |
| U.S. Treasury Inflation-Indexed Notes: | | | |
| 0.125% 7/15/24 | | 171,581,004 | 166,981,046 |
| 0.125% 7/15/26 | | 197,567,166 | 188,704,094 |
| 0.25% 1/15/25 | | 78,062,250 | 75,975,464 |
| 0.375% 7/15/25 | | 412,385,136 | 404,947,621 |
| 0.375% 1/15/27 | | 404,607,253 | 391,944,500 |
| 0.375% 7/15/27 | | 151,168,500 | 146,554,982 |
| 0.625% 1/15/26 | | 207,502,000 | 206,393,581 |
|
| TOTAL U.S. TREASURY INFLATION-PROTECTED OBLIGATIONS | | | 2,271,150,424 |
|
| U.S. Treasury Obligations - 33.9% | | | |
| U.S. Treasury Bonds: | | | |
| 2.5% 2/15/45 | | 2,580,000 | 2,284,812 |
| 2.5% 2/15/46 | | 2,072,000 | 1,828,135 |
| 2.75% 11/15/47 | | 286,780,000 | 265,697,191 |
| 3% 5/15/45 | | 145,382,000 | 142,048,436 |
| 3% 11/15/45 | | 207,323,000 | 202,431,473 |
| 3% 2/15/47 | | 658,626,000 | 642,237,534 |
| 3% 5/15/47 | | 103,797,000 | 101,169,638 |
| 3% 2/15/48 | | 6,295,000 | 6,139,838 |
| 5% 5/15/37 | | 620,000 | 800,866 |
| U.S. Treasury Notes: | | | |
| 0.75% 8/31/18 | | 5,500,000 | 5,468,203 |
| 1.125% 6/30/21 | | 1,125,000 | 1,076,045 |
| 1.25% 3/31/21 | | 1,180,775,000 | 1,138,894,387 |
| 1.25% 10/31/21 | | 453,470,000 | 433,187,847 |
| 1.375% 4/30/21 | | 334,800,000 | 323,735,905 |
| 1.5% 5/15/20 | | 308,760,000 | 303,368,760 |
| 1.5% 8/15/26 | | 218,742,000 | 196,320,945 |
| 1.625% 7/31/20 | | 7,093,000 | 6,973,583 |
| 1.625% 5/15/26 | | 25,000,000 | 22,750,000 |
| 1.75% 12/31/20 | | 600,000,000 | 589,265,628 |
| 1.75% 6/30/22 | | 952,845,000 | 919,458,207 |
| 1.875% 3/31/22 | | 1,455,761,000 | 1,415,841,204 |
| 1.875% 7/31/22 | | 903,426,000 | 875,476,258 |
| 1.875% 9/30/22 | | 67,650,000 | 65,448,733 |
| 2% 12/31/21 | | 906,934,000 | 888,511,903 |
| 2% 4/30/24 | | 25,000,000 | 23,928,711 |
| 2% 11/15/26 | | 11,480,000 | 10,706,894 |
| 2.125% 12/31/22 | | 368,686,000 | 360,001,716 |
| 2.125% 7/31/24 | | 649,329,000 | 624,700,152 |
| 2.125% 11/30/24 | | 424,340,000 | 406,918,853 |
| 2.25% 12/31/24 | | 618,783,000 | 597,778,219 |
| 2.25% 11/15/27 | | 192,640,000 | 182,278,075 |
|
| TOTAL U.S. TREASURY OBLIGATIONS | | | 10,756,728,151 |
|
| TOTAL U.S. GOVERNMENT AND GOVERNMENT AGENCY OBLIGATIONS | | | |
| (Cost $13,434,640,595) | | | 13,027,878,575 |
|
| U.S. Government Agency - Mortgage Securities - 17.3% | | | |
| Fannie Mae - 9.3% | | | |
| 12 month U.S. LIBOR + 1.445% 3.195% 4/1/37 (d)(e) | | 57,322 | 59,348 |
| 12 month U.S. LIBOR + 1.480% 3.312% 7/1/34 (d)(e) | | 26,487 | 27,427 |
| 12 month U.S. LIBOR + 1.495% 3.19% 1/1/35 (d)(e) | | 91,196 | 94,246 |
| 12 month U.S. LIBOR + 1.507% 3.2% 7/1/37 (d)(e) | | 16,188 | 16,790 |
| 12 month U.S. LIBOR + 1.553% 3.326% 6/1/36 (d)(e) | | 71,760 | 74,659 |
| 12 month U.S. LIBOR + 1.565% 3.315% 3/1/37 (d)(e) | | 24,859 | 25,827 |
| 12 month U.S. LIBOR + 1.594% 3.448% 5/1/36 (d)(e) | | 118,256 | 124,151 |
| 12 month U.S. LIBOR + 1.617% 3.327% 3/1/33 (d)(e) | | 62,037 | 64,355 |
| 12 month U.S. LIBOR + 1.641% 3.366% 9/1/36 (d)(e) | | 47,641 | 49,611 |
| 12 month U.S. LIBOR + 1.643% 3.315% 9/1/36 (d)(e) | | 32,237 | 33,517 |
| 12 month U.S. LIBOR + 1.645% 3.395% 6/1/47 (d)(e) | | 50,199 | 51,651 |
| 12 month U.S. LIBOR + 1.718% 3.429% 5/1/35 (d)(e) | | 147,194 | 153,272 |
| 12 month U.S. LIBOR + 1.725% 2.592% 6/1/42 (d)(e) | | 192,623 | 198,344 |
| 12 month U.S. LIBOR + 1.728% 3.445% 11/1/36 (d)(e) | | 48,021 | 50,608 |
| 12 month U.S. LIBOR + 1.741% 3.477% 3/1/40 (d)(e) | | 232,578 | 239,535 |
| 12 month U.S. LIBOR + 1.745% 3.448% 7/1/35 (d)(e) | | 59,048 | 60,719 |
| 12 month U.S. LIBOR + 1.750% 3.008% 8/1/41 (d)(e) | | 530,575 | 553,037 |
| 12 month U.S. LIBOR + 1.788% 3.444% 2/1/36 (d)(e) | | 180,231 | 185,591 |
| 12 month U.S. LIBOR + 1.800% 2.747% 1/1/42 (d)(e) | | 867,076 | 900,051 |
| 12 month U.S. LIBOR + 1.800% 3.573% 7/1/41 (d)(e) | | 173,614 | 182,989 |
| 12 month U.S. LIBOR + 1.810% 3.56% 12/1/39 (d)(e) | | 102,932 | 106,164 |
| 12 month U.S. LIBOR + 1.812% 3.562% 12/1/40 (d)(e) | | 5,892,241 | 6,164,575 |
| 12 month U.S. LIBOR + 1.818% 2.689% 2/1/42 (d)(e) | | 960,348 | 995,460 |
| 12 month U.S. LIBOR + 1.818% 3.016% 9/1/41 (d)(e) | | 100,102 | 103,184 |
| 12 month U.S. LIBOR + 1.818% 3.266% 7/1/41 (d)(e) | | 133,064 | 139,676 |
| 12 month U.S. LIBOR + 1.820% 3.695% 12/1/35 (d)(e) | | 193,062 | 202,327 |
| 12 month U.S. LIBOR + 1.830% 3.337% 10/1/41 (d)(e) | | 92,702 | 97,541 |
| 12 month U.S. LIBOR + 1.851% 3.518% 5/1/36 (d)(e) | | 68,918 | 71,209 |
| 12 month U.S. LIBOR + 1.900% 3.745% 7/1/37 (d)(e) | | 65,866 | 69,503 |
| 6 month U.S. LIBOR + 1.375% 2.875% 10/1/34 (d)(e) | | 1,269 | 1,310 |
| 6 month U.S. LIBOR + 1.475% 2.975% 10/1/33 (d)(e) | | 1,193 | 1,220 |
| 6 month U.S. LIBOR + 1.505% 3.031% 1/1/35 (d)(e) | | 172,936 | 177,592 |
| 6 month U.S. LIBOR + 1.510% 3.043% 2/1/33 (d)(e) | | 754 | 773 |
| 6 month U.S. LIBOR + 1.535% 2.938% 12/1/34 (d)(e) | | 30,703 | 31,548 |
| 6 month U.S. LIBOR + 1.535% 2.958% 3/1/35 (d)(e) | | 15,249 | 15,675 |
| 6 month U.S. LIBOR + 1.556% 3.046% 10/1/33 (d)(e) | | 11,644 | 11,981 |
| 6 month U.S. LIBOR + 1.565% 2.999% 7/1/35 (d)(e) | | 13,963 | 14,229 |
| 6 month U.S. LIBOR + 1.740% 3.316% 12/1/34 (d)(e) | | 3,625 | 3,781 |
| 6 month U.S. LIBOR + 1.960% 3.46% 9/1/35 (d)(e) | | 25,281 | 26,425 |
| U.S. TREASURY 1 YEAR INDEX + 1.945% 3.078% 10/1/33 (d)(e) | | 266,874 | 277,548 |
| U.S. TREASURY 1 YEAR INDEX + 2.208% 3.083% 3/1/35 (d)(e) | | 36,397 | 38,425 |
| U.S. TREASURY 1 YEAR INDEX + 2.270% 3.417% 6/1/36 (d)(e) | | 198,941 | 210,123 |
| U.S. TREASURY 1 YEAR INDEX + 2.295% 3.54% 10/1/33 (d)(e) | | 65,978 | 69,171 |
| U.S. TREASURY 1 YEAR INDEX + 2.447% 3.537% 7/1/34 (d)(e) | | 146,287 | 155,040 |
| 2.5% 10/1/30 to 8/1/43 | | 16,402,207 | 15,519,614 |
| 3% 3/1/25 to 2/1/47 | | 516,078,142 | 505,824,549 |
| 3% 3/1/33 (h) | | 53,050,000 | 52,820,294 |
| 3% 3/1/33 (h) | | 300,000 | 298,701 |
| 3% 3/1/33 (h) | | 14,900,000 | 14,835,483 |
| 3% 3/1/33 (h) | | 5,950,000 | 5,924,237 |
| 3% 3/1/33 (h) | | 22,600,000 | 22,502,142 |
| 3% 3/1/33 (h) | | 19,150,000 | 19,067,081 |
| 3% 3/1/33 (h) | | 113,700,000 | 113,207,679 |
| 3% 3/1/48 (h) | | 104,500,000 | 101,264,262 |
| 3% 3/1/48 (h) | | 61,600,000 | 59,692,618 |
| 3% 3/1/48 (h) | | 20,650,000 | 20,010,593 |
| 3.5% 3/1/25 to 10/1/56 | | 561,317,484 | 564,176,613 |
| 3.5% 3/1/48 (h) | | 160,000,000 | 159,707,536 |
| 3.5% 3/1/48 (h) | | 65,000,000 | 64,881,187 |
| 3.5% 3/1/48 (h) | | 28,200,000 | 28,148,453 |
| 3.5% 3/1/48 (h) | | 28,300,000 | 28,248,270 |
| 4% 9/1/24 to 10/1/46 | | 287,421,828 | 296,615,672 |
| 4% 3/1/48 (h) | | 50,400,000 | 51,628,500 |
| 4% 3/1/48 (h) | | 35,900,000 | 36,775,063 |
| 4% 3/1/48 (h) | | 38,500,000 | 39,438,438 |
| 4% 3/1/48 (h) | | 48,800,000 | 49,989,500 |
| 4% 3/1/48 (h) | | 46,950,000 | 48,094,406 |
| 4% 4/1/48 (h) | | 209,550,000 | 214,313,994 |
| 4.5% 6/1/33 to 8/1/56 | | 100,514,826 | 106,184,227 |
| 5% 3/1/18 to 8/1/56 | | 191,611,636 | 206,461,512 |
| 5.255% 8/1/41 | | 2,143,800 | 2,288,457 |
| 5.5% 3/1/18 to 5/1/44 | | 47,510,497 | 52,238,933 |
| 6% 7/1/19 to 1/1/42 | | 14,941,359 | 16,603,106 |
| 6.309% 2/1/39 | | 3,384,349 | 3,666,765 |
| 6.5% 4/1/18 to 8/1/39 | | 24,608,047 | 27,513,965 |
| 7% 9/1/21 to 7/1/37 | | 1,112,620 | 1,251,831 |
| 7.5% 6/1/25 to 2/1/32 | | 494,154 | 560,331 |
| 8% 7/1/29 to 3/1/37 | | 11,952 | 14,060 |
| 8.5% 12/1/19 to 6/1/22 | | 238 | 256 |
| 9.5% 6/1/18 to 9/1/21 | | 1,963 | 2,015 |
|
| TOTAL FANNIE MAE | | | 2,941,900,551 |
|
| Freddie Mac - 3.5% | | | |
| 12 month U.S. LIBOR + 1.325% 3.075% 1/1/36 (d)(e) | | 50,771 | 52,078 |
| 12 month U.S. LIBOR + 1.325% 3.075% 3/1/37 (d)(e) | | 16,145 | 16,560 |
| 12 month U.S. LIBOR + 1.375% 3.117% 3/1/36 (d)(e) | | 133,564 | 137,343 |
| 12 month U.S. LIBOR + 1.500% 3.208% 3/1/36 (d)(e) | | 111,865 | 114,281 |
| 12 month U.S. LIBOR + 1.515% 3.265% 11/1/35 (d)(e) | | 40,692 | 41,531 |
| 12 month U.S. LIBOR + 1.750% 3.25% 7/1/41 (d)(e) | | 727,883 | 763,143 |
| 12 month U.S. LIBOR + 1.750% 3.497% 12/1/40 (d)(e) | | 3,090,034 | 3,213,591 |
| 12 month U.S. LIBOR + 1.754% 3.067% 9/1/41 (d)(e) | | 980,120 | 1,025,593 |
| 12 month U.S. LIBOR + 1.793% 3.543% 4/1/37 (d)(e) | | 35,447 | 37,051 |
| 12 month U.S. LIBOR + 1.864% 3.614% 4/1/36 (d)(e) | | 79,634 | 83,578 |
| 12 month U.S. LIBOR + 1.874% 3.634% 10/1/42 (d)(e) | | 878,243 | 918,355 |
| 12 month U.S. LIBOR + 1.877% 3.213% 4/1/41 (d)(e) | | 87,546 | 90,486 |
| 12 month U.S. LIBOR + 1.880% 3.206% 9/1/41 (d)(e) | | 105,106 | 108,231 |
| 12 month U.S. LIBOR + 1.910% 3.278% 6/1/41 (d)(e) | | 107,222 | 112,599 |
| 12 month U.S. LIBOR + 1.910% 3.417% 5/1/41 (d)(e) | | 105,912 | 111,701 |
| 12 month U.S. LIBOR + 1.910% 3.579% 5/1/41 (d)(e) | | 145,204 | 152,789 |
| 12 month U.S. LIBOR + 1.910% 3.677% 6/1/41 (d)(e) | | 133,770 | 140,688 |
| 12 month U.S. LIBOR + 1.920% 3.67% 6/1/36 (d)(e) | | 20,217 | 21,243 |
| 12 month U.S. LIBOR + 1.993% 5.14% 4/1/38 (d)(e) | | 108,684 | 113,821 |
| 12 month U.S. LIBOR + 2.045% 3.811% 7/1/36 (d)(e) | | 56,271 | 59,437 |
| 12 month U.S. LIBOR + 2.197% 3.771% 3/1/33 (d)(e) | | 1,763 | 1,845 |
| 12 month U.S. LIBOR + 2.200% 3.95% 12/1/36 (d)(e) | | 109,608 | 115,874 |
| 6 month U.S. LIBOR + 1.125% 2.7% 8/1/37 (d)(e) | | 33,351 | 33,672 |
| 6 month U.S. LIBOR + 1.445% 2.945% 3/1/35 (d)(e) | | 35,982 | 36,725 |
| 6 month U.S. LIBOR + 1.608% 3.08% 12/1/35 (d)(e) | | 51,068 | 51,997 |
| 6 month U.S. LIBOR + 1.647% 3.221% 2/1/37 (d)(e) | | 135,025 | 139,367 |
| 6 month U.S. LIBOR + 1.675% 3.175% 6/1/37 (d)(e) | | 27,891 | 28,844 |
| 6 month U.S. LIBOR + 1.720% 3.15% 8/1/37 (d)(e) | | 51,577 | 53,386 |
| 6 month U.S. LIBOR + 1.746% 3.092% 5/1/37 (d)(e) | | 25,712 | 26,505 |
| 6 month U.S. LIBOR + 1.932% 3.297% 10/1/36 (d)(e) | | 176,456 | 180,869 |
| 6 month U.S. LIBOR + 1.976% 3.448% 10/1/35 (d)(e) | | 115,732 | 120,480 |
| 6 month U.S. LIBOR + 2.010% 3.51% 6/1/37 (d)(e) | | 23,362 | 24,416 |
| 6 month U.S. LIBOR + 2.040% 3.629% 6/1/37 (d)(e) | | 59,218 | 60,987 |
| 6 month U.S. LIBOR + 2.066% 3.544% 6/1/37 (d)(e) | | 38,687 | 40,521 |
| 6 month U.S. LIBOR + 2.755% 4.273% 10/1/35 (d)(e) | | 104,174 | 110,535 |
| U.S. TREASURY 1 YEAR INDEX + 2.035% 2.913% 6/1/33 (d)(e) | | 158,203 | 164,375 |
| U.S. TREASURY 1 YEAR INDEX + 2.267% 3.206% 6/1/33 (d)(e) | | 385,186 | 405,829 |
| U.S. TREASURY 1 YEAR INDEX + 2.418% 3.504% 3/1/35 (d)(e) | | 682,639 | 722,353 |
| 2.5% 7/1/31 | | 5,924,413 | 5,797,870 |
| 3% 2/1/32 to 2/1/47 | | 338,275,274 | 329,521,047 |
| 3.5% 1/1/32 to 12/1/47 (i)(j) | | 436,480,964 | 439,772,691 |
| 4% 7/1/31 to 6/1/47 | | 258,301,031 | 266,777,186 |
| 4% 3/1/48 (h) | | 2,600,000 | 2,663,883 |
| 4% 4/1/48 (h) | | 2,600,000 | 2,659,516 |
| 4.5% 6/1/25 to 1/1/45 | | 19,604,402 | 20,724,478 |
| 5% 6/1/20 to 7/1/41 | | 20,258,374 | 21,993,052 |
| 5.5% 5/1/18 to 3/1/41 | | 7,251,310 | 7,944,920 |
| 6% 2/1/19 to 12/1/37 | | 2,148,459 | 2,390,234 |
| 6.5% 7/1/21 to 9/1/39 | | 2,857,924 | 3,186,375 |
| 7% 6/1/21 to 9/1/36 | | 1,024,971 | 1,158,406 |
| 7.5% 1/1/27 to 4/1/32 | | 20,753 | 23,687 |
| 8% 7/1/24 to 1/1/37 | | 32,544 | 37,693 |
| 8.5% 9/1/19 to 1/1/28 | | 26,254 | 29,697 |
| 9% 10/1/20 | | 15 | 15 |
| 9.5% 5/1/21 to 7/1/21 | | 49 | 50 |
| 10% 2/1/20 to 11/1/20 | | 37 | 38 |
| 11% 7/1/19 to 9/1/20 | | 9 | 9 |
|
| TOTAL FREDDIE MAC | | | 1,114,313,526 |
|
| Ginnie Mae - 4.5% | | | |
| 3.5% 11/15/40 to 1/20/48 (i) | | 484,398,444 | 488,569,302 |
| 4% 5/20/33 to 1/20/48 | | 224,931,348 | 232,269,709 |
| 4.5% 6/20/33 to 8/15/41 | | 49,492,705 | 52,345,120 |
| 5% 12/15/32 to 9/15/41 | | 21,398,365 | 23,176,185 |
| 5.5% 7/15/33 to 9/15/39 | | 1,717,440 | 1,899,194 |
| 6% 10/15/30 to 11/15/39 | | 506,328 | 566,281 |
| 7% 10/15/22 to 3/15/33 | | 1,028,721 | 1,176,827 |
| 7.5% 11/15/21 to 9/15/31 | | 445,573 | 500,838 |
| 8% 11/15/21 to 11/15/29 | | 137,933 | 153,708 |
| 8.5% 10/15/21 to 1/15/31 | | 27,151 | 31,283 |
| 9% 9/15/19 to 1/15/23 | | 619 | 655 |
| 9.5% 12/15/20 to 3/15/23 | | 240 | 254 |
| 3% 5/20/42 to 4/20/47 | | 286,127,066 | 280,452,210 |
| 3% 3/1/48 (h) | | 79,550,000 | 77,783,330 |
| 3.5% 3/1/48 (h) | | 60,000,000 | 60,344,262 |
| 3.5% 3/1/48 (h) | | 50,350,000 | 50,638,893 |
| 4.5% 3/1/48 (h) | | 73,700,000 | 76,658,016 |
| 4.5% 4/1/48 (h) | | 34,500,000 | 35,842,913 |
| 4.5% 4/1/48 (h) | | 39,200,000 | 40,725,860 |
| 6.5% 3/20/31 to 6/15/37 | | 308,162 | 349,598 |
| 11% 9/20/19 | | 211 | 220 |
|
| TOTAL GINNIE MAE | | | 1,423,484,658 |
|
| TOTAL U.S. GOVERNMENT AGENCY - MORTGAGE SECURITIES | | | |
| (Cost $5,596,425,522) | | | 5,479,698,735 |
|
| Asset-Backed Securities - 1.0% | | | |
| AASET Trust Series 2018-1A Class A, 3.844% 1/16/38 (b) | | $23,934,703 | $23,934,667 |
| Accredited Mortgage Loan Trust Series 2005-1 Class M1, 1 month U.S. LIBOR + 0.705% 2.3257% 4/25/35 (d)(e) | | 664,344 | 669,584 |
| ACE Securities Corp. Home Equity Loan Trust Series 2004-HE1 Class M2, 1 month U.S. LIBOR + 1.650% 3.2707% 3/25/34 (d)(e) | | 183,174 | 187,121 |
| Airspeed Ltd. Series 2007-1A Class C1, 1 month U.S. LIBOR + 2.500% 4.0875% 6/15/32 (b)(d)(e)(g) | | 2,769,731 | 1,693,181 |
| American Homes 4 Rent: | | | |
| Series 2014-SFR2 Class E, 6.231% 10/17/36 (b) | | 147,000 | 163,015 |
| Series 2014-SFR3 Class E, 6.418% 12/17/36 (b) | | 428,000 | 481,091 |
| Series 2015-SFR1 Class E, 5.639% 4/17/52 (b) | | 599,438 | 646,295 |
| Series 2015-SFR2: | | | |
| Class E, 6.07% 10/17/45 (b) | | 981,000 | 1,086,515 |
| Class XS, 0% 10/17/45 (b)(d)(g)(k) | | 683,519 | 7 |
| Ameriquest Mortgage Securities, Inc. pass-thru certificates: | | | |
| Series 2003-10 Class M1, 1 month U.S. LIBOR + 1.050% 2.6707% 12/25/33 (d)(e) | | 31,366 | 31,126 |
| Series 2004-R2 Class M3, 1 month U.S. LIBOR + 0.825% 2.4457% 4/25/34 (d)(e) | | 89,819 | 84,198 |
| Argent Securities, Inc. pass-thru certificates: | | | |
| Series 2003-W7 Class A2, 1 month U.S. LIBOR + 0.780% 2.4007% 3/25/34 (d)(e) | | 46,970 | 45,958 |
| Series 2004-W11 Class M2, 1 month U.S. LIBOR + 1.050% 2.6707% 11/25/34 (d)(e) | | 410,612 | 417,519 |
| Series 2004-W7 Class M1, 1 month U.S. LIBOR + 0.825% 2.4457% 5/25/34 (d)(e) | | 1,122,875 | 1,152,384 |
| Series 2006-W4 Class A2C, 1 month U.S. LIBOR + 0.160% 1.7807% 5/25/36 (d)(e) | | 1,071,115 | 411,785 |
| Asset Backed Securities Corp. Home Equity Loan Trust: | | | |
| Series 2004-HE2 Class M1, 1 month U.S. LIBOR + 0.825% 2.3864% 4/25/34 (d)(e) | | 1,297,829 | 1,270,811 |
| Series 2006-HE2 Class M1, 1 month U.S. LIBOR + 0.370% 1.9907% 3/25/36 (d)(e) | | 18,318 | 7,512 |
| Avis Budget Rental Car Funding (AESOP) LLC Series 2012-3A Class A, 2.1% 3/20/19 (b) | | 1,533,333 | 1,533,339 |
| Blackbird Capital Aircraft Series 2016-1A: | | | |
| Class A, 4.213% 12/16/41 (b) | | 43,010,344 | 43,867,153 |
| Class AA, 4.213% 12/16/41 (b) | | 9,591,688 | 9,398,289 |
| CAM Mortgage Trust Series 2017-1 Class A1, 3.22% 8/1/57 (b) | | 13,098,454 | 13,041,169 |
| Carrington Mortgage Loan Trust Series 2007-RFC1 Class A3, 1 month U.S. LIBOR + 0.140% 1.7607% 12/25/36 (d)(e) | | 1,802,588 | 1,520,964 |
| Citi Mortgage Loan Trust Series 2007-1 Class 1A, 1 month U.S. LIBOR + 1.350% 2.9707% 10/25/37 (b)(d)(e) | | 18,204,215 | 18,294,648 |
| CLUB Credit Trust: | | | |
| Series 2017-NP1 Class A, 2.39% 4/17/23 (b) | | 1,344,227 | 1,344,431 |
| Series 2017-P1 Class A, 2.54% 9/15/23 (b) | | 3,746,443 | 3,740,405 |
| Consumer Loan Underlying Bond Credit Trust Series 2017-NP2 Class A, 2.55% 1/16/24 (b) | | 13,362,853 | 13,359,476 |
| Countrywide Home Loans, Inc.: | | | |
| Series 2003-BC1 Class B1, 1 month U.S. LIBOR + 5.250% 6.8707% 3/25/32 (d)(e) | | 3,192 | 3,334 |
| Series 2004-3 Class M4, 1 month U.S. LIBOR + 1.455% 3.0757% 4/25/34 (d)(e) | | 51,103 | 49,095 |
| Series 2004-4 Class M2, 1 month U.S. LIBOR + 0.795% 2.4157% 6/25/34 (d)(e) | | 73,864 | 74,749 |
| Series 2004-7 Class AF5, 5.868% 1/25/35 | | 962,875 | 973,246 |
| Series 2005-3 Class MV4, 1 month U.S. LIBOR + 0.620% 2.5507% 8/25/35 (d)(e) | | 1,781,294 | 1,786,150 |
| Credit Suisse First Boston Mortgage Securities Corp. Series 2003-5 Class A2, 1 month U.S. LIBOR + 0.700% 2.3207% 12/25/33 (d)(e) | | 32,929 | 32,411 |
| DB Master Finance LLC Series 2017-1A: | | | |
| Class A2I, 3.629% 11/20/47 (b) | | 17,324,580 | 17,138,329 |
| Class A2II, 4.03% 11/20/47 (b) | | 29,350,440 | 29,387,788 |
| Deutsche Financial Capital Securitization LLC Series 1997-I Class M, 7.275% 9/15/27 | | 141,639 | 145,054 |
| Exeter Automobile Receivables Trust Series 2017-2A Class A, 2.11% 6/15/21 (b) | | 9,680,635 | 9,657,838 |
| Fannie Mae Series 2004-T5 Class AB3, 1 month U.S. LIBOR + 0.392% 2.5147% 5/28/35 (d)(e) | | 38,916 | 37,768 |
| First Franklin Mortgage Loan Trust Series 2004-FF2 Class M3, 1 month U.S. LIBOR + 0.825% 2.4457% 3/25/34 (d)(e) | | 2,512 | 2,251 |
| Flagship Credit Auto Trust Series 2015-3 Class A, 2.38% 10/15/20 (b) | | 2,239,933 | 2,240,390 |
| Fremont Home Loan Trust Series 2005-A: | | | |
| Class M3, 1 month U.S. LIBOR + 0.735% 2.3557% 1/25/35 (d)(e) | | 948,695 | 941,524 |
| Class M4, 1 month U.S. LIBOR + 1.020% 2.6407% 1/25/35 (d)(e) | | 347,133 | 296,634 |
| GCO Education Loan Funding Master Trust II Series 2007-1A Class C1L, 3 month U.S. LIBOR + 0.380% 2.3236% 2/25/47 (b)(d)(e) | | 252,874 | 244,539 |
| GE Business Loan Trust Series 2006-2A: | | | |
| Class A, 1 month U.S. LIBOR + 0.180% 1.7675% 11/15/34 (b)(d)(e) | | 368,753 | 361,715 |
| Class B, 1 month U.S. LIBOR + 0.280% 1.8675% 11/15/34 (b)(d)(e) | | 133,205 | 130,477 |
| Class C, 1 month U.S. LIBOR + 0.380% 1.9675% 11/15/34 (b)(d)(e) | | 221,381 | 206,853 |
| Class D, 1 month U.S. LIBOR + 0.750% 2.3375% 11/15/34 (b)(d)(e) | | 84,065 | 77,373 |
| GSAMP Trust Series 2004-AR1 Class B4, 5.5% 6/25/34 (b) | | 75,390 | 6,715 |
| Home Equity Asset Trust: | | | |
| Series 2003-2 Class M1, 1 month U.S. LIBOR + 1.320% 2.9407% 8/25/33 (d)(e) | | 200,975 | 203,267 |
| Series 2003-3 Class M1, 1 month U.S. LIBOR + 1.290% 2.9107% 8/25/33 (d)(e) | | 311,943 | 314,423 |
| Home Partners of America Credit Trust Series 2017-1: | | | |
| Class E, 1 month U.S. LIBOR + 2.650% 4.24% 7/17/34 (b)(d)(e) | | 229,000 | 233,615 |
| Class F, 1 month U.S. LIBOR + 3.539% 5.129% 7/17/34 (b)(d)(e) | | 332,000 | 339,226 |
| HSI Asset Securitization Corp. Trust Series 2007-HE1 Class 2A3, 1 month U.S. LIBOR + 0.190% 1.8107% 1/25/37 (d)(e) | | 1,403,095 | 1,035,202 |
| Invitation Homes Trust: | | | |
| Series 2015-SFR2 Class E, 1 month U.S. LIBOR + 3.150% 4.74% 6/17/32 (b)(d)(e) | | 485,000 | 487,219 |
| Series 2015-SRF1 Class E, 1 month U.S. LIBOR + 4.300% 5.7832% 3/17/32 (b)(d)(e) | | 624,000 | 625,816 |
| Series 2017-SFR2: | | | |
| Class E, 1 month U.S. LIBOR + 2.250% 3.84% 12/17/36 (b)(d)(e) | | 525,000 | 534,967 |
| Class F, 1 month U.S. LIBOR + 3.000% 4.59% 12/17/36 (b)(d)(e) | | 441,000 | 449,967 |
| Series 2018-SFR1 Class F, 1 month U.S. LIBOR + 3.100% 4.611% 3/17/37 (b)(d)(e) | | 672,000 | 679,278 |
| Keycorp Student Loan Trust Series 2006-A Class 2C, 3 month U.S. LIBOR + 1.150% 2.8246% 3/27/42 (d)(e) | | 3,243,000 | 2,397,843 |
| Long Beach Mortgage Loan Trust Series 2006-10 Class 2A3, 1 month U.S. LIBOR + 0.160% 1.7807% 11/25/36 (d)(e) | | 3,853,089 | 1,779,838 |
| MASTR Asset Backed Securities Trust Series 2007-HE1 Class M1, 1 month U.S. LIBOR + 0.300% 1.9207% 5/25/37 (d)(e) | | 271,000 | 82,095 |
| Meritage Mortgage Loan Trust Series 2004-1 Class M1, 1 month U.S. LIBOR + 0.750% 2.3707% 7/25/34 (d)(e) | | 81,623 | 78,766 |
| Merrill Lynch Mortgage Investors Trust: | | | |
| Series 2003-OPT1 Class M1, 1 month U.S. LIBOR + 0.975% 2.5957% 7/25/34 (d)(e) | | 124,390 | 123,952 |
| Series 2006-FF1 Class M2, 1 month U.S. LIBOR + 0.290% 1.9107% 8/25/36 (d)(e) | | 12,490,396 | 12,489,083 |
| Series 2006-FM1 Class A2B, 1 month U.S. LIBOR + 0.110% 1.7307% 4/25/37 (d)(e) | | 2,687 | 1,658 |
| Series 2006-OPT1 Class A1A, 1 month U.S. LIBOR + 0.520% 2.1407% 6/25/35 (d)(e) | | 1,052,436 | 1,021,554 |
| Morgan Stanley ABS Capital I Trust: | | | |
| Series 2004-HE6 Class A2, 1 month U.S. LIBOR + 0.680% 2.3007% 8/25/34 (d)(e) | | 57,368 | 55,685 |
| Series 2004-NC6 Class M3, 1 month U.S. LIBOR + 2.175% 3.7957% 7/25/34 (d)(e) | | 11,965 | 11,842 |
| Series 2004-NC8 Class M6, 1 month U.S. LIBOR + 1.875% 3.4957% 9/25/34 (d)(e) | | 13,754 | 13,637 |
| Series 2005-NC1 Class M1, 1 month U.S. LIBOR + 0.660% 2.2807% 1/25/35 (d)(e) | | 101,204 | 97,345 |
| Series 2005-NC2 Class B1, 1 month U.S. LIBOR + 1.755% 3.3757% 3/25/35 (d)(e) | | 98,943 | 3,629 |
| Nationstar HECM Loan Trust: | | | |
| Series 2017-1A Class A, 1.9679% 5/25/27 (b) | | 15,338,071 | 15,274,709 |
| Series 2017-2A Class A1, 2.12% 9/25/27 (b) | | 24,276,718 | 24,186,700 |
| Navient Student Loan Trust Series 2017-3A Class A2, 1 month U.S. LIBOR + 0.600% 2.2207% 7/26/66 (b)(d)(e) | | 3,513,000 | 3,535,106 |
| New Century Home Equity Loan Trust Series 2005-4 Class M2, 1 month U.S. LIBOR + 0.510% 2.1307% 9/25/35 (d)(e) | | 1,426,957 | 1,418,001 |
| Park Place Securities, Inc.: | | | |
| Series 2004-WCW1: | | | |
| Class M3, 1 month U.S. LIBOR + 1.875% 3.4957% 9/25/34 (d)(e) | | 450,894 | 457,768 |
| Class M4, 1 month U.S. LIBOR + 2.175% 3.7957% 9/25/34 (d)(e) | | 683,353 | 616,422 |
| Series 2005-WCH1 Class M4, 1 month U.S. LIBOR + 1.245% 2.8657% 1/25/36 (d)(e) | | 1,475,804 | 1,473,958 |
| Progress Residential Trust: | | | |
| Series 2015-SFR3 Class F, 6.643% 11/12/32 (b) | | 168,000 | 176,632 |
| Series 2017-SFR1 Class F, 5.35% 8/17/34 (b) | | 160,000 | 164,401 |
| Series 2017-SFR2 Class F, 1 month U.S. LIBOR + 2.750% 4.836% 12/17/34 (b)(e) | | 134,000 | 134,893 |
| Series 2018-SFR1 Class F, 4.778% 3/17/35 (b) | | 384,000 | 383,880 |
| SLM Private Credit Student Loan Trust Series 2004-A Class C, 3 month U.S. LIBOR + 0.950% 2.5385% 6/15/33 (d)(e) | | 60,269 | 60,247 |
| Starwood Waypoint Homes Trust Series 2017-1: | | | |
| Class E, 1 month U.S. LIBOR + 2.600% 4.19% 1/17/35 (b)(d)(e) | | 1,040,000 | 1,056,046 |
| Class F, 1 month U.S. LIBOR + 3.400% 4.99% 1/17/35 (b)(d)(e) | | 903,000 | 902,975 |
| Structured Asset Investment Loan Trust Series 2004-8 Class M5, 1 month U.S. LIBOR + 1.725% 3.3457% 9/25/34 (d)(e) | | 31,675 | 31,138 |
| Terwin Mortgage Trust Series 2003-4HE Class A1, 1 month U.S. LIBOR + 0.860% 2.4214% 9/25/34 (d)(e) | | 28,819 | 27,765 |
| Thunderbolt Aircraft Lease Ltd. Series 2017-A Class A, 4.212% 5/17/32 (b) | | 24,454,768 | 24,649,452 |
| Trapeza CDO XII Ltd./Trapeza CDO XII, Inc. Series 2007-12A Class B, 3 month U.S. LIBOR + 0.560% 1.7978% 4/6/42 (b)(d)(e)(g) | | 2,573,000 | 1,358,639 |
| Tricon American Homes: | | | |
| Series 2017-SFR1 Class F, 5.151% 9/17/34 (b) | | 1,092,000 | 1,107,881 |
| Series 2017-SFR2 Class F, 5.16% 1/17/36 (b) | | 198,000 | 199,538 |
| Tricon American Homes Trust Series 2016-SFR1: | | | |
| Class B, 2.989% 11/17/33 (b) | | 517,000 | 507,580 |
| Class F, 5.769% 11/17/33 (b) | | 456,000 | 472,205 |
| VB-S1 Issuer LLC Series 2018-1A Class F, 5.25% 2/15/48 (b) | | 574,000 | 574,000 |
| Wrightwood Capital Real Estate CDO Ltd. Series 2005-1A Class D, 3 month U.S. LIBOR + 0.850% 2.1664% 11/21/40 (b)(d)(e) | | 305,000 | 283,803 |
| TOTAL ASSET-BACKED SECURITIES | | | |
| (Cost $295,195,553) | | | 304,290,522 |
|
| Collateralized Mortgage Obligations - 1.9% | | | |
| Private Sponsor - 0.4% | | | |
| Banc of America Funding Corp. Series 2015-R3 Class 10A1, 1 month U.S. LIBOR + 0.140% 1.6921% 6/27/36 (b)(d)(e) | | 8,874,710 | 8,736,871 |
| Banc of America Funding Trust sequential payer Series 2010-R3 Class 1A1, 3.6731% 12/26/35 (b)(d) | | 988,831 | 990,016 |
| BCAP LLC Trust sequential payer: | | | |
| Series 2012-RR5 Class 8A5, 1.7011% 7/26/36 (b)(d) | | 1,499,327 | 1,464,472 |
| Series 2013-RR4 Class 2A1, 3.761% 5/26/47 (b)(d) | | 1,865,700 | 1,872,777 |
| Bear Stearns ALT-A Trust floater Series 2005-1 Class A1, 1 month U.S. LIBOR + 0.560% 2.1807% 1/25/35 (d)(e) | | 408,345 | 410,125 |
| Citigroup Mortgage Loan Trust sequential payer Series 2014-8 Class 2A1, 3.45% 6/27/37 (b)(d) | | 6,785,380 | 6,729,330 |
| Citigroup Mortgage Loan Trust, Inc. sequential payer Series 2009-5 Class 5A1, 3.7416% 1/25/37 (b)(d) | | 2,038,877 | 2,078,100 |
| Credit Suisse Mortgage Trust Series 2010-9R Class 2A5, 4% 2/27/38 (b) | | 5,998,848 | 6,019,281 |
| CSMC: | | | |
| floater Series 2015-1R Class 6A1, 1 month U.S. LIBOR + 0.280% 1.8321% 5/27/37 (b)(d)(e) | | 7,422,975 | 7,202,517 |
| Series 2014-3R Class 2A1, 1 month U.S. LIBOR + 0.700% 2.2521% 5/27/37 (b)(d)(e) | | 700,952 | 685,706 |
| CSMC Trust Series 2009-5R Class 2A2, 3.3536% 7/26/49 (b)(d) | | 933,731 | 933,623 |
| First Horizon Mortgage pass-thru Trust Series 2004-AR5 Class 2A1, 3.5992% 10/25/34 (d) | | 303,912 | 311,382 |
| FirstKey Mortgage Trust sequential payer Series 2015-1 Class A9, 3% 3/25/45 (b)(d) | | 14,766,734 | 14,667,593 |
| Freddie Mac Seasoned Credit Risk Transfer Series sequential payer Series 2017-1 Class MA, 3% 1/25/56 | | 17,338,351 | 16,756,620 |
| FREMF Mortgage Trust: | | | |
| Series 2010-K6 Class B, 5.3637% 12/25/46 (b)(d) | | 910,000 | 943,959 |
| Series 2010-K7 Class B, 5.6853% 4/25/20 (b)(d) | | 1,000,000 | 1,046,686 |
| GSR Mortgage Loan Trust floater Series 2007-AR1 Class 6A1, 3.1565% 3/25/37 (d) | | 512,815 | 512,707 |
| JP Morgan Resecuritization Trust floater Series 2012-2 Class 6A1, 1 month U.S. LIBOR + 0.210% 1.7672% 6/21/36 (b)(d)(e) | | 4,814,911 | 4,753,528 |
| JPMorgan Mortgage Trust sequential payer Series 2006-A5 Class 3A5, 3.461% 8/25/36 (d) | | 696,686 | 674,556 |
| Merrill Lynch Alternative Note Asset Trust floater Series 2007-OAR1 Class A1, 1 month U.S. LIBOR + 0.170% 1.7221% 2/25/37 (d)(e) | | 1,340,405 | 1,315,496 |
| Nomura Resecuritization Trust sequential payer Series 2011-3RA Class 2A1, 3.5335% 3/26/37 (b)(d) | | 751,813 | 750,588 |
| Opteum Mortgage Acceptance Corp. floater Series 2005-3 Class APT, 1 month U.S. LIBOR + 0.290% 1.8514% 7/25/35 (d)(e) | | 362,020 | 358,413 |
| RBSSP Resecuritization Trust sequential payer Series 2010-1 Class 2A1, 3.3328% 7/26/45 (b)(d) | | 7,794,860 | 7,881,444 |
| RESI Finance LP/RESI Finance DE Corp. floater Series 2003-B: | | | |
| Class B5, 1 month U.S. LIBOR + 2.350% 3.9038% 6/10/35 (b)(d)(e) | | 184,397 | 146,896 |
| Class B6, 1 month U.S. LIBOR + 2.850% 4.4038% 6/10/35 (b)(d)(e) | | 41,114 | 27,535 |
| Sequoia Mortgage Trust floater Series 2004-6 Class A3B, 6 month U.S. LIBOR + 0.880% 2.6617% 7/20/34 (d)(e) | | 16,752 | 16,561 |
| Structured Asset Securities Corp. Series 2003-15A Class 4A, 3.493% 4/25/33 (d) | | 52,321 | 52,688 |
| Thornburg Mortgage Securities Trust floater Series 2003-4 Class A1, 1 month U.S. LIBOR + 0.640% 2.2607% 9/25/43 (d)(e) | | 7,143,954 | 6,906,200 |
| Wells Fargo Mortgage Backed Securities Trust: | | | |
| Series 2004-BB Class A2, 3.7231% 1/25/35 (d) | | 1,498,048 | 1,512,043 |
| Series 2005-AR10 Class 2A15, 3.5661% 6/25/35 (d) | | 8,197,246 | 8,376,803 |
| Series 2005-AR2: | | | |
| Class 1A2, 3.5392% 3/25/35 (d) | | 1,015,637 | 1,017,767 |
| Class 3A1, 3.6387% 3/25/35 (d) | | 13,400,547 | 13,624,618 |
| Wells Fargo Mortgage Loan Trust sequential payer Series 2011-RR4: | | | |
| Class 1A1, 3.5053% 6/27/36 (b)(d) | | 717,298 | 717,630 |
| Class 2A1, 3.4585% 6/27/36 (b)(d) | | 1,088,949 | 1,084,753 |
|
| TOTAL PRIVATE SPONSOR | | | 120,579,284 |
|
| U.S. Government Agency - 1.5% | | | |
| Fannie Mae: | | | |
| floater: | | | |
| Series 2002-18 Class FD, 1 month U.S. LIBOR + 0.800% 2.4207% 2/25/32 (d)(e) | | 20,139 | 20,474 |
| Series 2002-39 Class FD, 1 month U.S. LIBOR + 1.000% 2.59% 3/18/32 (d)(e) | | 35,625 | 36,285 |
| Series 2002-60 Class FV, 1 month U.S. LIBOR + 1.000% 2.6207% 4/25/32 (d)(e) | | 43,539 | 44,480 |
| Series 2002-63 Class FN, 1 month U.S. LIBOR + 1.000% 2.6207% 10/25/32 (d)(e) | | 56,889 | 58,102 |
| Series 2002-7 Class FC, 1 month U.S. LIBOR + 0.750% 2.3707% 1/25/32 (d)(e) | | 20,183 | 20,503 |
| Series 2003-118 Class S, 8.100% - 1 month U.S. LIBOR 6.4793% 12/25/33 (d)(k)(l) | | 664,863 | 141,082 |
| Series 2006-104 Class GI, 6.680% - 1 month U.S. LIBOR 5.0593% 11/25/36 (d)(k)(l) | | 503,477 | 79,058 |
| planned amortization class: | | | |
| Series 1992-168 Class KB, 7% 10/25/22 | | 22,719 | 23,924 |
| Series 1993-207 Class H, 6.5% 11/25/23 | | 327,187 | 349,763 |
| Series 1996-28 Class PK, 6.5% 7/25/25 | | 107,122 | 114,819 |
| Series 1999-17 Class PG, 6% 4/25/29 | | 314,161 | 339,533 |
| Series 1999-32 Class PL, 6% 7/25/29 | | 290,227 | 314,010 |
| Series 1999-33 Class PK, 6% 7/25/29 | | 217,332 | 235,415 |
| Series 2001-52 Class YZ, 6.5% 10/25/31 | | 25,558 | 28,555 |
| Series 2003-28 Class KG, 5.5% 4/25/23 | | 185,536 | 194,060 |
| Series 2005-102 Class CO 11/25/35 (m) | | 165,549 | 145,140 |
| Series 2005-73 Class SA, 17.500% - 1 month U.S. LIBOR 13.3362% 8/25/35 (d)(l) | | 55,574 | 64,818 |
| Series 2005-81 Class PC, 5.5% 9/25/35 | | 401,639 | 428,406 |
| Series 2006-12 Class BO 10/25/35 (m) | | 743,102 | 652,094 |
| Series 2006-37 Class OW 5/25/36 (m) | | 70,102 | 59,282 |
| Series 2006-45 Class OP 6/25/36 (m) | | 226,630 | 192,210 |
| Series 2006-62 Class KP 4/25/36 (m) | | 357,258 | 303,103 |
| Series 2012-149: | | | |
| Class DA, 1.75% 1/25/43 | | 8,300,032 | 7,937,781 |
| Class GA, 1.75% 6/25/42 | | 8,177,246 | 7,805,516 |
| sequential payer: | | | |
| Series 1997-41 Class J, 7.5% 6/18/27 | | 66,122 | 74,245 |
| Series 1999-25 Class Z, 6% 6/25/29 | | 227,851 | 248,150 |
| Series 2001-20 Class Z, 6% 5/25/31 | | 332,996 | 363,308 |
| Series 2001-31 Class ZC, 6.5% 7/25/31 | | 169,737 | 187,966 |
| Series 2002-16 Class ZD, 6.5% 4/25/32 | | 89,265 | 99,791 |
| Series 2002-74 Class SV, 7.550% - 1 month U.S. LIBOR 5.9293% 11/25/32 (d)(k)(l) | | 434,785 | 58,957 |
| Series 2012-67 Class AI, 4.5% 7/25/27 (k) | | 2,022,012 | 206,382 |
| Series 06-116 Class SG, 6.640% - 1 month U.S. LIBOR 5.0193% 12/25/36 (d)(k)(l) | | 319,774 | 58,127 |
| Series 07-40 Class SE, 6.440% - 1 month U.S. LIBOR 4.8193% 5/25/37 (d)(k)(l) | | 194,859 | 30,567 |
| Series 1993-165 Class SH, 19.800% - 1 month U.S. LIBOR 15.2156% 9/25/23 (d)(l) | | 14,087 | 16,504 |
| Series 2003-21 Class SK, 8.100% - 1 month U.S. LIBOR 6.4793% 3/25/33 (d)(k)(l) | | 47,374 | 8,426 |
| Series 2003-35 Class TQ, 7.500% - 1 month U.S. LIBOR 5.8793% 5/25/18 (d)(k)(l) | | 333 | 1 |
| Series 2005-72 Class ZC, 5.5% 8/25/35 | | 2,462,559 | 2,628,791 |
| Series 2005-79 Class ZC, 5.9% 9/25/35 | | 1,559,500 | 1,733,201 |
| Series 2007-57 Class SA, 40.600% - 1 month U.S. LIBOR 30.8958% 6/25/37 (d)(l) | | 161,875 | 294,642 |
| Series 2007-66: | | | |
| Class SA, 39.600% - 1 month U.S. LIBOR 29.8758% 7/25/37 (d)(l) | | 243,132 | 437,363 |
| Class SB, 39.600% - 1 month U.S. LIBOR 29.8758% 7/25/37 (d)(l) | | 100,974 | 162,845 |
| Series 2007-75 Class JI, 6.545% - 1 month U.S. LIBOR 4.9243% 8/25/37 (d)(k)(l) | | 7,247,543 | 1,112,027 |
| Series 2008-12 Class SG, 6.350% - 1 month U.S. LIBOR 4.7293% 3/25/38 (d)(k)(l) | | 1,298,528 | 186,663 |
| Series 2009-16 Class SA, 6.250% - 1 month U.S. LIBOR 4.6293% 3/25/24 (d)(k)(l) | | 20 | 0 |
| Series 2009-76 Class MI, 5.5% 9/25/24 (k) | | 6,089 | 151 |
| Series 2009-85 Class IB, 4.5% 8/25/24 (k) | | 67,578 | 2,359 |
| Series 2009-93 Class IC, 4.5% 9/25/24 (k) | | 92,776 | 2,993 |
| Series 2010-112 Class SG, 6.360% - 1 month U.S. LIBOR 4.7393% 6/25/21 (d)(k)(l) | | 50,797 | 1,179 |
| Series 2010-12 Class AI, 5% 12/25/18 (k) | | 33,729 | 164 |
| Series 2010-135 Class LS, 6.050% - 1 month U.S. LIBOR 4.4293% 12/25/40 (d)(k)(l) | | 1,206,807 | 160,531 |
| Series 2010-139 Class NI, 4.5% 2/25/40 (k) | | 1,086,899 | 110,902 |
| Series 2010-150 Class ZC, 4.75% 1/25/41 | | 5,407,537 | 5,785,605 |
| Series 2010-17 Class DI, 4.5% 6/25/21 (k) | | 38,649 | 962 |
| Series 2010-23: | | | |
| Class AI, 5% 12/25/18 (k) | | 8,216 | 60 |
| Class HI, 4.5% 10/25/18 (k) | | 18,874 | 149 |
| Series 2010-29 Class LI, 4.5% 6/25/19 (k) | | 40,179 | 271 |
| Series 2010-95 Class ZC, 5% 9/25/40 | | 10,952,982 | 11,858,980 |
| Series 2010-97 Class CI, 4.5% 8/25/25 (k) | | 270,230 | 12,757 |
| Series 2011-110 Class SA, 6.610% - 1 month U.S. LIBOR 4.9893% 4/25/41 (d)(k)(l) | | 3,152,311 | 438,431 |
| Series 2011-112 Class SA, 6.550% - 1 month U.S. LIBOR 4.9293% 11/25/41 (d)(k)(l) | | 3,257,728 | 507,197 |
| Series 2011-123 Class SD, 6.600% - 1 month U.S. LIBOR 4.9793% 8/25/39 (d)(k)(l) | | 2,691,703 | 332,837 |
| Series 2011-39 Class ZA, 6% 11/25/32 | | 874,098 | 965,640 |
| Series 2011-4 Class PZ, 5% 2/25/41 | | 2,309,122 | 2,571,532 |
| Series 2011-67 Class AI, 4% 7/25/26 (k) | | 339,899 | 31,267 |
| Series 2011-83 Class DI, 6% 9/25/26 (k) | | 443,591 | 39,272 |
| Series 2012-100 Class WI, 3% 9/25/27 (k) | | 5,427,503 | 517,635 |
| Series 2012-14 Class JS, 6.650% - 1 month U.S. LIBOR 5.0293% 12/25/30 (d)(k)(l) | | 1,788,022 | 210,598 |
| Series 2012-47 Class SD, 6.450% - 1 month U.S. LIBOR 4.8293% 5/25/42 (d)(k)(l) | | 8,106,114 | 1,467,255 |
| Series 2012-9 Class SH, 6.550% - 1 month U.S. LIBOR 4.9293% 6/25/41 (d)(k)(l) | | 2,375,384 | 323,701 |
| Series 2013-133 Class IB, 3% 4/25/32 (k) | | 3,436,343 | 328,584 |
| Series 2013-134 Class SA, 6.050% - 1 month U.S. LIBOR 4.4293% 1/25/44 (d)(k)(l) | | 1,798,340 | 272,351 |
| Series 2013-51 Class GI, 3% 10/25/32 (k) | | 5,119,640 | 514,299 |
| Series 2013-N1 Class A, 6.720% - 1 month U.S. LIBOR 5.0993% 6/25/35 (d)(k)(l) | | 1,041,615 | 166,131 |
| Series 2015-42: | | | |
| Class IL, 6% 6/25/45 (k) | | 7,733,022 | 1,852,838 |
| Class LS, 6.200% - 1 month U.S. LIBOR 4.5793% 6/25/45 (d)(k)(l) | | 12,901,063 | 1,745,851 |
| Series 2015-70 Class JC, 3% 10/25/45 | | 6,656,986 | 6,618,951 |
| Series 2016-78 Class CS, 6.100% - 1 month U.S. LIBOR 4.4793% 5/25/39 (d)(k)(l) | | 15,036,610 | 2,171,356 |
| Series 2017-30 Class AI, 5.5% 5/25/47 | | 4,031,994 | 943,163 |
| Fannie Mae Stripped Mortgage-Backed Securities: | | | |
| Series 339: | | | |
| Class 29, 5.5% 8/25/18 (k) | | 256 | 1 |
| Class 5, 5.5% 7/25/33 (k) | | 185,214 | 40,799 |
| Series 343 Class 16, 5.5% 5/25/34 (k) | | 159,587 | 28,416 |
| Series 348 Class 14, 6.5% 8/25/34 (d)(k) | | 114,418 | 26,353 |
| Series 351: | | | |
| Class 12, 5.5% 4/25/34 (d)(k) | | 72,605 | 14,178 |
| Class 13, 6% 3/25/34 (k) | | 99,395 | 19,504 |
| Series 359 Class 19, 6% 7/25/35 (d)(k) | | 61,469 | 11,570 |
| Series 384 Class 6, 5% 7/25/37 (k) | | 792,467 | 156,178 |
| Freddie Mac: | | | |
| floater: | | | |
| Series 2412 Class FK, 1 month U.S. LIBOR + 0.800% 2.3875% 1/15/32 (d)(e) | | 16,122 | 16,389 |
| Series 2423 Class FA, 1 month U.S. LIBOR + 0.900% 2.4875% 3/15/32 (d)(e) | | 21,872 | 22,290 |
| Series 2424 Class FM, 1 month U.S. LIBOR + 1.000% 2.5875% 3/15/32 (d)(e) | | 23,527 | 24,017 |
| Series 2432: | | | |
| Class FE, 1 month U.S. LIBOR + 0.900% 2.4875% 6/15/31 (d)(e) | | 41,776 | 42,532 |
| Class FG, 1 month U.S. LIBOR + 0.900% 2.4875% 3/15/32 (d)(e) | | 12,732 | 12,970 |
| floater target amortization class Series 3366 Class FD, 1 month U.S. LIBOR + 0.250% 1.8375% 5/15/37 (d)(e) | | 934,808 | 933,591 |
| planned amortization class: | | | |
| Series 2006-15 Class OP 3/25/36 (m) | | 666,785 | 566,416 |
| Series 2095 Class PE, 6% 11/15/28 | | 347,240 | 376,484 |
| Series 2101 Class PD, 6% 11/15/28 | | 31,284 | 33,112 |
| Series 2121 Class MG, 6% 2/15/29 | | 142,915 | 154,959 |
| Series 2131 Class BG, 6% 3/15/29 | | 974,477 | 1,058,194 |
| Series 2137 Class PG, 6% 3/15/29 | | 155,121 | 167,350 |
| Series 2154 Class PT, 6% 5/15/29 | | 247,377 | 268,754 |
| Series 2162 Class PH, 6% 6/15/29 | | 58,378 | 62,603 |
| Series 2520 Class BE, 6% 11/15/32 | | 321,050 | 354,872 |
| Series 2585 Class KS, 7.600% - 1 month U.S. LIBOR 6.0125% 3/15/23 (d)(k)(l) | | 15,004 | 974 |
| Series 2693 Class MD, 5.5% 10/15/33 | | 3,735,598 | 4,070,238 |
| Series 2802 Class OB, 6% 5/15/34 | | 539,070 | 577,903 |
| Series 2937 Class KC, 4.5% 2/15/20 | | 226,290 | 228,064 |
| Series 2962 Class BE, 4.5% 4/15/20 | | 376,650 | 382,270 |
| Series 3002 Class NE, 5% 7/15/35 | | 885,206 | 937,425 |
| Series 3110 Class OP 9/15/35 (m) | | 412,118 | 370,788 |
| Series 3119 Class PO 2/15/36 (m) | | 779,948 | 660,211 |
| Series 3121 Class KO 3/15/36 (m) | | 137,369 | 117,308 |
| Series 3123 Class LO 3/15/36 (m) | | 430,684 | 365,771 |
| Series 3145 Class GO 4/15/36 (m) | | 417,447 | 355,001 |
| Series 3189 Class PD, 6% 7/15/36 | | 801,755 | 892,596 |
| Series 3225 Class EO 10/15/36 (m) | | 244,781 | 207,656 |
| Series 3258 Class PM, 5.5% 12/15/36 | | 407,850 | 436,283 |
| Series 3415 Class PC, 5% 12/15/37 | | 310,898 | 330,846 |
| Series 3786 Class HI, 4% 3/15/38 (k) | | 1,017,996 | 82,748 |
| Series 3806 Class UP, 4.5% 2/15/41 | | 2,414,467 | 2,505,362 |
| Series 3832 Class PE, 5% 3/15/41 | | 2,375,210 | 2,542,509 |
| Series 4135 Class AB, 1.75% 6/15/42 | | 6,111,850 | 5,839,288 |
| sequential payer: | | | |
| Series 2135 Class JE, 6% 3/15/29 | | 71,321 | 77,479 |
| Series 2274 Class ZM, 6.5% 1/15/31 | | 81,760 | 90,363 |
| Series 2281 Class ZB, 6% 3/15/30 | | 193,435 | 204,311 |
| Series 2303 Class ZV, 6% 4/15/31 | | 80,823 | 87,984 |
| Series 2357 Class ZB, 6.5% 9/15/31 | | 598,312 | 668,782 |
| Series 2502 Class ZC, 6% 9/15/32 | | 163,249 | 179,822 |
| Series 2519 Class ZD, 5.5% 11/15/32 | | 262,096 | 275,495 |
| Series 2546 Class MJ, 5.5% 3/15/23 | | 113,978 | 118,036 |
| Series 2601 Class TB, 5.5% 4/15/23 | | 54,477 | 57,224 |
| Series 2998 Class LY, 5.5% 7/15/25 | | 165,607 | 174,868 |
| Series 3871 Class KB, 5.5% 6/15/41 | | 4,329,000 | 4,854,365 |
| Series 06-3115 Class SM, 6.600% - 1 month U.S. LIBOR 5.0125% 2/15/36 (d)(k)(l) | | 284,773 | 48,821 |
| Series 2013-4281 Class AI, 4% 12/15/28 (k) | | 3,411,752 | 289,957 |
| Series 2017-4683 Class LM, 3% 5/15/47 | | 8,972,578 | 8,938,714 |
| Series 2844: | | | |
| Class SC, 46.800% - 1 month U.S. LIBOR 36.4813% 8/15/24 (d)(l) | | 6,335 | 8,551 |
| Class SD, 86.400% - 1 month U.S. LIBOR 65.8125% 8/15/24 (d)(l) | | 9,320 | 15,519 |
| Series 2933 Class ZM, 5.75% 2/15/35 | | 2,921,423 | 3,297,204 |
| Series 2935 Class ZK, 5.5% 2/15/35 | | 3,643,269 | 3,982,631 |
| Series 2947 Class XZ, 6% 3/15/35 | | 1,063,809 | 1,158,373 |
| Series 2996 Class ZD, 5.5% 6/15/35 | | 2,366,776 | 2,628,966 |
| Series 3055 Class CS, 6.590% - 1 month U.S. LIBOR 5.0025% 10/15/35 (d)(k)(l) | | 402,196 | 66,712 |
| Series 3237 Class C, 5.5% 11/15/36 | | 3,318,748 | 3,639,754 |
| Series 3244 Class SG, 6.660% - 1 month U.S. LIBOR 5.0725% 11/15/36 (d)(k)(l) | | 962,470 | 157,515 |
| Series 3284 Class CI, 6.120% - 1 month U.S. LIBOR 4.5325% 3/15/37 (d)(k)(l) | | 2,262,661 | 341,550 |
| Series 3287 Class SD, 6.750% - 1 month U.S. LIBOR 5.1625% 3/15/37 (d)(k)(l) | | 1,426,247 | 248,544 |
| Series 3297 Class BI, 6.760% - 1 month U.S. LIBOR 5.1725% 4/15/37 (d)(k)(l) | | 2,175,728 | 389,324 |
| Series 3336 Class LI, 6.580% - 1 month U.S. LIBOR 4.9925% 6/15/37 (d)(k)(l) | | 689,534 | 102,702 |
| Series 3772 Class BI, 4.5% 10/15/18 (k) | | 63,345 | 496 |
| Series 3949 Class MK, 4.5% 10/15/34 | | 631,458 | 658,068 |
| Series 3955: | | | |
| Class GS, 5.950% - 1 month U.S. LIBOR 4.3625% 9/15/41 (d)(k)(l) | | 3,494,968 | 469,912 |
| Class YI, 3% 11/15/21 (k) | | 1,502,936 | 58,774 |
| Series 4055 Class BI, 3.5% 5/15/31 (k) | | 3,150,990 | 345,781 |
| Series 4149 Class IO, 3% 1/15/33 (k) | | 2,223,201 | 282,975 |
| Series 4314 Class AI, 5% 3/15/34 (k) | | 1,098,584 | 115,287 |
| Series 4427 Class LI, 3.5% 2/15/34 (k) | | 5,804,485 | 780,666 |
| Series 4471 Class PA 4% 12/15/40 | | 7,463,955 | 7,643,210 |
| target amortization class Series 2156 Class TC, 6.25% 5/15/29 | | 183,294 | 194,641 |
| Freddie Mac Manufactured Housing participation certificates guaranteed: | | | |
| floater Series 1686 Class FA, 1 month U.S. LIBOR + 0.900% 2.4875% 2/15/24 (d)(e) | | 73,743 | 74,530 |
| sequential payer: | | | |
| Series 2043 Class ZH, 6% 4/15/28 | | 125,565 | 136,196 |
| Series 2056 Class Z, 6% 5/15/28 | | 275,622 | 298,619 |
| Freddie Mac Multi-family Structured pass-thru certificates Series 4386 Class AZ, 4.5% 11/15/40 | | 7,467,209 | 7,728,682 |
| Ginnie Mae guaranteed REMIC pass-thru certificates: | | | |
| floater: | | | |
| Series 2007-37 Class TS, 6.690% - 1 month U.S. LIBOR 5.1019% 6/16/37 (d)(k)(l) | | 422,624 | 74,103 |
| Series 2010-H03 Class FA, 1 month U.S. LIBOR + 0.550% 2.1138% 3/20/60 (d)(e)(n) | | 5,451,488 | 5,469,234 |
| Series 2010-H17 Class FA, 1 month U.S. LIBOR + 0.330% 1.8938% 7/20/60 (d)(e)(n) | | 623,537 | 621,839 |
| Series 2010-H18 Class AF, 1 month U.S. LIBOR + 0.300% 1.6794% 9/20/60 (d)(e)(n) | | 754,119 | 751,572 |
| Series 2010-H19 Class FG, 1 month U.S. LIBOR + 0.300% 1.6794% 8/20/60 (d)(e)(n) | | 860,357 | 857,416 |
| Series 2010-H27 Series FA, 1 month U.S. LIBOR + 0.380% 1.7594% 12/20/60 (d)(e)(n) | | 1,539,467 | 1,537,702 |
| Series 2011-H05 Class FA, 1 month U.S. LIBOR + 0.500% 1.8794% 12/20/60 (d)(e)(n) | | 2,401,332 | 2,406,208 |
| Series 2011-H07 Class FA, 1 month U.S. LIBOR + 0.500% 2.0618% 2/20/61 (d)(e)(n) | | 4,832,731 | 4,840,817 |
| Series 2011-H12 Class FA, 1 month U.S. LIBOR + 0.490% 2.0518% 2/20/61 (d)(e)(n) | | 6,345,020 | 6,354,321 |
| Series 2011-H13 Class FA, 1 month U.S. LIBOR + 0.500% 1.8794% 4/20/61 (d)(e)(n) | | 2,121,639 | 2,125,999 |
| Series 2011-H14: | | | |
| Class FB, 1 month U.S. LIBOR + 0.500% 1.8794% 5/20/61 (d)(e)(n) | | 2,485,580 | 2,491,585 |
| Class FC, 1 month U.S. LIBOR + 0.500% 1.8794% 5/20/61 (d)(e)(n) | | 2,329,356 | 2,334,464 |
| Series 2011-H17 Class FA, 1 month U.S. LIBOR + 0.530% 1.9094% 6/20/61 (d)(e)(n) | | 2,964,997 | 2,972,871 |
| Series 2011-H21 Class FA, 1 month U.S. LIBOR + 0.600% 1.9794% 10/20/61 (d)(e)(n) | | 5,809,923 | 5,836,881 |
| Series 2012-H01 Class FA, 1 month U.S. LIBOR + 0.700% 2.0794% 11/20/61 (d)(e)(n) | | 2,852,489 | 2,874,380 |
| Series 2012-H03 Class FA, 1 month U.S. LIBOR + 0.700% 2.0794% 1/20/62 (d)(e)(n) | | 1,897,259 | 1,911,164 |
| Series 2012-H06 Class FA, 1 month U.S. LIBOR + 0.630% 2.0094% 1/20/62 (d)(e)(n) | | 2,733,255 | 2,748,778 |
| Series 2012-H07 Class FA, 1 month U.S. LIBOR + 0.630% 2.0094% 3/20/62 (d)(e)(n) | | 1,689,787 | 1,699,034 |
| Series 2012-H21 Class DF, 1 month U.S. LIBOR + 0.650% 2.0294% 5/20/61 (d)(e)(n) | | 2,289,349 | 2,293,787 |
| Series 2012-H23 Class WA, 1 month U.S. LIBOR + 0.520% 1.8994% 10/20/62 (d)(e)(n) | | 1,503,629 | 1,507,742 |
| Series 2012-H26, Class CA, 1 month U.S. LIBOR + 0.530% 1.9094% 7/20/60 (d)(e)(n) | | 4,432,296 | 4,442,138 |
| Series 2013-H07 Class BA, 1 month U.S. LIBOR + 0.360% 1.7394% 3/20/63 (d)(e)(n) | | 2,392,037 | 2,387,815 |
| Series 2014-H03 Class FA, 1 month U.S. LIBOR + 0.600% 2.1618% 1/20/64 (d)(e)(n) | | 2,750,755 | 2,763,574 |
| Series 2014-H05 Class FB, 1 month U.S. LIBOR + 0.600% 2.1618% 12/20/63 (d)(e)(n) | | 7,397,477 | 7,437,162 |
| Series 2014-H11 Class BA, 1 month U.S. LIBOR + 0.500% 2.0618% 6/20/64 (d)(e)(n) | | 10,961,021 | 10,986,273 |
| Series 2014-H20 Class BF, 1 month U.S. LIBOR + 0.500% 2.0618% 9/20/64 (d)(e)(n) | | 34,539,316 | 34,622,269 |
| Series 2016-H20 Class FM, 1 month U.S. LIBOR + 0.400% 1.9618% 12/20/62 (d)(e)(n) | | 10,122,466 | 10,132,472 |
| planned amortization class: | | | |
| Series 1993-13 Class PD, 6% 5/20/29 | | 351,326 | 384,008 |
| Series 1997-8 Class PE, 7.5% 5/16/27 | | 151,327 | 171,591 |
| Series 2010-158 Class MS, 10.000% - 1 month U.S. LIBOR 6.8776% 12/20/40 (d)(l) | | 5,680,000 | 5,868,770 |
| Series 2011-136 Class WI, 4.5% 5/20/40 (k) | | 714,509 | 85,509 |
| sequential payer: | | | |
| Series 2004-24 Class ZM, 5% 4/20/34 | | 1,352,609 | 1,447,489 |
| Series 2010-160 Class DY, 4% 12/20/40 | | 16,137,413 | 16,683,336 |
| Series 2010-170 Class B, 4% 12/20/40 | | 3,649,890 | 3,773,333 |
| Series 2004-32 Class GS, 6.500% - 1 month U.S. LIBOR 4.9119% 5/16/34 (d)(k)(l) | | 229,664 | 34,482 |
| Series 2004-73 Class AL, 7.200% - 1 month U.S. LIBOR 5.6119% 8/17/34 (d)(k)(l) | | 277,608 | 52,313 |
| Series 2007-35 Class SC, 40.200% - 1 month U.S. LIBOR 30.6712% 6/16/37 (d)(l) | | 16,996 | 28,118 |
| Series 2010-116 Class QB, 4% 9/16/40 | | 34,128,659 | 35,233,438 |
| Series 2010-H10 Class FA, 1 month U.S. LIBOR + 0.330% 1.8938% 5/20/60 (d)(e)(n) | | 2,018,300 | 2,012,968 |
| Series 2011-94 Class SA, 6.100% - 1 month U.S. LIBOR 4.5388% 7/20/41 (d)(k)(l) | | 1,409,888 | 210,515 |
| Series 2012-76 Class GS, 6.700% - 1 month U.S. LIBOR 5.1119% 6/16/42 (d)(k)(l) | | 882,626 | 139,978 |
| Series 2013-124: | | | |
| Class ES, 8.667% - 1 month U.S. LIBOR 6.5851% 4/20/39 (d)(l) | | 2,294,538 | 2,351,217 |
| Class ST, 8.800% - 1 month U.S. LIBOR 6.7184% 8/20/39 (d)(l) | | 6,369,770 | 6,601,525 |
| Series 2013-149 Class MA, 2.5% 5/20/40 | | 19,602,395 | 19,119,731 |
| Series 2014-2 Class BA, 3% 1/20/44 | | 15,998,622 | 15,809,006 |
| Series 2014-21 Class HA, 3% 2/20/44 | | 7,304,331 | 7,225,986 |
| Series 2014-25 Class HC, 3% 2/20/44 | | 10,349,933 | 10,203,901 |
| Series 2014-5 Class A, 3% 1/20/44 | | 9,689,540 | 9,575,476 |
| Series 2015-H13 Class HA, 2.5% 8/20/64 (n) | | 22,184,094 | 22,119,429 |
| Series 2015-H17 Class HA, 2.5% 5/20/65 (n) | | 20,412,281 | 20,350,411 |
| Series 2015-H21: | | | |
| Class HA, 2.5% 6/20/63 (n) | | 4,163,611 | 4,154,344 |
| Class JA, 2.5% 6/20/65 (n) | | 18,985,862 | 18,932,595 |
| Series 2017-H06 Class FA, U.S. TREASURY 1 YEAR INDEX + 0.350% 2.11% 8/20/66 (d)(e)(n) | | 24,063,842 | 24,127,662 |
|
| TOTAL U.S. GOVERNMENT AGENCY | | | 494,817,228 |
|
| TOTAL COLLATERALIZED MORTGAGE OBLIGATIONS | | | |
| (Cost $623,560,526) | | | 615,396,512 |
|
| Commercial Mortgage Securities - 1.8% | | | |
| 280 Park Avenue Mortgage Trust floater Series 2017-280P Class F, 1 month U.S. LIBOR + 3.150% 4.3865% 9/15/34 (b)(d)(e) | | 1,242,000 | 1,235,762 |
| Americold LLC Trust Series 2010-ARTA Class D, 7.443% 1/14/29 (b) | | 180,000 | 194,913 |
| Asset Securitization Corp.: | | | |
| Series 1997-D4 Class B5, 7.525% 4/14/29 | | 129,000 | 129,004 |
| Series 1997-D5 Class PS1, 1.8371% 2/14/43 (d)(k) | | 44,756 | 383 |
| Aventura Mall Trust Series 2013-AVM Class E, 3.7427% 12/5/32 (b)(d) | | 1,340,110 | 1,340,774 |
| BAMLL Trust Series 2015-200P Class F, 3.5958% 4/14/33 (b)(d) | | 767,000 | 716,487 |
| BANK: | | | |
| Series 2017-BNK4 Class D, 3.357% 5/15/50 (b) | | 1,323,000 | 1,058,831 |
| Series 2017-BNK6 Class D, 3.1% 7/15/60 (b) | | 765,000 | 594,129 |
| Series 2017-BNK8 Class D, 2.6% 11/15/50 (b) | | 965,000 | 717,243 |
| Bank of America Commercial Mortgage Securities Trust Series 2017-BNK3: | | | |
| Class C, 4.352% 2/15/50 (d) | | 957,000 | 948,941 |
| Class D, 3.25% 2/15/50 (b) | | 667,000 | 527,269 |
| Bank of America Commercial Mortgage Trust Series 2016-UB10 Class XA, 1.9953% 7/15/49 (d)(k) | | 45,866,901 | 4,769,681 |
| Barclays Commercial Mortgage Securities LLC Series 2015-STP: | | | |
| Class A, 3.3228% 9/10/28 (b) | | 4,201,978 | 4,219,549 |
| Class E, 4.2844% 9/10/28 (b)(d) | | 1,786,000 | 1,714,102 |
| Bayview Commercial Asset Trust: | | | |
| floater: | | | |
| Series 2003-2 Class M1, 1 month U.S. LIBOR + 0.850% 2.8957% 12/25/33 (b)(d)(e) | | 18,755 | 18,695 |
| Series 2005-4A: | | | |
| Class A2, 1 month U.S. LIBOR + 0.390% 2.0107% 1/25/36 (b)(d)(e) | | 533,873 | 500,491 |
| Class B1, 1 month U.S. LIBOR + 1.400% 3.0207% 1/25/36 (b)(d)(e) | | 23,977 | 18,663 |
| Class M1, 1 month U.S. LIBOR + 0.450% 2.0707% 1/25/36 (b)(d)(e) | | 172,217 | 160,357 |
| Class M2, 1 month U.S. LIBOR + 0.470% 2.0907% 1/25/36 (b)(d)(e) | | 51,665 | 47,708 |
| Class M3, 1 month U.S. LIBOR + 0.500% 2.1207% 1/25/36 (b)(d)(e) | | 75,453 | 69,060 |
| Class M4, 1 month U.S. LIBOR + 0.610% 2.2307% 1/25/36 (b)(d)(e) | | 41,730 | 38,297 |
| Class M5, 1 month U.S. LIBOR + 0.650% 2.2707% 1/25/36 (b)(d)(e) | | 41,730 | 31,798 |
| Class M6, 1 month U.S. LIBOR + 0.700% 2.3207% 1/25/36 (b)(d)(e) | | 44,321 | 34,002 |
| Series 2006-3A Class M4, 1 month U.S. LIBOR + 0.430% 2.0507% 10/25/36 (b)(d)(e) | | 23,330 | 18,782 |
| Series 2007-1 Class A2, 1 month U.S. LIBOR + 0.270% 1.8907% 3/25/37 (b)(d)(e) | | 343,368 | 319,394 |
| Series 2007-2A: | | | |
| Class A1, 1 month U.S. LIBOR + 0.270% 1.8221% 7/25/37 (b)(d)(e) | | 360,230 | 344,112 |
| Class A2, 1 month U.S. LIBOR + 0.320% 1.8721% 7/25/37 (b)(d)(e) | | 336,586 | 318,419 |
| Class M1, 1 month U.S. LIBOR + 0.370% 1.9221% 7/25/37 (b)(d)(e) | | 118,190 | 106,655 |
| Class M2, 1 month U.S. LIBOR + 0.410% 1.9621% 7/25/37 (b)(d)(e) | | 64,584 | 56,672 |
| Class M3, 1 month U.S. LIBOR + 0.490% 2.0421% 7/25/37 (b)(d)(e) | | 52,526 | 41,607 |
| Series 2007-3: | | | |
| Class A2, 1 month U.S. LIBOR + 0.290% 1.8421% 7/25/37 (b)(d)(e) | | 323,618 | 302,168 |
| Class M1, 1 month U.S. LIBOR + 0.310% 1.8621% 7/25/37 (b)(d)(e) | | 70,287 | 66,591 |
| Class M2, 1 month U.S. LIBOR + 0.340% 1.8921% 7/25/37 (b)(d)(e) | | 75,335 | 70,601 |
| Class M3, 1 month U.S. LIBOR + 0.370% 1.9221% 7/25/37 (b)(d)(e) | | 118,709 | 102,178 |
| Class M4, 1 month U.S. LIBOR + 0.500% 2.0521% 7/25/37 (b)(d)(e) | | 186,391 | 155,577 |
| Class M5, 1 month U.S. LIBOR + 0.600% 2.1521% 7/25/37 (b)(d)(e) | | 71,541 | 55,725 |
| Series 2006-3A, Class IO, 0% 10/25/36 (b)(d)(g)(k) | | 3,584,120 | 0 |
| BBCMS Mortgage Trust Series 2016-ETC: | | | |
| Class D, 3.6089% 8/14/36 (b)(d) | | 1,000,000 | 917,757 |
| Class E, 3.6089% 8/14/36 (b)(d) | | 1,000,000 | 871,624 |
| Beckman Coulter, Inc. sequential payer Series 2000-A Class A, 7.4975% 12/15/18 (b) | | 546,250 | 546,987 |
| BWAY Mortgage Trust Series 2015-1740 Class E, 4.4499% 1/10/35 (b)(d) | | 1,000,000 | 969,822 |
| BX Trust Series 2017-IMC Class F, 1 month U.S. LIBOR + 4.250% 5.8095% 10/15/32 (b)(d)(e) | | 1,253,000 | 1,259,648 |
| BXMT Ltd. floater Series 2017-FL1 Class D, 1 month U.S. LIBOR + 2.700% 4.061% 6/15/35 (b)(e) | | 836,000 | 838,592 |
| CCRESG Commercial Mortgage Trust Series 2016-HEAT Class E, 5.4883% 4/10/29 (b)(d) | | 606,000 | 581,009 |
| CD Mortgage Trust Series 2017-CD3: | | | |
| Class C, 4.563% 2/10/50 | | 1,360,000 | 1,380,272 |
| Class D, 3.25% 2/10/50 (b) | | 1,259,000 | 1,004,920 |
| CFCRE Commercial Mortgage Trust Series 2011-C2 Class B, 5.7537% 12/15/47 (b)(d) | | 750,000 | 808,648 |
| CG-CCRE Commercial Mortgage Trust: | | | |
| Series 2014-FL1: | | | |
| Class YTC2, 1 month U.S. LIBOR + 2.489% 4.0485% 6/15/31 (b)(d)(e) | | 435,090 | 413,963 |
| Class YTC3, 1 month U.S. LIBOR + 2.489% 4.0485% 6/15/31 (b)(d)(e) | | 156,667 | 147,845 |
| Series 2014-FL1, 1 month U.S. LIBOR + 2.489% 4.0485% 6/15/31 (b)(d)(e) | | 435,090 | 416,523 |
| CGBAM Commercial Mortgage Trust Series 2015-SMRT: | | | |
| Class E, 3.7859% 4/10/28 (b)(d) | | 162,000 | 161,307 |
| Class F, 3.7859% 4/10/28 (b)(d) | | 1,133,000 | 1,116,990 |
| CGDB Commercial Mortgage Trust: | | | |
| 1 month U.S. LIBOR + 2.500% 4.0595% 5/15/30 (b)(d)(e) | | 260,000 | 261,457 |
| Series 2017-BIO Class F, 1 month U.S. LIBOR + 3.250% 4.8095% 5/15/30 (b)(d)(e) | | 134,000 | 133,825 |
| Chase Commercial Mortgage Securities Corp.: | | | |
| Series 1998-1 Class H, 6.34% 5/18/30 (b) | | 57,754 | 58,753 |
| Series 1998-2 Class J, 6.39% 11/18/30 (b) | | 186,544 | 183,345 |
| Citigroup Commercial Mortgage Trust: | | | |
| Series 2013-375P Class E, 3.5176% 5/10/35 (b)(d) | | 1,205,000 | 1,136,261 |
| Series 2013-GC15 Class D, 5.0987% 9/10/46 (b)(d) | | 1,927,000 | 1,826,260 |
| Series 2015-GC29 Class XA, 1.1526% 4/10/48 (d)(k) | | 66,339,943 | 3,746,475 |
| Series 2015-GC33 Class XA, 0.9596% 9/10/58 (d)(k) | | 92,077,832 | 5,134,131 |
| Series 2015-SHP2 Class E, 1 month U.S. LIBOR + 4.100% 5.9095% 7/15/27 (b)(d)(e) | | 693,000 | 696,491 |
| Series 2016-C3 Class D, 3% 11/15/49 (b) | | 1,451,000 | 1,085,790 |
| Series 2016-P6 Class XA, 0.8303% 12/10/49 (d)(k) | | 83,087,022 | 3,812,431 |
| Series 2016-SMPL Class E, 4.509% 9/10/31 (b) | | 1,406,000 | 1,396,656 |
| COMM Mortgage Trust: | | | |
| floater Series 2014-PAT Class E, 1 month U.S. LIBOR + 3.150% 4.7025% 8/13/27 (b)(d)(e) | | 735,000 | 744,011 |
| sequential payer Series 2013-LC6 Class E, 3.5% 1/10/46 (b) | | 1,410,000 | 1,055,531 |
| Series 2012-CR1: | | | |
| Class C, 5.3197% 5/15/45 (d) | | 850,000 | 882,968 |
| Class D, 5.3197% 5/15/45 (b)(d) | | 1,510,000 | 1,458,645 |
| Class G, 2.462% 5/15/45 (b) | | 231,000 | 140,118 |
| Series 2012-CR5 Class D, 4.3253% 12/10/45 (b)(d) | | 740,000 | 699,027 |
| Series 2012-LC4: | | | |
| Class C, 5.6047% 12/10/44 (d) | | 260,000 | 264,214 |
| Class D, 5.6047% 12/10/44 (b)(d) | | 1,437,000 | 1,281,389 |
| Series 2013-CCRE6 Class E, 4.0668% 3/10/46 (b)(d) | | 42,000 | 33,372 |
| Series 2013-CR10: | | | |
| Class C, 4.7886% 8/10/46 (b)(d) | | 270,000 | 271,893 |
| Class D, 4.7886% 8/10/46 (b)(d) | | 1,578,000 | 1,366,364 |
| Series 2013-CR12 Class D, 5.0786% 10/10/46 (b)(d) | | 1,680,000 | 1,396,259 |
| Series 2013-CR6 Class F, 4.0668% 3/10/46 (b)(d) | | 418,000 | 267,555 |
| Series 2013-CR9: | | | |
| Class C, 4.2539% 7/10/45 (b)(d) | | 525,000 | 511,543 |
| Class D, 4.2539% 7/10/45 (b)(d) | | 252,000 | 214,154 |
| Series 2013-LC6 Class D, 4.3062% 1/10/46 (b)(d) | | 1,441,000 | 1,316,050 |
| Series 2014-CR15 Class D, 4.769% 2/10/47 (b)(d) | | 258,000 | 234,395 |
| Series 2014-CR17: | | | |
| Class D, 4.7985% 5/10/47 (b)(d) | | 1,292,000 | 1,087,115 |
| Class E, 4.7985% 5/10/47 (b)(d) | | 182,000 | 140,666 |
| Series 2014-CR19 Class XA, 1.22% 8/10/47 (d)(k) | | 154,962,614 | 7,449,146 |
| Series 2014-CR20 Class XA, 1.1559% 11/10/47 (d)(k) | | 125,328,396 | 6,564,965 |
| Series 2014-LC17 Class XA, 0.9465% 10/10/47 (d)(k) | | 108,231,032 | 3,737,564 |
| Series 2014-UBS2 Class D, 5.0145% 3/10/47 (b)(d) | | 844,000 | 734,001 |
| Series 2014-UBS4 Class XA, 1.2174% 8/10/47 (d)(k) | | 112,531,975 | 5,704,797 |
| Series 2014-UBS6 Class XA, 1.0169% 12/10/47 (d)(k) | | 152,033,333 | 6,866,525 |
| Series 2015-3BP Class F, 3.2384% 2/10/35 (b)(d) | | 1,500,000 | 1,344,707 |
| Series 2015-CR23 Class CME, 3.6845% 5/10/48 (b)(d) | | 483,000 | 471,517 |
| Series 2015-DC1 Class XA, 1.1593% 2/10/48 (d)(k) | | 154,253,411 | 8,027,255 |
| Series 2016-CD1 Class D, 2.771% 8/10/49 (b)(d) | | 1,006,000 | 770,490 |
| Series 2017-CD4 Class D, 3.3% 5/10/50 (b) | | 1,024,000 | 826,644 |
| COMM Mortgage Trust pass-thru certificates Series 2005-LP5 Class F, 4.5947% 5/10/43 (b)(d) | | 1,206,747 | 1,200,849 |
| COMM Trust Series 2017-COR2 Class D, 3% 9/10/50 (b) | | 340,000 | 274,312 |
| Commercial Mortgage Asset Trust Series 1999-C2 Class H, 6% 11/17/32 (b) | | 704,842 | 706,970 |
| Commercial Mortgage Trust Series 2016-CD2: | | | |
| Class C, 4.0306% 11/10/49 (d) | | 971,000 | 946,084 |
| Class D, 2.7806% 11/10/49 (d) | | 508,000 | 389,247 |
| Commercial Mortgage Trust pass-thru certificates: | | | |
| Series 2012-CR2: | | | |
| Class E, 4.832% 8/15/45 (b)(d) | | 1,727,000 | 1,655,692 |
| Class F, 4.25% 8/15/45 (b) | | 1,418,000 | 1,142,344 |
| Series 2014-CR2 Class G, 4.25% 8/15/45 (b) | | 496,000 | 315,430 |
| Core Industrial Trust: | | | |
| Series 2015-CALW Class G, 3.8504% 2/10/34 (b)(d) | | 625,000 | 600,708 |
| Series 2015-TEXW Class F, 3.8487% 2/10/34 (b)(d) | | 493,000 | 475,867 |
| Series 2015-WEST Class F, 4.2268% 2/10/37 (b)(d) | | 1,566,000 | 1,492,866 |
| Credit Suisse First Boston Mortgage Securities Corp.: | | | |
| Series 1998-C1 Class H, 6% 5/17/40 (b) | | 90,060 | 73,478 |
| Series 1998-C2 Class G, 6.75% 11/15/30 (b) | | 55,002 | 55,121 |
| CSAIL Commercial Mortgage Trust: | | | |
| Series 2017-C8 Class D, 4.47% 6/15/50 (b) | | 1,196,000 | 1,068,976 |
| Series 2017-CX10 Class UESD, 4.2366% 11/15/27 (b)(d) | | 588,000 | 558,639 |
| Series 2017-CX9 Class D, 4.161% 9/15/50 (b) | | 479,000 | 399,649 |
| CSMC Trust: | | | |
| floater Series 2015-DEAL: | | | |
| Class E, 1 month U.S. LIBOR + 4.000% 5.588% 4/15/29 (b)(d)(e) | | 1,109,000 | 1,108,999 |
| Class F, 1 month U.S. LIBOR + 4.750% 6.338% 4/15/29 (b)(d)(e) | | 989,000 | 987,576 |
| Series 2016-MFF Class F, 1 month U.S. LIBOR + 7.250% 8.8095% 11/15/33 (b)(d)(e) | | 968,000 | 977,272 |
| Series 2017-MOON Class E, 3.1965% 7/10/34 (b)(d) | | 377,000 | 360,155 |
| DBCCRE Mortgage Trust Series 2014-ARCP Class E, 4.9345% 1/10/34 (b)(d) | | 1,449,000 | 1,280,878 |
| DBUBS Mortgage Trust: | | | |
| Series 2011-LC1A: | | | |
| Class E, 5.6978% 11/10/46 (b)(d) | | 1,810,000 | 1,872,435 |
| Class F, 5.6978% 11/10/46 (b)(d) | | 1,560,000 | 1,504,611 |
| Class G, 4.652% 11/10/46 (b) | | 1,948,000 | 1,712,943 |
| Class XB, 0.306% 11/10/46 (b)(d)(k) | | 20,920,000 | 172,590 |
| Series 2011-LC3A Class D, 5.3405% 8/10/44 (b)(d) | | 812,000 | 836,884 |
| Deutsche Bank Commercial Mortgage Trust Series 2016-C3 Class C, 3.4938% 9/10/49 (d) | | 600,000 | 563,789 |
| Fannie Mae Series 2017-T1 Class A, 2.898% 6/25/27 | | 52,088,846 | 50,013,319 |
| Freddie Mac: | | | |
| floater: | | | |
| Series KP04 Class AG1, 1 month U.S. LIBOR + 0.220% 1.7997% 7/25/20 (d)(e) | | 12,900,000 | 12,912,193 |
| Series KP04, Class AG2, 1 month U.S. LIBOR + 0.200% 1.7797% 10/25/19 (d)(e) | | 26,000,000 | 26,012,815 |
| pass-thru certificates: | | | |
| Series K011 Class X3, 2.577% 12/25/43 (d)(k) | | 1,640,000 | 109,202 |
| Series K012 Class X3, 2.252% 1/25/41 (d)(k) | | 1,770,270 | 105,614 |
| Series K013 Class X3, 2.9089% 1/25/43 (d)(k) | | 820,000 | 62,863 |
| Series KAIV Class X2, 3.6147% 6/25/46 (d)(k) | | 420,000 | 43,498 |
| FREMF Mortgage Trust: | | | |
| Series 2010-K9 Class B, 5.2061% 9/25/45 (b)(d) | | 1,815,000 | 1,901,302 |
| Series 2011-K10 Class B, 4.6216% 11/25/49 (b)(d) | | 500,000 | 516,230 |
| Series 2011-K11 Class B, 4.4238% 12/25/48 (b)(d) | | 750,000 | 772,994 |
| GAHR Commercial Mortgage Trust Series 2015-NRF: | | | |
| Class BFX, 3.3822% 12/15/34 (b)(d) | | 18,910,000 | 18,960,616 |
| Class CFX, 3.3822% 12/15/34 (b)(d) | | 14,152,000 | 14,141,331 |
| Class DFX, 3.3822% 12/15/34 (b)(d) | | 27,804,000 | 27,711,780 |
| Class EFX, 3.3822% 12/15/34 (b)(d) | | 1,750,000 | 1,729,353 |
| Class FFX, 3.3822% 12/15/34 (b)(d) | | 1,967,000 | 1,933,872 |
| Class GFX, 3.3822% 12/15/34 (b)(d) | | 2,314,000 | 2,268,063 |
| GE Capital Commercial Mortgage Corp. Series 2007-C1 Class A1A, 5.483% 12/10/49 | | 1,111,667 | 1,115,802 |
| GMAC Commercial Mortgage Securities, Inc.: | | | |
| Series 1997-C1 Class H, 6.6% 7/15/29 | | 147,453 | 141,363 |
| Series 1997-C2 Class G, 6.75% 4/15/29 (d) | | 17,873 | 17,874 |
| Series 1999-C2I Class K, 6.481% 9/15/33 | | 835,000 | 757,645 |
| GP Portfolio Trust Series 2014-GPP: | | | |
| Class A, 1 month U.S. LIBOR + 1.200% 2.7595% 2/15/27 (b)(d)(e) | | 7,427,286 | 7,428,763 |
| Class D, 1 month U.S. LIBOR + 3.000% 4.5595% 2/15/27 (b)(d)(e) | | 291,000 | 291,064 |
| Class E, 1 month U.S. LIBOR + 4.100% 5.6595% 2/15/27 (b)(d)(e) | | 378,000 | 372,315 |
| Grace Mortgage Trust Series 2014-GRCE Class F, 3.5901% 6/10/28 (b)(d) | | 1,323,000 | 1,298,060 |
| GS Mortgage Securities Corp. II Series 2010-C1: | | | |
| Class D, 6.051% 8/10/43 (b)(d) | | 617,000 | 626,735 |
| Class F, 4% 8/10/43 (b) | | 327,000 | 234,405 |
| Class X, 1.377% 8/10/43 (b)(d)(k) | | 4,746,027 | 125,093 |
| GS Mortgage Securities Trust: | | | |
| Series 2010-C2: | | | |
| Class D, 5.1826% 12/10/43 (b)(d) | | 720,000 | 723,650 |
| Class XA, 0.1177% 12/10/43 (b)(d)(k) | | 3,170,775 | 10,891 |
| Series 2011-GC3 Class D, 5.6416% 3/10/44 (b)(d) | | 294,000 | 302,102 |
| Series 2011-GC5: | | | |
| Class C, 5.3983% 8/10/44 (b)(d) | | 1,050,000 | 1,099,642 |
| Class D, 5.3983% 8/10/44 (b)(d) | | 1,500,000 | 1,443,624 |
| Class E, 5.3983% 8/10/44 (b)(d) | | 711,000 | 576,023 |
| Class F, 4.5% 8/10/44 (b) | | 1,209,000 | 617,579 |
| Series 2012-GC6: | | | |
| Class D, 5.6521% 1/10/45 (b)(d) | | 1,156,000 | 1,096,984 |
| Class E, 5% 1/10/45 (b)(d) | | 412,000 | 351,121 |
| Series 2012-GC6I Class F, 5% 1/10/45 (d) | | 390,000 | 260,823 |
| Series 2012-GCJ7: | | | |
| Class C, 5.6977% 5/10/45 (d) | | 630,000 | 651,438 |
| Class D, 5.6977% 5/10/45 (b)(d) | | 2,204,000 | 2,123,212 |
| Class E, 5% 5/10/45 (b) | | 1,311,000 | 1,063,776 |
| Class F, 5% 5/10/45 (b) | | 2,079,000 | 1,146,462 |
| Series 2012-GCJ9: | | | |
| Class D, 4.7489% 11/10/45 (b)(d) | | 2,119,000 | 2,023,570 |
| Class E, 4.7489% 11/10/45 (b)(d) | | 1,290,000 | 1,132,939 |
| Series 2013-GC10 Class D, 4.4112% 2/10/46 (b)(d) | | 920,000 | 865,382 |
| Series 2013-GC12: | | | |
| Class D, 4.4423% 6/10/46 (b)(d) | | 219,000 | 186,801 |
| Class XA, 1.5229% 6/10/46 (d)(k) | | 29,591,814 | 1,615,503 |
| Series 2013-GC13 Class D, 4.0897% 7/10/46 (b)(d) | | 1,858,000 | 1,697,189 |
| Series 2013-GC16: | | | |
| Class C, 5.3272% 11/10/46 (d) | | 662,844 | 669,562 |
| Class D, 5.3272% 11/10/46 (b)(d) | | 1,009,000 | 948,605 |
| Class F, 3.5% 11/10/46 (b) | | 999,000 | 707,730 |
| Series 2014-GC20 Class XA, 1.0046% 4/10/47 (d)(k) | | 180,321,462 | 8,582,652 |
| Series 2015-GC34 Class XA, 1.3559% 10/10/48 (d)(k) | | 29,147,286 | 2,194,490 |
| Series 2016-GS2 Class C, 4.5293% 5/10/49 (d) | | 699,000 | 718,259 |
| Series 2016-GS3 Class D, 2.728% 10/10/49 (b) | | 1,776,000 | 1,363,738 |
| Series 2016-GS4 Class C, 3.8041% 11/10/49 | | 728,000 | 704,552 |
| Series 2016-REMZ Class MZB, 7.727% 2/10/21 (b) | | 1,113,000 | 1,091,007 |
| Series 2016-RENT: | | | |
| Class E, 4.0667% 2/10/29 (b)(d) | | 1,452,000 | 1,433,938 |
| Class F, 4.0667% 2/10/29 (b)(d) | | 1,520,000 | 1,407,769 |
| Series 2017-GS6 Class D, 3.331% 5/10/50 (b) | | 1,113,000 | 868,571 |
| Hilton U.S.A. Trust: | | | |
| Series 2016-HHV Class F, 4.1935% 11/5/38 (b)(d) | | 1,702,000 | 1,479,666 |
| Series 2016-SFP Class F, 6.0801% 11/5/35 (b) | | 1,344,000 | 1,342,045 |
| IMT Trust Series 2017-APTS: | | | |
| Class EFL, 1 month U.S. LIBOR + 2.150% 3.7095% 6/15/34 (b)(d)(e) | | 564,000 | 564,886 |
| Class FFL, 1 month U.S. LIBOR + 2.850% 4.4095% 6/15/34 (b)(d)(e) | | 226,000 | 226,479 |
| JPMBB Commercial Mortgage Securities Trust: | | | |
| Series 2014-C19 Class XA, 1.1383% 4/15/47 (d)(k) | | 23,349,322 | 586,920 |
| Series 2014-C22 Class D, 4.5589% 9/15/47 (b)(d) | | 525,000 | 424,178 |
| Series 2014-C23 Class UH5, 4.7094% 9/15/47 (b) | | 179,000 | 151,012 |
| Series 2014-C26 Class D, 3.924% 1/15/48 (b)(d) | | 707,000 | 601,010 |
| Series 2015-C30 Class XA, 0.683% 7/15/48 (d)(k) | | 82,989,433 | 2,529,452 |
| Series 2015-C32 Class C, 4.6675% 11/15/48 (d) | | 1,907,000 | 1,896,148 |
| JPMCC Commercial Mortgage Securities Trust Series 2016-JP4 Class D, 3.4619% 12/15/49 (b) | | 1,462,000 | 1,183,353 |
| JPMDB Commercial Mortgage Securities Trust: | | | |
| Series 2016-C4: | | | |
| Class C, 3.0971% 12/15/49 | | 946,000 | 863,294 |
| Class D, 3.0954% 12/15/49 (b)(d) | | 1,148,000 | 904,260 |
| Series 2017-C7: | | | |
| Class C, 4.1854% 10/15/50 (d) | | 545,000 | 538,089 |
| Class D, 3% 10/15/50 (b) | | 569,000 | 445,979 |
| JPMorgan Chase Commercial Mortgage Securities Corp.: | | | |
| sequential payer Series 2010-CNTR Class A2, 4.311% 8/5/32 (b) | | 319,521 | 326,224 |
| Series 2003-C1 Class F, 5.4825% 1/12/37 (b)(d) | | 182,122 | 187,834 |
| Series 2009-IWST: | | | |
| Class C, 7.4453% 12/5/27 (b)(d) | | 380,000 | 409,182 |
| Class D, 7.4453% 12/5/27 (b)(d) | | 1,885,000 | 2,025,778 |
| Series 2010-CNTR Class D, 6.1838% 8/5/32 (b)(d) | | 695,000 | 733,440 |
| Series 2012-CBX: | | | |
| Class C, 5.2137% 6/15/45 (d) | | 250,000 | 254,753 |
| Class D, 5.2137% 6/16/45 (b)(d) | | 690,000 | 689,720 |
| Class E, 5.2137% 6/15/45 (b)(d) | | 1,043,000 | 1,019,720 |
| Class F, 4% 6/15/45 (b) | | 988,000 | 790,939 |
| Class G 4% 6/15/45 (b) | | 1,079,000 | 600,425 |
| JPMorgan Chase Commercial Mortgage Securities Trust: | | | |
| Series 2004-CBX Class D, 5.097% 1/12/37 (d) | | 170,000 | 173,030 |
| Series 2005-LDP2: | | | |
| Class E, 4.981% 7/15/42 (d) | | 69,065 | 70,066 |
| Class F, 5.01% 7/15/42 (d) | | 189,000 | 187,551 |
| Series 2011-C3: | | | |
| Class E, 5.6301% 2/15/46 (b)(d) | | 700,000 | 690,242 |
| Class H, 4.409% 2/15/46 (b)(d) | | 756,000 | 554,419 |
| Class J, 4.409% 2/15/46 (b)(d) | | 106,000 | 67,575 |
| Series 2011-C4: | | | |
| Class E, 5.5344% 7/15/46 (b)(d) | | 1,130,000 | 1,139,338 |
| Class F, 3.873% 7/15/46 (b) | | 105,000 | 96,405 |
| Class H, 3.873% 7/15/46 (b) | | 674,250 | 483,661 |
| Class NR, 3.873% 7/15/46 (b) | | 385,000 | 243,513 |
| Class TAC1, 7.99% 7/15/46 (b) | | 715,915 | 713,665 |
| Class TAC2, 7.99% 7/15/46 (b) | | 671,000 | 667,892 |
| Series 2011-C5: | | | |
| Class B. 5.4078% 8/15/46 (b)(d) | | 1,140,000 | 1,205,854 |
| Class C, 5.4078% 8/15/46 (b)(d) | | 650,648 | 673,967 |
| Series 2013-LC11: | | | |
| Class C, 3.9582% 4/15/46 (d) | | 1,163,000 | 1,146,982 |
| Class D, 4.1949% 4/15/46 (d) | | 1,800,000 | 1,651,478 |
| Class F, 3.25% 4/15/46 (b)(d) | | 1,682,000 | 972,449 |
| Series 2014-DSTY: | | | |
| Class D, 3.8046% 6/10/27 (b)(d) | | 816,000 | 772,757 |
| Class E, 3.8046% 6/10/27 (b)(d) | | 1,169,000 | 1,089,984 |
| Series 2015-UES Class F, 3.621% 9/5/32 (b)(d) | | 1,155,000 | 1,122,801 |
| Series 2016-WP Class TA, 1 month U.S. LIBOR + 1.450% 3.0095% 10/15/33 (b)(d)(e) | | 15,063,000 | 15,086,421 |
| Ladder Capital Commercial Mortgage Securities Trust Series 2014-909 Class E, 3.8979% 5/15/31 (b)(d) | | 1,218,000 | 1,167,396 |
| Liberty Street Trust Series 2016-225L: | | | |
| Class D, 4.6485% 2/10/36 (b)(d) | | 588,000 | 606,135 |
| Class E, 4.6485% 2/10/36 (b)(d) | | 1,050,000 | 1,011,101 |
| Lone Star Portfolio Trust floater Series 2015-LSP Class A1A2, 1 month U.S. LIBOR + 1.800% 3.3595% 9/15/28 (b)(d)(e) | | 7,113,426 | 7,126,899 |
| LSTAR Commercial Mortgage Trust Series 2014-2: | | | |
| Class D, 5.1239% 1/20/41 (b)(d) | | 256,000 | 254,749 |
| Class E, 5.1239% 1/20/41 (b)(d) | | 400,000 | 369,524 |
| Merrill Lynch Mortgage Trust Series 2006-C1 Class AJ, 5.677% 5/12/39 (d) | | 282,634 | 284,802 |
| Morgan Stanley BAML Trust: | | | |
| sequential payer Series 2014-C18 Class 300E, 4.6896% 8/15/31 (b) | | 750,000 | 715,789 |
| Series 2012-C5 Class E, 4.6873% 8/15/45 (b)(d) | | 269,000 | 263,137 |
| Series 2012-C6 Class D, 4.5751% 11/15/45 (b)(d) | | 1,357,000 | 1,354,704 |
| Series 2013-C12 Class D, 4.7636% 10/15/46 (b)(d) | | 1,210,000 | 1,135,645 |
| Series 2013-C13: | | | |
| Class D, 4.8893% 11/15/46 (b)(d) | | 1,074,000 | 998,057 |
| Class E, 4.8893% 11/15/46 (b)(d) | | 887,000 | 697,348 |
| Series 2013-C7: | | | |
| Class D, 4.2502% 2/15/46 (b)(d) | | 1,111,000 | 1,004,072 |
| Class E, 4.2502% 2/15/46 (b)(d) | | 340,000 | 261,781 |
| Series 2013-C8 Class D, 4.0593% 12/15/48 (b)(d) | | 400,000 | 360,247 |
| Series 2013-C9: | | | |
| Class C, 4.0468% 5/15/46 (d) | | 790,000 | 774,157 |
| Class D, 4.1348% 5/15/46 (b)(d) | | 1,747,000 | 1,588,367 |
| Series 2014-C17 Class XA, 1.2301% 8/15/47 (d)(k) | | 172,274,284 | 7,811,691 |
| Series 2015-C25 Class XA, 1.1336% 10/15/48 (d)(k) | | 47,277,848 | 2,953,017 |
| Series 2016-C30: | | | |
| Class C, 4.1312% 9/15/49 (d) | | 417,000 | 407,285 |
| Class D, 3% 9/15/49 (b) | | 452,000 | 338,242 |
| Series 2016-C31: | | | |
| Class C, 4.3193% 11/15/49 (d) | | 946,000 | 925,319 |
| Class D, 3% 11/15/49 (b)(d) | | 703,000 | 522,860 |
| Series 2016-C32: | | | |
| Class C, 4.296% 12/15/49 | | 651,000 | 645,463 |
| Class D, 3.396% 12/15/49 (b) | | 924,000 | 681,861 |
| Series 2017-C33 Class D, 3.25% 5/15/50 (b) | | 879,000 | 703,726 |
| Morgan Stanley Capital I Trust: | | | |
| sequential payer Series 2012-C4 Class E, 5.4205% 3/15/45 (b)(d) | | 1,483,000 | 1,239,106 |
| Series 1997-RR Class F, 7.51% 4/30/39 (b)(d) | | 19,357 | 19,318 |
| Series 1998-CF1 Class G, 7.35% 7/15/32 (b) | | 83,471 | 80,800 |
| Series 1999-WF1: | | | |
| Class N, 5.91% 11/15/31 (b) | | 52,812 | 52,671 |
| Class O, 5.91% 11/15/31 (b) | | 160,287 | 154,600 |
| Series 2011-C1: | | | |
| Class D, 5.4264% 9/15/47 (b)(d) | | 1,760,000 | 1,833,956 |
| Class E, 5.4264% 9/15/47 (b)(d) | | 573,100 | 595,858 |
| Series 2011-C2: | | | |
| Class D, 5.4831% 6/15/44 (b)(d) | | 1,272,000 | 1,253,006 |
| Class E, 5.4831% 6/15/44 (b)(d) | | 600,000 | 563,788 |
| Class F, 5.4831% 6/15/44 (b)(d) | | 550,000 | 464,716 |
| Class XB, 0.5345% 6/15/44 (b)(d)(k) | | 9,001,008 | 141,729 |
| Series 2011-C3: | | | |
| Class C, 5.1549% 7/15/49 (b)(d) | | 1,000,000 | 1,043,815 |
| Class D, 5.1549% 7/15/49 (b)(d) | | 1,130,000 | 1,168,167 |
| Class E, 5.1549% 7/15/49 (b)(d) | | 532,000 | 512,965 |
| Class F, 5.1549% 7/15/49 (b)(d) | | 181,000 | 166,274 |
| Class G, 5.1549% 7/15/49 (b)(d) | | 957,000 | 795,462 |
| Series 2012-C4: | | | |
| Class D, 5.4205% 3/15/45 (b)(d) | | 330,000 | 313,469 |
| Class F, 3.07% 3/15/45 (b) | | 623,000 | 349,971 |
| Series 2014-150E: | | | |
| Class C, 4.295% 9/9/32 (b)(d) | | 656,000 | 671,444 |
| Class F, 4.295% 9/9/32 (b)(d) | | 651,000 | 624,335 |
| Series 2014-CPT Class F, 3.4455% 7/13/29 (b)(d) | | 1,436,000 | 1,405,329 |
| Series 2015-MS1: | | | |
| Class C, 4.0301% 5/15/48 (d) | | 734,000 | 708,708 |
| Class D, 4.0301% 5/15/48 (b)(d) | | 1,260,000 | 1,065,393 |
| Series 2015-UBS8 Class D, 3.18% 12/15/48 (b) | | 798,000 | 668,023 |
| Series 2016-BNK2: | | | |
| Class C, 3% 11/15/49 (b) | | 1,350,000 | 1,052,836 |
| Class D, 3.9101% 11/15/49 (d) | | 946,000 | 908,053 |
| Series 2017-CLS Class F, 1 month U.S. LIBOR + 2.600% 4.1595% 11/15/34 (b)(d)(e) | | 1,100,000 | 1,103,792 |
| Morgan Stanley Dean Witter Capital I Trust Series 2001-TOP3 Class E, 7.5867% 7/15/33 (b)(d) | | 91,000 | 97,060 |
| Motel 6 Trust floater: | | | |
| Series 2017-M6MZ, Class M, 1 month U.S. LIBOR + 6.927% 8.486% 8/15/19 (b)(d)(e) | | 494,792 | 497,855 |
| Series 2017-MTL6, Class F, 1 month U.S. LIBOR + 4.250% 5.8095% 8/15/34 (b)(d)(e) | | 3,179,551 | 3,200,386 |
| MSCG Trust Series 2016-SNR: | | | |
| Class A, 3.348% 11/15/34 (b)(d) | | 23,867,000 | 23,363,442 |
| Class B, 4.181% 11/15/34 (b) | | 8,435,000 | 8,324,624 |
| Class C, 5.205% 11/15/34 (b) | | 5,900,000 | 5,905,506 |
| Class D, 6.55% 11/15/34 (b) | | 2,222,000 | 2,218,115 |
| Class E, 6.8087% 11/15/34 (b) | | 615,000 | 583,817 |
| MSJP Commercial Securities Mortgage Trust Series 2015-HAUL Class E, 4.851% 9/5/47 (b)(d) | | 278,000 | 255,202 |
| NationsLink Funding Corp. Series 1999-LTL1 Class D, 6.45% 1/22/26 (b) | | 237,026 | 242,405 |
| Natixis Commercial Mortgage Securities Trust: | | | |
| Series 2018-285M Class F, 3.7904% 11/15/32 (b)(d) | | 294,000 | 273,124 |
| Series 2018-TECH Class F, 4.5595% 11/15/34 (b) | | 364,000 | 364,678 |
| Providence Place Group Ltd. Partnership Series 2000-C1 Class A2, 7.75% 7/20/28 (b) | | 943,493 | 1,152,948 |
| Real Estate Asset Liquidity Trust Series 2006-2: | | | |
| Class J, 4.456% 9/12/38 (b) | CAD | 20,949 | 16,245 |
| Class K, 4.456% 9/12/38 (b) | CAD | 18,000 | 13,970 |
| Class L, 4.456% 9/12/38 (b) | CAD | 26,000 | 20,146 |
| Class M, 4.456% 9/12/38 (b) | CAD | 104,391 | 79,401 |
| SCG Trust Series 2013-SRP1: | | | |
| Class A, 1 month U.S. LIBOR + 1.400% 3.2095% 11/15/26 (b)(d)(e) | | 19,989,000 | 19,988,996 |
| Class D, 1 month U.S. LIBOR + 3.344% 5.1532% 11/15/26 (b)(d)(e) | | 249,000 | 243,600 |
| Starwood Retail Property Trust Series 2014-STAR Class D, 1 month U.S. LIBOR + 3.250% 4.8095% 11/15/27 (b)(d)(e) | | 663,000 | 639,802 |
| TIAA Seasoned Commercial Mortgage Trust: | | | |
| sequential payer Series 2007-C4 Class AJ, 5.4762% 8/15/39 (d) | | 21,299 | 21,347 |
| Series 2007-C4 Class F, 5.4762% 8/15/39 (d) | | 820,000 | 757,344 |
| TPG Real Estate Finance floater Series 2018-FL1 Class D, 1 month U.S. LIBOR + 2.700% 4.261% 4/15/35 (b)(d)(e) | | 314,000 | 315,382 |
| UBS Commercial Mortgage Trust: | | | |
| Series 2012-C1: | | | |
| Class D, 5.5444% 5/10/45 (b)(d) | | 1,197,000 | 1,182,908 |
| Class E, 5% 5/10/45 (b)(d) | | 537,000 | 453,112 |
| Class F, 5% 5/10/45 (b)(d) | | 682,700 | 465,166 |
| Series 2017-C7 Class XA, 1.047% 12/15/50 (d)(k) | | 85,605,137 | 6,513,721 |
| UBS-BAMLL Trust: | | | |
| Series 12-WRM Class D, 4.238% 6/10/30 (b)(d) | | 310,000 | 299,808 |
| Series 2012-WRM Class E, 4.238% 6/10/30 (b)(d) | | 970,000 | 914,166 |
| VNO Mortgage Trust Series 2012-6AVE Class D, 3.3372% 11/15/30 (b)(d) | | 1,299,000 | 1,254,627 |
| Vornado DP LLC Series 2010-VNO Class D, 6.3555% 9/13/28 (b) | | 180,000 | 193,189 |
| Wells Fargo Commercial Mortgage Trust: | | | |
| Series 2010-C1 Class XB, 0.5836% 11/15/43 (b)(d)(k) | | 20,343,927 | 291,130 |
| Series 2012-LC5: | | | |
| Class C, 4.693% 10/15/45 (d) | | 569,000 | 573,619 |
| Class D, 4.7646% 10/15/45 (b)(d) | | 1,776,000 | 1,592,110 |
| Class E, 4.7646% 10/15/45 (b)(d) | | 284,000 | 227,837 |
| Series 2013-LC12 Class C, 4.2908% 7/15/46 (d) | | 760,000 | 749,864 |
| Series 2015-C31 Class XA, 1.0929% 11/15/48 (d)(k) | | 38,043,061 | 2,327,463 |
| Series 2015-NXS4 Class E, 3.6003% 12/15/48 (b)(d) | | 588,000 | 462,178 |
| Series 2016-BNK1: | | | |
| Class C, 3.071% 8/15/49 | | 700,000 | 629,655 |
| Class D, 3% 8/15/49 (b) | | 447,000 | 356,586 |
| Series 2016-C34 Class XA, 2.1737% 6/15/49 (d)(k) | | 34,252,998 | 4,056,363 |
| Series 2016-C35 Class D, 3.142% 7/15/48 (b) | | 1,596,000 | 1,169,329 |
| Series 2016-LC25 Class C, 4.4362% 12/15/59 (d) | | 903,000 | 863,345 |
| Series 2016-NXS6 Class D, 3.059% 11/15/49 (b) | | 1,218,000 | 874,827 |
| Series 2017-C38 Class D, 3% 7/15/50 (b)(d) | | 1,364,000 | 1,051,918 |
| Series 2017-RB1 Class D, 3.401% 3/15/50 (b) | | 556,000 | 446,808 |
| WF-RBS Commercial Mortgage Trust: | | | |
| sequential payer Series 2011-C4I Class G, 5% 6/15/44 (b) | | 325,000 | 218,039 |
| Series 2011-C3: | | | |
| Class C, 5.335% 3/15/44 (b) | | 360,000 | 371,978 |
| Class D, 5.6398% 3/15/44 (b)(d) | | 800,000 | 697,936 |
| Class E, 5% 3/15/44 (b) | | 890,000 | 717,744 |
| Class F, 5% 3/15/44 (b) | | 693,000 | 400,109 |
| Series 2011-C4: | | | |
| Class D, 5.2468% 6/15/44 (b)(d) | | 408,000 | 395,801 |
| Class E, 5.2468% 6/15/44 (b)(d) | | 263,432 | 230,739 |
| Series 2011-C5: | | | |
| Class C, 5.6706% 11/15/44 (b)(d) | | 260,000 | 277,151 |
| Class D, 5.6706% 11/15/44 (b)(d) | | 600,000 | 609,010 |
| Class E, 5.6706% 11/15/44 (b)(d) | | 1,853,000 | 1,856,924 |
| Class F, 5.25% 11/15/44 (b)(d) | | 933,000 | 806,436 |
| Class G, 5.25% 11/15/44 (b)(d) | | 329,000 | 266,676 |
| Class XA, 1.7517% 11/15/44 (b)(d)(k) | | 3,933,167 | 195,225 |
| Series 2012-C10: | | | |
| Class E, 4.4474% 12/15/45 (b)(d) | | 1,190,000 | 894,991 |
| Class F, 4.4474% 12/15/45 (b)(d) | | 1,726,000 | 955,698 |
| Series 2012-C6 Class D, 5.5799% 4/15/45 (b)(d) | | 540,000 | 525,137 |
| Series 2012-C7: | | | |
| Class C, 4.8252% 6/15/45 (d) | | 1,270,000 | 1,282,684 |
| Class E, 4.8252% 6/15/45 (b)(d) | | 2,501,000 | 2,023,762 |
| Class F, 4.5% 6/15/45 (b) | | 357,000 | 237,299 |
| Class G, 4.5% 6/15/45 (b) | | 1,076,000 | 635,315 |
| Series 2012-C8: | | | |
| Class D, 4.8934% 8/15/45 (b)(d) | | 650,000 | 632,976 |
| Class E, 4.8934% 8/15/45 (b)(d) | | 335,000 | 319,069 |
| Series 2013-C11: | | | |
| Class D, 4.2718% 3/15/45 (b)(d) | | 870,000 | 813,557 |
| Class E, 4.2718% 3/15/45 (b)(d) | | 1,750,000 | 1,354,369 |
| Series 2013-C13 Class D, 4.1386% 5/15/45 (b)(d) | | 600,000 | 547,839 |
| Series 2013-C16 Class D, 5.0284% 9/15/46 (b)(d) | | 193,000 | 181,279 |
| Series 2013-UBS1 Class D, 4.6234% 3/15/46 (b)(d) | | 756,000 | 694,486 |
| Series 2014-C21 Class XA, 1.1255% 8/15/47 (d)(k) | | 104,518,922 | 5,170,321 |
| Series 2014-C24 Class XA, 0.9498% 11/15/47 (d)(k) | | 34,595,625 | 1,531,268 |
| WFCG Commercial Mortgage Trust floater Series 2015-BXRP: | | | |
| Class F, 1 month U.S. LIBOR + 3.721% 5.2798% 11/15/29 (b)(d)(e) | | 1,054,900 | 1,056,228 |
| Class G, 1 month U.S. LIBOR + 3.001% 4.5795% 11/15/29 (b)(d)(e) | | 456,347 | 450,391 |
| Worldwide Plaza Trust Series 2017-WWP Class F, 3.5955% 11/10/36 (b)(d) | | 830,000 | 707,897 |
| WP Glimcher Mall Trust Series 2015-WPG: | | | |
| Class PR1, 3.516% 6/5/35 (b)(d) | | 489,000 | 375,529 |
| Class PR2, 3.516% 6/5/35 (b)(d) | | 1,260,000 | 897,936 |
| TOTAL COMMERCIAL MORTGAGE SECURITIES | | | |
| (Cost $574,795,283) | | | 569,196,111 |
|
| Municipal Securities - 1.2% | | | |
| California Gen. Oblig.: | | | |
| Series 2009, 7.35% 11/1/39 | | $2,650,000 | $3,846,820 |
| 7.3% 10/1/39 | | 27,595,000 | 39,775,433 |
| 7.5% 4/1/34 | | 9,105,000 | 12,999,573 |
| 7.55% 4/1/39 | | 18,745,000 | 28,223,409 |
| 7.6% 11/1/40 | | 14,220,000 | 21,842,773 |
| 7.625% 3/1/40 | | 10,110,000 | 15,188,657 |
| Chicago Gen. Oblig. (Taxable Proj.): | | | |
| Series 2008 B, 5.63% 1/1/22 | | 2,410,000 | 2,423,255 |
| Series 2010 C1, 7.781% 1/1/35 | | 13,950,000 | 16,074,864 |
| Series 2012 B, 5.432% 1/1/42 | | 3,285,000 | 3,026,175 |
| Illinois Gen. Oblig.: | | | |
| Series 2003: | | | |
| 4.35% 6/1/18 | | 3,508,000 | 3,521,190 |
| 4.95% 6/1/23 | | 24,240,000 | 24,996,530 |
| 5.1% 6/1/33 | | 63,045,000 | 59,440,717 |
| Series 2010-1, 6.63% 2/1/35 | | 11,945,000 | 12,642,707 |
| Series 2010-3: | | | |
| 5.547% 4/1/19 | | 330,000 | 336,815 |
| 6.725% 4/1/35 | | 17,810,000 | 18,713,679 |
| 7.35% 7/1/35 | | 8,165,000 | 8,956,842 |
| Series 2010-5, 6.2% 7/1/21 | | 6,528,000 | 6,812,033 |
| Series 2011: | | | |
| 5.665% 3/1/18 | | 21,275,000 | 21,275,000 |
| 5.877% 3/1/19 | | 77,850,000 | 79,734,749 |
| Series 2013, 3.14% 12/1/18 | | 3,490,000 | 3,485,219 |
| TOTAL MUNICIPAL SECURITIES | | | |
| (Cost $373,165,624) | | | 383,316,440 |
|
| Foreign Government and Government Agency Obligations - 0.9% | | | |
| Arab Republic of Egypt: | | | |
| 5.577% 2/21/23 (b) | | $1,675,000 | $1,703,358 |
| 5.875% 6/11/25 | | 765,000 | 769,529 |
| 5.875% 6/11/25 (b) | | 535,000 | 538,167 |
| 6.125% 1/31/22 (b) | | 5,720,000 | 5,926,606 |
| 7.5% 1/31/27 (b) | | 600,000 | 648,853 |
| 7.903% 2/21/48 (b) | | 1,265,000 | 1,327,752 |
| 8.5% 1/31/47 (b) | | 1,990,000 | 2,227,881 |
| Argentine Republic: | | | |
| 5.625% 1/26/22 | | 6,680,000 | 6,803,580 |
| 6.875% 4/22/21 | | 15,050,000 | 15,930,425 |
| 7.125% 6/28/2117 (b) | | 1,355,000 | 1,270,990 |
| 7.5% 4/22/26 | | 6,830,000 | 7,294,440 |
| Bahamian Republic 6% 11/21/28 (b) | | 785,000 | 816,400 |
| Barbados Government: | | | |
| 7% 8/4/22 (b) | | 825,000 | 682,374 |
| 7.25% 12/15/21 (b) | | 90,000 | 77,288 |
| Belarus Republic: | | | |
| 6.875% 2/28/23 (b) | | 1,910,000 | 2,041,706 |
| 7.625% 6/29/27 (b) | | 955,000 | 1,078,405 |
| Brazilian Federative Republic: | | | |
| 4.25% 1/7/25 | | 10,005,000 | 9,974,985 |
| 5.625% 1/7/41 | | 13,210,000 | 12,747,650 |
| 7.125% 1/20/37 | | 4,575,000 | 5,352,750 |
| 8.25% 1/20/34 | | 5,360,000 | 6,834,000 |
| Buenos Aires Province: | | | |
| 6.5% 2/15/23 (b) | | 1,350,000 | 1,377,270 |
| 9.95% 6/9/21 (b) | | 3,625,000 | 4,032,813 |
| 10.875% 1/26/21 (b) | | 1,360,000 | 1,502,800 |
| 10.875% 1/26/21 (Reg. S) | | 5,590,000 | 6,176,950 |
| Cameroon Republic 9.5% 11/19/25 (b) | | 1,260,000 | 1,445,850 |
| City of Buenos Aires 8.95% 2/19/21 (b) | | 525,000 | 561,750 |
| Colombian Republic: | | | |
| 6.125% 1/18/41 | | 5,000 | 5,695 |
| 7.375% 9/18/37 | | 1,320,000 | 1,684,980 |
| 10.375% 1/28/33 | | 1,875,000 | 2,990,625 |
| Croatia Republic 5.5% 4/4/23 (b) | | 560,000 | 598,102 |
| Democratic Socialist Republic of Sri Lanka: | | | |
| 6.2% 5/11/27 (b) | | 355,000 | 352,346 |
| 6.25% 10/4/20 (b) | | 430,000 | 446,211 |
| 6.25% 7/27/21 (b) | | 360,000 | 373,157 |
| Dominican Republic: | | | |
| 5.95% 1/25/27 (b) | | 1,355,000 | 1,434,268 |
| 6.6% 1/28/24 (b) | | 520,000 | 568,620 |
| 6.85% 1/27/45 (b) | | 745,000 | 810,188 |
| 6.875% 1/29/26 (b) | | 1,220,000 | 1,366,400 |
| 7.45% 4/30/44 (b) | | 1,265,000 | 1,454,750 |
| Ecuador Republic: | | | |
| 7.875% 1/23/28 (b) | | 610,000 | 610,000 |
| 8.875% 10/23/27 (b) | | 1,870,000 | 1,972,850 |
| 9.65% 12/13/26 (b) | | 1,000,000 | 1,100,700 |
| El Salvador Republic 7.375% 12/1/19 (b) | | 1,940,000 | 2,007,900 |
| German Federal Republic 0% 8/15/26(Reg. S) | EUR | 300,000 | 351,228 |
| Ghana Republic 10.75% 10/14/30 (b) | | 185,000 | 248,011 |
| Indonesian Republic: | | | |
| 2.625% 6/14/23 | EUR | 7,700,000 | 9,988,387 |
| 7.75% 1/17/38 (b) | | 2,300,000 | 3,116,001 |
| 8.5% 10/12/35 (Reg. S) | | 2,160,000 | 3,074,499 |
| Islamic Republic of Pakistan: | | | |
| 6.75% 12/3/19 (b) | | 1,605,000 | 1,647,455 |
| 7.25% 4/15/19 (b) | | 2,720,000 | 2,788,207 |
| 8.25% 4/15/24 (b) | | 975,000 | 1,050,914 |
| Jordanian Kingdom 7.375% 10/10/47 (b) | | 765,000 | 807,259 |
| Kingdom of Saudi Arabia 3.625% 3/4/28 (b) | | 790,000 | 751,685 |
| Lebanese Republic: | | | |
| 5.15% 6/12/18 | | 5,555,000 | 5,545,968 |
| 5.15% 11/12/18 | | 4,905,000 | 4,885,723 |
| 5.45% 11/28/19 | | 2,415,000 | 2,372,738 |
| 6% 5/20/19 | | 2,735,000 | 2,721,325 |
| Mongolian People's Republic 8.75% 3/9/24 (b) | | 2,255,000 | 2,563,297 |
| Panamanian Republic 9.375% 4/1/29 | | 365,000 | 538,193 |
| Peruvian Republic 4% 3/7/27 (g)(o) | | 1,360,000 | 1,308,344 |
| Plurinational State of Bolivia 5.95% 8/22/23 (b) | | 275,000 | 292,738 |
| Province of Santa Fe 7% 3/23/23 (b) | | 2,780,000 | 2,875,104 |
| Provincia de Cordoba: | | | |
| 7.125% 6/10/21 (b) | | 3,880,000 | 4,057,743 |
| 7.45% 9/1/24 (b) | | 1,920,000 | 2,009,818 |
| Republic of Angola 7% 8/17/19 (Issued by Northern Lights III BV for Republic of Angola) (Reg. S) | | 262,500 | 268,543 |
| Republic of Armenia: | | | |
| 6% 9/30/20 (b) | | 1,996,000 | 2,064,543 |
| 7.15% 3/26/25 (b) | | 995,000 | 1,098,540 |
| Republic of Iraq: | | | |
| 5.8% 1/15/28 (Reg. S) | | 5,350,000 | 5,160,011 |
| 6.752% 3/9/23 (b) | | 1,370,000 | 1,404,072 |
| Republic of Kenya 7.25% 2/28/28 (b) | | 620,000 | 627,440 |
| Republic of Nigeria: | | | |
| 6.5% 11/28/27 (b) | | 770,000 | 778,532 |
| 6.75% 1/28/21 (b) | | 240,000 | 252,442 |
| 7.625% 11/28/47 (b) | | 1,085,000 | 1,113,785 |
| 7.696% 2/23/38 (b) | | 780,000 | 809,250 |
| Republic of Serbia: | | | |
| 6.75% 11/1/24 (b) | | 1,070,575 | 1,076,600 |
| 7.25% 9/28/21 (b) | | 310,000 | 344,060 |
| Russian Federation: | | | |
| 5.25% 6/23/47 (b) | | 2,600,000 | 2,702,497 |
| 5.625% 4/4/42 (b) | | 850,000 | 937,094 |
| 5.875% 9/16/43 (b) | | 755,000 | 861,549 |
| 12.75% 6/24/28 (Reg. S) | | 5,155,000 | 8,736,343 |
| Rwanda Republic 6.625% 5/2/23 (b) | | 985,000 | 1,019,445 |
| South African Republic 5.875% 9/16/25 | | 575,000 | 616,285 |
| State of Qatar 9.75% 6/15/30 (b) | | 565,000 | 846,201 |
| Sultanate of Oman 6.75% 1/17/48 (b) | | 1,625,000 | 1,614,438 |
| Turkish Republic: | | | |
| 4.875% 10/9/26 | | 605,000 | 577,747 |
| 5.125% 3/25/22 | | 1,590,000 | 1,628,160 |
| 5.625% 3/30/21 | | 1,770,000 | 1,839,812 |
| 6% 3/25/27 | | 975,000 | 998,790 |
| 6.25% 9/26/22 | | 7,275,000 | 7,760,592 |
| 6.75% 5/30/40 | | 725,000 | 753,603 |
| 6.875% 3/17/36 | | 1,795,000 | 1,893,725 |
| 7% 6/5/20 | | 1,140,000 | 1,212,436 |
| 7.25% 3/5/38 | | 1,150,000 | 1,262,700 |
| 7.375% 2/5/25 | | 1,495,000 | 1,675,895 |
| 8% 2/14/34 | | 760,000 | 889,200 |
| 11.875% 1/15/30 | | 1,455,000 | 2,196,075 |
| Turkiye Ihracat Kredi Bankasi A/S 5.375% 2/8/21 (b) | | 895,000 | 910,491 |
| Ukraine Government: | | | |
| 7.75% 9/1/19 (b) | | 800,000 | 833,680 |
| 7.75% 9/1/20 (b) | | 4,780,000 | 5,027,317 |
| 7.75% 9/1/21 (b) | | 13,454,000 | 14,236,754 |
| 7.75% 9/1/22 (b) | | 12,474,000 | 13,158,573 |
| United Kingdom, Great Britain and Northern Ireland: | | | |
| 1.5% 7/22/26(Reg. S) | GBP | 200,000 | 277,266 |
| 1.5% 7/22/47 | GBP | 1,465,000 | 1,834,956 |
| 2% 9/7/25(Reg. S) | GBP | 1,285,000 | 1,856,333 |
| 4.25% 3/7/36 | GBP | 1,495,000 | 2,812,546 |
| 4.5% 9/7/34 (i)(p) | GBP | 2,135,000 | 4,058,540 |
| United Mexican States 6.05% 1/11/40 | | 1,135,000 | 1,276,875 |
| Uruguay Republic 7.875% 1/15/33 pay-in-kind | | 725,000 | 1,005,032 |
| Venezuelan Republic: | | | |
| 9.25% 9/15/27 (f) | | 4,770,000 | 1,335,600 |
| 11.95% 8/5/31 (Reg. S) (f) | | 2,420,000 | 695,750 |
| 12.75% 8/23/22 (f) | | 550,000 | 160,875 |
| Vietnamese Socialist Republic: | | | |
| 6 month U.S. LIBOR + 0.813% 2.25% 3/13/28 (d)(e)(g) | | 195,000 | 173,663 |
| 4% 3/12/28 (g)(o) | | 6,029,167 | 5,983,586 |
| 4.8% 11/19/24 (b) | | 550,000 | 564,424 |
| TOTAL FOREIGN GOVERNMENT AND GOVERNMENT AGENCY OBLIGATIONS | | | |
| (Cost $270,213,612) | | | 281,138,667 |
| | | Shares | Value |
|
| Common Stocks - 0.1% | | | |
| CONSUMER DISCRETIONARY - 0.0% | | | |
| Media - 0.0% | | | |
| Tribune Media Co. Class A | | 21,200 | 883,404 |
| ENERGY - 0.1% | | | |
| Energy Equipment & Services - 0.1% | | | |
| Expro Holdings U.S., Inc. (g) | | 179,923 | 4,264,175 |
| Expro Holdings U.S., Inc. (b)(g) | | 66,030 | 825,375 |
| Forbes Energy Services Ltd. | | 154,325 | 1,564,856 |
| | | | 6,654,406 |
| Oil, Gas & Consumable Fuels - 0.0% | | | |
| Pacific Exploration and Production Corp. (q) | | 59,896 | 2,007,580 |
| Warrior Metropolitan Coal, Inc. | | 31,922 | 996,286 |
| | | | 3,003,866 |
|
| TOTAL ENERGY | | | 9,658,272 |
|
| MATERIALS - 0.0% | | | |
| Chemicals - 0.0% | | | |
| LyondellBasell Industries NV Class A | | 31,400 | 3,398,108 |
| TELECOMMUNICATION SERVICES - 0.0% | | | |
| Diversified Telecommunication Services - 0.0% | | | |
| Consolidated Communications Holdings, Inc. | | 14,162 | 163,713 |
| Wireless Telecommunication Services - 0.0% | | | |
| CUI Acquisition Corp. Class E (g)(q) | | 1 | 34,600 |
|
| TOTAL TELECOMMUNICATION SERVICES | | | 198,313 |
|
| TOTAL COMMON STOCKS | | | |
| (Cost $26,130,974) | | | 14,138,097 |
|
| Preferred Stocks - 0.0% | | | |
| Convertible Preferred Stocks - 0.0% | | | |
| REAL ESTATE - 0.0% | | | |
| Equity Real Estate Investment Trusts (REITs) - 0.0% | | | |
| Alexandria Real Estate Equities, Inc. Series D, 7.00% (q) | | 9,000 | 323,801 |
| RLJ Lodging Trust Series A, 1.95% | | 17,900 | 465,042 |
| | | | 788,843 |
| Nonconvertible Preferred Stocks - 0.0% | | | |
| FINANCIALS - 0.0% | | | |
| Mortgage Real Estate Investment Trusts - 0.0% | | | |
| Annaly Capital Management, Inc. Series C, 7.625% | | 16,052 | 406,276 |
| CYS Investments, Inc. Series B, 7.50% | | 17,000 | 409,360 |
| MFA Financial, Inc. Series B, 7.50% | | 22,500 | 573,750 |
| | | | 1,389,386 |
| Thrifts & Mortgage Finance - 0.0% | | | |
| Nationwide Building Society 10.25% (q) | | 9,106 | 1,996,395 |
| TOTAL FINANCIALS | | | 3,385,781 |
| REAL ESTATE - 0.0% | | | |
| Equity Real Estate Investment Trusts (REITs) - 0.0% | | | |
| American Homes 4 Rent Series D, 6.50% | | 24,500 | 626,710 |
| Boston Properties, Inc. 5.25% | | 17,500 | 434,875 |
| Cedar Realty Trust, Inc.: | | | |
| Series B, 7.25% | | 1,816 | 44,238 |
| Series C, 6.50% | | 24,400 | 530,700 |
| DDR Corp. Series K, 6.25% | | 17,823 | 406,186 |
| National Storage Affiliates Trust Series A, 6.00% | | 11,900 | 293,325 |
| PS Business Parks, Inc. Series W, 5.20% | | 100 | 2,394 |
| Public Storage Series F, 5.15% | | 37,000 | 888,000 |
| Rexford Industrial Realty, Inc. Series B, 5.875% | | 28,300 | 661,937 |
| Sabra Health Care REIT, Inc. Series A, 7.125% | | 18,495 | 464,243 |
| Taubman Centers, Inc. Series J, 6.50% | | 11,338 | 280,616 |
| | | | 4,633,224 |
|
| TOTAL NONCONVERTIBLE PREFERRED STOCKS | | | 8,019,005 |
|
| TOTAL PREFERRED STOCKS | | | |
| (Cost $8,752,504) | | | 8,807,848 |
| | | Principal Amount(a) | Value |
|
| Bank Loan Obligations - 4.9% | | | |
| CONSUMER DISCRETIONARY - 1.4% | | | |
| Auto Components - 0.0% | | | |
| North American Lifting Holdings, Inc.: | | | |
| Tranche 1LN, term loan 3 month U.S. LIBOR + 4.500% 6.1934% 11/27/20 (d)(e) | | 4,517,977 | 4,242,381 |
| Tranche 2LN, term loan 3 month U.S. LIBOR + 9.000% 10.6934% 11/27/21 (d)(e) | | 1,594,000 | 1,325,013 |
| | | | 5,567,394 |
| Automobiles - 0.0% | | | |
| Caliber Holdings Corp.: | | | |
| Tranche 1LN, term loan 3 month U.S. LIBOR + 3.000% 4.648% 2/1/24 (d)(e) | | 1,401,110 | 1,408,115 |
| Tranche 2LN, term loan 3 month U.S. LIBOR + 7.250% 8.898% 2/1/25 (d)(e) | | 385,000 | 389,813 |
| Chrysler Group LLC term loan 3 month U.S. LIBOR + 2.000% 3.6% 12/31/18 (d)(e) | | 750,577 | 751,830 |
| UOS LLC Tranche B 1LN, term loan 3 month U.S. LIBOR + 5.500% 7.148% 4/18/23 (d)(e) | | 1,935,886 | 1,989,123 |
| | | | 4,538,881 |
| Diversified Consumer Services - 0.2% | | | |
| Bright Horizons Family Solutions Tranche B, term loan 3 month U.S. LIBOR + 2.000% 3.648% 11/7/23 (d)(e) | | 1,496,851 | 1,506,206 |
| Coinmach Service Corp. Tranche B, term loan 3 month U.S. LIBOR + 3.250% 5.0834% 11/14/22 (d)(e) | | 5,751,557 | 5,782,731 |
| CSM Bakery Supplies Tranche B 1LN, term loan 3 month U.S. LIBOR + 4.000% 5.7% 7/3/20 (d)(e) | | 2,428,725 | 2,398,366 |
| EAB Global, Inc. Tranche B, term loan 3 month U.S. LIBOR + 3.500% 5.4841% 11/17/24 (d)(e) | | 1,000,000 | 1,002,500 |
| KUEHG Corp.: | | | |
| Tranche B 1LN, term loan 3 month U.S. LIBOR + 3.750% 5.4434% 8/13/22 (d)(e) | | 4,420,294 | 4,442,395 |
| Tranche B, term loan 3 month U.S. LIBOR + 8.250% 9.9434% 8/22/25 (d)(e) | | 1,000,000 | 1,010,000 |
| Laureate Education, Inc. Tranche B 1LN, term loan 3 month U.S. LIBOR + 3.500% 5.148% 4/26/24 (d)(e) | | 18,210,206 | 18,309,816 |
| Seminole Tribe Florida Tranche B, term loan 3 month U.S. LIBOR + 2.000% 3.648% 7/6/24 (d)(e) | | 2,493,750 | 2,502,578 |
| The ServiceMaster Co. Tranche B, term loan 3 month U.S. LIBOR + 2.500% 4.148% 11/8/23 (d)(e) | | 2,970,000 | 2,983,365 |
| Wash Multifamily Acquisition, Inc.: | | | |
| Tranche B 1LN, term loan 3 month U.S. LIBOR + 3.250% 4.898% 5/14/22 (d)(e) | | 4,753,389 | 4,777,156 |
| Tranche B 2LN, term loan 3 month U.S. LIBOR + 7.000% 8.648% 5/14/23 (d)(e)(g) | | 360,000 | 356,400 |
| Weight Watchers International, Inc. Tranche B, term loan 3 month U.S. LIBOR + 4.750% 6.4274% 11/29/24 (d)(e) | | 8,000,000 | 8,090,000 |
| | | | 53,161,513 |
| Hotels, Restaurants & Leisure - 0.6% | | | |
| 24 Hour Fitness Worldwide, Inc. Tranche B, term loan 3 month U.S. LIBOR + 3.750% 5.4434% 5/30/21 (d)(e) | | 2,920,837 | 2,946,394 |
| Affinity Gaming LLC Tranche B, term loan 3 month U.S. LIBOR + 3.500% 5.1934% 7/1/23 (d)(e) | | 1,917,903 | 1,922,218 |
| AP Gaming I LLC Tranche B, term loan 3 month U.S. LIBOR + 4.250% 5.898% 2/15/24 (d)(e) | | 1,787,747 | 1,804,516 |
| Aramark Services, Inc. Tranche B-1, term loan 3 month U.S. LIBOR + 2.000% 3.648% 3/11/25 (d)(e) | | 7,255,000 | 7,298,095 |
| Aristocrat Technologies, Inc. Tranche B 2LN, term loan 3 month U.S. LIBOR + 2.000% 3.7447% 10/20/21 (d)(e) | | 4,125,923 | 4,145,274 |
| Boyd Gaming Corp. Tranche B 1LN, term loan 3 month U.S. LIBOR + 2.500% 3.9738% 9/15/23 (d)(e) | | 2,076,254 | 2,086,117 |
| Burger King Worldwide, Inc. Tranche B, term loan 3 month U.S. LIBOR + 2.250% 3.9158% 2/17/24 (d)(e) | | 3,459,185 | 3,463,509 |
| Caesars Resort Collection LLC Tranche B 1LN, term loan 3 month U.S. LIBOR + 2.750% 4.398% 12/22/24 (d)(e) | | 28,000,000 | 28,171,640 |
| CCM Merger, Inc. Tranche B, term loan 3 month U.S. LIBOR + 2.750% 4.398% 8/8/21 (d)(e) | | 2,613,493 | 2,631,474 |
| CEC Entertainment, Inc. Tranche B, term loan 3 month U.S. LIBOR + 3.250% 4.898% 2/14/21 (d)(e) | | 3,012,960 | 2,910,519 |
| Churchill Downs, Inc. Tranche B, term loan 3 month U.S. LIBOR + 2.000% 3.65% 12/27/24 (d)(e) | | 1,025,000 | 1,027,563 |
| CityCenter Holdings LLC Tranche B, term loan 3 month U.S. LIBOR + 2.500% 4.148% 4/18/24 (d)(e) | | 3,129,275 | 3,142,199 |
| Cyan Blue Holdco 3 Ltd. Tranche B, term loan 3 month U.S. LIBOR + 3.500% 5.1934% 8/25/24 (d)(e) | | 1,636,775 | 1,639,852 |
| Delta 2 SARL Tranche B, term loan 3 month U.S. LIBOR + 2.500% 4.148% 2/1/24 (d)(e) | | 10,480,709 | 10,451,258 |
| Eldorado Resorts, Inc. Tranche B, term loan 3 month U.S. LIBOR + 2.250% 3.9532% 4/17/24 (d)(e) | | 3,206,762 | 3,210,771 |
| Equinox Holdings, Inc.: | | | |
| Tranche 2LN, term loan 3 month U.S. LIBOR + 7.000% 8.648% 9/8/24 (d)(e) | | 940,000 | 967,025 |
| Tranche B-1, term loan 3 month U.S. LIBOR + 3.000% 4.648% 3/8/24 (d)(e) | | 2,233,153 | 2,247,579 |
| ESH Hospitality, Inc. Tranche B, term loan 3 month U.S. LIBOR + 2.250% 3.898% 8/30/23 (d)(e) | | 2,849,098 | 2,862,688 |
| Fitness International LLC Tranche B, term loan 3 month U.S. LIBOR + 3.500% 5.1934% 7/1/20 (d)(e) | | 1,086,193 | 1,096,512 |
| Four Seasons Holdings, Inc. Tranche B, term loan 3 month U.S. LIBOR + 2.500% 4.148% 11/30/23 (d)(e) | | 6,422,842 | 6,462,985 |
| Gateway Casinos & Entertainment Ltd. term loan 3 month U.S. LIBOR + 3.750% 5.4434% 2/22/23 (d)(e) | | 2,989,975 | 3,016,137 |
| Golden Entertainment, Inc. Tranche B, term loan: | | | |
| 3 month U.S. LIBOR + 3.000% 4.59% 10/20/24 (d)(e) | | 10,600,000 | 10,653,000 |
| 3 month U.S. LIBOR + 7.000% 8.6% 10/20/25 (d)(e) | | 2,700,000 | 2,706,750 |
| Golden Nugget, Inc. Tranche B 1LN, term loan 3 month U.S. LIBOR + 3.250% 4.9786% 10/4/23 (d)(e) | | 14,806,132 | 14,919,103 |
| Greektown Holdings LLC Tranche B, term loan 3 month U.S. LIBOR + 2.750% 4.398% 4/25/24 (d)(e) | | 1,104,450 | 1,102,385 |
| Hilton Worldwide Finance LLC Tranche B 2LN, term loan 3 month U.S. LIBOR + 2.000% 3.6207% 10/25/23 (d)(e) | | 4,955,651 | 4,981,965 |
| Intrawest Resorts Holdings, Inc. Tranche B 1LN, term loan 3 month U.S. LIBOR + 3.250% 4.898% 7/31/24 (d)(e) | | 3,415,000 | 3,425,689 |
| La Quinta Intermediate Holdings LLC Tranche B LN, term loan 3 month U.S. LIBOR + 2.750% 4.4702% 4/14/21 (d)(e) | | 3,521,201 | 3,536,624 |
| LTF Merger Sub, Inc. Tranche B, term loan 3 month U.S. LIBOR + 2.750% 4.7334% 6/10/22 (d)(e) | | 3,534,531 | 3,550,437 |
| MGM Mirage, Inc. Tranche A, term loan 3 month U.S. LIBOR + 2.250% 3.898% 4/25/21 (d)(e) | | 1,748,000 | 1,752,370 |
| Mohegan Tribal Gaming Authority Tranche B, term loan 3 month U.S. LIBOR + 4.000% 5.648% 10/14/23 (d)(e) | | 1,375,392 | 1,384,965 |
| NVA Holdings, Inc. Tranche B 3LN, term loan 3 month U.S. LIBOR + 2.750% 4.4089% 2/2/25 (d)(e) | | 975,000 | 974,269 |
| Penn National Gaming, Inc. Tranche B, term loan 3 month U.S. LIBOR + 2.500% 4.148% 1/19/24 (d)(e) | | 711,588 | 714,035 |
| Playa Resorts Holding BV Tranche B, term loan 3 month U.S. LIBOR + 3.250% 4.9997% 4/27/24 (d)(e) | | 5,705,465 | 5,738,728 |
| Red Lobster Hospitality LLC Tranche B, term loan 3 month U.S. LIBOR + 5.250% 6.898% 7/28/21 (d)(e) | | 2,041,160 | 2,044,998 |
| Ryman Hospitality Properties, Inc. Tranche B, term loan 3 month U.S. LIBOR + 2.250% 4.07% 5/11/24 (d)(e) | | 292,788 | 294,070 |
| Scientific Games Corp. Tranche B 5LN, term loan 3 month U.S. LIBOR + 2.750% 4.4488% 8/14/24 (d)(e) | | 13,847,400 | 13,908,052 |
| SMG: | | | |
| Tranche B 1LN, term loan 3 month U.S. LIBOR + 3.250% 4.8895% 1/12/25 (d)(e) | | 1,395,000 | 1,405,463 |
| Tranche B 2LN, term loan 3 month U.S. LIBOR + 7.000% 8.6439% 1/12/26 (d)(e) | | 85,000 | 86,700 |
| Station Casinos LLC Tranche B, term loan 3 month U.S. LIBOR + 2.500% 4.15% 6/8/23 (d)(e) | | 5,975,863 | 5,984,408 |
| Tacala Investment Corp. term loan 3 month U.S. LIBOR + 3.250% 4.8247% 2/1/25 (d)(e) | | 1,720,000 | 1,728,600 |
| Tropicana Entertainment, Inc. Tranche B, term loan 3 month U.S. LIBOR + 3.000% 4.648% 11/27/20 (d)(e) | | 708,051 | 711,591 |
| Wynn America LLC Tranche A 1LN, term loan 3 month U.S. LIBOR + 1.750% 3.4% 12/31/21 (d)(e) | | 2,540,000 | 2,533,650 |
| Yonkers Racing Corp. Tranche B 1LN, term loan 3 month U.S. LIBOR + 3.250% 4.9% 5/31/24 (d)(e) | | 1,958,600 | 1,970,841 |
| | | | 179,613,018 |
| Internet & Direct Marketing Retail - 0.1% | | | |
| Bass Pro Shops LLC. Tranche B, term loan 3 month U.S. LIBOR + 5.000% 6.648% 9/25/24 (d)(e) | | 22,523,796 | 22,439,332 |
| Harbor Freight Tools U.S.A., Inc. Tranche B, term loan 3 month U.S. LIBOR + 2.500% 4.148% 8/19/23 (d)(e) | | 3,877,781 | 3,883,249 |
| Red Ventures LLC Tranche B 1LN, term loan 3 month U.S. LIBOR + 4.000% 5.648% 11/8/24 (d)(e) | | 2,992,500 | 3,009,946 |
| | | | 29,332,527 |
| Leisure Products - 0.0% | | | |
| Varsity Brands Holding Co., Inc. Tranche B 1LN, term loan 3 month U.S. LIBOR + 3.500% 5.0735% 12/15/24 (d)(e) | | 5,000,000 | 5,053,150 |
| Media - 0.4% | | | |
| Acosta, Inc. Tranche B, term loan 3 month U.S. LIBOR + 3.250% 4.898% 9/26/21 (d)(e) | | 1,746,611 | 1,537,017 |
| Altice U.S. Finance SA Tranche B, term loan 3 month U.S. LIBOR + 2.250% 3.898% 7/28/25 (d)(e) | | 1,985,025 | 1,981,710 |
| AMC Entertainment Holdings, Inc. Tranche B, term loan 3 month U.S. LIBOR + 2.250% 3.8375% 12/15/23 (d)(e) | | 1,736,231 | 1,740,034 |
| AMC Entertainment, Inc. Tranche B, term loan 3 month U.S. LIBOR + 2.250% 3.8375% 12/15/22 (d)(e) | | 4,999,427 | 5,010,876 |
| Cable One, Inc. Tranche B, term loan 3 month U.S. LIBOR + 2.250% 3.95% 5/1/24 (d)(e) | | 1,014,900 | 1,017,437 |
| CBS Radio, Inc. Tranche B 1LN, term loan 3 month U.S. LIBOR + 2.750% 4.6225% 11/18/24 (d)(e) | | 4,987,500 | 5,010,343 |
| CDS U.S. Intermediate Holdings, Inc.: | | | |
| Tranche B 1LN, term loan 3 month U.S. LIBOR + 3.750% 5.4434% 7/8/22 (d)(e) | | 3,546,460 | 3,536,707 |
| Tranche B 2LN, term loan 3 month U.S. LIBOR + 8.250% 9.9434% 7/8/23 (d)(e) | | 465,000 | 462,387 |
| Cengage Learning, Inc. Tranche B, term loan 3 month U.S. LIBOR + 4.250% 5.8381% 6/7/23 (d)(e) | | 6,067,375 | 5,568,516 |
| Charter Communication Operating LLC Tranche B, term loan 3 month U.S. LIBOR + 2.000% 3.65% 4/30/25 (d)(e) | | 16,500,000 | 16,531,020 |
| Cineworld Finance U.S., Inc. Tranche B 1LN, term loan 3 month U.S. LIBOR + 2.500% 4.148% 2/5/25 (d)(e) | | 6,000,000 | 5,991,000 |
| Clear Channel Communications, Inc. Tranche D, term loan 3 month U.S. LIBOR + 6.750% 8.4434% 1/30/19 (d)(e) | | 8,600,000 | 6,826,250 |
| CSC Holdings LLC Tranche B, term loan 3 month U.S. LIBOR + 2.500% 4.1393% 1/25/26 (d)(e) | | 5,100,000 | 5,104,233 |
| Getty Images, Inc. Tranche B, term loan 3 month U.S. LIBOR + 3.500% 5.1934% 10/18/19 (d)(e) | | 3,916,422 | 3,742,807 |
| Houghton Mifflin Harcourt Publishing, Inc. Tranche B, term loan 3 month U.S. LIBOR + 3.000% 4.648% 5/29/21 (d)(e) | | 4,572,159 | 4,295,909 |
| ION Media Networks, Inc. Tranche B, term loan 3 month U.S. LIBOR + 2.750% 4.54% 12/18/20 (d)(e) | | 1,938,474 | 1,947,352 |
| Lamar Media Corp. Tranche B, term loan 3 month U.S. LIBOR + 1.750% 2/15/25 (e)(r) | | 2,130,000 | 2,140,650 |
| MCC Iowa LLC Tranche M, term loan 3 month U.S. LIBOR + 2.000% 3.48% 1/15/25 (d)(e) | | 827,925 | 829,217 |
| McGraw-Hill Global Education Holdings, LLC term loan 3 month U.S. LIBOR + 4.000% 5.648% 5/4/22 (d)(e) | | 7,779,193 | 7,652,781 |
| Neptune Finco Corp. Tranche B, term loan 3 month U.S. LIBOR + 2.250% 3.8381% 7/17/25 (d)(e) | | 2,631,639 | 2,623,744 |
| Numericable LLC Tranche B 12LN, term loan 3 month U.S. LIBOR + 3.000% 4.7202% 1/31/26 (d)(e) | | 3,416,438 | 3,279,780 |
| Proquest LLC Tranche B, term loan 3 month U.S. LIBOR + 3.750% 5.398% 10/24/21 (d)(e) | | 3,897,119 | 3,944,624 |
| Raycom Media, Inc. Tranche B, term loan 3 month U.S. LIBOR + 2.250% 3.8707% 8/23/24 (d)(e) | | 2,054,850 | 2,054,850 |
| Sinclair Television Group, Inc. Tranche B-1, term loan 3 month U.S. LIBOR + 2.500% 12/7/24 (e)(r) | | 3,000,000 | 3,003,750 |
| Springer Science+Business Media Deutschland GmbH Tranche B 13LN, term loan 3 month U.S. LIBOR + 3.500% 5.148% 8/24/22 (d)(e) | | 9,918,307 | 9,951,335 |
| Unitymedia Finance LLC Tranche B, term loan 3 month U.S. LIBOR + 2.250% 3.8375% 9/30/25 (d)(e) | | 4,130,000 | 4,122,277 |
| Virgin Media Bristol LLC Tranche B, term loan 3 month U.S. LIBOR + 2.500% 4.0875% 1/15/26 (d)(e) | | 5,000,000 | 5,015,950 |
| WideOpenWest Finance LLC Tranche B, term loan 3 month U.S. LIBOR + 3.250% 4.8456% 8/19/23 (d)(e) | | 10,962,313 | 10,914,407 |
| Ziggo Secured Finance Partnership Tranche E, term loan 3 month U.S. LIBOR + 2.500% 4.0875% 4/15/25 (d)(e) | | 4,610,000 | 4,565,928 |
| | | | 130,402,891 |
| Multiline Retail - 0.0% | | | |
| JC Penney Corp., Inc. Tranche B, term loan 3 month U.S. LIBOR + 4.250% 6.2342% 6/23/23 (d)(e) | | 6,502,598 | 6,217,199 |
| Specialty Retail - 0.1% | | | |
| ABB Optical Group LLC Tranche B, term loan 3 month U.S. LIBOR + 5.000% 6.5795% 6/15/23 (d)(e) | | 1,328,188 | 1,331,508 |
| Academy Ltd. Tranche B, term loan 3 month U.S. LIBOR + 4.000% 5.5529% 7/2/22 (d)(e) | | 5,122,076 | 4,083,268 |
| Burlington Coat Factory Warehouse Corp. Tranche B, term loan 3 month U.S. LIBOR + 2.500% 4.09% 11/17/24 (d)(e) | | 4,257,500 | 4,264,142 |
| Davids Bridal, Inc. Tranche B, term loan 3 month U.S. LIBOR + 4.000% 5.7% 10/11/19 (d)(e) | | 1,860,847 | 1,578,389 |
| Party City Holdings, Inc. term loan 3 month U.S. LIBOR + 2.750% 4.4694% 8/19/22 (d)(e) | | 4,662,903 | 4,671,669 |
| PETCO Animal Supplies, Inc. Tranche B 1LN, term loan 3 month U.S. LIBOR + 3.000% 4.7723% 1/26/23 (d)(e) | | 4,754,676 | 3,298,556 |
| PetSmart, Inc. term loan 3 month U.S. LIBOR + 3.000% 4.57% 3/11/22 (d)(e) | | 3,255,376 | 2,652,318 |
| Sports Authority, Inc. Tranche B, term loan 3 month U.S. LIBOR + 6.000% 0% 11/16/17 (d)(e)(f) | | 1,931,590 | 5,312 |
| | | | 21,885,162 |
|
| TOTAL CONSUMER DISCRETIONARY | | | 435,771,735 |
|
| CONSUMER STAPLES - 0.3% | | | |
| Beverages - 0.0% | | | |
| Arterra Wines Canada, Inc. Tranche B, term loan 3 month U.S. LIBOR + 2.750% 4.3755% 12/16/23 (d)(e) | | 1,980,000 | 1,989,900 |
| Food & Staples Retailing - 0.2% | | | |
| Agro Merchants Intermediate Ho Tranche B, term loan 3 month U.S. LIBOR + 3.750% 5.398% 12/6/24 (d)(e) | | 2,235,000 | 2,251,763 |
| Albertson's LLC Tranche B, term loan: | | | |
| 3 month U.S. LIBOR + 2.750% 4.398% 8/25/21 (d)(e) | | 21,457,564 | 21,159,519 |
| 3 month U.S. LIBOR + 3.000% 4.6746% 12/21/22 (d)(e) | | 4,569,456 | 4,509,231 |
| 3 month U.S. LIBOR + 3.000% 4.9563% 6/22/23 (d)(e) | | 8,069,606 | 7,943,559 |
| BJ's Wholesale Club, Inc.: | | | |
| Tranche 2LN, term loan 3 month U.S. LIBOR + 7.500% 9.0795% 2/3/25 (d)(e) | | 2,000,000 | 2,003,220 |
| Tranche B 1LN, term loan 3 month U.S. LIBOR + 3.500% 5.0796% 2/3/24 (d)(e) | | 9,643,478 | 9,618,309 |
| CTI Foods Holdings Co. LLC Tranche 1LN, term loan 3 month U.S. LIBOR + 3.500% 5.15% 6/28/20 (d)(e) | | 1,072,224 | 966,342 |
| Eg Finco Ltd. Tranche B, term loan 3 month U.S. LIBOR + 4.000% 2/1/25 (e)(r) | | 1,015,000 | 1,014,493 |
| GOBP Holdings, Inc. Tranche B, term loan 3 month U.S. LIBOR + 3.500% 5.1934% 10/21/21 (d)(e) | | 3,834,554 | 3,848,933 |
| Pizza Hut Holdings LLC Tranche B, term loan 3 month U.S. LIBOR + 2.000% 3.59% 6/16/23 (d)(e) | | 2,962,613 | 2,976,803 |
| Shearer's Foods, Inc.: | | | |
| Tranche 2LN, term loan 3 month U.S. LIBOR + 6.750% 8.4434% 6/30/22 (d)(e) | | 2,913,000 | 2,709,090 |
| Tranche B 1LN, term loan 3 month U.S. LIBOR + 3.938% 5.6309% 6/30/21 (d)(e) | | 3,315,203 | 3,333,868 |
| Smart & Final, Inc. Tranche B, term loan 3 month U.S. LIBOR + 3.500% 5.1934% 11/15/22 (d)(e) | | 4,033,000 | 3,977,546 |
| Tops Markets LLC term loan: | | | |
| 3 month U.S. LIBOR + 9.500% 2/23/19 (e)(r) | | 1,016,089 | 1,016,089 |
| 3 month U.S. LIBOR + 9.500% 11.125% 2/23/19 (d)(e) | | 1,016,089 | 1,016,089 |
| U.S. Foods, Inc. Tranche B, term loan 3 month U.S. LIBOR + 2.500% 4.148% 6/27/23 (d)(e) | | 3,447,500 | 3,472,563 |
| | | | 71,817,417 |
| Food Products - 0.1% | | | |
| Arctic Glacier Group Holdings, Inc. Tranche B, term loan 3 month U.S. LIBOR + 4.250% 5.898% 3/20/24 (d)(e) | | 803,925 | 805,268 |
| Chobani LLC Tranche B, term loan 3 month U.S. LIBOR + 3.500% 5.148% 10/7/23 (d)(e) | | 4,313,653 | 4,341,951 |
| Hostess Brands LLC Tranche B, term loan 3 month U.S. LIBOR + 2.250% 3.898% 8/3/22 (d)(e) | | 1,054,010 | 1,056,835 |
| JBS USA Lux SA Tranche B, term loan 3 month U.S. LIBOR + 2.500% 4.1004% 10/30/22 (d)(e) | | 6,423,782 | 6,391,663 |
| Post Holdings, Inc. Tranche B, term loan 3 month U.S. LIBOR + 2.250% 3.9% 5/24/24 (d)(e) | | 6,263,525 | 6,270,039 |
| | | | 18,865,756 |
| Personal Products - 0.0% | | | |
| Prestige Brands, Inc. term loan 3 month U.S. LIBOR + 2.750% 4.398% 1/26/24 (d)(e) | | 1,956,741 | 1,967,582 |
|
| TOTAL CONSUMER STAPLES | | | 94,640,655 |
|
| ENERGY - 0.3% | | | |
| Energy Equipment & Services - 0.1% | | | |
| Forbes Energy Services LLC Tranche B, term loan 12% 4/13/21 (d)(g) | | 1,547,508 | 1,559,114 |
| FTS International, Inc. Tranche B, term loan 3 month U.S. LIBOR + 4.750% 6.4142% 4/16/21 (d)(e) | | 4,070,798 | 4,070,798 |
| Lucid Energy Group Ii LLC Tranche B 1LN, term loan 3 month U.S. LIBOR + 3.000% 4.5881% 1/31/25 (d)(e) | | 3,000,000 | 3,001,890 |
| Seadrill Operating LP Tranche B, term loan 3 month U.S. LIBOR + 3.000% 4.6934% 2/21/21 (d)(e) | | 3,055,291 | 2,644,355 |
| | | | 11,276,157 |
| Oil, Gas & Consumable Fuels - 0.2% | | | |
| Alon U.S.A. Partners LP term loan 3 month U.S. LIBOR + 8.000% 9.648% 11/26/18 (d)(e) | | 2,116,383 | 2,116,383 |
| Arctic LNG Carriers Ltd. Tranche B 1LN, term loan 3 month U.S. LIBOR + 4.500% 6.148% 5/18/23 (d)(e) | | 2,275,000 | 2,297,750 |
| Bcp Raptor LLC Tranche B, term loan 3 month U.S. LIBOR + 4.250% 6.0386% 6/22/24 (d)(e) | | 2,668,458 | 2,687,137 |
| California Resources Corp.: | | | |
| Tranche 1LN, term loan 3 month U.S. LIBOR + 10.375% 11.9706% 12/31/21 (d)(e) | | 6,470,000 | 7,294,925 |
| Tranche B, term loan 3 month U.S. LIBOR + 4.750% 6.34% 12/31/22 (d)(e) | | 8,050,000 | 8,140,563 |
| Chesapeake Energy Corp. Tranche 1LN, term loan 3 month U.S. LIBOR + 7.500% 9.4436% 8/23/21 (d)(e) | | 13,630,000 | 14,512,543 |
| Chief Exploration & Development, LLC. Tranche 2LN, term loan 3 month U.S. LIBOR + 6.500% 7.9586% 5/16/21 (d)(e) | | 2,832,000 | 2,813,111 |
| Citgo Petroleum Corp. Tranche B, term loan 3 month U.S. LIBOR + 3.500% 5.1947% 7/29/21 (d)(e) | | 5,583,157 | 5,558,759 |
| Crestwood Holdings Partners LLC Tranche B, term loan 3 month U.S. LIBOR + 8.000% 9.4357% 6/19/19 (d)(e) | | 2,702,721 | 2,700,477 |
| Foresight Energy LLC Tranche B 1LN, term loan 3 month U.S. LIBOR + 5.750% 7.4434% 3/28/22 (d)(e) | | 1,985,000 | 1,905,600 |
| Gavilan Resources LLC Tranche 2LN, term loan 3 month U.S. LIBOR + 6.000% 7.5881% 3/1/24 (d)(e) | | 3,500,000 | 3,511,655 |
| Houston Fuel Oil Terminal Co. Tranche B, term loan 3 month U.S. LIBOR + 3.500% 5.19% 8/19/21 (d)(e) | | 7,171,061 | 7,233,808 |
| Limetree Bay Terminals LLC term loan 3 month U.S. LIBOR + 4.000% 5.5956% 2/15/24 (d)(e) | | 2,843,514 | 2,836,406 |
| Medallion Midland Acquisition Tranche B, term loan 3 month U.S. LIBOR + 3.250% 4.898% 10/30/24 (d)(e) | | 3,295,000 | 3,303,238 |
| Moxie Patriot LLC Tranche B, term loan 3 month U.S. LIBOR + 5.750% 7.4434% 12/19/20 (d)(e) | | 5,703,811 | 5,646,773 |
| | | | 72,559,128 |
|
| TOTAL ENERGY | | | 83,835,285 |
|
| FINANCIALS - 0.3% | | | |
| Capital Markets - 0.0% | | | |
| Cypress Intermediate Holdings, Inc. Tranche B 1LN, term loan 3 month U.S. LIBOR + 3.000% 4.65% 4/27/24 (d)(e) | | 3,029,775 | 3,037,349 |
| HarbourVest Partners LLC: | | | |
| Tranche B 1LN, term loan 3 month U.S. LIBOR + 2.250% 3.9142% 2/21/25 (d)(e) | | 3,370,000 | 3,365,788 |
| Tranche B, term loan 3 month U.S. LIBOR + 2.500% 4.0808% 2/4/21 (d)(e) | | 663,819 | 663,540 |
| IBC Capital U.S. LLC: | | | |
| Tranche 2LN, term loan 3 month U.S. LIBOR + 7.000% 8.5361% 9/9/22 (d)(e) | | 2,505,000 | 2,479,950 |
| Tranche B 1LN, term loan 3 month U.S. LIBOR + 3.750% 5.2861% 9/10/21 (d)(e) | | 1,402,661 | 1,407,051 |
| Recess Holdings, Inc. Tranche B, term loan: | | | |
| 3 month U.S. LIBOR + 3.750% 9/29/24 (e)(s) | | 205,357 | 206,513 |
| 3 month U.S. LIBOR + 3.750% 5.2539% 9/29/24 (d)(e) | | 1,515,844 | 1,524,378 |
| | | | 12,684,569 |
| Diversified Financial Services - 0.1% | | | |
| Bcp Renaissance Parent LLC Tranche B, term loan 3 month U.S. LIBOR + 4.000% 5.7723% 10/31/24 (d)(e) | | 3,415,000 | 3,443,174 |
| Deerfield Holdings Corp. Tranche B, term loan 3 month U.S. LIBOR + 3.250% 4.8332% 2/13/25 (d)(e) | | 1,705,000 | 1,717,310 |
| Delos Finance SARL Tranche B, term loan 3 month U.S. LIBOR + 2.000% 3.6934% 10/6/23 (d)(e) | | 4,118,000 | 4,126,813 |
| Extell Boston 5.154% 8/31/21 (d) | | 1,014,845 | 1,014,845 |
| Finco I LLC Tranche B, term loan 3 month U.S. LIBOR + 2.750% 4.398% 7/14/22 (d)(e) | | 3,000,000 | 3,027,000 |
| Flying Fortress Holdings, Inc. term loan 3 month U.S. LIBOR + 1.750% 3.4434% 10/30/22 (e) | | 2,000,000 | 2,003,220 |
| Focus Financial Partners LLC Tranche B 1LN, term loan 3 month U.S. LIBOR + 2.750% 4.4434% 7/3/24 (d)(e) | | 1,381,538 | 1,387,589 |
| Kingpin Intermediate Holdings LLC Tranche B, term loan 3 month U.S. LIBOR + 4.250% 5.73% 7/3/24 (d)(e) | | 995,000 | 1,011,169 |
| NAB Holdings LLC Tranche B, term loan 3 month U.S. LIBOR + 3.000% 4.6943% 6/30/24 (d)(e) | | 1,746,225 | 1,755,690 |
| Onvoy LLC Tranche B 1LN, term loan 3 month U.S. LIBOR + 4.500% 6.1934% 2/10/24 (d)(e) | | 2,729,375 | 2,592,906 |
| The Edelman Financial Center L Tranche B, term loan 3 month U.S. LIBOR + 4.250% 5.9702% 11/9/24 (d)(e) | | 2,500,000 | 2,534,375 |
| TransUnion LLC Tranche B, term loan 3 month U.S. LIBOR + 2.000% 3.648% 4/9/23 (d)(e) | | 4,881,683 | 4,895,547 |
| UFC Holdings LLC Tranche B 1LN, term loan 3 month U.S. LIBOR + 3.250% 4.9% 8/18/23 (d)(e) | | 2,958,788 | 2,972,191 |
| VF Holdings Corp. term loan 3 month U.S. LIBOR + 3.250% 4.898% 6/30/23(d)(e) | | 1,481,250 | 1,494,211 |
| | | | 33,976,040 |
| Insurance - 0.1% | | | |
| Acrisure LLC Tranche B, term loan 3 month U.S. LIBOR + 4.250% 5.9913% 11/22/23 (d)(e) | | 5,956,422 | 6,047,614 |
| Alliant Holdings Intermediate LLC Tranche B, term loan 3 month U.S. LIBOR + 3.250% 4.898% 8/14/22 (d)(e) | | 4,914,843 | 4,934,502 |
| AmWINS Group, Inc.: | | | |
| Tranche 2LN, term loan 3 month U.S. LIBOR + 6.750% 8.398% 1/25/25 (d)(e) | | 275,000 | 276,947 |
| Tranche B 1LN, term loan 3 month U.S. LIBOR + 2.750% 4.3786% 1/25/24 (d)(e) | | 1,485,000 | 1,492,425 |
| Asurion LLC: | | | |
| term loan 3 month U.S. LIBOR + 2.750% 4.398% 11/3/23 (e) | | 7,602,325 | 7,640,336 |
| Tranche B, term loan: | | | |
| 3 month U.S. LIBOR + 2.750% 4.398% 8/4/22 (d)(e) | | 4,669,242 | 4,689,694 |
| 3 month U.S. LIBOR + 6.000% 7.648% 8/4/25 (d)(e) | | 3,935,000 | 4,030,424 |
| HUB International Ltd. Tranche B 1LN, term loan 3 month U.S. LIBOR + 3.000% 4.8384% 10/2/20 (d)(e) | | 4,775,796 | 4,793,705 |
| USI, Inc. Tranche B, term loan 3 month U.S. LIBOR + 3.000% 4.6934% 5/16/24 (d)(e) | | 5,625,900 | 5,615,830 |
| | | | 39,521,477 |
| Real Estate Management & Development - 0.1% | | | |
| DTZ U.S. Borrower LLC Tranche B 1LN, term loan 3 month U.S. LIBOR + 3.250% 5.1598% 11/4/21 (d)(e) | | 9,982,335 | 9,961,572 |
| MGM Growth Properties Operating Partner LP Tranche B, term loan 3 month U.S. LIBOR + 2.250% 3.898% 4/25/23 (d)(e) | | 4,786,029 | 4,805,460 |
| | | | 14,767,032 |
| Thrifts & Mortgage Finance - 0.0% | | | |
| Ocwen Loan Servicing LLC Tranche B, term loan 3 month U.S. LIBOR + 5.000% 6.5881% 12/5/20 (d)(e) | | 1,167,531 | 1,169,959 |
|
| TOTAL FINANCIALS | | | 102,119,077 |
|
| HEALTH CARE - 0.3% | | | |
| Health Care Equipment & Supplies - 0.0% | | | |
| American Renal Holdings, Inc. Tranche B, term loan 3 month U.S. LIBOR + 3.250% 4.898% 6/22/24 (d)(e) | | 2,810,875 | 2,810,875 |
| CPI Holdco LLC Tranche B 1LN, term loan 3 month U.S. LIBOR + 3.500% 5.1934% 3/21/24 (d)(e) | | 1,900,641 | 1,917,272 |
| Ortho-Clinical Diagnostics, Inc. Tranche B, term loan 3 month U.S. LIBOR + 3.750% 5.4434% 6/30/21 (d)(e) | | 8,913,831 | 8,980,685 |
| | | | 13,708,832 |
| Health Care Providers & Services - 0.2% | | | |
| Community Health Systems, Inc.: | | | |
| Tranche G, term loan 3 month U.S. LIBOR + 2.750% 4.7342% 12/31/19 (d)(e) | | 1,209,624 | 1,198,386 |
| Tranche H, term loan 3 month U.S. LIBOR + 3.000% 4.9842% 1/27/21 (d)(e) | | 7,364,915 | 7,189,188 |
| Concentra, Inc. Tranche B 1LN, term loan 3 month U.S. LIBOR + 2.750% 4.53% 6/1/22 (d)(e) | | 1,220,000 | 1,227,625 |
| CVS Holdings I LP: | | | |
| Tranche 2LN, term loan 3 month U.S. LIBOR + 6.750% 8.54% 2/6/26 (d)(e) | | 750,000 | 748,125 |
| Tranche B 1LN, term loan 3 month U.S. LIBOR + 3.000% 4.79% 2/6/25 (d)(e) | | 1,225,000 | 1,220,406 |
| Envision Healthcare Corp. Tranche B, term loan 3 month U.S. LIBOR + 3.000% 4.65% 12/1/23 (d)(e) | | 5,447,481 | 5,459,411 |
| Equian Buyer Corp. Tranche B, term loan 3 month U.S. LIBOR + 3.250% 5.1539% 5/19/24 (d)(e) | | 2,000,000 | 2,008,760 |
| Ghx Ultimate Parent Corp. Tranche B, term loan 3 month U.S. LIBOR + 3.000% 4.6934% 6/30/24 (d)(e) | | 1,253,700 | 1,256,834 |
| HCA Holdings, Inc.: | | | |
| Tranche B 8LN, term loan 3 month U.S. LIBOR + 2.250% 3.898% 2/15/24 (d)(e) | | 2,970,056 | 2,991,084 |
| Tranche B 9LN, term loan 3 month U.S. LIBOR + 2.000% 3.648% 3/18/23 (d)(e) | | 7,880,450 | 7,920,956 |
| Kindred Healthcare, Inc. Tranche B, term loan 3 month U.S. LIBOR + 3.500% 5.25% 4/9/21 (d)(e) | | 1,554,448 | 1,557,370 |
| MPH Acquisition Holdings LLC Tranche B, term loan 3 month U.S. LIBOR + 3.000% 4.6934% 6/7/23 (d)(e) | | 2,201,009 | 2,210,913 |
| Onex Schumacher Finance LP Tranche B 1LN, term loan 3 month U.S. LIBOR + 4.000% 5.648% 7/31/22 (d)(e) | | 1,163,083 | 1,157,267 |
| Prospect Medical Holdings, Inc. Tranche 1LN, term loan 3 month U.S. LIBOR + 5.500% 7% 2/16/24 (d)(e) | | 2,130,000 | 2,140,650 |
| U.S. Anesthesia Partners, Inc. Tranche B, term loan 3 month U.S. LIBOR + 3.000% 4.648% 6/23/24 (d)(e) | | 1,495,000 | 1,502,101 |
| U.S. Renal Care, Inc.: | | | |
| Tranche 2LN, term loan 3 month U.S. LIBOR + 8.000% 9.6934% 12/31/23 (d)(e) | | 3,000,000 | 3,007,500 |
| Tranche B 1LN, term loan 3 month U.S. LIBOR + 4.250% 5.9434% 12/31/22 (d)(e) | | 7,373,742 | 7,397,706 |
| Vizient, Inc. Tranche B 3LN, term loan 3 month U.S. LIBOR + 3.500% 4.398% 2/11/23 (d)(e) | | 1,254,902 | 1,262,745 |
| Wink Holdco, Inc. Tranche B, term loan 3 month U.S. LIBOR + 3.000% 4.49% 12/1/24 (d)(e) | | 2,500,000 | 2,487,500 |
| | | | 53,944,527 |
| Health Care Technology - 0.0% | | | |
| Press Ganey Holdings, Inc.: | | | |
| Tranche 2LN, term loan 3 month U.S. LIBOR + 6.500% 8.148% 10/21/24 (d)(e) | | 673,321 | 680,896 |
| Tranche B 1LN, term loan 3 month U.S. LIBOR + 3.000% 4.648% 10/21/23 (d)(e) | | 3,867,733 | 3,891,906 |
| | | | 4,572,802 |
| Life Sciences Tools & Services - 0.0% | | | |
| Albany Molecular Research, Inc. Tranche B, term loan: | | | |
| 3 month U.S. LIBOR + 3.250% 4.898% 8/30/24 (d)(e) | | 1,602,238 | 1,608,246 |
| 3 month U.S. LIBOR + 7.000% 8.648% 8/30/25 (d)(e) | | 580,000 | 580,365 |
| PAREXEL International Corp. Tranche B, term loan 3 month U.S. LIBOR + 2.750% 4.398% 8/11/24 (d)(e) | | 4,568,550 | 4,564,256 |
| | | | 6,752,867 |
| Pharmaceuticals - 0.1% | | | |
| HLF Financing U.S. LLC Tranche B, term loan 3 month U.S. LIBOR + 5.500% 7.148% 2/15/23 (d)(e) | | 5,676,805 | 5,708,766 |
| Innoviva, Inc. Tranche B, term loan 3 month U.S. LIBOR + 4.500% 6.3725% 8/18/22 (d)(e) | | 1,257,300 | 1,271,445 |
| Lannett Co., Inc.: | | | |
| Tranche B, term loan 3 month U.S. LIBOR + 4.750% 6.398% 11/25/20 (d)(e) | | 244,928 | 243,245 |
| Tranche B, term loan 3 month U.S. LIBOR + 5.375% 7.023% 11/25/22 (d)(e) | | 9,197,077 | 9,174,084 |
| RPI Finance Trust Tranche B 6LN, term loan 3 month U.S. LIBOR + 2.000% 3.6934% 3/27/23 (d)(e) | | 3,935,757 | 3,955,436 |
| Valeant Pharmaceuticals International, Inc. Tranche B, term loan 3 month U.S. LIBOR + 3.500% 5.0808% 4/1/22 (d)(e) | | 8,359,184 | 8,455,315 |
| | | | 28,808,291 |
|
| TOTAL HEALTH CARE | | | 107,787,319 |
|
| INDUSTRIALS - 0.5% | | | |
| Aerospace & Defense - 0.1% | | | |
| TransDigm, Inc.: | | | |
| term loan 3 month U.S. LIBOR + 2.750% 4.398% 5/14/22 (d)(e) | | 978,418 | 984,348 |
| Tranche B, term loan 3 month U.S. LIBOR + 2.750% 4.4136% 6/9/23 (d)(e) | | 19,247,417 | 19,356,550 |
| Tranche G, term loan 3 month U.S. LIBOR + 2.500% 4.0956% 8/22/24 (d)(e) | | 7,801,150 | 7,830,404 |
| Wesco Aircraft Hardware Corp. Tranche B, term loan 3 month U.S. LIBOR + 2.500% 4.2% 2/28/21 (d)(e) | | 1,005,000 | 992,438 |
| | | | 29,163,740 |
| Air Freight & Logistics - 0.0% | | | |
| Hanjin International Corp. Tranche B, term loan 3 month U.S. LIBOR + 2.500% 4.2341% 10/18/20 (d)(e) | | 1,625,000 | 1,630,086 |
| Transplace Holding, Inc. Tranche B 1LN, term loan 3 month U.S. LIBOR + 4.250% 5.8293% 10/5/24 (d)(e) | | 3,000,000 | 3,028,140 |
| XPO Logistics, Inc. Tranche B, term loan 3 month U.S. LIBOR + 2.000% 3.9198% 2/23/25 (d)(e) | | 1,475,000 | 1,478,157 |
| | | | 6,136,383 |
| Airlines - 0.1% | | | |
| American Airlines, Inc. Tranche B, term loan: | | | |
| 3 month U.S. LIBOR + 2.000% 3.5808% 10/10/21 (d)(e) | | 6,177,773 | 6,190,314 |
| 3 month U.S. LIBOR + 2.000% 3.5875% 12/14/23 (d)(e) | | 4,400,550 | 4,399,934 |
| | | | 10,590,248 |
| Building Products - 0.0% | | | |
| GYP Holdings III Corp. Tranche B, term loan 3 month U.S. LIBOR + 3.000% 4.7723% 4/1/23 (d)(e) | | 3,786,268 | 3,805,200 |
| HD Supply, Inc. Tranche B 4LN, term loan 3 month U.S. LIBOR + 2.500% 4.1934% 10/17/23 (d)(e) | | 990,019 | 996,206 |
| Jeld-Wen, Inc. Tranche B, term loan 3 month U.S. LIBOR + 2.000% 3.6934% 12/14/24 (d)(e) | | 1,195,000 | 1,200,676 |
| | | | 6,002,082 |
| Commercial Services & Supplies - 0.2% | | | |
| ABG Intermediate Holdings 2 LLC Tranche B, term loan 3 month U.S. LIBOR + 3.500% 5.1934% 9/29/24 (d)(e) | | 452,563 | 455,676 |
| Brand Energy & Infrastructure Services, Inc. Tranche B, term loan 3 month U.S. LIBOR + 4.250% 5.9959% 6/21/24 (d)(e) | | 9,029,625 | 9,092,652 |
| Harland Clarke Holdings Corp. Tranche B 7LN, term loan 3 month U.S. LIBOR + 4.750% 6.4434% 11/3/23 (d)(e) | | 4,855,865 | 4,899,228 |
| Hd Supply Waterworks Ltd. Tranche B, term loan 3 month U.S. LIBOR + 3.000% 4.5747% 8/1/24 (d)(e) | | 798,000 | 799,333 |
| KAR Auction Services, Inc. Tranche B, term loan 3 month U.S. LIBOR + 2.500% 4.25% 3/9/23 (d)(e) | | 1,114,356 | 1,119,928 |
| Lineage Logistics Holdings, LLC. Tranche B, term loan 3 month U.S. LIBOR + 3.000% 4.6312% 2/16/25 (d)(e) | | 5,950,000 | 5,961,186 |
| Merrill Communications LLC Tranche B, term loan 3 month U.S. LIBOR + 5.250% 7.0223% 6/1/22 (d)(e) | | 1,631,466 | 1,633,505 |
| Metal Services LLC Tranche B, term loan 3 month U.S. LIBOR + 7.500% 9.1934% 6/30/19 (d)(e) | | 1,083,421 | 1,085,231 |
| Multi-Color Corp. Tranche B, term loan 3 month U.S. LIBOR + 2.250% 3.898% 10/31/24 (d)(e) | | 1,280,000 | 1,284,262 |
| Optiv Security, Inc. Tranche B 1LN, term loan 3 month U.S. LIBOR + 3.250% 4.8125% 2/1/24 (d)(e) | | 1,343,595 | 1,278,095 |
| Prime Security Services Borrower LLC Tranche B 1LN, term loan 3 month U.S. LIBOR + 2.750% 4.398% 5/2/22 (d)(e) | | 11,224,497 | 11,313,732 |
| Prometric Holdings, Inc. Tranche B 1LN, term loan 3 month U.S. LIBOR + 3.000% 4.77% 1/29/25 (d)(e) | | 1,010,000 | 1,016,313 |
| SAI Global GP Tranche B, term loan 3 month U.S. LIBOR + 4.500% 6.1934% 12/8/23 (d)(e)(g) | | 2,475,000 | 2,462,625 |
| The Brickman Group, Ltd. Tranche B 1LN, term loan 3 month U.S. LIBOR + 3.000% 4.622% 12/18/20 (d)(e) | | 2,673,614 | 2,687,811 |
| Thomson Reuters IP&S Tranche B, term loan 1 month U.S. LIBOR + 3.250% 4.898% 10/3/23 (d)(e) | | 3,767,503 | 3,792,406 |
| TMK Hawk Parent Corp. Tranche B, term loan: | | | |
| 3 month U.S. LIBOR + 3.500% 5.07% 9/26/24 (d)(e) | | 1,241,333 | 1,248,161 |
| 3 month U.S. LIBOR + 3.500% 5.15% 9/26/24 (d)(e) | | 55,556 | 55,861 |
| Wrangler Buyer Corp. Tranche B, term loan 3 month U.S. LIBOR + 3.000% 4.648% 9/28/24 (d)(e) | | 1,425,000 | 1,431,826 |
| WTG Holdings III Corp. Tranche B 1LN, term loan 3 month U.S. LIBOR + 3.000% 4.6934% 12/20/24 (d)(e) | | 2,206,886 | 2,227,587 |
| | | | 53,845,418 |
| Construction & Engineering - 0.1% | | | |
| AECOM Tranche B, term loan 3 month U.S. LIBOR + 1.750% 3/16/25 (e)(r) | | 2,040,000 | 2,041,693 |
| Traverse Midstream Partners Ll Tranche B, term loan 3 month U.S. LIBOR + 4.000% 5.85% 9/27/24 (d)(e) | | 3,515,000 | 3,538,445 |
| Ventia Deco LLC Tranche B, term loan 3 month U.S. LIBOR + 3.500% 5.1934% 5/21/22 (d)(e) | | 3,154,810 | 3,194,245 |
| | | | 8,774,383 |
| Electrical Equipment - 0.0% | | | |
| Cortes NP Acquisition Corp. Tranche B, term loan 3 month U.S. LIBOR + 4.000% 5.5797% 11/30/23 (d)(e) | | 3,257,499 | 3,273,787 |
| Machinery - 0.0% | | | |
| Doosan Bobcat Tranche B, term loan 3 month U.S. LIBOR + 2.500% 4.1934% 5/18/24 (d)(e) | | 1,597,582 | 1,600,250 |
| Gardner Denver, Inc. Tranche B, term loan 3 month U.S. LIBOR + 2.750% 4.4434% 7/30/24 (d)(e) | | 1,027,425 | 1,030,343 |
| Onex Wizard U.S. Acquisition, Inc. Tranche B, term loan 3 month U.S. LIBOR + 3.000% 4.4738% 3/13/22 (d)(e) | | 3,585,835 | 3,593,293 |
| The Gates Corp. Tranche B 1LN, term loan 3 month U.S. LIBOR + 3.000% 4.3883% 3/31/24 (d)(e) | | 391,039 | 393,483 |
| | | | 6,617,369 |
| Marine - 0.0% | | | |
| International Seaways Operating Corp. Tranche B, term loan 3 month U.S. LIBOR + 5.500% 7.15% 6/22/22 (d)(e) | | 2,893,375 | 2,889,758 |
| Navios Maritime Partners LP Tranche B, term loan 3 month U.S. LIBOR + 5.000% 6.54% 9/14/20 (d)(e) | | 2,887,501 | 2,898,329 |
| | | | 5,788,087 |
| Professional Services - 0.0% | | | |
| AlixPartners LLP Tranche B, term loan 3 month U.S. LIBOR + 2.750% 4.4434% 4/4/24 (d)(e) | | 3,349,688 | 3,367,843 |
| On Assignment, Inc. Tranche B, term loan 3 month U.S. LIBOR + 2.000% 2/20/25 (e)(r) | | 1,200,000 | 1,204,500 |
| Science Applications International Corp. Tranche B, term loan 3 month U.S. LIBOR + 2.000% 3.8125% 5/4/22 (d)(e) | | 1,405,732 | 1,415,108 |
| | | | 5,987,451 |
| Road & Rail - 0.0% | | | |
| Hertz Corp. Tranche B 1LN, term loan 3 month U.S. LIBOR + 2.750% 6/30/23 (e)(r) | | 1,255,000 | 1,254,410 |
| Trading Companies & Distributors - 0.0% | | | |
| Beacon Roofing Supply, Inc. Tranche B, term loan 3 month U.S. LIBOR + 2.250% 3.8297% 1/2/25 (d)(e) | | 1,000,000 | 1,004,170 |
| Fly Funding II SARL Tranche B, term loan 3 month U.S. LIBOR + 2.000% 3.8% 2/9/23 (d)(e) | | 3,529,769 | 3,531,993 |
| | | | 4,536,163 |
| Transportation Infrastructure - 0.0% | | | |
| American Commercial Barge Line Tranche B 1LN, term loan 3 month U.S. LIBOR + 8.750% 10.398% 11/12/20 (d)(e) | | 1,124,536 | 656,920 |
| DAE Aviation Holdings, Inc. Tranche B, term loan 3 month U.S. LIBOR + 3.750% 5.4% 7/7/22 (d)(e) | | 3,271,481 | 3,298,078 |
| | | | 3,954,998 |
|
| TOTAL INDUSTRIALS | | | 145,924,519 |
|
| INFORMATION TECHNOLOGY - 0.9% | | | |
| Communications Equipment - 0.0% | | | |
| Radiate Holdco LLC Tranche B, term loan 3 month U.S. LIBOR + 3.000% 4.5735% 2/1/24 (d)(e) | | 9,973,638 | 9,955,486 |
| Zayo Group LLC term loan 3 month U.S. LIBOR + 2.000% 3.648% 1/19/21 (d)(e) | | 1,950,263 | 1,956,230 |
| | | | 11,911,716 |
| Electronic Equipment & Components - 0.1% | | | |
| Atkore International, Inc. Tranche B 1LN, term loan 3 month U.S. LIBOR + 3.000% 4.45% 12/22/23 (d)(e) | | 1,300,000 | 1,307,579 |
| ATS Consolidated, Inc. Tranche B 1LN, term loan 3 month U.S. LIBOR + 3.750% 5.398% 2/23/25 (d)(e) | | 1,590,000 | 1,597,950 |
| DG Investment Intermediate Holdings, Inc. Tranche B 1LN, term loan 3 month U.S. LIBOR + 3.000% 1/26/25 (e)(s) | | 111,774 | 111,565 |
| Electro Rent Corp. Tranche B 1LN, term loan 3 month U.S. LIBOR + 5.000% 6.9833% 1/31/24 (d)(e) | | 1,281,763 | 1,286,570 |
| EPV Merger Sub, Inc.: | | | |
| Tranche 2LN, term loan 3 month U.S. LIBOR + 7.250% 2/27/26 (e)(r) | | 355,000 | 354,113 |
| Tranche B 1LN, term loan 3 month U.S. LIBOR + 3.250% 2/27/25 (e)(r) | | 810,000 | 810,510 |
| EXC Holdings III Corp. Tranche B, term loan: | | | |
| 3 month U.S. LIBOR + 3.500% 5.1605% 12/2/24 (d)(e) | | 1,210,000 | 1,219,450 |
| 3 month U.S. LIBOR + 7.500% 9.1605% 11/16/25 (d)(e) | | 750,000 | 758,910 |
| Go Daddy Operating Co. LLC Tranche B, term loan 3 month U.S. LIBOR + 2.250% 3.898% 2/15/24 (d)(e) | | 10,362,312 | 10,380,446 |
| Gopher Sub, Inc.: | | | |
| Tranche B 1LN, term loan 3 month U.S. LIBOR + 3.000% 4.6576% 2/1/25 (d)(e) | | 1,043,226 | 1,041,275 |
| Tranche B 2LN, term loan 3 month U.S. LIBOR + 6.750% 8.4076% 2/1/26 (d)(e) | | 435,000 | 437,175 |
| Infor U.S., Inc. Tranche B 6LN, term loan 3 month U.S. LIBOR + 2.750% 4.4434% 2/1/22 (d)(e) | | 2,191,859 | 2,193,613 |
| Lux FinCo U.S. SPV Tranche B 3LN, term loan 3 month U.S. LIBOR + 3.500% 5.1207% 10/16/22 (d)(e) | | 1,903,387 | 1,902,207 |
| TTM Technologies, Inc. Tranche B, term loan: | | | |
| 3 month U.S. LIBOR + 2.500% 9/28/24 (e)(r) | | 2,500,000 | 2,509,375 |
| 3 month U.S. LIBOR + 2.500% 4.0735% 9/28/24 (d)(e) | | 1,995,000 | 1,997,494 |
| | | | 27,908,232 |
| Internet Software & Services - 0.2% | | | |
| Abacus Innovations Corp. Tranche B, term loan 3 month U.S. LIBOR + 2.000% 3.6875% 8/16/23 (d)(e) | | 1,811,278 | 1,818,070 |
| Ancestry.Com Operations, Inc. Tranche B 1LN, term loan 3 month U.S. LIBOR + 3.250% 4.9% 10/19/23 (d)(e) | | 4,912,500 | 4,933,378 |
| Autodata, Inc. Tranche B 1LN, term loan 3 month U.S. LIBOR + 3.250% 4.8235% 12/14/24 (d)(e) | | 1,835,000 | 1,830,413 |
| Cvent, Inc. Tranche B, term loan 3 month U.S. LIBOR + 3.750% 5.3235% 11/29/24 (d)(e) | | 2,500,000 | 2,517,700 |
| EIG Investors Corp. Tranche B, term loan 3 month U.S. LIBOR + 4.000% 5.9545% 2/9/23 (d)(e) | | 5,180,707 | 5,208,476 |
| I-Logic Technologies Bidco Ltd. Tranche B, term loan 3 month U.S. LIBOR + 4.000% 5.642% 12/21/24 (d)(e) | | 2,500,000 | 2,512,500 |
| Marketo, Inc. Tranche B 1LN, term loan 3 month U.S. LIBOR + 3.250% 5.0434% 2/7/25 (d)(e) | | 2,675,000 | 2,668,313 |
| Mcafee LLC Tranche B, term loan: | | | |
| 3 month U.S. LIBOR + 4.500% 6.148% 9/29/24 (d)(e) | | 7,410,988 | 7,445,374 |
| 3 month U.S. LIBOR + 8.500% 10.148% 9/29/25 (d)(e) | | 2,000,000 | 2,005,000 |
| MH Sub I LLC Tranche B, term loan 3 month U.S. LIBOR + 3.750% 5.3385% 9/15/24 (d)(e) | | 1,995,000 | 1,994,501 |
| Rackspace Hosting, Inc. Tranche B, term loan 3 month U.S. LIBOR + 3.000% 4.7867% 11/3/23 (d)(e) | | 7,950,505 | 7,970,382 |
| Travelclick, Inc. Tranche B 1LN, term loan 3 month U.S. LIBOR + 4.000% 5.648% 5/12/21 (d)(e) | | 923,067 | 932,685 |
| Uber Technologies, Inc. Tranche B, term loan 3 month U.S. LIBOR + 4.000% 5.648% 7/13/23 (d)(e) | | 12,798,133 | 12,868,523 |
| VFH Parent LLC Tranche B 1LN, term loan 3 month U.S. LIBOR + 3.250% 4.9447% 12/30/21 (d)(e) | | 936,000 | 946,530 |
| | | | 55,651,845 |
| IT Services - 0.2% | | | |
| Ceridian HCM Holding, Inc. Tranche B 2LN, term loan 3 month U.S. LIBOR + 3.500% 5.148% 9/15/20 (d)(e) | | 7,301,067 | 7,326,183 |
| Cologix Holdings, Inc. Tranche B 1LN, term loan 3 month U.S. LIBOR + 3.000% 4.6025% 3/20/24 (d)(e) | | 1,985,000 | 1,984,385 |
| First Data Corp. Tranche B, term loan 3 month U.S. LIBOR + 2.250% 3.8707% 7/10/22 (d)(e) | | 16,093,329 | 16,118,918 |
| Global Payments, Inc. Tranche B 2LN, term loan 3 month U.S. LIBOR + 2.000% 3.648% 4/22/23 (d)(e) | | 1,235,276 | 1,240,427 |
| Mitchell International, Inc. Tranche B, term loan: | | | |
| 3 month U.S. LIBOR + 3.250% 11/20/24 (e)(s) | | 141,791 | 142,120 |
| 3 month U.S. LIBOR + 3.250% 4.9434% 12/1/24 (d)(e) | | 1,758,209 | 1,762,288 |
| 3 month U.S. LIBOR + 7.250% 8.9434% 12/1/25 (d)(e) | | 750,000 | 754,500 |
| Neustar, Inc.: | | | |
| Tranche 2LN, term loan 3 month U.S. LIBOR + 8.000% 9.6715% 8/8/25 (d)(e) | | 700,000 | 704,375 |
| Tranche B1 1LN, term loan 3 month U.S. LIBOR + 3.250% 4.9215% 1/8/20 (d)(e) | | 368,653 | 368,808 |
| Tranche B2 1LN, term loan 3 month U.S. LIBOR + 3.750% 5.4215% 8/8/24 (d)(e) | | 2,433,900 | 2,434,922 |
| Tempo Acquisition LLC Tranche B, term loan 3 month U.S. LIBOR + 3.000% 4.648% 5/1/24 (d)(e) | | 5,343,150 | 5,354,264 |
| Vantiv LLC Tranche B, term loan 3 month U.S. LIBOR + 2.000% 3.5875% 8/7/24 (d)(e) | | 3,750,000 | 3,771,413 |
| WEX, Inc. Tranche B, term loan 3 month U.S. LIBOR + 2.250% 3.898% 7/1/23 (d)(e) | | 3,194,427 | 3,214,392 |
| Xerox Business Services LLC Tranche B, term loan 3 month U.S. LIBOR + 3.000% 4.648% 12/7/23 (d)(e) | | 3,489,750 | 3,515,923 |
| | | | 48,692,918 |
| Semiconductors & Semiconductor Equipment - 0.0% | | | |
| Cavium, Inc. Tranche B 1LN, term loan 3 month U.S. LIBOR + 2.250% 3.8169% 8/16/22 (d)(e) | | 1,562,134 | 1,564,087 |
| Microsemi Corp. Tranche B, term loan 3 month U.S. LIBOR + 2.000% 3.7422% 1/15/23 (d)(e) | | 1,386,841 | 1,389,726 |
| | | | 2,953,813 |
| Software - 0.4% | | | |
| Almonde, Inc.: | | | |
| Tranche 2LN, term loan 3 month U.S. LIBOR + 7.250% 9.2342% 6/13/25 (d)(e) | | 2,365,000 | 2,345,938 |
| Tranche B 1LN, term loan 3 month U.S. LIBOR + 3.500% 5.4842% 6/13/24 (d)(e) | | 7,875,425 | 7,869,676 |
| Aptean, Inc.: | | | |
| Tranche 2LN, term loan 3 month U.S. LIBOR + 9.500% 11.2% 12/20/23 (d)(e) | | 685,000 | 687,856 |
| Tranche B 1LN, term loan 3 month U.S. LIBOR + 4.250% 5.95% 12/20/22 (d)(e) | | 1,915,525 | 1,924,298 |
| Compuware Corp. Tranche B 3LN, term loan 3 month U.S. LIBOR + 3.500% 5.15% 12/15/21 (d)(e) | | 6,088,297 | 6,161,844 |
| Digicert Holdings, Inc. Tranche B, term loan 3 month U.S. LIBOR + 4.750% 6.5223% 10/31/24 (d)(e) | | 4,580,000 | 4,628,685 |
| Epicor Software Corp. Tranche B, term loan 3 month U.S. LIBOR + 3.250% 4.9% 6/1/22 (d)(e) | | 9,771,568 | 9,811,241 |
| Evo Payments International LLC Tranche B 1LN, term loan 3 month U.S. LIBOR + 4.000% 5.64% 12/22/23 (d)(e) | | 2,481,250 | 2,507,105 |
| Flexera Software LLC: | | | |
| Tranche B 1LN, term loan 3 month U.S. LIBOR + 3.250% 4.87% 1/24/25 (d)(e) | | 975,000 | 977,135 |
| Tranche B 2LN, term loan 3 month U.S. LIBOR + 7.250% 8.87% 1/24/26 (d)(e) | | 85,000 | 85,425 |
| Hyland Software, Inc. Tranche B 1LN, term loan 3 month U.S. LIBOR + 3.250% 4.898% 7/1/22 (d)(e) | | 1,353,183 | 1,362,209 |
| ION Trading Technologies Ltd. Tranche B, term loan 3 month U.S. LIBOR + 2.750% 4.4036% 11/21/24 (d)(e) | | 4,500,000 | 4,455,000 |
| Kronos, Inc.: | | | |
| term loan 3 month U.S. LIBOR + 8.250% 10.0234% 11/1/24 (d)(e) | | 5,095,000 | 5,226,604 |
| Tranche B 1LN, term loan 3 month U.S. LIBOR + 3.500% 5.2995% 11/1/23 (d)(e) | | 14,469,124 | 14,557,964 |
| Landesk Group, Inc. term loan: | | | |
| 3 month U.S. LIBOR + 4.250% 5.9% 1/20/24 (d)(e) | | 7,341,092 | 7,208,658 |
| 3 month U.S. LIBOR + 9.000% 10.65% 1/20/25 (d)(e) | | 2,445,000 | 2,347,200 |
| MA FinanceCo. LLC Tranche B 3LN, term loan: | | | |
| 3 month U.S. LIBOR + 2.750% 4.398% 6/21/24 (d)(e) | | 7,012,898 | 7,026,082 |
| 3 month U.S. LIBOR + 2.750% 4.398% 6/21/24 (d)(e) | | 1,052,102 | 1,054,080 |
| Quest Software U.S. Holdings, Inc. Tranche B, term loan 3 month U.S. LIBOR + 5.500% 7.2723% 10/31/22 (d)(e) | | 4,087,236 | 4,152,182 |
| Renaissance Learning, Inc.: | | | |
| Tranche 1LN, term loan 3 month U.S. LIBOR + 3.750% 5.4434% 4/9/21 (d)(e) | | 6,379,949 | 6,411,849 |
| Tranche 2LN, term loan 3 month U.S. LIBOR + 7.000% 8.6934% 4/9/22 (d)(e) | | 2,813,000 | 2,817,698 |
| SolarWinds Holdings, Inc. Tranche B, term loan 3 month U.S. LIBOR + 3.500% 5.148% 2/5/23 (d)(e) | | 2,955,150 | 2,962,538 |
| Solera LLC: | | | |
| Tranche B, term loan 3 month U.S. LIBOR + 2.750% 3/3/23 (e)(r) | | 1,210,000 | 1,212,517 |
| Tranche B, term loan 3 month U.S. LIBOR + 3.250% 4.898% 3/3/23 (d)(e) | | 4,890,845 | 4,901,018 |
| Sophia L.P. term loan 3 month U.S. LIBOR + 3.250% 4.9434% 9/30/22 (d)(e) | | 4,813,193 | 4,817,862 |
| SS&C Technologies, Inc.: | | | |
| Tranche B 1LN, term loan 3 month U.S. LIBOR + 2.250% 3.898% 7/8/22 (d)(e) | | 1,516,380 | 1,523,583 |
| Tranche B 2LN, term loan 3 month U.S. LIBOR + 2.250% 3.898% 7/8/22 (d)(e) | | 23,746 | 23,858 |
| Tranche B 3LN, term loan 3 month U.S. LIBOR + 2.500% 2/27/25 (e)(r) | | 7,370,649 | 7,404,406 |
| Tranche B 4LN, term loan 3 month U.S. LIBOR + 2.500% 2/27/25 (e)(r) | | 2,629,351 | 2,641,394 |
| Sybil Software LLC. Tranche B, term loan 3 month U.S. LIBOR + 2.750% 4.4434% 9/30/23 (d)(e) | | 3,691,454 | 3,712,422 |
| TIBCO Software, Inc. Tranche B, term loan 3 month U.S. LIBOR + 3.500% 5.15% 12/4/20 (d)(e) | | 773,200 | 774,808 |
| | | | 123,593,135 |
| Technology Hardware, Storage & Peripherals - 0.0% | | | |
| Dell International LLC Tranche B, term loan 3 month U.S. LIBOR + 2.000% 3.65% 9/7/23 (d)(e) | | 1,604,180 | 1,603,843 |
|
| TOTAL INFORMATION TECHNOLOGY | | | 272,315,502 |
|
| MATERIALS - 0.3% | | | |
| Chemicals - 0.2% | | | |
| American Rock Salt Co. LLC Tranche B 1LN, term loan 3 month U.S. LIBOR + 3.750% 5.2288% 5/20/21 (d)(e) | | 3,716,414 | 3,716,414 |
| Ashland LLC Tranche B, term loan 3 month U.S. LIBOR + 2.000% 3.5981% 5/17/24 (d)(e) | | 1,990,000 | 2,000,786 |
| ASP Chromaflo Intermediate Holdings, Inc. Tranche B 1LN, term loan 3 month U.S. LIBOR + 3.500% 5.148% 11/18/23 (d)(e) | | 1,801,800 | 1,810,809 |
| Ineos Styrolution U.S. Holding LLC Tranche B, term loan 3 month U.S. LIBOR + 2.000% 3.6934% 3/29/24 (d)(e) | | 1,240,854 | 1,243,957 |
| Invictus U.S. Newco LLC: | | | |
| Tranche 1LN, term loan 3 month U.S. LIBOR + 3.000% 2/13/25 (e)(r) | | 1,365,000 | 1,374,105 |
| Tranche 2LN, term loan 3 month U.S. LIBOR + 6.750% 2/13/26 (e)(r) | | 750,000 | 755,160 |
| Jade Germany GmbH Tranche B, term loan 3 month U.S. LIBOR + 5.500% 7.1934% 5/31/23 (d)(e) | | 2,985,000 | 2,992,463 |
| Kraton Polymers LLC Tranche B, term loan 3 month U.S. LIBOR + 3.000% 4.648% 1/6/22 (d)(e) | | 1,508,509 | 1,512,597 |
| MacDermid, Inc.: | | | |
| Tranche B 6LN, term loan 3 month U.S. LIBOR + 3.000% 4% 6/7/23 (d)(e) | | 3,078,767 | 3,097,239 |
| Tranche B 7LN, term loan 3 month U.S. LIBOR + 2.500% 4.148% 6/7/20 (d)(e) | | 2,412,413 | 2,421,893 |
| Methanol Holdings (TRINIDAD) Ltd. Tranche B, term loan 3 month U.S. LIBOR + 3.500% 5.148% 6/30/22 (d)(e) | | 2,570,229 | 2,570,229 |
| OCI Beaumont, LLC Tranche B, term loan 3 month U.S. LIBOR + 4.250% 3/9/25 (e)(r) | | 2,500,000 | 2,509,375 |
| Oxea Corp. Tranche B, term loan 3 month U.S. LIBOR + 3.500% 5.25% 10/12/24 (d)(e) | | 4,099,725 | 4,120,224 |
| PQ Corp. Tranche B, term loan 3 month U.S. LIBOR + 2.500% 4.2907% 2/8/25 (d)(e) | | 950,000 | 954,456 |
| The Chemours Co. LLC Tranche B, term loan 3 month U.S. LIBOR + 2.500% 4.15% 5/12/22 (d)(e) | | 2,363,156 | 2,373,199 |
| Trinseo Materials Operating SCA/Trinseo Materials Finance, Inc. Tranche B, term loan 3 month U.S. LIBOR + 2.500% 4.148% 9/6/24 (d)(e) | | 1,995,000 | 2,009,344 |
| Tronox Blocked Borrower LLC Tranche B, term loan 3 month U.S. LIBOR + 3.000% 4.6934% 9/22/24 (d)(e) | | 1,900,116 | 1,911,403 |
| Tronox Finance LLC Tranche B, term loan 3 month U.S. LIBOR + 3.000% 4.6934% 9/22/24 (d)(e) | | 4,384,884 | 4,410,930 |
| U.S. Coatings Acquisition, Inc. Tranche B, term loan 3 month U.S. LIBOR + 2.000% 3.6934% 6/1/24 (d)(e) | | 1,960,000 | 1,970,212 |
| Univar, Inc. Tranche B, term loan 3 month U.S. LIBOR + 2.500% 4.148% 7/1/24 (d)(e) | | 1,212,572 | 1,218,416 |
| Venator Materials LLC Tranche B, term loan 3 month U.S. LIBOR + 3.000% 4.648% 8/8/24 (d)(e) | | 1,256,850 | 1,261,563 |
| W. R. Grace & Co.-Conn.: | | | |
| Tranche B 1LN, term loan 3 month U.S. LIBOR + 1.750% 2/23/25 (e)(r) | | 744,211 | 744,828 |
| Tranche B 2LN, term loan 3 month U.S. LIBOR + 1.750% 2/23/25 (e)(r) | | 1,275,789 | 1,276,848 |
| | | | 48,256,450 |
| Containers & Packaging - 0.1% | | | |
| Berlin Packaging, LLC: | | | |
| Tranche 2LN, term loan 3 month U.S. LIBOR + 6.750% 8.33% 10/1/22 (d)(e) | | 1,129,000 | 1,135,706 |
| Tranche B, term loan 3 month U.S. LIBOR + 3.250% 4.8855% 10/1/21 (d)(e) | | 5,325,858 | 5,350,837 |
| Berry Global, Inc.: | | | |
| Tranche P, term loan 3 month U.S. LIBOR + 2.000% 3.5808% 1/6/21 (d)(e) | | 3,552,000 | 3,563,828 |
| Tranche Q, term loan 3 month U.S. LIBOR + 2.000% 3.6216% 10/1/22 (d)(e) | | 4,956,562 | 4,971,183 |
| BWAY Holding Co. Tranche B, term loan 3 month U.S. LIBOR + 3.250% 4.9578% 4/3/24 (d)(e) | | 995,000 | 998,731 |
| Caraustar Industries, Inc. Tranche B, term loan 3 month U.S. LIBOR + 5.500% 7.1934% 3/14/22 (d)(e) | | 3,483,675 | 3,491,757 |
| Charter Nex U.S., Inc. Tranche B 1LN, term loan 3 month U.S. LIBOR + 3.250% 4.5735% 5/16/24 (d)(e) | | 1,228,825 | 1,230,668 |
| Consolidated Container Co. Tranche B 1LN, term loan 3 month U.S. LIBOR + 3.000% 4.648% 5/22/24 (d)(e) | | 2,284,275 | 2,295,696 |
| Crown Americas LLC Tranche B 1LN, term loan 3 month U.S. LIBOR + 2.000% 1/29/25 (e)(r) | | 2,690,000 | 2,712,408 |
| Flex Acquisition Co., Inc. Tranche B 1LN, term loan 3 month U.S. LIBOR + 3.000% 4.6947% 12/29/23 (d)(e) | | 4,515,875 | 4,535,655 |
| Plastipak Packaging, Inc. Tranche B, term loan 3 month U.S. LIBOR + 2.750% 4.45% 10/14/24 (d)(e) | | 817,950 | 822,449 |
| Printpack Holdings, Inc. Tranche B, term loan 3 month U.S. LIBOR + 3.000% 4.6875% 7/26/23 (d)(e) | | 1,066,500 | 1,072,504 |
| Reynolds Group Holdings, Inc. Tranche B, term loan 3 month U.S. LIBOR + 2.750% 4.398% 2/5/23 (d)(e) | | 12,994,202 | 13,051,117 |
| | | | 45,232,539 |
| Metals & Mining - 0.0% | | | |
| Gulf Finance LLC Tranche B 1LN, term loan 3 month U.S. LIBOR + 5.250% 6.95% 8/25/23 (d)(e) | | 7,184,864 | 6,538,226 |
| JMC Steel Group, Inc. Tranche B, term loan 3 month U.S. LIBOR + 2.750% 4.408% 6/14/21 (d)(e) | | 2,851,318 | 2,864,862 |
| Murray Energy Corp. Tranche B 2LN, term loan 3 month U.S. LIBOR + 7.250% 8.9434% 4/16/20 (d)(e) | | 5,948,904 | 5,208,266 |
| | | | 14,611,354 |
|
| TOTAL MATERIALS | | | 108,100,343 |
|
| REAL ESTATE - 0.0% | | | |
| Equity Real Estate Investment Trusts (REITs) - 0.0% | | | |
| iStar Financial, Inc. Tranche B, term loan 3 month U.S. LIBOR + 3.000% 4.5863% 10/1/21 (d)(e) | | 925,471 | 932,412 |
| The GEO Group, Inc. Tranche B, term loan 3 month U.S. LIBOR + 2.250% 3.95% 3/23/24 (d)(e) | | 1,463,938 | 1,468,329 |
| | | | 2,400,741 |
| Real Estate Management & Development - 0.0% | | | |
| Capital Automotive LP: | | | |
| Tranche 2LN, term loan 3 month U.S. LIBOR + 6.000% 7.65% 3/24/25 (d)(e) | | 922,111 | 936,708 |
| Tranche B 1LN, term loan 3 month U.S. LIBOR + 2.500% 4.15% 3/24/24 (d)(e) | | 170,730 | 171,478 |
| Realogy Group LLC Tranche B, term loan 3 month U.S. LIBOR + 2.250% 3.8293% 2/8/25 (d)(e) | | 4,963,817 | 4,986,849 |
| Simply Storage Management LLC 8.2375% 9/6/21 (d)(g) | | 1,305,000 | 1,305,000 |
| VICI Properties, LLC Tranche B 1LN, term loan 3 month U.S. LIBOR + 2.250% 3.5956% 12/22/24 (d)(e) | | 8,590,909 | 8,631,200 |
| | | | 16,031,235 |
|
| TOTAL REAL ESTATE | | | 18,431,976 |
|
| TELECOMMUNICATION SERVICES - 0.4% | | | |
| Diversified Telecommunication Services - 0.2% | | | |
| Altice Financing SA Tranche B, term loan: | | | |
| 3 month U.S. LIBOR + 2.750% 4.4702% 7/15/25 (d)(e) | | 3,126,375 | 3,082,825 |
| 3 month U.S. LIBOR + 2.750% 4.4702% 1/31/26 (d)(e) | | 5,486,250 | 5,408,071 |
| Frontier Communications Corp.: | | | |
| Tranche A, term loan 3 month U.S. LIBOR + 2.750% 4.4% 3/31/21 (d)(e) | | 5,598,851 | 5,535,864 |
| Tranche B 1LN, term loan 3 month U.S. LIBOR + 3.750% 5.4% 6/15/24 (d)(e) | | 11,057,444 | 10,877,760 |
| Level 3 Financing, Inc. Tranche B, term loan 3 month U.S. LIBOR + 2.250% 3.8456% 2/22/24 (d)(e) | | 11,805,000 | 11,823,062 |
| Sable International Finance Ltd. Tranche B 4LN, term loan 3 month U.S. LIBOR + 3.250% 4.8894% 1/31/26 (d)(e) | | 10,790,000 | 10,769,067 |
| Securus Technologies, Inc. Tranche B, term loan: | | | |
| 3 month U.S. LIBOR + 4.500% 6.148% 11/1/24 (d)(e) | | 9,580,000 | 9,681,835 |
| 3 month U.S. LIBOR + 8.250% 9.898% 11/1/25 (d)(e) | | 3,360,000 | 3,400,320 |
| SFR Group SA Tranche B 11LN, term loan 3 month U.S. LIBOR + 2.750% 4.5223% 7/31/25 (d)(e) | | 8,770,683 | 8,380,387 |
| | | | 68,959,191 |
| Wireless Telecommunication Services - 0.2% | | | |
| Digicel International Finance Ltd. Tranche B, term loan 3 month U.S. LIBOR + 3.750% 5.02% 5/25/24 (d)(e) | | 4,699,800 | 4,707,649 |
| Intelsat Jackson Holdings SA: | | | |
| Tranche B, term loan 3 month U.S. LIBOR + 3.750% 5.7063% 11/27/23 (d)(e) | | 20,300,000 | 20,144,096 |
| Tranche B-4, term loan 3 month U.S. LIBOR + 4.500% 6.4563% 1/2/24 (d)(e) | | 3,500,000 | 3,563,735 |
| Tranche B-5, term loan 6.625% 1/2/24 | | 4,735,000 | 4,749,063 |
| Syniverse Holdings, Inc.: | | | |
| Tranche B 2LN, term loan 3 month U.S. LIBOR + 9.000% 2/9/24 (e)(r) | | 1,740,000 | 1,763,925 |
| Tranche B, term loan 3 month U.S. LIBOR + 5.000% 2/9/23 (e)(r) | | 11,460,000 | 11,549,503 |
| Telesat LLC Tranche B 4LN, term loan 3 month U.S. LIBOR + 3.000% 4.7% 11/17/23 (d)(e) | | 3,148,742 | 3,161,873 |
| | | | 49,639,844 |
|
| TOTAL TELECOMMUNICATION SERVICES | | | 118,599,035 |
|
| UTILITIES - 0.2% | | | |
| Electric Utilities - 0.1% | | | |
| Empire Generating Co. LLC: | | | |
| Tranche B, term loan 3 month U.S. LIBOR + 4.250% 6.03% 3/14/21 (d)(e) | | 884,825 | 732,193 |
| Tranche C, term loan 3 month U.S. LIBOR + 4.250% 6.03% 3/14/21 (d)(e) | | 87,227 | 71,962 |
| Exgen Renewables Iv LLC Tranche B, term loan 3 month U.S. LIBOR + 3.000% 4.4676% 11/28/24 (d)(e) | | 2,992,500 | 3,018,684 |
| Exgen Texas Power LLC Tranche B, term loan 3 month U.S. LIBOR + 4.750% 0% 9/18/21 (e)(f) | | 4,473,483 | 2,721,354 |
| Green Energy Partners/Stonewall LLC Tranche B 1LN, term loan 3 month U.S. LIBOR + 5.500% 7.1934% 11/13/21 (d)(e) | | 3,034,395 | 3,004,051 |
| InterGen NV Tranche B, term loan 3 month U.S. LIBOR + 4.500% 6.15% 6/13/20 (d)(e) | | 6,245,489 | 6,245,489 |
| Lightstone Holdco LLC: | | | |
| Tranche B 1LN, term loan 3 month U.S. LIBOR + 3.750% 5.398% 1/30/24 (d)(e) | | 2,495,327 | 2,509,201 |
| Tranche C 1LN, term loan 3 month U.S. LIBOR + 3.750% 5.398% 1/30/24 (d)(e) | | 158,446 | 159,327 |
| Tex Operations Co. LLC: | | | |
| Tranche B, term loan 3 month U.S. LIBOR + 2.500% 4.148% 8/4/23 (d)(e) | | 7,182,358 | 7,219,563 |
| Tranche C, term loan 3 month U.S. LIBOR + 2.500% 4.148% 8/4/23 (d)(e) | | 1,272,791 | 1,279,384 |
| USIC Holdings, Inc. Tranche B, term loan 3 month U.S. LIBOR + 3.500% 5.0039% 12/9/23 (d)(e) | | 1,485,000 | 1,493,658 |
| Vistra Operations Co. LLC Tranche B 2LN, term loan 3 month U.S. LIBOR + 2.250% 3.8541% 12/14/23 (d)(e) | | 1,485,000 | 1,492,217 |
| | | | 29,947,083 |
| Independent Power and Renewable Electricity Producers - 0.1% | | | |
| Dynegy, Inc. Tranche C-2, term loan 3 month U.S. LIBOR + 2.750% 4.3456% 2/7/24 (d)(e) | | 6,806,790 | 6,845,792 |
| Energy Future Holdings Corp. Tranche B, term loan 3 month U.S. LIBOR + 3.000% 4.4737% 6/30/18 (d)(e) | | 13,500,000 | 13,498,380 |
| Terra-Gen Finance Co. LLC Tranche B, term loan 3 month U.S. LIBOR + 4.250% 5.9% 12/9/21 (d)(e) | | 2,689,367 | 2,433,877 |
| TerraForm AP Acquisition Holdings LLC Tranche B, term loan 3 month U.S. LIBOR + 4.250% 5.9434% 6/26/22 (d)(e) | | 2,403,186 | 2,415,201 |
| TerraForm Power Operating LLC Tranche B, term loan 3 month U.S. LIBOR + 2.750% 4.3293% 11/8/22 (d)(e) | | 810,000 | 814,390 |
| The AES Corp. Tranche B, term loan 3 month U.S. LIBOR + 2.000% 3.9436% 5/24/22 (d)(e) | | 4,039,475 | 4,041,495 |
| | | | 30,049,135 |
|
| TOTAL UTILITIES | | | 59,996,218 |
|
| TOTAL BANK LOAN OBLIGATIONS | | | |
| (Cost $1,545,110,198) | | | 1,547,521,664 |
|
| Bank Notes - 0.4% | | | |
| Capital One NA 2.95% 7/23/21 | | 18,827,000 | 18,629,865 |
| Discover Bank: | | | |
| (Delaware) 3.2% 8/9/21 | | $25,781,000 | $25,623,829 |
| 3.1% 6/4/20 | | 22,584,000 | 22,553,138 |
| 8.7% 11/18/19 | | 2,958,000 | 3,216,737 |
| KeyBank NA 6.95% 2/1/28 | | 1,977,000 | 2,434,607 |
| RBS Citizens NA 2.5% 3/14/19 | | 11,319,000 | 11,302,220 |
| Regions Bank 7.5% 5/15/18 | | 24,647,000 | 24,903,822 |
| UBS AG Stamford Branch 1.8% 3/26/18 | | 24,142,000 | 24,138,379 |
| TOTAL BANK NOTES | | | |
| (Cost $132,366,169) | | | 132,802,597 |
|
| Preferred Securities - 0.7% | | | |
| CONSUMER DISCRETIONARY - 0.0% | | | |
| Automobiles - 0.0% | | | |
| Volkswagen International Finance NV 2.5%(Reg. S) (c)(d) | EUR | $1,525,000 | $1,950,099 |
| CONSUMER STAPLES - 0.0% | | | |
| Food Products - 0.0% | | | |
| Cosan Overseas Ltd. 8.25% (c) | | 4,402,000 | 4,543,179 |
| Danone SA 1.75% (Reg. S) (c)(d) | EUR | 1,500,000 | 1,826,064 |
| | | | 6,369,243 |
| ENERGY - 0.1% | | | |
| Oil, Gas & Consumable Fuels - 0.1% | | | |
| Andeavor Logistics LP 6.875% (c)(d) | | 7,770,000 | 7,929,313 |
| Sunoco Logistics Partners LP 6.25% (c)(d) | | 11,264,000 | 10,949,083 |
| Total SA 2.625% (Reg. S) (c)(d) | EUR | 2,150,000 | 2,708,105 |
| | | | 21,586,501 |
| FINANCIALS - 0.5% | | | |
| Banks - 0.5% | | | |
| Alfa Bond Issuance PLC 8% (Reg. S) (c)(d) | | 1,860,000 | 1,938,906 |
| Banco Bilbao Vizcaya Argentaria SA 7% (c)(d) | EUR | 2,800,000 | 3,599,596 |
| Banco Do Brasil SA 9% (b)(c)(d) | | 3,445,000 | 3,782,780 |
| Banco Mercantil del Norte SA 7.625% (b)(c)(d) | | 1,930,000 | 2,121,335 |
| Bank of America Corp.: | | | |
| 6.1% (c)(d) | | 8,141,000 | 8,855,811 |
| 6.25% (c)(d) | | 5,325,000 | 5,888,169 |
| 6.5% (c)(d) | | 3,000,000 | 3,358,457 |
| Bank of Nova Scotia 4.65% (c)(d) | | 1,700,000 | 1,679,404 |
| Barclays Bank PLC 7.625% 11/21/22 | | 31,295,000 | 35,494,350 |
| Barclays PLC: | | | |
| 6.625% (c)(d) | | 15,585,000 | 16,252,071 |
| 7.875% (Reg. S) (c)(d) | GBP | 2,000,000 | 3,107,149 |
| BNP Paribas SA 6.75% (Reg. S) (c)(d) | | 1,500,000 | 1,648,239 |
| Citigroup, Inc.: | | | |
| 5.875% (c)(d) | | 4,305,000 | 4,569,350 |
| 5.95% (c)(d) | | 5,290,000 | 5,591,121 |
| 5.95% (c)(d) | | 2,285,000 | 2,372,061 |
| Credit Agricole SA: | | | |
| 6.625% (b)(c)(d) | | 10,445,000 | 10,967,395 |
| 7.875% (b)(c)(d) | | 4,250,000 | 4,807,281 |
| 8.125% 9/19/33 (Reg. S) (d) | | 2,500,000 | 2,656,537 |
| HSBC Holdings PLC 5.25% (c)(d) | EUR | 2,000,000 | 2,788,380 |
| Itau Unibanco Holding SA 6.125% (b)(c)(d) | | 2,510,000 | 2,568,442 |
| KBC Groep NV 5.625% (c)(d) | EUR | 800,000 | 1,029,530 |
| Royal Bank of Scotland Group PLC: | | | |
| 7.5% (c)(d) | | 9,170,000 | 9,730,363 |
| 8.625% (c)(d) | | 3,665,000 | 4,103,387 |
| Stichting AK Rabobank Certificaten 6.5% (Reg. S) (c) | EUR | 2,050,000 | 3,144,869 |
| | | | 142,054,983 |
| Capital Markets - 0.0% | | | |
| Goldman Sachs Group, Inc. 5% (c)(d) | | 7,500,000 | 7,418,992 |
| Diversified Financial Services - 0.0% | | | |
| Magnesita Finance Ltd.: | | | |
| 8.625% (b)(c) | | 1,018,800 | 1,037,319 |
| 8.625% (Reg. S) (c) | | 144,000 | 146,618 |
| | | | 1,183,937 |
| Insurance - 0.0% | | | |
| Assicurazioni Generali SpA 6.416% (c)(d) | GBP | 2,900,000 | 4,324,566 |
| Aviva PLC 6.125% (c)(d) | GBP | 3,270,000 | 5,140,601 |
| AXA SA 6.463% (c)(d) | | 1,012,000 | 1,035,956 |
| Credit Agricole Assurances SA 4.25% (Reg. S) (c)(d) | EUR | 2,600,000 | 3,518,930 |
| | | | 14,020,053 |
|
| TOTAL FINANCIALS | | | 164,677,965 |
|
| INDUSTRIALS - 0.0% | | | |
| Construction & Engineering - 0.0% | | | |
| Odebrecht Finance Ltd.: | | | |
| 7.5% (b)(c) | | 6,805,000 | 1,674,442 |
| 7.5% (Reg. S) (c) | | 100,000 | 24,604 |
| | | | 1,699,046 |
| MATERIALS - 0.0% | | | |
| Metals & Mining - 0.0% | | | |
| CSN Islands XII Corp. 7% (Reg. S) (c) | | 1,170,000 | 1,004,184 |
| REAL ESTATE - 0.0% | | | |
| Real Estate Management & Development - 0.0% | | | |
| Grand City Properties SA 3.75% (c)(d) | EUR | 2,500,000 | 3,248,403 |
| TELECOMMUNICATION SERVICES - 0.1% | | | |
| Diversified Telecommunication Services - 0.1% | | | |
| Colombia Telecomunicaciones SA 8.5% (b)(c)(d) | | 830,000 | 907,348 |
| Telefonica Europe BV 6.5% (Reg. S) (c)(d) | EUR | 5,500,000 | 7,127,801 |
| | | | 8,035,149 |
| TOTAL PREFERRED SECURITIES | | | |
| (Cost $201,315,366) | | | 208,570,590 |
| | | Shares | Value |
|
| Money Market Funds - 2.2% | | | |
| Fidelity Cash Central Fund, 1.41% (t) | | | |
| (Cost $700,075,650) | | 700,012,139 | 700,152,141 |
| Purchased Swaptions - 0.0% | | | | |
| | | Expiration Date | Notional Amount | Value |
| Put Options - 0.0% | | | | |
| Option with an exercise rate of 2.500% on a credit default swap with BNP Paribas to buy protection on the 5-Year iTraxx Europe Crossover Series 28 Index expiring December 2022, paying 5% quarterly | | 6/20/18 | EUR 29,000,000 | $734,533 |
| TOTAL PURCHASED SWAPTIONS | | | | |
| (Cost $472,991) | | | | 734,533 |
| TOTAL INVESTMENT IN SECURITIES - 103.7% | | | | |
| (Cost $33,217,065,450) | | | | 32,850,307,846 |
| NET OTHER ASSETS (LIABILITIES) - (3.7)% | | | | (1,158,730,663) |
| NET ASSETS - 100% | | | | $31,691,577,183 |
| TBA Sale Commitments | | |
| | Principal Amount | Value |
| Fannie Mae | | |
| 3% 3/1/33 | $(52,150,000) | $(51,924,191) |
| 3% 3/1/33 | (37,150,000) | (36,989,141) |
| 3% 3/1/33 | (39,850,000) | (39,677,450) |
| 3% 3/1/33 | (51,700,000) | (51,476,139) |
| 3% 3/1/33 | (24,400,000) | (24,294,348) |
| 3% 3/1/33 | (24,400,000) | (24,294,348) |
| 3% 3/1/48 | (5,600,000) | (5,426,602) |
| 3% 3/1/48 | (9,400,000) | (9,108,938) |
| 3% 3/1/48 | (68,100,000) | (65,991,352) |
| 3.5% 3/1/48 | (41,300,000) | (41,224,508) |
| 4% 3/1/48 | (11,000,000) | (11,268,125) |
| 4% 3/1/48 | (209,550,000) | (214,657,781) |
|
| TOTAL FANNIE MAE | | (576,332,923) |
|
| Freddie Mac | | |
| 4% 3/1/48 | (2,600,000) | (2,663,883) |
| Ginnie Mae | | |
| 4.5% 3/1/48 | (34,500,000) | (35,884,689) |
| 4.5% 3/1/48 | (39,200,000) | (40,773,325) |
|
| TOTAL GINNIE MAE | | (76,658,014) |
|
| TOTAL TBA SALE COMMITMENTS | | |
| (Proceeds $655,325,636) | | $(655,654,820) |
| Futures Contracts | | | | | |
| | Number of contracts | Expiration Date | Notional Amount | Value | Unrealized Appreciation/(Depreciation) |
| Purchased | | | | | |
| Bond Index Contracts | | | | | |
| ASX 10 Year Treasury Bond Index Contracts (Australia) | 29 | March 2018 | $2,878,442 | $(52,660) | $(52,660) |
| Eurex Euro-Buxl 30 Year Bond Contracts (Germany) | 38 | March 2018 | 7,488,994 | (261,518) | (261,518) |
| TOTAL BOND INDEX CONTRACTS | | | | | (314,178) |
| Treasury Contracts | | | | | |
| CBOT 10-Year U.S. Treasury Note Contracts (United States) | 143 | June 2018 | 17,166,703 | 27,628 | 27,628 |
| CBOT 2-Year U.S. Treasury Note Contracts (United States) | 111 | June 2018 | 23,584,031 | (218) | (218) |
| CBOT 5-Year U.S. Treasury Note Contracts (United States) | 147 | June 2018 | 16,747,664 | (44,124) | (44,124) |
| CBOT Long Term U.S. Treasury Bond Contracts (United States) | 18 | June 2018 | 2,581,875 | 31,461 | 31,461 |
| CBOT Ultra 10-Year U.S. Treasury Note Contracts (United States) | 40 | June 2018 | 5,122,500 | 9,955 | 9,955 |
| CBOT Ultra Long Term U.S. Treasury Bond Contracts (United States) | 23 | June 2018 | 3,585,125 | 13,809 | 13,809 |
| TME 10 Year Canadian Note Contracts (Canada) | 77 | June 2018 | 7,901,621 | 60,448 | 60,448 |
| TOTAL TREASURY CONTRACTS | | | | | 98,959 |
|
| TOTAL PURCHASED | | | | | (215,219) |
|
| Sold | | | | | |
| Bond Index Contracts | | | | | |
| Eurex Euro-Bobl Contracts (Germany) | 153 | March 2018 | 24,459,926 | 34,574 | 34,574 |
| Eurex Euro-Bund Contracts (Germany) | 9 | March 2018 | 1,750,651 | (7,116) | (7,116) |
| Eurex Euro-Bund Contracts (Germany) | 15 | June 2018 | 2,868,891 | (14) | (14) |
| ICE Long Gilt Contracts (United Kingdom) | 9 | June 2018 | 1,500,218 | (4,228) | (4,228) |
| ICE Medium Gilt Contracts (United Kingdom) | 25 | June 2018 | 3,876,099 | (2,323) | (2,323) |
| TOTAL BOND INDEX CONTRACTS | | | | | 20,893 |
| Treasury Contracts | | | | | |
| CBOT 10-Year U.S. Treasury Note Contracts (United States) | 372 | June 2018 | 44,657,438 | 127,148 | 127,148 |
| CBOT 2-Year U.S. Treasury Note Contracts (United States) | 515 | June 2018 | 109,421,406 | 146,881 | 146,881 |
| CBOT Long Term U.S. Treasury Bond Contracts (United States) | 61 | June 2018 | 8,749,688 | (27,772) | (27,772) |
| CBOT Ultra 10-Year U.S. Treasury Note Contracts (United States) | 519 | June 2018 | 66,464,438 | (203,834) | (203,834) |
| TOTAL TREASURY CONTRACTS | | | | | 42,423 |
|
| TOTAL SOLD | | | | | 63,316 |
|
| TOTAL FUTURES CONTRACTS | | | | | $(151,903) |
The notional amount of futures purchased as a percentage of Net Assets is 0.3%
The notional amount of futures sold as a percentage of Net Assets is 0.8%
| Forward Foreign Currency Contracts | | | | | | |
| Currency Purchased | Currency Sold | Counterparty | Settlement Date | Unrealized Appreciation/(Depreciation) |
| USD | 1,212,503 | EUR | 993,000 | JPMorgan Chase Bank | 3/2/18 | $1,043 |
| EUR | 229,000 | USD | 282,501 | Citibank, N.A. | 5/18/18 | (1,454) |
| EUR | 3,080,000 | USD | 3,808,174 | Goldman Sachs Bank USA | 5/18/18 | (28,154) |
| EUR | 11,840,228 | USD | 14,669,439 | JPMorgan Chase Bank | 5/18/18 | (138,175) |
| EUR | 1,056,000 | USD | 1,296,865 | JPMorgan Chase Bank | 5/18/18 | (859) |
| GBP | 341,000 | USD | 471,526 | JPMorgan Chase Bank | 5/18/18 | (428) |
| USD | 197,598 | AUD | 250,000 | JPMorgan Chase Bank | 5/18/18 | 3,387 |
| USD | 10,204,114 | CAD | 12,863,000 | BNP Paribas | 5/18/18 | 165,444 |
| USD | 167,241,046 | EUR | 134,653,000 | JPMorgan Chase Bank | 5/18/18 | 1,984,247 |
| USD | 7,253,187 | EUR | 5,788,180 | State Street Bank and Trust Co. | 5/18/18 | 149,475 |
| USD | 680,754 | EUR | 548,000 | State Street Bank and Trust Co. | 5/18/18 | 8,205 |
| USD | 68,573,788 | GBP | 48,787,000 | Goldman Sachs Bank USA | 5/18/18 | 1,173,563 |
| USD | 1,553,432 | GBP | 1,105,000 | State Street Bank and Trust Co. | 5/18/18 | 26,852 |
| USD | 29,553 | JPY | 3,150,000 | JPMorgan Chase Bank | 5/18/18 | (132) |
| TOTAL FORWARD FOREIGN CURRENCY CONTRACTS | | | | | | $3,343,014 |
| | | | | | Unrealized Appreciation | 3,512,216 |
| | | | | | Unrealized Depreciation | (169,202) |
Swaps
| Underlying Reference | Rating(1) | Maturity Date | Clearinghouse / Counterparty(2) | Fixed Payment Received/(Paid) | Payment Frequency | Notional Amount(3) | Value(1) | Upfront Premium Received/(Paid)(4) | Unrealized Appreciation/(Depreciation) |
| Credit Default Swaps | | | | | | | | | |
| Buy Protection | | | | | | | | | |
| 5-Year iTraxx Europe Series 25 Index | | Jun. 2021 | ICE | (1%) | Quarterly | EUR 8,300,000 | $(122,409) | $0 | $(122,409) |
| Accor SA | | Jun. 2022 | Citibank, N.A. | (1%) | Quarterly | EUR 4,200,000 | (120,580) | 80,071 | (40,509) |
| Carlsberg Breweries A/S | | Jun. 2022 | BNP Paribas SA | (1%) | Quarterly | EUR 4,150,000 | (152,423) | 137,049 | (15,374) |
| Energias De Portugal SA | | Jun. 2022 | JPMorgan Chase Bank, N.A. | (5%) | Quarterly | EUR 3,550,000 | (871,416) | 791,667 | (79,749) |
| Gas Natural Capital Markets SA | | Jun. 2022 | BNP Paribas SA | (1%) | Quarterly | EUR 4,200,000 | (107,836) | 104,014 | (3,822) |
| Kering SA | | Sep. 2018 | Morgan Stanley Capital Group, Inc. | (1%) | Quarterly | EUR 3,500,000 | (31,181) | 2,671 | (28,510) |
| Royal Bank Of Scotland Grp PLC (Ungtd) | | Jun. 2022 | BNP Paribas SA | (1%) | Quarterly | EUR 4,600,000 | (95,778) | (107,285) | (203,063) |
| Santander Issuances SA Unipersonal | | Jun. 2022 | BNP Paribas SA | (1%) | Quarterly | EUR 4,350,000 | (24,363) | (95,897) | (120,260) |
| Standard Chartered PLC | | Jun. 2021 | Goldman Sachs Bank USA | (1%) | Quarterly | EUR 1,550,000 | (35,435) | (105,808) | (141,243) |
| TOTAL BUY PROTECTION | | | | | | | (1,561,421) | 806,482 | (754,939) |
| Sell Protection | | | | | | | | | |
| 5-Year iTraxx Europe Senior Financials Series 25 Index | NR | Jun. 2021 | ICE | 1% | Quarterly | EUR 8,300,000 | 266,396 | 0 | 266,396 |
| Intesa Sanpaolo Spa | Ba1 | Jun. 2022 | BNP Paribas SA | 1% | Quarterly | EUR 1,850,000 | (42,895) | 163,034 | 120,139 |
| TOTAL SELL PROTECTION | | | | | | | 223,501 | 163,034 | 386,535 |
|
| TOTAL CREDIT DEFAULT SWAPS | | | | | | | $(1,337,920) | $969,516 | $(368,404) |
|
(1) Ratings are presented for credit default swaps in which the Fund has sold protection on the underlying referenced debt. Ratings for an underlying index represent a weighted average of the ratings of all securities included in the index. The credit rating or value can be measures of the current payment/performance risk. Ratings are from Moody's Investors Service, Inc. Where Moody's® ratings are not available, S&P® ratings are disclosed and are indicated as such. All ratings are as of the report date and do not reflect subsequent changes.
(2) Swaps with Intercontinental Exchange (ICE) are centrally cleared over-the-counter (OTC) swaps.
(3) The notional amount of each credit default swap where the Fund has sold protection approximates the maximum potential amount of future payments that the Fund could be required to make if a credit event were to occur.
(4) Any premiums for centrally cleared over-the-counter (OTC) swaps are recorded periodically throughout the term of the swap to variation margin and included in unrealized appreciation (depreciation).
Currency Abbreviations
AUD – Australian dollar
CAD – Canadian dollar
EUR – European Monetary Unit
GBP – British pound
JPY – Japanese yen
USD – U.S. dollar
Legend
(a) Amount is stated in United States dollars unless otherwise noted.
(b) Security exempt from registration under Rule 144A of the Securities Act of 1933. These securities may be resold in transactions exempt from registration, normally to qualified institutional buyers. At the end of the period, the value of these securities amounted to $2,674,654,323 or 8.4% of net assets.
(c) Security is perpetual in nature with no stated maturity date.
(d) Coupon rates for floating and adjustable rate securities reflect the rates in effect at period end.
(e) Coupon is indexed to a floating interest rate which may be multiplied by a specified factor and/or subject to caps or floors.
(f) Non-income producing - Security is in default.
(g) Level 3 security
(h) Security or a portion of the security purchased on a delayed delivery or when-issued basis.
(i) Security or a portion of the security was pledged to cover margin requirements for futures contracts. At period end, the value of securities pledged amounted to $2,248,587.
(j) Security or a portion of the security has been segregated as collateral for mortgage-backed or asset-backed securities purchased on a delayed delivery or when-issued basis. At period end, the value of securities pledged amounted to $3,740,484.
(k) Security represents right to receive monthly interest payments on an underlying pool of mortgages or assets. Principal shown is the outstanding par amount of the pool as of the end of the period.
(l) Coupon is inversely indexed to a floating interest rate multiplied by a specified factor. The price may be considerably more volatile than the price of a comparable fixed rate security.
(m) Principal Only Strips represent the right to receive the monthly principal payments on an underlying pool of mortgage loans.
(n) Represents an investment in an underlying pool of reverse mortgages which typically do not require regular principal and interest payments as repayment is deferred until a maturity event.
(o) Security initially issued at one coupon which converts to a higher coupon at a specified date. The rate shown is the rate at period end.
(p) Security or a portion of the security was pledged to cover margin requirements for centrally cleared OTC swaps. At period end, the value of securities pledged amounted to $264,233.
(q) Non-income producing
(r) The coupon rate will be determined upon settlement of the loan after period end.
(s) Position represents an unfunded loan commitment. At period end, the total principal amount and market value of unfunded commitments totaled $458,922 and $460,198, respectively.
(t) Affiliated fund that is generally available only to investment companies and other accounts managed by Fidelity Investments. The rate quoted is the annualized seven-day yield of the fund at period end. A complete unaudited listing of the fund's holdings as of its most recent quarter end is available upon request. In addition, each Fidelity Central Fund's financial statements are available on the SEC's website or upon request.
Affiliated Central Funds
Information regarding fiscal year to date income earned by the Fund from investments in Fidelity Central Funds is as follows:
| Fund | Income earned |
| Fidelity Cash Central Fund | $5,092,511 |
| Total | $5,092,511 |
Amounts in the income column in the above table include any capital gain distributions from underlying funds, which are presented in the corresponding line-item in the Statement of Operations if applicable.
Investment Valuation
The following is a summary of the inputs used, as of February 28, 2018, involving the Fund's assets and liabilities carried at fair value. The inputs or methodology used for valuing securities may not be an indication of the risk associated with investing in those securities. For more information on valuation inputs, and their aggregation into the levels used below, please refer to the Investment Valuation section in the accompanying Notes to Financial Statements.
| | Valuation Inputs at Reporting Date: |
| Description | Total | Level 1 | Level 2 | Level 3 |
| Investments in Securities: | | | | |
| Equities: | | | | |
| Consumer Discretionary | $883,404 | $883,404 | $-- | $-- |
| Energy | 9,658,272 | 4,568,722 | -- | 5,089,550 |
| Financials | 3,385,781 | 1,389,386 | 1,996,395 | -- |
| Materials | 3,398,108 | 3,398,108 | -- | -- |
| Real Estate | 5,422,067 | 4,633,224 | 788,843 | -- |
| Telecommunication Services | 198,313 | 163,713 | -- | 34,600 |
| Corporate Bonds | 9,576,664,814 | -- | 9,576,663,807 | 1,007 |
| U.S. Government and Government Agency Obligations | 13,027,878,575 | -- | 13,027,878,575 | -- |
| U.S. Government Agency - Mortgage Securities | 5,479,698,735 | -- | 5,479,698,735 | -- |
| Asset-Backed Securities | 304,290,522 | -- | 301,238,695 | 3,051,827 |
| Collateralized Mortgage Obligations | 615,396,512 | -- | 615,396,512 | -- |
| Commercial Mortgage Securities | 569,196,111 | -- | 569,196,111 | -- |
| Municipal Securities | 383,316,440 | -- | 383,316,440 | -- |
| Foreign Government and Government Agency Obligations | 281,138,667 | -- | 273,673,074 | 7,465,593 |
| Bank Loan Obligations | 1,547,521,664 | -- | 1,541,838,525 | 5,683,139 |
| Bank Notes | 132,802,597 | -- | 132,802,597 | -- |
| Preferred Securities | 208,570,590 | -- | 208,570,590 | -- |
| Money Market Funds | 700,152,141 | 700,152,141 | -- | -- |
| Purchased Swaptions | 734,533 | -- | 734,533 | -- |
| Total Investments in Securities: | $32,850,307,846 | $715,188,698 | $32,113,793,432 | $21,325,716 |
| Derivative Instruments: | | | | |
| Assets | | | | |
| Futures Contracts | $451,904 | $451,904 | $-- | $-- |
| Forward Foreign Currency Contracts | 3,512,216 | -- | 3,512,216 | -- |
| Swaps | 266,396 | -- | 266,396 | -- |
| Total Assets | $4,230,516 | $451,904 | $3,778,612 | $-- |
| Liabilities | | | | |
| Futures Contracts | $(603,807) | $(603,807) | $-- | $-- |
| Forward Foreign Currency Contracts | (169,202) | -- | (169,202) | -- |
| Swaps | (1,604,316) | -- | (1,604,316) | -- |
| Total Liabilities | $(2,377,325) | $(603,807) | $(1,773,518) | $-- |
| Total Derivative Instruments: | $1,853,191 | $(151,903) | $2,005,094 | $-- |
| Other Financial Instruments: | | | | |
| TBA Sale Commitments | $(655,654,820) | $-- | $(655,654,820) | $-- |
| Total Other Financial Instruments: | $(655,654,820) | $-- | $(655,654,820) | $-- |
Value of Derivative Instruments
The following table is a summary of the Fund's value of derivative instruments by primary risk exposure as of February 28, 2018. For additional information on derivative instruments, please refer to the Derivative Instruments section in the accompanying Notes to Financial Statements.
| Primary Risk Exposure / Derivative Type | Value |
| | Asset | Liability |
| Credit Risk | | |
| Purchased Swaptions(a) | $734,533 | $0 |
| Swaps(b) | 266,396 | (1,604,316) |
| Total Credit Risk | 1,000,929 | (1,604,316) |
| Foreign Exchange Risk | | |
| Forward Foreign Currency Contracts(c) | 3,512,216 | (169,202) |
| Total Foreign Exchange Risk | 3,512,216 | (169,202) |
| Interest Rate Risk | | |
| Futures Contracts(d) | 451,904 | (603,807) |
| Total Interest Rate Risk | 451,904 | (603,807) |
| Total Value of Derivatives | $4,965,049 | $(2,377,325) |
(a) Gross value is included in the Statement of Assets and Liabilities in the investments, at value line-item.
(b) For bi-lateral over-the-counter (OTC) swaps, reflects gross value which is presented in the Statement of Assets and Liabilities in the bi-lateral OTC swaps, at value line-items. For centrally cleared OTC swaps, reflects gross cumulative appreciation (depreciation) as presented in the Schedule of Investments. In the Statement of Assets and Liabilities, the period end daily variation margin for centrally cleared OTC swaps is included in receivable or payable for daily variation margin on centrally cleared OTC swaps, and the net cumulative appreciation (depreciation) for centrally cleared OTC swaps is included in net unrealized appreciation (depreciation).
(c) Gross value is presented in the Statement of Assets and Liabilities in the unrealized appreciation/depreciation on forward foreign currency contracts line-items.
(d) Reflects gross cumulative appreciation (depreciation) on futures contracts as presented in the Schedule of Investments. In the Statement of Assets and Liabilities, the period end daily variation margin is included in receivable or payable for daily variation margin on futures contracts, and the net cumulative appreciation (depreciation) is included in net unrealized appreciation (depreciation).
Other Information
Distribution of investments by country or territory of incorporation, as a percentage of Total Net Assets, is as follows (Unaudited):
| United States of America | 89.6% |
| Mexico | 2.0% |
| Netherlands | 1.9% |
| United Kingdom | 1.7% |
| Luxembourg | 1.0% |
| Others (Individually Less Than 1%) | 3.8% |
| | 100.0% |
See accompanying notes which are an integral part of the financial statements.
Financial Statements
Statement of Assets and Liabilities
| | | February 28, 2018 (Unaudited) |
| Assets | | |
Investment in securities, at value — See accompanying schedule:
Unaffiliated issuers (cost $32,516,989,800) | $32,150,155,705 | |
| Fidelity Central Funds (cost $700,075,650) | 700,152,141 | |
| Total Investment in Securities (cost $33,217,065,450) | | $32,850,307,846 |
| Cash | | 47,069,975 |
| Foreign currency held at value (cost $1,160,458) | | 1,147,868 |
| Receivable for investments sold | | 206,424,557 |
| Receivable for TBA sale commitments | | 655,325,636 |
| Unrealized appreciation on forward foreign currency contracts | | 3,512,216 |
| Receivable for fund shares sold | | 41,714,689 |
| Dividends receivable | | 146,447 |
| Interest receivable | | 204,719,910 |
| Distributions receivable from Fidelity Central Funds | | 732,736 |
| Receivable for daily variation margin on centrally cleared OTC swaps | | 811 |
| Other receivables | | 206,047 |
| Total assets | | 34,011,308,738 |
| Liabilities | | |
| Payable for investments purchased | | |
| Regular delivery | $118,666,725 | |
| Delayed delivery | 1,480,080,094 | |
| TBA sale commitments, at value | 655,654,820 | |
| Unrealized depreciation on forward foreign currency contracts | 169,202 | |
| Payable for fund shares redeemed | 48,039,325 | |
| Distributions payable | 2,764,249 | |
| Bi-lateral OTC swaps, at value | 1,481,907 | |
| Accrued management fee | 8,118,928 | |
| Distribution and service plan fees payable | 322,332 | |
| Payable for daily variation margin on futures contracts | 292,601 | |
| Other affiliated payables | 3,935,310 | |
| Other payables and accrued expenses | 206,062 | |
| Total liabilities | | 2,319,731,555 |
| Net Assets | | $31,691,577,183 |
| Net Assets consist of: | | |
| Paid in capital | | $32,094,442,060 |
| Undistributed net investment income | | 40,032,337 |
| Accumulated undistributed net realized gain (loss) on investments and foreign currency transactions | | (78,690,162) |
| Net unrealized appreciation (depreciation) on investments and assets and liabilities in foreign currencies | | (364,207,052) |
| Net Assets | | $31,691,577,183 |
| Calculation of Maximum Offering Price | | |
| Class A: | | |
| Net Asset Value and redemption price per share ($504,369,578 ÷ 48,398,404 shares) | | $10.42 |
| Maximum offering price per share (100/96.00 of $10.42) | | $10.85 |
| Class M: | | |
| Net Asset Value and redemption price per share ($301,987,901 ÷ 29,029,524 shares) | | $10.40 |
| Maximum offering price per share (100/96.00 of $10.40) | | $10.83 |
| Class C: | | |
| Net Asset Value and offering price per share ($183,067,903 ÷ 17,561,009 shares)(a) | | $10.42 |
| Total Bond: | | |
| Net Asset Value, offering price and redemption price per share ($23,808,092,252 ÷ 2,285,471,243 shares) | | $10.42 |
| Class I: | | |
| Net Asset Value, offering price and redemption price per share ($4,821,249,070 ÷ 463,536,932 shares) | | $10.40 |
| Class Z: | | |
| Net Asset Value, offering price and redemption price per share ($2,072,810,479 ÷ 199,275,788 shares) | | $10.40 |
(a) Redemption price per share is equal to net asset value less any applicable contingent deferred sales charge.
See accompanying notes which are an integral part of the financial statements.
Statement of Operations
| | | Six months ended February 28, 2018 (Unaudited) |
| Investment Income | | |
| Dividends | | $6,827,441 |
| Interest | | 475,672,800 |
| Income from Fidelity Central Funds | | 5,092,511 |
| Total income | | 487,592,752 |
| Expenses | | |
| Management fee | $48,363,852 | |
| Transfer agent fees | 16,446,345 | |
| Distribution and service plan fees | 1,957,268 | |
| Fund wide operations fee | 6,837,094 | |
| Independent trustees' fees and expenses | 59,065 | |
| Miscellaneous | 44,490 | |
| Total expenses before reductions | 73,708,114 | |
| Expense reductions | (48,555) | 73,659,559 |
| Net investment income (loss) | | 413,933,193 |
| Realized and Unrealized Gain (Loss) | | |
| Net realized gain (loss) on: | | |
| Investment securities: | | |
| Unaffiliated issuers | (3,982,221) | |
| Fidelity Central Funds | 3,792 | |
| Forward foreign currency contracts | (11,264,823) | |
| Foreign currency transactions | 16,466,381 | |
| Futures contracts | 5,209,636 | |
| Swaps | 352,421 | |
| Total net realized gain (loss) | | 6,785,186 |
| Change in net unrealized appreciation (depreciation) on: | | |
| Investment securities: | | |
| Unaffiliated issuers | (942,406,816) | |
| Fidelity Central Funds | (3,792) | |
| Forward foreign currency contracts | 4,610,970 | |
| Assets and liabilities in foreign currencies | (71,438) | |
| Futures contracts | 359,036 | |
| Swaps | 272,008 | |
| Delayed delivery commitments | 357,181 | |
| Total change in net unrealized appreciation (depreciation) | | (936,882,851) |
| Net gain (loss) | | (930,097,665) |
| Net increase (decrease) in net assets resulting from operations | | $(516,164,472) |
See accompanying notes which are an integral part of the financial statements.
Statement of Changes in Net Assets
| | Six months ended February 28, 2018 (Unaudited) | Year ended August 31, 2017 |
| Increase (Decrease) in Net Assets | | |
| Operations | | |
| Net investment income (loss) | $413,933,193 | $775,303,535 |
| Net realized gain (loss) | 6,785,186 | 36,180,617 |
| Change in net unrealized appreciation (depreciation) | (936,882,851) | (187,045,805) |
| Net increase (decrease) in net assets resulting from operations | (516,164,472) | 624,438,347 |
| Distributions to shareholders from net investment income | (449,309,447) | (739,976,289) |
| Distributions to shareholders from net realized gain | (72,496,766) | (67,918,257) |
| Total distributions | (521,806,213) | (807,894,546) |
| Share transactions - net increase (decrease) | 2,042,733,161 | 5,166,571,919 |
| Total increase (decrease) in net assets | 1,004,762,476 | 4,983,115,720 |
| Net Assets | | |
| Beginning of period | 30,686,814,707 | 25,703,698,987 |
| End of period | $31,691,577,183 | $30,686,814,707 |
| Other Information | | |
| Undistributed net investment income end of period | $40,032,337 | $75,408,591 |
See accompanying notes which are an integral part of the financial statements.
Financial Highlights
Fidelity Total Bond Fund Class A
| | Six months ended (Unaudited) February 28, | Years endedAugust 31, | | | | |
| | 2018 | 2017 | 2016 | 2015 | 2014 | 2013 |
| Selected Per–Share Data | | | | | | |
| Net asset value, beginning of period | $10.77 | $10.87 | $10.53 | $10.77 | $10.48 | $11.29 |
| Income from Investment Operations | | | | | | |
| Net investment income (loss)A | .124 | .272 | .312 | .287 | .292 | .263 |
| Net realized and unrealized gain (loss) | (.313) | (.086) | .377 | (.224) | .382 | (.468) |
| Total from investment operations | (.189) | .186 | .689 | .063 | .674 | (.205) |
| Distributions from net investment income | (.136) | (.258) | (.290) | (.270) | (.275) | (.250) |
| Distributions from net realized gain | (.025) | (.028) | (.059) | (.033) | (.109) | (.355) |
| Total distributions | (.161) | (.286) | (.349) | (.303) | (.384) | (.605) |
| Net asset value, end of period | $10.42 | $10.77 | $10.87 | $10.53 | $10.77 | $10.48 |
| Total ReturnB,C,D | (1.78)% | 1.77% | 6.71% | .58% | 6.56% | (1.94)% |
| Ratios to Average Net AssetsE,F | | | | | | |
| Expenses before reductions | .76%G | .75% | .75% | .75% | .76% | .79% |
| Expenses net of fee waivers, if any | .76%G | .75% | .75% | .75% | .76% | .79% |
| Expenses net of all reductions | .76%G | .75% | .75% | .75% | .76% | .79% |
| Net investment income (loss) | 2.35%G | 2.53% | 2.95% | 2.69% | 2.76% | 2.41% |
| Supplemental Data | | | | | | |
| Net assets, end of period (000 omitted) | $504,370 | $521,557 | $1,233,806 | $852,243 | $639,235 | $517,259 |
| Portfolio turnover rateH | 102%G | 137% | 134% | 140%I | 108% | 201% |
A Calculated based on average shares outstanding during the period.
B Total returns for periods of less than one year are not annualized.
C Total returns would have been lower if certain expenses had not been reduced during the applicable periods shown.
D Total returns do not include the effect of the sales charges.
E Fees and expenses of any underlying Fidelity Central Funds are not included in the Fund's expense ratio. The Fund indirectly bears its proportionate share of the expenses of any underlying Fidelity Central Funds.
F Expense ratios reflect operating expenses of the class. Expenses before reductions do not reflect amounts reimbursed by the investment adviser or reductions from brokerage service arrangements or reductions from other expense offset arrangements and do not represent the amount paid by the class during periods when reimbursements or reductions occur. Expenses net of fee waivers reflect expenses after reimbursement by the investment adviser but prior to reductions from brokerage service arrangements or other expense offset arrangements. Expenses net of all reductions represent the net expenses paid by the class.
G Annualized
H Amount does not include the portfolio activity of any underlying Fidelity Central Funds.
I Portfolio turnover rate excludes securities received or delivered in-kind.
See accompanying notes which are an integral part of the financial statements.
Fidelity Total Bond Fund Class M
| | Six months ended (Unaudited) February 28, | Years endedAugust 31, | | | | |
| | 2018 | 2017 | 2016 | 2015 | 2014 | 2013 |
| Selected Per–Share Data | | | | | | |
| Net asset value, beginning of period | $10.75 | $10.85 | $10.51 | $10.76 | $10.46 | $11.28 |
| Income from Investment Operations | | | | | | |
| Net investment income (loss)A | .124 | .267 | .309 | .285 | .290 | .265 |
| Net realized and unrealized gain (loss) | (.314) | (.083) | .378 | (.234) | .392 | (.477) |
| Total from investment operations | (.190) | .184 | .687 | .051 | .682 | (.212) |
| Distributions from net investment income | (.135) | (.256) | (.288) | (.268) | (.273) | (.253) |
| Distributions from net realized gain | (.025) | (.028) | (.059) | (.033) | (.109) | (.355) |
| Total distributions | (.160) | (.284) | (.347) | (.301) | (.382) | (.608) |
| Net asset value, end of period | $10.40 | $10.75 | $10.85 | $10.51 | $10.76 | $10.46 |
| Total ReturnB,C,D | (1.78)% | 1.76% | 6.71% | .47% | 6.65% | (2.01)% |
| Ratios to Average Net AssetsE,F | | | | | | |
| Expenses before reductions | .77%G | .76% | .77% | .77% | .78% | .76% |
| Expenses net of fee waivers, if any | .77%G | .76% | .77% | .77% | .78% | .76% |
| Expenses net of all reductions | .77%G | .76% | .77% | .77% | .78% | .76% |
| Net investment income (loss) | 2.35%G | 2.53% | 2.94% | 2.67% | 2.74% | 2.44% |
| Supplemental Data | | | | | | |
| Net assets, end of period (000 omitted) | $301,988 | $287,111 | $155,518 | $101,673 | $57,972 | $52,848 |
| Portfolio turnover rateH | 102%G | 137% | 134% | 140%I | 108% | 201% |
A Calculated based on average shares outstanding during the period.
B Total returns for periods of less than one year are not annualized.
C Total returns would have been lower if certain expenses had not been reduced during the applicable periods shown.
D Total returns do not include the effect of the sales charges.
E Fees and expenses of any underlying Fidelity Central Funds are not included in the Fund's expense ratio. The Fund indirectly bears its proportionate share of the expenses of any underlying Fidelity Central Funds.
F Expense ratios reflect operating expenses of the class. Expenses before reductions do not reflect amounts reimbursed by the investment adviser or reductions from brokerage service arrangements or reductions from other expense offset arrangements and do not represent the amount paid by the class during periods when reimbursements or reductions occur. Expenses net of fee waivers reflect expenses after reimbursement by the investment adviser but prior to reductions from brokerage service arrangements or other expense offset arrangements. Expenses net of all reductions represent the net expenses paid by the class.
G Annualized
H Amount does not include the portfolio activity of any underlying Fidelity Central Funds.
I Portfolio turnover rate excludes securities received or delivered in-kind.
See accompanying notes which are an integral part of the financial statements.
Fidelity Total Bond Fund Class C
| | Six months ended (Unaudited) February 28, | Years endedAugust 31, | | | | |
| | 2018 | 2017 | 2016 | 2015 | 2014 | 2013 |
| Selected Per–Share Data | | | | | | |
| Net asset value, beginning of period | $10.77 | $10.87 | $10.53 | $10.77 | $10.48 | $11.29 |
| Income from Investment Operations | | | | | | |
| Net investment income (loss)A | .084 | .188 | .231 | .205 | .211 | .185 |
| Net realized and unrealized gain (loss) | (.314) | (.084) | .378 | (.225) | .382 | (.469) |
| Total from investment operations | (.230) | .104 | .609 | (.020) | .593 | (.284) |
| Distributions from net investment income | (.095) | (.176) | (.210) | (.187) | (.194) | (.171) |
| Distributions from net realized gain | (.025) | (.028) | (.059) | (.033) | (.109) | (.355) |
| Total distributions | (.120) | (.204) | (.269) | (.220) | (.303) | (.526) |
| Net asset value, end of period | $10.42 | $10.77 | $10.87 | $10.53 | $10.77 | $10.48 |
| Total ReturnB,C,D | (2.15)% | .99% | 5.90% | (.20)% | 5.75% | (2.65)% |
| Ratios to Average Net AssetsE,F | | | | | | |
| Expenses before reductions | 1.53%G | 1.52% | 1.52% | 1.53% | 1.53% | 1.51% |
| Expenses net of fee waivers, if any | 1.53%G | 1.52% | 1.52% | 1.53% | 1.53% | 1.51% |
| Expenses net of all reductions | 1.53%G | 1.52% | 1.52% | 1.53% | 1.53% | 1.51% |
| Net investment income (loss) | 1.58%G | 1.77% | 2.19% | 1.92% | 1.99% | 1.69% |
| Supplemental Data | | | | | | |
| Net assets, end of period (000 omitted) | $183,068 | $190,273 | $186,380 | $139,264 | $83,818 | $79,711 |
| Portfolio turnover rateH | 102%G | 137% | 134% | 140%I | 108% | 201% |
A Calculated based on average shares outstanding during the period.
B Total returns for periods of less than one year are not annualized.
C Total returns would have been lower if certain expenses had not been reduced during the applicable periods shown.
D Total returns do not include the effect of the contingent deferred sales charge.
E Fees and expenses of any underlying Fidelity Central Funds are not included in the Fund's expense ratio. The Fund indirectly bears its proportionate share of the expenses of any underlying Fidelity Central Funds.
F Expense ratios reflect operating expenses of the class. Expenses before reductions do not reflect amounts reimbursed by the investment adviser or reductions from brokerage service arrangements or reductions from other expense offset arrangements and do not represent the amount paid by the class during periods when reimbursements or reductions occur. Expenses net of fee waivers reflect expenses after reimbursement by the investment adviser but prior to reductions from brokerage service arrangements or other expense offset arrangements. Expenses net of all reductions represent the net expenses paid by the class.
G Annualized
H Amount does not include the portfolio activity of any underlying Fidelity Central Funds.
I Portfolio turnover rate excludes securities received or delivered in-kind.
See accompanying notes which are an integral part of the financial statements.
Fidelity Total Bond Fund
| | Six months ended (Unaudited) February 28, | Years endedAugust 31, | | | | |
| | 2018 | 2017 | 2016 | 2015 | 2014 | 2013 |
| Selected Per–Share Data | | | | | | |
| Net asset value, beginning of period | $10.76 | $10.86 | $10.53 | $10.77 | $10.47 | $11.29 |
| Income from Investment Operations | | | | | | |
| Net investment income (loss)A | .140 | .302 | .343 | .320 | .326 | .300 |
| Net realized and unrealized gain (loss) | (.303) | (.085) | .368 | (.224) | .392 | (.478) |
| Total from investment operations | (.163) | .217 | .711 | .096 | .718 | (.178) |
| Distributions from net investment income | (.152) | (.289) | (.322) | (.303) | (.309) | (.287) |
| Distributions from net realized gain | (.025) | (.028) | (.059) | (.033) | (.109) | (.355) |
| Total distributions | (.177) | (.317) | (.381) | (.336) | (.418) | (.642) |
| Net asset value, end of period | $10.42 | $10.76 | $10.86 | $10.53 | $10.77 | $10.47 |
| Total ReturnB,C | (1.53)% | 2.07% | 6.94% | .88% | 7.00% | (1.70)% |
| Ratios to Average Net AssetsD,E | | | | | | |
| Expenses before reductions | .45%F | .45% | .45% | .45% | .45% | .45% |
| Expenses net of fee waivers, if any | .45%F | .45% | .45% | .45% | .45% | .45% |
| Expenses net of all reductions | .45%F | .45% | .45% | .45% | .45% | .45% |
| Net investment income (loss) | 2.66%F | 2.84% | 3.25% | 2.99% | 3.07% | 2.75% |
| Supplemental Data | | | | | | |
| Net assets, end of period (000 omitted) | $23,808,092 | $23,732,156 | $20,469,677 | $17,359,294 | $14,547,801 | $11,526,014 |
| Portfolio turnover rateG | 102%F | 137% | 134% | 140%H | 108% | 201% |
A Calculated based on average shares outstanding during the period.
B Total returns for periods of less than one year are not annualized.
C Total returns would have been lower if certain expenses had not been reduced during the applicable periods shown.
D Fees and expenses of any underlying Fidelity Central Funds are not included in the Fund's expense ratio. The Fund indirectly bears its proportionate share of the expenses of any underlying Fidelity Central Funds.
E Expense ratios reflect operating expenses of the class. Expenses before reductions do not reflect amounts reimbursed by the investment adviser or reductions from brokerage service arrangements or reductions from other expense offset arrangements and do not represent the amount paid by the class during periods when reimbursements or reductions occur. Expenses net of fee waivers reflect expenses after reimbursement by the investment adviser but prior to reductions from brokerage service arrangements or other expense offset arrangements. Expenses net of all reductions represent the net expenses paid by the class.
F Annualized
G Amount does not include the portfolio activity of any underlying Fidelity Central Funds.
H Portfolio turnover rate excludes securities received or delivered in-kind.
See accompanying notes which are an integral part of the financial statements.
Fidelity Total Bond Fund Class I
| | Six months ended (Unaudited) February 28, | Years endedAugust 31, | | | | |
| | 2018 | 2017 | 2016 | 2015 | 2014 | 2013 |
| Selected Per–Share Data | | | | | | |
| Net asset value, beginning of period | $10.75 | $10.85 | $10.51 | $10.76 | $10.46 | $11.27 |
| Income from Investment Operations | | | | | | |
| Net investment income (loss)A | .137 | .295 | .337 | .313 | .319 | .295 |
| Net realized and unrealized gain (loss) | (.313) | (.083) | .378 | (.233) | .393 | (.469) |
| Total from investment operations | (.176) | .212 | .715 | .080 | .712 | (.174) |
| Distributions from net investment income | (.149) | (.284) | (.316) | (.297) | (.303) | (.281) |
| Distributions from net realized gain | (.025) | (.028) | (.059) | (.033) | (.109) | (.355) |
| Total distributions | (.174) | (.312) | (.375) | (.330) | (.412) | (.636) |
| Net asset value, end of period | $10.40 | $10.75 | $10.85 | $10.51 | $10.76 | $10.46 |
| Total ReturnB,C | (1.66)% | 2.02% | 6.99% | .73% | 6.95% | (1.67)% |
| Ratios to Average Net AssetsD,E | | | | | | |
| Expenses before reductions | .50%F | .50% | .50% | .50% | .51% | .51% |
| Expenses net of fee waivers, if any | .50%F | .50% | .50% | .50% | .51% | .51% |
| Expenses net of all reductions | .50%F | .50% | .50% | .50% | .51% | .51% |
| Net investment income (loss) | 2.61%F | 2.79% | 3.20% | 2.94% | 3.02% | 2.69% |
| Supplemental Data | | | | | | |
| Net assets, end of period (000 omitted) | $4,821,249 | $4,481,725 | $2,846,878 | $1,266,870 | $573,410 | $244,911 |
| Portfolio turnover rateG | 102%F | 137% | 134% | 140%H | 108% | 201% |
A Calculated based on average shares outstanding during the period.
B Total returns for periods of less than one year are not annualized.
C Total returns would have been lower if certain expenses had not been reduced during the applicable periods shown.
D Fees and expenses of any underlying Fidelity Central Funds are not included in the Fund's expense ratio. The Fund indirectly bears its proportionate share of the expenses of any underlying Fidelity Central Funds.
E Expense ratios reflect operating expenses of the class. Expenses before reductions do not reflect amounts reimbursed by the investment adviser or reductions from brokerage service arrangements or reductions from other expense offset arrangements and do not represent the amount paid by the class during periods when reimbursements or reductions occur. Expenses net of fee waivers reflect expenses after reimbursement by the investment adviser but prior to reductions from brokerage service arrangements or other expense offset arrangements. Expenses net of all reductions represent the net expenses paid by the class.
F Annualized
G Amount does not include the portfolio activity of any underlying Fidelity Central Funds.
H Portfolio turnover rate excludes securities received or delivered in-kind.
See accompanying notes which are an integral part of the financial statements.
Fidelity Total Bond Fund Class Z
| | Six months ended (Unaudited) February 28, | Years endedAugust 31, | | |
| | 2018 | 2017 | 2016 | 2015 A |
| Selected Per–Share Data | | | | |
| Net asset value, beginning of period | $10.75 | $10.85 | $10.51 | $10.66 |
| Income from Investment Operations | | | | |
| Net investment income (loss)B | .144 | .310 | .352 | .234 |
| Net realized and unrealized gain (loss) | (.312) | (.083) | .378 | (.167) |
| Total from investment operations | (.168) | .227 | .730 | .067 |
| Distributions from net investment income | (.157) | (.299) | (.331) | (.217) |
| Distributions from net realized gain | (.025) | (.028) | (.059) | – |
| Total distributions | (.182) | (.327) | (.390) | (.217) |
| Net asset value, end of period | $10.40 | $10.75 | $10.85 | $10.51 |
| Total ReturnC,D | (1.59)% | 2.16% | 7.14% | .59% |
| Ratios to Average Net AssetsE,F | | | | |
| Expenses before reductions | .36%G | .36% | .36% | .36%G |
| Expenses net of fee waivers, if any | .36%G | .36% | .36% | .36%G |
| Expenses net of all reductions | .36%G | .36% | .36% | .36%G |
| Net investment income (loss) | 2.75%G | 2.93% | 3.34% | 3.29%G |
| Supplemental Data | | | | |
| Net assets, end of period (000 omitted) | $2,072,810 | $1,473,993 | $811,440 | $546,968 |
| Portfolio turnover rateH | 102%G | 137% | 134% | 140%I |
A For the period December 22, 2014 (commencement of sale of shares) to August 31, 2015.
B Calculated based on average shares outstanding during the period.
C Total returns for periods of less than one year are not annualized.
D Total returns would have been lower if certain expenses had not been reduced during the applicable periods shown.
E Fees and expenses of any underlying Fidelity Central Funds are not included in the Fund's expense ratio. The Fund indirectly bears its proportionate share of the expenses of any underlying Fidelity Central Funds.
F Expense ratios reflect operating expenses of the class. Expenses before reductions do not reflect amounts reimbursed by the investment adviser or reductions from brokerage service arrangements or reductions from other expense offset arrangements and do not represent the amount paid by the class during periods when reimbursements or reductions occur. Expense ratios before reductions for start-up periods may not be representative of longer-term operating periods. Expenses net of fee waivers reflect expenses after reimbursement by the investment adviser but prior to reductions from brokerage service arrangements or other expense offset arrangements. Expenses net of all reductions represent the net expenses paid by the class.
G Annualized
H Amount does not include the portfolio activity of any underlying Fidelity Central Funds.
I Portfolio turnover rate excludes securities received or delivered in-kind.
See accompanying notes which are an integral part of the financial statements.
Notes to Financial Statements (Unaudited)
For the period ended February 28, 2018
1. Organization.
Fidelity Total Bond Fund (the Fund) is a fund of Fidelity Income Fund (the Trust) and is authorized to issue an unlimited number of shares. The Trust is registered under the Investment Company Act of 1940, as amended (the 1940 Act), as an open-end management investment company organized as a Massachusetts business trust. The Fund offers Class A, Class M, Class C, Total Bond, Class I and Class Z shares, each of which has equal rights as to assets and voting privileges. Each class has exclusive voting rights with respect to matters that affect that class.
2. Investments in Fidelity Central Funds.
The Fund invests in Fidelity Central Funds, which are open-end investment companies generally available only to other investment companies and accounts managed by the investment adviser and its affiliates. The Fund's Schedule of Investments lists each of the Fidelity Central Funds held as of period end, if any, as an investment of the Fund, but does not include the underlying holdings of each Fidelity Central Fund. As an Investing Fund, the Fund indirectly bears its proportionate share of the expenses of the underlying Fidelity Central Funds.
The Money Market Central Funds seek preservation of capital and current income and are managed by Fidelity Investments Money Management, Inc. (FIMM), an affiliate of the investment adviser. Annualized expenses of the Money Market Central Funds as of their most recent shareholder report date are less than .005%.
A complete unaudited list of holdings for each Fidelity Central Fund is available upon request or at the Securities and Exchange Commission (the SEC) website at www.sec.gov. In addition, the financial statements of the Fidelity Central Funds are available on the SEC website or upon request.
3. Significant Accounting Policies.
The Fund is an investment company and applies the accounting and reporting guidance of the Financial Accounting Standards Board (FASB) Accounting Standards Codification Topic 946 Financial Services – Investments Companies. The financial statements have been prepared in conformity with accounting principles generally accepted in the United States of America (GAAP), which require management to make certain estimates and assumptions at the date of the financial statements. Actual results could differ from those estimates. Subsequent events, if any, through the date that the financial statements were issued have been evaluated in the preparation of the financial statements. The following summarizes the significant accounting policies of the Fund:
Investment Valuation. Investments are valued as of 4:00 p.m. Eastern time on the last calendar day of the period. The Board of Trustees (the Board) has delegated the day to day responsibility for the valuation of the Fund's investments to the Fair Value Committee (the Committee) established by the Fund's investment adviser. In accordance with valuation policies and procedures approved by the Board, the Fund attempts to obtain prices from one or more third party pricing vendors or brokers to value its investments. When current market prices, quotations or currency exchange rates are not readily available or reliable, investments will be fair valued in good faith by the Committee, in accordance with procedures adopted by the Board. Factors used in determining fair value vary by investment type and may include market or investment specific events, changes in interest rates and credit quality. The frequency with which these procedures are used cannot be predicted and they may be utilized to a significant extent. The Committee oversees the Fund's valuation policies and procedures and reports to the Board on the Committee's activities and fair value determinations. The Board monitors the appropriateness of the procedures used in valuing the Fund's investments and ratifies the fair value determinations of the Committee.
The Fund categorizes the inputs to valuation techniques used to value its investments into a disclosure hierarchy consisting of three levels as shown below:
- Level 1 – quoted prices in active markets for identical investments
- Level 2 – other significant observable inputs (including quoted prices for similar investments, interest rates, prepayment speeds, etc.)
- Level 3 – unobservable inputs (including the Fund's own assumptions based on the best information available)
Valuation techniques used to value the Fund's investments by major category are as follows:
Debt securities, including restricted securities, are valued based on evaluated prices received from third party pricing vendors or from brokers who make markets in such securities. Corporate bonds, bank notes, bank loan obligations, foreign government and government agency obligations, municipal securities, preferred securities and U.S. government and government agency obligations are valued by pricing vendors who utilize matrix pricing which considers yield or price of bonds of comparable quality, coupon, maturity and type or by broker-supplied prices. Asset backed securities, collateralized mortgage obligations, commercial mortgage securities and U.S. government agency mortgage securities are valued by pricing vendors who utilize matrix pricing which considers prepayment speed assumptions, attributes of the collateral, yield or price of bonds of comparable quality, coupon, maturity and type or by broker-supplied prices. Swaps are marked-to-market daily based on valuations from third party pricing vendors, registered derivatives clearing organizations (clearinghouses) or broker-supplied valuations. These pricing sources may utilize inputs such as interest rate curves, credit spread curves, default possibilities and recovery rates. When independent prices are unavailable or unreliable, debt securities and swaps may be valued utilizing pricing methodologies which consider similar factors that would be used by third party pricing vendors. For foreign debt securities, when significant market or security specific events arise, valuations may be determined in good faith in accordance with procedures adopted by the Board. Debt securities and swaps are generally categorized as Level 2 in the hierarchy but may be Level 3 depending on the circumstances.
Equity securities, including restricted securities, for which market quotations are readily available, are valued at the last reported sale price or official closing price as reported by a third party pricing vendor on the primary market or exchange on which they are traded and are categorized as Level 1 in the hierarchy. In the event there were no sales during the day or closing prices are not available, securities are valued at the last quoted bid price or may be valued using the last available price and are generally categorized as Level 2 in the hierarchy. For foreign equity securities, when market or security specific events arise, comparisons to the valuation of American Depositary Receipts (ADRs), futures contracts, Exchange-Traded Funds (ETFs) and certain indexes as well as quoted prices for similar securities may be used and would be categorized as Level 2 in the hierarchy. Utilizing these techniques may result in transfers between Level 1 and Level 2. For equity securities, including restricted securities, where observable inputs are limited, assumptions about market activity and risk are used and these securities may be categorized as Level 3 in the hierarchy.
The U.S. dollar value of foreign currency contracts is determined using currency exchange rates supplied by a pricing service and are categorized as Level 2 in the hierarchy. Futures contracts are valued at the settlement price established each day by the board of trade or exchange on which they are traded and are categorized as Level 1 in the hierarchy. Options traded over-the-counter are valued using broker-supplied valuations and are categorized as Level 2 in the hierarchy. Investments in open-end mutual funds, including the Fidelity Central Funds, are valued at their closing net asset value (NAV) each business day and are categorized as Level 1 in the hierarchy.
Changes in valuation techniques may result in transfers in or out of an assigned level within the disclosure hierarchy. The aggregate value of investments by input level as of February 28, 2018 is included at the end of the Fund's Schedule of Investments.
Foreign Currency. Foreign-denominated assets, including investment securities, and liabilities are translated into U.S. dollars at the exchange rates at period end. Purchases and sales of investment securities, income and dividends received and expenses denominated in foreign currencies are translated into U.S. dollars at the exchange rate in effect on the transaction date.
The effects of exchange rate fluctuations on investments are included with the net realized and unrealized gain (loss) on investment securities. Other foreign currency transactions resulting in realized and unrealized gain (loss) are disclosed separately.
Realized gains and losses on foreign currency transactions arise from the disposition of foreign currency, realized changes in the value of foreign currency between the trade and settlement dates on security transactions, and the difference between the amounts of dividends, interest and foreign withholding taxes recorded on transaction date and the U.S. dollar equivalent of the amounts actually received or paid. Unrealized gains and losses on assets and liabilities in foreign currencies arise from changes in the value of foreign currency, and from assets and liabilities denominated in foreign currencies, other than investments, which are held at period end.
Investment Transactions and Income. For financial reporting purposes, the Fund's investment holdings and NAV include trades executed through the end of the last business day of the period. The NAV per share for processing shareholder transactions is calculated as of the close of business of the New York Stock Exchange (NYSE), normally 4:00 p.m. Eastern time and includes trades executed through the end of the prior business day. Gains and losses on securities sold are determined on the basis of identified cost and includes proceeds received from litigation. Dividend income is recorded on the ex-dividend date, except for certain dividends from foreign securities where the ex-dividend date may have passed, which are recorded as soon as the Fund is informed of the ex-dividend date. Non-cash dividends included in dividend income, if any, are recorded at the fair market value of the securities received. Income and capital gain distributions from Fidelity Central Funds, if any, are recorded on the ex-dividend date. Certain distributions received by the Fund represent a return of capital or capital gain. The Fund determines the components of these distributions subsequent to the ex-dividend date, based upon receipt of tax filings or other correspondence relating to the underlying investment. These distributions are recorded as a reduction of cost of investments and/or as a realized gain. Interest income is accrued as earned and includes coupon interest and amortization of premium and accretion of discount on debt securities as applicable. Paid in Kind (PIK) income is recorded at the fair market value of the securities received. The principal amount on inflation-indexed securities is periodically adjusted to the rate of inflation and interest is accrued based on the principal amount. The adjustments to principal due to inflation are reflected as increases or decreases to Interest in the accompanying Statement of Operations. Investment income is recorded net of foreign taxes withheld where recovery of such taxes is uncertain. Debt obligations may be placed on non-accrual status and related interest income may be reduced by ceasing current accruals and writing off interest receivables when the collection of all or a portion of interest has become doubtful based on consistently applied procedures. A debt obligation is removed from non-accrual status when the issuer resumes interest payments or when collectability of interest is reasonably assured.
Class Allocations and Expenses. Investment income, realized and unrealized capital gains and losses, common expenses of the Fund, and certain fund-level expense reductions, if any, are allocated daily on a pro-rata basis to each class based on the relative net assets of each class to the total net assets of the Fund. Each class differs with respect to transfer agent and distribution and service plan fees incurred. Certain expense reductions may also differ by class. For the reporting period, the allocated portion of income and expenses to each class as a percent of its average net assets may vary due to the timing of recording these transactions in relation to fluctuating net assets of the classes. Expenses directly attributable to a fund are charged to that fund. Expenses attributable to more than one fund are allocated among the respective funds on the basis of relative net assets or other appropriate methods. Expense estimates are accrued in the period to which they relate and adjustments are made when actual amounts are known.
Deferred Trustee Compensation. Under a Deferred Compensation Plan (the Plan), independent Trustees may elect to defer receipt of a portion of their annual compensation. Deferred amounts are invested in a cross-section of Fidelity funds, are marked-to-market and remain in the Fund until distributed in accordance with the Plan. The investment of deferred amounts and the offsetting payable to the Trustees are included in the accompanying Statement of Assets and Liabilities.
Income Tax Information and Distributions to Shareholders. Each year, the Fund intends to qualify as a regulated investment company under Subchapter M of the Internal Revenue Code, including distributing substantially all of its taxable income and realized gains. As a result, no provision for U.S. Federal income taxes is required. The Fund files a U.S. federal tax return, in addition to state and local tax returns as required. The Fund's federal income tax returns are subject to examination by the Internal Revenue Service (IRS) for a period of three fiscal years after they are filed. State and local tax returns may be subject to examination for an additional fiscal year depending on the jurisdiction. Foreign taxes are provided for based on the Fund's understanding of the tax rules and rates that exist in the foreign markets in which it invests.
Dividends are declared and recorded daily and paid monthly from net investment income. Distributions from realized gains, if any, are declared and recorded on the ex-dividend date. Income dividends and capital gain distributions are declared separately for each class. Income and capital gain distributions are determined in accordance with income tax regulations, which may differ from GAAP.
Capital accounts within the financial statements are adjusted for permanent book-tax differences. These adjustments have no impact on net assets or the results of operations. Capital accounts are not adjusted for temporary book-tax differences which will reverse in a subsequent period.
Book-tax differences are primarily due to futures contracts, swaps, foreign currency transactions, defaulted bonds, certain conversion ratio adjustments, market discount, deferred trustees compensation and losses deferred due to wash sales and excise tax regulations.
As of period end, the cost and unrealized appreciation (depreciation) in securities, and derivatives if applicable, for federal income tax purposes were as follows:
| Gross unrealized appreciation | $393,286,506 |
| Gross unrealized depreciation | (722,483,134) |
| Net unrealized appreciation (depreciation) | $(329,196,628) |
| Tax cost | $33,182,685,369 |
The Fund elected to defer to its next fiscal year approximately $49,045,791 of capital losses recognized during the period November 1, 2016 to August 31, 2017.
Delayed Delivery Transactions and When-Issued Securities. During the period, the Fund transacted in securities on a delayed delivery or when-issued basis. Payment and delivery may take place after the customary settlement period for that security. The price of the underlying securities and the date when the securities will be delivered and paid for are fixed at the time the transaction is negotiated. The securities purchased on a delayed delivery or when-issued basis are identified as such in the Fund's Schedule of Investments. The Fund may receive compensation for interest forgone in the purchase of a delayed delivery or when-issued security. With respect to purchase commitments, the Fund identifies securities as segregated in its records with a value at least equal to the amount of the commitment. Losses may arise due to changes in the value of the underlying securities or if the counterparty does not perform under the contract's terms, or if the issuer does not issue the securities due to political, economic, or other factors.
To-Be-Announced (TBA) Securities and Mortgage Dollar Rolls. During the period, the Fund transacted in TBA securities that involved buying or selling mortgage-backed securities (MBS) on a forward commitment basis. A TBA transaction typically does not designate the actual security to be delivered and only includes an approximate principal amount; however delivered securities must meet specified terms defined by industry guidelines, including issuer, rate and current principal amount outstanding on underlying mortgage pools. The Fund may enter into a TBA transaction with the intent to take possession of or deliver the underlying MBS, or the Fund may elect to extend the settlement by entering into either a mortgage or reverse mortgage dollar roll. Mortgage dollar rolls are transactions where a fund sells TBA securities and simultaneously agrees to repurchase MBS on a later date at a lower price and with the same counterparty. Reverse mortgage dollar rolls involve the purchase and simultaneous agreement to sell TBA securities on a later date at a lower price. Transactions in mortgage dollar rolls and reverse mortgage dollar rolls are accounted for as purchases and sales and may result in an increase to the Fund's portfolio turnover rate.
Purchases and sales of TBA securities involve risks similar to those discussed above for delayed delivery and when-issued securities. Also, if the counterparty in a mortgage dollar roll or a reverse mortgage dollar roll transaction files for bankruptcy or becomes insolvent, the Fund's right to repurchase or sell securities may be limited. Additionally, when a fund sells TBA securities without already owning or having the right to obtain the deliverable securities (an uncovered forward commitment to sell), it incurs a risk of loss because it could have to purchase the securities at a price that is higher than the price at which it sold them. A fund may be unable to purchase the deliverable securities if the corresponding market is illiquid.
TBA securities subject to a forward commitment to sell at period end are included at the end of the Fund's Schedule of Investments under the caption "TBA Sale Commitments." The proceeds and value of these commitments are reflected in the Fund's Statement of Assets and Liabilities as Receivable for TBA sale commitments and TBA sale commitments, at value, respectively.
Restricted Securities. The Fund may invest in securities that are subject to legal or contractual restrictions on resale. These securities generally may be resold in transactions exempt from registration or to the public if the securities are registered. Disposal of these securities may involve time-consuming negotiations and expense, and prompt sale at an acceptable price may be difficult. Information regarding restricted securities is included at the end of the Fund's Schedule of Investments.
Loans and Other Direct Debt Instruments. The Fund invests in direct debt instruments which are interests in amounts owed to lenders by corporate or other borrowers. These instruments may be in the form of loans, trade claims or other receivables and may include standby financing commitments such as revolving credit facilities that obligate the Fund to supply additional cash to the borrower on demand. Loans may be acquired through assignment or participation. The Fund also invests in unfunded loan commitments, which are contractual obligations for future funding. Information regarding unfunded commitments is included at the end of the Fund's Schedule of Investments.
New Accounting Pronouncement. In March 2017, the Financial Accounting Standards Board (FASB) issued an Accounting Standards Update (ASU), ASU 2017-08, which amends the amortization period for certain callable debt securities that are held at a premium. The amendment requires the premium to be amortized to the earliest call date. The amendments do not require an accounting change for securities held at a discount. The ASU is effective for annual periods beginning after December 15, 2018. Management is currently evaluating the potential impact of these changes to the financial statements.
4. Derivative Instruments.
Risk Exposures and the Use of Derivative Instruments. The Fund's investment objective allows the Fund to enter into various types of derivative contracts, including futures contracts, forward foreign currency contracts, options and swaps. Derivatives are investments whose value is primarily derived from underlying assets, indices or reference rates and may be transacted on an exchange or over-the-counter (OTC). Derivatives may involve a future commitment to buy or sell a specified asset based on specified terms, to exchange future cash flows at periodic intervals based on a notional principal amount, or for one party to make one or more payments upon the occurrence of specified events in exchange for periodic payments from the other party.
The Fund used derivatives to increase returns, to gain exposure to certain types of assets, to facilitate transactions in foreign-denominated securities and to manage exposure to certain risks as defined below. The success of any strategy involving derivatives depends on analysis of numerous economic factors, and if the strategies for investment do not work as intended, the Fund may not achieve its objectives.
The Fund's use of derivatives increased or decreased its exposure to the following risks:
| Credit Risk | Credit risk relates to the ability of the issuer of a financial instrument to make further principal or interest payments on an obligation or commitment that it has to the Fund.
|
| Foreign Exchange Risk | Foreign exchange rate risk relates to fluctuations in the value of an asset or liability due to changes in currency exchange rates.
|
| Interest Rate Risk | Interest rate risk relates to the fluctuations in the value of interest-bearing securities due to changes in the prevailing levels of market interest rates. |
The Fund is also exposed to additional risks from investing in derivatives, such as liquidity risk and counterparty credit risk. Liquidity risk is the risk that the Fund will be unable to close out the derivative in the open market in a timely manner. Counterparty credit risk is the risk that the counterparty will not be able to fulfill its obligation to the Fund. Derivative counterparty credit risk is managed through formal evaluation of the creditworthiness of all potential counterparties. On certain OTC derivatives such as forward foreign currency contracts, options and bi-lateral swaps, the Fund attempts to reduce its exposure to counterparty credit risk by entering into an International Swaps and Derivatives Association, Inc. (ISDA) Master Agreement with each of its counterparties. The ISDA Master Agreement gives the Fund the right to terminate all transactions traded under such agreement upon the deterioration in the credit quality of the counterparty beyond specified levels. The ISDA Master Agreement gives each party the right, upon an event of default by the other party or a termination of the agreement, to close out all transactions traded under such agreement and to net amounts owed under each transaction to one net payable by one party to the other. To mitigate counterparty credit risk on bi-lateral OTC derivatives, the Fund receives collateral in the form of cash or securities once the Fund's net unrealized appreciation on outstanding derivative contracts under an ISDA Master Agreement exceeds certain applicable thresholds, subject to certain minimum transfer provisions. The collateral received is held in segregated accounts with the Fund's custodian bank in accordance with the collateral agreements entered into between the Fund, the counterparty and the Fund's custodian bank. The Fund could experience delays and costs in gaining access to the collateral even though it is held by the Fund's custodian bank. The Fund's maximum risk of loss from counterparty credit risk related to bi-lateral OTC derivatives is generally the aggregate unrealized appreciation and unpaid counterparty payments in excess of any collateral pledged by the counterparty to the Fund. The Fund may be required to pledge collateral for the benefit of the counterparties on bi-lateral OTC derivatives in an amount not less than each counterparty's unrealized appreciation on outstanding derivative contracts, subject to certain minimum transfer provisions, and any such pledged collateral is identified in the Schedule of Investments. Exchange-traded futures contracts are not covered by the ISDA Master Agreement; however counterparty credit risk related to exchange-traded futures contracts may be mitigated by the protection provided by the exchange on which they trade. Counterparty credit risk related to centrally cleared OTC swaps may be mitigated by the protection provided by the clearinghouse.
Investing in derivatives may involve greater risks than investing in the underlying assets directly and, to varying degrees, may involve risk of loss in excess of any initial investment and collateral received and amounts recognized in the Statement of Assets and Liabilities. In addition, there may be the risk that the change in value of the derivative contract does not correspond to the change in value of the underlying instrument.
Net Realized Gain (Loss) and Change in Net Unrealized Appreciation (Depreciation) on Derivatives. The table below, which reflects the impacts of derivatives on the financial performance of the Fund, summarizes the net realized gain (loss) and change in net unrealized appreciation (depreciation) for derivatives during the period as presented in the Statement of Operations.
| Primary Risk Exposure / Derivative Type | Net Realized Gain (Loss) | Change in Net Unrealized Appreciation (Depreciation) |
| Credit Risk | | |
| Purchased options | $(749,571) | $ 327,491 |
| Swaps | (53,903) | 66,782 |
| Total Credit Risk | (803,474) | 394,273 |
| Foreign Exchange Risk | | |
| Forward Foreign Currency Contracts | (11,264,823) | 4,610,970 |
| Interest Rate Risk | | |
| Futures Contracts | 5,209,636 | 359,036 |
| Swaps | 406,324 | 205,226 |
| Total Interest Rate Risk | 5,615,960 | 564,262 |
| Totals | $(6,452,337) | $5,569,505 |
A summary of the value of derivatives by primary risk exposure as of period end is included at the end of the Schedule of Investments.
Forward Foreign Currency Contracts. Forward foreign currency contracts represent obligations to purchase or sell foreign currency on a specified future date at a price fixed at the time the contracts are entered into. The Fund used forward foreign currency contracts to facilitate transactions in foreign-denominated securities and to manage exposure to certain foreign currencies.
Forward foreign currency contracts are valued daily and fluctuations in exchange rates on open contracts are recorded as unrealized appreciation or (depreciation) and reflected in the Statement of Assets and Liabilities. When the contract is closed, the Fund realizes a gain or loss equal to the difference between the closing value and the value at the time it was opened. Non-deliverable forward foreign currency exchange contracts are settled with the counterparty in cash without the delivery of foreign currency. The net realized gain (loss) and change in net unrealized appreciation (depreciation) on forward foreign currency contracts during the period is presented in the Statement of Operations.
Any open forward foreign currency contracts at period end are presented in the Schedule of Investments under the caption "Forward Foreign Currency Contracts." The contract amount and unrealized appreciation (depreciation) reflects each contract's exposure to the underlying currency at period end and is representative of volume of activity during the period.
Futures Contracts. A futures contract is an agreement between two parties to buy or sell a specified underlying instrument for a fixed price at a specified future date. The Fund used futures contracts to manage its exposure to the bond market and fluctuations in interest rates.
Upon entering into a futures contract, a fund is required to deposit either cash or securities (initial margin) with a clearing broker in an amount equal to a certain percentage of the face value of the contract. Futures contracts are marked-to-market daily and subsequent daily payments (variation margin) are made or received by a fund depending on the daily fluctuations in the value of the futures contracts and are recorded as unrealized appreciation or (depreciation). This receivable and/or payable, if any, is included in daily variation margin on futures contracts in the Statement of Assets and Liabilities. Realized gain or (loss) is recorded upon the expiration or closing of a futures contract. The net realized gain (loss) and change in net unrealized appreciation (depreciation) on futures contracts during the period is presented in the Statement of Operations.
Any open futures contracts at period end are presented in the Schedule of Investments under the caption "Futures Contracts". The notional amount at value reflects each contract's exposure to the underlying instrument or index at period end and is representative of volume of activity during the period. Securities deposited to meet initial margin requirements are identified in the Schedule of Investments.
Options. Options give the purchaser the right, but not the obligation, to buy (call) or sell (put) an underlying security or financial instrument at an agreed exercise or strike price between or on certain dates. Options obligate the seller (writer) to buy (put) or sell (call) an underlying instrument at the exercise or strike price or cash settle an underlying derivative instrument if the holder exercises the option on or before the expiration date. The Fund uses OTC options, such as swaptions, which are options where the underlying instrument is a swap, to manage its exposure to potential credit events.
Upon entering into an options contract, a fund will pay or receive a premium. Premiums paid on purchased options are reflected as cost of investments and premiums received on written options are reflected as a liability on the Statement of Assets and Liabilities. Certain options may be purchased or written with premiums to be paid or received on a future date. Options are valued daily and any unrealized appreciation (depreciation) is reflected on the Statement of Assets and Liabilities. When an option is exercised, the cost or proceeds of the underlying instrument purchased or sold is adjusted by the amount of the premium. When an option is closed the Fund will realize a gain or loss depending on whether the proceeds or amount paid for the closing sale transaction is greater or less than the premium received or paid. When an option expires, gains and losses are realized to the extent of premiums received and paid, respectively. The net realized and unrealized gains (losses) on purchased options are included in the Statement of Operations in net realized gain (loss) and change in net unrealized appreciation (depreciation) on investment securities. The net realized gain (loss) and change in net unrealized appreciation (depreciation) on written options are presented in the Statement of Operations.
Any open options at period end are presented in the Schedule of Investments under the captions "Purchased Options," "Purchased Swaptions," "Written Options" and "Written Swaptions," as applicable, and are representative of volume of activity during the period.
Writing puts and buying calls tend to increase exposure to the underlying instrument while buying puts and writing calls tend to decrease exposure to the underlying instrument. For purchased options, risk of loss is limited to the premium paid, and for written options, risk of loss is the change in value in excess of the premium received.
Swaps. A swap is a contract between two parties to exchange future cash flows at periodic intervals based on a notional principal amount. A bi-lateral OTC swap is a transaction between a fund and a dealer counterparty where cash flows are exchanged between the two parties for the life of the swap. A centrally cleared OTC swap is a transaction executed between a fund and a dealer counterparty, then cleared by a futures commission merchant (FCM) through a clearinghouse. Once cleared, the clearinghouse serves as a central counterparty, with whom a fund exchanges cash flows for the life of the transaction, similar to transactions in futures contracts.
Bi-lateral OTC swaps are marked-to-market daily and changes in value are reflected in the Statement of Assets and Liabilities in the bi-lateral OTC swaps at value line items. Any upfront premiums paid or received upon entering a bi-lateral OTC swap to compensate for differences between stated terms of the swap and prevailing market conditions (e.g. credit spreads, interest rates or other factors) are recorded in net unrealized appreciation (depreciation) in the Statement of Assets and Liabilities and amortized to realized gain or (loss) ratably over the term of the swap. Any unamortized upfront premiums are presented in the Schedule of Investments.
Centrally cleared OTC swaps require a fund to deposit either cash or securities (initial margin) with the FCM, at the instruction of and for the benefit of the clearinghouse. Securities deposited to meet initial margin requirements are identified in the Schedule of Investments. Centrally cleared OTC swaps are marked-to-market daily and subsequent payments (variation margin) are made or received depending on the daily fluctuations in the value of the swaps and are recorded as unrealized appreciation or (depreciation). These daily payments, if any, are included in receivable or payable for daily variation margin on centrally cleared OTC swaps in the Statement of Assets and Liabilities. Any premiums for centrally cleared OTC swaps are recorded periodically throughout the term of the swap to variation margin and included in unrealized appreciation (depreciation) in the Statement of Assets and Liabilities. Any premiums are recognized as realized gain (loss) upon termination or maturity of the swap.
For both bi-lateral and centrally cleared OTC swaps, payments are exchanged at specified intervals, accrued daily commencing with the effective date of the contract and recorded as realized gain or (loss). Some swaps may be terminated prior to the effective date and realize a gain or loss upon termination. The net realized gain (loss) and change in net unrealized appreciation (depreciation) on swaps during the period is presented in the Statement of Operations.
Any open swaps at period end are included in the Schedule of Investments under the caption "Swaps" and are representative of volume of activity during the period.
Credit Default Swaps. Credit default swaps enable the Fund to buy or sell protection against specified credit events on a single-name issuer or a traded credit index. Under the terms of a credit default swap the buyer of protection (buyer) receives credit protection in exchange for making periodic payments to the seller of protection (seller) based on a fixed percentage applied to a notional principal amount. In return for these payments, the seller will be required to make a payment upon the occurrence of one or more specified credit events. The Fund enters into credit default swaps as a seller to gain credit exposure to an issuer and/or as a buyer to obtain a measure of protection against defaults of an issuer. Periodic payments are made over the life of the contract by the buyer provided that no credit event occurs.
For credit default swaps on most corporate and sovereign issuers, credit events include bankruptcy, failure to pay or repudiation/moratorium. For credit default swaps on corporate or sovereign issuers, the obligation that may be put to the seller is not limited to the specific reference obligation described in the Schedule of Investments. For credit default swaps on asset-backed securities, a credit event may be triggered by events such as failure to pay principal, maturity extension, rating downgrade or write-down. For credit default swaps on asset-backed securities, the reference obligation described represents the security that may be put to the seller. For credit default swaps on a traded credit index, a specified credit event may affect all or individual underlying securities included in the index.
As a seller, if an underlying credit event occurs, the Fund will pay a net settlement amount of cash equal to the notional amount of the swap less the recovery value of the reference obligation or underlying securities comprising an index. Only in the event of the industry's inability to value the underlying asset will the Fund be required to take delivery of the reference obligation or underlying securities comprising an index and pay an amount equal to the notional amount of the swap.
As a buyer, if an underlying credit event occurs, the Fund will receive a net settlement amount of cash equal to the notional amount of the swap less the recovery value of the reference obligation or underlying securities comprising an index. Only in the event of the industry's inability to value the underlying asset will the Fund be required to deliver the reference obligation or underlying securities comprising an index in exchange for payment of an amount equal to the notional amount of the swap.
Typically, the value of each credit default swap and credit rating disclosed for each reference obligation in the Schedule of Investments, where the Fund is the seller, can be used as measures of the current payment/performance risk of the swap. As the value of the swap changes as a positive or negative percentage of the total notional amount, the payment/performance risk may decrease or increase, respectively. In addition to these measures, the investment adviser monitors a variety of factors including cash flow assumptions, market activity and market sentiment as part of its ongoing process of assessing payment/performance risk.
Interest Rate Swaps. Interest rate swaps are agreements between counterparties to exchange cash flows, one based on a fixed rate, and the other on a floating rate. The Fund entered into interest rate swaps to manage its exposure to interest rate changes. Changes in interest rates can have an effect on both the value of bond holdings as well as the amount of interest income earned. In general, the value of bonds can fall when interest rates rise and can rise when interest rates fall.
5. Purchases and Sales of Investments.
Purchases and sales of securities, other than short-term securities and U.S. government securities, aggregated $2,529,945,675 and $2,651,784,633, respectively.
6. Fees and Other Transactions with Affiliates.
Management Fee. Fidelity Management & Research Company (the investment adviser) and its affiliates provide the Fund with investment management related services for which the Fund pays a monthly management fee. The management fee is the sum of an individual fund fee rate that is based on an annual rate of .20% of the Fund's average net assets and an annualized group fee rate that averaged .11% during the period. The group fee rate is based upon the average net assets of all the mutual funds advised by the investment adviser, including any mutual funds previously advised by the investment adviser that are currently advised by Fidelity SelectCo, LLC, an affiliate of the investment adviser. The group fee rate decreases as assets under management increase and increases as assets under management decrease. For the reporting period, the total annualized management fee rate was .31% of the Fund's average net assets.
Distribution and Service Plan Fees. In accordance with Rule 12b-1 of the 1940 Act, the Fund has adopted separate Distribution and Service Plans for each class of shares. Certain classes pay Fidelity Distributors Corporation (FDC), an affiliate of the investment adviser, separate Distribution and Service Fees, each of which is based on an annual percentage of each class' average net assets. In addition, FDC may pay financial intermediaries for selling shares of the Fund and providing shareholder support services. For the period, the Distribution and Service Fee rates, total fees and amounts retained by FDC were as follows:
| | Distribution Fee | Service Fee | Total Fees | Retained by FDC |
| Class A | -% | .25% | $647,613 | $3,030 |
| Class M | -% | .25% | 374,919 | 98,226 |
| Class C | .75% | .25% | 934,736 | 134,223 |
| | | | $1,957,268 | $235,479 |
Sales Load. FDC may receive a front-end sales charge of up to 4.00% for selling Class A shares and Class M shares, some of which is paid to financial intermediaries for selling shares of the Fund. Depending on the holding period, FDC may receive contingent deferred sales charges levied on Class A, Class M and Class C redemptions. The deferred sales charges are 1.00% for Class C shares, .75% for certain purchases of Class A shares and .25% for certain purchases of Class M shares.
For the period, sales charge amounts retained by FDC were as follows:
| | Retained by FDC |
| Class A | $44,429 |
| Class M | 5,263 |
| Class C(a) | 11,995 |
| | $61,687 |
(a) When Class C shares are initially sold, FDC pays commissions from its own resources to financial intermediaries through which the sales are made.
Transfer Agent Fees. Fidelity Investments Institutional Operations Company, Inc., (FIIOC), an affiliate of the investment adviser, is the transfer, dividend disbursing and shareholder servicing agent for each class of the Fund. FIIOC receives an asset-based fee of .10% of Total Bond's average net assets. FIIOC pays for typesetting, printing and mailing of shareholder reports, except proxy statements. For the period, transfer agent fees for each class were as follows:
| | Amount | % of Class-Level Average Net Assets(a) |
| Class A | $398,784 | .16 |
| Class M | 239,340 | .16 |
| Class C | 156,517 | .17 |
| Total Bond | 12,087,968 | .10 |
| Class I | 3,477,687 | .15 |
| Class Z | 86,049 | .01 |
| | $16,446,345 | |
(a) Annualized
Fund Wide Operations Fee. Pursuant to the Fund Wide Operations and Expense Agreement (FWOE), the investment adviser has agreed to provide for fund level expenses (which do not include transfer agent, Rule 12b-1 fees, compensation of the independent Trustees, interest (including commitment fees), taxes or extraordinary expenses, if any) in return for a FWOE fee equal to .35% of the Fund's average net assets less the total amount of the management fee. The FWOE paid by the Fund is reduced by an amount equal to the fees and expenses paid to the independent Trustees. For the period, the FWOE fee was equivalent to an annualized rate of .04% of average net assets.
Interfund Trades. The Fund may purchase from or sell securities to other Fidelity Funds under procedures adopted by the Board. The procedures have been designed to ensure these interfund trades are executed in accordance with Rule 17a-7 of the 1940 Act. Interfund trades are included within the respective purchases and sales amounts shown in the Purchases and Sales of Investments note.
Other. During the period, the investment adviser reimbursed the Fund for certain losses in the amount of $8,400.
7. Committed Line of Credit.
The Fund participates with other funds managed by the investment adviser or an affiliate in a $4.25 billion credit facility (the "line of credit") to be utilized for temporary or emergency purposes to fund shareholder redemptions or for other short-term liquidity purposes. The Fund has agreed to pay commitment fees on its pro-rata portion of the line of credit, which amounted to $44,490 and is reflected in Miscellaneous expenses on the Statement of Operations. During the period, the Fund did not borrow on this line of credit.
8. Security Lending.
The Fund lends portfolio securities from time to time in order to earn additional income. On the settlement date of the loan, the Fund receives collateral (in the form of U.S. Treasury obligations, letters of credit and/or cash) against the loaned securities and maintains collateral in an amount not less than 100% of the market value of the loaned securities during the period of the loan. The market value of the loaned securities is determined at the close of business of the Fund and any additional required collateral is delivered to the Fund on the next business day. The Fund or borrower may terminate the loan at any time, and if the borrower defaults on its obligation to return the securities loaned because of insolvency or other reasons, the Fund may apply collateral received from the borrower against the obligation. The Fund may experience delays and costs in recovering the securities loaned. Any cash collateral received is maintained at the Fund's custodian and/or invested in cash equivalents. At period end, there were no security loans outstanding. Security lending income represents the income earned on investing cash collateral, less rebates paid to borrowers, plus any premium payments received for lending certain types of securities. Security lending income is presented in the Statement of Operations as a component of interest income. Total security lending income during the period amounted to $54,402.
9. Expense Reductions.
Through arrangements with the Fund's custodian, credits realized as a result of certain uninvested cash balances were used to reduce the Fund's expenses. During the period, these credits reduced the Fund's expenses by $48,555.
10. Distributions to Shareholders.
Distributions to shareholders of each class were as follows:
| | Six months ended
February 28, 2018 | Year ended
August 31, 2017 |
| From net investment income | | |
| Class A | $6,636,770 | $21,656,972 |
| Class M | 3,831,041 | 4,370,911 |
| Class C | 1,675,287 | 3,033,896 |
| Total Bond | 345,790,129 | 586,137,135 |
| Class I | 65,856,367 | 93,037,515 |
| Class Z | 25,519,853 | 31,739,860 |
| Total | $449,309,447 | $739,976,289 |
| From net realized gain | | |
| Class A | $1,217,520 | $3,152,995 |
| Class M | 687,881 | 416,240 |
| Class C | 431,234 | 491,517 |
| Total Bond | 55,742,692 | 54,284,285 |
| Class I | 10,651,705 | 7,617,861 |
| Class Z | 3,765,734 | 1,955,359 |
| Total | $72,496,766 | $67,918,257 |
11. Share Transactions.
Share transactions for each class were as follows and may contain automatic conversions between classes or exchanges between affiliated funds:
| | Shares | Shares | Dollars | Dollars |
| | Six months ended February 28, 2018 | Year ended August 31, 2017 | Six months ended February 28, 2018 | Year ended August 31, 2017 |
| Class A | | | | |
| Shares sold | 9,149,263 | 35,580,281 | $97,219,607 | $378,631,170 |
| Reinvestment of distributions | 724,842 | 2,271,068 | 7,705,261 | 24,175,284 |
| Shares redeemed | (9,912,451) | (102,937,028) | (105,299,107) | (1,089,228,226) |
| Net increase (decrease) | (38,346) | (65,085,679) | $(374,239) | $(686,421,772) |
| Class M | | | | |
| Shares sold | 5,489,771 | 17,161,400 | $58,318,822 | $182,620,103 |
| Reinvestment of distributions | 424,062 | 442,288 | 4,498,626 | 4,706,740 |
| Shares redeemed | (3,595,194) | (5,227,159) | (38,122,704) | (55,482,738) |
| Net increase (decrease) | 2,318,639 | 12,376,529 | $24,694,744 | $131,844,105 |
| Class C | | | | |
| Shares sold | 2,748,168 | 5,742,872 | $29,244,325 | $61,343,735 |
| Reinvestment of distributions | 191,889 | 311,520 | 2,041,252 | 3,319,847 |
| Shares redeemed | (3,043,819) | (5,532,987) | (32,364,386) | (58,835,524) |
| Net increase (decrease) | (103,762) | 521,405 | $(1,078,809) | $5,828,058 |
| Total Bond | | | | |
| Shares sold | 344,459,784 | 715,776,478 | $3,658,187,908 | $7,613,246,265 |
| Reinvestment of distributions | 36,367,309 | 57,507,306 | 386,286,653 | 612,532,396 |
| Shares redeemed | (300,207,835) | (452,613,004) | (3,174,971,426) | (4,806,739,429) |
| Net increase (decrease) | 80,619,258 | 320,670,780 | $869,503,135 | $3,419,039,232 |
| Class I | | | | |
| Shares sold | 95,336,215 | 245,139,592 | $1,010,770,765 | $2,596,745,220 |
| Reinvestment of distributions | 6,877,200 | 8,911,840 | 72,930,992 | 94,805,632 |
| Shares redeemed | (55,696,794) | (99,475,433) | (589,727,932) | (1,055,508,510) |
| Net increase (decrease) | 46,516,621 | 154,575,999 | $493,973,825 | $1,636,042,342 |
| Class Z | | | | |
| Shares sold | 91,489,578 | 155,922,153 | $965,955,052 | $1,656,237,293 |
| Reinvestment of distributions | 2,282,632 | 2,946,230 | 24,197,067 | 31,368,596 |
| Shares redeemed | (31,639,822) | (96,526,329) | (334,137,614) | (1,027,365,935) |
| Net increase (decrease) | 62,132,388 | 62,342,054 | $656,014,505 | $660,239,954 |
12. Other.
The Fund's organizational documents provide former and current trustees and officers with a limited indemnification against liabilities arising in connection with the performance of their duties to the Fund. In the normal course of business, the Fund may also enter into contracts that provide general indemnifications. The Fund's maximum exposure under these arrangements is unknown as this would be dependent on future claims that may be made against the Fund. The risk of material loss from such claims is considered remote.
At the end of the period, Strategic Advisers Core Income Fund was the owner of record of approximately 20% of the total outstanding shares of the Fund.
13. Credit Risk.
The Fund invests a portion of its assets in structured securities of issuers backed by commercial and residential mortgage loans, credit card receivables and automotive loans. The value and related income of these securities is sensitive to changes in economic conditions, including delinquencies and/or defaults.
Shareholder Expense Example
As a shareholder of the Fund, you incur two types of costs: (1) transaction costs, including sales charges (loads) on purchase payments or redemption proceeds, and (2) ongoing costs, including management fees, distribution and/or service (12b-1) fees and other Fund expenses. This Example is intended to help you understand your ongoing costs (in dollars) of investing in the Fund and to compare these costs with the ongoing costs of investing in other mutual funds.
The Example is based on an investment of $1,000 invested at the beginning of the period and held for the entire period (September 1, 2017 to February 28, 2018).
Actual Expenses
The first line of the accompanying table for each class of the Fund provides information about actual account values and actual expenses. You may use the information in this line, together with the amount you invested, to estimate the expenses that you paid over the period. Simply divide your account value by $1,000.00 (for example, an $8,600 account value divided by $1,000.00 = 8.6), then multiply the result by the number in the first line for a class of the Fund under the heading entitled "Expenses Paid During Period" to estimate the expenses you paid on your account during this period. A small balance maintenance fee of $12.00 that is charged once a year may apply for certain accounts with a value of less than $2,000. This fee is not included in the table below. If it was, the estimate of expenses you paid during the period would be higher, and your ending account value lower, by this amount. In addition, the Fund, as a shareholder in the underlying Fidelity Central Funds, will indirectly bear its pro-rata share of the fees and expenses incurred by the underlying Fidelity Central Funds. These fees and expenses are not included in the Fund's annualized expense ratio used to calculate the expense estimate in the table below.
Hypothetical Example for Comparison Purposes
The second line of the accompanying table for each class of the Fund provides information about hypothetical account values and hypothetical expenses based on a Class' actual expense ratio and an assumed rate of return of 5% per year before expenses, which is not the Class' actual return. The hypothetical account values and expenses may not be used to estimate the actual ending account balance or expenses you paid for the period. You may use this information to compare the ongoing costs of investing in the Fund and other funds. To do so, compare this 5% hypothetical example with the 5% hypothetical examples that appear in the shareholder reports of the other funds. A small balance maintenance fee of $12.00 that is charged once a year may apply for certain accounts with a value of less than $2,000. This fee is not included in the table below. If it was, the estimate of expenses you paid during the period would be higher, and your ending account value lower, by this amount. In addition, the Fund, as a shareholder in the underlying Fidelity Central Funds, will indirectly bear its pro-rata share of the fees and expenses incurred by the underlying Fidelity Central Funds. These fees and expenses are not included in the Fund's annualized expense ratio used to calculate the expense estimate in the table below.
Please note that the expenses shown in the table are meant to highlight your ongoing costs only and do not reflect any transaction costs. Therefore, the second line of the table is useful in comparing ongoing costs only, and will not help you determine the relative total costs of owning different funds. In addition, if these transactional costs were included, your costs would have been higher.
| | Annualized Expense Ratio-A | Beginning
Account Value
September 1, 2017 | Ending
Account Value
February 28, 2018 | Expenses Paid
During Period-B
September 1, 2017
to February 28, 2018 |
| Class A | .76% | | | |
| Actual | | $1,000.00 | $982.20 | $3.74 |
| Hypothetical-C | | $1,000.00 | $1,021.03 | $3.81 |
| Class M | .77% | | | |
| Actual | | $1,000.00 | $982.20 | $3.78 |
| Hypothetical-C | | $1,000.00 | $1,020.98 | $3.86 |
| Class C | 1.53% | | | |
| Actual | | $1,000.00 | $978.50 | $7.51 |
| Hypothetical-C | | $1,000.00 | $1,017.21 | $7.65 |
| Total Bond | .45% | | | |
| Actual | | $1,000.00 | $984.70 | $2.21 |
| Hypothetical-C | | $1,000.00 | $1,022.56 | $2.26 |
| Class I | .50% | | | |
| Actual | | $1,000.00 | $983.40 | $2.46 |
| Hypothetical-C | | $1,000.00 | $1,022.32 | $2.51 |
| Class Z | .36% | | | |
| Actual | | $1,000.00 | $984.10 | $1.77 |
| Hypothetical-C | | $1,000.00 | $1,023.01 | $1.81 |
A Annualized expense ratio reflects expenses net of applicable fee waivers.
B Expenses are equal to each Class' annualized expense ratio, multiplied by the average account value over the period, multiplied by 181/365 (to reflect the one-half year period).
C 5% return per year before expenses
Board Approval of Investment Advisory Contracts and Management Fees
Fidelity Total Bond Fund
Each year, the Board of Trustees, including the Independent Trustees (together, the Board), votes on the renewal of the management contract with Fidelity Management & Research Company (FMR) and the sub-advisory agreements (together, the Advisory Contracts) for the fund. FMR and the sub-advisers are referred to herein as the Investment Advisers. The Board, assisted by the advice of fund counsel and Independent Trustees' counsel, requests and considers a broad range of information relevant to the renewal of the Advisory Contracts throughout the year.
The Board meets regularly and, at each of its meetings, covers an extensive agenda of topics and materials and considers factors that are relevant to its annual consideration of the renewal of the fund's Advisory Contracts, including the services and support provided to the fund and its shareholders. The Board has established four standing committees (Committees) — Operations, Audit, Fair Valuation, and Governance and Nominating — each composed of and chaired by Independent Trustees with varying backgrounds, to which the Board has assigned specific subject matter responsibilities in order to enhance effective decision-making by the Board. The Operations Committee, of which all of the Independent Trustees are members, meets regularly throughout the year and considers, among other matters, information specifically related to the annual consideration of the renewal of the fund's Advisory Contracts. The Board, acting directly and through its Committees, requests and receives information concerning the annual consideration of the renewal of the fund's Advisory Contracts. The Board also meets as needed to review matters specifically related to the Board's annual consideration of the renewal of the Advisory Contracts. Members of the Board may also meet with trustees of other Fidelity funds through ad hoc joint committees to discuss certain matters relevant to all of the Fidelity funds.
At its September 2017 meeting, the Board unanimously determined to renew the fund's Advisory Contracts. In reaching its determination, the Board considered all factors it believed relevant, including (i) the nature, extent, and quality of the services to be provided to the fund and its shareholders (including the investment performance of the fund); (ii) the competitiveness of the fund's management fee and total expense ratio relative to peer funds; (iii) the total costs of the services to be provided by and the profits to be realized by Fidelity from its relationships with the fund; and (iv) the extent to which, if any, economies of scale exist and would be realized as the fund grows, and whether any economies of scale are appropriately shared with fund shareholders.
In considering whether to renew the Advisory Contracts for the fund, the Board reached a determination, with the assistance of fund counsel and Independent Trustees' counsel and through the exercise of its business judgment, that the renewal of the Advisory Contracts was in the best interests of the fund and its shareholders and that the compensation payable under the Advisory Contracts was fair and reasonable. The Board's decision to renew the Advisory Contracts was not based on any single factor, but rather was based on a comprehensive consideration of all the information provided to the Board at its meetings throughout the year. The Board, in reaching its determination to renew the Advisory Contracts, was aware that shareholders of the fund have a broad range of investment choices available to them, including a wide choice among funds offered by Fidelity's competitors, and that the fund's shareholders, who have the opportunity to review and weigh the disclosure provided by the fund in its prospectus and other public disclosures, have chosen to invest in this fund, which is part of the Fidelity family of funds.
Amendment to Group Fee Rate. The Board also approved an amendment to the management contract for the fund to add an additional breakpoint to the group fee schedule, effective October 1, 2017. The Board noted that the additional breakpoint would result in lower management fee rates as Fidelity's assets under management increase above the new breakpoint.
Nature, Extent, and Quality of Services Provided. The Board considered Fidelity's staffing as it relates to the fund, including the backgrounds of investment personnel of Fidelity, and also considered the fund's investment objective, strategies, and related investment philosophy. The Independent Trustees also had discussions with senior management of Fidelity's investment operations and investment groups. The Board considered the structure of the investment personnel compensation program and whether this structure provides appropriate incentives to act in the best interests of the fund. Additionally, the Board considered the portfolio managers' investments, if any, in the funds that they manage.
Resources Dedicated to Investment Management and Support Services. The Board reviewed the general qualifications and capabilities of Fidelity's investment staff, including its size, education, experience, and resources, as well as Fidelity's approach to recruiting, managing, and compensating investment personnel. The Board noted that Fidelity has continued to increase the resources devoted to non-U.S. offices, including expansion of Fidelity's global investment organization. The Board also noted that Fidelity's analysts have extensive resources, tools and capabilities that allow them to conduct sophisticated quantitative and fundamental analysis, as well as credit analysis of issuers, counterparties and guarantors. Further, the Board considered that Fidelity's investment professionals have sufficient access to global information and data so as to provide competitive investment results over time, and that those professionals also have access to sophisticated tools that permit them to assess portfolio construction and risk and performance attribution characteristics continuously, as well as to transmit new information and research conclusions rapidly around the world. Additionally, in its deliberations, the Board considered Fidelity's trading, risk management, compliance, and technology and operations capabilities and resources, which are integral parts of the investment management process.
Shareholder and Administrative Services. The Board considered (i) the nature, extent, quality, and cost of advisory, administrative, and shareholder services performed by the Investment Advisers and their affiliates under the Advisory Contracts and under separate agreements covering transfer agency, pricing and bookkeeping, and securities lending services for the fund; (ii) the nature and extent of the supervision of third party service providers, principally custodians, subcustodians, and pricing vendors; and (iii) the resources devoted to, and the record of compliance with, the fund's compliance policies and procedures.
The Board noted that the growth of fund assets over time across the complex allows Fidelity to reinvest in the development of services designed to enhance the value or convenience of the Fidelity funds as investment vehicles. These services include 24-hour access to account information and market information through telephone representatives and over the Internet, investor education materials and asset allocation tools, and the expanded availability of Fidelity Investor Centers.
Investment in a Large Fund Family. The Board considered the benefits to shareholders of investing in a Fidelity fund, including the benefits of investing in a fund that is part of a large family of funds offering a variety of investment disciplines and providing a large variety of mutual fund investor services. The Board noted that Fidelity had taken, or had made recommendations that resulted in the Fidelity funds taking, a number of actions over the previous year that benefited particular funds, including: (i) continuing to dedicate additional resources to Fidelity's investment research process, which includes meetings with management of issuers in which the funds invest, and to the support of the senior management team that oversees asset management; (ii) continuing efforts to enhance Fidelity's global research capabilities; (iii) launching new funds and making other enhancements to meet client needs; (iv) launching new share classes of existing funds; (v) eliminating purchase minimums and broadening eligibility requirements for certain lower-priced share classes; (vi) reducing management fees and total expenses for certain growth equity funds and index funds; (vii) lowering expense caps for certain existing funds and classes to reduce expenses borne by shareholders; (viii) eliminating short-term redemption fees for certain funds; (ix) introducing a new pricing structure for certain funds of funds that is expected to reduce overall expenses paid by shareholders; (x) rationalizing product lines and gaining increased efficiencies through proposals for fund mergers and share class consolidations; (xi) continuing to develop, acquire and implement systems and technology to improve services to the funds and shareholders, strengthen information security, and increase efficiency; and (xii) implementing enhancements to further strengthen Fidelity's product line to increase investors' probability of success in achieving their investment goals, including retirement income goals.
Investment Performance. The Board considered whether the fund has operated in accordance with its investment objective, as well as its record of compliance with its investment restrictions and its performance history. The Board noted that there was a portfolio management change for the fund in September 2017.
The Board took into account discussions with representatives of the Investment Advisers about fund investment performance that occur at Board meetings throughout the year. In this regard the Board noted that as part of regularly scheduled fund reviews and other reports to the Board on fund performance, the Board considers annualized return information for the fund for different time periods, measured against a securities market index ("benchmark index") and a peer group of funds with similar objectives ("peer group"), if any. In its evaluation of fund investment performance at meetings throughout the year, the Board gave particular attention to information indicating underperformance of certain Fidelity funds for specific time periods and discussed with the Investment Advisers the reasons for such underperformance.
In addition to reviewing absolute and relative fund performance, the Independent Trustees periodically consider the appropriateness of fund performance metrics in evaluating the results achieved. In general, the Independent Trustees believe that fund performance should be evaluated based on gross performance (before fees and expenses but after transaction costs) compared to appropriate benchmark indices, over appropriate time periods that may include full market cycles, and on net performance (after fees and expenses) compared to peer groups, as applicable, over the same periods, taking into account relevant factors including the following: general market conditions; expectations for interest rate levels and credit conditions; issuer-specific information including credit quality; the potential for incremental return versus the fund's benchmark index weighed against the risks involved in obtaining that incremental return, including the risk of diminished or negative total returns; and fund cash flows and other factors. Depending on the circumstances, the Independent Trustees may be satisfied with a fund's performance notwithstanding that it lags its benchmark index or peer group for certain periods.
The Independent Trustees recognize that shareholders evaluate performance on a net basis over their own holding periods, for which one-, three-, and five-year periods are often used as a proxy. For this reason, the performance information reviewed by the Board also included net cumulative calendar year total return information for the fund and an appropriate benchmark index and peer group for the most recent one-, three-, and five-year periods.
Based on its review, the Board concluded that the nature, extent, and quality of services provided to the fund under the Advisory Contracts should continue to benefit the shareholders of the fund.
Competitiveness of Management Fee and Total Expense Ratio. The Board considered the fund's management fee and total expense ratio compared to "mapped groups" of competitive funds and classes created for the purpose of facilitating the Trustees' competitive analysis of management fees and total expenses. Fidelity creates "mapped groups" by combining similar Lipper investment objective categories that have comparable investment mandates. Combining Lipper investment objective categories aids the Board's management fee and total expense ratio comparisons by broadening the competitive group used for comparison.
Management Fee. The Board considered two proprietary management fee comparisons for the 12-month periods shown in basis points (BP) in the chart below. The group of Lipper funds used by the Board for management fee comparisons is referred to below as the "Total Mapped Group" and, for the reasons explained above, is broader than the Lipper peer group used by the Board for performance comparisons. The Total Mapped Group comparison focuses on a fund's standing in terms of gross management fees before expense reimbursements or caps relative to the total universe of funds with comparable investment mandates, regardless of whether their management fee structures also are comparable. Funds with comparable investment mandates offer exposure to similar types of securities. Funds with comparable management fee structures have similar management fee contractual arrangements (
e.g., flat rate charged for advisory services, all-inclusive fee rate,
etc.). "TMG %" represents the percentage of funds in the Total Mapped Group that had management fees that were lower than the fund's. For example, a hypothetical TMG % of 20% would mean that 80% of the funds in the Total Mapped Group had higher, and 20% had lower, management fees than the fund. The fund's actual TMG %s and the number of funds in the Total Mapped Group are in the chart below. The "Asset-Size Peer Group" (ASPG) comparison focuses on a fund's standing relative to a subset of non-Fidelity funds within the Total Mapped Group that are similar in size and management fee structure. For example, if a fund is in the first quartile of the ASPG, the fund's management fee ranks in the least expensive or lowest 25% of funds in the ASPG. The ASPG represents at least 15% of the funds in the Total Mapped Group with comparable asset size and management fee structures, subject to a minimum of 50 funds (or all funds in the Total Mapped Group if fewer than 50). Additional information, such as the ASPG quartile in which the fund's management fee rate ranked, is also included in the chart and considered by the Board.
Fidelity Total Bond Fund
The Board noted that the fund's management fee rate ranked below the median of its Total Mapped Group and below the median of its ASPG for 2016.
The Board noted that it and the boards of other Fidelity funds formed an ad hoc Committee on Group Fee, which meets periodically, to conduct an in-depth review of the "group fee" component of the management fee of funds with such management fee structures. The Committee's focus included the mechanics of the group fee, the competitive landscape of group fee structures, Fidelity funds with no group fee component and investment products not included in group fee assets. The Board also considered that, for funds subject to the group fee, FMR agreed to voluntarily waive fees over a specified period of time in amounts designed to account for assets converted from certain funds to certain collective investment trusts.
Based on its review, the Board concluded that the fund's management fee is fair and reasonable in light of the services that the fund receives and the other factors considered.
Total Expense Ratio. In its review of each class's total expense ratio, the Board considered the fund's management fee rate as well as other fund or class expenses, as applicable, such as transfer agent fees, pricing and bookkeeping fees, fund-paid 12b-1 fees, and custodial, legal, and audit fees. The Board also noted that Fidelity may agree to waive fees and expenses from time to time, and the extent to which, if any, it has done so for the fund. As part of its review, the Board also considered the current and historical total expense ratios of each class of the fund compared to competitive fund median expenses. Each class of the fund is compared to those funds and classes in the Total Mapped Group (used by the Board for management fee comparisons) that have a similar sales load structure.
The Board noted that the total expense ratio of each class ranked below the competitive median for 2016.
The Board considered that the current contractual arrangements for the fund have the effect of setting the total "fund-level" (but not "class-level") expenses (including, among certain other "fund-level" expenses, the management fee) for each class at 0.35%. These contractual arrangements may not be amended to increase the fees or expenses payable except by a vote of a majority of the Board.
The Board recognized that the fund's management contract incorporates a "group fee" structure, which provides for lower group fee rates as total group assets increase, and for higher group fee rates as total group assets decrease (with "group assets" defined to include fund assets under FMR's management plus the assets of sector funds previously under FMR's management). FMR calculates the group fee rates based on a tiered asset "breakpoint" schedule that varies based on asset class. The Board noted, however, that because the current contractual arrangements set the total "fund-level" expenses for each class at 0.35%, increases or decreases in the management fee due to changes in the group fee rate will not impact the total expense ratio.
Fees Charged to Other Fidelity Clients. The Board also considered Fidelity fee structures and other information with respect to clients of Fidelity, such as other funds advised or subadvised by Fidelity, pension plan clients, and other institutional clients with similar mandates. The Board noted that an ad hoc joint committee created by it and the boards of other Fidelity funds periodically reviews and compares Fidelity's institutional investment advisory business with its business of providing services to the Fidelity funds, including the differences in services provided, fees charged, and costs incurred, as well as competition in their respective marketplaces.
Based on its review of total expense ratios and fees charged to other Fidelity clients, the Board concluded that the total expense ratio of each class of the fund was reasonable in light of the services that the fund and its shareholders receive and the other factors considered.
Costs of the Services and Profitability. The Board considered the revenues earned and the expenses incurred by Fidelity in conducting the business of developing, marketing, distributing, managing, administering and servicing the fund and servicing the fund's shareholders. The Board also considered the level of Fidelity's profits in respect of all the Fidelity funds.
On an annual basis, Fidelity presents to the Board information about the profitability of its relationships with the fund. Fidelity calculates profitability information for each fund, as well as aggregate profitability information for groups of Fidelity funds and all Fidelity funds, using a series of detailed revenue and cost allocation methodologies which originate with the books and records of Fidelity on which Fidelity's audited financial statements are based. The Audit Committee of the Board reviews any significant changes from the prior year's methodologies.
PricewaterhouseCoopers LLP (PwC), independent registered public accounting firm and auditor to Fidelity and certain Fidelity funds, has been engaged annually by the Board as part of the Board's assessment of Fidelity's profitability analysis. PwC's engagement includes the review and assessment of the methodologies used by Fidelity in determining the revenues and expenses attributable to Fidelity's mutual fund business, and completion of agreed-upon procedures in respect of the mathematical accuracy of the fund profitability information and its conformity to established allocation methodologies. After considering PwC's reports issued under the engagement and information provided by Fidelity, the Board concluded that while other allocation methods may also be reasonable, Fidelity's profitability methodologies are reasonable in all material respects.
The Board also reviewed Fidelity's non-fund businesses and potential fall-out benefits related to the mutual fund business as well as cases where Fidelity's affiliates may benefit from or be related to the fund's business.
The Board considered the costs of the services provided by and the profits realized by Fidelity in connection with the operation of the fund and was satisfied that the profitability was not excessive.
Economies of Scale. The Board considered whether there have been economies of scale in respect of the management of the Fidelity funds, whether the Fidelity funds (including the fund) have appropriately benefited from any such economies of scale, and whether there is potential for realization of any further economies of scale. The Board considered the extent to which the fund will benefit from economies of scale as assets grow through increased services to the fund, through waivers or reimbursements, or through fee or expense ratio reductions. The Board also noted that a committee (the Economies of Scale Committee) created by it and the boards of other Fidelity funds periodically analyzes whether Fidelity attains economies of scale in respect of the management and servicing of the Fidelity funds, whether the Fidelity funds have appropriately benefited from such economies of scale, and whether there is potential for realization of any further economies of scale.
The Board concluded, taking into account the analysis of the Economies of Scale Committee, that economies of scale, if any, are being appropriately shared between fund shareholders and Fidelity.
Additional Information Requested by the Board. In order to develop fully the factual basis for consideration of the Fidelity funds' advisory contracts, the Board requested and received additional information on certain topics, including: (i) Fidelity's fund profitability methodology, profitability trends for certain funds, and the impact of certain factors on fund profitability results; (ii) portfolio manager changes that have occurred during the past year and the amount of the investment that each portfolio manager has made in the Fidelity fund(s) that he or she manages; (iii) Fidelity's compensation structure for portfolio managers, research analysts, and other key personnel, including its effects on fund profitability, the rationale for the compensation structure, and the extent to which current market conditions have affected retention and recruitment; (iv) the arrangements with and compensation paid to certain fund sub-advisers on behalf of the Fidelity funds; (v) the terms of Fidelity's contractual and voluntary expense cap and waiver arrangements with the funds; (vi) the methodology with respect to competitive fund data and peer group classifications; (vii) Fidelity's transfer agent fee, expense, and service structures for different funds and classes relative to competitive trends, and the impact of the increased use of omnibus accounts; (viii) Fidelity's long-term expectations for its offerings in the workplace investing channel; (ix) new developments in the retail and institutional marketplaces and the competitive positioning of the funds relative to other investment products and services; (x) the approach to considering "fall-out" benefits; (xi) the impact of money market reform on Fidelity's money market funds, including with respect to costs and profitability; (xii) the funds' share class structures and distribution channels, including the impact of the Department of Labor's new fiduciary rule on the funds' distribution arrangements; and (xiii) explanations regarding the relative total expense ratios of certain funds and classes, total expense competitive trends and methodologies for total expense competitive comparisons, and actions that might be taken by Fidelity to reduce total expense ratios for certain classes. In addition, the Board considered its discussions with Fidelity throughout the year regarding enhanced information security initiatives and the funds' fair valuation policies.
Based on its evaluation of all of the conclusions noted above, and after considering all factors it believed relevant, the Board concluded that the advisory fee structures are fair and reasonable, and that the fund's Advisory Contracts should be renewed.
Corporate Headquarters
245 Summer St.
Boston, MA 02210
www.fidelity.com
TBD-SANN-0418
1.783111.115
Fidelity Flex℠ Funds Fidelity Flex℠ Core Bond Fund
Semi-Annual Report February 28, 2018 |
|
Contents
To view a fund's proxy voting guidelines and proxy voting record for the 12-month period ended June 30, visit http://www.fidelity.com/proxyvotingresults or visit the Securities and Exchange Commission's (SEC) web site at http://www.sec.gov.
You may also call 1-800-835-5092 to request a free copy of the proxy voting guidelines.
Standard & Poor's, S&P and S&P 500 are registered service marks of The McGraw-Hill Companies, Inc. and have been licensed for use by Fidelity Distributors Corporation.
Other third-party marks appearing herein are the property of their respective owners.
All other marks appearing herein are registered or unregistered trademarks or service marks of FMR LLC or an affiliated company. © 2018 FMR LLC. All rights reserved.
This report and the financial statements contained herein are submitted for the general information of the shareholders of the Fund. This report is not authorized for distribution to prospective investors in the Fund unless preceded or accompanied by an effective prospectus.
A fund files its complete schedule of portfolio holdings with the SEC for the first and third quarters of each fiscal year on Form N-Q. Forms N-Q are available on the SEC’s web site at http://www.sec.gov. A fund's Forms N-Q may be reviewed and copied at the SEC’s Public Reference Room in Washington, DC. Information regarding the operation of the SEC's Public Reference Room may be obtained by calling 1-800-SEC-0330.
For a complete list of a fund's portfolio holdings, view the most recent holdings listing, semiannual report, or annual report on Fidelity's web site at http://www.fidelity.com, http://www.institutional.fidelity.com, or http://www.401k.com, as applicable.
NOT FDIC INSURED •MAY LOSE VALUE •NO BANK GUARANTEE
Neither the Fund nor Fidelity Distributors Corporation is a bank.
Investment Summary (Unaudited)
The information in the following tables is based on the combined investments of the Fund and its pro-rata share of the investments of Fidelity's Fixed-Income Central Funds.
Quality Diversification (% of fund's net assets)
| As of February 28, 2018 |
| | U.S. Government and U.S. Government Agency Obligations | 53.7% |
| | AAA | 0.3% |
| | AA | 0.4% |
| | A | 5.8% |
| | BBB | 14.9% |
| | BB and Below | 18.8% |
| | Not Rated | 1.2% |
| | Short-Term Investments and Net Other Assets | 4.9% |

We have used ratings from Moody's Investors Service, Inc. Where Moody's® ratings are not available, we have used S&P® ratings. All ratings are as of the date indicated and do not reflect subsequent changes.
Asset Allocation (% of fund's net assets)
| As of February 28, 2018*,** |
| | Corporate Bonds | 32.1% |
| | U.S. Government and U.S. Government Agency Obligations | 53.7% |
| | Asset-Backed Securities | 0.6% |
| | CMOs and Other Mortgage Related Securities | 1.3% |
| | Municipal Bonds | 1.0% |
| | Other Investments | 6.4% |
| | Short-Term Investments and Net Other Assets (Liabilities) | 4.9% |
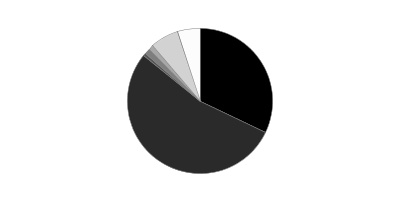
* Foreign investments - 10.0%
** Futures and Swaps - 0.2%
An unaudited holdings listing for the Fund, which presents direct holdings as well as the pro-rata share of any securities and other investments held indirectly through its investment in underlying non-money market Fidelity Central Funds, is available at fidelity.com and/or institutional.fidelity.com, as applicable.
Percentages in the above tables are adjusted for the effect of TBA Sale Commitments.
Schedule of Investments February 28, 2018 (Unaudited)
Showing Percentage of Net Assets
| Nonconvertible Bonds - 25.2% | | | |
| | | Principal Amount | Value |
| CONSUMER DISCRETIONARY - 1.9% | | | |
| Automobiles - 0.6% | | | |
| General Motors Financial Co., Inc. 4.375% 9/25/21 | | $200,000 | $205,742 |
| Media - 1.3% | | | |
| 21st Century Fox America, Inc. 7.75% 12/1/45 | | 20,000 | 30,398 |
| Charter Communications Operating LLC/Charter Communications Operating Capital Corp.: | | | |
| 4.908% 7/23/25 | | 45,000 | 46,341 |
| 5.375% 5/1/47 | | 30,000 | 29,695 |
| Comcast Corp. 6.45% 3/15/37 | | 15,000 | 19,205 |
| Time Warner Cable, Inc.: | | | |
| 4% 9/1/21 | | 80,000 | 80,772 |
| 7.3% 7/1/38 | | 120,000 | 143,901 |
| Time Warner, Inc. 6.2% 3/15/40 | | 40,000 | 46,778 |
| | | | 397,090 |
|
| TOTAL CONSUMER DISCRETIONARY | | | 602,832 |
|
| CONSUMER STAPLES - 0.9% | | | |
| Beverages - 0.6% | | | |
| Anheuser-Busch InBev Finance, Inc.: | | | |
| 2.65% 2/1/21 | | 45,000 | 44,582 |
| 4.7% 2/1/36 | | 125,000 | 131,357 |
| | | | 175,939 |
| Tobacco - 0.3% | | | |
| Reynolds American, Inc. 7.25% 6/15/37 | | 75,000 | 98,866 |
|
| TOTAL CONSUMER STAPLES | | | 274,805 |
|
| ENERGY - 5.8% | | | |
| Oil, Gas & Consumable Fuels - 5.8% | | | |
| Alberta Energy Co. Ltd.: | | | |
| 7.375% 11/1/31 | | 28,000 | 34,945 |
| 8.125% 9/15/30 | | 26,000 | 33,878 |
| Anadarko Finance Co. 7.5% 5/1/31 | | 40,000 | 50,594 |
| Anadarko Petroleum Corp.: | | | |
| 5.55% 3/15/26 | | 40,000 | 43,685 |
| 6.6% 3/15/46 | | 30,000 | 37,401 |
| Canadian Natural Resources Ltd.: | | | |
| 3.9% 2/1/25 | | 25,000 | 24,868 |
| 5.85% 2/1/35 | | 25,000 | 28,322 |
| Cenovus Energy, Inc. 4.25% 4/15/27 | | 24,000 | 23,454 |
| Columbia Pipeline Group, Inc.: | | | |
| 4.5% 6/1/25 | | 25,000 | 25,653 |
| 5.8% 6/1/45 | | 10,000 | 11,577 |
| DCP Midstream LLC 5.85% 5/21/43 (a)(b) | | 20,000 | 18,950 |
| DCP Midstream Operating LP 3.875% 3/15/23 | | 20,000 | 19,500 |
| Enbridge, Inc.: | | | |
| 4.25% 12/1/26 | | 25,000 | 25,164 |
| 5.5% 12/1/46 | | 25,000 | 28,142 |
| Encana Corp. 6.625% 8/15/37 | | 15,000 | 18,560 |
| Enterprise Products Operating LP 3.75% 2/15/25 | | 20,000 | 20,088 |
| Kinder Morgan Energy Partners LP 6.55% 9/15/40 | | 65,000 | 74,967 |
| Marathon Petroleum Corp. 5.125% 3/1/21 | | 35,000 | 37,071 |
| MPLX LP 4.875% 12/1/24 | | 10,000 | 10,521 |
| Petrobras Global Finance BV: | | | |
| 5.625% 5/20/43 | | 50,000 | 42,750 |
| 6.125% 1/17/22 | | 145,000 | 152,591 |
| 7.25% 3/17/44 | | 50,000 | 50,750 |
| 7.375% 1/17/27 | | 90,000 | 97,560 |
| Petroleos Mexicanos: | | | |
| 4.625% 9/21/23 | | 330,000 | 331,683 |
| 5.625% 1/23/46 | | 40,000 | 35,816 |
| 6.35% 2/12/48 (a) | | 15,000 | 14,624 |
| 6.5% 3/13/27 (a) | | 20,000 | 21,377 |
| 6.75% 9/21/47 | | 130,000 | 132,193 |
| 6.75% 9/21/47 (a) | | 20,000 | 20,337 |
| Sunoco Logistics Partner Operations LP 5.4% 10/1/47 | | 44,000 | 43,019 |
| The Williams Companies, Inc.: | | | |
| 4.55% 6/24/24 | | 70,000 | 70,525 |
| 5.75% 6/24/44 | | 35,000 | 37,188 |
| Western Gas Partners LP: | | | |
| 4.65% 7/1/26 | | 35,000 | 35,548 |
| 5.375% 6/1/21 | | 48,000 | 50,242 |
| Williams Partners LP 4.3% 3/4/24 | | 100,000 | 102,518 |
| | | | 1,806,061 |
| FINANCIALS - 10.6% | | | |
| Banks - 5.2% | | | |
| Bank of America Corp.: | | | |
| 3.004% 12/20/23 (a)(b) | | 66,000 | 64,578 |
| 3.5% 4/19/26 | | 160,000 | 157,574 |
| 3.705% 4/24/28 (b) | | 29,000 | 28,463 |
| 5.65% 5/1/18 | | 110,000 | 110,637 |
| Barclays PLC 4.375% 1/12/26 | | 200,000 | 200,211 |
| Citigroup, Inc.: | | | |
| 2.4% 2/18/20 | | 62,000 | 61,409 |
| 2.876% 7/24/23 (b) | | 43,000 | 41,969 |
| 3.142% 1/24/23 (b) | | 23,000 | 22,833 |
| 4.4% 6/10/25 | | 70,000 | 71,850 |
| Credit Suisse Group Funding Guernsey Ltd. 3.8% 6/9/23 | | 250,000 | 251,557 |
| JPMorgan Chase & Co.: | | | |
| 2.35% 1/28/19 | | 35,000 | 34,962 |
| 2.95% 10/1/26 | | 135,000 | 126,876 |
| 4.35% 8/15/21 | | 125,000 | 129,963 |
| Royal Bank of Scotland Group PLC: | | | |
| 5.125% 5/28/24 | | 165,000 | 169,051 |
| 6% 12/19/23 | | 65,000 | 69,399 |
| 6.125% 12/15/22 | | 80,000 | 85,318 |
| | | | 1,626,650 |
| Capital Markets - 3.5% | | | |
| Affiliated Managers Group, Inc. 4.25% 2/15/24 | | 22,000 | 22,666 |
| Deutsche Bank AG London Branch 4.1% 1/13/26 | | 100,000 | 97,650 |
| Deutsche Bank AG New York Branch 3.15% 1/22/21 | | 100,000 | 99,085 |
| Goldman Sachs Group, Inc.: | | | |
| 2.876% 10/31/22 (b) | | 170,000 | 166,675 |
| 3.2% 2/23/23 | | 35,000 | 34,463 |
| 3.691% 6/5/28 (b) | | 170,000 | 165,421 |
| 3.75% 5/22/25 | | 50,000 | 49,808 |
| Moody's Corp.: | | | |
| 3.25% 1/15/28 (a) | | 10,000 | 9,513 |
| 4.875% 2/15/24 | | 9,000 | 9,583 |
| Morgan Stanley: | | | |
| 3.125% 7/27/26 | | 171,000 | 162,194 |
| 5.625% 9/23/19 | | 100,000 | 104,228 |
| 5.75% 1/25/21 | | 150,000 | 160,861 |
| | | | 1,082,147 |
| Consumer Finance - 0.9% | | | |
| Capital One Financial Corp.: | | | |
| 2.5% 5/12/20 | | 125,000 | 123,522 |
| 3.8% 1/31/28 | | 22,000 | 21,359 |
| Discover Financial Services: | | | |
| 3.95% 11/6/24 | | 80,000 | 79,880 |
| 4.1% 2/9/27 | | 76,000 | 75,169 |
| | | | 299,930 |
| Diversified Financial Services - 0.3% | | | |
| Brixmor Operating Partnership LP: | | | |
| 3.25% 9/15/23 | | 35,000 | 33,886 |
| 3.85% 2/1/25 | | 40,000 | 39,008 |
| Voya Financial, Inc. 3.125% 7/15/24 | | 12,000 | 11,681 |
| | | | 84,575 |
| Insurance - 0.7% | | | |
| Pacific LifeCorp 5.125% 1/30/43 (a) | | 50,000 | 52,832 |
| Pricoa Global Funding I 5.375% 5/15/45 (b) | | 45,000 | 46,800 |
| TIAA Asset Management Finance LLC 4.125% 11/1/24 (a) | | 80,000 | 82,391 |
| Unum Group 3.875% 11/5/25 | | 50,000 | 49,756 |
| | | | 231,779 |
|
| TOTAL FINANCIALS | | | 3,325,081 |
|
| HEALTH CARE - 1.0% | | | |
| Biotechnology - 0.1% | | | |
| AbbVie, Inc. 4.5% 5/14/35 | | 25,000 | 25,754 |
| Health Care Providers & Services - 0.2% | | | |
| HCA Holdings, Inc. 6.5% 2/15/20 | | 50,000 | 52,625 |
| Pharmaceuticals - 0.7% | | | |
| Actavis Funding SCS 3.45% 3/15/22 | | 40,000 | 39,818 |
| Mylan NV: | | | |
| 3.15% 6/15/21 | | 50,000 | 49,551 |
| 3.95% 6/15/26 | | 20,000 | 19,345 |
| Teva Pharmaceutical Finance Netherlands III BV: | | | |
| 2.8% 7/21/23 | | 55,000 | 48,141 |
| 3.15% 10/1/26 | | 65,000 | 53,013 |
| Zoetis, Inc. 3.45% 11/13/20 | | 15,000 | 15,167 |
| | | | 225,035 |
|
| TOTAL HEALTH CARE | | | 303,414 |
|
| INDUSTRIALS - 0.5% | | | |
| Aerospace & Defense - 0.1% | | | |
| BAE Systems Holdings, Inc. 3.8% 10/7/24 (a) | | 40,000 | 40,401 |
| Trading Companies & Distributors - 0.4% | | | |
| International Lease Finance Corp. 5.875% 8/15/22 | | 100,000 | 109,071 |
|
| TOTAL INDUSTRIALS | | | 149,472 |
|
| REAL ESTATE - 2.9% | | | |
| Equity Real Estate Investment Trusts (REITs) - 1.7% | | | |
| Corporate Office Properties LP 5.25% 2/15/24 | | 157,000 | 165,109 |
| DDR Corp. 4.625% 7/15/22 | | 65,000 | 67,650 |
| Duke Realty LP 3.625% 4/15/23 | | 50,000 | 50,572 |
| Omega Healthcare Investors, Inc.: | | | |
| 4.375% 8/1/23 | | 165,000 | 164,360 |
| 4.5% 1/15/25 | | 6,000 | 5,840 |
| 4.75% 1/15/28 | | 59,000 | 57,111 |
| WP Carey, Inc. 4% 2/1/25 | | 28,000 | 27,687 |
| | | | 538,329 |
| Real Estate Management & Development - 1.2% | | | |
| Brandywine Operating Partnership LP: | | | |
| 3.95% 2/15/23 | | 103,000 | 103,272 |
| 3.95% 11/15/27 | | 19,000 | 18,304 |
| Digital Realty Trust LP: | | | |
| 4.75% 10/1/25 | | 45,000 | 47,494 |
| 5.25% 3/15/21 | | 30,000 | 31,757 |
| Liberty Property LP 4.4% 2/15/24 | | 40,000 | 41,731 |
| Mack-Cali Realty LP 3.15% 5/15/23 | | 50,000 | 45,504 |
| Ventas Realty LP: | | | |
| 3.5% 2/1/25 | | 65,000 | 63,741 |
| 4% 3/1/28 | | 11,000 | 10,887 |
| | | | 362,690 |
|
| TOTAL REAL ESTATE | | | 901,019 |
|
| TELECOMMUNICATION SERVICES - 0.9% | | | |
| Diversified Telecommunication Services - 0.9% | | | |
| AT&T, Inc.: | | | |
| 3.6% 2/17/23 | | 100,000 | 100,225 |
| 6.3% 1/15/38 | | 50,000 | 57,651 |
| Verizon Communications, Inc.: | | | |
| 5.012% 4/15/49 | | 30,000 | 30,443 |
| 5.012% 8/21/54 | | 85,000 | 84,198 |
| 5.5% 3/16/47 | | 11,000 | 12,017 |
| | | | 284,534 |
| UTILITIES - 0.7% | | | |
| Electric Utilities - 0.5% | | | |
| FirstEnergy Corp.: | | | |
| 4.25% 3/15/23 | | 45,000 | 46,315 |
| 7.375% 11/15/31 | | 85,000 | 112,072 |
| IPALCO Enterprises, Inc. 3.7% 9/1/24 | | 10,000 | 9,779 |
| | | | 168,166 |
| Independent Power and Renewable Electricity Producers - 0.2% | | | |
| Dolphin Subsidiary II, Inc. 7.25% 10/15/21 | | 50,000 | 54,500 |
|
| TOTAL UTILITIES | | | 222,666 |
|
| TOTAL NONCONVERTIBLE BONDS | | | |
| (Cost $7,926,480) | | | 7,869,884 |
|
| U.S. Government and Government Agency Obligations - 35.4% | | | |
| U.S. Treasury Inflation-Protected Obligations - 6.9% | | | |
| U.S. Treasury Inflation-Indexed Bonds 0.875% 2/15/47 | | 684,244 | 665,235 |
| U.S. Treasury Inflation-Indexed Notes: | | | |
| 0.375% 1/15/27 | | $1,352,229 | $1,309,909 |
| 0.375% 7/15/27 | | 171,324 | 166,096 |
|
| TOTAL U.S. TREASURY INFLATION-PROTECTED OBLIGATIONS | | | 2,141,240 |
|
| U.S. Treasury Obligations - 28.5% | | | |
| U.S. Treasury Bonds: | | | |
| 2.75% 11/15/47 | | 83,000 | 76,898 |
| 3% 2/15/47 | | 947,000 | 923,436 |
| 3% 5/15/47 | | 194,000 | 189,089 |
| U.S. Treasury Notes: | | | |
| 1.75% 6/30/22 | | 332,000 | 320,367 |
| 1.875% 3/31/22 | | 6,254,000 | 6,082,504 |
| 2.125% 7/31/24 | | 216,000 | 207,807 |
| 2.125% 11/30/24 | | 336,000 | 322,206 |
| 2.25% 12/31/24 | | 453,000 | 437,623 |
| 2.25% 2/15/27 | | 213,000 | 202,350 |
| 2.25% 11/15/27 | | 130,000 | 123,007 |
|
| TOTAL U.S. TREASURY OBLIGATIONS | | | 8,885,287 |
|
| TOTAL U.S. GOVERNMENT AND GOVERNMENT AGENCY OBLIGATIONS | | | |
| (Cost $11,347,121) | | | 11,026,527 |
|
| U.S. Government Agency - Mortgage Securities - 0.9% | | | |
| Fannie Mae - 0.9% | | | |
| 3.5% 3/1/48 (c) | | 150,000 | 149,726 |
| 3.5% 3/1/48 (c) | | 50,000 | 49,909 |
| 3.5% 3/1/48 (c) | | 50,000 | 49,909 |
| 3.5% 3/1/48 (c) | | 25,000 | 24,954 |
| TOTAL U.S. GOVERNMENT AGENCY - MORTGAGE SECURITIES | | | |
| (Cost $275,331) | | | 274,498 |
|
| Asset-Backed Securities - 0.6% | | | |
| CAM Mortgage Trust Series 2016-2 Class A2, 5% 6/15/57 (a) | | $100,000 | $99,346 |
| DB Master Finance LLC Series 2017-1A: | | | |
| Class A2I, 3.629% 11/20/47 (a) | | 49,875 | 49,339 |
| Class A2II, 4.03% 11/20/47 (a) | | 49,875 | 49,938 |
| TOTAL ASSET-BACKED SECURITIES | | | |
| (Cost $199,922) | | | 198,623 |
|
| Collateralized Mortgage Obligations - 0.1% | | | |
| Private Sponsor - 0.1% | | | |
| CSMC Trust Series 2009-5R Class 2A2, 3.3536% 7/26/49 (a)(b) | | 9,786 | 9,785 |
| FirstKey Mortgage Trust sequential payer Series 2015-1 Class A9, 3% 3/25/45 (a)(b) | | 30,770 | 30,564 |
| TOTAL COLLATERALIZED MORTGAGE OBLIGATIONS | | | |
| (Cost $40,960) | | | 40,349 |
|
| Commercial Mortgage Securities - 1.2% | | | |
| COMM Mortgage Trust: | | | |
| Series 2014-CR17 Class XA, 1.1241% 5/10/47 (b)(d) | | 98,688 | 4,406 |
| Series 2015-DC1 Class XA, 1.1593% 2/10/48 (b)(d) | | 874,227 | 45,494 |
| CSMC Trust Series 2017-PFHP Class D, 1 month U.S. LIBOR + 2.250% 3.8095% 12/15/30 (a)(b)(e) | | 76,000 | 76,000 |
| GAHR Commercial Mortgage Trust Series 2015-NRF Class DFX, 3.3822% 12/15/34 (a)(b) | | 125,000 | 124,585 |
| GP Portfolio Trust Series 2014-GPP Class A, 1 month U.S. LIBOR + 1.200% 2.7595% 2/15/27 (a)(b)(e) | | 35,155 | 35,162 |
| MSCG Trust Series 2016-SNR Class C, 5.205% 11/15/34 (a) | | 25,000 | 25,023 |
| WF-RBS Commercial Mortgage Trust Series 2014-C21 Class XA, 1.1255% 8/15/47 (b)(d) | | 953,944 | 47,190 |
| TOTAL COMMERCIAL MORTGAGE SECURITIES | | | |
| (Cost $364,009) | | | 357,860 |
|
| Municipal Securities - 1.0% | | | |
| California Gen. Oblig. Series 2009, 7.35% 11/1/39 | | 90,000 | 130,647 |
| Illinois Gen. Oblig.: | | | |
| Series 2003, 5.1% 6/1/33 | | $125,000 | $117,854 |
| Series 2010-3, 5.547% 4/1/19 | | 70,000 | 71,446 |
| TOTAL MUNICIPAL SECURITIES | | | |
| (Cost $312,163) | | | 319,947 |
|
| Foreign Government and Government Agency Obligations - 0.6% | | | |
| Argentine Republic 5.875% 1/11/28 | | $100,000 | $93,450 |
| Dominican Republic 5.95% 1/25/27 (a) | | 100,000 | 105,850 |
| TOTAL FOREIGN GOVERNMENT AND GOVERNMENT AGENCY OBLIGATIONS | | | |
| (Cost $205,219) | | | 199,300 |
| | | Shares | Value |
|
| Fixed-Income Funds - 30.8% | | | |
| Fidelity Floating Rate Central Fund (f) | | 16,092 | 1,662,580 |
| Fidelity Mortgage Backed Securities Central Fund (f) | | 50,675 | 5,342,196 |
| Fidelity Specialized High Income Central Fund (f) | | 25,743 | 2,588,747 |
| TOTAL FIXED-INCOME FUNDS | | | |
| (Cost $9,772,388) | | | 9,593,523 |
|
| Money Market Funds - 4.5% | | | |
| Fidelity Cash Central Fund, 1.41% (g) | | | |
| (Cost $1,398,468) | | 1,398,189 | 1,398,468 |
| TOTAL INVESTMENT IN SECURITIES - 100.3% | | | |
| (Cost $31,842,061) | | | 31,278,979 |
| NET OTHER ASSETS (LIABILITIES) - (0.3)% | | | (79,198) |
| NET ASSETS - 100% | | | $31,199,781 |
| TBA Sale Commitments | | |
| | Principal Amount | Value |
| Fannie Mae | | |
| 3.5% 3/1/48 | $(75,000) | $(74,863) |
| 3.5% 3/1/48 | (50,000) | (49,909) |
| 3.5% 3/1/48 | (25,000) | (24,954) |
| TOTAL TBA SALE COMMITMENTS | | |
| (Proceeds $149,719) | | $(149,726) |
Legend
(a) Security exempt from registration under Rule 144A of the Securities Act of 1933. These securities may be resold in transactions exempt from registration, normally to qualified institutional buyers. At the end of the period, the value of these securities amounted to $930,595 or 3.0% of net assets.
(b) Coupon rates for floating and adjustable rate securities reflect the rates in effect at period end.
(c) Security or a portion of the security purchased on a delayed delivery or when-issued basis.
(d) Security represents right to receive monthly interest payments on an underlying pool of mortgages or assets. Principal shown is the outstanding par amount of the pool as of the end of the period.
(e) Coupon is indexed to a floating interest rate which may be multiplied by a specified factor and/or subject to caps or floors.
(f) Affiliated fund that is generally available only to investment companies and other accounts managed by Fidelity Investments. A complete unaudited schedule of portfolio holdings for each Fidelity Central Fund is filed with the SEC for the first and third quarters of each fiscal year on Form N-Q and is available upon request or at the SEC's website at www.sec.gov. An unaudited holdings listing for the Fund, which presents direct holdings as well as the pro-rata share of securities and other investments held indirectly through its investment in underlying non-money market Fidelity Central Funds, is available at fidelity.com and/or institutional.fidelity.com, as applicable. In addition, each Fidelity Central Fund's financial statements are available on the SEC's website or upon request.
(g) Affiliated fund that is generally available only to investment companies and other accounts managed by Fidelity Investments. The rate quoted is the annualized seven-day yield of the fund at period end. A complete unaudited listing of the fund's holdings as of its most recent quarter end is available upon request. In addition, each Fidelity Central Fund's financial statements are available on the SEC's website or upon request.
Affiliated Central Funds
Information regarding fiscal year to date income earned by the Fund from investments in Fidelity Central Funds is as follows:
| Fund | Income earned |
| Fidelity Cash Central Fund | $5,447 |
| Fidelity Floating Rate Central Fund | 41,652 |
| Fidelity Mortgage Backed Securities Central Fund | 70,619 |
| Fidelity Specialized High Income Central Fund | 103,656 |
| Total | $221,374 |
Amounts in the income column in the above table include any capital gain distributions from underlying funds, which are presented in the corresponding line-item in the Statement of Operations if applicable.
Additional information regarding the Fund's fiscal year to date purchases and sales, including the ownership percentage, of the non Money Market Central Funds is as follows:
| Fund | Value, beginning of period | Purchases | Sales Proceeds | Realized Gain/Loss | Change in Unrealized appreciation (depreciation) | Value, end of period | % ownership, end of period |
| Fidelity Floating Rate Central Fund | $1,244,345 | $416,651 | $-- | $-- | $1,584 | $1,662,580 | 0.1% |
| Fidelity Mortgage Backed Securities Central Fund | 4,765,339 | 997,703 | 258,239 | (854) | (161,753) | 5,342,196 | 0.1% |
| Fidelity Specialized High Income Central Fund | 2,034,874 | 653,655 | -- | -- | (99,782) | 2,588,747 | 0.4% |
| Total | $8,044,558 | $2,068,009 | $258,239 | $(854) | $(259,951) | $9,593,523 | |
Investment Valuation
The following is a summary of the inputs used, as of February 28, 2018, involving the Fund's assets and liabilities carried at fair value. The inputs or methodology used for valuing securities may not be an indication of the risk associated with investing in those securities. For more information on valuation inputs, and their aggregation into the levels used below, please refer to the Investment Valuation section in the accompanying Notes to Financial Statements.
| | Valuation Inputs at Reporting Date: |
| Description | Total | Level 1 | Level 2 | Level 3 |
| Investments in Securities: | | | | |
| Corporate Bonds | $7,869,884 | $-- | $7,869,884 | $-- |
| U.S. Government and Government Agency Obligations | 11,026,527 | -- | 11,026,527 | -- |
| U.S. Government Agency - Mortgage Securities | 274,498 | -- | 274,498 | -- |
| Asset-Backed Securities | 198,623 | -- | 198,623 | -- |
| Collateralized Mortgage Obligations | 40,349 | -- | 40,349 | -- |
| Commercial Mortgage Securities | 357,860 | -- | 357,860 | -- |
| Municipal Securities | 319,947 | -- | 319,947 | -- |
| Foreign Government and Government Agency Obligations | 199,300 | -- | 199,300 | -- |
| Fixed-Income Funds | 9,593,523 | 9,593,523 | -- | -- |
| Money Market Funds | 1,398,468 | 1,398,468 | -- | -- |
| Total Investments in Securities: | $31,278,979 | $10,991,991 | $20,286,988 | $-- |
| Other Financial Instruments: | | | | |
| TBA Sale Commitments | $(149,726) | $-- | $(149,726) | $-- |
| Total Other Financial Instruments: | $(149,726) | $-- | $(149,726) | $-- |
Other Information
Distribution of investments by country or territory of incorporation, as a percentage of Total Net Assets, is as follows (Unaudited):
| United States of America | 90.0% |
| Netherlands | 2.0% |
| United Kingdom | 1.9% |
| Mexico | 1.8% |
| Canada | 1.4% |
| Others (Individually Less Than 1%) | 2.9% |
| | 100.0% |
See accompanying notes which are an integral part of the financial statements.
Financial Statements
Statement of Assets and Liabilities
| | | February 28, 2018 (Unaudited) |
| Assets | | |
Investment in securities, at value — See accompanying schedule:
Unaffiliated issuers (cost $20,671,205) | $20,286,988 | |
| Fidelity Central Funds (cost $11,170,856) | 10,991,991 | |
| Total Investment in Securities (cost $31,842,061) | | $31,278,979 |
| Cash | | 34,358 |
| Receivable for TBA sale commitments | | 149,719 |
| Receivable for fund shares sold | | 12,479 |
| Dividends receivable | | 14 |
| Interest receivable | | 153,789 |
| Distributions receivable from Fidelity Central Funds | | 708 |
| Total assets | | 31,630,046 |
| Liabilities | | |
| Payable for investments purchased | | |
| Delayed delivery | $275,332 | |
| TBA sale commitments, at value | 149,726 | |
| Payable for fund shares redeemed | 5,207 | |
| Total liabilities | | 430,265 |
| Net Assets | | $31,199,781 |
| Net Assets consist of: | | |
| Paid in capital | | $31,801,578 |
| Distributions in excess of net investment income | | (7,114) |
| Accumulated undistributed net realized gain (loss) on investments | | (31,594) |
| Net unrealized appreciation (depreciation) on investments | | (563,089) |
| Net Assets, for 3,168,469 shares outstanding | | $31,199,781 |
| Net Asset Value, offering price and redemption price per share ($31,199,781 ÷ 3,168,469 shares) | | $9.85 |
See accompanying notes which are an integral part of the financial statements.
Statement of Operations
| | | Six months ended February 28, 2018 (Unaudited) |
| Investment Income | | |
| Interest | | $300,363 |
| Income from Fidelity Central Funds | | 173,685 |
| Total income | | 474,048 |
| Expenses | | |
| Independent trustees' fees and expenses | $59 | |
| Miscellaneous | 43 | |
| Total expenses | | 102 |
| Net investment income (loss) | | 473,946 |
| Realized and Unrealized Gain (Loss) | | |
| Net realized gain (loss) on: | | |
| Investment securities: | | |
| Unaffiliated issuers | (53,936) | |
| Fidelity Central Funds | (854) | |
| Capital gain distributions from Fidelity Central Funds | 47,689 | |
| Total net realized gain (loss) | | (7,101) |
| Change in net unrealized appreciation (depreciation) on: | | |
| Investment securities: | | |
| Unaffiliated issuers | (702,694) | |
| Fidelity Central Funds | (259,951) | |
| Delayed delivery commitments | (7) | |
| Total change in net unrealized appreciation (depreciation) | | (962,652) |
| Net gain (loss) | | (969,753) |
| Net increase (decrease) in net assets resulting from operations | | $(495,807) |
See accompanying notes which are an integral part of the financial statements.
Statement of Changes in Net Assets
| | Six months ended February 28, 2018 (Unaudited) | For the period
March 7, 2017 (commencement of operations) to August 31, 2017 |
| Increase (Decrease) in Net Assets | | |
| Operations | | |
| Net investment income (loss) | $473,946 | $374,647 |
| Net realized gain (loss) | (7,101) | 134,165 |
| Change in net unrealized appreciation (depreciation) | (962,652) | 399,563 |
| Net increase (decrease) in net assets resulting from operations | (495,807) | 908,375 |
| Distributions to shareholders from net investment income | (509,213) | (344,679) |
| Distributions to shareholders from net realized gain | (160,473) | – |
| Total distributions | (669,686) | (344,679) |
| Share transactions | | |
| Proceeds from sales of shares | 31,298,134 | 27,990,779 |
| Reinvestment of distributions | 669,686 | 344,679 |
| Cost of shares redeemed | (28,405,235) | (96,465) |
| Net increase (decrease) in net assets resulting from share transactions | 3,562,585 | 28,238,993 |
| Total increase (decrease) in net assets | 2,397,092 | 28,802,689 |
| Net Assets | | |
| Beginning of period | 28,802,689 | – |
| End of period | $31,199,781 | $28,802,689 |
| Other Information | | |
| Undistributed net investment income end of period | $– | $28,153 |
| Distributions in excess of net investment income end of period | $(7,114) | $– |
| Shares | | |
| Sold | 3,131,351 | 2,794,789 |
| Issued in reinvestment of distributions | 66,578 | 33,972 |
| Redeemed | (2,848,726) | (9,495) |
| Net increase (decrease) | 349,203 | 2,819,266 |
See accompanying notes which are an integral part of the financial statements.
Financial Highlights
Fidelity Flex Core Bond Fund
| | Six months ended (Unaudited) February 28, | Years endedAugust 31, |
| | 2018 | 2017 A |
| Selected Per–Share Data | | |
| Net asset value, beginning of period | $10.22 | $10.00 |
| Income from Investment Operations | | |
| Net investment income (loss)B | .150 | .145 |
| Net realized and unrealized gain (loss) | (.307) | .209 |
| Total from investment operations | (.157) | .354 |
| Distributions from net investment income | (.161) | (.134) |
| Distributions from net realized gain | (.052) | – |
| Total distributions | (.213) | (.134) |
| Net asset value, end of period | $9.85 | $10.22 |
| Total ReturnC,D | (1.56)% | 3.55% |
| Ratios to Average Net AssetsE,F | | |
| Expenses before reductions | - %G,H | - %G,H |
| Expenses net of fee waivers, if any | - %G,H | - %G,H |
| Expenses net of all reductions | - %G,H | - %G,H |
| Net investment income (loss) | 3.01%G | 2.94%G |
| Supplemental Data | | |
| Net assets, end of period (000 omitted) | $31,200 | $28,803 |
| Portfolio turnover rateI | 43%G | 60%J |
A For the period March 7, 2017 (commencement of operations) to August 31, 2017.
B Calculated based on average shares outstanding during the period.
C Total returns for periods of less than one year are not annualized.
D Total returns would have been lower if certain expenses had not been reduced during the applicable periods shown.
E Fees and expenses of any underlying Fidelity Central Funds are not included in the Fund's expense ratio. The Fund indirectly bears its proportionate share of the expenses of any underlying Fidelity Central Funds. Based on their most recent shareholder report date, the expenses of any underlying non-money market Fidelity Central Funds ranged from less than .005% to .06%.
F Expense ratios reflect operating expenses of the Fund. Expenses before reductions do not reflect amounts reimbursed by the investment adviser or reductions from expense offset arrangements and do not represent the amount paid by the Fund during periods when reimbursements or reductions occur. Expenses net of fee waivers reflect expenses after reimbursement by the investment adviser but prior to reductions from expense offset arrangements. Expenses net of all reductions represent the net expenses paid by the Fund.
G Annualized
H Amount represents less than .005%.
I Amount does not include the portfolio activity of any underlying Fidelity Central Funds.
J Amount not annualized.
See accompanying notes which are an integral part of the financial statements.
Notes to Financial Statements (Unaudited)
For the period ended February 28, 2018
1. Organization.
Fidelity Flex Core Bond Fund (the Fund) is a fund of Fidelity Income Fund (the Trust) and is authorized to issue an unlimited number of shares. Share transactions on the Statement of Changes in Net Assets may contain exchanges between affiliated funds. The Trust is registered under the Investment Company Act of 1940, as amended (the 1940 Act), as an open-end management investment company organized as a Massachusetts business trust. The Fund is available only to certain fee-based accounts offered by Fidelity.
2. Investments in Fidelity Central Funds.
The Fund invests in Fidelity Central Funds, which are open-end investment companies generally available only to other investment companies and accounts managed by the investment adviser and its affiliates. The Fund's Schedule of Investments lists each of the Fidelity Central Funds held as of period end, if any, as an investment of the Fund, but does not include the underlying holdings of each Fidelity Central Fund. As an Investing Fund, the Fund indirectly bears its proportionate share of the expenses of the underlying Fidelity Central Funds.
Based on its investment objective, each Fidelity Central Fund may invest or participate in various investment vehicles or strategies that are similar to those of the Fund. These strategies are consistent with the investment objectives of the Fund and may involve certain economic risks which may cause a decline in value of each of the Fidelity Central Funds and thus a decline in the value of the Fund. The Money Market Central Funds seek preservation of capital and current income and are managed by Fidelity Investments Money Management, Inc. (FIMM), an affiliate of the investment adviser. Annualized expenses of the Money Market Central Funds as of their most recent shareholder report date are less than .005%. The following summarizes the Fund's investment in each non-money market Fidelity Central Fund.
| Fidelity Central Fund | Investment Manager | Investment Objective | Investment Practices | Expense Ratio(a) |
| Fidelity Floating Rate Central Fund | FMR Co., Inc. (FMRC) | Seeks a high level of income by normally investing in floating rate loans and other floating rate securities. | Loans & Direct Debt Instruments
Restricted Securities
| .06% |
| Fidelity Mortgage Backed Securities Central Fund | FIMM | Seeks a high level of income by normally investing in investment-grade mortgage-related securities and repurchase agreements for those securities. | Delayed Delivery & When Issued Securities
Futures
Swaps | Less than .005% |
| Fidelity Specialized High Income Central Fund | FMRC | Seeks a high level of current income by normally investing in income-producing debt securities, with an emphasis on lower-quality debt securities. | Loans & Direct Debt Instruments
Restricted Securities
| Less than .005% |
(a) Expenses expressed as a percentage of average net assets and are as of each underlying Central Fund's most recent annual or semi-annual shareholder report.
An unaudited holdings listing for the Fund, which presents direct holdings as well as the pro-rata share of any securities and other investments held indirectly through its investment in underlying non-money market Fidelity Central Funds, is available at fidelity.com. A complete unaudited list of holdings for each Fidelity Central Fund is available upon request or at the Securities and Exchange Commission (the SEC) website at www.sec.gov. In addition, the financial statements of the Fidelity Central Funds which contain the significant accounting policies (including investment valuation policies) of those funds are available on the SEC website or upon request.
3. Significant Accounting Policies.
The Fund is an investment company and applies the accounting and reporting guidance of the Financial Accounting Standards Board (FASB) Accounting Standards Codification Topic 946 Financial Services – Investments Companies. The financial statements have been prepared in conformity with accounting principles generally accepted in the United States of America (GAAP), which require management to make certain estimates and assumptions at the date of the financial statements. Actual results could differ from those estimates. Subsequent events, if any, through the date that the financial statements were issued have been evaluated in the preparation of the financial statements. The following summarizes the significant accounting policies of the Fund:
Investment Valuation. Investments are valued as of 4:00 p.m. Eastern time on the last calendar day of the period. The Board of Trustees (the Board) has delegated the day to day responsibility for the valuation of the Fund's investments to the Fair Value Committee (the Committee) established by the Fund's investment adviser. In accordance with valuation policies and procedures approved by the Board, the Fund attempts to obtain prices from one or more third party pricing vendors or brokers to value its investments. When current market prices, quotations or currency exchange rates are not readily available or reliable, investments will be fair valued in good faith by the Committee, in accordance with procedures adopted by the Board. Factors used in determining fair value vary by investment type and may include market or investment specific events, changes in interest rates and credit quality. The frequency with which these procedures are used cannot be predicted and they may be utilized to a significant extent. The Committee oversees the Fund's valuation policies and procedures and reports to the Board on the Committee's activities and fair value determinations. The Board monitors the appropriateness of the procedures used in valuing the Fund's investments and ratifies the fair value determinations of the Committee.
The Fund categorizes the inputs to valuation techniques used to value its investments into a disclosure hierarchy consisting of three levels as shown below:
- Level 1 – quoted prices in active markets for identical investments
- Level 2 – other significant observable inputs (including quoted prices for similar investments, interest rates, prepayment speeds, etc.)
- Level 3 – unobservable inputs (including the Fund's own assumptions based on the best information available)
Valuation techniques used to value the Fund's investments by major category are as follows:
Debt securities, including restricted securities, are valued based on evaluated prices received from third party pricing vendors or from brokers who make markets in such securities. Corporate bonds, foreign government and government agency obligations, municipal securities and U.S. government and government agency obligations are valued by pricing vendors who utilize matrix pricing which considers yield or price of bonds of comparable quality, coupon, maturity and type or by broker-supplied prices. Asset backed securities, collateralized mortgage obligations, commercial mortgage securities and U.S. government agency mortgage securities are valued by pricing vendors who utilize matrix pricing which considers prepayment speed assumptions, attributes of the collateral, yield or price of bonds of comparable quality, coupon, maturity and type or by broker-supplied prices. When independent prices are unavailable or unreliable, debt securities may be valued utilizing pricing methodologies which consider similar factors that would be used by third party pricing vendors. Debt securities are generally categorized as Level 2 in the hierarchy but may be Level 3 depending on the circumstances.
Investments in open-end mutual funds, including the Fidelity Central Funds, are valued at their closing net asset value (NAV) each business day and are categorized as Level 1 in the hierarchy.
Changes in valuation techniques may result in transfers in or out of an assigned level within the disclosure hierarchy. The aggregate value of investments by input level as of February 28, 2018 is included at the end of the Fund's Schedule of Investments.
Investment Transactions and Income. For financial reporting purposes, the Fund's investment holdings and NAV include trades executed through the end of the last business day of the period. The NAV per share for processing shareholder transactions is calculated as of the close of business of the New York Stock Exchange (NYSE), normally 4:00 p.m. Eastern time and includes trades executed through the end of the prior business day. Gains and losses on securities sold are determined on the basis of identified cost. Income and capital gain distributions from Fidelity Central Funds, if any, are recorded on the ex-dividend date. Interest income is accrued as earned and includes coupon interest and amortization of premium and accretion of discount on debt securities as applicable. The principal amount on inflation-indexed securities is periodically adjusted to the rate of inflation and interest is accrued based on the principal amount. The adjustments to principal due to inflation are reflected as increases or decreases to Interest in the accompanying Statement of Operations. Debt obligations may be placed on non-accrual status and related interest income may be reduced by ceasing current accruals and writing off interest receivables when the collection of all or a portion of interest has become doubtful based on consistently applied procedures. A debt obligation is removed from non-accrual status when the issuer resumes interest payments or when collectability of interest is reasonably assured.
Expenses. Expenses directly attributable to a fund are charged to that fund. Expenses attributable to more than one fund are allocated among the respective funds on the basis of relative net assets or other appropriate methods. Expense estimates are accrued in the period to which they relate and adjustments are made when actual amounts are known.
Income Tax Information and Distributions to Shareholders. Each year, the Fund intends to qualify as a regulated investment company under Subchapter M of the Internal Revenue Code, including distributing substantially all of its taxable income and realized gains. As a result, no provision for U.S. Federal income taxes is required. The Fund files a U.S. federal tax return, in addition to state and local tax returns as required. The Fund's federal income tax returns are subject to examination by the Internal Revenue Service (IRS) for a period of three fiscal years after they are filed. State and local tax returns may be subject to examination for an additional fiscal year depending on the jurisdiction.
Dividends are declared and recorded daily and paid monthly from net investment income. Distributions from realized gains, if any, are declared and recorded on the ex-dividend date. Income and capital gain distributions are determined in accordance with income tax regulations, which may differ from GAAP.
Capital accounts within the financial statements are adjusted for permanent book-tax differences. These adjustments have no impact on net assets or the results of operations. Capital accounts are not adjusted for temporary book-tax differences which will reverse in a subsequent period.
Book-tax differences are primarily due to market discount.
As of period end, the cost and unrealized appreciation (depreciation) in securities, and derivatives if applicable, for federal income tax purposes were as follows:
| Gross unrealized appreciation | $61,965 |
| Gross unrealized depreciation | (623,198) |
| Net unrealized appreciation (depreciation) | $(561,233) |
| Tax cost | $31,840,212 |
Delayed Delivery Transactions and When-Issued Securities. During the period, the Fund transacted in securities on a delayed delivery or when-issued basis. Payment and delivery may take place after the customary settlement period for that security. The price of the underlying securities and the date when the securities will be delivered and paid for are fixed at the time the transaction is negotiated. The securities purchased on a delayed delivery or when-issued basis are identified as such in the Fund's Schedule of Investments. The Fund may receive compensation for interest forgone in the purchase of a delayed delivery or when-issued security. With respect to purchase commitments, the Fund identifies securities as segregated in its records with a value at least equal to the amount of the commitment. Losses may arise due to changes in the value of the underlying securities or if the counterparty does not perform under the contract's terms, or if the issuer does not issue the securities due to political, economic, or other factors.
To-Be-Announced (TBA) Securities and Mortgage Dollar Rolls. During the period, the Fund transacted in TBA securities that involved buying or selling mortgage-backed securities (MBS) on a forward commitment basis. A TBA transaction typically does not designate the actual security to be delivered and only includes an approximate principal amount; however delivered securities must meet specified terms defined by industry guidelines, including issuer, rate and current principal amount outstanding on underlying mortgage pools. The Fund may enter into a TBA transaction with the intent to take possession of or deliver the underlying MBS, or the Fund may elect to extend the settlement by entering into either a mortgage or reverse mortgage dollar roll. Mortgage dollar rolls are transactions where a fund sells TBA securities and simultaneously agrees to repurchase MBS on a later date at a lower price and with the same counterparty. Reverse mortgage dollar rolls involve the purchase and simultaneous agreement to sell TBA securities on a later date at a lower price. Transactions in mortgage dollar rolls and reverse mortgage dollar rolls are accounted for as purchases and sales and may result in an increase to the Fund's portfolio turnover rate.
Purchases and sales of TBA securities involve risks similar to those discussed above for delayed delivery and when-issued securities. Also, if the counterparty in a mortgage dollar roll or a reverse mortgage dollar roll transaction files for bankruptcy or becomes insolvent, the Fund's right to repurchase or sell securities may be limited. Additionally, when a fund sells TBA securities without already owning or having the right to obtain the deliverable securities (an uncovered forward commitment to sell), it incurs a risk of loss because it could have to purchase the securities at a price that is higher than the price at which it sold them. A fund may be unable to purchase the deliverable securities if the corresponding market is illiquid.
TBA securities subject to a forward commitment to sell at period end are included at the end of the Fund's Schedule of Investments under the caption "TBA Sale Commitments." The proceeds and value of these commitments are reflected in the Fund's Statement of Assets and Liabilities as Receivable for TBA sale commitments and TBA sale commitments, at value, respectively.
Restricted Securities. The Fund may invest in securities that are subject to legal or contractual restrictions on resale. These securities generally may be resold in transactions exempt from registration or to the public if the securities are registered. Disposal of these securities may involve time-consuming negotiations and expense, and prompt sale at an acceptable price may be difficult. Information regarding restricted securities is included at the end of the Fund's Schedule of Investments.
New Accounting Pronouncement. In March 2017, the Financial Accounting Standards Board (FASB) issued an Accounting Standards Update (ASU), ASU 2017-08, which amends the amortization period for certain callable debt securities that are held at a premium. The amendment requires the premium to be amortized to the earliest call date. The amendments do not require an accounting change for securities held at a discount. The ASU is effective for annual periods beginning after December 15, 2018. Management is currently evaluating the potential impact of these changes to the financial statements.
4. Purchases and Sales of Investments.
Purchases and sales of securities (including the Fixed-Income Central Funds), other than short-term securities and U.S. government securities, aggregated $3,735,419 and $720,206, respectively.
5. Fees and Other Transactions with Affiliates.
Management Fee. Fidelity Management & Research Company (the investment adviser) and its affiliates provide the Fund with investment management related services and the Fund does not pay any fees for these services. Under the management contract, the investment adviser or an affiliate pays all other expenses of the Fund, excluding fees and expenses of the independent Trustees, and certain miscellaneous expenses such as proxy and shareholder meeting expenses.
Interfund Trades. The Fund may purchase from or sell securities to other Fidelity Funds under procedures adopted by the Board. The procedures have been designed to ensure these interfund trades are executed in accordance with Rule 17a-7 of the 1940 Act. Interfund trades are included within the respective purchases and sales amounts shown in the Purchases and Sales of Investments note.
6. Committed Line of Credit.
The Fund participates with other funds managed by the investment adviser or an affiliate in a $4.25 billion credit facility (the "line of credit") to be utilized for temporary or emergency purposes to fund shareholder redemptions or for other short-term liquidity purposes. The Fund has agreed to pay commitment fees on its pro-rata portion of the line of credit, which amounted to $43 and is reflected in Miscellaneous expenses on the Statement of Operations. During the period, the Fund did not borrow on this line of credit.
7. Other.
The Fund's organizational documents provide former and current trustees and officers with a limited indemnification against liabilities arising in connection with the performance of their duties to the Fund. In the normal course of business, the Fund may also enter into contracts that provide general indemnifications. The Fund's maximum exposure under these arrangements is unknown as this would be dependent on future claims that may be made against the Fund. The risk of material loss from such claims is considered remote.
Shareholder Expense Example
As a shareholder of the Fund, you incur two types of costs: (1) transaction costs, and (2) ongoing costs, including other Fund expenses. This Example is intended to help you understand your ongoing costs (in dollars) of investing in the Fund and to compare these costs with the ongoing costs of investing in other mutual funds.
The Example is based on an investment of $1,000 invested at the beginning of the period and held for the entire period (September 1, 2017 to February 28, 2018).
Actual Expenses
The first line of the accompanying table provides information about actual account values and actual expenses. You may use the information in this line, together with the amount you invested, to estimate the expenses that you paid over the period. Simply divide your account value by $1,000.00 (for example, an $8,600 account value divided by $1,000.00 = 8.6), then multiply the result by the number in the first line under the heading entitled "Expenses Paid During Period" to estimate the expenses you paid on your account during this period. In addition, the Fund, as a shareholder in the underlying Fidelity Central Funds, will indirectly bear its pro-rata share of the fees and expenses incurred by the underlying Fidelity Central Funds. These fees and expenses are not included in the Fund's annualized expense ratio used to calculate the expense estimate in the table below.
Hypothetical Example for Comparison Purposes
The second line of the accompanying table provides information about hypothetical account values and hypothetical expenses based on the Fund's actual expense ratio and an assumed rate of return of 5% per year before expenses, which is not the Fund's actual return. The hypothetical account values and expenses may not be used to estimate the actual ending account balance or expenses you paid for the period. You may use this information to compare the ongoing costs of investing in the Fund and other funds. To do so, compare this 5% hypothetical example with the 5% hypothetical examples that appear in the shareholder reports of the other funds. In addition, the Fund, as a shareholder in the underlying Fidelity Central Funds, will indirectly bear its pro-rata share of the fees and expenses incurred by the underlying Fidelity Central Funds. These fees and expenses are not included in the Fund's annualized expense ratio used to calculate the expense estimate in the table below.
Please note that the expenses shown in the table are meant to highlight your ongoing costs only and do not reflect any transaction costs. Therefore, the second line of the table is useful in comparing ongoing costs only, and will not help you determine the relative total costs of owning different funds.
| | Annualized Expense Ratio-A | Beginning
Account Value
September 1, 2017 | Ending
Account Value
February 28, 2018 | Expenses Paid
During Period-B
September 1, 2017
to February 28, 2018 |
| Actual | - %-C | $1,000.00 | $984.40 | $--D |
| Hypothetical-E | | $1,000.00 | $1,024.79 | $--D |
A Annualized expense ratio reflects expenses net of applicable fee waivers.
B Expenses are equal to the Fund's annualized expense ratio, multiplied by the average account value over the period, multiplied by 181/365 (to reflect the one-half year period). The fees and expenses of the underlying Fidelity Central Funds in which the Fund invests are not included in the Fund's annualized expense ratio. In addition to the expenses noted above, the Fund also indirectly bears its proportional share of the expenses of the underlying Fidelity Central Funds. Annualized expenses of the underlying non-money market Fidelity Central Funds as of their most recent fiscal half year ranged from less than .005% to .06%.
C Amount represents less than .005%.
D Amount represents less than $.005.
E 5% return per year before expenses
Corporate Headquarters
245 Summer St.
Boston, MA 02210
www.fidelity.com
ZCD-SANN-0418
1.9881606.100
Fidelity® Total Bond K6 Fund
Semi-Annual Report February 28, 2018 |
|
Contents
To view a fund's proxy voting guidelines and proxy voting record for the 12-month period ended June 30, visit http://www.fidelity.com/proxyvotingresults or visit the Securities and Exchange Commission's (SEC) web site at http://www.sec.gov.
You may also call 1-800-835-5092 to request a free copy of the proxy voting guidelines.
Standard & Poor's, S&P and S&P 500 are registered service marks of The McGraw-Hill Companies, Inc. and have been licensed for use by Fidelity Distributors Corporation.
Other third-party marks appearing herein are the property of their respective owners.
All other marks appearing herein are registered or unregistered trademarks or service marks of FMR LLC or an affiliated company. © 2018 FMR LLC. All rights reserved.
This report and the financial statements contained herein are submitted for the general information of the shareholders of the Fund. This report is not authorized for distribution to prospective investors in the Fund unless preceded or accompanied by an effective prospectus.
A fund files its complete schedule of portfolio holdings with the SEC for the first and third quarters of each fiscal year on Form N-Q. Forms N-Q are available on the SEC’s web site at http://www.sec.gov. A fund's Forms N-Q may be reviewed and copied at the SEC’s Public Reference Room in Washington, DC. Information regarding the operation of the SEC's Public Reference Room may be obtained by calling 1-800-SEC-0330.
For a complete list of a fund's portfolio holdings, view the most recent holdings listing, semiannual report, or annual report on Fidelity's web site at http://www.fidelity.com, http://www.institutional.fidelity.com, or http://www.401k.com, as applicable.
NOT FDIC INSURED •MAY LOSE VALUE •NO BANK GUARANTEE
Neither the Fund nor Fidelity Distributors Corporation is a bank.
Investment Summary (Unaudited)
The information in the following tables is based on the combined investments of the Fund and its pro-rata share of the investments of Fidelity's Fixed-Income Central Funds.
Quality Diversification (% of fund's net assets)
| As of February 28, 2018 |
| | U.S. Government and U.S. Government Agency Obligations | 61.4% |
| | AAA | 0.4% |
| | AA | 0.2% |
| | A | 5.2% |
| | BBB | 10.9% |
| | BB and Below | 16.6% |
| | Not Rated | 0.9% |
| | Short-Term Investments and Net Other Assets | 4.4% |

We have used ratings from Moody's Investors Service, Inc. Where Moody's® ratings are not available, we have used S&P® ratings. All ratings are as of the date indicated and do not reflect subsequent changes. Securities rated BB or below were rated investment grade at the time of acquisition.
Asset Allocation (% of fund's net assets)
| As of February 28, 2018*,** |
| | Corporate Bonds | 26.9% |
| | U.S. Government and U.S. Government Agency Obligations | 61.4% |
| | Asset-Backed Securities | 0.5% |
| | CMOs and Other Mortgage Related Securities | 0.7% |
| | Municipal Bonds | 0.7% |
| | Other Investments | 5.4% |
| | Short-Term Investments and Net Other Assets (Liabilities) | 4.4% |
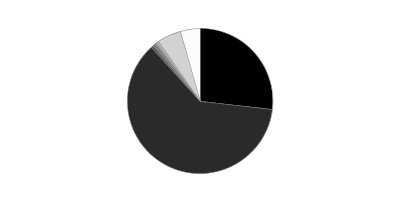
* Foreign investments - 7.4%
** Futures and Swaps - 0.2%
An unaudited holdings listing for the Fund, which presents direct holdings as well as the pro-rata share of any securities and other investments held indirectly through its investment in underlying non-money market Fidelity Central Funds, is available at fidelity.com.
Percentages in the above tables are adjusted for the effect of TBA Sale Commitments.
Schedule of Investments February 28, 2018 (Unaudited)
Showing Percentage of Net Assets
| Nonconvertible Bonds - 21.1% | | | |
| | | Principal Amount | Value |
| CONSUMER DISCRETIONARY - 1.9% | | | |
| Automobiles - 0.6% | | | |
| General Motors Financial Co., Inc. 4.375% 9/25/21 | | $3,950,000 | $4,063,396 |
| Media - 1.3% | | | |
| 21st Century Fox America, Inc. 7.75% 12/1/45 | | 370,000 | 562,367 |
| Charter Communications Operating LLC/Charter Communications Operating Capital Corp.: | | | |
| 4.908% 7/23/25 | | 945,000 | 973,164 |
| 5.375% 5/1/47 | | 750,000 | 742,377 |
| Comcast Corp. 6.45% 3/15/37 | | 365,000 | 467,325 |
| Time Warner Cable, Inc.: | | | |
| 4% 9/1/21 | | 1,480,000 | 1,494,275 |
| 7.3% 7/1/38 | | 2,420,000 | 2,902,007 |
| Time Warner, Inc. 6.2% 3/15/40 | | 840,000 | 982,343 |
| | | | 8,123,858 |
|
| TOTAL CONSUMER DISCRETIONARY | | | 12,187,254 |
|
| CONSUMER STAPLES - 0.4% | | | |
| Beverages - 0.4% | | | |
| Anheuser-Busch InBev Finance, Inc.: | | | |
| 2.65% 2/1/21 | | 45,000 | 44,582 |
| 4.7% 2/1/36 | | 2,325,000 | 2,443,245 |
| | | | 2,487,827 |
| Tobacco - 0.0% | | | |
| Reynolds American, Inc. 7.25% 6/15/37 | | 75,000 | 98,866 |
|
| TOTAL CONSUMER STAPLES | | | 2,586,693 |
|
| ENERGY - 5.5% | | | |
| Oil, Gas & Consumable Fuels - 5.5% | | | |
| Alberta Energy Co. Ltd.: | | | |
| 7.375% 11/1/31 | | 435,000 | 542,898 |
| 8.125% 9/15/30 | | 398,000 | 518,589 |
| Anadarko Finance Co. 7.5% 5/1/31 | | 790,000 | 999,239 |
| Anadarko Petroleum Corp.: | | | |
| 5.55% 3/15/26 | | 515,000 | 562,439 |
| 6.6% 3/15/46 | | 630,000 | 785,415 |
| Canadian Natural Resources Ltd.: | | | |
| 3.9% 2/1/25 | | 525,000 | 522,237 |
| 5.85% 2/1/35 | | 525,000 | 594,762 |
| Cenovus Energy, Inc. 4.25% 4/15/27 | | 534,000 | 521,851 |
| Columbia Pipeline Group, Inc.: | | | |
| 4.5% 6/1/25 | | 25,000 | 25,653 |
| 5.8% 6/1/45 | | 10,000 | 11,577 |
| DCP Midstream LLC 5.85% 5/21/43 (a)(b) | | 570,000 | 540,075 |
| DCP Midstream Operating LP 3.875% 3/15/23 | | 520,000 | 507,000 |
| Enbridge, Inc.: | | | |
| 4.25% 12/1/26 | | 525,000 | 528,442 |
| 5.5% 12/1/46 | | 525,000 | 590,988 |
| Encana Corp. 6.625% 8/15/37 | | 350,000 | 433,059 |
| Enterprise Products Operating LP 3.75% 2/15/25 | | 20,000 | 20,088 |
| Kinder Morgan Energy Partners LP 6.55% 9/15/40 | | 1,365,000 | 1,574,316 |
| Marathon Petroleum Corp. 5.125% 3/1/21 | | 35,000 | 37,071 |
| MPLX LP 4.875% 12/1/24 | | 200,000 | 210,415 |
| Petrobras Global Finance BV: | | | |
| 5.75% 2/1/29 | | 1,000,000 | 962,500 |
| 6.125% 1/17/22 | | 2,730,000 | 2,872,916 |
| 7.25% 3/17/44 | | 1,300,000 | 1,319,500 |
| 7.375% 1/17/27 | | 2,130,000 | 2,308,920 |
| Petroleos Mexicanos: | | | |
| 4.625% 9/21/23 | | 6,000,000 | 6,030,600 |
| 6.375% 1/23/45 | | 2,300,000 | 2,231,000 |
| 6.5% 3/13/27 (a) | | 20,000 | 21,377 |
| 6.75% 9/21/47 | | 2,110,000 | 2,145,596 |
| 6.75% 9/21/47 (a) | | 20,000 | 20,337 |
| Sunoco Logistics Partner Operations LP 5.4% 10/1/47 | | 692,000 | 676,567 |
| The Williams Companies, Inc.: | | | |
| 3.7% 1/15/23 | | 2,000,000 | 1,942,500 |
| 4.55% 6/24/24 | | 70,000 | 70,525 |
| 5.75% 6/24/44 | | 35,000 | 37,188 |
| Western Gas Partners LP: | | | |
| 4.5% 3/1/28 | | 200,000 | 201,259 |
| 4.65% 7/1/26 | | 35,000 | 35,548 |
| 5.375% 6/1/21 | | 1,563,000 | 1,636,015 |
| Williams Partners LP 4.3% 3/4/24 | | 2,000,000 | 2,050,360 |
| | | | 34,088,822 |
| FINANCIALS - 8.7% | | | |
| Banks - 4.1% | | | |
| Bank of America Corp.: | | | |
| 3.004% 12/20/23 (a)(b) | | 2,001,000 | 1,957,890 |
| 3.5% 4/19/26 | | 2,630,000 | 2,590,115 |
| 3.705% 4/24/28 (b) | | 528,000 | 518,222 |
| 5.65% 5/1/18 | | 110,000 | 110,637 |
| Barclays PLC 4.375% 1/12/26 | | 900,000 | 900,950 |
| Citigroup, Inc.: | | | |
| 2.4% 2/18/20 | | 1,142,000 | 1,131,116 |
| 3.142% 1/24/23 (b) | | 443,000 | 439,776 |
| 4.4% 6/10/25 | | 1,970,000 | 2,022,059 |
| 5.5% 9/13/25 | | 472,000 | 516,285 |
| Credit Suisse Group Funding Guernsey Ltd.: | | | |
| 3.75% 3/26/25 | | 1,200,000 | 1,184,617 |
| 3.8% 6/9/23 | | 1,250,000 | 1,257,786 |
| Intesa Sanpaolo SpA 5.71% 1/15/26 (a) | | 849,000 | 866,847 |
| JPMorgan Chase & Co.: | | | |
| 2.35% 1/28/19 | | 35,000 | 34,962 |
| 2.95% 10/1/26 | | 3,085,000 | 2,899,350 |
| 3.882% 7/24/38 (b) | | 1,000,000 | 968,036 |
| 4.35% 8/15/21 | | 2,425,000 | 2,521,292 |
| Rabobank Nederland 4.375% 8/4/25 | | 500,000 | 507,970 |
| Regions Bank 6.45% 6/26/37 | | 250,000 | 302,485 |
| Royal Bank of Scotland Group PLC 6.125% 12/15/22 | | 4,745,000 | 5,060,407 |
| | | | 25,790,802 |
| Capital Markets - 3.3% | | | |
| Affiliated Managers Group, Inc. 4.25% 2/15/24 | | 390,000 | 401,812 |
| Credit Suisse Group AG 3.869% 1/12/29 (a)(b) | | 370,000 | 359,398 |
| Deutsche Bank AG 4.5% 4/1/25 | | 1,500,000 | 1,469,505 |
| Deutsche Bank AG London Branch 4.1% 1/13/26 | | 1,100,000 | 1,074,149 |
| Deutsche Bank AG New York Branch 3.15% 1/22/21 | | 625,000 | 619,282 |
| Goldman Sachs Group, Inc.: | | | |
| 2.876% 10/31/22 (b) | | 170,000 | 166,675 |
| 3.2% 2/23/23 | | 3,000,000 | 2,953,943 |
| 3.691% 6/5/28 (b) | | 3,160,000 | 3,074,892 |
| 3.75% 5/22/25 | | 525,000 | 522,980 |
| 4.017% 10/31/38 (b) | | 1,000,000 | 966,331 |
| Moody's Corp.: | | | |
| 3.25% 1/15/28 (a) | | 10,000 | 9,513 |
| 4.875% 2/15/24 | | 9,000 | 9,583 |
| Morgan Stanley: | | | |
| 3.125% 7/27/26 | | 2,621,000 | 2,486,020 |
| 5.625% 9/23/19 | | 100,000 | 104,228 |
| 5.75% 1/25/21 | | 4,650,000 | 4,986,689 |
| UBS Group Funding AG 2.859% 8/15/23 (a)(b) | | 1,000,000 | 971,990 |
| UBS Group Funding Ltd. 4.125% 9/24/25 (a) | | 500,000 | 507,990 |
| | | | 20,684,980 |
| Consumer Finance - 0.6% | | | |
| Capital One Financial Corp.: | | | |
| 2.5% 5/12/20 | | 625,000 | 617,612 |
| 3.8% 1/31/28 | | 437,000 | 424,265 |
| Discover Financial Services: | | | |
| 3.95% 11/6/24 | | 2,580,000 | 2,576,116 |
| 4.1% 2/9/27 | | 366,000 | 362,000 |
| | | | 3,979,993 |
| Diversified Financial Services - 0.3% | | | |
| Brixmor Operating Partnership LP 3.25% 9/15/23 | | 1,035,000 | 1,002,053 |
| Voya Financial, Inc. 3.125% 7/15/24 | | 812,000 | 790,424 |
| | | | 1,792,477 |
| Insurance - 0.4% | | | |
| Pacific LifeCorp 5.125% 1/30/43 (a) | | 950,000 | 1,003,813 |
| Pricoa Global Funding I 5.375% 5/15/45 (b) | | 1,045,000 | 1,086,800 |
| TIAA Asset Management Finance LLC 4.125% 11/1/24 (a) | | 80,000 | 82,391 |
| Unum Group 3.875% 11/5/25 | | 50,000 | 49,756 |
| | | | 2,222,760 |
|
| TOTAL FINANCIALS | | | 54,471,012 |
|
| HEALTH CARE - 0.7% | | | |
| Biotechnology - 0.1% | | | |
| AbbVie, Inc. 4.5% 5/14/35 | | 525,000 | 540,827 |
| Health Care Providers & Services - 0.1% | | | |
| HCA Holdings, Inc. 6.5% 2/15/20 | | 950,000 | 999,875 |
| Pharmaceuticals - 0.5% | | | |
| Actavis Funding SCS 3.45% 3/15/22 | | 40,000 | 39,818 |
| Mylan NV: | | | |
| 3.15% 6/15/21 | | 50,000 | 49,551 |
| 3.95% 6/15/26 | | 1,370,000 | 1,325,107 |
| Teva Pharmaceutical Finance Netherlands III BV: | | | |
| 2.8% 7/21/23 | | 1,055,000 | 923,434 |
| 3.15% 10/1/26 | | 785,000 | 640,237 |
| Zoetis, Inc. 3.45% 11/13/20 | | 15,000 | 15,167 |
| | | | 2,993,314 |
|
| TOTAL HEALTH CARE | | | 4,534,016 |
|
| INDUSTRIALS - 0.5% | | | |
| Aerospace & Defense - 0.2% | | | |
| BAE Systems Holdings, Inc. 3.8% 10/7/24 (a) | | 1,040,000 | 1,050,438 |
| Trading Companies & Distributors - 0.3% | | | |
| International Lease Finance Corp. 5.875% 8/15/22 | | 2,000,000 | 2,181,411 |
|
| TOTAL INDUSTRIALS | | | 3,231,849 |
|
| MATERIALS - 0.2% | | | |
| Metals & Mining - 0.2% | | | |
| Corporacion Nacional del Cobre de Chile (Codelco): | | | |
| 3.625% 8/1/27 (a) | | 500,000 | 483,055 |
| 4.5% 8/1/47 (a) | | 500,000 | 498,780 |
| | | | 981,835 |
| REAL ESTATE - 1.7% | | | |
| Equity Real Estate Investment Trusts (REITs) - 0.9% | | | |
| Corporate Office Properties LP 5.25% 2/15/24 | | 146,000 | 153,541 |
| Duke Realty LP 3.625% 4/15/23 | | 50,000 | 50,572 |
| Omega Healthcare Investors, Inc.: | | | |
| 4.375% 8/1/23 | | 1,665,000 | 1,658,545 |
| 4.75% 1/15/28 | | 3,349,000 | 3,241,788 |
| WP Carey, Inc. 4% 2/1/25 | | 489,000 | 483,534 |
| | | | 5,587,980 |
| Real Estate Management & Development - 0.8% | | | |
| Brandywine Operating Partnership LP: | | | |
| 3.95% 2/15/23 | | 560,000 | 561,480 |
| 3.95% 11/15/27 | | 311,000 | 299,614 |
| 4.1% 10/1/24 | | 833,000 | 832,096 |
| Digital Realty Trust LP: | | | |
| 4.75% 10/1/25 | | 1,445,000 | 1,525,071 |
| 5.25% 3/15/21 | | 30,000 | 31,757 |
| Liberty Property LP 4.4% 2/15/24 | | 40,000 | 41,731 |
| Ventas Realty LP: | | | |
| 3.5% 2/1/25 | | 1,265,000 | 1,240,502 |
| 4% 3/1/28 | | 218,000 | 215,765 |
| | | | 4,748,016 |
|
| TOTAL REAL ESTATE | | | 10,335,996 |
|
| TELECOMMUNICATION SERVICES - 0.9% | | | |
| Diversified Telecommunication Services - 0.9% | | | |
| AT&T, Inc.: | | | |
| 3.6% 2/17/23 | | 2,000,000 | 2,004,503 |
| 6.3% 1/15/38 | | 1,100,000 | 1,268,316 |
| Verizon Communications, Inc.: | | | |
| 5.012% 8/21/54 | | 1,585,000 | 1,570,048 |
| 5.5% 3/16/47 | | 461,000 | 503,633 |
| | | | 5,346,500 |
| UTILITIES - 0.6% | | | |
| Electric Utilities - 0.4% | | | |
| FirstEnergy Corp.: | | | |
| 4.25% 3/15/23 | | 45,000 | 46,315 |
| 7.375% 11/15/31 | | 1,985,000 | 2,617,220 |
| IPALCO Enterprises, Inc. 3.7% 9/1/24 | | 172,000 | 168,201 |
| | | | 2,831,736 |
| Independent Power and Renewable Electricity Producers - 0.2% | | | |
| Dolphin Subsidiary II, Inc. 7.25% 10/15/21 | | 950,000 | 1,035,500 |
|
| TOTAL UTILITIES | | | 3,867,236 |
|
| TOTAL NONCONVERTIBLE BONDS | | | |
| (Cost $135,090,919) | | | 131,631,213 |
|
| U.S. Government and Government Agency Obligations - 43.7% | | | |
| U.S. Treasury Inflation-Protected Obligations - 7.0% | | | |
| U.S. Treasury Inflation-Indexed Bonds 0.875% 2/15/47 | | 11,201,792 | 10,890,597 |
| U.S. Treasury Inflation-Indexed Notes: | | | |
| 0.375% 1/15/27 | | $25,980,856 | $25,167,748 |
| 0.375% 7/15/27 | | 7,728,439 | 7,492,575 |
|
| TOTAL U.S. TREASURY INFLATION-PROTECTED OBLIGATIONS | | | 43,550,920 |
|
| U.S. Treasury Obligations - 36.7% | | | |
| U.S. Treasury Bonds: | | | |
| 2.75% 11/15/47 | | 3,880,000 | 3,594,759 |
| 3% 2/15/47 | | 23,921,000 | 23,325,778 |
| U.S. Treasury Notes: | | | |
| 1.5% 5/15/20 | | 38,929,000 | 38,249,263 |
| 1.75% 6/30/22 | | 227,000 | 219,046 |
| 1.875% 3/31/22 | | 77,961,000 | 75,823,162 |
| 1.875% 7/31/22 | | 34,215,000 | 33,156,473 |
| 2% 4/30/24 | | 1,427,000 | 1,365,851 |
| 2.125% 12/31/22 | | 11,155,000 | 10,892,247 |
| 2.125% 7/31/24 | | 17,335,000 | 16,677,489 |
| 2.125% 11/30/24 | | 10,774,000 | 10,331,677 |
| 2.25% 12/31/24 | | 14,563,000 | 14,068,654 |
| 2.25% 11/15/27 | | 1,300,000 | 1,230,074 |
|
| TOTAL U.S. TREASURY OBLIGATIONS | | | 228,934,473 |
|
| TOTAL U.S. GOVERNMENT AND GOVERNMENT AGENCY OBLIGATIONS | | | |
| (Cost $279,709,782) | | | 272,485,393 |
|
| U.S. Government Agency - Mortgage Securities - 1.0% | | | |
| Fannie Mae - 1.0% | | | |
| 3% 3/1/33 (c) | | 250,000 | 248,918 |
| 3% 3/1/48 (c) | | 900,000 | 872,132 |
| 3.5% 3/1/48 (c) | | 1,450,000 | 1,447,350 |
| 3.5% 3/1/48 (c) | | 300,000 | 299,452 |
| 3.5% 3/1/48 (c) | | 300,000 | 299,452 |
| 3.5% 3/1/48 (c) | | 1,150,000 | 1,147,898 |
| 4% 3/1/48 (c) | | 800,000 | 819,500 |
| 4% 4/1/48 (c) | | 800,000 | 818,188 |
| 4.5% 3/1/48 (c) | | 100,000 | 104,742 |
|
| TOTAL FANNIE MAE | | | 6,057,632 |
|
| Ginnie Mae - 0.0% | | | |
| 3.5% 3/1/48 (c) | | 200,000 | 201,148 |
| TOTAL U.S. GOVERNMENT AGENCY - MORTGAGE SECURITIES | | | |
| (Cost $6,275,904) | | | 6,258,780 |
|
| Asset-Backed Securities - 0.5% | | | |
| AASET Trust Series 2018-1A Class A, 3.844% 1/16/38 (a) | | $469,405 | $469,405 |
| CAM Mortgage Trust Series 2016-2 Class A2, 5% 6/15/57 (a) | | 1,000,000 | 993,459 |
| CLUB Credit Trust Series 2017-P1 Class A, 2.54% 9/15/23 (a) | | 220,379 | 220,024 |
| Consumer Loan Underlying Bond Credit Trust Series 2017-NP2 Class A, 2.55% 1/16/24 (a) | | 231,418 | 231,359 |
| DB Master Finance LLC Series 2017-1A: | | | |
| Class A2I, 3.629% 11/20/47 (a) | | 277,305 | 274,324 |
| Class A2II, 4.03% 11/20/47 (a) | | 476,805 | 477,412 |
| Nationstar HECM Loan Trust Series 2017-2A Class A1, 2.12% 9/25/27 (a) | | 385,668 | 384,238 |
| Navient Student Loan Trust Series 2017-3A Class A2, 1 month U.S. LIBOR + 0.600% 2.2207% 7/26/66 (a)(b)(d) | | 100,000 | 100,629 |
| TOTAL ASSET-BACKED SECURITIES | | | |
| (Cost $3,165,609) | | | 3,150,850 |
|
| Collateralized Mortgage Obligations - 0.1% | | | |
| Private Sponsor - 0.1% | | | |
| CSMC Trust Series 2009-5R Class 2A2, 3.3536% 7/26/49 (a)(b) | | 183,373 | 183,352 |
| FirstKey Mortgage Trust sequential payer Series 2015-1 Class A9, 3% 3/25/45 (a)(b) | | 381,553 | 378,992 |
| TOTAL COLLATERALIZED MORTGAGE OBLIGATIONS | | | |
| (Cost $570,310) | | | 562,344 |
|
| Commercial Mortgage Securities - 0.6% | | | |
| BX Trust Series 2017-IMC Class A, 1 month U.S. LIBOR + 1.050% 2.6095% 10/15/32 (a)(b)(d) | | 500,000 | 500,933 |
| Citigroup Commercial Mortgage Trust Series 2015-GC29 Class XA, 1.1526% 4/10/48 (b)(e) | | 3,569,568 | 201,587 |
| COMM Mortgage Trust: | | | |
| Series 2014-CR17 Class XA, 1.1241% 5/10/47 (b)(e) | | 1,925,862 | 85,974 |
| Series 2014-CR19 Class XA, 1.22% 8/10/47 (b)(e) | | 5,050,754 | 242,793 |
| Series 2014-LC17 Class XA, 0.9465% 10/10/47 (b)(e) | | 4,161,371 | 143,705 |
| Series 2015-DC1 Class XA, 1.1593% 2/10/48 (b)(e) | | 1,180,206 | 61,417 |
| CSMC Trust Series 2017-PFHP Class D, 1 month U.S. LIBOR + 2.250% 3.8095% 12/15/30 (a)(b)(d) | | 1,296,000 | 1,295,999 |
| GP Portfolio Trust Series 2014-GPP Class A, 1 month U.S. LIBOR + 1.200% 2.7595% 2/15/27 (a)(b)(d) | | 151,520 | 151,550 |
| SCG Trust Series 2013-SRP1 Class A, 1 month U.S. LIBOR + 1.400% 3.2095% 11/15/26 (a)(b)(d) | | 334,000 | 334,000 |
| UBS Commercial Mortgage Trust Series 2017-C7 Class XA, 1.047% 12/15/50 (b)(e) | | 1,498,340 | 114,009 |
| Wells Fargo Commercial Mortgage Trust Series 2017-C42 Class XA, 0.9025% 12/15/50 (b)(e) | | 3,697,807 | 257,533 |
| WF-RBS Commercial Mortgage Trust Series 2014-C21 Class XA, 1.1255% 8/15/47 (b)(e) | | 1,240,128 | 61,346 |
| TOTAL COMMERCIAL MORTGAGE SECURITIES | | | |
| (Cost $3,511,084) | | | 3,450,846 |
|
| Municipal Securities - 0.7% | | | |
| California Gen. Oblig.: | | | |
| Series 2009, 7.35% 11/1/39 | | $90,000 | $130,647 |
| 7.5% 4/1/34 | | 700,000 | 999,418 |
| Illinois Gen. Oblig.: | | | |
| Series 2003, 5.1% 6/1/33 | | 2,525,000 | 2,380,646 |
| Series 2011, 5.877% 3/1/19 | | 970,000 | 993,484 |
| TOTAL MUNICIPAL SECURITIES | | | |
| (Cost $4,664,024) | | | 4,504,195 |
|
| Foreign Government and Government Agency Obligations - 0.5% | | | |
| Argentine Republic 5.875% 1/11/28 | | $2,000,000 | $1,869,000 |
| Dominican Republic 5.95% 1/25/27 (a) | | 1,450,000 | 1,534,825 |
| TOTAL FOREIGN GOVERNMENT AND GOVERNMENT AGENCY OBLIGATIONS | | | |
| (Cost $3,558,436) | | | 3,403,825 |
| | | Shares | Value |
|
| Fixed-Income Funds - 27.8% | | | |
| Fidelity Floating Rate Central Fund (f) | | 267,860 | 27,675,325 |
| Fidelity Mortgage Backed Securities Central Fund (f) | | 978,403 | 103,143,224 |
| Fidelity Specialized High Income Central Fund (f) | | 427,895 | 43,029,102 |
| TOTAL FIXED-INCOME FUNDS | | | |
| (Cost $178,296,853) | | | 173,847,651 |
| | | Principal Amount | Value |
|
| Preferred Securities - 0.1% | | | |
| FINANCIALS - 0.1% | | | |
| Banks - 0.1% | | | |
Barclays Bank PLC 7.625% 11/21/22
(Cost $763,711) | | 650,000 | 737,223 |
| | | Shares | Value |
|
| Money Market Funds - 4.4% | | | |
| Fidelity Cash Central Fund, 1.41% (g) | | | |
| (Cost $27,416,079) | | 27,410,597 | 27,416,079 |
| TOTAL INVESTMENT IN SECURITIES - 100.5% | | | |
| (Cost $643,022,711) | | | 627,448,399 |
| NET OTHER ASSETS (LIABILITIES) - (0.5)% | | | (3,245,590) |
| NET ASSETS - 100% | | | $624,202,809 |
| TBA Sale Commitments | | |
| | Principal Amount | Value |
| Fannie Mae | | |
| 3.5% 3/1/48 | $(1,450,000) | $(1,447,350) |
| 3.5% 3/1/48 | (300,000) | (299,452) |
| 3.5% 3/1/48 | (1,150,000) | (1,147,897) |
| 4% 3/1/48 | (800,000) | (819,500) |
| TOTAL TBA SALE COMMITMENTS | | |
| (Proceeds $3,712,359) | | $(3,714,199) |
Legend
(a) Security exempt from registration under Rule 144A of the Securities Act of 1933. These securities may be resold in transactions exempt from registration, normally to qualified institutional buyers. At the end of the period, the value of these securities amounted to $15,904,395 or 2.5% of net assets.
(b) Coupon rates for floating and adjustable rate securities reflect the rates in effect at period end.
(c) Security or a portion of the security purchased on a delayed delivery or when-issued basis.
(d) Coupon is indexed to a floating interest rate which may be multiplied by a specified factor and/or subject to caps or floors.
(e) Security represents right to receive monthly interest payments on an underlying pool of mortgages or assets. Principal shown is the outstanding par amount of the pool as of the end of the period.
(f) Affiliated fund that is generally available only to investment companies and other accounts managed by Fidelity Investments. A complete unaudited schedule of portfolio holdings for each Fidelity Central Fund is filed with the SEC for the first and third quarters of each fiscal year on Form N-Q and is available upon request or at the SEC's website at www.sec.gov. An unaudited holdings listing for the Fund, which presents direct holdings as well as the pro-rata share of securities and other investments held indirectly through its investment in underlying non-money market Fidelity Central Funds is available at fidelity.com and/or institutional.fidelity.com, as applicable. In addition, each Fidelity Central Fund's financial statements are available on the SEC's website or upon request.
(g) Affiliated fund that is generally available only to investment companies and other accounts managed by Fidelity Investments. The rate quoted is the annualized seven-day yield of the fund at period end. A complete unaudited listing of the fund's holdings as of its most recent quarter end is available upon request. In addition, each Fidelity Central Fund's financial statements are available on the SEC's website or upon request.
Affiliated Central Funds
Information regarding fiscal year to date income earned by the Fund from investments in Fidelity Central Funds is as follows:
| Fund | Income earned |
| Fidelity Cash Central Fund | $160,812 |
| Fidelity Floating Rate Central Fund | 718,609 |
| Fidelity Mortgage Backed Securities Central Fund | 1,228,162 |
| Fidelity Specialized High Income Central Fund | 1,840,301 |
| Total | $3,947,884 |
Amounts in the income column in the above table include any capital gain distributions from underlying funds, which are presented in the corresponding line-item in the Statement of Operations if applicable.
Additional information regarding the Fund's fiscal year to date purchases and sales, including the ownership percentage, of the non Money Market Central Funds is as follows:
| Fund | Value, beginning of period | Purchases | Sales Proceeds | Realized Gain/Loss | Change in Unrealized appreciation (depreciation) | Value, end of period | % ownership, end of period |
| Fidelity Floating Rate Central Fund | $24,715,867 | $2,918,609 | $-- | $-- | $40,849 | $27,675,325 | 1.2% |
| Fidelity Mortgage Backed Securities Central Fund | 89,098,772 | 29,877,881 | 12,893,401 | 35,525 | (2,975,553) | 103,143,224 | 1.2% |
| Fidelity Specialized High Income Central Fund | 39,575,278 | 5,140,301 | -- | -- | (1,686,477) | 43,029,102 | 6.4% |
| Total | $153,389,917 | $37,936,791 | $12,893,401 | $35,525 | $(4,621,181) | $173,847,651 | |
Investment Valuation
The following is a summary of the inputs used, as of February 28, 2018, involving the Fund's assets and liabilities carried at fair value. The inputs or methodology used for valuing securities may not be an indication of the risk associated with investing in those securities. For more information on valuation inputs, and their aggregation into the levels used below, please refer to the Investment Valuation section in the accompanying Notes to Financial Statements.
| | Valuation Inputs at Reporting Date: |
| Description | Total | Level 1 | Level 2 | Level 3 |
| Investments in Securities: | | | | |
| Corporate Bonds | $131,631,213 | $-- | $131,631,213 | $-- |
| U.S. Government and Government Agency Obligations | 272,485,393 | -- | 272,485,393 | -- |
| U.S. Government Agency - Mortgage Securities | 6,258,780 | -- | 6,258,780 | -- |
| Asset-Backed Securities | 3,150,850 | -- | 3,150,850 | -- |
| Collateralized Mortgage Obligations | 562,344 | -- | 562,344 | -- |
| Commercial Mortgage Securities | 3,450,846 | -- | 3,450,846 | -- |
| Municipal Securities | 4,504,195 | -- | 4,504,195 | -- |
| Foreign Government and Government Agency Obligations | 3,403,825 | -- | 3,403,825 | -- |
| Fixed-Income Funds | 173,847,651 | 173,847,651 | -- | -- |
| Preferred Securities | 737,223 | -- | 737,223 | -- |
| Money Market Funds | 27,416,079 | 27,416,079 | -- | -- |
| Total Investments in Securities: | $627,448,399 | $201,263,730 | $426,184,669 | $-- |
| Other Financial Instruments: | | | | |
| TBA Sale Commitments | $(3,714,199) | $-- | $(3,714,199) | $-- |
| Total Other Financial Instruments: | $(3,714,199) | $-- | $(3,714,199) | $-- |
See accompanying notes which are an integral part of the financial statements.
Financial Statements
Statement of Assets and Liabilities
| | | February 28, 2018 (Unaudited) |
| Assets | | |
Investment in securities, at value — See accompanying schedule:
Unaffiliated issuers (cost $437,309,779) | $426,184,669 | |
| Fidelity Central Funds (cost $205,712,932) | 201,263,730 | |
| Total Investment in Securities (cost $643,022,711) | | $627,448,399 |
| Cash | | 28,365 |
| Receivable for TBA sale commitments | | 3,712,359 |
| Receivable for fund shares sold | | 1,139,953 |
| Interest receivable | | 2,697,815 |
| Distributions receivable from Fidelity Central Funds | | 30,270 |
| Total assets | | 635,057,161 |
| Liabilities | | |
| Payable for investments purchased | | |
| Regular delivery | $204,543 | |
| Delayed delivery | 6,275,902 | |
| TBA sale commitments, at value | 3,714,199 | |
| Payable for fund shares redeemed | 505,265 | |
| Accrued management fee | 154,443 | |
| Total liabilities | | 10,854,352 |
| Net Assets | | $624,202,809 |
| Net Assets consist of: | | |
| Paid in capital | | $639,942,423 |
| Distributions in excess of net investment income | | (50,878) |
| Accumulated undistributed net realized gain (loss) on investments | | (112,584) |
| Net unrealized appreciation (depreciation) on investments | | (15,576,152) |
| Net Assets, for 63,964,101 shares outstanding | | $624,202,809 |
| Net Asset Value, offering price and redemption price per share ($624,202,809 ÷ 63,964,101 shares) | | $9.76 |
See accompanying notes which are an integral part of the financial statements.
Statement of Operations
| | | Six months ended February 28, 2018 (Unaudited) |
| Investment Income | | |
| Dividends | | $24,782 |
| Interest | | 4,882,364 |
| Income from Fidelity Central Funds | | 3,074,935 |
| Total income | | 7,982,081 |
| Expenses | | |
| Management fee | $828,824 | |
| Independent trustees' fees and expenses | 992 | |
| Total expenses before reductions | 829,816 | |
| Expense reductions | (652) | 829,164 |
| Net investment income (loss) | | 7,152,917 |
| Realized and Unrealized Gain (Loss) | | |
| Net realized gain (loss) on: | | |
| Investment securities: | | |
| Unaffiliated issuers | (482,667) | |
| Fidelity Central Funds | 35,525 | |
| Capital gain distributions from Fidelity Central Funds | 872,949 | |
| Total net realized gain (loss) | | 425,807 |
| Change in net unrealized appreciation (depreciation) on: | | |
| Investment securities: | | |
| Unaffiliated issuers | (13,083,547) | |
| Fidelity Central Funds | (4,621,181) | |
| Delayed delivery commitments | (1,840) | |
| Total change in net unrealized appreciation (depreciation) | | (17,706,568) |
| Net gain (loss) | | (17,280,761) |
| Net increase (decrease) in net assets resulting from operations | | $(10,127,844) |
See accompanying notes which are an integral part of the financial statements.
Statement of Changes in Net Assets
| | Six months ended February 28, 2018 (Unaudited) | For the period
May 25, 2017 (commencement of operations) to August 31, 2017 |
| Increase (Decrease) in Net Assets | | |
| Operations | | |
| Net investment income (loss) | $7,152,917 | $1,174,624 |
| Net realized gain (loss) | 425,807 | 107,608 |
| Change in net unrealized appreciation (depreciation) | (17,706,568) | 2,130,416 |
| Net increase (decrease) in net assets resulting from operations | (10,127,844) | 3,412,648 |
| Distributions to shareholders from net investment income | (7,256,974) | (1,121,245) |
| Distributions to shareholders from net realized gain | (646,200) | – |
| Total distributions | (7,903,174) | (1,121,245) |
| Share transactions | | |
| Proceeds from sales of shares | 229,910,745 | 513,311,762 |
| Reinvestment of distributions | 7,903,169 | 1,121,245 |
| Cost of shares redeemed | (88,824,648) | (23,479,849) |
| Net increase (decrease) in net assets resulting from share transactions | 148,989,266 | 490,953,158 |
| Total increase (decrease) in net assets | 130,958,248 | 493,244,561 |
| Net Assets | | |
| Beginning of period | 493,244,561 | – |
| End of period | $624,202,809 | $493,244,561 |
| Other Information | | |
| Undistributed net investment income end of period | $– | $53,179 |
| Distributions in excess of net investment income end of period | $(50,878) | $– |
| Shares | | |
| Sold | 23,089,745 | 51,231,377 |
| Issued in reinvestment of distributions | 795,621 | 111,440 |
| Redeemed | (8,922,457) | (2,341,625) |
| Net increase (decrease) | 14,962,909 | 49,001,192 |
See accompanying notes which are an integral part of the financial statements.
Financial Highlights
Fidelity Total Bond K6 Fund
| | Six months ended (Unaudited) February 28, | Years endedAugust 31, |
| | 2018 | 2017 A |
| Selected Per–Share Data | | |
| Net asset value, beginning of period | $10.07 | $10.00 |
| Income from Investment Operations | | |
| Net investment income (loss)B | .129 | .061 |
| Net realized and unrealized gain (loss) | (.296) | .073 |
| Total from investment operations | (.167) | .134 |
| Distributions from net investment income | (.131) | (.064) |
| Distributions from net realized gain | (.012) | – |
| Total distributions | (.143) | (.064) |
| Net asset value, end of period | $9.76 | $10.07 |
| Total ReturnC,D | (1.68)% | 1.35% |
| Ratios to Average Net AssetsE,F | | |
| Expenses before reductions | .30%G | .30%G |
| Expenses net of fee waivers, if any | .30%G | .30%G |
| Expenses net of all reductions | .30%G | .30%G |
| Net investment income (loss) | 2.62%G | 2.45%G |
| Supplemental Data | | |
| Net assets, end of period (000 omitted) | $624,203 | $493,245 |
| Portfolio turnover rateH | 48%G | 51%I |
A For the period May 25, 2017 (commencement of operations) to August 31, 2017.
B Calculated based on average shares outstanding during the period.
C Total returns for periods of less than one year are not annualized.
D Total returns would have been lower if certain expenses had not been reduced during the applicable periods shown.
E Fees and expenses of any underlying Fidelity Central Funds are not included in the Fund's expense ratio. The Fund indirectly bears its proportionate share of the expenses of any underlying Fidelity Central Funds. Based on their most recent shareholder report date, the expenses of any underlying non-money market Fidelity Central Funds ranged from less than .005% to .06%.
F Expense ratios reflect operating expenses of the Fund. Expenses before reductions do not reflect amounts reimbursed by the investment adviser or reductions from expense offset arrangements and do not represent the amount paid by the Fund during periods when reimbursements or reductions occur. Expense ratios before reductions for start-up periods may not be representative of longer term operating periods. Expenses net of fee waivers reflect expenses after reimbursement by the investment adviser but prior to reductions from expense offset arrangements. Expenses net of all reductions represent the net expenses paid by the Fund.
G Annualized
H Amount does not include the portfolio activity of any underlying Fidelity Central Funds.
I Amount not annualized.
See accompanying notes which are an integral part of the financial statements.
Notes to Financial Statements (Unaudited)
For the period ended February 28, 2018
1. Organization.
Fidelity Total Bond K6 Fund (the Fund) is a fund of Fidelity Income Fund (the Trust) and is authorized to issue an unlimited number of shares. Share transactions on the Statement of Changes in Net Assets may contain exchanges between affiliated funds. The Trust is registered under the Investment Company Act of 1940, as amended (the 1940 Act), as an open-end management investment company organized as a Massachusetts business trust. Shares generally are available only to employer-sponsored retirement plans that are recordkept by Fidelity, or to certain employer-sponsored retirement plans that are not recordkept by Fidelity.
2. Investments in Fidelity Central Funds.
The Fund invests in Fidelity Central Funds, which are open-end investment companies generally available only to other investment companies and accounts managed by the investment adviser and its affiliates. The Fund's Schedule of Investments lists each of the Fidelity Central Funds held as of period end, if any, as an investment of the Fund, but does not include the underlying holdings of each Fidelity Central Fund. As an Investing Fund, the Fund indirectly bears its proportionate share of the expenses of the underlying Fidelity Central Funds.
Based on its investment objective, each Fidelity Central Fund may invest or participate in various investment vehicles or strategies that are similar to those of the Fund. These strategies are consistent with the investment objectives of the Fund and may involve certain economic risks which may cause a decline in value of each of the Fidelity Central Funds and thus a decline in the value of the Fund. The Money Market Central Funds seek preservation of capital and current income and are managed by Fidelity Investments Money Management, Inc. (FIMM), an affiliate of the investment adviser. Annualized expenses of the Money Market Central Funds as of their most recent shareholder report date are less than .005%. The following summarizes the Fund's investment in each non-money market Fidelity Central Fund.
| Fidelity Central Fund | Investment Manager | Investment Objective | Investment Practices | Expense Ratio(a) |
| Fidelity Floating Rate Central Fund | FMR Co., Inc. (FMRC) | Seeks a high level of income by normally investing in floating rate loans and other floating rate securities. | Loans & Direct Debt Instruments
Restricted Securities
| .06% |
| Fidelity Mortgage Backed Securities Central Fund | FIMM | Seeks a high level of income by normally investing in investment-grade mortgage-related securities and repurchase agreements for those securities. | Delayed Delivery & When Issued Securities
Futures
Swaps | Less than .005% |
| Fidelity Specialized High Income Central Fund | FMRC | Seeks a high level of current income by normally investing in income-producing debt securities, with an emphasis on lower-quality debt securities. | Loans & Direct Debt Instruments
Restricted Securities
| Less than .005% |
(a) Expenses expressed as a percentage of average net assets and are as of each underlying Central Fund's most recent annual or semi-annual shareholder report.
An unaudited holdings listing for the Fund, which presents direct holdings as well as the pro-rata share of any securities and other investments held indirectly through its investment in underlying non-money market Fidelity Central Funds, is available at fidelity.com. A complete unaudited list of holdings for each Fidelity Central Fund is available upon request or at the Securities and Exchange Commission (the SEC) website at www.sec.gov. In addition, the financial statements of the Fidelity Central Funds which contain the significant accounting policies (including investment valuation policies) of those funds are available on the SEC website or upon request.
3. Significant Accounting Policies.
The Fund is an investment company and applies the accounting and reporting guidance of the Financial Accounting Standards Board (FASB) Accounting Standards Codification Topic 946 Financial Services – Investments Companies. The financial statements have been prepared in conformity with accounting principles generally accepted in the United States of America (GAAP), which require management to make certain estimates and assumptions at the date of the financial statements. Actual results could differ from those estimates. Subsequent events, if any, through the date that the financial statements were issued have been evaluated in the preparation of the financial statements. The following summarizes the significant accounting policies of the Fund:
Investment Valuation. Investments are valued as of 4:00 p.m. Eastern time on the last calendar day of the period. The Board of Trustees (the Board) has delegated the day to day responsibility for the valuation of the Fund's investments to the Fair Value Committee (the Committee) established by the Fund's investment adviser. In accordance with valuation policies and procedures approved by the Board, the Fund attempts to obtain prices from one or more third party pricing vendors or brokers to value its investments. When current market prices, quotations or currency exchange rates are not readily available or reliable, investments will be fair valued in good faith by the Committee, in accordance with procedures adopted by the Board. Factors used in determining fair value vary by investment type and may include market or investment specific events, changes in interest rates and credit quality. The frequency with which these procedures are used cannot be predicted and they may be utilized to a significant extent. The Committee oversees the Fund's valuation policies and procedures and reports to the Board on the Committee's activities and fair value determinations. The Board monitors the appropriateness of the procedures used in valuing the Fund's investments and ratifies the fair value determinations of the Committee.
The Fund categorizes the inputs to valuation techniques used to value its investments into a disclosure hierarchy consisting of three levels as shown below:
- Level 1 – quoted prices in active markets for identical investments
- Level 2 – other significant observable inputs (including quoted prices for similar investments, interest rates, prepayment speeds, etc.)
- Level 3 – unobservable inputs (including the Fund's own assumptions based on the best information available)
Valuation techniques used to value the Fund's investments by major category are as follows:
Debt securities, including restricted securities, are valued based on evaluated prices received from third party pricing vendors or from brokers who make markets in such securities. Corporate bonds, foreign government and government agency obligations, municipal securities, preferred securities and U.S. government and government agency obligations, are valued by pricing vendors who utilize matrix pricing which considers yield or price of bonds of comparable quality, coupon, maturity and type or by broker-supplied prices. Asset backed securities, collateralized mortgage obligations, commercial mortgage securities and U.S. government agency mortgage securities are valued by pricing vendors who utilize matrix pricing which considers prepayment speed assumptions, attributes of the collateral, yield or price of bonds of comparable quality, coupon, maturity and type or by broker-supplied prices. When independent prices are unavailable or unreliable, debt securities may be valued utilizing pricing methodologies which consider similar factors that would be used by third party pricing vendors. Debt securities are generally categorized as Level 2 in the hierarchy but may be Level 3 depending on the circumstances.
Investments in open-end mutual funds, including the Fidelity Central Funds, are valued at their closing net asset value (NAV) each business day and are categorized as Level 1 in the hierarchy.
Changes in valuation techniques may result in transfers in or out of an assigned level within the disclosure hierarchy. The aggregate value of investments by input level as of February 28, 2018 is included at the end of the Fund's Schedule of Investments.
Investment Transactions and Income. For financial reporting purposes, the Fund's investment holdings and NAV include trades executed through the end of the last business day of the period. The NAV per share for processing shareholder transactions is calculated as of the close of business of the New York Stock Exchange (NYSE), normally 4:00 p.m. Eastern time and includes trades executed through the end of the prior business day. Gains and losses on securities sold are determined on the basis of identified cost. Dividend income is recorded on the ex-dividend date. Income and capital gain distributions from Fidelity Central Funds, if any, are recorded on the ex-dividend date. Interest income is accrued as earned and includes coupon interest and amortization of premium and accretion of discount on debt securities as applicable. The principal amount on inflation-indexed securities is periodically adjusted to the rate of inflation and interest is accrued based on the principal amount. The adjustments to principal due to inflation are reflected as increases or decreases to Interest in the accompanying Statement of Operations. Debt obligations may be placed on non-accrual status and related interest income may be reduced by ceasing current accruals and writing off interest receivables when the collection of all or a portion of interest has become doubtful based on consistently applied procedures. A debt obligation is removed from non-accrual status when the issuer resumes interest payments or when collectability of interest is reasonably assured.
Expenses. Expenses directly attributable to a fund are charged to that fund. Expenses attributable to more than one fund are allocated among the respective funds on the basis of relative net assets or other appropriate methods. Expense estimates are accrued in the period to which they relate and adjustments are made when actual amounts are known.
Income Tax Information and Distributions to Shareholders. Each year, the Fund intends to qualify as a regulated investment company under Subchapter M of the Internal Revenue Code, including distributing substantially all of its taxable income and realized gains. As a result, no provision for U.S. Federal income taxes is required. The Fund files a U.S. federal tax return, in addition to state and local tax returns as required. The Fund's federal income tax returns are subject to examination by the Internal Revenue Service (IRS) for a period of three fiscal years after they are filed. State and local tax returns may be subject to examination for an additional fiscal year depending on the jurisdiction.
Dividends are declared and recorded daily and paid monthly from net investment income. Distributions from realized gains, if any, are declared and recorded on the ex-dividend date. Income and capital gain distributions are determined in accordance with income tax regulations, which may differ from GAAP.
Capital accounts within the financial statements are adjusted for permanent book-tax differences. These adjustments have no impact on net assets or the results of operations. Capital accounts are not adjusted for temporary book-tax differences which will reverse in a subsequent period.
Book-tax differences are primarily due to market discount and losses deferred due to wash sales.
As of period end, the cost and unrealized appreciation (depreciation) in securities, and derivatives if applicable, for federal income tax purposes were as follows:
| Gross unrealized appreciation | $127,308 |
| Gross unrealized depreciation | (15,735,426) |
| Net unrealized appreciation (depreciation) | $(15,608,118) |
| Tax cost | $643,056,517 |
Delayed Delivery Transactions and When-Issued Securities. During the period, the Fund transacted in securities on a delayed delivery or when-issued basis. Payment and delivery may take place after the customary settlement period for that security. The price of the underlying securities and the date when the securities will be delivered and paid for are fixed at the time the transaction is negotiated. The securities purchased on a delayed delivery or when-issued basis are identified as such in the Fund's Schedule of Investments. The Fund may receive compensation for interest forgone in the purchase of a delayed delivery or when-issued security. With respect to purchase commitments, the Fund identifies securities as segregated in its records with a value at least equal to the amount of the commitment. Losses may arise due to changes in the value of the underlying securities or if the counterparty does not perform under the contract's terms, or if the issuer does not issue the securities due to political, economic, or other factors.
To-Be-Announced (TBA) Securities and Mortgage Dollar Rolls. During the period, the Fund transacted in TBA securities that involved buying or selling mortgage-backed securities (MBS) on a forward commitment basis. A TBA transaction typically does not designate the actual security to be delivered and only includes an approximate principal amount; however delivered securities must meet specified terms defined by industry guidelines, including issuer, rate and current principal amount outstanding on underlying mortgage pools. The Fund may enter into a TBA transaction with the intent to take possession of or deliver the underlying MBS, or the Fund may elect to extend the settlement by entering into either a mortgage or reverse mortgage dollar roll. Mortgage dollar rolls are transactions where a fund sells TBA securities and simultaneously agrees to repurchase MBS on a later date at a lower price and with the same counterparty. Reverse mortgage dollar rolls involve the purchase and simultaneous agreement to sell TBA securities on a later date at a lower price. Transactions in mortgage dollar rolls and reverse mortgage dollar rolls are accounted for as purchases and sales and may result in an increase to the Fund's portfolio turnover rate.
Purchases and sales of TBA securities involve risks similar to those discussed above for delayed delivery and when-issued securities. Also, if the counterparty in a mortgage dollar roll or a reverse mortgage dollar roll transaction files for bankruptcy or becomes insolvent, the Fund's right to repurchase or sell securities may be limited. Additionally, when a fund sells TBA securities without already owning or having the right to obtain the deliverable securities (an uncovered forward commitment to sell), it incurs a risk of loss because it could have to purchase the securities at a price that is higher than the price at which it sold them. A fund may be unable to purchase the deliverable securities if the corresponding market is illiquid.
TBA securities subject to a forward commitment to sell at period end are included at the end of the Fund's Schedule of Investments under the caption "TBA Sale Commitments." The proceeds and value of these commitments are reflected in the Fund's Statement of Assets and Liabilities as Receivable for TBA sale commitments and TBA sale commitments, at value, respectively.
Restricted Securities. The Fund may invest in securities that are subject to legal or contractual restrictions on resale. These securities generally may be resold in transactions exempt from registration or to the public if the securities are registered. Disposal of these securities may involve time-consuming negotiations and expense, and prompt sale at an acceptable price may be difficult. Information regarding restricted securities is included at the end of the Fund's Schedule of Investments.
New Accounting Pronouncement. In March 2017, the Financial Accounting Standards Board (FASB) issued an Accounting Standards Update (ASU), ASU 2017-08, which amends the amortization period for certain callable debt securities that are held at a premium. The amendment requires the premium to be amortized to the earliest call date. The amendments do not require an accounting change for securities held at a discount. The ASU is effective for annual periods beginning after December 15, 2018. Management is currently evaluating the potential impact of these changes to the financial statements.
4. Purchases and Sales of Investments.
Purchases and sales of securities (including the Fixed-Income Central Funds), other than short-term securities and U.S. government securities, aggregated $75,701,656 and $23,866,088, respectively.
5. Fees and Other Transactions with Affiliates.
Management Fee. Fidelity Management & Research Company (the investment adviser) and its affiliates provide the Fund with investment management related services for which the Fund pays a monthly management fee that is based on an annual rate of .30% of average net assets. Under the management contract, the investment adviser or an affiliate pays all other expenses of the Fund, excluding fees and expenses of the independent Trustees, and certain miscellaneous expenses such as proxy and shareholder meeting expenses.
Interfund Trades. The Fund may purchase from or sell securities to other Fidelity Funds under procedures adopted by the Board. The procedures have been designed to ensure these interfund trades are executed in accordance with Rule 17a-7 of the 1940 Act. Interfund trades are included within the respective purchases and sales amounts shown in the Purchases and Sales of Investments note.
6. Expense Reductions.
Through arrangements with the Fund's custodian, credits realized as a result of certain uninvested cash balances were used to reduce the Fund's management fee. During the period, these credits reduced the Fund's management fee by $652.
7. Other.
The Fund's organizational documents provide former and current trustees and officers with a limited indemnification against liabilities arising in connection with the performance of their duties to the Fund. In the normal course of business, the Fund may also enter into contracts that provide general indemnifications. The Fund's maximum exposure under these arrangements is unknown as this would be dependent on future claims that may be made against the Fund. The risk of material loss from such claims is considered remote.
Shareholder Expense Example
As a shareholder of the Fund, you incur two types of costs: (1) transaction costs and (2) ongoing costs, including management fees and other Fund expenses. This Example is intended to help you understand your ongoing costs (in dollars) of investing in the Fund and to compare these costs with the ongoing costs of investing in other mutual funds.
The Example is based on an investment of $1,000 invested at the beginning of the period and held for the entire period (September 1, 2017 to February 28, 2018).
Actual Expenses
The first line of the accompanying table provides information about actual account values and actual expenses. You may use the information in this line, together with the amount you invested, to estimate the expenses that you paid over the period. Simply divide your account value by $1,000.00 (for example, an $8,600 account value divided by $1,000.00 = 8.6), then multiply the result by the number in the first line under the heading entitled "Expenses Paid During Period" to estimate the expenses you paid on your account during this period. In addition, the Fund, as a shareholder in the underlying Fidelity Central Funds, will indirectly bear its pro-rata share of the fees and expenses incurred by the underlying Fidelity Central Funds. These fees and expenses are not included in the Fund's annualized expense ratio used to calculate the expense estimate in the table below.
Hypothetical Example for Comparison Purposes
The second line of the accompanying table provides information about hypothetical account values and hypothetical expenses based on the Fund's actual expense ratio and an assumed rate of return of 5% per year before expenses, which is not the Fund's actual return. The hypothetical account values and expenses may not be used to estimate the actual ending account balance or expenses you paid for the period. You may use this information to compare the ongoing costs of investing in the Fund and other funds. To do so, compare this 5% hypothetical example with the 5% hypothetical examples that appear in the shareholder reports of the other funds. In addition, the Fund, as a shareholder in the underlying Fidelity Central Funds, will indirectly bear its pro-rata share of the fees and expenses incurred by the underlying Fidelity Central Funds. These fees and expenses are not included in the Fund's annualized expense ratio used to calculate the expense estimate in the table below.
Please note that the expenses shown in the table are meant to highlight your ongoing costs only and do not reflect any transaction costs. Therefore, the second line of the table is useful in comparing ongoing costs only, and will not help you determine the relative total costs of owning different funds.
| | Annualized Expense Ratio-A | Beginning
Account Value
September 1, 2017 | Ending
Account Value
February 28, 2018 | Expenses Paid
During Period-B
September 1, 2017
to February 28, 2018 |
| Actual | .30% | $1,000.00 | $983.20 | $1.48 |
| Hypothetical-C | | $1,000.00 | $1,023.31 | $1.51 |
A Annualized expense ratio reflects expenses net of applicable fee waivers.
B Expenses are equal to the Fund's annualized expense ratio, multiplied by the average account value over the period, multiplied by 181/365 (to reflect the one-half year period). The fees and expenses of the underlying Fidelity Central Funds in which the Fund invests are not included in the Fund's annualized expense ratio. In addition to the expenses noted above, the Fund also indirectly bears its proportional share of the expenses of the underlying Fidelity Central Funds. Annualized expenses of the underlying non-money market Fidelity Central Funds as of their most recent fiscal half year ranged from less than .005% to .03%.
C 5% return per year before expenses
Corporate Headquarters
245 Summer St.
Boston, MA 02210
www.fidelity.com
TBDK6-SANN-0418
1.9884014.100
Item 2.
Code of Ethics
Not applicable.
Item 3.
Audit Committee Financial Expert
Not applicable.
Item 4.
Principal Accountant Fees and Services
Not applicable.
Item 5.
Audit Committee of Listed Registrants
Not applicable.
Item 6.
Investments
(a)
Not applicable.
(b)
Not applicable
Item 7.
Disclosure of Proxy Voting Policies and Procedures for Closed-End Management Investment Companies
Not applicable.
Item 8.
Portfolio Managers of Closed-End Management Investment Companies
Not applicable.
Item 9.
Purchase of Equity Securities by Closed-End Management Investment Company and Affiliated Purchasers
Not applicable.
Item 10.
Submission of Matters to a Vote of Security Holders
There were no material changes to the procedures by which shareholders may recommend nominees to the Fidelity Income Fund’s Board of Trustees.
Item 11.
Controls and Procedures
(a)(i) The President and Treasurer and the Chief Financial Officer have concluded that the Fidelity Income Fund’s (the “Trust”) disclosure controls and procedures (as defined
in Rule 30a-3(c) under the Investment Company Act) provide reasonable assurances that material information relating to the Trust is made known to them by the appropriate persons, based on their evaluation of these controls and procedures as of a date within 90 days of the filing date of this report.
(a)(ii) There was no change in the Trust’s internal control over financial reporting (as defined in Rule 30a-3(d) under the Investment Company Act) that occurred during the second fiscal quarter of the period covered by this report that has materially affected, or is reasonably likely to materially affect, the Trust’s internal control over financial reporting.
Item 12.
Exhibits
| | |
(a) | (1) | Not applicable. |
(a) | (2) | Certification pursuant to Rule 30a-2(a) under the Investment Company Act of 1940 (17 CFR 270.30a-2(a)) is filed and attached hereto as Exhibit 99.CERT. |
(a) | (3) | Not applicable. |
(b) |
| Certification pursuant to Rule 30a-2(b) under the Investment Company Act of 1940 (17 CFR 270.30a-2(b)) is furnished and attached hereto as Exhibit 99.906CERT. |
SIGNATURES
Pursuant to the requirements of the Securities Exchange Act of 1934 and the Investment Company Act of 1940, the registrant has duly caused this report to be signed on its behalf by the undersigned, thereunto duly authorized.
Fidelity Income Fund
| |
By: | /s/Stephanie J. Dorsey |
| Stephanie J. Dorsey |
| President and Treasurer |
|
|
Date: | April 24, 2018 |
Pursuant to the requirements of the Securities Exchange Act of 1934 and the Investment Company Act of 1940, this report has been signed below by the following persons on behalf of the registrant and in the capacities and on the dates indicated.
| |
By: | /s/Stephanie J. Dorsey |
| Stephanie J. Dorsey |
| President and Treasurer |
|
|
Date: | April 24, 2018 |
| |
By: | /s/Howard J. Galligan III |
| Howard J. Galligan III |
| Chief Financial Officer |
|
|
Date: | April 24, 2018 |