Table of Contents
UNITED STATES
SECURITIES AND EXCHANGE COMMISSION
Washington, D.C. 20549
FORM N-CSR
CERTIFIED SHAREHOLDER REPORT OF
REGISTERED MANAGEMENT INVESTMENT COMPANIES
Investment Company Act file number 811-04096
MFS MUNICIPAL SERIES TRUST
(Exact name of registrant as specified in charter)
111 Huntington Avenue, Boston, Massachusetts 02199
(Address of principal executive offices) (Zip code)
Susan S. Newton
Massachusetts Financial Services Company
111 Huntington Avenue, Boston, Massachusetts 02199
(Name and address of agents for service)
Registrant’s telephone number, including area code: (617) 954-5000
Date of fiscal year end: March 31
Date of reporting period: March 31, 2013
Table of Contents
| ITEM 1. | REPORTS TO STOCKHOLDERS. |
Table of Contents
ANNUAL REPORT
March 31, 2013

MFS® MUNICIPAL INCOME FUND

LMB-ANN
Table of Contents
MFS® MUNICIPAL INCOME FUND
The report is prepared for the general information of shareholders.
It is authorized for distribution to prospective investors only when preceded or accompanied by a current prospectus.
NOT FDIC INSURED Ÿ MAY LOSE VALUE Ÿ NO BANK GUARANTEE
Table of Contents

LETTER FROM THE CHAIRMAN AND CEO
Dear Shareholders:
The first quarter of 2013 delivered strong returns to global equity investors, particularly those holding U.S. and Japanese stocks, while bond returns were flat overall. The U.S.
economy picked up steam, driven by the improving housing and job markets. U.S. economic data were broadly positive, with growth in manufacturing activity, durable goods orders and auto sales. However, consumer confidence wavered somewhat, a likely reflection of the impact of the payroll tax increase and uncertainty over the U.S. government’s across-the-board sequestration cuts.
The eurozone’s unemployment picture and overall economic activity steadily worsened. Cyprus, the latest debt-crisis hot spot, faces unique challenges, with its oversized banking sector’s unhealthy exposure to Greek debt. In addition, the hefty cost to
large bank depositors could weaken confidence in the region’s financial stability. China’s economic activity rebounded after a mild slowdown in 2012. The Japanese government’s aggressive effort to stimulate its long-dormant economy by devaluing the yen lifted stock prices, exports and profits for struggling Japanese firms. The outlook for further economic growth and an extension of the U.S. bull market is highly dependent on how much damage is caused by the U.S. budget cuts, global growth prospects and the ebb and flow of global tail risk events. Most factors point to a continued slow and uneven global economic recovery.
As always, managing risk in the face of uncertainty remains a top priority for investors. At MFS®, our uniquely collaborative investment process employs global research and active risk management. Our global team of investment professionals shares ideas and evaluates opportunities across continents, investment disciplines and asset classes — all with a goal of building better insights, and ultimately better results, for our clients.
We remain mindful of the many economic challenges investors face today, and believe it is more important than ever to maintain a long-term view and employ time-tested principles, such as asset allocation and diversification. We also remain confident that our unique approach can serve investors well as they work with their financial advisors to identify and pursue the most suitable opportunities.
Respectfully,

Robert J. Manning
Chairman and Chief Executive Officer
MFS Investment Management®
May 15, 2013
The opinions expressed in this letter are subject to change, may not be relied upon for investment advice, and no forecasts can be guaranteed.
1
Table of Contents
Portfolio structure (i)

| Top five industries (i) | ||||
| Healthcare Revenue-Hospitals | 14.6% | |||
| Universities-Colleges | 8.3% | |||
| General Obligations-General Purpose | 7.9% | |||
| Utilities-Municipal Owned | 7.4% | |||
| Water & Sewer Utility Revenue | 6.6% |
| Composition including fixed income credit quality (a)(i) | ||||
| AAA | 10.2% | |||
| AA | 28.5% | |||
| A | 29.5% | |||
| BBB | 20.5% | |||
| BB | 2.9% | |||
| B | 3.2% | |||
| C | 0.2% | |||
| Not Rated | 2.1% | |||
| Cash & Other | 2.9% | |||
| Portfolio facts (i) | ||||
| Average Duration (d) | 8.7 | |||
| Average Effective Maturity (m) | 16.9 yrs. | |||
| (a) | For all securities other than those specifically described below, ratings are assigned to underlying securities utilizing ratings from Moody’s, Fitch, and Standard & Poor’s rating agencies and applying the following hierarchy: If all three agencies provide a rating, the middle rating (after dropping the highest and lowest ratings) is assigned; if two of the three agencies rate a security, the lower of the two is assigned. Ratings are shown in the S&P and Fitch scale (e.g., AAA). Securities rated BBB or higher are considered investment grade. All ratings are subject to change. Not Rated includes fixed income securities, including fixed income futures contracts, which have not been rated by any rating agency. Cash & Other includes cash, other assets less liabilities, offsets to derivative positions, and short-term securities. The fund may not hold all of these instruments. The fund is not rated by these agencies. |
| (d) | Duration is a measure of how much a bond’s price is likely to fluctuate with general changes in interest rates, e.g., if rates rise 1.00%, a bond with a 5-year duration is likely to lose about 5.00% of its value due to the interest rate move. |
| (i) | For purposes of this presentation, the components include the market value of securities, and reflect the impact of the equivalent exposure of derivative positions, if any. These amounts may be negative from time to time. The bond component will include any accrued interest amounts. Equivalent exposure is a calculated amount that translates the derivative position into a reasonable approximation of the amount of the underlying asset that the portfolio would have to hold at a given point in time to have the same price sensitivity that results from the portfolio’s ownership of the derivative contract. When dealing with derivatives, equivalent exposure is a more representative measure of the potential impact of a position on portfolio performance than market value. Where the fund holds convertible bonds, these are treated as part of the equity portion of the portfolio. |
| (m) | In determining an instrument’s effective maturity for purposes of calculating the fund’s dollar-weighted average effective maturity, MFS uses the instrument’s stated maturity or, if applicable, an earlier date on which MFS believes it is probable that a maturity-shortening device (such as a put, pre-refunding or prepayment) will cause the instrument to be repaid. Such an earlier date can be substantially shorter than the instrument’s stated maturity. |
Percentages are based on net assets as of 3/31/13.
The portfolio is actively managed and current holdings may be different.
2
Table of Contents
Summary of Results
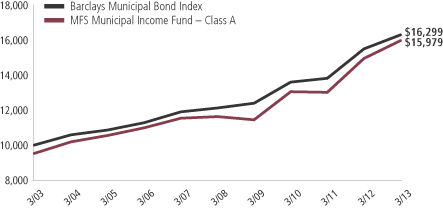
For the twelve months ended March 31, 2013, Class A shares of the MFS Municipal Income Fund (“fund”) provided a total return of 6.88%, at net asset value. This compares with a return of 5.25% for the fund’s benchmark, the Barclays Municipal Bond Index.
Market Environment
The beginning of the period was characterized by a risk-on sentiment as a result of additional liquidity measures by the Federal Reserve Bank (“Fed”) and the European Central Bank (“ECB”) as well as a commensurate improvement in macroeconomic conditions. During this time, global equity valuations rose, credit spreads contracted, and high-quality sovereign yields increased modestly.
Within a couple of months, however, conditions worsened, driven by broadly weaker global macroeconomic indicators, as well as renewed concerns over the eurozone’s capacity and determination to address its ongoing crisis. Despite this deterioration, broad market sentiment remained relatively resilient as equity markets generally maintained gains and credit spreads did not indicate deterioration.
However, this renewed weakness in the fundamentals precipitated a further round of monetary easing by both the Fed (through a third round of quantitative easing) and the ECB (through a new bond purchase facility) in the middle of the period, which soon instilled additional confidence in risk markets. Nonetheless, towards the end of the calendar year, weaker equity earnings reports and declining forward guidance caused market sentiment to soften. In addition, year-end fiscal cliff negotiations between the Republicans in the U.S. Congress and President Obama were a particular source of market attention, where uncertainty surrounding the fiscal negotiations continued right up to the end-of-year deadline. A last minute political agreement averted the worst-case scenario and markets gravitated towards risk assets again, though the implementation of the U.S. budget sequester, combined with the uncertainty surrounding the Italian election results, inserted a greater degree of caution as the reporting period ended.
Over the reporting period, municipal bond yields generally followed the direction of U.S. Treasury yields. Yields on “AAA” rated (r) municipal bonds declined throughout the first half of the period, hitting multi-generational lows in late November/early December, before rising over the second half of the period, and ending the twelve month period modestly lower. At the same time, spreads between higher quality bonds and lower quality bonds continued to decline, with “BBB” rated municipal bonds outperforming “AAA” rated municipal bonds and non-investment grade/non-rated bonds outperforming “BBB” rated municipal bonds. This reflects the strong technical backdrop over the trailing twelve months with demand for municipals outstripping supply, and investors continuing their search for yield. Near the end of the period, a number of developments emerged that have the potential to shift the balance of supply and demand. Amongst the more notable were a marked decline in the pace of inflows into, and even some outflows from, municipal bond funds, and proposals to alter the tax treatment of tax-exempt income.
3
Table of Contents
Management Review – continued
Factors affecting performance
A key factor that supported positive performance relative to the Barclays Municipal Bond Index was the fund’s longer duration (d) stance. The fund’s greater exposure to bonds rated “BBB”, and its lesser exposure to bonds rated “A”, also aided relative performance.
Among sectors, a lesser exposure to general obligation securities as well as a greater exposure to the health care sector contributed to the relative performance. Security selection within the education, tobacco, and credit enhanced sectors further supported relative returns.
The fund’s cash and/or cash equivalents position during the period detracted from relative performance. Under normal market conditions, the fund strives to be fully invested and generally holds cash to buy new holdings and to provide liquidity. In a period when markets rose, as measured by the benchmark, holding cash hurt performance versus the benchmark, which has no cash position.
Respectfully,
Geoffrey Schechter
Portfolio Manager
| (d) | Duration is a measure of how much a bond’s price is likely to fluctuate with general changes in interest rates, e.g., if rates rise 1.00%, a bond with a 5-year duration is likely to lose about 5.00% of its value. |
| (r) | Bonds rated “BBB”, “Baa”, or higher are considered investment grade; bonds rated “BB”, “Ba”, or below are considered non-investment grade. The sources for bond quality ratings are Moody’s Investors Service, Standard & Poor’s and Fitch, Inc. and are applied using the following hierarchy: If all three agencies provide a rating, the middle rating (after dropping the highest and lowest ratings) is assigned; if two of the three agencies rate a security, the lower of the two is assigned. Ratings are shown in the S&P and Fitch scale (e.g., AAA). For securities which are not rated by any of the three agencies, the security is considered Not Rated. |
The views expressed in this report are those of the portfolio manager only through the end of the period of the report as stated on the cover and do not necessarily reflect the views of MFS or any other person in the MFS organization. These views are subject to change at any time based on market or other conditions, and MFS disclaims any responsibility to update such views. These views may not be relied upon as investment advice or an indication of trading intent on behalf of any MFS portfolio. References to specific securities are not recommendations of such securities, and may not be representative of any MFS portfolio’s current or future investments.
4
Table of Contents
PERFORMANCE SUMMARY THROUGH 3/31/13
The following chart illustrates a representative class of the fund’s historical performance in comparison to its benchmark(s). Performance results include the deduction of the maximum applicable sales charge and reflect the percentage change in net asset value, including reinvestment of dividends and capital gains distributions. The performance of other share classes will be greater than or less than that of the class depicted below. Benchmarks are unmanaged and may not be invested in directly. Benchmark returns do not reflect sales charges, commissions or expenses. (See Notes to Performance Summary.)
Performance data shown represents past performance and is no guarantee of future results. Investment return and principal value fluctuate so your shares, when sold, may be worth more or less than the original cost; current performance may be lower or higher than quoted. The performance shown does not reflect the deduction of taxes, if any, that a shareholder would pay on fund distributions or the redemption of fund shares.
Growth of a Hypothetical $10,000 Investment
5
Table of Contents
Performance Summary – continued
Total Returns through 3/31/13
Average annual without sales charge
| Share class | Class inception date | 1-yr | 5-yr | 10-yr | Life (t) | |||||||||
| A | 9/07/93 | 6.88% | 6.57% | 5.31% | N/A | |||||||||
| B | 12/29/86 | 5.95% | 5.77% | 4.52% | N/A | |||||||||
| C | 1/03/94 | 6.06% | 5.76% | 4.53% | N/A | |||||||||
| I | 8/01/11 | 7.15% | N/A | N/A | 9.57% | |||||||||
| A1 | 6/25/07 | 7.14% | 6.86% | N/A | 6.25% | |||||||||
| B1 | 6/25/07 | 6.34% | 6.03% | N/A | 5.42% | |||||||||
| Comparative benchmark | ||||||||||||||
| Barclays Municipal Bond Index (f) | 5.25% | 6.10% | 5.01% | N/A | ||||||||||
| Average annual with sales charge | ||||||||||||||
| A With Initial Sales Charge (4.75%) | 1.80% | 5.54% | 4.80% | N/A | ||||||||||
| B With CDSC (Declining over six years | 1.95% | 5.45% | 4.52% | N/A | ||||||||||
| C With CDSC (1% for 12 months) (x) | 5.06% | 5.76% | 4.53% | N/A | ||||||||||
| A1 With Initial Sales Charge (4.75%) | 2.05% | 5.82% | N/A | 5.36% | ||||||||||
| B1 With CDSC (Declining over six years | 2.34% | 5.71% | N/A | 5.29% | ||||||||||
Class I shares do not have a sales charge.
CDSC – Contingent Deferred Sales Charge.
| (f) | Source: FactSet Research Systems Inc. |
| (t) | For the period from the class inception date through the stated period end (for those share classes with less than 10 years of performance history). No comparative benchmark performance information is provided for “life” periods. (See Notes to Performance Summary.) |
| (x) | Assuming redemption at the end of the applicable period. |
Benchmark Definition
Barclays Municipal Bond Index – a market capitalization-weighted index that measures the performance of the tax-exempt bond market.
It is not possible to invest directly in an index.
Notes to Performance Summary
Average annual total return represents the average annual change in value for each share class for the periods presented. Life returns are presented where the share class has less than 10 years of performance history and represent the average annual total return from the class inception date to the stated period end date. As the fund’s share
6
Table of Contents
Performance Summary – continued
classes may have different inception dates, the life returns may represent different time periods and may not be comparable. As a result, no comparative benchmark performance information is provided for life periods.
Performance results reflect any applicable expense subsidies and waivers in effect during the periods shown. Without such subsidies and waivers the fund’s performance results would be less favorable. Please see the prospectus and financial statements for complete details.
Performance results do not include adjustments made for financial reporting purposes in accordance with U.S. generally accepted accounting principles and may differ from amounts reported in the financial highlights.
A portion of income may be subject to state, federal, and/or alternative minimum tax. Capital gains, if any, are subject to a capital gains tax.
From time to time the fund may receive proceeds from litigation settlements, without which performance would be lower.
7
Table of Contents
Fund expenses borne by the shareholders during the period,
October 1, 2012 through March 31, 2013
As a shareholder of the fund, you incur two types of costs: (1) transaction costs, including sales charges (loads) on certain purchase or redemption payments, and (2) ongoing costs, including management fees; distribution and service (12b-1) fees; and other fund expenses. This example is intended to help you understand your ongoing costs (in dollars) of investing in the fund and to compare these costs with the ongoing costs of investing in other mutual funds.
The example is based on an investment of $1,000 invested at the beginning of the period and held for the entire period October 1, 2012 through March 31, 2013.
Actual Expenses
The first line for each share class in the following table provides information about actual account values and actual expenses. You may use the information in this line, together with the amount you invested, to estimate the expenses that you paid over the period. Simply divide your account value by $1,000 (for example, an $8,600 account value divided by $1,000 = 8.6), then multiply the result by the number in the first line under the heading entitled “Expenses Paid During Period” to estimate the expenses you paid on your account during this period.
Hypothetical Example for Comparison Purposes
The second line for each share class in the following table provides information about hypothetical account values and hypothetical expenses based on the fund’s actual expense ratio and an assumed rate of return of 5% per year before expenses, which is not the fund’s actual return. The hypothetical account values and expenses may not be used to estimate the actual ending account balance or expenses you paid for the period. You may use this information to compare the ongoing costs of investing in the fund and other funds. To do so, compare this 5% hypothetical example with the 5% hypothetical examples that appear in the shareholder reports of the other funds.
Please note that the expenses shown in the table are meant to highlight your ongoing costs only and do not reflect any transactional costs, such as sales charges (loads). Therefore, the second line for each share class in the table is useful in comparing ongoing costs only, and will not help you determine the relative total costs of owning different funds. In addition, if these transactional costs were included, your costs would have been higher.
8
Table of Contents
Expense Table – continued
| Share Class | Annualized Ratio | Beginning Account Value 10/01/12 | Ending Account Value | Expenses Paid During | ||||||||||||||
| A | Actual | 0.75% | $1,000.00 | $1,010.95 | $3.76 | |||||||||||||
| Hypothetical (h) | 0.75% | $1,000.00 | $1,021.19 | $3.78 | ||||||||||||||
| B | Actual | 1.50% | $1,000.00 | $1,007.18 | $7.51 | |||||||||||||
| Hypothetical (h) | 1.50% | $1,000.00 | $1,017.45 | $7.54 | ||||||||||||||
| C | Actual | 1.50% | $1,000.00 | $1,007.14 | $7.51 | |||||||||||||
| Hypothetical (h) | 1.50% | $1,000.00 | $1,017.45 | $7.54 | ||||||||||||||
| I | Actual | 0.50% | $1,000.00 | $1,012.18 | $2.51 | |||||||||||||
| Hypothetical (h) | 0.50% | $1,000.00 | $1,022.44 | $2.52 | ||||||||||||||
| A1 | Actual | 0.50% | $1,000.00 | $1,013.35 | $2.51 | |||||||||||||
| Hypothetical (h) | 0.50% | $1,000.00 | $1,022.44 | $2.52 | ||||||||||||||
| B1 | Actual | 1.26% | $1,000.00 | $1,008.41 | $6.31 | |||||||||||||
| Hypothetical (h) | 1.26% | $1,000.00 | $1,018.65 | $6.34 | ||||||||||||||
| (h) | 5% class return per year before expenses. |
| (p) | Expenses paid are equal to each class’s annualized expense ratio, as shown above, multiplied by the average account value over the period, multiplied by the number of days in the period, divided by the number of days in the year. Expenses paid do not include any applicable sales charges (loads). If these transaction costs had been included, your costs would have been higher. |
Expenses Impacting the Table
Expense ratios include 0.02% of investment related expenses from inverse floaters that are outside of the expense cap arrangement (See Note 3 of the Notes to Financial Statements).
9
Table of Contents
3/31/13
The Portfolio of Investments is a complete list of all securities owned by your fund. It is categorized by broad-based asset classes.
| Municipal Bonds - 95.9% | ||||||||
| Issuer | Shares/Par | Value ($) | ||||||
| Airport Revenue - 3.4% | ||||||||
| Atlanta, GA, Airport Rev., “B”, 5%, 2025 | $ | 1,415,000 | $ | 1,681,441 | ||||
| Atlanta, GA, Airport Rev., “B”, 5%, 2026 | 800,000 | 945,160 | ||||||
| Chicago, IL, O’Hare International Airport Rev., Third Lien, “A”, 5.625%, 2035 | 7,125,000 | 8,227,523 | ||||||
| Cleveland, OH, Airport System Rev., “A”, AGM, 5%, 2030 | 1,640,000 | 1,843,573 | ||||||
| Cleveland, OH, Airport System Rev., “A”, AGM, 5%, 2031 | 1,095,000 | 1,222,995 | ||||||
| Dallas Fort Worth, TX, International Airport Rev., “D”, 5%, 2038 | 12,440,000 | 13,288,781 | ||||||
| Denver, CO, City & County Airport Systems Rev., “A”, 5%, 2027 | 1,980,000 | 2,237,935 | ||||||
| Denver, CO, City & County Airport Systems Rev., “A”, 5%, 2028 | 1,930,000 | 2,171,308 | ||||||
| Houston, TX, Airport System Rev., “B”, 5%, 2026 | 1,855,000 | 2,147,589 | ||||||
| Houston, TX, Airport System Rev., Subordinate Lien, “A”, 5%, 2031 | 2,345,000 | 2,579,781 | ||||||
| Los Angeles, CA, Department of Airports Rev. (Los Angeles International), “A”, 5%, 2029 | 2,990,000 | 3,407,554 | ||||||
| Massachusetts Port Authority Rev., “A”, 5%, 2037 | 470,000 | 520,549 | ||||||
| Miami-Dade County, FL, Aviation Rev., “A”, 5%, 2022 | 3,910,000 | 4,691,374 | ||||||
| Miami-Dade County, FL, Aviation Rev., “A”, 5%, 2031 | 2,165,000 | 2,388,601 | ||||||
| Miami-Dade County, FL, Aviation Rev., “B”, AGM, 5%, 2035 | 5,885,000 | 6,544,473 | ||||||
| Niagara, NY, Frontier Transportation Authority Rev. (Buffalo-Niagara International Airport), NATL, 5.875%, 2013 | 1,485,000 | 1,485,000 | ||||||
| Port Authority of NY & NJ, Special Obligation Rev. (JFK International Air Terminal LLC), 6%, 2036 | 2,315,000 | 2,733,251 | ||||||
| Portland, ME, Airport Rev., 5%, 2023 | 175,000 | 204,488 | ||||||
| Portland, ME, Airport Rev., 5%, 2024 | 370,000 | 426,717 | ||||||
| Portland, ME, Airport Rev., 5%, 2025 | 500,000 | 572,415 | ||||||
| Portland, ME, Airport Rev., 5%, 2027 | 525,000 | 590,352 | ||||||
| Portland, ME, Airport Rev., 5%, 2028 | 1,000,000 | 1,118,100 | ||||||
| Portland, ME, Airport Rev., 5%, 2029 | 850,000 | 946,535 | ||||||
| Portland, ME, Airport Rev., 5%, 2032 | 600,000 | 661,662 | ||||||
| San Diego County, CA, Regional Airport Authority Rev., “B”, 5%, 2024 | 500,000 | 594,905 | ||||||
| San Diego County, CA, Regional Airport Authority Rev., “B”, 5%, 2025 | 1,500,000 | 1,761,405 | ||||||
| San Francisco, CA, City & County Airports Commission, International Airport Rev., “A”, 5%, 2028 | 6,000,000 | 6,739,260 | ||||||
10
Table of Contents
Portfolio of Investments – continued
| Issuer | Shares/Par | Value ($) | ||||||
| Municipal Bonds - continued | ||||||||
| Airport Revenue - continued | ||||||||
| San Jose, CA, Airport Rev., “A-2”, 5.25%, 2034 | $ | 7,570,000 | $ | 8,292,027 | ||||
|
| |||||||
| $ | 80,024,754 | |||||||
| General Obligations - General Purpose - 7.8% | ||||||||
| Allegheny County, PA, “C-70”, 5%, 2037 | $ | 2,010,000 | $ | 2,211,965 | ||||
| Chicago, IL, Greater Chicago Metropolitan Water Reclamation District, “C”, 5%, 2029 | 9,145,000 | 10,629,051 | ||||||
| Commonwealth of Massachusetts, “A”, 5%, 2017 | 10,000,000 | 11,695,200 | ||||||
| Commonwealth of Massachusetts, “A”, AMBAC, 5.5%, 2030 | 5,000,000 | 6,682,500 | ||||||
| Commonwealth of Puerto Rico, “A”, ETM, FGIC, 5.5%, 2015 (c) | 5,585,000 | 6,219,456 | ||||||
| Commonwealth of Puerto Rico, Public Improvement, “B”, 6.5%, 2037 | 2,180,000 | 2,281,959 | ||||||
| Detroit, MI, 5.25%, 2035 | 5,000,000 | 5,398,150 | ||||||
| Luzerne County, PA, AGM, 6.75%, 2023 | 1,200,000 | 1,395,936 | ||||||
| New York, NY, “B”, 5%, 2020 | 10,730,000 | 13,201,119 | ||||||
| New York, NY, “J-4”, FRN, 0.67%, 2025 | 1,715,000 | 1,715,000 | ||||||
| Palm Beach County, FL, Public Improvement Rev. “2”, 5.375%, 2028 | 1,000,000 | 1,172,660 | ||||||
| Providence, RI, “A”, 5%, 2025 | 1,345,000 | 1,519,178 | ||||||
| State of California, 5%, 2024 | 4,365,000 | 5,196,533 | ||||||
| State of California, 4%, 2026 | 9,275,000 | 9,967,379 | ||||||
| State of California, 5.25%, 2028 | 2,965,000 | 3,486,277 | ||||||
| State of California, 5.125%, 2033 | 2,155,000 | 2,420,130 | ||||||
| State of California, 6.5%, 2033 | 4,000,000 | 4,923,120 | ||||||
| State of California, 6%, 2039 | 3,000,000 | 3,588,930 | ||||||
| State of Hawaii, “DZ”, 5%, 2031 | 2,230,000 | 2,608,654 | ||||||
| State of Illinois, 5%, 2025 | 1,060,000 | 1,171,332 | ||||||
| State of Louisiana, “C”, 5%, 2026 | 4,380,000 | 5,318,415 | ||||||
| State of Maryland, “B”, 4.5%, 2017 | 25,000,000 | 29,054,250 | ||||||
| State of Maryland, “C”, 5%, 2019 | 6,890,000 | 8,531,336 | ||||||
| State of Tennessee, “A”, 5%, 2029 | 1,000,000 | 1,196,180 | ||||||
| State of Washington, “A”, 4%, 2030 | 7,585,000 | 8,108,668 | ||||||
| State of Washington, “A”, 5%, 2033 | 5,000,000 | 5,719,000 | ||||||
| Washington Motor Vehicle Fuel Tax, “B”, NATL, 5%, 2032 (u) | 25,010,000 | 28,080,478 | ||||||
|
| |||||||
| $ | 183,492,856 | |||||||
| General Obligations - Improvement - 2.1% | ||||||||
| Columbus, OH, “A”, 4%, 2028 | $ | 19,075,000 | $ | 20,998,523 | ||||
| Guam Government, “A”, 7%, 2039 | 910,000 | 1,014,641 | ||||||
| Massachusetts Bay Transportation Authority, “A”, 7%, 2021 | 3,245,000 | 4,266,169 | ||||||
| Massachusetts Bay Transportation Authority, “A”, ETM, 7%, 2021 (c) | 4,700,000 | 5,404,342 | ||||||
11
Table of Contents
Portfolio of Investments – continued
| Issuer | Shares/Par | Value ($) | ||||||
| Municipal Bonds - continued | ||||||||
| General Obligations - Improvement - continued | ||||||||
| New Orleans, LA, 5%, 2030 | $ | 660,000 | $ | 737,088 | ||||
| New Orleans, LA, 5%, 2031 | 790,000 | 871,394 | ||||||
| State of North Carolina, “C”, 4%, 2021 | 13,135,000 | 15,525,570 | ||||||
|
| |||||||
| $ | 48,817,727 | |||||||
| General Obligations - Schools - 4.2% | ||||||||
| Chesterfield County, SC, School District, 5%, 2025 | $ | 2,250,000 | $ | 2,690,843 | ||||
| Chicago, IL, Board of Education, NATL, 6.25%, 2015 | 10,745,000 | 11,391,097 | ||||||
| Clovis, CA, Unified School District (Election of 2004), Capital Appreciation, “A”, 0%, 2025 | 7,365,000 | 4,608,207 | ||||||
| Dallas, TX, Independent School District, 5%, 2023 | 6,000,000 | 7,507,140 | ||||||
| Denver, CO, City & County School District No. 1, 5%, 2024 | 10,000,000 | 12,117,800 | ||||||
| Escondido, CA, Union High School District (Election of 2008), Capital Appreciation, “A”, ASSD GTY, 0%, 2030 | 4,495,000 | 2,118,089 | ||||||
| Escondido, CA, Union High School District (Election of 2008), Capital Appreciation, “A”, ASSD GTY, 0%, 2031 | 4,015,000 | 1,795,307 | ||||||
| Escondido, CA, Union High School District (Election of 2008), Capital Appreciation, “A”, ASSD GTY, 0%, 2033 | 2,785,000 | 1,122,606 | ||||||
| Florence, AL, Board of Education, Tax Anticipation School Warrants, 4%, 2025 | 1,225,000 | 1,352,400 | ||||||
| Florida Board of Education, Capital Outlay, 9.125%, 2014 | 795,000 | 806,464 | ||||||
| Florida Board of Education, Capital Outlay, “E”, 5%, 2023 | 250,000 | 303,255 | ||||||
| Florida Board of Education, Capital Outlay, ETM, 9.125%, 2014 (c) | 665,000 | 717,715 | ||||||
| Florida Board of Education, Public Education, “J”, 5%, 2033 | 1,000,000 | 1,017,790 | ||||||
| Frisco, TX, Independent School District, School Building, “B”, PSF, 3%, 2042 | 2,405,000 | 2,181,263 | ||||||
| Hartnell, CA, Community College District (Election of 2002), Capital Appreciation, “D”, 0%, 2039 | 9,645,000 | 1,780,081 | ||||||
| Knox County, KY, SYNCORA, 5.5%, 2014 (c) | 640,000 | 694,317 | ||||||
| Knox County, KY, SYNCORA, 5.625%, 2014 (c) | 1,150,000 | 1,249,981 | ||||||
| Lancaster, TX, Independent School District, Capital Appreciation, AGM, 0%, 2014 (c) | 2,250,000 | 1,088,280 | ||||||
| Lancaster, TX, Independent School District, Capital Appreciation, AGM, 0%, 2014 (c) | 2,000,000 | 909,620 | ||||||
| Los Angeles, CA, Community College District (Election of 2008), “C”, 5.25%, 2039 | 5,000,000 | 5,918,950 | ||||||
| Los Angeles, CA, Unified School District, “D”, 5%, 2034 | 825,000 | 933,842 | ||||||
| Merced, CA, Union High School District, Capital Appreciation, “A”, ASSD GTY, 0%, 2030 | 580,000 | 262,850 | ||||||
| Monongalia County, WV, Board of Education, 5%, 2029 | 2,445,000 | 2,799,647 | ||||||
| Monongalia County, WV, Board of Education, 5%, 2031 | 675,000 | 766,631 | ||||||
| Monongalia County, WV, Board of Education, 5%, 2033 | 965,000 | 1,088,723 | ||||||
12
Table of Contents
Portfolio of Investments – continued
| Issuer | Shares/Par | Value ($) | ||||||
| Municipal Bonds - continued | ||||||||
| General Obligations - Schools - continued | ||||||||
| Oceanside, CA, Unified School District, Capital Appreciation, ASSD GTY, 0%, 2024 | $ | 2,900,000 | $ | 1,851,650 | ||||
| Oceanside, CA, Unified School District, Capital Appreciation, ASSD GTY, 0%, 2027 | 1,930,000 | 1,046,176 | ||||||
| Oceanside, CA, Unified School District, Capital Appreciation, ASSD GTY, 0%, 2029 | 3,915,000 | 1,905,235 | ||||||
| Oceanside, CA, Unified School District, Capital Appreciation, ASSD GTY, 0%, 2030 | 4,335,000 | 1,998,175 | ||||||
| Reading, PA, School District, “A”, 5%, 2020 | 1,000,000 | 1,140,910 | ||||||
| San Marcos, TX, Independent School District, PSF, 5.625%, 2014 (c) | 2,000,000 | 2,142,960 | ||||||
| San Marcos, TX, Independent School District, PSF, 5.625%, 2014 (c) | 2,000,000 | 2,142,960 | ||||||
| San Mateo County, CA, Community College District (Election of 2005), Capital Appreciation, “A”, NATL, 0%, 2026 | 5,100,000 | 3,198,210 | ||||||
| Schertz-Cibolo-Universal City, TX, Independent School District, PSF, 5%, 2036 | 10,000,000 | 10,930,300 | ||||||
| Sunnyvale, TX, Independent School District, PSF, 5.25%, 2028 | 1,900,000 | 1,983,201 | ||||||
| West Contra Costa, CA, Unified School District (Election of 2005), Capital Appreciation, “C”, ASSD GTY, 0%, 2029 | 3,440,000 | 1,573,078 | ||||||
| Whittier, CA, Union High School District, Capital Appreciation, 0%, 2034 | 2,005,000 | 606,452 | ||||||
|
| |||||||
| $ | 97,742,205 | |||||||
| Healthcare Revenue - Hospitals - 14.4% | ||||||||
| Baxter County, AR, Hospital Rev., 5.375%, 2014 | $ | 10,000 | $ | 10,030 | ||||
| Brunswick, GA, Hospital Authority Rev. (Glynn-Brunswick Memorial Hospital), 5.625%, 2034 | 1,320,000 | 1,469,437 | ||||||
| California Health Facilities Financing Authority Rev. (St. Joseph Health System), “A”, 5.75%, 2039 | 2,580,000 | 2,992,310 | ||||||
| California Health Facilities Financing Authority Rev. (Sutter Health), “D”, 5.25%, 2031 | 5,000,000 | 5,802,700 | ||||||
| California Statewide Communities Development Authority Rev. (Enloe Medical Center), CALHF, 5.75%, 2038 | 2,640,000 | 3,004,320 | ||||||
| Citrus County, FL, Hospital Rev. (Citrus Memorial Hospital), 6.25%, 2023 | 350,000 | 350,837 | ||||||
| Cullman County, AL, Health Care Authority (Cullman Regional Medical Center), “A”, 6.75%, 2029 | 3,550,000 | 3,839,929 | ||||||
| DeKalb County, GA, Hospital Authority Rev. (DeKalb Medical Center, Inc.), 6.125%, 2040 | 4,850,000 | 5,650,493 | ||||||
| Florence County, SC, Hospital Rev. (McLeod Regional Medical Center), “A”, AGM, 5.25%, 2034 | 5,000,000 | 5,221,600 | ||||||
13
Table of Contents
Portfolio of Investments – continued
| Issuer | Shares/Par | Value ($) | ||||||
| Municipal Bonds - continued | ||||||||
| Healthcare Revenue - Hospitals - continued | ||||||||
| Grundy County, MO, Industrial Development Authority, Health Facilities Rev. (Wright Memorial Hospital), 6.75%, 2034 | $ | 1,410,000 | $ | 1,579,919 | ||||
| Harris County, TX, Cultural Education Facilities Finance Corp. Medical Facilities Rev. (Baylor College of Medicine), “D”, 5.625%, 2032 | 8,235,000 | 9,390,123 | ||||||
| Harris County, TX, Health Facilities Development Corp., Hospital Rev. (Memorial Hermann Healthcare Systems), “B”, 7%, 2018 (c) | 1,795,000 | 2,370,046 | ||||||
| Harris County, TX, Health Facilities Development Corp., Hospital Rev. (Memorial Hermann Healthcare Systems), “B”, 7.25%, 2018 (c) | 2,050,000 | 2,734,762 | ||||||
| Harris County, TX, Health Facilities Development Corp., Hospital Rev. (Texas Children’s Hospital Project), “A”, ETM, 5.375%, 2015 (c) | 4,300,000 | 4,314,190 | ||||||
| Harrison County, TX, Health Facilities Development Corp., Hospital Rev. (Good Shepherd Health System), 5.25%, 2028 | 5,000,000 | 5,521,700 | ||||||
| Henrico County, VA, Industrial Development Authority Rev. (Bon Secours Health Systems, Inc.), RIBS, FRN, AGM, 11.214%, 2027 (p) | 4,700,000 | 6,194,224 | ||||||
| Hillsborough County, FL, Industrial Development Authority Rev. (University Community Hospital), “A”, 5.625%, 2018 (c) | 300,000 | 373,029 | ||||||
| Hillsborough County, FL, Industrial Development Authority Rev. (University Community Hospital), ETM, NATL, 6.5%, 2019 (c) | 1,000,000 | 1,213,030 | ||||||
| Illinois Finance Authority Rev. (Ascension Healthcare), “A”, 5%, 2042 | 2,775,000 | 3,069,178 | ||||||
| Illinois Finance Authority Rev. (Centegra Health System), 5%, 2038 | 4,455,000 | 4,761,727 | ||||||
| Illinois Finance Authority Rev. (Edward Hospital), “A”, AMBAC, 5.5%, 2040 | 3,040,000 | 3,311,989 | ||||||
| Illinois Finance Authority Rev. (KishHealth Systems Obligated Group), 5.75%, 2028 | 2,990,000 | 3,320,455 | ||||||
Illinois Finance Authority Rev. (O.S.F. Healthcare Systems) “A”, 7%, 2029 | 2,975,000 | 3,622,360 | ||||||
| Illinois Finance Authority Rev. (O.S.F. Healthcare Systems) “A”, 7.125%, 2037 | 2,445,000 | 2,959,061 | ||||||
| Illinois Finance Authority Rev. (Provena Health), “A”, 7.75%, 2034 | 3,685,000 | 4,619,516 | ||||||
| Illinois Finance Authority Rev. (Resurrection Health), 6.125%, 2025 | 6,900,000 | 7,804,107 | ||||||
| Illinois Finance Authority Rev. (Silver Cross Hospital & Medical Centers), 6.875%, 2038 | 1,500,000 | 1,786,605 | ||||||
| Illinois Finance Authority Rev. (Silver Cross Hospital & Medical Centers), 7%, 2044 | 2,455,000 | 2,926,016 | ||||||
14
Table of Contents
Portfolio of Investments – continued
| Issuer | Shares/Par | Value ($) | ||||||
| Municipal Bonds - continued | ||||||||
| Healthcare Revenue - Hospitals - continued | ||||||||
| Illinois Finance Authority Rev. (Silver Cross Hospital & Medical Centers), “A”, 5.5%, 2030 | $ | 2,975,000 | $ | 3,222,818 | ||||
| Indiana Finance Authority, Hospital Rev. (Deaconess Hospital, Inc.), “A”, 6.75%, 2039 | 3,000,000 | 3,490,350 | ||||||
| Indiana Finance Authority, Hospital Rev. (Parkview Health System), 5%, 2029 | 1,585,000 | 1,763,281 | ||||||
| Indiana Health & Educational Facilities Authority, Hospital Rev. (Deaconess Hospital), “A”, AMBAC, 5.375%, 2034 | 2,640,000 | 2,763,288 | ||||||
| Indiana Health & Educational Facilities Finance Authority, Hospital Rev. (Clarian Health), “B”, 5%, 2033 | 2,490,000 | 2,668,234 | ||||||
| Jacksonville, FL, Health Facilities Rev. (Ascension Health), “A”, 5.25%, 2032 | 955,000 | 966,775 | ||||||
| Jefferson Parish, LA, Hospital Rev., Hospital Service District No. 1 (West Jefferson Medical Center), “B”, AGM, 5.25%, 2028 | 1,980,000 | 2,156,458 | ||||||
| Jefferson Parish, LA, Hospital Service District No. 2 (East Jefferson General Hospital), 6.25%, 2031 | 3,355,000 | 3,893,243 | ||||||
| Kentucky Economic Development Finance Authority, Hospital Facilities Rev. (Baptist Healthcare System), “A”, 5.375%, 2024 | 2,305,000 | 2,628,345 | ||||||
| Kentucky Economic Development Finance Authority, Hospital Facilities Rev. (Baptist Healthcare System), “A”, 5.625%, 2027 | 770,000 | 873,149 | ||||||
| Kentucky Economic Development Finance Authority, Hospital Facilities Rev. (Owensboro Medical Health System), “A”, 6%, 2030 | 640,000 | 745,824 | ||||||
| Kentucky Economic Development Finance Authority, Hospital Facilities Rev. (Owensboro Medical Health System), “A”, 6.375%, 2040 | 4,445,000 | 5,269,681 | ||||||
| Knox County, IN, Economic Development Rev. (Good Samaritan Hospital), “A”, 5%, 2037 | 585,000 | 632,040 | ||||||
| Knox County, IN, Economic Development Rev. (Good Samaritan Hospital), “A”, 5%, 2042 | 1,170,000 | 1,251,268 | ||||||
| Knox County, TN, Health, Educational, Hospital & Housing Facilities Board Rev. (Covenant Health), Capital Appreciation, “A”, 0%, 2035 | 3,205,000 | 1,099,603 | ||||||
| Knox County, TN, Health, Educational, Hospital & Housing Facilities Board Rev. (Covenant Health), Capital Appreciation, “A”, 0%, 2036 | 2,010,000 | 653,431 | ||||||
| Laramie County, WY, Hospital Rev. (Cheyenne Regional Medical Center Project), 5%, 2032 | 440,000 | 484,453 | ||||||
| Laramie County, WY, Hospital Rev. (Cheyenne Regional Medical Center Project), 5%, 2037 | 1,005,000 | 1,083,832 | ||||||
| Laramie County, WY, Hospital Rev. (Cheyenne Regional Medical Center Project), 5%, 2042 | 2,205,000 | 2,348,016 | ||||||
15
Table of Contents
Portfolio of Investments – continued
| Issuer | Shares/Par | Value ($) | ||||||
| Municipal Bonds - continued | ||||||||
| Healthcare Revenue - Hospitals - continued | ||||||||
| Lebanon County, PA, Health Facilities Authority Rev. (Good Samaritan Hospital), 5.9%, 2028 | $ | 1,700,000 | $ | 1,700,374 | ||||
| Louisiana Public Facilities Authority Hospital Rev. (Lake Charles Memorial Hospital), 6.375%, 2034 | 3,990,000 | 4,250,268 | ||||||
| Louisiana Public Facilities Authority, Hospital Rev. (Lafayette General Medical Center), 5.5%, 2040 | 5,000,000 | 5,340,600 | ||||||
| Louisville & Jefferson County, KY, Metropolitan Government Healthcare Systems Rev. (Norton Healthcare, Inc.), 5.25%, 2036 | 5,850,000 | 6,180,057 | ||||||
| Lufkin, TX, Health Facilities Development Corp. Rev. (Memorial Health System), 5.5%, 2037 | 310,000 | 319,319 | ||||||
| Macomb County, MI, Hospital Finance Authority Rev. (Mount Clemens General Hospital), 5.75%, 2013 (c) | 1,000,000 | 1,034,120 | ||||||
| Maryland Health & Higher Educational Facilities Authority Rev. (Anne Arundel Health System, Inc.), “A”, 6.75%, 2039 | 1,510,000 | 1,813,027 | ||||||
| Massachusetts Development Finance Agency Rev. (Partners Healthcare), “L”, 5%, 2031 | 2,780,000 | 3,178,958 | ||||||
| Massachusetts Development Finance Agency Rev. (Partners Healthcare), “L”, 5%, 2036 | 1,670,000 | 1,856,806 | ||||||
| Mecosta County, MI, General Hospital Rev., 6%, 2018 | 220,000 | 220,266 | ||||||
| Miami-Dade County, FL, Health Facilities Authority, Hospital Rev. (Variety Children’s Hospital), “A”, 6.125%, 2042 | 2,240,000 | 2,574,880 | ||||||
| Michigan Finance Authority Rev. (Trinity Health Corp.), 5%, 2035 | 3,195,000 | 3,585,780 | ||||||
| Michigan Hospital Finance Authority Rev. (Henry Ford Health System), 5.625%, 2029 | 1,270,000 | 1,441,755 | ||||||
| Michigan Hospital Finance Authority Rev. (Henry Ford Health System), 5.75%, 2039 | 7,165,000 | 8,069,008 | ||||||
| Monroe County, PA, Hospital Authority Rev. (Pocono Medical Center), 6%, 2014 (c) | 750,000 | 781,530 | ||||||
| Monroe County, PA, Hospital Authority Rev. (Pocono Medical Center), “A”, 5%, 2032 | 610,000 | 658,806 | ||||||
| Monroe County, PA, Hospital Authority Rev. (Pocono Medical Center), “A”, 5%, 2041 | 440,000 | 462,880 | ||||||
| Montgomery, AL, Medical Clinic Board Health Care Facility Rev. (Jackson Hospital & Clinic), 5.25%, 2031 | 585,000 | 605,212 | ||||||
| Nassau County, NY, Local Economic Assistance Corp. Rev. (Winthrop-University Hospital Association Project), 5%, 2032 | 1,035,000 | 1,142,888 | ||||||
| Nassau County, NY, Local Economic Assistance Corp. Rev. (Winthrop-University Hospital Association Project), 5%, 2037 | 1,935,000 | 2,083,182 | ||||||
| New Hampshire Business Finance Authority Rev. (Elliot Hospital Obligated Group), “A”, 6%, 2027 | 4,610,000 | 5,346,862 | ||||||
| New Hampshire Business Finance Authority Rev. (Huggins Hospital), 6.875%, 2039 | 490,000 | 539,843 | ||||||
16
Table of Contents
Portfolio of Investments – continued
| Issuer | Shares/Par | Value ($) | ||||||
| Municipal Bonds - continued | ||||||||
| Healthcare Revenue - Hospitals - continued | ||||||||
| New Hampshire Health & Education Facilities Authority Rev. (Concord Hospital), “A”, 5%, 2043 | $ | 1,275,000 | $ | 1,383,286 | ||||
| New Hampshire Health & Education Facilities Authority Rev. (Memorial Hospital at Conway), 5.25%, 2036 | 565,000 | 570,356 | ||||||
| New Jersey Health Care Facilities, Financing Authority Rev. (Palisades Medical Center), 6.5%, 2021 | 500,000 | 502,095 | ||||||
| New York Dormitory Authority Rev., Non-State Supported Debt (Bronx-Lebanon Hospital Center), LOC, 6.5%, 2030 | 1,475,000 | 1,738,597 | ||||||
| New York Dormitory Authority Rev., Non-State Supported Debt (Bronx-Lebanon Hospital Center), LOC, 6.25%, 2035 | 1,395,000 | 1,602,381 | ||||||
| North Texas Health Facilities Development Corp. Rev. (United Regional Health Care System, Inc.), 6%, 2013 (c) | 5,000,000 | 5,116,800 | ||||||
| Ohio Higher Educational Facility Commission (University Hospital Health System), “A”, 6.75%, 2015 (c) | 6,000,000 | 6,682,020 | ||||||
| Orange County, FL, Health Facilities Authority Rev. (Orlando Health, Inc.), “A”, 5%, 2042 | 4,455,000 | 4,785,294 | ||||||
| Orange County, FL, Health Facilities Authority, Hospital Rev. (Orlando Regional Healthcare), “C”, 5.25%, 2035 | 1,000,000 | 1,110,520 | ||||||
| Palomar Pomerado Health Care District, CA, COP, 6.75%, 2039 | 2,210,000 | 2,480,946 | ||||||
| Rhode Island Health & Educational Building Corp. Rev., Hospital Financing (Lifespan Obligated Group), “A”, ASSD GTY, 7%, 2039 | 7,645,000 | 8,860,096 | ||||||
| Richmond, IN, Hospital Authority Rev. (Reid Hospital & Health Center Services), “A”, 6.625%, 2039 | 4,715,000 | 5,367,556 | ||||||
| Royal Oak, MI, Hospital Finance Authority Rev. (William Beaumont Hospital), 8.25%, 2039 | 2,325,000 | 2,913,225 | ||||||
| Scioto County, OH, Hospital Facilities Rev. (Southern Ohio Medical Center), 5.625%, 2031 | 1,095,000 | 1,179,950 | ||||||
| Scioto County, OH, Hospital Facilities Rev. (Southern Ohio Medical Center), 5.75%, 2038 | 4,195,000 | 4,528,041 | ||||||
| Shelby County, TN, Health, Educational & Housing Facilities Board Rev. (Methodist Le Bonheur Healthcare), 5%, 2042 | 2,290,000 | 2,512,153 | ||||||
| Skagit County, WA, Public Hospital District No. 001 Rev. (Skagit Valley Hospital), 5.625%, 2025 | 1,000,000 | 1,103,270 | ||||||
| South Broward, FL, Hospital District Rev., 5%, 2036 | 500,000 | 526,510 | ||||||
| South Dakota Health & Educational Facilities Authority Rev. (Avera Health), “A”, 5%, 2042 | 1,205,000 | 1,295,857 | ||||||
| South Dakota Health & Educational Facilities Authority Rev. (Sanford), “E”, 5%, 2037 | 1,075,000 | 1,185,897 | ||||||
| South Dakota Health & Educational Facilities Authority Rev. (Sanford), “E”, 5%, 2042 | 3,520,000 | 3,874,182 | ||||||
| South Lake County, FL, Hospital District Rev. (South Lake Hospital), “A”, 6%, 2029 | 1,025,000 | 1,172,006 | ||||||
17
Table of Contents
Portfolio of Investments – continued
| Issuer | Shares/Par | Value ($) | ||||||
| Municipal Bonds - continued | ||||||||
| Healthcare Revenue - Hospitals - continued | ||||||||
| St. Louis Park, MN, Health Care Facilities Rev. (Nicollet Health Services), 5.75%, 2039 | $ | 6,445,000 | $ | 7,182,824 | ||||
| Sullivan County, TN, Health, Educational & Housing Facilities Board Hospital Rev. (Wellmont Health Systems Project), “C”, 5.25%, 2026 | 3,135,000 | 3,358,839 | ||||||
| Sumner County, TN, Health, Educational & Housing Facilities Board Rev. (Sumner Regional Health Systems, Inc.), “A”, 5.5%, 2046 (a)(d) | 2,000,000 | 4,980 | ||||||
| Tallahassee, FL, Health Facilities Rev. (Tallahassee Memorial Healthcare, Inc.), 6.25%, 2020 | 3,300,000 | 3,306,699 | ||||||
| Tallahassee, FL, Health Facilities Rev. (Tallahassee Memorial Regional Medical Center), NATL, 6.625%, 2013 | 170,000 | 170,729 | ||||||
| Tyler, TX, Health Facilities Development Corp. (East Texas Medical Center), “A”, 5.25%, 2032 | 1,715,000 | 1,833,404 | ||||||
| Tyler, TX, Health Facilities Development Corp. (East Texas Medical Center), “A”, 5.375%, 2037 | 1,410,000 | 1,487,903 | ||||||
| Tyler, TX, Health Facilities Development Corp. (Mother Frances Hospital), 5.5%, 2027 | 5,360,000 | 6,117,529 | ||||||
| Upland, CA, COP (San Antonio Community Hospital), 6.375%, 2032 | 2,075,000 | 2,438,021 | ||||||
| Upland, CA, COP (San Antonio Community Hospital), 6.5%, 2041 | 915,000 | 1,065,325 | ||||||
| Washington Health Care Facilities Authority Rev. (Central Washington Health Services), 6.75%, 2029 | 1,450,000 | 1,708,622 | ||||||
| Washington Health Care Facilities Authority Rev. (Central Washington Health Services), 7%, 2039 | 3,690,000 | 4,265,160 | ||||||
| Washington Health Care Facilities Authority Rev. (Highline Medical Center), FHA, 6.25%, 2036 | 5,285,000 | 6,099,313 | ||||||
| Washington Health Care Facilities Authority Rev. (Providence Health & Services), “A”, 5%, 2027 | 14,095,000 | 16,485,230 | ||||||
| Washington Health Care Facilities Authority Rev. (Virginia Mason Medical Center), “A”, 6.25%, 2042 | 3,955,000 | 4,344,607 | ||||||
| West Virginia Hospital Finance Authority, Hospital Rev. (Thomas Health System), 6.5%, 2038 | 2,110,000 | 2,192,691 | ||||||
| Wisconsin Health & Educational Facilities Authority Rev. (Aurora Health Care, Inc.), 6.875%, 2030 | 2,750,000 | 2,758,635 | ||||||
| Wisconsin Health & Educational Facilities Authority Rev. (Aurora Health Care, Inc.), “A”, 5%, 2026 | 2,215,000 | 2,490,989 | ||||||
| Wisconsin Health & Educational Facilities Authority Rev. (Aurora Health Care, Inc.), “A”, 5%, 2028 | 665,000 | 729,638 | ||||||
| Wisconsin Health & Educational Facilities Authority Rev. (Mercy Alliance), 5%, 2039 | 3,115,000 | 3,327,163 | ||||||
18
Table of Contents
Portfolio of Investments – continued
| Issuer | Shares/Par | Value ($) | ||||||
| Municipal Bonds - continued | ||||||||
| Healthcare Revenue - Hospitals - continued | ||||||||
| Wisconsin Health & Educational Facilities Authority Rev. (ProHealth Care, Inc. Obligated Group), 6.625%, 2032 | $ | 1,730,000 | $ | 1,826,482 | ||||
| Wisconsin Health & Educational Facilities Authority Rev. (ProHealth Care, Inc. Obligated Group), 6.625%, 2039 | 1,220,000 | 1,415,639 | ||||||
| Wisconsin Health & Educational Facilities Authority Rev. (Wheaton Franciscan Healthcare), 5.25%, 2018 | 1,500,000 | 1,707,300 | ||||||
| Wisconsin Health & Educational Facilities Authority Rev. (Wheaton Franciscan Healthcare), 5.25%, 2031 | 4,155,000 | 4,443,856 | ||||||
| Wisconsin Health & Educational Facilities Authority Rev. (Wheaton Franciscan Services), 5.25%, 2034 | 1,360,000 | 1,453,650 | ||||||
| Wood County, OH, Hospital Facilities Rev. (Wood County Hospital Project), 5%, 2037 | 1,730,000 | 1,815,047 | ||||||
| Wood County, OH, Hospital Facilities Rev. (Wood County Hospital Project), 5%, 2042 | 1,730,000 | 1,809,494 | ||||||
|
| |||||||
| $ | 337,725,010 | |||||||
| Healthcare Revenue - Long Term Care - 2.7% | ||||||||
| Bell County, TX, Health Facility Development Corp. (Advanced Living Technologies, Inc.), 8%, 2036 (a)(d) | $ | 1,595,000 | $ | 1,068,650 | ||||
| Bucks County, PA, Industrial Development Authority Retirement Community Rev. (Ann’s Choice, Inc.), “A”, 6.25%, 2035 | 1,120,000 | 1,136,150 | ||||||
| California Statewide Communities Development Authority Rev. (American Baptist Homes of the West), 6.25%, 2039 | 1,050,000 | 1,191,005 | ||||||
| California Statewide Communities Development Authority Rev. (Episcopal Communities & Services for Seniors Obligated Group), 5%, 2027 | 220,000 | 245,925 | ||||||
| California Statewide Communities Development Authority Rev. (Episcopal Communities & Services for Seniors Obligated Group), 5%, 2032 | 285,000 | 313,902 | ||||||
| California Statewide Communities Development Authority Rev. (Episcopal Communities & Services for Seniors Obligated Group), 5%, 2042 | 670,000 | 726,059 | ||||||
| Cumberland County, PA, Municipal Authority Rev. (Asbury Atlantic, Inc.), 6%, 2030 | 715,000 | 781,080 | ||||||
| Cumberland County, PA, Municipal Authority Rev. (Asbury Atlantic, Inc.), 6%, 2040 | 505,000 | 548,602 | ||||||
| Cumberland County, PA, Municipal Authority Rev. (Diakon Lutheran Social Ministries), 6.125%, 2029 | 830,000 | 928,239 | ||||||
| Cumberland County, PA, Municipal Authority Rev. (Diakon Lutheran Social Ministries), 6.375%, 2039 | 5,045,000 | 5,613,117 | ||||||
| Hawaii Department of Budget & Finance, Special Purpose Rev. (15 Craigside Project), “A”, 8.75%, 2029 | 375,000 | 444,998 | ||||||
19
Table of Contents
Portfolio of Investments – continued
| Issuer | Shares/Par | Value ($) | ||||||
| Municipal Bonds - continued | ||||||||
| Healthcare Revenue - Long Term Care - continued | ||||||||
| Hawaii Department of Budget & Finance, Special Purpose Rev. (15 Craigside Project), “A”, 9%, 2044 | $ | 1,100,000 | $ | 1,310,342 | ||||
| Illinois Finance Authority Rev. (Christian Homes, Inc.), 5.5%, 2023 | 3,355,000 | 3,482,960 | ||||||
| Illinois Finance Authority Rev. (Franciscan Communities, Inc.), “A”, 4.75%, 2033 | 2,145,000 | 2,128,419 | ||||||
| Illinois Finance Authority Rev. (Franciscan Communities, Inc.), “A”, 5.125%, 2043 | 1,500,000 | 1,526,580 | ||||||
Iowa Finance Authority, Health Care Facilities Rev. (Care Initiatives), “A”, 5.5%, 2025 | 1,205,000 | 1,268,781 | ||||||
| Johnson City, TN, Health & Educational Facilities Board Rev. (Appalachian Christian Village Foundation, Inc.), 4%, 2023 | 1,130,000 | 1,126,305 | ||||||
| Johnson City, TN, Health & Educational Facilities Board Rev. (Appalachian Christian Village Foundation, Inc.), 5%, 2034 | 1,500,000 | 1,548,285 | ||||||
| Maryland Health & Higher Educational Facilities Authority Rev. (Charlestown Community), 6.25%, 2041 | 2,225,000 | 2,544,265 | ||||||
| Montgomery County, OH, Health Care & Multifamily Housing Rev. (St. Leonard), 6.375%, 2030 | 1,915,000 | 2,150,373 | ||||||
| Montgomery County, OH, Health Care & Multifamily Housing Rev. (St. Leonard), 6.625%, 2040 | 2,770,000 | 3,116,333 | ||||||
| Pell City, AL, Special Care Facilities, Financing Authority Rev. (Noland Health Services, Inc.), 5%, 2039 | 1,750,000 | 1,846,775 | ||||||
| St. John’s County, FL, Industrial Development Authority (Bayview Project), “A”, 5.2%, 2027 | 150,000 | 135,657 | ||||||
| St. John’s County, FL, Industrial Development Authority Rev. (Presbyterian Retirement), “A”, 6%, 2045 | 6,795,000 | 7,696,493 | ||||||
| Tarrant County, TX, Cultural Education Facilities Finance Corp. Retirement Facility (Air Force Village Foundation, Inc.), 6.125%, 2029 | 395,000 | 441,409 | ||||||
| Tarrant County, TX, Cultural Education Facilities Finance Corp. Retirement Facility (Air Force Village Foundation, Inc.), 6.375%, 2044 | 3,100,000 | 3,414,371 | ||||||
| Tarrant County, TX, Cultural Education Facilities Finance Corp. Retirement Facility (Stayton at Museum Way), 8.25%, 2044 | 4,500,000 | 5,066,685 | ||||||
| Travis County, TX, Health Facilities Development Corp. Rev. (Westminster Manor Health), 7%, 2030 | 735,000 | 877,891 | ||||||
| Travis County, TX, Health Facilities Development Corp. Rev. (Westminster Manor Health), 7.125%, 2040 | 2,575,000 | 3,057,581 | ||||||
| Washington Housing Finance Commission, Emerald Heights Project (Eastside Retirement Association), 5%, 2028 | 570,000 | 633,703 | ||||||
| Washington Housing Finance Commission, Emerald Heights Project (Eastside Retirement Association), 5%, 2033 | 600,000 | 662,736 | ||||||
20
Table of Contents
Portfolio of Investments – continued
| Issuer | Shares/Par | Value ($) | ||||||
| Municipal Bonds - continued | ||||||||
| Healthcare Revenue - Long Term Care - continued | ||||||||
| Westchester County, NY, Local Development Corp. Rev., (Kendal on Hudson Project), 4%, 2023 | $ | 2,805,000 | $ | 2,950,804 | ||||
| Wisconsin Health & Educational Facilities Authority Rev. (St. John’s Community, Inc.), “A”, 7.25%, 2029 | 430,000 | 503,156 | ||||||
| Wisconsin Health & Educational Facilities Authority Rev. (St. John’s Community, Inc.), “A”, 7.625%, 2039 | 1,390,000 | 1,621,491 | ||||||
|
| |||||||
| $ | 62,109,122 | |||||||
| Human Services - 0.1% | ||||||||
| Orange County, FL, Health Facilities Authority Rev. (GF/Orlando Healthcare Facilities), 8.875%, 2021 | $ | 280,000 | $ | 280,339 | ||||
| Orange County, FL, Health Facilities Authority Rev. (GF/Orlando Healthcare Facilities), 9%, 2031 | 890,000 | 890,223 | ||||||
|
| |||||||
| $ | 1,170,562 | |||||||
| Industrial Revenue - Airlines - 0.7% | ||||||||
| Clayton County, GA, Development Authority Special Facilities Rev. (Delta Airlines, Inc.), “A”, 8.75%, 2029 | $ | 1,295,000 | $ | 1,633,150 | ||||
| Clayton County, GA, Development Authority Special Facilities Rev. (Delta Airlines, Inc.), “B”, 9%, 2035 | 970,000 | 1,077,030 | ||||||
| Denver, CO, City & County Airport Rev. (United Airlines), 5.25%, 2032 | 720,000 | 734,414 | ||||||
| Denver, CO, City & County Airport Rev. (United Airlines), 5.75%, 2032 | 615,000 | 642,152 | ||||||
| Houston, TX, Airport Systems Rev., Special Facilities (Continental Airlines, Inc. Terminal E project), 6.75%, 2029 | 570,000 | 572,035 | ||||||
| Los Angeles, CA, Regional Airports Improvement Corp. Lease Rev. (American Airlines, Inc.), “C”, 7.5%, 2024 (d) | 1,435,000 | 1,463,958 | ||||||
| New Jersey Economic Development Authority, Special Facilities Rev. (Continental Airlines, Inc.), 4.875%, 2019 | 1,805,000 | 1,847,562 | ||||||
| New York, NY, City Industrial Development Agency Special Facility Rev. (American Airlines, Inc. - JFK International Airport Project), 7.75%, 2031 (d) | 1,190,000 | 1,351,260 | ||||||
| New York, NY, City Industrial Development Agency Special Facility Rev. (American Airlines, Inc. - JFK International Airport Project), FRN, 7.625%, 2025 (d) | 3,375,000 | 3,833,082 | ||||||
| New York, NY, City Industrial Development Agency, Special Facility Rev. (American Airlines, Inc. - JFK International Airport Project), “B”, 8.5%, 2028 (d)(q) | 1,875,000 | 2,035,990 | ||||||
|
| |||||||
| $ | 15,190,633 | |||||||
21
Table of Contents
Portfolio of Investments – continued
| Issuer | Shares/Par | Value ($) | ||||||
| Municipal Bonds - continued | ||||||||
| Industrial Revenue - Chemicals - 1.0% | ||||||||
| Brazos River, TX, Brazoria County Environmental Rev. (Dow Chemical, Co.), “A-7”, 6.625%, 2033 | $ | 500,000 | $ | 501,405 | ||||
| Brazos River, TX, Harbor Navigation District (Dow Chemical Co.), “A”, 5.95%, 2033 | 7,310,000 | 8,417,100 | ||||||
| Louisiana Environmental Facilities & Community Development Authority Rev. (Westlake Chemical), 6.75%, 2032 | 1,600,000 | 1,810,912 | ||||||
| Louisiana Environmental Facilities & Community Development Authority Rev. (Westlake Chemical), “A”, 6.5%, 2029 | 1,400,000 | 1,667,316 | ||||||
| Louisiana Environmental Facilities & Community Development Authority Rev. (Westlake Chemical), “A-2”, 6.5%, 2035 | 6,000,000 | 7,136,040 | ||||||
| Michigan Strategic Fund Ltd. Obligation Rev. (Dow Chemical Co.), 6.25%, 2014 | 2,870,000 | 3,049,002 | ||||||
| Red River Authority, TX, Pollution Control Rev. (Celanese Project) “B”, 6.7%, 2030 | 1,200,000 | 1,216,248 | ||||||
|
| |||||||
| $ | 23,798,023 | |||||||
| Industrial Revenue - Environmental Services - 0.4% | ||||||||
| California Pollution Control Financing Authority, Solid Waste Disposal Rev. (Republic Services, Inc.), “B”, 5.25%, 2023 (b) | $ | 950,000 | $ | 1,079,020 | ||||
| California Pollution Control Financing Authority, Solid Waste Disposal Rev. (Waste Management, Inc.), “C”, 5.125%, 2023 | 1,665,000 | 1,798,616 | ||||||
| Colorado Housing & Finance Authority, Solid Waste Rev. (Waste Management, Inc.), 5.7%, 2018 | 1,960,000 | 2,332,204 | ||||||
| Gulf Coast Waste Disposal Authority (Waste Management, Inc.), 5.2%, 2028 | 300,000 | 322,824 | ||||||
| Massachusetts Development Finance Agency, Resource Recovery Rev. (Covanta Energy Project), “A”, 4.875%, 2027 | 350,000 | 357,543 | ||||||
| Massachusetts Development Finance Agency, Resource Recovery Rev. (Covanta Energy Project), “C”, 5.25%, 2042 | 1,150,000 | 1,180,015 | ||||||
| Niagara County, NY, Industrial Development Agency, Solid Waste Disposal Rev. (Covanta Energy Project), “A”, 5.25%, 2042 | 1,170,000 | 1,204,925 | ||||||
| Vermont Economic Development Authority, Solid Waste Disposal Rev. (Casella Waste Systems, Inc.), FRN, 4.75%, 2036 (b) | 1,805,000 | 1,803,412 | ||||||
|
| |||||||
| $ | 10,078,559 | |||||||
| Industrial Revenue - Other - 0.1% | ||||||||
| California Statewide Communities, Development Authority Environmental Facilities (Microgy Holdings Project), 9%, 2038 (a)(d) | $ | 126,224 | $ | 1,262 | ||||
| Gulf Coast, TX, Industrial Development Authority Rev. (Microgy Holdings Project), 7%, 2036 (a)(d) | 116,013 | 1,160 | ||||||
| Houston, TX, Industrial Development Corp. (United Parcel Service, Inc.), 6%, 2023 | 215,000 | 214,811 | ||||||
22
Table of Contents
Portfolio of Investments – continued
| Issuer | Shares/Par | Value ($) | ||||||
| Municipal Bonds - continued | ||||||||
| Industrial Revenue - Other - continued | ||||||||
| Park Creek Metropolitan District, CO, Rev. (Custodial Receipts), “CR-2”, 7.875%, 2032 (b)(n) | $ | 560,000 | $ | 563,399 | ||||
| Peninsula Ports Authority, VA, Coal Terminal Rev. (Dominion Terminal Associates), 6%, 2033 | 470,000 | 475,189 | ||||||
|
| |||||||
| $ | 1,255,821 | |||||||
| Industrial Revenue - Paper - 0.4% | ||||||||
| Butler, AL, Industrial Development Board, Solid Waste Disposal Rev. (Georgia-Pacific Corp.), 5.75%, 2028 | $ | 1,760,000 | $ | 1,851,854 | ||||
| Jay, ME, Solid Waste Disposal Rev. (International Paper Co.), “A”, 5.125%, 2018 | 1,500,000 | 1,506,480 | ||||||
| Lowndes County, MS, Solid Waste Disposal & Pollution Control Rev. (Weyerhaeuser Co.), 6.8%, 2022 | 110,000 | 131,970 | ||||||
| Phenix City, AL, Industrial Development Board Environmental Improvement Rev. (MeadWestvaco Coated Board Project), “A”, 4.125%, 2035 | 1,950,000 | 1,877,265 | ||||||
| Rockdale County, GA, Development Authority Project Rev. (Visy Paper Project), “A”, 6.125%, 2034 | 2,055,000 | 2,142,132 | ||||||
| Sabine River, LA, Water Facilities Authority Rev. (International Paper Co.), 6.2%, 2025 | 1,250,000 | 1,255,013 | ||||||
| West Point, VA, Industrial Development Authority, Solid Waste Disposal Rev. (Chesapeake Corp.), “A”, 6.375%, 2019 (a)(d) | 550,000 | 55 | ||||||
|
| |||||||
| $ | 8,764,769 | |||||||
| Miscellaneous Revenue - Entertainment & Tourism - 1.1% | ||||||||
| Brooklyn, NY, Arena Local Development Corp. (Barclays Center Project), 6%, 2030 | $ | 2,015,000 | $ | 2,406,635 | ||||
| Brooklyn, NY, Arena Local Development Corp. (Barclays Center Project), 6.25%, 2040 | 3,205,000 | 3,833,340 | ||||||
| Harris County, Houston, TX, Sports Authority, Special Rev., “A”, NATL, 5%, 2025 | 2,460,000 | 2,483,444 | ||||||
| Louisiana Stadium & Exposition District Rev., “A”, 5%, 2020 | 665,000 | 793,458 | ||||||
| Louisiana Stadium & Exposition District Rev., “A”, 5%, 2021 | 830,000 | 991,203 | ||||||
| Louisiana Stadium & Exposition District Rev., “A”, 5%, 2022 | 500,000 | 593,505 | ||||||
| Louisiana Stadium & Exposition District Rev., “A”, 5%, 2023 | 1,325,000 | 1,579,095 | ||||||
| Louisiana Stadium & Exposition District Rev., “A”, 5%, 2024 | 1,270,000 | 1,491,323 | ||||||
| Louisiana Stadium & Exposition District Rev., “A”, 5%, 2025 | 1,000,000 | 1,165,630 | ||||||
| Louisiana Stadium & Exposition District Rev., “A”, 5%, 2026 | 2,000,000 | 2,314,140 | ||||||
| Louisiana Stadium & Exposition District Rev., “A”, 5%, 2029 | 1,330,000 | 1,513,952 | ||||||
| Seminole Tribe, FL, Special Obligation Rev., “A”, 5.75%, 2022 (n) | 2,850,000 | 3,157,031 | ||||||
| Seminole Tribe, FL, Special Obligation Rev., “A”, 5.5%, 2024 (n) | 2,000,000 | 2,185,020 | ||||||
23
Table of Contents
Portfolio of Investments – continued
| Issuer | Shares/Par | Value ($) | ||||||
| Municipal Bonds - continued | ||||||||
| Miscellaneous Revenue - Entertainment & Tourism - continued | ||||||||
| Seneca Nation of Indians, NY, Capital Improvements Authority, Special Obligation, 5%, 2023 (n) | $ | 670,000 | $ | 705,919 | ||||
|
| |||||||
| $ | 25,213,695 | |||||||
| Miscellaneous Revenue - Other - 1.9% | ||||||||
| Austin, TX, Convention Center (Convention Enterprises, Inc.), “A”, SYNCORA, 5.25%, 2017 | $ | 995,000 | $ | 1,101,206 | ||||
| Austin, TX, Convention Center (Convention Enterprises, Inc.), “A”, SYNCORA, 5.25%, 2019 | 1,375,000 | 1,515,003 | ||||||
| Austin, TX, Convention Center (Convention Enterprises, Inc.), “A”, SYNCORA, 5.25%, 2020 | 1,120,000 | 1,229,816 | ||||||
| Austin, TX, Convention Center (Convention Enterprises, Inc.), “A”, SYNCORA, 5.25%, 2024 | 2,230,000 | 2,417,878 | ||||||
| Capital Trust Agency Rev. (Aero Miami FX LLC), “A”, 5.35%, 2029 | 3,900,000 | 4,220,385 | ||||||
| Citizens Property Insurance Corp., “A-1”, 5.25%, 2017 | 750,000 | 872,588 | ||||||
| Citizens Property Insurance Corp., “A-1”, 5%, 2019 | 505,000 | 596,890 | ||||||
| Cleveland-Cuyahoga County, OH, Port Authority Rev., 7%, 2040 | 1,105,000 | 1,229,136 | ||||||
| District of Columbia Rev. (American Society Hematology), 5%, 2036 | 760,000 | 815,168 | ||||||
| District of Columbia Rev. (American Society Hematology), 5%, 2042 | 985,000 | 1,045,568 | ||||||
| Fulton County, GA, Development Authority Rev. (Georgia Tech Athletic Association), “A”, 5%, 2042 | 2,320,000 | 2,544,042 | ||||||
| Hardeman County, TN, Correctional Facilities Corp. (Corrections Corp. of America), 7.375%, 2017 | 430,000 | 430,258 | ||||||
| Harris County, TX, Cultural Education Facilities Finance Corp. Rev. (YMCA Greater Houston Area) , 5%, 2033 | 355,000 | 385,622 | ||||||
| Harris County, TX, Cultural Education Facilities Finance Corp. Rev. (YMCA Greater Houston Area), 5%, 2028 | 245,000 | 271,979 | ||||||
| Harris County, TX, Cultural Education Facilities Finance Corp. Rev. (YMCA Greater Houston Area), 5%, 2038 | 180,000 | 192,416 | ||||||
| Indiana Finance Authority Rev., Ohio River Bridges Crossing Project (WVB East End Partners LLC), “A”, 5%, 2035 | 2,190,000 | 2,295,449 | ||||||
| Indiana Finance Authority Rev., Ohio River Bridges Crossing Project (WVB East End Partners LLC), “A”, 5%, 2040 | 3,280,000 | 3,383,287 | ||||||
| Massachusetts Port Authority Facilities Rev. (Conrac Project), “A”, 5.125%, 2041 | 465,000 | 515,174 | ||||||
| Miami-Dade County, FL, Special Obligation, “B”, 5%, 2035 | 2,415,000 | 2,640,150 | ||||||
| Miami-Dade County, FL, Special Obligation, “B”, 5%, 2037 | 5,395,000 | 5,880,011 | ||||||
| Miami-Dade County, FL, Special Obligation, Capital Appreciation, “A”, NATL, 0%, 2032 | 2,000,000 | 740,940 | ||||||
24
Table of Contents
Portfolio of Investments – continued
| Issuer | Shares/Par | Value ($) | ||||||
| Municipal Bonds - continued | ||||||||
| Miscellaneous Revenue - Other - continued | ||||||||
| New Orleans, LA, Aviation Board Gulf Opportunity Zone CFC Rev. (Consolidated Rental Car), “A”, 6.25%, 2030 | $ | 1,810,000 | $ | 2,130,732 | ||||
| New York Liberty Development Corp., Liberty Rev. (World Trade Center Project), 5%, 2031 | 2,300,000 | 2,589,248 | ||||||
| Oklahoma Industries Authority Rev. (Oklahoma Medical Research Foundation Project), 5.5%, 2029 | 4,400,000 | 4,945,820 | ||||||
| Summit County, OH, Port Authority Building Rev. (Flats East Development Recovery Zone Facility Bonds), 6.875%, 2040 | 415,000 | 461,592 | ||||||
| Summit County, OH, Port Authority Building Rev. (Seville Project), “A”, 5.1%, 2025 | 155,000 | 155,370 | ||||||
|
| |||||||
| $ | 44,605,728 | |||||||
| Multi-Family Housing Revenue - 0.2% | ||||||||
| Bay County, FL, Housing Finance Authority, Multi-Family Rev. (Andrews Place II Apartments), AGM, 5%, 2035 | $ | 1,045,000 | $ | 1,057,101 | ||||
| Indianapolis, IN, Multi-Family Rev. (Cambridge Station Apartments II), FNMA, 5.25%, 2039 (b) | 1,375,000 | 1,391,679 | ||||||
| Michigan Housing Development Authority, GNMA, 5.2%, 2038 | 1,200,000 | 1,227,144 | ||||||
| MuniMae TE Bond Subsidiary LLC, “A-2”, 4.9%, 2049 (z) | 2,000,000 | 1,980,160 | ||||||
|
| |||||||
| $ | 5,656,084 | |||||||
| Parking - 0.2% | ||||||||
| Boston, MA, Metropolitan Transit Parking Corp., Systemwide Parking Rev., 5.25%, 2036 | $ | 3,250,000 | $ | 3,701,490 | ||||
| Port Revenue - 1.3% | ||||||||
| Alameda Corridor Transportation Authority, California Rev., “A”, AGM, 5%, 2028 | $ | 985,000 | $ | 1,147,722 | ||||
| Louisiana Offshore Terminal Authority Deepwater Port Rev. (LOOP LLC Project), 1.375%, 2037 (b) | 1,885,000 | 1,895,613 | ||||||
| Maryland Economic Development Corp. Rev. (Port America Chesapeake Terminal Project), “B”, 5.375%, 2025 | 795,000 | 907,572 | ||||||
| Maryland Economic Development Corp. Rev. (Port America Chesapeake Terminal Project), “B”, 5.75%, 2035 | 1,535,000 | 1,736,546 | ||||||
| Massachusetts Port Authority Rev., ETM, 13%, 2013 (c) | 545,000 | 561,950 | ||||||
| Port Authority of NY & NJ (170th Series), 4%, 2034 | 2,910,000 | 2,945,182 | ||||||
| Port Authority of NY & NJ (173rd Series), 4%, 2027 | 15,000,000 | 16,255,800 | ||||||
| Port New Orleans, LA, Board Of Commissioners Port Facility Rev., “B”, 5%, 2031 | 595,000 | 646,688 | ||||||
| Port New Orleans, LA, Board Of Commissioners Port Facility Rev., “B”, 5%, 2032 | 240,000 | 260,642 | ||||||
| Port of Oakland, CA, Rev., “P”, 5%, 2033 | 1,000,000 | 1,082,590 | ||||||
25
Table of Contents
Portfolio of Investments – continued
| Issuer | Shares/Par | Value ($) | ||||||
| Municipal Bonds - continued | ||||||||
| Port Revenue - continued | ||||||||
| Seattle, WA, Port Rev., “B”, 5%, 2024 | $ | 3,000,000 | $ | 3,541,080 | ||||
|
| |||||||
| $ | 30,981,385 | |||||||
| Sales & Excise Tax Revenue - 5.6% | ||||||||
| Chicago, IL, Transit Authority Sales Tax Receipts Rev., 5.25%, 2029 | $ | 1,755,000 | $ | 2,038,169 | ||||
| Chicago, IL, Transit Authority Sales Tax Receipts Rev., 5.25%, 2030 | 3,505,000 | 4,053,252 | ||||||
| Chicago, IL, Transit Authority Sales Tax Receipts Rev., 5.25%, 2031 | 655,000 | 754,776 | ||||||
| Chicago, IL, Transit Authority Sales Tax Receipts Rev., 5.25%, 2040 | 4,685,000 | 5,270,438 | ||||||
| Colorado Regional Transportation District, Private Activity Rev. (Denver Transportation Partners), 6.5%, 2030 | 6,150,000 | 7,401,279 | ||||||
| Colorado Regional Transportation District, Private Activity Rev. (Denver Transportation Partners), 6%, 2034 | 5,000,000 | 5,769,400 | ||||||
| Illinois Sales Tax Rev., “P”, 6.5%, 2022 | 5,000,000 | 6,136,200 | ||||||
| Massachusetts Bay Transportation Authority, Sales Tax Rev., “A”, 5%, 2024 | 9,445,000 | 11,948,019 | ||||||
| Massachusetts Bay Transportation Authority, Sales Tax Rev., Capital Appreciation, “A-2”, 0%, 2028 | 6,930,000 | 3,627,093 | ||||||
| Massachusetts School Building Authority, Dedicated Sales Tax Rev., “B”, 5%, 2032 (u) | 10,730,000 | 12,387,356 | ||||||
| Massachusetts School Building Authority, Sales Tax Rev., “A”, 5%, 2026 | 12,500,000 | 15,037,000 | ||||||
| Metropolitan Atlanta, GA, Rapid Transit Authority Rev., 6.25%, 2018 | 3,640,000 | 4,068,428 | ||||||
| Metropolitan Pier & Exposition Authority, Dedicated State Tax Rev. (McCormick Place), “B”, AGM, 5%, 2050 (u) | 20,000,000 | 21,239,400 | ||||||
| Miami-Dade County, FL, Transit Sales Surtax Rev., 5%, 2037 | 3,435,000 | 3,856,097 | ||||||
| Poplar Bluff, MO, Regional Transportation Development District, Sales Tax Rev., 4%, 2036 | 1,160,000 | 1,127,068 | ||||||
| Poplar Bluff, MO, Regional Transportation Development District, Sales Tax Rev., 4.75%, 2042 | 925,000 | 934,953 | ||||||
| Puerto Rico Sales Tax Financing Corp., Sales Tax Rev., “A”, 5.5%, 2019 (c) | 45,000 | 57,165 | ||||||
| Puerto Rico Sales Tax Financing Corp., Sales Tax Rev., “A”, 5.5%, 2028 | 5,855,000 | 6,327,791 | ||||||
| Puerto Rico Sales Tax Financing Corp., Sales Tax Rev., “A”, 5.5%, 2037 | 1,105,000 | 1,139,763 | ||||||
| Puerto Rico Sales Tax Financing Corp., Sales Tax Rev., “A”, 5.5%, 2042 | 1,530,000 | 1,573,682 | ||||||
26
Table of Contents
Portfolio of Investments – continued
| Issuer | Shares/Par | Value ($) | ||||||
| Municipal Bonds - continued | ||||||||
| Sales & Excise Tax Revenue - continued | ||||||||
| Puerto Rico Sales Tax Financing Corp., Sales Tax Rev., “A”, 6%, 2042 | $ | 3,460,000 | $ | 3,715,210 | ||||
| Puerto Rico Sales Tax Financing Corp., Sales Tax Rev., “C”, 5.375%, 2038 | 605,000 | 619,103 | ||||||
| Puerto Rico Sales Tax Financing Corp., Sales Tax Rev., Convertible Capital Appreciation, “A”, 0% to 2016, 6.75% to 2032 | 4,190,000 | 4,336,189 | ||||||
| Puerto Rico Sales Tax Financing Corp., Sales Tax Rev., Capital Appreciation, “A”, 0%, 2033 | 2,345,000 | 1,882,801 | ||||||
| Puerto Rico Sales Tax Financing Corp., Sales Tax Rev., Capital Appreciation, “A”, 0%, 2033 | 280,000 | 87,752 | ||||||
| State of Illinois, “B”, 5.25%, 2034 | 1,275,000 | 1,439,220 | ||||||
| Utah Transit Authority Sales Tax Rev., Capital Appreciation, “A”, NATL, 0%, 2028 | 2,225,000 | 1,135,128 | ||||||
| Volusia County, FL, Tourist Development Tax Rev., AGM, 5%, 2034 | 815,000 | 853,770 | ||||||
| Wyandotte County/Kansas City, KS, Unified Government Special Obligation Rev., Capital Appreciation, “B”, 0%, 2021 | 3,790,000 | 2,504,735 | ||||||
|
| |||||||
| $ | 131,321,237 | |||||||
| Single Family Housing - Local - 0.5% | ||||||||
| Chicago, IL, Single Family Mortgage Rev., “C”, GNMA, 5.5%, 2038 | $ | 740,000 | $ | 772,989 | ||||
| Chicago, IL, Single Family Mortgage Rev., “C”, GNMA, 5.75%, 2042 | 1,195,000 | 1,202,433 | ||||||
| Denver, CO, Single Family Mortgage Rev., GNMA, 7.3%, 2031 | 40,000 | 40,409 | ||||||
| Manatee County, FL, Housing Finance Mortgage Rev., Single Family, Sub-Series 2, GNMA, 6.5%, 2023 | 35,000 | 36,994 | ||||||
| Manatee County, FL, Housing Finance Mortgage Rev., Single Family, Sub-Series 3, GNMA, 5.3%, 2028 | 225,000 | 229,781 | ||||||
| Manatee County, FL, Housing Finance Mortgage Rev., Single Family, Sub-Series 3, GNMA, 5.4%, 2029 | 175,000 | 176,040 | ||||||
| Nortex, TX, Housing Finance Corp., Single Family Mortgage Rev., “A”, GNMA, 5.5%, 2038 | 1,655,000 | 1,713,306 | ||||||
| Oklahoma County, OK, Home Finance Authority, Single Family Mortgage Rev., “A”, GNMA, 5.4%, 2038 | 870,000 | 883,850 | ||||||
| Permian Basin Housing Finance Corp., TX, Single Family Mortgage Backed Securities (Mortgage Backed Project) “A”, GNMA, 5.65%, 2038 | 1,090,000 | 1,140,620 | ||||||
| Sedgwick & Shawnee Counties, KS, Single Family Housing Rev., “A”, GNMA, 5.9%, 2035 | 320,000 | 337,798 | ||||||
| Sedgwick & Shawnee Counties, KS, Single Family Housing Rev., “A”, GNMA, 6.25%, 2035 | 100,000 | 105,690 | ||||||
| Sedgwick & Shawnee Counties, KS, Single Family Housing Rev., “A”, GNMA, 5.8%, 2036 | 1,345,000 | 1,419,513 | ||||||
27
Table of Contents
Portfolio of Investments – continued
| Issuer | Shares/Par | Value ($) | ||||||
| Municipal Bonds - continued | ||||||||
| Single Family Housing - Local - continued | ||||||||
| Sedgwick & Shawnee Counties, KS, Single Family Housing Rev., “A-1”, GNMA, 5.75%, 2037 | $ | 95,000 | $ | 101,334 | ||||
| Sedgwick & Shawnee Counties, KS, Single Family Housing Rev., “A-3”, GNMA, 6%, 2035 | 475,000 | 509,224 | ||||||
| Sedgwick & Shawnee Counties, KS, Single Family Housing Rev., “A-3”, GNMA, 5.5%, 2037 | 480,000 | 516,192 | ||||||
| Sedgwick & Shawnee Counties, KS, Single Family Housing Rev., “A-4”, GNMA, 5.85%, 2037 | 110,000 | 112,499 | ||||||
| Sedgwick & Shawnee Counties, KS, Single Family Housing Rev., “A-5”, GNMA, 5.8%, 2027 | 295,000 | 300,620 | ||||||
| Sedgwick & Shawnee Counties, KS, Single Family Housing Rev., “A-5”, GNMA, 5.7%, 2036 | 1,270,000 | 1,362,494 | ||||||
| Sedgwick & Shawnee Counties, KS, Single Family Housing Rev., “A-5”, GNMA, 5.9%, 2037 | 155,000 | 161,061 | ||||||
| Sedgwick & Shawnee Counties, KS, Single Family Mortgage Rev., “A”, GNMA, 5.45%, 2038 | 1,340,000 | 1,428,065 | ||||||
|
| |||||||
| $ | 12,550,912 | |||||||
| Single Family Housing - State - 1.0% | ||||||||
| California Housing Finance Agency Rev. (Home Mortgage), “G”, 4.95%, 2023 | $ | 6,180,000 | $ | 6,315,651 | ||||
| California Housing Finance Agency Rev. (Home Mortgage), “G”, 5.5%, 2042 | 1,655,000 | 1,725,238 | ||||||
| California Housing Finance Agency Rev. (Home Mortgage), “L”, 5.45%, 2033 | 6,600,000 | 6,733,452 | ||||||
| California Housing Finance Agency Rev. (Home Mortgage), “L”, FNMA, 5.5%, 2038 | 1,765,000 | 1,786,462 | ||||||
| Colorado Housing & Finance Authority Rev., 6.05%, 2016 | 15,000 | 15,145 | ||||||
| Colorado Housing & Finance Authority Rev., “B-2”, 6.1%, 2023 | 35,000 | 35,695 | ||||||
| Colorado Housing & Finance Authority Rev., “B-3”, 6.55%, 2033 | 50,000 | 51,614 | ||||||
| Colorado Housing & Finance Authority Rev., “C-2”, 5.9%, 2023 | 275,000 | 289,039 | ||||||
| Colorado Housing & Finance Authority Rev., “C-2”, FHA, 6.6%, 2032 | 210,000 | 218,543 | ||||||
| Colorado Housing & Finance Authority Rev., “C-3”, FHA, 6.375%, 2033 | 20,000 | 20,637 | ||||||
| Delaware Housing Authority Rev. (Single Family), “C”, 6.25%, 2037 | 535,000 | 573,290 | ||||||
| Florida Housing Finance Corp. Rev. (Homeowner Mortgage), “1”, GNMA, 4.8%, 2031 | 490,000 | 498,306 | ||||||
| Georgia Housing & Finance Authority Rev., 3%, 2043 | 1,500,000 | 1,571,835 | ||||||
| Mississippi Home Corp., Single Family Rev., “A”, GNMA, 6.1%, 2034 | 795,000 | 812,339 | ||||||
28
Table of Contents
Portfolio of Investments – continued
| Issuer | Shares/Par | Value ($) | ||||||
| Municipal Bonds - continued | ||||||||
| Single Family Housing - State - continued | ||||||||
| New Hampshire Housing Finance Authority Rev., 6.85%, 2030 | $ | 105,000 | $ | 105,170 | ||||
| New Hampshire Housing Finance Authority Rev., “B”, 6.5%, 2035 | 60,000 | 60,946 | ||||||
| New Mexico Mortgage Finance Authority Rev., GNMA, 5.95%, 2037 | 580,000 | 613,489 | ||||||
| New Mexico Mortgage Finance Authority Rev., “I”, GNMA, 5.75%, 2038 | 820,000 | 856,449 | ||||||
| Oregon Health & Community Services (Single Family Mortgage), “B”, 6.25%, 2031 | 505,000 | 526,387 | ||||||
| Texas Affordable Housing Corp. (Single Family Mortgage), “B”, GNMA, 5.25%, 2039 | 420,000 | 438,014 | ||||||
|
| |||||||
| $ | 23,247,701 | |||||||
| Solid Waste Revenue - 0.1% | ||||||||
| Delaware County, PA, Industrial Development Authority, Resource Recovery Facilities Rev. (American Ref-Fuel Co.), “A”, 6.2%, 2019 | $ | 1,950,000 | $ | 1,951,541 | ||||
| Palm Beach County, FL, Solid Waste Authority Rev. Improvement, BHAC, 5%, 2027 | 295,000 | 345,123 | ||||||
| Pennsylvania Economic Development Financing Authority, Sewer Sludge Disposal Rev. (Philadelphia Biosolids Facility), 6.25%, 2032 | 575,000 | 661,773 | ||||||
|
| |||||||
| $ | 2,958,437 | |||||||
| State & Agency - Other - 0.1% | ||||||||
| Commonwealth of Puerto Rico (Mepsi Campus), “A”, 6.5%, 2037 | $ | 1,200,000 | $ | 1,241,904 | ||||
| Massachusetts Development Finance Agency (Visual & Performing Arts), 6%, 2021 | 1,000,000 | 1,207,230 | ||||||
| Tift County, GA, Hospital Authority Rev. Anticipation Certificates, 5%, 2038 | 440,000 | 481,967 | ||||||
|
| |||||||
| $ | 2,931,101 | |||||||
| State & Local Agencies - 3.5% | ||||||||
| Alabama Incentives Financing Authority Special Obligation, “A”, 5%, 2037 | $ | 1,720,000 | $ | 1,934,106 | ||||
| California Public Works Board Lease Rev. (Various Capital Projects), “G-1”, 5.75%, 2030 | 2,950,000 | 3,452,031 | ||||||
| Cape Coral, FL, Special Obligation Rev., NATL, 5%, 2030 | 500,000 | 535,860 | ||||||
| Colorado State University Board of Governors, System Enterprise Rev., “B”, 5%, 2025 | 3,000,000 | 3,729,900 | ||||||
| Commonwealth of Pennsylvania, Public School Building Authority Rev., Capital Appreciation, 0%, 2029 | 2,075,000 | 1,009,654 | ||||||
29
Table of Contents
Portfolio of Investments – continued
| Issuer | Shares/Par | Value ($) | ||||||
| Municipal Bonds - continued | ||||||||
| State & Local Agencies - continued | ||||||||
| Commonwealth of Pennsylvania, State Public School Building Authority Lease Rev. (School District of Philadelphia Project), 5%, 2028 | $ | 1,870,000 | $ | 2,065,097 | ||||
| Commonwealth of Pennsylvania, State Public School Building Authority Lease Rev. (School District of Philadelphia Project), 5%, 2030 | 935,000 | 1,023,535 | ||||||
| Commonwealth of Pennsylvania, State Public School Building Authority Lease Rev. (School District of Philadelphia Project), 5%, 2031 | 700,000 | 763,490 | ||||||
| Commonwealth of Pennsylvania, State Public School Building Authority Lease Rev. (School District of Philadelphia Project), 5%, 2032 | 235,000 | 255,382 | ||||||
| Delaware Valley, PA, Regional Finance Authority, AMBAC, 5.5%, 2018 | 7,840,000 | 9,056,925 | ||||||
| Delaware Valley, PA, Regional Finance Authority, “B”, FRN, AMBAC, 0.516%, 2018 | 250,000 | 250,000 | ||||||
| Delaware Valley, PA, Regional Finance Authority, “C”, FRN, 0.942%, 2037 | 7,000,000 | 5,103,420 | ||||||
| Delaware Valley, PA, Regional Finance Authority, RITES, FRN, AMBAC, 9.913%, 2018 (p) | 900,000 | 1,179,396 | ||||||
| FYI Properties Lease Rev. (Washington State Project), 5.5%, 2034 | 2,255,000 | 2,524,112 | ||||||
| Golden State, CA, Tobacco Securitization Corp., Tobacco Settlement Rev., “A”, AGM, 4.55%, 2022 | 3,415,000 | 3,760,598 | ||||||
| Golden State, CA, Tobacco Securitization Corp., Tobacco Settlement Rev., Enhanced, “A”, FGIC, 5%, 2035 | 1,000,000 | 1,048,790 | ||||||
| Golden State, CA, Tobacco Securitization Corp., Tobacco Settlement Rev., Enhanced, “A-1”, AMBAC, 4.6%, 2023 | 995,000 | 1,093,027 | ||||||
| Golden State, CA, Tobacco Securitization Corp., Tobacco Settlement Rev., Enhanced, “B”, 5.5%, 2013 (c) | 5,000,000 | 5,043,150 | ||||||
| Los Angeles, CA, Municipal Improvement Corp. Lease Rev. (Real Property), “E”, 6%, 2039 | 2,580,000 | 3,068,033 | ||||||
| Manassas Park, VA, Economic Development Authority Lease Rev., “A”, 6%, 2035 | 845,000 | 909,862 | ||||||
| Miami-Dade County, FL, School Board, COP, “B”, ASSD GTY, 5%, 2033 | 500,000 | 550,970 | ||||||
| Mississippi Development Bank (Harrison County Coliseum), “A”, 5.25%, 2034 | 2,455,000 | 3,083,014 | ||||||
| Mississippi Development Bank Special Obligation (Marshall County Industrial Development Authority Mississippi Highway Construction Project), 5%, 2028 | 1,450,000 | 1,687,293 | ||||||
| New York Dormitory Authority Rev. (City University), 5.75%, 2013 | 1,355,000 | 1,373,130 | ||||||
30
Table of Contents
Portfolio of Investments – continued
| Issuer | Shares/Par | Value ($) | ||||||
| Municipal Bonds - continued | ||||||||
| State & Local Agencies - continued | ||||||||
| Pennsylvania Convention Center Authority Rev., ETM, FGIC, 6.7%, 2016 (c) | $ | 14,765,000 | $ | 16,453,968 | ||||
| Philadelphia, PA, Municipal Authority Rev., 6.5%, 2034 | 1,020,000 | 1,175,305 | ||||||
| Puerto Rico Public Finance Corp., Commonwealth Appropriations, “B”, 6%, 2026 | 2,455,000 | 2,579,395 | ||||||
| San Bernardino, CA, Joint Powers Financing Authority Lease Rev. (California Department of Transportation), 5.5%, 2014 | 4,330,000 | 4,344,635 | ||||||
| Tennessee School Bond Authority, “B”, 5.125%, 2033 | 1,500,000 | 1,698,885 | ||||||
|
| |||||||
| $ | 80,752,963 | |||||||
| Student Loan Revenue - 1.6% | ||||||||
| Iowa Student Loan Liquidity Corp., “A-2”, 5.5%, 2025 | $ | 2,240,000 | $ | 2,533,843 | ||||
| Iowa Student Loan Liquidity Corp., “A-2”, 5.6%, 2026 | 2,240,000 | 2,531,312 | ||||||
| Iowa Student Loan Liquidity Corp., “A-2”, 5.7%, 2027 | 185,000 | 205,258 | ||||||
| Iowa Student Loan Liquidity Corp., “A-2”, 5.75%, 2028 | 3,795,000 | 4,276,396 | ||||||
| Massachusetts Educational Financing Authority, Education Loan Rev., “H”, ASSD GTY, 6.35%, 2030 | 2,520,000 | 2,769,984 | ||||||
| Massachusetts Educational Financing Authority, Education Loan Rev., “I-A”, 5.5%, 2022 | 225,000 | 258,809 | ||||||
| Massachusetts Educational Financing Authority, Education Loan Rev., “J”, 5%, 2021 | 1,255,000 | 1,393,489 | ||||||
| Massachusetts Educational Financing Authority, Education Loan Rev., “J”, 4.7%, 2026 | 2,600,000 | 2,687,620 | ||||||
| Massachusetts Educational Financing Authority, Education Loan Rev., “J”, 4.9%, 2028 | 2,705,000 | 2,801,082 | ||||||
| Rhode Island Student Loan Authority, Student Loan Rev., “A”, 3%, 2021 | 4,890,000 | 4,849,315 | ||||||
| Rhode Island Student Loan Authority, Student Loan Rev., “A”, 3.25%, 2022 | 1,500,000 | 1,492,560 | ||||||
| Rhode Island Student Loan Authority, Student Loan Rev., “A”, 3.375%, 2023 | 2,500,000 | 2,485,525 | ||||||
| Rhode Island Student Loan Authority, Student Loan Rev., “A”, 3.5%, 2024 | 4,550,000 | 4,511,098 | ||||||
| Rhode Island Student Loan Authority, Student Loan Rev., “A”, 3.625%, 2025 | 4,115,000 | 4,063,398 | ||||||
|
| |||||||
| $ | 36,859,689 | |||||||
| Tax - Other - 0.6% | ||||||||
| Hudson Yards, NY, Infrastructure Corp. Rev., “A”, 5.75%, 2047 | $ | 3,950,000 | $ | 4,600,644 | ||||
| New York Dormitory Authority, State Personal Income Tax Rev., “A”, 5%, 2025 | 5,000,000 | 6,061,000 | ||||||
| Virgin Islands Public Finance Authority Rev. (Diageo Project), “A”, 6.75%, 2037 | 2,200,000 | 2,522,718 | ||||||
31
Table of Contents
Portfolio of Investments – continued
| Issuer | Shares/Par | Value ($) | ||||||
| Municipal Bonds - continued | ||||||||
| Tax - Other - continued | ||||||||
| Virgin Islands Public Finance Authority Rev., “A”, 5.25%, 2024 | $ | 130,000 | $ | 136,881 | ||||
|
| |||||||
| $ | 13,321,243 | |||||||
| Tax Assessment - 0.8% | ||||||||
| Arborwood Community Development District, FL, Special Assessment (Master Infrastructure Projects), “B”, 5.1%, 2014 | $ | 165,000 | $ | 147,828 | ||||
| Baltimore, MD, Special Obligation, (East Baltimore Research Park Project), “A”, 7%, 2038 | 1,285,000 | 1,399,738 | ||||||
| Capital Region Community Development District, FL, Capital Improvement Rev., “A”, 7%, 2039 | 880,000 | 869,748 | ||||||
| Concord Station Community Development District, FL, Special Assessment, 5%, 2015 | 50,000 | 49,881 | ||||||
| Fishhawk Community Development District, FL, 7.04%, 2014 | 5,000 | 5,047 | ||||||
| Glendale, CA, Redevelopment Agency, Tax Allocation Rev. (Central Glendale Redevelopment Project), 5.5%, 2024 | 2,250,000 | 2,352,825 | ||||||
| Heritage Harbour North Community Development District, FL, Capital Improvement Rev., 6.375%, 2038 | 805,000 | 803,446 | ||||||
| Homestead 50, FL, Community Development District, Special Assessment, “A”, 6%, 2037 | 1,665,000 | 1,239,792 | ||||||
| Homestead 50, FL, Community Development District, Special Assessment, “B”, 5.9%, 2013 | 275,000 | 225,005 | ||||||
| Killarney Community Development District, FL, Special Assessment, “B”, 5.125%, 2009 (a)(d) | 190,000 | 85,500 | ||||||
| Lancaster County, SC, Assessment Rev. (Sun City Carolina Lakes), 5.45%, 2037 | 40,000 | 40,026 | ||||||
| Main Street Community Development District, FL, “A”, 6.8%, 2038 | 525,000 | 512,568 | ||||||
| Massachusetts Bay Transportation Authority Rev., “A”, 5.25%, 2034 | 2,000,000 | 2,315,560 | ||||||
| Middle Village Community Development District, FL, Special Assessment, “A”, 5.8%, 2022 | 65,000 | 52,586 | ||||||
| Noblesville, IN, Redevelopment Authority Lease Rental, 5.25%, 2025 | 2,000,000 | 2,183,200 | ||||||
| Old Palm Community Development District, FL, Special Assessment (Palm Beach Gardens), “B”, 5.375%, 2014 | 60,000 | 59,609 | ||||||
| Parkway Center Community Development District, FL, Special Assessment, “B”, 5.625%, 2014 | 545,000 | 516,300 | ||||||
| Pennsylvania Economic Development Financing Authority Unemployment Compensation Rev., “B”, 5%, 2023 | 3,230,000 | 3,576,999 | ||||||
| Pennsylvania Economic Development Financing Authority Unemployment Compensation Rev., “B”, 5%, 2023 | 1,940,000 | 2,117,219 | ||||||
| Sterling Hill Community Development District, FL, Capital Improvement Rev., “B”, 5.5%, 2010 (d) | 55,000 | 35,753 | ||||||
32
Table of Contents
Portfolio of Investments – continued
| Issuer | Shares/Par | Value ($) | ||||||
| Municipal Bonds - continued | ||||||||
| Tax Assessment - continued | ||||||||
| Tuscany Reserve Community Development District, FL, Special Assessment, “B”, 5.25%, 2016 | $ | 360,000 | $ | 352,397 | ||||
| Washington County, PA, Redevelopment Authority (Victory Centre Project), “A”, 5.45%, 2035 | 270,000 | 276,750 | ||||||
| Watergrass Community Development District, FL, Special Assessment, “B”, 6.96%, 2017 | 50,000 | 48,679 | ||||||
|
| |||||||
| $ | 19,266,456 | |||||||
| Tobacco - 4.0% | ||||||||
| Buckeye, OH, Tobacco Settlement Financing Authority, “A-2”, 5.125%, 2024 | $ | 8,600,000 | $ | 7,888,436 | ||||
| Buckeye, OH, Tobacco Settlement Financing Authority, “A-2”, 5.75%, 2034 | 5,000,000 | 4,450,800 | ||||||
| Buckeye, OH, Tobacco Settlement Financing Authority, “A-3”, 6.25%, 2037 | 8,900,000 | 8,322,212 | ||||||
| District of Columbia, Tobacco Settlement, 6.25%, 2024 | 855,000 | 875,640 | ||||||
| Golden State, CA, Tobacco Securitization Corp., Tobacco Settlement Rev., “A-1”, 6.25%, 2013 (c) | 1,405,000 | 1,418,825 | ||||||
| Golden State, CA, Tobacco Securitization Corp., Tobacco Settlement Rev., “A-1”, 4.5%, 2027 | 1,885,000 | 1,812,258 | ||||||
| Golden State, CA, Tobacco Securitization Corp., Tobacco Settlement Rev., “A-1”, 5.75%, 2047 | 4,760,000 | 4,554,320 | ||||||
| Golden State, CA, Tobacco Securitization Corp., Tobacco Settlement Rev., Asset Backed, “A-1”, 5%, 2033 | 475,000 | 437,551 | ||||||
| Illinois Railsplitter Tobacco Settlement Authority, 5.5%, 2023 | 3,970,000 | 4,798,539 | ||||||
| Illinois Railsplitter Tobacco Settlement Authority, 6.25%, 2024 | 2,610,000 | 2,915,735 | ||||||
| Illinois Railsplitter Tobacco Settlement Authority, 6%, 2028 | 8,750,000 | 10,602,025 | ||||||
| Iowa Tobacco Settlement Authority, Tobacco Settlement Rev., Asset Backed, “B”, 5.6%, 2034 | 3,070,000 | 3,062,202 | ||||||
| Louisiana Tobacco Settlement Authority Rev., “2001-B”, 5.5%, 2030 | 955,000 | 971,684 | ||||||
| Louisiana Tobacco Settlement Authority Rev., “2001-B”, 5.875%, 2039 | 2,835,000 | 2,873,273 | ||||||
| New Jersey Tobacco Settlement Financing Corp., “1-A”, 4.5%, 2023 | 17,465,000 | 17,421,687 | ||||||
| New Jersey Tobacco Settlement Financing Corp., “1-A”, 5%, 2041 | 12,095,000 | 10,898,200 | ||||||
| South Dakota Educational Enhancement Funding Corp., Tobacco Settlement Rev., “B”, 5%, 2024 | 1,000,000 | 1,202,180 | ||||||
| South Dakota Educational Enhancement Funding Corp., Tobacco Settlement Rev., “B”, 5%, 2025 | 1,000,000 | 1,188,480 | ||||||
| South Dakota Educational Enhancement Funding Corp., Tobacco Settlement Rev., “B”, 5%, 2026 | 1,400,000 | 1,650,334 | ||||||
33
Table of Contents
Portfolio of Investments – continued
| Issuer | Shares/Par | Value ($) | ||||||
| Municipal Bonds - continued | ||||||||
| Tobacco - continued | ||||||||
| Suffolk, NY, Tobacco Asset Securitization Corp., Tobacco Settlement, “B”, 5.25%, 2037 | $ | 765,000 | $ | 818,313 | ||||
| Washington Tobacco Settlement Authority Rev., 6.5%, 2026 | 180,000 | 186,284 | ||||||
| Washington Tobacco Settlement Authority Rev., 6.625%, 2032 | 4,485,000 | 4,578,198 | ||||||
|
| |||||||
| $ | 92,927,176 | |||||||
| Toll Roads - 2.3% | ||||||||
| Chesapeake, VA, Toll Road Rev. (Transportation System), “A”, 5%, 2047 | $ | 1,290,000 | $ | 1,358,435 | ||||
| Chesapeake, VA, Toll Road Rev. (Transportation System), Convertible Capital Appreciation, “B”, 0%, 2032 | 1,260,000 | 784,300 | ||||||
| Chesapeake, VA, Toll Road Rev. (Transportation System), Convertible Capital Appreciation, “B”, 0%, 2040 | 1,715,000 | 1,050,386 | ||||||
| E-470 Public Highway Authority Rev., CO, “C”, 5.375%, 2026 | 1,495,000 | 1,669,317 | ||||||
| Illinois Toll Highway Authority Rev., “B”, 5.5%, 2033 | 5,645,000 | 6,414,244 | ||||||
| Mid-Bay Bridge Authority, FL, Springing Lien Rev., “A”, 7.25%, 2040 | 6,920,000 | 8,806,807 | ||||||
| North Texas Tollway Authority Rev. (Special Projects System), “D”, 5%, 2029 | 15,000,000 | 17,323,650 | ||||||
| North Texas Tollway Authority Rev., “C”, 1.95%, 2038 (b) | 8,000,000 | 8,118,160 | ||||||
| Northwest Parkway, CO, Public Highway Authority Rev., “C”, ETM, AGM, 5.35%, 2016 (c) | 1,000,000 | 1,148,600 | ||||||
| Orlando & Orange County, FL, Expressway Authority Rev., “A”, 5%, 2040 | 1,000,000 | 1,097,210 | ||||||
| Triborough Bridge & Tunnel Authority Rev., NY, “A”, 5%, 2025 | 2,675,000 | 3,204,222 | ||||||
| Virginia Small Business Financing Authority Rev. (Elizabeth River Crossings Opco LLC Project), 5.25%, 2032 | 1,310,000 | 1,400,927 | ||||||
| Virginia Small Business Financing Authority Rev. (Elizabeth River Crossings Opco LLC Project), 6%, 2037 | 2,180,000 | 2,490,476 | ||||||
|
| |||||||
| $ | 54,866,734 | |||||||
| Transportation - Special Tax - 2.6% | ||||||||
| Arizona Transportation Board Highway Rev., “A”, 5%, 2023 | $ | 3,315,000 | $ | 4,084,378 | ||||
| Arizona Transportation Board Highway Rev., “A”, 5%, 2024 | 6,335,000 | 7,728,320 | ||||||
| Commonwealth of Virginia, Transportation Board Rev., “A”, 4%, 2026 | 8,180,000 | 8,959,063 | ||||||
| Commonwealth of Virginia, Transportation Board Rev., Capital Projects, 5%, 2020 | 4,870,000 | 6,016,398 | ||||||
| Jacksonville, FL, Transportation Authority Rev., ETM, 9.2%, 2015 (c) | 785,000 | 866,467 | ||||||
| New Jersey Transportation Trust Fund Authority Rev., “D”, 5.25%, 2023 | 7,500,000 | 9,282,450 | ||||||
| New York Metropolitan Transportation Authority Rev., ETM, 5.75%, 2013 (c) | 330,000 | 334,455 | ||||||
34
Table of Contents
Portfolio of Investments – continued
| Issuer | Shares/Par | Value ($) | ||||||
| Municipal Bonds - continued | ||||||||
| Transportation - Special Tax - continued | ||||||||
| Pennsylvania Turnpike Commission Oil Franchise Tax Rev., “A”, ETM, AMBAC, 5.25%, 2018 (c) | $ | 1,150,000 | $ | 1,266,564 | ||||
| State of Connecticut, Special Tax Obligation Rev., “A”, 5%, 2028 | 4,595,000 | 5,429,544 | ||||||
| State of Connecticut, Special Tax Obligation Rev., “A”, 5%, 2029 | 4,595,000 | 5,406,201 | ||||||
| State of Connecticut, Special Tax Obligation Rev., “A”, 5%, 2030 | 4,615,000 | 5,406,380 | ||||||
| State of Hawaii, Highway Rev., “A”, 5%, 2030 | 3,695,000 | 4,290,375 | ||||||
| State of Hawaii, Highway Rev., “A”, 5%, 2031 | 1,380,000 | 1,596,591 | ||||||
| State of Hawaii, Highway Rev., “A”, 5%, 2032 | 920,000 | 1,060,558 | ||||||
|
| |||||||
| $ | 61,727,744 | |||||||
| Universities - Colleges - 8.1% | ||||||||
| Alcorn State University, MS, Educational Building Corp. Rev. (Student Housing Project), “A”, 5.125%, 2034 | $ | 2,500,000 | $ | 2,766,200 | ||||
| Alcorn State University, MS, Educational Building Corp. Rev. (Student Housing Project), “A”, 5.25%, 2039 | 1,625,000 | 1,793,870 | ||||||
| Allegheny County, PA, Higher Education Building Authority Rev. (Robert Morris University), “A”, 5.9%, 2028 | 1,195,000 | 1,349,657 | ||||||
| Allegheny County, PA, Higher Education Building Authority Rev. (Robert Morris University), “A”, 6%, 2038 | 1,725,000 | 1,923,686 | ||||||
| California Educational Facilities Authority Rev. (California Lutheran University), 5.75%, 2038 | 2,640,000 | 2,883,540 | ||||||
| California Educational Facilities Authority Rev. (Chapman University), 5%, 2031 | 1,550,000 | 1,698,459 | ||||||
| California Educational Facilities Authority Rev. (University of San Francisco), 6.125%, 2036 | 925,000 | 1,093,887 | ||||||
| California Educational Facilities Authority Rev. (University of Southern California), “A”, 5.25%, 2038 | 4,610,000 | 5,326,210 | ||||||
| California Municipal Finance Authority Rev. (Biola University), 5.8%, 2028 | 1,785,000 | 1,965,624 | ||||||
| California Municipal Finance Authority Rev. (University of La Verne), “A”, 6.25%, 2040 | 850,000 | 982,320 | ||||||
| California Statewide Communities Development Authority Rev. (California Baptist University), “A”, 5.4%, 2027 | 245,000 | 262,765 | ||||||
| California Statewide Communities Development Authority Rev. (California Baptist University), “A”, 5.5%, 2038 | 280,000 | 299,272 | ||||||
| Claiborne County, TN, Industrial Development Board Rev. (Lincoln Memorial University Project), 6.125%, 2040 | 3,000,000 | 3,345,570 | ||||||
| Delaware County, PA, Authority College Rev. (Neumann University), 6%, 2025 | 490,000 | 542,749 | ||||||
| District of Columbia Rev. (Georgetown University), Convertible Capital Appreciation, BHAC, 0% to 2018, 5% to 2040 | 11,570,000 | 9,633,066 | ||||||
35
Table of Contents
Portfolio of Investments – continued
| Issuer | Shares/Par | Value ($) | ||||||
| Municipal Bonds - continued | ||||||||
| Universities - Colleges - continued | ||||||||
| Douglas County, NE, Educational Facilities Rev. (Creighton University), “A”, 5.875%, 2040 | $ | 6,355,000 | $ | 7,200,024 | ||||
| Florida State University Board of Governors, System Improvement Rev., 6.25%, 2030 | 2,685,000 | 3,291,112 | ||||||
| Forest Grove, OR, Student Housing Rev. (Oak Tree Foundation, Inc.), 5.5%, 2037 | 2,470,000 | 2,526,464 | ||||||
| Grand Valley, MI, State University Rev., 5.5%, 2027 | 985,000 | 1,123,688 | ||||||
| Grand Valley, MI, State University Rev., 5.625%, 2029 | 480,000 | 546,955 | ||||||
| Hempstead, NY, Local Development Corp. Rev. (Hofstra University Project), 5%, 2025 | 1,450,000 | 1,652,406 | ||||||
| Hempstead, NY, Local Development Corp. Rev. (Hofstra University Project), 5%, 2026 | 1,080,000 | 1,216,512 | ||||||
| Hempstead, NY, Local Development Corp. Rev. (Hofstra University Project), 5%, 2028 | 275,000 | 306,600 | ||||||
| Illinois Finance Authority Rev. (Illinois Institute of Technology), “A”, 5%, 2031 | 2,745,000 | 2,738,549 | ||||||
| Illinois Finance Authority Rev. (Illinois Institute of Technology), “A”, 5%, 2036 | 5,705,000 | 5,613,092 | ||||||
| Illinois Finance Authority Rev. (Roosevelt University Project), 6.25%, 2029 | 5,300,000 | 6,008,504 | ||||||
| Illinois Finance Authority Rev. (Roosevelt University Project), 6.5%, 2039 | 1,225,000 | 1,387,411 | ||||||
| Indiana County, PA, Industrial Development Authority (Student Cooperative Association, Inc./Indiana University of Pennsylvania), 5%, 2033 | 1,065,000 | 1,154,652 | ||||||
| Indiana University Rev., “A”, 5%, 2032 | 525,000 | 614,502 | ||||||
| Indiana University Rev., “A”, 5%, 2037 | 1,580,000 | 1,820,476 | ||||||
| Louisville & Jefferson County, KY, Metro Government College Rev. (Bellarmine University, Inc. Project), 6.125%, 2039 | 3,000,000 | 3,332,430 | ||||||
| Marietta, GA, Development Facilities Authority Rev. (Life University), 7%, 2030 | 540,000 | 582,206 | ||||||
| Marietta, GA, Development Facilities Authority Rev. (Life University), 7%, 2039 | 645,000 | 692,382 | ||||||
| Massachusetts Development Finance Agency Rev. (Simmons College), SYNCORA, 5.25%, 2026 | 880,000 | 987,976 | ||||||
| Massachusetts Development Finance Agency Rev. (Simmons College), “H”, SYNCORA, 5.25%, 2033 | 420,000 | 464,268 | ||||||
| Massachusetts Health & Educational Facilities Authority Rev. (Harvard University), 5.5%, 2036 (u) | 25,000,000 | 29,831,500 | ||||||
| Massachusetts Health & Educational Facilities Authority Rev. (Simmons College), “I”, 8%, 2029 | 2,030,000 | 2,317,996 | ||||||
| Massachusetts Health & Educational Facilities Authority Rev. (Suffolk University), “A”, 6.25%, 2030 | 4,055,000 | 4,737,254 | ||||||
36
Table of Contents
Portfolio of Investments – continued
| Issuer | Shares/Par | Value ($) | ||||||
| Municipal Bonds - continued | ||||||||
| Universities - Colleges - continued | ||||||||
| Massachusetts Health & Educational Facilities Authority Rev. (Wheaton College), “F”, 5%, 2041 | $ | 1,000,000 | $ | 1,080,630 | ||||
| Miami-Dade County, FL, Educational Facilities Authority Rev. (University of Miami), “A”, 5.75%, 2028 | 1,875,000 | 2,065,725 | ||||||
| New Jersey Educational Facilities Authority Rev. (University of Medicine & Dentistry), “B”, 7.5%, 2032 | 4,195,000 | 5,209,435 | ||||||
| New York Dormitory Authority Rev. (Pace University), “A”, 5%, 2025 | 1,000,000 | 1,150,270 | ||||||
| New York Dormitory Authority Rev. (Pace University), “A”, 5%, 2026 | 1,000,000 | 1,141,950 | ||||||
| New York Dormitory Authority Rev. (Pace University), “A”, 5%, 2027 | 1,090,000 | 1,239,722 | ||||||
| New York Dormitory Authority Rev. (Pace University), “A”, 5%, 2028 | 750,000 | 847,545 | ||||||
| New York Dormitory Authority Rev. (Pace University), “A”, 5%, 2029 | 800,000 | 901,872 | ||||||
| Oregon Health & Science University Rev., “A”, 5%, 2026 | 530,000 | 615,929 | ||||||
| Oregon Health & Science University Rev., “E”, 5%, 2030 | 930,000 | 1,062,999 | ||||||
| Oregon Health & Science University Rev., “E”, 5%, 2032 | 2,095,000 | 2,376,673 | ||||||
| Pennsylvania Higher Educational Facilities Authority Rev. (La Salle University), 5.5%, 2034 | 2,420,000 | 2,429,898 | ||||||
| Pennsylvania Higher Educational Facilities Authority Rev. (La Salle University), “A”, 5.25%, 2027 | 1,210,000 | 1,316,964 | ||||||
| Pennsylvania Higher Educational Facilities Authority Rev. (Saint Joseph’s University), “A”, 5%, 2040 | 3,500,000 | 3,757,495 | ||||||
| Pennsylvania Higher Educational Facilities Authority Rev. (Temple University), 5%, 2035 | 250,000 | 282,843 | ||||||
| Portage County, OH, Port Authority Rev. (Northeast Ohio Medical University Project), 5%, 2037 | 2,230,000 | 2,369,620 | ||||||
| St. Joseph County, IN, Educational Facilities Rev. (University of Notre Dame), 6.5%, 2026 | 1,000,000 | 1,445,920 | ||||||
| Texas A&M University, “A”, 5%, 2026 | 1,150,000 | 1,436,431 | ||||||
| Texas Tech University Rev., Refunding & Improvement, “A”, 5%, 2030 | 2,175,000 | 2,503,360 | ||||||
| Texas Tech University Rev., Refunding & Improvement, “A”, 5%, 2031 | 960,000 | 1,101,101 | ||||||
| Texas Tech University Rev., Refunding & Improvement, “A”, 5%, 2032 | 915,000 | 1,045,845 | ||||||
| Texas Tech University Rev., Refunding & Improvement, “A”, 5%, 2037 | 1,675,000 | 1,901,293 | ||||||
| Troy, NY, Capital Resource Corp. Rev. (Rensselaer Polytechnic Institute) “A”, 5.125%, 2040 | 9,895,000 | 10,787,925 | ||||||
37
Table of Contents
Portfolio of Investments – continued
| Issuer | Shares/Par | Value ($) | ||||||
| Municipal Bonds - continued | ||||||||
| Universities - Colleges - continued | ||||||||
| Tulsa, OK, Industrial Authority Rev. (University of Tulsa), 6%, 2027 | $ | 4,670,000 | $ | 5,404,638 | ||||
| University of Colorado, Enterprise Rev., 5%, 2029 | 4,220,000 | 4,896,339 | ||||||
| University of Delaware Rev., “C”, FRN, 0.7%, 2037 (b) | 5,000,000 | 4,996,950 | ||||||
| University of Minnesota, “A”, 5%, 2025 | 710,000 | 872,256 | ||||||
| University of Minnesota, “A”, 5%, 2027 | 1,000,000 | 1,216,160 | ||||||
| University of Southern Indiana Rev. (Student Fee), “J”, ASSD GTY, 5.75%, 2028 | 1,875,000 | 2,266,950 | ||||||
| University of Southern Mississippi Educational Building Corp. Rev. (Campus Facilities Project), 5.25%, 2032 | 1,665,000 | 1,897,601 | ||||||
| University of Southern Mississippi Educational Building Corp. Rev. (Campus Facilities Project), 5.375%, 2036 | 610,000 | 692,002 | ||||||
| Washington Higher Education Facilities Authority Rev. (Whitworth University), 5.875%, 2034 | 2,165,000 | 2,416,118 | ||||||
|
| |||||||
| $ | 188,744,293 | |||||||
| Universities - Dormitories - 1.3% | ||||||||
| Bowling Green, OH, Student Housing Rev. (State University Project), 6%, 2045 | $ | 3,975,000 | $ | 4,390,030 | ||||
| California Statewide Communities Development Authority Rev. (Lancer Educational Student Housing Project), 5.625%, 2033 | 1,025,000 | 1,097,416 | ||||||
| California Statewide Communities Development Authority Rev. (Lancer Educational Student Housing Project), 7.5%, 2042 | 925,000 | 1,054,121 | ||||||
| California Statewide Communities Development Authority Rev. (Student Housing, SUCI East Campus), 6%, 2040 | 1,655,000 | 1,811,513 | ||||||
| District of Columbia Student Dormitory Rev. (Provident Group - Howard Properties LLC), 5%, 2030 | 3,235,000 | 3,469,958 | ||||||
| District of Columbia Student Dormitory Rev. (Provident Group - Howard Properties LLC), 5%, 2035 | 4,080,000 | 4,323,576 | ||||||
| District of Columbia Student Dormitory Rev. (Provident Group - Howard Properties LLC), 5%, 2045 | 4,705,000 | 4,896,211 | ||||||
| Illinois Finance Authority Student Housing Rev. (Illinois State University), 6.75%, 2031 | 2,730,000 | 3,202,645 | ||||||
| Illinois Finance Authority Student Housing Rev. (Northern Illinois University Project), 6.625%, 2031 | 4,210,000 | 5,005,943 | ||||||
| Pennsylvania Higher Educational Facilities Authority Rev. (Edinboro University Foundation), 5.8%, 2030 | 510,000 | 579,911 | ||||||
| Pennsylvania Higher Educational Facilities Authority Rev. (Edinboro University Foundation), 6%, 2043 | 895,000 | 995,249 | ||||||
|
| |||||||
| $ | 30,826,573 | |||||||
| Universities - Secondary Schools - 1.6% | ||||||||
| California Statewide Communities Development Authority School Facility Rev. (Aspire Public Schools), 6.125%, 2046 | $ | 5,045,000 | $ | 5,381,905 | ||||
38
Table of Contents
Portfolio of Investments – continued
| Issuer | Shares/Par | Value ($) | ||||||
| Municipal Bonds - continued | ||||||||
| Universities - Secondary Schools - continued | ||||||||
| Clifton, TX, Higher Education Finance Corp. Rev. (Uplift Education), “A”, 6.125%, 2040 | $ | 2,355,000 | $ | 2,683,946 | ||||
| Clifton, TX, Higher Education Finance Corp. Rev. (Uplift Education), “A”, 6.25%, 2045 | 1,425,000 | 1,630,642 | ||||||
| Colorado Educational & Cultural Facilities Authority Rev. (Academy of Charter Schools Project), 5.625%, 2040 | 1,815,000 | 1,929,545 | ||||||
| Colorado Educational & Cultural Facilities Authority Rev. (Montessori Charter School Project), 4%, 2027 | 295,000 | 303,526 | ||||||
| Colorado Educational & Cultural Facilities Authority Rev. (Montessori Charter School Project), 5%, 2037 | 545,000 | 572,637 | ||||||
| Colorado Educational & Cultural Facilities Authority Rev. (Pinnacle Charter School Building Corp.), 5%, 2029 | 700,000 | 783,384 | ||||||
| Colorado Educational & Cultural Facilities Authority Rev. (Twin Peaks Charter Academy), 7%, 2038 | 4,330,000 | 4,854,883 | ||||||
| Florida Development Finance Corp. Educational Facilities Rev. (Renaissance Charter School),“A”, 6%, 2030 | 2,425,000 | 2,585,074 | ||||||
| Florida Development Finance Corp. Educational Facilities Rev. (Renaissance Charter School),“A”, 6%, 2040 | 5,130,000 | 5,370,956 | ||||||
| La Vernia, TX, Higher Education Finance Corp. Rev. (KIPP, Inc.), “A”, 6.25%, 2039 | 1,470,000 | 1,686,296 | ||||||
| La Vernia, TX, Higher Education Finance Corp. Rev. (Lifeschool of Dallas), “A”, 7.5%, 2041 | 4,230,000 | 4,974,311 | ||||||
| Maryland Health & Higher Educational Facilities Authority Rev. (Washington Christian Academy), 5.5%, 2038 (a)(d) | 100,000 | 36,000 | ||||||
| Philadelphia, PA, Authority for Industrial Development Rev. (Global Leadership Academy Project), 5.75%, 2030 | 480,000 | 494,270 | ||||||
| Philadelphia, PA, Authority for Industrial Development Rev. (MaST Charter School), 6%, 2035 | 415,000 | 463,057 | ||||||
| San Juan, TX, Higher Education Finance Authority Education Rev. (Idea Public Schools), “A”, 6.7%, 2040 | 2,795,000 | 3,297,821 | ||||||
|
| |||||||
| $ | 37,048,253 | |||||||
| Utilities - Investor Owned - 3.5% | ||||||||
| Brazos River Authority, TX, Pollution Control Rev. (TXU Energy Co. LLC), 5%, 2041 | $ | 2,460,000 | $ | 156,456 | ||||
| California Statewide Communities Development Authority, Pollution Control Rev., “A”, 4.5%, 2029 | 6,000,000 | 6,380,460 | ||||||
| Chula Vista, CA, Industrial Development Rev. (San Diego Gas & Electric Co.), “E”, 5.875%, 2034 | 1,840,000 | 2,199,444 | ||||||
| Farmington, NM, Pollution Control Rev. (Arizona Public Service Co.), “A”, 4.7%, 2024 | 5,990,000 | 6,722,996 | ||||||
| Farmington, NM, Pollution Control Rev. (Public Service New Mexico), “D”, 5.9%, 2040 | 9,975,000 | 11,111,552 | ||||||
39
Table of Contents
Portfolio of Investments – continued
| Issuer | Shares/Par | Value ($) | ||||||
| Municipal Bonds - continued | ||||||||
| Utilities - Investor Owned - continued | ||||||||
| Hawaii Department of Budget & Finance Special Purpose Rev. (Hawaiian Electric Co. & Subsidiary), 6.5%, 2039 | $ | 3,655,000 | $ | 4,260,560 | ||||
| Hawaii Department of Budget & Finance Special Purpose Rev. (Hawaiian Electric Co. & Subsidiary), “B”, SYNCORA, 5%, 2022 | 6,000,000 | 6,008,820 | ||||||
| Hillsborough County, FL, Industrial Development Authority, Pollution Control Rev. (Tempa Electric Co.), “A”, 5.65%, 2018 | 500,000 | 591,000 | ||||||
| Louisiana Public Facilities Authority Rev. (Entergy Gulf States Louisiana LLC), “A”, 5%, 2028 | 10,000,000 | 10,516,400 | ||||||
| Maricopa County, AZ, Pollution Control Rev. (El Paso Electric), “B”, 7.25%, 2040 | 1,710,000 | 2,021,596 | ||||||
| Maryland Economic Development Corp., Pollution Control Rev. (Potomac Electric Power Co.), 6.2%, 2022 | 1,455,000 | 1,769,615 | ||||||
| Massachusetts Development Finance Agency, Solid Waste Disposal Rev. (Dominion Energy Brayton), 5.75%, 2042 (b) | 670,000 | 815,671 | ||||||
| Matagorda County, TX, Pollution Control Rev. (Central Power & Light Co.), “A”, 6.3%, 2029 | 2,045,000 | 2,375,165 | ||||||
| Michigan Strategic Fund Ltd. Obligation Rev. (Detroit Edison Co.), 5.625%, 2020 | 985,000 | 1,210,486 | ||||||
| Michigan Strategic Fund Ltd. Obligation Rev. (Detroit Edison Co.), 5.5%, 2029 (b) | 1,970,000 | 2,247,573 | ||||||
| New Jersey Economic Development Authority, Water Facilities Rev. (New Jersey American Water Co.), “A”, 5.7%, 2039 | 5,000,000 | 5,407,700 | ||||||
| Owen County, KY, Waterworks System Rev. (American Water Co. Project), “B”, 5.625%, 2039 | 1,670,000 | 1,808,326 | ||||||
| Pennsylvania Economic Development Financing Authority (Allegheny Energy Supply Co. LLC), 7%, 2039 | 4,580,000 | 5,456,887 | ||||||
| Pima County, AZ, Industrial Development Authority Pollution Control Rev. (Tucson Electric Power Co.), “A”, 4.95%, 2020 | 4,610,000 | 5,239,173 | ||||||
| Pima County, AZ, Industrial Development Authority Rev. (Tucson Electric Power Co.), 4%, 2029 | 3,000,000 | 2,982,060 | ||||||
| Pima County, AZ, Industrial Development Authority Rev. (Tucson Electric Power Co.), 5.75%, 2029 | 3,715,000 | 3,912,564 | ||||||
|
| |||||||
| $ | 83,194,504 | |||||||
| Utilities - Municipal Owned - 7.3% | ||||||||
| American Municipal Power, Inc. Rev. (AMP Fremont Energy Center Project), “B”, 5%, 2024 | $ | 1,500,000 | $ | 1,752,345 | ||||
| California Department of Water Resources, Power Supply Rev., “N”, 5%, 2020 | 13,080,000 | 16,113,514 | ||||||
| Florida Municipal Power Agency Rev., All Requirements, “A”, 6.25%, 2031 | 400,000 | 481,692 | ||||||
| Florida Power Agency Rev., “A”, 5%, 2031 | 1,000,000 | 1,109,170 | ||||||
40
Table of Contents
Portfolio of Investments – continued
| Issuer | Shares/Par | Value ($) | ||||||
| Municipal Bonds - continued | ||||||||
| Utilities - Municipal Owned - continued | ||||||||
| Georgia Municipal Electric Authority Power Rev., AMBAC, 6.5%, 2014 (c) | $ | 145,000 | $ | 151,747 | ||||
| Georgia Municipal Electric Authority Power Rev., NATL, 6.375%, 2016 | 2,000,000 | 2,224,640 | ||||||
| Georgia Municipal Electric Authority Power Rev., AMBAC, 6.5%, 2017 | 8,000,000 | 8,878,160 | ||||||
| Georgia Municipal Electric Authority Power Rev., NATL, 6.5%, 2020 | 5,880,000 | 6,801,631 | ||||||
| Georgia Municipal Electric Authority Power Rev., “GG”, 5%, 2026 | 3,065,000 | 3,647,963 | ||||||
| Georgia Municipal Electric Authority Power Rev., ETM, AMBAC, 6.5%, 2017 (c) | 365,000 | 407,895 | ||||||
| Guam Power Authority Rev., “A”, AGM, 5%, 2025 | 1,155,000 | 1,327,130 | ||||||
| Guam Power Authority Rev., “A”, AGM, 5%, 2026 | 960,000 | 1,097,146 | ||||||
| Guam Power Authority Rev., “A”, AGM, 5%, 2027 | 385,000 | 437,976 | ||||||
| Guam Power Authority Rev., “A”, 5%, 2034 | 1,155,000 | 1,245,494 | ||||||
| Harris County, TX, Cultural Education Facilities Financial Corp., Thermal Utilities Rev. (Teco Project), “A”, 5.25%, 2035 | 1,560,000 | 1,744,361 | ||||||
| Intermountain Power Agency, UT, “A”, ETM, 6.15%, 2014 (c) | 14,020,000 | 14,316,243 | ||||||
| Intermountain Power Agency, UT, Power Supply Rev., “A”, 5%, 2021 | 2,495,000 | 2,944,824 | ||||||
| Intermountain Power Agency, UT, Power Supply Rev., “A”, 5%, 2022 | 1,250,000 | 1,464,325 | ||||||
| JEA, FL, Electric System Rev., “3-D-2”, 5%, 2038 | 480,000 | 529,022 | ||||||
| Lakeland, FL, Energy System Rev., “B”, 5.25%, 2036 | 265,000 | 329,101 | ||||||
| Lincoln, NB, Electric System Rev., 5%, 2028 | 2,000,000 | 2,379,980 | ||||||
| Los Angeles, CA, Department of Water & Power Rev., “A”, 5%, 2025 | 12,000,000 | 14,533,560 | ||||||
| Mercer County, ND, Pollution Control Rev. (Antelope Valley Station), AMBAC, 7.2%, 2013 | 550,000 | 558,734 | ||||||
| Metropolitan Government of Nashville & Davidson County, TN, Electric Rev., “A”, 5%, 2029 | 4,765,000 | 5,635,089 | ||||||
| Metropolitan Government of Nashville & Davidson County, TN, Electric Rev., “A”, 5%, 2030 | 2,500,000 | 2,950,450 | ||||||
| North Carolina Eastern Municipal Power Agency, “A”, NATL, 6.5%, 2018 | 9,250,000 | 11,431,890 | ||||||
| Northern California Transmission Agency, NATL, 7%, 2013 | 1,425,000 | 1,432,524 | ||||||
| Piedmont, SC, Municipal Power Agency, FGIC, 6.25%, 2021 | 4,150,000 | 5,350,886 | ||||||
| Sacramento, CA, Municipal Utility District, “X”, 5%, 2028 | 3,270,000 | 3,763,672 | ||||||
| Salt River, AZ, Project Agricultural Improvement & Power District Electric, “A”, 5%, 2032 | 2,195,000 | 2,493,147 | ||||||
| Salt River, AZ, Project Agricultural Improvement & Power District Electric, “A”, 5%, 2028 | 13,500,000 | 15,906,105 | ||||||
41
Table of Contents
Portfolio of Investments – continued
| Issuer | Shares/Par | Value ($) | ||||||
| Municipal Bonds - continued | ||||||||
| Utilities - Municipal Owned - continued | ||||||||
| San Antonio, TX, Electric & Gas Rev., 5.25%, 2025 (u) | $ | 25,000,000 | $ | 31,942,250 | ||||
| Washington Public Power Supply System Rev. (Nuclear Project #3), 7.125%, 2016 | 5,145,000 | 6,194,271 | ||||||
|
| |||||||
| $ | 171,576,937 | |||||||
| Utilities - Other - 2.8% | ||||||||
| California M-S-R Energy Authority Gas Rev., “A”, 7%, 2034 | $ | 595,000 | $ | 829,864 | ||||
| California M-S-R Energy Authority Gas Rev., “A”, 6.5%, 2039 | 1,810,000 | 2,454,794 | ||||||
| Georgia Main Street Natural Gas, Inc., Gas Project Rev., “A”, 5%, 2022 | 4,545,000 | 5,269,246 | ||||||
| Georgia Main Street Natural Gas, Inc., Gas Project Rev., “A”, 5.5%, 2026 | 845,000 | 1,025,044 | ||||||
| Georgia Main Street Natural Gas, Inc., Gas Project Rev., “A”, 5.5%, 2028 | 1,740,000 | 2,136,128 | ||||||
| Nebraska Central Plains Energy Project, Gas Project Rev., “3”, 5%, 2032 | 9,660,000 | 10,739,312 | ||||||
| Public Authority for Colorado Energy Natural Gas Purchase Rev., 6.5%, 2038 | 3,725,000 | 5,039,664 | ||||||
| Salt Verde Financial Corp., AZ, Senior Gas Rev., 5%, 2032 | 5,645,000 | 6,358,641 | ||||||
| Salt Verde Financial Corp., AZ, Senior Gas Rev., 5%, 2037 | 12,200,000 | 13,609,100 | ||||||
| Tennessee Energy Acquisition Corp., Gas Rev., “A”, 5.25%, 2017 | 1,575,000 | 1,790,775 | ||||||
| Tennessee Energy Acquisition Corp., Gas Rev., “A”, 5.25%, 2019 | 1,500,000 | 1,736,190 | ||||||
| Tennessee Energy Acquisition Corp., Gas Rev., “A”, 5.25%, 2022 | 1,665,000 | 1,936,029 | ||||||
| Tennessee Energy Acquisition Corp., Gas Rev., “A”, 5.25%, 2023 | 2,385,000 | 2,769,080 | ||||||
| Tennessee Energy Acquisition Corp., Gas Rev., “A”, 5.25%, 2024 | 2,215,000 | 2,577,020 | ||||||
| Tennessee Energy Acquisition Corp., Gas Rev., “A”, 5.25%, 2026 | 2,805,000 | 3,248,414 | ||||||
| Texas Gas Acquisition & Supply Corp III., Gas Supply Rev., 5%, 2031 | 1,835,000 | 1,946,348 | ||||||
| Texas Gas Acquisition & Supply Corp III., Gas Supply Rev., 5%, 2032 | 2,925,000 | 3,085,817 | ||||||
|
| |||||||
| $ | 66,551,466 | |||||||
| Water & Sewer Utility Revenue - 6.6% | ||||||||
| Atlanta, GA, Water & Wastewater Rev., “A”, 6%, 2022 | $ | 2,770,000 | $ | 3,498,399 | ||||
| Austin, TX, Water & Wastewater System Rev., 5%, 2027 | 3,000,000 | 3,575,280 | ||||||
| California Department of Water Resources Center (Central Valley Project Rev.), “AF”, 5%, 2028 (u) | 23,825,000 | 28,135,419 | ||||||
42
Table of Contents
Portfolio of Investments – continued
| Issuer | Shares/Par | Value ($) | ||||||
| Municipal Bonds - continued | ||||||||
| Water & Sewer Utility Revenue - continued | ||||||||
| Cary, NC, Combined Enterprise Systems Rev., 4%, 2037 | $ | 2,500,000 | $ | 2,673,575 | ||||
| Commonwealth of Puerto Rico Aqueduct & Sewer Authority Rev., “A”, 5.75%, 2037 | 5,415,000 | 5,351,645 | ||||||
| Dallas, TX, Waterworks & Sewer System Rev., 5%, 2039 | 10,000,000 | 11,276,200 | ||||||
| DeKalb County, GA, Water & Sewer Rev., “A”, 5.25%, 2028 | 5,285,000 | 6,235,930 | ||||||
| DeKalb County, GA, Water & Sewer Rev., “A”, 5.25%, 2029 | 1,415,000 | 1,662,611 | ||||||
| DeKalb County, GA, Water & Sewer Rev., “A”, 5.25%, 2030 | 4,345,000 | 5,087,474 | ||||||
| DeKalb County, GA, Water & Sewer Rev., “A”, 5.25%, 2031 | 235,000 | 274,198 | ||||||
| DeKalb County, GA, Water & Sewer Rev., “A”, 5.25%, 2041 | 3,910,000 | 4,421,311 | ||||||
| El Paso, TX, Water & Sewer Rev., 5%, 2028 | 455,000 | 531,103 | ||||||
| Fulton County, GA, Water & Sewer Rev., 5%, 2026 | 3,680,000 | 4,326,797 | ||||||
| Fulton County, GA, Water & Sewer Rev., 5%, 2027 | 2,285,000 | 2,662,116 | ||||||
| Houston, TX, Utility System Rev., “D”, 5%, 2036 | 3,760,000 | 4,238,874 | ||||||
| Indiana Finance Authority Rev. (State Revolving Fund Program), “A”, 5%, 2029 | 4,000,000 | 4,707,880 | ||||||
| Madera, CA, Irrigation Financing Authority Rev., 6.5%, 2040 | 3,595,000 | 4,002,314 | ||||||
| Massachusetts Water Resources Authority, “B”, AGM, 5.25%, 2029 | 4,215,000 | 5,400,427 | ||||||
| Massachusetts Water Resources Authority, ETM, 6.5%, 2019 (c) | 5,965,000 | 6,995,871 | ||||||
| Miami-Dade County, FL, Water & Sewer Rev., AGM, 5%, 2039 | 1,000,000 | 1,100,210 | ||||||
| New York Environmental Facilities Corp., Municipal Water Finance Authority Project, 5%, 2025 | 2,300,000 | 2,765,405 | ||||||
| New York Environmental Facilities, “C”, 5%, 2041 | 2,745,000 | 3,089,388 | ||||||
| New York Environmental Facilities, ETM, 5%, 2016 (c) | 570,000 | 571,585 | ||||||
| North Hudson, NJ, Sewerage Authority, Gross Rev. Lease Certificates, “A”, 5%, 2042 | 2,440,000 | 2,680,462 | ||||||
| North Texas Municipal Water District, Water System Rev., Refunding and Improvement, 4%, 2031 | 22,545,000 | 23,969,168 | ||||||
| Omaha, NE, Sanitation Sewer Rev., 4%, 2029 | 930,000 | 1,006,362 | ||||||
| Omaha, NE, Sanitation Sewer Rev., 4%, 2030 | 1,380,000 | 1,486,136 | ||||||
| Pinellas County, FL, Sewer Rev., AGM, 5%, 2013 (c) | 1,170,000 | 1,197,975 | ||||||
| Pinellas County, FL, Sewer Rev., AGM, 5%, 2032 | 330,000 | 336,379 | ||||||
| Polk County, FL, Utility Systems Rev., “A”, FGIC, 5%, 2030 | 1,000,000 | 1,050,470 | ||||||
| San Antonio, TX, Water System Rev., 4%, 2028 | 5,000,000 | 5,458,650 | ||||||
| Seminole County, FL, Water & Sewer Rev., Unrefunded Balance, NATL, 6%, 2019 | 940,000 | 992,668 | ||||||
| St. Johns County, FL, Water & Sewer Rev., Capital Appreciation, “B”, 0%, 2030 | 820,000 | 408,631 | ||||||
| St. Johns County, FL, Water & Sewer Rev., Capital Appreciation, “B”, 0%, 2033 | 915,000 | 392,691 | ||||||
| St. Johns County, FL, Water & Sewer Rev., Capital Appreciation, “B”, 0%, 2034 | 905,000 | 367,837 | ||||||
43
Table of Contents
Portfolio of Investments – continued
| Issuer | Shares/Par | Value ($) | ||||||
| Municipal Bonds - continued | ||||||||
| Water & Sewer Utility Revenue - continued | ||||||||
| Tampa Bay Water, FL, Regional Water Supply Authority, Utility System Rev., FGIC, 4.75%, 2033 | $ | 885,000 | $ | 960,508 | ||||
| Virginia Resources Authority, Water & Sewer System Rev. (Goochland County - Tuckahoe Creek Service District Project), Capital Appreciation, 0%, 2029 | 1,250,000 | 694,138 | ||||||
|
| |||||||
| $ | 153,586,087 | |||||||
| Total Municipal Bonds (Identified Cost, $2,060,643,831) | $ | 2,244,587,929 | ||||||
| Floating Rate Demand Notes - 0.2% | ||||||||
| Lincoln County, WY, Pollution Control Rev. (Exxon Mobil Corp.), “B”, 0.13%, due 4/01/13 | $ | 1,500,000 | $ | 1,500,000 | ||||
| Lincoln County, WY, Pollution Control Rev. (Exxon Mobil Corp.), “C”, 0.13%, due 4/01/13 | 2,300,000 | 2,300,000 | ||||||
| Total Floating Rate Demand Notes, at Identified Cost and Value | $ | 3,800,000 | ||||||
| Money Market Funds - 7.6% | ||||||||
| MFS Institutional Money Market Portfolio, 0.14%, at Cost and Net Asset Value (v) | 178,303,578 | $ | 178,303,578 | |||||
| Total Investments (Identified Cost, $2,242,747,409) | $ | 2,426,691,507 | ||||||
| Other Assets, Less Liabilities - (3.7)% | (85,882,481 | ) | ||||||
| Net Assets - 100.0% | $ | 2,340,809,026 | ||||||
| (a) | Non-income producing security. |
| (b) | Mandatory tender date is earlier than stated maturity date. |
| (c) | Refunded bond. |
| (d) | In default. Interest and/or scheduled principal payment(s) have been missed. |
| (n) | Securities exempt from registration under Rule 144A of the Securities Act of 1933. These securities may be sold in the ordinary course of business in transactions exempt from registration, normally to qualified institutional buyers. At period end, the aggregate value of these securities was $6,611,369 representing 0.3% of net assets. |
| (p) | Primary inverse floater. |
| (q) | Interest received was less than stated coupon rate. |
| (u) | Underlying security deposited into special purpose trust (“the trust”) by investment banker upon creation of self-deposited inverse floaters. |
| (v) | Underlying affiliated fund that is available only to investment companies managed by MFS. The rate quoted for the MFS Institutional Money Market Portfolio is the annualized seven-day yield of the fund at period end. |
44
Table of Contents
Portfolio of Investments – continued
| (z) | Restricted securities are not registered under the Securities Act of 1933 and are subject to legal restrictions on resale. These securities generally may be resold in transactions exempt from registration or to the public if the securities are subsequently registered. Disposal of these securities may involve time-consuming negotiations and prompt sale at an acceptable price may be difficult. The fund holds the following restricted securities: |
| Restricted Securities | Acquisition Date | Cost | Value | |||||||
| MuniMae TE Bond Subsidiary LLC, “A-2”, 4.9%, 2049 | 10/14/04 | $2,000,000 | $1,980,160 | |||||||
| % of Net assets | 0.1% | |||||||||
The following abbreviations are used in this report and are defined:
| COP | Certificate of Participation |
| ETM | Escrowed to Maturity |
| FRN | Floating Rate Note. Interest rate resets periodically and may not be the rate reported at period end. |
| LOC | Letter of Credit |
| Insurers | Inverse Floaters | |||||
| AGM | Assured Guaranty Municipal | RIBS | Residual Interest Bonds | |||
| AMBAC | AMBAC Indemnity Corp. | RITES | Residual Interest Tax-Exempt Security | |||
| ASSD GTY | Assured Guaranty Insurance Co. | |||||
| BHAC | Berkshire Hathaway Assurance Corp. | |||||
| CALHF | California Housing Finance Agency | |||||
| FGIC | Financial Guaranty Insurance Co. | |||||
| FHA | Federal Housing Administration | |||||
| FNMA | Federal National Mortgage Assn. | |||||
| GNMA | Government National Mortgage Assn. | |||||
| NATL | National Public Finance Guarantee Corp. | |||||
| PSF | Permanent School Fund | |||||
| SYNCORA | Syncora Guarantee Inc. | |||||
See Notes to Financial Statements
45
Table of Contents
Financial Statements
STATEMENT OF ASSETS AND LIABILITIES
At 3/31/13
This statement represents your fund’s balance sheet, which details the assets and liabilities comprising the total value of the fund.
| Assets | ||||
Investments- | ||||
Non-affiliated issuers, at value (identified cost, $2,064,443,831) | $2,248,387,929 | |||
Underlying affiliated funds, at cost and value | 178,303,578 | |||
Total investments, at value (identified cost, $2,242,747,409) | $2,426,691,507 | |||
Receivables for | ||||
Investments sold | 3,867,735 | |||
Fund shares sold | 5,305,579 | |||
Interest | 28,294,310 | |||
Other assets | 11,557 | |||
Total assets | $2,464,170,688 | |||
| Liabilities | ||||
Payable to custodian | $4,312 | |||
Payables for | ||||
Distributions | 1,554,885 | |||
Investments purchased | 50,613,217 | |||
Interest expense and fees | 137,006 | |||
Fund shares reacquired | 5,012,496 | |||
Payable to the holders of the floating rate certificates from trust assets | 64,934,589 | |||
Payable to affiliates | ||||
Investment adviser | 44,666 | |||
Shareholder servicing costs | 728,224 | |||
Distribution and service fees | 76,738 | |||
Payable for independent Trustees’ compensation | 32,773 | |||
Accrued expenses and other liabilities | 222,756 | |||
Total liabilities | $123,361,662 | |||
Net assets | $2,340,809,026 | |||
| Net assets consist of | ||||
Paid-in capital | $2,157,557,061 | |||
Unrealized appreciation (depreciation) on investments | 183,944,098 | |||
Accumulated net realized gain (loss) on investments | (2,640,992 | ) | ||
Undistributed net investment income | 1,948,859 | |||
Net assets | $2,340,809,026 | |||
Shares of beneficial interest outstanding | 261,698,740 |
| Net assets | Shares outstanding | Net asset value per share (a) | ||||||||||||
Class A | $1,027,992,150 | 114,971,038 | $8.94 | |||||||||||
Class B | 37,759,421 | 4,216,969 | 8.95 | |||||||||||
Class C | 234,735,137 | 26,162,356 | 8.97 | |||||||||||
Class I | 334,032,660 | 37,400,273 | 8.93 | |||||||||||
Class A1 | 703,915,962 | 78,682,985 | 8.95 | |||||||||||
Class B1 | 2,373,696 | 265,119 | 8.95 | |||||||||||
| (a) | Maximum offering price per share was equal to the net asset value per share for all share classes, except for Classes A and A1, for which the maximum offering prices per share were $9.39 [100 /95.25 x $8.94] and $9.40 [100 /95.25 x $8.95], respectively. On sales of $50,000 or more, the maximum offering price of Class A and Class A1 shares are reduced. A contingent deferred sales charge may be imposed on redemptions of Class A, Class B, Class C, Class A1, and Class B1 shares. |
See Notes to Financial Statements
46
Table of Contents
Financial Statements
Year ended 3/31/13
This statement describes how much your fund earned in investment income and accrued in expenses. It also describes any gains and/or losses generated by fund operations.
| Net investment income | ||||
Income | ||||
Interest | $101,021,383 | |||
Dividends from underlying affiliated funds | 170,299 | |||
Total investment income | $101,191,682 | |||
Expenses | ||||
Management fee | $8,655,075 | |||
Distribution and service fees | 4,937,902 | |||
Shareholder servicing costs | 1,652,260 | |||
Administrative services fee | 301,252 | |||
Independent Trustees’ compensation | 43,483 | |||
Custodian fee | 193,448 | |||
Shareholder communications | 89,037 | |||
Audit and tax fees | 56,426 | |||
Legal fees | 38,345 | |||
Interest expense and fees | 532,417 | |||
Miscellaneous | 262,350 | |||
Total expenses | $16,761,995 | |||
Fees paid indirectly | (42 | ) | ||
Reduction of expenses by investment adviser and distributor | (760,793 | ) | ||
Net expenses | $16,001,160 | |||
Net investment income | $85,190,522 | |||
| Realized and unrealized gain (loss) on investments | ||||
Realized gain (loss) (identified cost basis) | ||||
Investments | $9,659,299 | |||
Futures contracts | (516,930 | ) | ||
Net realized gain (loss) on investments | $9,142,369 | |||
Change in unrealized appreciation (depreciation) | ||||
Investments | $43,754,766 | |||
Futures contracts | (191,117 | ) | ||
Net unrealized gain (loss) on investments | $43,563,649 | |||
Net realized and unrealized gain (loss) on investments | $52,706,018 | |||
Change in net assets from operations | $137,896,540 |
See Notes to Financial Statements
47
Table of Contents
Financial Statements
STATEMENTS OF CHANGES IN NET ASSETS
These statements describe the increases and/or decreases in net assets resulting from operations, any distributions, and any shareholder transactions.
| Years ended 3/31 | ||||||||
| 2013 | 2012 | |||||||
| Change in net assets | ||||||||
| From operations | ||||||||
Net investment income | $85,190,522 | $82,595,972 | ||||||
Net realized gain (loss) on investments | 9,142,369 | (765,426 | ) | |||||
Net unrealized gain (loss) on investments | 43,563,649 | 158,561,689 | ||||||
Change in net assets from operations | $137,896,540 | $240,392,235 | ||||||
| Distributions declared to shareholders | ||||||||
From net investment income | $(80,639,245 | ) | $(80,046,813 | ) | ||||
Change in net assets from fund share transactions | $329,312,201 | $161,400,565 | ||||||
Total change in net assets | $386,569,496 | $321,745,987 | ||||||
| Net assets | ||||||||
At beginning of period | 1,954,239,530 | 1,632,493,543 | ||||||
At end of period (including undistributed net investment income of $1,948,859 and $2,286,749, respectively) | $2,340,809,026 | $1,954,239,530 | ||||||
See Notes to Financial Statements
48
Table of Contents
Financial Statements
The financial highlights table is intended to help you understand the fund’s financial performance for the past 5 years (or life of a particular share class, if shorter). Certain information reflects financial results for a single fund share. The total returns in the table represent the rate by which an investor would have earned (or lost) on an investment in the fund share class (assuming reinvestment of all distributions) held for the entire period.
| Class A | Years ended 3/31 | |||||||||||||||||||
| 2013 | 2012 | 2011 | 2010 | 2009 | ||||||||||||||||
Net asset value, beginning of period | $8.68 | $7.91 | $8.32 | $7.66 | $8.21 | |||||||||||||||
| Income (loss) from investment operations | ||||||||||||||||||||
Net investment income (d) | $0.35 | $0.39 | $0.41 | $0.41 | $0.38 | |||||||||||||||
Net realized and unrealized gain (loss) on investments | 0.24 | 0.76 | (0.42 | ) | 0.65 | (0.51 | ) | |||||||||||||
Total from investment operations | $0.59 | $1.15 | $(0.01 | ) | $1.06 | $(0.13 | ) | |||||||||||||
| Less distributions declared to shareholders | ||||||||||||||||||||
From net investment income | $(0.33 | ) | $(0.38 | ) | $(0.40 | ) | $(0.40 | ) | $(0.39 | ) | ||||||||||
From net realized gain on investments | — | — | — | — | (0.03 | ) | ||||||||||||||
Total distributions declared to shareholders | $(0.33 | ) | $(0.38 | ) | $(0.40 | ) | $(0.40 | ) | $(0.42 | ) | ||||||||||
Net asset value, end of period (x) | $8.94 | $8.68 | $7.91 | $8.32 | $7.66 | |||||||||||||||
Total return (%) (r)(s)(t)(x) | 6.88 | 14.83 | (0.24 | ) | 14.01 | (1.53 | ) | |||||||||||||
| Ratios (%) (to average net assets) and Supplemental data: | ||||||||||||||||||||
Expenses before expense reductions (f) | 0.79 | 0.81 | 0.81 | 0.82 | 0.92 | |||||||||||||||
Expenses after expense reductions (f) | 0.76 | 0.77 | 0.78 | 0.78 | 0.74 | |||||||||||||||
Net investment income | 3.90 | 4.69 | 4.95 | 5.04 | 4.88 | |||||||||||||||
Portfolio turnover | 23 | 25 | 23 | 15 | 25 | |||||||||||||||
Net assets at end of period (000 omitted) | $1,027,992 | $829,860 | $764,621 | $632,523 | $420,234 | |||||||||||||||
| Supplemental Ratios (%): | ||||||||||||||||||||
Ratio of expenses to average net assets after expense reductions and excluding interest expense and fees (f)(l) | 0.74 | 0.74 | 0.74 | 0.75 | 0.67 | |||||||||||||||
See Notes to Financial Statements
49
Table of Contents
Financial Highlights – continued
| Class B | Years ended 3/31 | |||||||||||||||||||
| 2013 | 2012 | 2011 | 2010 | 2009 | ||||||||||||||||
Net asset value, beginning of period | $8.70 | $7.92 | $8.34 | $7.68 | $8.22 | |||||||||||||||
| Income (loss) from investment operations | ||||||||||||||||||||
Net investment income (d) | $0.28 | $0.33 | $0.35 | $0.35 | $0.33 | |||||||||||||||
Net realized and unrealized gain (loss) | 0.23 | 0.77 | (0.43 | ) | 0.65 | (0.51 | ) | |||||||||||||
Total from investment operations | $0.51 | $1.10 | $(0.08 | ) | $1.00 | $(0.18 | ) | |||||||||||||
| Less distributions declared to shareholders | ||||||||||||||||||||
From net investment income | $(0.26 | ) | $(0.32 | ) | $(0.34 | ) | $(0.34 | ) | $(0.33 | ) | ||||||||||
From net realized gain on investments | — | — | — | — | (0.03 | ) | ||||||||||||||
Total distributions declared to shareholders | $(0.26 | ) | $(0.32 | ) | $(0.34 | ) | $(0.34 | ) | $(0.36 | ) | ||||||||||
Net asset value, end of period (x) | $8.95 | $8.70 | $7.92 | $8.34 | $7.68 | |||||||||||||||
Total return (%) (r)(s)(t)(x) | 5.95 | 14.09 | (1.10 | ) | 13.15 | (2.13 | ) | |||||||||||||
| Ratios (%) (to average net assets) and Supplemental data: | ||||||||||||||||||||
Expenses before expense reductions (f) | 1.54 | 1.56 | 1.56 | 1.57 | 1.68 | |||||||||||||||
Expenses after expense reductions (f) | 1.51 | 1.52 | 1.53 | 1.53 | 1.49 | |||||||||||||||
Net investment income | 3.15 | 3.91 | 4.21 | 4.30 | 4.12 | |||||||||||||||
Portfolio turnover | 23 | 25 | 23 | 15 | 25 | |||||||||||||||
Net assets at end of period (000 omitted) | $37,759 | $31,883 | $22,842 | $23,060 | $20,978 | |||||||||||||||
| Supplemental Ratios (%): | ||||||||||||||||||||
Ratio of expenses to average net assets | 1.48 | 1.49 | 1.49 | 1.50 | 1.42 | |||||||||||||||
See Notes to Financial Statements
50
Table of Contents
Financial Highlights – continued
| Class C | Years ended 3/31 | |||||||||||||||||||
| 2013 | 2012 | 2011 | 2010 | 2009 | ||||||||||||||||
Net asset value, beginning of period | $8.71 | $7.94 | $8.35 | $7.69 | $8.24 | |||||||||||||||
| Income (loss) from investment operations | ||||||||||||||||||||
Net investment income (d) | $0.28 | $0.33 | $0.35 | $0.35 | $0.32 | |||||||||||||||
Net realized and unrealized gain (loss) | 0.24 | 0.76 | (0.42 | ) | 0.65 | (0.51 | ) | |||||||||||||
Total from investment operations | $0.52 | $1.09 | $(0.07 | ) | $1.00 | $(0.19 | ) | |||||||||||||
| Less distributions declared to shareholders | ||||||||||||||||||||
From net investment income | $(0.26 | ) | $(0.32 | ) | $(0.34 | ) | $(0.34 | ) | $(0.33 | ) | ||||||||||
From net realized gain on investments | — | — | — | — | (0.03 | ) | ||||||||||||||
Total distributions declared to shareholders | $(0.26 | ) | $(0.32 | ) | $(0.34 | ) | $(0.34 | ) | $(0.36 | ) | ||||||||||
Net asset value, end of period (x) | $8.97 | $8.71 | $7.94 | $8.35 | $7.69 | |||||||||||||||
Total return (%) (r)(s)(t)(x) | 6.06 | 13.92 | (0.97 | ) | 13.13 | (2.25 | ) | |||||||||||||
| Ratios (%) (to average net assets) and Supplemental data: | ||||||||||||||||||||
Expenses before expense reductions (f) | 1.54 | 1.56 | 1.56 | 1.57 | 1.67 | |||||||||||||||
Expenses after expense reductions (f) | 1.51 | 1.52 | 1.52 | 1.53 | 1.48 | |||||||||||||||
Net investment income | 3.14 | 3.92 | 4.19 | 4.26 | 4.10 | |||||||||||||||
Portfolio turnover | 23 | 25 | 23 | 15 | 25 | |||||||||||||||
Net assets at end of period (000 omitted) | $234,735 | $187,078 | $149,727 | $143,504 | $77,937 | |||||||||||||||
| Supplemental Ratios (%): | ||||||||||||||||||||
Ratio of expenses to average net assets | 1.48 | 1.49 | 1.49 | 1.50 | 1.41 | |||||||||||||||
See Notes to Financial Statements
51
Table of Contents
Financial Highlights – continued
| Class I | Year ended 3/31/13 | Period ended 3/31/12 (i) | ||||||
Net asset value, beginning of period | $8.67 | $8.22 | ||||||
| Income (loss) from investment operations | ||||||||
Net investment income (d) | $0.37 | $0.27 | ||||||
Net realized and unrealized gain (loss) on investments | 0.24 | 0.44 | (g) | |||||
Total from investment operations | $0.61 | $0.71 | ||||||
| Less distributions declared to shareholders | ||||||||
From net investment income | $(0.35 | ) | $(0.26 | ) | ||||
Net asset value, end of period (x) | $8.93 | $8.67 | ||||||
Total return (%) (r)(s)(x) | 7.15 | 8.75 | (n) | |||||
| Ratios (%) (to average net assets) and Supplemental data: | ||||||||
Expenses before expense reductions (f) | 0.55 | 0.55 | (a) | |||||
Expenses after expense reductions (f) | 0.51 | 0.52 | (a) | |||||
Net investment income | 4.13 | 4.70 | (a) | |||||
Portfolio turnover | 23 | 25 | ||||||
Net assets at end of period (000 omitted) | $334,033 | $186,734 | ||||||
| Supplemental Ratios (%): | ||||||||
Ratio of expenses to average net assets | 0.49 | 0.49 | (a) | |||||
See Notes to Financial Statements
52
Table of Contents
Financial Highlights – continued
| Class A1 | Years ended 3/31 | |||||||||||||||||||
| 2013 | 2012 | 2011 | 2010 | 2009 | ||||||||||||||||
Net asset value, beginning of period | $8.69 | $7.92 | $8.33 | $7.67 | $8.21 | |||||||||||||||
| Income (loss) from investment operations | ||||||||||||||||||||
Net investment income (d) | $0.37 | $0.41 | $0.43 | $0.43 | $0.40 | |||||||||||||||
Net realized and unrealized gain (loss) | 0.24 | 0.76 | (0.42 | ) | 0.65 | (0.50 | ) | |||||||||||||
Total from investment operations | $0.61 | $1.17 | $0.01 | $1.08 | $(0.10 | ) | ||||||||||||||
| Less distributions declared to shareholders | ||||||||||||||||||||
From net investment income | $(0.35 | ) | $(0.40 | ) | $(0.42 | ) | $(0.42 | ) | $(0.41 | ) | ||||||||||
From net realized gain on investments | — | — | — | — | (0.03 | ) | ||||||||||||||
Total distributions declared to shareholders | $(0.35 | ) | $(0.40 | ) | $(0.42 | ) | $(0.42 | ) | $(0.44 | ) | ||||||||||
Net asset value, end of period (x) | $8.95 | $8.69 | $7.92 | $8.33 | $7.67 | |||||||||||||||
Total return (%) (r)(s)(t)(x) | 7.14 | 15.11 | 0.01 | 14.28 | (1.15 | ) | ||||||||||||||
| Ratios (%) (to average net assets) and Supplemental data: | ||||||||||||||||||||
Expenses before expense reductions (f) | 0.55 | 0.56 | 0.56 | 0.57 | 0.68 | |||||||||||||||
Expenses after expense reductions (f) | 0.51 | 0.52 | 0.53 | 0.53 | 0.49 | |||||||||||||||
Net investment income | 4.18 | 4.96 | 5.22 | 5.32 | 5.13 | |||||||||||||||
Portfolio turnover | 23 | 25 | 23 | 15 | 25 | |||||||||||||||
Net assets at end of period (000 omitted) | $703,916 | $714,380 | $689,074 | $787,041 | $746,020 | |||||||||||||||
| Supplemental Ratios (%): | ||||||||||||||||||||
Ratio of expenses to average net assets | 0.49 | 0.49 | 0.49 | 0.50 | 0.42 | |||||||||||||||
See Notes to Financial Statements
53
Table of Contents
Financial Highlights – continued
| Class B1 | Years ended 3/31 | |||||||||||||||||||
| 2013 | 2012 | 2011 | 2010 | 2009 | ||||||||||||||||
Net asset value, beginning of period | $8.69 | $7.92 | $8.34 | $7.67 | $8.22 | |||||||||||||||
| Income (loss) from investment operations | ||||||||||||||||||||
Net investment income (d) | $0.31 | $0.35 | $0.37 | $0.37 | $0.35 | |||||||||||||||
Net realized and unrealized gain (loss) | 0.24 | 0.76 | (0.43 | ) | 0.66 | (0.52 | ) | |||||||||||||
Total from investment operations | $0.55 | $1.11 | $(0.06 | ) | $1.03 | $(0.17 | ) | |||||||||||||
| Less distributions declared to shareholders | ||||||||||||||||||||
From net investment income | $(0.29 | ) | $(0.34 | ) | $(0.36 | ) | $(0.36 | ) | $(0.35 | ) | ||||||||||
From net realized gain on investments | — | — | — | — | (0.03 | ) | ||||||||||||||
Total distributions declared to shareholders | $(0.29 | ) | $(0.34 | ) | $(0.36 | ) | $(0.36 | ) | $(0.38 | ) | ||||||||||
Net asset value, end of period (x) | $8.95 | $8.69 | $7.92 | $8.34 | $7.67 | |||||||||||||||
Total return (%) (r)(s)(t)(x) | 6.34 | 14.24 | (0.86 | ) | 13.56 | (2.02 | ) | |||||||||||||
Ratios (%) (to average net assets) and Supplemental data: | ||||||||||||||||||||
Expenses before expense reductions (f) | 1.54 | 1.56 | 1.56 | 1.48 | 1.44 | |||||||||||||||
Expenses after expense reductions (f) | 1.27 | 1.28 | 1.29 | 1.29 | 1.24 | |||||||||||||||
Net investment income | 3.47 | 4.23 | 4.46 | 4.57 | 4.36 | |||||||||||||||
Portfolio turnover | 23 | 25 | 23 | 15 | 25 | |||||||||||||||
Net assets at end of period (000 omitted) | $2,374 | $4,304 | $6,230 | $12,558 | $18,190 | |||||||||||||||
| Supplemental Ratios (%): | ||||||||||||||||||||
Ratio of expenses to average net assets | 1.25 | 1.26 | 1.26 | 1.26 | 1.17 | |||||||||||||||
| (a) | Annualized. |
| (d) | Per share data is based on average shares outstanding. |
| (f) | Ratios do not reflect reductions from fees paid indirectly, if applicable. |
| (g) | The per share amount varies from the net realized and unrealized gain/loss for the period because of the timing of sales of fund shares and the per share amount of realized and unrealized gains and losses at such time. |
| (i) | For the period from the class inception, August 1, 2011, through the stated period end. |
| (l) | Interest expense and fees relate to payments made to the holders of the floating rate certificates from trust assets. |
| (n) | Not annualized. |
| (r) | Certain expenses have been reduced without which performance would have been lower. |
| (s) | From time to time the fund may receive proceeds from litigation settlements, without which performance would be lower. |
| (t) | Total returns do not include any applicable sales charges. |
| (x) | The net asset values per share and total returns have been calculated on net assets which include adjustments made in accordance with U.S. generally accepted accounting principles required at period end for financial reporting purposes. |
See Notes to Financial Statements
54
Table of Contents
(1) Business and Organization
MFS Municipal Income Fund (the fund) is a series of MFS Municipal Series Trust which is organized as a Massachusetts business trust and is registered under the Investment Company Act of 1940, as amended, as an open-end management investment company.
(2) Significant Accounting Policies
General – The preparation of financial statements in conformity with U.S. generally accepted accounting principles requires management to make estimates and assumptions that affect the reported amounts of assets and liabilities, and disclosure of contingent assets and liabilities at the date of the financial statements and the reported amounts of revenues and expenses during the reporting period. Actual results could differ from those estimates. In the preparation of these financial statements, management has evaluated subsequent events occurring after the date of the fund’s Statement of Assets and Liabilities through the date that the financial statements were issued. The fund invests primarily in municipal instruments. The value of municipal instruments can be affected by changes in their actual or perceived credit quality. The credit quality of municipal instruments can be affected by, among other things, the financial condition of the issuer or guarantor, the issuer’s future borrowing plans and sources of revenue, the economic feasibility of the revenue bond project or general borrowing purpose, political or economic developments in the region where the instrument is issued and the liquidity of the security. Municipal instruments generally trade in the over-the-counter market. Municipal instruments backed by current and anticipated revenues from a specific project or specific assets can be negatively affected by the discontinuance of the taxation supporting the projects or assets or the inability to collect revenues for the project or from the assets. If the Internal Revenue Service determines an issuer of a municipal instrument has not complied with the applicable tax requirements, the security could decline in value, interest from the security could become taxable and the funds may be required to issue Forms 1099-DIV.
In this reporting period the fund adopted Financial Accounting Standards Board (FASB) Accounting Standards Update 2011-04, Fair Value Measurement (Topic 820) – Amendments to Achieve Common Fair Value Measurement and Disclosure Requirements in U.S. GAAP and IFRSs (“ASU 2011-04”). ASU 2011-04 seeks to improve the comparability of fair value measurements as presented and disclosed in financial statements prepared in accordance with U.S. GAAP and International Financial Reporting Standards (IFRS) by providing common requirements for fair value measurement and disclosure.
In January 2013, the FASB issued Accounting Standards Update 2013-01 (“ASU 2013-01”) entitled Balance Sheet (Topic 210) – Clarifying the Scope of Disclosures about Offsetting Assets and Liabilities which is intended to clarify the scope of Accounting Standards Update 2011-11 (“ASU 2011-11”), Balance Sheet (Topic 210) – Disclosures about Offsetting Assets and Liabilities. Consistent with the effective date for ASU 2011-11, ASU 2013-01 is effective for annual reporting periods beginning on or after January 1, 2013, and interim periods within those annual periods. ASU 2013-01 limits the scope of ASU 2011-11’s disclosure requirements on offsetting
55
Table of Contents
Notes to Financial Statements – continued
to financial assets and financial liabilities related to derivatives, repurchase and reverse repurchase agreements, and securities lending and securities borrowing transactions. Although still evaluating the potential impact of these two ASUs to the fund, management expects that the impact of the fund’s adoption will be limited to additional financial statement disclosures.
Investment Valuations – Debt instruments and floating rate loans (other than short-term instruments), including restricted debt instruments, are generally valued at an evaluated or composite bid as provided by a third-party pricing service. Short-term instruments with a maturity at issuance of 60 days or less generally are valued at amortized cost, which approximates market value. Futures contracts are generally valued at last posted settlement price as provided by a third-party pricing service on the market on which they are primarily traded. Futures contracts for which there were no trades that day for a particular position are generally valued at the closing bid quotation as provided by a third-party pricing service on the market on which such futures contracts are primarily traded. Open-end investment companies are generally valued at net asset value per share. Securities and other assets generally valued on the basis of information from a third-party pricing service may also be valued at a broker/dealer bid quotation. Values obtained from third-party pricing services can utilize both transaction data and market information such as yield, quality, coupon rate, maturity, type of issue, trading characteristics, and other market data.
The Board of Trustees has delegated primary responsibility for determining or causing to be determined the value of the fund’s investments (including any fair valuation) to the adviser pursuant to valuation policies and procedures approved by the Board. If the adviser determines that reliable market quotations are not readily available, investments are valued at fair value as determined in good faith by the adviser in accordance with such procedures under the oversight of the Board of Trustees. Under the fund’s valuation policies and procedures, market quotations are not considered to be readily available for most types of debt instruments and floating rate loans and many types of derivatives. These investments are generally valued at fair value based on information from third-party pricing services. In addition, investments may be valued at fair value if the adviser determines that an investment’s value has been materially affected by events occurring after the close of the exchange or market on which the investment is principally traded (such as foreign exchange or market) and prior to the determination of the fund’s net asset value, or after the halting of trading of a specific security where trading does not resume prior to the close of the exchange or market on which the security is principally traded. The adviser generally relies on third-party pricing services or other information (such as the correlation with price movements of similar securities in the same or other markets; the type, cost and investment characteristics of the security; the business and financial condition of the issuer; and trading and other market data) to assist in determining whether to fair value and at what value to fair value an investment. The value of an investment for purposes of calculating the fund’s net asset value can differ depending on the source and method used to determine value. When fair valuation is used, the value of an investment used to determine the fund’s net asset value may differ from quoted or published prices for the same investment. There can be no assurance that the fund could obtain the fair value
56
Table of Contents
Notes to Financial Statements – continued
assigned to an investment if it were to sell the investment at the same time at which the fund determines its net asset value per share.
Various inputs are used in determining the value of the fund’s assets or liabilities. These inputs are categorized into three broad levels. In certain cases, the inputs used to measure fair value may fall into different levels of the fair value hierarchy. In such cases, an investment’s level within the fair value hierarchy is based on the lowest level of input that is significant to the fair value measurement. The fund’s assessment of the significance of a particular input to the fair value measurement in its entirety requires judgment, and considers factors specific to the investment. Level 1 includes unadjusted quoted prices in active markets for identical assets or liabilities. Level 2 includes other significant observable market-based inputs (including quoted prices for similar securities, interest rates, prepayment speed, and credit risk). Level 3 includes unobservable inputs, which may include the adviser’s own assumptions in determining the fair value of investments. The following is a summary of the levels used as of March 31, 2013 in valuing the fund’s assets or liabilities:
| Investments at Value | Level 1 | Level 2 | Level 3 | Total | ||||||||||||
| Municipal Bonds | $— | $2,244,587,929 | $— | $2,244,587,929 | ||||||||||||
| Short Term Securities | — | 3,800,000 | — | 3,800,000 | ||||||||||||
| Mutual Funds | 178,303,578 | — | — | 178,303,578 | ||||||||||||
| Total Investments | $178,303,578 | $2,248,387,929 | $— | $2,426,691,507 | ||||||||||||
For further information regarding security characteristics, see the Portfolio of Investments.
Derivatives – The fund uses derivatives for different purposes, primarily to increase or decrease exposure to a particular market or segment of the market, or security, to increase or decrease interest rate exposure, or as alternatives to direct investments. Derivatives are used for hedging or non-hedging purposes. While hedging can reduce or eliminate losses, it can also reduce or eliminate gains. When the fund uses derivatives as an investment to increase market exposure, or for hedging purposes, gains and losses from derivative instruments may be substantially greater than the derivative’s original cost.
The derivative instruments used by the fund were futures contracts. At March 31, 2013, the fund did not have any outstanding derivative instruments.
The following table presents, by major type of derivative contract, the realized gain (loss) on derivatives held by the fund for the year ended March 31, 2013 as reported in the Statement of Operations:
| Risk | Futures Contracts | |||
| Interest Rate | $(516,930 | ) | ||
The following table presents, by major type of derivative contract, the change in unrealized appreciation (depreciation) on derivatives held by the fund for the year ended March 31, 2013 as reported in the Statement of Operations:
| Risk | Futures Contracts | |||
| Interest Rate | $(191,117 | ) | ||
57
Table of Contents
Notes to Financial Statements – continued
Derivative counterparty credit risk is managed through formal evaluation of the creditworthiness of all potential counterparties. On certain over-the-counter derivatives, the fund attempts to reduce its exposure to counterparty credit risk whenever possible by entering into an International Swaps and Derivatives Association (ISDA) Master Agreement on a bilateral basis with each of the counterparties with whom it undertakes a significant volume of transactions. The ISDA Master Agreement gives each party to the agreement the right to terminate all transactions traded under such agreement if there is a certain deterioration in the credit quality of the other party. The ISDA Master Agreement gives the fund the right, upon an event of default by the applicable counterparty or a termination of the agreement, to close out all transactions traded under such agreement and to net amounts owed under each transaction to one net amount payable by one party to the other. This right to close out and net payments across all transactions traded under the ISDA Master Agreement could result in a reduction of the fund’s credit risk to such counterparty equal to any amounts payable by the fund under the applicable transactions, if any. However, absent an event of default by the counterparty or a termination of the agreement, the ISDA Master Agreement does not result in an offset of reported amounts of assets and liabilities in the Statement of Assets and Liabilities across transactions between the fund and the applicable counterparty.
Collateral requirements differ by type of derivative. Collateral or margin requirements are set by the broker or exchange clearing house for exchange traded derivatives (i.e., futures contracts and exchange-traded options) while collateral terms are contract specific for over-the-counter traded derivatives (i.e., forward foreign currency exchange contracts, swap agreements and over-the-counter options). For derivatives traded under an ISDA Master Agreement, the collateral requirements are netted across all transactions traded under such agreement and one amount is posted from one party to the other to collateralize such obligations. Cash collateral that has been segregated to cover obligations of the fund under derivative contracts, if any, will be reported separately in the Statement of Assets and Liabilities as restricted cash. Securities collateral pledged for the same purpose, if any, is noted in the Portfolio of Investments.
Futures Contracts – The fund entered into futures contracts which may be used to hedge against or obtain broad market exposure, interest rate exposure, or to manage duration. A futures contract represents a commitment for the future purchase or sale of an asset at a specified price on a specified date.
Upon entering into a futures contract, the fund is required to deposit with the broker, either in cash or securities, an initial margin in an amount equal to a certain percentage of the notional amount of the contract. Subsequent payments (variation margin) are made or received by the fund each day, depending on the daily fluctuations in the value of the contract, and are recorded for financial statement purposes as unrealized gain or loss by the fund until the contract is closed or expires at which point the gain or loss on futures contracts is realized.
The fund bears the risk of interest rates or securities prices moving unexpectedly, in which case, the fund may not achieve the anticipated benefits of the futures contracts and may realize a loss. While futures contracts may present less counterparty risk to the fund since the contracts are exchange traded and the exchange’s clearinghouse guarantees payments to the broker, there is still counterparty credit risk due to the
58
Table of Contents
Notes to Financial Statements – continued
insolvency of the broker. The fund’s maximum risk of loss due to counterparty credit risk is equal to the margin posted by the fund to the broker plus any gains or minus any losses on the outstanding futures contracts.
Inverse Floaters – The fund invests in municipal inverse floating rate securities which are structured by the issuer (known as primary market inverse floating rate securities) or by an investment banker utilizing municipal bonds which have already been issued (known as secondary market inverse floating rate securities) to have variable rates of interest which typically move in the opposite direction of short term interest rates. A secondary market inverse floating rate security is created when an investment banker transfers a fixed rate municipal bond to a special purpose trust, and causes the trust to (a) issue floating rate certificates to third parties, in an amount equal to a fraction of the par amount of the deposited bonds (these certificates usually pay tax-exempt interest at short-term interest rates that typically reset weekly; and the certificates holders typically, on seven days notice, have the option to tender their certificates to the investment banker or another party for redemption at par plus accrued interest), and (b) issue inverse floating rate certificates (sometimes referred to as “inverse floaters”). If the holders of the inverse floater transfer the municipal bonds to an investment banker for the purpose of depositing the municipal bonds into the special purpose trust, the inverse floating rate certificates that are issued by the trust are referred to as “self-deposited inverse floaters.” If the bonds held by the trust are purchased by the investment banker for deposit into the trust from someone other than the purchasers of the inverse floaters, the inverse floating rate certificates that are issued by the trust are referred to as “externally deposited inverse floaters.” Such self-deposited inverse floaters held by the fund are accounted for as secured borrowings, with the municipal bonds reflected in the investments of the fund and amounts owed to the holders of the floating rate certificates under the provisions of the trust, which amounts are paid solely from the assets of the trust, reflected as liabilities of the fund in the Statement of Assets and Liabilities under the caption, “Payable to the holders of the floating rate certificates from trust assets”. The carrying value of the fund’s payable to the holders of the floating rate certificates from trust assets as reported in the fund’s Statement of Assets and Liabilities approximates its fair value. The value of the payable to the holders of the floating rate certificates from trust assets as of the reporting date is considered Level 2 under the fair value hierarchy disclosure. At March 31, 2013, the fund’s payable to the holders of the floating rate certificates from trust assets was $64,934,589 and the interest rate on the floating rate certificates issued by these trust was 0.14%. For the year ended March 31, 2013, the average payable to the holders of the floating rate certificates from trust assets was $64,493,162 at a weighted average interest rate of 0.21%. Interest expense and fees relate to interest payments made to the holders of certain floating rate certificates and associated fees, both of which are made from trust assets. Interest expense and fees are recorded as incurred. For the year ended March 31, 2013, interest expense and fees in connection with self-deposited inverse floaters was $532,417. Primary and externally deposited inverse floaters held by the fund are not accounted for as secured borrowings.
Indemnifications – Under the fund’s organizational documents, its officers and Trustees may be indemnified against certain liabilities and expenses arising out of the
59
Table of Contents
Notes to Financial Statements – continued
performance of their duties to the fund. Additionally, in the normal course of business, the fund enters into agreements with service providers that may contain indemnification clauses. The fund’s maximum exposure under these agreements is unknown as this would involve future claims that may be made against the fund that have not yet occurred.
Investment Transactions and Income – Investment transactions are recorded on the trade date. Interest income is recorded on the accrual basis. All premium and discount is amortized or accreted for financial statement purposes in accordance with U.S. generally accepted accounting principles. Interest payments received in additional securities are recorded on the ex-interest date in an amount equal to the value of the security on such date. Debt obligations may be placed on non-accrual status or set to accrue at a rate of interest less than the contractual coupon when the collection of all or a portion of interest has become doubtful. Interest income for those debt obligations may be further reduced by the write-off of the related interest receivables when deemed uncollectible.
The fund may receive proceeds from litigation settlements. Any proceeds received from litigation involving portfolio holdings are reflected in the Statement of Operations in realized gain/loss if the security has been disposed of by the fund or in unrealized gain/loss if the security is still held by the fund. Any other proceeds from litigation not related to portfolio holdings are reflected as other income in the Statement of Operations.
Legal fees and other related expenses incurred to preserve and protect the value of a security owned are added to the cost of the security; other legal fees are expensed. Capital infusions made directly to the security issuer, which are generally non-recurring, incurred to protect or enhance the value of high-yield debt securities, are reported as additions to the cost basis of the security. Costs that are incurred to negotiate the terms or conditions of capital infusions or that are expected to result in a plan of reorganization are reported as realized losses. Ongoing costs incurred to protect or enhance an investment, or costs incurred to pursue other claims or legal actions, are expensed.
Fees Paid Indirectly – The fund’s custody fee may be reduced according to an arrangement that measures the value of cash deposited with the custodian by the fund. This amount, for the year ended March 31, 2013, is shown as a reduction of total expenses in the Statement of Operations.
Tax Matters and Distributions – The fund intends to qualify as a regulated investment company, as defined under Subchapter M of the Internal Revenue Code, and to distribute all of its taxable and tax-exempt income, including realized capital gains. As a result, no provision for federal income tax is required. The fund’s federal tax returns, when filed, will remain subject to examination by the Internal Revenue Service for a three year period.
Distributions to shareholders are recorded on the ex-dividend date. Income and capital gain distributions are determined in accordance with income tax regulations, which may differ from U.S. generally accepted accounting principles. Certain capital accounts in the financial statements are periodically adjusted for permanent differences in order to reflect their tax character. These adjustments have no impact on net assets or net
60
Table of Contents
Notes to Financial Statements – continued
asset value per share. Temporary differences which arise from recognizing certain items of income, expense, gain or loss in different periods for financial statement and tax purposes will reverse at some time in the future. Distributions in excess of net investment income or net realized gains are temporary overdistributions for financial statement purposes resulting from differences in the recognition or classification of income or distributions for financial statement and tax purposes.
Book/tax differences primarily relate to amortization and accretion of debt securities.
The tax character of distributions declared to shareholders for the last two fiscal years is as follows:
| 3/31/13 | 3/31/12 | |||||||
| Ordinary income (including any short-term capital gains) | $425,667 | $114,937 | ||||||
| Tax-exempt income | 80,213,578 | 79,931,876 | ||||||
| Total distributions | $80,639,245 | $80,046,813 | ||||||
The federal tax cost and the tax basis components of distributable earnings were as follows:
| As of 3/31/13 | ||||
| Cost of investments | $2,170,593,215 | |||
| Gross appreciation | 198,139,075 | |||
| Gross depreciation | (6,975,372 | ) | ||
| Net unrealized appreciation (depreciation) | $191,163,703 | |||
| Undistributed tax-exempt income | 9,419,314 | |||
| Capital loss carryforwards | (8,290,764 | ) | ||
| Post-October capital loss deferral | (1,790,412 | ) | ||
| Other temporary differences | (7,249,876 | ) | ||
Under the Regulated Investment Company Modernization Act of 2010 (the “Act”), net capital losses recognized for fund fiscal years beginning after March 31, 2011 may be carried forward indefinitely, and their character is retained as short-term and/or long-term losses (“post-enactment losses”). Previously, net capital losses were carried forward for eight years and treated as short-term losses (“pre-enactment losses”). As a transition rule, the Act requires that all post-enactment net capital losses be used before pre-enactment net capital losses.
As of March 31, 2013, the fund had capital loss carryforwards available to offset future realized gains. Such losses expire as follows:
| 3/31/18 | $(937,881 | ) | ||
| 3/31/19 | (7,352,883 | ) | ||
| Total | $(8,290,764 | ) |
Multiple Classes of Shares of Beneficial Interest – The fund offers multiple classes of shares, which differ in their respective distribution and service fees. The fund’s income and common expenses are allocated to shareholders based on the value of settled shares outstanding of each class. The fund’s realized and unrealized gain (loss)
61
Table of Contents
Notes to Financial Statements – continued
are allocated to shareholders based on the daily net assets of each class. Dividends are declared separately for each class. Differences in per share dividend rates are generally due to differences in separate class expenses. Class B and Class B1 shares will convert to Class A and Class A1 shares approximately eight years after purchase. The fund’s distributions declared to shareholders as reported in the Statements of Changes in Net Assets are presented by class as follows:
| From net investment income | ||||||||
| Year ended 3/31/13 | Year ended 3/31/12 (i) | |||||||
| Class A | $35,251,132 | $37,590,066 | ||||||
| Class B | 1,071,488 | 988,135 | ||||||
| Class C | 6,335,838 | 6,151,681 | ||||||
| Class I | 9,308,718 | 1,224,540 | ||||||
| Class A1 | 28,570,074 | 33,883,026 | ||||||
| Class B1 | 101,995 | 209,365 | ||||||
| Total | $80,639,245 | $80,046,813 | ||||||
| (i) | For Class I, the period is from inception, August 1, 2011, through the stated period end. |
(3) Transactions with Affiliates
Investment Adviser – The fund has an investment advisory agreement with MFS to provide overall investment management and related administrative services and facilities to the fund. The management fee is computed daily and paid monthly at an annual rate of 0.40% of the fund’s average daily net assets.
The investment adviser has agreed in writing to reduce its management fee to 0.37% of the fund’s average daily net assets in excess of $1.3 billion up to $2.0 billion and 0.35% of average daily net assets in excess of $2.0 billion. This written agreement will continue until modified by the fund’s Board of Trustees, but such agreement will continue at least until July 31, 2013. For the year ended March 31, 2013, this management fee reduction amounted to $294,047, which is shown as a reduction of total expenses in the Statement of Operations.
The management fee incurred for the year ended March 31, 2013 was equivalent to an annual effective rate of 0.39% of the fund’s average daily net assets.
The investment adviser has agreed in writing to pay a portion of the fund’s operating expenses, exclusive of management fees, distribution and service fees, interest, taxes, extraordinary expenses, brokerage and transaction costs, and investment-related expenses (including interest expenses and fees associated with investments in inverse floating rate instruments), such that operating expenses do not exceed 0.10% annually of the fund’s average daily net assets. This written agreement will continue until modified by the fund’s Board of Trustees, but such agreement will continue at least until July 31, 2013. For the year ended March 31, 2013, this reduction amounted to $452,409 and is reflected as a reduction of total expenses in the Statement of Operations.
62
Table of Contents
Notes to Financial Statements – continued
Distributor – MFS Fund Distributors, Inc. (MFD), a wholly-owned subsidiary of MFS, as distributor, received $1,121,090 and $40,023 for the year ended March 31, 2013, as its portion of the initial sales charge on sales of Class A and Class A1 shares of the fund, respectively.
The Board of Trustees has adopted a distribution plan for certain class shares pursuant to Rule 12b-1 of the Investment Company Act of 1940.
The fund’s distribution plan provides that the fund will pay MFD for services provided by MFD and financial intermediaries in connection with the distribution and servicing of certain share classes. One component of the plan is a distribution fee paid to MFD and another component of the plan is a service fee paid to MFD. MFD may subsequently pay all, or a portion, of the distribution and/or service fees to financial intermediaries.
Distribution Plan Fee Table:
Distribution Fee Rate (d) | Service Fee Rate (d) | Total Distribution Plan (d) | Annual Effective Rate (e) | Distribution and Service Fee | ||||||||||||||||
| Class A | — | 0.25% | 0.25% | 0.25% | $2,381,557 | |||||||||||||||
| Class B | 0.75% | 0.25% | 1.00% | 1.00% | 363,938 | |||||||||||||||
| Class C | 0.75% | 0.25% | 1.00% | 1.00% | 2,161,086 | |||||||||||||||
| Class B1 | 0.75% | 0.25% | 1.00% | 0.76% | 31,321 | |||||||||||||||
| Total Distribution and Service Fees | $4,937,902 | |||||||||||||||||||
| (d) | In accordance with the distribution plan for certain classes, the fund pays distribution and/or service fees equal to these annual percentage rates of each class’s average daily net assets. The distribution and service fee rates disclosed by class represent the current rates in effect at the end of the reporting period. |
| (e) | The annual effective rates represent actual fees incurred under the distribution plan for the year ended March 31, 2013 based on each class’s average daily net assets. The service fee rate attributable to Class B1 shares within the first year of purchase is 0.25%. The service fee rate attributable to all other Class B1 shares has been reduced by MFD to 0.00% under a written agreement that will continue until modified by the fund’s Board of Trustees, but such agreement will continue at least until July 31, 2013. For the year ended March 31, 2013, this reduction amounted to $7,481 and is reflected as a reduction of total expenses in the Statement of Operations. |
Certain Class A and A1 shares are subject to a contingent deferred sales charge (CDSC) in the event of a shareholder redemption within 18 months of purchase for shares purchased on or after August 1, 2012, and within 24 months of purchase for shares purchased prior to August 1, 2012. Class C shares are subject to a CDSC in the event of a shareholder redemption within 12 months of purchase. Class B and Class B1 shares are subject to a CDSC in the event of a shareholder redemption within six years of purchase. All contingent deferred sales charges are paid to MFD and during the year ended March 31, 2013, were as follows:
| Amount | ||||
| Class A | $30,254 | |||
| Class B | 46,302 | |||
| Class C | 40,718 | |||
| Class A1 | — | |||
| Class B1 | 1,791 | |||
63
Table of Contents
Notes to Financial Statements – continued
Shareholder Servicing Agent – MFS Service Center, Inc. (MFSC), a wholly-owned subsidiary of MFS, receives a fee from the fund for its services as shareholder servicing agent calculated as a percentage of the average daily net assets of the fund as determined periodically under the supervision of the fund’s Board of Trustees. For the year ended March 31, 2013, the fee was $403,735, which equated to 0.0186% annually of the fund’s average daily net assets. MFSC also receives payment from the fund for out-of-pocket expenses, sub-accounting and other shareholder servicing costs which may be paid to affiliated and unaffiliated service providers. For the year ended March 31, 2013, these out-of-pocket expenses, sub-accounting and other shareholder servicing costs amounted to $1,248,525.
Administrator – MFS provides certain financial, legal, shareholder communications, compliance, and other administrative services to the fund. Under an administrative services agreement, the fund partially reimburses MFS the costs incurred to provide these services. The fund is charged an annual fixed amount of $17,500 plus a fee based on average daily net assets. The administrative services fee incurred for the year ended March 31, 2013 was equivalent to an annual effective rate of 0.0139% of the fund’s average daily net assets.
Trustees’ and Officers’ Compensation – The fund pays compensation to independent Trustees in the form of a retainer, attendance fees, and additional compensation to Board and Committee chairpersons. The fund does not pay compensation directly to Trustees or officers of the fund who are also officers of the investment adviser, all of whom receive remuneration for their services to the fund from MFS. Certain officers and Trustees of the fund are officers or directors of MFS, MFD, and MFSC.
Prior to December 31, 2001, the fund had an unfunded defined benefit plan (“DB plan”) for independent Trustees. As of December 31, 2001, the Board took action to terminate the DB plan with respect to then-current and any future independent Trustees, such that the DB plan covers only certain of those former independent Trustees who retired on or before December 31, 2001. The DB plan resulted in a pension expense of $2,297 and is included in independent Trustees’ compensation for the year ended March 31, 2013. The liability for deferred retirement benefits payable to certain independent Trustees under the DB plan amounted to $32,753 at March 31, 2013, and is included in “Payable for independent Trustees’ compensation” in the Statement of Assets and Liabilities.
Other – This fund and certain other funds managed by MFS (the funds) have entered into services agreements (the Agreements) which provide for payment of fees by the funds to Tarantino LLC and Griffin Compliance LLC in return for the provision of services of an Independent Chief Compliance Officer (ICCO) and Assistant ICCO, respectively, for the funds. The ICCO and Assistant ICCO are officers of the funds and the sole members of Tarantino LLC and Griffin Compliance LLC, respectively. The funds can terminate the Agreements with Tarantino LLC and Griffin Compliance LLC at any time under the terms of the Agreements. For the year ended March 31, 2013, the aggregate fees paid by the fund to Tarantino LLC and Griffin Compliance LLC were $16,495 and are included in “Miscellaneous” expense in the Statement of Operations. MFS has agreed to reimburse the fund for a portion of the payments made by the fund in the amount of $6,856, which is shown as a reduction of total expenses in the
64
Table of Contents
Notes to Financial Statements – continued
Statement of Operations. Additionally, MFS has agreed to bear all expenses associated with office space, other administrative support, and supplies provided to the ICCO and Assistant ICCO.
The fund invests in the MFS Institutional Money Market Portfolio which is managed by MFS and seeks current income consistent with preservation of capital and liquidity. Income earned on this investment is included in “Dividends from underlying affiliated funds” in the Statement of Operations. This money market fund does not pay a management fee to MFS.
(4) Portfolio Securities
Purchases and sales of investments, other than short-term obligations, aggregated $774,481,034 and $485,222,571, respectively.
(5) Shares of Beneficial Interest
The fund’s Declaration of Trust permits the Trustees to issue an unlimited number of full and fractional shares of beneficial interest. Transactions in fund shares were as follows:
| Year ended 3/31/13 | Year ended 3/31/12 (i) | |||||||||||||||
| Shares | Amount | Shares | Amount | |||||||||||||
| Shares sold | ||||||||||||||||
Class A | 36,472,000 | $326,896,860 | 31,605,026 | $265,489,266 | ||||||||||||
Class B | 1,100,675 | 9,831,689 | 1,224,582 | 10,313,603 | ||||||||||||
Class C | 7,875,002 | 70,807,617 | 5,806,040 | 48,992,346 | ||||||||||||
Class I | 19,850,296 | 178,299,684 | 21,864,292 | 189,817,241 | ||||||||||||
Class A1 | 1,127,701 | 10,092,638 | 942,432 | 7,861,579 | ||||||||||||
Class B1 | 3,599 | 32,172 | 4,502 | 37,499 | ||||||||||||
| 66,429,273 | $595,960,660 | 61,446,874 | $522,511,534 | |||||||||||||
| Shares issued in connection with acquisition of MFS Florida Municipal Bond Fund | ||||||||||||||||
Class A | — | $— | 4,655,433 | $38,965,972 | ||||||||||||
Class B | — | — | 208,208 | 1,744,785 | ||||||||||||
| — | $— | 4,863,641 | $40,710,757 | |||||||||||||
| Shares issued to shareholders in reinvestment of distributions | ||||||||||||||||
Class A | 3,218,071 | $28,857,419 | 3,348,420 | $28,041,569 | ||||||||||||
Class B | 97,754 | 877,642 | 80,256 | 673,945 | ||||||||||||
Class C | 520,167 | 4,679,367 | 480,003 | 4,032,888 | ||||||||||||
Class I | 823,122 | 7,370,556 | 93,633 | 813,164 | ||||||||||||
Class A1 | 2,297,677 | 20,598,377 | 2,633,704 | 22,043,900 | ||||||||||||
Class B1 | 8,469 | 75,799 | 18,749 | 156,526 | ||||||||||||
| 6,965,260 | $62,459,160 | 6,654,765 | $55,761,992 | |||||||||||||
65
Table of Contents
Notes to Financial Statements – continued
| Year ended 3/31/13 | Year ended 3/31/12 (i) | |||||||||||||||
| Shares | Amount | Shares | Amount | |||||||||||||
| Shares reacquired | ||||||||||||||||
Class A | (20,294,809 | ) | $(182,345,429 | ) | (40,659,702 | ) | $(345,000,233 | ) | ||||||||
Class B | (648,148 | ) | (5,813,743 | ) | (728,776 | ) | (6,074,562 | ) | ||||||||
Class C | (3,704,313 | ) | (33,329,539 | ) | (3,670,868 | ) | (30,519,879 | ) | ||||||||
Class I | (4,803,799 | ) | (43,009,247 | ) | (427,271 | ) | (3,672,860 | ) | ||||||||
Class A1 | (6,971,461 | ) | (62,445,595 | ) | (8,379,647 | ) | (69,710,717 | ) | ||||||||
Class B1 | (242,009 | ) | (2,164,066 | ) | (314,515 | ) | (2,605,467 | ) | ||||||||
| (36,664,539 | ) | $(329,107,619 | ) | (54,180,779 | ) | $(457,583,718 | ) | |||||||||
| Net change | ||||||||||||||||
Class A | 19,395,262 | $173,408,850 | (1,050,823 | ) | $(12,503,426 | ) | ||||||||||
Class B | 550,281 | 4,895,588 | 784,270 | 6,657,771 | ||||||||||||
Class C | 4,690,856 | 42,157,445 | 2,615,175 | 22,505,355 | ||||||||||||
Class I | 15,869,619 | 142,660,993 | 21,530,654 | 186,957,545 | ||||||||||||
Class A1 | (3,546,083 | ) | (31,754,580 | ) | (4,803,511 | ) | (39,805,238 | ) | ||||||||
Class B1 | (229,941 | ) | (2,056,095 | ) | (291,264 | ) | (2,411,442 | ) | ||||||||
| 36,729,994 | $329,312,201 | 18,784,501 | $161,400,565 | |||||||||||||
| (i) | For Class I, the period is from inception, August 1, 2011, through the stated period end. |
(6) Line of Credit
The fund and certain other funds managed by MFS participate in a $1.1 billion unsecured committed line of credit, subject to a $1 billion sublimit, provided by a syndication of banks under a credit agreement. Borrowings may be made for temporary financing needs. Interest is charged to each fund, based on its borrowings, generally at a rate equal to the higher of the Federal Reserve funds rate or one month LIBOR plus an agreed upon spread. A commitment fee, based on the average daily, unused portion of the committed line of credit, is allocated among the participating funds at the end of each calendar quarter. In addition, the fund and other funds managed by MFS have established unsecured uncommitted borrowing arrangements with certain banks for temporary financing needs. Interest is charged to each fund, based on its borrowings, at a rate equal to the Federal Reserve funds rate plus an agreed upon spread. For the year ended March 31, 2013, the fund’s commitment fee and interest expense were $13,039 and $0, respectively, and are included in “Miscellaneous” expense in the Statement of Operations.
66
Table of Contents
Notes to Financial Statements – continued
(7) Transactions in Underlying Affiliated Funds-Affiliated Issuers
An affiliated issuer may be considered one in which the fund owns 5% or more of the outstanding voting securities, or a company which is under common control. For the purposes of this report, the fund assumes the following to be an affiliated issuer:
| Underlying Affiliated Fund | Beginning Shares/Par Amount | Acquisitions Shares/Par Amount | Dispositions Shares/Par Amount | Ending Shares/Par Amount | ||||||||||||
| MFS Institutional Money Market Portfolio | 104,294,056 | 704,136,886 | (630,127,364 | ) | 178,303,578 | |||||||||||
| Underlying Affiliated Fund | Realized Gain (Loss) | Capital Gain Distributions | Dividend Income | Ending Value | ||||||||||||
| MFS Institutional Money Market Portfolio | $— | $— | $170,299 | $178,303,578 | ||||||||||||
(8) Acquisitions
At close of business on November 4, 2011, the fund with net assets of $1,737,598,117, acquired all of the assets and liabilities of MFS Florida Municipal Bond Fund. The purpose of the transaction was to provide shareholders of the MFS Florida Municipal Bond Fund the opportunity to participate in a larger combined portfolio with an identical investment objective and similar investment policies and strategies. The acquisition was accomplished by a tax-free exchange of 4,863,641 shares of the fund (valued at $40,710,757) for all of the assets and liabilities of MFS Florida Municipal Bond Fund. MFS Florida Municipal Bond Fund then distributed the shares of the fund that MFS Florida Municipal Bond Fund received from the fund to its shareholders. MFS Florida Municipal Bond Fund’s investments on that date were valued at $40,178,414 with a cost basis of $39,210,441. For financial reporting purposes, assets received and shares issued by the fund were recorded at fair value; however, the cost basis of the investments received from MFS Florida Municipal Bond Fund were carried forward to align ongoing reporting of the fund’s realized and unrealized gains and losses with amounts distributable to shareholders for tax purposes.
67
Table of Contents
REPORT OF INDEPENDENT REGISTERED PUBLIC ACCOUNTING FIRM
To the Board of Trustees of MFS Municipal Series Trust and the Shareholders of MFS Municipal Income Fund:
We have audited the accompanying statement of assets and liabilities, including the portfolio of investments, of MFS Municipal Income Fund (one of the portfolios comprising MFS Municipal Series Trust) (the “Fund”) as of March 31, 2013, and the related statement of operations for the year then ended, the statements of changes in net assets for each of the two years in the period then ended, and the financial highlights for the periods presented. These financial statements and financial highlights are the responsibility of the Fund’s management. Our responsibility is to express an opinion on these financial statements and financial highlights based on our audits.
We conducted our audits in accordance with the standards of the Public Company Accounting Oversight Board (United States). Those standards require that we plan and perform the audit to obtain reasonable assurance about whether the financial statements and financial highlights are free of material misstatement. The Fund is not required to have, nor were we engaged to perform, an audit of its internal control over financial reporting. Our audits included consideration of internal control over financial reporting as a basis for designing audit procedures that are appropriate in the circumstances, but not for the purpose of expressing an opinion on the effectiveness of the Fund’s internal control over financial reporting. Accordingly, we express no such opinion. An audit also includes examining, on a test basis, evidence supporting the amounts and disclosures in the financial statements, assessing the accounting principles used and significant estimates made by management, as well as evaluating the overall financial statement presentation. Our procedures included confirmation of securities owned as of March 31, 2013, by correspondence with the custodian and brokers; where replies were not received from brokers, we performed other auditing procedures. We believe that our audits provide a reasonable basis for our opinion.
In our opinion, the financial statements and financial highlights referred to above present fairly, in all material respects, the financial position of MFS Municipal Income Fund as of March 31, 2013, the results of its operations for the year then ended, the changes in its net assets for each of the two years in the period then ended, and the financial highlights for the periods presented, in conformity with accounting principles generally accepted in the United States of America.
DELOITTE & TOUCHE LLP
Boston, Massachusetts
May 15, 2013
68
Table of Contents
TRUSTEES AND OFFICERS — IDENTIFICATION AND BACKGROUND
The Trustees and Officers of the Trust, as of May 1, 2013, are listed below, together with their principal occupations during the past five years. (Their titles may have varied during that period.) The address of each Trustee and officer is 111 Huntington Avenue, Boston, Massachusetts 02199-7618.
Name, Age | Position(s) Held with Fund | Trustee/Officer Since (h) | Principal Occupations During the Past Five Years | Other Directorships (j) | ||||
| INTERESTED TRUSTEES | ||||||||
Robert J. Manning (k) (age 49) | Trustee | February 2004 | Massachusetts Financial Services Company, Chairman, Chief Executive Officer and Director; President (until December 2009); Chief Investment Officer (until July 2010) | N/A | ||||
| INDEPENDENT TRUSTEES | ||||||||
| David H. Gunning (age 70) | Trustee and Chair of Trustees | January 2004 | Private investor | Lincoln Electric Holdings, Inc. (welding equipment manufacturer), Director; Development Alternatives, Inc. (consulting), Director/Non-Executive Chairman; Portman Limited (mining), Director (until 2008) | ||||
| Robert E. Butler (age 71) | Trustee | January 2006 | Consultant – investment company industry regulatory and compliance matters | N/A | ||||
| Maureen R. Goldfarb (age 58) | Trustee | January 2009 | Private investor | N/A | ||||
| William R. Gutow (age 71) | Trustee | December 1993 | Private investor and real estate consultant; Capitol Entertainment Management Company (video franchise), Vice Chairman | Texas Donuts (donut franchise), Vice Chairman (until 2010) | ||||
69
Table of Contents
Trustees and Officers – continued
Name, Age | Position(s) Held with Fund | Trustee/Officer Since (h) | Principal Occupations During the Past Five Years | Other Directorships (j) | ||||
| Michael Hegarty (age 68) | Trustee | December 2004 | Private investor | Brookfield Office Properties, Inc. (real estate), Director; Rouse Properties Inc. (real estate), Director; Capmark Financial Group Inc. (real estate), Director | ||||
| John P. Kavanaugh (age 58) | Trustee | January 2009 | Private investor | N/A | ||||
| J. Dale Sherratt (age 74) | Trustee | June 1989 | Insight Resources, Inc. (acquisition planning specialists), President; Wellfleet Investments (investor in health care companies), Managing General Partner | N/A | ||||
| Laurie J. Thomsen (age 55) | Trustee | March 2005 | Private investor; New Profit, Inc. (venture philanthropy), Executive Partner (until 2010) | The Travelers Companies (insurance), Director | ||||
| Robert W. Uek (age 71) | Trustee | January 2006 | Consultant to investment company industry | N/A | ||||
| OFFICERS | ||||||||
John M. Corcoran (k) (age 48) | President | October 2008 | Massachusetts Financial Services Company, Senior Vice President (since October 2008); State Street Bank and Trust (financial services provider), Senior Vice President, (until September 2008) | N/A | ||||
| Christopher R. Bohane (k) (age 39) | Assistant Secretary and Assistant Clerk | July 2005 | Massachusetts Financial Services Company, Vice President and Assistant General Counsel | N/A | ||||
| Kino Clark (k) (age 44) | Assistant Treasurer | January 2012 | Massachusetts Financial Services Company, Vice President | N/A | ||||
70
Table of Contents
Trustees and Officers – continued
Name, Age | Position(s) Held with Fund | Trustee/Officer Since (h) | Principal Occupations During the Past Five Years | Other Directorships (j) | ||||
| Thomas H. Connors (k) (age 53) | Assistant Secretary and Assistant Clerk | September 2012 | Massachusetts Financial Services Company, Vice President and Senior Counsel; Deutsche Investment Management Americas Inc. (financial service provider), Director and Senior Counsel (until 2012) | N/A | ||||
| Ethan D. Corey (k) (age 49) | Assistant Secretary and Assistant Clerk | July 2005 | Massachusetts Financial Services Company, Senior Vice President and Associate General Counsel | N/A | ||||
| David L. DiLorenzo (k) (age 44) | Treasurer | July 2005 | Massachusetts Financial Services Company, Senior Vice President | N/A | ||||
| Robyn L. Griffin (age 37) | Assistant Independent Chief Compliance Officer | August 2008 | Griffin Compliance LLC (provider of compliance services), Principal (since August 2008); State Street Corporation (financial services provider), Mutual Fund Administration Assistant Vice President (October 2006 – July 2008) | N/A | ||||
Brian E. Langenfeld (k) (age 40) | Assistant Secretary and Assistant Clerk | June 2006 | Massachusetts Financial Services Company, Vice President and Senior Counsel | N/A | ||||
| Susan S. Newton (k) (age 63) | Assistant Secretary and Assistant Clerk | May 2005 | Massachusetts Financial Services Company, Senior Vice President and Associate General Counsel | N/A |
71
Table of Contents
Trustees and Officers – continued
Name, Age | Position(s) Held with Fund | Trustee/Officer Since (h) | Principal Occupations During the Past Five Years | Other Directorships (j) | ||||
| Susan A. Pereira (k) (age 42) | Assistant Secretary and Assistant Clerk | July 2005 | Massachusetts Financial Services Company, Vice President and Senior Counsel | N/A | ||||
| Kasey L. Phillips (k) (age 42) | Assistant Treasurer | September 2012 | Massachusetts Financial Services Company, Vice President; Wells Fargo Funds Management, LLC, Senior Vice President, Fund Treasurer (until 2012) | N/A | ||||
| Mark N. Polebaum (k) (age 60) | Secretary and Clerk | January 2006 | Massachusetts Financial Services Company, Executive Vice President, General Counsel and Secretary | N/A | ||||
| Frank L. Tarantino (age 69) | Independent Chief Compliance Officer | June 2004 | Tarantino LLC (provider of compliance services), Principal | N/A | ||||
| Richard S. Weitzel (k) (age 42) | Assistant Secretary and Assistant Clerk | October 2007 | Massachusetts Financial Services Company, Senior Vice President and Associate General Counsel | N/A | ||||
| James O. Yost (k) (age 52) | Deputy Treasurer | September 1990 | Massachusetts Financial Services Company, Senior Vice President | N/A |
| (h) | Date first appointed to serve as Trustee/officer of an MFS Fund. Each Trustee has served continuously since appointment unless indicated otherwise. For the period from December 15, 2004 until February 22, 2005, Mr. Manning served as Advisory Trustee. For the period October 2008, until January 2012, Mr. Corcoran served as Treasurer of the Funds. Prior to January 2012, Messrs. DiLorenzo and Yost served as Assistant Treasurers of the Funds. |
| (j) | Directorships or trusteeships of companies required to report to the Securities and Exchange Commission (i.e., “public companies”). |
| (k) | “Interested person” of the Trust within the meaning of the Investment Company Act of 1940 (referred to as the 1940 Act), which is the principal federal law governing investment companies like the fund, as a result of position with MFS. The address of MFS is 111 Huntington Avenue, Boston, Massachusetts 02199-7618. |
Each Trustee has been elected by shareholders and each Trustee and officer holds office until his or her successor is chosen and qualified or until his or her earlier death, resignation, retirement or removal. The Trust does not hold annual meetings for the
72
Table of Contents
Trustees and Officers – continued
purpose of electing Trustees, and Trustees are not elected for fixed terms. Messrs. Butler, Kavanaugh, Uek and Ms. Thomsen are members of the Trust’s Audit Committee.
Each of the Fund’s Trustees and officers holds comparable positions with certain other funds of which MFS or a subsidiary is the investment adviser or distributor, and, in the case of the officers, with certain affiliates of MFS. As of January 1, 2013, the Trustees served as board members of 143 funds within the MFS Family of Funds.
73
Table of Contents
Trustees and Officers – continued
The Statement of Additional Information for the Fund includes further information about the Trustees and is available without charge upon request by calling 1-800-225-2606.
| Investment Adviser | Custodian | |
| Massachusetts Financial Services Company 111 Huntington Avenue Boston, MA 02199-7618 | JPMorgan Chase Bank One Chase Manhattan Plaza New York, NY 10081 | |
| Distributor | Independent Registered Public Accounting Firm | |
| MFS Fund Distributors, Inc. 111 Huntington Avenue Boston, MA 02199-7618 | Deloitte & Touche LLP 200 Berkeley Street Boston, MA 02116 | |
| Portfolio Manager | ||
Geoffrey Schechter |
74
Table of Contents
BOARD REVIEW OF INVESTMENT ADVISORY AGREEMENT
A discussion regarding the Board’s most recent review and renewal of the fund’s Investment Advisory Agreement with MFS is available by clicking on the fund’s name under “Mutual Funds” in the “Products” section of the MFS Web site (mfs.com).
PROXY VOTING POLICIES AND INFORMATION
A general description of the MFS funds’ proxy voting policies and procedures is available without charge, upon request, by calling 1-800-225-2606, by visiting the Proxy Voting section of mfs.com or by visiting the SEC’s Web site at http://www.sec.gov.
Information regarding how the fund voted proxies relating to portfolio securities during the most recent twelve-month period ended June 30 is available without charge by visiting the Proxy Voting section of mfs.com or by visiting the SEC’s Web site at http://www.sec.gov.
QUARTERLY PORTFOLIO DISCLOSURE
The fund will file a complete schedule of portfolio holdings with the Securities and Exchange Commission (the Commission) for the first and third quarters of each fiscal year on Form N-Q. A shareholder can obtain the quarterly portfolio holdings report at mfs.com. The fund’s Form N-Q is also available on the EDGAR database on the Commission’s Internet Web site at http://www.sec.gov, and may be reviewed and copied at the:
Public Reference Room
Securities and Exchange Commission
100 F Street, NE, Room 1580
Washington, D.C. 20549
Information on the operation of the Public Reference Room may be obtained by calling the Commission at 1-800-SEC-0330. Copies of the fund’s Form N-Q also may be obtained, upon payment of a duplicating fee, by electronic request at the following e-mail address: publicinfo@sec.gov or by writing the Public Reference Section at the above address.
From time to time, MFS may post important information about the fund or the MFS funds on the MFS web site (mfs.com). This information is available by visiting the “News & Commentary” section of mfs.com or by clicking on the fund’s name under “Mutual Funds” in the “Products” section of mfs.com.
FEDERAL TAX INFORMATION (unaudited)
The fund will notify shareholders of amounts for use in preparing 2013 income tax forms in January 2014. The following information is provided pursuant to provisions of the Internal Revenue Code.
Of the dividends paid from net investment income during the fiscal year 99.47% is designated as exempt interest dividends for federal income tax purposes. If the fund has earned income on private activity bonds, a portion of the dividends paid may be considered a tax preference item for purposes of computing a shareholder’s alternative minimum tax.
75
Table of Contents
rev. 3/11
| WHAT DOES MFS DO WITH YOUR PERSONAL INFORMATION? |  | ||
| Why? | Financial companies choose how they share your personal information. Federal law gives consumers the right to limit some but not all sharing. Federal law also requires us to tell you how we collect, share, and protect your personal information. Please read this notice carefully to understand what we do. |
| What? | The types of personal information we collect and share depend on the product or service you have with us. This information can include:
• Social Security number and account balances • Account transactions and transaction history • Checking account information and wire transfer instructions
When you are no longer our customer, we continue to share your information as described in this notice. |
| How? | All financial companies need to share customers’ personal information to run their everyday business. In the section below, we list the reasons financial companies can share their customers’ personal information; the reasons MFS chooses to share; and whether you can limit this sharing. |
| Reasons we can share your personal information | Does MFS share? | Can you limit this sharing? | ||
For our everyday business purposes – such as to process your transactions, maintain your account(s), respond to court orders and legal investigations, or report to credit bureaus | Yes | No | ||
For our marketing purposes – to offer our products and services to you | No | We don’t share | ||
| For joint marketing with other financial companies | No | We don’t share | ||
For our affiliates’ everyday business purposes – information about your transactions and experiences | No | We don’t share | ||
For our affiliates’ everyday business purposes – information about your creditworthiness | No | We don’t share | ||
| For nonaffiliates to market to you | No | We don’t share |
| Questions? | Call 800-225-2606 or go to mfs.com. |
76
Table of Contents
| Page 2 |
| Who we are | ||
| Who is providing this notice? | MFS Funds, MFS Investment Management, MFS Institutional Advisors, Inc., MFS Fund Distributors, Inc., MFS Heritage Trust Company, and MFS Service Center, Inc. | |
| What we do | ||
| How does MFS protect my personal information? | To protect your personal information from unauthorized access and use, we use security measures that comply with federal law. These measures include procedural, electronic, and physical safeguards for the protection of the personal information we collect about you. | |
| How does MFS collect my personal information? | We collect your personal information, for example, when you
•open an account or provide account information •direct us to buy securities or direct us to sell your securities •make a wire transfer
We also collect your personal information from others, such as credit bureaus, affiliates and other companies. | |
| Why can’t I limit all sharing? | Federal law gives you the right to limit only
•sharing for affiliates’ everyday business purposes – information about your creditworthiness •affiliates from using your information to market to you •sharing for nonaffiliates to market to you
State laws and individual companies may give you additional rights to limit sharing. | |
| Definitions | ||
| Affiliates | Companies related by common ownership or control. They can be financial and nonfinancial companies.
•MFS does not share personal information with affiliates, except for everyday business purposes as described on page one of this notice. | |
| Nonaffiliates | Companies not related by common ownership or control. They can be financial and nonfinancial companies.
•MFS does not share with nonaffiliates so they can market to you. | |
| Joint Marketing | A formal agreement between nonaffiliated financial companies that together market financial products or services to you.
•MFS doesn’t jointly market. | |
| Other important information | ||
| If you own an MFS product or receive an MFS service in the name of a third party such as a bank or broker-dealer, their privacy policy may apply to you instead of ours. | ||
77
Table of Contents
Save paper with eDelivery.
| MFS® will send you prospectuses, |

reports, and proxies directly via e-mail so you will get information faster with less mailbox clutter.
To sign up:
1. Go to mfs.com.
2. Log in via MFS® Access.
3. Select eDelivery.
If you own your MFS fund shares through a financial institution or a retirement plan, MFS® TALK, MFS® Access, or eDelivery may not be available to you.
WEB SITE
mfs.com
MFS TALK
1-800-637-8255
24 hours a day
ACCOUNT SERVICE AND LITERATURE
Shareholders
1-800-225-2606
Financial advisors
1-800-343-2829
Retirement plan services
1-800-637-1255
MAILING ADDRESS
MFS Service Center, Inc.
P.O. Box 55824
Boston, MA 02205-5824
OVERNIGHT MAIL
MFS Service Center, Inc.
c/o Boston Financial Data Services
30 Dan Road
Canton, MA 02021-2809
Table of Contents
ANNUAL REPORT
March 31, 2013

MFS® MUNICIPAL SERIES TRUST
For the states of:
Alabama, Arkansas, California, Georgia, Maryland, and Massachusetts

MSTA-ANN
Table of Contents
MFS® MUNICIPAL SERIES TRUST
For the states of: Alabama, Arkansas, California, Georgia, Maryland, and Massachusetts
The report is prepared for the general information of shareholders. It is authorized for distribution to prospective investors only when preceded or accompanied by a current prospectus.
NOT FDIC INSURED Ÿ MAY LOSE VALUE Ÿ NO BANK GUARANTEE
Table of Contents
LETTER FROM THE CHAIRMAN AND CEO

Dear Shareholders:
The first quarter of 2013 delivered strong returns to global equity investors, particularly those holding U.S. and Japanese stocks, while bond returns were flat overall. The U.S. economy picked up steam, driven by the improving housing and job markets. U.S. economic data were broadly positive, with growth in manufacturing activity, durable goods orders and auto sales. However, consumer confidence wavered somewhat, a likely reflection of the impact of the payroll tax increase and uncertainty over the U.S. government’s across-the-board sequestration cuts.
The eurozone’s unemployment picture and overall economic activity steadily worsened. Cyprus, the latest debt-crisis hot spot, faces unique challenges, with its oversized banking sector’s unhealthy exposure to Greek debt. In addition, the hefty cost to large bank depositors could weaken confidence in the region’s financial stability. China’s economic activity rebounded after a mild slowdown in 2012. The Japanese government’s aggressive effort to stimulate its long-dormant economy by devaluing the yen lifted stock prices, exports and profits for struggling Japanese firms. The outlook for further economic growth and an extension of the U.S. bull market is highly dependent on how much damage is caused by the U.S. budget cuts, global growth prospects and the ebb and flow of global tail risk events. Most factors point to a continued slow and uneven global economic recovery.
As always, managing risk in the face of uncertainty remains a top priority for investors. At MFS®, our uniquely collaborative investment process employs global research and active risk management. Our global team of investment professionals shares ideas and evaluates opportunities across continents, investment disciplines and asset classes — all with a goal of building better insights, and ultimately better results, for our clients.
We remain mindful of the many economic challenges investors face today, and believe it is more important than ever to maintain a long-term view and employ time-tested principles, such as asset allocation and diversification. We also remain confident that our unique approach can serve investors well as they work with their financial advisors to identify and pursue the most suitable opportunities.
Respectfully,

Robert J. Manning
Chairman and Chief Executive Officer
MFS Investment Management®
May 15, 2013
The opinions expressed in this letter are subject to change, may not be relied upon for investment advice, and no forecasts can be guaranteed.
1
Table of Contents
MFS Alabama Municipal Bond Fund
Portfolio structure (i)

| Top five industries (i) | ||||
| Healthcare Revenue – Hospitals | 19.6% | |||
| Universities – Colleges | 14.6% | |||
| Water & Sewer Utility Revenue | 12.6% | |||
| General Obligations – Schools | 11.4% | |||
| General Obligations – General Purpose | 9.1% |
| Composition including fixed income credit quality (a)(i) | ||||
| AAA | 3.6% | |||
| AA | 35.1% | |||
| A | 36.4% | |||
| BBB | 14.3% | |||
| BB | 4.0% | |||
| B | 0.5% | |||
| Not Rated | 4.1% | |||
| Cash & Other | 2.0% |
| Portfolio facts (i) | ||||
| Average Duration (d) | 8.3 | |||
| Average Effective Maturity (m) | 18.2 yrs. |
MFS Arkansas Municipal Bond Fund
Portfolio structure (i)

| Top five industries (i) | ||||
| Universities – Colleges | 22.2% | |||
| Water & Sewer Utility Revenue | 13.5% | |||
| General Obligations – Schools | 12.4% | |||
| Sales & Excise Tax Revenue | 10.4% | |||
| Healthcare Revenue – Hospitals | 9.4% |
| Composition including fixed income credit quality (a)(i) | ||||
| AAA | 4.5% | |||
| AA | 51.5% | |||
| A | 23.6% | |||
| BBB | 14.8% | |||
| BB | 1.3% | |||
| B | 0.7% | |||
| Not Rated | 1.9% | |||
| Cash & Other | 1.7% |
| Portfolio facts (i) | ||||
| Average Duration (d) | 8.4 | |||
| Average Effective Maturity (m) | 17.1 yrs. |
MFS California Municipal Bond Fund
Portfolio structure (i)

| Top five industries (i) | ||||
| Healthcare Revenue – Hospitals | 17.2% | |||
| Universities – Colleges | 10.7% | |||
| General Obligations – Schools | 8.5% | |||
| Tax Assessment | 7.7% | |||
| Water & Sewer Utility Revenue | 7.6% |
| Composition including fixed income credit quality (a)(i) | ||||
| AAA | 1.3% | |||
| AA | 23.7% | |||
| A | 44.2% | |||
| BBB | 17.9% | |||
| BB | 5.2% | |||
| B | 1.3% | |||
| Not Rated | 4.9% | |||
| Cash & Other | 1.5% |
| Portfolio facts (i) | ||||
| Average Duration (d) | 9.3 | |||
| Average Effective Maturity (m) | 18.9 yrs. |
| (a) | For all securities other than those specifically described below, ratings are assigned to underlying securities utilizing ratings from Moody’s, Fitch, and Standard & Poor’s rating agencies and applying the following hierarchy: If all three agencies provide a rating, the middle rating (after dropping the highest and lowest ratings) is assigned; if two of the three agencies rate a security, the lower of the two is assigned. Ratings are shown in the S&P and Fitch scale (e.g., AAA). Securities rated BBB or higher are considered investment grade. All ratings are subject to change. Not Rated includes fixed income securities, including fixed income futures contracts, which have not been rated by any rating agency. Cash & Other includes cash, other assets less liabilities, offsets to derivative positions, and short-term securities. The fund may not hold all of these instruments. The fund is not rated by these agencies. |
| (d) | Duration is a measure of how much a bond’s price is likely to fluctuate with general changes in interest rates, e.g., if rates rise 1.00%, a bond with a 5-year duration is likely to lose about 5.00% of its value due to the interest rate move. |
| (i) | For purposes of this presentation, the components include the market value of securities, and reflect the impact of the equivalent exposure of derivative positions, if any. These amounts may be negative from time to time. The bond component will include any accrued interest amounts. Equivalent exposure is a calculated amount that translates the derivative position into a reasonable approximation of the amount of the underlying asset that the portfolio would have to hold at a given point in time to have the same price sensitivity that results from the portfolio’s ownership of the derivative contract. When dealing with derivatives, equivalent exposure is a more representative measure of the potential impact of a position on portfolio performance than market value. Where the fund holds convertible bonds, these are treated as part of the equity portion of the portfolio. |
| (m) | In determining an instrument’s effective maturity for purposes of calculating the fund’s dollar-weighted average effective maturity, MFS uses the instrument’s stated maturity or, if applicable, an earlier date on which MFS believes it is probable that a maturity-shortening device (such as a put, pre-refunding or prepayment) will cause the instrument to be repaid. Such an earlier date can be substantially shorter than the instrument’s stated maturity. |
Percentages are based on net assets as of 3/31/13.
The portfolio is actively managed and current holdings may be different.
2
Table of Contents
Portfolio Composition – continued
MFS Georgia Municipal Bond Fund
Portfolio structure (i)

| Top five industries (i) | ||||
| Universities – Colleges | 18.5% | |||
| Healthcare Revenue – Hospitals | 16.3% | |||
| Water & Sewer Utility Revenue | 14.7% | |||
| General Obligations – General Purpose | 7.4% | |||
| Sales & Excise Tax Revenue | 6.2% |
| Composition including fixed income credit quality (a)(i) | ||||
| AAA | 9.4% | |||
| AA | 34.7% | |||
| A | 38.4% | |||
| BBB | 11.6% | |||
| BB | 1.4% | |||
| B | 0.8% | |||
| Not Rated | 0.9% | |||
| Cash & Other | 2.8% |
| Portfolio facts (i) | ||||
| Average Duration (d) | 9.0 | |||
| Average Effective Maturity (m) | 18.2 yrs. |
MFS Maryland Municipal Bond Fund
Portfolio structure (i)

| Top five industries (i) | ||||
| Healthcare Revenue – Hospitals | 22.1% | |||
| General Obligations – General Purpose | 13.4% | |||
| Universities – Colleges | 10.7% | |||
| Water & Sewer Utility Revenue | 8.7% | |||
| Multi-Family Housing Revenue | 5.9% |
| Composition including fixed income credit quality (a)(i) | ||||
| AAA | 15.9% | |||
| AA | 23.3% | |||
| A | 26.7% | |||
| BBB | 24.2% | |||
| BB | 1.5% | |||
| B | 0.7% | |||
| Not Rated | 4.0% | |||
| Cash & Other | 3.7% |
| Portfolio facts (i) | ||||
| Average Duration (d) | 8.8 | |||
| Average Effective Maturity (m) | 18.4 yrs. |
MFS Massachusetts Municipal Bond Fund
Portfolio structure (i)

| Top five industries (i) | ||||
| Universities – Colleges | 21.5% | |||
| Healthcare Revenue – Hospitals | 14.5% | |||
| General Obligations – General Purpose | 10.5% | |||
| Sales & Excise Tax Revenue | 8.5% | |||
| Multi-Family Housing Revenue | 5.9% |
| Composition including fixed income credit quality (a)(i) | ||||
| AAA | 5.5% | |||
| AA | 41.1% | |||
| A | 26.0% | |||
| BBB | 20.8% | |||
| BB | 1.9% | |||
| B | 1.0% | |||
| Not Rated | 1.3% | |||
| Cash & Other | 2.4% |
| Portfolio facts (i) | ||||
| Average Duration (d) | 9.4 | |||
| Average Effective Maturity (m) | 18.4 yrs. |
| (a) | For all securities other than those specifically described below, ratings are assigned to underlying securities utilizing ratings from Moody’s, Fitch, and Standard & Poor’s rating agencies and applying the following hierarchy: If all three agencies provide a rating, the middle rating (after dropping the highest and lowest ratings) is assigned; if two of the three agencies rate a security, the lower of the two is assigned. Ratings are shown in the S&P and Fitch scale (e.g., AAA). Securities rated BBB or higher are considered investment grade. All ratings are subject to change. Not Rated includes fixed income securities, including fixed income futures contracts, which have not been rated by any rating agency. Cash & Other includes cash, other assets less liabilities, offsets to derivative positions, and short-term securities. The fund may not hold all of these instruments. The fund is not rated by these agencies. |
| (d) | Duration is a measure of how much a bond’s price is likely to fluctuate with general changes in interest rates, e.g., if rates rise 1.00%, a bond with a 5-year duration is likely to lose about 5.00% of its value due to the interest rate move. |
| (i) | For purposes of this presentation, the components include the market value of securities, and reflect the impact of the equivalent exposure of derivative positions, if any. These amounts may be negative from time to time. The bond component will include any accrued interest amounts. Equivalent exposure is a calculated amount that translates the derivative position into a reasonable approximation of the amount of the underlying asset that the portfolio would have to hold at a given point in time to have the same price sensitivity that results from the portfolio’s ownership of the derivative contract. When dealing with derivatives, equivalent exposure is a more representative measure of the potential impact of a position on portfolio performance than market value. Where the fund holds convertible bonds, these are treated as part of the equity portion of the portfolio. |
| (m) | In determining an instrument’s effective maturity for purposes of calculating the fund’s dollar-weighted average effective maturity, MFS uses the instrument’s stated maturity or, if applicable, an earlier date on which MFS believes it is probable that a maturity-shortening device (such as a put, pre-refunding or prepayment) will cause the instrument to be repaid. Such an earlier date can be substantially shorter than the instrument’s stated maturity. |
Percentages are based on net assets as of 3/31/13.
The portfolio is actively managed and current holdings may be different.
3
Table of Contents
Summary of Results
For the twelve months ended March 31, 2013, Class A shares of each fund, at net asset value, with the exception of the municipal bond funds of Arkansas and Maryland, outperformed the Barclays Municipal Bond Index. These included the municipal bond funds of Alabama, California, Georgia, and Massachusetts. The performance for the individual funds and the benchmark are set forth in the Performance Summary.
Market Environment
The beginning of the period was characterized by a risk-on sentiment as a result of additional liquidity measures by the Federal Reserve Bank (“Fed”) and the European Central Bank (“ECB”) as well as a commensurate improvement in macroeconomic conditions. During this time, global equity valuations rose, credit spreads contracted, and high-quality sovereign yields increased modestly.
Within a couple of months, however, conditions worsened, driven by broadly weaker global macroeconomic indicators, as well as renewed concerns over the eurozone’s capacity and determination to address its ongoing crisis. Despite this deterioration, broad market sentiment remained relatively resilient as equity markets generally maintained gains and credit spreads did not indicate deterioration.
However, this renewed weakness in the fundamentals precipitated a further round of monetary easing by both the Fed (through a third round of quantitative easing) and the ECB (through a new bond purchase facility) in the middle of the period, which soon instilled additional confidence in risk markets. Nonetheless, towards the end of the calendar year, weaker equity earnings reports and declining forward guidance caused market sentiment to soften. In addition, year-end fiscal cliff negotiations between the Republicans in the U.S. Congress and President Obama were a particular source of market attention, where uncertainty surrounding the fiscal negotiations continued right up to the end-of-year deadline. A last minute political agreement averted the worst-case scenario and markets gravitated towards risk assets again, though the implementation of the U.S. budget sequester, combined with the uncertainty surrounding the Italian election results, inserted a greater degree of caution as the reporting period ended.
Over the reporting period, municipal bond yields generally followed the direction of U.S. Treasury yields. Yields on “AAA” rated (r) municipal bonds declined throughout the first half of the period, hitting multi-generational lows in late November/early December, before rising over the second half of the period, and ending the twelve month period modestly lower. At the same time, spreads between higher quality bonds and lower quality bonds continued to decline, with “BBB” rated municipal bonds outperforming “AAA” rated municipal bonds and non-investment grade/non-rated bonds outperforming “BBB” rated municipal bonds. This reflects the strong technical backdrop over the trailing twelve months with demand for municipals outstripping supply, and investors continuing their search for yield. Near the end of the period, a number of developments emerged that have the potential to shift the balance of supply and demand. Amongst the more notable were a marked decline in the pace of inflows into, and even some outflows from, municipal bond funds, and proposals to alter the tax treatment of tax-exempt income.
Factors Affecting Performance
The funds’ longer duration (d) stance relative to the Barclays Municipal Bond Index benefited results as the positive sentiment in the municipal bond markets pushed yields lower during the reporting period.
Among sectors, general obligation securities were notable contributors to the relative performance of all funds. A greater relative exposure to the health care sector aided relative returns across all funds, with the exception of the Arkansas Fund, where it had a neutral exposure. The credit enhanced sector was another positive factor for relative performance in all funds, with the exception of the Maryland Fund, where bond selection hurt relative results. Education bonds further supported relative returns in the California, Georgia, and Massachusetts funds. An underweight allocation to “AA” rated securities also strengthened relative performance across all funds.
Bond selection in the housing sector held back relative results for the Arkansas and Massachusetts funds. All funds’ cash and/or cash equivalents positions during the period were additional detractors from relative performance. Under normal market conditions, the funds strive to be fully invested and generally hold cash to buy new holdings and to provide liquidity. In a period when markets rose, as measured by the benchmark, holding cash hurt performance versus the benchmark, which has no cash position.
Respectfully,
Michael Dawson
Portfolio Manager
| (d) | Duration is a measure of how much a bond’s price is likely to fluctuate with general changes in interest rates, e.g., if rates rise 1.00%, a bond with a 5-year duration is likely to lose about 5.00% of its value. |
4
Table of Contents
Management Review – continued
| (r) | Bonds rated “BBB”, “Baa”, or higher are considered investment grade; bonds rated “BB”, “Ba”, or below are considered non-investment grade. The sources for bond quality ratings are Moody’s Investors Service, Standard & Poor’s and Fitch, Inc. and are applied using the following hierarchy: If all three agencies provide a rating, the middle rating (after dropping the highest and lowest ratings) is assigned; if two of the three agencies rate a security, the lower of the two is assigned. Ratings are shown in the S&P and Fitch scale (e.g., AAA). For securities which are not rated by any of the three agencies, the security is considered Not Rated. |
The views expressed in this report are those of the portfolio manager only through the end of the period of the report as stated on the cover and do not necessarily reflect the views of MFS or any other person in the MFS organization. These views are subject to change at any time based on market or other conditions, and MFS disclaims any responsibility to update such views. These views may not be relied upon as investment advice or an indication of trading intent on behalf of any MFS portfolio. References to specific securities are not recommendations of such securities, and may not be representative of any MFS portfolio’s current or future investments.
5
Table of Contents
PERFORMANCE SUMMARY THROUGH 3/31/13
The following charts illustrate a representative class of each fund’s historical performance in comparison to its benchmark(s). Performance results include the deduction of the maximum applicable sales charge and reflect the percentage change in net asset value, including reinvestment of dividends and capital gains distributions. Each fund's results have been compared to the Barclays Municipal Bond Index, a market capitalization-weighted index that measures the performance of the tax-exempt bond market. However, while this index is considered the benchmark for the performance of municipal bond funds, it is comprised of municipal bonds issued nationwide, while each of the funds is limited to investing primarily in the bonds of a particular state. The performance of other share classes will be greater than or less than that of the class depicted below. Benchmarks are unmanaged and may not be invested in directly. Benchmark returns do not reflect sales charges, commissions or expenses. (See Notes to Performance Summary.)
Performance data shown represents past performance and is no guarantee of future results. Investment return and principal value fluctuate so your shares, when sold, may be worth more or less than the original cost; current performance may be lower or higher than quoted. The performance shown does not reflect the deduction of taxes, if any, that a shareholder would pay on fund distributions or the redemption of fund shares.
MFS Alabama Municipal Bond Fund
Growth of a Hypothetical $10,000 Investment
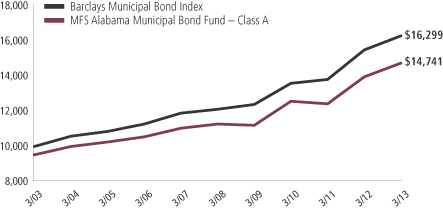
Total Returns through 3/31/13
Average annual without sales charge
| Share Class | Class inception date | 1-yr | 5-yr | 10-yr | ||||||||
| A | 2/01/90 | 5.63% | 5.51% | 4.46% | ||||||||
| B | 9/07/93 | 4.85% | 4.73% | 3.69% | ||||||||
| Comparative benchmark | ||||||||||||
| Barclays Municipal Bond Index (f) | 5.25% | 6.10% | 5.01% | |||||||||
| Average annual with sales charge | ||||||||||||
A With Initial Sales Charge (4.75%) | 0.62% | 4.49% | 3.96% | |||||||||
B With CDSC (Declining over six years from 4% to 0%) (x) | 0.85% | 4.39% | 3.69% | |||||||||
CDSC – Contingent Deferred Sales Charge.
| (f) | Source: FactSet Research Systems Inc. |
| (x) | Assuming redemption at the end of the applicable period. |
6
Table of Contents
Performance Summary – continued
MFS Arkansas Municipal Bond Fund
Growth of a Hypothetical $10,000 Investment
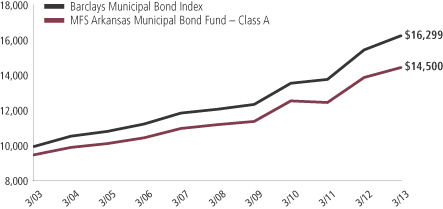
Total Returns through 3/31/13
Average annual without sales charge
| Share Class | Class inception date | 1-yr | 5-yr | 10-yr | ||||||||
| A | 2/03/92 | 4.10% | 5.22% | 4.29% | ||||||||
| B | 9/07/93 | 3.29% | 4.39% | 3.48% | ||||||||
| Comparative benchmark | ||||||||||||
| Barclays Municipal Bond Index (f) | 5.25% | 6.10% | 5.01% | |||||||||
| Average annual with sales charge | ||||||||||||
A With Initial Sales Charge (4.75%) | (0.84)% | 4.20% | 3.79% | |||||||||
B With CDSC (Declining over six years from 4% to 0%) (x) | (0.71)% | 4.05% | 3.48% | |||||||||
CDSC – Contingent Deferred Sales Charge.
| (f) | Source: FactSet Research Systems Inc. |
| (x) | Assuming redemption at the end of the applicable period. |
7
Table of Contents
Performance Summary – continued
MFS California Municipal Bond Fund
Growth of a Hypothetical $10,000 Investment
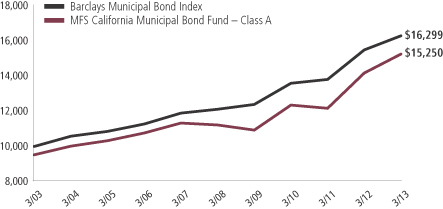
Total Returns through 3/31/13
Average annual without sales charge
| Share Class | Class inception date | 1-yr | 5-yr | 10-yr | ||||||||
| A | 6/18/85 | 7.59% | 6.32% | 4.82% | ||||||||
| B | 9/07/93 | 6.75% | 5.52% | 4.02% | ||||||||
| C | 1/03/94 | 6.60% | 5.35% | 3.87% | ||||||||
| Comparative benchmark | ||||||||||||
| Barclays Municipal Bond Index (f) | 5.25% | 6.10% | 5.01% | |||||||||
| Average annual with sales charge | ||||||||||||
A With Initial Sales Charge (4.75%) | 2.48% | 5.29% | 4.31% | |||||||||
B With CDSC (Declining over six years from 4% to 0%) (x) | 2.75% | 5.19% | 4.02% | |||||||||
C With CDSC (1% for 12 months) (x) | 5.60% | 5.35% | 3.87% | |||||||||
CDSC – Contingent Deferred Sales Charge.
| (f) | Source: FactSet Research Systems Inc. |
| (x) | Assuming redemption at the end of the applicable period. |
8
Table of Contents
Performance Summary – continued
MFS Georgia Municipal Bond Fund
Growth of a Hypothetical $10,000 Investment

Total Returns through 3/31/13
Average annual without sales charge
| Share Class | Class inception date | 1-yr | 5-yr | 10-yr | ||||||||
| A | 6/06/88 | 5.38% | 5.53% | 4.43% | ||||||||
| B | 9/07/93 | 4.57% | 4.73% | 3.67% | ||||||||
| Comparative benchmark | ||||||||||||
| Barclays Municipal Bond Index (f) | 5.25% | 6.10% | 5.01% | |||||||||
| Average annual with sales charge | ||||||||||||
A With Initial Sales Charge (4.75%) | 0.38% | 4.51% | 3.92% | |||||||||
B With CDSC (Declining over six years from 4% to 0%) (x) | 0.57% | 4.39% | 3.67% | |||||||||
CDSC – Contingent Deferred Sales Charge.
| (f) | Source: FactSet Research Systems Inc. |
| (x) | Assuming redemption at the end of the applicable period. |
9
Table of Contents
Performance Summary – continued
MFS Maryland Municipal Bond Fund
Growth of a Hypothetical $10,000 Investment

Total Returns through 3/31/13
Average annual without sales charge
| Share Class | Class inception date | 1-yr | 5-yr | 10-yr | ||||||||
| A | 10/31/84 | 4.86% | 5.51% | 4.28% | ||||||||
| B | 9/07/93 | 4.17% | 4.74% | 3.57% | ||||||||
| Comparative benchmark | ||||||||||||
| Barclays Municipal Bond Index (f) | 5.25% | 6.10% | 5.01% | |||||||||
| Average annual with sales charge | ||||||||||||
A With Initial Sales Charge (4.75%) | (0.13)% | 4.48% | 3.77% | |||||||||
B With CDSC (Declining over six years from 4% to 0%) (x) | 0.17% | 4.41% | 3.57% | |||||||||
CDSC – Contingent Deferred Sales Charge.
| (f) | Source: FactSet Research Systems Inc. |
| (x) | Assuming redemption at the end of the applicable period. |
10
Table of Contents
Performance Summary – continued
MFS Massachusetts Municipal Bond Fund
Growth of a Hypothetical $10,000 Investment
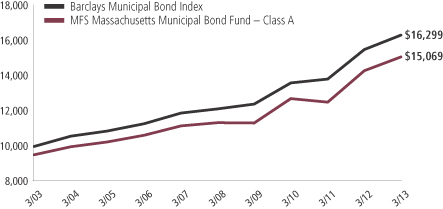
Total Returns through 3/31/13
Average annual without sales charge
| Share Class | Class inception date | 1-yr | 5-yr | 10-yr | ||||||||
| A | 4/09/85 | 5.48% | 5.85% | 4.69% | ||||||||
| B | 9/07/93 | 4.69% | 5.08% | 3.97% | ||||||||
| Comparative benchmark | ||||||||||||
| Barclays Municipal Bond Index (f) | 5.25% | 6.10% | 5.01% | |||||||||
| Average annual with sales charge | ||||||||||||
A With Initial Sales Charge (4.75%) | 0.47% | 4.83% | 4.19% | |||||||||
B With CDSC (Declining over six years from 4% to 0%) (x) | 0.69% | 4.75% | 3.97% | |||||||||
CDSC – Contingent Deferred Sales Charge.
| (f) | Source: FactSet Research Systems Inc. |
| (x) | Assuming redemption at the end of the applicable period. |
Benchmark Definition
Barclays Municipal Bond Index – a market capitalization-weighted index that measures the performance of the tax-exempt bond market.
It is not possible to invest directly in an index.
Notes to Performance Summary
Average annual total return represents the average annual change in value for each share class for the periods presented.
Performance results reflect any applicable expense subsidies and waivers in effect during the periods shown. Without such subsidies and waivers each fund’s performance results would be less favorable. Please see the prospectus and financial statements for complete details.
Performance results do not include adjustments made for financial reporting purposes in accordance with U.S. generally accepted accounting principles and may differ from amounts reported in the financial highlights.
A portion of income may be subject to state, federal, and/or alternative minimum tax. Capital gains, if any, are subject to a capital gains tax.
From time to time the funds may receive proceeds from litigation settlements, without which performance would be lower.
11
Table of Contents
Fund expenses borne by the shareholders during the period, October 1, 2012 through March 31, 2013
As a shareholder of the funds, you incur two types of costs: (1) transaction costs, including sales charges (loads) on certain purchase or redemption payments, and (2) ongoing costs, including management fees; distribution and service (12b-1) fees; and other fund expenses. These examples are intended to help you understand your ongoing costs (in dollars) of investing in the funds and to compare these costs with the ongoing costs of investing in other mutual funds.
These examples are based on an investment of $1,000 invested at the beginning of the period and held for the entire period October 1, 2012 through March 31, 2013.
Actual expenses
The first line for each share class in the following tables provides information about actual account values and actual expenses. You may use the information in this line, together with the amount you invested, to estimate the expenses that you paid over the period. Simply divide your account value by $1,000 (for example, an $8,600 account value divided by $1,000 = 8.6), then multiply the result by the number in the first line under the heading entitled “Expenses Paid During Period” to estimate the expenses you paid on your account during this period.
Hypothetical example for comparison purposes
The second line for each share class in the following tables provides information about hypothetical account values and hypothetical expenses based on each fund’s actual expense ratio and an assumed rate of return of 5% per year before expenses, which is not each fund’s actual return. The hypothetical account values and expenses may not be used to estimate the actual ending account balance or expenses you paid for the period. You may use this information to compare the ongoing costs of investing in each fund and other funds. To do so, compare this 5% hypothetical example with the 5% hypothetical examples that appear in the shareholder reports of the other funds.
Please note that the expenses shown in the tables are meant to highlight your ongoing costs only and do not reflect any transactional costs, such as sales charges (loads). Therefore, the second line for each share class in the tables is useful in comparing ongoing costs only, and will not help you determine the relative total costs of owning different funds. In addition, if these transactional costs were included, your costs would have been higher.
MFS ALABAMA MUNICIPAL BOND FUND
| Share Class | Annualized Expense Ratio | Beginning Account Value 10/01/12 | Ending Account Value 3/31/13 | Expenses Paid During Period (p) 10/01/12-3/31/13 | ||||||||||||||
| A | Actual | 0.93% | $1,000.00 | $1,007.82 | $4.66 | |||||||||||||
| Hypothetical (h) | 0.93% | $1,000.00 | $1,020.29 | $4.68 | ||||||||||||||
| B | Actual | 1.68% | $1,000.00 | $1,004.07 | $8.39 | |||||||||||||
| Hypothetical (h) | 1.68% | $1,000.00 | $1,016.55 | $8.45 | ||||||||||||||
MFS ARKANSAS MUNICIPAL BOND FUND
| Share Class | Annualized Expense Ratio | Beginning Account Value 10/01/12 | Ending Account Value 3/31/13 | Expenses Paid During Period (p) 10/01/12-3/31/13 | ||||||||||||||
| A | Actual | 0.72% | $1,000.00 | $1,003.97 | $3.60 | |||||||||||||
| Hypothetical (h) | 0.72% | $1,000.00 | $1,021.34 | $3.63 | ||||||||||||||
| B | Actual | 1.52% | $1,000.00 | $999.99 | $7.58 | |||||||||||||
| Hypothetical (h) | 1.52% | $1,000.00 | $1,017.35 | $7.64 | ||||||||||||||
| (h) | 5% class return per year before expenses. |
| (p) | Expenses paid are equal to each class’s annualized expense ratio, as shown above, multiplied by the average account value over the period, multiplied by the number of days in the period, divided by the number of days in the year. Expenses paid do not include any applicable sales charges (loads). If these transaction costs had been included, your costs would have been higher. |
12
Table of Contents
Expense Tables – continued
MFS CALIFORNIA MUNICIPAL BOND FUND
| Share Class | Annualized Expense Ratio | Beginning Account Value 10/01/12 | Ending Account Value 3/31/13 | Expenses Paid During Period (p) 10/01/12-3/31/13 | ||||||||||||||
| A | Actual | 0.70% | $1,000.00 | $1,020.32 | $3.53 | |||||||||||||
| Hypothetical (h) | 0.70% | $1,000.00 | $1,021.44 | $3.53 | ||||||||||||||
| B | Actual | 1.48% | $1,000.00 | $1,016.37 | $7.44 | |||||||||||||
| Hypothetical (h) | 1.48% | $1,000.00 | $1,017.55 | $7.44 | ||||||||||||||
| C | Actual | 1.60% | $1,000.00 | $1,015.69 | $8.04 | |||||||||||||
| Hypothetical (h) | 1.60% | $1,000.00 | $1,016.95 | $8.05 | ||||||||||||||
MFS GEORGIA MUNICIPAL BOND FUND
| Share Class | Annualized Expense Ratio | Beginning Account Value 10/01/12 | Ending Account Value 3/31/13 | Expenses Paid During Period (p) 10/01/12-3/31/13 | ||||||||||||||
| A | Actual | 0.95% | $1,000.00 | $1,005.16 | $4.75 | |||||||||||||
| Hypothetical (h) | 0.95% | $1,000.00 | $1,020.19 | $4.78 | ||||||||||||||
| B | Actual | 1.70% | $1,000.00 | $1,000.51 | $8.48 | |||||||||||||
| Hypothetical (h) | 1.70% | $1,000.00 | $1,016.45 | $8.55 | ||||||||||||||
MFS MARYLAND MUNICIPAL BOND FUND
| Share Class | Annualized Expense Ratio | Beginning Account Value 10/01/12 | Ending Account Value 3/31/13 | Expenses Paid During Period (p) 10/01/12-3/31/13 | ||||||||||||||
| A | Actual | 0.92% | $1,000.00 | $1,005.77 | $4.60 | |||||||||||||
| Hypothetical (h) | 0.92% | $1,000.00 | $1,020.34 | $4.63 | ||||||||||||||
| B | Actual | 1.67% | $1,000.00 | $1,002.03 | $8.34 | |||||||||||||
| Hypothetical (h) | 1.67% | $1,000.00 | $1,016.60 | $8.40 | ||||||||||||||
MFS MASSACHUSETTS MUNICIPAL BOND FUND
| Share Class | Annualized Expense Ratio | Beginning Account Value 10/01/12 | Ending Account Value 3/31/13 | Expenses Paid During Period (p) 10/01/12-3/31/13 | ||||||||||||||
| A | Actual | 0.83% | $1,000.00 | $1,005.79 | $4.15 | |||||||||||||
| Hypothetical (h) | 0.83% | $1,000.00 | $1,020.79 | $4.18 | ||||||||||||||
| B | Actual | 1.58% | $1,000.00 | $1,002.04 | $7.89 | |||||||||||||
| Hypothetical (h) | 1.58% | $1,000.00 | $1,017.05 | $7.95 | ||||||||||||||
| (h) | 5% class return per year before expenses. |
| (p) | Expenses paid are equal to each class’s annualized expense ratio, as shown above, multiplied by the average account value over the period, multiplied by the number of days in the period, divided by the number of days in the year. Expenses paid do not include any applicable sales charges (loads). If these transaction costs had been included, your costs would have been higher. |
13
Table of Contents
3/31/13
MFS ALABAMA MUNICIPAL BOND FUND
The Portfolio of Investments is a complete list of all securities owned by your fund. It is categorized by broad-based asset classes.
| Municipal Bonds - 96.9% | ||||||||
| Issuer | Shares/Par | Value ($) | ||||||
| Airport Revenue - 1.6% | ||||||||
| Birmingham, AL, Airport Authority Rev., AGM, 5.25%, 2030 | $ | 1,000,000 | $ | 1,144,080 | ||||
| General Obligations - General Purpose - 9.0% | ||||||||
| Auburn, AL, Sewer Rev., “H”, 5.625%, 2033 | $ | 1,000,000 | $ | 1,198,410 | ||||
| Boaz, AL, School Warrants, “A”, SYNCORA, 5%, 2029 | 650,000 | 687,661 | ||||||
| Commonwealth of Puerto Rico, “A”, 5.375%, 2033 | 180,000 | 179,435 | ||||||
| Commonwealth of Puerto Rico, “A”, 6%, 2038 | 305,000 | 309,755 | ||||||
| Enterprise, AL, School Warrants, ASSD GTY, 5%, 2029 | 250,000 | 269,728 | ||||||
| Huntsville, AL, Capital Improvement Warrants, “A”, 5%, 2024 | 215,000 | 261,913 | ||||||
| Huntsville, AL, Capital Improvement Warrants, “A”, 5%, 2025 | 1,000,000 | 1,208,790 | ||||||
| Madison, AL, Refunding Warrants, 5.15%, 2039 | 1,000,000 | 1,091,770 | ||||||
| Puerto Rico Public Buildings Authority Rev., Guaranteed (Government Facilities), “I”, 5.25%, 2033 | 310,000 | 300,579 | ||||||
| Puerto Rico Public Buildings Authority Rev., Guaranteed, “S”, 6%, 2041 | 285,000 | 289,036 | ||||||
| State of California, 6%, 2039 | 550,000 | 657,970 | ||||||
| $ | 6,455,047 | |||||||
| General Obligations - Improvement - 2.6% | ||||||||
| Birmingham, AL, “A”, AMBAC, 4.5%, 2032 | $ | 890,000 | $ | 956,723 | ||||
| Guam Government, “A”, 6.75%, 2029 | 260,000 | 290,776 | ||||||
| Guam Government, “A”, 7%, 2039 | 60,000 | 66,899 | ||||||
| Montgomery County, AL, Warrants, SYNCORA, 5%, 2028 | 500,000 | 561,165 | ||||||
| $ | 1,875,563 | |||||||
| General Obligations - Schools - 11.3% | ||||||||
| Clovis, CA, Unified School District (Election of 2004), Capital Appreciation, “A”, 0%, 2027 | $ | 685,000 | $ | 385,655 | ||||
| Florence, AL, Board of Education, Tax Anticipation School Warrants, 4%, 2025 | 750,000 | 828,000 | ||||||
| Huntsville, AL, School Warrants, “B”, 5%, 2029 | 500,000 | 582,980 | ||||||
| Jefferson County, AL, School Warrants, AGM, 5.5%, 2020 | 1,750,000 | 1,750,333 | ||||||
| Lee County, AL, School Warrants, ASSD GTY, 4.75%, 2029 | 880,000 | 983,074 | ||||||
| Madison County, AL, Board of Education, ASSD GTY, 5.125%, 2034 | 1,000,000 | 1,092,320 | ||||||
| Shelby County, AL, Board of Education Capital Outlay School Warrants (Ten Mill County Tax), 5%, 2024 | 750,000 | 880,778 | ||||||
| Shelby County, AL, Board of Education Capital Outlay School Warrants (Ten Mill County Tax), 5%, 2031 | 500,000 | 564,075 | ||||||
| Sumter County, AL, School Warrants, 5.2%, 2039 | 1,000,000 | 1,053,800 | ||||||
| $ | 8,121,015 | |||||||
| Issuer | Shares/Par | Value ($) | ||||||
| Healthcare Revenue - Hospitals - 19.4% | ||||||||
| Alabama Special Care Facilities Financing Authority (Ascension Health Senior Credit), “C-2”, 5%, 2036 | $ | 750,000 | $ | 825,630 | ||||
| Alabama Special Care Facilities Financing Authority (Daughters of Charity), ETM, AMBAC, 5%, 2025 (c) | 1,500,000 | 1,504,020 | ||||||
| Alabama Special Care Facilities Financing Authority Rev. (Ascension Health), BHAC, 5%, 2039 | 750,000 | 826,177 | ||||||
| Alexander City, AL, Special Care Facilities Financing Authority Medical Facilities Rev., “A” (Russell Hospital Corp.), 5.75%, 2036 | 500,000 | 514,385 | ||||||
| Arizona Health Facilities Authority Rev. (Banner Health), “A”, 4%, 2043 | 235,000 | 228,606 | ||||||
| Birmingham, AL, Special Care Facilities Financing Authority Health Care Rev. (Children’s Hospital), ASSD GTY, 6%, 2039 | 750,000 | 854,400 | ||||||
| Brazoria County, TX, Health Facilities Development Corp., Hospital Rev. (Brazosport Regional Health System), 5.25%, 2032 | 165,000 | 171,478 | ||||||
| Cullman County, AL, Health Care Authority (Cullman Regional Medical Center), “A”, 7%, 2036 | 300,000 | 326,664 | ||||||
| East Alabama Health Care Authority, Health Care Facilities Rev., 5.25%, 2036 (b) | 1,000,000 | 1,140,520 | ||||||
| East Alabama Health Care Authority, Health Care Facilities Rev., “A”, 5%, 2027 | 1,000,000 | 1,072,760 | ||||||
| Escambia County, FL, Health Facilities Authority (Baptist Hospital, Inc.), “A”, 6%, 2036 | 435,000 | 500,794 | ||||||
| Health Care Authority for Baptist Health, AL, “D”, 5%, 2021 | 875,000 | 922,539 | ||||||
| Huntsville, AL, Health Care Authority Rev., “A”, 5%, 2030 | 1,000,000 | 1,057,850 | ||||||
| Illinois Finance Authority Rev. (Silver Cross Hospital & Medical Centers), 7%, 2044 | 255,000 | 303,924 | ||||||
| Louisville & Jefferson County, KY, Metropolitan Government Healthcare Systems Rev. (Norton Healthcare, Inc.), 5.25%, 2036 | 265,000 | 279,951 | ||||||
| Martin County, FL, Health Facilities Authority Rev. (Martin Memorial Medical Center), 5.5%, 2042 | 105,000 | 116,460 | ||||||
| Mobile, AL, Special Care Facilities Financing Authority Rev. (Infirmary Health System, Inc.), “A”, 5.25%, 2030 | 500,000 | 526,605 | ||||||
| Montgomery, AL, Medical Clinic Board Health Care Facility Rev. (Jackson Hospital & Clinic), 5.25%, 2031 | 500,000 | 517,275 | ||||||
| New Hampshire Business Finance Authority Rev. (Elliot Hospital Obligated Group), “A”, 6%, 2027 | 370,000 | 429,141 | ||||||
| University of Alabama at Birmingham, AL, Hospital Rev., “A”, 5.25%, 2025 | 500,000 | 570,260 | ||||||
| Wisconsin Health & Educational Facilities Authority Rev. (Mercy Alliance), 5%, 2039 | 220,000 | 234,984 | ||||||
14
Table of Contents
Portfolio of Investments – continued
| Municipal Bonds - continued | ||||||||
| Issuer | Shares/Par | Value ($) | ||||||
| Healthcare Revenue - Hospitals - continued | ||||||||
| Wisconsin Health & Educational Facilities Authority Rev. (ProHealth Care, Inc. Obligated Group), 6.625%, 2039 | $ | 505,000 | $ | 585,982 | ||||
| Wisconsin Health & Educational Facilities Authority Rev. (Wheaton Franciscan Healthcare), 5.25%, 2031 | 340,000 | 363,637 | ||||||
| $ | 13,874,042 | |||||||
| Healthcare Revenue - Long Term Care - 1.1% | ||||||||
| Pell City, AL, Special Care Facilities, Financing Authority Rev. (Noland Health Services, Inc.), 5%, 2039 | $ | 750,000 | $ | 791,475 | ||||
| Industrial Revenue - Paper - 2.6% | ||||||||
| Butler, AL, Industrial Development Board, Solid Waste Disposal Rev. (Georgia-Pacific Corp.), 5.75%, 2028 | $ | 200,000 | $ | 210,438 | ||||
| Camden, AL, Industrial Development Board Exempt Facilities Rev., “B” (Weyerhaeuser Co.), 6.375%, 2013 (c) | 500,000 | 519,085 | ||||||
| Phenix City, AL, Industrial Development Board Environmental Improvement Rev. (MeadWestvaco Coated Board Project), “A”, 4.125%, 2035 | 500,000 | 481,350 | ||||||
| Selma, AL, Industrial Development Board Rev., Gulf Opportunity Zone (International Paper Co.), “A”, 6.25%, 2033 | 250,000 | 283,478 | ||||||
| Selma, AL, Industrial Development Board Rev., Gulf Opportunity Zone (International Paper Co.), “A”, 5.375%, 2035 | 300,000 | 331,083 | ||||||
| $ | 1,825,434 | |||||||
| Multi-Family Housing Revenue - 0.9% | ||||||||
| Alabama Housing Finance Authority, Multi-Family Residential Development Rev., FHA, 7.25%, 2023 | $ | 670,000 | $ | 670,482 | ||||
| Port Revenue - 0.8% | ||||||||
| Alabama Port Authority Docks Facility, 6%, 2040 | $ | 500,000 | $ | 594,135 | ||||
| Sales & Excise Tax Revenue - 3.1% | ||||||||
| Baldwin County, AL, Board of Education, Capital Outlay, School Warrants, AMBAC, 5%, 2029 | $ | 1,000,000 | $ | 1,054,670 | ||||
| Colorado Regional Transportation District, Private Activity Rev. (Denver Transportation Partners), 6%, 2041 | 325,000 | 372,544 | ||||||
| Guam Government Business Privilege Tax Rev., “B-1”, 5%, 2037 | 120,000 | 131,088 | ||||||
| Massachusetts Bay Transportation Authority, Sales Tax Rev., “A”, 5%, 2031 | 515,000 | 636,669 | ||||||
| $ | 2,194,971 | |||||||
| Single Family Housing - State - 0.8% | ||||||||
| Alabama Housing Finance Authority, Single Family Mortgage Rev., “B”, GNMA, 5.375%, 2033 | $ | 505,000 | $ | 536,623 | ||||
| Issuer | Shares/Par | Value ($) | ||||||
| State & Local Agencies - 6.6% | ||||||||
| Alabama Incentives Financing Authority Special Obligation, “A”, 5%, 2029 | $ | 1,000,000 | $ | 1,124,520 | ||||
| Alabama Public School & College Authority Rev., “A”, 5%, 2019 | 1,000,000 | 1,220,770 | ||||||
| Alabama Public School & College Authority Rev., “A”, 5%, 2019 (c) | 1,000,000 | 1,228,010 | ||||||
| Anniston, AL, Public Building Authority Rev. (Judicial Center Project), AGM, 5%, 2032 | 500,000 | 566,560 | ||||||
| Bessemer, AL, Public Educational Building Authority Rev. (DHR Building Project), “A”, ASSD GTY, 5%, 2030 | 385,000 | 433,983 | ||||||
| Los Angeles, CA, Municipal Improvement Corp. Lease Rev. (Real Property), “E”, 6%, 2039 | 145,000 | 172,428 | ||||||
| $ | 4,746,271 | |||||||
| Tax - Other - 1.6% | ||||||||
| Guam Government Ltd. Obligation Rev., “A”, 5.375%, 2024 | $ | 95,000 | $ | 103,786 | ||||
| Guam Government Ltd. Obligation Rev., “A”, 5.625%, 2029 | 30,000 | 32,733 | ||||||
| New Jersey Economic Development Authority Rev., 5%, 2025 | 70,000 | 79,850 | ||||||
| New Jersey Economic Development Authority Rev., 5%, 2026 | 35,000 | 39,657 | ||||||
| New Jersey Economic Development Authority Rev., 5%, 2028 | 15,000 | 16,781 | ||||||
| New Jersey Economic Development Authority Rev., 5%, 2029 | 15,000 | 16,706 | ||||||
| Virgin Islands Public Finance Authority Rev., “A-1”, 5%, 2029 | 65,000 | 70,620 | ||||||
| Virgin Islands Public Finance Authority Rev., “B”, 5%, 2025 | 65,000 | 71,731 | ||||||
| Virgin Islands Public Finance Authority Rev., Matching Fund Loan Note, “A”, 5%, 2029 | 400,000 | 437,872 | ||||||
| Virgin Islands Public Finance Authority Rev., Matching Fund Loan Note, “A”, 6%, 2039 | 235,000 | 259,668 | ||||||
| $ | 1,129,404 | |||||||
| Toll Roads - 0.8% | ||||||||
| Triborough Bridge & Tunnel Authority Rev., NY, Capital Appreciation ,“A”, 0%, 2029 | $ | 280,000 | $ | 148,579 | ||||
| Virginia Small Business Financing Authority Rev. (Elizabeth River Crossings Opco LLC Project), 5.25%, 2032 | 70,000 | 74,859 | ||||||
| Virginia Small Business Financing Authority Rev. (Elizabeth River Crossings Opco LLC Project), 6%, 2037 | 110,000 | 125,666 | ||||||
| Virginia Small Business Financing Authority Rev. (Elizabeth River Crossings Opco LLC Project), 5.5%, 2042 | 180,000 | 193,336 | ||||||
| $ | 542,440 | |||||||
| Universities - Colleges - 14.5% | ||||||||
| Alabama State University Board of Education Rev. (Chattahoochee Valley Community College), ASSD GTY, 5%, 2034 | $ | 1,300,000 | $ | 1,407,926 | ||||
15
Table of Contents
Portfolio of Investments – continued
| Municipal Bonds - continued | ||||||||
| Issuer | Shares/Par | Value ($) | ||||||
| Universities - Colleges - continued | ||||||||
| Alabama State University Rev., General Tuition & Fee, ASSD GTY, 5.75%, 2039 | $ | 1,000,000 | $ | 1,138,640 | ||||
| Auburn University, General Fee Rev., AMBAC, 5%, 2029 | 1,000,000 | 1,054,670 | ||||||
| Auburn University, General Fee Rev., “A”, 5%, 2019 | 500,000 | 608,525 | ||||||
| Florida Higher Educational Facilities, Financial Authority Rev. (University of Tampa Project), “A”, 5%, 2032 | 10,000 | 10,875 | ||||||
| Florida Higher Educational Facilities, Financial Authority Rev. (University of Tampa Project), “A”, 5.25%, 2042 | 70,000 | 76,777 | ||||||
| Illinois Finance Authority Rev. (Roosevelt University Project), 6.5%, 2039 | 550,000 | 622,919 | ||||||
| Jacksonville State University, Tuition & Fee Rev., ASSD GTY, 5.125%, 2038 | 1,000,000 | 1,076,900 | ||||||
| University of Alabama (Huntsville), General Fee Rev., “A2”, 4%, 2026 | 890,000 | 967,964 | ||||||
| University of Alabama, General Rev., NATL, 5%, 2034 | 1,000,000 | 1,045,380 | ||||||
| University of Alabama, General Rev., “A”, NATL, 5%, 2029 | 1,000,000 | 1,047,290 | ||||||
| University of South Alabama, University Rev., AMBAC, 5%, 2029 | 1,000,000 | 1,122,690 | ||||||
| University of South Alabama, University Rev., BHAC, 5%, 2038 | 150,000 | 161,978 | ||||||
| $ | 10,342,534 | |||||||
| Universities - Dormitories - 0.0% | ||||||||
| Oregon Facilities Authority, Student Housing Rev. (Southern Oregon University), ASSD GTY, 5%, 2044 | $ | 20,000 | $ | 21,774 | ||||
| Universities - Secondary Schools - 0.3% | ||||||||
| La Vernia, TX, Higher Education Finance Corp. Rev. (Lifeschool of Dallas), “A”, 7.5%, 2041 | $ | 190,000 | $ | 223,432 | ||||
| Utilities - Investor Owned - 0.1% | ||||||||
| Michigan Strategic Fund Ltd. Obligation Rev. (Detroit Edison Co.), 5.5%, 2029 (b) | $ | 70,000 | $ | 79,863 | ||||
| Utilities - Municipal Owned - 5.8% | ||||||||
| Alabama Municipal Electric Power Authority, “A”, NATL, 5%, 2023 | $ | 1,000,000 | $ | 1,019,860 | ||||
| Chatom, AL, Industrial Development Board Gulf Opportunity Zone (PowerSouth Energy), “A”, ASSD GTY, 5%, 2037 | 1,000,000 | 1,103,650 | ||||||
| Foley, AL, Utilities Board Utilities Rev., AGM, 5%, 2025 | 1,000,000 | 1,118,120 | ||||||
| Issuer | Shares/Par | Value ($) | ||||||
| Utilities - Municipal Owned - continued | ||||||||
| Long Island, NY, Power Authority, Electric Systems Rev., “A”, 6%, 2033 | $ | 130,000 | $ | 155,100 | ||||
| Tuskegee, AL, Utilities Board, Utility Rev., 4.5%, 2037 | 750,000 | 782,730 | ||||||
| $ | 4,179,460 | |||||||
| Utilities - Other - 1.5% | ||||||||
| Nebraska Central Plains Energy Project, Gas Project Rev., “3”, 5%, 2032 | $ | 305,000 | $ | 339,078 | ||||
| Salt Verde Financial Corp., AZ, Senior Gas Rev., 5%, 2037 | 155,000 | 172,903 | ||||||
| Tennessee Energy Acquisition Corp., Gas Rev., “A”, 5.25%, 2019 | 295,000 | 341,451 | ||||||
| Texas Gas Acquisition & Supply Corp III., Gas Supply Rev., 5%, 2027 | 205,000 | 222,021 | ||||||
| $ | 1,075,453 | |||||||
| Water & Sewer Utility Revenue - 12.5% | ||||||||
| Alabaster, AL, Sewer Rev., NATL, 5%, 2029 | $ | 750,000 | $ | 758,557 | ||||
| Bessemer, AL, Governmental Utilities Services Corp. Water Supply Rev., ASSD GTY, 5%, 2039 | 1,000,000 | 1,058,760 | ||||||
| Birmingham, AL, Waterworks & Sewer Board Rev., “A”, AGM, 4.5%, 2035 | 400,000 | 421,188 | ||||||
| Birmingham, AL, Waterworks Board Water Rev., “A”, ASSD GTY, 5.125%, 2034 | 750,000 | 824,760 | ||||||
| Commonwealth of Puerto Rico Aqueduct & Sewer Authority Rev., “A”, 6%, 2044 | 2,000,000 | 2,009,580 | ||||||
| Cullman, AL, Utilities Board Water Rev., AGM, 5%, 2026 | 500,000 | 574,230 | ||||||
| Montgomery, AL, Waterworks & Sanitary Sewer Board Rev., AGM, 5%, 2015 (c) | 1,000,000 | 1,089,500 | ||||||
| Scottsboro, AL, Waterworks Sewer & Gas Board Rev., 5%, 2032 | 1,000,000 | 1,110,040 | ||||||
| Tuscumbia, AL, Water & Sewer Rev., AGM, 4.5%, 2040 | 1,000,000 | 1,068,700 | ||||||
| $ | 8,915,315 | |||||||
Total Municipal Bonds (Identified Cost, $64,022,934) | $ | 69,338,813 | ||||||
| Money Market Funds - 2.1% | ||||||||
| MFS Institutional Money Market Portfolio, 0.14%, at Cost and Net Asset Value (v) | 1,531,701 | $ | 1,531,701 | |||||
Total Investments (Identified Cost, $65,554,635) | $ | 70,870,514 | ||||||
| Other Assets, Less Liabilities - 1.0% | 694,512 | |||||||
| Net Assets - 100.0% | $ | 71,565,026 | ||||||
See Portfolio Footnotes and Notes to Financial Statements
16
Table of Contents
PORTFOLIO OF INVESTMENTS
3/31/13
MFS ARKANSAS MUNICIPAL BOND FUND
The Portfolio of Investments is a complete list of all securities owned by your fund. It is categorized by broad-based asset classes.
| Municipal Bonds - 97.0% | ||||||||
| Issuer | Shares/Par | Value ($) | ||||||
| Airport Revenue - 0.2% | ||||||||
| Denver, CO, City & County Airport Systems Rev., “A”, 5%, 2027 | $ | 135,000 | $ | 152,586 | ||||
| Denver, CO, City & County Airport Systems Rev., “A”, 5%, 2028 | 130,000 | 146,254 | ||||||
| Denver, CO, City & County Airport Systems Rev., “B”, 5%, 2032 | 260,000 | 294,554 | ||||||
| $ | 593,394 | |||||||
| General Obligations - General Purpose - 6.0% | ||||||||
| Arkansas College Savings, Capital Appreciation, “A”, ETM, 0%, 2017 (c) | $ | 1,840,000 | $ | 1,773,981 | ||||
| Arkansas Federal Highway Grant Anticipation & Tax Rev., 5%, 2021 | 2,000,000 | 2,501,580 | ||||||
| Commonwealth of Puerto Rico, “A”, 5.5%, 2015 | 2,015,000 | 2,136,081 | ||||||
| Commonwealth of Puerto Rico, “A”, 5.25%, 2027 | 920,000 | 919,926 | ||||||
| Commonwealth of Puerto Rico, Public Improvement, “B”, 6.5%, 2037 | 2,000,000 | 2,093,540 | ||||||
| Puerto Rico Public Buildings Authority Rev. (State Office Building), “F”, SYNCORA, 5.25%, 2025 | 2,000,000 | 2,005,200 | ||||||
| Puerto Rico Public Buildings Authority Rev., Guaranteed, “M”, 6.25%, 2031 | 420,000 | 460,543 | ||||||
| Puerto Rico Public Buildings Authority Rev., Guaranteed, “Q”, 5.625%, 2039 | 1,255,000 | 1,243,831 | ||||||
| State of California, 6%, 2039 | 1,160,000 | 1,387,720 | ||||||
| $ | 14,522,402 | |||||||
| General Obligations - Improvement - 0.4% | ||||||||
| Guam Government, “A”, 6.75%, 2029 | $ | 515,000 | $ | 575,961 | ||||
| Guam Government, “A”, 5.25%, 2037 | 255,000 | 257,063 | ||||||
| Guam Government, “A”, 7%, 2039 | 65,000 | 72,474 | ||||||
| $ | 905,498 | |||||||
| General Obligations - Schools - 12.3% | ||||||||
| Arkansas College Savings, Capital Appreciation, “B”, ETM, 0%, 2013 (c) | $ | 1,000,000 | $ | 999,500 | ||||
| Arkansas College Savings, Capital Appreciation, “B”, ETM, 0%, 2014 (c) | 1,150,000 | 1,144,940 | ||||||
| Arkansas College Savings, Capital Appreciation, “B”, ETM, 0%, 2015 (c) | 1,100,000 | 1,087,251 | ||||||
| Benton, AR, School District No. 8, 4.85%, 2040 | 1,895,000 | 1,923,785 | ||||||
| Bentonville, AR, School District No. 6, “A”, 5%, 2024 | 3,185,000 | 3,608,191 | ||||||
| Bentonville, AR, School District No. 6, “A”, 4.5%, 2040 | 3,000,000 | 3,207,420 | ||||||
| Cabot, AR, School District No. 4, Lonoke County, “A”, AMBAC, 4.7%, 2038 | 1,500,000 | 1,522,050 | ||||||
| Clovis, CA, Unified School District (Election of 2004), Capital Appreciation, “A”, 0%, 2027 | 2,320,000 | 1,306,160 | ||||||
| Issuer | Shares/Par | Value ($) | ||||||
| General Obligations - Schools - continued | ||||||||
| Crittenden County, AR, Community College District, 4.6%, 2035 | $ | 285,000 | $ | 293,031 | ||||
| Crittenden County, AR, Community College District, 4.7%, 2040 | 625,000 | 641,600 | ||||||
| Crittenden County, AR, Community College District, 4%, 2042 | 1,500,000 | 1,442,775 | ||||||
| Lincoln, AR, School District No. 48, 4%, 2032 | 720,000 | 738,986 | ||||||
| Little Rock, AR, School District, 4%, 2033 | 2,000,000 | 2,048,300 | ||||||
| Northwest Arkansas Community College District, Capital Improvement, AMBAC, 5%, 2028 | 1,380,000 | 1,433,558 | ||||||
| Pine Bluff, AR, School District No. 003, AGM, 4.125%, 2034 | 2,070,000 | 2,112,870 | ||||||
| Pulaski, AR, Special School District Construction, 5%, 2035 | 2,000,000 | 2,052,400 | ||||||
| Springdale, AR, School District No. 050, “A”, 4.625%, 2037 | 2,000,000 | 2,123,760 | ||||||
| Springdale, AR, School District No. 50, 3%, 2029 | 910,000 | 873,782 | ||||||
| Van Buren, AR, School District No. 42, 4.5%, 2031 | 375,000 | 391,515 | ||||||
| Van Buren, AR, School District No. 42, 4.625%, 2033 | 745,000 | 778,279 | ||||||
| $ | 29,730,153 | |||||||
| Healthcare Revenue - Hospitals - 9.3% | ||||||||
| Arizona Health Facilities Authority Rev. (Banner Health), “A”, 4%, 2043 | $ | 790,000 | $ | 768,504 | ||||
| Arkansas Development Finance Authority, Health Refunding Rev. (Sister of Mercy), “A”, NATL, 5%, 2013 | 1,140,000 | 1,148,675 | ||||||
| Batesville, AR, Medical District Rev. (White River Medical Center), 5.5%, 2024 | 750,000 | 762,150 | ||||||
| Baxter County, AR, Hospital Rev. (Baxter Regional Hospital), 5%, 2026 | 1,000,000 | 1,051,090 | ||||||
| Brazoria County, TX, Health Facilities Development Corp., Hospital Rev. (Brazosport Regional Health System), 5.25%, 2032 | 520,000 | 540,415 | ||||||
| Conway, AR, Hospital Rev. (Conway Regional Medical Center), 4.45%, 2032 | 540,000 | 575,186 | ||||||
| Escambia County, FL, Health Facilities Authority (Baptist Hospital, Inc.), “A”, 6%, 2036 | 420,000 | 483,525 | ||||||
| Illinois Finance Authority Rev. (Resurrection Health), 6.125%, 2025 | 170,000 | 192,275 | ||||||
| Illinois Finance Authority Rev. (Silver Cross Hospital & Medical Centers), 7%, 2044 | 510,000 | 607,849 | ||||||
| Independence County, AR, Public Health Education & Housing Facilities Board Rev. (White River Health Systems), 5.75%, 2028 | 1,000,000 | 1,142,060 | ||||||
| Indiana Finance Authority Rev. (Sisters of St. Francis Health Services), 5.375%, 2032 | 1,085,000 | 1,188,390 | ||||||
| Jefferson County, AR, Hospital Rev., Refunding (Regional Medical Center), AGM, 5%, 2026 | 2,000,000 | 2,136,320 | ||||||
17
Table of Contents
Portfolio of Investments – continued
| Municipal Bonds - continued | ||||||||
| Issuer | Shares/Par | Value ($) | ||||||
| Healthcare Revenue - Hospitals - continued | ||||||||
| Kentucky Economic Development Finance Authority, Hospital Facilities Rev. (Owensboro Medical Health System), “A”, 5.75%, 2025 | $ | 510,000 | $ | 591,554 | ||||
| Kentucky Economic Development Finance Authority, Hospital Facilities Rev. (Owensboro Medical Health System), “A”, 6.375%, 2040 | 545,000 | 646,114 | ||||||
| Kentucky Economic Development Finance Authority, Hospital Facilities Rev. (Owensboro Medical Health System), “A”, 6.5%, 2045 | 395,000 | 470,291 | ||||||
| Louisville & Jefferson County, KY, Metropolitan Government Healthcare Systems Rev. (Norton Healthcare, Inc.), 5.25%, 2036 | 470,000 | 496,517 | ||||||
| Martin County, FL, Health Facilities Authority Rev. (Martin Memorial Medical Center), 5.5%, 2042 | 355,000 | 393,745 | ||||||
| Mena, AR, Hospital Rev., 4.25%, 2021 | 400,000 | 411,144 | ||||||
| Mena, AR, Hospital Rev., 4.6%, 2024 | 615,000 | 632,872 | ||||||
| Michigan Hospital Finance Authority Rev. (Henry Ford Health System), 5.625%, 2029 | 110,000 | 124,876 | ||||||
| New Hampshire Business Finance Authority Rev. (Elliot Hospital Obligated Group), “A”, 6%, 2027 | 355,000 | 411,743 | ||||||
| New Hampshire Business Finance Authority Rev. (Elliot Hospital Obligated Group), “A”, 6.125%, 2039 | 490,000 | 551,123 | ||||||
| Ohio Higher Educational Facility Commission (University Hospital Health System), “A”, 6.75%, 2015 (c) | 685,000 | 762,864 | ||||||
| Pulaski County, AR, Hospital Rev. (Arkansas Children’s Hospital Foundation), AGM, 4%, 2020 | 1,000,000 | 1,111,420 | ||||||
| Pulaski, AR, Hospital Rev. (Arkansas Children’s Hospital), ASSD GTY, 5.5%, 2034 | 750,000 | 859,598 | ||||||
| Pulaski, AR, Hospital Rev. (Arkansas Children’s Hospital), ASSD GTY, 5.5%, 2039 | 1,375,000 | 1,548,786 | ||||||
| Washington County, AR, Hospital Rev. (Regional Medical Center), “A”, 5%, 2035 | 1,000,000 | 1,025,750 | ||||||
| Wisconsin Health & Educational Facilities Authority Rev. (ProHealth Care, Inc. Obligated Group), 6.625%, 2039 | 990,000 | 1,148,756 | ||||||
| Wisconsin Health & Educational Facilities Authority Rev. (Wheaton Franciscan Healthcare), 5.25%, 2031 | 675,000 | 721,926 | ||||||
| $ | 22,505,518 | |||||||
| Miscellaneous Revenue - Entertainment & Tourism - 0.1% | ||||||||
| Louisiana Stadium & Exposition District Rev., “A”, 5%, 2031 | $ | 45,000 | $ | 50,767 | ||||
| Louisiana Stadium & Exposition District Rev., “A”, 5%, 2036 | 145,000 | 161,730 | ||||||
| $ | 212,497 | |||||||
| Miscellaneous Revenue - Other - 0.4% | ||||||||
| Citizens Property Insurance Corp., FL, “A-1”, 5%, 2020 | $ | 895,000 | $ | 1,064,083 | ||||
| Issuer | Shares/Par | Value ($) | ||||||
| Multi-Family Housing Revenue - 0.4% | ||||||||
| Fort Smith, AR, Residential Housing Facilities Board Rev. (Gorman Towers), “A”, GNMA, 5.45%, 2037 | $ | 1,000,000 | $ | 1,000,860 | ||||
| Sales & Excise Tax Revenue - 10.2% | ||||||||
| Bentonville, AR, Sales & Use Tax, AMBAC, 4.375%, 2025 | $ | 1,000,000 | $ | 1,050,510 | ||||
| Bentonville, AR, Sales & Use Tax, 4%, 2026 | 1,310,000 | 1,368,570 | ||||||
| Colorado Regional Transportation District, Private Activity Rev. (Denver Transportation Partners), 6%, 2041 | 760,000 | 871,180 | ||||||
| Colorado Regional Transportation District, Sales Tax Rev. (Fastracks Project), “A”, 5%, 2027 | 850,000 | 1,014,798 | ||||||
| Fort Smith, AR, Sales & Use Tax, 5%, 2024 | 2,040,000 | 2,376,172 | ||||||
| Guam Government Business Privilege Tax Rev., “C”, 5%, 2016 | 190,000 | 217,438 | ||||||
| Guam Government Business Privilege Tax Rev., “C”, 5%, 2017 | 210,000 | 246,042 | ||||||
| Guam Government Business Privilege Tax Rev., “C”, 5%, 2018 | 200,000 | 237,568 | ||||||
| Massachusetts Bay Transportation Authority, Sales Tax Rev., “A-1”, 5.25%, 2029 | 1,000,000 | 1,283,100 | ||||||
| Massachusetts School Building Authority, Dedicated Sales Tax Rev., “B”, 5%, 2035 | 1,430,000 | 1,638,108 | ||||||
| Puerto Rico Infrastructure Financing Authority, Special Tax Rev., “C”, FGIC, 5.5%, 2022 | 765,000 | 808,054 | ||||||
| Puerto Rico Sales Tax Financing Corp., Sales Tax Rev., 5.25%, 2057 | 1,010,000 | 1,043,431 | ||||||
| Puerto Rico Sales Tax Financing Corp., Sales Tax Rev., “C”, 6%, 2039 | 815,000 | 877,364 | ||||||
| Puerto Rico Sales Tax Financing Corp., Sales Tax Rev., “C”, 5.25%, 2040 | 945,000 | 997,070 | ||||||
| Puerto Rico Sales Tax Financing Corp., Sales Tax Rev., Capital Appreciation, 0%, 2056 | 9,770,000 | 676,084 | ||||||
| Rogers, AR, Sales & Use Tax Rev., 5%, 2023 | 1,000,000 | 1,183,440 | ||||||
| Rogers, AR, Sales & Use Tax Rev., 4.125%, 2031 | 500,000 | 524,075 | ||||||
| Springdale, AR, Sales & Use Tax Rev., 5%, 2015 | 1,420,000 | 1,436,756 | ||||||
| Springdale, AR, Sales & Use Tax Rev., 5%, 2027 | 3,145,000 | 3,693,803 | ||||||
| Springdale, AR, Sales & Use Tax Rev., 5%, 2028 | 1,000,000 | 1,162,690 | ||||||
| Stuttgart, AR, Sales & Use Tax Rev., AGM, 5%, 2032 | 1,840,000 | 1,985,581 | ||||||
| $ | 24,691,834 | |||||||
| Single Family Housing Revenue - Local - 1.1% | ||||||||
| Pulaski County, AR, Public Facilities Board Rev., Capital Appreciation, “C”, FNMA, 0%, 2014 | $ | 2,750,000 | $ | 2,653,558 | ||||
| Single Family Housing - State - 2.7% | ||||||||
| Arkansas Development Finance Authority Home Ownership Rev., Mortgage Backed Securities Program, “A”, GNMA, 4.85%, 2027 | $ | 1,130,000 | $ | 1,166,239 | ||||
| Arkansas Development Finance Authority Rev., Mortgage Backed Securities Program, “C”, GNMA, 5.625%, 2035 | 470,000 | 491,239 | ||||||
| Arkansas Development Finance Authority, Mortgage Rev., “B”, GNMA, 4.85%, 2031 | 660,000 | 670,190 | ||||||
18
Table of Contents
Portfolio of Investments – continued
| Municipal Bonds - continued | ||||||||
| Issuer | Shares/Par | Value ($) | ||||||
| Single Family Housing - State - continued | ||||||||
| Arkansas Development Finance Authority, Mortgage Rev., “B”, GNMA, 5.25%, 2035 | $ | 940,000 | $ | 948,714 | ||||
| Arkansas Development Finance Authority, Single Family Mortgage Rev., “B”, GNMA, 5.125%, 2024 | 440,000 | 441,360 | ||||||
| Arkansas Development Finance Authority, Single Family Mortgage Rev., “B”, GNMA, 5.7%, 2028 | 1,765,000 | 1,880,272 | ||||||
| Arkansas State University, Auxiliary Enterprises Rev., AGM, 4.65%, 2040 | 830,000 | 846,625 | ||||||
| $ | 6,444,639 | |||||||
| State & Local Agencies - 4.1% | ||||||||
| Arkansas Development Finance Authority Rev. (Donaghey Plaza Project), 5%, 2034 | $ | 2,605,000 | $ | 2,956,962 | ||||
| Arkansas Development Finance Authority Rev., “A”, AGM, 5%, 2014 | 435,000 | 464,937 | ||||||
| Arkansas Development Finance Authority Rev., Correctional Facilities, “A”, 5.125%, 2034 | 500,000 | 539,515 | ||||||
| Arkansas Development Finance Authority Rev., State Agency Environmental Facilities, “A”, AMBAC, 5%, 2013 (c) | 2,500,000 | 2,628,650 | ||||||
| Arkansas Development Finance Authority, Public Purpose Rev. (Arkansas Game & Fish Commission), AGM, 5%, 2027 | 3,205,000 | 3,311,630 | ||||||
| $ | 9,901,694 | |||||||
| Tax - Other - 4.3% | ||||||||
| Guam Government Ltd. Obligation Rev., “A”, 5.375%, 2024 | $ | 490,000 | $ | 535,315 | ||||
| Guam Government Ltd. Obligation Rev., “A”, 5.625%, 2029 | 65,000 | 70,921 | ||||||
| Little Rock, AR, Hotel & Restaurant Gross Receipts Tax Rev., 7.375%, 2015 | 1,535,000 | 1,644,998 | ||||||
| Little Rock, AR, Library Construction & Improvement Rev., 4%, 2023 | 810,000 | 858,114 | ||||||
| Little Rock, AR, Library Construction & Improvement Rev., 4%, 2024 | 1,685,000 | 1,773,985 | ||||||
| Little Rock, AR, Library Construction & Improvement Rev., 5%, 2027 | 315,000 | 358,946 | ||||||
| Rogers, AR, School District Number 30, 3%, 2026 | 1,025,000 | 1,014,197 | ||||||
| Rogers, AR, School District Number 30, 3%, 2027 | 1,095,000 | 1,069,454 | ||||||
| Rogers, AR, School District Number 30, 4.75%, 2032 | 935,000 | 951,578 | ||||||
| Virgin Islands Public Finance Authority Rev., “A-1”, 5%, 2029 | 135,000 | 146,672 | ||||||
| Virgin Islands Public Finance Authority Rev., “A-1”, 5%, 2039 | 150,000 | 157,280 | ||||||
| Virgin Islands Public Finance Authority Rev., “B”, 5%, 2025 | 135,000 | 148,981 | ||||||
| Virgin Islands Public Finance Authority Rev., Matching Fund Loan Note, “A”, 5%, 2029 | 940,000 | 1,028,999 | ||||||
| Virgin Islands Public Finance Authority Rev., Matching Fund Loan Note, “A”, 6%, 2039 | 505,000 | 558,010 | ||||||
| $ | 10,317,450 | |||||||
| Issuer | Shares/Par | Value ($) | ||||||
| Tobacco - 1.4% | ||||||||
| Arkansas Development Finance Authority, Tobacco Settlement Rev. (Cancer Research Center Project), Capital Appreciation, AMBAC, 0%, 2026 | $ | 2,000,000 | $ | 1,233,900 | ||||
| Arkansas Development Finance Authority, Tobacco Settlement Rev. (Cancer Research Center Project), Capital Appreciation, AMBAC, 0%, 2027 | 1,940,000 | 1,139,595 | ||||||
| Children’s Trust Fund, Tobacco Settlement Rev., Puerto Rico, 5.5%, 2039 | 290,000 | 293,170 | ||||||
| New Jersey Tobacco Settlement Financing Corp., “1-A”, 4.5%, 2023 | 685,000 | 683,301 | ||||||
| $ | 3,349,966 | |||||||
| Transportation - Special Tax - 0.6% | ||||||||
| Metropolitan Transportation Authority Rev., NY, “A”, 5%, 2037 | $ | 490,000 | $ | 533,042 | ||||
| Metropolitan Transportation Authority Rev., NY, Capital Appreciation, “A”, 0%, 2030 | 1,640,000 | 864,182 | ||||||
| $ | 1,397,224 | |||||||
| Universities - Colleges - 21.8% | ||||||||
| Arkansas Development Finance Authority Rev., Capital Improvement (Hendrix College), 3.875%, 2031 | $ | 870,000 | $ | 871,027 | ||||
| Arkansas Development Finance Authority Rev., Capital Improvement (Hendrix College), 4.1%, 2037 | 500,000 | 505,100 | ||||||
| Arkansas State University, Auxiliary Enterprises Rev., AGM, 4.65%, 2035 | 1,000,000 | 1,023,320 | ||||||
| Arkansas State University, Housing System Rev. (Jonesboro Campus), 4.5%, 2031 | 2,500,000 | 2,720,900 | ||||||
| Arkansas State University, Housing System Rev. (Jonesboro Campus), “C”, AMBAC, 5%, 2032 | 2,595,000 | 2,843,835 | ||||||
| Arkansas State University, Student Fee (Jonesboro Campus), “C”, AGM, 4.5%, 2023 | 550,000 | 641,674 | ||||||
| Arkansas State University, Student Fee (Jonesboro Campus), “C”, AGM, 4.5%, 2027 | 545,000 | 610,307 | ||||||
| Arkansas Technical University, Housing Systems Rev., AMBAC, 5.2%, 2026 | 500,000 | 545,710 | ||||||
| Illinois Finance Authority Rev. (Roosevelt University Project), 6.5%, 2039 | 750,000 | 849,435 | ||||||
| Massachusetts Development Finance Agency Higher Education Rev. (Emerson College), “A”, 5%, 2023 | 1,070,000 | 1,157,836 | ||||||
| Massachusetts State College, Building Authority Project Rev., “A”, 5%, 2036 | 685,000 | 784,359 | ||||||
| New York Dormitory Authority Rev., Non-State Supported Debt (New York University), “A”, 5.25%, 2048 | 1,605,000 | 1,816,411 | ||||||
| Puerto Rico Industrial, Tourist, Educational, Medical, & Environmental Control Facilities Financing Authority, Higher Education Rev. (Ana G. Mendez University System Project), 5.125%, 2032 | 85,000 | 83,632 | ||||||
19
Table of Contents
Portfolio of Investments – continued
| Municipal Bonds - continued | ||||||||
| Issuer | Shares/Par | Value ($) | ||||||
| Universities - Colleges - continued | ||||||||
| Puerto Rico Industrial, Tourist, Educational, Medical, & Environmental Control Facilities Financing Authority, Higher Education Rev. (Ana G. Mendez University System Project), 5.375%, 2042 | $ | 140,000 | $ | 140,346 | ||||
| Puerto Rico Industrial, Tourist, Medical, & Environmental Central Facilities (University of Sacred Heart), 4.375%, 2031 | 60,000 | 57,180 | ||||||
| Puerto Rico Industrial, Tourist, Medical, & Environmental Central Facilities (University of Sacred Heart), 5%, 2042 | 30,000 | 29,366 | ||||||
| Pulaski, AR, Student Tuition & Fee Rev. (Technical College), AGM, 4%, 2024 | 1,000,000 | 1,074,490 | ||||||
| Pulaski, AR, Student Tuition & Fee Rev. (Technical College), 5%, 2041 | 2,000,000 | 2,154,780 | ||||||
| University of Arkansas Rev. (Fayetteville Campus), “A”, 5%, 2021 | 1,310,000 | 1,626,509 | ||||||
| University of Arkansas Rev. (Fayetteville Campus), “A”, 5%, 2026 | 1,000,000 | 1,175,880 | ||||||
| University of Arkansas Rev. (Fort Smith Campus), 5%, 2028 | 860,000 | 974,681 | ||||||
| University of Arkansas Rev. (Student Fee-Fort Smith Campus), 4%, 2023 | 250,000 | 277,595 | ||||||
| University of Arkansas Rev. (Student Fee-Fort Smith Campus), 4%, 2024 | 250,000 | 274,943 | ||||||
| University of Arkansas Rev. (Student Fee-Fort Smith Campus), 4%, 2025 | 500,000 | 543,040 | ||||||
| University of Arkansas Rev. (Student Fee-Fort Smith Campus), 4%, 2026 | 305,000 | 327,140 | ||||||
| University of Arkansas Rev. (Student Fee-Fort Smith Campus), 4%, 2027 | 700,000 | 744,772 | ||||||
| University of Arkansas Rev. (Student Fee-Phillips), 5.1%, 2034 | 750,000 | 838,425 | ||||||
| University of Arkansas Rev., “A”, 5%, 2033 | 1,000,000 | 1,146,200 | ||||||
| University of Arkansas, Administration Building Rev. , “A”, 5%, 2038 | 1,000,000 | 1,137,760 | ||||||
| University of Arkansas, University Construction Rev. (Monticello), AMBAC, 5%, 2025 | 1,525,000 | 1,573,022 | ||||||
| University of Arkansas, University Construction Rev. (UAMS Campus), “B”, NATL, 5%, 2026 | 1,405,000 | 1,497,323 | ||||||
| University of Arkansas, University Construction Rev. (UAMS Campus), “B”, NATL, 5%, 2027 | 2,180,000 | 2,322,550 | ||||||
| University of Arkansas, University Construction Rev. (UAMS Campus), “B”, NATL, 5%, 2034 | 3,200,000 | 3,398,816 | ||||||
| University of Arkansas, University Facilities Rev. (Pine Bluff Campus), “A”, AMBAC, 5%, 2030 | 1,000,000 | 1,094,520 | ||||||
| University of Arkansas, University Facilities Rev. (UAMS Campus), FGIC, 5%, 2028 | 2,000,000 | 2,201,640 | ||||||
| University of Arkansas, University Rev. (Fayetteville Campus), “A”, 5%, 2032 | 1,000,000 | 1,165,740 | ||||||
| University of Arkansas, University Rev. (Monticello Campus), 4%, 2032 | 705,000 | 730,380 | ||||||
| University of Arkansas, University Rev. (Monticello Campus), 4%, 2035 | 600,000 | 612,294 | ||||||
| University of Arkansas, University Rev. (UAMS Campus), 4.5%, 2016 | 750,000 | 836,130 | ||||||
| Issuer | Shares/Par | Value ($) | ||||||
| Universities - Colleges - continued | ||||||||
| University of Arkansas, University Rev. (UAMS Campus), 4.5%, 2017 | $ | 725,000 | $ | 828,559 | ||||
| University of Arkansas, University Rev. (UAMS Campus), 4.5%, 2018 | 795,000 | 924,871 | ||||||
| University of Arkansas, University Rev. (UAMS Campus), 4.5%, 2019 | 320,000 | 375,763 | ||||||
| University of Arkansas, University Rev., Var Fac-Fayetteville Campus, AMBAC, 5%, 2036 | 2,500,000 | 2,770,450 | ||||||
| University of California Rev., “G”, 4%, 2029 | 1,260,000 | 1,328,922 | ||||||
| University of Central Arkansas Rev., “C”, ASSD GTY, 4.25%, 2040 | 3,000,000 | 3,175,830 | ||||||
| University of Puerto Rico Rev., “Q”, 5%, 2036 | 1,145,000 | 1,056,377 | ||||||
| $ | 52,869,840 | |||||||
| Utilities - Investor Owned - 1.1% | ||||||||
| Farmington, NM, Pollution Control Rev. (Arizona Public Service Co.), “A”, 4.7%, 2024 | $ | 710,000 | $ | 796,883 | ||||
| Independence County, AR, Pollution Control Rev. (Entergy Arkansas, Inc. Project), 2.375%, 2021 | 750,000 | 743,685 | ||||||
| Independence County, AR, Pollution Control Rev. (Entergy Mississippi, Inc. Project), AMBAC, 4.9%, 2022 | 1,000,000 | 1,027,000 | ||||||
| $ | 2,567,568 | |||||||
| Utilities - Municipal Owned - 6.2% | ||||||||
| Benton, AR, Public Utility Rev., AMBAC, 5%, 2031 | $ | 1,500,000 | $ | 1,672,050 | ||||
| Benton, AR, Public Utility Rev., AGM, 5%, 2032 | 1,130,000 | 1,267,770 | ||||||
| Benton, AR, Public Utility Rev., AGM, 5%, 2036 | 1,165,000 | 1,287,325 | ||||||
| Benton, AR, Public Utility Rev., AMBAC, 5%, 2036 | 1,500,000 | 1,657,140 | ||||||
| Guam Power Authority Rev., “A”, AGM, 5%, 2025 | 135,000 | 155,119 | ||||||
| Guam Power Authority Rev., “A”, AGM, 5%, 2026 | 110,000 | 125,715 | ||||||
| Guam Power Authority Rev., “A”, AGM, 5%, 2027 | 45,000 | 51,192 | ||||||
| Guam Power Authority Rev., “A”, 5.5%, 2030 | 450,000 | 500,724 | ||||||
| Guam Power Authority Rev., “A”, 5%, 2034 | 135,000 | 145,577 | ||||||
| Long Island, NY, Power Authority, Electric Systems Rev., “A”, 6%, 2033 | 245,000 | 292,305 | ||||||
| North Little Rock, AR, Electric Rev., “A”, NATL, 6.5%, 2015 | 3,820,000 | 4,085,681 | ||||||
| North Little Rock, AR, Electric Rev., “B”, AGM, 5%, 2021 | 1,040,000 | 1,154,473 | ||||||
| North Little Rock, AR, Electric Rev., “B”, AGM, 5%, 2022 | 1,090,000 | 1,196,319 | ||||||
| Puerto Rico Electric Power Authority Rev., “TT”, 5%, 2027 | 470,000 | 458,278 | ||||||
| Puerto Rico Electric Power Authority Rev., “VV”, NATL, 5.25%, 2030 | 1,000,000 | 987,630 | ||||||
| $ | 15,037,298 | |||||||
| Utilities - Other - 1.2% | ||||||||
| Nebraska Central Plains Energy Project, Gas Project Rev., “3”, 5%, 2032 | $ | 970,000 | $ | 1,078,378 | ||||
20
Table of Contents
Portfolio of Investments – continued
| Municipal Bonds - continued | ||||||||
| Issuer | Shares/Par | Value ($) | ||||||
| Utilities - Other - continued | ||||||||
| Salt Verde Financial Corp., AZ, Senior Gas Rev., 5%, 2037 | $ | 465,000 | $ | 518,708 | ||||
| Tennessee Energy Acquisition Corp., Gas Rev., “A”, 5.25%, 2021 | 300,000 | 348,630 | ||||||
| Tennessee Energy Acquisition Corp., Gas Rev., “A”, 5.25%, 2022 | 155,000 | 180,231 | ||||||
| Texas Gas Acquisition & Supply Corp III., Gas Supply Rev., 5%, 2027 | 695,000 | 752,706 | ||||||
| $ | 2,878,653 | |||||||
| Water & Sewer Utility Revenue - 13.2% | ||||||||
| Arkansas Community Public Water Systems Authority Rev., 5%, 2032 | $ | 1,020,000 | $ | 1,153,253 | ||||
| Arkansas Community Public Water Systems Authority Rev., 3.7%, 2036 | 1,500,000 | 1,445,160 | ||||||
| Arkansas Community Public Water Systems Authority Rev., 4%, 2042 | 1,000,000 | 986,350 | ||||||
| Arkansas Development Finance Authority, Capital Improvement Rev., Revolving Fund Loan, “C”, 5%, 2022 | 1,500,000 | 1,864,050 | ||||||
| Arkansas Development Finance Authority, Capital Improvement Rev., Revolving Fund Loan, “C”, 5%, 2024 | 2,645,000 | 3,255,360 | ||||||
| Arkansas Development Finance Authority, Capital Improvement Rev., Revolving Fund Loan, “C”, 5%, 2025 | 1,500,000 | 1,832,205 | ||||||
| Benton & Washington County, AR, Beaver Water District, Water Refunding Rev., 4%, 2022 | 610,000 | 685,689 | ||||||
| Central Arkansas Water Rev., “B”, 4%, 2014 | 880,000 | 924,854 | ||||||
| Central Arkansas Water Rev., “B”, 4%, 2016 | 795,000 | 879,596 | ||||||
| Commonwealth of Puerto Rico Aqueduct & Sewer Authority Rev., “A”, 6%, 2044 | 2,000,000 | 2,009,580 | ||||||
| DeKalb County, GA, Water & Sewer Rev., “A”, 5.25%, 2041 | 840,000 | 949,847 | ||||||
| Issuer | Shares/Par | Value ($) | ||||||
| Water & Sewer Utility Revenue - continued | ||||||||
| Fort Smith, AR, Water & Sewer Rev., AGM, 4.5%, 2021 | $ | 1,545,000 | $ | 1,805,920 | ||||
| Fort Smith, AR, Water & Sewer Rev., AGM, 4.5%, 2022 | 455,000 | 525,762 | ||||||
| Fort Smith, AR, Water & Sewer Rev., AGM, 5%, 2032 | 2,000,000 | 2,218,340 | ||||||
| Hot Springs, AR, Wastewater Rev., ASSD GTY, 4.625%, 2037 | 1,260,000 | 1,364,542 | ||||||
| Little Rock, AR, Sewer Rev., 5.5%, 2030 | 750,000 | 871,520 | ||||||
| Little Rock, AR, Sewer Rev., 5.75%, 2038 | 1,000,000 | 1,164,210 | ||||||
| Little Rock, AR, Sewer Rev., “A”, AGM, 4.375%, 2033 | 750,000 | 790,335 | ||||||
| Little Rock, AR, Sewer Rev., “C”, AGM, 5%, 2037 | 3,000,000 | 3,312,930 | ||||||
| Rogers, AR, Sewer Rev., AMBAC, 5%, 2037 | 1,000,000 | 1,082,690 | ||||||
| San Francisco, CA, City & County Public Utilities Commission Water Rev., “A”, 5.25%, 2031 | 1,275,000 | 1,477,215 | ||||||
| Wasco, CA, Semitropic Improvement District (Semitropic Water Storage District), “A”, 5%, 2038 | 1,325,000 | 1,430,682 | ||||||
| $ | 32,030,090 | |||||||
Total Municipal Bonds (Identified Cost, $224,293,488) | $ | 234,674,219 | ||||||
| Money Market Funds - 1.3% | ||||||||
| MFS Institutional Money Market Portfolio, 0.14%, at Cost and Net Asset Value (v) | 3,067,890 | $ | 3,067,890 | |||||
Total Investments (Identified Cost, $227,361,378) | $ | 237,742,109 | ||||||
| Other Assets, Less Liabilities - 1.7% | 4,203,502 | |||||||
| Net Assets - 100.0% | $ | 241,945,611 | ||||||
See Portfolio Footnotes and Notes to Financial Statements
21
Table of Contents
PORTFOLIO OF INVESTMENTS
3/31/13
MFS CALIFORNIA MUNICIPAL BOND FUND
The Portfolio of Investments is a complete list of all securities owned by your fund. It is categorized by broad-based asset classes.
| Municipal Bonds - 97.2% | ||||||||
| Issuer | Shares/Par | Value ($) | ||||||
| Airport Revenue - 7.1% | ||||||||
| Chicago, IL, O’Hare International Airport Rev., Third Lien, “A”, 5.625%, 2035 | $ | 780,000 | $ | 900,697 | ||||
| Los Angeles, CA, Department of Airports Rev. (Los Angeles International), “A”, 5%, 2029 | 3,000,000 | 3,418,950 | ||||||
| Orange County, CA, Airport Rev., “A”, 5%, 2031 | 1,310,000 | 1,448,690 | ||||||
| Sacramento County, CA, Airport Systems Rev., 5%, 2040 | 1,020,000 | 1,123,275 | ||||||
| San Diego County, CA, Regional Airport Authority Rev., “A”, 5%, 2021 | 1,500,000 | 1,772,085 | ||||||
| San Diego County, CA, Regional Airport Authority Rev., “A”, 5%, 2040 | 2,000,000 | 2,177,040 | ||||||
| San Diego County, CA, Regional Airport Authority Rev., “B”, 5%, 2038 | 1,695,000 | 1,854,127 | ||||||
| San Francisco, CA, City & County Airports Commission, International Airport Rev., “A”, 5%, 2030 | 1,715,000 | 1,905,091 | ||||||
| San Francisco, CA, City & County Airports Commission, International Airport Rev., “A”, 5%, 2031 | 850,000 | 940,738 | ||||||
| San Francisco, CA, City & County Airports Commission, International Airport Rev., “D”, 5%, 2025 | 2,000,000 | 2,360,420 | ||||||
| San Jose, CA, Airport Rev., “A”, BHAC, 5.5%, 2023 | 2,345,000 | 2,621,288 | ||||||
| San Jose, CA, Airport Rev., “A-2”, 5.25%, 2034 | 2,560,000 | 2,804,173 | ||||||
| $ | 23,326,574 | |||||||
| General Obligations - General Purpose - 6.7% | ||||||||
| Commonwealth of Puerto Rico, “A”, NATL, 5.5%, 2020 | $ | 2,535,000 | $ | 2,714,300 | ||||
| State of California, 5%, 2034 | 2,200,000 | 2,454,078 | ||||||
| State of California, 5.25%, 2035 | 2,545,000 | 2,900,867 | ||||||
| State of California, 6%, 2039 | 3,000,000 | 3,588,930 | ||||||
| State of California, 5.5%, 2040 | 3,670,000 | 4,293,643 | ||||||
| State of California, 5.25%, 2040 | 2,775,000 | 3,129,173 | ||||||
| State of California, 5%, 2042 | 2,500,000 | 2,732,725 | ||||||
| $ | 21,813,716 | |||||||
| General Obligations - Improvement - 0.3% | ||||||||
| Guam Government, “A”, 6.75%, 2029 | $ | 85,000 | $ | 95,061 | ||||
| Guam Government, “A”, 5.25%, 2037 | 815,000 | 821,593 | ||||||
| Guam Government, “A”, 7%, 2039 | 95,000 | 105,924 | ||||||
| $ | 1,022,578 | |||||||
| General Obligations - Schools - 8.5% | ||||||||
| Beaumont, CA, Unified School District (Election of 2008), Capital Appreciation, “C”, AGM, 0%, 2040 | $ | 5,315,000 | $ | 1,338,583 | ||||
| Beverly Hills, CA, Unified School District (Election of 2008), Capital Appreciation, 0%, 2029 | 4,335,000 | 2,397,732 | ||||||
| Issuer | Shares/Par | Value ($) | ||||||
| General Obligations - Schools - continued | ||||||||
| Cabrillo, CA, Community College District, Capital Appreciation, “A”, NATL, 0%, 2028 | $ | 1,000,000 | $ | 514,730 | ||||
| Chabot-Las Positas, CA, Community College (Election of 2004), “B”, AMBAC, 5%, 2030 | 1,090,000 | 1,235,788 | ||||||
| Clovis, CA, Unified School District (Election of 2001), Capital Appreciation, “B”, 0%, 2024 | 3,000,000 | 1,987,050 | ||||||
| Clovis, CA, Unified School District (Election of 2001), Capital Appreciation, “B”, 0%, 2027 | 2,500,000 | 1,407,500 | ||||||
| Colton, CA, Joint Union School District (Election of 2001), Capital Appreciation, “C”, FGIC, 0%, 2032 | 1,000,000 | 381,800 | ||||||
| Colton, CA, Joint Union School District (Election of 2001), Capital Appreciation, “C”, FGIC, 0%, 2033 | 3,000,000 | 1,083,840 | ||||||
| Garvey, CA, School District (Election of 2004), Capital Appreciation, AGM, 0%, 2031 | 2,120,000 | 893,538 | ||||||
| Glendale, CA, Community College District (Election of 2002), “D”, NATL, 5%, 2031 | 1,710,000 | 1,898,767 | ||||||
| Moorpark, CA, Unified School District (Election of 2008), Capital Appreciation, “A”, ASSD GTY, 0%, 2033 | 500,000 | 189,510 | ||||||
| Moreland, CA, School District (Election of 2002), Capital Appreciation, “B”, FGIC, 0%, 2028 | 1,440,000 | 717,163 | ||||||
| Napa Valley, CA, Unified School District (Election of 2006), Capital Appreciation, “A”, 0%, 2029 | 3,385,000 | 1,700,793 | ||||||
| Natomas Union School District (Election of 2002), “B”, FGIC, 5%, 2028 | 1,430,000 | 1,454,124 | ||||||
| San Diego County, CA, Southwestern Community College District (Election of 2008), “C”, 5%, 2040 | 2,060,000 | 2,259,614 | ||||||
| San Joaquin, CA, Delta Community College District (Election of 2004), “B”, Capital Appreciation, AGM, 0%, 2018 | 2,350,000 | 2,118,055 | ||||||
| San Mateo County, CA, Community College District (Election of 2001), Capital Appreciation, “A”, NATL, 0%, 2021 | 4,300,000 | 3,524,065 | ||||||
| San Ysidro, CA, School District, AMBAC, 6.125%, 2021 | 960,000 | 997,680 | ||||||
| Santa Monica, CA, Community College District (Election of 2002), Capital Appreciation, “C”, NATL, 0%, 2027 | 2,000,000 | 1,039,700 | ||||||
| Santee, CA, School District (Election of 2006), Capital Appreciation, “D”, ASSD GTY, 0%, 2043 | 4,235,000 | 861,611 | ||||||
| $ | 28,001,643 | |||||||
| Healthcare Revenue - Hospitals - 16.9% | ||||||||
| ABAG Finance Authority for Non-Profit Corps., CA, Rev. (San Diego Hospital), “C”, 5.375%, 2020 | $ | 2,000,000 | $ | 2,075,600 | ||||
| ABAG Finance Authority for Non-Profit Corps., CA, Rev. (Sharp Healthcare), “A”, 5%, 2026 | 1,090,000 | 1,245,205 | ||||||
22
Table of Contents
Portfolio of Investments – continued
| Municipal Bonds - continued | ||||||||
| Issuer | Shares/Par | Value ($) | ||||||
| Healthcare Revenue - Hospitals - continued | ||||||||
| ABAG Finance Authority for Non-Profit Corps., CA, Rev. (Sharp Healthcare), “A”, 5%, 2028 | $ | 500,000 | $ | 561,355 | ||||
| California Health Facilities Financing Authority Rev. (Catholic Healthcare West), “A”, 6%, 2029 | 1,500,000 | 1,786,425 | ||||||
| California Health Facilities Financing Authority Rev. (Catholic Healthcare West), “G”, 5.25%, 2023 | 2,000,000 | 2,092,340 | ||||||
| California Health Facilities Financing Authority Rev. (Cedars Sinai Medical Center), 5%, 2027 | 1,000,000 | 1,070,000 | ||||||
| California Health Facilities Financing Authority Rev. (Children’s Hospital Los Angeles), “A”, 5%, 2034 | 1,000,000 | 1,090,820 | ||||||
| California Health Facilities Financing Authority Rev. (Children’s Hospital of Orange County), 6.25%, 2029 | 2,000,000 | 2,384,020 | ||||||
| California Health Facilities Financing Authority Rev. (City of Hope), “A”, 5%, 2039 | 1,200,000 | 1,334,460 | ||||||
| California Health Facilities Financing Authority Rev. (Memorial Health Services), “A”, 5%, 2033 | 1,705,000 | 1,924,775 | ||||||
| California Health Facilities Financing Authority Rev. (Providence Health & Services), “B”, 5.5%, 2039 | 1,000,000 | 1,159,310 | ||||||
| California Health Facilities Financing Authority Rev. (Providence Health & Services), “C”, 6.5%, 2018 (c) | 30,000 | 39,024 | ||||||
| California Health Facilities Financing Authority Rev. (Providence Health & Services), “C”, 6.5%, 2033 | 1,500,000 | 1,792,635 | ||||||
| California Health Facilities Financing Authority Rev. (Providence Health & Services), “C”, 6.5%, 2038 | 1,720,000 | 2,050,704 | ||||||
| California Health Facilities Financing Authority Rev. (Scripps Health), “A”, 5%, 2032 | 2,955,000 | 3,256,735 | ||||||
| California Health Facilities Financing Authority Rev. (Scripps Health), “A”, 5%, 2040 | 1,495,000 | 1,652,319 | ||||||
| California Municipal Finance Authority, COP (Community Hospitals, Central California), 5.25%, 2037 | 2,000,000 | 2,100,840 | ||||||
| California Statewide Communities Development Authority Rev. (Community Hospital of the Monterey Peninsula), 6%, 2033 | 1,250,000 | 1,487,713 | ||||||
| California Statewide Communities Development Authority Rev. (Enloe Medical Center), CALHF, 6.25%, 2033 | 2,000,000 | 2,379,940 | ||||||
| California Statewide Communities Development Authority Rev. (Enloe Medical Center), “A”, CALHF, 5.5%, 2023 | 1,000,000 | 1,181,150 | ||||||
| California Statewide Communities Development Authority Rev. (John Muir Health), 5.125%, 2039 | 1,000,000 | 1,062,130 | ||||||
| California Statewide Communities Development Authority Rev. (Santa Ynez Valley Cottage Hospital), 5.25%, 2030 | 1,740,000 | 1,959,588 | ||||||
| California Statewide Communities Development Authority Rev. (Sutter Health), “A”, 5%, 2032 | 3,390,000 | 3,741,679 | ||||||
| Issuer | Shares/Par | Value ($) | ||||||
| Healthcare Revenue - Hospitals - continued | ||||||||
| California Statewide Communities Development Authority Rev. (Trinity Health Corp.), 5%, 2041 | $ | 2,550,000 | $ | 2,825,502 | ||||
| Madera County, CA, COP (Children’s Hospital Central California), 5.375%, 2036 | 3,000,000 | 3,232,980 | ||||||
| Palomar Pomerado Health Care District, CA, COP, 6.75%, 2039 | 1,805,000 | 2,026,293 | ||||||
| San Buenaventura, CA, Rev. (Community Memorial Health System), 7.5%, 2041 | 1,000,000 | 1,232,540 | ||||||
| Santa Clara County, CA, Financing Authority Rev. (El Camino Hospital), AMBAC, 5.125%, 2041 | 2,550,000 | 2,665,923 | ||||||
| Sierra View, CA, Local Health Care District Rev., 5.25%, 2037 | 1,000,000 | 1,024,340 | ||||||
| Washington Township, CA, Health Care District Rev., “A”, 6.25%, 2039 | 1,000,000 | 1,140,350 | ||||||
| West Contra Costa, CA, Healthcare District, AMBAC, 5.5%, 2029 | 2,000,000 | 2,046,460 | ||||||
| $ | 55,623,155 | |||||||
| Healthcare Revenue - Long Term Care - 3.3% | ||||||||
| ABAG Finance Authority for Non-Profit Corps., CA, Rev. (Episcopal Senior Communities), 6.125%, 2041 | $ | 850,000 | $ | 991,976 | ||||
| California Health Facilities Financing Authority Rev. (Paradise Valley Estates), CALHF, 5.125%, 2022 | 1,000,000 | 1,004,600 | ||||||
| California Statewide Communities Development Authority Rev. (American Baptist Homes of the West), 6.25%, 2039 | 1,500,000 | 1,701,435 | ||||||
| California Statewide Communities Development Authority Rev. (Episcopal Communities & Services for Seniors Obligated Group), 5%, 2047 | 1,785,000 | 1,928,657 | ||||||
| California Statewide Communities Development Authority Rev. (Eskaton Properties, Inc.), 5.25%, 2034 | 1,270,000 | 1,356,919 | ||||||
| California Statewide Communities Development Authority Rev. (Senior Living Presbyterian Homes), 4.875%, 2036 | 1,000,000 | 1,004,390 | ||||||
| California Statewide Communities Development Authority Rev. (The Terraces at San Joaquin Gardens), “A”, 6%, 2042 | 750,000 | 808,493 | ||||||
| Eden Township, CA, Healthcare District, COP, 6.125%, 2034 | 1,090,000 | 1,206,467 | ||||||
| La Verne, CA, COP (Brethren Hillcrest Homes), “B”, 6.625%, 2025 | 950,000 | 961,039 | ||||||
| $ | 10,963,976 | |||||||
| Miscellaneous Revenue - Entertainment & Tourism - 0.2% | ||||||||
| Agua Caliente Band of Cahuilla Indians, CA, Rev., 6%, 2018 (n) | $ | 750,000 | $ | 751,380 | ||||
| Miscellaneous Revenue - Other - 2.2% | ||||||||
| ABAG Finance Authority for Non-Profit Corps., CA, Rev. (Jackson Lab), 5.75%, 2037 | $ | 4,115,000 | $ | 4,691,964 | ||||
| California Infrastructure & Economic Development Bank Rev. (Walt Disney Family Museum), 5.25%, 2033 | 1,340,000 | 1,483,407 | ||||||
23
Table of Contents
Portfolio of Investments – continued
| Municipal Bonds - continued | ||||||||
| Issuer | Shares/Par | Value ($) | ||||||
| Miscellaneous Revenue - Other - continued | ||||||||
| San Diego County, CA, COP (Burnham Institute for Medical Research), 5%, 2034 | $ | 1,000,000 | $ | 1,037,580 | ||||
| $ | 7,212,951 | |||||||
| Port Revenue - 0.6% | ||||||||
| Alameda Corridor Transportation Authority, California Rev., “A”, AGM, 5%, 2028 | $ | 1,695,000 | $ | 1,975,014 | ||||
| Sales & Excise Tax Revenue - 0.7% | ||||||||
| Puerto Rico Sales Tax Financing Corp., Sales Tax Rev., “A”, 5.5%, 2028 | $ | 115,000 | $ | 124,286 | ||||
| Puerto Rico Sales Tax Financing Corp., Sales Tax Rev., Capital Appreciation, “A”, 0% to 2016, 6.75% to 2032 | 1,605,000 | 1,660,998 | ||||||
| Puerto Rico Sales Tax Financing Corp., Sales Tax Rev., Capital Appreciation, “A”, AMBAC, 0%, 2054 | 7,225,000 | 565,573 | ||||||
| $ | 2,350,857 | |||||||
| Single Family Housing - State - 2.4% | ||||||||
| California Housing Finance Agency Rev. (Home Mortgage), “E”, 4.75%, 2030 | $ | 1,760,000 | $ | 1,758,874 | ||||
| California Housing Finance Agency Rev. (Home Mortgage), “G”, 4.95%, 2023 | 2,000,000 | 2,043,900 | ||||||
| California Housing Finance Agency Rev. (Home Mortgage), “L”, 5.45%, 2033 | 3,240,000 | 3,305,513 | ||||||
| California Housing Finance Agency Rev. (Home Mortgage), “L”, FNMA, 5.5%, 2038 | 635,000 | 642,722 | ||||||
| $ | 7,751,009 | |||||||
| State & Agency - Other - 0.5% | ||||||||
| Pasadena, CA, COP, (Old Pasadena Parking Facilities Project), 6.25%, 2018 | $ | 1,520,000 | $ | 1,718,421 | ||||
| State & Local Agencies - 5.8% | ||||||||
| Banning, CA, COP, Water Systems Improvement Project, ETM, AMBAC, 8%, 2019 (c) | $ | 535,000 | $ | 651,363 | ||||
| California Public Works Board Lease Rev. (Judicial Council Projects), “A”, 5%, 2028 | 2,120,000 | 2,376,774 | ||||||
| California Public Works Board Lease Rev., Department of Education (Riverside Campus), 6%, 2026 | 2,000,000 | 2,442,220 | ||||||
| California Public Works Board Lease Rev., Department of General Services, 6.25%, 2034 | 1,500,000 | 1,810,410 | ||||||
| California Public Works Board Lease Rev., Department of Justice, “D”, 5.25%, 2020 | 1,565,000 | 1,569,820 | ||||||
| Delaware Valley, PA, Regional Finance Authority, “C”, FRN, 0.942%, 2037 | 2,320,000 | 1,691,419 | ||||||
| Golden State, CA, Tobacco Securitization Corp., Tobacco Settlement Rev., FGIC, 5%, 2035 | 1,745,000 | 1,826,020 | ||||||
| Golden State, CA, Tobacco Securitization Corp., Tobacco Settlement Rev., “A”, AGM, 4.55%, 2022 | 3,000,000 | 3,303,600 | ||||||
| Golden State, CA, Tobacco Securitization Corp., Tobacco Settlement Rev., Enhanced, “A”, FGIC, 5%, 2035 | 2,100,000 | 2,202,459 | ||||||
| Issuer | Shares/Par | Value ($) | ||||||
| State & Local Agencies - continued | ||||||||
| San Diego, CA, Public Facilities Financing Authority Lease Rev. (Master Refunding Project), “A”, 5.25%, 2040 | $ | 1,000,000 | $ | 1,101,680 | ||||
| $ | 18,975,765 | |||||||
| Tax - Other - 0.2% | ||||||||
| Guam Government Ltd. Obligation Rev., “A”, 5.375%, 2024 | $ | 445,000 | $ | 486,154 | ||||
| Guam Government Ltd. Obligation Rev., “A”, 5.625%, 2029 | 145,000 | 158,208 | ||||||
| $ | 644,362 | |||||||
| Tax Assessment - 7.6% | ||||||||
| Bay Area Governments Association, Tax Allocation, “A”, AMBAC, 5%, 2033 | $ | 3,700,000 | $ | 3,701,295 | ||||
| Fontana, CA, Redevelopment Agency Tax Allocation (Jurupa Hills Redevelopment Project), “A”, 5.5%, 2027 | 3,350,000 | 3,364,237 | ||||||
| Fullerton, CA, Community Facilities District, Special Tax (Amerige Heights), 5%, 2032 | 845,000 | 907,268 | ||||||
| Glendale, CA, Redevelopment Agency, Tax Allocation Rev. (Central Glendale Redevelopment Project), 5.5%, 2024 | 1,750,000 | 1,829,975 | ||||||
| Irvine, CA, Limited Obligation Improvement (Reassessment District #12-1), 4%, 2022 | 685,000 | 752,000 | ||||||
| Irvine, CA, Limited Obligation Improvement (Reassessment District #12-1), 5%, 2023 | 340,000 | 396,008 | ||||||
| Jurupa, CA, Community Facilities Services District, Special Tax (Eastvale Area District #31), “A”, 5%, 2037 | 1,000,000 | 1,035,650 | ||||||
| Lammersville, CA, Joint Unified School District, Special Tax (District #2002), 5%, 2037 | 1,000,000 | 1,024,860 | ||||||
| Orange County, CA, Community Facilities District, Special Tax (Rancho Santa Margarita), “A”, 5.55%, 2017 | 1,000,000 | 1,002,250 | ||||||
| Riverside County, CA, Redevelopment Agency, Tax Allocation, “A”, XLCA, 5%, 2037 | 1,900,000 | 1,873,590 | ||||||
| Sacramento, CA, City Financing Authority, Special Tax Rev. (Westlake and Regency Park), “A”, AGM, 5%, 2027 | 390,000 | 418,665 | ||||||
| San Diego, CA, Community Facilities District No. 3, Special Tax, 5%, 2036 | 840,000 | 883,856 | ||||||
| San Diego, CA, Redevelopment Agency, Tax Allocation (Centre City), “A”, AMBAC, 5.25%, 2025 | 2,360,000 | 2,486,189 | ||||||
| San Diego, CA, Redevelopment Agency, Tax Allocation (Centre City), “B”, AMBAC, 5.3%, 2020 | 1,250,000 | 1,250,887 | ||||||
| San Francisco, CA, City & County Redevelopment Financing Authority, Tax Allocation (Mission Bay North Redevelopment), “C”, 6.375%, 2032 | 1,000,000 | 1,166,180 | ||||||
| San Francisco, CA, City & County Redevelopment Financing Authority, Tax Allocation (Mission Bay North Redevelopment), “C”, 6.5%, 2039 | 1,000,000 | 1,169,520 | ||||||
24
Table of Contents
Portfolio of Investments – continued
| Municipal Bonds - continued | ||||||||
| Issuer | Shares/Par | Value ($) | ||||||
| Tax Assessment - continued | ||||||||
| San Francisco, CA, City & County Redevelopment Successor Agency, Community Facilities District No. 6 (Mission Bay South Public Improvements), “A”, 5%, 2030 | $ | 835,000 | $ | 889,383 | ||||
| San Francisco, CA, City & County Redevelopment Successor Agency, Community Facilities District No. 6 (Mission Bay South Public Improvements), “A”, 5%, 2033 | 715,000 | 758,164 | ||||||
| $ | 24,909,977 | |||||||
| Tobacco - 2.9% | ||||||||
| Golden State, CA, Tobacco Securitization Corp., Tobacco Settlement Rev., “A-1”, 6.75%, 2013 (c) | $ | 2,645,000 | $ | 2,673,143 | ||||
| Golden State, CA, Tobacco Securitization Corp., Tobacco Settlement Rev., “A-1”, 6.25%, 2013 (c) | 1,485,000 | 1,499,612 | ||||||
| Golden State, CA, Tobacco Securitization Corp., Tobacco Settlement Rev., “A-1”, 5.75%, 2047 | 3,405,000 | 3,257,870 | ||||||
| Illinois Railsplitter Tobacco Settlement Authority, 6%, 2028 | 1,800,000 | 2,180,988 | ||||||
| $ | 9,611,613 | |||||||
| Toll Roads - 0.2% | ||||||||
| Foothill/Eastern Corridor Agency, CA, Toll Road Rev., NATL, 5.125%, 2019 | $ | 500,000 | $ | 500,765 | ||||
| Transportation - Special Tax - 1.1% | ||||||||
| San Francisco, CA, Bay Area Rapid Transit District, Sales Tax Rev., “A”, 5%, 2036 | $ | 1,280,000 | $ | 1,470,797 | ||||
| San Francisco, CA, Municipal Transportation Agency Rev., “B”, 5%, 2037 | 1,910,000 | 2,110,703 | ||||||
| $ | 3,581,500 | |||||||
| Universities - Colleges - 10.5% | ||||||||
| California Educational Facilities Authority Rev. (Claremont Graduate University), “A”, 6%, 2033 | $ | 1,500,000 | $ | 1,708,440 | ||||
| California Educational Facilities Authority Rev. (Claremont Graduate University), “A”, 5%, 2042 | 1,000,000 | 1,040,250 | ||||||
| California Educational Facilities Authority Rev. (Dominican University of California), 5%, 2025 | 800,000 | 848,208 | ||||||
| California Educational Facilities Authority Rev. (Dominican University of California), 5%, 2036 | 1,150,000 | 1,189,135 | ||||||
| California Educational Facilities Authority Rev. (Lutheran University), “C”, 5%, 2029 | 2,500,000 | 2,605,350 | ||||||
| California Educational Facilities Authority Rev. (Pitzer College), 6%, 2040 | 3,000,000 | 3,498,150 | ||||||
| California Educational Facilities Authority Rev. (University Financing Project), 5%, 2017 | 685,000 | 718,469 | ||||||
| California Educational Facilities Authority Rev. (University Financing Project), 5%, 2026 | 1,315,000 | 1,315,815 | ||||||
| California Educational Facilities Authority Rev. (University of La Verne), “A”, 5%, 2029 | 1,500,000 | 1,553,025 | ||||||
| California Educational Facilities Authority Rev. (University of San Francisco), 6.125%, 2030 | 1,760,000 | 2,117,034 | ||||||
| California Educational Facilities Authority Rev. (University of The Pacific), 5.25%, 2029 | 1,265,000 | 1,390,905 | ||||||
| Issuer | Shares/Par | Value ($) | ||||||
| Universities - Colleges - continued | ||||||||
| California Municipal Finance Authority Rev. (Biola University), 5.8%, 2028 | $ | 2,000,000 | $ | 2,202,380 | ||||
| California Municipal Finance Authority Rev. (University of La Verne), “A”, 6.125%, 2030 | 1,500,000 | 1,742,265 | ||||||
| California Municipal Finance Authority Rev. (University of La Verne), “A”, 6.25%, 2040 | 1,500,000 | 1,733,505 | ||||||
| California Public Works Board Lease Rev. (The Regents of the University of California), 5%, 2028 | 2,125,000 | 2,536,336 | ||||||
| California Public Works Board Lease Rev. (The Regents of the University of California), 5%, 2034 | 1,500,000 | 1,674,810 | ||||||
| California State University Rev., “A”, 5%, 2024 | 2,130,000 | 2,564,307 | ||||||
| California Statewide Communities, Notre Dame de Namur University, 6.625%, 2033 | 1,000,000 | 1,004,200 | ||||||
| Oakland, CA, Joint Powers Financing Authority Rev., “A-1”, ASSD GTY, 5.25%, 2017 | 1,375,000 | 1,539,629 | ||||||
| University of California Rev., “G”, 4%, 2029 | 1,465,000 | 1,545,135 | ||||||
| $ | 34,527,348 | |||||||
| Universities - Dormitories - 1.3% | ||||||||
| California Statewide Communities Development Authority Rev. (Lancer Educational Student Housing Project), 5.625%, 2033 | $ | 2,000,000 | $ | 2,141,300 | ||||
| California Statewide Communities Development Authority Rev. (Student Housing, SUCI East Campus), 6%, 2040 | 2,000,000 | 2,189,140 | ||||||
| $ | 4,330,440 | |||||||
| Universities - Secondary Schools - 1.5% | ||||||||
| California Municipal Finance Authority Rev. (Partnerships to Uplift Communities Project), “A”, 5%, 2032 | $ | 825,000 | $ | 830,445 | ||||
| California Statewide Communities Development Authority School Facility Rev. (Aspire Public Schools), 6.125%, 2046 | 1,300,000 | 1,386,814 | ||||||
| California Statewide Communities Development Authority, School Facility Rev. (Alliance for College-Ready Public Schools), “A”, 6.1%, 2032 | 850,000 | 889,083 | ||||||
| California Statewide Communities Development Authority, School Facility Rev. (Alliance for College-Ready Public Schools), “A”, 6.375%, 2047 | 1,785,000 | 1,866,771 | ||||||
| $ | 4,973,113 | |||||||
| Utilities - Cogeneration - 0.5% | ||||||||
| California Pollution Control Financing Authority, Water Furnishing Rev. (Poseidon Resources Desalination Project), 5%, 2045 | $ | 1,695,000 | $ | 1,716,154 | ||||
| Utilities - Investor Owned - 0.7% | ||||||||
| California Pollution Control Financing Authority, Water Facilities Rev. (American Water Capital Corp. Project), 5.25%, 2040 | $ | 2,000,000 | $ | 2,146,820 | ||||
25
Table of Contents
Portfolio of Investments – continued
| Municipal Bonds - continued | ||||||||
| Issuer | Shares/Par | Value ($) | ||||||
| Utilities - Municipal Owned - 5.9% | ||||||||
| California Department of Water Resources, Power Supply Rev., “L”, 5%, 2019 | $ | 4,695,000 | $ | 5,719,214 | ||||
| California Infrastructure & Economic Development Bank Rev. (California Independent System Corp.), “A”, 6%, 2030 | 3,755,000 | 3,993,780 | ||||||
| Imperial, CA, Irrigation District Electric Rev., “B”, 5%, 2025 | 1,015,000 | 1,170,985 | ||||||
| Imperial, CA, Irrigation District Electric Rev., “B”, 5%, 2026 | 1,245,000 | 1,418,964 | ||||||
| Sacramento, CA, Municipal Utility District Rev., “X”, 5%, 2025 | 2,130,000 | 2,529,716 | ||||||
| Tuolumne Wind Project Authority Rev. (Tuolomne Co.), “A”, 5.625%, 2029 | 2,000,000 | 2,346,440 | ||||||
| Vernon, CA, Electric System Rev., “A”, 5.5%, 2041 | 2,130,000 | 2,317,738 | ||||||
| $ | 19,496,837 | |||||||
| Utilities - Other - 2.1% | ||||||||
| California M-S-R Energy Authority Gas Rev., “A”, 7%, 2034 | $ | 1,750,000 | $ | 2,440,777 | ||||
| Long Beach, CA, Bond Finance Authority Natural Gas Purchase Rev., “A”, 5.25%, 2022 | 2,210,000 | 2,558,605 | ||||||
| Southern California Public Power Authority (Natural Gas Project No. 1), “A”, 5%, 2033 | 1,655,000 | 1,878,028 | ||||||
| $ | 6,877,410 | |||||||
| Water & Sewer Utility Revenue - 7.5% | ||||||||
| Bay Area, CA, Water Supply & Conservation Agency, “A”, 5%, 2034 | $ | 1,275,000 | $ | 1,464,108 | ||||
| California Department of Water Resources, Center Valley Project Rev., “A-J”, 5%, 2025 | 2,550,000 | 3,119,186 | ||||||
| Commonwealth of Puerto Rico Aqueduct & Sewer Authority Rev., “A”, 5.75%, 2037 | 680,000 | 672,044 | ||||||
| Escondido CA, Joint Powers Financing Authority Rev. (Water System Financing), 5%, 2041 | 2,540,000 | 2,728,747 | ||||||
| Issuer | Shares/Par | Value ($) | ||||||
| Water & Sewer Utility Revenue - continued | ||||||||
| Guam Government Waterworks Authority, Water & Wastewater System Rev., 5.625%, 2040 | $ | 525,000 | $ | 548,908 | ||||
| Madera, CA, Irrigation Financing Authority Rev., 6.5%, 2040 | 2,560,000 | 2,850,048 | ||||||
| Ontario, CA, COP, Water Systems Improvement Project, NATL, 5%, 2034 | 2,000,000 | 2,067,060 | ||||||
| Placerville, CA, Public Financing Authority Rev. (Wastewater Systems Refining & Improvement Project), XLCA, 5%, 2034 | 2,000,000 | 2,003,640 | ||||||
| San Diego, CA, Public Facilities Financing Authority Sewer Rev., “A”, 5%, 2028 | 350,000 | 410,603 | ||||||
| San Diego, CA, Public Facilities Financing Authority Sewer Rev., “B”, 5%, 2022 | 1,175,000 | 1,409,154 | ||||||
| San Francisco, CA, City & County Public Utilities Commission Water Rev., “A”, 5%, 2023 | 2,555,000 | 3,129,313 | ||||||
| San Francisco, CA, City & County Public Utilities Commission Water Rev., “A”, 5.25%, 2031 | 1,885,000 | 2,183,961 | ||||||
| Southern California Metropolitan Water District Rev., “A”, 5%, 2028 | 1,875,000 | 2,138,306 | ||||||
| $ | 24,725,078 | |||||||
Total Municipal Bonds (Identified Cost, $295,225,558) | $ | 319,528,456 | ||||||
| Money Market Funds - 1.2% | ||||||||
| MFS Institutional Money Market Portfolio, 0.14%, at Cost and Net Asset Value (v) | 3,971,626 | $ | 3,971,626 | |||||
Total Investments (Identified Cost, $299,197,184) | $ | 323,500,082 | ||||||
| Other Assets, Less Liabilities - 1.6% | 5,163,595 | |||||||
| Net Assets - 100.0% | $ | 328,663,677 | ||||||
See Portfolio Footnotes and Notes to Financial Statements
26
Table of Contents
PORTFOLIO OF INVESTMENTS
3/31/13
MFS GEORGIA MUNICIPAL BOND FUND
The Portfolio of Investments is a complete list of all securities owned by your fund. It is categorized by broad-based asset classes.
| Municipal Bonds - 96.0% | ||||||||
| Issuer | Shares/Par | Value ($) | ||||||
| Airport Revenue - 3.9% | ||||||||
| Atlanta, GA, Airport Passenger Facilities Rev., “J”, AGM, 5%, 2029 | $ | 750,000 | $ | 792,210 | ||||
| Atlanta, GA, Airport Passenger Facilities Rev., “J”, AGM, 5%, 2034 | 750,000 | 791,415 | ||||||
| Atlanta, GA, Airport Rev., “B”, AGM, 5.25%, 2033 | 1,000,000 | 1,044,770 | ||||||
| Augusta, GA, Airport Rev., “B”, 5.35%, 2028 | 350,000 | 358,873 | ||||||
| Denver, CO, City & County Airport Systems Rev., “A”, 5%, 2027 | 45,000 | 50,862 | ||||||
| Denver, CO, City & County Airport Systems Rev., “A”, 5%, 2028 | 45,000 | 50,626 | ||||||
| Denver, CO, City & County Airport Systems Rev., “B”, 5%, 2032 | 85,000 | 96,297 | ||||||
| $ | 3,185,053 | |||||||
| General Obligations - General Purpose - 7.3% | ||||||||
| Atlanta & Fulton County, GA, Park Improvement, “A”, NATL, 5%, 2030 | $ | 500,000 | $ | 545,065 | ||||
| Gilmer County, GA, Building Authority Rev. (Courthouse Project), “A”, SYNCORA, 5%, 2029 | 500,000 | 518,825 | ||||||
| Gwinnett County, GA, Development Authority Rev. (Civic & Cultural Center), 4%, 2021 | 510,000 | 590,192 | ||||||
| Lagrange-Troup County, GA, Hospital Authority Rev., 5.5%, 2038 | 500,000 | 546,505 | ||||||
| Puerto Rico Public Buildings Authority Rev., Guaranteed (Government Facilities), “I”, 5.25%, 2033 | 245,000 | 237,554 | ||||||
| Puerto Rico Public Buildings Authority Rev., Guaranteed, “S”, 6%, 2041 | 265,000 | 268,752 | ||||||
| State of California, 5.125%, 2033 | 305,000 | 342,524 | ||||||
| State of California, 6%, 2039 | 420,000 | 502,450 | ||||||
| State of Georgia, “E”, 5%, 2016 | 1,000,000 | 1,143,940 | ||||||
| State of Georgia, “I”, 5%, 2019 | 1,000,000 | 1,232,680 | ||||||
| State of Georgia, “I”, 4%, 2024 | 100,000 | 114,504 | ||||||
| $ | 6,042,991 | |||||||
| General Obligations - Improvement - 0.4% | ||||||||
| Guam Government, “A”, 6.75%, 2029 | $ | 185,000 | $ | 206,898 | ||||
| Guam Government, “A”, 5.25%, 2037 | 100,000 | 100,809 | ||||||
| Guam Government, “A”, 7%, 2039 | 25,000 | 27,875 | ||||||
| $ | 335,582 | |||||||
| General Obligations - Schools - 4.5% | ||||||||
| Cherokee County, GA, School District, 5%, 2033 | $ | 500,000 | $ | 582,145 | ||||
| Commerce, GA, School District, 5%, 2022 | 500,000 | 608,965 | ||||||
| Forsyth County, GA, School District, 5%, 2018 | 610,000 | 726,937 | ||||||
| Gwinnett County, GA, School District, 5%, 2029 | 1,000,000 | 1,246,450 | ||||||
| Jefferson, GA, School District, “A”, 5.25%, 2029 | 500,000 | 587,475 | ||||||
| $ | 3,751,972 | |||||||
| Healthcare Revenue - Hospitals - 16.1% | ||||||||
| Brunswick, GA, Hospital Authority Rev. (Glynn-Brunswick Memorial Hospital), 5.625%, 2034 | $ | 750,000 | $ | 834,908 | ||||
| Issuer | Shares/Par | Value ($) | ||||||
| Healthcare Revenue - Hospitals - continued | ||||||||
| Chatham County, GA, Hospital Authority Rev., Hospital Improvement (Memorial Health University), ��A”, 5.375%, 2026 | $ | 200,000 | $ | 207,556 | ||||
| Clarke County, GA, Hospital Authority Rev. (Athens Regional Medical Center Project), 5%, 2032 | 1,000,000 | 1,125,740 | ||||||
| Cobb County, GA, Kennestone Hospital Authority Rev. (Wellstar Health System, Inc.), 5%, 2030 | 500,000 | 572,320 | ||||||
| Cobb County, GA, Kennestone Hospital Authority Rev. (Wellstar Health System, Inc.), “B”, AMBAC, 6.25%, 2034 | 500,000 | 591,800 | ||||||
| Dalton, GA, Development Authority Rev. (Hamilton Health Care System), 5%, 2028 | 500,000 | 553,960 | ||||||
| DeKalb County, GA, Hospital Authority Rev. (DeKalb Medical Center, Inc.), 6.125%, 2040 | 500,000 | 582,525 | ||||||
| DeKalb County, GA, Private Hospital Authority Rev. Anticipation Certificates (Children’s Healthcare), 5.25%, 2039 | 750,000 | 825,960 | ||||||
| Escambia County, FL, Health Facilities Authority (Baptist Hospital, Inc.), “A”, 6%, 2036 | 350,000 | 402,938 | ||||||
| Fulton County, GA, Development Authority Rev. (Piedmont Healthcare), “A”, 5.25%, 2037 | 700,000 | 775,523 | ||||||
| Gainesville & Hall Counties, GA, Hospital Authority Rev. (Northeast Georgia Health System, Inc.), “A”, 5.25%, 2034 | 500,000 | 523,600 | ||||||
| Gainesville & Hall Counties, GA, Hospital Authority Rev. (Northeast Georgia Health System, Inc.), “B”, 5%, 2033 | 500,000 | 543,500 | ||||||
| Georgia Medical Center Hospital Authority Rev. (Columbus Regional Healthcare System, Inc.), ASSD GTY, 6.5%, 2038 | 300,000 | 336,717 | ||||||
| Illinois Finance Authority Rev. (Resurrection Health), 6.125%, 2025 | 65,000 | 73,517 | ||||||
| Illinois Finance Authority Rev. (Silver Cross Hospital & Medical Centers), 7%, 2044 | 200,000 | 238,372 | ||||||
| Jefferson Parish, LA, Hospital Service District No. 2 (East Jefferson General Hospital), 6.25%, 2031 | 45,000 | 52,219 | ||||||
| Jefferson Parish, LA, Hospital Service District No. 2 (East Jefferson General Hospital), 6.375%, 2041 | 210,000 | 244,558 | ||||||
| Kentucky Economic Development Finance Authority, Hospital Facilities Rev. (Owensboro Medical Health System), “A”, 5.75%, 2025 | 160,000 | 185,586 | ||||||
| Kentucky Economic Development Finance Authority, Hospital Facilities Rev. (Owensboro Medical Health System), “A”, 6.375%, 2040 | 200,000 | 237,106 | ||||||
| Kentucky Economic Development Finance Authority, Hospital Facilities Rev. (Owensboro Medical Health System), “A”, 6.5%, 2045 | 135,000 | 160,732 | ||||||
| Martin County, FL, Health Facilities Authority Rev. (Martin Memorial Medical Center), 5.5%, 2042 | 110,000 | 122,005 | ||||||
27
Table of Contents
Portfolio of Investments – continued
| Municipal Bonds - continued | ||||||||
| Issuer | Shares/Par | Value ($) | ||||||
| Healthcare Revenue - Hospitals - continued | ||||||||
| Miami-Dade County, FL, Health Facilities Authority Hospital Rev. (Variety Children’s Hospital), “A”, 6%, 2030 | $ | 45,000 | $ | 52,340 | ||||
| Michigan Hospital Finance Authority Rev. (Henry Ford Health System), 5.625%, 2029 | 40,000 | 45,410 | ||||||
| New Hampshire Business Finance Authority Rev. (Elliot Hospital Obligated Group), “A”, 6%, 2027 | 130,000 | 150,779 | ||||||
| New Hampshire Business Finance Authority Rev. (Elliot Hospital Obligated Group), “A”, 6.125%, 2039 | 180,000 | 202,453 | ||||||
| North Carolina Medical Care Commission, Hospital Rev. (The North Carolina Baptist Hospitals, Inc.), 5.25%, 2029 | 355,000 | 402,446 | ||||||
| Richmond County, GA, Development Authority Rev., Capital Appreciation, ETM, 0%, 2021 (c) | 225,000 | 187,437 | ||||||
| Richmond County, GA, Hospital Authority Rev. Anticipation Certificates (University Health Services, Inc. Project), 5.5%, 2036 | 750,000 | 826,170 | ||||||
| Thomasville, GA, Hospital Authority Rev. Anticipation Certificates (John D. Archbold Memorial Hospital), 5.125%, 2030 | 500,000 | 536,105 | ||||||
| Thomasville, GA, Hospital Authority Rev. Anticipation Certificates (John D. Archbold Memorial Hospital), 5.375%, 2040 | 500,000 | 538,785 | ||||||
| Valdosta & Lowndes County, GA, Hospital Authority (South Georgia Medical Center Project), 5%, 2033 | 240,000 | 248,983 | ||||||
| Wisconsin Health & Educational Facilities Authority Rev. (Mercy Alliance), 5%, 2039 | 225,000 | 240,325 | ||||||
| Wisconsin Health & Educational Facilities Authority Rev. (ProHealth Care, Inc. Obligated Group), 6.625%, 2039 | 385,000 | 446,739 | ||||||
| Wisconsin Health & Educational Facilities Authority Rev. (Wheaton Franciscan Healthcare), 5.25%, 2031 | 260,000 | 278,075 | ||||||
| $ | 13,347,189 | |||||||
| Healthcare Revenue - Long Term Care - 1.2% | ||||||||
| Fulton County, GA, Residential Care Facilities, Elderly Authority Rev. (Canterbury Court), “A”, 6.125%, 2034 | $ | 150,000 | $ | 152,789 | ||||
| Gainesville & Hall County, GA, Development Authority Retirement Community Rev. (ACTS Retirement), 6.625%, 2039 | 200,000 | 232,136 | ||||||
| Georgia Medical Center Hospital Authority Rev. (Spring Harbor Green Island Project), 5.25%, 2037 | 200,000 | 198,898 | ||||||
| Savannah, GA, Economic Development Authority Rev., Capital Appreciation, “C”, ETM, 0%, 2021 (c) | 500,000 | 416,530 | ||||||
| $ | 1,000,353 | |||||||
| Industrial Revenue - Environmental Services - 0.7% | ||||||||
| Savannah, GA, Economic Development Authority, Solid Waste Disposal Rev. (Georgia Waste Management Project), “A”, 5.5%, 2016 | $ | 500,000 | $ | 565,130 | ||||
| Issuer | Shares/Par | Value ($) | ||||||
| Industrial Revenue - Paper - 0.9% | ||||||||
| Rockdale County, GA, Development Authority Project Rev. (Visy Paper Project), “A”, 6.125%, 2034 | $ | 150,000 | $ | 156,360 | ||||
| Savannah, GA, Economic Development Pollution (Union Camp Corp.), 6.15%, 2017 | 500,000 | 569,185 | ||||||
| $ | 725,545 | |||||||
| Miscellaneous Revenue - Other - 1.6% | ||||||||
| Citizens Property Insurance Corp., FL, “A-1”, 5%, 2020 | $ | 285,000 | $ | 338,842 | ||||
| Fulton County, GA, Development Authority Rev. (Georgia Tech Athletic Association), “A”, 5%, 2042 | 750,000 | 822,428 | ||||||
| Miami-Dade County, FL, Special Obligation, “B”, 5%, 2035 | 90,000 | 98,391 | ||||||
| Miami-Dade County, FL, Special Obligation, “B”, 5%, 2037 | 65,000 | 70,844 | ||||||
| $ | 1,330,505 | |||||||
| Multi-Family Housing Revenue - 0.8% | ||||||||
| Hinesville, GA, Leased Housing Corp., “A”, FHA, 6.7%, 2017 | $ | 685,000 | $ | 685,658 | ||||
| Sales & Excise Tax Revenue - 6.1% | ||||||||
| Colorado Regional Transportation District, Private Activity Rev. (Denver Transportation Partners), 6.5%, 2030 | $ | 265,000 | $ | 318,917 | ||||
| Colorado Regional Transportation District, Sales Tax Rev. (Fastracks Project), “A”, 5%, 2027 | 290,000 | 346,225 | ||||||
| Guam Government Business Privilege Tax Rev., “A”, 5.25%, 2036 | 170,000 | 189,523 | ||||||
| Guam Government Business Privilege Tax Rev., “C”, 5%, 2016 | 65,000 | 74,387 | ||||||
| Guam Government Business Privilege Tax Rev., “C”, 5%, 2017 | 70,000 | 82,014 | ||||||
| Guam Government Business Privilege Tax Rev., “C”, 5%, 2018 | 65,000 | 77,210 | ||||||
| Massachusetts School Building Authority, Dedicated Sales Tax Rev., “B”, 5%, 2035 | 485,000 | 555,582 | ||||||
| Metropolitan Atlanta, GA, Rapid Transit Authority Rev., “A”, 4%, 2031 | 1,000,000 | 1,056,160 | ||||||
| Metropolitan Atlanta, GA, Rapid Transit Authority Rev., “A”, 4%, 2033 | 1,000,000 | 1,048,020 | ||||||
| Metropolitan Atlanta, GA, Rapid Transit Authority Rev., “B”, AGM, 5%, 2037 | 250,000 | 277,995 | ||||||
| Puerto Rico Infrastructure Financing Authority, Special Tax Rev., “C”, FGIC, 5.5%, 2022 | 295,000 | 311,603 | ||||||
| Puerto Rico Sales Tax Financing Corp., Sales Tax Rev., 5.25%, 2057 | 280,000 | 289,268 | ||||||
| Puerto Rico Sales Tax Financing Corp., Sales Tax Rev., “C”, 6%, 2039 | 285,000 | 306,808 | ||||||
| Puerto Rico Sales Tax Financing Corp., Sales Tax Rev., Capital Appreciation, “A”, 0%, 2033 | 370,000 | 115,958 | ||||||
| $ | 5,049,670 | |||||||
28
Table of Contents
Portfolio of Investments – continued
| Municipal Bonds - continued | ||||||||
| Issuer | Shares/Par | Value ($) | ||||||
| Single Family Housing Revenue - Local - 0.6% | ||||||||
| Atlanta, GA, Urban Residential Financing Authority, Multifamily Housing Rev. (Ginnie Mae Collateralized - Amal Heights), GNMA, 4.9%, 2040 | $ | 500,000 | $ | 526,325 | ||||
| Single Family Housing - State - 3.1% | ||||||||
| California Housing Finance Agency Rev. (Home Mortgage), “I”, 4.7%, 2026 | $ | 300,000 | $ | 301,542 | ||||
| Georgia Housing & Finance Authority Rev., Single Family Mortgage, “A”, 3.125%, 2027 | 500,000 | 494,930 | ||||||
| Georgia Housing & Finance Authority Rev., Single Family Mortgage, “A”, 3.45%, 2032 | 500,000 | 498,215 | ||||||
| Georgia Housing & Finance Authority Rev., Single Family Mortgage, “C-2”, 5.1%, 2022 | 745,000 | 745,566 | ||||||
| Georgia Housing & Finance Authority Rev., Single Family Mortgage, “D-2”, 5.2%, 2032 | 500,000 | 521,205 | ||||||
| $ | 2,561,458 | |||||||
| State & Agency - Other - 4.0% | ||||||||
| Carroll City-County, GA, Hospital Authority Rev. (Tanner Medical Center), 5%, 2040 | $ | 500,000 | $ | 537,330 | ||||
| Floyd County, GA, Hospital Authority Rev. Anticipation Certificates (Floyd Medical Center Project), “B”, 5%, 2032 | 1,000,000 | 1,106,720 | ||||||
| Paulding County, GA, Hospital Authority Rev. Anticipation Certificates, “A”, 5%, 2042 | 500,000 | 550,955 | ||||||
| Tift County, GA, Hospital Authority Rev. Anticipation Certificates, 5%, 2038 | 1,000,000 | 1,095,380 | ||||||
| $ | 3,290,385 | |||||||
| State & Local Agencies - 2.0% | ||||||||
| Georgia Municipal Association, Inc. (Riverdale Public Purpose Project), ASSD GTY, 5.5%, 2038 | $ | 1,000,000 | $ | 1,103,430 | ||||
| Los Angeles, CA, Municipal Improvement Corp. Lease Rev. (Real Property), “E”, 6%, 2039 | 115,000 | 136,753 | ||||||
| Virginia Public School Authority, Special Obligation Montgomery County, 5%, 2030 | 320,000 | 371,098 | ||||||
| $ | 1,611,281 | |||||||
| Tax - Other - 1.0% | ||||||||
| Guam Government Ltd. Obligation Rev., “A”, 5.375%, 2024 | $ | 75,000 | $ | 81,936 | ||||
| Guam Government Ltd. Obligation Rev., “A”, 5.625%, 2029 | 25,000 | 27,277 | ||||||
| New Jersey Economic Development Authority Rev., 5%, 2025 | 75,000 | 85,553 | ||||||
| New Jersey Economic Development Authority Rev., 5%, 2026 | 35,000 | 39,657 | ||||||
| New Jersey Economic Development Authority Rev., 5%, 2028 | 15,000 | 16,781 | ||||||
| New Jersey Economic Development Authority Rev., 5%, 2029 | 15,000 | 16,706 | ||||||
| Virgin Islands Public Finance Authority Rev., “A-1”, 5%, 2029 | 50,000 | 54,323 | ||||||
| Virgin Islands Public Finance Authority Rev., “B”, 5%, 2025 | 50,000 | 55,178 | ||||||
| Issuer | Shares/Par | Value ($) | ||||||
| Tax - Other - continued | ||||||||
| Virgin Islands Public Finance Authority Rev., Matching Fund Loan Note, “A”, 5%, 2029 | $ | 190,000 | $ | 207,989 | ||||
| Virgin Islands Public Finance Authority Rev., Matching Fund Loan Note, “A”, 6%, 2039 | 180,000 | 198,895 | ||||||
| $ | 784,295 | |||||||
| Tax Assessment - 0.4% | ||||||||
| Atlanta, GA, Tax Allocation (Eastside Project), “B”, 5.6%, 2030 | $ | 150,000 | $ | 161,001 | ||||
| Atlanta, GA, Tax Allocation (Princeton Lakes Project), 5.5%, 2031 | 125,000 | 131,314 | ||||||
| $ | 292,315 | |||||||
| Tobacco - 0.7% | ||||||||
| Buckeye, OH, Tobacco Settlement Financing Authority, “A-2”, 5.125%, 2024 | $ | 90,000 | $ | 82,553 | ||||
| Illinois Railsplitter Tobacco Settlement Authority, 6%, 2028 | 235,000 | 284,740 | ||||||
| New Jersey Tobacco Settlement Financing Corp., “1-A”, 5%, 2041 | 230,000 | 207,240 | ||||||
| $ | 574,533 | |||||||
| Toll Roads - 0.5% | ||||||||
| Virginia Small Business Financing Authority Rev. (Elizabeth River Crossings Opco LLC Project), 5.25%, 2032 | $ | 70,000 | $ | 74,859 | ||||
| Virginia Small Business Financing Authority Rev. (Elizabeth River Crossings Opco LLC Project), 6%, 2037 | 120,000 | 137,090 | ||||||
| Virginia Small Business Financing Authority Rev. (Elizabeth River Crossings Opco LLC Project), 5.5%, 2042 | 190,000 | 204,077 | ||||||
| $ | 416,026 | |||||||
| Transportation - Special Tax - 0.3% | ||||||||
| Commonwealth of Puerto Rico Highway & Transportation Authority Rev., “CC”, AGM, 5.5%, 2028 | $ | 185,000 | $ | 205,452 | ||||
| Universities - Colleges - 18.3% | ||||||||
| Athens, GA, Housing Authority Rev. (University of Georgia East Campus Funding), 5.25%, 2035 | $ | 500,000 | $ | 559,590 | ||||
| Athens-Clarke County, GA, Unified Government Development Authority, Educational Facilities Rev., Convertible Capital Appreciation, 0%, 2024 | 250,000 | 268,420 | ||||||
| Athens-Clarke County, GA, Unified Government Development Authority, Educational Facilities Rev., Convertible Capital Appreciation, 0%, 2031 | 250,000 | 261,920 | ||||||
| Atkinson-Coffee County, GA, Joint Development Authority Rev. (SGC Real Estate Foundation LLC), ASSD GTY, 5.25%, 2034 | 500,000 | 561,340 | ||||||
| Atlanta, GA, Development Authority Educational Facilities Rev. (Panther Place), ASSD GTY, 4.75%, 2032 | 500,000 | 541,175 | ||||||
| Atlanta, GA, Development Authority Educational Facilities Rev. (Science Park LLC), 5%, 2032 | 500,000 | 547,025 | ||||||
29
Table of Contents
Portfolio of Investments – continued
| Municipal Bonds - continued | ||||||||
| Issuer | Shares/Par | Value ($) | ||||||
| Universities - Colleges - continued | ||||||||
| Atlanta, GA, Development Authority Educational Facilities Rev. (Science Park LLC), 5%, 2039 | $ | 500,000 | $ | 536,045 | ||||
| Bleckley-Dodge County, GA, Student Housing Facilities Rev. (Middle Georgia College), 5.25%, 2038 | 500,000 | 532,680 | ||||||
| Carrollton, GA, Payroll Development Authority Rev. (UWG Phase II, LLC Project), AGM, 5%, 2040 | 500,000 | 550,270 | ||||||
| Cobb County, GA, Development Authority, Dining Hall Lease Rev. (KSU Dining Hall), ASSD GTY, 5.75%, 2039 | 1,000,000 | 1,134,960 | ||||||
| Cobb County, GA, Development Authority, Sports & Recreation Facilities Lease Rev. (Kennesaw State University Foundation), AGM, 5%, 2035 | 750,000 | 809,723 | ||||||
| Dahlonega, GA, Downtown Development Authority Rev. (North Georgia MBA LLC), ASSD GTY, 4.75%, 2040 | 500,000 | 534,710 | ||||||
| Dahlonega, GA, Downtown Development Authority Rev. (North Georgia PHD LLC), ASSD GTY, 5.25%, 2034 | 500,000 | 555,780 | ||||||
| Dekalb Newton & Gwinnett Counties, GA, Joint Development Authority Rev. (GGC Foundation LLC), 6%, 2034 | 500,000 | 576,810 | ||||||
| Fulton County, GA, Development Authority Rev. (Georgia Tech Foundation Funding), SYNCORA, 5%, 2032 | 500,000 | 542,290 | ||||||
| Fulton County, GA, Development Authority Rev. (Molecular Science Building), NATL, 5%, 2034 | 1,000,000 | 1,038,360 | ||||||
| Fulton County, GA, Development Authority Rev. (Spelman College), 5%, 2032 | 775,000 | 840,867 | ||||||
| Georgia Higher Education Facilities Authority Rev. (Real Estate Foundation), 6%, 2034 | 300,000 | 344,733 | ||||||
| Illinois Finance Authority Rev. (Roosevelt University Project), 6.5%, 2039 | 430,000 | 487,009 | ||||||
| Marietta, GA, Development Facilities Authority Rev. (Life University), 7%, 2030 | 100,000 | 107,816 | ||||||
| New Jersey Educational Facilities Authority Rev. (University of Medicine & Dentistry), “B”, 6%, 2017 | 275,000 | 323,983 | ||||||
| Pinellas County, FL, Educational Facilities Authority Rev. (Barry University), 6%, 2041 | 65,000 | 74,790 | ||||||
| Private Colleges & Universities, GA, Authority Rev. (Agnes Scott College), 5%, 2024 | 500,000 | 582,430 | ||||||
| Private Colleges & Universities, GA, Authority Rev. (Emory University), “C”, 4.5%, 2032 | 825,000 | 921,129 | ||||||
| Private Colleges & Universities, GA, Authority Rev. (Mercer University), “C”, 5.25%, 2027 | 350,000 | 404,625 | ||||||
| Puerto Rico Industrial, Tourist, Educational, Medical, & Environmental Control Facilities Financing Authority, Higher Education Rev. (Ana G. Mendez University System Project), 5.125%, 2032 | 25,000 | 24,598 | ||||||
| Issuer | Shares/Par | Value ($) | ||||||
| Universities - Colleges - continued | ||||||||
| Puerto Rico Industrial, Tourist, Educational, Medical, & Environmental Control Facilities Financing Authority, Higher Education Rev. (Ana G. Mendez University System Project), 5.375%, 2042 | $ | 45,000 | $ | 45,111 | ||||
| Puerto Rico Industrial, Tourist, Educational, Medical, & Environmental Control Facilities Financing Authority, Higher Education Rev. (International American University of Puerto Rico Project), 5%, 2031 | 55,000 | 57,495 | ||||||
| Savannah, GA, Economic Development Authority Rev. (AASU Student Union LLC), ASSD GTY, 5.125%, 2039 | 500,000 | 540,270 | ||||||
| Savannah, GA, Economic Development Authority Rev. (SSU Community Development I LLC Project), ASSD GTY, 5.5%, 2035 | 500,000 | 559,420 | ||||||
| University of California Rev., “G”, 4%, 2029 | 260,000 | 274,222 | ||||||
| $ | 15,139,596 | |||||||
| Universities - Secondary Schools - 0.1% | ||||||||
| North Texas Education Finance Corp., Education Rev. (Uplift Education), “A”, 4.875%, 2032 | $ | 30,000 | $ | 32,258 | ||||
| North Texas Education Finance Corp., Education Rev. (Uplift Education), “A”, 5.125%, 2042 | 75,000 | 81,355 | ||||||
| $ | 113,613 | |||||||
| Utilities - Investor Owned - 0.2% | ||||||||
| Michigan Strategic Fund Ltd. Obligation Rev. (Detroit Edison Co.), 5.5%, 2029 (b) | $ | 160,000 | $ | 182,544 | ||||
| Utilities - Municipal Owned - 4.0% | ||||||||
| Georgia Municipal Electric Authority Power Rev., “A”, NATL, 6.5%, 2020 | $ | 1,130,000 | $ | 1,306,992 | ||||
| Georgia Municipal Electric Authority Power Rev., “GG”, 5%, 2039 | 500,000 | 560,130 | ||||||
| Georgia Municipal Gas Authority Rev. (Gas Portfolio III Project), “S”, 5%, 2025 | 500,000 | 587,960 | ||||||
| Georgia Municipal Gas Authority Rev. (Gas Portfolio III Project), “S”, 5%, 2026 | 500,000 | 582,540 | ||||||
| Guam Power Authority Rev., “A”, 5.5%, 2030 | 160,000 | 178,035 | ||||||
| Long Island, NY, Power Authority, Electric Systems Rev., “A”, 6%, 2033 | 100,000 | 119,308 | ||||||
| $ | 3,334,965 | |||||||
| Utilities - Other - 2.8% | ||||||||
| Georgia Main Street Natural Gas, Inc., Gas Project Rev., “A”, 5%, 2022 | $ | 910,000 | $ | 1,055,009 | ||||
| Georgia Main Street Natural Gas, Inc., Gas Project Rev., “B”, 5%, 2019 | 250,000 | 282,580 | ||||||
| Nebraska Central Plains Energy Project, Gas Project Rev., “3”, 5%, 2032 | 310,000 | 344,636 | ||||||
| Tennessee Energy Acquisition Corp. Gas Rev., “A”, 5.25%, 2020 | 250,000 | 290,548 | ||||||
| Tennessee Energy Acquisition Corp., Gas Rev., “A”, 5.25%, 2019 | 225,000 | 260,427 | ||||||
30
Table of Contents
Portfolio of Investments – continued
| Municipal Bonds - continued | ||||||||
| Issuer | Shares/Par | Value ($) | ||||||
| Utilities - Other - continued | ||||||||
| Texas Gas Acquisition & Supply Corp III., Gas Supply Rev., 5%, 2031 | $ | 40,000 | $ | 42,427 | ||||
| Texas Gas Acquisition & Supply Corp III., Gas Supply Rev., 5%, 2032 | 65,000 | 68,574 | ||||||
| $ | 2,344,201 | |||||||
| Water & Sewer Utility Revenue - 14.5% | ||||||||
| Athens-Clarke County, GA, Unified Government Water & Sewer Rev., 5.625%, 2033 | $ | 500,000 | $ | 589,260 | ||||
| Augusta, GA, Water & Sewer Rev., 4%, 2031 | 500,000 | 533,795 | ||||||
| Augusta, GA, Water & Sewer Rev., AGM, 5.25%, 2034 | 1,000,000 | 1,064,120 | ||||||
| Cherokee County, GA, Water & Sewer Authority Rev., 5%, 2021 | 385,000 | 478,193 | ||||||
| Cherokee County, GA, Water & Sewer Authority Rev., 5%, 2028 | 800,000 | 914,696 | ||||||
| Commonwealth of Puerto Rico Aqueduct & Sewer Authority Rev., “A”, 6%, 2044 | 1,000,000 | 1,004,790 | ||||||
| DeKalb County, GA, Water & Sewer Rev., “A”, 5.25%, 2031 | 1,000,000 | 1,166,800 | ||||||
| DeKalb County, GA, Water & Sewer Rev., “B”, 5.25%, 2025 | 1,000,000 | 1,282,390 | ||||||
| Fulton County, GA, Water & Sewer Rev., 5%, 2023 | 1,000,000 | 1,200,710 | ||||||
| Issuer | Shares/Par | Value ($) | ||||||
| Water & Sewer Utility Revenue - continued | ||||||||
| Fulton County, GA, Water & Sewer Rev., 5%, 2026 | $ | 500,000 | $ | 607,975 | ||||
| Fulton County, GA, Water & Sewer Rev., ETM, FGIC, 6.375%, 2014 (c) | 495,000 | 517,572 | ||||||
| Guam Government Waterworks Authority, Water & Wastewater System Rev., 5.625%, 2040 | 60,000 | 62,732 | ||||||
| Henry County, GA, Water & Sewer Authority Rev., BHAC, 5.25%, 2027 | 1,000,000 | 1,293,940 | ||||||
| Henry County, GA, Water & Sewer Authority Rev., 5.25%, 2028 | 1,000,000 | 1,295,600 | ||||||
| $ | 12,012,573 | |||||||
| Total Municipal Bonds (Identified Cost, $73,922,908) | $ | 79,409,210 | ||||||
| Money Market Funds - 3.7% | ||||||||
| MFS Institutional Money Market Portfolio, 0.14%, at Cost and Net Asset Value (v) | 3,019,083 | $ | 3,019,083 | |||||
| Total Investments (Identified Cost, $76,941,991) | $ | 82,428,293 | ||||||
| Other Assets, Less Liabilities - 0.3% | 289,481 | |||||||
| Net Assets - 100.0% | $ | 82,717,774 | ||||||
See Portfolio Footnotes and Notes to Financial Statements
31
Table of Contents
PORTFOLIO OF INVESTMENTS
3/31/13
MFS MARYLAND MUNICIPAL BOND FUND
The Portfolio of Investments is a complete list of all securities owned by your fund. It is categorized by broad-based asset classes.
| Municipal Bonds - 95.0% | ||||||||
| Issuer | Shares/Par | Value ($) | ||||||
| Airport Revenue - 0.7% | ||||||||
| Metropolitan Washington, DC, Airport Authority Rev., “A”, 5%, 2039 | $ | 750,000 | $ | 859,215 | ||||
| General Obligations - General Purpose - 13.3% | ||||||||
| Anne Arundel County, MD, General Improvement, 5%, 2025 | $ | 2,000,000 | $ | 2,467,580 | ||||
| Baltimore County, MD, Public Improvement, 5%, 2028 | 2,000,000 | 2,388,560 | ||||||
| Baltimore, MD, Public Improvement, “A”, AGM, 5%, 2027 | 1,050,000 | 1,217,801 | ||||||
| Commonwealth of Puerto Rico, “A”, 5.375%, 2033 | 260,000 | 259,184 | ||||||
| Commonwealth of Puerto Rico, Public Improvement, “B”, 6.5%, 2037 | 1,500,000 | 1,570,155 | ||||||
| State of California, 6%, 2039 | 720,000 | 861,343 | ||||||
| State of Maryland, 5%, 2020 | 3,500,000 | 4,097,975 | ||||||
| State of Maryland, “B”, 4.5%, 2017 | 2,000,000 | 2,324,340 | ||||||
| $ | 15,186,938 | |||||||
| General Obligations - Improvement - 1.7% | ||||||||
| Guam Government, “A”, 6.75%, 2029 | $ | 70,000 | $ | 78,286 | ||||
| Guam Government, “A”, 7%, 2039 | 80,000 | 89,199 | ||||||
| Prince George’s County, MD, Consolidated Public Improvement, “A”, 5%, 2030 | 1,500,000 | 1,770,255 | ||||||
| $ | 1,937,740 | |||||||
| Healthcare Revenue - Hospitals - 21.8% | ||||||||
| Brazoria County, TX, Health Facilities Development Corp., Hospital Rev. (Brazosport Regional Health System), 5.25%, 2032 | $ | 255,000 | $ | 265,011 | ||||
| Escambia County, FL, Health Facilities Authority (Baptist Hospital, Inc.), “A”, 6%, 2036 | 590,000 | 679,238 | ||||||
| Illinois Finance Authority Rev. (Silver Cross Hospital & Medical Centers), 7%, 2044 | 345,000 | 411,192 | ||||||
| Kentucky Economic Development Finance Authority, Hospital Facilities Rev. (Owensboro Medical Health System), “A”, 6.375%, 2040 | 370,000 | 438,646 | ||||||
| Kentucky Economic Development Finance Authority, Hospital Facilities Rev. (Owensboro Medical Health System), “A”, 6.5%, 2045 | 575,000 | 684,601 | ||||||
| Louisville & Jefferson County, KY, Metropolitan Government Healthcare Systems Rev. (Norton Healthcare, Inc.), 5.25%, 2036 | 640,000 | 676,109 | ||||||
| Martin County, FL, Health Facilities Authority Rev. (Martin Memorial Medical Center), 5.5%, 2042 | 165,000 | 183,008 | ||||||
| Maryland Health & Higher Educational Facilities Authority Rev. (Adventist Healthcare), “A”, 5.75%, 2025 | 500,000 | 505,890 | ||||||
| Maryland Health & Higher Educational Facilities Authority Rev. (Anne Arundel Health System, Inc.), 5%, 2040 | 1,000,000 | 1,074,140 | ||||||
| Issuer | Shares/Par | Value ($) | ||||||
| Healthcare Revenue - Hospitals - continued | ||||||||
| Maryland Health & Higher Educational Facilities Authority Rev. (Anne Arundel Health System, Inc.), “A”, 6.75%, 2039 | $ | 1,000,000 | $ | 1,200,680 | ||||
| Maryland Health & Higher Educational Facilities Authority Rev. (Ascension Health), “B”, 5%, 2051 | 1,000,000 | 1,096,680 | ||||||
| Maryland Health & Higher Educational Facilities Authority Rev. (Calvert Health Systems), 5.5%, 2039 | 1,000,000 | 1,024,580 | ||||||
| Maryland Health & Higher Educational Facilities Authority Rev. (Carroll Hospital), “A”, 5%, 2037 | 1,000,000 | 1,091,120 | ||||||
| Maryland Health & Higher Educational Facilities Authority Rev. (Doctors Community Hospital), “A”, 5%, 2029 | 750,000 | 788,835 | ||||||
| Maryland Health & Higher Educational Facilities Authority Rev. (Frederick Memorial Hospital), “A”, 4%, 2038 | 1,000,000 | 967,490 | ||||||
| Maryland Health & Higher Educational Facilities Authority Rev. (Johns Hopkins Health System), “A”, 5%, 2026 | 250,000 | 292,248 | ||||||
| Maryland Health & Higher Educational Facilities Authority Rev. (Johns Hopkins Medical Institutions), “A”, 5%, 2037 | 750,000 | 782,873 | ||||||
| Maryland Health & Higher Educational Facilities Authority Rev. (Lifebridge Health), ASSD GTY, 4.75%, 2038 | 965,000 | 1,015,653 | ||||||
| Maryland Health & Higher Educational Facilities Authority Rev. (Lifebridge Health), 4.75%, 2039 | 590,000 | 599,021 | ||||||
| Maryland Health & Higher Educational Facilities Authority Rev. (Medlantic/Helix Parent, Inc.), “A”, AGM, 5.25%, 2038 | 1,000,000 | 1,214,330 | ||||||
| Maryland Health & Higher Educational Facilities Authority Rev. (Medstar Health), 5.5%, 2033 | 635,000 | 666,121 | ||||||
| Maryland Health & Higher Educational Facilities Authority Rev. (Mercy Medical Center), “A”, 5.5%, 2042 | 750,000 | 812,648 | ||||||
| Maryland Health & Higher Educational Facilities Authority Rev. (Peninsula Regional Medical Center), 5%, 2036 | 1,000,000 | 1,060,070 | ||||||
| Maryland Health & Higher Educational Facilities Authority Rev. (Suburban Hospital), “A”, 5.5%, 2016 | 1,000,000 | 1,058,460 | ||||||
| Maryland Health & Higher Educational Facilities Authority Rev. (Union Hospital of Cecil County Issue), 5%, 2035 | 500,000 | 521,525 | ||||||
| Maryland Health & Higher Educational Facilities Authority Rev. (University of Maryland Medical System), AMBAC, 5%, 2031 | 1,000,000 | 1,085,720 | ||||||
| Maryland Health & Higher Educational Facilities Authority Rev. (University of Maryland Medical System), “A”, 5%, 2041 | 500,000 | 518,590 | ||||||
32
Table of Contents
Portfolio of Investments – continued
| Municipal Bonds - continued | ||||||||
| Issuer | Shares/Par | Value ($) | ||||||
| Healthcare Revenue - Hospitals - continued | ||||||||
| Maryland Health & Higher Educational Facilities Authority Rev. (Washington County Hospital), 5.75%, 2038 | $ | 500,000 | $ | 536,990 | ||||
| Maryland Industrial Development Authority, Economic Development Rev., RIBS, FRN, AGM, 11.212%, 2022 (p) | 1,150,000 | 1,484,489 | ||||||
| Michigan Hospital Finance Authority Rev. (Henry Ford Health System), 5.625%, 2029 | 65,000 | 73,791 | ||||||
| Montgomery County, MD, Rev. (Trinity Health Corp.), 5%, 2040 | 1,000,000 | 1,109,620 | ||||||
| New Hampshire Business Finance Authority Rev. (Elliot Hospital Obligated Group), “A”, 6%, 2027 | 480,000 | 556,723 | ||||||
| Richmond, IN, Hospital Authority Rev. (Reid Hospital), “A”, 6.5%, 2029 | 415,000 | 466,614 | ||||||
| $ | 24,942,706 | |||||||
| Healthcare Revenue - Long Term Care - 1.8% | ||||||||
| Gaithersburg, MD, Economic Development Rev. (Asbury Maryland Obligations Group), “A”, 5.125%, 2036 | $ | 400,000 | $ | 407,672 | ||||
| Howard County, MD, Retirement Rev. (Vantage House Facilities), “B”, 5.25%, 2037 | 300,000 | 289,686 | ||||||
| Maryland Health & Higher Educational Facilities Authority Rev. (Charlestown Community), 6.25%, 2041 | 750,000 | 857,618 | ||||||
| Maryland Health & Higher Educational Facilities Authority Rev. (King Farm Presbyterian Community), “A”, 5.3%, 2037 | 300,000 | 290,526 | ||||||
| Travis County, TX, Health Facilities Development Corp. Rev. (Westminster Manor Health), 7%, 2030 | 55,000 | 65,693 | ||||||
| Travis County, TX, Health Facilities Development Corp. Rev. (Westminster Manor Health), 7.125%, 2040 | 85,000 | 100,930 | ||||||
| $ | 2,012,125 | |||||||
| Healthcare Revenue - Other - 0.7% | ||||||||
| Maryland Economic Development Corp., Economic Development Rev. (Lutheran World Relief Refugee), 5.25%, 2019 | $ | 165,000 | $ | 180,766 | ||||
| Maryland Economic Development Corp., Economic Development Rev. (Lutheran World Relief Refugee), 5.25%, 2029 | 565,000 | 599,397 | ||||||
| $ | 780,163 | |||||||
| Industrial Revenue - Other - 0.5% | ||||||||
| Maryland Economic Development Corp., Pollution Control Rev. (CNX Marine Terminals, Inc.), 5.75%, 2025 | $ | 500,000 | $ | 557,010 | ||||
| Miscellaneous Revenue - Entertainment & Tourism - 0.1% | ||||||||
| Louisiana Stadium & Exposition District Rev., “A”, 5%, 2031 | $ | 20,000 | $ | 22,563 | ||||
| Louisiana Stadium & Exposition District Rev., “A”, 5%, 2036 | 60,000 | 66,923 | ||||||
| $ | 89,486 | |||||||
| Issuer | Shares/Par | Value ($) | ||||||
| Miscellaneous Revenue - Other - 1.6% | ||||||||
| Harford County, MD, Economic Development Rev. (Battelle Memorial Institute Project), 5.25%, 2034 | $ | 1,600,000 | $ | 1,626,816 | ||||
| Miami-Dade County, FL, Special Obligation, “B”, 5%, 2035 | 120,000 | 131,188 | ||||||
| Miami-Dade County, FL, Special Obligation, “B”, 5%, 2037 | 85,000 | 92,642 | ||||||
| $ | 1,850,646 | |||||||
| Multi-Family Housing Revenue - 5.8% | ||||||||
| Maryland Community Development Administration, Department of Housing & Community Development, “A”, 5.05%, 2047 | $ | 1,000,000 | $ | 1,022,270 | ||||
| Maryland Community Development Administration, Department of Housing & Community Development, “B”, FNMA, 5%, 2039 | 500,000 | 510,755 | ||||||
| Maryland Community Development Administration, Department of Housing & Community Development, “B”, FHA, 4.45%, 2040 | 1,500,000 | 1,560,195 | ||||||
| Maryland Community Development Administration, Department of Housing & Community Development, “D”, 5%, 2032 | 1,000,000 | 1,001,460 | ||||||
| Montgomery County, MD, Housing Opportunities Commission, Multifamily & Reconstruction Development Rev., “D”, 3.25%, 2037 | 1,500,000 | 1,450,935 | ||||||
| Montgomery County, MD, Housing Opportunities Commission, Multifamily Rev., 5.125%, 2037 | 1,000,000 | 1,091,430 | ||||||
| $ | 6,637,045 | |||||||
| Parking - 1.2% | ||||||||
| Maryland Health & Higher Educational Facilities Authority Rev. (Johns Hopkins Medical Institutions), AMBAC, 5%, 2034 | $ | 1,385,000 | $ | 1,399,085 | ||||
| Port Revenue - 0.5% | ||||||||
| Maryland Economic Development Corp. Rev. (Port America Chesapeake Terminal Project), “B”, 5.75%, 2035 | $ | 550,000 | $ | 622,215 | ||||
| Sales & Excise Tax Revenue - 3.6% | ||||||||
| Colorado Regional Transportation District, Private Activity Rev. (Denver Transportation Partners), 6%, 2041 | $ | 435,000 | $ | 498,636 | ||||
| Colorado Regional Transportation District, Sales Tax Rev. (Fastracks Project), “A”, 5%, 2027 | 405,000 | 483,521 | ||||||
| Guam Government Business Privilege Tax Rev., “A”, 5.25%, 2036 | 260,000 | 289,858 | ||||||
| Guam Government Business Privilege Tax Rev., “C”, 5%, 2016 | 80,000 | 91,553 | ||||||
| Guam Government Business Privilege Tax Rev., “C”, 5%, 2017 | 90,000 | 105,447 | ||||||
| Guam Government Business Privilege Tax Rev., “C”, 5%, 2018 | 85,000 | 100,966 | ||||||
33
Table of Contents
Portfolio of Investments – continued
| Municipal Bonds - continued | ||||||||
| Issuer | Shares/Par | Value ($) | ||||||
| Sales & Excise Tax Revenue - continued | ||||||||
| Massachusetts School Building Authority, Dedicated Sales Tax Rev., “B”, 5%, 2035 | $ | 680,000 | $ | 778,960 | ||||
| Puerto Rico Infrastructure Financing Authority, Special Tax Rev., “C”, FGIC, 5.5%, 2022 | 510,000 | 538,703 | ||||||
| Puerto Rico Sales Tax Financing Corp., Sales Tax Rev., “A”, 5.5%, 2028 (c) | 5,000 | 6,352 | ||||||
| Puerto Rico Sales Tax Financing Corp., Sales Tax Rev., “A”, 5.5%, 2028 | 515,000 | 556,586 | ||||||
| Puerto Rico Sales Tax Financing Corp., Sales Tax Rev., “C”, 5.25%, 2040 | 435,000 | 458,969 | ||||||
| Puerto Rico Sales Tax Financing Corp., Sales Tax Rev., Capital Appreciation, “A”, 0%, 2033 | 620,000 | 194,308 | ||||||
| $ | 4,103,859 | |||||||
| Single Family Housing Revenue - Local - 0.0% | ||||||||
| Prince George’s County, MD, Housing Single Family Collateral, “A”, GNMA, 5.6%, 2034 | $ | 20,000 | $ | 20,150 | ||||
| Single Family Housing - State - 3.1% | ||||||||
| Maryland Community Development Administration, Department of Housing & Community Development, 5%, 2034 | $ | 1,500,000 | $ | 1,562,655 | ||||
| Maryland Community Development Administration, Department of Housing & Community Development , “B”, 4.75%, 2019 | 215,000 | 215,092 | ||||||
| Maryland Community Development Administration, Department of Housing & Community Development, “A”, 5.875%, 2016 | 270,000 | 270,240 | ||||||
| Maryland Community Development Administration, Department of Housing & Community Development, “I”, 6%, 2041 | 305,000 | 313,269 | ||||||
| Montgomery County, MD, Housing Opportunities Commission (Single Family Mortgage Rev.), “B”, 4.55%, 2026 | 1,000,000 | 1,011,510 | ||||||
| Puerto Rico Housing Finance Authority, Home Mortgage Rev., Mortgage Backed Securities, “A”, 4.75%, 2023 | 125,000 | 125,196 | ||||||
| $ | 3,497,962 | |||||||
| State & Agency - Other - 2.9% | ||||||||
| Howard County, MD, COP, “A”, 8%, 2019 | $ | 805,000 | $ | 1,151,722 | ||||
| Howard County, MD, COP, “B”, 8%, 2019 | 385,000 | 550,823 | ||||||
| Howard County, MD, COP, “B”, 8.15%, 2021 | 450,000 | 672,530 | ||||||
| Howard County, MD, COP, “C”, 8%, 2019 | 680,000 | 972,883 | ||||||
| $ | 3,347,958 | |||||||
| State & Local Agencies - 2.2% | ||||||||
| FYI Properties Lease Rev. (Washington State Project), 5.5%, 2034 | $ | 370,000 | $ | 414,156 | ||||
| Los Angeles, CA, Municipal Improvement Corp. Lease Rev. (Real Property), “E”, 6%, 2039 | 180,000 | 214,049 | ||||||
| Maryland Department of Transportation, Port Administration Facilities Project, AMBAC, 5.25%, 2020 | 1,690,000 | 1,894,575 | ||||||
| $ | 2,522,780 | |||||||
| Issuer | Shares/Par | Value ($) | ||||||
| Tax - Other - 1.3% | ||||||||
| Guam Government Ltd. Obligation Rev., “A”, 5.375%, 2024 | $ | 325,000 | $ | 355,056 | ||||
| Guam Government Ltd. Obligation Rev., “A”, 5.625%, 2029 | 45,000 | 49,099 | ||||||
| New Jersey Economic Development Authority Rev., 5%, 2025 | 110,000 | 125,478 | ||||||
| New Jersey Economic Development Authority Rev., 5%, 2026 | 55,000 | 62,318 | ||||||
| New Jersey Economic Development Authority Rev., 5%, 2028 | 20,000 | 22,375 | ||||||
| New Jersey Economic Development Authority Rev., 5%, 2029 | 20,000 | 22,275 | ||||||
| Virgin Islands Public Finance Authority Rev., Matching Fund Loan Note, “A”, 5%, 2029 | 520,000 | 569,234 | ||||||
| Virgin Islands Public Finance Authority Rev., Matching Fund Loan Note, “A”, 6%, 2039 | 285,000 | 314,916 | ||||||
| $ | 1,520,751 | |||||||
| Tax Assessment - 4.5% | ||||||||
| Anne Arundel County, MD, Consolidated Special Taxing District Refunding Rev. (The Villages of Dorchester and Farmington Village Projects), 5%, 2032 | $ | 500,000 | $ | 565,915 | ||||
| Anne Arundel County, MD, Special Obligation (Arundel Mills Project), 5.125%, 2029 | 1,000,000 | 1,049,720 | ||||||
| Anne Arundel County, MD, Special Obligation (National Business Park-North Project), 6.1%, 2040 | 350,000 | 380,559 | ||||||
| Anne Arundel County, MD, Special Obligation (VLG South Waugh Chapel Project), 6.25%, 2040 | 300,000 | 326,946 | ||||||
| Baltimore, MD, Special Obligation, (East Baltimore Research Park Project), “A”, 7%, 2038 | 400,000 | 435,716 | ||||||
| Brunswick, MD, Special Obligation (Brunswick Crossing Special Taxing), 5.5%, 2036 | 244,000 | 229,077 | ||||||
| Frederick County, MD, Special Obligation (Urbana Community Development Authority), “A”, 5%, 2040 | 1,500,000 | 1,640,790 | ||||||
| Prince George’s County, MD, Special Obligation (National Harbor Project), 5.2%, 2034 | 500,000 | 511,055 | ||||||
| $ | 5,139,778 | |||||||
| Tobacco - 0.9% | ||||||||
| Buckeye, OH, Tobacco Settlement Financing Authority, “A-2”, 5.125%, 2024 | $ | 160,000 | $ | 146,762 | ||||
| Illinois Railsplitter Tobacco Settlement Authority, 6%, 2028 | 215,000 | 260,507 | ||||||
| New Jersey Tobacco Settlement Financing Corp., “1-A”, 5%, 2041 | 525,000 | 473,051 | ||||||
| Virgin Islands Tobacco Settlement Financing Corp., 5%, 2021 | 140,000 | 140,029 | ||||||
| $ | 1,020,349 | |||||||
34
Table of Contents
Portfolio of Investments – continued
| Municipal Bonds - continued | ||||||||
| Issuer | Shares/Par | Value ($) | ||||||
| Transportation - Special Tax - 2.2% | ||||||||
| Commonwealth of Puerto Rico Highway & Transportation Authority Rev., AGM, 5.25%, 2033 | $ | 1,365,000 | $ | 1,436,608 | ||||
| Washington, DC, Metropolitan Area Transit Authority Gross Rev., “A”, 5.25%, 2029 | 515,000 | 585,225 | ||||||
| Washington, DC, Metropolitan Area Transit Authority Gross Rev., “A”, 5.125%, 2032 | 485,000 | 541,512 | ||||||
| $ | 2,563,345 | |||||||
| Universities - Colleges - 10.6% | ||||||||
| Annapolis, MD, Economic Development Rev. (St. John’s College), 5.5%, 2018 | $ | 130,000 | $ | 130,462 | ||||
| Illinois Finance Authority Rev. (University of Chicago), “A”, 5%, 2051 | 290,000 | 317,707 | ||||||
| Maryland Health & Higher Educational Facilities Authority Rev. (Goucher College), 5.375%, 2025 | 500,000 | 531,625 | ||||||
| Maryland Health & Higher Educational Facilities Authority Rev. (Goucher College), “A”, 5%, 2034 | 500,000 | 563,825 | ||||||
| Maryland Health & Higher Educational Facilities Authority Rev. (Johns Hopkins University), “A”, 5%, 2030 | 1,500,000 | 1,763,070 | ||||||
| Maryland Health & Higher Educational Facilities Authority Rev. (Johns Hopkins University), “A”, 5%, 2037 | 1,500,000 | 1,724,880 | ||||||
| Maryland Health & Higher Educational Facilities Authority Rev. (Loyola College), “A”, 5.125%, 2045 | 1,600,000 | 1,681,520 | ||||||
| Maryland Health & Higher Educational Facilities Authority Rev. (Maryland Institute College of Art), 5%, 2030 | 750,000 | 782,670 | ||||||
| Maryland Health & Higher Educational Facilities Authority Rev. (Notre Dame College), 5%, 2035 | 1,000,000 | 1,100,900 | ||||||
| Morgan State University, Academic & Auxiliary Facilities Fees Rev., NATL, 6.05%, 2015 | 950,000 | 1,009,489 | ||||||
| Morgan State University, Academic & Auxiliary Facilities Fees Rev., 5%, 2030 | 150,000 | 173,925 | ||||||
| Morgan State University, Academic & Auxiliary Facilities Fees Rev., 5%, 2032 | 440,000 | 506,348 | ||||||
| New Jersey Educational Facilities Authority Rev. (University of Medicine & Dentistry), “B”, 6%, 2017 | 480,000 | 565,498 | ||||||
| Puerto Rico Industrial, Tourist, Educational, Medical, & Environmental Control Facilities Financing Authority, Higher Education Rev. (Ana G. Mendez University System Project), 5.125%, 2032 | 30,000 | 29,517 | ||||||
| Puerto Rico Industrial, Tourist, Educational, Medical, & Environmental Control Facilities Financing Authority, Higher Education Rev. (Ana G. Mendez University System Project), 5.375%, 2042 | 60,000 | 60,148 | ||||||
| Puerto Rico Industrial, Tourist, Educational, Medical, & Environmental Control Facilities Financing Authority, Higher Education Rev. (International American University of Puerto Rico Project), 5%, 2031 | 85,000 | 88,856 | ||||||
| Issuer | Shares/Par | Value ($) | ||||||
| Universities - Colleges - continued | ||||||||
| Westminster, MD, Educational Facilities Rev. (McDaniel College, Inc.), 5%, 2031 | $ | 1,000,000 | $ | 1,031,310 | ||||
| $ | 12,061,750 | |||||||
| Universities - Dormitories - 1.7% | ||||||||
| Maryland Economic Development Corp., Student Housing Rev. (Salisbury University Project), 5%, 2027 | $ | 500,000 | $ | 542,805 | ||||
| Maryland Economic Development Corp., Student Housing Rev. (Salisbury University Project), 5%, 2030 | 300,000 | 320,667 | ||||||
| Maryland Economic Development Corp., Student Housing Rev. (Towson University Project), 5%, 2027 | 700,000 | 774,704 | ||||||
| Maryland Economic Development Corp., Student Housing Rev. (Towson University Project), 5%, 2029 | 250,000 | 273,800 | ||||||
| $ | 1,911,976 | |||||||
| Universities - Secondary Schools - 0.8% | ||||||||
| La Vernia, TX, Higher Education Finance Corp. Rev. (Lifeschool of Dallas), “A”, 7.5%, 2041 | $ | 265,000 | $ | 311,629 | ||||
| Maryland Health & Higher Educational Facilities Authority Rev. (Washington Christian Academy), 5.5%, 2038 (a)(d) | 500,000 | 180,000 | ||||||
| Maryland Industrial Development Financing Authority, Economic Development Authority Rev. (Our Lady of Good Council), “A”, 6%, 2035 | 400,000 | 416,352 | ||||||
| $ | 907,981 | |||||||
| Utilities - Investor Owned - 0.8% | ||||||||
| Maryland Economic Development Corp., Pollution Control Rev. (Potomac Electric Power Co.), 6.2%, 2022 | $ | 500,000 | $ | 608,115 | ||||
| Michigan Strategic Fund Ltd. Obligation Rev. (Detroit Edison Co.), 5.5%, 2029 (b) | 275,000 | 313,748 | ||||||
| $ | 921,863 | |||||||
| Utilities - Municipal Owned - 0.4% | ||||||||
| Guam Power Authority Rev., “A”, AGM, 5%, 2025 | $ | 60,000 | $ | 68,942 | ||||
| Guam Power Authority Rev., “A”, AGM, 5%, 2026 | 50,000 | 57,143 | ||||||
| Guam Power Authority Rev., “A”, AGM, 5%, 2027 | 20,000 | 22,752 | ||||||
| Guam Power Authority Rev., “A”, 5%, 2034 | 60,000 | 64,701 | ||||||
| Long Island, NY, Power Authority, Electric Systems Rev., “A”, 6%, 2033 | 185,000 | 220,720 | ||||||
| $ | 434,258 | |||||||
| Utilities - Other - 1.7% | ||||||||
| Nebraska Central Plains Energy Project, Gas Project Rev., “3”, 5%, 2032 | $ | 480,000 | $ | 533,630 | ||||
| Tennessee Energy Acquisition Corp., Gas Rev., “A”, 5.25%, 2019 | 400,000 | 462,984 | ||||||
| Tennessee Energy Acquisition Corp., Gas Rev., “A”, 5.25%, 2021 | 195,000 | 226,610 | ||||||
35
Table of Contents
Portfolio of Investments – continued
| Municipal Bonds - continued | ||||||||
| Issuer | Shares/Par | Value ($) | ||||||
| Utilities - Other - continued | ||||||||
| Tennessee Energy Acquisition Corp., Gas Rev., “A”, 5.25%, 2022 | $ | 100,000 | $ | 116,278 | ||||
| Tennessee Energy Acquisition Corp., Gas Rev., “A”, 5.25%, 2023 | 140,000 | 162,546 | ||||||
| Tennessee Energy Acquisition Corp., Gas Rev., “C”, 5%, 2021 | 235,000 | 267,038 | ||||||
| Texas Gas Acquisition & Supply Corp III., Gas Supply Rev., 5%, 2031 | 55,000 | 58,337 | ||||||
| Texas Gas Acquisition & Supply Corp III., Gas Supply Rev., 5%, 2032 | 85,000 | 89,673 | ||||||
| $ | 1,917,096 | |||||||
| Water & Sewer Utility Revenue - 8.6% | ||||||||
| Baltimore, MD, Rev., LEVRRS, FRN, NATL, 10.765%, 2020 (p) | $ | 3,000,000 | $ | 4,025,271 | ||||
| Baltimore, MD, Wastewater Rev. Project, “A”, NATL, 5.65%, 2020 | 2,000,000 | 2,341,760 | ||||||
| Baltimore, MD, Wastewater Rev. Project, “A”, 5%, 2041 | 1,000,000 | 1,145,860 | ||||||
| Issuer | Shares/Par | Value ($) | ||||||
| Water & Sewer Utility Revenue - continued | ||||||||
| Commonwealth of Puerto Rico Aqueduct & Sewer Authority Rev., “A”, 6%, 2044 | $ | 1,000,000 | $ | 1,004,790 | ||||
| Montgomery County, MD, Water Quality Protection Charge Rev., “A”, 5%, 2032 | 1,125,000 | 1,297,429 | ||||||
| $ | 9,815,110 | |||||||
| Total Municipal Bonds (Identified Cost, $100,892,329) | $ | 108,581,340 | ||||||
| Money Market Funds - 3.5% | ||||||||
| MFS Institutional Money Market Portfolio, 0.14%, at Cost and Net Asset Value (v) | 3,980,610 | $ | 3,980,610 | |||||
| Total Investments (Identified Cost, $104,872,939) | $ | 112,561,950 | ||||||
| Other Assets, Less Liabilities - 1.5% | 1,673,615 | |||||||
| Net Assets - 100.0% | $ | 114,235,565 | ||||||
See Portfolio Footnotes and Notes to Financial Statements
36
Table of Contents
PORTFOLIO OF INVESTMENTS
3/31/13
MFS MASSACHUSETTS MUNICIPAL BOND FUND
The Portfolio of Investments is a complete list of all securities owned by your fund. It is categorized by broad-based asset classes.
| Municipal Bonds - 96.4% | ||||||||
| Issuer | Shares/Par | Value ($) | ||||||
| General Obligations - General Purpose - 10.4% | ||||||||
| Boston, MA, “B”, 4%, 2019 | $ | 2,000,000 | $ | 2,330,520 | ||||
| Boston, MA, “B”, 4%, 2021 | 1,870,000 | 2,199,401 | ||||||
| Commonwealth of Massachusetts, “B”, 5.25%, 2023 | 1,000,000 | 1,285,710 | ||||||
| Commonwealth of Massachusetts, “B”, 5.25%, 2028 | 2,225,000 | 2,836,408 | ||||||
| Commonwealth of Massachusetts, “C”, NATL, 5.5%, 2019 | 4,000,000 | 5,068,600 | ||||||
| Commonwealth of Massachusetts, “C”, 3%, 2030 | 3,000,000 | 2,912,250 | ||||||
| Commonwealth of Massachusetts, “C”, AMBAC, 5%, 2032 | 4,815,000 | 5,453,613 | ||||||
| Commonwealth of Puerto Rico, Public Improvement, “B”, 6.5%, 2037 | 1,650,000 | 1,727,171 | ||||||
| Duxbury, MA, 3%, 2015 | 1,985,000 | 2,107,733 | ||||||
| Natick, MA, Municipal Purpose Loan, 3%, 2014 | 1,560,000 | 1,611,745 | ||||||
| Puerto Rico Public Buildings Authority Rev., Guaranteed (Government Facilities), “I”, 5.25%, 2033 | 925,000 | 896,889 | ||||||
| Puerto Rico Public Buildings Authority Rev., Guaranteed, “S”, 6%, 2041 | 1,145,000 | 1,161,213 | ||||||
| State of California, 6%, 2039 | 1,555,000 | 1,860,262 | ||||||
| $ | 31,451,515 | |||||||
| General Obligations - Improvement - 0.4% | ||||||||
| Guam Government, “A”, 6.75%, 2029 | $ | 685,000 | $ | 766,083 | ||||
| Guam Government, “A”, 5.25%, 2037 | 395,000 | 398,196 | ||||||
| Guam Government, “A”, 7%, 2039 | 75,000 | 83,624 | ||||||
| $ | 1,247,903 | |||||||
| General Obligations - Schools - 0.4% | ||||||||
| Clovis, CA, Unified School District (Election of 2004), Capital Appreciation, “A”, 0%, 2026 | $ | 1,970,000 | $ | 1,169,668 | ||||
| Healthcare Revenue - Hospitals - 14.3% | ||||||||
| Arizona Health Facilities Authority Rev. (Banner Health), “A”, 4%, 2043 | $ | 1,000,000 | $ | 972,790 | ||||
| Brazoria County, TX, Health Facilities Development Corp., Hospital Rev. (Brazosport Regional Health System), 5.25%, 2032 | 680,000 | 706,697 | ||||||
| Escambia County, FL, Health Facilities Authority (Baptist Hospital, Inc.), “A”, 6%, 2036 | 1,315,000 | 1,513,894 | ||||||
| Illinois Finance Authority Rev. (Little Company of Mary Hospital and Health Care Centers), 5.375%, 2040 | 410,000 | 440,471 | ||||||
| Jefferson Parish, LA, Hospital Service District No. 2 (East Jefferson General Hospital), 6.25%, 2031 | 235,000 | 272,701 | ||||||
| Jefferson Parish, LA, Hospital Service District No. 2 (East Jefferson General Hospital), 6.375%, 2041 | 935,000 | 1,088,864 | ||||||
| Issuer | Shares/Par | Value ($) | ||||||
| Healthcare Revenue - Hospitals - continued | ||||||||
| Kentucky Economic Development Finance Authority, Hospital Facilities Rev. (Owensboro Medical Health System), “A”, 5.75%, 2025 | $ | 690,000 | $ | 800,338 | ||||
| Kentucky Economic Development Finance Authority, Hospital Facilities Rev. (Owensboro Medical Health System), “A”, 6.375%, 2040 | 745,000 | 883,220 | ||||||
| Kentucky Economic Development Finance Authority, Hospital Facilities Rev. (Owensboro Medical Health System), “A”, 6.5%, 2045 | 520,000 | 619,117 | ||||||
| Louisville & Jefferson County, KY, Metropolitan Government Healthcare Systems Rev. (Norton Healthcare, Inc.), 5.25%, 2036 | 1,180,000 | 1,246,576 | ||||||
| Massachusetts Development Finance Agency Healthcare System Rev. (Covenant Health System Obligated Group), 5%, 2031 | 1,560,000 | 1,688,248 | ||||||
| Massachusetts Development Finance Agency Rev. (Berkshire Health System), “G”, 5%, 2029 | 1,000,000 | 1,122,680 | ||||||
| Massachusetts Development Finance Agency Rev. (Southcoast Health System, Inc.), “F”, 4%, 2043 | 1,000,000 | 962,560 | ||||||
| Massachusetts Development Finance Agency Rev. (Tufts Medical Center), “I”, 7.25%, 2032 | 1,000,000 | 1,242,410 | ||||||
| Massachusetts Development Finance Agency Rev. (UMass Memorial Medical Center, Inc.), “H”, 5.5%, 2031 | 1,000,000 | 1,130,630 | ||||||
| Massachusetts Health & Educational Facilities Authority Rev. (Bay State Medical Center), “I”, 5.75%, 2036 | 500,000 | 548,185 | ||||||
| Massachusetts Health & Educational Facilities Authority Rev. (Caregroup, Inc.), 5.125%, 2038 | 2,000,000 | 2,207,800 | ||||||
| Massachusetts Health & Educational Facilities Authority Rev. (Children’s Hospital), “M”, 5.25%, 2039 | 1,500,000 | 1,641,630 | ||||||
| Massachusetts Health & Educational Facilities Authority Rev. (Children’s Hospital), “M”, 5.5%, 2039 | 1,000,000 | 1,110,960 | ||||||
| Massachusetts Health & Educational Facilities Authority Rev. (Jordan Hospital), “D”, 5.25%, 2018 | 1,210,000 | 1,211,089 | ||||||
| Massachusetts Health & Educational Facilities Authority Rev. (Lahey Clinic), “D”, 5.25%, 2037 | 1,550,000 | 1,674,543 | ||||||
| Massachusetts Health & Educational Facilities Authority Rev. (Lowell General Hospital), “C”, 5.125%, 2035 | 1,600,000 | 1,687,424 | ||||||
| Massachusetts Health & Educational Facilities Authority Rev. (Massachusetts Eye & Ear Infirmary), “C”, 5.375%, 2035 | 1,500,000 | 1,622,625 | ||||||
| Massachusetts Health & Educational Facilities Authority Rev. (Milford-Whitinsville Hospital), “C”, 5.25%, 2018 | 1,500,000 | 1,500,885 | ||||||
37
Table of Contents
Portfolio of Investments – continued
| Municipal Bonds - continued | ||||||||
| Issuer | Shares/Par | Value ($) | ||||||
| Healthcare Revenue - Hospitals - continued | ||||||||
| Massachusetts Health & Educational Facilities Authority Rev. (Partners Healthcare System), “G”, 5%, 2032 | $ | 2,000,000 | $ | 2,149,120 | ||||
| Massachusetts Health & Educational Facilities Authority Rev. (Partners Healthcare System), “J-1”, 5%, 2039 | 2,000,000 | 2,177,400 | ||||||
| Massachusetts Health & Educational Facilities Authority Rev. (Partners Healthcare System), “J1”, 5%, 2034 | 1,375,000 | 1,504,236 | ||||||
| Massachusetts Health & Educational Facilities Authority Rev. (South Shore), 5.625%, 2019 | 740,000 | 741,450 | ||||||
| Massachusetts Health & Educational Facilities Authority Rev. (Southcoast Health Obligation), “D”, 5%, 2029 | 1,000,000 | 1,064,950 | ||||||
| Massachusetts Health & Educational Facilities Authority Rev. (Southcoast Health Obligation), “D”, 5%, 2039 | 1,000,000 | 1,052,460 | ||||||
| Massachusetts Health & Educational Facilities Authority Rev. (Winchester Hospital), 5.25%, 2038 | 2,000,000 | 2,206,000 | ||||||
| Miami-Dade County, FL, Health Facilities Authority Hospital Rev. (Variety Children’s Hospital), “A”, 6%, 2030 | 430,000 | 500,137 | ||||||
| New Hampshire Business Finance Authority Rev. (Elliot Hospital Obligated Group), “A”, 6.125%, 2039 | 655,000 | 736,705 | ||||||
| New Hampshire Business Finance Authority Rev. (Huggins Hospital), 6.875%, 2039 | 35,000 | 38,560 | ||||||
| Washington Health Care Facilities Authority Rev. (Central Washington Health Services), 6.75%, 2029 | 165,000 | 194,429 | ||||||
| Washington Health Care Facilities Authority Rev. (Central Washington Health Services), 7%, 2039 | 395,000 | 456,569 | ||||||
| Wisconsin Health & Educational Facilities Authority Rev. (ProHealth Care, Inc. Obligated Group), 6.625%, 2039 | 1,355,000 | 1,572,288 | ||||||
| Wisconsin Health & Educational Facilities Authority Rev. (Wheaton Franciscan Healthcare), 5.25%, 2031 | 915,000 | 978,611 | ||||||
| $ | 43,269,252 | |||||||
| Healthcare Revenue - Long Term Care - 0.8% | ||||||||
| Massachusetts Development Finance Agency Rev. (Adventcare), “A”, 6.75%, 2037 | $ | 500,000 | $ | 526,605 | ||||
| Massachusetts Development Finance Agency Rev. (Carleton-Willard Village), 5.625%, 2030 | 525,000 | 573,463 | ||||||
| Massachusetts Development Finance Agency Rev. (Linden Ponds, Inc.), “A-1”, 6.25%, 2039 | 352,582 | 315,772 | ||||||
| Massachusetts Development Finance Agency Rev. (Linden Ponds, Inc.), “A-2”, 5.5%, 2046 | 18,820 | 14,729 | ||||||
| Massachusetts Development Finance Agency Rev. (Linden Ponds, Inc.), Capital Appreciation, “B”, 0%, 2056 | 93,608 | 667 | ||||||
| Massachusetts Development Finance Agency Rev. (Loomis Communities, Inc.), “A”, 6.9%, 2032 | 530,000 | 536,016 | ||||||
| Issuer | Shares/Par | Value ($) | ||||||
| Healthcare Revenue - Long Term Care - continued | ||||||||
| Massachusetts Development Finance Agency Rev. (The Groves in Lincoln), “A”, 7.75%, 2039 | $ | 500,000 | $ | 234,615 | ||||
| Wisconsin Health & Educational Facilities Authority Rev. (St. John’s Community, Inc.), “A”, 7.25%, 2029 | 20,000 | 23,403 | ||||||
| Wisconsin Health & Educational Facilities Authority Rev. (St. John’s Community, Inc.), “A”, 7.625%, 2039 | 130,000 | 151,650 | ||||||
| $ | 2,376,920 | |||||||
| Healthcare Revenue - Other - 0.7% | ||||||||
| Massachusetts Health & Educational Facilities Authority Rev. (Dana Faber Cancer Institute), “K”, 5%, 2037 | $ | 2,000,000 | $ | 2,135,820 | ||||
| Human Services - 0.4% | ||||||||
| Massachusetts Development Finance Agency Rev. (Evergreen Center, Inc.), 5.5%, 2035 | $ | 1,200,000 | $ | 1,216,404 | ||||
| Industrial Revenue - Airlines - 0.6% | ||||||||
| Massachusetts Port Authority Rev., Special Facilities (U.S. Airways), NATL, 5.875%, 2016 | $ | 1,900,000 | $ | 1,901,501 | ||||
| Industrial Revenue - Environmental Services - 0.8% | ||||||||
| Massachusetts Development Finance Agency Rev. (Waste Management, Inc.), FRN, 5.5%, 2027 (b) | $ | 750,000 | $ | 787,328 | ||||
| Massachusetts Development Finance Agency, Resource Recovery Rev. (Covanta Energy Project), “C”, 5.25%, 2042 | 1,535,000 | 1,575,064 | ||||||
| $ | 2,362,392 | |||||||
| Miscellaneous Revenue - Other - 5.1% | ||||||||
| Martha’s Vineyard, MA, Land Bank Rev., AMBAC, 5%, 2029 | $ | 785,000 | $ | 804,201 | ||||
| Massachusetts Development Finance Agency Rev., 5.5%, 2020 | 1,205,000 | 1,458,785 | ||||||
| Massachusetts Health & Educational Facilities Authority Rev., 5.5%, 2034 | 1,500,000 | 1,685,640 | ||||||
| Massachusetts Health & Educational Facilities Authority Rev. (The Sterling & Francine Clark Art Institute), “B”, 5%, 2030 | 3,500,000 | 3,962,350 | ||||||
| Massachusetts Health & Educational Facilities Authority Rev. (The Sterling & Francine Clark Art Institute), “B”, 5%, 2040 | 1,700,000 | 1,874,420 | ||||||
| Massachusetts Port Authority Facilities Rev. (Boston Fuel Project), FGIC, 5%, 2024 | 2,000,000 | 2,110,800 | ||||||
| Massachusetts Port Authority Facilities Rev. (Conrac Project), “A”, 5.125%, 2041 | 3,000,000 | 3,323,700 | ||||||
| $ | 15,219,896 | |||||||
| Multi-Family Housing Revenue - 5.8% | ||||||||
| Massachusetts Development Finance Agency Rev. (Credit Housing-Chelsea Homes), “I-A”, LOC, 5%, 2024 | $ | 1,185,000 | $ | 1,203,249 | ||||
38
Table of Contents
Portfolio of Investments – continued
| Municipal Bonds - continued | ||||||||
| Issuer | Shares/Par | Value ($) | ||||||
| Multi-Family Housing Revenue - continued | ||||||||
| Massachusetts Development Finance Agency Rev. (Morville House Apartments), “A”, LOC, 4.95%, 2023 | $ | 2,500,000 | $ | 2,520,050 | ||||
| Massachusetts Housing Finance Agency Rev., “A”, 5.25%, 2035 | 1,000,000 | 1,066,850 | ||||||
| Massachusetts Housing Finance Agency Rev., “A”, 5.25%, 2048 | 1,000,000 | 1,013,780 | ||||||
| Massachusetts Housing Finance Agency Rev., “C”, 5.35%, 2049 | 1,680,000 | 1,781,959 | ||||||
| Massachusetts Housing Finance Agency Rev., “E”, 2.875%, 2027 | 1,000,000 | 978,250 | ||||||
| Massachusetts Housing Finance Agency Rev., “F”, 3.45%, 2037 | 1,000,000 | 966,050 | ||||||
| Massachusetts Housing Finance Agency Rev., “F”, 5.125%, 2034 | 720,000 | 724,831 | ||||||
| Massachusetts Housing Finance Agency Rev., “P”, 5%, 2023 | 1,240,000 | 1,242,133 | ||||||
| Massachusetts Housing Finance Agency Rev., “P”, 5.2%, 2045 | 1,445,000 | 1,445,968 | ||||||
| Massachusetts Housing Finance Agency, “B”, 5.25%, 2030 | 1,700,000 | 1,794,248 | ||||||
| Massachusetts Housing Finance Agency, Multi-Family Housing, “A”, 4.75%, 2030 | 1,425,000 | 1,561,031 | ||||||
| Massachusetts Housing Finance Agency, Multi-Family Housing, “A”, 4.875%, 2032 | 1,190,000 | 1,305,240 | ||||||
| $ | 17,603,639 | |||||||
| Parking - 1.1% | ||||||||
| Boston, MA, Metropolitan Transit Parking Corp., Systemwide Parking Rev., 5.25%, 2036 | $ | 3,000,000 | $ | 3,416,760 | ||||
| Port Revenue - 1.6% | ||||||||
| Massachusetts Port Authority Rev., “A”, NATL, 5%, 2033 | $ | 1,265,000 | $ | 1,279,801 | ||||
| Massachusetts Port Authority Rev., “B”, 5%, 2040 | 2,000,000 | 2,257,240 | ||||||
| Massachusetts Port Authority Rev., ETM, 13%, 2013 (c) | 125,000 | 128,888 | ||||||
| Massachusetts Port Authority, “B”, 5%, 2033 | 1,080,000 | 1,241,914 | ||||||
| $ | 4,907,843 | |||||||
| Sales & Excise Tax Revenue - 8.4% | ||||||||
| Colorado Regional Transportation District, Private Activity Rev. (Denver Transportation Partners), 6%, 2041 | $ | 985,000 | $ | 1,129,096 | ||||
| Colorado Regional Transportation District, Sales Tax Rev. (Fastracks Project), “A”, 5%, 2027 | 1,075,000 | 1,283,421 | ||||||
| Guam Government Business Privilege Tax Rev., “B-1”, 5%, 2037 | 555,000 | 606,282 | ||||||
| Massachusetts Bay Transportation Authority, Sales Tax Rev., “A”, 5%, 2024 | 1,590,000 | 2,011,366 | ||||||
| Massachusetts Bay Transportation Authority, Sales Tax Rev., “A”, 5%, 2031 | 2,045,000 | 2,528,131 | ||||||
| Massachusetts Bay Transportation Authority, Sales Tax Rev., “A-1”, 5.25%, 2029 | 1,850,000 | 2,373,735 | ||||||
| Massachusetts Bay Transportation Authority, Sales Tax Rev., Capital Appreciation, 0%, 2034 | 4,000,000 | 1,544,600 | ||||||
| Issuer | Shares/Par | Value ($) | ||||||
| Sales & Excise Tax Revenue - continued | ||||||||
| Massachusetts School Building Authority, Dedicated Sales Tax Rev., AMBAC, 4.75%, 2032 | $ | 2,000,000 | $ | 2,194,560 | ||||
| Massachusetts School Building Authority, Dedicated Sales Tax Rev., “A”, 5%, 2030 | 3,000,000 | 3,521,460 | ||||||
| Massachusetts School Building Authority, Dedicated Sales Tax Rev., “A”, AMBAC, 4.5%, 2035 | 950,000 | 1,015,512 | ||||||
| Massachusetts School Building Authority, Dedicated Sales Tax Rev., “B”, 5%, 2035 | 1,810,000 | 2,073,409 | ||||||
| Puerto Rico Infrastructure Financing Authority, Special Tax Rev., “C”, FGIC, 5.5%, 2022 | 1,050,000 | 1,109,094 | ||||||
| Puerto Rico Sales Tax Financing Corp., Sales Tax Rev., “A”, 5.5%, 2019 (c) | 10,000 | 12,703 | ||||||
| Puerto Rico Sales Tax Financing Corp., Sales Tax Rev., “A”, 5.5%, 2028 | 1,040,000 | 1,123,980 | ||||||
| Puerto Rico Sales Tax Financing Corp., Sales Tax Rev., “C”, 6%, 2039 | 1,070,000 | 1,151,876 | ||||||
| Puerto Rico Sales Tax Financing Corp., Sales Tax Rev., Convertible Capital Appreciation, “A”, 0% to 2016, 6.75% to 2032 | 1,175,000 | 1,215,996 | ||||||
| Puerto Rico Sales Tax Financing Corp., Sales Tax Rev., Capital Appreciation, “A”, AMBAC, 0%, 2054 | 6,700,000 | 524,476 | ||||||
| $ | 25,419,697 | |||||||
| Single Family Housing - State - 2.2% | ||||||||
| Massachusetts Housing Finance Agency, Single Family Housing Rev., “122”, 4.85%, 2031 | $ | 1,625,000 | $ | 1,650,886 | ||||
| Massachusetts Housing Finance Agency, Single Family Housing Rev., “128”, AGM, 4.875%, 2038 | 1,040,000 | 1,054,477 | ||||||
| Massachusetts Housing Finance Agency, Single Family Housing Rev., “157”, 4.35%, 2027 | 1,000,000 | 1,029,790 | ||||||
| Massachusetts Housing Finance Agency, Single Family Housing Rev., “162”, 3.15%, 2032 | 2,000,000 | 1,937,060 | ||||||
| Massachusetts Housing Finance Agency, Single Family Housing Rev., “162”, 3.45%, 2037 | 1,000,000 | 973,350 | ||||||
| $ | 6,645,563 | |||||||
| State & Agency - Other - 0.5% | ||||||||
| Massachusetts Development Finance Agency Rev. (Visual & Performing Arts Project), 6%, 2015 | $ | 1,235,000 | $ | 1,370,047 | ||||
| State & Local Agencies - 3.9% | ||||||||
| Delaware Valley, PA, Regional Finance Authority, “C”, FRN, 0.942%, 2037 | $ | 1,370,000 | $ | 998,812 | ||||
| Massachusetts College Building Authority Project Rev., “A”, SYNCORA, 5%, 2043 | 2,110,000 | 2,117,913 | ||||||
| Massachusetts College Building Authority Project Rev., Capital Appreciation, “A”, SYNCORA, 0%, 2022 | 8,310,000 | 6,632,128 | ||||||
| Massachusetts State College, Building Authority Project Rev., “A”, 5.5%, 2049 | 1,680,000 | 1,937,930 | ||||||
| $ | 11,686,783 | |||||||
39
Table of Contents
Portfolio of Investments – continued
| Municipal Bonds - continued | ||||||||
| Issuer | Shares/Par | Value ($) | ||||||
| Student Loan Revenue - 4.3% | ||||||||
| Massachusetts Educational Financing Authority, “J”, 5.625%, 2029 | $ | 2,000,000 | $ | 2,186,520 | ||||
| Massachusetts Educational Financing Authority, Education Loan Rev., “E”, AMBAC, 5%, 2015 | 90,000 | 90,237 | ||||||
| Massachusetts Educational Financing Authority, Education Loan Rev., “H”, ASSD GTY, 6.35%, 2030 | 1,755,000 | 1,929,096 | ||||||
| Massachusetts Educational Financing Authority, Education Loan Rev., “I”, 6%, 2028 | 1,190,000 | 1,333,121 | ||||||
| Massachusetts Educational Financing Authority, Education Loan Rev., “I-A”, 5.5%, 2022 | 3,000,000 | 3,450,780 | ||||||
| Massachusetts Educational Financing Authority, Education Loan Rev., “I-A”, 5.15%, 2026 | 1,660,000 | 1,809,649 | ||||||
| Massachusetts Educational Financing Authority, Education Loan Rev., “I-A”, 5.2%, 2027 | 795,000 | 865,063 | ||||||
| Massachusetts Educational Financing Authority, Education Loan Rev., “Issue E”, AMBAC, 5.3%, 2016 | 1,360,000 | 1,363,346 | ||||||
| $ | 13,027,812 | |||||||
| Tax - Other - 1.0% | ||||||||
| Guam Government Ltd. Obligation Rev., “A”, 5.375%, 2024 | $ | 260,000 | $ | 284,045 | ||||
| Guam Government Ltd. Obligation Rev., “A”, 5.625%, 2029 | 85,000 | 92,743 | ||||||
| Massachusetts Special Obligation Dedicated Tax Rev., NATL, 5.5%, 2023 | 1,585,000 | 1,929,547 | ||||||
| Virgin Islands Public Finance Authority Rev. (Diageo), “A”, 6.625%, 2029 | 600,000 | 687,456 | ||||||
| $ | 2,993,791 | |||||||
| Tobacco - 1.2% | ||||||||
| Buckeye, OH, Tobacco Settlement Financing Authority, “A-2”, 5.125%, 2024 | $ | 315,000 | $ | 288,937 | ||||
| Children’s Trust Fund, Tobacco Settlement Rev., Puerto Rico, 5.5%, 2039 | 400,000 | 404,372 | ||||||
| Golden State, CA, Tobacco Securitization Corp., Tobacco Settlement Rev., “A-1”, 5.75%, 2047 | 440,000 | 420,988 | ||||||
| Illinois Railsplitter Tobacco Settlement Authority, 6%, 2028 | 1,335,000 | 1,617,566 | ||||||
| New Jersey Tobacco Settlement Financing Corp., “1-A”, 5%, 2041 | 960,000 | 865,008 | ||||||
| $ | 3,596,871 | |||||||
| Toll Roads - 1.5% | ||||||||
| Massachusetts Department of Transportation, Metropolitan Highway System Rev., “B”, 5%, 2015 | $ | 1,500,000 | $ | 1,602,120 | ||||
| Massachusetts Department of Transportation, Metropolitan Highway System Rev., “B”, 5%, 2032 | 2,600,000 | 2,876,770 | ||||||
| $ | 4,478,890 | |||||||
| Transportation - Special Tax - 0.1% | ||||||||
| Massachusetts Bay Transportation Authority, Sales Tax Rev., ETM, “C”, 5.5%, 2016 (c) | $ | 200,000 | $ | 231,790 | ||||
| Issuer | Shares/Par | Value ($) | ||||||
| Universities - Colleges - 21.2% | ||||||||
| Illinois Finance Authority Rev. (Roosevelt University Project), 6.25%, 2029 | $ | 2,005,000 | $ | 2,273,028 | ||||
| Massachusetts Development Finance Agency Higher Education Rev. (Emerson College), “A”, 5%, 2023 | 1,750,000 | 1,893,658 | ||||||
| Massachusetts Development Finance Agency Rev. (Boston College), “R-1”, 5%, 2024 | 3,950,000 | 4,657,801 | ||||||
| Massachusetts Development Finance Agency Rev. (Boston University), “V-1”, 5%, 2029 | 2,165,000 | 2,369,289 | ||||||
| Massachusetts Development Finance Agency Rev. (Curry College), “A”, ACA, 5%, 2036 | 2,000,000 | 2,040,040 | ||||||
| Massachusetts Development Finance Agency Rev. (Hampshire College), 5.7%, 2034 | 1,000,000 | 1,028,230 | ||||||
| Massachusetts Development Finance Agency Rev. (Holy Cross), AMBAC, 5.25%, 2032 | 1,500,000 | 1,924,290 | ||||||
| Massachusetts Development Finance Agency Rev. (Massachusetts College of Pharmacy), “F”, 4%, 2032 | 1,000,000 | 1,040,070 | ||||||
| Massachusetts Development Finance Agency Rev. (Massachusetts College of Pharmacy), “F”, 4%, 2035 | 500,000 | 515,255 | ||||||
| Massachusetts Development Finance Agency Rev. (Merrimack College), “A”, 5.25%, 2042 | 1,500,000 | 1,641,195 | ||||||
| Massachusetts Development Finance Agency Rev. (New England Conservatory of Music), 5.25%, 2038 | 2,000,000 | 2,131,700 | ||||||
| Massachusetts Development Finance Agency Rev. (Pharmacy & Allied Health Sciences), 5.75%, 2013 (c) | 1,000,000 | 1,023,520 | ||||||
| Massachusetts Development Finance Agency Rev. (Simmons College), SYNCORA, 5.25%, 2026 | 2,250,000 | 2,526,075 | ||||||
| Massachusetts Development Finance Agency Rev. (Suffolk University), 5.125%, 2040 | 1,000,000 | 1,094,430 | ||||||
| Massachusetts Development Finance Agency Rev. (The Broad Institute, Inc.), “A”, 5.25%, 2037 | 2,000,000 | 2,228,960 | ||||||
| Massachusetts Development Finance Agency Rev. (Wheelock College), “C”, 5.25%, 2037 | 1,500,000 | 1,568,895 | ||||||
| Massachusetts Development Finance Agency Rev. (Worcester Polytechnic Institute), 5%, 2050 | 2,000,000 | 2,175,140 | ||||||
| Massachusetts Health & Educational Facilities Authority Rev. (Berklee College of Music), “A”, 5%, 2027 | 905,000 | 990,133 | ||||||
| Massachusetts Health & Educational Facilities Authority Rev. (Berklee College of Music), “A”, 5%, 2037 | 2,000,000 | 2,160,020 | ||||||
| Massachusetts Health & Educational Facilities Authority Rev. (Boston College), 5.5%, 2027 | 1,735,000 | 2,200,119 | ||||||
| Massachusetts Health & Educational Facilities Authority Rev. (Boston College), 5.5%, 2028 | 1,355,000 | 1,717,612 | ||||||
| Massachusetts Health & Educational Facilities Authority Rev. (Harvard University), 5.5%, 2036 | 1,500,000 | 1,789,890 | ||||||
| Massachusetts Health & Educational Facilities Authority Rev. (Lesley University), “A”, ASSD GTY, 5.25%, 2039 | 1,000,000 | 1,094,990 | ||||||
40
Table of Contents
Portfolio of Investments – continued
| Municipal Bonds - continued | ||||||||
| Issuer | Shares/Par | Value ($) | ||||||
| Universities - Colleges - continued | ||||||||
| Massachusetts Health & Educational Facilities Authority Rev. (Massachusetts Institute of Technology), “A”, 5%, 2038 | $ | 750,000 | $ | 846,645 | ||||
| Massachusetts Health & Educational Facilities Authority Rev. (Massachusetts Institute of Technology), “I-1”, 5.2%, 2028 | 1,000,000 | 1,332,680 | ||||||
| Massachusetts Health & Educational Facilities Authority Rev. (Northeastern University), “A”, 5%, 2035 | 1,500,000 | 1,663,890 | ||||||
| Massachusetts Health & Educational Facilities Authority Rev. (Northeastern University), “T-1”, 5%, 2030 | 1,500,000 | 1,715,610 | ||||||
| Massachusetts Health & Educational Facilities Authority Rev. (Northeastern University), “T-1”, 5%, 2031 | 1,250,000 | 1,424,188 | ||||||
| Massachusetts Health & Educational Facilities Authority Rev. (Simmons College), “I”, 8%, 2029 | 500,000 | 570,935 | ||||||
| Massachusetts Health & Educational Facilities Authority Rev. (Stonehill College), MSQLF, 4.875%, 2027 | 250,000 | 281,655 | ||||||
| Massachusetts Health & Educational Facilities Authority Rev. (Stonehill College), 5%, 2028 | 640,000 | 721,690 | ||||||
| Massachusetts Health & Educational Facilities Authority Rev. (Stonehill College), 5%, 2029 | 300,000 | 336,462 | ||||||
| Massachusetts Health & Educational Facilities Authority Rev. (Suffolk University), “A”, 6.25%, 2030 | 2,000,000 | 2,336,500 | ||||||
| Massachusetts Health & Educational Facilities Authority Rev. (Wheaton College), “F”, 5%, 2041 | 500,000 | 540,315 | ||||||
| Massachusetts Health & Higher Educational Facilities Authority Rev. (Williams College), “H”, 5%, 2028 | 1,000,000 | 1,009,570 | ||||||
| Massachusetts State College, Building Authority Project Rev., “A”, 5%, 2029 | 2,000,000 | 2,340,020 | ||||||
| Massachusetts State College, Building Authority Project Rev., “A”, 5%, 2036 | 1,000,000 | 1,145,050 | ||||||
| Pinellas County, FL, Educational Facilities Authority Rev. (Barry University), 6%, 2041 | 295,000 | 339,430 | ||||||
| Puerto Rico Industrial, Tourist, Educational, Medical, & Environmental Control Facilities Financing Authority, Higher Education Rev. (Ana G. Mendez University System Project), 5.125%, 2032 | 110,000 | 108,229 | ||||||
| Puerto Rico Industrial, Tourist, Educational, Medical, & Environmental Control Facilities Financing Authority, Higher Education Rev. (Ana G. Mendez University System Project), 5.375%, 2042 | 180,000 | 180,445 | ||||||
| Puerto Rico Industrial, Tourist, Medical, & Environmental Central Facilities (University of Sacred Heart), 4.375%, 2031 | 75,000 | 71,475 | ||||||
| Puerto Rico Industrial, Tourist, Medical, & Environmental Central Facilities (University of Sacred Heart), 5%, 2042 | 35,000 | 34,260 | ||||||
| Issuer | Shares/Par | Value ($) | ||||||
| Universities - Colleges - continued | ||||||||
| University of Massachusetts Building Authority Project Rev., 5%, 2034 | $ | 1,000,000 | $ | 1,104,490 | ||||
| University of Massachusetts Building Authority Project Rev., “1”, 5%, 2019 | 3,000,000 | 3,682,740 | ||||||
| $ | 63,870,619 | |||||||
| Universities - Secondary Schools - 3.1% | ||||||||
| La Vernia, TX, Higher Education Finance Corp. Rev. (Lifeschool of Dallas), “A”, 7.5%, 2041 | $ | 665,000 | $ | 782,013 | ||||
| Massachusetts Development Finance Agency Rev. (Belmont Hill School), 4.375%, 2031 | 1,080,000 | 1,253,124 | ||||||
| Massachusetts Development Finance Agency Rev. (Belmont Hill School), 4.5%, 2036 | 1,000,000 | 1,165,720 | ||||||
| Massachusetts Development Finance Agency Rev. (Dexter School), 4.75%, 2032 | 1,130,000 | 1,179,720 | ||||||
| Massachusetts Development Finance Agency Rev. (Dexter School), 5%, 2037 | 2,000,000 | 2,090,580 | ||||||
| Massachusetts Development Finance Agency Rev. (Foxborough Regional Charter School), “A”, 6.375%, 2030 | 1,000,000 | 1,139,990 | ||||||
| Massachusetts Development Finance Agency Rev. (Middlesex School), 5.125%, 2023 | 500,000 | 504,410 | ||||||
| Massachusetts Development Finance Agency Rev. (Milton Academy), “A”, 5%, 2028 | 1,000,000 | 1,157,160 | ||||||
| $ | 9,272,717 | |||||||
| Utilities - Investor Owned - 0.4% | ||||||||
| Massachusetts Development Finance Agency, Solid Waste Disposal Rev. (Dominion Energy Brayton), 5.75%, 2042 (b) | $ | 1,000,000 | $ | 1,217,420 | ||||
| Utilities - Municipal Owned - 0.2% | ||||||||
| Guam Power Authority Rev., “A”, 5.5%, 2030 | $ | 590,000 | $ | 656,505 | ||||
| Utilities - Other - 1.9% | ||||||||
| Nebraska Central Plains Energy Project, Gas Project Rev., “3”, 5%, 2032 | $ | 1,270,000 | $ | 1,411,897 | ||||
| Salt Verde Financial Corp., AZ, Senior Gas Rev., 5%, 2037 | 645,000 | 719,498 | ||||||
| Tennessee Energy Acquisition Corp., Gas Rev., “A”, 5.25%, 2019 | 805,000 | 931,755 | ||||||
| Tennessee Energy Acquisition Corp., Gas Rev., “A”, 5.25%, 2021 | 405,000 | 470,651 | ||||||
| Tennessee Energy Acquisition Corp., Gas Rev., “A”, 5.25%, 2022 | 210,000 | 244,184 | ||||||
| Tennessee Energy Acquisition Corp., Gas Rev., “C”, 5%, 2021 | 480,000 | 545,438 | ||||||
| Texas Gas Acquisition & Supply Corp III., Gas Supply Rev., 5%, 2027 | 880,000 | 953,066 | ||||||
| Texas Gas Acquisition & Supply Corp III., Gas Supply Rev., 5%, 2031 | 160,000 | 169,709 | ||||||
| Texas Gas Acquisition & Supply Corp III., Gas Supply Rev., 5%, 2032 | 260,000 | 274,295 | ||||||
| $ | 5,720,493 | |||||||
41
Table of Contents
Portfolio of Investments – continued
| Municipal Bonds - continued | ||||||||
| Issuer | Shares/Par | Value ($) | ||||||
| Water & Sewer Utility Revenue - 4.1% | ||||||||
| Commonwealth of Puerto Rico Aqueduct & Sewer Authority Rev., “A”, 5.75%, 2037 | $ | 655,000 | $ | 647,337 | ||||
| Commonwealth of Puerto Rico Aqueduct & Sewer Authority Rev., “A”, 6%, 2038 | 2,000,000 | 2,022,160 | ||||||
| DeKalb County, GA, Water & Sewer Rev., “A”, 5.25%, 2041 | 1,155,000 | 1,306,039 | ||||||
| Guam Government Waterworks Authority, Water & Wastewater System Rev., 5.625%, 2040 | 305,000 | 318,890 | ||||||
| Massachusetts Water Pollution Abatement Trust, 5.25%, 2027 | 1,280,000 | 1,647,987 | ||||||
| Massachusetts Water Pollution Abatement Trust, 5.25%, 2033 | 2,000,000 | 2,588,080 | ||||||
| Massachusetts Water Pollution Abatement Trust (MWRA Program), “A”, 5%, 2032 | 75,000 | 75,177 | ||||||
| Massachusetts Water Pollution Abatement Trust, “10”, 5%, 2029 | 160,000 | 168,302 | ||||||
| Massachusetts Water Pollution Abatement Trust, “10”, 5%, 2034 | 145,000 | 152,254 | ||||||
| Issuer | Shares/Par | Value ($) | ||||||
| Water & Sewer Utility Revenue - continued | ||||||||
| Massachusetts Water Resources Authority, “B”, AGM, 5.25%, 2029 | $ | 595,000 | $ | 762,338 | ||||
| Massachusetts Water Resources Authority, General Rev., “B”, AGM, 5.25%, 2031 | 1,625,000 | 2,068,479 | ||||||
| Massachusetts Water Resources Authority, General Rev., “B”, 5%, 2034 | 655,000 | 742,069 | ||||||
| $ | 12,499,112 | |||||||
| Total Municipal Bonds (Identified Cost, $265,177,402) | $ | 290,967,623 | ||||||
| Money Market Funds - 2.4% | ||||||||
| MFS Institutional Money Market Portfolio, 0.14%, at Cost and Net Asset Value (v) | 7,304,229 | $ | 7,304,229 | |||||
| Total Investments (Identified Cost, $272,481,631) | $ | 298,271,852 | ||||||
| Other Assets, Less Liabilities - 1.2% | 3,718,132 | |||||||
| Net Assets - 100.0% | $ | 301,989,984 | ||||||
Portfolio Footnotes:
| (a) | Non-income producing security. |
| (b) | Mandatory tender date is earlier than stated maturity date. |
| (c) | Refunded bond. |
| (d) | In default. Interest and/or scheduled principal payment(s) have been missed. |
| (n) | Securities exempt from registration under Rule 144A of the Securities Act of 1933. These securities may be sold in the ordinary course of business in transactions exempt from registration, normally to qualified institutional buyers. At period end, the aggregate value of these securities was $751,380, representing 0.2% of net assets for the California fund. |
| (p) | Primary inverse floater. |
| (v) | Underlying affiliated fund that is available only to investment companies managed by MFS. The rate quoted for the MFS Institutional Money Market Portfolio is the annualized seven-day yield of the fund at period end. |
The following abbreviations are used in this report and are defined:
| COP | Certificate of Participation | |||||
| ETM | Escrowed to Maturity | |||||
| FRN | Floating Rate Note. Interest rate resets periodically and may not be the rate reported at period end. | |||||
| LOC | Letter of Credit | |||||
| Insurers | Inverse Floaters | |||||
| ACA | ACA Financial Guaranty Corp. | LEVRRS | Leveraged Reverse Rate Security | |||
| AGM | Assured Guaranty Municipal | RIBS | Residual Interest Bonds | |||
| AMBAC | AMBAC Indemnity Corp. | |||||
| ASSD GTY | Assured Guaranty Insurance Co. | |||||
| BHAC | Berkshire Hathaway Assurance Corp. | |||||
| CALHF | California Health Construction Loan Insurance | |||||
| FGIC | Financial Guaranty Insurance Co. | |||||
| FHA | Federal Housing Administration | |||||
| FNMA | Federal National Mortgage Assn. | |||||
| GNMA | Government National Mortgage Assn. | |||||
| MSQLF | Michigan Student Qualified Loan Fund | |||||
| NATL | National Public Finance Guarantee Corp. | |||||
| SYNCORA | Syncora Guarantee Inc. | |||||
| XLCA | XL Capital Insurance Co. | |||||
See Notes to Financial Statements
42
Table of Contents
Financial Statements
STATEMENTS OF ASSETS AND LIABILITIES
At 3/31/13
These statements represent each fund’s balance sheet, which details the assets and liabilities comprising the total value of each fund.
| Alabama Fund | Arkansas Fund | California Fund | ||||||||||
| Assets | ||||||||||||
| Investments – | ||||||||||||
Non-affiliated issuers, at identified cost | $64,022,934 | $224,293,488 | $295,225,558 | |||||||||
Underlying affiliated funds, at cost and net asset value | 1,531,701 | 3,067,890 | 3,971,626 | |||||||||
| Total investments, at identified cost | $65,554,635 | $227,361,378 | $299,197,184 | |||||||||
Unrealized appreciation (depreciation) | 5,315,879 | 10,380,731 | 24,302,898 | |||||||||
| Total investments, at value | $70,870,514 | $237,742,109 | $323,500,082 | |||||||||
Cash | — | 261,351 | — | |||||||||
| Receivables for | ||||||||||||
Investments sold | 1,009,351 | 2,069,238 | 1,570,963 | |||||||||
Fund shares sold | 61,028 | 272,273 | 490,559 | |||||||||
Interest | 814,503 | 3,041,226 | 4,175,729 | |||||||||
Other assets | 625 | 1,623 | 2,117 | |||||||||
Total assets | $72,756,021 | $243,387,820 | $329,739,450 | |||||||||
| Liabilities | ||||||||||||
| Payables for | ||||||||||||
Distributions | $49,569 | $170,437 | $268,771 | |||||||||
Investments purchased | 966,335 | 553,378 | — | |||||||||
Fund shares reacquired | 75,730 | 526,182 | 538,966 | |||||||||
| Payable to affiliates | ||||||||||||
Investment adviser | 3,209 | 15,474 | 20,944 | |||||||||
Shareholder servicing costs | 27,915 | 87,964 | 148,231 | |||||||||
Distribution and service fees | 2,562 | 7,641 | 11,605 | |||||||||
| Payable for independent Trustees’ compensation | 4,682 | 4,657 | 11,680 | |||||||||
Accrued expenses and other liabilities | 60,993 | 76,476 | 75,576 | |||||||||
Total liabilities | $1,190,995 | $1,442,209 | $1,075,773 | |||||||||
Net assets | $71,565,026 | $241,945,611 | $328,663,677 | |||||||||
| Net assets consist of | ||||||||||||
| Paid-in capital | $66,700,312 | $230,661,116 | $310,004,260 | |||||||||
| Unrealized appreciation (depreciation) on investments | 5,315,879 | 10,380,731 | 24,302,898 | |||||||||
| Accumulated net realized gain (loss) on investments | (478,851 | ) | 944,297 | (5,715,727 | ) | |||||||
Accumulated undistributed (distributions in excess of) net investment income | 27,686 | (40,533 | ) | 72,246 | ||||||||
Net assets | $71,565,026 | $241,945,611 | $328,663,677 | |||||||||
43
Table of Contents
Statements of Assets and Liabilities – continued
| Alabama Fund | Arkansas Fund | California Fund | ||||||||||
Net assets | ||||||||||||
| Class A | $70,432,062 | $232,510,276 | $288,367,389 | |||||||||
| Class B | 1,132,964 | 9,435,335 | 5,176,471 | |||||||||
Class C | — | — | 35,119,817 | |||||||||
Total net assets | $71,565,026 | $241,945,611 | $328,663,677 | |||||||||
Shares of beneficial interest outstanding | ||||||||||||
| Class A | 6,582,396 | 22,717,712 | 47,668,691 | |||||||||
| Class B | 105,867 | 921,017 | 855,487 | |||||||||
Class C | — | — | 5,785,706 | |||||||||
Total shares of beneficial interest outstanding | 6,688,263 | 23,638,729 | 54,309,884 | |||||||||
Class A shares | ||||||||||||
| Net asset value per share | ||||||||||||
(net assets/shares of beneficial interest outstanding) | $10.70 | $10.23 | $6.05 | |||||||||
Offering price per share (100 / 95.25 x net asset value per share) | $11.23 | $10.74 | $6.35 | |||||||||
Class B shares | ||||||||||||
| Net asset value and offering price per share | ||||||||||||
(net assets/shares of beneficial interest outstanding) | $10.70 | $10.24 | $6.05 | |||||||||
Class C shares | ||||||||||||
| Net asset value and offering price per share | ||||||||||||
(net assets/shares of beneficial interest outstanding) | $— | $— | $6.07 | |||||||||
On sales of $50,000 or more, the maximum offering price of Class A shares is reduced. A contingent deferred sales charge may be imposed on redemptions of Class A, Class B, and Class C shares.
See Notes to Financial Statements
44
Table of Contents
Statements of Assets and Liabilities – continued
| At 3/31/13 | Georgia Fund | Maryland Fund | Massachusetts Fund | |||||||||
| Assets | ||||||||||||
| Investments – | ||||||||||||
Non-affiliated issuers, at identified cost | $73,922,908 | $100,892,329 | $265,177,402 | |||||||||
Underlying affiliated funds, at cost and net asset value | 3,019,083 | 3,980,610 | 7,304,229 | |||||||||
| Total investments, at identified cost | $76,941,991 | $104,872,939 | $272,481,631 | |||||||||
Unrealized appreciation (depreciation) | 5,486,302 | 7,689,011 | 25,790,221 | |||||||||
| Total investments, at value | $82,428,293 | $112,561,950 | $298,271,852 | |||||||||
Receivables for | ||||||||||||
Investments sold | — | 1,267,355 | 725,521 | |||||||||
Fund shares sold | 277,976 | 91,139 | 186,098 | |||||||||
Interest | 1,010,566 | 1,389,389 | 3,749,657 | |||||||||
Other assets | 714 | 911 | 2,012 | |||||||||
Total assets | $83,717,549 | $115,310,744 | $302,935,140 | |||||||||
| Liabilities | ||||||||||||
| Payables for | ||||||||||||
Distributions | $42,075 | $77,570 | $185,834 | |||||||||
Investments purchased | 604,575 | 560,330 | — | |||||||||
Fund shares reacquired | 242,270 | 304,331 | 504,489 | |||||||||
| Payable to affiliates | ||||||||||||
Investment adviser | 6,162 | 7,387 | 19,264 | |||||||||
Shareholder servicing costs | 30,665 | 46,462 | 139,392 | |||||||||
Distribution and service fees | 3,074 | 4,324 | 10,941 | |||||||||
Payable for independent Trustees’ compensation | 5,256 | 7,897 | 7,968 | |||||||||
Accrued expenses and other liabilities | 65,698 | 66,878 | 77,268 | |||||||||
Total liabilities | $999,775 | $1,075,179 | $945,156 | |||||||||
Net assets | $82,717,774 | $114,235,565 | $301,989,984 | |||||||||
| Net assets consist of | ||||||||||||
| Paid-in capital | $77,536,844 | $106,644,416 | $275,460,868 | |||||||||
| Unrealized appreciation (depreciation) on investments | 5,486,302 | 7,689,011 | 25,790,221 | |||||||||
| Accumulated net realized gain (loss) on investments | (313,509 | ) | (190,782 | ) | 656,462 | |||||||
Undistributed net investment income | 8,137 | 92,920 | 82,433 | |||||||||
Net assets | $82,717,774 | $114,235,565 | $301,989,984 | |||||||||
45
Table of Contents
Statements of Assets and Liabilities – continued
Georgia Fund | Maryland Fund | Massachusetts Fund | ||||||||||
Net assets | ||||||||||||
| Class A | $80,335,584 | $110,728,766 | $296,895,257 | |||||||||
Class B | 2,382,190 | 3,506,799 | 5,094,727 | |||||||||
Total net assets | $82,717,774 | $114,235,565 | $301,989,984 | |||||||||
Shares of beneficial interest outstanding | ||||||||||||
| Class A | 7,185,503 | 9,650,376 | 25,466,333 | |||||||||
Class B | 212,284 | 305,756 | 436,250 | |||||||||
Total shares of beneficial interest outstanding | 7,397,787 | 9,956,132 | 25,902,583 | |||||||||
Class A shares | ||||||||||||
| Net asset value per share | ||||||||||||
(net assets/shares of beneficial interest outstanding) | $11.18 | $11.47 | $11.66 | |||||||||
Offering price per share (100 / 95.25 x net asset value per share) | $11.74 | $12.04 | $12.24 | |||||||||
Class B shares | ||||||||||||
| Net asset value and offering price per share | ||||||||||||
(net assets/shares of beneficial interest outstanding) | $11.22 | $11.47 | $11.68 | |||||||||
On sales of $50,000 or more, the maximum offering price of Class A shares is reduced. A contingent deferred sales charge may be imposed on redemptions of Class A and Class B shares.
See Notes to Financial Statements
46
Table of Contents
Financial Statements
Year ended 3/31/13
These statements describe how much each fund earned in investment income and accrued in expenses. They also describe any gains or losses generated by each fund’s operations.
| Alabama Fund | Arkansas Fund | California Fund | ||||||||||
| Net investment income | ||||||||||||
| Interest | $3,368,107 | $10,207,392 | $14,990,661 | |||||||||
Dividends from underlying affiliated funds | 1,503 | 10,195 | 8,601 | |||||||||
Total investment income | $3,369,610 | $10,217,587 | $14,999,262 | |||||||||
| Expenses | ||||||||||||
Management fee | $323,773 | $1,065,994 | $1,463,173 | |||||||||
Distribution and service fees | 190,126 | 663,021 | 1,116,773 | |||||||||
Shareholder servicing costs | 48,119 | 174,412 | 264,040 | |||||||||
Administrative services fee | 20,473 | 42,639 | 54,527 | |||||||||
Independent Trustees’ compensation | 3,165 | 10,436 | 11,323 | |||||||||
Custodian fee | 19,895 | 41,196 | 48,714 | |||||||||
Shareholder communications | 7,072 | 13,989 | 15,072 | |||||||||
Audit and tax fees | 49,315 | 49,358 | 49,397 | |||||||||
Legal fees | 5,476 | 4,002 | 9,196 | |||||||||
Miscellaneous | 33,448 | 50,352 | 49,529 | |||||||||
Total expenses | $700,862 | $2,115,399 | $3,081,744 | |||||||||
Fees paid indirectly | (1 | ) | — | (9 | ) | |||||||
Reduction of expenses by investment adviser and distributor | (19,612 | ) | (352,412 | ) | (434,648 | ) | ||||||
Net expenses | $681,249 | $1,762,987 | $2,647,087 | |||||||||
Net investment income | $2,688,361 | $8,454,600 | $12,352,175 | |||||||||
| Realized and unrealized gain (loss) on investments | ||||||||||||
| Realized gain (loss) (identified cost basis) | ||||||||||||
Investments | $265,559 | $543,680 | $3,024,734 | |||||||||
Futures contracts | (44,398 | ) | — | (195,962 | ) | |||||||
Net realized gain (loss) on investments | $221,161 | $543,680 | $2,828,772 | |||||||||
| Change in unrealized appreciation (depreciation) | ||||||||||||
Investments | $1,079,171 | $317,806 | $8,039,237 | |||||||||
Futures contracts | (26,176 | ) | — | (117,088 | ) | |||||||
Net unrealized gain (loss) on investments | $1,052,995 | $317,806 | $7,922,149 | |||||||||
Net realized and unrealized gain (loss) on investments | $1,274,156 | $861,486 | $10,750,921 | |||||||||
Change in net assets from operations | $3,962,517 | $9,316,086 | $23,103,096 | |||||||||
See Notes to Financial Statements
47
Table of Contents
Statements of Operations – continued
| Year ended 3/31/13 | Georgia Fund | Maryland Fund | Massachusetts Fund | |||||||||
| Net investment income | ||||||||||||
| Interest | $3,422,799 | $5,592,267 | $13,619,672 | |||||||||
Dividends from underlying affiliated funds | 3,887 | 4,986 | 11,291 | |||||||||
Total investment income | $3,426,686 | $5,597,253 | $13,630,963 | |||||||||
| Expenses | ||||||||||||
Management fee | $352,957 | $512,161 | $1,364,303 | |||||||||
Distribution and service fees | 212,742 | 310,600 | 798,713 | |||||||||
Shareholder servicing costs | 58,789 | 87,933 | 239,268 | |||||||||
Administrative services fee | 21,322 | 26,101 | 51,580 | |||||||||
Independent Trustees’ compensation | 3,178 | 5,668 | 11,163 | |||||||||
Custodian fee | 24,160 | 26,433 | 46,864 | |||||||||
Shareholder communications | 7,931 | 10,172 | 14,902 | |||||||||
Audit and tax fees | 49,312 | 49,327 | 49,387 | |||||||||
Legal fees | 4,345 | 6,843 | 3,979 | |||||||||
Miscellaneous | 36,177 | 38,250 | 44,369 | |||||||||
Total expenses | $770,913 | $1,073,488 | $2,624,528 | |||||||||
Fees paid indirectly | (1 | ) | (5 | ) | (8 | ) | ||||||
Reduction of expenses by investment adviser | (7,508 | ) | (366 | ) | (973 | ) | ||||||
Net expenses | $763,404 | $1,073,117 | $2,623,547 | |||||||||
Net investment income | $2,663,282 | $4,524,136 | $11,007,416 | |||||||||
| Realized and unrealized gain (loss) on investments | ||||||||||||
| Realized gain (loss) (identified cost basis) | ||||||||||||
Investments | $118,278 | $269,571 | $1,458,844 | |||||||||
Futures contracts | (44,091 | ) | (59,299 | ) | (149,013 | ) | ||||||
Net realized gain (loss) on investments | $74,187 | $210,272 | $1,309,831 | |||||||||
| Change in unrealized appreciation (depreciation) | ||||||||||||
Investments | $1,267,325 | $699,971 | $3,842,885 | |||||||||
Futures contracts | (25,220 | ) | (35,220 | ) | (90,442 | ) | ||||||
Net unrealized gain (loss) on investments | $1,242,105 | $664,751 | $3,752,443 | |||||||||
Net realized and unrealized gain (loss) on investments | $1,316,292 | $875,023 | $5,062,274 | |||||||||
Change in net assets from operations | $3,979,574 | $5,399,159 | $16,069,690 | |||||||||
See Notes to Financial Statements
48
Table of Contents
Financial Statements
STATEMENTS OF CHANGES IN NET ASSETS
These statements describe the increases and/or decreases in net assets resulting from operations, any distributions, and any shareholder transactions.
| Year ended 3/31/13 | Alabama Fund | Arkansas Fund | California Fund | |||||||||
| Change in net assets | ||||||||||||
| From operations | ||||||||||||
| Net investment income | $2,688,361 | $8,454,600 | $12,352,175 | |||||||||
Net realized gain (loss) on investments | 221,161 | 543,680 | 2,828,772 | |||||||||
Net unrealized gain (loss) on investments | 1,052,995 | 317,806 | 7,922,149 | |||||||||
Change in net assets from operations | $3,962,517 | $9,316,086 | $23,103,096 | |||||||||
| Distributions declared to shareholders | ||||||||||||
From net investment income | $(2,587,536 | ) | $(8,079,772 | ) | $(11,992,142 | ) | ||||||
Change in net assets from fund share transactions | $(1,522,773 | ) | $18,224,694 | $1,015,019 | ||||||||
Total change in net assets | $(147,792 | ) | $19,461,008 | $12,125,973 | ||||||||
| Net assets | ||||||||||||
| At beginning of period | 71,712,818 | 222,484,603 | 316,537,704 | |||||||||
At end of period | $71,565,026 | $241,945,611 | $328,663,677 | |||||||||
Accumulated undistributed (distributions in excess of) net investment income included in net assets at end of period | $27,686 | $(40,533 | ) | $72,246 | ||||||||
| Year ended 3/31/13 | Georgia Fund | Maryland Fund | Massachusetts Fund | |||||||||
| Change in net assets | ||||||||||||
| From operations | ||||||||||||
| Net investment income | $2,663,282 | $4,524,136 | $11,007,416 | |||||||||
Net realized gain (loss) on investments | 74,187 | 210,272 | 1,309,831 | |||||||||
Net unrealized gain (loss) on investments | 1,242,105 | 664,751 | 3,752,443 | |||||||||
Change in net assets from operations | $3,979,574 | $5,399,159 | $16,069,690 | |||||||||
| Distributions declared to shareholders | ||||||||||||
From net investment income | $(2,539,962 | ) | $(4,088,801 | ) | $(10,410,844 | ) | ||||||
Change in net assets from fund share transactions | $10,233,705 | $1,780,645 | $1,798,812 | |||||||||
Total change in net assets | $11,673,317 | $3,091,003 | $7,457,658 | |||||||||
| Net assets | ||||||||||||
| At beginning of period | 71,044,457 | 111,144,562 | 294,532,326 | |||||||||
At end of period | $82,717,774 | $114,235,565 | $301,989,984 | |||||||||
Undistributed net investment income included in net assets at end of period | $8,137 | $92,920 | $82,433 | |||||||||
See Notes to Financial Statements
49
Table of Contents
Statements of Changes in Net Assets – continued
| Year ended 3/31/12 | Alabama Fund | Arkansas Fund | California Fund | |||||||||
| Change in net assets | ||||||||||||
| From operations | ||||||||||||
| Net investment income | $2,846,222 | $7,766,796 | $12,895,692 | |||||||||
Net realized gain (loss) on investments | (290,002 | ) | (297,147 | ) | (4,295,817 | ) | ||||||
Net unrealized gain (loss) on investments | 5,737,628 | 13,862,869 | 38,502,254 | |||||||||
Change in net assets from operations | $8,293,848 | $21,332,518 | $47,102,129 | |||||||||
| Distributions declared to shareholders | ||||||||||||
From net investment income | $(2,766,439 | ) | $(7,701,555 | ) | $(12,838,950 | ) | ||||||
Change in net assets from fund share transactions | $(7,575,629 | ) | $22,352,418 | $(18,194,793 | ) | |||||||
Total change in net assets | $(2,048,220 | ) | $35,983,381 | $16,068,386 | ||||||||
| Net assets | ||||||||||||
| At beginning of period | 73,761,038 | 186,501,222 | 300,469,318 | |||||||||
At end of period | $71,712,818 | $222,484,603 | $316,537,704 | |||||||||
Accumulated undistributed (distributions in excess of) net investment income included in net assets at end of period | $28,689 | $(51 | ) | $148,045 | ||||||||
| Year ended 3/31/12 | Georgia Fund | Maryland Fund | Massachusetts Fund | |||||||||
| Change in net assets | ||||||||||||
| From operations | ||||||||||||
| Net investment income | $2,488,818 | $4,432,250 | $11,396,730 | |||||||||
Net realized gain (loss) on investments | (192,910 | ) | (549,836 | ) | (1,231,931 | ) | ||||||
Net unrealized gain (loss) on investments | 5,388,551 | 9,102,033 | 27,052,808 | |||||||||
Change in net assets from operations | $7,684,459 | $12,984,447 | $37,217,607 | |||||||||
| Distributions declared to shareholders | ||||||||||||
From net investment income | $(2,458,315 | ) | $(4,329,991 | ) | $(11,201,993 | ) | ||||||
Change in net assets from fund share transactions | $5,555,284 | $(1,605,548 | ) | $(5,416,666 | ) | |||||||
Total change in net assets | $10,781,428 | $7,048,908 | $20,598,948 | |||||||||
| Net assets | ||||||||||||
| At beginning of period | 60,263,029 | 104,095,654 | 273,933,378 | |||||||||
At end of period | $71,044,457 | $111,144,562 | $294,532,326 | |||||||||
Undistributed net investment income included in net assets at end of period | $10,873 | $96,710 | $90,312 | |||||||||
See Notes to Financial Statements
50
Table of Contents
Financial Statements
MFS ALABAMA MUNICIPAL BOND FUND
The financial highlights table is intended to help you understand the fund financial performance for the past 5 years. Certain information reflects financial results for a single fund share. The total returns in the table represent the rate by which an investor would have earned (or lost) on an investment in the fund share class (assuming reinvestment of all distributions) held for the entire period.
| Years ended 3/31 | ||||||||||||||||||||
| Class A | 2013 | 2012 | 2011 | 2010 | 2009 | |||||||||||||||
Net asset value, beginning of period | $10.50 | $9.72 | $10.25 | $9.60 | $10.17 | |||||||||||||||
| Income (loss) from investment operations | ||||||||||||||||||||
| Net investment income (d) | $0.40 | $0.41 | $0.42 | $0.44 | $0.43 | |||||||||||||||
Net realized and unrealized gain (loss) on investments | 0.19 | 0.77 | (0.54 | ) | 0.72 | (0.50 | ) | |||||||||||||
Total from investment operations | $0.59 | $1.18 | $(0.12 | ) | $1.16 | $(0.07 | ) | |||||||||||||
| Less distributions declared to shareholders | ||||||||||||||||||||
| From net investment income | $(0.39 | ) | $(0.40 | ) | $(0.41 | ) | $(0.42 | ) | $(0.44 | ) | ||||||||||
From net realized gain on investments | — | — | (0.00 | )(w) | (0.09 | ) | (0.06 | ) | ||||||||||||
Total distributions declared to shareholders | $(0.39 | ) | $(0.40 | ) | $(0.41 | ) | $(0.51 | ) | $(0.50 | ) | ||||||||||
Net asset value, end of period (x) | $10.70 | $10.50 | $9.72 | $10.25 | $9.60 | |||||||||||||||
Total return (%) (r)(s)(t)(x) | 5.63 | 12.30 | (1.21 | ) | 12.25 | (0.59 | ) | |||||||||||||
| Ratios (%) (to average net assets) and Supplemental data: | ||||||||||||||||||||
| Expenses before expense reductions (f) | 0.96 | 0.99 | 0.97 | 0.97 | 1.01 | |||||||||||||||
| Expenses after expense reductions (f) | 0.93 | 0.93 | 0.93 | 0.93 | 0.84 | |||||||||||||||
| Net investment income | 3.74 | 4.01 | 4.12 | 4.33 | 4.36 | |||||||||||||||
| Portfolio turnover | 10 | 21 | 20 | 27 | 35 | |||||||||||||||
Net assets at end of period (000 omitted) | $70,432 | $69,887 | $70,582 | $78,842 | $68,320 | |||||||||||||||
| Supplemental Ratios (%): | ||||||||||||||||||||
Ratios of expenses to average net assets after expense reductions and excluding interest expense and fees (f)(l) | N/A | N/A | N/A | N/A | 0.80 | |||||||||||||||
See Notes to Financial Statements
51
Table of Contents
Financial Highlights – continued
MFS ALABAMA MUNICIPAL BOND FUND – continued
| Years ended 3/31 | ||||||||||||||||||||
| Class B | 2013 | 2012 | 2011 | 2010 | 2009 | |||||||||||||||
Net asset value, beginning of period | $10.50 | $9.72 | $10.24 | $9.60 | $10.17 | |||||||||||||||
| Income (loss) from investment operations | ||||||||||||||||||||
| Net investment income (d) | $0.32 | $0.33 | $0.34 | $0.36 | $0.36 | |||||||||||||||
Net realized and unrealized gain (loss) on investments | 0.19 | 0.77 | (0.52 | ) | 0.72 | (0.50 | ) | |||||||||||||
Total from investment operations | $0.51 | $1.10 | $(0.18 | ) | $1.08 | $(0.14 | ) | |||||||||||||
| Less distributions declared to shareholders | ||||||||||||||||||||
| From net investment income | $(0.31 | ) | $(0.32 | ) | $(0.34 | ) | $(0.35 | ) | $(0.37 | ) | ||||||||||
From net realized gain on investments | — | — | (0.00 | )(w) | (0.09 | ) | (0.06 | ) | ||||||||||||
Total distributions declared to shareholders | $(0.31 | ) | $(0.32 | ) | $(0.34 | ) | $(0.44 | ) | $(0.43 | ) | ||||||||||
Net asset value, end of period (x) | $10.70 | $10.50 | $9.72 | $10.24 | $9.60 | |||||||||||||||
Total return (%) (r)(s)(t)(x) | 4.85 | 11.47 | (1.84 | ) | 11.31 | (1.34 | ) | |||||||||||||
| Ratios (%) (to average net assets) and Supplemental data: | ||||||||||||||||||||
| Expenses before expense reductions (f) | 1.71 | 1.74 | 1.72 | 1.72 | 1.76 | |||||||||||||||
| Expenses after expense reductions (f) | 1.68 | 1.68 | 1.68 | 1.68 | 1.58 | |||||||||||||||
| Net investment income | 2.99 | 3.28 | 3.37 | 3.60 | 3.62 | |||||||||||||||
| Portfolio turnover | 10 | 21 | 20 | 27 | 35 | |||||||||||||||
Net assets at end of period (000 omitted) | $1,133 | $1,826 | $3,179 | $5,477 | $6,884 | |||||||||||||||
| Supplemental Ratios (%): | ||||||||||||||||||||
Ratios of expenses to average net assets after expense reductions and excluding interest expense and fees (f)(l) | N/A | N/A | N/A | N/A | 1.55 | |||||||||||||||
| (d) | Per share data is based on average shares outstanding. |
| (f) | Ratios do not reflect reductions from fees paid indirectly, if applicable. |
| (l) | Interest expense and fees relate to payments made to the holders of the floating rate certificates from trust assets. |
| (r) | Certain expenses have been reduced without which performance would have been lower. |
| (s) | From time to time the fund may receive proceeds from litigation settlements, without which performance would be lower. |
| (t) | Total returns do not include any applicable sales charges. |
| (w) | Per share amount was less than $0.01. |
| (x) | The net asset values per share and total returns have been calculated on net assets which include adjustments made in accordance with U.S. generally accepted accounting principles required at period end for financial reporting purposes. |
See Notes to Financial Statements
52
Table of Contents
Financial Highlights – continued
MFS ARKANSAS MUNICIPAL BOND FUND
The financial highlights table is intended to help you understand the fund financial performance for the past 5 years. Certain information reflects financial results for a single fund share. The total returns in the table represent the rate by which an investor would have earned (or lost) on an investment in the fund share class (assuming reinvestment of all distributions) held for the entire period.
| Years ended 3/31 | ||||||||||||||||||||
| Class A | 2013 | 2012 | 2011 | 2010 | 2009 | |||||||||||||||
Net asset value, beginning of period | $10.17 | $9.49 | $9.95 | $9.43 | $9.80 | |||||||||||||||
| Income (loss) from investment operations | ||||||||||||||||||||
| Net investment income (d) | $0.37 | $0.38 | $0.41 | $0.42 | $0.43 | |||||||||||||||
Net realized and unrealized gain (loss) on investments | 0.05 | 0.68 | (0.47 | ) | 0.53 | (0.29 | ) | |||||||||||||
Total from investment operations | $0.42 | $1.06 | $(0.06 | ) | $0.95 | $0.14 | ||||||||||||||
| Less distributions declared to shareholders | ||||||||||||||||||||
| From net investment income | $(0.36 | ) | $(0.38 | ) | $(0.40 | ) | $(0.41 | ) | $(0.43 | ) | ||||||||||
From net realized gain on investments | — | — | (0.00 | )(w) | (0.02 | ) | (0.08 | ) | ||||||||||||
Total distributions declared to shareholders | $(0.36 | ) | $(0.38 | ) | $(0.40 | ) | $(0.43 | ) | $(0.51 | ) | ||||||||||
Net asset value, end of period (x) | $10.23 | $10.17 | $9.49 | $9.95 | $9.43 | |||||||||||||||
Total return (%) (r)(s)(t)(x) | 4.10 | 11.34 | (0.62 | ) | 10.17 | 1.61 | ||||||||||||||
| Ratios (%) (to average net assets) and Supplemental data: | ||||||||||||||||||||
| Expenses before expense reductions (f) | 0.86 | 0.87 | 0.87 | 0.84 | 0.83 | |||||||||||||||
| Expenses after expense reductions (f) | 0.71 | 0.72 | 0.72 | 0.74 | 0.66 | |||||||||||||||
| Net investment income | 3.59 | 3.86 | 4.20 | 4.32 | 4.48 | |||||||||||||||
| Portfolio turnover | 16 | 12 | 20 | 9 | 23 | |||||||||||||||
Net assets at end of period (000 omitted) | $232,510 | $213,736 | $178,685 | $179,094 | $141,100 | |||||||||||||||
| Supplemental Ratios (%): | ||||||||||||||||||||
Ratios of expenses to average net assets after expense reductions and excluding interest expense and fees (f)(l) | N/A | N/A | N/A | N/A | 0.60 | |||||||||||||||
See Notes to Financial Statements
53
Table of Contents
Financial Highlights – continued
MFS ARKANSAS MUNICIPAL BOND FUND – continued
| Years ended 3/31 | ||||||||||||||||||||
| Class B | 2013 | 2012 | 2011 | 2010 | 2009 | |||||||||||||||
Net asset value, beginning of period | $10.18 | $9.50 | $9.96 | $9.44 | $9.81 | |||||||||||||||
| Income (loss) from investment operations | ||||||||||||||||||||
| Net investment income (d) | $0.29 | $0.31 | $0.33 | $0.35 | $0.35 | |||||||||||||||
Net realized and unrealized gain (loss) on investments | 0.04 | 0.67 | (0.47 | ) | 0.52 | (0.28 | ) | |||||||||||||
Total from investment operations | $0.33 | $0.98 | $(0.14 | ) | $0.87 | $0.07 | ||||||||||||||
| Less distributions declared to shareholders | ||||||||||||||||||||
| From net investment income | $(0.27 | ) | $(0.30 | ) | $(0.32 | ) | $(0.33 | ) | $(0.36 | ) | ||||||||||
From net realized gain on investments | — | — | (0.00 | )(w) | (0.02 | ) | (0.08 | ) | ||||||||||||
Total distributions declared to shareholders | $(0.27 | ) | $(0.30 | ) | $(0.32 | ) | $(0.35 | ) | $(0.44 | ) | ||||||||||
Net asset value, end of period (x) | $10.24 | $10.18 | $9.50 | $9.96 | $9.44 | |||||||||||||||
Total return (%) (r)(s)(t)(x) | 3.29 | 10.47 | (1.43 | ) | 9.30 | 0.85 | ||||||||||||||
| Ratios (%) (to average net assets) and Supplemental data: | ||||||||||||||||||||
| Expenses before expense reductions (f) | 1.61 | 1.62 | 1.62 | 1.59 | 1.59 | |||||||||||||||
| Expenses after expense reductions (f) | 1.50 | 1.49 | 1.53 | 1.52 | 1.42 | |||||||||||||||
| Net investment income | 2.80 | 3.08 | 3.37 | 3.53 | 3.71 | |||||||||||||||
| Portfolio turnover | 16 | 12 | 20 | 9 | 23 | |||||||||||||||
Net assets at end of period (000 omitted) | $9,435 | $8,749 | $7,816 | $8,129 | $6,111 | |||||||||||||||
| Supplemental Ratios (%): | ||||||||||||||||||||
Ratios of expenses to average net assets after expense reductions and excluding interest expense and fees (f)(l) | N/A | N/A | N/A | N/A | 1.35 | |||||||||||||||
| (d) | Per share data is based on average shares outstanding. |
| (f) | Ratios do not reflect reductions from fees paid indirectly, if applicable. |
| (l) | Interest expense and fees relate to payments made to the holders of the floating rate certificates from trust assets. |
| (r) | Certain expenses have been reduced without which performance would have been lower. |
| (s) | From time to time the fund may receive proceeds from litigation settlements, without which performance would be lower. |
| (t) | Total returns do not include any applicable sales charges. |
| (w) | Per share amount was less than $0.01. |
| (x) | The net asset values per share and total returns have been calculated on net assets which include adjustments made in accordance with U.S. generally accepted accounting principles required at period end for financial reporting purposes. |
See Notes to Financial Statements
54
Table of Contents
Financial Highlights – continued
MFS CALIFORNIA MUNICIPAL BOND FUND
The financial highlights table is intended to help you understand the fund financial performance for the past 5 years. Certain information reflects financial results for a single fund share. The total returns in the table represent the rate by which an investor would have earned (or lost) on an investment in the fund share class (assuming reinvestment of all distributions) held for the entire period.
| Years ended 3/31 | ||||||||||||||||||||
| Class A | 2013 | 2012 | 2011 | 2010 | 2009 | |||||||||||||||
Net asset value, beginning of period | $5.84 | $5.23 | $5.56 | $5.15 | $5.56 | |||||||||||||||
| Income (loss) from investment operations | ||||||||||||||||||||
| Net investment income (d) | $0.23 | $0.24 | $0.26 | $0.26 | $0.27 | |||||||||||||||
Net realized and unrealized gain (loss) on investments | 0.21 | 0.61 | (0.34 | ) | 0.41 | (0.42 | ) | |||||||||||||
Total from investment operations | $0.44 | $0.85 | $(0.08 | ) | $0.67 | $(0.15 | ) | |||||||||||||
| Less distributions declared to shareholders | ||||||||||||||||||||
From net investment income | $(0.23 | ) | $(0.24 | ) | $(0.25 | ) | $(0.26 | ) | $(0.26 | ) | ||||||||||
Net asset value, end of period (x) | $6.05 | $5.84 | $5.23 | $5.56 | $5.15 | |||||||||||||||
Total return (%) (r)(s)(t)(x) | 7.59 | 16.48 | (1.53 | ) | 13.11 | (2.66 | ) | |||||||||||||
| Ratios (%) (to average net assets) and Supplemental data: | ||||||||||||||||||||
| Expenses before expense reductions (f) | 0.85 | 0.86 | 0.85 | 0.81 | 0.81 | |||||||||||||||
| Expenses after expense reductions (f) | 0.70 | 0.71 | 0.70 | 0.71 | 0.63 | |||||||||||||||
| Net investment income | 3.90 | 4.26 | 4.79 | 4.78 | 5.05 | |||||||||||||||
| Portfolio turnover | 20 | 35 | 24 | 31 | 27 | |||||||||||||||
Net assets at end of period (000 omitted) | $288,367 | $277,271 | $263,306 | $324,093 | $291,509 | |||||||||||||||
| Supplemental Ratios (%): | ||||||||||||||||||||
Ratios of expenses to average net assets after expense reductions and excluding interest expense and fees (f)(l) | N/A | N/A | N/A | N/A | 0.56 | |||||||||||||||
| Years ended 3/31 | ||||||||||||||||||||
| Class B | 2013 | 2012 | 2011 | 2010 | 2009 | |||||||||||||||
Net asset value, beginning of period | $5.84 | $5.23 | $5.57 | $5.15 | $5.56 | |||||||||||||||
| Income (loss) from investment operations | ||||||||||||||||||||
| Net investment income (d) | $0.19 | $0.20 | $0.22 | $0.22 | $0.23 | |||||||||||||||
Net realized and unrealized gain (loss) on investments | 0.20 | 0.60 | (0.35 | ) | 0.41 | (0.42 | ) | |||||||||||||
Total from investment operations | $0.39 | $0.80 | $(0.13 | ) | $0.63 | $(0.19 | ) | |||||||||||||
| Less distributions declared to shareholders | ||||||||||||||||||||
From net investment income | $(0.18 | ) | $(0.19 | ) | $(0.21 | ) | $(0.21 | ) | $(0.22 | ) | ||||||||||
Net asset value, end of period (x) | $6.05 | $5.84 | $5.23 | $5.57 | $5.15 | |||||||||||||||
Total return (%) (r)(s)(t)(x) | 6.75 | 15.60 | (2.46 | ) | 12.47 | (3.39 | ) | |||||||||||||
| Ratios (%) (to average net assets) and Supplemental data: | ||||||||||||||||||||
| Expenses before expense reductions (f) | 1.60 | 1.61 | 1.60 | 1.56 | 1.57 | |||||||||||||||
| Expenses after expense reductions (f) | 1.48 | 1.47 | 1.47 | 1.47 | 1.39 | |||||||||||||||
| Net investment income | 3.12 | 3.51 | 4.01 | 4.03 | 4.29 | |||||||||||||||
| Portfolio turnover | 20 | 35 | 24 | 31 | 27 | |||||||||||||||
Net assets at end of period (000 omitted) | $5,176 | $5,640 | $6,769 | $13,866 | $19,477 | |||||||||||||||
| Supplemental Ratios (%): | ||||||||||||||||||||
Ratios of expenses to average net assets after expense reductions and excluding interest expense and fees (f)(l) | N/A | N/A | N/A | N/A | 1.32 | |||||||||||||||
See Notes to Financial Statements
55
Table of Contents
Financial Highlights – continued
MFS CALIFORNIA MUNICIPAL BOND FUND – continued
| Years ended 3/31 | ||||||||||||||||||||
| Class C | 2013 | 2012 | 2011 | 2010 | 2009 | |||||||||||||||
Net asset value, beginning of period | $5.86 | $5.25 | $5.58 | $5.16 | $5.58 | |||||||||||||||
| Income (loss) from investment operations | ||||||||||||||||||||
| Net investment income (d) | $0.18 | $0.19 | $0.21 | $0.21 | $0.22 | |||||||||||||||
Net realized and unrealized gain (loss) on investments | 0.20 | 0.61 | (0.34 | ) | 0.42 | (0.42 | ) | |||||||||||||
Total from investment operations | $0.38 | $0.80 | $(0.13 | ) | $0.63 | $(0.20 | ) | |||||||||||||
| Less distributions declared to shareholders | ||||||||||||||||||||
From net investment income | $(0.17 | ) | $(0.19 | ) | $(0.20 | ) | $(0.21 | ) | $(0.22 | ) | ||||||||||
Net asset value, end of period (x) | $6.07 | $5.86 | $5.25 | $5.58 | $5.16 | |||||||||||||||
Total return (%) (r)(s)(t)(x) | 6.60 | 15.38 | (2.41 | ) | 12.27 | (3.70 | ) | |||||||||||||
| Ratios (%) (to average net assets) and Supplemental data: | ||||||||||||||||||||
| Expenses before expense reductions (f) | 1.60 | 1.61 | 1.60 | 1.60 | 1.70 | |||||||||||||||
| Expenses after expense reductions (f) | 1.60 | 1.61 | 1.60 | 1.60 | 1.53 | |||||||||||||||
| Net investment income | 2.99 | 3.34 | 3.87 | 3.85 | 4.14 | |||||||||||||||
| Portfolio turnover | 20 | 35 | 24 | 31 | 27 | |||||||||||||||
Net assets at end of period (000 omitted) | $35,120 | $33,626 | $30,393 | $37,810 | $29,480 | |||||||||||||||
| Supplemental Ratios (%): | ||||||||||||||||||||
Ratios of expenses to average net assets after expense reductions and excluding interest expense and fees (f)(l) | N/A | N/A | N/A | N/A | 1.46 | |||||||||||||||
| (d) | Per share data is based on average shares outstanding. |
| (f) | Ratios do not reflect reductions from fees paid indirectly, if applicable. |
| (l) | Interest expense and fees relate to payments made to the holders of the floating rate certificates from trust assets. |
| (r) | Certain expenses have been reduced without which performance would have been lower. |
| (s) | From time to time the fund may receive proceeds from litigation settlements, without which performance would be lower. |
| (t) | Total returns do not include any applicable sales charges. |
| (x) | Total returns have been calculated on net asset values which include adjustments made in accordance with U.S. generally accepted accounting principles required at period end for financial reporting purposes. |
See Notes to Financial Statements
56
Table of Contents
Financial Highlights – continued
MFS GEORGIA MUNICIPAL BOND FUND
The financial highlights table is intended to help you understand the fund financial performance for the past 5 years. Certain information reflects financial results for a single fund share. The total returns in the table represent the rate by which an investor would have earned (or lost) on an investment in the fund share class (assuming reinvestment of all distributions) held for the entire period.
| Years ended 3/31 | ||||||||||||||||||||
| Class A | 2013 | 2012 | 2011 | 2010 | 2009 | |||||||||||||||
Net asset value, beginning of period | $10.96 | $10.08 | $10.59 | $9.99 | $10.64 | |||||||||||||||
| Income (loss) from investment operations | ||||||||||||||||||||
| Net investment income (d) | $0.38 | $0.41 | $0.44 | $0.45 | $0.47 | |||||||||||||||
Net realized and unrealized gain (loss) on investments | 0.21 | 0.88 | (0.52 | ) | 0.62 | (0.48 | ) | |||||||||||||
Total from investment operations | $0.59 | $1.29 | $(0.08 | ) | $1.07 | $(0.01 | ) | |||||||||||||
| Less distributions declared to shareholders | ||||||||||||||||||||
| From net investment income | $(0.37 | ) | $(0.41 | ) | $(0.43 | ) | $(0.44 | ) | $(0.44 | ) | ||||||||||
From net realized gain on investments | — | — | — | (0.03 | ) | (0.20 | ) | |||||||||||||
Total distributions declared to shareholders | $(0.37 | ) | $(0.41 | ) | $(0.43 | ) | $(0.47 | ) | $(0.64 | ) | ||||||||||
Net asset value, end of period (x) | $11.18 | $10.96 | $10.08 | $10.59 | $9.99 | |||||||||||||||
Total return (%) (r)(s)(t)(x) | 5.38 | 12.98 | (0.84 | ) | 10.84 | 0.04 | ||||||||||||||
| Ratios (%) (to average net assets) and Supplemental data: | ||||||||||||||||||||
| Expenses before expense reductions (f) | 0.96 | 1.02 | 1.02 | 1.03 | 1.06 | |||||||||||||||
| Expenses after expense reductions (f) | 0.95 | 0.95 | 0.98 | 1.00 | 0.89 | |||||||||||||||
| Net investment income | 3.41 | 3.89 | 4.16 | 4.26 | 4.55 | |||||||||||||||
| Portfolio turnover | 14 | 19 | 22 | 16 | 26 | |||||||||||||||
Net assets at end of period (000 omitted) | $80,336 | $69,093 | $57,878 | $63,964 | $53,156 | |||||||||||||||
| Supplemental Ratios (%): | ||||||||||||||||||||
Ratios of expenses to average net assets after expense reductions and excluding interest expense and fees (f)(l) | N/A | N/A | N/A | N/A | 0.87 | |||||||||||||||
See Notes to Financial Statements
57
Table of Contents
Financial Highlights – continued
MFS GEORGIA MUNICIPAL BOND FUND – continued
| Years ended 3/31 | ||||||||||||||||||||
| Class B | 2013 | 2012 | 2011 | 2010 | 2009 | |||||||||||||||
Net asset value, beginning of period | $11.00 | $10.12 | $10.63 | $10.02 | $10.68 | |||||||||||||||
| Income (loss) from investment operations | ||||||||||||||||||||
| Net investment income (d) | $0.30 | $0.33 | $0.36 | $0.37 | $0.39 | |||||||||||||||
Net realized and unrealized gain (loss) on investments | 0.20 | 0.88 | (0.52 | ) | 0.63 | (0.49 | ) | |||||||||||||
Total from investment operations | $0.50 | $1.21 | $(0.16 | ) | $1.00 | $(0.10 | ) | |||||||||||||
| Less distributions declared to shareholders | ||||||||||||||||||||
| From net investment income | $(0.28 | ) | $(0.33 | ) | $(0.35 | ) | $(0.36 | ) | $(0.36 | ) | ||||||||||
From net realized gain on investments | — | — | — | (0.03 | ) | (0.20 | ) | |||||||||||||
Total distributions declared to shareholders | $(0.28 | ) | $(0.33 | ) | $(0.35 | ) | $(0.39 | ) | $(0.56 | ) | ||||||||||
Net asset value, end of period (x) | $11.22 | $11.00 | $10.12 | $10.63 | $10.02 | |||||||||||||||
Total return (%) (r)(s)(t)(x) | 4.57 | 12.09 | (1.58 | ) | 10.08 | (0.79 | ) | |||||||||||||
| Ratios (%) (to average net assets) and Supplemental data: | ||||||||||||||||||||
| Expenses before expense reductions (f) | 1.70 | 1.78 | 1.77 | 1.78 | 1.80 | |||||||||||||||
| Expenses after expense reductions (f) | 1.70 | 1.70 | 1.72 | 1.75 | 1.62 | |||||||||||||||
| Net investment income | 2.64 | 3.14 | 3.39 | 3.51 | 3.78 | |||||||||||||||
| Portfolio turnover | 14 | 19 | 22 | 16 | 26 | |||||||||||||||
Net assets at end of period (000 omitted) | $2,382 | $1,952 | $2,385 | $3,212 | $4,344 | |||||||||||||||
| Supplemental Ratios (%): | ||||||||||||||||||||
Ratios of expenses to average net assets after expense reductions and excluding interest expense and fees (f)(l) | N/A | N/A | N/A | N/A | 1.61 | |||||||||||||||
| (d) | Per share data is based on average shares outstanding. |
| (f) | Ratios do not reflect reductions from fees paid indirectly, if applicable. |
| (l) | Interest expense and fees relate to payments made to the holders of the floating rate certificates from trust assets. |
| (r) | Certain expenses have been reduced without which performance would have been lower. |
| (s) | From time to time the fund may receive proceeds from litigation settlements, without which performance would be lower. |
| (t) | Total returns do not include any applicable sales charges. |
| (x) | The net asset values per share and total returns have been calculated on net assets which include adjustments made in accordance with U.S. generally accepted accounting principles required at period end for financial reporting purposes. |
See Notes to Financial Statements
58
Table of Contents
Financial Highlights – continued
MFS MARYLAND MUNICIPAL BOND FUND
The financial highlights table is intended to help you understand the fund financial performance for the past 5 years. Certain information reflects financial results for a single fund share. The total returns in the table represent the rate by which an investor would have earned (or lost) on an investment in the fund share class (assuming reinvestment of all distributions) held for the entire period.
| Years ended 3/31 | ||||||||||||||||||||
| Class A | 2013 | 2012 | 2011 | 2010 | 2009 | |||||||||||||||
Net asset value, beginning of period | $11.34 | $10.45 | $10.93 | $10.15 | $10.83 | |||||||||||||||
| Income (loss) from investment operations | ||||||||||||||||||||
| Net investment income (d) | $0.46 | $0.46 | $0.46 | $0.48 | $0.48 | |||||||||||||||
Net realized and unrealized gain (loss) on investments | 0.09 | 0.88 | (0.49 | ) | 0.77 | (0.65 | ) | |||||||||||||
Total from investment operations | $0.55 | $1.34 | $(0.03 | ) | $1.25 | $(0.17 | ) | |||||||||||||
| Less distributions declared to shareholders | ||||||||||||||||||||
| From net investment income | $(0.42 | ) | $(0.45 | ) | $(0.45 | ) | $(0.47 | ) | $(0.47 | ) | ||||||||||
From net realized gain on investments | — | — | (0.00 | )(w) | (0.00 | )(w) | (0.04 | ) | ||||||||||||
Total distributions declared to shareholders | $(0.42 | ) | $(0.45 | ) | $(0.45 | ) | $(0.47 | ) | $(0.51 | ) | ||||||||||
Net asset value, end of period (x) | $11.47 | $11.34 | $10.45 | $10.93 | $10.15 | |||||||||||||||
Total return (%) (r)(s)(t)(x) | 4.86 | 13.01 | (0.35 | ) | 12.49 | (1.57 | ) | |||||||||||||
| Ratios (%) (to average net assets) and Supplemental data: | ||||||||||||||||||||
| Expenses before expense reductions (f) | 0.92 | 0.94 | 0.94 | 0.95 | 1.11 | |||||||||||||||
| Expenses after expense reductions (f) | 0.92 | 0.94 | 0.94 | 0.95 | 0.94 | |||||||||||||||
| Net investment income | 4.00 | 4.16 | 4.20 | 4.47 | 4.67 | |||||||||||||||
| Portfolio turnover | 23 | 13 | 14 | 24 | 24 | |||||||||||||||
Net assets at end of period (000 omitted) | $110,729 | $107,738 | $100,324 | $107,182 | $93,075 | |||||||||||||||
| Supplemental Ratios (%): | ||||||||||||||||||||
Ratios of expenses to average net assets after expense reductions and excluding interest expense and fees (f)(l) | N/A | N/A | N/A | N/A | 0.89 | |||||||||||||||
See Notes to Financial Statements
59
Table of Contents
Financial Highlights – continued
MFS MARYLAND MUNICIPAL BOND FUND – continued
| Years ended 3/31 | ||||||||||||||||||||
| Class B | 2013 | 2012 | 2011 | 2010 | 2009 | |||||||||||||||
Net asset value, beginning of period | $11.33 | $10.45 | $10.93 | $10.14 | $10.83 | |||||||||||||||
| Income (loss) from investment operations | ||||||||||||||||||||
| Net investment income (d) | $0.37 | $0.38 | $0.38 | $0.40 | $0.42 | |||||||||||||||
Net realized and unrealized gain (loss) on investments | 0.10 | 0.86 | (0.49 | ) | 0.78 | (0.67 | ) | |||||||||||||
Total from investment operations | $0.47 | $1.24 | $(0.11 | ) | $1.18 | $(0.25 | ) | |||||||||||||
| Less distributions declared to shareholders | ||||||||||||||||||||
| From net investment income | $(0.33 | ) | $(0.36 | ) | $(0.37 | ) | $(0.39 | ) | $(0.40 | ) | ||||||||||
From net realized gain on investments | — | — | (0.00 | )(w) | (0.00 | )(w) | (0.04 | ) | ||||||||||||
Total distributions declared to shareholders | $(0.33 | ) | $(0.36 | ) | $(0.37 | ) | $(0.39 | ) | $(0.44 | ) | ||||||||||
Net asset value, end of period (x) | $11.47 | $11.33 | $10.45 | $10.93 | $10.14 | |||||||||||||||
Total return (%) (r)(s)(t)(x) | 4.17 | 12.07 | (1.09 | ) | 11.77 | (2.31 | ) | |||||||||||||
| Ratios (%) (to average net assets) and Supplemental data: | ||||||||||||||||||||
| Expenses before expense reductions (f) | 1.67 | 1.70 | 1.69 | 1.70 | 1.77 | |||||||||||||||
| Expenses after expense reductions (f) | 1.67 | 1.69 | 1.69 | 1.70 | 1.59 | |||||||||||||||
| Net investment income | 3.25 | 3.42 | 3.44 | 3.75 | 4.01 | |||||||||||||||
| Portfolio turnover | 23 | 13 | 14 | 24 | 24 | |||||||||||||||
Net assets at end of period (000 omitted) | $3,507 | $3,406 | $3,772 | $6,251 | $8,385 | |||||||||||||||
| Supplemental Ratios (%): | ||||||||||||||||||||
Ratios of expenses to average net assets after expense reductions and excluding interest expense and fees (f)(l) | N/A | N/A | N/A | N/A | 1.55 | |||||||||||||||
| (d) | Per share data is based on average shares outstanding. |
| (f) | Ratios do not reflect reductions from fees paid indirectly, if applicable. |
| (l) | Interest expense and fees relate to payments made to the holders of the floating rate certificates from trust assets. |
| (r) | Certain expenses have been reduced without which performance would have been lower. |
| (s) | From time to time the fund may receive proceeds from litigation settlements, without which performance would be lower. |
| (t) | Total returns do not include any applicable sales charges. |
| (w) | Per share amount was less than $0.01. |
| (x) | The net asset values per share and total returns have been calculated on net assets which include adjustments made in accordance with U.S. generally accepted accounting principles required at period end for financial reporting purposes. |
See Notes to Financial Statements
60
Table of Contents
Financial Highlights – continued
MFS MASSACHUSETTS MUNICIPAL BOND FUND
The financial highlights table is intended to help you understand the fund financial performance for the past 5 years. Certain information reflects financial results for a single fund share. The total returns in the table represent the rate by which an investor would have earned (or lost) on an investment in the fund share class (assuming reinvestment of all distributions) held for the entire period.
| Years ended 3/31 | ||||||||||||||||||||
| Class A | 2013 | 2012 | 2011 | 2010 | 2009 | |||||||||||||||
Net asset value, beginning of period | $11.44 | $10.42 | $11.07 | $10.35 | $10.91 | |||||||||||||||
| Income (loss) from investment operations | ||||||||||||||||||||
| Net investment income (d) | $0.43 | $0.45 | $0.47 | $0.48 | $0.49 | |||||||||||||||
Net realized and unrealized gain (loss) on investments | 0.19 | 1.01 | (0.63 | ) | 0.77 | (0.52 | ) | |||||||||||||
Total from investment operations | $0.62 | $1.46 | $(0.16 | ) | $1.25 | $(0.03 | ) | |||||||||||||
| Less distributions declared to shareholders | ||||||||||||||||||||
| From net investment income | $(0.40 | ) | $(0.44 | ) | $(0.45 | ) | $(0.47 | ) | $(0.48 | ) | ||||||||||
From net realized gain on investments | — | — | (0.04 | ) | (0.06 | ) | (0.05 | ) | ||||||||||||
Total distributions declared to shareholders | $(0.40 | ) | $(0.44 | ) | $(0.49 | ) | $(0.53 | ) | $(0.53 | ) | ||||||||||
Net asset value, end of period (x) | $11.66 | $11.44 | $10.42 | $11.07 | $10.35 | |||||||||||||||
Total return (%) (r)(s)(t)(x) | 5.48 | 14.21 | (1.57 | ) | 12.31 | (0.21 | ) | |||||||||||||
| Ratios (%) (to average net assets) and Supplemental data: | ||||||||||||||||||||
| Expenses before expense reductions (f) | 0.85 | 0.85 | 0.86 | 0.87 | 1.04 | |||||||||||||||
| Expenses after expense reductions (f) | 0.85 | 0.85 | 0.86 | 0.87 | 0.87 | |||||||||||||||
| Net investment income | 3.64 | 4.04 | 4.25 | 4.44 | 4.69 | |||||||||||||||
| Portfolio turnover | 15 | 26 | 25 | 21 | 40 | |||||||||||||||
Net assets at end of period (000 omitted) | $296,895 | $289,090 | $266,600 | $236,724 | $185,105 | |||||||||||||||
| Supplemental Ratios (%): | ||||||||||||||||||||
Ratios of expenses to average net assets after expense reductions and excluding interest expense and fees (f)(l) | N/A | N/A | N/A | N/A | 0.83 | |||||||||||||||
See Notes to Financial Statements
61
Table of Contents
Financial Highlights – continued
MFS MASSACHUSETTS MUNICIPAL BOND FUND – continued
| Years ended 3/31 | ||||||||||||||||||||
| Class B | 2013 | 2012 | 2011 | 2010 | 2009 | |||||||||||||||
Net asset value, beginning of period | $11.46 | $10.44 | $11.09 | $10.37 | $10.93 | |||||||||||||||
| Income (loss) from investment operations | ||||||||||||||||||||
| Net investment income (d) | $0.34 | $0.36 | $0.39 | $0.40 | $0.42 | |||||||||||||||
Net realized and unrealized gain (loss) on investments | 0.20 | 1.02 | (0.63 | ) | 0.77 | (0.52 | ) | |||||||||||||
Total from investment operations | $0.54 | $1.38 | $(0.24 | ) | $1.17 | $(0.10 | ) | |||||||||||||
| Less distributions declared to shareholders | ||||||||||||||||||||
| From net investment income | $(0.32 | ) | $(0.36 | ) | $(0.37 | ) | $(0.39 | ) | $(0.41 | ) | ||||||||||
From net realized gain on investments | — | — | (0.04 | ) | (0.06 | ) | (0.05 | ) | ||||||||||||
Total distributions declared to shareholders | $(0.32 | ) | $(0.36 | ) | $(0.41 | ) | $(0.45 | ) | $(0.46 | ) | ||||||||||
Net asset value, end of period (x) | $11.68 | $11.46 | $10.44 | $11.09 | $10.37 | |||||||||||||||
Total return (%) (r)(s)(t)(x) | 4.69 | 13.33 | (2.30 | ) | 11.45 | (0.86 | ) | |||||||||||||
| Ratios (%) (to average net assets) and Supplemental data: | ||||||||||||||||||||
| Expenses before expense reductions (f) | 1.60 | 1.60 | 1.60 | 1.62 | 1.70 | |||||||||||||||
| Expenses after expense reductions (f) | 1.60 | 1.60 | 1.60 | 1.62 | 1.53 | |||||||||||||||
| Net investment income | 2.88 | 3.29 | 3.50 | 3.70 | 4.01 | |||||||||||||||
| Portfolio turnover | 15 | 26 | 25 | 21 | 40 | |||||||||||||||
Net assets at end of period (000 omitted) | $5,095 | $5,443 | $7,333 | $13,804 | $17,166 | |||||||||||||||
| Supplemental Ratios (%): | ||||||||||||||||||||
Ratios of expenses to average net assets after expense reductions and excluding interest expense and fees (f)(l) | N/A | N/A | N/A | N/A | 1.48 | |||||||||||||||
| (d) | Per share data is based on average shares outstanding. |
| (f) | Ratios do not reflect reductions from fees paid indirectly, if applicable. |
| (l) | Interest expense and fees relate to payments made to the holders of the floating rate certificates from trust assets. |
| (r) | Certain expenses have been reduced without which performance would have been lower. |
| (s) | From time to time the fund may receive proceeds from litigation settlements, without which performance would be lower. |
| (t) | Total returns do not include any applicable sales charges. |
| (x) | The net asset values per share and total returns have been calculated on net assets which include adjustments made in accordance with U.S. generally accepted accounting principles required at period end for financial reporting purposes. |
See Notes to Financial Statements
62
Table of Contents
| (1) | Business and Organization |
MFS Alabama Municipal Bond Fund (Alabama Fund), MFS Arkansas Municipal Bond Fund (Arkansas Fund), MFS California Municipal Bond Fund (California Fund), MFS Georgia Municipal Bond Fund (Georgia Fund), MFS Maryland Municipal Bond Fund (Maryland Fund), and MFS Massachusetts Municipal Bond Fund (Massachusetts Fund) are each a series of MFS Municipal Series Trust which is organized as a Massachusetts business trust and is registered under the Investment Company Act of 1940, as amended, as an open-end management investment company.
| (2) | Significant Accounting Policies |
General – The preparation of financial statements in conformity with U.S. generally accepted accounting principles requires management to make estimates and assumptions that affect the reported amounts of assets and liabilities, and disclosure of contingent assets and liabilities at the date of the financial statements and the reported amounts of revenues and expenses during the reporting period. Actual results could differ from those estimates. In the preparation of these financial statements, management has evaluated subsequent events occurring after the date of each fund’s Statement of Assets and Liabilities through the date that the financial statements were issued. Each fund invests primarily in municipal instruments. The value of municipal instruments can be affected by changes in their actual or perceived credit quality. The credit quality of municipal instruments can be affected by, among other things, the financial condition of the issuer or guarantor, the issuer’s future borrowing plans and sources of revenue, the economic feasibility of the revenue bond project or general borrowing purpose, political or economic developments in the region or state where the instrument is issued and the liquidity of the security. Municipal instruments generally trade in the over-the-counter market. Municipal instruments backed by current and anticipated revenues from a specific project or specific assets can be negatively affected by the discontinuance of the taxation supporting the projects or assets or the inability to collect revenues for the project or from the assets. If the Internal Revenue Service determines an issuer of a municipal instrument has not complied with the applicable tax requirements, the security could decline in value, interest from the security could become taxable and the funds may be required to issue Forms 1099-DIV.
In this reporting period each fund adopted Financial Accounting Standards Board (FASB) Accounting Standards Update 2011-04, Fair Value Measurement (Topic 820) – Amendments to Achieve Common Fair Value Measurement and Disclosure Requirements in U.S. GAAP and IFRSs (“ASU 2011-04”). ASU 2011-04 seeks to improve the comparability of fair value measurements as presented and disclosed in financial statements prepared in accordance with U.S. GAAP and International Financial Reporting Standards (IFRS) by providing common requirements for fair value measurement and disclosure.
In January 2013, the FASB issued Accounting Standards Update 2013-01 (“ASU 2013-01”) entitled Balance Sheet (Topic 210) – Clarifying the Scope of Disclosures about Offsetting Assets and Liabilities which is intended to clarify the scope of Accounting Standards Update 2011-11 (“ASU 2011-11”), Balance Sheet (Topic 210) – Disclosures about Offsetting Assets and Liabilities. Consistent with the effective date for ASU 2011-11, ASU 2013-01 is effective for annual reporting periods beginning on or after January 1, 2013, and interim periods within those annual periods. ASU 2013-01 limits the scope of ASU 2011-11’s disclosure requirements on offsetting to financial assets and financial liabilities related to derivatives, repurchase and reverse repurchase agreements, and securities lending and securities borrowing transactions. Although still evaluating the potential impact of these two ASUs to each fund, management expects that the impact of each fund’s adoption will be limited to additional financial statement disclosures.
Investment Valuations – Debt instruments and floating rate loans (other than short-term instruments), including restricted debt instruments, are generally valued at an evaluated or composite bid as provided by a third-party pricing service. Short-term instruments with a maturity at issuance of 60 days or less generally are valued at amortized cost, which approximates market value. Futures contracts are generally valued at last posted settlement price as provided by a third-party pricing service on the market on which they are primarily traded. Futures contracts for which there were no trades that day for a particular position are generally valued at the closing bid quotation as provided by a third-party pricing service on the market on which such futures contracts are primarily traded. Open-end investment companies are generally valued at net asset value per share. Securities and other assets generally valued on the basis of information from a third-party pricing service may also be valued at a broker/dealer bid quotation. Values obtained from third-party pricing services can utilize both transaction data and market information such as yield, quality, coupon rate, maturity, type of issue, trading characteristics, and other market data.
The Board of Trustees has delegated primary responsibility for determining or causing to be determined the value of each fund’s investments (including any fair valuation) to the adviser pursuant to valuation policies and procedures approved by the Board. If the adviser determines that reliable market quotations are not readily available, investments are valued at fair value as determined in good faith by the adviser in accordance with such procedures under the oversight of the Board of Trustees. Under each fund’s valuation policies and procedures, market quotations are not considered to be readily available for most types of debt instruments and floating rate loans and many types of derivatives. These investments are generally valued at fair value based on information from third-party pricing services. In addition, investments may be valued at fair value if the adviser determines that an investment’s value has been materially affected by events occurring after the close of the exchange or market on which the investment is principally
63
Table of Contents
Notes to Financial Statements – continued
traded (such as foreign exchange or market) and prior to the determination of each fund’s net asset value, or after the halting of trading of a specific security where trading does not resume prior to the close of the exchange or market on which the security is principally traded. The adviser generally relies on third-party pricing services or other information (such as the correlation with price movements of similar securities in the same or other markets; the type, cost and investment characteristics of the security; the business and financial condition of the issuer; and trading and other market data) to assist in determining whether to fair value and at what value to fair value an investment. The value of an investment for purposes of calculating each fund’s net asset value can differ depending on the source and method used to determine value. When fair valuation is used, the value of an investment used to determine each fund’s net asset value may differ from quoted or published prices for the same investment. There can be no assurance that each fund could obtain the fair value assigned to an investment if it were to sell the investment at the same time at which the fund determines its net asset value per share.
Various inputs are used in determining the value of each fund’s assets or liabilities. These inputs are categorized into three broad levels. In certain cases, the inputs used to measure fair value may fall into different levels of the fair value hierarchy. In such cases, an investment’s level within the fair value hierarchy is based on the lowest level of input that is significant to the fair value measurement. Each fund’s assessment of the significance of a particular input to the fair value measurement in its entirety requires judgment, and considers factors specific to the investment. Level 1 includes unadjusted quoted prices in active markets for identical assets or liabilities. Level 2 includes other significant observable market-based inputs (including quoted prices for similar securities, interest rates, prepayment speed, and credit risk). Level 3 includes unobservable inputs, which may include the adviser’s own assumptions in determining the fair value of investments. The following is a summary of the levels used as of March 31, 2013 in valuing each fund’s assets or liabilities:
| Level 1 | Level 2 | Level 3 | Total | |||||||||||||
Alabama Fund | ||||||||||||||||
| Investments at Value | ||||||||||||||||
| Municipal Bonds | $— | $69,338,813 | $— | $69,338,813 | ||||||||||||
| Mutual Funds | 1,531,701 | — | — | 1,531,701 | ||||||||||||
| Total Investments | $1,531,701 | $69,338,813 | $— | $70,870,514 | ||||||||||||
Arkansas Fund | ||||||||||||||||
| Investments at Value | ||||||||||||||||
| Municipal Bonds | $— | $234,674,219 | $— | $234,674,219 | ||||||||||||
| Mutual Funds | 3,067,890 | — | — | 3,067,890 | ||||||||||||
| Total Investments | $3,067,890 | $234,674,219 | $— | $237,742,109 | ||||||||||||
California Fund | ||||||||||||||||
| Investments at Value | ||||||||||||||||
| Municipal Bonds | $— | $319,528,456 | $— | $319,528,456 | ||||||||||||
| Mutual Funds | 3,971,626 | — | — | 3,971,626 | ||||||||||||
| Total Investments | $3,971,626 | $319,528,456 | $— | $323,500,082 | ||||||||||||
Georgia Fund | ||||||||||||||||
| Investments at Value | ||||||||||||||||
| Municipal Bonds | $— | $79,409,210 | $— | $79,409,210 | ||||||||||||
| Mutual Funds | 3,019,083 | — | — | 3,019,083 | ||||||||||||
| Total Investments | $3,019,083 | $79,409,210 | $— | $82,428,293 | ||||||||||||
Maryland Fund | ||||||||||||||||
| Investments at Value | ||||||||||||||||
| Municipal Bonds | $— | $108,581,340 | $— | $108,581,340 | ||||||||||||
| Mutual Funds | 3,980,610 | — | — | 3,980,610 | ||||||||||||
| Total Investments | $3,980,610 | $108,581,340 | $— | $112,561,950 | ||||||||||||
Massachusetts Fund | ||||||||||||||||
| Investments at Value | ||||||||||||||||
| Municipal Bonds | $— | $290,967,623 | $— | $290,967,623 | ||||||||||||
| Mutual Funds | 7,304,229 | — | — | 7,304,229 | ||||||||||||
| Total Investments | $7,304,229 | $290,967,623 | $— | $298,271,852 | ||||||||||||
For further information regarding security characteristics, see the Portfolio of Investments.
Derivatives – Certain funds use derivatives for different purposes, primarily to increase or decrease exposure to a particular market or segment of the market, or security, to increase or decrease interest rate exposure, or as alternatives to direct investments.
64
Table of Contents
Notes to Financial Statements – continued
Derivatives are used for hedging or non-hedging purposes. While hedging can reduce or eliminate losses, it can also reduce or eliminate gains. When each fund uses derivatives as an investment to increase market exposure, or for hedging purposes, gains and losses from derivative instruments may be substantially greater than the derivative’s original cost. The Arkansas Fund did not use derivatives during the period.
The derivative instruments used by certain funds were futures contracts. At March 31, 2013, the funds did not have any outstanding derivative instruments.
The following table presents, by major type of derivative contract, the realized gain (loss) on derivatives held by certain funds for the year ended March 31, 2013 as reported in the Statements of Operations:
| Fund | Risk | Futures Contracts | ||
| Alabama Fund | Interest Rate | $(44,398) | ||
| California Fund | Interest Rate | (195,962) | ||
| Georgia Fund | Interest Rate | (44,091) | ||
| Maryland Fund | Interest Rate | (59,299) | ||
| Massachusetts Fund | Interest Rate | (149,013) |
The following table presents, by major type of derivative contract, the change in unrealized appreciation (depreciation) on derivatives held by certain funds for the year ended March 31, 2013 as reported in the Statements of Operations:
| Fund | Risk | Futures Contracts | ||
| Alabama Fund | Interest Rate | $(26,176) | ||
| California Fund | Interest Rate | (117,088) | ||
| Georgia Fund | Interest Rate | (25,220) | ||
| Maryland Fund | Interest Rate | (35,220) | ||
| Massachusetts Fund | Interest Rate | (90,442) |
Derivative counterparty credit risk is managed through formal evaluation of the creditworthiness of all potential counterparties. On certain over-the-counter derivatives, each fund attempts to reduce its exposure to counterparty credit risk whenever possible by entering into an International Swaps and Derivatives Association (ISDA) Master Agreement on a bilateral basis with each of the counterparties with whom it undertakes a significant volume of transactions. The ISDA Master Agreement gives each party to the agreement the right to terminate all transactions traded under such agreement if there is a certain deterioration in the credit quality of the other party. The ISDA Master Agreement gives each fund the right, upon an event of default by the applicable counterparty or a termination of the agreement, to close out all transactions traded under such agreement and to net amounts owed under each transaction to one net amount payable by one party to the other. This right to close out and net payments across all transactions traded under the ISDA Master Agreement could result in a reduction of each fund’s credit risk to such counterparty equal to any amounts payable by each fund under the applicable transactions, if any. However, absent an event of default by the counterparty or a termination of the agreement, the ISDA Master Agreement does not result in an offset of reported amounts of assets and liabilities in the Statements of Assets and Liabilities across transactions between each fund and the applicable counterparty.
Collateral requirements differ by type of derivative. Collateral or margin requirements are set by the broker or exchange clearing house for exchange traded derivatives (i.e., futures contracts and exchange-traded options) while collateral terms are contract specific for over-the-counter traded derivatives (i.e., forward foreign currency exchange contracts, swap agreements and over-the-counter options). For derivatives traded under an ISDA Master Agreement, the collateral requirements are netted across all transactions traded under such agreement and one amount is posted from one party to the other to collateralize such obligations. Cash collateral that has been segregated to cover obligations of each fund under derivative contracts, if any, will be reported separately in the Statements of Assets and Liabilities as restricted cash. Securities collateral pledged for the same purpose, if any, is noted in the Portfolio of Investments.
Futures Contracts – Each fund, with the exception of the Arkansas Fund, entered into futures contracts which may be used to hedge against or obtain broad market exposure, interest rate exposure, or to manage duration. A futures contract represents a commitment for the future purchase or sale of an asset at a specified price on a specified date.
Upon entering into a futures contract, each fund is required to deposit with the broker, either in cash or securities, an initial margin in an amount equal to a certain percentage of the notional amount of the contract. Subsequent payments (variation margin) are made or received by each fund each day, depending on the daily fluctuations in the value of the contract, and are recorded for financial statement purposes as unrealized gain or loss by each fund until the contract is closed or expires at which point the gain or loss on futures contracts is realized.
Each fund bears the risk of interest rates or securities prices moving unexpectedly, in which case, each fund may not achieve the anticipated benefits of the futures contracts and may realize a loss. While futures contracts may present less counterparty risk to each fund since the contracts are exchange traded and the exchange’s clearinghouse guarantees payments to the broker, there is still counterparty credit risk due to the insolvency of the broker. Each fund’s maximum risk of loss due to counterparty credit risk is equal to the margin posted by each fund to the broker plus any gains or minus any losses on the outstanding futures contracts.
65
Table of Contents
Notes to Financial Statements – continued
Indemnifications – Under each fund’s organizational documents, its officers and Trustees may be indemnified against certain liabilities and expenses arising out of the performance of their duties to each fund. Additionally, in the normal course of business, each fund enters into agreements with service providers that may contain indemnification clauses. Each fund’s maximum exposure under these agreements is unknown as this would involve future claims that may be made against each fund that have not yet occurred.
Investment Transactions and Income – Investment transactions are recorded on the trade date. Interest income is recorded on the accrual basis. All premium and discount is amortized or accreted for financial statement purposes in accordance with U.S. generally accepted accounting principles. Interest payments received in additional securities are recorded on the ex-interest date in an amount equal to the value of the security on such date. Debt obligations may be placed on non-accrual status or set to accrue at a rate of interest less than the contractual coupon when the collection of all or a portion of interest has become doubtful. Interest income for those debt obligations may be further reduced by the write-off of the related interest receivables when deemed uncollectible.
Each fund may receive proceeds from litigation settlements. Any proceeds received from litigation involving portfolio holdings are reflected in the Statements of Operations in realized gain/loss if the security has been disposed of by the fund or in unrealized gain/loss if the security is still held by the fund. Any other proceeds from litigation not related to portfolio holdings are reflected as other income in the Statements of Operations.
Fees Paid Indirectly – Each fund’s custody fee may be reduced according to an arrangement that measures the value of cash deposited with the custodian by each fund. For each fund, with the exception of the Arkansas Fund, this amount, for the year ended March 31, 2013, is shown as a reduction of total expenses in the Statements of Operations.
Tax Matters and Distributions – Each fund intends to qualify as a regulated investment company, as defined under Subchapter M of the Internal Revenue Code, and to distribute all of its taxable and tax-exempt income, including realized capital gains. As a result, no provision for federal income tax is required. Each fund’s federal tax returns, when filed, will remain subject to examination by the Internal Revenue Service for a three year period.
Distributions to shareholders are recorded on the ex-dividend date. Income and capital gain distributions are determined in accordance with income tax regulations, which may differ from U.S. generally accepted accounting principles. Certain capital accounts in the financial statements are periodically adjusted for permanent differences in order to reflect their tax character. These adjustments have no impact on net assets or net asset value per share. Temporary differences which arise from recognizing certain items of income, expense, gain or loss in different periods for financial statement and tax purposes will reverse at some time in the future. Distributions in excess of net investment income or net realized gains are temporary overdistributions for financial statement purposes resulting from differences in the recognition or classification of income or distributions for financial statement and tax purposes.
Book/tax differences primarily relate to amortization and accretion of debt securities and defaulted bonds.
The tax character of distributions declared to shareholders for the last two fiscal years is as follows:
| Year ended 3/31/13 | Alabama Fund | Arkansas Fund | California Fund | Georgia Fund | Maryland Fund | Massachusetts Fund | ||||||||||||||||||
| Ordinary income (including any short-term capital gains) | $— | $58,712 | $164,760 | $8,530 | $— | $348,639 | ||||||||||||||||||
| Tax-exempt income | 2,587,536 | 8,021,060 | 11,827,382 | 2,531,432 | 4,088,801 | 10,062,205 | ||||||||||||||||||
| Long-term capital gain | — | — | — | — | — | — | ||||||||||||||||||
| Total distributions | $2,587,536 | $8,079,772 | $11,992,142 | $2,539,962 | $4,088,801 | $10,410,844 | ||||||||||||||||||
| Year ended 3/31/12 | Alabama Fund | Arkansas Fund | California Fund | Georgia Fund | Maryland Fund | Massachusetts Fund | ||||||||||||||||||
| Ordinary income (including any short-term capital gains) | $— | $14,654 | $— | $— | $— | $— | ||||||||||||||||||
| Tax-exempt income | 2,766,439 | 7,686,901 | 12,838,950 | 2,458,315 | 4,329,991 | 11,201,993 | ||||||||||||||||||
| Long-term capital gain | — | — | — | — | — | — | ||||||||||||||||||
| Total distributions | $2,766,439 | $7,701,555 | $12,838,950 | $2,458,315 | $4,329,991 | $11,201,993 | ||||||||||||||||||
66
Table of Contents
Notes to Financial Statements – continued
The federal tax cost and the tax basis components of distributable earnings were as follows:
| As of 3/31/13 | Alabama Fund | Arkansas Fund | California Fund | Georgia Fund | Maryland Fund | Massachusetts Fund | ||||||||||||||||||
| Cost of investments | $65,326,392 | $226,219,417 | $298,218,128 | $76,695,811 | $104,391,179 | $271,336,607 | ||||||||||||||||||
| Gross appreciation | 5,633,378 | 12,849,763 | 26,279,256 | 5,877,065 | 8,668,152 | 28,129,723 | ||||||||||||||||||
| Gross depreciation | (89,256 | ) | (1,327,071 | ) | (997,302 | ) | (144,583 | ) | (497,381 | ) | (1,194,478 | ) | ||||||||||||
| Net unrealized appreciation (depreciation) | $5,544,122 | $11,522,692 | $25,281,954 | $5,732,482 | $8,170,771 | $26,935,245 | ||||||||||||||||||
| Undistributed tax-exempt income | 248,795 | 640,526 | 1,100,665 | 229,768 | 500,453 | 970,423 | ||||||||||||||||||
| Capital loss carryforwards | (707,094 | ) | (197,659 | ) | (6,694,783 | ) | (559,689 | ) | (579,646 | ) | (488,562 | ) | ||||||||||||
| Post-October capital loss deferral | — | (5 | ) | — | — | (92,896 | ) | — | ||||||||||||||||
| Other temporary differences | (221,109 | ) | (681,059 | ) | (1,028,419 | ) | (221,631 | ) | (407,533 | ) | (887,990 | ) | ||||||||||||
Under the Regulated Investment Company Modernization Act of 2010 (the “Act”), net capital losses recognized for fund fiscal years beginning after March 31, 2011 may be carried forward indefinitely, and their character is retained as short-term and/or long-term losses (“post-enactment losses”). Previously, net capital losses were carried forward for eight years and treated as short-term losses (“pre-enactment losses”). As a transition rule, the Act requires that all post-enactment net capital losses be used before pre-enactment net capital losses.
As of March 31, 2013, each fund had capital loss carryforwards available to offset future realized gains as follows:
| Pre-enactment losses which expire as follows: | Alabama Fund | Arkansas Fund | California Fund | Georgia Fund | Maryland Fund | Massachusetts Fund | ||||||||||||||||||
| 3/31/16 | $— | $— | $(40,368 | ) | $— | $— | $— | |||||||||||||||||
| 3/31/17 | — | — | (1,063,041 | ) | — | — | — | |||||||||||||||||
| 3/31/18 | — | — | — | (153,718 | ) | — | — | |||||||||||||||||
| 3/31/19 | (674,377 | ) | (197,659 | ) | (2,804,636 | ) | (266,409 | ) | (579,646 | ) | (488,562 | ) | ||||||||||||
| Total | $(674,377 | ) | $(197,659 | ) | $(3,908,045 | ) | $(420,127 | ) | $(579,646 | ) | $(488,562 | ) | ||||||||||||
| Post-enactment losses which are characterized as follows: | ||||||||||||||||||||||||
| Short-Term | $(32,717 | ) | $— | $— | $— | $— | $— | |||||||||||||||||
| Long-Term | — | — | (2,786,738 | ) | (139,562 | ) | — | — | ||||||||||||||||
| Total | $(32,717 | ) | $— | $(2,786,738 | ) | $(139,562 | ) | $— | $— | |||||||||||||||
Multiple Classes of Shares of Beneficial Interest – Each fund offers multiple classes of shares, which differ in their respective distribution and service fees. Each fund’s income and common expenses are allocated to shareholders based on the value of settled shares outstanding of each class. Each fund’s realized and unrealized gain (loss) are allocated to shareholders based on the daily net assets of each class. Dividends are declared separately for each class. Differences in per share dividend rates are generally due to differences in separate class expenses. Class B shares will convert to Class A shares approximately eight years after purchase. Each fund’s distributions declared to shareholders as reported in the Statements of Changes in Net Assets are presented by class as follows:
Distributions declared to shareholders:
From net investment income
Alabama Fund | Arkansas Fund | California Fund | ||||||||||
Year ended | Year ended | Year ended | Year ended | Year ended | Year ended | |||||||
| Class A | $2,548,506 | $2,689,423 | $7,830,576 | $7,453,276 | $10,818,016 | $11,566,523 | ||||||
| Class B | 39,030 | 77,016 | 249,196 | 248,279 | 164,264 | 210,487 | ||||||
| Class C | — | — | — | — | 1,009,862 | 1,061,940 | ||||||
| Total | $2,587,536 | $2,766,439 | $8,079,772 | $7,701,555 | $11,992,142 | $12,838,950 | ||||||
Georgia Fund | Maryland Fund | Massachusetts Fund | ||||||||||
Year ended 3/31/13 | Year ended 3/31/12 | Year ended 3/31/13 | Year ended 3/31/12 | Year ended 3/31/13 | Year ended 3/31/12 | |||||||
| Class A | $2,484,819 | $2,397,107 | $3,989,469 | $4,214,393 | $10,264,971 | $11,006,411 | ||||||
| Class B | 55,143 | 61,208 | 99,332 | 115,598 | 145,873 | 195,582 | ||||||
| Total | $2,539,962 | $2,458,315 | $4,088,801 | $4,329,991 | $10,410,844 | $11,201,993 | ||||||
67
Table of Contents
Notes to Financial Statements – continued
| (3) | Transactions with Affiliates |
Investment Adviser – Each fund has an investment advisory agreement with MFS to provide overall investment management and related administrative services and facilities to each fund. The management fee is computed daily and paid monthly at an annual rate of 0.45% of each fund’s average daily net assets.
The investment adviser has agreed in writing to pay a portion of the following funds’ total annual operating expenses, exclusive of interest, taxes, extraordinary expenses, brokerage and transaction costs, and investment-related expenses (including interest expenses and fees associated with investments in inverse floating rate instruments), such that total annual fund operating expenses do not exceed the following rates annually of these funds’ average daily net assets:
| Alabama Fund | Georgia Fund | Maryland Fund | ||||||||||
| Class A | 0.93% | 0.95% | 0.95% | |||||||||
| Class B | 1.68% | 1.70% | 1.70% | |||||||||
For the Alabama Fund and the Maryland Fund, these written agreements will continue until modified by the funds’ Board of Trustees, but such agreements will continue at least until July 31, 2013. For the Georgia Fund, this written agreement will continue until at least July 31, 2013, after which MFS, under certain conditions, may increase such expense limitation to 1.00% of the fund’s average daily net assets annually for Class A shares and 1.75% of the fund’s average daily net assets annually for Class B shares without a vote of the fund’s Board of Trustees. Any increase above 1.00% and 1.75% of the fund’s average daily net assets annually for Class A and Class B shares, respectively, would require a vote of the fund’s Board of Trustees. For the year ended March 31, 2013, these reductions amounted to $19,380 for the Alabama Fund and $7,260 for the Georgia Fund and are reflected as a reduction of total expenses in the Statements of Operations. The actual operating expenses for the Maryland Fund did not exceed the limits described above and therefore, the investment adviser did not pay any portion of the Maryland Fund expenses under this agreement.
Distributor – MFS Fund Distributors, Inc. (MFD), a wholly-owned subsidiary of MFS, as distributor, received the following for the year ended March 31, 2013, as its portion of the initial sales charge on sales of Class A shares of each fund:
| Alabama Fund | Arkansas Fund | California Fund | Georgia Fund | Maryland Fund | Massachusetts Fund | |||||||||||||||
| $26,427 | $197,474 | $84,746 | $82,339 | $48,073 | $84,567 | |||||||||||||||
The Board of Trustees has adopted a distribution plan for certain class shares pursuant to Rule 12b-1 of the Investment Company Act of 1940.
Each fund’s distribution plan provides that each fund will pay MFD for services provided by MFD and financial intermediaries in connection with the distribution and servicing of certain share classes. One component of the plan is a distribution fee paid to MFD and another component of the plan is a service fee paid to MFD. MFD may subsequently pay all, or a portion, of the distribution and/or service fees to financial intermediaries.
Distribution Plan Fee Table:
| CLASS A | ||||||||||||||||||||
Distribution Fee Rate (d) | Service Fee Rate (d) | Total Plan (d) | Annual Effective Rate (e) | Distribution and Service Fee | ||||||||||||||||
| Alabama Fund | — | 0.25% | 0.25% | 0.25% | $176,461 | |||||||||||||||
| Arkansas Fund | — | 0.25% | 0.25% | 0.10% | 568,681 | |||||||||||||||
| California Fund | — | 0.25% | 0.25% | 0.10% | 711,798 | |||||||||||||||
| Georgia Fund | — | 0.25% | 0.25% | 0.25% | 190,541 | |||||||||||||||
| Maryland Fund | — | 0.25% | 0.25% | 0.25% | 275,862 | |||||||||||||||
| Massachusetts Fund | — | 0.25% | 0.25% | 0.25% | 744,384 | |||||||||||||||
| CLASS B | ||||||||||||||||||||
Distribution Fee Rate (d) | Service Fee Rate (d) | Total Distribution Plan (d) | Annual Effective Rate (e) | Distribution and Service Fee | ||||||||||||||||
| Alabama Fund | 0.75% | 0.25% | 1.00% | 1.00% | $13,665 | |||||||||||||||
| Arkansas Fund | 0.75% | 0.25% | 1.00% | 0.89% | 94,340 | |||||||||||||||
| California Fund | 0.75% | 0.25% | 1.00% | 0.88% | 54,533 | |||||||||||||||
| Georgia Fund | 0.75% | 0.25% | 1.00% | 1.00% | 22,201 | |||||||||||||||
| Maryland Fund | 0.75% | 0.25% | 1.00% | 1.00% | 34,738 | |||||||||||||||
| Massachusetts Fund | 0.75% | 0.25% | 1.00% | 1.00% | 54,329 | |||||||||||||||
| CLASS C | ||||||||||||||||||||
Distribution Fee Rate (d) | Service Fee Rate (d) | Total Distribution Plan (d) | Annual Effective Rate (e) | Distribution and Service Fee | ||||||||||||||||
| California Fund | 0.75% | 0.25% | 1.00% | 1.00% | $350,442 | |||||||||||||||
68
Table of Contents
Notes to Financial Statements – continued
| Alabama Fund | Arkansas Fund | California Fund | Georgia Fund | Maryland Fund | Massachusetts Fund | |||||||||||||||||||
| Total Distribution and Service Fees | $190,126 | $663,021 | $1,116,773 | $212,742 | $310,600 | $798,713 | ||||||||||||||||||
| (d) | In accordance with the distribution plan for certain classes, each fund pays distribution and/or service fees equal to these annual percentage rates of each class’s average daily net assets. The distribution and service fee rates disclosed by class represent the current rates in effect at the end of the reporting period. Any rate changes, if applicable, are detailed below. |
| (e) | The annual effective rates represent actual fees incurred under the distribution plan for the year ended March 31, 2013 based on each class’s average daily net assets. |
| Arkansas Fund: MFD has agreed in writing to reduce the Class A service fee rate to 0.10%. This written agreement will continue until modified by the fund’s Board of Trustees, but such agreement will continue at least until July 31, 2013. This reduction amounted to $341,212 which is shown as a reduction of total expenses in the Statements of Operations. The service fee rate attributable to Class B shares within the first year of purchase is 0.25%. The service fee rate attributable to all other Class B shares has been reduced by MFD to 0.10% under a written agreement that will continue until modified by the fund’s Board of Trustees, but such agreement will continue at least until July 31, 2013. This reduction amounted to $10,446 which is shown as a reduction of total expenses in the Statements of Operations. |
| California Fund: MFD has agreed in writing to reduce the Class A service fee rate to 0.10%. This written agreement will continue until modified by the fund’s Board of Trustees, but such agreement will continue at least until July 31, 2013. This reduction amounted to $427,083 which is shown as a reduction of total expenses in the Statements of Operations. The service fee rate attributable to Class B shares within the first year of purchase is 0.25%. The service fee rate attributable to all other Class B shares has been reduced by MFD to 0.10% under a written agreement that will continue until modified by the fund’s Board of Trustees, but such agreement will continue at least until July 31, 2013. This reduction amounted to $6,520 which is shown as a reduction of total expenses in the Statements of Operations. |
Certain Class A shares are subject to a contingent deferred sales charge (CDSC) in the event of a shareholder redemption within 18 months of purchase for shares purchased on or after August 1, 2012, and within 24 months of purchase for shares purchased prior to August 1, 2012. Class C shares are subject to a CDSC in the event of a shareholder redemption within 12 months of purchase. Class B shares are subject to a CDSC in the event of a shareholder redemption within six years of purchase. All contingent deferred sales charges are paid to MFD and during the year ended March 31, 2013, were as follows:
| CDSC imposed | Alabama Fund | Arkansas Fund | California Fund | Georgia Fund | Maryland Fund | Massachusetts Fund | ||||||||||||||||||
| Class A | $— | $12,589 | $3,067 | $— | $— | $358 | ||||||||||||||||||
| Class B | 886 | 8,961 | 8,375 | 2,010 | 2,050 | 5,575 | ||||||||||||||||||
| Class C | N/A | N/A | 3,932 | N/A | N/A | N/A | ||||||||||||||||||
Shareholder Servicing Agent – MFS Service Center, Inc. (MFSC), a wholly-owned subsidiary of MFS, receives a fee from each fund for its services as shareholder servicing agent calculated as a percentage of the average daily net assets of each fund as determined periodically under the supervision of the fund’s Board of Trustees. For the year ended March 31, 2013, each fund paid the following fee, which equated to the following annual percentage of each fund’s average daily net assets:
| Alabama Fund | Arkansas Fund | California Fund | Georgia Fund | Maryland Fund | Massachusetts Fund | |||||||||||||||||||
| Expenses paid | $10,822 | $32,168 | $48,780 | $11,088 | $24,785 | $53,759 | ||||||||||||||||||
| Percentage of average daily net assets | 0.0150% | 0.0136% | 0.0150% | 0.0141% | 0.0217% | 0.0177% | ||||||||||||||||||
MFSC also receives payment from each fund for out-of-pocket expenses, sub-accounting and other shareholder servicing costs which may be paid to affiliated and unaffiliated service providers. For the year ended March 31, 2013, these out-of-pocket expenses, sub-accounting and other shareholder servicing costs amounted to the following:
| Alabama Fund | Arkansas Fund | California Fund | Georgia Fund | Maryland Fund | Massachusetts Fund | |||||||||||||||
| $37,297 | $142,244 | $215,260 | $47,701 | $63,148 | $185,509 | |||||||||||||||
Administrator – MFS provides certain financial, legal, shareholder communications, compliance, and other administrative services to each fund. Under an administrative services agreement, each fund partially reimburses MFS the costs incurred to provide these services. Each fund is charged an annual fixed amount of $17,500 plus a fee based on average daily net assets. The administrative services fee incurred for the year ended March 31, 2013 was equivalent to an annual effective rate of each fund’s average daily net assets as follows:
| Alabama Fund | Arkansas Fund | California Fund | Georgia Fund | Maryland Fund | Massachusetts Fund | |||||||||||||||||||
| Percentage of average daily net assets | 0.0284% | 0.0180% | 0.0167% | 0.0271% | 0.0229% | 0.0170% | ||||||||||||||||||
Trustees’ and Officers’ Compensation – Each fund pays compensation to independent Trustees in the form of a retainer, attendance fees, and additional compensation to Board and Committee chairpersons. Each fund does not pay compensation directly to Trustees or officers of each fund who are also officers of the investment adviser, all of whom receive remuneration for their services to each fund from MFS. Certain officers and Trustees of each fund are officers or directors of MFS, MFD, and MFSC.
69
Table of Contents
Notes to Financial Statements – continued
Prior to December 31, 2001, each fund had an unfunded defined benefit plan (“DB plan”) for independent Trustees. As of December 31, 2001, the Board took action to terminate the DB plan with respect to then-current and any future independent Trustees, such that the DB plan covers only certain of those former independent Trustees who retired on or before December 31, 2001. The DB plan resulted in a pension expense for each fund. These amounts are included in “Independent Trustees’ compensation” in the Statements of Operations and were as follows:
| Alabama Fund | Arkansas Fund | California Fund | Georgia Fund | Maryland Fund | Massachusetts Fund | |||||||||||||||
| $31 | $65 | $588 | $25 | $490 | $505 | |||||||||||||||
The liability for deferred retirement benefits payable to certain independent Trustees under the DB plan amounted to the following at March 31, 2013, and is included in “Payable for independent Trustees’ compensation” in the Statements of Assets and Liabilities:
| Alabama Fund | Arkansas Fund | California Fund | Georgia Fund | Maryland Fund | Massachusetts Fund | |||||||||||||||
| $4,623 | $4,463 | $11,470 | $5,198 | $7,795 | $7,756 | |||||||||||||||
Other– These funds and certain other funds managed by MFS (the funds) have entered into services agreements (the Agreements) which provide for payment of fees by the funds to Tarantino LLC and Griffin Compliance LLC in return for the provision of services of an Independent Chief Compliance Officer (ICCO) and Assistant ICCO, respectively, for the funds. The ICCO and Assistant ICCO are officers of the funds and the sole members of Tarantino LLC and Griffin Compliance LLC, respectively. The funds can terminate the Agreements with Tarantino LLC and Griffin Compliance LLC at any time under the terms of the Agreements. For the year ended March 31, 2013, the aggregate fees paid by each fund to Tarantino LLC and Griffin Compliance LLC amounted to the following and are included in “Miscellaneous” expense in the Statements of Operations:
| Alabama Fund | Arkansas Fund | California Fund | Georgia Fund | Maryland Fund | Massachusetts Fund | |||||||||||||||
| $569 | $1,830 | $2,546 | $599 | $891 | $2,371 | |||||||||||||||
MFS has agreed to reimburse the funds for a portion of the payments made by each fund in the following amounts, which are shown as a reduction of total expenses in the Statements of Operations. Additionally, MFS has agreed to bear all expenses associated with office space, other administrative support, and supplies provided to the ICCO and Assistant ICCO:
| Alabama Fund | Arkansas Fund | California Fund | Georgia Fund | Maryland Fund | Massachusetts Fund | |||||||||||||||
| $232 | $754 | $1,045 | $248 | $366 | $973 | |||||||||||||||
Each fund invests in the MFS Institutional Money Market Portfolio which is managed by MFS and seeks current income consistent with preservation of capital and liquidity. Income earned on this investment is included in “Dividends from underlying affiliated funds” in the Statements of Operations. This money market fund does not pay a management fee to MFS.
| (4) | Portfolio Securities |
Purchases and sales of investments, other than short-term obligations, were as follows:
| Alabama Fund | Arkansas Fund | California Fund | Georgia Fund | Maryland Fund | Massachusetts Fund | |||||||||||||||||||
| Purchases | $7,212,026 | $49,907,183 | $62,531,449 | $20,986,482 | $25,410,102 | $45,199,214 | ||||||||||||||||||
| Sales | $7,062,769 | $35,727,773 | $62,411,491 | $10,390,731 | $26,310,515 | $48,560,469 | ||||||||||||||||||
70
Table of Contents
Notes to Financial Statements – continued
| (5) | Shares of Beneficial Interest |
Each fund’s Declaration of Trust permits the Trustees to issue an unlimited number of full and fractional shares of beneficial interest. Transactions in fund shares were as follows:
| Alabama Fund | Arkansas Fund | |||||||||||||||||||||||||||||||
| Year ended 3/31/13 | Year ended 3/31/12 | Year ended 3/31/13 | Year ended 3/31/12 | |||||||||||||||||||||||||||||
| Shares | Amount | Shares | Amount | Shares | Amount | Shares | Amount | |||||||||||||||||||||||||
| Shares sold | ||||||||||||||||||||||||||||||||
Class A | 608,036 | $6,526,733 | 703,578 | $7,219,417 | 4,465,572 | $46,121,592 | 3,501,369 | $35,147,982 | ||||||||||||||||||||||||
Class B | 12,616 | 135,535 | 10,105 | 102,943 | 207,990 | 2,146,156 | 153,017 | 1,537,065 | ||||||||||||||||||||||||
| 620,652 | $6,662,268 | 713,683 | $7,322,360 | 4,673,562 | $48,267,748 | 3,654,386 | $36,685,047 | |||||||||||||||||||||||||
| Shares issued to shareholders in reinvestment of distributions | ||||||||||||||||||||||||||||||||
Class A | 174,498 | $1,876,667 | 163,919 | $1,679,395 | 559,333 | $5,777,695 | 485,489 | $4,841,357 | ||||||||||||||||||||||||
Class B | 2,807 | 30,167 | 5,200 | 53,105 | 19,322 | 199,785 | 18,232 | 181,818 | ||||||||||||||||||||||||
| 177,305 | $1,906,834 | 169,119 | $1,732,500 | 578,655 | $5,977,480 | 503,721 | $5,023,175 | |||||||||||||||||||||||||
| Shares reacquired | ||||||||||||||||||||||||||||||||
Class A | (854,873 | ) | $(9,197,619 | ) | (1,471,611 | ) | $(14,918,654 | ) | (3,321,798 | ) | $(34,306,542 | ) | (1,806,304 | ) | $(18,018,828 | ) | ||||||||||||||||
Class B | (83,405 | ) | (894,256 | ) | (168,372 | ) | (1,711,835 | ) | (165,705 | ) | (1,713,992 | ) | (134,901 | ) | (1,336,976 | ) | ||||||||||||||||
| (938,278 | ) | $(10,091,875 | ) | (1,639,983 | ) | $(16,630,489 | ) | (3,487,503 | ) | $(36,020,534 | ) | (1,941,205 | ) | $(19,355,804 | ) | |||||||||||||||||
| Net change | ||||||||||||||||||||||||||||||||
Class A | (72,339 | ) | $(794,219 | ) | (604,114 | ) | $(6,019,842 | ) | 1,703,107 | $17,592,745 | 2,180,554 | $21,970,511 | ||||||||||||||||||||
Class B | (67,982 | ) | (728,554 | ) | (153,067 | ) | (1,555,787 | ) | 61,607 | 631,949 | 36,348 | 381,907 | ||||||||||||||||||||
| (140,321 | ) | $(1,522,773 | ) | (757,181 | ) | $(7,575,629 | ) | 1,764,714 | $18,224,694 | 2,216,902 | $22,352,418 | |||||||||||||||||||||
| California Fund | Georgia Fund | |||||||||||||||||||||||||||||||
| Year ended 3/31/13 | Year ended 3/31/12 | Year ended 3/31/13 | Year ended 3/31/12 | |||||||||||||||||||||||||||||
| Shares | Amount | Shares | Amount | Shares | Amount | Shares | Amount | |||||||||||||||||||||||||
| Shares sold | ||||||||||||||||||||||||||||||||
Class A | 5,296,099 | $31,954,748 | 3,851,119 | $21,577,650 | 1,898,647 | $21,337,661 | 1,138,606 | $12,163,061 | ||||||||||||||||||||||||
Class B | 120,645 | 727,186 | 188,052 | 1,063,185 | 67,566 | 760,151 | 35,580 | 384,083 | ||||||||||||||||||||||||
Class C | 843,848 | 5,091,689 | 804,255 | 4,569,883 | — | — | — | — | ||||||||||||||||||||||||
| 6,260,592 | $37,773,623 | 4,843,426 | $27,210,718 | 1,966,213 | $22,097,812 | 1,174,186 | $12,547,144 | |||||||||||||||||||||||||
| Shares issued to shareholders in reinvestment of distributions | ||||||||||||||||||||||||||||||||
Class A | 1,303,835 | $7,864,323 | 1,209,901 | $6,794,486 | 163,236 | $1,837,027 | 128,481 | $1,369,522 | ||||||||||||||||||||||||
Class B | 18,596 | 112,162 | 22,688 | 126,877 | 4,345 | 49,087 | 4,317 | 46,048 | ||||||||||||||||||||||||
Class C | 118,607 | 717,821 | 101,546 | 572,790 | — | — | — | — | ||||||||||||||||||||||||
| 1,441,038 | $8,694,306 | 1,334,135 | $7,494,153 | 167,581 | $1,886,114 | 132,798 | $1,415,570 | |||||||||||||||||||||||||
| Shares reacquired | ||||||||||||||||||||||||||||||||
Class A | (6,388,909 | ) | $(38,446,008 | ) | (7,973,623 | ) | $(44,482,860 | ) | (1,183,157 | ) | $(13,331,926 | ) | (700,057 | ) | $(7,376,612 | ) | ||||||||||||||||
Class B | (248,899 | ) | (1,496,420 | ) | (540,187 | ) | (3,005,789 | ) | (37,143 | ) | (418,295 | ) | (98,066 | ) | (1,030,818 | ) | ||||||||||||||||
Class C | (912,621 | ) | (5,510,482 | ) | (964,385 | ) | (5,411,015 | ) | — | — | — | — | ||||||||||||||||||||
| (7,550,429 | ) | $(45,452,910 | ) | (9,478,195 | ) | $(52,899,664 | ) | (1,220,300 | ) | $(13,750,221 | ) | (798,123 | ) | $(8,407,430 | ) | |||||||||||||||||
| Net change | ||||||||||||||||||||||||||||||||
Class A | 211,025 | $1,373,063 | (2,912,603 | ) | $(16,110,724 | ) | 878,726 | $9,842,762 | 567,030 | $6,155,971 | ||||||||||||||||||||||
Class B | (109,658 | ) | (657,072 | ) | (329,447 | ) | (1,815,727 | ) | 34,768 | 390,943 | (58,169 | ) | (600,687 | ) | ||||||||||||||||||
Class C | 49,834 | 299,028 | (58,584 | ) | (268,342 | ) | — | — | — | — | ||||||||||||||||||||||
| 151,201 | $1,015,019 | (3,300,634 | ) | $(18,194,793 | ) | 913,494 | $10,233,705 | 508,861 | $5,555,284 | |||||||||||||||||||||||
71
Table of Contents
Notes to Financial Statements – continued
| Maryland Fund | Massachusetts Fund | |||||||||||||||||||||||||||||||
| Year ended 3/31/13 | Year ended 3/31/12 | Year ended 3/31/13 | Year ended 3/31/12 | |||||||||||||||||||||||||||||
| Shares | Amount | Shares | Amount | Shares | Amount | Shares | Amount | |||||||||||||||||||||||||
| Shares sold | ||||||||||||||||||||||||||||||||
Class A | 948,826 | $10,965,224 | 801,812 | $8,888,395 | 2,834,096 | $33,310,122 | 2,139,063 | $23,802,974 | ||||||||||||||||||||||||
Class B | 80,482 | 927,072 | 42,075 | 470,694 | 85,512 | 1,003,191 | 69,369 | 775,955 | ||||||||||||||||||||||||
| 1,029,308 | $11,892,296 | 843,887 | $9,359,089 | 2,919,608 | $34,313,313 | 2,208,432 | $24,578,929 | |||||||||||||||||||||||||
| Shares issued to shareholders in reinvestment of distributions | ||||||||||||||||||||||||||||||||
Class A | 246,809 | $2,853,563 | 230,545 | $2,541,617 | 602,549 | $7,080,805 | 452,098 | $5,022,252 | ||||||||||||||||||||||||
Class B | 7,399 | 85,494 | 7,388 | 81,344 | 8,614 | 101,305 | 10,474 | 116,058 | ||||||||||||||||||||||||
| 254,208 | $2,939,057 | 237,933 | $2,622,961 | 611,163 | $7,182,110 | 462,572 | $5,138,310 | |||||||||||||||||||||||||
| Shares reacquired | ||||||||||||||||||||||||||||||||
Class A | (1,047,468 | ) | $(12,097,690 | ) | (1,129,932 | ) | $(12,384,961 | ) | (3,250,453 | ) | $(38,134,479 | ) | (2,890,274 | ) | $(31,756,927 | ) | ||||||||||||||||
Class B | (82,662 | ) | (953,018 | ) | (109,952 | ) | (1,202,637 | ) | (132,997 | ) | (1,562,132 | ) | (307,096 | ) | (3,376,978 | ) | ||||||||||||||||
| (1,130,130 | ) | $(13,050,708 | ) | (1,239,884 | ) | $(13,587,598 | ) | (3,383,450 | ) | $(39,696,611 | ) | (3,197,370 | ) | $(35,133,905 | ) | |||||||||||||||||
| Net change | ||||||||||||||||||||||||||||||||
Class A | 148,167 | $1,721,097 | (97,575 | ) | $(954,949 | ) | 186,192 | $2,256,448 | (299,113 | ) | $(2,931,701 | ) | ||||||||||||||||||||
Class B | 5,219 | 59,548 | (60,489 | ) | (650,599 | ) | (38,871 | ) | (457,636 | ) | (227,253 | ) | (2,484,965 | ) | ||||||||||||||||||
| 153,386 | $1,780,645 | (158,064 | ) | $(1,605,548 | ) | 147,321 | $1,798,812 | (526,366 | ) | $(5,416,666 | ) | |||||||||||||||||||||
| (6) | Line of Credit |
Each fund and certain other funds managed by MFS participate in a $1.1 billion unsecured committed line of credit, subject to a $1 billion sublimit, provided by a syndication of banks under a credit agreement. Borrowings may be made for temporary financing needs. Interest is charged to each fund, based on its borrowings, generally at a rate equal to the higher of the Federal Reserve funds rate or one month LIBOR plus an agreed upon spread. A commitment fee, based on the average daily, unused portion of the committed line of credit, is allocated among the participating funds at the end of each calendar quarter. In addition, each fund and other funds managed by MFS have established unsecured uncommitted borrowing arrangements with certain banks for temporary financing needs. Interest is charged to each fund, based on its borrowings, at a rate equal to the Federal Reserve funds rate plus an agreed upon spread. For the year ended March 31, 2013, each fund’s commitment fee and interest expense were as follows, and are included in “Miscellaneous” expense in the Statements of Operations:
| Alabama Fund | Arkansas Fund | California Fund | Georgia Fund | Maryland Fund | Massachusetts Fund | |||||||||||||||||||
| Commitment Fee | $440 | $1,447 | $1,975 | $477 | $693 | $1,857 | ||||||||||||||||||
| Interest Expense | — | — | — | — | — | — | ||||||||||||||||||
72
Table of Contents
Notes to Financial Statements – continued
| (7) | Transactions in Underlying Affiliated Funds - Affiliated Issuers |
An affiliated issuer of a fund may be considered one in which the fund owns 5% or more of the outstanding voting securities, or a company which is under common control. For the purposes of this report, each fund assumes the MFS Institutional Money Market Portfolio to be an affiliated issuer. Each fund’s transactions in the MFS Institutional Money Market Portfolio for the year ended March 31, 2013, are as follows:
| Underlying Affiliated Fund – MFS Institutional Money Market Portfolio | ||||||||||||||||
| Beginning Share/Par Amount | Acquisitions Share/Par Amount | Dispositions Share/Par Amount | Ending Share/Par Amount | |||||||||||||
| Alabama Fund | 2,200,178 | 12,067,911 | (12,736,388) | 1,531,701 | ||||||||||||
| Arkansas Fund | 6,384,699 | 61,944,469 | (65,261,278) | 3,067,890 | ||||||||||||
| California Fund | 1,908,727 | 76,029,479 | (73,966,580) | 3,971,626 | ||||||||||||
| Georgia Fund | 3,210,147 | 26,927,251 | (27,118,315) | 3,019,083 | ||||||||||||
| Maryland Fund | 2,918,509 | 33,686,106 | (32,624,005) | 3,980,610 | ||||||||||||
| Massachusetts Fund | 6,347,027 | 68,095,251 | (67,138,049) | 7,304,229 | ||||||||||||
| Realized Gain (Loss) | Capital Gain Distributions | Dividend Income | Ending Value | |||||||||||||
| Alabama Fund | $— | $— | $1,503 | $1,531,701 | ||||||||||||
| Arkansas Fund | — | — | 10,195 | 3,067,890 | ||||||||||||
| California Fund | — | — | 8,601 | 3,971,626 | ||||||||||||
| Georgia Fund | — | — | 3,887 | 3,019,083 | ||||||||||||
| Maryland Fund | — | — | 4,986 | 3,980,610 | ||||||||||||
| Massachusetts Fund | — | — | 11,291 | 7,304,229 | ||||||||||||
73
Table of Contents
REPORT OF INDEPENDENT REGISTERED PUBLIC ACCOUNTING FIRM
To the Board of Trustees of MFS Municipal Series Trust and the Shareholders of MFS Alabama Municipal Bond Fund, MFS Arkansas Municipal Bond Fund, MFS California Municipal Bond Fund, MFS Georgia Municipal Bond Fund, MFS Maryland Municipal Bond Fund and MFS Massachusetts Municipal Bond Fund:
We have audited the accompanying statements of assets and liabilities, including the portfolios of investments, of MFS Alabama Municipal Bond Fund, MFS Arkansas Municipal Bond Fund, MFS California Municipal Bond Fund, MFS Georgia Municipal Bond Fund, MFS Maryland Municipal Bond Fund and MFS Massachusetts Municipal Bond Fund (each a series of MFS Municipal Series Trust) (the “Funds”) as of March 31, 2013, and the related statements of operations for the year then ended, the statements of changes in net assets for each of the two years in the period then ended, and the financial highlights for each of the five years in the period then ended. These financial statements and financial highlights are the responsibility of the Funds’ management. Our responsibility is to express an opinion on these financial statements and financial highlights based on our audits.
We conducted our audits in accordance with the standards of the Public Company Accounting Oversight Board (United States). Those standards require that we plan and perform the audit to obtain reasonable assurance about whether the financial statements and financial highlights are free of material misstatement. The Funds are not required to have, nor were we engaged to perform, an audit of their internal control over financial reporting. Our audits included consideration of internal control over financial reporting as a basis for designing audit procedures that are appropriate in the circumstances, but not for the purpose of expressing an opinion on the effectiveness of the Funds’ internal control over financial reporting. Accordingly, we express no such opinion. An audit also includes examining, on a test basis, evidence supporting the amounts and disclosures in the financial statements, assessing the accounting principles used and significant estimates made by management, as well as evaluating the overall financial statement presentation. Our procedures included confirmation of securities owned as of March 31, 2013, by correspondence with the custodian and brokers; where replies were not received from brokers, we performed other auditing procedures. We believe that our audits provide a reasonable basis for our opinion.
In our opinion, the financial statements and financial highlights referred to above present fairly, in all material respects, the financial position of each of the Funds as of March 31, 2013, the results of their operations for the year then ended, the changes in their net assets for each of the two years in the period then ended, and the financial highlights for each of the five years in the period then ended, in conformity with accounting principles generally accepted in the United States of America.
DELOITTE & TOUCHE LLP
Boston, Massachusetts
May 15, 2013
74
Table of Contents
TRUSTEES AND OFFICERS — IDENTIFICATION AND BACKGROUND
The Trustees and Officers of the Trust, as of May 1, 2013, are listed below, together with their principal occupations during the past five years. (Their titles may have varied during that period.) The address of each Trustee and officer is 111 Huntington Avenue, Boston, Massachusetts 02199-7618.
Name, Age | Position(s) Held with Fund | Trustee/Officer Since (h) | Principal Occupations the Past Five Years | Other Directorships (j) | ||||
| INTERESTED TRUSTEES | ||||||||
| Robert J. Manning (k) (Age 49) | Trustee | February 2004 | Massachusetts Financial Services Company, Chairman, Chief Executive Officer and Director; President (until December 2009); Chief Investment Officer (until July 2010) | N/A | ||||
| INDEPENDENT TRUSTEES | ||||||||
| David H. Gunning (Age 70) | Trustee and Chair of Trustees | January 2004 | Private investor | Lincoln Electric Holdings, Inc. (welding equipment manufacturer), Director; Development Alternatives, Inc. (consulting), Director/Non-Executive Chairman; Portman Limited (mining), Director (until 2008) | ||||
| Robert E. Butler (Age 71) | Trustee | January 2006 | Consultant – investment company industry regulatory and compliance matters | N/A | ||||
Maureen R. Goldfarb (Age 58) | Trustee | January 2009 | Private investor | N/A | ||||
| William R. Gutow (Age 71) | Trustee | December 1993 | Private investor and real estate consultant; Capitol Entertainment Management Company (video franchise), Vice Chairman | Texas Donuts (donut franchise), Vice Chairman (until 2010) | ||||
| Michael Hegarty (Age 68) | Trustee | December 2004 | Private investor | Brookfield Office Properties, Inc. (real estate), Director; Rouse Properties Inc. (real estate), Director; Capmark Financial Group Inc. (real estate), Director | ||||
John P. Kavanaugh (Age 58) | Trustee | January 2009 | Private investor | N/A | ||||
| J. Dale Sherratt (Age 74) | Trustee | June 1989 | Insight Resources, Inc. (acquisition planning specialists), President; Wellfleet Investments (investor in health care companies), Managing General Partner | N/A | ||||
| Laurie J. Thomsen (Age 55) | Trustee | March 2005 | Private investor; New Profit, Inc. (venture philanthropy), Executive Partner (until 2010) | The Travelers Companies (insurance), Director | ||||
| Robert W. Uek (Age 71) | Trustee | January 2006 | Consultant to investment company industry | N/A | ||||
| OFFICERS | ||||||||
John M. Corcoran (k) (Age 48) | President | October 2008 | Massachusetts Financial Services Company, Senior Vice President (since October 2008); State Street Bank and Trust (financial services provider), Senior Vice President, (until September 2008) | N/A | ||||
| Christopher R. Bohane (k) (Age 39) | Assistant Secretary and Assistant Clerk | July 2005 | Massachusetts Financial Services Company, Vice President and Assistant General Counsel | N/A | ||||
Kino Clark (k) (Age 44) | Assistant Treasurer | January 2012 | Massachusetts Financial Services Company, Vice President | N/A | ||||
75
Table of Contents
Trustees and Officers – continued
Name, Age | Position(s) Held with Fund | Trustee/Officer Since (h) | Principal Occupations the Past Five Years | Other Directorships (j) | ||||
Thomas H. Connors (k) (Age 53) | Assistant Secretary and Assistant Clerk | September 2012 | Massachusetts Financial Services Company, Vice President and Senior Counsel; Deutsche Investment Management Americas Inc. (financial service provider), Director and Senior Counsel (until 2012) | N/A | ||||
| Ethan D. Corey (k) (Age 49) | Assistant Secretary and Assistant Clerk | July 2005 | Massachusetts Financial Services Company, Senior Vice President and Associate General Counsel | N/A | ||||
| David L. DiLorenzo (k) (Age 44) | Treasurer | July 2005 | Massachusetts Financial Services Company, Senior Vice President | N/A | ||||
| Robyn L. Griffin (Age 37) | Assistant Independent Chief Compliance Officer | August 2008 | Griffin Compliance LLC (provider of compliance services), Principal (since August 2008); State Street Corporation (financial services provider), Mutual Fund Administration Assistant Vice President (October 2006 – July 2008) | N/A | ||||
Brian E. Langenfeld (k) (Age 40) | Assistant Secretary and Assistant Clerk | June 2006 | Massachusetts Financial Services Company, Vice President and Senior Counsel | N/A | ||||
Susan S. Newton (k) (Age 63) | Assistant Secretary and Assistant Clerk | May 2005 | Massachusetts Financial Services Company, Senior Vice President and Associate General Counsel | N/A | ||||
| Susan A. Pereira (k) (Age 42) | Assistant Secretary and Assistant Clerk | July 2005 | Massachusetts Financial Services Company, Vice President and Senior Counsel | N/A | ||||
Kasey L. Phillips (k) (Age 42) | Assistant Treasurer | September 2012 | Massachusetts Financial Services Company, Vice President; Wells Fargo Funds Management, LLC, Senior Vice President, Fund Treasurer (until 2012) | N/A | ||||
Mark N. Polebaum (k) (Age 60) | Secretary and Clerk | January 2006 | Massachusetts Financial Services Company, Executive Vice President, General Counsel and Secretary | N/A | ||||
| Frank L. Tarantino (Age 69) | Independent Chief Compliance Officer | June 2004 | Tarantino LLC (provider of compliance services), Principal | N/A | ||||
| Richard S. Weitzel (k) (Age 42) | Assistant Secretary and Assistant Clerk | October 2007 | Massachusetts Financial Services Company, Senior Vice President and Associate General Counsel | N/A | ||||
| James O. Yost (k) (Age 52) | Deputy Treasurer | September 1990 | Massachusetts Financial Services Company, Senior Vice President | N/A | ||||
| (h) | Date first appointed to serve as Trustee/officer of an MFS Fund. Each Trustee has served continuously since appointment unless indicated otherwise. For the period from December 15, 2004 until February 22, 2005, Mr. Manning served as Advisory Trustee. For the period October 2008, until January 2012, Mr. Corcoran served as Treasurer of the Funds. Prior to January 2012, Messrs. DiLorenzo and Yost served as Assistant Treasurers of the Funds. |
| (j) | Directorships or trusteeships of companies required to report to the Securities and Exchange Commission (i.e., “public companies”). |
| (k) | “Interested person” of the Trust within the meaning of the Investment Company Act of 1940 (referred to as the 1940 Act), which is the principal federal law governing investment companies like the fund, as a result of position with MFS. The address of MFS is 111 Huntington Avenue, Boston, Massachusetts 02199-7618. |
Each Trustee has been elected by shareholders and each Trustee and officer holds office until his or her successor is chosen and qualified or until his or her earlier death, resignation, retirement or removal. The Trust does not hold annual meetings for the purpose of electing Trustees, and Trustees are not elected for fixed terms. Messrs. Butler, Kavanaugh, Uek and Ms. Thomsen are members of the Trust’s Audit Committee.
76
Table of Contents
Trustees and Officers – continued
Each of the Fund’s Trustees and officers holds comparable positions with certain other funds of which MFS or a subsidiary is the investment adviser or distributor, and, in the case of the officers, with certain affiliates of MFS. As of January 1, 2013, the Trustees served as board members of 143 funds within the MFS Family of Funds.
The Statement of Additional Information for the Fund includes further information about the Trustees and is available without charge upon request by calling 1-800-225-2606.
Investment Adviser Massachusetts Financial Services Company 111 Huntington Avenue Boston, MA 02199-7618 Distributor MFS Fund Distributors, Inc. 111 Huntington Avenue Boston, MA 02199-7618 Portfolio Manager Michael Dawson | Custodian JPMorgan Chase Bank One Chase Manhattan Plaza New York, NY 10081 Independent Registered Public Accounting Firm Deloitte & Touche LLP 200 Berkeley Street Boston, MA 02116 |
77
Table of Contents
BOARD REVIEW OF INVESTMENT ADVISORY AGREEMENT
A discussion regarding the Board’s most recent review and renewal of each fund’s Investment Advisory Agreement with MFS is available by clicking on the fund’s name under “Mutual Funds” in the “Products” section of the MFS Web site (mfs.com).
PROXY VOTING POLICIES AND INFORMATION
A general description of the MFS funds’ proxy voting policies and procedures is available without charge, upon request, by calling 1-800-225-2606, by visiting the Proxy Voting section of mfs.com or by visiting the SEC’s Web site at http://www.sec.gov.
Information regarding how each fund voted proxies relating to portfolio securities during the most recent twelve-month period ended June 30 is available without charge by visiting the Proxy Voting section of mfs.com or by visiting the SEC’s Web site at http://www.sec.gov.
QUARTERLY PORTFOLIO DISCLOSURE
Each fund will file a complete schedule of portfolio holdings with the Securities and Exchange Commission (the Commission) for the first and third quarters of each fiscal year on Form N-Q. A shareholder can obtain the quarterly portfolio holdings report at mfs.com. Each fund’s Form N-Q is also available on the EDGAR database on the Commission’s Internet Website at http://www.sec.gov, and may be reviewed and copied at the:
Public Reference Room
Securities and Exchange Commission
100 F Street, NE, Room 1580
Washington, D.C. 20549
Information on the operation of the Public Reference Room may be obtained by calling the Commission at 1-800-SEC-0330. Copies of each fund’s Form N-Q also may be obtained, upon payment of a duplicating fee, by electronic request at the following e-mail address: publicinfo@sec.gov or by writing the Public Reference Section at the above address.
From time to time, MFS may post important information about each fund or the MFS funds on the MFS web site (mfs.com). This information is available by visiting the “News & Commentary” section of mfs.com or by clicking on the fund’s name under “Mutual Funds” in the “Products” section of mfs.com.
FEDERAL TAX INFORMATION (unaudited)
The funds will notify shareholders of amounts for use in preparing 2013 income tax forms in January 2014. The following information is provided pursuant to provisions of the Internal Revenue Code.
Of the dividends paid from net investment income during the fiscal year, the following percentages were designated as exempt interest dividends for federal income tax purposes. If each fund has earned income on private activity bonds, a portion of the dividends paid may be considered a tax preference item for purposes of computing a shareholder’s alternative minimum tax.
Exempt Interest Dividends | ||||
| Alabama Fund | 100.00% | |||
| Arkansas Fund | 99.27% | |||
| California Fund | 98.63% | |||
| Georgia Fund | 99.66% | |||
| Maryland Fund | 100.00% | |||
| Massachusetts Fund | 96.65% | |||
78
Table of Contents
rev. 3/11
| WHAT DOES MFS DO WITH YOUR
|  |
| Why? | Financial companies choose how they share your personal information. Federal law gives consumers the right to limit some but not all sharing. Federal law also requires us to tell you how we collect, share, and protect your personal information. Please read this notice carefully to understand what we do. |
| What? | The types of personal information we collect and share depend on the product or service you have with us. This information can include:
• Social Security number and account balances • Account transactions and transaction history • Checking account information and wire transfer instructions
When you are no longer our customer, we continue to share your information as described in this notice. |
| How? | All financial companies need to share customers’ personal information to run their everyday business. In the section below, we list the reasons financial companies can share their customers’ personal information; the reasons MFS chooses to share; and whether you can limit this sharing. |
| Reasons we can share your personal information | Does MFS share? | Can you limit this sharing? | ||
For our everyday business purposes – such as to process your transactions, maintain your account(s), respond to court orders and legal investigations, or report to credit bureaus | Yes | No | ||
For our marketing purposes – to offer our products and services to you | No | We don’t share | ||
| For joint marketing with other financial companies | No | We don’t share | ||
For our affiliates’ everyday business purposes – information about your transactions and experiences | No | We don’t share | ||
For our affiliates’ everyday business purposes – information about your creditworthiness | No | We don’t share | ||
| For nonaffiliates to market to you | No | We don’t share |
| Questions? | Call 800-225-2606 or go to mfs.com. |
79
Table of Contents
| Page 2 |
| Who we are | ||
| Who is providing this notice? | MFS Funds, MFS Investment Management, MFS Institutional Advisors, Inc., MFS Fund Distributors, Inc., MFS Heritage Trust Company, and MFS Service Center, Inc. | |
| What we do | ||
| How does MFS protect my personal information? | To protect your personal information from unauthorized access and use, we use security measures that comply with federal law. These measures include procedural, electronic, and physical safeguards for the protection of the personal information we collect about you. | |
| How does MFS collect my personal information? | We collect your personal information, for example, when you
• open an account or provide account information • direct us to buy securities or direct us to sell your securities • make a wire transfer
We also collect your personal information from others, such as credit bureaus, affiliates and other companies. | |
| Why can’t I limit all sharing? | Federal law gives you the right to limit only
• sharing for affiliates’ everyday business purposes – information about your creditworthiness • affiliates from using your information to market to you • sharing for nonaffiliates to market to you
State laws and individual companies may give you additional rights to limit sharing. | |
| Definitions | ||
| Affiliates | Companies related by common ownership or control. They can be financial and nonfinancial companies.
•MFS does not share personal information with affiliates, except for everyday business purposes as described on page one of this notice. | |
| Nonaffiliates | Companies not related by common ownership or control. They can be financial and nonfinancial companies.
•MFS does not share with nonaffiliates so they can market to you. | |
| Joint Marketing | A formal agreement between nonaffiliated financial companies that together market financial products or services to you.
•MFS doesn’t jointly market. | |
| Other important information | ||
| If you own an MFS product or receive an MFS service in the name of a third party such as a bank or broker-dealer, their privacy policy may apply to you instead of ours. | ||
80
Table of Contents
Save paper with eDelivery.
| MFS® will send you prospectuses, |

reports, and proxies directly via e-mail so you will get information faster with less mailbox clutter.
To sign up:
1. Go to mfs.com.
2. Log in via MFS® Access.
3. Select eDelivery.
If you own your MFS fund shares through a financial institution or a retirement plan, MFS® TALK, MFS® Access, or eDelivery may not be available to you.
WEB SITE
mfs.com
MFS TALK
1-800-637-8255
24 hours a day
ACCOUNT SERVICE AND LITERATURE
Shareholders
1-800-225-2606
Financial advisors
1-800-343-2829
Retirement plan services
1-800-637-1255
MAILING ADDRESS
MFS Service Center, Inc.
P.O. Box 55824
Boston, MA 02205-5824
OVERNIGHT MAIL
MFS Service Center, Inc.
c/o Boston Financial Data Services
30 Dan Road
Canton, MA 02021-2809
Table of Contents
ANNUAL REPORT
March 31, 2013

MFS® MUNICIPAL
SERIES TRUST
For the states of:
Mississippi, New York, North Carolina, Pennsylvania, South Carolina, Tennessee, Virginia, and
West Virginia

MSTB-ANN
Table of Contents
MFS® MUNICIPAL SERIES TRUST
For the states of: Mississippi, New York, North Carolina, Pennsylvania, South Carolina, Tennessee,
Virginia, and West Virginia
The report is prepared for the general information of shareholders. It is authorized for distribution to prospective investors only when preceded or accompanied by a current prospectus.
NOT FDIC INSURED Ÿ MAY LOSE VALUE Ÿ NO BANK GUARANTEE
Table of Contents
LETTER FROM THE CHAIRMAN AND CEO

Dear Shareholders:
The first quarter of 2013 delivered strong returns to global equity investors, particularly those holding U.S. and Japanese stocks, while bond returns were flat overall. The U.S. economy picked up steam, driven by the improving housing and job markets. U.S. economic data were broadly positive, with growth in manufacturing activity, durable goods orders and auto sales. However, consumer confidence wavered somewhat, a likely reflection of the impact of the payroll tax increase and uncertainty over the U.S. government’s across-the-board sequestration cuts.
The eurozone’s unemployment picture and overall economic activity steadily worsened. Cyprus, the latest debt-crisis hot spot, faces unique challenges, with its oversized banking sector’s unhealthy exposure to Greek debt. In addition, the hefty cost to large bank depositors could weaken confidence in the region’s financial stability. China’s economic activity rebounded after a mild slowdown in 2012. The Japanese government’s aggressive effort to stimulate its long-dormant economy by devaluing the yen lifted stock prices, exports and profits for struggling Japanese firms. The outlook for further economic growth and an extension of the U.S. bull market is highly dependent on how much damage is caused by the U.S. budget cuts, global growth prospects and the ebb and flow of global tail risk events. Most factors point to a continued slow and uneven global economic recovery.
As always, managing risk in the face of uncertainty remains a top priority for investors. At MFS®, our uniquely collaborative investment process employs global research and active risk management. Our global team of investment professionals shares ideas and evaluates opportunities across continents, investment disciplines and asset classes — all with a goal of building better insights, and ultimately better results, for our clients.
We remain mindful of the many economic challenges investors face today, and believe it is more important than ever to maintain a long-term view and employ time-tested principles, such as asset allocation and diversification. We also remain confident that our unique approach can serve investors well as they work with their financial advisors to identify and pursue the most suitable opportunities.
Respectfully,

Robert J. Manning
Chairman and Chief Executive Officer
MFS Investment Management®
May 15, 2013
The opinions expressed in this letter are subject to change, may not be relied upon for investment advice, and no forecasts can be guaranteed.
1
Table of Contents
MFS Mississippi Municipal Bond Fund
Portfolio structure (i)
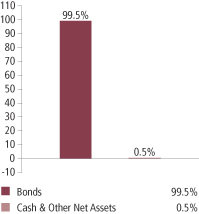
| Top five industries (i) | ||||
| State & Local Agencies | 19.5% | |||
| Universities – Colleges | 17.1% | |||
| Healthcare Revenue – Hospitals | 12.7% | |||
| Water & Sewer Utility Revenue | 9.7% | |||
| General Obligations – General Purpose | 9.2% | |||
| Composition including fixed income credit quality (a)(i) | ||||
| AAA | 4.9% | |||
| AA | 41.2% | |||
| A | 30.5% | |||
| BBB | 15.3% | |||
| BB | 2.8% | |||
| B | 0.7% | |||
| CCC | 0.9% | |||
| Not Rated | 3.2% | |||
| Cash & Other | 0.5% | |||
| Portfolio facts (i) | ||||
| Average Duration (d) | 8.3 | |||
| Average Effective Maturity (m) | 17.1 yrs. | |||
MFS New York Municipal Bond Fund
Portfolio structure (i)

| Top five industries (i) | ||||
| Universities – Colleges | 20.0% | |||
| Healthcare Revenue – Hospitals | 11.6% | |||
| Tax-Other | 11.2% | |||
| State & Local Agencies | 11.0% | |||
| Miscellaneous Revenue – Other | 4.6% | |||
| Composition including fixed income credit quality (a)(i) | ||||
| AAA | 2.6% | |||
| AA | 36.2% | |||
| A | 28.6% | |||
| BBB | 23.6% | |||
| BB | 2.3% | |||
| B | 2.5% | |||
| Not Rated | 1.9% | |||
| Cash & Other | 2.3% | |||
| Portfolio facts (i) | ||||
| Average Duration (d) | 8.9 | |||
| Average Effective Maturity (m) | 18.3 yrs. | |||
MFS North Carolina Municipal Bond Fund
Portfolio structure (i)
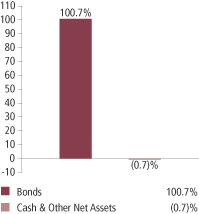
| Top five industries (i) | ||||
| Healthcare Revenue – Hospitals | 22.8% | |||
| Universities – Colleges | 12.9% | |||
| Water & Sewer Utility Revenue | 11.1% | |||
| State & Local Agencies | 8.8% | |||
| Utilities – Municipal Owned | 5.9% | |||
| Composition including fixed income credit quality (a)(i) | ||||
| AAA | 19.0% | |||
| AA | 35.1% | |||
| A | 26.6% | |||
| BBB | 16.0% | |||
| BB | 0.2% | |||
| B | 1.1% | |||
| Not Rated | 2.7% | |||
| Cash & Other | (0.7)% | |||
| Portfolio facts (i) | ||||
| Average Duration (d) | 8.8 | |||
| Average Effective Maturity (m) | 17.1 yrs. | |||
| (a) | For all securities other than those specifically described below, ratings are assigned to underlying securities utilizing ratings from Moody’s, Fitch, and Standard & Poor’s rating agencies and applying the following hierarchy: If all three agencies provide a rating, the middle rating (after dropping the highest and lowest ratings) is assigned; if two of the three agencies rate a security, the lower of the two is assigned. Ratings are shown in the S&P and Fitch scale (e.g., AAA). Securities rated BBB or higher are considered investment grade. All ratings are subject to change. Not Rated includes fixed income securities, including fixed income futures contracts, which have not been rated by any rating agency. Cash & Other includes cash, other assets less liabilities, offsets to derivative positions, and short-term securities. The fund may not hold all of these instruments. The fund is not rated by these agencies. |
| (d) | Duration is a measure of how much a bond’s price is likely to fluctuate with general changes in interest rates, e.g., if rates rise 1.00%, a bond with a 5-year duration is likely to lose about 5.00% of its value due to the interest rate move. |
| (i) | For purposes of this presentation, the components include the market value of securities, and reflect the impact of the equivalent exposure of derivative positions, if any. These amounts may be negative from time to time. The bond component will include any accrued interest amounts. Equivalent exposure is a calculated amount that translates the derivative position into a reasonable approximation of the amount of the underlying asset that the portfolio would have to hold at a given point in time to have the same price sensitivity that results from the portfolio’s ownership of the derivative contract. When dealing with derivatives, equivalent exposure is a more representative measure of the potential impact of a position on portfolio performance than market value. Where the fund holds convertible bonds, these are treated as part of the equity portion of the portfolio. |
| (m) | In determining an instrument’s effective maturity for purposes of calculating the fund’s dollar-weighted average effective maturity, MFS uses the instrument’s stated maturity or, if applicable, an earlier date on which MFS believes it is probable that a maturity-shortening device (such as a put, pre-refunding or prepayment) will cause the instrument to be repaid. Such an earlier date can be substantially shorter than the instrument’s stated maturity. |
From time to time “Cash & Other Net Assets” may be negative due to timing of cash receipts and/or equivalent exposure from any derivative holdings.
Percentages are based on net assets as of 3/31/13.
The portfolio is actively managed and current holdings may be different.
2
Table of Contents
Portfolio Composition – continued
MFS Pennsylvania Municipal Bond Fund
Portfolio structure (i)

| Top five industries (i) | ||||
| Universities – Colleges | 19.4% | |||
| Healthcare Revenue-Hospitals | 19.4% | |||
| General Obligations – Schools | 12.3% | |||
| General Obligations – General Purpose | 7.3% | |||
| Water & Sewer Utility Revenue | 6.7% | |||
| Composition including fixed income credit quality (a)(i) | ||||
| AAA | 2.8% | |||
| AA | 26.7% | |||
| A | 35.4% | |||
| BBB | 24.3% | |||
| BB | 2.0% | |||
| B | 2.0% | |||
| Not Rated | 3.9% | |||
| Cash & Other | 2.9% | |||
| Portfolio facts (i) | ||||
| Average Duration (d) | 9.1 | |||
| Average Effective Maturity (m) | 18.2 yrs. | |||
MFS South Carolina Municipal Bond Fund
Portfolio structure (i)

| Top five industries (i) | ||||
| Water & Sewer Utility Revenue | 18.7% | |||
| Healthcare Revenue – Hospitals | 17.0% | |||
| Utilities-Municipal Owned | 8.4% | |||
| Universities – Colleges | 7.9% | |||
| General Obligations – Schools | 7.8% | |||
| Composition including fixed income credit quality (a)(i) | ||||
| AAA | 5.6% | |||
| AA | 45.0% | |||
| A | 28.9% | |||
| BBB | 14.7% | |||
| BB | 1.0% | |||
| B | 1.8% | |||
| Not Rated | 0.7% | |||
| Cash & Other | 2.3% | |||
| Portfolio facts (i) | ||||
| Average Duration (d) | 8.6 | |||
| Average Effective Maturity (m) | 17.9 yrs. | |||
MFS Tennessee Municipal Bond Fund
Portfolio structure (i)
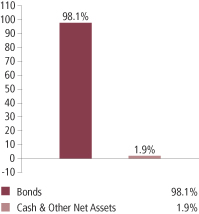
| Top five industries (i) | ||||
| Healthcare Revenue – Hospitals | 17.9% | |||
| General Obligations – General Purpose | 17.4% | |||
| Water & Sewer Utility Revenue | 11.9% | |||
| Universities – Colleges | 8.4% | |||
| Utilities-Municipal Owned | 7.4% | |||
| Composition including fixed income credit quality (a)(i) | ||||
| AAA | 5.1% | |||
| AA | 51.8% | |||
| A | 19.9% | |||
| BBB | 17.6% | |||
| BB | 0.8% | |||
| B | 0.8% | |||
| Not Rated | 2.1% | |||
| Cash & Other | 1.9% | |||
| Portfolio facts (i) | ||||
| Average Duration (d) | 9.3 | |||
| Average Effective Maturity (m) | 18.4 yrs. | |||
| (a) | For all securities other than those specifically described below, ratings are assigned to underlying securities utilizing ratings from Moody’s, Fitch, and Standard & Poor’s rating agencies and applying the following hierarchy: If all three agencies provide a rating, the middle rating (after dropping the highest and lowest ratings) is assigned; if two of the three agencies rate a security, the lower of the two is assigned. Ratings are shown in the S&P and Fitch scale (e.g., AAA). Securities rated BBB or higher are considered investment grade. All ratings are subject to change. Not Rated includes fixed income securities, including fixed income futures contracts, which have not been rated by any rating agency. Cash & Other includes cash, other assets less liabilities, offsets to derivative positions, and short-term securities. The fund may not hold all of these instruments. The fund is not rated by these agencies. |
| (d) | Duration is a measure of how much a bond’s price is likely to fluctuate with general changes in interest rates, e.g., if rates rise 1.00%, a bond with a 5-year duration is likely to lose about 5.00% of its value due to the interest rate move. |
| (i) | For purposes of this presentation, the components include the market value of securities, and reflect the impact of the equivalent exposure of derivative positions, if any. These amounts may be negative from time to time. The bond component will include any accrued interest amounts. Equivalent exposure is a calculated amount that translates the derivative position into a reasonable approximation of the amount of the underlying asset that the portfolio would have to hold at a given point in time to have the same price sensitivity that results from the portfolio’s ownership of the derivative contract. When dealing with derivatives, equivalent exposure is a more representative measure of the potential impact of a position on portfolio performance than market value. Where the fund holds convertible bonds, these are treated as part of the equity portion of the portfolio. |
| (m) | In determining an instrument’s effective maturity for purposes of calculating the fund’s dollar-weighted average effective maturity, MFS uses the instrument’s stated maturity or, if applicable, an earlier date on which MFS believes it is probable that a maturity-shortening device (such as a put, pre-refunding or prepayment) will cause the instrument to be repaid. Such an earlier date can be substantially shorter than the instrument’s stated maturity. |
Percentages are based on net assets as of 3/31/13.
The portfolio is actively managed and current holdings may be different.
3
Table of Contents
Portfolio Composition – continued
MFS Virginia Municipal Bond Fund
Portfolio structure (i)
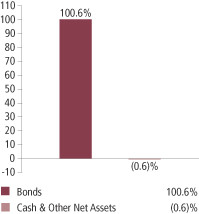
| Top five industries (i) | ||||
| Water & Sewer Utility Revenue | 18.1% | |||
| Healthcare Revenue – Hospitals | 15.5% | |||
| State & Local Agencies | 14.0% | |||
| Universities – Colleges | 7.8% | |||
| Single Family – Housing State | 5.3% | |||
| Composition including fixed income credit quality (a)(i) | ||||
| AAA | 17.7% | |||
| AA | 40.9% | |||
| A | 18.4% | |||
| BBB | 15.7% | |||
| BB | 1.9% | |||
| B | 1.2% | |||
| Not Rated | 4.8% | |||
| Cash & Other | (0.6)% | |||
| Portfolio facts (i) | ||||
| Average Duration (d) | 9.1 | |||
| Average Effective Maturity (m) | 18.2 yrs. | |||
MFS West Virginia Municipal Bond Fund
Portfolio structure (i)
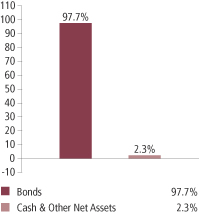
| Top five industries (i) | ||||
| Universities – Colleges | 22.4% | |||
| Healthcare Revenue – Hospitals | 12.8% | |||
| Water & Sewer Utility Revenue | 10.3% | |||
| General Obligations – General Purpose | 8.3% | |||
| State & Local Agencies | 8.3% | |||
| Composition including fixed income credit quality (a)(i) | ||||
| AAA | 1.0% | |||
| AA | 26.5% | |||
| A | 42.7% | |||
| BBB | 14.5% | |||
| BB | 1.7% | |||
| B | 0.7% | |||
| Not Rated | 10.6% | |||
| Cash & Other | 2.3% | |||
| Portfolio facts (i) | ||||
| Average Duration (d) | 7.8 | |||
| Average Effective Maturity (m) | 16.7 yrs. | |||
| (a) | For all securities other than those specifically described below, ratings are assigned to underlying securities utilizing ratings from Moody’s, Fitch, and Standard & Poor’s rating agencies and applying the following hierarchy: If all three agencies provide a rating, the middle rating (after dropping the highest and lowest ratings) is assigned; if two of the three agencies rate a security, the lower of the two is assigned. Ratings are shown in the S&P and Fitch scale (e.g., AAA). Securities rated BBB or higher are considered investment grade. All ratings are subject to change. Not Rated includes fixed income securities, including fixed income futures contracts, which have not been rated by any rating agency. Cash & Other includes cash, other assets less liabilities, offsets to derivative positions, and short-term securities. The fund may not hold all of these instruments. The fund is not rated by these agencies. |
| (d) | Duration is a measure of how much a bond’s price is likely to fluctuate with general changes in interest rates, e.g., if rates rise 1.00%, a bond with a 5-year duration is likely to lose about 5.00% of its value due to the interest rate move. |
| (i) | For purposes of this presentation, the components include the market value of securities, and reflect the impact of the equivalent exposure of derivative positions, if any. These amounts may be negative from time to time. The bond component will include any accrued interest amounts. Equivalent exposure is a calculated amount that translates the derivative position into a reasonable approximation of the amount of the underlying asset that the portfolio would have to hold at a given point in time to have the same price sensitivity that results from the portfolio’s ownership of the derivative contract. When dealing with derivatives, equivalent exposure is a more representative measure of the potential impact of a position on portfolio performance than market value. Where the fund holds convertible bonds, these are treated as part of the equity portion of the portfolio. |
| (m) | In determining an instrument’s effective maturity for purposes of calculating the fund’s dollar-weighted average effective maturity, MFS uses the instrument’s stated maturity or, if applicable, an earlier date on which MFS believes it is probable that a maturity-shortening device (such as a put, pre-refunding or prepayment) will cause the instrument to be repaid. Such an earlier date can be substantially shorter than the instrument’s stated maturity. |
| From | time to time “Cash & Other Net Assets” may be negative due to timing of cash receipts and/or equivalent exposure from any derivative holdings. |
Percentages are based on net assets as of 3/31/13.
The portfolio is actively managed and current holdings may be different.
4
Table of Contents
Summary of Results
For the twelve months ended March 31, 2013, Class A shares of each fund, at net asset value, with the exception of the municipal bond funds of South Carolina, Virginia, and West Virginia, outperformed the Barclays Municipal Bond Index. These included the municipal bond funds of Mississippi, New York, North Carolina, Pennsylvania, and Tennessee. The performance for the individual funds and the benchmark are set forth in the Performance Summary.
Market Environment
The beginning of the period was characterized by a risk-on sentiment as a result of additional liquidity measures by the Federal Reserve Bank (“Fed”) and the European Central Bank (“ECB”) as well as a commensurate improvement in macroeconomic conditions. During this time, global equity valuations rose, credit spreads contracted, and high-quality sovereign yields increased modestly.
Within a couple of months, however, conditions worsened, driven by broadly weaker global macroeconomic indicators, as well as renewed concerns over the eurozone’s capacity and determination to address its ongoing crisis. Despite this deterioration, broad market sentiment remained relatively resilient as equity markets generally maintained gains and credit spreads did not indicate deterioration.
However, this renewed weakness in the fundamentals precipitated a further round of monetary easing by both the Fed (through a third round of quantitative easing) and the ECB (through a new bond purchase facility) in the middle of the period, which soon instilled additional confidence in risk markets. Nonetheless, towards the end of the calendar year, weaker equity earnings reports and declining forward guidance caused market sentiment to soften. In addition, year-end fiscal cliff negotiations between the Republicans in the U.S. Congress and President Obama were a particular source of market attention, where uncertainty surrounding the fiscal negotiations continued right up to the end-of-year deadline. A last minute political agreement averted the worst-case scenario and markets gravitated towards risk assets again, though the implementation of the U.S. budget sequester, combined with the uncertainty surrounding the Italian election results, inserted a greater degree of caution as the reporting period ended.
Over the reporting period, municipal bond yields generally followed the direction of U.S. Treasury yields. Yields on “AAA” rated (r) municipal bonds declined throughout the first half of the period, hitting multi-generational lows in late November/early December, before rising over the second half of the period, and ending the twelve month period modestly lower. At the same time, spreads between higher quality bonds and lower quality bonds continued to decline, with “BBB” rated municipal bonds outperforming “AAA” rated municipal bonds and non-investment grade/non-rated bonds outperforming “BBB” rated municipal bonds. This reflects the strong technical backdrop over the trailing twelve months with demand for municipals outstripping supply, and investors continuing their search for yield. Near the end of the period, a number of developments emerged that have the potential to shift the balance of supply and demand. Amongst the more notable were a marked decline in the pace of inflows into, and even some outflows from, municipal bond funds, and proposals to alter the tax treatment of tax-exempt income.
Factors Affecting Performance
A longer duration (d) stance relative to the Barclays Municipal Bond Index benefited results across all funds, with the exception of the West Virginia Fund where a neutral duration stance had a negligible impact. The positive sentiment in the municipal bond markets pushed yields lower during the reporting period.
Among sectors, tobacco and utilities were notable contributors to the relative performance of all funds. A combination of bond selection and a greater exposure to both the education and health care sectors aided relative returns across all funds, with the exception of the Virginia Fund, where bond selection had a lesser impact. The general obligation sector was another positive factor for relative performance in all funds, with the exception of the Pennsylvania Fund, where the impact from bond selection was negligible. An underweight allocation to “AA” rated securities in all funds, with the exception of the Tennessee Fund, where it had an overweight allocation to this credit quality sector, also strengthened relative performance across all funds.
An underweight allocation to “A” rated securities held back relative results for the Mississippi, South Carolina, Virginia, and West Virginia funds. All funds’ cash and/or cash equivalents positions during the period were additional detractors from relative performance. Under normal market conditions, the funds strive to be fully invested and generally hold cash to buy new holdings and to provide liquidity. In a period when markets rose, as measured by the benchmark, holding cash hurt performance versus the benchmark, which has no cash position.
Respectfully,
Michael Dawson
Portfolio Manager
| (d) | Duration is a measure of how much a bond’s price is likely to fluctuate with general changes in interest rates, e.g., if rates rise 1.00%, a bond with a 5-year duration is likely to lose about 5.00% of its value. |
5
Table of Contents
Management Review – continued
| (r) | Bonds rated “BBB”, “Baa”, or higher are considered investment grade; bonds rated “BB”, “Ba”, or below are considered non-investment grade. The sources for bond quality ratings are Moody’s Investors Service, Standard & Poor’s and Fitch, Inc. and are applied using the following hierarchy: If all three agencies provide a rating, the middle rating (after dropping the highest and lowest ratings) is assigned; if two of the three agencies rate a security, the lower of the two is assigned. Ratings are shown in the S&P and Fitch scale (e.g., AAA). For securities which are not rated by any of the three agencies, the security is considered Not Rated. |
The views expressed in this report are those of the portfolio manager only through the end of the period of the report as stated on the cover and do not necessarily reflect the views of MFS or any other person in the MFS organization. These views are subject to change at any time based on market or other conditions, and MFS disclaims any responsibility to update such views. These views may not be relied upon as investment advice or an indication of trading intent on behalf of any MFS portfolio. References to specific securities are not recommendations of such securities, and may not be representative of any MFS portfolio’s current or future investments.
6
Table of Contents
PERFORMANCE SUMMARY THROUGH 3/31/13
The following charts illustrate a representative class of each fund’s historical performance in comparison to its benchmark(s). Performance results include the deduction of the maximum applicable sales charge and reflect the percentage change in net asset value, including reinvestment of dividends and capital gains distributions. Each fund’s results have been compared to the Barclays Municipal Bond Index, a market capitalization-weighted index that measures the performance of the tax-exempt bond market. However, while this index is considered the benchmark for the performance of municipal bond funds, it is comprised of municipal bonds issued nationwide, while each of the funds is limited to investing primarily in the bonds of a particular state. The performance of other share classes will be greater than or less than that of the class depicted below. Benchmarks are unmanaged and may not be invested in directly. Benchmark returns do not reflect sales charges, commissions or expenses. (See Notes to Performance Summary.)
Performance data shown represents past performance and is no guarantee of future results. Investment return and principal value fluctuate so your shares, when sold, may be worth more or less than the original cost; current performance may be lower or higher than quoted. The performance shown does not reflect the deduction of taxes, if any, that a shareholder would pay on fund distributions or the redemption of fund shares.
MFS Mississippi Municipal Bond Fund
Growth of a Hypothetical $10,000 Investment
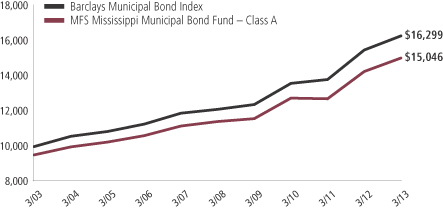
Total Returns through 3/31/13
Average annual without sales charge
| Share Class | Class inception date | 1-yr | 5-yr | 10-yr | ||||||||
| A | 8/06/92 | 5.43% | 5.66% | 4.68% | ||||||||
| B | 9/07/93 | 4.67% | 4.91% | 3.89% | ||||||||
| Comparative benchmark | ||||||||||||
| Barclays Municipal Bond Index (f) | 5.25% | 6.10% | 5.01% | |||||||||
| Average annual with sales charge | ||||||||||||
A With Initial Sales Charge (4.75%) | 0.42% | 4.64% | 4.17% | |||||||||
B With CDSC (Declining over six years from 4% to 0%) (x) | 0.67% | 4.58% | 3.89% | |||||||||
CDSC – Contingent Deferred Sales Charge.
| (f) | Source: FactSet Research Systems Inc. |
| (x) | Assuming redemption at the end of the applicable period. |
7
Table of Contents
Performance Summary – continued
MFS New York Municipal Bond Fund
Growth of a Hypothetical $10,000 Investment

Total Returns through 3/31/13
Average annual without sales charge
| Share Class | Class inception date | 1-yr | 5-yr | 10-yr | ||||||||
| A | 6/06/88 | 6.19% | 5.59% | 4.54% | ||||||||
| B | 9/07/93 | 5.41% | 4.81% | 3.77% | ||||||||
| C | 12/11/00 | 5.31% | 4.78% | 3.76% | ||||||||
| Comparative benchmark | ||||||||||||
| Barclays Municipal Bond Index (f) | 5.25% | 6.10% | 5.01% | |||||||||
| Average annual with sales charge | ||||||||||||
A With Initial Sales Charge (4.75%) | 1.14% | 4.56% | 4.03% | |||||||||
B With CDSC (Declining over six years from 4% to 0%) (x) | 1.41% | 4.48% | 3.77% | |||||||||
C With CDSC (1% for 12 months) (x) | 4.31% | 4.78% | 3.76% | |||||||||
CDSC – Contingent Deferred Sales Charge.
| (f) | Source: FactSet Research Systems Inc. |
| (x) | Assuming redemption at the end of the applicable period. |
8
Table of Contents
Performance Summary – continued
MFS North Carolina Municipal Bond Fund
Growth of a Hypothetical $10,000 Investment
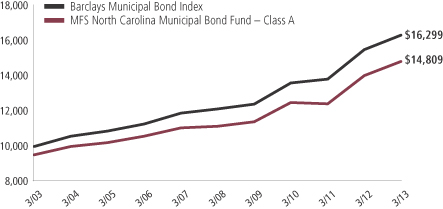
Total Returns through 3/31/13
Average annual without sales charge
| Share class | Class inception date | 1-yr | 5-yr | 10-yr | ||||||||
| A | 10/31/84 | 5.59% | 5.84% | 4.51% | ||||||||
| B | 9/07/93 | 4.81% | 5.09% | 3.80% | ||||||||
| C | 1/03/94 | 4.72% | 5.07% | 3.79% | ||||||||
| Comparative benchmark | ||||||||||||
| Barclays Municipal Bond Index (f) | 5.25% | 6.10% | 5.01% | |||||||||
| Average annual with sales charge | ||||||||||||
A With Initial Sales Charge (4.75%) | 0.58% | 4.81% | 4.00% | |||||||||
B With CDSC (Declining over six years from 4% to 0%) (x) | 0.81% | 4.76% | 3.80% | |||||||||
C With CDSC (1% for 12 months) (x) | 3.72% | 5.07% | 3.79% | |||||||||
CDSC – Contingent Deferred Sales Charge.
| (f) | Source: FactSet Research Systems Inc. |
| (x) | Assuming redemption at the end of the applicable period. |
9
Table of Contents
Performance Summary – continued
MFS Pennsylvania Municipal Bond Fund
Growth of a Hypothetical $10,000 Investment
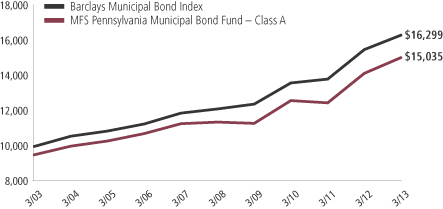
Total Returns through 3/31/13
Average annual without sales charge
| Share Class | Class inception date | 1-yr | 5-yr | 10-yr | ||||||||
| A | 2/01/93 | 6.35% | 5.72% | 4.67% | ||||||||
| B | 9/07/93 | 5.42% | 4.89% | 3.87% | ||||||||
| Comparative benchmark | ||||||||||||
| Barclays Municipal Bond Index (f) | 5.25% | 6.10% | 5.01% | |||||||||
| Average annual with sales charge | ||||||||||||
A With Initial Sales Charge (4.75%) | 1.30% | 4.70% | 4.16% | |||||||||
B With CDSC (Declining over six years from 4% to 0%) (x) | 1.42% | 4.55% | 3.87% | |||||||||
CDSC – Contingent Deferred Sales Charge.
| (f) | Source: FactSet Research Systems Inc. |
| (x) | Assuming redemption at the end of the applicable period. |
10
Table of Contents
Performance Summary – continued
MFS South Carolina Municipal Bond Fund
Growth of a Hypothetical $10,000 Investment
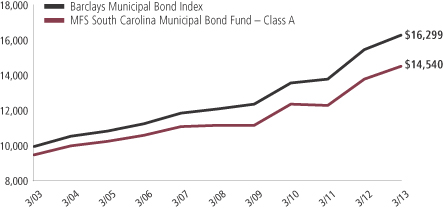
Total Returns through 3/31/13
Average annual without sales charge
| Share Class | Class inception date | 1-yr | 5-yr | 10-yr | ||||||||
| A | 10/31/84 | 5.24% | 5.37% | 4.32% | ||||||||
| B | 9/07/93 | 4.55% | 4.62% | 3.61% | ||||||||
| Comparative benchmark | ||||||||||||
| Barclays Municipal Bond Index (f) | 5.25% | 6.10% | 5.01% | |||||||||
| Average annual with sales charge | ||||||||||||
A With Initial Sales Charge (4.75%) | 0.24% | 4.35% | 3.81% | |||||||||
B With CDSC (Declining over six years from 4% to 0%) (x) | 0.55% | 4.28% | 3.61% | |||||||||
| CDSC | – Contingent Deferred Sales Charge. |
| (f) | Source: FactSet Research Systems Inc. |
| (x) | Assuming redemption at the end of the applicable period. |
11
Table of Contents
Performance Summary – continued
MFS Tennessee Municipal Bond Fund
Growth of a Hypothetical $10,000 Investment
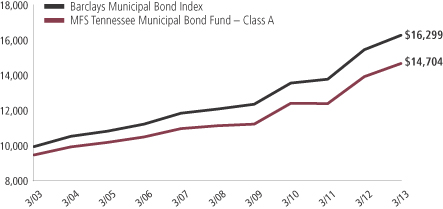
Total Returns through 3/31/13
Average annual without sales charge
| Share Class | Class inception date | 1-yr | 5-yr | 10-yr | ||||||||
| A | 8/12/88 | 5.33% | 5.64% | 4.44% | ||||||||
| B | 9/07/93 | 4.55% | 4.88% | 3.72% | ||||||||
| Comparative benchmark | ||||||||||||
| Barclays Municipal Bond Index (f) | 5.25% | 6.10% | 5.01% | |||||||||
| Average annual with sales charge | ||||||||||||
A With Initial Sales Charge (4.75%) | 0.32% | 4.62% | 3.93% | |||||||||
B With CDSC (Declining over six years from 4% to 0%) (x) | 0.55% | 4.55% | 3.72% | |||||||||
CDSC – Contingent Deferred Sales Charge.
| (f) | Source: FactSet Research Systems Inc. |
| (x) | Assuming redemption at the end of the applicable period. |
12
Table of Contents
Performance Summary – continued
MFS Virginia Municipal Bond Fund
Growth of a Hypothetical $10,000 Investment
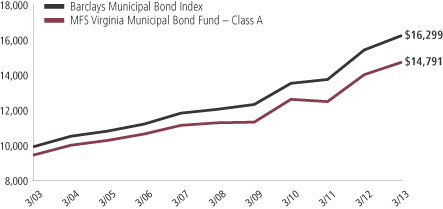
Total Returns through 3/31/13
Average annual without sales charge
| Share Class | Class inception date | 1-yr | 5-yr | 10-yr | ||||||||
| A | 10/31/84 | 4.99% | 5.44% | 4.50% | ||||||||
| B | 9/07/93 | 4.21% | 4.68% | 3.78% | ||||||||
| C | 1/03/94 | 4.12% | 4.67% | 3.77% | ||||||||
| Comparative benchmark | ||||||||||||
| Barclays Municipal Bond Index (f) | 5.25% | 6.10% | 5.01% | |||||||||
| Average annual with sales charge | ||||||||||||
A With Initial Sales Charge (4.75%) | 0.00% | 4.42% | 3.99% | |||||||||
B With CDSC (Declining over six years from 4% to 0%) (x) | 0.21% | 4.34% | 3.78% | |||||||||
C With CDSC (1% for 12 months) (x) | 3.12% | 4.67% | 3.77% | |||||||||
CDSC – Contingent Deferred Sales Charge.
| (f) | Source: FactSet Research Systems Inc. |
| (x) | Assuming redemption at the end of the applicable period. |
13
Table of Contents
Performance Summary – continued
MFS West Virginia Municipal Bond Fund
Growth of a Hypothetical $10,000 Investment
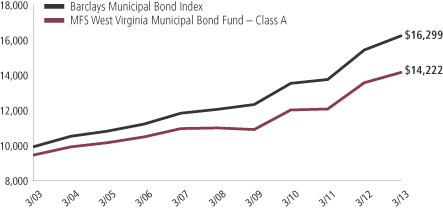
Total Returns through 3/31/13
Average annual without sales charge
| Share Class | Class inception date | 1-yr | 5-yr | 10-yr | ||||||||
| A | 10/31/84 | 4.32% | 5.15% | 4.09% | ||||||||
| B | 9/07/93 | 3.46% | 4.37% | 3.38% | ||||||||
| Comparative benchmark | ||||||||||||
| Barclays Municipal Bond Index (f) | 5.25% | 6.10% | 5.01% | |||||||||
| Average annual with sales charge | ||||||||||||
A With Initial Sales Charge (4.75%) | (0.64)% | 4.13% | 3.59% | |||||||||
B With CDSC (Declining over six years from 4% to 0%) (x) | (0.54)% | 4.03% | 3.38% | |||||||||
CDSC – Contingent Deferred Sales Charge.
| (f) | Source: FactSet Research Systems Inc. |
| (x) | Assuming redemption at the end of the applicable period. |
Benchmark Definition
Barclays Municipal Bond Index – a market capitalization-weighted index that measures the performance of the tax-exempt bond market.
It is not possible to invest directly in an index.
Notes to Performance Summary
Average annual total return represents the average annual change in value for each share class for the periods presented.
Performance results reflect any applicable expense subsidies and waivers in effect during the periods shown. Without such subsidies and waivers each fund’s performance results would be less favorable. Please see the prospectus and financial statements for complete details.
Performance results do not include adjustments made for financial reporting purposes in accordance with U.S. generally accepted accounting principles and may differ from amounts reported in the financial highlights.
A portion of income may be subject to state, federal, and/or alternative minimum tax. Capital gains, if any, are subject to a capital gains tax.
From time to time the funds may receive proceeds from litigation settlements, without which performance would be lower.
14
Table of Contents
Fund expenses borne by the shareholders during the period, October 1, 2012 through March 31, 2013
As a shareholder of the funds, you incur two types of costs: (1) transaction costs, including sales charges (loads) on certain purchase or redemption payments, and (2) ongoing costs, including management fees; distribution and service (12b-1) fees; and other fund expenses. These examples are intended to help you understand your ongoing costs (in dollars) of investing in the funds and to compare these costs with the ongoing costs of investing in other mutual funds.
These examples are based on an investment of $1,000 invested at the beginning of the period and held for the entire period October 1, 2012 through March 31, 2013.
Actual expenses
The first line for each share class in the following tables provides information about actual account values and actual expenses. You may use the information in this line, together with the amount you invested, to estimate the expenses that you paid over the period. Simply divide your account value by $1,000 (for example, an $8,600 account value divided by $1,000 = 8.6), then multiply the result by the number in the first line under the heading entitled “Expenses Paid During Period” to estimate the expenses you paid on your account during this period.
Hypothetical example for comparison purposes
The second line for each share class in the following tables provides information about hypothetical account values and hypothetical expenses based on each fund’s actual expense ratio and an assumed rate of return of 5% per year before expenses, which is not each fund’s actual return. The hypothetical account values and expenses may not be used to estimate the actual ending account balance or expenses you paid for the period. You may use this information to compare the ongoing costs of investing in each fund and other funds. To do so, compare this 5% hypothetical example with the 5% hypothetical examples that appear in the shareholder reports of the other funds.
Please note that the expenses shown in the tables are meant to highlight your ongoing costs only and do not reflect any transactional costs, such as sales charges (loads). Therefore, the second line for each share class in the tables is useful in comparing ongoing costs only, and will not help you determine the relative total costs of owning different funds. In addition, if these transactional costs were included, your costs would have been higher.
MFS MISSISSIPPI MUNICIPAL BOND FUND
Share Class | Annualized Ratio | Beginning Account Value 10/01/12 | Ending Account Value 3/31/13 | Expenses Paid During Period (p) 10/01/12-3/31/13 | ||||||||||||||
| A | Actual | 0.75% | $1,000.00 | $1,007.14 | $3.75 | |||||||||||||
| Hypothetical (h) | 0.75% | $1,000.00 | $1,021.19 | $3.78 | ||||||||||||||
| B | Actual | 1.50% | $1,000.00 | $1,003.36 | $7.49 | |||||||||||||
| Hypothetical (h) | 1.50% | $1,000.00 | $1,017.45 | $7.54 | ||||||||||||||
MFS NEW YORK MUNICIPAL BOND FUND
Share Class | Annualized Expense Ratio | Beginning Account Value 10/01/12 | Ending Account Value 3/31/13 | Expenses Paid During Period (p) | ||||||||||||||
| A | Actual | 0.86% | $1,000.00 | $1,010.28 | $4.31 | |||||||||||||
| Hypothetical (h) | 0.86% | $1,000.00 | $1,020.64 | $4.33 | ||||||||||||||
| B | Actual | 1.61% | $1,000.00 | $1,006.52 | $8.05 | |||||||||||||
| Hypothetical (h) | 1.61% | $1,000.00 | $1,016.90 | $8.10 | ||||||||||||||
| C | Actual | 1.61% | $1,000.00 | $1,006.53 | $8.05 | |||||||||||||
| Hypothetical (h) | 1.61% | $1,000.00 | $1,016.90 | $8.10 | ||||||||||||||
| (h) | 5% class return per year before expenses. |
| (p) | Expenses paid are equal to each class’s annualized expense ratio, as shown above, multiplied by the average account value over the period, multiplied by the number of days in the period, divided by the number of days in the year. Expenses paid do not include any applicable sales charges (loads). If these transaction costs had been included, your costs would have been higher. |
15
Table of Contents
Expense Tables – continued
MFS NORTH CAROLINA MUNICIPAL BOND FUND
Share Class | Annualized Expense Ratio | Beginning Account Value 10/01/12 | Ending Account Value 3/31/13 | Expenses Paid During Period (p) | ||||||||||||||
| A | Actual | 0.84% | $1,000.00 | $1,005.99 | $4.20 | |||||||||||||
| Hypothetical (h) | 0.84% | $1,000.00 | $1,020.74 | $4.23 | ||||||||||||||
| B | Actual | 1.59% | $1,000.00 | $1,002.28 | $7.94 | |||||||||||||
| Hypothetical (h) | 1.59% | $1,000.00 | $1,017.00 | $8.00 | ||||||||||||||
| C | Actual | 1.59% | $1,000.00 | $1,002.25 | $7.94 | |||||||||||||
| Hypothetical (h) | 1.59% | $1,000.00 | $1,017.00 | $8.00 | ||||||||||||||
MFS PENNSYLVANIA MUNICIPAL BOND FUND
Share Class | Annualized Expense Ratio | Beginning Account Value 10/01/12 | Ending Account Value 3/31/13 | Expenses Paid During Period (p) 10/01/12-3/31/13 | ||||||||||||||
| A | Actual | 0.74% | $1,000.00 | $1,012.67 | $3.71 | |||||||||||||
| Hypothetical (h) | 0.74% | $1,000.00 | $1,021.24 | $3.73 | ||||||||||||||
| B | Actual | 1.52% | $1,000.00 | $1,007.78 | $7.61 | |||||||||||||
| Hypothetical (h) | 1.52% | $1,000.00 | $1,017.35 | $7.64 | ||||||||||||||
MFS SOUTH CAROLINA MUNICIPAL BOND FUND
Share Class | Annualized Ratio | Beginning Account Value 10/01/12 | Ending Account Value 3/31/13 | Expenses Paid During Period (p) 10/01/12-3/31/13 | ||||||||||||||
| A | Actual | 0.87% | $1,000.00 | $1,006.38 | $4.35 | |||||||||||||
| Hypothetical (h) | 0.87% | $1,000.00 | $1,020.59 | $4.38 | ||||||||||||||
| B | Actual | 1.62% | $1,000.00 | $1,002.65 | $8.09 | |||||||||||||
| Hypothetical (h) | 1.62% | $1,000.00 | $1,016.85 | $8.15 | ||||||||||||||
MFS TENNESSEE MUNICIPAL BOND FUND
Share Class | Annualized Ratio | Beginning Account Value 10/01/12 | Ending Account Value 3/31/13 | Expenses Paid During Period (p) 10/01/12-3/31/13 | ||||||||||||||
| A | Actual | 0.89% | $1,000.00 | $1,007.01 | $4.45 | |||||||||||||
| Hypothetical (h) | 0.89% | $1,000.00 | $1,020.49 | $4.48 | ||||||||||||||
| B | Actual | 1.64% | $1,000.00 | $1,003.27 | $8.19 | |||||||||||||
| Hypothetical (h) | 1.64% | $1,000.00 | $1,016.75 | $8.25 | ||||||||||||||
| (h) | 5% class return per year before expenses. |
| (p) | Expenses paid are equal to each class’s annualized expense ratio, as shown above, multiplied by the average account value over the period, multiplied by the number of days in the period, divided by the number of days in the year. Expenses paid do not include any applicable sales charges (loads). If these transaction costs had been included, your costs would have been higher. |
16
Table of Contents
Expense Tables – continued
MFS VIRGINIA MUNICIPAL BOND FUND
Share Class | Annualized Ratio | Beginning Account Value 10/01/12 | Ending Account Value 3/31/13 | Expenses Paid During Period (p) 10/01/12-3/31/13 | ||||||||||||||
| A | Actual | 0.86% | $1,000.00 | $1,006.23 | $4.30 | |||||||||||||
| Hypothetical (h) | 0.86% | $1,000.00 | $1,020.64 | $4.33 | ||||||||||||||
| B | Actual | 1.61% | $1,000.00 | $1,002.50 | $8.04 | |||||||||||||
| Hypothetical (h) | 1.61% | $1,000.00 | $1,016.90 | $8.10 | ||||||||||||||
| C | Actual | 1.61% | $1,000.00 | $1,001.63 | $8.03 | |||||||||||||
| Hypothetical (h) | 1.61% | $1,000.00 | $1,016.90 | $8.10 | ||||||||||||||
Expenses Impacting the Table: Expense ratios include 0.01% of investment related expenses from inverse floaters that are outside of the expense cap arrangement (See Note 3 of the Notes to Financial Statements).
MFS WEST VIRGINIA MUNICIPAL BOND FUND
Share Class | Annualized Ratio | Beginning Account Value 10/01/12 | Ending Account Value 3/31/13 | Expenses Paid During Period (p) 10/01/12-3/31/13 | ||||||||||||||
| A | Actual | 0.89% | $1,000.00 | $1,003.31 | $4.45 | |||||||||||||
| Hypothetical (h) | 0.89% | $1,000.00 | $1,020.49 | $4.48 | ||||||||||||||
| B | Actual | 1.64% | $1,000.00 | $999.59 | $8.18 | |||||||||||||
| Hypothetical (h) | 1.64% | $1,000.00 | $1,016.75 | $8.25 | ||||||||||||||
| (h) | 5% class return per year before expenses. |
| (p) | Expenses paid are equal to each class’s annualized expense ratio, as shown above, multiplied by the average account value over the period, multiplied by the number of days in the period, divided by the number of days in the year. Expenses paid do not include any applicable sales charges (loads). If these transaction costs had been included, your costs would have been higher. |
17
Table of Contents
3/31/13
MFS MISSISSIPPI MUNICIPAL BOND FUND
The Portfolio of Investments is a complete list of all securities owned by your fund. It is categorized by broad-based asset classes.
| Municipal Bonds - 98.3% | ||||||||
| Issuer | Shares/Par | Value ($) | ||||||
| Airport Revenue - 1.4% | ||||||||
| Jackson, MS, Municipal Airport Authority, Airport Rev., “A”, AMBAC, 5%, 2031 | $ | 1,510,000 | $ | 1,598,099 | ||||
| General Obligations - General Purpose - 9.1% | ||||||||
| Canton, MS, Mississippi Development Bank Special Obligation, “A”, AGM, 5.75%, 2031 | $ | 625,000 | $ | 728,063 | ||||
| Commonwealth of Puerto Rico, “A”, 5.25%, 2027 | 455,000 | 454,964 | ||||||
| Commonwealth of Puerto Rico, “A”, 5.375%, 2033 | 220,000 | 219,309 | ||||||
| Commonwealth of Puerto Rico, Public Improvement, FGIC, 5.5%, 2016 | 1,000,000 | 1,067,750 | ||||||
| Commonwealth of Puerto Rico, Public Improvement, “B”, 6.5%, 2037 | 1,250,000 | 1,308,463 | ||||||
| Desoto County, MS, 4%, 2022 | 1,000,000 | 1,180,960 | ||||||
| Jackson County, MS, Development Bank Special Obligations, AGM, 5.25%, 2020 | 620,000 | 752,568 | ||||||
| Jackson County, MS, Development Bank Special Obligations, ASSD GTY, 5.625%, 2039 | 1,000,000 | 1,105,810 | ||||||
| Mississippi Development Bank (Harrison County Coliseum), “A”, 5.25%, 2026 | 1,270,000 | 1,566,177 | ||||||
| Puerto Rico Public Buildings Authority Rev., Guaranteed (Government Facilities), “I”, 5.25%, 2033 | 410,000 | 397,540 | ||||||
| Puerto Rico Public Buildings Authority Rev., Guaranteed, “M”, 6.25%, 2031 | 370,000 | 405,716 | ||||||
| State of California, 5.125%, 2033 | 530,000 | 595,206 | ||||||
| State of California, 6%, 2039 | 700,000 | 837,417 | ||||||
| $ | 10,619,943 | |||||||
| General Obligations - Improvement - 4.4% | ||||||||
| Guam Government, “A”, 6.75%, 2029 | $ | 35,000 | $ | 39,143 | ||||
| Guam Government, “A”, 5.25%, 2037 | 155,000 | 156,254 | ||||||
| Guam Government, “A”, 7%, 2039 | 40,000 | 44,600 | ||||||
| Mississippi Development Bank Special Obligation (Greenville, MS Project), 5%, 2027 | 205,000 | 209,309 | ||||||
| State of Mississippi, “A”, 5%, 2018 | 500,000 | 604,285 | ||||||
| State of Mississippi, “B”, 5%, 2024 | 580,000 | 681,918 | ||||||
| State of Mississippi, Capital Improvement Projects, “A”, 5%, 2030 | 1,000,000 | 1,174,370 | ||||||
| State of Mississippi, Capital Improvement Projects, “A”, 5%, 2036 | 2,000,000 | 2,293,140 | ||||||
| $ | 5,203,019 | |||||||
| General Obligations - Schools - 0.5% | ||||||||
| Jackson, MS, Public School District, Capital Appreciation, “B”, AMBAC, 0%, 2023 | $ | 1,000,000 | $ | 577,400 | ||||
| Healthcare Revenue - Hospitals - 12.5% | ||||||||
| Arizona Health Facilities Authority Rev. (Banner Health), “A”, 4%, 2043 | $ | 385,000 | $ | 374,524 | ||||
| Issuer | Shares/Par | Value ($) | ||||||
| Healthcare Revenue - Hospitals - continued | ||||||||
| Brazoria County, TX, Health Facilities Development Corp., Hospital Rev. (Brazosport Regional Health System), 5.25%, 2032 | $ | 270,000 | $ | 280,600 | ||||
| Gulfport, MS, Hospital Facilities Rev. (Memorial Hospital), NATL, 6.125%, 2015 | 1,425,000 | 1,430,629 | ||||||
| Gulfport, MS, Hospital Facilities Rev. (Memorial Hospital), NATL, 6.2%, 2018 | 1,000,000 | 1,003,980 | ||||||
| Gulfport, MS, Hospital Facilities Rev. (Memorial Hospital), 5.75%, 2031 | 500,000 | 500,570 | ||||||
| Illinois Finance Authority Rev. (Resurrection Health), 6.125%, 2025 | 105,000 | 118,758 | ||||||
| Illinois Finance Authority Rev. (Silver Cross Hospital & Medical Centers), 7%, 2044 | 325,000 | 387,355 | ||||||
| Kentucky Economic Development Finance Authority, Hospital Facilities Rev. (Owensboro Medical Health System), “A”, 6.375%, 2040 | 380,000 | 450,501 | ||||||
| Louisville & Jefferson County, KY, Metropolitan Government Healthcare Systems Rev. (Norton Healthcare, Inc.), 5.25%, 2036 | 320,000 | 338,054 | ||||||
| Martin County, FL, Health Facilities Authority Rev. (Martin Memorial Medical Center), 5.5%, 2042 | 185,000 | 205,191 | ||||||
| Miami-Dade County, FL, Health Facilities Authority Hospital Rev. (Variety Children’s Hospital), “A”, 6%, 2030 | 80,000 | 93,049 | ||||||
| Mississippi Development Bank Special Obligation (Magnolia Regional Health Center Project), “A”, 6.75%, 2036 | 500,000 | 608,255 | ||||||
| Mississippi Hospital Equipment & Facilities Authority Rev. (Baptist Memorial Healthcare), “B-1”, 5%, 2024 | 1,000,000 | 1,032,170 | ||||||
| Mississippi Hospital Equipment & Facilities Authority Rev. (Clay County Medical Corp.), 5%, 2039 | 2,000,000 | 2,157,960 | ||||||
| Mississippi Hospital Equipment & Facilities Authority Rev. (Delta Regional Medical Center), FHA, 5%, 2035 | 1,000,000 | 1,034,030 | ||||||
| Mississippi Hospital Equipment & Facilities Authority Rev. (Forrest County General Hospital), 5.25%, 2029 | 1,000,000 | 1,063,460 | ||||||
| Mississippi Hospital Equipment & Facilities Authority Rev., Refunding & Improvement, Hospital South Central, 5.25%, 2031 | 500,000 | 520,025 | ||||||
| Mississippi Hospital Equipment & Facilities Authority Rev., Refunding & Improvement, Southwest Regional Medical Center, 5.5%, 2019 | 250,000 | 252,855 | ||||||
| Mississippi Hospital Equipment & Facilities Authority Rev., Refunding & Improvement, Southwest Regional Medical Center, 5.75%, 2023 | 250,000 | 252,760 | ||||||
18
Table of Contents
Portfolio of Investments – continued
| Municipal Bonds - continued | ||||||||
| Issuer | Shares/Par | Value ($) | ||||||
| Healthcare Revenue - Hospitals - continued | ||||||||
| New Hampshire Business Finance Authority Rev. (Elliot Hospital Obligated Group), “A”, 6%, 2027 | $ | 215,000 | $ | 249,366 | ||||
| New Hampshire Business Finance Authority Rev. (Elliot Hospital Obligated Group), “A”, 6.125%, 2039 | 550,000 | 618,607 | ||||||
| St. Petersburg, FL, Health Facilities Authority Rev., 6.5%, 2039 | 135,000 | 159,779 | ||||||
| Washington Health Care Facilities Authority Rev. (Central Washington Health Services), 6.75%, 2029 | 75,000 | 88,377 | ||||||
| Washington Health Care Facilities Authority Rev. (Central Washington Health Services), 7%, 2039 | 185,000 | 213,836 | ||||||
| Wisconsin Health & Educational Facilities Authority Rev. (ProHealth Care, Inc. Obligated Group), 6.625%, 2039 | 640,000 | 742,630 | ||||||
| Wisconsin Health & Educational Facilities Authority Rev. (Wheaton Franciscan Healthcare), 5.25%, 2031 | 430,000 | 459,894 | ||||||
| $ | 14,637,215 | |||||||
| Industrial Revenue - Other - 0.3% | ||||||||
| Liberty, NY, Development Corp. Rev. (Goldman Sachs Headquarters), 5.25%, 2035 | $ | 255,000 | $ | 298,233 | ||||
| Industrial Revenue - Paper - 1.4% | ||||||||
| Lowndes County, MS, Solid Waste Disposal & Pollution Control Rev. (Weyerhaeuser Co.), 6.8%, 2022 | $ | 750,000 | $ | 899,798 | ||||
| Warren County, MS, Environmental Improvement Rev. (International Paper Co.), “A”, 4.4%, 2015 | 750,000 | 787,478 | ||||||
| $ | 1,687,276 | |||||||
| Miscellaneous Revenue - Other - 0.5% | ||||||||
| Citizens Property Insurance Corp., FL, “A-1”, 5%, 2020 | $ | 500,000 | $ | 594,460 | ||||
| Multi-Family Housing Revenue - 1.0% | ||||||||
| Mississippi Home Corp. Rev. (Kirkwood Apartments Project), 6.8%, 2037 (d)(q) | $ | 150,000 | $ | 97,164 | ||||
| Mississippi Home Corp., Multifamily Rev. (Providence Place of Senatobia LLC), GNMA, 5.35%, 2048 | 1,000,000 | 1,014,300 | ||||||
| $ | 1,111,464 | |||||||
| Sales & Excise Tax Revenue - 2.3% | ||||||||
| Colorado Regional Transportation District, Private Activity Rev. (Denver Transportation Partners), 6%, 2041 | $ | 450,000 | $ | 515,831 | ||||
| Guam Government Business Privilege Tax Rev., “A”, 5.25%, 2036 | 295,000 | 328,878 | ||||||
| Massachusetts Bay Transportation Authority, Sales Tax Rev., “A-1”, 5.25%, 2029 | 750,000 | 962,325 | ||||||
| Puerto Rico Sales Tax Financing Corp., Sales Tax Rev., 5.25%, 2057 | 720,000 | 743,832 | ||||||
| Issuer | Shares/Par | Value ($) | ||||||
| Sales & Excise Tax Revenue - continued | ||||||||
| Puerto Rico Sales Tax Financing Corp., Sales Tax Rev., Capital Appreciation, “A”, 0%, 2033 | $ | 620,000 | $ | 194,308 | ||||
| $ | 2,745,174 | |||||||
| Single Family Housing - State - 3.9% | ||||||||
| Mississippi Home Corp. Rev., Single Family Mortgage Rev., “A-2”, GNMA, 5.3%, 2034 | $ | 180,000 | $ | 192,398 | ||||
| Mississippi Home Corp. Rev., Single Family Rev., “A-2”, GNMA, 5.625%, 2039 | 190,000 | 198,265 | ||||||
| Mississippi Home Corp. Rev., Single Family Rev., “A-2”, GNMA, 5.3%, 2023 | 345,000 | 346,170 | ||||||
| Mississippi Home Corp. Rev., Single Family Rev., “B”, GNMA, 5.3%, 2035 | 300,000 | 301,740 | ||||||
| Mississippi Home Corp. Rev., Single Family Rev., “B-2”, GNMA, 6.375%, 2032 | 120,000 | 126,734 | ||||||
| Mississippi Home Corp. Rev., Single Family Rev., “B-2”, GNMA, 6.45%, 2033 | 140,000 | 147,181 | ||||||
| Mississippi Home Corp. Rev., Single Family Rev., “C”, GNMA, 4.95%, 2025 | 300,000 | 302,139 | ||||||
| Mississippi Home Corp., Homeownership Mortgage Rev., “A”, 4.55%, 2031 | 1,770,000 | 1,870,660 | ||||||
| Mississippi Home Corp., Single Family Rev., “A-2”, GNMA, 6.5%, 2032 | 65,000 | 68,485 | ||||||
| Mississippi Housing Finance Corp., Single Family Mortgage Rev., Capital Appreciation, ETM, 0%, 2015 (c) | 1,000,000 | 989,480 | ||||||
| $ | 4,543,252 | |||||||
| State & Agency - Other - 0.9% | ||||||||
| Mississippi Development Bank Special Obligations, Harrison County Mississippi Highway Construction, “N”, FGIC, 5%, 2026 | $ | 1,000,000 | $ | 1,084,170 | ||||
| State & Local Agencies - 19.3% | ||||||||
| Los Angeles, CA, Municipal Improvement Corp. Lease Rev. (Real Property), “E”, 6%, 2039 | $ | 190,000 | $ | 225,940 | ||||
| Mississippi Development Bank (Harrison County Coliseum), “A”, 5.25%, 2034 | 1,000,000 | 1,255,810 | ||||||
| Mississippi Development Bank Special Obligation (Capital Project & Equipment Prepayment), AGM, 5%, 2028 | 1,320,000 | 1,455,419 | ||||||
| Mississippi Development Bank Special Obligation (Department of Corrections), “C”, 5.25%, 2027 | 1,000,000 | 1,150,530 | ||||||
| Mississippi Development Bank Special Obligation (Department of Rehabilitation Services Capital Improvement Project), AGM, 5%, 2023 | 345,000 | 410,019 | ||||||
| Mississippi Development Bank Special Obligation (Department of Rehabilitation Services Capital Improvement Project), AGM, 5%, 2024 | 360,000 | 424,901 | ||||||
| Mississippi Development Bank Special Obligation (Department of Rehabilitation Services Capital Improvement Project), AGM, 5%, 2025 | 380,000 | 445,117 | ||||||
19
Table of Contents
Portfolio of Investments – continued
| Municipal Bonds - continued | ||||||||
| Issuer | Shares/Par | Value ($) | ||||||
| State & Local Agencies - continued | ||||||||
| Mississippi Development Bank Special Obligation (Forrest County Public Improvement Project), 5%, 2029 | $ | 1,000,000 | $ | 1,091,110 | ||||
| Mississippi Development Bank Special Obligation (Harrison County), “D”, ASSD GTY, 4.75%, 2028 | 1,120,000 | 1,255,934 | ||||||
| Mississippi Development Bank Special Obligation (Jackson County), ASSD GTY, 5%, 2022 | 500,000 | 570,970 | ||||||
| Mississippi Development Bank Special Obligation (Jackson County), ASSD GTY, 5.375%, 2036 | 500,000 | 551,910 | ||||||
| Mississippi Development Bank Special Obligation (Jackson Public School District), AGM, 5.375%, 2028 | 1,000,000 | 1,116,280 | ||||||
| Mississippi Development Bank Special Obligation (Marshall County Industrial Development Authority Mississippi Highway Construction Project), 5%, 2028 | 750,000 | 872,738 | ||||||
| Mississippi Development Bank Special Obligation (Mississippi Highway Construction), AMBAC, 4.75%, 2035 | 1,000,000 | 1,078,190 | ||||||
| Mississippi Development Bank Special Obligation (Mississippi Highway), 5%, 2025 | 1,000,000 | 1,244,960 | ||||||
| Mississippi Development Bank Special Obligation (Montfort Jones Memorial Hospital Project), 5.75%, 2036 | 500,000 | 550,450 | ||||||
| Mississippi Development Bank Special Obligation (Southaven Water & Sewer System), ASSD GTY, 5%, 2029 | 750,000 | 843,645 | ||||||
| Mississippi Development Bank Special Obligation (Washington County Regional Correctional Facility), ASSD GTY, 4.75%, 2031 | 1,200,000 | 1,324,224 | ||||||
| Mississippi Development Bank Special Obligations (City of Jackson, MS), 4.375%, 2031 | 1,400,000 | 1,556,156 | ||||||
| Mississippi Development Bank Special Obligations (DeSoto County Regional Utility Authority), 5.25%, 2031 | 905,000 | 995,129 | ||||||
| Mississippi Development Bank Special Obligations (Mississippi, Ltd. Tax Hospital Rev.), 5.1%, 2020 | 1,000,000 | 1,010,960 | ||||||
| Mississippi Development Bank Special Obligations (Natchez Mississippi Convention Center), AMBAC, 6%, 2013 (c) | 750,000 | 767,528 | ||||||
| Mississippi Development Bank Special Obligations (Tunica County Building Project), AMBAC, 5%, 2026 | 1,695,000 | 1,780,225 | ||||||
| Mississippi Development Bank Special Obligations, Madison County (Highway Construction), FGIC, 5%, 2027 | 500,000 | 555,540 | ||||||
| $ | 22,533,685 | |||||||
| Tax - Other - 2.5% | ||||||||
| D’Iberville, MS, Tax Increment Ltd. Rev. (Gulf Coast Promenade Project), 5%, 2033 | $ | 1,000,000 | $ | 1,065,580 | ||||
| Issuer | Shares/Par | Value ($) | ||||||
| Tax - Other - continued | ||||||||
| Guam Government Ltd. Obligation Rev., “A”, 5.375%, 2024 | $ | 125,000 | $ | 136,560 | ||||
| Guam Government Ltd. Obligation Rev., “A”, 5.625%, 2029 | 40,000 | 43,644 | ||||||
| Virgin Islands Public Finance Authority Rev. (Diageo Project), “A”, 6.75%, 2037 | 110,000 | 126,136 | ||||||
| Virgin Islands Public Finance Authority Rev., “A”, 5.25%, 2024 | 135,000 | 142,146 | ||||||
| Virgin Islands Public Finance Authority Rev., “A-1”, 5%, 2029 | 790,000 | 858,303 | ||||||
| Virgin Islands Public Finance Authority Rev., “A-1”, 5%, 2039 | 95,000 | 99,610 | ||||||
| Virgin Islands Public Finance Authority Rev., “B”, 5%, 2025 | 85,000 | 93,803 | ||||||
| Virgin Islands Public Finance Authority Rev., Matching Fund Loan Note, “A”, 6%, 2039 | 295,000 | 325,966 | ||||||
| $ | 2,891,748 | |||||||
| Tobacco - 1.5% | ||||||||
| Buckeye, OH, Tobacco Settlement Financing Authority, “A-2”, 5.125%, 2024 | $ | 150,000 | $ | 137,589 | ||||
| Illinois Railsplitter Tobacco Settlement Authority, 5.5%, 2023 | 545,000 | 658,742 | ||||||
| Illinois Railsplitter Tobacco Settlement Authority, 6%, 2028 | 420,000 | 508,897 | ||||||
| New Jersey Tobacco Settlement Financing Corp., “1-A”, 5%, 2041 | 530,000 | 477,557 | ||||||
| $ | 1,782,785 | |||||||
| Toll Roads - 0.8% | ||||||||
| Triborough Bridge & Tunnel Authority Rev., NY, Capital Appreciation,“A”, 0%, 2029 | $ | 475,000 | $ | 252,054 | ||||
| Virginia Small Business Financing Authority Rev. (Elizabeth River Crossings Opco LLC Project), 5.25%, 2032 | 110,000 | 117,635 | ||||||
| Virginia Small Business Financing Authority Rev. (Elizabeth River Crossings Opco LLC Project), 6%, 2037 | 195,000 | 222,772 | ||||||
| Virginia Small Business Financing Authority Rev. (Elizabeth River Crossings Opco LLC Project), 5.5%, 2042 | 310,000 | 332,968 | ||||||
| $ | 925,429 | |||||||
| Transportation - Special Tax - 2.4% | ||||||||
| Commonwealth of Puerto Rico Highway & Transportation Authority Rev., AGM, 5.25%, 2033 | $ | 1,135,000 | $ | 1,194,542 | ||||
| Metropolitan Transportation Authority Rev., NY, Capital Appreciation, “A”, 0%, 2030 | 800,000 | 421,552 | ||||||
| Mississippi Development Bank Special Obligations, Madison County (Road & Bridge), AMBAC, 5.1%, 2013 (c) | 1,175,000 | 1,183,860 | ||||||
| $ | 2,799,954 | |||||||
20
Table of Contents
Portfolio of Investments – continued
| Municipal Bonds - continued | ||||||||
| Issuer | Shares/Par | Value ($) | ||||||
| Universities - Colleges - 16.9% | ||||||||
| Alcorn State University, MS, Educational Building Corp. Rev. (Student Housing Project), “A”, 5.125%, 2034 | $ | 1,000,000 | $ | 1,106,480 | ||||
| Alcorn State University, MS, Educational Building Corp. Rev. (Student Housing Project), “A”, 5.25%, 2039 | 920,000 | 1,015,606 | ||||||
| Florida Higher Educational Facilities, Financial Authority Rev. (University of Tampa Project), “A”, 5%, 2032 | 15,000 | 16,313 | ||||||
| Florida Higher Educational Facilities, Financial Authority Rev. (University of Tampa Project), “A”, 5.25%, 2042 | 135,000 | 148,071 | ||||||
| Jackson State University, Educational Building Corp. Rev. (Campus Facilities), “A”, FGIC, 5%, 2014 (c) | 3,100,000 | 3,232,742 | ||||||
| Jackson State University, Educational Building Corp. Rev., “A-1”, 5%, 2034 | 1,500,000 | 1,670,115 | ||||||
| Massachusetts Health & Educational Facilities Authority Rev. (Massachusetts Institute of Technology), “I-1”, 5.2%, 2028 | 920,000 | 1,226,066 | ||||||
| Massachusetts State College, Building Authority Project Rev., “A”, 5%, 2036 | 360,000 | 412,218 | ||||||
| Medical Center, Educational Building Corp. Rev. (University of Mississippi Medical Center), “A”, 5%, 2041 | 1,000,000 | 1,111,680 | ||||||
| Medical Center, Educational Building Corp. Rev. (University of Mississippi Medical Center), “B”, AMBAC, 5.5%, 2023 | 1,000,000 | 1,190,370 | ||||||
| Mississippi Business Finance Corp., Rev. (Statesman Housing LLC Project), “A”, 4.75%, 2039 | 1,500,000 | 1,564,980 | ||||||
| Mississippi Valley State University, Educational Building Corp. Rev., AMBAC, 4.5%, 2037 | 2,000,000 | 2,110,640 | ||||||
| University of Mississippi, Educational Building Corp. Rev. (Residential College Project), “A”, 5%, 2033 | 1,500,000 | 1,726,305 | ||||||
| University of Mississippi, Educational Building Corp. Rev. (Residential College Project), “C”, 4.75%, 2034 | 715,000 | 774,953 | ||||||
| University of Southern Mississippi, COP (Package Facilities Project), ASSD GTY, 5.125%, 2039 | 500,000 | 539,350 | ||||||
| University of Southern Mississippi, Educational Building Corp. Rev. (Athletics Facilities Improvement Project), AGM, 5%, 2034 | 750,000 | 836,625 | ||||||
| University of Southern Mississippi, Educational Building Corp. Rev., “B”, AGM, 5%, 2032 | 1,000,000 | 1,108,080 | ||||||
| $ | 19,790,594 | |||||||
| Universities - Dormitories - 1.0% | ||||||||
| Mississippi State University, Educational Building Corp., 5%, 2036 | $ | 1,000,000 | $ | 1,115,920 | ||||
| Oregon Facilities Authority, Student Housing Rev. (Southern Oregon University), ASSD GTY, 5%, 2044 | 40,000 | 43,547 | ||||||
| $ | 1,159,467 | |||||||
| Issuer | Shares/Par | Value ($) | ||||||
| Utilities - Investor Owned - 1.0% | ||||||||
| Farmington, NM, Pollution Control Rev. (Arizona Public Service Co.), “A”, 4.7%, 2024 | $ | 410,000 | $ | 460,172 | ||||
| Michigan Strategic Fund Ltd. Obligation Rev. (Detroit Edison Co.), 5.625%, 2020 | 370,000 | 454,700 | ||||||
| Michigan Strategic Fund Ltd. Obligation Rev. (Detroit Edison Co.), 5.5%, 2029 (b) | 265,000 | 302,339 | ||||||
| $ | 1,217,211 | |||||||
| Utilities - Municipal Owned - 3.7% | ||||||||
| Guam Power Authority Rev., “A”, AGM, 5%, 2025 | $ | 65,000 | $ | 74,687 | ||||
| Guam Power Authority Rev., “A”, AGM, 5%, 2026 | 55,000 | 62,857 | ||||||
| Guam Power Authority Rev., “A”, AGM, 5%, 2027 | 20,000 | 22,752 | ||||||
| Guam Power Authority Rev., “A”, 5%, 2034 | 65,000 | 70,093 | ||||||
| Long Island, NY, Power Authority, Electric Systems Rev., “A”, 6%, 2033 | 155,000 | 184,927 | ||||||
| Mississippi Business Finance Corp., Gulf Opportunity Zone Rev., “A”, 5%, 2037 | 1,000,000 | 1,075,220 | ||||||
| Mississippi Development Bank Special Obligation (Columbus Electric Systems Project), ASSD GTY, 4.7%, 2027 | 155,000 | 174,119 | ||||||
| Mississippi Development Bank Special Obligation (Columbus Electric Systems Project), ASSD GTY, 4.75%, 2028 | 100,000 | 112,009 | ||||||
| Mississippi Development Bank Special Obligation (Columbus Electric Systems Project), ASSD GTY, 4.85%, 2029 | 485,000 | 544,238 | ||||||
| Mississippi Development Bank Special Obligation (Municipal Energy Agency Power Supply Project), “A”, SYNCORA, 5%, 2026 | 1,000,000 | 1,052,470 | ||||||
| Puerto Rico Electric Power Authority Rev., “WW”, 5.25%, 2025 | 1,000,000 | 1,010,410 | ||||||
| $ | 4,383,782 | |||||||
| Utilities - Other - 1.4% | ||||||||
| Nebraska Central Plains Energy Project, Gas Project Rev., “3”, 5%, 2032 | $ | 505,000 | $ | 561,424 | ||||
| Salt Verde Financial Corp., AZ, Senior Gas Rev., 5%, 2037 | 255,000 | 284,453 | ||||||
| Tennessee Energy Acquisition Corp., Gas Rev., “A”, 5.25%, 2019 | 375,000 | 434,048 | ||||||
| Tennessee Energy Acquisition Corp., Gas Rev., “A”, 5.25%, 2021 | 185,000 | 214,989 | ||||||
| Tennessee Energy Acquisition Corp., Gas Rev., “A”, 5.25%, 2022 | 95,000 | 110,464 | ||||||
| $ | 1,605,378 | |||||||
| Water & Sewer Utility Revenue - 9.6% | ||||||||
| Commonwealth of Puerto Rico Aqueduct & Sewer Authority Rev., “A”, 6%, 2044 | $ | 2,000,000 | $ | 2,009,580 | ||||
| DeKalb County, GA, Water & Sewer Rev., “A”, 5.25%, 2041 | 460,000 | 520,154 | ||||||
| Grenada, MS, Development Bank Special Obligations (Water & Sewer Systems Project), “N”, AGM, 5%, 2030 | 1,000,000 | 1,048,540 | ||||||
21
Table of Contents
Portfolio of Investments – continued
| Municipal Bonds - continued | ||||||||
| Issuer | Shares/Par | Value ($) | ||||||
| Water & Sewer Utility Revenue - continued | ||||||||
| Guam Government Waterworks Authority, Water & Wastewater System Rev., 5.625%, 2040 | $ | 285,000 | $ | 297,979 | ||||
| Mississippi Development Bank Special Obligations (Combined Water Sewer & Solid Waste Management), AGM, 5.25%, 2021 | 1,270,000 | 1,313,777 | ||||||
| Mississippi Development Bank Special Obligations (Combined Water Sewer & Solid Waste Management), AGM, 5.05%, 2027 | 1,610,000 | 1,661,713 | ||||||
| Mississippi Development Bank Special Obligations (Jackson Water & Sewer System Project), AGM, 5%, 2029 | 2,000,000 | 2,132,840 | ||||||
| Mississippi Development Bank Special Obligations (Jackson Water & Sewer System Project), “A”, AGM, 5%, 2023 | 1,220,000 | 1,419,873 | ||||||
| San Francisco, CA, City & County Public Utilities Commission Water Rev., “A”, 5.25%, 2031 | 695,000 | 805,227 | ||||||
| $ | 11,209,683 | |||||||
| Total Municipal Bonds (Identified Cost, $107,352,082) | $ | 114,999,421 | ||||||
| Money Market Funds - 0.3% | ||||||||
| Issuer | Shares/Par | Value ($) | ||||||
| MFS Institutional Money Market Portfolio, 0.14%, at Cost and Net Asset Value (v) | 361,850 | $ | 361,850 | |||||
| Total Investments (Identified Cost, $107,713,932) | $ | 115,361,271 | ||||||
| Other Assets, Less Liabilities - 1.4% | 1,673,261 | |||||||
| Net Assets - 100.0% | $ | 117,034,532 | ||||||
See Portfolio Footnotes and Notes to Financial Statements
22
Table of Contents
PORTFOLIO OF INVESTMENTS
3/31/13
MFS NEW YORK MUNICIPAL BOND FUND
The Portfolio of Investments is a complete list of all securities owned by your fund. It is categorized by broad-based asset classes.
| Municipal Bonds - 96.3% | ||||||||
| Issuer | Shares/Par | Value ($) | ||||||
| Airport Revenue - 1.8% | ||||||||
| Chicago, IL, O’Hare International Airport Rev., Third Lien, “A”, 5.625%, 2035 | $ | 555,000 | $ | 640,875 | ||||
| New York, NY, City Industrial Development Agency, Special Facilities Rev. (Terminal One Group), 5.5%, 2024 | 1,000,000 | 1,076,290 | ||||||
| Port Authority of NY & NJ, Special Obligation Rev. (JFK International Air Terminal LLC), NATL, 6.25%, 2015 | 1,000,000 | 1,093,490 | ||||||
| Port Authority of NY & NJ, Special Obligation Rev. (JFK International Air Terminal LLC), 6%, 2042 | 1,160,000 | 1,355,042 | ||||||
| $ | 4,165,697 | |||||||
| General Obligations - General Purpose - 3.9% | ||||||||
| Commonwealth of Puerto Rico, “A”, 5.375%, 2033 | $ | 495,000 | $ | 493,446 | ||||
| Commonwealth of Puerto Rico, Public Improvement, “B”, 6.5%, 2037 | 1,600,000 | 1,674,832 | ||||||
| New York, NY, “B”, 5%, 2018 | 3,000,000 | 3,584,880 | ||||||
| New York, NY, “E-1”, 6.25%, 2028 | 1,000,000 | 1,228,040 | ||||||
| New York, NY, “J”, FGIC, 5.5%, 2026 | 5,000 | 5,016 | ||||||
| Puerto Rico Public Buildings Authority Rev., Guaranteed, “S”, 6%, 2041 | 855,000 | 867,107 | ||||||
| State of California, 5.125%, 2033 | 990,000 | 1,111,800 | ||||||
| $ | 8,965,121 | |||||||
| General Obligations - Improvement - 0.2% | ||||||||
| Guam Government, “A”, 5.25%, 2037 | $ | 290,000 | $ | 292,346 | ||||
| Guam Government, “A”, 7%, 2039 | 105,000 | 117,074 | ||||||
| $ | 409,420 | |||||||
| General Obligations - Schools - 1.6% | ||||||||
| Beaumont, CA, Unified School District (Election of 2008), Capital Appreciation, “C”, AGM, 0%, 2040 | $ | 3,730,000 | $ | 939,401 | ||||
| Clovis, CA, Unified School District (Election of 2004), Capital Appreciation, “A”, 0%, 2027 | 2,220,000 | 1,249,860 | ||||||
| Port Byron, NY, Central School District, ETM, AMBAC, 7.4%, 2013 (c) | 500,000 | 507,205 | ||||||
| Port Byron, NY, Central School District, ETM, AMBAC, 7.4%, 2014 (c) | 500,000 | 542,805 | ||||||
| Port Byron, NY, Central School District, ETM, AMBAC, 7.4%, 2015 (c) | 500,000 | 577,060 | ||||||
| $ | 3,816,331 | |||||||
| Healthcare Revenue - Hospitals - 11.5% | ||||||||
| Arizona Health Facilities Authority Rev. (Banner Health), “A”, 4%, 2043 | $ | 760,000 | $ | 739,320 | ||||
| Chautauqua County, NY, Capital Resource Corp. Rev. (Women’s Christian Assn.), “A”, 8%, 2030 | 550,000 | 594,116 | ||||||
| Issuer | Shares/Par | Value ($) | ||||||
| Healthcare Revenue - Hospitals - continued | ||||||||
| Genesee County, NY, Industrial Development Agency, Civic Facilities Rev. (United Medical Center Project), 5%, 2032 | $ | 500,000 | $ | 493,805 | ||||
| Illinois Finance Authority Rev. (Little Company of Mary Hospital and Health Care Centers), 5.375%, 2040 | 365,000 | 392,127 | ||||||
| Jefferson Parish, LA, Hospital Service District No. 2 (East Jefferson General Hospital), 6.25%, 2031 | 215,000 | 249,492 | ||||||
| Jefferson Parish, LA, Hospital Service District No. 2 (East Jefferson General Hospital), 6.375%, 2041 | 715,000 | 832,660 | ||||||
| Madison County, NY, Industrial Development Agency, Civic Facilities Rev. (Oneida), 5.25%, 2027 | 1,425,000 | 1,458,587 | ||||||
| Miami-Dade County, FL, Health Facilities Authority Hospital Rev. (Variety Children’s Hospital), “A”, 6%, 2030 | 165,000 | 191,913 | ||||||
| Michigan Hospital Finance Authority Rev. (Henry Ford Health System), 5.625%, 2029 | 145,000 | 164,610 | ||||||
| Monroe County, NY, Industrial Development Agency, Civic Facilities Rev. (Highland Hospital of Rochester), 5%, 2025 | 995,000 | 1,059,486 | ||||||
| Monroe County, NY, Industrial Development Agency, Civic Facilities Rev. (Rochester General Hospital Project), “A”, 5%, 2042 | 1,000,000 | 1,089,470 | ||||||
| Nassau County, NY, Local Economic Assistance Corp. Rev. (South Nassau Communities Hospital), 5%, 2037 | 1,000,000 | 1,067,820 | ||||||
| Nassau County, NY, Local Economic Assistance Corp. Rev. (Winthrop-University Hospital Association Project), 5%, 2037 | 1,500,000 | 1,614,870 | ||||||
| New Hampshire Business Finance Authority Rev. (Huggins Hospital), 6.875%, 2039 | 35,000 | 38,560 | ||||||
| New York Dormitory Authority Rev., Non-State Supported Debt (Bronx-Lebanon Hospital Center), LOC, 6.25%, 2035 | 1,495,000 | 1,717,247 | ||||||
| New York Dormitory Authority Rev., Non-State Supported Debt (Catholic Health Systems), “A”, 4.75%, 2039 | 325,000 | 342,378 | ||||||
| New York Dormitory Authority Rev., Non-State Supported Debt (Catholic Health Systems), “B”, 5%, 2032 | 385,000 | 417,271 | ||||||
| New York Dormitory Authority Rev., Non-State Supported Debt (Catholic Health Systems), “B”, 4.75%, 2039 | 300,000 | 316,041 | ||||||
| New York Dormitory Authority Rev., Non-State Supported Debt (Hospital Special Surgery), FHA, 6.25%, 2034 | 2,000,000 | 2,423,100 | ||||||
| New York Dormitory Authority Rev., Non-State Supported Debt (Mount Sinai Hospital), “A”, 5%, 2026 | 2,000,000 | 2,261,400 | ||||||
23
Table of Contents
Portfolio of Investments – continued
| Municipal Bonds - continued | ||||||||
| Issuer | Shares/Par | Value ($) | ||||||
| Healthcare Revenue - Hospitals - continued | ||||||||
| New York Dormitory Authority Rev., Non-State Supported Debt (North Shore Long Island Jewish Obligated Group), “B”, 5%, 2039 | $ | 1,000,000 | $ | 1,121,550 | ||||
| New York Dormitory Authority Rev., Non-State Supported Debt (NYU Hospitals Center), “A”, 5.5%, 2025 | 750,000 | 877,088 | ||||||
| New York Dormitory Authority Rev., Non-State Supported Debt (Orange Regional Medical Center), 6.25%, 2037 | 750,000 | 827,895 | ||||||
| New York, NY, Health & Hospital Corp. Rev., “A”, 5.5%, 2023 | 1,000,000 | 1,154,980 | ||||||
| Onondaga, NY, Civic Development Corp. Rev. (St. Joseph’s Hospital Health Center), 4.5%, 2032 | 500,000 | 487,395 | ||||||
| Suffolk County, NY, Economic Development Corp. Rev. (Catholic Health Services of Long Island), 5%, 2028 | 1,000,000 | 1,108,080 | ||||||
| Washington Health Care Facilities Authority Rev. (Central Washington Health Services), 6.75%, 2029 | 165,000 | 194,429 | ||||||
| Washington Health Care Facilities Authority Rev. (Central Washington Health Services), 7%, 2039 | 395,000 | 456,569 | ||||||
| Westchester County, NY, Health Care Corp. Rev., “B”, 6%, 2030 | 1,000,000 | 1,181,900 | ||||||
| Wisconsin Health & Educational Facilities Authority Rev. (Mercy Alliance), 5%, 2039 | 700,000 | 747,677 | ||||||
| Wisconsin Health & Educational Facilities Authority Rev. (Wheaton Franciscan Healthcare), 5.25%, 2031 | 945,000 | 1,010,696 | ||||||
| $ | 26,632,532 | |||||||
| Healthcare Revenue - Long Term Care - 1.6% | ||||||||
| Nassau County, NY, Industrial Development Agency Continuing Care (Amsterdam at Harborside), 6.7%, 2043 | $ | 550,000 | $ | 366,454 | ||||
| New York Dormitory Authority Rev., Non-State Supported Debt (Miriam Osborn Memorial Home Association), 5%, 2042 | 500,000 | 529,340 | ||||||
| Suffolk County, NY, Economic Development Corp. Rev. (Peconic Landing at Southold, Inc.), 6%, 2040 | 1,000,000 | 1,118,890 | ||||||
| Suffolk County, NY, Industrial Development Agency, Civic Facilities Rev. (Gurwin Jewish Phase II), 6.7%, 2039 | 380,000 | 391,788 | ||||||
| Travis County, TX, Health Facilities Development Corp. Rev. (Westminster Manor Health), 7%, 2030 | 120,000 | 143,329 | ||||||
| Travis County, TX, Health Facilities Development Corp. Rev. (Westminster Manor Health), 7.125%, 2040 | 180,000 | 213,734 | ||||||
| Ulster County, NY, Industrial Development Agency (Woodland Pond), “A”, 6%, 2037 | 500,000 | 336,835 | ||||||
| Westchester County, NY, Local Development Agency, Civic Facilities Rev. (Kendal on Hudson), 5%, 2034 | 500,000 | 537,065 | ||||||
| Issuer | Shares/Par | Value ($) | ||||||
| Healthcare Revenue - Long Term Care - continued | ||||||||
| Wisconsin Health & Educational Facilities Authority Rev. (St. John’s Community, Inc.), “A”, 7.25%, 2029 | $ | 20,000 | $ | 23,403 | ||||
| Wisconsin Health & Educational Facilities Authority Rev. (St. John’s Community, Inc.), “A”, 7.625%, 2039 | 130,000 | 151,650 | ||||||
| $ | 3,812,488 | |||||||
| Human Services - 0.7% | ||||||||
| Nassau County, NY, Industrial Development Agency, Civic Facility Rev. (Special Needs Facility), “B-1”, 6.5%, 2017 | $ | 205,000 | $ | 207,103 | ||||
| New York Dormitory Authority Rev. (Jewish Board of Families & Children), AMBAC, 5%, 2023 | 695,000 | 697,127 | ||||||
| New York Dormitory Authority Rev., Non-State Supported Debt (NYSARC, Inc.), “A”, 6%, 2032 | 705,000 | 800,090 | ||||||
| $ | 1,704,320 | |||||||
| Industrial Revenue - Airlines - 0.2% | ||||||||
| New York, NY, City Industrial Development Agency Special Facility Rev. (American Airlines, Inc. - JFK International Airport Project), 7.75%, 2031 (d) | $ | 100,000 | $ | 113,551 | ||||
| New York, NY, City Industrial Development Agency Special Facility Rev. (American Airlines, Inc. - JFK International Airport Project), FRN, 7.625%, 2025 (d) | 350,000 | 397,505 | ||||||
| $ | 511,056 | |||||||
| Industrial Revenue - Environmental Services - 0.5% | ||||||||
| Niagara County, NY, Industrial Development Agency, Solid Waste Disposal Rev. (Covanta Energy Project), “A”, 5.25%, 2042 | $ | 1,160,000 | $ | 1,194,626 | ||||
| Industrial Revenue - Other - 1.1% | ||||||||
| Liberty, NY, Development Corp. Rev. (Goldman Sachs Headquarters), 5.25%, 2035 | $ | 580,000 | $ | 678,333 | ||||
| New York, NY, City Industrial Development Agency Rev., Liberty Bonds (IAC/InterActiveCorp), 5%, 2035 | 500,000 | 520,830 | ||||||
| Onondaga County, NY, Industrial Development Agency, Sewer Facilities Rev. (Bristol-Meyers Squibb Co.), 5.75%, 2024 | 1,000,000 | 1,281,110 | ||||||
| $ | 2,480,273 | |||||||
| Industrial Revenue - Paper - 0.5% | ||||||||
| Essex County, NY, Industrial Development Agency, Pollution Control Rev. (International Paper Corp.), 6.15%, 2021 | $ | 470,000 | $ | 470,738 | ||||
| Essex County, NY, Industrial Development Agency, Pollution Control Rev. (International Paper Corp.), 6.45%, 2023 | 700,000 | 701,078 | ||||||
| $ | 1,171,816 | |||||||
24
Table of Contents
Portfolio of Investments – continued
| Municipal Bonds - continued | ||||||||
| Issuer | Shares/Par | Value ($) | ||||||
| Miscellaneous Revenue - Entertainment & Tourism - 1.0% | ||||||||
| Brooklyn, NY, Arena Local Development Corp. (Barclays Center Project), 6.25%, 2040 | $ | 1,750,000 | $ | 2,093,088 | ||||
| Louisiana Stadium & Exposition District Rev., “A”, 5%, 2031 | 45,000 | 50,767 | ||||||
| Louisiana Stadium & Exposition District Rev., “A”, 5%, 2036 | 135,000 | 150,576 | ||||||
| $ | 2,294,431 | |||||||
| Miscellaneous Revenue - Other - 4.5% | ||||||||
| New York Liberty Development Corp., Liberty Rev. (One Bryant Park LLC), 6.375%, 2049 | $ | 2,500,000 | $ | 2,967,000 | ||||
| New York Liberty Development Corp., Liberty Rev. (World Trade Center Project), 5%, 2044 | 3,000,000 | 3,297,000 | ||||||
| New York, NY, Industrial Development Agency, Airport Facilities Rev. (Transportation Infrastructure Properties LLC), 5%, 2028 | 3,000,000 | 3,232,170 | ||||||
| New York, NY, Industrial Development Agency, Civic Facilities Rev. (United Jewish Appeal - Federation of Jewish Philanthropies of NY, Inc.), “A”, 5%, 2027 | 1,000,000 | 1,050,740 | ||||||
| $ | 10,546,910 | |||||||
| Multi-Family Housing Revenue - 2.3% | ||||||||
| East Rochester, NY, Housing Authority Rev. (Woodland Village Project), 5.5%, 2033 | $ | 400,000 | $ | 405,676 | ||||
| New York Housing Finance Agency Rev. (Affordable Housing), “D”, 5%, 2040 | 1,520,000 | 1,586,242 | ||||||
| New York Housing Finance Agency Rev., “A”, 5.1%, 2041 | 770,000 | 776,953 | ||||||
| New York Housing Finance Agency Rev., “A”, 5.25%, 2041 | 1,000,000 | 1,047,690 | ||||||
| New York, NY, City Housing Development Corp., 5.5%, 2034 | 15,000 | 15,052 | ||||||
| New York, NY, City Housing Development Corp., “C”, 5%, 2026 | 500,000 | 510,640 | ||||||
| New York, NY, City Housing Development Corp., Multifamily Housing Rev., 4.8%, 2035 | 1,000,000 | 1,045,650 | ||||||
| $ | 5,387,903 | |||||||
| Port Revenue - 1.8% | ||||||||
| Port Authority of NY & NJ (170th Series), 4%, 2034 | $ | 2,000,000 | $ | 2,024,180 | ||||
| Port Authority of NY & NJ (173rd Series), 4%, 2027 | 2,000,000 | 2,167,440 | ||||||
| $ | 4,191,620 | |||||||
| Sales & Excise Tax Revenue - 2.7% | ||||||||
| Colorado Regional Transportation District, Private Activity Rev. (Denver Transportation Partners), 6%, 2034 | $ | 1,000,000 | $ | 1,153,880 | ||||
| Guam Government Business Privilege Tax Rev., “B-1”, 5%, 2037 | 395,000 | 431,498 | ||||||
| Guam Government Business Privilege Tax Rev., “C”, 5%, 2016 | 180,000 | 205,994 | ||||||
| Guam Government Business Privilege Tax Rev., “C”, 5%, 2017 | 200,000 | 234,326 | ||||||
| Guam Government Business Privilege Tax Rev., “C”, 5%, 2018 | 190,000 | 225,690 | ||||||
| Issuer | Shares/Par | Value ($) | ||||||
| Sales & Excise Tax Revenue - continued | ||||||||
| Massachusetts Bay Transportation Authority, Sales Tax Rev., “A”, 5%, 2031 | $ | 1,195,000 | $ | 1,477,319 | ||||
| Puerto Rico Sales Tax Financing Corp., Sales Tax Rev., “A”, 5.5%, 2019 (c) | 10,000 | 12,703 | ||||||
| Puerto Rico Sales Tax Financing Corp., Sales Tax Rev., “A”, 5.5%, 2028 | 1,060,000 | 1,145,595 | ||||||
| Puerto Rico Sales Tax Financing Corp., Sales Tax Rev., “C”, 6%, 2039 | 930,000 | 1,001,164 | ||||||
| Puerto Rico Sales Tax Financing Corp., Sales Tax Rev., Capital Appreciation, “A”, AMBAC, 0%, 2054 | 5,025,000 | 393,357 | ||||||
| $ | 6,281,526 | |||||||
| Single Family Housing - State - 1.9% | ||||||||
| New York Housing Finance Agency Rev., “E”, 3%, 2030 | $ | 1,000,000 | $ | 971,940 | ||||
| New York Housing Finance Agency Rev., “E”, 3.4%, 2037 | 1,000,000 | 964,370 | ||||||
| New York Mortgage Agency Rev., 5.1%, 2024 | 315,000 | 322,245 | ||||||
| New York Mortgage Agency Rev., “130”, 4.65%, 2027 | 1,680,000 | 1,698,480 | ||||||
| New York Mortgage Agency Rev., “130”, 4.75%, 2030 | 500,000 | 504,540 | ||||||
| $ | 4,461,575 | |||||||
| State & Agency - Other - 0.7% | ||||||||
| New York Dormitory Authority (City University), AMBAC, 5.75%, 2018 | $ | 800,000 | $ | 916,456 | ||||
| New York State Dormitory Authority Rev. (State University) , “B”, FGIC, 5.25%, 2019 | 715,000 | 803,553 | ||||||
| $ | 1,720,009 | |||||||
| State & Local Agencies - 10.8% | ||||||||
| Delaware Valley, PA, Regional Finance Authority, “C”, FRN, 0.942%, 2037 | $ | 1,405,000 | $ | 1,024,329 | ||||
| New York City Educational Construction Fund Rev., “A”, 5.75%, 2033 | 1,860,000 | 2,235,832 | ||||||
| New York Dormitory Authority Rev. (School Program), 6.25%, 2020 | 1,545,000 | 1,551,165 | ||||||
| New York Dormitory Authority Rev., City University System, “A”, 5.625%, 2016 | 2,430,000 | 2,695,866 | ||||||
| New York Dormitory Authority Rev., Non-State Supported Debt, 5%, 2032 | 2,000,000 | 2,171,340 | ||||||
| New York Dormitory Authority Rev., State University Educational Facilities, “A”, 5.875%, 2017 | 1,130,000 | 1,313,908 | ||||||
| New York Municipal Bond Bank Agency, Special School Purpose Rev., 5.25%, 2022 | 1,000,000 | 1,008,140 | ||||||
| New York Thruway Authority, Personal Income Tax Rev., “A”, 5%, 2018 | 1,710,000 | 2,039,517 | ||||||
| New York Tobacco Settlement Financing Corp., “A-1”, 5.5%, 2018 | 140,000 | 140,505 | ||||||
| New York Tobacco Settlement Financing Corp., “B”, 5%, 2018 | 2,000,000 | 2,379,220 | ||||||
| New York Urban Development Corp. Rev. (State Facilities), AMBAC, 5.6%, 2015 | 1,920,000 | 2,009,453 | ||||||
25
Table of Contents
Portfolio of Investments – continued
| Municipal Bonds - continued | ||||||||
| Issuer | Shares/Par | Value ($) | ||||||
| State & Local Agencies - continued | ||||||||
| New York Urban Development Corp. Rev., “D”, 5.625%, 2028 | $ | 2,000,000 | $ | 2,264,880 | ||||
| New York Urban Development Corp. Rev., Personal Income Tax, “C”, 5%, 2018 | 3,000,000 | 3,642,810 | ||||||
| United Nations Development Corp., “A”, 5%, 2026 | 500,000 | 558,345 | ||||||
| $ | 25,035,310 | |||||||
| Tax - Other - 11.1% | ||||||||
| Guam Government Ltd. Obligation Rev., “A”, 5.375%, 2024 | $ | 270,000 | $ | 294,970 | ||||
| Guam Government Ltd. Obligation Rev., “A”, 5.625%, 2029 | 90,000 | 98,198 | ||||||
| Hudson Yards, NY, Infrastructure Corp. Rev., “A”, 5.75%, 2047 | 3,000,000 | 3,494,160 | ||||||
| New York Dormitory Authority, State Personal Income Tax Rev., “A”, 5%, 2025 | 2,000,000 | 2,424,400 | ||||||
| New York Dormitory Authority, State Personal Income Tax Rev., “E”, 5%, 2018 | 3,000,000 | 3,570,180 | ||||||
| New York, NY, City Transitional Finance Authority Building Aid Rev., “S-2A”, 5%, 2040 | 2,000,000 | 2,210,980 | ||||||
| New York, NY, City Transitional Finance Authority Building Aid Rev., “S-3”, 5.25%, 2039 | 2,000,000 | 2,295,540 | ||||||
| New York, NY, City Transitional Finance Authority Building Aid Rev., “S-5”, 5%, 2026 | 3,000,000 | 3,437,940 | ||||||
| New York, NY, City Transitional Finance Authority Building Aid Rev., “S-5”, 5%, 2032 | 1,000,000 | 1,121,780 | ||||||
| New York, NY, City Transitional Finance Authority Rev., “D”, 5%, 2027 | 3,000,000 | 3,495,330 | ||||||
| Virgin Islands Public Finance Authority Rev. (Diageo), “A”, 6.625%, 2029 | 605,000 | 693,185 | ||||||
| Virgin Islands Public Finance Authority Rev., “A-1”, 5%, 2039 | 1,250,000 | 1,310,663 | ||||||
| Virgin Islands Public Finance Authority Rev., Matching Fund Loan Note, “A”, 5%, 2029 | 1,080,000 | 1,182,254 | ||||||
| $ | 25,629,580 | |||||||
| Tobacco - 3.5% | ||||||||
| Buckeye, OH, Tobacco Settlement Financing Authority, “A-2”, 5.125%, 2024 | $ | 320,000 | $ | 293,523 | ||||
| Buckeye, OH, Tobacco Settlement Financing Authority, “A-3”, 6.25%, 2037 | 765,000 | 715,336 | ||||||
| Golden State, CA, Tobacco Securitization Corp., Tobacco Settlement Rev., “A-1”, 5.75%, 2047 | 1,370,000 | 1,310,802 | ||||||
| Golden State, CA, Tobacco Securitization Corp., Tobacco Settlement Rev., “A-2”, 5.3%, 2037 | 1,235,000 | 1,131,223 | ||||||
| Illinois Railsplitter Tobacco Settlement Authority, 6%, 2028 | 355,000 | 430,139 | ||||||
| New Jersey Tobacco Settlement Financing Corp., “1-A”, 4.5%, 2023 | 655,000 | 653,376 | ||||||
| New Jersey Tobacco Settlement Financing Corp., “1-A”, 5%, 2041 | 1,040,000 | 937,092 | ||||||
| New York County Tobacco Trust II, 5.625%, 2035 | 800,000 | 799,936 | ||||||
| Suffolk, NY, Tobacco Asset Securitization Corp., Tobacco Settlement, “B”, 5%, 2032 | 750,000 | 801,083 | ||||||
| Issuer | Shares/Par | Value ($) | ||||||
| Tobacco - continued | ||||||||
| Suffolk, NY, Tobacco Asset Securitization Corp., Tobacco Settlement, “B”, 5.25%, 2037 | $ | 500,000 | $ | 534,845 | ||||
| Westchester, NY, Tobacco Asset Securitization Corp., 5.125%, 2045 | 500,000 | 426,040 | ||||||
| $ | 8,033,395 | |||||||
| Toll Roads - 2.1% | ||||||||
| Triborough Bridge & Tunnel Authority Rev., NY, “A”, 5%, 2028 | $ | 1,000,000 | $ | 1,170,390 | ||||
| Triborough Bridge & Tunnel Authority Rev., NY, “A-2”, 5%, 2029 | 2,000,000 | 2,305,740 | ||||||
| Triborough Bridge & Tunnel Authority Rev., NY, Capital Appreciation,“A”, 0%, 2029 | 2,540,000 | 1,347,826 | ||||||
| $ | 4,823,956 | |||||||
| Transportation - Special Tax - 2.4% | ||||||||
| Metropolitan Transportation Authority Rev., NY, “A”, 5%, 2035 | $ | 2,000,000 | $ | 2,161,020 | ||||
| Metropolitan Transportation Authority Rev., NY, “C”, 6.5%, 2028 | 2,000,000 | 2,495,120 | ||||||
| Metropolitan Transportation Authority Rev., NY, Capital Appreciation, “A”, 0%, 2030 | 1,585,000 | 835,200 | ||||||
| Metropolitan Transportation Authority Rev., NY, ETM, AMBAC, 5.75%, 2013 (c) | 65,000 | 65,878 | ||||||
| $ | 5,557,218 | |||||||
| Universities - Colleges - 19.8% | ||||||||
| Albany, NY, Capital Resource Corp. Rev. (The College Saint Rose), “A”, 5.625%, 2031 | $ | 1,000,000 | $ | 1,122,810 | ||||
| Albany, NY, Industrial Development Agency Rev. (Albany Law School), 5%, 2031 | 1,000,000 | 1,058,630 | ||||||
| Hempstead, NY, Industrial Development Agency Civic Rev. (Adelphi University), 5%, 2030 | 1,515,000 | 1,619,702 | ||||||
| Hempstead, NY, Local Development Corp. Rev. (Adelphi University), “B”, 5.25%, 2039 | 500,000 | 535,125 | ||||||
| Hempstead, NY, Local Development Corp. Rev. (Hofstra University Project), 5%, 2028 | 1,000,000 | 1,114,910 | ||||||
| Illinois Finance Authority Rev. (Roosevelt University Project), 6.25%, 2029 | 1,945,000 | 2,205,008 | ||||||
| Madison County, NY, Industrial Development Agency Civic Facilities Rev. (Colgate University), “A”, AMBAC, 5%, 2035 | 1,585,000 | 1,653,234 | ||||||
| Miami-Dade County, FL, Educational Facilities Authority Rev. (University of Miami), “B”, 5.25%, 2029 | 1,325,000 | 1,587,284 | ||||||
| Monroe County, NY, Industrial Development Corp. Rev., “A”, 5%, 2023 | 500,000 | 604,180 | ||||||
| Monroe County, NY, Industrial Development Corp. Rev., “A”, 5%, 2024 | 1,000,000 | 1,185,180 | ||||||
| Nassau County, NY, Industrial Development Agency Rev. (New York Institute of Technology), “A”, 4.75%, 2026 | 1,000,000 | 1,085,060 | ||||||
| New Jersey Educational Facilities Authority Rev. (University of Medicine & Dentistry), “B”, 6%, 2017 | 985,000 | 1,160,448 | ||||||
26
Table of Contents
Portfolio of Investments – continued
| Municipal Bonds - continued | ||||||||
| Issuer | Shares/Par | Value ($) | ||||||
| Universities - Colleges - continued | ||||||||
| New York Dormitory Authority Rev. (New York University), “A”, FGIC, 5%, 2029 | $ | 1,000,000 | $ | 1,046,140 | ||||
| New York Dormitory Authority Rev., Non-State Supported Debt (Brooklyn Law School), 5.75%, 2033 | 600,000 | 671,532 | ||||||
| New York Dormitory Authority Rev., Non-State Supported Debt (Brooklyn Law School), “A”, 5%, 2028 | 1,000,000 | 1,137,870 | ||||||
| New York Dormitory Authority Rev., Non-State Supported Debt (Cornell University), “A”, 5%, 2031 | 2,000,000 | 2,235,660 | ||||||
| New York Dormitory Authority Rev., Non-State Supported Debt (Culinary Institute of America), 5%, 2042 | 250,000 | 265,570 | ||||||
| New York Dormitory Authority Rev., Non-State Supported Debt (Manhattan Marymount), 5.125%, 2039 | 2,000,000 | 2,143,660 | ||||||
| New York Dormitory Authority Rev., Non-State Supported Debt (New York University), “A”, 5.25%, 2048 | 1,955,000 | 2,212,513 | ||||||
| New York Dormitory Authority Rev., Non-State Supported Debt (Pace University), “A”, 5%, 2038 | 500,000 | 539,400 | ||||||
| New York Dormitory Authority Rev., Non-State Supported Debt (Pace University), “A”, 4.25%, 2042 | 1,000,000 | 981,940 | ||||||
| New York Dormitory Authority Rev., Non-State Supported Debt (Rockefeller University), “A”, 5%, 2037 | 1,000,000 | 1,169,180 | ||||||
| New York Dormitory Authority Rev., Non-State Supported Debt (St. John’s University), “A”, 5%, 2027 | 1,000,000 | 1,156,010 | ||||||
| New York Dormitory Authority Rev., Non-State Supported Debt (St. Josephs College), 5.25%, 2035 | 2,000,000 | 2,216,740 | ||||||
| New York Dormitory Authority Rev., Non-State Supported Debt (Teachers College), “A”, 5%, 2031 | 1,750,000 | 1,991,273 | ||||||
| New York Dormitory Authority Rev., Non-State Supported Debt, “A”, 5%, 2020 | 2,000,000 | 2,389,540 | ||||||
| Niagara, NY, Area Development Corp. Rev. (Niagara University), “A”, 5%, 2035 | 500,000 | 552,150 | ||||||
| Onondaga, NY, Civic Development Corp. Rev. (Le Moyne College Project), 5.375%, 2040 | 2,000,000 | 2,185,820 | ||||||
| Puerto Rico Industrial, Tourist, Educational, Medical, & Environmental Control Facilities Financing Authority, Higher Education Rev. (Ana G. Mendez University System Project), 5.125%, 2032 | 80,000 | 78,712 | ||||||
| Puerto Rico Industrial, Tourist, Educational, Medical, & Environmental Control Facilities Financing Authority, Higher Education Rev. (Ana G. Mendez University System Project), 5.375%, 2042 | 135,000 | 135,333 | ||||||
| Issuer | Shares/Par | Value ($) | ||||||
| Universities - Colleges - continued | ||||||||
| Schenectady, NY, New York Dormitory Authority Rev. (Cornell University), “A”, AMBAC, 5%, 2013 (c) | $ | 2,000,000 | $ | 2,023,500 | ||||
| Seneca County, NY, Industrial Development Agency, Civic Facilities Rev. (New York Chiropractic), 5%, 2027 | 500,000 | 533,510 | ||||||
| St. Lawrence County, NY, Industrial Development Agency Rev. (Clarkson University), 5%, 2031 | 2,225,000 | 2,359,056 | ||||||
| Troy, NY, Capital Resource Corp. Rev. (Rensselaer Polytechnic Institute) “A”, 5.125%, 2040 | 1,000,000 | 1,090,240 | ||||||
| Troy, NY, Industrial Development Authority, Civic Facility Rev. (Rensselaer Polytechnical Institute), “E”, 5%, 2031 | 1,000,000 | 1,123,160 | ||||||
| Yonkers, NY, Industrial Development Agency, Civic Facilities Rev. (Sarah Lawrence College Project), “A”, 6%, 2041 | 595,000 | 674,296 | ||||||
| $ | 45,844,376 | |||||||
| Universities - Dormitories - 1.0% | ||||||||
| Buffalo & Erie County, NY, Industrial Land Development Corp. Rev. (Buffalo State College), “A”, 5.375%, 2041 | $ | 2,000,000 | $ | 2,241,760 | ||||
| Universities - Secondary Schools - 0.5% | ||||||||
| Build NYC Resource Corp. Rev. (International Leadership Charter School Project), 6%, 2043 (n) | $ | 500,000 | $ | 500,325 | ||||
| La Vernia, TX, Higher Education Finance Corp. Rev. (Lifeschool of Dallas), “A”, 7.5%, 2041 | 535,000 | 629,139 | ||||||
| $ | 1,129,464 | |||||||
| Utilities - Municipal Owned - 2.6% | ||||||||
| Guam Power Authority Rev., “A”, 5.5%, 2030 | $ | 515,000 | $ | 573,051 | ||||
| Long Island, NY, Power Authority, Electric Systems Rev., “A”, 5%, 2021 | 1,500,000 | 1,799,430 | ||||||
| Long Island, NY, Power Authority, Electric Systems Rev., “A”, 6.25%, 2033 | 1,000,000 | 1,213,760 | ||||||
| Long Island, NY, Power Authority, Electric Systems Rev., “A”, 6%, 2033 | 2,000,000 | 2,386,160 | ||||||
| $ | 5,972,401 | |||||||
| Utilities - Other - 1.3% | ||||||||
| Public Authority for Colorado Energy Natural Gas Purchase Rev., 6.5%, 2038 | $ | 1,085,000 | $ | 1,467,929 | ||||
| Salt Verde Financial Corp., AZ, Senior Gas Rev., 5%, 2037 | 480,000 | 535,440 | ||||||
| Texas Gas Acquisition & Supply Corp III., Gas Supply Rev., 5%, 2027 | 670,000 | 725,630 | ||||||
| Texas Gas Acquisition & Supply Corp III., Gas Supply Rev., 5%, 2031 | 115,000 | 121,978 | ||||||
| Texas Gas Acquisition & Supply Corp III., Gas Supply Rev., 5%, 2032 | 190,000 | 200,446 | ||||||
| $ | 3,051,423 | |||||||
27
Table of Contents
Portfolio of Investments – continued
| Municipal Bonds - continued | ||||||||
| Issuer | Shares/Par | Value ($) | ||||||
| Water & Sewer Utility Revenue - 2.7% | ||||||||
| Commonwealth of Puerto Rico Aqueduct & Sewer Authority Rev., “A”, 5.75%, 2037 | $ | 475,000 | $ | 469,443 | ||||
| Commonwealth of Puerto Rico Aqueduct & Sewer Authority Rev., “A”, 6%, 2038 | 1,240,000 | 1,253,739 | ||||||
| Guam Government Waterworks Authority, Water & Wastewater System Rev., 5.625%, 2040 | 315,000 | 329,345 | ||||||
| New York Environmental Facilities Corp., Clean Water & Drinking Rev., “B”, 5%, 2033 | 2,140,000 | 2,444,137 | ||||||
| New York, NY, Municipal Water & Sewer Finance Authority Rev., 4.75%, 2030 | 1,245,000 | 1,373,770 | ||||||
| New York, NY, Municipal Water & Sewer Finance Authority Rev., ETM, AMBAC, 6.75%, 2014 (c) | 335,000 | 357,083 | ||||||
| $ | 6,227,517 | |||||||
| Total Municipal Bonds (Identified Cost, $205,093,698) | $ | 223,294,054 | ||||||
| Money Market Funds - 2.1% | ||||||||
| Issuer | Shares/Par | Value ($) | ||||||
| MFS Institutional Money Market Portfolio, 0.14%, at Cost and Net Asset Value (v) | 4,835,359 | $ | 4,835,359 | |||||
| Total Investments (Identified Cost, $209,929,057) | $ | 228,129,413 | ||||||
| Other Assets, Less Liabilities - 1.6% | 3,688,382 | |||||||
| Net Assets - 100.0% | $ | 231,817,795 | ||||||
See Portfolio Footnotes and Notes to Financial Statements
28
Table of Contents
PORTFOLIO OF INVESTMENTS
3/31/13
MFS NORTH CAROLINA MUNICIPAL BOND FUND
The Portfolio of Investments is a complete list of all securities owned by your fund. It is categorized by broad-based asset classes.
| Municipal Bonds - 99.3% | ||||||||
| Issuer | Shares/Par | Value ($) | ||||||
| Airport Revenue - 4.0% | ||||||||
| Charlotte, NC, Airport Rev. (Charlotte/Douglas International Airport), AMBAC, 5%, 2023 | $ | 1,430,000 | $ | 1,583,396 | ||||
| Charlotte, NC, Airport Rev., “A”, 4.75%, 2028 | 1,250,000 | 1,376,888 | ||||||
| Charlotte, NC, Airport Rev., “A”, NATL, 5%, 2029 | 2,000,000 | 2,059,560 | ||||||
| Charlotte, NC, Airport Rev., “A”, NATL, 5%, 2034 | 4,485,000 | 4,603,539 | ||||||
| Charlotte, NC, Airport Rev., “A”, 5%, 2036 | 3,000,000 | 3,386,130 | ||||||
| Chicago, IL, O’Hare International Airport Rev., Third Lien, “A”, 5.625%, 2035 | 1,055,000 | 1,218,251 | ||||||
| Denver, CO, City & County Airport Systems Rev., “A”, 5%, 2027 | 260,000 | 293,870 | ||||||
| Denver, CO, City & County Airport Systems Rev., “A”, 5%, 2028 | 255,000 | 286,883 | ||||||
| Denver, CO, City & County Airport Systems Rev., “B”, 5%, 2032 | 505,000 | 572,115 | ||||||
| Raleigh Durham, NC, Airport Authority Rev., “A”, 5%, 2036 | 3,440,000 | 3,840,863 | ||||||
| $ | 19,221,495 | |||||||
| General Obligations - General Purpose - 4.7% | ||||||||
| Charlotte, NC, “C”, 5%, 2014 | $ | 1,000,000 | $ | 1,055,280 | ||||
| Durham County, NC, 5%, 2019 | 3,615,000 | 4,522,835 | ||||||
| Harnett County, NC, Water & Sewer Systems Rev., AMBAC, 5%, 2028 | 700,000 | 733,656 | ||||||
| Mecklenburg County, NC, “A”, 5%, 2018 | 5,100,000 | 6,161,667 | ||||||
| Mecklenburg County, NC, “A”, 5%, 2024 | 2,000,000 | 2,580,320 | ||||||
| Mecklenburg County, NC, “C”, 5.25%, 2025 | 1,415,000 | 1,856,636 | ||||||
| Puerto Rico Public Buildings Authority Rev., Guaranteed, “Q”, 5.625%, 2039 | 1,705,000 | 1,689,825 | ||||||
| Puerto Rico Public Buildings Authority Rev., Guaranteed, “S”, 6%, 2041 | 1,695,000 | 1,719,001 | ||||||
| State of California, 5.25%, 2029 | 1,980,000 | 2,303,809 | ||||||
| $ | 22,623,029 | |||||||
| General Obligations - Improvement - 5.4% | ||||||||
| Guam Government, “A”, 6.75%, 2029 | $ | 240,000 | $ | 268,409 | ||||
| Guam Government, “A”, 7%, 2039 | 265,000 | 295,472 | ||||||
| New Hanover County, NC, Public Improvement, “A”, 5%, 2030 | 2,000,000 | 2,301,040 | ||||||
| North Carolina Capital Improvement Obligation, “A”, 5%, 2026 | 1,450,000 | 1,719,642 | ||||||
| North Carolina Capital Improvement Obligation, “C”, 5%, 2025 | 2,710,000 | 3,270,943 | ||||||
| State of North Carolina, “B”, 5%, 2018 | 5,000,000 | 6,034,300 | ||||||
| State of North Carolina, “C”, 3.5%, 2017 | 5,000,000 | 5,570,350 | ||||||
| State of North Carolina, “C”, 5%, 2020 | 5,000,000 | 6,247,050 | ||||||
| $ | 25,707,206 | |||||||
| Issuer | Shares/Par | Value ($) | ||||||
| General Obligations - Schools - 4.5% | ||||||||
| Clovis, CA, Unified School District (Election of 2004), Capital Appreciation, “A”, 0%, 2026 | $ | 3,045,000 | $ | 1,807,938 | ||||
| Johnston County, NC, “B”, 5%, 2018 | 1,425,000 | 1,701,892 | ||||||
| San Diego County, CA, Southwestern Community College District (Election of 2008), “C”, 5%, 2040 | 2,885,000 | 3,164,556 | ||||||
| Wake County, NC, “C”, 5%, 2020 | 3,000,000 | 3,722,430 | ||||||
| Wake County, NC, “C”, 5%, 2021 | 3,000,000 | 3,783,030 | ||||||
| Wake County, NC, “C”, 5%, 2024 | 5,570,000 | 7,175,385 | ||||||
| $ | 21,355,231 | |||||||
| Healthcare Revenue - Hospitals - 22.5% | ||||||||
| Albemarle, NC, Hospital Authority Health Care Facilities Rev., 5.25%, 2038 | $ | 2,000,000 | $ | 2,024,720 | ||||
| Arizona Health Facilities Authority Rev. (Banner Health), “A”, 4%, 2043 | 1,575,000 | 1,532,144 | ||||||
| Charlotte-Mecklenburg, NC, Hospital Authority Health Care System Rev. (Carolinas Health Care System), “A”, 5%, 2031 | 1,000,000 | 1,069,870 | ||||||
| Charlotte-Mecklenburg, NC, Hospital Authority Health Care System Rev. (Carolinas Health Care System), “A”, 5.25%, 2034 | 4,000,000 | 4,454,200 | ||||||
| Charlotte-Mecklenburg, NC, Hospital Authority Health Care System Rev. (Carolinas Health Care System), “A”, 5%, 2043 | 2,500,000 | 2,781,325 | ||||||
| Charlotte-Mecklenburg, NC, Hospital Authority Health Care System Rev. (Carolinas Health Care System), “A”, 5%, 2047 | 1,000,000 | 1,064,130 | ||||||
| Illinois Finance Authority Rev. (Little Company of Mary Hospital and Health Care Centers), 5.375%, 2040 | 725,000 | 778,882 | ||||||
| Illinois Finance Authority Rev. (Resurrection Health), 6.125%, 2025 | 380,000 | 429,791 | ||||||
| Illinois Finance Authority Rev. (Silver Cross Hospital & Medical Centers), 7%, 2044 | 1,140,000 | 1,358,720 | ||||||
| Jefferson Parish, LA, Hospital Service District No. 2 (East Jefferson General Hospital), 6.25%, 2031 | 360,000 | 417,755 | ||||||
| Jefferson Parish, LA, Hospital Service District No. 2 (East Jefferson General Hospital), 6.375%, 2041 | 1,385,000 | 1,612,916 | ||||||
| Louisville & Jefferson County, KY, Metropolitan Government Healthcare Systems Rev. (Norton Healthcare, Inc.), 5.25%, 2036 | 1,820,000 | 1,922,684 | ||||||
| Miami-Dade County, FL, Health Facilities Authority Hospital Rev. (Variety Children’s Hospital), “A”, 6%, 2030 | 310,000 | 360,564 | ||||||
| Michigan Hospital Finance Authority Rev. (Henry Ford Health System), 5.625%, 2029 | 245,000 | 278,134 | ||||||
| Michigan Hospital Finance Authority Rev. (Henry Ford Health System), 5.75%, 2039 | 1,450,000 | 1,632,947 | ||||||
29
Table of Contents
Portfolio of Investments – continued
| Municipal Bonds - continued | ||||||||
| Issuer | Shares/Par | Value ($) | ||||||
| Healthcare Revenue - Hospitals - continued | ||||||||
| New Hampshire Business Finance Authority Rev. (Elliot Hospital Obligated Group), “A”, 6%, 2027 | $ | 790,000 | $ | 916,274 | ||||
| New Hampshire Business Finance Authority Rev. (Elliot Hospital Obligated Group), “A”, 6.125%, 2039 | 1,110,000 | 1,248,461 | ||||||
| New Hampshire Business Finance Authority Rev. (Huggins Hospital), 6.875%, 2039 | 55,000 | 60,595 | ||||||
| North Carolina Hospital Authority Mortgage Rev. (Johnston Memorial), AGM, 5.25%, 2036 | 2,000,000 | 2,160,060 | ||||||
| North Carolina Medical Care Commission Health Care Facilities Rev. (Columbus Regional Healthcare System), “A”, 4%, 2042 | 3,000,000 | 2,923,860 | ||||||
| North Carolina Medical Care Commission, Health Care Facilities Rev. (Appalachian Regional Healthcare System), “A”, 6.375%, 2026 | 2,000,000 | 2,375,460 | ||||||
| North Carolina Medical Care Commission, Health Care Facilities Rev. (Appalachian Regional Healthcare System), “A”, 6.5%, 2031 | 1,000,000 | 1,192,620 | ||||||
| North Carolina Medical Care Commission, Health Care Facilities Rev. (Cleveland County HealthCare System), 5.75%, 2035 | 800,000 | 883,984 | ||||||
| North Carolina Medical Care Commission, Health Care Facilities Rev. (Cleveland County HealthCare System), “A”, AMBAC, 5%, 2035 | 1,155,000 | 1,168,109 | ||||||
| North Carolina Medical Care Commission, Health Care Facilities Rev. (Cumberland County Hospital Syste) “A”, 5%, 2032 | 3,950,000 | 4,301,827 | ||||||
| North Carolina Medical Care Commission, Health Care Facilities Rev. (Duke University Health System), “A”, 5%, 2035 | 1,620,000 | 1,840,741 | ||||||
| North Carolina Medical Care Commission, Health Care Facilities Rev. (Duke University Health System), “A”, 5%, 2035 | 3,000,000 | 3,428,280 | ||||||
| North Carolina Medical Care Commission, Health Care Facilities Rev. (Duke University Health System), “A”, 5%, 2042 | 3,500,000 | 3,870,230 | ||||||
| North Carolina Medical Care Commission, Health Care Facilities Rev. (Duke University Health System), “A”, 5%, 2042 | 2,000,000 | 2,217,880 | ||||||
| North Carolina Medical Care Commission, Health Care Facilities Rev. (Novant Health Obligation Group), 5%, 2039 | 1,945,000 | 2,028,285 | ||||||
| North Carolina Medical Care Commission, Health Care Facilities Rev. (Novant Health Obligation Group), “A”, 5.25%, 2040 | 3,000,000 | 3,294,360 | ||||||
| North Carolina Medical Care Commission, Health Care Facilities Rev. (Rex Healthcare), “A”, 5%, 2030 | 5,250,000 | 5,834,955 | ||||||
| North Carolina Medical Care Commission, Health Care Facilities Rev. (Vidant Health), “A”, 5%, 2036 | 2,000,000 | 2,145,700 | ||||||
| North Carolina Medical Care Commission, Health Care Facilities Rev. (Wake Forest Baptist Obligated Group), “B”, 5%, 2033 | 2,000,000 | 2,258,040 | ||||||
| Issuer | Shares/Par | Value ($) | ||||||
| Healthcare Revenue - Hospitals - continued | ||||||||
| North Carolina Medical Care Commission, Health Care Facilities Rev. (WakeMed), “A”, 5%, 2031 | $ | 3,000,000 | $ | 3,423,300 | ||||
| North Carolina Medical Care Commission, Health Care Facilities Rev. (WakeMed), “A”, ASSD GTY, 5.625%, 2038 | 500,000 | 539,830 | ||||||
| North Carolina Medical Care Commission, Health System Rev. (Mission Health System, Inc.), 5%, 2025 | 1,600,000 | 1,759,040 | ||||||
| North Carolina Medical Care Commission, Health System Rev. (Mission Health System, Inc.), 4.75%, 2035 | 2,000,000 | 2,104,900 | ||||||
| North Carolina Medical Care Commission, Hospital Rev. (Southeastern Regional Medical Center), 5%, 2032 | 1,645,000 | 1,838,255 | ||||||
| North Carolina Medical Care Commission, Hospital Rev. (The North Carolina Baptist Hospitals, Inc.), 5.25%, 2029 | 2,215,000 | 2,511,035 | ||||||
| North Carolina Medical Care Commission, Hospital Rev. (The North Carolina Baptist Hospitals, Inc.), 5%, 2034 | 4,000,000 | 4,382,280 | ||||||
| North Carolina Medical Care Commission, Hospital Rev. (Wilson Memorial Hospital), Capital Appreciation, AMBAC, 0%, 2013 | 1,000,000 | 983,500 | ||||||
| North Carolina Medical Care Commission, Hospital Rev. (Wilson Memorial Hospital), Capital Appreciation, AMBAC, 0%, 2015 | 1,140,000 | 1,044,844 | ||||||
| Northern Hospital District, Surry County, NC, Health Care Facilities Rev., 6.25%, 2038 | 1,000,000 | 1,080,280 | ||||||
| Onslow County, NC, Hospital Authority (Onslow Memorial Hospital Project), NATL, 5%, 2026 | 1,155,000 | 1,235,446 | ||||||
| Pitt County, NC, Rev., Pitt County Memorial Hospital, ETM, 5.25%, 2021 (c) | 10,135,000 | 11,002,860 | ||||||
| Royal Oak, MI, Hospital Finance Authority Rev. (William Beaumont Hospital), 8.25%, 2039 | 2,040,000 | 2,556,120 | ||||||
| St. Petersburg, FL, Health Facilities Authority Rev., 6.5%, 2039 | 470,000 | 556,268 | ||||||
| Washington Health Care Facilities Authority Rev. (Central Washington Health Services), 6.75%, 2029 | 270,000 | 318,157 | ||||||
| Washington Health Care Facilities Authority Rev. (Central Washington Health Services), 7%, 2039 | 635,000 | 733,977 | ||||||
| Wisconsin Health & Educational Facilities Authority Rev. (Mercy Alliance), 5%, 2039 | 1,395,000 | 1,490,013 | ||||||
| Wisconsin Health & Educational Facilities Authority Rev. (ProHealth Care, Inc. Obligated Group), 6.625%, 2039 | 2,195,000 | 2,546,990 | ||||||
| Wisconsin Health & Educational Facilities Authority Rev. (Wheaton Franciscan Healthcare), 5.25%, 2031 | 1,495,000 | 1,598,932 | ||||||
| $ | 107,574,530 | |||||||
30
Table of Contents
Portfolio of Investments – continued
| Municipal Bonds - continued | ||||||||
| Issuer | Shares/Par | Value ($) | ||||||
| Healthcare Revenue - Long Term Care - 1.2% | ||||||||
| North Carolina Medical Care Commission, Health Care Facilities Rev. (Givens Estates), 6.5%, 2013 (c) | $ | 800,000 | $ | 820,184 | ||||
| North Carolina Medical Care Commission, Health Care Facilities Rev. (Lutheran Services for the Aging, Inc. Obligated Services) “A”, 5%, 2037 | 1,000,000 | 1,014,320 | ||||||
| North Carolina Medical Care Commission, Retirement Facilities Rev. (Galloway Ridge Project), “A”, 5.875%, 2031 | 480,000 | 509,957 | ||||||
| North Carolina Medical Care Commission, Retirement Facilities Rev. (Galloway Ridge Project), “A”, 6%, 2039 | 1,520,000 | 1,612,218 | ||||||
| North Carolina Medical Care Commission, Retirement Facilities Rev. (The United Methodist Retirement Homes), “A”, 5%, 2033 | 1,590,000 | 1,649,180 | ||||||
| Wisconsin Health & Educational Facilities Authority Rev. (St. John’s Community, Inc.), “A”, 7.25%, 2029 | 35,000 | 40,955 | ||||||
| Wisconsin Health & Educational Facilities Authority Rev. (St. John’s Community, Inc.), “A”, 7.625%, 2039 | 220,000 | 256,639 | ||||||
| $ | 5,903,453 | |||||||
| Industrial Revenue - Paper - 0.2% | ||||||||
| Columbus County, NC, Industrial Facilities & Pollution Control, Financing Authority Rev. (International Paper Co.), 5.7%, 2034 | $ | 1,000,000 | $ | 1,114,940 | ||||
| Miscellaneous Revenue - Other - 0.3% | ||||||||
| Durham County, NC, Industrial Facilities & Pollution Control Financing Authority Rev. (Research Triangle Institute), 5%, 2025 | $ | 1,000,000 | $ | 1,276,980 | ||||
| Summit County, OH, Port Authority Building Rev. (Flats East Development Recovery Zone Facility Bonds), 6.875%, 2040 | 100,000 | 111,227 | ||||||
| $ | 1,388,207 | |||||||
| Multi-Family Housing Revenue - 1.1% | ||||||||
| Charlotte, NC, Housing Authority Rev., GNMA, 4.8%, 2048 | $ | 2,000,000 | $ | 2,027,300 | ||||
| Elizabeth City, NC, Multi-Family Housing Rev. (Walker Landing), “A”, GNMA, 5.125%, 2049 | 1,500,000 | 1,398,930 | ||||||
| Mecklenburg County, NC (Little Rock Apartments), FNMA, 5.15%, 2022 | 930,000 | 936,761 | ||||||
| North Carolina Medical Care Commission, Health Care Facilities Rev., “A” (ARC Projects), 5.8%, 2034 | 1,000,000 | 1,049,730 | ||||||
| $ | 5,412,721 | |||||||
| Port Revenue - 0.2% | ||||||||
| North Carolina Ports Authority Facilities Rev., “A”, 5.25%, 2040 | $ | 1,000,000 | $ | 1,110,540 | ||||
| Issuer | Shares/Par | Value ($) | ||||||
| Sales & Excise Tax Revenue - 3.5% | ||||||||
| Colorado Regional Transportation District, Private Activity Rev. (Denver Transportation Partners), 6.5%, 2030 | $ | 1,675,000 | $ | 2,015,795 | ||||
| Colorado Regional Transportation District, Sales Tax Rev. (Fastracks Project), “A”, 5%, 2027 | 1,685,000 | 2,011,688 | ||||||
| Guam Government Business Privilege Tax Rev., “A”, 5.25%, 2036 | 1,140,000 | 1,270,918 | ||||||
| Guam Government Business Privilege Tax Rev., “B-1”, 5%, 2037 | 805,000 | 879,382 | ||||||
| Massachusetts School Building Authority, Dedicated Sales Tax Rev., “B”, 5%, 2035 | 2,840,000 | 3,253,305 | ||||||
| Puerto Rico Infrastructure Financing Authority, Special Tax Rev., “C”, FGIC, 5.5%, 2022 | 1,740,000 | 1,837,927 | ||||||
| Puerto Rico Sales Tax Financing Corp., Sales Tax Rev., “A”, 5.5%, 2019 (c) | 15,000 | 19,055 | ||||||
| Puerto Rico Sales Tax Financing Corp., Sales Tax Rev., “A”, 5.5%, 2028 | 1,725,000 | 1,864,294 | ||||||
| Puerto Rico Sales Tax Financing Corp., Sales Tax Rev., Capital Appreciation, 0%, 2034 | 4,540,000 | 1,330,038 | ||||||
| Puerto Rico Sales Tax Financing Corp., Sales Tax Rev., Convertible Capital Appreciation, “A”, 0% to 2016, 6.75% to 2032 | 1,970,000 | 2,038,733 | ||||||
| $ | 16,521,135 | |||||||
| Single Family Housing - State - 2.1% | ||||||||
| North Carolina Housing Finance Agency Rev., “15-A”, AGM, 4.95%, 2032 | $ | 285,000 | $ | 285,125 | ||||
| North Carolina Housing Finance Agency Rev., “19-A”, 5.1%, 2030 | 2,065,000 | 2,077,741 | ||||||
| North Carolina Housing Finance Agency Rev., “23-A”, 4.8%, 2037 | 1,715,000 | 1,725,753 | ||||||
| North Carolina Housing Finance Agency Rev., “24-A”, 4.75%, 2026 | 1,650,000 | 1,676,615 | ||||||
| North Carolina Housing Finance Agency Rev., “25-A”, 5.75%, 2037 | 480,000 | 486,518 | ||||||
| North Carolina Housing Finance Agency Rev., “29-A”, 4.85%, 2038 | 1,650,000 | 1,668,447 | ||||||
| North Carolina Housing Finance Agency Rev., “31-A”, 5.25%, 2038 | 1,870,000 | 1,971,504 | ||||||
| North Carolina Housing Finance Agency Rev., “A”, 5.375%, 2023 | 130,000 | 130,120 | ||||||
| $ | 10,021,823 | |||||||
| State & Agency - Other - 2.1% | ||||||||
| Charlotte, NC, COP (Equipment Acquisitions and Public Facilities), “A”, 5%, 2029 | $ | 1,075,000 | $ | 1,264,523 | ||||
| Charlotte, NC, COP (Transit Projects), 5%, 2033 | 3,000,000 | 3,426,510 | ||||||
| Charlotte, NC, COP (Transit Projects), “E”, 5%, 2035 | 1,990,000 | 2,145,479 | ||||||
| Charlotte, NC, COP, “E”, 5%, 2026 | 760,000 | 856,740 | ||||||
| Charlotte, NC, COP, “E”, 5%, 2034 | 2,000,000 | 2,215,100 | ||||||
| $ | 9,908,352 | |||||||
31
Table of Contents
Portfolio of Investments – continued
| Municipal Bonds - continued | ||||||||
| Issuer | Shares/Par | Value ($) | ||||||
| State & Local Agencies - 8.7% | ||||||||
| Asheville, NC, Limited Obligation, 5%, 2028 | $ | 400,000 | $ | 460,952 | ||||
| Asheville, NC, Limited Obligation, 5%, 2030 | 300,000 | 343,176 | ||||||
| Asheville, NC, Limited Obligation, 5%, 2032 | 250,000 | 283,885 | ||||||
| Charlotte, NC, COP (NASCAR Hall of Fame), “C”, 5%, 2039 | 5,130,000 | 5,624,378 | ||||||
| Delaware Valley, PA, Regional Finance Authority, “C”, FRN, 0.942%, 2037 | 2,260,000 | 1,647,676 | ||||||
| Duplin, NC, Limited Obligation (County Water Districts), 5%, 2037 | 3,595,000 | 3,966,903 | ||||||
| Golden State, CA, Tobacco Securitization Corp., Tobacco Settlement Rev., Enhanced, “A”, ASSD GTY, 5%, 2045 | 1,355,000 | 1,412,113 | ||||||
| Harnett County, NC, COP, ASSD GTY, 5%, 2029 | 400,000 | 448,264 | ||||||
| Iredell County, NC, Public Facilities (School Projects), AGM, 5.125%, 2027 | 3,230,000 | 3,646,379 | ||||||
| Mecklenburg County, NC, COP, “A”, 5%, 2028 | 350,000 | 394,132 | ||||||
| Mooresville, NC, COP, 5%, 2032 | 3,120,000 | 3,361,238 | ||||||
| Nash County, NC, Limited Obligation, ASSD GTY, 5%, 2030 | 2,000,000 | 2,295,600 | ||||||
| Orange County, NC, Public Facilities Co., Limited Obligation, 5%, 2024 | 750,000 | 894,593 | ||||||
| Pitt County, NC, Limited Obligation, “A”, 5%, 2035 | 2,000,000 | 2,241,300 | ||||||
| Salisbury, NC, COP, ASSD GTY, 5.625%, 2026 | 1,000,000 | 1,152,890 | ||||||
| Wake County, NC, 5%, 2033 | 6,000,000 | 7,051,560 | ||||||
| Wake County, NC, Annual Appropriation Ltd., Obligation Bonds, “2009”, 5%, 2032 | 3,000,000 | 3,515,370 | ||||||
| Wilmington, NC, COP, “A”, 5%, 2038 | 2,650,000 | 2,993,493 | ||||||
| $ | 41,733,902 | |||||||
| Tax - Other - 1.1% | ||||||||
| Guam Government Ltd. Obligation Rev., “A”, 5.375%, 2024 | $ | 420,000 | $ | 458,842 | ||||
| Guam Government Ltd. Obligation Rev., “A”, 5.625%, 2029 | 145,000 | 158,208 | ||||||
| Virgin Islands Public Finance Authority Rev. (Diageo), “A”, 6.625%, 2029 | 1,005,000 | 1,151,489 | ||||||
| Virgin Islands Public Finance Authority Rev., “A-1”, 5%, 2029 | 305,000 | 331,370 | ||||||
| Virgin Islands Public Finance Authority Rev., “A-1”, 5%, 2039 | 350,000 | 366,986 | ||||||
| Virgin Islands Public Finance Authority Rev., “B”, 5%, 2025 | 305,000 | 336,586 | ||||||
| Virgin Islands Public Finance Authority Rev., Matching Fund Loan Note, “A”, 5%, 2029 | 2,090,000 | 2,287,881 | ||||||
| $ | 5,091,362 | |||||||
| Tobacco - 1.9% | ||||||||
| Buckeye, OH, Tobacco Settlement Financing Authority, “A-2”, 5.125%, 2024 | $ | 515,000 | $ | 472,389 | ||||
| Buckeye, OH, Tobacco Settlement Financing Authority, “A-3”, 6.25%, 2037 | 1,295,000 | 1,210,929 | ||||||
| Illinois Railsplitter Tobacco Settlement Authority, 5.5%, 2023 | 2,020,000 | 2,441,574 | ||||||
| Issuer | Shares/Par | Value ($) | ||||||
| Tobacco - continued | ||||||||
| Illinois Railsplitter Tobacco Settlement Authority, 6%, 2028 | $ | 1,975,000 | $ | 2,393,028 | ||||
| New Jersey Tobacco Settlement Financing Corp., “1-A”, 4.5%, 2023 | 1,335,000 | 1,331,689 | ||||||
| New Jersey Tobacco Settlement Financing Corp., “1-A”, 5%, 2041 | 1,480,000 | 1,333,554 | ||||||
| $ | 9,183,163 | |||||||
| Toll Roads - 0.5% | ||||||||
| Virginia Small Business Financing Authority Rev. (Elizabeth River Crossings Opco LLC Project), 5.25%, 2032 | $ | 430,000 | $ | 459,846 | ||||
| Virginia Small Business Financing Authority Rev. (Elizabeth River Crossings Opco LLC Project), 6%, 2037 | 725,000 | 828,254 | ||||||
| Virginia Small Business Financing Authority Rev. (Elizabeth River Crossings Opco LLC Project), 5.5%, 2042 | 1,160,000 | 1,245,944 | ||||||
| $ | 2,534,044 | |||||||
| Transportation - Special Tax - 3.1% | ||||||||
| Commonwealth of Puerto Rico Highway & Transportation Authority Rev., “CC”, AGM, 5.5%, 2028 | $ | 1,715,000 | $ | 1,904,593 | ||||
| Commonwealth of Puerto Rico Highway & Transportation Authority Rev., ETM, AGM, 6%, 2018 (c) | 5,810,000 | 7,071,816 | ||||||
| North Carolina Turnpike Authority, Monroe Connector System State Appropriation Rev., 5%, 2028 | 2,300,000 | 2,679,316 | ||||||
| North Carolina Turnpike Authority, Monroe Connector System State Appropriation Rev., 5%, 2036 | 3,000,000 | 3,381,510 | ||||||
| $ | 15,037,235 | |||||||
| Universities - Colleges - 12.7% | ||||||||
| Appalachian State University, NC, Rev., NATL, 5%, 2015 (c) | $ | 370,000 | $ | 408,735 | ||||
| Appalachian State University, NC, Rev., 4%, 2019 | 1,080,000 | 1,252,282 | ||||||
| Appalachian State University, NC, Rev., 4%, 2026 | 1,445,000 | 1,590,425 | ||||||
| Appalachian State University, NC, Rev., NATL, 5%, 2030 | 630,000 | 662,855 | ||||||
| Florida Higher Educational Facilities, Financial Authority Rev. (University of Tampa Project), “A”, 5%, 2032 | 60,000 | 65,251 | ||||||
| Florida Higher Educational Facilities, Financial Authority Rev. (University of Tampa Project), “A”, 5.25%, 2042 | 515,000 | 564,862 | ||||||
| Florida State University Board of Governors, System Improvement Rev., 6.25%, 2030 | 1,000,000 | 1,225,740 | ||||||
| Illinois Finance Authority Rev. (Roosevelt University Project), 6.25%, 2029 | 2,000,000 | 2,267,360 | ||||||
| New Jersey Educational Facilities Authority Rev. (University of Medicine & Dentistry), “B”, 6%, 2017 | 1,545,000 | 1,820,195 | ||||||
32
Table of Contents
Portfolio of Investments – continued
| Municipal Bonds - continued | ||||||||
| Issuer | Shares/Par | Value ($) | ||||||
| Universities - Colleges - continued | ||||||||
| North Carolina Agricultural & Technical University Rev. (University of North Carolina), 5%, 2037 | $ | 1,000,000 | $ | 1,103,990 | ||||
| North Carolina Capital Facilities Finance Agency Rev. (Methodist University), 5%, 2034 | 1,000,000 | 1,084,450 | ||||||
| North Carolina Capital Facilities Finance Agency, Educational Facilities Rev. (High Point University), 5%, 2032 | 500,000 | 547,940 | ||||||
| North Carolina Capital Facilities Finance Agency, Educational Facilities Rev. (High Point University), 5.25%, 2033 | 1,000,000 | 1,106,160 | ||||||
| North Carolina Capital Facilities Finance Agency, Educational Facilities Rev. (Wake Forest University), 5%, 2028 | 980,000 | 1,129,568 | ||||||
| North Carolina Capital Facilities Finance Agency, Educational Facilities Rev. (Wake Forest University), 5%, 2029 | 865,000 | 994,499 | ||||||
| North Carolina Capital Facilities Finance Agency, Educational Facilities Rev. (Wake Forest University), 5%, 2031 | 2,000,000 | 2,286,640 | ||||||
| North Carolina Capital Facilities Finance Agency, Educational Facilities Rev. (Wake Forest University), 5%, 2038 | 1,000,000 | 1,123,850 | ||||||
| North Carolina Capital Facilities, Finance Agency Rev. (Davidson College), 5%, 2040 | 1,565,000 | 1,814,758 | ||||||
| North Carolina Capital Facilities, Finance Agency Rev. (Duke University), “A”, 5%, 2038 | 2,500,000 | 2,901,775 | ||||||
| North Carolina Capital Facilities, Finance Agency Rev. (Johnson & Wales University), “A”, SYNCORA, 5.25%, 2022 | 1,870,000 | 1,872,637 | ||||||
| North Carolina Capital Facilities, Finance Agency Rev. (Meredith College), 6%, 2031 | 3,240,000 | 3,632,267 | ||||||
| North Carolina State University at Raleigh Rev., “A”, 5%, 2037 | 2,000,000 | 2,344,080 | ||||||
| Pinellas County, FL, Educational Facilities Authority Rev. (Barry University), 6%, 2041 | 450,000 | 517,775 | ||||||
| Puerto Rico Industrial Tourist Authority (University Plaza), “A”, NATL, 5%, 2020 | 2,180,000 | 2,186,605 | ||||||
| Puerto Rico Industrial, Tourist, Educational, Medical, & Environmental Control Facilities Financing Authority, Higher Education Rev. (Ana G. Mendez University System Project), 5.125%, 2032 | 170,000 | 167,263 | ||||||
| Puerto Rico Industrial, Tourist, Educational, Medical, & Environmental Control Facilities Financing Authority, Higher Education Rev. (Ana G. Mendez University System Project), 5.375%, 2042 | 275,000 | 275,679 | ||||||
| Puerto Rico Industrial, Tourist, Medical, & Environmental Central Facilities (University of Sacred Heart), 4.375%, 2031 | 115,000 | 109,595 | ||||||
| Puerto Rico Industrial, Tourist, Medical, & Environmental Central Facilities (University of Sacred Heart), 5%, 2042 | 55,000 | 53,837 | ||||||
| Issuer | Shares/Par | Value ($) | ||||||
| Universities - Colleges - continued | ||||||||
| University of North Carolina System (East Carolina University) “C”, AMBAC, 5%, 2014 (c) | $ | 960,000 | $ | 1,004,870 | ||||
| University of North Carolina System (East Carolina University) “C”, AMBAC, 5%, 2029 (c) | 445,000 | 466,026 | ||||||
| University of North Carolina, Chapel Hill, 5%, 2028 | 2,000,000 | 2,063,660 | ||||||
| University of North Carolina, Chapel Hill, 5%, 2031 | 3,250,000 | 3,757,000 | ||||||
| University of North Carolina, Chapel Hill, “A”, ASSD GTY, 5%, 2034 | 200,000 | 226,366 | ||||||
| University of North Carolina, Charlotte, “A”, 5%, 2037 | 2,000,000 | 2,306,460 | ||||||
| University of North Carolina, Greensboro, 5%, 2026 | 3,000,000 | 3,564,330 | ||||||
| University of North Carolina, Systems Pool Rev. (General Trust Indenture), “C”, 5.5%, 2034 | 1,890,000 | 2,133,640 | ||||||
| University of North Carolina, Systems Pool Rev., “B”, NATL, 5%, 2033 | 1,180,000 | 1,263,001 | ||||||
| University of North Carolina, Systems Pool Rev., “B”, 5.125%, 2034 | 2,000,000 | 2,294,840 | ||||||
| University of North Carolina, Systems Pool Rev., “B-1”, 5.25%, 2024 | 1,615,000 | 1,956,007 | ||||||
| University of North Carolina, Systems Pool Rev., “B-1”, 5.25%, 2025 | 1,705,000 | 2,052,667 | ||||||
| University of North Carolina, Systems Pool Rev., “C”, AMBAC, 5%, 2014 (c) | 595,000 | 623,114 | ||||||
| University of North Carolina, Wilmington, COP (Student Housing Project), FGIC, 5%, 2028 | 1,825,000 | 1,944,446 | ||||||
| $ | 60,767,500 | |||||||
| Universities - Dormitories - 0.4% | ||||||||
| Oregon Facilities Authority, Student Housing Rev. (Southern Oregon University), ASSD GTY, 5%, 2044 | $ | 160,000 | $ | 174,189 | ||||
| Western Carolina University Rev., 5%, 2033 | 1,400,000 | 1,551,830 | ||||||
| $ | 1,726,019 | |||||||
| Utilities - Investor Owned - 0.5% | ||||||||
| Wake County, NC, Industrial Facilities & Pollution Control Rev. (Carolina Power & Light Co.), 5.375%, 2017 | $ | 2,500,000 | $ | 2,520,250 | ||||
| Utilities - Municipal Owned - 5.9% | ||||||||
| Guam Power Authority Rev., “A”, ASSD GTY, 5%, 2020 | $ | 1,000,000 | $ | 1,177,370 | ||||
| Guam Power Authority Rev., “A”, AGM, 5%, 2021 | 1,000,000 | 1,187,740 | ||||||
| Long Island, NY, Power Authority, Electric Systems Rev., “A”, 6%, 2033 | 520,000 | 620,402 | ||||||
| North Carolina Eastern Municipal Power Agency, AMBAC, 6%, 2018 | 14,245,000 | 17,330,182 | ||||||
| North Carolina Municipal Power Agency, Catawba Electric Rev., “A”, 5%, 2030 | 2,500,000 | 2,782,850 | ||||||
| Raleigh, NC, “A”, 5%, 2020 | 4,000,000 | 4,994,360 | ||||||
| $ | 28,092,904 | |||||||
33
Table of Contents
Portfolio of Investments – continued
| Municipal Bonds - continued | ||||||||
| Issuer | Shares/Par | Value ($) | ||||||
| Utilities - Other - 1.8% | ||||||||
| California M-S-R Energy Authority Gas Rev., “A”, 6.5%, 2039 | $ | 1,695,000 | $ | 2,298,827 | ||||
| Nebraska Central Plains Energy Project, Gas Project Rev., “3”, 5%, 2032 | 1,905,000 | 2,117,846 | ||||||
| Tennessee Energy Acquisition Corp., Gas Rev., “A”, 5.25%, 2019 | 1,055,000 | 1,221,120 | ||||||
| Tennessee Energy Acquisition Corp., Gas Rev., “A”, 5.25%, 2026 | 1,290,000 | 1,493,923 | ||||||
| Tennessee Energy Acquisition Corp., Gas Rev., “C”, 5%, 2021 | 805,000 | 914,746 | ||||||
| Texas Gas Acquisition & Supply Corp III., Gas Supply Rev., 5%, 2031 | 255,000 | 270,473 | ||||||
| Texas Gas Acquisition & Supply Corp III., Gas Supply Rev., 5%, 2032 | 405,000 | 427,267 | ||||||
| $ | 8,744,202 | |||||||
| Water & Sewer Utility Revenue - 10.9% | ||||||||
| Asheville, NC, Water & Sewer Systems Rev., NATL, 5%, 2032 | $ | 1,000,000 | $ | 1,131,300 | ||||
| Cape Fear Public Utility Authority, Water & Sewer System Rev., 5%, 2035 | 3,000,000 | 3,370,260 | ||||||
| Cape Fear Public Utility Authority, Water & Sewer System Rev., 5%, 2036 | 4,410,000 | 5,118,952 | ||||||
| Cary, NC, Combined Enterprise Systems Rev., 4%, 2037 | 5,500,000 | 5,881,865 | ||||||
| Charlotte, NC, Storm Water Fee Rev., 5%, 2034 | 3,675,000 | 3,843,793 | ||||||
| Charlotte, NC, Water & Sewer Systems Rev., 5%, 2021 | 1,800,000 | 2,318,310 | ||||||
| Commonwealth of Puerto Rico Aqueduct & Sewer Authority Rev., “A”, 5.75%, 2037 | 960,000 | 948,768 | ||||||
| DeKalb County, GA, Water & Sewer Rev., “A”, 5.25%, 2041 | 1,710,000 | 1,933,617 | ||||||
| Durham County, NC, Enterprise Systems Rev., NATL, 5%, 2023 | 1,675,000 | 1,687,914 | ||||||
| Durham County, NC, Enterprise Systems Rev., 5%, 2029 | 1,590,000 | 1,897,283 | ||||||
| Issuer | Shares/Par | Value ($) | ||||||
| Water & Sewer Utility Revenue - continued | ||||||||
| Durham, NC, Water and Sewer Utility System Rev., 5.25%, 2017 | $ | 2,400,000 | $ | 2,848,128 | ||||
| Fayetteville, NC, Public Works Commission Rev., “B”, 5%, 2035 | 1,750,000 | 1,962,415 | ||||||
| Greensboro, NC, Enterprise Systems Rev., “A”, 5%, 2016 | 4,005,000 | 4,538,386 | ||||||
| Greenville, NC, Utilities Commission, Combined Enterprise System Rev., “A”, AGM, 5%, 2033 | 2,400,000 | 2,686,632 | ||||||
| High Point, NC, Combined Enterprise System Rev., AGM, 5%, 2033 | 2,000,000 | 2,320,880 | ||||||
| Oak Island, NC, Enterprise System Rev., ASSD GTY, 5.625%, 2030 | 500,000 | 591,415 | ||||||
| Oak Island, NC, Enterprise System Rev., ASSD GTY, 6%, 2034 | 1,000,000 | 1,168,180 | ||||||
| Oak Island, NC, Enterprise System Rev., ASSD GTY, 5.75%, 2036 | 800,000 | 936,296 | ||||||
| San Francisco, CA, City & County Public Utilities Commission Water Rev., “A”, 5.25%, 2031 | 2,590,000 | 3,000,774 | ||||||
| Winston-Salem, NC, Water & Sewer Systems Rev., 5%, 2033 | 1,600,000 | 1,732,880 | ||||||
| Winston-Salem, NC, Water & Sewer Systems Rev., 5%, 2034 | 2,000,000 | 2,327,220 | ||||||
| $ | 52,245,268 | |||||||
| Total Municipal Bonds (Identified Cost, $442,249,228) | $ | 475,538,511 | ||||||
| Money Market Funds - 0.5% | ||||||||
| MFS Institutional Money Market Portfolio, 0.14%, at Cost and Net Asset Value (v) | 2,618,244 | $ | 2,618,244 | |||||
Total Investments (Identified Cost, $444,867,472) | $ | 478,156,755 | ||||||
| Other Assets, Less Liabilities - 0.2% | 788,144 | |||||||
| Net Assets - 100.0% | $ | 478,944,899 | ||||||
See Portfolio Footnotes and Notes to Financial Statements
34
Table of Contents
PORTFOLIO OF INVESTMENTS
3/31/13
MFS PENNSYLVANIA MUNICIPAL BOND FUND
The Portfolio of Investments is a complete list of all securities owned by your fund. It is categorized by broad-based asset classes.
| Municipal Bonds - 95.6% | ||||||||
| Issuer | Shares/Par | Value ($) | ||||||
| Airport Revenue - 2.5% | ||||||||
| Allegheny County, PA, Airport Rev. (Pittsburgh International Airport), NATL, 5.75%, 2014 | $ | 1,000,000 | $ | 1,038,566 | ||||
| Chicago, IL, O’Hare International Airport Rev., Third Lien, “A”, 5.625%, 2035 | 335,000 | 386,838 | ||||||
| Philadelphia, PA, Airport Rev., “A”, AGM, 5%, 2040 | 2,000,000 | 2,208,120 | ||||||
| Sacramento County, CA, Airport Systems Rev., 5%, 2040 | 470,000 | 517,588 | ||||||
| $ | 4,151,112 | |||||||
| General Obligations - General Purpose - 7.2% | ||||||||
| Allegheny County, PA, “C-70”, 5%, 2037 | $ | 1,000,000 | $ | 1,100,480 | ||||
| Berks County, PA, 5%, 2022 | 1,700,000 | 1,997,279 | ||||||
| Commonwealth of Pennsylvania, 5%, 2015 | 1,515,000 | 1,654,365 | ||||||
| Commonwealth of Pennsylvania, 5%, 2019 | 1,000,000 | 1,218,570 | ||||||
| Commonwealth of Pennsylvania, 5%, 2021 | 500,000 | 625,810 | ||||||
| Commonwealth of Pennsylvania, 5%, 2022 | 500,000 | 626,975 | ||||||
| Commonwealth of Puerto Rico, “A”, 5.375%, 2033 | 250,000 | 249,215 | ||||||
| Commonwealth of Puerto Rico, “A”, 6%, 2038 | 425,000 | 431,626 | ||||||
| Commonwealth of Puerto Rico, “A”, ETM, FGIC, 5.5%, 2015 (c) | 1,860,000 | 2,071,296 | ||||||
| Luzerne County, PA, AGM, 6.75%, 2023 | 500,000 | 581,640 | ||||||
| State of Maryland, “C”, 5%, 2019 | 1,000,000 | 1,238,220 | ||||||
| $ | 11,795,476 | |||||||
| General Obligations - Improvement - 0.1% | ||||||||
| Guam Government, “A”, 6.75%, 2029 | $ | 75,000 | $ | 83,878 | ||||
| Guam Government, “A”, 7%, 2039 | 90,000 | 100,349 | ||||||
| $ | 184,227 | |||||||
| General Obligations - Schools - 12.2% | ||||||||
| Allegheny Valley, PA, School District, “A”, NATL, 5%, 2028 | $ | 1,000,000 | $ | 1,035,590 | ||||
| Carlisle, PA, School District, 5%, 2026 | 1,000,000 | 1,179,320 | ||||||
| Clovis, CA, Unified School District (Election of 2004), Capital Appreciation, “A”, 0%, 2027 | 1,515,000 | 852,945 | ||||||
| Conneaut, PA, School District, Capital Appreciation, “B”, AGM, 0%, 2031 | 1,150,000 | 569,377 | ||||||
| Conneaut, PA, School District, Capital Appreciation, “B”, AGM, 0%, 2033 | 760,000 | 334,377 | ||||||
| Daniel Boone, PA, School District, 5%, 2032 | 500,000 | 541,475 | ||||||
| Deer Lakes, PA, School District, ASSD GTY, 5.375%, 2034 | 1,275,000 | 1,428,867 | ||||||
| Gateway, PA, Allegheny School District, FGIC, 5.2%, 2023 | 1,000,000 | 1,026,580 | ||||||
| Gettysburg, PA, School District, 5.25%, 2024 | 2,000,000 | 2,350,940 | ||||||
| Governor Mifflin, PA, School District, “A”, 4%, 2024 | 1,890,000 | 2,141,124 | ||||||
| Lower Merion, PA, School District, 3%, 2015 | 2,310,000 | 2,437,466 | ||||||
| Penn Delco, PA, School District, 4%, 2038 | 1,000,000 | 1,032,520 | ||||||
| Reading, PA, School District, “A”, 5%, 2018 | 1,000,000 | 1,132,760 | ||||||
| Issuer | Shares/Par | Value ($) | ||||||
| General Obligations - Schools - continued | ||||||||
| Reading, PA, School District, “A”, 5%, 2020 | $ | 665,000 | $ | 758,705 | ||||
| Scranton, PA, School District, “A”, AGM, 5%, 2027 | 1,340,000 | 1,456,044 | ||||||
| State Public School Building Authority, PA School (Colonial Intermediate Unit 20), FGIC, 5%, 2030 | 500,000 | 527,720 | ||||||
| Whitehall-Coplay, PA, School District, “A”, AGM, 5.375%, 2034 | 1,000,000 | 1,122,870 | ||||||
| $ | 19,928,680 | |||||||
| Healthcare Revenue - Hospitals - 19.1% | ||||||||
| Allegheny County, PA, Hospital Development Authority Rev. (University of Pittsburgh Medical Center), “A”, 5.375%, 2029 | $ | 1,000,000 | $ | 1,139,790 | ||||
| Allegheny County, PA, Hospital Development Authority Rev. (UPMC Health Systems), 5%, 2018 | 500,000 | 594,915 | ||||||
| Berks County, PA, Municipal Authority Rev. (Reading Hospital & Medical Center), “A”, 5%, 2040 | 1,500,000 | 1,627,470 | ||||||
| Blair County, PA, Hospital Authority Rev. (Altoona Regional Health System), 6%, 2039 | 750,000 | 804,480 | ||||||
| Butler County, PA, Hospital Development Authority Rev. (Butler Health System, Inc.), 7.25%, 2039 | 500,000 | 613,760 | ||||||
| Centre County, PA, Hospital Authority Rev. (Mount Nittany Medical Center), ASSD GTY, 5.875%, 2029 | 500,000 | 545,090 | ||||||
| Centre County, PA, Hospital Authority Rev. (Mount Nittany Medical Center), 6.25%, 2041 | 500,000 | 606,890 | ||||||
| Chester County, PA, Health & Educational Facilities Authority Rev. (Chester County Junior High School), “A”, 5%, 2040 | 1,000,000 | 1,085,210 | ||||||
| Dauphin County, PA, General Authority Health System Rev. (Pinnacle Health System), “A”, 5.75%, 2020 | 750,000 | 855,240 | ||||||
| DeKalb County, GA, Hospital Authority Rev. (DeKalb Medical Center, Inc.), 6.125%, 2040 | 305,000 | 355,340 | ||||||
| Escambia County, FL, Health Facilities Authority (Baptist Hospital, Inc.), “A”, 6%, 2036 | 705,000 | 811,631 | ||||||
| Geisinger Authority, PA, Health System Rev., “A”, 5.125%, 2034 | 1,000,000 | 1,112,740 | ||||||
| Illinois Finance Authority Rev. (Provena Health), “A”, 6%, 2028 | 500,000 | 565,040 | ||||||
| Jefferson Parish, LA, Hospital Service District No. 2 (East Jefferson General Hospital), 6.25%, 2031 | 165,000 | 191,471 | ||||||
| Jefferson Parish, LA, Hospital Service District No. 2 (East Jefferson General Hospital), 6.375%, 2041 | 445,000 | 518,229 | ||||||
35
Table of Contents
Portfolio of Investments – continued
| Municipal Bonds - continued | ||||||||
| Issuer | Shares/Par | Value ($) | ||||||
| Healthcare Revenue - Hospitals - continued | ||||||||
| Kentucky Economic Development Finance Authority, Hospital Facilities Rev. (Owensboro Medical Health System), “A”, 5.75%, 2025 | $ | 335,000 | $ | 388,570 | ||||
| Kentucky Economic Development Finance Authority, Hospital Facilities Rev. (Owensboro Medical Health System), “A”, 6.375%, 2040 | 390,000 | 462,357 | ||||||
| Lancaster County, PA, Hospital Authority Health System Rev. (Lancaster General Hospital), 5%, 2042 | 1,500,000 | 1,644,465 | ||||||
| Lancaster County, PA, Hospital Authority Rev., 5.5%, 2013 (c) | 500,000 | 511,775 | ||||||
| Lebanon County, PA, Health Facilities Authority Rev. (Good Samaritan Hospital), 5%, 2018 | 200,000 | 200,290 | ||||||
| Lebanon County, PA, Health Facilities Authority Rev. (Good Samaritan Hospital), 6%, 2035 | 450,000 | 446,117 | ||||||
| Lehigh County, PA, General Purpose Authority (Good Shepherd Group), 4%, 2036 | 1,000,000 | 968,770 | ||||||
| Lehigh County, PA, General Purpose Authority (Good Shepherd Group), “A”, 5.625%, 2034 | 350,000 | 379,428 | ||||||
| Lehigh County, PA, General Purpose Authority (Lehigh Valley Hospital), NATL, 7%, 2016 | 160,000 | 169,573 | ||||||
| Lehigh County, PA, General Purpose Authority (Lehigh Valley Hospital), 5.25%, 2032 | 600,000 | 613,380 | ||||||
| Lehigh County, PA, General Purpose Authority (St. Luke’s Bethlehem Hospital), 5.375%, 2013 (c) | 600,000 | 611,352 | ||||||
| Lehigh County, PA, General Purpose Authority Hospital Rev. (Lehigh Valley Hospital), “B”, 4%, 2033 | 1,000,000 | 1,015,420 | ||||||
| Lycoming County, PA, Health Authority Rev. (Susquehanna Health System), “A”, 5.75%, 2039 | 750,000 | 827,505 | ||||||
| Miami-Dade County, FL, Health Facilities Authority Hospital Rev. (Variety Children’s Hospital), “A”, 6%, 2030 | 105,000 | 122,127 | ||||||
| Michigan Hospital Finance Authority Rev. (Henry Ford Health System), 5.625%, 2029 | 75,000 | 85,143 | ||||||
| Monroe County, PA, Hospital Authority Rev. (Pocono Medical Center), 6%, 2014 (c) | 750,000 | 781,530 | ||||||
| Monroe County, PA, Hospital Authority Rev. (Pocono Medical Center), 5%, 2027 | 250,000 | 260,365 | ||||||
| Monroe County, PA, Hospital Authority Rev. (Pocono Medical Center), 5.125%, 2037 | 250,000 | 259,060 | ||||||
| Monroe County, PA, Hospital Authority Rev. (Pocono Medical Center), “A”, 5%, 2041 | 750,000 | 789,000 | ||||||
| Montgomery County, PA, Higher Education & Health Authority Rev. (Abington Memorial Hospital Obligated Group), 5%, 2031 | 1,000,000 | 1,101,000 | ||||||
| New Hampshire Business Finance Authority Rev. (Huggins Hospital), 6.875%, 2039 | 20,000 | 22,034 | ||||||
| Northampton County, PA, General Purpose Authority Hospital Rev. (St. Luke’s Hospital), “A”, 5.5%, 2040 | 500,000 | 531,905 | ||||||
| Philadelphia, PA, Hospitals & Higher Education Facilities Authority Rev. (Temple University Health System), 5.5%, 2026 | 500,000 | 538,075 | ||||||
| Issuer | Shares/Par | Value ($) | ||||||
| Healthcare Revenue - Hospitals - continued | ||||||||
| Philadelphia, PA, Hospitals & Higher Education Facilities Authority Rev. (Temple University Health System), “A”, 5.625%, 2042 | $ | 300,000 | $ | 329,316 | ||||
| Philadelphia, PA, Hospitals & Higher Education Facilities Authority Rev. (The Children’s Hospital of Philadelphia), “C”, 5%, 2025 | 1,000,000 | 1,177,030 | ||||||
| Philadelphia, PA, Hospitals & Higher Education Facilities Authority Rev. (The Children’s Hospital of Philadelphia), “D”, 5%, 2032 | 1,000,000 | 1,134,140 | ||||||
| South Central, PA, General Authority Rev. (Wellspan Health Properties, Inc.), “A”, 6%, 2025 | 750,000 | 861,833 | ||||||
| St. Mary Hospital Authority, PA, Health System Rev. (Catholic Health East), “A”, 5%, 2033 | 500,000 | 538,995 | ||||||
| St. Petersburg, FL, Health Facilities Authority Rev., 6.5%, 2039 | 155,000 | 183,450 | ||||||
| West Shore, PA, Hospital Authority Rev. (Holy Spirit Hospital), “B”, 5.625%, 2032 | 500,000 | 564,145 | ||||||
| Westmoreland County, PA, Industrial Development Authority Rev. (Excela Health Project), 5.125%, 2030 | 1,000,000 | 1,052,090 | ||||||
| Wisconsin Health & Educational Facilities Authority Rev. (Mercy Alliance), 5%, 2039 | 705,000 | 753,018 | ||||||
| Wisconsin Health & Educational Facilities Authority Rev. (Wheaton Franciscan Healthcare), 5.25%, 2031 | 485,000 | 518,717 | ||||||
| $ | 31,269,271 | |||||||
| Healthcare Revenue - Long Term Care - 2.3% | ||||||||
| Bucks County, PA, Industrial Development Authority Retirement Community Rev. (Ann’s Choice, Inc.), “A”, 6.125%, 2025 | $ | 250,000 | $ | 253,605 | ||||
| Bucks County, PA, Industrial Development Authority Rev. (Lutheran Community Telford Center), 5.75%, 2037 | 300,000 | 302,982 | ||||||
| Chartiers Valley, PA, Industrial & Commercial Development Authority (Asbury Health Center Project), 5.75%, 2022 | 250,000 | 257,785 | ||||||
| Cumberland County, PA, Municipal Authority Rev. (Asbury Atlantic, Inc.), 6%, 2040 | 500,000 | 543,170 | ||||||
| Cumberland County, PA, Municipal Authority Rev. (Asbury Atlantic, Inc.), 5.25%, 2041 | 500,000 | 510,505 | ||||||
| Cumberland County, PA, Municipal Authority Rev. (Diakon Lutheran Social Ministries), 6.375%, 2039 | 500,000 | 556,305 | ||||||
| Cumberland County, PA, Municipal Authority Rev. (Presbyterian Homes), “A”, 5.45%, 2021 | 500,000 | 500,680 | ||||||
| Montgomery County, PA, Industrial Development Authority Retirement Community Rev. (Lanier Village Estates, Inc.), “A-1”, 6.25%, 2029 | 250,000 | 289,963 | ||||||
| Montgomery County, PA, Industrial Development Authority Rev. (Whitemarsh Continuing Care), 6.25%, 2035 | 250,000 | 253,890 | ||||||
| Travis County, TX, Health Facilities Development Corp. Rev. (Westminster Manor Health), 7%, 2030 | 65,000 | 77,637 | ||||||
36
Table of Contents
Portfolio of Investments – continued
| Municipal Bonds - continued | ||||||||
| Issuer | Shares/Par | Value ($) | ||||||
| Healthcare Revenue - Long Term Care - continued | ||||||||
| Travis County, TX, Health Facilities Development Corp. Rev. (Westminster Manor Health), 7.125%, 2040 | $ | 105,000 | $ | 124,678 | ||||
| Wisconsin Health & Educational Facilities Authority Rev. (St. John’s Community, Inc.), “A”, 7.25%, 2029 | 10,000 | 11,701 | ||||||
| Wisconsin Health & Educational Facilities Authority Rev. (St. John’s Community, Inc.), “A”, 7.625%, 2039 | 70,000 | 81,658 | ||||||
| $ | 3,764,559 | |||||||
| Human Services - 0.1% | ||||||||
| Montgomery County, PA, Industrial Development Authority (Wordsworth Academy), 8%, 2024 | $ | 150,000 | $ | 150,113 | ||||
| Industrial Revenue - Other - 0.7% | ||||||||
| Pennsylvania Economic Development Financing Authority, Solid Waste Disposal Rev. (Procter & Gamble), 5.375%, 2031 | $ | 1,000,000 | $ | 1,240,330 | ||||
| Miscellaneous Revenue - Entertainment & Tourism - 0.1% | ||||||||
| Louisiana Stadium & Exposition District Rev., “A”, 5%, 2031 | $ | 30,000 | $ | 33,845 | ||||
| Louisiana Stadium & Exposition District Rev., “A”, 5%, 2036 | 95,000 | 105,961 | ||||||
| $ | 139,806 | |||||||
| Sales & Excise Tax Revenue - 1.9% | ||||||||
| Colorado Regional Transportation District, Private Activity Rev. (Denver Transportation Partners), 6.5%, 2030 | $ | 580,000 | $ | 698,007 | ||||
| Colorado Regional Transportation District, Sales Tax Rev. (Fastracks Project), “A”, 5%, 2027 | 565,000 | 674,542 | ||||||
| Guam Government Business Privilege Tax Rev., “B-1”, 5%, 2037 | 250,000 | 273,100 | ||||||
| Guam Government Business Privilege Tax Rev., “C”, 5%, 2016 | 120,000 | 137,329 | ||||||
| Guam Government Business Privilege Tax Rev., “C”, 5%, 2017 | 135,000 | 158,170 | ||||||
| Guam Government Business Privilege Tax Rev., “C”, 5%, 2018 | 130,000 | 154,419 | ||||||
| Puerto Rico Sales Tax Financing Corp., Sales Tax Rev., “C”, 6%, 2039 | 570,000 | 613,616 | ||||||
| Puerto Rico Sales Tax Financing Corp., Sales Tax Rev., Capital Appreciation, “A”, 0%, 2033 | 735,000 | 230,349 | ||||||
| Puerto Rico Sales Tax Financing Corp., Sales Tax Rev., Capital Appreciation, “A”, AMBAC, 0%, 2054 | 3,140,000 | 245,799 | ||||||
| $ | 3,185,331 | |||||||
| Single Family Housing - Local - 0.5% | ||||||||
| Allegheny County, PA, Residential Financing Authority, Single Family Mortgage Rev., “RR”, GNMA, 4.75%, 2025 | $ | 95,000 | $ | 96,689 | ||||
| Issuer | Shares/Par | Value ($) | ||||||
| Single Family Housing - Local - continued | ||||||||
| Allegheny County, PA, Residential Financing Authority, Single Family Mortgage Rev., “VV”, GNMA, 4.95%, 2037 | $ | 655,000 | $ | 669,004 | ||||
| $ | 765,693 | |||||||
| Single Family Housing - State - 3.0% | ||||||||
| Pennsylvania Housing Finance Agency, Single Family Mortgage Rev., 4.75%, 2028 | $ | 1,000,000 | $ | 1,081,350 | ||||
| Pennsylvania Housing Finance Agency, Single Family Mortgage Rev., “105-C”, 4.875%, 2034 | 310,000 | 319,991 | ||||||
| Pennsylvania Housing Finance Agency, Single Family Mortgage Rev., “91-A”, 4.875%, 2026 | 350,000 | 355,075 | ||||||
| Pennsylvania Housing Finance Agency, Single Family Mortgage Rev., “92-A”, 4.75%, 2031 | 965,000 | 1,002,210 | ||||||
| Pennsylvania Housing Finance Agency, Single Family Mortgage Rev., “93-A”, 5.75%, 2037 | 135,000 | 137,311 | ||||||
| Pennsylvania Housing Finance Agency, Single Family Mortgage Rev., “95-A”, 4.875%, 2031 | 1,000,000 | 1,008,990 | ||||||
| Pennsylvania Housing Finance Agency, Single Family Mortgage Rev., “97-A”, 4.5%, 2022 | 1,000,000 | 1,017,460 | ||||||
| $ | 4,922,387 | |||||||
| Solid Waste Revenue - 0.5% | ||||||||
| Delaware County, PA, Industrial Development Authority, Resource Recovery Facilities Rev. (American Ref-Fuel Co.), “A”, 6.2%, 2019 | $ | 300,000 | $ | 300,237 | ||||
| Pennsylvania Economic Development Financing Authority, Sewer Sludge Disposal Rev. (Philadelphia Biosolids Facility), 6.25%, 2032 | 500,000 | 575,455 | ||||||
| $ | 875,692 | |||||||
| State & Agency - Other - 0.5% | ||||||||
| New York State Dormitory Authority Rev. (State University) , “B”, FGIC, 5.25%, 2019 | $ | 675,000 | $ | 758,599 | ||||
| State & Local Agencies - 2.9% | ||||||||
| Commonwealth of Pennsylvania, State Public School Building Authority Lease Rev. (School District of Philadelphia Project), 5%, 2032 | $ | 1,000,000 | $ | 1,086,730 | ||||
| Delaware Valley, PA, Regional Finance Authority, AMBAC, 5.5%, 2018 | 715,000 | 825,982 | ||||||
| Delaware Valley, PA, Regional Finance Authority, “C”, FRN, 0.942%, 2037 | 730,000 | 532,214 | ||||||
| Delaware Valley, PA, Regional Finance Authority, RITES, FRN, AMBAC, 9.913%, 2018 (p) | 50,000 | 65,522 | ||||||
| Pennsylvania Industrial Development Authority, Economic Development Authority Rev., 5.5%, 2018 (c) | 60,000 | 74,072 | ||||||
| Pennsylvania Industrial Development Authority, Economic Development Authority Rev., 5.5%, 2023 | 440,000 | 511,298 | ||||||
| Philadelphia, PA, Municipal Authority Rev., 6.5%, 2034 | 500,000 | 576,130 | ||||||
37
Table of Contents
Portfolio of Investments – continued
| Municipal Bonds - continued | ||||||||
| Issuer | Shares/Par | Value ($) | ||||||
| State & Local Agencies - continued | ||||||||
| State Public School Building Authority, PA, Jefferson County (Dubois Technical School), FGIC, 5%, 2026 | $ | 1,000,000 | $ | 1,062,510 | ||||
| $ | 4,734,458 | |||||||
| Tax - Other - 0.8% | ||||||||
| Allentown, PA, Neighborhood Improvement Zone Development Authority Tax Rev., “A”, 5%, 2035 | $ | 750,000 | $ | 806,603 | ||||
| Guam Government Ltd. Obligation Rev., “A”, 5.375%, 2024 | 140,000 | 152,947 | ||||||
| Guam Government Ltd. Obligation Rev., “A”, 5.625%, 2029 | 45,000 | 49,099 | ||||||
| Virgin Islands Public Finance Authority Rev. (Diageo Project), “A”, 6.75%, 2037 | 125,000 | 143,336 | ||||||
| Virgin Islands Public Finance Authority Rev., “A”, 5.25%, 2024 | 135,000 | 142,146 | ||||||
| $ | 1,294,131 | |||||||
| Tax Assessment - 0.1% | ||||||||
| Washington County, PA, Redevelopment Authority (Victory Centre Project), “A”, 5.45%, 2035 | $ | 235,000 | $ | 240,875 | ||||
| Tobacco - 2.1% | ||||||||
| Buckeye, OH, Tobacco Settlement Financing Authority, “A-2”, 5.125%, 2024 | $ | 160,000 | $ | 146,762 | ||||
| Golden State, CA, Tobacco Securitization Corp., Tobacco Settlement Rev., “A-1”, 5.75%, 2047 | 755,000 | 722,376 | ||||||
| Golden State, CA, Tobacco Securitization Corp., Tobacco Settlement Rev., “A-2”, 5.3%, 2037 | 665,000 | 609,120 | ||||||
| Illinois Railsplitter Tobacco Settlement Authority, 6%, 2028 | 755,000 | 914,803 | ||||||
| New Jersey Tobacco Settlement Financing Corp., “1-A”, 4.5%, 2023 | 445,000 | 443,896 | ||||||
| New Jersey Tobacco Settlement Financing Corp., “1-A”, 5%, 2041 | 500,000 | 450,525 | ||||||
| Virgin Islands Tobacco Settlement Financing Corp., 5%, 2021 | 90,000 | 90,019 | ||||||
| $ | 3,377,501 | |||||||
| Toll Roads - 1.3% | ||||||||
| Delaware River, PA, Joint Toll Bridge Commission Rev., “A”, 4%, 2027 | $ | 1,000,000 | $ | 1,072,650 | ||||
| Pennsylvania Turnpike Commission, “A-1”, ASSD GTY, 5%, 2033 | 1,000,000 | 1,085,460 | ||||||
| $ | 2,158,110 | |||||||
| Transportation - Special Tax - 2.3% | ||||||||
| Commonwealth of Virginia, Transportation Board Rev., Capital Projects, 5%, 2020 | $ | 655,000 | $ | 809,187 | ||||
| Pennsylvania Turnpike Commission, NATL, 5%, 2024 | 1,775,000 | 1,818,186 | ||||||
| Pennsylvania Turnpike Commission (Motor License Fund), “B”, 5%, 2030 | 1,000,000 | 1,127,120 | ||||||
| $ | 3,754,493 | |||||||
| Issuer | Shares/Par | Value ($) | ||||||
| Universities - Colleges - 19.1% | ||||||||
| Adams County, PA, Industrial Development Authority Rev. (Gettysburg College), “A”, 5.875%, 2021 | $ | 250,000 | $ | 253,335 | ||||
| Allegheny County, PA, Higher Education Building Authority Rev. (Duquesne University), 5%, 2033 | 1,250,000 | 1,346,175 | ||||||
| Allegheny County, PA, Higher Education Building Authority Rev. (Duquesne University), “A”, SYNCORA, 5%, 2024 | 1,000,000 | 1,081,760 | ||||||
| Allegheny County, PA, Higher Education Building Authority Rev. (Robert Morris University), “A”, 6%, 2038 | 250,000 | 278,795 | ||||||
| Allegheny County, PA, Higher Education Building Authority Rev. (Robert Morris University), “A”, 5.75%, 2040 | 500,000 | 566,145 | ||||||
| Crawford County, PA, Industrial Development Authority, College Rev., “A”, 6%, 2031 | 250,000 | 281,033 | ||||||
| Cumberland County, PA, Municipal Authority College Rev. (Dickinson College), 5%, 2026 | 1,000,000 | 1,104,430 | ||||||
| Cumberland County, PA, Municipal Authority College Rev. (Dickinson College), “HH1”, 5%, 2039 | 300,000 | 321,852 | ||||||
| Delaware County, PA, Authority College Rev. (Neumann University), 5.25%, 2031 | 565,000 | 615,686 | ||||||
| Delaware County, PA, Authority College Rev. (Neumann University), 6.125%, 2034 | 750,000 | 823,650 | ||||||
| Delaware County, PA, Authority University Rev. (Villanova University), 5.25%, 2031 | 350,000 | 394,961 | ||||||
| Erie, PA, Higher Education Building Authority Rev. (Gannon University), “A”, 5.5%, 2040 | 1,000,000 | 1,088,420 | ||||||
| Erie, PA, Higher Education Building Authority Rev. (Mercyhurst College), 5.5%, 2038 | 500,000 | 537,405 | ||||||
| Illinois Finance Authority Rev. (Roosevelt University Project), 6.25%, 2029 | 1,050,000 | 1,190,364 | ||||||
| Lancaster, PA, Higher Education Authority College Rev. (Franklin & Marshall College), 5%, 2037 | 500,000 | 542,740 | ||||||
| Lycoming County, PA, College Rev. (Pennsylvania College of Technology), 5%, 2032 | 1,000,000 | 1,079,420 | ||||||
| Massachusetts State College, Building Authority Project Rev., “A”, 5%, 2036 | 420,000 | 480,921 | ||||||
| Montgomery County, PA, Higher Education & Health Authority Rev. (Acadia University), 5.25%, 2030 | 1,100,000 | 1,202,102 | ||||||
| New Jersey Educational Facilities Authority Rev. (University of Medicine & Dentistry), “B”, 6%, 2017 | 505,000 | 594,951 | ||||||
| Northampton County, PA, General Purpose Authority Rev. (Lafayette College), 5%, 2034 | 250,000 | 274,153 | ||||||
| Northampton County, PA, General Purpose Authority Rev. (Lehigh University), 5.5%, 2033 | 500,000 | 568,465 | ||||||
| Pennsylvania Higher Educational Facilities Authority Rev. (Allegheny College), 4.75%, 2031 | 500,000 | 524,780 | ||||||
| Pennsylvania Higher Educational Facilities Authority Rev. (Drexel University), NATL, 5%, 2037 | 630,000 | 671,007 | ||||||
38
Table of Contents
Portfolio of Investments – continued
| Municipal Bonds - continued | ||||||||
| Issuer | Shares/Par | Value ($) | ||||||
| Universities - Colleges - continued | ||||||||
| Pennsylvania Higher Educational Facilities Authority Rev. (La Salle University), 5%, 2037 | $ | 500,000 | $ | 555,415 | ||||
| Pennsylvania Higher Educational Facilities Authority Rev. (La Salle University), “A”, 5.25%, 2027 | 500,000 | 544,200 | ||||||
| Pennsylvania Higher Educational Facilities Authority Rev. (LaSalle University), “A”, 5%, 2037 | 500,000 | 528,855 | ||||||
| Pennsylvania Higher Educational Facilities Authority Rev. (Philadelphia University), 5.5%, 2020 | 500,000 | 542,920 | ||||||
| Pennsylvania Higher Educational Facilities Authority Rev. (Saint Francis University Project), “JJ2”, 6.25%, 2041 | 500,000 | 566,620 | ||||||
| Pennsylvania Higher Educational Facilities Authority Rev. (Saint Joseph’s University), “A”, 5%, 2040 | 1,500,000 | 1,610,355 | ||||||
| Pennsylvania Higher Educational Facilities Authority Rev. (Temple University), 5%, 2035 | 2,000,000 | 2,262,740 | ||||||
| Pennsylvania Higher Educational Facilities Authority Rev. (University of Pennsylvania Health System), “A”, 5%, 2024 | 1,945,000 | 2,312,994 | ||||||
| Pennsylvania Higher Educational Facilities Authority Rev. (Widener University), 5.375%, 2029 | 300,000 | 303,378 | ||||||
| Snyder County, PA, Higher Education Authority Rev. (Susquehanna University), 5%, 2038 | 1,000,000 | 1,063,850 | ||||||
| Union County, PA, Higher Educational Facilities Financing Authority, University Rev. (Bucknell University), 5.25%, 2021 | 1,000,000 | 1,000,280 | ||||||
| Union County, PA, Higher Educational Facilities Financing Authority, University Rev. (Bucknell University), “A”, 5%, 2037 | 1,000,000 | 1,133,030 | ||||||
| Washington County, PA, Industrial Development Authority College Rev. (Washington Jefferson College), 5.25%, 2030 | 1,000,000 | 1,108,840 | ||||||
| Wilkes-Barre, PA, Finance Authority Rev. (The University of Scranton), 5%, 2035 | 1,000,000 | 1,085,190 | ||||||
| Wilkes-Barre, PA, Finance Authority Rev. (Wilkes University), 5%, 2037 | 750,000 | 769,770 | ||||||
| $ | 31,210,987 | |||||||
| Universities - Dormitories - 2.4% | ||||||||
| Chester County, PA, Industrial Development Authority Student Housing Rev., (University Student Housing LLC Project), 5%, 2045 | $ | 1,000,000 | $ | 1,044,240 | ||||
| Pennsylvania Higher Educational Facilities Authority Rev. (Edinboro University Foundation), 6%, 2043 | 1,000,000 | 1,112,010 | ||||||
| Pennsylvania Higher Educational Facilities Authority Rev. (Indiana University Foundation), “A”, 5%, 2041 | 750,000 | 809,243 | ||||||
| Pennsylvania Higher Educational Facilities Authority Rev. (Shippensburg University Student Services), 5%, 2030 | 300,000 | 334,545 | ||||||
| Issuer | Shares/Par | Value ($) | ||||||
| Universities - Dormitories - continued | ||||||||
| Pennsylvania Higher Educational Facilities Authority Rev. (Shippensburg University Student Services), 6.25%, 2043 | $ | 500,000 | $ | 584,665 | ||||
| $ | 3,884,703 | |||||||
| Universities - Secondary Schools - 1.4% | ||||||||
| La Vernia, TX, Higher Education Finance Corp. Rev. (Lifeschool of Dallas), “A”, 7.5%, 2041 | $ | 345,000 | $ | 405,706 | ||||
| Philadelphia, PA, Authority for Industrial Development Rev. (Discovery Charter School Project), 6.25%, 2037 | 500,000 | 551,685 | ||||||
| Philadelphia, PA, Authority for Industrial Development Rev. (Global Leadership Academy Charter School), 6.375%, 2040 | 500,000 | 529,120 | ||||||
| Philadelphia, PA, Authority for Industrial Development Rev. (MaST Charter School), 6%, 2035 | 665,000 | 742,007 | ||||||
| $ | 2,228,518 | |||||||
| Utilities - Investor Owned - 2.8% | ||||||||
| Clarion County, PA, Industrial Development Authority, Water Facility Rev. (Pennsylvania American Water Co.), 5.5%, 2039 | $ | 1,000,000 | $ | 1,096,700 | ||||
| Michigan Strategic Fund Ltd. Obligation Rev. (Detroit Edison Co.), 5.625%, 2020 | 415,000 | 510,002 | ||||||
| Michigan Strategic Fund Ltd. Obligation Rev. (Detroit Edison Co.), 5.5%, 2029 (b) | 110,000 | 125,499 | ||||||
| Pennsylvania Economic Development Financing Authority (Allegheny Energy Supply Co. LLC), 7%, 2039 | 600,000 | 714,876 | ||||||
| Pennsylvania Economic Development Financing Authority, Water Facilities Rev. (Aqua Pennsylvania, Inc.), “A”, 5%, 2039 | 1,000,000 | 1,090,100 | ||||||
| Pennsylvania Economic Development Financing Authority, Water Facilities Rev. (Aqua Pennsylvania, Inc.), “B”, 5%, 2043 | 1,000,000 | 1,090,860 | ||||||
| $ | 4,628,037 | |||||||
| Utilities - Municipal Owned - 0.9% | ||||||||
| Guam Power Authority Rev., “A”, 5.5%, 2030 | $ | 315,000 | $ | 350,507 | ||||
| Philadelphia, PA, Gas Works Rev., 5.25%, 2040 | 1,000,000 | 1,070,140 | ||||||
| $ | 1,420,647 | |||||||
| Utilities - Other - 2.2% | ||||||||
| California M-S-R Energy Authority Gas Rev., “A”, 6.5%, 2039 | $ | 545,000 | $ | 739,151 | ||||
| Nebraska Central Plains Energy Project, Gas Project Rev., “3”, 5%, 2032 | 625,000 | 694,831 | ||||||
| Public Authority for Colorado Energy Natural Gas Purchase Rev., 6.5%, 2038 | 280,000 | 378,820 | ||||||
| Tennessee Energy Acquisition Corp., Gas Rev., “A”, 5.25%, 2019 | 420,000 | 486,133 | ||||||
| Tennessee Energy Acquisition Corp., Gas Rev., “A”, 5.25%, 2022 | 235,000 | 273,253 | ||||||
| Tennessee Energy Acquisition Corp., Gas Rev., “C”, 5%, 2021 | 255,000 | 289,764 | ||||||
39
Table of Contents
Portfolio of Investments – continued
| Municipal Bonds - continued | ||||||||
| Issuer | Shares/Par | Value ($) | ||||||
| Utilities - Other - continued | ||||||||
| Texas Gas Acquisition & Supply Corp III., Gas Supply Rev., 5%, 2027 | $ | 470,000 | $ | 509,024 | ||||
| Texas Gas Acquisition & Supply Corp III., Gas Supply Rev., 5%, 2031 | 75,000 | 79,551 | ||||||
| Texas Gas Acquisition & Supply Corp III., Gas Supply Rev., 5%, 2032 | 125,000 | 131,873 | ||||||
| $ | 3,582,400 | |||||||
| Water & Sewer Utility Revenue - 6.6% | ||||||||
| Allegheny County, PA, Sanitation Authority Sewer Rev., AGM, 5%, 2040 | $ | 1,000,000 | $ | 1,105,650 | ||||
| Bucks County, PA, Water & Sewer Authority, Water System Rev., 5%, 2033 | 1,000,000 | 1,135,990 | ||||||
| Clairton, PA, Municipal Authority Sewer Rev., “B”, 5%, 2042 | 1,000,000 | 1,041,150 | ||||||
| Commonwealth of Puerto Rico Aqueduct & Sewer Authority Rev., “A”, 5.75%, 2037 | 290,000 | 286,607 | ||||||
| Commonwealth of Puerto Rico Aqueduct & Sewer Authority Rev., “A”, 6%, 2044 | 1,000,000 | 1,004,790 | ||||||
| Erie, PA, Water Authority Rev., AGM, 4%, 2036 | 500,000 | 501,970 | ||||||
| Erie, PA, Water Authority Rev., AGM, 5%, 2043 | 1,000,000 | 1,071,080 | ||||||
| Guam Government Waterworks Authority, Water & Wastewater System Rev., 5.625%, 2040 | 260,000 | 271,840 | ||||||
| Issuer | Shares/Par | Value ($) | ||||||
| Water & Sewer Utility Revenue - continued | ||||||||
| Harrisburg, PA, Water Authority Rev., 5.25%, 2031 | $ | 1,000,000 | $ | 920,440 | ||||
| Lancaster County, PA, Water & Sewer Authority Rev., NATL, 5%, 2028 | 440,000 | 460,790 | ||||||
| Philadelphia, PA, Water & Wastewater Rev., “A”, 5.25%, 2032 | 1,000,000 | 1,118,430 | ||||||
| Philadelphia, PA, Water & Wastewater Rev., “A”, 5%, 2036 | 1,000,000 | 1,111,680 | ||||||
| St. Mary’s, PA, Water Authority Rev., 5.15%, 2030 | 750,000 | 808,478 | ||||||
| $ | 10,838,895 | |||||||
| Total Municipal Bonds (Identified Cost, $146,236,157) | $ | 156,485,031 | ||||||
| Money Market Funds - 3.0% | ||||||||
| MFS Institutional Money Market Portfolio, 0.14%, at Cost and Net Asset Value (v) | 4,870,172 | $ | 4,870,172 | |||||
| Total Investments (Identified Cost, $151,106,329) | $ | 161,355,203 | ||||||
| Other Assets, Less Liabilities - 1.4% | 2,241,585 | |||||||
| Net Assets - 100.0% | $ | 163,596,788 | ||||||
See Portfolio Footnotes and Notes to Financial Statements
40
Table of Contents
PORTFOLIO OF INVESTMENTS
3/31/13
MFS SOUTH CAROLINA MUNICIPAL BOND FUND
The Portfolio of Investments is a complete list of all securities owned by your fund. It is categorized by broad-based asset classes.
| Municipal Bonds - 96.6% | ||||||||
| Issuer | Shares/Par | Value ($) | ||||||
| Airport Revenue - 1.7% | ||||||||
| Horry County, SC, Airport Rev. (Myrtle Beach International Airport), “A”, 5%, 2040 | $ | 2,250,000 | $ | 2,400,360 | ||||
| Richland Lexington, SC, Airport Rev. (Columbia Airport), AGM, 5.125%, 2025 | 1,500,000 | 1,567,530 | ||||||
| $ | 3,967,890 | |||||||
| General Obligations - General Purpose - 3.6% | ||||||||
| Charleston County, SC, Capital Improvement Rev., 5%, 2019 | $ | 455,000 | $ | 569,924 | ||||
| Charleston County, SC, Capital Improvement, Transportation Sales Tax Rev., 4%, 2029 | 2,000,000 | 2,194,640 | ||||||
| Clinton, SC, Laurens County School District, ASSD GTY, 6.125%, 2033 | 1,000,000 | 1,230,750 | ||||||
| Commonwealth of Puerto Rico, “A”, 6%, 2038 | 560,000 | 568,730 | ||||||
| Puerto Rico Public Buildings Authority Rev., Guaranteed (Government Facilities), “I”, 5.25%, 2033 | 630,000 | 610,854 | ||||||
| Puerto Rico Public Buildings Authority Rev., Guaranteed, “Q”, 5.625%, 2039 | 1,235,000 | 1,224,009 | ||||||
| Puerto Rico Public Buildings Authority Rev., Guaranteed, “S”, 6%, 2041 | 755,000 | 765,691 | ||||||
| State of California, 5.25%, 2029 | 890,000 | 1,035,551 | ||||||
| $ | 8,200,149 | �� | ||||||
| General Obligations - Improvement - 4.9% | ||||||||
| Aiken County, SC, County Administration Building Project, 5%, 2025 | $ | 910,000 | $ | 1,115,150 | ||||
| Guam Government, “A”, 5.25%, 2037 | 280,000 | 282,265 | ||||||
| Guam Government, “A”, 7%, 2039 | 50,000 | 55,750 | ||||||
| South Carolina, State Highway, “A”, 5%, 2017 | 3,000,000 | 3,532,170 | ||||||
| South Carolina, State Highway, “A”, 5%, 2018 | 5,150,000 | 6,212,445 | ||||||
| $ | 11,197,780 | |||||||
| General Obligations - Schools - 7.8% | ||||||||
| Chesterfield County, SC, School District, 5%, 2025 | $ | 3,000,000 | $ | 3,587,790 | ||||
| Lexington County, SC, School District No. 1, “A”, 5%, 2019 | 2,120,000 | 2,570,267 | ||||||
| Orangeburg County, SC, Consolidated School District, 4%, 2019 | 1,315,000 | 1,512,566 | ||||||
| Richland County, SC, School District No. 1, N, 5%, 2014 | 1,255,000 | 1,309,693 | ||||||
| Richland County, SC, School District No. 1, “A”, 5%, 2025 | 2,000,000 | 2,412,480 | ||||||
| Richland County, SC, School District No. 1, “A”, 5%, 2029 | 3,000,000 | 3,548,220 | ||||||
| York County, SC, Fort Mill School District, “A”, 3%, 2032 | 1,315,000 | 1,224,581 | ||||||
| York County, SC, School District, 5%, 2030 | 1,570,000 | 1,637,965 | ||||||
| $ | 17,803,562 | |||||||
| Issuer | Shares/Par | Value ($) | ||||||
| Healthcare Revenue - Hospitals - 16.7% | ||||||||
| Arizona Health Facilities Authority Rev. (Banner Health), “A”, 4%, 2043 | $ | 745,000 | $ | 724,729 | ||||
| DeKalb County, GA, Hospital Authority Rev. (DeKalb Medical Center, Inc.), 6.125%, 2040 | 400,000 | 466,020 | ||||||
| Escambia County, FL, Health Facilities Authority (Baptist Hospital, Inc.), “A”, 6%, 2036 | 925,000 | 1,064,906 | ||||||
| Florence County, SC, Hospital Rev. (McLeod Regional Medical Center), “A”, AGM, 5.25%, 2034 | 1,050,000 | 1,096,536 | ||||||
| Florence County, SC, Hospital Rev. (McLeod Regional Medical Center), “A”, 5%, 2037 | 3,000,000 | 3,288,810 | ||||||
| Greenville, SC, Hospital Systems, Hospital Facilities Rev., 6%, 2020 | 3,400,000 | 4,045,218 | ||||||
| Greenwood County, SC, Hospital Rev. (Self Regional Healthcare), 5.375%, 2039 | 1,000,000 | 1,088,090 | ||||||
| Greenwood County, SC, Hospital Rev. (Self Regional Healthcare), “B”, 5%, 2031 | 2,000,000 | 2,223,260 | ||||||
| Illinois Finance Authority Rev. (Edward Hospital), “A”, AMBAC, 5.5%, 2040 | 1,055,000 | 1,149,391 | ||||||
| Illinois Finance Authority Rev. (Provena Health), “A”, 6%, 2028 | 550,000 | 621,544 | ||||||
| Illinois Finance Authority Rev. (Resurrection Health), 6.125%, 2025 | 155,000 | 175,310 | ||||||
| Illinois Finance Authority Rev. (Silver Cross Hospital & Medical Centers), 7%, 2044 | 480,000 | 572,093 | ||||||
| Jefferson Parish, LA, Hospital Service District No. 2 (East Jefferson General Hospital), 6.25%, 2031 | 155,000 | 179,867 | ||||||
| Jefferson Parish, LA, Hospital Service District No. 2 (East Jefferson General Hospital), 6.375%, 2041 | 605,000 | 704,559 | ||||||
| Kentucky Economic Development Finance Authority, Hospital Facilities Rev. (Owensboro Medical Health System), “A”, 5.75%, 2025 | 465,000 | 539,358 | ||||||
| Kentucky Economic Development Finance Authority, Hospital Facilities Rev. (Owensboro Medical Health System), “A”, 6.375%, 2040 | 605,000 | 717,246 | ||||||
| Kentucky Economic Development Finance Authority, Hospital Facilities Rev. (Owensboro Medical Health System), “A”, 6.5%, 2045 | 865,000 | 1,029,878 | ||||||
| Lexington County, SC, Health Services District, Inc., Hospital Rev., 5.5%, 2014 (c) | 250,000 | 264,145 | ||||||
| Lexington County, SC, Health Services District, Inc., Hospital Rev., 5.5%, 2014 (c) | 250,000 | 264,145 | ||||||
| Lexington County, SC, Health Services District, Inc., Hospital Rev., 5%, 2032 | 1,500,000 | 1,611,450 | ||||||
| Lexington County, SC, Health Services District, Inc., Hospital Rev., Refunding & Improvement, 5.5%, 2013 (c) | 1,000,000 | 1,030,530 | ||||||
| Lexington County, SC, Health Services District, Inc., Hospital Rev., Refunding & Improvement, 5%, 2026 | 500,000 | 572,685 | ||||||
41
Table of Contents
Portfolio of Investments – continued
| Municipal Bonds - continued | ||||||||
| Issuer | Shares/Par | Value ($) | ||||||
| Healthcare Revenue - Hospitals - continued | ||||||||
| Louisville & Jefferson County, KY, Metropolitan Government Healthcare Systems Rev. (Norton Healthcare, Inc.), 5.25%, 2036 | $ | 465,000 | $ | 491,235 | ||||
| Martin County, FL, Health Facilities Authority Rev. (Martin Memorial Medical Center), 5.5%, 2042 | 315,000 | 349,379 | ||||||
| New Hampshire Business Finance Authority Rev. (Elliot Hospital Obligated Group), “A”, 6%, 2027 | 400,000 | 463,936 | ||||||
| New Hampshire Business Finance Authority Rev. (Elliot Hospital Obligated Group), “A”, 6.125%, 2039 | 445,000 | 500,509 | ||||||
| Richmond, IN, Hospital Authority Rev. (Reid Hospital), “A”, 6.5%, 2029 | 585,000 | 657,756 | ||||||
| Royal Oak, MI, Hospital Finance Authority Rev. (William Beaumont Hospital), 8.25%, 2039 | 915,000 | 1,146,495 | ||||||
| South Carolina Jobs & Economic Development Authority, Hospital Facilities Rev. (Anmed Health), “B”, ASSD GTY, 5.5%, 2038 | 1,500,000 | 1,647,720 | ||||||
| South Carolina Jobs & Economic Development Authority, Hospital Facilities Rev. (Palmetto Health Alliance), 6.25%, 2031 | 750,000 | 762,008 | ||||||
| South Carolina Jobs & Economic Development Authority, Hospital Facilities Rev. (Tuomey Health), CIFG, 5%, 2030 | 375,000 | 387,503 | ||||||
| South Carolina Jobs & Economic Development Authority, Hospital Rev. (Conway Hospital, Inc.), 5%, 2037 | 1,250,000 | 1,338,738 | ||||||
| South Carolina Jobs & Economic Development Authority, Hospital Rev. (Palmetto Health), 5.75%, 2039 | 275,000 | 309,169 | ||||||
| Spartanburg County, SC, Regional Health Services District, “A”, 5%, 2032 | 2,000,000 | 2,222,420 | ||||||
| Spartanburg County, SC, Regional Health Services District, “A”, 5%, 2037 | 2,000,000 | 2,196,460 | ||||||
| Washington Health Care Facilities Authority Rev. (Central Washington Health Services), 6.75%, 2029 | 105,000 | 123,728 | ||||||
| Washington Health Care Facilities Authority Rev. (Central Washington Health Services), 7%, 2039 | 255,000 | 294,747 | ||||||
| Wisconsin Health & Educational Facilities Authority Rev. (ProHealth Care, Inc. Obligated Group), 6.625%, 2039 | 945,000 | 1,096,540 | ||||||
| Wisconsin Health & Educational Facilities Authority Rev. (Wheaton Franciscan Healthcare), 5.25%, 2031 | 640,000 | 684,493 | ||||||
| $ | 38,102,606 | |||||||
| Healthcare Revenue - Long Term Care - 0.5% | ||||||||
| South Carolina Jobs & Economic Development Authority Rev. (Woodlands at Furman), “A”, 6%, 2047 | $ | 356,475 | $ | 230,850 | ||||
| South Carolina Jobs & Economic Development Authority Rev. (Woodlands at Furman), Capital Appreciation, “B”, 0%, 2047 | 152,775 | 3,007 | ||||||
| Issuer | Shares/Par | Value ($) | ||||||
| Healthcare Revenue - Long Term Care - continued | ||||||||
| South Carolina Jobs & Economic Development Authority, Health & Facilities Rev., First Mortgage (Wesley Commons), 5.125%, 2026 | $ | 400,000 | $ | 401,076 | ||||
| South Carolina Jobs & Economic Development Authority, Residential Care Facilities Rev. (Episcopal Home), “A”, 6.375%, 2032 | 400,000 | 413,048 | ||||||
| $ | 1,047,981 | |||||||
| Human Services - 0.3% | ||||||||
| Greenville County, SC, Hospital Rev. (Chestnut Hill), “A”, 8%, 2015 | $ | 560,000 | $ | 568,837 | ||||
| Industrial Revenue - Chemicals - 0.4% | ||||||||
| York County, SC, Industrial Rev. (Hoechst Celanese), 5.7%, 2024 | $ | 1,000,000 | $ | 1,000,830 | ||||
| Industrial Revenue - Other - 0.5% | ||||||||
| Calhoun County, SC, Solid Waste Disposal Facilities Rev. (Carolina Eastman Co.), ETM, 6.75%, 2017 (c) | $ | 1,000,000 | $ | 1,229,180 | ||||
| Industrial Revenue - Paper - 0.4% | ||||||||
| Richland County, SC, Environmental Improvement Rev. (International Paper), “A”, 6.1%, 2023 | $ | 1,000,000 | $ | 1,012,550 | ||||
| Miscellaneous Revenue - Entertainment & Tourism - 0.1% | ||||||||
| Louisiana Stadium & Exposition District Rev., “A”, 5%, 2031 | $ | 45,000 | $ | 50,767 | ||||
| Louisiana Stadium & Exposition District Rev., “A”, 5%, 2036 | 140,000 | 156,153 | ||||||
| $ | 206,920 | |||||||
| Miscellaneous Revenue - Other - 0.8% | ||||||||
| South Carolina Jobs & Economic Development Authority Rev. (Myrtle Beach Convention), “B”, NATL, 5.125%, 2018 | $ | 570,000 | $ | 570,747 | ||||
| South Carolina Jobs & Economic Development Authority Rev. (Myrtle Beach Convention), “B”, NATL, 5.125%, 2019 | 595,000 | 595,714 | ||||||
| South Carolina Jobs & Economic Development Authority Rev. (Myrtle Beach Convention), “B”, NATL, 5.125%, 2020 | 630,000 | 630,674 | ||||||
| Summit County, OH, Port Authority Building Rev. (Flats East Development Recovery Zone Facility Bonds), 6.875%, 2040 | 45,000 | 50,052 | ||||||
| $ | 1,847,187 | |||||||
| Multi-Family Housing Revenue - 1.0% | ||||||||
| North Charleston, SC, Housing Authority Rev. (Horizon Village), “A”, GNMA, 5%, 2038 | $ | 1,000,000 | $ | 1,023,850 | ||||
| North Charleston, SC, Housing Authority Rev. (Horizon Village), “A”, GNMA, 5.1%, 2041 | 1,210,000 | 1,232,954 | ||||||
| $ | 2,256,804 | |||||||
42
Table of Contents
Portfolio of Investments – continued
| Municipal Bonds - continued | ||||||||
| Issuer | Shares/Par | Value ($) | ||||||
| Port Revenue - 0.1% | ||||||||
| South Carolina Ports Authority, Ports Rev., 5.25%, 2040 | $ | 250,000 | $ | 276,253 | ||||
| Sales & Excise Tax Revenue - 2.4% | ||||||||
| Colorado Regional Transportation District, Private Activity Rev. (Denver Transportation Partners), 6%, 2041 | $ | 725,000 | $ | 831,060 | ||||
| Guam Government Business Privilege Tax Rev., “C”, 5%, 2016 | 185,000 | 211,716 | ||||||
| Guam Government Business Privilege Tax Rev., “C”, 5%, 2017 | 200,000 | 234,326 | ||||||
| Guam Government Business Privilege Tax Rev., “C”, 5%, 2018 | 190,000 | 225,690 | ||||||
| Puerto Rico Sales Tax Financing Corp., Sales Tax Rev., 5.25%, 2057 | 735,000 | 759,329 | ||||||
| Puerto Rico Sales Tax Financing Corp., Sales Tax Rev., “C”, 6%, 2039 | 745,000 | 802,007 | ||||||
| Puerto Rico Sales Tax Financing Corp., Sales Tax Rev., “C”, 5%, 2040 | 820,000 | 848,167 | ||||||
| Puerto Rico Sales Tax Financing Corp., Sales Tax Rev., “C”, 5.25%, 2040 | 845,000 | 891,560 | ||||||
| Puerto Rico Sales Tax Financing Corp., Sales Tax Rev., Capital Appreciation, 0%, 2034 | 1,840,000 | 539,046 | ||||||
| $ | 5,342,901 | |||||||
| Single Family Housing - State - 2.7% | ||||||||
| California Housing Finance Agency Rev. (Home Mortgage), “I”, 4.7%, 2026 | $ | 830,000 | $ | 834,266 | ||||
| South Carolina Housing, Finance & Development Authority Mortgage Rev., “A-2”, AGM, 5.2%, 2035 | 640,000 | 644,774 | ||||||
| South Carolina Housing, Finance & Development Authority Rev., 5.55%, 2038 | 880,000 | 909,093 | ||||||
| South Carolina Housing, Finance & Development Authority Rev., “A-2”, AGM, 5.35%, 2024 | 1,280,000 | 1,283,725 | ||||||
| South Carolina Housing, Finance & Development Authority Rev., “A-2”, AMBAC, 5.15%, 2037 | 920,000 | 957,472 | ||||||
| South Carolina Housing, Finance & Development Authority Rev., “C-2”, AGM, 4.6%, 2032 | 1,460,000 | 1,482,323 | ||||||
| $ | 6,111,653 | |||||||
| Solid Waste Revenue - 0.5% | ||||||||
| Three Rivers, SC, Solid Waste Authority Rev., 5%, 2028 | $ | 1,000,000 | $ | 1,113,310 | ||||
| State & Local Agencies - 4.0% | ||||||||
| Charleston, SC, Educational Excellence Finance Corp. Rev. (Charleston County School District Project), 5%, 2031 | $ | 3,720,000 | $ | 4,118,933 | ||||
| Greenville County, SC, School District Installment Purchase Rev., 5%, 2027 | 500,000 | 559,070 | ||||||
| Greenville County, SC, School District Installment Purchase Rev., AGM, 5%, 2028 | 680,000 | 759,050 | ||||||
| Los Angeles, CA, Municipal Improvement Corp. Lease Rev. (Real Property), “E”, 6%, 2039 | 290,000 | 344,856 | ||||||
| North Charleston, SC, Public Facilities Corp., Installment Purchase Rev., 5%, 2035 | 2,000,000 | 2,260,080 | ||||||
| Issuer | Shares/Par | Value ($) | ||||||
| State & Local Agencies - continued | ||||||||
| Virginia Public School Authority, Special Obligation Montgomery County, 5%, 2030 | $ | 910,000 | $ | 1,055,309 | ||||
| $ | 9,097,298 | |||||||
| Tax - Other - 2.9% | ||||||||
| Greenville County, SC, Hospitality Tax Rev., AGM, 5%, 2022 | $ | 1,025,000 | $ | 1,210,453 | ||||
| Greenville County, SC, Tourism Public Facilities Corp., Hospitality Tax, 4.75%, 2029 | 750,000 | 816,938 | ||||||
| Greenville County, SC, Tourism Public Facilities Corp., Hospitality Tax, 4.75%, 2030 | 500,000 | 543,325 | ||||||
| Guam Government Ltd. Obligation Rev., “A”, 5.375%, 2024 | 180,000 | 196,646 | ||||||
| Guam Government Ltd. Obligation Rev., “A”, 5.625%, 2029 | 60,000 | 65,465 | ||||||
| Hudson Yards, NY, Infrastructure Corp. Rev., “A”, 5%, 2047 | 665,000 | 703,224 | ||||||
| New Jersey Economic Development Authority Rev., 5%, 2025 | 215,000 | 245,253 | ||||||
| New Jersey Economic Development Authority Rev., 5%, 2026 | 110,000 | 124,636 | ||||||
| New Jersey Economic Development Authority Rev., 5%, 2028 | 45,000 | 50,343 | ||||||
| New Jersey Economic Development Authority Rev., 5%, 2029 | 45,000 | 50,118 | ||||||
| Virgin Islands Public Finance Authority Rev. (Diageo Project), “A”, 6.75%, 2037 | 160,000 | 183,470 | ||||||
| Virgin Islands Public Finance Authority Rev., “A”, 5.25%, 2024 | 180,000 | 189,527 | ||||||
| Virgin Islands Public Finance Authority Rev., “A”, 5%, 2032 | 2,100,000 | 2,311,596 | ||||||
| $ | 6,690,994 | |||||||
| Tax Assessment - 0.2% | ||||||||
| Lancaster County, SC, Assessment Rev. (Sun City Carolina Lakes), 5.45%, 2037 | $ | 425,000 | $ | 425,276 | ||||
| Tobacco - 2.1% | ||||||||
| Buckeye, OH, Tobacco Settlement Financing Authority, “A-2”, 5.125%, 2024 | $ | 225,000 | $ | 206,384 | ||||
| Golden State, CA, Tobacco Securitization Corp., Tobacco Settlement Rev., “A-1”, 5.75%, 2047 | 930,000 | 889,815 | ||||||
| Golden State, CA, Tobacco Securitization Corp., Tobacco Settlement Rev., “A-2”, 5.3%, 2037 | 840,000 | 769,415 | ||||||
| Illinois Railsplitter Tobacco Settlement Authority, 5.5%, 2023 | 910,000 | 1,099,917 | ||||||
| Illinois Railsplitter Tobacco Settlement Authority, 6%, 2028 | 850,000 | 1,029,911 | ||||||
| New Jersey Tobacco Settlement Financing Corp., “1-A”, 5%, 2041 | 845,000 | 761,387 | ||||||
| $ | 4,756,829 | |||||||
| Toll Roads - 0.5% | ||||||||
| Virginia Small Business Financing Authority Rev. (Elizabeth River Crossings Opco LLC Project), 5.25%, 2032 | $ | 200,000 | $ | 213,882 | ||||
43
Table of Contents
Portfolio of Investments – continued
| Municipal Bonds - continued | ||||||||
| Issuer | Shares/Par | Value ($) | ||||||
| Toll Roads - continued | ||||||||
| Virginia Small Business Financing Authority Rev. (Elizabeth River Crossings Opco LLC Project), 6%, 2037 | $ | 335,000 | $ | 382,711 | ||||
| Virginia Small Business Financing Authority Rev. (Elizabeth River Crossings Opco LLC Project), 5.5%, 2042 | 535,000 | 574,638 | ||||||
| $ | 1,171,231 | |||||||
| Transportation - Special Tax - 4.6% | ||||||||
| Commonwealth of Puerto Rico Highway & Transportation Authority Rev., “AA-1”, AGM, 4.95%, 2026 | $ | 735,000 | $ | 769,545 | ||||
| Metropolitan Transportation Authority Rev., NY, Capital Appreciation, “A”, 0%, 2030 | 1,545,000 | 814,122 | ||||||
| South Carolina Transportation Infrastructure Bank Rev., “A”, 5%, 2013 | 1,500,000 | 1,534,275 | ||||||
| South Carolina Transportation Infrastructure Rev., “A”, 5%, 2023 | 2,825,000 | 3,427,488 | ||||||
| South Carolina Transportation Infrastructure Rev., “A”, AMBAC, 5%, 2027 | 2,000,000 | 2,047,320 | ||||||
| South Carolina Transportation Infrastructure Rev., “A”, AMBAC, 5%, 2033 | 1,645,000 | 1,760,709 | ||||||
| $ | 10,353,459 | |||||||
| Universities - Colleges - 7.8% | ||||||||
| California Educational Facilities Authority Rev. (Pitzer College), “A”, 5%, 2030 | $ | 900,000 | $ | 934,596 | ||||
| College of Charleston, SC, Academic & Administrative Facilities Rev., “B”, SYNCORA, 5%, 2024 | 800,000 | 819,760 | ||||||
| Educational Facilities Authority Private Non-Profit Institutions of Higher Learning (Wofford College), “A”, 5%, 2036 | 1,000,000 | 1,052,410 | ||||||
| Illinois Finance Authority Rev. (Roosevelt University Project), 6.5%, 2039 | 1,055,000 | 1,194,872 | ||||||
| Illinois Finance Authority Rev. (University of Chicago), “A”, 5%, 2051 | 555,000 | 608,025 | ||||||
| Pinellas County, FL, Educational Facilities Authority Rev. (Barry University), 6%, 2041 | 200,000 | 230,122 | ||||||
| Puerto Rico Industrial, Tourist, Educational, Medical, & Environmental Control Facilities Financing Authority, Higher Education Rev. (Ana G. Mendez University System Project), 5.125%, 2032 | 75,000 | 73,793 | ||||||
| Puerto Rico Industrial, Tourist, Educational, Medical, & Environmental Control Facilities Financing Authority, Higher Education Rev. (Ana G. Mendez University System Project), 5.375%, 2042 | 125,000 | 125,309 | ||||||
| Puerto Rico Industrial, Tourist, Medical, & Environmental Central Facilities (University of Sacred Heart), 4.375%, 2031 | 55,000 | 52,415 | ||||||
| Puerto Rico Industrial, Tourist, Medical, & Environmental Central Facilities (University of Sacred Heart), 5%, 2042 | 30,000 | 29,366 | ||||||
| South Carolina Educational Facilities Authority (Wofford College), 5.25%, 2032 | 1,000,000 | 1,061,260 | ||||||
| Issuer | Shares/Par | Value ($) | ||||||
| Universities - Colleges - continued | ||||||||
| University of California Rev., “G”, 4%, 2029 | $ | 1,155,000 | $ | 1,218,179 | ||||
| University of South Carolina, Athletic Facilities Rev., “A”, 5%, 2035 | 1,000,000 | 1,112,500 | ||||||
| University of South Carolina, Athletic Facilities Rev., “A”, 5.5%, 2038 | 1,000,000 | 1,121,420 | ||||||
| University of South Carolina, Athletic Facilities Rev., “A”, 5%, 2040 | 2,000,000 | 2,206,360 | ||||||
| University of South Carolina, Higher Education Rev., “A”, 5%, 2035 | 2,555,000 | 2,869,750 | ||||||
| University of South Carolina, Higher Education Rev., “A”, 5%, 2039 | 1,000,000 | 1,129,620 | ||||||
| University of South Carolina, University Rev., “A”, AMBAC, 5%, 2034 | 1,815,000 | 1,821,806 | ||||||
| $ | 17,661,563 | |||||||
| Universities - Secondary Schools - 0.2% | ||||||||
| North Texas Education Finance Corp., Education Rev. (Uplift Education), “A”, 4.875%, 2032 | $ | 90,000 | $ | 96,773 | ||||
| North Texas Education Finance Corp., Education Rev. (Uplift Education), “A”, 5.125%, 2042 | 220,000 | 238,641 | ||||||
| $ | 335,414 | |||||||
| Utilities - Investor Owned - 1.9% | ||||||||
| Michigan Strategic Fund Ltd. Obligation Rev. (Detroit Edison Co.), 5.625%, 2020 | $ | 800,000 | $ | 983,136 | ||||
| Michigan Strategic Fund Ltd. Obligation Rev. (Detroit Edison Co.), 5.5%, 2029 (b) | 150,000 | 171,135 | ||||||
| South Carolina Jobs-Economic Development Authority Industrial Rev. (Electric & Gas Co. Project), 4%, 2028 | 3,000,000 | 3,213,990 | ||||||
| $ | 4,368,261 | |||||||
| Utilities - Municipal Owned - 8.3% | ||||||||
| Easley, SC, Utility Rev., AGM, 5.25%, 2031 | $ | 2,500,000 | $ | 2,771,525 | ||||
| Easley, SC, Utility Rev., ASSD GTY, 5%, 2034 | 2,325,000 | 2,606,767 | ||||||
| Greenwood, SC, Combined Public Utility, Refunding & Improvement Systems, NATL, 5%, 2021 | 175,000 | 179,058 | ||||||
| Piedmont, SC, Municipal Power Agency, FGIC, 6.25%, 2021 | 2,700,000 | 3,481,299 | ||||||
| Piedmont, SC, Municipal Power Agency, “C”, AGM, 5%, 2030 | 1,000,000 | 1,132,580 | ||||||
| Puerto Rico Electric Power Authority Rev., “TT”, 5%, 2027 | 530,000 | 516,782 | ||||||
| South Carolina Public Service Authority Rev. (Santee Cooper), “B”, 5%, 2033 | 1,000,000 | 1,131,400 | ||||||
| South Carolina Public Service Authority Rev. (Santee Cooper), “E”, 5%, 2040 | 2,000,000 | 2,230,860 | ||||||
| South Carolina Public Service Authority Rev., “A”, 5.5%, 2038 | 2,500,000 | 2,877,250 | ||||||
| South Carolina Public Service Authority, “A”, AMBAC, 5%, 2034 | 2,000,000 | 2,057,480 | ||||||
| $ | 18,985,001 | |||||||
44
Table of Contents
Portfolio of Investments – continued
| Municipal Bonds - continued | ||||||||
| Issuer | Shares/Par | Value ($) | ||||||
| Utilities - Other - 1.2% | ||||||||
| California M-S-R Energy Authority Gas Rev., “A”, 6.5%, 2039 | $ | 685,000 | $ | 929,024 | ||||
| Public Authority for Colorado Energy Natural Gas Purchase Rev., 6.25%, 2028 | 130,000 | 163,375 | ||||||
| Tennessee Energy Acquisition Corp., Gas Rev., “A”, 5.25%, 2021 | 270,000 | 313,767 | ||||||
| Tennessee Energy Acquisition Corp., Gas Rev., “A”, 5.25%, 2022 | 290,000 | 337,206 | ||||||
| Tennessee Energy Acquisition Corp., Gas Rev., “A”, 5.25%, 2026 | 570,000 | 660,106 | ||||||
| Tennessee Energy Acquisition Corp., Gas Rev., “C”, 5%, 2021 | 330,000 | 374,989 | ||||||
| $ | 2,778,467 | |||||||
| Water & Sewer Utility Revenue - 18.5% | ||||||||
| Charleston, SC, Waterworks & Sewer Rev., 5%, 2024 | $ | 2,995,000 | $ | 3,688,133 | ||||
| Charleston, SC, Waterworks & Sewer Rev., 5%, 2023 | 2,000,000 | 2,486,360 | ||||||
| Charleston, SC, Waterworks & Sewer Rev., 5%, 2033 | 3,000,000 | 3,513,720 | ||||||
| Charleston, SC, Waterworks & Sewer Rev., Capital Improvement, 5%, 2035 | 1,000,000 | 1,142,450 | ||||||
| Columbia, SC, Waterworks & Sewer Systems Rev., AGM, 5%, 2029 | 1,020,000 | 1,106,333 | ||||||
| Columbia, SC, Waterworks & Sewer Systems Rev., 5%, 2030 | 1,000,000 | 1,185,590 | ||||||
| Columbia, SC, Waterworks & Sewer Systems Rev., “A”, 5%, 2025 | 580,000 | 692,955 | ||||||
| Columbia, SC, Waterworks & Sewer Systems Rev., “A”, 5%, 2036 | 3,000,000 | 3,417,960 | ||||||
| Commonwealth of Puerto Rico Aqueduct & Sewer Authority Rev., “A”, 6%, 2044 | 2,000,000 | 2,009,580 | ||||||
| Dorchester County, SC, Waterworks & Sewer Systems Rev., ASSD GTY, 5%, 2029 | 1,000,000 | 1,102,330 | ||||||
| Grand Strand, SC, Waterworks & Sewer Systems Rev., “A”, 5%, 2041 | 3,000,000 | 3,426,690 | ||||||
| Greenville, SC, Renewable Water Resource Sewer Systems Rev., “A”, 5%, 2024 | 1,000,000 | 1,165,710 | ||||||
| Issuer | Shares/Par | Value ($) | ||||||
| Water & Sewer Utility Revenue - continued | ||||||||
| Greenwood, SC, Sewer Systems Rev., AGM, 5%, 2030 | $ | 1,000,000 | $ | 1,125,410 | ||||
| Guam Government Waterworks Authority, Water & Wastewater System Rev., 5.625%, 2040 | 315,000 | 329,345 | ||||||
| Laurens County, SC, Water & Sewer Commission, Waterworks District (Rabon Creek), “A”, 5%, 2032 | 1,405,000 | 1,530,691 | ||||||
| Lexington, SC, Waterworks & Sewer Systems Rev., ASSD GTY, 5%, 2039 | 2,000,000 | 2,284,640 | ||||||
| Myrtle Beach, SC, Water & Sewer Authority Rev., AGM, 4.5%, 2028 | 1,770,000 | 1,902,077 | ||||||
| Rock Hill, SC, Utility Systems Rev., Refunding & Improvement, “B”, N, 5%, 2039 | 2,500,000 | 2,805,050 | ||||||
| Rock Hill, SC, Utility Systems Rev., Refunding & Improvement, “B”, N, 4%, 2042 | 750,000 | 757,208 | ||||||
| Spartanburg, SC, Water & Sewer Authority Rev., “B”, NATL, 5.25%, 2030 | 1,250,000 | 1,289,925 | ||||||
| Spartanburg, SC, Waterworks Rev., ASSD GTY, 5%, 2039 | 2,000,000 | 2,223,400 | ||||||
| Spartanburg, SC, Waterworks Rev., “A”, AGM, 5%, 2017 | 2,040,000 | 2,389,942 | ||||||
| Sumter, SC, Waterworks & Sewer Systems Rev., SYNCORA, 5%, 2025 | 540,000 | 610,713 | ||||||
| $ | 42,186,212 | |||||||
Total Municipal Bonds (Identified Cost, $206,657,951) | $ | 220,096,398 | ||||||
| Money Market Funds - 3.5% | ||||||||
| MFS Institutional Money Market Portfolio, 0.14%, at Cost and Net Asset Value (v) | 7,947,671 | $ | 7,947,671 | |||||
Total Investments (Identified Cost, $214,605,622) | $ | 228,044,069 | ||||||
| Other Assets, Less Liabilities - (0.1)% | (253,442) | |||||||
| Net Assets - 100.0% | $ | 227,790,627 | ||||||
See Portfolio Footnotes and Notes to Financial Statements
45
Table of Contents
PORTFOLIO OF INVESTMENTS
3/31/13
MFS TENNESSEE MUNICIPAL BOND FUND
The Portfolio of Investments is a complete list of all securities owned by your fund. It is categorized by broad-based asset classes.
| Municipal Bonds - 96.8% | ||||||||
| Issuer | Shares/Par | Value ($) | ||||||
| Airport Revenue - 1.9% | ||||||||
| Denver, CO, City & County Airport Systems Rev., “A”, 5%, 2027 | $ | 70,000 | $ | 79,119 | ||||
| Denver, CO, City & County Airport Systems Rev., “A”, 5%, 2028 | 70,000 | 78,752 | ||||||
| Denver, CO, City & County Airport Systems Rev., “B”, 5%, 2032 | 140,000 | 158,606 | ||||||
| Memphis-Shelby County, TN, Airport Authority Facilities Rev., “A”, ASSD GTY, 5%, 2039 | 1,000,000 | 1,148,960 | ||||||
| Memphis-Shelby County, TN, Airport Authority Facilities Rev., “D”, 5%, 2025 | 1,000,000 | 1,160,120 | ||||||
| $ | 2,625,557 | |||||||
| General Obligations - General Purpose - 17.2% | ||||||||
| Chattanooga, TN, “B”, 4%, 2026 | $ | 1,270,000 | $ | 1,422,197 | ||||
| Commonwealth of Puerto Rico, “A”, 5.375%, 2033 | 270,000 | 269,152 | ||||||
| Commonwealth of Puerto Rico, “A”, 6%, 2038 | 455,000 | 462,093 | ||||||
| Johnson City, TN, 5%, 2031 | 1,000,000 | 1,139,450 | ||||||
| Metropolitan Government of Nashville & Davidson County, TN, 5%, 2021 | 2,000,000 | 2,448,020 | ||||||
| Metropolitan Government of Nashville & Davidson County, TN, 5%, 2028 | 2,000,000 | 2,382,040 | ||||||
| Metropolitan Government of Nashville & Davidson County, TN, “A”, 5%, 2019 | 1,500,000 | 1,834,830 | ||||||
| Morristown, TN, 4%, 2026 | 1,235,000 | 1,350,250 | ||||||
| Pigeon Forge, TN, Industrial Development Board, Public Facilities, 5%, 2034 | 1,000,000 | 1,135,260 | ||||||
| Puerto Rico Public Buildings Authority Rev., Guaranteed (Government Facilities), “I”, 5.25%, 2033 | 480,000 | 465,413 | ||||||
| Puerto Rico Public Buildings Authority Rev., Guaranteed, “L”, 5.5%, 2021 | 1,000,000 | 1,044,210 | ||||||
| Puerto Rico Public Buildings Authority Rev., Guaranteed, “M”, 6.25%, 2031 | 525,000 | 575,678 | ||||||
| Shelby County, TN, “A”, 5%, 2028 | 2,000,000 | 2,395,400 | ||||||
| State of California, 5.25%, 2029 | 535,000 | 622,494 | ||||||
| State of California, 5.125%, 2033 | 525,000 | 589,591 | ||||||
| State of Tennessee, “A”, 5%, 2022 | 1,500,000 | 1,910,430 | ||||||
| State of Tennessee, “A”, 5%, 2029 | 1,500,000 | 1,794,270 | ||||||
| Sumner County, TN, 5%, 2021 | 1,300,000 | 1,635,738 | ||||||
| $ | 23,476,516 | |||||||
| General Obligations - Improvement - 2.9% | ||||||||
| Bartlett, TN, 3%, 2020 | $ | 625,000 | $ | 691,444 | ||||
| Bartlett, TN, 3%, 2020 | 250,000 | 276,578 | ||||||
| Guam Government, “A”, 5.25%, 2037 | 215,000 | 216,739 | ||||||
| Montgomery County, TN, 4%, 2025 | 600,000 | 674,664 | ||||||
| Williamson County, TN, “A”, 4%, 2022 | 780,000 | 931,757 | ||||||
| Williamson County, TN, School District, “A”, 4%, 2019 | 1,015,000 | 1,193,813 | ||||||
| $ | 3,984,995 | |||||||
| Issuer | Shares/Par | Value ($) | ||||||
| General Obligations - Schools - 1.2% | ||||||||
| Clovis, CA, Unified School District (Election of 2004), Capital Appreciation, “A”, 0%, 2027 | $ | 1,260,000 | $ | 709,380 | ||||
| Williamson County, TN, School District, 5%, 2026 | 740,000 | 989,920 | ||||||
| $ | 1,699,300 | |||||||
| Healthcare Revenue - Hospitals - 17.7% | ||||||||
| Brazoria County, TX, Health Facilities Development Corp., Hospital Rev. (Brazosport Regional Health System), 5.25%, 2032 | $ | 280,000 | $ | 290,993 | ||||
| Chattanooga, TN, Health Educational & Housing Facility Board Rev. (Catholic Health Initiatives), “D”, 6.25%, 2033 | 1,000,000 | 1,202,210 | ||||||
| DeKalb County, GA, Hospital Authority Rev. (DeKalb Medical Center, Inc.), 6.125%, 2040 | 295,000 | 343,690 | ||||||
| Escambia County, FL, Health Facilities Authority (Baptist Hospital, Inc.), “A”, 6%, 2036 | 680,000 | 782,850 | ||||||
| Illinois Finance Authority Rev. (Resurrection Health), 6.125%, 2025 | 125,000 | 141,379 | ||||||
| Illinois Finance Authority Rev. (Silver Cross Hospital & Medical Centers), 7%, 2044 | 405,000 | 482,703 | ||||||
| Jackson, TN, Hospital Rev. (Jackson-Madison Project), 5.625%, 2038 | 1,000,000 | 1,093,250 | ||||||
| Johnson City, TN, Health & Education Financing Authority Rev. (Johnson City Medical Center Hospital), ETM, NATL, 5%, 2018 (c) | 225,000 | 225,486 | ||||||
| Johnson City, TN, Health & Educational Facilities Board, Hospital Rev. (Mountain States Health Alliance), “A”, 5.5%, 2031 | 400,000 | 427,860 | ||||||
| Johnson City, TN, Health & Educational Facilities Board, Hospital Rev. (Mountain States Health Alliance), “A”, 5.5%, 2036 | 600,000 | 636,090 | ||||||
| Kentucky Economic Development Finance Authority, Hospital Facilities Rev. (Owensboro Medical Health System), “A”, 6.375%, 2040 | 790,000 | 936,569 | ||||||
| Kentucky Economic Development Finance Authority, Hospital Facilities Rev. (Owensboro Medical Health System), “A”, 6.5%, 2045 | 265,000 | 315,512 | ||||||
| Knox County, TN, Health, Educational, Hospital & Housing Facilities Board Rev. (Covenant Health), Capital Appreciation, “A”, 0%, 2036 | 2,000,000 | 650,180 | ||||||
| Knox County, TN, Health, Educational, Hospital & Housing Facilities Board Rev. (Covenant Health), Capital Appreciation, “A”, AGM, 0%, 2041 | 900,000 | 238,887 | ||||||
| Knox County, TN, Health, Educational, Hospital & Housing Facilities Board Rev. (Fort Sanders), NATL, 5.75%, 2014 | 3,250,000 | 3,378,083 | ||||||
| Knox County, TN, Health, Educational, Hospital & Housing Facilities Board Rev. (University Health Systems, Inc.), 5.25%, 2036 | 1,000,000 | 1,052,510 | ||||||
46
Table of Contents
Portfolio of Investments – continued
| Municipal Bonds - continued | ||||||||
| Issuer | Shares/Par | Value ($) | ||||||
| Healthcare Revenue - Hospitals - continued | ||||||||
| Louisville & Jefferson County, KY, Metropolitan Government Healthcare Systems Rev. (Norton Healthcare, Inc.), 5.25%, 2036 | $ | 675,000 | $ | 713,083 | ||||
| Martin County, FL, Health Facilities Authority Rev. (Martin Memorial Medical Center), 5.5%, 2042 | 190,000 | 210,737 | ||||||
| Miami-Dade County, FL, Health Facilities Authority Hospital Rev. (Variety Children’s Hospital), “A”, 6%, 2030 | 85,000 | 98,864 | ||||||
| New Hampshire Business Finance Authority Rev. (Elliot Hospital Obligated Group), “A”, 6%, 2027 | 510,000 | 591,518 | ||||||
| Rutherford County, TN, Health & Educational Facilities Board Rev. (Ascencion Health Senior Credit Group), “C”, 5%, 2047 | 1,000,000 | 1,101,330 | ||||||
| Rutherford County, TN, Health & Educational Facilities Board Rev. (Ascension Health Senior Credit Group), “C”, 5%, 2040 | 1,500,000 | 1,633,665 | ||||||
| Shelby County, TN, Health, Educational & Housing Facilities Board Rev. (Methodist Healthcare), “B”, AGM, 5.25%, 2027 | 1,500,000 | 1,628,025 | ||||||
| Shelby County, TN, Health, Educational & Housing Facilities Board Rev. (Methodist Le Bonheur Healthcare), 5%, 2042 | 1,000,000 | 1,097,010 | ||||||
| Shelby County, TN, Health, Educational & Housing Facilities Board Rev. (St. Jude Children’s Research Hospital), 5%, 2031 | 500,000 | 546,055 | ||||||
| Shelby County, TN, Health, Educational & Housing Facilities Board Rev. (St. Jude Children’s Research Hospital), 5%, 2036 | 1,250,000 | 1,360,612 | ||||||
| St. Petersburg, FL, Health Facilities Authority Rev., 6.5%, 2039 | 170,000 | 201,203 | ||||||
| Sullivan County, TN, Health, Educational & Housing Facilities Board Hospital Rev. (Wellmont Health Systems Project), “C”, 5.25%, 2036 | 635,000 | 674,199 | ||||||
| Sumner County, TN, Health, Educational & Housing Facilities Board Rev. (Sumner Regional Health Systems, Inc.), “A”, 5.5%, 2046 (a)(d) | 1,000,000 | 2,490 | ||||||
| Wisconsin Health & Educational Facilities Authority Rev. (Mercy Alliance), 5%, 2039 | 580,000 | 619,504 | ||||||
| Wisconsin Health & Educational Facilities Authority Rev. (ProHealth Care, Inc. Obligated Group), 6.625%, 2039 | 785,000 | 910,883 | ||||||
| Wisconsin Health & Educational Facilities Authority Rev. (Wheaton Franciscan Healthcare), 5.25%, 2031 | 535,000 | 572,193 | ||||||
| $ | 24,159,623 | |||||||
| Healthcare Revenue - Long Term Care - 2.1% | ||||||||
| Blount County, TN, Health & Educational Facilities Board Rev. (Asbury, Inc.), “A”, 5.125%, 2023 | $ | 465,000 | $ | 481,010 | ||||
| Johnson City, TN, Health & Educational Facilities Board Rev. (Appalachian Christian Village Project), “A”, 5%, 2043 | 1,000,000 | 1,015,520 | ||||||
| Issuer | Shares/Par | Value ($) | ||||||
| Healthcare Revenue - Long Term Care - continued | ||||||||
| Nashville & Davidson County, TN, Metropolitan Government Health & Educational Facilities Board Rev. (The Blakeford at Green Hills), 5%, 2037 | $ | 1,000,000 | $ | 1,052,870 | ||||
| Shelby County, TN, Health, Educational & Housing Facilities Board Rev. (Germantown Village), “A”, 7.25%, 2034 | 250,000 | 261,243 | ||||||
| $ | 2,810,643 | |||||||
| Industrial Revenue - Other - 0.2% | ||||||||
| Liberty, NY, Development Corp. Rev. (Goldman Sachs Headquarters), 5.25%, 2035 | $ | 255,000 | $ | 298,233 | ||||
| Miscellaneous Revenue - Entertainment & Tourism - 2.1% | ||||||||
| Memphis-Shelby County, TN, Sports Authority, Inc. Rev., “B”, 5.375%, 2029 | $ | 2,500,000 | $ | 2,840,800 | ||||
| Miscellaneous Revenue - Other - 2.0% | ||||||||
| ABAG Finance Authority for Non-Profit Corps., CA, Rev. (Jackson Lab), 5.75%, 2037 | $ | 1,000,000 | $ | 1,140,210 | ||||
| Hardeman County, TN, Correctional Facilities Rev., 7.75%, 2017 | 525,000 | 527,315 | ||||||
| Metropolitan Nashville Airport Authority, Special Facilities Rev. (Aero Nashville LLC Project), 5.2%, 2026 | 960,000 | 1,059,898 | ||||||
| $ | 2,727,423 | |||||||
| Multi-Family Housing Revenue - 1.1% | ||||||||
| Knoxville, TN, Community Development Corp., 5%, 2024 | $ | 1,000,000 | $ | 1,038,170 | ||||
| Metropolitan Government of Nashville & Davidson County, TN, Health, Educational & Housing Facilities Board Rev. (Herman Street), FHA, 7.25%, 2032 | 485,000 | 474,631 | ||||||
| $ | 1,512,801 | |||||||
| Sales & Excise Tax Revenue - 2.9% | ||||||||
| Colorado Regional Transportation District, Private Activity Rev. (Denver Transportation Partners), 6.5%, 2030 | $ | 480,000 | $ | 577,661 | ||||
| Colorado Regional Transportation District, Sales Tax Rev. (Fastracks Project), “A”, 5%, 2027 | 485,000 | 579,032 | ||||||
| Guam Government Business Privilege Tax Rev., “A”, 5.25%, 2036 | 300,000 | 334,452 | ||||||
| Guam Government Business Privilege Tax Rev., “C”, 5%, 2016 | 105,000 | 120,163 | ||||||
| Guam Government Business Privilege Tax Rev., “C”, 5%, 2017 | 120,000 | 140,596 | ||||||
| Guam Government Business Privilege Tax Rev., “C”, 5%, 2018 | 115,000 | 136,602 | ||||||
| Massachusetts School Building Authority, Dedicated Sales Tax Rev., “B”, 5%, 2035 | 810,000 | 927,879 | ||||||
| Puerto Rico Sales Tax Financing Corp., Sales Tax Rev., 5.25%, 2057 | 525,000 | 542,377 | ||||||
47
Table of Contents
Portfolio of Investments – continued
| Municipal Bonds - continued | ||||||||
| Issuer | Shares/Par | Value ($) | ||||||
| Sales & Excise Tax Revenue - continued | ||||||||
| Puerto Rico Sales Tax Financing Corp., Sales Tax Rev., Capital Appreciation, 0%, 2056 | $ | 7,755,000 | $ | 536,646 | ||||
| $ | 3,895,408 | |||||||
| Single Family Housing - State - 5.5% | ||||||||
| Tennessee Housing Development Agency Rev., Homeownership Program, 5%, 2026 | $ | 1,255,000 | $ | 1,281,669 | ||||
| Tennessee Housing Development Agency Rev., Homeownership Program, 5%, 2029 | 855,000 | 901,657 | ||||||
| Tennessee Housing Development Agency Rev., Homeownership Program, 5.25%, 2034 | 80,000 | 80,602 | ||||||
| Tennessee Housing Development Agency Rev., Homeownership Program, 5.45%, 2038 | 1,310,000 | 1,385,639 | ||||||
| Tennessee Housing Development Agency Rev., Homeownership Program, “2”, 4.55%, 2024 | 1,470,000 | 1,542,897 | ||||||
| Tennessee Housing Development Agency Rev., Homeownership Program, “2-C”, 3.1%, 2028 | 660,000 | 650,496 | ||||||
| Tennessee Housing Development Agency Rev., Homeownership Program, “2-C”, 3.3%, 2031 | 1,000,000 | 980,180 | ||||||
| Tennessee Housing Development Agency Rev., Mortgage Finance, 5.2%, 2023 | 680,000 | 683,012 | ||||||
| $ | 7,506,152 | |||||||
| State & Agency - Other - 0.8% | ||||||||
| Hardeman County, TN, Industrial Development Board Rev., “B”, ASSD GTY, 5%, 2040 | $ | 1,000,000 | $ | 1,074,620 | ||||
| State & Local Agencies - 5.5% | ||||||||
| Chattanooga, TN, Industrial Development Board, Lease Rental Rev. (Southside Redevelopment Corp.), 5%, 2020 | $ | 700,000 | $ | 834,736 | ||||
| Chattanooga, TN, Industrial Development Board, Lease Rental Rev. (Southside Redevelopment Corp.), 5%, 2024 | 1,000,000 | 1,174,370 | ||||||
| Tennessee School Bond Authority, “A”, 4%, 2042 | 1,000,000 | 1,047,300 | ||||||
| Tennessee School Bond Authority, “B”, 5.125%, 2033 | 2,000,000 | 2,265,180 | ||||||
| Tennessee School Bond Authority, “C”, AGM, 5%, 2032 | 2,000,000 | 2,237,960 | ||||||
| $ | 7,559,546 | |||||||
| Tax - Other - 1.2% | ||||||||
| Guam Government Ltd. Obligation Rev., “A”, 5.375%, 2024 | $ | 150,000 | $ | 163,872 | ||||
| Guam Government Ltd. Obligation Rev., “A”, 5.625%, 2029 | 50,000 | 54,555 | ||||||
| Hudson Yards, NY, Infrastructure Corp. Rev., “A”, 5%, 2047 | 425,000 | 449,429 | ||||||
| New Jersey Economic Development Authority Rev., 5%, 2025 | 125,000 | 142,589 | ||||||
| New Jersey Economic Development Authority Rev., 5%, 2026 | 65,000 | 73,648 | ||||||
| New Jersey Economic Development Authority Rev., 5%, 2028 | 25,000 | 27,968 | ||||||
| Issuer | Shares/Par | Value ($) | ||||||
| Tax - Other - continued | ||||||||
| New Jersey Economic Development Authority Rev., 5%, 2029 | $ | 25,000 | $ | 27,843 | ||||
| Virgin Islands Public Finance Authority Rev., Matching Fund Loan Note, “A”, 5%, 2029 | 625,000 | 684,175 | ||||||
| $ | 1,624,079 | |||||||
| Tobacco - 1.4% | ||||||||
| Buckeye, OH, Tobacco Settlement Financing Authority, “A-2”, 5.125%, 2024 | $ | 185,000 | $ | 169,693 | ||||
| Illinois Railsplitter Tobacco Settlement Authority, 6%, 2028 | 200,000 | 242,332 | ||||||
| New Jersey Tobacco Settlement Financing Corp., “1-A”, 4.5%, 2023 | 370,000 | 369,082 | ||||||
| New Jersey Tobacco Settlement Financing Corp., “1-A”, 5%, 2041 | 410,000 | 369,430 | ||||||
| Tobacco Settlement Financing Corp., 5%, 2031 | 750,000 | 702,382 | ||||||
| $ | 1,852,919 | |||||||
| Toll Roads - 0.5% | ||||||||
| Virginia Small Business Financing Authority Rev. (Elizabeth River Crossings Opco LLC Project), 5.25%, 2032 | $ | 120,000 | $ | 128,329 | ||||
| Virginia Small Business Financing Authority Rev. (Elizabeth River Crossings Opco LLC Project), 6%, 2037 | 200,000 | 228,484 | ||||||
| Virginia Small Business Financing Authority Rev. (Elizabeth River Crossings Opco LLC Project), 5.5%, 2042 | 320,000 | 343,709 | ||||||
| $ | 700,522 | |||||||
| Transportation - Special Tax - 0.8% | ||||||||
| Commonwealth of Puerto Rico Highway & Transportation Authority Rev., “CC”, AGM, 5.5%, 2028 | $ | 600,000 | $ | 666,330 | ||||
| Metropolitan Transportation Authority Rev., NY, Capital Appreciation, “A”, 0%, 2030 | 930,000 | 490,054 | ||||||
| $ | 1,156,384 | |||||||
| Universities - Colleges - 8.2% | ||||||||
| Claiborne County, TN, Industrial Development Board Rev. (Lincoln Memorial University Project), 6.625%, 2039 | $ | 500,000 | $ | 564,060 | ||||
| Claiborne County, TN, Industrial Development Board Rev. (Lincoln Memorial University Project), 6.125%, 2040 | 250,000 | 278,798 | ||||||
| Florida Higher Educational Facilities, Financial Authority Rev. (University of Tampa Project), “A”, 5%, 2032 | 15,000 | 16,313 | ||||||
| Florida Higher Educational Facilities, Financial Authority Rev. (University of Tampa Project), “A”, 5.25%, 2042 | 140,000 | 153,555 | ||||||
| Franklin County, TN, Health & Educational Facilities Board Rev. (University of the South), 4%, 2023 | 1,000,000 | 1,099,590 | ||||||
| Franklin County, TN, Health & Educational Facilities Board Rev. (University of the South), 3%, 2026 | 1,000,000 | 967,680 | ||||||
48
Table of Contents
Portfolio of Investments – continued
| Municipal Bonds - continued | ||||||||
| Issuer | Shares/Par | Value ($) | ||||||
| Universities - Colleges - continued | ||||||||
| Illinois Finance Authority Rev. (Roosevelt University Project), 6.5%, 2039 | $ | 835,000 | $ | 945,704 | ||||
| Illinois Finance Authority Rev. (University of Chicago), “A”, 5%, 2051 | 335,000 | 367,006 | ||||||
| Massachusetts State College, Building Authority Project Rev., “A”, 5%, 2036 | 370,000 | 423,669 | ||||||
| Nashville & Davidson County, TN, Metropolitan Government Health & Educational Facilities Board, 5%, 2034 | 2,500,000 | 2,832,450 | ||||||
| Nashville & Davidson County, TN, Metropolitan Government Health & Educational Facilities Board (Belmont University), 5%, 2029 | 515,000 | 576,661 | ||||||
| Nashville & Davidson County, TN, Metropolitan Government Health & Educational Facilities Board (Belmont University), 5%, 2030 | 600,000 | 669,474 | ||||||
| Nashville & Davidson County, TN, Metropolitan Government Health & Educational Facilties Board (Vanderbilt University), “D”, 5%, 2030 | 850,000 | 1,008,074 | ||||||
| Nashville & Davidson County, TN, Metropolitan Government Health & Educational Facilties Board (Vanderbilt University), “D”, 4%, 2031 | 1,100,000 | 1,187,461 | ||||||
| Pinellas County, FL, Educational Facilities Authority Rev. (Barry University), 6%, 2041 | 120,000 | 138,073 | ||||||
| $ | 11,228,568 | |||||||
| Universities - Dormitories - 0.9% | ||||||||
| Oregon Facilities Authority, Student Housing Rev. (Southern Oregon University), ASSD GTY, 5%, 2044 | $ | 40,000 | $ | 43,547 | ||||
| Shelby County, TN, Health Educational & Housing Facilities Board Rev. (Rhodes College), 5.5%, 2040 | 1,000,000 | 1,170,920 | ||||||
| $ | 1,214,467 | |||||||
| Universities - Secondary Schools - 0.1% | ||||||||
| North Texas Education Finance Corp., Education Rev. (Uplift Education), “A”, 4.875%, 2032 | $ | 55,000 | $ | 59,139 | ||||
| North Texas Education Finance Corp., Education Rev. (Uplift Education), “A”, 5.125%, 2042 | 130,000 | 141,015 | ||||||
| $ | 200,154 | |||||||
| Utilities - Municipal Owned - 7.4% | ||||||||
| Chattanooga, TN, Electric Rev., “A”, 5%, 2033 | $ | 3,000,000 | $ | 3,369,630 | ||||
| Citizens Gas Utility District, TN, Gas Rev., 5%, 2035 | 1,000,000 | 1,078,620 | ||||||
| Clarksville, TN, Electric System Rev., “A”, 5%, 2034 | 1,250,000 | 1,420,325 | ||||||
| Guam Power Authority Rev., “A”, AGM, 5%, 2025 | 75,000 | 86,177 | ||||||
| Guam Power Authority Rev., “A”, AGM, 5%, 2026 | 60,000 | 68,572 | ||||||
| Guam Power Authority Rev., “A”, AGM, 5%, 2027 | 25,000 | 28,440 | ||||||
| Guam Power Authority Rev., “A”, 5.5%, 2030 | 300,000 | 333,816 | ||||||
| Guam Power Authority Rev., “A”, 5%, 2034 | 75,000 | 80,876 | ||||||
| Johnson City, TN, Electric Rev., AGM, 5%, 2029 | 1,000,000 | 1,145,190 | ||||||
| Issuer | Shares/Par | Value ($) | ||||||
| Utilities - Municipal Owned - continued | ||||||||
| Long Island, NY, Power Authority, Electric Systems Rev., “A”, 6%, 2033 | $ | 195,000 | $ | 232,651 | ||||
| Metropolitan Government of Nashville & Davidson County, TN, Electrical Rev., “A”, AMBAC, 5%, 2029 | 1,000,000 | 1,041,210 | ||||||
| Metropolitan Government of Nashville & Davidson County, TN, Electrical Rev., “A”, 5%, 2036 | 1,000,000 | 1,153,220 | ||||||
| $ | 10,038,727 | |||||||
| Utilities - Other - 1.4% | ||||||||
| Tennessee Energy Acquisition Corp., Gas Rev., “A”, 5.25%, 2021 | $ | 225,000 | $ | 261,472 | ||||
| Tennessee Energy Acquisition Corp., Gas Rev., “A”, 5.25%, 2022 | 115,000 | 133,720 | ||||||
| Tennessee Energy Acquisition Corp., Gas Rev., “A”, 5.25%, 2023 | 85,000 | 98,688 | ||||||
| Tennessee Energy Acquisition Corp., Gas Rev., “A”, 5.25%, 2026 | 1,200,000 | 1,389,696 | ||||||
| $ | 1,883,576 | |||||||
| Water & Sewer Utility Revenue - 11.8% | ||||||||
| Commonwealth of Puerto Rico Aqueduct & Sewer Authority Rev., “A”, 6%, 2044 | $ | 1,000,000 | $ | 1,004,790 | ||||
| DeKalb County, GA, Water & Sewer Rev., “A”, 5.25%, 2041 | 460,000 | 520,154 | ||||||
| Harpeth Valley, TN, Utilities District, Davidson & Williamson Counties Rev., FGIC, 5.25%, 2037 | 1,000,000 | 1,123,050 | ||||||
| Harpeth Valley, TN, Utilities District, Davidson & Williamson Counties Rev., “A”, 5%, 2040 | 1,000,000 | 1,140,890 | ||||||
| Hendersonville, TN, Utility District Waterworks & Sewer Rev., AGM, 5%, 2031 | 1,000,000 | 1,101,510 | ||||||
| Knox County, TN, Water & Sewer Rev., Hallsdale-Powell Utility District, 4%, 2031 | 1,000,000 | 1,070,170 | ||||||
| Knox County, TN, Water & Sewer Rev., Hallsdale-Powell Utility District, 4%, 2034 | 1,000,000 | 1,054,890 | ||||||
| Knoxville, TN, Electrical System Rev., “BB”, 3%, 2042 | 1,475,000 | 1,280,123 | ||||||
| Knoxville, TN, Waste Water System Rev., “A”, NATL, 5%, 2037 | 2,620,000 | 2,861,931 | ||||||
| Metropolitan Government of Nashville & Davidson County, TN, Water & Sewer Rev., “A”, AGM, 5.25%, 2022 | 1,365,000 | 1,734,287 | ||||||
| Rutherford County, TN, Consolidated Utility District Waterworks Rev., 5%, 2027 | 770,000 | 807,807 | ||||||
| South Blount County, TN, Utility District Waterworks Rev., AGM, 5%, 2033 | 2,140,000 | 2,417,280 | ||||||
| $ | 16,116,882 | |||||||
Total Municipal Bonds (Identified Cost, $123,569,420) | $ | 132,187,895 | ||||||
49
Table of Contents
Portfolio of Investments – continued
| Money Market Funds - 3.9% | ||||||||
| Issuer | Shares/Par | Value ($) | ||||||
| MFS Institutional Money Market Portfolio, 0.14%, at Cost and Net Asset Value (v) | 5,367,445 | $ | 5,367,445 | |||||
Total Investments (Identified Cost, $128,936,865) | $ | 137,555,340 | ||||||
| Other Assets, Less Liabilities - (0.7)% | (917,398) | |||||||
| Net Assets - 100.0% | $ | 136,637,942 | ||||||
See Portfolio Footnotes and Notes to Financial Statements
50
Table of Contents
PORTFOLIO OF INVESTMENTS
3/31/13
MFS VIRGINIA MUNICIPAL BOND FUND
The Portfolio of Investments is a complete list of all securities owned by your fund. It is categorized by broad-based asset classes.
| Municipal Bonds - 99.2% | ||||||||
| Issuer | Shares/Par | Value ($) | ||||||
| Airport Revenue - 3.9% | ||||||||
| Chicago, IL, O’Hare International Airport Rev., Third Lien, “A”, 5.625%, 2035 | $ | 855,000 | $ | 987,294 | ||||
| Metropolitan Washington, DC, Airport Authority Rev., 5.375%, 2028 | 1,500,000 | 1,684,065 | ||||||
| Metropolitan Washington, DC, Airport Authority Rev., “A”, FGIC, 5.125%, 2024 | 1,000,000 | 1,016,290 | ||||||
| Metropolitan Washington, DC, Airport Authority Rev., “A”, FGIC, 5%, 2025 | 705,000 | 715,455 | ||||||
| Metropolitan Washington, DC, Airport Authority Rev., “A”, AGM, 5%, 2032 | 1,455,000 | 1,553,853 | ||||||
| Metropolitan Washington, DC, Airport Authority Rev., “A”, NATL, 5%, 2035 | 3,000,000 | 3,167,610 | ||||||
| Norfolk, VA, Airport Authority Rev., AGM, 5%, 2023 | 2,000,000 | 2,290,160 | ||||||
| Norfolk, VA, Airport Authority Rev., AGM, 5%, 2024 | 1,000,000 | 1,134,910 | ||||||
| Sacramento County, CA, Airport Systems Rev., 5%, 2040 | 1,060,000 | 1,167,325 | ||||||
| Virginia Resources Authority, Airport Rev., “B”, 5.125%, 2027 | 720,000 | 720,929 | ||||||
| $ | 14,437,891 | |||||||
| General Obligations - General Purpose - 5.1% | ||||||||
| Chesapeake, VA, “B”, 5%, 2019 | $ | 550,000 | $ | 668,289 | ||||
| Chesapeake, VA, “B”, 5%, 2023 | 1,930,000 | 2,342,885 | ||||||
| Commonwealth of Puerto Rico, “A”, 6%, 2038 | 1,070,000 | 1,086,681 | ||||||
| Isle Wight County, VA, “A”, 4%, 2020 | 1,045,000 | 1,205,104 | ||||||
| Newport News, VA, Economic Development, “A”, 5%, 2030 | 1,345,000 | 1,577,308 | ||||||
| Puerto Rico Public Buildings Authority Rev., Guaranteed, “M”, 6.25%, 2031 | 920,000 | 1,008,808 | ||||||
| Puerto Rico Public Buildings Authority Rev., Guaranteed, “Q”, 5.625%, 2039 | 1,565,000 | 1,551,072 | ||||||
| Roanoke, VA, Public Improvement Rev., “A”, 5%, 2018 | 2,450,000 | 2,947,938 | ||||||
| Roanoke, VA, Public Improvement Rev., “A”, 5%, 2033 | 1,335,000 | 1,589,224 | ||||||
| Stafford County, VA, Industrial Development Authority Rev., “B”, NATL, 5%, 2034 | 3,060,000 | 3,119,701 | ||||||
| State of California, 5.25%, 2029 | 1,595,000 | 1,855,846 | ||||||
| $ | 18,952,856 | |||||||
| General Obligations - Improvement - 3.5% | ||||||||
| Arlington County, VA, “A”, 5%, 2026 | $ | 1,000,000 | $ | 1,231,140 | ||||
| Guam Government, “A”, 6.75%, 2029 | 925,000 | 1,034,492 | ||||||
| Guam Government, “A”, 5.25%, 2037 | 540,000 | 544,369 | ||||||
| Guam Government, “A”, 7%, 2039 | 110,000 | 122,649 | ||||||
| Loudoun County, VA, “B”, 5%, 2018 | 5,500,000 | 6,703,950 | ||||||
| Lynchburg, VA, Public Improvement, 5%, 2023 | 1,000,000 | 1,197,950 | ||||||
| Prince William County, VA, Public Improvement, “A”, 5%, 2026 | 1,000,000 | 1,289,740 | ||||||
| Issuer | Shares/Par | Value ($) | ||||||
| General Obligations - Improvement - continued | ||||||||
| Prince William County, VA, Public Improvement, “A”, 5%, 2028 | $ | 800,000 | $ | 1,036,704 | ||||
| $ | 13,160,994 | |||||||
| General Obligations - Schools - 0.8% | ||||||||
| Norfolk, VA, Capital Improvement, “C”, 5%, 2042 | $ | 2,825,000 | $ | 3,172,701 | ||||
| Healthcare Revenue - Hospitals - 15.3% | ||||||||
| Arizona Health Facilities Authority Rev. (Banner Health), “A”, 4%, 2043 | $ | 1,235,000 | $ | 1,201,396 | ||||
| Arlington County, VA, Industrial Development Authority, Hospital Facility Rev. (Virginia Hospital Center Arlington Health Systems), 5%, 2031 | 2,000,000 | 2,138,860 | ||||||
| Brazoria County, TX, Health Facilities Development Corp., Hospital Rev. (Brazosport Regional Health System), 5.25%, 2032 | 830,000 | 862,586 | ||||||
| Charlotte County, VA, Industrial Development Authority Rev. (Halifax Hospital), 5%, 2037 | 1,000,000 | 1,045,800 | ||||||
| Fairfax County, VA, Industrial Development Authority Rev. (Inova Health Systems), 4%, 2042 | 3,000,000 | 3,022,740 | ||||||
| Fairfax County, VA, Industrial Development Authority Rev. (Inova Health Systems), “A”, 5.5%, 2029 | 1,000,000 | 1,058,620 | ||||||
| Fairfax County, VA, Industrial Development Authority Rev. (Inova Health Systems), “A”, 5.5%, 2035 | 1,500,000 | 1,700,910 | ||||||
| Fairfax County, VA, Industrial Development Authority Rev. (Inova Health Systems), “C”, 5%, 2025 | 500,000 | 574,455 | ||||||
| Fauquier County, VA, Industrial Development Authority, Hospital Rev., 5.25%, 2037 | 2,000,000 | 2,139,240 | ||||||
| Fredericksburg, VA, Economic Development Authority, Hospital Facilities Rev. (Medicorp Health System), 5.25%, 2019 | 1,125,000 | 1,315,001 | ||||||
| Fredericksburg, VA, Industrial Development Rev. (Medicorp Health Systems), “B”, 5.125%, 2033 | 750,000 | 750,443 | ||||||
| Henrico County, VA, Economic Development Authority Rev. (Bon Secours Health Systems, Inc.), “B-2”, AGM, 5.25%, 2042 | 1,750,000 | 1,898,873 | ||||||
| Henrico County, VA, Industrial Development Authority Rev. (Bon Secours Health Systems, Inc.), NATL, 6.25%, 2020 | 1,500,000 | 1,752,030 | ||||||
| Illinois Finance Authority Rev. (Silver Cross Hospital & Medical Centers), 7%, 2044 | 970,000 | 1,156,104 | ||||||
| Jefferson Parish, LA, Hospital Service District No. 2 (East Jefferson General Hospital), 6.25%, 2031 | 375,000 | 435,161 | ||||||
| Jefferson Parish, LA, Hospital Service District No. 2 (East Jefferson General Hospital), 6.375%, 2041 | 1,110,000 | 1,292,662 | ||||||
51
Table of Contents
Portfolio of Investments – continued
| Municipal Bonds - continued | ||||||||
| Issuer | Shares/Par | Value ($) | ||||||
| Healthcare Revenue - Hospitals - continued | ||||||||
| Louisville & Jefferson County, KY, Metropolitan Government Healthcare Systems Rev. (Norton Healthcare, Inc.), 5.25%, 2036 | $ | 1,635,000 | $ | 1,727,247 | ||||
| Martin County, FL, Health Facilities Authority Rev. (Martin Memorial Medical Center), 5.5%, 2042 | 550,000 | 610,027 | ||||||
| Michigan Hospital Finance Authority Rev. (Henry Ford Health System), 5.625%, 2029 | 200,000 | 227,048 | ||||||
| New Hampshire Business Finance Authority Rev. (Elliot Hospital Obligated Group), “A”, 6%, 2027 | 635,000 | 736,498 | ||||||
| Ohio Higher Educational Facility Commission (University Hospital Health System), “A”, 6.75%, 2015 (c) | 1,315,000 | 1,464,476 | ||||||
| Prince William County, VA, Industrial Development Authority, Hospital Rev. (Potomac Hospital Corp.), 5.2%, 2026 | 1,000,000 | 1,044,370 | ||||||
| Roanoke, VA, Economic Development Authority, Hospital Rev. (Carilion Medical Center), 5%, 2033 | 2,385,000 | 2,563,064 | ||||||
| Roanoke, VA, Industrial Development Authority, Hospital Rev. (Carilion Health Systems), “B”, 5%, 2020 (c) | 45,000 | 56,263 | ||||||
| Roanoke, VA, Industrial Development Authority, Hospital Rev. (Carilion Health Systems), “B”, N, 5%, 2038 | 2,955,000 | 3,139,067 | ||||||
| Roanoke, VA, Industrial Development Authority, Hospital Rev. (Roanoke Memorial Hospital), “B”, ETM, NATL, 6.125%, 2017 (c) | 3,000,000 | 3,377,640 | ||||||
| Royal Oak, MI, Hospital Finance Authority Rev. (William Beaumont Hospital), 8.25%, 2039 | 1,805,000 | 2,261,665 | ||||||
| Virginia Small Business Financing Authority, Healthcare Facility Rev. (Sentra Healthcare), 5%, 2040 | 4,000,000 | 4,370,560 | ||||||
| Virginia Small Business Financing Authority, Hospital Rev. (Wellmont Health Project), ‘‘A’’, 5.25%, 2037 | 2,000,000 | 2,141,000 | ||||||
| Washington County, VA, Industrial Development Authority, Hospital Facilities Rev. (Mountain States Health Alliance), “C”, 7.5%, 2029 | 1,400,000 | 1,754,438 | ||||||
| Washington Health Care Facilities Authority Rev. (Central Washington Health Services), 6.75%, 2029 | 220,000 | 259,239 | ||||||
| Washington Health Care Facilities Authority Rev. (Central Washington Health Services), 7%, 2039 | 530,000 | 612,611 | ||||||
| Winchester, VA, Industrial Development Authority, Hospital Rev. (Valley Health Systems), “E”, 5.75%, 2039 | 3,000,000 | 3,174,810 | ||||||
| Wisconsin Health & Educational Facilities Authority Rev. (Mercy Alliance), 5%, 2039 | 1,715,000 | 1,831,809 | ||||||
| Wisconsin Health & Educational Facilities Authority Rev. (ProHealth Care, Inc. Obligated Group), 6.625%, 2039 | 1,880,000 | 2,181,477 | ||||||
| Issuer | Shares/Par | Value ($) | ||||||
| Healthcare Revenue - Hospitals - continued | ||||||||
| Wisconsin Health & Educational Facilities Authority Rev. (Wheaton Franciscan Healthcare), 5.25%, 2031 | $ | 1,280,000 | $ | 1,368,986 | ||||
| $ | 57,247,176 | |||||||
| Healthcare Revenue - Long Term Care - 1.8% | ||||||||
| Albemarle County, VA, Economic Development Authority, Residential Care Facilities Rev. (Westminster-Canterbury Blue Ridge), “A”, 5%, 2042 | $ | 1,000,000 | $ | 999,920 | ||||
| Chesterfield County, VA, Health Center Commission Residential Care Facility, 6.25%, 2038 | 750,000 | 728,483 | ||||||
| Henrico County, VA, Economic Development Authority Rev., Residential Care Facility (Virginia United Methodist Homes, Inc.), 5%, 2024 | 395,000 | 425,972 | ||||||
| Henrico County, VA, Economic Development Authority Rev., Residential Care Facility (Virginia United Methodist Homes, Inc.), 5%, 2025 | 385,000 | 412,435 | ||||||
| James City County, VA, Economic Development (WindsorMeade Project), “A”, 5.5%, 2037 (a) | 1,000,000 | 550,000 | ||||||
| Lexington, VA, Industrial Development Authority Residential Care Facilities (Kendal at Lexington), “A”, 5.5%, 2037 | 1,000,000 | 1,011,700 | ||||||
| Norfolk, VA, Redevelopment & Housing Authority Rev. (Fort Norfolk Retirement Community), “A”, 6.125%, 2035 | 1,240,000 | 1,246,076 | ||||||
| Suffolk, VA, Industrial Development Authority, Retirement Facilities Rev. (Lake Prince Center, Inc.), 5.3%, 2031 | 750,000 | 763,995 | ||||||
| Travis County, TX, Health Facilities Development Corp. Rev. (Westminster Manor Health), 7%, 2030 | 175,000 | 209,022 | ||||||
| Travis County, TX, Health Facilities Development Corp. Rev. (Westminster Manor Health), 7.125%, 2040 | 265,000 | 314,664 | ||||||
| $ | 6,662,267 | |||||||
| Industrial Revenue - Environmental Services - 0.5% | ||||||||
| Henrico County, VA, Industrial Development Authority Rev. (Browning Ferris, Inc.), 5.45%, 2014 | $ | 1,750,000 | $ | 1,792,228 | ||||
| Industrial Revenue - Other - 0.8% | ||||||||
| Loudoun County, VA, Industrial Development Authority Rev. (Dulles Airport Marriott Hotel), 7.125%, 2015 | $ | 2,000,000 | $ | 2,005,280 | ||||
| Peninsula Ports Authority, VA, Coal Terminal Rev. (Dominion Terminal Associates), 6%, 2033 | 1,000,000 | 1,011,040 | ||||||
| $ | 3,016,320 | |||||||
| Industrial Revenue - Paper - 0.0% | ||||||||
| West Point, VA, Industrial Development Authority, Solid Waste Disposal Rev. (Chesapeake Corp.), “A”, 6.375%, 2019 (a)(d) | $ | 1,750,000 | $ | 175 | ||||
52
Table of Contents
Portfolio of Investments – continued
| Municipal Bonds - continued | ||||||||
| Issuer | Shares/Par | Value ($) | ||||||
| Miscellaneous Revenue - Other - 0.0% | ||||||||
| Summit County, OH, Port Authority Building Rev. (Flats East Development Recovery Zone Facility Bonds), 6.875%, 2040 | $ | 80,000 | $ | 88,982 | ||||
| Multi-Family Housing Revenue - 4.5% | ||||||||
| Arlington County, VA, Industrial Development Authority Rev. (Colonial Village), FNMA, 5.15%, 2031 | $ | 2,885,000 | $ | 2,905,310 | ||||
| Virginia Housing Development Authority Rev., “C”, 5.625%, 2038 | 1,355,000 | 1,399,376 | ||||||
| Virginia Housing Development Authority Rev., “D”, 4.6%, 2033 | 1,000,000 | 1,015,130 | ||||||
| Virginia Housing Development Authority Rev., Rental Housing, “B”, 5.5%, 2030 | 1,450,000 | 1,617,910 | ||||||
| Virginia Housing Development Authority Rev., Rental Housing, “B”, 5%, 2045 | 3,050,000 | 3,201,158 | ||||||
| Virginia Housing Development Authority Rev., Rental Housing, “E”, 4.8%, 2039 | 3,000,000 | 3,136,230 | ||||||
| Virginia Housing Development Authority Rev., Rental Housing, “F”, 4.8%, 2037 | 1,330,000 | 1,394,199 | ||||||
| Virginia Housing Development Authority Rev., Rental Housing, “F”, 5%, 2045 | 2,125,000 | 2,224,450 | ||||||
| $ | 16,893,763 | |||||||
| Parking - 0.4% | ||||||||
| Norfolk, VA, Parking Systems Rev., NATL, 5%, 2020 | $ | 1,630,000 | $ | 1,632,494 | ||||
| Port Revenue - 1.1% | ||||||||
| Virginia Port Authority Facilities Rev., FGIC, 5%, 2036 | $ | 1,000,000 | $ | 1,001,730 | ||||
| Virginia Port Authority Facilities Rev., 5%, 2040 | 3,000,000 | 3,273,150 | ||||||
| $ | 4,274,880 | |||||||
| Sales & Excise Tax Revenue - 1.7% | ||||||||
| Colorado Regional Transportation District, Private Activity Rev. (Denver Transportation Partners), 6%, 2041 | $ | 1,320,000 | $ | 1,513,103 | ||||
| Guam Government Business Privilege Tax Rev., “B-1”, 5%, 2037 | 625,000 | 682,750 | ||||||
| Puerto Rico Infrastructure Financing Authority, Special Tax Rev., “C”, FGIC, 5.5%, 2022 | 1,445,000 | 1,526,325 | ||||||
| Puerto Rico Sales Tax Financing Corp., Sales Tax Rev., “A”, 5.5%, 2019 (c) | 40,000 | 50,813 | ||||||
| Puerto Rico Sales Tax Financing Corp., Sales Tax Rev., “A”, 5.5%, 2028 | 1,430,000 | 1,545,473 | ||||||
| Puerto Rico Sales Tax Financing Corp., Sales Tax Rev., Capital Appreciation, 0%, 2034 | 3,795,000 | 1,111,783 | ||||||
| $ | 6,430,247 | |||||||
| Single Family Housing - State - 5.2% | ||||||||
| California Housing Finance Agency Rev. (Home Mortgage), “I”, 4.7%, 2026 | $ | 1,370,000 | $ | 1,377,042 | ||||
| Virginia Housing Development Authority Commonwealth, 5.1%, 2035 | 2,000,000 | 2,067,620 | ||||||
| Virginia Housing Development Authority Commonwealth, “A”, 5%, 2031 | 2,000,000 | 2,016,020 | ||||||
| Issuer | Shares/Par | Value ($) | ||||||
| Single Family Housing - State - continued | ||||||||
| Virginia Housing Development Authority Commonwealth, “B”, 4.75%, 2032 | $ | 2,000,000 | $ | 2,037,180 | ||||
| Virginia Housing Development Authority Commonwealth, “C”, 4.4%, 2022 | 1,270,000 | 1,281,392 | ||||||
| Virginia Housing Development Authority Commonwealth, “C”, 4.66%, 2027 | 1,285,000 | 1,296,706 | ||||||
| Virginia Housing Development Authority Commonwealth, “C”, 4.625%, 2027 | 2,630,000 | 2,652,434 | ||||||
| Virginia Housing Development Authority Commonwealth, “C”, 4.75%, 2032 | 1,795,000 | 1,813,130 | ||||||
| Virginia Housing Development Authority Rev., Rental Housing, “F”, 5.1%, 2041 | 3,770,000 | 4,006,417 | ||||||
| Virginia Housing Development Authority, Commonwealth Mortgage, “A-5”, 4.4%, 2015 | 1,000,000 | 1,023,240 | ||||||
| $ | 19,571,181 | |||||||
| State & Agency - Other - 1.6% | ||||||||
| Fairfax County, VA, “A”, 5%, 2019 | $ | 4,000,000 | $ | 4,915,600 | ||||
| Fairfax County, VA, “B”, 4%, 2022 | 1,000,000 | 1,181,650 | ||||||
| $ | 6,097,250 | |||||||
| State & Local Agencies - 13.8% | ||||||||
| Caroline County, VA, Industrial Development Authority Lease Rev., AMBAC, 5.125%, 2034 | $ | 1,000,000 | $ | 1,007,390 | ||||
| Delaware Valley, PA, Regional Finance Authority, “C”, FRN, 0.942%, 2037 | 1,915,000 | 1,396,150 | ||||||
| Dinwiddie County, VA, Industrial Development Authority Lease Rev., “B”, NATL, 5%, 2030 | 2,500,000 | 2,602,950 | ||||||
| Fairfax County, VA, Economic Development Authority (Fairfax Public Improvement Project), 5%, 2030 | 1,000,000 | 1,082,590 | ||||||
| Fairfax County, VA, Economic Development Authority Rev. (U.S. Route 28), NATL, 5%, 2029 | 1,000,000 | 1,047,250 | ||||||
| Fairfax County, VA, Economic Development Authority Transportation District Improvement Rev. (Silver Line Phase I Project), 5%, 2037 | 2,500,000 | 2,763,525 | ||||||
| Front Royal & Warren County, VA, Industrial Development Authority Lease Rev., School & Capital Improvement, “B”, AGM, 5%, 2035 (c) | 2,875,000 | 3,010,844 | ||||||
| King George County, VA, Industrial Development Authority Lease Rev., AGM, 5%, 2036 (c) | 2,000,000 | 2,086,580 | ||||||
| Manassas Park, VA, Economic Development Authority Lease Rev., “A”, 6%, 2035 | 1,000,000 | 1,076,760 | ||||||
| Montgomery County, VA, Industrial Development Authority (Public Facilities Project), 5%, 2029 | 500,000 | 549,330 | ||||||
| Powhatan County, VA, 5%, 2032 | 2,500,000 | 2,852,475 | ||||||
| Southwest Virginia Regional Jail Authority Rev., NATL, 5%, 2035 | 1,720,000 | 1,724,403 | ||||||
| Stafford County, VA, Economic Development Authority Lease Rev., ASSD GTY, 5%, 2033 | 3,000,000 | 3,248,850 | ||||||
| Virginia Beach, VA, Development Authority Facility Rev., “A”, 4%, 2030 | 905,000 | 956,241 | ||||||
| Virginia College Building Authority, Educational Facilities Rev., 5%, 2023 | 2,140,000 | 2,671,191 | ||||||
53
Table of Contents
Portfolio of Investments – continued
| Municipal Bonds - continued | ||||||||
| Issuer | Shares/Par | Value ($) | ||||||
| State & Local Agencies - continued | ||||||||
| Virginia College Building Authority, Educational Facilities Rev. (21st Century College & Equipment), “A”, 5%, 2029 | $ | 1,500,000 | $ | 1,706,505 | ||||
| Virginia College Building Authority, Educational Facilities Rev. (21st Century College & Equipment), “B”, 4%, 2024 | 3,000,000 | 3,364,500 | ||||||
| Virginia College Building Authority, Educational Facilities Rev. (Public Higher Education Financing), “A”, 5%, 2027 | 3,000,000 | 3,540,750 | ||||||
| Virginia College Building Authority, Educational Facilities Rev. (Public Higher Education Financing), “A”, 4.5%, 2028 | 3,000,000 | 3,358,290 | ||||||
| Virginia Public Building Authority, Public Facilities Rev., “B”, 5.25%, 2028 | 1,000,000 | 1,162,350 | ||||||
| Virginia Public Building Authority, Public Facilities Rev., “B”, 5%, 2029 | 1,050,000 | 1,229,519 | ||||||
| Virginia Public Building Authority, Public Facilities Rev., “B-3”, 4%, 2021 | 1,000,000 | 1,161,020 | ||||||
| Virginia Public School Authority (1997 Resolution), “A”, 5%, 2019 | 1,175,000 | 1,438,247 | ||||||
| Virginia Public School Authority (1997 Resolution), “A”, 5%, 2030 | 1,000,000 | 1,147,650 | ||||||
| Virginia Public School Authority, Special Obligation Montgomery County, 5%, 2030 | 1,670,000 | 1,936,666 | ||||||
| Virginia Small Business Financing Authority Rev. (95 Express Lanes LLC), 5%, 2022 | 3,000,000 | 3,762,300 | ||||||
| $ | 51,884,326 | |||||||
| Tax - Other - 1.5% | ||||||||
| Guam Government Ltd. Obligation Rev., “A”, 5.375%, 2024 | $ | 365,000 | $ | 398,755 | ||||
| Guam Government Ltd. Obligation Rev., “A”, 5.625%, 2029 | 120,000 | 130,931 | ||||||
| Hudson Yards, NY, Infrastructure Corp. Rev., “A”, 5%, 2047 | 1,265,000 | 1,337,712 | ||||||
| Virgin Islands Public Finance Authority Rev. (Diageo), “A”, 6.625%, 2029 | 830,000 | 950,981 | ||||||
| Virgin Islands Public Finance Authority Rev., “A-1”, 5%, 2029 | 250,000 | 271,615 | ||||||
| Virgin Islands Public Finance Authority Rev., “A-1”, 5%, 2039 | 285,000 | 298,831 | ||||||
| Virgin Islands Public Finance Authority Rev., “B”, 5%, 2025 | 250,000 | 275,890 | ||||||
| Virgin Islands Public Finance Authority Rev., Matching Fund Loan Note, “A”, 5%, 2029 | 1,645,000 | 1,800,749 | ||||||
| $ | 5,465,464 | |||||||
| Tobacco - 1.7% | ||||||||
| Golden State, CA, Tobacco Securitization Corp., Tobacco Settlement Rev., “A-1”, 5.75%, 2047 | $ | 175,000 | $ | 167,438 | ||||
| Illinois Railsplitter Tobacco Settlement Authority, 6%, 2028 | 1,575,000 | 1,908,365 | ||||||
| New Jersey Tobacco Settlement Financing Corp., “1-A”, 4.5%, 2023 | 1,050,000 | 1,047,396 | ||||||
| Tobacco Settlement Financing Corp., 5.625%, 2015 (c) | 1,000,000 | 1,111,390 | ||||||
| Issuer | Shares/Par | Value ($) | ||||||
| Tobacco - continued | ||||||||
| Virgin Islands Tobacco Settlement Financing Corp., 5%, 2021 | $ | 340,000 | $ | 340,071 | ||||
| Virginia Tobacco Settlement Financing Corp., “B-1”, 5%, 2047 | 2,000,000 | 1,687,980 | ||||||
| $ | 6,262,640 | |||||||
| Toll Roads - 1.8% | ||||||||
| Chesapeake, VA, Toll Road Rev. (Transportation System), “A”, 5%, 2047 | $ | 2,000,000 | $ | 2,106,100 | ||||
| Virginia Small Business Financing Authority Rev. (95 Express Lanes LLC), 5%, 2034 | 2,500,000 | 2,593,025 | ||||||
| Virginia Small Business Financing Authority Rev. (Elizabeth River Crossings Opco LLC Project), 5.25%, 2032 | 340,000 | 363,599 | ||||||
| Virginia Small Business Financing Authority Rev. (Elizabeth River Crossings Opco LLC Project), 6%, 2037 | 565,000 | 645,467 | ||||||
| Virginia Small Business Financing Authority Rev. (Elizabeth River Crossings Opco LLC Project), 5.5%, 2042 | 905,000 | 972,051 | ||||||
| $ | 6,680,242 | |||||||
| Transportation - Special Tax - 4.6% | ||||||||
| Commonwealth of Virginia, Transportation Board Rev., “A”, 4%, 2026 | $ | 4,000,000 | $ | 4,380,960 | ||||
| Commonwealth of Virginia, Transportation Board Rev., Capital Projects, 5%, 2019 | 2,200,000 | 2,679,996 | ||||||
| Commonwealth of Virginia, Transportation Board Rev., Capital Projects, 5%, 2020 | 1,635,000 | 2,019,879 | ||||||
| Commonwealth of Virginia, Transportation Board Rev., Capital Projects, 5%, 2025 | 3,000,000 | 3,589,170 | ||||||
| Virginia Port Authority, Port Fund Rev., 5%, 2032 | 1,200,000 | 1,375,356 | ||||||
| Washington, DC, Metropolitan Area Transit Authority Gross Rev., “A”, 5.25%, 2029 | 1,485,000 | 1,687,495 | ||||||
| Washington, DC, Metropolitan Area Transit Authority Gross Rev., “A”, 5.125%, 2032 | 1,365,000 | 1,524,050 | ||||||
| $ | 17,256,906 | |||||||
| Universities - Colleges - 7.8% | ||||||||
| Amherst, VA, Industrial Development Authority Rev. (Educational Facilities Sweet Briar), 5%, 2026 | $ | 1,770,000 | $ | 1,858,695 | ||||
| Florida Higher Educational Facilities, Financial Authority Rev. (University of Tampa Project), “A”, 5%, 2032 | 45,000 | 48,938 | ||||||
| Florida Higher Educational Facilities, Financial Authority Rev. (University of Tampa Project), “A”, 5.25%, 2042 | 405,000 | 444,212 | ||||||
| Illinois Finance Authority Rev. (Roosevelt University Project), 6.5%, 2039 | 2,130,000 | 2,412,395 | ||||||
| Massachusetts Development Finance Agency Rev. (Suffolk University), 5%, 2030 | 615,000 | 678,517 | ||||||
| Prince William County, VA, Industrial Development Authority Rev. (George Mason University Foundation Prince William Life Sciences Lab), 5.5%, 2034 | 1,000,000 | 1,125,210 | ||||||
54
Table of Contents
Portfolio of Investments – continued
| Municipal Bonds - continued | ||||||||
| Issuer | Shares/Par | Value ($) | ||||||
| Universities - Colleges - continued | ||||||||
| University of California Rev., “G”, 4%, 2029 | $ | 1,170,000 | $ | 1,233,999 | ||||
| University of Virginia (University Rev.), 5%, 2025 | 3,760,000 | 4,603,142 | ||||||
| University of Virginia (University Rev.), “B”, 5%, 2013 (c) | 2,255,000 | 2,272,566 | ||||||
| University of Virginia (University Rev.), “B”, 5%, 2027 | 435,000 | 438,389 | ||||||
| Virginia College Building Authority, Educational Facilities Rev. (Regent University), 5%, 2026 | 2,000,000 | 2,119,700 | ||||||
| Virginia College Building Authority, Educational Facilities Rev. (Richmond University), 4%, 2042 | 5,000,000 | 5,169,550 | ||||||
| Virginia College Building Authority, Educational Facilities Rev. (Richmond University), “A”, 5%, 2021 | 2,115,000 | 2,610,185 | ||||||
| Virginia College Building Authority, Educational Facilities Rev. (Roanoke College), 4.5%, 2037 | 2,180,000 | 2,236,048 | ||||||
| Virginia College Building Authority, Educational Facilities Rev. (Washington & Lee University), NATL, 5.25%, 2031 | 1,000,000 | 1,276,210 | ||||||
| Virginia Small Business Financing Authority, Educational Facilities Rev. (Roanoke College), 5.5%, 2033 | 500,000 | 552,100 | ||||||
| $ | 29,079,856 | |||||||
| Universities - Dormitories - 0.0% | ||||||||
| Oregon Facilities Authority, Student Housing Rev. (Southern Oregon University), ASSD GTY, 5%, 2044 | $ | 120,000 | $ | 130,642 | ||||
| Universities - Secondary Schools - 0.6% | ||||||||
| Alexandria, VA, Industrial Development Authority, Educational Facilities Rev. (Episcopal High School), “A”, 5%, 2040 | $ | 1,900,000 | $ | 2,097,410 | ||||
| Utilities - Investor Owned - 0.8% | ||||||||
| Halifax County, VA, Industrial Development Authority (Old Dominion Electric Cooperative), AMBAC, 5.625%, 2028 | $ | 3,000,000 | $ | 3,048,480 | ||||
| Utilities - Municipal Owned - 1.3% | ||||||||
| Bristol, VA, Utility Systems Rev., ETM, AGM, 5.75%, 2016 (c) | $ | 240,000 | $ | 280,550 | ||||
| Guam Power Authority Rev., “A”, 5.5%, 2030 | 785,000 | 873,485 | ||||||
| Long Island, NY, Power Authority, Electric Systems Rev., “A”, 6%, 2033 | 470,000 | 560,748 | ||||||
| Puerto Rico Electric Power Authority, Power Rev., “WW”, 5.5%, 2038 | 2,000,000 | 1,999,820 | ||||||
| Richmond, VA, Public Utilities Rev., AGM, 5%, 2035 | 1,000,000 | 1,066,280 | ||||||
| $ | 4,780,883 | |||||||
| Utilities - Other - 1.3% | ||||||||
| Tennessee Energy Acquisition Corp., Gas Rev., “A”, 5.25%, 2019 | $ | 945,000 | $ | 1,093,800 | ||||
| Tennessee Energy Acquisition Corp., Gas Rev., “A”, 5.25%, 2021 | 555,000 | 644,966 | ||||||
| Issuer | Shares/Par | Value ($) | ||||||
| Utilities - Other - continued | ||||||||
| Tennessee Energy Acquisition Corp., Gas Rev., “A”, 5.25%, 2022 | $ | 290,000 | $ | 337,206 | ||||
| Tennessee Energy Acquisition Corp., Gas Rev., “A”, 5.25%, 2024 | 215,000 | 250,140 | ||||||
| Tennessee Energy Acquisition Corp., Gas Rev., “A”, 5.25%, 2026 | 1,140,000 | 1,320,211 | ||||||
| Texas Gas Acquisition & Supply Corp III., Gas Supply Rev., 5%, 2027 | 1,080,000 | 1,169,672 | ||||||
| $ | 4,815,995 | |||||||
| Water & Sewer Utility Revenue - 17.8% | ||||||||
| Commonwealth of Puerto Rico Aqueduct & Sewer Authority Rev., “A”, 6%, 2038 | $ | 1,885,000 | $ | 1,905,886 | ||||
| Commonwealth of Puerto Rico Aqueduct & Sewer Authority Rev., “A”, 6%, 2044 | 3,000,000 | 3,014,370 | ||||||
| DeKalb County, GA, Water & Sewer Rev., “A”, 5.25%, 2041 | 1,375,000 | 1,554,809 | ||||||
| Fairfax County, VA, Water Authority Rev., 5%, 2028 | 1,000,000 | 1,205,620 | ||||||
| Guam Government Waterworks Authority, Water & Wastewater System Rev., 5.625%, 2040 | 620,000 | 648,235 | ||||||
| Hampton Roads, VA, Sanitation District Wastewater Rev., 5%, 2033 | 2,000,000 | 2,238,380 | ||||||
| Hampton Roads, VA, Sanitation District Wastewater Rev., 5%, 2038 | 3,750,000 | 4,159,725 | ||||||
| James City, VA, Water & Sewer Rev., 5%, 2040 | 1,290,000 | 1,438,814 | ||||||
| Norfolk, VA, Water Rev., 4.75%, 2038 | 4,000,000 | 4,356,960 | ||||||
| Norfolk, VA, Water Rev., 4%, 2039 | 4,400,000 | 4,533,408 | ||||||
| Spotsylvania County, VA, Water & Sewer Rev., AGM, 5%, 2035 | 1,000,000 | 1,033,300 | ||||||
| Upper Occoquan, VA, Sewage Authority Regional Sewage Rev., 5%, 2041 | 2,000,000 | 2,218,820 | ||||||
| Virginia Resources Authority Rev., 5%, 2013 (c) | 55,000 | 56,537 | ||||||
| Virginia Resources Authority Rev., 5%, 2013 (c) | 60,000 | 61,676 | ||||||
| Virginia Resources Authority Rev., 5%, 2013 (c) | 375,000 | 385,478 | ||||||
| Virginia Resources Authority, Clean Water Rev., 4.75%, 2027 | 3,000,000 | 3,366,660 | ||||||
| Virginia Resources Authority, Clean Water Rev., 5%, 2031 | 1,000,000 | 1,171,230 | ||||||
| Virginia Resources Authority, Infrastructure Rev., 5%, 2013 (c) | 220,000 | 226,147 | ||||||
| Virginia Resources Authority, Infrastructure Rev., 5%, 2013 (c) | 305,000 | 313,342 | ||||||
| Virginia Resources Authority, Infrastructure Rev., 5%, 2013 (c) | 60,000 | 61,641 | ||||||
| Virginia Resources Authority, Infrastructure Rev., 5%, 2013 (c) | 220,000 | 226,147 | ||||||
| Virginia Resources Authority, Infrastructure Rev., 5%, 2013 (c) | 1,880,000 | 1,931,418 | ||||||
| Virginia Resources Authority, Infrastructure Rev., 5%, 2023 | 2,395,000 | 2,452,720 | ||||||
| Virginia Resources Authority, Infrastructure Rev., 5%, 2033 | 2,765,000 | 2,817,203 | ||||||
55
Table of Contents
Portfolio of Investments – continued
| Municipal Bonds - continued | ||||||||
| Issuer | Shares/Par | Value ($) | ||||||
| Water & Sewer Utility Revenue - continued | ||||||||
| Virginia Resources Authority, Infrastructure Rev. (Virginia Pooled Funding Program), “B”, 5.25%, 2033 | $ | 3,000,000 | $ | 3,496,620 | ||||
| Virginia Resources Authority, Infrastructure Rev. (Virginia Pooled Funding Program), “B”, 5%, 2040 | 1,400,000 | 1,561,364 | ||||||
| Virginia Resources Authority, Infrastructure Rev., “A”, 5%, 2025 | 1,595,000 | 1,945,134 | ||||||
| Virginia Resources Authority, Infrastructure Rev., “B”, 5%, 2038 | 2,600,000 | 2,956,720 | ||||||
| Virginia Resources Authority, Infrastructure Rev., Pooled Financing Program, “B”, 5%, 2025 (u) | 1,245,000 | 1,523,756 | ||||||
| Virginia Resources Authority, Infrastructure Rev., Pooled Financing Program, “B”, 5%, 2027 (u) | 5,755,000 | 6,933,394 | ||||||
| Virginia Resources Authority, Infrastructure Rev., Pooled Financing Program, “B”, 5%, 2028 (u) | 3,000,000 | 3,591,120 | ||||||
| Virginia Resources Authority, Water & Sewer Systems Rev. (Turkahoe Creek Project), Capital Appreciation, 0%, 2033 | 2,245,000 | 1,035,641 | ||||||
| Virginia Resources Authority, Water & Sewer Systems Rev. (Turkahoe Creek Project), Capital Appreciation, 0%, 2034 | 2,250,000 | 985,838 | ||||||
| Issuer | Shares/Par | Value ($) | ||||||
| Water & Sewer Utility Revenue - continued | ||||||||
| Virginia Resources Authority, Water & Sewer Systems Rev. (Turkahoe Creek Project), Capital Appreciation, 0%, 2035 | $ | 1,950,000 | $ | 811,142 | ||||
| Virginia Resources Authority, Water & Sewer Systems Rev. (Turkahoe Creek Project), Capital Appreciation, 0%, 2036 | 1,250,000 | 492,500 | ||||||
| $ | 66,711,755 | |||||||
Total Municipal Bonds (Identified Cost, $351,772,571) |
| $ | 371,646,004 | |||||
| Money Market Funds - 0.8% | ||||||||
| MFS Institutional Money Market Portfolio, 0.14%, at Cost and Net Asset Value (v) | 3,198,956 | $ | 3,198,956 | |||||
| Total Investments (Identified Cost, $354,971,527) | $ | 374,844,960 | ||||||
| Other Assets, Less Liabilities - (0.0)% | (147,789) | |||||||
| Net Assets - 100.0% | $ | 374,697,171 | ||||||
See Portfolio Footnotes and Notes to Financial Statements
56
Table of Contents
PORTFOLIO OF INVESTMENTS
3/31/13
MFS WEST VIRGINIA MUNICIPAL BOND FUND
The Portfolio of Investments is a complete list of all securities owned by your fund. It is categorized by broad-based asset classes.
| Municipal Bonds - 96.2% | ||||||||
| Issuer | Shares/Par | Value ($) | ||||||
| General Obligations - General Purpose - 8.2% | ||||||||
| Commonwealth of Puerto Rico, Public Improvement, 5.25%, 2023 | $ | 1,500,000 | $ | 1,518,335 | ||||
| Commonwealth of Puerto Rico, Public Improvement, “A”, CIFG, 5%, 2034 | 780,000 | 745,532 | ||||||
| Puerto Rico Public Buildings Authority Rev. (State Office Building), “F”, SYNCORA, 5.25%, 2025 | 2,000,000 | 2,005,200 | ||||||
| Puerto Rico Public Buildings Authority Rev., Guaranteed, “M”, 6.25%, 2031 | 725,000 | 794,984 | ||||||
| Puerto Rico Public Buildings Authority Rev., Guaranteed, “Q”, 5.625%, 2039 | 740,000 | 733,414 | ||||||
| State of California, 5.125%, 2033 | 650,000 | 729,970 | ||||||
| State of West Virginia, NATL, 5%, 2015 | 1,500,000 | 1,643,190 | ||||||
| State of West Virginia, 4%, 2022 | 2,000,000 | 2,265,600 | ||||||
| State of West Virginia, 4%, 2023 | 2,000,000 | 2,240,080 | ||||||
| $ | 12,676,305 | |||||||
| General Obligations - Improvement - 0.2% | ||||||||
| Guam Government, “A”, 6.75%, 2029 | $ | 35,000 | $ | 39,143 | ||||
| Guam Government, “A”, 5.25%, 2037 | 250,000 | 252,023 | ||||||
| Guam Government, “A”, 7%, 2039 | 45,000 | 50,175 | ||||||
| $ | 341,341 | |||||||
| General Obligations - Schools - 7.2% | ||||||||
| Clovis, CA, Unified School District (Election of 2004), Capital Appreciation, “A”, 0%, 2026 | $ | 985,000 | $ | 584,834 | ||||
| Hancock County, WV, Board of Education, 5%, 2019 | 1,130,000 | 1,348,045 | ||||||
| Hardy County, WV, Board of Education, 3%, 2029 | 570,000 | 548,699 | ||||||
| Monongalia County, WV, Board of Education, NATL, 5%, 2027 | 2,350,000 | 2,493,773 | ||||||
| Monongalia County, WV, Board of Education, 5%, 2031 | 2,000,000 | 2,271,500 | ||||||
| Putnam County, WV, Board of Education, 4%, 2020 | 2,500,000 | 2,860,375 | ||||||
| Putnam County, WV, Board of Education, 4%, 2025 | 1,000,000 | 1,098,100 | ||||||
| $ | 11,205,326 | |||||||
| Healthcare Revenue - Hospitals - 12.7% | ||||||||
| Arizona Health Facilities Authority Rev. (Banner Health), “A”, 4%, 2043 | $ | 505,000 | $ | 491,259 | ||||
| Escambia County, FL, Health Facilities Authority (Baptist Hospital, Inc.), “A”, 6%, 2036 | 725,000 | 834,656 | ||||||
| Illinois Finance Authority Rev. (Edward Hospital), “A”, AMBAC, 5.5%, 2040 | 945,000 | 1,029,549 | ||||||
| Illinois Finance Authority Rev. (Provena Health), “A”, 6%, 2028 | 450,000 | 508,536 | ||||||
| Illinois Finance Authority Rev. (Silver Cross Hospital & Medical Centers), 7%, 2044 | 420,000 | 500,581 | ||||||
| Issuer | Shares/Par | Value ($) | ||||||
| Healthcare Revenue - Hospitals - continued | ||||||||
| Indiana Finance Authority Rev. (Community Foundation of Northwest Indiana Obligated Group), 5%, 2041 | $ | 725,000 | $ | 772,712 | ||||
| Kentucky Economic Development Finance Authority, Hospital Facilities Rev. (Owensboro Medical Health System), “A”, 5.75%, 2025 | 340,000 | 394,369 | ||||||
| Kentucky Economic Development Finance Authority, Hospital Facilities Rev. (Owensboro Medical Health System), “A”, 6.375%, 2040 | 410,000 | 486,067 | ||||||
| Kentucky Economic Development Finance Authority, Hospital Facilities Rev. (Owensboro Medical Health System), “A”, 6.5%, 2045 | 290,000 | 345,277 | ||||||
| Louisville & Jefferson County, KY, Metropolitan Government Healthcare Systems Rev. (Norton Healthcare, Inc.), 5.25%, 2036 | 725,000 | 765,905 | ||||||
| Massachusetts Health & Educational Facilities Authority Rev. (Caregroup, Inc.), 5.125%, 2038 | 675,000 | 745,133 | ||||||
| Michigan Hospital Finance Authority Rev. (Henry Ford Health System), 5.625%, 2029 | 85,000 | 96,495 | ||||||
| Michigan Hospital Finance Authority Rev. (Henry Ford Health System), 5.75%, 2039 | 855,000 | 962,875 | ||||||
| Monongalia County, WV, Building Commission Hospital Rev. (Monongalia General Hospital), 6.5%, 2041 | 1,100,000 | 1,260,644 | ||||||
| Princeton, WV, Hospital Rev. (Princeton Community Hospital), “A”, 5%, 2027 | 750,000 | 823,973 | ||||||
| West Virginia Hospital Finance Authority, Hospital Rev. (Camden Clark Memorial Hospital), ASSD GTY, 5.875%, 2034 | 1,000,000 | 1,147,770 | ||||||
| West Virginia Hospital Finance Authority, Hospital Rev. (Charleston Area Medical Center), “A”, ETM, 6.5%, 2023 (c) | 2,000,000 | 2,660,580 | ||||||
| West Virginia Hospital Finance Authority, Hospital Rev. (Health Systems Obligations), 5.75%, 2039 | 1,000,000 | 1,038,730 | ||||||
| West Virginia Hospital Finance Authority, Hospital Rev. (Thomas Health System), 6.5%, 2038 | 500,000 | 519,595 | ||||||
| West Virginia Hospital Finance Authority, Hospital Rev. (United Hospital Center, Inc.), “A”, AMBAC, 5%, 2022 | 2,500,000 | 2,681,650 | ||||||
| West Virginia Hospital Finance Authority, Hospital Rev. (West Virginia United Health Systems), “E”, 5.625%, 2035 | 1,000,000 | 1,087,870 | ||||||
| Wisconsin Health & Educational Facilities Authority Rev. (Mercy Alliance), 5%, 2039 | 460,000 | 491,331 | ||||||
| $ | 19,645,557 | |||||||
| Industrial Revenue - Other - 0.2% | ||||||||
| Liberty, NY, Development Corp. Rev. (Goldman Sachs Headquarters), 5.25%, 2035 | $ | 310,000 | $ | 362,557 | ||||
57
Table of Contents
Portfolio of Investments – continued
| Municipal Bonds - continued | ||||||||
| Issuer | Shares/Par | Value ($) | ||||||
| Miscellaneous Revenue - Entertainment & Tourism - 0.1% | ||||||||
| Louisiana Stadium & Exposition District Rev., “A”, 5%, 2031 | $ | 25,000 | $ | 28,204 | ||||
| Louisiana Stadium & Exposition District Rev., “A”, 5%, 2036 | 85,000 | 94,807 | ||||||
| $ | 123,011 | |||||||
| Miscellaneous Revenue - Other - 8.0% | ||||||||
| Citizens Property Insurance Corp., FL, “A-1”, 5%, 2020 | $ | 605,000 | $ | 719,297 | ||||
| Miami-Dade County, FL, Special Obligation, “B”, 5%, 2035 | 160,000 | 174,917 | ||||||
| Miami-Dade County, FL, Special Obligation, “B”, 5%, 2037 | 110,000 | 119,889 | ||||||
| West Virginia Building Commission, Lease Rev. (WV Regional Jail), “A”, AMBAC, 5.375%, 2018 | 8,040,000 | 8,956,158 | ||||||
| West Virginia, Higher Education Policy Commission Rev. (Community & Technology-Capital Improvement), “A”, 5%, 2039 | 2,200,000 | 2,456,718 | ||||||
| $ | 12,426,979 | |||||||
| Sales & Excise Tax Revenue - 4.7% | ||||||||
| Colorado Regional Transportation District, Sales Tax Rev. (Fastracks Project), “A”, 5%, 2027 | $ | 545,000 | $ | 650,665 | ||||
| Guam Government Business Privilege Tax Rev., “A”, 5.25%, 2036 | 335,000 | 373,471 | ||||||
| Guam Government Business Privilege Tax Rev., “C”, 5%, 2016 | 110,000 | 125,885 | ||||||
| Guam Government Business Privilege Tax Rev., “C”, 5%, 2017 | 125,000 | 146,454 | ||||||
| Guam Government Business Privilege Tax Rev., “C”, 5%, 2018 | 120,000 | 142,541 | ||||||
| Massachusetts Bay Transportation Authority, Sales Tax Rev., “A”, 5%, 2031 | 1,000,000 | 1,236,250 | ||||||
| Massachusetts School Building Authority, Dedicated Sales Tax Rev., “B”, 5%, 2035 | 920,000 | 1,053,888 | ||||||
| Puerto Rico Sales Tax Financing Corp., Sales Tax Rev., 5.25%, 2057 | 1,015,000 | 1,048,597 | ||||||
| Puerto Rico Sales Tax Financing Corp., Sales Tax Rev., “A”, 5.5%, 2028 | 635,000 | 686,276 | ||||||
| Puerto Rico Sales Tax Financing Corp., Sales Tax Rev., “C”, 6%, 2039 | 585,000 | 629,764 | ||||||
| Puerto Rico Sales Tax Financing Corp., Sales Tax Rev., “C”, 5%, 2040 | 615,000 | 636,125 | ||||||
| Puerto Rico Sales Tax Financing Corp., Sales Tax Rev., “C”, 5.25%, 2040 | 555,000 | 585,581 | ||||||
| $ | 7,315,497 | |||||||
| Single Family Housing - State - 0.2% | ||||||||
| West Virginia Housing Development Fund Rev., “A”, 2.95%, 2021 | $ | 300,000 | $ | 310,260 | ||||
| State & Local Agencies - 8.1% | ||||||||
| FYI Properties Lease Rev. (Washington State Project), 5.5%, 2034 | $ | 545,000 | $ | 610,040 | ||||
| Virginia Public School Authority, Special Obligation Montgomery County, 5%, 2030 | 680,000 | 788,582 | ||||||
| Issuer | Shares/Par | Value ($) | ||||||
| State & Local Agencies - continued | ||||||||
| West Virginia Building Commission, Lease Rev., “B”, AMBAC, 5.375%, 2018 | $ | 2,200,000 | $ | 2,306,128 | ||||
| West Virginia Economic Development Authority, Auto Lease Rev., 5.2%, 2033 | 1,000,000 | 1,011,790 | ||||||
| West Virginia Economic Development Authority, Lease Rev. (Correctional Juvenile Public Safety Facilities), 5%, 2022 | 1,000,000 | 1,183,490 | ||||||
| West Virginia Economic Development Authority, Lease Rev. (Correctional Juvenile Public Safety Facilities), “A”, NATL, 5%, 2029 | 1,530,000 | 1,613,645 | ||||||
| West Virginia Economic Development Authority, Lease Rev. (Correctional Juvenile Public Safety Facilities), “A”, 5%, 2029 | 2,000,000 | 2,275,300 | ||||||
| West Virginia Economic Development Authority, Lease Rev. (State Office Building), “B”, NATL, 5.25%, 2025 | 645,000 | 659,280 | ||||||
| West Virginia Economic Development Authority, Lease Rev. (State Office Building), “B”, NATL, 5.25%, 2030 | 1,355,000 | 1,380,637 | ||||||
| West Virginia Hospital Finance Authority, Hospital Rev. (Veterans Nursing Home), 5.5%, 2034 | 795,000 | 801,487 | ||||||
| $ | 12,630,379 | |||||||
| Tax - Other - 6.7% | ||||||||
| Guam Government Ltd. Obligation Rev., “A”, 5.375%, 2024 | $ | 160,000 | $ | 174,797 | ||||
| Guam Government Ltd. Obligation Rev., “A”, 5.625%, 2029 | 55,000 | 60,010 | ||||||
| Virgin Islands Public Finance Authority Rev. (Diageo), “A”, 6.625%, 2029 | 360,000 | 412,474 | ||||||
| Virgin Islands Public Finance Authority Rev., “A-1”, 5%, 2029 | 110,000 | 119,511 | ||||||
| Virgin Islands Public Finance Authority Rev., “A-1”, 5%, 2039 | 120,000 | 125,824 | ||||||
| Virgin Islands Public Finance Authority Rev., “B”, 5%, 2025 | 110,000 | 121,392 | ||||||
| Virgin Islands Public Finance Authority Rev., Matching Fund Loan Note, “A”, 5%, 2029 | 390,000 | 426,925 | ||||||
| West Virginia Economic Development Authority, Lottery Rev., “A”, 5%, 2040 | 2,000,000 | 2,206,780 | ||||||
| West Virginia Housing Development Fund, “A”, 3.8%, 2024 | 1,200,000 | 1,262,124 | ||||||
| West Virginia School Building Authority Rev., “A”, FGIC, 5%, 2020 | 2,000,000 | 2,320,760 | ||||||
| West Virginia School Building Authority, Excess Lottery Rev., 5%, 2026 | 1,000,000 | 1,130,530 | ||||||
| West Virginia School Building Authority, Excess Lottery Rev., 5%, 2028 | 750,000 | 840,030 | ||||||
| West Virginia School Building Authority, Excess Lottery Rev., “B”, 5%, 2030 | 1,000,000 | 1,135,580 | ||||||
| $ | 10,336,737 | |||||||
58
Table of Contents
Portfolio of Investments – continued
| Municipal Bonds - continued | ||||||||
| Issuer | Shares/Par | Value ($) | ||||||
| Tax Assessment - 0.5% | ||||||||
| Morgantown, WV, Tax Increment Rev., Parking Garage Project, “A”, 5%, 2033 | $ | 455,000 | $ | 457,776 | ||||
| Ohio County, WV, Commission Tax Increment Rev. (Fort Henry Centre), “A”, 5.85%, 2034 | 300,000 | 313,917 | ||||||
| $ | 771,693 | |||||||
| Tobacco - 1.0% | ||||||||
| Buckeye, OH, Tobacco Settlement Financing Authority, “A-2”, 5.125%, 2024 | $ | 185,000 | $ | 169,693 | ||||
| Illinois Railsplitter Tobacco Settlement Authority, 6%, 2028 | 620,000 | 751,229 | ||||||
| New Jersey Tobacco Settlement Financing Corp., “1-A”, 5%, 2041 | 650,000 | 585,683 | ||||||
| $ | 1,506,605 | |||||||
| Toll Roads - 0.2% | ||||||||
| Triborough Bridge & Tunnel Authority Rev., NY, Capital Appreciation, “A”, 0%, 2029 | $ | 580,000 | $ | 307,771 | ||||
| Transportation - Special Tax - 0.4% | ||||||||
| Commonwealth of Puerto Rico Highway & Transportation Authority Rev., “AA-1”, AGM, 4.95%, 2026 | $ | 560,000 | $ | 586,320 | ||||
| Universities - Colleges - 22.0% | ||||||||
| Fairmont State College, WV, Board of Governors Rev., “A”, 5%, 2032 | $ | 4,035,000 | $ | 4,491,560 | ||||
| Fairmont State College, WV, College Rev., “A”, FGIC, 5%, 2032 | 1,210,000 | 1,219,644 | ||||||
| Fairmont State College, WV, College Rev., “B”, FGIC, 5%, 2032 | 2,250,000 | 2,267,933 | ||||||
| Florida Higher Educational Facilities, Financial Authority Rev. (University of Tampa Project), “A”, 5%, 2032 | 20,000 | 21,750 | ||||||
| Florida Higher Educational Facilities, Financial Authority Rev. (University of Tampa Project), “A”, 5.25%, 2042 | 155,000 | 170,007 | ||||||
| Illinois Finance Authority Rev. (University of Chicago), “A”, 5%, 2051 | 375,000 | 410,828 | ||||||
| Marshall University, WV, University Rev., 5%, 2030 | 2,000,000 | 2,238,440 | ||||||
| Marshall University, WV, University Rev., 5%, 2041 | 1,000,000 | 1,095,150 | ||||||
| Massachusetts State College, Building Authority Project Rev., “A”, 5%, 2036 | 405,000 | 463,745 | ||||||
| Puerto Rico Industrial, Tourist, Educational, Medical, & Environmental Control Facilities Financing Authority, Educational Facilities Rev. (University Plaza), “A”, NATL, 5%, 2021 | 1,270,000 | 1,273,442 | ||||||
| Puerto Rico Industrial, Tourist, Educational, Medical, & Environmental Control Facilities Financing Authority, Higher Education Rev. (International American University of Puerto Rico Project), 5%, 2031 | 110,000 | 114,990 | ||||||
| Shepherd University Board of Governors, WV Rev. (Residence Facilities Projects), NATL, 5%, 2035 | 1,675,000 | 1,760,693 | ||||||
| Issuer | Shares/Par | Value ($) | ||||||
| Universities - Colleges - continued | ||||||||
| University of California Rev., “G”, 4%, 2029 | $ | 755,000 | $ | 796,299 | ||||
| West Virginia Department of Higher Education, “B”, FGIC, 5%, 2014 (c) | 2,000,000 | 2,094,500 | ||||||
| West Virginia Higher Education Policy Commission Rev. (Higher Education Facilities), “A”, 5%, 2026 | 1,600,000 | 1,879,568 | ||||||
| West Virginia School Building Authority Rev., “A”, NATL, 5%, 2021 | 1,250,000 | 1,443,163 | ||||||
| West Virginia University Board of Governors University Rev., 3.375%, 2037 | 1,000,000 | 952,600 | ||||||
| West Virginia University Rev. (West Virginia University Project), “A”, 5%, 2035 | 3,000,000 | 3,386,700 | ||||||
| West Virginia University, University Systems Rev., “A”, NATL, 5.5%, 2020 | 1,700,000 | 2,115,429 | ||||||
| West Virginia University, University Systems Rev., “A”, NATL, 5.25%, 2028 | 2,000,000 | 2,501,600 | ||||||
| West Virginia, Higher Education Facilities Rev., “B”, FGIC, 5%, 2014 (c) | 3,230,000 | 3,382,618 | ||||||
| $ | 34,080,659 | |||||||
| Universities - Dormitories - 0.0% | ||||||||
| Oregon Facilities Authority, Student Housing Rev. (Southern Oregon University), ASSD GTY, 5%, 2044 | $ | 45,000 | $ | 48,991 | ||||
| Utilities - Investor Owned - 2.8% | ||||||||
| Michigan Strategic Fund Ltd. Obligation Rev. (Detroit Edison Co.), 5.625%, 2020 | $ | 470,000 | $ | 577,592 | ||||
| Michigan Strategic Fund Ltd. Obligation Rev. (Detroit Edison Co.), 5.5%, 2029 (b) | 340,000 | 387,906 | ||||||
| Pleasants County, WV, Pollution Control Rev. (Allegheny Community), “F”, 5.25%, 2037 | 300,000 | 319,110 | ||||||
| West Virginia Economic Development Authority, Solid Waste Disposal Facilities Rev., AMBAC, 4.9%, 2037 | 3,000,000 | 3,000,960 | ||||||
| $ | 4,285,568 | |||||||
| Utilities - Municipal Owned - 0.9% | ||||||||
| Guam Power Authority Rev., “A”, 5.5%, 2030 | $ | 325,000 | $ | 361,634 | ||||
| Puerto Rico Electric Power Authority, Power Rev., “XX”, 5.25%, 2040 | 1,085,000 | 1,036,522 | ||||||
| $ | 1,398,156 | |||||||
| Utilities - Other - 2.0% | ||||||||
| California M-S-R Energy Authority Gas Rev., “A”, 6.5%, 2039 | $ | 615,000 | $ | 834,088 | ||||
| Nebraska Central Plains Energy Project, Gas Project Rev., “3”, 5%, 2032 | 630,000 | 700,390 | ||||||
| Tennessee Energy Acquisition Corp., Gas Rev., “A”, 5.25%, 2019 | 480,000 | 555,581 | ||||||
| Tennessee Energy Acquisition Corp., Gas Rev., “A”, 5.25%, 2021 | 245,000 | 284,715 | ||||||
| Tennessee Energy Acquisition Corp., Gas Rev., “A”, 5.25%, 2022 | 125,000 | 145,348 | ||||||
| Tennessee Energy Acquisition Corp., Gas Rev., “C”, 5%, 2021 | 290,000 | 329,536 | ||||||
59
Table of Contents
Portfolio of Investments – continued
| Municipal Bonds - continued | ||||||||
| Issuer | Shares/Par | Value ($) | ||||||
| Utilities - Other - continued | ||||||||
| Texas Gas Acquisition & Supply Corp III., Gas Supply Rev., 5%, 2031 | $ | 70,000 | $ | 74,248 | ||||
| Texas Gas Acquisition & Supply Corp III., Gas Supply Rev., 5%, 2032 | 115,000 | 121,323 | ||||||
| $ | 3,045,229 | |||||||
| Water & Sewer Utility Revenue - 10.1% | ||||||||
| Berkeley County, WV, Public Service Sewer District, “A”, 5%, 2047 | $ | 1,000,000 | $ | 1,018,070 | ||||
| Commonwealth of Puerto Rico Aqueduct & Sewer Authority Rev., “A”, 6%, 2044 | 2,005,000 | 2,014,604 | ||||||
| Fairmont, WV, Waterworks Rev., AMBAC, 5.25%, 2022 | 200,000 | 226,248 | ||||||
| Fairmont, WV, Waterworks Rev., “D”, AGM, 3.2%, 2029 | 500,000 | 481,515 | ||||||
| Guam Government Waterworks Authority, Water & Wastewater System Rev., 5.625%, 2040 | 515,000 | 538,453 | ||||||
| West Virginia Water Development Authority Rev. (Loan Program III), “A”, 3.75%, 2039 | 2,000,000 | 1,906,600 | ||||||
| West Virginia Water Development Authority Rev. (Loan Program III), “B”, 3.75%, 2040 | 1,000,000 | 947,560 | ||||||
| Issuer | Shares/Par | Value ($) | ||||||
| Water & Sewer Utility Revenue - continued | ||||||||
| West Virginia Water Development Authority Rev. (Loan Program IV), “A”, AGM, 5%, 2044 | $ | 2,000,000 | $ | 2,128,680 | ||||
| West Virginia Water Development Authority Rev. (Loan Program IV), “B”, AMBAC, 5.125%, 2024 | 2,140,000 | 2,315,031 | ||||||
| West Virginia Water Development Authority, Infrastructure Rev., “A”, AMBAC, 5%, 2033 | 1,950,000 | 2,015,618 | ||||||
| West Virginia Water Development Authority, Infrastructure Rev., ‘‘A’’, AGM, 4.75%, 2045 | 2,000,000 | 2,131,020 | ||||||
| $ | 15,723,399 | |||||||
Total Municipal Bonds (Identified Cost, $140,666,642) |
| $ | 149,128,340 | |||||
| Money Market Funds - 2.5% | ||||||||
| MFS Institutional Money Market Portfolio, 0.14%, at Cost and Net Asset Value (v) | 3,831,989 | $ | 3,831,989 | |||||
Total Investments (Identified Cost, $144,498,631) | $ | 152,960,329 | ||||||
| Other Assets, Less Liabilities - 1.3% | 1,962,442 | |||||||
| Net Assets - 100.0% | $ | 154,922,771 | ||||||
Portfolio Footnotes:
| (a) | Non-income producing security. |
| (b) | Mandatory tender date is earlier than stated maturity date. |
| (c) | Refunded bond. |
| (d) | In default. Interest and/or scheduled principal payment(s) have been missed. |
| (n) | Securities exempt from registration under Rule 144A of the Securities Act of 1933. These securities may be sold in the ordinary course of business in transactions exempt from registration, normally to qualified institutional buyers. At period end, the aggregate value of these securities for the New York Fund was $500,325 representing 0.2% of net assets. |
| (p) | Primary inverse floater. |
| (q) | Interest received was less than stated coupon rate. |
| (u) | Underlying security deposited into special purpose trust (“the trust”) by investment banker upon creation of self-deposited inverse floaters. |
| (v) | Underlying affiliated fund that is available only to investment companies managed by MFS. The rate quoted for the MFS Institutional Money Market Portfolio is the annualized seven-day yield of the fund at period end. |
The following abbreviations are used in this report and are defined:
| COP | Certificate of Participation | |||||
| ETM | Escrowed to Maturity | |||||
| FRN | Floating Rate Note. Interest rate resets periodically and may not be the rate reported at period end. | |||||
| LOC | Letter of Credit | |||||
| Insurers |
| Inverse Floaters | ||||
| AGM | Assured Guaranty Municipal | RITES | Residual Interest Tax-Exempt Security | |||
| AMBAC | AMBAC Indemnity Corp. | |||||
| ASSD GTY | Assured Guaranty Insurance Co. | |||||
| CIFG | CDC IXIS Financial Guaranty | |||||
| FGIC | Financial Guaranty Insurance Co. | |||||
| FHA | Federal Housing Administration | |||||
| FNMA | Federal National Mortgage Assn. | |||||
| GNMA | Government National Mortgage Assn. | |||||
| NATL | National Public Finance Guarantee Corp. | |||||
| SYNCORA | Syncora Guarantee Inc. | |||||
See Notes to Financial Statements
60
Table of Contents
Financial Statements
STATEMENTS OF ASSETS AND LIABILITIES
At 3/31/13
These statements represent each fund’s balance sheet, which details the assets and liabilities comprising the total value of each fund.
Mississippi Fund | New York Fund | North Carolina Fund | Pennsylvania Fund | |||||||||||||
| Assets | ||||||||||||||||
| Investments – | ||||||||||||||||
Non-affiliated issuers, at identified cost | $107,352,082 | $205,093,698 | $442,249,228 | $146,236,157 | ||||||||||||
Underlying affiliated funds, at cost and net asset value | 361,850 | 4,835,359 | 2,618,244 | 4,870,172 | ||||||||||||
| Total investments, at identified cost | $107,713,932 | $209,929,057 | $444,867,472 | $151,106,329 | ||||||||||||
Unrealized appreciation (depreciation) | 7,647,339 | 18,200,356 | 33,289,283 | 10,248,874 | ||||||||||||
| Total investments, at value | $115,361,271 | $228,129,413 | $478,156,755 | $161,355,203 | ||||||||||||
| Receivables for | ||||||||||||||||
Investments sold | 359,630 | 1,478,338 | — | 215,617 | ||||||||||||
Fund shares sold | 235,363 | 284,593 | 664,957 | 156,000 | ||||||||||||
Interest | 1,427,978 | 2,966,421 | 6,290,012 | 2,307,665 | ||||||||||||
Other assets | 944 | 1,546 | 2,909 | 1,202 | ||||||||||||
Total assets | $117,385,186 | $232,860,311 | $485,114,633 | $164,035,687 | ||||||||||||
| Liabilities | ||||||||||||||||
| Payables for | ||||||||||||||||
Distributions | $82,041 | $142,838 | $262,838 | $102,110 | ||||||||||||
Investments purchased | — | 536,935 | 4,462,504 | — | ||||||||||||
Fund shares reacquired | 148,266 | 175,928 | 1,084,892 | 186,919 | ||||||||||||
| Payable to affiliates | ||||||||||||||||
Investment adviser | 7,556 | 14,808 | 30,453 | 10,502 | ||||||||||||
Shareholder servicing costs | 40,076 | 78,737 | 202,967 | 53,657 | ||||||||||||
Distribution and service fees | 2,435 | 13,054 | 27,482 | 6,722 | ||||||||||||
| Payable for independent Trustees’ compensation | 4,216 | 5,409 | 8,035 | 4,180 | ||||||||||||
Accrued expenses and other liabilities | 66,064 | 74,807 | 90,563 | 74,809 | ||||||||||||
Total liabilities | $350,654 | $1,042,516 | $6,169,734 | $438,899 | ||||||||||||
Net assets | $117,034,532 | $231,817,795 | $478,944,899 | $163,596,788 | ||||||||||||
| Net assets consist of | ||||||||||||||||
| Paid-in capital | $108,514,208 | $214,636,432 | $442,090,875 | $154,210,271 | ||||||||||||
| Unrealized appreciation (depreciation) on investments | 7,647,339 | 18,200,356 | 33,289,283 | 10,248,874 | ||||||||||||
| Accumulated net realized gain (loss) on investments | 819,407 | (1,012,767 | ) | 3,414,607 | (881,560 | ) | ||||||||||
Accumulated undistributed (distributions in excess of) net investment income | 53,578 | (6,226 | ) | 150,134 | 19,203 | |||||||||||
Net assets | $117,034,532 | $231,817,795 | $478,944,899 | $163,596,788 | ||||||||||||
61
Table of Contents
Statements of Assets and Liabilities – continued
Mississippi Fund | New York Fund | North Carolina Fund | Pennsylvania Fund | |||||||||||||
Net assets | ||||||||||||||||
| Class A | $114,430,211 | $188,290,872 | $384,212,836 | $152,803,853 | ||||||||||||
| Class B | 2,604,321 | 7,019,341 | 7,617,607 | 10,792,935 | ||||||||||||
Class C | — | 36,507,582 | 87,114,456 | — | ||||||||||||
Total net assets | $117,034,532 | $231,817,795 | $478,944,899 | $163,596,788 | ||||||||||||
Shares of beneficial interest outstanding | ||||||||||||||||
| Class A | 11,139,651 | 16,377,481 | 31,030,925 | 14,380,120 | ||||||||||||
| Class B | 253,231 | 612,144 | 616,012 | 1,013,169 | ||||||||||||
Class C | — | 3,179,320 | 7,040,048 | — | ||||||||||||
Total shares of beneficial interest outstanding | 11,392,882 | 20,168,945 | 38,686,985 | 15,393,289 | ||||||||||||
Class A shares | ||||||||||||||||
| Net asset value per share | ||||||||||||||||
(net assets/shares of beneficial interest outstanding) | $10.27 | $11.50 | $12.38 | $10.63 | ||||||||||||
Offering price per share (100 / 95.25 × net asset value per share) | $10.78 | $12.07 | $13.00 | $11.16 | ||||||||||||
Class B shares | ||||||||||||||||
| Net asset value and offering price per share | ||||||||||||||||
(net assets/shares of beneficial interest outstanding) | $10.28 | $11.47 | $12.37 | $10.65 | ||||||||||||
Class C shares | ||||||||||||||||
| Net asset value and offering price per share | ||||||||||||||||
(net assets/shares of beneficial interest outstanding) | $— | $11.48 | $12.37 | $— | ||||||||||||
On sales of $50,000 or more, the maximum offering price of Class A shares is reduced. A contingent deferred sales charge may be imposed on redemptions of Class A, Class B, and Class C shares.
See Notes to Financial Statements
62
Table of Contents
Statements of Assets and Liabilities – continued
| At 3/31/13 | South Carolina Fund | Tennessee Fund | Virginia Fund | West Virginia Fund | ||||||||||||
| Assets | ||||||||||||||||
| Investments – | ||||||||||||||||
Non-affiliated issuers, at identified cost | $206,657,951 | $123,569,420 | $351,772,571 | $140,666,642 | ||||||||||||
Underlying affiliated funds, at cost and net asset value | 7,947,671 | 5,367,445 | 3,198,956 | 3,831,989 | ||||||||||||
| Total investments, at identified cost | $214,605,622 | $128,936,865 | $354,971,527 | $144,498,631 | ||||||||||||
Unrealized appreciation (depreciation) | 13,438,447 | 8,618,475 | 19,873,433 | 8,461,698 | ||||||||||||
| Total investments, at value | $228,044,069 | $137,555,340 | $374,844,960 | $152,960,329 | ||||||||||||
| Receivables for | ||||||||||||||||
Investments sold | 65,784 | 1,447,556 | 4,785,354 | — | ||||||||||||
Fund shares sold | 120,969 | 179,493 | 166,228 | 162,629 | ||||||||||||
Interest | 3,033,889 | 1,787,291 | 5,218,956 | 2,184,537 | ||||||||||||
Other assets | 1,544 | 1,003 | 2,368 | 1,171 | ||||||||||||
Total assets | $231,266,255 | $140,970,683 | $385,017,866 | $155,308,666 | ||||||||||||
| Liabilities | ||||||||||||||||
| Payables for | ||||||||||||||||
Distributions | $101,635 | $77,045 | $234,890 | $64,482 | ||||||||||||
Investments purchased | 2,569,016 | 3,784,727 | 4,137,199 | — | ||||||||||||
Interest expense and fees | — | — | 14,905 | — | ||||||||||||
Fund shares reacquired | 607,009 | 337,212 | 625,805 | 161,958 | ||||||||||||
| Payable to the holders of the floating rate certificates from trust assets | — | — | 5,002,691 | — | ||||||||||||
| Payable to affiliates | ||||||||||||||||
Investment adviser | 14,565 | 8,797 | 23,867 | 9,951 | ||||||||||||
Shareholder servicing costs | 91,986 | 48,340 | 171,818 | 69,215 | ||||||||||||
Distribution and service fees | 8,668 | 4,994 | 17,445 | 5,523 | ||||||||||||
| Payable for independent Trustees’ compensation | 7,824 | 5,282 | 8,025 | 7,903 | ||||||||||||
Accrued expenses and other liabilities | 74,925 | 66,344 | 84,050 | 66,863 | ||||||||||||
Total liabilities | $3,475,628 | $4,332,741 | $10,320,695 | $385,895 | ||||||||||||
Net assets | $227,790,627 | $136,637,942 | $374,697,171 | $154,922,771 | ||||||||||||
| Net assets consist of | ||||||||||||||||
| Paid-in capital | $215,039,856 | $127,342,994 | $353,253,657 | $146,736,735 | ||||||||||||
| Unrealized appreciation (depreciation) on investments | 13,438,447 | 8,618,475 | 19,873,433 | 8,461,698 | ||||||||||||
| Accumulated net realized gain (loss) on investments | (656,366 | ) | 357,342 | 1,593,850 | (271,284 | ) | ||||||||||
Accumulated undistributed (distributions in excess of) net investment income | (31,310 | ) | 319,131 | (23,769 | ) | (4,378 | ) | |||||||||
Net assets | $227,790,627 | $136,637,942 | $374,697,171 | $154,922,771 | ||||||||||||
63
Table of Contents
Statements of Assets and Liabilities – continued
| South Carolina Fund | Tennessee Fund | Virginia Fund | West Virginia Fund | |||||||||||||
Net assets | ||||||||||||||||
| Class A | $220,369,500 | $133,910,659 | $335,394,651 | $153,032,273 | ||||||||||||
| Class B | 7,421,127 | 2,727,283 | 3,424,901 | 1,890,498 | ||||||||||||
Class C | — | — | 35,877,619 | — | ||||||||||||
Total net assets | $227,790,627 | $136,637,942 | $374,697,171 | $154,922,771 | ||||||||||||
Shares of beneficial interest outstanding | ||||||||||||||||
| Class A | 17,470,980 | 12,217,953 | 28,702,225 | 13,193,001 | ||||||||||||
| Class B | 588,607 | 249,030 | 293,284 | 163,051 | ||||||||||||
Class C | — | — | 3,071,050 | — | ||||||||||||
Total shares of beneficial interest outstanding | 18,059,587 | 12,466,983 | 32,066,559 | 13,356,052 | ||||||||||||
Class A shares | ||||||||||||||||
| Net asset value per share | ||||||||||||||||
(net assets/shares of beneficial interest outstanding) | $12.61 | $10.96 | $11.69 | $11.60 | ||||||||||||
Offering price per share (100 / 95.25 × net asset value per share) | $13.24 | $11.51 | $12.27 | $12.18 | ||||||||||||
Class B shares | ||||||||||||||||
| Net asset value and offering price per share | ||||||||||||||||
(net assets/shares of beneficial interest outstanding) | $12.61 | $10.95 | $11.68 | $11.59 | ||||||||||||
Class C shares | ||||||||||||||||
| Net asset value and offering price per share | ||||||||||||||||
(net assets/shares of beneficial interest outstanding) | $— | $— | $11.68 | $— | ||||||||||||
On sales of $50,000 or more, the maximum offering price of Class A shares is reduced. A contingent deferred sales charge may be imposed on redemptions of Class A, Class B, and Class C shares.
See Notes to Financial Statements
64
Table of Contents
Financial Statements
Year ended 3/31/13
These statements describe how much each fund earned in investment income and accrued in expenses. They also describe any gains or losses generated by each fund’s operations.
Mississippi Fund | New York Fund | North Carolina Fund | Pennsylvania Fund | |||||||||||||
| Net investment income | ||||||||||||||||
| Interest | $5,429,788 | $10,565,054 | $19,705,086 | $6,997,029 | ||||||||||||
Dividends from underlying affiliated funds | 1,997 | 7,453 | 14,816 | 6,633 | ||||||||||||
Total investment income | $5,431,785 | $10,572,507 | $19,719,902 | $7,003,662 | ||||||||||||
| Expenses | ||||||||||||||||
Management fee | $536,038 | $1,034,608 | $2,111,443 | $697,160 | ||||||||||||
Distribution and service fees | 317,404 | 894,873 | 1,857,471 | 468,653 | ||||||||||||
Shareholder servicing costs | 76,756 | 157,264 | 360,395 | 117,713 | ||||||||||||
Administrative services fee | 26,823 | 41,719 | 73,882 | 31,602 | ||||||||||||
Independent Trustees’ compensation | 5,315 | 10,400 | 11,822 | 5,417 | ||||||||||||
Custodian fee | 26,933 | 41,777 | 63,865 | 35,658 | ||||||||||||
Shareholder communications | 9,042 | 15,034 | 25,635 | 15,130 | ||||||||||||
Audit and tax fees | 49,328 | 49,364 | 49,431 | 49,337 | ||||||||||||
Legal fees | 6,987 | 8,078 | 7,360 | 6,731 | ||||||||||||
Interest expense and fees | — | — | 21,112 | 2,108 | ||||||||||||
Miscellaneous | 39,542 | 47,967 | 65,425 | 36,031 | ||||||||||||
Total expenses | $1,094,168 | $2,301,084 | $4,647,841 | $1,465,540 | ||||||||||||
Fees paid indirectly | (3 | ) | (2 | ) | (12 | ) | (7 | ) | ||||||||
Reduction of expenses by investment adviser and/or distributor | (179,774 | ) | (738 | ) | (1,497 | ) | (230,132 | ) | ||||||||
Net expenses | $914,391 | $2,300,344 | $4,646,332 | $1,235,401 | ||||||||||||
Net investment income | $4,517,394 | $8,272,163 | $15,073,570 | $5,768,261 | ||||||||||||
| Realized and unrealized gain (loss) on investments | ||||||||||||||||
| Realized gain (loss) (identified cost basis) | ||||||||||||||||
Investments | $437,217 | $1,139,929 | $3,025,675 | $440,329 | ||||||||||||
Futures contracts | — | (100,839 | ) | (114,307 | ) | (62,463 | ) | |||||||||
Net realized gain (loss) on investments | $437,217 | $1,039,090 | $2,911,368 | $377,866 | ||||||||||||
| Change in unrealized appreciation (depreciation) | ||||||||||||||||
Investments | $1,439,006 | $4,036,056 | $6,276,041 | $3,015,218 | ||||||||||||
Futures contracts | — | (59,970 | ) | (57,050 | ) | (37,603 | ) | |||||||||
Net unrealized gain (loss) on investments | $1,439,006 | $3,976,086 | $6,218,991 | $2,977,615 | ||||||||||||
Net realized and unrealized gain (loss) on investments | $1,876,223 | $5,015,176 | $9,130,359 | $3,355,481 | ||||||||||||
Change in net assets from operations | $6,393,617 | $13,287,339 | $24,203,929 | $9,123,742 | ||||||||||||
65
Table of Contents
Statements of Operations – continued
| Year ended 3/31/13 | South Carolina Fund | Tennessee Fund | Virginia Fund | West Virginia Fund | ||||||||||||
| Net investment income | ||||||||||||||||
| Interest | $9,382,534 | $5,698,012 | $16,351,918 | $6,576,578 | ||||||||||||
Dividends from underlying affiliated funds | 6,299 | 5,209 | 8,173 | 5,255 | ||||||||||||
Total investment income | $9,388,833 | $5,703,221 | $16,360,091 | $6,581,833 | ||||||||||||
| Expenses | ||||||||||||||||
Management fee | $984,623 | $582,089 | $1,660,632 | $684,860 | ||||||||||||
Distribution and service fees | 602,998 | 343,685 | 1,209,835 | 396,336 | ||||||||||||
Shareholder servicing costs | 160,733 | 91,022 | 287,322 | 110,534 | ||||||||||||
Administrative services fee | 40,188 | 28,160 | 60,421 | 31,255 | ||||||||||||
Independent Trustees’ compensation | 6,483 | 5,253 | 11,402 | 5,808 | ||||||||||||
Custodian fee | 37,922 | 26,224 | 55,564 | 26,978 | ||||||||||||
Shareholder communications | 13,969 | 9,326 | 20,709 | 9,841 | ||||||||||||
Audit and tax fees | 49,351 | 49,329 | 49,405 | 49,337 | ||||||||||||
Legal fees | 7,209 | 4,330 | 4,782 | 3,910 | ||||||||||||
Interest expense and fees | — | — | 37,363 | — | ||||||||||||
Miscellaneous | 45,239 | 39,316 | 59,818 | 39,800 | ||||||||||||
Total expenses | $1,948,715 | $1,178,734 | $3,457,253 | $1,358,659 | ||||||||||||
Fees paid indirectly | (2 | ) | (2 | ) | (5 | ) | (5 | ) | ||||||||
Reduction of expenses by investment adviser | (694 | ) | (412 | ) | (1,181 | ) | (487 | ) | ||||||||
Net expenses | $1,948,019 | $1,178,320 | $3,456,067 | $1,358,167 | ||||||||||||
Net investment income | $7,440,814 | $4,524,901 | $12,904,024 | $5,223,666 | ||||||||||||
| Realized and unrealized gain (loss) on investments | ||||||||||||||||
| Realized gain (loss) (identified cost basis) | ||||||||||||||||
Investments | $601,456 | $44,805 | $786,841 | $326,860 | ||||||||||||
Futures contracts | (48,581 | ) | (40,008 | ) | (195,962 | ) | (40,008 | ) | ||||||||
Net realized gain (loss) on investments | $552,875 | $4,797 | $590,879 | $286,852 | ||||||||||||
| Change in unrealized appreciation (depreciation) | ||||||||||||||||
Investments | $2,914,513 | $1,922,156 | $3,916,479 | $788,944 | ||||||||||||
Futures contracts | (24,246 | ) | (19,967 | ) | (117,088 | ) | (19,967 | ) | ||||||||
Net unrealized gain (loss) on investments | $2,890,267 | $1,902,189 | $3,799,391 | $768,977 | ||||||||||||
Net realized and unrealized gain (loss) on investments | $3,443,142 | $1,906,986 | $4,390,270 | $1,055,829 | ||||||||||||
Change in net assets from operations | $10,883,956 | $6,431,887 | $17,294,294 | $6,279,495 | ||||||||||||
See Notes to Financial Statements
66
Table of Contents
Financial Statements
STATEMENTS OF CHANGES IN NET ASSETS
These statements describe the increases and/or decreases in net assets resulting from operations, any distributions, and any shareholder transactions.
| Year ended 3/31/13 | Mississippi Fund | New York Fund | North Carolina Fund | Pennsylvania Fund | ||||||||||||
| Change in net assets | ||||||||||||||||
| From operations | ||||||||||||||||
| Net investment income | $4,517,394 | $8,272,163 | $15,073,570 | $5,768,261 | ||||||||||||
| Net realized gain (loss) on investments | 437,217 | 1,039,090 | 2,911,368 | 377,866 | ||||||||||||
Net unrealized gain (loss) on investments | 1,439,006 | 3,976,086 | 6,218,991 | 2,977,615 | ||||||||||||
Change in net assets from operations | $6,393,617 | $13,287,339 | $24,203,929 | $9,123,742 | ||||||||||||
| Distributions declared to shareholders | ||||||||||||||||
From net investment income | $(4,322,240 | ) | $(7,854,148 | ) | $(14,357,119 | ) | $(5,483,765 | ) | ||||||||
From net realized gain on investments | (108,083 | ) | — | (2,583,171 | ) | — | ||||||||||
Total distributions declared to shareholders | $(4,430,323 | ) | $(7,854,148 | ) | $(16,940,290 | ) | $(5,483,765 | ) | ||||||||
Change in net assets from fund share transactions | $(1,754,072 | ) | $3,934,666 | $30,199,922 | $16,105,193 | |||||||||||
Total change in net assets | $209,222 | $9,367,857 | $37,463,561 | $19,745,170 | ||||||||||||
| Net assets | ||||||||||||||||
| At beginning of period | 116,825,310 | 222,449,938 | 441,481,338 | 143,851,618 | ||||||||||||
At end of period | $117,034,532 | $231,817,795 | $478,944,899 | $163,596,788 | ||||||||||||
Accumulated undistributed (distributions in excess of) net investment income included in net assets at end of period | $53,578 | $(6,226 | ) | $150,134 | $19,203 | |||||||||||
| Year ended 3/31/13 | South Carolina Fund | Tennessee Fund | Virginia Fund | West Virginia Fund | ||||||||||||
| Change in net assets | ||||||||||||||||
| From operations | ||||||||||||||||
| Net investment income | $7,440,814 | $4,524,901 | $12,904,024 | $5,223,666 | ||||||||||||
| Net realized gain (loss) on investments | 552,875 | 4,797 | 590,879 | 286,852 | ||||||||||||
Net unrealized gain (loss) on investments | 2,890,267 | 1,902,189 | 3,799,391 | 768,977 | ||||||||||||
Change in net assets from operations | $10,883,956 | $6,431,887 | $17,294,294 | $6,279,495 | ||||||||||||
| Distributions declared to shareholders | ||||||||||||||||
From net investment income | $(7,114,177 | ) | $(4,319,638 | ) | $(12,316,868 | ) | $(4,987,231 | ) | ||||||||
Change in net assets from fund share transactions | $22,483,564 | $14,895,694 | $16,303,441 | $7,621,312 | ||||||||||||
Total change in net assets | $26,253,343 | $17,007,943 | $21,280,867 | $8,913,576 | ||||||||||||
| Net assets | ||||||||||||||||
| At beginning of period | 201,537,284 | 119,629,999 | 353,416,304 | 146,009,195 | ||||||||||||
At end of period | $227,790,627 | $136,637,942 | $374,697,171 | $154,922,771 | ||||||||||||
Accumulated undistributed (distributions in excess of) net investment income included in net assets at end of period | $(31,310 | ) | $319,131 | $(23,769 | ) | $(4,378 | ) | |||||||||
67
Table of Contents
Statements of Changes in Net Assets – continued
| Year ended 3/31/12 | Mississippi Fund | New York Fund | North Carolina Fund | Pennsylvania Fund | ||||||||||||
| Change in net assets | ||||||||||||||||
| From operations | ||||||||||||||||
| Net investment income | $4,488,080 | $8,298,133 | $15,364,047 | $5,628,599 | ||||||||||||
| Net realized gain (loss) on investments | 58,153 | (1,448,108 | ) | 1,075,201 | (581,076 | ) | ||||||||||
Net unrealized gain (loss) on investments | 8,241,415 | 18,637,221 | 33,416,985 | 11,734,981 | ||||||||||||
Change in net assets from operations | $12,787,648 | $25,487,246 | $49,856,233 | $16,782,504 | ||||||||||||
| Distributions declared to shareholders | ||||||||||||||||
From net investment income | $(4,414,895 | ) | $(8,085,698 | ) | $(14,764,189 | ) | $(5,515,201 | ) | ||||||||
Change in net assets from fund share transactions | $1,328,016 | $(3,051,997 | ) | $12,729,631 | $1,124,883 | |||||||||||
Total change in net assets | $9,700,769 | $14,349,551 | $47,821,675 | $12,392,186 | ||||||||||||
| Net assets | ||||||||||||||||
| At beginning of period | 107,124,541 | 208,100,387 | 393,659,663 | 131,459,432 | ||||||||||||
At end of period | $116,825,310 | $222,449,938 | $441,481,338 | $143,851,618 | ||||||||||||
Accumulated undistributed (distributions in excess of) net investment income included in net assets at end of period | $56,783 | $(37,138 | ) | $196,231 | $26,445 | |||||||||||
| Year ended 3/31/12 | South Carolina Fund | Tennessee Fund | Virginia Fund | West Virginia Fund | ||||||||||||
| Change in net assets | ||||||||||||||||
| From operations | ||||||||||||||||
| Net investment income | $7,185,676 | $4,632,344 | $13,278,479 | $5,246,848 | ||||||||||||
| Net realized gain (loss) on investments | (790,198 | ) | 123,996 | (172,589 | ) | (140,234 | ) | |||||||||
Net unrealized gain (loss) on investments | 14,115,109 | 8,352,331 | 25,414,474 | 10,727,899 | ||||||||||||
Change in net assets from operations | $20,510,587 | $13,108,671 | $38,520,364 | $15,834,513 | ||||||||||||
| Distributions declared to shareholders | ||||||||||||||||
From net investment income | $(6,940,669 | ) | $(4,534,415 | ) | $(12,849,907 | ) | $(5,028,417 | ) | ||||||||
Change in net assets from fund share transactions | $14,626,386 | $605,599 | $834,049 | $3,828,587 | ||||||||||||
Total change in net assets | $28,196,304 | $9,179,855 | $26,504,506 | $14,634,683 | ||||||||||||
| Net assets | ||||||||||||||||
| At beginning of period | 173,340,980 | 110,450,144 | 326,911,798 | 131,374,512 | ||||||||||||
At end of period | $201,537,284 | $119,629,999 | $353,416,304 | $146,009,195 | ||||||||||||
Accumulated undistributed (distributions in excess of) net investment income included in net assets at end of period | $(17,550 | ) | $316,744 | $900 | $(19,625 | ) | ||||||||||
See Notes to Financial Statements
68
Table of Contents
Financial Statements
MFS MISSISSIPPI MUNICIPAL BOND FUND
The financial highlights table is intended to help you understand the fund financial performance for the past 5 years Certain information reflects financial results for a single fund share. The total returns in the table represent the rate by which an investor would have earned (or lost) on an investment in the fund share class (assuming reinvestment of all distributions) held for the entire period.
| Years ended 3/31 | ||||||||||||||||||||
| Class A | 2013 | 2012 | 2011 | 2010 | 2009 | |||||||||||||||
Net asset value, beginning of period | $10.11 | $9.37 | $9.82 | $9.30 | $9.58 | |||||||||||||||
| Income (loss) from investment operations | ||||||||||||||||||||
| Net investment income (d) | $0.39 | $0.39 | $0.41 | $0.41 | $0.43 | |||||||||||||||
Net realized and unrealized gain (loss) on investments | 0.16 | 0.74 | (0.44 | ) | 0.52 | (0.30 | ) | |||||||||||||
Total from investment operations | $0.55 | $1.13 | $(0.03 | ) | $0.93 | $0.13 | ||||||||||||||
| Less distributions declared to shareholders | ||||||||||||||||||||
| From net investment income | $(0.38 | ) | $(0.39 | ) | $(0.40 | ) | $(0.41 | ) | $(0.41 | ) | ||||||||||
From net realized gain on investments | (0.01 | ) | — | (0.02 | ) | — | — | |||||||||||||
Total distributions declared to shareholders | $(0.39 | ) | $(0.39 | ) | $(0.42 | ) | $(0.41 | ) | $(0.41 | ) | ||||||||||
Net asset value, end of period (x) | $10.27 | $10.11 | $9.37 | $9.82 | $9.30 | |||||||||||||||
Total return (%) (r)(s)(t)(x) | 5.43 | 12.23 | (0.36 | ) | 10.10 | 1.47 | ||||||||||||||
| Ratios (%) (to average net assets) and Supplemental data: | ||||||||||||||||||||
| Expenses before expense reductions (f) | 0.90 | 0.92 | 0.92 | 0.88 | 0.74 | |||||||||||||||
Expenses after expense reductions (f) | 0.75 | 0.77 | 0.77 | 0.77 | 0.57 | |||||||||||||||
Net investment income | 3.80 | 4.01 | 4.20 | 4.28 | 4.55 | |||||||||||||||
Portfolio turnover | 12 | 14 | 15 | 11 | 24 | |||||||||||||||
Net assets at end of period (000 omitted) | $114,430 | $114,748 | $104,478 | $107,625 | $89,793 | |||||||||||||||
| Supplemental Ratios (%): | ||||||||||||||||||||
Ratios of expenses to average net assets after expense reductions and excluding interest expense and fees (f)(l) | N/A | N/A | N/A | N/A | 0.54 | |||||||||||||||
See Notes to Financial Statements
69
Table of Contents
Financial Highlights – continued
MFS MISSISSIPPI MUNICIPAL BOND FUND – continued
| Years ended 3/31 | ||||||||||||||||||||
| Class B | 2013 | 2012 | 2011 | 2010 | 2009 | |||||||||||||||
Net asset value, beginning of period | $10.12 | $9.38 | $9.83 | $9.32 | $9.59 | |||||||||||||||
| Income (loss) from investment operations | ||||||||||||||||||||
| Net investment income (d) | $0.32 | $0.33 | $0.34 | $0.35 | $0.36 | |||||||||||||||
Net realized and unrealized gain (loss) on investments | 0.15 | 0.73 | (0.44 | ) | 0.50 | (0.29 | ) | |||||||||||||
Total from investment operations | $0.47 | $1.06 | $(0.10 | ) | $0.85 | $0.07 | ||||||||||||||
| Less distributions declared to shareholders | ||||||||||||||||||||
| From net investment income | $(0.30 | ) | $(0.32 | ) | $(0.33 | ) | $(0.34 | ) | $(0.34 | ) | ||||||||||
From net realized gain on investments | (0.01 | ) | — | (0.02 | ) | — | — | |||||||||||||
Total distributions declared to shareholders | $(0.31 | ) | $(0.32 | ) | $(0.35 | ) | $(0.34 | ) | $(0.34 | ) | ||||||||||
Net asset value, end of period (x) | $10.28 | $10.12 | $9.38 | $9.83 | $9.32 | |||||||||||||||
Total return (%) (r)(s)(t)(x) | 4.67 | 11.47 | (1.05 | ) | 9.22 | 0.80 | ||||||||||||||
| Ratios (%) (to average net assets) and Supplemental data: | ||||||||||||||||||||
| Expenses before expense reductions (f) | 1.65 | 1.67 | 1.67 | 1.61 | 1.51 | |||||||||||||||
Expenses after expense reductions (f) | 1.47 | 1.44 | 1.46 | 1.46 | 1.33 | |||||||||||||||
Net investment income | 3.06 | 3.35 | 3.49 | 3.59 | 3.79 | |||||||||||||||
Portfolio turnover | 12 | 14 | 15 | 11 | 24 | |||||||||||||||
Net assets at end of period (000 omitted) | $2,604 | $2,078 | $2,647 | $4,425 | $5,374 | |||||||||||||||
| Supplemental Ratios (%): | ||||||||||||||||||||
Ratios of expenses to average net assets after expense reductions and excluding interest expense and fees (f)(l) | N/A | N/A | N/A | N/A | 1.31 | |||||||||||||||
| (d) | Per share data is based on average shares outstanding. |
| (f) | Ratios do not reflect reductions from fees paid indirectly, if applicable. |
| (l) | Interest expense and fees relate to payments made to the holders of the floating rate certificates from trust assets. |
| (r) | Certain expenses have been reduced without which performance would have been lower. |
| (s) | From time to time the fund may receive proceeds from litigation settlements, without which performance would be lower. |
| (t) | Total returns do not include any applicable sales charges. |
| (x) | The net asset values per share and total returns have been calculated on net assets which include adjustments made in accordance with U.S. generally accepted accounting principles required at period end for financial reporting purposes. |
See Notes to Financial Statements
70
Table of Contents
Financial Highlights – continued
MFS NEW YORK MUNICIPAL BOND FUND
The financial highlights table is intended to help you understand the fund financial performance for the past 5 years. Certain information reflects financial results for a single fund share. The total returns in the table represent the rate by which an investor would have earned (or lost) on an investment in the fund share class (assuming reinvestment of all distributions) held for the entire period.
| Years ended 3/31 | ||||||||||||||||||||
| Class A | 2013 | 2012 | 2011 | 2010 | 2009 | |||||||||||||||
Net asset value, beginning of period | $11.22 | $10.34 | $10.93 | $10.23 | $10.82 | |||||||||||||||
| Income (loss) from investment operations | ||||||||||||||||||||
| Net investment income (d) | $0.43 | $0.43 | $0.47 | $0.47 | $0.44 | |||||||||||||||
Net realized and unrealized gain (loss) on investments | 0.26 | 0.87 | (0.60 | ) | 0.69 | (0.50 | ) | |||||||||||||
Total from investment operations | $0.69 | $1.30 | $(0.13 | ) | $1.16 | $(0.06 | ) | |||||||||||||
| Less distributions declared to shareholders | ||||||||||||||||||||
| From net investment income | $(0.41 | ) | $(0.42 | ) | $(0.46 | ) | $(0.45 | ) | $(0.46 | ) | ||||||||||
From net realized gain on investments | — | — | — | (0.01 | ) | (0.07 | ) | |||||||||||||
Total distributions declared to shareholders | $(0.41 | ) | $(0.42 | ) | $(0.46 | ) | $(0.46 | ) | $(0.53 | ) | ||||||||||
Net asset value, end of period (x) | $11.50 | $11.22 | $10.34 | $10.93 | $10.23 | |||||||||||||||
Total return (%) (r)(s)(t)(x) | 6.19 | 12.80 | (1.31 | ) | 11.53 | (0.46 | ) | |||||||||||||
| Ratios (%) (to average net assets) and Supplemental data: | ||||||||||||||||||||
| Expenses before expense reductions (f) | 0.86 | 0.88 | 0.87 | 0.88 | 0.94 | |||||||||||||||
Expenses after expense reductions (f) | 0.86 | 0.88 | 0.87 | 0.88 | 0.78 | |||||||||||||||
Net investment income | 3.73 | 3.99 | 4.30 | 4.35 | 4.29 | |||||||||||||||
Portfolio turnover | 18 | 28 | 27 | 26 | 29 | |||||||||||||||
Net assets at end of period (000 omitted) | $188,291 | $183,191 | $171,142 | $177,429 | $169,525 | |||||||||||||||
| Supplemental Ratios (%): | ||||||||||||||||||||
Ratios of expenses to average net assets after expense reductions and excluding interest expense and fees (f)(l) | N/A | N/A | N/A | N/A | 0.75 | |||||||||||||||
| Years ended 3/31 | ||||||||||||||||||||
| Class B | 2013 | 2012 | 2011 | 2010 | 2009 | |||||||||||||||
Net asset value, beginning of period | $11.19 | $10.31 | $10.90 | $10.20 | $10.79 | |||||||||||||||
| Income (loss) from investment operations | ||||||||||||||||||||
| Net investment income (d) | $0.34 | $0.35 | $0.39 | $0.39 | $0.37 | |||||||||||||||
Net realized and unrealized gain (loss) on investments | 0.26 | 0.87 | (0.60 | ) | 0.69 | (0.51 | ) | |||||||||||||
Total from investment operations | $0.60 | $1.22 | $(0.21 | ) | $1.08 | $(0.14 | ) | |||||||||||||
| Less distributions declared to shareholders | ||||||||||||||||||||
| From net investment income | $(0.32 | ) | $(0.34 | ) | $(0.38 | ) | $(0.37 | ) | $(0.38 | ) | ||||||||||
From net realized gain on investments | — | — | — | (0.01 | ) | (0.07 | ) | |||||||||||||
Total distributions declared to shareholders | $(0.32 | ) | $(0.34 | ) | $(0.38 | ) | $(0.38 | ) | $(0.45 | ) | ||||||||||
Net asset value, end of period (x) | $11.47 | $11.19 | $10.31 | $10.90 | $10.20 | |||||||||||||||
Total return (%) (r)(s)(t)(x) | 5.41 | 12.00 | (2.04 | ) | 10.73 | (1.23 | ) | |||||||||||||
| Ratios (%) (to average net assets) and Supplemental data: | ||||||||||||||||||||
| Expenses before expense reductions (f) | 1.61 | 1.63 | 1.62 | 1.63 | 1.70 | |||||||||||||||
Expenses after expense reductions (f) | 1.61 | 1.63 | 1.62 | 1.63 | 1.52 | |||||||||||||||
Net investment income | 2.98 | 3.26 | 3.56 | 3.61 | 3.55 | |||||||||||||||
Portfolio turnover | 18 | 28 | 27 | 26 | 29 | |||||||||||||||
Net assets at end of period (000 omitted) | $7,019 | $6,298 | $8,178 | $14,229 | $16,285 | |||||||||||||||
| Supplemental Ratios (%): | ||||||||||||||||||||
Ratios of expenses to average net assets after expense reductions and excluding interest expense and fees (f)(l) | N/A | N/A | N/A | N/A | 1.50 | |||||||||||||||
See Notes to Financial Statements
71
Table of Contents
Financial Highlights – continued
MFS NEW YORK MUNICIPAL BOND FUND – continued
| Years ended 3/31 | ||||||||||||||||||||
| Class C | 2013 | 2012 | 2011 | 2010 | 2009 | |||||||||||||||
Net asset value, beginning of period | $11.21 | $10.33 | $10.92 | $10.22 | $10.81 | |||||||||||||||
| Income (loss) from investment operations | ||||||||||||||||||||
| Net investment income (d) | $0.34 | $0.35 | $0.38 | $0.39 | $0.37 | |||||||||||||||
Net realized and unrealized gain (loss) on investments | 0.25 | 0.87 | (0.59 | ) | 0.69 | (0.51 | ) | |||||||||||||
Total from investment operations | $0.59 | $1.22 | $(0.21 | ) | $1.08 | $(0.14 | ) | |||||||||||||
| Less distributions declared to shareholders | ||||||||||||||||||||
| From net investment income | $(0.32 | ) | $(0.34 | ) | $(0.38 | ) | $(0.37 | ) | $(0.38 | ) | ||||||||||
From net realized gain on investments | — | — | — | (0.01 | ) | (0.07 | ) | |||||||||||||
Total distributions declared to shareholders | $(0.32 | ) | $(0.34 | ) | $(0.38 | ) | $(0.38 | ) | $(0.45 | ) | ||||||||||
Net asset value, end of period (x) | $11.48 | $11.21 | $10.33 | $10.92 | $10.22 | |||||||||||||||
Total return (%) (r)(s)(t)(x) | 5.31 | 11.97 | (2.04 | ) | 10.70 | (1.22 | ) | |||||||||||||
| Ratios (%) (to average net assets) and Supplemental data: | ||||||||||||||||||||
| Expenses before expense reductions (f) | 1.61 | 1.63 | 1.62 | 1.63 | 1.70 | |||||||||||||||
Expenses after expense reductions (f) | 1.61 | 1.63 | 1.62 | 1.63 | 1.53 | |||||||||||||||
Net investment income | 2.98 | 3.24 | 3.55 | 3.59 | 3.54 | |||||||||||||||
Portfolio turnover | 18 | 28 | 27 | 26 | 29 | |||||||||||||||
Net assets at end of period (000 omitted) | $36,508 | $32,962 | $28,780 | $31,421 | $21,874 | |||||||||||||||
| Supplemental Ratios (%): | ||||||||||||||||||||
Ratios of expenses to average net assets after expense reductions and excluding interest expense and fees (f)(l) | N/A | N/A | N/A | N/A | 1.50 | |||||||||||||||
| (d) | Per share data is based on average shares outstanding. |
| (f) | Ratios do not reflect reductions from fees paid indirectly, if applicable. |
| (l) | Interest expense and fees relate to payments made to the holders of the floating rate certificates from trust assets. |
| (r) | Certain expenses have been reduced without which performance would have been lower. |
| (s) | From time to time the fund may receive proceeds from litigation settlements, without which performance would be lower. |
| (t) | Total returns do not include any applicable sales charges. |
| (x) | The net asset values per share and total returns have been calculated on net assets which include adjustments made in accordance with U.S. generally accepted accounting principles required at period end for financial reporting purposes. |
See Notes to Financial Statements
72
Table of Contents
Financial Highlights – continued
MFS NORTH CAROLINA MUNICIPAL BOND FUND
The financial highlights table is intended to help you understand the fund financial performance for the past 5 years. Certain information reflects financial results for a single fund share. The total returns in the table represent the rate by which an investor would have earned (or lost) on an investment in the fund share class (assuming reinvestment of all distributions) held for the entire period.
| Years ended 3/31 | ||||||||||||||||||||
| Class A | 2013 | 2012 | 2011 | 2010 | 2009 | |||||||||||||||
Net asset value, beginning of period | $12.17 | $11.18 | $11.71 | $11.15 | $11.44 | |||||||||||||||
| Income (loss) from investment operations | ||||||||||||||||||||
| Net investment income (d) | $0.42 | $0.45 | $0.49 | $0.51 | $0.45 | |||||||||||||||
Net realized and unrealized gain (loss) on investments | 0.26 | 0.97 | (0.55 | ) | 0.55 | (0.21 | ) | |||||||||||||
Total from investment operations | $0.68 | $1.42 | $(0.06 | ) | $1.06 | $0.24 | ||||||||||||||
| Less distributions declared to shareholders | ||||||||||||||||||||
| From net investment income | $(0.40 | ) | $(0.43 | ) | $(0.47 | ) | $(0.48 | ) | $(0.48 | ) | ||||||||||
From net realized gain on investments | (0.07 | ) | — | (0.00 | )(w) | (0.02 | ) | (0.05 | ) | |||||||||||
Total distributions declared to shareholders | $(0.47 | ) | $(0.43 | ) | $(0.47 | ) | $(0.50 | ) | $(0.53 | ) | ||||||||||
Net asset value, end of period (x) | $12.38 | $12.17 | $11.18 | $11.71 | $11.15 | |||||||||||||||
Total return (%) (r)(s)(t)(x) | 5.59 | 12.92 | (0.55 | ) | 9.55 | 2.22 | ||||||||||||||
| Ratios (%) (to average net assets) and Supplemental data: | ||||||||||||||||||||
| Expenses before expense reductions (f) | 0.84 | 0.85 | 0.85 | 0.87 | 1.08 | |||||||||||||||
Expenses after expense reductions (f) | 0.84 | 0.85 | 0.85 | 0.87 | 0.91 | |||||||||||||||
Net investment income | 3.35 | 3.82 | 4.22 | 4.42 | 4.05 | |||||||||||||||
Portfolio turnover | 18 | 24 | 20 | 12 | 20 | |||||||||||||||
Net assets at end of period (000 omitted) | $384,213 | $357,793 | $320,834 | $346,345 | $274,487 | |||||||||||||||
| Supplemental Ratios (%): | ||||||||||||||||||||
Ratios of expenses to average net assets after expense reductions and excluding interest expense and fees (f)(l) | 0.84 | 0.83 | 0.84 | 0.85 | 0.81 | |||||||||||||||
| Years ended 3/31 | ||||||||||||||||||||
| Class B | 2013 | 2012 | 2011 | 2010 | 2009 | |||||||||||||||
Net asset value, beginning of period | $12.16 | $11.17 | $11.69 | $11.14 | $11.42 | |||||||||||||||
| Income (loss) from investment operations | ||||||||||||||||||||
| Net investment income (d) | $0.33 | $0.36 | $0.40 | $0.43 | $0.38 | |||||||||||||||
Net realized and unrealized gain (loss) on investments | 0.26 | 0.98 | (0.53 | ) | 0.53 | (0.20 | ) | |||||||||||||
Total from investment operations | $0.59 | $1.34 | $(0.13 | ) | $0.96 | $0.18 | ||||||||||||||
| Less distributions declared to shareholders | ||||||||||||||||||||
| From net investment income | $(0.31 | ) | $(0.35 | ) | $(0.39 | ) | $(0.39 | ) | $(0.41 | ) | ||||||||||
From net realized gain on investments | (0.07 | ) | — | (0.00 | )(w) | (0.02 | ) | (0.05 | ) | |||||||||||
Total distributions declared to shareholders | $(0.38 | ) | $(0.35 | ) | $(0.39 | ) | $(0.41 | ) | $(0.46 | ) | ||||||||||
Net asset value, end of period (x) | $12.37 | $12.16 | $11.17 | $11.69 | $11.14 | |||||||||||||||
Total return (%) (r)(s)(t)(x) | 4.81 | 12.09 | (1.20 | ) | 8.65 | 1.63 | ||||||||||||||
| Ratios (%) (to average net assets) and Supplemental data: | ||||||||||||||||||||
| Expenses before expense reductions (f) | 1.59 | 1.60 | 1.60 | 1.62 | 1.74 | |||||||||||||||
Expenses after expense reductions (f) | 1.59 | 1.60 | 1.60 | 1.62 | 1.56 | |||||||||||||||
Net investment income | 2.61 | 3.08 | 3.46 | 3.68 | 3.39 | |||||||||||||||
Portfolio turnover | 18 | 24 | 20 | 12 | 20 | |||||||||||||||
Net assets at end of period (000 omitted) | $7,618 | $7,793 | $8,296 | $11,331 | $13,652 | |||||||||||||||
| Supplemental Ratios (%): | ||||||||||||||||||||
Ratios of expenses to average net assets after expense reductions and excluding interest expense and fees (f)(l) | 1.59 | 1.58 | 1.59 | 1.60 | 1.46 | |||||||||||||||
See Notes to Financial Statements
73
Table of Contents
Financial Highlights – continued
MFS NORTH CAROLINA MUNICIPAL BOND FUND – continued
| Years ended 3/31 | ||||||||||||||||||||
| Class C | 2013 | 2012 | 2011 | 2010 | 2009 | |||||||||||||||
Net asset value, beginning of period | $12.17 | $11.17 | $11.70 | $11.15 | $11.43 | |||||||||||||||
| Income (loss) from investment operations | ||||||||||||||||||||
| Net investment income (d) | $0.32 | $0.36 | $0.40 | $0.42 | $0.38 | |||||||||||||||
Net realized and unrealized gain (loss) on investments | 0.26 | 0.98 | (0.54 | ) | 0.54 | (0.20 | ) | |||||||||||||
Total from investment operations | $0.58 | $1.34 | $(0.14 | ) | $0.96 | $0.18 | ||||||||||||||
| Less distributions declared to shareholders | ||||||||||||||||||||
| From net investment income | $(0.31 | ) | $(0.34 | ) | $(0.39 | ) | $(0.39 | ) | $(0.41 | ) | ||||||||||
From net realized gain on investments | (0.07 | ) | — | (0.00 | )(w) | (0.02 | ) | (0.05 | ) | |||||||||||
Total distributions declared to shareholders | $(0.38 | ) | $(0.34 | ) | $(0.39 | ) | $(0.41 | ) | $(0.46 | ) | ||||||||||
Net asset value, end of period (x) | $12.37 | $12.17 | $11.17 | $11.70 | $11.15 | |||||||||||||||
Total return (%) (r)(s)(t)(x) | 4.72 | 12.18 | (1.29 | ) | 8.63 | 1.63 | ||||||||||||||
| Ratios (%) (to average net assets) and Supplemental data: | ||||||||||||||||||||
| Expenses before expense reductions (f) | 1.59 | 1.60 | 1.60 | 1.62 | 1.73 | |||||||||||||||
Expenses after expense reductions (f) | 1.59 | 1.60 | 1.60 | 1.62 | 1.56 | |||||||||||||||
Net investment income | 2.60 | 3.06 | 3.46 | 3.64 | 3.39 | |||||||||||||||
Portfolio turnover | 18 | 24 | 20 | 12 | 20 | |||||||||||||||
Net assets at end of period (000 omitted) | $87,114 | $75,895 | $64,530 | $68,989 | $37,668 | |||||||||||||||
| Supplemental Ratios (%): | ||||||||||||||||||||
Ratios of expenses to average net assets after expense reductions and excluding interest expense and fees (f)(l) | 1.59 | 1.58 | 1.59 | 1.60 | 1.47 | |||||||||||||||
| (d) | Per share data is based on average shares outstanding. |
| (f) | Ratios do not reflect reductions from fees paid indirectly, if applicable. |
| (l) | Interest expense and fees relate to payments made to the holders of the floating rate certificates from trust assets. |
| (r) | Certain expenses have been reduced without which performance would have been lower. |
| (s) | From time to time the fund may receive proceeds from litigation settlements, without which performance would be lower. |
| (t) | Total returns do not include any applicable sales charges. |
| (w) | Per share amount was less than $0.01. |
| (x) | The net asset values per share and total returns have been calculated on net assets which include adjustments made in accordance with U.S. generally accepted accounting principles required at period end for financial reporting purposes. |
See Notes to Financial Statements
74
Table of Contents
Financial Highlights – continued
MFS PENNSYLVANIA MUNICIPAL BOND FUND
The financial highlights table is intended to help you understand the fund financial performance for the past 5 years (or life of a particular share class, if shorter). Certain information reflects financial results for a single fund share. The total returns in the table represent the rate by which an investor would have earned (or lost) on an investment in the fund share class (assuming reinvestment of all distributions) held for the entire period.
| Years ended 3/31 | ||||||||||||||||||||
| Class A | 2013 | 2012 | 2011 | 2010 | 2009 | |||||||||||||||
Net asset value, beginning of period | $10.36 | $9.53 | $10.04 | $9.40 | $9.90 | |||||||||||||||
| Income (loss) from investment operations | ||||||||||||||||||||
| Net investment income (d) | $0.40 | $0.42 | $0.43 | $0.43 | $0.45 | |||||||||||||||
Net realized and unrealized gain (loss) on investments | 0.25 | 0.82 | (0.52 | ) | 0.64 | (0.52 | ) | |||||||||||||
Total from investment operations | $0.65 | $1.24 | $(0.09 | ) | $1.07 | $(0.07 | ) | |||||||||||||
| Less distributions declared to shareholders | ||||||||||||||||||||
From net investment income | $(0.38 | ) | $(0.41 | ) | $(0.42 | ) | $(0.43 | ) | $(0.43 | ) | ||||||||||
Net asset value, end of period (x) | $10.63 | $10.36 | $9.53 | $10.04 | $9.40 | |||||||||||||||
Total return (%) (r)(s)(t)(x) | 6.35 | 13.27 | (0.97 | ) | 11.49 | (0.69 | ) | |||||||||||||
| Ratios (%) (to average net assets) and Supplemental data: | ||||||||||||||||||||
| Expenses before expense reductions (f) | 0.89 | 0.93 | 0.93 | 0.91 | 0.88 | |||||||||||||||
Expenses after expense reductions (f) | 0.74 | 0.78 | 0.78 | 0.79 | 0.66 | |||||||||||||||
Net investment income | 3.77 | 4.20 | 4.34 | 4.40 | 4.67 | |||||||||||||||
Portfolio turnover | 15 | 21 | 21 | 12 | 28 | |||||||||||||||
Net assets at end of period (000 omitted) | $152,804 | $133,328 | $118,709 | $113,411 | $84,422 | |||||||||||||||
| Supplemental Ratios (%): | ||||||||||||||||||||
Ratios of expenses to average net assets after expense reductions and excluding interest expense and fees (f)(l) | 0.74 | 0.78 | 0.78 | 0.79 | 0.61 | |||||||||||||||
See Notes to Financial Statements
75
Table of Contents
Financial Highlights – continued
MFS PENNSYLVANIA MUNICIPAL BOND FUND – continued
| Years ended 3/31 | ||||||||||||||||||||
| Class B | 2013 | 2012 | 2011 | 2010 | 2009 | |||||||||||||||
Net asset value, beginning of period | $10.39 | $9.55 | $10.06 | $9.43 | $9.93 | |||||||||||||||
| Income (loss) from investment operations | ||||||||||||||||||||
| Net investment income (d) | $0.32 | $0.35 | $0.36 | $0.36 | $0.37 | |||||||||||||||
Net realized and unrealized gain (loss) on investments | 0.24 | 0.83 | (0.53 | ) | 0.62 | (0.51 | ) | |||||||||||||
Total from investment operations | $0.56 | $1.18 | $(0.17 | ) | $0.98 | $(0.14 | ) | |||||||||||||
| Less distributions declared to shareholders | ||||||||||||||||||||
From net investment income | $(0.30 | ) | $(0.34 | ) | $(0.34 | ) | $(0.35 | ) | $(0.36 | ) | ||||||||||
Net asset value, end of period (x) | $10.65 | $10.39 | $9.55 | $10.06 | $9.43 | |||||||||||||||
Total return (%) (r)(s)(t)(x) | 5.42 | 12.49 | (1.74 | ) | 10.51 | (1.42 | ) | |||||||||||||
| Ratios (%) (to average net assets) and Supplemental data: | ||||||||||||||||||||
| Expenses before expense reductions (f) | 1.64 | 1.68 | 1.68 | 1.65 | 1.64 | |||||||||||||||
| Expenses after expense reductions (f) | 1.51 | 1.55 | 1.56 | 1.54 | 1.41 | |||||||||||||||
| Net investment income | 2.99 | 3.44 | 3.55 | 3.64 | 3.91 | |||||||||||||||
| Portfolio turnover | 15 | 21 | 21 | 12 | 28 | |||||||||||||||
Net assets at end of period (000 omitted) | $10,793 | $10,524 | $12,750 | $20,864 | $22,721 | |||||||||||||||
| Supplemental Ratios (%): | ||||||||||||||||||||
Ratios of expenses to average net assets after expense reductions and excluding interest expense and fees (f)(l) | 1.51 | 1.54 | 1.56 | 1.54 | 1.37 | |||||||||||||||
| (d) | Per share data is based on average shares outstanding. |
| (f) | Ratios do not reflect reductions from fees paid indirectly, if applicable. |
| (l) | Interest expense and fees relate to payments made to the holders of the floating rate certificates from trust assets. |
| (r) | Certain expenses have been reduced without which performance would have been lower. |
| (s) | From time to time the fund may receive proceeds from litigation settlements, without which performance would be lower. |
| (t) | Total returns do not include any applicable sales charges. |
| (x) | The net asset values per share and total returns have been calculated on net assets which include adjustments made in accordance with U.S. generally accepted accounting principles required at period end for financial reporting purposes. |
See Notes to Financial Statements
76
Table of Contents
Financial Highlights – continued
MFS SOUTH CAROLINA MUNICIPAL BOND FUND
The financial highlights table is intended to help you understand the fund financial performance for the past 5 years Certain information reflects financial results for a single fund share. The total returns in the table represent the rate by which an investor would have earned (or lost) on an investment in the fund share class (assuming reinvestment of all distributions) held for the entire period.
| Years ended 3/31 | ||||||||||||||||||||
| Class A | 2013 | 2012 | 2011 | 2010 | 2009 | |||||||||||||||
Net asset value, beginning of period | $12.38 | $11.48 | $12.04 | $11.33 | $11.85 | |||||||||||||||
| Income (loss) from investment operations | ||||||||||||||||||||
| Net investment income (d) | $0.43 | $0.47 | $0.50 | $0.53 | $0.50 | |||||||||||||||
Net realized and unrealized gain (loss) on investments | 0.22 | 0.89 | (0.56 | ) | 0.68 | (0.50 | ) | |||||||||||||
Total from investment operations | $0.65 | $1.36 | $(0.06 | ) | $1.21 | $(0.00 | )(w) | |||||||||||||
| Less distributions declared to shareholders | ||||||||||||||||||||
| From net investment income | $(0.42 | ) | $(0.46 | ) | $(0.50 | ) | $(0.49 | ) | $(0.50 | ) | ||||||||||
From net realized gain on investments | — | — | — | (0.01 | ) | (0.02 | ) | |||||||||||||
Total distributions declared to shareholders | $(0.42 | ) | $(0.46 | ) | $(0.50 | ) | $(0.50 | ) | $(0.52 | ) | ||||||||||
Net asset value, end of period (x) | $12.61 | $12.38 | $11.48 | $12.04 | $11.33 | |||||||||||||||
Total return (%) (r)(s)(t)(x) | 5.24 | 12.02 | (0.59 | ) | 10.77 | 0.03 | ||||||||||||||
| Ratios (%) (to average net assets) and Supplemental data: | ||||||||||||||||||||
| Expenses before expense reductions (f) | 0.86 | 0.88 | 0.88 | 0.90 | 1.10 | |||||||||||||||
Expenses after expense reductions (f) | 0.86 | 0.88 | 0.88 | 0.90 | 0.93 | |||||||||||||||
Net investment income | 3.42 | 3.94 | 4.20 | 4.47 | 4.38 | |||||||||||||||
Portfolio turnover | 15 | 19 | 26 | 14 | 19 | |||||||||||||||
Net assets at end of period (000 omitted) | $220,370 | $194,840 | $166,413 | $165,017 | $129,510 | |||||||||||||||
| Supplemental Ratios (%): | ||||||||||||||||||||
Ratios of expenses to average net assets after expense reductions and excluding interest expense and fees (f)(l) | N/A | N/A | N/A | N/A | 0.85 | |||||||||||||||
See Notes to Financial Statements
77
Table of Contents
Financial Highlights – continued
MFS SOUTH CAROLINA MUNICIPAL BOND FUND – continued
| Years ended 3/31 | ||||||||||||||||||||
| Class B | 2013 | 2012 | 2011 | 2010 | 2009 | |||||||||||||||
Net asset value, beginning of period | $12.37 | $11.47 | $12.04 | $11.33 | $11.84 | |||||||||||||||
| Income (loss) from investment operations | ||||||||||||||||||||
| Net investment income (d) | $0.34 | $0.38 | $0.41 | $0.44 | $0.43 | |||||||||||||||
Net realized and unrealized gain (loss) on investments | 0.22 | 0.89 | (0.57 | ) | 0.68 | (0.50 | ) | |||||||||||||
Total from investment operations | $0.56 | $1.27 | $(0.16 | ) | $1.12 | $(0.07 | ) | |||||||||||||
| Less distributions declared to shareholders | ||||||||||||||||||||
| From net investment income | $(0.32 | ) | $(0.37 | ) | $(0.41 | ) | $(0.40 | ) | $(0.42 | ) | ||||||||||
From net realized gain on investments | — | — | — | (0.01 | ) | (0.02 | ) | |||||||||||||
Total distributions declared to shareholders | $(0.32 | ) | $(0.37 | ) | $(0.41 | ) | $(0.41 | ) | $(0.44 | ) | ||||||||||
Net asset value, end of period (x) | $12.61 | $12.37 | $11.47 | $12.04 | $11.33 | |||||||||||||||
Total return (%) (r)(s)(t)(x) | 4.55 | 11.20 | (1.41 | ) | 9.95 | (0.54 | ) | |||||||||||||
| Ratios (%) (to average net assets) and Supplemental data: | ||||||||||||||||||||
| Expenses before expense reductions (f) | 1.61 | 1.63 | 1.63 | 1.65 | 1.76 | |||||||||||||||
| Expenses after expense reductions (f) | 1.61 | 1.63 | 1.63 | 1.65 | 1.58 | |||||||||||||||
| Net investment income | 2.67 | 3.20 | 3.45 | 3.73 | 3.72 | |||||||||||||||
| Portfolio turnover | 15 | 19 | 26 | 14 | 19 | |||||||||||||||
Net assets at end of period (000 omitted) | $7,421 | $6,698 | $6,928 | $9,438 | $11,640 | |||||||||||||||
| Supplemental Ratios (%): | ||||||||||||||||||||
Ratios of expenses to average net assets after expense reductions and excluding interest expense and fees (f)(l) | N/A | N/A | N/A | N/A | 1.50 | |||||||||||||||
| (d) | Per share data is based on average shares outstanding. |
| (f) | Ratios do not reflect reductions from fees paid indirectly, if applicable. |
| (l) | Interest expense and fees relate to payments made to the holders of the floating rate certificates from trust assets. |
| (r) | Certain expenses have been reduced without which performance would have been lower. |
| (s) | From time to time the fund may receive proceeds from litigation settlements, without which performance would be lower. |
| (t) | Total returns do not include any applicable sales charges. |
| (w) | Per share amount was less than $0.01. |
| (x) | The net asset values per share and total returns have been calculated on net assets which include adjustments made in accordance with U.S. generally accepted accounting principles required at period end for financial reporting purposes. |
See Notes to Financial Statements
78
Table of Contents
Financial Highlights – continued
MFS TENNESSEE MUNICIPAL BOND FUND
The financial highlights table is intended to help you understand the fund financial performance for the past 5 years. Certain information reflects financial results for a single fund share. The total returns in the table represent the rate by which an investor would have earned (or lost) on an investment in the fund share class (assuming reinvestment of all distributions) held for the entire period.
| Years ended 3/31 | ||||||||||||||||||||
| Class A | 2013 | 2012 | 2011 | 2010 | 2009 | |||||||||||||||
Net asset value, beginning of period | $10.76 | $9.97 | $10.40 | $9.84 | $10.25 | |||||||||||||||
| Income (loss) from investment operations | ||||||||||||||||||||
| Net investment income (d) | $0.39 | $0.43 | $0.43 | $0.45 | $0.44 | |||||||||||||||
Net realized and unrealized gain (loss) on investments | 0.18 | 0.78 | (0.44 | ) | 0.56 | (0.37 | ) | |||||||||||||
Total from investment operations | $0.57 | $1.21 | $(0.01 | ) | $1.01 | $0.07 | ||||||||||||||
| Less distributions declared to shareholders | ||||||||||||||||||||
| From net investment income | $(0.37 | ) | $(0.42 | ) | $(0.42 | ) | $(0.42 | ) | $(0.44 | ) | ||||||||||
From net realized gain on investments | — | — | — | (0.03 | ) | (0.04 | ) | |||||||||||||
Total distributions declared to shareholders | $(0.37 | ) | $(0.42 | ) | $(0.42 | ) | $(0.45 | ) | $(0.48 | ) | ||||||||||
Net asset value, end of period (x) | $10.96 | $10.76 | $9.97 | $10.40 | $9.84 | |||||||||||||||
Total return (%) (r)(s)(t)(x) | 5.33 | 12.31 | (0.14 | ) | 10.46 | 0.84 | ||||||||||||||
| Ratios (%) (to average net assets) and Supplemental data: | ||||||||||||||||||||
| Expenses before expense reductions (f) | 0.89 | 0.91 | 0.91 | 0.91 | 1.02 | |||||||||||||||
Expenses after expense reductions (f) | 0.89 | 0.91 | 0.91 | 0.91 | 0.85 | |||||||||||||||
Net investment income | 3.51 | 4.08 | 4.13 | 4.36 | 4.42 | |||||||||||||||
Portfolio turnover | 20 | 14 | 18 | 20 | 23 | |||||||||||||||
Net assets at end of period (000 omitted) | $133,911 | $117,095 | $107,334 | $125,641 | $108,763 | |||||||||||||||
See Notes to Financial Statements
79
Table of Contents
Financial Highlights – continued
MFS TENNESSEE MUNICIPAL BOND FUND – continued
| Years ended 3/31 | ||||||||||||||||||||
| Class B | 2013 | 2012 | 2011 | 2010 | 2009 | |||||||||||||||
Net asset value, beginning of period | $10.75 | $9.97 | $10.39 | $9.83 | $10.24 | |||||||||||||||
| Income (loss) from investment operations | ||||||||||||||||||||
| Net investment income (d) | $0.30 | $0.35 | $0.35 | $0.37 | $0.37 | |||||||||||||||
Net realized and unrealized gain (loss) on investments | 0.19 | 0.77 | (0.43 | ) | 0.57 | (0.36 | ) | |||||||||||||
Total from investment operations | $0.49 | $1.12 | $(0.08 | ) | $0.94 | $0.01 | ||||||||||||||
| Less distributions declared to shareholders | ||||||||||||||||||||
| From net investment income | $(0.29 | ) | $(0.34 | ) | $(0.34 | ) | $(0.35 | ) | $(0.38 | ) | ||||||||||
From net realized gain on investments | — | — | — | (0.03 | ) | (0.04 | ) | |||||||||||||
Total distributions declared to shareholders | $(0.29 | ) | $(0.34 | ) | $(0.34 | ) | $(0.38 | ) | $(0.42 | ) | ||||||||||
Net asset value, end of period (x) | $10.95 | $10.75 | $9.97 | $10.39 | $9.83 | |||||||||||||||
Total return (%) (r)(s)(t)(x) | 4.55 | 11.37 | (0.78 | ) | 9.65 | 0.17 | ||||||||||||||
| Ratios (%) (to average net assets) and Supplemental data: | ||||||||||||||||||||
| Expenses before expense reductions (f) | 1.64 | 1.66 | 1.66 | 1.66 | 1.69 | |||||||||||||||
Expenses after expense reductions (f) | 1.64 | 1.66 | 1.65 | 1.66 | 1.51 | |||||||||||||||
Net investment income | 2.76 | 3.34 | 3.38 | 3.63 | 3.76 | |||||||||||||||
Portfolio turnover | 20 | 14 | 18 | 20 | 23 | |||||||||||||||
Net assets at end of period (000 omitted) | $2,727 | $2,535 | $3,116 | $4,907 | $7,956 | |||||||||||||||
| (d) | Per share data is based on average shares outstanding. |
| (f) | Ratios do not reflect reductions from fees paid indirectly, if applicable. |
| (r) | Certain expenses have been reduced without which performance would have been lower. |
| (s) | From time to time the fund may receive proceeds from litigation settlements, without which performance would be lower. |
| (t) | Total returns do not include any applicable sales charges. |
| (x) | The net asset values per share and total returns have been calculated on net assets which include adjustments made in accordance with U.S. generally accepted accounting principles required at period end for financial reporting purposes. |
See Notes to Financial Statements
80
Table of Contents
Financial Highlights – continued
MFS VIRGINIA MUNICIPAL BOND FUND
The financial highlights table is intended to help you understand the fund financial performance for the past 5 years. Certain information reflects financial results for a single fund share. The total returns in the table represent the rate by which an investor would have earned (or lost) on an investment in the fund share class (assuming reinvestment of all distributions) held for the entire period.
| Years ended 3/31 | ||||||||||||||||||||
| Class A | 2013 | 2012 | 2011 | 2010 | 2009 | |||||||||||||||
Net asset value, beginning of period | $11.52 | $10.67 | $11.24 | $10.54 | $11.07 | |||||||||||||||
| Income (loss) from investment operations | ||||||||||||||||||||
| Net investment income (d) | $0.42 | $0.45 | $0.47 | $0.49 | $0.50 | |||||||||||||||
Net realized and unrealized gain (loss) on investments | 0.15 | 0.83 | (0.57 | ) | 0.69 | (0.47 | ) | |||||||||||||
Total from investment operations | $0.57 | $1.28 | $(0.10 | ) | $1.18 | $0.03 | ||||||||||||||
| Less distributions declared to shareholders | ||||||||||||||||||||
| From net investment income | $(0.40 | ) | $(0.43 | ) | $(0.46 | ) | $(0.48 | ) | $(0.47 | ) | ||||||||||
From net realized gain on investments | — | — | (0.01 | ) | (0.00 | )(w) | (0.09 | ) | ||||||||||||
Total distributions declared to shareholders | $(0.40 | ) | $(0.43 | ) | $(0.47 | ) | $(0.48 | ) | $(0.56 | ) | ||||||||||
Net asset value, end of period (x) | $11.69 | $11.52 | $10.67 | $11.24 | $10.54 | |||||||||||||||
Total return (%) (r)(s)(t)(x) | 4.99 | 12.21 | (1.03 | ) | 11.34 | 0.40 | ||||||||||||||
| Ratios (%) (to average net assets) and Supplemental data: | ||||||||||||||||||||
| Expenses before expense reductions (f) | 0.86 | 0.86 | 0.86 | 0.87 | 1.08 | |||||||||||||||
| Expenses after expense reductions (f) | 0.86 | 0.86 | 0.86 | 0.87 | 0.91 | |||||||||||||||
| Net investment income | 3.57 | 3.99 | 4.23 | 4.40 | 4.69 | |||||||||||||||
| Portfolio turnover | 11 | 24 | 21 | 15 | 22 | |||||||||||||||
Net assets at end of period (000 omitted) | $335,395 | $317,117 | $292,027 | $302,736 | $254,234 | |||||||||||||||
| Supplemental Ratios (%): | ||||||||||||||||||||
Ratios of expenses to average net assets after expense reductions and excluding interest expense and fees (f)(l) | 0.85 | 0.85 | 0.85 | 0.86 | 0.82 | |||||||||||||||
| Years ended 3/31 | ||||||||||||||||||||
| Class B | 2013 | 2012 | 2011 | 2010 | 2009 | |||||||||||||||
Net asset value, beginning of period | $11.51 | $10.66 | $11.24 | $10.53 | $11.06 | |||||||||||||||
| Income (loss) from investment operations | ||||||||||||||||||||
| Net investment income (d) | $0.33 | $0.36 | $0.39 | $0.40 | $0.43 | |||||||||||||||
Net realized and unrealized gain (loss) on investments | 0.15 | 0.84 | (0.58 | ) | 0.70 | (0.47 | ) | |||||||||||||
Total from investment operations | $0.48 | $1.20 | $(0.19 | ) | $1.10 | $(0.04 | ) | |||||||||||||
| Less distributions declared to shareholders | ||||||||||||||||||||
| From net investment income | $(0.31 | ) | $(0.35 | ) | $(0.38 | ) | $(0.39 | ) | $(0.40 | ) | ||||||||||
From net realized gain on investments | — | — | (0.01 | ) | (0.00 | )(w) | (0.09 | ) | ||||||||||||
Total distributions declared to shareholders | $(0.31 | ) | $(0.35 | ) | $(0.39 | ) | $(0.39 | ) | $(0.49 | ) | ||||||||||
Net asset value, end of period (x) | $11.68 | $11.51 | $10.66 | $11.24 | $10.53 | |||||||||||||||
Total return (%) (r)(s)(t)(x) | 4.21 | 11.38 | (1.85 | ) | 10.62 | (0.26 | ) | |||||||||||||
| Ratios (%) (to average net assets) and Supplemental data: | ||||||||||||||||||||
| Expenses before expense reductions (f) | 1.61 | 1.61 | 1.61 | 1.62 | 1.74 | |||||||||||||||
| Expenses after expense reductions (f) | 1.61 | 1.61 | 1.61 | 1.62 | 1.56 | |||||||||||||||
| Net investment income | 2.83 | 3.25 | 3.47 | 3.66 | 4.04 | |||||||||||||||
| Portfolio turnover | 11 | 24 | 21 | 15 | 22 | |||||||||||||||
Net assets at end of period (000 omitted) | $3,425 | $3,781 | $4,159 | $6,558 | $7,401 | |||||||||||||||
| Supplemental Ratios (%): | ||||||||||||||||||||
Ratios of expenses to average net assets after expense reductions and excluding interest expense and fees (f)(l) | 1.60 | 1.60 | 1.60 | 1.61 | 1.47 | |||||||||||||||
See Notes to Financial Statements
81
Table of Contents
Financial Highlights – continued
MFS VIRGINIA MUNICIPAL BOND FUND – continued
| Years ended 3/31 | ||||||||||||||||||||
| Class C | 2013 | 2012 | 2011 | 2010 | 2009 | |||||||||||||||
Net asset value, beginning of period | $11.51 | $10.67 | $11.24 | $10.54 | $11.06 | |||||||||||||||
| Income (loss) from investment operations | ||||||||||||||||||||
| Net investment income (d) | $0.33 | $0.36 | $0.39 | $0.40 | $0.43 | |||||||||||||||
Net realized and unrealized gain (loss) on investments | 0.15 | 0.83 | (0.58 | ) | 0.69 | (0.46 | ) | |||||||||||||
Total from investment operations | $0.48 | $1.19 | $(0.19 | ) | $1.09 | $(0.03 | ) | |||||||||||||
| Less distributions declared to shareholders | ||||||||||||||||||||
| From net investment income | $(0.31 | ) | $(0.35 | ) | $(0.37 | ) | $(0.39 | ) | $(0.40 | ) | ||||||||||
From net realized gain on investments | — | — | (0.01 | ) | (0.00 | )(w) | (0.09 | ) | ||||||||||||
Total distributions declared to shareholders | $(0.31 | ) | $(0.35 | ) | $(0.38 | ) | $(0.39 | ) | $(0.49 | ) | ||||||||||
Net asset value, end of period (x) | $11.68 | $11.51 | $10.67 | $11.24 | $10.54 | |||||||||||||||
Total return (%) (r)(s)(t)(x) | 4.21 | 11.27 | (1.77 | ) | 10.50 | (0.17 | ) | |||||||||||||
| Ratios (%) (to average net assets) and Supplemental data: | ||||||||||||||||||||
| Expenses before expense reductions (f) | 1.61 | 1.61 | 1.61 | 1.62 | 1.73 | |||||||||||||||
| Expenses after expense reductions (f) | 1.61 | 1.61 | 1.61 | 1.62 | 1.56 | |||||||||||||||
| Net investment income | 2.81 | 3.24 | 3.47 | 3.63 | 4.02 | |||||||||||||||
| Portfolio turnover | 11 | 24 | 21 | 15 | 22 | |||||||||||||||
Net assets at end of period (000 omitted) | $35,878 | $32,519 | $30,726 | $29,660 | $19,745 | |||||||||||||||
| Supplemental Ratios (%): | ||||||||||||||||||||
Ratios of expenses to average net assets after expense reductions and excluding interest expense and fees (f)(l) | 1.60 | 1.60 | 1.60 | 1.61 | 1.48 | |||||||||||||||
| (d) | Per share data is based on average shares outstanding. |
| (f) | Ratios do not reflect reductions from fees paid indirectly, if applicable. |
| (l) | Interest expense and fees relate to payments made to the holders of the floating rate certificates from trust assets. |
| (r) | Certain expenses have been reduced without which performance would have been lower. |
| (s) | From time to time the fund may receive proceeds from litigation settlements, without which performance would be lower. |
| (t) | Total returns do not include any applicable sales charges. |
| (w) | Per share amount was less than $0.01. |
| (x) | The net asset values per share and total returns have been calculated on net assets which include adjustments made in accordance with U.S. generally accepted accounting principles required at period end for financial reporting purposes. |
See Notes to Financial Statements
82
Table of Contents
Financial Highlights – continued
MFS WEST VIRGINIA MUNICIPAL BOND FUND
The financial highlights table is intended to help you understand the fund financial performance for the past 5 years. Certain information reflects financial results for a single fund share. The total returns in the table represent the rate by which an investor would have earned (or lost) on an investment in the fund share class (assuming reinvestment of all distributions) held for the entire period.
| Years ended 3/31 | ||||||||||||||||||||
| Class A | 2013 | 2012 | 2011 | 2010 | 2009 | |||||||||||||||
Net asset value, beginning of period | $11.49 | $10.61 | $10.98 | $10.36 | $11.01 | |||||||||||||||
| Income (loss) from investment operations | ||||||||||||||||||||
| Net investment income (d) | $0.40 | $0.43 | $0.44 | $0.45 | $ 0.47 | (b) | ||||||||||||||
Net realized and unrealized gain (loss) on investments | 0.09 | 0.86 | (0.39 | ) | 0.60 | (0.58) | (b) | |||||||||||||
Total from investment operations | $0.49 | $1.29 | $0.05 | $1.05 | $(0.11 | ) | ||||||||||||||
| Less distributions declared to shareholders | ||||||||||||||||||||
| From net investment income | $(0.38 | ) | $(0.41 | ) | $(0.42 | ) | $(0.42 | ) | $(0.43 | ) | ||||||||||
From net realized gain on investments | — | — | — | (0.01 | ) | (0.11 | ) | |||||||||||||
Total distributions declared to shareholders | $(0.38 | ) | $(0.41 | ) | $(0.42 | ) | $(0.43 | ) | $(0.54 | ) | ||||||||||
Net asset value, end of period (x) | $11.60 | $11.49 | $10.61 | $10.98 | $10.36 | |||||||||||||||
Total return (%) (r)(s)(t)(x) | 4.32 | 12.32 | 0.41 | 10.22 | (0.87 | ) | ||||||||||||||
| Ratios (%) (to average net assets) and Supplemental data: | ||||||||||||||||||||
| Expenses before expense reductions (f) | 0.88 | 0.88 | 0.89 | 0.90 | 1.03 | |||||||||||||||
Expenses after expense reductions (f) | 0.88 | 0.88 | 0.89 | 0.90 | 0.86 | |||||||||||||||
Net investment income | 3.44 | 3.81 | 3.98 | 4.12 | 4.39 | (b) | ||||||||||||||
Portfolio turnover | 14 | 14 | 17 | 12 | 14 | |||||||||||||||
Net assets at end of period (000 omitted) | $153,032 | $143,789 | $128,450 | $133,244 | $116,564 | |||||||||||||||
| Supplemental Ratios (%): | ||||||||||||||||||||
Ratios of expenses to average net assets after expense reductions and excluding interest expense and fees (f)(l) | N/A | N/A | N/A | N/A | 0.85 | |||||||||||||||
See Notes to Financial Statements
83
Table of Contents
Financial Highlights – continued
MFS WEST VIRGINIA MUNICIPAL BOND FUND – continued
| Years ended 3/31 | ||||||||||||||||||||
| Class B | 2013 | 2012 | 2011 | 2010 | 2009 | |||||||||||||||
Net asset value, beginning of period | $11.49 | $10.61 | $10.97 | $10.36 | $11.01 | |||||||||||||||
| Income (loss) from investment operations | ||||||||||||||||||||
| Net investment income (d) | $0.31 | $0.34 | $0.36 | $0.37 | $0.40 | (b) | ||||||||||||||
Net realized and unrealized gain (loss) on investments | 0.09 | 0.86 | (0.38 | ) | 0.59 | (0.58 | )(b) | |||||||||||||
Total from investment operations | $0.40 | $1.20 | $(0.02 | ) | $0.96 | $(0.18 | ) | |||||||||||||
| Less distributions declared to shareholders | ||||||||||||||||||||
| From net investment income | $(0.30 | ) | $(0.32 | ) | $(0.34 | ) | $(0.34 | ) | $(0.36 | ) | ||||||||||
From net realized gain on investments | — | — | — | (0.01 | ) | (0.11 | ) | |||||||||||||
Total distributions declared to shareholders | $(0.30 | ) | $(0.32 | ) | $(0.34 | ) | $(0.35 | ) | $(0.47 | ) | ||||||||||
Net asset value, end of period (x) | $11.59 | $11.49 | $10.61 | $10.97 | $10.36 | |||||||||||||||
Total return (%) (r)(s)(t)(x) | 3.46 | 11.48 | (0.24 | ) | 9.31 | (1.52 | ) | |||||||||||||
| Ratios (%) (to average net assets) and Supplemental data: | ||||||||||||||||||||
| Expenses before expense reductions (f) | 1.63 | 1.63 | 1.64 | 1.66 | 1.69 | |||||||||||||||
Expenses after expense reductions (f) | 1.63 | 1.63 | 1.64 | 1.65 | 1.52 | |||||||||||||||
Net investment income | 2.69 | 3.08 | 3.23 | 3.39 | 3.75 | (b) | ||||||||||||||
Portfolio turnover | 14 | 14 | 17 | 12 | 14 | |||||||||||||||
Net assets at end of period (000 omitted) | $1,890 | $2,220 | $2,925 | $4,639 | $6,454 | |||||||||||||||
| Supplemental Ratios (%): | ||||||||||||||||||||
Ratios of expenses to average net assets after expense reductions and excluding interest | N/A | N/A | N/A | N/A | 1.51 | |||||||||||||||
| (b) | Amounts reflect a correction which reclassifies income and gains previously reported relating to activity for certain municipal bonds held in connection with self-deposited inverse floating rate securities. The corrected amounts resulted in an increase of $0.11 per share to previously reported net investment income, a decrease of $0.11 per share to previously reported net realized and unrealized gain (loss) on investments, and an increase of 1.02% to the previously reported net investment income ratio of each class. There is no impact on previously reported income from operations. |
| (d) | Per share data is based on average shares outstanding. |
| (f) | Ratios do not reflect reductions from fees paid indirectly, if applicable. |
| (l) | Interest expense and fees relate to payments made to the holders of the floating rate certificates from trust assets. |
| (r) | Certain expenses have been reduced without which performance would have been lower. |
| (s) | From time to time the fund may receive proceeds from litigation settlements, without which performance would be lower. |
| (t) | Total returns do not include any applicable sales charges. |
| (x) | The net asset values per share and total returns have been calculated on net assets which include adjustments made in accordance with U.S. generally accepted accounting principles required at period end for financial reporting purposes. |
See Notes to Financial Statements
84
Table of Contents
| (1) | Business and Organization |
MFS Mississippi Municipal Bond Fund (Mississippi Fund), MFS New York Municipal Bond Fund (New York Fund), MFS North Carolina Municipal Bond Fund (North Carolina Fund), MFS Pennsylvania Municipal Bond Fund (Pennsylvania Fund), MFS South Carolina Municipal Bond Fund (South Carolina Fund), MFS Tennessee Municipal Bond Fund (Tennessee Fund), MFS Virginia Municipal Bond Fund (Virginia Fund), and MFS West Virginia Municipal Bond Fund (West Virginia Fund) are each a series of MFS Municipal Series Trust, which is organized as a Massachusetts business trust and is registered under the Investment Company Act of 1940, as amended, as an open-end management investment company.
| (2) | Significant Accounting Policies |
General – The preparation of financial statements in conformity with U.S. generally accepted accounting principles requires management to make estimates and assumptions that affect the reported amounts of assets and liabilities, and disclosure of contingent assets and liabilities at the date of the financial statements and the reported amounts of revenues and expenses during the reporting period. Actual results could differ from those estimates. In the preparation of these financial statements, management has evaluated subsequent events occurring after the date of each fund’s Statement of Assets and Liabilities through the date that the financial statements were issued. Each fund invests primarily in municipal instruments. The value of municipal instruments can be affected by changes in their actual or perceived credit quality. The credit quality of municipal instruments can be affected by, among other things, the financial condition of the issuer or guarantor, the issuer’s future borrowing plans and sources of revenue, the economic feasibility of the revenue bond project or general borrowing purpose, political or economic developments in the region or state where the instrument is issued and the liquidity of the security. Municipal instruments generally trade in the over-the counter market. Municipal instruments backed by current and anticipated revenues from a specific project or specific assets can be negatively affected by the discontinuance of the taxation supporting the projects or assets or the inability to collect revenues for the project or from the assets. If the Internal Revenue Service determines an issuer of a municipal instrument has not complied with the applicable tax requirements, the security could decline in value, interest from the security could become taxable and the funds may be required to issue Forms 1099-DIV.
In this reporting period each fund adopted Financial Accounting Standards Board (FASB) Accounting Standards Update 2011-04, Fair Value Measurement (Topic 820) – Amendments to Achieve Common Fair Value Measurement and Disclosure Requirements in U.S. GAAP and IFRSs (“ASU 2011-04”). ASU 2011-04 seeks to improve the comparability of fair value measurements as presented and disclosed in financial statements prepared in accordance with U.S. GAAP and International Financial Reporting Standards (IFRS) by providing common requirements for fair value measurement and disclosure.
In January 2013, the FASB issued Accounting Standards Update 2013-01 (“ASU 2013-01”) entitled Balance Sheet (Topic 210) – Clarifying the Scope of Disclosures about Offsetting Assets and Liabilities which is intended to clarify the scope of Accounting Standards Update 2011-11 (“ASU 2011-11”), Balance Sheet (Topic 210) – Disclosures about Offsetting Assets and Liabilities. Consistent with the effective date for ASU 2011-11, ASU 2013-01 is effective for annual reporting periods beginning on or after January 1, 2013, and interim periods within those annual periods. ASU 2013-01 limits the scope of ASU 2011-11’s disclosure requirements on offsetting to financial assets and financial liabilities related to derivatives, repurchase and reverse repurchase agreements, and securities lending and securities borrowing transactions. Although still evaluating the potential impact of these two ASUs to each fund, management expects that the impact of each fund’s adoption will be limited to additional financial statement disclosures.
Investment Valuations – Debt instruments and floating rate loans (other than short-term instruments), including restricted debt instruments, are generally valued at an evaluated or composite bid as provided by a third-party pricing service. Short-term instruments with a maturity at issuance of 60 days or less generally are valued at amortized cost, which approximates market value. Futures contracts are generally valued at last posted settlement price as provided by a third-party pricing service on the market on which they are primarily traded. Futures contracts for which there were no trades that day for a particular position are generally valued at the closing bid quotation as provided by a third-party pricing service on the market on which such futures contracts are primarily traded. Open-end investment companies are generally valued at net asset value per share. Securities and other assets generally valued on the basis of information from a third-party pricing service may also be valued at a broker/dealer bid quotation. Values obtained from third-party pricing services can utilize both transaction data and market information such as yield, quality, coupon rate, maturity, type of issue, trading characteristics, and other market data.
The Board of Trustees has delegated primary responsibility for determining or causing to be determined the value of each fund’s investments (including any fair valuation) to the adviser pursuant to valuation policies and procedures approved by the Board. If the adviser determines that reliable market quotations are not readily available, investments are valued at fair value as determined in good faith by the adviser in accordance with such procedures under the oversight of the Board of Trustees. Under each fund’s valuation policies and procedures, market quotations are not considered to be readily available for most types of debt instruments and floating rate loans and many types of derivatives. These investments are generally valued at fair value based on information from third-party pricing services. In addition, investments may be valued at fair value if the adviser determines that an investment’s value
85
Table of Contents
Notes to Financial Statements – continued
has been materially affected by events occurring after the close of the exchange or market on which the investment is principally traded (such as foreign exchange or market) and prior to the determination of each fund’s net asset value, or after the halting of trading of a specific security where trading does not resume prior to the close of the exchange or market on which the security is principally traded. The adviser generally relies on third-party pricing services or other information (such as the correlation with price movements of similar securities in the same or other markets; the type, cost and investment characteristics of the security; the business and financial condition of the issuer; and trading and other market data) to assist in determining whether to fair value and at what value to fair value an investment. The value of an investment for purposes of calculating each fund’s net asset value can differ depending on the source and method used to determine value. When fair valuation is used, the value of an investment used to determine each fund’s net asset value may differ from quoted or published prices for the same investment. There can be no assurance that each fund could obtain the fair value assigned to an investment if it were to sell the investment at the same time at which each fund determines its net asset value per share.
Various inputs are used in determining the value of each fund’s assets or liabilities. These inputs are categorized into three broad levels. In certain cases, the inputs used to measure fair value may fall into different levels of the fair value hierarchy. In such cases, an investment’s level within the fair value hierarchy is based on the lowest level of input that is significant to the fair value measurement. Each fund’s assessment of the significance of a particular input to the fair value measurement in its entirety requires judgment, and considers factors specific to the investment. Level 1 includes unadjusted quoted prices in active markets for identical assets or liabilities. Level 2 includes other significant observable market-based inputs (including quoted prices for similar securities, interest rates, prepayment speed, and credit risk). Level 3 includes unobservable inputs, which may include the adviser’s own assumptions in determining the fair value of investments. The following is a summary of the levels used as of March 31, 2013 in valuing each fund’s assets or liabilities:
| Level 1 | Level 2 | Level 3 | Total | |||||||||||||
Mississippi Fund | ||||||||||||||||
| Investments at Value | ||||||||||||||||
| Municipal Bonds | $— | $114,999,421 | $— | $114,999,421 | ||||||||||||
| Mutual Funds | 361,850 | — | — | 361,850 | ||||||||||||
| Total Investments | $361,850 | $114,999,421 | $— | $115,361,271 | ||||||||||||
New York Fund | ||||||||||||||||
| Investments at Value | ||||||||||||||||
| Municipal Bonds | $— | $223,294,054 | $— | $223,294,054 | ||||||||||||
| Mutual Funds | 4,835,359 | — | — | 4,835,359 | ||||||||||||
| Total Investments | $4,835,359 | $223,294,054 | $— | $228,129,413 | ||||||||||||
North Carolina Fund | ||||||||||||||||
| Investments at Value | ||||||||||||||||
| Municipal Bonds | $— | $475,538,511 | $— | $475,538,511 | ||||||||||||
| Mutual Funds | 2,618,244 | — | — | 2,618,244 | ||||||||||||
| Total Investments | $2,618,244 | $475,538,511 | $— | $478,156,755 | ||||||||||||
Pennsylvania Fund | ||||||||||||||||
| Investments at Value | ||||||||||||||||
| Municipal Bonds | $— | $156,485,031 | $— | $156,485,031 | ||||||||||||
| Mutual Funds | 4,870,172 | — | — | 4,870,172 | ||||||||||||
| Total Investments | $4,870,172 | $156,485,031 | $— | $161,355,203 | ||||||||||||
South Carolina Fund | ||||||||||||||||
| Investments at Value | ||||||||||||||||
| Municipal Bonds | $— | $220,096,398 | $— | $220,096,398 | ||||||||||||
| Mutual Funds | 7,947,671 | — | — | 7,947,671 | ||||||||||||
| Total Investments | $7,947,671 | $220,096,398 | $— | $228,044,069 | ||||||||||||
Tennessee Fund | ||||||||||||||||
| Investments at Value | ||||||||||||||||
| Municipal Bonds | $— | $132,187,895 | $— | $132,187,895 | ||||||||||||
| Mutual Funds | 5,367,445 | — | — | 5,367,445 | ||||||||||||
| Total Investments | $5,367,445 | $132,187,895 | $— | $137,555,340 | ||||||||||||
86
Table of Contents
Notes to Financial Statements – continued
| Level 1 | Level 2 | Level 3 | Total | |||||||||||||
Virginia Fund | ||||||||||||||||
| Investments at Value | ||||||||||||||||
| Municipal Bonds | $— | $371,646,004 | $— | $371,646,004 | ||||||||||||
| Mutual Funds | 3,198,956 | — | — | 3,198,956 | ||||||||||||
| Total Investments | $3,198,956 | $371,646,004 | $— | $374,844,960 | ||||||||||||
West Virginia Fund | ||||||||||||||||
| Investments at Value | ||||||||||||||||
| Municipal Bonds | $— | $149,128,340 | $— | $149,128,340 | ||||||||||||
| Mutual Funds | 3,831,989 | — | — | 3,831,989 | ||||||||||||
| Total Investments | $3,831,989 | $149,128,340 | $— | $152,960,329 | ||||||||||||
For further information regarding security characteristics, see the Portfolio of Investments.
Derivatives – Certain funds use derivatives for different purposes, primarily to increase or decrease exposure to a particular market or segment of the market, or security, to increase or decrease interest rate exposure, or as alternatives to direct investments. Derivatives are used for hedging or non-hedging purposes. While hedging can reduce or eliminate losses, it can also reduce or eliminate gains. When each fund uses derivatives as an investment to increase market exposure, or for hedging purposes, gains and losses from derivative instruments may be substantially greater than the derivative’s original cost. The Mississippi Fund did not use derivatives during the period.
The derivative instruments used by certain funds were futures contracts. At March 31, 2013, the funds did not have any outstanding derivative instruments.
The following table presents, by major type of derivative contract, the realized gain (loss) on derivatives held by certain funds, for the year ended March 31, 2013 as reported in the Statements of Operations:
| Fund | Risk | Futures Contracts | ||
| New York Fund | Interest Rate | $(100,839) | ||
| North Carolina Fund | Interest Rate | (114,307) | ||
| Pennsylvania Fund | Interest Rate | (62,463) | ||
| South Carolina Fund | Interest Rate | (48,581) | ||
| Tennessee Fund | Interest Rate | (40,008) | ||
| Virginia Fund | Interest Rate | (195,962) | ||
| West Virginia Fund | Interest Rate | (40,008) |
The following table presents, by major type of derivative contract, the change in unrealized appreciation (depreciation) on derivatives held by certain funds, for the year ended March 31, 2013 as reported in the Statements of Operations:
| Fund | Risk | Futures Contracts | ||
| New York Fund | Interest Rate | $(59,970) | ||
| North Carolina Fund | Interest Rate | (57,050) | ||
| Pennsylvania Fund | Interest Rate | (37,603) | ||
| South Carolina Fund | Interest Rate | (24,246) | ||
| Tennessee Fund | Interest Rate | (19,967) | ||
| Virginia Fund | Interest Rate | (117,088) | ||
| West Virginia Fund | Interest Rate | (19,967) |
Derivative counterparty credit risk is managed through formal evaluation of the creditworthiness of all potential counterparties. On certain over-the-counter derivatives, each fund attempts to reduce its exposure to counterparty credit risk whenever possible by entering into an International Swaps and Derivatives Association (ISDA) Master Agreement on a bilateral basis with each of the counterparties with whom it undertakes a significant volume of transactions. The ISDA Master Agreement gives each party to the agreement the right to terminate all transactions traded under such agreement if there is a certain deterioration in the credit quality of the other party. The ISDA Master Agreement gives each fund the right, upon an event of default by the applicable counterparty or a termination of the agreement, to close out all transactions traded under such agreement and to net amounts owed under each transaction to one net amount payable by one party to the other. This right to close out and net payments across all transactions traded under the ISDA Master Agreement could result in a reduction of each fund’s credit risk to such counterparty equal to any amounts payable by each fund under the applicable transactions, if any. However, absent an event of default by the counterparty or a termination of the agreement, the ISDA Master Agreement does not result in an offset of reported amounts of assets and liabilities in the Statements of Assets and Liabilities across transactions between each fund and the applicable counterparty.
Collateral requirements differ by type of derivative. Collateral or margin requirements are set by the broker or exchange clearing house for exchange traded derivatives (i.e., futures contracts and exchange-traded options) while collateral terms are contract specific for over-the-counter traded derivatives (i.e., forward foreign currency exchange contracts, swap agreements and over-the-counter options). For derivatives traded under an ISDA Master Agreement, the collateral requirements are netted across all
87
Table of Contents
Notes to Financial Statements – continued
transactions traded under such agreement and one amount is posted from one party to the other to collateralize such obligations. Cash collateral that has been segregated to cover obligations of each fund under derivative contracts, if any, will be reported separately in the Statements of Assets and Liabilities as restricted cash. Securities collateral pledged for the same purpose, if any, is noted in the Portfolio of Investments.
Futures Contracts – Each fund, with the exception of the Mississippi Fund, entered into futures contracts which may be used to hedge against or obtain broad market exposure, interest rate exposure, or to manage duration. A futures contract represents a commitment for the future purchase or sale of an asset at a specified price on a specified date.
Upon entering into a futures contract, each fund is required to deposit with the broker, either in cash or securities, an initial margin in an amount equal to a certain percentage of the notional amount of the contract. Subsequent payments (variation margin) are made or received by each fund each day, depending on the daily fluctuations in the value of the contract, and are recorded for financial statement purposes as unrealized gain or loss by each fund until the contract is closed or expires at which point the gain or loss on futures contracts is realized.
Each fund bears the risk of interest rates, exchange rates or securities prices moving unexpectedly, in which case, each fund may not achieve the anticipated benefits of the futures contracts and may realize a loss. While futures contracts may present less counterparty risk to each fund since the contracts are exchange traded and the exchange’s clearinghouse guarantees payments to the broker, there is still counterparty credit risk due to the insolvency of the broker. Each fund’s maximum risk of loss due to counterparty credit risk is equal to the margin posted by each fund to the broker plus any gains or minus any losses on the outstanding futures contracts.
Inverse Floaters – During the year ended March 31, 2013, the North Carolina Fund, Pennsylvania Fund, and Virginia Fund invested in municipal inverse floating rate securities which are structured by the issuer (known as primary market inverse floating rate securities) or by an investment banker utilizing municipal bonds which have already been issued (known as secondary market inverse floating rate securities) to have variable rates of interest which typically move in the opposite direction of short term interest rates. A secondary market inverse floating rate security is created when an investment banker transfers a fixed rate municipal bond to a special purpose trust, and causes the trust to (a) issue floating rate certificates to third parties, in an amount equal to a fraction of the par amount of the deposited bonds (these certificates usually pay tax-exempt interest at short-term interest rates that typically reset weekly; and the certificates holders typically, on seven days notice, have the option to tender their certificates to the investment banker or another party for redemption at par plus accrued interest), and (b) issue inverse floating rate certificates (sometimes referred to as “inverse floaters”). If the holders of the inverse floater transfer the municipal bonds to an investment banker for the purpose of depositing the municipal bonds into the special purpose trust, the inverse floating rate certificates that are issued by the trust are referred to as “self-deposited inverse floaters.” If the bonds held by the trust are purchased by the investment banker for deposit into the trust from someone other than the purchasers of the inverse floaters, the inverse floating rate certificates that are issued by the trust are referred to as “externally deposited inverse floaters.” Such self-deposited inverse floaters held by each fund are accounted for as secured borrowings, with the municipal bonds reflected in the investments of each fund and amounts owed to the holders of the floating rate certificates under the provisions of the trust, which amounts are paid solely from the assets of the trust, reflected as liabilities of each fund in the Statements of Assets and Liabilities under the caption, “Payable to the holders of the floating rate certificates from trust assets”. The carrying value of the Virginia Fund’s payable to the holders of the floating rate certificates from trust assets as reported in its Statement of Assets and Liabilities approximates its fair value. The value of the payable to the holders of the floating rate certificates from trust assets as of the reporting date is considered Level 2 under the fair value hierarchy disclosure. At March 31, 2013, the Virginia Fund’s payable to the holders of the floating rate certificates from trust assets was $5,002,691 and the interest rate on the floating rate certificates issued by the trust was 0.17%. At March 31, 2013, the North Carolina Fund and Pennsylvania Fund did not have any outstanding floating rate certificates.
For the year ended March 31, 2013, the average payable to the holders of the floating rate certificates from trust assets; the weighted average interest rate related to this payable; and the interest expense and fees related to interest payments made to the holders of certain floating rate certificates which are made from trust assets were as follows:
Average of the floating rate certificates from trust assets for the year ended 3/31/13 | Weighted average interest rate for the year ended 3/31/13 on floating rate certificates issued by the trust | Interest expense and fees in connection with self-deposited inverse floaters for the year ended 3/31/13 | ||||||||||
| Fund | ||||||||||||
| North Carolina Fund | $2,566,111 | 0.10% | $21,112 | |||||||||
| Pennsylvania Fund | 224,219 | 0.06% | 2,108 | |||||||||
| Virginia Fund | 5,003,298 | 0.17% | 37,363 | |||||||||
Primary and externally deposited inverse floaters held by certain funds are not accounted for as secured borrowings.
88
Table of Contents
Notes to Financial Statements – continued
Indemnifications – Under each fund’s organizational documents, its officers and Trustees may be indemnified against certain liabilities and expenses arising out of the performance of their duties to each fund. Additionally, in the normal course of business, each fund enters into agreements with service providers that may contain indemnification clauses. Each fund’s maximum exposure under these agreements is unknown as this would involve future claims that may be made against each fund that have not yet occurred.
Investment Transactions and Income – Investment transactions are recorded on the trade date. Interest income is recorded on the accrual basis. All premium and discount is amortized or accreted for financial statement purposes in accordance with U.S. generally accepted accounting principles. Interest payments received in additional securities are recorded on the ex-interest date in an amount equal to the value of the security on such date. Debt obligations may be placed on non-accrual status or set to accrue at a rate of interest less than the contractual coupon when the collection of all or a portion of interest has become doubtful. Interest income for those debt obligations may be further reduced by the write-off of the related interest receivables when deemed uncollectible.
Each fund may receive proceeds from litigation settlements. Any proceeds received from litigation involving portfolio holdings are reflected in the Statements of Operations in realized gain/loss if the security has been disposed of by the fund or in unrealized gain/loss if the security is still held by the fund. Any other proceeds from litigation not related to portfolio holdings are reflected as other income in the Statements of Operations.
Legal fees and other related expenses incurred to preserve and protect the value of a security owned are added to the cost of the security; other legal fees are expensed. Capital infusions made directly to the security issuer, which are generally non-recurring, incurred to protect or enhance the value of high-yield debt securities, are reported as additions to the cost basis of the security. Costs that are incurred to negotiate the terms or conditions of capital infusions or that are expected to result in a plan of reorganization are reported as realized losses. Ongoing costs incurred to protect or enhance an investment, or costs incurred to pursue other claims or legal actions, are expensed.
Fees Paid Indirectly – Each fund’s custody fee may be reduced according to an arrangement that measures the value of cash deposited with the custodian by each fund. This amount, for the year ended March 31, 2013, is shown as a reduction of total expenses in the Statements of Operations.
Tax Matters and Distributions – Each fund intends to qualify as a regulated investment company, as defined under Subchapter M of the Internal Revenue Code, and to distribute all of its taxable and tax-exempt income, including realized capital gains. As a result, no provision for federal income tax is required. Each fund’s federal tax returns, when filed, will remain subject to examination by the Internal Revenue Service for a three year period.
Distributions to shareholders are recorded on the ex-dividend date. Income and capital gain distributions are determined in accordance with income tax regulations, which may differ from U.S. generally accepted accounting principles. Certain capital accounts in the financial statements are periodically adjusted for permanent differences in order to reflect their tax character. These adjustments have no impact on net assets or net asset value per share. Temporary differences which arise from recognizing certain items of income, expense, gain or loss in different periods for financial statement and tax purposes will reverse at some time in the future. Distributions in excess of net investment income or net realized gains are temporary overdistributions for financial statement purposes resulting from differences in the recognition or classification of income or distributions for financial statement and tax purposes.
Book/tax differences primarily relate to amortization and accretion of debt securities, defaulted bonds, treating a portion of the proceeds from redemptions as a distribution for tax purposes, and secured borrowings.
The tax character of distributions declared to shareholders for the last two fiscal years is as follows:
| Year ended 3/31/13 | Mississippi Fund | New York Fund | North Carolina Fund | Pennsylvania Fund | South Carolina Fund | Tennessee Fund | Virginia Fund | West Virginia Fund | ||||||||||||||||||||||||
| Ordinary income (including any short-term capital gains) | $34,046 | $— | $1,068,031 | $— | $13,912 | $— | $— | $— | ||||||||||||||||||||||||
| Tax-exempt income | 4,322,240 | 7,854,148 | 14,357,119 | 5,483,765 | 7,100,265 | 4,319,638 | 12,316,868 | 4,987,231 | ||||||||||||||||||||||||
| Long-term capital gain | 74,037 | — | 1,515,140 | — | — | — | — | — | ||||||||||||||||||||||||
| Total distributions | $4,430,323 | $7,854,148 | $16,940,290 | $5,483,765 | $7,114,177 | $4,319,638 | $12,316,868 | $4,987,231 | ||||||||||||||||||||||||
| Year ended 3/31/12 | Mississippi Fund | New York Fund | North Carolina Fund | Pennsylvania Fund | South Carolina Fund | Tennessee Fund | Virginia Fund | West Virginia Fund | ||||||||||||||||||||||||
| Tax-exempt income | $4,414,895 | $8,085,698 | $14,764,189 | $5,515,201 | $6,940,669 | $4,534,415 | $12,849,907 | $5,028,417 | ||||||||||||||||||||||||
89
Table of Contents
Notes to Financial Statements – continued
The federal tax cost and the tax basis components of distributable earnings were as follows:
| As of 3/31/13 | Mississippi Fund | New York Fund | North Carolina Fund | Pennsylvania Fund | ||||||||||||
| Cost of investments | $107,234,728 | $208,984,895 | $443,245,274 | $150,688,718 | ||||||||||||
| Gross appreciation | 8,260,215 | 20,113,238 | 36,200,454 | 11,101,580 | ||||||||||||
| Gross depreciation | (133,672 | ) | (968,720 | ) | (1,288,973 | ) | (435,095 | ) | ||||||||
| Net unrealized appreciation (depreciation) | $8,126,543 | $19,144,518 | $34,911,481 | $10,666,485 | ||||||||||||
| Undistributed ordinary income | 206,918 | — | 39,695 | — | ||||||||||||
| Undistributed tax-exempt income | 430,960 | 672,295 | 1,313,015 | 489,738 | ||||||||||||
| Undistributed long-term capital gain | 133,285 | — | 1,752,714 | — | ||||||||||||
| Capital loss carryforwards | — | (1,955,098 | ) | — | (1,297,922 | ) | ||||||||||
| Post-October capital loss deferral | — | (1,831 | ) | — | (1,249 | ) | ||||||||||
| Other temporary differences | (377,382 | ) | (678,521 | ) | (1,162,881 | ) | (470,535 | ) | ||||||||
| As of 3/31/13 | South Carolina Fund | Tennessee Fund | Virginia Fund | West Virginia | ||||||||||||
| Cost of investments | $213,324,033 | $128,516,424 | $348,171,365 | $144,455,359 | ||||||||||||
| Gross appreciation | 15,124,163 | 9,812,856 | 24,325,839 | 9,179,472 | ||||||||||||
| Gross depreciation | (404,127 | ) | (773,940 | ) | (2,654,935 | ) | (674,502 | ) | ||||||||
| Net unrealized appreciation (depreciation) | $14,720,036 | $9,038,916 | $21,670,904 | $8,504,970 | ||||||||||||
| Undistributed tax-exempt income | 556,567 | 820,784 | 1,031,545 | 443,364 | ||||||||||||
| Capital loss carryforwards | (1,937,955 | ) | (57,345 | ) | (203,621 | ) | (314,556 | ) | ||||||||
| Post-October capital loss deferral | — | (5,754 | ) | — | — | |||||||||||
| Other temporary differences | (587,877 | ) | (501,653 | ) | (1,055,314 | ) | (447,742 | ) | ||||||||
Under the Regulated Investment Company Modernization Act of 2010 (the “Act”), net capital losses recognized for fund fiscal years beginning after March 31, 2011 may be carried forward indefinitely, and their character is retained as short-term and/or long-term losses (“post-enactment losses”). Previously, net capital losses were carried forward for eight years and treated as short-term losses (“pre-enactment losses”). As a transition rule, the Act requires that all post-enactment net capital losses be used before pre-enactment net capital losses.
As of March 31, 2013, certain funds had capital loss carryforwards available to offset future realized gains as follows:
| Pre-enactment losses which expire as follows: | New York Fund | Pennsylvania Fund | South Carolina Fund | Tennessee Fund | Virginia Fund | West Virginia Fund | ||||||||||||||||||
| 3/31/17 | $— | $(310,955 | ) | $— | $— | $— | $— | |||||||||||||||||
| 3/31/18 | — | (139,728 | ) | (620,248 | ) | — | — | (314,556 | ) | |||||||||||||||
| 3/31/19 | (1,676,455 | ) | (847,239 | ) | (825,001 | ) | (57,345 | ) | (203,621 | ) | — | |||||||||||||
| Total | $(1,676,455 | ) | $(1,297,922 | ) | $(1,445,249 | ) | $(57,345 | ) | $(203,621 | ) | $(314,556 | ) | ||||||||||||
| Post-enactment losses which are characterized as follows: | New York Fund | South Fund | ||||||||||||||||||||||
| Long-Term | $(278,643 | ) | $(492,706 | ) | ||||||||||||||||||||
Multiple Classes of Shares of Beneficial Interest – Each fund offers multiple classes of shares, which differ in their respective distribution and service fees. Each fund’s income and common expenses are allocated to shareholders based on the value of settled shares outstanding of each class. Each fund’s realized and unrealized gain (loss) are allocated to shareholders based on the daily net assets of each class. Dividends are declared separately for each class. Differences in per share dividend rates are generally due to
90
Table of Contents
Notes to Financial Statements – continued
differences in separate class expenses. Class B shares will convert to Class A shares approximately eight years after purchase. Each fund’s distributions declared to shareholders as reported in the Statements of Changes in Net Assets are presented by class as follows:
Distributions declared to shareholders:
From net investment income
| Mississippi Fund | New York Fund | North Carolina Fund | Pennsylvania Fund | |||||||||||||||||||||||||||||
| Year ended 3/31/13 | Year ended 3/31/12 | Year ended 3/31/13 | Year ended 3/31/12 | Year ended 3/31/13 | Year ended 3/31/12 | Year ended 3/31/13 | Year ended 3/31/12 | |||||||||||||||||||||||||
| Class A | $4,246,586 | $4,339,245 | $6,660,265 | $6,902,586 | $12,124,204 | $12,522,830 | $5,179,316 | $5,147,054 | ||||||||||||||||||||||||
| Class B | 75,654 | 75,650 | 186,269 | 221,647 | 195,983 | 228,042 | 304,449 | 368,147 | ||||||||||||||||||||||||
| Class C | — | — | 1,007,614 | 961,465 | 2,036,932 | 2,013,317 | — | — | ||||||||||||||||||||||||
| Total | $4,322,240 | $4,414,895 | $7,854,148 | $8,085,698 | $14,357,119 | $14,764,189 | $5,483,765 | $5,515,201 | ||||||||||||||||||||||||
| South Carolina Fund | Tennessee Fund | Virginia Fund | West Virginia Fund | |||||||||||||||||||||||||||||
| Year ended 3/31/13 | Year ended 3/31/12 | Year ended 3/31/13 | Year ended 3/31/12 | Year ended 3/31/13 | Year ended 3/31/12 | Year ended 3/31/13 | Year ended 3/31/12 | |||||||||||||||||||||||||
| Class A | $6,925,932 | $6,747,737 | $4,249,314 | $4,444,672 | $11,299,255 | $11,731,510 | $4,933,555 | $4,954,844 | ||||||||||||||||||||||||
| Class B | 188,245 | 192,932 | 70,324 | 89,743 | 97,627 | 122,047 | 53,676 | 73,573 | ||||||||||||||||||||||||
| Class C | — | — | — | — | 919,986 | 996,350 | — | — | ||||||||||||||||||||||||
| Total | $7,114,177 | $6,940,669 | $4,319,638 | $4,534,415 | $12,316,868 | $12,849,907 | $4,987,231 | $5,028,417 | ||||||||||||||||||||||||
From net realized gain on investments
| Mississippi Fund | North Carolina Fund | |||||||||||||||||||||||
| Year ended 3/31/13 | Year ended 3/31/12 | Year ended 3/31/13 | Year ended 3/31/12 | |||||||||||||||||||||
| Class A | $105,620 | $— | $2,075,167 | $— | ||||||||||||||||||||
| Class B | 2,463 | — | 43,426 | — | ||||||||||||||||||||
| Class C | — | — | 464,578 | — | ||||||||||||||||||||
| Total | $108,083 | $— | $2,583,171 | $— | ||||||||||||||||||||
| (3) | Transactions with Affiliates |
Investment Adviser – Each fund has an investment advisory agreement with MFS to provide overall investment management and related administrative services and facilities to each fund. The management fee is computed daily and paid monthly at an annual rate of 0.45% of each fund’s average daily net assets.
The investment adviser has agreed in writing to pay a portion of the following funds’ total annual operating expenses, exclusive of interest, taxes, extraordinary expenses, brokerage and transaction costs, and investment-related expenses (including interest expense and fees associated with investments in inverse floating rate instruments), such that total fund operating expenses do not exceed the following rates annually of these funds’ average daily net assets:
| New York Fund | North Carolina Fund | South Carolina Fund | Tennessee Fund | Virginia Fund | West Virginia Fund | |||||||||||||||||||
| Class A | 0.90% | 0.93% | 0.91% | 0.94% | 0.89% | 0.90% | ||||||||||||||||||
| Class B | 1.65% | 1.68% | 1.66% | 1.69% | 1.64% | 1.65% | ||||||||||||||||||
| Class C | 1.65% | 1.68% | N/A | N/A | 1.64% | N/A | ||||||||||||||||||
These written agreements will continue until modified by the funds’ Board of Trustees, but such agreements will continue at least until July 31, 2013. For the year ended March 31, 2013, the actual operating expenses for each fund did not exceed the limits described above and therefore, the investment adviser did not pay any portion of these funds’ expenses under these arrangements.
Distributor – MFS Fund Distributors, Inc. (MFD), a wholly-owned subsidiary of MFS, as distributor, received the following amounts for the year ended March 31, 2013, as its portion of the initial sales charge on sales of Class A shares of each fund:
| Mississippi Fund | New York Fund | North Carolina Fund | Pennsylvania Fund | South Carolina Fund | Tennessee Fund | Virginia Fund | West Virginia Fund | |||||||||||||||||||||
| $58,426 | $64,898 | $150,876 | $108,361 | $218,850 | $78,762 | $80,847 | $72,684 | |||||||||||||||||||||
The Board of Trustees has adopted a distribution plan for certain class shares pursuant to Rule 12b-1 of the Investment Company Act of 1940.
91
Table of Contents
Notes to Financial Statements – continued
Each fund’s distribution plan provides that each fund will pay MFD for services provided by MFD and financial intermediaries in connection with the distribution and servicing of certain share classes. One component of the plan is a distribution fee paid to MFD and another component of the plan is a service fee paid to MFD. MFD may subsequently pay all, or a portion, of the distribution and/or service fees to financial intermediaries.
Distribution Plan Fee Table:
| CLASS A | ||||||||||||||||||||
| Distribution Fee Rate (d) | Service Fee Rate (d) | Total Distribution Plan (d) | Annual Effective Rate (e) | Distribution and Service Fee | ||||||||||||||||
| Mississippi Fund | — | 0.25% | 0.25% | 0.10% | $291,281 | |||||||||||||||
| New York Fund | — | 0.25% | 0.25% | 0.25% | 468,307 | |||||||||||||||
| North Carolina Fund | — | 0.25% | 0.25% | 0.25% | 945,343 | |||||||||||||||
| Pennsylvania Fund | — | 0.25% | 0.25% | 0.10% | 360,272 | |||||||||||||||
| South Carolina Fund | — | 0.25% | 0.25% | 0.25% | 528,388 | |||||||||||||||
| Tennessee Fund | — | 0.25% | 0.25% | 0.25% | 316,628 | |||||||||||||||
| Virginia Fund | — | 0.25% | 0.25% | 0.25% | 827,014 | |||||||||||||||
| West Virginia Fund | — | 0.25% | 0.25% | 0.25% | 375,202 | |||||||||||||||
| CLASS B | ||||||||||||||||||||
Distribution Fee Rate (d) | Service Fee Rate (d) | Total Distribution Plan (d) | Annual Effective Rate (e) | Distribution and Service Fee | ||||||||||||||||
| Mississippi Fund | 0.75% | 0.25% | 1.00% | 0.82% | $26,123 | |||||||||||||||
| New York Fund | 0.75% | 0.25% | 1.00% | 1.00% | 66,633 | |||||||||||||||
| North Carolina Fund | 0.75% | 0.25% | 1.00% | 1.00% | 79,619 | |||||||||||||||
| Pennsylvania Fund | 0.75% | 0.25% | 1.00% | 0.88% | 108,381 | |||||||||||||||
| South Carolina Fund | 0.75% | 0.25% | 1.00% | 1.00% | 74,610 | |||||||||||||||
| Tennessee Fund | 0.75% | 0.25% | 1.00% | 1.00% | 27,057 | |||||||||||||||
| Virginia Fund | 0.75% | 0.25% | 1.00% | 1.00% | 36,571 | |||||||||||||||
| West Virginia Fund | 0.75% | 0.25% | 1.00% | 1.00% | 21,134 | |||||||||||||||
| CLASS C | ||||||||||||||||||||
Distribution Fee Rate (d) | Service Fee Rate (d) | Total Distribution Plan (d) | Annual Effective Rate (e) | Distribution and Service Fee | ||||||||||||||||
| New York Fund | 0.75% | 0.25% | 1.00% | 1.00% | $359,933 | |||||||||||||||
| North Carolina Fund | 0.75% | 0.25% | 1.00% | 1.00% | 832,509 | |||||||||||||||
| Virginia Fund | 0.75% | 0.25% | 1.00% | 1.00% | 346,250 | |||||||||||||||
| Mississippi Fund | New York Fund | North Carolina Fund | Pennsylvania Fund | South Carolina Fund | Tennessee Fund | Virginia Fund | West Virginia Fund | |||||||||||||||||||||||||
| Total Distribution and Service Fees | $317,404 | $894,873 | $1,857,471 | $468,653 | $602,998 | $343,685 | $1,209,835 | $396,336 | ||||||||||||||||||||||||
| (d) | In accordance with the distribution plan for certain classes, each fund pays distribution and/or service fees equal to these annual percentage rates of each class’s average daily net assets. The distribution and service fee rates disclosed by class represent the current rates in effect at the end of the reporting period. Any rate changes, if applicable, are detailed below. |
| (e) | The annual effective rates represent actual fees incurred under the distribution plan for the year ended March 31, 2013 based on each class’s average daily net assets. |
| Mississippi Fund: MFD has agreed in writing to reduce the Class A service fee rate to 0.10%. This written agreement will continue until modified by the fund’s Board of Trustees, but such agreement will continue at least until July 31, 2013. This reduction amounted to $174,770 which is shown as a reduction of total expenses in the Statements of Operations. The service fee rate attributable to Class B shares within the first year of purchase is 0.25%. The service fee rate attributable to all other Class B shares has been reduced by MFD to 0.00% under a written agreement that will continue until modified by the fund’s Board of Trustees, but such agreement will continue at least until July 31, 2013. This reduction amounted to $4,622, which is shown as a reduction of total expenses in the Statements of Operations. |
| Pennsylvania Fund: MFD has agreed in writing to reduce the Class A service fee rate to 0.10%. This written agreement will continue until modified by the fund’s Board of Trustees, but such agreement will continue until at least July 31, 2013. This reduction amounted to $216,166 which is shown as a reduction of total expenses in the Statements of Operations. The service fee rate attributable to Class B shares within the first year of purchase is 0.25%. The service fee rate attributable to all other Class B shares has been reduced by MFD to 0.10% under a written agreement that will continue until modified by the fund’s Board of Trustees, but will continue at least until July 31, 2013. This reduction amounted to $13,472 which is shown as a reduction of total expenses in the Statements of Operations. |
Certain Class A shares are subject to a contingent deferred sales charge (CDSC) in the event of a shareholder redemption within 18 months of purchase for shares purchased on or after August 1, 2012, and within 24 months of purchase for shares purchased
92
Table of Contents
Notes to Financial Statements – continued
prior to August 1, 2012. Class C shares are subject to a CDSC in the event of a shareholder redemption within 12 months of purchase. Class B shares are subject to a CDSC in the event of a shareholder redemption within six years of purchase. All contingent deferred sales charges are paid to MFD and during the year ended March 31, 2013, were as follows:
| CDSC imposed | Mississippi Fund | New York Fund | North Carolina Fund | Pennsylvania Fund | South Carolina Fund | Tennessee Fund | Virginia Fund | West Virginia Fund | ||||||||||||||||||||||||
| Class A | $5,939 | $14,229 | $2,809 | $44 | $17,043 | $— | $500 | $— | ||||||||||||||||||||||||
| Class B | 1,727 | 5,033 | 10,188 | 8,248 | 9,528 | 1,170 | 2,272 | 1,289 | ||||||||||||||||||||||||
| Class C | N/A | 2,828 | 7,708 | N/A | N/A | N/A | 3,942 | N/A | ||||||||||||||||||||||||
Shareholder Servicing Agent – MFS Service Center, Inc. (MFSC), a wholly-owned subsidiary of MFS, receives a fee from each fund for its services as shareholder servicing agent calculated as a percentage of the average daily net assets of each fund as determined periodically under the supervision of the funds’ Board of Trustees. For the year ended March 31, 2013, each fund paid the following, which equated to the following annual percentage of each fund’s average daily net assets:
| Mississippi Fund | New York Fund | North Carolina Fund | Pennsylvania Fund | South Carolina Fund | Tennessee Fund | Virginia Fund | West Virginia Fund | |||||||||||||||||||||||||
| Expenses paid | $16,939 | $40,980 | $71,352 | $36,351 | $32,057 | $19,108 | $58,523 | $22,770 | ||||||||||||||||||||||||
| Percent of average daily net assets | 0.0142% | 0.0178% | 0.0152% | 0.0234% | 0.0146% | 0.0147% | 0.0158% | 0.0149% | ||||||||||||||||||||||||
MFSC also receives payment from each fund for out-of-pocket expenses, sub-accounting and other shareholder servicing costs which may be paid to affiliated and unaffiliated service providers. For the year ended March 31, 2013, these out-of-pocket expenses, sub-accounting and other shareholder servicing costs amounted to the following:
| Mississippi Fund | New York Fund | North Fund | Pennsylvania Fund | South Carolina Fund | Tennessee Fund | Virginia Fund | West Virginia Fund | |||||||||||||||||||||
| $59,817 | $116,284 | $289,043 | $81,362 | $128,676 | $71,914 | $228,799 | $87,764 | |||||||||||||||||||||
Administrator – MFS provides certain financial, legal, shareholder communications, compliance, and other administrative services to each fund. Under an administrative services agreement, each fund partially reimburses MFS the costs incurred to provide these services. Each fund is charged an annual fixed amount of $17,500 plus a fee based on average daily net assets. The administrative services fee incurred for the year ended March 31, 2013 was equivalent to an annual effective rate of each fund’s average daily net assets as follows:
Mississippi Fund | New York Fund | North Carolina Fund | Pennsylvania Fund | South Carolina Fund | Tennessee Fund | Virginia Fund | West Virginia Fund | |||||||||||||||||||||||||
| Percentage of average daily net assets | 0.0225% | 0.0181% | 0.0157% | 0.0204% | 0.0183% | 0.0217% | 0.0163% | 0.0205% | ||||||||||||||||||||||||
Trustees’ and Officers’ Compensation – Each fund pays compensation to independent Trustees in the form of a retainer, attendance fees, and additional compensation to Board and Committee chairpersons. Each fund does not pay compensation directly to Trustees or officers of each fund who are also officers of the investment adviser, all of whom receive remuneration for their services to each fund from MFS. Certain officers and Trustees of each fund are officers or directors of MFS, MFD, and MFSC.
Prior to December 31, 2001, each fund had an unfunded defined benefit plan (“DB plan”) for independent Trustees. As of December 31, 2001, the Board took action to terminate the DB plan with respect to then-current and any future independent Trustees, such that the DB plan covers only certain of those former independent Trustees who retired on or before December 31, 2001. The DB plan resulted in a pension expense for each fund. These amounts are included in “Independent Trustees’ compensation” on the Statements of Operations and were as follows:
| Mississippi Fund | New York Fund | North Carolina Fund | Pennsylvania Fund | South Carolina Fund | Tennessee Fund | Virginia Fund | West Virginia Fund | |||||||||||||||||||||
| $113 | $31 | $512 | $113 | $493 | $34 | $508 | $490 | |||||||||||||||||||||
The liability for deferred retirement benefits payable to certain independent Trustees under the DB plan amounted to the following at March 31, 2013, and is included in “Payable for independent Trustees’ compensation” in the Statements of Assets and Liabilities:
Mississippi Fund | New York Fund | North Carolina Fund | Pennsylvania Fund | South Carolina Fund | Tennessee Fund | Virginia Fund | West Virginia Fund | |||||||||||||||||||||
| $4,113 | $5,206 | $7,801 | $4,076 | $7,802 | $5,182 | $7,816 | $7,797 | |||||||||||||||||||||
Other – These funds and certain other funds managed by MFS (the funds) have entered into services agreements (the Agreements) which provide for payment of fees by the funds to Tarantino LLC and Griffin Compliance LLC in return for the provision of services of an Independent Chief Compliance Officer (ICCO) and Assistant ICCO, respectively, for the funds. The ICCO and Assistant ICCO are officers of the funds and the sole members of Tarantino LLC and Griffin Compliance LLC, respectively. The funds can terminate the
93
Table of Contents
Notes to Financial Statements – continued
Agreements with Tarantino LLC and Griffin Compliance LLC at any time under the terms of the Agreements. For the year ended March 31, 2013, the aggregate fees paid by each fund to Tarantino LLC and Griffin Compliance LLC amounted to the following and are in “Miscellaneous” expense in the Statements of Operations:
| Mississippi Fund | New York Fund | North Carolina Fund | Pennsylvania Fund | South Carolina Fund | Tennessee Fund | Virginia Fund | West Virginia Fund | |||||||||||||||||||||
| $934 | $1,795 | $3,628 | $1,192 | $1,680 | $995 | $2,869 | $1,183 | |||||||||||||||||||||
MFS has agreed to reimburse the funds for a portion of the payments made by each fund in the following amounts, which are shown as a reduction of total expenses in the Statements of Operations. Additionally, MFS has agreed to bear all expenses associated with office space, other administrative support, and supplies provided to the ICCO and Assistant ICCO:
| Mississippi Fund | New York Fund | North Carolina Fund | Pennsylvania Fund | South Carolina Fund | Tennessee Fund | Virginia Fund | West Virginia Fund | |||||||||||||||||||||
| $382 | $738 | $1,497 | $494 | $694 | $412 | $1,181 | $487 | |||||||||||||||||||||
Each fund invests in the MFS Institutional Money Market Portfolio which is managed by MFS and seeks current income consistent with preservation of capital and liquidity. Income earned on this investment is included in “Dividends from underlying affiliated funds” in the Statements of Operations. This money market fund does not pay a management fee to MFS.
| (4) | Portfolio Securities |
Purchases and sales of investments, other than short-term obligations, were as follows:
Mississippi Fund | New York Fund | North Carolina Fund | Pennsylvania Fund | South Carolina Fund | Tennessee Fund | Virginia Fund | West Virginia Fund | |||||||||||||||||||||||||
| Purchases | $13,700,681 | $40,125,628 | $113,188,556 | $34,637,088 | $56,209,901 | $40,105,569 | $56,898,108 | $28,121,500 | ||||||||||||||||||||||||
| Sales | $16,870,485 | $40,000,604 | $82,031,253 | $21,776,320 | $31,199,135 | $25,276,801 | $40,499,607 | $20,422,398 | ||||||||||||||||||||||||
| (5) | Shares of Beneficial Interest |
Each fund’s Declaration of Trust permits the Trustees to issue an unlimited number of full and fractional shares of beneficial interest. Transactions in fund shares were as follows:
| Mississippi Fund | New York Fund | |||||||||||||||||||||||||||||||
| Year ended 3/31/13 | Year ended 3/31/12 | Year ended 3/31/13 | Year ended 3/31/12 | |||||||||||||||||||||||||||||
| Shares | Amount | Shares | Amount | Shares | Amount | Shares | Amount | |||||||||||||||||||||||||
| Shares sold | ||||||||||||||||||||||||||||||||
Class A | 1,208,127 | $12,467,119 | 1,530,886 | $15,106,849 | 1,516,731 | $17,484,941 | 1,329,909 | $14,531,111 | ||||||||||||||||||||||||
Class B | 91,242 | 940,244 | 15,183 | 150,159 | 192,782 | 2,221,189 | 81,993 | 898,564 | ||||||||||||||||||||||||
Class C | — | — | — | — | 528,552 | 6,070,863 | 463,436 | 5,072,436 | ||||||||||||||||||||||||
| 1,299,369 | $13,407,363 | 1,546,069 | $15,257,008 | 2,238,065 | $25,776,993 | 1,875,338 | $20,502,111 | |||||||||||||||||||||||||
| Shares issued to shareholders in reinvestment of distributions | ||||||||||||||||||||||||||||||||
Class A | 316,305 | $3,270,514 | 290,841 | $2,870,488 | 449,215 | $5,182,772 | 455,182 | $4,968,745 | ||||||||||||||||||||||||
Class B | 6,056 | 62,694 | 5,673 | 55,937 | 11,372 | 130,868 | 13,891 | 150,822 | ||||||||||||||||||||||||
Class C | — | — | — | — | 65,010 | 749,287 | 55,834 | 609,238 | ||||||||||||||||||||||||
| 322,361 | $3,333,208 | 296,514 | $2,926,425 | 525,597 | $6,062,927 | 524,907 | $5,728,805 | |||||||||||||||||||||||||
Shares reacquired | ||||||||||||||||||||||||||||||||
Class A | (1,739,790 | ) | $(17,982,782 | ) | (1,618,118 | ) | $(15,898,828 | ) | (1,913,726 | ) | $(22,026,235 | ) | (2,011,543 | ) | $(21,802,897 | ) | ||||||||||||||||
Class B | (49,420 | ) | (511,861 | ) | (97,647 | ) | (956,589 | ) | (154,747 | ) | (1,775,282 | ) | (326,184 | ) | (3,527,211 | ) | ||||||||||||||||
Class C | — | — | — | — | (355,342 | ) | (4,103,737 | ) | (365,075 | ) | (3,952,805 | ) | ||||||||||||||||||||
| (1,789,210 | ) | $(18,494,643 | ) | (1,715,765 | ) | $(16,855,417 | ) | (2,423,815 | ) | $(27,905,254 | ) | (2,702,802 | ) | $(29,282,913 | ) | |||||||||||||||||
Net change | ||||||||||||||||||||||||||||||||
Class A | (215,358 | ) | $(2,245,149 | ) | 203,609 | $2,078,509 | 52,220 | $641,478 | (226,452 | ) | $(2,303,041 | ) | ||||||||||||||||||||
Class B | 47,878 | 491,077 | (76,791 | ) | (750,493 | ) | 49,407 | 576,775 | (230,300 | ) | (2,477,825 | ) | ||||||||||||||||||||
Class C | — | — | — | — | 238,220 | 2,716,413 | 154,195 | 1,728,869 | ||||||||||||||||||||||||
| (167,480 | ) | $(1,754,072 | ) | 126,818 | $1,328,016 | 339,847 | $3,934,666 | (302,557 | ) | $(3,051,997 | ) | |||||||||||||||||||||
94
Table of Contents
Notes to Financial Statements – continued
| North Carolina Fund | Pennsylvania Fund | |||||||||||||||||||||||||||||||
| Year ended 3/31/13 | Year ended 3/31/12 | Year ended 3/31/13 | Year ended 3/31/12 | |||||||||||||||||||||||||||||
| Shares | Amount | Shares | Amount | Shares | Amount | Shares | Amount | |||||||||||||||||||||||||
| Shares sold | ||||||||||||||||||||||||||||||||
Class A | 5,408,039 | $67,474,845 | 3,709,642 | $43,955,439 | 2,765,146 | $29,455,693 | 2,133,900 | $21,428,400 | ||||||||||||||||||||||||
Class B | 92,547 | 1,148,649 | 140,795 | 1,662,724 | 161,293 | 1,720,253 | 125,191 | 1,264,472 | ||||||||||||||||||||||||
Class C | 1,575,868 | 19,644,273 | 1,249,576 | 14,822,023 | — | — | — | — | ||||||||||||||||||||||||
| 7,076,454 | $88,267,767 | 5,100,013 | $60,440,186 | 2,926,439 | $31,175,946 | 2,259,091 | $22,692,872 | |||||||||||||||||||||||||
| Shares issued to shareholders in reinvestment of distributions | ||||||||||||||||||||||||||||||||
Class A | 847,500 | $10,601,429 | 646,559 | $7,643,337 | 374,271 | $3,988,085 | 349,151 | $3,510,332 | ||||||||||||||||||||||||
Class B | 17,003 | 212,479 | 13,866 | 163,575 | 24,923 | 266,102 | 28,459 | 286,380 | ||||||||||||||||||||||||
Class C | 144,538 | 1,807,335 | 104,907 | 1,240,106 | — | — | — | — | ||||||||||||||||||||||||
| 1,009,041 | $12,621,243 | 765,332 | $9,047,018 | 399,194 | $4,254,187 | 377,610 | $3,796,712 | |||||||||||||||||||||||||
| Shares reacquired | ||||||||||||||||||||||||||||||||
Class A | (4,612,798 | ) | $(57,585,563 | ) | (3,668,036 | ) | $(43,336,913 | ) | (1,629,269 | ) | $(17,335,307 | ) | (2,070,561 | ) | $(20,644,781 | ) | ||||||||||||||||
Class B | (134,445 | ) | (1,671,548 | ) | (256,780 | ) | (2,993,305 | ) | (186,390 | ) | (1,989,633 | ) | (474,861 | ) | (4,719,920 | ) | ||||||||||||||||
Class C | (917,879 | ) | (11,431,977 | ) | (892,898 | ) | (10,427,355 | ) | — | — | — | — | ||||||||||||||||||||
| (5,665,122 | ) | $(70,689,088 | ) | (4,817,714 | ) | $(56,757,573 | ) | (1,815,659 | ) | $(19,324,940 | ) | (2,545,422 | ) | $(25,364,701 | ) | |||||||||||||||||
| Net change | ||||||||||||||||||||||||||||||||
Class A | 1,642,741 | $20,490,711 | 688,165 | $8,261,863 | 1,510,148 | $16,108,471 | 412,490 | $4,293,951 | ||||||||||||||||||||||||
Class B | (24,895 | ) | (310,420 | ) | (102,119 | ) | (1,167,006 | ) | (174 | ) | (3,278 | ) | (321,211 | ) | (3,169,068 | ) | ||||||||||||||||
Class C | 802,527 | 10,019,631 | 461,585 | 5,634,774 | — | — | — | — | ||||||||||||||||||||||||
| 2,420,373 | $ 30,199,922 | 1,047,631 | $12,729,631 | 1,509,974 | $16,105,193 | 91,279 | $1,124,883 | |||||||||||||||||||||||||
| South Carolina Fund | Tennessee Fund | |||||||||||||||||||||||||||||||
| Year ended 3/31/13 | Year ended 3/31/12 | Year ended 3/31/13 | Year ended 3/31/12 | |||||||||||||||||||||||||||||
| Shares | Amount | Shares | Amount | Shares | Amount | Shares | Amount | |||||||||||||||||||||||||
| Shares sold | ||||||||||||||||||||||||||||||||
Class A | 3,498,436 | $44,368,310 | 2,749,437 | $33,339,613 | 2,425,577 | $26,772,623 | 1,081,396 | $11,380,543 | ||||||||||||||||||||||||
Class B | 139,120 | 1,754,617 | 139,916 | 1,705,571 | 58,718 | 645,747 | 53,872 | 565,382 | ||||||||||||||||||||||||
| 3,637,556 | $46,122,927 | 2,889,353 | $35,045,184 | 2,484,295 | $27,418,370 | 1,135,268 | $11,945,925 | |||||||||||||||||||||||||
| Shares issued to shareholders in reinvestment of distributions | ||||||||||||||||||||||||||||||||
Class A | 435,594 | $5,523,200 | 385,099 | $4,646,912 | 289,980 | $3,196,408 | 259,084 | $2,714,861 | ||||||||||||||||||||||||
Class B | 13,202 | 167,331 | 12,145 | 146,237 | 4,707 | 51,846 | 5,727 | 59,869 | ||||||||||||||||||||||||
| 448,796 | $5,690,531 | 397,244 | $4,793,149 | 294,687 | $3,248,254 | 264,811 | $2,774,730 | |||||||||||||||||||||||||
| Shares reacquired | ||||||||||||||||||||||||||||||||
Class A | (2,205,326 | ) | $(27,994,936 | ) | (1,890,185 | ) | $(22,660,239 | ) | (1,378,254 | ) | $(15,218,250 | ) | (1,221,691 | ) | $(12,695,932 | ) | ||||||||||||||||
Class B | (105,105 | ) | (1,334,958 | ) | (214,513 | ) | (2,551,708 | ) | (50,176 | ) | (552,680 | ) | (136,465 | ) | (1,419,124 | ) | ||||||||||||||||
| (2,310,431 | ) | $(29,329,894 | ) | (2,104,698 | ) | $(25,211,947 | ) | (1,428,430 | ) | $(15,770,930 | ) | (1,358,156 | ) | $(14,115,056 | ) | |||||||||||||||||
| Net change | ||||||||||||||||||||||||||||||||
Class A | 1,728,704 | $21,896,574 | 1,244,351 | $15,326,286 | 1,337,303 | $14,750,781 | 118,789 | $1,399,472 | ||||||||||||||||||||||||
Class B | 47,217 | 586,990 | (62,452 | ) | (699,900 | ) | 13,249 | 144,913 | (76,866 | ) | (793,873 | ) | ||||||||||||||||||||
| 1,775,921 | $22,483,564 | 1,181,899 | $14,626,386 | 1,350,552 | $14,895,694 | 41,923 | $605,599 | |||||||||||||||||||||||||
95
Table of Contents
Notes to Financial Statements – continued
| Virginia Fund | West Virginia Fund | |||||||||||||||||||||||||||||||
| Year ended 3/31/13 | Year ended 3/31/12 | Year ended 3/31/13 | Year ended 3/31/12 | |||||||||||||||||||||||||||||
| Shares | Amount | Shares | Amount | Shares | Amount | Shares | Amount | |||||||||||||||||||||||||
| Shares sold | ||||||||||||||||||||||||||||||||
Class A | 3,267,014 | $38,443,282 | 3,015,011 | $34,047,802 | 1,293,968 | $15,137,213 | 995,753 | $11,198,271 | ||||||||||||||||||||||||
Class B | 20,125 | 237,791 | 38,351 | 431,864 | 9,245 | 108,391 | 47,307 | 531,103 | ||||||||||||||||||||||||
Class C | 637,917 | 7,521,087 | 385,512 | 4,345,338 | — | — | — | — | ||||||||||||||||||||||||
| 3,925,056 | $46,202,160 | 3,438,874 | $38,825,004 | 1,303,213 | $15,245,604 | 1,043,060 | $11,729,374 | |||||||||||||||||||||||||
| Shares issued to shareholders in reinvestment of distributions | ||||||||||||||||||||||||||||||||
Class A | 714,616 | $8,415,159 | 632,749 | $7,109,951 | 347,667 | $4,069,651 | 305,792 | $3,422,524 | ||||||||||||||||||||||||
Class B | 6,307 | 74,172 | 7,635 | 85,564 | 3,240 | 37,906 | 3,922 | 43,743 | ||||||||||||||||||||||||
Class C | 56,099 | 660,306 | 54,485 | 611,698 | — | — | — | — | ||||||||||||||||||||||||
| 777,022 | $9,149,637 | 694,869 | $7,807,213 | 350,907 | $4,107,557 | 309,714 | $3,466,267 | |||||||||||||||||||||||||
| Shares reacquired | ||||||||||||||||||||||||||||||||
Class A | (2,811,966 | ) | $(33,066,376 | ) | (3,484,058 | ) | $(38,999,618 | ) | (960,701 | ) | $(11,232,675 | ) | (891,403 | ) | $(9,881,502 | ) | ||||||||||||||||
Class B | (61,646 | ) | (723,557 | ) | (107,502 | ) | (1,197,849 | ) | (42,724 | ) | (499,174 | ) | (133,584 | ) | (1,485,552 | ) | ||||||||||||||||
Class C | (446,987 | ) | (5,258,423 | ) | (496,366 | ) | (5,600,701 | ) | — | — | — | — | ||||||||||||||||||||
| (3,320,599 | ) | $(39,048,356 | ) | (4,087,926 | ) | $(45,798,168 | ) | (1,003,425 | ) | $(11,731,849 | ) | (1,024,987 | ) | $(11,367,054 | ) | |||||||||||||||||
| Net change | ||||||||||||||||||||||||||||||||
Class A | 1,169,664 | $13,792,065 | 163,702 | $2,158,135 | 680,934 | $7,974,189 | 410,142 | $4,739,293 | ||||||||||||||||||||||||
Class B | (35,214 | ) | (411,594 | ) | (61,516 | ) | (680,421 | ) | (30,239 | ) | (352,877 | ) | (82,355 | ) | (910,706 | ) | ||||||||||||||||
Class C | 247,029 | 2,922,970 | (56,369 | ) | (643,665 | ) | — | — | — | — | ||||||||||||||||||||||
| 1,381,479 | $16,303,441 | 45,817 | $834,049 | 650,695 | $7,621,312 | 327,787 | $3,828,587 | |||||||||||||||||||||||||
| (6) | Line of Credit |
Each fund and certain other funds managed by MFS participate in a $1.1 billion unsecured committed line of credit, subject to a $1 billion sublimit, provided by a syndication of banks under a credit agreement. Borrowings may be made for temporary financing needs. Interest is charged to each fund, based on its borrowings, generally at a rate equal to the higher of the Federal Reserve funds rate or one month LIBOR plus an agreed upon spread. A commitment fee, based on the average daily, unused portion of the committed line of credit, is allocated among the participating funds at the end of each calendar quarter. In addition, each fund and other funds managed by MFS have established unsecured uncommitted borrowing arrangements with certain banks for temporary financing needs. Interest is charged to each fund, based on its borrowings, at a rate equal to the Federal Reserve funds rate plus an agreed upon spread. For the year ended March 31, 2013, each fund’s commitment fee and interest expense were as follows, and are included in “Miscellaneous” expense in the Statements of Operations:
Mississippi Fund | New York Fund | North Carolina Fund | Pennsylvania Fund | South Carolina Fund | Tennessee Fund | Virginia Fund | West Virginia Fund | |||||||||
| Commitment Fee | $731 | $1,401 | $2,850 | $937 | $1,329 | $776 | $2,242 | $930 | ||||||||
| Interest Expense | — | — | — | — | — | — | — | — |
96
Table of Contents
Notes to Financial Statements – continued
| (7) | Transactions in Underlying Affiliated Funds - Affiliated Issuers |
An affiliated issuer of a fund may be considered one in which the fund owns 5% or more of the outstanding voting securities, or a company which is under common control. For the purposes of this report, each fund assumes the MFS Institutional Money Market Portfolio to be an affiliated issuer. Each fund’s transactions in the MFS Institutional Money Market Portfolio for the year ended March 31, 2013, are as follows:
| Underlying Affiliated Fund - MFS Institutional Money Market Portfolio | ||||||||||||||||
| Beginning Shares/Par Amount | Acquisitions Shares/Par Amount | Dispositions Shares/Par Amount | Ending Shares/Par Amount | |||||||||||||
| Mississippi Fund | 409,619 | 19,789,595 | (19,837,364) | 361,850 | ||||||||||||
| New York Fund | 2,701,616 | 52,542,174 | (50,408,431) | 4,835,359 | ||||||||||||
| North Carolina Fund | 7,019,962 | 127,838,338 | (132,240,056) | 2,618,244 | ||||||||||||
| Pennsylvania Fund | 4,148,879 | 42,258,842 | (41,537,549) | 4,870,172 | ||||||||||||
| South Carolina Fund | 9,094,418 | 64,670,420 | (65,817,167) | 7,947,671 | ||||||||||||
| Tennessee Fund | 2,440,114 | 42,243,055 | (39,315,724) | 5,367,445 | ||||||||||||
| Virginia Fund | 5,186,428 | 66,735,709 | (68,723,181) | 3,198,956 | ||||||||||||
| West Virginia Fund | 3,411,024 | 34,358,939 | (33,937,974) | 3,831,989 | ||||||||||||
| Realized Gain (Loss) | Capital Gain Distributions | Dividend Income | Ending Value | |||||||||||||
| Mississippi Fund | $— | $— | $1,997 | $361,850 | ||||||||||||
| New York Fund | — | — | 7,453 | 4,835,359 | ||||||||||||
| North Carolina Fund | — | — | 14,816 | 2,618,244 | ||||||||||||
| Pennsylvania Fund | — | — | 6,633 | 4,870,172 | ||||||||||||
| South Carolina Fund | — | — | 6,299 | 7,947,671 | ||||||||||||
| Tennessee Fund | — | — | 5,209 | 5,367,445 | ||||||||||||
| Virginia Fund | — | — | 8,173 | 3,198,956 | ||||||||||||
| West Virginia Fund | — | — | 5,255 | 3,831,989 | ||||||||||||
97
Table of Contents
REPORT OF INDEPENDENT REGISTERED PUBLIC ACCOUNTING FIRM
To the Board of Trustees of MFS Municipal Series Trust and the Shareholders of MFS Mississippi Municipal Bond Fund, MFS New York Municipal Bond Fund, MFS North Carolina Municipal Bond Fund, MFS Pennsylvania Municipal Bond Fund, MFS South Carolina Municipal Bond Fund, MFS Tennessee Municipal Bond Fund, MFS Virginia Municipal Bond Fund and MFS West Virginia Municipal Bond Fund:
We have audited the accompanying statements of assets and liabilities, including the portfolios of investments, of MFS Mississippi Municipal Bond Fund, MFS New York Municipal Bond Fund, MFS North Carolina Municipal Bond Fund, MFS Pennsylvania Municipal Bond Fund, MFS South Carolina Municipal Bond Fund, MFS Tennessee Municipal Bond Fund, MFS Virginia Municipal Bond Fund and MFS West Virginia Municipal Bond Fund (each a series of MFS Municipal Series Trust) (the “Funds”) as of March 31, 2013, and the related statements of operations for the year then ended, the statements of changes in net assets for each of the two years in the period then ended, and the financial highlights for each of the five years in the period then ended. These financial statements and financial highlights are the responsibility of the Funds’ management. Our responsibility is to express an opinion on these financial statements and financial highlights based on our audits.
We conducted our audits in accordance with the standards of the Public Company Accounting Oversight Board (United States). Those standards require that we plan and perform the audit to obtain reasonable assurance about whether the financial statements and financial highlights are free of material misstatement. The Funds are not required to have, nor were we engaged to perform, an audit of their internal control over financial reporting. Our audits included consideration of internal control over financial reporting as a basis for designing audit procedures that are appropriate in the circumstances, but not for the purpose of expressing an opinion on the effectiveness of the Funds’ internal control over financial reporting. Accordingly, we express no such opinion. An audit also includes examining, on a test basis, evidence supporting the amounts and disclosures in the financial statements, assessing the accounting principles used and significant estimates made by management, as well as evaluating the overall financial statement presentation. Our procedures included confirmation of securities owned as of March 31, 2013, by correspondence with the custodian and brokers; where replies were not received from brokers, we performed other auditing procedures. We believe that our audits provide a reasonable basis for our opinion.
In our opinion, the financial statements and financial highlights referred to above present fairly, in all material respects, the financial position of each of the Funds as of March 31, 2013, the results of their operations for the year then ended, the changes in their net assets for each of the two years in the period then ended, and the financial highlights for each of the five years in the period then ended, in conformity with accounting principles generally accepted in the United States of America.
DELOITTE & TOUCHE LLP
Boston, Massachusetts
May 15, 2013
98
Table of Contents
TRUSTEES AND OFFICERS — IDENTIFICATION AND BACKGROUND
The Trustees and Officers of the Trust, as of May 1, 2013, are listed below, together with their principal occupations during the past five years. (Their titles may have varied during that period.) The address of each Trustee and officer is 111 Huntington Avenue, Boston, Massachusetts 02199-7618.
Name, Age | Position(s) Held with Fund | Trustee/Officer Since (h) | Principal Occupations the Past Five Years | Other Directorships (j) | ||||
| INTERESTED TRUSTEES | ||||||||
| Robert J. Manning (k) (Age 49) | Trustee | February 2004 | Massachusetts Financial Services Company, Chairman, Chief Executive Officer and Director; President (until December 2009); Chief Investment Officer (until July 2010) | N/A | ||||
| INDEPENDENT TRUSTEES | ||||||||
| David H. Gunning (Age 70) | Trustee and Chair of Trustees | January 2004 | Private investor | Lincoln Electric Holdings, Inc. (welding equipment manufacturer), Director; Development Alternatives, Inc. (consulting), Director/Non-Executive Chairman; Portman Limited (mining), Director (until 2008) | ||||
| Robert E. Butler (Age 71) | Trustee | January 2006 | Consultant – investment company industry regulatory and compliance matters | N/A | ||||
Maureen R. Goldfarb (Age 58) | Trustee | January 2009 | Private investor | N/A | ||||
| William R. Gutow (Age 71) | Trustee | December 1993 | Private investor and real estate consultant; Capitol Entertainment Management Company (video franchise), Vice Chairman | Texas Donuts (donut franchise), Vice Chairman (until 2010) | ||||
| Michael Hegarty (Age 68) | Trustee | December 2004 | Private investor | Brookfield Office Properties, Inc. (real estate), Director; Rouse Properties Inc. (real estate), Director; Capmark Financial Group Inc. (real estate), Director | ||||
John P. Kavanaugh (Age 58) | Trustee | January 2009 | Private investor | N/A | ||||
| J. Dale Sherratt (Age 74) | Trustee | June 1989 | Insight Resources, Inc. (acquisition planning specialists), President; Wellfleet Investments (investor in health care companies), Managing General Partner | N/A | ||||
| Laurie J. Thomsen (Age 55) | Trustee | March 2005 | Private investor; New Profit, Inc. (venture philanthropy), Executive Partner (until 2010) | The Travelers Companies (insurance), Director | ||||
| Robert W. Uek (Age 71) | Trustee | January 2006 | Consultant to investment company industry | N/A | ||||
| OFFICERS | ||||||||
John M. Corcoran (k) (Age 48) | President | October 2008 | Massachusetts Financial Services Company, Senior Vice President (since October 2008); State Street Bank and Trust (financial services provider), Senior Vice President, (until September 2008) | N/A | ||||
| Christopher R. Bohane (k) (Age 39) | Assistant Secretary and Assistant Clerk | July 2005 | Massachusetts Financial Services Company, Vice President and Assistant General Counsel | N/A | ||||
Kino Clark (k) (Age 44) | Assistant Treasurer | January 2012 | Massachusetts Financial Services Company, Vice President | N/A | ||||
99
Table of Contents
Trustees and Officers – continued
Name, Age | Position(s) Held with Fund | Trustee/Officer Since (h) | Principal Occupations the Past Five Years | Other Directorships (j) | ||||
Thomas H. Connors (k) (Age 53) | Assistant Secretary and Assistant Clerk | September 2012 | Massachusetts Financial Services Company, Vice President and Senior Counsel; Deutsche Investment Management Americas Inc. (financial service provider), Director and Senior Counsel (until 2012) | N/A | ||||
| Ethan D. Corey (k) (Age 49) | Assistant Secretary and Assistant Clerk | July 2005 | Massachusetts Financial Services Company, Senior Vice President and Associate General Counsel | N/A | ||||
| David L. DiLorenzo (k) (Age 44) | Treasurer | July 2005 | Massachusetts Financial Services Company, Senior Vice President | N/A | ||||
| Robyn L. Griffin (Age 37) | Assistant Independent Chief Compliance Officer | August 2008 | Griffin Compliance LLC (provider of compliance services), Principal (since August 2008); State Street Corporation (financial services provider), Mutual Fund Administration Assistant Vice President (October 2006 – July 2008) | N/A | ||||
Brian E. Langenfeld (k) (Age 40) | Assistant Secretary and Assistant Clerk | June 2006 | Massachusetts Financial Services Company, Vice President and Senior Counsel | N/A | ||||
Susan S. Newton (k) (Age 63) | Assistant Secretary and Assistant Clerk | May 2005 | Massachusetts Financial Services Company, Senior Vice President and Associate General Counsel | N/A | ||||
| Susan A. Pereira (k) (Age 42) | Assistant Secretary and Assistant Clerk | July 2005 | Massachusetts Financial Services Company, Vice President and Senior Counsel | N/A | ||||
Kasey L. Phillips (k) (Age 42) | Assistant Treasurer | September 2012 | Massachusetts Financial Services Company, Vice President; Wells Fargo Funds Management, LLC, Senior Vice President, Fund Treasurer (until 2012) | N/A | ||||
Mark N. Polebaum (k) (Age 60) | Secretary and Clerk | January 2006 | Massachusetts Financial Services Company, Executive Vice President, General Counsel and Secretary | N/A | ||||
| Frank L. Tarantino (Age 69) | Independent Chief Compliance Officer | June 2004 | Tarantino LLC (provider of compliance services), Principal | N/A | ||||
| Richard S. Weitzel (k) (Age 42) | Assistant Secretary and Assistant Clerk | October 2007 | Massachusetts Financial Services Company, Senior Vice President and Associate General Counsel | N/A | ||||
| James O. Yost (k) (Age 52) | Deputy Treasurer | September 1990 | Massachusetts Financial Services Company, Senior Vice President | N/A | ||||
| (h) | Date first appointed to serve as Trustee/officer of an MFS Fund. Each Trustee has served continuously since appointment unless indicated otherwise. For the period from December 15, 2004 until February 22, 2005, Mr. Manning served as Advisory Trustee. For the period October 2008, until January 2012, Mr. Corcoran served as Treasurer of the Funds. Prior to January 2012, Messrs. DiLorenzo and Yost served as Assistant Treasurers of the Funds. |
| (j) | Directorships or trusteeships of companies required to report to the Securities and Exchange Commission (i.e., “public companies”). |
| (k) | “Interested person” of the Trust within the meaning of the Investment Company Act of 1940 (referred to as the 1940 Act), which is the principal federal law governing investment companies like the fund, as a result of position with MFS. The address of MFS is 111 Huntington Avenue, Boston, Massachusetts 02199-7618. |
Each Trustee has been elected by shareholders and each Trustee and officer holds office until his or her successor is chosen and qualified or until his or her earlier death, resignation, retirement or removal. The Trust does not hold annual meetings for the purpose of electing Trustees, and Trustees are not elected for fixed terms. Messrs. Butler, Kavanaugh, Uek and Ms. Thomsen are members of the Trust’s Audit Committee.
100
Table of Contents
Trustees and Officers – continued
Each of the Fund’s Trustees and officers holds comparable positions with certain other funds of which MFS or a subsidiary is the investment adviser or distributor, and, in the case of the officers, with certain affiliates of MFS. As of January 1, 2013, the Trustees served as board members of 143 funds within the MFS Family of Funds.
The Statement of Additional Information for the Fund includes further information about the Trustees and is available without charge upon request by calling 1-800-225-2606.
Investment Adviser Massachusetts Financial Services Company 111 Huntington Avenue Boston, MA 02199-7618 Distributor MFS Fund Distributors, Inc. 111 Huntington Avenue Boston, MA 02199-7618 Portfolio Manager Michael Dawson | Custodian JPMorgan Chase Bank One Chase Manhattan Plaza New York, NY 10081
Independent Registered Public Accounting Firm Deloitte & Touche LLP 200 Berkeley Street Boston, MA 02116 |
101
Table of Contents
BOARD REVIEW OF INVESTMENT ADVISORY AGREEMENT
A discussion regarding the Board’s most recent review and renewal of each fund’s Investment Advisory Agreement with MFS is available by clicking on the fund’s name under “Mutual Funds” in the “Products” section of the MFS Web site (mfs.com).
PROXY VOTING POLICIES AND INFORMATION
A general description of the MFS funds’ proxy voting policies and procedures is available without charge, upon request, by calling 1-800-225-2606, by visiting the Proxy Voting section of mfs.com or by visiting the SEC’s Web site at http://www.sec.gov.
Information regarding how each fund voted proxies relating to portfolio securities during the most recent twelve-month period ended June 30 is available without charge by visiting the Proxy Voting section of mfs.com or by visiting the SEC’s Web site at http://www.sec.gov.
QUARTERLY PORTFOLIO DISCLOSURE
Each fund will file a complete schedule of portfolio holdings with the Securities and Exchange Commission (the Commission) for the first and third quarters of each fiscal year on Form N-Q. A shareholder can obtain the quarterly portfolio holdings report at mfs.com. Each fund’s Form N-Q is also available on the EDGAR database on the Commission’s Internet Web site at http://www.sec.gov, and may be reviewed and copied at the:
Public Reference Room
Securities and Exchange Commission
100 F Street, NE, Room 1580
Washington, D.C. 20549
Information on the operation of the Public Reference Room may be obtained by calling the Commission at 1-800-SEC-0330. Copies of each fund’s Form N-Q also may be obtained, upon payment of a duplicating fee, by electronic request at the following e-mail address: publicinfo@sec.gov or by writing the Public Reference Section at the above address.
From time to time, MFS may post important information about each fund or the MFS funds on the MFS web site (mfs.com). This information is available by visiting the “News & Commentary” section of mfs.com or by clicking on the fund’s name under “Mutual Funds” in the “Products” section of mfs.com.
FEDERAL TAX INFORMATION (unaudited)
The funds will notify shareholders of amounts for use in preparing 2013 income tax forms in January 2014. The following information is provided pursuant to provisions of the Internal Revenue Code.
The funds below designate the following amounts as capital gain dividends paid during the fiscal year:
| Mississippi Fund | $165,000 | |||
| North Carolina Fund | 1,946,000 |
Of the dividends paid from net investment income during the fiscal year, the following percentages were designated as exempt interest dividends for federal income tax purposes. If each fund has earned income on private activity bonds, a portion of the dividends paid may be considered a tax preference item for purposes of computing a shareholder’s alternative minimum tax.
| Exempt Interest Dividends | ||||
| Mississippi Fund | 100.00% | |||
| New York Fund | 100.00% | |||
| North Carolina Fund | 100.00% | |||
| Pennsylvania Fund | 100.00% | |||
| South Carolina Fund | 99.80% | |||
| Tennessee Fund | 100.00% | |||
| Virginia Fund | 100.00% | |||
| West Virginia Fund | 100.00% | |||
102
Table of Contents
rev. 3/11
| WHAT DOES MFS DO WITH YOUR
|  |
| Why? | Financial companies choose how they share your personal information. Federal law gives consumers the right to limit some but not all sharing. Federal law also requires us to tell you how we collect, share, and protect your personal information. Please read this notice carefully to understand what we do. |
| What? | The types of personal information we collect and share depend on the product or service you have with us. This information can include:
• Social Security number and account balances • Account transactions and transaction history • Checking account information and wire transfer instructions
When you are no longer our customer, we continue to share your information as described in this notice. |
| How? | All financial companies need to share customers’ personal information to run their everyday business. In the section below, we list the reasons financial companies can share their customers’ personal information; the reasons MFS chooses to share; and whether you can limit this sharing. |
| Reasons we can share your personal information | Does MFS share? | Can you limit this sharing? | ||
For our everyday business purposes – such as to process your transactions, maintain your account(s), respond to court orders and legal investigations, or report to credit bureaus | Yes | No | ||
For our marketing purposes – to offer our products and services to you | No | We don’t share | ||
| For joint marketing with other financial companies | No | We don’t share | ||
For our affiliates’ everyday business purposes – information about your transactions and experiences | No | We don’t share | ||
For our affiliates’ everyday business purposes – information about your creditworthiness | No | We don’t share | ||
| For nonaffiliates to market to you | No | We don’t share |
| Questions? | Call 800-225-2606 or go to mfs.com. |
103
Table of Contents
| Page 2 |
| Who we are | ||
| Who is providing this notice? | MFS Funds, MFS Investment Management, MFS Institutional Advisors, Inc., MFS Fund Distributors, Inc., MFS Heritage Trust Company, and MFS Service Center, Inc. | |
| What we do | ||
| How does MFS protect my personal information? | To protect your personal information from unauthorized access and use, we use security measures that comply with federal law. These measures include procedural, electronic, and physical safeguards for the protection of the personal information we collect about you. | |
| How does MFS collect my personal information? | We collect your personal information, for example, when you
• open an account or provide account information • direct us to buy securities or direct us to sell your securities • make a wire transfer
We also collect your personal information from others, such as credit bureaus, affiliates and other companies. | |
| Why can’t I limit all sharing? | Federal law gives you the right to limit only
• sharing for affiliates’ everyday business purposes – information about your creditworthiness • affiliates from using your information to market to you • sharing for nonaffiliates to market to you
State laws and individual companies may give you additional rights to limit sharing. | |
| Definitions | ||
| Affiliates | Companies related by common ownership or control. They can be financial and nonfinancial companies.
•MFS does not share personal information with affiliates, except for everyday business purposes as described on page one of this notice. | |
| Nonaffiliates | Companies not related by common ownership or control. They can be financial and nonfinancial companies.
•MFS does not share with nonaffiliates so they can market to you. | |
| Joint Marketing | A formal agreement between nonaffiliated financial companies that together market financial products or services to you.
•MFS doesn’t jointly market. | |
| Other important information | ||
| If you own an MFS product or receive an MFS service in the name of a third party such as a bank or broker-dealer, their privacy policy may apply to you instead of ours. | ||
104
Table of Contents
Save paper with eDelivery.
| MFS® will send you prospectuses, |

reports, and proxies directly via e-mail so you will get information faster with less mailbox clutter.
To sign up:
1. Go to mfs.com.
2. Log in via MFS® Access.
3. Select eDelivery.
If you own your MFS fund shares through a financial institution or a retirement plan, MFS® TALK, MFS® Access, or eDelivery may not be available to you.
WEB SITE
mfs.com
MFS TALK
1-800-637-8255
24 hours a day
ACCOUNT SERVICE AND LITERATURE
Shareholders
1-800-225-2606
Financial advisors
1-800-343-2829
Retirement plan services
1-800-637-1255
MAILING ADDRESS
MFS Service Center, Inc.
P.O. Box 55824
Boston, MA 02205-5824
OVERNIGHT MAIL
MFS Service Center, Inc.
c/o Boston Financial Data Services
30 Dan Road
Canton, MA 02021-2809
Table of Contents
| ITEM 2. | CODE OF ETHICS. |
The Registrant has adopted a Code of Ethics pursuant to Section 406 of the Sarbanes-Oxley Act and as defined in Form N-CSR that applies to the Registrant’s principal executive officer and principal financial and accounting officer. During the period covered by this report, the Registrant has not amended any provision in its Code of Ethics (the “Code”) that relates to an element of the Code’s definitions enumerated in paragraph (b) of Item 2 of this Form N-CSR. During the period covered by this report, the Registrant did not grant a waiver, including an implicit waiver, from any provision of the Code.
A copy of the Code of Ethics is filed as an exhibit to this Form N-CSR.
| ITEM 3. | AUDIT COMMITTEE FINANCIAL EXPERT. |
Messrs. Robert E. Butler, John P. Kavanaugh and Robert W. Uek and Ms. Laurie J. Thomsen, members of the Audit Committee, have been determined by the Board of Trustees in their reasonable business judgment to meet the definition of “audit committee financial expert” as such term is defined in Form N-CSR. In addition, Messrs. Butler, Kavanaugh and Uek and Ms. Thomsen are “independent” members of the Audit Committee (as such term has been defined by the Securities and Exchange Commission in regulations implementing Section 407 of the Sarbanes-Oxley Act of 2002). The Securities and Exchange Commission has stated that the designation of a person as an audit committee financial expert pursuant to this Item 3 on the Form N-CSR does not impose on such a person any duties, obligations or liability that are greater than the duties, obligations or liability imposed on such person as a member of the Audit Committee and the Board of Trustees in the absence of such designation or identification.
| ITEM 4. | PRINCIPAL ACCOUNTANT FEES AND SERVICES. |
Items 4(a) through 4(d) and 4(g):
The Board of Trustees has appointed Deloitte & Touche LLP (“Deloitte”) to serve as independent accountants to each series of the Registrant (collectively, the “Funds”). The tables below set forth the audit fees billed to the Funds as well as fees for non-audit services provided to the Funds and/or to the Funds’ investment adviser, Massachusetts Financial Services Company (“MFS”) and to various entities either controlling, controlled by, or under common control with MFS that provide ongoing services to the Funds (“MFS Related Entities”).
Table of Contents
For the fiscal years ended March 31, 2013 and 2012, audit fees billed to the Funds by Deloitte were as follows:
| Audit Fees | ||||||||
| 2013 | 2012 | |||||||
| Fees billed by Deloitte: | ||||||||
MFS Alabama Municipal Bond Fund | 42,849 | 40,064 | ||||||
MFS Arkansas Municipal Bond Fund | 42,849 | 40,064 | ||||||
MFS California Municipal Bond Fund | 42,849 | 40,064 | ||||||
MFS Florida Municipal Bond Fund+ | N/A | 0 | ||||||
MFS Georgia Municipal Bond Fund | 42,849 | 40,064 | ||||||
MFS Maryland Municipal Bond Fund | 42,849 | 40,064 | ||||||
MFS Massachusetts Municipal Bond Fund | 42,849 | 40,064 | ||||||
MFS Mississippi Municipal Bond Fund | 42,849 | 40,064 | ||||||
MFS Municipal Income Fund | 49,339 | 45,436 | ||||||
MFS New York Municipal Bond Fund | 42,849 | 40,064 | ||||||
MFS North Carolina Municipal Bond Fund | 42,849 | 40,064 | ||||||
MFS Pennsylvania Municipal Bond Fund | 42,849 | 40,064 | ||||||
MFS South Carolina Municipal Bond Fund | 42,849 | 40,064 | ||||||
MFS Tennessee Municipal Bond Fund | 42,849 | 40,064 | ||||||
MFS Virginia Municipal Bond Fund | 42,849 | 40,064 | ||||||
MFS West Virginia Municipal Bond Fund | 42,849 | 40,064 | ||||||
Total | 649,225 | 606,332 | ||||||
For the fiscal years ended March 31, 2013 and 2012, fees billed by Deloitte for audit-related, tax and other services provided to the Funds and for audit-related, tax and other services provided to MFS and MFS Related Entities were as follows:
| Audit-Related Fees1 | Tax Fees2 | All Other Fees3 | ||||||||||||||||||||||
| 2013 | 2012 | 2013 | 2012 | 2013 | 2012 | |||||||||||||||||||
Fees billed by Deloitte: | ||||||||||||||||||||||||
To MFS Alabama Municipal Bond Fund | 0 | 0 | 5,615 | 5,505 | 1,007 | 1,328 | ||||||||||||||||||
To MFS Arkansas Municipal Bond Fund | 0 | 0 | 5,615 | 5,505 | 1,021 | 1,328 | ||||||||||||||||||
To MFS California Municipal Bond Fund | 0 | 0 | 5,615 | 5,505 | 1,030 | 1,328 | ||||||||||||||||||
To MFS Florida Municipal Bond Fund+ | N/A | 2,500 | N/A | 8,124 | N/A | 1,328 | ||||||||||||||||||
To MFS Georgia Municipal Bond Fund | 0 | 0 | 5,615 | 5,505 | 1,007 | 1,328 | ||||||||||||||||||
To MFS Maryland Municipal Bond Fund | 0 | 0 | 5,615 | 5,505 | 1,010 | 1,328 | ||||||||||||||||||
To MFS Massachusetts Municipal Bond Fund | 0 | 0 | 5,615 | 5,505 | 1,028 | 1,328 | ||||||||||||||||||
To MFS Mississippi Municipal Bond Fund | 0 | 0 | 5,615 | 5,505 | 1,011 | 1,328 | ||||||||||||||||||
To MFS Municipal Income Fund | 0 | 2,500 | 5,674 | 5,563 | 1,189 | 1,328 | ||||||||||||||||||
To MFS New York Municipal Bond Fund | 0 | 0 | 5,615 | 5,505 | 1,021 | 1,328 | ||||||||||||||||||
To MFS North Carolina Municipal Bond Fund | 0 | 0 | 5,615 | 5,505 | 1,042 | 1,328 | ||||||||||||||||||
To MFS Pennsylvania Municipal Bond Fund | 0 | 0 | 5,615 | 5,505 | 1,014 | 1,328 | ||||||||||||||||||
To MFS South Carolina Municipal Bond Fund | 0 | 0 | 5,615 | 5,505 | 1,019 | 1,328 | ||||||||||||||||||
To MFS Tennessee Municipal Bond Fund | 0 | 0 | 5,615 | 5,505 | 1,011 | 1,328 | ||||||||||||||||||
To MFS Virginia Municipal Bond Fund | 0 | 0 | 5,615 | 5,505 | 1,033 | 1,328 | ||||||||||||||||||
To MFS West Virginia Municipal Bond Fund | 0 | 0 | 5,615 | 5,505 | 1,014 | 1,328 | ||||||||||||||||||
Total fees billed by Deloitte To above Funds: | 0 | 5,000 | 84,284 | 90,757 | 15,547 | 21,248 | ||||||||||||||||||
Table of Contents
| Audit-Related Fees1 | Tax Fees2 | All Other Fees3 | ||||||||||||||||||||||
| 2013 | 2012 | 2013 | 2012 | 2013 | 2012 | |||||||||||||||||||
Fees billed by Deloitte: | ||||||||||||||||||||||||
To MFS and MFS Related Entities of MFS Alabama Municipal Bond Fund* | 1,276,472 | 1,285,664 | 0 | 0 | 0 | 0 | ||||||||||||||||||
To MFS and MFS Related Entities of MFS Arkansas Municipal Bond Fund* | 1,276,472 | 1,285,664 | 0 | 0 | 0 | 0 | ||||||||||||||||||
To MFS and MFS Related Entities of MFS California Municipal Bond Fund* | 1,276,472 | 1,285,664 | 0 | 0 | 0 | 0 | ||||||||||||||||||
To MFS and MFS Related Entities of MFS Florida Municipal Bond Fund*+ | N/A | 1,285,664 | N/A | 0 | N/A | 0 | ||||||||||||||||||
To MFS and MFS Related Entities of MFS Georgia Municipal Bond Fund* | 1,276,472 | 1,285,664 | 0 | 0 | 0 | 0 | ||||||||||||||||||
To MFS and MFS Related Entities of MFS Maryland Municipal Bond Fund* | 1,276,472 | 1,285,664 | 0 | 0 | 0 | 0 | ||||||||||||||||||
To MFS and MFS Related Entities of MFS Massachusetts Municipal Bond Fund* | 1,276,472 | 1,285,664 | 0 | 0 | 0 | 0 | ||||||||||||||||||
To MFS and MFS Related Entities of MFS Mississippi Municipal Bond Fund* | 1,276,472 | 1,285,664 | 0 | 0 | 0 | 0 | ||||||||||||||||||
To MFS and MFS Related Entities of MFS Municipal Income Fund* | 1,276,472 | 1,285,664 | 0 | 0 | 0 | 0 | ||||||||||||||||||
To MFS and MFS Related Entities of MFS New York Municipal Bond Fund* | 1,276,472 | 1,285,664 | 0 | 0 | 0 | 0 | ||||||||||||||||||
To MFS and MFS Related Entities of MFS North Carolina Municipal Bond Fund* | 1,276,472 | 1,285,664 | 0 | 0 | 0 | 0 | ||||||||||||||||||
To MFS and MFS Related Entities of MFS Pennsylvania Municipal Bond Fund* | 1,276,472 | 1,285,664 | 0 | 0 | 0 | 0 | ||||||||||||||||||
To MFS and MFS Related Entities of MFS South Carolina Municipal Bond Fund* | 1,276,472 | 1,285,664 | 0 | 0 | 0 | 0 | ||||||||||||||||||
To MFS and MFS Related Entities of MFS Tennessee Municipal Bond Fund* | 1,276,472 | 1,285,664 | 0 | 0 | 0 | 0 | ||||||||||||||||||
To MFS and MFS Related Entities of MFS Virginia Municipal Bond Fund* | 1,276,472 | 1,285,664 | 0 | 0 | 0 | 0 | ||||||||||||||||||
To MFS and MFS Related Entities of MFS West Virginia Municipal Bond Fund* | 1,276,472 | 1,285,664 | 0 | 0 | 0 | 0 | ||||||||||||||||||
Table of Contents
| 2013 | 20124 | |||||||
Aggregate fees for non-audit services: | ||||||||
To MFS Alabama Municipal Bond Fund, MFS and MFS Related Entities# | 1,409,614 | 1,719,962 | ||||||
To MFS Arkansas Municipal Bond Fund, MFS and MFS Related Entities# | 1,409,628 | 1,719,962 | ||||||
To MFS California Municipal Bond Fund, MFS and MFS Related Entities# | 1,409,637 | 1,719,962 | ||||||
To MFS Florida Municipal Bond Fund, MFS and MFS Related Entities# + | N/A | 1,725,081 | ||||||
To MFS Georgia Municipal Bond Fund, MFS and MFS Related Entities# | 1,409,614 | 1,719,962 | ||||||
To MFS Maryland Municipal Bond Fund, MFS and MFS Related Entities# | 1,409,617 | 1,719,962 | ||||||
To MFS Massachusetts Municipal Bond Fund, MFS and MFS Related Entities# | 1,409,635 | 1,719,962 | ||||||
To MFS Mississippi Municipal Bond Fund, MFS and MFS Related Entities# | 1,409,618 | 1,719,962 | ||||||
To MFS Municipal Income Fund, MFS and MFS Related Entities# | 1,409,855 | 1,722,520 | ||||||
To MFS New York Municipal Bond Fund, MFS and MFS Related Entities# | 1,409,628 | 1,719,962 | ||||||
To MFS North Carolina Municipal Bond Fund, MFS And MFS Related Entities# | 1,409,649 | 1,719,962 | ||||||
To MFS Pennsylvania Municipal Bond Fund, MFS and MFS Related Entities# | 1,409,621 | 1,719,962 | ||||||
To MFS South Carolina Municipal Bond Fund, MFS and MFS Related Entities# | 1,409,626 | 1,719,962 | ||||||
To MFS Tennessee Municipal Bond Fund, MFS and MFS Related Entities# | 1,409,618 | 1,719,962 | ||||||
To MFS Virginia Municipal Bond Fund, MFS and MFS Related Entities# | 1,409,640 | 1,719,962 | ||||||
To MFS West Virginia Municipal Bond Fund, MFS and MFS Related Entities# | 1,409,621 | 1,719,962 | ||||||
Table of Contents
| + | MFS Florida Municipal Bond Fund was reorganized into the MFS Municipal Income Fund, as of November 4, 2011. |
| * | This amount reflects the fees billed to MFS and MFS Related Entities for non-audit services relating directly to the operations and financial reporting of the Funds (portions of which services also related to the operations and financial reporting of other funds within the MFS Funds complex). |
| # | This amount reflects the aggregate fees billed by Deloitte, as the case may be, for non-audit services rendered to the Funds and for non-audit services rendered to MFS and the MFS Related Entities. |
| 1 | The fees included under “Audit-Related Fees” are fees related to assurance and related services that are reasonably related to the performance of the audit or review of financial statements, but not reported under ‘‘Audit Fees,’’ including accounting consultations, agreed-upon procedure reports, attestation reports, comfort letters and internal control reviews. |
| 2 | The fees included under “Tax Fees” are fees associated with tax compliance, tax advice and tax planning, including services relating to the filing or amendment of federal, state or local income tax returns, regulated investment company qualification reviews and tax distribution and analysis. |
| 3 | The fees included under “All Other Fees” are fees for products and services provided by Deloitte other than those reported under “Audit Fees,” “Audit-Related Fees” and “Tax Fees,” including fees for services related to review of internal controls and review of Rule 38a-1 compliance program. |
| 4 | Fees reported in 2012 have been restated in this filing from those reported in the Registrant’s filing for the reporting period ended March 31, 2012. |
Item 4(e)(1):
Set forth below are the policies and procedures established by the Audit Committee of the Board of Trustees relating to the pre-approval of audit and non-audit related services:
To the extent required by applicable law, pre-approval by the Audit Committee of the Board is needed for all audit and permissible non-audit services rendered to the Funds and all permissible non-audit services rendered to MFS or MFS Related Entities if the services relate directly to the operations and financial reporting of the Registrant. Pre-approval is currently on an engagement-by-engagement basis. In the event pre-approval of such services is necessary between regular meetings of the Audit Committee and it is not practical to wait to seek pre-approval at the next regular meeting of the Audit Committee, pre-approval of such services may be referred to the Chair of the Audit Committee for approval; provided that the Chair may not pre-approve any individual engagement for such services exceeding $50,000 or multiple engagements for such services in the aggregate exceeding $100,000 in each period between regular meetings of the Audit Committee. Any engagement pre-approved by the Chair between regular meetings of the Audit Committee shall be presented for ratification by the entire Audit Committee at its next regularly scheduled meeting.
Table of Contents
Item 4(e)(2):
None, or 0%, of the services relating to the Audit-Related Fees, Tax Fees and All Other Fees paid by the Fund and MFS and MFS Related Entities relating directly to the operations and financial reporting of the Registrant disclosed above were approved by the audit committee pursuant to paragraphs (c)(7)(i)(C) of Rule 2-01 of Regulation S-X (which permits audit committee approval after the start of the engagement with respect to services other than audit, review or attest services, if certain conditions are satisfied).
Item 4(f): Not applicable.
Item 4(h): The Registrant’s Audit Committee has considered whether the provision by a Registrant’s independent registered public accounting firm of non-audit services to MFS and MFS Related Entities that were not pre-approved by the Committee (because such services did not relate directly to the operations and financial reporting of the Registrant) was compatible with maintaining the independence of the independent registered public accounting firm as the Registrant’s principal auditors.
| ITEM 5. | AUDIT COMMITTEE OF LISTED REGISTRANTS. |
Not applicable to the Registrant.
| ITEM 6. | INVESTMENTS |
A schedule of investments of the Registrant is included as part of the report to shareholders of such series under Item 1 of this
Form N-CSR.
| ITEM 7. | DISCLOSURE OF PROXY VOTING POLICIES AND PROCEDURES FOR CLOSED-END MANAGEMENT INVESTMENT COMPANIES. |
Not applicable to the Registrant.
| ITEM 8. | PORTFOLIO MANAGERS OF CLOSED-END MANAGEMENT INVESTMENT COMPANIES. |
Not applicable to the Registrant.
| ITEM 9. | PURCHASES OF EQUITY SECURITIES BY CLOSED-END MANAGEMENT INVESTMENT COMPANY AND AFFILIATED PURCHASERS. |
Not applicable to the Registrant.
| ITEM 10. | SUBMISSION OF MATTERS TO A VOTE OF SECURITY HOLDERS. |
There were no material changes to the procedures by which shareholders may send recommendations to the Board for nominees to the Registrant’s Board since the Registrant last provided disclosure as to such procedures in response to the requirements of Item 407 (c)(2)(iv) of Regulation S-K or this Item.
Table of Contents
| ITEM 11. | CONTROLS AND PROCEDURES. |
| (a) | Based upon their evaluation of the effectiveness of the registrant’s disclosure controls and procedures (as defined in Rule 30a-3(c) under the Investment Company Act of 1940 (the “Act”)) as conducted within 90 days of the filing date of this report on Form N-CSR, the registrant’s principal financial officer and principal executive officer have concluded that those disclosure controls and procedures provide reasonable assurance that the material information required to be disclosed by the registrant on this report is recorded, processed, summarized and reported within the time periods specified in the Securities and Exchange Commission’s rules and forms. |
| (b) | There were no changes in the registrant’s internal controls over financial reporting (as defined in Rule 30a-3(d) under the Act) that occurred during the second fiscal quarter of the period covered by the report that have materially affected, or are reasonably likely to materially affect, the registrant’s internal control over financial reporting. |
| ITEM 12. | EXHIBITS. |
| (a) | File the exhibits listed below as part of this form. Letter or number the exhibits in the sequence indicated. |
| (1) | Any code of ethics, or amendment thereto, that is the subject of the disclosure required by Item 2, to the extent that the registrant intends to satisfy the Item 2 requirements through filing of an exhibit: Code of Ethics attached hereto. |
| (2) | A separate certification for each principal executive officer and principal financial officer of the registrant as required by Rule 30a-2(a) under the Act (17 CFR 270.30a-2): Attached hereto. |
| (b) | If the report is filed under Section 13(a) or 15(d) of the Exchange Act, provide the certifications required by Rule 30a-2(b) under the Act (17 CFR 270.30a-2(b)), Rule 13a-14(b) or Rule 15d-14(b) under the Exchange Act (17 CFR 240.13a-14(b) or 240.15d-14(b)) and Section 1350 of Chapter 63 of Title 18 of the United States Code (18 U.S.C. 1350) as an exhibit. A certification furnished pursuant to this paragraph will not be deemed “filed” for the purposes of Section 18 of the Exchange Act (15 U.S.C. 78r), or otherwise subject to the liability of that section. Such certification will not be deemed to be incorporated by reference into any filing under the Securities Act of 1933 or the Exchange Act, except to the extent that the registrant specifically incorporates it by reference: Attached hereto. |
Table of Contents
Notice
A copy of the Amended and Restated Declaration of Trust, as amended, of the Registrant is on file with the Secretary of State of The Commonwealth of Massachusetts and notice is hereby given that this instrument is executed on behalf of the Registrant by an officer of the Registrant as an officer and not individually and the obligations of or arising out of this instrument are not binding upon any of the Trustees or shareholders individually, but are binding only upon the assets and property of the respective constituent series of the Registrant.
Table of Contents
SIGNATURES
Pursuant to the requirements of the Securities Exchange Act of 1934 and the Investment Company Act of 1940, the registrant has duly caused this report to be signed on its behalf by the undersigned, thereunto duly authorized.
(Registrant) MFS MUNICIPAL SERIES TRUST
| By (Signature and Title)* | JOHN M. CORCORAN | |
| John M. Corcoran, President |
Date: May 15, 2013
Pursuant to the requirements of the Securities Exchange Act of 1934 and the Investment Company Act of 1940, this report has been signed below by the following persons on behalf of the registrant and in the capacities and on the dates indicated.
| By (Signature and Title)* | JOHN M. CORCORAN | |
| John M. Corcoran, President (Principal Executive Officer) |
Date: May 15, 2013
| By (Signature and Title)* | DAVID L. DILORENZO | |
David L. DiLorenzo, Treasurer (Principal Financial Officer and Accounting Officer) |
Date: May 15, 2013
| * | Print name and title of each signing officer under his or her signature. |