UNITED STATES
SECURITIES AND EXCHANGE COMMISSION
Washington, D.C. 20549
FORMN-CSR
CERTIFIED SHAREHOLDER REPORT OF
REGISTERED MANAGEMENT INVESTMENT COMPANIES
Investment Company Act file number811-04096
MFS MUNICIPAL SERIES TRUST
(Exact name of registrant as specified in charter)
111 Huntington Avenue, Boston, Massachusetts 02199
(Address of principal executive offices) (Zip code)
Christopher R. Bohane
Massachusetts Financial Services Company
111 Huntington Avenue, Boston, Massachusetts 02199
(Name and address of agents for service)
Registrant’s telephone number, including area code: (617)954-5000
Date of fiscal year end: March 31
Date of reporting period: March 31, 2020
| ITEM 1. | REPORTS TO STOCKHOLDERS. |
Annual Report
March 31, 2020

MFS® Municipal Series Trust

For the states of:
Alabama, Arkansas, California, Georgia, Maryland, and Massachusetts
Beginning on January 1, 2021, as permitted by regulations adopted by the U.S. Securities and Exchange Commission, paper copies of the fund’s annual and semiannual shareholder reports will no longer be sent by mail, unless you specifically request paper copies of the reports. Instead, the complete reports will be made available on the fund’s Web site (funds.mfs.com), and you will be notified by mail each time a report is posted and provided with a Web site link to access the report.
If you are already signed up to receive shareholder reports by email, you will not be affected by this change and you need not take any action. You may sign up to receive shareholder reports and other communications from the fund by email by contacting your financial intermediary (such as a broker-dealer or bank) or, if you hold your shares directly with the fund, by calling 1-800-225-2606 or by logging on to MFS Access at mfs.com.
Beginning on January 1, 2019, you may elect to receive all future reports in paper free of charge. Contact your financial intermediary to request that you continue to receive paper copies of your shareholder reports. If you invest directly with the fund, you can call 1-800-225-2606 or send an email request to orderliterature@mfs.com to let the fund know that you wish to continue receiving paper copies of your shareholder reports. Your election to receive reports in paper will apply to all funds held in your account if you invest through your financial intermediary or all funds held with the MFS fund complex if you invest directly.
MSTA-ANN
MFS® Municipal Series Trust
For the states of: Alabama, Arkansas, California, Georgia, Maryland, and Massachusetts
CONTENTS
The report is prepared for the general information of shareholders. It is authorized for distribution to prospective investors only when preceded or accompanied by a current prospectus.
NOT FDIC INSURED• MAY LOSE VALUE• NO BANK GUARANTEE
LETTER FROM THE EXECUTIVE CHAIR

Dear Shareholders:
During the first quarter of 2020, equity prices experienced their fastest 30% fall in history and market volatility reached levels not seen since the global financial crisis. Optimism heading into the year — on receding trade and geopolitical risk along with easier central bank policies — was overwhelmed in February as the health effects of a novel coronavirus, COVID-19, spread beyond China’s borders, ultimately impacting more than 187 countries. The global pandemic prompted many governments to take drastic action to slow the spread of the virus, such as quarantines, school and business closures, and prohibitions on public gatherings. While these were important steps to protect the public health, they came at a cost: greater market volatility and an abrupt downturn in economic growth.
Global central banks have taken aggressive, coordinated steps to cushion the economic and market fallout related to the virus, and governments are undertaking unprecedented levels of fiscal stimulus. As uncertainty recedes, these measures can help build a supportive environment and encourage economic recovery. In the aftermath of the crisis, there are likely to be societal changes as households, businesses, and governments adjust to a new reality, and these alterations could change the investment landscape. Occurrences such as the COVID-19 outbreak demonstrate the importance of having a deep understanding of company fundamentals, and our global research platform has been built to do just that.
Here at MFS®, we aim to help our clients navigate the growing complexity of the markets and world economies. Our long-term investment philosophy and commitment to the responsible allocation of capital allow us to tune out the noise and uncover what we believe are the best, most durable investment opportunities in the market. Through our powerful global investment platform, we combine collective expertise, thoughtful risk management, and long-term discipline to create sustainable value for investors.
Respectfully,

Robert J. Manning
Executive Chair
MFS Investment Management
May 15, 2020
The opinions expressed in this letter are subject to change and may not be relied upon for investment advice. No forecasts can be guaranteed.
1
PORTFOLIO COMPOSITION
MFS Alabama Municipal Bond Fund
Portfolio structure (i)
| | | | |
| Top five industries (i) | | | | |
| Universities – Colleges | | | 20.1% | |
| Water & Sewer Utility Revenue | | | 11.7% | |
| General Obligations – General Purpose | | | 10.8% | |
| Healthcare Revenue – Hospitals | | | 10.2% | |
| Sales & Excise Tax Revenue | | | 9.0% | |
| | | | |
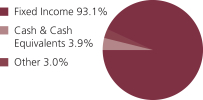
| Composition including fixed income credit quality (a)(i) | |
| AAA | | | 4.5% | |
| AA | | | 33.4% | |
| A | | | 38.3% | |
| BBB | | | 9.4% | |
| BB | | | 0.8% | |
| CC | | | 0.2% | |
| C | | | 2.3% | |
| D | | | 1.8% | |
| Not Rated | | | 2.4% | |
| Cash & Cash Equivalents | | | 3.9% | |
| Other | | | 3.0% | |
| | | | |
| Portfolio facts (i) | | | | |
| Average Duration (d) | | | 6.4 | |
| Average Effective Maturity (m) | | | 17.5 yrs. | |
| | | | |
| Jurisdiction (i) | | | | |
| Alabama | | | 77.6% | |
| Puerto Rico | | | 7.8% | |
| California | | | 1.6% | |
| New York | | | 1.0% | |
| Colorado | | | 0.9% | |
| South Carolina | | | 0.9% | |
| Guam | �� | | 0.8% | |
| Ohio | | | 0.8% | |
| New Jersey | | | 0.7% | |
| Florida | | | 0.6% | |
| Pennsylvania | | | 0.5% | |
| Illinois | | | 0.5% | |
| Texas | | | 0.5% | |
| Virginia | | | 0.4% | |
| Connecticut | | | 0.4% | |
| Maryland | | | 0.4% | |
| Indiana | | | 0.2% | |
| Iowa | | | 0.2% | |
| Michigan | | | 0.1% | |
| Minnesota | | | 0.1% | |
| Nebraska | | | 0.1% | |
| Tennessee (o) | | | 0.0% | |
| U.S. Treasury Securities (j) | | | (3.0)% | |
| (a) | For all securities other than those specifically described below, ratings are assigned to underlying securities utilizing ratings from Moody’s, Fitch, and Standard & Poor’s rating agencies and applying the following hierarchy: If all three agencies provide a rating, the middle rating (after dropping the highest and lowest ratings) is assigned; if two of the three agencies rate a security, the lower of the two is assigned. Ratings are shown in the S&P and Fitch scale (e.g., AAA). Securities rated BBB or higher are considered investment grade. All ratings are subject to change. Not Rated includes fixed income securities and fixed income derivatives, which have not been rated by any rating agency. The fund may or may not have held all of these instruments on this date. The fund is not rated by these agencies. |
| (d) | Duration is a measure of how much a bond’s price is likely to fluctuate with general changes in interest rates, e.g., if rates rise 1.00%, a bond with a5-year duration is likely to lose about 5.00% of its value due to the interest rate move. |
| (i) | For purposes of this presentation, the components include the value of securities, and reflect the impact of the equivalent exposure of derivative positions, if any. These amounts may be negative from time to time. Equivalent exposure is a calculated amount that translates the derivative position into a reasonable approximation of the amount of the underlying asset that the portfolio would have to hold at a given point in time to have the same price sensitivity that results from the portfolio’s ownership of the derivative contract. When dealing with derivatives, equivalent exposure is a more representative measure of the potential impact of a position on portfolio performance than value. The bond component will include any accrued interest amounts. |
| (j) | For the purpose of managing the fund’s duration, the fund holds treasury futures with a bond equivalent exposure of (3.0)%, which impacts the fund’s interest rate exposure but not its credit exposure. |
| (m) | In determining each instrument’s effective maturity for purposes of calculating the fund’s dollar-weighted average effective maturity, MFS uses the instrument’s stated maturity or, if applicable, an earlier date on which MFS believes it is probable that a maturity-shortening device (such as a put,pre-refunding or prepayment) will cause the instrument to be repaid. Such an earlier date can be substantially shorter than the instrument’s stated maturity. |
Cash & Cash Equivalents includes any cash, investments in money market funds, short-term securities, and other assets less liabilities. Please see the Statements of Assets and Liabilities for additional information related to the fund’s cash position and other assets and liabilities.
Other includes equivalent exposure from currency derivatives and/or any offsets to derivative positions.
Percentages are based on net assets as of March 31, 2020.
The portfolio is actively managed and current holdings may be different.
2
Portfolio Composition – continued
MFS Arkansas Municipal Bond Fund
Portfolio structure (i)
| | | | |
| Top five industries (i) | | | | |
| Sales & Excise Tax Revenue | | | 16.4% | |
| Universities – Colleges | | | 15.6% | |
| Healthcare Revenue – Hospitals | | | 12.1% | |
| Water & Sewer Utility Revenue | | | 11.3% | |
| Utilities – Municipal Owned | | | 8.2% | |
| | | | |
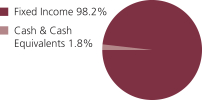
| Composition including fixed income credit quality (a)(i) | |
| AAA | | | 3.7% | |
| AA | | | 40.6% | |
| A | | | 32.4% | |
| BBB | | | 10.7% | |
| BB | | | 2.1% | |
| C | | | 2.6% | |
| D | | | 1.8% | |
| Not Rated | | | 4.3% | |
| Cash & Cash Equivalents | | | 1.8% | |
| | | | |
| Portfolio facts (i) | | | | |
| Average Duration (d) | | | 5.5 | |
| Average Effective Maturity (m) | | | 14.6 yrs. | |
| | | | |
| Jurisdiction (i) | | | | |
| Arkansas | | | 70.9% | |
| Puerto Rico | | | 8.7% | |
| Guam | | | 3.7% | |
| New Jersey | | | 2.2% | |
| Colorado | | | 1.2% | |
| New York | | | 1.1% | |
| Texas | | | 1.0% | |
| Kentucky | | | 1.0% | |
| Massachusetts | | | 0.9% | |
| Pennsylvania | | | 0.8% | |
| California | | | 0.8% | |
| Ohio | | | 0.7% | |
| North Carolina | | | 0.7% | |
| Iowa | | | 0.7% | |
| Illinois | | | 0.6% | |
| Connecticut | | | 0.5% | |
| Maryland | | | 0.5% | |
| Michigan | | | 0.4% | |
| South Carolina | | | 0.4% | |
| Alabama | | | 0.3% | |
| Tennessee | | | 0.3% | |
| Florida | | | 0.3% | |
| Washington DC | | | 0.2% | |
| Virginia | | | 0.1% | |
| New Hampshire | | | 0.1% | |
| Indiana | | | 0.1% | |
| (a) | For all securities other than those specifically described below, ratings are assigned to underlying securities utilizing ratings from Moody’s, Fitch, and Standard & Poor’s rating agencies and applying the following hierarchy: If all three agencies provide a rating, the middle rating (after dropping the highest and lowest ratings) is assigned; if two of the three agencies rate a security, the lower of the two is assigned. Ratings are shown in the S&P and Fitch scale (e.g., AAA). Securities rated BBB or higher are considered investment grade. All ratings are subject to change. Not Rated includes fixed income securities and fixed income derivatives, which have not been rated by any rating agency. The fund may or may not have held all of these instruments on this date. The fund is not rated by these agencies. |
| (d) | Duration is a measure of how much a bond’s price is likely to fluctuate with general changes in interest rates, e.g., if rates rise 1.00%, a bond with a5-year duration is likely to lose about 5.00% of its value due to the interest rate move. |
| (i) | For purposes of this presentation, the components include the value of securities, and reflect the impact of the equivalent exposure of derivative positions, if any. These amounts may be negative from time to time. Equivalent exposure is a calculated amount that translates the derivative position into a reasonable approximation of the amount of the underlying asset that the portfolio would have to hold at a given point in time to have the same price sensitivity that results from the portfolio’s ownership of the derivative contract. When dealing with derivatives, equivalent exposure is a more representative measure of the potential impact of a position on portfolio performance than value. The bond component will include any accrued interest amounts. |
| (m) | In determining each instrument’s effective maturity for purposes of calculating the fund’s dollar-weighted average effective maturity, MFS uses the instrument’s stated maturity or, if applicable, an earlier date on which MFS believes it is probable that a maturity-shortening device (such as a put,pre-refunding or prepayment) will cause the instrument to be repaid. Such an earlier date can be substantially shorter than the instrument’s stated maturity. |
Cash & Cash Equivalents includes any cash, investments in money market funds, short-term securities, and other assets less liabilities. Please see the Statements of Assets and Liabilities for additional information related to the fund’s cash position and other assets and liabilities.
Percentages are based on net assets as of March 31, 2020.
The portfolio is actively managed and current holdings may be different.
3
Portfolio Composition – continued
MFS California Municipal Bond Fund
Portfolio structure (i)
| | | | |
| Top five industries (i) | | | | |
| General Obligations – Schools | | | 18.3% | |
| Healthcare Revenue – Hospitals | | | 12.3% | |
| Airports | | | 10.7% | |
| Water & Sewer Utility Revenue | | | 6.2% | |
| Universities – Colleges | | | 6.1% | |
| | | | |
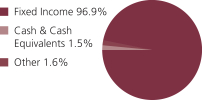
| Composition including fixed income credit quality (a)(i) | |
| AAA | | | 3.2% | |
| AA | | | 37.1% | |
| A | | | 27.2% | |
| BBB | | | 15.5% | |
| BB | | | 3.1% | |
| CC | | | 0.1% | |
| C | | | 2.2% | |
| D | | | 1.9% | |
| Not Rated | | | 6.6% | |
| Cash & Cash Equivalents | | | 1.5% | |
| Other | | | 1.6% | |
| | | | |
| Portfolio facts (i) | | | | |
| Average Duration (d) | | | 7.4 | |
| Average Effective Maturity (m) | | | 18.2 yrs. | |
| | | | |
| Jurisdiction (i) | | | | |
| California | | | 87.1% | |
| Puerto Rico | | | 7.0% | |
| Illinois | | | 0.9% | |
| Pennsylvania | | | 0.8% | |
| Ohio | | | 0.8% | |
| New Jersey | | | 0.8% | |
| Guam | | | 0.4% | |
| Alabama | | | 0.3% | |
| Texas | | | 0.2% | |
| Virginia | | | 0.1% | |
| Minnesota | | | 0.1% | |
| U.S. Treasury Securities (j) | | | (1.6)% | |
| (a) | For all securities other than those specifically described below, ratings are assigned to underlying securities utilizing ratings from Moody’s, Fitch, and Standard & Poor’s rating agencies and applying the following hierarchy: If all three agencies provide a rating, the middle rating (after dropping the highest and lowest ratings) is assigned; if two of the three agencies rate a security, the lower of the two is assigned. Ratings are shown in the S&P and Fitch scale (e.g., AAA). Securities rated BBB or higher are considered investment grade. All ratings are subject to change. Not Rated includes fixed income securities and fixed income derivatives, which have not been rated by any rating agency. The fund may or may not have held all of these instruments on this date. The fund is not rated by these agencies. |
| (d) | Duration is a measure of how much a bond’s price is likely to fluctuate with general changes in interest rates, e.g., if rates rise 1.00%, a bond with a5-year duration is likely to lose about 5.00% of its value due to the interest rate move. |
| (i) | For purposes of this presentation, the components include the value of securities, and reflect the impact of the equivalent exposure of derivative positions, if any. These amounts may be negative from time to time. Equivalent exposure is a calculated amount that translates the derivative position into a reasonable approximation of the amount of the underlying asset that the portfolio would have to hold at a given point in time to have the same price sensitivity that results from the portfolio’s ownership of the derivative contract. When dealing with derivatives, equivalent exposure is a more representative measure of the potential impact of a position on portfolio performance than value. The bond component will include any accrued interest amounts. |
| (j) | For the purpose of managing the fund’s duration, the fund holds treasury futures with a bond equivalent exposure of (1.6)%, which impacts the fund’s interest rate exposure but not its credit exposure. |
| (m) | In determining each instrument’s effective maturity for purposes of calculating the fund’s dollar-weighted average effective maturity, MFS uses the instrument’s stated maturity or, if applicable, an earlier date on which MFS believes it is probable that a maturity-shortening device (such as a put,pre-refunding or prepayment) will cause the instrument to be repaid. Such an earlier date can be substantially shorter than the instrument’s stated maturity. |
Cash & Cash Equivalents includes any cash, investments in money market funds, short-term securities, and other assets less liabilities. Please see the Statements of Assets and Liabilities for additional information related to the fund’s cash position and other assets and liabilities.
Other includes equivalent exposure from currency derivatives and/or any offsets to derivative positions.
Percentages are based on net assets as of March 31, 2020.
The portfolio is actively managed and current holdings may be different.
4
Portfolio Composition – continued
MFS Georgia Municipal Bond Fund
Portfolio structure (i)
| | | | |
| Top five industries (i) | | | | |
| Universities – Colleges | | | 20.0% | |
| Healthcare Revenue – Hospitals | | | 14.0% | |
| Water & Sewer Utility Revenue | | | 11.6% | |
| General Obligations – Schools | | | 9.5% | |
| Utilities – Municipal Owned | | | 5.8% | |
| | | | |
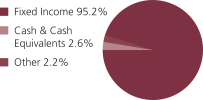
| Composition including fixed income credit quality (a)(i) | |
| AAA | | | 9.1% | |
| AA | | | 34.9% | |
| A | | | 35.7% | |
| BBB | | | 7.5% | |
| BB | | | 1.1% | |
| CCC | | | 0.1% | |
| CC | | | 0.2% | |
| C | | | 1.7% | |
| D | | | 1.6% | |
| Not Rated | | | 3.3% | |
| Cash & Cash Equivalents | | | 2.6% | |
| Other | | | 2.2% | |
| | | | |
| Portfolio facts (i) | | | | |
| Average Duration (d) | | | 6.5 | |
| Average Effective Maturity (m) | | | 15.3 yrs. | |
| | | | |
| Jurisdiction (i) | | | | |
| Georgia | | | 76.4% | |
| Puerto Rico | | | 7.6% | |
| California | | | 1.4% | |
| New Jersey | | | 1.3% | |
| Pennsylvania | | | 1.2% | |
| Guam | | | 1.1% | |
| Connecticut | | | 0.9% | |
| Illinois | | | 0.8% | |
| Ohio | | | 0.8% | |
| Iowa | | | 0.7% | |
| Florida | | | 0.7% | |
| South Carolina | | | 0.5% | |
| Texas | | | 0.5% | |
| Massachusetts | | | 0.4% | |
| Virginia | | | 0.4% | |
| Maryland | | | 0.3% | |
| North Carolina | | | 0.3% | |
| Kentucky | | | 0.3% | |
| Colorado | | | 0.3% | |
| New York | | | 0.3% | |
| Tennessee | | | 0.2% | |
| Alabama | | | 0.2% | |
| Washington DC | | | 0.2% | |
| Michigan | | | 0.2% | |
| Indiana | | | 0.2% | |
| Louisiana | | | 0.1% | |
| Minnesota | | | 0.1% | |
| U.S. Treasury Securities (j) | | | (2.2)% | |
| (a) | For all securities other than those specifically described below, ratings are assigned to underlying securities utilizing ratings from Moody’s, Fitch, and Standard & Poor’s rating agencies and applying the following hierarchy: If all three agencies provide a rating, the middle rating (after dropping the highest and lowest ratings) is assigned; if two of the three agencies rate a security, the lower of the two is assigned. Ratings are shown in the S&P and Fitch scale (e.g., AAA). Securities rated BBB or higher are considered investment grade. All ratings are subject to change. Not Rated includes fixed income securities and fixed income derivatives, which have not been rated by any rating agency. The fund may or may not have held all of these instruments on this date. The fund is not rated by these agencies. |
| (d) | Duration is a measure of how much a bond’s price is likely to fluctuate with general changes in interest rates, e.g., if rates rise 1.00%, a bond with a5-year duration is likely to lose about 5.00% of its value due to the interest rate move. |
| (i) | For purposes of this presentation, the components include the value of securities, and reflect the impact of the equivalent exposure of derivative positions, if any. These amounts may be negative from time to time. Equivalent exposure is a calculated amount that translates the derivative position into a reasonable approximation of the amount of the underlying asset that the portfolio would have to hold at a given point in time to have the same price sensitivity that results from the portfolio’s ownership of the derivative contract. When dealing with derivatives, equivalent exposure is a more representative measure of the potential impact of a position on portfolio performance than value. The bond component will include any accrued interest amounts. |
| (j) | For the purpose of managing the fund’s duration, the fund holds treasury futures with a bond equivalent exposure of (2.2)%, which impacts the fund’s interest rate exposure but not its credit exposure. |
| (m) | In determining each instrument’s effective maturity for purposes of calculating the fund’s dollar-weighted average effective maturity, MFS uses the instrument’s stated maturity or, if applicable, an earlier date on which MFS believes it is probable that a maturity-shortening device (such as a put,pre-refunding or prepayment) will cause the instrument to be repaid. Such an earlier date can be substantially shorter than the instrument’s stated maturity. |
Cash & Cash Equivalents includes any cash, investments in money market funds, short-term securities, and other assets less liabilities. Please see the Statements of Assets and Liabilities for additional information related to the fund’s cash position and other assets and liabilities.
Other includes equivalent exposure from currency derivatives and/or any offsets to derivative positions.
Percentages are based on net assets as of March 31, 2020.
The portfolio is actively managed and current holdings may be different.
5
Portfolio Composition – continued
MFS Maryland Municipal Bond Fund
Portfolio structure (i)
| | | | |
| Top five industries (i) | | | | |
| Healthcare Revenue – Hospitals | | | 19.5% | |
| General Obligations – General Purpose | | | 11.7% | |
| Multi-family Housing | | | 9.4% | |
| Universities – Colleges | | | 7.7% | |
| Water & Sewer Utility Revenue | | | 6.2% | |
| | | | |
| Composition including fixed income credit quality (a)(i) | |
| AAA | | | 13.6% | |
| AA | | | 30.9% | |
| A | | | 22.1% | |
| BBB | | | 15.3% | |
| BB | | | 2.0% | |
| CC | | | 0.1% | |
| C | | | 2.6% | |
| D | | | 1.4% | |
| Not Rated | | | 6.8% | |
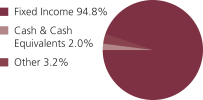
| Cash & Cash Equivalents | | | 2.0% | |
| Other | | | 3.2% | |
| | | | |
| Portfolio facts (i) | | | | |
| Average Duration (d) | | | 6.5 | |
| Average Effective Maturity (m) | | | 16.7 yrs. | |
| | | | |
| Jurisdiction (i) | | | | |
| Maryland | | | 75.8% | |
| Puerto Rico | | | 6.9% | |
| Washington DC | | | 3.2% | |
| Pennsylvania | | | 1.2% | |
| Colorado | | | 0.9% | |
| Kentucky | | | 0.9% | |
| Illinois | | | 0.9% | |
| Guam | | | 0.8% | |
| Ohio | | | 0.7% | |
| Iowa | | | 0.7% | |
| Tennessee | | | 0.7% | |
| California | | | 0.7% | |
| South Carolina | | | 0.7% | |
| New Jersey | | | 0.6% | |
| Florida | | | 0.6% | |
| Connecticut | | | 0.5% | |
| New York | | | 0.4% | |
| Indiana | | | 0.4% | |
| Texas | | | 0.3% | |
| Alabama | | | 0.3% | |
| Virginia | | | 0.2% | |
| U.S. Virgin Islands | | | 0.2% | |
| Nebraska | | | 0.2% | |
| Michigan | | | 0.1% | |
| Mississippi | | | 0.1% | |
| U.S. Treasury Securities (j) | | | (3.2)% | |
| (a) | For all securities other than those specifically described below, ratings are assigned to underlying securities utilizing ratings from Moody’s, Fitch, and Standard & Poor’s rating agencies and applying the following hierarchy: If all three agencies provide a rating, the middle rating (after dropping the highest and lowest ratings) is assigned; if two of the three agencies rate a security, the lower of the two is assigned. Ratings are shown in the S&P and Fitch scale (e.g., AAA). Securities rated BBB or higher are considered investment grade. All ratings are subject to change. Not Rated includes fixed income securities and fixed income derivatives, which have not been rated by any rating agency. The fund may or may not have held all of these instruments on this date. The fund is not rated by these agencies. |
| (d) | Duration is a measure of how much a bond’s price is likely to fluctuate with general changes in interest rates, e.g., if rates rise 1.00%, a bond with a5-year duration is likely to lose about 5.00% of its value due to the interest rate move. |
| (i) | For purposes of this presentation, the components include the value of securities, and reflect the impact of the equivalent exposure of derivative positions, if any. These amounts may be negative from time to time. Equivalent exposure is a calculated amount that translates the derivative position into a reasonable approximation of the amount of the underlying asset that the portfolio would have to hold at a given point in time to have the same price sensitivity that results from the portfolio’s ownership of the derivative contract. When dealing with derivatives, equivalent exposure is a more representative measure of the potential impact of a position on portfolio performance than value. The bond component will include any accrued interest amounts. |
| (j) | For the purpose of managing the fund’s duration, the fund holds treasury futures with a bond equivalent exposure of (3.2)%, which impacts the fund’s interest rate exposure but not its credit exposure. |
| (m) | In determining each instrument’s effective maturity for purposes of calculating the fund’s dollar-weighted average effective maturity, MFS uses the instrument’s stated maturity or, if applicable, an earlier date on which MFS believes it is probable that a maturity-shortening device (such as a put,pre-refunding or prepayment) will cause the instrument to be repaid. Such an earlier date can be substantially shorter than the instrument’s stated maturity. |
Cash & Cash Equivalents includes any cash, investments in money market funds, short-term securities, and other assets less liabilities. Please see the Statements of Assets and Liabilities for additional information related to the fund’s cash position and other assets and liabilities.
Other includes equivalent exposure from currency derivatives and/or any offsets to derivative positions.
Percentages are based on net assets as of March 31, 2020.
The portfolio is actively managed and current holdings may be different.
6
Portfolio Composition – continued
MFS Massachusetts Municipal Bond Fund
Portfolio structure (i)
| | | | |
| Top five industries (i) | | | | |
| Universities – Colleges | | | 20.8% | |
| Healthcare Revenue – Hospitals | | | 13.2% | |
| Sales & Excise Tax Revenue | | | 7.6% | |
| General Obligations – General Purpose | | | 6.8% | |
| Miscellaneous Revenue – Other | | | 5.3% | |
| | | | |
| Composition including fixed income credit quality (a)(i) | |
| AAA | | | 4.1% | |
| AA | | | 40.7% | |
| A | | | 19.1% | |
| BBB | | | 21.6% | |
| BB | | | 1.6% | |
| CCC | | | 0.2% | |
| CC | | | 0.2% | |
| C | | | 2.0% | |
| D | | | 1.8% | |
| Not Rated | | | 3.4% | |
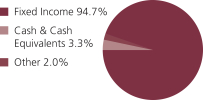
| Cash & Cash Equivalents | | | 3.3% | |
| Other | | | 2.0% | |
| | | | |
| Portfolio facts (i) | | | | |
| Average Duration (d) | | | 6.8 | |
| Average Effective Maturity (m) | | | 16.9 yrs. | |
| | | | |
| Jurisdiction (i) | | | | |
| Massachusetts | | | 77.7% | |
| Puerto Rico | | | 7.7% | |
| Illinois | | | 2.3% | |
| Pennsylvania | | | 1.4% | |
| New Jersey | | | 1.3% | |
| Guam | | | 0.9% | |
| Ohio | | | 0.8% | |
| Colorado | | | 0.7% | |
| Florida | | | 0.6% | |
| Connecticut | | | 0.4% | |
| California | | | 0.4% | |
| Texas | | | 0.4% | |
| Kentucky | | | 0.4% | |
| Maryland | | | 0.3% | |
| New York | | | 0.3% | |
| Tennessee | | | 0.3% | |
| Alabama | | | 0.3% | |
| Louisiana | | | 0.2% | |
| Virginia | | | 0.1% | |
| Washington DC | | | 0.1% | |
| Minnesota | | | 0.1% | |
| U.S. Treasury Securities (j) | | | (2.0)% | |
| (a) | For all securities other than those specifically described below, ratings are assigned to underlying securities utilizing ratings from Moody’s, Fitch, and Standard & Poor’s rating agencies and applying the following hierarchy: If all three agencies provide a rating, the middle rating (after dropping the highest and lowest ratings) is assigned; if two of the three agencies rate a security, the lower of the two is assigned. Ratings are shown in the S&P and Fitch scale (e.g., AAA). Securities rated BBB or higher are considered investment grade. All ratings are subject to change. Not Rated includes fixed income securities and fixed income derivatives, which have not been rated by any rating agency. The fund may or may not have held all of these instruments on this date. The fund is not rated by these agencies. |
| (d) | Duration is a measure of how much a bond’s price is likely to fluctuate with general changes in interest rates, e.g., if rates rise 1.00%, a bond with a5-year duration is likely to lose about 5.00% of its value due to the interest rate move. |
| (i) | For purposes of this presentation, the components include the value of securities, and reflect the impact of the equivalent exposure of derivative positions, if any. These amounts may be negative from time to time. Equivalent exposure is a calculated amount that translates the derivative position into a reasonable approximation of the amount of the underlying asset that the portfolio would have to hold at a given point in time to have the same price sensitivity that results from the portfolio’s ownership of the derivative contract. When dealing with derivatives, equivalent exposure is a more representative measure of the potential impact of a position on portfolio performance than value. The bond component will include any accrued interest amounts. |
| (j) | For the purpose of managing the fund’s duration, the fund holds treasury futures with a bond equivalent exposure of (2.0)%, which impacts the fund’s interest rate exposure but not its credit exposure. |
| (m) | In determining each instrument’s effective maturity for purposes of calculating the fund’s dollar-weighted average effective maturity, MFS uses the instrument’s stated maturity or, if applicable, an earlier date on which MFS believes it is probable that a maturity-shortening device (such as a put,pre-refunding or prepayment) will cause the instrument to be repaid. Such an earlier date can be substantially shorter than the instrument’s stated maturity. |
Cash & Cash Equivalents includes any cash, investments in money market funds, short-term securities, and other assets less liabilities. Please see the Statements of Assets and Liabilities for additional information related to the fund’s cash position and other assets and liabilities.
Other includes equivalent exposure from currency derivatives and/or any offsets to derivative positions.
Percentages are based on net assets as of March 31, 2020.
The portfolio is actively managed and current holdings may be different.
7
MANAGEMENT REVIEW
Summary of Results
For the twelve months ended March 31, 2020, Class A shares, at net asset value, of the municipal bond funds of Alabama, Arkansas, California, Georgia, Maryland and Massachusetts underperformed the Bloomberg Barclays Municipal Bond Index. The performance for the individual funds and the benchmark are set forth in the Performance Summary.
Market Environment
Market volatility soared at the end of the period asCOVID-19, the illness caused by the novel coronavirus first detected in China, spread around the world in early 2020. Government-imposed social distancing measures taken to slow the spread of the virus forced the shutdown of large portions of the global economy. In an attempt to limit the economic fallout from the crisis, central bankers and policymakers took a variety of actions, unprecedented in both size and speed, but despite their best efforts, a global recession has undoubtedly begun. Given the unique circumstances surrounding the genesis of the downturn, it is difficult to forecast how long the crisis will linger.
High levels of investor uncertainty saw equity prices plunge, market volatility rise and large segments of global fixed income markets freeze as investors sought liquidity wherever they could find it. Central banks around the world quickly put programs in place to improve liquidity, and they proved largely successful, helping to recover market function and ease volatility at the end of the period. Compounding market turmoil was an oil price war between Saudi Arabia and Russia over the size of production cuts amid a burgeoning supply glut as the global economy rapidly slowed. That action undercut oil exporters, many emerging markets and a large segment of the high-yield credit market.
As is often the case in a serious crisis, market vulnerabilities were revealed. For example, companies that added significant leverage to their balance sheets in recent years by borrowing to fund dividend payments and stock buybacks may find it difficult to follow that path in the future, and investors may not reward that behavior if they do. Very long supply chains designed to squeeze out every bit of savings may be shifted closer to home markets if companies seek to emphasize resiliency over cost after a series of supply disruptions. Consumer, business and government behavior could all be impacted by the after-effects of the global pandemic in ways it will be difficult to forecast.
Over the past year, municipal bonds delivered modest positive performance, fueled by lower US Treasury rates and supportive fundamentals and technicals for most of the period. Longer-duration and higher-quality segments of the market outperformed. Each sector produced modest positive performance, with sectors perceived as higher quality outperforming. The favorable backdrop for municipals changed abruptly in March, impacted by the economic slowdown associated with limiting the spread of the coronavirus. The revenues of municipalities were, and continue to be, affected by both declining tax receipts and the increased costs brought on by the response to the outbreak. The fundamentals of many sectors will be impacted by the slowdown. Federal assistance will help in the effort to meet the challenges; however, the selection of sectors and issuers will likely increase in importance over the coming months.
Factors Affecting Performance
In all funds, anout-of-benchmark exposure tonon-rated (r) securities weighed on performance relative to the Bloomberg Barclays Municipal Bond Index. The combination of security selection and a greater exposure to Puerto Rican bonds further held back relative performance across all funds.
In contrast, bond selection within thehealth caresector across all funds, with the exception of the municipal bond fund of Massachusetts, benefited relative performance. Security selection within “AA” and “BBB” rated securities in the municipal bond funds of Alabama, Arkansas, Georgia and Maryland, also aided relative results. Yield curve positioning (y), particularly a greater exposure to shifts in the long end of the yield curve, was another area of relative strength for all funds.
Respectfully,
Portfolio Manager(s)
Michael Dawson
| (r) | Bonds rated “BBB”, “Baa”, or higher are considered investment grade; bonds rated “BB”, “Ba”, or below are considerednon-investment grade. The sources for bond quality ratings are Moody’s Investors Service, Standard & Poor’s and Fitch, Inc. and are applied using the following hierarchy: If all three agencies provide a rating, the middle rating (after dropping the highest and lowest ratings) is assigned; if two of the three agencies rate a security, the lower of the two is assigned. Ratings are shown in the S&P and Fitch scale (e.g., AAA). For securities which are not rated by any of the three agencies, the security is considered Not Rated. |
| (y) | A yield curve graphically depicts the yields of different maturity bonds of the same credit quality and type; a normal yield curve is upward sloping, with short-term rates lower than long-term rates. |
8
Management Review – continued
The views expressed in this report are those of the portfolio manager(s) only through the end of the period of the report as stated on the cover and do not necessarily reflect the views of MFS or any other person in the MFS organization. These views are subject to change at any time based on market or other conditions, and MFS disclaims any responsibility to update such views. These views may not be relied upon as investment advice or an indication of trading intent on behalf of any MFS portfolio. References to specific securities are not recommendations of such securities, and may not be representative of any MFS portfolio’s current or future investments.
9
PERFORMANCE SUMMARY THROUGH 3/31/20
The following charts illustrate a representative class of each fund’s historical performance in comparison to its benchmark(s). Performance results include the deduction of the maximum applicable sales charge and reflect the percentage change in net asset value, including reinvestment of dividends and capital gains distributions. Each fund's results have been compared to the Bloomberg Barclays Municipal Bond Index, a market capitalization-weighted index that measures the performance of thetax-exempt bond market. However, while this index is considered the benchmark for the performance of municipal bond funds, it is comprised of municipal bonds issued within the 50 states and the District of Columbia as well as U.S. territories and possessions such as Guam, Puerto Rico, and the Virgin Islands, while each of the funds invests a large percentage of its assets in municipal issuers of the state that is in the fund’s name. The performance of other share classes will be greater than or less than that of the class depicted below. Benchmarks are unmanaged and may not be invested in directly. Benchmark returns do not reflect sales charges, commissions or expenses. (See Notes to Performance Summary.)
Performance data shown represents past performance and is no guarantee of future results. Investment return and principal value fluctuate so your shares, when sold, may be worth more or less than the original cost; current performance may be lower or higher than quoted. The performance shown does not reflect the deduction of taxes, if any, that a shareholder would pay on fund distributions or the redemption of fund shares.
MFS Alabama Municipal Bond Fund
Growth of a Hypothetical $10,000 Investment
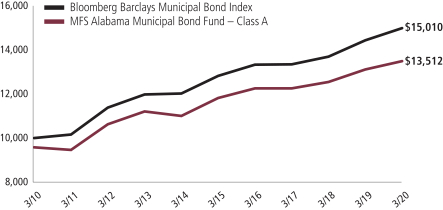
Total Returns through 3/31/20
Average annual without sales charge
| | | | | | | | | | | | | | |
| | | Share Class | | Class Inception Date | | 1-yr | | 5-yr | | 10-yr | | Life (t) | | |
| | | | | | | | |
| | | A | | 2/01/90 | | 2.89% | | 2.70% | | 3.50% | | N/A | | |
| | | | | | | | |
| | | B | | 9/07/93 | | 2.13% | | 1.93% | | 2.75% | | N/A | | |
| | | | | | | | |
| | | I | | 4/01/16 | | 3.15% | | N/A | | N/A | | 2.67% | | |
| | | R6 | | 8/01/17 | | 3.23% | | N/A | | N/A | | 3.13% | | |
| | | | | |
| Comparative benchmark(s) | | | | | | | | | | |
| | | Bloomberg Barclays Municipal Bond Index (f) | | 3.85% | | 3.19% | | 4.15% | | N/A | | |
| | | | | |
| Average annual with sales charge | | | | | | | | | | |
| | | A With Initial Sales Charge (4.25%) | | (1.48)% | | 1.81% | | 3.06% | | N/A | | |
| | | B
With CDSC (Declining over six years from 4% to 0%) (v) | | (1.87)% | | 1.57% | | 2.75% | | N/A | | |
CDSC – Contingent Deferred Sales Charge.
Class I and R6 shares do not have a sales charge.
| (f) | Source: FactSet Research Systems Inc. |
| (t) | For the period from the class inception date through the stated period end (for those share classes with less than 10 years of performance history). No comparative benchmark performance information is provided for “life” periods. (See Notes to Performance Summary.) |
| (v) | Assuming redemption at the end of the applicable period. |
10
Performance Summary – continued
MFS Arkansas Municipal Bond Fund
Growth of a Hypothetical $10,000 Investment
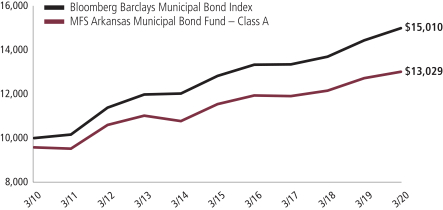
Total Returns through 3/31/20
Average annual without sales charge
| | | | | | | | | | | | | | |
| | | Share Class | | Class Inception Date | | 1-yr | | 5-yr | | 10-yr | | Life (t) | | |
| | | | | | | | |
| | | A | | 2/03/92 | | 2.27% | | 2.44% | | 3.13% | | N/A | | |
| | | | | | | | |
| | | B | | 9/07/93 | | 1.51% | | 1.67% | | 2.34% | | N/A | | |
| | | | | | | | |
| | | I | | 4/01/16 | | 2.36% | | N/A | | N/A | | 2.30% | | |
| | | R6 | | 8/01/17 | | 2.44% | | N/A | | N/A | | 2.74% | | |
| | | | | |
| Comparative benchmark(s) | | | | | | | | | | |
| | | Bloomberg Barclays Municipal Bond Index (f) | | 3.85% | | 3.19% | | 4.15% | | N/A | | |
| | | | | |
| Average annual with sales charge | | | | | | | | | | |
| | | A
With Initial Sales Charge (4.25%) | | (2.08)% | | 1.55% | | 2.68% | | N/A | | |
| | | B
With CDSC (Declining over six years from 4% to 0%) (v) | | (2.47)% | | 1.30% | | 2.34% | | N/A | | |
CDSC – Contingent Deferred Sales Charge.
Class I and R6 shares do not have a sales charge.
| (f) | Source: FactSet Research Systems Inc. |
| (t) | For the period from the class inception date through the stated period end (for those share classes with less than 10 years of performance history). No comparative benchmark performance information is provided for “life” periods. (See Notes to Performance Summary.) |
| (v) | Assuming redemption at the end of the applicable period. |
11
Performance Summary – continued
MFS California Municipal Bond Fund
Growth of a Hypothetical $10,000 Investment
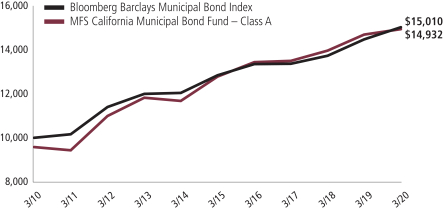
Total Returns through 3/31/20
Average annual without sales charge
| | | | | | | | | | | | | | |
| | | Share Class | | Class Inception Date | | 1-yr | | 5-yr | | 10-yr | | Life (t) | | |
| | | | | | | | |
| | | A | | 6/18/85 | | 1.76% | | 3.18% | | 4.54% | | N/A | | |
| | | | | | | | |
| | | B | | 9/07/93 | | 1.00% | | 2.41% | | 3.73% | | N/A | | |
| | | | | | | | |
| | | C | | 1/03/94 | | 0.85% | | 2.26% | | 3.60% | | N/A | | |
| | | | | | | | |
| | | I | | 4/01/16 | | 1.79% | | N/A | | N/A | | 2.70% | | |
| | | R6 | | 8/01/17 | | 1.97% | | N/A | | N/A | | 2.96% | | |
| | | | | |
| Comparative benchmark(s) | | | | | | | | | | |
| | | Bloomberg Barclays Municipal Bond Index (f) | | 3.85% | | 3.19% | | 4.15% | | N/A | | |
| | | | | |
| Average annual with sales charge | | | | | | | | | | |
| | | A
With Initial Sales Charge (4.25%) | | (2.57)% | | 2.29% | | 4.09% | | N/A | | |
| | | B
With CDSC (Declining over six years from 4% to 0%) (v) | | (2.95)% | | 2.04% | | 3.73% | | N/A | | |
| | | C
With CDSC (1% for 12 months) (v) | | (0.14)% | | 2.26% | | 3.60% | | N/A | | |
CDSC – Contingent Deferred Sales Charge.
Class I and R6 shares do not have a sales charge.
| (f) | Source: FactSet Research Systems Inc. |
| (t) | For the period from the class inception date through the stated period end (for those share classes with less than 10 years of performance history). No comparative benchmark performance information is provided for “life” periods. (See Notes to Performance Summary.) |
| (v) | Assuming redemption at the end of the applicable period. |
12
Performance Summary – continued
MFS Georgia Municipal Bond Fund
Growth of a Hypothetical $10,000 Investment
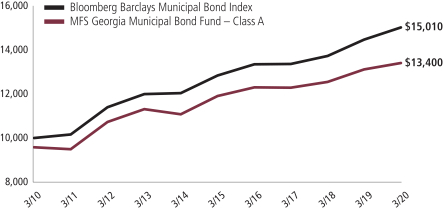
Total Returns through 3/31/20
Average annual without sales charge
| | | | | | | | | | | | | | |
| | | Share Class | | Class Inception Date | | 1-yr | | 5-yr | | 10-yr | | Life (t) | | |
| | | | | | | | |
| | | A | | 6/06/88 | | 2.17% | | 2.40% | | 3.42% | | N/A | | |
| | | | | | | | |
| | | B | | 9/07/93 | | 1.44% | | 1.64% | | 2.64% | | N/A | | |
| | | | | | | | |
| | | I | | 4/01/16 | | 2.39% | | N/A | | N/A | | 2.41% | | |
| | | R6 | | 8/01/17 | | 2.44% | | N/A | | N/A | | 2.67% | | |
| | | | | |
| Comparative benchmark(s) | | | | | | | | | | |
| | | Bloomberg Barclays Municipal Bond Index (f) | | 3.85% | | 3.19% | | 4.15% | | N/A | | |
| | | | | |
| Average annual with sales charge | | | | | | | | | | |
| | | A
With Initial Sales Charge (4.25%) | | (2.17)% | | 1.51% | | 2.97% | | N/A | | |
| | | B
With CDSC (Declining over six years from 4% to 0%) (v) | | (2.55)% | | 1.28% | | 2.64% | | N/A | | |
CDSC – Contingent Deferred Sales Charge.
Class I and R6 shares do not have a sales charge.
| (f) | Source: FactSet Research Systems Inc. |
| (t) | For the period from the class inception date through the stated period end (for those share classes with less than 10 years of performance history). No comparative benchmark performance information is provided for “life” periods. (See Notes to Performance Summary.) |
| (v) | Assuming redemption at the end of the applicable period. |
13
Performance Summary – continued
MFS Maryland Municipal Bond Fund
Growth of a Hypothetical $10,000 Investment
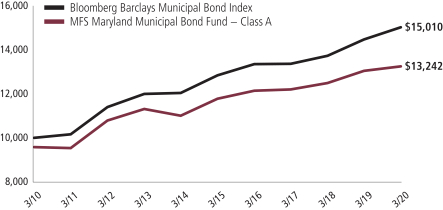
Total Returns through 3/31/20
Average annual without sales charge
| | | | | | | | | | | | | | |
| | | Share Class | | Class Inception Date | | 1-yr | | 5-yr | | 10-yr | | Life (t) | | |
| | | | | | | | |
| | | A | | 10/31/84 | | 1.57% | | 2.38% | | 3.30% | | N/A | | |
| | | | | | | | |
| | | B | | 9/07/93 | | 0.91% | | 1.63% | | 2.53% | | N/A | | |
| | | | | | | | |
| | | I | | 4/01/16 | | 1.88% | | N/A | | N/A | | 2.46% | | |
| | | R6 | | 8/01/17 | | 1.93% | | N/A | | N/A | | 2.60% | | |
| | | | | |
| Comparative benchmark(s) | | | | | | | | | | |
| | | Bloomberg Barclays Municipal Bond Index (f) | | 3.85% | | 3.19% | | 4.15% | | N/A | | |
| | | | | |
| Average annual with sales charge | | | | | | | | | | |
| | | A
With Initial Sales Charge (4.25%) | | (2.75)% | | 1.49% | | 2.85% | | N/A | | |
| | | B
With CDSC (Declining over six years from 4% to 0%) (v) | | (3.05)% | | 1.27% | | 2.53% | | N/A | | |
CDSC – Contingent Deferred Sales Charge.
Class I and R6 shares do not have a sales charge.
| (f) | Source: FactSet Research Systems Inc. |
| (t) | For the period from the class inception date through the stated period end (for those share classes with less than 10 years of performance history). No comparative benchmark performance information is provided for “life” periods. (See Notes to Performance Summary.) |
| (v) | Assuming redemption at the end of the applicable period. |
14
Performance Summary – continued
MFS Massachusetts Municipal Bond Fund
Growth of a Hypothetical $10,000 Investment

Total Returns through 3/31/20
Average annual without sales charge
| | | | | | | | | | | | | | |
| | | Share Class | | Class Inception Date | | 1-yr | | 5-yr | | 10-yr | | Life (t) | | |
| | | | | | | | |
| | | A | | 4/09/85 | | 1.61% | | 2.52% | | 3.49% | | N/A | | |
| | | | | | | | |
| | | B | | 9/07/93 | | 0.84% | | 1.74% | | 2.71% | | N/A | | |
| | | | | | | | |
| | | I | | 4/01/16 | | 1.86% | | N/A | | N/A | | 2.46% | | |
| | | R6 | | 8/01/17 | | 1.93% | | N/A | | N/A | | 2.73% | | |
| | | | | |
| Comparative benchmark(s) | | | | | | | | | | |
| | | Bloomberg Barclays Municipal Bond Index (f) | | 3.85% | | 3.19% | | 4.15% | | N/A | | |
| | | | | |
| Average annual with sales charge | | | | | | | | | | |
| | | A
With Initial Sales Charge (4.25%) | | (2.71)% | | 1.64% | | 3.04% | | N/A | | |
| | | B
With CDSC (Declining over six years from 4% to 0%) (v) | | (3.11)% | | 1.38% | | 2.71% | | N/A | | |
CDSC – Contingent Deferred Sales Charge.
Class I and R6 shares do not have a sales charge.
| (f) | Source: FactSet Research Systems Inc. |
| (t) | For the period from the class inception date through the stated period end (for those share classes with less than 10 years of performance history). No comparative benchmark performance information is provided for “life” periods. (See Notes to Performance Summary.) |
| (v) | Assuming redemption at the end of the applicable period. |
Benchmark Definition(s)
Bloomberg Barclays Municipal Bond Index – a market capitalization-weighted index that measures the performance of the tax-exempt bond market. BLOOMBERG® is a trademark and service mark of Bloomberg Finance L.P. and its affiliates (collectively “Bloomberg”). BARCLAYS® is a trademark and service mark of Barclays Bank Plc (collectively with its affiliates, “Barclays”), used under license. Bloomberg or Bloomberg’s licensors, including Barclays, own all proprietary rights in the Bloomberg Barclays Indices. Neither Bloomberg nor Barclays approves or endorses this material, or guarantees the accuracy or completeness of any information herein, or makes any warranty, express or implied, as to the results to be obtained therefrom, and, to the maximum extent allowed by law, neither shall have any liability or responsibility for injury or damages arising in connection therewith.
It is not possible to invest directly in an index.
Notes to Performance Summary
Average annual total return represents the average annual change in value for each share class for the periods presented. Life returns are presented where the share class has less than 10 years of performance history and represent the average annual total return
15
Performance Summary – continued
from the class inception date to the stated period end date. As the fund’s share classes may have different inception dates, the life returns may represent different time periods and may not be comparable. As a result, no comparative benchmark performance information is provided for life periods.
Performance results reflect any applicable expense subsidies and waivers in effect during the periods shown. Without such subsidies and waivers each fund’s performance results would be less favorable. Please see the prospectus and financial statements for complete details.
Performance results do not include adjustments made for financial reporting purposes in accordance with U.S. generally accepted accounting principles and may differ from amounts reported in the financial highlights.
A portion of income may be subject to state, federal, and/or alternative minimum tax. Capital gains, if any, are subject to a capital gains tax.
From time to time the funds may receive proceeds from litigation settlements, without which performance would be lower.
16
EXPENSE TABLES
Fund expenses borne by the shareholders during the period, October 1, 2019 through March 31, 2020
As a shareholder of the funds, you incur two types of costs: (1) transaction costs, including sales charges (loads) on certain purchase or redemption payments, and (2) ongoing costs, including management fees; distribution and service(12b-1) fees; and other fund expenses. These examples are intended to help you understand your ongoing costs (in dollars) of investing in the funds and to compare these costs with the ongoing costs of investing in other mutual funds.
These examples are based on an investment of $1,000 invested at the beginning of the period and held for the entire period October 1, 2019 through March 31, 2020.
Actual Expenses
The first line for each share class in the following tables provides information about actual account values and actual expenses. You may use the information in this line, together with the amount you invested, to estimate the expenses that you paid over the period. Simply divide your account value by $1,000 (for example, an $8,600 account value divided by $1,000 = 8.6), then multiply the result by the number in the first line under the heading entitled “Expenses Paid During Period” to estimate the expenses you paid on your account during this period.
Hypothetical Example for Comparison Purposes
The second line for each share class in the following tables provides information about hypothetical account values and hypothetical expenses based on each fund’s actual expense ratio and an assumed rate of return of 5% per year before expenses, which is not each fund’s actual return. The hypothetical account values and expenses may not be used to estimate the actual ending account balance or expenses you paid for the period. You may use this information to compare the ongoing costs of investing in each fund and other funds. To do so, compare this 5% hypothetical example with the 5% hypothetical examples that appear in the shareholder reports of the other funds.
Please note that the expenses shown in the tables are meant to highlight your ongoing costs only and do not reflect any transactional costs, such as sales charges (loads). Therefore, the second line for each share class in the tables is useful in comparing ongoing costs only, and will not help you determine the relative total costs of owning different funds. In addition, if these transactional costs were included, your costs would have been higher.
MFS ALABAMA MUNICIPAL BOND FUND
| | | | | | | | | | | | | | | | | | |
Share
Class | | | | Annualized
Expense
Ratio | | | Beginning
Account Value
10/01/19 | | | Ending
Account Value
3/31/20 | | | Expenses
Paid During
Period (p)
10/01/19-3/31/20 | |
| A | | Actual | | | 0.90% | | | | $1,000.00 | | | | $991.53 | | | | $4.48 | |
| | Hypothetical (h) | | | 0.90% | | | | $1,000.00 | | | | $1,020.50 | | | | $4.55 | |
| B | | Actual | | | 1.65% | | | | $1,000.00 | | | | $986.92 | | | | $8.20 | |
| | Hypothetical (h) | | | 1.65% | | | | $1,000.00 | | | | $1,016.75 | | | | $8.32 | |
| I | | Actual | | | 0.65% | | | | $1,000.00 | | | | $991.73 | | | | $3.24 | |
| | Hypothetical (h) | | | 0.65% | | | | $1,000.00 | | | | $1,021.75 | | | | $3.29 | |
| R6 | | Actual | | | 0.57% | | | | $1,000.00 | | | | $992.14 | | | | $2.84 | |
| | Hypothetical (h) | | | 0.57% | | | | $1,000.00 | | | | $1,022.15 | | | | $2.88 | |
| | (h) | 5% class return per year before expenses. |
| | (p) | “Expenses Paid During Period” are equal to each class’s annualized expense ratio, as shown above, multiplied by the average account value over the period, multiplied by 183/366 (to reflect theone-half year period). Expenses paid do not include any applicable sales charges (loads). If these transaction costs had been included, your costs would have been higher. |
17
Expense Tables – continued
MFS ARKANSAS MUNICIPAL BOND FUND
| | | | | | | | | | | | | | | | | | |
Share
Class | | | | Annualized
Expense
Ratio | | | Beginning
Account Value
10/01/19 | | | Ending
Account Value
3/31/20 | | | Expenses
Paid During
Period (p)
10/01/19-3/31/20 | |
| A | | Actual | | | 0.76% | | | | $1,000.00 | | | | $993.11 | | | | $3.79 | |
| | Hypothetical (h) | | | 0.76% | | | | $1,000.00 | | | | $1,021.20 | | | | $3.84 | |
| B | | Actual | | | 1.51% | | | | $1,000.00 | | | | $989.44 | | | | $7.51 | |
| | Hypothetical (h) | | | 1.51% | | | | $1,000.00 | | | | $1,017.45 | | | | $7.62 | |
| I | | Actual | | | 0.66% | | | | $1,000.00 | | | | $993.41 | | | | $3.29 | |
| | Hypothetical (h) | | | 0.66% | | | | $1,000.00 | | | | $1,021.70 | | | | $3.34 | |
| R6 | | Actual | | | 0.58% | | | | $1,000.00 | | | | $993.76 | | | | $2.89 | |
| | Hypothetical (h) | | | 0.58% | | | | $1,000.00 | | | | $1,022.10 | | | | $2.93 | |
MFS CALIFORNIA MUNICIPAL BOND FUND
| | | | | | | | | | | | | | | | | | |
Share
Class | | | | Annualized
Expense
Ratio | | | Beginning
Account Value
10/01/19 | | | Ending
Account Value
3/31/20 | | | Expenses
Paid During
Period (p)
10/01/19-3/31/20 | |
| A | | Actual | | | 0.71% | | | | $1,000.00 | | | | $972.95 | | | | $3.50 | |
| | Hypothetical (h) | | | 0.71% | | | | $1,000.00 | | | | $1,021.45 | | | | $3.59 | |
| B | | Actual | | | 1.46% | | | | $1,000.00 | | | | $969.35 | | | | $7.19 | |
| | Hypothetical (h) | | | 1.46% | | | | $1,000.00 | | | | $1,017.70 | | | | $7.36 | |
| C | | Actual | | | 1.61% | | | | $1,000.00 | | | | $968.71 | | | | $7.92 | |
| | Hypothetical (h) | | | 1.61% | | | | $1,000.00 | | | | $1,016.95 | | | | $8.12 | |
| I | | Actual | | | 0.61% | | | | $1,000.00 | | | | $973.10 | | | | $3.01 | |
| | Hypothetical (h) | | | 0.61% | | | | $1,000.00 | | | | $1,021.95 | | | | $3.08 | |
| R6 | | Actual | | | 0.52% | | | | $1,000.00 | | | | $974.45 | | | | $2.57 | |
| | Hypothetical (h) | | | 0.52% | | | | $1,000.00 | | | | $1,022.40 | | | | $2.63 | |
| | (h) | 5% class return per year before expenses. |
| | (p) | “Expenses Paid During Period” are equal to each class’s annualized expense ratio, as shown above, multiplied by the average account value over the period, multiplied by 183/366 (to reflect theone-half year period). Expenses paid do not include any applicable sales charges (loads). If these transaction costs had been included, your costs would have been higher. |
18
Expense Tables – continued
MFS GEORGIA MUNICIPAL BOND FUND
| | | | | | | | | | | | | | | | | | |
Share
Class | | | | Annualized
Expense
Ratio | | | Beginning
Account Value
10/01/19 | | | Ending
Account Value
3/31/20 | | | Expenses
Paid During
Period (p)
10/01/19-3/31/20 | |
| A | | Actual | | | 0.90% | | | | $1,000.00 | | | | $985.54 | | | | $4.47 | |
| | Hypothetical (h) | | | 0.90% | | | | $1,000.00 | | | | $1,020.50 | | | | $4.55 | |
| B | | Actual | | | 1.63% | | | | $1,000.00 | | | | $982.08 | | | | $8.08 | |
| | Hypothetical (h) | | | 1.63% | | | | $1,000.00 | | | | $1,016.85 | | | | $8.22 | |
| I | | Actual | | | 0.65% | | | | $1,000.00 | | | | $987.13 | | | | $3.23 | |
| | Hypothetical (h) | | | 0.65% | | | | $1,000.00 | | | | $1,021.75 | | | | $3.29 | |
| R6 | | Actual | | | 0.60% | | | | $1,000.00 | | | | $986.39 | | | | $2.98 | |
| | Hypothetical (h) | | | 0.60% | | | | $1,000.00 | | | | $1,022.00 | | | | $3.03 | |
MFS MARYLAND MUNICIPAL BOND FUND
| | | | | | | | | | | | | | | | | | |
Share
Class | | | | Annualized
Expense
Ratio | | | Beginning
Account Value
10/01/19 | | | Ending
Account Value
3/31/20 | | | Expenses
Paid During
Period (p)
10/01/19-3/31/20 | |
| A | | Actual | | | 0.82% | | | | $1,000.00 | | | | $981.98 | | | | $4.06 | |
| | Hypothetical (h) | | | 0.82% | | | | $1,000.00 | | | | $1,020.90 | | | | $4.14 | |
| B | | Actual | | | 1.58% | | | | $1,000.00 | | | | $979.21 | | | | $7.82 | |
| | Hypothetical (h) | | | 1.58% | | | | $1,000.00 | | | | $1,017.10 | | | | $7.97 | |
| I | | Actual | | | 0.58% | | | | $1,000.00 | | | | $982.83 | | | | $2.88 | |
| | Hypothetical (h) | | | 0.58% | | | | $1,000.00 | | | | $1,022.10 | | | | $2.93 | |
| R6 | | Actual | | | 0.51% | | | | $1,000.00 | | | | $983.15 | | | | $2.53 | |
| | Hypothetical (h) | | | 0.51% | | | | $1,000.00 | | | | $1,022.45 | | | | $2.58 | |
| | (h) | 5% class return per year before expenses. |
| | (p) | “Expenses Paid During Period” are equal to each class’s annualized expense ratio, as shown above, multiplied by the average account value over the period, multiplied by 183/366 (to reflect theone-half year period). Expenses paid do not include any applicable sales charges (loads). If these transaction costs had been included, your costs would have been higher. |
Notes to Expense Table
For the MFS Georgia Municipal Bond Fund, each class with a Rule12b-1 service fee is subject to a rebate of a portion of such fee. Such rebates are included in the expense ratios above and are outside of the expense limitation arrangement. For Class B shares, this rebate reduced the expense ratio above by 0.02%. See Note 3 in the Notes to Financial Statements for additional information.
For the MFS Maryland Municipal Bond Fund, each class with a Rule12b-1 service fee is subject to a rebate of a portion of such fee. Such rebates are included in the expense ratios above and are outside of the expense limitation arrangement. For Class A shares, this rebate reduced the expense ratio above by 0.01%. See Note 3 in the Notes to Financial Statements for additional information.
19
Expense Tables – continued
MFS MASSACHUSETTS MUNICIPAL BOND FUND
| | | | | | | | | | | | | | | | | | |
Share
Class | | | | Annualized
Expense
Ratio | | | Beginning
Account Value
10/01/19 | | | Ending
Account Value
3/31/20 | | | Expenses
Paid During
Period (p)
10/01/19-3/31/20 | |
| A | | Actual | | | 0.84% | | | | $1,000.00 | | | | $978.22 | | | | $4.15 | |
| | Hypothetical (h) | | | 0.84% | | | | $1,000.00 | | | | $1,020.80 | | | | $4.24 | |
| B | | Actual | | | 1.60% | | | | $1,000.00 | | | | $974.59 | | | | $7.90 | |
| | Hypothetical (h) | | | 1.60% | | | | $1,000.00 | | | | $1,017.00 | | | | $8.07 | |
| I | | Actual | | | 0.60% | | | | $1,000.00 | | | | $979.46 | | | | $2.97 | |
| | Hypothetical (h) | | | 0.60% | | | | $1,000.00 | | | | $1,022.00 | | | | $3.03 | |
| R6 | | Actual | | | 0.52% | | | | $1,000.00 | | | | $979.87 | | | | $2.57 | |
| | Hypothetical (h) | | | 0.52% | | | | $1,000.00 | | | | $1,022.40 | | | | $2.63 | |
| | (h) | 5% class return per year before expenses. |
| | (p) | “Expenses Paid During Period” are equal to each class’s annualized expense ratio, as shown above, multiplied by the average account value over the period, multiplied by 183/366 (to reflect theone-half year period). Expenses paid do not include any applicable sales charges (loads). If these transaction costs had been included, your costs would have been higher. |
Notes to Expense Table
For the MFS Massachusetts Municipal Bond Fund, each class with a Rule12b-1 service fee is subject to a rebate of a portion of such fee. Such rebates are included in the expense ratios above and are outside of the expense limitation arrangement. For Class A shares, this rebate reduced the expense ratio above by 0.02%. See Note 3 in the Notes to Financial Statements for additional information.
20
PORTFOLIO OF INVESTMENTS
3/31/20
MFS ALABAMA MUNICIPAL BOND FUND
The Portfolio of Investments is a complete list of all securities owned by your fund. It is categorized by broad-based asset classes.
| | | | | | | | |
| Municipal Bonds - 94.9% | | | | | | |
| | | | | | | | |
| | |
| Issuer | | Shares/Par | | | Value ($) | |
| Airport Revenue - 2.0% | | | | | |
| Birmingham, AL, Airport Authority Rev., AGM, 5.25%, 7/01/2030 | | $ | 1,000,000 | | | $ | 1,008,510 | |
| Dallas and Fort Worth, TX, International Airport Rev., “B”, 5%, 11/01/2044 | | | 70,000 | | | | 74,158 | |
| Dallas and Fort Worth, TX, International Airport Rev., “C”, 5%, 11/01/2045 | | | 45,000 | | | | 46,790 | |
| San Francisco, CA, City & County Airports Commission, International Airport Rev., “H”, 5%, 5/01/2021 | | | 395,000 | | | | 408,936 | |
| | | | | | | $ | 1,538,394 | |
| General Obligations - General Purpose - 10.7% | | | | | |
| Birmingham, AL, General Obligation Warrants, “B”, 5%, 12/01/2043 | | $ | 245,000 | | | $ | 295,850 | |
| Bridgeview, IL, Stadium and Redevelopment Projects, AAC, 5.14%, 12/01/2036 | | | 160,000 | | | | 147,706 | |
| Chicago, IL, “A”, 5.5%, 1/01/2033 | | | 95,000 | | | | 98,827 | |
| Chicago, IL, “D”, 5.5%, 1/01/2040 | | | 15,000 | | | | 15,448 | |
| Chicago, IL, “F”, 5.5%, 1/01/2042 | | | 110,000 | | | | 113,039 | |
| Commonwealth of Puerto Rico, General Obligation, “A”, 8%, 7/01/2035 (a)(d) | | | 850,000 | | | | 510,000 | |
| Commonwealth of Puerto Rico, Public Improvement, “A”, AGM, 5%, 7/01/2035 | | | 150,000 | | | | 151,224 | |
| Commonwealth of Puerto Rico, Public Improvement, “A”, NATL, 5.5%, 7/01/2020 | | | 145,000 | | | | 145,664 | |
| Commonwealth of Puerto Rico, Public Improvement,“A-4”, AGM, 5.25%, 7/01/2030 | | | 20,000 | | | | 20,116 | |
| Commonwealth of Puerto Rico, Public Improvement,“A-4”, AGM, 5%, 7/01/2031 | | | 40,000 | | | | 40,137 | |
| Fort Payne, AL, General Obligation Warrants, “A”, AGM, 5%, 5/01/2047 | | | 750,000 | | | | 900,900 | |
| Jasper, AL, General Obligation Warrants, 5%, 3/01/2032 | | | 500,000 | | | | 573,875 | |
| Mobile County, AL, General Obligation Improvement Warrants, 5%, 2/01/2038 | | | 250,000 | | | | 311,015 | |
| Mobile County, AL, General Obligation Improvement Warrants, 5%, 2/01/2039 | | | 250,000 | | | | 310,185 | |
| Mobile County, AL, General Obligation Warrants, 5%, 8/01/2036 | | | 500,000 | | | | 606,530 | |
| Montevallo, AL, American Village Public Educational Building Authority Refunding Rev. (Alabama Veterans Living Legacy Project), 4%, 12/01/2033 | | | 420,000 | | | | 477,124 | |
| Montevallo, AL, American Village Public Educational Building Authority Refunding Rev. (Alabama Veterans Living Legacy Project), 4%, 12/01/2034 | | | 655,000 | | | | 741,899 | |
| Montevallo, AL, American Village Public Educational Building Authority Refunding Rev. (Alabama Veterans Living Legacy Project), 4%, 12/01/2035 | | | 250,000 | | | | 281,152 | |
| Puerto Rico Public Buildings Authority Rev.,“M-2”, AAC, 10%, 7/01/2035 | | | 115,000 | | | | 124,869 | |
| | | | | | | | |
| | | | | | | |
| | |
| Issuer | | Shares/Par | | | Value ($) | |
| General Obligations - General Purpose - continued | | | | | |
| Trussville, AL, General Obligation Warrants, “A”, 4%, 8/01/2041 | | $ | 750,000 | | | $ | 843,907 | |
| Vestavia Hills, AL, 4%, 8/01/2048 | | | 500,000 | | | | 560,910 | |
| Vestavia Hills, AL, General Obligation Warrants, 4%, 8/01/2038 | | | 1,000,000 | | | | 1,140,860 | |
| | | | | | | $ | 8,411,237 | |
| General Obligations - Schools - 4.4% | | | | | |
| Downey, CA, Unified School District (Election of 2014), “B”, 4%, 8/01/2040 | | $ | 445,000 | | | $ | 501,778 | |
| Huntsville, AL, “A”, 5%, 5/01/2039 | | | 1,000,000 | | | | 1,261,510 | |
| Huntsville, AL, School Warrants, “C”, 5%, 11/01/2029 (Prerefunded 11/01/2023) | | | 200,000 | | | | 227,234 | |
| Huntsville, AL, School Warrants, “C”, 5%, 11/01/2030 (Prerefunded 11/01/2023) | | | 1,000,000 | | | | 1,136,170 | |
| Montebello, CA, Unified School District (Election of 2016), “A”, 4%, 8/01/2046 | | | 270,000 | | | | 290,420 | |
| | | | | | | $ | 3,417,112 | |
| Healthcare Revenue - Hospitals - 10.1% | | | | | |
| Alabama Special Care Facilities Financing Authority Rev. (Ascension Health), “C”, 5%, 11/15/2046 | | $ | 500,000 | | | $ | 571,860 | |
| Alabama Special Care Facilities Financing Authority Rev. (Daughters of Charity), ETM, AAC, 5%, 11/01/2025 | | | 865,000 | | | | 928,041 | |
| Birmingham, AL, Special Care Facilities Financing Authority Health Care Rev. (Children’s Hospital), 5%, 6/01/2031 | | | 750,000 | | | | 868,417 | |
| Chattanooga, TN, Health, Educational & Housing Facility Board Rev. (CommonSpirit Health),“A-1”, 4%, 8/01/2044 | | | 10,000 | | | | 9,972 | |
| Chattanooga, TN, Health, Educational & Housing Facility Board Rev. (CommonSpirit Health),“A-2”, 5%, 8/01/2044 | | | 5,000 | | | | 5,383 | |
| Chattanooga, TN, Health, Educational & Housing Facility Board Rev. (CommonSpirit Health),“A-2”, 5%, 8/01/2049 | | | 5,000 | | | | 5,306 | |
| Colorado Health Facilities Authority Rev. (CommonSpirit Health),“A-2”, 4%, 8/01/2044 | | | 40,000 | | | | 39,889 | |
| DCH Health Care Authority, AL, Health Care Facilities Rev., 5%, 6/01/2033 | | | 500,000 | | | | 571,305 | |
| East Alabama Health Care Authority, Health Care Facilities Rev., “A”, 4%, 9/01/2048 | | | 500,000 | | | | 544,145 | |
| Escambia County, FL, Health Facilities Authority Rev. (Baptist Hospital, Inc.), “A”, 6%, 8/15/2036 | | | 435,000 | | | | 440,986 | |
| Huntsville, AL, Health Care Authority Rev., “A”, 5%, 6/01/2030 (Prerefunded 6/01/2020) | | | 1,000,000 | | | | 1,006,220 | |
| New Jersey Health Care Facilities, Financing Authority Rev. (University Hospital), “A”, AGM, 5%, 7/01/2046 | | | 50,000 | | | | 52,654 | |
21
Portfolio of Investments – continued
| | | | | | | | |
| Municipal Bonds - continued | | | | | | |
| | | | | | | | |
| | |
| Issuer | | Shares/Par | | | Value ($) | |
| Healthcare Revenue - Hospitals - continued | | | | | |
| Spartanburg County, SC, Regional Health Services District Hospital Rev., “A”, 4%, 4/15/2043 | | $ | 425,000 | | | $ | 457,827 | |
| UAB Medicine Finance Authority Rev., “B”, 5%, 9/01/2035 | | | 1,000,000 | | | | 1,202,020 | |
| UAB Medicine Finance Authority Rev., “B2”, 5%, 9/01/2041 | | | 1,000,000 | | | | 1,193,560 | |
| | | | | | | $ | 7,897,585 | |
| Healthcare Revenue - Long Term Care - 1.7% | | | | | |
| Birmingham, AL, Special Care Facilities Financing Authority Rev. (Methodist Home for the Aging), 5.75%, 6/01/2045 | | $ | 250,000 | | | $ | 252,300 | |
| Pell City, AL, Special Care Facilities Financing Authority Rev. (Noland Health Services, Inc.), 5%, 12/01/2039 | | | 1,050,000 | | | | 1,104,390 | |
| | | | | | | $ | 1,356,690 | |
| Industrial Revenue - Other - 0.7% | | | | | |
| Port Beaumont, TX, Navigation District Facility Rev. (Jefferson Gulf Coast Energy Project), “A”, 3.625%, 1/01/2035 (n) | | $ | 100,000 | | | $ | 84,188 | |
| Port Beaumont, TX, Navigation District Facility Rev. (Jefferson Gulf Coast Energy Project), “A”, 4%, 1/01/2050 (n) | | | 200,000 | | | | 154,372 | |
| Tuscaloosa County, AL, Industrial Development Authority, Gulf Opportunity Zone (Hunt Refining Project), “A”, 5.25%, 5/01/2044 | | | 305,000 | | | | 293,291 | |
| | | | | | | $ | 531,851 | |
| Industrial Revenue - Paper - 0.4% | | | | | |
| Selma, AL, Industrial Development Board Rev., Gulf Opportunity Zone (International Paper Co.), “A”, 5.375%, 12/01/2035 | | $ | 300,000 | | | $ | 307,290 | |
| |
| Miscellaneous Revenue - Other - 1.2% | | | | | |
| Indiana Finance Authority Rev. (Ohio River Bridges East End Crossing Project), “A”, 5%, 7/01/2040 | | $ | 65,000 | | | $ | 66,519 | |
| Indiana Finance Authority Rev. (Ohio River Bridges East End Crossing Project), “A”, 5%, 7/01/2044 | | | 95,000 | | | | 96,903 | |
| New York Liberty Development Corp., Liberty Rev. (3 World Trade Center Project), “1”, 5%, 11/15/2044 | | | 260,000 | | | | 263,515 | |
| New York Liberty Development Corp., Liberty Rev. (7 World Trade Center Project), 5%, 9/15/2040 | | | 495,000 | | | | 523,012 | |
| | | | | | | $ | 949,949 | |
| Port Revenue - 2.2% | | | | | |
| Alabama Port Authority Docks Facilities Refunding Rev., “A”, AGM, 5%, 10/01/2035 | | $ | 1,000,000 | | | $ | 1,175,200 | |
| Alabama Port Authority Docks Facilities Rev., 6%, 10/01/2040 (Prerefunded 10/01/2020) | | | 500,000 | | | | 512,040 | |
| | | | | | | $ | 1,687,240 | |
| | | | | | | | |
| | | | | | | |
| | |
| Issuer | | Shares/Par | | | Value ($) | |
| Sales & Excise Tax Revenue - 9.0% | | | | | |
| Cherokee County, AL, Board of Education Special Tax School Warrants (Sales Tax), 5%, 12/01/2048 | | $ | 1,000,000 | | | $ | 1,193,130 | |
| Colorado Regional Transportation District, Private Activity Rev. (Denver Transportation Partners), 6%, 1/15/2041 | | | 325,000 | | | | 326,940 | |
| Elmore County, AL, Board of Education School Tax Warrants, 5%, 8/01/2032 | | | 515,000 | | | | 649,657 | |
| Elmore County, AL, Board of Education School Tax Warrants, 4%, 8/01/2038 | | | 745,000 | | | | 851,848 | |
| Jefferson County, AL, Board of Education, 4%, 2/01/2042 | | | 805,000 | | | | 896,351 | |
| Jefferson County, AL, Limited Obligation Warrants, 5%, 9/15/2033 | | | 500,000 | | | | 600,330 | |
| Puerto Rico Sales Tax Financing Corp., Restructured Sales Tax Rev.,“2019A-1”, 4.55%, 7/01/2040 | | | 16,000 | | | | 15,146 | |
| Puerto Rico Sales Tax Financing Corp., Restructured Sales Tax Rev.,“2019A-1”, 5%, 7/01/2058 | | | 650,000 | | | | 632,093 | |
| Puerto Rico Sales Tax Financing Corp., Restructured Sales Tax Rev.,“2019A-2”, 4.329%, 7/01/2040 | | | 164,000 | | | | 150,649 | |
| Puerto Rico Sales Tax Financing Corp., Restructured Sales Tax Rev.,“2019A-2”, 4.329%, 7/01/2040 | | | 58,000 | | | | 53,278 | |
| Puerto Rico Sales Tax Financing Corp., Restructured Sales Tax Rev.,“2019A-2”, 4.784%, 7/01/2058 | | | 25,000 | | | | 23,413 | |
| Puerto Rico Sales Tax Financing Corp., Restructured Sales Tax Rev., Capital Appreciation,“2019A-1”, 0%, 7/01/2024 | | | 1,000 | | | | 856 | |
| Puerto Rico Sales Tax Financing Corp., Restructured Sales Tax Rev., Capital Appreciation,“2019A-1”, 0%, 7/01/2027 | | | 26,000 | | | | 19,797 | |
| Puerto Rico Sales Tax Financing Corp., Restructured Sales Tax Rev., Capital Appreciation,“2019A-1”, 0%, 7/01/2029 | | | 4,000 | | | | 2,768 | |
| Puerto Rico Sales Tax Financing Corp., Restructured Sales Tax Rev., Capital Appreciation,“2019A-1”, 0%, 7/01/2031 | | | 247,000 | | | | 153,604 | |
| Puerto Rico Sales Tax Financing Corp., Restructured Sales Tax Rev., Capital Appreciation,“2019A-1”, 0%, 7/01/2033 | | | 237,000 | | | | 131,142 | |
| Puerto Rico Sales Tax Financing Corp., Restructured Sales Tax Rev., Capital Appreciation,“2019A-1”, 0%, 7/01/2046 | | | 1,837,000 | | | | 434,304 | |
| Tuscaloosa County, AL, Board of Education, School Tax Warrants, 5%, 2/01/2037 | | | 750,000 | | | | 890,168 | |
| | | | | | | $ | 7,025,474 | |
| Single Family Housing - State - 0.4% | | | | | |
| Connecticut Housing Finance Authority Rev. (Housing Mortgage Finance Program), “C1”, 4%, 11/15/2047 | | $ | 310,000 | | | $ | 327,416 | |
22
Portfolio of Investments – continued
| | | | | | | | |
| Municipal Bonds - continued | | | | | | |
| | | | | | | | |
| | |
| Issuer | | Shares/Par | | | Value ($) | |
| State & Local Agencies - 5.1% | | | | | |
| Alabama Public Health Care Authority Lease Rev. (Department of Public Health Facilities), 5%, 9/01/2030 | | $ | 280,000 | | | $ | 324,990 | |
| Alabama Public School & College Authority Rev., “B”, 5%, 6/01/2025 | | | 800,000 | | | | 895,328 | |
| Anniston, AL, Public Building Authority Rev. (Judicial Center Project), AGM, 5%, 3/01/2032 | | | 500,000 | | | | 515,125 | |
| Bessemer, AL, Public Educational Building Authority Rev. (DHR Building Project), “A”, ASSD GTY, 5%, 7/01/2030 | | | 385,000 | | | | 388,380 | |
| Colorado State University Board of Governors, System Enterprise Refunding Rev., “E”, 4%, 3/01/2043 | | | 315,000 | | | | 352,044 | |
| Golden State, CA, Tobacco Securitization Corp., Tobacco Settlement Rev., “A”, 5%, 6/01/2030 | | | 35,000 | | | | 38,260 | |
| Huntsville, AL, Public Building Authority Lease Refunding Rev., 5%, 10/01/2033 | | | 500,000 | | | | 613,455 | |
| Maryland Stadium Authority Rev., Baltimore City Public Schools Construction and Revitalization Program, “A”, 5%, 5/01/2047 | | | 230,000 | | | | 272,175 | |
| New Jersey Building Authority Rev., Unrefunded Balance, “A”, BAM, 5%, 6/15/2029 | | | 10,000 | | | | 11,106 | |
| Orangeburg County, SC, Facilities Corp. Installment Purchase Rev. (Detention Center Project), 4%, 12/01/2042 | | | 185,000 | | | | 201,578 | |
| Pennsylvania Public School Building Authority, School Lease Rev. (School District of Philadelphia Project), “A”, AGM, 5%, 6/01/2033 | | | 350,000 | | | | 410,707 | |
| | | | | | | $ | 4,023,148 | |
| Student Loan Revenue - 0.2% | | | | | |
| Iowa Student Loan Liquidity Corp. Rev., “B”, 3%, 12/01/2039 | | $ | 35,000 | | | $ | 34,468 | |
| Iowa Student Loan Liquidity Corp. Rev., “B”, 3.5%, 12/01/2044 | | | 90,000 | | | | 88,303 | |
| Minnesota Office of Higher Education Supplemental Student Loan Program Rev., 2.65%, 11/01/2038 | | | 60,000 | | | | 57,502 | |
| | | | | | | $ | 180,273 | |
| Tax - Other - 7.9% | | | | | |
| Birmingham-Jefferson, AL, Civic Center Authority, “A”, 4%, 7/01/2043 | | $ | 750,000 | | | $ | 822,660 | |
| Birmingham-Jefferson, AL, Civic Center Authority, “B”, 5%, 7/01/2043 | | | 500,000 | | | | 599,525 | |
| Cullman, AL, Board of Education, 4%, 3/01/2047 | | | 1,000,000 | | | | 1,118,050 | |
| Guam Government Ltd. Obligation Rev., “A”, 5%, 12/01/2035 | | | 55,000 | | | | 54,656 | |
| Guam Government Ltd. Obligation Rev., “A”, 5%, 12/01/2036 | | | 30,000 | | | | 29,706 | |
| Guam Government Ltd. Obligation Rev., “A”, 5%, 12/01/2046 | | | 85,000 | | | | 80,606 | |
| Lauderdale County, AL, Agriculture Center Authority Special Tax Rev., 5%, 7/01/2049 | | | 1,000,000 | | | | 1,117,320 | |
| | | | | | | | |
| | | | | | | |
| | |
| Issuer | | Shares/Par | | | Value ($) | |
| Tax - Other - continued | | | | | |
| Puerto Rico Convention Center District Authority, Hotel Occupancy Tax Rev., “A”, AAC, 5%, 7/01/2031 | | $ | 70,000 | | | $ | 70,009 | |
| Puerto Rico Infrastructure Financing Authority Special Tax Rev., “C”, AAC, 5.5%, 7/01/2024 | | | 105,000 | | | | 110,704 | |
| Puerto Rico Infrastructure Financing Authority Special Tax Rev., “C”, AAC, 5.5%, 7/01/2026 | | | 265,000 | | | | 282,551 | |
| Puerto Rico Infrastructure Financing Authority Special Tax Rev., “C”, AAC, 5.5%, 7/01/2027 | | | 190,000 | | | | 203,089 | |
| Shelby County, AL, Board of Education Capital Outlay School Warrants (Ten Mill County Tax), 5%, 2/01/2031 | | | 500,000 | | | | 513,875 | |
| Tuscaloosa, AL, Board of Education, School Tax Warrants, 5%, 8/01/2036 | | | 1,000,000 | | | | 1,181,750 | |
| | | | | | | $ | 6,184,501 | |
| Tobacco - 0.8% | | | | | |
| Buckeye, OH, Tobacco Settlement Financing Authority Senior Asset-Backed Refunding,2020A-2, “1”, 5%, 6/01/2033 | | $ | 55,000 | | | $ | 68,052 | |
| Buckeye, OH, Tobacco Settlement Financing Authority Senior Asset-Backed Refunding,2020A-2, “1”, 4%, 6/01/2038 | | | 35,000 | | | | 38,314 | |
| Buckeye, OH, Tobacco Settlement Financing Authority Senior Asset-Backed Refunding,2020B-2, “2”, 5%, 6/01/2055 | | | 445,000 | | | | 394,279 | |
| Buckeye, OH, Tobacco Settlement Financing Authority Senior Asset-Backed Refunding,2020B-3, Capital Appreciation, “2”, 0%, 6/01/2057 | | | 1,040,000 | | | | 114,743 | |
| | | | | | | $ | 615,388 | |
| Toll Roads - 0.3% | | | | | |
| Virginia Small Business Financing Authority Rev. (Elizabeth River Crossings Opco LLC Project), 6%, 1/01/2037 | | $ | 90,000 | | | $ | 92,692 | |
| Virginia Small Business Financing Authority Rev. (Elizabeth River Crossings Opco LLC Project), 5.5%, 1/01/2042 | | | 180,000 | | | | 182,639 | |
| | | | | | | $ | 275,331 | |
| Transportation - Special Tax - 3.4% | | | | | |
| Alabama Federal Aid Highway Finance Authority Special Obligation, “A”, 5%, 9/01/2035 | | $ | 500,000 | | | $ | 594,645 | |
| Commonwealth of Puerto Rico Highway & Transportation Authority Rev., “CC”, AGM, 5.25%, 7/01/2036 | | | 145,000 | | | | 152,656 | |
| Commonwealth of Puerto Rico Highway & Transportation Authority Rev., “D”, AGM, 5%, 7/01/2032 | | | 125,000 | | | | 125,034 | |
| Commonwealth of Puerto Rico Highway & Transportation Authority Rev., “L”, AAC, 5.25%, 7/01/2038 | | | 325,000 | | | | 329,810 | |
| Commonwealth of Puerto Rico Highway & Transportation Authority Rev., “L”, ASSD GTY, 5.25%, 7/01/2041 | | | 225,000 | | | | 232,663 | |
23
Portfolio of Investments – continued
| | | | | | | | |
| Municipal Bonds - continued | | | | | | |
| | | | | | | | |
| | |
| Issuer | | Shares/Par | | | Value ($) | |
| Transportation - Special Tax - continued | | | | | |
| Commonwealth of Puerto Rico Highway & Transportation Authority Rev., “L”, NATL, 5.25%, 7/01/2035 | | $ | 120,000 | | | $ | 120,323 | |
| Commonwealth of Puerto Rico Highway & Transportation Authority Rev., “N”, AAC, 5.5%, 7/01/2029 | | | 330,000 | | | | 353,199 | |
| Commonwealth of Puerto Rico Highway & Transportation Authority Rev., “N”, AAC, 5.25%, 7/01/2031 | | | 240,000 | | | | 251,006 | |
| Commonwealth of Puerto Rico Highway & Transportation Authority Rev., “N”, ASSD GTY, 5.25%, 7/01/2036 | | | 5,000 | | | | 5,264 | |
| Commonwealth of Puerto Rico Highway & Transportation Authority Rev., “N”, NATL, 5.25%, 7/01/2032 | | | 35,000 | | | | 35,559 | |
| New Jersey Transportation Trust Fund Authority, Federal Highway Reimbursement Rev.,“A-1”, 5%, 6/15/2027 | | | 105,000 | | | | 117,256 | |
| New Jersey Transportation Trust Fund Authority, Transportation System, “BB”, 5%, 6/15/2044 | | | 370,000 | | | | 386,032 | |
| | | | | | | $ | 2,703,447 | |
| Universities - Colleges - 19.9% | | | | | |
| Alabama Community College System Board of Trustees Rev. (Bishop State Community College), BAM, 4%, 1/01/2044 | | $ | 300,000 | | | $ | 333,396 | |
| Alabama Community College System Board of Trustees Rev. (Bishop State Community College), BAM, 4%, 1/01/2049 | | | 1,000,000 | | | | 1,102,490 | |
| Alabama Community College System Board of Trustees Rev. (Snead State Community College), BAM, 4%, 9/01/2038 | | | 680,000 | | | | 762,946 | |
| Alabama State University Board of Education Rev. (Chattahoochee Valley Community College), ASSD GTY, 5%, 6/01/2034 | | | 1,300,000 | | | | 1,303,536 | |
| Auburn University, General Fee Rev., “A”, 5%, 6/01/2038 | | | 500,000 | | | | 580,625 | |
| Auburn University, General Fee Rev., “A”, 5%, 6/01/2048 | | | 1,500,000 | | | | 1,779,525 | |
| Homewood, AL, Educational Building Authority Facilities Rev. (Samford University), “A”, 5%, 12/01/2034 | | | 500,000 | | | | 574,445 | |
| Jacksonville, AL, Public Educational Building Authority Higher Education Facilities Rev. (Jacksonville State University Foundation), “A”, 5%, 7/01/2036 | | | 600,000 | | | | 687,186 | |
| Puerto Rico Industrial, Tourist, Educational, Medical & Environmental Control Facilities Financing Authority, Educational Facilities Rev. (University Plaza Project), NATL, 5%, 7/01/2033 | | | 65,000 | | | | 64,565 | |
| Troy University, Facilities Rev., “A”, BAM, 5%, 11/01/2028 | | | 500,000 | | | | 579,120 | |
| University of Alabama at Birmingham, Rev., “B”, 4%, 10/01/2037 | | | 1,000,000 | | | | 1,153,860 | |
| University of Alabama in Huntsville, General Fee Rev., “B2”, 5%, 9/01/2035 | | | 755,000 | | | | 929,216 | |
| | | | | | | | |
| | | | | | | |
| | |
| Issuer | | Shares/Par | | | Value ($) | |
| Universities - Colleges - continued | | | | | |
| University of Alabama in Huntsville, General Fee Rev., “B2”, 5%, 9/01/2036 | | $ | 475,000 | | | $ | 581,619 | |
| University of North Alabama, General Fee Rev., “B”, BAM, 5%, 11/01/2039 | | | 1,000,000 | | | | 1,234,630 | |
| University of North Alabama, General Fee Rev., “C”, BAM, 4%, 11/01/2038 | | | 500,000 | | | | 562,520 | |
| University of South Alabama, Facilities Rev., BAM, 5%, 10/01/2036 | | | 500,000 | | | | 604,290 | |
| University of South Alabama, Facilities Rev., “A”, BAM, 5%, 4/01/2049 | | | 750,000 | | | | 910,155 | |
| University of West Alabama, General Fee Rev., AGM, 4%, 1/01/2036 | | | 355,000 | | | | 399,443 | |
| University of West Alabama, General Fee Rev., AGM, 4%, 1/01/2038 | | | 500,000 | | | | 559,920 | |
| University of West Alabama, General Fee Rev., AGM, 4%, 1/01/2040 | | | 770,000 | | | | 859,135 | |
| | | | | | | $ | 15,562,622 | |
| Utilities - Cogeneration - 0.2% | | | | | |
| Puerto Rico Industrial, Tourist, Educational, Medical & Environmental Control Facilities Financing Authority Rev. (Cogeneration Facilities - AES Puerto Rico Project), 9.12%, 6/01/2022 | | $ | 185,000 | | | $ | 189,625 | |
| |
| Utilities - Municipal Owned - 2.7% | | | | | |
| Chatom, AL, Industrial Development Board Gulf Opportunity Zone (PowerSouth Energy), “A”, ASSD GTY, 5%, 8/01/2037 | | $ | 1,000,000 | | | $ | 1,010,300 | |
| Guam Power Authority Rev., “A”, 5.5%, 10/01/2040 (Prerefunded 10/01/2020) | | | 230,000 | | | | 234,970 | |
| Puerto Rico Electric Power Authority Rev., “A”, 5%, 7/01/2029 (a)(d) | | | 180,000 | | | | 127,350 | |
| Puerto Rico Electric Power Authority Rev., “A”, 5%, 7/01/2042 (a)(d) | | | 30,000 | | | | 21,225 | |
| Puerto Rico Electric Power Authority Rev., “AAA”, 5.25%, 7/01/2021 (a)(d) | | | 15,000 | | | | 10,650 | |
| Puerto Rico Electric Power Authority Rev., “AAA”, 5.25%, 7/01/2030 (a)(d) | | | 5,000 | | | | 3,550 | |
| Puerto Rico Electric Power Authority Rev., “CCC”, 5.25%, 7/01/2027 (a)(d) | | | 65,000 | | | | 46,150 | |
| Puerto Rico Electric Power Authority Rev., “DDD”, 5%, 7/01/2020 (a)(d) | | | 5,000 | | | | 3,538 | |
| Puerto Rico Electric Power Authority Rev., “DDD”, 5%, 7/01/2021 (a)(d) | | | 70,000 | | | | 49,525 | |
| Puerto Rico Electric Power Authority Rev., “DDD”, 5%, 7/01/2022 (a)(d) | | | 115,000 | | | | 81,362 | |
| Puerto Rico Electric Power Authority Rev., “DDD”, AGM, 3.625%, 7/01/2023 | | | 10,000 | | | | 9,953 | |
| Puerto Rico Electric Power Authority Rev., “DDD”, AGM, 3.65%, 7/01/2024 | | | 50,000 | | | | 49,552 | |
| Puerto Rico Electric Power Authority Rev., “EEE”, 6.05%, 7/01/2032 (a)(d) | | | 40,000 | | | | 28,450 | |
| Puerto Rico Electric Power Authority Rev., “SS”, ASSD GTY, 4.375%, 7/01/2030 | | | 10,000 | | | | 9,962 | |
| Puerto Rico Electric Power Authority Rev., “TT”, 5%, 7/01/2021 (a)(d) | | | 40,000 | | | | 28,300 | |
24
Portfolio of Investments – continued
| | | | | | | | |
| Municipal Bonds - continued | | | | | | |
| | | | | | | | |
| | |
| Issuer | | Shares/Par | | | Value ($) | |
| Utilities - Municipal Owned - continued | | | | | |
| Puerto Rico Electric Power Authority Rev., “TT”, 5%, 7/01/2023 (a)(d) | | $ | 30,000 | | | $ | 21,225 | |
| Puerto Rico Electric Power Authority Rev., “TT”, 5%, 7/01/2027 (a)(d) | | | 5,000 | | | | 3,538 | |
| Puerto Rico Electric Power Authority Rev., “TT”, 5%, 7/01/2037 (a)(d) | | | 95,000 | | | | 67,212 | |
| Puerto Rico Electric Power Authority Rev., “UU”, ASSD GTY, 4.25%, 7/01/2027 | | | 70,000 | | | | 69,999 | |
| Puerto Rico Electric Power Authority Rev., “V”, NATL, 5.25%, 7/01/2033 | | | 35,000 | | | | 35,422 | |
| Puerto Rico Electric Power Authority Rev., “VV”, NATL, 5.25%, 7/01/2032 | | | 70,000 | | | | 71,119 | |
| Puerto Rico Electric Power Authority Rev., “VV”, NATL, 5.25%, 7/01/2034 | | | 15,000 | | | | 15,114 | |
| Puerto Rico Electric Power Authority Rev., “WW”, 5.375%, 7/01/2022 (a)(d) | | | 5,000 | | | | 3,556 | |
| Puerto Rico Electric Power Authority Rev., “WW”, 5.25%, 7/01/2025 (a)(d) | | | 15,000 | | | | 10,650 | |
| Puerto Rico Electric Power Authority Rev., “ZZ”, 5%, 7/01/2018 (a)(d) | | | 40,000 | | | | 27,850 | |
| Puerto Rico Electric Power Authority Rev., “ZZ”, 5.25%, 7/01/2023 (a)(d) | | | 50,000 | | | | 35,500 | |
| Puerto Rico Electric Power Authority Rev., “ZZ”, 5.25%, 7/01/2024 (a)(d) | | | 15,000 | | | | 10,650 | |
| Puerto Rico Electric Power Authority Rev., “ZZ”, 5.25%, 7/01/2026 (a)(d) | | | 55,000 | | | | 39,050 | |
| | | | | | | $ | 2,125,722 | |
| Utilities - Other - 0.1% | | | | | |
| Central Plains Energy Project, NE, Gas Project Rev. (Project No. 3), “A”, 5%, 9/01/2036 | | $ | 40,000 | | | $ | 47,397 | |
| |
| Water & Sewer Utility Revenue - 11.5% | | | | | |
| Auburn, AL, Waterworks Board Water Rev., 5%, 9/01/2036 | | $ | 1,000,000 | | | $ | 1,183,620 | |
| Birmingham, AL, Waterworks Board Water Rev., 5%, 1/01/2036 | | | 750,000 | | | | 919,673 | |
| Birmingham, AL, Waterworks Board Water Rev., “A”, 5%, 1/01/2030 | | | 500,000 | | | | 588,425 | |
| Commonwealth of Puerto Rico Aqueduct & Sewer Authority Rev., “A”, ASSD GTY, 5%, 7/01/2028 | | | 10,000 | | | | 10,004 | |
| Cullman, AL, Utilities Board Water Rev., “A”, AGM, 5%, 9/01/2035 | | | 1,000,000 | | | | 1,133,550 | |
| Gadsden, AL, Waterworks and Sewer Rev., AGM, 4%, 6/01/2033 | | | 1,000,000 | | | | 1,122,320 | |
| Guam Waterworks Authority Rev. (Water and Wastewater System), 5%, 7/01/2036 | | | 45,000 | | | | 45,521 | |
| Guam Waterworks Authority Rev. (Water and Wastewater System), 5%, 1/01/2046 | | | 120,000 | | | | 118,796 | |
| Guam Waterworks Authority Rev. (Water and Wastewater System), “A”, 5%, 7/01/2029 | | | 45,000 | | | | 46,012 | |
| | | | | | | | |
| | | | | | | |
| | |
| Issuer | | Shares/Par | | | Value ($) | |
| Water & Sewer Utility Revenue - continued | | | | | |
| Guam Waterworks Authority Rev. (Water and Wastewater System), “A”, 5%, 7/01/2035 | | $ | 45,000 | | | $ | 45,532 | |
| Jefferson County, AL, Senior Lien Sewer Rev., Current Interest Warrants, “A”, AGM, 5%, 10/01/2044 | | | 750,000 | | | | 832,275 | |
| Jefferson County, AL, Sewer Rev. Warrants, Subordinate Lien, “D”, 5%, 10/01/2021 | | | 300,000 | | | | 314,367 | |
| Michigan Finance Authority Local Government Loan Program Rev. (Detroit Water and Sewerage Department Sewage Disposal System Rev. Refunding Second Lien Local Project),“C-7”, NATL, 5%, 7/01/2032 | | | 15,000 | | | | 16,900 | |
| Michigan Finance Authority Local Government Loan Program Rev. (Detroit Water and Sewerage Department Water Supply System Rev. Refunding Second Lien Local Project),“D-6”, NATL, 5%, 7/01/2036 | | | 20,000 | | | | 22,429 | |
| Michigan Finance Authority Local Government Loan Program Rev. (Detroit Water and Sewerage Department Water Supply System Rev. Refunding Senior Lien Local Project),“D-1”, AGM, 5%, 7/01/2035 | | | 10,000 | | | | 11,276 | |
| Michigan Finance Authority Local Government Loan Program Rev. (Detroit Water and Sewerage Department Water Supply System Rev. Refunding Senior Lien Local Project),“D-1”, AGM, 5%, 7/01/2037 | | | 20,000 | | | | 22,464 | |
| Prichard, AL, Waterworks & Sewer Board Rev., 4%, 11/01/2044 | | | 700,000 | | | | 740,901 | |
| Scottsboro, AL, Waterworks Sewer & Gas Board Rev., 5%, 8/01/2032 | | | 500,000 | | | | 538,560 | |
| Warrior River, AL, Water Authority Rev., BAM, 4%, 8/01/2039 | | | 1,180,000 | | | | 1,333,825 | |
| | | | | | | $ | 9,046,450 | |
Total Municipal Bonds
(Identified Cost, $71,790,822) | | | | | | $ | 74,404,142 | |
| | |
| Bonds - 0.1% | | | | | | | | |
| Consumer Services - 0.1% | | | | | |
| Toll Road Investors Partnership II LP, Capital Appreciation, NATL, 0%, 2/15/2043 (n) (Identified Cost, $62,009) | | $ | 200,000 | | | $ | 73,199 | |
| | |
| Investment Companies (h) - 3.7% | | | | | | | | |
| Money Market Funds - 3.7% | | | | | |
| MFS Institutional Money Market Portfolio, 1.28% (v) (Identified Cost, $2,877,225) | | | 2,876,635 | | | $ | 2,877,210 | |
| | |
| Other Assets, Less Liabilities - 1.3% | | | | | | | 1,038,156 | |
| Net Assets - 100.0% | | | | | | $ | 78,392,707 | |
25
Portfolio of Investments – continued
Derivative Contracts at 3/31/20
Futures Contracts
| | | | | | | | | | | | | | | | | | | | | | |
| Description | | Long/
Short | | | Currency | | | Contracts | | Notional
Amount | | | Expiration
Date | | | Value/Unrealized
Appreciation
(Depreciation) | |
| Liability Derivatives | | | | | | | | | | | | | | | | | | | | | | |
| Interest Rate Futures | | | | | | | | | | | | | | | | | | | | | | |
| U.S. Treasury Bond | | | Short | | | | USD | | | 13 | | | $2,327,813 | | | | June - 2020 | | | | $(156,454 | ) |
| | | | | | | | | | | | | | | | | | | | | | |
At March 31, 2020, the fund had cash collateral of $84,500 to cover any collateral or margin obligations for certain derivative contracts. Restricted cash and/or deposits with brokers in the Statements of Assets and Liabilities are comprised of cash collateral.
See Portfolio Footnotes and Notes to Financial Statements
26
PORTFOLIO OF INVESTMENTS
3/31/20
MFS ARKANSAS MUNICIPAL BOND FUND
The Portfolio of Investments is a complete list of all securities owned by your fund. It is categorized by broad-based asset classes.
| | | | | | | | |
| Municipal Bonds - 96.8% | | | | | | |
| | | | | | | | |
| | |
| Issuer | | Shares/Par | | | Value ($) | |
| Airport Revenue - 0.5% | | | | | | | | |
| Dallas and Fort Worth, TX, International Airport Rev., “B”, 5%, 11/01/2044 | | $ | 235,000 | | | $ | 248,959 | |
| Dallas and Fort Worth, TX, International Airport Rev., “C”, 5%, 11/01/2045 | | | 160,000 | | | | 166,366 | |
| Wayne County, MI, Airport Authority Rev. (Detroit Metropolitan Wayne County Airport), “B”, 5%, 12/01/2044 | | | 95,000 | | | | 105,251 | |
| Wayne County, MI, Airport Authority Rev. (Detroit Metropolitan Wayne County Airport), “B”, BAM, 5%, 12/01/2039 | | | 105,000 | | | | 117,114 | |
| Wayne County, MI, Airport Authority Rev. (Detroit Metropolitan Wayne County Airport), “C”, 5%, 12/01/2039 | | | 80,000 | | | | 87,930 | |
| Wayne County, MI, Airport Authority Rev. (Detroit Metropolitan Wayne County Airport), “C”, 5%, 12/01/2044 | | | 125,000 | | | | 136,759 | |
| | | | | | | $ | 862,379 | |
| General Obligations - General Purpose - 4.7% | | | | | |
| Arkansas Higher Education, 4%, 6/01/2029 | | $ | 2,000,000 | | | $ | 2,199,460 | |
| Bridgeview, IL, Stadium and Redevelopment Projects, AAC, 5.14%, 12/01/2036 | | | 375,000 | | | | 346,185 | |
| Chicago, IL, “A”, 5.5%, 1/01/2033 | | | 190,000 | | | | 197,653 | |
| Chicago, IL, “D”, 5.5%, 1/01/2040 | | | 30,000 | | | | 30,895 | |
| Chicago, IL, “F”, 5.5%, 1/01/2042 | | | 225,000 | | | | 231,217 | |
| Chicago, IL, General Obligation (Neighborhood Alive 21 Program), “B”, 5.5%, 1/01/2037 | | | 70,000 | | | | 72,391 | |
| Chicago, IL, General Obligation Refunding Project, “A”, 5.25%, 1/01/2030 | | | 50,000 | | | | 51,211 | |
| Commonwealth of Puerto Rico, General Obligation, “A”, 8%, 7/01/2035 (a)(d) | | | 1,620,000 | | | | 972,000 | |
| Commonwealth of Puerto Rico, Public Improvement, “A”, AGM, 5%, 7/01/2035 | | | 430,000 | | | | 433,509 | |
| Commonwealth of Puerto Rico, Public Improvement, “A”, NATL, 5.5%, 7/01/2020 | | | 475,000 | | | | 477,175 | |
| Commonwealth of Puerto Rico, Public Improvement,“A-4”, AGM, 5.25%, 7/01/2030 | | | 60,000 | | | | 60,349 | |
| Commonwealth of Puerto Rico, Public Improvement,“A-4”, AGM, 5%, 7/01/2031 | | | 130,000 | | | | 130,445 | |
| State of Arkansas, Federal Highway Grant Anticipation and Tax Rev., 5%, 4/01/2026 | | | 1,815,000 | | | | 2,104,511 | |
| | | | | | | $ | 7,307,001 | |
| General Obligations - Schools - 5.1% | | | | | | | | |
| Bentonville, AR, School District No. 6 Construction Refunding, “B”, 4%, 6/01/2037 | | $ | 1,500,000 | | | $ | 1,637,775 | |
| Bentonville, AR, School District No. 6 Construction Refunding, “B”, 4%, 6/01/2047 | | | 1,000,000 | | | | 1,085,030 | |
| Berks County, PA, Reading School District, AGM, 5%, 3/01/2036 | | | 40,000 | | | | 47,429 | |
| Crittenden County, AR, Community College District, 4.6%, 2/01/2035 | | | 285,000 | | | | 285,234 | |
| | | | | | | | |
| | | | | | | |
| | |
| Issuer | | Shares/Par | | | Value ($) | |
| General Obligations - Schools - continued | |
| Crittenden County, AR, Community College District, 4.7%, 2/01/2040 | | $ | 625,000 | | | $ | 625,975 | |
| Crittenden County, AR, Earle Special School District Refunding and Construction, 4%, 2/01/2048 | | | 2,060,000 | | | | 2,141,576 | |
| Pulaski County, AR, Special School District Construction, 4%, 2/01/2041 | | | 2,000,000 | | | | 2,100,300 | |
| | | | | | | $ | 7,923,319 | |
| Healthcare Revenue - Hospitals - 12.0% | |
| Arkansas Development Finance Authority, Health Care Rev. (Baptist Health), 5%, 12/01/2047 | | $ | 2,000,000 | | | $ | 2,389,260 | |
| Arkansas Development Finance Authority, Health Care Rev. (Baptist Health), “A”, 5%, 12/01/2029 | | | 1,000,000 | | | | 1,171,650 | |
| Arkansas Development Finance Authority, Hospital Rev. (Washington Regional Medical Center), 5%, 2/01/2038 | | | 1,900,000 | | | | 2,244,090 | |
| Arkansas Development Finance Authority, Hospital Rev. (Washington Regional Medical Center), “A”, 5%, 2/01/2033 | | | 1,645,000 | | | | 1,859,706 | |
| Chattanooga, TN, Health, Educational & Housing Facility Board Rev. (CommonSpirit Health),“A-1”, 4%, 8/01/2044 | | | 20,000 | | | | 19,944 | |
| Chattanooga, TN, Health, Educational & Housing Facility Board Rev. (CommonSpirit Health),“A-2”, 5%, 8/01/2044 | | | 10,000 | | | | 10,766 | |
| Chattanooga, TN, Health, Educational & Housing Facility Board Rev. (CommonSpirit Health),“A-2”, 5%, 8/01/2049 | | | 5,000 | | | | 5,306 | |
| Colorado Health Facilities Authority Rev. (CommonSpirit Health),“A-2”, 4%, 8/01/2044 | | | 85,000 | | | | 84,764 | |
| Conway, AR, Hospital Rev. (Conway Regional Medical Center), 4.45%, 8/01/2032 | | | 540,000 | | | | 561,255 | |
| Conway, AR, Hospital Rev. (Conway Regional Medical Center), “A”, 4%, 8/01/2038 | | | 1,000,000 | | | | 1,053,440 | |
| Doylestown, PA, Hospital Rev., “A”, 4%, 7/01/2045 | | | 20,000 | | | | 20,972 | |
| Escambia County, FL, Health Facilities Authority Rev. (Baptist Hospital, Inc.), “A”, 6%, 8/15/2036 | | | 420,000 | | | | 425,779 | |
| Independence County, AR, Public Health Education & Housing Facilities Board Rev. (White River Health Systems), 5.75%, 6/01/2028 | | | 1,000,000 | | | | 1,005,870 | |
| Jefferson County, AR, Hospital Rev., Refunding (Regional Medical Center), AGM, 5%, 6/01/2026 | | | 2,150,000 | | | | 2,156,020 | |
| Kentucky Economic Development Finance Authority Hospital Rev. (Owensboro Medical Health System, Inc.), “A”, 5.75%, 6/01/2025 (Prerefunded 6/01/2020) | | | 510,000 | | | | 513,794 | |
27
Portfolio of Investments – continued
| | | | | | | | |
| Municipal Bonds - continued | | | | | | |
| | | | | | | | |
| | |
| Issuer | | Shares/Par | | | Value ($) | |
| Healthcare Revenue - Hospitals - continued | |
| Kentucky Economic Development Finance Authority Hospital Rev. (Owensboro Medical Health System, Inc.), “A”, 6.375%, 6/01/2040 (Prerefunded 6/01/2020) | | $ | 545,000 | | | $ | 549,562 | |
| Kentucky Economic Development Finance Authority Hospital Rev. (Owensboro Medical Health System, Inc.), “A”, 6.5%, 3/01/2045 (Prerefunded 6/01/2020) | | | 395,000 | | | | 398,381 | |
| New Hampshire Health & Education Facilities Authority Rev. (Dartmouth-Hitchcock Obligated Group), “A”, 5%, 8/01/2059 | | | 115,000 | | | | 165,065 | |
| Pulaski County, AR, Public Facilities Board, Health Facilities Rev. (Carti Project), 5.5%, 7/01/2043 | | | 750,000 | | | | 770,948 | |
| Springdale, AR, Public Facilities Board Hospital Rev. (Children’s Northwest Project), 5%, 3/01/2040 | | | 2,820,000 | | | | 3,290,545 | |
| | | | | | | $ | 18,697,117 | |
| Industrial Revenue - Other - 0.5% | | | | | | | | |
| Port Beaumont, TX, Navigation District Facility Rev. (Jefferson Gulf Coast Energy Project), “A”, 4%, 1/01/2050 (n) | | $ | 390,000 | | | $ | 301,025 | |
| Tuscaloosa County, AL, Industrial Development Authority, Gulf Opportunity Zone (Hunt Refining Project), “A”, 4.5%, 5/01/2032 | | | 225,000 | | | | 213,901 | |
| Tuscaloosa County, AL, Industrial Development Authority, Gulf Opportunity Zone (Hunt Refining Project), “A”, 5.25%, 5/01/2044 | | | 330,000 | | | | 317,331 | |
| | | | | | | $ | 832,257 | |
| Industrial Revenue - Paper - 0.1% | | | | | | | | |
| Valparaiso, IN, Exempt Facilities Rev. (Pratt Paper LLC Project), 7%, 1/01/2044 | | $ | 100,000 | | | $ | 103,807 | |
| | |
| Miscellaneous Revenue - Other - 2.6% | | | | | | | | |
| Fayetteville, AR, Hotel, Motel and Restaurant Rev., BAM, 5%, 11/01/2034 | | $ | 2,000,000 | | | $ | 2,304,360 | |
| New York Liberty Development Corp., Liberty Rev. (7 World Trade Center Project), 5%, 9/15/2040 | | | 1,615,000 | | | | 1,706,393 | |
| | | | | | | $ | 4,010,753 | |
| Sales & Excise Tax Revenue - 16.2% | | | | | | | | |
| Bentonville, AR, Sales & Use Tax, 4%, 11/01/2026 | | $ | 1,310,000 | | | $ | 1,312,659 | |
| Cabot, AR, Sales & Use Tax, 5%, 6/01/2026 | | | 700,000 | | | | 777,868 | |
| Cabot, AR, Sales & Use Tax, 5%, 6/01/2027 | | | 1,300,000 | | | | 1,443,754 | |
| Colorado Regional Transportation District, Private Activity Rev. (Denver Transportation Partners), 6%, 1/15/2041 | | | 760,000 | | | | 764,537 | |
| Conway, AR, Sales & Use Tax Rev., Capital Improvement, 4.5%, 5/01/2030 | | | 850,000 | | | | 927,937 | |
| Conway, AR, Sales & Use Tax Rev., Capital Improvement, 4.5%, 5/01/2035 | | | 1,150,000 | | | | 1,248,762 | |
| | | | | | | | |
| | | | | | | |
| | |
| Issuer | | Shares/Par | | | Value ($) | |
| Sales & Excise Tax Revenue - continued | |
| Fort Smith, AR, Sales & Use Tax, 5%, 5/01/2023 | | $ | 380,000 | | | $ | 420,348 | |
| Fort Smith, AR, Sales & Use Tax, 5%, 5/01/2024 | | | 2,040,000 | | | | 2,197,304 | |
| Guam Government Business Privilege Tax Rev., “D”, 5%, 11/15/2031 | | | 415,000 | | | | 416,365 | |
| Massachusetts Bay Transportation Authority, Sales Tax Rev.,“A-1”, 5.25%, 7/01/2029 | | | 1,000,000 | | | | 1,319,400 | |
| Mississippi County, AR, 4%, 6/01/2036 | | | 650,000 | | | | 700,882 | |
| Mississippi County, AR, 4%, 6/01/2038 | | | 1,095,000 | | | | 1,174,399 | |
| Phillips County, AR, Sales & Use Tax, BAM, 3.75%, 9/01/2038 | | | 1,170,000 | | | | 1,208,739 | |
| Puerto Rico Sales Tax Financing Corp., Restructured Sales Tax Rev.,“2019A-1”, 4.55%, 7/01/2040 | | | 36,000 | | | | 34,079 | |
| Puerto Rico Sales Tax Financing Corp., Restructured Sales Tax Rev.,“2019A-1”, 5%, 7/01/2058 | | | 1,031,000 | | | | 1,002,596 | |
| Puerto Rico Sales Tax Financing Corp., Restructured Sales Tax Rev.,“2019A-2”, 4.329%, 7/01/2040 | | | 355,000 | | | | 326,100 | |
| Puerto Rico Sales Tax Financing Corp., Restructured Sales Tax Rev.,“2019A-2”, 4.329%, 7/01/2040 | | | 120,000 | | | | 110,231 | |
| Puerto Rico Sales Tax Financing Corp., Restructured Sales Tax Rev.,“2019A-2”, 4.536%, 7/01/2053 | | | 2,000 | | | | 1,815 | |
| Puerto Rico Sales Tax Financing Corp., Restructured Sales Tax Rev.,“2019A-2”, 4.784%, 7/01/2058 | | | 62,000 | | | | 58,064 | |
| Puerto Rico Sales Tax Financing Corp., Restructured Sales Tax Rev., Capital Appreciation,“2019A-1”, 0%, 7/01/2024 | | | 7,000 | | | | 5,994 | |
| Puerto Rico Sales Tax Financing Corp., Restructured Sales Tax Rev., Capital Appreciation,“2019A-1”, 0%, 7/01/2027 | | | 66,000 | | | | 50,254 | |
| Puerto Rico Sales Tax Financing Corp., Restructured Sales Tax Rev., Capital Appreciation,“2019A-1”, 0%, 7/01/2029 | | | 12,000 | | | | 8,304 | |
| Puerto Rico Sales Tax Financing Corp., Restructured Sales Tax Rev., Capital Appreciation,“2019A-1”, 0%, 7/01/2031 | | | 593,000 | | | | 368,775 | |
| Puerto Rico Sales Tax Financing Corp., Restructured Sales Tax Rev., Capital Appreciation,“2019A-1”, 0%, 7/01/2033 | | | 568,000 | | | | 314,297 | |
| Puerto Rico Sales Tax Financing Corp., Restructured Sales Tax Rev., Capital Appreciation,“2019A-1”, 0%, 7/01/2046 | | | 2,189,000 | | | | 517,523 | |
| Rogers, AR, 5%, 11/01/2023 (Prerefunded 11/01/2021) | | | 85,000 | | | | 85,264 | |
| Rogers, AR, Sales & Use Tax Rev., “B”, 5%, 11/01/2036 | | | 2,000,000 | | | | 2,354,140 | |
| Springdale, AR, Sales & Use Tax Rev., 5%, 11/01/2028 | | | 1,000,000 | | | | 1,097,610 | |
| Springdale, AR, Sales & Use Tax Rev., BAM, 5%, 4/01/2037 | | | 1,000,000 | | | | 1,123,330 | |
28
Portfolio of Investments – continued
| | | | | | | | |
| Municipal Bonds - continued | | | | | | |
| | | | | | | | |
| | |
| Issuer | | Shares/Par | | | Value ($) | |
| Sales & Excise Tax Revenue - continued | |
| Springdale, AR, Sales & Use Tax Rev., BAM, 3.6%, 4/01/2041 | | $ | 2,000,000 | | | $ | 2,072,580 | |
| Stuttgart, AR, Sales & Use Tax Rev., AGM, 5%, 6/01/2032 | | | 1,840,000 | | | | 1,850,635 | |
| | | | | | | $ | 25,294,545 | |
| Secondary Schools - 0.6% | | | | | | | | |
| Arkansas Development Finance Authority, Charter School Capital Improvement Rev. (LISA Academy Project), 4.5%, 7/01/2039 | | $ | 750,000 | | | $ | 668,940 | |
| District of Columbia Rev. (Rocketship D.C.), “A”, 5%, 6/01/2039 | | | 250,000 | | | | 246,038 | |
| | | | | | | $ | 914,978 | |
| Single Family Housing - State - 1.2% | | | | | | | | |
| Arkansas Development Finance Authority, Mortgage Rev., “B”, GNMA, 4.85%, 7/01/2031 | | $ | 305,000 | | | $ | 305,982 | |
| Connecticut Housing Finance Authority Rev. (Housing Mortgage Finance Program),“D-1”, GNMA, 4%, 11/15/2047 | | | 730,000 | | | | 771,873 | |
| Iowa Finance Authority, Single Family Mortgage Rev., “A”, GNMA, 4%, 7/01/2047 | | | 775,000 | | | | 818,818 | |
| | | | | | | $ | 1,896,673 | |
| State & Local Agencies - 5.3% | | | | | | | | |
| Arkansas Development Finance Authority Rev. (Donaghey Plaza Project), 5%, 6/01/2034 | | $ | 2,605,000 | | | $ | 2,809,076 | |
| Colorado State University Board of Governors, System Enterprise Refunding Rev., “E”, 4%, 3/01/2043 | | | 840,000 | | | | 938,784 | |
| Delaware Valley, PA, Regional Finance Authority, “C”, FLR, 1.809% (LIBOR - 3mo. + 0.75%), 6/01/2037 | | | 1,315,000 | | | | 1,190,417 | |
| Maryland Stadium Authority Rev., Baltimore City Public Schools Construction and Revitalization Program, “A”, 5%, 5/01/2047 | | | 585,000 | | | | 692,272 | |
| New Jersey Economic Development Authority Rev., School Facilities Construction Rev., “LLL”, 5%, 6/15/2039 | | | 345,000 | | | | 365,703 | |
| New Jersey Economic Development Authority Rev., School Facilities Construction Rev., “LLL”, 5%, 6/15/2044 | | | 580,000 | | | | 607,457 | |
| North Carolina Turnpike Authority, Triangle Expressway System Appropriation Rev., Capital Appreciation, 0%, 1/01/2044 | | | 2,360,000 | | | | 1,163,126 | |
| Orangeburg County, SC, Facilities Corp. Installment Purchase Rev. (Detention Center Project), 4%, 12/01/2042 | | | 525,000 | | | | 572,045 | |
| | | | | | | $ | 8,338,880 | |
| Student Loan Revenue - 0.2% | | | | | | | | |
| Iowa Student Loan Liquidity Corp. Rev., “B”, 3%, 12/01/2039 | | $ | 70,000 | | | $ | 68,937 | |
| Iowa Student Loan Liquidity Corp. Rev., “B”, 3.5%, 12/01/2044 | | | 185,000 | | | | 181,511 | |
| | | | | | | $ | 250,448 | |
| | | | | | | | |
| | | | | | | |
| | |
| Issuer | | Shares/Par | | | Value ($) | |
| Tax - Other - 4.7% | | | | | | | | |
| Fayetteville, AR, Liberty Improvement Bonds, 4%, 1/01/2037 | | $ | 2,000,000 | | | $ | 2,212,600 | |
| Little Rock, AR, Hotel & Restaurant Gross Receipts Tax Rev., 5%, 7/01/2034 | | | 3,000,000 | | | | 3,414,600 | |
| Puerto Rico Convention Center District Authority, Hotel Occupancy Tax Rev., “A”, AAC, 5%, 7/01/2031 | | | 210,000 | | | | 210,027 | |
| Puerto Rico Infrastructure Financing Authority Special Tax Rev., “C”, AAC, 5.5%, 7/01/2026 | | | 890,000 | | | | 948,945 | |
| Puerto Rico Infrastructure Financing Authority Special Tax Rev., “C”, AAC, 5.5%, 7/01/2027 | | | 590,000 | | | | 630,645 | |
| | | | | | | $ | 7,416,817 | |
| Tax Assessment - 0.0% | | | | | | | | |
| Brunswick, MD, Special Obligation Refunding (Brunswick Crossing Special Taxing District), 4%, 7/01/2029 | | $ | 15,000 | | | $ | 14,514 | |
| Brunswick, MD, Special Obligation Refunding (Brunswick Crossing Special Taxing District), 5%, 7/01/2036 | | | 15,000 | | | | 15,179 | |
| | | | | | | $ | 29,693 | |
| Tobacco - 2.4% | | | | | | | | |
| Arkansas Development Finance Authority, Tobacco Settlement Rev. (Cancer Research Center Project), Capital Appreciation, AAC, 0%, 7/01/2027 | | $ | 2,470,000 | | | $ | 2,156,853 | |
| Arkansas Development Finance Authority, Tobacco Settlement Rev. (Cancer Research Center Project), Capital Appreciation, AAC, 0%, 7/01/2028 | | | 500,000 | | | | 425,435 | |
| Buckeye, OH, Tobacco Settlement Financing Authority Senior Asset-Backed Refunding,2020A-2, “1”, 5%, 6/01/2033 | | | 105,000 | | | | 129,917 | |
| Buckeye, OH, Tobacco Settlement Financing Authority Senior Asset-Backed Refunding,2020A-2, “1”, 4%, 6/01/2038 | | | 60,000 | | | | 65,681 | |
| Buckeye, OH, Tobacco Settlement Financing Authority Senior Asset-Backed Refunding,2020B-2, “2”, 5%, 6/01/2055 | | | 840,000 | | | | 744,257 | |
| Buckeye, OH, Tobacco Settlement Financing Authority Senior Asset-Backed Refunding,2020B-3, Capital Appreciation, “2”, 0%, 6/01/2057 | | | 2,010,000 | | | | 221,763 | |
| | | | | | | $ | 3,743,906 | |
| Toll Roads - 0.3% | | | | | | | | |
| Texas Private Activity Surface Transportation Corp., Senior Lien Rev. (NTE Mobility Partners Segments 3 LLC Segments 3A & 3B Facility), 7%, 12/31/2038 | | $ | 230,000 | | | $ | 259,475 | |
| Texas Private Activity Surface Transportation Corp., Senior Lien Rev. (NTE Mobility Partners Segments 3 LLC Segments 3A & 3B Facility), 6.75%, 6/30/2043 | | | 180,000 | | | | 201,308 | |
| | | | | | | $ | 460,783 | |
29
Portfolio of Investments – continued
| | | | | | | | |
| Municipal Bonds - continued | | | | | | |
| | | | | | | | |
| | |
| Issuer | | Shares/Par | | | Value ($) | |
| Transportation - Special Tax - 4.5% | | | | | | | | |
| Commonwealth of Puerto Rico Highway & Transportation Authority Rev., “CC”, AGM, 5.25%, 7/01/2036 | | $ | 430,000 | | | $ | 452,704 | |
| Commonwealth of Puerto Rico Highway & Transportation Authority Rev., “J”, NATL, 5%, 7/01/2029 | | | 20,000 | | | | 20,000 | |
| Commonwealth of Puerto Rico Highway & Transportation Authority Rev., “L”, AAC, 5.25%, 7/01/2038 | | | 1,075,000 | | | | 1,090,910 | |
| Commonwealth of Puerto Rico Highway & Transportation Authority Rev., “L”, ASSD GTY, 5.25%, 7/01/2041 | | | 615,000 | | | | 635,947 | |
| Commonwealth of Puerto Rico Highway & Transportation Authority Rev., “L”, NATL, 5.25%, 7/01/2035 | | | 480,000 | | | | 481,291 | |
| Commonwealth of Puerto Rico Highway & Transportation Authority Rev., “N”, AAC, 5.25%, 7/01/2031 | | | 715,000 | | | | 747,790 | |
| Commonwealth of Puerto Rico Highway & Transportation Authority Rev., “N”, ASSD GTY, 5.25%, 7/01/2036 | | | 320,000 | | | | 336,880 | |
| Commonwealth of Puerto Rico Highway & Transportation Authority Rev., “N”, NATL, 5.25%, 7/01/2032 | | | 380,000 | | | | 386,073 | |
| Commonwealth of Puerto Rico Highway & Transportation Authority Rev., “N”, NATL, 5.25%, 7/01/2033 | | | 445,000 | | | | 450,362 | |
| New Jersey Economic Development Authority Rev. (NJ Transit Transportation Project), 4%, 11/01/2044 | | | 1,015,000 | | | | 986,479 | |
| New Jersey Transportation Trust Fund Authority, Federal Highway Reimbursement Rev.,“A-1”, 5%, 6/15/2027 | | | 310,000 | | | | 346,183 | |
| New Jersey Transportation Trust Fund Authority, Transportation System, “BB”, 5%, 6/15/2044 | | | 1,000,000 | | | | 1,043,330 | |
| | | | | | | $ | 6,977,949 | |
| Universities - Colleges - 15.4% | | | | | | | | |
| Arkansas State University, Housing System Rev. (Jonesboro Campus), 4.5%, 3/01/2031 | | $ | 2,500,000 | | | $ | 2,698,475 | |
| Arkansas State University, Student Fee Rev. (Jonesboro Campus), “C”, AGM, 4.5%, 3/01/2027 | | | 545,000 | | | | 577,139 | |
| Puerto Rico Industrial, Tourist, Educational, Medical & Environmental Control Facilities Financing Authority, Higher Education Rev. (Ana G. Mendez University System Project), 5.125%, 4/01/2032 | | | 85,000 | | | | 75,476 | |
| Puerto Rico Industrial, Tourist, Educational, Medical & Environmental Control Facilities Financing Authority, Higher Education Rev. (Ana G. Mendez University System Project), 5.375%, 4/01/2042 | | | 140,000 | | | | 118,457 | |
| Puerto Rico Industrial, Tourist, Educational, Medical & Environmental Control Facilities Financing Authority, Higher Education Rev. (University of Sacred Heart), 4.375%, 10/01/2031 | | | 60,000 | | | | 52,598 | |
| | | | | | | | |
| | | | | | | |
| | |
| Issuer | | Shares/Par | | | Value ($) | |
| Universities - Colleges - continued | | | | | | | | |
| Puerto Rico Industrial, Tourist, Educational, Medical & Environmental Control Facilities Financing Authority, Higher Education Rev. (University of Sacred Heart), 5%, 10/01/2042 | | $ | 65,000 | | | $ | 54,376 | |
| Pulaski, AR, Student Tuition & Fee Rev. (Technical College), AGM, 4%, 4/01/2024 | | | 1,000,000 | | | | 1,043,560 | |
| Pulaski, AR, Student Tuition & Fee Rev. (Technical College), AGM, 5%, 4/01/2041 | | | 1,000,000 | | | | 1,058,220 | |
| Pulaski, AR, Student Tuition & Fee Rev. (Technical College), BAM, 5%, 9/01/2030 | | | 1,000,000 | | | | 1,172,720 | |
| Red River, TX, Education Finance Corp., Higher Education Rev. (Houston Baptist University Project), 5.5%, 10/01/2046 | | | 340,000 | | | | 369,451 | |
| University of Arkansas Auxiliary Enterprises Rev., 5%, 12/01/2029 | | | 605,000 | | | | 662,287 | |
| University of Arkansas Auxiliary Enterprises Rev. (UALR Campus), “A”, 5%, 5/01/2029 | | | 200,000 | | | | 215,080 | |
| University of Arkansas Facilities Rev. (Fayetteville Campus), 5%, 11/01/2047 | | | 1,500,000 | | | | 1,772,550 | |
| University of Arkansas Facilities Rev. (Fayetteville Campus), “A”, 5%, 11/01/2021 | | | 1,310,000 | | | | 1,390,670 | |
| University of Arkansas Facilities Rev. (Fayetteville Campus), “A”, 5%, 11/01/2026 | | | 1,000,000 | | | | 1,061,420 | |
| University of Arkansas Facilities Rev. (Fayetteville Campus), “A”, 5%, 11/01/2032 | | | 1,000,000 | | | | 1,131,120 | |
| University of Arkansas Facilities Rev. (Fayetteville Campus), “A”, 5%, 11/01/2043 | | | 1,500,000 | | | | 1,817,040 | |
| University of Arkansas Facilities Rev. (Monticello Campus), 4%, 12/01/2035 | | | 600,000 | | | | 601,002 | |
| University of Arkansas Facilities Rev. (UAMS Campus), 5%, 11/01/2023 | | | 520,000 | | | | 587,298 | |
| University of Arkansas Facilities Rev. (UAMS Campus), 5%, 10/01/2025 | | | 780,000 | | | | 880,698 | |
| University of Arkansas Facilities Rev. (UAMS Campus), 5%, 11/01/2025 | | | 2,000,000 | | | | 2,264,100 | |
| University of Arkansas Student Fee Rev. (Fort Smith Campus), 4%, 12/01/2023 | | | 250,000 | | | | 260,985 | |
| University of Arkansas Student Fee Rev. (Fort Smith Campus), 4%, 12/01/2024 | | | 250,000 | | | | 260,728 | |
| University of Arkansas Student Fee Rev. (Fort Smith Campus), 4%, 12/01/2025 | | | 500,000 | | | | 521,195 | |
| University of Arkansas Student Fee Rev. (Fort Smith Campus), 4%, 12/01/2026 | | | 305,000 | | | | 317,694 | |
| University of Central Arkansas Rev., “C”, ASSD GTY, 4.25%, 9/01/2040 | | | 1,950,000 | | | | 1,969,246 | |
| University of Central Arkansas Student Fee Rev., “A”, AGM, 5%, 11/01/2038 | | | 500,000 | | | | 577,955 | |
| University of Central Arkansas Student Fee Rev., “A”, AGM, 4%, 11/01/2048 | | | 550,000 | | | | 573,380 | |
| | | | | | | $ | 24,084,920 | |
| Universities - Dormitories - 0.8% | | | | | | | | |
| California Municipal Finance Authority, Student Housing Rev.(CHF-Davis I LLC - West Village Student Housing Project), BAM, 5%, 5/15/2051 | | $ | 1,130,000 | | | $ | 1,211,360 | |
30
Portfolio of Investments – continued
| | | | | | | | |
| Municipal Bonds - continued | | | | | | |
| | | | | | | | |
| | |
| Issuer | | Shares/Par | | | Value ($) | |
| Utilities - Cogeneration - 0.2% | | | | | | | | |
| Puerto Rico Industrial, Tourist, Educational, Medical & Environmental Control Facilities Financing Authority Rev. (Cogeneration Facilities - AES Puerto Rico Project), 9.12%, 6/01/2022 | | $ | 355,000 | | | $ | 363,875 | |
| | |
| Utilities - Municipal Owned - 8.1% | | | | | | | | |
| Benton, AR, Public Utility Rev., AGM, 5%, 9/01/2030 | | $ | 1,000,000 | | | $ | 1,184,100 | |
| Benton, AR, Public Utility Rev., AGM, 5%, 9/01/2032 | | | 1,130,000 | | | | 1,234,683 | |
| Benton, AR, Public Utility Rev., AGM, 5%, 9/01/2035 | | | 1,000,000 | | | | 1,171,920 | |
| Benton, AR, Public Utility Rev., AGM, 5%, 9/01/2036 | | | 1,165,000 | | | | 1,272,926 | |
| Guam Power Authority Rev., “A”, 5.5%, 10/01/2030 (Prerefunded 10/01/2020) | | | 450,000 | | | | 459,724 | |
| Guam Power Authority Rev., “A”, 5.5%, 10/01/2040 (Prerefunded 10/01/2020) | | | 790,000 | | | | 807,072 | |
| Guam Power Authority Rev., “A”, AGM, 5%, 10/01/2030 | | | 2,805,000 | | | | 2,890,160 | |
| North Little Rock, AR, Electric Rev., “B”, AGM, 5%, 7/01/2021 | | | 1,040,000 | | | | 1,042,974 | |
| North Little Rock, AR, Electric Rev., “B”, AGM, 5%, 7/01/2022 | | | 1,090,000 | | | | 1,093,117 | |
| Puerto Rico Electric Power Authority Rev., “A”, 5%, 7/01/2029 (a)(d) | | | 410,000 | | | | 290,075 | |
| Puerto Rico Electric Power Authority Rev., “A”, 5%, 7/01/2042 (a)(d) | | | 65,000 | | | | 45,987 | |
| Puerto Rico Electric Power Authority Rev., “AAA”, 5.25%, 7/01/2021 (a)(d) | | | 30,000 | | | | 21,300 | |
| Puerto Rico Electric Power Authority Rev., “AAA”, 5.25%, 7/01/2030 (a)(d) | | | 15,000 | | | | 10,650 | |
| Puerto Rico Electric Power Authority Rev., “CCC”, 5.25%, 7/01/2027 (a)(d) | | | 145,000 | | | | 102,950 | |
| Puerto Rico Electric Power Authority Rev., “DDD”, 5%, 7/01/2020 (a)(d) | | | 15,000 | | | | 10,613 | |
| Puerto Rico Electric Power Authority Rev., “DDD”, 5%, 7/01/2021 (a)(d) | | | 155,000 | | | | 109,662 | |
| Puerto Rico Electric Power Authority Rev., “DDD”, 5%, 7/01/2022 (a)(d) | | | 260,000 | | | | 183,950 | |
| Puerto Rico Electric Power Authority Rev., “DDD”, AGM, 5%, 7/01/2023 | | | 135,000 | | | | 135,894 | |
| Puerto Rico Electric Power Authority Rev., “EEE”, 6.05%, 7/01/2032 (a)(d) | | | 80,000 | | | | 56,900 | |
| Puerto Rico Electric Power Authority Rev., “TT”, 5%, 7/01/2021 (a)(d) | | | 60,000 | | | | 42,450 | |
| Puerto Rico Electric Power Authority Rev., “TT”, 5%, 7/01/2023 (a)(d) | | | 70,000 | | | | 49,525 | |
| Puerto Rico Electric Power Authority Rev., “TT”, 5%, 7/01/2027 (a)(d) | | | 10,000 | | | | 7,075 | |
| Puerto Rico Electric Power Authority Rev., “TT”, 5%, 7/01/2037 (a)(d) | | | 210,000 | | | | 148,575 | |
| Puerto Rico Electric Power Authority Rev., “VV”, NATL, 5.25%, 7/01/2032 | | | 25,000 | | | | 25,400 | |
| Puerto Rico Electric Power Authority Rev., “VV”, NATL, 5.25%, 7/01/2034 | | | 15,000 | | | | 15,114 | |
| | | | | | | | |
| | | | | | | |
| | |
| Issuer | | Shares/Par | | | Value ($) | |
| Utilities - Municipal Owned - continued | |
| Puerto Rico Electric Power Authority Rev., “WW”, 5.375%, 7/01/2022 (a)(d) | | $ | 10,000 | | | $ | 7,113 | |
| Puerto Rico Electric Power Authority Rev., “WW”, 5.25%, 7/01/2025 (a)(d) | | | 25,000 | | | | 17,750 | |
| Puerto Rico Electric Power Authority Rev., “ZZ”, 5%, 7/01/2018 (a)(d) | | | 95,000 | | | | 66,144 | |
| Puerto Rico Electric Power Authority Rev., “ZZ”, 5.25%, 7/01/2023 (a)(d) | | | 110,000 | | | | 78,100 | |
| Puerto Rico Electric Power Authority Rev., “ZZ”, 5.25%, 7/01/2024 (a)(d) | | | 35,000 | | | | 24,850 | |
| Puerto Rico Electric Power Authority Rev., “ZZ”, 5.25%, 7/01/2026 (a)(d) | | | 95,000 | | | | 67,450 | |
| | | | | | | $ | 12,674,203 | |
| Utilities - Other - 0.3% | | | | | | | | |
| Tennessee Energy Acquisition Corp., Gas Rev., “A”, 5.25%, 9/01/2021 | | $ | 300,000 | | | $ | 309,339 | |
| Tennessee Energy Acquisition Corp., Gas Rev., “A”, 5.25%, 9/01/2022 | | | 155,000 | | | | 162,995 | |
| | | | | | | $ | 472,334 | |
| Water & Sewer Utility Revenue - 11.1% | |
| Arkansas Community Public Water Systems Authority Rev., 5%, 10/01/2032 | | $ | 1,020,000 | | | $ | 1,112,963 | |
| Arkansas Development Finance Authority, Capital Improvement Rev., Revolving Fund Loan, “C”, 5%, 6/01/2023 | | | 795,000 | | | | 829,185 | |
| Arkansas Development Finance Authority, Capital Improvement Rev., Revolving Fund Loan, “C”, 5%, 6/01/2025 | | | 1,500,000 | | | | 1,563,960 | |
| Commonwealth of Puerto Rico Aqueduct & Sewer Authority Rev., “A”, ASSD GTY, 5%, 7/01/2028 | | | 35,000 | | | | 35,015 | |
| Conway, AR, Wastewater Improvement Rev., “A”, 4%, 10/01/2039 | | | 1,525,000 | | | | 1,747,619 | |
| Fort Smith, AR, Water and Sewer and Construction Rev., 5%, 10/01/2035 | | | 3,850,000 | | | | 4,751,939 | |
| Fort Smith, AR, Water and Sewer Rev., AGM, 4.5%, 10/01/2021 | | | 1,545,000 | | | | 1,621,848 | |
| Fort Smith, AR, Water and Sewer Rev., AGM, 4.5%, 10/01/2022 | | | 455,000 | | | | 477,277 | |
| Fort Smith, AR, Water and Sewer Rev., BAM, 5%, 10/01/2029 | | | 1,000,000 | | | | 1,200,010 | |
| Guam Waterworks Authority Rev. (Water and Wastewater System), 5%, 7/01/2036 | | | 85,000 | | | | 85,983 | |
| Guam Waterworks Authority Rev. (Water and Wastewater System), 5%, 1/01/2046 | | | 500,000 | | | | 494,985 | |
| Guam Waterworks Authority Rev. (Water and Wastewater System), “A”, 5%, 7/01/2029 | | | 245,000 | | | | 250,508 | |
| Guam Waterworks Authority Rev. (Water and Wastewater System), “A”, 5%, 7/01/2035 | | | 245,000 | | | | 247,896 | |
| Hot Springs, AR, Waterworks Rev., BAM, 3.75%, 10/01/2043 | | | 1,750,000 | | | | 1,862,507 | |
| Malvern, AR, Water and Sewer Refunding and Construction Rev., BAM, 3.7%, 8/01/2043 | | | 750,000 | | | | 774,795 | |
| Michigan Finance Authority Local Government Loan Program Rev. (Detroit Water and Sewerage Department Sewage Disposal System Rev. Refunding Second Lien Local Project),“C-7”, NATL, 5%, 7/01/2032 | | | 50,000 | | | | 56,335 | |
31
Portfolio of Investments – continued
| | | | | | | | |
| Municipal Bonds - continued | | | | | | |
| | | | | | | | |
| | |
| Issuer | | Shares/Par | | | Value ($) | |
| Water & Sewer Utility Revenue - continued | |
| Michigan Finance Authority Local Government Loan Program Rev. (Detroit Water and Sewerage Department Water Supply System Rev. Refunding Second Lien Local Project),“D-6”, NATL, 5%, 7/01/2036 | | $ | 65,000 | | | $ | 72,896 | |
| Michigan Finance Authority Local Government Loan Program Rev. (Detroit Water and Sewerage Department Water Supply System Rev. Refunding Senior Lien Local Project),“D-1”, AGM, 5%, 7/01/2035 | | | 30,000 | | | | 33,827 | |
| Michigan Finance Authority Local Government Loan Program Rev. (Detroit Water and Sewerage Department Water Supply System Rev. Refunding Senior Lien Local Project),“D-1”, AGM, 5%, 7/01/2037 | | | 75,000 | | | | 84,241 | |
| | | | | | | $ | 17,303,789 | |
Total Municipal Bonds
(Identified Cost, $146,649,538) | | | | | | $ | 151,171,786 | |
| | | | | | | | |
| Bonds - 0.1% | | | | | | |
| | |
| Issuer | | Shares/Par | | | Value ($) | |
| Consumer Services - 0.1% | | | | | | | | |
| Toll Road Investors Partnership II LP, Capital Appreciation, NATL, 0%, 2/15/2043 (n) (Identified Cost, $155,144) | | $ | 500,000 | | | $ | 182,997 | |
| | |
| Investment Companies (h) - 2.0% | | | | | | | | |
| Money Market Funds - 2.0% | | | | | | | | |
| MFS Institutional Money Market Portfolio, 1.28% (v) (Identified Cost, $3,037,778) | | | 3,037,105 | | | $ | 3,037,713 | |
| | |
| Other Assets, Less Liabilities - 1.1% | | | | | | | 1,788,862 | |
| Net Assets - 100.0% | | | | | | $ | 156,181,358 | |
See Portfolio Footnotes and Notes to Financial Statements
32
PORTFOLIO OF INVESTMENTS
3/31/20
MFS CALIFORNIA MUNICIPAL BOND FUND
The Portfolio of Investments is a complete list of all securities owned by your fund. It is categorized by broad-based asset classes.
| | | | | | | | |
| Municipal Bonds - 97.3% | | | | | | |
| | | | | | | | |
| | |
| Issuer | | Shares/Par | | | Value ($) | |
| Airport Revenue - 10.5% | | | | | | | | |
| California Municipal Finance Authority Rev. (LINXS APM Project), “A”, 5%, 12/31/2043 | | $ | 2,190,000 | | | $ | 2,334,387 | |
| Chicago, IL, O’Hare International Airport Rev., Third Lien, “A”, 5.625%, 1/01/2035 (Prerefunded 1/01/2021) | | | 615,000 | | | | 635,547 | |
| Chicago, IL, O’Hare International Airport Rev., Third Lien, Unrefunded Balance, “A”, 5.625%, 1/01/2035 | | | 165,000 | | | | 169,833 | |
| Los Angeles, CA, Department of Airports Rev. (Los Angeles International), “A”, 5%, 5/15/2029 | | | 1,180,000 | | | | 1,185,039 | |
| Los Angeles, CA, Department of Airports Rev. (Los Angeles International), “C”, 5%, 5/15/2038 | | | 1,935,000 | | | | 2,255,900 | |
| Los Angeles, CA, Department of Airports Rev. (Los Angeles International), “D”, 5%, 5/15/2037 | | | 1,305,000 | | | | 1,565,308 | |
| Los Angeles, CA, Department of Airports Rev. (Los Angeles International), “D”, 5%, 5/15/2038 | | | 1,305,000 | | | | 1,559,266 | |
| Los Angeles, CA, Department of Airports Rev. (Los Angeles International), “F”, 5%, 5/15/2044 | | | 6,200,000 | | | | 7,322,386 | |
| Sacramento County, CA, Airport System Rev., “B”, 5%, 7/01/2038 | | | 2,000,000 | | | | 2,285,280 | |
| Sacramento County, CA, Airport System Rev., “C”, 5%, 7/01/2039 | | | 1,000,000 | | | | 1,140,500 | |
| San Diego County, CA, Regional Airport Authority Rev., “A”, 5%, 7/01/2021 | | | 1,500,000 | | | | 1,513,875 | |
| San Diego County, CA, Regional Airport Authority Rev., “B”, 5%, 7/01/2036 | | | 750,000 | | | | 892,170 | |
| San Diego County, CA, Regional Airport Authority Rev., “B”, 5%, 7/01/2037 | | | 1,400,000 | | | | 1,660,288 | |
| San Diego County, CA, Regional Airport Authority Rev., “B”, 5%, 7/01/2038 | | | 1,000,000 | | | | 1,181,540 | |
| San Diego County, CA, Regional Airport Authority Rev., “B”, 5%, 7/01/2039 | | | 1,000,000 | | | | 1,179,090 | |
| San Diego County, CA, Regional Airport Authority Rev., “B”, 5%, 7/01/2042 | | | 665,000 | | | | 757,515 | |
| San Diego County, CA, Regional Airport Authority Rev., “B”, 5%, 7/01/2047 | | | 665,000 | | | | 751,796 | |
| San Francisco, CA, City & County Airports Commission, International Airport Rev., “A”, 5%, 5/01/2031 | | | 850,000 | | | | 901,986 | |
| San Francisco, CA, City & County Airports Commission, International Airport Rev., “A”, 5%, 5/01/2044 | | | 2,605,000 | | | | 3,018,309 | |
| San Francisco, CA, City & County Airports Commission, International Airport Rev., “B”, 5%, 5/01/2046 | | | 3,000,000 | | | | 3,322,530 | |
| San Francisco, CA, City & County Airports Commission, International Airport Rev., “D”, 5%, 5/01/2025 (Prerefunded 5/03/2021) | | | 570,000 | | | | 594,185 | |
| | | | | | | | |
| | | | | | | |
| | |
| Issuer | | Shares/Par | | | Value ($) | |
| Airport Revenue - continued | |
| San Francisco, CA, City & County Airports Commission, International Airport Rev., “H”, 5%, 5/01/2021 | | $ | 5,000,000 | | | $ | 5,176,400 | |
| San Francisco, CA, City & County Airports Commission, International Airport Rev., “A”, 5%, 5/01/2039 | | | 3,420,000 | | | | 3,999,519 | |
| San Francisco, CA, City & County Airports Commission, International Airport Rev., “B”, 5%, 5/01/2041 | | | 5,000,000 | | | | 5,578,500 | |
| San Francisco, CA, City & County Airports Commission, International Airport Rev., Unrefunded Balance, “D”, 5%, 5/01/2025 | | | 1,430,000 | | | | 1,488,430 | |
| San Jose, CA, Airport Rev., “A”, 5%, 3/01/2035 | | | 1,000,000 | | | | 1,136,590 | |
| San Jose, CA, Airport Rev., “A”, 5%, 3/01/2047 | | | 2,000,000 | | | | 2,224,360 | |
| San Jose, CA, Airport Rev.,“A-2”, 5.25%, 3/01/2034 | | | 3,000,000 | | | | 3,093,360 | |
| | | | | | | $ | 58,923,889 | |
| General Obligations - General Purpose - 5.7% | | | | | |
| Bridgeview, IL, Stadium and Redevelopment Projects, AAC, 5.14%, 12/01/2036 | | $ | 1,080,000 | | | $ | 997,013 | |
| Chicago, IL, “A”, 5%, 1/01/2025 | | | 810,000 | | | | 831,036 | |
| Chicago, IL, General Obligation, “A”, 5%, 1/01/2026 | | | 225,000 | | | | 231,745 | |
| Chicago, IL, General Obligation, “A”, 5%, 1/01/2027 | | | 255,000 | | | | 263,530 | |
| Commonwealth of Puerto Rico, General Obligation, “A”, 8%, 7/01/2035 (a)(d) | | | 5,930,000 | | | | 3,558,000 | |
| Commonwealth of Puerto Rico, Public Improvement, “A”, AGM, 5%, 7/01/2035 | | | 80,000 | | | | 80,653 | |
| Commonwealth of Puerto Rico, Public Improvement, “A”, NATL, 5.5%, 7/01/2020 | | | 820,000 | | | | 823,756 | |
| Marin County, CA, Healthcare District (Election of 2013), “A”, 4%, 8/01/2047 | | | 3,000,000 | | | | 3,302,940 | |
| Puerto Rico Public Buildings Authority Rev.,“M-2”, AAC, 10%, 7/01/2035 | | | 430,000 | | | | 466,903 | |
| State of California, 5.25%, 4/01/2035 | | | 2,545,000 | | | | 2,726,331 | |
| State of California, 4%, 8/01/2037 | | | 1,700,000 | | | | 1,922,394 | |
| State of California, 5.5%, 3/01/2040 | | | 3,275,000 | | | | 3,284,137 | |
| State of California, 5.25%, 11/01/2040 | | | 2,775,000 | | | | 2,830,333 | |
| State of California, 5%, 4/01/2045 | | | 7,000,000 | | | | 8,538,110 | |
| Tulare County, CA, Tulare Local Health Care District, BAM, 4%, 8/01/2039 | | | 1,500,000 | | | | 1,734,765 | |
| | | | | | | $ | 31,591,646 | |
| General Obligations - Schools - 18.2% | | | | | | | | |
| Beverly Hills, CA, Unified School District (Election of 2008), Capital Appreciation, 0%, 8/01/2029 | | $ | 4,335,000 | | | $ | 3,692,986 | |
| Compton, CA, Unified School District (Election of 2015), “B”, BAM, 4%, 6/01/2049 | | | 1,750,000 | | | | 1,919,225 | |
33
Portfolio of Investments – continued
| | | | | | | | |
| Municipal Bonds - continued | | | | | | |
| | | | | | | | |
| | |
| Issuer | | Shares/Par | | | Value ($) | |
| General Obligations - Schools - continued | |
| Compton, CA, Unified School District (Election of 2015), Capital Appreciation, “B”, BAM, 0%, 6/01/2038 | | $ | 2,250,000 | | | $ | 1,354,905 | |
| Compton, CA, Unified School District (Election of 2015), Capital Appreciation, “B”, BAM, 0%, 6/01/2039 | | | 2,125,000 | | | | 1,231,884 | |
| Downey, CA, Unified School District (Election of 2014), “B”, 4%, 8/01/2040 | | | 2,785,000 | | | | 3,140,338 | |
| Dublin, CA, Unified School District (Election of 2016), “B”, 4%, 8/01/2043 | | | 1,945,000 | | | | 2,155,021 | |
| Folsom Cordova, CA, Unified School District (Election of 2007), “D”, AGM, 4%, 10/01/2038 | | | 4,000,000 | | | | 4,415,920 | |
| Folsom Cordova, CA, Unified School District (Election of 2007), “D”, AGM, 4%, 10/01/2039 | | | 4,000,000 | | | | 4,410,320 | |
| Folsom Cordova, CA, Unified School District (Election of 2012), “A”, 5%, 10/01/2038 | | | 2,465,000 | | | | 2,716,381 | |
| Garvey, CA, School District (Election of 2004), Capital Appreciation, AGM, 0%, 8/01/2031 | | | 2,120,000 | | | | 1,665,472 | |
| Grossmont, CA, Union High School District (Election of 2008),“I-2”, 4%, 8/01/2044 | | | 5,190,000 | | | | 5,872,174 | |
| Imperial County, CA, Community College District Rev., BAM, 4%, 8/01/2040 | | | 465,000 | | | | 516,131 | |
| Imperial County, CA, Community College District Rev., Capital Appreciation, “C”, BAM, 0%, 8/01/2034 | | | 500,000 | | | | 306,610 | |
| Kern County, CA, Sierra Sands Unified School District (Election of 2006), Capital Appreciation, ASSD GTY, 0%, 11/01/2033 | | | 1,260,000 | | | | 855,565 | |
| Lake Tahoe, CA, Unified School District (Election of 2008), Convertible Capital Appreciation, AGM, 0% to 8/01/2032, 6.375% to 8/01/2045 | | | 1,590,000 | | | | 1,458,825 | |
| Los Angeles County, CA, Mt. San Antonio Community College District (Election of 2018), “A”, 4%, 8/01/2049 | | | 875,000 | | | | 985,994 | |
| Los Angeles County, CA, Palmdale School District (Election of 2016), 4%, 8/01/2044 | | | 2,395,000 | | | | 2,648,104 | |
| Marin County, CA, Community College District (Election of 2016), “B”, 4%, 8/01/2039 | | | 2,000,000 | | | | 2,235,200 | |
| Marin County, CA, Community College District (Election of 2016), “B”, 4%, 8/01/2040 | | | 1,000,000 | | | | 1,106,370 | |
| Marin County, CA, San Rafael City Elementary School District Rev., “B”, 4%, 8/01/2047 | | | 2,595,000 | | | | 2,864,595 | |
| Mendocino Lake, CA, Community College District Rev. (Election of 2006), Capital Appreciation, “B”, AGM, 0%, 8/01/2032 | | | 1,570,000 | | | | 1,176,354 | |
| Montebello, CA, Unified School District (Election of 2016), “A”, 4%, 8/01/2046 | | | 1,570,000 | | | | 1,688,739 | |
| Moorpark, CA, Unified School District (Election of 2008), Capital Appreciation, “A”, ASSD GTY, 0%, 8/01/2033 | | | 500,000 | | | | 364,765 | |
| Moreland, CA, School District (Election of 2002), Capital Appreciation, “B”, FGIC, 0%, 8/01/2028 | | | 1,440,000 | | | | 1,224,878 | |
| | | | | | | | |
| | | | | | | |
| | |
| Issuer | | Shares/Par | | | Value ($) | |
| General Obligations - Schools - continued | |
| Mount Diablo, CA, Unified School District (Election of 2010), Convertible Capital Appreciation, “A”, AGM, 0% to 8/01/2019, 6% to 8/01/2030 | | $ | 3,000,000 | | | $ | 3,246,390 | |
| Mount San Antonio, CA, Community College District Rev. (Election of 2008), Convertible Capital Appreciation, “A”, 0% to 8/01/2028, 6.25% to 8/01/2043 | | | 5,000,000 | | | | 5,120,600 | |
| Napa Valley, CA, Unified School District (Election of 2006), Capital Appreciation, “A”, 0%, 8/01/2029 | | | 3,385,000 | | | | 2,865,064 | |
| Oakland, CA, Unified School District Rev., AGM, 5%, 8/01/2028 | | | 830,000 | | | | 973,573 | |
| Oakland, CA, Unified School District Rev., AGM, 5%, 8/01/2030 | | | 830,000 | | | | 969,872 | |
| Oakland, CA, Unified School District Rev. (Election of 2012), “A”, AGM, 4%, 8/01/2034 | | | 1,000,000 | | | | 1,130,380 | |
| Oakland, CA, Unified School District Rev. (Election of 2012), “A”, AGM, 4%, 8/01/2035 | | | 1,000,000 | | | | 1,126,870 | |
| Orange County, CA, Garden Grove Unified School District, 4%, 8/01/2046 | | | 3,000,000 | | | | 3,316,110 | |
| Oxnard, CA, School District (Ventura County), “A”, BAM, 5%, 8/01/2045 | | | 2,590,000 | | | | 3,079,251 | |
| Placer & Nevada Counties, CA, Tahoe-Trukee Unified School District (Election of 2014) (School Facilities Improvement District No. 1), “B”, 5%, 8/01/2033 | | | 500,000 | | | | 599,085 | |
| Placer & Nevada Counties, CA, Tahoe-Trukee Unified School District (Election of 2014) (School Facilities Improvement District No. 1), “B”, 5%, 8/01/2034 | | | 1,400,000 | | | | 1,672,790 | |
| Placer & Nevada Counties, CA, Tahoe-Trukee Unified School District (Election of 2014) (School Facilities Improvement District No. 1), “B”, 5%, 8/01/2035 | | | 1,105,000 | | | | 1,316,972 | |
| Placer and Sacramento Counties, CA, Roseville Joint Union High School District (School Facilities Improvement District No. 1), 4%, 8/01/2046 | | | 1,515,000 | | | | 1,643,745 | |
| San Bernardino, CA, City Unified School District, “A”, AGM, 5%, 8/01/2023 | | | 600,000 | | | | 669,294 | |
| San Diego, CA, Community College District (Election of 2002), Convertible Capital Appreciation, 6% to 8/01/2019, 6% to 8/01/2033 | | | 2,000,000 | | | | 2,591,960 | |
| San Diego, CA, Unified School District (Election of 2008), Capital Appreciation, “G”, 0%, 7/01/2034 | | | 1,235,000 | | | | 671,852 | |
| San Diego, CA, Unified School District (Election of 2012), “I”, 4%, 7/01/2047 | | | 2,145,000 | | | | 2,369,989 | |
| San Jose, CA, Evergreen Community College District (Election of 2010), “A”, 5%, 8/01/2041 | | | 1,235,000 | | | | 1,345,804 | |
| San Mateo County, CA, Community College District (Election of 2001), Capital Appreciation, “A”, NATL, 0%, 9/01/2021 | | | 4,300,000 | | | | 4,230,684 | |
34
Portfolio of Investments – continued
| | | | | | | | |
| Municipal Bonds - continued | | | | | | |
| | | | | | | | |
| | |
| Issuer | | Shares/Par | | | Value ($) | |
| General Obligations - Schools - continued | |
| Santa Barbara and San Luis Obispo Counties, CA, Santa Maria-Bonita School District, 4%, 8/01/2042 | | $ | 1,000,000 | | | $ | 1,109,660 | |
| Santa Barbara and San Luis Obispo Counties, CA, Santa Maria-Bonita School District, 4%, 8/01/2044 | | | 1,250,000 | | | | 1,382,100 | |
| Santa Clara and Santa Cruz Counties, CA, West Valley-Mission Community College District (Election of 2018), “A”, 4%, 8/01/2044 | | | 2,650,000 | | | | 2,998,316 | |
| South Monterey County, CA, Joint Union High School District (Election of 2018), “A-1”, AGM, 4%, 8/01/2049 | | | 2,480,000 | | | | 2,754,338 | |
| Stanislaus County, CA, CERES Unified School District, Capital Appreciation, BAM, 0%, 8/01/2046 | | | 2,775,000 | | | | 1,027,777 | |
| Stanislaus County, CA, CERES Unified School District, Capital Appreciation, BAM, 0%, 8/01/2047 | | | 3,035,000 | | | | 1,075,452 | |
| Sweetwater, CA, Union High School District, “C”, 4%, 8/01/2043 | | | 2,000,000 | | | | 2,234,600 | |
| | | | | | | $ | 101,529,284 | |
| Healthcare Revenue - Hospitals - 12.1% | | | | | |
| Allegheny County, PA, Hospital Development Authority Rev. (Allegheny Health Network Obligated Group), “A”, 5%, 4/01/2047 | | $ | 2,075,000 | | | $ | 2,463,730 | |
| California Health Facilities Financing Authority Rev. (Children’s Hospital Los Angeles), “A”, 5%, 8/15/2042 | | | 2,550,000 | | | | 3,004,282 | |
| California Health Facilities Financing Authority Rev. (City of Hope), 5%, 11/15/2049 | | | 4,000,000 | | | | 4,516,640 | |
| California Health Facilities Financing Authority Rev. (El Camino Hospital), 5%, 2/01/2037 | | | 1,000,000 | | | | 1,206,700 | |
| California Health Facilities Financing Authority Rev. (Marshall Medical Center), 5%, 11/01/2033 | | | 750,000 | | | | 866,865 | |
| California Health Facilities Financing Authority Rev. (Sutter Health), “A”, 5%, 11/15/2038 | | | 1,000,000 | | | | 1,178,220 | |
| California Health Facilities Financing Authority Rev. (Sutter Health), “A”, 5%, 11/15/2048 | | | 3,500,000 | | | | 4,142,180 | |
| California Health Facilities Financing Authority Rev. (Sutter Health), “B”, 5%, 11/15/2046 | | | 3,180,000 | | | | 3,646,315 | |
| California Municipal Finance Authority Rev. (Community Medical Centers), “A”, 5%, 2/01/2036 | | | 1,275,000 | | | | 1,432,603 | |
| California Municipal Finance Authority Rev. (Community Medical Centers), “A”, 5%, 2/01/2037 | | | 850,000 | | | | 952,969 | |
| California Municipal Finance Authority Rev. (Community Medical Centers), “A”, 5%, 2/01/2042 | | | 425,000 | | | | 473,484 | |
| California Municipal Finance Authority Rev. (Eisenhower Medical Center), 5%, 7/01/2042 | | | 2,000,000 | | | | 2,189,080 | |
| California Municipal Finance Authority Rev. (Eisenhower Medical Center), “A”, 5%, 7/01/2047 | | | 1,000,000 | | | | 1,087,670 | |
| | | | | | | | |
| | | | | | | |
| | |
| Issuer | | Shares/Par | | | Value ($) | |
| Healthcare Revenue - Hospitals - continued | | | | | |
| California Municipal Finance Authority Rev. (Eisenhower Medical Center), “B”, 4%, 7/01/2047 | | $ | 1,685,000 | | | $ | 1,699,356 | |
| California Municipal Finance Authority Rev. (NorthBay Healthcare Group), 5%, 11/01/2028 | | | 205,000 | | | | 228,616 | |
| California Municipal Finance Authority Rev. (NorthBay Healthcare Group), 5%, 11/01/2029 | | | 165,000 | | | | 183,310 | |
| California Municipal Finance Authority Rev. (NorthBay Healthcare Group), 5%, 11/01/2030 | | | 85,000 | | | | 94,065 | |
| California Municipal Finance Authority Rev. (NorthBay Healthcare Group), 5%, 11/01/2035 | | | 315,000 | | | | 342,137 | |
| California Municipal Finance Authority Rev. (NorthBay Healthcare Group), 5%, 11/01/2044 | | | 415,000 | | | | 437,456 | |
| California Municipal Finance Authority Rev. (NorthBay Healthcare Group), “A”, 5.25%, 11/01/2047 | | | 1,500,000 | | | | 1,610,430 | |
| California Public Finance Authority Rev. (Henry Mayo Newhall Hospital), 5%, 10/15/2047 | | | 2,545,000 | | | | 2,858,417 | |
| California Statewide Communities Development Authority Hospital Rev. (Methodist Hospital of Southern California), 5%, 1/01/2038 | | | 1,500,000 | | | | 1,774,185 | |
| California Statewide Communities Development Authority Rev. (Adventist Health System/West), “A”, 5%, 3/01/2042 | | | 4,000,000 | | | | 4,798,560 | |
| California Statewide Communities Development Authority Rev. (Community Hospital of the Monterey Peninsula), “A”, 6%, 6/01/2033 (Prerefunded 6/01/2021) | | | 1,250,000 | | | | 1,320,463 | |
| California Statewide Communities Development Authority Rev. (Enloe Medical Center), “A”, CALHF, 5.5%, 8/15/2023 | | | 1,000,000 | | | | 1,003,550 | |
| California Statewide Communities Development Authority Rev. (John Muir Health), “A”, 5%, 12/01/2053 | | | 1,000,000 | | | | 1,180,310 | |
| California Statewide Communities Development Authority Rev. (John Muir Health), “A”, 5%, 12/01/2057 | | | 2,000,000 | | | | 2,354,000 | |
| California Statewide Communities Development Authority Rev. (Loma Linda University Medical Center), “A”, 5.5%, 12/01/2054 | | | 1,650,000 | | | | 1,758,686 | |
| California Statewide Communities Development Authority Rev. (Loma Linda University Medical Center), “A”, 5.25%, 12/01/2056 | | | 1,000,000 | | | | 1,062,460 | |
| California Statewide Communities Development Authority Rev. (Marin General Hospital), “A”, 5%, 8/01/2036 | | | 635,000 | | | | 780,421 | |
| California Statewide Communities Development Authority Rev. (Marin General Hospital), “A”, 5%, 8/01/2037 | | | 455,000 | | | | 557,639 | |
| California Statewide Communities Development Authority Rev. (Marin General Hospital), “A”, 5%, 8/01/2038 | | | 430,000 | | | | 525,353 | |
| California Statewide Communities Development Authority Rev. (Redlands Community Hospital), 5%, 10/01/2046 | | | 1,925,000 | | | | 2,129,878 | |
35
Portfolio of Investments – continued
| | | | | | | | |
| Municipal Bonds - continued | | | | | | |
| | | | | | | | |
| | |
| Issuer | | Shares/Par | | | Value ($) | |
| Healthcare Revenue - Hospitals - continued | | | | | |
| California Statewide Communities Development Authority Rev. (Santa Ynez Valley Cottage Hospital), 5.25%, 11/01/2030 | | $ | 1,740,000 | | | $ | 1,782,891 | |
| California Statewide Communities Development Authority Rev. (Sutter Health), “A”, 5%, 8/15/2032 | | | 390,000 | | | | 416,598 | |
| California Statewide Communities Development Authority Rev. (Trinity Health Corp.), 5%, 12/01/2041 | | | 2,550,000 | | | | 2,706,493 | |
| Doylestown, PA, Hospital Rev., “A”, 5%, 7/01/2049 | | | 70,000 | | | | 80,270 | |
| Oroville, CA, Rev. (Oroville Hospital), 5.25%, 4/01/2049 | | | 2,000,000 | | | | 2,218,820 | |
| Palomar Health, CA, Refunding Rev., AGM, 5%, 11/01/2047 | | | 2,000,000 | | | | 2,334,700 | |
| San Buenaventura, CA, Rev. (Community Memorial Health System), 7.5%, 12/01/2041 | | | 1,000,000 | | | | 1,077,930 | |
| Upland, CA, (San Antonio Regional Hospital), COP, 4%, 1/01/2042 | | | 1,000,000 | | | | 1,045,460 | |
| Upland, CA, (San Antonio Regional Hospital), COP, 5%, 1/01/2047 | | | 1,000,000 | | | | 1,096,890 | |
| Washington Township, CA, Health Care District Rev., “A”, 5%, 7/01/2042 | | | 1,000,000 | | | | 1,158,970 | |
| | | | | | | $ | 67,779,052 | |
| Healthcare Revenue - Long Term Care - 3.1% | |
| ABAG Finance Authority forNon-Profit Corps., CA, Rev. (Episcopal Senior Communities), 6.125%, 7/01/2041 | | $ | 850,000 | | | $ | 872,695 | |
| ABAG Finance Authority forNon-Profit Corps., CA, Rev. (Eskaton Properties, Inc.), 5%, 11/15/2035 | | | 1,270,000 | | | | 1,326,705 | |
| California Health Facilities Financing Authority Rev. (Northern California Presbyterian Homes and Services, Inc.), 5%, 7/01/2034 | | | 700,000 | | | | 818,993 | |
| California Health Facilities Financing Authority Rev. (Northern California Presbyterian Homes and Services, Inc.), 5%, 7/01/2039 | | | 1,000,000 | | | | 1,160,690 | |
| California Municipal Finance Authority Rev. (Channing House Project), “B”, 5%, 5/15/2047 | | | 2,000,000 | | | | 2,340,160 | |
| California Statewide Communities Development Authority Insured Rev. (Viamonte Senior Living 1 Project), “A”, 4%, 7/01/2038 | | | 435,000 | | | | 491,594 | |
| California Statewide Communities Development Authority Insured Rev. (Viamonte Senior Living 1 Project), “A”, 4%, 7/01/2039 | | | 430,000 | | | | 485,001 | |
| California Statewide Communities Development Authority Insured Rev. (Viamonte Senior Living 1 Project), “A”, 4%, 7/01/2040 | | | 435,000 | | | | 490,080 | |
| California Statewide Communities Development Authority Insured Rev. (Viamonte Senior Living 1 Project), “A”, 4%, 7/01/2043 | | | 980,000 | | | | 1,098,031 | |
| California Statewide Communities Development Authority Rev. (899 Charleston Project), “A”, 5.25%, 11/01/2044 | | | 1,405,000 | | | | 1,432,974 | |
| | | | | | | | |
| | | | | | | |
| | |
| Issuer | | Shares/Par | | | Value ($) | |
| Healthcare Revenue - Long Term Care - continued | |
| California Statewide Communities Development Authority Rev. (Episcopal Communities & Services for Seniors Obligated Group), 5%, 5/15/2047 | | $ | 1,785,000 | | | $ | 1,882,122 | |
| California Statewide Communities Development Authority Rev. (Front Port Communities and Services), “A”, 4%, 4/01/2042 | | | 735,000 | | | | 794,778 | |
| California Statewide Communities Development Authority Rev. (Front Port Communities and Services), “A”, 5%, 4/01/2047 | | | 1,835,000 | | | | 2,141,867 | |
| California Statewide Communities Development Authority Rev. (Terraces at San Joaquin Gardens), “A”, 6%, 10/01/2042 | | | 750,000 | | | | 799,462 | |
| Eden Township, CA, Healthcare District, COP, 6.125%, 6/01/2034 (Prerefunded 6/01/2020) | | | 1,090,000 | | | | 1,098,676 | |
| | | | | | | $ | 17,233,828 | |
| Industrial Revenue - Environmental Services - 0.6% | | | | | |
| California Municipal Finance Authority Solid Waste Disposal Rev. (Waste Management, Inc. Project), “A”, 2.4%, 10/01/2044 (Put Date 10/01/2029) | | $ | 3,000,000 | | | $ | 2,902,980 | |
| California Pollution Control Financing Authority, Solid Waste Disposal Subordinate Rev. (CalPlant I Project), 7.5%, 12/01/2039 | | | 2,000,000 | | | | 460,000 | |
| | | | | | | $ | 3,362,980 | |
| Industrial Revenue - Other - 0.5% | | | | | | | | |
| Port Beaumont, TX, Navigation District Facility Rev. (Jefferson Gulf Coast Energy Project), “A”, 3.625%, 1/01/2035 (n) | | $ | 400,000 | | | $ | 336,752 | |
| Port Beaumont, TX, Navigation District Facility Rev. (Jefferson Gulf Coast Energy Project), “A”, 4%, 1/01/2050 (n) | | | 1,120,000 | | | | 864,483 | |
| Tuscaloosa County, AL, Industrial Development Authority, Gulf Opportunity Zone (Hunt Refining Project), “A”, 4.5%, 5/01/2032 | | | 640,000 | | | | 608,429 | |
| Tuscaloosa County, AL, Industrial Development Authority, Gulf Opportunity Zone (Hunt Refining Project), “A”, 5.25%, 5/01/2044 | | | 885,000 | | | | 851,025 | |
| | | | | | | $ | 2,660,689 | |
| Miscellaneous Revenue - Other - 1.9% | | | | | | | | |
| California Infrastructure & Economic Development Bank Rev. (Academy of Motion Picture Arts and Sciences Obligated Group), “A”, 5%, 11/01/2034 | | $ | 830,000 | | | $ | 924,761 | |
| California Infrastructure & Economic Development Bank Rev. (Academy of Motion Picture Arts and Sciences Obligated Group), “A”, 5%, 11/01/2035 | | | 830,000 | | | | 923,234 | |
| California Statewide Communities Development Authority Rev. (Infrastructure Program), “B”, 5%, 9/02/2039 | | | 1,000,000 | | | | 1,116,800 | |
| California Statewide Communities Development Authority Rev. (Infrastructure Program), “B”, 5%, 9/02/2044 | | | 1,000,000 | | | | 1,108,420 | |
36
Portfolio of Investments – continued
| | | | | | | | |
| Municipal Bonds - continued | | | | | | |
| | | | | | | | |
| | |
| Issuer | | Shares/Par | | | Value ($) | |
| Miscellaneous Revenue - Other - continued | |
| Long Beach, CA, Marina Rev. (Alamitos Bay Marina Project), 5%, 5/15/2031 | | $ | 1,335,000 | | | $ | 1,374,756 | |
| Sacramento, CA, Transient Occupancy Tax Rev. (Convention Center Complex), “C”, 5%, 6/01/2037 | | | 1,465,000 | | | | 1,748,434 | |
| Sacramento, CA, Transient Occupancy Tax Rev. (Convention Center Complex), “C”, 5%, 6/01/2038 | | | 1,250,000 | | | | 1,484,637 | |
| San Francisco, CA, City & County Airports Commission, International Airport Rev., Special Facilities Lease Rev. (SFO Fuel Co. LLC), 5%, 1/01/2040 | | | 1,510,000 | | | | 1,756,598 | |
| | | | | | | $ | 10,437,640 | |
| Multi-Family Housing Revenue - 0.6% | | | | | | | | |
| California Housing Finance Agency Municipal Certificates, “A”, 4%, 3/20/2033 | | $ | 2,988,874 | | | $ | 3,170,807 | |
| | |
| Parking - 0.3% | | | | | | | | |
| Stockton, CA, Public Financing Authority Parking Rev., 5%, 3/01/2047 | | $ | 1,625,000 | | | $ | 1,867,385 | |
| | |
| Port Revenue - 0.4% | | | | | | | | |
| Alameda, CA, Corridor Transportation Authority Second Subordinate Lien Rev., “B”, AGM, 5%, 10/01/2036 | | $ | 1,710,000 | | | $ | 1,998,169 | |
| | |
| Sales & Excise Tax Revenue - 2.0% | | | | | | | | |
| Puerto Rico Sales Tax Financing Corp., Restructured Sales Tax Rev.,“2019A-1”, 4.55%, 7/01/2040 | | $ | 114,000 | | | $ | 107,918 | |
| Puerto Rico Sales Tax Financing Corp., Restructured Sales Tax Rev.,“2019A-1”, 5%, 7/01/2058 | | | 4,615,000 | | | | 4,487,857 | |
| Puerto Rico Sales Tax Financing Corp., Restructured Sales Tax Rev.,“2019A-2”, 4.329%, 7/01/2040 | | | 1,100,000 | | | | 1,010,449 | |
| Puerto Rico Sales Tax Financing Corp., Restructured Sales Tax Rev.,“2019A-2”, 4.329%, 7/01/2040 | | | 385,000 | | | | 353,657 | |
| Puerto Rico Sales Tax Financing Corp., Restructured Sales Tax Rev.,“2019A-2”, 4.536%, 7/01/2053 | | | 9,000 | | | | 8,168 | |
| Puerto Rico Sales Tax Financing Corp., Restructured Sales Tax Rev.,“2019A-2”, 4.784%, 7/01/2058 | | | 186,000 | | | | 174,193 | |
| Puerto Rico Sales Tax Financing Corp., Restructured Sales Tax Rev., Capital Appreciation,“2019A-1”, 0%, 7/01/2024 | | | 16,000 | | | | 13,700 | |
| Puerto Rico Sales Tax Financing Corp., Restructured Sales Tax Rev., Capital Appreciation,“2019A-1”, 0%, 7/01/2027 | | | 171,000 | | | | 130,203 | |
| Puerto Rico Sales Tax Financing Corp., Restructured Sales Tax Rev., Capital Appreciation,“2019A-1”, 0%, 7/01/2029 | | | 31,000 | | | | 21,452 | |
| Puerto Rico Sales Tax Financing Corp., Restructured Sales Tax Rev., Capital Appreciation,“2019A-1”, 0%, 7/01/2031 | | | 1,566,000 | | | | 973,864 | |
| | | | | | | | |
| | | | | | | |
| | |
| Issuer | | Shares/Par | | | Value ($) | |
| Sales & Excise Tax Revenue - continued | |
| Puerto Rico Sales Tax Financing Corp., Restructured Sales Tax Rev., Capital Appreciation,“2019A-1”, 0%, 7/01/2033 | | $ | 1,524,000 | | | $ | 843,290 | |
| Puerto Rico Sales Tax Financing Corp., Restructured Sales Tax Rev., Capital Appreciation,“2019A-1”, 0%, 7/01/2046 | | | 13,175,000 | | | | 3,114,833 | |
| | | | | | | $ | 11,239,584 | |
| Secondary Schools - 3.9% | | | | | | | | |
| California Infrastructure & Economic Development Bank Charter School Rev. (Alliance for College-Ready Public Schools), “B”, 5%, 11/01/2039 | | $ | 300,000 | | | $ | 364,758 | |
| California Infrastructure & Economic Development Bank Charter School Rev. (Alliance for College-Ready Public Schools), “B”, 5%, 11/01/2044 | | | 350,000 | | | | 420,364 | |
| California Infrastructure & Economic Development Bank Rev. (Colburn School), 1.75%, 8/01/2055 (Put Date 8/01/2026) | | | 1,000,000 | | | | 1,009,520 | |
| California Municipal Finance Authority Rev. (Partnerships to Uplift Communities Project), “A”, 5%, 8/01/2032 | | | 825,000 | | | | 832,161 | |
| California Municipal Finance Authority, Charter School Lease Rev. (Nova Academy Project), “A”, 5%, 6/15/2036 | | | 750,000 | | | | 753,915 | |
| California Municipal Finance Authority, Charter School Lease Rev. (Palmdale Aerospace Academy Project), “A”, 5%, 7/01/2038 (n) | | | 970,000 | | | | 978,400 | |
| California Municipal Finance Authority, Education Rev. (American Heritage Education Foundation Project), “A”, 5%, 6/01/2046 | | | 750,000 | | | | 783,487 | |
| California Public Finance Authority, Educational Facilities Rev. (Trinity Classical Academy), “A”, 5%, 7/01/2036 | | | 400,000 | | | | 384,056 | |
| California Public Finance Authority, Educational Facilities Rev. (Trinity Classical Academy), “A”, 5%, 7/01/2044 | | | 375,000 | | | | 344,389 | |
| California Public Finance Authority, Educational Facilities Rev. (Trinity Classical Academy), “A”, 5%, 7/01/2054 | | | 1,000,000 | | | | 892,280 | |
| California School Finance Authority, Charter School Rev. (Aspire Public Schools - Obligated Group), 5%, 8/01/2040 | | | 415,000 | | | | 434,169 | |
| California School Finance Authority, Charter School Rev. (Aspire Public Schools - Obligated Group), 5%, 8/01/2041 | | | 500,000 | | | | 522,615 | |
| California School Finance Authority, Charter School Rev. (Aspire Public Schools - Obligated Group), 5%, 8/01/2045 | | | 415,000 | | | | 431,579 | |
| California School Finance Authority, Charter School Rev. (Downtown Prep), 5%, 6/01/2046 | | | 1,000,000 | | | | 979,910 | |
| California School Finance Authority, Charter School Rev. (Social Bonds - Fenton Charter Public Schools Obligated Group), “A”, 5%, 7/01/2040 (n) | | | 600,000 | | | | 611,640 | |
37
Portfolio of Investments – continued
| | | | | | | | |
| Municipal Bonds - continued | | | | | | |
| | | | | | | | |
| | |
| Issuer | | Shares/Par | | | Value ($) | |
| Secondary Schools - continued | | | | | | | | |
| California School Finance Authority, Charter School Rev. (Social Bonds - Fenton Charter Public Schools Obligated Group), “A”, 5%, 7/01/2050 (n) | | $ | 525,000 | | | $ | 529,725 | |
| California School Finance Authority, Charter School Rev. (Social Bonds - Fenton Charter Public Schools Obligated Group), “A”, 5%, 7/01/2058 (n) | | | 625,000 | | | | 625,706 | |
| California School Finance Authority, Educational Facilities Rev. (New Designs Charter School Adams Campus Project), “A”, 5%, 6/01/2030 | | | 1,190,000 | | | | 1,230,436 | |
| California School Finance Authority, Educational Facilities Rev. (New Designs Charter School Adams Campus Project), “A”, 5%, 6/01/2040 | | | 750,000 | | | | 753,083 | |
| California School Finance Authority, Educational Facilities Rev. (New Designs Charter School Adams Campus Project), “A”, 5%, 6/01/2050 | | | 1,060,000 | | | | 1,038,895 | |
| California School Finance Authority, School Facility Rev. (Alliance for College-Ready Public Schools Projects), “A”, 5%, 7/01/2030 | | | 1,245,000 | | | | 1,325,539 | |
| California School Finance Authority, School Facility Rev. (Green Dot Public Schools California Projects), “A”, 5%, 8/01/2038 | | | 870,000 | | | | 908,228 | |
| California School Finance Authority, School Facility Rev. (Green Dot Public Schools California Projects), “A”, 5%, 8/01/2048 | | | 870,000 | | | | 895,082 | |
| California School Finance Authority, School Facility Rev. (Kipp LA Projects), “A”, 5%, 7/01/2034 | | | 530,000 | | | | 563,046 | |
| California School Finance Authority, School Facility Rev. (Kipp LA Projects), “A”, 5%, 7/01/2037 | | | 505,000 | | | | 544,284 | |
| California School Finance Authority, School Facility Rev. (Kipp LA Projects), “A”, 5.125%, 7/01/2044 | | | 470,000 | | | | 497,105 | |
| California School Finance Authority, School Facility Rev. (Kipp LA Projects), “A”, 5%, 7/01/2047 | | | 745,000 | | | | 792,233 | |
| California School Finance Authority, School Facility Rev. (Kipp SoCal), “A”, 5%, 7/01/2049 | | | 1,050,000 | | | | 1,130,640 | |
| California Statewide Communities Development Authority, School Facility Rev. (Alliance for College-Ready Public Schools), “A”, 6.375%, 7/01/2047 | | | 1,270,000 | | | | 1,312,939 | |
| | | | | | | $ | 21,890,184 | |
| State & Local Agencies - 2.9% | | | | | | | | |
| California Infrastructure & Economic Development Bank Lease Rev. (California State Teachers’ Retirement System Headquarters Expansion Green Bonds - Climate Bond Certified), 5%, 8/01/2044 | | $ | 1,500,000 | | | $ | 1,825,965 | |
| California Municipal Finance Authority, Lease Rev. (Orange County Civic Center Infrastructure Improvement Program - Phase II), “A”, 5%, 6/01/2043 | | | 2,095,000 | | | | 2,541,675 | |
| | | | | | | | |
| | | | | | | |
| | |
| Issuer | | Shares/Par | | | Value ($) | |
| State & Local Agencies - continued | | | | | | | | |
| California Public Works Board Lease Rev. (Department of Justice), “D”, 5.25%, 11/01/2020 | | $ | 550,000 | | | $ | 551,832 | |
| California Public Works Board Lease Rev. (Judicial Council Projects), “A”, 5%, 3/01/2028 | | | 2,120,000 | | | | 2,342,430 | |
| Delaware Valley, PA, Regional Finance Authority, “C”, FLR, 1.809% (LIBOR - 3mo. + 0.75%), 6/01/2037 | | | 2,360,000 | | | | 2,136,414 | |
| Fresno, CA, Joint Powers Financing Authority Rev., Lease Revenue Refunding Rev. (Master Lease Projects), “A”, AGM, 5%, 4/01/2034 | | | 1,000,000 | | | | 1,200,260 | |
| Fresno, CA, Joint Powers Financing Authority Rev., Lease Revenue Refunding Rev. (Master Lease Projects), “A”, AGM, 5%, 4/01/2037 | | | 800,000 | | | | 949,144 | |
| Ontario Public Finance Authority Lease Rev., AGM, 5%, 11/01/2042 | | | 1,025,000 | | | | 1,233,403 | |
| Sacramento, CA, City Financing Authority Rev. (Master Lease Program Facilities), BAM, 5%, 12/01/2030 | | | 500,000 | | | | 593,700 | |
| Sacramento, CA, City Financing Authority Rev. (Master Lease Program Facilities), BAM, 5%, 12/01/2031 | | | 1,000,000 | | | | 1,189,200 | |
| Sacramento, CA, City Financing Authority Rev. (Master Lease Program Facilities), BAM, 5%, 12/01/2032 | | | 550,000 | | | | 653,070 | |
| San Diego, CA, Public Facilities Financing Authority Lease Rev. (Master Refunding Project), “A”, 5.25%, 3/01/2040 (Prerefunded 9/01/2020) | | | 1,000,000 | | | | 1,017,370 | |
| | | | | | | $ | 16,234,463 | |
| Student Loan Revenue - 0.1% | | | | | | | | |
| Minnesota Office of Higher Education Supplemental Student Loan Program Rev., 2.65%, 11/01/2038 | | $ | 425,000 | | | $ | 407,303 | |
| | |
| Tax - Other - 1.4% | | | | | | | | |
| Guam Government Ltd. Obligation Rev., “A”, 5%, 12/01/2035 | | $ | 315,000 | | | $ | 313,031 | |
| Guam Government Ltd. Obligation Rev., “A”, 5%, 12/01/2036 | | | 170,000 | | | | 168,336 | |
| Guam Government Ltd. Obligation Rev., “A”, 5%, 12/01/2046 | | | 500,000 | | | | 474,150 | |
| Puerto Rico Convention Center District Authority, Hotel Occupancy Tax Rev., “A”, AAC, 5%, 7/01/2031 | | | 635,000 | | | | 635,083 | |
| Puerto Rico Infrastructure Financing Authority Special Tax Rev., “C”, AAC, 5.5%, 7/01/2024 | | | 665,000 | | | | 701,123 | |
| Puerto Rico Infrastructure Financing Authority Special Tax Rev., “C”, AAC, 5.5%, 7/01/2026 | | | 2,010,000 | | | | 2,143,122 | |
| Puerto Rico Infrastructure Financing Authority Special Tax Rev., “C”, AAC, 5.5%, 7/01/2027 | | | 1,145,000 | | | | 1,223,879 | |
| Puerto Rico Infrastructure Financing Authority Special Tax Rev., Capital Appreciation, “A”, AAC, 0%, 7/01/2036 | | | 4,870,000 | | | | 2,232,213 | |
| | | | | | | $ | 7,890,937 | |
38
Portfolio of Investments – continued
| | | | | | | | |
| Municipal Bonds - continued | | | | | | |
| | | | | | | | |
| | |
| Issuer | | Shares/Par | | | Value ($) | |
| Tax Assessment - 4.2% | | | | | | | | |
| California Statewide Communities Development Authority Rev., “A”, 5%, 9/02/2048 | | $ | 1,000,000 | | | $ | 1,106,670 | |
| California Statewide Communities Development Authority, Statewide Community Infrastructure Program Rev., “C”, 5%, 9/02/2044 | | | 500,000 | | | | 544,635 | |
| California Statewide Communities Development Authority, Statewide Community Infrastructure Program Rev., “C”, 5%, 9/02/2049 | | | 500,000 | | | | 541,305 | |
| Huntington Beach, CA, Community Facilities District Special Tax (Grand Coast Resort), 5.125%, 9/01/2031 | | | 1,000,000 | | | | 1,070,320 | |
| Jurupa, CA, Community Facilities Services District, Special Tax (Eastvale Area District No. 31), “A”, 5%, 9/01/2037 | | | 1,000,000 | | | | 1,041,190 | |
| Jurupa, CA, Public Financing Authority, Special Tax Refunding Rev., “A”, AGM, 4%, 9/01/2043 | | | 1,745,000 | | | | 1,972,949 | |
| Lake Elsinore, CA, Public Financing Authority Rev., 5%, 9/01/2035 | | | 920,000 | | | | 999,037 | |
| Lee Lake, CA, Public Financing Authority, Senior Lien Rev., “A”, 5.125%, 9/01/2035 | | | 1,000,000 | | | | 1,100,320 | |
| Los Angeles County, CA, Redevelopment Refunding Authority Tax Allocation Rev., “D”, AGM, 5%, 9/01/2022 | | | 340,000 | | | | 371,351 | |
| Los Angeles County, CA, Redevelopment Refunding Authority Tax Allocation Rev., “D”, AGM, 5%, 9/01/2023 | | | 340,000 | | | | 383,367 | |
| North Natomas, CA, Community Facilities District Special Tax,“4-E”, 5.25%, 9/01/2033 | | | 840,000 | | | | 930,132 | |
| Pittsburg, CA, Redevelopment Successor Agency, Tax Allocation (Los Medanos Community Development Project), AGM, 5%, 8/01/2028 | | | 650,000 | | | | 744,627 | |
| Pittsburg, CA, Redevelopment Successor Agency, Tax Allocation (Los Medanos Community Development Project), AGM, 5%, 8/01/2029 | | | 1,350,000 | | | | 1,543,482 | |
| Rancho Cucamonga, CA, Community Facilities District Special Tax, 5.25%, 9/01/2033 | | | 1,000,000 | | | | 1,067,340 | |
| Rancho Cucamonga, CA, Redevelopment Agency, Tax Allocation Refunding (Successor Agency to the Rancho Redevelopment Project Area), AGM, 5%, 9/01/2032 | | | 2,625,000 | | | | 3,012,844 | |
| Riverside County, CA, Jurupa Valley Redevelopment Project Rev., “B”, AGM, 5%, 10/01/2030 | | | 890,000 | | | | 1,057,044 | |
| Riverside County, CA, Jurupa Valley Redevelopment Project Rev., “B”, AGM, 5%, 10/01/2031 | | | 1,095,000 | | | | 1,294,170 | |
| Riverside County, CA, Redevelopment Agency, Tax Allocation, “A”, AGM, 5%, 10/01/2034 | | | 1,385,000 | | | | 1,591,947 | |
| San Francisco, CA, City & County Redevelopment Successor Agency, Tax Allocation (Mission Bay South Redevelopment Project), “A”, 5%, 8/01/2043 | | | 750,000 | | | | 843,750 | |
| | | | | | | | |
| | | | | | | |
| | |
| Issuer | | Shares/Par | | | Value ($) | |
| Tax Assessment - continued | | | | | | | | |
| San Francisco, CA, City & County Redevelopment Successor Agency, Tax Allocation (Mission Bay South Redevelopment Project), “B”, NATL, 5%, 8/01/2043 | | $ | 1,100,000 | | | $ | 1,277,100 | |
| Santa Cruz County, CA, Redevelopment Agency Tax Allocation Rev., 5%, 9/01/2023 | | | 1,000,000 | | | | 1,128,990 | |
| | | | | | | $ | 23,622,570 | |
| Tobacco - 2.7% | | | | | | | | |
| Buckeye, OH, Tobacco Settlement Financing Authority Senior Asset-Backed Refunding,2020A-2, “1”, 5%, 6/01/2033 | | $ | 370,000 | | | $ | 457,801 | |
| Buckeye, OH, Tobacco Settlement Financing Authority Senior Asset-Backed Refunding,2020A-2, “1”, 4%, 6/01/2038 | | | 235,000 | | | | 257,252 | |
| Buckeye, OH, Tobacco Settlement Financing Authority Senior Asset-Backed Refunding,2020B-2, “2”, 5%, 6/01/2055 | | | 3,070,000 | | | | 2,720,081 | |
| Buckeye, OH, Tobacco Settlement Financing Authority Senior Asset-Backed Refunding,2020B-3, Capital Appreciation, “2”, 0%, 6/01/2057 | | | 7,375,000 | | | | 813,684 | |
| Golden State, CA, Tobacco Securitization Corp., Tobacco Settlement Rev.,“A-1”, 5%, 6/01/2029 | | | 2,000,000 | | | | 2,320,260 | |
| Illinois Railsplitter Tobacco Settlement Authority Rev., 6%, 6/01/2028 (Prerefunded 6/01/2021) | | | 1,800,000 | | | | 1,900,170 | |
| Tobacco Securitization Authority of Southern California (San Diego County Tobacco Asset Securitization Corp.), “A”, 5%, 6/01/2036 | | | 250,000 | | | | 295,690 | |
| Tobacco Securitization Authority of Southern California (San Diego County Tobacco Asset Securitization Corp.), “A”, 5%, 6/01/2037 | | | 1,000,000 | | | | 1,177,770 | |
| Tobacco Securitization Authority of Southern California (San Diego County Tobacco Asset Securitization Corp.), “A”, 5%, 6/01/2038 | | | 750,000 | | | | 877,193 | |
| Tobacco Securitization Authority of Southern California (San Diego County Tobacco Asset Securitization Corp.), “A”, 5%, 6/01/2048 | | | 4,250,000 | | | | 4,462,415 | |
| | | | | | | $ | 15,282,316 | |
| Toll Roads - 1.1% | | | | | | | | |
| Bay Area Toll Authority, California Toll Bridge Rev.,“S-7”, 4%, 4/01/2033 | | $ | 2,985,000 | | | $ | 3,367,587 | |
| Bay Area Toll Authority, California Toll Bridge Rev.,“S-7”, 4%, 4/01/2034 | | | 855,000 | | | | 960,977 | |
| Riverside County, CA, Transportation Commission, Toll Rev., “A”, 5.75%, 6/01/2044 | | | 1,680,000 | | | | 1,805,782 | |
| | | | | | | $ | 6,134,346 | |
| Transportation - Special Tax - 2.5% | | | | | | | | |
| Commonwealth of Puerto Rico Highway & Transportation Authority Rev., ASSD GTY, 5.25%, 7/01/2041 | | $ | 330,000 | | | $ | 341,240 | |
| Commonwealth of Puerto Rico Highway & Transportation Authority Rev., “D”, AGM, 5%, 7/01/2032 | | | 470,000 | | | | 470,127 | |
39
Portfolio of Investments – continued
| | | | | | | | |
| Municipal Bonds - continued | | | | | | |
| | | | | | | | |
| | |
| Issuer | | Shares/Par | | | Value ($) | |
| Transportation - Special Tax - continued | |
| Commonwealth of Puerto Rico Highway & Transportation Authority Rev., “J”, NATL, 5%, 7/01/2029 | | $ | 65,000 | | | $ | 65,000 | |
| Commonwealth of Puerto Rico Highway & Transportation Authority Rev., “L”, AAC, 5.25%, 7/01/2038 | | | 2,060,000 | | | | 2,090,488 | |
| Commonwealth of Puerto Rico Highway & Transportation Authority Rev., “L”, NATL, 5.25%, 7/01/2035 | | | 2,330,000 | | | | 2,336,268 | |
| Commonwealth of Puerto Rico Highway & Transportation Authority Rev., “N”, AAC, 5.25%, 7/01/2030 | | | 225,000 | | | | 236,095 | |
| Commonwealth of Puerto Rico Highway & Transportation Authority Rev., “N”, AAC, 5.25%, 7/01/2031 | | | 1,530,000 | | | | 1,600,166 | |
| Commonwealth of Puerto Rico Highway & Transportation Authority Rev., “N”, ASSD GTY, 5.25%, 7/01/2036 | | | 615,000 | | | | 647,441 | |
| Commonwealth of Puerto Rico Highway & Transportation Authority Rev., “N”, NATL, 5.25%, 7/01/2032 | | | 285,000 | | | | 289,554 | |
| Commonwealth of Puerto Rico Highway & Transportation Authority Rev., “N”, NATL, 5.25%, 7/01/2033 | | | 195,000 | | | | 197,350 | |
| Commonwealth of Puerto Rico Highway & Transportation Authority Rev., Unrefunded Balance, “A”, NATL, 5%, 7/01/2038 | | | 75,000 | | | | 74,383 | |
| Lancaster, CA, Financing Authority Rev. (Measure M&R Structure Improvement Project), BAM, 4%, 6/01/2039 | | | 1,365,000 | | | | 1,575,469 | |
| New Jersey Transportation Trust Fund Authority, Transportation System, “BB”, 5%, 6/15/2044 | | | 4,000,000 | | | | 4,173,320 | |
| | | | | | | $ | 14,096,901 | |
| Universities - Colleges - 6.0% | | | | | | | | |
| California Educational Facilities Authority Rev. (Art Center College of Design), “A”, 5%, 12/01/2036 | | $ | 2,060,000 | | | $ | 2,291,214 | |
| California Educational Facilities Authority Rev. (Chapman University), “B”, 4%, 4/01/2047 | | | 1,000,000 | | | | 1,032,020 | |
| California Educational Facilities Authority Rev. (Loma Linda University), “A”, 5%, 4/01/2036 | | | 425,000 | | | | 482,209 | |
| California Educational Facilities Authority Rev. (Loma Linda University), “A”, 5%, 4/01/2037 | | | 1,265,000 | | | | 1,432,220 | |
| California Educational Facilities Authority Rev. (Loyola Marymount University), “B”, 5%, 10/01/2038 | | | 630,000 | | | | 725,432 | |
| California Educational Facilities Authority Rev. (University of Redlands), “A”, 5%, 10/01/2036 | | | 1,000,000 | | | | 1,107,220 | |
| California Educational Facilities Authority Rev. (University of Redlands), “A”, 5%, 10/01/2037 | | | 1,000,000 | | | | 1,104,620 | |
| California Educational Facilities Authority Rev. (University of Redlands), “A”, 5%, 10/01/2038 | | | 500,000 | | | | 551,060 | |
| California Educational Facilities Authority Rev. (University of San Francisco), 6.125%, 10/01/2030 (Prerefunded 10/01/2021) | | | 860,000 | | | | 919,865 | |
| | | | | | | | |
| | | | | | | |
| | |
| Issuer | | Shares/Par | | | Value ($) | |
| Universities - Colleges - continued | | | | | | | | |
| California Educational Facilities Authority Rev. (University of San Francisco), 6.125%, 10/01/2030 (Prerefunded 10/01/2021) | | $ | 900,000 | | | $ | 962,649 | |
| California Educational Facilities Authority Rev. (University of San Francisco), “A”, 5%, 10/01/2038 | | | 1,000,000 | | | | 1,151,480 | |
| California Educational Facilities Authority Rev. (University of the Pacific), 5.25%, 11/01/2029 | | | 1,265,000 | | | | 1,269,149 | |
| California Municipal Finance Authority Rev. (Biola University), 5%, 10/01/2033 | | | 625,000 | | | | 691,713 | |
| California Municipal Finance Authority Rev. (Biola University), 5%, 10/01/2035 | | | 1,195,000 | | | | 1,314,811 | |
| California Municipal Finance Authority Rev. (Biola University), 5%, 10/01/2039 | | | 1,000,000 | | | | 1,088,420 | |
| California Municipal Finance Authority Rev. (Emerson College), “B”, 5%, 1/01/2042 | | | 4,310,000 | | | | 4,841,897 | |
| California Municipal Finance Authority Rev. (University of La Verne), “A”, 6.125%, 6/01/2030 (Prerefunded 6/01/2020) | | | 1,500,000 | | | | 1,512,585 | |
| California Municipal Finance Authority Rev. (University of La Verne), “A”, 6.25%, 6/01/2040 (Prerefunded 6/01/2020) | | | 1,500,000 | | | | 1,512,885 | |
| California Municipal Finance Authority Rev. (University of La Verne), “A”, 5%, 6/01/2043 | | | 1,500,000 | | | | 1,694,175 | |
| California Municipal Finance Authority Rev. (William Jessup University), 5%, 8/01/2039 | | | 500,000 | | | | 508,545 | |
| California Municipal Finance Authority Rev. (William Jessup University), 5%, 8/01/2048 | | | 2,500,000 | | | | 2,507,225 | |
| California Public Works Board Lease Rev. (Regents of the University of California), 5%, 12/01/2028 (Prerefunded 12/01/2021) | | | 2,125,000 | | | | 2,266,355 | |
| California State University Rev., “A”, 5%, 11/01/2024 | | | 1,580,000 | | | | 1,669,412 | |
| California State University Rev., “A”, ETM, 5%, 11/01/2024 (Prerefunded 11/01/2021) | | | 550,000 | | | | 582,533 | |
| | | | | | | $ | 33,219,694 | |
| Universities - Dormitories - 3.1% | | | | | | | | |
| California Municipal Finance Authority, Student Housing Rev. (Bowles Hall Foundation), “A”, 5%, 6/01/2035 | | $ | 225,000 | | | $ | 244,530 | |
| California Municipal Finance Authority, Student Housing Rev.(CHF-Davis I LLC - West Village Student Housing Project), 5%, 5/15/2037 | | | 2,605,000 | | | | 2,809,805 | |
| California Municipal Finance Authority, Student Housing Rev.(CHF-Davis I LLC - West Village Student Housing Project), BAM, 5%, 5/15/2036 | | | 4,000,000 | | | | 4,393,720 | |
| California Municipal Finance Authority, Student Housing Rev.(CHF-Davis I LLC - West Village Student Housing Project), BAM, 5%, 5/15/2051 | | | 3,065,000 | | | | 3,285,680 | |
| California Statewide Communities Development Authority Rev. (Lancer Educational Student Housing Project), “A”, 5%, 6/01/2034 (n) | | | 375,000 | | | | 388,931 | |
40
Portfolio of Investments – continued
| | | | | | | | |
| Municipal Bonds - continued | | | | | | |
| | | | | | | | |
| | |
| Issuer | | Shares/Par | | | Value ($) | |
| Universities - Dormitories - continued | | | | | | | | |
| California Statewide Communities Development Authority Rev. (Lancer Educational Student Housing Project), “A”, 5%, 6/01/2039 (n) | | $ | 475,000 | | | $ | 484,063 | |
| California Statewide Communities Development Authority Rev. (Lancer Educational Student Housing Project), “A”, 5%, 6/01/2051 (n) | | | 1,440,000 | | | | 1,444,104 | |
| California Statewide Communities Development Authority Rev. (Lancer Plaza Project), 5.875%, 11/01/2043 | | | 1,500,000 | | | | 1,575,540 | |
| California Statewide Communities Development Authority Rev. (University of California, Irvine East Campus Apartments), 5%, 5/15/2034 | | | 1,000,000 | | | | 1,118,550 | |
| California Statewide Communities Development Authority, College Housing Rev. (NCCD-Hooper Street LLC College of the Arts Project), 5.25%, 7/01/2039 | | | 1,740,000 | | | | 1,797,786 | |
| | | | | | | $ | 17,542,709 | |
| Utilities - Cogeneration - 0.7% | | | | | | | | |
| California Pollution Control Financing Authority, Water Furnishing Refunding Rev. (San Diego County Water Authority Desalination Project Pipeline), 5%, 7/01/2039 | | $ | 1,000,000 | | | $ | 1,001,330 | |
| California Pollution Control Financing Authority, Water Furnishing Refunding Rev. (San Diego County Water Authority Desalination Project Pipeline), 5%, 11/21/2045 | | | 1,610,000 | | | | 1,575,739 | |
| Puerto Rico Industrial, Tourist, Educational, Medical & Environmental Control Facilities Financing Authority Rev. (Cogeneration Facilities - AES Puerto Rico Project), 9.12%, 6/01/2022 | | | 1,300,000 | | | | 1,332,500 | |
| | | | | | | $ | 3,909,569 | |
| Utilities - Investor Owned - 0.4% | | | | | | | | |
| California Pollution Control Financing Authority, Water Facilities Rev. (American Water Capital Corp. Project), 5.25%, 8/01/2040 | | $ | 2,000,000 | | | $ | 2,024,240 | |
| | |
| Utilities - Municipal Owned - 5.1% | | | | | | | | |
| Guam Power Authority Rev., “A”, AGM, 5%, 10/01/2039 | | $ | 280,000 | | | $ | 290,002 | |
| Guam Power Authority Rev., “A”, AGM, 5%, 10/01/2044 | | | 315,000 | | | | 324,554 | |
| Imperial, CA, Irrigation District Electric Rev., “B”, 5%, 11/01/2026 (Prerefunded 11/01/2020) | | | 1,245,000 | | | | 1,273,896 | |
| Los Angeles, CA, Department of Water & Power Water System Rev., “A”, 5%, 7/01/2022 | | | 10,845,000 | | | | 11,353,739 | |
| Los Angeles, CA, Department of Water & Power Water System Rev., “A”, 5%, 7/01/2041 | | | 3,000,000 | | | | 3,510,150 | |
| | | | | | | | |
| | | | | | | |
| | |
| Issuer | | Shares/Par | | | Value ($) | |
| Utilities - Municipal Owned - continued | |
| Puerto Rico Electric Power Authority Rev., “A”, 5%, 7/01/2029 (a)(d) | | $ | 1,200,000 | | | $ | 849,000 | |
| Puerto Rico Electric Power Authority Rev., “A”, 5%, 7/01/2042 (a)(d) | | | 180,000 | | | | 127,350 | |
| Puerto Rico Electric Power Authority Rev., “AAA”, 5.25%, 7/01/2021 (a)(d) | | | 100,000 | | | | 71,000 | |
| Puerto Rico Electric Power Authority Rev., “AAA”, 5.25%, 7/01/2030 (a)(d) | | | 50,000 | | | | 35,500 | |
| Puerto Rico Electric Power Authority Rev., “CCC”, 5.25%, 7/01/2027 (a)(d) | | | 455,000 | | | | 323,050 | |
| Puerto Rico Electric Power Authority Rev., “DDD”, 5%, 7/01/2020 (a)(d) | | | 50,000 | | | | 35,375 | |
| Puerto Rico Electric Power Authority Rev., “DDD”, 5%, 7/01/2021 (a)(d) | | | 475,000 | | | | 336,062 | |
| Puerto Rico Electric Power Authority Rev., “DDD”, 5%, 7/01/2022 (a)(d) | | | 765,000 | | | | 541,237 | |
| Puerto Rico Electric Power Authority Rev., “DDD”, AGM, 3.625%, 7/01/2023 | | | 10,000 | | | | 9,953 | |
| Puerto Rico Electric Power Authority Rev., “EEE”, 6.05%, 7/01/2032 (a)(d) | | | 280,000 | | | | 199,150 | |
| Puerto Rico Electric Power Authority Rev., “RR”, NATL, 5%, 7/01/2022 | | | 1,315,000 | | | | 1,315,881 | |
| Puerto Rico Electric Power Authority Rev., “TT”, 5%, 7/01/2021 (a)(d) | | | 235,000 | | | | 166,263 | |
| Puerto Rico Electric Power Authority Rev., “TT”, 5%, 7/01/2023 (a)(d) | | | 200,000 | | | | 141,500 | |
| Puerto Rico Electric Power Authority Rev., “TT”, 5%, 7/01/2027 (a)(d) | | | 40,000 | | | | 28,300 | |
| Puerto Rico Electric Power Authority Rev., “TT”, 5%, 7/01/2037 (a)(d) | | | 620,000 | | | | 438,650 | |
| Puerto Rico Electric Power Authority Rev., “V”, NATL, 5.25%, 7/01/2033 | | | 260,000 | | | | 263,133 | |
| Puerto Rico Electric Power Authority Rev., “VV”, NATL, 5.25%, 7/01/2032 | | | 495,000 | | | | 502,910 | |
| Puerto Rico Electric Power Authority Rev., “VV”, NATL, 5.25%, 7/01/2034 | | | 55,000 | | | | 55,420 | |
| Puerto Rico Electric Power Authority Rev., “WW”, 5.375%, 7/01/2022 (a)(d) | | | 45,000 | | | | 32,006 | |
| Puerto Rico Electric Power Authority Rev., “WW”, 5.25%, 7/01/2025 (a)(d) | | | 95,000 | | | | 67,450 | |
| Puerto Rico Electric Power Authority Rev., “ZZ”, 5%, 7/01/2018 (a)(d) | | | 290,000 | | | | 201,913 | |
| Puerto Rico Electric Power Authority Rev., “ZZ”, 5.25%, 7/01/2023 (a)(d) | | | 325,000 | | | | 230,750 | |
| Puerto Rico Electric Power Authority Rev., “ZZ”, 5.25%, 7/01/2024 (a)(d) | | | 115,000 | | | | 81,650 | |
| Puerto Rico Electric Power Authority Rev., “ZZ”, 5.25%, 7/01/2026 (a)(d) | | | 355,000 | | | | 252,050 | |
| Sacramento, CA, Municipal Utility District Electric Rev., “X”, 5%, 8/15/2025 (Prerefunded 8/15/2021) | | | 545,000 | | | | 574,108 | |
| Sacramento, CA, Municipal Utility District Electric Rev., Unrefunded Balance, “X”, 5%, 8/15/2025 | | | 1,585,000 | | | | 1,667,626 | |
| Turlock, CA, Irrigation District Rev., 5%, 1/01/2039 | | | 600,000 | | | | 761,232 | |
| Vernon, CA, Electric System Rev., “A”, 5.5%, 8/01/2041 | | | 2,130,000 | | | | 2,243,146 | |
| | | | | | | $ | 28,304,006 | |
41
Portfolio of Investments – continued
| | | | | | | | |
| Municipal Bonds - continued | | | | | | |
| | | | | | | | |
| | |
| Issuer | | Shares/Par | | | Value ($) | |
| Utilities - Other - 1.2% | | | | | | | | |
| CaliforniaM-S-R Energy Authority Gas Rev., “A”, 7%, 11/01/2034 | | $ | 1,750,000 | | | $ | 2,418,972 | |
| Long Beach, CA, Bond Finance Authority Natural Gas Purchase Rev., “A”, 5.25%, 11/15/2022 | | | 2,210,000 | | | | 2,370,910 | |
| Southern California Public Power Authority (Natural Gas Project No. 1), “A”, 5%, 11/01/2033 | | | 1,655,000 | | | | 1,978,983 | |
| | | | | | | $ | 6,768,865 | |
| Water & Sewer Utility Revenue - 6.1% | | | | | | | | |
| Belmont, CA, Joint Powers Financing Authority, Sewer Rev., 5%, 8/01/2045 | | $ | 1,710,000 | | | $ | 2,117,442 | |
| Belmont, CA, Joint Powers Financing Authority, Sewer Rev., 5%, 8/01/2047 | | | 1,885,000 | | | | 2,327,202 | |
| Fillmore, CA, Wastewater Refunding Rev., AGM, 5%, 5/01/2047 | | | 3,000,000 | | | | 3,515,430 | |
| Guam Waterworks Authority Rev. (Water and Wastewater System), 5.625%, 7/01/2040 (Prerefunded 7/01/2020) | | | 525,000 | | | | 530,733 | |
| Irvine Ranch Water District, CA, “B”, VRDN, 0.52%, 10/01/2041 | | | 10,000,000 | | | | 10,000,000 | |
| Oxnard, CA, Financing Authority, Wastewater Rev., AGM, 5%, 6/01/2030 | | | 1,660,000 | | | | 1,909,614 | |
| Oxnard, CA, Financing Authority, Wastewater Rev., AGM, 5%, 6/01/2031 | | | 415,000 | | | | 475,586 | |
| San Mateo-Foster City, CA, Public Financing Authority, Wastewater Rev. (Clean Water Program), 4%, 8/01/2044 | | | 2,205,000 | | | | 2,438,488 | |
| | | | | | | | |
| | | | | | | |
| | |
| Issuer | | Shares/Par | | | Value ($) | |
| Water & Sewer Utility Revenue - continued | |
| Santa Barbara County, CA, Solid Waste System Rev., COP, “B”, 5%, 12/01/2036 | | $ | 2,000,000 | | | $ | 2,466,620 | |
| Silicon Valley Clean Water, CA, Wastewater Rev., 4%, 8/01/2044 | | | 3,250,000 | | | | 3,614,780 | |
| Soquel Creek, CA, Water District, COP, 5%, 3/01/2043 | | | 1,715,000 | | | | 1,872,780 | |
| Tulare, CA, Sewer Rev., AGM, 5%, 11/15/2031 | | | 1,700,000 | | | | 2,014,330 | |
| Tulare, CA, Sewer Rev., AGM, 5%, 11/15/2035 | | | 830,000 | | | | 980,039 | |
| | | | | | | $ | 34,263,044 | |
Total Municipal Bonds
(Identified Cost, $530,170,011) | | | | | | $ | 543,386,100 | |
| | |
| Bonds - 0.1% | | | | | | | | |
| Consumer Services - 0.1% | | | | | | | | |
| Toll Road Investors Partnership II LP, Capital Appreciation, NATL, 0%, 2/15/2043 (n) (Identified Cost, $589,449) | | $ | 1,900,000 | | | $ | 695,390 | |
| | |
| Investment Companies (h) - 0.6% | | | | | | | | |
| Money Market Funds - 0.6% | | | | | | | | |
| MFS Institutional Money Market Portfolio, 1.28% (v) (Identified Cost, $3,337,044) | | | 3,336,949 | | | $ | 3,337,616 | |
| | |
| Other Assets, Less Liabilities - 2.0% | | | | | | | 11,417,540 | |
| Net Assets - 100.0% | | | | | | $ | 558,836,646 | |
Derivative Contracts at 3/31/20
Futures Contracts
| | | | | | | | | | | | | | | | | | | | | | |
| Description | | Long/
Short | | | Currency | | | Contracts | | Notional
Amount | | | Expiration
Date | | | Value/Unrealized
Appreciation
(Depreciation) | |
| Liability Derivatives | | | | | | | | | | | | | | | | | | | | | | |
| Interest Rate Futures | | | | | | | | | | | | | | | | | | | | | | |
| U.S. Treasury Bond | | | Short | | | | USD | | | 50 | | | $8,953,125 | | | | June - 2020 | | | | $(601,747 | ) |
| | | | | | | | | | | | | | | | | | | | | | |
At March 31, 2020, the fund had cash collateral of $325,000 to cover any collateral or margin obligations for certain derivative contracts. Restricted cash and/or deposits with brokers in the Statements of Assets and Liabilities are comprised of cash collateral.
See Portfolio Footnotes and Notes to Financial Statements
42
PORTFOLIO OF INVESTMENTS
3/31/20
MFS GEORGIA MUNICIPAL BOND FUND
The Portfolio of Investments is a complete list of all securities owned by your fund. It is categorized by broad-based asset classes.
| | | | | | | | |
| Municipal Bonds - 96.1% | | | | | | |
| | | | | | | | |
| | |
| Issuer | | Shares/Par | | | Value ($) | |
| Airport Revenue - 3.4% | | | | | | | | |
| Atlanta, GA, Airport Passenger Facility Charge and Subordinate Lien Rev., “D”, 4%, 7/01/2038 | | $ | 1,000,000 | | | $ | 1,070,880 | |
| Atlanta, GA, Airport Rev., “B”, 5%, 1/01/2033 | | | 1,000,000 | | | | 1,120,760 | |
| Atlanta, GA, Airport Rev., “B”, 5%, 7/01/2044 | | | 1,000,000 | | | | 1,159,050 | |
| Dallas and Fort Worth, TX, International Airport Rev., “B”, 5%, 11/01/2044 | | | 75,000 | | | | 79,455 | |
| Dallas and Fort Worth, TX, International Airport Rev., “C”, 5%, 11/01/2045 | | | 55,000 | | | | 57,189 | |
| San Francisco, CA, City & County Airports Commission, International Airport Rev., “B”, 5%, 5/01/2046 | | | 265,000 | | | | 293,490 | |
| Wayne County, MI, Airport Authority Rev. (Detroit Metropolitan Wayne County Airport), “B”, 5%, 12/01/2044 | | | 30,000 | | | | 33,237 | |
| Wayne County, MI, Airport Authority Rev. (Detroit Metropolitan Wayne County Airport), “B”, BAM, 5%, 12/01/2039 | | | 35,000 | | | | 39,038 | |
| Wayne County, MI, Airport Authority Rev. (Detroit Metropolitan Wayne County Airport), “C”, 5%, 12/01/2039 | | | 25,000 | | | | 27,478 | |
| Wayne County, MI, Airport Authority Rev. (Detroit Metropolitan Wayne County Airport), “C”, 5%, 12/01/2044 | | | 40,000 | | | | 43,763 | |
| | | | | | | $ | 3,924,340 | |
| General Obligations - General Purpose - 4.5% | | | | | |
| Atlanta, GA, Public Improvement Rev., 4.875%, 12/01/2026 | | $ | 1,000,000 | | | $ | 1,163,640 | |
| Bridgeview, IL, Stadium and Redevelopment Projects, AAC, 5.14%, 12/01/2036 | | | 220,000 | | | | 203,095 | |
| Chicago, IL, “A”, 5.5%, 1/01/2033 | | | 135,000 | | | | 140,438 | |
| Chicago, IL, “D”, 5.5%, 1/01/2040 | | | 20,000 | | | | 20,597 | |
| Chicago, IL, “F”, 5.5%, 1/01/2042 | | | 165,000 | | | | 169,559 | |
| Chicago, IL, General Obligation (Neighborhood Alive 21 Program), “B”, 5.5%, 1/01/2037 | | | 55,000 | | | | 56,879 | |
| Chicago, IL, General Obligation Refunding Project, “A”, 5.25%, 1/01/2030 | | | 35,000 | | | | 35,848 | |
| Commonwealth of Puerto Rico, General Obligation, “A”, 8%, 7/01/2035 (a)(d) | | | 1,250,000 | | | | 750,000 | |
| Commonwealth of Puerto Rico, Public Improvement, AGM, 5.25%, 7/01/2020 | | | 120,000 | | | | 120,596 | |
| Commonwealth of Puerto Rico, Public Improvement, ASSD GTY, 5.5%, 7/01/2020 | | | 275,000 | | | | 276,534 | |
| Commonwealth of Puerto Rico, Public Improvement, “A”, AGM, 5%, 7/01/2035 | | | 165,000 | | | | 166,346 | |
| Commonwealth of Puerto Rico, Public Improvement, “A”, NATL, 5.5%, 7/01/2020 | | | 165,000 | | | | 165,756 | |
| Commonwealth of Puerto Rico, Public Improvement,“A-4”, AGM, 5%, 7/01/2031 | | | 50,000 | | | | 50,171 | |
| Gwinnett County, GA, Development Authority Rev. (Civic & Cultural Center), 4%, 9/01/2021 | | | 510,000 | | | | 516,171 | |
| | | | | | | | |
| | | | | | | |
| | |
| Issuer | | Shares/Par | | | Value ($) | |
| General Obligations - General Purpose - continued | |
| Puerto Rico Public Buildings Authority Rev.,“M-2”, AAC, 10%, 7/01/2035 | | $ | 130,000 | | | $ | 141,157 | |
| Valdosta & Lowndes County, GA, Hospital Authority Rev. Anticipation Certificate, “A”, 5%, 10/01/2036 | | | 1,000,000 | | | | 1,265,120 | |
| | | | | | | $ | 5,241,907 | |
| General Obligations - Schools - 9.4% | | | | | |
| Ben Hill County, GA, School District Rev., 4%, 4/01/2037 | | $ | 750,000 | | | $ | 868,995 | |
| Bryan County, GA, School District General Obligation, 4%, 8/01/2032 | | | 500,000 | | | | 566,975 | |
| Dalton, GA, General Obligation, 5%, 2/01/2036 | | | 500,000 | | | | 615,315 | |
| Downey, CA, Unified School District (Election of 2014), “B”, 4%, 8/01/2040 | | | 585,000 | | | | 659,640 | |
| Evans County, GA, School District, 4%, 6/01/2035 | | | 660,000 | | | | 770,979 | |
| Forsyth County, GA, 5%, 9/01/2021 | | | 2,435,000 | | | | 2,563,958 | |
| Gwinnett County, GA, School District, 5%, 2/01/2029 | | | 1,000,000 | | | | 1,172,380 | |
| Gwinnett County, GA, School District, 5%, 2/01/2039 | | | 1,500,000 | | | | 1,890,150 | |
| Jackson County, GA, School District, 5%, 3/01/2032 | | | 1,000,000 | | | | 1,277,460 | |
| Jefferson, GA, School District, “A”, 5.25%, 2/01/2029 (Prerefunded 2/01/2021) | | | 500,000 | | | | 517,230 | |
| | | | | | | $ | 10,903,082 | |
| Healthcare Revenue - Hospitals - 13.8% | | | | | |
| Allegheny County, PA, Hospital Development Authority Rev. (Allegheny Health Network Obligated Group), “A”, 4%, 4/01/2044 | | $ | 250,000 | | | $ | 260,972 | |
| Augusta, GA, Development Authority Rev. (AU Health System, Inc. Project), 5%, 7/01/2036 | | | 500,000 | | | | 583,015 | |
| Cedartown Polk County, GA, Hospital Authority Rev., Anticipation Certificates (Polk Medical Center Project), 5%, 7/01/2039 | | | 500,000 | | | | 569,725 | |
| Chattanooga, TN, Health, Educational & Housing Facility Board Rev. (CommonSpirit Health),“A-1”, 4%, 8/01/2044 | | | 15,000 | | | | 14,958 | |
| Chattanooga, TN, Health, Educational & Housing Facility Board Rev. (CommonSpirit Health),“A-2”, 5%, 8/01/2044 | | | 10,000 | | | | 10,766 | |
| Chattanooga, TN, Health, Educational & Housing Facility Board Rev. (CommonSpirit Health),“A-2”, 5%, 8/01/2049 | | | 5,000 | | | | 5,306 | |
| Clarke County, GA, Hospital Authority Rev. | | | | | | | | |
| (Athens Regional Medical Center Project), 5%, 1/01/2032 (Prerefunded 1/01/2022) | | | 1,000,000 | | | | 1,067,290 | |
| Colorado Health Facilities Authority Rev. | | | | | | | | |
| (CommonSpirit Health),“A-2”, 4%, 8/01/2044 | | | 55,000 | | | | 54,847 | |
43
Portfolio of Investments – continued
| | | | | | | | |
| Municipal Bonds - continued | | | | | | |
| | | | | | | | |
| | |
| Issuer | | Shares/Par | | | Value ($) | |
| Healthcare Revenue - Hospitals - continued | | | | | |
| Dalton, GA, Development Authority Rev. (Hamilton Health Care System), 5%, 8/15/2028 | | $ | 500,000 | | | $ | 534,850 | |
| Dalton-Whitfield County, GA, Joint Development Authority Rev. (Hamilton Health Care System), 4%, 8/15/2048 | | | 250,000 | | | | 274,575 | |
| DeKalb County, GA, Hospital Authority Rev. (DeKalb Medical Center, Inc. Project), 6.125%, 9/01/2040 (Prerefunded 9/01/2020) | | | 500,000 | | | | 509,960 | |
| Doylestown, PA, Hospital Rev., “A”, 5%, 7/01/2049 | | | 15,000 | | | | 17,201 | |
| Escambia County, FL, Health Facilities Authority Rev. (Baptist Hospital, Inc.), “A”, 6%, 8/15/2036 | | | 350,000 | | | | 354,816 | |
| Fulton County, GA, Development Authority Hospital Rev. (Piedmont Healthcare, Inc. Project), “A”, 4%, 7/01/2039 | | | 500,000 | | | | 540,145 | |
| Fulton County, GA, Development Authority Hospital Rev. (Piedmont Healthcare, Inc. Project), “A”, 4%, 7/01/2049 | | | 1,000,000 | | | | 1,044,190 | |
| Fulton County, GA, Development Authority Hospital Rev. (Wellstar Health System, Inc. Project), 5%, 4/01/2034 | | | 1,000,000 | | | | 1,196,650 | |
| Fulton County, GA, Development Authority Hospital Rev. (Wellstar Health System, Inc. Project), “A”, 5%, 4/01/2042 | | | 750,000 | | | | 878,287 | |
| Fulton County, GA, Development Authority Rev. (Piedmont Healthcare, Inc. Project), “A”, 5%, 7/01/2032 | | | 500,000 | | | | 584,395 | |
| Fulton County, GA, Development Authority Rev. (Piedmont Healthcare, Inc. Project), “A”, 4%, 7/01/2035 | | | 500,000 | | | | 537,780 | |
| Glynn-Brunswick, GA, Memorial Hospital Authority Rev. (Southeast Georgia Health System Project), 5%, 8/01/2028 | | | 500,000 | | | | 581,750 | |
| Hall County and Gainesville, GA, Hospital Authority Rev. (Northeast Georgia Health System, Inc. Project), “A”, 5%, 2/15/2042 | | | 1,000,000 | | | | 1,143,130 | |
| Jefferson Parish, LA, Hospital Service District No. 2 Hospital Rev. (East Jefferson General Hospital), 6.25%, 7/01/2031 | | | 45,000 | | | | 46,049 | |
| Jefferson Parish, LA, Hospital Service District No. 2 Hospital Rev. (East Jefferson General Hospital), 6.375%, 7/01/2041 | | | 65,000 | | | | 66,444 | |
| Kentucky Economic Development Finance Authority Hospital Rev. (Owensboro Medical Health System, Inc.), “A”, 6.375%, 6/01/2040 (Prerefunded 6/01/2020) | | | 200,000 | | | | 201,674 | |
| Kentucky Economic Development Finance Authority Hospital Rev. (Owensboro Medical Health System, Inc.), “A”, 6.5%, 3/01/2045 (Prerefunded 6/01/2020) | | | 135,000 | | | | 136,156 | |
| Massachusetts Development Finance Agency Rev. (Partners Healthcare System Issue), “S”, 4%, 7/01/2041 | | | 465,000 | | | | 508,877 | |
| Miami-Dade County, FL, Health Facilities Authority Hospital Rev., 6%, 8/01/2030 (Prerefunded 8/01/2020) | | | 35,000 | | | | 35,542 | |
| | | | | | | | |
| | | | | | | |
| | |
| Issuer | | Shares/Par | | | Value ($) | |
| Healthcare Revenue - Hospitals - continued | | | | | |
| Miami-Dade County, FL, Health Facilities Authority Hospital Rev., Unrefunded Balance, 6%, 8/01/2030 | | $ | 10,000 | | | $ | 10,141 | |
| New Jersey Health Care Facilities, Financing Authority Rev. (University Hospital), “A”, AGM, 5%, 7/01/2046 | | | 55,000 | | | | 57,919 | |
| North Carolina Medical Care Commission, Hospital Rev. (North Carolina Baptist Hospitals, Inc.), 5.25%, 6/01/2029 | | | 355,000 | | | | 357,382 | |
| Richmond County, GA, Hospital Authority Rev., Anticipation Certificates (University Health Services, Inc. Project), 4%, 1/01/2036 | | | 1,000,000 | | | | 1,094,010 | |
| Savannah, GA, Hospital Authority Rev. (St. Joseph’s/Candler Health System, Inc.), “A”, 4%, 7/01/2043 | | | 1,000,000 | | | | 1,111,570 | |
| Spartanburg County, SC, Regional Health Services District Hospital Rev., “A”, 4%, 4/15/2043 | | | 570,000 | | | | 614,027 | |
| Thomasville, GA, Hospital Authority Rev. Anticipation Certificates (John D. Archbold Memorial Hospital, Inc. Project), 5.125%, 11/01/2030 (Prerefunded 11/02/2020) | | | 500,000 | | | | 511,725 | |
| Thomasville, GA, Hospital Authority Rev. Anticipation Certificates (John D. Archbold Memorial Hospital, Inc. Project), 5.375%, 11/01/2040 (Prerefunded 11/02/2020) | | | 500,000 | | | | 512,450 | |
| | | | | | | $ | 16,028,574 | |
| Healthcare Revenue - Long Term Care - 1.5% | | | | | |
| Fulton County, GA, Residential Care Facilities, Elderly Authority Rev. (Lenbrook Square Foundation, Inc. Project), “A, 5%, 7/01/2036 | | $ | 500,000 | | | $ | 518,410 | |
| Hall County and Gainesville, GA, Development Authority Retirement Community Rev. (ACTS Retirement - Life Communities, Inc. Obligated Group), 5%, 11/15/2033 | | | 500,000 | | | | 512,710 | |
| Richmond County, GA, Development Authority Rev., Capital Appreciation, ”C“, ETM, 0%, 12/01/2021 | | | 225,000 | | | | 220,347 | |
| Savannah, GA, Economic Development Authority Rev., Capital Appreciation, ”C“, ETM, 0%, 12/01/2021 | | | 500,000 | | | | 489,660 | |
| | | | | | | $ | 1,741,127 | |
| Healthcare Revenue - Other - 1.9% | | | | | |
| Carroll City-County, GA, Hospital Authority Rev. (Tanner Medical Center), 5%, 7/01/2028 | | $ | 500,000 | | | $ | 602,060 | |
| Carroll City-County, GA, Hospital Authority Rev. (Tanner Medical Center), 5%, 7/01/2040 (Prerefunded 7/01/2020) | | | 500,000 | | | | 504,690 | |
| Floyd County, GA, Hospital Authority Rev. Anticipation Certificates (Floyd Medical Center Project), ”B“, 5%, 7/01/2032 | | | 1,000,000 | | | | 1,059,850 | |
| | | | | | | $ | 2,166,600 | |
44
Portfolio of Investments – continued
| | | | | | | | |
| Municipal Bonds - continued | | | | | | |
| | | | | | | | |
| | |
| Issuer | | Shares/Par | | | Value ($) | |
| Industrial Revenue - Other - 0.4% | | | | | |
| Port Beaumont, TX, Navigation District Facility Rev. (Jefferson Gulf Coast Energy Project), ”A“, 4%, 1/01/2050 (n) | | $ | 200,000 | | | $ | 154,372 | |
| Tuscaloosa County, AL, Industrial Development Authority, Gulf Opportunity Zone (Hunt Refining Project), ”A“, 5.25%, 5/01/2044 | | | 285,000 | | | | 274,059 | |
| | | | | | | $ | 428,431 | |
| Industrial Revenue - Paper - 0.1% | | | | | |
| Rockdale County, GA, Development Authority Refunding Rev. (Pratt Paper LLC Project), 4%, 1/01/2038 | | $ | 150,000 | | | $ | 133,128 | |
| |
| Miscellaneous Revenue - Other - 2.3% | | | | | |
| Florida Citizens Property Insurance Corp.,”A-1“, 5%, 6/01/2020 | | $ | 285,000 | | | $ | 286,747 | |
| Fulton County, GA, Development Authority Rev. (Robert W. Woodruff Arts Center, Inc. Project), ”A“, 5%, 3/15/2036 | | | 500,000 | | | | 565,445 | |
| Fulton County, GA, Development Authority Rev. (Robert W. Woodruff Arts Center, Inc. Project), ”A“, 5%, 3/15/2044 | | | 660,000 | | | | 770,972 | |
| Fulton County, GA, Development Authority Rev. (Robert W. Woodruff Arts Center, Inc. Project), ”A“, 5%, 3/15/2034 | | | 500,000 | | | | 599,035 | |
| Indiana Finance Authority Rev. (Ohio River Bridges East End Crossing Project), ”A“, 5%, 7/01/2040 | | | 75,000 | | | | 76,753 | |
| Indiana Finance Authority Rev. (Ohio River Bridges East End Crossing Project), ”A“, 5%, 7/01/2044 | | | 110,000 | | | | 112,203 | |
| New York, NY, Industrial Development Agency, Airport Facilities Rev. (Transportation Infrastructure Properties LLC), 5%, 7/01/2028 | | | 310,000 | | | | 320,370 | |
| | | | | | | $ | 2,731,525 | |
| Multi-Family Housing Revenue - 0.4% | | | | | | | | |
| Atlanta, GA, Urban Residential Financing Authority, Multi-Family Housing Rev. (Ginnie Mae Collateralized - Amal Heights), GNMA, 4.9%, 5/20/2040 (Prerefunded 5/20/2020) | | $ | 500,000 | | | $ | 502,435 | |
| | |
| Sales & Excise Tax Revenue - 5.1% | | | | | | | | |
| Colorado Regional Transportation District, Private Activity Rev. (Denver Transportation Partners), 6.5%, 1/15/2030 | | $ | 265,000 | | | $ | 266,956 | |
| Guam Government Business Privilege Tax Rev., ”A“, 5.25%, 1/01/2036 | | | 170,000 | | | | 171,108 | |
| Metropolitan Atlanta Rapid Transit Authority, GA, Sales Tax Rev. (Third Indenture Series) ”C“, 4%, 7/01/2036 | | | 750,000 | | | | 846,810 | |
| Metropolitan Atlanta Rapid Transit Authority, GA, Sales Tax Rev. (Third Indenture Series), ”A“, 5%, 7/01/2044 | | | 1,000,000 | | | | 1,132,410 | |
| Metropolitan Atlanta Rapid Transit Authority, GA, Sales Tax Rev. (Third Indenture Series), “A”, 4%, 7/01/2046 | | | 1,000,000 | | | | 1,100,850 | |
| | | | | | | | |
| | | | | | | |
| | |
| Issuer | | Shares/Par | | | Value ($) | |
| Sales & Excise Tax Revenue - continued | | | | | |
| Puerto Rico Sales Tax Financing Corp., Restructured Sales Tax Rev.,”2019A-1“, 4.55%, 7/01/2040 | | $ | 24,000 | | | $ | 22,720 | |
| Puerto Rico Sales Tax Financing Corp., Restructured Sales Tax Rev.,”2019A-1“, 5%, 7/01/2058 | | | 938,000 | | | | 912,158 | |
| Puerto Rico Sales Tax Financing Corp., Restructured Sales Tax Rev.,”2019A-2“, 4.329%, 7/01/2040 | | | 237,000 | | | | 217,706 | |
| Puerto Rico Sales Tax Financing Corp., Restructured Sales Tax Rev.,”2019A-2“, 4.329%, 7/01/2040 | | | 83,000 | | | | 76,243 | |
| Puerto Rico Sales Tax Financing Corp., Restructured Sales Tax Rev.,”2019A-2“, 4.784%, 7/01/2058 | | | 38,000 | | | | 35,588 | |
| Puerto Rico Sales Tax Financing Corp., Restructured Sales Tax Rev., Capital Appreciation,”2019A-1“, 0%, 7/01/2024 | | | 1,000 | | | | 856 | |
| Puerto Rico Sales Tax Financing Corp., Restructured Sales Tax Rev., Capital Appreciation,”2019A-1“, 0%, 7/01/2027 | | | 35,000 | | | | 26,650 | |
| Puerto Rico Sales Tax Financing Corp., Restructured Sales Tax Rev., Capital Appreciation,”2019A-1“, 0%, 7/01/2029 | | | 6,000 | | | | 4,152 | |
| Puerto Rico Sales Tax Financing Corp., Restructured Sales Tax Rev., Capital Appreciation,”2019A-1“, 0%, 7/01/2031 | | | 326,000 | | | | 202,733 | |
| Puerto Rico Sales Tax Financing Corp., Restructured Sales Tax Rev., Capital Appreciation,”2019A-1“, 0%, 7/01/2033 | | | 316,000 | | | | 174,855 | |
| Puerto Rico Sales Tax Financing Corp., Restructured Sales Tax Rev., Capital Appreciation,”2019A-1“, 0%, 7/01/2046 | | | 2,899,000 | | | | 685,381 | |
| | | | | | | $ | 5,877,176 | |
| Secondary Schools - 0.3% | | | | | | | | |
| District of Columbia Rev. (Rocketship D.C.), ”A“, 5%, 6/01/2049 | | $ | 250,000 | | | $ | 237,488 | |
| North Texas Education Finance Corp., Education Rev. (Uplift Education), ”A“, 5.125%, 12/01/2042 | | | 75,000 | | | | 80,849 | |
| | | | | | | $ | 318,337 | |
| Single Family Housing - State - 3.7% | | | | | |
| Connecticut Housing Finance Authority Rev. (Housing Mortgage Finance Program), ”C1“, 4%, 11/15/2047 | | $ | 460,000 | | | $ | 485,843 | |
| Connecticut Housing Finance Authority Rev. (Housing Mortgage Finance Program), ”D-1“, GNMA, 4%, 11/15/2047 | | | 565,000 | | | | 597,408 | |
| Georgia Housing & Finance Authority Rev., Single Family Mortgage, ”A“, 3.6%, 12/01/2044 | | | 1,000,000 | | | | 1,056,050 | |
| Georgia Housing & Finance Authority Rev., Single Family Mortgage, ”A“, 3.5%, 6/01/2045 | | | 315,000 | | | | 325,348 | |
45
Portfolio of Investments – continued
| | | | | | | | |
| Municipal Bonds - continued | | | | | | |
| | | | | | | | |
| | |
| Issuer | | Shares/Par | | | Value ($) | |
| Single Family Housing - State - continued | |
| Georgia Housing & Finance Authority Rev., Single Family Mortgage, ”A“, 4%, 12/01/2048 | | $ | 500,000 | | | $ | 533,470 | |
| Iowa Finance Authority, Single Family Mortgage Rev., ”A“, GNMA, 4%, 7/01/2047 | | | 595,000 | | | | 628,641 | |
| Pennsylvania Housing Finance Agency, Single Family Mortgage Rev., “125A”, 3.7%, 10/01/2037 | | | 590,000 | | | | 638,097 | |
| | | | | | | $ | 4,264,857 | |
| State & Local Agencies - 1.8% | | | | | |
| Delaware Valley, PA, Regional Finance Authority, ”C“, FLR, 1.809% (LIBOR - 3mo. + 0.75%), 6/01/2037 | | $ | 460,000 | | | $ | 416,420 | |
| Maryland Stadium Authority Rev., Baltimore City Public Schools Construction and Revitalization Program, “A”, 5%, 5/01/2047 | | | 310,000 | | | | 366,845 | |
| New Jersey Building Authority Rev., Unrefunded Balance, “A”, BAM, 5%, 6/15/2029 | | | 10,000 | | | | 11,106 | |
| New Jersey Economic Development Authority Rev., School Facilities Construction Rev., ”LLL“, 5%, 6/15/2039 | | | 255,000 | | | | 270,302 | |
| New Jersey Economic Development Authority Rev., School Facilities Construction Rev., ”LLL“, 5%, 6/15/2044 | | | 425,000 | | | | 445,119 | |
| Villa Rica, GA, Public Facilities Authority Rev. (Water and Sewerage Project), 5%, 3/01/2039 | | | 500,000 | | | | 568,830 | |
| | | | | | | $ | 2,078,622 | |
| Student Loan Revenue - 0.2% | | | | | |
| Iowa Student Loan Liquidity Corp. Rev., ”B“, 3%, 12/01/2039 | | $ | 50,000 | | | $ | 49,241 | |
| Iowa Student Loan Liquidity Corp. Rev., ”B“, 3.5%, 12/01/2044 | | | 130,000 | | | | 127,548 | |
| Minnesota Office of Higher Education Supplemental Student Loan Program Rev., 2.65%, 11/01/2038 | | | 90,000 | | | | 86,252 | |
| | | | | | | $ | 263,041 | |
| Tax - Other - 1.2% | | | | | | | | |
| Atlanta & Fulton County, GA, Recreation Authority Park Improvement, ”A“, 5%, 12/01/2032 | | $ | 500,000 | | | $ | 581,190 | |
| Guam Government Ltd. Obligation Rev., ”A“, 5%, 12/01/2035 | | | 65,000 | | | | 64,594 | |
| Guam Government Ltd. Obligation Rev., ”A“, 5%, 12/01/2036 | | | 35,000 | | | | 34,657 | |
| Guam Government Ltd. Obligation Rev., ”A“, 5%, 12/01/2046 | | | 100,000 | | | | 94,830 | |
| Puerto Rico Convention Center District Authority, Hotel Occupancy Tax Rev., ”A“, AAC, 5%, 7/01/2031 | | | 95,000 | | | | 95,012 | |
| Puerto Rico Infrastructure Financing Authority Special Tax Rev., ”C“, AAC, 5.5%, 7/01/2024 | | | 125,000 | | | | 131,790 | |
| Puerto Rico Infrastructure Financing Authority Special Tax Rev., ”C“, AAC, 5.5%, 7/01/2026 | | | 145,000 | | | | 154,603 | |
| | | | | | | | |
| | | | | | | |
| | |
| Issuer | | Shares/Par | | | Value ($) | |
| Tax - Other - continued | |
| Puerto Rico Infrastructure Financing Authority Special Tax Rev., ”C“, AAC, 5.5%, 7/01/2027 | | $ | 220,000 | | | $ | 235,156 | |
| | | | | | | $ | 1,391,832 | |
| Tax Assessment - 1.5% | | | | | | | | |
| Atlanta, GA, Tax Allocation (Beltline Project), ”B“, 5%, 1/01/2030 | | $ | 1,000,000 | | | $ | 1,198,090 | |
| Atlanta, GA, Tax Allocation (Eastside Project), 5%, 1/01/2030 | | | 410,000 | | | | 495,001 | |
| Brunswick, MD, Special Obligation Refunding (Brunswick Crossing Special Taxing District), 4%, 7/01/2029 | | | 10,000 | | | | 9,676 | |
| Brunswick, MD, Special Obligation Refunding (Brunswick Crossing Special Taxing District), 5%, 7/01/2036 | | | 10,000 | | | | 10,120 | |
| | | | | | | $ | 1,712,887 | |
| Tobacco - 1.0% | | | | | | | | |
| Buckeye, OH, Tobacco Settlement Financing Authority Senior Asset-Backed Refunding,2020A-2, ”1“, 5%, 6/01/2033 | | $ | 75,000 | | | $ | 92,798 | |
| Buckeye, OH, Tobacco Settlement Financing Authority Senior Asset-Backed Refunding,2020A-2, ”1“, 4%, 6/01/2038 | | | 55,000 | | | | 60,208 | |
| Buckeye, OH, Tobacco Settlement Financing Authority Senior Asset-Backed Refunding,2020B-2, ”2“, 5%, 6/01/2055 | | | 620,000 | | | | 549,332 | |
| Buckeye, OH, Tobacco Settlement Financing Authority Senior Asset-Backed Refunding,2020B-3, Capital Appreciation, ”2“, 0%, 6/01/2057 | | | 1,555,000 | | | | 171,563 | |
| Illinois Railsplitter Tobacco Settlement Authority Rev., 6%, 6/01/2028 (Prerefunded 6/01/2021) | | | 235,000 | | | | 248,078 | |
| | | | | | | $ | 1,121,979 | |
| Toll Roads - 2.0% | | | | | | | | |
| State Road and Tollway Authority, GA, Federal Highway Grant Anticipation Rev., ”B“, 5%, 6/01/2020 | | $ | 1,870,000 | | | $ | 1,881,538 | |
| Texas Private Activity Surface Transportation Corp., Senior Lien Rev. (NTE Mobility Partners Segments 3 LLC Segments 3A & 3B Facility), 7%, 12/31/2038 | | | 80,000 | | | | 90,252 | |
| Texas Private Activity Surface Transportation Corp., Senior Lien Rev. (NTE Mobility Partners Segments 3 LLC Segments 3A & 3B Facility), 6.75%, 6/30/2043 | | | 60,000 | | | | 67,103 | |
| Virginia Small Business Financing Authority Rev. (Elizabeth River Crossings Opco LLC Project), 6%, 1/01/2037 | | | 95,000 | | | | 97,841 | |
| Virginia Small Business Financing Authority Rev. (Elizabeth River Crossings Opco LLC Project), 5.5%, 1/01/2042 | | | 190,000 | | | | 192,785 | |
| | | | | | | $ | 2,329,519 | |
46
Portfolio of Investments – continued
| | | | | | | | |
| Municipal Bonds - continued | | | | | | |
| | | | | | | | |
| | |
| Issuer | | Shares/Par | | | Value ($) | |
| Transportation - Special Tax - 2.5% | | | | | | | | |
| Commonwealth of Puerto Rico Highway & Transportation Authority Rev., ”A“, NATL, 4.75%, 7/01/2038 | | $ | 140,000 | | | $ | 131,799 | |
| Commonwealth of Puerto Rico Highway & Transportation Authority Rev., ”CC“, AGM, 5.5%, 7/01/2028 | | | 275,000 | | | | 298,295 | |
| Commonwealth of Puerto Rico Highway & Transportation Authority Rev., ”D“, AGM, 5%, 7/01/2032 | | | 70,000 | | | | 70,019 | |
| Commonwealth of Puerto Rico Highway & Transportation Authority Rev., ”E“, AGM, 5.5%, 7/01/2020 | | | 40,000 | | | | 40,223 | |
| Commonwealth of Puerto Rico Highway & Transportation Authority Rev., ”J“, NATL, 5%, 7/01/2029 | | | 10,000 | | | | 10,000 | |
| Commonwealth of Puerto Rico Highway & Transportation Authority Rev., ”L“, AAC, 5.25%, 7/01/2038 | | | 700,000 | | | | 710,360 | |
| Commonwealth of Puerto Rico Highway & Transportation Authority Rev., ”L“, NATL, 5.25%, 7/01/2035 | | | 170,000 | | | | 170,457 | |
| Commonwealth of Puerto Rico Highway & Transportation Authority Rev., ”N“, AAC, 5.25%, 7/01/2031 | | | 330,000 | | | | 345,134 | |
| Commonwealth of Puerto Rico Highway & Transportation Authority Rev., ”N“, ASSD GTY, 5.25%, 7/01/2036 | | | 120,000 | | | | 126,330 | |
| Commonwealth of Puerto Rico Highway & Transportation Authority Rev., ”N“, NATL, 5.25%, 7/01/2032 | | | 160,000 | | | | 162,557 | |
| Commonwealth of Puerto Rico Highway & Transportation Authority Rev., ”N“, NATL, 5.25%, 7/01/2033 | | | 135,000 | | | | 136,627 | |
| New Jersey Transportation Trust Fund Authority, Federal Highway Reimbursement Rev.,”A-1“, 5%, 6/15/2027 | | | 120,000 | | | | 134,006 | |
| New Jersey Transportation Trust Fund Authority, Transportation System, ”BB“, 5%, 6/15/2044 | | | 535,000 | | | | 558,182 | |
| | | | | | | $ | 2,893,989 | |
| Universities - Colleges - 19.8% | | | | | | | | |
| Albany-Dougherty County, GA, Inner City Authority Refunding Rev. (USG Real Estate Foundation X LLC Project), 4%, 6/01/2034 | | $ | 1,430,000 | | | $ | 1,624,094 | |
| Americus-Sumter Payroll Development Authority Rev. (USG Real Estate Foundation VII LLC Project), ”A“, 3.5%, 6/01/2035 | | | 500,000 | | | | 545,435 | |
| Barnesville-Lamar County, GA, Industrial Development Authority Refunding Rev. (USG Real Estate Foundation VI LLC Project), 5%, 6/01/2038 | | | 600,000 | | | | 726,954 | |
| Bibb County, GA, Development Authority Rev. (USG Real Estate Foundation IX LLC Project), 4%, 6/01/2037 | | | 560,000 | | | | 628,001 | |
| | | | | | | | |
| | | | | | | |
| | |
| Issuer | | Shares/Par | | | Value ($) | |
| Universities - Colleges - continued | | | | | | | | |
| Bibb County, GA, Development Authority Rev. (USG Real Estate Foundation IX LLC Project), 4%, 6/01/2044 | | $ | 1,000,000 | | | $ | 1,102,870 | |
| Bleckley-Dodge County, GA, Joint Development Authority Refunding Rev. (USG Real Estate Foundation VII LLC Project), 5%, 7/01/2038 | | | 815,000 | | | | 980,673 | |
| Bulloch County, GA, Development Authority Rev. (Georgia Southern University Housing Foundation Four, LLC Project), 5%, 7/01/2038 | | | 1,000,000 | | | | 1,193,870 | |
| Carrollton, GA, Payroll Development Authority Refunding Rev. (UWG Housing, LLC Project), 5%, 7/01/2038 | | | 750,000 | | | | 927,540 | |
| Cobb County, GA, Development Authority, Parking & Dining Hall Refunding Lease Rev. (Kennesaw State University Real Estate Foundations Projects), 5%, 7/15/2034 | | | 500,000 | | | | 603,430 | |
| Cobb County, GA, Development Authority, Sports & Recreation Facilities Lease Rev. (Kennesaw State University Foundation), AGM, 5%, 7/15/2035 | | | 750,000 | | | | 757,072 | |
| Dahlonega, GA, Downtown Development Authority Refunding Rev. (North Georgia MAC LLC), 5%, 7/01/2036 | | | 1,000,000 | | | | 1,196,040 | |
| Fulton County, GA, Development Authority Rev. (Georgia Tech Facilities, Inc.), 5%, 3/01/2034 | | | 300,000 | | | | 371,421 | |
| Fulton County, GA, Development Authority Rev. (Georgia Tech Facilities, Inc.), 5%, 6/15/2044 | | | 1,000,000 | | | | 1,232,590 | |
| Fulton County, GA, Development Authority Rev. (Georgia Tech Facilities, Inc.), 4%, 6/15/2049 | | | 500,000 | | | | 560,570 | |
| Fulton County, GA, Development Authority Rev. (Georgia Tech Facilities, Inc.), 5%, 6/15/2052 | | | 1,000,000 | | | | 1,219,580 | |
| Fulton County, GA, Development Authority | | | | | | | | |
| Rev. (Georgia Tech Facilities, Inc.) ”A“, 5%, 6/01/2039 | | | 1,000,000 | | | | 1,245,490 | |
| Fulton County, GA, Development Authority Rev. (Spelman College), 5%, 6/01/2028 | | | 500,000 | | | | 585,945 | |
| Georgia Higher Education Facilities Authority Refunding Rev. (USG Real Estate Foundation II LLC Project), 4%, 6/15/2036 | | | 750,000 | | | | 855,135 | |
| Georgia Private Colleges & Universities Authority Refunding Rev. (Agnes Scott College), ”A“, 4%, 6/01/2044 | | | 1,000,000 | | | | 1,102,020 | |
| Gwinnett County, GA, Development Authority Rev. (Georgia Gwinnet County Student Housing), ”A“, 5%, 7/01/2040 | | | 1,000,000 | | | | 1,193,620 | |
| Marietta, GA, Development Facilities Authority Rev. (Life University, Inc. Project), ”A“, 5%, 11/01/2047 | | | 250,000 | | | | 241,643 | |
| Moultrie-Colquitt County, GA, Development Authority Rev. (Philadelphia College of Osteopathic Medicine), 5%, 12/01/2048 | | | 870,000 | | | | 1,035,039 | |
47
Portfolio of Investments – continued
| | | | | | | | |
| Municipal Bonds - continued | | | | | | |
| | | | | | | | |
| | |
| Issuer | | Shares/Par | | | Value ($) | |
| Universities - Colleges - continued | | | | | | | | |
| Pinellas County, FL, Educational Facilities Authority Rev. (Barry University), 6%, 10/01/2041 | | $ | 65,000 | | | $ | 67,185 | |
| Private Colleges & Universities, GA, Authority Rev. (Agnes Scott College), ”A“, 4%, 6/01/2039 | | | 500,000 | | | | 555,105 | |
| Private Colleges & Universities, GA, Authority Rev. (Mercer University Project), 5%, 10/01/2040 | | | 350,000 | | | | 372,046 | |
| Private Colleges & Universities, GA, Authority Rev. (Mercer University Project), ”C“, 5.25%, 10/01/2027 | | | 350,000 | | | | 368,309 | |
| Puerto Rico Industrial, Tourist, Educational, Medical & Environmental Control Facilities Financing Authority, Educational Facilities Rev. (University Plaza Project), NATL, 5%, 7/01/2033 | | | 80,000 | | | | 79,465 | |
| Puerto Rico Industrial, Tourist, Educational, Medical & Environmental Control Facilities Financing Authority, Higher Education Rev. (Ana G. Mendez University System Project), 5.125%, 4/01/2032 | | | 25,000 | | | | 22,199 | |
| Puerto Rico Industrial, Tourist, Educational, Medical & Environmental Control Facilities Financing Authority, Higher Education Rev. (Ana G. Mendez University System Project), 5.375%, 4/01/2042 | | | 45,000 | | | | 38,075 | |
| Puerto Rico Industrial, Tourist, Educational, Medical & Environmental Control Facilities Financing Authority, Higher Education Rev. (International American University of Puerto Rico Project), 5%, 10/01/2031 | | | 55,000 | | | | 57,646 | |
| Richmond County, GA, Development Authority Rev. (Georgia Regents University Academic Research Center Project), AGM, 5%, 12/15/2032 | | | 325,000 | | | | 375,391 | |
| Savannah, GA, Economic Development Authority Rev. (SSU Community Development I LLC Project), ASSD GTY, 5.5%, 6/15/2035 | | | 500,000 | | | | 503,845 | |
| South Regional, GA, Joint Development Authority Rev. (VSU Parking and Student Service Center Project), ”A“, 5%, 8/01/2035 | | | 500,000 | | | | 590,850 | |
| | | | | | | $ | 22,959,148 | |
| Universities - Dormitories - 0.9% | | | | | | | | |
| California Municipal Finance Authority, Student Housing Rev.(CHF-Davis I LLC - West Village Student Housing Project), BAM, 5%, 5/15/2051 | | $ | 635,000 | | | $ | 680,720 | |
| Cobb County, GA, Development Authority, Student Housing Rev. (Kennesaw State University Real Estate Foundations), ”C“, 5%, 7/15/2030 | | | 400,000 | | | | 437,480 | |
| | | | | | | $ | 1,118,200 | |
| | | | | | | | |
| | | | | | | |
| | |
| Issuer | | Shares/Par | | | Value ($) | |
| Utilities - Cogeneration - 0.2% | | | | | | | | |
| Puerto Rico Industrial, Tourist, Educational, Medical & Environmental Control Facilities Financing Authority Rev. (Cogeneration Facilities - AES Puerto Rico Project), 9.12%, 6/01/2022 | | $ | 270,000 | | | $ | 276,750 | |
| | |
| Utilities - Municipal Owned - 5.7% | | | | | | | | |
| Dalton, GA, Combined Utilities Rev., 5%, 3/01/2029 | | $ | 1,195,000 | | | $ | 1,433,211 | |
| Dalton, GA, Combined Utilities Rev., 4%, 3/01/2035 | | | 500,000 | | | | 551,955 | |
| Dalton, GA, Combined Utilities Rev., 4%, 3/01/2036 | | | 500,000 | | | | 550,365 | |
| Georgia Municipal Electric Authority (Plant Vogtle Units 3 & 4 Project), ”A“, 5%, 1/01/2039 | | | 750,000 | | | | 852,502 | |
| Georgia Municipal Electric Authority (Project One), ”A“, 5%, 1/01/2038 | | | 125,000 | | | | 143,380 | |
| Georgia Municipal Gas Authority Rev. (Gas Portfolio III Project), ”S“, 5%, 10/01/2025 | | | 500,000 | | | | 546,340 | |
| Georgia Municipal Gas Authority Rev. (Gas Portfolio III Project), ”S“, 5%, 10/01/2026 | | | 500,000 | | | | 545,690 | |
| Guam Power Authority Rev., ”A“, 5.5%, 10/01/2030 (Prerefunded 10/01/2020) | | | 160,000 | | | | 163,458 | |
| Guam Power Authority Rev., ”A“, 5.5%, 10/01/2040 (Prerefunded 10/01/2020) | | | 260,000 | | | | 265,619 | |
| Guam Power Authority Rev., ”A“, AGM, 5%, 10/01/2039 | | | 50,000 | | | | 51,786 | |
| Guam Power Authority Rev., ”A“, AGM, 5%, 10/01/2044 | | | 60,000 | | | | 61,820 | |
| Puerto Rico Electric Power Authority Rev., ”A“, 5%, 7/01/2029 (a)(d) | | | 245,000 | | | | 173,337 | |
| Puerto Rico Electric Power Authority Rev., ”A“, 5%, 7/01/2042 (a)(d) | | | 40,000 | | | | 28,300 | |
| Puerto Rico Electric Power Authority Rev., ”AAA“, 5.25%, 7/01/2021 (a)(d) | | | 20,000 | | | | 14,200 | |
| Puerto Rico Electric Power Authority Rev., ”AAA“, 5.25%, 7/01/2030 (a)(d) | | | 10,000 | | | | 7,100 | |
| Puerto Rico Electric Power Authority Rev., ”CCC“, 5.25%, 7/01/2027 (a)(d) | | | 95,000 | | | | 67,450 | |
| Puerto Rico Electric Power Authority Rev., ”DDD“, 5%, 7/01/2020 (a)(d) | | | 10,000 | | | | 7,075 | |
| Puerto Rico Electric Power Authority Rev., ”DDD“, 5%, 7/01/2021 (a)(d) | | | 100,000 | | | | 70,750 | |
| Puerto Rico Electric Power Authority Rev., ”DDD“, 5%, 7/01/2022 (a)(d) | | | 155,000 | | | | 109,662 | |
| Puerto Rico Electric Power Authority Rev., ”EEE“, 6.05%, 7/01/2032 (a)(d) | | | 60,000 | | | | 42,675 | |
| Puerto Rico Electric Power Authority Rev., ”RR“, ASSD GTY, 5%, 7/01/2028 | | | 490,000 | | | | 490,216 | |
| Puerto Rico Electric Power Authority Rev., ”TT“, 5%, 7/01/2021 (a)(d) | | | 45,000 | | | | 31,838 | |
| Puerto Rico Electric Power Authority Rev., ”TT“, 5%, 7/01/2023 (a)(d) | | | 45,000 | | | | 31,837 | |
| Puerto Rico Electric Power Authority Rev., ”TT“, 5%, 7/01/2027 (a)(d) | | | 10,000 | | | | 7,075 | |
48
Portfolio of Investments – continued
| | | | | | | | |
| Municipal Bonds - continued | | | | | | |
| | | | | | | | |
| | |
| Issuer | | Shares/Par | | | Value ($) | |
| Utilities - Municipal Owned - continued | |
| Puerto Rico Electric Power Authority Rev., ”TT“, 5%, 7/01/2037 (a)(d) | | $ | 125,000 | | | $ | 88,437 | |
| Puerto Rico Electric Power Authority Rev., ”VV“, NATL, 5.25%, 7/01/2030 | | | 70,000 | | | | 71,538 | |
| Puerto Rico Electric Power Authority Rev., ”VV“, NATL, 5.25%, 7/01/2032 | | | 5,000 | | | | 5,080 | |
| Puerto Rico Electric Power Authority Rev., ”VV“, NATL, 5.25%, 7/01/2034 | | | 10,000 | | | | 10,076 | |
| Puerto Rico Electric Power Authority Rev., ”WW“, 5.375%, 7/01/2022 (a)(d) | | | 10,000 | | | | 7,113 | |
| Puerto Rico Electric Power Authority Rev., ”WW“, 5.25%, 7/01/2025 (a)(d) | | | 20,000 | | | | 14,200 | |
| Puerto Rico Electric Power Authority Rev., ”ZZ“, 5%, 7/01/2018 (a)(d) | | | 60,000 | | | | 41,775 | |
| Puerto Rico Electric Power Authority Rev., ”ZZ“, 5.25%, 7/01/2023 (a)(d) | | | 70,000 | | | | 49,700 | |
| Puerto Rico Electric Power Authority Rev., ”ZZ“, 5.25%, 7/01/2024 (a)(d) | | | 25,000 | | | | 17,750 | |
| Puerto Rico Electric Power Authority Rev., ”ZZ“, 5.25%, 7/01/2026 (a)(d) | | | 75,000 | | | | 53,250 | |
| | | | | | | $ | 6,606,560 | |
| Utilities - Other - 1.1% | | | | | | | | |
| Georgia Main Street Natural Gas, Inc., Gas Project Rev., ”A“, 5%, 3/15/2022 | | $ | 910,000 | | | $ | 959,340 | |
| Tennessee Energy Acquisition Corp., Gas Rev., ”A“, 5.25%, 9/01/2020 | | | 250,000 | | | | 252,328 | |
| Texas Gas Acquisition & Supply Corp. III., Gas Supply Rev., 5%, 12/15/2031 | | | 40,000 | | | | 41,340 | |
| | | | | | | $ | 1,253,008 | |
| Water & Sewer Utility Revenue - 11.4% | | | | | |
| Atlanta, GA, Water & Wastewater Refunding Rev., 5%, 11/01/2036 | | $ | 750,000 | | | $ | 922,080 | |
| Atlanta, GA, Water & Wastewater Refunding Rev., ”A“, 5%, 11/01/2032 | | | 1,000,000 | | | | 1,243,190 | |
| Atlanta, GA, Water & Wastewater Refunding Rev., ”A“, 5%, 11/01/2037 | | | 1,000,000 | | | | 1,225,730 | |
| Atlanta, GA, Water & Wastewater Refunding Rev., ”A“, 5%, 11/01/2038 | | | 1,000,000 | | | | 1,222,430 | |
| Atlanta, GA, Water & Wastewater Refunding Rev., ”B“, 4%, 11/01/2038 | | | 500,000 | | | | 563,540 | |
| Cartersville, GA, Development Authority Waste & Water Facilities Rev., 4%, 6/01/2038 | | | 500,000 | | | | 568,555 | |
| Cherokee County, GA, Water & Sewer Authority Rev., 5%, 8/01/2021 | | | 385,000 | | | | 404,878 | |
| Cherokee County, GA, Water & Sewer Authority Rev., 5%, 8/01/2028 | | | 800,000 | | | | 809,768 | |
| Columbus, GA, Water and Sewerage Rev., 5%, 5/01/2035 | | | 350,000 | | | | 416,007 | |
| Columbus, GA, Water and Sewerage Rev., 5%, 5/01/2036 | | | 150,000 | | | | 177,846 | |
| DeKalb County, GA, Water & Sewer Rev., ”A“, 5.25%, 10/01/2031 | | | 1,000,000 | | | | 1,055,230 | |
| DeKalb County, GA, Water & Sewer Rev., ”B“, 5.25%, 10/01/2025 | | | 1,000,000 | | | | 1,206,740 | |
| | | | | | | | |
| | | | | | | |
| | |
| Issuer | | Shares/Par | | | Value ($) | |
| Water & Sewer Utility Revenue - continued | | | | | |
| Fulton County, GA, Water & Sewer Rev., 5%, 1/01/2023 | | $ | 500,000 | | | $ | 514,425 | |
| Guam Waterworks Authority Rev. (Water and Wastewater System), 5%, 7/01/2036 | | | 30,000 | | | | 30,347 | |
| Guam Waterworks Authority Rev. (Water and Wastewater System), 5.625%, 7/01/2040 (Prerefunded 7/01/2020) | | | 60,000 | | | | 60,655 | |
| Guam Waterworks Authority Rev. (Water and Wastewater System), 5%, 1/01/2046 | | | 125,000 | | | | 123,746 | |
| Guam Waterworks Authority Rev. (Water and Wastewater System), ”A“, 5%, 7/01/2029 | | | 45,000 | | | | 46,012 | |
| Guam Waterworks Authority Rev. (Water and Wastewater System), ”A“, 5%, 7/01/2035 | | | 45,000 | | | | 45,532 | |
| Henry County, GA, Water & Sewer Authority Rev., BHAC, 5.25%, 2/01/2027 | | | 1,000,000 | | | | 1,254,810 | |
| Michigan Finance Authority Local Government Loan Program Rev. (Detroit Water and Sewerage Department Sewage Disposal System Rev. Refunding Second Lien Local Project),”C-7“, NATL, 5%, 7/01/2032 | | | 15,000 | | | | 16,900 | |
| Michigan Finance Authority Local Government Loan Program Rev. (Detroit Water and Sewerage Department Water Supply System Rev. Refunding Second Lien Local Project),”D-6“, NATL, 5%, 7/01/2036 | | | 20,000 | | | | 22,429 | |
| Michigan Finance Authority Local Government Loan Program Rev. (Detroit Water and Sewerage Department Water Supply System Rev. Refunding Senior Lien Local Project),”D-1“, AGM, 5%, 7/01/2035 | | | 10,000 | | | | 11,276 | |
| Michigan Finance Authority Local Government Loan Program Rev. (Detroit Water and Sewerage Department Water Supply System Rev. Refunding Senior Lien Local Project),”D-1“, AGM, 5%, 7/01/2037 | | | 20,000 | | | | 22,464 | |
| Oconee County, GA, Water & Sewerage Rev., ”A“, 5%, 9/01/2033 | | | 555,000 | | | | 680,191 | |
| Walton County, GA, Water & Sewer Authority Rev. (Walton-Hard Labor Creek Project), 5%, 2/01/2038 | | | 500,000 | | | | 583,820 | |
| | | | | | | $ | 13,228,601 | |
Total Municipal Bonds
(Identified Cost, $108,632,622) | | | | | | $ | 111,495,655 | |
| | |
| Bonds - 0.1% | | | | | | | | |
| Consumer Services - 0.1% | | | | | | | | |
| Toll Road Investors Partnership II LP, Capital Appreciation, NATL, 0%, 2/15/2043 (n) (Identified Cost, $124,017) | | $ | 400,000 | | | $ | 146,398 | |
| | |
| Investment Companies (h) - 1.6% | | | | | | | | |
| Money Market Funds - 1.6% | | | | | | | | |
| MFS Institutional Money Market Portfolio, 1.28% (v) (Identified Cost, $1,836,112) | | | 1,835,562 | | | $ | 1,835,929 | |
| |
| Other Assets, Less Liabilities - 2.2% | | | | 2,502,702 | |
| Net Assets - 100.0% | | | | | | $ | 115,980,684 | |
49
Portfolio of Investments – continued
Derivative Contracts at 3/31/20
Futures Contracts
| | | | | | | | | | | | | | | | | | | | | | |
| Description | | Long/
Short | | | Currency | | | Contracts | | Notional
Amount | | | Expiration
Date | | | Value/Unrealized
Appreciation
(Depreciation) | |
| Liability Derivatives | | | | | | | | | | | | | | | | | | | | | | |
| Interest Rate Futures | | | | | | | | | | | | | | | | | | | | | | |
U.S. Treasury Bond | | | Short | | | | USD | | | 14 | | | $2,506,875 | | | | June - 2020 | | | | $(168,489 | ) |
| | | | | | | | | | | | | | | | | | | | | | |
At March 31, 2020, the fund had cash collateral of $91,000 to cover any collateral or margin obligations for certain derivative contracts. Restricted cash and/or deposits with brokers in the Statements of Assets and Liabilities are comprised of cash collateral.
See Portfolio Footnotes and Notes to Financial Statements
50
PORTFOLIO OF INVESTMENTS
3/31/20
MFS MARYLAND MUNICIPAL BOND FUND
The Portfolio of Investments is a complete list of all securities owned by your fund. It is categorized by broad-based asset classes.
| | | | | | | | |
| Municipal Bonds - 96.8% | | | | | | |
| | | | | | | | |
| | |
| Issuer | | Shares/Par | | | Value ($) | |
| Airport Revenue - 0.7% | | | | | | | | |
| Metropolitan Washington, DC, Airport Authority Rev., ”A“, 5%, 10/01/2039 | | $ | 750,000 | | | $ | 764,542 | |
| |
| General Obligations - General Purpose - 11.6% | | | | | |
| Anne Arundel County, MD, Consolidated Water & Sewer, 5%, 10/01/2040 | | $ | 400,000 | | | $ | 508,784 | |
| Anne Arundel County, MD, Consolidated Water & Sewer, 5%, 10/01/2048 | | | 575,000 | | | | 720,573 | |
| Baltimore County, MD, Metropolitan District (80th Issue), 5%, 3/01/2033 | | | 1,250,000 | | | | 1,572,813 | |
| Baltimore County, MD, Public Improvement, 5%, 2/01/2028 | | | 2,000,000 | | | | 2,134,520 | |
| Baltimore County, MD, Public Improvement, 4%, 3/01/2037 | | | 1,750,000 | | | | 2,035,040 | |
| Baltimore, MD, Mayor and City Council of Consolidated Public Improvement (Tax Exempt), ”A“, 5%, 10/15/2036 | | | 360,000 | | | | 441,335 | |
| Bridgeview, IL, Stadium and Redevelopment Projects, AAC, 5.14%, 12/01/2036 | | | 225,000 | | | | 207,711 | |
| Commonwealth of Puerto Rico, General Obligation, ”A“, 8%, 7/01/2035 (a)(d) | | | 1,120,000 | | | | 672,000 | |
| Commonwealth of Puerto Rico, Public Improvement,”A-4“, AGM, 5%, 7/01/2031 | | | 65,000 | | | | 65,222 | |
| Howard County, MD, Metropolitan District Project, ”C“, 4%, 2/15/2048 | | | 1,500,000 | | | | 1,683,645 | |
| Montgomery County, MD, Consolidated Public Improvement, ”A“, 5%, 11/01/2026 (Prerefunded 11/01/2024) | | | 500,000 | | | | 586,135 | |
| Prince George’s County, MD, Consolidated Public Improvement, ”A“, 5%, 9/15/2030 (Prerefunded 9/15/2021) | | | 1,500,000 | | | | 1,585,860 | |
| Puerto Rico Public Buildings Authority Rev., Guaranteed, ”D“, AAC, 5.45%, 7/01/2030 | | | 115,000 | | | | 115,064 | |
| | | | | | | $ | 12,328,702 | |
| General Obligations - Schools - 0.0% | | | | | | | | |
| Berks County, PA, Reading School District, AGM, 5%, 3/01/2036 | | $ | 20,000 | | | $ | 23,715 | |
| |
| Healthcare Revenue - Hospitals - 19.3% | | | | | |
| Chattanooga, TN, Health, Educational & Housing Facility Board Rev. (CommonSpirit Health),”A-1“, 4%, 8/01/2044 | | $ | 10,000 | | | $ | 9,972 | |
| Chattanooga, TN, Health, Educational & Housing Facility Board Rev. (CommonSpirit Health),”A-2“, 5%, 8/01/2044 | | | 10,000 | | | | 10,766 | |
| Chattanooga, TN, Health, Educational & Housing Facility Board Rev. (CommonSpirit Health),”A-2“, 5%, 8/01/2049 | | | 5,000 | | | | 5,306 | |
| Colorado Health Facilities Authority Rev. (CommonSpirit Health),”A-2“, 4%, 8/01/2044 | | | 55,000 | | | | 54,847 | |
| Doylestown, PA, Hospital Rev., ”A“, 4%, 7/01/2045 | | | 15,000 | | | | 15,729 | |
| | | | | | | | |
| | | | | | | |
| | |
| Issuer | | Shares/Par | | | Value ($) | |
| Healthcare Revenue - Hospitals - continued | |
| Escambia County, FL, Health Facilities Authority Rev. (Baptist Hospital, Inc.), ”A“, 6%, 8/15/2036 | | $ | 590,000 | | | $ | 598,118 | |
| Kentucky Economic Development Finance Authority Hospital Rev. (Owensboro Medical Health System, Inc.), ”A“, 6.375%, 6/01/2040 (Prerefunded 6/01/2020) | | | 370,000 | | | | 373,097 | |
| Kentucky Economic Development Finance Authority Hospital Rev. (Owensboro Medical Health System, Inc.), ”A“, 6.5%, 3/01/2045 (Prerefunded 6/01/2020) | | | 575,000 | | | | 579,922 | |
| Maryland Health & Higher Educational Facilities Authority Rev. (Carroll Hospital), ”A“, 5%, 7/01/2037 | | | 1,000,000 | | | | 1,083,990 | |
| Maryland Health & Higher Educational Facilities Authority Rev. (Doctors Community Hospital), ”A“, 5%, 7/01/2034 | | | 750,000 | | | | 860,738 | |
| Maryland Health & Higher Educational Facilities Authority Rev. (Johns Hopkins Health System), ”A“, 5%, 5/15/2026 | | | 250,000 | | | | 261,045 | |
| Maryland Health & Higher Educational Facilities Authority Rev. (LifeBridge Health), 5%, 7/01/2028 | | | 750,000 | | | | 884,543 | |
| Maryland Health & Higher Educational Facilities Authority Rev. (LifeBridge Health), 5%, 7/01/2033 | | | 400,000 | | | | 478,268 | |
| Maryland Health & Higher Educational Facilities Authority Rev. (LifeBridge Health), 4%, 7/01/2042 | | | 1,000,000 | | | | 1,086,370 | |
| Maryland Health & Higher Educational Facilities Authority Rev. (Medlantic/Helix Parent, Inc.), ”A“, AGM, 5.25%, 8/15/2038 | | | 1,000,000 | | | | 1,350,690 | |
| Maryland Health & Higher Educational Facilities Authority Rev. (MedStar Health), ”A“, 5%, 8/15/2041 | | | 505,000 | | | | 550,697 | |
| Maryland Health & Higher Educational Facilities Authority Rev. (MedStar Health), ”A“, 5%, 5/15/2042 | | | 750,000 | | | | 866,910 | |
| Maryland Health & Higher Educational Facilities Authority Rev. (Mercy Medical Center), ”A“, 5%, 7/01/2032 | | | 600,000 | | | | 700,512 | |
| Maryland Health & Higher Educational Facilities Authority Rev. (Meritus Medical Center), 5%, 7/01/2027 | | | 500,000 | | | | 577,605 | |
| Maryland Health & Higher Educational Facilities Authority Rev. (Trinity Health Credit Group), ”MD“, 5%, 12/01/2046 | | | 1,000,000 | | | | 1,179,080 | |
| Maryland Health & Higher Educational Facilities Authority Rev. (University of Maryland Medical System), ”B“, 5%, 7/01/2034 | | | 1,000,000 | | | | 1,199,990 | |
| Maryland Health & Higher Educational Facilities Authority Rev. (University of Maryland Medical System), ”D“, 4%, 7/01/2048 | | | 1,250,000 | | | | 1,304,363 | |
51
Portfolio of Investments – continued
| | | | | | | | |
| Municipal Bonds - continued | | | | | | |
| | | | | | | | |
| | |
| Issuer | | Shares/Par | | | Value ($) | |
| Healthcare Revenue - Hospitals - continued | | | | | |
| Maryland Health & Higher Educational Facilities Authority Rev. (University of Maryland Medical System), ”D“, VRDN, LOC, 0.65%, 7/01/2041 | | $ | 3,000,000 | | | $ | 3,000,000 | |
| Maryland Health & Higher Educational Facilities Authority Rev. (Western Maryland Health System), 5.25%, 7/01/2034 | | | 1,000,000 | | | | 1,161,330 | |
| Maryland Industrial Development Authority, Economic Development Rev., RIBS, AGM, 10.488%, 8/26/2022 (p) | | | 400,000 | | | | 450,704 | |
| Montgomery County, MD, Rev. (Trinity Health Corp.), 5%, 12/01/2040 | | | 1,000,000 | | | | 1,062,910 | |
| Spartanburg County, SC, Regional Health Services District Hospital Rev., ”A“, 4%, 4/15/2043 | | | 635,000 | | | | 684,047 | |
| | | | | | | $ | 20,391,549 | |
| Healthcare Revenue - Long Term Care - 4.7% | | | | | |
| Baltimore County, MD, Rev. (Oak Crest Village, Inc.), 4%, 1/01/2045 | | $ | 1,000,000 | | | $ | 1,094,360 | |
| Baltimore County, MD, Rev. (Riderwood Village, Inc.), 4%, 1/01/2038 | | | 450,000 | | | | 496,530 | |
| Howard County, MD, Retirement Community Rev. (Vantage House Facility), 5%, 4/01/2036 | | | 500,000 | | | | 485,530 | |
| Maryland Health & Higher Educational Facilities Authority Rev. (Charlestown Community Project), 6.25%, 1/01/2041 (Prerefunded 1/01/2021) | | | 750,000 | | | | 777,097 | |
| Maryland Health & Higher Educational Facilities Authority Rev. (Charlestown Community Project), ”A“, 5%, 1/01/2045 | | | 500,000 | | | | 569,440 | |
| Rockville, MD, Mayor & Council Economic Development Rev. (Ingleside at King Farm Project), ”B“, 5%, 11/01/2042 | | | 350,000 | | | | 345,786 | |
| Travis County, TX, Health Facilities Development Corp. Rev. (Westminster Manor Health), 7%, 11/01/2030 (Prerefunded 11/01/2020) | | | 45,000 | | | | 46,483 | |
| Travis County, TX, Health Facilities Development Corp. Rev. (Westminster Manor Health), 7.125%, 11/01/2040 (Prerefunded 11/01/2020) | | | 85,000 | | | | 87,864 | |
| Travis County, TX, Health Facilities Development Corp. Rev. (Westminster Manor Health), Unrefunded Balance, 7%, 11/01/2030 | | | 5,000 | | | | 5,115 | |
| Washington County, MD, County Commissioners Rev. (Diakon Lutheran Social Ministries Project), ”B“, 5%, 1/01/2032 | | | 575,000 | | | | 648,905 | |
| Westminster, MD, Refunding Rev. (Carroll Lutheran Village, Inc.), 5.125%, 7/01/2040 | | | 400,000 | | | | 400,196 | |
| | | | | | | $ | 4,957,306 | |
| Healthcare Revenue - Other - 0.5% | | | | | | | | |
| Maryland Economic Development Corp., Economic Development Rev. (Lutheran World Relief Refugee), 5.25%, 4/01/2029 | | $ | 520,000 | | | $ | 520,744 | |
| | | | | | | | |
| | | | | | | |
| | |
| Issuer | | Shares/Par | | | Value ($) | |
| Industrial Revenue - Other - 0.4% | | | | | |
| Port Beaumont, TX, Navigation District Facility Rev. (Jefferson Gulf Coast Energy Project), ”A“, 4%, 1/01/2050 (n) | | $ | 200,000 | | | $ | 154,372 | |
| Tuscaloosa County, AL, Industrial Development Authority, Gulf Opportunity Zone (Hunt Refining Project), ”A“, 5.25%, 5/01/2044 | | | 295,000 | | | | 283,675 | |
| | | | | | | $ | 438,047 | |
| Industrial Revenue - Paper - 0.1% | | | | | | | | |
| Valparaiso, IN, Exempt Facilities Rev. (Pratt Paper LLC Project), 7%, 1/01/2044 | | $ | 100,000 | | | $ | 103,807 | |
| | |
| Miscellaneous Revenue - Other - 3.5% | | | | | | | | |
| Indiana Finance Authority Rev. (Ohio River Bridges East End Crossing Project), ”A“, 5%, 7/01/2040 | | $ | 105,000 | | | $ | 107,454 | |
| Indiana Finance Authority Rev. (Ohio River Bridges East End Crossing Project), ”A“, 5%, 7/01/2044 | | | 160,000 | | | | 163,205 | |
| Maryland Economic Development Corp., Air Cargo Obligated Group Rev. (AFCO Airport Real Estate Group), 5%, 7/01/2028 | | | 90,000 | | | | 102,722 | |
| Maryland Economic Development Corp., Air Cargo Obligated Group Rev. (AFCO Airport Real Estate Group), 5%, 7/01/2029 | | | 210,000 | | | | 242,002 | |
| Maryland Economic Development Corp., Air Cargo Obligated Group Rev. (AFCO Airport Real Estate Group), 4%, 7/01/2039 | | | 1,100,000 | | | | 1,137,906 | |
| Maryland Economic Development Corp., Air Cargo Obligated Group Rev. (AFCO Airport Real Estate Group), 4%, 7/01/2044 | | | 600,000 | | | | 612,282 | |
| Montgomery County, MD, Transportation Fund Lease Authority Rev., ”A“, 5%, 11/01/2036 | | | 750,000 | | | | 870,637 | |
| New York, NY, Industrial Development Agency, Airport Facilities Rev. (Transportation Infrastructure Properties LLC), 5%, 7/01/2028 | | | 450,000 | | | | 465,053 | |
| | | | | | | $ | 3,701,261 | |
| Multi-Family Housing Revenue - 9.4% | | | | | | | | |
| Howard County, MD, Housing Commission Rev. (Columbia Commons Apartments), ”A“, 5%, 6/01/2044 | | $ | 500,000 | | | $ | 543,680 | |
| Howard County, MD, Housing Commission Rev. (Woodfield Oxford Square Apartments), 5%, 12/01/2037 | | | 750,000 | | | | 875,722 | |
| Maryland Community Development Administration, Department of Housing & Community Development Housing Rev., ”A“, FHA, 4%, 7/01/2048 | | | 500,000 | | | | 538,000 | |
| Maryland Community Development Administration, Department of Housing & Community Development Housing Rev., ”B“, 3.65%, 7/01/2049 | | | 505,000 | | | | 531,922 | |
| Maryland Community Development Administration, Department of Housing & Community Development Housing Rev., ”D“, 3.35%, 7/01/2049 | | | 1,765,000 | | | | 1,826,422 | |
52
Portfolio of Investments – continued
| | | | | | | | |
| Municipal Bonds - continued | | | | | | |
| | | | | | | | |
| | |
| Issuer | | Shares/Par | | | Value ($) | |
| Multi-Family Housing Revenue - continued | | | | | |
| Maryland Community Development Administration, Department of Housing & Community Development Residential Rev., “C”, 5%, 3/01/2031 | | $ | 1,150,000 | | | $ | 1,456,613 | |
| Maryland Community Development Administration, Department of Housing & Community Development Residential Rev., “C”, 3%, 9/01/2039 | | | 1,000,000 | | | | 1,021,960 | |
| Montgomery County, MD, Housing Opportunities Commission, Multi-Family Housing Development Rev.,”A-1“, FHA, 3.05%, 7/01/2044 | | | 1,000,000 | | | | 1,033,740 | |
| Montgomery County, MD, Housing Opportunities Commission, Multi-Family Housing Development Rev., ”C“, 5.125%, 7/01/2037 | | | 1,000,000 | | | | 1,007,390 | |
| Montgomery County, MD, Housing Opportunities Commission, Multi-Family Housing Development, “C”, 3.1%, 7/01/2036 | | | 1,065,000 | | | | 1,068,845 | |
| | | | | | | $ | 9,904,294 | |
| Parking - 1.3% | | | | | | | | |
| Maryland Health & Higher Educational Facilities Authority Rev. (Johns Hopkins Medical Institutions), AAC, 5%, 7/01/2034 | | $ | 1,385,000 | | | $ | 1,398,061 | |
| | |
| Port Revenue - 2.0% | | | | | | | | |
| Maryland Economic Development Corp. Rev. (Terminal Project), ”A“, 5%, 6/01/2044 | | $ | 500,000 | | | $ | 532,350 | |
| Maryland Economic Development Corp. Rev. (Terminal Project), ”A“, 5%, 6/01/2049 | | | 250,000 | | | | 264,172 | |
| Maryland Economic Development Corp. Rev. (Transportation Facilities Project), ”A“, 5%, 6/01/2031 | | | 650,000 | | | | 709,267 | |
| Maryland Economic Development Corp. Rev. | | | | | | | | |
| (Transportation Facilities Project), ”A“, 5.75%, 6/01/2035 (Prerefunded 6/01/2020) | | | 550,000 | | | | 553,674 | |
| | | | | | | $ | 2,059,463 | |
| Sales & Excise Tax Revenue - 3.1% | | | | | | | | |
| Colorado Regional Transportation District, Private Activity Rev. (Denver Transportation Partners), 6%, 1/15/2041 | | $ | 435,000 | | | $ | 437,597 | |
| Guam Government Business Privilege Tax Rev., ”A“, 5.25%, 1/01/2036 | | | 260,000 | | | | 261,695 | |
| Illinois Sales Tax Securitization Corp., Second Lien, ”A“, 5%, 1/01/2026 | | | 40,000 | | | | 44,721 | |
| Illinois Sales Tax Securitization Corp., Second Lien, ”A“, 5%, 1/01/2027 | | | 90,000 | | | | 102,189 | |
| Illinois Sales Tax Securitization Corp., Second Lien, ”A“, 5%, 1/01/2029 | | | 100,000 | | | | 116,643 | |
| Illinois Sales Tax Securitization Corp., Second Lien, ”A“, 5%, 1/01/2030 | | | 40,000 | | | | 47,203 | |
| Illinois Sales Tax Securitization Corp., Second Lien, ”A“, 5%, 1/01/2036 | | | 25,000 | | | | 29,030 | |
| Illinois Sales Tax Securitization Corp., Second Lien, ”A“, 5%, 1/01/2037 | | | 50,000 | | | | 57,905 | |
| Illinois Sales Tax Securitization Corp., Second Lien, ”A“, 4%, 1/01/2038 | | | 40,000 | | | | 41,228 | |
| | | | | | | | |
| | | | | | | |
| | |
| Issuer | | Shares/Par | | | Value ($) | |
| Sales & Excise Tax Revenue - continued | | | | | |
| Illinois Sales Tax Securitization Corp., Second Lien, ”A“, 4%, 1/01/2040 | | $ | 25,000 | | | $ | 25,653 | |
| Puerto Rico Sales Tax Financing Corp., Restructured Sales Tax Rev.,”2019A-1“, 4.55%, 7/01/2040 | | | 21,000 | | | | 19,880 | |
| Puerto Rico Sales Tax Financing Corp., Restructured Sales Tax Rev.,”2019A-1“, 5%, 7/01/2058 | | | 797,000 | | | | 775,043 | |
| Puerto Rico Sales Tax Financing Corp., Restructured Sales Tax Rev.,”2019A-2“, 4.329%, 7/01/2040 | | | 241,000 | | | | 221,380 | |
| Puerto Rico Sales Tax Financing Corp., Restructured Sales Tax Rev.,”2019A-2“, 4.329%, 7/01/2040 | | | 75,000 | | | | 68,894 | |
| Puerto Rico Sales Tax Financing Corp., Restructured Sales Tax Rev.,”2019A-2“, 4.784%, 7/01/2058 | | | 46,000 | | | | 43,080 | |
| Puerto Rico Sales Tax Financing Corp., Restructured Sales Tax Rev., Capital Appreciation,”2019A-1“, 0%, 7/01/2024 | | | 3,000 | | | | 2,569 | |
| Puerto Rico Sales Tax Financing Corp., Restructured Sales Tax Rev., Capital Appreciation,”2019A-1“, 0%, 7/01/2027 | | | 36,000 | | | | 27,411 | |
| Puerto Rico Sales Tax Financing Corp., Restructured Sales Tax Rev., Capital Appreciation,”2019A-1“, 0%, 7/01/2029 | | | 6,000 | | | | 4,152 | |
| Puerto Rico Sales Tax Financing Corp., Restructured Sales Tax Rev., Capital Appreciation,”2019A-1“, 0%, 7/01/2031 | | | 338,000 | | | | 210,195 | |
| Puerto Rico Sales Tax Financing Corp., Restructured Sales Tax Rev., Capital Appreciation,”2019A-1“, 0%, 7/01/2033 | | | 332,000 | | | | 183,709 | |
| Puerto Rico Sales Tax Financing Corp., Restructured Sales Tax Rev., Capital Appreciation,”2019A-1“, 0%, 7/01/2046 | | | 2,229,000 | | | | 526,980 | |
| | | | | | | $ | 3,247,157 | |
| Secondary Schools - 0.2% | | | | | | | | |
| District of Columbia Rev. (Rocketship D.C.), ”A“, 5%, 6/01/2039 | | $ | 250,000 | | | $ | 246,037 | |
| | |
| Single Family Housing - State - 3.5% | | | | | | | | |
| Connecticut Housing Finance Authority Rev. (Housing Mortgage Finance Program), ”D-1“, GNMA, 4%, 11/15/2047 | | $ | 510,000 | | | $ | 539,254 | |
| Iowa Finance Authority, Single Family Mortgage Rev., ”A“, GNMA, 4%, 7/01/2047 | | | 535,000 | | | | 565,249 | |
| Maryland Community Development Administration, Department of Housing & Community Development Housing Rev., ”A“, 3.75%, 9/01/2039 | | | 750,000 | | | | 811,837 | |
| Maryland Community Development Administration, Department of Housing & Community Development Rev., ”A“, 2.5%, 9/01/2040 | | | 750,000 | | | | 725,430 | |
| Montgomery County, MD, Housing Opportunities Commission, Single Family Mortgage Rev., ”A“, FHA, 3.85%, 1/01/2042 | | | 495,000 | | | | 533,956 | |
53
Portfolio of Investments – continued
| | | | | | | | |
| Municipal Bonds - continued | | | | | | |
| | | | | | | | |
| | |
| Issuer | | Shares/Par | | | Value ($) | |
| Single Family Housing - State - continued | | | | | |
| Pennsylvania Housing Finance Agency, Single Family Mortgage Rev., “125A”, 3.7%, 10/01/2037 | | $ | 530,000 | | | $ | 573,206 | |
| | | | | | | $ | 3,748,932 | |
| State & Local Agencies - 5.8% | | | | | | | | |
| Colorado State University Board of Governors, System Enterprise Refunding Rev., ”E“, 4%, 3/01/2043 | | $ | 455,000 | | | $ | 508,508 | |
| Delaware Valley, PA, Regional Finance Authority, ”C“, FLR, 1.809% (LIBOR - 3mo. + 0.75%), 6/01/2037 | | | 665,000 | | | | 601,998 | |
| Howard County, MD, COP, ”B“, 8.15%, 2/15/2021 | | | 450,000 | | | | 477,410 | |
| Maryland Stadium Authority Rev., Baltimore City Public Schools Construction and Revitalization Program, 5%, 5/01/2041 | | | 500,000 | | | | 576,810 | |
| Maryland Stadium Authority Rev., Baltimore City Public Schools Construction and Revitalization Program, ”A“, 5%, 5/01/2038 | | | 500,000 | | | | 600,815 | |
| Maryland Stadium Authority Rev., Baltimore City Public Schools Construction and Revitalization Program, “A”, 5%, 5/01/2047 | | | 335,000 | | | | 396,429 | |
| New Jersey Economic Development Authority Rev., School Facilities Construction Rev., ”LLL“, 5%, 6/15/2039 | | | 230,000 | | | | 243,802 | |
| New Jersey Economic Development Authority Rev., School Facilities Construction Rev., ”LLL“, 5%, 6/15/2044 | | | 380,000 | | | | 397,989 | |
| Prince George’s County, MD, COP (Suitland Public Infrastructure), 3%, 10/01/2038 | | | 1,000,000 | | | | 1,053,770 | |
| Prince George’s County, MD, COP (University of Maryland Capital Region Medical Center), 5%, 10/01/2037 | | | 1,000,000 | | | | 1,239,860 | |
| | | | | | | $ | 6,097,391 | |
| Student Loan Revenue - 0.2% | | | | | | | | |
| Iowa Student Loan Liquidity Corp. Rev., ”B“, 3%, 12/01/2039 | | $ | 45,000 | | | $ | 44,317 | |
| Iowa Student Loan Liquidity Corp. Rev., ”B“, 3.5%, 12/01/2044 | | | 115,000 | | | | 112,831 | |
| | | | | | | $ | 157,148 | |
| Tax - Other - 0.9% | | | | | | | | |
| Puerto Rico Convention Center District Authority, Hotel Occupancy Tax Rev., ”A“, AAC, 5%, 7/01/2031 | | $ | 110,000 | | | $ | 110,014 | |
| Puerto Rico Infrastructure Financing Authority Special Tax Rev., ”C“, AAC, 5.5%, 7/01/2027 | | | 635,000 | | | | 678,745 | |
| Virgin Islands Public Finance Authority Rev., Matching Fund Loan Note, ”B“, AGM, 5%, 10/01/2025 | | | 200,000 | | | | 207,570 | |
| | | | | | | $ | 996,329 | |
| Tax Assessment - 4.3% | | | | | | | | |
| Baltimore, MD, Special Obligation (East Baltimore Research Park Project), ”A“, 5%, 9/01/2038 | | $ | 500,000 | | | $ | 505,455 | |
| | | | | | | | |
| | | | | | | |
| | |
| Issuer | | Shares/Par | | | Value ($) | |
| Tax Assessment - continued | | | | | | | | |
| Baltimore, MD, Special Obligation Rev. (Harbor Point Project), ”B“, 3.875%, 6/01/2046 | | $ | 300,000 | | | $ | 245,160 | |
| Brunswick, MD, Special Obligation Refunding (Brunswick Crossing Special Taxing District), 5%, 7/01/2036 | | | 500,000 | | | | 505,970 | |
| Frederick County, MD, Limited Obligation (Oakdale-Lake Linganore Project), 3.75%, 7/01/2039 | | | 500,000 | | | | 426,055 | |
| Frederick County, MD, Special Obligation (Urbana Community Development Authority), ”A“, 5%, 7/01/2040 | | | 1,500,000 | | | | 1,512,270 | |
| Howard County, MD, Special Obligation (Annapolis Junction Town Center Project), 6.1%, 2/15/2044 | | | 230,000 | | | | 213,139 | |
| Howard County, MD, Special Obligation (Downtown Columbia Project), ”A“, 4.5%, 2/15/2047 | | | 300,000 | | | | 286,041 | |
| Prince George’s County, MD, Special Obligation (National Harbor Project), 5.2%, 7/01/2034 | | | 431,000 | | | | 432,349 | |
| Prince George’s County, MD, Special Obligation (Westphalia Town Center Project), 5.25%, 7/01/2048 | | | 400,000 | | | | 403,924 | |
| | | | | | | $ | 4,530,363 | |
| Tobacco - 0.9% | | | | | | | | |
| Buckeye, OH, Tobacco Settlement Financing Authority Senior Asset-Backed Refunding,2020A-2, ”1“, 5%, 6/01/2032 | | $ | 75,000 | | | $ | 93,183 | |
| Buckeye, OH, Tobacco Settlement Financing Authority Senior Asset-Backed Refunding,2020A-2, ”1“, 4%, 6/01/2037 | | | 40,000 | | | | 43,964 | |
| Buckeye, OH, Tobacco Settlement Financing Authority Senior Asset-Backed Refunding,2020B-2, ”2“, 5%, 6/01/2055 | | | 530,000 | | | | 469,590 | |
| Buckeye, OH, Tobacco Settlement Financing Authority Senior Asset-Backed Refunding,2020B-3, Capital Appreciation, ”2“, 0%, 6/01/2057 | | | 1,400,000 | | | | 154,462 | |
| Illinois Railsplitter Tobacco Settlement Authority Rev., 6%, 6/01/2028 (Prerefunded 6/01/2021) | | | 215,000 | | | | 226,965 | |
| | | | | | | $ | 988,164 | |
| Transportation - Special Tax - 4.3% | | | | | | | | |
| Commonwealth of Puerto Rico Highway & Transportation Authority Rev., ”E“, AGM, 5.5%, 7/01/2020 | | $ | 50,000 | | | $ | 50,279 | |
| Commonwealth of Puerto Rico Highway & Transportation Authority Rev., ”L“, AAC, 5.25%, 7/01/2038 | | | 870,000 | | | | 882,876 | |
| Commonwealth of Puerto Rico Highway & Transportation Authority Rev., ”L“, NATL, 5.25%, 7/01/2035 | | | 170,000 | | | | 170,457 | |
| Commonwealth of Puerto Rico Highway & Transportation Authority Rev., ”N“, AAC, 5.5%, 7/01/2029 | | | 355,000 | | | | 379,957 | |
54
Portfolio of Investments – continued
| | | | | | | | |
| Municipal Bonds - continued | | | | | | |
| | | | | | | | |
| | |
| Issuer | | Shares/Par | | | Value ($) | |
| Transportation - Special Tax - continued | | | | | |
| Commonwealth of Puerto Rico Highway & Transportation Authority Rev., ”N“, AAC, 5.25%, 7/01/2031 | | $ | 360,000 | | | $ | 376,510 | |
| Commonwealth of Puerto Rico Highway & Transportation Authority Rev., ”N“, NATL, 5.25%, 7/01/2032 | | | 200,000 | | | | 203,196 | |
| Commonwealth of Puerto Rico Highway & Transportation Authority Rev., ”N“, NATL, 5.25%, 7/01/2033 | | | 165,000 | | | | 166,988 | |
| Washington, DC, Metropolitan Area Transit Authority Gross Rev., 5%, 7/01/2037 | | | 440,000 | | | | 519,429 | |
| Washington, DC, Metropolitan Area Transit Authority Gross Rev., 5%, 7/01/2038 | | | 440,000 | | | | 516,899 | |
| Washington, DC, Metropolitan Area Transit Authority Gross Rev., ”B“, 5%, 7/01/2042 | | | 1,140,000 | | | | 1,325,318 | |
| | | | | | | $ | 4,591,909 | |
| Universities - Colleges - 7.6% | | | | | | | | |
| Maryland Health & Higher Educational Facilities Authority Rev. (Goucher College), ”A“, 5%, 7/01/2034 | | $ | 500,000 | | | $ | 529,620 | |
| Maryland Health & Higher Educational Facilities Authority Rev. (Goucher College), ”A“, 5%, 7/01/2044 | | | 500,000 | | | | 564,135 | |
| Maryland Health & Higher Educational Facilities Authority Rev. (Johns Hopkins University), ”A“, 5%, 7/01/2037 | | | 1,500,000 | | | | 1,629,480 | |
| Maryland Health & Higher Educational Facilities Authority Rev. (Loyola University Maryland), 5%, 10/01/2032 | | | 500,000 | | | | 552,630 | |
| Maryland Health & Higher Educational Facilities Authority Rev. (Loyola University Maryland), “A”, 5%, 10/01/2049 | | | 1,000,000 | | | | 1,153,280 | |
| Maryland Health & Higher Educational Facilities Authority Rev. (Maryland Institute College of Art Issue), 5%, 6/01/2033 | | | 450,000 | | | | 504,238 | |
| Maryland Health & Higher Educational Facilities Authority Rev. (Notre Dame College), 5%, 10/01/2035 | | | 1,000,000 | | | | 1,005,810 | |
| Morgan State University, Academic & Auxiliary Facilities Fees Rev., 5%, 7/01/2030 | | | 150,000 | | | | 161,346 | |
| Morgan State University, Academic & Auxiliary Facilities Fees Rev., 5%, 7/01/2032 | | | 440,000 | | | | 472,978 | |
| Puerto Rico Industrial, Tourist, Educational, Medical & Environmental Control Facilities Financing Authority, Higher Education Rev. (Ana G. Mendez University System Project), 5.125%, 4/01/2032 | | | 30,000 | | | | 26,639 | |
| Puerto Rico Industrial, Tourist, Educational, Medical & Environmental Control Facilities Financing Authority, Higher Education Rev. (Ana G. Mendez University System Project), 5.375%, 4/01/2042 | | | 135,000 | | | | 114,226 | |
| Puerto Rico Industrial, Tourist, Educational, Medical & Environmental Control Facilities Financing Authority, Higher Education Rev. (International American University of Puerto Rico Project), 5%, 10/01/2031 | | | 85,000 | | | | 89,089 | |
| | | | | | | | |
| | | | | | | |
| | |
| Issuer | | Shares/Par | | | Value ($) | |
| Universities - Colleges - continued | | | | | | | | |
| University System of Maryland, Auxiliary Facility & Tuition Rev., ”D“, 5%, 10/01/2022 | | $ | 1,000,000 | | | $ | 1,092,420 | |
| Virginia College Building Authority, Educational Facilities Rev. (Marymount University Project), ”B“, 5.25%, 7/01/2035 | | | 110,000 | | | | 109,991 | |
| | | | | | | $ | 8,005,882 | |
| Universities - Dormitories - 3.8% | | | | | | | | |
| California Municipal Finance Authority, Student Housing Rev.(CHF-Davis I LLC - West Village Student Housing Project), BAM, 5%, 5/15/2051 | | $ | 660,000 | | | $ | 707,520 | |
| Maryland Economic Development Corp., Senior Student Housing Project and Refunding Rev. (Townson University Project), 5%, 7/01/2036 | | | 500,000 | | | | 550,230 | |
| Maryland Economic Development Corp., Senior Student Housing Rev. (University of Maryland, Baltimore Project), 5%, 7/01/2031 | | | 500,000 | | | | 536,185 | |
| Maryland Economic Development Corp., Senior Student Housing Rev. (University of Maryland, College Park Projects), AGM, 5%, 6/01/2035 | | | 750,000 | | | | 883,477 | |
| Maryland Economic Development Corp., Student Housing Rev. (Bowie State University Project), 4%, 7/01/2040 | | | 500,000 | | | | 508,265 | |
| Maryland Economic Development Corp., Student Housing Rev. (Salisbury University Project), 5%, 6/01/2027 | | | 500,000 | | | | 523,820 | |
| Maryland Economic Development Corp., Student Housing Rev. (Salisbury University Project), 5%, 6/01/2030 | | | 300,000 | | | | 313,176 | |
| | | | | | | $ | 4,022,673 | |
| Utilities - Cogeneration - 0.2% | | | | | | | | |
| Puerto Rico Industrial, Tourist, Educational, Medical & Environmental Control Facilities Financing Authority Rev. (Cogeneration Facilities - AES Puerto Rico Project), 9.12%, 6/01/2022 | | $ | 245,000 | | | $ | 251,125 | |
| | |
| Utilities - Investor Owned - 0.7% | | | | | | | | |
| Maryland Economic Development Corp. Adjustable Mode Rev. Refunding (Constellation Energy Group, Inc. Project), ”B“, 2.55%, 12/01/2025 (Put Date 6/01/2020) | | $ | 750,000 | | | $ | 750,532 | |
| | |
| Utilities - Municipal Owned - 0.8% | | | | | | | | |
| Puerto Rico Electric Power Authority Rev., ”A“, 5%, 7/01/2029 (a)(d) | | $ | 250,000 | | | $ | 176,875 | |
| Puerto Rico Electric Power Authority Rev., ”A“, 5%, 7/01/2042 (a)(d) | | | 40,000 | | | | 28,300 | |
| Puerto Rico Electric Power Authority Rev., ”AAA“, 5.25%, 7/01/2021 (a)(d) | | | 20,000 | | | | 14,200 | |
| Puerto Rico Electric Power Authority Rev., ”AAA“, 5.25%, 7/01/2030 (a)(d) | | | 10,000 | | | | 7,100 | |
| Puerto Rico Electric Power Authority Rev., ”CCC“, 5.25%, 7/01/2027 (a)(d) | | | 95,000 | | | | 67,450 | |
55
Portfolio of Investments – continued
| | | | | | | | |
| Municipal Bonds - continued | | | | | | |
| | | | | | | | |
| | |
| Issuer | | Shares/Par | | | Value ($) | |
| Utilities - Municipal Owned - continued | | | | | |
| Puerto Rico Electric Power Authority Rev., ”DDD“, 5%, 7/01/2020 (a)(d) | | $ | 10,000 | | | $ | 7,075 | |
| Puerto Rico Electric Power Authority Rev., ”DDD“, 5%, 7/01/2021 (a)(d) | | | 100,000 | | | | 70,750 | |
| Puerto Rico Electric Power Authority Rev., ”DDD“, 5%, 7/01/2022 (a)(d) | | | 160,000 | | | | 113,200 | |
| Puerto Rico Electric Power Authority Rev., ”EEE“, 6.05%, 7/01/2032 (a)(d) | | | 50,000 | | | | 35,562 | |
| Puerto Rico Electric Power Authority Rev., ”TT“, 5%, 7/01/2021 (a)(d) | | | 45,000 | | | | 31,838 | |
| Puerto Rico Electric Power Authority Rev., ”TT“, 5%, 7/01/2023 (a)(d) | | | 40,000 | | | | 28,300 | |
| Puerto Rico Electric Power Authority Rev., ”TT“, 5%, 7/01/2027 (a)(d) | | | 10,000 | | | | 7,075 | |
| Puerto Rico Electric Power Authority Rev., ”TT“, 5%, 7/01/2037 (a)(d) | | | 125,000 | | | | 88,437 | |
| Puerto Rico Electric Power Authority Rev., ”VV“, NATL, 5.25%, 7/01/2034 | | | 10,000 | | | | 10,076 | |
| Puerto Rico Electric Power Authority Rev., ”WW“, 5.375%, 7/01/2022 (a)(d) | | | 10,000 | | | | 7,113 | |
| Puerto Rico Electric Power Authority Rev., ”WW“, 5.25%, 7/01/2025 (a)(d) | | | 20,000 | | | | 14,200 | |
| Puerto Rico Electric Power Authority Rev., ”ZZ“, 5%, 7/01/2018 (a)(d) | | | 60,000 | | | | 41,775 | |
| Puerto Rico Electric Power Authority Rev., ”ZZ“, 5.25%, 7/01/2023 (a)(d) | | | 65,000 | | | | 46,150 | |
| Puerto Rico Electric Power Authority Rev., ”ZZ“, 5.25%, 7/01/2024 (a)(d) | | | 20,000 | | | | 14,200 | |
| Puerto Rico Electric Power Authority Rev., ”ZZ“, 5.25%, 7/01/2026 (a)(d) | | | 65,000 | | | | 46,150 | |
| | | | | | | $ | 855,826 | |
| Utilities - Other - 0.9% | | | | | | | | |
| Central Plains Energy Project, NE, Gas Project Rev. (Project No. 3), ”A“, 5%, 9/01/2036 | | $ | 55,000 | | | $ | 65,171 | |
| Central Plains Energy Project, NE, Gas Project Rev. (Project No. 3), ”A“, 5%, 9/01/2042 | | | 110,000 | | | | 131,969 | |
| Tennessee Energy Acquisition Corp., Gas Rev., ”A“, 5.25%, 9/01/2021 | | | 195,000 | | | | 201,070 | |
| Tennessee Energy Acquisition Corp., Gas Rev., ”A“, 5.25%, 9/01/2022 | | | 100,000 | | | | 105,158 | |
| Tennessee Energy Acquisition Corp., Gas Rev., ”A“, 5.25%, 9/01/2023 | | | 140,000 | | | | 149,691 | |
| Tennessee Energy Acquisition Corp., Gas Rev., ”C“, 5%, 2/01/2021 | | | 235,000 | | | | 239,324 | |
| Texas Gas Acquisition & Supply Corp. III., Gas Supply Rev., 5%, 12/15/2031 | | | 55,000 | | | | 56,843 | |
| | | | | | | $ | 949,226 | |
| Water & Sewer Utility Revenue - 6.1% | | | | | | | | |
| Baltimore, MD, Project Rev. (Wastewater Projects), “A”, 5%, 7/01/2049 | | $ | 1,000,000 | | | $ | 1,212,810 | |
| Baltimore, MD, Project Rev. (Water Projects), ”A“, 4%, 7/01/2049 | | | 1,165,000 | | | | 1,291,426 | |
| Baltimore, MD, Refunding Rev. (Mayor and City Council of Baltimore Water Projects), ”B“, 5%, 7/01/2042 | | | 1,320,000 | | | | 1,454,191 | |
| | | | | | | | |
| | | | | | | |
| | |
| Issuer | | Shares/Par | | | Value ($) | |
| Water & Sewer Utility Revenue - continued | | | | | |
| Baltimore, MD, Refunding Rev., LEVRRS, NATL, 8.683%, 7/01/2020 (p) | | $ | 650,000 | | | $ | 664,339 | |
| Guam Waterworks Authority Rev. (Water and Wastewater System), 5%, 7/01/2036 | | | 20,000 | | | | 20,231 | |
| Guam Waterworks Authority Rev. (Water and Wastewater System), 5%, 1/01/2046 | | | 105,000 | | | | 103,947 | |
| Guam Waterworks Authority Rev. (Water and Wastewater System), ”A“, 5%, 7/01/2029 | | | 205,000 | | | | 209,609 | |
| Guam Waterworks Authority Rev. (Water and Wastewater System), ”A“, 5%, 7/01/2035 | | | 205,000 | | | | 207,423 | |
| Michigan Finance Authority Local Government Loan Program Rev. (Detroit Water and Sewerage Department Sewage Disposal System Rev. Refunding Second Lien Local Project),”C-7“, NATL, 5%, 7/01/2032 | | | 25,000 | | | | 28,167 | |
| Michigan Finance Authority Local Government Loan Program Rev. (Detroit Water and Sewerage Department Water Supply System Rev. Refunding Second Lien Local Project),”D-6“, NATL, 5%, 7/01/2036 | | | 30,000 | | | | 33,644 | |
| Michigan Finance Authority Local Government Loan Program Rev. (Detroit Water and Sewerage Department Water Supply System Rev. Refunding Senior Lien Local Project),”D-1“, AGM, 5%, 7/01/2035 | | | 15,000 | | | | 16,913 | |
| Michigan Finance Authority Local Government Loan Program Rev. (Detroit Water and Sewerage Department Water Supply System Rev. Refunding Senior Lien Local Project),”D-1“, AGM, 5%, 7/01/2037 | | | 35,000 | | | | 39,312 | |
| Mississippi Development Bank Special Obligation (City of Jackson Water and Sewer System Rev. Bond Project), AGM, 6.875%, 12/01/2040 | | | 50,000 | | | | 59,034 | |
| Montgomery County, MD, Water Quality Protection Charge Rev., ”A“, 5%, 4/01/2032 | | | 1,125,000 | | | | 1,128,128 | |
| | | | | | | $ | 6,469,174 | |
Total Municipal Bonds
(Identified Cost, $100,505,831) | | | | | | $ | 102,499,359 | |
| |
| Bonds - 0.2% | | | | | |
| Consumer Services - 0.2% | | | | | |
| Toll Road Investors Partnership II LP, Capital Appreciation, NATL, 0%, 2/15/2043 (n) (Identified Cost, $124,017) | | $ | 400,000 | | | $ | 146,398 | |
| | |
| Investment Companies (h) - 1.7% | | | | | | | | |
| Money Market Funds - 1.7% | | | | | |
| MFS Institutional Money Market Portfolio, 1.28% (v) (Identified Cost, $1,796,819) | | | 1,796,313 | | | $ | 1,796,671 | |
| |
| Other Assets, Less Liabilities - 1.3% | | | | 1,426,849 | |
| Net Assets - 100.0% | | | | | | $ | 105,869,277 | |
56
Portfolio of Investments – continued
Derivative Contracts at 3/31/20
Futures Contracts
| | | | | | | | | | | | | | | | | | | | | | |
| Description | | Long/
Short | | | Currency | | | Contracts | | Notional
Amount | | | Expiration
Date | | | Value/Unrealized
Appreciation
(Depreciation) | |
| Liability Derivatives | | | | | | | | | | | | | | | | | | | | | | |
| Interest Rate Futures | | | | | | | | | | | | | | | | | | | | | | |
| U.S. Treasury Bond | | | Short | | | | USD | | | 19 | | | $3,402,188 | | | | June - 2020 | | | | $(228,664 | ) |
| | | | | | | | | | | | | | | | | | | | | | |
At March 31, 2020, the fund had cash collateral of $201,500 to cover any collateral or margin obligations for certain derivative contracts. Restricted cash and/or deposits with brokers in the Statements of Assets and Liabilities are comprised of cash collateral.
See Portfolio Footnotes and Notes to Financial Statements
57
PORTFOLIO OF INVESTMENTS
3/31/20
MFS MASSACHUSETTS MUNICIPAL BOND FUND
The Portfolio of Investments is a complete list of all securities owned by your fund. It is categorized by broad-based asset classes.
| | | | | | | | |
| Municipal Bonds - 95.5% | | | | | | |
| | | | | | | | |
| | |
| Issuer | | Shares/Par | | | Value ($) | |
| Airport Revenue - 5.2% | | | | | | | | |
| Massachusetts Port Authority Rev., ”A“, 5%, 7/01/2038 | | $ | 2,000,000 | | | $ | 2,417,520 | |
| Massachusetts Port Authority Rev., ”A“, 5%, 7/01/2040 | | | 2,755,000 | | | | 3,306,579 | |
| Massachusetts Port Authority Rev., ”A“, 5%, 7/01/2042 | | | 3,000,000 | | | | 3,459,780 | |
| Massachusetts Port Authority Rev., ”A“, 5%, 7/01/2047 | | | 1,500,000 | | | | 1,711,515 | |
| Massachusetts Port Authority Rev., ”B“, 5%, 7/01/2043 | | | 3,625,000 | | | | 4,105,131 | |
| Massachusetts Port Authority Rev., ”C“, 5%, 7/01/2044 | | | 3,000,000 | | | | 3,556,980 | |
| | | | | | | $ | 18,557,505 | |
| General Obligations - General Purpose - 6.8% | | | | | |
| Bridgeview, IL, Stadium and Redevelopment Projects, AAC, 5.14%, 12/01/2036 | | $ | 705,000 | | | $ | 650,828 | |
| Chicago, IL, ”A“, 5%, 1/01/2025 | | | 535,000 | | | | 548,894 | |
| Chicago, IL, General Obligation, ”A“, 5%, 1/01/2026 | | | 145,000 | | | | 149,347 | |
| Chicago, IL, General Obligation, ”A“, 5%, 1/01/2027 | | | 170,000 | | | | 175,687 | |
| Commonwealth of Massachusetts, ”B“, 5.25%, 8/01/2023 | | | 1,000,000 | | | | 1,132,680 | |
| Commonwealth of Massachusetts, ”B“, 5.25%, 8/01/2028 | | | 2,225,000 | | | | 2,902,090 | |
| Commonwealth of Massachusetts, General Obligation Consolidated Loan, ”C“, 5%, 8/01/2020 | | | 1,000,000 | | | | 1,012,980 | |
| Commonwealth of Massachusetts, General Obligation Consolidated Loan, ”D“, 4%, 2/01/2044 | | | 2,000,000 | | | | 2,219,960 | |
| Commonwealth of Massachusetts, General Obligation Consolidated Loan, ”D“, 4%, 2/01/2046 | | | 2,600,000 | | | | 2,875,704 | |
| Commonwealth of Massachusetts, General Obligation Consolidated Loan, ”E“, 5%, 9/01/2037 | | | 3,000,000 | | | | 3,714,240 | |
| Commonwealth of Massachusetts, General Obligation Consolidated Loan, ”F“, 5%, 11/01/2042 | | | 3,000,000 | | | | 3,614,610 | |
| Commonwealth of Massachusetts, General Obligation Consolidated Loan, ”I“, 5%, 12/01/2034 | | | 1,000,000 | | | | 1,210,590 | |
| Commonwealth of Puerto Rico, General Obligation, ”A“, 8%, 7/01/2035 (a)(d) | | | 3,880,000 | | | | 2,328,000 | |
| Commonwealth of Puerto Rico, Public Improvement, ”A“, AGM, 5%, 7/01/2035 | | | 600,000 | | | | 604,896 | |
| Commonwealth of Puerto Rico, Public Improvement, ”A“, NATL, 5.5%, 7/01/2020 | | | 640,000 | | | | 642,931 | |
| Puerto Rico Public Buildings Authority Rev.,”M-2“, AAC, 10%, 7/01/2035 | | | 510,000 | | | | 553,768 | |
| | | | | | | $ | 24,337,205 | |
| | | | | | | | |
| | | | | | | |
| | |
| Issuer | | Shares/Par | | | Value ($) | |
| General Obligations - Schools - 0.4% | | | | | | | | |
| San Marcos, CA, Unified School District (Election of 2010), Capital Appreciation, ”C“, 0%, 8/01/2038 | | $ | 3,375,000 | | | $ | 1,503,225 | |
| |
| Healthcare Revenue - Hospitals - 13.0% | | | | | |
| Allegheny County, PA, Hospital Development Authority Rev. (Allegheny Health Network Obligated Group), ”A“, 5%, 4/01/2047 | | $ | 1,365,000 | | | $ | 1,620,719 | |
| Escambia County, FL, Health Facilities Authority Rev. (Baptist Hospital, Inc.), ”A“, 6%, 8/15/2036 | | | 1,315,000 | | | | 1,333,094 | |
| Jefferson Parish, LA, Hospital Service District No. 2 Hospital Rev. (East Jefferson General Hospital), 6.25%, 7/01/2031 | | | 235,000 | | | | 240,478 | |
| Jefferson Parish, LA, Hospital Service District No. 2 Hospital Rev. (East Jefferson General Hospital), 6.375%, 7/01/2041 | | | 345,000 | | | | 352,662 | |
| Kentucky Economic Development Finance Authority Hospital Rev. (Owensboro Medical Health System, Inc.), ”A“, 6.375%, 6/01/2040 (Prerefunded 6/01/2020) | | | 745,000 | | | | 751,236 | |
| Kentucky Economic Development Finance Authority Hospital Rev. (Owensboro Medical Health System, Inc.), ”A“, 6.5%, 3/01/2045 (Prerefunded 6/01/2020) | | | 520,000 | | | | 524,451 | |
| Massachusetts Development Finance Agency Rev. (Atrius Health Issue), ”A“, 4%, 6/01/2049 | | | 1,500,000 | | | | 1,548,090 | |
| Massachusetts Development Finance Agency Rev. (Baystate Medical Center), ”N“, 5%, 7/01/2044 | | | 2,000,000 | | | | 2,234,820 | |
| Massachusetts Development Finance Agency Rev. (Beth Israel Lahey Health), ”K“, 5%, 7/01/2036 | | | 635,000 | | | | 769,855 | |
| Massachusetts Development Finance Agency Rev. (Beth Israel Lahey Health), ”K“, 5%, 7/01/2037 | | | 850,000 | | | | 1,027,352 | |
| Massachusetts Development Finance Agency Rev. (Beth Israel Lahey Health), ”K“, 5%, 7/01/2038 | | | 700,000 | | | | 842,919 | |
| Massachusetts Development Finance Agency Rev. (CareGroup), ”I“, 5%, 7/01/2037 | | | 1,000,000 | | | | 1,155,450 | |
| Massachusetts Development Finance Agency Rev. (CareGroup),”J-2“, 5%, 7/01/2036 | | | 1,000,000 | | | | 1,195,750 | |
| Massachusetts Development Finance Agency Rev. (CareGroup),”J-2“, 5%, 7/01/2037 | | | 1,000,000 | | | | 1,192,410 | |
| Massachusetts Development Finance Agency Rev. (Children’s Hospital), ”P“, 5%, 10/01/2032 | | | 1,000,000 | | | | 1,160,160 | |
| Massachusetts Development Finance Agency Rev. (Dana-Farber Cancer Institute Issue), ”N“, 5%, 12/01/2041 | | | 1,690,000 | | | | 1,966,247 | |
| Massachusetts Development Finance Agency Rev. (Dana-Farber Cancer Institute), ”O“, 5%, 12/01/2029 | | | 100,000 | | | | 126,759 | |
58
Portfolio of Investments – continued
| | | | | | | | |
| Municipal Bonds - continued | | | | | | |
| | | | | | | | |
| | |
| Issuer | | Shares/Par | | | Value ($) | |
| Healthcare Revenue - Hospitals - continued | | | | | |
| Massachusetts Development Finance Agency Rev. (Dana-Farber Cancer Institute), ”O“, 5%, 12/01/2030 | | $ | 100,000 | | | $ | 126,305 | |
| Massachusetts Development Finance Agency Rev. (Dana-Farber Cancer Institute), ”O“, 5%, 12/01/2031 | | | 125,000 | | | | 157,393 | |
| Massachusetts Development Finance Agency Rev. (Dana-Farber Cancer Institute), ”O“, 5%, 12/01/2032 | | | 175,000 | | | | 219,776 | |
| Massachusetts Development Finance Agency Rev. (Dana-Farber Cancer Institute), ”O“, 5%, 12/01/2033 | | | 150,000 | | | | 187,814 | |
| Massachusetts Development Finance Agency Rev. (Dana-Farber Cancer Institute), ”O“, 5%, 12/01/2034 | | | 400,000 | | | | 499,000 | |
| Massachusetts Development Finance Agency Rev. (Lahey Health System Obligated Group), ”F“, 5%, 8/15/2030 | | | 2,000,000 | | | | 2,311,760 | |
| Massachusetts Development Finance Agency Rev. (Milford Regional Medical Center), ”F“, 5.75%, 7/15/2043 | | | 1,000,000 | | | | 1,030,200 | |
| Massachusetts Development Finance Agency Rev. (Partners Healthcare System Issue), ”Q“, 5%, 7/01/2041 | | | 1,500,000 | | | | 1,689,285 | |
| Massachusetts Development Finance Agency Rev. (Partners Healthcare System Issue), ”Q“, 5%, 7/01/2047 | | | 1,500,000 | | | | 1,660,365 | |
| Massachusetts Development Finance Agency Rev. (Partners Healthcare System Issue), ”S“, 4%, 7/01/2041 | | | 3,500,000 | | | | 3,830,260 | |
| Massachusetts Development Finance Agency Rev. (South Shore Hospital), ”I“, 5%, 7/01/2041 | | | 2,300,000 | | | | 2,621,356 | |
| Massachusetts Development Finance Agency Rev. (Tufts Medical Center), ”I“, 7.25%, 1/01/2032 (Prerefunded 1/01/2021) | | | 600,000 | | | | 626,580 | |
| Massachusetts Development Finance Agency Rev. (Tufts Medical Center), ”I“, 7.25%, 1/01/2032 | | | 400,000 | | | | 417,720 | |
| Massachusetts Development Finance Agency Rev. (UMass Memorial Health Care Obligated Group), ”I“, 5%, 7/01/2041 | | | 1,850,000 | | | | 1,957,078 | |
| Massachusetts Development Finance Agency Rev. (UMass Memorial Health Care Obligated Group), ”K“, 5%, 7/01/2038 | | | 2,000,000 | | | | 2,126,660 | |
| Massachusetts Development Finance Agency Rev. (UMass Memorial Health Care Obligated Group), ”L“, 5%, 7/01/2044 | | | 1,000,000 | | | | 1,069,090 | |
| Massachusetts Development Finance Agency Rev. (Wellforce), ”A“, 4%, 7/01/2044 | | | 2,080,000 | | | | 2,088,195 | |
| Massachusetts Development Finance Agency Rev. (Wellforce), ”A“, 5%, 7/01/2044 | | | 2,000,000 | | | | 2,245,800 | |
| Massachusetts Health & Educational Facilities Authority Rev. (Baystate Medical Center),”K-1“, VRDN, 0.8%, 7/01/2039 | | | 2,365,000 | | | | 2,365,000 | |
| Massachusetts Health & Educational Facilities Authority Rev. (Southcoast Health Obligation), ”D“, 5%, 7/01/2029 | | | 1,000,000 | | | | 1,003,360 | |
| | | | | | | | |
| | | | | | | |
| | |
| Issuer | | Shares/Par | | | Value ($) | |
| Healthcare Revenue - Hospitals - continued | | | | | |
| Miami-Dade County, FL, Health Facilities Authority Hospital Rev., 6%, 8/01/2030 (Prerefunded 8/01/2020) | | $ | 310,000 | | | $ | 314,802 | |
| Miami-Dade County, FL, Health Facilities Authority Hospital Rev., Unrefunded Balance, 6%, 8/01/2030 | | | 120,000 | | | | 121,686 | |
| | | | | | | $ | 46,711,937 | |
| Healthcare Revenue - Long Term Care - 1.6% | | | | | |
| Massachusetts Development Finance Agency First Mortgage Rev. (Berkshire Retirement Community), 5%, 7/01/2031 | | $ | 1,000,000 | | | $ | 1,130,160 | |
| Massachusetts Development Finance Agency Rev. (Adventcare), ”A“, 6.75%, 10/15/2037 (a) | | | 500,000 | | | | 324,000 | |
| Massachusetts Development Finance Agency Rev. (Carleton-Willard Village), 4%, 12/01/2042 | | | 485,000 | | | | 504,536 | |
| Massachusetts Development Finance Agency Rev. (Carleton-Willard Village), 5%, 12/01/2042 | | | 525,000 | | | | 588,562 | |
| Massachusetts Development Finance Agency Rev. (Linden Ponds, Inc.), Capital Appreciation, ”B“, 0%, 11/15/2056 | | | 93,608 | | | | 15,794 | |
| Massachusetts Development Finance Agency Rev. (Loomis Community), ETM, 6%, 1/01/2033 (Prerefunded 7/01/2023) | | | 250,000 | | | | 287,583 | |
| Massachusetts Development Finance Agency Rev. (Loomis Community), Unrefunded Balance, 6%, 1/01/2033 | | | 250,000 | | | | 267,505 | |
| Massachusetts Development Finance Agency Rev. (Newbridge on the Charles, Inc.), 5%, 10/01/2037 | | | 1,250,000 | | | | 1,263,237 | |
| Massachusetts Development Finance Agency Rev. (North Hill Communities), ”A“, 6.5%, 11/15/2043 (Prerefunded 11/15/2023) | | | 1,000,000 | | | | 1,185,980 | |
| | | | | | | $ | 5,567,357 | |
| Industrial Revenue - Other - 0.5% | | | | | | | | |
| Port Beaumont, TX, Navigation District Facility Rev. (Jefferson Gulf Coast Energy Project), ”A“, 3.625%, 1/01/2035 (n) | | $ | 400,000 | | | $ | 336,752 | |
| Port Beaumont, TX, Navigation District Facility Rev. (Jefferson Gulf Coast Energy Project), ”A“, 4%, 1/01/2050 (n) | | | 555,000 | | | | 428,382 | |
| Tuscaloosa County, AL, Industrial Development Authority, Gulf Opportunity Zone (Hunt Refining Project), ”A“, 4.5%, 5/01/2032 | | | 420,000 | | | | 399,281 | |
| Tuscaloosa County, AL, Industrial Development Authority, Gulf Opportunity Zone (Hunt Refining Project), ”A“, 5.25%, 5/01/2044 | | | 575,000 | | | | 552,926 | |
| | | | | | | $ | 1,717,341 | |
| Miscellaneous Revenue - Other - 5.2% | | | | | | | | |
| Massachusetts Development Finance Agency Rev. (Broad Institute), ”A“, 5.25%, 4/01/2037 (Prerefunded 4/01/2021) | | $ | 2,000,000 | | | $ | 2,076,600 | |
59
Portfolio of Investments – continued
| | | | | | | | |
| Municipal Bonds - continued | | | | | | |
| | | | | | | | |
| | |
| Issuer | | Shares/Par | | | Value ($) | |
| Miscellaneous Revenue - Other - continued | | | | | |
| Massachusetts Development Finance Agency Rev. (Woods Hole Oceanographic Institution), 5%, 6/01/2037 | | $ | 1,000,000 | | | $ | 1,228,440 | |
| Massachusetts Development Finance Agency Rev. (Woods Hole Oceanographic Institution), 5%, 6/01/2038 | | | 1,000,000 | | | | 1,224,160 | |
| Massachusetts Development Finance Agency Rev. (Woods Hole Oceanographic Institution), 5%, 6/01/2043 | | | 1,000,000 | | | | 1,205,730 | |
| Massachusetts Health & Educational Facilities Authority Rev. (Sterling & Francine Clark Art Institute), ”B“, 5%, 7/01/2030 (Prerefunded 7/01/2020) | | | 3,500,000 | | | | 3,534,160 | |
| Massachusetts Health & Educational Facilities Authority Rev. (Sterling & Francine Clark Art Institute), ”B“, 5%, 7/01/2040 (Prerefunded 7/01/2020) | | | 1,700,000 | | | | 1,716,592 | |
| Massachusetts Port Authority Special Facilities Rev. (BOSFuel Project), ”A“, 5%, 7/01/2038 | | | 1,000,000 | | | | 1,179,750 | |
| Massachusetts Port Authority Special Facilities Rev. (BOSFuel Project), ”A“, 5%, 7/01/2039 | | | 2,000,000 | | | | 2,354,620 | |
| Massachusetts Port Authority Special Facilities Rev. (ConRAC Project), ”A“, 5.125%, 7/01/2041 | | | 3,000,000 | | | | 3,115,410 | |
| New York Liberty Development Corp., Liberty Rev. (7 World Trade Center Project), 5%, 9/15/2040 | | | 1,095,000 | | | | 1,156,966 | |
| | | | | | | $ | 18,792,428 | |
| Multi-Family Housing Revenue - 3.6% | | | | | | | | |
| Massachusetts Development Finance Agency Rev. (Credit Housing-Chelsea Homes),”I-A“, LOC, 5%, 12/15/2024 | | $ | 1,005,000 | | | $ | 1,006,608 | |
| Massachusetts Development Finance Agency Rev. (Morville House Apartments), ”A“, LOC, 4.95%, 12/15/2023 | | | 2,090,000 | | | | 2,102,895 | |
| Massachusetts Housing Finance Agency Rev., ”A“, FHA, 5.25%, 12/01/2035 | | | 1,000,000 | | | | 1,006,540 | |
| Massachusetts Housing Finance Agency Rev., ”C“, 5.35%, 12/01/2049 | | | 1,035,000 | | | | 1,036,346 | |
| Massachusetts Housing Finance Agency, ”A“, 3.7%, 12/01/2038 | | | 1,000,000 | | | | 1,069,750 | |
| Massachusetts Housing Finance Agency, ”A“, 3.8%, 12/01/2043 | | | 1,000,000 | | | | 1,064,650 | |
| Massachusetts Housing Finance Agency,“C-1”, 2.9%, 12/01/2039 | | | 1,000,000 | | | | 1,019,720 | |
| Massachusetts Housing Finance Agency,“C-1”, 3.1%, 12/01/2044 | | | 2,000,000 | | | | 2,041,800 | |
| Massachusetts Housing Finance Agency, Multi-Family Housing, ”A“, FHA, 4.75%, 12/01/2030 | | | 1,425,000 | | | | 1,478,153 | |
| Massachusetts Housing Finance Agency, Multi-Family Housing, ”A“, FHA, 4.875%, 12/01/2032 | | | 1,190,000 | | | | 1,236,493 | |
| | | | | | | $ | 13,062,955 | |
| Parking - 0.9% | | | | | | | | |
| Boston, MA, Metropolitan Transit Parking Corp., Systemwide Parking Rev., 5.25%, 7/01/2036 | | $ | 3,000,000 | | | $ | 3,127,470 | |
| | | | | | | | |
| | | | | | | |
| | |
| Issuer | | Shares/Par | | | Value ($) | |
| Port Revenue - 0.8% | | | | | | | | |
| Martha’s Vineyard, MA, Woods Hole Steamship Authority, ”A“, 4%, 3/01/2028 | | $ | 2,660,000 | | | $ | 2,984,148 | |
| | |
| Sales & Excise Tax Revenue - 7.5% | | | | | | | | |
| Colorado Regional Transportation District, Private Activity Rev. (Denver Transportation Partners), 6%, 1/15/2041 | | $ | 985,000 | | | $ | 990,880 | |
| Illinois Sales Tax Securitization Corp., Second Lien, ”A“, 5%, 1/01/2026 | | | 140,000 | | | | 156,524 | |
| Illinois Sales Tax Securitization Corp., Second Lien, ”A“, 5%, 1/01/2027 | | | 310,000 | | | | 351,983 | |
| Illinois Sales Tax Securitization Corp., Second Lien, ”A“, 5%, 1/01/2029 | | | 330,000 | | | | 384,922 | |
| Illinois Sales Tax Securitization Corp., Second Lien, ”A“, 5%, 1/01/2030 | | | 140,000 | | | | 165,210 | |
| Illinois Sales Tax Securitization Corp., Second Lien, ”A“, 5%, 1/01/2036 | | | 85,000 | | | | 98,703 | |
| Illinois Sales Tax Securitization Corp., Second Lien, ”A“, 5%, 1/01/2037 | | | 175,000 | | | | 202,666 | |
| Illinois Sales Tax Securitization Corp., Second Lien, ”A“, 4%, 1/01/2038 | | | 80,000 | | | | 82,456 | |
| Illinois Sales Tax Securitization Corp., Second Lien, ”A“, 4%, 1/01/2039 | | | 55,000 | | | | 56,532 | |
| Illinois Sales Tax Securitization Corp., Second Lien, ”A“, 4%, 1/01/2040 | | | 85,000 | | | | 87,221 | |
| Massachusetts Bay Transportation Authority, Sales Tax Rev., 4%, 12/01/2021 | | | 500,000 | | | | 523,075 | |
| Massachusetts Bay Transportation Authority, Sales Tax Rev., ”A“, 5.25%, 7/01/2022 | | | 1,275,000 | | | | 1,389,113 | |
| Massachusetts Bay Transportation Authority, Sales Tax Rev., ”A“, 5%, 7/01/2024 | | | 1,590,000 | | | | 1,832,173 | |
| Massachusetts Bay Transportation Authority, Sales Tax Rev.,”A-1“, 5.25%, 7/01/2029 | | | 1,850,000 | | | | 2,440,890 | |
| Massachusetts Bay Transportation Authority, Sales Tax Rev.,”A-1“, 5.25%, 7/01/2031 | | | 2,000,000 | | | | 2,726,900 | |
| Massachusetts School Building Authority, Senior Dedicated Sales Tax Rev., ”A“, 5%, 2/15/2044 | | | 4,000,000 | | | | 4,888,880 | |
| Massachusetts School Building Authority, Senior Dedicated Sales Tax Rev., ”B“, 4%, 11/15/2046 | | | 3,000,000 | | | | 3,306,450 | |
| Puerto Rico Sales Tax Financing Corp., Restructured Sales Tax Rev.,”2019A-1“, 4.55%, 7/01/2040 | | | 73,000 | | | | 69,105 | |
| Puerto Rico Sales Tax Financing Corp., Restructured Sales Tax Rev.,”2019A-1“, 5%, 7/01/2058 | | | 2,905,000 | | | | 2,824,967 | |
| Puerto Rico Sales Tax Financing Corp., Restructured Sales Tax Rev.,”2019A-2“, 4.329%, 7/01/2040 | | | 671,000 | | | | 616,374 | |
| Puerto Rico Sales Tax Financing Corp., Restructured Sales Tax Rev.,”2019A-2“, 4.329%, 7/01/2040 | | | 256,000 | | | | 235,159 | |
| Puerto Rico Sales Tax Financing Corp., Restructured Sales Tax Rev.,”2019A-2“, 4.536%, 7/01/2053 | | | 5,000 | | | | 4,538 | |
60
Portfolio of Investments – continued
| | | | | | | | |
| Municipal Bonds - continued | | | | | | |
| | | | | | | | |
| | |
| Issuer | | Shares/Par | | | Value ($) | |
| Sales & Excise Tax Revenue - continued | | | | | |
| Puerto Rico Sales Tax Financing Corp., Restructured Sales Tax Rev.,”2019A-2“, 4.784%, 7/01/2058 | | $ | 101,000 | | | $ | 94,589 | |
| Puerto Rico Sales Tax Financing Corp., Restructured Sales Tax Rev., Capital Appreciation,”2019A-1“, 0%, 7/01/2024 | | | 12,000 | | | | 10,275 | |
| Puerto Rico Sales Tax Financing Corp., Restructured Sales Tax Rev., Capital Appreciation,”2019A-1“, 0%, 7/01/2027 | | | 117,000 | | | | 89,086 | |
| Puerto Rico Sales Tax Financing Corp., Restructured Sales Tax Rev., Capital Appreciation,”2019A-1“, 0%, 7/01/2029 | | | 22,000 | | | | 15,224 | |
| Puerto Rico Sales Tax Financing Corp., Restructured Sales Tax Rev., Capital Appreciation,”2019A-1“, 0%, 7/01/2031 | | | 1,059,000 | | | | 658,571 | |
| Puerto Rico Sales Tax Financing Corp., Restructured Sales Tax Rev., Capital Appreciation,”2019A-1“, 0%, 7/01/2033 | | | 1,011,000 | | | | 559,427 | |
| Puerto Rico Sales Tax Financing Corp., Restructured Sales Tax Rev., Capital Appreciation,”2019A-1“, 0%, 7/01/2046 | | | 9,313,000 | | | | 2,201,779 | |
| | | | | | | $ | 27,063,672 | |
| Secondary Schools - 2.5% | | | | | | | | |
| District of Columbia Rev. (Rocketship D.C.), ”A“, 5%, 6/01/2056 | | $ | 290,000 | | | $ | 269,459 | |
| Lowell, MA, Collegiate Charter School Rev., 5%, 6/15/2039 | | | 1,000,000 | | | | 955,000 | |
| Lowell, MA, Collegiate Charter School Rev., 5%, 6/15/2054 | | | 1,000,000 | | | | 901,980 | |
| Massachusetts Development Finance Agency Rev. (Dexter Southfield), 5%, 5/01/2030 | | | 500,000 | | | | 573,010 | |
| Massachusetts Development Finance Agency Rev. (Dexter Southfield), 5%, 5/01/2031 | | | 1,015,000 | | | | 1,158,105 | |
| Massachusetts Development Finance Agency Rev. (Dexter Southfield), 5%, 5/01/2037 | | | 170,000 | | | | 170,425 | |
| Massachusetts Development Finance Agency Rev. (Foxborough Regional Charter School), ”A“, 6.375%, 7/01/2030 (Prerefunded 7/01/2020) | | | 740,000 | | | | 749,065 | |
| Massachusetts Development Finance Agency Rev. (Foxborough Regional Charter School), ”B“, 5%, 7/01/2037 | | | 1,000,000 | | | | 1,099,750 | |
| Massachusetts Development Finance Agency Rev. (Milton Academy), ”A“, 5%, 9/01/2028 | | | 1,000,000 | | | | 1,015,840 | |
| Massachusetts Development Finance Agency Rev. (Sabis International Charter School Issue), 5%, 4/15/2033 | | | 2,000,000 | | | | 2,163,500 | |
| | | | | | | $ | 9,056,134 | |
| Single Family Housing - State - 2.3% | | | | | | | | |
| Connecticut Housing Finance Authority Rev. (Housing Mortgage Finance Program), ”C1“, 4%, 11/15/2047 | | $ | 1,450,000 | | | $ | 1,531,461 | |
| Massachusetts Housing Finance Agency, Single Family Housing Rev., ”206“, 3.3%, 6/01/2034 | | | 365,000 | | | | 382,524 | |
| | | | | | | | |
| | | | | | | |
| | |
| Issuer | | Shares/Par | | | Value ($) | |
| Single Family Housing - State - continued | | | | | |
| Massachusetts Housing Finance Agency, Single Family Housing Rev., ”206“, 3.45%, 12/01/2036 | | $ | 485,000 | | | $ | 509,580 | |
| Massachusetts Housing Finance Agency, Single Family Housing Rev., “214”, GNMA, 2.95%, 12/01/2044 | | | 4,000,000 | | | | 4,039,720 | |
| Pennsylvania Housing Finance Agency, Single Family Mortgage Rev., “125A”, 3.7%, 10/01/2037 | | | 1,780,000 | | | | 1,925,105 | |
| | | | | | | $ | 8,388,390 | |
| State & Local Agencies - 4.9% | | | | | | | | |
| Colorado State University Board of Governors, System Enterprise Refunding Rev., ”E“, 4%, 3/01/2043 | | $ | 1,245,000 | | | $ | 1,391,412 | |
| Commonwealth of Pennsylvania, Tobacco Master Settlement Financing Authority Rev., 5%, 6/01/2032 | | | 75,000 | | | | 90,119 | |
| Commonwealth of Pennsylvania, Tobacco Master Settlement Financing Authority Rev., 5%, 6/01/2033 | | | 60,000 | | | | 71,782 | |
| Commonwealth of Pennsylvania, Tobacco Master Settlement Financing Authority Rev., 5%, 6/01/2034 | | | 30,000 | | | | 35,812 | |
| Delaware Valley, PA, Regional Finance Authority, ”C“, FLR, 1.809% (LIBOR - 3mo. + 0.75%), 6/01/2037 | | | 1,400,000 | | | | 1,267,364 | |
| Maryland Stadium Authority Rev., Baltimore City Public Schools Construction and Revitalization Program, “A”, 5%, 5/01/2047 | | | 1,015,000 | | | | 1,201,120 | |
| Massachusetts College Building Authority Project Rev., ”A“, 5%, 5/01/2029 (Prerefunded 5/01/2022) | | | 995,000 | | | | 1,073,525 | |
| Massachusetts College Building Authority Project Rev., ”A“, 5%, 5/01/2031 | | | 275,000 | | | | 302,888 | |
| Massachusetts College Building Authority Project Rev., ”A“, 5%, 5/01/2032 | | | 760,000 | | | | 836,593 | |
| Massachusetts College Building Authority Project Rev., Capital Appreciation, ”A“, SYNCORA, 0%, 5/01/2022 | | | 8,310,000 | | | | 8,076,572 | |
| Massachusetts College Building Authority Project Rev., Unrefunded Balance, ”A“, 5%, 5/01/2029 | | | 1,005,000 | | | | 1,084,314 | |
| New Jersey Building Authority Rev., Unrefunded Balance, “A”, BAM, 5%, 6/15/2029 | | | 45,000 | | | | 49,976 | |
| New Jersey Economic Development Authority Rev., School Facilities Construction Rev., ”LLL“, 5%, 6/15/2039 | | | 765,000 | | | | 810,908 | |
| New Jersey Economic Development Authority Rev., School Facilities Construction Rev., ”LLL“, 5%, 6/15/2044 | | | 1,280,000 | | | | 1,340,595 | |
| | | | | | | $ | 17,632,980 | |
| Student Loan Revenue - 3.4% | | | | | | | | |
| Massachusetts Educational Financing Authority, ”J“, 5.625%, 7/01/2029 | | $ | 645,000 | | | $ | 672,232 | |
61
Portfolio of Investments – continued
| | | | | | | | |
| Municipal Bonds - continued | | | | | | |
| | | | | | | | |
| | |
| Issuer | | Shares/Par | | | Value ($) | |
| Student Loan Revenue - continued | | | | | | | | |
| Massachusetts Educational Financing Authority, Education Loan Rev., ”C“, 4.125%, 7/01/2046 | | $ | 2,000,000 | | | $ | 2,134,420 | |
| Massachusetts Educational Financing Authority, Education Loan Rev., ”C“, 3.75%, 7/01/2047 | | | 4,000,000 | | | | 4,112,280 | |
| Massachusetts Educational Financing Authority, Education Loan Rev., ”I“, 6%, 1/01/2028 | | | 170,000 | | | | 170,173 | |
| Massachusetts Educational Financing Authority, Education Loan Rev.,”I-A“, 5.5%, 1/01/2022 | | | 3,000,000 | | | | 3,003,420 | |
| Massachusetts Educational Financing Authority, Education Loan Rev.,”I-A“, 5.15%, 1/01/2026 | | | 205,000 | | | | 205,199 | |
| Massachusetts Educational Financing Authority, Education Loan Rev.,”I-A“, 5.2%, 1/01/2027 | | | 95,000 | | | | 95,093 | |
| Massachusetts Educational Financing Authority, Education Loan Rev., ”J“, 3.5%, 7/01/2033 | | | 660,000 | | | | 684,895 | |
| Massachusetts Educational Financing Authority, Education Loan Rev., ”K“, 4.5%, 7/01/2024 | | | 675,000 | | | | 705,632 | |
| Minnesota Office of Higher Education Supplemental Student Loan Program Rev., 2.65%, 11/01/2038 | | | 280,000 | | | | 268,341 | |
| | | | | | | $ | 12,051,685 | |
| Tax - Other - 2.3% | | | | | | | | |
| Guam Government Ltd. Obligation Rev., ”A“, 5%, 12/01/2035 | | $ | 225,000 | | | $ | 223,594 | |
| Guam Government Ltd. Obligation Rev., ”A“, 5%, 12/01/2036 | | | 120,000 | | | | 118,825 | |
| Guam Government Ltd. Obligation Rev., ”A“, 5%, 12/01/2046 | | | 370,000 | | | | 350,871 | |
| Illinois Sports Facilities Authority Refunding Rev., BAM, 5%, 6/15/2028 | | | 815,000 | | | | 998,693 | |
| Illinois Sports Facilities Authority Refunding Rev., BAM, 5%, 6/15/2029 | | | 1,980,000 | | | | 2,467,476 | |
| Illinois Sports Facilities Authority, State Tax Supported Refunding Rev., BAM, 5%, 6/15/2029 | | | 210,000 | | | | 261,702 | |
| Massachusetts Special Obligation Dedicated Tax Rev., NATL, 5.5%, 1/01/2023 | | | 1,585,000 | | | | 1,760,824 | |
| Puerto Rico Convention Center District Authority, Hotel Occupancy Tax Rev., ”A“, AAC, 5%, 7/01/2031 | | | 305,000 | | | | 305,040 | |
| Puerto Rico Infrastructure Financing Authority Special Tax Rev., ”C“, AAC, 5.5%, 7/01/2026 | | | 995,000 | | | | 1,060,899 | |
| Puerto Rico Infrastructure Financing Authority Special Tax Rev., ”C“, AAC, 5.5%, 7/01/2027 | | | 815,000 | | | | 871,145 | |
| | | | | | | $ | 8,419,069 | |
| Tax Assessment - 0.0% | | | | | | | | |
| Brunswick, MD, Special Obligation Refunding (Brunswick Crossing Special Taxing District), 4%, 7/01/2029 | | $ | 25,000 | | | $ | 24,190 | |
| | | | | | | | |
| | | | | | | |
| | |
| Issuer | | Shares/Par | | | Value ($) | |
| Tax Assessment - continued | | | | | | | | |
| Brunswick, MD, Special Obligation Refunding (Brunswick Crossing Special Taxing District), 5%, 7/01/2036 | | $ | 35,000 | | | $ | 35,418 | |
| | | | | | | $ | 59,608 | |
| Tobacco - 1.2% | | | | | | | | |
| Buckeye, OH, Tobacco Settlement Financing Authority Senior Asset-Backed Refunding,2020A-2, ”1“, 5%, 6/01/2032 | | $ | 250,000 | | | $ | 310,610 | |
| Buckeye, OH, Tobacco Settlement Financing Authority Senior Asset-Backed Refunding,2020A-2, ”1“, 4%, 6/01/2037 | | | 145,000 | | | | 159,368 | |
| Buckeye, OH, Tobacco Settlement Financing Authority Senior Asset-Backed Refunding,2020B-2, ”2“, 5%, 6/01/2055 | | | 2,000,000 | | | | 1,772,040 | |
| Buckeye, OH, Tobacco Settlement Financing Authority Senior Asset-Backed Refunding,2020B-3, Capital Appreciation, ”2“, 0%, 6/01/2057 | | | 4,885,000 | | | | 538,962 | |
| Illinois Railsplitter Tobacco Settlement Authority Rev., 6%, 6/01/2028 (Prerefunded 6/01/2021) | | | 1,335,000 | | | | 1,409,293 | |
| | | | | | | $ | 4,190,273 | |
| Toll Roads - 1.4% | | | | | | | | |
| Massachusetts Department of Transportation, Metropolitan Highway System Refunding Rev., Subordinated Contract Assistance, 5%, 1/01/2037 | | $ | 1,000,000 | | | $ | 1,254,190 | |
| Massachusetts Department of Transportation, Metropolitan Highway System Rev., “C”, 5%, 1/01/2035 | | | 3,000,000 | | | | 3,786,480 | |
| | | | | | | $ | 5,040,670 | |
| Transportation - Special Tax - 4.8% | | | | | | | | |
| Commonwealth of Massachusetts Transportation Fund Rev. (Rail Enhancement & Accelerated Bridge Programs), ”A“, 5%, 6/01/2036 | | $ | 2,850,000 | | | $ | 3,367,132 | |
| Commonwealth of Massachusetts Transportation Fund Rev. (Rail Enhancement & Accelerated Bridge Programs), ”A“, 5%, 6/01/2042 | | | 3,000,000 | | | | 3,573,810 | |
| Commonwealth of Puerto Rico Highway & Transportation Authority Rev., ASSD GTY, 5.25%, 7/01/2041 | | | 230,000 | | | | 237,834 | |
| Commonwealth of Puerto Rico Highway & Transportation Authority Rev., ”A“, NATL, 4.75%, 7/01/2038 | | | 465,000 | | | | 437,760 | |
| Commonwealth of Puerto Rico Highway & Transportation Authority Rev.,”AA-1“, AGM, 4.95%, 7/01/2026 | | | 275,000 | | | | 280,558 | |
| Commonwealth of Puerto Rico Highway & Transportation Authority Rev., ”CC“, AGM, 5.25%, 7/01/2036 | | | 610,000 | | | | 642,208 | |
| Commonwealth of Puerto Rico Highway & Transportation Authority Rev., ”D“, AGM, 5%, 7/01/2032 | | | 280,000 | | | | 280,076 | |
62
Portfolio of Investments – continued
| | | | | | | | |
| Municipal Bonds - continued | | | | | | |
| | | | | | | | |
| | |
| Issuer | | Shares/Par | | | Value ($) | |
| Transportation - Special Tax - continued | | | | | |
| Commonwealth of Puerto Rico Highway & Transportation Authority Rev., ”L“, AAC, 5.25%, 7/01/2038 | | $ | 2,415,000 | | | $ | 2,450,742 | |
| Commonwealth of Puerto Rico Highway & Transportation Authority Rev., ”L“, ASSD GTY, 5.25%, 7/01/2041 | | | 1,265,000 | | | | 1,308,086 | |
| Commonwealth of Puerto Rico Highway & Transportation Authority Rev., ”L“, NATL, 5.25%, 7/01/2035 | | | 465,000 | | | | 466,251 | |
| Commonwealth of Puerto Rico Highway & Transportation Authority Rev., ”N“, AAC, 5.5%, 7/01/2029 | | | 520,000 | | | | 556,556 | |
| Commonwealth of Puerto Rico Highway & Transportation Authority Rev., ”N“, AAC, 5.25%, 7/01/2031 | | | 1,055,000 | | | | 1,103,382 | |
| Commonwealth of Puerto Rico Highway & Transportation Authority Rev., ”N“, NATL, 5.25%, 7/01/2033 | | | 300,000 | | | | 303,615 | |
| Commonwealth of Puerto Rico Highway & Transportation Authority Rev., Unrefunded Balance, ”A“, NATL, 5%, 7/01/2038 | | | 45,000 | | | | 44,630 | |
| New Jersey Transportation Trust Fund Authority, Federal Highway Reimbursement Rev.,”A-1“, 5%, 6/15/2027 | | | 420,000 | | | | 469,022 | |
| New Jersey Transportation Trust Fund Authority, Transportation System, ”BB“, 5%, 6/15/2044 | | | 1,790,000 | | | | 1,867,561 | |
| | | | | | | $ | 17,389,223 | |
| Universities - Colleges - 20.6% | | | | | | | | |
| Massachusetts Development Finance Agency Refunding Rev. (Brandeis University),”S-1“, 5%, 10/01/2038 | | $ | 605,000 | | | $ | 755,482 | |
| Massachusetts Development Finance Agency Refunding Rev. (Brandeis University),”S-1“, 5%, 10/01/2040 | | | 2,665,000 | | | | 3,317,259 | |
| Massachusetts Development Finance Agency Refunding Rev. (Suffolk University), 5%, 7/01/2031 | | | 910,000 | | | | 1,034,816 | |
| Massachusetts Development Finance Agency Refunding Rev. (Suffolk University), 5%, 7/01/2035 | | | 150,000 | | | | 168,802 | |
| Massachusetts Development Finance Agency Refunding Rev. (Suffolk University), 5%, 7/01/2035 | | | 970,000 | | | | 1,120,709 | |
| Massachusetts Development Finance Agency Refunding Rev. (Suffolk University), 5%, 7/01/2036 | | | 850,000 | | | | 953,938 | |
| Massachusetts Development Finance Agency Refunding Rev. (Suffolk University), 5%, 7/01/2037 | | | 625,000 | | | | 718,037 | |
| Massachusetts Development Finance Agency Refunding Rev. (Suffolk University), 5%, 7/01/2038 | | | 340,000 | | | | 388,885 | |
| Massachusetts Development Finance Agency Refunding Rev. (Suffolk University), 4%, 7/01/2039 | | | 3,055,000 | | | | 3,158,076 | |
| | | | | | | | |
| | | | | | | |
| | |
| Issuer | | Shares/Par | | | Value ($) | |
| Universities - Colleges - continued | | | | | | | | |
| Massachusetts Development Finance Agency Rev. (Bentley University), 5%, 7/01/2040 | | $ | 1,500,000 | | | $ | 1,705,845 | |
| Massachusetts Development Finance Agency Rev. (Brandeis University), ”R“, 5%, 10/01/2038 | | | 835,000 | | | | 1,032,085 | |
| Massachusetts Development Finance Agency Rev. (Brandeis University),”S-1“, 5%, 10/01/2039 | | | 2,660,000 | | | | 3,316,169 | |
| Massachusetts Development Finance Agency Rev. (Emerson College), 5%, 1/01/2043 | | | 725,000 | | | | 811,826 | |
| Massachusetts Development Finance Agency Rev. (Emerson College), 5%, 1/01/2048 | | | 250,000 | | | | 278,487 | |
| Massachusetts Development Finance Agency Rev. (Emerson College), ”A“, 5.25%, 1/01/2042 | | | 2,000,000 | | | | 2,245,800 | |
| Massachusetts Development Finance Agency Rev. (Emmanuel College), ”A“, 5%, 10/01/2035 | | | 1,875,000 | | | | 2,041,762 | |
| Massachusetts Development Finance Agency Rev. (Emmanuel College), ”A“, 5%, 10/01/2043 | | | 2,000,000 | | | | 2,145,200 | |
| Massachusetts Development Finance Agency Rev. (Emmanuel College), “A”, 4%, 10/01/2046 | | | 1,375,000 | | | | 1,349,810 | |
| Massachusetts Development Finance Agency Rev. (Lesley University), ”A“, 5%, 7/01/2044 | | | 2,250,000 | | | | 2,598,052 | |
| Massachusetts Development Finance Agency Rev. (Merrimack College), 5%, 7/01/2047 | | | 3,000,000 | | | | 3,211,560 | |
| Massachusetts Development Finance Agency Rev. (Simmons College), SYNCORA, 5.25%, 10/01/2026 | | | 2,250,000 | | | | 2,558,070 | |
| Massachusetts Development Finance Agency Rev. (Simmons University), ”L“, 5%, 10/01/2035 | | | 2,000,000 | | | | 2,352,220 | |
| Massachusetts Development Finance Agency Rev. (Suffolk University), 5.125%, 7/01/2040 | | | 1,000,000 | | | | 1,008,180 | |
| Massachusetts Development Finance Agency Rev. (Wentworth Institute of Technology Issue), 5%, 10/01/2046 | | | 2,000,000 | | | | 2,187,060 | |
| Massachusetts Development Finance Agency Rev. (Western New England University), 5%, 9/01/2031 | | | 1,110,000 | | | | 1,231,623 | |
| Massachusetts Development Finance Agency Rev. (Western New England University), 5%, 9/01/2048 | | | 1,985,000 | | | | 2,207,876 | |
| Massachusetts Development Finance Agency Rev. (Western New England University), AGM, 5%, 9/01/2038 | | | 2,550,000 | | | | 2,995,663 | |
| Massachusetts Development Finance Agency Rev. (Worcester Polytechnic Institute), 5%, 9/01/2038 | | | 865,000 | | | | 1,012,370 | |
| Massachusetts Development Finance Agency Rev. (Worcester Polytechnic Institute), 5%, 9/01/2039 | | | 950,000 | | | | 1,109,828 | |
| Massachusetts Development Finance Agency Rev. (Worcester Polytechnic Institute), 5%, 9/01/2047 | | | 1,395,000 | | | | 1,565,860 | |
63
Portfolio of Investments – continued
| | | | | | | | |
| Municipal Bonds - continued | | | | | | |
| | | | | | | | |
| | |
| Issuer | | Shares/Par | | | Value ($) | |
| Universities - Colleges - continued | | | | | | | | |
| Massachusetts Development Finance Agency Rev. (Worcester Polytechnic Institute), 4%, 9/01/2049 | | $ | 3,000,000 | | | $ | 3,057,300 | |
| Massachusetts Health & Educational Facilities Authority Rev. (Boston College), 5.5%, 6/01/2027 | | | 1,735,000 | | | | 2,205,185 | |
| Massachusetts Health & Educational Facilities Authority Rev. (Massachusetts Institute of Technology),”I-1“, 5.2%, 1/01/2028 | | | 1,000,000 | | | | 1,285,040 | |
| Massachusetts Health & Educational Facilities Authority Rev. (Northeastern University), ”A“, 5%, 10/01/2035 | | | 1,500,000 | | | | 1,524,630 | |
| Pinellas County, FL, Educational Facilities Authority Rev. (Barry University), 6%, 10/01/2041 | | | 295,000 | | | | 304,918 | |
| Puerto Rico Industrial, Tourist, Educational, Medical & Environmental Control Facilities Financing Authority, Educational Facilities Rev. (University Plaza Project), NATL, 5%, 7/01/2033 | | | 310,000 | | | | 307,926 | |
| Puerto Rico Industrial, Tourist, Educational, Medical & Environmental Control Facilities Financing Authority, Higher Education Rev. (Ana G. Mendez University System Project), 5.125%, 4/01/2032 | | | 110,000 | | | | 97,675 | |
| Puerto Rico Industrial, Tourist, Educational, Medical & Environmental Control Facilities Financing Authority, Higher Education Rev. (Ana G. Mendez University System Project), 5.375%, 4/01/2042 | | | 370,000 | | | | 313,064 | |
| Puerto Rico Industrial, Tourist, Educational, Medical & Environmental Control Facilities Financing Authority, Higher Education Rev. (University of Sacred Heart), 4.375%, 10/01/2031 | | | 75,000 | | | | 65,747 | |
| Puerto Rico Industrial, Tourist, Educational, Medical & Environmental Control Facilities Financing Authority, Higher Education Rev. (University of Sacred Heart), 5%, 10/01/2042 | | | 90,000 | | | | 75,290 | |
| Red River, TX, Education Finance Corp., Higher Education Rev. (Houston Baptist University Project), 5.5%, 10/01/2046 | | | 470,000 | | | | 510,711 | |
| University of Massachusetts Building Authority Project Senior Rev., ”1“, 5%, 11/01/2037 | | | 1,000,000 | | | | 1,257,300 | |
| University of Massachusetts Building Authority Project Senior Rev., ”1“, 5%, 11/01/2039 | | | 3,000,000 | | | | 3,300,900 | |
| University of Massachusetts Building Authority Project Senior Rev., ”1“, 5%, 11/01/2040 | | | 2,500,000 | | | | 2,907,775 | |
| University of Massachusetts Building Authority Project Senior Rev., ”1“, 5%, 11/01/2045 | | | 1,845,000 | | | | 2,270,402 | |
| University of Massachusetts Building Authority Senior Refunding Rev.,”2019-1“, 5%, 5/01/2039 | | | 3,000,000 | | | | 3,719,430 | |
| | | | | | | $ | 73,784,643 | |
| Universities - Dormitories - 0.6% | | | | | | | | |
| Massachusetts Development Finance Agency Rev., Provident Commonwealth Education Resources Issue (Umass Boston Student Housing Project), 5%, 10/01/2041 | | $ | 1,000,000 | | | $ | 1,043,830 | |
| | | | | | | | |
| | | | | | | |
| | |
| Issuer | | Shares/Par | | | Value ($) | |
| Universities - Dormitories - continued | | | | | | | | |
| Massachusetts Development Finance Agency Rev., Provident Commonwealth Education Resources Issue (Umass Boston Student Housing Project), 5%, 10/01/2048 | | $ | 1,000,000 | | | $ | 1,035,160 | |
| | | | | | | $ | 2,078,990 | |
| Utilities - Cogeneration - 0.2% | | | | | | | | |
| Puerto Rico Industrial, Tourist, Educational, Medical & Environmental Control Facilities Financing Authority Rev. (Cogeneration Facilities - AES Puerto Rico Project), 9.12%, 6/01/2022 | | $ | 850,000 | | | $ | 871,250 | |
| | |
| Utilities - Municipal Owned - 1.3% | | | | | | | | |
| Guam Power Authority Rev., ”A“, 5.5%, 10/01/2030 (Prerefunded 10/01/2020) | | $ | 590,000 | | | $ | 602,750 | |
| Guam Power Authority Rev., ”A“, AGM, 5%, 10/01/2039 | | | 200,000 | | | | 207,144 | |
| Guam Power Authority Rev., ”A“, AGM, 5%, 10/01/2044 | | | 235,000 | | | | 242,128 | |
| Puerto Rico Electric Power Authority Rev., ”A“, 5%, 7/01/2029 (a)(d) | | | 800,000 | | | | 566,000 | |
| Puerto Rico Electric Power Authority Rev., ”A“, 5%, 7/01/2042 (a)(d) | | | 125,000 | | | | 88,437 | |
| Puerto Rico Electric Power Authority Rev., ”AAA“, 5.25%, 7/01/2021 (a)(d) | | | 65,000 | | | | 46,150 | |
| Puerto Rico Electric Power Authority Rev., ”AAA“, 5.25%, 7/01/2030 (a)(d) | | | 30,000 | | | | 21,300 | |
| Puerto Rico Electric Power Authority Rev., ”CCC“, 5.25%, 7/01/2027 (a)(d) | | | 300,000 | | | | 213,000 | |
| Puerto Rico Electric Power Authority Rev., ”DDD“, 5%, 7/01/2020 (a)(d) | | | 35,000 | | | | 24,762 | |
| Puerto Rico Electric Power Authority Rev., ”DDD“, 5%, 7/01/2021 (a)(d) | | | 315,000 | | | | 222,862 | |
| Puerto Rico Electric Power Authority Rev., ”DDD“, 5%, 7/01/2022 (a)(d) | | | 510,000 | | | | 360,825 | |
| Puerto Rico Electric Power Authority Rev., ”EEE“, 6.05%, 7/01/2032 (a)(d) | | | 190,000 | | | | 135,137 | |
| Puerto Rico Electric Power Authority Rev., ”TT“, 5%, 7/01/2021 (a)(d) | | | 150,000 | | | | 106,125 | |
| Puerto Rico Electric Power Authority Rev., ”TT“, 5%, 7/01/2023 (a)(d) | | | 135,000 | | | | 95,512 | |
| Puerto Rico Electric Power Authority Rev., ”TT“, 5%, 7/01/2027 (a)(d) | | | 25,000 | | | | 17,688 | |
| Puerto Rico Electric Power Authority Rev., ”TT“, 5%, 7/01/2037 (a)(d) | | | 415,000 | | | | 293,612 | |
| Puerto Rico Electric Power Authority Rev., ”V“, NATL, 5.25%, 7/01/2033 | | | 160,000 | | | | 161,928 | |
| Puerto Rico Electric Power Authority Rev., ”VV“, NATL, 5.25%, 7/01/2029 | | | 220,000 | | | | 225,298 | |
| Puerto Rico Electric Power Authority Rev., ”VV“, NATL, 5.25%, 7/01/2032 | | | 320,000 | | | | 325,114 | |
| Puerto Rico Electric Power Authority Rev., ”VV“, NATL, 5.25%, 7/01/2034 | | | 35,000 | | | | 35,267 | |
| Puerto Rico Electric Power Authority Rev., ”WW“, 5.375%, 7/01/2022 (a)(d) | | | 30,000 | | | | 21,338 | |
| Puerto Rico Electric Power Authority Rev., ”WW“, 5.25%, 7/01/2025 (a)(d) | | | 65,000 | | | | 46,150 | |
64
Portfolio of Investments – continued
| | | | | | | | |
| Municipal Bonds - continued | | | | | | |
| | | | | | | | |
| | |
| Issuer | | Shares/Par | | | Value ($) | |
| Utilities - Municipal Owned - continued | | | | | |
| Puerto Rico Electric Power Authority Rev., ”ZZ“, 5%, 7/01/2018 (a)(d) | | $ | 195,000 | | | $ | 135,769 | |
| Puerto Rico Electric Power Authority Rev., ”ZZ“, 5.25%, 7/01/2023 (a)(d) | | | 220,000 | | | | 156,200 | |
| Puerto Rico Electric Power Authority Rev., ”ZZ“, 5.25%, 7/01/2024 (a)(d) | | | 75,000 | | | | 53,250 | |
| Puerto Rico Electric Power Authority Rev., ”ZZ“, 5.25%, 7/01/2026 (a)(d) | | | 230,000 | | | | 163,300 | |
| | | | | | | $ | 4,567,046 | |
| Utilities - Other - 0.4% | | | | | | | | |
| Tennessee Energy Acquisition Corp., Gas Rev., ”A“, 5.25%, 9/01/2021 | | $ | 405,000 | | | $ | 417,608 | |
| Tennessee Energy Acquisition Corp., Gas Rev., ”A“, 5.25%, 9/01/2022 | | | 210,000 | | | | 220,832 | |
| Tennessee Energy Acquisition Corp., Gas Rev., ”C“, 5%, 2/01/2021 | | | 480,000 | | | | 488,832 | |
| Texas Gas Acquisition & Supply Corp. III., Gas Supply Rev., 5%, 12/15/2031 | | | 160,000 | | | | 165,361 | |
| | | | | | | $ | 1,292,633 | |
| Water & Sewer Utility Revenue - 4.1% | | | | | | | | |
| Commonwealth of Puerto Rico Aqueduct & Sewer Authority Rev., ”A“, ASSD GTY, 5%, 7/01/2028 | | $ | 90,000 | | | $ | 90,040 | |
| Commonwealth of Puerto Rico Aqueduct & Sewer Authority Rev., ”A“, ASSD GTY, 5.125%, 7/01/2047 | | | 225,000 | | | | 224,989 | |
| Guam Waterworks Authority Rev. (Water and Wastewater System), 5.625%, 7/01/2040 (Prerefunded 7/01/2020) | | | 1,305,000 | | | | 1,319,250 | |
Massachusetts Clean Water Trust, State Revolving Fund, 5%, 8/01/2038 | | | 1,255,000 | | | | 1,578,326 | |
| | | | | | | | |
| | | | | | | |
| | |
| Issuer | | Shares/Par | | | Value ($) | |
| Water & Sewer Utility Revenue - continued | | | | | |
| Massachusetts Clean Water Trust, State Revolving Fund, 5%, 8/01/2039 | | $ | 545,000 | | | $ | 684,057 | |
| Massachusetts Water Pollution Abatement Trust, 5.25%, 8/01/2027 | | | 1,280,000 | | | | 1,627,033 | |
| Massachusetts Water Pollution Abatement Trust, 5.25%, 8/01/2033 | | | 2,000,000 | | | | 2,846,660 | |
| Massachusetts Water Pollution Abatement Trust (MWRA Program), ”A“, 5%, 8/01/2032 | | | 75,000 | | | | 75,208 | |
| Massachusetts Water Resources Authority General Refunding Rev. (Green Bonds), ”C“, 4%, 8/01/2040 | | | 2,910,000 | | | | 3,216,539 | |
| Massachusetts Water Resources Authority Rev., ”B“, AGM, 5.25%, 8/01/2029 | | | 595,000 | | | | 784,620 | |
| Massachusetts Water Resources Authority, General Rev., ”B“, AGM, 5.25%, 8/01/2031 | | | 1,625,000 | | | | 2,219,019 | |
| | | | | | | $ | 14,665,741 | |
Total Municipal Bonds
(Identified Cost, $331,986,689) | | | | | | $ | 342,913,578 | |
| | |
| Bonds - 0.1% | | | | | | | | |
| Consumer Services - 0.1% | | | | | | | | |
| Toll Road Investors Partnership II LP, Capital Appreciation, NATL, 0%, 2/15/2043 (n) (Identified Cost, $372,297) | | $ | 1,200,000 | | | $ | 439,194 | |
| | |
| Investment Companies (h) - 2.6% | | | | | | | | |
| Money Market Funds - 2.6% | | | | | | | | |
| MFS Institutional Money Market Portfolio, 1.28% (v) (Identified Cost, $9,124,496) | | | 9,122,944 | | | $ | 9,124,769 | |
| | |
| Other Assets, Less Liabilities - 1.8% | | | | | | | 6,586,511 | |
| Net Assets - 100.0% | | | | | | $ | 359,064,052 | |
Derivative Contracts at 3/31/20
Futures Contracts
| | | | | | | | | | | | | | | | | | | | | | |
| Description | | Long/
Short | | | Currency | | | Contracts | | Notional
Amount | | | Expiration
Date | | | Value/Unrealized
Appreciation
(Depreciation) | |
| Liability Derivatives | | | | | | | | | | | | | | | | | | | | | | |
| Interest Rate Futures | | | | | | | | | | | | | | | | | | | | | | |
U.S. Treasury Bond | | | Short | | | | USD | | | 40 | | | $7,162,500 | | | | June - 2020 | | | | $(481,397 | ) |
| | | | | | | | | | | | | | | | | | | | | | |
At March 31, 2020, the fund had cash collateral of $260,000 to cover any collateral or margin obligations for certain derivative contracts. Restricted cash and/or deposits with brokers in the Statements of Assets and Liabilities are comprised of cash collateral.
Portfolio Footnotes:
| (a) | Non-income producing security. |
| (h) | An affiliated issuer, which may be considered one in which the fund owns 5% or more of the outstanding voting securities, or a company which is under common control. At period end, the aggregate values of each fund’s investments in affiliated issuers and in unaffiliated issuers were as follows: |
| | | | | | | | |
| | | Affiliated Issuers | | | Unaffiliated Issuers | |
| Alabama Fund | | $ | 2,877,210 | | | $ | 74,477,341 | |
| Arkansas Fund | | | 3,037,713 | | | | 151,354,783 | |
| California Fund | | | 3,337,616 | | | | 544,081,490 | |
| Georgia Fund | | | 1,835,929 | | | | 111,642,053 | |
| Maryland Fund | | | 1,796,671 | | | | 102,645,757 | |
| Massachusetts Fund | | | 9,124,769 | | | | 343,352,772 | |
65
Portfolio of Investments – continued
| (n) | Securities exempt from registration under Rule 144A of the Securities Act of 1933. These securities may be sold in the ordinary course of business in transactions exempt from registration, normally to qualified institutional buyers. At period end, the aggregate value of these securities and percentage of net assets for each fund is as follows: |
| | | | | | | | |
| | | Value | | | Percent of net assets | |
| Alabama Fund | | $ | 311,759 | | | | 0.4% | |
| Arkansas Fund | | | 484,022 | | | | 0.3% | |
| California Fund | | | 6,959,194 | | | | 1.2% | |
| Georgia Fund | | | 300,770 | | | | 0.3% | |
| Maryland Fund | | | 300,770 | | | | 0.3% | |
| Massachusetts Fund | | | 1,204,328 | | | | 0.3% | |
| (p) | Primary market inverse floater. |
| (v) | Affiliated issuer that is available only to investment companies managed by MFS. The rate quoted for the MFS Institutional Money Market Portfolio is the annualizedseven-day yield of the fund at period end. |
The following abbreviations are used in this report and are defined:
| | |
| AAC | | Ambac Assurance Corp. |
| AGM | | Assured Guaranty Municipal |
| ASSD GTY | | Assured Guaranty Insurance Co. |
| BAM | | Build America Mutual |
| BHAC | | Berkshire Hathaway Assurance Corp. |
| CALHF | | California Health Facility Construction Loan Insurance Program |
| COP | | Certificate of Participation |
| ETM | | Escrowed to Maturity |
| FGIC | | Financial Guaranty Insurance Co. |
| FHA | | Federal Housing Administration |
| FLR | | Floating Rate. Interest rate resets periodically based on the parenthetically disclosed reference rate plus a spread (if any). Theperiod-end rate reported may not be the current rate. All reference rates are USD unless otherwise noted. |
| GNMA | | Government National Mortgage Assn. |
| LEVRRS | | Leveraged Reverse Rate Security |
| LIBOR | | London Interbank Offered Rate |
| LOC | | Letter of Credit |
| NATL | | National Public Finance Guarantee Corp. |
| RIBS | | Residual Interest Bonds |
| SYNCORA | | Syncora Guarantee Inc. |
| VRDN | | Variable rate demand note that may be puttable to the issuer at the option of the holder. The stated interest rate, which generally resets either daily or weekly, represents the rate in effect at period end and may not be the current rate. |
See Notes to Financial Statements
66
Financial Statements
STATEMENTS OF ASSETS AND LIABILITIES
At 3/31/20
These statements represent each fund’s balance sheet, which details the assets and liabilities comprising the total value of each fund.
| | | | | | | | | | | | |
| | | Alabama
Fund | | | Arkansas
Fund | | | California
Fund | |
| | | |
| Assets | | | | | | | | | | | | |
Investments in unaffiliated issuers, at value (identified cost, $71,852,831, $146,804,682, and $530,759,460, respectively) | | | $74,477,341 | | | | $151,354,783 | | | | $544,081,490 | |
Investments in affiliated issuers, at value (identified cost, $2,877,225, $3,037,778, and $3,337,044, respectively) | | | 2,877,210 | | | | 3,037,713 | | | | 3,337,616 | |
Deposits with brokers for futures contracts | | | 84,500 | | | | — | | | | 325,000 | |
Receivables for | | | | | | | | | | | | |
| | | |
Net daily variation margin on open futures contracts | | | 21,534 | | | | — | | | | 82,819 | |
| | | |
Investments sold | | | 304,746 | | | | 563,018 | | | | 5,905,336 | |
| | | |
Fund shares sold | | | 87,270 | | | | 71,773 | | | | 1,664,861 | |
| | | |
Interest | | | 823,407 | | | | 1,967,282 | | | | 6,477,847 | |
| | | |
Receivable from investment adviser | | | 11,959 | | | | — | | | | — | |
Other assets | | | 454 | | | | 703 | | | | 1,807 | |
Total assets | | | $78,688,421 | | | | $156,995,272 | | | | $561,876,776 | |
| | | |
| Liabilities | | | | | | | | | | | | |
| | | |
Payables for | | | | | | | | | | | | |
| | | |
Distributions | | | $36,233 | | | | $25,974 | | | | $198,947 | |
| | | |
Investments purchased | | | 115,163 | | | | 235,562 | | | | 1,078,460 | |
| | | |
Fund shares reacquired | | | 44,388 | | | | 410,477 | | | | 1,406,763 | |
| | | |
Payable to affiliates | | | | | | | | | | | | |
| | | |
Investment adviser | | | — | | | | 3,774 | | | | 13,532 | |
| | | |
Administrative services fee | | | 117 | | | | 174 | | | | 470 | |
| | | |
Shareholder servicing costs | | | 30,013 | | | | 65,167 | | | | 223,578 | |
| | | |
Distribution and service fees | | | 638 | | | | 688 | | | | 2,853 | |
| | | |
Payable for independent Trustees’ compensation | | | 12 | | | | 12 | | | | 5,430 | |
Accrued expenses and other liabilities | | | 69,150 | | | | 72,086 | | | | 110,097 | |
Total liabilities | | | $295,714 | | | | $813,914 | | | | $3,040,130 | |
Net assets | | | $78,392,707 | | | | $156,181,358 | | | | $558,836,646 | |
| | | |
| Net assets consist of | | | | | | | | | | | | |
| | | |
Paid-in capital | | | $77,088,132 | | | | $157,231,605 | | | | $551,102,590 | |
Total distributable earnings (loss) | | | 1,304,575 | | | | (1,050,247 | ) | | | 7,734,056 | |
Net assets | | | $78,392,707 | | | | $156,181,358 | | | | $558,836,646 | |
67
Statements of Assets and Liabilities – continued
| | | | | | | | | | | | |
| | | Alabama
Fund | | | Arkansas
Fund | | | California
Fund | |
| | | |
Net assets | | | | | | | | | | | | |
| | | |
Class A | | | $53,320,589 | | | | $123,979,488 | | | | $374,941,264 | |
| | | |
Class B | | | 175,703 | | | | 1,586,610 | | | | 1,032,647 | |
| | | |
Class C | | | — | | | | — | | | | 25,552,409 | |
| | | |
Class I | | | 22,796,046 | | | | 29,077,530 | | | | 128,914,076 | |
Class R6 | | | 2,100,369 | | | | 1,537,730 | | | | 28,396,250 | |
Total net assets | | | $78,392,707 | | | | $156,181,358 | | | | $558,836,646 | |
| | | |
Shares of beneficial interest outstanding | | | | | | | | | | | | |
| | | |
Class A | | | 5,237,533 | | | | 12,715,393 | | | | 62,837,648 | |
| | | |
Class B | | | 17,257 | | | | 162,584 | | | | 173,019 | |
| | | |
Class C | | | — | | | | — | | | | 4,268,148 | |
| | | |
Class I | | | 2,349,531 | | | | 3,004,414 | | | | 13,272,273 | |
Class R6 | | | 216,470 | | | | 158,853 | | | | 2,925,369 | |
Total shares of beneficial interest outstanding | | | 7,820,791 | | | | 16,041,244 | | | | 83,476,457 | |
| | | |
Class A shares | | | | | | | | | | | | |
| | | |
Net asset value per share | | | | | | | | | | | | |
(net assets / shares of beneficial interest outstanding) | | | $10.18 | | | | $9.75 | | | | $5.97 | |
Offering price per share (100 / 95.75 × net asset value per share) | | | $10.63 | | | | $10.18 | | | | $6.23 | |
| | | |
Class B shares | | | | | | | | | | | | |
| | | |
Net asset value and offering price per share | | | | | | | | | | | | |
(net assets / shares of beneficial interest outstanding) | | | $10.18 | | | | $9.76 | | | | $5.97 | |
| | | |
Class C shares | | | | | | | | | | | | |
| | | |
Net asset value and offering price per share | | | | | | | | | | | | |
(net assets / shares of beneficial interest outstanding) | | | $— | | | | $— | | | | $5.99 | |
| | | |
Class I shares | | | | | | | | | | | | |
| | | |
Net asset value, offering price, and redemption price per share | | | | | | | | | | | | |
(net assets / shares of beneficial interest outstanding) | | | $9.70 | | | | $9.68 | | | | $9.71 | |
| | | |
Class R6 shares | | | | | | | | | | | | |
| | | |
Net asset value, offering price, and redemption price per share | | | | | | | | | | | | |
(net assets / shares of beneficial interest outstanding) | | | $9.70 | | | | $9.68 | | | | $9.71 | |
On sales of $100,000 or more, the maximum offering price of Class A shares is reduced. A contingent deferred sales charge may be imposed on redemptions of Class A, Class B, and Class C shares.
See Notes to Financial Statements
68
Statements of Assets and Liabilities – continued
| | | | | | | | | | | | |
| At 3/31/20 | | Georgia
Fund | | | Maryland
Fund | | | Massachusetts
Fund | |
| | | |
| Assets | | | | | | | | | | | | |
Investments in unaffiliated issuers, at value (identified cost, $108,756,639, $100,629,848, and $332,358,986, respectively) | | | $111,642,053 | | | | $102,645,757 | | | | $343,352,772 | |
| | | |
Investments in affiliated issuers, at value (identified cost, $1,836,112, $1,796,819, and $9,124,496, respectively) | | | 1,835,929 | | | | 1,796,671 | | | | 9,124,769 | |
| | | |
Deposits with brokers for futures contracts | | | 91,000 | | | | 201,500 | | | | 260,000 | |
| | | |
Receivables for | | | | | | | | | | | | |
| | | |
Net daily variation margin on open futures contracts | | | 23,193 | | | | 21,654 | | | | 66,260 | |
| | | |
Investments sold | | | 977,743 | | | | 332,375 | | | | 3,030,567 | |
| | | |
Fund shares sold | | | 662,552 | | | | 82,326 | | | | 1,211,350 | |
| | | |
Interest | | | 1,277,730 | | | | 1,161,386 | | | | 3,986,182 | |
| | | |
Receivable from investment adviser | | | 9,126 | | | | 18,578 | | | | 17,010 | |
| | | |
Receivable from distributor | | | — | | | | — | | | | 7,305 | |
Other assets | | | 592 | | | | 558 | | | | 1,230 | |
Total assets | | | $116,519,918 | | | | $106,260,805 | | | | $361,057,445 | |
| | | |
| Liabilities | | | | | | | | | | | | |
| | | |
Payables for | | | | | | | | | | | | |
| | | |
Distributions | | | $19,216 | | | | $46,849 | | | | $95,375 | |
| | | |
Investments purchased | | | 172,745 | | | | — | | | | 708,538 | |
| | | |
Fund shares reacquired | | | 242,509 | | | | 230,978 | | | | 957,208 | |
| | | |
Payable to affiliates | | | | | | | | | | | | |
| | | |
Administrative services fee | | | 144 | | | | 137 | | | | 323 | |
| | | |
Shareholder servicing costs | | | 27,970 | | | | 36,892 | | | | 134,244 | |
| | | |
Distribution and service fees | | | 948 | | | | 212 | | | | — | |
| | | |
Payable for independent Trustees’ compensation | | | 7 | | | | 3,256 | | | | 3,243 | |
Accrued expenses and other liabilities | | | 75,695 | | | | 73,204 | | | | 94,462 | |
Total liabilities | | | $539,234 | | | | $391,528 | | | | $1,993,393 | |
Net assets | | | $115,980,684 | | | | $105,869,277 | | | | $359,064,052 | |
| | | |
| Net assets consist of | | | | | | | | | | | | |
| | | |
Paid-in capital | | | $115,558,222 | | | | $106,856,469 | | | | $356,486,869 | |
Total distributable earnings (loss) | | | 422,462 | | | | (987,192 | ) | | | 2,577,183 | |
Net assets | | | $115,980,684 | | | | $105,869,277 | | | | $359,064,052 | |
69
Statements of Assets and Liabilities – continued
| | | | | | | | | | | | |
| | | Georgia
Fund | | | Maryland
Fund | | | Massachusetts
Fund | |
| | | |
Net assets | | | | | | | | | | | | |
| | | |
Class A | | | $95,351,713 | | | | $83,851,982 | | | | $226,471,317 | |
| | | |
Class B | | | 261,371 | | | | 1,040,445 | | | | 1,080,817 | |
| | | |
Class I | | | 9,345,111 | | | | 18,139,674 | | | | 124,875,454 | |
Class R6 | | | 11,022,489 | | | | 2,837,176 | | | | 6,636,464 | |
Total net assets | | | $115,980,684 | | | | $105,869,277 | | | | $359,064,052 | |
| | | |
Shares of beneficial interest outstanding | | | | | | | | | | | | |
| | | |
Class A | | | 8,913,128 | | | | 7,893,198 | | | | 20,774,665 | |
| | | |
Class B | | | 24,343 | | | | 97,986 | | | | 98,970 | |
| | | |
Class I | | | 963,473 | | | | 1,892,826 | | | | 13,088,322 | |
Class R6 | | | 1,135,772 | | | | 296,008 | | | | 695,119 | |
Total shares of beneficial interest outstanding | | | 11,036,716 | | | | 10,180,018 | | | | 34,657,076 | |
| | | |
Class A shares | | | | | | | | | | | | |
| | | |
Net asset value per share | | | | | | | | | | | | |
(net assets / shares of beneficial interest outstanding) | | | $10.70 | | | | $10.62 | | | | $10.90 | |
Offering price per share (100 / 95.75 × net asset value per share) | | | $11.17 | | | | $11.09 | | | | $11.38 | |
| | | |
Class B shares | | | | | | | | | | | | |
| | | |
Net asset value and offering price per share | | | | | | | | | | | | |
(net assets / shares of beneficial interest outstanding) | | | $10.74 | | | | $10.62 | | | | $10.92 | |
| | | |
Class I shares | | | | | | | | | | | | |
| | | |
Net asset value, offering price, and redemption price per share | | | | | | | | | | | | |
(net assets / shares of beneficial interest outstanding) | | | $9.70 | | | | $9.58 | | | | $9.54 | |
| | | |
Class R6 shares | | | | | | | | | | | | |
| | | |
Net asset value, offering price, and redemption price per share | | | | | | | | | | | | |
(net assets / shares of beneficial interest outstanding) | | | $9.70 | | | | $9.58 | | | | $9.55 | |
On sales of $100,000 or more, the maximum offering price of Class A shares is reduced. A contingent deferred sales charge may be imposed on redemptions of Class A and Class B shares.
See Notes to Financial Statements
70
Financial Statements
STATEMENTS OF OPERATIONS
Year ended 3/31/20
These statements describe how much each fund earned in investment income and accrued in expenses. They also describe any gains or losses generated by each fund’s operations.
| | | | | | | | | | | | |
| | | Alabama
Fund | | | Arkansas
Fund | | | California
Fund | |
| | | |
| Net investment income (loss) | | | | | | | | | | | | |
| Interest | | | $2,570,522 | | | | $5,501,844 | | | | $18,681,662 | |
| Dividends from affiliated issuers | | | 43,796 | | | | 30,628 | | | | 251,600 | |
Other | | | 380 | | | | 556 | | | | 2,400 | |
Total investment income | | | $2,614,698 | | | | $5,533,028 | | | | $18,935,662 | |
| Expenses | | | | | | | | | | | | |
| | | |
Management fee | | | $341,228 | | | | $705,511 | | | | $2,344,457 | |
| | | |
Distribution and service fees | | | 137,608 | | | | 334,598 | | | | 1,166,585 | |
| | | |
Shareholder servicing costs | | | 59,246 | | | | 123,324 | | | | 420,398 | |
| | | |
Administrative services fee | | | 20,864 | | | | 31,483 | | | | 79,099 | |
| | | |
Independent Trustees’ compensation | | | 1,871 | | | | 3,937 | | | | 11,974 | |
| | | |
Custodian fee | | | 17,750 | | | | 23,739 | | | | 62,648 | |
| | | |
Shareholder communications | | | 6,468 | | | | 9,862 | | | | 18,844 | |
| | | |
Audit and tax fees | | | 56,041 | | | | 56,314 | | | | 56,140 | |
| | | |
Legal fees | | | 7,392 | | | | 5,916 | | | | 18,459 | |
| | | |
Registration fees | | | 58,088 | | | | 60,528 | | | | 96,056 | |
Miscellaneous | | | 28,203 | | | | 29,737 | | | | 36,194 | |
Total expenses | | | $734,759 | | | | $1,384,949 | | | | $4,310,854 | |
| | | |
Fees paid indirectly | | | (146 | ) | | | (113 | ) | | | (225 | ) |
Reduction of expenses by investment adviser and distributor | | | (106,272 | ) | | | (207,130 | ) | | | (593,950 | ) |
Net expenses | | | $628,341 | | | | $1,177,706 | | | | $3,716,679 | |
Net investment income (loss) | | | $1,986,357 | | | | $4,355,322 | | | | $15,218,983 | |
| | | |
| Realized and unrealized gain (loss) | | | | | | | | | | | | |
| Realized gain (loss) (identified cost basis) | | | | | | | | | | | | |
| | | |
Unaffiliated issuers | | | $363,261 | | | | $279,498 | | | | $2,035,827 | |
| | | |
Affiliated issuers | | | (125 | ) | | | 149 | | | | 351 | |
Futures contracts | | | (542,764 | ) | | | (126,040 | ) | | | (3,510,254 | ) |
Net realized gain (loss) | | | $(179,628 | ) | | | $153,607 | | | | $(1,474,076 | ) |
| Change in unrealized appreciation or depreciation | | | | | | | | | | | | |
| | | |
Unaffiliated issuers | | | $142,298 | | | | $(1,270,085 | ) | | | $(9,264,489 | ) |
| | | |
Affiliated issuers | | | (16 | ) | | | (282 | ) | | | 170 | |
Futures contracts | | | (118,917 | ) | | | 93,842 | | | | (354,004 | ) |
Net unrealized gain (loss) | | | $23,365 | | | | $(1,176,525 | ) | | | $(9,618,323 | ) |
Net realized and unrealized gain (loss) | | | $(156,263 | ) | | | $(1,022,918 | ) | | | $(11,092,399 | ) |
Change in net assets from operations | | | $1,830,094 | | | | $3,332,404 | | | | $4,126,584 | |
See Notes to Financial Statements
71
Statements of Operations – continued
| | | | | | | | | | | | |
| Year ended 3/31/20 | | Georgia
Fund | | | Maryland
Fund | | | Massachusetts
Fund | |
| | | |
| Net investment income (loss) | | | | | | | | | | | | |
| Interest | | | $3,566,260 | | | | $3,673,076 | | | | $12,530,639 | |
| Dividends from affiliated issuers | | | 66,269 | | | | 44,279 | | | | 168,206 | |
Other | | | 602 | | | | 395 | | | | 1,218 | |
Total investment income | | | $3,633,131 | | | | $3,717,750 | | | | $12,700,063 | |
| Expenses | | | | | |
| | | |
Management fee | | | $497,407 | | | | $456,748 | | | | $1,536,140 | |
| | | |
Distribution and service fees | | | 231,476 | | | | 217,760 | | | | 581,252 | |
| | | |
Shareholder servicing costs | | | 56,756 | | | | 75,912 | | | | 263,569 | |
| | | |
Administrative services fee | | | 25,399 | | | | 24,227 | | | | 55,603 | |
| | | |
Independent Trustees’ compensation | | | 2,001 | | | | 3,941 | | | | 10,714 | |
| | | |
Custodian fee | | | 25,719 | | | | 21,028 | | | | 41,492 | |
| | | |
Shareholder communications | | | 9,207 | | | | 11,528 | | | | 17,975 | |
| | | |
Audit and tax fees | | | 56,049 | | | | 56,048 | | | | 56,102 | |
| | | |
Legal fees | | | 9,610 | | | | 9,923 | | | | 30,318 | |
| | | |
Registration fees | | | 60,941 | | | | 61,211 | | | | 74,445 | |
Miscellaneous | | | 29,339 | | | | 28,901 | | | | 32,523 | |
Total expenses | | | $1,003,904 | | | | $967,227 | | | | $2,700,133 | |
| | | |
Fees paid indirectly | | | (122 | ) | | | (263 | ) | | | (115 | ) |
Reduction of expenses by investment adviser and distributor | | | (62,561 | ) | | | (168,119 | ) | | | (121,693 | ) |
Net expenses | | | $941,221 | | | | $798,845 | | | | $2,578,325 | |
Net investment income (loss) | | | $2,691,910 | | | | $2,918,905 | | | | $10,121,738 | |
| | | |
| Realized and unrealized gain (loss) | | | | | | | | | | | | |
| Realized gain (loss) (identified cost basis) | | | | | | | | | | | | |
| | | |
Unaffiliated issuers | | | $(82,240 | ) | | | $467,059 | | | | $(2,653,468 | ) |
| | | |
Affiliated issuers | | | 315 | | | | 1,016 | | | | (588 | ) |
Futures contracts | | | (754,420 | ) | | | (753,842 | ) | | | (1,455,588 | ) |
Net realized gain (loss) | | | $(836,345 | ) | | | $(285,767 | ) | | | $(4,109,644 | ) |
| Change in unrealized appreciation or depreciation | | | | | | | | | | | | |
| | | |
Unaffiliated issuers | | | $(152,969 | ) | | | $(1,380,181 | ) | | | $(3,174,824 | ) |
| | | |
Affiliated issuers | | | (256 | ) | | | (290 | ) | | | 10 | |
Futures contracts | | | (115,937 | ) | | | (176,112 | ) | | | (316,235 | ) |
Net unrealized gain (loss) | | | $(269,162 | ) | | | $(1,556,583 | ) | | | $(3,491,049 | ) |
Net realized and unrealized gain (loss) | | | $(1,105,507 | ) | | | $(1,842,350 | ) | | | $(7,600,693 | ) |
Change in net assets from operations | | | $1,586,403 | | | | $1,076,555 | | | | $2,521,045 | |
See Notes to Financial Statements
72
Financial Statements
STATEMENTS OF CHANGES IN NET ASSETS
These statements describe the increases and/or decreases in net assets resulting from operations, any distributions, and any shareholder transactions.
| | | | | | | | | | | | |
| Year ended 3/31/20 | | Alabama
Fund | | | Arkansas
Fund | | | California
Fund | |
| Change in net assets | | | | | | | | | | | | |
| | | |
| From operations | | | | | | | | | | | | |
| Net investment income (loss) | | | $1,986,357 | | | | $4,355,322 | | | | $15,218,983 | |
| | | |
Net realized gain (loss) | | | (179,628 | ) | | | 153,607 | | | | (1,474,076 | ) |
Net unrealized gain (loss) | | | 23,365 | | | | (1,176,525 | ) | | | (9,618,323 | ) |
Change in net assets from operations | | | $1,830,094 | | | | $3,332,404 | | | | $4,126,584 | |
Total distributions to shareholders | | | $(1,981,863 | ) | | | $(4,341,088 | ) | | | $(14,951,745 | ) |
Change in net assets from fund share transactions | | | $14,281,691 | | | | $5,285,713 | | | | $153,438,096 | |
Total change in net assets | | | $14,129,922 | | | | $4,277,029 | | | | $142,612,935 | |
| | | |
| Net assets | | | | | | | | | | | | |
| At beginning of period | | | 64,262,785 | | | | 151,904,329 | | | | 416,223,711 | |
At end of period | | | $78,392,707 | | | | $156,181,358 | | | | $558,836,646 | |
| | | |
| Year ended 3/31/20 | | Georgia
Fund | | | Maryland
Fund | | | Massachusetts
Fund | |
| Change in net assets | | | | | | | | | | | | |
| | | |
| From operations | | | | | | | | | | | | |
| Net investment income (loss) | | | $2,691,910 | | | | $2,918,905 | | | | $10,121,738 | |
| | | |
Net realized gain (loss) | | | (836,345 | ) | | | (285,767 | ) | | | (4,109,644 | ) |
Net unrealized gain (loss) | | | (269,162 | ) | | | (1,556,583 | ) | | | (3,491,049 | ) |
Change in net assets from operations | | | $1,586,403 | | | | $1,076,555 | | | | $2,521,045 | |
Total distributions to shareholders | | | $(2,708,728 | ) | | | $(2,932,004 | ) | | | $(9,982,094 | ) |
Change in net assets from fund share transactions | | | $31,043,555 | | | | $18,146,839 | | | | $85,452,067 | |
Total change in net assets | | | $29,921,230 | | | | $16,291,390 | | | | $77,991,018 | |
| | | |
| Net assets | | | | | | | | | | | | |
| At beginning of period | | | 86,059,454 | | | | 89,577,887 | | | | 281,073,034 | |
At end of period | | | $115,980,684 | | | | $105,869,277 | | | | $359,064,052 | |
See Notes to Financial Statements
73
Statements of Changes in Net Assets – continued
| | | | | | | | | | | | |
| Year ended 3/31/19 | | Alabama
Fund | | | Arkansas
Fund | | | California
Fund | |
| Change in net assets | | | | | | | | | | | | |
| | | |
| From operations | | | | | | | | | | | | |
| Net investment income (loss) | | | $2,191,085 | | | | $5,222,740 | | | | $14,230,502 | |
| | | |
Net realized gain (loss) | | | (98,704 | ) | | | 55,783 | | | | 368,101 | |
Net unrealized gain (loss) | | | 720,766 | | | | 1,691,672 | | | | 5,060,787 | |
Change in net assets from operations | | | $2,813,147 | | | | $6,970,195 | | | | $19,659,390 | |
Total distributions to shareholders | | | $(1,974,686 | ) | | | $(4,604,311 | ) | | | $(12,903,267 | ) |
Change in net assets from fund share transactions | | | $4,035,574 | | | | $(10,773,492 | ) | | | $40,248,546 | |
Total change in net assets | | | $4,874,035 | | | | $(8,407,608 | ) | | | $47,004,669 | |
| | | |
| Net assets | | | | | | | | | | | | |
| At beginning of period | | | 59,388,750 | | | | 160,311,937 | | | | 369,219,042 | |
At end of period | | | $64,262,785 | | | | $151,904,329 | | | | $416,223,711 | |
| | | |
| Year ended 3/31/19 | | Georgia
Fund | | | Maryland
Fund | | | Massachusetts
Fund | |
| Change in net assets | | | | | | | | | | | | |
| | | |
| From operations | | | | | | | | | | | | |
| Net investment income (loss) | | | $2,793,240 | | | | $3,307,386 | | | | $9,952,546 | |
| | | |
Net realized gain (loss) | | | (49,354 | ) | | | (181,702 | ) | | | (347,871 | ) |
Net unrealized gain (loss) | | | 841,149 | | | | 661,161 | | | | 2,830,963 | |
Change in net assets from operations | | | $3,585,035 | | | | $3,786,845 | | | | $12,435,638 | |
Total distributions to shareholders | | | $(2,467,393 | ) | | | $(2,936,196 | ) | | | $(8,931,567 | ) |
Change in net assets from fund share transactions | | | $5,652,435 | | | | $182,112 | | | | $21,236,786 | |
Total change in net assets | | | $6,770,077 | | | | $1,032,761 | | | | $24,740,857 | |
| | | |
| Net assets | | | | | | | | | | | | |
| At beginning of period | | | 79,289,377 | | | | 88,545,126 | | | | 256,332,177 | |
At end of period | | | $86,059,454 | | | | $89,577,887 | | | | $281,073,034 | |
See Notes to Financial Statements
74
Financial Statements
FINANCIAL HIGHLIGHTS
MFS ALABAMA MUNICIPAL BOND FUND
The financial highlights table is intended to help you understand the fund’s financial performance for the past 5 years (or life of a particular share class, if shorter). Certain information reflects financial results for a single fund share. The total returns in the table represent the rate that an investor would have earned (or lost) on an investment in the fund share class (assuming reinvestment of all distributions) held for the entire period.
| | | | | | | | | | | | | | | | | | | | |
| | | Year ended | |
| Class A | | 3/31/20 | | | 3/31/19 | | | 3/31/18 | | | 3/31/17 | | | 3/31/16 | |
| | | | | |
Net asset value, beginning of period | | | $10.15 | | | | $10.02 | | | | $10.12 | | | | $10.49 | | | | $10.48 | |
| | | | | |
| Income (loss) from investment operations | | | | | | | | | | | | | | | | | | | | |
Net investment income (loss) (d) | | | $0.27 | | | | $0.36 | | | | $0.34 | | | | $0.37 | (c) | | | $0.39 | |
Net realized and unrealized gain (loss) | | | 0.02 | | | | 0.09 | | | | (0.10 | ) | | | (0.37 | ) | | | (0.01 | ) |
Total from investment operations | | | $0.29 | | | | $0.45 | | | | $0.24 | | | | $0.00 | (w) | | | $0.38 | |
| | | | | |
| Less distributions declared to shareholders | | | | | | | | | | | | | | | | | | | | |
From net investment income | | | $(0.26 | ) | | | $(0.32 | ) | | | $(0.34 | ) | | | $(0.37 | ) | | | $(0.37 | ) |
Net asset value, end of period (x) | | | $10.18 | | | | $10.15 | | | | $10.02 | | | | $10.12 | | | | $10.49 | |
Total return (%) (r)(s)(t)(x) | | | 2.89 | | | | 4.63 | | | | 2.35 | | | | (0.07 | )(c) | | | 3.75 | |
| | | | | |
| Ratios (%) (to average net assets) and Supplemental data: | | | | | | | | | | | | | | | | | | | | |
Expenses before expense reductions (f) | | | 1.04 | | | | 1.09 | | | | 1.10 | | | | 1.07 | (c) | | | 1.06 | |
| | | | | |
Expenses after expense reductions (f) | | | 0.90 | | | | 0.90 | | | | 0.90 | | | | 0.89 | (c) | | | 0.93 | |
| | | | | |
Net investment income (loss) | | | 2.56 | | | | 3.60 | | | | 3.37 | | | | 3.61 | (c) | | | 3.76 | |
| | | | | |
Portfolio turnover | | | 30 | | | | 19 | | | | 17 | | | | 15 | | | | 16 | |
Net assets at end of period (000 omitted) | | | $53,321 | | | | $51,280 | | | | $50,914 | | | | $53,883 | | | | $52,956 | |
| |
| | | Year ended | |
| Class B | | 3/31/20 | | | 3/31/19 | | | 3/31/18 | | | 3/31/17 | | | 3/31/16 | |
| | | | | |
Net asset value, beginning of period | | | $10.15 | | | | $10.02 | | | | $10.12 | | | | $10.49 | | | | $10.48 | |
| | | | | |
| Income (loss) from investment operations | | | | | | | | | | | | | | | | | | | | |
Net investment income (loss) (d) | | | $0.19 | | | | $0.28 | | | | $0.27 | | | | $0.30 | (c) | | | $0.31 | |
Net realized and unrealized gain (loss) | | | 0.03 | | | | 0.10 | | | | (0.11 | ) | | | (0.38 | ) | | | (0.01 | ) |
Total from investment operations | | | $0.22 | | | | $0.38 | | | | $0.16 | | | | $(0.08 | ) | | | $0.30 | |
| | | | | |
| Less distributions declared to shareholders | | | | | | | | | | | | | | | | | | | | |
From net investment income | | | $(0.19 | ) | | | $(0.25 | ) | | | $(0.26 | ) | | | $(0.29 | ) | | | $(0.29 | ) |
Net asset value, end of period (x) | | | $10.18 | | | | $10.15 | | | | $10.02 | | | | $10.12 | | | | $10.49 | |
Total return (%) (r)(s)(t)(x) | | | 2.13 | | | | 3.85 | | | | 1.59 | | | | (0.81 | )(c) | | | 2.97 | |
| | | | | |
| Ratios (%) (to average net assets) and Supplemental data: | | | | | | | | | | | | | | | | | | | | |
Expenses before expense reductions (f) | | | 1.80 | | | | 1.84 | | | | 1.84 | | | | 1.82 | (c) | | | 1.81 | |
| | | | | |
Expenses after expense reductions (f) | | | 1.65 | | | | 1.65 | | | | 1.65 | | | | 1.65 | (c) | | | 1.68 | |
| | | | | |
Net investment income (loss) | | | 1.86 | | | | 2.85 | | | | 2.63 | | | | 2.86 | (c) | | | 2.99 | |
| | | | | |
Portfolio turnover | | | 30 | | | | 19 | | | | 17 | | | | 15 | | | | 16 | |
Net assets at end of period (000 omitted) | | | $176 | | | | $250 | | | | $303 | | | | $467 | | | | $614 | |
See Notes to Financial Statements
75
Financial Highlights – continued
MFS ALABAMA MUNICIPAL BOND FUND – continued
| | | | | | | | | | | | | | | | |
| | | Year ended | |
| Class I | | 3/31/20 | | | 3/31/19 | | | 3/31/18 | | | 3/31/17 (i) | |
| | | | |
Net asset value, beginning of period | | | $9.67 | | | | $9.55 | | | | $9.65 | | | | $10.00 | |
| | | | |
| Income (loss) from investment operations | | | | | | | | | | | | | | | | |
Net investment income (loss) (d) | | | $0.27 | | | | $0.37 | | | | $0.35 | | | | $0.38 | (c) |
Net realized and unrealized gain (loss) | | | 0.04 | | | | 0.08 | | | | (0.11 | ) | | | (0.36 | ) |
Total from investment operations | | | $0.31 | | | | $0.45 | | | | $0.24 | | | | $0.02 | |
| | | | |
| Less distributions declared to shareholders | | | | | | | | | | | | | | | | |
From net investment income | | | $(0.28 | ) | | | $(0.33 | ) | | | $(0.34 | ) | | | $(0.37 | ) |
Net asset value, end of period (x) | | | $9.70 | | | | $9.67 | | | | $9.55 | | | | $9.65 | |
Total return (%) (r)(s)(t)(x) | | | 3.15 | | | | 4.83 | | | | 2.55 | | | | 0.21 | (c) |
| | | | |
| Ratios (%) (to average net assets) and Supplemental data: | | | | | | | | | | | | | | | | |
Expenses before expense reductions (f) | | | 0.79 | | | | 0.84 | | | | 0.85 | | | | 0.86 | (c) |
| | | | |
Expenses after expense reductions (f) | | | 0.65 | | | | 0.65 | | | | 0.65 | | | | 0.64 | (c) |
| | | | |
Net investment income (loss) | | | 2.77 | | | | 3.85 | | | | 3.62 | | | | 3.84 | (c) |
| | | | |
Portfolio turnover | | | 30 | | | | 19 | | | | 17 | | | | 15 | |
Net assets at end of period (000 omitted) | | | $22,796 | | | | $11,490 | | | | $6,898 | | | | $5,876 | |
| | |
| | | | | | Year ended | |
| Class R6 | | | | | 3/31/20 | | | 3/31/19 | | | 3/31/18 (i) | |
| | | | |
Net asset value, beginning of period | | | | | | | $9.67 | | | | $9.55 | | | | $9.76 | |
| | | | |
| Income (loss) from investment operations | | | | | | | | | | | | | | | | |
Net investment income (loss) (d) | | | | | | | $0.28 | | | | $0.37 | | | | $0.24 | |
Net realized and unrealized gain (loss) | | | | | | | 0.03 | | | | 0.09 | | | | (0.22 | ) |
Total from investment operations | | | | | | | $0.31 | | | | $0.46 | | | | $0.02 | |
| | | | |
| Less distributions declared to shareholders | | | | | | | | | | | | | | | | |
From net investment income | | | | | | | $(0.28 | ) | | | $(0.34 | ) | | | $(0.23 | ) |
Net asset value, end of period (x) | | | | | | | $9.70 | | | | $9.67 | | | | $9.55 | |
Total return (%) (r)(s)(t)(x) | | | | | | | 3.23 | | | | 4.92 | | | | 0.25 | (n) |
| | | | |
| Ratios (%) (to average net assets) and Supplemental data: | | | | | | | | | | | | | | | | |
Expenses before expense reductions (f) | | | | | | | 0.71 | | | | 0.77 | | | | 0.84 | (a) |
| | | | |
Expenses after expense reductions (f) | | | | | | | 0.57 | | | | 0.58 | | | | 0.58 | (a) |
| | | | |
Net investment income (loss) | | | | | | | 2.85 | | | | 3.92 | | | | 3.70 | (a) |
| | | | |
Portfolio turnover | | | | | | | 30 | | | | 19 | | | | 17 | |
Net assets at end of period (000 omitted) | | | | | | | $2,100 | | | | $1,242 | | | | $1,274 | |
| (c) | Amount reflects aone-time reimbursement of expenses by the custodian (or former custodian) without which net investment income and performance would be lower and expenses would be higher. |
| (d) | Per share data is based on average shares outstanding. |
| (f) | Ratios do not reflect reductions from fees paid indirectly, if applicable. |
| (i) | For Class I and Class R6, the period is from the class inception, April 1, 2016 (Class I) and August 1, 2017 (Class R6), through the stated period end. |
| (r) | Certain expenses have been reduced without which performance would have been lower. |
| (s) | From time to time the fund may receive proceeds from litigation settlements, without which performance would be lower. |
| (t) | Total returns do not include any applicable sales charges. |
| (w) | Per share amount was less than $0.01. |
| (x) | The net asset values and total returns have been calculated on net assets which include adjustments made in accordance with U.S. generally accepted accounting principles required at period end for financial reporting purposes. |
See Notes to Financial Statements
76
Financial Highlights – continued
MFS ARKANSAS MUNICIPAL BOND FUND
The financial highlights table is intended to help you understand the fund’s financial performance for the past 5 years (or life of a particular share class, if shorter). Certain information reflects financial results for a single fund share. The total returns in the table represent the rate that an investor would have earned (or lost) on an investment in the fund share class (assuming reinvestment of all distributions) held for the entire period.
| | | | | | | | | | | | | | | | | | | | |
| | | Year ended | |
| Class A | | 3/31/20 | | | 3/31/19 | | | 3/31/18 | | | 3/31/17 | | | 3/31/16 | |
| | | | | |
Net asset value, beginning of period | | | $9.80 | | | | $9.64 | | | | $9.73 | | | | $10.07 | | | | $10.04 | |
| | | | | |
| Income (loss) from investment operations | | | | | | | | | | | | | | | | | | | | |
Net investment income (loss) (d) | | | $0.27 | | | | $0.33 | | | | $0.30 | | | | $0.33 | (c) | | | $0.34 | |
Net realized and unrealized gain (loss) | | | (0.05 | ) | | | 0.12 | | | | (0.09 | ) | | | (0.35 | ) | | | (0.01 | ) |
Total from investment operations | | | $0.22 | | | | $0.45 | | | | $0.21 | | | | $(0.02 | ) | | | $0.33 | |
| | | | | |
| Less distributions declared to shareholders | | | | | | | | | | | | | | | | | | | | |
From net investment income | | | $(0.27 | ) | | | $(0.29 | ) | | | $(0.30 | ) | | | $(0.32 | ) | | | $(0.30 | ) |
Net asset value, end of period (x) | | | $9.75 | | | | $9.80 | | | | $9.64 | | | | $9.73 | | | | $10.07 | |
Total return (%) (r)(s)(t)(x) | | | 2.27 | | | | 4.74 | | | | 2.12 | | | | (0.25 | )(c) | | | 3.36 | |
| | | | | |
| Ratios (%) (to average net assets) and Supplemental data: | | | | | | | | | | | | | | | | | | | | |
Expenses before expense reductions (f) | | | 0.92 | | | | 0.93 | | | | 0.92 | | | | 0.92 | (c) | | | 0.90 | |
| | | | | |
Expenses after expense reductions (f) | | | 0.76 | | | | 0.77 | | | | 0.77 | | | | 0.76 | (c) | | | 0.74 | |
| | | | | |
Net investment income (loss) | | | 2.77 | | | | 3.40 | | | | 3.06 | | | | 3.33 | (c) | | | 3.41 | |
| | | | | |
Portfolio turnover | | | 20 | | | | 14 | | | | 17 | | | | 17 | | | | 11 | |
Net assets at end of period (000 omitted) | | | $123,979 | | | | $121,888 | | | | $141,605 | | | | $145,392 | | | | $160,133 | |
| |
| | | Year ended | |
| Class B | | 3/31/20 | | | 3/31/19 | | | 3/31/18 | | | 3/31/17 | | | 3/31/16 | |
| | | | | |
Net asset value, beginning of period | | | $9.81 | | | | $9.65 | | | | $9.73 | | | | $10.08 | | | | $10.05 | |
| | | | | |
| Income (loss) from investment operations | | | | | | | | | | | | | | | | | | | | |
Net investment income (loss) (d) | | | $0.20 | | | | $0.25 | | | | $0.23 | | | | $0.26 | (c) | | | $0.26 | |
Net realized and unrealized gain (loss) | | | (0.05 | ) | | | 0.13 | | | | (0.09 | ) | | | (0.37 | ) | | | (0.01 | ) |
Total from investment operations | | | $0.15 | | | | $0.38 | | | | $0.14 | | | | $(0.11 | ) | | | $0.25 | |
| | | | | |
| Less distributions declared to shareholders | | | | | | | | | | | | | | | | | | | | |
From net investment income | | | $(0.20 | ) | | | $(0.22 | ) | | | $(0.22 | ) | | | $(0.24 | ) | | | $(0.22 | ) |
Net asset value, end of period (x) | | | $9.76 | | | | $9.81 | | | | $9.65 | | | | $9.73 | | | | $10.08 | |
Total return (%) (r)(s)(t)(x) | | | 1.51 | | | | 3.97 | | | | 1.47 | | | | (1.10 | )(c) | | | 2.58 | |
| | | | | |
| Ratios (%) (to average net assets) and Supplemental data: | | | | | | | | | | | | | | | | | | | | |
Expenses before expense reductions (f) | | | 1.67 | | | | 1.68 | | | | 1.68 | | | | 1.66 | (c) | | | 1.65 | |
| | | | | |
Expenses after expense reductions (f) | | | 1.51 | | | | 1.52 | | | | 1.52 | | | | 1.52 | (c) | | | 1.51 | |
| | | | | |
Net investment income (loss) | | | 2.03 | | | | 2.64 | | | | 2.31 | | | | 2.57 | (c) | | | 2.65 | |
| | | | | |
Portfolio turnover | | | 20 | | | | 14 | | | | 17 | | | | 17 | | | | 11 | |
Net assets at end of period (000 omitted) | | | $1,587 | | | | $2,477 | | | | $4,209 | | | | $5,882 | | | | $6,791 | |
See Notes to Financial Statements
77
Financial Highlights – continued
MFS ARKANSAS MUNICIPAL BOND FUND – continued
| | | | | | | | | | | | | | | | |
| | | Year ended | |
| Class I | | 3/31/20 | | | 3/31/19 | | | 3/31/18 | | | 3/31/17 (i) | |
| | | | |
Net asset value, beginning of period | | | $9.73 | | | | $9.57 | | | | $9.65 | | | | $10.00 | |
| | | | |
| Income (loss) from investment operations | | | | | | | | | | | | | | | | |
Net investment income (loss) (d) | | | $0.28 | | | | $0.33 | | | | $0.31 | | | | $0.34 | (c) |
Net realized and unrealized gain (loss) | | | (0.05 | ) | | | 0.13 | | | | (0.09 | ) | | | (0.37 | ) |
Total from investment operations | | | $0.23 | | | | $0.46 | | | | $0.22 | | | | $(0.03 | ) |
| | | | |
| Less distributions declared to shareholders | | | | | | | | | | | | | | | | |
From net investment income | | | $(0.28 | ) | | | $(0.30 | ) | | | $(0.30 | ) | | | $(0.32 | ) |
Net asset value, end of period (x) | | | $9.68 | | | | $9.73 | | | | $9.57 | | | | $9.65 | |
Total return (%) (r)(s)(t)(x) | | | 2.36 | | | | 4.86 | | | | 2.32 | | | | (0.28 | )(c) |
| | | | |
| Ratios (%) (to average net assets) and Supplemental data: | | | | | | | | | | | | | | | | |
Expenses before expense reductions (f) | | | 0.67 | | | | 0.68 | | | | 0.67 | | | | 0.68 | (c) |
| | | | |
Expenses after expense reductions (f) | | | 0.66 | | | | 0.67 | | | | 0.67 | | | | 0.67 | (c) |
| | | | |
Net investment income (loss) | | | 2.86 | | | | 3.49 | | | | 3.16 | | | | 3.43 | (c) |
| | | | |
Portfolio turnover | | | 20 | | | | 14 | | | | 17 | | | | 17 | |
Net assets at end of period (000 omitted) | | | $29,078 | | | | $26,586 | | | | $13,733 | | | | $10,733 | |
| | |
| | | | | | Year ended | |
| Class R6 | | | | | 3/31/20 | | | 3/31/19 | | | 3/31/18 (i) | |
| | | | |
Net asset value, beginning of period | | | | | | | $9.73 | | | | $9.58 | | | | $9.78 | |
| | | | |
| Income (loss) from investment operations | | | | | | | | | | | | | | | | |
Net investment income (loss) (d) | | | | | | | $0.29 | | | | $0.34 | | | | $0.20 | |
Net realized and unrealized gain (loss) | | | | | | | (0.05 | ) | | | 0.11 | | | | (0.19 | ) |
Total from investment operations | | | | | | | $0.24 | | | | $0.45 | | | | $0.01 | |
| | | | |
| Less distributions declared to shareholders | | | | | | | | | | | | | | | | |
From net investment income | | | | | | | $(0.29 | ) | | | $(0.30 | ) | | | $(0.21 | ) |
Net asset value, end of period (x) | | | | | | | $9.68 | | | | $9.73 | | | | $9.58 | |
Total return (%) (r)(s)(t)(x) | | | | | | | 2.44 | | | | 4.83 | | | | 0.09 | (n) |
| | | | |
| Ratios (%) (to average net assets) and Supplemental data: | | | | | | | | | | | | | | | | |
Expenses before expense reductions (f) | | | | | | | 0.59 | | | | 0.60 | | | | 0.61 | (a) |
| | | | |
Expenses after expense reductions (f) | | | | | | | 0.58 | | | | 0.59 | | | | 0.61 | (a) |
| | | | |
Net investment income (loss) | | | | | | | 2.92 | | | | 3.58 | | | | 3.19 | (a) |
| | | | |
Portfolio turnover | | | | | | | 20 | | | | 14 | | | | 17 | |
Net assets at end of period (000 omitted) | | | | | | | $1,538 | | | | $954 | | | | $766 | |
| (c) | Amount reflects aone-time reimbursement of expenses by the custodian (or former custodian) without which net investment income and performance would be lower and expenses would be higher. |
| (d) | Per share data is based on average shares outstanding. |
| (f) | Ratios do not reflect reductions from fees paid indirectly, if applicable. |
| (i) | For Class I and Class R6, the period is from the class inception, April 1, 2016 (Class I) and August 1, 2017 (Class R6), through the stated period end. |
| (r) | Certain expenses have been reduced without which performance would have been lower. |
| (s) | From time to time the fund may receive proceeds from litigation settlements, without which performance would be lower. |
| (t) | Total returns do not include any applicable sales charges. |
| (x) | The net asset values and total returns have been calculated on net assets which include adjustments made in accordance with U.S. generally accepted accounting principles required at period end for financial reporting purposes. |
See Notes to Financial Statements
78
Financial Highlights – continued
MFS CALIFORNIA MUNICIPAL BOND FUND
The financial highlights table is intended to help you understand the fund’s financial performance for the past 5 years (or life of a particular share class, if shorter). Certain information reflects financial results for a single fund share. The total returns in the table represent the rate that an investor would have earned (or lost) on an investment in the fund share class (assuming reinvestment of all distributions) held for the entire period.
| | | | | | | | | | | | | | | | | | | | |
| | | Year ended | |
| Class A | | 3/31/20 | | | 3/31/19 | | | 3/31/18 | | | 3/31/17 | | | 3/31/16 | |
| | | | | |
Net asset value, beginning of period | | | $6.04 | | | | $5.94 | | | | $5.95 | | | | $6.14 | | | | $6.05 | |
| | | | | |
| Income (loss) from investment operations | | | | | | | | | | | | | | | | | | | | |
Net investment income (loss) (d) | | | $0.18 | | | | $0.22 | | | | $0.23 | | | | $0.23 | (c) | | | $0.23 | |
Net realized and unrealized gain (loss) | | | (0.07 | ) | | | 0.08 | | | | (0.02 | ) | | | (0.21 | ) | | | 0.08 | |
Total from investment operations | | | $0.11 | | | | $0.30 | | | | $0.21 | | | | $0.02 | | | | $0.31 | |
| | | | | |
| Less distributions declared to shareholders | | | | | | | | | | | | | | | | | | | | |
From net investment income | | | $(0.18 | ) | | | $(0.20 | ) | | | $(0.22 | ) | | | $(0.21 | ) | | | $(0.22 | ) |
Net asset value, end of period (x) | | | $5.97 | | | | $6.04 | | | | $5.94 | | | | $5.95 | | | | $6.14 | |
Total return (%) (r)(s)(t)(x) | | | 1.76 | | | | 5.21 | | | | 3.47 | | | | 0.33 | (c) | | | 5.23 | |
| | | | | |
| Ratios (%) (to average net assets) and Supplemental data: | | | | | | | | | | | | | | | | | | | | |
Expenses before expense reductions (f) | | | 0.86 | | | | 0.87 | | | | 0.88 | | | | 0.88 | (c) | | | 0.88 | |
| | | | | |
Expenses after expense reductions (f) | | | 0.70 | | | | 0.71 | | | | 0.72 | | | | 0.72 | (c) | | | 0.72 | |
| | | | | |
Net investment income (loss) | | | 2.94 | | | | 3.76 | | | | 3.75 | | | | 3.72 | (c) | | | 3.78 | |
| | | | | |
Portfolio turnover | | | 22 | | | | 15 | | | | 15 | | | | 17 | | | | 18 | |
Net assets at end of period (000 omitted) | | | $374,941 | | | | $299,882 | | | | $272,958 | | | | $251,271 | | | | $281,670 | |
| |
| | | Year ended | |
| Class B | | 3/31/20 | | | 3/31/19 | | | 3/31/18 | | | 3/31/17 | | | 3/31/16 | |
| | | | | |
Net asset value, beginning of period | | | $6.04 | | | | $5.94 | | | | $5.95 | | | | $6.14 | | | | $6.05 | |
| | | | | |
| Income (loss) from investment operations | | | | | | | | | | | | | | | | | | | | |
Net investment income (loss) (d) | | | $0.14 | | | | $0.18 | | | | $0.18 | | | | $0.18 | (c) | | | $0.18 | |
Net realized and unrealized gain (loss) | | | (0.08 | ) | | | 0.08 | | | | (0.02 | ) | | | (0.20 | ) | | | 0.08 | |
Total from investment operations | | | $0.06 | | | | $0.26 | | | | $0.16 | | | | $(0.02 | ) | | | $0.26 | |
| | | | | |
| Less distributions declared to shareholders | | | | | | | | | | | | | | | | | | | | |
From net investment income | | | $(0.13 | ) | | | $(0.16 | ) | | | $(0.17 | ) | | | $(0.17 | ) | | | $(0.17 | ) |
Net asset value, end of period (x) | | | $5.97 | | | | $6.04 | | | | $5.94 | | | | $5.95 | | | | $6.14 | |
Total return (%) (r)(s)(t)(x) | | | 1.00 | | | | 4.43 | | | | 2.69 | | | | (0.43 | )(c) | | | 4.43 | |
| | | | | |
| Ratios (%) (to average net assets) and Supplemental data: | | | | | | | | | | | | | | | | | | | | |
Expenses before expense reductions (f) | | | 1.61 | | | | 1.62 | | | | 1.63 | | | | 1.63 | (c) | | | 1.63 | |
| | | | | |
Expenses after expense reductions (f) | | | 1.45 | | | | 1.46 | | | | 1.48 | | | | 1.49 | (c) | | | 1.49 | |
| | | | | |
Net investment income (loss) | | | 2.22 | | | | 3.01 | | | | 3.02 | | | | 2.95 | (c) | | | 3.03 | |
| | | | | |
Portfolio turnover | | | 22 | | | | 15 | | | | 15 | | | | 17 | | | | 18 | |
Net assets at end of period (000 omitted) | | | $1,033 | | | | $1,506 | | | | $1,913 | | | | $2,672 | | | | $3,131 | |
See Notes to Financial Statements
79
Financial Highlights – continued
MFS CALIFORNIA MUNICIPAL BOND FUND – continued
| | | | | | | | | | | | | | | | | | | | |
| | | Year ended | |
| Class C | | 3/31/20 | | | 3/31/19 | | | 3/31/18 | | | 3/31/17 | | | 3/31/16 | |
| | | | | |
Net asset value, beginning of period | | | $6.06 | | | | $5.96 | | | | $5.97 | | | | $6.16 | | | | $6.07 | |
| | | | | |
| Income (loss) from investment operations | | | | | | | | | | | | | | | | | | | | |
Net investment income (loss) (d) | | | $0.13 | | | | $0.17 | | | | $0.17 | | | | $0.17 | (c) | | | $0.17 | |
Net realized and unrealized gain (loss) | | | (0.08 | ) | | | 0.08 | | | | (0.02 | ) | | | (0.20 | ) | | | 0.08 | |
Total from investment operations | | | $0.05 | | | | $0.25 | | | | $0.15 | | | | $(0.03 | ) | | | $0.25 | |
| | | | | |
| Less distributions declared to shareholders | | | | | | | | | | | | | | | | | | | | |
From net investment income | | | $(0.12 | ) | | | $(0.15 | ) | | | $(0.16 | ) | | | $(0.16 | ) | | | $(0.16 | ) |
Net asset value, end of period (x) | | | $5.99 | | | | $6.06 | | | | $5.96 | | | | $5.97 | | | | $6.16 | |
Total return (%) (r)(s)(t)(x) | | | 0.85 | | | | 4.26 | | | | 2.54 | | | | (0.55 | )(c) | | | 4.27 | |
| | | | | |
| Ratios (%) (to average net assets) and Supplemental data: | | | | | | | | | | | | | | | | | | | | |
Expenses before expense reductions (f) | | | 1.61 | | | | 1.62 | | | | 1.63 | | | | 1.63 | (c) | | | 1.63 | |
| | | | | |
Expenses after expense reductions (f) | | | 1.60 | | | | 1.61 | | | | 1.62 | | | | 1.62 | (c) | | | 1.62 | |
| | | | | |
Net investment income (loss) | | | 2.05 | | | | 2.86 | | | | 2.86 | | | | 2.82 | (c) | | | 2.87 | |
| | | | | |
Portfolio turnover | | | 22 | | | | 15 | | | | 15 | | | | 17 | | | | 18 | |
Net assets at end of period (000 omitted) | | | $25,552 | | | | $22,786 | | | | $31,800 | | | | $33,950 | | | | $33,748 | |
| | |
| | | | | | Year ended | |
| Class I | | | | | 3/31/20 | | | 3/31/19 | | | 3/31/18 | | | 3/31/17 (i) | |
| | | | | |
Net asset value, beginning of period | | | | | | | $9.83 | | | | $9.67 | | | | $9.68 | | | | $10.00 | |
| | | | | |
| Income (loss) from investment operations | | | | | | | | | | | | | | | | | | | | |
Net investment income (loss) (d) | | | | | | | $0.31 | | | | $0.37 | | | | $0.37 | | | | $0.38 | (c) |
Net realized and unrealized gain (loss) | | | | | | | (0.13 | ) | | | 0.13 | | | | (0.02 | ) | | | (0.36 | ) |
Total from investment operations | | | | | | | $0.18 | | | | $0.50 | | | | $0.35 | | | | $0.02 | |
| | | | | |
| Less distributions declared to shareholders | | | | | | | | | | | | | | | | | | | | |
From net investment income | | | | | | | $(0.30 | ) | | | $(0.34 | ) | | | $(0.36 | ) | | | $(0.34 | ) |
Net asset value, end of period (x) | | | | | | | $9.71 | | | | $9.83 | | | | $9.67 | | | | $9.68 | |
Total return (%) (r)(s)(t)(x) | | | | | | | 1.79 | | | | 5.27 | | | | 3.63 | | | | 0.20 | (c) |
| | | | | |
| Ratios (%) (to average net assets) and Supplemental data: | | | | | | | | | | | | | | | | | | | | |
Expenses before expense reductions (f) | | | | | | | 0.61 | | | | 0.62 | | | | 0.62 | | | | 0.63 | (c) |
| | | | | |
Expenses after expense reductions (f) | | | | | | | 0.60 | | | | 0.61 | | | | 0.61 | | | | 0.63 | (c) |
| | | | | |
Net investment income (loss) | | | | | | | 3.04 | | | | 3.85 | | | | 3.83 | | | | 3.83 | (c) |
| | | | | |
Portfolio turnover | | | | | | | 22 | | | | 15 | | | | 15 | | | | 17 | |
Net assets at end of period (000 omitted) | | | | | | | $128,914 | | | | $79,276 | | | | $56,553 | | | | $42,369 | |
See Notes to Financial Statements
80
Financial Highlights – continued
MFS CALIFORNIA MUNICIPAL BOND FUND – continued
| | | | | | | | | | | | |
| | | Year ended | |
| Class R6 | | 3/31/20 | | | 3/31/19 | | | 3/31/18 (i) | |
| | | |
Net asset value, beginning of period | | | $9.82 | | | | $9.66 | | | | $9.84 | |
| | | |
| Income (loss) from investment operations | | | | | | | | | | | | |
Net investment income (loss) (d) | | | $0.31 | | | | $0.38 | | | | $0.24 | |
Net realized and unrealized gain (loss) | | | (0.11 | ) | | | 0.12 | | | | (0.18 | ) |
Total from investment operations | | | $0.20 | | | | $0.50 | | | | $0.06 | |
| | | |
| Less distributions declared to shareholders | | | | | | | | | | | | |
From net investment income | | | $(0.31 | ) | | | $(0.34 | ) | | | $(0.24 | ) |
Net asset value, end of period (x) | | | $9.71 | | | | $9.82 | | | | $9.66 | |
Total return (%) (r)(s)(t)(x) | | | 1.97 | | | | 5.36 | | | | 0.61 | (n) |
| | | |
| Ratios (%) (to average net assets) and Supplemental data: | | | | | | | | | | | | |
Expenses before expense reductions (f) | | | 0.53 | | | | 0.54 | | | | 0.56 | (a) |
| | | |
Expenses after expense reductions (f) | | | 0.52 | | | | 0.53 | | | | 0.55 | (a) |
| | | |
Net investment income (loss) | | | 3.10 | | | | 3.92 | | | | 3.78 | (a) |
| | | |
Portfolio turnover | | | 22 | | | | 15 | | | | 15 | |
Net assets at end of period (000 omitted) | | | $28,396 | | | | $12,773 | | | | $5,995 | |
| (c) | Amount reflects aone-time reimbursement of expenses by the custodian (or former custodian) without which net investment income and performance would be lower and expenses would be higher. |
| (d) | Per share data is based on average shares outstanding. |
| (f) | Ratios do not reflect reductions from fees paid indirectly, if applicable. |
| (i) | For Class I and Class R6, the period is from the class inception, April 1, 2016 (Class I) and August 1, 2017 (Class R6), through the stated period end. |
| (r) | Certain expenses have been reduced without which performance would have been lower. |
| (s) | From time to time the fund may receive proceeds from litigation settlements, without which performance would be lower. |
| (t) | Total returns do not include any applicable sales charges. |
| (x) | The net asset values and total returns have been calculated on net assets which include adjustments made in accordance with U.S. generally accepted accounting principles required at period end for financial reporting purposes. |
See Notes to Financial Statements
81
Financial Highlights – continued
MFS GEORGIA MUNICIPAL BOND FUND
The financial highlights table is intended to help you understand the fund’s financial performance for the past 5 years (or life of a particular share class, if shorter). Certain information reflects financial results for a single fund share. The total returns in the table represent the rate that an investor would have earned (or lost) on an investment in the fund share class (assuming reinvestment of all distributions) held for the entire period.
| | | | | | | | | | | | | | | | | | | | |
| | | Year ended | |
| Class A | | 3/31/20 | | | 3/31/19 | | | 3/31/18 | | | 3/31/17 | | | 3/31/16 | |
| | | | | |
Net asset value, beginning of period | | | $10.73 | | | | $10.58 | | | | $10.68 | | | | $11.02 | | | | $11.02 | |
| | | | | |
| Income (loss) from investment operations | | | | | | | | | | | | | | | | | | | | |
Net investment income (loss) (d) | | | $0.26 | | | | $0.36 | | | | $0.35 | | | | $0.36 | (c) | | | $0.36 | |
Net realized and unrealized gain (loss) | | | (0.02 | ) | | | 0.11 | | | | (0.12 | ) | | | (0.36 | ) | | | (0.01 | ) |
Total from investment operations | | | $0.24 | | | | $0.47 | | | | $0.23 | | | | $0.00 | (w) | | | $0.35 | |
| | | | | |
| Less distributions declared to shareholders | | | | | | | | | | | | | | | | | | | | |
From net investment income | | | $(0.27 | ) | | | $(0.32 | ) | | | $(0.33 | ) | | | $(0.34 | ) | | | $(0.35 | ) |
Net asset value, end of period (x) | | | $10.70 | | | | $10.73 | | | | $10.58 | | | | $10.68 | | | | $11.02 | |
Total return (%) (r)(s)(t)(x) | | | 2.17 | | | | 4.51 | | | | 2.15 | | | | (0.06 | )(c) | | | 3.28 | |
| | | | | |
| Ratios (%) (to average net assets) and Supplemental data: | | | | | | | | | | | | | | | | | | | | |
Expenses before expense reductions (f) | | | 0.95 | | | | 1.02 | | | | 1.04 | | | | 1.03 | (c) | | | 1.03 | |
| | | | | |
Expenses after expense reductions (f) | | | 0.90 | | | | 0.90 | | | | 0.90 | | | | 0.90 | (c) | | | 0.95 | |
| | | | | |
Net investment income (loss) | | | 2.39 | | | | 3.41 | | | | 3.26 | | | | 3.26 | (c) | | | 3.32 | |
| | | | | |
Portfolio turnover | | | 28 | | | | 14 | | | | 12 | | | | 8 | | | | 11 | |
Net assets at end of period (000 omitted) | | | $95,352 | | | | $70,456 | | | | $65,922 | | | | $61,229 | | | | $61,065 | |
| |
| | | Year ended | |
| Class B | | 3/31/20 | | | 3/31/19 | | | 3/31/18 | | | 3/31/17 | | | 3/31/16 | |
| | | | | |
Net asset value, beginning of period | | | $10.77 | | | | $10.62 | | | | $10.72 | | | | $11.06 | | | | $11.06 | |
| | | | | |
| Income (loss) from investment operations | | | | | | | | | | | | | | | | | | | | |
Net investment income (loss) (d) | | | $0.19 | | | | $0.28 | | | | $0.27 | | | | $0.28 | (c) | | | $0.28 | |
Net realized and unrealized gain (loss) | | | (0.03 | ) | | | 0.11 | | | | (0.12 | ) | | | (0.36 | ) | | | (0.01 | ) |
Total from investment operations | | | $0.16 | | | | $0.39 | | | | $0.15 | | | | $(0.08 | ) | | | $0.27 | |
| | | | | |
| Less distributions declared to shareholders | | | | | | | | | | | | | | | | | | | | |
From net investment income | | | $(0.19 | ) | | | $(0.24 | ) | | | $(0.25 | ) | | | $(0.26 | ) | | | $(0.27 | ) |
Net asset value, end of period (x) | | | $10.74 | | | | $10.77 | | | | $10.62 | | | | $10.72 | | | | $11.06 | |
Total return (%) (r)(s)(t)(x) | | | 1.44 | | | | 3.73 | | | | 1.40 | | | | (0.79 | )(c) | | | 2.50 | |
| | | | | |
| Ratios (%) (to average net assets) and Supplemental data: | | | | | | | | | | | | | | | | | | | | |
Expenses before expense reductions (f) | | | 1.71 | | | | 1.77 | | | | 1.79 | | | | 1.78 | (c) | | | 1.78 | |
| | | | | |
Expenses after expense reductions (f) | | | 1.63 | | | | 1.65 | | | | 1.65 | | | | 1.66 | (c) | | | 1.70 | |
| | | | | |
Net investment income (loss) | | | 1.72 | | | | 2.67 | | | | 2.54 | | | | 2.52 | (c) | | | 2.56 | |
| | | | | |
Portfolio turnover | | | 28 | | | | 14 | | | | 12 | | | | 8 | | | | 11 | |
Net assets at end of period (000 omitted) | | | $261 | | | | $399 | | | | $563 | | | | $1,105 | | | | $1,296 | |
See Notes to Financial Statements
82
Financial Highlights – continued
MFS GEORGIA MUNICIPAL BOND FUND – continued
| | | | | | | | | | | | | | | | |
| | | Year ended | |
| Class I | | 3/31/20 | | | 3/31/19 | | | 3/31/18 | | | 3/31/17 (i) | |
| | | | |
Net asset value, beginning of period | | | $9.73 | | | | $9.60 | | | | $9.69 | | | | $10.00 | |
| | | | |
| Income (loss) from investment operations | | | | | | | | | | | | | | | | |
Net investment income (loss) (d) | | | $0.26 | | | | $0.35 | | | | $0.34 | | | | $0.35 | (c) |
Net realized and unrealized gain (loss) | | | (0.02 | ) | | | 0.09 | | | | (0.11 | ) | | | (0.33 | ) |
Total from investment operations | | | $0.24 | | | | $0.44 | | | | $0.23 | | | | $0.02 | |
| | | | |
| Less distributions declared to shareholders | | | | | | | | | | | | | | | | |
From net investment income | | | $(0.27 | ) | | | $(0.31 | ) | | | $(0.32 | ) | | | $(0.33 | ) |
Net asset value, end of period (x) | | | $9.70 | | | | $9.73 | | | | $9.60 | | | | $9.69 | |
Total return (%) (r)(s)(t)(x) | | | 2.39 | | | | 4.70 | | | | 2.40 | | | | 0.19 | (c) |
| | | |
| Ratios (%) (to average net assets) and Supplemental data: | | | | | | | | | | | | | |
Expenses before expense reductions (f) | | | 0.70 | | | | 0.77 | | | | 0.79 | | | | 0.80 | (c) |
| | | | |
Expenses after expense reductions (f) | | | 0.65 | | | | 0.65 | | | | 0.65 | | | | 0.64 | (c) |
| | | | |
Net investment income (loss) | | | 2.64 | | | | 3.65 | | | | 3.49 | | | | 3.52 | (c) |
| | | | |
Portfolio turnover | | | 28 | | | | 14 | | | | 12 | | | | 8 | |
Net assets at end of period (000 omitted) | | | $9,345 | | | | $7,834 | | | | $6,817 | | | | $7,451 | |
| | |
| | | | | | Year ended | |
| Class R6 | | | | | 3/31/20 | | | 3/31/19 | | | 3/31/18 (i) | |
| | | | |
Net asset value, beginning of period | | | | | | | $9.73 | | | | $9.60 | | | | $9.82 | |
| | | | |
| Income (loss) from investment operations | | | | | | | | | | | | | | | | |
Net investment income (loss) (d) | | | | | | | $0.27 | | | | $0.36 | | | | $0.23 | |
Net realized and unrealized gain (loss) | | | | | | | (0.03 | ) | | | 0.09 | | | | (0.23 | ) |
Total from investment operations | | | | | | | $0.24 | | | | $0.45 | | | | $0.00 | (w) |
| | | | |
| Less distributions declared to shareholders | | | | | | | | | | | | | | | | |
From net investment income | | | | | | | $(0.27 | ) | | | $(0.32 | ) | | | $(0.22 | ) |
Net asset value, end of period (x) | | | | | | | $9.70 | | | | $9.73 | | | | $9.60 | |
Total return (%) (r)(s)(t)(x) | | | | | | | 2.44 | | | | 4.77 | | | | (0.05 | )(n) |
| | | |
| Ratios (%) (to average net assets) and Supplemental data: | | | | | | | | | | | | | |
Expenses before expense reductions (f) | | | | | | | 0.65 | | | | 0.70 | | | | 0.82 | (a) |
| | | | |
Expenses after expense reductions (f) | | | | | | | 0.60 | | | | 0.59 | | | | 0.59 | (a) |
| | | | |
Net investment income (loss) | | | | | | | 2.68 | | | | 3.72 | | | | 3.56 | (a) |
| | | | |
Portfolio turnover | | | | | | | 28 | | | | 14 | | | | 12 | |
Net assets at end of period (000 omitted) | | | | | | | $11,022 | | | | $7,371 | | | | $5,988 | |
| (c) | Amount reflects aone-time reimbursement of expenses by the custodian (or former custodian) without which net investment income and performance would be lower and expenses would be higher. |
| (d) | Per share data is based on average shares outstanding. |
| (f) | Ratios do not reflect reductions from fees paid indirectly, if applicable. |
| (i) | For Class I and Class R6, the period is from the class inception, April 1, 2016 (Class I) and August 1, 2017 (Class R6), through the stated period end. |
| (r) | Certain expenses have been reduced without which performance would have been lower. |
| (s) | From time to time the fund may receive proceeds from litigation settlements, without which performance would be lower. |
| (t) | Total returns do not include any applicable sales charges. |
| (w) | Per share amount was less than $0.01. |
| (x) | The net asset values and total returns have been calculated on net assets which include adjustments made in accordance with U.S. generally accepted accounting principles required at period end for financial reporting purposes. |
See Notes to Financial Statements
83
Financial Highlights – continued
MFS MARYLAND MUNICIPAL BOND FUND
The financial highlights table is intended to help you understand the fund’s financial performance for the past 5 years (or life of a particular share class, if shorter). Certain information reflects financial results for a single fund share. The total returns in the table represent the rate that an investor would have earned (or lost) on an investment in the fund share class (assuming reinvestment of all distributions) held for the entire period.
| | | | | | | | | | | | | | | | | | | | |
| | | Year ended | |
| Class A | | 3/31/20 | | | 3/31/19 | | | 3/31/18 | | | 3/31/17 | | | 3/31/16 | |
| | | | | |
Net asset value, beginning of period | | | $10.76 | | | | $10.65 | | | | $10.76 | | | | $11.09 | | | | $11.13 | |
| | | | | |
| Income (loss) from investment operations | | | | | | | | | | | | | | | | | | | | |
Net investment income (loss) (d) | | | $0.31 | | | | $0.40 | | | | $0.38 | | | | $0.40 | (c) | | | $0.39 | |
Net realized and unrealized gain (loss) | | | (0.14 | ) | | | 0.06 | | | | (0.12 | ) | | | (0.35 | ) | | | (0.05 | ) |
Total from investment operations | | | $0.17 | | | | $0.46 | | | | $0.26 | | | | $0.05 | | | | $0.34 | |
| | | | | |
| Less distributions declared to shareholders | | | | | | | | | | | | | | | | | | | | |
From net investment income | | | $(0.31 | ) | | | $(0.35 | ) | | | $(0.37 | ) | | | $(0.38 | ) | | | $(0.38 | ) |
Net asset value, end of period (x) | | | $10.62 | | | | $10.76 | | | | $10.65 | | | | $10.76 | | | | $11.09 | |
Total return (%) (r)(s)(t)(x) | | | 1.57 | | | | 4.46 | | | | 2.39 | | | | 0.43 | (c) | | | 3.09 | |
| | | | | |
| Ratios (%) (to average net assets) and Supplemental data: | | | | | | | | | | | | | | | | | | | | |
Expenses before expense reductions (f) | | | 0.99 | | | | 1.01 | | | | 1.02 | | | | 0.99 | (c) | | | 0.98 | |
| | | | | |
Expenses after expense reductions (f) | | | 0.82 | | | | 0.82 | | | | 0.82 | | | | 0.82 | (c) | | | 0.87 | |
| | | | | |
Net investment income (loss) | | | 2.85 | | | | 3.77 | | | | 3.48 | | | | 3.68 | (c) | | | 3.57 | |
| | | | | |
Portfolio turnover | | | 27 | | | | 14 | | | | 23 | | | | 17 | | | | 10 | |
Net assets at end of period (000 omitted) | | | $83,852 | | | | $75,215 | | | | $76,993 | | | | $80,456 | | | | $82,145 | |
| |
| | | Year ended | |
| Class B | | 3/31/20 | | | 3/31/19 | | | 3/31/18 | | | 3/31/17 | | | 3/31/16 | |
| | | | | |
Net asset value, beginning of period | | | $10.75 | | | | $10.65 | | | | $10.76 | | | | $11.08 | | | | $11.12 | |
| | | | | |
| Income (loss) from investment operations | | | | | | | | | | | | | | | | | | | | |
Net investment income (loss) (d) | | | $0.23 | | | | $0.32 | | | | $0.29 | | | | $0.32 | (c) | | | $0.31 | |
Net realized and unrealized gain (loss) | | | (0.13 | ) | | | 0.05 | | | | (0.11 | ) | | | (0.34 | ) | | | (0.06 | ) |
Total from investment operations | | | $0.10 | | | | $0.37 | | | | $0.18 | | | | $(0.02 | ) | | | $0.25 | |
| | | | | |
| Less distributions declared to shareholders | | | | | | | | | | | | | | | | | | | | |
From net investment income | | | $(0.23 | ) | | | $(0.27 | ) | | | $(0.29 | ) | | | $(0.30 | ) | | | $(0.29 | ) |
Net asset value, end of period (x) | | | $10.62 | | | | $10.75 | | | | $10.65 | | | | $10.76 | | | | $11.08 | |
Total return (%) (r)(s)(t)(x) | | | 0.91 | | | | 3.58 | | | | 1.62 | | | | (0.23 | )(c) | | | 2.32 | |
| | | | | |
| Ratios (%) (to average net assets) and Supplemental data: | | | | | | | | | | | | | | | | | | | | |
Expenses before expense reductions (f) | | | 1.74 | | | | 1.76 | | | | 1.77 | | | | 1.74 | (c) | | | 1.73 | |
| | | | | |
Expenses after expense reductions (f) | | | 1.58 | | �� | | 1.58 | | | | 1.58 | | | | 1.57 | (c) | | | 1.62 | |
| | | | | |
Net investment income (loss) | | | 2.12 | | | | 3.01 | | | | 2.73 | | | | 2.94 | (c) | | | 2.82 | |
| | | | | |
Portfolio turnover | | | 27 | | | | 14 | | | | 23 | | | | 17 | | | | 10 | |
Net assets at end of period (000 omitted) | | | $1,040 | | | | $1,217 | | | | $1,331 | | | | $1,605 | | | | $1,958 | |
See Notes to Financial Statements
84
Financial Highlights – continued
MFS MARYLAND MUNICIPAL BOND FUND – continued
| | | | | | | | | | | | | | | | |
| | | Year ended | |
| Class I | | 3/31/20 | | | 3/31/19 | | | 3/31/18 | | | 3/31/17 (i) | |
| | | | |
Net asset value, beginning of period | | | $9.70 | | | | $9.61 | | | | $9.71 | | | | $10.00 | |
| | | | |
| Income (loss) from investment operations | | | | | | | | | | | | | | | | |
Net investment income (loss) (d) | | | $0.30 | | | | $0.38 | | | | $0.36 | | | | $0.38 | (c) |
Net realized and unrealized gain (loss) | | | (0.11 | ) | | | 0.05 | | | | (0.11 | ) | | | (0.30 | ) |
Total from investment operations | | | $0.19 | | | | $0.43 | | | | $0.25 | | | | $0.08 | |
| | | | |
| Less distributions declared to shareholders | | | | | | | | | | | | | | | | |
From net investment income | | | $(0.31 | ) | | | $(0.34 | ) | | | $(0.35 | ) | | | $(0.37 | ) |
Net asset value, end of period (x) | | | $9.58 | | | | $9.70 | | | | $9.61 | | | | $9.71 | |
Total return (%) (r)(s)(t)(x) | | | 1.88 | | | | 4.61 | | | | 2.62 | | | | 0.78 | (c) |
| | | | |
| Ratios (%) (to average net assets) and Supplemental data: | | | | | | | | | | | | | | | | |
Expenses before expense reductions (f) | | | 0.74 | | | | 0.76 | | | | 0.77 | | | | 0.78 | (c) |
| | | | |
Expenses after expense reductions (f) | | | 0.58 | | | | 0.58 | | | | 0.58 | | | | 0.57 | (c) |
| | | | |
Net investment income (loss) | | | 3.07 | | | | 4.01 | | | | 3.72 | | | | 3.85 | (c) |
| | | | |
Portfolio turnover | | | 27 | | | | 14 | | | | 23 | | | | 17 | |
Net assets at end of period (000 omitted) | | | $18,140 | | | | $11,831 | | | | $9,261 | | | | $6,437 | |
| | |
| | | | | | Year ended | |
| Class R6 | | | | | 3/31/20 | | | 3/31/19 | | | 3/31/18 (i) | |
| | | | |
Net asset value, beginning of period | | | | | | | $9.70 | | | | $9.61 | | | | $9.81 | |
| | | | |
| Income (loss) from investment operations | | | | | | | | | | | | | | | | |
Net investment income (loss) (d) | | | | | | | $0.30 | | | | $0.39 | | | | $0.24 | |
Net realized and unrealized gain (loss) | | | | | | | (0.11 | ) | | | 0.05 | | | | (0.21 | ) |
Total from investment operations | | | | | | | $0.19 | | | | $0.44 | | | | $0.03 | |
| | | | |
| Less distributions declared to shareholders | | | | | | | | | | | | | | | | |
From net investment income | | | | | | | $(0.31 | ) | | | $(0.35 | ) | | | $(0.23 | ) |
Net asset value, end of period (x) | | | | | | | $9.58 | | | | $9.70 | | | | $9.61 | |
Total return (%) (r)(s)(t)(x) | | | | | | | 1.93 | | | | 4.67 | | | | 0.35 | (n) |
| | | | |
| Ratios (%) (to average net assets) and Supplemental data: | | | | | | | | | | | | | | | | |
Expenses before expense reductions (f) | | | | | | | 0.68 | | | | 0.70 | | | | 0.76 | (a) |
| | | | |
Expenses after expense reductions (f) | | | | | | | 0.52 | | | | 0.52 | | | | 0.52 | (a) |
| | | | |
Net investment income (loss) | | | | | | | 3.10 | | | | 4.07 | | | | 3.79 | (a) |
| | | | |
Portfolio turnover | | | | | | | 27 | | | | 14 | | | | 23 | |
Net assets at end of period (000 omitted) | | | | | | | $2,837 | | | | $1,315 | | | | $961 | |
| (c) | Amount reflects aone-time reimbursement of expenses by the custodian (or former custodian) without which net investment income and performance would be lower and expenses would be higher. |
| (d) | Per share data is based on average shares outstanding. |
| (f) | Ratios do not reflect reductions from fees paid indirectly, if applicable. |
| (i) | For Class I and Class R6, the period is from the class inception, April 1, 2016 (Class I) and August 1, 2017 (Class R6), through the stated period end. |
| (r) | Certain expenses have been reduced without which performance would have been lower. |
| (s) | From time to time the fund may receive proceeds from litigation settlements, without which performance would be lower. |
| (t) | Total returns do not include any applicable sales charges. |
| (x) | The net asset values and total returns have been calculated on net assets which include adjustments made in accordance with U.S. generally accepted accounting principles required at period end for financial reporting purposes. |
See Notes to Financial Statements
85
Financial Highlights – continued
MFS MASSACHUSETTS MUNICIPAL BOND FUND
The financial highlights table is intended to help you understand the fund’s financial performance for the past 5 years (or life of a particular share class, if shorter). Certain information reflects financial results for a single fund share. The total returns in the table represent the rate that an investor would have earned (or lost) on an investment in the fund share class (assuming reinvestment of all distributions) held for the entire period.
| | | | | | | | | | | | | | | | | | | | |
| | | Year ended | |
| Class A | | 3/31/20 | | | 3/31/19 | | | 3/31/18 | | | 3/31/17 | | | 3/31/16 | |
| | | | | |
Net asset value, beginning of period | | | $11.04 | | | | $10.90 | | | | $11.02 | | | | $11.43 | | | | $11.40 | |
| | | | | |
| Income (loss) from investment operations | | | | | | | | | | | | | | | | | | | | |
Net investment income (loss) (d) | | | $0.33 | | | | $0.41 | | | | $0.42 | | | | $0.46 | (c) | | | $0.41 | |
Net realized and unrealized gain (loss) | | | (0.15 | ) | | | 0.09 | | | | (0.13 | ) | | | (0.46 | ) | | | 0.01 | |
Total from investment operations | | | $0.18 | | | | $0.50 | | | | $0.29 | | | | $0.00 | (w) | | | $0.42 | |
| | | | | |
| Less distributions declared to shareholders | | | | | | | | | | | | | | | | | | | | |
From net investment income | | | $(0.32 | ) | | | $(0.36 | ) | | | $(0.41 | ) | | | $(0.41 | ) | | | $(0.39 | ) |
Net asset value, end of period (x) | | | $10.90 | | | | $11.04 | | | | $10.90 | | | | $11.02 | | | | $11.43 | |
Total return (%) (r)(s)(t)(x) | | | 1.61 | | | | 4.74 | | | | 2.60 | | | | (0.04 | )(c) | | | 3.78 | |
| | | | | |
| Ratios (%) (to average net assets) and Supplemental data: | | | | | | | | | | | | | | | | | | | | |
Expenses before expense reductions (f) | | | 0.87 | | | | 0.88 | | | | 0.89 | | | | 0.88 | (c) | | | 0.88 | |
| | | | | |
Expenses after expense reductions (f) | | | 0.83 | | | | 0.85 | | | | 0.86 | | | | 0.85 | (c) | | | 0.85 | |
| | | | | |
Net investment income (loss) | | | 2.91 | | | | 3.75 | | | | 3.82 | | | | 4.06 | (c) | | | 3.66 | |
| | | | | |
Portfolio turnover | | | 29 | | | | 13 | | | | 19 | | | | 15 | | | | 15 | |
Net assets at end of period (000 omitted) | | | $226,471 | | | | $207,565 | | | | $202,967 | | | | $207,001 | | | | $226,552 | |
| |
| | | Year ended | |
| Class B | | 3/31/20 | | | 3/31/19 | | | 3/31/18 | | | 3/31/17 | | | 3/31/16 | |
| | | | | |
Net asset value, beginning of period | | | $11.06 | | | | $10.92 | | | | $11.04 | | | | $11.45 | | | | $11.42 | |
| | | | | |
| Income (loss) from investment operations | | | | | | | | | | | | | | | | | | | | |
Net investment income (loss) (d) | | | $0.25 | | | | $0.32 | | | | $0.34 | | | | $0.37 | (c) | | | $0.33 | |
Net realized and unrealized gain (loss) | | | (0.15 | ) | | | 0.10 | | | | (0.14 | ) | | | (0.46 | ) | | | 0.00 | (w) |
Total from investment operations | | | $0.10 | | | | $0.42 | | | | $0.20 | | | | $(0.09 | ) | | | $0.33 | |
| | | | | |
| Less distributions declared to shareholders | | | | | | | | | | | | | | | | | | | | |
From net investment income | | | $(0.24 | ) | | | $(0.28 | ) | | | $(0.32 | ) | | | $(0.32 | ) | | | $(0.30 | ) |
Net asset value, end of period (x) | | | $10.92 | | | | $11.06 | | | | $10.92 | | | | $11.04 | | | | $11.45 | |
Total return (%) (r)(s)(t)(x) | | | 0.84 | | | | 3.94 | | | | 1.81 | | | | (0.80 | )(c) | | | 2.98 | |
| | | | | |
| Ratios (%) (to average net assets) and Supplemental data: | | | | | | | | | | | | | | | | | | | | |
Expenses before expense reductions (f) | | | 1.62 | | | | 1.63 | | | | 1.64 | | | | 1.63 | (c) | | | 1.63 | |
| | | | | |
Expenses after expense reductions (f) | | | 1.60 | | | | 1.62 | | | | 1.63 | | | | 1.62 | (c) | | | 1.62 | |
| | | | | |
Net investment income (loss) | | | 2.19 | | | | 2.98 | | | | 3.06 | | | | 3.29 | (c) | | | 2.88 | |
| | | | | |
Portfolio turnover | | | 29 | | | | 13 | | | | 19 | | | | 15 | | | | 15 | |
Net assets at end of period (000 omitted) | | | $1,081 | | | | $1,664 | | | | $1,858 | | | | $2,509 | | | | $3,206 | |
See Notes to Financial Statements
86
Financial Highlights – continued
MFS MASSACHUSETTS MUNICIPAL BOND FUND – continued
| | | | | | | | | | | | | | | | |
| | | Year ended | |
| Class I | | 3/31/20 | | | 3/31/19 | | | 3/31/18 | | | 3/31/17 (i) | |
| | | | |
Net asset value, beginning of period | | | $9.66 | | | | $9.54 | | | | $9.65 | | | | $10.00 | |
| | | | |
| Income (loss) from investment operations | | | | | | | | | | | | | | | | |
Net investment income (loss) (d) | | | $0.30 | | | | $0.38 | | | | $0.39 | | | | $0.42 | (c) |
Net realized and unrealized gain (loss) | | | (0.12 | ) | | | 0.08 | | | | (0.12 | ) | | | (0.39 | ) |
Total from investment operations | | | $0.18 | | | | $0.46 | | | | $0.27 | | | | $0.03 | |
| | | | |
| Less distributions declared to shareholders | | | | | | | | | | | | | | | | |
From net investment income | | | $(0.30 | ) | | | $(0.34 | ) | | | $(0.38 | ) | | | $(0.38 | ) |
Net asset value, end of period (x) | | | $9.54 | | | | $9.66 | | | | $9.54 | | | | $9.65 | |
Total return (%) (r)(s)(t)(x) | | | 1.86 | | | | 4.95 | | | | 2.76 | | | | 0.30 | (c) |
| | | | |
| Ratios (%) (to average net assets) and Supplemental data: | | | | | | | | | | | | | | | | |
Expenses before expense reductions (f) | | | 0.62 | | | | 0.63 | | | | 0.64 | | | | 0.64 | (c) |
| | | | |
Expenses after expense reductions (f) | | | 0.60 | | | | 0.62 | | | | 0.63 | | | | 0.63 | (c) |
| | | | |
Net investment income (loss) | | | 3.10 | | | | 3.98 | | | | 4.00 | | | | 4.30 | (c) |
| | | | |
Portfolio turnover | | | 29 | | | | 13 | | | | 19 | | | | 15 | |
Net assets at end of period (000 omitted) | | | $124,875 | | | | $68,669 | | | | $49,523 | | | | $23,470 | |
| | |
| | | | | | Year ended | |
| Class R6 | | | | | 3/31/20 | | | 3/31/19 | | | 3/31/18 (i) | |
| | | | |
Net asset value, beginning of period | | | | | | | $9.67 | | | | $9.54 | | | | $9.77 | |
| | | | |
| Income (loss) from investment operations | | | | | | | | | | | | | | | | |
Net investment income (loss) (d) | | | | | | | $0.31 | | | | $0.38 | | | | $0.24 | |
Net realized and unrealized gain (loss) | | | | | | | (0.12 | ) | | | 0.10 | | | | (0.21 | ) |
Total from investment operations | | | | | | | $0.19 | | | | $0.48 | | | | $0.03 | |
| | | | |
| Less distributions declared to shareholders | | | | | | | | | | | | | | | | |
From net investment income | | | | | | | $(0.31 | ) | | | $(0.35 | ) | | | $(0.26 | ) |
Net asset value, end of period (x) | | | | | | | $9.55 | | | | $9.67 | | | | $9.54 | |
Total return (%) (r)(s)(t)(x) | | | | | | | 1.93 | | | | 5.13 | | | | 0.26 | (n) |
| | | | |
| Ratios (%) (to average net assets) and Supplemental data: | | | | | | | | | | | | | | | | |
Expenses before expense reductions (f) | | | | | | | 0.55 | | | | 0.56 | | | | 0.58 | (a) |
| | | | |
Expenses after expense reductions (f) | | | | | | | 0.53 | | | | 0.55 | | | | 0.57 | (a) |
| | | | |
Net investment income (loss) | | | | | | | 3.15 | | | | 4.05 | | | | 3.85 | (a) |
| | | | |
Portfolio turnover | | | | | | | 29 | | | | 13 | | | | 19 | |
Net assets at end of period (000 omitted) | | | | | | | $6,636 | | | | $3,176 | | | | $1,983 | |
| (c) | Amount reflects aone-time reimbursement of expenses by the custodian (or former custodian) without which net investment income and performance would be lower and expenses would be higher. |
| (d) | Per share data is based on average shares outstanding. |
| (f) | Ratios do not reflect reductions from fees paid indirectly, if applicable. |
| (i) | For Class I and Class R6, the period is from the class inception, April 1, 2016 (Class I) and August 1, 2017 (Class R6), through the stated period end. |
| (r) | Certain expenses have been reduced without which performance would have been lower. |
| (s) | From time to time the fund may receive proceeds from litigation settlements, without which performance would be lower. |
| (t) | Total returns do not include any applicable sales charges. |
| (w) | Per share amount was less than $0.01. |
| (x) | The net asset values and total returns have been calculated on net assets which include adjustments made in accordance with U.S. generally accepted accounting principles required at period end for financial reporting purposes. |
See Notes to Financial Statements
87
NOTES TO FINANCIAL STATEMENTS
| (1) | | Business and Organization |
MFS Alabama Municipal Bond Fund (Alabama Fund), MFS Arkansas Municipal Bond Fund (Arkansas Fund), MFS California Municipal Bond Fund (California Fund), MFS Georgia Municipal Bond Fund (Georgia Fund), MFS Maryland Municipal Bond Fund (Maryland Fund), and MFS Massachusetts Municipal Bond Fund (Massachusetts Fund) are each a diversified series of MFS Municipal Series Trust which is organized as a Massachusetts business trust and is registered under the Investment Company Act of 1940, as amended, as anopen-end management investment company.
Each fund is an investment company and accordingly follows the investment company accounting and reporting guidance of the Financial Accounting Standards Board (FASB) Accounting Standards Codification Topic 946 Financial Services – Investment Companies.
| (2) | | Significant Accounting Policies |
General– The preparation of financial statements in conformity with U.S. generally accepted accounting principles requires management to make estimates and assumptions that affect the reported amounts of assets and liabilities, and disclosure of contingent assets and liabilities at the date of the financial statements and the reported amounts of increases and decreases in net assets from operations during the reporting period. Actual results could differ from those estimates. In the preparation of these financial statements, management has evaluated subsequent events occurring after the date of each fund’s Statement of Assets and Liabilities through the date that the financial statements were issued. Each fund invests primarily in municipal instruments, which generally trade in theover-the-counter market. The value of municipal instruments can be affected by changes in their actual or perceived credit quality. The credit quality of, and the ability to pay principal and interest when due by, an issuer of a municipal instrument depends on the credit quality of the entity supporting the municipal instrument, how essential any services supported by the municipal instrument are, the sufficiency of any revenues or taxes that support the municipal instrument, and/or the willingness or ability of the appropriate government entity to approve any appropriations necessary to support the municipal instrument. Municipal instruments may be supported by insurance which typically guarantees the timely payment of all principal and interest due on the underlying municipal instrument. The value of a municipal instrument can be volatile and significantly affected by adverse tax changes or court rulings, legislative or political changes, changes in specific or general market and economic conditions in the region or state where the instrument is issued, and the financial condition of municipal issuers and of municipal instrument insurers of which there are a limited number. Also, because many municipal instruments are issued to finance similar projects, conditions in certain industries can significantly affect the funds and the overall municipal market. If the Internal Revenue Service determines an issuer of a municipal instrument has not complied with the applicable tax requirements, interest from the security could become taxable, the security could decline in value, and distributions made by the funds could be taxable to shareholders.
In March 2020, the FASB issued Accounting Standards Update2020-04, Reference Rate Reform (Topic 848) – Facilitation of the Effects of Reference Rate Reform on Financial Reporting (“ASU2020-04”), which provides optional, temporary relief with respect to the financial reporting of contracts subject to certain types of modifications due to the planned discontinuation of the London Interbank Offered Rate (LIBOR) and other IBOR-based reference rates as of the end of 2021. The temporary relief provided byASU 2020-04 is effective for certain reference rate-related contract modifications that occur during the period from March 12, 2020 through December 31, 2022. Management is evaluating the impact of ASU2020-04 on the fund’s investments, derivatives, debt and other contracts that will undergo reference rate-related modifications as a result of the reference rate reform.
In March 2017, the FASB issued Accounting Standards Update2017-08, Receivables – Nonrefundable Fees and Other Costs (Subtopic310-20) – Premium Amortization on Purchased Callable Debt Securities (“ASU2017-08”). For callable debt securities purchased at a premium that have explicit,non-contingent call features and that are callable at fixed prices on preset dates,ASU 2017-08 requires the premium to be amortized to the earliest call date. The funds adopted ASU2017-08 as of the beginning of the reporting period on a modified retrospective basis. The adoption resulted in a change in accounting principle, since each fund had historically amortized such premiums to maturity for U.S. GAAP. As a result of the adoption, each fund recognized a cumulative effect adjustment that decreased the beginning of period cost of investments and increased the unrealized appreciation on investments by the amounts noted in the table below:
| | | | |
| Alabama Fund | | | $458,025 | |
| Arkansas Fund | | | 1,815,043 | |
| California Fund | | | 2,794,689 | |
| Georgia Fund | | | 688,937 | |
| Maryland Fund | | | 900,281 | |
| Massachusetts Fund | | | 1,524,830 | |
Adoption had no impact on each fund’s net assets or any prior period information presented in the financial statements. With respect to each fund’s results of operations, amortization of premium to first call date under ASU2017-08 accelerates amortization with the intent of more closely aligning the recognition of income on such bonds with the economics of the instrument.
Balance Sheet Offsetting– Each fund’s accounting policy with respect to balance sheet offsetting is that, absent an event of default by the counterparty or a termination of the agreement, the International Swaps and Derivatives Association (ISDA) Master
88
Notes to Financial Statements – continued
Agreement, or similar agreement, does not result in an offset of reported amounts of financial assets and financial liabilities in the Statements of Assets and Liabilities across transactions between each fund and the applicable counterparty. Each fund’s right to setoff may be restricted or prohibited by the bankruptcy or insolvency laws of the particular jurisdiction to which a specific master netting agreement counterparty is subject. Balance sheet offsetting disclosures, to the extent applicable to each fund, have been included in each fund’s Significant Accounting Policies note under the captions for each of the fund’sin-scope financial instruments and transactions.
Investment Valuations– Debt instruments and floating rate loans, including restricted debt instruments, are generally valued at an evaluated or composite bid as provided by a third-party pricing service. Short-term instruments with a maturity at issuance of 60 days or less may be valued at amortized cost, which approximates market value. Futures contracts are generally valued at last posted settlement price on their primary exchange as provided by a third-party pricing service. Futures contracts for which there were no trades that day for a particular position are generally valued at the closing bid quotation on their primary exchange as provided by a third-party pricing service.Open-end investment companies are generally valued at net asset value per share. Securities and other assets generally valued on the basis of information from a third-party pricing service may also be valued at a broker/dealer bid quotation. In determining values, third-party pricing services can utilize both transaction data and market information such as yield, quality, coupon rate, maturity, type of issue, trading characteristics, and other market data.
The Board of Trustees has delegated primary responsibility for determining or causing to be determined the value of each fund’s investments (including any fair valuation) to the adviser pursuant to valuation policies and procedures approved by the Board. If the adviser determines that reliable market quotations are not readily available, investments are valued at fair value as determined in good faith by the adviser in accordance with such procedures under the oversight of the Board of Trustees. Under each fund’s valuation policies and procedures, market quotations are not considered to be readily available for most types of debt instruments and floating rate loans and many types of derivatives. These investments are generally valued at fair value based on information from third-party pricing services. In addition, investments may be valued at fair value if the adviser determines that an investment’s value has been materially affected by events occurring after the close of the exchange or market on which the investment is principally traded (such as foreign exchange or market) and prior to the determination of each fund’s net asset value, or after the halt of trading of a specific security where trading does not resume prior to the close of the exchange or market on which the security is principally traded. The adviser generally relies on third-party pricing services or other information (such as the correlation with price movements of similar securities in the same or other markets; the type, cost and investment characteristics of the security; the business and financial condition of the issuer; and trading and other market data) to assist in determining whether to fair value and at what value to fair value an investment. The value of an investment for purposes of calculating each fund’s net asset value can differ depending on the source and method used to determine value. When fair valuation is used, the value of an investment used to determine each fund’s net asset value may differ from quoted or published prices for the same investment. There can be no assurance that each fund could obtain the fair value assigned to an investment if it were to sell the investment at the same time at which each fund determines its net asset value per share.
Various inputs are used in determining the value of each fund’s assets or liabilities. These inputs are categorized into three broad levels. In certain cases, the inputs used to measure fair value may fall into different levels of the fair value hierarchy. In such cases, an investment’s level within the fair value hierarchy is based on the lowest level of input that is significant to the fair value measurement. Each fund’s assessment of the significance of a particular input to the fair value measurement in its entirety requires judgment, and considers factors specific to the investment. Level 1 includes unadjusted quoted prices in active markets for identical assets or liabilities. Level 2 includes other significant observable market-based inputs (including quoted prices for similar securities, interest rates, prepayment speed, and credit risk). Level 3 includes unobservable inputs, which may include the adviser’s own assumptions in determining the fair value of investments. Other financial instruments are derivative instruments, such as futures contracts. The following is a summary of the levels used as of March 31, 2020 in valuing each fund’s assets or liabilities:
| | | | | | | | | | | | | | | | |
| | | | |
| | | Level 1 | | | Level 2 | | | Level 3 | | | Total | |
Alabama Fund | | | | | | | | | | | | |
| | | | |
| Financial Instruments | | | | | | | | | | | | |
| Municipal Bonds | | | $— | | | | $74,404,142 | | | | $— | | | | $74,404,142 | |
| U.S. Corporate Bonds | | | — | | | | 73,199 | | | | — | | | | 73,199 | |
| Mutual Funds | | | 2,877,210 | | | | — | | | | — | | | | 2,877,210 | |
| Total | | | $2,877,210 | | | | $74,477,341 | | | | $— | | | | $77,354,551 | |
| | | | |
| Other Financial Instruments | | | | | | | | | | | | |
| Futures Contracts – Liabilities | | | $(156,454 | ) | | | $— | | | | $— | | | | $(156,454 | ) |
| | | | |
Arkansas Fund | | | | | | | | | | | | |
| | | | |
| Financial Instruments | | | | | | | | | | | | |
| Municipal Bonds | | | $— | | | | $151,171,786 | | | | $— | | | | $151,171,786 | |
| U.S. Corporate Bonds | | | — | | | | 182,997 | | | | — | | | | 182,997 | |
| Mutual Funds | | | 3,037,713 | | | | — | | | | — | | | | 3,037,713 | |
| Total | | | $3,037,713 | | | | $151,354,783 | | | | $— | | | | $154,392,496 | |
89
Notes to Financial Statements – continued
| | | | | | | | | | | | | | | | |
| | | | |
| | | Level 1 | | | Level 2 | | | Level 3 | | | Total | |
California Fund | | | | | | | | | | | | |
| | | | |
| Financial Instruments | | | | | | | | | | | | |
| Municipal Bonds | | | $— | | | | $543,386,100 | | | | $— | | | | $543,386,100 | |
| U.S. Corporate Bonds | | | — | | | | 695,390 | | | | — | | | | 695,390 | |
| Mutual Funds | | | 3,337,616 | | | | — | | | | — | | | | 3,337,616 | |
| Total | | | $3,337,616 | | | | $544,081,490 | | | | $— | | | | $547,419,106 | |
| | | | |
| Other Financial Instruments | | | | | | | | | | | | |
| Futures Contracts – Liabilities | | | $(601,747 | ) | | | $— | | | | $— | | | | $(601,747 | ) |
| | | | |
Georgia Fund | | | | | | | | | | | | |
| | | | |
| Financial Instruments | | | | | | | | | | | | |
| Municipal Bonds | | | $— | | | | $111,495,655 | | | | $— | | | | $111,495,655 | |
| U.S. Corporate Bonds | | | — | | | | 146,398 | | | | — | | | | 146,398 | |
| Mutual Funds | | | 1,835,929 | | | | — | | | | — | | | | 1,835,929 | |
| Total | | | $1,835,929 | | | | $111,642,053 | | | | $— | | | | $113,477,982 | |
| | | | |
| Other Financial Instruments | | | | | | | | | | | | |
| Futures Contracts – Liabilities | | | $(168,489 | ) | | | $— | | | | $— | | | | $(168,489 | ) |
| | | | |
Maryland Fund | | | | | | | | | | | | |
| | | | |
| Financial Instruments | | | | | | | | | | | | |
| Municipal Bonds | | | $— | | | | $102,499,359 | | | | $— | | | | $102,499,359 | |
| U.S. Corporate Bonds | | | — | | | | 146,398 | | | | — | | | | 146,398 | |
| Mutual Funds | | | 1,796,671 | | | | — | | | | — | | | | 1,796,671 | |
| Total | | | $1,796,671 | | | | $102,645,757 | | | | $— | | | | $104,442,428 | |
| | | | |
| Other Financial Instruments | | | | | | | | | | | | |
| Futures Contracts – Liabilities | | | $(228,664 | ) | | | $— | | | | $— | | | | $(228,664 | ) |
| | | | |
Massachusetts Fund | | | | | | | | | | | | |
| | | | |
| Financial Instruments | | | | | | | | | | | | |
| Municipal Bonds | | | $— | | | | $342,913,578 | | | | $— | | | | $342,913,578 | |
| U.S. Corporate Bonds | | | — | | | | 439,194 | | | | — | | | | 439,194 | |
| Mutual Funds | | | 9,124,769 | | | | — | | | | — | | | | 9,124,769 | |
| Total | | | $9,124,769 | | | | $343,352,772 | | | | $— | | | | $352,477,541 | |
| | | | |
| Other Financial Instruments | | | | | | | | | | | | |
| Futures Contracts – Liabilities | | | $(481,397 | ) | | | $— | | | | $— | | | | $(481,397 | ) |
For further information regarding security characteristics, see the Portfolio of Investments.
Derivatives– The funds use derivatives primarily to increase or decrease exposure to a particular market or segment of the market, or security, to increase or decrease interest rate exposure, or as alternatives to direct investments. Derivatives are used for hedging ornon-hedging purposes. While hedging can reduce or eliminate losses, it can also reduce or eliminate gains. When the funds use derivatives as an investment to increase market exposure, or for hedging purposes, gains and losses from derivative instruments may be substantially greater than the derivative’s original cost.
The derivative instruments used by the funds during the period were futures contracts. Depending on the type of derivative, the fund may exit a derivative position by entering into an offsetting transaction with a counterparty or exchange, negotiating an agreement with the derivative counterparty, or novating the position to a third party. The funds may be unable to promptly close out a futures position in instances where the daily fluctuation in the price for that type of future exceeds the daily limit set by the exchange. The funds’ period end derivatives, as presented in the Portfolio of Investments and the associated Derivative Contract tables, generally are indicative of the volume of the funds’ derivative activity during the period.
The following table presents, by major type of derivative contract, the fair value, on a gross basis, of the asset and liability components of derivatives held by the funds at March 31, 2020 as reported in the Statements of Assets and Liabilities:
| | | | | | | | | | |
| | | | | | | | Fair Value (a) | |
| | | |
| Fund | | Risk | | Derivative Contracts | | | Liability Derivatives | |
| Alabama Fund | | Interest Rate | | | Interest Rate Futures | | | | $(156,454 | ) |
| California Fund | | Interest Rate | | | Interest Rate Futures | | | | (601,747 | ) |
| Georgia Fund | | Interest Rate | | | Interest Rate Futures | | | | (168,489 | ) |
| Maryland Fund | | Interest Rate | | | Interest Rate Futures | | | | (228,664 | ) |
| Massachusetts Fund | | Interest Rate | | | Interest Rate Futures | | | | (481,397 | ) |
| (a) | Values presented in this table for futures contracts correspond to the values reported in the funds’ Portfolio of Investments. Only the current day net variation margin for futures contracts is separately reported within the funds’ Statements of Assets and Liabilities. |
90
Notes to Financial Statements – continued
The following table presents, by major type of derivative contract, the realized gain (loss) on derivatives held by the funds for the year ended March 31, 2020 as reported in the Statements of Operations:
| | | | |
| | |
| Fund | | Risk | | Futures Contracts |
| Alabama Fund | | Interest Rate | | $(542,764) |
| Arkansas Fund | | Interest Rate | | (126,040) |
| California Fund | | Interest Rate | | (3,510,254) |
| Georgia Fund | | Interest Rate | | (754,420) |
| Maryland Fund | | Interest Rate | | (753,842) |
| Massachusetts Fund | | Interest Rate | | (1,455,588) |
The following table presents, by major type of derivative contract, the change in unrealized appreciation or depreciation on derivatives held by the funds for the year ended March 31, 2020 as reported in the Statements of Operations:
| | | | |
| | |
| Fund | | Risk | | Futures Contracts |
| Alabama Fund | | Interest Rate | | $(118,917) |
| Arkansas Fund | | Interest Rate | | 93,842 |
| California Fund | | Interest Rate | | (354,004) |
| Georgia Fund | | Interest Rate | | (115,937) |
| Maryland Fund | | Interest Rate | | (176,112) |
| Massachusetts Fund | | Interest Rate | | (316,235) |
Derivative counterparty credit risk is managed through formal evaluation of the creditworthiness of all potential counterparties. On certain, but not all, uncleared derivatives, each fund attempts to reduce its exposure to counterparty credit risk whenever possible by entering into an ISDA Master Agreement on a bilateral basis. The ISDA Master Agreement gives each party to the agreement the right to terminate all transactions traded under such agreement if there is a specified deterioration in the credit quality of the other party. Upon an event of default or a termination of the ISDA Master Agreement, thenon-defaulting party has the right to close out all transactions traded under such agreement and to net amounts owed under each agreement to one net amount payable by one party to the other. This right to close out and net payments across all transactions traded under the ISDA Master Agreement could result in a reduction of each fund’s credit risk to such counterparty equal to any amounts payable by each fund under the applicable transactions, if any.
Collateral and margin requirements differ by type of derivative. For cleared derivatives (e.g., futures contracts, cleared swaps, and exchange-traded options), margin requirements are set by the clearing broker and the clearing house and collateral, in the form of cash or securities, is posted by the fund directly with the clearing broker. Collateral terms are counterparty agreement specific for uncleared derivatives (e.g., forward foreign currency exchange contracts, uncleared swap agreements, and uncleared options) and collateral, in the form of cash and securities, is held in segregated accounts with the fund’s custodian in connection with these agreements. For derivatives traded under an ISDA Master Agreement, which contains a collateral support annex, the collateral requirements are netted across all transactions traded under such counterparty-specific agreement and an amount is posted from one party to the other to collateralize such obligations. Cash that has been segregated or delivered to cover each fund’s collateral or margin obligations under derivative contracts, if any, will be reported separately in the Statements of Assets and Liabilities as restricted cash for uncleared derivatives and/or deposits with brokers for cleared derivatives. Securities pledged as collateral or margin for the same purpose, if any, are noted in the Portfolio of Investments. The funds may be required to make payments of interest on uncovered collateral or margin obligations with the broker. Any such payments are included in “Miscellaneous” expense in the Statements of Operations.
Futures Contracts– The funds entered into futures contracts which may be used to hedge against or obtain broad market exposure, interest rate exposure, or to manage duration. A futures contract represents a commitment for the future purchase or sale of an asset at a specified price on a specified date.
Upon entering into a futures contract, the fund is required to deposit with the broker, either in cash or securities, an initial margin in an amount equal to a specified percentage of the notional amount of the contract. Subsequent payments (variation margin) are made or received by the fund each day, depending on the daily fluctuations in the value of the contract, and are recorded for financial statement purposes as unrealized gain or loss by the fund until the contract is closed or expires at which point the gain or loss on futures contracts is realized.
The fund bears the risk of interest rates or securities prices moving unexpectedly, in which case, the fund may not achieve the anticipated benefits of the futures contracts and may realize a loss. While futures contracts may present less counterparty risk to the fund since the contracts are exchange traded and the exchange’s clearinghouse guarantees payments to the broker, there is still counterparty credit risk due to the insolvency of the broker. The fund’s maximum risk of loss due to counterparty credit risk is equal to the margin posted by the fund to the broker plus any gains or minus any losses on the outstanding futures contracts.
Indemnifications– Under each fund’s organizational documents, its officers and Trustees may be indemnified against certain liabilities and expenses arising out of the performance of their duties to each fund. Additionally, in the normal course of business,
91
Notes to Financial Statements – continued
each fund enters into agreements with service providers that may contain indemnification clauses. Each fund’s maximum exposure under these agreements is unknown as this would involve future claims that may be made against each fund that have not yet occurred.
Investment Transactions and Income– Investment transactions are recorded on the trade date. Interest income is recorded on the accrual basis. All premium and discount is amortized or accreted for financial statement purposes in accordance with U.S. generally accepted accounting principles. Interest payments received in additional securities are recorded on theex-interest date in an amount equal to the value of the security on such date. Debt obligations may be placed onnon-accrual status or set to accrue at a rate of interest less than the contractual coupon when the collection of all or a portion of interest has become doubtful. Interest income for those debt obligations may be further reduced by thewrite-off of the related interest receivables when deemed uncollectible.
Each fund may receive proceeds from litigation settlements. Any proceeds received from litigation involving portfolio holdings are reflected in the Statements of Operations in realized gain/loss if the security has been disposed of by the fund or in unrealized gain/loss if the security is still held by the fund. Any other proceeds from litigation not related to portfolio holdings are reflected as other income in the Statements of Operations.
Fees Paid Indirectly– Each fund’s custody fee may be reduced by a credit earned under an arrangement that measures the value of U.S. dollars deposited with the custodian by each fund. The amount of the credit, for the year ended March 31, 2020, is shown as a reduction of total expenses in the Statements of Operations.
Tax Matters and Distributions– Each fund intends to qualify as a regulated investment company, as defined under Subchapter M of the Internal Revenue Code, and to distribute all of its taxable andtax-exempt income, including realized capital gains. As a result, no provision for federal income tax is required. Each fund’s federal tax returns, when filed, will remain subject to examination by the Internal Revenue Service for a three year period. Management has analyzed each fund’s tax positions taken on federal and state tax returns for all open tax years and does not believe that there are any uncertain tax positions that require recognition of a tax liability.
Distributions to shareholders are recorded on theex-dividend date. Income and capital gain distributions are determined in accordance with income tax regulations, which may differ from U.S. generally accepted accounting principles. Certain capital accounts in the financial statements are periodically adjusted for permanent differences in order to reflect their tax character. These adjustments have no impact on net assets or net asset value per share. Temporary differences which arise from recognizing certain items of income, expense, gain or loss in different periods for financial statement and tax purposes will reverse at some time in the future.
Book/tax differences primarily relate to defaulted bonds, amortization and accretion of debt securities, and derivative transactions, as applicable to each fund.
The tax character of distributions declared to shareholders for the last two fiscal years is as follows:
| | | | | | | | | | | | | | | | | | | | | | | | |
| | | | | | |
| Year ended 3/31/20 | | Alabama
Fund | | | Arkansas
Fund | | | California
Fund | | | Georgia
Fund | | | Maryland
Fund | | | Massachusetts
Fund | |
| Ordinary income (including any short-term capital gains) | | | $14,525 | | | | $35,222 | | | | $195,824 | | | | $34,341 | | | | $61,301 | | | | $46,879 | |
| Tax-exempt income | | | 1,967,338 | | | | 4,305,866 | | | | 14,755,921 | | | | 2,674,387 | | | | 2,870,703 | | | | 9,935,215 | |
| Total distributions | | | $1,981,863 | | | | $4,341,088 | | | | $14,951,745 | | | | $2,708,728 | | | | $2,932,004 | | | | $9,982,094 | |
| | | | | | |
| Year ended 3/31/19 | | Alabama
Fund | | | Arkansas
Fund | | | California
Fund | | | Georgia
Fund | | | Maryland
Fund | | | Massachusetts
Fund | |
| Ordinary income (including any short-term capital gains) | | | $20,750 | | | | $160,700 | | | | $244,503 | | | | $19,398 | | | | $12,372 | | | | $500,500 | |
| Tax-exempt income | | | 1,953,936 | | | | 4,443,611 | | | | 12,658,764 | | | | 2,447,995 | | | | 2,923,824 | | | | 8,431,067 | |
| Total distributions | | | $1,974,686 | | | | $4,604,311 | | | | $12,903,267 | | | | $2,467,393 | | | | $2,936,196 | | | | $8,931,567 | |
The federal tax cost and the tax basis components of distributable earnings were as follows:
| | | | | | | | | | | | | | | | | | | | | | | | |
| | | | | | |
| As of 3/31/20 | | Alabama
Fund | | | Arkansas
Fund | | | California
Fund | | | Georgia
Fund | | | Maryland
Fund | | | Massachusetts
Fund | |
| | | | | | |
| Cost of investments | | | $74,592,009 | | | | $149,811,952 | | | | $533,239,133 | | | | $110,408,122 | | | | $102,139,021 | | | | $340,310,090 | |
| Gross appreciation | | | 3,383,420 | | | | 6,290,348 | | | | 24,140,940 | | | | 4,273,914 | | | | 3,636,529 | | | | 16,215,897 | |
| Gross depreciation | | | (777,332 | ) | | | (1,709,804 | ) | | | (10,562,714 | ) | | | (1,372,543 | ) | | | (1,561,786 | ) | | | (4,529,843 | ) |
| Net unrealized appreciation (depreciation) | | | $2,606,088 | | | | $4,580,544 | | | | $13,578,226 | | | | $2,901,371 | | | | $2,074,743 | | | | $11,686,054 | |
| Undistributed ordinary income | | | 31,321 | | | | 34,422 | | | | 398,946 | | | | 70,771 | | | | 19,543 | | | | 226,236 | |
| Undistributedtax-exempt income | | | 232,881 | | | | 539,837 | | | | 1,680,064 | | | | 253,316 | | | | 546,710 | | | | 899,734 | |
| Capital loss carryforwards | | | (1,396,066 | ) | | | (5,844,222 | ) | | | (6,554,565 | ) | | | (2,566,178 | ) | | | (3,373,155 | ) | | | (9,378,983 | ) |
| Other temporary differences | | | (169,649 | ) | | | (360,828 | ) | | | (1,368,615 | ) | | | (236,818 | ) | | | (255,033 | ) | | | (855,858 | ) |
92
Notes to Financial Statements – continued
As of March 31, 2020, each fund had capital loss carryforwards available to offset future realized gains. These net capital losses may be carried forward indefinitely and their character is retained as short-term and/or long-term losses. Such losses are characterized as follows:
| | | | | | | | | | | | | | | | | | | | | | | | |
| | | | | | |
| | | Alabama
Fund | | | Arkansas
Fund | | | California
Fund | | | Georgia
Fund | | | Maryland
Fund | | | Massachusetts
Fund | |
| Short-Term | | | $(984,472 | ) | | | $(2,580,365 | ) | | | $(4,930,818 | ) | | | $(1,901,833 | ) | | | $(2,070,805 | ) | | | $(8,487,285 | ) |
| Long-Term | | | (411,594 | ) | | | (3,263,857 | ) | | | (1,623,747 | ) | | | (664,345 | ) | | | (1,302,350 | ) | | | (891,698 | ) |
| Total | | | $(1,396,066 | ) | | | $(5,844,222 | ) | | | $(6,554,565 | ) | | | $(2,566,178 | ) | | | $(3,373,155 | ) | | | $(9,378,983 | ) |
Multiple Classes of Shares of Beneficial Interest– Each fund offers multiple classes of shares, which differ in their respective distribution and service fees. Each fund’s income and common expenses are allocated to shareholders based on the value of settled shares outstanding of each class. Each fund’s realized and unrealized gain (loss) are allocated to shareholders based on the daily net assets of each class. Dividends are declared separately for each class. Differences in per share dividend rates are generally due to differences in separate class expenses. Class B shares will convert to Class A shares approximately eight years after purchase. Class C shares will convert to Class A shares approximately ten years after purchase. Each fund’s distributions declared to shareholders as reported in the Statements of Changes in Net Assets are presented by class as follows:
| | | | | | | | | | | | |
| | | Alabama Fund | | Arkansas Fund | | California Fund |
| | | | | | |
| | | Year Ended
3/31/20 | | Year Ended
3/31/19 | | Year Ended
3/31/20 | | Year Ended
3/31/19 | | Year Ended
3/31/20 | | Year Ended
3/31/19 |
| Class A | | $1,383,808 | | $1,637,250 | | $3,454,854 | | $4,027,144 | | $10,321,915 | | $9,783,893 |
| Class B | | 3,904 | | 6,813 | | 43,361 | | 70,976 | | 29,998 | | 44,491 |
| Class C | | — | | — | | — | | — | | 517,209 | | 552,726 |
| Class I | | 545,211 | | 289,817 | | 808,049 | | 479,446 | | 3,470,554 | | 2,189,523 |
| Class R6 | | 48,940 | | 40,806 | | 34,824 | | 26,745 | | 612,069 | | 332,634 |
| Total | | $1,981,863 | | $1,974,686 | | $4,341,088 | | $4,604,311 | | $14,951,745 | | $12,903,267 |
| | | |
| | | Georgia Fund | | Maryland Fund | | Massachusetts Fund |
| | | | | | |
| | | Year Ended
3/31/20 | | Year Ended
3/31/19 | | Year Ended
3/31/20 | | Year Ended
3/31/19 | | Year Ended
3/31/20 | | Year Ended
3/31/19 |
| Class A | | $2,191,274 | | $1,999,684 | | $2,341,193 | | $2,502,266 | | $6,483,058 | | $6,793,890 |
| Class B | | 6,083 | | 10,107 | | 26,983 | | 32,351 | | 31,262 | | 45,375 |
| Class I | | 251,523 | | 242,008 | | 488,867 | | 358,415 | | 3,308,614 | | 2,004,415 |
| Class R6 | | 259,848 | | 215,594 | | 74,961 | | 43,164 | | 159,160 | | 87,887 |
| Total | | $2,708,728 | | $2,467,393 | | $2,932,004 | | $2,936,196 | | $9,982,094 | | $8,931,567 |
| (3) | | Transactions with Affiliates |
Investment Adviser– Each fund has an investment advisory agreement with MFS to provide overall investment management and related administrative services and facilities to each fund. The management fee is computed daily and paid monthly at an annual rate of 0.45% of each fund’s average daily net assets.
MFS has agreed in writing to reduce its management fee by a specified amount if certain MFS mutual fund assets exceed thresholds agreed to by MFS and the funds’ Board of Trustees. For the year ended March 31, 2020, these management fee reductions amounted to the following, which are included in the reduction of total expenses in the Statements of Operations:
| | | | | | | | | | |
| | | | | |
Alabama
Fund | | Arkansas
Fund | | California
Fund | | Georgia
Fund | | Maryland
Fund | | Massachusetts
Fund |
| | | | | |
| $7,498 | | $15,470 | | $51,559 | | $10,937 | | $10,035 | | $33,752 |
The management fee incurred for the year ended March 31, 2020 was equivalent to an annual effective rate of 0.44% of each fund’s average daily net assets.
The investment adviser has agreed in writing to pay a portion of the following funds’ total annual operating expenses, excluding interest, taxes, extraordinary expenses, brokerage and transaction costs, and investment-related expenses, such that total fund operating expenses do not exceed the following rates annually of these funds’ average daily net assets:
| | | | | | | | | | | | |
| | | |
| | | Alabama
Fund | | | Georgia
Fund | | | Maryland
Fund | |
| Class A | | | 0.90% | | | | 0.90% | | | | 0.83% | |
| Class B | | | 1.65% | | | | 1.65% | | | | 1.58% | |
| Class I | | | 0.65% | | | | 0.65% | | | | 0.58% | |
| Class R6 | | | 0.59% | | | | 0.60% | | | | 0.53% | |
93
Notes to Financial Statements – continued
Effective August 1, 2019, the investment adviser has agreed in writing to pay a portion of the Massachusetts Fund’s total annual operating expenses, excluding interest, taxes, extraordinary expenses, brokerage and transaction costs, and investment-related expenses, such that total fund operating expenses do not exceed the following rates annually of this fund’s average daily net assets:
| | | | |
| |
| | | Massachusetts
Fund | |
| Class A | | | 0.85% | |
| Class B | | | 1.60% | |
| Class I | | | 0.60% | |
| Class R6 | | | 0.53% | |
These written agreements will continue until modified by the funds’ Board of Trustees, but such agreements will continue at least until July 31, 2020. For the year ended March 31, 2020, these reductions amounted to $97,937 for the Alabama Fund, $49,411 for the Georgia Fund, and $151,968 for the Maryland Fund. For the period from August 1, 2019 through March 31, 2020, this reduction amounted to $46,057 for the Massachusetts Fund. Each reduction is included in the reduction of total expenses in the Statements of Operations.
Distributor– MFS Fund Distributors, Inc. (MFD), a wholly-owned subsidiary of MFS, as distributor, received the following amounts for the year ended March 31, 2020, as its portion of the initial sales charge on sales of Class A shares of each fund:
| | | | | | | | | | |
| | | | | |
Alabama
Fund | | Arkansas
Fund | | California
Fund | | Georgia
Fund | | Maryland
Fund | | Massachusetts
Fund |
| | | | | |
| $8,050 | | $16,980 | | $22,182 | | $15,018 | | $9,961 | | $19,106 |
The Board of Trustees has adopted a distribution plan for certain share classes pursuant to Rule12b-1 of the Investment Company Act of 1940.
Each fund’s distribution plan provides that each fund will pay MFD for services provided by MFD and financial intermediaries in connection with the distribution and servicing of certain share classes. One component of the plan is a distribution fee paid to MFD and another component of the plan is a service fee paid to MFD. MFD may subsequently pay all, or a portion, of the distribution and/or service fees to financial intermediaries.
Distribution Plan Fee Table:
| | | | | | | | | | | | | | | | | | | | |
| | | Class A | |
| | | | | |
| | | Distribution Fee Rate (d) | | | Service Fee Rate (d) | | | Total
Distribution Plan (d) | | | Annual Effective Rate (e) | | | Distribution and Service Fee | |
| Alabama Fund | | | — | | | �� | 0.25% | | | | 0.25% | | | | 0.25% | | | | $135,495 | |
| Arkansas Fund | | | — | | | | 0.25% | | | | 0.25% | | | | 0.10% | | | | 313,171 | |
| California Fund | | | — | | | | 0.25% | | | | 0.25% | | | | 0.10% | | | | 893,667 | |
| Georgia Fund | | | — | | | | 0.25% | | | | 0.25% | | | | 0.25% | | | | 227,965 | |
| Maryland Fund | | | — | | | | 0.25% | | | | 0.25% | | | | 0.24% | | | | 205,092 | |
| Massachusetts Fund | | | — | | | | 0.25% | | | | 0.25% | | | | 0.23% | | | | 566,683 | |
| |
| | | Class B | |
| | | | | |
| | | Distribution Fee Rate (d) | | | Service Fee Rate (d) | | | Total
Distribution Plan (d) | | | Annual Effective Rate (e) | | | Distribution and Service Fee | |
| Alabama Fund | | | 0.75% | | | | 0.25% | | | | 1.00% | | | | 1.00% | | | | $2,113 | |
| Arkansas Fund | | | 0.75% | | | | 0.25% | | | | 1.00% | | | | 0.85% | | | | 21,427 | |
| California Fund | | | 0.75% | | | | 0.25% | | | | 1.00% | | | | 0.85% | | | | 13,745 | |
| Georgia Fund | | | 0.75% | | | | 0.25% | | | | 1.00% | | | | 0.98% | | | | 3,511 | |
| Maryland Fund | | | 0.75% | | | | 0.25% | | | | 1.00% | | | | 1.00% | | | | 12,668 | |
| Massachusetts Fund | | | 0.75% | | | | 0.25% | | | | 1.00% | | | | 1.00% | | | | 14,569 | |
| |
| | | Class C | |
| | | | | |
| | | Distribution Fee Rate (d) | | | Service Fee Rate (d) | | | Total Distribution Plan (d) | | | Annual Effective Rate (e) | | | Distribution and Service Fee | |
| California Fund | | | 0.75% | | | | 0.25% | | | | 1.00% | | | | 1.00% | | | | $259,173 | |
| | | | | | | | | | | | | | | | | | | | | | | | |
| | | | | | |
| | | Alabama
Fund | | | Arkansas
Fund | | | California
Fund | | | Georgia
Fund | | | Maryland
Fund | | | Massachusetts
Fund | |
| Total Distribution and Service Fees | | | $137,608 | | | | $334,598 | | | | $1,166,585 | | | | $231,476 | | | | $217,760 | | | | $581,252 | |
| (d) | In accordance with the distribution plan for certain classes, each fund pays distribution and/or service fees equal to these annual percentage rates of each class’s average daily net assets. The distribution and service fee rates disclosed by class represent the current rates in effect at the end of the reporting period. Any rate changes, if applicable, are detailed below. |
94
Notes to Financial Statements – continued
| (e) | The annual effective rates represent actual fees incurred under the distribution plan for the year ended March 31, 2020 based on each class’s average daily net assets. MFD has voluntarily agreed to rebate a portion of each class’s 0.25% service fee attributable to accounts for which there is no financial intermediary specified on the account except for accounts attributable to MFS or its affiliates’ seed money. For the year ended March 31, 2020, these rebates amounted to the following and are included in the reduction of total expenses in the Statements of Operations: |
| | | | | | | | | | | | | | | | | | | | | | | | |
| | | | | | |
| | | Alabama
Fund | | | Arkansas
Fund | | | California
Fund | | | Georgia
Fund | | | Maryland
Fund | | | Massachusetts
Fund | |
| Class A | | | $837 | | | | $539 | | | | $4,123 | | | | $2,140 | | | | $6,116 | | | | $41,868 | |
| Class B | | | — | | | | — | | | | — | | | | 73 | | | | — | | | | 16 | |
| | Arkansas Fund:MFD has agreed in writing to reduce the Class A and Class B service fee rate to 0.10%. This written agreement will continue until modified by the fund’s Board of Trustees, but such agreement will continue at least until July 31, 2020. For the year ended March 31, 2020, these reductions amounted to $187,904 and $3,217 for Class A and Class B, respectively, and are included in the reduction of total expenses in the Statements of Operations. |
| | California Fund:MFD has agreed in writing to reduce the Class A and Class B service fee rate to 0.10%. This written agreement will continue until modified by the fund’s Board of Trustees, but such agreement will continue at least until July 31, 2020. For the year ended March 31, 2020, these reductions amounted to $536,204 and $2,064 for Class A and Class B, respectively, and are included in the reduction of total expenses in the Statements of Operations. |
Certain Class A shares are subject to a contingent deferred sales charge (CDSC) in the event of a shareholder redemption within 18 months of purchase. Class B shares are subject to a CDSC in the event of a shareholder redemption within six years of purchase. Class C shares are subject to a CDSC in the event of a shareholder redemption within 12 months of purchase. All contingent deferred sales charges are paid to MFD and during the year ended March 31, 2020, were as follows:
| | | | | | | | | | | | | | | | | | | | | | | | |
| | | | | | |
| CDSC Imposed | | Alabama
Fund | | | Arkansas
Fund | | | California
Fund | | | Georgia
Fund | | | Maryland
Fund | | | Massachusetts
Fund | |
| Class A | | | $191 | | | | $681 | | | | $14,099 | | | | $1,441 | | | | $346 | | | | $179 | |
| Class B | | | 426 | | | | 75 | | | | 2,194 | | | | 370 | | | | 827 | | | | 885 | |
| Class C | | | N/A | | | | N/A | | | | 5,659 | | | | N/A | | | | N/A | | | | N/A | |
Shareholder Servicing Agent– MFS Service Center, Inc. (MFSC), a wholly-owned subsidiary of MFS, receives a fee from each fund for its services as shareholder servicing agent calculated as a percentage of the average daily net assets of each fund as determined periodically under the supervision of the funds’ Board of Trustees. For the year ended March 31, 2020, each fund paid the following fee, which equated to the following annual percentage of each fund’s average daily net assets:
| | | | | | | | | | | | | | | | | | | | | | | | |
| | | | | | |
| | | Alabama
Fund | | | Arkansas
Fund | | | California
Fund | | | Georgia
Fund | | | Maryland
Fund | | | Massachusetts
Fund | |
| Expenses paid | | | $2,041 | | | | $2,917 | | | | $14,233 | | | | $2,715 | | | | $9,945 | | | | $17,043 | |
| Percentage of average daily net assets | | | 0.0027% | | | | 0.0019% | | | | 0.0027% | | | | 0.0025% | | | | 0.0098% | | | | 0.0050% | |
MFSC also receives payment from each fund forout-of-pocket expenses,sub-accounting and other shareholder servicing costs which may be paid to affiliated and unaffiliated service providers. Class R6 shares do not incursub-accounting fees. For the year ended March 31, 2020, theseout-of-pocket expenses,sub-accounting and other shareholder servicing costs amounted to the following:
| | | | | | | | | | |
| | | | | |
Alabama
Fund | | Arkansas
Fund | | California
Fund | | Georgia
Fund | | Maryland
Fund | | Massachusetts
Fund |
| | | | | |
| $57,205 | | $120,407 | | $406,165 | | $54,041 | | $65,967 | | $246,526 |
Administrator– MFS provides certain financial, legal, shareholder communications, compliance, and other administrative services to each fund. Under an administrative services agreement, each fund reimburses MFS the costs incurred to provide these services. Each fund is charged an annual fixed amount of $17,500 plus a fee based on average daily net assets. The administrative services fee incurred for the year ended March 31, 2020 was equivalent to the following annual effective rates of each fund’s average daily net assets:
| | | | | | | | | | | | | | | | | | | | | | | | |
| | | | | | |
| | | Alabama
Fund | | | Arkansas
Fund | | | California
Fund | | | Georgia
Fund | | | Maryland
Fund | | | Massachusetts
Fund | |
| Percentage of average daily net assets | | | 0.0275% | | | | 0.0201% | | | | 0.0152% | | | | 0.0230% | | | | 0.0239% | | | | 0.0163% | |
Trustees’ and Officers’ Compensation– Each fund pays compensation to independent Trustees in the form of a retainer, attendance fees, and additional compensation to Board and Committee chairpersons. Each fund does not pay compensation directly to Trustees or officers of each fund who are also officers of the investment adviser, all of whom receive remuneration from MFS for their services to each fund. Certain officers and Trustees of each fund are officers or directors of MFS, MFD, and MFSC.
Prior to December 31, 2001, each fund had an unfunded defined benefit plan (“DB plan”) for independent Trustees. As of December 31, 2001, the Board took action to terminate the DB plan with respect to then-current and any future independent Trustees, such that the DB plan covers only certain of those former independent Trustees who retired on or before
95
Notes to Financial Statements – continued
December 31, 2001. Effective June 30, 2019, the Alabama Fund, the Arkansas Fund, and the Georgia Fund no longer participate in the DB plan. The DB plan resulted in a pension expense for the following funds. These amounts are included in “Independent Trustees’ compensation” in the Statements of Operations for the year ended March 31, 2020:
| | | | |
| | |
California
Fund | | Maryland
Fund | | Massachusetts
Fund |
| | |
| $860 | | $706 | | $721 |
The liability for deferred retirement benefits payable to those former independent Trustees under the DB plan amounted to the following at March 31, 2020, and is included in “Payable for independent Trustees’ compensation” in the Statements of Assets and Liabilities:
| | | | |
| | |
California
Fund | | Maryland
Fund | | Massachusetts
Fund |
| | |
| $5,392 | | $3,249 | | $3,232 |
Other– These funds and certain other funds managed by MFS (the funds) had entered into a service agreement (the ISO Agreement) which provided for payment of fees solely by the funds to Tarantino LLC in return for the provision of services of an Independent Senior Officer (ISO) for the funds. Frank L. Tarantino served as the ISO and was an officer of the funds and the sole member of Tarantino LLC. Effective June 30, 2019, Mr. Tarantino retired from his position as ISO for the funds, and the ISO Agreement was terminated. For the year ended March 31, 2020, the fee paid by each fund under this agreement amounted to the following and is included in “Miscellaneous” expense in the Statements of Operations:
| | | | | | | | | | |
| | | | | |
Alabama
Fund | | Arkansas
Fund | | California
Fund | | Georgia
Fund | | Maryland
Fund | | Massachusetts
Fund |
| | | | | |
| $49 | | $114 | | $340 | | $71 | | $68 | | $225 |
MFS had agreed to bear all expenses associated with office space, other administrative support, and supplies provided to the ISO.
Each fund invests in the MFS Institutional Money Market Portfolio which is managed by MFS and seeks current income consistent with preservation of capital and liquidity. This money market fund does not pay a management fee to MFS but does incur investment and operating costs.
Each fund is permitted to engage in purchase and sale transactions with funds and accounts for which MFS serves as investment adviser orsub-adviser (“cross-trades”) pursuant to a policy adopted by the Board of Trustees. This policy has been designed to ensure that cross-trades conducted by the fund comply with Rule17a-7 under the Investment Company Act of 1940. During the year ended March 31, 2020, the following funds engaged in purchase transactions pursuant to this policy:
| | | | |
| |
| Fund | | Amount | |
| Alabama Fund | | | $108,319 | |
| Arkansas Fund | | | 349,121 | |
| California Fund | | | 2,597,687 | |
For the year ended March 31, 2020, purchases and sales of investments, other than short-term obligations, were as follows:
| | | | | | | | | | | | | | | | | | | | | | | | |
| | | | | | |
| | | Alabama
Fund | | | Arkansas
Fund | | | California
Fund | | | Georgia
Fund | | | Maryland
Fund | | | Massachusetts
Fund | |
| Purchases | | | $34,950,707 | | | | $35,636,894 | | | | $262,598,576 | | | | $56,439,640 | | | | $44,112,859 | | | | $168,177,697 | |
| Sales | | | $21,697,928 | | | | $31,479,199 | | | | $110,033,505 | | | | $29,513,415 | | | | $26,626,799 | | | | $95,425,279 | |
| (5) | | Shares of Beneficial Interest |
Each fund’s Declaration of Trust permits the Trustees to issue an unlimited number of full and fractional shares of beneficial interest. Transactions in fund shares were as follows:
| | | | | | | | | | | | | | | | | | | | | | | | | | | | | | | | |
| | | Alabama Fund | | | Arkansas Fund | |
| | | | |
| | | Year ended
3/31/20 | | | Year ended
3/31/19 | | | Year ended
3/31/20 | | | Year ended
3/31/19 | |
| | | | | | | | |
| | | Shares | | | Amount | | | Shares | | | Amount | | | Shares | | | Amount | | | Shares | | | Amount | |
| Shares sold | | | | | | | | | | | | | | | | | | | | | | | | | | | | | | | | |
| | | | | | | | |
Class A | | | 934,632 | | | | $9,666,873 | | | | 804,616 | | | | $8,024,625 | | | | 1,833,663 | | | | $18,196,899 | | | | 1,145,081 | | | | $11,032,471 | |
| | | | | | | | |
Class B | | | 82 | | | | 847 | | | | 175 | | | | 1,749 | | | | 2,719 | | | | 27,391 | | | | 4,901 | | | | 47,179 | |
| | | | | | | | |
Class I | | | 1,747,498 | | | | 17,227,312 | | | | 774,532 | | | | 7,359,941 | | | | 885,818 | | | | 8,733,330 | | | | 1,681,419 | | | | 16,282,372 | |
Class R6 | | | 110,728 | | | | 1,092,431 | | | | 52,986 | | | | 505,469 | | | | 81,884 | | | | 807,905 | | | | 28,821 | | | | 277,124 | |
| | | 2,792,940 | | | | $27,987,463 | | | | 1,632,309 | | | | $15,891,784 | | | | 2,804,084 | | | | $27,765,525 | | | | 2,860,222 | | | | $27,639,146 | |
96
Notes to Financial Statements – continued
| | | | | | | | | | | | | | | | | | | | | | | | | | | | | | | | |
| | | Alabama Fund – continued | | | Arkansas Fund – continued | |
| | | | |
| | | Year ended
3/31/20 | | | Year ended
3/31/19 | | | Year ended
3/31/20 | | | Year ended
3/31/19 | |
| | | | | | | | |
| | | Shares | | | Amount | | | Shares | | | Amount | | | Shares | | | Amount | | | Shares | | | Amount | |
| Shares issued to shareholders in reinvestment of distributions | | | | | | | | | | | | | | | | | | | | | | | | | | | | | | | | |
| | | | | | | | |
Class A | | | 118,172 | | | | $1,223,757 | | | | 142,690 | | | | $1,424,396 | | | | 321,051 | | | | $3,189,040 | | | | 387,669 | | | | $3,737,120 | |
| | | | | | | | |
Class B | | | 297 | | | | 3,069 | | | | 568 | | | | 5,673 | | | | 4,363 | | | | 43,361 | | | | 7,284 | | | | 70,267 | |
| | | | | | | | |
Class I | | | 33,840 | | | | 334,414 | | | | 20,801 | | | | 198,014 | | | | 74,226 | | | | 732,002 | | | | 40,451 | | | | 387,097 | |
Class R6 | | | 4,954 | | | | 48,926 | | | | 4,290 | | | | 40,806 | | | | 3,530 | | | | 34,824 | | | | 2,795 | | | | 26,745 | |
| | | 157,263 | | | | $1,610,166 | | | | 168,349 | | | | $1,668,889 | | | | 403,170 | | | | $3,999,227 | | | | 438,199 | | | | $4,221,229 | |
| | | | | | | | |
| Shares reacquired | | | | | | | | | | | | | | | | | | | | | | | | | | | | | | | | |
| | | | | | | | |
Class A | | | (869,315 | ) | | | $(8,948,909 | ) | | | (976,415 | ) | | | $(9,734,286 | ) | | | (1,874,713 | ) | | | $(18,568,920 | ) | | | (3,779,791 | ) | | | $(36,577,667 | ) |
| | | | | | | | |
Class B | | | (7,764 | ) | | | (80,654 | ) | | | (6,352 | ) | | | (63,202 | ) | | | (96,960 | ) | | | (948,997 | ) | | | (195,756 | ) | | | (1,883,503 | ) |
| | | | | | | | |
Class I | | | (619,915 | ) | | | (6,016,316 | ) | | | (329,702 | ) | | | (3,136,724 | ) | | | (688,030 | ) | | | (6,723,372 | ) | | | (423,873 | ) | | | (4,043,459 | ) |
Class R6 | | | (27,665 | ) | | | (270,059 | ) | | | (62,247 | ) | | | (590,887 | ) | | | (24,556 | ) | | | (237,750 | ) | | | (13,572 | ) | | | (129,238 | ) |
| | | (1,524,659 | ) | | | $(15,315,938 | ) | | | (1,374,716 | ) | | | $(13,525,099 | ) | | | (2,684,259 | ) | | | $(26,479,039 | ) | | | (4,412,992 | ) | | | $(42,633,867 | ) |
| | | | | | | | |
| Net change | | | | | | | | | | | | | | | | | | | | | | | | | | | | | | | | |
| | | | | | | | |
Class A | | | 183,489 | | | | $1,941,721 | | | | (29,109 | ) | | | $(285,265 | ) | | | 280,001 | | | | $2,817,019 | | | | (2,247,041 | ) | | | $(21,808,076 | ) |
| | | | | | | | |
Class B | | | (7,385 | ) | | | (76,738 | ) | | | (5,609 | ) | | | (55,780 | ) | | | (89,878 | ) | | | (878,245 | ) | | | (183,571 | ) | | | (1,766,057 | ) |
| | | | | | | | |
Class I | | | 1,161,423 | | | | 11,545,410 | | | | 465,631 | | | | 4,421,231 | | | | 272,014 | | | | 2,741,960 | | | | 1,297,997 | | | | 12,626,010 | |
Class R6 | | | 88,017 | | | | 871,298 | | | | (4,971 | ) | | | (44,612 | ) | | | 60,858 | | | | 604,979 | | | | 18,044 | | | | 174,631 | |
| | | 1,425,544 | | | | $14,281,691 | | | | 425,942 | | | | $4,035,574 | | | | 522,995 | | | | $5,285,713 | | | | (1,114,571 | ) | | | $(10,773,492 | ) |
| | |
| | | California Fund | | | Georgia Fund | |
| | | | |
| | | Year ended
3/31/20 | | | Year ended
3/31/19 | | | Year ended
3/31/20 | | | Year ended
3/31/19 | |
| | | | | | | | |
| | | Shares | | | Amount | | | Shares | | | Amount | | | Shares | | | Amount | | | Shares | | | Amount | |
| Shares sold | | | | | | | | | | | | | | | | | | | | | | | | | | | | | | | | |
| | | | | | | | |
Class A | | | 21,682,795 | | | | $133,751,600 | | | | 11,751,370 | | | | $69,448,845 | | | | 3,588,416 | | | | $39,152,664 | | | | 1,355,979 | | | | $14,298,908 | |
| | | | | | | | |
Class B | | | 5,239 | | | | 31,939 | | | | 26,721 | | | | 156,765 | | | | 2,105 | | | | 22,865 | | | | 5,192 | | | | 54,901 | |
| | | | | | | | |
Class C | | | 1,790,349 | | | | 11,063,365 | | | | 1,020,829 | | | | 6,069,419 | | | | — | | | | — | | | | — | | | | — | |
| | | | | | | | |
Class I | | | 7,523,674 | | | | 75,138,059 | | | | 4,575,310 | | | | 43,948,441 | | | | 446,342 | | | | 4,423,409 | | | | 383,666 | | | | 3,659,719 | |
Class R6 | | | 1,996,232 | | | | 20,070,657 | | | | 1,030,911 | | | | 9,912,259 | | | | 573,041 | | | | 5,692,331 | | | | 226,976 | | | | 2,176,866 | |
| | | 32,998,289 | | | | $240,055,620 | | | | 18,405,141 | | | | $129,535,729 | | | | 4,609,904 | | | | $49,291,269 | | | | 1,971,813 | | | | $20,190,394 | |
| | | | | | | | |
| Shares issued to shareholders in reinvestment of distributions | | | | | | | | | | | | | | | | | | | | | | | | | | | | | | | | |
| | | | | | | | |
Class A | | | 1,470,511 | | | | $9,095,146 | | | | 1,447,536 | | | | $8,571,006 | | | | 186,038 | | | | $2,036,227 | | | | 174,154 | | | | $1,837,427 | |
| | | | | | | | |
Class B | | | 4,793 | | | | 29,616 | | | | 7,479 | | | | 44,280 | | | | 379 | | | | 4,157 | | | | 721 | | | | 7,638 | |
| | | | | | | | |
Class C | | | 71,952 | | | | 446,218 | | | | 80,958 | | | | 481,001 | | | | — | | | | — | | | | — | | | | — | |
| | | | | | | | |
Class I | | | 242,123 | | | | 2,438,153 | | | | 153,419 | | | | 1,479,674 | | | | 18,480 | | | | 183,409 | | | | 18,063 | | | | 172,725 | |
Class R6 | | | 60,792 | | | | 611,771 | | | | 34,521 | | | | 332,634 | | | | 26,165 | | | | 259,848 | | | | 22,528 | | | | 215,594 | |
| | | 1,850,171 | | | | $12,620,904 | | | | 1,723,913 | | | | $10,908,595 | | | | 231,062 | | | | $2,483,641 | | | | 215,466 | | | | $2,233,384 | |
| | | | | | | | |
| Shares reacquired | | | | | | | | | | | | | | | | | | | | | | | | | | | | | | | | |
| | | | | | | | |
Class A | | | (10,000,799 | ) | | | $(60,676,740 | ) | | | (9,481,467 | ) | | | $(55,947,273 | ) | | | (1,429,577 | ) | | | $(15,378,751 | ) | | | (1,189,748 | ) | | | $(12,514,426 | ) |
| | | | | | | | |
Class B | | | (86,383 | ) | | | (530,112 | ) | | | (106,830 | ) | | | (630,692 | ) | | | (15,172 | ) | | | (167,309 | ) | | | (21,842 | ) | | | (231,125 | ) |
| | | | | | | | |
Class C | | | (1,356,632 | ) | | | (8,346,672 | ) | | | (2,676,276 | ) | | | (15,863,179 | ) | | | — | | | | — | | | | — | | | | — | |
| | | | | | | | |
Class I | | | (2,561,525 | ) | | | (25,415,024 | ) | | | (2,510,569 | ) | | | (24,060,626 | ) | | | (306,845 | ) | | | (3,001,216 | ) | | | (306,615 | ) | | | (2,920,884 | ) |
Class R6 | | | (432,454 | ) | | | (4,269,880 | ) | | | (385,179 | ) | | | (3,694,008 | ) | | | (220,912 | ) | | | (2,184,079 | ) | | | (115,600 | ) | | | (1,104,908 | ) |
| | | (14,437,793 | ) | | | $(99,238,428 | ) | | | (15,160,321 | ) | | | $(100,195,778 | ) | | | (1,972,506 | ) | | | $(20,731,355 | ) | | | (1,633,805 | ) | | | $(16,771,343 | ) |
97
Notes to Financial Statements – continued
| | | | | | | | | | | | | | | | | | | | | | | | | | | | | | | | |
| | |
| | | California Fund – continued | | | Georgia Fund – continued | |
| | | | |
| | | Year ended
3/31/20 | | | Year ended
3/31/19 | | | Year ended
3/31/20 | | | Year ended
3/31/19 | |
| | | | | | | | |
| | | Shares | | | Amount | | | Shares | | | Amount | | | Shares | | | Amount | | | Shares | | | Amount | |
| Net change | | | | | | | | | | | | | | | | | | | | | | | | | | | | | | | | |
| | | | | | | | |
Class A | | | 13,152,507 | | | | $82,170,006 | | | | 3,717,439 | | | | $22,072,578 | | | | 2,344,877 | | | | $25,810,140 | | | | 340,385 | | | | $3,621,909 | |
| | | | | | | | |
Class B | | | (76,351 | ) | | | (468,557 | ) | | | (72,630 | ) | | | (429,647 | ) | | | (12,688 | ) | | | (140,287 | ) | | | (15,929 | ) | | | (168,586 | ) |
| | | | | | | | |
Class C | | | 505,669 | | | | 3,162,911 | | | | (1,574,489 | ) | | | (9,312,759 | ) | | | — | | | | — | | | | — | | | | — | |
| | | | | | | | |
Class I | | | 5,204,272 | | | | 52,161,188 | | | | 2,218,160 | | | | 21,367,489 | | | | 157,977 | | | | 1,605,602 | | | | 95,114 | | | | 911,560 | |
Class R6 | | | 1,624,570 | | | | 16,412,548 | | | | 680,253 | | | | 6,550,885 | | | | 378,294 | | | | 3,768,100 | | | | 133,904 | | | | 1,287,552 | |
| | | 20,410,667 | | | | $153,438,096 | | | | 4,968,733 | | | | $40,248,546 | | | | 2,868,460 | | | | $31,043,555 | | | | 553,474 | | | | $5,652,435 | |
| | |
| | | Maryland Fund | | | Massachusetts Fund | |
| | | | |
| | | Year ended
3/31/20 | | | Year ended
3/31/19 | | | Year ended
3/31/20 | | | Year ended
3/31/19 | |
| | | | | | | | |
| | | Shares | | | Amount | | | Shares | | | Amount | | | Shares | | | Amount | | | Shares | | | Amount | |
| Shares sold | | | | | | | | | | | | | | | | | | | | | | | | | | | | | | | | |
| | | | | | | | |
Class A | | | 1,779,229 | | | | $19,474,987 | | | | 1,210,203 | | | | $12,837,273 | | | | 5,375,306 | | | | $60,294,523 | | | | 3,779,063 | | | | $40,886,507 | |
| | | | | | | | |
Class B | | | 13,122 | | | | 141,270 | | | | 15,694 | | | | 166,296 | | | | 189 | | | | 2,100 | | | | 10,930 | | | | 119,307 | |
| | | | | | | | |
Class I | | | 898,148 | | | | 8,831,357 | | | | 557,025 | | | | 5,340,122 | | | | 8,201,325 | | | | 80,663,060 | | | | 3,601,166 | | | | 34,166,606 | |
Class R6 | | | 196,150 | | | | 1,931,715 | | | | 47,879 | | | | 458,594 | | | | 437,534 | | | | 4,297,124 | | | | 175,388 | | | | 1,665,389 | |
| | | 2,886,649 | | | | $30,379,329 | | | | 1,830,801 | | | | $18,802,285 | | | | 14,014,354 | | | | $145,256,807 | | | | 7,566,547 | | | | $76,837,809 | |
| | | | | | | | |
| Shares issued to shareholders in reinvestment of distributions | | | | | | | | | | | | | | | | | | | | | | | | | | | | | | | | |
| | | | | | | | |
Class A | | | 172,011 | | | | $1,878,639 | | | | 191,420 | | | | $2,033,205 | | | | 510,733 | | | | $5,745,240 | | | | 547,516 | | | | $5,943,231 | |
| | | | | | | | |
Class B | | | 2,028 | | | | 22,136 | | | | 2,722 | | | | 28,905 | | | | 2,678 | | | | 30,149 | | | | 3,844 | | | | 41,796 | |
| | | | | | | | |
Class I | | | 37,355 | | | | 368,269 | | | | 26,720 | | | | 256,056 | | | | 293,672 | | | | 2,893,008 | | | | 178,163 | | | | 1,692,561 | |
Class R6 | | | 7,600 | | | | 74,961 | | | | 4,506 | | | | 43,164 | | | | 16,143 | | | | 159,160 | | | | 9,244 | | | | 87,887 | |
| | | 218,994 | | | | $2,344,005 | | | | 225,368 | | | | $2,361,330 | | | | 823,226 | | | | $8,827,557 | | | | 738,767 | | | | $7,765,475 | |
| | | | | | | | |
| Shares reacquired | | | | | | | | | | | | | | | | | | | | | | | | | | | | | | | | |
| | | | | | | | |
Class A | | | (1,049,647 | ) | | | $(11,285,559 | ) | | | (1,639,579 | ) | | | $(17,356,831 | ) | | | (3,917,200 | ) | | | $(42,998,175 | ) | | | (4,144,935 | ) | | | $(44,772,721 | ) |
| | | | | | | | |
Class B | | | (30,330 | ) | | | (333,959 | ) | | | (30,242 | ) | | | (321,145 | ) | | | (54,366 | ) | | | (609,183 | ) | | | (34,512 | ) | | | (375,384 | ) |
| | | | | | | | |
Class I | | | (261,793 | ) | | | (2,546,598 | ) | | | (328,658 | ) | | | (3,142,092 | ) | | | (2,515,254 | ) | | | (24,191,702 | ) | | | (1,862,808 | ) | | | (17,614,182 | ) |
Class R6 | | | (43,223 | ) | | | (410,379 | ) | | | (16,897 | ) | | | (161,435 | ) | | | (87,124 | ) | | | (833,237 | ) | | | (63,863 | ) | | �� | (604,211 | ) |
| | | (1,384,993 | ) | | | $(14,576,495 | ) | | | (2,015,376 | ) | | | $(20,981,503 | ) | | | (6,573,944 | ) | | | $(68,632,297 | ) | | | (6,106,118 | ) | | | $(63,366,498 | ) |
| | | | | | | | |
| Net change | | | | | | | | | | | | | | | | | | | | | | | | | | | | | | | | |
| | | | | | | | |
Class A | | | 901,593 | | | | $10,068,067 | | | | (237,956 | ) | | | $(2,486,353 | ) | | | 1,968,839 | | | | $23,041,588 | | | | 181,644 | | | | $2,057,017 | |
| | | | | | | | |
Class B | | | (15,180 | ) | | | (170,553 | ) | | | (11,826 | ) | | | (125,944 | ) | | | (51,499 | ) | | | (576,934 | ) | | | (19,738 | ) | | | (214,281 | ) |
| | | | | | | | |
Class I | | | 673,710 | | | | 6,653,028 | | | | 255,087 | | | | 2,454,086 | | | | 5,979,743 | | | | 59,364,366 | | | | 1,916,521 | | | | 18,244,985 | |
Class R6 | | | 160,527 | | | | 1,596,297 | | | | 35,488 | | | | 340,323 | | | | 366,553 | | | | 3,623,047 | | | | 120,769 | | | | 1,149,065 | |
| | | 1,720,650 | | | | $18,146,839 | | | | 40,793 | | | | $182,112 | | | | 8,263,636 | | | | $85,452,067 | | | | 2,199,196 | | | | $21,236,786 | |
Class T shares were not publicly available for sale during the period. Please see each fund’s prospectus for details.
Effective June 1, 2019, purchases of each fund’s Class B shares are closed to new and existing investors subject to certain exceptions. Please see each fund’s prospectus for details.
Each fund and certain other funds managed by MFS participate in a $1.25 billion unsecured committed line of credit, subject to a $1 billion sublimit, provided by a syndicate of banks under a credit agreement. Borrowings may be made for temporary financing needs. Interest is charged to each fund, based on its borrowings, generally at a rate equal to the highest of one month LIBOR, the Federal Funds Effective Rate and the Overnight Bank Funding Rate, plus an agreed upon spread. A commitment fee, based on the average daily, unused portion of the committed line of credit, is allocated among the participating funds. In addition, each fund and other funds managed by MFS have established unsecured uncommitted borrowing arrangements with certain banks for temporary
98
Notes to Financial Statements – continued
financing needs. Interest is charged to each fund, based on its borrowings, at rates equal to customary reference rates plus an agreed upon spread. For the year ended March 31, 2020, each fund’s commitment fee and interest expense were as follows and are included in “Miscellaneous” expense in the Statements of Operations:
| | | | | | | | | | | | | | | | | | | | | | | | |
| | | | | | |
| | | Alabama
Fund | | | Arkansas
Fund | | | California
Fund | | | Georgia
Fund | | | Maryland
Fund | | | Massachusetts
Fund | |
Commitment Fee | | | $440 | | | | $916 | | | | $2,984 | | | | $628 | | | | $556 | | | | $1,904 | |
Interest Expense | | | — | | | | — | | | | — | | | | — | | | | — | | | | — | |
| (7) | | Investments in Affiliated Issuers |
An affiliated issuer of a fund may be considered one in which the fund owns 5% or more of the outstanding voting securities, or a company which is under common control. For the purposes of this report, each fund assumes the MFS Institutional Money Market Portfolio to be an affiliated issuer. Each fund’s transactions in the MFS Institutional Money Market Portfolio for the year ended March 31, 2020, are as follows:
| | | | | | | | | | | | | | | | | | | | | | | | |
| | | Affiliated Issuer - MFS Institutional Money Market Portfolio | |
| | | | | | |
| | | Beginning
Value | | | Purchases | | | Sales
Proceeds | | | Realized Gain (Loss) | | | Change in
Unrealized
Appreciation or
Depreciation | | | Ending
Value | |
| Alabama Fund | | | $267,171 | | | | $38,436,723 | | | | $35,826,543 | | | | $(125 | ) | | | $(16 | ) | | | $2,877,210 | |
| Arkansas Fund | | | 3,016,600 | | | | 36,870,625 | | | | 36,849,379 | | | | 149 | | | | (282 | ) | | | 3,037,713 | |
| California Fund | | | 11,566,146 | | | | 201,836,803 | | | | 210,065,854 | | | | 351 | | | | 170 | | | | 3,337,616 | |
| Georgia Fund | | | 1,286,347 | | | | 53,099,986 | | | | 52,550,463 | | | | 315 | | | | (256 | ) | | | 1,835,929 | |
| Maryland Fund | | | 1,803,289 | | | | 43,286,110 | | | | 43,293,454 | | | | 1,016 | | | | (290 | ) | | | 1,796,671 | |
| Massachusetts Fund | | | 7,689,228 | | | | 145,573,579 | | | | 144,137,460 | | | | (588 | ) | | | 10 | | | | 9,124,769 | |
| | | | | | |
| | | | | | | | | | | | | | | Dividend
Income | | | Capital Gain
Distributions | |
| Alabama Fund | | | | | | | | | | | | | | | | | | | $43,796 | | | | $— | |
| Arkansas Fund | | | | | | | | | | | | | | | | | | | 30,628 | | | | — | |
| California Fund | | | | | | | | | | | | | | | | | | | 251,600 | | | | — | |
| Georgia Fund | | | | | | | | | | | | | | | | | | | 66,269 | | | | — | |
| Maryland Fund | | | | | | | | | | | | | | | | | | | 44,279 | | | | — | |
| Massachusetts Fund | | | | | | | | | | | | | | | | | | | 168,206 | | | | — | |
The pandemic related to the global spread of novel coronavirus disease(COVID-19), which was first detected in December 2019, has resulted in significant disruptions to global business activity and the global economy, as well as the economies of individual countries, the financial performance of individual companies and sectors, and the securities and commodities markets in general. This pandemic, the full effects of which are still unknown, has resulted in substantial market volatility and may have adversely impacted the prices and liquidity of each fund’s investments and each fund’s performance.
99
REPORT OF INDEPENDENT REGISTERED PUBLIC ACCOUNTING FIRM
To the Board of Trustees of MFS Municipal Series Trust and the Shareholders of MFS Alabama Municipal Bond Fund, MFS Arkansas Municipal Bond Fund, MFS California Municipal Bond Fund, MFS Georgia Municipal Bond Fund, MFS Maryland Municipal Bond Fund and MFS Massachusetts Municipal Bond Fund:
Opinion on the Financial Statements and Financial Highlights
We have audited the accompanying statements of assets and liabilities of MFS Alabama Municipal Bond Fund, MFS Arkansas Municipal Bond Fund, MFS California Municipal Bond Fund, MFS Georgia Municipal Bond Fund, MFS Maryland Municipal Bond Fund and MFS Massachusetts Municipal Bond Fund (the “Funds”), including the portfolios of investments, as of March 31, 2020, the related statements of operations for the year then ended, the statements of changes in net assets for each of the two years in the period then ended, the financial highlights for each of the five years in the period then ended, and the related notes. In our opinion, the financial statements and financial highlights present fairly, in all material respects, the financial position of each of the Funds as of March 31, 2020, and the results of their operations for the year then ended, the changes in their net assets for each of the two years in the period then ended, and the financial highlights for each of the five years in the period then ended, in conformity with accounting principles generally accepted in the United States of America.
Basis for Opinion
These financial statements and financial highlights are the responsibility of the Funds’ management. Our responsibility is to express an opinion on the Funds’ financial statements and financial highlights based on our audits. We are a public accounting firm registered with the Public Company Accounting Oversight Board (United States) (PCAOB) and are required to be independent with respect to the Funds in accordance with the U.S. federal securities laws and the applicable rules and regulations of the Securities and Exchange Commission and the PCAOB.
We conducted our audits in accordance with the standards of the PCAOB. Those standards require that we plan and perform the audits to obtain reasonable assurance about whether the financial statements and financial highlights are free of material misstatement, whether due to error or fraud. The Funds are not required to have, nor were we engaged to perform, an audit of their internal control over financial reporting. As part of our audits we are required to obtain an understanding of internal control over financial reporting but not for the purpose of expressing an opinion on the effectiveness of the Funds’ internal control over financial reporting. Accordingly, we express no such opinion.
Our audits included performing procedures to assess the risks of material misstatement of the financial statements and financial highlights, whether due to error or fraud, and performing procedures that respond to those risks. Such procedures included examining, on a test basis, evidence regarding the amounts and disclosures in the financial statements and financial highlights. Our audits also included evaluating the accounting principles used and significant estimates made by management, as well as evaluating the overall presentation of the financial statements and financial highlights. Our procedures included confirmation of securities owned as of March 31, 2020, by correspondence with the custodian and brokers; when replies were not received from brokers, we performed other auditing procedures. We believe that our audits provide a reasonable basis for our opinion.
DELOITTE & TOUCHE LLP
Boston, Massachusetts
May 15, 2020
We have served as the auditor of one or more of the MFS investment companies since 1924.
100
TRUSTEES AND OFFICERS — IDENTIFICATION AND BACKGROUND
The Trustees and Officers of the Trust, as of May 1, 2020, are listed below, together with their principal occupations during the past five years. (Their titles may have varied during that period.) The address of each Trustee and Officer is 111 Huntington Avenue, Boston, Massachusetts 02199-7618.
| | | | | | | | | | |
Name, Age | | Position(s) Held with Fund | | Trustee/Officer Since (h) | | Number of MFS Funds overseen by the Trustee | | Principal Occupations
During the Past Five Years | | Other Directorships
During the Past Five Years (j) |
| INTERESTED TRUSTEES |
Robert J. Manning (k)
(age 56) | | Trustee | | February 2004 | | 133 | | Massachusetts Financial Services Company, Executive Chairman (since January 2017); Director; Chairman of the Board; Chief Executive Officer (until 2015);Co-Chief Executive Officer (2015-2016) | | N/A |
| | | | | |
Robin A. Stelmach (k) (age 58) | | Trustee | | January 2014 | | 133 | | Massachusetts Financial Services Company, Vice Chair (since January 2017); Chief Operating Officer and Executive Vice President (until January 2017) | | N/A |
| | | | |
| INDEPENDENT TRUSTEES | | | | | | | | |
John P. Kavanaugh (age 65) | | Trustee and Chair of Trustees | | January 2009 | | 133 | | Private investor | | N/A |
| | | | | |
Steven E. Buller (age 68) | | Trustee | | February 2014 | | 133 | | Financial Accounting Standards Advisory Council, Chairman(2014-2015); Public Company Accounting Oversight Board, Standing Advisory Group, Member (until 2014); BlackRock, Inc. (investment management), Managing Director (until 2014), BlackRock Finco UK (investment management), Director (until 2014) | | N/A |
| | | | | |
John A. Caroselli (age 65) | | Trustee | | March 2017 | | 133 | | JC Global Advisors, LLC (management consulting), President (since 2015); First Capital Corporation (commercial finance), Executive Vice President (until 2015) | | N/A |
| | | | | |
Maureen R. Goldfarb (age 65) | | Trustee | | January 2009 | | 133 | | Private investor | | N/A |
| | | | | |
Peter D. Jones
(age 64) | | Trustee | | January 2019 | | 133 | | Franklin Templeton Distributors, Inc. (investment management), President (until 2015); Franklin Templeton Institutional, LLC (investment management), Chairman (until 2015) | | N/A |
| | | | | |
James W. Kilman, Jr.
(age 59) | | Trustee | | January 2019 | | 133 | | Burford Capital Limited (finance and investment management), Chief Financial Officer (since 2019); KielStrand Capital LLC (family office), Chief Executive Officer (since 2016); Morgan Stanley & Co. (financial services), Vice Chairman of Investment Banking,Co-Head of Diversified Financials Coverage – Financial Institutions Investment Banking Group (until 2016) | | Alpha-En Corporation, Director
(2016-2019) |
| | | | | |
Clarence Otis, Jr. (age 64) | | Trustee | | March 2017 | | 133 | | Darden Restaurants, Inc., Chief Executive Officer (until 2014) | | VF Corporation, Director; Verizon Communications, Inc., Director; The Travelers Companies, Director; Federal Reserve Bank of Atlanta, Director (until 2015) |
101
Trustees and Officers – continued
| | | | | | | | | | |
Name, Age | | Position(s) Held with Fund | | Trustee/Officer Since (h) | | Number of MFS Funds overseen by the Trustee | | Principal Occupations
During the Past Five Years | | Other Directorships
During the Past Five Years (j) |
Maryanne L. Roepke (age 64) | | Trustee | | May 2014 | | 133 | | American Century Investments (investment management), Senior Vice President and Chief Compliance Officer (until 2014) | | N/A |
| | | | | |
Laurie J. Thomsen
(age 62) | | Trustee | | March 2005 | | 133 | | Private investor | | The Travelers Companies, Director; Dycom Industries, Inc., Director (since 2015) |
| | | | | | | | |
Name, Age | | Position(s) Held with Fund | | Trustee/Officer Since (h) | | Number of MFS Funds for which the Person is an Officer | | Principal Occupations During the Past Five Years |
| OFFICERS | | | | | | | | |
Christopher R. Bohane (k)
(age 46) | | Assistant Secretary and Assistant Clerk | | July 2005 | | 133 | | Massachusetts Financial Services Company, Senior Vice President and Associate General Counsel |
| | | | |
Kino Clark(k) (age 51) | | Assistant Treasurer | | January 2012 | | 133 | | Massachusetts Financial Services Company, Vice President |
| | | | |
John W. Clark, Jr. (k) (age 53) | | Assistant Treasurer | | April 2017 | | 133 | | Massachusetts Financial Services Company, Vice President (since March 2017); Deutsche Bank (financial services), Department Head – Treasurer’s Office (until February 2017) |
| | | | |
Thomas H. Connors (k) (age 60) | | Assistant Secretary and Assistant Clerk | | September 2012 | | 133 | | Massachusetts Financial Services Company, Vice President and Senior Counsel |
| | | | |
David L. DiLorenzo(k)
(age 51) | | President | | July 2005 | | 133 | | Massachusetts Financial Services Company, Senior Vice President |
| | | | |
Heidi W. Hardin (k) (age 52) | | Secretary and Clerk | | April 2017 | | 133 | | Massachusetts Financial Services Company, Executive Vice President and General Counsel (since March 2017); Harris Associates (investment management), General Counsel (from September 2015 to January 2017); Janus Capital Management LLC (investment management), Senior Vice President and General Counsel (until September 2015) |
| | | | |
Brian E. Langenfeld (k) (age 47) | | Assistant Secretary and Assistant Clerk | | June 2006 | | 133 | | Massachusetts Financial Services Company, Vice President and Senior Counsel |
| | | | |
Amanda S. Mooradian (k) (age 41) | | Assistant Secretary and Assistant Clerk | | September 2018 | | 133 | | Massachusetts Financial Services Company, Assistant Vice President and Senior Counsel |
| | | | |
Susan A. Pereira (k)
(age 49) | | Assistant Secretary and Assistant Clerk | | July 2005 | | 133 | | Massachusetts Financial Services Company, Vice President and Assistant General Counsel |
| | | | |
Kasey L. Phillips (k) (age 49) | | Assistant Treasurer | | September 2012 | | 133 | | Massachusetts Financial Services Company, Vice President |
| | | | |
Matthew A. Stowe (k) (age 45) | | Assistant Secretary and Assistant Clerk | | October 2014 | | 133 | | Massachusetts Financial Services Company, Vice President and Assistant General Counsel |
| | | | |
Martin J. Wolin (k) (age 52) | | Chief Compliance Officer | | July 2015 | | 133 | | Massachusetts Financial Services Company, Senior Vice President and Chief Compliance Officer (since July 2015); Mercer (financial service provider), Chief Risk and Compliance Officer, North America and Latin America (until June 2015) |
| | | | |
James O. Yost (k)
(age 59) | | Treasurer | | September 1990 | | 133 | | Massachusetts Financial Services Company, Senior Vice President |
| (h) | Date first appointed to serve as Trustee/officer of an MFS Fund. Each Trustee has served continuously since appointment unless indicated otherwise. For the period from December 15, 2004 until February 22, 2005, Mr. Manning served as Advisory Trustee. From January 2012 through December 2016, Messrs. DiLorenzo and Yost served as Treasurer and Deputy Treasurer of the Funds, respectively. |
| (j) | Directorships or trusteeships of companies required to report to the Securities and Exchange Commission (i.e., “public companies”). |
| (k) | “Interested person” of the Trust within the meaning of the Investment Company Act of 1940 (referred to as the 1940 Act), which is the principal federal law governing investment companies like the fund, as a result of a position with MFS. The address of MFS is 111 Huntington Avenue, Boston, Massachusetts 02199-7618. |
102
Trustees and Officers – continued
Each Trustee (other than Messrs. Jones and Kilman) has been elected by shareholders and each Trustee and Officer holds office until his or her successor is chosen and qualified or until his or her earlier death, resignation, retirement or removal. Messrs. Jones and Kilman became Trustees of the Funds on January 1, 2019. The Trust does not hold annual meetings for the purpose of electing Trustees, and Trustees are not elected for fixed terms. Under the terms of the Board’s retirement policy, an Independent Trustee shall retire at the end of the calendar year in which he or she reaches the earlier of 75 years of age or 15 years of service on the Board (or, in the case of any Independent Trustee who joined the Board prior to 2015, 20 years of service on the Board).
Messrs. Buller, Kilman and Otis and Ms. Roepke are members of the Trust’s Audit Committee.
Each of the Interested Trustees and certain Officers hold comparable officer positions with certain affiliates of MFS.
The Statement of Additional Information for a Fund includes further information about the Trustees and is available without charge upon request by calling1-800-225-2606.
| | |
Investment Adviser Massachusetts Financial Services Company 111 Huntington Avenue Boston, MA 02199-7618 Distributor MFS Fund Distributors, Inc. 111 Huntington Avenue Boston, MA 02199-7618 Portfolio Manager(s) Michael Dawson | | Custodian JPMorgan Chase Bank, NA 4 Metrotech Center New York, NY 11245 Independent Registered Public Accounting Firm Deloitte & Touche LLP 200 Berkeley Street Boston, MA 02116 |
103
PROXY VOTING POLICIES AND INFORMATION
MFS votes proxies on behalf of the funds pursuant to proxy voting policies and procedures that are available without charge, upon request, by calling 1-800-225-2606, by visitingmfs.com/proxyvoting, or by visiting the SEC’s Web site athttp://www.sec.gov.
Information regarding how each fund voted proxies relating to portfolio securities during the most recent twelve-month period ended June 30 is available by August 31 of each year without charge by visitingmfs.com/proxyvoting, or by visiting the SEC’s Web site athttp://www.sec.gov.
QUARTERLY PORTFOLIO DISCLOSURE
Each fund files a complete schedule of portfolio holdings with the SEC for the first and third quarters of each fiscal year as an exhibit to its reports on Form N-PORT. Each fund’s Form N-PORT reports are available on the SEC’s website athttp://www.sec.gov.A shareholder can obtain the portfolio holdings report for the first and third quarters of each fund’s fiscal year atmfs.com/openendfundsby choosing the fund’s name and then selecting the “Resources” tab and clicking on “Prospectus and Reports”.
FURTHER INFORMATION
From time to time, MFS may post important information about each fund or the MFS funds on the MFS web site (mfs.com). This information is available athttps://www.mfs.com/en-us/what-we-do/announcements.htmlor atmfs.com/openendfunds by choosing the fund’s name.
INFORMATION ABOUT FUND CONTRACTS AND LEGAL CLAIMS
Each fund has entered into contractual arrangements with an investment adviser, administrator, distributor, shareholder servicing agent, 529 program manager (if applicable), and custodian who each provide services to the fund. Unless expressly stated otherwise, shareholders are not parties to, or intended beneficiaries of these contractual arrangements, and these contractual arrangements are not intended to create any shareholder right to enforce them against the service providers or to seek any remedy under them against the service providers, either directly or on behalf of the fund.
Under the Trust’s By-Laws and Declaration of Trust, any claims asserted against or on behalf of the MFS Funds, including claims against Trustees and Officers, must be brought in state and federal courts located within the Commonwealth of Massachusetts.
FEDERAL TAX INFORMATION (unaudited)
The funds will notify shareholders of amounts for use in preparing 2020 income tax forms in January 2021. The following information is provided pursuant to provisions of the Internal Revenue Code.
Of the dividends paid from net investment income during the fiscal year, the following percentages were designated as exempt interest dividends for federal income tax purposes. If each fund has earned income on private activity bonds, a portion of the dividends paid may be considered a tax preference item for purposes of computing a shareholder’s alternative minimum tax.
| | | | |
| |
| | | Exempt Interest
Dividends | |
| Alabama Fund | | | 99.27% | |
| Arkansas Fund | | | 99.19% | |
| California Fund | | | 98.69% | |
| Georgia Fund | | | 98.73% | |
| Maryland Fund | | | 97.91% | |
| Massachusetts Fund | | | 99.53% | |
104
rev. 3/16
| | | | |
| | | |
FACTS | | WHAT DOES MFS DO WITH YOUR
PERSONAL INFORMATION? | |  |
| | |
| Why? | | Financial companies choose how they share your personal information. Federal law gives consumers the right to limit some but not all sharing. Federal law also requires us to tell you how we collect, share, and protect your personal information. Please read this notice carefully to understand what we do. |
| | |
| What? | | The types of personal information we collect and share depend on the product or service you have with us. This information can include: • Social Security number and account balances • Account transactions and transaction history • Checking account information and wire transfer instructions When you areno longer our customer, we continue to share your information as described in this notice. |
| | |
| How? | | All financial companies need to share customers’ personal information to run their everyday business. In the section below, we list the reasons financial companies can share their customers’ personal information; the reasons MFS chooses to share; and whether you can limit this sharing. |
| | | | |
Reasons we can share your
personal information | | Does MFS share? | | Can you limit this
sharing? |
For our everyday business purposes – such as to process your transactions, maintain your account(s), respond to court orders and legal investigations, or report to credit bureaus | | Yes | | No |
For our marketing purposes – to offer our products and services to you | | No | | We don’t share |
| For joint marketing with other financial companies | | No | | We don’t share |
For our affiliates’ everyday business purposes – information about your transactions and experiences | | No | | We don’t share |
For our affiliates’ everyday business purposes – information about your creditworthiness | | No | | We don’t share |
| For nonaffiliates to market to you | | No | | We don’t share |
| | |
| | |
| Questions? | | Call800-225-2606 or go tomfs.com. |
105
| | |
| Who we are |
| Who is providing this notice? | | MFS Funds, MFS Investment Management, MFS Institutional Advisors, Inc., and MFS Heritage Trust Company. |
| | |
| What we do |
| How does MFS protect my personal information? | | To protect your personal information from unauthorized access and use, we use security measures that comply with federal law. These measures include procedural, electronic, and physical safeguards for the protection of the personal information we collect about you. |
How does MFS
collect my personal information? | | We collect your personal information, for example, when you • open an account or provide account information • direct us to buy securities or direct us to sell your securities • make a wire transfer We also collect your personal information from others, such as credit bureaus, affiliates, or other companies. |
| Why can’t I limit all sharing? | | Federal law gives you the right to limit only • sharing for affiliates’ everyday business purposes – information about your creditworthiness • affiliates from using your information to market to you • sharing for nonaffiliates to market to you State laws and individual companies may give you additional rights to limit sharing. |
| | |
| Definitions |
| Affiliates | | Companies related by common ownership or control. They can be financial and nonfinancial companies. • MFS does not share personal information with affiliates, except for everyday business purposes as described on page one of this notice. |
| Nonaffiliates | | Companies not related by common ownership or control. They can be financial and nonfinancial companies. • MFS does not share with nonaffiliates so they can market to you. |
| Joint marketing | | A formal agreement between nonaffiliated financial companies that together market financial products or services to you. • MFS doesn’t jointly market. |
| | |
| Other important information |
| If you own an MFS product or receive an MFS service in the name of a third party such as a bank or broker-dealer, their privacy policy may apply to you instead of ours. |
106
Save paper with eDelivery.

| MFS® will send you prospectuses, |
reports, and proxies directly viae-mail so you will get information faster with less mailbox clutter.
To sign up:
1. Go to mfs.com.
2. Log in via MFS® Access.
3. Select eDelivery.
If you own your MFS fund shares through a financial institution or a retirement plan, MFS® TALK, MFS® Access, or eDelivery may not be available to you.
CONTACT US
WEB SITE
mfs.com
MFS TALK
1-800-637-8255
24 hours a day
ACCOUNT SERVICE AND LITERATURE
Shareholders
1-800-225-2606
Financial advisors
1-800-343-2829
Retirement plan services
1-800-637-1255
MAILING ADDRESS
MFS Service Center, Inc.
P.O. Box 219341
Kansas City, MO 64121-9341
OVERNIGHT MAIL
MFS Service Center, Inc.
Suite 219341
430 W 7th Street
Kansas City, MO 64105-1407
Annual Report
March 31, 2020

MFS® Municipal Series Trust

For the states of:
Mississippi, New York, North Carolina, Pennsylvania, South Carolina, Tennessee, Virginia, and West Virginia
Beginning on January 1, 2021, as permitted by regulations adopted by the U.S. Securities and Exchange Commission, paper copies of the fund’s annual and semiannual shareholder reports will no longer be sent by mail, unless you specifically request paper copies of the reports. Instead, the complete reports will be made available on the fund’s Web site (funds.mfs.com), and you will be notified by mail each time a report is posted and provided with a Web site link to access the report.
If you are already signed up to receive shareholder reports by email, you will not be affected by this change and you need not take any action. You may sign up to receive shareholder reports and other communications from the fund by email by contacting your financial intermediary (such as a broker-dealer or bank) or, if you hold your shares directly with the fund, by calling 1-800-225-2606 or by logging on to MFS Access at mfs.com.
Beginning on January 1, 2019, you may elect to receive all future reports in paper free of charge. Contact your financial intermediary to request that you continue to receive paper copies of your shareholder reports. If you invest directly with the fund, you can call 1-800-225-2606 or send an email request to orderliterature@mfs.com to let the fund know that you wish to continue receiving paper copies of your shareholder reports. Your election to receive reports in paper will apply to all funds held in your account if you invest through your financial intermediary or all funds held with the MFS fund complex if you invest directly.
MSTB-ANN
MFS® Municipal Series Trust
For the states of: Mississippi, New York, North Carolina, Pennsylvania, South Carolina, Tennessee, Virginia, and West Virginia
CONTENTS
The report is prepared for the general information of shareholders. It is authorized for distribution to prospective investors only when preceded or accompanied by a current prospectus.
NOT FDIC INSURED• MAY LOSE VALUE• NO BANK GUARANTEE
LETTER FROM THE EXECUTIVE CHAIR

Dear Shareholders:
During the first quarter of 2020, equity prices experienced their fastest 30% fall in history and market volatility reached levels not seen since the global financial crisis. Optimism heading into the year — on receding trade and geopolitical risk along with easier central bank policies — was overwhelmed in February as the health effects of a novel coronavirus, COVID-19, spread beyond China’s borders, ultimately impacting more than 187 countries. The global pandemic prompted many governments to take drastic action to slow the spread of the virus, such as quarantines, school and business closures, and prohibitions on public gatherings. While these were important steps to protect the public health, they came at a cost: greater market volatility and an abrupt downturn in economic growth.
Global central banks have taken aggressive, coordinated steps to cushion the economic and market fallout related to the virus, and governments are undertaking unprecedented levels of fiscal stimulus. As uncertainty recedes, these measures can help build a supportive environment and encourage economic recovery. In the aftermath of the crisis, there are likely to be societal changes as households, businesses, and governments adjust to a new reality, and these alterations could change the investment landscape. Occurrences such as the COVID-19 outbreak demonstrate the importance of having a deep understanding of company fundamentals, and our global research platform has been built to do just that.
Here at MFS®, we aim to help our clients navigate the growing complexity of the markets and world economies. Our long-term investment philosophy and commitment to the responsible allocation of capital allow us to tune out the noise and uncover what we believe are the best, most durable investment opportunities in the market. Through our powerful global investment platform, we combine collective expertise, thoughtful risk management, and long-term discipline to create sustainable value for investors.
Respectfully,

Robert J. Manning
Executive Chair
MFS Investment Management
May 15, 2020
The opinions expressed in this letter are subject to change and may not be relied upon for investment advice. No forecasts can be guaranteed.
1
PORTFOLIO COMPOSITION
MFS Mississippi Municipal Bond Fund
Portfolio structure (i)
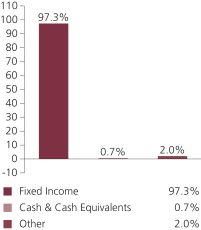
| | | | |
| Top five industries (i) | | | | |
| General Obligations – General Purpose | | | 21.5% | |
| Universities – Colleges | | | 12.4% | |
| General Obligations – Schools | | | 12.0% | |
| Healthcare Revenue – Hospitals | | | 11.1% | |
| State & Local Agencies | | | 9.5% | |
| | | | |
| Composition including fixed income credit quality (a)(i) | |
| AAA | | | 6.2% | |
| AA | | | 48.0% | |
| A | | | 27.1% | |
| BBB | | | 5.7% | |
| BB | | | 3.1% | |
| B | | | 0.5% | |
| CC | | | 0.2% | |
| C | | | 3.2% | |
| D | | | 1.7% | |
| Not Rated | | | 1.6% | |
| Cash & Cash Equivalents | | | 0.7% | |
| Other | | | 2.0% | |
| |
| Portfolio facts (i) | | | | |
| Average Duration (d) | | | 6.1 | |
| Average Effective Maturity (m) | | | 14.6 yrs. | |
| | | | |
| Jurisdiction (i) | | | | |
| Mississippi | | | 74.8% | |
| Puerto Rico | | | 8.5% | |
| Massachusetts | | | 2.8% | |
| Guam | | | 1.6% | |
| Illinois | | | 1.4% | |
| California | | | 1.2% | |
| South Carolina | | | 1.0% | |
| Michigan | | | 0.9% | |
| Alabama | | | 0.8% | |
| New Jersey | | | 0.8% | |
| Ohio | | | 0.8% | |
| Iowa | | | 0.7% | |
| Pennsylvania | | | 0.6% | |
| Virginia | | | 0.6% | |
| Texas | | �� | 0.6% | |
| Colorado | | | 0.5% | |
| Connecticut | | | 0.5% | |
| Maryland | | | 0.4% | |
| Kentucky | | | 0.4% | |
| Tennessee | | | 0.3% | |
| Florida | | | 0.1% | |
| U.S. Treasury Securities (j) | | | (2.0)% | |
| (a) | For all securities other than those specifically described below, ratings are assigned to underlying securities utilizing ratings from Moody’s, Fitch, and Standard & Poor’s rating agencies and applying the following hierarchy: If all three agencies provide a rating, the middle rating (after dropping the highest and lowest ratings) is assigned; if two of the three agencies rate a security, the lower of the two is assigned. Ratings are shown in the S&P and Fitch scale (e.g., AAA). Securities rated BBB or higher are considered investment grade. All ratings are subject to change. Not Rated includes fixed income securities and fixed income derivatives, which have not been rated by any rating agency. The fund may or may not have held all of these instruments on this date. The fund is not rated by these agencies. |
| (d) | Duration is a measure of how much a bond’s price is likely to fluctuate with general changes in interest rates, e.g., if rates rise 1.00%, a bond with a5-year duration is likely to lose about 5.00% of its value due to the interest rate move. |
| (i) | For purposes of this presentation, the components include the value of securities, and reflect the impact of the equivalent exposure of derivative positions, if any. These amounts may be negative from time to time. Equivalent exposure is a calculated amount that translates the derivative position into a reasonable approximation of the amount of the underlying asset that the portfolio would have to hold at a given point in time to have the same price sensitivity that results from the portfolio’s ownership of the derivative contract. When dealing with derivatives, equivalent exposure is a more representative measure of the potential impact of a position on portfolio performance than value. The bond component will include any accrued interest amounts. |
| (j) | For the purpose of managing the fund’s duration, the fund holds treasury futures with a bond equivalent exposure of (2.0)%, which impacts the fund’s interest rate exposure but not its credit exposure. |
| (m) | In determining each instrument’s effective maturity for purposes of calculating the fund’s dollar-weighted average effective maturity, MFS uses the instrument’s stated maturity or, if applicable, an earlier date on which MFS believes it is probable that a maturity-shortening device (such as a put,pre-refunding or prepayment) will cause the instrument to be repaid. Such an earlier date can be substantially shorter than the instrument’s stated maturity. |
Cash & Cash Equivalents includes any cash, investments in money market funds, short-term securities, and other assets less liabilities. Please see the Statements of Assets and Liabilities for additional information related to the fund’s cash position and other assets and liabilities.
Other includes equivalent exposure from currency derivatives and/or any offsets to derivative positions.
Percentages are based on net assets as of March 31, 2020.
The portfolio is actively managed and current holdings may be different.
2
Portfolio Composition – continued
MFS New York Municipal Bond Fund
Portfolio structure (i)

| | | | |
| Top five industries (i) | | | | |
| Universities – Colleges | | | 12.6% | |
| Water & Sewer Utility Revenue | | | 11.7% | |
| Tax Assessment | | | 9.6% | |
| Healthcare Revenue – Hospitals | | | 9.0% | |
| General Obligations – General Purpose | | | 8.1% | |
| | | | |
| Composition including fixed income credit quality (a)(i) | |
| AAA | | | 8.8% | |
| AA | | | 33.5% | |
| A | | | 25.7% | |
| BBB | | | 14.6% | |
| BB | | | 1.8% | |
| B | | | 0.4% | |
| CCC | | | 0.5% | |
| CC | | | 0.1% | |
| C | | | 2.8% | |
| D | | | 2.1% | |
| Not Rated | | | 7.7% | |
| Cash & Cash Equivalents | | | 1.0% | |
| Other | | | 1.0% | |
| |
| Portfolio facts (i) | | | | |
| Average Duration (d) | | | 6.7 | |
| Average Effective Maturity (m) | | | 17.4 yrs. | |
| | | | |
| Jurisdiction (i) | | | | |
| New York | | | 81.9% | |
| Puerto Rico | | | 8.2% | |
| Guam | | | 1.4% | |
| New Jersey | | | 1.3% | |
| Ohio | | | 1.1% | |
| Illinois | | | 1.0% | |
| Colorado | | | 0.9% | |
| Florida | | | 0.7% | |
| Texas | | | 0.6% | |
| Michigan | | | 0.6% | |
| Pennsylvania | | | 0.5% | |
| Alabama | | | 0.3% | |
| Indiana | | | 0.2% | |
| Louisiana | | | 0.2% | |
| Virginia | | | 0.1% | |
| Mississippi (o) | | | 0.0% | |
| U.S. Treasury Securities (j) | | | (1.0)% | |
| (a) | For all securities other than those specifically described below, ratings are assigned to underlying securities utilizing ratings from Moody’s, Fitch, and Standard & Poor’s rating agencies and applying the following hierarchy: If all three agencies provide a rating, the middle rating (after dropping the highest and lowest ratings) is assigned; if two of the three agencies rate a security, the lower of the two is assigned. Ratings are shown in the S&P and Fitch scale (e.g., AAA). Securities rated BBB or higher are considered investment grade. All ratings are subject to change. Not Rated includes fixed income securities and fixed income derivatives, which have not been rated by any rating agency. The fund may or may not have held all of these instruments on this date. The fund is not rated by these agencies. |
| (d) | Duration is a measure of how much a bond’s price is likely to fluctuate with general changes in interest rates, e.g., if rates rise 1.00%, a bond with a 5-year duration is likely to lose about 5.00% of its value due to the interest rate move. |
| (i) | For purposes of this presentation, the components include the value of securities, and reflect the impact of the equivalent exposure of derivative positions, if any. These amounts may be negative from time to time. Equivalent exposure is a calculated amount that translates the derivative position into a reasonable approximation of the amount of the underlying asset that the portfolio would have to hold at a given point in time to have the same price sensitivity that results from the portfolio’s ownership of the derivative contract. When dealing with derivatives, equivalent exposure is a more representative measure of the potential impact of a position on portfolio performance than value. The bond component will include any accrued interest amounts. |
| (j) | For the purpose of managing the fund’s duration, the fund holds treasury futures with a bond equivalent exposure of (1.0)%, which impacts the fund’s interest rate exposure but not its credit exposure. |
| (m) | In determining each instrument’s effective maturity for purposes of calculating the fund’s dollar-weighted average effective maturity, MFS uses the instrument’s stated maturity or, if applicable, an earlier date on which MFS believes it is probable that a maturity-shortening device (such as a put, pre-refunding or prepayment) will cause the instrument to be repaid. Such an earlier date can be substantially shorter than the instrument’s stated maturity. |
Cash & Cash Equivalents includes any cash, investments in money market funds, short-term securities, and other assets less liabilities. Please see the Statements of Assets and Liabilities for additional information related to the fund’s cash position and other assets and liabilities.
Other includes equivalent exposure from currency derivatives and/or any offsets to derivative positions.
Percentages are based on net assets as of March 31, 2020.
The portfolio is actively managed and current holdings may be different.
3
Portfolio Composition – continued
MFS North Carolina Municipal Bond Fund
Portfolio structure (i)
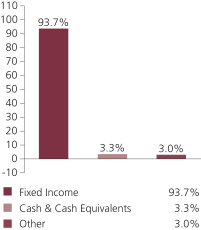
| | | | |
| Top five industries (i) | | | | |
| Universities – Colleges | | | 20.2% | |
| Healthcare Revenue – Hospitals | | | 14.9% | |
| State & Local Agencies | | | 14.5% | |
| Airport Revenue | | | 7.9% | |
| Water & Sewer Utility Revenue | | | 6.8% | |
| | | | |
| Composition including fixed income credit quality (a)(i) | |
| AAA | | | 4.7% | |
| AA | | | 39.2% | |
| A | | | 28.3% | |
| BBB | | | 9.5% | |
| BB | | | 0.9% | |
| CCC | | | 0.5% | |
| CC | | | 0.6% | |
| C | | | 2.5% | |
| D | | | 1.7% | |
| Not Rated | | | 5.8% | |
| Cash & Cash Equivalents | | | 3.3% | |
| Other | | | 3.0% | |
| |
| Portfolio facts (i) | | | | |
| Average Duration (d) | | | 6.8 | |
| Average Effective Maturity (m) | | | 17.1 yrs. | |
| | | | |
| Jurisdiction (i) | | | | |
| North Carolina | | | 72.4% | |
| Puerto Rico | | | 8.2% | |
| Pennsylvania | | | 1.8% | |
| Illinois | | | 1.6% | |
| California | | | 1.6% | |
| Virginia | | | 1.4% | |
| Guam | | | 1.2% | |
| New Jersey | | | 1.1% | |
| Georgia | | | 1.1% | |
| Ohio | | | 1.1% | |
| New York | | | 1.0% | |
| Texas | | | 0.8% | |
| Tennessee | | | 0.5% | |
| Connecticut | | | 0.4% | |
| Colorado | | | 0.4% | |
| Maryland | | | 0.4% | |
| South Carolina | | | 0.4% | |
| Alabama | | | 0.3% | |
| Michigan | | | 0.3% | |
| Indiana | | | 0.2% | |
| Louisiana | | | 0.2% | |
| Florida | | | 0.2% | |
| Washington DC | | | 0.1% | |
| U.S. Treasury Securities (j) | | | (3.0)% | |
| (a) | For all securities other than those specifically described below, ratings are assigned to underlying securities utilizing ratings from Moody’s, Fitch, and Standard & Poor’s rating agencies and applying the following hierarchy: If all three agencies provide a rating, the middle rating (after dropping the highest and lowest ratings) is assigned; if two of the three agencies rate a security, the lower of the two is assigned. Ratings are shown in the S&P and Fitch scale (e.g., AAA). Securities rated BBB or higher are considered investment grade. All ratings are subject to change. Not Rated includes fixed income securities and fixed income derivatives, which have not been rated by any rating agency. The fund may or may not have held all of these instruments on this date. The fund is not rated by these agencies. |
| (d) | Duration is a measure of how much a bond’s price is likely to fluctuate with general changes in interest rates, e.g., if rates rise 1.00%, a bond with a5-year duration is likely to lose about 5.00% of its value due to the interest rate move. |
| (i) | For purposes of this presentation, the components include the value of securities, and reflect the impact of the equivalent exposure of derivative positions, if any. These amounts may be negative from time to time. Equivalent exposure is a calculated amount that translates the derivative position into a reasonable approximation of the amount of the underlying asset that the portfolio would have to hold at a given point in time to have the same price sensitivity that results from the portfolio’s ownership of the derivative contract. When dealing with derivatives, equivalent exposure is a more representative measure of the potential impact of a position on portfolio performance than value. The bond component will include any accrued interest amounts. |
| (j) | For the purpose of managing the fund’s duration, the fund holds treasury futures with a bond equivalent exposure of (3.0)%, which impacts the fund’s interest rate exposure but not its credit exposure. |
| (m) | In determining each instrument’s effective maturity for purposes of calculating the fund’s dollar-weighted average effective maturity, MFS uses the instrument’s stated maturity or, if applicable, an earlier date on which MFS believes it is probable that a maturity-shortening device (such as a put,pre-refunding or prepayment) will cause the instrument to be repaid. Such an earlier date can be substantially shorter than the instrument’s stated maturity. |
Cash & Cash Equivalents includes any cash, investments in money market funds, short-term securities, and other assets less liabilities. Please see the Statements of Assets and Liabilities for additional information related to the fund’s cash position and other assets and liabilities.
Other includes equivalent exposure from currency derivatives and/or any offsets to derivative positions.
Percentages are based on net assets as of March 31, 2020.
The portfolio is actively managed and current holdings may be different.
4
Portfolio Composition – continued
MFS Pennsylvania Municipal Bond Fund
Portfolio structure (i)
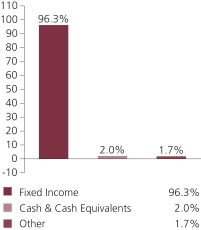
| | | | |
| Top five industries (i) | | | | |
| Healthcare Revenue – Hospitals | | | 20.2% | |
| General Obligations – Schools | | | 12.3% | |
| Water & Sewer Utility Revenue | | | 10.2% | |
| Universities – Colleges | | | 9.1% | |
| State & Local Agencies | | | 6.7% | |
| | | | |
| Composition including fixed income credit quality (a)(i) | |
| AAA | | | 0.7% | |
| AA | | | 24.1% | |
| A | | | 39.9% | |
| BBB | | | 14.7% | |
| BB | | | 5.1% | |
| B | | | 0.3% | |
| CCC | | | 0.2% | |
| CC | | | 0.1% | |
| C | | | 2.6% | |
| D | | | 1.8% | |
| Not Rated | | | 6.8% | |
| Cash & Cash Equivalents | | | 2.0% | |
| Other | | | 1.7% | |
| |
| Portfolio facts (i) | | | | |
| Average Duration (d) | | | 6.6 | |
| Average Effective Maturity (m) | | | 17.1 yrs. | |
| | | | |
| Jurisdiction (i) | | | | |
| Pennsylvania | | | 79.5% | |
| Puerto Rico | | | 7.5% | |
| Illinois | | | 2.1% | |
| New Jersey | | | 1.2% | |
| Colorado | | | 1.1% | |
| California | | | 1.1% | |
| Michigan | | | 1.0% | |
| Guam | | | 0.8% | |
| Ohio | | | 0.8% | |
| Texas | | | 0.5% | |
| Florida | | | 0.5% | |
| Kentucky | | | 0.5% | |
| Tennessee | | | 0.3% | |
| Alabama | | | 0.3% | |
| Indiana | | | 0.2% | |
| Louisiana | | | 0.2% | |
| Georgia | | | 0.2% | |
| Virginia | | | 0.1% | |
| Nebraska | | | 0.1% | |
| U.S. Treasury Securities (j) | | | (1.7)% | |
| (a) | For all securities other than those specifically described below, ratings are assigned to underlying securities utilizing ratings from Moody’s, Fitch, and Standard & Poor’s rating agencies and applying the following hierarchy: If all three agencies provide a rating, the middle rating (after dropping the highest and lowest ratings) is assigned; if two of the three agencies rate a security, the lower of the two is assigned. Ratings are shown in the S&P and Fitch scale (e.g., AAA). Securities rated BBB or higher are considered investment grade. All ratings are subject to change. Not Rated includes fixed income securities and fixed income derivatives, which have not been rated by any rating agency. The fund may or may not have held all of these instruments on this date. The fund is not rated by these agencies. |
| (d) | Duration is a measure of how much a bond’s price is likely to fluctuate with general changes in interest rates, e.g., if rates rise 1.00%, a bond with a5-year duration is likely to lose about 5.00% of its value due to the interest rate move. |
| (i) | For purposes of this presentation, the components include the value of securities, and reflect the impact of the equivalent exposure of derivative positions, if any. These amounts may be negative from time to time. Equivalent exposure is a calculated amount that translates the derivative position into a reasonable approximation of the amount of the underlying asset that the portfolio would have to hold at a given point in time to have the same price sensitivity that results from the portfolio’s ownership of the derivative contract. When dealing with derivatives, equivalent exposure is a more representative measure of the potential impact of a position on portfolio performance than value. The bond component will include any accrued interest amounts. |
| (j) | For the purpose of managing the fund’s duration, the fund holds treasury futures with a bond equivalent exposure of (1.7)%, which impacts the fund’s interest rate exposure but not its credit exposure. |
| (m) | In determining each instrument’s effective maturity for purposes of calculating the fund’s dollar-weighted average effective maturity, MFS uses the instrument’s stated maturity or, if applicable, an earlier date on which MFS believes it is probable that a maturity-shortening device (such as a put,pre-refunding or prepayment) will cause the instrument to be repaid. Such an earlier date can be substantially shorter than the instrument’s stated maturity. |
Cash & Cash Equivalents includes any cash, investments in money market funds, short-term securities, and other assets less liabilities. Please see the Statements of Assets and Liabilities for additional information related to the fund’s cash position and other assets and liabilities.
Other includes equivalent exposure from currency derivatives and/or any offsets to derivative positions.
Percentages are based on net assets as of March 31, 2020.
The portfolio is actively managed and current holdings may be different.
5
Portfolio Composition – continued
MFS South Carolina Municipal Bond Fund
Portfolio structure (i)
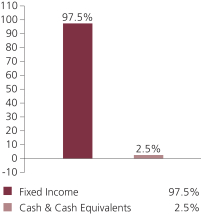
| | | | |
| Top five industries (i) | | | | |
| Healthcare Revenue – Hospitals | | | 15.8% | |
| Water & Sewer Utility Revenue | | | 14.6% | |
| State & Local Agencies | | | 9.3% | |
| General Obligations – Schools | | | 8.8% | |
| Transportation – Special Tax | | | 8.7% | |
| | | | |
| Composition including fixed income credit quality (a)(i) | |
| AAA | | | 1.8% | |
| AA | | | 34.0% | |
| A | | | 41.6% | |
| BBB | | | 7.0% | |
| BB | | | 1.6% | |
| CCC | | | 0.1% | |
| CC | | | 0.1% | |
| C | | | 2.6% | |
| D | | | 1.7% | |
| Not Rated | | | 7.0% | |
| Cash & Cash Equivalents | | | 2.5% | |
| |
| Portfolio facts (i) | | | | |
| Average Duration (d) | | | 6.2 | |
| Average Effective Maturity (m) | | | 14.9 yrs. | |
| | | | |
| Jurisdiction (i) | | | | |
| South Carolina | | | 74.6% | |
| Puerto Rico | | | 7.7% | |
| Illinois | | | 2.4% | |
| Pennsylvania | | | 1.8% | |
| New Jersey | | | 1.2% | |
| California | | | 1.2% | |
| Georgia | | | 0.9% | |
| Alabama | | | 0.8% | |
| Ohio | | | 0.8% | |
| Guam | | | 0.7% | |
| Tennessee | | | 0.7% | |
| Kentucky | | | 0.6% | |
| Texas | | | 0.6% | |
| Michigan | | | 0.6% | |
| Florida | | | 0.5% | |
| Virginia | | | 0.5% | |
| Colorado | | | 0.4% | |
| Connecticut | | | 0.4% | |
| Maryland | | | 0.4% | |
| Nebraska | | | 0.4% | |
| Louisiana | | | 0.1% | |
| New Hampshire | | | 0.1% | |
| Washington DC | | | 0.1% | |
| Indiana (o) | | | 0.0% | |
| (a) | For all securities other than those specifically described below, ratings are assigned to underlying securities utilizing ratings from Moody’s, Fitch, and Standard & Poor’s rating agencies and applying the following hierarchy: If all three agencies provide a rating, the middle rating (after dropping the highest and lowest ratings) is assigned; if two of the three agencies rate a security, the lower of the two is assigned. Ratings are shown in the S&P and Fitch scale (e.g., AAA). Securities rated BBB or higher are considered investment grade. All ratings are subject to change. Not Rated includes fixed income securities and fixed income derivatives, which have not been rated by any rating agency. The fund may or may not have held all of these instruments on this date. The fund is not rated by these agencies. |
| (d) | Duration is a measure of how much a bond’s price is likely to fluctuate with general changes in interest rates, e.g., if rates rise 1.00%, a bond with a5-year duration is likely to lose about 5.00% of its value due to the interest rate move. |
| (i) | For purposes of this presentation, the components include the value of securities, and reflect the impact of the equivalent exposure of derivative positions, if any. These amounts may be negative from time to time. Equivalent exposure is a calculated amount that translates the derivative position into a reasonable approximation of the amount of the underlying asset that the portfolio would have to hold at a given point in time to have the same price sensitivity that results from the portfolio’s ownership of the derivative contract. When dealing with derivatives, equivalent exposure is a more representative measure of the potential impact of a position on portfolio performance than value. The bond component will include any accrued interest amounts. |
| (m) | In determining each instrument’s effective maturity for purposes of calculating the fund’s dollar-weighted average effective maturity, MFS uses the instrument’s stated maturity or, if applicable, an earlier date on which MFS believes it is probable that a maturity-shortening device (such as a put,pre-refunding or prepayment) will cause the instrument to be repaid. Such an earlier date can be substantially shorter than the instrument’s stated maturity. |
Cash & Cash Equivalents includes any cash, investments in money market funds, short-term securities, and other assets less liabilities. Please see the Statements of Assets and Liabilities for additional information related to the fund’s cash position and other assets and liabilities.
Percentages are based on net assets as of March 31, 2020.
The portfolio is actively managed and current holdings may be different.
6
Portfolio Composition – continued
MFS Tennessee Municipal Bond Fund
Portfolio structure (i)

| | | | |
| Top five industries (i) | | | | |
| Healthcare Revenue – Hospitals | | | 18.5% | |
| General Obligations – General Purpose | | | 13.0% | |
| Water & Sewer Utility Revenue | | | 8.8% | |
| Universities – Colleges | | | 8.7% | |
| Airports | | | 6.9% | |
| | | | |
| Composition including fixed income credit quality (a)(i) | |
| AAA | | | 5.3% | |
| AA | | | 33.2% | |
| A | | | 27.9% | |
| BBB | | | 18.2% | |
| BB | | | 2.4% | |
| CC | | | 0.2% | |
| C | | | 3.2% | |
| D | | | 1.9% | |
| Not Rated | | | 4.4% | |
| Cash & Cash Equivalents | | | 1.5% | |
| Other | | | 1.8% | |
| |
| Portfolio facts (i) | | | | |
| Average Duration (d) | | | 6.7 | |
| Average Effective Maturity (m) | | | 15.8 yrs. | |
| | | | |
| Jurisdiction (i) | | | | |
| Tennessee | | | 72.4% | |
| Puerto Rico | | | 9.0% | |
| Guam | | | 2.8% | |
| Pennsylvania | | | 1.6% | |
| New Jersey | | | 1.5% | |
| Illinois | | | 1.4% | |
| Kentucky | | | 1.1% | |
| New York | | | 1.1% | |
| Florida | | | 0.9% | |
| Alabama | | | 0.9% | |
| South Carolina | | | 0.8% | |
| Iowa | | | 0.7% | |
| Virginia | | | 0.7% | |
| Ohio | | | 0.6% | |
| Connecticut | | | 0.5% | |
| Colorado | | | 0.5% | |
| Maryland | | | 0.5% | |
| Virgin Islands | | | 0.4% | |
| Texas | | | 0.3% | |
| Georgia | | | 0.3% | |
| Washington DC | | | 0.2% | |
| Michigan | | | 0.1% | |
| Nebraska | | | 0.1% | |
| Mississippi | | | 0.1% | |
| U.S. Treasury Securities (j) | | | (1.8)% | |
| (a) | For all securities other than those specifically described below, ratings are assigned to underlying securities utilizing ratings from Moody’s, Fitch, and Standard & Poor’s rating agencies and applying the following hierarchy: If all three agencies provide a rating, the middle rating (after dropping the highest and lowest ratings) is assigned; if two of the three agencies rate a security, the lower of the two is assigned. Ratings are shown in the S&P and Fitch scale (e.g., AAA). Securities rated BBB or higher are considered investment grade. All ratings are subject to change. Not Rated includes fixed income securities and fixed income derivatives, which have not been rated by any rating agency. The fund may or may not have held all of these instruments on this date. The fund is not rated by these agencies. |
| (d) | Duration is a measure of how much a bond’s price is likely to fluctuate with general changes in interest rates, e.g., if rates rise 1.00%, a bond with a5-year duration is likely to lose about 5.00% of its value due to the interest rate move. |
| (i) | For purposes of this presentation, the components include the value of securities, and reflect the impact of the equivalent exposure of derivative positions, if any. These amounts may be negative from time to time. Equivalent exposure is a calculated amount that translates the derivative position into a reasonable approximation of the amount of the underlying asset that the portfolio would have to hold at a given point in time to have the same price sensitivity that results from the portfolio’s ownership of the derivative contract. When dealing with derivatives, equivalent exposure is a more representative measure of the potential impact of a position on portfolio performance than value. The bond component will include any accrued interest amounts. |
| (j) | For the purpose of managing the fund’s duration, the fund holds treasury futures with a bond equivalent exposure of (1.8)%, which impact the fund’s interest rate exposure but not its credit exposure. |
| (m) | In determining each instrument’s effective maturity for purposes of calculating the fund’s dollar-weighted average effective maturity, MFS uses the instrument’s stated maturity or, if applicable, an earlier date on which MFS believes it is probable that a maturity-shortening device (such as a put,pre-refunding or prepayment) will cause the instrument to be repaid. Such an earlier date can be substantially shorter than the instrument’s stated maturity. |
Cash & Cash Equivalents includes any cash, investments in money market funds, short-term securities, and other assets less liabilities. Please see the Statements of Assets and Liabilities for additional information related to the fund’s cash position and other assets and liabilities.
Other includes equivalent exposure from currency derivatives and/or any offsets to derivative positions.
Percentages are based on net assets as of March 31, 2020.
The portfolio is actively managed and current holdings may be different.
7
Portfolio Composition – continued
MFS Virginia Municipal Bond Fund
Portfolio structure (i)

| | | | |
| Top five industries (i) | | | | |
| Healthcare Revenue – Hospitals | | | 16.5% | |
| Water & Sewer Utility Revenue | | | 12.0% | |
| State & Local Agencies | | | 12.0% | |
| Universities – Colleges | | | 10.9% | |
| General Obligations – General Purpose | | | 10.6% | |
| | | | |
| Composition including fixed income credit quality (a)(i) | |
| AAA | | | 17.1% | |
| AA | | | 43.8% | |
| A | | | 14.0% | |
| BBB | | | 11.6% | |
| BB | | | 1.3% | |
| B | | | 0.3% | |
| CCC | | | 0.2% | |
| CC | | | 0.3% | |
| C | | | 2.7% | |
| D | | | 1.8% | |
| Not Rated | | | 4.9% | |
| Cash & Cash Equivalents | | | 0.3% | |
| Other | | | 1.7% | |
| |
| Portfolio facts (i) | | | | |
| Average Duration (d) | | | 6.8 | |
| Average Effective Maturity (m) | | | 16.3 yrs. | |
| | | | |
| Jurisdiction (i) | | | | |
| Virginia | | | 75.3% | |
| Puerto Rico | | | 8.5% | |
| Washington DC | | | 6.3% | |
| Illinois | | | 1.7% | |
| Pennsylvania | | | 1.6% | |
| Guam | | | 1.4% | |
| Colorado | | | 1.0% | |
| Ohio | | | 0.8% | |
| Tennessee | | | 0.7% | |
| New York | | | 0.6% | |
| Massachusetts | | | 0.6% | |
| Texas | | | 0.5% | |
| New Jersey | | | 0.5% | |
| Maryland | | | 0.4% | |
| California | | | 0.4% | |
| Alabama | | | 0.3% | |
| Louisiana | | | 0.2% | |
| Iowa | | | 0.2% | |
| Michigan | | | 0.1% | |
| Indiana | | | 0.1% | |
| U.S. Treasury Securities (j) | | | (3.2)% | |
| (a) | For all securities other than those specifically described below, ratings are assigned to underlying securities utilizing ratings from Moody’s, Fitch, and Standard & Poor’s rating agencies and applying the following hierarchy: If all three agencies provide a rating, the middle rating (after dropping the highest and lowest ratings) is assigned; if two of the three agencies rate a security, the lower of the two is assigned. Ratings are shown in the S&P and Fitch scale (e.g., AAA). Securities rated BBB or higher are considered investment grade. All ratings are subject to change. Not Rated includes fixed income securities and fixed income derivatives, which have not been rated by any rating agency. The fund may or may not have held all of these instruments on this date. The fund is not rated by these agencies. |
| (d) | Duration is a measure of how much a bond’s price is likely to fluctuate with general changes in interest rates, e.g., if rates rise 1.00%, a bond with a5-year duration is likely to lose about 5.00% of its value due to the interest rate move. |
| (i) | For purposes of this presentation, the components include the value of securities, and reflect the impact of the equivalent exposure of derivative positions, if any. These amounts may be negative from time to time. Equivalent exposure is a calculated amount that translates the derivative position into a reasonable approximation of the amount of the underlying asset that the portfolio would have to hold at a given point in time to have the same price sensitivity that results from the portfolio’s ownership of the derivative contract. When dealing with derivatives, equivalent exposure is a more representative measure of the potential impact of a position on portfolio performance than value. The bond component will include any accrued interest amounts. |
| (j) | For the purpose of managing the fund’s duration, the fund holds treasury futures with a bond equivalent exposure of (3.2)%, which impacts the fund’s interest rate exposure but not its credit exposure. |
| (m) | In determining each instrument’s effective maturity for purposes of calculating the fund’s dollar-weighted average effective maturity, MFS uses the instrument’s stated maturity or, if applicable, an earlier date on which MFS believes it is probable that a maturity-shortening device (such as a put,pre-refunding or prepayment) will cause the instrument to be repaid. Such an earlier date can be substantially shorter than the instrument’s stated maturity. |
Cash & Cash Equivalents includes any cash, investments in money market funds, short-term securities, and other assets less liabilities. Please see the Statements of Assets and Liabilities for additional information related to the fund’s cash position and other assets and liabilities.
Other includes equivalent exposure from currency derivatives and/or any offsets to derivative positions and/or the leverage created through the issuance of self-deposited inverse floaters (and may be negative).
Percentages are based on net assets as of March 31, 2020.
The portfolio is actively managed and current holdings may be different.
8
Portfolio Composition – continued
MFS West Virginia Municipal Bond Fund
Portfolio structure (i)
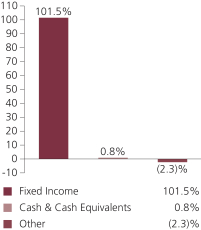
| | | | |
| Top five industries (i) | | | | |
| Healthcare Revenue – Hospitals | | | 20.1% | |
| Universities – Colleges | | | 14.3% | |
| Water & Sewer Utility Revenue | | | 12.8% | |
| Miscellaneous Revenue – Other | | | 10.3% | |
| State & Local Agencies | | | 7.7% | |
| | | | |
| Composition including fixed income credit quality (a)(i) | |
| AAA | | | 2.9% | |
| AA | | | 24.3% | |
| A | | | 46.3% | |
| BBB | | | 9.6% | |
| BB | | | 2.4% | |
| CC | | | 1.2% | |
| C | | | 3.1% | |
| D | | | 1.6% | |
| Not Rated | | | 10.1% | |
| Cash & Cash Equivalents | | | 0.8% | |
| Other | | | (2.3)% | |
| |
| Portfolio facts (i) | | | | |
| Average Duration (d) | | | 5.4 | |
| Average Effective Maturity (m) | | | 14.4 yrs. | |
| | | | |
| Jurisdiction (i) | | | | |
| West Virginia | | | 73.2% | |
| Puerto Rico | | | 9.2% | |
| Guam | | | 2.5% | |
| U.S. Treasury Securities (j) | | | 2.3% | |
| New York | | | 1.6% | |
| Illinois | | | 1.3% | |
| Florida | | | 1.3% | |
| U.S. Virgin Islands | | | 1.0% | |
| Kentucky | | | 1.0% | |
| Alabama | | | 0.9% | |
| Michigan | | | 0.9% | |
| South Carolina | | | 0.8% | |
| Texas | | | 0.8% | |
| North Carolina | | | 0.8% | |
| Tennessee | | | 0.6% | |
| Massachusetts | | | 0.6% | |
| Ohio | | | 0.6% | |
| California | | | 0.5% | |
| Maryland | | | 0.5% | |
| Indiana | | | 0.4% | |
| New Jersey | | | 0.2% | |
| Pennsylvania | | | 0.2% | |
| Virginia | | | 0.1% | |
| New Hampshire | | | 0.1% | |
| Mississippi | | | 0.1% | |
| (a) | For all securities other than those specifically described below, ratings are assigned to underlying securities utilizing ratings from Moody’s, Fitch, and Standard & Poor’s rating agencies and applying the following hierarchy: If all three agencies provide a rating, the middle rating (after dropping the highest and lowest ratings) is assigned; if two of the three agencies rate a security, the lower of the two is assigned. Ratings are shown in the S&P and Fitch scale (e.g., AAA). Securities rated BBB or higher are considered investment grade. All ratings are subject to change. Not Rated includes fixed income securities and fixed income derivatives, which have not been rated by any rating agency. The fund may or may not have held all of these instruments on this date. The fund is not rated by these agencies. |
| (d) | Duration is a measure of how much a bond’s price is likely to fluctuate with general changes in interest rates, e.g., if rates rise 1.00%, a bond with a5-year duration is likely to lose about 5.00% of its value due to the interest rate move. |
| (i) | For purposes of this presentation, the components include the value of securities, and reflect the impact of the equivalent exposure of derivative positions, if any. These amounts may be negative from time to time. Equivalent exposure is a calculated amount that translates the derivative position into a reasonable approximation of the amount of the underlying asset that the portfolio would have to hold at a given point in time to have the same price sensitivity that results from the portfolio’s ownership of the derivative contract. When dealing with derivatives, equivalent exposure is a more representative measure of the potential impact of a position on portfolio performance than value. The bond component will include any accrued interest amounts. |
| (j) | For the purpose of managing the fund’s duration, the fund holds treasury futures with a bond equivalent exposure of 2.3%, which reduce the fund’s interest rate exposure but not its credit exposure. |
| (m) | In determining each instrument’s effective maturity for purposes of calculating the fund’s dollar-weighted average effective maturity, MFS uses the instrument’s stated maturity or, if applicable, an earlier date on which MFS believes it is probable that a maturity-shortening device (such as a put,pre-refunding or prepayment) will cause the instrument to be repaid. Such an earlier date can be substantially shorter than the instrument’s stated maturity. |
Cash & Cash Equivalents includes any cash, investments in money market funds, short-term securities, and other assets less liabilities. Please see the Statements of Assets and Liabilities for additional information related to the fund’s cash position and other assets and liabilities.
Other includes equivalent exposure from currency derivatives and/or any offsets to derivative positions and may be negative.
Percentages are based on net assets as of March 31, 2020.
The portfolio is actively managed and current holdings may be different.
9
MANAGEMENT REVIEW
Summary of Results
For the twelve months ended March 31, 2020, Class A shares, at net asset value, of the municipal bond funds of Mississippi, New York, North Carolina, Pennsylvania, South Carolina, Tennessee, Virginia and West Virginia underperformed the Bloomberg Barclays Municipal Bond Index. The performance for the individual funds and the benchmark are set forth in the Performance Summary.
Market Environment
Market volatility soared at the end of the period asCOVID-19, the illness caused by the novel coronavirus first detected in China, spread around the world in early 2020. Government-imposed social distancing measures taken to slow the spread of the virus forced the shutdown of large portions of the global economy. In an attempt to limit the economic fallout from the crisis, central bankers and policymakers took a variety of actions, unprecedented in both size and speed, but despite their best efforts, a global recession has undoubtedly begun. Given the unique circumstances surrounding the genesis of the downturn, it is difficult to forecast how long the crisis will linger.
High levels of investor uncertainty saw equity prices plunge, market volatility rise and large segments of global fixed income markets freeze as investors sought liquidity wherever they could find it. Central banks around the world quickly put programs in place to improve liquidity, and they proved largely successful, helping to recover market function and ease volatility at the end of the period. Compounding market turmoil was an oil price war between Saudi Arabia and Russia over the size of production cuts amid a burgeoning supply glut as the global economy rapidly slowed. That action undercut oil exporters, many emerging markets and a large segment of the high-yield credit market.
As is often the case in a serious crisis, market vulnerabilities were revealed. For example, companies that added significant leverage to their balance sheets in recent years by borrowing to fund dividend payments and stock buybacks may find it difficult to follow that path in the future, and investors may not reward that behavior if they do. Very long supply chains designed to squeeze out every bit of savings may be shifted closer to home markets if companies seek to emphasize resiliency over cost after a series of supply disruptions. Consumer, business and government behavior could all be impacted by the after-effects of the global pandemic in ways it will be difficult to forecast.
Over the past year, municipal bonds delivered modest positive performance, fueled by lower US Treasury rates and supportive fundamentals and technicals for most of the period. Longer-duration and higher-quality segments of the market outperformed. Each sector produced modest positive performance, with sectors perceived as higher quality outperforming. The favorable backdrop for municipals changed abruptly in March, impacted by the economic slowdown associated with limiting the spread of the coronavirus. The revenues of municipalities were, and continue to be, affected by both declining tax receipts and the increased costs brought on by the response to the outbreak. The fundamentals of many sectors will be impacted by the slowdown. Federal assistance will help in the effort to meet the challenges; however, the selection of sectors and issuers will likely increase in importance over the coming months.
Factors Affecting Performance
In all funds, anout-of-benchmark exposure tonon-rated (r) securities weighed on performance relative to the Bloomberg Barclays Municipal Bond Index. The combination of security selection and a greater exposure to Puerto Rican bonds further held back relative performance across all funds.
In contrast, bond selection within thehealth caresector across all funds, and within theleasingsector in all funds, with the exception of the municipal bond funds of New York and Tennessee, benefited relative performance. Security selection within “AA” rated securities in all funds, with the exception of the municipal bond fund of New York, also aided relative results. Yield curve positioning (y), particularly a greater exposure to shifts in the long end of the yield curve, was another area of relative strength for all funds.
Respectfully,
Portfolio Manager(s)
Michael Dawson
| (r) | Bonds rated “BBB”, “Baa”, or higher are considered investment grade; bonds rated “BB”, “Ba”, or below are considerednon-investment grade. The sources for bond quality ratings are Moody’s Investors Service, Standard & Poor’s and Fitch, Inc. and are applied using the following hierarchy: If all three agencies provide a rating, the middle rating (after dropping the highest and lowest ratings) is assigned; if two of the three agencies rate a security, the lower of the two is assigned. Ratings are shown in the S&P and Fitch scale (e.g., AAA). For securities which are not rated by any of the three agencies, the security is considered Not Rated. |
| (y) | A yield curve graphically depicts the yields of different maturity bonds of the same credit quality and type; a normal yield curve is upward sloping, with short-term rates lower than long-term rates. |
10
Management Review – continued
The views expressed in this report are those of the portfolio manager(s) only through the end of the period of the report as stated on the cover and do not necessarily reflect the views of MFS or any other person in the MFS organization. These views are subject to change at any time based on market or other conditions, and MFS disclaims any responsibility to update such views. These views may not be relied upon as investment advice or an indication of trading intent on behalf of any MFS portfolio. References to specific securities are not recommendations of such securities, and may not be representative of any MFS portfolio’s current or future investments.
11
PERFORMANCE SUMMARY THROUGH 3/31/20
The following charts illustrate a representative class of each fund’s historical performance in comparison to its benchmark(s). Performance results include the deduction of the maximum applicable sales charge and reflect the percentage change in net asset value, including reinvestment of dividends and capital gains distributions. Each fund’s results have been compared to the Barclays Municipal Bond Index, a market capitalization-weighted index that measures the performance of the tax-exempt bond market. However, while this index is considered the benchmark for the performance of municipal bond funds, it is comprised of municipal bonds issued within the 50 states and the District of Columbia as well as U.S. territories and possessions such as Guam, Puerto Rico, and the Virgin Islands, while each of the funds invests a large percentage of its assets in municipal issuers of the state that is in the fund’s name. The performance of other share classes will be greater than or less than that of the class depicted below. Benchmarks are unmanaged and may not be invested in directly. Benchmark returns do not reflect sales charges, commissions or expenses. (See Notes to Performance Summary.)
Performance data shown represents past performance and is no guarantee of future results. Investment return and principal value fluctuate so your shares, when sold, may be worth more or less than the original cost; current performance may be lower or higher than quoted. The performance shown does not reflect the deduction of taxes, if any, that a shareholder would pay on fund distributions or the redemption of fund shares.
MFS Mississippi Municipal Bond Fund
Growth of a hypothetical $10,000 investment

Total returns through 3/31/20
Average annual without sales charge
| | | | | | | | | | | | | | |
| | | Share Class | | Class Inception Date | | 1-yr | | 5-yr | | 10-yr | | Life (t) | | |
| | | | | | | | |
| | | A | | 8/06/92 | | 2.80% | | 2.47% | | 3.44% | | N/A | | |
| | | | | | | | |
| | | B | | 9/07/93 | | 2.14% | | 1.80% | | 2.74% | | N/A | | |
| | | | | | | | |
| | | I | | 4/01/16 | | 2.79% | | N/A | | N/A | | 2.28% | | |
| | | R6 | | 8/01/17 | | 2.85% | | N/A | | N/A | | 2.69% | | |
| | | | | |
| Comparative benchmark(s) | | | | | | | | | | |
| | | Bloomberg Barclays Municipal Bond Index (f) | | 3.85% | | 3.19% | | 4.15% | | N/A | | |
| | | | | |
| Average annual with sales charge | | | | | | | | | | |
| | | A
With Initial Sales Charge (4.25%) | | (1.57)% | | 1.59% | | 2.99% | | N/A | | |
| | | B
With CDSC (Declining over six years from 4% to 0%) (v) | | (1.86)% | | 1.44% | | 2.74% | | N/A | | |
CDSC – Contingent Deferred Sales Charge.
Class I and R6 shares do not have a sales charge.
| (f) | Source: FactSet Research Systems Inc. |
| (t) | For the period from the class inception date through the stated period end (for those share classes with less than 10 years of performance history). No comparative benchmark performance information is provided for “life” periods. (See Notes to Performance Summary.) |
| (v) | Assuming redemption at the end of the applicable period. |
12
Performance Summary – continued
MFS New York Municipal Bond Fund
Growth of a hypothetical $10,000 investment
Total returns through 3/31/20
Average annual without sales charge
| | | | | | | | | | | | | | |
| | | Share Class | | Class Inception Date | | 1-yr | | 5-yr | | 10-yr | | Life (t) | | |
| | | | | | | | |
| | | A | | 6/06/88 | | 2.08% | | 2.79% | | 3.62% | | N/A | | |
| | | | | | | | |
| | | B | | 9/07/93 | | 1.32% | | 2.02% | | 2.85% | | N/A | | |
| | | | | | | | |
| | | C | | 12/11/00 | | 1.32% | | 2.02% | | 2.84% | | N/A | | |
| | | | | | | | |
| | | I | | 4/01/16 | | 2.25% | | N/A | | N/A | | 2.72% | | |
| | | R6 | | 8/01/17 | | 2.31% | | N/A | | N/A | | 2.84% | | |
| | | | | |
| Comparative benchmark(s) | | | | | | | | | | |
| | | Bloomberg Barclays Municipal Bond Index (f) | | 3.85% | | 3.19% | | 4.15% | | N/A | | |
| | | | | |
| Average annual with sales charge | | | | | | | | | | |
| | | A
With Initial Sales Charge (4.25%) | | (2.26)% | | 1.90% | | 3.17% | | N/A | | |
| | | B
With CDSC (Declining over six years from 4% to 0%) (v) | | (2.65)% | | 1.66% | | 2.85% | | N/A | | |
| | | C
With CDSC (1% for 12 months) (v) | | 0.32% | | 2.02% | | 2.84% | | N/A | | |
CDSC – Contingent Deferred Sales Charge.
Class I and R6 shares do not have a sales charge.
| (f) | Source: FactSet Research Systems Inc. |
| (t) | For the period from the class inception date through the stated period end (for those share classes with less than 10 years of performance history). No comparative benchmark performance information is provided for “life” periods. (See Notes to Performance Summary.) |
| (v) | Assuming redemption at the end of the applicable period. |
13
Performance Summary – continued
MFS North Carolina Municipal Bond Fund
Growth of a hypothetical $10,000 investment

Total returns through 3/31/20
Average annual without sales charge
| | | | | | | | | | | | | | |
| | | Share Class | | Class Inception Date | | 1-yr | | 5-yr | | 10-yr | | Life (t) | | |
| | | | | | | | |
| | | A | | 10/31/84 | | 1.55% | | 2.27% | | 3.30% | | N/A | | |
| | | | | | | | |
| | | B | | 9/07/93 | | 0.88% | | 1.52% | | 2.54% | | N/A | | |
| | | | | | | | |
| | | C | | 1/03/94 | | 0.88% | | 1.52% | | 2.54% | | N/A | | |
| | | | | | | | |
| | | I | | 4/01/16 | | 1.87% | | N/A | | N/A | | 2.27% | | |
| | | R6 | | 8/01/17 | | 1.94% | | N/A | | N/A | | 2.47% | | |
| | | | | |
| Comparative benchmark(s) | | | | | | | | | | |
| | | Bloomberg Barclays Municipal Bond Index (f) | | 3.85% | | 3.19% | | 4.15% | | N/A | | |
| | | | | |
| Average annual with sales charge | | | | | | | | | | |
| | | A
With Initial Sales Charge (4.25%) | | (2.76)% | | 1.39% | | 2.85% | | N/A | | |
| | | B
With CDSC (Declining over six years from 4% to 0%) (v) | | (3.07)% | | 1.16% | | 2.54% | | N/A | | |
| | | C
With CDSC (1% for 12 months) (v) | | (0.11)% | | 1.52% | | 2.54% | | N/A | | |
CDSC – Contingent Deferred Sales Charge.
Class I and R6 shares do not have a sales charge.
| (f) | Source: FactSet Research Systems Inc. |
| (t) | For the period from the class inception date through the stated period end (for those share classes with less than 10 years of performance history). No comparative benchmark performance information is provided for “life” periods. (See Notes to Performance Summary.) |
| (v) | Assuming redemption at the end of the applicable period. |
14
Performance Summary – continued
MFS Pennsylvania Municipal Bond Fund
Growth of a hypothetical $10,000 investment
Total returns through 3/31/20
Average annual without sales charge
| | | | | | | | | | | | | | |
| | | Share Class | | Class Inception Date | | 1-yr | | 5-yr | | 10-yr | | Life (t) | | |
| | | | | | | | |
| | | A | | 2/01/93 | | 2.97% | | 3.13% | | 3.90% | | N/A | | |
| | | | | | | | |
| | | B | | 9/07/93 | | 2.21% | | 2.36% | | 3.12% | | N/A | | |
| | | | | | | | |
| | | I | | 4/01/16 | | 3.06% | | N/A | | N/A | | 3.00% | | |
| | | R6 | | 8/01/17 | | 3.13% | | N/A | | N/A | | 3.31% | | |
| | | | | |
| Comparative benchmark(s) | | | | | | | | | | |
| | | Bloomberg Barclays Municipal Bond Index (f) | | 3.85% | | 3.19% | | 4.15% | | N/A | | |
| | | | | |
| Average annual with sales charge | | | | | | | | | | |
| | | A
With Initial Sales Charge (4.25%) | | (1.40)% | | 2.24% | | 3.45% | | N/A | | |
| | | B
With CDSC (Declining over six years from 4% to 0%) (v) | | (1.78)% | | 2.00% | | 3.12% | | N/A | | |
CDSC – Contingent Deferred Sales Charge.
Class I and R6 shares do not have a sales charge.
| (f) | Source: FactSet Research Systems Inc. |
| (t) | For the period from the class inception date through the stated period end (for those share classes with less than 10 years of performance history). No comparative benchmark performance information is provided for “life” periods. (See Notes to Performance Summary.) |
| (v) | Assuming redemption at the end of the applicable period. |
15
Performance Summary – continued
MFS South Carolina Municipal Bond Fund
Growth of a hypothetical $10,000 investment
Total returns through 3/31/20
Average annual without sales charge
| | | | | | | | | | | | | | |
| | | Share Class | | Class Inception Date | | 1-yr | | 5-yr | | 10-yr | | Life (t) | | |
| | | | | | | | |
| | | A | | 10/31/84 | | 2.44% | | 2.42% | | 3.22% | | N/A | | |
| | | | | | | | |
| | | B | | 9/07/93 | | 1.59% | | 1.66% | | 2.44% | | N/A | | |
| | | | | | | | |
| | | I | | 4/01/16 | | 2.63% | | N/A | | N/A | | 2.42% | | |
| | | R6 | | 8/01/17 | | 2.68% | | N/A | | N/A | | 2.81% | | |
| | | | | |
| Comparative benchmark(s) | | | | | | | | | | |
| | | Bloomberg Barclays Municipal Bond Index (f) | | 3.85% | | 3.19% | | 4.15% | | N/A | | |
| | | | | |
| Average annual with sales charge | | | | | | | | | | |
| | | A
With Initial Sales Charge (4.25%) | | (1.92)% | | 1.54% | | 2.77% | | N/A | | |
| | | B
With CDSC (Declining over six years from 4% to 0%) (v) | | (2.39)% | | 1.30% | | 2.44% | | N/A | | |
CDSC – Contingent Deferred Sales Charge.
Class I and R6 shares do not have a sales charge.
| (f) | Source: FactSet Research Systems Inc. |
| (t) | For the period from the class inception date through the stated period end (for those share classes with less than 10 years of performance history). No comparative benchmark performance information is provided for “life” periods. (See Notes to Performance Summary.) |
| (v) | Assuming redemption at the end of the applicable period. |
16
Performance Summary – continued
MFS Tennessee Municipal Bond Fund
Growth of a hypothetical $10,000 investment
Total returns through 3/31/20
Average annual without sales charge
| | | | | | | | | | | | | | |
| | | Share Class | | Class Inception Date | | 1-yr | | 5-yr | | 10-yr | | Life (t) | | |
| | | | | | | | |
| | | A | | 8/12/88 | | 1.13% | | 2.16% | | 3.14% | | N/A | | |
| | | | | | | | |
| | | B | | 9/07/93 | | 0.48% | | 1.43% | | 2.39% | | N/A | | |
| | | | | | | | |
| | | I | | 4/01/16 | | 1.46% | | N/A | | N/A | | 2.13% | | |
| | | R6 | | 8/01/17 | | 1.54% | | N/A | | N/A | | 2.30% | | |
| | | | | |
| Comparative benchmark(s) | | | | | | | | | | |
| | | Bloomberg Barclays Municipal Bond Index (f) | | 3.85% | | 3.19% | | 4.15% | | N/A | | |
| | | | | |
| Average annual with sales charge | | | | | | | | | | |
| | | A
With Initial Sales Charge (4.25%) | | (3.17)% | | 1.28% | | 2.69% | | N/A | | |
| | | B
With CDSC (Declining over six years from 4% to 0%) (v) | | (3.45)% | | 1.06% | | 2.39% | | N/A | | |
CDSC – Contingent Deferred Sales Charge.
Class I and R6 shares do not have a sales charge.
| (f) | Source: FactSet Research Systems Inc. |
| (t) | For the period from the class inception date through the stated period end (for those share classes with less than 10 years of performance history). No comparative benchmark performance information is provided for “life” periods. (See Notes to Performance Summary.) |
| (v) | Assuming redemption at the end of the applicable period. |
17
Performance Summary – continued
MFS Virginia Municipal Bond Fund
Growth of a hypothetical $10,000 investment
Total returns through 3/31/20
Average annual without sales charge
| | | | | | | | | | | | | | |
| | | Share Class | | Class Inception Date | | 1-yr | | 5-yr | | 10-yr | | Life (t) | | |
| | | | | | | | |
| | | A | | 10/31/84 | | 2.22% | | 2.56% | | 3.32% | | N/A | | |
| | | | | | | | |
| | | B | | 9/07/93 | | 1.46% | | 1.78% | | 2.54% | | N/A | | |
| | | | | | | | |
| | | C | | 1/03/94 | | 1.36% | | 1.77% | | 2.54% | | N/A | | |
| | | | | | | | |
| | | I | | 4/01/16 | | 2.47% | | N/A | | N/A | | 2.47% | | |
| | | R6 | | 8/01/17 | | 2.55% | | N/A | | N/A | | 2.84% | | |
| | | | |
| Comparative benchmark(s) | | | | | | | | |
| | | Bloomberg Barclays Municipal Bond Index (f) | | 3.85% | | 3.19% | | 4.15% | | N/A | | |
| | | | | |
| Average annual with sales charge | | | | | | | | | | |
| | | A
With Initial Sales Charge (4.25%) | | (2.13)% | | 1.67% | | 2.87% | | N/A | | |
| | | B
With CDSC (Declining over six years from 4% to 0%) (v) | | (2.52)% | | 1.41% | | 2.54% | | N/A | | |
| | | C
With CDSC (1% for 12 months) (v) | | 0.37% | | 1.77% | | 2.54% | | N/A | | |
CDSC – Contingent Deferred Sales Charge.
Class I and R6 shares do not have a sales charge.
| (f) | Source: FactSet Research Systems Inc. |
| (t) | For the period from the class inception date through the stated period end (for those share classes with less than 10 years of performance history). No comparative benchmark performance information is provided for “life” periods. (See Notes to Performance Summary.) |
| (v) | Assuming redemption at the end of the applicable period. |
18
Performance Summary – continued
MFS West Virginia Municipal Bond Fund
Growth of a hypothetical $10,000 investment
Total returns through 3/31/20
Average annual without sales charge
| | | | | | | | | | | | | | |
| | | Share Class | | Class Inception Date | | 1-yr | | 5-yr | | 10-yr | | Life (t) | | |
| | | | | | | | |
| | | A | | 10/31/84 | | 2.75% | | 2.44% | | 3.32% | | N/A | | |
| | | | | | | | |
| | | B | | 9/07/93 | | 1.98% | | 1.69% | | 2.56% | | N/A | | |
| | | | | | | | |
| | | I | | 4/01/16 | | 2.95% | | N/A | | N/A | | 2.51% | | |
| | | R6 | | 8/01/17 | | 3.02% | | N/A | | N/A | | 2.85% | | |
| | |
| Comparative benchmark(s) | | | | |
| | | Bloomberg Barclays Municipal Bond Index (f) | | 3.85% | | 3.19% | | 4.15% | | N/A | | |
| | | | | |
| Average annual with sales charge | | | | | | | | | | |
| | | A
With Initial Sales Charge (4.25%) | | (1.62)% | | 1.55% | | 2.87% | | N/A | | |
| | | B
With CDSC (Declining over six years from 4% to 0%) (v) | | (2.00)% | | 1.33% | | 2.56% | | N/A | | |
CDSC – Contingent Deferred Sales Charge.
Class I and R6 shares do not have a sales charge.
| (f) | Source: FactSet Research Systems Inc. |
| (t) | For the period from the class inception date through the stated period end (for those share classes with less than 10 years of performance history). No comparative benchmark performance information is provided for “life” periods. (See Notes to Performance Summary.) |
| (v) | Assuming redemption at the end of the applicable period. |
Benchmark Definition(s)
Bloomberg Barclays Municipal Bond Index – a market capitalization-weighted index that measures the performance of thetax-exempt bond market. BLOOMBERG® is a trademark and service mark of Bloomberg Finance L.P. and its affiliates (collectively “Bloomberg”). BARCLAYS® is a trademark and service mark of Barclays Bank Plc (collectively with its affiliates, “Barclays”), used under license. Bloomberg or Bloomberg’s licensors, including Barclays, own all proprietary rights in the Bloomberg Barclays Indices. Neither Bloomberg nor Barclays approves or endorses this material, or guarantees the accuracy or completeness of any information herein, or makes any warranty, express or implied, as to the results to be obtained therefrom, and, to the maximum extent allowed by law, neither shall have any liability or responsibility for injury or damages arising in connection therewith.
It is not possible to invest directly in an index.
Notes to Performance Summary
Average annual total return represents the average annual change in value for each share class for the periods presented. Life returns are presented where the share class has less than 10 years of performance history and represent the average annual total return
19
Performance Summary – continued
from the class inception date to the stated period end date. As the fund’s share classes may have different inception dates, the life returns may represent different time periods and may not be comparable. As a result, no comparative benchmark performance information is provided for life periods.
Performance results reflect any applicable expense subsidies and waivers in effect during the periods shown. Without such subsidies and waivers each fund’s performance results would be less favorable. Please see the prospectus and financial statements for complete details.
Performance results do not include adjustments made for financial reporting purposes in accordance with U.S. generally accepted accounting principles and may differ from amounts reported in the financial highlights.
A portion of income may be subject to state, federal, and/or alternative minimum tax. Capital gains, if any, are subject to a capital gains tax.
From time to time the funds may receive proceeds from litigation settlements, without which performance would be lower.
20
EXPENSE TABLES
Fund expenses borne by the shareholders during the period, October 1, 2019 through March 31, 2020
As a shareholder of the funds, you incur two types of costs: (1) transaction costs, including sales charges (loads) on certain purchase or redemption payments, and (2) ongoing costs, including management fees; distribution and service(12b-1) fees; and other fund expenses. These examples are intended to help you understand your ongoing costs (in dollars) of investing in the funds and to compare these costs with the ongoing costs of investing in other mutual funds.
These examples are based on an investment of $1,000 invested at the beginning of the period and held for the entire period October 1, 2019 through March 31, 2020.
Actual Expenses
The first line for each share class in the following tables provides information about actual account values and actual expenses. You may use the information in this line, together with the amount you invested, to estimate the expenses that you paid over the period. Simply divide your account value by $1,000 (for example, an $8,600 account value divided by $1,000 = 8.6), then multiply the result by the number in the first line under the heading entitled “Expenses Paid During Period” to estimate the expenses you paid on your account during this period.
Hypothetical Example for Comparison Purposes
The second line for each share class in the following tables provides information about hypothetical account values and hypothetical expenses based on each fund’s actual expense ratio and an assumed rate of return of 5% per year before expenses, which is not each fund’s actual return. The hypothetical account values and expenses may not be used to estimate the actual ending account balance or expenses you paid for the period. You may use this information to compare the ongoing costs of investing in each fund and other funds. To do so, compare this 5% hypothetical example with the 5% hypothetical examples that appear in the shareholder reports of the other funds.
Please note that the expenses shown in the tables are meant to highlight your ongoing costs only and do not reflect any transactional costs, such as sales charges (loads). Therefore, the second line for each share class in the tables is useful in comparing ongoing costs only, and will not help you determine the relative total costs of owning different funds. In addition, if these transactional costs were included, your costs would have been higher.
MFS MISSISSIPPI MUNICIPAL BOND FUND
| | | | | | | | | | | | | | | | | | |
Share
Class | | | | Annualized
Expense
Ratio | | | Beginning
Account Value
10/01/19 | | | Ending
Account Value
3/31/20 | | | Expenses Paid During
Period (p) 10/01/19-3/31/20 | |
| A | | Actual | | | 0.81% | | | | $1,000.00 | | | | $992.72 | | | | $4.04 | |
| | Hypothetical (h) | | | 0.81% | | | | $1,000.00 | | | | $1,020.95 | | | | $4.09 | |
| B | | Actual | | | 1.46% | | | | $1,000.00 | | | | $988.53 | | | | $7.26 | |
| | Hypothetical (h) | | | 1.46% | | | | $1,000.00 | | | | $1,017.70 | | | | $7.36 | |
| I | | Actual | | | 0.71% | | | | $1,000.00 | | | | $992.14 | | | | $3.54 | |
| | Hypothetical (h) | | | 0.71% | | | | $1,000.00 | | | | $1,021.45 | | | | $3.59 | |
| R6 | | Actual | | | 0.64% | | | | $1,000.00 | | | | $992.39 | | | | $3.19 | |
| | Hypothetical (h) | | | 0.64% | | | | $1,000.00 | | | | $1,021.80 | | | | $3.23 | |
| | (h) | 5% class return per year before expenses. |
| | (p) | “Expenses Paid During Period” are equal to each class’s annualized expense ratio, as shown above, multiplied by the average account value over the period, multiplied by 183/366 (to reflect theone-half year period). Expenses paid do not include any applicable sales charges (loads). If these transaction costs had been included, your costs would have been higher. |
21
Expense Tables – continued
MFS NEW YORK MUNICIPAL BOND FUND
| | | | | | | | | | | | | | | | | | |
Share Class | | | | Annualized
Expense
Ratio | | | Beginning
Account Value
10/01/19 | | | Ending Account Value
3/31/20 | | | Expenses Paid During
Period (p) 10/01/19-3/31/20 | |
| A | | Actual | | | 0.87% | | | | $1,000.00 | | | | $980.58 | | | | $4.31 | |
| | Hypothetical (h) | | | 0.87% | | | | $1,000.00 | | | | $1,020.65 | | | | $4.39 | |
| B | | Actual | | | 1.63% | | | | $1,000.00 | | | | $976.83 | | | | $8.06 | |
| | Hypothetical (h) | | | 1.63% | | | | $1,000.00 | | | | $1,016.85 | | | | $8.22 | |
| C | | Actual | | | 1.63% | | | | $1,000.00 | | | | $975.98 | | | | $8.05 | |
| | Hypothetical (h) | | | 1.63% | | | | $1,000.00 | | | | $1,016.85 | | | | $8.22 | |
| I | | Actual | | | 0.63% | | | | $1,000.00 | | | | $980.61 | | | | $3.12 | |
| | Hypothetical (h) | | | 0.63% | | | | $1,000.00 | | | | $1,021.85 | | | | $3.18 | |
| R6 | | Actual | | | 0.55% | | | | $1,000.00 | | | | $980.97 | | | | $2.72 | |
| | Hypothetical (h) | | | 0.55% | | | | $1,000.00 | | | | $1,022.25 | | | | $2.78 | |
MFS NORTH CAROLINA MUNICIPAL BOND FUND
| | | | | | | | | | | | | | | | | | |
Share Class | | | | Annualized
Expense Ratio | | | Beginning
Account Value
10/01/19 | | | Ending Account Value
3/31/20 | | | Expenses Paid During
Period (p) 10/01/19-3/31/20 | |
| A | | Actual | | | 0.84% | | | | $1,000.00 | | | | $978.85 | | | | $4.16 | |
| | Hypothetical (h) | | | 0.84% | | | | $1,000.00 | | | | $1,020.80 | | | | $4.24 | |
| B | | Actual | | | 1.59% | | | | $1,000.00 | | | | $975.99 | | | | $7.85 | |
| | Hypothetical (h) | | | 1.59% | | | | $1,000.00 | | | | $1,017.05 | | | | $8.02 | |
| C | | Actual | | | 1.59% | | | | $1,000.00 | | | | $975.97 | | | | $7.85 | |
| | Hypothetical (h) | | | 1.59% | | | | $1,000.00 | | | | $1,017.05 | | | | $8.02 | |
| I | | Actual | | | 0.59% | | | | $1,000.00 | | | | $981.36 | | | | $2.92 | |
| | Hypothetical (h) | | | 0.59% | | | | $1,000.00 | | | | $1,022.05 | | | | $2.98 | |
| R6 | | Actual | | | 0.52% | | | | $1,000.00 | | | | $981.73 | | | | $2.58 | |
| | Hypothetical (h) | | | 0.52% | | | | $1,000.00 | | | | $1,022.40 | | | | $2.63 | |
| | (h) | 5% class return per year before expenses. |
| | (p) | “Expenses Paid During Period” are equal to each class’s annualized expense ratio, as shown above, multiplied by the average account value over the period, multiplied by 183/366 (to reflect theone-half year period). Expenses paid do not include any applicable sales charges (loads). If these transaction costs had been included, your costs would have been higher. |
Notes to Expense Table
For the MFS North Carolina Municipal Bond Fund, each class with a Rule12b-1 service fee is subject to a rebate of a portion of such fee. Such rebates are included in the expense ratios above and are outside of the expense limitation arrangement. For Class A shares, this rebate reduced the expense ratio above by 0.01%. See Note 3 in the Notes to Financial Statements for additional information.
22
Expense Tables – continued
MFS PENNSYLVANIA MUNICIPAL BOND FUND
| | | | | | | | | | | | | | | | | | |
Share Class | | | | Annualized
Expense Ratio | | | Beginning
Account Value
10/01/19 | | | Ending Account Value
3/31/20 | | | Expenses Paid During
Period (p) 10/01/19-3/31/20 | |
| A | | Actual | | | 0.78% | | | | $1,000.00 | | | | $987.98 | | | | $3.88 | |
| | Hypothetical (h) | | | 0.78% | | | | $1,000.00 | | | | $1,021.10 | | | | $3.94 | |
| B | | Actual | | | 1.53% | | | | $1,000.00 | | | | $984.40 | | | | $7.59 | |
| | Hypothetical (h) | | | 1.53% | | | | $1,000.00 | | | | $1,017.35 | | | | $7.72 | |
| I | | Actual | | | 0.68% | | | | $1,000.00 | | | | $989.13 | | | | $3.38 | |
| | Hypothetical (h) | | | 0.68% | | | | $1,000.00 | | | | $1,021.60 | | | | $3.44 | |
| R6 | | Actual | | | 0.60% | | | | $1,000.00 | | | | $989.51 | | | | $2.98 | |
| | Hypothetical (h) | | | 0.60% | | | | $1,000.00 | | | | $1,022.00 | | | | $3.03 | |
MFS SOUTH CAROLINA MUNICIPAL BOND FUND
| | | | | | | | | | | | | | | | | | |
Share Class | | | | Annualized
Expense Ratio | | | Beginning
Account Value
10/01/19 | | | Ending Account Value
3/31/20 | | | Expenses Paid During
Period (p) 10/01/19-3/31/20 | |
| A | | Actual | | | 0.84% | | | | $1,000.00 | | | | $989.48 | | | | $4.18 | |
| | Hypothetical (h) | | | 0.84% | | | | $1,000.00 | | | | $1,020.80 | | | | $4.24 | |
| B | | Actual | | | 1.59% | | | | $1,000.00 | | | | $985.79 | | | | $7.89 | |
| | Hypothetical (h) | | | 1.59% | | | | $1,000.00 | | | | $1,017.05 | | | | $8.02 | |
| I | | Actual | | | 0.59% | | | | $1,000.00 | | | | $990.37 | | | | $2.94 | |
| | Hypothetical (h) | | | 0.59% | | | | $1,000.00 | | | | $1,022.05 | | | | $2.98 | |
| R6 | | Actual | | | 0.53% | | | | $1,000.00 | | | | $990.67 | | | | $2.64 | |
| | Hypothetical (h) | | | 0.53% | | | | $1,000.00 | | | | $1,022.35 | | | | $2.68 | |
MFS TENNESSEE MUNICIPAL BOND FUND
| | | | | | | | | | | | | | | | | | |
Share Class | | | | Annualized
Expense Ratio | | | Beginning
Account Value
10/01/19 | | | Ending Account Value
3/31/20 | | | Expenses Paid During
Period (p) 10/01/19-3/31/20 | |
| A | | Actual | | | 0.86% | | | | $1,000.00 | | | | $978.28 | | | | $4.25 | |
| | Hypothetical (h) | | | 0.86% | | | | $1,000.00 | | | | $1,020.70 | | | | $4.34 | |
| B | | Actual | | | 1.61% | | | | $1,000.00 | | | | $975.62 | | | | $7.95 | |
| | Hypothetical (h) | | | 1.61% | | | | $1,000.00 | | | | $1,016.95 | | | | $8.12 | |
| I | | Actual | | | 0.61% | | | | $1,000.00 | | | | $980.09 | | | | $3.02 | |
| | Hypothetical (h) | | | 0.61% | | | | $1,000.00 | | | | $1,021.95 | | | | $3.08 | |
| R6 | | Actual | | | 0.54% | | | | $1,000.00 | | | | $979.41 | | | | $2.67 | |
| | Hypothetical (h) | | | 0.54% | | | | $1,000.00 | | | | $1,022.30 | | | | $2.73 | |
| | (h) | 5% class return per year before expenses. |
| | (p) | “Expenses Paid During Period” are equal to each class’s annualized expense ratio, as shown above, multiplied by the average account value over the period, multiplied by 183/366 (to reflect theone-half year period). Expenses paid do not include any applicable sales charges (loads). If these transaction costs had been included, your costs would have been higher. |
23
Expense Tables – continued
MFS VIRGINIA MUNICIPAL BOND FUND
| | | | | | | | | | | | | | | | | | |
Share Class | | | | Annualized
Expense Ratio | | | Beginning
Account Value
10/01/19 | | | Ending Account Value
3/31/20 | | | Expenses Paid During
Period (p) 10/01/19-3/31/20 | |
| A | | Actual | | | 0.84% | | | | $1,000.00 | | | | $985.97 | | | | $4.17 | |
| | Hypothetical (h) | | | 0.84% | | | | $1,000.00 | | | | $1,020.80 | | | | $4.24 | |
| B | | Actual | | | 1.59% | | | | $1,000.00 | | | | $982.29 | | | | $7.88 | |
| | Hypothetical (h) | | | 1.59% | | | | $1,000.00 | | | | $1,017.05 | | | | $8.02 | |
| C | | Actual | | | 1.59% | | | | $1,000.00 | | | | $981.39 | | | | $7.88 | |
| | Hypothetical (h) | | | 1.59% | | | | $1,000.00 | | | | $1,017.05 | | | | $8.02 | |
| I | | Actual | | | 0.59% | | | | $1,000.00 | | | | $987.09 | | | | $2.93 | |
| | Hypothetical (h) | | | 0.59% | | | | $1,000.00 | | | | $1,022.05 | | | | $2.98 | |
| R6 | | Actual | | | 0.51% | | | | $1,000.00 | | | | $987.51 | | | | $2.53 | |
| | Hypothetical (h) | | | 0.51% | | | | $1,000.00 | | | | $1,022.45 | | | | $2.58 | |
MFS WEST VIRGINIA MUNICIPAL BOND FUND
| | | | | | | | | | | | | | | | | | |
Share Class | | | | Annualized
Expense Ratio | | | Beginning
Account Value
10/01/19 | | | Ending Account Value
3/31/20 | | | Expenses Paid During
Period (p) 10/01/19-3/31/20 | |
| A | | Actual | | | 0.86% | | | | $1,000.00 | | | | $993.92 | | | | $4.29 | |
| | Hypothetical (h) | | | 0.86% | | | | $1,000.00 | | | | $1,020.70 | | | | $4.34 | |
| B | | Actual | | | 1.62% | | | | $1,000.00 | | | | $990.18 | | | | $8.06 | |
| | Hypothetical (h) | | | 1.62% | | | | $1,000.00 | | | | $1,016.90 | | | | $8.17 | |
| I | | Actual | | | 0.62% | | | | $1,000.00 | | | | $995.34 | | | | $3.09 | |
| | Hypothetical (h) | | | 0.62% | | | | $1,000.00 | | | | $1,021.90 | | | | $3.13 | |
| R6 | | Actual | | | 0.54% | | | | $1,000.00 | | | | $994.68 | | | | $2.69 | |
| | Hypothetical (h) | | | 0.54% | | | | $1,000.00 | | | | $1,022.30 | | | | $2.73 | |
| | (h) | 5% class return per year before expenses. |
| | (p) | “Expenses Paid During Period” are equal to each class’s annualized expense ratio, as shown above, multiplied by the average account value over the period, multiplied by 183/366 (to reflect theone-half year period). Expenses paid do not include any applicable sales charges (loads). If these transaction costs had been included, your costs would have been higher. |
Notes to Expense Table
For the MFS Virginia Municipal Bond Fund, expense ratios include 0.03% of investment related expenses from self-deposited inverse floaters (See Note 2 of the Notes to Financial Statements) that are outside of the expense limitation arrangement (See Note 3 of the Notes to Financial Statements).
For the MFS West Virginia Municipal Bond Fund, each class with a Rule12b-1 service fee is subject to a rebate of a portion of such fee. Such rebates are included in the expense ratios above and are outside of the expense limitation arrangement. For Class A shares, this rebate reduced the expense ratio above by 0.01%. See Note 3 in the Notes to Financial Statements for additional information.
24
PORTFOLIO OF INVESTMENTS
3/31/20
MFS MISSISSIPPI MUNICIPAL BOND FUND
The Portfolio of Investments is a complete list of all securities owned by your fund. It is categorized by broad-based asset classes.
| | | | | | | | |
| Municipal Bonds - 98.0% | | | | | | |
| | | | | | | | |
| | |
| Issuer | | Shares/Par | | | Value ($) | |
| Airport Revenue - 1.1% | |
| Dallas and Fort Worth, TX, International Airport Rev., “B”, 5%, 11/01/2044 | | $ | 115,000 | | | $ | 121,831 | |
| Dallas and Fort Worth, TX, International Airport Rev., “C”, 5%, 11/01/2045 | | | 75,000 | | | | 77,985 | |
| San Francisco, CA, City & County Airports Commission, International Airport Rev., “H”, 5%, 5/01/2021 | | | 500,000 | | | | 517,640 | |
| Wayne County, MI, Airport Authority Rev. (Detroit Metropolitan Wayne County Airport), “B”, 5%, 12/01/2044 | | | 45,000 | | | | 49,856 | |
| Wayne County, MI, Airport Authority Rev. (Detroit Metropolitan Wayne County Airport), “B”, BAM, 5%, 12/01/2039 | | | 230,000 | | | | 256,535 | |
| Wayne County, MI, Airport Authority Rev. (Detroit Metropolitan Wayne County Airport), “C”, 5%, 12/01/2039 | | | 35,000 | | | | 38,469 | |
| Wayne County, MI, Airport Authority Rev. (Detroit Metropolitan Wayne County Airport), “C”, 5%, 12/01/2044 | | | 60,000 | | | | 65,644 | |
| | | | | | | $ | 1,127,960 | |
| General Obligations - General Purpose - 21.2% | |
| Biloxi, MS, Development Bank Special Obligation, 4%, 3/01/2037 | | $ | 500,000 | | | $ | 572,215 | |
| Bridgeview, IL, Stadium and Redevelopment Projects, AAC, 5.14%, 12/01/2036 | | | 220,000 | | | | 203,095 | |
| Canton, MS, Mississippi Development Bank Special Obligation, “A”, AGM, 5.75%, 10/01/2031 (Prerefunded 10/01/2021) | | | 625,000 | | | | 667,362 | |
| Chicago, IL, “A”, 5.5%, 1/01/2033 | | | 115,000 | | | | 119,632 | |
| Chicago, IL, “D”, 5.5%, 1/01/2040 | | | 20,000 | | | | 20,597 | |
| Chicago, IL, “F”, 5.5%, 1/01/2042 | | | 135,000 | | | | 138,730 | |
| Chicago, IL, General Obligation (Neighborhood Alive 21 Program), “B”, 5.5%, 1/01/2037 | | | 45,000 | | | | 46,537 | |
| Chicago, IL, General Obligation Refunding Project, “A”, 5.25%, 1/01/2030 | | | 30,000 | | | | 30,727 | |
| Commonwealth of Puerto Rico, General Obligation, “A”, 8%, 7/01/2035 (a)(d) | | | 1,025,000 | | | | 615,000 | |
| Commonwealth of Puerto Rico, Public Improvement, AGM, 5.25%, 7/01/2020 | | | 400,000 | | | | 401,988 | |
| Hattiesburg, MS, Development Bank Special Obligation, 5.25%, 2/01/2049 | | | 750,000 | | | | 918,540 | |
| Mississippi Development Bank Special Obligation (Harrison County Coliseum), “A”, 5.25%, 1/01/2034 | | | 1,000,000 | | | | 1,337,530 | |
| Mississippi Development Bank Special Obligation (Hinds County), 5%, 11/01/2032 | | | 500,000 | | | | 608,435 | |
| Mississippi Development Bank Special Obligation (Hinds County), 4%, 11/01/2042 | | | 500,000 | | | | 554,550 | |
| Mississippi Development Bank Special Obligation (Rankin County), 5%, 3/01/2031 | | | 1,000,000 | | | | 1,211,810 | |
| | | | | | | | |
| | | | | | | |
| | |
| Issuer | | Shares/Par | | | Value ($) | |
| General Obligations - General Purpose - continued | |
| Mississippi Development Bank Special Obligation (Rankin County), 5%, 3/01/2032 | | $ | 1,000,000 | | | $ | 1,209,220 | |
| Mississippi Development Bank Special Obligation (Vicksburg, Mississippi Sports Complex General Obligation Bond Project), BAM, 5%, 7/01/2048 | | | 1,000,000 | | | | 1,185,460 | |
| Mississippi General Obligation (Capital Improvements Project), “A”, 5%, 10/01/2036 | | | 1,000,000 | | | | 1,058,220 | |
| Mississippi General Obligation, “A”, 5%, 11/01/2034 | | | 1,010,000 | | | | 1,213,485 | |
| Mississippi General Obligation, “B”, 3%, 10/01/2035 | | | 875,000 | | | | 930,860 | |
| Puerto Rico Public Buildings Authority Rev.,“M-2”, AAC, 10%, 7/01/2035 | | | 150,000 | | | | 162,873 | |
| State of Mississippi, “A”, 5%, 10/01/2033 | | | 1,000,000 | | | | 1,231,640 | |
| State of Mississippi, “A”, 5%, 11/01/2036 | | | 1,000,000 | | | | 1,195,390 | |
| State of Mississippi, “B”, 5%, 12/01/2033 | | | 1,000,000 | | | | 1,206,820 | |
| State of Mississippi, “B”, 4%, 10/01/2036 | | | 1,000,000 | | | | 1,150,630 | |
| State of Mississippi, “B”, 4%, 10/01/2038 | | | 1,000,000 | | | | 1,137,920 | |
| State of Mississippi, “D”, 4%, 12/01/2030 | | | 1,000,000 | | | | 1,161,200 | |
| State of Mississippi, Capital Improvement Projects, “A”, 5%, 10/01/2030 (Prerefunded 10/01/2021) | | | 1,000,000 | | | | 1,058,220 | |
| | | | | | | $ | 21,348,686 | |
| General Obligations - Schools - 11.9% | |
| Berks County, PA, Reading School District, AGM, 5%, 3/01/2036 | | $ | 20,000 | | | $ | 23,715 | |
| Clinton, MS, Development Bank Special Obligation (Public School District General Obligation Project), 4%, 4/01/2036 | | | 500,000 | | | | 573,835 | |
Lamar County, MS, School District,
5%, 9/01/2031 (Prerefunded 9/01/2023) | | | 1,095,000 | | | | 1,235,335 | |
| Mississippi Development Bank Special Obligation (Canton Public School District), AGM, 5%, 12/01/2031 | | | 1,000,000 | | | | 1,172,580 | |
| Mississippi Development Bank Special Obligation (Clinton Public School District), 4%, 4/01/2037 | | | 500,000 | | | | 572,260 | |
| Mississippi Development Bank Special Obligation (Gulfport School District), BAM, 5%, 4/01/2031 | | | 500,000 | | | | 564,340 | |
| Mississippi Development Bank Special Obligation (Gulfport School District), BAM, 5%, 4/01/2032 | | | 500,000 | | | | 563,625 | |
Mississippi Development Bank Special Obligation (Hinds County School District),
5%, 3/01/2043 | | | 450,000 | | | | 538,456 | |
| Mississippi Development Bank Special Obligation (Jackson Public School District), BAM, 5.25%, 10/01/2037 | | | 1,000,000 | | | | 1,240,780 | |
25
Portfolio of Investments – continued
| | | | | | | | |
| Municipal Bonds - continued | | | | | | |
| | | | | | | | |
| | |
| Issuer | | Shares/Par | | | Value ($) | |
| General Obligations - Schools - continued | |
| Mississippi Development Bank Special Obligation (Vicksburg Warren School District General Obligation Project), BAM, 5%, 3/01/2048 | | $ | 1,500,000 | | | $ | 1,799,130 | |
| Natchez-Adams, MS, School District Trust Certificates, 5%, 2/01/2025 | | | 470,000 | | | | 540,077 | |
| Natchez-Adams, MS, School District Trust Certificates, 5%, 2/01/2030 | | | 1,245,000 | | | | 1,576,158 | |
| Rankin County, MS, Development Bank Special Obligation (School District General Obligation Project), 4%, 6/01/2043 | | | 750,000 | | | | 829,605 | |
| San Diego, CA, Unified School District (Election of 2008), Capital Appreciation, “C”, 0%, 7/01/2035 | | | 1,020,000 | | | | 726,505 | |
| | | | | | | $ | 11,956,401 | |
| Healthcare Revenue - Hospitals - 11.0% | |
| Chattanooga, TN, Health, Educational & Housing Facility Board Rev. (CommonSpirit Health),“A-1”, 4%, 8/01/2044 | | $ | 10,000 | | | $ | 9,972 | |
| Chattanooga, TN, Health, Educational & Housing Facility Board Rev. (CommonSpirit Health),“A-2”, 5%, 8/01/2044 | | | 10,000 | | | | 10,766 | |
| Chattanooga, TN, Health, Educational & Housing Facility Board Rev. (CommonSpirit Health),“A-2”, 5%, 8/01/2049 | | | 5,000 | | | | 5,306 | |
| Colorado Health Facilities Authority Rev. (CommonSpirit Health),“A-2”, 4%, 8/01/2044 | | | 50,000 | | | | 49,861 | |
| Gulfport, MS, Hospital Facilities Rev. (Memorial Hospital at Gulfport Project), 5%, 7/01/2027 | | | 500,000 | | | | 581,620 | |
| Kentucky Economic Development Finance Authority Hospital Rev. (Owensboro Medical Health System, Inc.), “A”, 6.375%, 6/01/2040 (Prerefunded 6/01/2020) | | | 380,000 | | | | 383,181 | |
| Massachusetts Development Finance Agency Rev. (Partners Healthcare System Issue), “S”, 4%, 7/01/2041 | | | 535,000 | | | | 585,483 | |
| Miami-Dade County, FL, Health Facilities Authority Hospital Rev., 6%, 8/01/2030 (Prerefunded 8/01/2020) | | | 60,000 | | | | 60,929 | |
| Miami-Dade County, FL, Health Facilities Authority Hospital Rev., Unrefunded Balance, 6%, 8/01/2030 | | | 20,000 | | | | 20,281 | |
| Mississippi Development Bank Special Obligation (Magnolia Regional Health Center Project), “A”, 6.75%, 10/01/2036 | | | 500,000 | | | | 508,865 | |
| Mississippi Hospital Equipment & Facilities Authority Rev. (Baptist Memorial Healthcare), “A”, 5%, 9/01/2022 | | | 1,000,000 | | | | 1,066,980 | |
| Mississippi Hospital Equipment & Facilities Authority Rev. (Clay County Medical Corp.), 5%, 10/01/2039 | | | 2,100,000 | | | | 2,140,173 | |
| Mississippi Hospital Equipment & Facilities Authority Rev. (Forrest County General Hospital Refunding Project), “A”, 4%, 1/01/2040 | | | 1,000,000 | | | | 1,109,410 | |
| | | | | | | | |
| | | | | | | |
| | |
| Issuer | | Shares/Par | | | Value ($) | |
| Healthcare Revenue - Hospitals - continued | |
| Mississippi Hospital, Equipment & Facilities Authority Refunding Rev. (Forrest County General Hospital Refunding Project), “A”, 5%, 1/01/2028 | | $ | 575,000 | | | $ | 702,955 | |
| Mississippi Hospital, Equipment & Facilities Authority Rev. (North Mississippi Health Services), “I”, 5%, 10/01/2020 | | | 1,300,000 | | | | 1,317,901 | |
| Mississippi Hospital, Equipment & Facilities Authority Rev. (North Mississippi Health Services), “IV”, 5%, 10/01/2037 (w) | | | 1,500,000 | | | | 1,835,475 | |
| Spartanburg County, SC, Regional Health Services District Hospital Rev., “A”, 4%, 4/15/2043 | | | 655,000 | | | | 705,592 | |
| | | | | | | $ | 11,094,750 | |
| Industrial Revenue - Other - 0.4% | |
| Port Beaumont, TX, Navigation District Facility Rev. (Jefferson Gulf Coast Energy Project), “A”, 4%, 1/01/2050 (n) | | $ | 200,000 | | | $ | 154,372 | |
| Tuscaloosa County, AL, Industrial Development Authority, Gulf Opportunity Zone (Hunt Refining Project), “A”, 5.25%, 5/01/2044 | | | 290,000 | | | | 278,867 | |
| | | | | | | $ | 433,239 | |
| Industrial Revenue - Paper - 0.8% | |
| Lowndes County, MS, Solid Waste Disposal & Pollution Control Rev. (Weyerhaeuser Co.), 6.8%, 4/01/2022 | | $ | 750,000 | | | $ | 797,040 | |
|
| Multi-Family Housing Revenue - 1.0% | |
| Mississippi Home Corp., Multi-Family Rev. (Providence Place of Senatobia LLC), GNMA, 5.35%, 8/20/2048 | | $ | 1,000,000 | | | $ | 1,040,490 | |
|
| Sales & Excise Tax Revenue - 4.3% | |
| Colorado Regional Transportation District, Private Activity Rev. (Denver Transportation Partners), 6%, 1/15/2041 | | $ | 450,000 | | | $ | 452,687 | |
| Guam Government Business Privilege Tax Rev., “A”, 5.25%, 1/01/2036 | | | 295,000 | | | | 296,923 | |
| Guam Government Business Privilege Tax Rev., “D”, 5%, 11/15/2031 | | | 270,000 | | | | 270,888 | |
| Illinois Sales Tax Securitization Corp., Second Lien, “A”, 5%, 1/01/2026 | | | 40,000 | | | | 44,721 | |
| Illinois Sales Tax Securitization Corp., Second Lien, “A”, 5%, 1/01/2027 | | | 80,000 | | | | 90,834 | |
| Illinois Sales Tax Securitization Corp., Second Lien, “A”, 5%, 1/01/2029 | | | 80,000 | | | | 93,314 | |
| Illinois Sales Tax Securitization Corp., Second Lien, “A”, 5%, 1/01/2030 | | | 35,000 | | | | 41,302 | |
| Illinois Sales Tax Securitization Corp., Second Lien, “A”, 5%, 1/01/2036 | | | 25,000 | | | | 29,030 | |
| Illinois Sales Tax Securitization Corp., Second Lien, “A”, 5%, 1/01/2037 | | | 45,000 | | | | 52,114 | |
| Illinois Sales Tax Securitization Corp., Second Lien, “A”, 4%, 1/01/2038 | | | 35,000 | | | | 36,075 | |
26
Portfolio of Investments – continued
| | | | | | | | |
| Municipal Bonds - continued | | | | | | |
| | | | | | | | |
| | |
| Issuer | | Shares/Par | | | Value ($) | |
| Sales & Excise Tax Revenue - continued | |
| Illinois Sales Tax Securitization Corp., Second Lien, “A”, 4%, 1/01/2039 | | $ | 30,000 | | | $ | 30,836 | |
| Massachusetts Bay Transportation Authority, Sales Tax Rev.,“A-1”, 5.25%, 7/01/2029 | | | 750,000 | | | | 989,550 | |
| Puerto Rico Sales Tax Financing Corp., Restructured Sales Tax Rev.,“2019A-1”, 4.55%, 7/01/2040 | | | 20,000 | | | | 18,933 | |
| Puerto Rico Sales Tax Financing Corp., Restructured Sales Tax Rev.,“2019A-1”, 5%, 7/01/2058 | | | 727,000 | | | | 706,971 | |
| Puerto Rico Sales Tax Financing Corp., Restructured Sales Tax Rev.,“2019A-2”, 4.329%, 7/01/2040 | | | 203,000 | | | | 186,474 | |
| Puerto Rico Sales Tax Financing Corp., Restructured Sales Tax Rev.,“2019A-2”, 4.329%, 7/01/2040 | | | 71,000 | | | | 65,220 | |
| Puerto Rico Sales Tax Financing Corp., Restructured Sales Tax Rev.,“2019A-2”, 4.536%, 7/01/2053 | | | 1,000 | | | | 908 | |
| Puerto Rico Sales Tax Financing Corp., Restructured Sales Tax Rev.,“2019A-2”, 4.784%, 7/01/2058 | | | 33,000 | | | | 30,905 | |
| Puerto Rico Sales Tax Financing Corp., Restructured Sales Tax Rev., Capital Appreciation,“2019A-1”, 0%, 7/01/2024 | | | 2,000 | | | | 1,713 | |
| Puerto Rico Sales Tax Financing Corp., Restructured Sales Tax Rev., Capital Appreciation,“2019A-1”, 0%, 7/01/2027 | | | 38,000 | | | | 28,934 | |
| Puerto Rico Sales Tax Financing Corp., Restructured Sales Tax Rev., Capital Appreciation,“2019A-1”, 0%, 7/01/2029 | | | 7,000 | | | | 4,844 | |
| Puerto Rico Sales Tax Financing Corp., Restructured Sales Tax Rev., Capital Appreciation,“2019A-1”, 0%, 7/01/2031 | | | 346,000 | | | | 215,171 | |
| Puerto Rico Sales Tax Financing Corp., Restructured Sales Tax Rev., Capital Appreciation,“2019A-1”, 0%, 7/01/2033 | | | 330,000 | | | | 182,602 | |
| Puerto Rico Sales Tax Financing Corp., Restructured Sales Tax Rev., Capital Appreciation,“2019A-1”, 0%, 7/01/2046 | | | 1,891,000 | | | | 447,070 | |
| | | | | | | $ | 4,318,019 | |
| Single Family Housing - State - 5.5% | |
| Connecticut Housing Finance Authority Rev. (Housing Mortgage Finance Program),“D-1”, GNMA, 4%, 11/15/2047 | | $ | 465,000 | | | $ | 491,672 | |
| Iowa Finance Authority, Single Family Mortgage Rev., “A”, GNMA, 4%, 7/01/2047 | | | 490,000 | | | | 517,705 | |
| Mississippi Home Corp., Homeownership Mortgage Rev., “A”, 4.55%, 12/01/2031 | | | 675,000 | | | | 678,112 | |
| Mississippi Home Corp., Single Family Mortgage Rev., “A”, 3.75%, 12/01/2035 | | | 750,000 | | | | 826,132 | |
| Mississippi Home Corp., Single Family Mortgage Rev., “A”, FNMA, 3.875%, 12/01/2043 | | | 750,000 | | | | 814,305 | |
| | | | | | | | |
| | | | | | | |
| | |
| Issuer | | Shares/Par | | | Value ($) | |
| Single Family Housing - State - continued | |
| Mississippi Home Corp., Single Family Mortgage Rev., “A”, GNMA, 2.45%, 12/01/2039 | | $ | 700,000 | | | $ | 674,086 | |
| Mississippi Home Corp., Single Family Mortgage Rev., “B”, GNMA, 2.875%, 12/01/2043 | | | 1,000,000 | | | | 1,033,180 | |
| Pennsylvania Housing Finance Agency, Single Family Mortgage Rev., “125A”, 3.7%, 10/01/2037 | | | 485,000 | | | | 524,537 | |
| | | | | | | $ | 5,559,729 | |
| State & Local Agencies - 9.4% | | | | | | | | |
| Commonwealth of Pennsylvania, Tobacco Master Settlement Financing Authority Rev., 5%, 6/01/2032 | | $ | 25,000 | | | $ | 30,040 | |
| Commonwealth of Pennsylvania, Tobacco Master Settlement Financing Authority Rev., 5%, 6/01/2033 | | | 25,000 | | | | 29,909 | |
| Commonwealth of Pennsylvania, Tobacco Master Settlement Financing Authority Rev., 5%, 6/01/2034 | | | 10,000 | | | | 11,937 | |
| Maryland Stadium Authority Rev., Baltimore City Public Schools Construction and Revitalization Program, “A”, 5%, 5/01/2047 | | | 340,000 | | | | 402,346 | |
| Mississippi Development Bank Special Obligation (Capital Projects), AGM, 5%, 7/01/2027 | | | 640,000 | | | | 641,798 | |
| Mississippi Development Bank Special Obligation (Department of Corrections), “C”, 5.25%, 8/01/2027 (Prerefunded 8/01/2020) | | | 1,000,000 | | | | 1,012,860 | |
| Mississippi Development Bank Special Obligation (Department of Rehabilitation Services Capital Improvement Project), AGM, 5%, 7/01/2023 | | | 345,000 | | | | 360,787 | |
| Mississippi Development Bank Special Obligation (Department of Rehabilitation Services Capital Improvement Project), AGM, 5%, 7/01/2024 | | | 360,000 | | | | 376,200 | |
| Mississippi Development Bank Special Obligation (Department of Rehabilitation Services Capital Improvement Project), AGM, 5%, 7/01/2025 | | | 380,000 | | | | 396,906 | |
| Mississippi Development Bank Special Obligation (Desoto County Mississippi Highway Construction Project), 5%, 1/01/2029 | | | 500,000 | | | | 546,775 | |
| Mississippi Development Bank Special Obligation (Desoto County Mississippi Highway Construction Project), 5%, 1/01/2030 | | | 500,000 | | | | 546,775 | |
| Mississippi Development Bank Special Obligation (Jackson County), ASSD GTY, 5%, 7/01/2022 (Prerefunded 7/01/2021) | | | 500,000 | | | | 524,270 | |
| Mississippi Development Bank Special Obligation (Laurel Highway Refunding Project), “B”, 4%, 1/01/2022 | | | 735,000 | | | | 770,074 | |
| Mississippi Development Bank Special Obligation (Montfort Jones Memorial Hospital Project), 5.75%, 5/01/2036 | | | 500,000 | | | | 517,660 | |
27
Portfolio of Investments – continued
| | | | | | | | |
| Municipal Bonds - continued | | | | | | |
| | | | | | | | |
| | |
| Issuer | | Shares/Par | | | Value ($) | |
| State & Local Agencies - continued | |
| Mississippi Development Bank Special Obligation (Singing River Health System), ASSD GTY, 5.375%, 7/01/2036 (Prerefunded 7/01/2021) | | $ | 500,000 | | | $ | 526,590 | |
| Mississippi Development Bank Special Obligation (Tupelo Public Improvement Rev. Project), 5%, 7/01/2049 | | | 1,500,000 | | | | 1,813,680 | |
| New Jersey Economic Development Authority Rev., School Facilities Construction Rev., “LLL”, 5%, 6/15/2039 | | | 210,000 | | | | 222,602 | |
| New Jersey Economic Development Authority Rev., School Facilities Construction Rev., “LLL”, 5%, 6/15/2044 | | | 355,000 | | | | 371,806 | |
| Orangeburg County, SC, Facilities Corp. Installment Purchase Rev. (Detention Center Project), 4%, 12/01/2042 | | | 280,000 | | | | 305,091 | |
| | | | | | | $ | 9,408,106 | |
| Student Loan Revenue - 0.2% | |
| Iowa Student Loan Liquidity Corp. Rev., “B”, 3%, 12/01/2039 | | $ | 45,000 | | | $ | 44,317 | |
| Iowa Student Loan Liquidity Corp. Rev., “B”, 3.5%, 12/01/2044 | | | 110,000 | | | | 107,925 | |
| | | | | | | $ | 152,242 | |
| Tax - Other - 5.0% | |
| Birmingham-Jefferson, AL, Civic Center Authority, “B”, 5%, 7/01/2043 | | $ | 455,000 | | | $ | 545,568 | |
| Mississippi Development Bank Special Obligation (Jackson Public School District Limited Tax Refunding Note Project), “B”, 5%, 10/01/2023 | | | 830,000 | | | | 895,919 | |
| Puerto Rico Convention Center District Authority, Hotel Occupancy Tax Rev., “A”, AAC, 5%, 7/01/2031 | | | 510,000 | | | | 510,066 | |
| Puerto Rico Infrastructure Financing Authority Special Tax Rev., “C”, AAC, 5.5%, 7/01/2027 | | | 315,000 | | | | 336,700 | |
| Puerto Rico Infrastructure Financing Authority Special Tax Rev., Capital Appreciation, “A”, AAC, 0%, 7/01/2036 | | | 1,195,000 | | | | 547,740 | |
| State of Mississippi, Gaming Tax Rev., “A”, 4%, 10/15/2038 | | | 1,000,000 | | | | 1,069,280 | |
| State of Mississippi, Gaming Tax Rev., “E”, 5%, 10/15/2030 | | | 1,040,000 | | | | 1,164,644 | |
| | | | | | | $ | 5,069,917 | |
| Tobacco - 1.2% | |
| Buckeye, OH, Tobacco Settlement Financing Authority Senior Asset-Backed Refunding,2020A-2, “1”, 5%, 6/01/2032 | | $ | 70,000 | | | $ | 86,971 | |
| Buckeye, OH, Tobacco Settlement Financing Authority Senior Asset-Backed Refunding,2020A-2, “1”, 4%, 6/01/2037 | | | 35,000 | | | | 38,468 | |
| Buckeye, OH, Tobacco Settlement Financing Authority Senior Asset-Backed Refunding,2020B-2, “2”, 5%, 6/01/2055 | | | 560,000 | | | | 496,171 | |
| | | | | | | | |
| | | | | | | |
| | |
| Issuer | | Shares/Par | | | Value ($) | |
| Tobacco - continued | |
| Buckeye, OH, Tobacco Settlement Financing Authority Senior Asset-Backed Refunding,2020B-3, Capital Appreciation, “2”, 0%, 6/01/2057 | | $ | 1,285,000 | | | $ | 141,774 | |
| Illinois Railsplitter Tobacco Settlement Authority Rev., 6%, 6/01/2028 (Prerefunded 6/01/2021) | | | 420,000 | | | | 443,373 | |
| | | | | | | $ | 1,206,757 | |
| Toll Roads - 0.7% | | | | | | | | |
| Texas Private Activity Surface Transportation Corp., Senior Lien Rev. (NTE Mobility Partners Segments 3 LLC Segments 3A & 3B Facility), 7%, 12/31/2038 | | $ | 110,000 | | | $ | 124,096 | |
| Texas Private Activity Surface Transportation Corp., Senior Lien Rev. (NTE Mobility Partners Segments 3 LLC Segments 3A & 3B Facility), 6.75%, 6/30/2043 | | | 85,000 | | | | 95,062 | |
| Virginia Small Business Financing Authority Rev. (Elizabeth River Crossings Opco LLC Project), 6%, 1/01/2037 | | | 160,000 | | | | 164,786 | |
| Virginia Small Business Financing Authority Rev. (Elizabeth River Crossings Opco LLC Project), 5.5%, 1/01/2042 | | | 310,000 | | | | 314,545 | |
| | | | | | | $ | 698,489 | |
| Transportation - Special Tax - 2.1% | | | | | | | | |
| Commonwealth of Puerto Rico Highway & Transportation Authority Rev., “J”, NATL, 5%, 7/01/2029 | | $ | 10,000 | | | $ | 10,000 | |
| Commonwealth of Puerto Rico Highway & Transportation Authority Rev., “L”, AAC, 5.25%, 7/01/2038 | | | 910,000 | | | | 923,468 | |
| Commonwealth of Puerto Rico Highway & Transportation Authority Rev., “L”, ASSD GTY, 5.25%, 7/01/2041 | | | 135,000 | | | | 139,598 | |
| Commonwealth of Puerto Rico Highway & Transportation Authority Rev., “L”, NATL, 5.25%, 7/01/2035 | | | 255,000 | | | | 255,686 | |
| Commonwealth of Puerto Rico Highway & Transportation Authority Rev., “N”, AAC, 5.5%, 7/01/2029 | | | 555,000 | | | | 594,017 | |
| Commonwealth of Puerto Rico Highway & Transportation Authority Rev., Capital Appreciation, “N”, AAC, 0%, 7/01/2020 | | | 35,000 | | | | 34,663 | |
| New Jersey Transportation Trust Fund Authority, Federal Highway Reimbursement Rev.,“A-1”, 5%, 6/15/2027 | | | 165,000 | | | | 184,259 | |
| | | | | | | $ | 2,141,691 | |
| Universities - Colleges - 12.3% | |
| Massachusetts Health & Educational Facilities Authority Rev. (Massachusetts Institute of Technology),“I-1”, 5.2%, 1/01/2028 | | $ | 920,000 | | | $ | 1,182,237 | |
| Medical Center, Educational Building Corp. Rev. (University of Mississippi Medical Center), “B”, AAC, 5.5%, 12/01/2023 | | | 615,000 | | | | 672,300 | |
28
Portfolio of Investments – continued
| | | | | | | | |
| Municipal Bonds - continued | | | | | | |
| | | | | | | | |
| | |
| Issuer | | Shares/Par | | | Value ($) | |
| Universities - Colleges - continued | |
| Mississippi State University, Educational Building Corp. Refunding Rev. (Mississippi State University Facilities Refinancing), “A”, 4%, 8/01/2043 | | $ | 600,000 | | | $ | 664,788 | |
| Mississippi State University, Educational Building Corp. Rev. (Mississippi State University Refunding and Improvements Project), 5.25%, 8/01/2038 (Prerefunded 8/01/2023) | | | 1,000,000 | | | | 1,134,980 | |
| Mississippi State University, Educational Building Corp. Rev. (Residence Hall Construction and Refunding Project), 5%, 8/01/2036 (Prerefunded 8/01/2021) | | | 1,585,000 | | | | 1,668,133 | |
| Puerto Rico Industrial, Tourist, Educational, Medical & Environmental Control Facilities Financing Authority, Higher Education Rev. (Ana G. Mendez University System Project), 5.375%, 12/01/2021 | | | 5,000 | | | | 4,954 | |
| University of Mississippi Medical Center, Educational Building Corp. Rev. (New Facilities & Refinancing Project), “A”, 4%, 6/01/2047 | | | 1,000,000 | | | | 1,108,020 | |
| University of Mississippi Medical Center, Educational Building Corp. Rev. (New Facilities & Refinancing Project), “A”, 5%, 6/01/2047 | | | 1,250,000 | | | | 1,485,112 | |
| University of Southern Mississippi, Educational Building Corp. Rev. (Facilities Refinancing Project), 5%, 9/01/2034 | | | 1,480,000 | | | | 1,759,809 | |
| University of Southern Mississippi, Educational Building Corp. Rev. (Facilities Refinancing Project), “A”, 5%, 3/01/2028 | | | 745,000 | | | | 868,543 | |
| University of Southern Mississippi, Educational Building Corp. Rev. (Facilities Refinancing Project), “A”, 5%, 9/01/2035 | | | 1,515,000 | | | | 1,798,411 | |
| | | | | | | $ | 12,347,287 | |
| Utilities - Cogeneration - 0.2% | | | | | | | | |
| Puerto Rico Industrial, Tourist, Educational, Medical & Environmental Control Facilities Financing Authority Rev. (Cogeneration Facilities - AES Puerto Rico Project), 9.12%, 6/01/2022 | | $ | 220,000 | | | $ | 225,500 | |
| | |
| Utilities - Investor Owned - 0.4% | | | | | | | | |
| Michigan Strategic Fund Ltd. Obligation Rev. (Detroit Edison Co.), 5.625%, 7/01/2020 | | $ | 370,000 | | | $ | 373,844 | |
| | |
| Utilities - Municipal Owned - 2.8% | | | | | | | | |
| Guam Power Authority Rev., “A”, AGM, 5%, 10/01/2033 | | $ | 315,000 | | | $ | 329,477 | |
| Guam Power Authority Rev., “A”, AGM, 5%, 10/01/2039 | | | 75,000 | | | | 77,679 | |
| Guam Power Authority Rev., “A”, AGM, 5%, 10/01/2044 | | | 85,000 | | | | 87,578 | |
| Mississippi Development Bank Special Obligation (Municipal Energy Agency Power Supply Project), AGM, 5%, 3/01/2035 | | | 500,000 | | | | 565,030 | |
| | | | | | | | |
| | | | | | | |
| | |
| Issuer | | Shares/Par | | | Value ($) | |
| Utilities - Municipal Owned - continued | |
| Puerto Rico Electric Power Authority Rev., “A”, 5%, 7/01/2029 (a)(d) | | $ | 240,000 | | | $ | 169,800 | |
| Puerto Rico Electric Power Authority Rev., “A”, 5%, 7/01/2042 (a)(d) | | | 35,000 | | | | 24,763 | |
| Puerto Rico Electric Power Authority Rev., “AAA”, 5.25%, 7/01/2021 (a)(d) | | | 20,000 | | | | 14,200 | |
| Puerto Rico Electric Power Authority Rev., “AAA”, 5.25%, 7/01/2030 (a)(d) | | | 10,000 | | | | 7,100 | |
| Puerto Rico Electric Power Authority Rev., “CCC”, 5.25%, 7/01/2027 (a)(d) | | | 90,000 | | | | 63,900 | |
| Puerto Rico Electric Power Authority Rev., “DDD”, 5%, 7/01/2020 (a)(d) | | | 10,000 | | | | 7,075 | |
| Puerto Rico Electric Power Authority Rev., “DDD”, 5%, 7/01/2021 (a)(d) | | | 90,000 | | | | 63,675 | |
| Puerto Rico Electric Power Authority Rev., “DDD”, 5%, 7/01/2022 (a)(d) | | | 150,000 | | | | 106,125 | |
| Puerto Rico Electric Power Authority Rev., “DDD”, AGM, 3.625%, 7/01/2023 | | | 15,000 | | | | 14,929 | |
| Puerto Rico Electric Power Authority Rev., “DDD”, AGM, 3.65%, 7/01/2024 | | | 80,000 | | | | 79,283 | |
| Puerto Rico Electric Power Authority Rev., “EEE”, 6.05%, 7/01/2032 (a)(d) | | | 50,000 | | | | 35,562 | |
| Puerto Rico Electric Power Authority Rev., “SS”, ASSD GTY, 4.375%, 7/01/2030 | | | 10,000 | | | | 9,962 | |
| Puerto Rico Electric Power Authority Rev., “TT”, 5%, 7/01/2021 (a)(d) | | | 40,000 | | | | 28,300 | |
| Puerto Rico Electric Power Authority Rev., “TT”, 5%, 7/01/2023 (a)(d) | | | 40,000 | | | | 28,300 | |
| Puerto Rico Electric Power Authority Rev., “TT”, 5%, 7/01/2027 (a)(d) | | | 5,000 | | | | 3,538 | |
| Puerto Rico Electric Power Authority Rev., “TT”, 5%, 7/01/2037 (a)(d) | | | 120,000 | | | | 84,900 | |
| Puerto Rico Electric Power Authority Rev., “UU”, AGM, 5%, 7/01/2024 | | | 500,000 | | | | 531,275 | |
| Puerto Rico Electric Power Authority Rev., “UU”, ASSD GTY, 4.25%, 7/01/2027 | | | 60,000 | | | | 59,999 | |
| Puerto Rico Electric Power Authority Rev., “V”, NATL, 5.25%, 7/01/2033 | | | 55,000 | | | | 55,663 | |
| Puerto Rico Electric Power Authority Rev., “VV”, NATL, 5.25%, 7/01/2030 | | | 105,000 | | | | 107,307 | |
| Puerto Rico Electric Power Authority Rev., “VV”, NATL, 5.25%, 7/01/2032 | | | 120,000 | | | | 121,918 | |
| Puerto Rico Electric Power Authority Rev., “VV”, NATL, 5.25%, 7/01/2034 | | | 10,000 | | | | 10,076 | |
| Puerto Rico Electric Power Authority Rev., “WW”, 5.375%, 7/01/2022 (a)(d) | | | 10,000 | | | | 7,113 | |
| Puerto Rico Electric Power Authority Rev., “WW”, 5.25%, 7/01/2025 (a)(d) | | | 15,000 | | | | 10,650 | |
| Puerto Rico Electric Power Authority Rev., “ZZ”, 5%, 7/01/2018 (a)(d) | | | 60,000 | | | | 41,775 | |
| Puerto Rico Electric Power Authority Rev., “ZZ”, 5.25%, 7/01/2023 (a)(d) | | | 65,000 | | | | 46,150 | |
| Puerto Rico Electric Power Authority Rev., “ZZ”, 5.25%, 7/01/2024 (a)(d) | | | 20,000 | | | | 14,200 | |
| Puerto Rico Electric Power Authority Rev., “ZZ”, 5.25%, 7/01/2026 (a)(d) | | | 60,000 | | | | 42,600 | |
| | | | | | | $ | 2,849,902 | |
29
Portfolio of Investments – continued
| | | | | | | | |
| Municipal Bonds - continued | | | | | | |
| | | | | | | | |
| | |
| Issuer | | Shares/Par | | | Value ($) | |
| Utilities - Other - 0.3% | | | | | | | | |
| Tennessee Energy Acquisition Corp., Gas Rev., “A”, 5.25%, 9/01/2021 | | $ | 185,000 | | | $ | 190,759 | |
| Tennessee Energy Acquisition Corp., Gas Rev., “A”, 5.25%, 9/01/2022 | | | 95,000 | | | | 99,900 | |
| | | | | | | $ | 290,659 | |
| Water & Sewer Utility Revenue - 6.2% | |
| Guam Waterworks Authority Rev. (Water and Wastewater System), 5%, 7/01/2036 | | $ | 30,000 | | | $ | 30,347 | |
| Guam Waterworks Authority Rev. (Water and Wastewater System), 5.625%, 7/01/2040 (Prerefunded 7/01/2020) | | | 285,000 | | | | 288,112 | |
| Guam Waterworks Authority Rev. (Water and Wastewater System), 5%, 1/01/2046 | | | 145,000 | | | | 143,546 | |
| Guam Waterworks Authority Rev. (Water and Wastewater System), “A”, 5%, 7/01/2029 | | | 30,000 | | | | 30,675 | |
| Guam Waterworks Authority Rev. (Water and Wastewater System), “A”, 5%, 7/01/2035 | | | 30,000 | | | | 30,355 | |
| Jackson County, MS, Utility Authority Rev. (Water and Wastewater Treatment System), AGM, 5%, 9/01/2040 | | | 2,000,000 | | | | 2,288,720 | |
| Michigan Finance Authority Local Government Loan Program Rev. (Detroit Water and Sewerage Department Sewage Disposal System Rev. Refunding Second Lien Local Project),“C-7”, NATL, 5%, 7/01/2032 | | | 25,000 | | | | 28,167 | |
| Michigan Finance Authority Local Government Loan Program Rev. (Detroit Water and Sewerage Department Water Supply System Rev. Refunding Second Lien Local Project),“D-6”, NATL, 5%, 7/01/2036 | | | 30,000 | | | | 33,644 | |
| Michigan Finance Authority Local Government Loan Program Rev. (Detroit Water and Sewerage Department Water Supply System Rev. Refunding Senior Lien Local Project),“D-1”, AGM, 5%, 7/01/2035 | | | 15,000 | | | | 16,913 | |
| | | | | | | | |
| | | | | | | |
| | |
| Issuer | | Shares/Par | | | Value ($) | |
| Water & Sewer Utility Revenue - continued | |
| Michigan Finance Authority Local Government Loan Program Rev. (Detroit Water and Sewerage Department Water Supply System Rev. Refunding Senior Lien Local Project),“D-1”, AGM, 5%, 7/01/2037 | | $ | 35,000 | | | $ | 39,312 | |
| Mississippi Development Bank Special Obligation (City of Jackson Water and Sewer System Rev. Bond Project), AGM, 6.875%, 12/01/2040 | | | 750,000 | | | | 885,503 | |
| Mississippi Development Bank Special Obligation (City of Jackson Water and Sewer System Rev. Bond Project), “A”, AGM, 5%, 9/01/2023 | | | 1,220,000 | | | | 1,283,147 | |
| West Rankin, MS, Utility Authority Rev., AGM, 5%, 1/01/2048 | | | 1,000,000 | | | | 1,172,040 | |
| | | | | | | $ | 6,270,481 | |
Total Municipal Bonds
(Identified Cost, $94,718,940) | | | $ | 98,711,189 | |
| | |
| Bonds - 0.1% | | | | | | | | |
| Consumer Services - 0.1% | | | | | | | | |
| Toll Road Investors Partnership II LP, Capital Appreciation, NATL, 0%, 2/15/2043 (n) (Identified Cost, $93,136) | | $ | 300,000 | | | $ | 109,799 | |
| | |
| Investment Companies (h) - 3.9% | | | | | | | | |
| Money Market Funds - 3.9% | | | | | | | | |
| MFS Institutional Money Market Portfolio, 1.28% (v) (Identified Cost, $3,901,807) | | | 3,901,417 | | | $ | 3,902,197 | |
| |
| Other Assets, Less Liabilities - (2.0)% | | | | (2,004,692) | |
| Net Assets - 100.0% | | | | | | $ | 100,718,493 | |
Derivative Contracts at 3/31/20
Futures Contracts
| | | | | | | | | | | | | | | | | | | | | | |
| Description | | Long/
Short | | | Currency | | | Contracts | | Notional
Amount | | | Expiration
Date | | | Value/Unrealized
Appreciation
(Depreciation) | |
| Liability Derivatives | | | | | | | | | | | | | | | | | | | | | | |
| Interest Rate Futures | | | | | | | | | | | | | | | | | | | | | | |
| U.S. Treasury Bond | | | Short | | | | USD | | | 11 | | | $1,969,688 | | | | June - 2020 | | | | $(132,385 | ) |
| | | | | | | | | | | | | | | | | | | | | | |
At March 31, 2020, the fund had cash collateral of $78,000 to cover any collateral or margin obligations for certain derivative contracts. Restricted cash and/or deposits with brokers in the Statements of Assets and Liabilities are comprised of cash collateral.
See Portfolio Footnotes and Notes to Financial Statements
30
PORTFOLIO OF INVESTMENTS
3/31/20
MFS NEW YORK MUNICIPAL BOND FUND
The Portfolio of Investments is a complete list of all securities owned by your fund. It is categorized by broad-based asset classes.
| | | | | | | | |
| Municipal Bonds - 97.7% | | | | | | |
| | | | | | | | |
| | |
| Issuer | | Shares/Par | | | Value ($) | |
| Airport Revenue - 2.9% | |
| Albany County, NY, Airport Authority Rev., “A”, 5%, 12/15/2043 | | $ | 1,500,000 | | | $ | 1,812,615 | |
| Chicago, IL, O’Hare International Airport Rev., Third Lien, “A”, 5.625%, 1/01/2035 (Prerefunded 1/01/2021) | | | 450,000 | | | | 465,035 | |
| Chicago, IL, O’Hare International Airport Rev., Third Lien, Unrefunded Balance, “A”, 5.625%, 1/01/2035 | | | 105,000 | | | | 108,075 | |
| Dallas and Fort Worth, TX, International Airport Rev., “B”, 5%, 11/01/2044 | | | 245,000 | | | | 259,553 | |
| Dallas and Fort Worth, TX, International Airport Rev., “C”, 5%, 11/01/2045 | | | 170,000 | | | | 176,764 | |
| Niagara, NY, Frontier Transportation Authority Rev. (Buffalo-Niagara International Airport), “A”, 5%, 4/01/2028 | | | 650,000 | | | | 719,920 | |
| Niagara, NY, Frontier Transportation Authority Rev. (Buffalo-Niagara International Airport), “A”, 5%, 4/01/2029 | | | 500,000 | | | | 552,570 | |
| Niagara, NY, Frontier Transportation Authority Rev. (Buffalo-Niagara International Airport), “A”, 5%, 4/01/2035 | | | 1,000,000 | | | | 1,201,560 | |
| Niagara, NY, Frontier Transportation Authority Rev. (Buffalo-Niagara International Airport), “A”, 5%, 4/01/2038 | | | 1,000,000 | | | | 1,189,370 | |
| Port Authority of NY & NJ, Special Obligation Rev. (JFK International Air Terminal LLC), 6%, 12/01/2042 | | | 1,160,000 | | | | 1,174,465 | |
| Wayne County, MI, Airport Authority Rev. (Detroit Metropolitan Wayne County Airport), “B”, 5%, 12/01/2044 | | | 90,000 | | | | 99,712 | |
| Wayne County, MI, Airport Authority Rev. (Detroit Metropolitan Wayne County Airport), “B”, BAM, 5%, 12/01/2039 | | | 15,000 | | | | 16,731 | |
| Wayne County, MI, Airport Authority Rev. (Detroit Metropolitan Wayne County Airport), “C”, 5%, 12/01/2039 | | | 80,000 | | | | 87,930 | |
| Wayne County, MI, Airport Authority Rev. (Detroit Metropolitan Wayne County Airport), “C”, 5%, 12/01/2044 | | | 130,000 | | | | 142,229 | |
| | | | | | | $ | 8,006,529 | |
| General Obligations - General Purpose - 8.0% | |
| Bridgeview, IL, Stadium and Redevelopment Projects, AAC, 5.14%, 12/01/2036 | | $ | 615,000 | | | $ | 567,744 | |
| Commonwealth of Puerto Rico, “A”, AGM, 5.375%, 7/01/2025 | | | 45,000 | | | | 46,464 | |
| Commonwealth of Puerto Rico, General Obligation, “A”, 8%, 7/01/2035 (a)(d) | | | 2,935,000 | | | | 1,761,000 | |
| Commonwealth of Puerto Rico, Public Improvement, “A”, NATL, 5.5%, 7/01/2020 | | | 550,000 | | | | 552,519 | |
| Commonwealth of Puerto Rico, Public Improvement,“A-4”, AGM, 5%, 7/01/2031 | | | 165,000 | | | | 165,564 | |
| | | | | | | | |
| | | | | | | |
| | |
| Issuer | | Shares/Par | | | Value ($) | |
| General Obligations - General Purpose - continued | |
| Nassau County, NY, General Improvement, “B”, 5%, 4/01/2023 | | $ | 1,820,000 | | | $ | 2,010,481 | |
| Nassau County, NY, General Improvement, “B”, AGM, 5%, 7/01/2035 | | | 2,175,000 | | | | 2,685,908 | |
| Nassau County, NY, General Improvement, “B”, AGM, 5%, 7/01/2037 | | | 3,000,000 | | | | 3,680,340 | |
| New York, NY,“B-1”, 5%, 12/01/2041 | | | 3,000,000 | | | | 3,542,760 | |
| New York, NY,“D-1”, 5%, 12/01/2038 | | | 2,000,000 | | | | 2,443,880 | |
| New York, NY, “J”, FGIC, 5.5%, 2/15/2026 | | | 5,000 | | | | 5,018 | |
| New York, NY, General Obligation,“F-1”, 5%, 4/01/2043 | | | 3,000,000 | | | | 3,595,080 | |
| Poughkeepsie, NY, Dutchess County Public Improvement, 5%, 6/01/2031 | | | 635,000 | | | | 714,889 | |
| Puerto Rico Public Buildings Authority Rev.,“M-2”, AAC, 10%, 7/01/2035 | | | 115,000 | | | | 124,869 | |
| Puerto Rico Public Buildings Authority Rev., Guaranteed, “D”, AAC, 5.45%, 7/01/2030 | | | 270,000 | | | | 270,151 | |
| | | | | | | $ | 22,166,667 | |
| Healthcare Revenue - Hospitals - 8.9% | |
| Buffalo & Erie County, NY, Industrial Land Development Corp. Rev. (Catholic Health System, Inc. Project), 5%, 7/01/2026 | | $ | 450,000 | | | $ | 524,651 | |
| Buffalo & Erie County, NY, Industrial Land Development Corp. Rev. (Catholic Health System, Inc. Project), 5%, 7/01/2027 | | | 300,000 | | | | 349,827 | |
| Buffalo & Erie County, NY, Industrial Land Development Corp. Rev. (Catholic Health System, Inc. Project), 5%, 7/01/2029 | | | 590,000 | | | | 685,651 | |
| Dutchess County, NY, Local Development Corp. Rev. (Health Quest Systems, Inc. Project), 4%, 7/01/2041 | | | 1,375,000 | | | | 1,466,932 | |
| Dutchess County, NY, Local Development Corp. Rev. (Health Quest Systems, Inc. Project), “A”, 5%, 7/01/2044 | | | 1,000,000 | | | | 1,157,320 | |
| Dutchess County, NY, Local Development Corp. Rev. (Nuvance Health Issue), “B”, 4%, 7/01/2044 | | | 1,100,000 | | | | 1,235,861 | |
| Dutchess County, NY, Local Development Corp. Rev. (Nuvance Health Issue), “B”, 4%, 7/01/2049 | | | 750,000 | | | | 835,950 | |
| Jefferson County, NY, Civic Development Corp. Rev. (Samaritan Medical Center), “A”, 5%, 11/01/2037 | | | 2,000,000 | | | | 2,322,200 | |
| Jefferson Parish, LA, Hospital Service District No. 2 Hospital Rev. (East Jefferson General Hospital), 6.25%, 7/01/2031 | | | 215,000 | | | | 220,012 | |
| Jefferson Parish, LA, Hospital Service District No. 2 Hospital Rev. (East Jefferson General Hospital), 6.375%, 7/01/2041 | | | 245,000 | | | | 250,441 | |
31
Portfolio of Investments – continued
| | | | | | | | |
| Municipal Bonds - continued | | | | | | |
| | | | | | | | |
| | |
| Issuer | | Shares/Par | | | Value ($) | |
| Healthcare Revenue - Hospitals - continued | |
| Miami-Dade County, FL, Health Facilities Authority Hospital Rev., 6%, 8/01/2030 (Prerefunded 8/01/2020) | | $ | 125,000 | | | $ | 126,936 | |
| Miami-Dade County, FL, Health Facilities Authority Hospital Rev., Unrefunded Balance, 6%, 8/01/2030 | | | 40,000 | | | | 40,562 | |
| Monroe County, NY, Industrial Development Corp. Rev. (Rochester General Hospital Project), 5%, 12/01/2046 | | | 2,000,000 | | | | 2,348,500 | |
| Nassau County, NY, Local Economic Assistance Corp. Rev. (Catholic Health Services of Long Island Obligated Group Project), 5%, 7/01/2032 | | | 1,000,000 | | | | 1,127,100 | |
| New Jersey Health Care Facilities, Financing Authority Rev. (University Hospital), “A”, AGM, 5%, 7/01/2046 | | | 170,000 | | | | 179,024 | |
| New York Dormitory Authority Rev. (Montefiore Obligated Group), “A”, 4%, 9/01/2045 | | | 1,500,000 | | | | 1,584,435 | |
| New York Dormitory Authority Rev. (Orange Regional Medical Center Obligated Group Rev.), 5%, 12/01/2035 | | | 800,000 | | | | 906,416 | |
| New York Dormitory Authority Rev., Non- State Supported Debt (Mount Sinai Hospital), “A”, 5%, 7/01/2026 (Prerefunded 7/01/2020) | | | 2,000,000 | | | | 2,019,620 | |
| New York Dormitory Authority Rev., Non- State Supported Debt (NYU Hospitals Center), “A”, 5.5%, 7/01/2025 (Prerefunded 7/01/2020) | | | 750,000 | | | | 757,995 | |
| New York, NY, Health & Hospital Corp. Rev., “A”, 5.5%, 2/15/2023 | | | 1,000,000 | | | | 1,002,250 | |
| Oneida County, NY, Local Development Corp. Rev. (Mohawk Valley Health System Project), “A”, AGM, 4%, 12/01/2037 | | | 1,000,000 | | | | 1,138,600 | |
| Oneida County, NY, Local Development Corp. Rev. (Mohawk Valley Health System Project), “A”, AGM, 4%, 12/01/2038 | | | 1,000,000 | | | | 1,134,920 | |
| Royal Oak, MI, Hospital Finance Authority Rev. (William Beaumont Hospital), 5%, 9/01/2039 | | | 1,290,000 | | | | 1,438,543 | |
| Suffolk County, NY, Economic Development Corp. Rev. (Catholic Health Services of Long Island), 5%, 7/01/2028 (Prerefunded 7/01/2021) | | | 145,000 | | | | 151,928 | |
| Suffolk County, NY, Economic Development Corp. Rev. (Catholic Health Services of Long Island), 5%, 7/01/2028 | | | 855,000 | | | | 893,253 | |
| Westchester County, NY, Health Care Corp. Rev., “B”,“C-2”, 6%, 11/01/2030 (Prerefunded 11/01/2020) | | | 870,000 | | | | 893,255 | |
| Westchester County, NY, Health Care Corp. Rev., “B”,“C-2”, 6%, 11/01/2030 | | | 130,000 | | | | 133,522 | |
| | | | | | | $ | 24,925,704 | |
| | | | | | | | |
| | | | | | | |
| | |
| Issuer | | Shares/Par | | | Value ($) | |
| Healthcare Revenue - Long Term Care - 1.6% | |
| Brookhaven, NY, Local Development Corp. Rev. (Active Retirement Community, Inc. d/b/a/ Jefferson’s Ferry Project), 5.25%, 11/01/2036 | | $ | 1,000,000 | | | $ | 1,070,760 | |
| Buffalo & Erie County, NY, Industrial Land Development Corp. Rev. (Orchard Park CCRC, Inc. Project), 5%, 11/15/2037 | | | 750,000 | | | | 767,280 | |
| Suffolk County, NY, Economic Development Corp. Rev. (Peconic Landing at Southold, Inc. Project), 6%, 12/01/2040 | | | 1,000,000 | | | | 1,031,560 | |
| Tompkins County, NY, Development Corp. Continuing Care Retirement Community Rev. (Kendal at Ithaca, Inc. Project), “A”, 5%, 7/01/2044 | | | 915,000 | | | | 939,687 | |
| Travis County, TX, Health Facilities Development Corp. Rev. (Westminster Manor Health), 7%, 11/01/2030 (Prerefunded 11/01/2020) | | | 95,000 | | | | 98,131 | |
| Travis County, TX, Health Facilities Development Corp. Rev. (Westminster Manor Health), 7.125%, 11/01/2040 (Prerefunded 11/01/2020) | | | 180,000 | | | | 186,064 | |
| Travis County, TX, Health Facilities Development Corp. Rev. (Westminster Manor Health), Unrefunded Balance, 7%, 11/01/2030 | | | 5,000 | | | | 5,115 | |
| Ulster County, NY, Capital Resource Corp. Rev. (Woodland Pond at New Paltz Project), 4%, 9/15/2025 | | | 410,000 | | | | 385,404 | |
| | | | | | | $ | 4,484,001 | |
| Industrial Revenue - Airlines - 1.4% | |
| New York Transportation Development Corp., Special Facilities Rev. (American Airlines, Inc. John F. Kennedy International Airport Project), 5%, 8/01/2031 | | $ | 1,000,000 | | | $ | 993,100 | |
| New York Transportation Development Corp., Special Facilities Rev. (Delta Airlines, Inc. LaGuardia Airport Terminals C&D Redevelopment Project), 5%, 1/01/2034 | | | 1,000,000 | | | | 982,370 | |
| New York Transportation Development Corp., Special Facilities Rev. (Delta Airlines, Inc. LaGuardia Airport Terminals C&D Redevelopment Project), 5%, 1/01/2036 | | | 2,000,000 | | | | 1,946,720 | |
| | | | | | | $ | 3,922,190 | |
| Industrial Revenue - Other - 0.9% | |
| Onandaga County, NY, Industrial Development Agency Sewer Facilities Rev. (Bristol-Meyers Squibb Co. Project), 5.75%, 3/01/2024 | | $ | 1,000,000 | | | $ | 1,145,180 | |
| Port Beaumont, TX, Navigation District Facility Rev. (Jefferson Gulf Coast Energy Project), “A”, 3.625%, 1/01/2035 (n) | | | 200,000 | | | | 168,376 | |
| Port Beaumont, TX, Navigation District Facility Rev. (Jefferson Gulf Coast Energy Project), “A”, 4%, 1/01/2050 (n) | | | 460,000 | | | | 355,056 | |
32
Portfolio of Investments – continued
| | | | | | | | |
| Municipal Bonds - continued | | | | | | |
| | | | | | | | |
| | |
| Issuer | | Shares/Par | | | Value ($) | |
| Industrial Revxenue - Other - continued | |
| Tuscaloosa County, AL, Industrial Development Authority, Gulf Opportunity Zone (Hunt Refining Project), “A”, 4.5%, 5/01/2032 | | $ | 365,000 | | | $ | 346,994 | |
| Tuscaloosa County, AL, Industrial Development Authority, Gulf Opportunity Zone (Hunt Refining Project), “A”, 5.25%, 5/01/2044 | | | 495,000 | | | | 475,997 | |
| | | | | | | $ | 2,491,603 | |
| Industrial Revenue - Paper - 0.4% | |
| Build NYC Resource Corp. Solid Waste Disposal Rev. (Pratt Paper, Inc. Project), 4.5%, 1/01/2025 | | $ | 1,200,000 | | | $ | 1,243,188 | |
|
| Miscellaneous Revenue - Other - 4.6% | |
| Indiana Finance Authority Rev. (Ohio River Bridges East End Crossing Project), “A”, 5%, 7/01/2040 | | $ | 205,000 | | | $ | 209,791 | |
| Indiana Finance Authority Rev. (Ohio River Bridges East End Crossing Project), “A”, 5%, 7/01/2044 | | | 315,000 | | | | 321,309 | |
| New York City Convention Center Development Corp., Capital Appreciation, “B”, ASSD GTY, 0%, 11/15/2043 | | | 680,000 | | | | 325,326 | |
| New York Liberty Development Corp., Liberty Rev. (3 World Trade Center Project), “1”, 5%, 11/15/2044 | | | 1,940,000 | | | | 1,966,229 | |
| New York Liberty Development Corp., Liberty Rev. (3 World Trade Center Project), “2”, 5.375%, 11/15/2040 | | | 1,500,000 | | | | 1,549,695 | |
| New York Liberty Development Corp., Liberty Rev. (4 World Trade Center Project), 5%, 11/15/2044 | | | 1,000,000 | | | | 1,052,650 | |
New York Liberty Development Corp., Liberty Rev. (7 World Trade Center Project), 5%, 9/15/2040 | | | 1,665,000 | | | | 1,759,222 | |
| New York, NY, Industrial Development Agency, Airport Facilities Rev. (Transportation Infrastructure Properties LLC), 5%, 7/01/2028 | | | 3,000,000 | | | | 3,100,350 | |
| New York, NY, Trust for Cultural Resources Refunding Rev. (Carnegie Hall), 5%, 12/01/2038 | | | 250,000 | | | | 314,970 | |
| New York, NY, Trust for Cultural Resources Refunding Rev. (Carnegie Hall), 5%, 12/01/2039 | | | 250,000 | | | | 314,510 | |
| Syracuse, NY, Industrial Development Agency PILOT Rev. (Carousel Center Project), “A”, 5%, 1/01/2035 | | | 1,000,000 | | | | 984,550 | |
| Syracuse, NY, Industrial Development Agency PILOT Rev. (Carousel Center Project), “A”, 5%, 1/01/2036 | | | 1,000,000 | | | | 979,650 | |
| | | | | | | $ | 12,878,252 | |
| Multi-Family Housing Revenue - 3.4% | | | | | | | | |
| New York Housing Finance Agency Affordable Housing Rev. (Climate Bond), “B”, 3.7%, 11/01/2038 | | $ | 1,450,000 | | | $ | 1,545,512 | |
| | | | | | | | |
| | | | | | | |
| | |
| Issuer | | Shares/Par | | | Value ($) | |
| Multi-Family Housing Revenue - continued | | | | | |
| New York Housing Finance Agency Affordable Housing Rev. (Climate Bond), “I”, 4%, 11/01/2043 | | $ | 1,015,000 | | | $ | 1,098,057 | |
| New York, NY, City Housing Development Corp., Multi-Family Housing Rev. (8 Spruce Street), “F”, 4.5%, 2/15/2048 | | | 750,000 | | | | 803,055 | |
| New York, NY, City Housing Development Corp., Multi-Family Housing Rev.,“L-1”, 4.8%, 11/01/2035 | | | 1,000,000 | | | | 1,001,810 | |
| New York, NY, Housing Development Corp., Multi-Family Housing Rev. (Sustainable Neighborhood Bonds),“A-3-A”, 3.8%, 11/01/2039 | | | 2,000,000 | | | | 2,137,280 | |
| New York, NY, Housing Development Corp., Multi-Family Housing Rev. (Sustainable Neighborhood Bonds),“C-1-A”, 3.95%, 11/01/2048 | | | 2,810,000 | | | | 2,972,671 | |
| | | | | | | $ | 9,558,385 | |
| Port Revenue - 3.0% | | | | | |
| Port Authority of NY & NJ (205th Series), 5%, 11/15/2042 | | $ | 2,000,000 | | | $ | 2,438,340 | |
| Port Authority of NY & NJ (211th Series), 4%, 9/01/2043 | | | 2,000,000 | | | | 2,197,900 | |
| Port Authority of NY & NJ (220th Series), 5%, 11/01/2044 | | | 3,000,000 | | | | 3,648,540 | |
| | | | | | | $ | 8,284,780 | |
| Sales & Excise Tax Revenue - 4.8% | | | | | |
| Colorado Regional Transportation District, Private Activity Rev. (Denver Transportation Partners), 6%, 1/15/2034 | | $ | 1,000,000 | | | $ | 1,005,970 | |
| Guam Government Business Privilege Tax Rev., “D”, 5%, 11/15/2031 | | | 750,000 | | | | 752,467 | |
| Illinois Sales Tax Securitization Corp., Second Lien, “A”, 5%, 1/01/2026 | | | 110,000 | | | | 122,983 | |
| Illinois Sales Tax Securitization Corp., Second Lien, “A”, 5%, 1/01/2027 | | | 235,000 | | | | 266,826 | |
| Illinois Sales Tax Securitization Corp., Second Lien, “A”, 5%, 1/01/2029 | | | 255,000 | | | | 297,440 | |
| Illinois Sales Tax Securitization Corp., Second Lien, “A”, 5%, 1/01/2030 | | | 105,000 | | | | 123,907 | |
| Illinois Sales Tax Securitization Corp., Second Lien, “A”, 5%, 1/01/2036 | | | 65,000 | | | | 75,479 | |
| Illinois Sales Tax Securitization Corp., Second Lien, “A”, 5%, 1/01/2037 | | | 130,000 | | | | 150,552 | |
| Illinois Sales Tax Securitization Corp., Second Lien, “A”, 4%, 1/01/2038 | | | 55,000 | | | | 56,688 | |
| Illinois Sales Tax Securitization Corp., Second Lien, “A”, 4%, 1/01/2039 | | | 40,000 | | | | 41,114 | |
| Illinois Sales Tax Securitization Corp., Second Lien, “A”, 4%, 1/01/2040 | | | 60,000 | | | | 61,568 | |
| New York Dormitory Authority Rev., State Personal Income Tax, “A“, 5%, 3/15/2041 | | | 4,000,000 | | | | 4,932,640 | |
| Puerto Rico Sales Tax Financing Corp., Restructured Sales Tax Rev.,”2019A-1“, 4.55%, 7/01/2040 | | | 63,000 | | | | 59,639 | |
33
Portfolio of Investments – continued
| | | | | | | | |
| Municipal Bonds - continued | | | | | | |
| | | | | | | | |
| | |
| Issuer | | Shares/Par | | | Value ($) | |
| Sales & Excise Tax Revenue - continued | | | | | |
| Puerto Rico Sales Tax Financing Corp., Restructured Sales Tax Rev.,”2019A-1“, 5%, 7/01/2058 | | $ | 2,186,000 | | | $ | 2,125,776 | |
| Puerto Rico Sales Tax Financing Corp., Restructured Sales Tax Rev.,”2019A-2“, 4.329%, 7/01/2040 | | | 567,000 | | | | 520,841 | |
| Puerto Rico Sales Tax Financing Corp., Restructured Sales Tax Rev.,”2019A-2“, 4.329%, 7/01/2040 | | | 210,000 | | | | 192,904 | |
| Puerto Rico Sales Tax Financing Corp., Restructured Sales Tax Rev.,”2019A-2“, 4.536%, 7/01/2053 | | | 4,000 | | | | 3,630 | |
| Puerto Rico Sales Tax Financing Corp., Restructured Sales Tax Rev.,”2019A-2“, 4.784%, 7/01/2058 | | | 90,000 | | | | 84,287 | |
| Puerto Rico Sales Tax Financing Corp., Restructured Sales Tax Rev., Capital Appreciation,”2019A-1“, 0%, 7/01/2024 | | | 8,000 | | | | 6,850 | |
| Puerto Rico Sales Tax Financing Corp., Restructured Sales Tax Rev., Capital Appreciation,”2019A-1“, 0%, 7/01/2027 | | | 103,000 | | | | 78,426 | |
| Puerto Rico Sales Tax Financing Corp., Restructured Sales Tax Rev., Capital Appreciation,”2019A-1“, 0%, 7/01/2029 | | | 17,000 | | | | 11,764 | |
| Puerto Rico Sales Tax Financing Corp., Restructured Sales Tax Rev., Capital Appreciation,”2019A-1“, 0%, 7/01/2031 | | | 942,000 | | | | 585,811 | |
| Puerto Rico Sales Tax Financing Corp., Restructured Sales Tax Rev., Capital Appreciation,”2019A-1“, 0%, 7/01/2033 | | | 904,000 | | | | 500,219 | |
| Puerto Rico Sales Tax Financing Corp., Restructured Sales Tax Rev., Capital Appreciation,”2019A-1“, 0%, 7/01/2046 | | | 5,509,000 | | | | 1,302,438 | |
| | | | | | | $ | 13,360,219 | |
| Secondary Schools - 1.6% | | | | | |
| Buffalo & Erie County, NY, Industrial Land Development Corp. Rev. (Charter School for Applied Technologies Project), ”A“, 5%, 6/01/2035 | | $ | 1,000,000 | | | $ | 1,075,690 | |
| Build NYC Resource Corp. Rev. (International Leadership Charter School Project), 6%, 7/01/2043 | | | 750,000 | | | | 648,682 | |
| Build NYC Resource Corp. Rev. (Packer Collegiate Institute Project), 5%, 6/01/2040 | | | 675,000 | | | | 770,465 | |
| Rensselaer County, NY, Industrial Development Agency, Civic Facility Rev. (Emma Willard School Refunding Project), 5%, 1/01/2034 | | | 450,000 | | | | 516,695 | |
| Rensselaer County, NY, Industrial Development Agency, Civic Facility Rev. (Emma Willard School Refunding Project), 5%, 1/01/2035 | | | 500,000 | | | | 573,365 | |
| Rensselaer County, NY, Industrial Development Agency, Civic Facility Rev. (Emma Willard School Refunding Project), 5%, 1/01/2036 | | | 645,000 | | | | 738,061 | |
| | | | | | | $ | 4,322,958 | |
| | | | | | | | |
| | | | | | | |
| | |
| Issuer | | Shares/Par | | | Value ($) | |
| Single Family Housing - State - 1.3% | | | | | |
| New York Mortgage Agency Rev., ”212“, AMT, 3.7%, 10/01/2033 | | $ | 2,000,000 | | | $ | 2,119,340 | |
| New York Mortgage Agency Rev., ”217“, 3.625%, 4/01/2039 | | | 1,280,000 | | | | 1,380,326 | |
| | | | | | | $ | 3,499,666 | |
| State & Local Agencies - 6.2% | | | | | |
| Delaware Valley, PA, Regional Finance Authority, ”C“, FLR, 1.809% (LIBOR - 3mo. + 0.75%), 6/01/2037 | | $ | 1,430,000 | | | $ | 1,294,522 | |
| New Jersey Building Authority Rev., Unrefunded Balance, “A”, BAM, 5%, 6/15/2029 | | | 30,000 | | | | 33,317 | |
| New Jersey Economic Development Authority Rev., School Facilities Construction Rev., ”LLL“, 5%, 6/15/2039 | | | 615,000 | | | | 651,906 | |
| New Jersey Economic Development Authority Rev., School Facilities Construction Rev., ”LLL“, 5%, 6/15/2044 | | | 1,020,000 | | | | 1,068,287 | |
| New York City Educational Construction Fund Rev., ”A“, 5.75%, 4/01/2033 | | | 1,860,000 | | | | 1,943,458 | |
| New York Dormitory Authority Rev., Non- State Supported Debt, ”A“, 5%, 10/01/2020 | | | 2,000,000 | | | | 2,038,980 | |
| New York Dormitory Authority Rev., State Personal Income Tax, ”A“ (Group C), 5%, 2/15/2037 | | | 1,000,000 | | | | 1,168,940 | |
| New York Dormitory Authority Rev., State Personal Income Tax, ”D“, 5%, 2/15/2040 | | | 830,000 | | | | 873,459 | |
| New York Urban Development Corp., State Personal Income Tax Rev., ”C“, 5%, 3/15/2034 | | | 2,000,000 | | | | 2,439,000 | |
| New York, NY, City Transitional Finance Authority Building Aid Rev.,”S-2A“, 5%, 7/15/2040 | | | 2,000,000 | | | | 2,080,720 | |
| New York, NY, City Transitional Finance Authority Building Aid Rev.,”S-3“, 5%, 7/15/2043 | | | 3,000,000 | | | | 3,629,520 | |
| | | | | | | $ | 17,222,109 | |
| Tax - Other - 9.5% | | | | | |
| Glen Cove, NY, Local Economic Assistance Corp. (Garvies Point Public Improvement Project), Capital Appreciation, ”B“, 0%, 1/01/2045 | | $ | 2,000,000 | | | $ | 533,720 | |
| Guam Government Ltd. Obligation Rev., ”A“, 5%, 12/01/2035 | | | 190,000 | | | | 188,813 | |
| Guam Government Ltd. Obligation Rev., ”A“, 5%, 12/01/2036 | | | 100,000 | | | | 99,021 | |
| Guam Government Ltd. Obligation Rev., ”A“, 5%, 12/01/2046 | | | 300,000 | | | | 284,490 | |
| Hudson Yards, NY, Infrastructure Corp. Rev., ”A“, 5%, 2/15/2042 | | | 2,000,000 | | | | 2,366,020 | |
| Hudson Yards, NY, Infrastructure Corp. Rev., ”A“, 5.75%, 2/15/2047 (Prerefunded 2/15/2021) | | | 1,860,000 | | | | 1,934,102 | |
34
Portfolio of Investments – continued
| | | | | | | | |
| Municipal Bonds - continued | | | | | | |
| | | | | | | | |
| | |
| Issuer | | Shares/Par | | | Value ($) | |
| Tax - Other - continued | | | | | |
| Hudson Yards, NY, Infrastructure Corp. Rev., ”A“, Unrefunded Balance, 5.75%, 2/15/2047 | | $ | 1,140,000 | | | $ | 1,179,353 | |
| New York, NY, City Transitional Finance Authority Rev.,”A-3“, 4%, 8/01/2043 | | | 3,000,000 | | | | 3,321,810 | |
| New York, NY, City Transitional Finance Authority Rev.,”B-1“, 5%, 8/01/2038 | | | 1,175,000 | | | | 1,430,704 | |
| New York, NY, City Transitional Finance Authority Rev.,”B-1“, 4%, 8/01/2042 | | | 2,000,000 | | | | 2,217,880 | |
| New York, NY, City Transitional Finance Authority Rev., ”D“, 5%, 2/01/2027 | | | 3,000,000 | | | | 3,090,840 | |
| New York, NY, City Transitional Finance Authority Rev.,”E-1“, 5%, 2/01/2035 | | | 2,300,000 | | | | 2,745,257 | |
| New York, NY, City Transitional Finance Authority Rev.,”E-1“, 5%, 2/01/2043 | | | 2,500,000 | | | | 2,932,900 | |
| Puerto Rico Convention Center District Authority, Hotel Occupancy Tax Rev., ”A“, AAC, 5%, 7/01/2031 | | | 350,000 | | | | 350,046 | |
| Puerto Rico Infrastructure Financing Authority Special Tax Rev., ”C“, AAC, 5.5%, 7/01/2024 | | | 425,000 | | | | 448,086 | |
| Puerto Rico Infrastructure Financing Authority Special Tax Rev., ”C“, AAC, 5.5%, 7/01/2026 | | | 1,215,000 | | | | 1,295,469 | |
| Puerto Rico Infrastructure Financing Authority Special Tax Rev., ”C“, AAC, 5.5%, 7/01/2027 | | | 715,000 | | | | 764,256 | |
| Puerto Rico Infrastructure Financing Authority Special Tax Rev., Capital Appreciation, ”A“, AAC, 0%, 7/01/2036 | | | 3,020,000 | | | | 1,384,247 | |
| | | | | | | $ | 26,567,014 | |
| Tobacco - 2.3% | | | | | |
| Buckeye, OH, Tobacco Settlement Financing Authority Rev.,”A-3“, 6.25%, 6/01/2037 | | $ | 765,000 | | | $ | 848,133 | |
| Buckeye, OH, Tobacco Settlement Financing Authority Senior Asset-Backed Refunding,2020A-2, ”1“, 5%, 6/01/2033 | | | 180,000 | | | | 222,714 | |
| Buckeye, OH, Tobacco Settlement Financing Authority Senior Asset-Backed Refunding,2020A-2, ”1“, 4%, 6/01/2038 | | | 115,000 | | | | 125,889 | |
| Buckeye, OH, Tobacco Settlement Financing Authority Senior Asset-Backed Refunding,2020B-2, ”2“, 5%, 6/01/2055 | | | 1,515,000 | | | | 1,342,320 | |
| Buckeye, OH, Tobacco Settlement Financing Authority Senior Asset-Backed Refunding,2020B-3, Capital Appreciation, ”2“, 0%, 6/01/2057 | | | 3,650,000 | | | | 402,705 | |
| Illinois Railsplitter Tobacco Settlement Authority Rev., 6%, 6/01/2028 (Prerefunded 6/01/2021) | | | 355,000 | | | | 374,756 | |
| New York Counties Tobacco Trust II, 5.625%, 6/01/2035 | | | 70,000 | | | | 70,214 | |
| Suffolk, NY, Tobacco Asset Securitization Corp., Tobacco Settlement, ”B“, 5%, 6/01/2032 | | | 750,000 | | | | 767,865 | |
| Tobacco Settlement Asset Securitization Corp., NY, ”A“, 5%, 6/01/2035 | | | 1,000,000 | | | | 1,094,360 | |
| Tobacco Settlement Asset Securitization Corp., NY, ”A“, 5%, 6/01/2036 | | | 1,000,000 | | | | 1,091,830 | |
| | | | | | | $ | 6,340,786 | |
| | | | | | | | |
| | | | | | | |
| | |
| Issuer | | Shares/Par | | | Value ($) | |
| Toll Roads - 2.2% | | | | | |
| Buffalo & Fort Erie Public Bridge Authority Toll System Rev., 5%, 1/01/2042 | | $ | 1,000,000 | | | $ | 1,176,100 | |
| Buffalo & Fort Erie Public Bridge Authority Toll System Rev., 5%, 1/01/2047 | | | 1,000,000 | | | | 1,168,000 | |
| New York Thruway Authority General Rev., Junior Indebtedness Obligations, ”A“, 5.25%, 1/01/2056 | | | 2,000,000 | | | | 2,331,640 | |
| Texas Private Activity Surface Transportation Corp., Senior Lien Rev. (NTE Mobility Partners Segments 3 LLC Segments 3A & 3B Facility), 7%, 12/31/2038 | | | 205,000 | | | | 231,271 | |
| Texas Private Activity Surface Transportation Corp., Senior Lien Rev. (NTE Mobility Partners Segments 3 LLC Segments 3A & 3B Facility), 6.75%, 6/30/2043 | | | 170,000 | | | | 190,124 | |
| Triborough Bridge & Tunnel Authority Rev., NY, ”A“, 5%, 1/01/2028 (Prerefunded 1/01/2022) | | | 1,000,000 | | | | 1,068,910 | |
| | | | | | | $ | 6,166,045 | |
| Transportation - Special Tax - 5.8% | | | | | |
| Commonwealth of Puerto Rico Highway & Transportation Authority Rev., ASSD GTY, 5.25%, 7/01/2041 | | $ | 195,000 | | | $ | 201,642 | |
| Commonwealth of Puerto Rico Highway & Transportation Authority Rev., ”A“, NATL, 4.75%, 7/01/2038 | | | 395,000 | | | | 371,861 | |
| Commonwealth of Puerto Rico Highway & Transportation Authority Rev., ”D“, AGM, 5%, 7/01/2032 | | | 275,000 | | | | 275,074 | |
| Commonwealth of Puerto Rico Highway & Transportation Authority Rev., ”J“, NATL, 5%, 7/01/2029 | | | 25,000 | | | | 25,000 | |
| Commonwealth of Puerto Rico Highway & Transportation Authority Rev., ”L“, AAC, 5.25%, 7/01/2038 | | | 1,290,000 | | | | 1,309,092 | |
| Commonwealth of Puerto Rico Highway & Transportation Authority Rev., ”L“, ASSD GTY, 5.25%, 7/01/2041 | | | 805,000 | | | | 832,418 | |
| Commonwealth of Puerto Rico Highway & Transportation Authority Rev., ”L“, NATL, 5.25%, 7/01/2035 | | | 545,000 | | | | 546,466 | |
| Commonwealth of Puerto Rico Highway & Transportation Authority Rev., ”N“, AAC, 5.5%, 7/01/2029 | | | 1,255,000 | | | | 1,343,227 | |
| Commonwealth of Puerto Rico Highway & Transportation Authority Rev., ”N“, NATL, 5.25%, 7/01/2032 | | | 150,000 | | | | 152,397 | |
| Commonwealth of Puerto Rico Highway & Transportation Authority Rev., ”N“, NATL, 5.25%, 7/01/2033 | | | 105,000 | | | | 106,265 | |
| Commonwealth of Puerto Rico Highway & Transportation Authority Rev., Capital Appreciation, ”N“, AAC, 0%, 7/01/2020 | | | 80,000 | | | | 79,230 | |
| Commonwealth of Puerto Rico Highway & Transportation Authority Rev., Unrefunded Balance, ”A“, NATL, 5%, 7/01/2038 | | | 40,000 | | | | 39,671 | |
35
Portfolio of Investments – continued
| | | | | | | | |
| Municipal Bonds - continued | | | | | | |
| | | | | | | | |
| | |
| Issuer | | Shares/Par | | | Value ($) | |
| Transportation - Special Tax - continued | | | | | |
| Metropolitan Transportation Authority Refunding Rev., NY (Climate Bond Certified),”A-2“, AGM, 5%, 11/15/2044 | | $ | 2,000,000 | | | $ | 2,320,720 | |
| Metropolitan Transportation Authority Refunding Rev., NY (Climate Bond Certified),”C-1“, 4%, 11/15/2037 | | | 2,000,000 | | | | 2,065,360 | |
| Metropolitan Transportation Authority Rev., ”E“, 4%, 9/01/2020 | | | 2,995,000 | | | | 3,015,276 | |
| Metropolitan Transportation Authority Rev., NY, Anticipation Note,”B-1C“, 5%, 5/15/2020 | | | 2,000,000 | | | | 2,000,240 | |
| New Jersey Transportation Trust Fund Authority, Transportation System, ”BB“, 5%, 6/15/2044 | | | 1,475,000 | | | | 1,538,912 | |
| | | | | | | $ | 16,222,851 | |
| Universities - Colleges - 12.4% | | | | | |
| Albany, NY, Capital Resource Corp. Rev. (Albany College of Pharmacy Project), ”A“, 5%, 12/01/2033 | | $ | 125,000 | | | $ | 132,980 | |
| Build NYC Resource Corp. Rev. (Albert Einstein School of Medicine, Inc.), 5.5%, 9/01/2045 | | | 1,000,000 | | | | 1,071,330 | |
| Build NYC Resource Corp. Rev. (Manhattan College Project), 5%, 8/01/2047 | | | 2,000,000 | | | | 2,354,300 | |
| Dobbs Ferry, NY, Local Development Corp. (Mercy College Project), 5%, 7/01/2039 | | | 1,000,000 | | | | 1,124,950 | |
| Dutchess County, NY, Local Development Corp. Rev. (Vassar College Project), 5%, 7/01/2042 | | | 1,500,000 | | | | 1,769,955 | |
| Hempstead, NY, Local Development Corp. Rev. (Hofstra University Project), 5%, 7/01/2028 | | | 1,000,000 | | | | 1,044,620 | |
| Hempstead, NY, Local Development Corp. Rev. (Hofstra University Project), 5%, 7/01/2047 | | | 2,000,000 | | | | 2,363,880 | |
| Hempstead, NY, Local Development Corp. Rev. (Molloy College Project), 5%, 7/01/2036 | | | 675,000 | | | | 745,544 | |
| Hempstead, NY, Local Development Corp. Rev. (Molloy College Project), 5%, 7/01/2038 | | | 480,000 | | | | 526,949 | |
| Miami-Dade County, FL, Educational Facilities Authority Rev. (University of Miami), ”B“, 5.25%, 4/01/2029 | | | 1,325,000 | | | | 1,620,276 | |
| Monroe County, NY, Industrial Development Corp. Rev. (University of Rochester Project), ”A“, 5%, 7/01/2023 (Prerefunded 7/01/2021) | | | 500,000 | | | | 524,850 | |
| Monroe County, NY, Industrial Development Corp. Rev. (University of Rochester Project), ”A“, 5%, 7/01/2024 (Prerefunded 7/01/2021) | | | 1,000,000 | | | | 1,049,700 | |
| Monroe County, NY, Industrial Development Corp. Rev. (University of Rochester Project), ”A“, 5%, 7/01/2030 | | | 1,000,000 | | | | 1,180,480 | |
| Monroe County, NY, Industrial Development Corp. Rev. (University of Rochester Project), ”A“, 5%, 7/01/2037 | | | 1,000,000 | | | | 1,223,120 | |
| New York Dormitory Authority Rev. (Columbia University), ”B“, 5%, 10/01/2038 | | | 1,000,000 | | | | 1,219,890 | |
| New York Dormitory Authority Rev. (Cornell University), ”D“, 5%, 7/01/2035 | | | 1,410,000 | | | | 1,973,027 | |
| | | | | | | | |
| | | | | | | |
| | |
| Issuer | | Shares/Par | | | Value ($) | |
| Universities - Colleges - continued | | | | | |
| New York Dormitory Authority Rev. (New York University), ”A“, 4%, 7/01/2041 | | $ | 1,500,000 | | | $ | 1,657,920 | |
| New York Dormitory Authority Rev., Non- State Supported Debt (New School), ”A“, 5%, 7/01/2032 | | | 1,000,000 | | | | 1,202,990 | |
| New York Dormitory Authority Rev., Non- State Supported Debt (New School), ”A“, 5%, 7/01/2036 | | | 500,000 | | | | 593,100 | |
| New York Dormitory Authority Rev., Non- State Supported Debt, ”A“, 5%, 7/01/2039 | | | 2,000,000 | | | | 2,485,320 | |
| Onondaga, NY, Civic Development Corp. Refunding Rev. (Le Moyne College Project), 4%, 7/01/2037 (w) | | | 275,000 | | | | 279,089 | |
| Onondaga, NY, Civic Development Corp. Refunding Rev. (Le Moyne College Project), 4%, 7/01/2038 (w) | | | 255,000 | | | | 257,736 | |
| Onondaga, NY, Civic Development Corp. Refunding Rev. (Le Moyne College Project), 4%, 7/01/2039 (w) | | | 325,000 | | | | 328,013 | |
| Onondaga, NY, Civic Development Corp. Refunding Rev. (Le Moyne College Project), 4%, 7/01/2040 (w) | | | 300,000 | | | | 302,376 | |
| Onondaga, NY, Civic Development Corp. Refunding Rev. (Le Moyne College Project), 5%, 1/01/2043 | | | 740,000 | | | | 800,673 | |
| Onondaga, NY, Civic Development Corp. Rev. (Le Moyne College Project), 5.375%, 7/01/2040 | | | 2,000,000 | | | | 2,012,140 | |
| Puerto Rico Industrial, Tourist, Educational, Medical & Environmental Control Facilities Financing Authority, Higher Education Rev. (Ana G. Mendez University System Project), 5.125%, 4/01/2032 | | | 80,000 | | | | 71,036 | |
| Puerto Rico Industrial, Tourist, Educational, Medical & Environmental Control Facilities Financing Authority, Higher Education Rev. (Ana G. Mendez University System Project), 5.375%, 4/01/2042 | | | 135,000 | | | | 114,226 | |
| Schenectady County, NY, Capital Resource Corp.Tax-Exempt Rev. (Union College Project), 5%, 1/01/2047 | | | 2,000,000 | | | | 2,349,660 | |
| Tompkins County, NY, Development Corp. Continuing Care Retirement Community Rev. (Ithaca College Project), ”A“, 5%, 7/01/2041 | | | 1,000,000 | | | | 1,205,170 | |
| Troy, NY, Industrial Development Authority, Civic Facility Rev. (Rensselaer Polytechnic Institute), ”E“, 5%, 9/01/2031 | | | 1,000,000 | | | | 1,047,580 | |
| | | | | | | $ | 34,632,880 | |
| Universities - Dormitories - 2.1% | | | | | |
| Amherst, NY, Development Corporation, Student Housing Facility Refunding Rev. (UBF Facility/Student Housing Corp./Greiner and Hadley Projects at SUNY Buffalo), ”A“, AGM, 5%, 10/01/2045 | | $ | 1,000,000 | | | $ | 1,190,940 | |
36
Portfolio of Investments – continued
| | | | | | | | |
| Municipal Bonds - continued | | | | | | |
| | | | | | | | |
| | |
| Issuer | | Shares/Par | | | Value ($) | |
| Universities - Dormitories - continued | | | | | |
| Buffalo & Erie County, NY, Industrial Land Development Corp. Rev. (Buffalo State College Foundation Housing Corp. Project), ”A“, 5.375%, 10/01/2041 | | $ | 2,000,000 | | | $ | 2,080,900 | |
| Onondaga County, NY, Trust for Cultural Resources Rev. (Abby Lane Housing Corp. Project), 5%, 5/01/2040 | | | 1,000,000 | | | | 1,147,320 | |
| Westchester County, NY, Local Development Corp. Rev. (Purchase Housing Corp. II Project), 5%, 6/01/2042 | | | 1,250,000 | | | | 1,362,150 | |
| | | | | | | $ | 5,781,310 | |
| Utilities - Cogeneration - 0.2% | | | | | |
| Puerto Rico Industrial, Tourist, Educational, Medical & Environmental Control Facilities Financing Authority Rev. (Cogeneration Facilities - AES Puerto Rico Project), 9.12%, 6/01/2022 | | $ | 645,000 | | | $ | 661,125 | |
| | |
| Utilities - Municipal Owned - 2.0% | | | | | | | | |
| Guam Power Authority Rev., ”A“, 5.5%, 10/01/2030 (Prerefunded 10/01/2020) | | $ | 515,000 | | | $ | 526,129 | |
| Guam Power Authority Rev., ”A“, AGM, 5%, 10/01/2039 | | | 155,000 | | | | 160,537 | |
| Guam Power Authority Rev., ”A“, AGM, 5%, 10/01/2044 | | | 180,000 | | | | 185,459 | |
| Long Island, NY, Power Authority, Electric Systems Rev., 5%, 9/01/2035 | | | 1,000,000 | | | | 1,191,640 | |
| Puerto Rico Electric Power Authority Rev., ”A“, 5%, 7/01/2029 (a)(d) | | | 675,000 | | | | 477,562 | |
| Puerto Rico Electric Power Authority Rev., ”A“, 5%, 7/01/2042 (a)(d) | | | 100,000 | | | | 70,750 | |
| Puerto Rico Electric Power Authority Rev., ”AAA“, 5.25%, 7/01/2021 (a)(d) | | | 50,000 | | | | 35,500 | |
| Puerto Rico Electric Power Authority Rev., ”AAA“, 5.25%, 7/01/2030 (a)(d) | | | 25,000 | | | | 17,750 | |
| Puerto Rico Electric Power Authority Rev., ”CCC“, 5.25%, 7/01/2027 (a)(d) | | | 250,000 | | | | 177,500 | |
| Puerto Rico Electric Power Authority Rev., ”DDD“, 5%, 7/01/2020 (a)(d) | | | 25,000 | | | | 17,688 | |
| Puerto Rico Electric Power Authority Rev., ”DDD“, 5%, 7/01/2021 (a)(d) | | | 265,000 | | | | 187,487 | |
| Puerto Rico Electric Power Authority Rev., ”DDD“, 5%, 7/01/2022 (a)(d) | | | 430,000 | | | | 304,225 | |
| Puerto Rico Electric Power Authority Rev., ”EEE“, 6.05%, 7/01/2032 (a)(d) | | | 140,000 | | | | 99,575 | |
| Puerto Rico Electric Power Authority Rev., ”RR“, NATL, 5%, 7/01/2022 | | | 885,000 | | | | 885,593 | |
| Puerto Rico Electric Power Authority Rev., ”TT“, 5%, 7/01/2021 (a)(d) | | | 115,000 | | | | 81,363 | |
| Puerto Rico Electric Power Authority Rev., ”TT“, 5%, 7/01/2023 (a)(d) | | | 110,000 | | | | 77,825 | |
| Puerto Rico Electric Power Authority Rev., ”TT“, 5%, 7/01/2027 (a)(d) | | | 20,000 | | | | 14,150 | |
| Puerto Rico Electric Power Authority Rev., ”TT“, 5%, 7/01/2037 (a)(d) | | | 345,000 | | | | 244,087 | |
| | | | | | | | |
| | | | | | | |
| | |
| Issuer | | Shares/Par | | | Value ($) | |
| Utilities - Municipal Owned - continued | | | | | |
| Puerto Rico Electric Power Authority Rev., ”V“, NATL, 5.25%, 7/01/2033 | | $ | 140,000 | | | $ | 141,687 | |
| Puerto Rico Electric Power Authority Rev., ”VV“, NATL, 5.25%, 7/01/2032 | | | 310,000 | | | | 314,954 | |
| Puerto Rico Electric Power Authority Rev., ”VV“, NATL, 5.25%, 7/01/2034 | | | 30,000 | | | | 30,229 | |
| Puerto Rico Electric Power Authority Rev., ”WW“, 5.375%, 7/01/2022 (a)(d) | | | 20,000 | | | | 14,225 | |
| Puerto Rico Electric Power Authority Rev., ”WW“, 5.25%, 7/01/2025 (a)(d) | | | 50,000 | | | | 35,500 | |
| Puerto Rico Electric Power Authority Rev., ”ZZ“, 5%, 7/01/2018 (a)(d) | | | 170,000 | | | | 118,363 | |
| Puerto Rico Electric Power Authority Rev., ”ZZ“, 5.25%, 7/01/2023 (a)(d) | | | 180,000 | | | | 127,800 | |
| Puerto Rico Electric Power Authority Rev., ”ZZ“, 5.25%, 7/01/2024 (a)(d) | | | 55,000 | | | | 39,050 | |
| Puerto Rico Electric Power Authority Rev., ”ZZ“, 5.25%, 7/01/2026 (a)(d) | | | 170,000 | | | | 120,700 | |
| | | | | | | $ | 5,697,328 | |
| Utilities - Other - 0.6% | | | | | | | | |
| Public Authority for Colorado Energy Natural Gas Purchase Rev., 6.5%, 11/15/2038 | | $ | 1,085,000 | | | $ | 1,536,089 | |
| Texas Gas Acquisition & Supply Corp. III., Gas Supply Rev., 5%, 12/15/2031 | | | 115,000 | | | | 118,853 | |
| | | | | | | $ | 1,654,942 | |
| Water & Sewer Utility Revenue - 11.6% | | | | | |
| Commonwealth of Puerto Rico Aqueduct & Sewer Authority Rev., ”A“, ASSD GTY, 5.125%, 7/01/2047 | | $ | 190,000 | | | $ | 189,991 | |
| Guam Waterworks Authority Rev. (Water and Wastewater System), 5%, 7/01/2036 | | | 215,000 | | | | 217,823 | |
| Guam Waterworks Authority Rev. (Water and Wastewater System), 5%, 7/01/2037 | | | 270,000 | | | | 272,878 | |
| Guam Waterworks Authority Rev. (Water and Wastewater System), 5%, 7/01/2040 | | | 750,000 | | | | 753,795 | |
| Guam Waterworks Authority Rev. (Water and Wastewater System), 5.625%, 7/01/2040 (Prerefunded 7/01/2020) | | | 315,000 | | | | 318,440 | |
| Mississippi Development Bank Special Obligation (City of Jackson Water and Sewer System Rev. Bond Project), AGM, 6.875%, 12/01/2040 | | | 100,000 | | | | 118,067 | |
| New York Environmental Facilities Corp., Clean Water & Drinking Water Rev. (New York City Municipal Water Finance Authority Project), ”A“, 5%, 6/15/2039 (w) | | | 590,000 | | | | 740,184 | |
| New York Environmental Facilities Corp., Clean Water & Drinking Water Rev. (New York City Municipal Water Finance Authority Project), ”A“, 5%, 6/15/2040 (w) | | | 625,000 | | | | 781,394 | |
| New York Environmental Facilities Corp., Clean Water & Drinking Water Rev. (New York City Municipal Water Finance Authority Project), ”B“, 5%, 6/15/2043 | | | 3,500,000 | | | | 4,266,710 | |
37
Portfolio of Investments – continued
| | | | | | | | |
| Municipal Bonds - continued | | | | | | |
| | | | | | | | |
| | |
| Issuer | | Shares/Par | | | Value ($) | |
| Water & Sewer Utility Revenue - continued | | | | | |
| New York, NY, Municipal Water Finance Authority, Water & Sewer System Rev., 4%, 6/15/2041 | | $ | 3,000,000 | | | $ | 3,409,200 | |
| New York, NY, Municipal Water Finance Authority, Water & Sewer System Rev., ”BB“, 5%, 6/15/2046 | | | 1,000,000 | | | | 1,181,110 | |
| New York, NY, Municipal Water Finance Authority, Water & Sewer System Rev., ”DD“, 5%, 6/15/2034 | | | 2,000,000 | | | | 2,211,180 | |
| New York, NY, Municipal Water Finance Authority, Water & Sewer System Rev., ”DD“, 5%, 6/15/2037 | | | 3,000,000 | | | | 3,675,000 | |
| New York, NY, Municipal Water Finance Authority, Water & Sewer System Rev.,”DD-1“, VRDN, 0.65%, 6/15/2043 | | | 6,575,000 | | | | 6,575,000 | |
| New York, NY, Municipal Water Finance Authority, Water & Sewer System Second General Resolution Rev., ”BB“, 5%, 6/15/2049 | | | 4,000,000 | | | | 4,916,000 | |
| New York, NY, Municipal Water Finance Authority, Water System Rev., ”A“, AGM, 5%, 7/01/2043 | | | 600,000 | | | | 701,238 | |
| | | | | | | | |
| | | | | | | |
| | |
| Issuer | | Shares/Par | | | Value ($) | |
| Water & Sewer Utility Revenue - continued | | | | | |
| New York, NY, Municipal Water Finance Authority, Water System Rev., ”A“, AGM, 5%, 7/01/2048 | | $ | 1,750,000 | | | $ | 2,033,045 | |
| | | | | | | $ | 32,361,055 | |
Total Municipal Bonds
(Identified Cost, $264,015,635) | | | $ | 272,451,587 | |
| | |
| Bonds - 0.1% | | | | | | | | |
| Consumer Services - 0.1% | | | | | | | | |
| Toll Road Investors Partnership II LP, Capital Appreciation, NATL, 0%, 2/15/2043 (n) (Identified Cost, $310,288) | | $ | 1,000,000 | | | $ | 365,995 | |
| | |
| Investment Companies (h) - 1.9% | | | | | | | | |
| Money Market Funds - 1.9% | | | | | | | | |
| MFS Institutional Money Market Portfolio, 1.28% (v) (Identified Cost, $5,289,974) | | | 5,288,813 | | | $ | 5,289,871 | |
| | |
| Other Assets, Less Liabilities - 0.3% | | | | | | | 748,232 | |
| Net Assets - 100.0% | | | | | | $ | 278,855,685 | |
Derivative Contracts at 3/31/20
Futures Contracts
| | | | | | | | | | | | | | | | | | | | | | |
| Description | | Long/ Short | | | Currency | | | Contracts | | Notional
Amount | | | Expiration
Date | | | Value/Unrealized
Appreciation
(Depreciation) | |
| Liability Derivatives | | | | | | | | | | | | | | | | | | | | | | |
| Interest Rate Futures | | | | | | | | | | | | | | | | | | | | | | |
| U.S. Treasury Bond | | | Short | | | | USD | | | 15 | | | $2,685,938 | | | | June - 2020 | | | | $(180,524 | ) |
| | | | | | | | | | | | | | | | | | | | | | |
At March 31, 2020, the fund had cash collateral of $97,500 to cover any collateral or margin obligations for certain derivative contracts. Restricted cash and/or deposits with brokers in the Statements of Assets and Liabilities are comprised of cash collateral.
See Portfolio Footnotes and Notes to Financial Statements
38
PORTFOLIO OF INVESTMENTS
3/31/20
MFS NORTH CAROLINA MUNICIPAL BOND FUND
The Portfolio of Investments is a complete list of all securities owned by your fund. It is categorized by broad-based asset classes.
| | | | | | | | |
| Municipal Bonds - 95.3% | | | | | | |
| | | | | | | | |
| | |
| Issuer | | Shares/Par | | | Value ($) | |
| Airport Revenue - 7.8% | | | | | | | | |
| Charlotte, NC, Airport Rev. (Charlotte/Douglas International Airport), ”A“, 4.75%, 7/01/2028 | | $ | 1,250,000 | | | $ | 1,259,012 | |
| Charlotte, NC, Airport Rev. (Charlotte/Douglas International Airport), ”A“, 5%, 7/01/2032 | | | 1,245,000 | | | | 1,397,849 | |
| Charlotte, NC, Airport Rev. (Charlotte/Douglas International Airport), ”A“, 5%, 7/01/2036 | | | 3,000,000 | | | | 3,114,840 | |
| Charlotte, NC, Airport Rev. (Charlotte/Douglas International Airport), ”A“, 5%, 7/01/2038 | | | 3,245,000 | | | | 3,982,653 | |
| Charlotte, NC, Airport Rev. (Charlotte/Douglas International Airport), ”A“, 5%, 7/01/2039 | | | 1,000,000 | | | | 1,224,760 | |
| Charlotte, NC, Airport Rev. (Charlotte/Douglas International Airport), ”B“, 4%, 7/01/2038 | | | 1,155,000 | | | | 1,274,970 | |
| Charlotte, NC, Airport Rev. (Charlotte/Douglas International Airport), ”B“, 5%, 7/01/2042 | | | 1,000,000 | | | | 1,153,970 | |
| Charlotte, NC, Airport Rev. (Charlotte/Douglas International Airport), ”B“, 5%, 7/01/2047 | | | 2,000,000 | | | | 2,290,480 | |
| Charlotte, NC, Airport Rev. (Charlotte/Douglas International Airport), ”B“, 5%, 7/01/2049 | | | 2,500,000 | | | | 2,928,025 | |
| Chicago, IL, O’Hare International Airport Rev., Third Lien, ”A“, 5.625%, 1/01/2035 (Prerefunded 1/01/2021) | | | 860,000 | | | | 888,733 | |
| Chicago, IL, O’Hare International Airport Rev., Third Lien, Unrefunded Balance, ”A“, 5.625%, 1/01/2035 | | | 195,000 | | | | 200,712 | |
| Dallas and Fort Worth, TX, International Airport Rev., ”B“, 5%, 11/01/2044 | | | 440,000 | | | | 466,136 | |
| Dallas and Fort Worth, TX, International Airport Rev., ”C“, 5%, 11/01/2045 | | | 305,000 | | | | 317,136 | |
| Raleigh Durham, NC, Airport Authority Rev., ”A“, 5%, 5/01/2036 | | | 3,440,000 | | | | 3,450,802 | |
| Raleigh Durham, NC, Airport Authority Rev., ”A“, 5%, 5/01/2036 | | | 2,000,000 | | | | 2,303,480 | |
| Raleigh Durham, NC, Airport Authority Rev., ”A“, 5%, 5/01/2037 | | | 2,000,000 | | | | 2,298,280 | |
| Raleigh-Durham, NC, Airport Authority Refunding Rev., ”A“, 5%, 5/01/2034 | | | 1,150,000 | | | | 1,400,067 | |
| Raleigh-Durham, NC, Airport Authority Refunding Rev., ”A“, 5%, 5/01/2035 | | | 1,000,000 | | | | 1,212,600 | |
| Raleigh-Durham, NC, Airport Authority Refunding Rev., ”A“, 5%, 5/01/2036 | | | 1,000,000 | | | | 1,208,020 | |
| San Francisco, CA, City & County Airports Commission, International Airport Rev., ”B“, 5%, 5/01/2046 | | | 1,445,000 | | | | 1,600,352 | |
| | | | | | | | |
| | | | | | | |
| | |
| Issuer | | Shares/Par | | | Value ($) | |
| Airport Revenue - continued | |
| San Francisco, CA, City & County Airports Commission, International Airport Rev., ”H“, 5%, 5/01/2021 | | $ | 2,390,000 | | | $ | 2,474,319 | |
| Wayne County, MI, Airport Authority Rev. (Detroit Metropolitan Wayne County Airport), ”B“, 5%, 12/01/2044 | | | 175,000 | | | | 193,884 | |
| Wayne County, MI, Airport Authority Rev. (Detroit Metropolitan Wayne County Airport), ”B“, BAM, 5%, 12/01/2039 | | | 195,000 | | | | 217,497 | |
| Wayne County, MI, Airport Authority Rev. (Detroit Metropolitan Wayne County Airport), ”C“, 5%, 12/01/2039 | | | 150,000 | | | | 164,868 | |
| Wayne County, MI, Airport Authority Rev. (Detroit Metropolitan Wayne County Airport), ”C“, 5%, 12/01/2044 | | | 240,000 | | | | 262,577 | |
| | | | | | | $ | 37,286,022 | |
| General Obligations - General Purpose - 4.0% | | | | | |
| Bridgeview, IL, Stadium and Redevelopment | | | | | | | | |
| Projects, AAC, 5.14%, 12/01/2036 | | $ | 1,030,000 | | | $ | 950,855 | |
| Chicago, IL, ”A“, 5.5%, 1/01/2033 | | | 550,000 | | | | 572,154 | |
| Chicago, IL, ”D“, 5.5%, 1/01/2040 | | | 85,000 | | | | 87,536 | |
| Chicago, IL, ”F“, 5.5%, 1/01/2042 | | | 665,000 | | | | 683,374 | |
| Commonwealth of Puerto Rico, General Obligation, ”A“, 8%, 7/01/2035 (a)(d) | | | 5,015,000 | | | | 3,009,000 | |
| Commonwealth of Puerto Rico, Public Improvement, ”A“, AGM, 5%, 7/01/2035 | | | 915,000 | | | | 922,466 | |
| Durham County, NC, 4%, 6/01/2037 | | | 450,000 | | | | 525,492 | |
| Durham County, NC, 4%, 6/01/2039 | | | 650,000 | | | | 754,332 | |
| Durham County, NC, General Obligation Refunding, 4%, 6/01/2036 | | | 500,000 | | | | 585,655 | |
| Gaston County, NC, Rev., 5%, 4/01/2033 | | | 675,000 | | | | 857,776 | |
| Gaston County, NC, Rev., 5%, 4/01/2035 | | | 610,000 | | | | 769,972 | |
| Granville County, NC, 5%, 10/01/2034 | | | 675,000 | | | | 841,988 | |
| Granville County, NC, 5%, 10/01/2035 | | | 690,000 | | | | 857,746 | |
| Lee County, NC, Limited Obligation, 3.25%, 5/01/2035 | | | 1,000,000 | | | | 1,062,090 | |
| Lee County, NC, Limited Obligation, 4%, 5/01/2036 | | | 500,000 | | | | 573,610 | |
| Lee County, NC, Limited Obligation, 4%, 5/01/2037 | | | 855,000 | | | | 974,897 | |
| New Hanover County, NC, Public Improvement, ”A“, 5%, 8/01/2030 (Prerefunded 8/01/2020) | | | 2,000,000 | | | | 2,026,100 | |
| Puerto Rico Public Buildings Authority Rev.,”M-2“, AAC, 10%, 7/01/2035 | | | 625,000 | | | | 678,638 | |
| Randolph County, NC, 4%, 10/01/2037 | | | 1,045,000 | | | | 1,212,587 | |
| Randolph County, NC, 4%, 10/01/2038 | | | 500,000 | | | | 578,160 | |
| Randolph County, NC, 4%, 10/01/2039 | | | 500,000 | | | | 577,140 | |
| | | | | | | $ | 19,101,568 | |
39
Portfolio of Investments – continued
| | | | | | | | |
| Municipal Bonds - continued | | | | | | |
| | | | | | | | |
| | |
| Issuer | | Shares/Par | | | Value ($) | |
| General Obligations - Schools - 0.7% | |
| Wake County, NC, Limited Obligation, ”A“, 4%, 8/01/2037 | | $ | 3,000,000 | | | $ | 3,441,570 | |
|
| Healthcare Revenue - Hospitals - 14.7% | |
| Allegheny County, PA, Hospital Development Authority Rev. (Allegheny Health Network Obligated Group), ”A“, 4%, 4/01/2044 | | $ | 720,000 | | | $ | 751,601 | |
| Charlotte-Mecklenburg, NC, Hospital Authority Health Care System Rev. (Carolinas Health Care System), ”A“, 5%, 1/15/2036 | | | 3,000,000 | | | | 3,707,220 | |
| Charlotte-Mecklenburg, NC, Hospital Authority Health Care System Rev. (Carolinas Health Care System), ”A“, 5%, 1/15/2040 | | | 3,000,000 | | | | 3,418,080 | |
| Chattanooga, TN, Health, Educational & Housing Facility Board Rev. (CommonSpirit Health),”A-1“, 4%, 8/01/2044 | | | 55,000 | | | | 54,847 | |
| Chattanooga, TN, Health, Educational & Housing Facility Board Rev. (CommonSpirit Health),”A-2“, 5%, 8/01/2044 | | | 40,000 | | | | 43,062 | |
| Chattanooga, TN, Health, Educational & Housing Facility Board Rev. (CommonSpirit Health),”A-2“, 5%, 8/01/2049 | | | 20,000 | | | | 21,225 | |
| Colorado Health Facilities Authority Rev. (CommonSpirit Health),”A-2“, 4%, 8/01/2044 | | | 245,000 | | | | 244,319 | |
| Jefferson Parish, LA, Hospital Service District No. 2 Hospital Rev. (East Jefferson General Hospital), 6.25%, 7/01/2031 | | | 360,000 | | | | 368,392 | |
| Jefferson Parish, LA, Hospital Service District No. 2 Hospital Rev. (East Jefferson General Hospital), 6.375%, 7/01/2041 | | | 525,000 | | | | 536,660 | |
| Miami-Dade County, FL, Health Facilities Authority Hospital Rev., 6%, 8/01/2030 (Prerefunded 8/01/2020) | | | 225,000 | | | | 228,485 | |
| Miami-Dade County, FL, Health Facilities Authority Hospital Rev., Unrefunded Balance, 6%, 8/01/2030 | | | 85,000 | | | | 86,194 | |
| New Hanover County, NC, Hospital Rev. (New Hanover Regional Medical Center), 5%, 10/01/2036 | | | 1,500,000 | | | | 1,742,550 | |
| New Hanover County, NC, Hospital Rev. (New Hanover Regional Medical Center), 5%, 10/01/2047 | | | 2,425,000 | | | | 2,770,102 | |
| New Jersey Health Care Facilities, Financing Authority Rev. (University Hospital), ”A“, AGM, 5%, 7/01/2046 | | | 320,000 | | | | 336,986 | |
| North Carolina Medical Care Commission Health Care Facilities Rev. (Rex Healthcare), ”A“, 5%, 7/01/2032 | | | 600,000 | | | | 774,522 | |
| North Carolina Medical Care Commission Health Care Facilities Rev. (Rex Healthcare), ”A“, 5%, 7/01/2033 | | | 255,000 | | | | 327,741 | |
| North Carolina Medical Care Commission Health Care Facilities Rev. (Rex Healthcare), ”A“, 4%, 7/01/2049 | | | 1,000,000 | | | | 1,069,300 | |
| | | | | | | | |
| | | | | | | |
| | |
| Issuer | | Shares/Par | | | Value ($) | |
| Healthcare Revenue - Hospitals - continued | |
| North Carolina Medical Care Commission, Health Care Facilities First Mortgage Rev. (Appalachian Regional Healthcare System, Inc.), ”A“, 6.375%, 7/01/2026 (Prerefunded 7/01/2021) | | $ | 2,000,000 | | | $ | 2,127,180 | |
| North Carolina Medical Care Commission, Health Care Facilities First Mortgage Rev. (Appalachian Regional Healthcare System, Inc.), ”A“, 6.5%, 7/01/2031 (Prerefunded 7/01/2021) | | | 1,000,000 | | | | 1,065,000 | |
| North Carolina Medical Care Commission, Health Care Facilities Rev. (Cleveland County HealthCare System), 5.75%, 1/01/2035 (Prerefunded 1/01/2021) | | | 800,000 | | | | 827,160 | |
| North Carolina Medical Care Commission, Health Care Facilities Rev. (Duke University Health System), ”A“, 5%, 6/01/2035 (Prerefunded 6/01/2020) | | | 1,620,000 | | | | 1,630,076 | |
| North Carolina Medical Care Commission, Health Care Facilities Rev. (Duke University Health System), ”A“, 5%, 6/01/2042 | | | 2,420,000 | | | | 2,618,513 | |
| North Carolina Medical Care Commission, Health Care Facilities Rev. (Novant Health Obligation Group), ”A“, 5.25%, 11/01/2040 | | | 3,000,000 | | | | 3,062,010 | |
| North Carolina Medical Care Commission, Health Care Facilities Rev. (Rex Healthcare), ”A“, 5%, 7/01/2030 | | | 5,250,000 | | | | 5,294,572 | |
| North Carolina Medical Care Commission, Health Care Facilities Rev. (Vidant Health), 5%, 6/01/2031 | | | 2,800,000 | | | | 3,255,588 | |
| North Carolina Medical Care Commission, Health Care Facilities Rev. (Vidant Health), 5%, 6/01/2033 | | | 3,000,000 | | | | 3,470,820 | |
| North Carolina Medical Care Commission, Health Care Facilities Rev. (Vidant Health), 5%, 6/01/2045 | | | 2,500,000 | | | | 2,838,550 | |
| North Carolina Medical Care Commission, Health Care Facilities Rev. (Wake Forest Baptist Obligated Group), ”A“, 5%, 12/01/2033 | | | 1,000,000 | | | | 1,206,310 | |
| North Carolina Medical Care Commission, Health Care Facilities Rev. (WakeMed), ”A“, 5%, 10/01/2031 | | | 4,355,000 | | | | 4,670,955 | |
| North Carolina Medical Care Commission, Health Care Facilities Rev. (WakeMed), ”A“, 5%, 10/01/2038 | | | 1,825,000 | | | | 1,939,811 | |
| North Carolina Medical Care Commission, Hospital Rev. (North Carolina Baptist Hospitals, Inc.), 5.25%, 6/01/2029 | | | 2,215,000 | | | | 2,229,863 | |
| North Carolina Medical Care Commission, Hospital Rev. (North Carolina Baptist Hospitals, Inc.), 5%, 6/01/2034 | | | 2,000,000 | | | | 2,011,520 | |
| Northern Hospital District, Surry County, NC, Health Care Facilities Rev., 5%, 10/01/2035 | | | 1,515,000 | | | | 1,620,429 | |
| Northern Hospital District, Surry County, NC, Health Care Facilities Rev., 5%, 10/01/2038 | | | 1,065,000 | | | | 1,129,880 | |
40
Portfolio of Investments – continued
| | | | | | | | |
| Municipal Bonds - continued | | | | | | |
| | | | | | | | |
| | |
| Issuer | | Shares/Par | | | Value ($) | |
| Healthcare Revenue - Hospitals - continued | |
| Spartanburg County, SC, Regional Health Services District Hospital Rev., ”A“, 4%, 4/15/2043 | | $ | 1,580,000 | | | $ | 1,702,039 | |
| University of North Carolina, Hospitals at Chapel Hill Rev., 4%, 2/01/2037 | | | 405,000 | | | | 464,498 | |
| University of North Carolina, Hospitals at Chapel Hill Rev., 4%, 2/01/2038 | | | 1,040,000 | | | | 1,188,190 | |
| University of North Carolina, Hospitals at Chapel Hill Rev., 5%, 2/01/2046 | | | 6,500,000 | | | | 7,510,620 | |
| Virginia Small Business Financing Authority Rev. (Sentara Healthcare), 3%, 11/01/2040 | | | 2,350,000 | | | | 2,348,214 | |
| | | | | | | $ | 70,693,084 | |
| Healthcare Revenue - Long Term Care - 4.6% | |
| North Carolina Medical Care Commission, Health Care Facilities First Mortgage Rev. (Deerfield Episcopal Retirement Community), 5%, 11/01/2037 | | $ | 2,750,000 | | | $ | 3,150,207 | |
| North Carolina Medical Care Commission, Health Care Facilities First Mortgage Rev. (Presbyterian Homes Obligated Group), 5%, 10/01/2031 | | | 1,000,000 | | | | 1,132,460 | |
| North Carolina Medical Care Commission, Health Care Facilities First Mortgage Rev. (Presbyterian Homes Obligated Group), 5%, 10/01/2036 | | | 800,000 | | | | 897,744 | |
| North Carolina Medical Care Commission, Health Care Facilities Rev. (Pennybyrn at Maryfield), 5%, 10/01/2035 | | | 1,500,000 | | | | 1,401,675 | |
| North Carolina Medical Care Commission, Retirement Facilities First Mortgage Rev. (Aldersgate), 5%, 7/01/2045 | | | 1,000,000 | | | | 911,800 | |
| North Carolina Medical Care Commission, Retirement Facilities First Mortgage Rev. (Aldersgate), ”A“, 5%, 7/01/2047 | | | 1,000,000 | | | | 904,940 | |
| North Carolina Medical Care Commission, Retirement Facilities First Mortgage Rev. (Carolina Village Project), ”B“, 5%, 4/01/2047 | | | 2,000,000 | | | | 1,849,640 | |
| North Carolina Medical Care Commission, Retirement Facilities First Mortgage Rev. (Galloway Ridge), ”A“, 5%, 1/01/2039 | | | 1,225,000 | | | | 1,160,663 | |
| North Carolina Medical Care Commission, Retirement Facilities First Mortgage Rev. (Salemtowne Project), 5.25%, 10/01/2037 | | | 1,500,000 | | | | 1,507,815 | |
| North Carolina Medical Care Commission, Retirement Facilities First Mortgage Rev. (Sharon Towers), ”A“, 5%, 7/01/2049 | | | 2,000,000 | | | | 2,110,460 | |
| North Carolina Medical Care Commission, Retirement Facilities First Mortgage Rev. (Southminster), 5%, 10/01/2031 | | | 800,000 | | | | 814,648 | |
| North Carolina Medical Care Commission, Retirement Facilities First Mortgage Rev. (Southminster), 5%, 10/01/2037 | | | 2,200,000 | | | | 2,218,194 | |
| North Carolina Medical Care Commission, Retirement Facilities First Mortgage Rev. (United Church Homes and Services), ”A“, 5%, 9/01/2037 | | | 1,500,000 | | | | 1,479,360 | |
| | | | | | | | |
| | | | | | | |
| | |
| Issuer | | Shares/Par | | | Value ($) | |
| Healthcare Revenue - Long Term Care - continued | |
| North Carolina Medical Care Commission, Retirement Facilities First Mortgage Rev. (United Methodist Retirement Homes), ”A“, 5%, 10/01/2033 | | $ | 1,590,000 | | | $ | 1,707,056 | |
| North Carolina Medical Care Commission, Retirement Facilities First Mortgage Rev. (United Methodist Retirement Homes), ”A“, 5%, 10/01/2035 | | | 1,000,000 | | | | 1,041,040 | |
| | | | | | | $ | 22,287,702 | |
| Human Services - 0.2% | |
| North Carolina Capital Facilities Finance Agency Rev. (Arc of North Carolina Projects), ”A“, 5%, 10/01/2034 | | $ | 1,000,000 | | | $ | 1,142,660 | |
| | |
| Industrial Revenue - Other - 0.5% | | | | | | | | |
| Port Beaumont, TX, Navigation District Facility Rev. (Jefferson Gulf Coast Energy Project), ”A“, 3.625%, 1/01/2035 (n) | | $ | 500,000 | | | $ | 420,940 | |
| Port Beaumont, TX, Navigation District Facility Rev. (Jefferson Gulf Coast Energy Project), ”A“, 4%, 1/01/2050 (n) | | | 840,000 | | | | 648,363 | |
| Tuscaloosa County, AL, Industrial Development Authority, Gulf Opportunity Zone (Hunt Refining Project), ”A“, 4.5%, 5/01/2032 | | | 615,000 | | | | 584,662 | |
| Tuscaloosa County, AL, Industrial Development Authority, Gulf Opportunity Zone (Hunt Refining Project), ”A“, 5.25%, 5/01/2044 | | | 830,000 | | | | 798,136 | |
| | | | | | | $ | 2,452,101 | |
| Industrial Revenue - Paper - 0.2% | |
| Columbus County, NC, Industrial Facilities & Pollution Control, Financing Authority Rev. (International Paper Co.), 5.7%, 5/01/2034 | | $ | 1,000,000 | | | $ | 1,001,450 | |
|
| Miscellaneous Revenue - Other - 1.2% | |
| Durham County, NC, Industrial Facilities & Pollution Control Financing Authority Rev. (Research Triangle Institute), 5%, 2/01/2025 | | $ | 1,000,000 | | | $ | 1,165,750 | |
| Indiana Finance Authority Rev. (Ohio River Bridges East End Crossing Project), ”A“, 5%, 7/01/2040 | | | 420,000 | | | | 429,815 | |
| Indiana Finance Authority Rev. (Ohio River Bridges East End Crossing Project), ”A“, 5%, 7/01/2044 | | | 640,000 | | | | 652,819 | |
| New York Liberty Development Corp., Liberty Rev. (7 World Trade Center Project), 5%, 9/15/2040 | | | 3,145,000 | | | | 3,322,976 | |
| Summit County, OH, Port Authority Building Rev. (Flats East Development Recovery Zone Facility Bonds), 6.875%, 5/15/2040 | | | 85,000 | | | | 86,944 | |
| | | | | | | $ | 5,658,304 | |
| Multi-Family Housing Revenue - 0.1% | |
| Mecklenburg County, NC (Little Rock Apartments), FNMA, 5.15%, 1/01/2022 | | $ | 255,000 | | | $ | 256,566 | |
41
Portfolio of Investments – continued
| | | | | | | | |
| Municipal Bonds - continued | | | | | | |
| | | | | | | | |
| | |
| Issuer | | Shares/Par | | | Value ($) | |
| Sales & Excise Tax Revenue - 3.2% | |
| Colorado Regional Transportation District, Private Activity Rev. (Denver Transportation Partners), 6.5%, 1/15/2030 | | $ | 1,675,000 | | | $ | 1,687,361 | |
| Guam Government Business Privilege Tax Rev., ”A“, 5.25%, 1/01/2036 | | | 1,140,000 | | | | 1,147,433 | |
| Guam Government Business Privilege Tax Rev., ”D“, 5%, 11/15/2031 | | | 1,295,000 | | | | 1,299,260 | |
| Illinois Sales Tax Securitization Corp., Second Lien, ”A“, 5%, 1/01/2026 | | | 185,000 | | | | 206,836 | |
| Illinois Sales Tax Securitization Corp., Second Lien, ”A“, 5%, 1/01/2027 | | | 400,000 | | | | 454,172 | |
| Illinois Sales Tax Securitization Corp., Second Lien, ”A“, 5%, 1/01/2029 | | | 435,000 | | | | 507,397 | |
| Illinois Sales Tax Securitization Corp., Second Lien, ”A“, 5%, 1/01/2030 | | | 175,000 | | | | 206,512 | |
| Illinois Sales Tax Securitization Corp., Second Lien, ”A“, 5%, 1/01/2036 | | | 110,000 | | | | 127,733 | |
| Illinois Sales Tax Securitization Corp., Second Lien, ”A“, 5%, 1/01/2037 | | | 220,000 | | | | 254,780 | |
| Illinois Sales Tax Securitization Corp., Second Lien, ”A“, 4%, 1/01/2038 | | | 100,000 | | | | 103,070 | |
| Illinois Sales Tax Securitization Corp., Second Lien, ”A“, 4%, 1/01/2039 | | | 65,000 | | | | 66,811 | |
| Illinois Sales Tax Securitization Corp., Second Lien, ”A“, 4%, 1/01/2040 | | | 105,000 | | | | 107,744 | |
| Puerto Rico Sales Tax Financing Corp., Restructured Sales Tax Rev.,”2019A-1“, 4.55%, 7/01/2040 | | | 105,000 | | | | 99,398 | |
| Puerto Rico Sales Tax Financing Corp., Restructured Sales Tax Rev.,”2019A-1“, 5%, 7/01/2058 | | | 3,722,000 | | | | 3,619,459 | |
| Puerto Rico Sales Tax Financing Corp., Restructured Sales Tax Rev.,”2019A-2“, 4.329%, 7/01/2040 | | | 957,000 | | | | 879,091 | |
| Puerto Rico Sales Tax Financing Corp., Restructured Sales Tax Rev.,”2019A-2“, 4.329%, 7/01/2040 | | | 348,000 | | | | 319,669 | |
| Puerto Rico Sales Tax Financing Corp., Restructured Sales Tax Rev.,”2019A-2“, 4.536%, 7/01/2053 | | | 9,000 | | | | 8,168 | |
| Puerto Rico Sales Tax Financing Corp., Restructured Sales Tax Rev.,”2019A-2“, 4.784%, 7/01/2058 | | | 154,000 | | | | 144,224 | |
| Puerto Rico Sales Tax Financing Corp., Restructured Sales Tax Rev., Capital Appreciation,”2019A-1“, 0%, 7/01/2024 | | | 16,000 | | | | 13,700 | |
| Puerto Rico Sales Tax Financing Corp., Restructured Sales Tax Rev., Capital Appreciation,”2019A-1“, 0%, 7/01/2027 | | | 174,000 | | | | 132,487 | |
| Puerto Rico Sales Tax Financing Corp., Restructured Sales Tax Rev., Capital Appreciation,”2019A-1“, 0%, 7/01/2029 | | | 31,000 | | | | 21,452 | |
| Puerto Rico Sales Tax Financing Corp., Restructured Sales Tax Rev., Capital Appreciation,”2019A-1“, 0%, 7/01/2031 | | | 1,584,000 | | | | 985,058 | |
| | | | | | | | |
| | | | | | | |
| | |
| Issuer | | Shares/Par | | | Value ($) | |
| Sales & Excise Tax Revenue - continued | |
| Puerto Rico Sales Tax Financing Corp., Restructured Sales Tax Rev., Capital Appreciation,”2019A-1“, 0%, 7/01/2033 | | $ | 1,515,000 | | | $ | 838,310 | |
| Puerto Rico Sales Tax Financing Corp., Restructured Sales Tax Rev., Capital Appreciation,”2019A-1“, 0%, 7/01/2046 | | | 9,954,000 | | | | 2,353,325 | |
| | | | | | | $ | 15,583,450 | |
| Secondary Schools - 0.1% | | | | | | | | |
| District of Columbia Rev. (Rocketship D.C.), ”A“, 5%, 6/01/2056 | | $ | 430,000 | | | $ | 399,543 | |
|
| Single Family Housing - State - 2.1% | |
| Connecticut Housing Finance Authority Rev. (Housing Mortgage Finance Program), ”C1“, 4%, 11/15/2047 | | $ | 1,865,000 | | | $ | 1,969,776 | |
| North Carolina Housing Finance Agency, Home Ownership Rev., ”41“, FNMA, 3.55%, 7/01/2044 | | | 1,990,000 | | | | 2,096,823 | |
| North Carolina Housing Finance Agency, Home Ownership Rev., ”43“, GNMA, 2.95%, 7/01/2043 | | | 3,500,000 | | | | 3,545,185 | |
| Pennsylvania Housing Finance Agency, Single Family Mortgage Rev., “125A”, 3.7%, 10/01/2037 | | | 2,390,000 | | | | 2,584,833 | |
| | | | | | | $ | 10,196,617 | |
| State & Local Agencies - 14.3% | | | | | | | | |
| Asheville, NC, Limited Obligation, 5%, 4/01/2028 (Prerefunded 4/01/2022) | | $ | 400,000 | | | $ | 431,148 | |
| Buncombe County, NC, Limited Obligation, 4%, 6/01/2034 | | | 1,700,000 | | | | 1,965,268 | |
| Buncombe County, NC, Limited Obligation, 4%, 6/01/2035 | | | 1,465,000 | | | | 1,687,768 | |
| Buncombe County, NC, Limited Obligation, ”A“, 5%, 6/01/2027 (w) | | | 125,000 | | | | 154,093 | |
| Buncombe County, NC, Limited Obligation, ”A“, 5%, 6/01/2028 (w) | | | 200,000 | | | | 251,310 | |
| Buncombe County, NC, Limited Obligation, ”A“, 5%, 6/01/2029 (w) | | | 275,000 | | | | 351,315 | |
| Buncombe County, NC, Limited Obligation, ”A“, 5%, 6/01/2030 (w) | | | 250,000 | | | | 323,613 | |
| Cabarrus County, NC, Limited Obligation, 4%, 6/01/2034 | | | 1,000,000 | | | | 1,141,800 | |
| Charlotte, NC, Convention Facility Projects, COP, ”A“, 4%, 6/01/2037 | | | 1,320,000 | | | | 1,509,328 | |
| Charlotte, NC, Convention Facility Projects, COP, ”A“, 4%, 6/01/2049 | | | 2,500,000 | | | | 2,758,800 | |
| Charlotte, NC, COP, 5%, 12/01/2034 | | | 1,000,000 | | | | 1,259,310 | |
| Charlotte, NC, COP, 5%, 12/01/2035 | | | 2,000,000 | | | | 2,508,040 | |
| Charlotte, NC, Cultural Arts Facilities, COP, ”B“, 4%, 6/01/2038 | | | 2,015,000 | | | | 2,312,898 | |
| Charlotte, NC, Cultural Arts Facilities, COP, ”B“, 4%, 6/01/2039 | | | 1,250,000 | | | | 1,425,988 | |
| Charlotte, NC, NASCAR Hall of Fame Public Facilities, COP, ”C“, 4%, 6/01/2038 | | | 4,500,000 | | | | 5,165,280 | |
| Charlotte, NC, NASCAR Hall of Fame Public Facilities, COP, ”C“, 3%, 6/01/2039 | | | 3,000,000 | | | | 3,178,200 | |
42
Portfolio of Investments – continued
| | | | | | | | |
| Municipal Bonds - continued | | | | | | |
| | | | | | | | |
| | |
| Issuer | | Shares/Par | | | Value ($) | |
| State & Local Agencies - continued | | | | | | | | |
| Charlotte, NC, Transit Projects, COP, 5%, 6/01/2033 | | $ | 3,000,000 | | | $ | 3,008,220 | |
| Charlotte, NC, Transit Projects/Phase II, COP, ”B“, 5%, 6/01/2026 | | | 1,250,000 | | | | 1,476,137 | |
| Chatham County, NC, Limited Obligation, 4%, 11/01/2037 | | | 1,750,000 | | | | 2,012,657 | |
| Commonwealth of Pennsylvania, Tobacco Master Settlement Financing Authority Rev., 5%, 6/01/2032 | | | 115,000 | | | | 138,183 | |
| Commonwealth of Pennsylvania, Tobacco Master Settlement Financing Authority Rev., 5%, 6/01/2033 | | | 100,000 | | | | 119,636 | |
| Commonwealth of Pennsylvania, Tobacco Master Settlement Financing Authority Rev., 5%, 6/01/2034 | | | 45,000 | | | | 53,717 | |
| Delaware Valley, PA, Regional Finance Authority, ”C“, FLR, 1.809% (LIBOR - 3mo. + 0.75%), 6/01/2037 | | | 2,310,000 | | | | 2,091,151 | |
| Durham County, NC, Financing Corp. Limited Obligation, 4%, 10/01/2034 | | | 2,000,000 | | | | 2,321,080 | |
| Durham County, NC, Financing Corp. Limited Obligation, 4%, 10/01/2035 | | | 1,240,000 | | | | 1,433,998 | |
| Durham County, NC, Financing Corp. Limited Obligation, 4%, 10/01/2036 | | | 1,375,000 | | | | 1,585,292 | |
| Durham, NC, Limited Obligation, 4%, 4/01/2035 | | | 1,270,000 | | | | 1,460,297 | |
| Durham, NC, Limited Obligation, 4%, 4/01/2037 | | | 3,000,000 | | | | 3,429,690 | |
| Maryland Stadium Authority Rev., Baltimore City Public Schools Construction and Revitalization Program, “A”, 5%, 5/01/2047 | | | 1,530,000 | | | | 1,810,556 | |
| Nash County, NC, Limited Obligation, ASSD GTY, 5%, 10/01/2030 (Prerefunded 10/01/2020) | | | 2,000,000 | | | | 2,036,260 | |
| New Jersey Economic Development Authority Rev., School Facilities Construction Rev., ”LLL“, 5%, 6/15/2039 | | | 1,030,000 | | | | 1,091,810 | |
| New Jersey Economic Development Authority Rev., School Facilities Construction Rev., ”LLL“, 5%, 6/15/2044 | | | 1,710,000 | | | | 1,790,951 | |
| North Carolina Turnpike Authority, Triangle Expressway System Appropriation Refunding Rev., ”A“, 4%, 1/01/2034 | | | 2,555,000 | | | | 2,938,429 | |
| North Carolina Turnpike Authority, Triangle Expressway System Appropriation Rev., Capital Appreciation, 0%, 1/01/2043 | | | 3,500,000 | | | | 1,793,505 | |
| Orange County, NC, Public Facilities Co., Limited Obligation, 5%, 10/01/2024 (Prerefunded 10/01/2021) | | | 750,000 | | | | 794,243 | |
| Pennsylvania Public School Building Authority, School Lease Rev. (School District of Philadelphia Project), ”A“, AGM, 5%, 6/01/2033 | | | 2,530,000 | | | | 2,968,828 | |
| Scotland County, NC, Limited Obligation, 5%, 12/01/2033 | | | 210,000 | | | | 261,519 | |
| Scotland County, NC, Limited Obligation, 5%, 12/01/2034 | | | 1,000,000 | | | | 1,240,260 | |
| Wake County, NC, 5%, 9/01/2036 | | | 5,000,000 | | | | 6,345,950 | |
| | | | | | | $ | 68,626,528 | |
| | | | | | | | |
| | | | | | | |
| | |
| Issuer | | Shares/Par | | | Value ($) | |
| Tax - Other - 1.2% | | | | | | | | |
| Illinois Sports Facilities Authority, State Tax Supported Refunding Rev., BAM, 5%, 6/15/2029 | | $ | 290,000 | | | $ | 361,398 | |
| Puerto Rico Convention Center District Authority, Hotel Occupancy Tax Rev., ”A“, AAC, 5%, 7/01/2031 | | | 2,415,000 | | | | 2,415,314 | |
| Puerto Rico Infrastructure Financing Authority Special Tax Rev., ”C“, AAC, 5.5%, 7/01/2024 | | | 760,000 | | | | 801,283 | |
| Puerto Rico Infrastructure Financing Authority Special Tax Rev., ”C“, AAC, 5.5%, 7/01/2027 | | | 1,990,000 | | | | 2,127,091 | |
| | | | | | | $ | 5,705,086 | |
| Tax Assessment - 0.2% | | | | | | | | |
| Mooresville, NC, Special Assessment Rev., 5.375%, 3/01/2040 | | $ | 1,000,000 | | | $ | 905,260 | |
| | |
| Tobacco - 1.5% | | | | | | | | |
| Buckeye, OH, Tobacco Settlement Financing Authority Rev.,”A-3“, 6.25%, 6/01/2037 | | $ | 1,295,000 | | | $ | 1,435,728 | |
| Buckeye, OH, Tobacco Settlement Financing Authority Senior Asset-Backed Refunding,2020A-2, ”1“, 5%, 6/01/2032 | | | 325,000 | | | | 403,793 | |
| Buckeye, OH, Tobacco Settlement Financing Authority Senior Asset-Backed Refunding,2020A-2, ”1“, 4%, 6/01/2037 | | | 190,000 | | | | 208,827 | |
| Buckeye, OH, Tobacco Settlement Financing Authority Senior Asset-Backed Refunding,2020B-2, ”2“, 5%, 6/01/2055 | | | 2,615,000 | | | | 2,316,942 | |
| Buckeye, OH, Tobacco Settlement Financing Authority Senior Asset-Backed Refunding,2020B-3, Capital Appreciation, ”2“, 0%, 6/01/2057 | | | 6,270,000 | | | | 691,769 | |
| Illinois Railsplitter Tobacco Settlement Authority Rev., 6%, 6/01/2028 (Prerefunded 6/01/2021) | | | 1,975,000 | | | | 2,084,909 | |
| | | | | | | $ | 7,141,968 | |
| Toll Roads - 4.3% | | | | | | | | |
| North Carolina Turnpike Authority, Monroe Expressway Toll Rev., ”A“, 5%, 7/01/2047 | | $ | 2,000,000 | | | $ | 2,128,400 | |
| North Carolina Turnpike Authority, Triangle Expressway System Rev., 5%, 1/01/2040 | | | 2,000,000 | | | | 2,233,200 | |
| North Carolina Turnpike Authority, Triangle Expressway System Rev., AGM, 5%, 1/01/2038 | | | 3,000,000 | | | | 3,409,050 | |
| North Carolina Turnpike Authority, Triangle Expressway System Senior Lien Refunding Rev., AGM, 5%, 1/01/2036 | | | 1,235,000 | | | | 1,412,346 | |
| North Carolina Turnpike Authority, Triangle Expressway System Senior Lien Rev., 5%, 1/01/2032 | | | 1,150,000 | | | | 1,284,596 | |
| North Carolina Turnpike Authority, Triangle Expressway System Senior Lien Rev., AGM, 5%, 1/01/2039 | | | 2,600,000 | | | | 2,875,574 | |
43
Portfolio of Investments – continued
| | | | | | | | |
| Municipal Bonds - continued | | | | | | |
| | | | | | | | |
| | |
| Issuer | | Shares/Par | | | Value ($) | |
| Toll Roads - continued | | | | | | | | |
| North Carolina Turnpike Authority, Triangle Expressway System Senior Lien Rev., AGM, 5%, 1/01/2049 | | $ | 4,000,000 | | | $ | 4,503,120 | |
| Texas Private Activity Surface Transportation Corp., Senior Lien Rev. (NTE Mobility Partners Segments 3 LLC Segments 3A & 3B Facility), 7%, 12/31/2038 | | | 435,000 | | | | 490,745 | |
| Texas Private Activity Surface Transportation Corp., Senior Lien Rev. (NTE Mobility Partners Segments 3 LLC Segments 3A & 3B Facility), 6.75%, 6/30/2043 | | | 350,000 | | | | 391,433 | |
| Virginia Small Business Financing Authority Rev. (Elizabeth River Crossings Opco LLC Project), 6%, 1/01/2037 | | | 595,000 | | | | 612,796 | |
| Virginia Small Business Financing Authority Rev. (Elizabeth River Crossings Opco LLC Project), 5.5%, 1/01/2042 | | | 1,160,000 | | | | 1,177,006 | |
| | | | | | | $ | 20,518,266 | |
| Transportation - Special Tax - 3.2% | |
| Commonwealth of Puerto Rico Highway & Transportation Authority Rev., ”CC“, AGM, 5.5%, 7/01/2028 | | $ | 2,185,000 | | | $ | 2,370,091 | |
| Commonwealth of Puerto Rico Highway & Transportation Authority Rev., ”CC“, AGM, 5.25%, 7/01/2036 | | | 930,000 | | | | 979,104 | |
| Commonwealth of Puerto Rico Highway & Transportation Authority Rev., ”D“, AGM, 5%, 7/01/2032 | | | 435,000 | | | | 435,118 | |
| Commonwealth of Puerto Rico Highway & Transportation Authority Rev., ”J“, NATL, 5%, 7/01/2029 | | | 65,000 | | | | 65,001 | |
| Commonwealth of Puerto Rico Highway & Transportation Authority Rev., ”L“, AAC, 5.25%, 7/01/2038 | | | 3,660,000 | | | | 3,714,168 | |
| Commonwealth of Puerto Rico Highway & Transportation Authority Rev., ”L“, NATL, 5.25%, 7/01/2035 | | | 970,000 | | | | 972,609 | |
| Commonwealth of Puerto Rico Highway & Transportation Authority Rev., ”N“, AAC, 5.25%, 7/01/2031 | | | 1,640,000 | | | | 1,715,210 | |
| New Jersey Transportation Trust Fund Authority, Transportation System, ”BB“, 5%, 6/15/2044 | | | 2,090,000 | | | | 2,180,560 | |
| North Carolina Turnpike Authority, Monroe Connector System State Appropriation Rev., 5%, 7/01/2036 | | | 3,000,000 | | | | 3,123,570 | |
| | | | | | | $ | 15,555,431 | |
| Universities - Colleges - 19.9% | | | | | | | | |
| Appalachian State University Rev., 4%, 10/01/2048 | | $ | 1,415,000 | | | $ | 1,577,937 | |
| Appalachian State University, Millennial Campus Rev. (End Zone Project), 5%, 5/01/2044 | | | 3,000,000 | | | | 3,606,030 | |
| East Carolina University, NC, General Rev., ”A“, 4%, 10/01/2045 | | | 2,195,000 | | | | 2,337,741 | |
| | | | | | | | |
| | | | | | | |
| | |
| Issuer | | Shares/Par | | | Value ($) | |
| Universities - Colleges - continued | | | | | | | | |
| Elizabeth City State University Rev., AGM, 5%, 4/01/2040 | | $ | 3,155,000 | | | $ | 3,879,072 | |
| Georgia Private Colleges & Universities Authority Refunding Rev. (Agnes Scott College), ”A“, 4%, 6/01/2044 | | | 2,915,000 | | | | 3,212,388 | |
| North Carolina Agricultural & Technical University Rev., ”A“, 5%, 10/01/2035 | | | 3,075,000 | | | | 3,520,291 | |
| North Carolina Capital Facilities Finance Agency Refunding Rev. (Duke University), ”B“, 4%, 10/01/2039 | | | 3,265,000 | | | | 3,608,152 | |
| North Carolina Capital Facilities Finance Agency Refunding Rev. (Duke University), ”B“, 5%, 10/01/2044 | | | 4,955,000 | | | | 5,872,369 | |
| North Carolina Capital Facilities Finance Agency Rev. (Davidson College), 5%, 3/01/2045 | | | 1,500,000 | | | | 1,589,070 | |
| North Carolina Capital Facilities Finance Agency Rev. (Wake Forest University), 4%, 1/01/2048 | | | 3,000,000 | | | | 3,348,840 | |
| North Carolina Capital Facilities Finance Agency, Educational Facilities Rev. (High Point University), 5.25%, 3/01/2033 | | | 1,000,000 | | | | 1,028,040 | |
| North Carolina Capital Facilities Finance Agency, Educational Facilities Rev. (Meredith College), 4%, 6/01/2034 | | | 1,370,000 | | | | 1,435,116 | |
| North Carolina Central University Rev., 5%, 4/01/2044 | | | 3,265,000 | | | | 3,773,948 | |
| Pinellas County, FL, Educational Facilities Authority Rev. (Barry University), 6%, 10/01/2041 | | | 450,000 | | | | 465,129 | |
| Puerto Rico Industrial Tourist Authority (University Plaza), ”A“, NATL, 5%, 7/01/2020 | | | 2,180,000 | | | | 2,187,347 | |
| Puerto Rico Industrial, Tourist, Educational, Medical & Environmental Control Facilities Financing Authority, Higher Education Rev. (Ana G. Mendez University System Project), 5.125%, 4/01/2032 | | | 170,000 | | | | 150,952 | |
| Puerto Rico Industrial, Tourist, Educational, Medical & Environmental Control Facilities Financing Authority, Higher Education Rev. (Ana G. Mendez University System Project), 5.375%, 4/01/2042 | | | 275,000 | | | | 232,683 | |
| Puerto Rico Industrial, Tourist, Educational, Medical & Environmental Control Facilities Financing Authority, Higher Education Rev. (University of Sacred Heart), 4.375%, 10/01/2031 | | | 115,000 | | | | 100,812 | |
| Puerto Rico Industrial, Tourist, Educational, Medical & Environmental Control Facilities Financing Authority, Higher Education Rev. (University of Sacred Heart), 5%, 10/01/2042 | | | 140,000 | | | | 117,117 | |
| Red River, TX, Education Finance Corp., Higher Education Rev. (Houston Baptist University Project), 5.5%, 10/01/2046 | | | 735,000 | | | | 798,666 | |
| University of North Carolina Board of Governors Rev., 4%, 4/01/2049 | | | 5,000,000 | | | | 5,325,600 | |
44
Portfolio of Investments – continued
| | | | | | | | |
| Municipal Bonds - continued | | | | | | |
| | | | | | | | |
| | |
| Issuer | | Shares/Par | | | Value ($) | |
| Universities - Colleges - continued | | | | | | | | |
| University of North Carolina, Ashville, Rev., 4%, 6/01/2039 | | $ | 1,450,000 | | | $ | 1,609,805 | |
| University of North Carolina, Charlotte, Rev., 5%, 4/01/2043 | | | 1,715,000 | | | | 1,903,101 | |
| University of North Carolina, Charlotte, Rev., ”A“, 5%, 10/01/2038 | | | 1,110,000 | | | | 1,389,132 | |
| University of North Carolina, Charlotte, Rev., ”A“, 4%, 10/01/2040 | | | 6,310,000 | | | | 7,039,120 | |
| University of North Carolina, Charlotte, Rev., ”A“, 4%, 10/01/2040 | | | 305,000 | | | | 350,064 | |
| University of North Carolina, Charlotte, Rev., ”A“, 4%, 10/01/2045 | | | 1,500,000 | | | | 1,702,575 | |
| University of North Carolina, Greensboro, Refunding Rev., 4%, 4/01/2036 | | | 1,750,000 | | | | 1,982,120 | |
| University of North Carolina, Greensboro, Rev., 5%, 4/01/2026 (Prerefunded 4/01/2021) | | | 3,000,000 | | | | 3,118,170 | |
| University of North Carolina, Greensboro, Rev., 4%, 4/01/2034 | | | 1,000,000 | | | | 1,141,820 | |
| University of North Carolina, Greensboro, Rev., 4%, 4/01/2035 | | | 1,000,000 | | | | 1,137,940 | |
| University of North Carolina, Greensboro, Rev., 5%, 4/01/2039 | | | 2,000,000 | | | | 2,234,620 | |
| University of North Carolina, Raleigh, Rev., ”A“, 5%, 10/01/2029 | | | 5,000,000 | | | | 5,618,050 | |
| University of North Carolina, Wilmington, Limited Obligation (Student Housing Projects), 5%, 6/01/2028 | | | 3,045,000 | | | | 3,575,013 | |
| University of North Carolina, Wilmington, Limited Obligation (Student Housing Projects), 4%, 6/01/2032 | | | 500,000 | | | | 560,810 | |
| University of North Carolina, Wilmington, Limited Obligation (Student Housing Projects), 4%, 6/01/2033 | | | 400,000 | | | | 447,820 | |
| University of North Carolina, Wilmington, Limited Obligation (Student Housing Projects), 4%, 6/01/2034 | | | 500,000 | | | | 558,475 | |
| University of North Carolina, Wilmington, Rev., ”B“, 4%, 10/01/2039 | | | 1,000,000 | | | | 1,145,060 | |
| University of North Carolina, Wilmington, Rev., ”B“, 4%, 10/01/2044 | | | 1,405,000 | | | | 1,590,839 | |
| Virginia College Building Authority, Educational Facilities Rev. (Marymount University Project), ”B“, 5.25%, 7/01/2035 | | | 195,000 | | | | 194,984 | |
| Western Carolina University, NC, General Obligation Rev., 5%, 10/01/2043 | | | 3,700,000 | | | | 4,503,936 | |
| Winston-Salem State University, NC, General Rev., 5%, 4/01/2033 | | | 1,000,000 | | | | 1,053,890 | |
| Winston-Salem State University, NC, General Rev., AGM, 5%, 10/01/2042 | | | 2,470,000 | | | | 2,957,924 | |
| Winston-Salem State University, NC, Student Housing Project Rev., 5%, 6/01/2029 | | | 1,550,000 | | | | 1,671,768 | |
| | | | | | | $ | 95,654,336 | |
| Universities - Dormitories - 0.7% | | | | | | | | |
| California Municipal Finance Authority, Student Housing Rev.(CHF-Davis I LLC - West Village Student Housing Project), BAM, 5%, 5/15/2051 | | $ | 3,045,000 | | | $ | 3,264,240 | |
| | | | | | | | |
| | | | | | | |
| | |
| Issuer | | Shares/Par | | | Value ($) | |
| Utilities - Cogeneration - 0.2% | | | | | | | | |
| Puerto Rico Industrial, Tourist, Educational, Medical & Environmental Control Facilities Financing Authority Rev. (Cogeneration Facilities - AES Puerto Rico Project), 9.12%, 6/01/2022 | | $ | 1,100,000 | | | $ | 1,127,500 | |
| | |
| Utilities - Municipal Owned - 3.1% | | | | | | | | |
| Dalton, GA, Combined Utilities Rev., 5%, 3/01/2029 | | $ | 1,695,000 | | | $ | 2,032,881 | |
| Greenville, NC, Greenville Utilities Commission Combined Enterprise System Rev., 5%, 8/01/2044 | | | 300,000 | | | | 372,564 | |
| North Carolina Municipal Power Agency No. 1, Catawba Electric Refunding Rev., ”A“, 5%, 1/01/2032 | | | 5,655,000 | | | | 7,118,797 | |
| Puerto Rico Electric Power Authority Rev., ”A“, 5%, 7/01/2029 (a)(d) | | | 1,125,000 | | | | 795,937 | |
| Puerto Rico Electric Power Authority Rev., ”A“, 5%, 7/01/2042 (a)(d) | | | 175,000 | | | | 123,813 | |
| Puerto Rico Electric Power Authority Rev., ”AAA“, 5.25%, 7/01/2021 (a)(d) | | | 85,000 | | | | 60,350 | |
| Puerto Rico Electric Power Authority Rev., ”AAA“, 5.25%, 7/01/2030 (a)(d) | | | 40,000 | | | | 28,400 | |
| Puerto Rico Electric Power Authority Rev., ”CCC“, 5.25%, 7/01/2027 (a)(d) | | | 415,000 | | | | 294,650 | |
| Puerto Rico Electric Power Authority Rev., ”DDD“, 5%, 7/01/2020 (a)(d) | | | 40,000 | | | | 28,300 | |
| Puerto Rico Electric Power Authority Rev., ”DDD“, 5%, 7/01/2021 (a)(d) | | | 440,000 | | | | 311,300 | |
| Puerto Rico Electric Power Authority Rev., ”DDD“, 5%, 7/01/2022 (a)(d) | | | 720,000 | | | | 509,400 | |
| Puerto Rico Electric Power Authority Rev., ”EEE“, 6.05%, 7/01/2032 (a)(d) | | | 240,000 | | | | 170,700 | |
| Puerto Rico Electric Power Authority Rev., ”TT“, 5%, 7/01/2021 (a)(d) | | | 195,000 | | | | 137,963 | |
| Puerto Rico Electric Power Authority Rev., ”TT“, 5%, 7/01/2023 (a)(d) | | | 190,000 | | | | 134,425 | |
| Puerto Rico Electric Power Authority Rev., ”TT“, 5%, 7/01/2027 (a)(d) | | | 35,000 | | | | 24,763 | |
| Puerto Rico Electric Power Authority Rev., ”TT“, 5%, 7/01/2037 (a)(d) | | | 585,000 | | | | 413,887 | |
| Puerto Rico Electric Power Authority Rev., ”V“, NATL, 5.25%, 7/01/2033 | | | 240,000 | | | | 242,892 | |
| Puerto Rico Electric Power Authority Rev., ”VV“, NATL, 5.25%, 7/01/2029 | | | 340,000 | | | | 348,187 | |
| Puerto Rico Electric Power Authority Rev., ”VV“, NATL, 5.25%, 7/01/2030 | | | 420,000 | | | | 429,227 | |
| Puerto Rico Electric Power Authority Rev., ”VV“, NATL, 5.25%, 7/01/2032 | | | 530,000 | | | | 538,469 | |
| Puerto Rico Electric Power Authority Rev., ”VV“, NATL, 5.25%, 7/01/2034 | | | 50,000 | | | | 50,382 | |
| Puerto Rico Electric Power Authority Rev., ”WW“, 5.375%, 7/01/2022 (a)(d) | | | 35,000 | | | | 24,894 | |
| Puerto Rico Electric Power Authority Rev., ”WW“, 5.25%, 7/01/2025 (a)(d) | | | 80,000 | | | | 56,800 | |
| Puerto Rico Electric Power Authority Rev., ”ZZ“, 5%, 7/01/2018 (a)(d) | | | 265,000 | | | | 184,506 | |
45
Portfolio of Investments – continued
| | | | | | | | |
| Municipal Bonds - continued | | | | | | |
| | | | | | | | |
| | |
| Issuer | | Shares/Par | | | Value ($) | |
| Utilities - Municipal Owned - continued | | | | | |
| Puerto Rico Electric Power Authority Rev., ”ZZ“, 5.25%, 7/01/2023 (a)(d) | | $ | 305,000 | | | $ | 216,550 | |
| Puerto Rico Electric Power Authority Rev., ”ZZ“, 5.25%, 7/01/2024 (a)(d) | | | 95,000 | | | | 67,450 | |
| Puerto Rico Electric Power Authority Rev., ”ZZ“, 5.25%, 7/01/2026 (a)(d) | | | 300,000 | | | | 213,000 | |
| | | | | | | $ | 14,930,487 | |
| Utilities - Other - 0.5% | | | | | | | | |
| Tennessee Energy Acquisition Corp., Gas Rev., ”A“, 5.25%, 9/01/2026 | | $ | 1,290,000 | | | $ | 1,443,871 | |
| Tennessee Energy Acquisition Corp., Gas Rev., ”C“, 5%, 2/01/2021 | | | 805,000 | | | | 819,812 | |
| Texas Gas Acquisition & Supply Corp. III., Gas Supply Rev., 5%, 12/15/2031 | | | 255,000 | | | | 263,545 | |
| | | | | | | $ | 2,527,228 | |
| Water & Sewer Utility Revenue - 6.8% | |
| Cape Fear Public Utility Authority, Water & Sewer System Rev., 5%, 8/01/2036 (Prerefunded 8/01/2021) | | $ | 4,410,000 | | | $ | 4,635,307 | |
| Cape Fear Public Utility Authority, Water & Sewer System Rev., 5%, 6/01/2040 | | | 1,250,000 | | | | 1,446,200 | |
| Charlotte, NC, Water & Sewer Systems Rev., 4%, 7/01/2047 | | | 4,000,000 | | | | 4,500,600 | |
| Durham County, NC, Enterprise Systems Rev., 5%, 6/01/2029 (Prerefunded 6/01/2021) | | | 1,590,000 | | | | 1,663,013 | |
| Greensboro, NC, Enterprise Systems Rev., ”A“, 4%, 6/01/2047 | | | 2,000,000 | | | | 2,223,000 | |
| Guam Waterworks Authority Rev. (Water and Wastewater System), 5%, 7/01/2036 | | | 220,000 | | | | 222,545 | |
| Guam Waterworks Authority Rev. (Water and Wastewater System), 5%, 7/01/2036 | | | 380,000 | | | | 384,989 | |
| Guam Waterworks Authority Rev. (Water and Wastewater System), 5%, 7/01/2037 | | | 480,000 | | | | 485,117 | |
| Guam Waterworks Authority Rev. (Water and Wastewater System), 5%, 7/01/2040 | | | 1,325,000 | | | | 1,331,705 | |
| Guam Waterworks Authority Rev. (Water and Wastewater System), 5%, 1/01/2046 | | | 1,000,000 | | | | 989,970 | |
| Michigan Finance Authority Local Government Loan Program Rev. (Detroit Water and Sewerage Department Sewage Disposal System Rev. Refunding Second Lien Local Project),”C-7“, NATL, 5%, 7/01/2032 | | | 95,000 | | | | 107,036 | |
| Michigan Finance Authority Local Government Loan Program Rev. (Detroit Water and Sewerage Department Water Supply System Rev. Refunding Second Lien Local Project),”D-6“, NATL, 5%, 7/01/2036 | | | 115,000 | | | | 128,969 | |
| Michigan Finance Authority Local Government Loan Program Rev. (Detroit Water and Sewerage Department Water Supply System Rev. Refunding Senior Lien Local Project),”D-1“, AGM, 5%, 7/01/2035 | | | 60,000 | | | | 67,654 | |
| | | | | | | | |
| | | | | | | |
| | |
| Issuer | | Shares/Par | | | Value ($) | |
| Water & Sewer Utility Revenue - continued | |
| Michigan Finance Authority Local Government Loan Program Rev. (Detroit Water and Sewerage Department Water Supply System Rev. Refunding Senior Lien Local Project),”D-1“, AGM, 5%, 7/01/2037 | | $ | 140,000 | | | $ | 157,249 | |
| New York Environmental Facilities Corp., Clean Water & Drinking Water Rev. (New York City Municipal Water Finance Authority Project), ”A“, 5%, 6/15/2039 (w) | | | 595,000 | | | | 746,457 | |
| New York Environmental Facilities Corp., Clean Water & Drinking Water Rev. (New York City Municipal Water Finance Authority Project), ”A“, 5%, 6/15/2040 (w) | | | 625,000 | | | | 781,394 | |
| Oak Island, NC, Enterprise System Rev., AGM, 5%, 6/01/2025 | | | 2,010,000 | | | | 2,356,584 | |
| Oak Island, NC, Enterprise System Rev., AGM, 5%, 6/01/2028 | | | 500,000 | | | | 612,950 | |
| Oak Island, NC, Enterprise System Rev., AGM, 5%, 6/01/2029 | | | 1,400,000 | | | | 1,632,820 | |
| Oak Island, NC, Enterprise System Rev., AGM, 5%, 6/01/2031 | | | 1,600,000 | | | | 1,858,624 | |
| Oak Island, NC, Enterprise System Rev., ASSD GTY, 5.625%, 6/01/2030 (Prerefunded 6/01/2020) | | | 500,000 | | | | 503,745 | |
| Oak Island, NC, Enterprise System Rev., ASSD GTY, 5.75%, 6/01/2036 (Prerefunded 6/01/2020) | | | 800,000 | | | | 806,152 | |
| Raleigh, NC, Combined Enterprise Systems Rev., ”A“, 5%, 3/01/2029 | | | 3,145,000 | | | | 3,494,787 | |
| Winston-Salem, NC, Water & Sewer Systems Rev., 4%, 6/01/2034 | | | 700,000 | | | | 800,772 | |
| Winston-Salem, NC, Water & Sewer Systems Rev., 4%, 6/01/2035 | | | 500,000 | | | | 570,225 | |
| | | | | | | $ | 32,507,864 | |
Total Municipal Bonds
(Identified Cost, $446,614,651) | | | | | | $ | 457,964,831 | |
| | |
| Bonds - 0.1% | | | | | | | | |
| Consumer Services - 0.1% | | | | | | | | |
| Toll Road Investors Partnership II LP, Capital Appreciation, NATL, 0%, 2/15/2043 (n) (Identified Cost, $527,441) | | $ | 1,700,000 | | | $ | 622,191 | |
| |
| Investment Companies (h) - 2.4% | | | | | |
| Money Market Funds - 2.4% | | | | | | | | |
| MFS Institutional Money Market Portfolio, 1.28% (v) (Identified Cost, $11,539,379) | | | 11,536,654 | | | $ | 11,538,961 | |
| |
| Other Assets, Less Liabilities - 2.2% | | | | 10,614,513 | |
| Net Assets - 100.0% | | | | | | $ | 480,740,496 | |
46
Portfolio of Investments – continued
Derivative Contracts at 3/31/20
Futures Contracts
| | | | | | | | | | | | | | | | | | | | | | |
| Description | | Long/
Short | | | Currency | | | Contracts | | Notional
Amount | | | Expiration
Date | | | Value/Unrealized
Appreciation
(Depreciation) | |
| Liability Derivatives | | | | | | | | | | | | | | | | | | | | | | |
| Interest Rate Futures | | | | | | | | | | | | | | | | | | | | | | |
| U.S. Treasury Bond | | | Short | | | | USD | | | 80 | | | $14,325,000 | | | | June - 2020 | | | | $(962,795 | ) |
| | | | | | | | | | | | | | | | | | | | | | |
At March 31, 2020, the fund had cash collateral of $520,000 to cover any collateral or margin obligations for certain derivative contracts. Restricted cash and/or deposits with brokers in the Statements of Assets and Liabilities are comprised of cash collateral.
See Portfolio Footnotes and Notes to Financial Statements
47
PORTFOLIO OF INVESTMENTS
3/31/20
MFS PENNSYLVANIA MUNICIPAL BOND FUND
The Portfolio of Investments is a complete list of all securities owned by your fund. It is categorized by broad-based asset classes.
| | | | | | | | |
| Municipal Bonds - 96.7% | | | | | | |
| | | | | | | | |
| | |
| Issuer | | Shares/Par | | | Value ($) | |
| Airport Revenue - 2.4% | | | | | | | | |
| Chicago, IL, O’Hare International Airport Rev., Senior Lien, ”B“, 5%, 1/01/2030 | | $ | 215,000 | | | $ | 240,303 | |
| Chicago, IL, O’Hare International Airport Rev., Third Lien, ”A“, 5.625%, 1/01/2035 (Prerefunded 1/01/2021) | | | 270,000 | | | | 279,021 | |
| Chicago, IL, O’Hare International Airport Rev., Third Lien, Unrefunded Balance, ”A“, 5.625%, 1/01/2035 | | | 65,000 | | | | 66,904 | |
| Philadelphia, PA, Airport Rev., ”A“, AGM, 5%, 6/15/2040 | | | 2,000,000 | | | | 2,012,160 | |
| Philadelphia, PA, Airport Rev., ”B“, 5%, 7/01/2034 | | | 750,000 | | | | 869,287 | |
| Wayne County, MI, Airport Authority Rev. (Detroit Metropolitan Wayne County Airport), ”B“, 5%, 12/01/2044 | | | 55,000 | | | | 60,935 | |
| Wayne County, MI, Airport Authority Rev. (Detroit Metropolitan Wayne County Airport), ”B“, BAM, 5%, 12/01/2039 | | | 65,000 | | | | 72,499 | |
| Wayne County, MI, Airport Authority Rev. (Detroit Metropolitan Wayne County Airport), ”C“, 5%, 12/01/2039 | | | 45,000 | | | | 49,460 | |
| Wayne County, MI, Airport Authority Rev. (Detroit Metropolitan Wayne County Airport), ”C“, 5%, 12/01/2044 | | | 80,000 | | | | 87,526 | |
| | | | | | | $ | 3,738,095 | |
| General Obligations - General Purpose - 4.9% | | | | | |
| Bridgeview, IL, Stadium and Redevelopment Projects, AAC, 5.14%, 12/01/2036 | | $ | 350,000 | | | $ | 323,106 | |
| Bucks County, PA, Northampton Township, General Obligation, 4%, 5/15/2043 | | | 1,000,000 | | | | 1,071,770 | |
| Chicago, IL, ”A“, 5%, 1/01/2025 | | | 220,000 | | | | 225,713 | |
| Chicago, IL, General Obligation, ”A“, 5%, 1/01/2026 | | | 65,000 | | | | 66,949 | |
| Chicago, IL, General Obligation, ”A“, 5%, 1/01/2027 | | | 70,000 | | | | 72,342 | |
| Commonwealth of Puerto Rico, General Obligation, ”A“, 8%, 7/01/2035 (a)(d) | | | 1,650,000 | | | | 990,000 | |
| Commonwealth of Puerto Rico, Public Improvement, ”A“, AGM, 5%, 7/01/2035 | | | 315,000 | | | | 317,570 | |
| Commonwealth of Puerto Rico, Public Improvement, ”A“, NATL, 5.5%, 7/01/2020 | | | 325,000 | | | | 326,489 | |
| Commonwealth of Puerto Rico, Public Improvement,”A-4“, AGM, 5%, 7/01/2031 | | | 100,000 | | | | 100,342 | |
| Penn Hills, PA, Capital Appreciation, ”D“, 0%, 12/01/2032 | | | 595,000 | | | | 445,090 | |
| Philadelphia, PA, ”B“, 5%, 2/01/2035 | | | 1,000,000 | | | | 1,261,180 | |
| Puerto Rico Public Buildings Authority Government Facilities Rev., ”I“, ASSD GTY, 5%, 7/01/2036 | | | 25,000 | | | | 25,002 | |
| Puerto Rico Public Buildings Authority Rev., Guaranteed, ”D“, AAC, 5.45%, 7/01/2030 | | | 165,000 | | | | 165,092 | |
| | | | | | | | |
| | | | | | | |
| | |
| Issuer | | Shares/Par | | | Value ($) | |
| General Obligations - General Purpose - continued | |
| Reading, Berks County, PA, General Obligation, BAM, 5%, 11/01/2030 | | $ | 1,000,000 | | | $ | 1,217,920 | |
| Reading, Berks County, PA, General Obligation, BAM, 5%, 11/01/2031 | | | 1,000,000 | | | | 1,210,050 | |
| | | | | | | $ | 7,818,615 | |
| General Obligations - Schools - 12.1% | | | | | | | | |
| Beaver County, PA, Aliquippa School District, General Obligation, BAM, 4%, 12/01/2041 | | $ | 1,000,000 | | | $ | 1,101,860 | |
| Berks County, PA, Reading School District, AGM, 5%, 3/01/2038 | | | 1,000,000 | | | | 1,172,440 | |
| Carlisle, PA, School District, 5%, 9/01/2026 (Prerefunded 3/01/2022) | | | 1,000,000 | | | | 1,072,660 | |
| Centre County, PA, State College Area School District General Obligation, 5%, 5/15/2044 | | | 1,000,000 | | | | 1,226,940 | |
| Conneaut, PA, School District, Capital Appreciation, ”B“, AGM, 0%, 11/01/2031 | | | 1,150,000 | | | | 880,452 | |
| Erie, PA, City School District General Obligation, ”A“, AGM, 4%, 4/01/2033 | | | 1,150,000 | | | | 1,311,472 | |
| Luzerne County, PA, Wilkes-Barre Area School District, General Obligation, BAM, 4%, 4/15/2054 | | | 765,000 | | | | 840,880 | |
| Luzerne County, PA, Wilkes-Barre Area School District, General Obligation, BAM, 5%, 4/15/2059 | | | 1,500,000 | | | | 1,779,990 | |
| Montebello, CA, Unified School District (Election of 2016), ”A“, 4%, 8/01/2046 | | | 545,000 | | | | 586,218 | |
| Montgomery County, PA, Springfield Township School District, General Obligation, 4%, 11/15/2037 | | | 1,500,000 | | | | 1,627,650 | |
| Northampton County, PA, Area School District, ”A“, 5%, 10/01/2033 | | | 1,000,000 | | | | 1,085,970 | |
| Philadelphia School District, PA, General Obligation, ”A“, 5%, 9/01/2044 | | | 1,500,000 | | | | 1,819,830 | |
| Philadelphia, PA, School District, ”F“, 5%, 9/01/2038 | | | 1,500,000 | | | | 1,740,285 | |
| Reading, PA, School District, ”A“, 5%, 4/01/2020 | | | 665,000 | | | | 665,000 | |
| Scranton, PA, School District, ”E“, BAM, 5%, 12/01/2034 | | | 1,000,000 | | | | 1,205,090 | |
| Upper St. Clair Township, PA, School District General Obligation, ”B“, 3.625%, 10/01/2039 | | | 1,000,000 | | | | 1,079,430 | |
| | | | | | | $ | 19,196,167 | |
| Healthcare Revenue - Hospitals - 20.0% | | | | | |
| Allegheny County, PA, Hospital Development Authority Rev. (Allegheny Health Network Obligated Group), ”A“, 5%, 4/01/2047 | | $ | 580,000 | | | $ | 688,657 | |
| Allegheny County, PA, Mt. Lebanon Hospital Authority Rev. (St. Clair Memorial Hospital), 5%, 7/01/2038 | | | 1,000,000 | | | | 1,207,460 | |
| Berks County, PA, Municipal Authority Rev. (Reading Hospital & Medical Center), ”A“, 5%, 11/01/2040 | | | 1,500,000 | | | | 1,573,515 | |
48
Portfolio of Investments – continued
| | | | | | | | |
| Municipal Bonds - continued | |
| |
| | |
| Issuer | | Shares/Par | | | Value ($) | |
| Healthcare Revenue - Hospitals - continued | | | | | |
| Bucks County, PA, Industrial Development Authority, Hospital Rev. (St. Luke’s University Health Network Project), 4%, 8/15/2044 | | $ | 1,000,000 | | | $ | 1,095,310 | |
| Bucks County, PA, St. Mary Hospital Authority Refunding Rev. (Trinity Health Credit Group), 5%, 12/01/2048 | | | 1,000,000 | | | | 1,171,880 | |
| Centre County, PA, Hospital Authority Rev. (Mount Nittany Medical Center), 5%, 11/15/2041 | | | 850,000 | | | | 974,397 | |
| Centre County, PA, Hospital Authority Rev. (Mount Nittany Medical Center), 6.25%, 11/15/2041 (Prerefunded 11/15/2021) | | | 500,000 | | | | 540,620 | |
| Chester County, PA, Health & Education Facilities Authority Health System Rev. (Jefferson Health System), ”A“, 5%, 5/15/2040 (Prerefunded 5/15/2020) | | | 735,000 | | | | 737,793 | |
| Chester County, PA, Health & Education Facilities Authority Health System Rev. (Jefferson Health System), ”A“, 5%, 5/15/2040 | | | 265,000 | | | | 266,007 | |
| Chester County, PA, Health & Education Facilities Authority Health System Rev. (Main Line Health System), ”A“, 4%, 9/01/2041 | | | 1,500,000 | | | | 1,671,735 | |
| Chester County, PA, Health & Education Facilities Authority Health System Rev. (Main Line Health System), ”A“, 5%, 10/01/2052 | | | 1,750,000 | | | | 2,072,735 | |
| DeKalb County, GA, Hospital Authority Rev. (DeKalb Medical Center, Inc. Project), 6.125%, 9/01/2040 (Prerefunded 9/01/2020) | | | 305,000 | | | | 311,076 | |
| Doylestown, PA, Hospital Rev., ”A“, 5%, 7/01/2049 | | | 1,000,000 | | | | 1,146,710 | |
| DuBois, PA, Hospital Authority Rev. (Penn Highlands Healthcare), 5%, 7/15/2043 | | | 1,000,000 | | | | 1,177,100 | |
| Escambia County, FL, Health Facilities Authority Rev. (Baptist Hospital, Inc.), ”A“, 6%, 8/15/2036 | | | 705,000 | | | | 714,701 | |
| Fulton County, PA, Industrial Development Authority Hospital Rev. (Medical Center Project), 5%, 7/01/2040 | | | 500,000 | | | | 521,610 | |
| Illinois Finance Authority Rev. (Provena Health), ”A“, 6%, 5/01/2028 (Prerefunded 5/01/2020) | | | 500,000 | | | | 501,660 | |
| Jefferson Parish, LA, Hospital Service District No. 2 Hospital Rev. (East Jefferson General Hospital), 6.25%, 7/01/2031 | | | 165,000 | | | | 168,846 | |
| Jefferson Parish, LA, Hospital Service District No. 2 Hospital Rev. (East Jefferson General Hospital), 6.375%, 7/01/2041 | | | 150,000 | | | | 153,332 | |
| Kentucky Economic Development Finance Authority Hospital Rev. (Owensboro Medical Health System, Inc.), ”A“, 5.75%, 6/01/2025 (Prerefunded 6/01/2020) | | | 335,000 | | | | 337,492 | |
| Kentucky Economic Development Finance Authority Hospital Rev. (Owensboro Medical Health System, Inc.), ”A“, 6.375%, 6/01/2040 (Prerefunded 6/01/2020) | | | 390,000 | | | | 393,264 | |
| Lancaster County, PA, Hospital Authority Rev. (University of Pennsylvania Health System), ”A“, 5%, 8/15/2036 | | | 1,000,000 | | | | 1,195,280 | |
| | | | | | | | |
| | | | | | | |
| | |
| Issuer | | Shares/Par | | | Value ($) | |
| Healthcare Revenue - Hospitals - continued | |
| Lancaster County, PA, Hospital Authority Rev. (Saint Anne’s Retirement Community, Inc. Project), 5%, 3/01/2040 | | $ | 500,000 | | | $ | 507,525 | |
| Lancaster County, PA, Hospital Authority Rev. (Saint Anne’s Retirement Community, Inc. Project), 5%, 3/01/2045 | | | 500,000 | | | | 502,480 | |
| Lehigh County, PA, Hospital Authority, General Purpose Refunding Rev. (Health Network), ”A“, 4%, 7/01/2039 | | | 1,000,000 | | | | 1,089,570 | |
| Miami-Dade County, FL, Health Facilities Authority Hospital Rev., 6%, 8/01/2030 (Prerefunded 8/01/2020) | | | 80,000 | | | | 81,239 | |
| Miami-Dade County, FL, Health Facilities Authority Hospital Rev., Unrefunded Balance, 6%, 8/01/2030 | | | 25,000 | | | | 25,351 | |
| Montour County, PA, Geisinger Authority Health System Rev.,”A-1“, 5%, 2/15/2045 | | | 1,000,000 | | | | 1,170,550 | |
| Northampton County, PA, General Purpose Authority Hospital Rev. (St. Luke’s Hospital), ”A“, 5%, 8/15/2048 | | | 500,000 | | | | 593,865 | |
| Philadelphia, PA, Authority for Industrial Development Rev. (Thomas Jefferson University), ”A“, 5%, 9/01/2036 | | | 1,000,000 | | | | 1,135,490 | |
| Philadelphia, PA, Authority for Industrial Development Rev. (Thomas Jefferson University), ”A“, 5%, 9/01/2042 | | | 1,000,000 | | | | 1,116,530 | |
| Philadelphia, PA, Hospitals and Higher Education Facilities Authority Rev. (Children’s Hospital of Philadelphia), ”C“, 5%, 7/01/2025 | | | 1,000,000 | | | | 1,047,030 | |
| Philadelphia, PA, Hospitals and Higher Education Facilities Authority Rev. (Temple University Health System Obligated Group), ”A“, 5%, 7/01/2034 | | | 500,000 | | | | 548,315 | |
| Royal Oak, MI, Hospital Finance Authority Rev. (William Beaumont Hospital), 5%, 9/01/2039 | | | 810,000 | | | | 903,272 | |
| Southcentral, PA, General Authority Rev. (WellSpan Health Obligated Group), 4%, 6/01/2044 | | | 1,000,000 | | | | 1,132,340 | |
| Southcentral, PA, General Authority Rev. (WellSpan Health Obligated Group), ”A“, 5%, 6/01/2044 | | | 1,000,000 | | | | 1,108,540 | |
| St. Mary Hospital Authority, PA, Health System Rev. (Catholic Health East), ”A“, 5%, 11/15/2033 (Prerefunded 11/15/2020) | | | 500,000 | | | | 511,905 | |
| West Shore, PA, Hospital Authority Rev. (Holy Spirit Hospital), ”B“, 5.625%, 1/01/2032 | | | 500,000 | | | | 532,775 | |
| Westmoreland County, PA, Industrial Development Authority Rev. (Excela Health Project), 5.125%, 7/01/2030 | | | 1,000,000 | | | | 1,007,560 | |
| | | | | | | $ | 31,635,517 | |
| Healthcare Revenue - Long Term Care - 4.7% | | | | | |
| Chester County, PA, Health & Education Facilities Authority Rev. (Simpson Senior Services Project), ”A“, 5.25%, 12/01/2045 | | $ | 500,000 | | | $ | 504,345 | |
| Cumberland County, PA, Municipal Authority Rev. (Diakon Lutheran Social Ministries Project), ”A“, 5%, 1/01/2039 | | | 1,000,000 | | | | 1,061,660 | |
49
Portfolio of Investments – continued
| | | | | | | | |
| Municipal Bonds - continued | | | | | | |
| | | | | | | | |
| | |
| Issuer | | Shares/Par | | | Value ($) | |
| Healthcare Revenue - Long Term Care - continued | | | | | |
| East Hempfield Township, PA, Industrial Development Authority Rev. (Willow Valley Communities Project), 5%, 12/01/2039 | | $ | 750,000 | | | $ | 847,425 | |
| Lancaster County, PA, Hospital Authority Health Center Rev. (Landis Homes Retirement Community Project), ”A“, 5%, 7/01/2045 | | | 500,000 | | | | 490,815 | |
| Lancaster County, PA, Hospital Authority Health Center Rev. (Masonic Villages Project), 5%, 11/01/2035 | | | 500,000 | | | | 553,650 | |
| Lancaster County, PA, Hospital Authority Health Center Rev. (Masonic Villages Project), 5%, 11/01/2036 | | | 260,000 | | | | 297,593 | |
| Lancaster County, PA, Hospital Authority Health Center Rev. (Masonic Villages Project), 5%, 11/01/2037 | | | 250,000 | | | | 284,930 | |
| Lancaster County, PA, Hospital Authority Rev. (Brethren Village Project), 5.125%, 7/01/2037 | | | 500,000 | | | | 455,845 | |
| Lancaster County, PA, Hospital Authority Rev. (Masonic Homes), ”D“, VRDN, 0.81%, 7/01/2034 | | | 1,935,000 | | | | 1,935,000 | |
| Montgomery County, PA, Industrial Development Authority Rev. (Whitemarsh Continuing Care Retirement Community Project), 5.375%, 1/01/2050 | | | 400,000 | | | | 381,440 | |
| Philadelphia, PA, Authority for Industrial Development, Senior Living Facilities Rev. (Wesley Enhanced Living Obligated Group), ”A“, 5%, 7/01/2049 | | | 500,000 | | | | 464,485 | |
| Travis County, TX, Health Facilities Development Corp. Rev. (Westminster Manor Health), 7%, 11/01/2030 (Prerefunded 11/01/2020) | | | 55,000 | | | | 56,813 | |
| Travis County, TX, Health Facilities Development Corp. Rev. (Westminster Manor Health), 7.125%, 11/01/2040 (Prerefunded 11/01/2020) | | | 105,000 | | | | 108,537 | |
| Travis County, TX, Health Facilities Development Corp. Rev. (Westminster Manor Health), Unrefunded Balance, 7%, 11/01/2030 | | | 5,000 | | | | 5,115 | |
| | | | | | | $ | 7,447,653 | |
| Industrial Revenue - Environmental Services - 0.5% | | | | | |
| Blythe Township, PA, Solid Waste Authority Rev., 7.75%, 12/01/2037 | | $ | 250,000 | | | $ | 270,948 | |
| Delaware County, PA, Industrial Development Authority Rev. (Covanta Project), ”A“, 5%, 7/01/2043 | | | 500,000 | | | | 502,245 | |
| | | | | | | $ | 773,193 | |
| Industrial Revenue - Other - 1.3% | | | | | | | | |
| Pennsylvania Economic Development Financing Authority, Solid Waste Disposal Rev. (Procter & Gamble), 5.375%, 3/01/2031 | | $ | 1,000,000 | | | $ | 1,304,790 | |
| Port Beaumont, TX, Navigation District Facility Rev. (Jefferson Gulf Coast Energy Project), ”A“, 4%, 1/01/2050 (n) | | | 390,000 | | | | 301,025 | |
| | | | | | | | |
| | | | | | | |
| | |
| Issuer | | Shares/Par | | | Value ($) | |
| Industrial Revenue - Other - continued | | | | | |
| Tuscaloosa County, AL, Industrial Development Authority, Gulf Opportunity Zone (Hunt Refining Project), ”A“, 4.5%, 5/01/2032 | | $ | 115,000 | | | $ | 109,327 | |
| Tuscaloosa County, AL, Industrial Development Authority, Gulf Opportunity Zone (Hunt Refining Project), ”A“, 5.25%, 5/01/2044 | | | 400,000 | | | | 384,644 | |
| | | | | | | $ | 2,099,786 | |
| Miscellaneous Revenue - Other - 0.8% | | | | | | | | |
| Indiana Finance Authority Rev. (Ohio River Bridges East End Crossing Project), ”A“, 5%, 7/01/2040 | | $ | 145,000 | | | $ | 148,389 | |
| Indiana Finance Authority Rev. (Ohio River Bridges East End Crossing Project), ”A“, 5%, 7/01/2044 | | | 225,000 | | | | 229,507 | |
| Pennsylvania Economic Development Financing Authority Rev. (Pennsylvania Rapid Bridge Replacement Project), 5%, 12/31/2034 | | | 750,000 | | | | 819,082 | |
| | | | | | | $ | 1,196,978 | |
| Multi-Family Housing Revenue - 1.6% | | | | | | | | |
| Pennsylvania Housing Finance Agency, Special Limited Obligation, Multi-Family Housing Development Rev. (Country Commons Apartments), FNMA, 3.6%, 8/01/2035 | | $ | 983,070 | | | $ | 1,083,570 | |
| Philadelphia, PA, Authority for Industrial Development, Multi-Family Housing Rev. (University Square Apartment Project- Section 8), ”I“, 5%, 12/01/2058 | | | 1,250,000 | | | | 1,401,375 | |
| | | | | | | $ | 2,484,945 | |
| Sales & Excise Tax Revenue - 2.7% | | | | | | | | |
| Colorado Regional Transportation District, Private Activity Rev. (Denver Transportation Partners), 6.5%, 1/15/2030 | | $ | 580,000 | | | $ | 584,280 | |
| Illinois Sales Tax Securitization Corp., Second Lien, ”A“, 5%, 1/01/2026 | | | 60,000 | | | | 67,082 | |
| Illinois Sales Tax Securitization Corp., Second Lien, ”A“, 5%, 1/01/2027 | | | 130,000 | | | | 147,606 | |
| Illinois Sales Tax Securitization Corp., Second Lien, ”A“, 5%, 1/01/2029 | | | 145,000 | | | | 169,132 | |
| Illinois Sales Tax Securitization Corp., Second Lien, ”A“, 5%, 1/01/2030 | | | 60,000 | | | | 70,804 | |
| Illinois Sales Tax Securitization Corp., Second Lien, ”A“, 5%, 1/01/2036 | | | 35,000 | | | | 40,642 | |
| Illinois Sales Tax Securitization Corp., Second Lien, ”A“, 5%, 1/01/2037 | | | 70,000 | | | | 81,066 | |
| Illinois Sales Tax Securitization Corp., Second Lien, ”A“, 4%, 1/01/2038 | | | 55,000 | | | | 56,688 | |
| Illinois Sales Tax Securitization Corp., Second Lien, ”A“, 4%, 1/01/2040 | | | 35,000 | | | | 35,915 | |
| Puerto Rico Sales Tax Financing Corp., Restructured Sales Tax Rev.,”2019A-1“, 4.55%, 7/01/2040 | | | 35,000 | | | | 33,133 | |
| Puerto Rico Sales Tax Financing Corp., Restructured Sales Tax Rev.,”2019A-1“, 5%, 7/01/2058 | | | 1,126,000 | | | | 1,094,979 | |
50
Portfolio of Investments – continued
| | | | | | | | |
| Municipal Bonds - continued | | | | | | |
| | | | | | | | |
| | |
| Issuer | | Shares/Par | | | Value ($) | |
| Sales & Excise Tax Revenue - continued | | | | | |
| Puerto Rico Sales Tax Financing Corp., Restructured Sales Tax Rev.,”2019A-2“, 4.329%, 7/01/2040 | | $ | 367,000 | | | $ | 337,123 | |
| Puerto Rico Sales Tax Financing Corp., Restructured Sales Tax Rev.,”2019A-2“, 4.329%, 7/01/2040 | | | 116,000 | | | | 106,556 | |
| Puerto Rico Sales Tax Financing Corp., Restructured Sales Tax Rev.,”2019A-2“, 4.536%, 7/01/2053 | | | 1,000 | | | | 908 | |
| Puerto Rico Sales Tax Financing Corp., Restructured Sales Tax Rev.,”2019A-2“, 4.784%, 7/01/2058 | | | 69,000 | | | | 64,620 | |
| Puerto Rico Sales Tax Financing Corp., Restructured Sales Tax Rev., Capital Appreciation,”2019A-1“, 0%, 7/01/2024 | | | 6,000 | | | | 5,138 | |
| Puerto Rico Sales Tax Financing Corp., Restructured Sales Tax Rev., Capital Appreciation,”2019A-1“, 0%, 7/01/2027 | | | 55,000 | | | | 41,878 | |
| Puerto Rico Sales Tax Financing Corp., Restructured Sales Tax Rev., Capital Appreciation,”2019A-1“, 0%, 7/01/2029 | | | 9,000 | | | | 6,228 | |
| Puerto Rico Sales Tax Financing Corp., Restructured Sales Tax Rev., Capital Appreciation,”2019A-1“, 0%, 7/01/2031 | | | 524,000 | | | | 325,865 | |
| Puerto Rico Sales Tax Financing Corp., Restructured Sales Tax Rev., Capital Appreciation,”2019A-1“, 0%, 7/01/2033 | | | 509,000 | | | | 281,650 | |
| Puerto Rico Sales Tax Financing Corp., Restructured Sales Tax Rev., Capital Appreciation,”2019A-1“, 0%, 7/01/2046 | | | 2,990,000 | | | | 706,896 | |
| | | | | | | $ | 4,258,189 | |
| Secondary Schools - 3.3% | | | | | | | | |
| Bucks County, PA, Industrial Development Authority Rev. (School Lane Charter School Project), ”A“, 5.125%, 3/15/2046 | | $ | 500,000 | | | $ | 530,515 | |
| Chester County, PA, Industrial Development Authority Educational Facilities Rev. (Avon Grove Charter School), ”A“, 5%, 12/15/2047 | | | 500,000 | | | | 521,425 | |
| Montgomery County, PA, Industrial Development Authority Rev. (Haverford School Project), 4%, 3/01/2049 | | | 1,000,000 | | | | 1,109,080 | |
| Philadelphia, PA, Authority for Industrial Development Rev. (Discovery Charter School Project), 6.25%, 4/01/2037 | | | 500,000 | | | | 492,295 | |
| Philadelphia, PA, Authority for Industrial Development Rev. (Global Leadership Academy Charter School), 6.375%, 11/15/2040 | | | 500,000 | | | | 502,800 | |
| Philadelphia, PA, Authority for Industrial Development Rev. (MaST Charter School Project), 6%, 8/01/2035 (Prerefunded 8/01/2020) | | | 665,000 | | | | 675,527 | |
| Philadelphia, PA, Authority for Industrial Development Rev. (MaST Charter School Project), ”B“, 6%, 8/01/2051 | | | 500,000 | | | | 505,190 | |
| | | | | | | | |
| | | | | | | |
| | |
| Issuer | | Shares/Par | | | Value ($) | |
| Secondary Schools - continued | | | | | | | | |
| Philadelphia, PA, Authority for Industrial Development Rev. (Philadelphia Performing Arts Charter School Project), 6.75%, 6/15/2043 | | $ | 400,000 | | | $ | 401,324 | |
| Philadelphia, PA, Authority for Industrial Development Rev. (Tacony Academy Charter School Project),”A-1“, 7%, 6/15/2043 | | | 400,000 | | | | 420,708 | |
| | | | | | | $ | 5,158,864 | |
| Single Family Housing - State - 1.9% | | | | | | | | |
| Pennsylvania Housing Finance Agency, Single Family Mortgage Rev., ”2019-128A“, 3.65%, 10/01/2032 | | $ | 1,000,000 | | | $ | 1,058,500 | |
| Pennsylvania Housing Finance Agency, Single Family Mortgage Rev., ”A“, 4%, 4/01/2039 | | | 645,000 | | | | 675,844 | |
| Pennsylvania Housing Finance Agency, Single Family Mortgage Rev., “125A”, 3.7%, 10/01/2037 | | | 1,245,000 | | | | 1,346,492 | |
| | | | | | | $ | 3,080,836 | |
| State & Local Agencies - 6.6% | | | | | | | | |
| Colorado State University Board of Governors, System Enterprise Refunding Rev., ”E“, 4%, 3/01/2043 | | $ | 655,000 | | | $ | 732,028 | |
| Commonwealth Financing Authority Rev.,”A-2“, 5%, 6/01/2036 | | | 1,500,000 | | | | 1,623,045 | |
| Commonwealth of Pennsylvania, Tobacco Master Settlement Financing Authority Rev., 5%, 6/01/2034 | | | 1,000,000 | | | | 1,193,720 | |
| Delaware Valley, PA, Regional Finance Authority, ”C“, FLR, 1.809% (LIBOR - 3mo. + 0.75%), 6/01/2037 | | | 745,000 | | | | 674,419 | |
| New Jersey Economic Development Authority Rev., School Facilities Construction Rev., ”LLL“, 5%, 6/15/2039 | | | 340,000 | | | | 360,403 | |
| New Jersey Economic Development Authority Rev., School Facilities Construction Rev., ”LLL“, 5%, 6/15/2044 | | | 570,000 | | | | 596,984 | |
| Pennsylvania Public School Building Authority, School Lease Rev. (School District of Philadelphia Project), ”A“, AGM, 5%, 6/01/2033 | | | 1,255,000 | | | | 1,472,680 | |
| Philadelphia, PA, Authority for Industrial Development Rev. (Rebuild Project), 5%, 5/01/2037 | | | 250,000 | | | | 303,752 | |
| Philadelphia, PA, Authority for Industrial Development Rev. (Rebuild Project), 5%, 5/01/2038 | | | 1,000,000 | | | | 1,210,670 | |
| Philadelphia, PA, Redevelopment Authority City Agreement Rev., ”A“, 5%, 4/15/2028 | | | 1,000,000 | | | | 1,158,560 | |
| Philadelphia, PA, Redevelopment Authority Refunding Rev. (Neighborhood Transformation Initiative), BAM, 5%, 4/15/2024 | | | 1,000,000 | | | | 1,071,130 | |
| | | | | | | $ | 10,397,391 | |
51
Portfolio of Investments – continued
| | | | | | | | |
| Municipal Bonds - continued | | | | | | |
| | | | | | | | |
| | |
| Issuer | | Shares/Par | | | Value ($) | |
| Tax - Other - 2.5% | | | | | | | | |
| Allentown, PA, Neighborhood Improvement Zone Development Authority Tax Rev. (City Center Project), 5.375%, 5/01/2042 | | $ | 300,000 | | | $ | 303,564 | |
| Allentown, PA, Neighborhood Improvement Zone Development Authority Tax Rev. (City Center Refunding Project), 5%, 5/01/2042 | | | 500,000 | | | | 503,535 | |
| Allentown, PA, Neighborhood Improvement Zone Development Authority Tax Rev., ”A“, 5%, 5/01/2035 | | | 750,000 | | | | 787,297 | |
| Guam Government Ltd. Obligation Rev., ”A“, 5%, 12/01/2035 | | | 115,000 | | | | 114,281 | |
| Guam Government Ltd. Obligation Rev., ”A“, 5%, 12/01/2036 | | | 60,000 | | | | 59,413 | |
| Guam Government Ltd. Obligation Rev., ”A“, 5%, 12/01/2046 | | | 185,000 | | | | 175,436 | |
| Puerto Rico Convention Center District Authority, Hotel Occupancy Tax Rev., ”A“, AAC, 5%, 7/01/2031 | | | 155,000 | | | | 155,020 | |
| Puerto Rico Infrastructure Financing Authority Special Tax Rev., ”C“, AAC, 5.5%, 7/01/2026 | | | 655,000 | | | | 698,381 | |
| Puerto Rico Infrastructure Financing Authority Special Tax Rev., ”C“, AAC, 5.5%, 7/01/2027 | | | 430,000 | | | | 459,623 | |
| Puerto Rico Infrastructure Financing Authority Special Tax Rev., Capital Appreciation, ”A“, AAC, 0%, 7/01/2036 | | | 1,640,000 | | | | 751,710 | |
| | | | | | | $ | 4,008,260 | |
| Tax Assessment - 0.3% | | | | | | | | |
| Washington County, PA, Redevelopment Authority Refunding Rev. (Victory Centre Tax Increment Financing Project), 5%, 7/01/2035 | | $ | 500,000 | | | $ | 490,550 | |
| | |
| Tobacco - 1.3% | | | | | | | | |
| Buckeye, OH, Tobacco Settlement Financing Authority Senior Asset-Backed Refunding,2020A-2, ”1“, 5%, 6/01/2032 | | $ | 110,000 | | | $ | 136,669 | |
| Buckeye, OH, Tobacco Settlement Financing Authority Senior Asset-Backed Refunding,2020A-2, ”1“, 4%, 6/01/2037 | | | 60,000 | | | | 65,945 | |
| Buckeye, OH, Tobacco Settlement Financing Authority Senior Asset-Backed Refunding,2020B-2, ”2“, 5%, 6/01/2055 | | | 855,000 | | | | 757,547 | |
| Buckeye, OH, Tobacco Settlement Financing Authority Senior Asset-Backed Refunding,2020B-3, Capital Appreciation, ”2“, 0%, 6/01/2057 | | | 2,055,000 | | | | 226,728 | |
| Illinois Railsplitter Tobacco Settlement Authority Rev., 6%, 6/01/2028 (Prerefunded 6/01/2021) | | | 755,000 | | | | 797,016 | |
| | | | | | | $ | 1,983,905 | |
| Toll Roads - 2.1% | | | | | | | | |
| Delaware River Port Authority Rev., 5%, 1/01/2029 | | $ | 1,145,000 | | | $ | 1,291,285 | |
| Pennsylvania Turnpike Commission Subordinate Rev., ”A“, AGM, 4%, 12/01/2049 | | | 1,500,000 | | | | 1,668,135 | |
| | | | | | | | |
| | | | | | | |
| | |
| Issuer | | Shares/Par | | | Value ($) | |
| Toll Roads - continued | | | | | | | | |
| Texas Private Activity Surface Transportation Corp., Senior Lien Rev. (NTE Mobility Partners Segments 3 LLC Segments 3A & 3B Facility), 7%, 12/31/2038 | | $ | 140,000 | | | $ | 157,941 | |
| Texas Private Activity Surface Transportation Corp., Senior Lien Rev. (NTE Mobility Partners Segments 3 LLC Segments 3A & 3B Facility), 6.75%, 6/30/2043 | | | 110,000 | | | | 123,022 | |
| | | | | | | $ | 3,240,383 | |
| Transportation - Special Tax - 2.9% | | | | | | | | |
| Commonwealth of Puerto Rico Highway & Transportation Authority Rev., ASSD GTY, 5.25%, 7/01/2041 | | $ | 110,000 | | | $ | 113,747 | |
| Commonwealth of Puerto Rico Highway & Transportation Authority Rev.,”AA-1“, AGM, 4.95%, 7/01/2026 | | | 145,000 | | | | 147,930 | |
| Commonwealth of Puerto Rico Highway & Transportation Authority Rev., ”D“, AGM, 5%, 7/01/2032 | | | 270,000 | | | | 270,073 | |
| Commonwealth of Puerto Rico Highway & Transportation Authority Rev., ”L“, AAC, 5.25%, 7/01/2038 | | | 765,000 | | | | 776,322 | |
| Commonwealth of Puerto Rico Highway & Transportation Authority Rev., ”L“, NATL, 5.25%, 7/01/2035 | | | 240,000 | | | | 240,646 | |
| Commonwealth of Puerto Rico Highway & Transportation Authority Rev., ”N“, AAC, 5.5%, 7/01/2029 | | | 755,000 | | | | 808,076 | |
| Commonwealth of Puerto Rico Highway & Transportation Authority Rev., ”N“, AAC, 5.25%, 7/01/2030 | | | 75,000 | | | | 78,698 | |
| Commonwealth of Puerto Rico Highway & Transportation Authority Rev., ”N“, NATL, 5.25%, 7/01/2032 | | | 90,000 | | | | 91,438 | |
| Commonwealth of Puerto Rico Highway & Transportation Authority Rev., ”N“, NATL, 5.25%, 7/01/2033 | | | 55,000 | | | | 55,663 | |
| Commonwealth of Puerto Rico Highway & Transportation Authority Rev., Unrefunded Balance, ”A“, NATL, 5%, 7/01/2038 | | | 20,000 | | | | 19,835 | |
| New Jersey Transportation Trust Fund Authority, Federal Highway Reimbursement Rev.,”A-1“, 5%, 6/15/2027 | | | 215,000 | | | | 240,095 | |
| New Jersey Transportation Trust Fund Authority, Transportation System, ”BB“, 5%, 6/15/2044 | | | 690,000 | | | | 719,898 | |
| Pennsylvania Turnpike Commission (Motor License Fund), ”B“, 5%, 12/01/2030 (Prerefunded 12/01/2021) | | | 1,000,000 | | | | 1,065,480 | |
| | | | | | | $ | 4,627,901 | |
| Universities - Colleges - 9.0% | | | | | | | | |
| Allegheny County, PA, Higher Education Building Authority Rev. (Duquesne University), ”A“, 5%, 3/01/2032 | | $ | 500,000 | | | $ | 588,825 | |
52
Portfolio of Investments – continued
| | | | | | | | |
| Municipal Bonds - continued | | | | | | |
| | | | | | | | |
| | |
| Issuer | | Shares/Par | | | Value ($) | |
| Universities - Colleges - continued | | | | | | | | |
| Allegheny County, PA, Higher Education Building Authority Rev. (Robert Morris University), ”A“, 5.75%, 10/15/2040 | | $ | 500,000 | | | $ | 505,935 | |
| Dallas, PA, Municipal Authority, University Rev. (Misericordia University Project), 5%, 5/01/2039 | | | 1,200,000 | | | | 1,256,400 | |
| Delaware County, PA, Authority University Rev. (Neumann University), 5.25%, 10/01/2031 | | | 565,000 | | | | 571,096 | |
| Erie, PA, Higher Education Building Authority Rev. (Gannon University), ”A“, 5.5%, 5/01/2040 | | | 1,000,000 | | | | 1,001,870 | |
| Northampton County, PA, General Purpose Authority College Rev. (Lafayette College), 4%, 11/01/2038 | | | 1,000,000 | | | | 1,126,500 | |
| Northeastern, PA, Hospital & Education Authority College Rev. (King’s College Project), 5%, 5/01/2049 | | | 1,000,000 | | | | 1,104,790 | |
| Northeastern, PA, Hospital & Education Authority Rev. (Wilkes University), ”B“, 5.25%, 3/01/2037 | | | 750,000 | | | | 817,770 | |
| Pennsylvania Higher Educational Facilities Authority Rev. (Duquesne University), ”A“, 4%, 3/01/2037 | | | 750,000 | | | | 820,785 | |
| Pennsylvania Higher Educational Facilities Authority Rev. (Duquesne University), ”A“, 5%, 3/01/2039 | | | 750,000 | | | | 873,983 | |
| Pennsylvania Higher Educational Facilities Authority Rev. (Saint Francis University Project), ”JJ2“, 6.25%, 11/01/2041 (Prerefunded 11/01/2021) | | | 500,000 | | | | 540,070 | |
| Pennsylvania Higher Educational Facilities Authority Rev. (Trustees of the University of Pennsylvania), ”A“, 5%, 8/15/2036 | | | 500,000 | | | | 594,875 | |
| Pennsylvania Public School Building Authority Rev. (Montgomery County Community College), 5%, 5/01/2033 | | | 1,000,000 | | | | 1,150,510 | |
| Puerto Rico Industrial, Tourist, Educational, Medical & Environmental Control Facilities Financing Authority, Higher Education Rev. (Ana G. Mendez University System Project), 5.375%, 4/01/2042 | | | 95,000 | | | | 80,381 | |
| University of Puerto Rico Rev., ”P“, NATL, 5%, 6/01/2025 | | | 25,000 | | | | 25,007 | |
| Washington County, PA, Industrial Development Authority College Rev. (Washington Jefferson College), 5.25%, 11/01/2030 (Prerefunded 5/01/2020) | | | 1,000,000 | | | | 1,003,050 | |
| Wilkes-Barre, PA, Finance Authority Rev. (University of Scranton), 5%, 11/01/2035 (Prerefunded 11/01/2020) | | | 1,000,000 | | | | 1,018,500 | |
| Wilkes-Barre, PA, Finance Authority Rev. (University of Scranton), ”A“, 5%, 11/01/2026 | | | 1,000,000 | | | | 1,139,220 | |
| | | | | | | $ | 14,219,567 | |
| | | | | | | | |
| | | | | | | |
| | |
| Issuer | | Shares/Par | | | Value ($) | |
| Universities - Dormitories - 2.3% | | | | | | | | |
| California Municipal Finance Authority, Student Housing Rev.(CHF-Davis I LLC - West Village Student Housing Project), BAM, 5%, 5/15/2051 | | $ | 1,025,000 | | | $ | 1,098,800 | |
| East Hempfield Township, PA, Industrial Development Authority Rev. (Student Services, Inc., Student Housing Project at Millersville University of Pennsylvania), 5%, 7/01/2046 | | | 1,000,000 | | | | 1,038,200 | |
| Pennsylvania Higher Educational Facilities Authority Rev. (Edinboro University Foundation), 6%, 7/01/2043 (Prerefunded 7/01/2020) | | | 1,000,000 | | | | 1,011,960 | |
| Pennsylvania Higher Educational Facilities Authority Rev. (Shippensburg University Student Services, Inc. Housing Project), 6.25%, 10/01/2043 (Prerefunded 10/01/2021) | | | 500,000 | | | | 533,720 | |
| | | | | | | $ | 3,682,680 | |
| Utilities - Cogeneration - 0.2% | | | | | | | | |
| Puerto Rico Industrial, Tourist, Educational, Medical & Environmental Control Facilities Financing Authority Rev. (Cogeneration Facilities - AES Puerto Rico Project), 9.12%, 6/01/2022 | | $ | 365,000 | | | $ | 374,125 | |
| | |
| Utilities - Investor Owned - 0.3% | | | | | | | | |
| Michigan Strategic Fund Ltd. Obligation Rev. (Detroit Edison Co.), 5.625%, 7/01/2020 | | $ | 415,000 | | | $ | 419,312 | |
| | |
| Utilities - Municipal Owned - 2.3% | | | | | | | | |
| Guam Power Authority Rev., ”A“, 5.5%, 10/01/2030 (Prerefunded 10/01/2020) | | $ | 315,000 | | | $ | 321,807 | |
| Guam Power Authority Rev., ”A“, AGM, 5%, 10/01/2039 | | | 95,000 | | | | 98,393 | |
| Guam Power Authority Rev., ”A“, AGM, 5%, 10/01/2044 | | | 105,000 | | | | 108,185 | |
| Philadelphia, PA, Gas Works Rev., 5%, 8/01/2031 | | | 500,000 | | | | 579,005 | |
| Philadelphia, PA, Gas Works Rev. (1998 General Ordinance), ”9“, 5.25%, 8/01/2040 (Prerefunded 8/01/2020) | | | 390,000 | | | | 395,409 | |
| Philadelphia, PA, Gas Works Rev., Unrefunded Balance, (1998 General Ordinance), ”9“, 5.25%, 8/01/2040 | | | 610,000 | | | | 617,906 | |
| Puerto Rico Electric Power Authority Rev., ”A“, 5%, 7/01/2029 (a)(d) | | | 390,000 | | | | 275,925 | |
| Puerto Rico Electric Power Authority Rev., ”A“, 5%, 7/01/2042 (a)(d) | | | 55,000 | | | | 38,913 | |
| Puerto Rico Electric Power Authority Rev., ”AAA“, 5.25%, 7/01/2021 (a)(d) | | | 25,000 | | | | 17,750 | |
| Puerto Rico Electric Power Authority Rev., ”AAA“, 5.25%, 7/01/2030 (a)(d) | | | 15,000 | | | | 10,650 | |
| Puerto Rico Electric Power Authority Rev., ”CCC“, 5.25%, 7/01/2027 (a)(d) | | | 140,000 | | | | 99,400 | |
| Puerto Rico Electric Power Authority Rev., ”DDD“, 5%, 7/01/2020 (a)(d) | | | 15,000 | | | | 10,613 | |
53
Portfolio of Investments – continued
| | | | | | | | |
| Municipal Bonds - continued | | | | | | |
| | | | | | | | |
| | |
| Issuer | | Shares/Par | | | Value ($) | |
| Utilities - Municipal Owned - continued | |
| Puerto Rico Electric Power Authority Rev., ”DDD“, 5%, 7/01/2021 (a)(d) | | $ | 150,000 | | | $ | 106,125 | |
| Puerto Rico Electric Power Authority Rev., ”DDD“, 5%, 7/01/2022 (a)(d) | | | 245,000 | | | | 173,337 | |
| Puerto Rico Electric Power Authority Rev., ”EEE“, 6.05%, 7/01/2032 (a)(d) | | | 80,000 | | | | 56,900 | |
| Puerto Rico Electric Power Authority Rev., ”TT“, 5%, 7/01/2021 (a)(d) | | | 65,000 | | | | 45,987 | |
| Puerto Rico Electric Power Authority Rev., ”TT“, 5%, 7/01/2023 (a)(d) | | | 65,000 | | | | 45,987 | |
| Puerto Rico Electric Power Authority Rev., ”TT“, 5%, 7/01/2027 (a)(d) | | | 10,000 | | | | 7,075 | |
| Puerto Rico Electric Power Authority Rev., ”TT“, 5%, 7/01/2037 (a)(d) | | | 200,000 | | | | 141,500 | |
| Puerto Rico Electric Power Authority Rev., ”V“, NATL, 5.25%, 7/01/2033 | | | 75,000 | | | | 75,904 | |
| Puerto Rico Electric Power Authority Rev., ”VV“, NATL, 5.25%, 7/01/2032 | | | 155,000 | | | | 157,477 | |
| Puerto Rico Electric Power Authority Rev., ”VV“, NATL, 5.25%, 7/01/2034 | | | 15,000 | | | | 15,114 | |
| Puerto Rico Electric Power Authority Rev., ”WW“, 5.375%, 7/01/2022 (a)(d) | | | 10,000 | | | | 7,113 | |
| Puerto Rico Electric Power Authority Rev., ”WW“, 5.25%, 7/01/2025 (a)(d) | | | 30,000 | | | | 21,300 | |
| Puerto Rico Electric Power Authority Rev., ”ZZ“, 5%, 7/01/2018 (a)(d) | | | 95,000 | | | | 66,144 | |
| Puerto Rico Electric Power Authority Rev., ”ZZ“, 5.25%, 7/01/2023 (a)(d) | | | 105,000 | | | | 74,550 | |
| Puerto Rico Electric Power Authority Rev., ”ZZ“, 5.25%, 7/01/2024 (a)(d) | | | 30,000 | | | | 21,300 | |
| Puerto Rico Electric Power Authority Rev., ”ZZ“, 5.25%, 7/01/2026 (a)(d) | | | 95,000 | | | | 67,450 | |
| | | | | | | $ | 3,657,219 | |
| Utilities - Other - 0.7% | | | | | | | | |
| Central Plains Energy Project, NE, Gas Project Rev. (Project No. 3), ”A“, 5%, 9/01/2036 | | $ | 75,000 | | | $ | 88,869 | |
| Public Authority for Colorado Energy Natural Gas Purchase Rev., 6.5%, 11/15/2038 | | | 280,000 | | | | 396,410 | |
| Tennessee Energy Acquisition Corp., Gas Rev., ”A“, 5.25%, 9/01/2022 | | | 235,000 | | | | 247,122 | |
| Tennessee Energy Acquisition Corp., Gas Rev., ”C“, 5%, 2/01/2021 | | | 255,000 | | | | 259,692 | |
| Texas Gas Acquisition & Supply Corp. III., Gas Supply Rev., 5%, 12/15/2031 | | | 75,000 | | | | 77,513 | |
| | | | | | | $ | 1,069,606 | |
| Water & Sewer Utility Revenue - 10.0% | | | | | |
| Allegheny County, PA, Sanitation Authority Sewer Rev., AGM, 5%, 6/01/2040 | | $ | 1,000,000 | | | $ | 1,023,280 | |
| Allegheny County, PA, Sanitation Authority Sewer Rev., BAM, 5%, 12/01/2030 | | | 500,000 | | | | 578,700 | |
| Bucks County, PA, Water & Sewer Authority, Water System Rev., 5%, 12/01/2033 (Prerefunded 12/01/2021) | | | 1,000,000 | | | | 1,065,480 | |
| | | | | | | | |
| | | | | | | |
| | |
| Issuer | | Shares/Par | | | Value ($) | |
| Water & Sewer Utility Revenue - continued | |
| Canonsburg-Houston, PA, Joint Authority Sewer Rev., ”A“, 5%, 12/01/2040 | | $ | 1,000,000 | | | $ | 1,143,010 | |
| Capital Region Water Sewer System Rev., 5%, 7/15/2042 | | | 1,000,000 | | | | 1,183,750 | |
| Clairton, PA, Municipal Authority Sewer Rev., ”B“, 5%, 12/01/2042 | | | 500,000 | | | | 534,975 | |
| Commonwealth of Puerto Rico Aqueduct & Sewer Authority Rev., ”A“, ASSD GTY, 5%, 7/01/2028 | | | 45,000 | | | | 45,020 | |
| Commonwealth of Puerto Rico Aqueduct & Sewer Authority Rev., ”A“, ASSD GTY, 5.125%, 7/01/2047 | | | 110,000 | | | | 109,994 | |
| Erie, PA, Water Authority Rev., ”A“, AGM, 5%, 12/01/2043 | | | 1,000,000 | | | | 1,220,860 | |
| Erie, PA, Water Authority Rev., ”A“, AGM, 4%, 12/01/2050 | | | 995,000 | | | | 1,099,256 | |
| Erie, PA, Water Authority Rev., ”D“, BAM, 4%, 12/01/2041 | | | 1,500,000 | | | | 1,679,655 | |
| Guam Waterworks Authority Rev. (Water and Wastewater System), 5.25%, 7/01/2020 | | | 45,000 | | | | 45,151 | |
| Guam Waterworks Authority Rev. (Water and Wastewater System), 5.25%, 7/01/2021 | | | 120,000 | | | | 121,964 | |
| Guam Waterworks Authority Rev. (Water and Wastewater System), 5.625%, 7/01/2040 (Prerefunded 7/01/2020) | | | 260,000 | | | | 262,839 | |
| Pennsylvania Economic Development Financing Authority, Sewer Sludge Disposal Rev. (Philadelphia Biosolids Facility), 6.25%, 1/01/2032 | | | 475,000 | | | | 483,631 | |
| Philadelphia, PA, Water and Wastewater Rev., ”A“, 5%, 10/01/2037 | | | 1,000,000 | | | | 1,194,360 | |
| Philadelphia, PA, Water and Wastewater Rev., ”A“, 5%, 10/01/2038 | | | 1,000,000 | | | | 1,214,220 | |
| Pittsburgh, PA, Water and Sewer System Authority Subordinate Refunding Rev., ”B“, AGM, 4%, 9/01/2034 | | | 2,500,000 | | | | 2,885,925 | |
| | | | | | | $ | 15,892,070 | |
Total Municipal Bonds
(Identified Cost, $147,344,938) | | | $ | 152,951,807 | |
|
| Bonds - 0.1% | |
| Consumer Services - 0.1% | | | | | | | | |
| Toll Road Investors Partnership II LP, Capital Appreciation, NATL, 0%, 2/15/2043 (n) (Identified Cost, $155,144) | | $ | 500,000 | | | $ | 182,997 | |
| |
| Investment Companies (h) - 1.6% | | | | | |
| Money Market Funds - 1.6% | | | | | | | | |
| MFS Institutional Money Market Portfolio, 1.28% (v) (Identified Cost, $2,584,397) | | | 2,583,569 | | | $ | 2,584,086 | |
| |
| Other Assets, Less Liabilities - 1.6% | | | | 2,457,289 | |
| Net Assets - 100.0% | | | | | | $ | 158,176,179 | |
54
Portfolio of Investments – continued
Derivative Contracts at 3/31/20
Futures Contracts
| | | | | | | | | | | | | | | | | | | | | | |
| Description | | Long/ Short | | | Currency | | | Contracts | | Notional
Amount | | | Expiration
Date | | | Value/Unrealized
Appreciation
(Depreciation) | |
| Liability Derivatives | | | | | | | | | | | | | | | | | | | | | | |
| Interest Rate Futures | | | | | | | | | | | | | | | | | | | | | | |
| U.S. Treasury Bond | | | Short | | | | USD | | | 15 | | | $2,685,938 | | | | June - 2020 | | | | $(180,524 | ) |
| | | | | | | | | | | | | | | | | | | | | | |
At March 31, 2020, the fund had cash collateral of $97,500 to cover any collateral or margin obligations for certain derivative contracts. Restricted cash and/or deposits with brokers in the Statements of Assets and Liabilities are comprised of cash collateral.
See Portfolio Footnotes and Notes to Financial Statements
55
PORTFOLIO OF INVESTMENTS
3/31/20
MFS SOUTH CAROLINA MUNICIPAL BOND FUND
The Portfolio of Investments is a complete list of all securities owned by your fund. It is categorized by broad-based asset classes.
| | | | | | | | |
| Municipal Bonds - 96.1% | | | | | | |
| | | | | | | | |
| | |
| Issuer | | Shares/Par | | | Value ($) | |
| Airport Revenue - 4.7% | | | | | |
| Charleston County, SC, Airport District Rev., 5%, 7/01/2038 | | $ | 750,000 | | | $ | 912,105 | |
| Charleston County, SC, Airport District Rev., 5%, 7/01/2039 | | | 450,000 | | | | 546,125 | |
| Charleston County, SC, Airport District Rev., 5%, 7/01/2043 | | | 1,250,000 | | | | 1,505,125 | |
| Charleston County, SC, Airport District Rev., 5%, 7/01/2048 | | | 1,500,000 | | | | 1,790,445 | |
| Charleston County, SC, Airport District Rev., ”A“, 5.25%, 7/01/2021 | | | 2,000,000 | | | | 2,099,940 | |
| Dallas and Fort Worth, TX, International Airport Rev., ”B“, 5%, 11/01/2044 | | | 220,000 | | | | 233,068 | |
| Dallas and Fort Worth, TX, International Airport Rev., ”C“, 5%, 11/01/2045 | | | 155,000 | | | | 161,167 | |
| Horry County, SC, Airport Rev. (Myrtle Beach International Airport), ”A“, 5%, 7/01/2040 | | | 2,250,000 | | | | 2,268,000 | |
| San Francisco, CA, City & County Airports Commission, International Airport Rev., ”H“, 5%, 5/01/2021 | | | 1,180,000 | | | | 1,221,630 | |
| Wayne County, MI, Airport Authority Rev. (Detroit Metropolitan Wayne County Airport), ”B“, 5%, 12/01/2044 | | | 90,000 | | | | 99,712 | |
| Wayne County, MI, Airport Authority Rev. (Detroit Metropolitan Wayne County Airport), ”B“, BAM, 5%, 12/01/2039 | | | 10,000 | | | | 11,154 | |
| Wayne County, MI, Airport Authority Rev. (Detroit Metropolitan Wayne County Airport), ”C“, 5%, 12/01/2039 | | | 75,000 | | | | 82,434 | |
| Wayne County, MI, Airport Authority Rev. (Detroit Metropolitan Wayne County Airport), ”C“, 5%, 12/01/2044 | | | 120,000 | | | | 131,288 | |
| | | | | | | $ | 11,062,193 | |
| General Obligations - General Purpose - 2.4% | | | | | |
| Aiken County, SC, County Administration Building Project, 5%, 3/01/2025 | | $ | 910,000 | | | $ | 976,339 | |
| Bridgeview, IL, Stadium and Redevelopment Projects, AAC, 5.14%, 12/01/2036 | | | 475,000 | | | | 438,501 | |
| Chicago, IL, ”A“, 5%, 1/01/2025 | | | 325,000 | | | | 333,440 | |
| Chicago, IL, ”A“, 5.25%, 1/01/2033 | | | 405,000 | | | | 413,453 | |
| Chicago, IL, General Obligation (Neighborhood Alive 21 Program), ”B“, 5.5%, 1/01/2037 | | | 105,000 | | | | 108,587 | |
| Chicago, IL, General Obligation Refunding Project, ”A“, 5.25%, 1/01/2030 | | | 70,000 | | | | 71,696 | |
| Chicago, IL, General Obligation, ”A“, 5%, 1/01/2026 | | | 95,000 | | | | 97,848 | |
| Chicago, IL, General Obligation, ”A“, 5%, 1/01/2027 | | | 105,000 | | | | 108,512 | |
| Commonwealth of Puerto Rico, General Obligation, ”A“, 8%, 7/01/2035 (a)(d) | | | 2,435,000 | | | | 1,461,000 | |
| Commonwealth of Puerto Rico, Public Improvement, ”A“, AGM, 5%, 7/01/2035 | | | 45,000 | | | | 45,367 | |
| | | | | | | | |
| | | | | | | |
| | |
| Issuer | | Shares/Par | | | Value ($) | |
| General Obligations - General Purpose - continued | | | | | |
| Commonwealth of Puerto Rico, Public Improvement, ”A“, NATL, 5.5%, 7/01/2020 | | $ | 495,000 | | | $ | 497,267 | |
| Commonwealth of Puerto Rico, Public Improvement,”A-4“, AGM, 5.25%, 7/01/2030 | | | 65,000 | | | | 65,378 | |
| Commonwealth of Puerto Rico, Public Improvement,”A-4“, AGM, 5%, 7/01/2031 | | | 145,000 | | | | 145,496 | |
| Lancaster County, SC, General Obligation Refunding, 3%, 3/01/2039 | | | 725,000 | | | | 767,282 | |
| Puerto Rico Public Buildings Authority Rev.,”M-2“, AAC, 10%, 7/01/2035 | | | 105,000 | | | | 114,011 | |
| | | | | | | $ | 5,644,177 | |
| General Obligations - Schools - 8.7% | | | | | |
| Aiken County, SC, Consolidated School District Special Obligation, 4%, 6/01/2035 | | $ | 275,000 | | | $ | 321,495 | |
| Aiken County, SC, Consolidated School District Special Obligation, 3.125%, 6/01/2041 | | | 1,400,000 | | | | 1,451,198 | |
| Aiken County, SC, Consolidated School District Special Obligation, ”A“, 4%, 4/01/2036 | | | 2,000,000 | | | | 2,325,480 | |
| Anderson County, SC, School District, ”A“, 5%, 3/01/2026 | | | 1,240,000 | | | | 1,500,251 | |
| Chesterfield County, SC, School District, 5%, 3/01/2025 | | | 1,000,000 | | | | 1,072,310 | |
| Downey, CA, Unified School District (Election of 2014), ”B“, 4%, 8/01/2040 | | | 1,295,000 | | | | 1,460,229 | |
| Lexington County, SC, School District No. 1, ”A“, 5%, 3/01/2023 | | | 1,030,000 | | | | 1,142,445 | |
| Richland County, SC, School District No. 1, ”A“, 5%, 3/01/2025 | | | 2,000,000 | | | | 2,109,900 | |
| Richland County, SC, School District No. 1, ”A“, 5%, 3/01/2029 | | | 3,000,000 | | | | 3,153,120 | |
| Spartanburg County, SC, School District No. 7, General Obligation, ”B“, 5%, 3/01/2048 | | | 2,000,000 | | | | 2,452,620 | |
| Spartanburg County, SC, School District No. 7, General Obligation, ”D“, 5%, 3/01/2042 | | | 3,000,000 | | | | 3,730,410 | |
| | | | | | | $ | 20,719,458 | |
| Healthcare Revenue - Hospitals - 15.6% | | | | | |
| Allegheny County, PA, Hospital Development Authority Rev. (Allegheny Health Network Obligated Group), ”A“, 4%, 4/01/2044 | | $ | 340,000 | | | $ | 354,923 | |
| Chattanooga, TN, Health, Educational & Housing Facility Board Rev. (CommonSpirit Health),”A-1“, 4%, 8/01/2044 | | | 25,000 | | | | 24,931 | |
| Chattanooga, TN, Health, Educational & Housing Facility Board Rev. (CommonSpirit Health),”A-2“, 5%, 8/01/2044 | | | 20,000 | | | | 21,531 | |
| Chattanooga, TN, Health, Educational & Housing Facility Board Rev. (CommonSpirit Health),”A-2“, 5%, 8/01/2049 | | | 10,000 | | | | 10,612 | |
| Colorado Health Facilities Authority Rev. (CommonSpirit Health),”A-2“, 4%, 8/01/2044 | | | 115,000 | | | | 114,680 | |
56
Portfolio of Investments – continued
| | | | | | | | |
| Municipal Bonds - continued | | | | | | |
| | | | | | | | |
| | |
| Issuer | | Shares/Par | | | Value ($) | |
| Healthcare Revenue - Hospitals - continued | | | | | |
| DeKalb County, GA, Hospital Authority Rev. (DeKalb Medical Center, Inc. Project), 6.125%, 9/01/2040 (Prerefunded 9/01/2020) | | $ | 400,000 | | | $ | 407,968 | |
| Doylestown, PA, Hospital Rev., ”A“, 4%, 7/01/2045 | | | 30,000 | | | | 31,459 | |
| Escambia County, FL, Health Facilities Authority Rev. (Baptist Hospital, Inc.), ”A“, 6%, 8/15/2036 | | | 925,000 | | | | 937,728 | |
| Florence County, SC, Hospital Rev. (McLeod Regional Medical Center), ”A“, 5%, 11/01/2037 | | | 3,000,000 | | | | 3,047,610 | |
| Greenville, SC, Hospital Systems, Hospital Facilities Rev., 6%, 5/01/2020 | | | 1,195,000 | | | | 1,199,529 | |
| Greenwood County, SC, Hospital Facilities Refunding Rev. (Self Regional Healthcare), 4%, 10/01/2036 | | | 1,500,000 | | | | 1,653,900 | |
| Greenwood County, SC, Hospital Facilities Refunding Rev. (Self Regional Healthcare), ”B“, 5%, 10/01/2031 | | | 1,950,000 | | | | 2,063,314 | |
| Illinois Finance Authority Rev. (Provena Health), ”A“, 6%, 5/01/2028 (Prerefunded 5/01/2020) | | | 550,000 | | | | 551,826 | |
| Jefferson Parish, LA, Hospital Service District No. 2 Hospital Rev. (East Jefferson General Hospital), 6.25%, 7/01/2031 | | | 155,000 | | | | 158,613 | |
| Jefferson Parish, LA, Hospital Service District No. 2 Hospital Rev. (East Jefferson General Hospital), 6.375%, 7/01/2041 | | | 180,000 | | | | 183,998 | |
| Kentucky Economic Development Finance Authority Hospital Rev. (Owensboro Medical Health System, Inc.), ”A“, 6.375%, 6/01/2040 (Prerefunded 6/01/2020) | | | 605,000 | | | | 610,064 | |
| Kentucky Economic Development Finance Authority Hospital Rev. (Owensboro Medical Health System, Inc.), ”A“, 6.5%, 3/01/2045 (Prerefunded 6/01/2020) | | | 865,000 | | | | 872,404 | |
| Lexington County, SC, Health Services District, Inc., Hospital Rev., 4%, 11/01/2031 | | | 1,000,000 | | | | 1,100,830 | |
| Lexington County, SC, Health Services District, Inc., Hospital Rev., 4%, 11/01/2032 | | | 1,000,000 | | | | 1,098,430 | |
| Lexington County, SC, Health Services District, Inc., Hospital Rev., 5%, 11/01/2035 | | | 1,000,000 | | | | 1,140,580 | |
| Lexington County, SC, Health Services District, Inc., Hospital Rev., 5%, 11/01/2036 | | | 1,000,000 | | | | 1,138,120 | |
| Lexington County, SC, Health Services District, Inc., Hospital Rev., Refunding & Improvement, 5%, 11/01/2026 | | | 500,000 | | | | 523,895 | |
| New Hampshire Health & Education Facilities Authority Rev. (Dartmouth-Hitchcock Obligated Group), ”A“, 5%, 8/01/2059 | | | 170,000 | | | | 244,009 | |
| South Carolina Jobs & Economic Development Authority, Hospital Rev. (Anmed Health), 5%, 2/01/2038 | | | 1,500,000 | | | | 1,732,665 | |
| South Carolina Jobs & Economic Development Authority, Hospital Rev. (Conway Hospital, Inc.), 5%, 7/01/2037 | | | 1,250,000 | | | | 1,357,900 | |
| | | | | | | | |
| | | | | | | |
| | |
| Issuer | | Shares/Par | | | Value ($) | |
| Healthcare Revenue - Hospitals - continued | | | | | |
| South Carolina Jobs & Economic Development Authority, Hospital Rev. (Conway Hospital, Inc.), 5.25%, 7/01/2047 | | $ | 2,000,000 | | | $ | 2,299,560 | |
| South Carolina Jobs & Economic Development Authority, Hospital Rev. (Hampton Regional Medical Center Project), 5%, 11/01/2037 | | | 500,000 | | | | 550,095 | |
| South Carolina Jobs & Economic Development Authority, Hospital Rev. (McLeod Health Projects), 4%, 11/01/2048 | | | 2,000,000 | | | | 2,156,820 | |
| South Carolina Jobs & Economic Development Authority, Hospital Rev. (Palmetto Health), ”A“, 5.25%, 8/01/2030 (Prerefunded 8/01/2023) | | | 1,000,000 | | | | 1,133,230 | |
| South Carolina Jobs & Economic Development Authority, Hospital Rev. (Palmetto Health), ”A“, AGM, 6.5%, 8/01/2039 (Prerefunded 8/01/2021) | | | 2,000,000 | | | | 2,142,780 | |
| South Carolina Jobs & Economic Development Authority, Hospital Rev. (Prisma Health Obligated Group), 5%, 5/01/2037 | | | 2,000,000 | | | | 2,384,120 | |
| Spartanburg County, SC, Regional Health Services District Hospital Rev., ”A“, 5%, 4/15/2037 (Prerefunded 4/15/2022) | | | 30,000 | | | | 32,255 | |
| Spartanburg County, SC, Regional Health Services District Hospital Rev., ”A“, 5%, 4/15/2037 | | | 1,970,000 | | | | 2,072,716 | |
| Spartanburg County, SC, Regional Health Services District Hospital Rev., ”A“, 4%, 4/15/2043 | | | 3,340,000 | | | | 3,597,982 | |
| | | | | | | $ | 36,951,077 | |
| Healthcare Revenue - Long Term Care - 2.0% | | | | | |
| South Carolina Jobs & Economic Development Authority Rev. (Bishop Gadsden Episcopal Retirement Community), ”A“, 5%, 4/01/2049 | | $ | 1,250,000 | | | $ | 1,289,287 | |
| South Carolina Jobs & Economic Development Authority, Health Facilities Rev. (Lutheran Homes of South Carolina, Inc.), 5%, 5/01/2043 | | | 750,000 | | | | 631,373 | |
| South Carolina Jobs & Economic Development Authority, Health Facilities Rev. (Lutheran Homes of South Carolina, Inc.), 5.125%, 5/01/2048 | | | 250,000 | | | | 209,808 | |
| South Carolina Jobs & Economic Development Authority, Health Facilities Rev. (Lutheran Homes of South Carolina, Inc.), ”B“, 5%, 5/01/2042 | | | 750,000 | | | | 635,332 | |
| South Carolina Jobs & Economic Development Authority, Health Facilities Rev. (Wesley Commons), 5%, 10/01/2036 | | | 1,000,000 | | | | 1,014,390 | |
| South Carolina Jobs & Economic Development Authority, Residential Care Facilities Rev. (South Carolina Episcopal Home at Still Hopes), 5%, 4/01/2047 | | | 1,000,000 | | | | 989,760 | |
| | | | | | | $ | 4,769,950 | |
57
Portfolio of Investments – continued
| | | | | | | | |
| Municipal Bonds - continued | | | | | | |
| | | | | | | | |
| | |
| Issuer | | Shares/Par | | | Value ($) | |
| Industrial Revenue - Other - 0.4% | | | | | |
| Port Beaumont, TX, Navigation District Facility Rev. (Jefferson Gulf Coast Energy Project), ”A“, 3.625%, 1/01/2035 (n) | | $ | 100,000 | | | $ | 84,188 | |
| Port Beaumont, TX, Navigation District Facility Rev. (Jefferson Gulf Coast Energy Project), ”A“, 4%, 1/01/2050 (n) | | | 410,000 | | | | 316,463 | |
| Tuscaloosa County, AL, Industrial Development Authority, Gulf Opportunity Zone (Hunt Refining Project), ”A“, 4.5%, 5/01/2032 | | | 285,000 | | | | 270,941 | |
| Tuscaloosa County, AL, Industrial Development Authority, Gulf Opportunity Zone (Hunt Refining Project), ”A“, 5.25%, 5/01/2044 | | | 395,000 | | | | 379,836 | |
| | | | | | | $ | 1,051,428 | |
| Industrial Revenue - Paper - 0.5% | | | | | |
| Richland County, SC, Environmental Improvement Rev. (International Paper), ”A“, 3.875%, 4/01/2023 | | $ | 1,000,000 | | | $ | 1,048,330 | |
| Valparaiso, IN, Exempt Facilities Rev. (Pratt Paper LLC Project), 7%, 1/01/2044 | | | 100,000 | | | | 103,807 | |
| | | | | | | $ | 1,152,137 | |
| Miscellaneous Revenue - Other - 0.0% | | | | | |
| Summit County, OH, Port Authority Building Rev. (Flats East Development Recovery Zone Facility Bonds), 6.875%, 5/15/2040 | | $ | 45,000 | | | $ | 46,029 | |
| | |
| Port Revenue - 4.6% | | | | | | | | |
| South Carolina Port Authority Rev., 5%, 7/01/2028 | | $ | 300,000 | | | $ | 343,197 | |
| South Carolina Port Authority Rev., 5%, 7/01/2029 | | | 450,000 | | | | 512,536 | |
| South Carolina Port Authority Rev., 5%, 7/01/2033 | | | 500,000 | | | | 591,860 | |
| South Carolina Port Authority Rev., 5%, 7/01/2036 | | | 3,000,000 | | | | 3,550,230 | |
| South Carolina Port Authority Rev., 5.25%, 7/01/2040 (Prerefunded 7/01/2020) | | | 250,000 | | | | 252,498 | |
| South Carolina Port Authority Rev., 4%, 7/01/2055 | | | 2,000,000 | | | | 2,117,760 | |
| South Carolina Ports Authority Rev. (tax-exempt), ”B“, 5%, 7/01/2044 | | | 3,000,000 | | | | 3,543,510 | |
| | | | | | | $ | 10,911,591 | |
| Sales & Excise Tax Revenue - 2.7% | | | | | |
| Colorado Regional Transportation District, Private Activity Rev. (Denver Transportation Partners), 6%, 1/15/2041 | | $ | 725,000 | | | $ | 729,328 | |
| Illinois Sales Tax Securitization Corp., Second Lien, ”A“, 5%, 1/01/2026 | | | 95,000 | | | | 106,213 | |
| Illinois Sales Tax Securitization Corp., Second Lien, ”A“, 5%, 1/01/2027 | | | 185,000 | | | | 210,055 | |
| Illinois Sales Tax Securitization Corp., Second Lien, ”A“, 5%, 1/01/2029 | | | 205,000 | | | | 239,118 | |
| Illinois Sales Tax Securitization Corp., Second Lien, ”A“, 5%, 1/01/2030 | | | 85,000 | | | | 100,306 | |
| | | | | | | | |
| | | | | | | |
| | |
| Issuer | | Shares/Par | | | Value ($) | |
| Sales & Excise Tax Revenue - continued | | | | | |
| Illinois Sales Tax Securitization Corp., Second Lien, ”A“, 5%, 1/01/2036 | | $ | 55,000 | | | $ | 63,867 | |
| Illinois Sales Tax Securitization Corp., Second Lien, ”A“, 5%, 1/01/2037 | | | 105,000 | | | | 121,599 | |
| Illinois Sales Tax Securitization Corp., Second Lien, ”A“, 4%, 1/01/2038 | | | 40,000 | | | | 41,228 | |
| Illinois Sales Tax Securitization Corp., Second Lien, ”A“, 4%, 1/01/2039 | | | 45,000 | | | | 46,254 | |
| Illinois Sales Tax Securitization Corp., Second Lien, ”A“, 4%, 1/01/2040 | | | 50,000 | | | | 51,307 | |
| Puerto Rico Sales Tax Financing Corp., Restructured Sales Tax Rev.,”2019A-1“, 4.55%, 7/01/2040 | | | 49,000 | | | | 46,386 | |
| Puerto Rico Sales Tax Financing Corp., Restructured Sales Tax Rev.,”2019A-1“, 5%, 7/01/2058 | | | 1,831,000 | | | | 1,780,556 | |
| Puerto Rico Sales Tax Financing Corp., Restructured Sales Tax Rev.,”2019A-2“, 4.329%, 7/01/2040 | | | 450,000 | | | | 413,365 | |
| Puerto Rico Sales Tax Financing Corp., Restructured Sales Tax Rev.,”2019A-2“, 4.329%, 7/01/2040 | | | 163,000 | | | | 149,730 | |
| Puerto Rico Sales Tax Financing Corp., Restructured Sales Tax Rev.,”2019A-2“, 4.536%, 7/01/2053 | | | 4,000 | | | | 3,630 | |
| Puerto Rico Sales Tax Financing Corp., Restructured Sales Tax Rev.,”2019A-2“, 4.784%, 7/01/2058 | | | 71,000 | | | | 66,493 | |
| Puerto Rico Sales Tax Financing Corp., Restructured Sales Tax Rev., Capital Appreciation,”2019A-1“, 0%, 7/01/2024 | | | 7,000 | | | | 5,994 | |
| Puerto Rico Sales Tax Financing Corp., Restructured Sales Tax Rev., Capital Appreciation,”2019A-1“, 0%, 7/01/2027 | | | 79,000 | | | | 60,152 | |
| Puerto Rico Sales Tax Financing Corp., Restructured Sales Tax Rev., Capital Appreciation,”2019A-1“, 0%, 7/01/2029 | | | 14,000 | | | | 9,688 | |
| Puerto Rico Sales Tax Financing Corp., Restructured Sales Tax Rev., Capital Appreciation,”2019A-1“, 0%, 7/01/2031 | | | 725,000 | | | | 450,863 | |
| Puerto Rico Sales Tax Financing Corp., Restructured Sales Tax Rev., Capital Appreciation,”2019A-1“, 0%, 7/01/2033 | | | 695,000 | | | | 384,571 | |
| Puerto Rico Sales Tax Financing Corp., Restructured Sales Tax Rev., Capital Appreciation,”2019A-1“, 0%, 7/01/2046 | | | 5,158,000 | | | | 1,219,454 | |
| | | | | | | $ | 6,300,157 | |
| Secondary Schools - 0.2% | | | | | | | | |
| District of Columbia Rev. (Rocketship D.C.), ”A“, 5%, 6/01/2049 | | $ | 250,000 | | | $ | 237,487 | |
| North Texas Education Finance Corp., Education Rev. (Uplift Education), ”A“, 5.125%, 12/01/2042 | | | 220,000 | | | | 237,158 | |
| | | | | | | $ | 474,645 | |
58
Portfolio of Investments – continued
| | | | | | | | |
| Municipal Bonds - continued | | | | | | |
| | | | | | | | |
| | |
| Issuer | | Shares/Par | | | Value ($) | |
| Single Family Housing - State - 1.8% | | | | | |
| Connecticut Housing Finance Authority Rev. (Housing Mortgage Finance Program), ”C1“, 4%, 11/15/2047 | | $ | 895,000 | | | $ | 945,281 | |
| Pennsylvania Housing Finance Agency, Single Family Mortgage Rev., “125A”, 3.7%, 10/01/2037 | | | 1,135,000 | | | | 1,227,525 | |
| South Carolina Housing, Finance & Development Authority Rev., ”A“, 3.75%, 7/01/2043 | | | 1,000,000 | | | | 1,063,080 | |
| South Carolina Housing, Finance & Development Authority Rev., ”A“, 3.8%, 1/01/2049 | | | 1,000,000 | | | | 1,057,910 | |
| | | | | | | $ | 4,293,796 | |
| State & Local Agencies - 9.1% | | | | | |
| Berkeley County, SC, School District Special Obligation, 5%, 12/01/2021 | | $ | 1,000,000 | | | $ | 1,063,940 | |
| Charleston County, SC, Special Source Rev., ”C“, 5%, 12/01/2021 | | | 1,000,000 | | | | 1,064,800 | |
| Charleston, SC, Educational Excellence Finance Corp. Rev. (Charleston County School District Project), ”B“, 5%, 12/01/2030 | | | 3,595,000 | | | | 4,029,096 | |
| Commonwealth of Pennsylvania, Tobacco Master Settlement Financing Authority Rev., 5%, 6/01/2032 | | | 55,000 | | | | 66,087 | |
| Commonwealth of Pennsylvania, Tobacco Master Settlement Financing Authority Rev., 5%, 6/01/2033 | | | 45,000 | | | | 53,836 | |
| Commonwealth of Pennsylvania, Tobacco Master Settlement Financing Authority Rev., 5%, 6/01/2034 | | | 25,000 | | | | 29,843 | |
| Delaware Valley, PA, Regional Finance Authority, ”C“, FLR, 1.809% (LIBOR - 3mo. + 0.75%), 6/01/2037 | | | 1,330,000 | | | | 1,203,996 | |
| Greenwood, SC, Fifty School Facilities, Inc., Installment Purchase Rev. (Greenwood School District No. 50), BAM, 5%, 12/01/2028 | | | 3,000,000 | | | | 3,571,740 | |
| Maryland Stadium Authority Rev., Baltimore City Public Schools Construction and Revitalization Program, “A”, 5%, 5/01/2047 | | | 705,000 | | | | 834,276 | |
| New Jersey Building Authority Rev., Unrefunded Balance, “A”, BAM, 5%, 6/15/2029 | | | 35,000 | | | | 38,870 | |
| New Jersey Economic Development Authority Rev., School Facilities Construction Rev., ”LLL“, 5%, 6/15/2039 | | | 490,000 | | | | 519,405 | |
| New Jersey Economic Development Authority Rev., School Facilities Construction Rev., ”LLL“, 5%, 6/15/2044 | | | 815,000 | | | | 853,582 | |
| Orangeburg County, SC, Facilities Corp. Installment Purchase Rev. (Detention Center Project), 4%, 12/01/2042 | | | 2,000,000 | | | | 2,179,220 | |
| Pennsylvania Public School Building Authority, School Lease Rev. (School District of Philadelphia Project), ”A“, AGM, 5%, 6/01/2033 | | | 1,115,000 | | | | 1,308,397 | |
| | | | | | | | |
| | | | | | | |
| | |
| Issuer | | Shares/Par | | | Value ($) | |
| State & Local Agencies - continued | | | | | |
| Scago, SC, Educational Facilities Installment Purchase Rev. (School District of Pickens County Project), 5%, 12/01/2028 | | $ | 2,000,000 | | | $ | 2,334,940 | |
| Sumter, SC, School Facilities, Inc., Installment Purchase Rev. (Sumter Two School Facilities, Inc.), BAM, 5%, 12/01/2026 | | | 1,000,000 | | | | 1,169,900 | |
| Sumter, SC, School Facilities, Inc., Installment Purchase Rev. (Sumter Two School Facilities, Inc.), BAM, 5%, 12/01/2027 | | | 1,195,000 | | | | 1,390,610 | |
| | | | | | | $ | 21,712,538 | |
| Tax - Other - 4.5% | | | | | |
| Birmingham-Jefferson, AL, Civic Center Authority, “B”, 5%, 7/01/2043 | | $ | 940,000 | | | $ | 1,127,107 | |
| Greenville County, SC, Hospitality Tax Rev., AGM, 5%, 4/01/2022 | | | 1,025,000 | | | | 1,063,909 | |
| Guam Government Ltd. Obligation Rev., ”A“, 5%, 12/01/2035 | | | 180,000 | | | | 178,875 | |
| Guam Government Ltd. Obligation Rev., ”A“, 5%, 12/01/2036 | | | 95,000 | | | | 94,070 | |
| Guam Government Ltd. Obligation Rev., ”A“, 5%, 12/01/2046 | | | 285,000 | | | | 270,265 | |
| Illinois Sports Facilities Authority Refunding Rev., BAM, 5%, 6/15/2029 | | | 1,260,000 | | | | 1,570,212 | |
| Myrtle Beach, SC, Tax Increment Refunding Bonds Rev. (Myrtle Beach Air Force Base Redevelopment Project Area), 5%, 10/01/2030 | | | 1,000,000 | | | | 1,182,900 | |
| North Charleston, SC, Limited Obligation Bond (Hospitality Fee Pledge), ”A“, 5%, 10/01/2040 | | | 2,000,000 | | | | 2,340,960 | |
| Puerto Rico Convention Center District Authority, Hotel Occupancy Tax Rev., ”A“, AAC, 5%, 7/01/2031 | | | 405,000 | | | | 405,053 | |
| Puerto Rico Infrastructure Financing Authority Special Tax Rev., ”C“, AAC, 5.5%, 7/01/2024 | | | 440,000 | | | | 463,901 | |
| Puerto Rico Infrastructure Financing Authority Special Tax Rev., ”C“, AAC, 5.5%, 7/01/2025 | | | 50,000 | | | | 53,080 | |
| Puerto Rico Infrastructure Financing Authority Special Tax Rev., ”C“, AAC, 5.5%, 7/01/2026 | | | 1,245,000 | | | | 1,327,456 | |
| Puerto Rico Infrastructure Financing Authority Special Tax Rev., ”C“, AAC, 5.5%, 7/01/2027 | | | 635,000 | | | | 678,745 | |
| | | | | | | $ | 10,756,533 | |
| Tax Assessment - 0.4% | | | | | |
| Berkeley County, SC, Assessment Rev. (Nexton Improvement District), 4.375%, 11/01/2049 | | $ | 1,000,000 | | | $ | 815,870 | |
| Brunswick, MD, Special Obligation Refunding (Brunswick Crossing Special Taxing District), 4%, 7/01/2029 | | | 20,000 | | | | 19,352 | |
| Brunswick, MD, Special Obligation Refunding (Brunswick Crossing Special Taxing District), 5%, 7/01/2036 | | | 20,000 | | | | 20,239 | |
| | | | | | | $ | 855,461 | |
| Tobacco - 1.1% | | | | | |
| Buckeye, OH, Tobacco Settlement Financing Authority Senior Asset-Backed Refunding,2020A-2, ”1“, 5%, 6/01/2032 | | $ | 150,000 | | | $ | 186,366 | |
59
Portfolio of Investments – continued
| | | | | | | | |
| Municipal Bonds - continued | | | | | | |
| | | | | | | | |
| | |
| Issuer | | Shares/Par | | | Value ($) | |
| Tobacco - continued | | | | | |
| Buckeye, OH, Tobacco Settlement Financing Authority Senior Asset-Backed Refunding,2020A-2, ”1“, 4%, 6/01/2037 | | $ | 90,000 | | | $ | 98,918 | |
| Buckeye, OH, Tobacco Settlement Financing Authority Senior Asset-Backed Refunding,2020B-2, ”2“, 5%, 6/01/2055 | | | 1,265,000 | | | | 1,120,815 | |
| Buckeye, OH, Tobacco Settlement Financing Authority Senior Asset-Backed Refunding,2020B-3, Capital Appreciation, ”2“, 0%, 6/01/2057 | | | 3,020,000 | | | | 333,197 | |
| Illinois Railsplitter Tobacco Settlement Authority Rev., 6%, 6/01/2028 (Prerefunded 6/01/2021) | | | 850,000 | | | | 897,302 | |
| | | | | | | $ | 2,636,598 | |
| Toll Roads - 0.3% | | | | | |
| Virginia Small Business Financing Authority Rev. (Elizabeth River Crossings Opco LLC Project), 6%, 1/01/2037 | | $ | 275,000 | | | $ | 283,225 | |
| Virginia Small Business Financing Authority Rev. (Elizabeth River Crossings Opco LLC Project), 5.5%, 1/01/2042 | | | 535,000 | | | | 542,843 | |
| | | | | | | $ | 826,068 | |
| Transportation - Special Tax - 8.6% | | | | | |
| Commonwealth of Puerto Rico Highway & Transportation Authority Rev.,”AA-1“, AGM, 4.95%, 7/01/2026 | | $ | 755,000 | | | $ | 770,259 | |
| Commonwealth of Puerto Rico Highway & Transportation Authority Rev., ”CC“, AGM, 5.25%, 7/01/2036 | | | 470,000 | | | | 494,816 | |
| Commonwealth of Puerto Rico Highway & Transportation Authority Rev., ”J“, NATL, 5%, 7/01/2029 | | | 20,000 | | | | 20,000 | |
| Commonwealth of Puerto Rico Highway & Transportation Authority Rev., ”L“, AAC, 5.25%, 7/01/2038 | | | 1,340,000 | | | | 1,359,832 | |
| Commonwealth of Puerto Rico Highway & Transportation Authority Rev., ”L“, NATL, 5.25%, 7/01/2035 | | | 480,000 | | | | 481,291 | |
| Commonwealth of Puerto Rico Highway & Transportation Authority Rev., ”N“, AAC, 5.5%, 7/01/2029 | | | 1,125,000 | | | | 1,204,087 | |
| Commonwealth of Puerto Rico Highway & Transportation Authority Rev., ”N“, AAC, 5.25%, 7/01/2031 | | | 90,000 | | | | 94,127 | |
| Commonwealth of Puerto Rico Highway & Transportation Authority Rev., ”N“, ASSD GTY, 5.25%, 7/01/2036 | | | 15,000 | | | | 15,791 | |
| Commonwealth of Puerto Rico Highway & Transportation Authority Rev., ”N“, NATL, 5.25%, 7/01/2032 | | | 435,000 | | | | 441,951 | |
| Commonwealth of Puerto Rico Highway & Transportation Authority Rev., ”N“, NATL, 5.25%, 7/01/2033 | | | 350,000 | | | | 354,218 | |
| | | | | | | | |
| | | | | | | |
| | |
| Issuer | | Shares/Par | | | Value ($) | |
| Transportation - Special Tax - continued | | | | | |
| New Jersey Transportation Trust Fund Authority, Federal Highway Reimbursement Rev.,”A-1“, 5%, 6/15/2027 | | $ | 350,000 | | | $ | 390,852 | |
| New Jersey Transportation Trust Fund Authority, Transportation System, ”BB“, 5%, 6/15/2044 | | | 1,005,000 | | | | 1,048,547 | |
| South Carolina Transportation Infrastructure Bank Refunding Rev., ”A“, 5%, 10/01/2036 | | | 1,205,000 | | | | 1,456,339 | |
| South Carolina Transportation Infrastructure Bank Refunding Rev., ”A“, AGM, 5%, 10/01/2035 | | | 2,000,000 | | | | 2,432,940 | |
| South Carolina Transportation Infrastructure Bank Refunding Rev., ”B“, 1.509%, 10/01/2031 (Put Date 10/01/2022) | | | 5,000,000 | | | | 4,885,200 | |
| South Carolina Transportation Infrastructure Bank Rev., ”A“, 5%, 10/01/2030 | | | 2,000,000 | | | | 2,495,840 | |
| South Carolina Transportation Infrastructure Bank Rev., ”A“, 5%, 10/01/2040 | | | 2,000,000 | | | | 2,396,960 | |
| | | | | | | $ | 20,343,050 | |
| Universities - Colleges - 7.9% | | | | | |
| College of Charleston, SC, Academic & Administrative Facilities Rev., ”B“, 5%, 4/01/2022 | | $ | 1,205,000 | | | $ | 1,292,857 | |
| Pinellas County, FL, Educational Facilities Authority Rev. (Barry University), 6%, 10/01/2041 | | | 200,000 | | | | 206,724 | |
| Private Colleges & Universities, GA, Authority Refunding Rev. (Agnes Scott College), ”A“, 5%, 6/01/2027 | | | 420,000 | | | | 506,612 | |
| Private Colleges & Universities, GA, Authority Refunding Rev. (Agnes Scott College), ”A“, 5%, 6/01/2028 | | | 495,000 | | | | 608,672 | |
| Private Colleges & Universities, GA, Authority Refunding Rev. (Agnes Scott College), ”A“, 5%, 6/01/2029 | | | 400,000 | | | | 500,440 | |
| Puerto Rico Industrial, Tourist, Educational, Medical & Environmental Control Facilities Financing Authority, Higher Education Rev. (Ana G. Mendez University System Project), 5.125%, 4/01/2032 | | | 75,000 | | | | 66,596 | |
| Puerto Rico Industrial, Tourist, Educational, Medical & Environmental Control Facilities Financing Authority, Higher Education Rev. (Ana G. Mendez University System Project), 5.375%, 4/01/2042 | | | 125,000 | | | | 105,765 | |
| Puerto Rico Industrial, Tourist, Educational, Medical & Environmental Control Facilities Financing Authority, Higher Education Rev. (University of Sacred Heart), 4.375%, 10/01/2031 | | | 55,000 | | | | 48,215 | |
| Puerto Rico Industrial, Tourist, Educational, Medical & Environmental Control Facilities Financing Authority, Higher Education Rev. (University of Sacred Heart), 5%, 10/01/2042 | | | 70,000 | | | | 58,559 | |
60
Portfolio of Investments – continued
| | | | | | | | |
| Municipal Bonds - continued | | | | | | |
| | | | | | | | |
| | |
| Issuer | | Shares/Par | | | Value ($) | |
| Universities - Colleges - continued | | | | | |
| Red River, TX, Education Finance Corp., Higher Education Rev. (Houston Baptist University Project), 5.5%, 10/01/2046 | | $ | 390,000 | | | $ | 423,782 | |
| South Carolina Jobs & Economic Development Authority (Furman University), 5%, 10/01/2028 | | | 700,000 | | | | 828,947 | |
| South Carolina Jobs & Economic Development Authority (Wofford College), 5%, 4/01/2035 | | | 1,565,000 | | | | 1,789,515 | |
| South Carolina Jobs & Economic Development Authority (Wofford College), 5%, 4/01/2049 | | | 2,000,000 | | | | 2,294,220 | |
| South Carolina Private Nonprofit Institutions Higher Learning Educational Facilities Authority Rev. (Furman University), ”B“, VRDN, 0.83%, 10/01/2039 | | | 3,000,000 | | | | 3,000,000 | |
| University of Puerto Rico Rev., ”P“, NATL, 5%, 6/01/2025 | | | 30,000 | | | | 30,008 | |
| University of South Carolina, Athletic Facilities Rev., ”A“, 4%, 5/01/2035 | | | 365,000 | | | | 403,358 | |
| University of South Carolina, Athletic Facilities Rev., ”A“, 5%, 5/01/2035 (Prerefunded 5/01/2020) | | | 830,000 | | | | 832,606 | |
| University of South Carolina, Athletic Facilities Rev., ”A“, 5%, 5/01/2035 | | | 170,000 | | | | 170,450 | |
| University of South Carolina, Athletic Facilities Rev., ”A“, 4%, 5/01/2036 | | | 400,000 | | | | 441,316 | |
| University of South Carolina, Athletic Facilities Rev., ”A“, 5%, 5/01/2036 | | | 440,000 | | | | 531,049 | |
| University of South Carolina, Athletic Facilities Rev., ”A“, 5%, 5/01/2037 | | | 1,560,000 | | | | 1,878,521 | |
| University of South Carolina, Athletic Facilities Rev., ”A“, 5%, 5/01/2040 (Prerefunded 5/01/2020) | | | 1,665,000 | | | | 1,670,228 | |
| University of South Carolina, Athletic Facilities Rev., ”A“, 5%, 5/01/2040 | | | 335,000 | | | | 335,834 | |
| University of South Carolina, Higher Education Facilities Refunding Rev., ”A“, 5%, 5/01/2040 | | | 575,000 | | | | 690,454 | |
| | | | | | | $ | 18,714,728 | |
| Universities - Dormitories - 1.1% | | | | | |
| University of South Carolina, Higher Education Rev., ”A“, 5%, 6/01/2035 (Prerefunded 6/01/2020) | | $ | 2,555,000 | | | $ | 2,571,531 | |
| | |
| Utilities - Cogeneration - 0.2% | | | | | | | | |
| Puerto Rico Industrial, Tourist, Educational, Medical & Environmental Control Facilities Financing Authority Rev. (Cogeneration Facilities - AES Puerto Rico Project), 9.12%, 6/01/2022 | | $ | 535,000 | | | $ | 548,375 | |
| | |
| Utilities - Investor Owned - 0.3% | | | | | | | | |
| Michigan Strategic Fund Ltd. Obligation Rev. (Detroit Edison Co.), 5.625%, 7/01/2020 | | $ | 800,000 | | | $ | 808,312 | |
| | |
| Utilities - Municipal Owned - 3.5% | | | | | | | | |
| Guam Power Authority Rev., ”A“, AGM, 5%, 10/01/2039 | | $ | 145,000 | | | $ | 150,179 | |
| | | | | | | | |
| | | | | | | |
| | |
| Issuer | | Shares/Par | | | Value ($) | |
| Utilities - Municipal Owned - continued | | | | | |
| Guam Power Authority Rev., ”A“, AGM, 5%, 10/01/2044 | | $ | 170,000 | | | $ | 175,156 | |
| Piedmont, SC, Municipal Power Agency, FGIC, 6.25%, 1/01/2021 | | | 2,700,000 | | | | 2,801,898 | |
| Piedmont, SC, Municipal Power Agency, ”C“, AGM, 5%, 1/01/2030 | | | 1,000,000 | | | | 1,041,770 | |
| Puerto Rico Electric Power Authority Rev., ”A“, 5%, 7/01/2029 (a)(d) | | | 525,000 | | | | 371,437 | |
| Puerto Rico Electric Power Authority Rev., ”A“, 5%, 7/01/2042 (a)(d) | | | 80,000 | | | | 56,600 | |
| Puerto Rico Electric Power Authority Rev., ”AAA“, 5.25%, 7/01/2021 (a)(d) | | | 40,000 | | | | 28,400 | |
| Puerto Rico Electric Power Authority Rev., ”AAA“, 5.25%, 7/01/2030 (a)(d) | | | 20,000 | | | | 14,200 | |
| Puerto Rico Electric Power Authority Rev., ”CCC“, 5.25%, 7/01/2027 (a)(d) | | | 190,000 | | | | 134,900 | |
| Puerto Rico Electric Power Authority Rev., ”DDD“, 5%, 7/01/2020 (a)(d) | | | 20,000 | | | | 14,150 | |
| Puerto Rico Electric Power Authority Rev., ”DDD“, 5%, 7/01/2021 (a)(d) | | | 205,000 | | | | 145,038 | |
| Puerto Rico Electric Power Authority Rev., ”DDD“, 5%, 7/01/2022 (a)(d) | | | 330,000 | | | | 233,475 | |
| Puerto Rico Electric Power Authority Rev., ”EEE“, 6.05%, 7/01/2032 (a)(d) | | | 115,000 | | | | 81,794 | |
| Puerto Rico Electric Power Authority Rev., ”TT“, 5%, 7/01/2021 (a)(d) | | | 100,000 | | | | 70,750 | |
| Puerto Rico Electric Power Authority Rev., ”TT“, 5%, 7/01/2023 (a)(d) | | | 90,000 | | | | 63,675 | |
| Puerto Rico Electric Power Authority Rev., ”TT“, 5%, 7/01/2027 (a)(d) | | | 15,000 | | | | 10,613 | |
| Puerto Rico Electric Power Authority Rev., ”TT“, 5%, 7/01/2037 (a)(d) | | | 270,000 | | | | 191,025 | |
| Puerto Rico Electric Power Authority Rev., ”V“, NATL, 5.25%, 7/01/2033 | | | 115,000 | | | | 116,386 | |
| Puerto Rico Electric Power Authority Rev., ”VV“, NATL, 5.25%, 7/01/2032 | | | 245,000 | | | | 248,915 | |
| Puerto Rico Electric Power Authority Rev., ”VV“, NATL, 5.25%, 7/01/2034 | | | 25,000 | | | | 25,191 | |
| Puerto Rico Electric Power Authority Rev., ”WW“, 5.375%, 7/01/2022 (a)(d) | | | 15,000 | | | | 10,669 | |
| Puerto Rico Electric Power Authority Rev., ”WW“, 5.25%, 7/01/2025 (a)(d) | | | 40,000 | | | | 28,400 | |
| Puerto Rico Electric Power Authority Rev., ”ZZ“, 5%, 7/01/2018 (a)(d) | | | 120,000 | | | | 83,550 | |
| Puerto Rico Electric Power Authority Rev., ”ZZ“, 5.25%, 7/01/2023 (a)(d) | | | 140,000 | | | | 99,400 | |
| Puerto Rico Electric Power Authority Rev., ”ZZ“, 5.25%, 7/01/2024 (a)(d) | | | 45,000 | | | | 31,950 | |
| Puerto Rico Electric Power Authority Rev., ”ZZ“, 5.25%, 7/01/2026 (a)(d) | | | 145,000 | | | | 102,950 | |
| Rock Hill, SC, Combined Utility System Rev., ”A“, 4%, 1/01/2049 | | | 650,000 | | | | 723,053 | |
| Rock Hill, SC, Utility Systems Rev., 5%, 1/01/2041 | | | 1,000,000 | | | | 1,155,040 | |
| | | | | | | $ | 8,210,564 | |
61
Portfolio of Investments – continued
| | | | | | | | |
| Municipal Bonds - continued | | | | | | |
| | | | | | | | |
| | |
| Issuer | | Shares/Par | | | Value ($) | |
| Utilities - Other - 1.1% | | | | | | | | |
| Nebraska Central Plains Energy Project, Gas Project Rev., ”3“, 5%, 9/01/2042 | | $ | 790,000 | | | $ | 846,532 | |
| Public Authority for Colorado Energy Natural Gas Purchase Rev., 6.25%, 11/15/2028 | | | 130,000 | | | | 154,794 | |
| Tennessee Energy Acquisition Corp., Gas Rev., ”A“, 5.25%, 9/01/2021 | | | 270,000 | | | | 278,405 | |
| Tennessee Energy Acquisition Corp., Gas Rev., ”A“, 5.25%, 9/01/2022 | | | 290,000 | | | | 304,958 | |
| Tennessee Energy Acquisition Corp., Gas Rev., ”A“, 5.25%, 9/01/2026 | | | 570,000 | | | | 637,990 | |
| Tennessee Energy Acquisition Corp., Gas Rev., ”C“, 5%, 2/01/2021 | | | 330,000 | | | | 336,072 | |
| | | | | | | $ | 2,558,751 | |
| Water & Sewer Utility Revenue - 14.4% | | | | | |
| Charleston, SC, Waterworks & Sewer System Rev., Capital Improvement, 5%, 1/01/2035 (Prerefunded 1/01/2021) | | $ | 1,000,000 | | | $ | 1,029,540 | |
| Columbia, SC, Stormwater System Rev. (City Improvements), 5%, 2/01/2038 | | | 755,000 | | | | 924,875 | |
| Columbia, SC, Waterworks & Sewer System Rev., 4%, 2/01/2043 | | | 2,000,000 | | | | 2,231,620 | |
| Columbia, SC, Waterworks & Sewer System Rev., ”A“, 5%, 2/01/2025 (Prerefunded 2/01/2021) | | | 580,000 | | | | 599,036 | |
| Columbia, SC, Waterworks & Sewer System Rev., ”A“, 5%, 2/01/2036 | | | 3,000,000 | | | | 3,098,460 | |
| Columbia, SC, Waterworks & Sewer System Rev., ”A“, 4%, 2/01/2044 | | | 3,990,000 | | | | 4,494,017 | |
| Commonwealth of Puerto Rico Aqueduct & Sewer Authority Rev., ”A“, ASSD GTY, 5%, 7/01/2028 | | | 35,000 | | | | 35,015 | |
| Guam Waterworks Authority Rev. (Water and Wastewater System), 5%, 7/01/2036 | | | 90,000 | | | | 91,041 | |
| Guam Waterworks Authority Rev. (Water and Wastewater System), 5.625%, 7/01/2040 (Prerefunded 7/01/2020) | | | 315,000 | | | | 318,440 | |
| Guam Waterworks Authority Rev. (Water and Wastewater System), 5%, 1/01/2046 | | | 410,000 | | | | 405,888 | |
| Kershaw County, SC, Waterworks System Rev. (Lugoff Water District), ”B“, 5%, 7/01/2030 | | | 500,000 | | | | 594,335 | |
| Kershaw County, SC, Waterworks System Rev. (Lugoff Water District), ”B“, 5%, 7/01/2035 | | | 500,000 | | | | 588,055 | |
| Lexington County, SC, Joint Municipal Water & Sewer Commission and Improvement Refunding Rev., ”A“, 4%, 6/01/2040 | | | 1,235,000 | | | | 1,418,286 | |
| Lexington County, SC, Joint Municipal Water & Sewer Commission and Improvement Refunding Rev., ”A“, 4%, 6/01/2043 | | | 1,260,000 | | | | 1,427,215 | |
| Lexington, SC, Waterworks & Sewer Systems Rev., 4%, 6/01/2041 | | | 2,000,000 | | | | 2,254,540 | |
| Michigan Finance Authority Local Government Loan Program Rev. (Detroit Water and Sewerage Department Sewage Disposal System Rev. Refunding Second Lien Local Project),”C-7“, NATL, 5%, 7/01/2032 | | | 50,000 | | | | 56,334 | |
| | | | | | | | |
| | | | | | | |
| | |
| Issuer | | Shares/Par | | | Value ($) | |
| Water & Sewer Utility Revenue - continued | | | | | |
| Michigan Finance Authority Local Government Loan Program Rev. (Detroit Water and Sewerage Department Water Supply System Rev. Refunding Second Lien Local Project),”D-6“, NATL, 5%, 7/01/2036 | | $ | 60,000 | | | $ | 67,288 | |
| Michigan Finance Authority Local Government Loan Program Rev. (Detroit Water and Sewerage Department Water Supply System Rev. Refunding Senior Lien Local Project),”D-1“, AGM, 5%, 7/01/2035 | | | 30,000 | | | | 33,827 | |
| Michigan Finance Authority Local Government Loan Program Rev. (Detroit Water and Sewerage Department Water Supply System Rev. Refunding Senior Lien Local Project),”D-1“, AGM, 5%, 7/01/2037 | | | 70,000 | | | | 78,625 | |
| Mount Pleasant, SC, Waterworks & Sewer System Rev., ”A“, 5%, 6/01/2036 | | | 1,000,000 | | | | 1,211,960 | |
| Mount Pleasant, SC, Waterworks & Sewer System Rev., ”A“, 5%, 6/01/2037 | | | 1,000,000 | | | | 1,209,060 | |
| North Charleston, SC, Sewer District, 5%, 7/01/2039 | | | 3,425,000 | | | | 3,857,817 | |
| Spartanburg, SC, Sanitary Sewer District Convertible Rev., ”B“, 5%, 3/01/2033 | | | 1,000,000 | | | | 1,097,090 | |
| Spartanburg, SC, Sanitary Sewer District Convertible Rev., ”B“, 5%, 3/01/2034 | | | 2,000,000 | | | | 2,298,280 | |
| Spartanburg, SC, Water System Refunding & Improvement Rev., ”B“, 5%, 6/01/2039 | | | 4,000,000 | | | | 4,800,680 | |
| | | | | | | $ | 34,221,324 | |
Total Municipal Bonds
(Identified Cost, $222,892,447) | | | | | | $ | 228,140,471 | |
| | |
| Bonds - 0.1% | | | | | | | | |
| Consumer Services - 0.1% | | | | | |
| Toll Road Investors Partnership II LP, Capital Appreciation, NATL, 0%, 2/15/2043 (n) (Identified Cost, $248,280) | | $ | 800,000 | | | $ | 292,796 | |
| | |
| Investment Companies (h) - 2.1% | | | | | | | | |
| Money Market Funds - 2.1% | | | | | |
| MFS Institutional Money Market Portfolio, 1.28% (v) (Identified Cost, $4,915,050) | | | 4,913,213 | | | $ | 4,914,196 | |
| | |
| Other Assets, Less Liabilities - 1.7% | | | | | | | 3,991,621 | |
| Net Assets - 100.0% | | | | | | $ | 237,339,084 | |
See Portfolio Footnotes and Notes to Financial Statements
62
PORTFOLIO OF INVESTMENTS
3/31/20
MFS TENNESSEE MUNICIPAL BOND FUND
The Portfolio of Investments is a complete list of all securities owned by your fund. It is categorized by broad-based asset classes.
| | | | | | | | |
| Municipal Bonds - 97.1% | | | | | | |
| | | | | | | | |
| | |
| Issuer | | Shares/Par | | | Value ($) | |
| Airport Revenue - 6.9% | | | | | | | | |
| Memphis-Shelby County, TN, Airport Authority Facilities Rev., 5%, 7/01/2037 | | $ | 1,000,000 | | | $ | 1,159,160 | |
| Memphis-Shelby County, TN, Airport Authority Facilities Rev., ”A“, ASSD GTY, 5%, 7/01/2039 | | | 1,000,000 | | | | 1,007,640 | |
| Memphis-Shelby County, TN, Airport Authority Facilities Rev., ”D“, 5%, 7/01/2025 | | | 1,000,000 | | | | 1,039,920 | |
| Metropolitan Government of Nashville, TN, Airport Authority Improvement Rev., ”B“, 5%, 7/01/2035 | | | 1,100,000 | | | | 1,226,478 | |
| Metropolitan Nashville Airport Authority, TN, Airport Rev., ”B“, 5%, 7/01/2049 | | | 1,000,000 | | | | 1,173,580 | |
| Metropolitan Nashville Airport Authority, TN, Airport Rev., ”B“, 5%, 7/01/2054 | | | 1,000,000 | | | | 1,168,090 | |
| | | | | | | $ | 6,774,868 | |
| General Obligations - General Purpose - 12.8% | |
| Bedford County, TN, General Obligation Refunding Rev., BAM, 5%, 4/01/2023 | | $ | 1,190,000 | | | $ | 1,321,590 | |
| Bridgeview, IL, Stadium and Redevelopment Projects, AAC, 5.14%, 12/01/2036 | | | 245,000 | | | | 226,174 | |
| Chicago, IL, ”A“, 5%, 1/01/2025 | | | 145,000 | | | | 148,766 | |
| Chicago, IL, ”A“, 5.25%, 1/01/2033 | | | 175,000 | | | | 178,652 | |
| Chicago, IL, General Obligation (Neighborhood Alive 21 Program), ”B“, 5.5%, 1/01/2037 | | | 45,000 | | | | 46,537 | |
| Chicago, IL, General Obligation Refunding Project, ”A“, 5.25%, 1/01/2030 | | | 30,000 | | | | 30,727 | |
| Chicago, IL, General Obligation, ”A“, 5%, 1/01/2026 | | | 40,000 | | | | 41,199 | |
| Chicago, IL, General Obligation, ”A“, 5%, 1/01/2027 | | | 45,000 | | | | 46,505 | |
| Commonwealth of Puerto Rico, General Obligation, ”A“, 8%, 7/01/2035 (a)(d) | | | 1,045,000 | | | | 627,000 | |
| Commonwealth of Puerto Rico, Public Improvement, ”A“, NATL, 5.5%, 7/01/2020 | | | 195,000 | | | | 195,893 | |
| Commonwealth of Puerto Rico, Public Improvement,”A-4“, AGM, 5%, 7/01/2031 | | | 90,000 | | | | 90,308 | |
| Franklin, TN, ”C“, 5%, 6/01/2029 | | | 500,000 | | | | 656,365 | |
| Jackson, TN, 5%, 6/01/2031 | | | 1,000,000 | | | | 1,277,420 | |
| Memphis, TN, General Improvement, 4%, 6/01/2041 | | | 1,000,000 | | | | 1,098,230 | |
| Memphis, TN, General Improvement, ”B“, 5%, 4/01/2031 | | | 1,000,000 | | | | 1,136,320 | |
| Memphis, TN, General Improvement, ”B“, 5%, 4/01/2034 | | | 1,025,000 | | | | 1,161,315 | |
| Metropolitan Government of Nashville & Davidson County, TN, 5%, 7/01/2021 | | | 1,500,000 | | | | 1,514,520 | |
| Pigeon Forge, TN, Industrial Development Board, Public Facilities, 5%, 6/01/2034 | | | 1,000,000 | | | | 1,038,610 | |
| Puerto Rico Public Buildings Authority Rev.,”M-2“, AAC, 10%, 7/01/2035 | | | 190,000 | | | | 206,306 | |
| State of Tennessee, ”A“, 5%, 10/01/2029 (Prerefunded 10/01/2021) | | | 1,500,000 | | | | 1,587,330 | |
| | | | | | | $ | 12,629,767 | |
| | | | | | | | |
| | | | | | | |
| | |
| Issuer | | Shares/Par | | | Value ($) | |
| General Obligations - Schools - 2.7% | |
| Berks County, PA, Reading School District, AGM, 5%, 3/01/2036 | | $ | 25,000 | | | $ | 29,644 | |
| Williamson County, TN, School District, 5%, 4/01/2026 | | | 740,000 | | | | 900,143 | |
| Wilson County, TN, Tenth Special School District, Limited Obligation, 4%, 4/01/2037 | | | 460,000 | | | | 531,346 | |
| Wilson County, TN, Tenth Special School District, Limited Obligation, 4%, 4/01/2038 | | | 460,000 | | | | 529,143 | |
| Wilson County, TN, Tenth Special School District, Limited Obligation, 4%, 4/01/2039 | | | 605,000 | | | | 694,195 | |
| | | | | | | $ | 2,684,471 | |
| Healthcare Revenue - Hospitals - 18.3% | |
| Chattanooga, TN, Health, Educational & Housing Facility Board Rev. (Catholic Health Initiatives), ”A“, 5%, 10/01/2044 | | $ | 1,000,000 | | | $ | 1,053,330 | |
| Chattanooga, TN, Health, Educational & Housing Facility Board Rev. (Catholic Health Initiatives), ”A“, 5.25%, 1/01/2045 | | | 500,000 | | | | 552,975 | |
| Chattanooga, TN, Health, Educational & Housing Facility Board Rev. (CommonSpirit Health),”A-2“, 5%, 8/01/2044 | | | 500,000 | | | | 538,280 | |
| Chattanooga, TN, Health, Educational & Housing Facility Board Rev. (CommonSpirit Health),”A-2“, 5%, 8/01/2049 | | | 1,000,000 | | | | 1,061,240 | |
| DeKalb County, GA, Hospital Authority Rev. (DeKalb Medical Center, Inc. Project), 6.125%, 9/01/2040 (Prerefunded 9/01/2020) | | | 295,000 | | | | 300,877 | |
| Doylestown, PA, Hospital Rev., ”A“, 4%, 7/01/2045 | | | 10,000 | | | | 10,486 | |
| Escambia County, FL, Health Facilities Authority Rev. (Baptist Hospital, Inc.), ”A“, 6%, 8/15/2036 | | | 680,000 | | | | 689,357 | |
| Greenville, TN, Health and Educational Facilities Board Hospital Rev. (Ballad Health), ”A“, 4%, 7/01/2040 | | | 1,000,000 | | | | 1,079,760 | |
| Jackson, TN, Hospital Refunding Rev. (Jackson- Madison County General Hospital), 4%, 4/01/2041 | | | 425,000 | | | | 434,325 | |
| Jackson, TN, Hospital Rev. (Jackson-Madison County General Hospital), 5%, 4/01/2028 | | | 1,500,000 | | | | 1,741,935 | |
| Jackson, TN, Hospital Rev. (Jackson-Madison County General Hospital), ”A“, 5%, 4/01/2041 | | | 1,000,000 | | | | 1,154,920 | |
| Kentucky Economic Development Finance Authority Hospital Rev. (Owensboro Medical Health System, Inc.), ”A“, 6.375%, 6/01/2040 (Prerefunded 6/01/2020) | | | 790,000 | | | | 796,612 | |
| Kentucky Economic Development Finance Authority Hospital Rev. (Owensboro Medical Health System, Inc.), ”A“, 6.5%, 3/01/2045 (Prerefunded 6/01/2020) | | | 265,000 | | | | 267,268 | |
63
Portfolio of Investments – continued
| | | | | | | | |
| Municipal Bonds - continued | | | | | | |
| | | | | | | | |
| | |
| Issuer | | Shares/Par | | | Value ($) | |
| Healthcare Revenue - Hospitals - continued | |
| Knox County, TN, Health, Educational & Housing Facility Board Hospital Rev. (Covenant Health), ”A“, 5%, 1/01/2033 | | $ | 1,000,000 | | | $ | 1,185,800 | |
| Knox County, TN, Health, Educational & Housing Facility Board Hospital Rev. (East Tennessee Children’s Hospital), 5%, 11/15/2038 | | | 1,000,000 | | | | 1,207,120 | |
| Knox County, TN, Health, Educational & Housing Facility Board Rev. (University Health Systems, Inc.), 5%, 4/01/2036 | | | 750,000 | | | | 856,575 | |
| Knox County, TN, Health, Educational & Housing Facility Board Rev. (University Health Systems, Inc.), 5%, 9/01/2036 | | | 1,000,000 | | | | 1,137,230 | |
| Metropolitan Government of Nashville & Davidson County, TN, Health & Educational Facilities Board Rev. (Vanderbilt University Medical Center), ”A“, 4%, 7/01/2047 | | | 1,500,000 | | | | 1,539,525 | |
| Miami-Dade County, FL, Health Facilities Authority Hospital Rev., 6%, 8/01/2030 (Prerefunded 8/01/2020) | | | 60,000 | | | | 60,929 | |
| Miami-Dade County, FL, Health Facilities Authority Hospital Rev., Unrefunded Balance, 6%, 8/01/2030 | | | 25,000 | | | | 25,351 | |
| New Jersey Health Care Facilities, Financing Authority Rev. (University Hospital), ”A“, AGM, 5%, 7/01/2046 | | | 100,000 | | | | 105,308 | |
| Shelby County, TN, Health, Educational & Housing Facility Board Rev. (Methodist Healthcare), ”A“, 5%, 5/01/2035 | | | 1,500,000 | | | | 1,798,980 | |
| Spartanburg County, SC, Regional Health Services District Hospital Rev., ”A“, 4%, 4/15/2043 | | | 420,000 | | | | 452,441 | |
| | | | | | | $ | 18,050,624 | |
| Healthcare Revenue - Long Term Care - 1.6% | |
| Metropolitan Government of Nashville & Davidson County, TN, Health & Educational Facilities Board Rev. (Blakeford at Green Hills), 5%, 7/01/2037 | | $ | 1,000,000 | | | $ | 1,013,490 | |
| Shelby County, TN, Health, Educational & Housing Facility Board, Residential Care Facility Mortgage Rev. (Village at Germantown), 5.25%, 12/01/2049 | | | 550,000 | | | | 549,137 | |
| | | | | | | $ | 1,562,627 | |
| Industrial Revenue - Other - 0.5% | |
| Port Beaumont, TX, Navigation District Facility Rev. (Jefferson Gulf Coast Energy Project), ”A“, 4%, 1/01/2050 (n) | | $ | 220,000 | | | $ | 169,809 | |
| Tuscaloosa County, AL, Industrial Development Authority, Gulf Opportunity Zone (Hunt Refining Project), ”A“, 5.25%, 5/01/2044 | | | 310,000 | | | | 298,099 | |
| | | | | | | $ | 467,908 | |
| Miscellaneous Revenue - Other - 3.0% | |
| Metropolitan Government of Nashville & Davidson County, TN, Sports Authority Rev., Public Improvement, ”A“, 5%, 8/01/2023 | | $ | 1,205,000 | | | $ | 1,350,443 | |
| | | | | | | | |
| | | | | | | |
| | |
| Issuer | | Shares/Par | | | Value ($) | |
| Miscellaneous Revenue - Other - continued | | | | | |
| Metropolitan Nashville Airport Authority, Special Facilities Rev. (Aero Nashville LLC Project), 5.2%, 7/01/2026 | | $ | 605,000 | | | $ | 608,231 | |
| New York Liberty Development Corp., Liberty Rev. (7 World Trade Center Project), 5%, 9/15/2040 | | | 980,000 | | | | 1,035,458 | |
| | | | | | | $ | 2,994,132 | |
| Sales & Excise Tax Revenue - 3.4% | |
| Colorado Regional Transportation District, Private Activity Rev. (Denver Transportation Partners), 6.5%, 1/15/2030 | | $ | 480,000 | | | $ | 483,542 | |
| Guam Government Business Privilege Tax Rev., ”A“, 5.25%, 1/01/2036 | | | 300,000 | | | | 301,956 | |
| Guam Government Business Privilege Tax Rev., ”D“, 5%, 11/15/2031 | | | 270,000 | | | | 270,888 | |
| Illinois Sales Tax Securitization Corp., Second Lien, ”A“, 5%, 1/01/2026 | | | 40,000 | | | | 44,721 | |
| Illinois Sales Tax Securitization Corp., Second Lien, ”A“, 5%, 1/01/2027 | | | 80,000 | | | | 90,834 | |
| Illinois Sales Tax Securitization Corp., Second Lien, ”A“, 5%, 1/01/2029 | | | 100,000 | | | | 116,643 | |
| Illinois Sales Tax Securitization Corp., Second Lien, ”A“, 5%, 1/01/2030 | | | 35,000 | | | | 41,303 | |
| Illinois Sales Tax Securitization Corp., Second Lien, ”A“, 5%, 1/01/2036 | | | 25,000 | | | | 29,030 | |
| Illinois Sales Tax Securitization Corp., Second Lien, ”A“, 5%, 1/01/2037 | | | 50,000 | | | | 57,905 | |
| Illinois Sales Tax Securitization Corp., Second Lien, ”A“, 4%, 1/01/2040 | | | 50,000 | | | | 51,307 | |
| Puerto Rico Sales Tax Financing Corp., Restructured Sales Tax Rev.,”2019A-1“, 4.55%, 7/01/2040 | | | 23,000 | | | | 21,773 | |
| Puerto Rico Sales Tax Financing Corp., Restructured Sales Tax Rev.,”2019A-1“, 5%, 7/01/2058 | | | 658,000 | | | | 639,872 | |
| Puerto Rico Sales Tax Financing Corp., Restructured Sales Tax Rev.,”2019A-2“, 4.329%, 7/01/2040 | | | 226,000 | | | | 207,601 | |
| Puerto Rico Sales Tax Financing Corp., Restructured Sales Tax Rev.,”2019A-2“, 4.329%, 7/01/2040 | | | 76,000 | | | | 69,813 | |
| Puerto Rico Sales Tax Financing Corp., Restructured Sales Tax Rev.,”2019A-2“, 4.536%, 7/01/2053 | | | 1,000 | | | | 908 | |
| Puerto Rico Sales Tax Financing Corp., Restructured Sales Tax Rev.,”2019A-2“, 4.784%, 7/01/2058 | | | 39,000 | | | | 36,524 | |
| Puerto Rico Sales Tax Financing Corp., Restructured Sales Tax Rev., Capital Appreciation,”2019A-1“, 0%, 7/01/2024 | | | 3,000 | | | | 2,569 | |
| Puerto Rico Sales Tax Financing Corp., Restructured Sales Tax Rev., Capital Appreciation,”2019A-1“, 0%, 7/01/2027 | | | 41,000 | | | | 31,218 | |
| Puerto Rico Sales Tax Financing Corp., Restructured Sales Tax Rev., Capital Appreciation,”2019A-1“, 0%, 7/01/2029 | | | 7,000 | | | | 4,844 | |
64
Portfolio of Investments – continued
| | | | | | | | |
| Municipal Bonds - continued | | | | | | |
| | | | | | | | |
| | |
| Issuer | | Shares/Par | | | Value ($) | |
| Sales & Excise Tax Revenue - continued | |
| Puerto Rico Sales Tax Financing Corp., Restructured Sales Tax Rev., Capital Appreciation,”2019A-1“, 0%, 7/01/2031 | | $ | 380,000 | | | $ | 236,314 | |
| Puerto Rico Sales Tax Financing Corp., Restructured Sales Tax Rev., Capital Appreciation,”2019A-1“, 0%, 7/01/2033 | | | 363,000 | | | | 200,862 | |
| Puerto Rico Sales Tax Financing Corp., Restructured Sales Tax Rev., Capital Appreciation,”2019A-1“, 0%, 7/01/2046 | | | 1,787,000 | | | | 422,483 | |
| | | | | | | $ | 3,362,910 | |
| Secondary Schools - 0.4% | |
| District of Columbia Rev. (Rocketship D.C.), ”A“, 5%, 6/01/2049 | | $ | 250,000 | | | $ | 237,487 | |
| North Texas Education Finance Corp., Education Rev. (Uplift Education), ”A“, 5.125%, 12/01/2042 | | | 130,000 | | | | 140,139 | |
| | | | | | | $ | 377,626 | |
| Single Family Housing - State - 6.5% | |
| Connecticut Housing Finance Authority Rev. (Housing Mortgage Finance Program),”D-1“, GNMA, 4%, 11/15/2047 | | $ | 470,000 | | | $ | 496,959 | |
| Iowa Finance Authority, Single Family Mortgage Rev., ”A“, GNMA, 4%, 7/01/2047 | | | 500,000 | | | | 528,270 | |
| Tennessee Housing Development Agency, Residential Finance Program Rev., ”1“, 3.75%, 7/01/2039 | | | 1,500,000 | | | | 1,646,085 | |
| Tennessee Housing Development Agency, Residential Finance Program Rev., ”1A“, 2.4%, 1/01/2044 | | | 1,250,000 | | | | 1,153,312 | |
| Tennessee Housing Development Agency, Residential Finance Program Rev., ”3“, 3.85%, 7/01/2043 | | | 990,000 | | | | 1,065,646 | |
| Tennessee Housing Development Agency, Residential Finance Program Rev., ”3“, 3.75%, 1/01/2050 | | | 1,000,000 | | | | 1,084,330 | |
| Tennessee Housing Development Agency, Residential Finance Program Rev., ”4“, 2.9%, 7/01/2039 | | | 225,000 | | | | 232,227 | |
| Tennessee Housing Development Agency, Residential Finance Program Rev., ”4“, 3.05%, 7/01/2044 | | | 250,000 | | | | 256,463 | |
| | | | | | | $ | 6,463,292 | |
| State & Local Agencies - 6.4% | |
| Chattanooga, TN, Industrial Development Board, Lease Rental Rev. (Southside Redevelopment Corp.), 5%, 10/01/2024 (Prerefunded 10/01/2020) | | $ | 1,000,000 | | | $ | 1,019,390 | |
| Delaware Valley, PA, Regional Finance Authority, ”C“, FLR, 1.809% (LIBOR - 3mo. + 0.75%), 6/01/2037 | | | 795,000 | | | | 719,682 | |
| Maryland Stadium Authority Rev., Baltimore City Public Schools Construction and Revitalization Program, “A”, 5%, 5/01/2047 | | | 385,000 | | | | 455,598 | |
| | | | | | | | |
| | | | | | | |
| | |
| Issuer | | Shares/Par | | | Value ($) | |
| State & Local Agencies - continued | |
| New Jersey Economic Development Authority Rev., School Facilities Construction Rev., ”LLL“, 5%, 6/15/2039 | | $ | 220,000 | | | $ | 233,202 | |
| New Jersey Economic Development Authority Rev., School Facilities Construction Rev., ”LLL“, 5%, 6/15/2044 | | | 365,000 | | | | 382,279 | |
| Orangeburg County, SC, Facilities Corp. Installment Purchase Rev. (Detention Center Project), 4%, 12/01/2042 | | | 335,000 | | | | 365,019 | |
| Pennsylvania Public School Building Authority, School Lease Rev. (School District of Philadelphia Project), ”A“, AGM, 5%, 6/01/2033 | | | 665,000 | | | | 780,344 | |
| Tennessee School Board Authority, Higher Education Facilities Second Program, ”A“, 5%, 11/01/2043 | | | 1,000,000 | | | | 1,079,430 | |
| Tennessee School Board Authority, Higher Education Facilities Second Program, ”A“, 5%, 11/01/2045 | | | 1,000,000 | | | | 1,244,180 | |
| | | | | | | $ | 6,279,124 | |
| Student Loan Revenue - 0.2% | |
| Iowa Student Loan Liquidity Corp. Rev., ”B“, 3%, 12/01/2039 | | $ | 45,000 | | | $ | 44,317 | |
| Iowa Student Loan Liquidity Corp. Rev., ”B“, 3.5%, 12/01/2044 | | | 115,000 | | | | 112,831 | |
| | | | | | | $ | 157,148 | |
| Tax - Other - 2.8% | | | | | | | | |
| Birmingham-Jefferson, AL, Civic Center Authority, “B”, 5%, 7/01/2043 | | $ | 495,000 | | | $ | 593,530 | |
| Guam Government Ltd. Obligation Rev., ”A“, 5%, 12/01/2035 | | | 105,000 | | | | 104,344 | |
| Guam Government Ltd. Obligation Rev., ”A“, 5%, 12/01/2036 | | | 60,000 | | | | 59,413 | |
| Guam Government Ltd. Obligation Rev., ”A“, 5%, 12/01/2046 | | | 175,000 | | | | 165,952 | |
| Memphis-Shelby County, TN, Economic Development Growth Engine Industrial Development Board, Senior Tax Rev. (Graceland Project), ”A“, 4.75%, 7/01/2027 | | | 400,000 | | | | 397,460 | |
| Memphis-Shelby County, TN, Economic Development Growth Engine Industrial Development Board, Senior Tax Rev. (Graceland Project), ”A“, 5.5%, 7/01/2037 | | | 100,000 | | | | 100,763 | |
| Puerto Rico Convention Center District Authority, Hotel Occupancy Tax Rev., ”A“, AAC, 5%, 7/01/2031 | | | 230,000 | | | | 230,030 | |
| Puerto Rico Infrastructure Financing Authority Special Tax Rev., ”C“, AAC, 5.5%, 7/01/2024 | | | 260,000 | | | | 274,123 | |
| Puerto Rico Infrastructure Financing Authority Special Tax Rev., ”C“, AAC, 5.5%, 7/01/2025 | | | 25,000 | | | | 26,540 | |
| Puerto Rico Infrastructure Financing Authority Special Tax Rev., ”C“, AAC, 5.5%, 7/01/2026 | | | 415,000 | | | | 442,485 | |
| Puerto Rico Infrastructure Financing Authority Special Tax Rev., ”C“, AAC, 5.5%, 7/01/2027 | | | 380,000 | | | | 406,178 | |
| | | | | | | $ | 2,800,818 | |
65
Portfolio of Investments – continued
| | | | | | | | |
| Municipal Bonds - continued | | | | | | |
| | | | | | | | |
| | |
| Issuer | | Shares/Par | | | Value ($) | |
| Tax Assessment - 0.5% | |
| Nashville, TN, Metropolitan Development and Housing Agency Rev. (Fifth + Broadway Development), 5.125%, 6/01/2036 | | $ | 500,000 | | | $ | 509,485 | |
| | |
| Tobacco - 1.3% | | | | | | | | |
| Buckeye, OH, Tobacco Settlement Financing Authority Senior Asset-Backed Refunding,2020A-2, ”1“, 5%, 6/01/2032 | | $ | 70,000 | | | $ | 86,971 | |
| Buckeye, OH, Tobacco Settlement Financing Authority Senior Asset-Backed Refunding,2020A-2, ”1“, 4%, 6/01/2037 | | | 35,000 | | | | 38,468 | |
| Buckeye, OH, Tobacco Settlement Financing Authority Senior Asset-Backed Refunding,2020B-2, ”2“, 5%, 6/01/2055 | | | 570,000 | | | | 505,031 | |
| Illinois Railsplitter Tobacco Settlement Authority Rev., 6%, 6/01/2028 (Prerefunded 6/01/2021) | | | 200,000 | | | | 211,130 | |
| Virgin Islands Tobacco Settlement Financing Corp., 5%, 5/15/2031 | | | 420,000 | | | | 420,546 | |
| | | | | | | $ | 1,262,146 | |
| Toll Roads - 0.5% | | | | | | | | |
| Virginia Small Business Financing Authority Rev. (Elizabeth River Crossings Opco LLC Project), 6%, 1/01/2037 | | $ | 165,000 | | | $ | 169,935 | |
| Virginia Small Business Financing Authority Rev. (Elizabeth River Crossings Opco LLC Project), 5.5%, 1/01/2042 | | | 320,000 | | | | 324,691 | |
| | | | | | | $ | 494,626 | |
| Transportation - Special Tax - 3.9% | |
| Commonwealth of Puerto Rico Highway & Transportation Authority Rev., ”CC“, AGM, 5.5%, 7/01/2028 | | $ | 745,000 | | | $ | 808,109 | |
| Commonwealth of Puerto Rico Highway & Transportation Authority Rev., ”CC“, AGM, 5.25%, 7/01/2036 | | | 280,000 | | | | 294,784 | |
| Commonwealth of Puerto Rico Highway & Transportation Authority Rev., ”J“, NATL, 5%, 7/01/2029 | | | 15,000 | | | | 15,000 | |
| Commonwealth of Puerto Rico Highway & Transportation Authority Rev., ”L“, AAC, 5.25%, 7/01/2038 | | | 765,000 | | | | 776,322 | |
| Commonwealth of Puerto Rico Highway & Transportation Authority Rev., ”L“, NATL, 5.25%, 7/01/2035 | | | 270,000 | | | | 270,726 | |
| Commonwealth of Puerto Rico Highway & Transportation Authority Rev., ”N“, AAC, 5.5%, 7/01/2029 | | | 665,000 | | | | 711,749 | |
| Commonwealth of Puerto Rico Highway & Transportation Authority Rev., ”N“, AAC, 5.25%, 7/01/2031 | | | 45,000 | | | | 47,064 | |
| Commonwealth of Puerto Rico Highway & Transportation Authority Rev., ”N“, NATL, 5.25%, 7/01/2032 | | | 70,000 | | | | 71,119 | |
| Commonwealth of Puerto Rico Highway & Transportation Authority Rev., ”N“, NATL, 5.25%, 7/01/2033 | | | 90,000 | | | | 91,085 | |
| | | | | | | | |
| | | | | | | |
| | |
| Issuer | | Shares/Par | | | Value ($) | |
| Transportation - Special Tax - continued | |
| New Jersey Transportation Trust Fund Authority, Federal Highway Reimbursement Rev.,”A-1“, 5%, 6/15/2027 | | $ | 200,000 | | | $ | 223,344 | |
| New Jersey Transportation Trust Fund Authority, Transportation System, ”BB“, 5%, 6/15/2044 | | | 530,000 | | | | 552,965 | |
| | | | | | | $ | 3,862,267 | |
| Universities - Colleges - 8.5% | | | | | | | | |
| Claiborne County, TN, Industrial Development Board Rev. (Lincoln Memorial University Project), 6.625%, 10/01/2039 | | $ | 500,000 | | | $ | 501,120 | |
| Claiborne County, TN, Industrial Development Board Rev. (Lincoln Memorial University Project), 6.125%, 10/01/2040 | | | 250,000 | | | | 252,663 | |
| Franklin County, TN, Health & Educational Facilities Board Rev. (University of the South), 5%, 9/01/2030 | | | 375,000 | | | | 405,836 | |
| Metropolitan Government of Nashville & Davidson County, TN, Health & Educational Facilities Board Rev. (Lipscomb University Project), ”A“, 5%, 10/01/2041 | | | 1,000,000 | | | | 1,079,760 | |
| Metropolitan Government of Nashville & Davidson County, TN, Health & Educational Facilities Board Rev. (Lipscomb University Project), ”A“, 4%, 10/01/2049 | | | 1,000,000 | | | | 954,560 | |
| Metropolitan Government of Nashville & Davidson County, TN, Health & Educational Facilities Board Rev., Refunding & Improvement (Trevecca Nazarene University Project), 5%, 10/01/2039 | | | 200,000 | | | | 213,852 | |
| Metropolitan Government of Nashville & Davidson County, TN, Health & Educational Facilities Board Rev., Refunding & Improvement (Trevecca Nazarene University Project), 5%, 10/01/2048 | | | 1,800,000 | | | | 1,897,056 | |
| Pinellas County, FL, Educational Facilities Authority Rev. (Barry University), 6%, 10/01/2041 | | | 120,000 | | | | 124,034 | |
| Puerto Rico Industrial, Tourist, Educational, Medical & Environmental Control Facilities Financing Authority, Higher Education Rev. (Ana G. Mendez University System Project), 5.375%, 12/01/2021 | | | 10,000 | | | | 9,907 | |
| Shelby County, TN, Health, Educational & Housing Facility Board, Educational Facilities Rev. (Rhodes College), 4%, 8/01/2035 | | | 605,000 | | | | 688,442 | |
| Shelby County, TN, Health, Educational & Housing Facility Board, Educational Facilities Rev. (Rhodes College), 4%, 8/01/2040 | | | 1,120,000 | | | | 1,253,370 | |
| Shelby County, TN, Health, Educational & Housing Facility Board, Educational Facilities Rev. (Rhodes College), 5.5%, 8/01/2040 (Prerefunded 8/01/2021) | | | 1,000,000 | | | | 1,056,300 | |
| University of Puerto Rico Rev., ”P“, NATL, 5%, 6/01/2025 | | | 15,000 | | | | 15,004 | |
| | | | | | | $ | 8,451,904 | |
66
Portfolio of Investments – continued
| | | | | | | | |
| Municipal Bonds - continued | | | | | | |
| | | | | | | | |
| | |
| Issuer | | Shares/Par | | | Value ($) | |
| Universities - Dormitories - 0.5% | |
| Chattanooga, TN, Health, Educational & Housing Facility Board Rev. (CDFI Phase I LLC, University of Tennessee at Chattanooga), 5%, 10/01/2035 | | $ | 500,000 | | | $ | 532,585 | |
| | |
| Utilities - Cogeneration - 0.2% | | | | | | | | |
| Puerto Rico Industrial, Tourist, Educational, Medical & Environmental Control Facilities Financing Authority Rev. (Cogeneration Facilities - AES Puerto Rico Project), 9.12%, 6/01/2022 | | $ | 225,000 | | | $ | 230,625 | |
| | |
| Utilities - Municipal Owned - 5.6% | | | | | | | | |
| Clarksville, TN, Electric System Rev., ”A“, 5%, 9/01/2034 (Prerefunded 9/01/2020) | | $ | 1,250,000 | | | $ | 1,268,325 | |
| Guam Power Authority Rev., ”A“, 5.5%, 10/01/2030 (Prerefunded 10/01/2020) | | | 300,000 | | | | 306,483 | |
| Guam Power Authority Rev., ”A“, 5.5%, 10/01/2040 (Prerefunded 10/01/2020) | | | 470,000 | | | | 480,157 | |
| Memphis, TN, Electric Systems Rev., 5%, 12/01/2034 | | | 1,000,000 | | | | 1,153,570 | |
| Metropolitan Government of Nashville & Davidson County, TN, Electric System Rev., ”A“, 5%, 5/15/2037 | | | 1,000,000 | | | | 1,212,470 | |
| Puerto Rico Electric Power Authority Rev., ”A“, 5%, 7/01/2029 (a)(d) | | | 260,000 | | | | 183,950 | |
| Puerto Rico Electric Power Authority Rev., ”A“, 5%, 7/01/2042 (a)(d) | | | 40,000 | | | | 28,300 | |
| Puerto Rico Electric Power Authority Rev., ”AAA“, 5.25%, 7/01/2021 (a)(d) | | | 20,000 | | | | 14,200 | |
| Puerto Rico Electric Power Authority Rev., ”AAA“, 5.25%, 7/01/2030 (a)(d) | | | 10,000 | | | | 7,100 | |
| Puerto Rico Electric Power Authority Rev., ”CCC“, 5.25%, 7/01/2027 (a)(d) | | | 90,000 | | | | 63,900 | |
| Puerto Rico Electric Power Authority Rev., ”DDD“, 5%, 7/01/2020 (a)(d) | | | 10,000 | | | | 7,075 | |
| Puerto Rico Electric Power Authority Rev., ”DDD“, 5%, 7/01/2021 (a)(d) | | | 100,000 | | | | 70,750 | |
| Puerto Rico Electric Power Authority Rev., ”DDD“, 5%, 7/01/2022 (a)(d) | | | 165,000 | | | | 116,738 | |
| Puerto Rico Electric Power Authority Rev., ”EEE“, 6.05%, 7/01/2032 (a)(d) | | | 50,000 | | | | 35,563 | |
| Puerto Rico Electric Power Authority Rev., ”TT“, 5%, 7/01/2021 (a)(d) | | | 40,000 | | | | 28,300 | |
| Puerto Rico Electric Power Authority Rev., ”TT“, 5%, 7/01/2023 (a)(d) | | | 40,000 | | | | 28,300 | |
| Puerto Rico Electric Power Authority Rev., ”TT“, 5%, 7/01/2027 (a)(d) | | | 10,000 | | | | 7,075 | |
| Puerto Rico Electric Power Authority Rev., ”TT“, 5%, 7/01/2037 (a)(d) | | | 130,000 | | | | 91,975 | |
| Puerto Rico Electric Power Authority Rev., ”V“, NATL, 5.25%, 7/01/2033 | | | 65,000 | | | | 65,783 | |
| Puerto Rico Electric Power Authority Rev., ”VV“, NATL, 5.25%, 7/01/2032 | | | 145,000 | | | | 147,317 | |
| Puerto Rico Electric Power Authority Rev., ”VV“, NATL, 5.25%, 7/01/2034 | | | 10,000 | | | | 10,076 | |
| | | | | | | | |
| | | | | | | |
| | |
| Issuer | | Shares/Par | | | Value ($) | |
| Utilities - Municipal Owned - continued | | | | | | | | |
| Puerto Rico Electric Power Authority Rev., ”WW“, 5.375%, 7/01/2022 (a)(d) | | $ | 10,000 | | | $ | 7,112 | |
| Puerto Rico Electric Power Authority Rev., ”WW“, 5.25%, 7/01/2025 (a)(d) | | | 15,000 | | | | 10,650 | |
| Puerto Rico Electric Power Authority Rev., ”ZZ“, 5%, 7/01/2018 (a)(d) | | | 65,000 | | | | 45,256 | |
| Puerto Rico Electric Power Authority Rev., ”ZZ“, 5.25%, 7/01/2023 (a)(d) | | | 70,000 | | | | 49,700 | |
| Puerto Rico Electric Power Authority Rev., ”ZZ“, 5.25%, 7/01/2024 (a)(d) | | | 20,000 | | | | 14,200 | |
| Puerto Rico Electric Power Authority Rev., ”ZZ“, 5.25%, 7/01/2026 (a)(d) | | | 60,000 | | | | 42,600 | |
| | | | | | | $ | 5,496,925 | |
| Utilities - Other - 1.9% | |
| Central Plains Energy Project, NE, Gas Project Rev. (Project No. 3), ”A“, 5%, 9/01/2036 | | $ | 70,000 | | | $ | 82,944 | |
| Tennessee Energy Acquisition Corp., Gas Rev., ”A“, 5.25%, 9/01/2021 | | | 225,000 | | | | 232,004 | |
| Tennessee Energy Acquisition Corp., Gas Rev., ”A“, 5.25%, 9/01/2022 | | | 115,000 | | | | 120,932 | |
| Tennessee Energy Acquisition Corp., Gas Rev., ”A“, 5.25%, 9/01/2023 | | | 85,000 | | | | 90,884 | |
| Tennessee Energy Acquisition Corp., Gas Rev., ”A“, 5.25%, 9/01/2026 | | | 1,200,000 | | | | 1,343,136 | |
| | | | | | | $ | 1,869,900 | |
| Water & Sewer Utility Revenue - 8.7% | |
| Clarksville, TN, Water, Sewer & Gas Rev., 5%, 2/01/2029 (Prerefunded 2/01/2023) | | $ | 1,000,000 | | | $ | 1,106,610 | |
| Clarksville, TN, Water, Sewer & Gas Rev., 4%, 2/01/2038 | | | 500,000 | | | | 566,540 | |
| Guam Waterworks Authority Rev. (Water and Wastewater System), 5%, 7/01/2036 | | | 65,000 | | | | 65,752 | |
| Guam Waterworks Authority Rev. (Water and Wastewater System), 5%, 7/01/2036 | | | 110,000 | | | | 111,444 | |
| Guam Waterworks Authority Rev. (Water and Wastewater System), 5%, 7/01/2037 | | | 135,000 | | | | 136,439 | |
| Guam Waterworks Authority Rev. (Water and Wastewater System), 5%, 7/01/2040 | | | 380,000 | | | | 381,923 | |
| Guam Waterworks Authority Rev. (Water and Wastewater System), 5%, 1/01/2046 | | | 300,000 | | | | 296,991 | |
| Knox County, TN, Hallsdale-Powell Utility District, Waterworks & Sewer Rev., 4%, 4/01/2035 | | | 1,000,000 | | | | 1,166,980 | |
| Memphis, TN, Storm Water System Rev., 5%, 10/01/2039 | | | 1,410,000 | | | | 1,704,056 | |
| Metropolitan Government of Nashville & Davidson County, TN, Water & Sewer Rev., 5%, 7/01/2032 | | | 2,000,000 | | | | 2,218,020 | |
| Michigan Finance Authority Local Government Loan Program Rev. (Detroit Water and Sewerage Department Sewage Disposal System Rev. Refunding Second Lien Local Project),”C-7“, NATL, 5%, 7/01/2032 | | | 30,000 | | | | 33,801 | |
67
Portfolio of Investments – continued
| | | | | | | | |
| Municipal Bonds - continued | | | | | | |
| | | | | | | | |
| | |
| Issuer | | Shares/Par | | | Value ($) | |
| Water & Sewer Utility Revenue - continued | | | | | |
| Michigan Finance Authority Local Government Loan Program Rev. (Detroit Water and Sewerage Department Water Supply System Rev. Refunding Second Lien Local Project),”D-6“, NATL, 5%, 7/01/2036 | | $ | 35,000 | | | $ | 39,251 | |
| Michigan Finance Authority Local Government Loan Program Rev. (Detroit Water and Sewerage Department Water Supply System Rev. Refunding Senior Lien Local Project),”D-1“, AGM, 5%, 7/01/2035 | | | 20,000 | | | | 22,551 | |
| Michigan Finance Authority Local Government Loan Program Rev. (Detroit Water and Sewerage Department Water Supply System Rev. Refunding Senior Lien Local Project),”D-1“, AGM, 5%, 7/01/2037 | | | 45,000 | | | | 50,544 | |
| Mississippi Development Bank Special Obligation (City of Jackson Water and Sewer System Rev. Bond Project), AGM, 6.875%, 12/01/2040 | | | 65,000 | | | | 76,744 | |
| | | | | | | |
| | | | | | | | |
| | | | | | | |
| | |
| Issuer | | Shares/Par | | | Value ($) | |
| Water & Sewer Utility Revenue - continued | | | | | |
| Wilson County, TN, West Wilson Utility District Waterworks Rev., 5%, 6/01/2030 | | $ | 550,000 | | | $ | 646,030 | |
| | | | | | | $ | 8,623,676 | |
Total Municipal Bonds
(Identified Cost, $94,021,560) | | | $ | 95,939,454 | |
|
| Bonds - 0.1% | |
| Consumer Services - 0.1% | | | | | | | | |
| Toll Road Investors Partnership II LP, Capital Appreciation, NATL, 0%, 2/15/2043 (n) (Identified Cost, $124,016) | | $ | 400,000 | | | $ | 146,398 | |
|
| Investment Companies (h) - 1.5% | |
| Money Market Funds - 1.5% | | | | | | | | |
| MFS Institutional Money Market Portfolio, 1.28% (v) (Identified Cost, $1,471,620) | | | 1,471,223 | | | $ | 1,471,518 | |
| |
| Other Assets, Less Liabilities - 1.3% | | | | 1,275,690 | |
| Net Assets - 100.0% | | | | | | $ | 98,833,060 | |
Derivative Contracts at 3/31/20
Futures Contracts
| | | | | | | | | | | | | | | | | | | | | | |
| Description | | Long/
Short | | | Currency | | | Contracts | | | Notional
Amount | | | Expiration
Date | | Value/Unrealized
Appreciation
(Depreciation) | |
| Liability Derivatives | | | | | | | | | | | | | | | | | | | | | | |
| Interest Rate Futures | | | | | | | | | | | | | | | | | | | | | | |
| U.S. Treasury Bond | | | Short | | | | USD | | | | 10 | | | | $1,790,625 | | | June - 2020 | | | $(120,349 | ) |
| | | | | | | | | | | | | | | | | | | | | | |
At March 31, 2020, the fund had cash collateral of $65,000 to cover any collateral or margin obligations for certain derivative contracts. Restricted cash and/or deposits with brokers in the Statements of Assets and Liabilities are comprised of cash collateral.
See Portfolio Footnotes and Notes to Financial Statements
68
PORTFOLIO OF INVESTMENTS
3/31/20
MFS VIRGINIA MUNICIPAL BOND FUND
The Portfolio of Investments is a complete list of all securities owned by your fund. It is categorized by broad-based asset classes.
| | | | | | | | |
| Municipal Bonds - 99.8% | |
| |
| | |
| Issuer | | Shares/Par | | | Value ($) | |
| Airport Revenue - 3.1% | | | | | | | | |
| Chicago, IL, O’Hare International Airport Rev., Senior Lien, ”B“, 5%, 1/01/2030 | | $ | 510,000 | | | $ | 570,022 | |
| Chicago, IL, O’Hare International Airport Rev., Third Lien, ”A“, 5.625%, 1/01/2035 (Prerefunded 1/01/2021) | | | 695,000 | | | | 718,220 | |
| Chicago, IL, O’Hare International Airport Rev., Third Lien, Unrefunded Balance, ”A“, 5.625%, 1/01/2035 | | | 160,000 | | | | 164,686 | |
| Metropolitan Washington, DC, Airport Authority Refunding Rev., ”A“, 5%, 10/01/2037 | | | 1,000,000 | | | | 1,172,250 | |
| Metropolitan Washington, DC, Airport Authority Refunding Rev., ”A“, 5%, 10/01/2038 | | | 1,000,000 | | | | 1,168,660 | |
| Metropolitan Washington, DC, Airport Authority Rev., ”B“, 5%, 10/01/2027 | | | 980,000 | | | | 1,122,610 | |
| Metropolitan Washington, DC, Airport Authority Rev., ”B“, 5%, 10/01/2028 | | | 1,000,000 | | | | 1,141,070 | |
| Norfolk, VA, Airport Authority Rev., AGM, 5%, 7/01/2023 | | | 2,000,000 | | | | 2,081,360 | |
| Norfolk, VA, Airport Authority Rev., AGM, 5%, 7/01/2024 | | | 1,000,000 | | | | 1,040,680 | |
| San Francisco, CA, City & County Airports Commission, International Airport Rev., ”B“, 5%, 5/01/2046 | | | 1,160,000 | | | | 1,284,711 | |
| | | | | | | $ | 10,464,269 | |
| General Obligations - General Purpose - 10.4% | | | | | |
| Bridgeview, IL, Stadium and Redevelopment Projects, AAC, 5.14%, 12/01/2036 | | $ | 775,000 | | | $ | 715,449 | |
| Chesapeake, VA, ”B“, 5%, 6/01/2023 | | | 1,930,000 | | | | 2,018,626 | |
| Chesterfield County, VA, Public Improvement, ”A“, 4%, 1/01/2036 | | | 1,570,000 | | | | 1,805,029 | |
| Chicago, IL, ”A“, 5.5%, 1/01/2033 | | | 400,000 | | | | 416,112 | |
| Chicago, IL, ”D“, 5.5%, 1/01/2040 | | | 65,000 | | | | 66,940 | |
| Chicago, IL, ”F“, 5.5%, 1/01/2042 | | | 475,000 | | | | 488,124 | |
| Commonwealth of Massachusetts, General Obligation Consolidated Loan, ”E“, 5%, 9/01/2037 | | | 1,000,000 | | | | 1,238,080 | |
| Commonwealth of Puerto Rico, General Obligation, ”A“, 8%, 7/01/2035 (a)(d) | | | 3,605,000 | | | | 2,163,000 | |
| Commonwealth of Puerto Rico, Public Improvement, ”A“, NATL, 5.5%, 7/01/2020 | | | 790,000 | | | | 793,618 | |
| Commonwealth of Puerto Rico, Public Improvement,”A-4“, AGM, 5%, 7/01/2031 | | | 240,000 | | | | 240,821 | |
| Fairfax County, VA, Public Improvement, ”A���, 4%, 10/01/2034 | | | 3,000,000 | | | | 3,472,260 | |
| Fairfax County, VA, Public Improvement, ”A“, 5%, 10/01/2037 | | | 2,000,000 | | | | 2,553,020 | |
| Loudoun County, VA, General Obligation Public Improvement, ”A“, 5%, 12/01/2022 | | | 3,000,000 | | | | 3,312,330 | |
| Lynchburg, VA, Public Improvement, 5%, 12/01/2023 | | | 1,000,000 | | | | 1,025,640 | |
| | | | | | | | |
| | |
| | |
| Issuer | | Shares/Par | | | Value ($) | |
| General Obligations - General Purpose - continued | | | | | |
| Lynchburg, VA, Public Improvement, 5%, 6/01/2026 | | $ | 1,000,000 | | | $ | 1,148,180 | |
| Manassas Park, VA, General Obligation Refunding, 5%, 1/15/2030 | | | 2,080,000 | | | | 2,674,506 | |
| Newport News, VA, General Obligation Improvement, ”A“, 4%, 2/01/2038 | | | 1,425,000 | | | | 1,649,081 | |
| Norfolk, VA, General Obligation Capital Improvement, 5%, 8/01/2043 | | | 2,615,000 | | | | 3,381,299 | |
| Portsmouth, VA, General Obligation Public Improvement, ”A“, 5%, 2/01/2032 (Prerefunded 2/01/2023) | | | 440,000 | | | | 486,257 | |
| Portsmouth, VA, General Obligation Public Improvement, ”A“, 5%, 2/01/2032 | | | 60,000 | | | | 65,790 | |
| Puerto Rico Public Buildings Authority Rev.,”M-2“, AAC, 10%, 7/01/2035 | | | 170,000 | | | | 184,589 | |
| Puerto Rico Public Buildings Authority Rev., Guaranteed, ”D“, AAC, 5.45%, 7/01/2030 | | | 380,000 | | | | 380,213 | |
| Richmond, VA, Public Improvement, ”A“, 5%, 3/01/2028 (Prerefunded 3/01/2023) | | | 220,000 | | | | 244,468 | |
| Suffolk, VA, General Obligation, 5%, 12/01/2022 | | | 2,480,000 | | | | 2,731,993 | |
| Virginia Beach, VA, Public Improvement, ”B“, 5%, 4/01/2022 | | | 2,000,000 | | | | 2,154,460 | |
| | | | | | | $ | 35,409,885 | |
| General Obligations - Schools - 0.0% | | | | | | | | |
| Berks County, PA, Reading School District, AGM, 5%, 3/01/2036 | | $ | 70,000 | | | $ | 83,002 | |
| |
| Healthcare Revenue - Hospitals - 16.3% | | | | | |
| Allegheny County, PA, Hospital Development Authority Rev. (Allegheny Health Network Obligated Group), ”A“, 5%, 4/01/2047 | | $ | 1,260,000 | | | $ | 1,496,048 | |
| Chattanooga, TN, Health, Educational & Housing Facility Board Rev. (CommonSpirit Health),”A-1“, 4%, 8/01/2044 | | | 40,000 | | | | 39,889 | |
| Chattanooga, TN, Health, Educational & Housing Facility Board Rev. (CommonSpirit Health),”A-2“, 5%, 8/01/2044 | | | 30,000 | | | | 32,297 | |
| Chattanooga, TN, Health, Educational & Housing Facility Board Rev. (CommonSpirit Health),”A-2“, 5%, 8/01/2049 | | | 15,000 | | | | 15,919 | |
| Chesapeake, VA, Hospital Authority Facility Rev. (Chesapeake Regional Medical Center), 5%, 7/01/2033 | | | 2,000,000 | | | | 2,510,660 | |
| Chesapeake, VA, Hospital Authority Facility Rev. (Chesapeake Regional Medical Center), 5%, 7/01/2034 | | | 1,475,000 | | | | 1,845,535 | |
| Colorado Health Facilities Authority Rev. (CommonSpirit Health),”A-2“, 4%, 8/01/2044 | | | 175,000 | | | | 174,514 | |
| Commonwealth of Virginia, University Health System General Rev., ”A“, 4%, 7/01/2040 | | | 2,000,000 | | | | 2,239,200 | |
69
Portfolio of Investments – continued
| | | | | | | | |
| Municipal Bonds - continued | |
| | | | | | | | |
| | |
| Issuer | | Shares/Par | | | Value ($) | |
| Healthcare Revenue - Hospitals - continued | | | | | |
| Doylestown, PA, Hospital Rev., ”A“, 4%, 7/01/2045 | | $ | 45,000 | | | $ | 47,188 | |
| Fairfax County, VA, Industrial Development Authority Health Care Rev. (Inova Health System Project), ”A“, 5%, 5/15/2044 | | | 2,000,000 | | | | 2,265,520 | |
| Fairfax County, VA, Industrial Development Authority Health Care Rev. (Inova Health System Project), ”A“, 4%, 5/15/2048 | | | 4,000,000 | | | | 4,505,800 | |
| Fredericksburg, VA, Economic Development Authority, Hospital Facilities Rev. (Mary Washington Healthcare Obligated Group), 5%, 6/15/2031 | | | 750,000 | | | | 852,682 | |
| Fredericksburg, VA, Economic Development Authority, Hospital Facilities Rev. (Mary Washington Healthcare Obligated Group), 5%, 6/15/2033 | | | 1,000,000 | | | | 1,131,780 | |
| Henrico County, VA, Economic Development Authority Rev. (Bon Secours Health Systems, Inc.),”B-2“, AGM, 5.25%, 11/01/2042 | | | 1,705,000 | | | | 1,745,511 | |
| Henrico County, VA, Industrial Development Authority Rev. (Bon Secours Health Systems, Inc.), NATL, 6.25%, 8/15/2020 | | | 410,000 | | | | 417,556 | |
| Jefferson Parish, LA, Hospital Service District No. 2 Hospital Rev. (East Jefferson General Hospital), 6.25%, 7/01/2031 | | | 375,000 | | | | 383,741 | |
| Jefferson Parish, LA, Hospital Service District No. 2 Hospital Rev. (East Jefferson General Hospital), 6.375%, 7/01/2041 | | | 395,000 | | | | 403,773 | |
| Lynchburg, VA, Economic Development Authority Rev. (Centra Health), ”A“, 5%, 1/01/2047 | | | 3,000,000 | | | | 3,487,710 | |
| Norfolk, VA, Economic Development Authority Health Care Facilities Rev. (Sentara Healthcare), ”B“, 5%, 11/01/2036 | | | 2,875,000 | | | | 3,084,501 | |
| Norfolk, VA, Economic Development Authority Hospital Facilities Refunding Rev. (Sentara Healthcare), ”B“, 4%, 11/01/2048 | | | 3,000,000 | | | | 3,384,060 | |
| Roanoke, VA, Economic Development Authority, Hospital Rev. (Carilion Medical Center), 5%, 7/01/2033 | | | 2,385,000 | | | | 2,407,968 | |
| Roanoke, VA, Economic Development Authority, Hospital Rev. (Carilion Medical Center), ”A“, 4%, 7/01/2037 (w) | | | 760,000 | | | | 881,638 | |
| Roanoke, VA, Economic Development Authority, Hospital Rev. (Carilion Medical Center), ”A“, 4%, 7/01/2038 (w) | | | 1,550,000 | | | | 1,792,125 | |
| Roanoke, VA, Economic Development Authority, Hospital Rev. (Carilion Medical Center), ”A“, 5%, 7/01/2047 (w) | | | 1,625,000 | | | | 2,385,662 | |
| Roanoke, VA, Industrial Development Authority, Hospital Rev. (Carilion Health Systems), ”B“, 5%, 7/01/2038 (Prerefunded 7/01/2020) | | | 45,000 | | | | 45,422 | |
| Roanoke, VA, Industrial Development Authority, Hospital Rev. (Carilion Health Systems), ”B“, AGM, 5%, 7/01/2038 | | | 2,955,000 | | | | 2,983,102 | |
| | | | | | | | |
| | |
| | |
| Issuer | | Shares/Par | | | Value ($) | |
| Healthcare Revenue - Hospitals - continued | | | | | |
| Virginia Small Business Financing Authority Rev. (Sentara Healthcare), 4%, 11/01/2039 | | $ | 3,750,000 | | | $ | 4,065,825 | |
| Virginia Small Business Financing Authority Rev. (Sentara Healthcare), 3%, 11/01/2040 | | | 3,370,000 | | | | 3,367,439 | |
| Virginia Small Business Financing Authority, Healthcare Facility Rev. (Sentra Healthcare), 5%, 11/01/2040 | | | 4,000,000 | | | | 4,012,560 | |
| Winchester, VA, Economic Development Authority Hospital Rev. (Valley Health System Obligated Group), 5%, 1/01/2028 | | | 600,000 | | | | 712,758 | |
| Winchester, VA, Economic Development Authority Hospital Rev. (Valley Health System Obligated Group), 5%, 1/01/2030 | | | 400,000 | | | | 473,136 | |
| Winchester, VA, Economic Development Authority Hospital Rev. (Valley Health System Obligated Group), ”A“, 5%, 1/01/2044 | | | 2,000,000 | | | | 2,182,940 | |
| | | | | | | $ | 55,374,459 | |
| Healthcare Revenue - Long Term Care - 3.0% | | | | | |
| Albemarle County, VA, Economic Development Authority, Residential Care Facilities Rev. (Westminster-Canterbury Blue Ridge), ”A“, 5%, 1/01/2042 | | $ | 1,000,000 | | | $ | 958,970 | |
| Alexandria, VA, Industrial Development Authority, Residential Care Facilities Mortgage Rev. (Goodwin House, Inc.), 5%, 10/01/2030 | | | 1,000,000 | | | | 1,061,270 | |
| Fairfax County, VA, Economic Development Authority Residential Care Facilities Rev. (Goodwin House, Inc.), 5%, 10/01/2036 | | | 1,000,000 | | | | 1,056,720 | |
| Henrico County, VA, Economic Development Authority Rev., Residential Care Facility (Lifespire of Virginia.), ”C“, 5%, 12/01/2037 | | | 765,000 | | | | 765,910 | |
| Henrico County, VA, Economic Development Authority Rev., Residential Care Facility (Virginia United Methodist Homes, Inc.), 5%, 6/01/2024 | | | 395,000 | | | | 399,491 | |
| Henrico County, VA, Economic Development Authority Rev., Residential Care Facility (Virginia United Methodist Homes, Inc.), 5%, 6/01/2025 | | | 385,000 | | | | 389,143 | |
| James City County, VA, Economic Development Authority, Residential Care Facilities Rev. (Virginia United Methodist Homes of Williamsburg), ”A“, 2%, 10/01/2048 | | | 200,800 | | | | 17,570 | |
| Lexington, VA, Industrial Development Authority Residential Care Facilities Rev. (Kendal at Lexington), 4%, 1/01/2037 | | | 1,000,000 | | | | 888,450 | |
| Lexington, VA, Industrial Development Authority Residential Care Facilities Rev. (Kendal at Lexington), ”A“, 5%, 1/01/2042 | | | 1,000,000 | | | | 1,009,370 | |
| Prince William County, VA, Industrial Development Authority, Residential Care Facilities Rev. (Westminster at Lake Ridge), 5%, 1/01/2037 | | | 1,000,000 | | | | 1,037,000 | |
70
Portfolio of Investments – continued
| | | | | | | | |
| Municipal Bonds - continued | |
| | | | | | | | |
| | |
| Issuer | | Shares/Par | | | Value ($) | |
| Healthcare Revenue - Long Term Care - continued | | | | | |
| Suffolk, VA, Economic Development Facilities First Mortgage Rev. (Lake Prince Center, Inc.), 5%, 9/01/2031 | | $ | 1,000,000 | | | $ | 1,009,790 | |
| Travis County, TX, Health Facilities Development Corp. Rev. (Westminster Manor Health), 7%, 11/01/2030 (Prerefunded 11/01/2020) | | | 140,000 | | | | 144,614 | |
| Travis County, TX, Health Facilities Development Corp. Rev. (Westminster Manor Health), 7.125%, 11/01/2040 (Prerefunded 11/01/2020) | | | 265,000 | | | | 273,928 | |
| Travis County, TX, Health Facilities Development Corp. Rev. (Westminster Manor Health), Unrefunded Balance, 7%, 11/01/2030 | | | 5,000 | | | | 5,115 | |
| Virginia Small Business Financing Authority, Residential Care Facility Rev. (Pinnacle Living), ”C“, 5%, 6/01/2042 | | | 1,000,000 | | | | 1,003,090 | |
| | | | | | | $ | 10,020,431 | |
| Industrial Revenue - Environmental Services - 0.3% | | | | | |
| Virginia Small Business Financing Authority Rev., Solid Waste Disposal (Covanta Project), 5%, 1/01/2048 (Put Date 7/01/2038) | | $ | 1,000,000 | | | $ | 1,001,110 | |
| | |
| Industrial Revenue - Other - 1.1% | | | | | | | | |
| New York Liberty Development Corp. Rev. (Goldman Sachs Headquarters), 5.25%, 10/01/2035 | | $ | 1,520,000 | | | $ | 1,873,218 | |
| Port Beaumont, TX, Navigation District Facility Rev. (Jefferson Gulf Coast Energy Project), ”A“, 3.625%, 1/01/2035 (n) | | | 300,000 | | | | 252,564 | |
| Port Beaumont, TX, Navigation District Facility Rev. (Jefferson Gulf Coast Energy Project), ”A“, 4%, 1/01/2050 (n) | | | 590,000 | | | | 455,397 | |
| Tuscaloosa County, AL, Industrial Development Authority, Gulf Opportunity Zone (Hunt Refining Project), ”A“, 4.5%, 5/01/2032 | | | 465,000 | | | | 442,062 | |
| Tuscaloosa County, AL, Industrial Development Authority, Gulf Opportunity Zone (Hunt Refining Project), ”A“, 5.25%, 5/01/2044 | | | 635,000 | | | | 610,622 | |
| | | | | | | $ | 3,633,863 | |
| Industrial Revenue - Paper - 0.1% | | | | | | | | |
| Valparaiso, IN, Exempt Facilities Rev. (Pratt Paper LLC Project), 6.75%, 1/01/2034 | | $ | 100,000 | | | $ | 103,827 | |
| Valparaiso, IN, Exempt Facilities Rev. (Pratt Paper LLC Project), 7%, 1/01/2044 | | | 130,000 | | | | 134,949 | |
West Point, VA, Industrial Development Authority, Solid Waste Disposal Rev. (Chesapeake Corp.), ”A“,
6.375%, 3/01/2019 (a)(d) | | | 1,683,272 | | | | 168 | |
| | | | | | | $ | 238,944 | |
| | | | | | | | |
| | |
| | |
| Issuer | | Shares/Par | | | Value ($) | |
| Miscellaneous Revenue - Other - 0.9% | |
| Loudon County, VA, Economic Development Authority Rev. (Howard Hughes Medical Institute), Capital Appreciation, ”A“, 0%, 7/01/2049 | | $ | 7,500,000 | | | $ | 3,010,950 | |
| Summit County, OH, Port Authority Building Rev. (Flats East Development Recovery Zone Facility Bonds), 6.875%, 5/15/2040 | | | 80,000 | | | | 81,830 | |
| | | | | | | $ | 3,092,780 | |
| Multi-Family Housing Revenue - 2.7% | |
| Virginia Housing Development Authority Rev., Rental Housing, ”A“, 3.8%, 9/01/2044 | | $ | 2,000,000 | | | $ | 2,160,260 | |
| Virginia Housing Development Authority Rev., Rental Housing, ”D“, 3.7%, 10/01/2038 | | | 3,000,000 | | | | 3,261,900 | |
| Virginia Housing Development Authority Rev., Rental Housing, ”F“, 5.1%, 1/01/2041 | | | 3,770,000 | | | | 3,804,873 | |
| | | | | | | $ | 9,227,033 | |
| Parking - 1.1% | | | | | | | | |
| Fairfax County, VA, Economic Development Authority Metrorail Parking System Project Rev., 5%, 4/01/2035 | | $ | 1,250,000 | | | $ | 1,525,100 | |
| Fairfax County, VA, Economic Development Authority Metrorail Parking System Project Rev., 5%, 4/01/2036 | | | 1,000,000 | | | | 1,214,390 | |
| Fairfax County, VA, Economic Development Authority Metrorail Parking System Project Rev., 5%, 4/01/2037 | | | 750,000 | | | | 908,265 | |
| | | | | | | $ | 3,647,755 | |
| Port Revenue - 1.6% | | | | | | | | |
| Virginia Port Authority Facilities Refunding Rev., ”B“, 5%, 7/01/2027 | | $ | 1,500,000 | | | $ | 1,779,165 | |
| Virginia Port Authority Facilities Rev, ”A“, 5%, 7/01/2031 (Prerefunded 7/01/2025) | | | 3,000,000 | | | | 3,542,820 | |
| | | | | | | $ | 5,321,985 | |
| Sales & Excise Tax Revenue - 2.4% | | | | | | | | |
| Colorado Regional Transportation District, Private Activity Rev. (Denver Transportation Partners), 6%, 1/15/2041 | | $ | 1,320,000 | | | $ | 1,327,880 | |
| Puerto Rico Sales Tax Financing Corp., Restructured Sales Tax Rev.,”2019A-1“, 4.55%, 7/01/2040 | | | 77,000 | | | | 72,892 | |
| Puerto Rico Sales Tax Financing Corp., Restructured Sales Tax Rev.,”2019A-1“, 5%, 7/01/2058 | | | 2,435,000 | | | | 2,367,916 | |
| Puerto Rico Sales Tax Financing Corp., Restructured Sales Tax Rev.,”2019A-2“, 4.329%, 7/01/2040 | | | 717,000 | | | | 658,629 | |
| Puerto Rico Sales Tax Financing Corp., Restructured Sales Tax Rev.,”2019A-2“, 4.329%, 7/01/2040 | | | 251,000 | | | | 230,566 | |
| Puerto Rico Sales Tax Financing Corp., Restructured Sales Tax Rev.,”2019A-2“, 4.536%, 7/01/2053 | | | 6,000 | | | | 5,445 | |
71
Portfolio of Investments – continued
| | | | | | | | |
| Municipal Bonds - continued | |
| | | | | | | | |
| | |
| Issuer | | Shares/Par | | | Value ($) | |
| Sales & Excise Tax Revenue - continued | |
| Puerto Rico Sales Tax Financing Corp., | | | | | | | | |
| Restructured Sales Tax Rev.,”2019A-2“, 4.784%, 7/01/2058 | | $ | 122,000 | | | $ | 114,256 | |
| Puerto Rico Sales Tax Financing Corp., Restructured Sales Tax Rev., Capital Appreciation,”2019A-1“, 0%, 7/01/2024 | | | 13,000 | | | | 11,131 | |
| Puerto Rico Sales Tax Financing Corp., Restructured Sales Tax Rev., Capital Appreciation,”2019A-1“, 0%, 7/01/2027 | | | 135,000 | | | | 102,792 | |
| Puerto Rico Sales Tax Financing Corp., Restructured Sales Tax Rev., Capital Appreciation,”2019A-1“, 0%, 7/01/2029 | | | 26,000 | | | | 17,992 | |
| Puerto Rico Sales Tax Financing Corp., Restructured Sales Tax Rev., Capital Appreciation,”2019A-1“, 0%, 7/01/2031 | | | 1,212,000 | | | | 753,719 | |
| Puerto Rico Sales Tax Financing Corp., Restructured Sales Tax Rev., Capital Appreciation,”2019A-1“, 0%, 7/01/2033 | | | 1,160,000 | | | | 641,874 | |
| Puerto Rico Sales Tax Financing Corp., Restructured Sales Tax Rev., Capital Appreciation,”2019A-1“, 0%, 7/01/2046 | | | 7,149,000 | | | | 1,690,167 | |
| | | | | | | $ | 7,995,259 | |
| Secondary Schools - 0.1% | | | | | | | | |
| District of Columbia Rev. (Rocketship D.C.), ”A“, 5%, 6/01/2056 | | $ | 325,000 | | | $ | 301,980 | |
| | |
| Single Family Housing - State - 0.6% | | | | | | | | |
| Pennsylvania Housing Finance Agency, Single Family Mortgage Rev., “125A”, 3.7%, 10/01/2037 | | $ | 1,780,000 | | | $ | 1,925,106 | |
| | |
| State & Local Agencies - 11.8% | | | | | | | | |
| Colorado State University Board of Governors, System Enterprise Refunding Rev., ”E“, 4%, 3/01/2043 | | $ | 1,555,000 | | | $ | 1,737,868 | |
| Delaware Valley, PA, Regional Finance Authority, ”C“, FLR, 1.809% (LIBOR - 3mo. + 0.75%), 6/01/2037 | | | 1,955,000 | | | | 1,769,783 | |
| Fairfax County, VA, Economic Development Authority Facilities Rev. (County Facilities Projects), ”A“, 5%, 10/01/2033 | | | 500,000 | | | | 575,415 | |
| Fairfax County, VA, Economic Development Authority Facilities Rev. (County Facilities Projects), ”A“, 5%, 10/01/2034 | | | 1,000,000 | | | | 1,148,950 | |
| Fairfax County, VA, Redevelopment and Housing Authority Refunding Rev. (Wedgewood Affordable Housing Acquisition), 5%, 10/01/2039 | | | 3,265,000 | | | | 3,984,671 | |
| Henry County, VA, Industrial Development Authority, Public Facility Leave Rev., 4%, 11/01/2045 | | | 3,000,000 | | | | 3,310,410 | |
| Manassas Park, VA, Economic Development Authority Lease Rev., ”A“, 6%, 7/15/2035 (Prerefunded 7/15/2020) | | | 1,000,000 | | | | 1,013,550 | |
| Maryland Stadium Authority Rev., Baltimore City Public Schools Construction and Revitalization Program, “A”, 5%, 5/01/2047 | | | 1,165,000 | | | | 1,378,626 | |
| | | | | | | | |
| | |
| | |
| Issuer | | Shares/Par | | | Value ($) | |
| State & Local Agencies - continued | | | | | | | | |
| New River Valley, VA, Regional Jail Authority Rev., 5%, 10/01/2036 | | $ | 3,205,000 | | | $ | 3,802,669 | |
| Virginia College Building Authority, Educational Facilities Rev. (21st Century College and Equipment Programs), ”B“, 5%, 2/01/2031 | | | 3,500,000 | | | | 4,502,365 | |
| Virginia College Building Authority, Educational Facilities Rev. (21st Century College and Equipment Programs),”E-1“, 5%, 2/01/2023 | | | 2,140,000 | | | | 2,364,101 | |
| Virginia College Building Authority, Educational Facilities Rev. (Public Higher Education Financing), ”A“, 5%, 9/01/2027 | | | 3,000,000 | | | | 3,159,210 | |
| Virginia Public Building Authority Facilities Rev., ”A“, 4%, 8/01/2039 | | | 4,500,000 | | | | 5,241,735 | |
| Virginia Public Building Authority, Public Facilities Rev.,”B-3“, 4%, 8/01/2021 | | | 1,000,000 | | | | 1,038,050 | |
| Virginia Public School Authority (1997 Resolution), ”A“, 5%, 8/01/2030 (Prerefunded 8/01/2020) | | | 1,000,000 | | | | 1,013,050 | |
| Virginia Resources Authority, Infrastructure Rev. (Virginia Pooled Financing Program), ”C“, 4%, 11/01/2036 | | | 3,450,000 | | | | 4,028,772 | |
| | | | | | | $ | 40,069,225 | |
| Student Loan Revenue - 0.2% | | | | | | | | |
| Iowa Student Loan Liquidity Corp. Rev., ”B“, 3%, 12/01/2039 | | $ | 150,000 | | | $ | 147,721 | |
| Iowa Student Loan Liquidity Corp. Rev., ”B“, 3.5%, 12/01/2044 | | | 385,000 | | | | 377,739 | |
| | | | | | | $ | 525,460 | |
| Tax - Other - 1.6% | | | | | | | | |
| Illinois Sports Facilities Authority Refunding Rev., BAM, 5%, 6/15/2028 | | $ | 800,000 | | | $ | 980,312 | |
| Puerto Rico Convention Center District Authority, Hotel Occupancy Tax Rev., ”A“, AAC, 5%, 7/01/2031 | | | 375,000 | | | | 375,049 | |
| Puerto Rico Infrastructure Financing Authority Special Tax Rev., ”C“, AAC, 5.5%, 7/01/2024 | | | 700,000 | | | | 738,024 | |
| Puerto Rico Infrastructure Financing Authority Special Tax Rev., ”C“, AAC, 5.5%, 7/01/2025 | | | 85,000 | | | | 90,235 | |
| Puerto Rico Infrastructure Financing Authority Special Tax Rev., ”C“, AAC, 5.5%, 7/01/2026 | | | 2,030,000 | | | | 2,164,447 | |
| Puerto Rico Infrastructure Financing Authority Special Tax Rev., ”C“, AAC, 5.5%, 7/01/2027 | | | 990,000 | | | | 1,058,201 | |
| | | | | | | $ | 5,406,268 | |
| Tax Assessment - 0.7% | | | | | | | | |
| Embrey Mill Community Development Authority, VA, Special Assessment Rev., 7.25%, 3/01/2043 | | $ | 745,000 | | | $ | 770,710 | |
72
Portfolio of Investments – continued
| | | | | | | | |
| Municipal Bonds - continued | |
| | | | | | | | |
| | |
| Issuer | | Shares/Par | | | Value ($) | |
| Tax Assessment - continued | | | | | | | | |
| Peninsula Town Center Community Development Authority, VA, Special Obligation Refunding, 5%, 9/01/2045 | | $ | 1,000,000 | | | $ | 1,016,650 | |
| Prince William County, VA, Cherry Hill Community Development Authority Rev. (Potomac Shores Project), 5.15%, 3/01/2035 | | | 500,000 | | | | 489,790 | |
| | | | | | | $ | 2,277,150 | |
| Tobacco - 1.2% | | | | | | | | |
| Buckeye, OH, Tobacco Settlement Financing Authority Senior Asset-Backed Refunding,2020A-2, ”1“, 5%, 6/01/2032 | | $ | 225,000 | | | $ | 279,549 | |
| Buckeye, OH, Tobacco Settlement Financing Authority Senior Asset-Backed Refunding,2020A-2, ”1“, 4%, 6/01/2037 | | | 145,000 | | | | 159,368 | |
| Buckeye, OH, Tobacco Settlement Financing Authority Senior Asset-Backed Refunding,2020B-2, ”2“, 5%, 6/01/2055 | | | 1,850,000 | | | | 1,639,137 | |
| Buckeye, OH, Tobacco Settlement Financing Authority Senior Asset-Backed Refunding,2020B-3, Capital Appreciation, ”2“, 0%, 6/01/2057 | | | 4,495,000 | | | | 495,933 | |
| Illinois Railsplitter Tobacco Settlement Authority Rev., 6%, 6/01/2028 (Prerefunded 6/01/2021) | | | 1,575,000 | | | | 1,662,649 | |
| | | | | | | $ | 4,236,636 | |
| Toll Roads - 5.2% | | | | | | | | |
| Chesapeake Bay Bridge & Tunnel District First Tier General Resolution Rev., 5%, 7/01/2051 | | $ | 3,000,000 | | | $ | 3,272,640 | |
| Metropolitan Washington D.C. Airports Authority, Toll Road Subordinate Lien Refunding Rev. (Dulles Metrorail and Capital Improvement Project), ”B“, 4%, 10/01/2044 | | | 3,000,000 | | | | 3,063,270 | |
| Metropolitan Washington D.C. Airports Authority, Toll Road Subordinate Lien Refunding Rev. (Dulles Metrorail and Capital Improvement Project), ”B“, AGM, 4%, 10/01/2053 | | | 2,830,000 | | | | 2,904,967 | |
| Metropolitan Washington, DC, Airports Authority Rev. Senior Lien (Dulles Toll Road), 5%, 10/01/2053 | | | 2,000,000 | | | | 2,059,620 | |
| Virginia Small Business Financing Authority Rev. (95 Express Lanes LLC Project), 5%, 7/01/2034 | | | 2,500,000 | | | | 2,518,500 | |
| Virginia Small Business Financing Authority Rev. (95 Express Lanes LLC Project), 5%, 7/01/2049 | | | 1,500,000 | | | | 1,495,545 | |
| Virginia Small Business Financing Authority Rev. (Elizabeth River Crossings Opco LLC Project), 6%, 1/01/2037 | | | 465,000 | | | | 478,908 | |
| Virginia Small Business Financing Authority Rev. (Elizabeth River Crossings Opco LLC Project), 5.5%, 1/01/2042 | | | 905,000 | | | | 918,267 | |
| Virginia Small Business Financing Authority, Senior Lien Private Activity Rev. (Transform 66 P3 Project), 5%, 12/31/2049 | | | 1,000,000 | | | | 1,091,340 | |
| | | | | | | $ | 17,803,057 | |
| | | | | | | | |
| | |
| | |
| Issuer | | Shares/Par | | | Value ($) | |
| Transportation - Special Tax - 8.1% | | | | | | | | |
| Commonwealth of Puerto Rico Highway & Transportation Authority Rev., ”J“, NATL, 5%, 7/01/2029 | | $ | 50,000 | | | $ | 50,001 | |
| Commonwealth of Puerto Rico Highway & Transportation Authority Rev., ”L“, AAC, 5.25%, 7/01/2038 | | | 1,840,000 | | | | 1,867,232 | |
| Commonwealth of Puerto Rico Highway & Transportation Authority Rev., ”L“, ASSD GTY, 5.25%, 7/01/2041 | | | 1,120,000 | | | | 1,158,147 | |
| Commonwealth of Puerto Rico Highway & Transportation Authority Rev., ”L“, NATL, 5.25%, 7/01/2035 | | | 1,995,000 | | | | 2,000,367 | |
| Commonwealth of Puerto Rico Highway & Transportation Authority Rev., ”N“, AAC, 5.5%, 7/01/2029 | | | 1,715,000 | | | | 1,835,564 | |
| Commonwealth of Puerto Rico Highway & Transportation Authority Rev., ”N“, NATL, 5.25%, 7/01/2032 | | | 685,000 | | | | 695,946 | |
| Commonwealth of Puerto Rico Highway & Transportation Authority Rev., ”N“, NATL, 5.25%, 7/01/2033 | | | 570,000 | | | | 576,869 | |
| Commonwealth of Virginia, Transportation Board Rev., Capital Projects, 4%, 5/15/2042 | | | 3,000,000 | | | | 3,362,790 | |
| Commonwealth of Virginia, Transportation Board Rev., Capital Projects, ”A“, 4%, 5/15/2035 | | | 2,750,000 | | | | 3,153,232 | |
| New Jersey Transportation Trust Fund Authority, Transportation System, ”BB“, 5%, 6/15/2044 | | | 1,515,000 | | | | 1,580,645 | |
| Virginia Port Authority Rev., 5%, 7/01/2030 | | | 1,000,000 | | | | 1,168,340 | |
| Virginia Port Authority Rev., 5%, 7/01/2031 | | | 500,000 | | | | 583,625 | |
| Virginia Port Authority, Port Fund Rev., 5%, 7/01/2032 (Prerefunded 7/01/2020) | | | 1,200,000 | | | | 1,211,712 | |
| Washington, DC, Metropolitan Area Transit Authority Gross Rev., 5%, 7/01/2037 | | | 1,560,000 | | | | 1,841,611 | |
| Washington, DC, Metropolitan Area Transit Authority Gross Rev., 5%, 7/01/2038 | | | 1,560,000 | | | | 1,832,641 | |
| Washington, DC, Metropolitan Area Transit Authority Gross Rev., ”B“, 5%, 7/01/2042 | | | 3,860,000 | | | | 4,487,482 | |
| | | | | | | $ | 27,406,204 | |
| Universities - Colleges - 10.8% | | | | | | | | |
| Amherst, VA, Industrial Development Authority Rev. (Educational Facilities Sweet Briar), 5%, 9/01/2026 | | $ | 1,585,000 | | | $ | 1,555,139 | |
| Commonwealth of Virginia, University General Pledge Refunding Rev., ”A“, 4%, 11/01/2037 | | | 745,000 | | | | 857,450 | |
| Commonwealth of Virginia, University General Pledge Refunding Rev., ”A“, 4%, 5/01/2048 | | | 2,475,000 | | | | 2,793,953 | |
| Lexington, VA, Industrial Development Authority Educational Facilities Rev. (Washington and Lee Universities), ”A“, 5%, 1/01/2043 | | | 1,000,000 | | | | 1,221,600 | |
| Massachusetts Development Finance Agency Rev. (Suffolk University), 5%, 7/01/2030 | | | 615,000 | | | | 619,840 | |
73
Portfolio of Investments – continued
| | | | | | | | |
| Municipal Bonds - continued | |
| | | | | | | | |
| | |
| Issuer | | Shares/Par | | | Value ($) | |
| Universities - Colleges - continued | | | | | | | | |
| Montgomery County, VA, Economic Development Authority Rev.,Tax-Exempt (Virginia Tech Foundation), ”A“, 4%, 6/01/2037 | | $ | 1,000,000 | | | $ | 1,161,390 | |
| Montgomery County, VA, Economic Development Authority Rev.,Tax-Exempt (Virginia Tech Foundation), ”A“, 4%, 6/01/2038 | | | 1,750,000 | | | | 2,024,435 | |
| Prince William County, VA, Industrial Development Authority Rev. (George Mason University Foundation Prince William Life Sciences Lab), 5.5%, 9/01/2034 (Prerefunded 9/01/2021) | | | 1,000,000 | | | | 1,061,260 | |
| Puerto Rico Industrial, Tourist, Educational, Medical & Environmental Control Facilities Financing Authority, Educational Facilities Rev. (University Plaza Project), NATL, 5%, 7/01/2033 | | | 445,000 | | | | 442,023 | |
| Puerto Rico Industrial, Tourist, Educational, Medical & Environmental Control Facilities Financing Authority, Higher Education Rev. (Ana G. Mendez University System Project), 5.375%, 4/01/2042 | | | 230,000 | | | | 194,608 | |
| Red River, TX, Education Finance Corp., Higher Education Rev. (Houston Baptist University Project), 5.5%, 10/01/2046 | | | 595,000 | | | | 646,539 | |
| Roanoke, VA, Economic Development Authority, Educational Facilities Rev. (Lynchburg College), ”A“, 5%, 9/01/2034 | | | 1,000,000 | | | | 1,094,940 | |
| Salem, VA, Economic Development Authority, Educational Facilities (Roanoke College), 4%, 4/01/2038 | | | 250,000 | | | | 248,307 | |
| Salem, VA, Economic Development Authority, Educational Facilities (Roanoke College), 4%, 4/01/2039 | | | 225,000 | | | | 221,875 | |
| Salem, VA, Economic Development Authority, Educational Facilities (Roanoke College), 4%, 4/01/2040 | | | 250,000 | | | | 246,362 | |
| Salem, VA, Economic Development Authority, Educational Facilities (Roanoke College), 5%, 4/01/2049 | | | 900,000 | | | | 967,212 | |
| University of Virginia, General Rev. Pledge Refunding, 5%, 9/01/2025 | | | 3,760,000 | | | | 3,964,055 | |
| University of Virginia, General Rev. Pledge Refunding, ”A“, 5%, 6/01/2043 | | | 685,000 | | | | 766,474 | |
| University of Virginia, General Rev. Pledge Refunding, ”B“, 5%, 4/01/2046 | | | 2,500,000 | | | | 2,984,225 | |
| University of Virginia, Rector and Visitors General Pledge Rev. (Multi-Year Capital Project), ”A“, 4%, 8/01/2048 | | | 2,000,000 | | | | 2,200,740 | |
| Virginia College Building Authority, Educational Facilities Rev. (Marymount University Project), ”A“, 5%, 7/01/2035 | | | 1,000,000 | | | | 973,910 | |
| Virginia College Building Authority, Educational Facilities Rev. (Marymount University Project), ”B“, 5.25%, 7/01/2035 | | | 1,000,000 | | | | 999,920 | |
| | | | | | | | |
| | |
| | |
| Issuer | | Shares/Par | | | Value ($) | |
| Universities - Colleges - continued | | | | | | | | |
| Virginia College Building Authority, Educational Facilities Rev. (Randolph-Macon College), 4%, 1/15/2041 | | $ | 1,600,000 | | | $ | 1,750,880 | |
| Virginia College Building Authority, Educational Facilities Rev. (Richmond University), ”A“, 5%, 3/01/2021 | | | 2,115,000 | | | | 2,190,569 | |
| Virginia College Building Authority, Educational Facilities Rev. (Washington & Lee University), NATL, 5.25%, 1/01/2031 | | | 1,000,000 | | | | 1,309,920 | |
| Virginia College Building Authority, Educational Facilities Rev. (Washington & Lee University), ”A“, 5%, 1/01/2040 | | | 1,000,000 | | | | 1,142,320 | |
| Virginia Small Business Financing Authority Rev. (Hampton University), 5.25%, 10/01/2029 | | | 2,500,000 | | | | 2,887,650 | |
| | | | | | | $ | 36,527,596 | |
| Utilities - Cogeneration - 0.2% | | | | | | | | |
| Puerto Rico Industrial, Tourist, Educational, Medical & Environmental Control Facilities Financing Authority Rev. (Cogeneration Facilities - AES Puerto Rico Project), 9.12%, 6/01/2022 | | $ | 795,000 | | | $ | 814,875 | |
| | |
| Utilities - Municipal Owned - 3.9% | | | | | | | | |
| Guam Power Authority Rev., ”A“, 5.5%, 10/01/2030 (Prerefunded 10/01/2020) | | $ | 785,000 | | | $ | 801,964 | |
| Guam Power Authority Rev., ”A“, 5.5%, 10/01/2040 (Prerefunded 10/01/2020) | | | 1,250,000 | | | | 1,277,012 | |
| Puerto Rico Electric Power Authority Rev., ”A“, 5%, 7/01/2029 (a)(d) | | | 835,000 | | | | 590,762 | |
| Puerto Rico Electric Power Authority Rev., ”A“, 5%, 7/01/2042 (a)(d) | | | 130,000 | | | | 91,975 | |
| Puerto Rico Electric Power Authority Rev., ”AAA“, 5.25%, 7/01/2021 (a)(d) | | | 60,000 | | | | 42,600 | |
| Puerto Rico Electric Power Authority Rev., ”AAA“, 5.25%, 7/01/2030 (a)(d) | | | 30,000 | | | | 21,300 | |
| Puerto Rico Electric Power Authority Rev., ”CCC“, 5.25%, 7/01/2027 (a)(d) | | | 305,000 | | | | 216,550 | |
| Puerto Rico Electric Power Authority Rev., ”DDD“, 5%, 7/01/2020 (a)(d) | | | 30,000 | | | | 21,225 | |
| Puerto Rico Electric Power Authority Rev., ”DDD“, 5%, 7/01/2021 (a)(d) | | | 320,000 | | | | 226,400 | |
| Puerto Rico Electric Power Authority Rev., ”DDD“, 5%, 7/01/2022 (a)(d) | | | 535,000 | | | | 378,513 | |
| Puerto Rico Electric Power Authority Rev., ”DDD“, AGM, 3.625%, 7/01/2023 | | | 60,000 | | | | 59,716 | |
| Puerto Rico Electric Power Authority Rev., ”DDD“, AGM, 3.65%, 7/01/2024 | | | 315,000 | | | | 312,178 | |
| Puerto Rico Electric Power Authority Rev., ”EEE“, 6.05%, 7/01/2032 (a)(d) | | | 175,000 | | | | 124,469 | |
| Puerto Rico Electric Power Authority Rev., ”MM“, NATL, 5%, 7/01/2020 | | | 5,000 | | | | 5,017 | |
| Puerto Rico Electric Power Authority Rev., ”PP“, NATL, 5%, 7/01/2024 | | | 25,000 | | | | 25,009 | |
| Puerto Rico Electric Power Authority Rev., ”SS“, ASSD GTY, 4.375%, 7/01/2030 | | | 30,000 | | | | 29,886 | |
74
Portfolio of Investments – continued
| | | | | | | | |
| Municipal Bonds - continued | |
| | | | | | | | |
| | |
| Issuer | | Shares/Par | | | Value ($) | |
| Utilities - Municipal Owned - continued | | | | | |
| Puerto Rico Electric Power Authority Rev., ”TT“, 5%, 7/01/2021 (a)(d) | | $ | 145,000 | | | $ | 102,588 | |
| Puerto Rico Electric Power Authority Rev., ”TT“, 5%, 7/01/2023 (a)(d) | | | 140,000 | | | | 99,050 | |
| Puerto Rico Electric Power Authority Rev., ”TT“, 5%, 7/01/2027 (a)(d) | | | 25,000 | | | | 17,688 | |
| Puerto Rico Electric Power Authority Rev., ”TT“, 5%, 7/01/2037 (a)(d) | | | 430,000 | | | | 304,225 | |
| Puerto Rico Electric Power Authority Rev., ”UU“, ASSD GTY, 4.25%, 7/01/2027 | | | 185,000 | | | | 184,998 | |
| Puerto Rico Electric Power Authority Rev., ”VV“, NATL, 5.25%, 7/01/2030 | | | 340,000 | | | | 347,470 | |
| Puerto Rico Electric Power Authority Rev., ”VV“, NATL, 5.25%, 7/01/2032 | | | 30,000 | | | | 30,479 | |
| Puerto Rico Electric Power Authority Rev., ”VV“, NATL, 5.25%, 7/01/2034 | | | 35,000 | | | | 35,267 | |
| Puerto Rico Electric Power Authority Rev., ”WW“, 5.375%, 7/01/2022 (a)(d) | | | 25,000 | | | | 17,781 | |
| Puerto Rico Electric Power Authority Rev., ”WW“, 5.25%, 7/01/2025 (a)(d) | | | 60,000 | | | | 42,600 | |
| Puerto Rico Electric Power Authority Rev., ”ZZ“, 5%, 7/01/2018 (a)(d) | | | 205,000 | | | | 142,731 | |
| Puerto Rico Electric Power Authority Rev., ”ZZ“, 5.25%, 7/01/2023 (a)(d) | | | 225,000 | | | | 159,750 | |
| Puerto Rico Electric Power Authority Rev., ”ZZ“, 5.25%, 7/01/2024 (a)(d) | | | 70,000 | | | | 49,700 | |
| Puerto Rico Electric Power Authority Rev., ”ZZ“, 5.25%, 7/01/2026 (a)(d) | | | 215,000 | | | | 152,650 | |
| Richmond, VA, Public Utility Rev., ”A“, 5%, 1/15/2027 | | | 2,555,000 | | | | 2,814,843 | |
| Richmond, VA, Public Utility Rev., ”A“, 5%, 1/15/2035 | | | 2,000,000 | | | | 2,389,360 | |
| Richmond, VA, Public Utility Rev., ”A“, 5%, 1/15/2038 | | | 2,000,000 | | | | 2,194,740 | |
| | | | | | | $ | 13,310,496 | |
| Utilities - Other - 0.6% | | | | | | | | |
| Tennessee Energy Acquisition Corp., Gas Rev., ”A“, 5.25%, 9/01/2021 | | $ | 555,000 | | | $ | 572,277 | |
| Tennessee Energy Acquisition Corp., Gas Rev., ”A“, 5.25%, 9/01/2022 | | | 290,000 | | | | 304,958 | |
| Tennessee Energy Acquisition Corp., Gas Rev., ”A“, 5.25%, 9/01/2026 | | | 1,140,000 | | | | 1,275,980 | |
| | | | | | | $ | 2,153,215 | |
| Water & Sewer Utility Revenue - 11.8% | |
| Commonwealth of Puerto Rico Aqueduct & Sewer Authority Rev., ”A“, ASSD GTY, 5%, 7/01/2028 | | $ | 105,000 | | | $ | 105,046 | |
| Commonwealth of Puerto Rico Aqueduct & Sewer Authority Rev., ”A“, ASSD GTY, 5.125%, 7/01/2047 | | | 265,000 | | | | 264,987 | |
| Fairfax County, VA, Water Authority Rev., 5%, 4/01/2028 | | | 1,000,000 | | | | 1,077,870 | |
| Fairfax County, VA, Water Authority Rev., 5%, 4/01/2041 | | | 3,000,000 | | | | 3,635,670 | |
| Guam Waterworks Authority Rev. (Water and Wastewater System), 5.25%, 7/01/2020 | | | 60,000 | | | | 60,201 | |
| | | | | | | | |
| | |
| | |
| Issuer | | Shares/Par | | | Value ($) | |
| Water & Sewer Utility Revenue - continued | |
| Guam Waterworks Authority Rev. (Water and Wastewater System), 5.25%, 7/01/2021 | | $ | 175,000 | | | $ | 177,865 | |
| Guam Waterworks Authority Rev. (Water and Wastewater System), 5%, 7/01/2036 | | | 295,000 | | | | 298,873 | |
| Guam Waterworks Authority Rev. (Water and Wastewater System), 5%, 7/01/2037 | | | 375,000 | | | | 378,998 | |
| Guam Waterworks Authority Rev. (Water and Wastewater System), 5%, 7/01/2040 | | | 1,045,000 | | | | 1,050,288 | |
| Guam Waterworks Authority Rev. (Water and Wastewater System), 5.625%, 7/01/2040 (Prerefunded 7/01/2020) | | | 620,000 | | | | 626,770 | |
| Hampton Roads, VA, Sanitation District Wastewater Rev., ”A“, 5%, 10/01/2035 | | | 660,000 | | | | 834,979 | |
| Hampton Roads, VA, Sanitation District Wastewater Rev., ”A“, 4%, 10/01/2037 | | | 1,350,000 | | | | 1,533,465 | |
| Hampton Roads, VA, Sanitation District Wastewater Rev., ”A“, 4%, 10/01/2038 | | | 1,265,000 | | | | 1,432,828 | |
| Henrico County, VA, Water and Sewer System Rev. , 4%, 5/01/2046 | | | 1,435,000 | | | | 1,623,085 | |
| Michigan Finance Authority Local Government Loan Program Rev. (Detroit Water and Sewerage Department Sewage Disposal System Rev. Refunding Second Lien Local Project),”C-7“, NATL, 5%, 7/01/2032 | | | 80,000 | | | | 90,135 | |
| Michigan Finance Authority Local Government Loan Program Rev. (Detroit Water and Sewerage Department Water Supply System Rev. Refunding Second Lien Local Project),”D-6“, NATL, 5%, 7/01/2036 | | | 100,000 | | | | 112,147 | |
| Michigan Finance Authority Local Government Loan Program Rev. (Detroit Water and Sewerage Department Water Supply System Rev. Refunding Senior Lien Local Project),”D-1“, AGM, 5%, 7/01/2035 | | | 50,000 | | | | 56,378 | |
| Michigan Finance Authority Local Government Loan Program Rev. (Detroit Water and Sewerage Department Water Supply System Rev. Refunding Senior Lien Local Project),”D-1“, AGM, 5%, 7/01/2037 | | | 110,000 | | | | 123,553 | |
| Norfolk, VA, Water Rev., 5%, 11/01/2028 (Prerefunded 5/01/2022) | | | 985,000 | | | | 1,064,854 | |
| Norfolk, VA, Water Rev., 5%, 11/01/2028 | | | 15,000 | | | | 16,121 | |
| Upper Occoquan, VA, Sewage Authority Regional Sewage Rev., 3%, 7/01/2044 | | | 2,065,000 | | | | 2,147,022 | |
| Virginia Beach, VA, Water & Sewer System Rev., 5%, 10/01/2022 | | | 1,310,000 | | | | 1,435,485 | |
| Virginia Resources Authority, Infrastructure Rev. (St. Moral, VA), 5%, 11/01/2040 (Prerefunded 11/01/2020) | | | 1,240,000 | | | | 1,268,408 | |
| Virginia Resources Authority, Infrastructure Rev. (St. Moral, VA), 5%, 11/01/2040 | | | 160,000 | | | | 163,288 | |
| Virginia Resources Authority, Infrastructure Rev. (Virginia Pooled Financing Program), ”C“, 4%, 11/01/2044 | | | 3,235,000 | | | | 3,713,230 | |
| Virginia Resources Authority, Infrastructure Rev., Pooled Financing Program, 5%, 11/01/2025 (Prerefunded 11/01/2021) | | | 1,540,000 | | | | 1,634,587 | |
75
Portfolio of Investments – continued
| | | | | | | | |
| Municipal Bonds - continued | |
| | | | | | | | |
| | |
| Issuer | | Shares/Par | | | Value ($) | |
| Water & Sewer Utility Revenue - continued | |
| Virginia Resources Authority, Infrastructure Rev., Pooled Financing Program, ”B“, 5%, 11/01/2025 (Prerefunded 11/01/2021) (u) | | $ | 1,090,000 | | | $ | 1,155,182 | |
| Virginia Resources Authority, Infrastructure Rev., Pooled Financing Program, ”B“, 5%, 11/01/2025 (u) | | | 155,000 | | | | 164,198 | |
| Virginia Resources Authority, Infrastructure Rev., Pooled Financing Program, ”B“, 5%, 11/01/2027 (Prerefunded 11/01/2021) (u) | | | 5,590,000 | | | | 5,924,282 | |
| Virginia Resources Authority, Infrastructure Rev., Pooled Financing Program, ”B“, 5%, 11/01/2027 (u) | | | 165,000 | | | | 174,765 | |
| Virginia Resources Authority, Infrastructure Rev., Pooled Financing Program, ”B“, 5%, 11/01/2028 (Prerefunded 11/01/2021) (u) | | | 2,900,000 | | | | 3,073,420 | |
| Virginia Resources Authority, Infrastructure Rev., Pooled Financing Program, ”B“, 5%, 11/01/2028 (u) | | | 100,000 | | | | 105,902 | |
| Virginia Resources Authority, Infrastructure Rev., Unrefunded Balance, 5%, 11/01/2025 | | | 55,000 | | | | 58,264 | |
| Virginia Resources Authority, Water & Sewer Systems Rev. (Tukahoe Creek Project), Capital Appreciation, 0%, 11/01/2033 | | | 2,245,000 | | | | 1,389,049 | |
| | | | | | | | |
| Municipal Bonds - continued | |
| | |
| Issuer | | Shares/Par | | | Value ($) | |
| Water & Sewer Utility Revenue - continued | |
| Virginia Resources Authority, Water & Sewer Systems Rev. (Tukahoe Creek Project), Capital Appreciation, 0%, 11/01/2034 | | $ | 2,250,000 | | | $ | 1,322,955 | |
| Virginia Resources Authority, Water & Sewer Systems Rev. (Tukahoe Creek Project), Capital Appreciation, 0%, 11/01/2035 | | | 1,950,000 | | | | 1,091,142 | |
| Virginia Resources Authority, Water & Sewer Systems Rev. (Tukahoe Creek Project), Capital Appreciation, 0%, 11/01/2036 | | | 1,250,000 | | | | 665,062 | |
| | | | | | | $ | 40,050,354 | |
Total Municipal Bonds
(Identified Cost, $331,066,420) | | | | | | $ | 338,318,397 | |
| | |
| Bonds - 0.1% | | | | | | | | |
| Consumer Services - 0.1% | | | | | | | | |
| Toll Road Investors Partnership II LP, Capital Appreciation, NATL, 0%, 2/15/2043 (n) (Identified Cost, $372,297) | | $ | 1,200,000 | | | $ | 439,194 | |
| | |
| Investment Companies (h) - 0.6% | | | | | | | | |
| Money Market Funds - 0.6% | | | | | | | | |
| MFS Institutional Money Market Portfolio, 1.28% (v) (Identified Cost, $1,935,791) | | | 1,935,803 | | | $ | 1,936,190 | |
| |
| Other Assets, Less Liabilities - (0.5)% | | | | (1,645,058) | |
| Net Assets - 100.0% | | | | | | $ | 339,048,723 | |
Derivative Contracts at 3/31/20
Futures Contracts
| | | | | | | | | | | | | | | | | | | | | | |
| Description | | Long/
Short | | | Currency | | | Contracts | | Notional
Amount | | | Expiration
Date | | | Value/Unrealized
Appreciation
(Depreciation) | |
| Liability Derivatives | | | | | | | | | | | | | | | | | | | | | | |
| Interest Rate Futures | | | | | | | | | | | | | | | | | | | | | | |
| U.S. Treasury Bond | | | Short | | | | USD | | | 60 | | | $10,743,750 | | | | June - 2020 | | | | $(722,096 | ) |
| | | | | | | | | | | | | | | | | | | | | | |
At March 31, 2020, the fund had cash collateral of $390,000 to cover any collateral or margin obligations for certain derivative contracts. Restricted cash and/or deposits with brokers in the Statements of Assets and Liabilities are comprised of cash collateral.
See Portfolio Footnotes and Notes to Financial Statements
76
PORTFOLIO OF INVESTMENTS
3/31/20
MFS WEST VIRGINIA MUNICIPAL BOND FUND
The Portfolio of Investments is a complete list of all securities owned by your fund. It is categorized by broad-based asset classes.
| | | | | | | | |
| Municipal Bonds - 97.7% | | | | | | |
| | | | | | | | |
| | |
| Issuer | | Shares/Par | | | Value ($) | |
| Airport Revenue - 1.1% | | | | | | | | |
| Dallas and Fort Worth, TX, International Airport Rev., ”B“, 5%, 11/01/2044 | | $ | 155,000 | | | $ | 164,207 | |
| Dallas and Fort Worth, TX, International Airport Rev., ”C“, 5%, 11/01/2045 | | | 110,000 | | | | 114,377 | |
| San Francisco, CA, City & County Airports Commission, International Airport Rev., ”H“, 5%, 5/01/2021 | | | 535,000 | | | | 553,875 | |
| Wayne County, MI, Airport Authority Rev. (Detroit Metropolitan Wayne County Airport), ”B“, 5%, 12/01/2044 | | | 60,000 | | | | 66,474 | |
| Wayne County, MI, Airport Authority Rev. (Detroit Metropolitan Wayne County Airport), ”B“, BAM, 5%, 12/01/2039 | | | 70,000 | | | | 78,076 | |
| Wayne County, MI, Airport Authority Rev. (Detroit Metropolitan Wayne County Airport), ”C“, 5%, 12/01/2039 | | | 55,000 | | | | 60,452 | |
| Wayne County, MI, Airport Authority Rev. (Detroit Metropolitan Wayne County Airport), ”C“, 5%, 12/01/2044 | | | 85,000 | | | | 92,996 | |
| | | | | | | $ | 1,130,457 | |
| General Obligations - General Purpose - 5.4% | | | | | |
| Bridgeview, IL, Stadium and Redevelopment Projects, AAC, 5.14%, 12/01/2036 | | $ | 260,000 | | | $ | 240,022 | |
| Commonwealth of Puerto Rico, General Obligation, ”A“, 8%, 7/01/2035 (a)(d) | | | 1,100,000 | | | | 660,000 | |
| Commonwealth of Puerto Rico, Public Improvement,”A-4“, AGM, 5%, 7/01/2031 | | | 95,000 | | | | 95,325 | |
| State of West Virginia, General Obligation Road Bonds, ”B“, 4%, 12/01/2042 | | | 1,000,000 | | | | 1,107,200 | |
| West Virginia State Road General Obligation, ”A“, 5%, 6/01/2044 | | | 3,000,000 | | | | 3,695,400 | |
| | | | | | | $ | 5,797,947 | |
| General Obligations - Schools - 7.0% | | | | | | | | |
| Hancock County, WV, Board of Education, Public School General Obligation, 4.5%, 5/01/2032 | | $ | 1,405,000 | | | $ | 1,456,774 | |
| Monongalia County, WV, Board of Education, 5%, 5/01/2031 | | | 2,000,000 | | | | 2,159,980 | |
| Putnam County, WV, Board of Education, 4%, 5/01/2020 | | | 2,500,000 | | | | 2,505,875 | |
| Putnam County, WV, Board of Education, 4%, 5/01/2025 | | | 1,000,000 | | | | 1,016,030 | |
| Wood County, WV, Board of Education Public School, 4%, 5/01/2020 | | | 360,000 | | | | 360,846 | |
| | | | | | | $ | 7,499,505 | |
| Healthcare Revenue - Hospitals - 19.9% | |
| Allegheny County, PA, Hospital Development Authority Rev. (Allegheny Health Network Obligated Group), ”A“, 4%, 4/01/2044 | | $ | 190,000 | | | $ | 198,339 | |
| Doylestown, PA, Hospital Rev., ”A“, 4%, 7/01/2045 | | | 15,000 | | | | 15,729 | |
| | | | | | | | |
| | | | | | | |
| | |
| Issuer | | Shares/Par | | | Value ($) | |
| Healthcare Revenue - Hospitals - continued | |
| Escambia County, FL, Health Facilities Authority Rev. (Baptist Hospital, Inc.), ”A“, 6%, 8/15/2036 | | $ | 725,000 | | | $ | 734,976 | |
| Illinois Finance Authority Rev. (Provena Health), ”A“, 6%, 5/01/2028 (Prerefunded 5/01/2020) | | | 450,000 | | | | 451,494 | |
| Kentucky Economic Development Finance Authority Hospital Rev. (Owensboro Medical Health System, Inc.), ”A“, 5.75%, 6/01/2025 (Prerefunded 6/01/2020) | | | 340,000 | | | | 342,530 | |
| Kentucky Economic Development Finance Authority Hospital Rev. (Owensboro Medical Health System, Inc.), ”A“, 6.375%, 6/01/2040 (Prerefunded 6/01/2020) | | | 410,000 | | | | 413,432 | |
| Kentucky Economic Development Finance Authority Hospital Rev. (Owensboro Medical Health System, Inc.), ”A“, 6.5%, 3/01/2045 (Prerefunded 6/01/2020) | | | 290,000 | | | | 292,482 | |
| Monongalia County, WV, Building Commission Hospital Rev. (Monongalia General Hospital), 6.5%, 7/01/2041 | | | 1,100,000 | | | | 1,159,587 | |
| Monongalia County, WV, Building Commission Improvement Rev. (Monongalia Health System Obligated Group), 5%, 7/01/2029 | | | 1,000,000 | | | | 1,112,710 | |
| New Hampshire Health & Education Facilities Authority Rev. (Dartmouth-Hitchcock Obligated Group), ”A“, 5%, 8/01/2059 | | | 80,000 | | | | 114,828 | |
| Spartanburg County, SC, Regional Health Services District Hospital Rev., ”A“, 4%, 4/15/2043 | | | 780,000 | | | | 840,247 | |
| West Virginia Hospital Finance Authority Hospital Improvement Rev. (Charleston Area Medical Center, Inc.), ”A“, 5%, 9/01/2028 | | | 1,000,000 | | | | 1,139,950 | |
| West Virginia Hospital Finance Authority Hospital Improvement Rev. (Charleston Area Medical Center, Inc.), ”A“, 5%, 9/01/2039 | | | 1,500,000 | | | | 1,825,320 | |
| West Virginia Hospital Finance Authority Hospital Improvement Rev. (Thomas Health System), 6.5%, 10/01/2038 (a)(d) | | | 500,000 | | | | 275,000 | |
| West Virginia Hospital Finance Authority Hospital Improvement Rev. (West Virginia University Health System Obligated Group), ”A“, 4%, 6/01/2051 | | | 220,000 | | | | 240,590 | |
| West Virginia Hospital Finance Authority Hospital Rev. (Cabell Huntington Hospital Obligated Group), ”A“, 4.125%, 1/01/2047 | | | 1,000,000 | | | | 1,057,730 | |
| West Virginia Hospital Finance Authority Hospital Rev. (Charleston Area Medical Center), ”A“, ETM, 6.5%, 9/01/2023 | | | 1,250,000 | | | | 1,357,387 | |
| West Virginia Hospital Finance Authority Hospital Rev. (Valley Health System Obligation Group), 5%, 1/01/2044 | | | 1,000,000 | | | | 1,083,250 | |
77
Portfolio of Investments – continued
| | | | | | | | |
| Municipal Bonds - continued | | | | | | |
| | | | | | | | |
| | |
| Issuer | | Shares/Par | | | Value ($) | |
| Healthcare Revenue - Hospitals - continued | |
| West Virginia Hospital Finance Authority Hospital Rev. (Valley Health System Obligation Group), 5%, 1/01/2044 | | $ | 1,000,000 | | | $ | 1,119,360 | |
| West Virginia Hospital Finance Authority Hospital Rev. (West Virginia United Health System Obligated Group), ”A“, 4%, 6/01/2035 | | | 1,500,000 | | | | 1,637,265 | |
| West Virginia Hospital Finance Authority Hospital Rev. (West Virginia United Health System Obligated Group), ”A“, 5.5%, 6/01/2044 | | | 1,460,000 | | | | 1,589,444 | |
| West Virginia Hospital Finance Authority Hospital Rev. (West Virginia United Health System Obligated Group), “A”, AGM, 4%, 6/01/2051 | | | 2,000,000 | | | | 2,213,420 | |
| West Virginia Hospital Finance Authority Hospital Rev. (West Virginia University Health System Obligated Group), ”A“, 5%, 6/01/2042 | | | 1,000,000 | | | | 1,123,990 | |
| West Virginia Hospital Finance Authority Hospital Rev. (West Virginia University Health System Obligated Group), “C”, VRDN, 4.25%, 6/01/2034 | | | 1,000,000 | | | | 1,000,000 | |
| | | | | | | $ | 21,339,060 | |
| Industrial Revenue - Other - 0.9% | | | | | | | | |
| New York Liberty Development Corp. Rev. (Goldman Sachs Headquarters), 5.25%, 10/01/2035 | | $ | 420,000 | | | $ | 517,600 | |
| Port Beaumont, TX, Navigation District Facility Rev. (Jefferson Gulf Coast Energy Project), ”A“, 4%, 1/01/2050 (n) | | | 200,000 | | | | 154,372 | |
| Tuscaloosa County, AL, Industrial Development Authority, Gulf Opportunity Zone (Hunt Refining Project), ”A“, 5.25%, 5/01/2044 | | | 325,000 | | | | 312,523 | |
| | | | | | | $ | 984,495 | |
| Miscellaneous Revenue - Other - 10.2% | |
| Florida Citizens Property Insurance Corp.,”A-1“, 5%, 6/01/2020 | | $ | 605,000 | | | $ | 608,709 | |
| Indiana Finance Authority Rev. (Ohio River Bridges East End Crossing Project), ”A“, 5%, 7/01/2040 | | | 140,000 | | | | 143,272 | |
| Indiana Finance Authority Rev. (Ohio River Bridges East End Crossing Project), ”A“, 5%, 7/01/2044 | | | 215,000 | | | | 219,306 | |
| New York Liberty Development Corp., Liberty Rev. (3 World Trade Center Project), ”1“, 5%, 11/15/2044 | | | 580,000 | | | | 587,842 | |
| New York Liberty Development Corp., Liberty Rev. (7 World Trade Center Project), 5%, 9/15/2040 | | | 545,000 | | | | 575,842 | |
| West Virginia Economic Development Authority, Excess Lottery Rev., 5%, 6/15/2022 | | | 250,000 | | | | 270,765 | |
| West Virginia Economic Development Authority, Excess Lottery Rev., ”A“, 5%, 7/01/2038 | | | 1,000,000 | | | | 1,218,390 | |
| | | | | | | | |
| | | | | | | |
| | |
| Issuer | | Shares/Par | | | Value ($) | |
| Miscellaneous Revenue - Other - continued | |
| West Virginia Economic Development Authority, Lottery Rev., ”A“, 5%, 6/15/2040 (Prerefunded 6/15/2020) | | $ | 2,475,000 | | | $ | 2,494,552 | |
| West Virginia School Building Authority, ”A“, 3%, 7/01/2033 | | | 2,000,000 | | | | 2,133,060 | |
| West Virginia School Building Authority, Excess Lottery Rev., ”B“, 5%, 7/01/2030 | | | 1,000,000 | | | | 1,008,930 | |
| West Virginia School Building Authority, Lottery Capital Improvement Rev., “A”, 5%, 7/01/2028 | | | 1,500,000 | | | | 1,671,090 | |
| | | | | | | $ | 10,931,758 | |
| Sales & Excise Tax Revenue - 3.9% | | | | | | | | |
| Guam Government Business Privilege Tax Rev., ”A“, 5.25%, 1/01/2036 | | $ | 335,000 | | | $ | 337,184 | |
| Guam Government Business Privilege Tax Rev., ”A“, 5.125%, 1/01/2042 | | | 790,000 | | | | 778,347 | |
| Massachusetts Bay Transportation Authority, Sales Tax Rev., ”A“, 5%, 7/01/2031 | | | 500,000 | | | | 668,970 | |
| Ohio County, WV, Commission Special District Excise Tax Improvement Refunding Rev. (Fort Henry Economic Opportunity Development District - The Highlands Project), ”B“, 2.75%, 3/01/2041 | | | 455,000 | | | | 440,531 | |
| Puerto Rico Sales Tax Financing Corp., Restructured Sales Tax Rev.,”2019A-1“, 4.55%, 7/01/2040 | | | 25,000 | | | | 23,666 | |
| Puerto Rico Sales Tax Financing Corp., Restructured Sales Tax Rev.,”2019A-1“, 5%, 7/01/2058 | | | 771,000 | | | | 749,759 | |
| Puerto Rico Sales Tax Financing Corp., Restructured Sales Tax Rev.,”2019A-2“, 4.329%, 7/01/2040 | | | 238,000 | | | | 218,624 | |
| Puerto Rico Sales Tax Financing Corp., Restructured Sales Tax Rev.,”2019A-2“, 4.329%, 7/01/2040 | | | 83,000 | | | | 76,243 | |
| Puerto Rico Sales Tax Financing Corp., Restructured Sales Tax Rev.,”2019A-2“, 4.536%, 7/01/2053 | | | 1,000 | | | | 908 | |
| Puerto Rico Sales Tax Financing Corp., Restructured Sales Tax Rev.,”2019A-2“, 4.784%, 7/01/2058 | | | 39,000 | | | | 36,524 | |
| Puerto Rico Sales Tax Financing Corp., Restructured Sales Tax Rev., Capital Appreciation,”2019A-1“, 0%, 7/01/2024 | | | 3,000 | | | | 2,569 | |
| Puerto Rico Sales Tax Financing Corp., Restructured Sales Tax Rev., Capital Appreciation,”2019A-1“, 0%, 7/01/2027 | | | 45,000 | | | | 34,264 | |
| Puerto Rico Sales Tax Financing Corp., Restructured Sales Tax Rev., Capital Appreciation,”2019A-1“, 0%, 7/01/2029 | | | 7,000 | | | | 4,844 | |
| Puerto Rico Sales Tax Financing Corp., Restructured Sales Tax Rev., Capital Appreciation,”2019A-1“, 0%, 7/01/2031 | | | 412,000 | | | | 256,215 | |
| Puerto Rico Sales Tax Financing Corp., Restructured Sales Tax Rev., Capital Appreciation,”2019A-1“, 0%, 7/01/2033 | | | 396,000 | | | | 219,123 | |
78
Portfolio of Investments – continued
| | | | | | | | |
| Municipal Bonds - continued | | | | | | |
| | | | | | | | |
| | |
| Issuer | | Shares/Par | | | Value ($) | |
| Sales & Excise Tax Revenue - continued | |
| Puerto Rico Sales Tax Financing Corp., Restructured Sales Tax Rev., Capital Appreciation,”2019A-1“, 0%, 7/01/2046 | | $ | 1,503,000 | | | $ | 355,339 | |
| | | | | | | $ | 4,203,110 | |
| Single Family Housing - State - 2.3% | | | | | | | | |
| West Virginia Housing Development Fund, ”A“, 3.8%, 11/01/2024 | | $ | 30,000 | | | $ | 30,049 | |
| West Virginia Housing Development Fund, ”A“, 3.875%, 11/01/2044 | | | 1,500,000 | | | | 1,617,510 | |
| West Virginia Housing Development Fund, ”A“, FHA, 3.9%, 11/01/2048 | | | 800,000 | | | | 848,536 | |
| | | | | | | $ | 2,496,095 | |
| State & Local Agencies - 7.6% | | | | | | | | |
| Maryland Stadium Authority Rev., Baltimore City Public Schools Construction and Revitalization Program, “A”, 5%, 5/01/2047 | | $ | 400,000 | | | $ | 473,348 | |
| North Carolina Turnpike Authority, Triangle Expressway System Appropriation Rev., Capital Appreciation, 0%, 1/01/2044 | | | 1,640,000 | | | | 808,274 | |
| West Virginia Economic Development Authority, Auto Lease Rev., 5.2%, 5/01/2033 | | | 1,000,000 | | | | 1,001,580 | |
| West Virginia Economic Development Authority, Lease Rev. (Correctional Juvenile Public Safety Facilities), 5%, 6/01/2022 | | | 1,000,000 | | | | 1,042,640 | |
| West Virginia Economic Development Authority, Lease Rev. (Correctional Juvenile Public Safety Facilities), ”A“, 5%, 6/01/2029 | | | 2,000,000 | | | | 2,147,680 | |
| West Virginia Economic Development Authority, Lease Rev. (State Office Building), ”B“, NATL, 5.25%, 1/01/2025 | | | 490,000 | | | | 491,632 | |
| West Virginia Economic Development Authority, Lease Rev. (State Office Building), ”B“, NATL, 5.25%, 1/01/2030 | | | 1,355,000 | | | | 1,359,512 | |
| West Virginia Hospital Finance Authority Hospital Rev. (Veterans Nursing Home), 5.5%, 3/01/2034 | | | 795,000 | | | | 796,828 | |
| | | | | | | $ | 8,121,494 | |
| Tax - Other - 3.0% | | | | | | | | |
| Birmingham-Jefferson, AL, Civic Center Authority, “B”, 5%, 7/01/2043 | | $ | 535,000 | | | $ | 641,492 | |
| Puerto Rico Convention Center District Authority, Hotel Occupancy Tax Rev., ”A“, AAC, 5%, 7/01/2031 | | | 945,000 | | | | 945,123 | |
| Puerto Rico Infrastructure Financing Authority Special Tax Rev., ”C“, AAC, 5.5%, 7/01/2026 | | | 95,000 | | | | 101,292 | |
| Puerto Rico Infrastructure Financing Authority Special Tax Rev., ”C“, AAC, 5.5%, 7/01/2027 | | | 430,000 | | | | 459,622 | |
| Virgin Islands Public Finance Authority Rev. (Gross Receipts), AGM, 5%, 10/01/2032 | | | 1,000,000 | | | | 1,082,140 | |
| | | | | | | $ | 3,229,669 | |
| Tax Assessment - 1.3% | | | | | | | | |
| Morgantown, WV, Tax Increment Rev., Parking Garage Project, ”A“, 5%, 6/01/2033 | | $ | 455,000 | | | $ | 419,405 | |
| | | | | | | | |
| | | | | | | |
| | |
| Issuer | | Shares/Par | | | Value ($) | |
| Tax Assessment - continued | | | | | | | | |
| Ohio County, WV, Commission Tax Increment Rev. (Fort Henry Centre), 4%, 6/01/2034 | | $ | 1,000,000 | | | $ | 949,000 | |
| | | | | | | $ | 1,368,405 | |
| Tobacco - 1.2% | | | | | | | | |
| Buckeye, OH, Tobacco Settlement Financing Authority Senior Asset-Backed Refunding,2020A-2, ”1“, 5%, 6/01/2032 | | $ | 75,000 | | | $ | 93,183 | |
| Buckeye, OH, Tobacco Settlement Financing Authority Senior Asset-Backed Refunding,2020A-2, ”1“, 4%, 6/01/2037 | | | 35,000 | | | | 38,468 | |
| Buckeye, OH, Tobacco Settlement Financing Authority Senior Asset-Backed Refunding,2020B-2, ”2“, 5%, 6/01/2055 | | | 415,000 | | | | 367,698 | |
| Buckeye, OH, Tobacco Settlement Financing Authority Senior Asset-Backed Refunding,2020B-3, Capital Appreciation, ”2“, 0%, 6/01/2057 | | | 1,360,000 | | | | 150,049 | |
| Illinois Railsplitter Tobacco Settlement Authority Rev., 6%, 6/01/2028 (Prerefunded 6/01/2021) | | | 620,000 | | | | 654,503 | |
| | | | | | | $ | 1,303,901 | |
| Toll Roads - 1.3% | | | | | | | | |
| Texas Private Activity Surface Transportation Corp., Senior Lien Rev. (NTE Mobility Partners Segments 3 LLC Segments 3A & 3B Facility), 7%, 12/31/2038 | | $ | 155,000 | | | $ | 174,863 | |
| Texas Private Activity Surface Transportation Corp., Senior Lien Rev. (NTE Mobility Partners Segments 3 LLC Segments 3A & 3B Facility), 6.75%, 6/30/2043 | | | 120,000 | | | | 134,206 | |
| West Virginia Parkways Authority, Turnpike Toll Rev., 4%, 6/01/2047 | | | 1,000,000 | | | | 1,107,600 | |
| | | | | | | $ | 1,416,669 | |
| Transportation - Special Tax - 2.8% | | | | | | | | |
| Commonwealth of Puerto Rico Highway & Transportation Authority Rev.,”AA-1“, AGM, 4.95%, 7/01/2026 | | $ | 575,000 | | | $ | 586,621 | |
| Commonwealth of Puerto Rico Highway & Transportation Authority Rev., ”L“, AAC, 5.25%, 7/01/2038 | | | 755,000 | | | | 766,174 | |
| Commonwealth of Puerto Rico Highway & Transportation Authority Rev., ”L“, ASSD GTY, 5.25%, 7/01/2041 | | | 160,000 | | | | 165,450 | |
| Commonwealth of Puerto Rico Highway & Transportation Authority Rev., ”L“, NATL, 5.25%, 7/01/2035 | | | 340,000 | | | | 340,914 | |
| Commonwealth of Puerto Rico Highway & Transportation Authority Rev., ”N“, AAC, 5.5%, 7/01/2029 | | | 760,000 | | | | 813,428 | |
| Commonwealth of Puerto Rico Highway & Transportation Authority Rev., ”N“, NATL, 5.25%, 7/01/2032 | | | 115,000 | | | | 116,838 | |
| New Jersey Transportation Trust Fund Authority, Federal Highway Reimbursement Rev.,”A-1“, 5%, 6/15/2027 | | | 220,000 | | | | 245,678 | |
| | | | | | | $ | 3,035,103 | |
79
Portfolio of Investments – continued
| | | | | | | | |
| Municipal Bonds - continued | | | | | | |
| | | | | | | | |
| | |
| Issuer | | Shares/Par | | | Value ($) | |
| Universities - Colleges - 14.0% | | | | | | | | |
| Fairmont State University, WV, Board of Governors Rev., ”A“, 5%, 6/01/2032 | | $ | 4,035,000 | | | $ | 4,149,876 | |
| Marshall University, WV, University Rev., 5%, 5/01/2030 | | | 2,000,000 | | | | 2,005,800 | |
| Marshall University, WV, University Rev., 5%, 5/01/2041 | | | 1,000,000 | | | | 1,037,770 | |
| Puerto Rico Industrial, Tourist, Educational, Medical & Environmental Control Facilities Financing Authority, Educational Facilities Rev. (University Plaza), ”A“, NATL, 5%, 7/01/2021 | | | 1,270,000 | | | | 1,273,493 | |
| Puerto Rico Industrial, Tourist, Educational, Medical & Environmental Control Facilities Financing Authority, Higher Education Rev. (Ana G. Mendez University System Project), 5.375%, 12/01/2021 | | | 5,000 | | | | 4,954 | |
| Puerto Rico Industrial, Tourist, Educational, Medical & Environmental Control Facilities Financing Authority, Higher Education Rev. (International American University of Puerto Rico Project), 5%, 10/01/2031 | | | 110,000 | | | | 115,291 | |
| West Virginia University, Board of Governors Improvement Rev. (West Virginia University Project), ”A“, 5%, 10/01/2049 | | | 1,000,000 | | | | 1,230,860 | |
| West Virginia University, University Systems Rev., ”A“, NATL, 5.5%, 4/01/2020 | | | 1,700,000 | | | | 1,700,000 | |
| West Virginia University, University Systems Rev., ”A“, NATL, 5.25%, 4/01/2028 | | | 3,035,000 | | | | 3,552,589 | |
| | | | | | | $ | 15,070,633 | |
| Utilities - Cogeneration - 0.2% | | | | | | | | |
| Puerto Rico Industrial, Tourist, Educational, Medical & Environmental Control Facilities Financing Authority Rev. (Cogeneration Facilities - AES Puerto Rico Project), 9.12%, 6/01/2022 | | $ | 240,000 | | | $ | 246,000 | |
| | |
| Utilities - Investor Owned - 0.5% | | | | | | | | |
| Michigan Strategic Fund Ltd. Obligation Rev. (Detroit Edison Co.), 5.625%, 7/01/2020 | | $ | 470,000 | | | $ | 474,883 | |
| | |
| Utilities - Municipal Owned - 1.7% | | | | | | | | |
| Guam Power Authority Rev., ”A“, 5.5%, 10/01/2030 (Prerefunded 10/01/2020) | | $ | 325,000 | | | $ | 332,023 | |
| Guam Power Authority Rev., ”A“, AGM, 5%, 10/01/2033 | | | 435,000 | | | | 454,993 | |
| Puerto Rico Electric Power Authority Rev., ”A“, 5%, 7/01/2029 (a)(d) | | | 285,000 | | | | 201,637 | |
| Puerto Rico Electric Power Authority Rev., ”A“, 5%, 7/01/2042 (a)(d) | | | 45,000 | | | | 31,838 | |
| Puerto Rico Electric Power Authority Rev., ”AAA“, 5.25%, 7/01/2021 (a)(d) | | | 20,000 | | | | 14,200 | |
| Puerto Rico Electric Power Authority Rev., ”AAA“, 5.25%, 7/01/2030 (a)(d) | | | 10,000 | | | | 7,100 | |
| Puerto Rico Electric Power Authority Rev., ”CCC“, 5.25%, 7/01/2027 (a)(d) | | | 100,000 | | | | 71,000 | |
| Puerto Rico Electric Power Authority Rev., ”DDD“, 5%, 7/01/2020 (a)(d) | | | 10,000 | | | | 7,075 | |
| | | | | | | | |
| | | | | | | |
| | |
| Issuer | | Shares/Par | | | Value ($) | |
| Utilities - Municipal Owned - continued | |
| Puerto Rico Electric Power Authority Rev., ”DDD“, 5%, 7/01/2021 (a)(d) | | $ | 110,000 | | | $ | 77,825 | |
| Puerto Rico Electric Power Authority Rev., ”DDD“, 5%, 7/01/2022 (a)(d) | | | 180,000 | | | | 127,350 | |
| Puerto Rico Electric Power Authority Rev., ”EEE“, 6.05%, 7/01/2032 (a)(d) | | | 50,000 | | | | 35,563 | |
| Puerto Rico Electric Power Authority Rev., ”TT“, 5%, 7/01/2021 (a)(d) | | | 40,000 | | | | 28,300 | |
| Puerto Rico Electric Power Authority Rev., ”TT“, 5%, 7/01/2023 (a)(d) | | | 50,000 | | | | 35,375 | |
| Puerto Rico Electric Power Authority Rev., ”TT“, 5%, 7/01/2027 (a)(d) | | | 10,000 | | | | 7,075 | |
| Puerto Rico Electric Power Authority Rev., ”TT“, 5%, 7/01/2037 (a)(d) | | | 145,000 | | | | 102,587 | |
| Puerto Rico Electric Power Authority Rev., ”VV“, NATL, 5.25%, 7/01/2030 | | | 135,000 | | | | 137,966 | |
| Puerto Rico Electric Power Authority Rev., ”VV“, NATL, 5.25%, 7/01/2034 | | | 10,000 | | | | 10,076 | |
| Puerto Rico Electric Power Authority Rev., ”WW“, 5.375%, 7/01/2022 (a)(d) | | | 10,000 | | | | 7,113 | |
| Puerto Rico Electric Power Authority Rev., ”WW“, 5.25%, 7/01/2025 (a)(d) | | | 20,000 | | | | 14,200 | |
| Puerto Rico Electric Power Authority Rev., ”ZZ“, 5%, 7/01/2018 (a)(d) | | | 70,000 | | | | 48,737 | |
| Puerto Rico Electric Power Authority Rev., ”ZZ“, 5.25%, 7/01/2023 (a)(d) | | | 75,000 | | | | 53,250 | |
| Puerto Rico Electric Power Authority Rev., ”ZZ“, 5.25%, 7/01/2024 (a)(d) | | | 20,000 | | | | 14,200 | |
| Puerto Rico Electric Power Authority Rev., ”ZZ“, 5.25%, 7/01/2026 (a)(d) | | | 65,000 | | | | 46,150 | |
| | | | | | | $ | 1,865,633 | |
| Utilities - Other - 0.7% | | | | | | | | |
| Tennessee Energy Acquisition Corp., Gas Rev., ”A“, 5.25%, 9/01/2021 | | $ | 245,000 | | | $ | 252,627 | |
| Tennessee Energy Acquisition Corp., Gas Rev., ”A“, 5.25%, 9/01/2022 | | | 125,000 | | | | 131,447 | |
| Tennessee Energy Acquisition Corp., Gas Rev., ”C“, 5%, 2/01/2021 | | | 290,000 | | | | 295,336 | |
| Texas Gas Acquisition & Supply Corp. III., Gas Supply Rev., 5%, 12/15/2031 | | | 70,000 | | | | 72,346 | |
| | | | | | | $ | 751,756 | |
| Water & Sewer Utility Revenue - 12.7% | |
| Berkeley County, WV, Public Service Sewer District, ”A“, BAM, 5%, 6/01/2036 | | $ | 1,700,000 | | | $ | 1,979,310 | |
| Fairmont, WV, Waterworks Rev., AAC, 5.25%, 7/01/2022 | | | 200,000 | | | | 208,326 | |
| Guam Waterworks Authority Rev. (Water and Wastewater System), 5%, 7/01/2036 | | | 40,000 | | | | 40,463 | |
| Guam Waterworks Authority Rev. (Water and Wastewater System), 5.625%, 7/01/2040 (Prerefunded 7/01/2020) | | | 515,000 | | | | 520,624 | |
| Guam Waterworks Authority Rev. (Water and Wastewater System), 5%, 1/01/2046 | | | 180,000 | | | | 178,195 | |
| Guam Waterworks Authority Rev. (Water and Wastewater System), ”A“, 5%, 7/01/2029 | | | 20,000 | | | | 20,450 | |
80
Portfolio of Investments – continued
| | | | | | | | |
| Municipal Bonds - continued | | | | | | |
| | | | | | | | |
| | |
| Issuer | | Shares/Par | | | Value ($) | |
| Water & Sewer Utility Revenue - continued | |
| Guam Waterworks Authority Rev. (Water and Wastewater System), ”A“, 5%, 7/01/2035 | | $ | 20,000 | | | $ | 20,236 | |
| Michigan Finance Authority Local Government Loan Program Rev. (Detroit Water and Sewerage Department Sewage Disposal System Rev. Refunding Second Lien Local Project),”C-7“, NATL, 5%, 7/01/2032 | | | 35,000 | | | | 39,434 | |
| Michigan Finance Authority Local Government Loan Program Rev. (Detroit Water and Sewerage Department Water Supply System Rev. Refunding Second Lien Local Project),”D-6“, NATL, 5%, 7/01/2036 | | | 40,000 | | | | 44,859 | |
| Michigan Finance Authority Local Government Loan Program Rev. (Detroit Water and Sewerage Department Water Supply System Rev. Refunding Senior Lien Local Project),”D-1“, AGM, 5%, 7/01/2035 | | | 20,000 | | | | 22,551 | |
| Michigan Finance Authority Local Government Loan Program Rev. (Detroit Water and Sewerage Department Water Supply System Rev. Refunding Senior Lien Local Project),”D-1“, AGM, 5%, 7/01/2037 | | | 50,000 | | | | 56,160 | |
| Mississippi Development Bank Special Obligation (City of Jackson Water and Sewer System Rev. Bond Project), AGM, 6.875%, 12/01/2040 | | | 75,000 | | | | 88,550 | |
| Morgantown, WV, Combined Utility System Rev., ”A“, AGM, 5%, 12/01/2041 | | | 1,000,000 | | | | 1,174,800 | |
| Morgantown, WV, Combined Utility System Rev., ”B“, 5%, 12/01/2043 | | | 2,000,000 | | | | 2,415,100 | |
| | | | | | | | |
| | | | | | | |
| | |
| Issuer | | Shares/Par | | | Value ($) | |
| Water & Sewer Utility Revenue - continued | |
| West Virginia Water Development Authority Rev. (Loan Program II),”A-II“, 5%, 11/01/2033 | | $ | 1,475,000 | | | $ | 1,765,118 | |
| West Virginia Water Development Authority Rev. (Loan Program IV),”A-IV“, ETM, 5%, 11/01/2038 | | | 500,000 | | | | 610,030 | |
| Wheeling, WV, Combined Waterworks and Sewerage System Rev., 5%, 6/01/2038 | | | 3,000,000 | | | | 3,291,630 | |
| Wheeling, WV, Combined Waterworks and Sewerage System Rev., 5%, 6/01/2043 | | | 1,000,000 | | | | 1,093,340 | |
| | | | | | | $ | 13,569,176 | |
Total Municipal Bonds
(Identified Cost, $101,703,015) | | | | | | $ | 104,835,749 | |
| | |
| Bonds - 0.1% | | | | | | | | |
| Consumer Services - 0.1% | | | | | | | | |
| Toll Road Investors Partnership II LP, Capital Appreciation, NATL, 0%, 2/15/2043 (n) (Identified Cost, $124,017) | | $ | 400,000 | | | $ | 146,398 | |
| | |
| Investment Companies (h) - 0.7% | | | | | | | | |
| Money Market Funds - 0.7% | | | | | | | | |
| MFS Institutional Money Market Portfolio, 1.28% (v) (Identified Cost, $782,041) | | | 781,832 | | | $ | 781,988 | |
| | |
| Other Assets, Less Liabilities - 1.5% | | | | | | | 1,600,819 | |
| Net Assets - 100.0% | | | | | | $ | 107,364,954 | |
Derivative Contracts at 3/31/20
Futures Contracts
| | | | | | | | | | | | | | | | | | | | | | |
| Description | | Long/
Short | | | Currency | | | Contracts | | Notional
Amount | | | Expiration
Date | | | Value/Unrealized
Appreciation
(Depreciation) | |
| Asset Derivatives | | | | | | | | | | | | | | | | | | | | | | |
| Interest Rate Futures | | | | | | | | | | | | | | | | | | | | | | |
| U.S. Treasury Bond | | | Long | | | | USD | | | 14 | | | $2,506,875 | | | | June - 2020 | | | | $172,291 | |
| | | | | | | | | | | | | | | | | | | | | | |
At March 31, 2020, the fund had cash collateral of $91,000 to cover any collateral or margin obligations for certain derivative contracts. Restricted cash and/or deposits with brokers in the Statements of Assets and Liabilities are comprised of cash collateral.
Portfolio Footnotes:
| (a) | Non-income producing security. |
| (h) | An affiliated issuer, which may be considered one in which the fund owns 5% or more of the outstanding voting securities, or a company which is under common control. At period end, the aggregate values of each fund’s investments in affiliated issuers and in unaffiliated issuers were as follows: |
| | | | | | | | |
| | | Affiliated Issuers | | | Unaffiliated Issuers | |
| Mississippi Fund | | $ | 3,902,197 | | | $ | 98,820,988 | |
| New York Fund | | | 5,289,871 | | | | 272,817,582 | |
| North Carolina Fund | | | 11,538,961 | | | | 458,587,022 | |
| Pennsylvania Fund | | | 2,584,086 | | | | 153,134,804 | |
| South Carolina Fund | | | 4,914,196 | | | | 228,433,267 | |
| Tennessee Fund | | | 1,471,518 | | | | 96,085,852 | |
| Virginia Fund | | | 1,936,190 | | | | 338,757,591 | |
| West Virginia Fund | | | 781,988 | | | | 104,982,147 | |
81
Portfolio of Investments – continued
| (n) | Securities exempt from registration under Rule 144A of the Securities Act of 1933. These securities may be sold in the ordinary course of business in transactions exempt from registration, normally to qualified institutional buyers. At period end, the aggregate value of these securities and percentage of net assets for each fund is as follows: |
| | | | | | | | |
| | | Value | | | Percent of net assets | |
| Mississippi Fund | | $ | 264,171 | | | | 0.3% | |
| New York Fund | | | 889,427 | | | | 0.3% | |
| North Carolina Fund | | | 1,691,494 | | | | 0.4% | |
| Pennsylvania Fund | | | 484,022 | | | | 0.3% | |
| South Carolina Fund | | | 693,447 | | | | 0.3% | |
| Tennessee Fund | | | 316,207 | | | | 0.3% | |
| Virginia Fund | | | 1,147,155 | | | | 0.3% | |
| West Virginia Fund | | | 300,770 | | | | 0.3% | |
| (u) | Underlying security deposited into special purpose trust upon creation of self-deposited inverse floaters. |
| (v) | Affiliated issuer that is available only to investment companies managed by MFS. The rate quoted for the MFS Institutional Money Market Portfolio is the annualizedseven-day yield of the fund at period end. |
The following abbreviations are used in this report and are defined:
| | |
| AAC | | Ambac Assurance Corp. |
| AGM | | Assured Guaranty Municipal |
| ASSD GTY | | Assured Guaranty Insurance Co. |
| BAM | | Build America Mutual |
| COP | | Certificate of Participation |
| ETM | | Escrowed to Maturity |
| FGIC | | Financial Guaranty Insurance Co. |
| FHA | | Federal Housing Administration |
| FLR | | Floating Rate. Interest rate resets periodically based on the parenthetically disclosed reference rate plus a spread (if any). Theperiod-end rate reported may not be the current rate. All reference rates are USD unless otherwise noted. |
| FNMA | | Federal National Mortgage Assn. |
| GNMA | | Government National Mortgage Assn. |
| LIBOR | | London Interbank Offered Rate |
| NATL | | National Public Finance Guarantee Corp. |
| VRDN | | Variable rate demand note that may be puttable to the issuer at the option of the holder. The stated interest rate, which generally resets either daily or weekly, represents the rate in effect at period end and may not be the current rate. |
See Notes to Financial Statements
82
Financial Statements
STATEMENTS OF ASSETS AND LIABILITIES
At 3/31/20
These statements represent each fund’s balance sheet, which details the assets and liabilities comprising the total value of each fund.
| | | | | | | | | | | | | | | | |
| | | Mississippi
Fund | | | New York
Fund | | | North Carolina
Fund | | | Pennsylvania
Fund | |
| | | | |
| Assets | | | | | | | | | | | | | | | | |
| | | | |
Investments in unaffiliated issuers, at value (identified cost, $94,812,076, $264,325,923, $447,142,092, and $147,500,082, respectively) | | | $98,820,988 | | | | $272,817,582 | | | | $458,587,022 | | | | $153,134,804 | |
| | | | |
Investments in affiliated issuers, at value (identified cost, $3,901,807, $5,289,974, $11,539,379, and $2,584,397, respectively) | | | 3,902,197 | | | | 5,289,871 | | | | 11,538,961 | | | | 2,584,086 | |
| | | | |
Deposits with brokers for futures contracts | | | 78,000 | | | | 97,500 | | | | 520,000 | | | | 97,500 | |
| | | | |
Receivables for | | | | | | | | | | | | | | | | |
| | | | |
Net daily variation margin on open futures contracts | | | 28,031 | | | | 24,853 | | | | 132,509 | | | | 24,848 | |
| | | | |
Investments sold | | | 336,222 | | | | 602,400 | | | | 7,207,425 | | | | 697,807 | |
| | | | |
Fund shares sold | | | 20,630 | | | | 219,862 | | | | 1,039,098 | | | | 399,538 | |
| | | | |
Interest | | | 1,133,931 | | | | 3,182,620 | | | | 6,311,117 | | | | 1,961,217 | |
| | | | |
Receivable from investment adviser | | | — | | | | — | | | | 2,675 | | | | — | |
Other assets | | | 481 | | | | 1,095 | | | | 1,485 | | | | 718 | |
Total assets | | | $104,320,480 | | | | $282,235,783 | | | | $485,340,292 | | | | $158,900,518 | |
| | | | |
| Liabilities | | | | | | | | | | | | | | | | |
| | | | |
Payable to custodian | | | $— | | | | $— | | | | $— | | | | $1,159 | |
| | | | |
Payables for | | | | | | | | | | | | | | | | |
| | | | |
Distributions | | | 19,570 | | | | 81,760 | | | | 83,877 | | | | 58,930 | |
| | | | |
Investments purchased on an extended settlement basis | | | 1,853,205 | | | | 2,909,712 | | | | 2,610,846 | | | | — | |
| | | | |
Investments purchased | | | 1,459,654 | | | | — | | | | 696,215 | | | | 296,984 | |
| | | | |
Fund shares reacquired | | | 166,544 | | | | 195,310 | | | | 910,640 | | | | 228,755 | |
| | | | |
Payable to affiliates | | | | | | | | | | | | | | | | |
| | | | |
Investment adviser | | | 2,433 | | | | 6,739 | | | | — | | | | 3,815 | |
| | | | |
Administrative services fee | | | 133 | | | | 264 | | | | 412 | | | | 175 | |
| | | | |
Shareholder servicing costs | | | 31,409 | | | | 102,941 | | | | 191,740 | | | | 57,362 | |
| | | | |
Distribution and service fees | | | 471 | | | | 2,095 | | | | 3,504 | | | | 635 | |
| | | | |
Payable for independent Trustees’ compensation | | | 12 | | | | 13 | | | | 3,235 | | | | 11 | |
Accrued expenses and other liabilities | | | 68,556 | | | | 81,264 | | | | 99,327 | | | | 76,513 | |
Total liabilities | | | $3,601,987 | | | | $3,380,098 | | | | $4,599,796 | | | | $724,339 | |
Net assets | | | $100,718,493 | | | | $278,855,685 | | | | $480,740,496 | | | | $158,176,179 | |
| | | | |
| Net assets consist of | | | | | | | | | | | | | | | | |
| | | | |
Paid-in capital | | | $100,023,842 | | | | $274,454,157 | | | | $484,087,408 | | | | $155,483,503 | |
Total distributable earnings (loss) | | | 694,651 | | | | 4,401,528 | | | | (3,346,912 | ) | | | 2,692,676 | |
Net assets | | | $100,718,493 | | | | $278,855,685 | | | | $480,740,496 | | | | $158,176,179 | |
83
Statements of Assets and Liabilities – continued
| | | | | | | | | | | | | | | | |
| | | Mississippi
Fund | | | New York
Fund | | | North Carolina
Fund | | | Pennsylvania
Fund | |
| | | | |
Net assets | | | | | | | | | | | | | | | | |
| | | | |
Class A | | | $86,334,643 | | | | $174,514,395 | | | | $326,916,281 | | | | $117,575,284 | |
| | | | |
Class B | | | 626,225 | | | | 2,193,323 | | | | 787,644 | | | | 1,506,713 | |
| | | | |
Class C | | | — | | | | 15,470,553 | | | | 45,135,166 | | | | — | |
| | | | |
Class I | | | 11,373,645 | | | | 83,585,564 | | | | 83,861,154 | | | | 26,063,584 | |
Class R6 | | | 2,383,980 | | | | 3,091,850 | | | | 24,040,251 | | | | 13,030,598 | |
Total net assets | | | $100,718,493 | | | | $278,855,685 | | | | $480,740,496 | | | | $158,176,179 | |
| | | | |
Shares of beneficial interest outstanding | | | | | | | | | | | | | | | | |
| | | | |
Class A | | | 8,969,624 | | | | 15,970,733 | | | | 28,545,984 | | | | 11,479,960 | |
| | | | |
Class B | | | 64,973 | | | | 201,235 | | | | 68,864 | | | | 146,738 | |
| | | | |
Class C | | | — | | | | 1,417,473 | | | | 3,943,410 | | | | — | |
| | | | |
Class I | | | 1,183,500 | | | | 8,648,460 | | | | 8,784,123 | | | | 2,671,604 | |
Class R6 | | | 248,072 | | | | 319,988 | | | | 2,518,246 | | | | 1,335,118 | |
Total shares of beneficial interest outstanding | | | 10,466,169 | | | | 26,557,889 | | | | 43,860,627 | | | | 15,633,420 | |
| | | | |
Class A shares | | | | | | | | | | | | | | | | |
| | | | |
Net asset value per share | | | | | | | | | | | | | | | | |
(net assets / shares of beneficial interest outstanding) | | | $9.63 | | | | $10.93 | | | | $11.45 | | | | $10.24 | |
Offering price per share (100 / 95.75 × net asset value per share) | | | $10.06 | | | | $11.42 | | | | $11.96 | | | | $10.69 | |
| | | | |
Class B shares | | | | | | | | | | | | | | | | |
| | | | |
Net asset value and offering price per share | | | | | | | | | | | | | | | | |
(net assets / shares of beneficial interest outstanding) | | | $9.64 | | | | $10.90 | | | | $11.44 | | | | $10.27 | |
| | | | |
Class C shares | | | | | | | | | | | | | | | | |
| | | | |
Net asset value and offering price per share | | | | | | | | | | | | | | | | |
(net assets / shares of beneficial interest outstanding) | | | $— | | | | $10.91 | | | | $11.45 | | | | $— | |
| | | | |
Class I shares | | | | | | | | | | | | | | | | |
| | | | |
Net asset value, offering price, and redemption price per share | | | | | | | | | | | | | | | | |
(net assets / shares of beneficial interest outstanding) | | | $9.61 | | | | $9.66 | | | | $9.55 | | | | $9.76 | |
| | | | |
Class R6 shares | | | | | | | | | | | | | | | | |
| | | | |
Net asset value, offering price, and redemption price per share | | | | | | | | | | | | | | | | |
(net assets / shares of beneficial interest outstanding) | | | $9.61 | | | | $9.66 | | | | $9.55 | | | | $9.76 | |
On sales of $100,000 or more, the maximum offering price of Class A shares is reduced. A contingent deferred sales charge may be imposed on redemptions of Class A, Class B, and Class C shares.
See Notes to Financial Statements
84
Statements of Assets and Liabilities – continued
| | | | | | | | | | | | | | | | |
| At 3/31/20 | | South Carolina
Fund | | | Tennessee
Fund | | | Virginia Fund | | | West Virginia
Fund | |
| | | | |
| Assets | | | | | | | | | | | | | | | | |
| | | | |
Investments in unaffiliated issuers, at value (identified cost, $223,140,727, $94,145,576, $331,438,717, and $101,827,032, respectively) | | | $228,433,267 | | | | $96,085,852 | | | | $338,757,591 | | | | $104,982,147 | |
| | | | |
Investments in affiliated issuers, at value (identified cost, $4,915,050, $1,471,620, $1,935,791, and $782,041, respectively) | | | 4,914,196 | | | | 1,471,518 | | | | 1,936,190 | | | | 781,988 | |
| | | | |
Deposits with brokers for futures contracts | | | — | | | | 65,000 | | | | 390,000 | | | | 91,000 | |
| | | | |
Receivables for | | | | | | | | | | | | | | | | |
| | | | |
Net daily variation margin on open futures contracts | | | — | | | | 16,565 | | | | 99,378 | | | | — | |
| | | | |
Investments sold | | | 1,703,125 | | | | 382,310 | | | | 4,033,264 | | | | 367,088 | |
| | | | |
Fund shares sold | | | 348,592 | | | | 16,924 | | | | 1,219,330 | | | | 67 | |
| | | | |
Interest | | | 2,898,637 | | | | 1,311,907 | | | | 4,223,909 | | | | 1,470,130 | |
| | | | |
Receivable from investment adviser | | | 10,459 | | | | 8,722 | | | | 19,077 | | | | 7,224 | |
| | | | |
Receivable from distributor | | | — | | | | — | | | | — | | | | 1,348 | |
Other assets | | | 857 | | | | 474 | | | | 1,184 | | | | 553 | |
Total assets | | | $238,309,133 | | | | $99,359,272 | | | | $350,679,923 | | | | $107,701,545 | |
| | | | |
| Liabilities | | | | | | | | | | | | | | | | |
| | | | |
Payables for | | | | | | | | | | | | | | | | |
| | | | |
Distributions | | | $24,975 | | | | $17,250 | | | | $92,722 | | | | $17,868 | |
| | | | |
Investments purchased on an extended settlement basis | | | — | | | | — | | | | 5,174,940 | | | | — | |
| | | | |
Investments purchased | | | 437,656 | | | | 192,767 | | | | 497,297 | | | | — | |
| | | | |
Interest expense and fees | | | — | | | | — | | | | 40,801 | | | | — | |
| | | | |
Fund shares reacquired | | | 346,429 | | | | 207,915 | | | | 581,483 | | | | 167,875 | |
| | | | |
Net daily variation margin on open futures contracts | | | — | | | | — | | | | — | | | | 23,186 | |
| | | | |
Payable to the holders of the floating rate certificates | | | — | | | | — | | | | 5,000,101 | | | | — | |
| | | | |
Payable to affiliates | | | | | | | | | | | | | | | | |
| | | | |
Administrative services fee | | | 233 | | | | 132 | | | | 307 | | | | 138 | |
| | | | |
Shareholder servicing costs | | | 75,404 | | | | 39,851 | | | | 150,387 | | | | 56,525 | |
| | | | |
Distribution and service fees | | | 1,724 | | | | 843 | | | | 2,358 | | | | — | |
| | | | |
Payable for independent Trustees’ compensation | | | 3,287 | | | | 8 | | | | 3,255 | | | | 3,273 | |
Accrued expenses and other liabilities | | | 80,341 | | | | 67,446 | | | | 87,549 | | | | 67,726 | |
Total liabilities | | | $970,049 | | | | $526,212 | | | | $11,631,200 | | | | $336,591 | |
Net assets | | | $237,339,084 | | | | $98,833,060 | | | | $339,048,723 | | | | $107,364,954 | |
| | | | |
| Net assets consist of | | | | | | | | | | | | | | | | |
| | | | |
Paid-in capital | | | $237,997,372 | | | | $99,892,909 | | | | $340,034,427 | | | | $107,865,426 | |
Total distributable earnings (loss) | | | (658,288 | ) | | | (1,059,849 | ) | | | (985,704 | ) | | | (500,472 | ) |
Net assets | | | $237,339,084 | | | | $98,833,060 | | | | $339,048,723 | | | | $107,364,954 | |
85
Statements of Assets and Liabilities – continued
| | | | | | | | | | | | | | | | |
| | | South Carolina
Fund | | | Tennessee
Fund | | | Virginia Fund | | | West Virginia
Fund | |
| | | | |
Net assets | | | | | | | | | | | | | | | | |
| | | | |
Class A | | | $192,058,918 | | | | $71,671,618 | | | | $235,639,293 | | | | $98,950,003 | |
| | | | |
Class B | | | 1,200,031 | | | | 228,390 | | | | 580,680 | | | | 155,119 | |
| | | | |
Class C | | | — | | | | — | | | | 16,735,865 | | | | — | |
| | | | |
Class I | | | 35,188,586 | | | | 23,156,383 | | | | 71,807,118 | | | | 7,544,814 | |
Class R6 | | | 8,891,549 | | | | 3,776,669 | | | | 14,285,767 | | | | 715,018 | |
Total net assets | | | $237,339,084 | | | | $98,833,060 | | | | $339,048,723 | | | | $107,364,954 | |
| | | | |
Shares of beneficial interest outstanding | | | | | | | | | | | | | | | | |
| | | | |
Class A | | | 16,087,240 | | | | 7,044,384 | | | | 21,293,639 | | | | 9,038,246 | |
| | | | |
Class B | | | 100,573 | | | | 22,463 | | | | 52,512 | | | | 14,172 | |
| | | | |
Class C | | | — | | | | — | | | | 1,512,747 | | | | — | |
| | | | |
Class I | | | 3,638,100 | | | | 2,435,124 | | | | 7,465,963 | | | | 782,945 | |
Class R6 | | | 919,166 | | | | 397,406 | | | | 1,484,209 | | | | 74,216 | |
Total shares of beneficial interest outstanding | | | 20,745,079 | | | | 9,899,377 | | | | 31,809,070 | | | | 9,909,579 | |
| | | | |
Class A shares | | | | | | | | | | | | | | | | |
| | | | |
Net asset value per share | | | | | | | | | | | | | | | | |
(net assets / shares of beneficial interest outstanding) | | | $11.94 | | | | $10.17 | | | | $11.07 | | | | $10.95 | |
Offering price per share (100 / 95.75 × net asset value per share) | | | $12.47 | | | | $10.62 | | | | $11.56 | | | | $11.44 | |
| | | | |
Class B shares | | | | | | | | | | | | | | | | |
| | | | |
Net asset value and offering price per share | | | | | | | | | | | | | | | | |
(net assets / shares of beneficial interest outstanding) | | | $11.93 | | | | $10.17 | | | | $11.06 | | | | $10.95 | |
| | | | |
Class C shares | | | | | | | | | | | | | | | | |
| | | | |
Net asset value and offering price per share | | | | | | | | | | | | | | | | |
(net assets / shares of beneficial interest outstanding) | | | $— | | | | $— | | | | $11.06 | | | | $— | |
| | | | |
Class I shares | | | | | | | | | | | | | | | | |
| | | | |
Net asset value, offering price, and redemption price per share | | | | | | | | | | | | | | | | |
(net assets / shares of beneficial interest outstanding) | | | $9.67 | | | | $9.51 | | | | $9.62 | | | | $9.64 | |
| | | | |
Class R6 shares | | | | | | | | | | | | | | | | |
| | | | |
Net asset value, offering price, and redemption price per share | | | | | | | | | | | | | | | | |
(net assets / shares of beneficial interest outstanding) | | | $9.67 | | | | $9.50 | | | | $9.63 | | | | $9.63 | |
On sales of $100,000 or more, the maximum offering price of Class A shares is reduced. A contingent deferred sales charge may be imposed on redemptions of Class A, Class B, and Class C shares.
See Notes to Financial Statements
86
Financial Statements
STATEMENTS OF OPERATIONS
Year ended 3/31/20
These statements describe how much each fund earned in investment income and accrued in expenses. They also describe any gains or losses generated by each fund’s operations.
| | | | | | | | | | | | | | | | |
| | | Mississippi
Fund | | | New York
Fund | | | North Carolina
Fund | | | Pennsylvania
Fund | |
| | | | |
| Net investment income (loss) | | | | | | | | | | | | | | | | |
Interest | | | $3,491,594 | | | | $9,733,164 | | | | $16,146,468 | | | | $5,936,773 | |
Dividends from affiliated issuers | | | 29,240 | | | | 95,573 | | | | 185,525 | | | | 49,568 | |
Other | | | 30 | | | | 1,062 | | | | 2,396 | | | | 586 | |
Total investment income | | | $3,520,864 | | | | $9,829,799 | | | | $16,334,389 | | | | $5,986,927 | |
Expenses | | | | | | | | | | | | | | | | |
| | | | |
Management fee | | | $429,591 | | | | $1,231,413 | | | | $2,071,595 | | | | $691,439 | |
| | | | |
Distribution and service fees | | | 215,478 | | | | 634,647 | | | | 1,244,941 | | | | 308,360 | |
| | | | |
Shareholder servicing costs | | | 59,673 | | | | 201,954 | | | | 344,961 | | | | 119,245 | |
| | | | |
Administrative services fee | | | 23,444 | | | | 46,775 | | | | 71,198 | | | | 31,065 | |
| | | | |
Independent Trustees’ compensation | | | 2,064 | | | | 8,653 | | | | 10,957 | | | | 4,044 | |
| | | | |
Custodian fee | | | 17,670 | | | | 36,694 | | | | 50,909 | | | | 28,544 | |
| | | | |
Shareholder communications | | | 6,879 | | | | 14,118 | | | | 22,644 | | | | 13,574 | |
| | | | |
Audit and tax fees | | | 56,048 | | | | 56,090 | | | | 56,135 | | | | 56,061 | |
| | | | |
Legal fees | | | 9,118 | | | | 14,007 | | | | 12,543 | | | | 11,559 | |
| | | | |
Registration fees | | | 58,145 | | | | 75,858 | | | | 86,401 | | | | 59,143 | |
Miscellaneous | | | 28,537 | | | | 32,430 | | | | 35,162 | | | | 30,077 | |
Total expenses | | | $906,647 | | | | $2,352,639 | | | | $4,007,446 | | | | $1,353,111 | |
| | | | |
Fees paid indirectly | | | (52 | ) | | | (136 | ) | | | (171 | ) | | | (151 | ) |
Reduction of expenses by investment adviser and distributor | | | (137,053 | ) | | | (35,131 | ) | | | (81,869 | ) | | | (191,487 | ) |
Net expenses | | | $769,542 | | | | $2,317,372 | | | | $3,925,406 | | | | $1,161,473 | |
Net investment income (loss) | | | $2,751,322 | | | | $7,512,427 | | | | $12,408,983 | | | | $4,825,454 | |
| | | | |
| Realized and unrealized gain (loss) | | | | | | | | | | | | | | | | |
| Realized gain (loss) (identified cost basis) | | | | | | | | | | | | | | | | |
| | | | |
Unaffiliated issuers | | | $153,926 | | | | $242,759 | | | | $1,467,628 | | | | $503,441 | |
| | | | |
Affiliated issuers | | | 297 | | | | 812 | | | | 2,461 | | | | 433 | |
Futures contracts | | | (329,757 | ) | | | (1,443,390 | ) | | | (3,683,758 | ) | | | (649,002 | ) |
Net realized gain (loss) | | | $(175,534 | ) | | | $(1,199,819 | ) | | | $(2,213,669 | ) | | | $(145,128 | ) |
| Change in unrealized appreciation or depreciation | | | | | | | | | | | | | | | | |
| | | | |
Unaffiliated issuers | | | $(194,299 | ) | | | $(1,629,184 | ) | | | $(4,708,538 | ) | | | $(592,295 | ) |
| | | | |
Affiliated issuers | | | 320 | | | | (369 | ) | | | (1,076 | ) | | | (526 | ) |
Futures contracts | | | (132,385 | ) | | | (120,465 | ) | | | (711,298 | ) | | | (101,697 | ) |
Net unrealized gain (loss) | | | $(326,364 | ) | | | $(1,750,018 | ) | | | $(5,420,912 | ) | | | $(694,518 | ) |
Net realized and unrealized gain (loss) | | | $(501,898 | ) | | | $(2,949,837 | ) | | | $(7,634,581 | ) | | | $(839,646 | ) |
Change in net assets from operations | | | $2,249,424 | | | | $4,562,590 | | | | $4,774,402 | | | | $3,985,808 | |
See Notes to Financial Statements
87
Statements of Operations – continued
| | | | | | | | | | | | | | | | |
| Year ended 3/31/20 | | South Carolina
Fund | | | Tennessee
Fund | | | Virginia
Fund | | | West Virginia
Fund | |
| | | | |
| Net investment income (loss) | | | | | | | | | | | | | | | | |
| Interest | | | $7,567,891 | | | | $3,827,755 | | | | $12,273,116 | | | | $4,174,472 | |
| Dividends from affiliated issuers | | | 75,888 | | | | 28,513 | | | | 94,483 | | | | 19,267 | |
Other | | | 744 | | | | 403 | | | | 1,229 | | | | 183 | |
Total investment income | | | $7,644,523 | | | | $3,856,671 | | | | $12,368,828 | | | | $4,193,922 | |
| Expenses | | | | | | | | | | | | | | | | |
| | | | |
Management fee | | | $979,594 | | | | $449,943 | | | | $1,498,988 | | | | $488,885 | |
| | | | |
Distribution and service fees | | | 459,468 | | | | 184,955 | | | | 770,828 | | | | 254,514 | |
| | | | |
Shareholder servicing costs | | | 142,834 | | | | 77,552 | | | | 279,783 | | | | 95,945 | |
| | | | |
Administrative services fee | | | 39,441 | | | | 24,037 | | | | 54,575 | | | | 25,175 | |
| | | | |
Independent Trustees’ compensation | | | 6,374 | | | | 1,715 | | | | 10,723 | | | | 5,599 | |
| | | | |
Custodian fee | | | 29,728 | | | | 18,143 | | | | 41,990 | | | | 16,716 | |
| | | | |
Shareholder communications | | | 11,830 | | | | 7,327 | | | | 19,372 | | | | 8,079 | |
| | | | |
Audit and tax fees | | | 56,075 | | | | 56,050 | | | | 56,357 | | | | 56,052 | |
| | | | |
Legal fees | | | 12,169 | | | | 7,524 | | | | 11,998 | | | | 6,541 | |
| | | | |
Registration fees | | | 64,006 | | | | 55,835 | | | | 76,468 | | | | 57,703 | |
| | | | |
Interest expense and fees | | | — | | | | — | | | | 108,151 | | | | — | |
Miscellaneous | | | 30,751 | | | | 28,697 | | | | 31,500 | | | | 28,582 | |
Total expenses | | | $1,832,270 | | | | $911,778 | | | | $2,960,733 | | | | $1,043,791 | |
| | | | |
Fees paid indirectly | | | (111 | ) | | | (494 | ) | | | (448 | ) | | | (99 | ) |
Reduction of expenses by investment adviser and distributor | | | (100,464 | ) | | | (113,927 | ) | | | (237,542 | ) | | | (126,775 | ) |
Net expenses | | | $1,731,695 | | | | $797,357 | | | | $2,722,743 | | | | $916,917 | |
Net investment income (loss) | | | $5,912,828 | | | | $3,059,314 | | | | $9,646,085 | | | | $3,277,005 | |
| | | | |
| Realized and unrealized gain (loss) | | | | | | | | | | | | | | | | |
| Realized gain (loss) (identified cost basis) | | | | | | | | | | | | | | | | |
| | | | |
Unaffiliated issuers | | | $555,427 | | | | $102,943 | | | | $1,484,582 | | | | $550,235 | |
| | | | |
Affiliated issuers | | | 773 | | | | (285 | ) | | | (430 | ) | | | (742 | ) |
Futures contracts | | | (693,327 | ) | | | (407,407 | ) | | | (1,473,277 | ) | | | 129,108 | |
Net realized gain (loss) | | | $(137,127 | ) | | | $(304,749 | ) | | | $10,875 | | | | $678,601 | |
| Change in unrealized appreciation or depreciation | | | | | | | | | | | | | | | | |
| | | | |
Unaffiliated issuers | | | $(1,787,746 | ) | | | $(1,632,732 | ) | | | $(3,485,463 | ) | | | $(1,250,090 | ) |
| | | | |
Affiliated issuers | | | (1,236 | ) | | | (149 | ) | | | 255 | | | | (104 | ) |
Futures contracts | | | 116,364 | | | | (60,290 | ) | | | (526,905 | ) | | | 172,291 | |
Net unrealized gain (loss) | | | $(1,672,618 | ) | | | $(1,693,171 | ) | | | $(4,012,113 | ) | | | $(1,077,903 | ) |
Net realized and unrealized gain (loss) | | | $(1,809,745 | ) | | | $(1,997,920 | ) | | | $(4,001,238 | ) | | | $(399,302 | ) |
Change in net assets from operations | | | $4,103,083 | | | | $1,061,394 | | | | $5,644,847 | | | | $2,877,703 | |
See Notes to Financial Statements
88
Financial Statements
STATEMENTS OF CHANGES IN NET ASSETS
These statements describe the increases and/or decreases in net assets resulting from operations, any distributions, and any shareholder transactions.
| | | | | | | | | | | | | | | | |
| Year ended 3/31/20 | | Mississippi
Fund | | | New York
Fund | | | North Carolina
Fund | | | Pennsylvania
Fund | |
| Change in net assets | | | | | | | | | | | | | | | | |
| | | | |
| From operations | | | | | | | | | | | | | | | | |
| Net investment income (loss) | | | $2,751,322 | | | | $7,512,427 | | | | $12,408,983 | | | | $4,825,454 | |
| | | | |
Net realized gain (loss) | | | (175,534 | ) | | | (1,199,819 | ) | | | (2,213,669 | ) | | | (145,128 | ) |
Net unrealized gain (loss) | | | (326,364 | ) | | | (1,750,018 | ) | | | (5,420,912 | ) | | | (694,518 | ) |
Change in net assets from operations | | | $2,249,424 | | | | $4,562,590 | | | | $4,774,402 | | | | $3,985,808 | |
Total distributions to shareholders | | | $(2,737,558 | ) | | | $(7,428,830 | ) | | | $(12,560,484 | ) | | | $(4,829,636 | ) |
Change in net assets from fund share transactions | | | $11,818,604 | | | | $36,761,020 | | | | $78,111,036 | | | | $19,881,006 | |
Total change in net assets | | | $11,330,470 | | | | $33,894,780 | | | | $70,324,954 | | | | $19,037,178 | |
| | | | |
| Net assets | | | | | | | | | | | | | | | | |
| | | | |
At beginning of period | | | 89,388,023 | | | | 244,960,905 | | | | 410,415,542 | | | | 139,139,001 | |
At end of period | | | $100,718,493 | | | | $278,855,685 | | | | $480,740,496 | | | | $158,176,179 | |
| | | | |
| Year ended 3/31/20 | | South Carolina
Fund | | | Tennessee
Fund | | | Virginia
Fund | | | West Virginia
Fund | |
| Change in net assets | | | | | | | | | | | | | | | | |
| | | | |
| From operations | | | | | | | | | | | | | | | | |
| Net investment income (loss) | | | $5,912,828 | | | | $3,059,314 | | | | $9,646,085 | | | | $3,277,005 | |
| | | | |
Net realized gain (loss) | | | (137,127 | ) | | | (304,749 | ) | | | 10,875 | | | | 678,601 | |
Net unrealized gain (loss) | | | (1,672,618 | ) | | | (1,693,171 | ) | | | (4,012,113 | ) | | | (1,077,903 | ) |
Change in net assets from operations | | | $4,103,083 | | | | $1,061,394 | | | | $5,644,847 | | | | $2,877,703 | |
Total distributions to shareholders | | | $(5,861,320 | ) | | | $(3,039,898 | ) | | | $(9,466,489 | ) | | | $(3,267,035 | ) |
Change in net assets from fund share transactions | | | $48,193,172 | | | | $2,813,238 | | | | $30,792,526 | | | | $2,256,866 | |
Total change in net assets | | | $46,434,935 | | | | $834,734 | | | | $26,970,884 | | | | $1,867,534 | |
| | | | |
| Net assets | | | | | | | | | | | | | | | | |
| | | | |
At beginning of period | | | 190,904,149 | | | | 97,998,326 | | | | 312,077,839 | | | | 105,497,420 | |
At end of period | | | $237,339,084 | | | | $98,833,060 | | | | $339,048,723 | | | | $107,364,954 | |
See Notes to Financial Statements
89
Statements of Changes in Net Assets – continued
| | | | | | | | | | | | | | | | |
| Year ended 3/31/19 | | Mississippi
Fund | | | New York
Fund | | | North Carolina
Fund | | | Pennsylvania
Fund | |
| Change in net assets | | | | | | | | | | | | | | | | |
| | | | |
| From operations | | | | | | | | | | | | | | | | |
| Net investment income (loss) | | | $3,136,267 | | | | $8,545,924 | | | | $13,926,013 | | | | $4,971,166 | |
| | | | |
Net realized gain (loss) | | | (380,547 | ) | | | 1,353 | | | | (1,042,838 | ) | | | 159,478 | |
Net unrealized gain (loss) | | | 1,132,486 | | | | 2,523,383 | | | | 3,575,085 | | | | 890,571 | |
Change in net assets from operations | | | $3,888,206 | | | | $11,070,660 | | | | $16,458,260 | | | | $6,021,215 | |
Total distributions to shareholders | | | $(2,866,935 | ) | | | $(8,046,040 | ) | | | $(12,599,570 | ) | | | $(4,505,538 | ) |
Change in net assets from fund share transactions | | | $(2,266,723 | ) | | | $12,693,368 | | | | $9,262,693 | | | | $13,059,554 | |
Total change in net assets | | | $(1,245,452 | ) | | | $15,717,988 | | | | $13,121,383 | | | | $14,575,231 | |
| | | | |
| Net assets | | | | | | | | | | | | | | | | |
| | | | |
At beginning of period | | | 90,633,475 | | | | 229,242,917 | | | | 397,294,159 | | | | 124,563,770 | |
At end of period | | | $89,388,023 | | | | $244,960,905 | | | | $410,415,542 | | | | $139,139,001 | |
| | | | |
| Year ended 3/31/19 | | South Carolina
Fund | | | Tennessee
Fund | | | Virginia
Fund | | | West Virginia
Fund | |
| Change in net assets | | | | | | | | | | | | | | | | |
| | | | |
| From operations | | | | | | | | | | | | | | | | |
| Net investment income (loss) | | | $6,477,480 | | | | $3,568,598 | | | | $10,162,878 | | | | $3,734,238 | |
| | | | |
Net realized gain (loss) | | | (195,219 | ) | | | (33,638 | ) | | | (17,495 | ) | | | (102,445 | ) |
Net unrealized gain (loss) | | | 1,802,091 | | | | 821,948 | | | | 3,710,589 | | | | 596,598 | |
Change in net assets from operations | | | $8,084,352 | | | | $4,356,908 | | | | $13,855,972 | | | | $4,228,391 | |
Total distributions to shareholders | | | $(5,798,616 | ) | | | $(3,225,738 | ) | | | $(9,427,032 | ) | | | $(3,372,239 | ) |
Change in net assets from fund share transactions | | | $2,084,600 | | | | $(8,760,970 | ) | | | $11,300,168 | | | | $(4,152,969 | ) |
Total change in net assets | | | $4,370,336 | | | | $(7,629,800 | ) | | | $15,729,108 | | | | $(3,296,817 | ) |
| | | | |
| Net assets | | | | | | | | | | | | | | | | |
| | | | |
At beginning of period | | | 186,533,813 | | | | 105,628,126 | | | | 296,348,731 | | | | 108,794,237 | |
At end of period | | | $190,904,149 | | | | $97,998,326 | | | | $312,077,839 | | | | $105,497,420 | |
See Notes to Financial Statements
90
Financial Statements
FINANCIAL HIGHLIGHTS
MFS MISSISSIPPI MUNICIPAL BOND FUND
The financial highlights table is intended to help you understand the fund’s financial performance for the past 5 years (or life of a particular share class, if shorter). Certain information reflects financial results for a single fund share. The total returns in the table represent the rate that an investor would have earned (or lost) on an investment in the fund share class (assuming reinvestment of all distributions) held for the entire period.
| | | | | | | | | | | | | | | | | | | | |
| | | Year ended | |
| Class A | | 3/31/20 | | | 3/31/19 | | | 3/31/18 | | | 3/31/17 | | | 3/31/16 | |
| | | | | |
Net asset value, beginning of period | | | $9.64 | | | | $9.53 | | | | $9.64 | | | | $10.02 | | | | $10.01 | |
| | | | | |
| Income (loss) from investment operations | | | | | | | | | | | | | | | | | | | | |
Net investment income (loss) (d) | | | $0.28 | | | | $0.34 | | | | $0.31 | | | | $0.34 | (c) | | | $0.36 | |
Net realized and unrealized gain (loss) | | | (0.01 | ) | | | 0.08 | | | | (0.11 | ) | | | (0.39 | ) | | | (0.01 | ) |
Total from investment operations | | | $0.27 | | | | $0.42 | | | | $0.20 | | | | $(0.05 | ) | | | $0.35 | |
| | | | | |
| Less distributions declared to shareholders | | | | | | | | | | | | | | | | | | | | |
From net investment income | | | $(0.28 | ) | | | $(0.31 | ) | | | $(0.31 | ) | | | $(0.33 | ) | | | $(0.34 | ) |
Net asset value, end of period (x) | | | $9.63 | | | | $9.64 | | | | $9.53 | | | | $9.64 | | | | $10.02 | |
Total return (%) (r)(s)(t)(x) | | | 2.80 | | | | 4.47 | | | | 2.07 | | | | (0.49 | )(c) | | | 3.60 | |
| | | | | |
| Ratios (%) (to average net assets) and Supplemental data: | | | | | | | | | | | | | | | | | | | | |
Expenses before expense reductions (f) | | | 0.98 | | | | 1.00 | | | | 1.00 | | | | 0.98 | (c) | | | 0.96 | |
| | | | | |
Expenses after expense reductions (f) | | | 0.82 | | | | 0.83 | | | | 0.83 | | | | 0.81 | (c) | | | 0.80 | |
| | | | | |
Net investment income (loss) | | | 2.88 | | | | 3.53 | | | | 3.21 | | | | 3.41 | (c) | | | 3.63 | |
| | | | | |
Portfolio turnover | | | 30 | | | | 16 | | | | 11 | | | | 14 | | | | 17 | |
Net assets at end of period (000 omitted) | | | $86,335 | | | | $79,190 | | | | $82,526 | | | | $84,401 | | | | $88,070 | |
| |
| | | Year ended | |
| Class B | | 3/31/20 | | | 3/31/19 | | | 3/31/18 | | | 3/31/17 | | | 3/31/16 | |
| | | | | |
Net asset value, beginning of period | | | $9.65 | | | | $9.54 | | | | $9.65 | | | | $10.04 | | | | $10.02 | |
| | | | | |
| Income (loss) from investment operations | | | | | | | | | | | | | | | | | | | | |
Net investment income (loss) (d) | | | $0.22 | | | | $0.27 | | | | $0.25 | | | | $0.27 | (c) | | | $0.29 | |
Net realized and unrealized gain (loss) | | | (0.01 | ) | | | 0.09 | | | | (0.11 | ) | | | (0.39 | ) | | | (0.00 | )(w) |
Total from investment operations | | | $0.21 | | | | $0.36 | | | | $0.14 | | | | $(0.12 | ) | | | $0.29 | |
| | | | | |
| Less distributions declared to shareholders | | | | | | | | | | | | | | | | | | | | |
From net investment income | | | $(0.22 | ) | | | $(0.25 | ) | | | $(0.25 | ) | | | $(0.27 | ) | | | $(0.27 | ) |
Net asset value, end of period (x) | | | $9.64 | | | | $9.65 | | | | $9.54 | | | | $9.65 | | | | $10.04 | |
Total return (%) (r)(s)(t)(x) | | | 2.14 | | | | 3.79 | | | | 1.40 | | | | (1.25 | )(c) | | | 3.01 | |
| | | | | |
| Ratios (%) (to average net assets) and Supplemental data: | | | | | | | | | | | | | | | | | | | | |
Expenses before expense reductions (f) | | | 1.73 | | | | 1.75 | | | | 1.75 | | | | 1.72 | (c) | | | 1.71 | |
| | | | | |
Expenses after expense reductions (f) | | | 1.47 | | | | 1.49 | | | | 1.50 | | | | 1.48 | (c) | | | 1.47 | |
| | | | | |
Net investment income (loss) | | | 2.24 | | | | 2.87 | | | | 2.55 | | | | 2.74 | (c) | | | 2.96 | |
| | | | | |
Portfolio turnover | | | 30 | | | | 16 | | | | 11 | | | | 14 | | | | 17 | |
Net assets at end of period (000 omitted) | | | $626 | | | | $659 | | | | $1,007 | | | | $1,180 | | | | $1,477 | |
See Notes to Financial Statements
91
Financial Highlights – continued
MFS MISSISSIPPI MUNICIPAL BOND FUND – continued
| | | | | | | | | | | | | | | | |
| | | Year ended | |
| Class I | | 3/31/20 | | | 3/31/19 | | | 3/31/18 | | | 3/31/17 (i) | |
| | | | |
Net asset value, beginning of period | | | $9.63 | | | | $9.51 | | | | $9.62 | | | | $10.00 | |
| | | | |
| Income (loss) from investment operations | | | | | | | | | | | | | | | | |
Net investment income (loss) (d) | | | $0.29 | | | | $0.34 | | | | $0.32 | | | | $0.34 | (c) |
Net realized and unrealized gain (loss) | | | (0.02 | ) | | | 0.09 | | | | (0.11 | ) | | | (0.38 | ) |
Total from investment operations | | | $0.27 | | | | $0.43 | | | | $0.21 | | | | $(0.04 | ) |
| | | | |
| Less distributions declared to shareholders | | | | | | | | | | | | | | | | |
From net investment income | | | $(0.29 | ) | | | $(0.31 | ) | | | $(0.32 | ) | | | $(0.34 | ) |
Net asset value, end of period (x) | | | $9.61 | | | | $9.63 | | | | $9.51 | | | | $9.62 | |
Total return (%) (r)(s)(t)(x) | | | 2.79 | | | | 4.67 | | | | 2.15 | | | | (0.42 | )(c) |
| | | | |
| Ratios (%) (to average net assets) and Supplemental data: | | | | | | | | | | | | | | | | |
Expenses before expense reductions (f) | | | 0.72 | | | | 0.75 | | | | 0.74 | | | | 0.75 | (c) |
| | | | |
Expenses after expense reductions (f) | | | 0.71 | | | | 0.74 | | | | 0.74 | | | | 0.75 | (c) |
| | | | |
Net investment income (loss) | | | 2.96 | | | | 3.63 | | | | 3.29 | | | | 3.44 | (c) |
| | | | |
Portfolio turnover | | | 30 | | | | 16 | | | | 11 | | | | 14 | |
Net assets at end of period (000 omitted) | | | $11,374 | | | | $8,672 | | | | $6,540 | | | | $4,646 | |
| | |
| | | | | | Year ended | |
| Class��R6 | | | | | 3/31/20 | | | 3/31/19 | | | 3/31/18 (i) | |
| | | | |
Net asset value, beginning of period | | | | | | | $9.63 | | | | $9.51 | | | | $9.76 | |
| | | | |
| Income (loss) from investment operations | | | | | | | | | | | | | | | | |
Net investment income (loss) (d) | | | | | | | $0.29 | | | | $0.35 | | | | $0.21 | |
Net realized and unrealized gain (loss) | | | | | | | (0.01 | ) | | | 0.09 | | | | (0.24 | ) |
Total from investment operations | | | | | | | $0.28 | | | | $0.44 | | | | $(0.03 | ) |
| | | | |
| Less distributions declared to shareholders | | | | | | | | | | | | | | | | |
From net investment income | | | | | | | $(0.30 | ) | | | $(0.32 | ) | | | $(0.22 | ) |
Net asset value, end of period (x) | | | | | | | $9.61 | | | | $9.63 | | | | $9.51 | |
Total return (%) (r)(s)(t)(x) | | | | | | | 2.85 | | | | 4.74 | | | | (0.36 | )(n) |
| | | | |
| Ratios (%) (to average net assets) and Supplemental data: | | | | | | | | | | | | | | | | |
Expenses before expense reductions (f) | | | | | | | 0.66 | | | | 0.68 | | | | 0.71 | (a) |
| | | | |
Expenses after expense reductions (f) | | | | | | | 0.65 | | | | 0.67 | | | | 0.70 | (a) |
| | | | |
Net investment income (loss) | | | | | | | 2.95 | | | | 3.71 | | | | 3.33 | (a) |
| | | | |
Portfolio turnover | | | | | | | 30 | | | | 16 | | | | 11 | |
Net assets at end of period (000 omitted) | | | | | | | $2,384 | | | | $867 | | | | $560 | |
| (c) | Amount reflects aone-time reimbursement of expenses by the custodian (or former custodian) without which net investment income and performance would be lower and expenses would be higher. |
| (d) | Per share data is based on average shares outstanding. |
| (f) | Ratios do not reflect reductions from fees paid indirectly, if applicable. |
| (i) | For Class I and Class R6, the period is from the class inception, April 1, 2016 (Class I) and August 1, 2017 (Class R6), through the stated period end. |
| (r) | Certain expenses have been reduced without which performance would have been lower. |
| (s) | From time to time the fund may receive proceeds from litigation settlements, without which performance would be lower. |
| (t) | Total returns do not include any applicable sales charges. |
| (w) | Per share amount was less than $0.01. |
| (x) | The net asset values and total returns have been calculated on net assets which include adjustments made in accordance with U.S. generally accepted accounting principles required at period end for financial reporting purposes. |
See Notes to Financial Statements
92
Financial Highlights – continued
MFS NEW YORK MUNICIPAL BOND FUND
The financial highlights table is intended to help you understand the fund’s financial performance for the past 5 years (or life of a particular share class, if shorter). Certain information reflects financial results for a single fund share. The total returns in the table represent the rate that an investor would have earned (or lost) on an investment in the fund share class (assuming reinvestment of all distributions) held for the entire period.
| | | | | | | | | | | | | | | | | | | | |
| | | Year ended | |
| Class A | | 3/31/20 | | | 3/31/19 | | | 3/31/18 | | | 3/31/17 | | | 3/31/16 | |
| | | | | |
Net asset value, beginning of period | | | $11.00 | | | | $10.87 | | | | $10.93 | | | | $11.31 | | | | $11.25 | |
| | | | | |
| Income (loss) from investment operations | | | | | | | | | | | | | | | | | | | | |
Net investment income (loss) (d) | | | $0.31 | | | | $0.40 | | | | $0.40 | | | | $0.41 | (c) | | | $0.43 | |
Net realized and unrealized gain (loss) | | | (0.08 | ) | | | 0.11 | | | | (0.08 | ) | | | (0.39 | ) | | | 0.01 | |
Total from investment operations | | | $0.23 | | | | $0.51 | | | | $0.32 | | | | $0.02 | | | | $0.44 | |
| | | | | |
| Less distributions declared to shareholders | | | | | | | | | | | | | | | | | | | | |
From net investment income | | | $(0.30 | ) | | | $(0.38 | ) | | | $(0.38 | ) | | | $(0.40 | ) | | | $(0.38 | ) |
Net asset value, end of period (x) | | | $10.93 | | | | $11.00 | | | | $10.87 | | | | $10.93 | | | | $11.31 | |
Total return (%) (r)(s)(t)(x) | | | 2.08 | | | | 4.82 | | | | 2.89 | | | | 0.15 | (c) | | | 4.05 | |
| | | | | |
| Ratios (%) (to average net assets) and Supplemental data: | | | | | | | | | | | | | | | | | | | | |
Expenses before expense reductions (f) | | | 0.88 | | | | 0.89 | | | | 0.89 | | | | 0.89 | (c) | | | 0.88 | |
| | | | | |
Expenses after expense reductions (f) | | | 0.86 | | | | 0.88 | | | | 0.88 | | | | 0.88 | (c) | | | 0.87 | |
| | | | | |
Net investment income (loss) | | | 2.73 | | | | 3.75 | | | | 3.60 | | | | 3.68 | (c) | | | 3.84 | |
| | | | | |
Portfolio turnover | | | 25 | | | | 17 | | | | 23 | | | | 28 | | | | 13 | |
Net assets at end of period (000 omitted) | | | $174,514 | | | | $154,803 | | | | $143,689 | | | | $124,890 | | | | $169,905 | |
| |
| | | Year ended | |
| Class B | | 3/31/20 | | | 3/31/19 | | | 3/31/18 | | | 3/31/17 | | | 3/31/16 | |
| | | | | |
Net asset value, beginning of period | | | $10.97 | | | | $10.84 | | | | $10.90 | | | | $11.28 | | | | $11.22 | |
| | | | | |
| Income (loss) from investment operations | | | | | | | | | | | | | | | | | | | | |
Net investment income (loss) (d) | | | $0.22 | | | | $0.32 | | | | $0.32 | | | | $0.33 | (c) | | | $0.34 | |
Net realized and unrealized gain (loss) | | | (0.07 | ) | | | 0.11 | | | | (0.09 | ) | | | (0.40 | ) | | | 0.02 | |
Total from investment operations | | | $0.15 | | | | $0.43 | | | | $0.23 | | | | $(0.07 | ) | | | $0.36 | |
| | | | | |
| Less distributions declared to shareholders | | | | | | | | | | | | | | | | | | | | |
From net investment income | | | $(0.22 | ) | | | $(0.30 | ) | | | $(0.29 | ) | | | $(0.31 | ) | | | $(0.30 | ) |
Net asset value, end of period (x) | | | $10.90 | | | | $10.97 | | | | $10.84 | | | | $10.90 | | | | $11.28 | |
Total return (%) (r)(s)(t)(x) | | | 1.32 | | | | 4.05 | | | | 2.12 | | | | (0.60 | )(c) | | | 3.28 | |
| | | | | |
| Ratios (%) (to average net assets) and Supplemental data: | | | | | | | | | | | | | | | | | | | | |
Expenses before expense reductions (f) | | | 1.63 | | | | 1.64 | | | | 1.64 | | | | 1.64 | (c) | | | 1.63 | |
| | | | | |
Expenses after expense reductions (f) | | | 1.62 | | | | 1.63 | | | | 1.64 | | | | 1.63 | (c) | | | 1.63 | |
| | | | | |
Net investment income (loss) | | | 2.00 | | | | 3.01 | | | | 2.87 | | | | 2.94 | (c) | | | 3.10 | |
| | | | | |
Portfolio turnover | | | 25 | | | | 17 | | | | 23 | | | | 28 | | | | 13 | |
Net assets at end of period (000 omitted) | | | $2,193 | | | | $2,876 | | | | $3,980 | | | | $5,032 | | | | $5,398 | |
See Notes to Financial Statements
93
Financial Highlights – continued
MFS NEW YORK MUNICIPAL BOND FUND – continued
| | | | | | | | | | | | | | | | | | | | |
| | | Year ended | |
| Class C | | 3/31/20 | | | 3/31/19 | | | 3/31/18 | | | 3/31/17 | | | 3/31/16 | |
| | | | | |
Net asset value, beginning of period | | | $10.98 | | | | $10.86 | | | | $10.92 | | | | $11.30 | | | | $11.23 | |
| | | | | |
| Income (loss) from investment operations | | | | | | | | | | | | | | | | | | | | |
Net investment income (loss) (d) | | | $0.22 | | | | $0.32 | | | | $0.31 | | | | $0.33 | (c) | | | $0.34 | |
Net realized and unrealized gain (loss) | | | (0.07 | ) | | | 0.10 | | | | (0.08 | ) | | | (0.39 | ) | | | 0.03 | |
Total from investment operations | | | $0.15 | | | | $0.42 | | | | $0.23 | | | | $(0.06 | ) | | | $0.37 | |
| | | | | |
| Less distributions declared to shareholders | | | | | | | | | | | | | | | | | | | | |
From net investment income | | | $(0.22 | ) | | | $(0.30 | ) | | | $(0.29 | ) | | | $(0.32 | ) | | | $(0.30 | ) |
Net asset value, end of period (x) | | | $10.91 | | | | $10.98 | | | | $10.86 | | | | $10.92 | | | | $11.30 | |
Total return (%) (r)(s)(t)(x) | | | 1.32 | | | | 3.95 | | | | 2.12 | | | | (0.60 | )(c) | | | 3.37 | |
| | | | | |
| Ratios (%) (to average net assets) and Supplemental data: | | | | | | | | | | | | | | | | | | | | |
Expenses before expense reductions (f) | | | 1.63 | | | | 1.64 | | | | 1.64 | | | | 1.64 | (c) | | | 1.63 | |
| | | | | |
Expenses after expense reductions (f) | | | 1.62 | | | | 1.63 | | | | 1.64 | | | | 1.63 | (c) | | | 1.62 | |
| | | | | |
Net investment income (loss) | | | 1.98 | | | | 2.99 | | | | 2.85 | | | | 2.94 | (c) | | | 3.09 | |
| | | | | |
Portfolio turnover | | | 25 | | | | 17 | | | | 23 | | | | 28 | | | | 13 | |
Net assets at end of period (000 omitted) | | | $15,471 | | | | $16,953 | | | | $22,932 | | | | $25,246 | | | | $26,751 | |
| | |
| | | | | | Year ended | |
| Class I | | | | | 3/31/20 | | | 3/31/19 | | | 3/31/18 | | | 3/31/17 (i) | |
| | | | | |
Net asset value, beginning of period | | | | | | | $9.73 | | | | $9.61 | | | | $9.67 | | | | $10.00 | |
| | | | | |
| Income (loss) from investment operations | | | | | | | | | | | | | | | | | | | | |
Net investment income (loss) (d) | | | | | | | $0.30 | | | | $0.38 | | | | $0.38 | | | | $0.39 | (c) |
Net realized and unrealized gain (loss) | | | | | | | (0.08 | ) | | | 0.10 | | | | (0.08 | ) | | | (0.34 | ) |
Total from investment operations | | | | | | | $0.22 | | | | $0.48 | | | | $0.30 | | | | $0.05 | |
| | | | | |
| Less distributions declared to shareholders | | | | | | | | | | | | | | | | | | | | |
From net investment income | | | | | | | $(0.29 | ) | | | $(0.36 | ) | | | $(0.36 | ) | | | $(0.38 | ) |
Net asset value, end of period (x) | | | | | | | $9.66 | | | | $9.73 | | | | $9.61 | | | | $9.67 | |
Total return (%) (r)(s)(t)(x) | | | | | | | 2.25 | | | | 5.13 | | | | 3.07 | | | | 0.49 | (c) |
| | | | | |
| Ratios (%) (to average net assets) and Supplemental data: | | | | | | | | | | | | | | | | | | | | |
Expenses before expense reductions (f) | | | | | | | 0.63 | | | | 0.64 | | | | 0.64 | | | | 0.64 | (c) |
| | | | | |
Expenses after expense reductions (f) | | | | | | | 0.62 | | | | 0.63 | | | | 0.64 | | | | 0.64 | (c) |
| | | | | |
Net investment income (loss) | | | | | | | 2.97 | | | | 3.99 | | | | 3.84 | | | | 3.97 | (c) |
| | | | | |
Portfolio turnover | | | | | | | 25 | | | | 17 | | | | 23 | | | | 28 | |
Net assets at end of period (000 omitted) | | | | | | | $83,586 | | | | $68,415 | | | | $57,349 | | | | $50,414 | |
See Notes to Financial Statements
94
Financial Highlights – continued
MFS NEW YORK MUNICIPAL BOND FUND – continued
| | | | | | | | | | | | |
| | | Year ended | |
| Class R6 | | 3/31/20 | | | 3/31/19 | | | 3/31/18 (i) | |
| | | |
Net asset value, beginning of period | | | $9.73 | | | | $9.61 | | | | $9.83 | |
| | | |
| Income (loss) from investment operations | | | | | | | | | | | | |
Net investment income (loss) (d) | | | $0.30 | | | | $0.39 | | | | $0.24 | |
Net realized and unrealized gain (loss) | | | (0.07 | ) | | | 0.10 | | | | (0.23 | ) |
Total from investment operations | | | $0.23 | | | | $0.49 | | | | $0.01 | |
| | | |
| Less distributions declared to shareholders | | | | | | | | | | | | |
From net investment income | | | $(0.30 | ) | | | $(0.37 | ) | | | $(0.23 | ) |
Net asset value, end of period (x) | | | $9.66 | | | | $9.73 | | | | $9.61 | |
Total return (%) (r)(s)(t)(x) | | | 2.31 | | | | 5.19 | | | | 0.11 | (n) |
| | | |
| Ratios (%) (to average net assets) and Supplemental data: | | | | | | | | | | | | |
Expenses before expense reductions (f) | | | 0.56 | | | | 0.57 | | | | 0.60 | (a) |
| | | |
Expenses after expense reductions (f) | | | 0.55 | | | | 0.57 | | | | 0.59 | (a) |
| | | |
Net investment income (loss) | | | 3.01 | | | | 4.04 | | | | 3.80 | (a) |
| | | |
Portfolio turnover | | | 25 | | | | 17 | | | | 23 | |
Net assets at end of period (000 omitted) | | | $3,092 | | | | $1,914 | | | | $1,293 | |
| (c) | Amount reflects aone-time reimbursement of expenses by the custodian (or former custodian) without which net investment income and performance would be lower and expenses would be higher. |
| (d) | Per share data is based on average shares outstanding. |
| (f) | Ratios do not reflect reductions from fees paid indirectly, if applicable. |
| (i) | For Class I and Class R6, the period is from the class inception, April 1, 2016 (Class I) and August 1, 2017 (Class R6), through the stated period end. |
| (r) | Certain expenses have been reduced without which performance would have been lower. |
| (s) | From time to time the fund may receive proceeds from litigation settlements, without which performance would be lower. |
| (t) | Total returns do not include any applicable sales charges. |
| (x) | The net asset values and total returns have been calculated on net assets which include adjustments made in accordance with U.S. generally accepted accounting principles required at period end for financial reporting purposes. |
See Notes to Financial Statements
95
Financial Highlights – continued
MFS NORTH CAROLINA MUNICIPAL BOND FUND
The financial highlights table is intended to help you understand the fund’s financial performance for the past 5 years (or life of a particular share class, if shorter). Certain information reflects financial results for a single fund share. The total returns in the table represent the rate that an investor would have earned (or lost) on an investment in the fund share class (assuming reinvestment of all distributions) held for the entire period.
| | | | | | | | | | | | | | | | | | | | |
| | | Year ended | |
| Class A | | 3/31/20 | | | 3/31/19 | | | 3/31/18 | | | 3/31/17 | | | 3/31/16 | |
| | | | | |
Net asset value, beginning of period | | | $11.59 | | | | $11.48 | | | | $11.59 | | | | $12.01 | | | | $12.00 | |
| | | | | |
| Income (loss) from investment operations | | | | | | | | | | | | | | | | | | | | |
Net investment income (loss) (d) | | | $0.32 | | | | $0.40 | | | | $0.40 | | | | $0.41 | (c) | | | $0.42 | |
Net realized and unrealized gain (loss) | | | (0.13 | ) | | | 0.07 | | | | (0.14 | ) | | | (0.42 | ) | | | (0.01 | ) |
Total from investment operations | | | $0.19 | | | | $0.47 | | | | $0.26 | | | | $(0.01 | ) | | | $0.41 | |
| | | | | |
| Less distributions declared to shareholders | | | | | | | | | | | | | | | | | | | | |
From net investment income | | | $(0.33 | ) | | | $(0.36 | ) | | | $(0.37 | ) | | | $(0.41 | ) | | | $(0.40 | ) |
Net asset value, end of period (x) | | | $11.45 | | | | $11.59 | | | | $11.48 | | | | $11.59 | | | | $12.01 | |
Total return (%) (r)(s)(t)(x) | | | 1.55 | | | | 4.23 | | | | 2.28 | | | | (0.14 | )(c) | | | 3.48 | |
| | | | | |
| Ratios (%) (to average net assets) and Supplemental data: | | | | | | | | | | | | | | | | | | | | |
Expenses before expense reductions (f) | | | 0.85 | | | | 0.86 | | | | 0.87 | | | | 0.87 | (c) | | | 0.87 | |
| | | | | |
Expenses after expense reductions (f) | | | 0.83 | | | | 0.85 | | | | 0.86 | | | | 0.86 | (c) | | | 0.86 | |
| | | | | |
Net investment income (loss) | | | 2.72 | | | | 3.53 | | | | 3.39 | | | | 3.48 | (c) | | | 3.52 | |
| | | | | |
Portfolio turnover | | | 28 | | | | 19 | | | | 12 | | | | 22 | | | | 9 | |
Net assets at end of period (000 omitted) | | | $326,916 | | | | $295,515 | | | | $283,545 | | | | $263,433 | | | | $289,167 | |
| |
| | | Year ended | |
| Class B | | 3/31/20 | | | 3/31/19 | | | 3/31/18 | | | 3/31/17 | | | 3/31/16 | |
| | | | | |
Net asset value, beginning of period | | | $11.57 | | | | $11.46 | | | | $11.58 | | | | $11.99 | | | | $11.98 | |
| | | | | |
| Income (loss) from investment operations | | | | | | | | | | | | | | | | | | | | |
Net investment income (loss) (d) | | | $0.24 | | | | $0.32 | | | | $0.31 | | | | $0.32 | (c) | | | $0.33 | |
Net realized and unrealized gain (loss) | | | (0.13 | ) | | | 0.07 | | | | (0.14 | ) | | | (0.41 | ) | | | (0.01 | ) |
Total from investment operations | | | $0.11 | | | | $0.39 | | | | $0.17 | | | | $(0.09 | ) | | | $0.32 | |
| | | | | |
| Less distributions declared to shareholders | | | | | | | | | | | | | | | | | | | | |
From net investment income | | | $(0.24 | ) | | | $(0.28 | ) | | | $(0.29 | ) | | | $(0.32 | ) | | | $(0.31 | ) |
Net asset value, end of period (x) | | | $11.44 | | | | $11.57 | | | | $11.46 | | | | $11.58 | | | | $11.99 | |
Total return (%) (r)(s)(t)(x) | | | 0.88 | | | | 3.46 | | | | 1.43 | | | | (0.81 | )(c) | | | 2.71 | |
| | | | | |
| Ratios (%) (to average net assets) and Supplemental data: | | | | | | | | | | | | | | | | | | | | |
Expenses before expense reductions (f) | | | 1.61 | | | | 1.62 | | | | 1.62 | | | | 1.62 | (c) | | | 1.62 | |
| | | | | |
Expenses after expense reductions (f) | | | 1.59 | | | | 1.61 | | | | 1.62 | | | | 1.61 | (c) | | | 1.61 | |
| | | | | |
Net investment income (loss) | | | 2.01 | | | | 2.78 | | | | 2.65 | | | | 2.73 | (c) | | | 2.78 | |
| | | | | |
Portfolio turnover | | | 28 | | | | 19 | | | | 12 | | | | 22 | | | | 9 | |
Net assets at end of period (000 omitted) | | | $788 | | | | $1,299 | | | | $2,288 | | | | $3,303 | | | | $4,213 | |
See Notes to Financial Statements
96
Financial Highlights – continued
MFS NORTH CAROLINA MUNICIPAL BOND FUND – continued
| | | | | | | | | | | | | | | | | | | | |
| | | Year ended | |
| Class C | | 3/31/20 | | | 3/31/19 | | | 3/31/18 | | | 3/31/17 | | | 3/31/16 | |
| | | | | |
Net asset value, beginning of period | | | $11.58 | | | | $11.47 | | | | $11.59 | | | | $12.00 | | | | $11.99 | |
| | | | | |
| Income (loss) from investment operations | | | | | | | | | | | | | | | | | | | | |
Net investment income (loss) (d) | | | $0.23 | | | | $0.32 | | | | $0.31 | | | | $0.32 | (c) | | | $0.33 | |
Net realized and unrealized gain (loss) | | | (0.12 | ) | | | 0.07 | | | | (0.14 | ) | | | (0.41 | ) | | | (0.01 | ) |
Total from investment operations | | | $0.11 | | | | $0.39 | | | | $0.17 | | | | $(0.09 | ) | | | $0.32 | |
| | | | | |
| Less distributions declared to shareholders | | | | | | | | | | | | | | | | | | | | |
From net investment income | | | $(0.24 | ) | | | $(0.28 | ) | | | $(0.29 | ) | | | $(0.32 | ) | | | $(0.31 | ) |
Net asset value, end of period (x) | | | $11.45 | | | | $11.58 | | | | $11.47 | | | | $11.59 | | | | $12.00 | |
Total return (%) (r)(s)(t)(x) | | | 0.88 | | | | 3.45 | | | | 1.42 | | | | (0.81 | )(c) | | | 2.71 | |
| | | | | |
| Ratios (%) (to average net assets) and Supplemental data: | | | | | | | | | | | | | | | | | | | | |
Expenses before expense reductions (f) | | | 1.61 | | | | 1.62 | | | | 1.62 | | | | 1.62 | (c) | | | 1.62 | |
| | | | | |
Expenses after expense reductions (f) | | | 1.59 | | | | 1.61 | | | | 1.62 | | | | 1.61 | (c) | | | 1.61 | |
| | | | | |
Net investment income (loss) | | | 1.96 | | | | 2.78 | | | | 2.64 | | | | 2.73 | (c) | | | 2.77 | |
| | | | | |
Portfolio turnover | | | 28 | | | | 19 | | | | 12 | | | | 22 | | | | 9 | |
Net assets at end of period (000 omitted) | | | $45,135 | | | | $38,639 | | | | $53,117 | | | | $57,868 | | | | $57,161 | |
| | |
| | | | | | Year ended | |
| Class I | | | | | 3/31/20 | | | 3/31/19 | | | 3/31/18 | | | 3/31/17 (i) | |
| | | | | |
Net asset value, beginning of period | | | | | | | $9.66 | | | | $9.57 | | | | $9.66 | | | | $10.00 | |
| | | | | |
| Income (loss) from investment operations | | | | | | | | | | | | | | | | | | | | |
Net investment income (loss) (d) | | | | | | | $0.29 | | | | $0.36 | | | | $0.35 | | | | $0.37 | (c) |
Net realized and unrealized gain (loss) | | | | | | | (0.10 | ) | | | 0.06 | | | | (0.10 | ) | | | (0.34 | ) |
Total from investment operations | | | | | | | $0.19 | | | | $0.42 | | | | $0.25 | | | | $0.03 | |
| | | | | |
| Less distributions declared to shareholders | | | | | | | | | | | | | | | | | | | | |
From net investment income | | | | | | | $(0.30 | ) | | | $(0.33 | ) | | | $(0.34 | ) | | | $(0.37 | ) |
Net asset value, end of period (x) | | | | | | | $9.55 | | | | $9.66 | | | | $9.57 | | | | $9.66 | |
Total return (%) (r)(s)(t)(x) | | | | | | | 1.87 | | | | 4.46 | | | | 2.54 | | | | 0.23 | (c) |
| | | | | |
| Ratios (%) (to average net assets) and Supplemental data: | | | | | | | | | | | | | | | | | | | | |
Expenses before expense reductions (f) | | | | | | | 0.60 | | | | 0.61 | | | | 0.62 | | | | 0.62 | (c) |
| | | | | |
Expenses after expense reductions (f) | | | | | | | 0.59 | | | | 0.60 | | | | 0.61 | | | | 0.62 | (c) |
| | | | | |
Net investment income (loss) | | | | | | | 2.95 | | | | 3.77 | | | | 3.62 | | | | 3.71 | (c) |
| | | | | |
Portfolio turnover | | | | | | | 28 | | | | 19 | | | | 12 | | | | 22 | |
Net assets at end of period (000 omitted) | | | | | | | $83,861 | | | | $58,802 | | | | $45,147 | | | | $38,561 | |
See Notes to Financial Statements
97
Financial Highlights – continued
MFS NORTH CAROLINA MUNICIPAL BOND FUND – continued
| | | | | | | | | | | | |
| | | Year ended | |
| Class R6 | | 3/31/20 | | | 3/31/19 | | | 3/31/18 (i) | |
| | | |
Net asset value, beginning of period | | | $9.66 | | | | $9.57 | | | | $9.78 | |
| | | |
| Income (loss) from investment operations | | | | | | | | | | | | |
Net investment income (loss) (d) | | | $0.30 | | | | $0.37 | | | | $0.23 | |
Net realized and unrealized gain (loss) | | | (0.11 | ) | | | 0.05 | | | | (0.22 | ) |
Total from investment operations | | | $0.19 | | | | $0.42 | | | | $0.01 | |
| | | |
| Less distributions declared to shareholders | | | | | | | | | | | | |
From net investment income | | | $(0.30 | ) | | | $(0.33 | ) | | | $(0.22 | ) |
Net asset value, end of period (x) | | | $9.55 | | | | $9.66 | | | | $9.57 | |
Total return (%) (r)(s)(t)(x) | | | 1.94 | | | | 4.54 | | | | 0.15 | (n) |
| | | |
| Ratios (%) (to average net assets) and Supplemental data: | | | | | | | | | | | | |
Expenses before expense reductions (f) | | | 0.53 | | | | 0.54 | | | | 0.55 | (a) |
| | | |
Expenses after expense reductions (f) | | | 0.52 | | | | 0.53 | | | | 0.55 | (a) |
| | | |
Net investment income (loss) | | | 3.01 | | | | 3.85 | | | | 3.64 | (a) |
| | | |
Portfolio turnover | | | 28 | | | | 19 | | | | 12 | |
Net assets at end of period (000 omitted) | | | $24,040 | | | | $16,161 | | | | $13,198 | |
| (c) | Amount reflects aone-time reimbursement of expenses by the custodian (or former custodian) without which net investment income and performance would be lower and expenses would be higher. |
| (d) | Per share data is based on average shares outstanding. |
| (f) | Ratios do not reflect reductions from fees paid indirectly, if applicable. |
| (i) | For Class I and Class R6, the period is from the class inception, April 1, 2016 (Class I) and August 1, 2017 (Class R6), through the stated period end. |
| (r) | Certain expenses have been reduced without which performance would have been lower. |
| (s) | From time to time the fund may receive proceeds from litigation settlements, without which performance would be lower. |
| (t) | Total returns do not include any applicable sales charges. |
| (x) | The net asset values and total returns have been calculated on net assets which include adjustments made in accordance with U.S. generally accepted accounting principles required at period end for financial reporting purposes. |
See Notes to Financial Statements
98
Financial Highlights – continued
MFS PENNSYLVANIA MUNICIPAL BOND FUND
The financial highlights table is intended to help you understand the fund’s financial performance for the past 5 years (or life of a particular share class, if shorter). Certain information reflects financial results for a single fund share. The total returns in the table represent the rate that an investor would have earned (or lost) on an investment in the fund share class (assuming reinvestment of all distributions) held for the entire period.
| | | | | | | | | | | | | | | | | | | | |
| | | Year ended | |
| Class A | | 3/31/20 | | | 3/31/19 | | | 3/31/18 | | | 3/31/17 | | | 3/31/16 | |
| | | | | |
Net asset value, beginning of period | | | $10.26 | | | | $10.15 | | | | $10.19 | | | | $10.50 | | | | $10.44 | |
| | | | | |
| Income (loss) from investment operations | | | | | | | | | | | | | | | | | | | | |
Net investment income (loss) (d) | | | $0.33 | | | | $0.40 | | | | $0.40 | | | | $0.38 | | | | $0.39 | |
Net realized and unrealized gain (loss) | | | (0.02 | ) | | | 0.07 | | | | (0.07 | ) | | | (0.32 | ) | | | 0.03 | |
Total from investment operations | | | $0.31 | | | | $0.47 | | | | $0.33 | | | | $0.06 | | | | $0.42 | |
| | | | | |
| Less distributions declared to shareholders | | | | | | | | | | | | | | | | | | | | |
From net investment income | | | $(0.33 | ) | | | $(0.36 | ) | | | $(0.37 | ) | | | $(0.37 | ) | | | $(0.36 | ) |
Net asset value, end of period (x) | | | $10.24 | | | | $10.26 | | | | $10.15 | | | | $10.19 | | | | $10.50 | |
Total return (%) (r)(s)(t)(x) | | | 2.97 | | | | 4.73 | | | | 3.29 | | | | 0.57 | | | | 4.16 | |
| | | | | |
| Ratios (%) (to average net assets) and Supplemental data: | | | | | | | | | | | | | | | | | | | | |
Expenses before expense reductions (f) | | | 0.94 | | | | 0.96 | | | | 0.97 | | | | 0.96 | | | | 0.94 | |
| | | | | |
Expenses after expense reductions (f) | | | 0.78 | | | | 0.80 | | | | 0.81 | | | | 0.80 | | | | 0.79 | |
| | | | | |
Net investment income (loss) | | | 3.13 | | | | 3.91 | | | | 3.90 | | | | 3.64 | | | | 3.73 | |
| | | | | |
Portfolio turnover | | | 17 | | | | 16 | | | | 16 | | | | 15 | | | | 16 | |
Net assets at end of period (000 omitted) | | | $117,575 | | | | $105,777 | | | | $99,319 | | | | $98,907 | | | | $115,732 | |
| |
| | | Year ended | |
| Class B | | 3/31/20 | | | 3/31/19 | | | 3/31/18 | | | 3/31/17 | | | 3/31/16 | |
| | | | | |
Net asset value, beginning of period | | | $10.29 | | | | $10.18 | | | | $10.21 | | | | $10.52 | | | | $10.47 | |
| | | | | |
| Income (loss) from investment operations | | | | | | | | | | | | | | | | | | | | |
Net investment income (loss) (d) | | | $0.25 | | | | $0.32 | | | | $0.32 | | | | $0.30 | | | | $0.31 | |
Net realized and unrealized gain (loss) | | | (0.02 | ) | | | 0.07 | | | | (0.05 | ) | | | (0.32 | ) | | | 0.02 | |
Total from investment operations | | | $0.23 | | | | $0.39 | | | | $0.27 | | | | $(0.02 | ) | | | $0.33 | |
| | | | | |
| Less distributions declared to shareholders | | | | | | | | | | | | | | | | | | | | |
From net investment income | | | $(0.25 | ) | | | $(0.28 | ) | | | $(0.30 | ) | | | $(0.29 | ) | | | $(0.28 | ) |
Net asset value, end of period (x) | | | $10.27 | | | | $10.29 | | | | $10.18 | | | | $10.21 | | | | $10.52 | |
Total return (%) (r)(s)(t)(x) | | | 2.21 | | | | 3.95 | | | | 2.62 | | | | (0.19 | ) | | | 3.26 | |
| | | | | |
| Ratios (%) (to average net assets) and Supplemental data: | | | | | | | | | | | | | | | | | | | | |
Expenses before expense reductions (f) | | | 1.69 | | | | 1.71 | | | | 1.72 | | | | 1.71 | | | | 1.69 | |
| | | | | |
Expenses after expense reductions (f) | | | 1.53 | | | | 1.55 | | | | 1.56 | | | | 1.56 | | | | 1.54 | |
| | | | | |
Net investment income (loss) | | | 2.40 | | | | 3.15 | | | | 3.15 | | | | 2.87 | | | | 2.96 | |
| | | | | |
Portfolio turnover | | | 17 | | | | 16 | | | | 16 | | | | 15 | | | | 16 | |
Net assets at end of period (000 omitted) | | | $1,507 | | | | $2,373 | | | | $3,462 | | | | $4,740 | | | | $5,647 | |
See Notes to Financial Statements
99
Financial Highlights – continued
MFS PENNSYLVANIA MUNICIPAL BOND FUND – continued
| | | | | | | | | | | | | | | | |
| | | Year ended | |
| Class I | | 3/31/20 | | | 3/31/19 | | | 3/31/18 | | | 3/31/17 (i) | |
| | | | |
Net asset value, beginning of period | | | $9.78 | | | | $9.67 | | | | $9.71 | | | | $10.00 | |
| | | | |
| Income (loss) from investment operations | | | | | | | | | | | | | | | | |
Net investment income (loss) (d) | | | $0.32 | | | | $0.38 | | | | $0.39 | | | | $0.36 | |
Net realized and unrealized gain (loss) | | | (0.02 | ) | | | 0.08 | | | | (0.07 | ) | | | (0.29 | ) |
Total from investment operations | | | $0.30 | | | | $0.46 | | | | $0.32 | | | | $0.07 | |
| | | | |
| Less distributions declared to shareholders | | | | | | | | | | | | | | | | |
From net investment income | | | $(0.32 | ) | | | $(0.35 | ) | | | $(0.36 | ) | | | $(0.36 | ) |
Net asset value, end of period (x) | | | $9.76 | | | | $9.78 | | | | $9.67 | | | | $9.71 | |
Total return (%) (r)(s)(t)(x) | | | 3.06 | | | | 4.88 | | | | 3.37 | | | | 0.73 | |
| | | | |
| Ratios (%) (to average net assets) and Supplemental data: | | | | | | | | | | | | | | | | |
Expenses before expense reductions (f) | | | 0.69 | | | | 0.71 | | | | 0.71 | | | | 0.74 | |
| | | | |
Expenses after expense reductions (f) | | | 0.68 | | | | 0.70 | | | | 0.71 | | | | 0.73 | |
| | | | |
Net investment income (loss) | | | 3.21 | | | | 4.00 | | | | 3.99 | | | | 3.69 | |
| | | | |
Portfolio turnover | | | 17 | | | | 16 | | | | 16 | | | | 15 | |
Net assets at end of period (000 omitted) | | | $26,064 | | | | $20,253 | | | | $20,579 | | | | $19,388 | |
| | |
| | | | | | Year ended | |
| Class R6 | | | | | 3/31/20 | | | 3/31/19 | | | 3/31/18 (i) | |
| | | | |
Net asset value, beginning of period | | | | | | | $9.78 | | | | $9.67 | | | | $9.84 | |
| | | | |
| Income (loss) from investment operations | | | | | | | | | | | | | | | | |
Net investment income (loss) (d) | | | | | | | $0.33 | | | | $0.40 | | | | $0.26 | |
Net realized and unrealized gain (loss) | | | | | | | (0.02 | ) | | | 0.07 | | | | (0.18 | ) |
Total from investment operations | | | | | | | $0.31 | | | | $0.47 | | | | $0.08 | |
| | | | |
| Less distributions declared to shareholders | | | | | | | | | | | | | | | | |
From net investment income | | | | | | | $(0.33 | ) | | | $(0.36 | ) | | | $(0.25 | ) |
Net asset value, end of period (x) | | | | | | | $9.76 | | | | $9.78 | | | | $9.67 | |
Total return (%) (r)(s)(t)(x) | | | | | | | 3.13 | | | | 4.94 | | | | 0.78 | (n) |
| | | | |
| Ratios (%) (to average net assets) and Supplemental data: | | | | | | | | | | | | | | | | |
Expenses before expense reductions (f) | | | | | | | 0.61 | | | | 0.64 | | | | 0.67 | (a) |
| | | | |
Expenses after expense reductions (f) | | | | | | | 0.60 | | | | 0.63 | | | | 0.66 | (a) |
| | | | |
Net investment income (loss) | | | | | | | 3.28 | | | | 4.13 | | | | 4.02 | (a) |
| | | | |
Portfolio turnover | | | | | | | 17 | | | | 16 | | | | 16 | |
Net assets at end of period (000 omitted) | | | | | | | $13,031 | | | | $10,736 | | | | $1,205 | |
| (d) | Per share data is based on average shares outstanding. |
| (f) | Ratios do not reflect reductions from fees paid indirectly, if applicable. |
| (i) | For Class I and Class R6, the period is from the class inception, April 1, 2016 (Class I) and August 1, 2017 (Class R6), through the stated period end. |
| (r) | Certain expenses have been reduced without which performance would have been lower. |
| (s) | From time to time the fund may receive proceeds from litigation settlements, without which performance would be lower. |
| (t) | Total returns do not include any applicable sales charges. |
| (x) | The net asset values and total returns have been calculated on net assets which include adjustments made in accordance with U.S. generally accepted accounting principles required at period end for financial reporting purposes. |
See Notes to Financial Statements
100
Financial Highlights – continued
MFS SOUTH CAROLINA MUNICIPAL BOND FUND
The financial highlights table is intended to help you understand the fund’s financial performance for the past 5 years (or life of a particular share class, if shorter). Certain information reflects financial results for a single fund share. The total returns in the table represent the rate that an investor would have earned (or lost) on an investment in the fund share class (assuming reinvestment of all distributions) held for the entire period.
| | | | | | | | | | | | | | | | | | | | |
| | | Year ended | |
| Class A | | 3/31/20 | | | 3/31/19 | | | 3/31/18 | | | 3/31/17 | | | 3/31/16 | |
| | | | | |
Net asset value, beginning of period | | | $11.97 | | | | $11.83 | | | | $11.91 | | | | $12.35 | | | | $12.29 | |
| | | | | |
| Income (loss) from investment operations | | | | | | | | | | | | | | | | | | | | |
Net investment income (loss) (d) | | | $0.33 | | | | $0.41 | | | | $0.38 | | | | $0.39 | (c) | | | $0.39 | |
Net realized and unrealized gain (loss) | | | (0.04 | ) | | | 0.10 | | | | (0.09 | ) | | | (0.46 | ) | | | 0.03 | |
Total from investment operations | | | $0.29 | | | | $0.51 | | | | $0.29 | | | | $(0.07 | ) | | | $0.42 | |
| | | | | |
| Less distributions declared to shareholders | | | | | | | | | | | | | | | | | | | | |
From net investment income | | | $(0.32 | ) | | | $(0.37 | ) | | | $(0.37 | ) | | | $(0.37 | ) | | | $(0.36 | ) |
Net asset value, end of period (x) | | | $11.94 | | | | $11.97 | | | | $11.83 | | | | $11.91 | | | | $12.35 | |
Total return (%) (r)(s)(t)(x) | | | 2.44 | | | | 4.39 | | | | 2.41 | | | | (0.56 | )(c) | | | 3.52 | |
| | | | | |
| Ratios (%) (to average net assets) and Supplemental data: | | | | | | | | | | | | | | | | | | | | |
Expenses before expense reductions (f) | | | 0.88 | | | | 0.90 | | | | 0.91 | | | | 0.90 | (c) | | | 0.89 | |
| | | | | |
Expenses after expense reductions (f) | | | 0.84 | | | | 0.84 | | | | 0.84 | | | | 0.83 | (c) | | | 0.85 | |
| | | | | |
Net investment income (loss) | | | 2.68 | | | | 3.49 | | | | 3.20 | | | | 3.19 | (c) | | | 3.17 | |
| | | | | |
Portfolio turnover | | | 22 | | | | 14 | | | | 15 | | | | 19 | | | | 8 | |
Net assets at end of period (000 omitted) | | | $192,059 | | | | $156,427 | | | | $159,257 | | | | $169,953 | | | | $176,282 | |
| |
| | | Year ended | |
| Class B | | 3/31/20 | | | 3/31/19 | | | 3/31/18 | | | 3/31/17 | | | 3/31/16 | |
| | | | | |
Net asset value, beginning of period | | | $11.97 | | | | $11.82 | | | | $11.90 | | | | $12.34 | | | | $12.28 | |
| | | | | |
| Income (loss) from investment operations | | | | | | | | | | | | | | | | | | | | |
Net investment income (loss) (d) | | | $0.24 | | | | $0.32 | | | | $0.29 | | | | $0.30 | (c) | | | $0.29 | |
Net realized and unrealized gain (loss) | | | (0.05 | ) | | | 0.11 | | | | (0.09 | ) | | | (0.46 | ) | | | 0.04 | |
Total from investment operations | | | $0.19 | | | | $0.43 | | | | $0.20 | | | | $(0.16 | ) | | | $0.33 | |
| | | | | |
| Less distributions declared to shareholders | | | | | | | | | | | | | | | | | | | | |
From net investment income | | | $(0.23 | ) | | | $(0.28 | ) | | | $(0.28 | ) | | | $(0.28 | ) | | | $(0.27 | ) |
Net asset value, end of period (x) | | | $11.93 | | | | $11.97 | | | | $11.82 | | | | $11.90 | | | | $12.34 | |
Total return (%) (r)(s)(t)(x) | | | 1.59 | | | | 3.70 | | | | 1.64 | | | | (1.31 | )(c) | | | 2.75 | |
| | | | | |
| Ratios (%) (to average net assets) and Supplemental data: | | | | | | | | | | | | | | | | | | | | |
Expenses before expense reductions (f) | | | 1.64 | | | | 1.65 | | | | 1.66 | | | | 1.65 | (c) | | | 1.65 | |
| | | | | |
Expenses after expense reductions (f) | | | 1.59 | | | | 1.59 | | | | 1.59 | | | | 1.59 | (c) | | | 1.61 | |
| | | | | |
Net investment income (loss) | | | 1.96 | | | | 2.74 | | | | 2.46 | | | | 2.44 | (c) | | | 2.42 | |
| | | | | |
Portfolio turnover | | | 22 | | | | 14 | | | | 15 | | | | 19 | | | | 8 | |
Net assets at end of period (000 omitted) | | | $1,200 | | | | $1,955 | | | | $2,718 | | | | $3,777 | | | | $4,238 | |
See Notes to Financial Statements
101
Financial Highlights – continued
MFS SOUTH CAROLINA MUNICIPAL BOND FUND – continued
| | | | | | | | | | | | | | | | |
| | | Year ended | |
| Class I | | 3/31/20 | | | 3/31/19 | | | 3/31/18 | | | 3/31/17 (i) | |
| | | | |
Net asset value, beginning of period | | | $9.70 | | | | $9.58 | | | | $9.65 | | | | $10.00 | |
| | | | |
| Income (loss) from investment operations | | | | | | | | | | | | | | | | |
Net investment income (loss) (d) | | | $0.29 | | | | $0.36 | | | | $0.33 | | | | $0.34 | (c) |
Net realized and unrealized gain (loss) | | | (0.03 | ) | | | 0.08 | | | | (0.08 | ) | | | (0.36 | ) |
Total from investment operations | | | $0.26 | | | | $0.44 | | | | $0.25 | | | | $(0.02 | ) |
| | | | |
| Less distributions declared to shareholders | | | | | | | | | | | | | | | | |
From net investment income | | | $(0.29 | ) | | | $(0.32 | ) | | | $(0.32 | ) | | | $(0.33 | ) |
Net asset value, end of period (x) | | | $9.67 | | | | $9.70 | | | | $9.58 | | | | $9.65 | |
Total return (%) (r)(s)(t)(x) | | | 2.63 | | | | 4.71 | | | | 2.60 | | | | (0.21 | )(c) |
| | | | |
| Ratios (%) (to average net assets) and Supplemental data: | | | | | | | | | | | | | | | | |
Expenses before expense reductions (f) | | | 0.63 | | | | 0.65 | | | | 0.66 | | | | 0.65 | (c) |
Expenses after expense reductions (f) | | | 0.59 | | | | 0.59 | | | | 0.59 | | | | 0.59 | (c) |
Net investment income (loss) | | | 2.92 | | | | 3.74 | | | | 3.44 | | | | 3.45 | (c) |
Portfolio turnover | | | 22 | | | | 14 | | | | 15 | | | | 19 | |
Net assets at end of period (000 omitted) | | | $35,189 | | | | $28,182 | | | | $21,954 | | | | $12,140 | |
| | |
| | | | | | Year ended | |
| Class R6 | | | | | 3/31/20 | | | 3/31/19 | | | 3/31/18 (i) | |
| | | | |
Net asset value, beginning of period | | | | | | | $9.70 | | | | $9.58 | | | | $9.79 | |
| | | | |
| Income (loss) from investment operations | | | | | | | | | | | | | | | | |
Net investment income (loss) (d) | | | | | | | $0.29 | | | | $0.36 | | | | $0.23 | |
Net realized and unrealized gain (loss) | | | | | | | (0.03 | ) | | | 0.09 | | | | (0.22 | ) |
Total from investment operations | | | | | | | $0.26 | | | | $0.45 | | | | $0.01 | |
| | | | |
| Less distributions declared to shareholders | | | | | | | | | | | | | | | | |
From net investment income | | | | | | | $(0.29 | ) | | | $(0.33 | ) | | | $(0.22 | ) |
Net asset value, end of period (x) | | | | | | | $9.67 | | | | $9.70 | | | | $9.58 | |
Total return (%) (r)(s)(t)(x) | | | | | | | 2.68 | | | | 4.77 | | | | 0.08 | (n) |
| | | | |
| Ratios (%) (to average net assets) and Supplemental data: | | | | | | | | | | | | | | | | |
Expenses before expense reductions (f) | | | | | | | 0.57 | | | | 0.58 | | | | 0.60 | (a) |
| | | | |
Expenses after expense reductions (f) | | | | | | | 0.53 | | | | 0.52 | | | | 0.52 | (a) |
| | | | |
Net investment income (loss) | | | | | | | 2.95 | | | | 3.81 | | | | 3.53 | (a) |
| | | | |
Portfolio turnover | | | | | | | 22 | | | | 14 | | | | 15 | |
Net assets at end of period (000 omitted) | | | | | | | $8,892 | | | | $4,341 | | | | $2,605 | |
| (c) | Amount reflects aone-time reimbursement of expenses by the custodian (or former custodian) without which net investment income and performance would be lower and expenses would be higher. |
| (d) | Per share data is based on average shares outstanding. |
| (f) | Ratios do not reflect reductions from fees paid indirectly, if applicable. |
| (i) | For Class I and Class R6, the period is from the class inception, April 1, 2016 (Class I) and August 1, 2017 (Class R6), through the stated period end. |
| (r) | Certain expenses have been reduced without which performance would have been lower. |
| (s) | From time to time the fund may receive proceeds from litigation settlements, without which performance would be lower. |
| (t) | Total returns do not include any applicable sales charges. |
| (x) | The net asset values and total returns have been calculated on net assets which include adjustments made in accordance with U.S. generally accepted accounting principles required at period end for financial reporting purposes. |
See Notes to Financial Statements
102
Financial Highlights – continued
MFS TENNESSEE MUNICIPAL BOND FUND
The financial highlights table is intended to help you understand the fund’s financial performance for the past 5 years (or life of a particular share class, if shorter). Certain information reflects financial results for a single fund share. The total returns in the table represent the rate that an investor would have earned (or lost) on an investment in the fund share class (assuming reinvestment of all distributions) held for the entire period.
| | | | | | | | | | | | | | | | | | | | |
| | | Year ended | |
| Class A | | 3/31/20 | | | 3/31/19 | | | 3/31/18 | | | 3/31/17 | | | 3/31/16 | |
| | | | | |
Net asset value, beginning of period | | | $10.36 | | | | $10.23 | | | | $10.36 | | | | $10.70 | | | | $10.67 | |
| | | | | |
| Income (loss) from investment operations | | | | | | | | | | | | | | | | | | | | |
Net investment income (loss) (d) | | | $0.31 | | | | $0.36 | | | | $0.35 | | | | $0.36 | (c) | | | $0.34 | |
Net realized and unrealized gain (loss) | | | (0.19 | ) | | | 0.09 | | | | (0.15 | ) | | | (0.36 | ) | | | 0.01 | |
Total from investment operations | | | $0.12 | | | | $0.45 | | | | $0.20 | | | | $0.00 | (w) | | | $0.35 | |
| | | | | |
| Less distributions declared to shareholders | | | | | | | | | | | | | | | | | | | | |
From net investment income | | | $(0.31 | ) | | | $(0.32 | ) | | | $(0.33 | ) | | | $(0.34 | ) | | | $(0.32 | ) |
Net asset value, end of period (x) | | | $10.17 | | | | $10.36 | | | | $10.23 | | | | $10.36 | | | | $10.70 | |
Total return (%) (r)(s)(t)(x) | | | 1.13 | | | | 4.52 | | | | 1.92 | | | | (0.01 | )(c) | | | 3.32 | |
| | | | | |
| Ratios (%) (to average net assets) and Supplemental data: | | | | | | | | | | | | | | | | | | | | |
Expenses before expense reductions (f) | | | 0.98 | | | | 0.98 | | | | 0.98 | | | | 0.96 | (c) | | | 0.95 | |
| | | | | |
Expenses after expense reductions (f) | | | 0.87 | | | | 0.88 | | | | 0.88 | | | | 0.87 | (c) | | | 0.90 | |
| | | | | |
Net investment income (loss) | | | 3.00 | | | | 3.50 | | | | 3.32 | | | | 3.42 | (c) | | | 3.17 | |
| | | | | |
Portfolio turnover | | | 34 | | | | 13 | | | | 18 | | | | 11 | | | | 14 | |
Net assets at end of period (000 omitted) | | | $71,672 | | | | $70,930 | | | | $84,131 | | | | $90,616 | | | | $105,722 | |
| |
| | | Year ended | |
| Class B | | 3/31/20 | | | 3/31/19 | | | 3/31/18 | | | 3/31/17 | | | 3/31/16 | |
| | | | | |
Net asset value, beginning of period | | | $10.35 | | | | $10.22 | | | | $10.35 | | | | $10.69 | | | | $10.66 | |
| | | | | |
| Income (loss) from investment operations | | | | | | | | | | | | | | | | | | | | |
Net investment income (loss) (d) | | | $0.24 | | | | $0.28 | | | | $0.27 | | | | $0.28 | (c) | | | $0.26 | |
Net realized and unrealized gain (loss) | | | (0.18 | ) | | | 0.10 | | | | (0.15 | ) | | | (0.36 | ) | | | 0.01 | |
Total from investment operations | | | $0.06 | | | | $0.38 | | | | $0.12 | | | | $(0.08 | ) | | | $0.27 | |
| | | | | |
| Less distributions declared to shareholders | | | | | | | | | | | | | | | | | | | | |
From net investment income | | | $(0.24 | ) | | | $(0.25 | ) | | | $(0.25 | ) | | | $(0.26 | ) | | | $(0.24 | ) |
Net asset value, end of period (x) | | | $10.17 | | | | $10.35 | | | | $10.22 | | | | $10.35 | | | | $10.69 | |
Total return (%) (r)(s)(t)(x) | | | 0.48 | | | | 3.75 | | | | 1.16 | | | | (0.76 | )(c) | | | 2.56 | |
| | | | | |
| Ratios (%) (to average net assets) and Supplemental data: | | | | | | | | | | | | | | | | | | | | |
Expenses before expense reductions (f) | | | 1.73 | | | | 1.73 | | | | 1.73 | | | | 1.71 | (c) | | | 1.70 | |
| | | | | |
Expenses after expense reductions (f) | | | 1.62 | | | | 1.63 | | | | 1.63 | | | | 1.62 | (c) | | | 1.65 | |
| | | | | |
Net investment income (loss) | | | 2.32 | | | | 2.73 | | | | 2.57 | | | | 2.67 | (c) | | | 2.42 | |
| | | | | |
Portfolio turnover | | | 34 | | | | 13 | | | | 18 | | | | 11 | | | | 14 | |
Net assets at end of period (000 omitted) | | | $228 | | | | $677 | | | | $1,230 | | | | $1,418 | | | | $1,827 | |
See Notes to Financial Statements
103
Financial Highlights – continued
MFS TENNESSEE MUNICIPAL BOND FUND – continued
| | | | | | | | | | | | | | | | |
| | | Year ended | |
| Class I | | 3/31/20 | | | 3/31/19 | | | 3/31/18 | | | 3/31/17 (i) | |
| | | | |
Net asset value, beginning of period | | | $9.68 | | | | $9.56 | | | | $9.68 | | | | $10.00 | |
| | | | |
| Income (loss) from investment operations | | | | | | | | | | | | | | | | |
Net investment income (loss) (d) | | | $0.32 | | | | $0.36 | | | | $0.35 | | | | $0.36 | (c) |
Net realized and unrealized gain (loss) | | | (0.17 | ) | | | 0.08 | | | | (0.14 | ) | | | (0.34 | ) |
Total from investment operations | | | $0.15 | | | | $0.44 | | | | $0.21 | | | | $0.02 | |
| | | | |
| Less distributions declared to shareholders | | | | | | | | | | | | | | | | |
From net investment income | | | $(0.32 | ) | | | $(0.32 | ) | | | $(0.33 | ) | | | $(0.34 | ) |
Net asset value, end of period (x) | | | $9.51 | | | | $9.68 | | | | $9.56 | | | | $9.68 | |
Total return (%) (r)(s)(t)(x) | | | 1.46 | | | | 4.75 | | | | 2.18 | | | | 0.19 | (c) |
| | | | |
| Ratios (%) (to average net assets) and Supplemental data: | | | | | | | | | | | | | | | | |
Expenses before expense reductions (f) | | | 0.73 | | | | 0.73 | | | | 0.73 | | | | 0.74 | (c) |
| | | | |
Expenses after expense reductions (f) | | | 0.62 | | | | 0.63 | | | | 0.63 | | | | 0.62 | (c) |
| | | | |
Net investment income (loss) | | | 3.25 | | | | 3.77 | | | | 3.56 | | | | 3.68 | (c) |
| | | | |
Portfolio turnover | | | 34 | | | | 13 | | | | 18 | | | | 11 | |
Net assets at end of period (000 omitted) | | | $23,156 | | | | $23,310 | | | | $17,243 | | | | $18,416 | |
| | |
| | | | | | Year ended | |
| Class R6 | | | | | 3/31/20 | | | 3/31/19 | | | 3/31/18 (i) | |
| | | | |
Net asset value, beginning of period | | | | | | | $9.67 | | | | $9.55 | | | | $9.79 | |
| | | | |
| Income (loss) from investment operations | | | | | | | | | | | | | | | | |
Net investment income (loss) (d) | | | | | | | $0.32 | | | | $0.36 | | | | $0.23 | |
Net realized and unrealized gain (loss) | | | | | | | (0.17 | ) | | | 0.09 | | | | (0.25 | ) |
Total from investment operations | | | | | | | $0.15 | | | | $0.45 | | | | $(0.02 | ) |
| | | | |
| Less distributions declared to shareholders | | | | | | | | | | | | | | | | |
From net investment income | | | | | | | $(0.32 | ) | | | $(0.33 | ) | | | $(0.22 | ) |
Net asset value, end of period (x) | | | | | | | $9.50 | | | | $9.67 | | | | $9.55 | |
Total return (%) (r)(s)(t)(x) | | | | | | | 1.54 | | | | 4.84 | | | | (0.19 | )(n) |
| | | | |
| Ratios (%) (to average net assets) and Supplemental data: | | | | | | | | | | | | | | | | |
Expenses before expense reductions (f) | | | | | | | 0.65 | | | | 0.65 | | | | 0.69 | (a) |
| | | | |
Expenses after expense reductions (f) | | | | | | | 0.54 | | | | 0.55 | | | | 0.55 | (a) |
| | | | |
Net investment income (loss) | | | | | | | 3.30 | | | | 3.83 | | | | 3.65 | (a) |
| | | | |
Portfolio turnover | | | | | | | 34 | | | | 13 | | | | 18 | |
Net assets at end of period (000 omitted) | | | | | | | $3,777 | | | | $3,081 | | | | $3,024 | |
| (c) | Amount reflects aone-time reimbursement of expenses by the custodian (or former custodian) without which net investment income and performance would be lower and expenses would be higher. |
| (d) | Per share data is based on average shares outstanding. |
| (f) | Ratios do not reflect reductions from fees paid indirectly, if applicable. |
| (i) | For Class I and Class R6, the period is from the class inception, April 1, 2016 (Class I) and August 1, 2017 (Class R6), through the stated period end. |
| (r) | Certain expenses have been reduced without which performance would have been lower. |
| (s) | From time to time the fund may receive proceeds from litigation settlements, without which performance would be lower. |
| (t) | Total returns do not include any applicable sales charges. |
| (w) | Per share amount was less than $0.01. |
| (x) | The net asset values and total returns have been calculated on net assets which include adjustments made in accordance with U.S. generally accepted accounting principles required at period end for financial reporting purposes. |
See Notes to Financial Statements
104
Financial Highlights – continued
MFS VIRGINIA MUNICIPAL BOND FUND
The financial highlights table is intended to help you understand the fund’s financial performance for the past 5 years (or life of a particular share class, if shorter). Certain information reflects financial results for a single fund share. The total returns in the table represent the rate that an investor would have earned (or lost) on an investment in the fund share class (assuming reinvestment of all distributions) held for the entire period.
| | | | | | | | | | | | | | | | | | | | |
| | | Year ended | |
| Class A | | 3/31/20 | | | 3/31/19 | | | 3/31/18 | | | 3/31/17 | | | 3/31/16 | |
| | | | | |
Net asset value, beginning of period | | | $11.14 | | | | $10.98 | | | | $11.10 | | | | $11.51 | | | | $11.44 | |
| | | | | |
| Income (loss) from investment operations | | | | | | | | | | | | | | | | | | | | |
Net investment income (loss) (d) | | | $0.33 | | | | $0.37 | | | | $0.38 | | | | $0.41 | (c) | | | $0.40 | |
Net realized and unrealized gain (loss) | | | (0.08 | ) | | | 0.13 | | | | (0.14 | ) | | | (0.42 | ) | | | 0.04 | |
Total from investment operations | | | $0.25 | | | | $0.50 | | | | $0.24 | | | | $(0.01 | ) | | | $0.44 | |
| | | | | |
| Less distributions declared to shareholders | | | | | | | | | | | | | | | | | | | | |
From net investment income | | | $(0.32 | ) | | | $(0.34 | ) | | | $(0.36 | ) | | | $(0.40 | ) | | | $(0.37 | ) |
Net asset value, end of period (x) | | | $11.07 | | | | $11.14 | | | | $10.98 | | | | $11.10 | | | | $11.51 | |
Total return (%) (r)(s)(t)(x) | | | 2.22 | | | | 4.67 | | | | 2.13 | | | | (0.11 | )(c) | | | 3.95 | |
| | | | | |
| Ratios (%) (to average net assets) and Supplemental data: | | | | | | | | | | | | | | | | | | | | |
Expenses before expense reductions (f) | | | 0.91 | | | | 0.92 | | | | 0.92 | | | | 0.91 | (c) | | | 0.89 | |
| | | | | |
Expenses after expense reductions (f) | | | 0.84 | | | | 0.84 | | | | 0.83 | | | | 0.83 | (c) | | | 0.84 | |
| | | | | |
Net investment income (loss) | | | 2.88 | | | | 3.37 | | | | 3.36 | | | | 3.60 | (c) | | | 3.52 | |
| | | | | |
Portfolio turnover | | | 24 | | | | 15 | | | | 15 | | | | 13 | | | | 9 | |
Net assets at end of period (000 omitted) | | | $235,639 | | | | $226,366 | | | | $221,291 | | | | $228,297 | | | | $251,733 | |
| | | | | |
| Supplemental Ratios (%): | | | | | | | | | | | | | | | | | | | | |
Ratios of expenses to average net assets after expense reductions and excluding interest expense and fees (f)(l) | | | 0.81 | | | | 0.81 | | | | 0.81 | | | | 0.81 | (c) | | | 0.83 | |
| |
| | | Year ended | |
| Class B | | 3/31/20 | | | 3/31/19 | | | 3/31/18 | | | 3/31/17 | | | 3/31/16 | |
| | | | | |
Net asset value, beginning of period | | | $11.13 | | | | $10.98 | | | | $11.10 | | | | $11.50 | | | | $11.44 | |
| | | | | |
| Income (loss) from investment operations | | | | | | | | | | | | | | | | | | | | |
Net investment income (loss) (d) | | | $0.24 | | | | $0.29 | | | | $0.29 | | | | $0.32 | (c) | | | $0.31 | |
Net realized and unrealized gain (loss) | | | (0.07 | ) | | | 0.12 | | | | (0.14 | ) | | | (0.41 | ) | | | 0.04 | |
Total from investment operations | | | $0.17 | | | | $0.41 | | | | $0.15 | | | | $(0.09 | ) | | | $0.35 | |
| | | | | |
| Less distributions declared to shareholders | | | | | | | | | | | | | | | | | | | | |
From net investment income | | | $(0.24 | ) | | | $(0.26 | ) | | | $(0.27 | ) | | | $(0.31 | ) | | | $(0.29 | ) |
Net asset value, end of period (x) | | | $11.06 | | | | $11.13 | | | | $10.98 | | | | $11.10 | | | | $11.50 | |
Total return (%) (r)(s)(t)(x) | | | 1.46 | | | | 3.80 | | | | 1.37 | | | | (0.77 | )(c) | | | 3.09 | |
| | | | | |
| Ratios (%) (to average net assets) and Supplemental data: | | | | | | | | | | | | | | | | | | | | |
Expenses before expense reductions (f) | | | 1.66 | | | | 1.67 | | | | 1.67 | | | | 1.66 | (c) | | | 1.65 | |
| | | | | |
Expenses after expense reductions (f) | | | 1.59 | | | | 1.60 | | | | 1.59 | | | | 1.58 | (c) | | | 1.60 | |
| | | | | |
Net investment income (loss) | | | 2.14 | | | | 2.62 | | | | 2.61 | | | | 2.82 | (c) | | | 2.76 | |
| | | | | |
Portfolio turnover | | | 24 | | | | 15 | | | | 15 | | | | 13 | | | | 9 | |
Net assets at end of period (000 omitted) | | | $581 | | | | $755 | | | | $914 | | | | $1,118 | | | | $1,501 | |
| | | | | |
| Supplemental Ratios (%): | | | | | | | | | | | | | | | | | | | | |
Ratios of expenses to average net assets after expense reductions and excluding interest expense and fees (f)(l) | | | 1.56 | | | | 1.56 | | | | 1.56 | | | | 1.56 | (c) | | | 1.58 | |
See Notes to Financial Statements
105
Financial Highlights – continued
MFS VIRGINIA MUNICIPAL BOND FUND – continued
| | | | | | | | | | | | | | | | | | | | |
| | | Year ended | |
| Class C | | 3/31/20 | | | 3/31/19 | | | 3/31/18 | | | 3/31/17 | | | 3/31/16 | |
| | | | | |
Net asset value, beginning of period | | | $11.14 | | | | $10.98 | | | | $11.10 | | | | $11.51 | | | | $11.44 | |
| | | | | |
| Income (loss) from investment operations | | | | | | | | | | | | | | | | | | | | |
Net investment income (loss) (d) | | | $0.24 | | | | $0.29 | | | | $0.29 | | | | $0.32 | (c) | | | $0.31 | |
Net realized and unrealized gain (loss) | | | (0.08 | ) | | | 0.13 | | | | (0.14 | ) | | | (0.42 | ) | | | 0.05 | |
Total from investment operations | | | $0.16 | | | | $0.42 | | | | $0.15 | | | | $(0.10 | ) | | | $0.36 | |
| | | | | |
| Less distributions declared to shareholders | | | | | | | | | | | | | | | | | | | | |
From net investment income | | | $(0.24 | ) | | | $(0.26 | ) | | | $(0.27 | ) | | | $(0.31 | ) | | | $(0.29 | ) |
Net asset value, end of period (x) | | | $11.06 | | | | $11.14 | | | | $10.98 | | | | $11.10 | | | | $11.51 | |
Total return (%) (r)(s)(t)(x) | | | 1.36 | | | | 3.89 | | | | 1.36 | | | | (0.86 | )(c) | | | 3.18 | |
| | | | | |
| Ratios (%) (to average net assets) and Supplemental data: | | | | | | | | | | | | | | | | | | | | |
Expenses before expense reductions (f) | | | 1.66 | | | | 1.67 | | | | 1.67 | | | | 1.66 | (c) | | | 1.65 | |
| | | | | |
Expenses after expense reductions (f) | | | 1.59 | | | | 1.60 | | | | 1.59 | | | | 1.58 | (c) | | | 1.59 | |
| | | | | |
Net investment income (loss) | | | 2.13 | | | | 2.62 | | | | 2.61 | | | | 2.85 | (c) | | | 2.77 | |
| | | | | |
Portfolio turnover | | | 24 | | | | 15 | | | | 15 | | | | 13 | | | | 9 | |
Net assets at end of period (000 omitted) | | | $16,736 | | | | $17,665 | | | | $24,116 | | | | $26,034 | | | | $24,861 | |
| | | | | |
| Supplemental Ratios (%): | | | | | | | | | | | | | | | | | | | | |
Ratios of expenses to average net assets after expense reductions and excluding interest expense and fees (f)(l) | | | 1.56 | | | | 1.56 | | | | 1.56 | | | | 1.56 | (c) | | | 1.58 | |
| | |
| | | | | | Year ended | |
| Class I | | | | | 3/31/20 | | | 3/31/19 | | | 3/31/18 | | | 3/31/17 (i) | |
| | | | | |
Net asset value, beginning of period | | | | | | | $9.68 | | | | $9.55 | | | | $9.65 | | | | $10.00 | |
| | | | | |
| Income (loss) from investment operations | | | | | | | | | | | | | | | | | | | | |
Net investment income (loss) (d) | | | | | | | $0.31 | | | | $0.34 | | | | $0.35 | | | | $0.38 | (c) |
Net realized and unrealized gain (loss) | | | | | | | (0.07 | ) | | | 0.11 | | | | (0.12 | ) | | | (0.36 | ) |
Total from investment operations | | | | | | | $0.24 | | | | $0.45 | | | | $0.23 | | | | $0.02 | |
| | | | | |
| Less distributions declared to shareholders | | | | | | | | | | | | | | | | | | | | |
From net investment income | | | | | | | $(0.30 | ) | | | $(0.32 | ) | | | $(0.33 | ) | | | $(0.37 | ) |
Net asset value, end of period (x) | | | | | | | $9.62 | | | | $9.68 | | | | $9.55 | | | | $9.65 | |
Total return (%) (r)(s)(t)(x) | | | | | | | 2.47 | | | | 4.82 | | | | 2.42 | | | | 0.21 | (c) |
| | | | | |
| Ratios (%) (to average net assets) and Supplemental data: | | | | | | | | | | | | | | | | | | | | |
Expenses before expense reductions (f) | | | | | | | 0.66 | | | | 0.67 | | | | 0.67 | | | | 0.67 | (c) |
| | | | | |
Expenses after expense reductions (f) | | | | | | | 0.59 | | | | 0.60 | | | | 0.59 | | | | 0.58 | (c) |
| | | | | |
Net investment income (loss) | | | | | | | 3.12 | | | | 3.61 | | | | 3.60 | | | | 3.83 | (c) |
| | | | | |
Portfolio turnover | | | | | | | 24 | | | | 15 | | | | 15 | | | | 13 | |
Net assets at end of period (000 omitted) | | | | | | | $71,807 | | | | $57,139 | | | | $43,832 | | | | $39,856 | |
| | | | | |
| Supplemental Ratios (%): | | | | | | | | | | | | | | | | | | | | |
Ratios of expenses to average net assets after expense reductions and excluding interest expense and fees (f)(l) | | | | | | | 0.56 | | | | 0.56 | | | | 0.56 | | | | 0.56 | (c) |
See Notes to Financial Statements
106
Financial Highlights – continued
MFS VIRGINIA MUNICIPAL BOND FUND – continued
| | | | | | | | | | | | |
| | | Year ended | |
| Class R6 | | 3/31/20 | | | 3/31/19 | | | 3/31/18 (i) | |
| | | |
Net asset value, beginning of period | | | $9.69 | | | | $9.55 | | | | $9.77 | |
| | | |
| Income (loss) from investment operations | | | | | | | | | | | | |
Net investment income (loss) (d) | | | $0.31 | | | | $0.35 | | | | $0.23 | |
Net realized and unrealized gain (loss) | | | (0.06 | ) | | | 0.12 | | | | (0.22 | ) |
Total from investment operations | | | $0.25 | | | | $0.47 | | | | $0.01 | |
| | | |
| Less distributions declared to shareholders | | | | | | | | | | | | |
From net investment income | | | $(0.31 | ) | | | $(0.33 | ) | | | $(0.23 | ) |
Net asset value, end of period (x) | | | $9.63 | | | | $9.69 | | | | $9.55 | |
Total return (%) (r)(s)(t)(x) | | | 2.55 | | | | 5.01 | | | | 0.05 | (n) |
| | | |
| Ratios (%) (to average net assets) and Supplemental data: | | | | | | | | | | | | |
Expenses before expense reductions (f) | | | 0.58 | | | | 0.59 | | | | 0.60 | (a) |
| | | |
Expenses after expense reductions (f) | | | 0.51 | | | | 0.51 | | | | 0.51 | (a) |
| | | |
Net investment income (loss) | | | 3.20 | | | | 3.69 | | | | 3.61 | (a) |
| | | |
Portfolio turnover | | | 24 | | | | 15 | | | | 15 | |
Net assets at end of period (000 omitted) | | | $14,286 | | | | $10,153 | | | | $6,196 | |
| | | |
| Supplemental Ratios (%): | | | | | | | | | | | | |
Ratios of expenses to average net assets after expense reductions and excluding interest expense and fees (f)(l) | | | 0.48 | | | | 0.48 | | | | 0.48 | (a) |
| (c) | Amount reflects aone-time reimbursement of expenses by the custodian (or former custodian) without which net investment income and performance would be lower and expenses would be higher. |
| (d) | Per share data is based on average shares outstanding. |
| (f) | Ratios do not reflect reductions from fees paid indirectly, if applicable. |
| (i) | For Class I and Class R6, the period is from the class inception, April 1, 2016 (Class I) and August 1, 2017 (Class R6), through the stated period end. |
| (l) | Interest expense and fees include payments made to the holders of the floating rate certificates. |
| (r) | Certain expenses have been reduced without which performance would have been lower. |
| (s) | From time to time the fund may receive proceeds from litigation settlements, without which performance would be lower. |
| (t) | Total returns do not include any applicable sales charges. |
| (x) | The net asset values and total returns have been calculated on net assets which include adjustments made in accordance with U.S. generally accepted accounting principles required at period end for financial reporting purposes. |
See Notes to Financial Statements
107
Financial Highlights – continued
MFS WEST VIRGINIA MUNICIPAL BOND FUND
The financial highlights table is intended to help you understand the fund’s financial performance for the past 5 years (or life of a particular share class, if shorter). Certain information reflects financial results for a single fund share. The total returns in the table represent the rate that an investor would have earned (or lost) on an investment in the fund share class (assuming reinvestment of all distributions) held for the entire period.
| | | | | | | | | | | | | | | | | | | | |
| | | Year ended | |
| Class A | | 3/31/20 | | | 3/31/19 | | | 3/31/18 | | | 3/31/17 | | | 3/31/16 | |
| | | | | |
Net asset value, beginning of period | | | $10.98 | | | | $10.89 | | | | $11.01 | | | | $11.37 | | | | $11.36 | |
| | | | | |
| Income (loss) from investment operations | | | | | | | | | | | | | | | | | | | | |
Net investment income (loss) (d) | | | $0.33 | | | | $0.38 | | | | $0.37 | | | | $0.38 | (c) | | | $0.38 | |
Net realized and unrealized gain (loss) | | | (0.03 | ) | | | 0.06 | | | | (0.13 | ) | | | (0.38 | ) | | | (0.02 | ) |
Total from investment operations | | | $0.30 | | | | $0.44 | | | | $0.24 | | | | $0.00 | (w) | | | $0.36 | |
| | | | | |
| Less distributions declared to shareholders | | | | | | | | | | | | | | | | | | | | |
From net investment income | | | $(0.33 | ) | | | $(0.35 | ) | | | $(0.36 | ) | | | $(0.36 | ) | | | $(0.35 | ) |
Net asset value, end of period (x) | | | $10.95 | | | | $10.98 | | | | $10.89 | | | | $11.01 | | | | $11.37 | |
Total return (%) (r)(s)(t)(x) | | | 2.75 | | | | 4.09 | | | | 2.15 | | | | 0.02 | (c) | | | 3.23 | |
| | | | | |
| Ratios (%) (to average net assets) and Supplemental data: | | | | | | | | | | | | | | | | | | | | |
Expenses before expense reductions (f) | | | 0.98 | | | | 0.98 | | | | 0.97 | | | | 0.95 | (c) | | | 0.94 | |
| | | | | |
Expenses after expense reductions (f) | | | 0.86 | | | | 0.86 | | | | 0.86 | | | | 0.86 | (c) | | | 0.88 | |
| | | | | |
Net investment income (loss) | | | 3.00 | | | | 3.53 | | | | 3.34 | | | | 3.38 | (c) | | | 3.34 | |
| | | | | |
Portfolio turnover | | | 19 | | | | 17 | | | | 11 | | | | 18 | | | | 9 | |
Net assets at end of period (000 omitted) | | | $98,950 | | | | $98,510 | | | | $101,013 | | | | $111,179 | | | | $121,455 | |
| |
| | | Year ended | |
| Class B | | 3/31/20 | | | 3/31/19 | | | 3/31/18 | | | 3/31/17 | | | 3/31/16 | |
| | | | | |
Net asset value, beginning of period | | | $10.98 | | | | $10.88 | | | | $11.00 | | | | $11.37 | | | | $11.35 | |
| | | | | |
| Income (loss) from investment operations | | | | | | | | | | | | | | | | | | | | |
Net investment income (loss) (d) | | | $0.25 | | | | $0.30 | | | | $0.29 | | | | $0.30 | (c) | | | $0.29 | |
Net realized and unrealized gain (loss) | | | (0.03 | ) | | | 0.06 | | | | (0.14 | ) | | | (0.39 | ) | | | (0.01 | ) |
Total from investment operations | | | $0.22 | | | | $0.36 | | | | $0.15 | | | | $(0.09 | ) | | | $0.28 | |
| | | | | |
| Less distributions declared to shareholders | | | | | | | | | | | | | | | | | | | | |
From net investment income | | | $(0.25 | ) | | | $(0.26 | ) | | | $(0.27 | ) | | | $(0.28 | ) | | | $(0.26 | ) |
Net asset value, end of period (x) | | | $10.95 | | | | $10.98 | | | | $10.88 | | | | $11.00 | | | | $11.37 | |
Total return (%) (r)(s)(t)(x) | | | 1.98 | | | | 3.40 | | | | 1.38 | | | | (0.81 | )(c) | | | 2.56 | |
| | | | | |
| Ratios (%) (to average net assets) and Supplemental data: | | | | | | | | | | | | | | | | | | | | |
Expenses before expense reductions (f) | | | 1.73 | | | | 1.73 | | | | 1.72 | | | | 1.70 | (c) | | | 1.69 | |
| | | | | |
Expenses after expense reductions (f) | | | 1.62 | | | | 1.62 | | | | 1.62 | | | | 1.62 | (c) | | | 1.63 | |
| | | | | |
Net investment income (loss) | | | 2.28 | | | | 2.77 | | | | 2.58 | | | | 2.63 | (c) | | | 2.59 | |
| | | | | |
Portfolio turnover | | | 19 | | | | 17 | | | | 11 | | | | 18 | | | | 9 | |
Net assets at end of period (000 omitted) | | | $155 | | | | $494 | | | | $613 | | | | $866 | | | | $1,062 | |
See Notes to Financial Statements
108
Financial Highlights – continued
MFS WEST VIRGINIA MUNICIPAL BOND FUND – continued
| | | | | | | | | | | | | | | | |
| | | Year ended | |
| Class I | | 3/31/20 | | | 3/31/19 | | | 3/31/18 | | | 3/31/17 (i) | |
| | | | |
Net asset value, beginning of period | | | $9.67 | | | | $9.58 | | | | $9.69 | | | | $10.00 | |
| | | | |
| Income (loss) from investment operations | | | | | | | | | | | | | | | | |
Net investment income (loss) (d) | | | $0.32 | | | | $0.36 | | | | $0.35 | | | | $0.35 | (c) |
Net realized and unrealized gain (loss) | | | (0.03 | ) | | | 0.06 | | | | (0.12 | ) | | | (0.31 | ) |
Total from investment operations | | | $0.29 | | | | $0.42 | | | | $0.23 | | | | $0.04 | |
| | | | |
| Less distributions declared to shareholders | | | | | | | | | | | | | | | | |
From net investment income | | | $(0.32 | ) | | | $(0.33 | ) | | | $(0.34 | ) | | | $(0.35 | ) |
Net asset value, end of period (x) | | | $9.64 | | | | $9.67 | | | | $9.58 | | | | $9.69 | |
Total return (%) (r)(s)(t)(x) | | | 2.95 | | | | 4.44 | | | | 2.33 | | | | 0.37 | (c) |
| | | | |
| Ratios (%) (to average net assets) and Supplemental data: | | | | | | | | | | | | | | | | |
Expenses before expense reductions (f) | | | 0.73 | | | | 0.73 | | | | 0.72 | | | | 0.72 | (c) |
| | | | |
Expenses after expense reductions (f) | | | 0.62 | | | | 0.62 | | | | 0.62 | | | | 0.61 | (c) |
| | | | |
Net investment income (loss) | | | 3.23 | | | | 3.75 | | | | 3.58 | | | | 3.63 | (c) |
| | | | |
Portfolio turnover | | | 19 | | | | 17 | | | | 11 | | | | 18 | |
Net assets at end of period (000 omitted) | | | $7,545 | | | | $6,248 | | | | $7,038 | | | | $4,820 | |
| | |
| | | | | | Year ended | |
| Class R6 | | | | | 3/31/20 | | | 3/31/19 | | | 3/31/18 (i) | |
| | | | |
Net asset value, beginning of period | | | | | | | $9.66 | | | | $9.58 | | | | $9.79 | |
| | | | |
| Income (loss) from investment operations | | | | | | | | | | | | | | | | |
Net investment income (loss) (d) | | | | | | | $0.32 | | | | $0.37 | | | | $0.24 | |
Net realized and unrealized gain (loss) | | | | | | | (0.03 | ) | | | 0.04 | | | | (0.22 | ) |
Total from investment operations | | | | | | | $0.29 | | | | $0.41 | | | | $0.02 | |
| | | | |
| Less distributions declared to shareholders | | | | | | | | | | | | | | | | |
From net investment income | | | | | | | $(0.32 | ) | | | $(0.33 | ) | | | $(0.23 | ) |
Net asset value, end of period (x) | | | | | | | $9.63 | | | | $9.66 | | | | $9.58 | |
Total return (%) (r)(s)(t)(x) | | | | | | | 3.02 | | | | 4.42 | | | | 0.18 | (n) |
| | | | |
| Ratios (%) (to average net assets) and Supplemental data: | | | | | | | | | | | | | | | | |
Expenses before expense reductions (f) | | | | | | | 0.64 | | | | 0.64 | | | | 0.65 | (a) |
| | | | |
Expenses after expense reductions (f) | | | | | | | 0.54 | | | | 0.53 | | | | 0.54 | (a) |
| | | | |
Net investment income (loss) | | | | | | | 3.27 | | | | 3.87 | | | | 3.67 | (a) |
| | | | |
Portfolio turnover | | | | | | | 19 | | | | 17 | | | | 11 | |
Net assets at end of period (000 omitted) | | | | | | | $715 | | | | $246 | | | | $130 | |
| (c) | Amount reflects aone-time reimbursement of expenses by the custodian (or former custodian) without which net investment income and performance would be lower and expenses would be higher. |
| (d) | Per share data is based on average shares outstanding. |
| (f) | Ratios do not reflect reductions from fees paid indirectly, if applicable. |
| (i) | For Class I and Class R6, the period is from the class inception, April 1, 2016 (Class I) and August 1, 2017 (Class R6), through the stated period end. |
| (r) | Certain expenses have been reduced without which performance would have been lower. |
| (s) | From time to time the fund may receive proceeds from litigation settlements, without which performance would be lower. |
| (t) | Total returns do not include any applicable sales charges. |
| (w) | Per share amount was less than $0.01. |
| (x) | The net asset values and total returns have been calculated on net assets which include adjustments made in accordance with U.S. generally accepted accounting principles required at period end for financial reporting purposes. |
See Notes to Financial Statements
109
NOTES TO FINANCIAL STATEMENTS
| (1) | | Business and Organization |
MFS Mississippi Municipal Bond Fund (Mississippi Fund), MFS New York Municipal Bond Fund (New York Fund), MFS North Carolina Municipal Bond Fund (North Carolina Fund), MFS Pennsylvania Municipal Bond Fund (Pennsylvania Fund), MFS South Carolina Municipal Bond Fund (South Carolina Fund), MFS Tennessee Municipal Bond Fund (Tennessee Fund), MFS Virginia Municipal Bond Fund (Virginia Fund), and MFS West Virginia Municipal Bond Fund (West Virginia Fund) are each a diversified series of MFS Municipal Series Trust (with the exception of Mississippi Fund and West Virginia Fund which arenon-diversified) which is organized as a Massachusetts business trust and is registered under the Investment Company Act of 1940, as amended, as anopen-end management investment company.
Each fund is an investment company and accordingly follows the investment company accounting and reporting guidance of the Financial Accounting Standards Board (FASB) Accounting Standards Codification Topic 946 Financial Services – Investment Companies.
| (2) | | Significant Accounting Policies |
General– The preparation of financial statements in conformity with U.S. generally accepted accounting principles requires management to make estimates and assumptions that affect the reported amounts of assets and liabilities, and disclosure of contingent assets and liabilities at the date of the financial statements and the reported amounts of increases and decreases in net assets from operations during the reporting period. Actual results could differ from those estimates. In the preparation of these financial statements, management has evaluated subsequent events occurring after the date of each fund’s Statement of Assets and Liabilities through the date that the financial statements were issued. Each fund invests primarily in municipal instruments, which generally trade in theover-the-counter market. The value of municipal instruments can be affected by changes in their actual or perceived credit quality. The credit quality of, and the ability to pay principal and interest when due by, an issuer of a municipal instrument depends on the credit quality of the entity supporting the municipal instrument, how essential any services supported by the municipal instrument are, the sufficiency of any revenues or taxes that support the municipal instrument, and/or the willingness or ability of the appropriate government entity to approve any appropriations necessary to support the municipal instrument. Municipal instruments may be supported by insurance which typically guarantees the timely payment of all principal and interest due on the underlying municipal instrument. The value of a municipal instrument can be volatile and significantly affected by adverse tax changes or court rulings, legislative or political changes, changes in specific or general market and economic conditions in the region where the instrument is issued, and the financial condition of municipal issuers and of municipal instrument insurers of which there are a limited number. Also, because many municipal instruments are issued to finance similar projects, conditions in certain industries can significantly affect the funds and the overall municipal market. If the Internal Revenue Service determines an issuer of a municipal instrument has not complied with the applicable tax requirements, interest from the security could become taxable, the security could decline in value, and distributions made by the funds could be taxable to shareholders.
In March 2020, the FASB issued Accounting Standards Update2020-04, Reference Rate Reform (Topic 848) – Facilitation of the Effects of Reference Rate Reform on Financial Reporting (“ASU2020-04”), which provides optional, temporary relief with respect to the financial reporting of contracts subject to certain types of modifications due to the planned discontinuation of the London Interbank Offered Rate (LIBOR) and other IBOR-based reference rates as of the end of 2021. The temporary relief provided by ASU2020-04 is effective for certain reference rate-related contract modifications that occur during the period from March 12, 2020 through December 31, 2022. Management is evaluating the impact of ASU2020-04 on the fund’s investments, derivatives, debt and other contracts that will undergo reference rate-related modifications as a result of the reference rate reform.
In March 2017, the FASB issued Accounting Standards Update2017-08, Receivables – Nonrefundable Fees and Other Costs (Subtopic310-20) – Premium Amortization on Purchased Callable Debt Securities (“ASU2017-08”). For callable debt securities purchased at a premium that have explicit,non-contingent call features and that are callable at fixed prices on preset dates, ASU2017-08 requires the premium to be amortized to the earliest call date. The funds adopted ASU2017-08 as of the beginning of the reporting period on a modified retrospective basis. The adoption resulted in a change in accounting principle, since each fund had historically amortized such premiums to maturity for U.S. GAAP. As a result of the adoption, each fund recognized a cumulative effect adjustment that decreased the beginning of period cost of investments and increased the unrealized appreciation on investments by the amounts noted in the table below:
| | | | |
| Mississippi Fund | | | $590,012 | |
| New York Fund | | | 1,794,102 | |
| North Carolina Fund | | | 3,464,323 | |
| Pennsylvania Fund | | | 823,324 | |
| South Carolina Fund | | | 1,808,508 | |
| Tennessee Fund | | | 719,997 | |
| Virginia Fund | | | 2,584,342 | |
| West Virginia Fund | | | 1,105,184 | |
110
Notes to Financial Statements – continued
Adoption had no impact on each fund’s net assets or any prior period information presented in the financial statements. With respect to each fund’s results of operations, amortization of premium to first call date under ASU2017-08 accelerates amortization with the intent of more closely aligning the recognition of income on such bonds with the economics of the instrument.
Balance Sheet Offsetting– Each fund’s accounting policy with respect to balance sheet offsetting is that, absent an event of default by the counterparty or a termination of the agreement, the International Swaps and Derivatives Association (ISDA) Master Agreement, or similar agreement, does not result in an offset of reported amounts of financial assets and financial liabilities in the Statements of Assets and Liabilities across transactions between each fund and the applicable counterparty. Each fund’s right to setoff may be restricted or prohibited by the bankruptcy or insolvency laws of the particular jurisdiction to which a specific master netting agreement counterparty is subject. Balance sheet offsetting disclosures, to the extent applicable to each fund, have been included in each fund’s Significant Accounting Policies note under the captions for each of the fund’sin-scope financial instruments and transactions.
Investment Valuations– Debt instruments and floating rate loans, including restricted debt instruments, are generally valued at an evaluated or composite bid as provided by a third-party pricing service. Short-term instruments with a maturity at issuance of 60 days or less may be valued at amortized cost, which approximates market value. Futures contracts are generally valued at last posted settlement price on their primary exchange as provided by a third-party pricing service. Futures contracts for which there were no trades that day for a particular position are generally valued at the closing bid quotation on their primary exchange as provided by a third-party pricing service.Open-end investment companies are generally valued at net asset value per share. Securities and other assets generally valued on the basis of information from a third-party pricing service may also be valued at a broker/dealer bid quotation. In determining values, third-party pricing services can utilize both transaction data and market information such as yield, quality, coupon rate, maturity, type of issue, trading characteristics, and other market data.
The Board of Trustees has delegated primary responsibility for determining or causing to be determined the value of each fund’s investments (including any fair valuation) to the adviser pursuant to valuation policies and procedures approved by the Board. If the adviser determines that reliable market quotations are not readily available, investments are valued at fair value as determined in good faith by the adviser in accordance with such procedures under the oversight of the Board of Trustees. Under each fund’s valuation policies and procedures, market quotations are not considered to be readily available for most types of debt instruments and floating rate loans and many types of derivatives. These investments are generally valued at fair value based on information from third-party pricing services. In addition, investments may be valued at fair value if the adviser determines that an investment’s value has been materially affected by events occurring after the close of the exchange or market on which the investment is principally traded (such as foreign exchange or market) and prior to the determination of each fund’s net asset value, or after the halt of trading of a specific security where trading does not resume prior to the close of the exchange or market on which the security is principally traded. The adviser generally relies on third-party pricing services or other information (such as the correlation with price movements of similar securities in the same or other markets; the type, cost and investment characteristics of the security; the business and financial condition of the issuer; and trading and other market data) to assist in determining whether to fair value and at what value to fair value an investment. The value of an investment for purposes of calculating each fund’s net asset value can differ depending on the source and method used to determine value. When fair valuation is used, the value of an investment used to determine each fund’s net asset value may differ from quoted or published prices for the same investment. There can be no assurance that each fund could obtain the fair value assigned to an investment if it were to sell the investment at the same time at which each fund determines its net asset value per share.
Various inputs are used in determining the value of each fund’s assets or liabilities. These inputs are categorized into three broad levels. In certain cases, the inputs used to measure fair value may fall into different levels of the fair value hierarchy. In such cases, an investment’s level within the fair value hierarchy is based on the lowest level of input that is significant to the fair value measurement. Each fund’s assessment of the significance of a particular input to the fair value measurement in its entirety requires judgment, and considers factors specific to the investment. Level 1 includes unadjusted quoted prices in active markets for identical assets or liabilities. Level 2 includes other significant observable market-based inputs (including quoted prices for similar securities, interest rates, prepayment speed, and credit risk). Level 3 includes unobservable inputs, which may include the adviser’s own assumptions in determining the fair value of investments. Other financial instruments are derivative instruments, such as futures contracts. The following is a summary of the levels used as of March 31, 2020 in valuing each fund’s assets or liabilities:
| | | | | | | | | | | | | | | | |
| | | | |
| | | Level 1 | | | Level 2 | | | Level 3 | | | Total | |
Mississippi Fund | | | | | | | | | | | | |
| | | | |
| Financial Instruments | | | | | | | | | | | | |
| Municipal Bonds | | | $— | | | | $98,711,189 | | | | $— | | | | $98,711,189 | |
| U.S. Corporate Bonds | | | — | | | | 109,799 | | | | — | | | | 109,799 | |
| Mutual Funds | | | 3,902,197 | | | | — | | | | — | | | | 3,902,197 | |
| Total | | | $3,902,197 | | | | $98,820,988 | | | | $— | | | | $102,723,185 | |
| | | | |
| Other Financial Instruments | | | | | | | | | | | | |
| Futures Contracts – Liabilities | | | $(132,385 | ) | | | $— | | | | $— | | | | $(132,385 | ) |
111
Notes to Financial Statements – continued
| | | | | | | | | | | | | | | | |
| | | | |
| | | Level 1 | | | Level 2 | | | Level 3 | | | Total | |
New York Fund | | | | | | | | | | | | |
| | | | |
| Financial Instruments | | | | | | | | | | | | |
| Municipal Bonds | | | $— | | | | $272,451,587 | | | | $— | | | | $272,451,587 | |
| U.S. Corporate Bonds | | | — | | | | 365,995 | | | | — | | | | 365,995 | |
| Mutual Funds | | | 5,289,871 | | | | — | | | | — | | | | 5,289,871 | |
| Total | | | $5,289,871 | | | | $272,817,582 | | | | $— | | | | $278,107,453 | |
| | | | |
| Other Financial Instruments | | | | | | | | | | | | |
| Futures Contracts – Liabilities | | | $(180,524 | ) | | | $— | | | | $— | | | | $(180,524 | ) |
| | | | |
North Carolina Fund | | | | | | | | | | | | |
| | | | |
| Financial Instruments | | | | | | | | | | | | |
| Municipal Bonds | | | $— | | | | $457,964,831 | | | | $— | | | | $457,964,831 | |
| U.S. Corporate Bonds | | | — | | | | 622,191 | | | | — | | | | 622,191 | |
| Mutual Funds | | | 11,538,961 | | | | — | | | | — | | | | 11,538,961 | |
| Total | | | $11,538,961 | | | | $458,587,022 | | | | $— | | | | $470,125,983 | |
| | | | |
| Other Financial Instruments | | | | | | | | | | | | |
| Futures Contracts – Liabilities | | | $(962,795 | ) | | | $— | | | | $— | | | | $(962,795 | ) |
| | | | |
Pennsylvania Fund | | | | | | | | | | | | |
| | | | |
| Financial Instruments | | | | | | | | | | | | |
| Municipal Bonds | | | $— | | | | $152,951,807 | | | | $— | | | | $152,951,807 | |
| U.S. Corporate Bonds | | | — | | | | 182,997 | | | | — | | | | 182,997 | |
| Mutual Funds | | | 2,584,086 | | | | — | | | | — | | | | 2,584,086 | |
| Total | | | $2,584,086 | | | | $153,134,804 | | | | $— | | | | $155,718,890 | |
| | | | |
| Other Financial Instruments | | | | | | | | | | | | |
| Futures Contracts – Liabilities | | | $(180,524 | ) | | | $— | | | | $— | | | | $(180,524 | ) |
| | | | |
South Carolina Fund | | | | | | | | | | | | |
| | | | |
| Financial Instruments | | | | | | | | | | | | |
| Municipal Bonds | | | $— | | | | $228,140,471 | | | | $— | | | | $228,140,471 | |
| U.S. Corporate Bonds | | | — | | | | 292,796 | | | | — | | | | 292,796 | |
| Mutual Funds | | | 4,914,196 | | | | — | | | | — | | | | 4,914,196 | |
| Total | | | $4,914,196 | | | | $228,433,267 | | | | $— | | | | $233,347,463 | |
| | | | |
Tennessee Fund | | | | | | | | | | | | |
| | | | |
| Financial Instruments | | | | | | | | | | | | |
| Municipal Bonds | | | $— | | | | $95,939,454 | | | | $— | | | | $95,939,454 | |
| U.S. Corporate Bonds | | | — | | | | 146,398 | | | | — | | | | 146,398 | |
| Mutual Funds | | | 1,471,518 | | | | — | | | | — | | | | 1,471,518 | |
| Total | | | $1,471,518 | | | | $96,085,852 | | | | $— | | | | $97,557,370 | |
| | | | |
| Other Financial Instruments | | | | | | | | | | | | |
| Futures Contracts – Liabilities | | | $(120,349 | ) | | | $— | | | | $— | | | | $(120,349 | ) |
| | | | |
Virginia Fund | | | | | | | | | | | | |
| | | | |
| Financial Instruments | | | | | | | | | | | | |
| Municipal Bonds | | | $— | | | | $338,318,397 | | | | $— | | | | $338,318,397 | |
| U.S. Corporate Bonds | | | — | | | | 439,194 | | | | — | | | | 439,194 | |
| Mutual Funds | | | 1,936,190 | | | | — | | | | — | | | | 1,936,190 | |
| Total | | | $1,936,190 | | | | $338,757,591 | | | | $— | | | | $340,693,781 | |
| | | | |
| Other Financial Instruments | | | | | | | | | | | | |
| Futures Contracts – Liabilities | | | $(722,096 | ) | | | $— | | | | $— | | | | $(722,096 | ) |
112
Notes to Financial Statements – continued
| | | | | | | | | | | | | | | | |
| | | | |
| | | Level 1 | | | Level 2 | | | Level 3 | | | Total | |
West Virginia Fund | | | | | | | | | | | | |
| | | | |
| Financial Instruments | | | | | | | | | | | | |
| Municipal Bonds | | | $— | | | | $104,835,749 | | | | $— | | | | $104,835,749 | |
| U.S. Corporate Bonds | | | — | | | | 146,398 | | | | — | | | | 146,398 | |
| Mutual Funds | | | 781,988 | | | | — | | | | — | | | | 781,988 | |
| Total | | | $781,988 | | | | $104,982,147 | | | | $— | | | | $105,764,135 | |
| | | | |
| Other Financial Instruments | | | | | | | | | | | | |
| Futures Contracts – Assets | | | $172,291 | | | | $— | | | | $— | | | | $172,291 | |
For further information regarding security characteristics, see the Portfolio of Investments.
Derivatives– Certain funds use derivatives primarily to increase or decrease exposure to a particular market or segment of the market, or security, to increase or decrease interest rate exposure, or as alternatives to direct investments. Derivatives are used for hedging ornon-hedging purposes. While hedging can reduce or eliminate losses, it can also reduce or eliminate gains. When the funds use derivatives as an investment to increase market exposure, or for hedging purposes, gains and losses from derivative instruments may be substantially greater than the derivative’s original cost.
The derivative instruments used by the funds during the period were futures contracts. Depending on the type of derivative, the fund may exit a derivative position by entering into an offsetting transaction with a counterparty or exchange, negotiating an agreement with the derivative counterparty, or novating the position to a third party. The funds may be unable to promptly close out a futures position in instances where the daily fluctuation in the price for that type of future exceeds the daily limit set by the exchange. The funds’ period end derivatives, as presented in the Portfolio of Investments and the associated Derivative Contract tables, generally are indicative of the volume of its derivative activity during the period.
The following table presents, by major type of derivative contract, the fair value, on a gross basis, of the asset and liability components of derivatives held by the funds at March 31, 2020 as reported in the Statements of Assets and Liabilities:
| | | | | | | | | | | | | | |
| | | | | | | | Fair Value (a) | |
| | | | |
| Fund | | Risk | | Derivative Contracts | | | Asset Derivatives | | | Liability Derivatives | |
| Mississippi Fund | | Interest Rate | | | Interest Rate Futures | | | | $— | | | | $(132,385 | ) |
| New York Fund | | Interest Rate | | | Interest Rate Futures | | | | — | | | | (180,524 | ) |
| North Carolina Fund | | Interest Rate | | | Interest Rate Futures | | | | — | | | | (962,795 | ) |
| Pennsylvania Fund | | Interest Rate | | | Interest Rate Futures | | | | — | | | | (180,524 | ) |
| Tennessee Fund | | Interest Rate | | | Interest Rate Futures | | | | — | | | | (120,349 | ) |
| Virginia Fund | | Interest Rate | | | Interest Rate Futures | | | | — | | | | (722,096 | ) |
| West Virginia Fund | | Interest Rate | | | Interest Rate Futures | | | | 172,291 | | | | — | |
| (a) | Values presented in this table for futures contracts correspond to the values reported in the funds’ Portfolio of Investments. Only the current day net variation margin for futures contracts is separately reported within the funds’ Statements of Assets and Liabilities. |
The following table presents, by major type of derivative contract, the realized gain (loss) on derivatives held by the funds for the year ended March 31, 2020 as reported in the Statements of Operations:
| | | | |
| | |
| Fund | | Risk | | Futures Contracts |
| Mississippi Fund | | Interest Rate | | $(329,757) |
| New York Fund | | Interest Rate | | (1,443,390) |
| North Carolina | | Interest Rate | | (3,683,758) |
| Pennsylvania Fund | | Interest Rate | | (649,002) |
| South Carolina Fund | | Interest Rate | | (693,327) |
| Tennessee Fund | | Interest Rate | | (407,407) |
| Virginia Fund | | Interest Rate | | (1,473,277) |
| West Virginia Fund | | Interest Rate | | 129,108 |
The following table presents, by major type of derivative contract, the change in unrealized appreciation or depreciation on derivatives held by the funds for the year ended March 31, 2020 as reported in the Statements of Operations:
| | | | |
| | |
| Fund | | Risk | | Futures Contracts |
| Mississippi Fund | | Interest Rate | | $(132,385) |
| New York Fund | | Interest Rate | | (120,465) |
| North Carolina | | Interest Rate | | (711,298) |
| Pennsylvania Fund | | Interest Rate | | (101,697) |
| South Carolina Fund | | Interest Rate | | 116,364 |
| Tennessee Fund | | Interest Rate | | (60,290) |
| Virginia Fund | | Interest Rate | | (526,905) |
| West Virginia Fund | | Interest Rate | | 172,291 |
113
Notes to Financial Statements – continued
Derivative counterparty credit risk is managed through formal evaluation of the creditworthiness of all potential counterparties. On certain, but not all, uncleared derivatives, each fund attempts to reduce its exposure to counterparty credit risk whenever possible by entering into an ISDA Master Agreement on a bilateral basis. The ISDA Master Agreement gives each party to the agreement the right to terminate all transactions traded under such agreement if there is a specified deterioration in the credit quality of the other party. Upon an event of default or a termination of the ISDA Master Agreement, thenon-defaulting party has the right to close out all transactions traded under such agreement and to net amounts owed under each agreement to one net amount payable by one party to the other. This right to close out and net payments across all transactions traded under the ISDA Master Agreement could result in a reduction of each fund’s credit risk to such counterparty equal to any amounts payable by each fund under the applicable transactions, if any.
Collateral and margin requirements differ by type of derivative. For cleared derivatives (e.g., futures contracts, cleared swaps, and exchange-traded options), margin requirements are set by the clearing broker and the clearing house and collateral, in the form of cash or securities, is posted by the fund directly with the clearing broker. Collateral terms are counterparty agreement specific for uncleared derivatives (e.g., forward foreign currency exchange contracts, uncleared swap agreements, and uncleared options) and collateral, in the form of cash and securities, is held in segregated accounts with the fund’s custodian in connection with these agreements. For derivatives traded under an ISDA Master Agreement, which contains a collateral support annex, the collateral requirements are netted across all transactions traded under such counterparty-specific agreement and an amount is posted from one party to the other to collateralize such obligations. Cash that has been segregated or delivered to cover each fund’s collateral or margin obligations under derivative contracts, if any, will be reported separately in the Statements of Assets and Liabilities as restricted cash for uncleared derivatives and/or deposits with brokers for cleared derivatives. Securities pledged as collateral or margin for the same purpose, if any, are noted in the Portfolio of Investments. The funds may be required to make payments of interest on uncovered collateral or margin obligations with the broker. Any such payments are included in “Miscellaneous” expense in the Statements of Operations.
Futures Contracts– Certain funds entered into futures contracts which may be used to hedge against or obtain broad market exposure, interest rate exposure, or to manage duration. A futures contract represents a commitment for the future purchase or sale of an asset at a specified price on a specified date.
Upon entering into a futures contract, the fund is required to deposit with the broker, either in cash or securities, an initial margin in an amount equal to a specified percentage of the notional amount of the contract. Subsequent payments (variation margin) are made or received by the fund each day, depending on the daily fluctuations in the value of the contract, and are recorded for financial statement purposes as unrealized gain or loss by the fund until the contract is closed or expires at which point the gain or loss on futures contracts is realized.
The fund bears the risk of interest rates or securities prices moving unexpectedly, in which case, the fund may not achieve the anticipated benefits of the futures contracts and may realize a loss. While futures contracts may present less counterparty risk to the fund since the contracts are exchange traded and the exchange’s clearinghouse guarantees payments to the broker, there is still counterparty credit risk due to the insolvency of the broker. The fund’s maximum risk of loss due to counterparty credit risk is equal to the margin posted by the fund to the broker plus any gains or minus any losses on the outstanding futures contracts.
Inverse Floaters– The Virginia Fund invests in municipal inverse floating rate securities which are structured by the issuer (known as primary market inverse floating rate securities) or by the Virginia Fund utilizing the fund’s municipal bonds which have already been issued (known as self-deposited secondary market inverse floating rate securities) to have variable rates of interest which typically move in the opposite direction of short-term interest rates. A self-deposited secondary market inverse floating rate security is created when the Virginia Fund transfers a fixed rate municipal bond to a special purpose trust, and causes the trust to (a) issue floating rate certificates to third parties, in an amount equal to a fraction of the par amount of the deposited bonds (these certificates usually paytax-exempt interest at short-term interest rates that typically reset weekly; and the certificate holders typically, on seven days notice, have the option to tender their certificates to the trust or another party for redemption at par plus accrued interest), and (b) issue inverse floating rate certificates (sometimes referred to as “inverse floaters”) which are held by the Virginia Fund. Such self-deposited inverse floaters held by the Virginia Fund are accounted for as secured borrowings, with the municipal bonds reflected in the investments of the Virginia Fund and amounts owed to the holders of the floating rate certificates under the provisions of the trust, which amounts are paid solely from the assets of the trust, reflected as liabilities of the Virginia Fund in its Statements of Assets and Liabilities under the caption, “Payable to the holders of the floating rate certificates”. The carrying value of the Virginia Fund’s payable to the holders of the floating rate certificates as reported in the Virginia Fund’s Statements of Assets and Liabilities approximates its fair value. The value of the payable to the holders of the floating rate certificates as of the reporting date is considered level 2 under the fair value hierarchy disclosure. At March 31, 2020, the Virginia Fund’s payable to the holders of the floating rate certificates was $5,000,101 and the weighted average interest rate on the settled floating rate certificates issued by the trust was 4.76%. For the year ended March 31, 2020, the average payable to the holders of the settled floating rate certificates was $5,001,347 at a weighted average interest rate of 1.72%. Interest expense and fees include interest payments made to the holders of certain floating rate certificates and associated fees, both of which are made from trust assets. Interest expense and fees are
114
Notes to Financial Statements – continued
recorded as incurred. For the year ended March 31, 2020, interest expense and fees related to self-deposited inverse floaters amounted to $105,940 and are included in “Interest expense and fees” in the Statements of Operations.
Indemnifications– Under each fund’s organizational documents, its officers and Trustees may be indemnified against certain liabilities and expenses arising out of the performance of their duties to each fund. Additionally, in the normal course of business, each fund enters into agreements with service providers that may contain indemnification clauses. Each fund’s maximum exposure under these agreements is unknown as this would involve future claims that may be made against each fund that have not yet occurred.
Investment Transactions and Income– Investment transactions are recorded on the trade date. Interest income is recorded on the accrual basis. All premium and discount is amortized or accreted for financial statement purposes in accordance with U.S. generally accepted accounting principles. Some securities may be purchased or sold on an extended settlement basis which includes “when-issued”, “delayed delivery” or “To Be Announced” (TBA) securities. For extended settlement transactions, the receipt or delivery of the securities by the fund and related payments occur at a future date, usually beyond the customary settlement time. Interest payments received in additional securities are recorded on theex-interest date in an amount equal to the value of the security on such date. Debt obligations may be placed onnon-accrual status or set to accrue at a rate of interest less than the contractual coupon when the collection of all or a portion of interest has become doubtful. Interest income for those debt obligations may be further reduced by thewrite-off of the related interest receivables when deemed uncollectible.
Each fund may receive proceeds from litigation settlements. Any proceeds received from litigation involving portfolio holdings are reflected in the Statements of Operations in realized gain/loss if the security has been disposed of by the fund or in unrealized gain/loss if the security is still held by the fund. Any other proceeds from litigation not related to portfolio holdings are reflected as other income in the Statements of Operations.
Certain funds purchased or sold debt securities on a when-issued or delayed delivery basis, or in a “To Be Announced” (TBA) or “forward commitment” transaction with delivery or payment to occur at a later date beyond the normal settlement period. When the fund sells securities on a when-issued, delayed delivery, TBA, or forward commitment basis, the fund typically owns or has the right to acquire securities equivalent in kind and amount to the delivered securities. At the time a fund enters into a commitment to purchase or sell a security, the transaction is recorded and the value of the security acquired or sold is reflected in the fund’s net asset value. The price of such security and the date that the security will be delivered and paid for are fixed at the time the transaction is negotiated. The value of the security may vary with market fluctuations. When-issued investments purchased are held at carrying amount, which approximates fair value and are categorized as level 2 within the fair value hierarchy and included in Investments purchased or sold on an extended settlement basis in the Statement of Assets and Liabilities. No interest accrues to the fund until payment takes place. At the time that a fund enters into this type of transaction, the fund is required to have sufficient cash and/or liquid securities to cover its commitments. Losses may arise due to changes in the value of the underlying securities prior to settlement date or if the counterparty does not perform under the contract’s terms, or if the issuer does not issue the securities due to political, economic or other factors.
Fees Paid Indirectly– Each fund’s custody fee may be reduced by a credit earned under an arrangement that measures the value of U.S. dollars deposited with the custodian by each fund. The amount of the credit, for the year ended March 31, 2020, is shown as a reduction of total expenses in the Statements of Operations.
Tax Matters and Distributions– Each fund intends to qualify as a regulated investment company, as defined under Subchapter M of the Internal Revenue Code, and to distribute all of its taxable andtax-exempt income, including realized capital gains. As a result, no provision for federal income tax is required. Each fund’s federal tax returns, when filed, will remain subject to examination by the Internal Revenue Service for a three year period. Management has analyzed each fund’s tax positions taken on federal and state tax returns for all open tax years and does not believe that there are any uncertain tax positions that require recognition of a tax liability.
Distributions to shareholders are recorded on theex-dividend date. Income and capital gain distributions are determined in accordance with income tax regulations, which may differ from U.S. generally accepted accounting principles. Certain capital accounts in the financial statements are periodically adjusted for permanent differences in order to reflect their tax character. These adjustments have no impact on net assets or net asset value per share. Temporary differences which arise from recognizing certain items of income, expense, gain or loss in different periods for financial statement and tax purposes will reverse at some time in the future.
Book/tax differences primarily relate to defaulted bonds, amortization and accretion of debt securities, and derivative transactions, as applicable to each fund.
115
Notes to Financial Statements – continued
The tax character of distributions declared to shareholders for the last two fiscal years is as follows:
| | | | | | | | | | | | | | | | | | | | | | | | | | | | | | | | |
| | | | | | | | |
| Year ended 3/31/20 | | Mississippi
Fund | | | New York
Fund | | | North Carolina Fund | | | Pennsylvania
Fund | | | South
Carolina
Fund | | | Tennessee
Fund | | | Virginia
Fund | | | West
Virginia
Fund | |
| Ordinary income (including any short-term capital gains) | | | $8,988 | | | | $135,659 | | | | $208,491 | | | | $80,724 | | | | $48,199 | | | | $27,122 | | | | $190,368 | | | | $12,404 | |
| Tax-exempt income | | | 2,728,570 | | | | 7,293,171 | | | | 12,351,993 | | | | 4,748,912 | | | | 5,813,121 | | | | 3,012,776 | | | | 9,276,121 | | | | 3,254,631 | |
| Total distributions | | | $2,737,558 | | | | $7,428,830 | | | | $12,560,484 | | | | $4,829,636 | | | | $5,861,320 | | | | $3,039,898 | | | | $9,466,489 | | | | $3,267,035 | |
| | | | | | | | |
| Year ended 3/31/19 | | Mississippi
Fund | | | New York
Fund | | | North
Carolina
Fund | | | Pennsylvania
Fund | | | South
Carolina
Fund | | | Tennessee
Fund | | | Virginia
Fund | | | West
Virginia
Fund | |
| Ordinary income (including any short-term capital gains) | | | $28,290 | | | | $362,773 | | | | $43,839 | | | | $48,916 | | | | $31,004 | | | | $700 | | | | $147,719 | | | | $33,726 | |
| Tax-exempt income | | | 2,838,645 | | | | 7,683,267 | | | | 12,555,731 | | | | 4,456,622 | | | | 5,767,612 | | | | 3,225,038 | | | | 9,279,313 | | | | 3,338,513 | |
| Total distributions | | | $2,866,935 | | | | $8,046,040 | | | | $12,599,570 | | | | $4,505,538 | | | | $5,798,616 | | | | $3,225,738 | | | | $9,427,032 | | | | $3,372,239 | |
The federal tax cost and the tax basis components of distributable earnings were as follows:
| | | | | | | | | | | | | | | | |
| As of 3/31/20 | | Mississippi
Fund | | | New York Fund | | | North
Carolina
Fund | | | Pennsylvania
Fund | |
| | | | |
| Cost of investments | | | $98,549,100 | | | | $269,290,727 | | | | $457,287,508 | | | | $149,778,179 | |
| | | | |
| Gross appreciation | | | 4,976,273 | | | | 12,207,007 | | | | 18,789,818 | | | | 7,490,020 | |
| Gross depreciation | | | (934,573 | ) | | | (3,570,805 | ) | | | (6,914,138 | ) | | | (1,729,833 | ) |
| Net unrealized appreciation (depreciation) | | | $4,041,700 | | | | $8,636,202 | | | | $11,875,680 | | | | $5,760,187 | |
| Undistributed ordinary income | | | 26,771 | | | | 85,903 | | | | 364,522 | | | | 20,403 | |
| Undistributedtax-exempt income | | | 339,834 | | | | 744,828 | | | | 1,178,742 | | | | 576,252 | |
| Capital loss carryforwards | | | (3,498,568 | ) | | | (4,439,176 | ) | | | (15,719,206 | ) | | | (3,261,919 | ) |
| Other temporary differences | | | (215,086 | ) | | | (626,229 | ) | | | (1,046,650 | ) | | | (402,247 | ) |
| | | | |
| As of 3/31/20 | | South
Carolina
Fund | | | Tennessee
Fund | | | Virginia
Fund | | | West
Virginia
Fund | |
| | | | |
| Cost of investments | | | $227,872,116 | | | | $95,431,753 | | | | $327,110,975 | | | | $102,776,923 | |
| | | | |
| Gross appreciation | | | 8,470,219 | | | | 3,503,779 | | | | 14,236,608 | | | | 4,098,044 | |
| Gross depreciation | | | (2,994,872 | ) | | | (1,498,511 | ) | | | (6,375,999 | ) | | | (938,541 | ) |
| Net unrealized appreciation (depreciation) | | | $5,475,347 | | | | $2,005,268 | | | | $7,860,609 | | | | $3,159,503 | |
| Undistributed ordinary income | | | 53,021 | | | | 13,991 | | | | 302,302 | | | | 28,503 | |
| Undistributedtax-exempt income | | | 648,904 | | | | 801,701 | | | | 1,080,503 | | | | 377,008 | |
| Capital loss carryforwards | | | (6,316,790 | ) | | | (3,646,740 | ) | | | (9,407,999 | ) | | | (3,789,853 | ) |
| Other temporary differences | | | (518,770 | ) | | | (234,069 | ) | | | (821,119 | ) | | | (275,633 | ) |
As of March 31, 2020, each fund had capital loss carryforwards available to offset future realized gains. These net capital losses may be carried forward indefinitely and their character is retained as short-term and/or long-term losses. Such losses are characterized as follows:
| | | | | | | | | | | | | | | | | | | | | | | | | | | | | | | | |
| | | Mississippi
Fund | | | New York
Fund | | | North Carolina Fund | | | Pennsylvania
Fund | | | South
Carolina Fund | | | Tennessee
Fund | | | Virginia
Fund | | | West Virginia Fund | |
| Short-Term | | | $(1,457,393 | ) | | | $(4,105,239 | ) | | | $(12,436,549 | ) | | | $(3,053,544 | ) | | | $(4,260,497 | ) | | | $(2,457,059 | ) | | | $(5,329,857 | ) | | | $(1,720,267 | ) |
| Long-Term | | | (2,041,175 | ) | | | (333,937 | ) | | | (3,282,657 | ) | | | (208,375 | ) | | | (2,056,293 | ) | | | (1,189,681 | ) | | | (4,078,142 | ) | | | (2,069,586 | ) |
| Total | | | $(3,498,568 | ) | | | $(4,439,176 | ) | | | $(15,719,206 | ) | | | $(3,261,919 | ) | | | $(6,316,790 | ) | | | $(3,646,740 | ) | | | $(9,407,999 | ) | | | $(3,789,853 | ) |
Multiple Classes of Shares of Beneficial Interest– Each fund offers multiple classes of shares, which differ in their respective distribution and service fees. Each fund’s income and common expenses are allocated to shareholders based on the value of settled shares outstanding of each class. Each fund’s realized and unrealized gain (loss) are allocated to shareholders based on the daily net assets of each class. Dividends are declared separately for each class. Differences in per share dividend rates are generally due to
116
Notes to Financial Statements – continued
differences in separate class expenses. Class B shares will convert to Class A shares approximately eight years after purchase. Class C shares will convert to Class A shares approximately ten years after purchase. Each fund’s distributions declared to shareholders as reported in the Statements of Changes in Net Assets are presented by class as follows:
| | | | | | | | | | | | | | | | | | | | | | | | | | | | | | | | |
| | | Mississippi Fund | | | New York Fund | | | North Carolina Fund | | | Pennsylvania Fund | |
| | | | | | | | |
| | | Year Ended
3/31/20 | | | Year Ended
3/31/19 | | | Year Ended
3/31/20 | | | Year Ended
3/31/19 | | | Year Ended
3/31/20 | | | Year Ended
3/31/19 | | | Year Ended
3/31/20 | | | Year Ended
3/31/19 | |
| Class A | | | $2,389,980 | | | | $2,559,212 | | | | $4,661,295 | | | | $5,132,518 | | | | $8,874,823 | | | | $9,258,094 | | | | $3,595,955 | | | | $3,507,237 | |
| Class B | | | 14,406 | | | | 20,999 | | | | 50,871 | | | | 91,901 | | | | 22,162 | | | | 43,239 | | | | 49,173 | | | | 79,795 | |
| Class C | | | — | | | | — | | | | 343,835 | | | | 478,514 | | | | 849,632 | | | | 1,030,707 | | | | — | | | | — | |
| Class I | | | 293,990 | | | | 264,522 | | | | 2,291,148 | | | | 2,281,737 | | | | 2,168,796 | | | | 1,765,747 | | | | 772,775 | | | | 748,128 | |
| Class R6 | | | 39,182 | | | | 22,202 | | | | 81,681 | | | | 61,370 | | | | 645,071 | | | | 501,783 | | | | 411,733 | | | | 170,378 | |
| Total | | | $2,737,558 | | | | $2,866,935 | | | | $7,428,830 | | | | $8,046,040 | | | | $12,560,484 | | | | $12,599,570 | | | | $4,829,636 | | | | $4,505,538 | |
| | | | | | | | | | | | | | | | | | | | | | | | | | | | | | | | |
| | | | |
| | | South Carolina Fund | | | Tennessee Fund | | | Virginia Fund | | | West Virginia Fund | |
| | | | | | | | |
| | | Year Ended
3/31/20 | | | Year Ended
3/31/19 | | | Year Ended
3/31/20 | | | Year Ended
3/31/19 | | | Year Ended
3/31/20 | | | Year Ended
3/31/19 | | | Year Ended
3/31/20 | | | Year Ended
3/31/19 | |
| Class A | | | $4,684,189 | | | | $4,830,396 | | | | $2,141,360 | | | | $2,414,781 | | | | $6,697,032 | | | | $7,015,038 | | | | $3,006,955 | | | | $3,119,866 | |
| Class B | | | 33,930 | | | | 52,376 | | | | 10,808 | | | | 22,121 | | | | 13,397 | | | | 19,027 | | | | 6,765 | | | | 13,124 | |
| Class C | | | — | | | | — | | | | — | | | | — | | | | 354,559 | | | | 448,859 | | | | — | | | | — | |
| Class I | | | 933,765 | | | | 810,576 | | | | 771,032 | | | | 682,504 | | | | 2,013,065 | | | | 1,660,352 | | | | 237,273 | | | | 234,008 | |
| Class R6 | | | 209,436 | | | | 105,268 | | | | 116,698 | | | | 106,332 | | | | 388,436 | | | | 283,756 | | | | 16,042 | | | | 5,241 | |
| Total | | | $5,861,320 | | | | $5,798,616 | | | | $3,039,898 | | | | $3,225,738 | | | | $9,466,489 | | | | $9,427,032 | | | | $3,267,035 | | | | $3,372,239 | |
| (3) | | Transactions with Affiliates |
Investment Adviser– Each fund has an investment advisory agreement with MFS to provide overall investment management and related administrative services and facilities to each fund. The management fee is computed daily and paid monthly at an annual rate of 0.45% of each fund’s average daily net assets.
MFS has agreed in writing to reduce its management fee by a specified amount if certain MFS mutual fund assets exceed thresholds agreed to by MFS and the funds’ Board of Trustees. For the year ended March 31, 2020, these management fee reductions amounted to the following, which are included in the reduction of total expenses in the Statements of Operations:
| | | | | | | | | | | | | | |
| | | | | | | |
Mississippi
Fund | | New York
Fund | | North Carolina
Fund | | Pennsylvania
Fund | | South Carolina
Fund | | Tennessee
Fund | | Virginia
Fund | | West Virginia
Fund |
| | | | | | | |
| $9,430 | | $27,026 | | $45,466 | | $15,173 | | $21,522 | | $9,862 | | $32,898 | | $10,717 |
The management fee incurred for the year ended March 31, 2020 was equivalent to an annual effective rate of 0.44% of each fund’s average daily net assets.
The investment adviser has agreed in writing to pay a portion of the following funds’ total annual operating expenses, excluding interest, taxes, extraordinary expenses, brokerage and transaction costs, and investment-related expenses (including interest expense and fees associated with investments in inverse floating rate instruments), such that total fund operating expenses do not exceed the following rates annually of these funds’ average daily net assets:
| | | | | | | | | | | | | | | | |
| | | | |
| | | New York
Fund | | | South
Carolina
Fund | | | Virginia
Fund | | | West
Virginia
Fund | |
| Class A | | | 0.90% | | | | 0.84% | | | | 0.81% | | | | 0.87% | |
| Class B | | | 1.65% | | | | 1.59% | | | | 1.56% | | | | 1.62% | |
| Class C | | | 1.65% | | | | N/A | | | | 1.56% | | | | N/A | |
| Class I | | | 0.65% | | | | 0.59% | | | | 0.56% | | | | 0.62% | |
| Class R6 | | | 0.60% | | | | 0.53% | | | | 0.49% | | | | 0.55% | |
These written agreements will continue until modified by the funds’ Board of Trustees, but such agreements will continue at least until July 31, 2020. For the year ended March 31, 2020, the New York Fund’s actual operating expenses did not exceed the limits described above and therefore, the investment adviser did not pay any portion of the fund’s expenses related to these agreements. For the year ended March 31, 2020, these reductions amounted to the following for the South Carolina Fund, the Virginia Fund, and the West Virginia Fund and are included in the reduction of total expenses in the Statements of Operations:
| | | | |
| | |
South
Carolina
Fund | | Virginia
Fund | | West Virginia
Fund |
| | |
| $72,926 | | $194,674 | | $105,080 |
For the period from April 1, 2019 through July 31, 2019, the investment adviser had agreed in writing to pay a portion of the following funds’ total annual operating expenses, excluding interest, taxes, extraordinary expenses, brokerage and transaction costs,
117
Notes to Financial Statements – continued
and investment-related expenses (including interest expense and fees associated with investments in inverse floating rate instruments), such that total fund operating expenses did not exceed the following rates annually of these funds’ average daily net assets:
| | | | | | | | |
| | |
| | | North
Carolina
Fund | | | Tennessee
Fund | |
| Class A | | | 0.93% | | | | 0.88% | |
| Class B | | | 1.68% | | | | 1.63% | |
| Class C | | | 1.68% | | | | N/A | |
| Class I | | | 0.68% | | | | 0.63% | |
| Class R6 | | | 0.61% | | | | 0.56% | |
These written agreements terminated on July 31, 2019. For the period from April 1, 2019 through July 31, 2019, these reductions amounted to $30,221 for the Tennessee Fund and are included in the reduction of total expenses in the Statements of Operations. For the same period, the North Carolina Fund’s actual operating expenses did not exceed the limits described above and therefore, the investment adviser did not pay any portion of the fund’s expenses related to these agreements.
Effective August 1, 2019, the investment adviser has agreed in writing to pay a portion of the following funds’ total annual operating expenses, excluding interest, taxes, extraordinary expenses, brokerage and transaction costs, and investment-related expenses (including interest expense and fees associated with investments in inverse floating rate instruments), such that total fund operating expenses do not exceed the following rates annually of these funds’ average daily net assets:
| | | | | | | | |
| | |
| | | North
Carolina
Fund | | | Tennessee
Fund | |
| Class A | | | 0.84% | | | | 0.86% | |
| Class B | | | 1.59% | | | | 1.61% | |
| Class C | | | 1.59% | | | | N/A | |
| Class I | | | 0.59% | | | | 0.61% | |
| Class R6 | | | 0.52% | | | | 0.54% | |
These written agreements will continue until modified by the funds’ Board of Trustees, but such agreements will continue at least until July 31, 2020. For the period from August 1, 2019 through March 31, 2020, these reductions amounted to $14,298 for the North Carolina Fund and $72,910 for the Tennessee Fund and are included in the reduction of total expenses in the Statements of Operations.
Distributor– MFS Fund Distributors, Inc. (MFD), a wholly-owned subsidiary of MFS, as distributor, received the following amounts for the year ended March 31, 2020, as its portion of the initial sales charge on sales of Class A shares of each fund:
| | | | | | | | | | | | | | |
| | | | | | | |
Mississippi
Fund | | New York
Fund | | North Carolina
Fund | | Pennsylvania
Fund | | South Carolina
Fund | | Tennessee
Fund | | Virginia
Fund | | West Virginia
Fund |
| | | | | | | |
| $10,549 | | $12,295 | | $33,809 | | $15,392 | | $31,801 | | $7,660 | | $19,558 | | $8,763 |
The Board of Trustees has adopted a distribution plan for certain share classes pursuant to Rule12b-1 of the Investment Company Act of 1940.
Each fund’s distribution plan provides that each fund will pay MFD for services provided by MFD and financial intermediaries in connection with the distribution and servicing of certain share classes. One component of the plan is a distribution fee paid to MFD and another component of the plan is a service fee paid to MFD. MFD may subsequently pay all, or a portion, of the distribution and/or service fees to financial intermediaries.
Distribution Plan Fee Table:
| | | | | | | | | | | | | | | | | | | | |
| | | Class A | |
| | | | | |
| | | Distribution
Fee Rate (d) | | | Service
Fee Rate (d) | | | Total
Distribution
Plan (d) | | | Annual
Effective
Rate (e) | | | Distribution
and Service
Fee | |
| Mississippi Fund | | | — | | | | 0.25% | | | | 0.25% | | | | 0.10% | | | | $209,008 | |
| New York Fund | | | — | | | | 0.25% | | | | 0.25% | | | | 0.25% | | | | 432,463 | |
| North Carolina Fund | | | — | | | | 0.25% | | | | 0.25% | | | | 0.24% | | | | 806,808 | |
| Pennsylvania Fund | | | — | | | | 0.25% | | | | 0.25% | | | | 0.10% | | | | 287,910 | |
| South Carolina Fund | | | — | | | | 0.25% | | | | 0.25% | | | | 0.25% | | | | 441,930 | |
| Tennessee Fund | | | — | | | | 0.25% | | | | 0.25% | | | | 0.25% | | | | 180,244 | |
| Virginia Fund | | | — | | | | 0.25% | | | | 0.25% | | | | 0.25% | | | | 593,511 | |
| West Virginia Fund | | | — | | | | 0.25% | | | | 0.25% | | | | 0.24% | | | | 251,533 | |
118
Notes to Financial Statements – continued
| | | | | | | | | | | | | | | | | | | | |
| |
| | | Class B | |
| | | | | |
| | | Distribution
Fee Rate (d) | | | Service
Fee Rate (d) | | | Total
Distribution
Plan (d) | | | Annual
Effective
Rate (e) | | | Distribution
and Service
Fee | |
| Mississippi Fund | | | 0.75% | | | | 0.25% | | | | 1.00% | | | | 0.75% | | | | $6,470 | |
| New York Fund | | | 0.75% | | | | 0.25% | | | | 1.00% | | | | 1.00% | | | | 25,869 | |
| North Carolina Fund | | | 0.75% | | | | 0.25% | | | | 1.00% | | | | 1.00% | | | | 10,871 | |
| Pennsylvania Fund | | | 0.75% | | | | 0.25% | | | | 1.00% | | | | 0.85% | | | | 20,450 | |
| South Carolina Fund | | | 0.75% | | | | 0.25% | | | | 1.00% | | | | 1.00% | | | | 17,538 | |
| Tennessee Fund | | | 0.75% | | | | 0.25% | | | | 1.00% | | | | 1.00% | | | | 4,711 | |
| Virginia Fund | | | 0.75% | | | | 0.25% | | | | 1.00% | | | | 1.00% | | | | 6,397 | |
| West Virginia Fund | | | 0.75% | | | | 0.25% | | | | 1.00% | | | | 1.00% | | | | 2,981 | |
| |
| | | Class C | |
| | | | | |
| | | Distribution
Fee Rate (d) | | | Service
Fee Rate (d) | | | Total
Distribution
Plan (d) | | | Annual
Effective
Rate (e) | | | Distribution
and Service
Fee | |
| New York Fund | | | 0.75% | | | | 0.25% | | | | 1.00% | | | | 1.00% | | | | $176,315 | |
| North Carolina Fund | | | 0.75% | | | | 0.25% | | | | 1.00% | | | | 1.00% | | | | 427,262 | |
| Virginia Fund | | | 0.75% | | | | 0.25% | | | | 1.00% | | | | 1.00% | | | | 170,920 | |
| | | | | | | | | | | | | | | | | | | | | | | | | | | | | | | | |
| | | | | | | | |
| | | Mississippi
Fund | | | New York
Fund | | | North
Carolina
Fund | | | Pennsylvania
Fund | | | South
Carolina
Fund | | | Tennessee
Fund | | | Virginia
Fund | | | West
Virginia
Fund | |
| Total Distribution and Service Fees | | | $215,478 | | | | $634,647 | | | | $1,244,941 | | | | $308,360 | | | | $459,468 | | | | $184,955 | | | | $770,828 | | | | $254,514 | |
| (d) | In accordance with the distribution plan for certain classes, each fund pays distribution and/or service fees equal to these annual percentage rates of each class’s average daily net assets. The distribution and service fee rates disclosed by class represent the current rates in effect at the end of the reporting period. Any rate changes, if applicable, are detailed below. |
| (e) | The annual effective rates represent actual fees incurred under the distribution plan for the year ended March 31, 2020 based on each class’s average daily net assets. MFD has voluntarily agreed to rebate a portion of each class’s 0.25% service fee attributable to accounts for which there is no financial intermediary specified on the account except for accounts attributable to MFS or its affiliates’ seed money. For the year ended March 31, 2020, these rebates amounted to the following and are included in the reduction of total expenses in the Statements of Operations: |
| | | | | | | | | | | | | | | | | | | | | | | | | | | | | | | | |
| | | | | | | | |
| | | Mississippi
Fund | | | New York
Fund | | | North
Carolina
Fund | | | Pennsylvania
Fund | | | South
Carolina
Fund | | | Tennessee
Fund | | | Virginia
Fund | | | West
Virginia
Fund | |
| Class A | | | $598 | | | | $8,105 | | | | $22,098 | | | | $496 | | | | $6,016 | | | | $934 | | | | $9,970 | | | | $10,978 | |
| Class C | | | N/A | | | | — | | | | 7 | | | | N/A | | | | N/A | | | | N/A | | | | — | | | | N/A | |
| | Mississippi Fund:MFD has agreed in writing to reduce the Class A and Class B service fee rates to 0.10% and 0.00%, respectively. This written agreement will continue until modified by the fund’s Board of Trustees, but such agreement will continue at least until July 31, 2020. For the year ended March 31, 2020, these reductions amounted to $125,406 and $1,619 for Class A and Class B, respectively, and are included in the reduction of total expenses in the Statements of Operations. |
| | Pennsylvania Fund:MFD has agreed in writing to reduce the Class A and Class B service fee rates to 0.10%. This written agreement will continue until modified by the fund’s Board of Trustees, but such agreement will continue at least until July 31, 2020. For the year ended March 31, 2020, these reductions amounted to $172,747 and $3,071 for Class A and Class B, respectively, and are included in the reduction of total expenses in the Statements of Operations. |
Certain Class A shares are subject to a contingent deferred sales charge (CDSC) in the event of a shareholder redemption within 18 months of purchase. Class B shares are subject to a CDSC in the event of a shareholder redemption within six years of purchase. Class C shares are subject to a CDSC in the event of a shareholder redemption within 12 months of purchase. All contingent deferred sales charges are paid to MFD and during the year ended March 31, 2020, were as follows:
| | | | | | | | | | | | | | | | | | | | | | | | | | | | | | | | |
| | | | | | | | |
| CDSC Imposed | | Mississippi
Fund | | | New York
Fund | | | North
Carolina
Fund | | | Pennsylvania
Fund | | | South
Carolina
Fund | | | Tennessee
Fund | | | Virginia
Fund | | | West
Virginia
Fund | |
| Class A | | | $2,666 | | | | $21,247 | | | | $8,344 | | | | $1,141 | | | | $966 | | | | $685 | | | | $3,198 | | | | $— | |
| Class B | | | 980 | | | | 2,838 | | | | 107 | | | | 1,232 | | | | 449 | | | | 1,366 | | | | — | | | | 292 | |
| Class C | | | N/A | | | | 1,593 | | | | 2,846 | | | | N/A | | | | N/A | | | | N/A | | | | 1,329 | | | | N/A | |
Shareholder Servicing Agent– MFS Service Center, Inc. (MFSC), a wholly-owned subsidiary of MFS, receives a fee from each fund for its services as shareholder servicing agent calculated as a percentage of the average daily net assets of each fund as determined
119
Notes to Financial Statements – continued
periodically under the supervision of the funds’ Board of Trustees. For the year ended March 31, 2020, each fund paid the following fee, which equated to the following annual percentage of each fund’s average daily net assets:
| | | | | | | | | | | | | | | | | | | | | | | | | | | | | | | | |
| | | | | | | | |
| | | Mississippi
Fund | | | New York
Fund | | | North
Carolina
Fund | | | Pennsylvania
Fund | | | South
Carolina
Fund | | | Tennessee
Fund | | | Virginia
Fund | | | West
Virginia
Fund | |
| Expenses paid | | | $2,026 | | | | $13,427 | | | | $14,110 | | | | $12,603 | | | | $6,627 | | | | $2,374 | | | | $16,742 | | | | $3,719 | |
| Percentage of average daily net assets | | | 0.0021% | | | | 0.0049% | | | | 0.0031% | | | | 0.0082% | | | | 0.0030% | | | | 0.0024% | | | | 0.0050% | | | | 0.0034% | |
MFSC also receives payment from each fund forout-of-pocket expenses,sub-accounting and other shareholder servicing costs which may be paid to affiliated and unaffiliated service providers. Class R6 shares do not incursub-accounting fees. For the year ended March 31, 2020, theseout-of-pocket expenses,sub-accounting and other shareholder servicing costs amounted to the following:
| | | | | | | | | | | | | | |
| | | | | | | |
Mississippi
Fund | | New York
Fund | | North Carolina
Fund | | Pennsylvania
Fund | | South Carolina
Fund | | Tennessee
Fund | | Virginia
Fund | | West Virginia
Fund |
| | | | | | | |
| $57,647 | | $188,527 | | $330,851 | | $106,642 | | $136,207 | | $75,178 | | $263,041 | | $92,226 |
Administrator– MFS provides certain financial, legal, shareholder communications, compliance, and other administrative services to each fund. Under an administrative services agreement, each fund reimburses MFS the costs incurred to provide these services. Each fund is charged an annual fixed amount of $17,500 plus a fee based on average daily net assets. The administrative services fee incurred for the year ended March 31, 2020 was equivalent to the following annual effective rates of each fund’s average daily net assets:
| | | | | | | | | | | | | | | | | | | | | | | | | | | | | | | | |
| | | | | | | | |
| | | Mississippi
Fund | | | New York
Fund | | | North
Carolina
Fund | | | Pennsylvania
Fund | | | South
Carolina
Fund | | | Tennessee
Fund | | | Virginia
Fund | | | West Virginia
Fund | |
| Percentage of average daily net assets | | | 0.0246% | | | | 0.0171% | | | | 0.0155% | | | | 0.0202% | | | | 0.0181% | | | | 0.0241% | | | | 0.0164% | | | | 0.0232% | |
Trustees’ and Officers’ Compensation– Each fund pays compensation to independent Trustees in the form of a retainer, attendance fees, and additional compensation to Board and Committee chairpersons. Each fund does not pay compensation directly to Trustees or officers of each fund who are also officers of the investment adviser, all of whom receive remuneration from MFS for their services to each fund. Certain officers and Trustees of each fund are officers or directors of MFS, MFD, and MFSC.
Prior to December 31, 2001, each fund had an unfunded defined benefit plan (“DB plan”) for independent Trustees. As of December 31, 2001, the Board took action to terminate the DB plan with respect to then-current and any future independent Trustees, such that the DB plan covers only certain of those former independent Trustees who retired on or before December 31, 2001. Effective June 30, 2019, the Mississippi Fund, the New York Fund, the Pennsylvania Fund, and the Tennessee Fund no longer participate in the DB plan.The DB plan resulted in a pension expense for the following funds. These amounts are included in “Independent Trustees’ compensation” in the Statements of Operations for the year ended March 31, 2020:
| | | | | | |
| | | |
North Carolina
Fund | | South Carolina
Fund | | Virginia
Fund | | West Virginia
Fund |
| | | |
| $729 | | $709 | | $726 | | $706 |
The liability for deferred retirement benefits payable to those former independent Trustees under the DB plan amounted to the following at March 31, 2020, and is included in “Payable for independent Trustees’ compensation” in the Statements of Assets and Liabilities:
| | | | | | |
| | | |
North Carolina
Fund | | South Carolina
Fund | | Virginia
Fund | | West Virginia
Fund |
| | | |
| $3,223 | | $3,261 | | $3,245 | | $3,260 |
Other– These funds and certain other funds managed by MFS (the funds) had entered into a service agreement (the ISO Agreement) which provided for payment of fees solely by the funds to Tarantino LLC in return for the provision of services of an Independent Senior Officer (ISO) for the funds. Frank L. Tarantino served as the ISO and was an officer of the funds and the sole member of Tarantino LLC. Effective June 30, 2019, Mr. Tarantino retired from his position as ISO for the funds, and the ISO Agreement was terminated. For the year ended March 31, 2020, the fee paid by each fund under this agreement amounted to the following and is included in “Miscellaneous” expense in the Statements of Operations:
| | | | | | | | | | | | | | |
| | | | | | | |
Mississippi
Fund | | New York
Fund | | North Carolina
Fund | | Pennsylvania
Fund | | South Carolina
Fund | | Tennessee
Fund | | Virginia
Fund | | West Virginia
Fund |
| | | | | | | |
| $69 | | $204 | | $317 | | $110 | | $143 | | $69 | | $236 | | $83 |
MFS had agreed to bear all expenses associated with office space, other administrative support, and supplies provided to the ISO.
Each fund invests in the MFS Institutional Money Market Portfolio which is managed by MFS and seeks current income consistent with preservation of capital and liquidity. This money market fund does not pay a management fee to MFS but does incur investment and operating costs.
Each fund is permitted to engage in purchase and sale transactions with funds and accounts for which MFS serves as investment adviser orsub-adviser (“cross-trades”) pursuant to a policy adopted by the Board of Trustees. This policy has been designed to
120
Notes to Financial Statements – continued
ensure that cross-trades conducted by the fund comply with Rule17a-7 under the Investment Company Act of 1940. During the year ended March 31, 2020, the Virginia fund engaged in purchase transactions pursuant to this policy, which amounted to $130,112.
For the year ended March 31, 2020, purchases and sales of investments, other than short-term obligations, were as follows:
| | | | | | | | | | | | | | | | | | | | | | | | | | | | | | | | |
| | | | | | | | |
| | | Mississippi
Fund | | | New York
Fund | | | North
Carolina
Fund | | | Pennsylvania
Fund | | | South
Carolina
Fund | | | Tennessee
Fund | | | Virginia
Fund | | | West Virginia
Fund | |
| Purchases | | | $36,940,042 | | | | $99,672,074 | | | | $197,579,832 | | | | $43,601,197 | | | | $94,379,788 | | | | $34,871,629 | | | | $114,648,511 | | | | $21,988,121 | |
| Sales | | | $27,996,648 | | | | $67,815,634 | | | | $127,282,850 | | | | $26,326,182 | | | | $46,966,427 | | | | $33,534,620 | | | | $80,007,205 | | | | $20,743,996 | |
| (5) | | Shares of Beneficial Interest |
Each fund’s Declaration of Trust permits the Trustees to issue an unlimited number of full and fractional shares of beneficial interest. Transactions in fund shares were as follows:
| | | | | | | | | | | | | | | | | | | | | | | | | | | | | | | | |
| | | Mississippi Fund | | | New York Fund | |
| | | | |
| | | Year ended
3/31/20 | | | Year ended
3/31/19 | | | Year ended
3/31/20 | | | Year ended
3/31/19 | |
| | | | | | | | |
| | | Shares | | | Amount | | | Shares | | | Amount | | | Shares | | | Amount | | | Shares | | | Amount | |
| Shares sold | | | | | | | | | | | | | | | | | | | | | | | | | | | | | | | | |
| | | | | | | | |
Class A | | | 1,609,474 | | | | $15,813,418 | | | | 545,608 | | | | $5,190,264 | | | | 3,965,636 | | | | $44,561,293 | | | | 3,275,968 | | | | $35,336,253 | |
| | | | | | | | |
Class B | | | 228 | | | | 2,238 | | | | 5,519 | | | | 52,598 | | | | 6,138 | | | | 68,162 | | | | 17,751 | | | | 191,010 | |
| | | | | | | | |
Class C | | | — | | | | — | | | | — | | | | — | | | | 359,199 | | | | 4,023,122 | | | | 267,399 | | | | 2,889,240 | |
| | | | | | | | |
Class I | | | 357,630 | | | | 3,505,417 | | | | 473,183 | | | | 4,502,400 | | | | 2,068,782 | | | | 20,546,180 | | | | 1,320,098 | | | | 12,577,410 | |
Class R6 | | | 197,206 | | | | 1,945,776 | | | | 35,081 | | | | 331,385 | | | | 194,696 | | | | 1,937,054 | | | | 113,363 | | | | 1,080,551 | |
| | | 2,164,538 | | | | $21,266,849 | | | | 1,059,391 | | | | $10,076,647 | | | | 6,594,451 | | | | $71,135,811 | | | | 4,994,579 | | | | $52,074,464 | |
| | | | | | | | |
| Shares issued to shareholders in reinvestment of distributions | | | | | | | | | | | | | | | | | | | | | | | | | | | | | | | | |
| | | | | | | | |
Class A | | | 221,922 | | | | $2,175,719 | | | | 244,649 | | | | $2,324,953 | | | | 344,332 | | | | $3,870,583 | | | | 392,614 | | | | $4,246,243 | |
| | | | | | | | |
Class B | | | 1,088 | | | | 10,673 | | | | 1,642 | | | | 15,621 | | | | 3,848 | | | | 43,101 | | | | 7,340 | | | | 79,179 | |
| | | | | | | | |
Class C | | | — | | | | — | | | | — | | | | — | | | | 26,470 | | | | 297,128 | | | | 38,069 | | | | 411,169 | |
| | | | | | | | |
Class I | | | 26,854 | | | | 262,939 | | | | 25,116 | | | | 238,243 | | | | 215,636 | | | | 2,143,920 | | | | 224,949 | | | | 2,151,625 | |
Class R6 | | | 4,002 | | | | 39,182 | | | | 2,339 | | | | 22,202 | | | | 8,204 | | | | 81,615 | | | | 6,419 | | | | 61,370 | |
| | | 253,866 | | | | $2,488,513 | | | | 273,746 | | | | $2,601,019 | | | | 598,490 | | | | $6,436,347 | | | | 669,391 | | | | $6,949,586 | |
| | | | | | | | |
| Shares reacquired | | | | | | | | | | | | | | | | | | | | | | | | | | | | | | | | |
| | | | | | | | |
Class A | | | (1,075,513 | ) | | | $(10,496,129 | ) | | | (1,238,444 | ) | | | $(11,763,289 | ) | | | (2,414,814 | ) | | | $(26,976,784 | ) | | | (2,813,771 | ) | | | $(30,379,241 | ) |
| | | | | | | | |
Class B | | | (4,559 | ) | | | (44,687 | ) | | | (44,553 | ) | | | (423,104 | ) | | | (70,948 | ) | | | (791,554 | ) | | | (130,055 | ) | | | (1,401,065 | ) |
| | | | | | | | |
Class C | | | — | | | | — | | | | — | | | | — | | | | (511,488 | ) | | | (5,702,333 | ) | | | (874,616 | ) | | | (9,448,349 | ) |
| | | | | | | | |
Class I | | | (101,916 | ) | | | (989,172 | ) | | | (284,865 | ) | | | (2,698,902 | ) | | | (669,227 | ) | | | (6,565,350 | ) | | | (477,721 | ) | | | (4,555,778 | ) |
Class R6 | | | (43,200 | ) | | | (406,770 | ) | | | (6,219 | ) | | | (59,094 | ) | | | (79,743 | ) | | | (775,117 | ) | | | (57,538 | ) | | | (546,249 | ) |
| | | (1,225,188 | ) | | | $(11,936,758 | ) | | | (1,574,081 | ) | | | $(14,944,389 | ) | | | (3,746,220 | ) | | | $(40,811,138 | ) | | | (4,353,701 | ) | | | $(46,330,682 | ) |
| | | | | | | | |
| Net change | | | | | | | | | | | | | | | | | | | | | | | | | | | | | | | | |
| | | | | | | | |
Class A | | | 755,883 | | | | $7,493,008 | | | | (448,187 | ) | | | $(4,248,072 | ) | | | 1,895,154 | | | | $21,455,092 | | | | 854,811 | | | | $9,203,255 | |
| | | | | | | | |
Class B | | | (3,243 | ) | | | (31,776 | ) | | | (37,392 | ) | | | (354,885 | ) | | | (60,962 | ) | | | (680,291 | ) | | | (104,964 | ) | | | (1,130,876 | ) |
| | | | | | | | |
Class C | | | — | | | | — | | | | — | | | | — | | | | (125,819 | ) | | | (1,382,083 | ) | | | (569,148 | ) | | | (6,147,940 | ) |
| | | | | | | | |
Class I | | | 282,568 | | | | 2,779,184 | | | | 213,434 | | | | 2,041,741 | | | | 1,615,191 | | | | 16,124,750 | | | | 1,067,326 | | | | 10,173,257 | |
Class R6 | | | 158,008 | | | | 1,578,188 | | | | 31,201 | | | | 294,493 | | | | 123,157 | | | | 1,243,552 | | | | 62,244 | | | | 595,672 | |
| | | 1,193,216 | | | | $11,818,604 | | | | (240,944 | ) | | | $(2,266,723 | ) | | | 3,446,721 | | | | $36,761,020 | | | | 1,310,269 | | | | $12,693,368 | |
121
Notes to Financial Statements – continued
| | | | | | | | | | | | | | | | | | | | | | | | | | | | | | | | |
| | |
| | | North Carolina Fund | | | Pennsylvania Fund | |
| | | | |
| | | Year ended
3/31/20 | | | Year ended
3/31/19 | | | Year ended
3/31/20 | | | Year ended
3/31/19 | |
| | | | | | | | |
| | | Shares | | | Amount | | | Shares | | | Amount | | | Shares | | | Amount | | | Shares | | | Amount | |
| Shares sold | | | | | | | | | | | | | | | | | | | | | | | | | | | | | | | | |
| | | | | | | | |
Class A | | | 6,788,880 | | | | $80,032,695 | | | | 7,261,189 | | | | $82,693,501 | | | | 2,172,639 | | | | $22,734,481 | | | | 1,771,061 | | | | $17,891,142 | |
| | | | | | | | |
Class B | | | 4,245 | | | | 49,839 | | | | 2,493 | | | | 28,398 | | | | 382 | | | | 3,963 | | | | 18,928 | | | | 192,165 | |
| | | | | | | | |
Class C | | | 1,584,590 | | | | 18,705,421 | | | | 489,994 | | | | 5,591,897 | | | | — | | | | — | | | | — | | | | — | |
| | | | | | | | |
Class I | | | 3,852,801 | | | | 37,917,683 | | | | 2,775,520 | | | | 26,356,354 | | | | 1,030,330 | | | | 10,303,616 | | | | 1,293,868 | | | | 12,459,198 | |
Class R6 | | | 1,261,947 | | | | 12,392,720 | | | | 850,563 | | | | 8,080,984 | | | | 544,560 | | | | 5,436,073 | | | | 1,044,407 | | | | 10,047,765 | |
| | | 13,492,463 | | | | $149,098,358 | | | | 11,379,759 | | | | $122,751,134 | | | | 3,747,911 | | | | $38,478,133 | | | | 4,128,264 | | | | $40,590,270 | |
| | | | | | | | |
Shares issued to shareholders in reinvestment of distributions | | | | | | | | | | | | | | | | | | | | | | | | | | | | | | | | |
| | | | | | | | |
Class A | | | 694,690 | | | | $8,197,079 | | | | 748,567 | | | | $8,549,737 | | | | 319,269 | | | | $3,344,338 | | | | 319,198 | | | | $3,227,465 | |
| | | | | | | | |
Class B | | | 1,810 | | | | 21,317 | | | | 3,555 | | | | 40,567 | | | | 4,474 | | | | 46,954 | | | | 7,592 | | | | 76,974 | |
| | | | | | | | |
Class C | | | 66,234 | | | | 781,059 | | | | 82,267 | | | | 939,237 | | | | — | | | | — | | | | — | | | | — | |
| | | | | | | | |
Class I | | | 187,525 | | | | 1,845,285 | | | | 157,548 | | | | 1,499,681 | | | | 62,461 | | | | 623,485 | | | | 53,760 | | | | 517,724 | |
Class R6 | | | 63,649 | | | | 626,385 | | | | 50,784 | | | | 483,519 | | | | 7,580 | | | | 75,696 | | | | 5,131 | | | | 49,427 | |
| | | 1,013,908 | | | | $11,471,125 | | | | 1,042,721 | | | | $11,512,741 | | | | 393,784 | | | | $4,090,473 | | | | 385,681 | | | | $3,871,590 | |
| | | | | | | | |
| Shares reacquired | | | | | | | | | | | | | | | | | | | | | | | | | | | | | | | | |
| | | | | | | | |
Class A | | | (4,439,963 | ) | | | $(51,996,852 | ) | | | (7,214,292 | ) | | | $(82,016,720 | ) | | | (1,319,609 | ) | | | $(13,708,762 | ) | | | (1,567,420 | ) | | | $(15,820,539 | ) |
| | | | | | | | |
Class B | | | (49,423 | ) | | | (577,616 | ) | | | (93,447 | ) | | | (1,066,180 | ) | | | (88,776 | ) | | | (927,619 | ) | | | (136,042 | ) | | | (1,375,724 | ) |
| | | | | | | | |
Class C | | | (1,043,687 | ) | | | (12,212,329 | ) | | | (1,867,146 | ) | | | (21,304,816 | ) | | | — | | | | — | | | | — | | | | — | |
| | | | | | | | |
Class I | | | (1,343,615 | ) | | | (13,060,807 | ) | | | (1,564,867 | ) | | | (14,848,940 | ) | | | (493,004 | ) | | | (4,868,718 | ) | | | (1,403,939 | ) | | | (13,476,827 | ) |
Class R6 | | | (480,389 | ) | | | (4,610,843 | ) | | | (607,918 | ) | | | (5,764,526 | ) | | | (314,896 | ) | | | (3,182,501 | ) | | | (76,263 | ) | | | (729,216 | ) |
| | | (7,357,077 | ) | | | $(82,458,447 | ) | | | (11,347,670 | ) | | | $(125,001,182 | ) | | | (2,216,285 | ) | | | $(22,687,600 | ) | | | (3,183,664 | ) | | | $(31,402,306 | ) |
| | | | | | | | |
| Net change | | | | | | | | | | | | | | | | | | | | | | | | | | | | | | | | |
| | | | | | | | |
Class A | | | 3,043,607 | | | | $36,232,922 | | | | 795,464 | | | | $9,226,518 | | | | 1,172,299 | | | | $12,370,057 | | | | 522,839 | | | | $5,298,068 | |
| | | | | | | | |
Class B | | | (43,368 | ) | | | (506,460 | ) | | | (87,399 | ) | | | (997,215 | ) | | | (83,920 | ) | | | (876,702 | ) | | | (109,522 | ) | | | (1,106,585 | ) |
| | | | | | | | |
Class C | | | 607,137 | | | | 7,274,151 | | | | (1,294,885 | ) | | | (14,773,682 | ) | | | — | | | | — | | | | — | | | | — | |
| | | | | | | | |
Class I | | | 2,696,711 | | | | 26,702,161 | | | | 1,368,201 | | | | 13,007,095 | | | | 599,787 | | | | 6,058,383 | | | | (56,311 | ) | | | (499,905 | ) |
Class R6 | | | 845,207 | | | | 8,408,262 | | | | 293,429 | | | | 2,799,977 | | | | 237,244 | | | | 2,329,268 | | | | 973,275 | | | | 9,367,976 | |
| | | 7,149,294 | | | | $78,111,036 | | | | 1,074,810 | | | | $9,262,693 | | | | 1,925,410 | | | | $19,881,006 | | | | 1,330,281 | | | | $13,059,554 | |
| | |
| | | South Carolina Fund | | | Tennessee Fund | |
| | | | |
| | | Year ended
3/31/20 | | | Year ended
3/31/19 | | | Year ended
3/31/20 | | | Year ended
3/31/19 | |
| | | | | | | | |
| | | Shares | | | Amount | | | Shares | | | Amount | | | Shares | | | Amount | | | Shares | | | Amount | |
| Shares sold | | | | | | | | | | | | | | | | | | | | | | | | | | | | | | | | |
| | | | | | | | |
Class A | | | 4,128,135 | | | | $50,391,924 | | | | 1,719,921 | | | | $20,279,544 | | | | 938,422 | | | | $9,863,837 | | | | 462,110 | | | | $4,713,140 | |
| | | | | | | | |
Class B | | | 2,177 | | | | 26,253 | | | | 255 | | | | 3,013 | | | | — | | | | — | | | | 7,072 | | | | 71,857 | |
| | | | | | | | |
Class I | | | 1,443,638 | | | | 14,229,213 | | | | 1,702,198 | | | | 16,284,807 | | | | 410,363 | | | | 4,051,856 | | | | 1,412,957 | | | | 13,431,827 | |
Class R6 | | | 566,629 | | | | 5,590,195 | | | | 255,394 | | | | 2,438,833 | | | | 117,452 | | | | 1,148,762 | | | | 107,918 | | | | 1,025,704 | |
| | | 6,140,579 | | | | $70,237,585 | | | | 3,677,768 | | | | $39,006,197 | | | | 1,466,237 | | | | $15,064,455 | | | | 1,990,057 | | | | $19,242,528 | |
| | | | | | | | |
| Shares issued to shareholders in reinvestment of distributions | | | | | | | | | | | | | | | | | | | | | | | | | | | | | | | | |
| | | | | | | | |
Class A | | | 367,994 | | | | $4,484,749 | | | | 387,494 | | | | $4,570,191 | | | | 183,569 | | | | $1,929,258 | | | | 214,720 | | | | $2,191,612 | |
| | | | | | | | |
Class B | | | 2,765 | | | | 33,666 | | | | 4,408 | | | | 51,955 | | | | 937 | | | | 9,837 | | | | 1,965 | | | | 20,028 | |
| | | | | | | | |
Class I | | | 80,487 | | | | 794,670 | | | | 77,428 | | | | 739,976 | | | | 77,085 | | | | 757,213 | | | | 70,422 | | | | 671,481 | |
Class R6 | | | 21,191 | | | | 209,432 | | | | 11,011 | | | | 105,268 | | | | 11,884 | | | | 116,698 | | | | 11,155 | | | | 106,332 | |
| | | 472,437 | | | | $5,522,517 | | | | 480,341 | | | | $5,467,390 | | | | 273,475 | | | | $2,813,006 | | | | 298,262 | | | | $2,989,453 | |
122
Notes to Financial Statements – continued
| | | | | | | | | | | | | | | | | | | | | | | | | | | | | | | | |
| | |
| | | South Carolina Fund | | | Tennessee Fund | |
| | | | |
| | | Year ended
3/31/20 | | | Year ended
3/31/19 | | | Year ended
3/31/20 | | | Year ended
3/31/19 | |
| | | | | | | | |
| | | Shares | | | Amount | | | Shares | | | Amount | | | Shares | | | Amount | | | Shares | | | Amount | |
| Shares reacquired | | | | | | | | | | | | | | | | | | | | | | | | | | | | | | | | |
| | | | | | | | |
Class A | | | (1,472,666 | ) | | | $(17,860,081 | ) | | | (2,508,703 | ) | | | $(29,554,039 | ) | | | (926,056 | ) | | | $(9,683,865 | ) | | | (2,052,103 | ) | | | $(20,871,310 | ) |
| | | | | | | | |
Class B | | | (67,685 | ) | | | (829,366 | ) | | | (71,279 | ) | | | (837,585 | ) | | | (43,946 | ) | | | (455,480 | ) | | | (63,868 | ) | | | (650,432 | ) |
| | | | | | | | |
Class I | | | (791,073 | ) | | | (7,749,279 | ) | | | (1,165,616 | ) | | | (11,129,599 | ) | | | (460,291 | ) | | | (4,435,877 | ) | | | (879,035 | ) | | | (8,362,904 | ) |
Class R6 | | | (116,057 | ) | | | (1,128,204 | ) | | | (90,825 | ) | | | (867,764 | ) | | | (50,437 | ) | | | (489,001 | ) | | | (117,076 | ) | | | (1,108,305 | ) |
| | | (2,447,481 | ) | | | $(27,566,930 | ) | | | (3,836,423 | ) | | | $(42,388,987 | ) | | | (1,480,730 | ) | | | $(15,064,223 | ) | | | (3,112,082 | ) | | | $(30,992,951 | ) |
| | | | | | | | |
| Net change | | | | | | | | | | | | | | | | | | | | | | | | | | | | | | | | |
| | | | | | | | |
Class A | | | 3,023,463 | | | | $37,016,592 | | | | (401,288 | ) | | | $(4,704,304 | ) | | | 195,935 | | | | $2,109,230 | | | | (1,375,273 | ) | | | $(13,966,558 | ) |
| | | | | | | | |
Class B | | | (62,743 | ) | | | (769,447 | ) | | | (66,616 | ) | | | (782,617 | ) | | | (43,009 | ) | | | (445,643 | ) | | | (54,831 | ) | | | (558,547 | ) |
| | | | | | | | |
Class I | | | 733,052 | | | | 7,274,604 | | | | 614,010 | | | | 5,895,184 | | | | 27,157 | | | | 373,192 | | | | 604,344 | | | | 5,740,404 | |
Class R6 | | | 471,763 | | | | 4,671,423 | | | | 175,580 | | | | 1,676,337 | | | | 78,899 | | | | 776,459 | | | | 1,997 | | | | 23,731 | |
| | | 4,165,535 | | | | $48,193,172 | | | | 321,686 | | | | $2,084,600 | | | | 258,982 | | | | $2,813,238 | | | | (823,763 | ) | | | $(8,760,970 | ) |
| | |
| | | Virginia Fund | | | West Virginia Fund | |
| | | | |
| | | Year ended
3/31/20 | | | Year ended
3/31/19 | | | Year ended
3/31/20 | | | Year ended
3/31/19 | |
| | | | | | | | |
| | | Shares | | | Amount | | | Shares | | | Amount | | | Shares | | | Amount | | | Shares | | | Amount | |
| Shares sold | | | | | | | | | | | | | | | | | | | | | | | | | | | | | | | | |
| | | | | | | | |
Class A | | | 3,791,249 | | | | $43,000,739 | | | | 3,271,999 | | | | $35,765,836 | | | | 742,514 | | | | $8,278,921 | | | | 413,719 | | | | $4,470,771 | |
| | | | | | | | |
Class B | | | 9,988 | | | | 113,355 | | | | 402 | | | | 4,383 | | | | 28 | | | | 524 | | | | 489 | | | | 5,327 | |
| | | | | | | | |
Class C | | | 369,189 | | | | 4,189,711 | | | | 190,412 | | | | 2,082,951 | | | | — | | | | — | | | | — | | | | — | |
| | | | | | | | |
Class I | | | 3,225,520 | | | | 31,813,495 | | | | 3,157,924 | | | | 30,014,524 | | | | 333,928 | | | | 3,268,929 | | | | 283,316 | | | | 2,706,452 | |
Class R6 | | | 616,171 | | | | 6,068,979 | | | | 636,159 | | | | 6,047,513 | | | | 56,296 | | | | 553,127 | | | | 14,480 | | | | 137,894 | |
| | | 8,012,117 | | | | $85,186,279 | | | | 7,256,896 | | | | $73,915,207 | | | | 1,132,766 | | | | $12,101,501 | | | | 712,004 | | | | $7,320,444 | |
| | | | | | | | |
| Shares issued to shareholders in reinvestment of distributions | | | | | | | | | | | | | | | | | | | | | | | | | | | | | | | | |
| | | | | | | | |
Class A | | | 521,449 | | | | $5,911,974 | | | | 566,761 | | | | $6,210,296 | | | | 256,180 | | | | $2,854,273 | | | | 274,241 | | | | $2,972,867 | |
| | | | | | | | |
Class B | | | 1,073 | | | | 12,150 | | | | 1,597 | | | | 17,496 | | | | 578 | | | | 6,432 | | | | 1,181 | | | | 12,797 | |
| | | | | | | | |
Class C | | | 27,297 | | | | 309,296 | | | | 37,095 | | | | 406,380 | | | | — | | | | — | | | | — | | | | — | |
| | | | | | | | |
Class I | | | 178,923 | | | | 1,763,250 | | | | 155,514 | | | | 1,481,342 | | | | 19,163 | | | | 187,924 | | | | 23,410 | | | | 223,368 | |
Class R6 | | | 39,375 | | | | 388,418 | | | | 29,762 | | | | 283,726 | | | | 1,632 | | | | 16,018 | | | | 548 | | | | 5,235 | |
| | | 768,117 | | | | $8,385,088 | | | | 790,729 | | | | $8,399,240 | | | | 277,553 | | | | $3,064,647 | | | | 299,380 | | | | $3,214,267 | |
| | | | | | | | |
| Shares reacquired | | | | | | | | | | | | | | | | | | | | | | | | | | | | | | | | |
| | | | | | | | |
Class A | | | (3,334,484 | ) | | | $(37,436,033 | ) | | | (3,668,679 | ) | | | $(40,097,012 | ) | | | (931,124 | ) | | | $(10,357,477 | ) | | | (994,867 | ) | | | $(10,776,457 | ) |
| | | | | | | | |
Class B | | | (26,350 | ) | | | (297,271 | ) | | | (17,442 | ) | | | (191,260 | ) | | | (31,443 | ) | | | (351,000 | ) | | | (13,020 | ) | | | (141,096 | ) |
| | | | | | | | |
Class C | | | (469,551 | ) | | | (5,274,047 | ) | | | (837,521 | ) | | | (9,171,726 | ) | | | — | | | | — | | | | — | | | | — | |
| | | | | | | | |
Class I | | | (1,838,521 | ) | | | (17,649,504 | ) | | | (2,004,384 | ) | | | (19,022,513 | ) | | | (216,501 | ) | | | (2,110,913 | ) | | | (394,764 | ) | | | (3,740,093 | ) |
Class R6 | | | (218,932 | ) | | | (2,121,986 | ) | | | (266,778 | ) | | | (2,531,768 | ) | | | (9,139 | ) | | | (89,892 | ) | | | (3,150 | ) | | | (30,034 | ) |
| | | (5,887,838 | ) | | | $(62,778,841 | ) | | | (6,794,804 | ) | | | $(71,014,279 | ) | | | (1,188,207 | ) | | | $(12,909,282 | ) | | | (1,405,801 | ) | | | $(14,687,680 | ) |
| | | | | | | | |
| Net change | | | | | | | | | | | | | | | | | | | | | | | | | | | | | | | | |
| | | | | | | | |
Class A | | | 978,214 | | | | $11,476,680 | | | | 170,081 | | | | $1,879,120 | | | | 67,570 | | | | $775,717 | | | | (306,907 | ) | | | $(3,332,819 | ) |
| | | | | | | | |
Class B | | | (15,289 | ) | | | (171,766 | ) | | | (15,443 | ) | | | (169,381 | ) | | | (30,837 | ) | | | (344,044 | ) | | | (11,350 | ) | | | (122,972 | ) |
| | | | | | | | |
Class C | | | (73,065 | ) | | | (775,040 | ) | | | (610,014 | ) | | | (6,682,395 | ) | | | — | | | | — | | | | — | | | | — | |
| | | | | | | | |
Class I | | | 1,565,922 | | | | 15,927,241 | | | | 1,309,054 | | | | 12,473,353 | | | | 136,590 | | | | 1,345,940 | | | | (88,038 | ) | | | (810,273 | ) |
Class R6 | | | 436,614 | | | | 4,335,411 | | | | 399,143 | | | | 3,799,471 | | | | 48,789 | | | | 479,253 | | | | 11,878 | | | | 113,095 | |
| | | 2,892,396 | | | | $30,792,526 | | | | 1,252,821 | | | | $11,300,168 | | | | 222,112 | | | | $2,256,866 | | | | (394,417 | ) | | | $(4,152,969 | ) |
Class T shares were not publicly available for sale during the period. Please see each fund’s prospectus for details.
123
Notes to Financial Statements – continued
Effective June 1, 2019, purchases of each fund’s Class B shares are closed to new and existing investors subject to certain exceptions. Please see each fund’s prospectus for details.
Each fund and certain other funds managed by MFS participate in a $1.25 billion unsecured committed line of credit, subject to a $1 billion sublimit, provided by a syndicate of banks under a credit agreement. Borrowings may be made for temporary financing needs. Interest is charged to each fund, based on its borrowings, generally at a rate equal to the highest of one month LIBOR, the Federal Funds Effective Rate and the Overnight Bank Funding Rate, plus an agreed upon spread. A commitment fee, based on the average daily, unused portion of the committed line of credit, is allocated among the participating funds. In addition, each fund and other funds managed by MFS have established unsecured uncommitted borrowing arrangements with certain banks for temporary financing needs. Interest is charged to each fund, based on its borrowings, at rates equal to customary reference rates plus an agreed upon spread. For the year ended March 31, 2020, each fund’s commitment fee and interest expense were as follows and are included in “Miscellaneous” expense in the Statements of Operations, with the exception of the Virginia Fund, whose commitment fee and interest expense are included in “Interest expense and fees” in the Statements of Operations.
| | | | | | | | | | | | | | | | | | | | | | | | | | | | | | | | |
| | | | | | | | |
| | | Mississippi
Fund | | | New York
Fund | | | North Carolina
Fund | | | Pennsylvania
Fund | | | South Carolina
Fund | | | Tennessee
Fund | | | Virginia
Fund | | | West Virginia
Fund | |
Commitment Fee | | | $528 | | | | $1,594 | | | | $2,556 | | | | $900 | | | | $1,219 | | | | $577 | | | | $2,060 | | | | $642 | |
Interest Expense | | | — | | | | — | | | | — | | | | — | | | | — | | | | — | | | | — | | | | — | |
| (7) | | Investments in Affiliated Issuers |
An affiliated issuer of a fund may be considered one in which the fund owns 5% or more of the outstanding voting securities, or a company which is under common control. For the purposes of this report, each fund assumes the MFS Institutional Money Market Portfolio to be an affiliated issuer. Each fund’s transactions in the MFS Institutional Money Market Portfolio for the year ended March 31, 2020, are as follows:
| | | | | | | | | | | | | | | | | | | | | | | | |
| | | Affiliated Issuer - MFS Institutional Money Market Portfolio | |
| | | | | | |
| | | Beginning
Value | | | Purchases | | | Sales
Proceeds | | | Realized
Gain
(Loss) | | | Change in
Unrealized
Appreciation or
Depreciation | | | Ending
Value | |
Mississippi Fund | | | $697,666 | | | | $38,339,896 | | | | $35,135,982 | | | | $297 | | | | $320 | | | | $3,902,197 | |
New York Fund | | | 2,766,824 | | | | 90,744,033 | | | | 88,221,429 | | | | 812 | | | | (369) | | | | 5,289,871 | |
North Carolina Fund | | | 8,877,352 | | | | 175,074,756 | | | | 172,414,532 | | | | 2,461 | | | | (1,076) | | | | 11,538,961 | |
Pennsylvania Fund | | | 2,730,549 | | | | 49,139,712 | | | | 49,286,082 | | | | 433 | | | | (526) | | | | 2,584,086 | |
South Carolina Fund | | | 5,275,936 | | | | 77,478,392 | | | | 77,839,669 | | | | 773 | | | | (1,236) | | | | 4,914,196 | |
Tennessee Fund | | | 940,434 | | | | 33,943,878 | | | | 33,412,360 | | | | (285) | | | | (149) | | | | 1,471,518 | |
Virginia Fund | | | 4,084,274 | | | | 101,313,541 | | | | 103,461,450 | | | | (430) | | | | 255 | | | | 1,936,190 | |
West Virginia Fund | | | 518,129 | | | | 26,428,343 | | | | 26,163,638 | | | | (742) | | | | (104) | | | | 781,988 | |
| | | | | | | | | | | | | | | | | | | | | | | | |
| | | | | | |
| | | | | | | | | | | | | | | Dividend
Income | | | Capital Gain
Distributions | |
Mississippi Fund | | | | | | | | | | | | | | | | | | | $29,240 | | | | $— | |
New York Fund | | | | | | | | | | | | | | | | | | | 95,573 | | | | — | |
North Carolina Fund | | | | | | | | | | | | | | | | | | | 185,525 | | | | — | |
Pennsylvania Fund | | | | | | | | | | | | | | | | | | | 49,568 | | | | — | |
South Carolina Fund | | | | | | | | | | | | | | | | | | | 75,888 | | | | — | |
Tennessee Fund | | | | | | | | | | | | | | | | | | | 28,513 | | | | — | |
Virginia Fund | | | | | | | | | | | | | | | | | | | 94,483 | | | | — | |
West Virginia Fund | | | | | | | | | | | | | | | | | | | 19,267 | | | | — | |
The pandemic related to the global spread of novel coronavirus disease(COVID-19), which was first detected in December 2019, has resulted in significant disruptions to global business activity and the global economy, as well as the economies of individual countries, the financial performance of individual companies and sectors, and the securities and commodities markets in general. This pandemic, the full effects of which are still unknown, has resulted in substantial market volatility and may have adversely impacted the prices and liquidity of each fund’s investments and each fund’s performance.
124
REPORT OF INDEPENDENT REGISTERED PUBLIC ACCOUNTING FIRM
To the Board of Trustees of MFS Municipal Series Trust and the Shareholders of MFS Mississippi Municipal Bond Fund, MFS New York Municipal Bond Fund, MFS North Carolina Municipal Bond Fund, MFS Pennsylvania Municipal Bond Fund, MFS South Carolina Municipal Bond Fund, MFS Tennessee Municipal Bond Fund, MFS Virginia Municipal Bond Fund and MFS West Virginia Municipal Bond Fund:
Opinion on the Financial Statements and Financial Highlights
We have audited the accompanying statements of assets and liabilities of MFS Mississippi Municipal Bond Fund, MFS New York Municipal Bond Fund, MFS North Carolina Municipal Bond Fund, MFS Pennsylvania Municipal Bond Fund, MFS South Carolina Municipal Bond Fund, MFS Tennessee Municipal Bond Fund, MFS Virginia Municipal Bond Fund and MFS West Virginia Municipal Bond Fund (the “Funds”), including the portfolios of investments, as of March 31, 2020, the related statements of operations for the year then ended, the statements of changes in net assets for each of the two years in the period then ended, the financial highlights for each of the five years in the period then ended, and the related notes. In our opinion, the financial statements and financial highlights present fairly, in all material respects, the financial position of each of the Funds as of March 31, 2020, and the results of their operations for the year then ended, the changes in their net assets for each of the two years in the period then ended, and the financial highlights for each of the five years in the period then ended, in conformity with accounting principles generally accepted in the United States of America.
Basis for Opinion
These financial statements and financial highlights are the responsibility of the Funds’ management. Our responsibility is to express an opinion on the Funds’ financial statements and financial highlights based on our audits. We are a public accounting firm registered with the Public Company Accounting Oversight Board (United States) (PCAOB) and are required to be independent with respect to the Funds in accordance with the U.S. federal securities laws and the applicable rules and regulations of the Securities and Exchange Commission and the PCAOB.
We conducted our audits in accordance with the standards of the PCAOB. Those standards require that we plan and perform the audits to obtain reasonable assurance about whether the financial statements and financial highlights are free of material misstatement, whether due to error or fraud. The Funds are not required to have, nor were we engaged to perform, an audit of their internal control over financial reporting. As part of our audits we are required to obtain an understanding of internal control over financial reporting but not for the purpose of expressing an opinion on the effectiveness of the Funds’ internal control over financial reporting. Accordingly, we express no such opinion.
Our audits included performing procedures to assess the risks of material misstatement of the financial statements and financial highlights, whether due to error or fraud, and performing procedures that respond to those risks. Such procedures included examining, on a test basis, evidence regarding the amounts and disclosures in the financial statements and financial highlights. Our audits also included evaluating the accounting principles used and significant estimates made by management, as well as evaluating the overall presentation of the financial statements and financial highlights. Our procedures included confirmation of securities owned as of March 31, 2020, by correspondence with the custodian and brokers; when replies were not received from brokers, we performed other auditing procedures. We believe that our audits provide a reasonable basis for our opinion.
DELOITTE & TOUCHE LLP
Boston, Massachusetts
May 15, 2020
We have served as the auditor of one or more of the MFS investment companies since 1924.
125
TRUSTEES AND OFFICERS — IDENTIFICATION AND BACKGROUND
The Trustees and Officers of the Trust, as of May 1, 2020, are listed below, together with their principal occupations during the past five years. (Their titles may have varied during that period.) The address of each Trustee and Officer is 111 Huntington Avenue, Boston, Massachusetts 02199-7618.
| | | | | | | | | | |
Name, Age | | Position(s) Held with Fund | | Trustee/Officer Since (h) | | Number of
MFS Funds
overseen by
the Trustee | | Principal Occupations
During the Past Five Years | | Other Directorships
During the Past Five Years (j) |
| INTERESTED TRUSTEES |
Robert J. Manning (k)
(age 56) | | Trustee | | February 2004 | | 133 | | Massachusetts Financial Services Company, Executive Chairman (since January 2017); Director; Chairman of the Board; Chief Executive Officer (until 2015);Co-Chief Executive Officer (2015-2016) | | N/A |
| | | | | |
Robin A. Stelmach (k) (age 58) | | Trustee | | January 2014 | | 133 | | Massachusetts Financial Services Company, Vice Chair (since January 2017); Chief Operating Officer and Executive Vice President (until January 2017) | | N/A |
| | | | |
| INDEPENDENT TRUSTEES | | | | | | | | |
John P. Kavanaugh (age 65) | | Trustee and Chair of Trustees | | January 2009 | | 133 | | Private investor | | N/A |
| | | | | |
Steven E. Buller (age 68) | | Trustee | | February 2014 | | 133 | | Financial Accounting Standards Advisory Council, Chairman (2014-2015); Public Company Accounting Oversight Board, Standing Advisory Group, Member (until 2014); BlackRock, Inc. (investment management), Managing Director (until 2014), BlackRock Finco UK (investment management), Director (until 2014) | | N/A |
| | | | | |
John A. Caroselli (age 65) | | Trustee | | March 2017 | | 133 | | JC Global Advisors, LLC (management consulting), President (since 2015); First Capital Corporation (commercial finance), Executive Vice President (until 2015) | | N/A |
| | | | | |
Maureen R. Goldfarb (age 65) | | Trustee | | January 2009 | | 133 | | Private investor | | N/A |
| | | | | |
Peter D. Jones
(age 64) | | Trustee | | January 2019 | | 133 | | Franklin Templeton Distributors, Inc. (investment management), President (until 2015); Franklin Templeton Institutional, LLC (investment management), Chairman (until 2015) | | N/A |
| | | | | |
James W. Kilman, Jr.
(age 59) | | Trustee | | January 2019 | | 133 | | Burford Capital Limited (finance and investment management), Chief Financial Officer (since 2019); KielStrand Capital LLC (family office), Chief Executive Officer (since 2016); Morgan Stanley & Co. (financial services), Vice Chairman of Investment Banking,Co-Head of Diversified Financials Coverage – Financial Institutions Investment Banking Group (until 2016) | | Alpha-En Corporation, Director(2016-2019) |
| | | | | |
Clarence Otis, Jr. (age 64) | | Trustee | | March 2017 | | 133 | | Darden Restaurants, Inc., Chief Executive Officer (until 2014) | | VF Corporation, Director; Verizon Communications, Inc., Director; The Travelers Companies, Director; Federal Reserve Bank of Atlanta, Director (until 2015) |
126
Trustees and Officers – continued
| | | | | | | | | | |
Name, Age | | Position(s) Held with Fund | | Trustee/Officer Since (h) | | Number of
MFS Funds
overseen by
the Trustee | | Principal Occupations
During the Past Five Years | | Other Directorships
During the Past Five Years (j) |
Maryanne L. Roepke (age 64) | | Trustee | | May 2014 | | 133 | | American Century Investments (investment management), Senior Vice President and Chief Compliance Officer (until 2014) | | N/A |
| | | | | |
Laurie J. Thomsen
(age 62) | | Trustee | | March 2005 | | 133 | | Private investor | | The Travelers Companies, Director; Dycom Industries, Inc., Director (since 2015) |
| | | | | | | | |
Name, Age | | Position(s) Held with Fund | | Trustee/Officer Since (h) | | Number of
MFS Funds for
which the Person
is an Officer | | Principal Occupations During the Past Five Years |
| OFFICERS | | | | | | | | |
Christopher R. Bohane (k)
(age 46) | | Assistant Secretary and Assistant Clerk | | July 2005 | | 133 | | Massachusetts Financial Services Company, Senior Vice President and Associate General Counsel |
| | | | |
Kino Clark (k) (age 51) | | Assistant Treasurer | | January 2012 | | 133 | | Massachusetts Financial Services Company, Vice President |
| | | | |
John W. Clark, Jr. (k) (age 53) | | Assistant Treasurer | | April 2017 | | 133 | | Massachusetts Financial Services Company, Vice President (since March 2017); Deutsche Bank (financial services), Department Head – Treasurer’s Office (until February 2017) |
| | | | |
Thomas H. Connors (k) (age 60) | | Assistant Secretary and Assistant Clerk | | September 2012 | | 133 | | Massachusetts Financial Services Company, Vice President and Senior Counsel |
| | | | |
David L. DiLorenzo (k)
(age 51) | | President | | July 2005 | | 133 | | Massachusetts Financial Services Company, Senior Vice President |
| | | | |
Heidi W. Hardin (k) (age 52) | | Secretary and Clerk | | April 2017 | | 133 | | Massachusetts Financial Services Company, Executive Vice President and General Counsel (since March 2017); Harris Associates (investment management), General Counsel (from September 2015 to January 2017); Janus Capital Management LLC (investment management), Senior Vice President and General Counsel (until September 2015) |
| | | | |
Brian E. Langenfeld (k) (age 47) | | Assistant Secretary and Assistant Clerk | | June 2006 | | 133 | | Massachusetts Financial Services Company, Vice President and Senior Counsel |
| | | | |
Amanda S. Mooradian (k) (age 41) | | Assistant Secretary and Assistant Clerk | | September 2018 | | 133 | | Massachusetts Financial Services Company, Assistant Vice President and Senior Counsel |
| | | | |
Susan A. Pereira (k)
(age 49) | | Assistant Secretary and Assistant Clerk | | July 2005 | | 133 | | Massachusetts Financial Services Company, Vice President and Assistant General Counsel |
| | | | |
Kasey L. Phillips (k) (age 49) | | Assistant Treasurer | | September 2012 | | 133 | | Massachusetts Financial Services Company, Vice President |
| | | | |
Matthew A. Stowe (k) (age 45) | | Assistant Secretary and Assistant Clerk | | October 2014 | | 133 | | Massachusetts Financial Services Company, Vice President and Assistant General Counsel |
| | | | |
Martin J. Wolin (k) (age 52) | | Chief Compliance Officer | | July 2015 | | 133 | | Massachusetts Financial Services Company, Senior Vice President and Chief Compliance Officer (since July 2015); Mercer (financial service provider), Chief Risk and Compliance Officer, North America and Latin America (until June 2015) |
| | | | |
James O. Yost (k)
(age 59) | | Treasurer | | September 1990 | | 133 | | Massachusetts Financial Services Company, Senior Vice President |
| (h) | Date first appointed to serve as Trustee/officer of an MFS Fund. Each Trustee has served continuously since appointment unless indicated otherwise. For the period from December 15, 2004 until February 22, 2005, Mr. Manning served as Advisory Trustee. From January 2012 through December 2016, Messrs. DiLorenzo and Yost served as Treasurer and Deputy Treasurer of the Funds, respectively. |
| (j) | Directorships or trusteeships of companies required to report to the Securities and Exchange Commission (i.e., “public companies”). |
| (k) | “Interested person” of the Trust within the meaning of the Investment Company Act of 1940 (referred to as the 1940 Act), which is the principal federal law governing investment companies like the fund, as a result of a position with MFS. The address of MFS is 111 Huntington Avenue, Boston, Massachusetts 02199-7618. |
127
Trustees and Officers – continued
Each Trustee (other than Messrs. Jones and Kilman) has been elected by shareholders and each Trustee and Officer holds office until his or her successor is chosen and qualified or until his or her earlier death, resignation, retirement or removal. Messrs. Jones and Kilman became Trustees of the Funds on January 1, 2019. The Trust does not hold annual meetings for the purpose of electing Trustees, and Trustees are not elected for fixed terms. Under the terms of the Board’s retirement policy, an Independent Trustee shall retire at the end of the calendar year in which he or she reaches the earlier of 75 years of age or 15 years of service on the Board (or, in the case of any Independent Trustee who joined the Board prior to 2015, 20 years of service on the Board).
Messrs. Buller, Kilman and Otis and Ms. Roepke are members of the Trust’s Audit Committee.
Each of the Interested Trustees and certain Officers hold comparable officer positions with certain affiliates of MFS.
The Statement of Additional Information for a Fund includes further information about the Trustees and is available without charge upon request by calling1-800-225-2606.
| | |
Investment Adviser Massachusetts Financial Services Company 111 Huntington Avenue Boston, MA 02199-7618 Distributor MFS Fund Distributors, Inc. 111 Huntington Avenue Boston, MA 02199-7618 Portfolio Manager(s) Michael Dawson | | Custodian JPMorgan Chase Bank, NA 4 Metrotech Center New York, NY 11245 Independent Registered Public Accounting Firm Deloitte & Touche LLP 200 Berkeley Street Boston, MA 02116 |
128
PROXY VOTING POLICIES AND INFORMATION
MFS votes proxies on behalf of the funds pursuant to proxy voting policies and procedures that are available without charge, upon request, by calling 1-800-225-2606, by visitingmfs.com/proxyvoting, or by visiting the SEC’s Web site athttp://www.sec.gov.
Information regarding how each fund voted proxies relating to portfolio securities during the most recent twelve-month period ended June 30 is available by August 31 of each year without charge by visitingmfs.com/proxyvoting, or by visiting the SEC’s Web site athttp://www.sec.gov.
QUARTERLY PORTFOLIO DISCLOSURE
Each fund files a complete schedule of portfolio holdings with the SEC for the first and third quarters of each fiscal year as an exhibit to its reports on Form N-PORT. Each fund’s Form N-PORT reports are available on the SEC’s website athttp://www.sec.gov.A shareholder can obtain the portfolio holdings report for the first and third quarters of each fund’s fiscal year atmfs.com/openendfunds by choosing the fund’s name and then selecting the “Resources” tab and clicking on “Prospectus and Reports”.
FURTHER INFORMATION
From time to time, MFS may post important information about each fund or the MFS funds on the MFS web site (mfs.com). This information is available athttps://www.mfs.com/en-us/what-we-do/announcements.htmlor atmfs.com/openendfunds by choosing the fund’s name.
INFORMATION ABOUT FUND CONTRACTS AND LEGAL CLAIMS
Each fund has entered into contractual arrangements with an investment adviser, administrator, distributor, shareholder servicing agent, 529 program manager (if applicable), and custodian who each provide services to the fund. Unless expressly stated otherwise, shareholders are not parties to, or intended beneficiaries of these contractual arrangements, and these contractual arrangements are not intended to create any shareholder right to enforce them against the service providers or to seek any remedy under them against the service providers, either directly or on behalf of the fund.
Under the Trust’s By-Laws and Declaration of Trust, any claims asserted against or on behalf of the MFS Funds, including claims against Trustees and Officers, must be brought in state and federal courts located within the Commonwealth of Massachusetts.
FEDERAL TAX INFORMATION (unaudited)
The funds will notify shareholders of amounts for use in preparing 2020 income tax forms in January 2021. The following information is provided pursuant to provisions of the Internal Revenue Code.
Of the dividends paid from net investment income during the fiscal year, the following percentages were designated as exempt interest dividends for federal income tax purposes. If each fund has earned income on private activity bonds, a portion of the dividends paid may be considered a tax preference item for purposes of computing a shareholder’s alternative minimum tax.
| | | | |
| |
| | | Exempt Interest
Dividends | |
| Mississippi Fund | | | 99.67% | |
| New York Fund | | | 98.17% | |
| North Carolina Fund | | | 98.34% | |
| Pennsylvania Fund | | | 98.33% | |
| South Carolina Fund | | | 99.18% | |
| Tennessee Fund | | | 99.11% | |
| Virginia Fund | | | 97.99% | |
| West Virginia Fund | | | 99.62% | |
129
rev. 3/16
| | | | |
| | | |
FACTS | | WHAT DOES MFS DO WITH YOUR
PERSONAL INFORMATION? | |  |
| | |
| Why? | | Financial companies choose how they share your personal information. Federal law gives consumers the right to limit some but not all sharing. Federal law also requires us to tell you how we collect, share, and protect your personal information. Please read this notice carefully to understand what we do. |
| | |
| What? | | The types of personal information we collect and share depend on the product or service you have with us. This information can include: • Social Security number and account balances • Account transactions and transaction history • Checking account information and wire transfer instructions When you areno longer our customer, we continue to share your information as described in this notice. |
| | |
| How? | | All financial companies need to share customers’ personal information to run their everyday business. In the section below, we list the reasons financial companies can share their customers’ personal information; the reasons MFS chooses to share; and whether you can limit this sharing. |
| | | | |
Reasons we can share your
personal information | | Does MFS share? | | Can you limit this
sharing? |
For our everyday business purposes – such as to process your transactions, maintain your account(s), respond to court orders and legal investigations, or report to credit bureaus | | Yes | | No |
For our marketing purposes – to offer our products and services to you | | No | | We don’t share |
| For joint marketing with other financial companies | | No | | We don’t share |
For our affiliates’ everyday business purposes – information about your transactions and experiences | | No | | We don’t share |
For our affiliates’ everyday business purposes – information about your creditworthiness | | No | | We don’t share |
| For nonaffiliates to market to you | | No | | We don’t share |
| | |
| | |
| Questions? | | Call800-225-2606 or go tomfs.com. |
130
| | |
| Who we are |
| Who is providing this notice? | | MFS Funds, MFS Investment Management, MFS Institutional Advisors, Inc., and MFS Heritage Trust Company. |
| | |
| What we do |
| How does MFS protect my personal information? | | To protect your personal information from unauthorized access and use, we use security measures that comply with federal law. These measures include procedural, electronic, and physical safeguards for the protection of the personal information we collect about you. |
How does MFS
collect my personal information? | | We collect your personal information, for example, when you • open an account or provide account information • direct us to buy securities or direct us to sell your securities • make a wire transfer We also collect your personal information from others, such as credit bureaus, affiliates, or other companies. |
| Why can’t I limit all sharing? | | Federal law gives you the right to limit only • sharing for affiliates’ everyday business purposes – information about your creditworthiness • affiliates from using your information to market to you • sharing for nonaffiliates to market to you State laws and individual companies may give you additional rights to limit sharing. |
| | |
| Definitions |
| Affiliates | | Companies related by common ownership or control. They can be financial and nonfinancial companies. • MFS does not share personal information with affiliates, except for everyday business purposes as described on page one of this notice. |
| Nonaffiliates | | Companies not related by common ownership or control. They can be financial and nonfinancial companies. • MFS does not share with nonaffiliates so they can market to you. |
| Joint marketing | | A formal agreement between nonaffiliated financial companies that together market financial products or services to you. • MFS doesn’t jointly market. |
| | |
| Other important information |
| If you own an MFS product or receive an MFS service in the name of a third party such as a bank or broker-dealer, their privacy policy may apply to you instead of ours. |
131
Save paper with eDelivery.

| MFS® will send you prospectuses, |
reports, and proxies directly viae-mail so you will get information faster with less mailbox clutter.
To sign up:
1. Go to mfs.com.
2. Log in via MFS® Access.
3. Select eDelivery.
If you own your MFS fund shares through a financial institution or a retirement plan, MFS® TALK, MFS® Access, or eDelivery may not be available to you.
CONTACT US
WEB SITE
mfs.com
MFS TALK
1-800-637-8255
24 hours a day
ACCOUNT SERVICE AND LITERATURE
Shareholders
1-800-225-2606
Financial advisors
1-800-343-2829
Retirement plan services
1-800-637-1255
MAILING ADDRESS
MFS Service Center, Inc.
P.O. Box 219341
Kansas City, MO 64121-9341
OVERNIGHT MAIL
MFS Service Center, Inc.
Suite 219341
430 W 7th Street
Kansas City, MO 64105-1407
Annual Report
March 31, 2020

MFS® Municipal Income Fund

Beginning on January 1, 2021, as permitted by regulations adopted by the U.S. Securities and Exchange Commission, paper copies of the fund’s annual and semiannual shareholder reports will no longer be sent by mail, unless you specifically request paper copies of the reports. Instead, the complete reports will be made available on the fund’s Web site (funds.mfs.com), and you will be notified by mail each time a report is posted and provided with a Web site link to access the report.
If you are already signed up to receive shareholder reports by email, you will not be affected by this change and you need not take any action. You may sign up to receive shareholder reports and other communications from the fund by email by contacting your financial intermediary (such as a broker-dealer or bank) or, if you hold your shares directly with the fund, by calling 1-800-225-2606 or by logging on to MFS Access at mfs.com.
Beginning on January 1, 2019, you may elect to receive all future reports in paper free of charge. Contact your financial intermediary to request that you continue to receive paper copies of your shareholder reports. If you invest directly with the fund, you can call 1-800-225-2606 or send an email request to orderliterature@mfs.com to let the fund know that you wish to continue receiving paper copies of your shareholder reports. Your election to receive reports in paper will apply to all funds held in your account if you invest through your financial intermediary or all funds held with the MFS fund complex if you invest directly.
LMB-ANN
MFS® Municipal Income Fund
CONTENTS
The report is prepared for the general information of shareholders. It is authorized for distribution to prospective investors only when preceded or accompanied by a current prospectus.
NOT FDIC INSURED• MAY LOSE VALUE• NO BANK GUARANTEE

LETTER FROM THE EXECUTIVE CHAIR
Dear Shareholders:
During the first quarter of 2020, equity prices experienced their fastest 30% fall in history and market volatility reached levels not seen since the global financial crisis.
Optimism heading into the year — on receding trade and geopolitical risk along with easier central bank policies — was overwhelmed in February as the health effects of a novel coronavirus, COVID-19, spread beyond China’s borders, ultimately impacting more than 187 countries. The global pandemic prompted many governments to take drastic action to slow the spread of the virus, such as quarantines, school and business closures, and prohibitions on public gatherings. While these were important steps to protect the public health, they came at a cost: greater market volatility and an abrupt downturn in economic growth.
Global central banks have taken aggressive, coordinated steps to cushion the economic and market fallout related to the virus, and governments are undertaking unprecedented levels of fiscal stimulus. As uncertainty recedes, these measures can help build a supportive environment and encourage economic recovery. In the aftermath of the crisis, there are likely to be societal changes as households, businesses, and governments adjust to a new reality, and these alterations could change the investment landscape. Occurrences such as the COVID-19 outbreak demonstrate the importance of having a deep understanding of company fundamentals, and our global research platform has been built to do just that.
Here at MFS®, we aim to help our clients navigate the growing complexity of the markets and world economies. Our long-term investment philosophy and commitment to the responsible allocation of capital allow us to tune out the noise and uncover what we believe are the best, most durable investment opportunities in the market. Through our powerful global investment platform, we combine collective expertise, thoughtful risk management, and long-term discipline to create sustainable value for investors.
Respectfully,

Robert J. Manning
Executive Chair
MFS Investment Management
May 15, 2020
The opinions expressed in this letter are subject to change and may not be relied upon for investment advice. No forecasts can be guaranteed.
1
PORTFOLIO COMPOSITION
Portfolio structure (i)
| | | | |
| Top ten industries (i) | | | | |
| Healthcare Revenue – Hospitals | | | 16.2% | |
| General Obligations – General Purpose | | | 8.4% | |
| Universities – Colleges | | | 5.5% | |
| General Obligations – Schools | | | 5.2% | |
| Airport Revenue | | | 5.1% | |
| Housing – Single Family | | | 4.6% | |
| Transportation – Special Tax | | | 4.2% | |
| Sales & Excise Tax Revenue | | | 4.1% | |
| State & Local Agencies | | | 4.0% | |
| Water & Sewer Utility Revenue | | | 3.8% | |
| | | | |
| Composition including fixed income credit quality (a)(i) | |
| AAA | | | 3.3% | |
| AA | | | 25.7% | |
| A | | | 32.2% | |
| BBB | | | 20.6% | |
| BB | | | 5.2% | |
| B | | | 0.6% | |
| CCC | | | 0.1% | |
| CC | | | 0.2% | |
| C | | | 1.5% | |
| D | | | 1.7% | |
| Not Rated | | | 7.1% | |
| Cash & Cash Equivalents | | | 3.4% | |
| Other | | | (1.6)% | |
| |
| Portfolio facts (i) | | | | |
| Average Duration (d) | | | 7.4 | |
| Average Effective Maturity (m) | | | 16.4 yrs. | |
| (a) | For all securities other than those specifically described below, ratings are assigned to underlying securities utilizing ratings from Moody’s, Fitch, and Standard & Poor’s rating agencies and applying the following hierarchy: If all three agencies provide a rating, the middle rating (after dropping the highest and lowest ratings) is assigned; if two of the three agencies rate a security, the lower of the two is assigned. Ratings are shown in the S&P and Fitch scale (e.g., AAA). Securities rated BBB or higher are considered investment grade. All ratings are subject to change. Not Rated includes fixed income securities and fixed income derivatives, which have not been rated by any rating agency. The fund may or may not have held all of these instruments on this date. The fund is not rated by these agencies. |
| (d) | Duration is a measure of how much a bond’s price is likely to fluctuate with general changes in interest rates, e.g., if rates rise 1.00%, a bond with a5-year duration is likely to lose about 5.00% of its value due to the interest rate move. |
2
Portfolio Composition – continued
| (i) | For purposes of this presentation, the components include the value of securities, and reflect the impact of the equivalent exposure of derivative positions, if any. These amounts may be negative from time to time. Equivalent exposure is a calculated amount that translates the derivative position into a reasonable approximation of the amount of the underlying asset that the portfolio would have to hold at a given point in time to have the same price sensitivity that results from the portfolio’s ownership of the derivative contract. When dealing with derivatives, equivalent exposure is a more representative measure of the potential impact of a position on portfolio performance than value. The bond component will include any accrued interest amounts. |
| (m) | In determining each instrument’s effective maturity for purposes of calculating the fund’s dollar-weighted average effective maturity, MFS uses the instrument’s stated maturity or, if applicable, an earlier date on which MFS believes it is probable that a maturity-shortening device (such as a put,pre-refunding or prepayment) will cause the instrument to be repaid. Such an earlier date can be substantially shorter than the instrument’s stated maturity. |
Cash & Cash Equivalents includes any cash, investments in money market funds, short-term securities, and other assets less liabilities. Please see the Statement of Assets and Liabilities for additional information related to the fund’s cash position and other assets and liabilities.
Other includes equivalent exposure from currency derivatives and/or any offsets to derivative positions and/or the leverage created through the issuance of self-deposited inverse floaters and may be negative.
Percentages are based on net assets as of March 31, 2020.
The portfolio is actively managed and current holdings may be different.
3
MANAGEMENT REVIEW
Summary of Results
For the twelve months ended March 31, 2020, Class A shares of the MFS Municipal Income Fund (fund) provided a total return of 1.88%, at net asset value. This compares with a return of 3.85% for the fund’s benchmark, the Bloomberg Barclays Municipal Bond Index.
Market Environment
Market volatility soared at the end of the period asCOVID-19, the illness caused by the novel coronavirus first detected in China, spread around the world in early 2020. Government-imposed social distancing measures taken to slow the spread of the virus forced the shutdown of large portions of the global economy. In an attempt to limit the economic fallout from the crisis, central bankers and policymakers took a variety of actions, unprecedented in both size and speed, but despite their best efforts, a global recession has undoubtedly begun. Given the unique circumstances surrounding the genesis of the downturn, it is difficult to forecast how long the crisis will linger.
High levels of investor uncertainty saw equity prices plunge, market volatility rise and large segments of global fixed income markets freeze as investors sought liquidity wherever they could find it. Central banks around the world quickly put programs in place to improve liquidity, and they proved largely successful, helping to recover market function and ease volatility at the end of the period. Compounding market turmoil was an oil price war between Saudi Arabia and Russia over the size of production cuts amid a burgeoning supply glut as the global economy rapidly slowed. That action undercut oil exporters, many emerging markets and a large segment of the high-yield credit market.
As is often the case in a serious crisis, market vulnerabilities were revealed. For example, companies that added significant leverage to their balance sheets in recent years by borrowing to fund dividend payments and stock buybacks may find it difficult to follow that path in the future, and investors may not reward that behavior if they do. Very long supply chains designed to squeeze out every bit of savings may be shifted closer to home markets if companies seek to emphasize resiliency over cost after a series of supply disruptions. Consumer, business and government behavior could all be impacted by the after-effects of the global pandemic in ways it will be difficult to forecast.
Over the past year, municipal bonds delivered modest positive performance, fueled by lower US Treasury rates and supportive fundamentals and technicals for most of the period. Longer-duration and higher-quality segments of the market outperformed. Each sector produced modest positive performance, with sectors perceived as higher quality outperforming. The favorable backdrop for municipals changed abruptly in March, impacted by the economic slowdown associated with limiting the spread of the coronavirus. The revenues of municipalities were, and continue to be, affected by both declining tax receipts and the increased costs brought on by the response to the outbreak. The fundamentals of many sectors will be impacted by the slowdown. Federal assistance will help in the effort to meet the challenges; however, the selection of sectors and issuers will likely increase in importance over the coming months.
4
Management Review – continued
Factors Affecting Performance
Relative to the Bloomberg Barclays Municipal Bond Index, the fund’s asset allocation was the largest detractor from relative performance. Specifically, from a sector perspective, a greater-than-benchmark exposure to theindustrial revenuesector weakened relative returns. From a quality perspective, anout-of-benchmark exposure tonon-rated and BB rated (r) bonds, and a greater exposure to BBB rated bonds, weighed on relative results. Security selection within AA rated bonds also dampened relative returns.
In contrast, the fund’s longer duration (d) stance contributed to relative performance as interest rates generally fell throughout the reporting period. The fund’s yield curve (y) positioning also strengthened relative performance. Although bond yields generally declined across all maturities, it was the fund’s greater exposure to longer-dated maturities that benefited relative performance during the reporting period.
Respectfully,
Portfolio Manager(s)
Jason Kosty and Geoffrey Schechter
| (d) | Duration is a measure of how much a bond’s price is likely to fluctuate with general changes in interest rates, e.g., if rates rise 1.00%, a bond with a5-year duration is likely to lose about 5.00% of its value. |
| (r) | Bonds rated BBB, Baa, or higher are considered investment grade; bonds rated BB”, “Ba, or below are considerednon-investment grade. The sources for bond quality ratings are Moody’s Investors Service, Standard & Poor’s and Fitch, Inc. and are applied using the following hierarchy: If all three agencies provide a rating, the middle rating (after dropping the highest and lowest ratings) is assigned; if two of the three agencies rate a security, the lower of the two is assigned. Ratings are shown in the S&P and Fitch scale (e.g., AAA). For securities which are not rated by any of the three agencies, the security is considered Not Rated. |
| (y) | A yield curve graphically depicts the yields of different maturity bonds of the same credit quality and type; a normal yield curve is upward sloping, with short-term rates lower than long-term rates. |
The views expressed in this report are those of the portfolio manager(s) only through the end of the period of the report as stated on the cover and do not necessarily reflect the views of MFS or any other person in the MFS organization. These views are subject to change at any time based on market or other conditions, and MFS disclaims any responsibility to update such views. These views may not be relied upon as investment advice or an indication of trading intent on behalf of any MFS portfolio. References to specific securities are not recommendations of such securities, and may not be representative of any MFS portfolio’s current or future investments.
5
PERFORMANCE SUMMARYTHROUGH3/31/20
The following chart illustrates a representative class of the fund’s historical performance in comparison to its benchmark(s). Performance results include the deduction of the maximum applicable sales charge and reflect the percentage change in net asset value, including reinvestment of dividends and capital gains distributions. The performance of other share classes will be greater than or less than that of the class depicted below. Benchmarks are unmanaged and may not be invested in directly. Benchmark returns do not reflect sales charges, commissions or expenses. (See Notes to Performance Summary.)
Performance data shown represents past performance and is no guarantee of future results. Investment return and principal value fluctuate so your shares, when sold, may be worth more or less than the original cost; current performance may be lower or higher than quoted. The performance shown does not reflect the deduction of taxes, if any, that a shareholder would pay on fund distributions or the redemption of fund shares.
Growth of a Hypothetical $10,000 Investment
6
Performance Summary – continued
Total Returns through 3/31/20
Average annual without sales charge
| | | | | | | | | | | | | | |
| | | Share Class | | Class Inception Date | | 1-yr | | 5-yr | | 10-yr | | Life (t) | | |
| | | A | | 9/07/93 | | 1.88% | | 3.00% | | 4.21% | | N/A | | |
| | | B | | 12/29/86 | | 1.14% | | 2.24% | | 3.42% | | N/A | | |
| | | C | | 1/03/94 | | 1.13% | | 2.23% | | 3.42% | | N/A | | |
| | | I | | 8/01/11 | | 2.13% | | 3.25% | | N/A | | 4.48% | | |
| | | R6 | | 8/01/17 | | 2.21% | | N/A | | N/A | | 3.15% | | |
| | | A1 | | 6/25/07 | | 2.14% | | 3.28% | | 4.47% | | N/A | | |
| | | B1 | | 6/25/07 | | 1.38% | | 2.48% | | 3.67% | | N/A | | |
| | | | | |
| Comparative benchmark(s) | | | | | | | | | | |
| | | Bloomberg Barclays Municipal Bond Index (f) | | 3.85% | | 3.19% | | 4.15% | | N/A | | |
| | | | | |
| Average annual with sales charge | | | | | | | | | | |
| | | A
With Initial Sales Charge (4.25%) | | (2.45)% | | 2.11% | | 3.75% | | N/A | | |
| | | B
With CDSC (Declining over six years from 4% to 0%) (v) | | (2.82)% | | 1.87% | | 3.42% | | N/A | | |
| | | C
With CDSC (1% for 12 months) (v) | | 0.14% | | 2.23% | | 3.42% | | N/A | | |
| | | A1
With Initial Sales Charge (4.25%) | | (2.20)% | | 2.39% | | 4.01% | | N/A | | |
| | | B1
With CDSC (Declining over six years from 4% to 0%) (v) | | (2.57)% | | 2.12% | | 3.67% | | N/A | | |
CDSC – Contingent Deferred Sales Charge.
Class I and R6 shares do not have a sales charge.
| (f) | Source: FactSet Research Systems Inc. |
| (t) | For the period from the class inception date through the stated period end (for those share classes with less than 10 years of performance history). No comparative benchmark performance information is provided for “life” periods. (See Notes to Performance Summary.) |
| (v) | Assuming redemption at the end of the applicable period. |
Benchmark Definition(s)
Bloomberg Barclays Municipal Bond Index – a market capitalization-weighted index that measures the performance of the tax-exempt bond market. BLOOMBERG® is a trademark and service mark of Bloomberg Finance L.P. and its affiliates (collectively “Bloomberg”). BARCLAYS® is a trademark and service mark of Barclays Bank Plc (collectively with its affiliates, “Barclays”), used under license. Bloomberg or Bloomberg’s licensors, including Barclays, own all proprietary rights in the Bloomberg Barclays Indices. Neither Bloomberg nor Barclays approves or endorses this material, or guarantees the accuracy or completeness of any information herein, or makes any warranty, express or implied, as to the results to be obtained therefrom, and, to the maximum extent allowed by law, neither shall have any liability or responsibility for injury or damages arising in connection therewith.
7
Performance Summary – continued
It is not possible to invest directly in an index.
Notes to Performance Summary
Average annual total return represents the average annual change in value for each share class for the periods presented. Life returns are presented where the share class has less than 10 years of performance history and represent the average annual total return from the class inception date to the stated period end date. As the fund’s share classes may have different inception dates, the life returns may represent different time periods and may not be comparable. As a result, no comparative benchmark performance information is provided for life periods.
Performance results reflect any applicable expense subsidies and waivers in effect during the periods shown. Without such subsidies and waivers the fund’s performance results would be less favorable. Please see the prospectus and financial statements for complete details.
Performance results do not include adjustments made for financial reporting purposes in accordance with U.S. generally accepted accounting principles and may differ from amounts reported in the financial highlights.
A portion of income may be subject to state, federal, and/or alternative minimum tax. Capital gains, if any, are subject to a capital gains tax.
From time to time the fund may receive proceeds from litigation settlements, without which performance would be lower.
8
EXPENSE TABLE
Fund expenses borne by the shareholders during the period, October 1, 2019 through March 31, 2020
As a shareholder of the fund, you incur two types of costs: (1) transaction costs, including sales charges (loads) on certain purchase or redemption payments, and (2) ongoing costs, including management fees; distribution and service(12b-1) fees; and other fund expenses. This example is intended to help you understand your ongoing costs (in dollars) of investing in the fund and to compare these costs with the ongoing costs of investing in other mutual funds.
The example is based on an investment of $1,000 invested at the beginning of the period and held for the entire period October 1, 2019 through March 31, 2020.
Actual Expenses
The first line for each share class in the following table provides information about actual account values and actual expenses. You may use the information in this line, together with the amount you invested, to estimate the expenses that you paid over the period. Simply divide your account value by $1,000 (for example, an $8,600 account value divided by $1,000 = 8.6), then multiply the result by the number in the first line under the heading entitled “Expenses Paid During Period” to estimate the expenses you paid on your account during this period.
Hypothetical Example for Comparison Purposes
The second line for each share class in the following table provides information about hypothetical account values and hypothetical expenses based on the fund’s actual expense ratio and an assumed rate of return of 5% per year before expenses, which is not the fund’s actual return. The hypothetical account values and expenses may not be used to estimate the actual ending account balance or expenses you paid for the period. You may use this information to compare the ongoing costs of investing in the fund and other funds. To do so, compare this 5% hypothetical example with the 5% hypothetical examples that appear in the shareholder reports of the other funds.
Please note that the expenses shown in the table are meant to highlight your ongoing costs only and do not reflect any transactional costs, such as sales charges (loads). Therefore, the second line for each share class in the table is useful in comparing ongoing costs only, and will not help you determine the relative total costs of owning different funds. In addition, if these transactional costs were included, your costs would have been higher.
9
Expense Table – continued
| | | | | | | | | | | | | | | | | | |
Share
Class | | | | Annualized
Expense
Ratio | | | Beginning
Account Value
10/01/19 | | | Ending
Account Value
3/31/20 | | | Expenses
Paid During
Period (p)
10/01/19-3/31/20 | |
| A | | Actual | | | 0.77% | | | | $1,000.00 | | | | $975.58 | | | | $3.80 | |
| | Hypothetical (h) | | | 0.77% | | | | $1,000.00 | | | | $1,021.15 | | | | $3.89 | |
| B | | Actual | | | 1.52% | | | | $1,000.00 | | | | $972.03 | | | | $7.49 | |
| | Hypothetical (h) | | | 1.52% | | | | $1,000.00 | | | | $1,017.40 | | | | $7.67 | |
| C | | Actual | | | 1.52% | | | | $1,000.00 | | | | $972.07 | | | | $7.49 | |
| | Hypothetical (h) | | | 1.52% | | | | $1,000.00 | | | | $1,017.40 | | | | $7.67 | |
| I | | Actual | | | 0.52% | | | | $1,000.00 | | | | $976.74 | | | | $2.57 | |
| | Hypothetical (h) | | | 0.52% | | | | $1,000.00 | | | | $1,022.40 | | | | $2.63 | |
| R6 | | Actual | | | 0.44% | | | | $1,000.00 | | | | $978.22 | | | | $2.18 | |
| | Hypothetical (h) | | | 0.44% | | | | $1,000.00 | | | | $1,022.80 | | | | $2.23 | |
| A1 | | Actual | | | 0.52% | | | | $1,000.00 | | | | $977.94 | | | | $2.57 | |
| | Hypothetical (h) | | | 0.52% | | | | $1,000.00 | | | | $1,022.40 | | | | $2.63 | |
| B1 | | Actual | | | 1.27% | | | | $1,000.00 | | | | $973.22 | | | | $6.26 | |
| | Hypothetical (h) | | | 1.27% | | | | $1,000.00 | | | | $1,018.65 | | | | $6.41 | |
| (h) | 5% class return per year before expenses. |
| (p) | “Expenses Paid During Period” are equal to each class’s annualized expense ratio, as shown above, multiplied by the average account value over the period, multiplied by 183/366 (to reflect theone-half year period). Expenses paid do not include any applicable sales charges (loads). If these transaction costs had been included, your costs would have been higher. |
Notes to Expense Table
Expense ratios include 0.04% of investment related expenses from self-deposited inverse floaters (See Note 2 of the Notes to Financial Statements) that are outside of the expense limitation arrangement (See Note 3 of the Notes to Financial Statements).
10
PORTFOLIO OF INVESTMENTS
3/31/20
The Portfolio of Investments is a complete list of all securities owned by your fund. It is categorized by jurisdiction.
| | | | | | | | |
| | |
| Issuer | | Shares/Par | | | Value ($) | |
| Municipal Bonds - 96.2% | | | | | | |
| Alabama - 2.1% | | | | | | |
| Birmingham, AL, Special Care Facilities Financing Authority Rev. | | | | | | | | |
| (Methodist Home for the Aging), 5.25%, 6/01/2025 | | $ | 930,000 | | | $ | 944,192 | |
| Black Belt Energy Gas District, AL, Gas Prepay Rev., “A”, 4%, 12/01/2048 (Put Date 12/01/2023) | | | 6,570,000 | | | | 6,757,968 | |
| Black Belt Energy Gas District, AL, Gas Prepay Rev.,“A-1”, 4%, 10/01/2049 (Put Date 10/01/2026) | | | 4,945,000 | | | | 5,183,547 | |
| Black Belt Energy Gas District, AL, Gas Prepay Rev.,“B-1”, FLR, 1.959% (67% of LIBOR - 1mo. + 0.9%), 12/01/2048 (Put Date 12/01/2023) | | | 20,175,000 | | | | 20,105,194 | |
| DCH Health Care Authority, AL, Health Care Facilities Rev., 5%, 6/01/2033 | | | 785,000 | | | | 896,949 | |
| Jefferson County, AL, Sewer Rev. Warrants, Capital | | | | | | | | |
| Appreciation, Senior Lien, “B”, AGM, 0%, 10/01/2026 | | | 1,175,000 | | | | 961,679 | |
| Jefferson County, AL, Sewer Rev. Warrants, Capital | | | | | | | | |
| Appreciation, Senior Lien, “B”, AGM, 0%, 10/01/2029 | | | 1,655,000 | | | | 1,102,462 | |
| Jefferson County, AL, Sewer Rev. Warrants, Capital | | | | | | | | |
| Appreciation, Senior Lien, “B”, AGM, 0%, 10/01/2034 | | | 2,370,000 | | | | 1,110,108 | |
| Jefferson County, AL, Sewer Rev. Warrants, Capital | | | | | | | | |
| Appreciation, Senior Lien, “B”, AGM, 0%, 10/01/2035 | | | 4,495,000 | | | | 1,971,237 | |
| Jefferson County, AL, Sewer Rev. Warrants, Subordinate Lien, “D”, 5%, 10/01/2021 | | | 310,000 | | | | 324,846 | |
| Jefferson County, AL, Sewer Rev. Warrants, Subordinate Lien, “D”, 5%, 10/01/2023 | | | 455,000 | | | | 502,861 | |
| Lower, AL, Gas District Project Rev., “A”, 5%, 9/01/2046 | | | 2,805,000 | | | | 3,288,666 | |
| Mobile, AL, General Obligation Warrants, “A”, 5%, 2/15/2030 | | | 3,130,000 | | | | 3,806,737 | |
| Selma, AL, Industrial Development Board Rev., Gulf | | | | | | | | |
| Opportunity Zone (International Paper Co.), “A”, 5.8%, 5/01/2034 | | | 3,565,000 | | | | 3,570,454 | |
| Southeast Alabama Gas Supply District Rev. (Project No. 1), “A”, 4%, 4/01/2049 | | | 14,580,000 | | | | 15,029,501 | |
| Tuscaloosa County, AL, Industrial Development Authority, Gulf Opportunity Zone (Hunt Refining Project), “A”, 4.5%, 5/01/2032 | | | 7,460,000 | | | | 7,091,998 | |
| Tuscaloosa County, AL, Industrial Development Authority, Gulf Opportunity Zone (Hunt Refining Project), “A”, 5.25%, 5/01/2044 | | | 14,090,000 | | | | 13,549,085 | |
| University of North Alabama, General Fee Rev., “B”, BAM, 5%, 11/01/2038 | | | 1,505,000 | | | | 1,860,948 | |
| University of North Alabama, General Fee Rev., “B”, BAM, 5%, 11/01/2039 | | | 620,000 | | | | 765,471 | |
| University of South Alabama, Facilities Rev., “A”, BAM, 5%, 4/01/2044 | | | 4,070,000 | | | | 4,977,244 | |
11
Portfolio of Investments – continued
| | | | | | | | |
| | |
| Issuer | | Shares/Par | | | Value ($) | |
| Municipal Bonds - continued | | | | | | |
| Alabama - continued | | | | | | |
| University of South Alabama, Facilities Rev., “A”, BAM, 5%, 4/01/2049 | | $ | 2,480,000 | | | $ | 3,009,579 | |
| | | | | | | | |
| | | | | | | $ | 96,810,726 | |
| Arizona - 2.0% | | | | | | |
| Arizona Industrial Development Authority Education Rev. (Academies of Math & Science), “A”, 5%, 7/01/2038 | | $ | 370,000 | | | $ | 419,665 | |
| Arizona Industrial Development Authority Education Rev. (Academies of Math & Science), “A”, 5%, 7/01/2048 | | | 990,000 | | | | 1,106,533 | |
| Arizona Industrial Development Authority Education Rev. (Academies of Math & Science), “A”, 5%, 7/01/2052 | | | 1,235,000 | | | | 1,370,776 | |
| Arizona Industrial Development Authority Education Rev. (Basis Schools Projects), “A”, 5.125%, 7/01/2037 | | | 1,000,000 | | | | 978,080 | |
| Arizona Industrial Development Authority Education Rev. (Basis Schools Projects), “A”, 5.25%, 7/01/2047 | | | 750,000 | | | | 714,382 | |
| Arizona Industrial Development Authority Education Rev. (Basis Schools Projects), “D”, 5%, 7/01/2037 | | | 95,000 | | | | 91,589 | |
| Arizona Industrial Development Authority Education Rev. (Basis Schools Projects), “D”, 5%, 7/01/2047 | | | 160,000 | | | | 146,859 | |
| Arizona Industrial Development Authority Education Rev. (Basis Schools Projects), “D”, 5%, 7/01/2051 | | | 425,000 | | | | 385,794 | |
| Arizona Industrial Development Authority Education Rev. (Basis Schools Projects), “F”, 5%, 7/01/2037 | | | 1,000,000 | | | | 1,132,650 | |
| Arizona Industrial Development Authority Education Rev. (Basis Schools Projects), “F”, 5%, 7/01/2047 | | | 2,350,000 | | | | 2,621,025 | |
| Arizona Industrial Development Authority Education Rev. (Basis Schools Projects), “F”, 5%, 7/01/2052 | | | 1,870,000 | | | | 2,070,202 | |
| Arizona Industrial Development Authority Education Rev. (Basis Schools Projects), “G”, 5%, 7/01/2037 | | | 165,000 | | | | 159,075 | |
| Arizona Industrial Development Authority Education Rev. (Basis Schools Projects), “G”, 5%, 7/01/2047 | | | 165,000 | | | | 151,449 | |
| Arizona Industrial Development Authority Education Rev. (Basis Schools Projects), “G”, 5%, 7/01/2051 | | | 310,000 | | | | 281,403 | |
| Arizona Industrial Development Authority Senior Living Rev. (Great Lakes Senior Living Facilities LLC, First Tier), “A”, 5%, 1/01/2043 | | | 1,875,000 | | | | 1,673,625 | |
| Arizona Industrial Development Authority Senior Living Rev. (Great Lakes Senior Living Facilities LLC, First Tier), “A”, 5%, 1/01/2054 | | | 4,790,000 | | | | 4,039,455 | |
| Glendale, AZ, Industrial Development Authority, Graduate & Professional Student Loan Program Rev. (Midwestern University Foundation), “A”, 3%, 7/01/2035 | | | 1,965,000 | | | | 2,059,261 | |
| Glendale, AZ, Industrial Development Authority, Senior Living Rev. (Sun Health Services), “A”, 5%, 11/15/2042 | | | 7,000,000 | | | | 7,716,730 | |
12
Portfolio of Investments – continued
| | | | | | | | |
| | |
| Issuer | | Shares/Par | | | Value ($) | |
| Municipal Bonds - continued | | | | | | |
| Arizona - continued | | | | | | |
| La Paz County, AZ, Industrial Development Authority Education Facility Lease Rev. (Charter School Solutions-Harmony Public Schools Project), “A”, 5%, 2/15/2038 | | $ | 675,000 | | | $ | 736,006 | |
| La Paz County, AZ, Industrial Development Authority Education Facility Lease Rev. (Charter School Solutions-Harmony Public Schools Project), “A”, 5%, 2/15/2048 | | | 465,000 | | | | 499,336 | |
| Maricopa County, AZ, Industrial Development Authority Education Rev. (Legacy Traditional Schools Projects), “A”, 4%, 7/01/2034 | | | 170,000 | | | | 180,676 | |
| Maricopa County, AZ, Industrial Development Authority Education Rev. (Legacy Traditional Schools Projects), “A”, 5%, 7/01/2039 | | | 295,000 | | | | 339,524 | |
| Maricopa County, AZ, Industrial Development Authority Education Rev. (Legacy Traditional Schools Projects), “A”, 5%, 7/01/2039 (n) | | | 860,000 | | | | 833,073 | |
| Maricopa County, AZ, Industrial Development Authority Education Rev. (Legacy Traditional Schools Projects), “A”, 5%, 7/01/2049 | | | 545,000 | | | | 618,869 | |
| Maricopa County, AZ, Industrial Development Authority Education Rev. (Legacy Traditional Schools Projects), “A”, 5%, 7/01/2049 (n) | | | 1,465,000 | | | | 1,362,948 | |
| Maricopa County, AZ, Industrial Development Authority Education Rev. (Legacy Traditional Schools Projects), “A”, 5%, 7/01/2054 | | | 690,000 | | | | 776,664 | |
| Maricopa County, AZ, Industrial Development Authority Education Rev. (Legacy Traditional Schools Projects), “A”, 5%, 7/01/2054 (n) | | | 1,045,000 | | | | 960,219 | |
| Maricopa County, AZ, Industrial Development Authority Rev. (Banner Health), “A”, 5%, 1/01/2038 | | | 3,000,000 | | | | 3,444,870 | |
| Phoenix, AZ, Civic Improvement Corp., Rental Car Facility Charge Rev., “A”, 5%, 7/01/2037 | | | 8,000,000 | | | | 9,595,920 | |
| Phoenix, AZ, Civic Improvement Corp., Rental Car Facility Charge Rev., “A”, 5%, 7/01/2038 | | | 8,420,000 | | | | 10,062,405 | |
| Phoenix, AZ, Industrial Development Authority, Education Facility Rev. (Basis Schools Projects), “A”, 5%, 7/01/2035 | | | 470,000 | | | | 459,181 | |
| Phoenix, AZ, Industrial Development Authority, Education Facility Rev. (Basis Schools Projects), “A”, 5%, 7/01/2035 | | | 140,000 | | | | 136,777 | |
| Phoenix, AZ, Industrial Development Authority, Education Facility Rev. (Basis Schools Projects), “A”, 5%, 7/01/2045 | | | 570,000 | | | | 526,190 | |
| Phoenix, AZ, Industrial Development Authority, Education Facility Rev. (Basis Schools Projects), “A”, 5%, 7/01/2046 | | | 340,000 | | | | 312,967 | |
| Phoenix, AZ, Industrial Development Authority, Education Facility Rev. (Great Hearts Academies Project), “A”, 5%, 7/01/2036 | | | 700,000 | | | | 756,091 | |
| Phoenix, AZ, Industrial Development Authority, Education Facility Rev. (Great Hearts Academies Project), “A”, 5%, 7/01/2041 | | | 560,000 | | | | 599,794 | |
| Phoenix, AZ, Industrial Development Authority, Education Facility Rev. (Great Hearts Academies Project), “A”, 5%, 7/01/2046 | | | 895,000 | | | | 953,005 | |
| Phoenix, AZ, Industrial Development Authority, Education Facility Rev. (Legacy Traditional Schools Project), 5%, 7/01/2035 | | | 840,000 | | | | 832,163 | |
13
Portfolio of Investments – continued
| | | | | | | | |
| | |
| Issuer | | Shares/Par | | | Value ($) | |
| Municipal Bonds - continued | | | | | | |
| Arizona - continued | | | | | | |
| Phoenix, AZ, Industrial Development Authority, Education Facility Rev. (Legacy Traditional Schools Project), 5%, 7/01/2045 | | $ | 925,000 | | | $ | 869,407 | |
| Phoenix, AZ, Industrial Development Authority, Education Facility Rev. (Legacy Traditional Schools Project), 5%, 7/01/2046 | | | 610,000 | | | | 571,863 | |
| Phoenix, AZ, Industrial Development Authority, Solid Waste Disposal Rev. (Republic Services, Inc. Project), 1.1%, 12/01/2035 (Put Date 5/01/2020) | | | 6,570,000 | | | | 6,568,555 | |
| Phoenix, AZ, Industrial Development Authority, Student Housing Refunding Rev. (Downtown Phoenix Student Housing IILLC-Arizona State University Project), “A”, 5%, 7/01/2044 | | | 420,000 | | | | 460,832 | |
| Phoenix, AZ, Industrial Development Authority, Student Housing Refunding Rev. (Downtown Phoenix Student Housing IILLC-Arizona State University Project), “A”, 5%, 7/01/2049 | | | 470,000 | | | | 512,549 | |
| Phoenix, AZ, Industrial Development Authority, Student Housing Refunding Rev. (Downtown Phoenix Student Housing IILLC-Arizona State University Project), “A”, 5%, 7/01/2054 | | | 560,000 | | | | 607,645 | |
| Phoenix, AZ, Industrial Development Authority, Student Housing Refunding Rev. (Downtown Phoenix Student Housing IILLC-Arizona State University Project), “A”, 5%, 7/01/2059 | | | 840,000 | | | | 904,873 | |
| Phoenix, AZ, Industrial Development Authority, Student Housing Refunding Rev. (Downtown Phoenix Student HousingLLC-Arizona State University Project), “A”, 5%, 7/01/2030 | | | 150,000 | | | | 172,080 | |
| Phoenix, AZ, Industrial Development Authority, Student Housing Refunding Rev. (Downtown Phoenix Student HousingLLC-Arizona State University Project), “A”, 5%, 7/01/2031 | | | 530,000 | | | | 604,910 | |
| Phoenix, AZ, Industrial Development Authority, Student Housing Refunding Rev. (Downtown Phoenix Student HousingLLC-Arizona State University Project), “A”, 5%, 7/01/2033 | | | 285,000 | | | | 323,099 | |
| Phoenix, AZ, Industrial Development Authority, Student Housing Refunding Rev. (Downtown Phoenix Student HousingLLC-Arizona State University Project), “A”, 5%, 7/01/2037 | | | 500,000 | | | | 559,275 | |
| Phoenix, AZ, Industrial Development Authority, Student Housing Refunding Rev. (Downtown Phoenix Student HousingLLC-Arizona State University Project), “A”, 5%, 7/01/2042 | | | 605,000 | | | | 669,935 | |
| Pima County, AZ, Industrial Development Authority Education Facility Rev. (American Leadership Academy Project), 4.75%, 6/15/2037 | | | 1,075,000 | | | | 959,545 | |
| Pima County, AZ, Industrial Development Authority Education Facility Rev. (American Leadership Academy Project), 5%, 6/15/2047 | | | 1,020,000 | | | | 893,979 | |
| Pima County, AZ, Industrial Development Authority Education Facility Rev. (American Leadership Academy Project), 5%, 6/15/2052 | | | 550,000 | | | | 477,581 | |
14
Portfolio of Investments – continued
| | | | | | | | |
| | |
| Issuer | | Shares/Par | | | Value ($) | |
| Municipal Bonds - continued | | | | | | |
| Arizona - continued | | | | | | |
| Salt River, AZ, Agricultural Improvement & Power District, “A”, 5%, 1/01/2038 | | $ | 8,000,000 | | | $ | 9,625,200 | |
| Salt Verde Financial Corp., AZ, Senior Gas Rev., 5%, 12/01/2037 | | | 4,000,000 | | | | 4,706,560 | |
| Yavapai County, AZ, Industrial Development Authority Rev. (Waste Management, Inc.),“A-2”, 2.2%, 3/01/2028 (Put Date 6/03/2024) | | | 2,150,000 | | | | 2,078,921 | |
| | | | | | | | |
| | | | | | | $ | 92,672,040 | |
| Arkansas - 0.2% | | | | | | |
| Arkansas Development Finance Authority, Charter School Capital Improvement Rev. (LISA Academy Project), 4%, 7/01/2028 | | $ | 215,000 | | | $ | 215,314 | |
| Arkansas Development Finance Authority, Charter School Capital Improvement Rev. (LISA Academy Project), 4.5%, 7/01/2033 | | | 435,000 | | | | 431,973 | |
| Arkansas Development Finance Authority, Charter School Capital Improvement Rev. (LISA Academy Project), 4.5%, 7/01/2039 | | | 45,000 | | | | 40,136 | |
| Arkansas Development Finance Authority, Health Care Rev. | | | | | | | | |
| (Baptist Health), 5%, 12/01/2047 | | | 905,000 | | | | 1,081,140 | |
| Arkansas Development Finance Authority, Hospital Rev. | | | | | | | | |
| (Washington Regional Medical Center), 5%, 2/01/2038 | | | 1,665,000 | | | | 1,966,532 | |
| Arkansas Development Finance Authority, Hospital Rev. | | | | | | | | |
| (Washington Regional Medical Center), “A”, 5%, 2/01/2035 | | | 435,000 | | | | 489,501 | |
| Arkansas Development Finance Authority, Tobacco Settlement | | | | | | | | |
| Rev. (Cancer Research Center Project), Capital Appreciation, | | | | | | | | |
| AAC, 0%, 7/01/2046 | | | 4,995,000 | | | | 2,092,056 | |
| Pulaski County, AR, Public Facilities Board, Healthcare Rev. | | | | | | | | |
| (Baptist Health), 5%, 12/01/2042 | | | 1,520,000 | | | | 1,706,367 | |
| | | | | | | | |
| | | | | | | $ | 8,023,019 | |
| California - 7.9% | | | | | | |
| Alameda, CA, Corridor Transportation Authority Senior Lien Rev., “A”, AGM, 5%, 10/01/2028 | | $ | 985,000 | | | $ | 1,094,621 | |
| California Community College Financing Authority Lease Rev. (West Valley Mission Community College), “C”, 5%, 6/01/2025 | | | 3,960,000 | | | | 4,722,181 | |
| California Community College Financing Authority Lease Rev. (West Valley Mission Community College), “C”, 5%, 6/01/2026 | | | 4,145,000 | | | | 5,080,817 | |
| California Educational Facilities Authority Rev. (Chapman University), 5%, 4/01/2031 | | | 1,550,000 | | | | 1,585,464 | |
| California Educational Facilities Authority Rev. (University of San Francisco), 6.125%, 10/01/2036 (Prerefunded 10/01/2021) | | | 450,000 | | | | 481,325 | |
| California Educational Facilities Authority Rev. (University of San Francisco), 6.125%, 10/01/2036 (Prerefunded 10/01/2021) | | | 475,000 | | | | 508,065 | |
| California Health Facilities Financing Authority Rev. (Sutter Health), “A”, 5%, 11/15/2046 | | | 2,530,000 | | | | 2,855,965 | |
15
Portfolio of Investments – continued
| | | | | | | | |
| | |
| Issuer | | Shares/Par | | | Value ($) | |
| Municipal Bonds - continued | | | | | | |
| California - continued | | | | | | |
| California Health Facilities Financing Authority Rev. (Sutter Health), “D”, 5.25%, 8/15/2031 | | $ | 5,000,000 | | | $ | 5,269,750 | |
| California Housing Finance Agency Municipal Certificates, “A”, 4%, 3/20/2033 | | | 5,198,126 | | | | 5,514,536 | |
| CaliforniaM-S-R Energy Authority Gas Rev., “A”, 7%, 11/01/2034 | | | 595,000 | | | | 822,451 | |
| California Municipal Finance Authority Rev. (Channing House Project), “B”, 5%, 5/15/2047 | | | 1,500,000 | | | | 1,755,120 | |
| California Municipal Finance Authority Rev. (Community Medical Centers), “A”, 5%, 2/01/2042 | | | 1,750,000 | | | | 1,949,640 | |
| California Municipal Finance Authority Rev. (LINXS APM Project), “A”, 5%, 12/31/2043 | | | 1,000,000 | | | | 1,065,930 | |
| California Municipal Finance Authority Rev. (NorthBay Healthcare Group), “A”, 5.25%, 11/01/2036 | | | 1,510,000 | | | | 1,667,418 | |
| California Municipal Finance Authority Rev. (NorthBay Healthcare Group), “A”, 5.25%, 11/01/2041 | | | 4,890,000 | | | | 5,283,254 | |
| California Municipal Finance Authority Rev. (NorthBay Healthcare Group), “A”, 5.25%, 11/01/2047 | | | 235,000 | | | | 252,301 | |
| California Municipal Finance Authority Rev. (University of La Verne), “A”, 6.25%, 6/01/2040 (Prerefunded 6/01/2020) | | | 850,000 | | | | 857,302 | |
| California Municipal Finance Authority Rev. (William Jessup University), 5%, 8/01/2039 | | | 2,150,000 | | | | 2,186,743 | |
| California Municipal Finance Authority Solid Waste Disposal Rev. (Waste Management, Inc. Project), “A”, 2.4%, 10/01/2044 (Put Date 10/01/2029) | | | 4,280,000 | | | | 4,141,585 | |
| California Pollution Control Financing Authority, Solid Waste Disposal Rev. (Republic Services, Inc. Project), “A”, 1.09%, 8/01/2023 (Put Date 5/01/2020) | | | 17,080,000 | | | | 17,076,242 | |
| California Pollution Control Financing Authority, Solid Waste Disposal Rev. (Republic Services, Inc. Project),“A-1”, 1.17%, 11/01/2042 (Put Date 4/15/2020) | | | 2,620,000 | | | | 2,619,817 | |
| California Pollution Control Financing Authority, Solid Waste Disposal Rev. (Republic Services, Inc. Project),“A-2”, 1.17%, 11/01/2042 (Put Date 4/15/2020) | | | 2,785,000 | | | | 2,784,805 | |
| California Pollution Control Financing Authority, Solid Waste Disposal Rev. (Waste Management, Inc.), “A”, 2.5%, 11/01/2038 (Put Date 5/01/2024) | | | 3,635,000 | | | | 3,627,948 | |
| California Public Finance Authority Rev. (Henry Mayo Newhall Hospital), 5%, 10/15/2033 | | | 260,000 | | | | 299,169 | |
| California Public Finance Authority Rev. (Henry Mayo Newhall Hospital), 5%, 10/15/2037 | | | 510,000 | | | | 580,880 | |
| California Public Finance Authority Rev. (Henry Mayo Newhall Hospital), 5%, 10/15/2047 | | | 510,000 | | | | 572,807 | |
16
Portfolio of Investments – continued
| | | | | | | | |
| | |
| Issuer | | Shares/Par | | | Value ($) | |
| Municipal Bonds - continued | | | | | | |
| California - continued | | | | | | |
| California Public Works Board Lease Rev. (Various Capital Projects), “I”, 5%, 11/01/2038 | | $ | 9,180,000 | | | $ | 10,152,896 | |
| California Public Works Board Lease Rev., Department of Corrections and Rehabilitation (Various Correctional Facilities), “A”, 5%, 9/01/2033 | | | 9,250,000 | | | | 10,603,922 | |
| California School Finance Authority, Charter School Rev. (Inspire Charter Schools), “B”, 3%, 7/15/2020 | | | 2,005,000 | | | | 2,005,982 | |
| California School Finance Authority, Charter School Rev. (Inspire Charter Schools), “C”, 4%, 7/15/2020 | | | 4,775,000 | | | | 4,771,132 | |
| California School Finance Authority, School Facility Rev. (Alliance for College-Ready Public Schools Projects), “A”, 4%, 7/01/2024 | | | 560,000 | | | | 573,793 | |
| California School Finance Authority, School Facility Rev. (Alliance for College-Ready Public Schools Projects), “A”, 4%, 7/01/2025 | | | 585,000 | | | | 599,783 | |
| California School Finance Authority, School Facility Rev. (Alliance for College-Ready Public Schools Projects), “A”, 5%, 7/01/2030 | | | 505,000 | | | | 537,668 | |
| California School Finance Authority, School Facility Rev. (Alliance for College-Ready Public Schools Projects), “A”, 5%, 7/01/2045 | | | 1,340,000 | | | | 1,396,159 | |
| California Statewide Communities Development Authority Insured Rev. (Viamonte Senior Living 1 Project), “A”, 3.5%, 7/01/2034 | | | 795,000 | | | | 866,327 | |
| California Statewide Communities Development Authority Rev. (Adventist Health System/West), “A”, 5%, 3/01/2034 | | | 1,000,000 | | | | 1,223,180 | |
| California Statewide Communities Development Authority Rev. (Adventist Health System/West), “A”, 5%, 3/01/2035 | | | 1,475,000 | | | | 1,798,350 | |
| California Statewide Communities Development Authority Rev. (California Baptist University), “A”, 3%, 11/01/2022 | | | 1,065,000 | | | | 1,049,621 | |
| California Statewide Communities Development Authority Rev. (California Baptist University), “A”, 3.5%, 11/01/2027 | | | 3,930,000 | | | | 3,863,033 | |
| California Statewide Communities Development Authority Rev. (California Baptist University), “A”, 5%, 11/01/2032 | | | 485,000 | | | | 509,628 | |
| California Statewide Communities Development Authority Rev. (California Baptist University), “A”, 5%, 11/01/2041 | | | 955,000 | | | | 976,115 | |
| California Statewide Communities Development Authority Rev. (Lancer Plaza Project), 5.125%, 11/01/2023 | | | 70,000 | | | | 73,336 | |
| California Statewide Communities Development Authority Rev. (Lancer Plaza Project), 5.625%, 11/01/2033 | | | 190,000 | | | | 200,912 | |
| California Statewide Communities Development Authority Rev. (Loma Linda University Medical Center), “A”, 5.25%, 12/01/2034 | | | 645,000 | | | | 710,068 | |
| California Statewide Communities Development Authority Rev. (Loma Linda University Medical Center), “A”, 5.25%, 12/01/2044 | | | 2,475,000 | | | | 2,632,806 | |
| California Statewide Communities Development Authority Rev. (Loma Linda University Medical Center), “A”, 5%, 12/01/2046 | | | 3,770,000 | | | | 3,972,637 | |
| California Statewide Communities Development Authority Rev. (Loma Linda University Medical Center), “A”, 5.25%, 12/01/2056 | | | 990,000 | | | | 1,051,835 | |
17
Portfolio of Investments – continued
| | | | | | | | |
| | |
| Issuer | | Shares/Par | | | Value ($) | |
| Municipal Bonds - continued | | | | | | |
| California - continued | | | | | | |
| California Statewide Communities Development Authority, College Housing Rev. (NCCD-Hooper Street LLC College of the Arts Project), 5%, 7/01/2029 | | $ | 340,000 | | | $ | 353,756 | |
| California Statewide Communities Development Authority, College Housing Rev. (NCCD-Hooper Street LLC College of the Arts Project), 5.25%, 7/01/2039 | | | 475,000 | | | | 490,775 | |
| California Statewide Communities Development Authority, College Housing Rev. (NCCD-Hooper Street LLC College of the Arts Project), 5.25%, 7/01/2049 | | | 1,040,000 | | | | 1,058,980 | |
| California Statewide Communities Development Authority, College Housing Rev. (NCCD-Hooper Street LLC College of the Arts Project), 5.25%, 7/01/2052 | | | 505,000 | | | | 513,095 | |
| Chula Vista, CA, Industrial Development Rev. (San Diego Gas & Electric Co.), “E”, 5.875%, 1/01/2034 | | | 1,840,000 | | | | 1,846,734 | |
| Escondido, CA, Union High School District (Election of 2008), Capital Appreciation, “A”, ASSD GTY, 0%, 8/01/2030 | | | 4,495,000 | | | | 3,597,528 | |
| Escondido, CA, Union High School District (Election of 2008), Capital Appreciation, “A”, ASSD GTY, 0%, 8/01/2031 | | | 4,015,000 | | | | 3,119,053 | |
| Escondido, CA, Union High School District (Election of 2008), Capital Appreciation, “A”, ASSD GTY, 0%, 8/01/2033 | | | 2,785,000 | | | | 2,026,394 | |
| Foothill-De Anza, CA, Community College District, Capital Appreciation, NATL, 0%, 8/01/2034 | | | 21,410,000 | | | | 15,160,207 | |
| Golden State, CA, Tobacco Securitization Corp., Tobacco Settlement Rev., “A”, 5%, 6/01/2034 | | | 3,000,000 | | | | 3,419,610 | |
| Golden State, CA, Tobacco Securitization Corp., Tobacco Settlement Rev., “A”, 3.5%, 6/01/2036 | | | 2,320,000 | | | | 2,271,883 | |
| Golden State, CA, Tobacco Securitization Corp., Tobacco Settlement Rev., “A”, 5.25%, 6/01/2047 | | | 880,000 | | | | 860,130 | |
| Inland Valley, CA, Development Successor Agency Tax Allocation, “A”, AGM, 5%, 9/01/2044 | | | 2,620,000 | | | | 2,896,279 | |
| La Verne, CA, Brethren Hillcrest Homes, COP, 5%, 5/15/2036 | | | 640,000 | | | | 650,432 | |
| Long Beach, CA, Marina Rev. (Alamitos Bay Marina Project), 5%, 5/15/2035 | | | 480,000 | | | | 486,418 | |
| Los Angeles County, CA, Regional Financing Authority Rev. (Montecedro, Inc. Project), “A”, CALHF, 5%, 11/15/2034 | | | 480,000 | | | | 523,819 | |
| Los Angeles County, CA, Regional Financing Authority Rev. (Montecedro, Inc. Project), “A”, CALHF, 5%, 11/15/2044 | | | 820,000 | | | | 887,363 | |
| Los Angeles, CA, Department of Airports Rev. (Los Angeles International), “A”, 5%, 5/15/2028 | | | 1,000,000 | | | | 1,165,570 | |
| Los Angeles, CA, Department of Airports Rev. (Los Angeles International), “A”, 5%, 5/15/2029 | | | 1,165,000 | | | | 1,169,975 | |
| Los Angeles, CA, Department of Airports Rev. (Los Angeles International), “A”, 5%, 5/15/2034 | | | 465,000 | | | | 553,583 | |
18
Portfolio of Investments – continued
| | | | | | | | |
| | |
| Issuer | | Shares/Par | | | Value ($) | |
| Municipal Bonds - continued | | | | | | |
| California - continued | | | | | | |
| Los Angeles, CA, Department of Airports Rev. (Los Angeles International), “A”, 5%, 5/15/2036 | | $ | 825,000 | | | $ | 975,843 | |
| Los Angeles, CA, Department of Airports Rev. (Los Angeles International), “A”, 5%, 5/15/2037 | | | 1,030,000 | | | | 1,215,163 | |
| Los Angeles, CA, Department of Airports Rev. (Los Angeles International), “A”, 5.25%, 5/15/2038 | | | 1,770,000 | | | | 2,056,793 | |
| Los Angeles, CA, Department of Airports Rev. (Los Angeles International), “A”, 5%, 5/15/2044 | | | 3,605,000 | | | | 4,193,696 | |
| Los Angeles, CA, Department of Water & Power Water System Rev., “A”, 5%, 7/01/2038 | | | 4,040,000 | | | | 4,748,697 | |
| Los Angeles, CA, Department of Water & Power Water System Rev., “A”, 5%, 7/01/2041 | | | 6,435,000 | | | | 7,529,272 | |
| Merced, CA, Union High School District, Capital Appreciation, “A”, ASSD GTY, 0%, 8/01/2030 | | | 580,000 | | | | 469,928 | |
| Montebello, CA, Public Financing Authority Lease Rev. (Montebello Home2 Suites by Hilton Hotel Project), “A”, 5%, 6/01/2041 | | | 6,500,000 | | | | 7,555,730 | |
| Montebello, CA, Public Financing Authority Lease Rev. (Montebello Home2 Suites by Hilton Hotel Project), “A”, 5%, 6/01/2046 | | | 2,000,000 | | | | 2,311,100 | |
| Mount San Antonio, CA, Community College District Rev. (Election of 2008), Convertible Capital Appreciation, “A”, 0% to 8/01/2023, 5.875% to 8/01/2028 | | | 1,860,000 | | | | 2,048,269 | |
| Oceanside, CA, Unified School District, Capital Appreciation, ASSD GTY, 0%, 8/01/2027 | | | 1,930,000 | | | | 1,704,480 | |
| Oceanside, CA, Unified School District, Capital Appreciation, ASSD GTY, 0%, 8/01/2029 | | | 3,915,000 | | | | 3,277,090 | |
| Oceanside, CA, Unified School District, Capital Appreciation, ASSD GTY, 0%, 8/01/2030 | | | 4,335,000 | | | | 3,512,304 | |
| Oceanside, CA, Unified School District, Capital Appreciation, ETM, ASSD GTY, 0%, 8/01/2024 | | | 350,000 | | | | 329,907 | |
| Oroville, CA, Rev. (Oroville Hospital), 5.25%, 4/01/2049 | | | 820,000 | | | | 909,716 | |
| Oroville, CA, Rev. (Oroville Hospital), 5.25%, 4/01/2054 | | | 1,230,000 | | | | 1,358,707 | |
| Oxnard, CA, Financing Authority, Wastewater Rev., AGM, 5%, 6/01/2030 | | | 1,640,000 | | | | 1,886,607 | |
| Port of Oakland, CA, Rev., “P”, 5%, 5/01/2033 | | | 10,815,000 | | | | 11,515,271 | |
| Riverside County, CA, Transportation Commission Sales Tax Rev. (Limited Tax), “A”, 2%, 6/01/2029 | | | 2,015,000 | | | | 2,054,796 | |
| Riverside County, CA, Transportation Commission Sales Tax Rev. (Limited Tax), “A”, 5.25%, 6/01/2039 (Prerefunded 6/01/2023) | | | 4,655,000 | | | | 5,261,779 | |
| Sacramento County, CA, Airport System Rev., “A”, 5%, 7/01/2041 | | | 10,000,000 | | | | 11,503,100 | |
| Sacramento County, CA, Airport System Rev., “B”, 5%, 7/01/2041 | | | 6,000,000 | | | | 6,883,140 | |
19
Portfolio of Investments – continued
| | | | | | | | |
| | |
| Issuer | | Shares/Par | | | Value ($) | |
| Municipal Bonds - continued | | | | | | |
| California - continued | | | | | | |
| Sacramento, CA, Municipal Utility District Electric Rev., “X”, 5%, 8/15/2028 (Prerefunded 8/15/2021) | | $ | 835,000 | | | $ | 879,597 | |
| Sacramento, CA, Municipal Utility District Electric Rev., “X”, 5%, 8/15/2028 | | | 2,435,000 | | | | 2,556,117 | |
| San Diego County, CA, Regional Airport Authority Rev., “A”, 5%, 7/01/2040 | | | 9,315,000 | | | | 9,401,164 | |
| San Diego County, CA, Regional Airport Authority Rev., “B”, 5%, 7/01/2024 | | | 500,000 | | | | 548,335 | |
| San Diego County, CA, Regional Airport Authority Rev., “B”, 5%, 7/01/2025 | | | 1,500,000 | | | | 1,641,525 | |
| San Diego, CA, Association of Governments Capital Grant Receipts Rev.(Mid-Coast Corridor Transit Project), 1.8%, 11/15/2027 | | | 6,465,000 | | | | 6,496,485 | |
| San Francisco, CA, City & County Airports Commission, International Airport Rev., “A”, 5%, 5/01/2028 | | | 6,000,000 | | | | 6,380,880 | |
| San Francisco, CA, City & County Airports Commission, International Airport Rev., “A”, 5%, 1/01/2047 | | | 1,230,000 | | | | 1,412,126 | |
| San Francisco, CA, City & County Airports Commission, International Airport Rev., “E”, 5%, 5/01/2038 | | | 4,300,000 | | | | 5,040,202 | |
| San Francisco, CA, City & County Airports Commission, International Airport Rev., “E”, 5%, 5/01/2039 | | | 4,900,000 | | | | 5,730,305 | |
| San Francisco, CA, City & County Airports Commission, International Airport Rev., “E”, 5%, 5/01/2040 | | | 2,285,000 | | | | 2,669,611 | |
| San Francisco, CA, City & County Redevelopment Successor Agency, Tax Allocation (Mission Bay South Redevelopment Project), “A”, 5%, 8/01/2043 | | | 340,000 | | | | 382,500 | |
| San Jose, CA, Airport Rev.,“A-2”, 5.25%, 3/01/2034 | | | 7,570,000 | | | | 7,805,578 | |
| San Mateo County, CA, Community College District (Election of 2005), Capital Appreciation, “A”, NATL, 0%, 9/01/2026 | | | 5,100,000 | | | | 4,642,989 | |
| State of California, 5%, 4/01/2024 | | | 4,365,000 | | | | 4,687,748 | |
| State of California, 5.25%, 10/01/2028 | | | 2,965,000 | | | | 3,147,436 | |
| State of California, 5%, 8/01/2029 | | | 5,000,000 | | | | 6,068,050 | |
| State of California, 5%, 4/01/2031 | | | 3,180,000 | | | | 4,274,111 | |
| State of California, 5%, 9/01/2034 | | | 9,000,000 | | | | 10,805,040 | |
| State of California, 5%, 4/01/2045 | | | 9,730,000 | | | | 11,867,973 | |
| State of California, AGM, 5.25%, 8/01/2032 | | | 9,160,000 | | | | 12,478,393 | |
| Upland, CA (San Antonio Community Hospital), COP, 6.375%, 1/01/2032 (Prerefunded 1/01/2021) | | | 2,075,000 | | | | 2,148,081 | |
| Upland, CA (San Antonio Community Hospital), COP, 6.5%, 1/01/2041 (Prerefunded 1/01/2021) | | | 915,000 | | | | 948,004 | |
| West Contra Costa, CA, Unified School District (Election of 2005), Capital Appreciation, “C”, ASSD GTY, 0%, 8/01/2029 | | | 3,440,000 | | | | 2,829,400 | |
| | | | | | | | |
| | | | | | | $ | 365,419,941 | |
20
Portfolio of Investments – continued
| | | | | | | | |
| | |
| Issuer | | Shares/Par | | | Value ($) | |
| Municipal Bonds - continued | | | | | | |
| Colorado - 3.8% | | | | | | |
Arvada, CO, Vauxmont Metropolitan District Rev., AGM,
5%, 12/15/2027 | | $ | 57,000 | | | $ | 65,829 | |
Arvada, CO, Vauxmont Metropolitan District Rev., AGM,
5%, 12/01/2028 (w) | | | 92,000 | | | | 110,126 | |
| Arvada, CO, Vauxmont Metropolitan District Rev., AGM, 5%, 12/15/2028 | | | 55,000 | | | | 63,403 | |
Arvada, CO, Vauxmont Metropolitan District Rev., AGM,
5%, 12/01/2029 (w) | | | 92,000 | | | | 111,741 | |
Arvada, CO, Vauxmont Metropolitan District Rev., AGM,
5%, 12/15/2029 | | | 55,000 | | | | 63,292 | |
Arvada, CO, Vauxmont Metropolitan District Rev., AGM,
5%, 12/01/2030 (w) | | | 96,000 | | | | 116,199 | |
| Arvada, CO, Vauxmont Metropolitan District Rev., AGM, 5%, 12/15/2030 | | | 13,000 | | | | 14,931 | |
Arvada, CO, Vauxmont Metropolitan District Rev., AGM,
5%, 12/01/2031 (w) | | | 101,000 | | | | 121,889 | |
| Arvada, CO, Vauxmont Metropolitan District Rev., AGM, 5%, 12/15/2031 | | | 59,000 | | | | 67,654 | |
Arvada, CO, Vauxmont Metropolitan District Rev., AGM,
5%, 12/01/2032 (w) | | | 110,000 | | | | 132,419 | |
| Arvada, CO, Vauxmont Metropolitan District Rev., AGM, 5%, 12/15/2032 | | | 70,000 | | | | 80,156 | |
Arvada, CO, Vauxmont Metropolitan District Rev., AGM,
5%, 12/01/2033 (w) | | | 110,000 | | | | 132,039 | |
Arvada, CO, Vauxmont Metropolitan District Rev., AGM,
5%, 12/01/2034 (w) | | | 125,000 | | | | 149,518 | |
Arvada, CO, Vauxmont Metropolitan District Rev., AGM, 5%, 12/01/2035 (w) | | | 44,000 | | | | 52,439 | |
Arvada, CO, Vauxmont Metropolitan District Rev., AGM,
5%, 12/01/2050 (w) | | | 527,000 | | | | 615,768 | |
| Arvada, CO, Vauxmont Metropolitan District Rev., AGM, 3.25%, 12/15/2050 | | | 868,000 | | | | 901,383 | |
| Colorado Eagle County School District RE50J, Garfield Routt Counties, General Obligation, 5%, 12/01/2034 | | | 2,535,000 | | | | 3,040,758 | |
| Colorado Eagle County School District RE50J, Garfield Routt Counties, General Obligation, 5%, 12/01/2035 | | | 5,000,000 | | | | 5,980,200 | |
| Colorado Educational & Cultural Facilities Authority Rev. (Academy of Charter Schools Project), 5.625%, 5/01/2040 | | | 1,815,000 | | | | 1,818,721 | |
| Colorado Educational & Cultural Facilities Authority Rev. (Classical Academy Project), 5%, 12/01/2031 | | | 1,725,000 | | | | 1,912,663 | |
| Colorado Educational & Cultural Facilities Authority Rev. (Classical Academy Project), “A”, 5%, 12/01/2038 | | | 1,020,000 | | | | 1,116,257 | |
| Colorado Educational & Cultural Facilities Authority Rev. (Liberty Common Project), 5%, 1/15/2029 | | | 195,000 | | | | 212,185 | |
21
Portfolio of Investments – continued
| | | | | | | | |
| | |
| Issuer | | Shares/Par | | | Value ($) | |
| Municipal Bonds - continued | | | | | | |
| Colorado - continued | | | | | | |
| Colorado Educational & Cultural Facilities Authority Rev. (Liberty Common Project), 5%, 1/15/2039 | | $ | 740,000 | | | $ | 792,311 | |
| Colorado Educational & Cultural Facilities Authority Rev. (Liberty Common Project), 5%, 1/15/2044 | | | 605,000 | | | | 644,803 | |
| Colorado Educational & Cultural Facilities Authority Rev. (Montessori Charter School Project), 5%, 7/15/2037 | | | 545,000 | | | | 576,883 | |
| Colorado Educational & Cultural Facilities Authority Rev. (Peak to Peak Charter School Project), 5%, 8/15/2030 | | | 490,000 | | | | 542,548 | |
| Colorado Educational & Cultural Facilities Authority Rev. (Peak to Peak Charter School Project), 5%, 8/15/2034 | | | 495,000 | | | | 544,069 | |
| Colorado Educational & Cultural Facilities Authority Rev. (Pinnacle Charter School Building Corp.), 5%, 6/01/2029 | | | 700,000 | | | | 748,734 | |
| Colorado Educational & Cultural Facilities Authority Rev. (Stargate Charter School Project), “A”, 5%, 12/01/2038 | | | 1,335,000 | | | | 1,542,259 | |
| Colorado Educational & Cultural Facilities Authority Rev. (Stargate Charter School Project), “A”, 4%, 12/01/2048 | | | 3,440,000 | | | | 3,563,324 | |
| Colorado Educational & Cultural Facilities Authority Rev. (Twin Peaks Charter Academy Project), 5%, 11/15/2031 | | | 1,855,000 | | | | 2,033,896 | |
| Colorado Educational & Cultural Facilities Authority Rev. (Union Colony School Project), 5%, 4/01/2038 | | | 305,000 | | | | 348,941 | |
| Colorado Educational & Cultural Facilities Authority Rev. (Union Colony School Project), 5%, 4/01/2048 | | | 365,000 | | | | 410,432 | |
| Colorado Educational & Cultural Facilities Authority Rev. (Union Colony School Project), 5%, 4/01/2053 | | | 385,000 | | | | 431,188 | |
| Colorado Health Facilities Authority Rev. (Adventist System/Sunbelt Obligated Group), “A”, 5%, 11/15/2041 | | | 10,000,000 | | | | 11,024,800 | |
| Colorado Health Facilities Authority Rev. (CommonSpirit Health),“A-2”, 4%, 8/01/2044 | | | 3,950,000 | | | | 3,939,019 | |
| Colorado Health Facilities Authority Rev. (Evangelical Lutheran Good Samaritan Society), 5.625%, 6/01/2043 | | | 1,195,000 | | | | 1,354,270 | |
| Colorado Health Facilities Authority Rev. (Sanford), “A”, 5%, 11/01/2039 | | | 9,400,000 | | | | 11,568,580 | |
| Colorado Health Facilities Authority Rev. (SCL Health System), “A”, 4%, 1/01/2036 | | | 5,710,000 | | | | 6,341,469 | |
| Colorado Health Facilities Authority Rev. (SCL Health System), “A”, 4%, 1/01/2037 | | | 4,725,000 | | | | 5,222,495 | |
| Colorado Health Facilities Authority Rev. (SCL Health System), “A”, 5%, 1/01/2044 | | | 4,620,000 | | | | 4,941,506 | |
| Colorado Health Facilities Authority, Hospital Rev. (AdventHealth Obligated Group), “A”, 4%, 11/15/2038 | | | 3,200,000 | | | | 3,557,792 | |
| Colorado Health Facilities Authority, Hospital Rev. (AdventHealth Obligated Group), “A”, 4%, 11/15/2043 | | | 4,685,000 | | | | 5,059,238 | |
22
Portfolio of Investments – continued
| | | | | | | | |
| | |
| Issuer | | Shares/Par | | | Value ($) | |
| Municipal Bonds - continued | | | | | | |
| Colorado - continued | | | | | | |
| Colorado High Performance Transportation Enterprise Rev.(C-470 Express Lanes), 5%, 12/31/2056 | | $ | 1,900,000 | | | $ | 1,926,277 | |
| Colorado Housing & Finance Authority Rev.,“B-1”, GNMA, 4%, 11/01/2048 | | | 2,615,000 | | | | 2,781,131 | |
| Colorado Housing & Finance Authority Rev., Single Family Mortgage Class I, “C”, 4.75%, 5/01/2049 (u) | | | 5,935,000 | | | | 6,536,453 | |
| Colorado Housing & Finance Authority Rev., Single Family Mortgage Class III, “H”, 4.25%, 11/01/2049 | | | 6,915,000 | | | | 7,573,861 | |
| Colorado Regional Transportation District, Private Activity Rev. (Denver Transportation Partners), 6.5%, 1/15/2030 | | | 6,150,000 | | | | 6,195,387 | |
| Colorado Regional Transportation District, Private Activity Rev. (Denver Transportation Partners), 6%, 1/15/2034 | | | 5,000,000 | | | | 5,029,850 | |
| Colorado Regional Transportation District, Sales Tax Rev. (Fastracks Project), “A”, 5%, 11/01/2036 | | | 2,755,000 | | | | 3,310,132 | |
| Colorado Regional Transportation District, Sales Tax Rev. (Fastracks Project), “A”, 5%, 11/01/2040 | | | 10,000,000 | | | | 11,919,100 | |
| Colorado State University Board of Governors, System Enterprise Rev., “B”, 5%, 3/01/2025 | | | 3,000,000 | | | | 3,531,750 | |
| Colorado State University Board of Governors, System Enterprise Rev., “B”, 5%, 3/01/2041 | | | 1,500,000 | | | | 1,782,285 | |
| Denver, CO, City & County Airport Systems Rev., “A”, 5%, 11/15/2028 | | | 1,930,000 | | | | 2,062,919 | |
| Denver, CO, City & County School District No. 1, 5%, 12/01/2024 (Prerefunded 12/01/2021) | | | 10,000,000 | | | | 10,654,800 | |
| Denver, CO, City & County Special Facilities Airport Refunding Rev. (United Airlines), 5%, 10/01/2032 | | | 1,145,000 | | | | 1,129,314 | |
| Denver, CO, Convention Center Hotel Authority Rev., 5%, 12/01/2035 | | | 965,000 | | | | 976,512 | |
| Denver, CO, Convention Center Hotel Authority Rev., 5%, 12/01/2040 | | | 1,635,000 | | | | 1,636,962 | |
| Denver, CO, Health & Hospital Authority Rev., “A”, 5.25%, 12/01/2045 | | | 1,210,000 | | | | 1,323,679 | |
| Park Creek Metropolitan District, CO, Senior Limited Property Tax Supported Rev., “A”, NATL, 5%, 12/01/2030 | | | 1,470,000 | | | | 1,747,021 | |
| Park Creek Metropolitan District, CO, Senior Limited Property Tax Supported Rev., “A”, NATL, 5%, 12/01/2031 | | | 1,660,000 | | | | 1,968,279 | |
| Park Creek Metropolitan District, CO, Senior Limited Property Tax Supported Rev., “A”, NATL, 5%, 12/01/2032 | | | 1,755,000 | | | | 2,077,306 | |
| Park Creek Metropolitan District, CO, Senior Limited Property Tax Supported Rev., “A”, NATL, 5%, 12/01/2033 | | | 1,760,000 | | | | 2,079,616 | |
| Park Creek Metropolitan District, CO, Senior Limited Property Tax Supported Rev., “A”, NATL, 5%, 12/01/2034 | | | 1,445,000 | | | | 1,704,464 | |
| Park Creek Metropolitan District, CO, Senior Limited Property Tax Supported Rev., “A”, NATL, 5%, 12/01/2035 | | | 1,630,000 | | | | 1,919,358 | |
23
Portfolio of Investments – continued
| | | | | | | | |
| | |
| Issuer | | Shares/Par | | | Value ($) | |
| Municipal Bonds - continued | | | | | | |
| Colorado - continued | | | | | | |
| Park Creek Metropolitan District, CO, Senior Limited Property Tax Supported Rev., “A”, NATL, 5%, 12/01/2045 | | $ | 5,280,000 | | | $ | 5,996,021 | |
| Public Authority for Colorado Energy Natural Gas Purchase Rev., 6.25%, 11/15/2028 | | | 1,215,000 | | | | 1,446,725 | |
| University of Colorado, Enterprise Rev., 5%, 6/01/2029 (Prerefunded 6/01/2021) | | | 4,220,000 | | | | 4,413,782 | |
| | | | | | | | |
| | | | | | | $ | 173,791,111 | |
| Connecticut - 1.1% | | | | | | |
| Connecticut Health and Educational Facilities Authority Rev. (Masonicare), “F”, 5%, 7/01/2025 | | $ | 2,990,000 | | | $ | 3,224,536 | |
| Connecticut Health and Educational Facilities Authority Rev. (Masonicare), “F”, 5%, 7/01/2043 | | | 4,230,000 | | | | 4,396,324 | |
| Connecticut Housing Finance Authority Rev. (Housing Mortgage Finance Program),“B-2”, 4%, 11/15/2032 | | | 840,000 | | | | 857,674 | |
| Connecticut Housing Finance Authority Rev. (Housing Mortgage Finance Program),“C-1”, 3.5%, 11/15/2045 | | | 1,700,000 | | | | 1,756,967 | |
| Connecticut Housing Finance Authority Rev. (Housing Mortgage Finance Program),“D-1”, 4%, 11/15/2044 | | | 840,000 | | | | 860,588 | |
| Connecticut State Health and Educational Facilities Authority Rev. (University of Hartford), “N”, 5%, 7/01/2033 | | | 195,000 | | | | 213,626 | |
| Connecticut State Health and Educational Facilities Authority Rev. (University of Hartford), “N”, 5%, 7/01/2034 | | | 180,000 | | | | 196,564 | |
| Connecticut State Health and Educational Facilities Authority Rev. (University of Hartford), “N”, 4%, 7/01/2039 | | | 785,000 | | | | 760,453 | |
| Connecticut State Health and Educational Facilities Authority Rev. (University of Hartford), “N”, 4%, 7/01/2044 | | | 1,470,000 | | | | 1,387,915 | |
| Connecticut State Health and Educational Facilities Authority Rev. (University of Hartford), “N”, 4%, 7/01/2049 | | | 1,470,000 | | | | 1,362,852 | |
| Hartford County, CT, Metropolitan District, “C”, AGM, 5%, 11/01/2028 | | | 4,290,000 | | | | 5,247,013 | |
| Hartford County, CT, Metropolitan District, “C”, AGM, 5%, 11/01/2029 | | | 2,375,000 | | | | 2,899,804 | |
| Hartford County, CT, Metropolitan District, “C”, AGM, 5%, 11/01/2030 | | | 2,355,000 | | | | 2,868,767 | |
| Hartford County, CT, Metropolitan District, “C”, AGM, 5%, 11/01/2031 | | | 2,015,000 | | | | 2,448,970 | |
| Mohegan Tribal Finance Authority, CT, Economic Development Bonds, 7%, 2/01/2045 (n) | | | 5,970,000 | | | | 5,628,695 | |
| New Haven, CT, General Obligation, “A”, ASSD GTY, 5%, 8/15/2032 | | | 1,000,000 | | | | 1,112,840 | |
| State of Connecticut, Special Tax Obligation Rev., “A”, 5%, 12/01/2028 | | | 4,595,000 | | | | 4,834,813 | |
24
Portfolio of Investments – continued
| | | | | | | | |
| | |
| Issuer | | Shares/Par | | | Value ($) | |
| Municipal Bonds - continued | | | | | | |
| Connecticut - continued | | | | | | |
| State of Connecticut, Special Tax Obligation Rev., “A”, 5%, 12/01/2029 | | $ | 4,595,000 | | | $ | 4,826,312 | |
| State of Connecticut, Special Tax Obligation Rev., “A”, 5%, 12/01/2030 | | | 4,615,000 | | | | 4,838,781 | |
| | | | | | | | |
| | | | | | | $ | 49,723,494 | |
| Delaware - 0.2% | | | | | | |
| Delaware Economic Development Authority Rev. (Newark Charter School, Inc.), “A”, 5%, 9/01/2036 | | $ | 235,000 | | | $ | 252,874 | |
| Delaware Economic Development Authority Rev. (Newark Charter School, Inc.), “A”, 5%, 9/01/2046 | | | 475,000 | | | | 501,258 | |
| Delaware Health Facilities Authority Rev. (Christiana Care Health System), “A”, 4%, 10/01/2049 | | | 4,685,000 | | | | 5,191,214 | |
| University of Delaware, 5%, 11/01/2040 | | | 1,085,000 | | | | 1,562,042 | |
| | | | | | | | |
| | | | | | | $ | 7,507,388 | |
| District of Columbia - 0.7% | | | | | | |
| District of Columbia Rev. (Kipp D.C. Charter School), 4%, 7/01/2039 | | $ | 550,000 | | | $ | 553,833 | |
| District of Columbia Rev. (Kipp D.C. Charter School), 4%, 7/01/2044 | | | 535,000 | | | | 532,041 | |
| District of Columbia Rev. (Kipp D.C. Charter School), 4%, 7/01/2049 | | | 1,045,000 | | | | 1,024,163 | |
| District of Columbia Rev. (Kipp D.C. Charter School), “A”, 6%, 7/01/2043 (Prerefunded 7/01/2023) | | | 1,450,000 | | | | 1,672,981 | |
| District of Columbia Student Dormitory Rev. (Provident Group - Howard Properties LLC), 5%, 10/01/2030 | | | 3,435,000 | | | | 3,489,719 | |
| District of Columbia Student Dormitory Rev. (Provident Group - Howard Properties LLC), 5%, 10/01/2035 | | | 4,505,000 | | | | 4,536,490 | |
| District of Columbia University Rev. (Georgetown University), 5%, 4/01/2035 | | | 3,000,000 | | | | 3,433,980 | |
| District of Columbia University Rev. (Georgetown University), BHAC, 5%, 4/01/2040 | | | 11,570,000 | | | | 12,019,842 | |
| Metropolitan Washington D.C. Airports Authority, Toll Road Subordinate Lien Refunding Rev. (Dulles Metrorail and Capital Improvement Project), “B”, AGM, 4%, 10/01/2053 | | | 5,440,000 | | | | 5,584,106 | |
| | | | | | | | |
| | | | | | | $ | 32,847,155 | |
| Florida - 3.4% | | | | | | |
| Alachua County, FL, Health Facilities Authority Rev. (Shands Teaching Hospital & Clinics),“B-1”, 5%, 12/01/2035 | | $ | 1,005,000 | | | $ | 1,210,141 | |
| Alachua County, FL, Health Facilities Authority Rev. (Shands Teaching Hospital & Clinics),“B-1”, 5%, 12/01/2036 | | | 1,705,000 | | | | 2,046,631 | |
25
Portfolio of Investments – continued
| | | | | | | | |
| | |
| Issuer | | Shares/Par | | | Value ($) | |
| Municipal Bonds - continued | | | | | | |
| Florida - continued | | | | | | |
| Alachua County, FL, Health Facilities Authority Rev. (Shands Teaching Hospital & Clinics),“B-1”, 5%, 12/01/2037 | | $ | 2,225,000 | | | $ | 2,660,722 | |
| Arborwood Community Development District, FL, Capital Improvement Rev.,“A-1”, 6.9%, 5/01/2036 | | | 20,000 | | | | 20,432 | |
| Bellalago, FL, Educational Facilities Benefit District Capital Improvement Refunding Rev., 4.375%, 5/01/2030 | | | 1,045,000 | | | | 1,150,587 | |
| Bellalago, FL, Educational Facilities Benefit District Capital Improvement Refunding Rev., 4.5%, 5/01/2033 | | | 485,000 | | | | 534,688 | |
| Bellalago, FL, Educational Facilities Benefit District Capital Improvement Refunding Rev., 4.6%, 5/01/2034 | | | 1,405,000 | | | | 1,551,443 | |
| Broward County, FL, Airport System Rev., 5%, 10/01/2042 | | | 1,085,000 | | | | 1,229,370 | |
| Broward County, FL, Airport System Rev., “A”, 5%, 10/01/2038 | | | 3,000,000 | | | | 3,500,820 | |
| Broward County, FL, Airport System Rev., “A”, 5%, 10/01/2039 | | | 4,500,000 | | | | 5,242,320 | |
| Broward County, FL, Airport System Rev., “A”, 5%, 10/01/2044 | | | 3,500,000 | | | | 4,036,655 | |
| Capital Region Community Development District, FL, Capital Improvement Rev.,“A-1”, 4.125%, 5/01/2023 | | | 55,000 | | | | 54,528 | |
| Capital Region Community Development District, FL, Capital Improvement Rev.,“A-1”, 4.625%, 5/01/2028 | | | 100,000 | | | | 98,996 | |
| Capital Region Community Development District, FL, Capital Improvement Rev.,“A-1”, 5.125%, 5/01/2039 | | | 625,000 | | | | 616,000 | |
| Capital Trust Agency Rev. (Aero Miami FX LLC), “A”, 5.35%, 7/01/2029 | | | 2,855,000 | | | | 2,875,014 | |
| Collier County, FL, Educational Facilities Authority Rev. (Ave Maria University, Inc. Project), “A”, 6.125%, 6/01/2043 | | | 5,850,000 | | | | 6,072,943 | |
Collier County, FL, Industrial Development Authority, Continuing Care Community Rev. (Arlington of Naples Project), “A”,
6.25%, 5/15/2035 (a)(d) | | | 100,000 | | | | 87,125 | |
Collier County, FL, Industrial Development Authority, Continuing Care Community Rev. (Arlington of Naples Project), “A”,
7.75%, 5/15/2035 (a)(d) | | | 835,000 | | | | 727,494 | |
Collier County, FL, Industrial Development Authority, Continuing Care Community Rev. (Arlington of Naples Project), “A”,
8.125%, 5/15/2044 (a)(d) | | | 1,265,000 | | | | 1,102,131 | |
Collier County, FL, Industrial Development Authority, Continuing Care Community Rev. (Arlington of Naples Project), “A”,
6.5%, 5/15/2049 (a)(d) | | | 180,000 | | | | 156,825 | |
| Daytona Beach, FL, Halifax Hospital Medical Center Rev., 5%, 6/01/2029 | | | 1,350,000 | | | | 1,555,699 | |
| Daytona Beach, FL, Halifax Hospital Medical Center Rev., 5%, 6/01/2030 | | | 1,420,000 | | | | 1,633,284 | |
| Daytona Beach, FL, Halifax Hospital Medical Center Rev., 5%, 6/01/2036 | | | 585,000 | | | | 677,845 | |
| Daytona Beach, FL, Halifax Hospital Medical Center Rev., 5%, 6/01/2046 | | | 2,270,000 | | | | 2,533,910 | |
26
Portfolio of Investments – continued
| | | | | | | | |
| | |
| Issuer | | Shares/Par | | | Value ($) | |
| Municipal Bonds - continued | | | | | | |
| Florida - continued | | | | | | |
| Escambia County, FL, Health Facilities Authority Rev. (Baptist Health Care Corp.), “A”, 4%, 8/15/2045 | | $ | 6,550,000 | | | $ | 6,901,145 | |
| Escambia County, FL, Health Facilities Authority Rev. (Baptist Health Care Corp.), “A”, 4%, 8/15/2050 | | | 5,240,000 | | | | 5,480,988 | |
| Florida Development Finance Corp. Educational Facilities Rev. (Renaissance Charter School), “A”, 6%, 9/15/2030 | | | 2,425,000 | | | | 2,443,187 | |
| Florida Development Finance Corp. Educational Facilities Rev. (Renaissance Charter School), “A”, 6%, 9/15/2040 | | | 5,130,000 | | | | 5,157,445 | |
| Florida Development Finance Corp. Educational Facilities Rev. (Southwest Charter Foundation, Inc. Project), “A”, 6%, 6/15/2037 | | | 305,000 | | | | 294,508 | |
| Florida Development Finance Corp. Educational Facilities Rev. (Southwest Charter Foundation, Inc. Project), “A”, 6.125%, 6/15/2047 | | | 1,200,000 | | | | 1,135,476 | |
| Florida Higher Educational Facilities Financing Authority Rev. (Florida Institute of Technology), 5%, 10/01/2031 | | | 935,000 | | | | 1,033,418 | |
| Florida Higher Educational Facilities Financing Authority Rev. (Florida Institute of Technology), 5%, 10/01/2032 | | | 755,000 | | | | 832,357 | |
| Florida Higher Educational Facilities Financing Authority Rev. (Florida Institute of Technology), 5%, 10/01/2033 | | | 550,000 | | | | 603,746 | |
| Florida Higher Educational Facilities Financing Authority Rev. (Florida Institute of Technology), 5%, 10/01/2034 | | | 1,025,000 | | | | 1,121,309 | |
| Florida Higher Educational Facilities Financing Authority Rev. (Florida Institute of Technology), 5%, 10/01/2035 | | | 595,000 | | | | 648,520 | |
| Florida Higher Educational Facilities Financing Authority Rev. (Florida Institute of Technology), 5%, 10/01/2036 | | | 815,000 | | | | 884,829 | |
| Florida Higher Educational Facilities Financing Authority Rev. (Florida Institute of Technology), 4%, 10/01/2037 | | | 1,140,000 | | | | 1,106,951 | |
| Florida Higher Educational Facilities Financing Authority Rev. (Florida Institute of Technology), 4%, 10/01/2038 | | | 1,575,000 | | | | 1,519,088 | |
| Florida Higher Educational Facilities Financing Authority Rev. (Florida Institute of Technology), 4%, 10/01/2039 | | | 1,880,000 | | | | 1,803,258 | |
| Florida Higher Educational Facilities Financing Authority Rev. (Florida Institute of Technology), 4%, 10/01/2044 | | | 2,040,000 | | | | 1,906,237 | |
| Florida Higher Educational Facilities Financing Authority Rev. (Jacksonville University Project), “A”, 4.5%, 6/01/2033 | | | 550,000 | | | | 524,854 | |
| Florida Higher Educational Facilities Financing Authority Rev. (Jacksonville University Project), “A”, 4.75%, 6/01/2038 | | | 680,000 | | | | 641,981 | |
| Florida Higher Educational Facilities Financing Authority Rev. (Jacksonville University Project), “A”, 5%, 6/01/2048 | | | 1,230,000 | | | | 1,171,071 | |
| Florida Housing Finance Corp., Homeowner Mortgage Rev. (Special Program), “B”, 3%, 7/01/2045 | | | 1,395,000 | | | | 1,419,552 | |
| Florida Housing Finance Corp., Homeowner Mortgage Rev., “1”, 4%, 7/01/2049 (u) | | | 5,050,000 | | | | 5,390,673 | |
27
Portfolio of Investments – continued
| | | | | | | | |
| | |
| Issuer | | Shares/Par | | | Value ($) | |
| Municipal Bonds - continued | | | | | | |
| Florida - continued | | | | | | |
| Homestead 50, FL, Community Development District, Special Assessment, “A”, 6%, 5/01/2037 | | $ | 1,190,000 | | | $ | 981,441 | |
| Jacksonville, FL, Educational Facilities Rev. (Jacksonville University Project), “B”, 5%, 6/01/2053 | | | 570,000 | | | | 536,621 | |
| Lakeland, FL, Hospital Rev. (Lakeland Regional Health Systems), 5%, 11/15/2034 | | | 1,935,000 | | | | 2,203,868 | |
| Lakewood Ranch Stewardship District, FL, Special Assessment Rev. (Lakewood Centre North Project), 4.25%, 5/01/2025 | | | 235,000 | | | | 236,542 | |
| Lakewood Ranch Stewardship District, FL, Special Assessment Rev. (Lakewood Centre North Project), 4.875%, 5/01/2035 | | | 125,000 | | | | 126,929 | |
| Lakewood Ranch Stewardship District, FL, Special Assessment Rev. (Lakewood Centre North Project), 4.875%, 5/01/2045 | | | 195,000 | | | | 195,819 | |
| Lakewood Ranch Stewardship District, FL, Special Assessment Rev. (Lakewood National and Polo Run Projects), 5.375%, 5/01/2047 | | | 605,000 | | | | 627,119 | |
| Marshall Creek Community Development District, FL, Capital Improvement and Special Assessment, “A”, 3.5%, 5/01/2020 | | | 520,000 | | | | 519,802 | |
| Martin County, FL, Health Facilities Authority Hospital Rev. (Cleveland Clinic Health System), “A”, 4%, 1/01/2046 | | | 6,490,000 | | | | 6,970,520 | |
| Miami Beach, FL, Health Facilities Authority Hospital Rev. (Mount Sinai Medical Center of Florida), 5%, 11/15/2039 | | | 2,000,000 | | | | 2,138,040 | |
| Miami-Dade County, FL, Aviation Rev., “B”, AGM, 5%, 10/01/2035 | | | 5,885,000 | | | | 5,977,218 | |
| Miami-Dade County, FL, Health Facilities Authority Hospital Rev., 6.125%, 8/01/2042 (Prerefunded 8/01/2020) | | | 1,645,000 | | | | 1,671,155 | |
| Miami-Dade County, FL, Health Facilities Authority Hospital Rev., Unrefunded Balance, 6.125%, 8/01/2042 | | | 595,000 | | | | 603,015 | |
| Miami-Dade County, FL, Water & Sewer Rev., AGM, 5%, 10/01/2039 (Prerefunded 10/01/2020) | | | 1,000,000 | | | | 1,019,640 | |
| Mid-Bay Bridge Authority Rev., FL, Springing Lien, “A”, 7.25%, 10/01/2040 (Prerefunded 10/01/2021) | | | 6,920,000 | | | | 7,504,740 | |
| Midtown Miami, FL, Community Development District Special Assessment (Infrastructure Project), “B”, 5%, 5/01/2029 | | | 280,000 | | | | 288,030 | |
| Midtown Miami, FL, Community Development District Special Assessment (Infrastructure Project), “B”, 5%, 5/01/2037 | | | 135,000 | | | | 138,086 | |
| Midtown Miami, FL, Community Development District Special Assessment (Parking Garage Project), “A”, 5%, 5/01/2037 | | | 230,000 | | | | 235,258 | |
| North Broward, FL, Hospital District Rev. (Broward Health), “B”, 5%, 1/01/2042 | | | 5,785,000 | | | | 6,762,665 | |
| Orlando, FL, Senior Tourist Development Tax Refunding Rev. (6th Cent Contract Payments), “A”, AGM, 5%, 11/01/2034 | | | 495,000 | | | | 599,138 | |
| Osceola County, FL, Transportation Improvement and Refunding Rev. (Osceola Parkway),“A-1”, 5%, 10/01/2044 | | | 750,000 | | | | 915,308 | |
28
Portfolio of Investments – continued
| | | | | | | | |
| | |
| Issuer | | Shares/Par | | | Value ($) | |
| Municipal Bonds - continued | | | | | | |
| Florida - continued | | | | | | |
| Osceola County, FL, Transportation Improvement and Refunding Rev. (Osceola Parkway),“A-1”, 5%, 10/01/2049 | | $ | 1,040,000 | | | $ | 1,259,336 | |
| Osceola County, FL, Transportation Improvement and Refunding Rev. (Osceola Parkway), Capital Appreciation,“A-2”, 0%, 10/01/2035 | | | 550,000 | | | | 349,630 | |
| Osceola County, FL, Transportation Improvement and Refunding Rev. (Osceola Parkway), Capital Appreciation,“A-2”, 0%, 10/01/2036 | | | 660,000 | | | | 402,719 | |
| Osceola County, FL, Transportation Improvement and | | | | | | | | |
| Refunding Rev. (Osceola Parkway), Capital Appreciation,“A-2”, 0%, 10/01/2037 | | | 250,000 | | | | 146,398 | |
| Osceola County, FL, Transportation Improvement and Refunding Rev. (Osceola Parkway), Capital Appreciation,“A-2”, 0%, 10/01/2038 | | | 770,000 | | | | 432,848 | |
| Osceola County, FL, Transportation Improvement and Refunding Rev. (Osceola Parkway), Capital Appreciation,“A-2”, 0%, 10/01/2039 | | | 920,000 | | | | 497,159 | |
| Osceola County, FL, Transportation Improvement and Refunding Rev. (Osceola Parkway), Capital Appreciation,“A-2”, 0%, 10/01/2040 | | | 985,000 | | | | 511,924 | |
| Osceola County, FL, Transportation Improvement and Refunding Rev. (Osceola Parkway), Capital Appreciation,“A-2”, 0%, 10/01/2041 | | | 1,095,000 | | | | 547,084 | |
| Osceola County, FL, Transportation Improvement and Refunding Rev. (Osceola Parkway), Capital Appreciation,“A-2”, 0%, 10/01/2042 | | | 880,000 | | | | 421,863 | |
| Osceola County, FL, Transportation Improvement and Refunding Rev. (Osceola Parkway), Capital Appreciation,“A-2”, 0%, 10/01/2043 | | | 1,205,000 | | | | 554,276 | |
| Osceola County, FL, Transportation Improvement and Refunding Rev. (Osceola Parkway), Capital Appreciation,“A-2”, 0%, 10/01/2044 | | | 1,315,000 | | | | 581,020 | |
| Osceola County, FL, Transportation Improvement and Refunding Rev. (Osceola Parkway), Capital Appreciation,“A-2”, 0%, 10/01/2045 | | | 1,535,000 | | | | 651,408 | |
| Osceola County, FL, Transportation Improvement and Refunding Rev. (Osceola Parkway), Capital Appreciation,“A-2”, 0%, 10/01/2046 | | | 1,315,000 | | | | 536,191 | |
| Osceola County, FL, Transportation Improvement and Refunding Rev. (Osceola Parkway), Capital Appreciation,“A-2”, 0%, 10/01/2047 | | | 800,000 | | | | 313,392 | |
| Osceola County, FL, Transportation Improvement and Refunding Rev. (Osceola Parkway), Capital Appreciation,“A-2”, 0%, 10/01/2048 | | | 875,000 | | | | 329,438 | |
29
Portfolio of Investments – continued
| | | | | | | | |
| | |
| Issuer | | Shares/Par | | | Value ($) | |
| Municipal Bonds - continued | | | | | | |
| Florida - continued | | | | | | |
| Osceola County, FL, Transportation Improvement and Refunding Rev. (Osceola Parkway), Capital Appreciation,“A-2”, 0%, 10/01/2050 | | $ | 1,755,000 | | | $ | 608,002 | |
| Osceola County, FL, Transportation Improvement and Refunding Rev. (Osceola Parkway), Capital Appreciation,“A-2”, 0%, 10/01/2051 | | | 1,055,000 | | | | 350,144 | |
| Osceola County, FL, Transportation Improvement and Refunding Rev. (Osceola Parkway), Capital Appreciation,“A-2”, 0%, 10/01/2052 | | | 1,085,000 | | | | 345,616 | |
| Osceola County, FL, Transportation Improvement and Refunding Rev. (Osceola Parkway), Capital Appreciation,“A-2”, 0%, 10/01/2053 | | | 715,000 | | | | 218,561 | |
| Osceola County, FL, Transportation Improvement and Refunding Rev. (Osceola Parkway), Capital Appreciation,“A-2”, 0%, 10/01/2054 | | | 1,010,000 | | | | 296,203 | |
| Palm Beach County, FL, Health Facilities Authority Hospital Rev. (Baptist Health South Florida Obligated Group), 4%, 8/15/2049 | | | 9,785,000 | | | | 10,430,419 | |
| Palm Beach County, FL, Health Facilities Rev. (Sinai Residences of Boca Raton Project), 7.5%, 6/01/2049 | | | 430,000 | | | | 450,958 | |
| Pasco County, FL, Del Webb Bexley Community Development District, Special Assessment Rev., 5.3%, 5/01/2039 | | | 685,000 | | | | 689,569 | |
| Pasco County, FL, Del Webb Bexley Community Development District, Special Assessment Rev., 5.4%, 5/01/2049 | | | 885,000 | | | | 890,876 | |
| Pinellas County, FL, Sewer Rev., AGM, 5%, 10/01/2032 | | | 330,000 | | | | 331,033 | |
| St. John’s County, FL, Industrial Development Authority Rev. (Bayview Project), “A”, 5.2%, 10/01/2027 (a) | | | 125,000 | | | | 97,911 | |
| St. John’s County, FL, Industrial Development Authority Rev. (Presbyterian Retirement), “A”, 6%, 8/01/2045 (Prerefunded 8/01/2020) | | | 6,795,000 | | | | 6,895,702 | |
| Sterling Hill Community Development District, FL, Capital Improvement Rev., “B”, 5.5%, 11/01/2010 (d) | | | 52,264 | | | | 32,926 | |
| Sumter County, FL, Industrial Development Authority Hospital Rev. (Central Florida Health Alliance Projects), “A”, 5%, 7/01/2026 | | | 245,000 | | | | 273,912 | |
| Sumter County, FL, Industrial Development Authority Hospital Rev. (Central Florida Health Alliance Projects), “A”, 5%, 7/01/2029 | | | 225,000 | | | | 250,002 | |
| Sumter County, FL, Industrial Development Authority Hospital Rev. (Central Florida Health Alliance Projects), “A”, 5.125%, 7/01/2034 | | | 485,000 | | | | 537,419 | |
| Sumter County, FL, Industrial Development Authority Hospital Rev. (Central Florida Health Alliance Projects), “A”, 5.25%, 7/01/2044 | | | 1,455,000 | | | | 1,610,656 | |
| | | | | | | | |
| | | | | | | $ | 155,491,745 | |
| Georgia - 3.5% | | | | | | |
| Americus and Sumter County, GA, Hospital Authority Rev. (Magnolia Manor Obligated Group), “A”, 6.25%, 5/15/2033 | | $ | 965,000 | | | $ | 1,057,659 | |
30
Portfolio of Investments – continued
| | | | | | | | |
| | |
| Issuer | | Shares/Par | | | Value ($) | |
| Municipal Bonds - continued | | | | | | |
| Georgia - continued | | | | | | |
| Americus and Sumter County, GA, Hospital Authority Rev. (Magnolia Manor Obligated Group), “A”, 6.375%, 5/15/2043 | | $ | 965,000 | | | $ | 1,050,808 | |
| Atlanta, GA, Airport Passenger Facility Charge and Subordinate Lien Rev., “D”, 4%, 7/01/2035 | | | 7,450,000 | | | | 8,061,347 | |
| Atlanta, GA, Airport Passenger Facility Charge and Subordinate Lien Rev., “D”, 4%, 7/01/2038 | | | 4,000,000 | | | | 4,283,520 | |
| Atlanta, GA, Airport Passenger Facility Charge and Subordinate Lien Rev., “D”, 4%, 7/01/2039 | | | 2,000,000 | | | | 2,137,220 | |
| Atlanta, GA, Airport Passenger Facility Charge and Subordinate Lien Rev., “D”, 4%, 7/01/2040 | | | 5,250,000 | | | | 5,603,272 | |
| Atlanta, GA, Airport Rev., “B”, 5%, 1/01/2025 | | | 1,415,000 | | | | 1,499,221 | |
| Atlanta, GA, Airport Rev., “B”, 5%, 1/01/2026 | | | 800,000 | | | | 847,760 | |
| Atlanta, GA, Airport Rev., “B”, 5%, 7/01/2044 | | | 9,800,000 | | | | 11,358,690 | |
| Bibb County, GA, Development Authority Rev. (USG Real Estate Foundation IX LLC Project), 4%, 6/01/2044 | | | 855,000 | | | | 942,954 | |
| Burke County, GA, Development Authority Pollution Control | | | | | | | | |
| Rev. (Georgia Power Co. Plant Vogtle Project), 2.25%, 10/01/2032 (Put Date 5/25/2023) | | | 5,115,000 | | | | 5,031,779 | |
| Clayton County, GA, Development Authority, Special Facilities Rev. (Delta Airlines, Inc.), “A”, 8.75%, 6/01/2029 | | | 1,295,000 | | | | 1,294,870 | |
| Cobb County, GA, Development Authority, Student Housing Rev. (Kennesaw State University Real Estate Foundations), “C”, 5%, 7/15/2030 | | | 650,000 | | | | 710,905 | |
| Cobb County, GA, Development Authority, Student Housing Rev. (Kennesaw State University Real Estate Foundations), “C”, 5%, 7/15/2033 | | | 1,140,000 | | | | 1,238,553 | |
| Columbia County, GA, Water and Sewerage Rev., 5%, 6/01/2030 | | | 1,200,000 | | | | 1,586,640 | |
| Columbia County, GA, Water and Sewerage Rev., 5%, 6/01/2033 | | | 1,380,000 | | | | 1,799,962 | |
| Columbia County, GA, Water and Sewerage Rev., 5%, 6/01/2034 | | | 1,800,000 | | | | 2,339,550 | |
| Coweta County, GA, Development Authority Rev. (Piedmont Healthcare, Inc. Project), “A”, 5%, 7/01/2044 | | | 9,425,000 | | | | 11,090,492 | |
| DeKalb County, GA, Hospital Authority Rev. (DeKalb Medical Center, Inc. Project), 6.125%, 9/01/2040 (Prerefunded 9/01/2020) | | | 4,850,000 | | | | 4,946,612 | |
| DeKalb County, GA, Water & Sewer Rev., “A”, 5.25%, 10/01/2028 | | | 5,285,000 | | | | 5,589,839 | |
| DeKalb County, GA, Water & Sewer Rev., “A”, 5.25%, 10/01/2029 | | | 1,415,000 | | | | 1,495,542 | |
| DeKalb County, GA, Water & Sewer Rev., “A”, 5.25%, 10/01/2030 | | | 4,345,000 | | | | 4,589,623 | |
| DeKalb County, GA, Water & Sewer Rev., “A”, 5.25%, 10/01/2041 | | | 3,910,000 | | | | 4,106,282 | |
| Fulton County, GA, Water & Sewer Rev., 5%, 1/01/2026 | | | 3,680,000 | | | | 3,786,168 | |
| Fulton County, GA, Water & Sewer Rev., 5%, 1/01/2027 | | | 2,285,000 | | | | 2,350,579 | |
| Georgia Housing & Finance Authority Rev., Single Family Mortgage, “A”, 4%, 12/01/2047 | | | 2,865,000 | | | | 3,022,661 | |
| Georgia Housing & Finance Authority Rev., Single Family Mortgage,“A-1”, 4%, 6/01/2044 | | | 695,000 | | | | 718,950 | |
31
Portfolio of Investments – continued
| | | | | | | | |
| | |
| Issuer | | Shares/Par | | | Value ($) | |
| Municipal Bonds - continued | | | | | | |
| Georgia - continued | | | | | | |
| Georgia Main Street Natural Gas, Inc., Gas Project Rev., “A”, 5%, 3/15/2022 | | $ | 4,545,000 | | | $ | 4,791,430 | |
| Georgia Main Street Natural Gas, Inc., Gas Project Rev., “A”, 5.5%, 9/15/2026 | | | 845,000 | | | | 989,115 | |
| Georgia Main Street Natural Gas, Inc., Gas Project Rev., “A”, 5.5%, 9/15/2028 | | | 1,740,000 | | | | 2,106,357 | |
| Georgia Main Street Natural Gas, Inc., Gas Project Rev., “A”, 5%, 5/15/2043 | | | 1,865,000 | | | | 2,006,591 | |
| Georgia Main Street Natural Gas, Inc., Gas Supply Rev., “A”, 5%, 5/15/2031 | | | 5,760,000 | | | | 6,347,174 | |
| Georgia Main Street Natural Gas, Inc., Gas Supply Rev., “B”, 4%, 8/01/2049 (Put Date 12/02/2024) | | | 6,390,000 | | | | 6,818,258 | |
| Georgia Main Street Natural Gas, Inc., Gas Supply Rev., “C”, 4%, 3/01/2050 (Put Date 9/01/2026) | | | 20,295,000 | | | | 21,132,981 | |
| Georgia Municipal Electric Authority (Plant Vogtle Units 3 & 4 Project), “A”, 5%, 1/01/2056 | | | 1,940,000 | | | | 2,133,360 | |
| Georgia Municipal Electric Authority (Plant Vogtle Units 3 & 4 Project), “A”, 5%, 1/01/2063 | | | 1,945,000 | | | | 2,133,043 | |
| Georgia Municipal Electric Authority Power Rev., “GG”, 5%, 1/01/2026 | | | 3,065,000 | | | | 3,250,708 | |
| Glynn-Brunswick Memorial Hospital Authority Rev., Anticipation Certificates (Southeast Georgia Health System Project), 4%, 8/01/2035 | | | 305,000 | | | | 346,663 | |
| Glynn-Brunswick Memorial Hospital Authority Rev., Anticipation Certificates (Southeast Georgia Health System Project), 4%, 8/01/2036 | | | 335,000 | | | | 362,845 | |
| Glynn-Brunswick Memorial Hospital Authority Rev., Anticipation Certificates (Southeast Georgia Health System Project), 4%, 8/01/2037 | | | 230,000 | | | | 247,176 | |
| Hall County and Gainesville, GA, Hospital Authority Rev. (Northeast Georgia Health System, Inc. Project), “A”, 5%, 2/15/2042 | | | 4,000,000 | | | | 4,572,520 | |
| Hall County and Gainesville, GA, Hospital Authority Rev. | | | | | | | | |
| (Northeast Georgia Health System, Inc. Project), “A”, 5%, 2/15/2045 | | | 5,000,000 | | | | 5,689,200 | |
| Hall County and Gainesville, GA, Hospital Authority Rev. (Northeast Georgia Health System, Inc. Project), “A”, 5.5%, 8/15/2054 | | | 4,215,000 | | | | 4,935,470 | |
| Marietta, GA, Development Facilities Authority Rev. (Life University, Inc. Project), “A”, 5%, 11/01/2027 (n) | | | 2,220,000 | | | | 2,311,642 | |
| Marietta, GA, Development Facilities Authority Rev. (Life University, Inc. Project), “A”, 5%, 11/01/2037 | | | 590,000 | | | | 591,451 | |
32
Portfolio of Investments – continued
| | | | | | | | |
| | |
| Issuer | | Shares/Par | | | Value ($) | |
| Municipal Bonds - continued | | | | | | |
| Georgia - continued | | | | | | |
| Marietta, GA, Development Facilities Authority Rev. (Life University, Inc. Project), “A”, 5%, 11/01/2047 | | $ | 405,000 | | | $ | 391,461 | |
| | | | | | | | |
| | | | | | | $ | 163,698,903 | |
| Guam - 0.0% | | | | | | |
| Guam Government Business Privilege Tax Rev., “A”, 5.25%, 1/01/2036 | | $ | 545,000 | | | $ | 548,553 | |
| Guam Waterworks Authority Rev. (Water and Wastewater System), 5.25%, 7/01/2020 | | | 130,000 | | | | 130,436 | |
| Guam Waterworks Authority Rev. (Water and Wastewater System), 5.25%, 7/01/2021 | | | 370,000 | | | | 376,057 | |
| | | | | | | | |
| | | | | | | $ | 1,055,046 | |
| Hawaii - 0.2% | | | | | | |
| State of Hawaii, “DZ”, 5%, 12/01/2031 (Prerefunded 12/01/2021) | | $ | 1,380,000 | | | $ | 1,467,768 | |
| State of Hawaii, “DZ”, 5%, 12/01/2031 (Prerefunded 12/01/2021) | | | 850,000 | | | | 905,514 | |
| State of Hawaii, Highway Rev., “A”, 5%, 1/01/2030 (Prerefunded 1/01/2022) | | | 3,695,000 | | | | 3,942,971 | |
| State of Hawaii, Highway Rev., “A”, 5%, 1/01/2031 | | | 1,380,000 | | | | 1,466,098 | |
| State of Hawaii, Highway Rev., “A”, 5%, 1/01/2032 | | | 920,000 | | | | 977,068 | |
| | | | | | | | |
| | | | | | | $ | 8,759,419 | |
| Idaho - 0.0% | | | | | | |
| Idaho Housing and Finance Association, Tax Exempt Mortgage-Backed Securities, “E”, GNMA, 3.5%, 8/21/2049 | | $ | 2,176,613 | | | $ | 2,282,723 | |
| | |
| Illinois - 10.0% | | | | | | |
| Bridgeview, IL, Stadium and Redevelopment Projects, AAC, 5.14%, 12/01/2036 | | $ | 9,190,000 | | | $ | 8,483,840 | |
| Chicago, IL, “A”, 5%, 1/01/2025 | | | 745,000 | | | | 764,348 | |
| Chicago, IL, “A”, 5.25%, 1/01/2028 | | | 6,375,000 | | | | 6,548,081 | |
| Chicago, IL, “A”, 5%, 1/01/2036 | | | 1,110,000 | | | | 1,119,224 | |
| Chicago, IL, “A”, 5%, 1/01/2040 | | | 2,170,000 | | | | 2,186,969 | |
| Chicago, IL, “A”, 5%, 1/01/2044 | | | 6,715,000 | | | | 6,720,238 | |
| Chicago, IL, “A”, 5.5%, 1/01/2049 | | | 6,995,000 | | | | 7,243,113 | |
| Chicago, IL, “C”, 5%, 1/01/2024 | | | 2,240,000 | | | | 2,263,296 | |
| Chicago, IL, “D”, 5.5%, 1/01/2033 | | | 935,000 | | | | 972,662 | |
| Chicago, IL, Board of Education, 5%, 12/01/2042 | | | 4,045,000 | | | | 4,006,572 | |
| Chicago, IL, Board of Education (School Reform), “A”, NATL, 5.25%, 12/01/2023 | | | 6,805,000 | | | | 7,407,719 | |
| Chicago, IL, Board of Education (School Reform), Capital Appreciation, “A”, NATL, 0%, 12/01/2022 | | | 1,405,000 | | | | 1,287,092 | |
| Chicago, IL, Board of Education (School Reform), Capital Appreciation, “A”, NATL, 0%, 12/01/2023 | | | 1,205,000 | | | | 1,066,485 | |
33
Portfolio of Investments – continued
| | | | | | | | |
| | |
| Issuer | | Shares/Par | | | Value ($) | |
| Municipal Bonds - continued | | | | | | |
| Illinois - continued | | | | | | |
| Chicago, IL, Board of Education (School Reform), Capital Appreciation, “A”, NATL, 0%, 12/01/2028 | | $ | 9,895,000 | | | $ | 7,228,693 | |
| Chicago, IL, Board of Education (School Reform), Capital Appreciation, “A”, NATL, 0%, 12/01/2029 | | | 3,290,000 | | | | 2,306,652 | |
| Chicago, IL, Board of Education (School Reform), Capital Appreciation, “A”, NATL, 0%, 12/01/2030 | | | 1,335,000 | | | | 897,013 | |
| Chicago, IL, Board of Education (School Reform), Capital Appreciation,“B-1”, NATL, 0%, 12/01/2022 | | | 3,410,000 | | | | 3,123,833 | |
| Chicago, IL, Board of Education (School Reform), Capital Appreciation,“B-1”, NATL, 0%, 12/01/2023 | | | 14,590,000 | | | | 12,912,879 | |
| Chicago, IL, Board of Education (School Reform), Capital Appreciation,“B-1”, NATL, 0%, 12/01/2026 | | | 3,405,000 | | | | 2,695,330 | |
| Chicago, IL, Board of Education (School Reform), Capital Appreciation,“B-1”, NATL, 0%, 12/01/2028 | | | 3,895,000 | | | | 2,845,453 | |
| Chicago, IL, Board of Education, “A”, 5.5%, 12/01/2039 | | | 105,000 | | | | 105,637 | |
| Chicago, IL, Board of Education, Dedicated Capital Improvement Tax Bond, 5%, 4/01/2033 | | | 270,000 | | | | 276,245 | |
| Chicago, IL, Board of Education, Dedicated Capital Improvement Tax Bond, 5%, 4/01/2033 | | | 220,000 | | | | 225,694 | |
| Chicago, IL, Board of Education, Dedicated Capital Improvement Tax Bond, 5%, 4/01/2042 | | | 1,785,000 | | | | 1,794,407 | |
| Chicago, IL, Board of Education, Dedicated Capital Improvement Tax Bond, 5%, 4/01/2046 | | | 1,620,000 | | | | 1,616,096 | |
| Chicago, IL, Board of Education, Dedicated Capital Improvement Tax Bond, 6%, 4/01/2046 | | | 15,110,000 | | | | 16,023,399 | |
| Chicago, IL, Board of Education, Unlimited Tax General Obligation Dedicated Rev., “A”, AAC, 5.5%, 12/01/2025 | | | 2,505,000 | | | | 2,761,261 | |
| Chicago, IL, Board of Education, Unlimited Tax General Obligation Dedicated Rev., “A”, AAC, 5.5%, 12/01/2026 | | | 970,000 | | | | 1,076,574 | |
| Chicago, IL, Board of Education, Unlimited Tax General Obligation Dedicated Rev., “A”, AAC, 5.5%, 12/01/2027 | | | 2,455,000 | | | | 2,744,911 | |
| Chicago, IL, Board of Education, Unlimited Tax General Obligation Dedicated Rev., “A”, AAC, 5.5%, 12/01/2028 | | | 1,165,000 | | | | 1,313,922 | |
| Chicago, IL, Board of Education, Unlimited Tax General Obligation Dedicated Rev., “A”, AAC, 5.5%, 12/01/2029 | | | 775,000 | | | | 880,795 | |
| Chicago, IL, Board of Education, Unlimited Tax General Obligation Dedicated Rev., “A”, AAC, 5.5%, 12/01/2030 | | | 580,000 | | | | 663,375 | |
| Chicago, IL, Board of Education, Unlimited Tax General Obligation Dedicated Rev., “A”, AAC, 5.5%, 12/01/2031 | | | 1,550,000 | | | | 1,783,290 | |
| Chicago, IL, Board of Education, Unlimited Tax General Obligation Dedicated Rev., “C”, AGM, 5%, 12/01/2030 | | | 2,760,000 | | | | 3,331,789 | |
| Chicago, IL, Board of Education, Unlimited Tax General Obligation Dedicated Rev., “C”, AGM, 5%, 12/01/2031 | | | 5,300,000 | | | | 6,379,981 | |
34
Portfolio of Investments – continued
| | | | | | | | |
| | |
| Issuer | | Shares/Par | | | Value ($) | |
| Municipal Bonds - continued | | | | | | |
| Illinois - continued | | | | | | |
| Chicago, IL, Board of Education, Unlimited Tax General Obligation Dedicated Rev., “C”, AGM, 5%, 12/01/2032 | | $ | 4,540,000 | | | $ | 5,452,177 | |
| Chicago, IL, Board of Education, Unlimited Tax General Obligation Refunding Dedicated Rev., “A”, AGM, 5%, 12/01/2029 | | | 310,000 | | | | 375,441 | |
| Chicago, IL, Board of Education, Unlimited Tax General Obligation Refunding Dedicated Rev., “A”, AGM, 5%, 12/01/2030 | | | 200,000 | | | | 241,434 | |
| Chicago, IL, Board of Education, Unlimited Tax General Obligation Refunding Dedicated Rev., “A”, AGM, 5%, 12/01/2031 | | | 200,000 | | | | 240,754 | |
| Chicago, IL, Board of Education, Unlimited Tax General Obligation Refunding Dedicated Rev., “A”, AGM, 5%, 12/01/2032 | | | 200,000 | | | | 240,184 | |
| Chicago, IL, Board of Education, Unlimited Tax General Obligation Refunding Dedicated Rev., “A”, AGM, 5%, 12/01/2033 | | | 180,000 | | | | 215,577 | |
| Chicago, IL, Board of Education, Unlimited Tax General Obligation Refunding Dedicated Rev., “A”, AGM, 5%, 12/01/2034 | | | 175,000 | | | | 208,891 | |
| Chicago, IL, Board of Education, Unlimited Tax General Obligation Refunding Dedicated Rev., “A”, AGM, 5%, 12/01/2035 | | | 130,000 | | | | 154,642 | |
| Chicago, IL, Board of Education, Unlimited Tax General Obligation Refunding Dedicated Rev., “G”, 5%, 12/01/2034 | | | 1,205,000 | | | | 1,218,990 | |
| Chicago, IL, Board of Education, Unlimited Tax General Obligation Refunding Dedicated Rev., “H”, 5%, 12/01/2036 | | | 3,245,000 | | | | 3,266,157 | |
| Chicago, IL, Board of Education, Unlimited Tax General Obligation Refunding Dedicated Rev., “H”, 5%, 12/01/2046 | | | 3,675,000 | | | | 3,582,463 | |
| Chicago, IL, Capital Appreciation “A”, NATL, 0%, 1/01/2027 | | | 1,490,000 | | | | 1,179,693 | |
| Chicago, IL, City Colleges of Chicago Capital Improvement Project, Capital Appreciation, NATL, 0%, 1/01/2026 | | | 9,690,000 | | | | 7,967,215 | |
| Chicago, IL, City Colleges of Chicago Capital Improvement Project, Capital Appreciation, NATL, 0%, 1/01/2027 | | | 1,820,000 | | | | 1,440,967 | |
| Chicago, IL, General Obligation, “A”, 5%, 1/01/2026 | | | 3,885,000 | | | | 4,001,472 | |
| Chicago, IL, General Obligation, “A”, 5%, 1/01/2027 | | | 230,000 | | | | 237,694 | |
| Chicago, IL, General Obligation, “A”, 5%, 1/01/2028 | | | 6,075,000 | | | | 6,290,237 | |
| Chicago, IL, General Obligation, “A”, 5%, 1/01/2029 | | | 810,000 | | | | 838,593 | |
| Chicago, IL, General Obligation, “A”, 5%, 1/01/2030 | | | 3,180,000 | | | | 3,294,575 | |
| Chicago, IL, General Obligation, “A”, 5%, 1/01/2031 | | | 625,000 | | | | 645,575 | |
| Chicago, IL, General Obligation, “A”, 5%, 1/01/2032 | | | 265,000 | | | | 273,067 | |
| Chicago, IL, General Obligation, “A”, AGM, 5.25%, 1/01/2031 | | | 1,000,000 | | | | 1,108,050 | |
| Chicago, IL, Greater Chicago Metropolitan Water Reclamation District, “C”, 5%, 12/01/2029 | | | 9,145,000 | | | | 9,613,041 | |
| Chicago, IL, Midway Airport Rev., Second Lien, “A”, BAM, 5%, 1/01/2031 | | | 1,525,000 | | | | 1,674,160 | |
| Chicago, IL, O’Hare International Airport Rev., Special Facilities, 5%, 7/01/2033 | | | 745,000 | | | | 823,493 | |
| Chicago, IL, O’Hare International Airport Rev., Special Facilities, 5%, 7/01/2038 | | | 1,850,000 | | | | 2,006,972 | |
35
Portfolio of Investments – continued
| | | | | | | | |
| | |
| Issuer | | Shares/Par | | | Value ($) | |
| Municipal Bonds - continued | | | | | | |
| Illinois - continued | | | | | | |
| Chicago, IL, O’Hare International Airport Rev., Special Facilities, 5%, 7/01/2048 | | $ | 5,900,000 | | | $ | 6,299,017 | |
| Chicago, IL, O’Hare International Airport Rev., Customer Facility Charge, AGM, 5.25%, 1/01/2032 | | | 945,000 | | | | 1,019,542 | |
| Chicago, IL, O’Hare International Airport Rev., Customer Facility Charge, AGM, 5.25%, 1/01/2033 | | | 470,000 | | | | 506,420 | |
| Chicago, IL, O’Hare International Airport Rev., Customer Facility Charge, AGM, 5.5%, 1/01/2043 | | | 1,890,000 | | | | 2,032,733 | |
| Chicago, IL, O’Hare International Airport Rev., Senior Lien, “A”, 5%, 1/01/2048 | | | 3,315,000 | | | | 3,713,463 | |
| Chicago, IL, O’Hare International Airport Rev., Senior Lien, “B”, 5%, 1/01/2030 | | | 2,735,000 | | | | 3,056,882 | |
| Chicago, IL, O’Hare International Airport Rev., Third Lien, “A”, 5.625%, 1/01/2035 (Prerefunded 1/01/2021) | | | 5,520,000 | | | | 5,704,423 | |
| Chicago, IL, O’Hare International Airport Rev., Third Lien, Unrefunded Balance, “A”, 5.625%, 1/01/2035 | | | 1,605,000 | | | | 1,652,010 | |
| Chicago, IL, Transit Authority Sales Tax Receipts Rev., 5.25%, 12/01/2029 | | | 1,755,000 | | | | 1,857,334 | |
| Chicago, IL, Transit Authority Sales Tax Receipts Rev., 5.25%, 12/01/2031 | | | 655,000 | | | | 689,204 | |
| Chicago, IL, Transit Authority Sales Tax Receipts Rev., 5.25%, 12/01/2040 | | | 4,685,000 | | | | 4,913,862 | |
| Cook County, IL, Community College District No. 508 (City Colleges), BAM, 5%, 12/01/2047 | | | 9,665,000 | | | | 11,066,038 | |
| Cook County, IL, General Obligation Refunding, “C”, AGM, 5%, 11/15/2025 | | | 3,000,000 | | | | 3,249,210 | |
| Granite City, IL, Solid Waste Disposal Rev. (Waste Management, Inc. Project), 2.2%, 5/01/2027 (Put Date 5/01/2020) | | | 6,595,000 | | | | 6,595,659 | |
| Illinois Finance Authority Rev. (Advocate Health Care Network),“A-1”, 4%, 11/01/2030 | | | 4,410,000 | | | | 5,067,487 | |
| Illinois Finance Authority Rev. (Advocate Health Care Network),“A-2”, 4%, 11/01/2030 | | | 4,410,000 | | | | 5,066,649 | |
| Illinois Finance Authority Rev. (Christian Homes, Inc.), 5%, 5/15/2036 | | | 640,000 | | | | 613,299 | |
| Illinois Finance Authority Rev. (Christian Homes, Inc.), 5%, 5/15/2040 | | | 585,000 | | | | 549,631 | |
| Illinois Finance Authority Rev. (Edward-Elmhurst Healthcare), “A”, 5%, 1/01/2034 | | | 2,310,000 | | | | 2,709,214 | |
| Illinois Finance Authority Rev. (Edward-Elmhurst Healthcare), “A”, 5%, 1/01/2035 | | | 2,315,000 | | | | 2,704,476 | |
| Illinois Finance Authority Rev. (Franciscan Communities), “A”, 4.75%, 5/15/2033 | | | 1,905,000 | | | | 1,903,057 | |
36
Portfolio of Investments – continued
| | | | | | | | |
| | |
| Issuer | | Shares/Par | | | Value ($) | |
| Municipal Bonds - continued | | | | | | |
| Illinois - continued | | | | | | |
| Illinois Finance Authority Rev. (Franciscan Communities), “A”, 5.125%, 5/15/2043 | | $ | 1,310,000 | | | $ | 1,311,231 | |
| Illinois Finance Authority Rev. (Franciscan Communities), “A”, ETM, 4.75%, 5/15/2033 (Prerefunded 5/15/2023) | | | 275,000 | | | | 304,354 | |
| Illinois Finance Authority Rev. (Franciscan Communities), “A”, ETM, 5.125%, 5/15/2043 (Prerefunded 5/15/2023) | | | 190,000 | | | | 212,392 | |
| Illinois Finance Authority Rev. (Mercy Health Corp.), 5%, 12/01/2046 | | | 9,235,000 | | | | 10,368,504 | |
| Illinois Finance Authority Rev. (Presbyterian Homes Obligated Group), “B”, FLR, 2.457% (70% of LIBOR - 1mo. + 1.35%), 5/01/2036 (Put Date 5/01/2021) | | | 885,000 | | | | 886,062 | |
| Illinois Finance Authority Rev. (Presence Health Network), “C”, 5%, 2/15/2036 | | | 1,035,000 | | | | 1,169,633 | |
| Illinois Finance Authority Rev. (Presence Health Network), “C”, 5%, 2/15/2041 | | | 1,535,000 | | | | 1,721,856 | |
| Illinois Finance Authority Rev. (Rehabilitation Institute of Chicago), “A”, 6%, 7/01/2043 | | | 6,315,000 | | | | 7,007,819 | |
| Illinois Finance Authority Rev. (Rosalind Franklin University), “A”, 5%, 8/01/2042 | | | 510,000 | | | | 538,060 | |
| Illinois Finance Authority Rev. (Rosalind Franklin University), “A”, 5%, 8/01/2047 | | | 745,000 | | | | 781,065 | |
| Illinois Finance Authority Rev. (Rosalind Franklin University, Research Building Project), “C”, 5%, 8/01/2046 | | | 615,000 | | | | 645,252 | |
| Illinois Finance Authority Rev. (Rosalind Franklin University, Research Building Project), “C”, 5%, 8/01/2049 | | | 795,000 | | | | 832,214 | |
| Illinois Finance Authority Rev. (Southern Illinois Healthcare Enterprises, Inc.), “A”, 5%, 3/01/2047 | | | 10,000,000 | | | | 11,489,500 | |
| Illinois Finance Authority Rev. (Southern Illinois Healthcare Enterprises, Inc.), “C”, 5%, 3/01/2034 | | | 140,000 | | | | 164,389 | |
| Illinois Finance Authority, Academic Facilities Lease Rev. (Provident Group-UIUC Properties LLC-University of Illinois at Urbana-Champaign Project), “A”, 5%, 10/01/2044 | | | 420,000 | | | | 511,375 | |
| Illinois Finance Authority, Academic Facilities Lease Rev. | | | | | | | | |
| (Provident Group-UIUC Properties LLC-University of Illinois at Urbana-Champaign Project), “A”, 5%, 10/01/2049 | | | 525,000 | | | | 634,242 | |
| Illinois Finance Authority, Academic Facilities Lease Rev. | | | | | | | | |
| (Provident Group-UIUC Properties LLC-University of Illinois at Urbana-Champaign Project), “A”, 5%, 10/01/2051 | | | 420,000 | | | | 504,458 | |
| Illinois Finance Authority, Graduate & Professional Student | | | | | | | | |
| Loan Program Rev. (Midwestern University Foundation), “A”, 3%, 7/01/2035 | | | 770,000 | | | | 806,937 | |
| Illinois Finance Authority, Student Housing and Academic Facility Rev.(CHF-ChicagoLLC-University of Illinois at Chicago Project), “A”, 5%, 2/15/2037 | | | 490,000 | | | | 533,880 | |
37
Portfolio of Investments – continued
| | | | | | | | |
| | |
| Issuer | | Shares/Par | | | Value ($) | |
| Municipal Bonds - continued | | | | | | |
| Illinois - continued | | | | | | |
| Illinois Finance Authority, Student Housing and Academic Facility Rev.(CHF-ChicagoLLC-University of Illinois at Chicago Project), “A”, 5%, 2/15/2047 | | $ | 980,000 | | | $ | 1,049,149 | |
| Illinois Finance Authority, Student Housing and Academic Facility Rev.(CHF-ChicagoLLC-University of Illinois at Chicago Project), “A”, 5%, 2/15/2050 | | | 490,000 | | | | 523,570 | |
| Illinois Finance Authority, Student Housing Rev. (Illinois State University), 6.75%, 4/01/2031 (Prerefunded 4/01/2021) | | | 2,730,000 | | | | 2,871,905 | |
| Illinois Finance Authority, Student Housing Rev. (Northern Illinois University Project), 6.625%, 10/01/2031 | | | 4,210,000 | | | | 4,337,521 | |
| Illinois Housing Development Authority Rev., “A”, 4.5%, 10/01/2048 | | | 7,310,000 | | | | 7,982,520 | |
| Illinois Housing Development Authority, Multi-Family Housing Rev. (Century Woods), FHLMC, 1.9%, 10/01/2022 (Put Date 10/01/2021) | | | 2,230,000 | | | | 2,241,997 | |
| Illinois Housing Development Authority, Water Facilities Rev. (American Water Capital Corp.), 2.45%, 10/01/2039 (Put Date 10/01/2029) | | | 7,000,000 | | | | 7,350,700 | |
| Illinois Railsplitter Tobacco Settlement Authority Rev., 5.5%, 6/01/2023 (Prerefunded 6/01/2021) | | | 4,455,000 | | | | 4,679,933 | |
| Illinois Railsplitter Tobacco Settlement Authority Rev., 6%, 6/01/2028 (Prerefunded 6/01/2021) | | | 10,615,000 | | | | 11,205,725 | |
| Illinois Sales Tax Securitization Corp., “A”, 5%, 1/01/2029 | | | 120,000 | | | | 137,929 | |
| Illinois Sales Tax Securitization Corp., “A”, 5%, 1/01/2030 | | | 155,000 | | | | 177,797 | |
| Illinois Sales Tax Securitization Corp., Second Lien, “A”, 5%, 1/01/2026 | | | 1,800,000 | | | | 2,012,454 | |
| Illinois Sales Tax Securitization Corp., Second Lien, “A”, 5%, 1/01/2027 | | | 3,995,000 | | | | 4,536,043 | |
| Illinois Sales Tax Securitization Corp., Second Lien, “A”, 5%, 1/01/2029 | | | 4,270,000 | | | | 4,980,656 | |
| Illinois Sales Tax Securitization Corp., Second Lien, “A”, 5%, 1/01/2030 | | | 1,750,000 | | | | 2,065,122 | |
| Illinois Sales Tax Securitization Corp., Second Lien, “A”, 5%, 1/01/2036 | | | 1,085,000 | | | | 1,259,913 | |
| Illinois Sales Tax Securitization Corp., Second Lien, “A”, 5%, 1/01/2037 | | | 2,185,000 | | | | 2,530,427 | |
| Illinois Sales Tax Securitization Corp., Second Lien, “A”, 4%, 1/01/2038 | | | 1,050,000 | | | | 1,082,235 | |
| Illinois Sales Tax Securitization Corp., Second Lien, “A”, 4%, 1/01/2039 | | | 615,000 | | | | 632,134 | |
| Illinois Sales Tax Securitization Corp., Second Lien, “A”, 4%, 1/01/2040 | | | 1,050,000 | | | | 1,077,437 | |
38
Portfolio of Investments – continued
| | | | | | | | |
| | |
| Issuer | | Shares/Par | | | Value ($) | |
| Municipal Bonds - continued | | | | | | |
| Illinois - continued | | | | | | |
| Illinois Sports Facilities Authority, State Tax Supported Refunding Rev., AGM, 5%, 6/15/2027 | | $ | 1,770,000 | | | $ | 2,012,030 | |
| Illinois Sports Facilities Authority, State Tax Supported Refunding Rev., BAM, 5%, 6/15/2028 | | | 815,000 | | | | 998,693 | |
| Illinois Sports Facilities Authority, State Tax Supported Refunding Rev., BAM, 5%, 6/15/2029 | | | 1,020,000 | | | | 1,271,124 | |
| Illinois Sports Facilities Authority, State Tax Supported Refunding Rev., BAM, 5%, 6/15/2030 | | | 610,000 | | | | 745,792 | |
| Illinois Toll Highway Authority Rev., “A”, 5%, 12/01/2022 | | | 5,000,000 | | | | 5,428,200 | |
| Kane County, IL, East Aurora School District No. 131, “A”, AGM, 4%, 12/01/2033 | | | 250,000 | | | | 288,013 | |
| Kane County, IL, East Aurora School District No. 131, “A”, AGM, 4%, 12/01/2036 | | | 250,000 | | | | 283,898 | |
| Kane County, IL, East Aurora School District No. 131, “A”, AGM, 4%, 12/01/2039 | | | 820,000 | | | | 923,861 | |
| Madison County, IL, Edwardsville Community Unit School | | | | | | | | |
| District No. 007, BAM, 4%, 12/01/2020 | | | 1,315,000 | | | | 1,338,552 | |
| Madison County, IL, Edwardsville Community Unit School | | | | | | | | |
| District No. 007, BAM, 5%, 12/01/2028 | | | 765,000 | | | | 894,775 | |
| Madison County, IL, Edwardsville Community Unit School | | | | | | | | |
| District No. 007, BAM, 5%, 12/01/2029 | | | 785,000 | | | | 917,249 | |
| Metropolitan Pier & Exposition Authority Refunding Bonds | | | | | | | | |
| (McCormick Place Expansion Project), Capital Appreciation, | | | | | | | | |
| “A”, AGM, 0%, 6/15/2026 | | | 2,400,000 | | | | 2,084,976 | |
| Metropolitan Pier & Exposition Authority Rev. (McCormick | | | | | | | | |
| Place Expansion Project), “A”, BAM, 5%, 6/15/2042 | | | 4,550,000 | | | | 4,680,630 | |
| Metropolitan Pier & Exposition Authority, Dedicated State Tax | | | | | | | | |
| Rev. (McCormick Place Expansion Project), NATL, 5.5%, 6/15/2029 | | | 5,725,000 | | | | 6,284,161 | |
| Northern Illinois University, Auxiliary Facilities System | | | | | | | | |
| Refunding Rev., “B”, BAM, 4%, 4/01/2036 (w) | | | 620,000 | | | | 679,762 | |
| Northern Illinois University, Auxiliary Facilities System | | | | | | | | |
| Refunding Rev., “B”, BAM, 4%, 4/01/2038 (w) | | | 700,000 | | | | 762,391 | |
| Northern Illinois University, Auxiliary Facilities System | | | | | | | | |
| Refunding Rev., “B”, BAM, 4%, 4/01/2040 (w) | | | 665,000 | | | | 721,026 | |
| Northern Illinois University, Auxiliary Facilities System | | | | | | | | |
| Refunding Rev., “B”, BAM, 4%, 4/01/2041 (w) | | | 315,000 | | | | 340,975 | |
| Romeoville, IL, Rev. (Lewis University Project), “A”, 5%, 10/01/2042 | | | 1,690,000 | | | | 1,751,567 | |
| Romeoville, IL, Rev. (Lewis University Project), “B”, 5%, 10/01/2039 | | | 1,390,000 | | | | 1,445,906 | |
| Romeoville, IL, Rev. (Lewis University Project), “B”, 4.125%, 10/01/2041 | | | 1,130,000 | | | | 1,083,794 | |
39
Portfolio of Investments – continued
| | | | | | | | |
| | |
| Issuer | | Shares/Par | | | Value ($) | |
| Municipal Bonds - continued | | | | | | |
| Illinois - continued | | | | | | |
| Romeoville, IL, Rev. (Lewis University Project), “B”, 4.125%, 10/01/2046 | | $ | 1,125,000 | | | $ | 1,057,725 | |
| State of Illinois, 5%, 2/01/2025 | | | 1,010,000 | | | | 1,059,985 | |
| State of Illinois, 5%, 2/01/2026 | | | 1,590,000 | | | | 1,672,028 | |
| State of Illinois, 5%, 1/01/2028 | | | 425,000 | | | | 429,875 | |
| State of Illinois, 5%, 5/01/2028 | | | 870,000 | | | | 891,881 | |
| State of Illinois, 5.25%, 7/01/2028 | | | 2,530,000 | | | | 2,599,803 | |
| State of Illinois, 5%, 11/01/2028 | | | 2,005,000 | | | | 2,079,606 | |
| State of Illinois, 5%, 2/01/2029 | | | 2,180,000 | | | | 2,254,425 | |
| State of Illinois, 4.125%, 11/01/2031 | | | 1,720,000 | | | | 1,672,872 | |
| State of Illinois, 4.5%, 11/01/2039 | | | 1,895,000 | | | | 1,836,710 | |
| State of Illinois, AGM, 5%, 4/01/2024 | | | 5,000,000 | | | | 5,169,100 | |
| State of Illinois, AGM, 5%, 2/01/2027 | | | 1,465,000 | | | | 1,522,575 | |
| State of Illinois, AGM, 4%, 2/01/2030 | | | 720,000 | | | | 713,326 | |
| State of Illinois, NATL, 6%, 11/01/2026 | | | 4,615,000 | | | | 5,027,812 | |
| State of Illinois, “A”, 5%, 12/01/2020 | | | 2,975,000 | | | | 3,001,745 | |
| State of Illinois, “A”, 5%, 11/01/2027 | | | 9,820,000 | | | | 10,324,355 | |
| State of Illinois, “A”, 5%, 11/01/2028 | | | 13,010,000 | | | | 13,616,266 | |
| State of Illinois, “A”, 5%, 4/01/2036 | | | 2,120,000 | | | | 2,136,790 | |
| State of Illinois, “B”, 5%, 12/01/2020 | | | 1,645,000 | | | | 1,659,789 | |
| State of Illinois, “B”, 5%, 11/01/2030 | | | 6,000,000 | | | | 6,236,100 | |
| State of Illinois, “A”, 5%, 12/01/2024 | | | 425,000 | | | | 446,373 | |
| State of Illinois, “P“, ETM, 6.5%, 6/15/2022 | | | 1,985,000 | | | | 2,022,993 | |
| Western Illinois Economic Development Authority, Local | | | | | | | | |
| Government Program Rev. (City of Quincy Project), ”B“, BAM, 4%, 12/01/2029 | | | 675,000 | | | | 764,397 | |
| Western Illinois Economic Development Authority, Local Government Program Rev. (City of Quincy Project), ”B“, BAM, 4%, 12/01/2030 | | | 850,000 | | | | 956,480 | |
| Western Illinois Economic Development Authority, Local | | | | | | | | |
| Government Program Rev. (City of Quincy Project), ”B“, BAM, 4%, 12/01/2032 | | | 1,180,000 | | | | 1,317,942 | |
| Western Illinois Economic Development Authority, Local Government Program Rev. (City of Quincy Project), ”B“, BAM, 4%, 12/01/2034 | | | 1,755,000 | | | | 1,942,732 | |
| Western Illinois Economic Development Authority, Local Government Program Rev. (City of Quincy Project), ”B“, BAM, 4%, 12/01/2036 | | | 2,000,000 | | | | 2,199,620 | |
| | | | | | | | |
| | | | | | | $ | 463,327,062 | |
| Indiana - 1.5% | | | | | | |
| Indiana Development Finance Authority Solid Water Disposal Rev. (Waste Management, Inc. Project), 2.95%, 10/01/2031 (Put Date 10/01/2021) | | $ | 1,075,000 | | | $ | 1,089,040 | |
40
Portfolio of Investments – continued
| | | | | | | | |
| | |
| Issuer | | Shares/Par | | | Value ($) | |
| Municipal Bonds - continued | | | | | | |
| Indiana - continued | | | | | | |
| Indiana Economic Development Finance Authority Rev. (Republic Services, Inc. Project), 1.15%, 12/01/2037 (Put Date 6/01/2020) | | $ | 4,615,000 | | | $ | 4,613,339 | |
| Indiana Finance Authority Health Facilities Rev. (Baptist Healthcare System Obligated Group), 5%, 8/15/2051 | | | 5,955,000 | | | | 6,802,158 | |
| Indiana Finance Authority Rev. (BHI Senior Living), ”A“, 6%, 11/15/2041 | | | 2,840,000 | | | | 3,032,438 | |
| Indiana Finance Authority Rev. (Marquette Project), ”A“, 5%, 3/01/2030 | | | 530,000 | | | | 551,497 | |
| Indiana Finance Authority Rev. (Marquette Project), ”A“, 5%, 3/01/2039 | | | 1,340,000 | | | | 1,372,160 | |
| Indiana Finance Authority Rev. (Ohio River Bridges East End Crossing Project), ”A“, 5%, 7/01/2035 | | | 2,190,000 | | | | 2,252,568 | |
| Indiana Finance Authority Rev. (Ohio River Bridges East End Crossing Project), ”A“, 5%, 7/01/2044 | | | 1,595,000 | | | | 1,626,948 | |
| Indiana Finance Authority Rev. (State Revolving Fund Program), ”A“, 5%, 2/01/2029 (Prerefunded 2/01/2022) | | | 4,000,000 | | | | 4,281,880 | |
| Indiana Housing & Community Development Authority, Single Family Mortgage Rev., ”A“, GNMA, 4%, 7/01/2048 | | | 3,245,000 | | | | 3,456,087 | |
| Indianapolis, IN, Local Public Improvement Bond Bank (Indianapolis Airport Authority), ”D“, 5%, 1/01/2028 | | | 5,000,000 | | | | 5,883,950 | |
| Indianapolis, IN, Local Public Improvement Bond Bank (Indianapolis Airport Authority), ”D“, 5%, 1/01/2029 | | | 5,000,000 | | | | 5,958,800 | |
| Indianapolis, IN, Water System First Lien Refunding Rev., ”A“, 5%, 10/01/2037 | | | 5,250,000 | | | | 6,560,610 | |
| Knox County, IN, Economic Development Rev. (Good Samaritan Hospital), ”A“, 5%, 4/01/2042 | | | 1,170,000 | | | | 1,197,530 | |
| Lake County, IN, Hammond Multi-School Building Corp., 5%, 7/15/2032 | | | 625,000 | | | | 764,425 | |
| Lake County, IN, Hammond Multi-School Building Corp., 5%, 7/15/2033 | | | 455,000 | | | | 554,490 | |
| Lake County, IN, Hammond Multi-School Building Corp., 5%, 7/15/2035 | | | 565,000 | | | | 682,571 | |
| Lake County, IN, Hammond Multi-School Building Corp., 5%, 7/15/2038 | | | 1,700,000 | | | | 2,027,743 | |
| St. Joseph County, IN, Educational Facilities Rev. (University of Notre Dame), 6.5%, 3/01/2026 | | | 1,000,000 | | | | 1,290,380 | |
| Valparaiso, IN, Exempt Facilities Rev. (Pratt Paper LLC Project), 6.75%, 1/01/2034 | | | 330,000 | | | | 342,629 | |
| Valparaiso, IN, Exempt Facilities Rev. (Pratt Paper LLC Project), 7%, 1/01/2044 | | | 755,000 | | | | 783,743 | |
| Whiting, IN, Environmental Facilities Rev. (BP Products North America, Inc. Project), ”A“, 5%, 12/01/2044 (Put Date 6/05/2026) | | | 11,910,000 | | | | 12,990,475 | |
| | | | | | | | |
| | | | | | | $ | 68,115,461 | |
41
Portfolio of Investments – continued
| | | | | | | | |
| | |
| Issuer | | Shares/Par | | | Value ($) | |
| Municipal Bonds - continued | | | | | | |
| Iowa - 0.5% | | | | | | |
| Iowa Finance Authority Health Facilities Rev. (UnityPoint Health), ”C“, 5%, 2/15/2030 | | $ | 1,200,000 | | | $ | 1,345,428 | |
| Iowa Finance Authority Health Facilities Rev. (UnityPoint Health), ”C“, 5%, 2/15/2031 | | | 2,230,000 | | | | 2,493,430 | |
| Iowa Finance Authority Health Facilities Rev. (UnityPoint Health), ”C“, 5%, 2/15/2032 | | | 1,085,000 | | | | 1,210,317 | |
| Iowa Finance Authority Rev. (Iowa Health System Obligated Group), ”A“, 5.25%, 2/15/2044 | | | 3,000,000 | | | | 3,193,950 | |
| Iowa Finance Authority Senior Housing Rev. (Northcrest, Inc. Project), ”A“, 5%, 3/01/2033 | | | 745,000 | | | | 748,859 | |
| Iowa Finance Authority Senior Housing Rev. (Northcrest, Inc. Project), ”A“, 5%, 3/01/2038 | | | 615,000 | | | | 609,945 | |
| Iowa Finance Authority Senior Housing Rev. (Northcrest, Inc. Project), ”A“, 5%, 3/01/2048 | | | 1,125,000 | | | | 1,071,338 | |
| Iowa Finance Authority Single Family Mortgage Rev., ”A“, FNMA, 4%, 7/01/2047 | | | 1,140,000 | | | | 1,215,764 | |
| Iowa Student Loan Liquidity Corp. Rev., ”B“, 3%, 12/01/2039 | | | 1,965,000 | | | | 1,935,152 | |
| Iowa Student Loan Liquidity Corp. Rev., ”B“, 3.5%, 12/01/2044 | | | 5,865,000 | | | | 5,754,386 | |
| Iowa Tobacco Settlement Authority, Tobacco Settlement Rev., Asset Backed, ”B“, 5.6%, 6/01/2034 | | | 3,070,000 | | | | 3,030,182 | |
| | | | | | | | |
| | | | | | | $ | 22,608,751 | |
| Kansas - 1.0% | | | | | | |
| Coffeyville, KS, Electric Utility System Rev., ”B“, NATL, 5%, 6/01/2038 | | $ | 3,800,000 | | | $ | 4,336,750 | |
| Coffeyville, KS, Electric Utility System Rev., ”B“, NATL, 5%, 6/01/2042 | | | 1,500,000 | | | | 1,704,000 | |
| Hutchinson, KS, Hospital Facilities Rev. (Hutchinson Regional Medical Center, Inc.), 5%, 12/01/2036 | | | 1,295,000 | | | | 1,453,055 | |
| Hutchinson, KS, Hospital Facilities Rev. (Hutchinson Regional Medical Center, Inc.), 5%, 12/01/2041 | | | 680,000 | | | | 756,078 | |
| Lyon County, KS, School District No. 253 General Obligation, 4%, 9/01/2032 | | | 125,000 | | | | 142,724 | |
| Lyon County, KS, School District No. 253 General Obligation, 4%, 9/01/2033 | | | 520,000 | | | | 591,968 | |
| Lyon County, KS, School District No. 253 General Obligation, 4%, 9/01/2034 | | | 585,000 | | | | 663,624 | |
| Lyon County, KS, School District No. 253 General Obligation, 4%, 9/01/2039 | | | 3,000,000 | | | | 3,330,480 | |
| Overland Park, KS, Development Corp. Improvement and Refunding Rev. (Overland Park Convention Center Hotel), 5%, 3/01/2032 | | | 1,030,000 | | | | 1,069,634 | |
42
Portfolio of Investments – continued
| | | | | | | | |
| | |
| Issuer | | Shares/Par | | | Value ($) | |
| Municipal Bonds - continued | | | | | | |
| Kansas - continued | | | | | | |
| Overland Park, KS, Development Corp. Improvement and Refunding Rev. (Overland Park Convention Center Hotel), 5%, 3/01/2033 | | $ | 1,085,000 | | | $ | 1,119,329 | |
| Overland Park, KS, Development Corp. Improvement and Refunding Rev. (Overland Park Convention Center Hotel), 5%, 3/01/2034 | | | 1,145,000 | | | | 1,173,625 | |
| Overland Park, KS, Development Corp. Improvement and Refunding Rev. (Overland Park Convention Center Hotel), 5%, 3/01/2036 | | | 1,260,000 | | | | 1,281,760 | |
| Overland Park, KS, Development Corp. Improvement and Refunding Rev. (Overland Park Convention Center Hotel), 5%, 3/01/2038 | | | 1,395,000 | | | | 1,409,048 | |
| Overland Park, KS, Development Corp. Improvement and Refunding Rev. (Overland Park Convention Center Hotel), 5%, 3/01/2044 | | | 1,510,000 | | | | 1,502,344 | |
| Overland Park, KS, Development Corp. Improvement and Refunding Rev. (Overland Park Convention Center Hotel), 5%, 3/01/2049 | | | 2,160,000 | | | | 2,107,966 | |
| Sedgwick County, KS, Unified School District No. 266 General Obligation, ”A“, 4%, 9/01/2031 | | | 1,145,000 | | | | 1,335,173 | |
| Sedgwick County, KS, Unified School District No. 266 General Obligation, ”A“, 4%, 9/01/2032 | | | 855,000 | | | | 994,827 | |
| University of Kansas Hospital Authority, Health Facilities Rev. (University of Kansas Health System), ”A“, 5%, 9/01/2048 | | | 13,460,000 | | | | 16,276,370 | |
| Wichita, KS, Health Care Facilities Rev. (Presbyterian Manors, Inc.), ”I“, 5%, 5/15/2033 | | | 145,000 | | | | 145,857 | |
| Wichita, KS, Health Care Facilities Rev. (Presbyterian Manors, Inc.), ”I“, 5%, 5/15/2038 | | | 175,000 | | | | 171,518 | |
| Wichita, KS, Health Care Facilities Rev. (Presbyterian Manors, Inc.), ”I“, 4.625%, 5/15/2041 | | | 145,000 | | | | 131,105 | |
| Wichita, KS, Health Care Facilities Rev. (Presbyterian Manors, Inc.), ”I“, 5%, 5/15/2047 | | | 720,000 | | | | 677,246 | |
| Wichita, KS, Sales Tax Special Obligations Rev.(K-96 Greenwich Star Bond Project), 3%, 9/01/2023 | | | 285,000 | | | | 278,382 | |
| Wichita, KS, Sales Tax Special Obligations Rev.(K-96 Greenwich Star Bond Project), 4.2%, 9/01/2027 | | | 1,515,000 | | | | 1,456,976 | |
| Wyandotte County/Kansas City, KS, Unified Government Community Improvement District Sales Tax Rev. (Legends Apartments Garage & West Lawn Project), 4.5%, 6/01/2040 | | | 515,000 | | | | 477,549 | |
| | | | | | | | |
| | | | | | | $ | 44,587,388 | |
| Kentucky - 2.0% | | | | | | |
| Commonwealth of Kentucky State Property & Buildings Commission Rev. (Project No. 119), BAM, 5%, 5/01/2032 | | $ | 810,000 | | | $ | 984,620 | |
43
Portfolio of Investments – continued
| | | | | | | | |
| | |
| Issuer | | Shares/Par | | | Value ($) | |
| Municipal Bonds - continued | | | | | | |
| Kentucky - continued | | | | | | |
| Commonwealth of Kentucky State Property & Buildings Commission Rev. (Project No. 119), BAM, 5%, 5/01/2033 | | $ | 800,000 | | | $ | 969,632 | |
| Commonwealth of Kentucky State Property & Buildings Commission Rev. (Project No. 119), BAM, 5%, 5/01/2034 | | | 910,000 | | | | 1,100,590 | |
| Kentucky Economic Development Finance Authority Hospital Rev. (Baptist Healthcare System), ”B“, 5%, 8/15/2037 | | | 590,000 | | | | 683,556 | |
| Kentucky Economic Development Finance Authority Hospital Rev. (Baptist Healthcare System), ”B“, 5%, 8/15/2041 | | | 4,235,000 | | | | 4,885,496 | |
| Kentucky Economic Development Finance Authority Hospital Rev. (Baptist Healthcare System), ”B“, 5%, 8/15/2046 | | | 2,685,000 | | | | 3,071,425 | |
| Kentucky Economic Development Finance Authority Hospital Rev. (Owensboro Health, Inc.), ”A“, 5%, 6/01/2037 | | | 2,530,000 | | | | 2,804,303 | |
| Kentucky Economic Development Finance Authority Hospital Rev. (Owensboro Health, Inc.), ”A“, 5%, 6/01/2041 | | | 1,655,000 | | | | 1,798,770 | |
| Kentucky Economic Development Finance Authority Hospital Rev. (Owensboro Health, Inc.), ”A“, 5.25%, 6/01/2041 | | | 1,290,000 | | | | 1,448,206 | |
| Kentucky Economic Development Finance Authority Hospital Rev. (Owensboro Health, Inc.), ”A“, 5%, 6/01/2045 | | | 2,070,000 | | | | 2,208,359 | |
| Kentucky Economic Development Finance Authority Hospital Rev. (Owensboro Medical Health System, Inc.), ”A“, 6%, 6/01/2030 (Prerefunded 6/01/2020) | | | 2,695,000 | | | | 2,715,913 | |
| Kentucky Economic Development Finance Authority Hospital Rev. (Owensboro Medical Health System, Inc.), ”A“, 6.375%, 6/01/2040 (Prerefunded 6/01/2020) | | | 5,500,000 | | | | 5,546,035 | |
| Kentucky Economic Development Finance Authority Louisville Arena Project Rev. (Louisville Arena Authority, Inc.), ”A“, AGM, 5%, 12/01/2045 | | | 3,390,000 | | | | 3,963,012 | |
| Kentucky Economic Development Finance Authority Louisville Arena Project Rev. (Louisville Arena Authority, Inc.), ”A“, AGM, 5%, 12/01/2047 | | | 1,895,000 | | | | 2,050,030 | |
| Kentucky Higher Education Student Loan Corp. Rev.,Tax-Exempt,”B-1“, 5%, 6/01/2036 | | | 6,475,000 | | | | 7,416,659 | |
| Kentucky Public Energy Authority, Gas Supply Rev., ”C“, 4%, 2/01/2050 (Put Date 2/01/2028) | | | 6,935,000 | | | | 7,277,658 | |
| Kentucky Turnpike Authority, Economic Development Road Rev. (Revitalization Projects), ”A“, 5%, 7/01/2032 | | | 2,000,000 | | | | 2,222,880 | |
| Louisville & Jefferson County, KY, Metropolitan Government Healthcare System Rev. (Norton Healthcare, Inc.), ”A“, 4%, 10/01/2039 | | | 1,500,000 | | | | 1,710,720 | |
| Louisville & Jefferson County, KY, Metropolitan Government Healthcare System Rev. (Norton Healthcare, Inc.), ”A“, 4%, 10/01/2040 | | | 1,225,000 | | | | 1,394,773 | |
44
Portfolio of Investments – continued
| | | | | | | | |
| | |
| Issuer | | Shares/Par | | | Value ($) | |
| Municipal Bonds - continued | | | | | | |
| Kentucky - continued | | | | | | |
| Public Energy Authority of Kentucky, Gas Supply Rev., ”B“, 4%, 1/01/2049 | | $ | 3,215,000 | | | $ | 3,217,926 | |
| Public Energy Authority of Kentucky, Gas Supply Rev.,”C-1“, 4%, 12/01/2049 | | | 31,565,000 | | | | 32,862,637 | |
| | | | | | | | |
| | | | | | | $ | 90,333,200 | |
| Louisiana - 1.4% | | | | | | |
| Jefferson Parish, LA, Hospital Service District No. 2 Hospital Rev. (East Jefferson General Hospital), 6.25%, 7/01/2031 | | $ | 3,355,000 | | | $ | 3,433,205 | |
| Louisiana Citizens Property Insurance Corp. Rev., AGM, 5%, 6/01/2022 | | | 1,470,000 | | | | 1,588,703 | |
| Louisiana Housing Corp. Single Family Mortgage Rev. (Home Ownership Program),”A-1“, 4.5%, 12/01/2047 | | | 740,000 | | | | 806,985 | |
| Louisiana Local Government, Environmental Facilities & Community Development Authority Rev. (CDF Healthcare), ”A“, 5.625%, 6/01/2045 | | | 4,990,000 | | | | 4,463,405 | |
| Louisiana Local Government, Environmental Facilities & Community Development Authority Rev. (Ragin’ Cajun Facilities, Inc.-Student Housing & Parking Project), AGM, 5%, 10/01/2043 | | | 590,000 | | | | 691,527 | |
| Louisiana Local Government, Environmental Facilities & Community Development Authority Rev. (Ragin’ Cajun Facilities, Inc. -Student Housing & Parking Project), AGM, 5%, 10/01/2048 | | | 2,555,000 | | | | 2,962,267 | |
| Louisiana Local Government, Environmental Facilities & Community Development Authority Rev. (St. James Place of Baton Rouge Project), ”A“, 6%, 11/15/2035 | | | 580,000 | | | | 596,066 | |
| Louisiana Local Government, Environmental Facilities & Community Development Authority Rev. (St. James Place of Baton Rouge Project), ”A“, 6.25%, 11/15/2045 | | | 2,240,000 | | | | 2,302,675 | |
| Louisiana Local Government, Environmental Facilities & Community Development Authority Rev. (Westlake Chemical), ”A“, 6.5%, 8/01/2029 | | | 1,400,000 | | | | 1,403,094 | |
| Louisiana Local Government, Environmental Facilities & Community Development Authority Rev. (Westlake Chemical),”A-2“, 6.5%, 11/01/2035 | | | 6,000,000 | | | | 6,011,640 | |
| Louisiana Local Government, Environmental Facilities & Community Development Authority Student Housing Rev. (Provident Group-ULM Properties LLC-University of Louisiana at Monroe Project), ”A“, 5%, 7/01/2029 | | | 480,000 | | | | 507,523 | |
| Louisiana Local Government, Environmental Facilities & Community Development Authority Student Housing Rev. (Provident Group-ULM Properties LLC-University of Louisiana at Monroe Project), ”A“, 5%, 7/01/2039 | | | 1,200,000 | | | | 1,182,408 | |
45
Portfolio of Investments – continued
| | | | | | | | |
| | |
| Issuer | | Shares/Par | | | Value ($) | |
| Municipal Bonds - continued | | | | | | |
| Louisiana - continued | | | | | | |
| Louisiana Local Government, Environmental Facilities & Community Development Authority Student Housing Rev. (Provident Group-ULM Properties LLC-University of Louisiana at Monroe Project), ”A“, 5%, 7/01/2054 | | $ | 1,925,000 | | | $ | 1,815,237 | |
| Louisiana Offshore Terminal Authority, Deepwater Port Rev. (Loop LLC Project), ”A“, 1.65%, 9/01/2027 | | | 5,020,000 | | | | 5,054,688 | |
| Louisiana Offshore Terminal Authority, Deepwater Port Rev. (Loop LLC Project), ”A“, 1.65%, 9/01/2033 (Put Date 12/01/2023) | | | 4,075,000 | | | | 4,115,139 | |
| Louisiana Offshore Terminal Authority, Deepwater Port Rev. (Loop LLC Project), ”A“, 1.65%, 9/01/2034 (Put Date 12/01/2023) | | | 3,140,000 | | | | 3,169,328 | |
| Louisiana Public Facilities Authority Lease Rev. (Provident Group-Flagship Properties LLC–Louisiana State University Greenhouse District (Phase III)), ”A“, 5%, 7/01/2059 | | | 5,365,000 | | | | 6,333,866 | |
| Louisiana Public Facilities Authority Rev. (Loyola University Project), Convertible Capital Appreciation, 0% to 10/01/2023, 5.25% to 10/01/2046 | | | 5,465,000 | | | | 5,325,533 | |
| Louisiana Stadium & Exposition District Rev., ”A“, 5%, 7/01/2023 | | | 1,325,000 | | | | 1,478,819 | |
| Louisiana Stadium & Exposition District Rev., ”A“, 5%, 7/01/2024 | | | 1,270,000 | | | | 1,414,856 | |
| Louisiana Stadium & Exposition District Rev., ”A“, 5%, 7/01/2025 | | | 1,000,000 | | | | 1,113,380 | |
| New Orleans, LA, Aviation Board Special Facility Rev. (Parking Facilities Corp. Consolidated Garage System), ”A“, AGM, 5%, 10/01/2043 | | | 745,000 | | | | 893,009 | |
| New Orleans, LA, Aviation Board Special Facility Rev. (Parking Facilities Corp. Consolidated Garage System), ”A“, AGM, 5%, 10/01/2048 | | | 1,210,000 | | | | 1,440,045 | |
| New Orleans, LA, Sewerage Service Rev., 5%, 12/01/2040 | | | 800,000 | | | | 908,728 | |
| Shreveport, LA, Water & Sewer Rev., ”B“, AGM, 4%, 12/01/2044 | | | 1,000,000 | | | | 1,113,200 | |
| Shreveport, LA, Water & Sewer Rev., ”B“, AGM, 4%, 12/01/2049 | | | 1,250,000 | | | | 1,380,275 | |
| St. Charles Parish, LA, Gulf Zone Opportunity Zone Rev. (Valero Energy Corp.), 4%, 12/01/2040 (Put Date 6/01/2022) | | | 2,000,000 | | | | 2,021,120 | |
| | | | | | | | |
| | | | | | | $ | 63,526,721 | |
| Maine - 0.1% | | | | | | |
| Maine Finance Authority Solid Waste Disposal Rev. (Casella Waste Systems, Inc.),”R-2“, 4.375%, 8/01/2035 (Put Date 8/01/2025) | | $ | 1,140,000 | | | $ | 1,168,546 | |
| Maine Finance Authority Solid Waste Disposal Rev. (Casella Waste Systems, Inc.),”R-3“, 5.25%, 1/01/2025 | | | 570,000 | | | | 604,285 | |
| Maine Housing Authority Mortgage,”C-1“, 3.5%, 11/15/2044 | | | 2,285,000 | | | | 2,356,429 | |
| | | | | | | | |
| | | | | | | $ | 4,129,260 | |
| Maryland - 1.4% | | | | | | |
| Baltimore, MD, Project Rev. (Water Projects), ”A“, 4%, 7/01/2039 | | $ | 1,500,000 | | | $ | 1,712,775 | |
| Baltimore, MD, Special Obligation (East Baltimore Research Park Project), ”A“, 5%, 9/01/2038 | | | 1,565,000 | | | | 1,582,074 | |
46
Portfolio of Investments – continued
| | | | | | | | |
| | |
| Issuer | | Shares/Par | | | Value ($) | |
| Municipal Bonds - continued | | | | | | |
| Maryland - continued | | | | | | |
| Baltimore, MD, Subordinate Project Rev. (Mayor and City Council of Baltimore Water Projects), ”A“, 5%, 7/01/2041 | | $ | 5,000,000 | | | $ | 5,827,350 | |
| Brunswick, MD, Special Obligation Refunding (Brunswick Crossing Special Taxing District), 4%, 7/01/2029 | | | 380,000 | | | | 367,692 | |
| Brunswick, MD, Special Obligation Refunding (Brunswick Crossing Special Taxing District), 5%, 7/01/2036 | | | 420,000 | | | | 425,015 | |
| Howard County, MD, Special Obligation (Downtown Columbia Project), ”A“, 4.125%, 2/15/2034 | | | 150,000 | | | | 144,687 | |
| Howard County, MD, Special Obligation (Downtown Columbia Project), ”A“, 4.375%, 2/15/2039 | | | 155,000 | | | | 149,865 | |
| Howard County, MD, Special Obligation (Downtown Columbia Project), ”A“, 4.5%, 2/15/2047 | | | 1,105,000 | | | | 1,053,584 | |
| Maryland Community Development Administration, Department of Housing & Community Development Housing Rev., ”A“, 4.5%, 9/01/2048 (u) | | | 10,085,000 | | | | 11,104,291 | |
| Maryland Community Development Administration, Department of Housing & Community Development Housing Rev., ”B“, 4.5%, 9/01/2048 (u) | | | 8,185,000 | | | | 8,960,938 | |
| Maryland Community Development Administration, Department of Housing & Community Development Housing Rev., ”C“, 4%, 9/01/2044 | | | 2,170,000 | | | | 2,274,681 | |
| Maryland Community Development Administration, Department of Housing & Community Development Residential Rev., ”C“, 5%, 9/01/2026 | | | 300,000 | | | | 363,585 | |
| Maryland Community Development Administration, Department of Housing & Community Development Residential Rev., ”C“, 5%, 9/01/2027 | | | 455,000 | | | | 564,341 | |
| Maryland Community Development Administration, Department of Housing & Community Development Residential Rev., ”C“, 5%, 9/01/2028 | | | 355,000 | | | | 449,803 | |
| Maryland Economic Development Corp. Adjustable Mode Rev. Refunding (Constellation Energy Group, Inc. Project), ”B“, 2.55%, 12/01/2025 (Put Date 6/01/2020) | | | 3,385,000 | | | | 3,387,403 | |
| Maryland Economic Development Corp. Rev. (Port America Chesapeake Terminal Project), ”B“, 5.375%, 6/01/2025 (Prerefunded 6/01/2020) | | | 795,000 | | | | 799,826 | |
| Maryland Economic Development Corp. Rev. (Transportation Facilities Project), ”A“, 5%, 6/01/2030 | | | 180,000 | | | | 197,685 | |
| Maryland Economic Development Corp. Rev. (Transportation Facilities Project), ”A“, 5%, 6/01/2032 | | | 125,000 | | | | 136,084 | |
| Maryland Economic Development Corp. Rev. (Transportation Facilities Project), ”A“, 5%, 6/01/2035 | | | 225,000 | | | | 242,903 | |
47
Portfolio of Investments – continued
| | | | | | | | |
| | |
| Issuer | | Shares/Par | | | Value ($) | |
| Municipal Bonds - continued | | | | | | |
| Maryland - continued | | | | | | |
| Maryland Economic Development Corp., Senior Student Housing Rev. (University of Maryland, College Park Projects), AGM, 5%, 6/01/2035 | | $ | 695,000 | | | $ | 818,689 | |
| Maryland Economic Development Corp., Subordinate Parking Facilities Rev. (Baltimore City Project), ”C“, 4%, 6/01/2038 | | | 180,000 | | | | 159,458 | |
| Maryland Economic Development Corp., Subordinate Parking Facilities Rev. (Baltimore City Project), ”C“, 4%, 6/01/2048 | | | 550,000 | | | | 456,484 | |
| Maryland Economic Development Corp., Subordinate Parking Facilities Rev. (Baltimore City Project), ”C“, 4%, 6/01/2058 | | | 1,665,000 | | | | 1,323,342 | |
| Maryland Health & Higher Educational Facilities Authority Rev. (Adventist Healthcare Issue), ”A“, 5.5%, 1/01/2036 | | | 5,090,000 | | | | 5,686,548 | |
| Maryland Health & Higher Educational Facilities Authority Rev. (Charlestown Community Project), 6.25%, 1/01/2041 (Prerefunded 1/01/2021) | | | 2,225,000 | | | | 2,305,389 | |
| Maryland Health & Higher Educational Facilities Authority Rev. (Doctors Community Hospital), ”A“, 5%, 7/01/2033 | | | 1,745,000 | | | | 2,010,432 | |
| Maryland Health & Higher Educational Facilities Authority Rev. (Doctors Community Hospital), ”A“, 5%, 7/01/2034 | | | 1,090,000 | | | | 1,250,939 | |
| Maryland Health & Higher Educational Facilities Authority Rev. (Doctors Community Hospital), ”A“, 5%, 7/01/2038 | | | 4,845,000 | | | | 5,477,951 | |
| Prince George’s County, MD, Special Obligation (Westphalia Town Center Project), 5.125%, 7/01/2039 | | | 555,000 | | | | 560,550 | |
| Prince George’s County, MD, Special Obligation (Westphalia Town Center Project), 5.25%, 7/01/2048 | | | 545,000 | | | | 550,346 | |
| Rockville, MD, Mayor & Council Economic Development Refunding Rev. (Ingleside at King Farm Project),”A-1“, 5%, 11/01/2037 | | | 185,000 | | | | 186,269 | |
| Rockville, MD, Mayor & Council Economic Development Rev. (Ingleside at King Farm Project), ”B“, 5%, 11/01/2042 | | | 315,000 | | | | 311,207 | |
| Rockville, MD, Mayor & Council Economic Development Rev. (Ingleside at King Farm Project), ”B“, 5%, 11/01/2047 | | | 330,000 | | | | 320,846 | |
| State of Maryland, ”B“, 4%, 8/01/2027 | | | 2,570,000 | | | | 2,731,653 | |
| | | | | | | | |
| | | | | | | $ | 63,894,685 | |
| Massachusetts - 3.8% | | | | | | |
| Commonwealth of Massachusetts Transportation Fund Rev. (Accelerated Bridge Program), ”A“, 5%, 6/01/2023 | | $ | 2,645,000 | | | $ | 2,953,169 | |
| Commonwealth of Massachusetts Transportation Fund Rev., ”A“, 5%, 6/01/2043 | | | 9,290,000 | | | | 11,166,301 | |
| Commonwealth of Massachusetts, ”A“, AAC, 5.5%, 8/01/2030 | | | 5,000,000 | | | | 6,809,350 | |
| Commonwealth of Massachusetts, General Obligation Consolidated Loan, ”H“, 5%, 12/01/2026 | | | 10,000,000 | | | | 12,370,100 | |
| Massachusetts Bay Transportation Authority Rev., ”A“, 7%, 3/01/2021 | | | 1,065,000 | | | | 1,092,040 | |
48
Portfolio of Investments – continued
| | | | | | | | |
| | |
| Issuer | | Shares/Par | | | Value ($) | |
| Municipal Bonds - continued | | | | | | |
| Massachusetts - continued | | | | | | |
| Massachusetts Bay Transportation Authority, Sales Tax Rev., ”A“, 5%, 7/01/2024 | | $ | 9,445,000 | | | $ | 10,883,568 | |
| Massachusetts College Building Authority Project Rev., ”A“, 5%, 5/01/2031 | | | 2,395,000 | | | | 2,637,877 | |
| Massachusetts Development Finance Agency Lease Rev. (University of Massachusetts at Dartmouth, College of Visual & Performing Arts Project), 6%, 8/01/2021 | | | 530,000 | | | | 549,027 | |
| Massachusetts Development Finance Agency Refunding Rev. (Suffolk University), 5%, 7/01/2035 | | | 415,000 | | | | 467,020 | |
| Massachusetts Development Finance Agency Rev. (Atrius Health Issue), ”A“, 5%, 6/01/2039 | | | 945,000 | | | | 1,106,321 | |
| Massachusetts Development Finance Agency Rev. (CareGroup),”J-1“, 5%, 7/01/2048 | | | 3,000,000 | | | | 3,505,230 | |
| Massachusetts Development Finance Agency Rev. (Emerson College), 5%, 1/01/2029 | | | 1,550,000 | | | | 1,717,927 | |
| Massachusetts Development Finance Agency Rev. (Emerson College), 5%, 1/01/2030 | | | 3,225,000 | | | | 3,559,078 | |
| Massachusetts Development Finance Agency Rev. (Emerson College), 5%, 1/01/2031 | | | 895,000 | | | | 984,947 | |
| Massachusetts Development Finance Agency Rev. (Emerson College), ”A“, 5.25%, 1/01/2042 | | | 250,000 | | | | 280,725 | |
| Massachusetts Development Finance Agency Rev. (Emmanuel College), ”A“, 5%, 10/01/2043 | | | 3,515,000 | | | | 3,770,189 | |
| Massachusetts Development Finance Agency Rev. (Lahey Health System Obligated Group), ”F“, 5%, 8/15/2030 | | | 1,000,000 | | | | 1,155,880 | |
| Massachusetts Development Finance Agency Rev. (Milford Regional Medical Center), ”F“, 5.75%, 7/15/2043 | | | 460,000 | | | | 473,892 | |
| Massachusetts Development Finance Agency Rev. (Newbridge on the Charles, Inc.), 5%, 10/01/2037 | | | 110,000 | | | | 111,165 | |
| Massachusetts Development Finance Agency Rev. (Newbridge on the Charles, Inc.), 5%, 10/01/2047 | | | 1,530,000 | | | | 1,503,072 | |
| Massachusetts Development Finance Agency Rev. (Newbridge on the Charles, Inc.), 5%, 10/01/2057 | | | 1,775,000 | | | | 1,711,029 | |
| Massachusetts Development Finance Agency Rev. (North Hill Communities), ”A“, 6.25%, 11/15/2033 (Prerefunded 11/15/2023) | | | 275,000 | | | | 323,934 | |
| Massachusetts Development Finance Agency Rev. (North Hill Communities), ”A“, 6.5%, 11/15/2043 (Prerefunded 11/15/2023) | | | 435,000 | | | | 515,901 | |
| Massachusetts Development Finance Agency Rev. (Partners Healthcare), ”L“, 5%, 7/01/2031 (Prerefunded 7/01/2021) | | | 1,430,000 | | | | 1,500,327 | |
| Massachusetts Development Finance Agency Rev. (Partners Healthcare), ”L“, 5%, 7/01/2036 (Prerefunded 7/01/2021) | | | 1,670,000 | | | | 1,752,131 | |
| Massachusetts Development Finance Agency Rev. (Partners Healthcare), ”S“, 5%, 7/01/2032 | | | 1,275,000 | | | | 1,527,756 | |
49
Portfolio of Investments – continued
| | | | | | | | |
| | |
| Issuer | | Shares/Par | | | Value ($) | |
| Municipal Bonds - continued | | | | | | |
| Massachusetts - continued | | | | | | |
| Massachusetts Development Finance Agency Rev. (Partners Healthcare), Unrefunded Balance, ”L“, 5%, 7/01/2031 | | $ | 1,350,000 | | | $ | 1,416,393 | |
| Massachusetts Development Finance Agency Rev. (Sabis International Charter School Issue), 4%, 4/15/2020 | | | 20,000 | | | | 20,013 | |
| Massachusetts Development Finance Agency Rev. (Sabis International Charter School Issue), 5%, 4/15/2025 | | | 185,000 | | | | 197,297 | |
| Massachusetts Development Finance Agency Rev. (Suffolk University), 5%, 7/01/2033 | | | 605,000 | | | | 684,678 | |
| Massachusetts Development Finance Agency Rev. (Suffolk University), 5%, 7/01/2034 | | | 710,000 | | | | 801,391 | |
| Massachusetts Development Finance Agency Rev. (UMass Memorial Health Care Obligated Group), ”I“, 5%, 7/01/2036 | | | 1,440,000 | | | | 1,536,667 | |
| Massachusetts Development Finance Agency Rev. (UMass Memorial Health Care Obligated Group), ”K“, 5%, 7/01/2038 | | | 1,300,000 | | | | 1,382,329 | |
| Massachusetts Development Finance Agency Rev. (Wellforce), ”A“, 4%, 7/01/2044 | | | 2,240,000 | | | | 2,248,826 | |
| Massachusetts Development Finance Agency Rev. (Wellforce), ”A“, 5%, 7/01/2044 | | | 935,000 | | | | 1,049,911 | |
| Massachusetts Development Finance Agency Rev. (Wentworth Institute of Technology Issue), 5%, 10/01/2046 | | | 1,145,000 | | | | 1,252,092 | |
| Massachusetts Development Finance Agency, Solid Waste Disposal Rev. (Waste Management, Inc. Project), 2.15%, 5/01/2027 (Put Date 5/01/2020) | | | 3,180,000 | | | | 3,180,191 | |
| Massachusetts Educational Financing Authority, Education Loan Rev., ”B“, 3%, 7/01/2035 | | | 4,210,000 | | | | 4,334,279 | |
| Massachusetts Educational Financing Authority, Education Loan Rev., ”C“, 4.125%, 7/01/2046 | | | 6,960,000 | | | | 7,427,782 | |
| Massachusetts Educational Financing Authority, Education Loan Rev., ”C“, 3.75%, 7/01/2047 | | | 9,170,000 | | | | 9,427,402 | |
| Massachusetts Educational Financing Authority, Education Loan Rev.,”I-A“, 5.5%, 1/01/2022 | | | 225,000 | | | | 225,257 | |
| Massachusetts Educational Financing Authority, Education Loan Rev., ”J“, 5%, 7/01/2021 | | | 1,255,000 | | | | 1,309,241 | |
| Massachusetts Educational Financing Authority, Education Loan Rev., ”J“, 4.7%, 7/01/2026 | | | 830,000 | | | | 860,021 | |
| Massachusetts Educational Financing Authority, Education Loan Rev., ”J“, 4.9%, 7/01/2028 | | | 860,000 | | | | 892,955 | |
| Massachusetts Educational Financing Authority, Education Loan Rev., ”J“, 3.5%, 7/01/2033 (u) | | | 9,855,000 | | | | 10,226,731 | |
Massachusetts Educational Financing Authority, Education Loan Rev., ”J“, 3.5%, 7/01/2033 | | | 1,235,000 | | | | 1,281,584 | |
| Massachusetts Educational Financing Authority, Education Loan Rev., ”K“, 5.25%, 7/01/2029 | | | 2,095,000 | | | | 2,222,795 | |
50
Portfolio of Investments – continued
| | | | | | | | |
| | |
| Issuer | | Shares/Par | | | Value ($) | |
| Municipal Bonds - continued | | | | | | |
| Massachusetts - continued | | | | | | |
| Massachusetts Educational Financing Authority, Education Loan Rev., ”K“, 3.625%, 7/01/2032 | | $ | 7,510,000 | | | $ | 7,428,967 | |
| Massachusetts Port Authority Rev., ”A“, 5%, 7/01/2037 | | | 470,000 | | | | 503,281 | |
| Massachusetts Port Authority Rev., ”A“, 5%, 7/01/2037 | | | 3,915,000 | | | | 4,749,913 | |
| Massachusetts Port Authority Rev., ”A“, 5%, 7/01/2038 | | | 4,915,000 | | | | 5,941,055 | |
| Massachusetts Port Authority Rev., ”A“, 5%, 7/01/2039 | | | 7,975,000 | | | | 9,619,844 | |
| Massachusetts Port Authority Special Facilities Rev. (BOSFuel Project), ”A“, 5%, 7/01/2035 | | | 500,000 | | | | 595,430 | |
| Massachusetts Port Authority Special Facilities Rev. (BOSFuel Project), ”A“, 5%, 7/01/2036 | | | 1,000,000 | | | | 1,186,860 | |
| Massachusetts Port Authority Special Facilities Rev. (BOSFuel Project), ”A“, 5%, 7/01/2037 | | | 1,435,000 | | | | 1,700,504 | |
| Massachusetts Port Authority Special Facilities Rev. (BOSFuel Project), ”A“, 5%, 7/01/2038 | | | 180,000 | | | | 212,355 | |
| Massachusetts Port Authority Special Facilities Rev. (ConRAC Project), ”A“, 5.125%, 7/01/2041 | | | 465,000 | | | | 482,889 | |
| Massachusetts Water Resources Authority Rev., ”B“, AGM, 5.25%, 8/01/2029 | | | 4,215,000 | | | | 5,558,278 | |
| University of Massachusetts Building Authority Rev.,”2017-3“, 5%, 11/01/2036 | | | 8,895,000 | | | | 10,921,637 | |
| | | | | | | | |
| | | | | | | $ | 175,306,804 | |
| Michigan - 2.1% | | | | | | |
| Detroit, MI, Downtown Development Authority Tax Increment Rev. (Catalyst Development), ”A“, AGM, 5%, 7/01/2043 | | $ | 1,565,000 | | | $ | 1,724,880 | |
| Detroit, MI, Water & Sewerage Department, Senior Lien Sewage Disposal System Rev., ”A“, 5%, 7/01/2020 | | | 1,725,000 | | | | 1,740,922 | |
| Detroit, MI, Water & Sewerage Department, Senior Lien Sewage Disposal System Rev., ”A“, 5.25%, 7/01/2039 | | | 5,920,000 | | | | 6,347,247 | |
| Detroit, MI, Water Supply System Rev., Senior Lien, ”A“, 5%, 7/01/2036 | | | 295,000 | | | | 308,051 | |
| Detroit, MI, Water Supply System Rev., Senior Lien, ”C“, 5%, 7/01/2041 | | | 410,000 | | | | 424,559 | |
| Downriver, MI, Utility Wastewater Authority, Sewer System Rev., AGM, 5%, 4/01/2036 | | | 505,000 | | | | 604,354 | |
| Downriver, MI, Utility Wastewater Authority, Sewer System Rev., AGM, 5%, 4/01/2038 | | | 460,000 | | | | 547,170 | |
| Downriver, MI, Utility Wastewater Authority, Sewer System Rev., AGM, 5%, 4/01/2043 | | | 815,000 | | | | 963,591 | |
| Eastern Michigan University Board of Regents, General Rev., ”A“, 4%, 3/01/2047 | | | 9,675,000 | | | | 10,261,208 | |
| Great Lakes Water Authority, Michigan Water Supply System Rev., ”B“, BAM, 5%, 7/01/2046 | | | 5,745,000 | | | | 6,736,415 | |
| Great Lakes Water Authority, Michigan Water Supply System Rev., ”D“, 5%, 7/01/2036 | | | 3,155,000 | | | | 3,729,904 | |
51
Portfolio of Investments – continued
| | | | | | | | |
| | |
| Issuer | | Shares/Par | | | Value ($) | |
| Municipal Bonds - continued | | | | | | |
| Michigan - continued | | | | | | |
| Great Lakes Water Authority, Michigan Water Supply System Rev., ”D“, AGM, 5%, 7/01/2034 | | $ | 3,710,000 | | | $ | 4,407,703 | |
| Michigan Building Authority Rev., ”I“, 4%, 10/15/2049 | | | 2,800,000 | | | | 3,145,968 | |
| Michigan Finance Authority (Detroit Financial Recovery Income Tax Rev.), ”F“, 3.875%, 10/01/2023 | | | 685,000 | | | | 724,175 | |
| Michigan Finance Authority (Detroit Financial Recovery Income Tax Rev.), ”F“, 4%, 10/01/2024 | | | 860,000 | | | | 926,409 | |
| Michigan Finance Authority Hospital Rev. (Henry Ford Health System), ”A“, 4%, 11/15/2050 | | | 6,145,000 | | | | 6,348,400 | |
| Michigan Finance Authority Hospital Rev. (Trinity Health Credit Group), 5%, 12/01/2030 | | | 1,000,000 | | | | 1,194,590 | |
| Michigan Finance Authority Hospital Rev. (Trinity Health Credit Group), 5%, 12/01/2031 | | | 2,000,000 | | | | 2,380,540 | |
| Michigan Finance Authority Hospital Rev. (Trinity Health Credit Group), 5%, 12/01/2035 | | | 3,195,000 | | | | 3,371,524 | |
| Michigan Finance Authority Hospital Rev. (Trinity Health Credit Group), 5%, 12/01/2048 | | | 3,690,000 | | | | 4,324,237 | |
| Michigan Finance Authority Hospital Rev. (Trinity Health Credit Group), ”2“, 4%, 12/01/2036 | | | 5,265,000 | | | | 5,897,274 | |
| Michigan Finance Authority Local Government Loan Program Rev. (Detroit Water and Sewerage Department Sewage Disposal System Rev. Refunding Second Lien Local Project), ”C“, 5%, 7/01/2033 | | | 800,000 | | | | 918,608 | |
| Michigan Finance Authority Local Government Loan Program Rev. (Detroit Water and Sewerage Department Sewage Disposal System Rev. Refunding Second Lien Local Project), ”C“, 5%, 7/01/2034 | | | 1,790,000 | | | | 2,053,452 | |
| Michigan Finance Authority Local Government Loan Program Rev. (Detroit Water and Sewerage Department Sewage Disposal System Rev. Refunding Second Lien Local Project), ”C“, 5%, 7/01/2035 | | | 1,155,000 | | | | 1,323,133 | |
| Michigan Finance Authority Local Government Loan Program Rev. (Detroit Water and Sewerage Department Sewage Disposal System Rev. Refunding Second Lien Local Project),”C-7“, NATL, 5%, 7/01/2032 | | | 580,000 | | | | 653,480 | |
| Michigan Finance Authority Local Government Loan Program Rev. (Detroit Water and Sewerage Department Sewage Disposal System Rev. Senior Lien Local Project),”C-1“, 5%, 7/01/2044 | | | 450,000 | | | | 477,252 | |
| Michigan Finance Authority Local Government Loan Program Rev. (Detroit Water and Sewerage Department Water Supply System Rev. Refunding Local Project),”D-2“, 5%, 7/01/2034 | | | 800,000 | | | | 917,744 | |
| Michigan Finance Authority Local Government Loan Program Rev. (Detroit Water and Sewerage Department Water Supply System Rev. Refunding Second Lien Local Project),”D-6“, NATL, 5%, 7/01/2036 | | | 485,000 | | | | 543,913 | |
52
Portfolio of Investments – continued
| | | | | | | | |
| | |
| Issuer | | Shares/Par | | | Value ($) | |
| Municipal Bonds - continued | | | | | | |
| Michigan - continued | | | | | | |
| Michigan Finance Authority Local Government Loan Program Rev. (Detroit Water and Sewerage Department Water Supply System Rev. Refunding Senior Lien Local Project),”D-1“, AGM, 5%, 7/01/2035 | | $ | 240,000 | | | $ | 270,614 | |
| Michigan Finance Authority Local Government Loan Program Rev. (Detroit Water and Sewerage Department Water Supply System Rev. Refunding Senior Lien Local Project),”D-1“, AGM, 5%, 7/01/2037 | | | 570,000 | | | | 640,230 | |
| Michigan Housing Development Authority, ”A“, 4%, 6/01/2046 | | | 1,105,000 | | | | 1,154,073 | |
| Michigan Strategic Fund Ltd. Obligation Rev. (Detroit Edison Co.), 5.625%, 7/01/2020 | | | 985,000 | | | | 995,234 | |
| Michigan Strategic Fund Ltd. Obligation Rev.(I-75 Improvement Project), 5%, 6/30/2048 | | | 5,000,000 | | | | 5,874,600 | |
| Wayne County, MI, Airport Authority Rev. (Detroit Metropolitan Wayne County Airport), ”B“, 5%, 12/01/2044 | | | 1,000,000 | | | | 1,107,910 | |
| Wayne County, MI, Airport Authority Rev. (Detroit Metropolitan Wayne County Airport), ”B“, BAM, 5%, 12/01/2039 | | | 610,000 | | | | 680,376 | |
| Wayne County, MI, Airport Authority Rev. (Detroit Metropolitan Wayne County Airport), ”C“, 5%, 12/01/2039 | | | 470,000 | | | | 516,586 | |
| Wayne County, MI, Airport Authority Rev. (Detroit Metropolitan Wayne County Airport), ”C“, 5%, 12/01/2044 | | | 1,020,000 | | | | 1,115,951 | |
| Wayne County, MI, Airport Authority Rev. (Detroit Metropolitan Wayne County Airport), ”D“, AGM, 5%, 12/01/2040 | | | 7,105,000 | | | | 8,052,452 | |
| Wayne County, MI, Airport Authority Rev. (Detroit Metropolitan Wayne County Airport), “D”, 5%, 12/01/2031 | | | 2,490,000 | | | | 2,958,792 | |
| Wayne County, MI, Airport Authority Rev. (Detroit Metropolitan Wayne County Airport), “D”, 5%, 12/01/2032 | | | 2,580,000 | | | | 3,056,294 | |
| | | | | | | | |
| | | | | | | $ | 99,419,815 | |
| Minnesota - 0.7% | | | | | | |
| Duluth, MN, Economic Development Authority, Health Care Facilities Rev. (Essentia Health), ”A“, 4.25%, 2/15/2043 | | $ | 2,275,000 | | | $ | 2,439,755 | |
| Duluth, MN, Economic Development Authority, Health Care Facilities Rev. (Essentia Health), ”A“, 5%, 2/15/2043 | | | 2,550,000 | | | | 2,943,439 | |
| Duluth, MN, Economic Development Authority, Health Care Facilities Rev. (Essentia Health), ”A“, 4.25%, 2/15/2048 | | | 2,280,000 | | | | 2,433,763 | |
| Duluth, MN, Economic Development Authority, Health Care Facilities Rev. (Essentia Health), ”A“, 5%, 2/15/2048 | | | 2,015,000 | | | | 2,315,255 | |
| Duluth, MN, Independent School District No. 709, ”A“, COP, 5%, 2/01/2025 | | | 240,000 | | | | 278,076 | |
| Duluth, MN, Independent School District No. 709, ”A“, COP, 4%, 3/01/2032 | | | 1,145,000 | | | | 1,078,476 | |
53
Portfolio of Investments – continued
| | | | | | | | |
| | |
| Issuer | | Shares/Par | | | Value ($) | |
| Municipal Bonds - continued | | | | | | |
| Minnesota - continued | | | | | | |
| Duluth, MN, Independent School District No. 709, ”A“, COP, 4.2%, 3/01/2034 | | $ | 305,000 | | | $ | 285,392 | |
| Duluth, MN, Independent School District No. 709, ”B“, COP, 5%, 2/01/2026 | | | 765,000 | | | | 906,969 | |
| Duluth, MN, Independent School District No. 709, ”B“, COP, 5%, 2/01/2028 | | | 225,000 | | | | 277,540 | |
| Minneapolis & St. Paul, MN, Metropolitan Airports Commission Rev., ”C“, 5%, 1/01/2041 | | | 2,500,000 | | | | 2,921,275 | |
| Minneapolis & St. Paul, MN, Metropolitan Airports Commission Rev., ”C“, 5%, 1/01/2046 | | | 3,000,000 | | | | 3,477,090 | |
| Minnesota Housing Finance Agency, Residential Housing, ”A“, 4%, 1/01/2041 | | | 855,000 | | | | 889,952 | |
| Minnesota Office of Higher Education Supplemental Student Loan Program Rev., 4%, 11/01/2037 (u) | | | 5,895,000 | | | | 6,387,115 | |
| Minnesota Office of Higher Education Supplemental Student Loan Program Rev., 2.65%, 11/01/2038 | | | 3,570,000 | | | | 3,421,345 | |
| St. Paul, MN, Housing & Redevelopment Authority Charter School Lease Rev. (Great River School Project), ”A“, 5.5%, 7/01/2052 | | | 240,000 | | | | 225,216 | |
| University of Minnesota, ”A“, 5%, 12/01/2025 (Prerefunded 12/01/2021) | | | 710,000 | | | | 755,887 | |
| | | | | | | | |
| | | | | | | $ | 31,036,545 | |
| Mississippi - 1.2% | | | | | | |
| Lowndes County, MS, Solid Waste Disposal & Pollution Control Rev. (Weyerhaeuser Co.), 6.8%, 4/01/2022 | | $ | 1,750,000 | | | $ | 1,859,760 | |
| Mississippi Development Bank Special Obligation (City of Jackson Water and Sewer System Rev. Bond Project), AGM, 6.875%, 12/01/2040 | | | 495,000 | | | | 584,432 | |
| Mississippi Development Bank Special Obligation (Harrison County Coliseum), ”A“, 5.25%, 1/01/2034 | | | 2,455,000 | | | | 3,283,636 | |
| Mississippi Development Bank Special Obligation (Vicksburg Warren School District General Obligation Project), BAM, 5%, 3/01/2048 | | | 4,000,000 | | | | 4,797,680 | |
| Mississippi Home Corp. Single Family Mortgage Rev., ”A“, 4%, 12/01/2044 | | | 1,880,000 | | | | 2,019,910 | |
| Mississippi Hospital Equipment & Facilities Authority Rev. (Baptist Memorial Healthcare), ”A“, 5%, 9/01/2022 | | | 1,445,000 | | | | 1,541,786 | |
| Mississippi Hospital Equipment & Facilities Authority Rev. (Baptist Memorial Healthcare), ”A“, 5%, 9/01/2023 | | | 3,560,000 | | | | 3,890,119 | |
| Mississippi Hospital Equipment & Facilities Authority Rev. (Baptist Memorial Healthcare), ”A“, 5%, 9/01/2046 | | | 1,905,000 | | | | 1,964,646 | |
| Mississippi Hospital Equipment & Facilities Authority Rev. (Forrest County General Hospital Refunding Project), ”A“, 4%, 1/01/2036 | | | 845,000 | | | | 948,453 | |
54
Portfolio of Investments – continued
| | | | | | | | |
| | |
| Issuer | | Shares/Par | | | Value ($) | |
| Municipal Bonds - continued | | | | | | |
| Mississippi - continued | | | | | | |
| Mississippi Hospital Equipment & Facilities Authority Rev. (Forrest County General Hospital Refunding Project), ”A“, 4%, 1/01/2037 | | $ | 760,000 | | | $ | 851,056 | |
| Mississippi Hospital Equipment & Facilities Authority Rev. (Forrest County General Hospital Refunding Project), ”A“, 4%, 1/01/2039 | | | 760,000 | | | | 844,983 | |
| Mississippi Hospital Equipment & Facilities Authority Rev. (Forrest County General Hospital Refunding Project), ”A“, 4%, 1/01/2040 | | | 425,000 | | | | 471,499 | |
| Mississippi Hospital Equipment & Facilities Authority Rev. (North Mississippi Health Services), ”IV“, 5%, 10/01/2033 (w) | | | 350,000 | | | | 434,847 | |
| Mississippi Hospital Equipment & Facilities Authority Rev. (North Mississippi Health Services), ”IV“, 5%, 10/01/2035 (w) | | | 1,200,000 | | | | 1,478,088 | |
| Mississippi Hospital Equipment & Facilities Authority Rev. (North Mississippi Health Services), ”IV“, 5%, 10/01/2039 (w) | | | 850,000 | | | | 1,034,934 | |
| Mississippi State University, Educational Building Corp. Rev. (Mississippi State University Refunding and Improvements Project), 5.25%, 8/01/2038 (Prerefunded 8/01/2023) | | | 1,250,000 | | | | 1,418,725 | |
| State of Mississippi, ”B“, 5%, 12/01/2025 | | | 585,000 | | | | 703,076 | |
| State of Mississippi, ”B“, 5%, 12/01/2032 | | | 2,500,000 | | | | 3,023,700 | |
| State of Mississippi, ”B“, 5%, 12/01/2033 | | | 2,500,000 | | | | 3,017,050 | |
| State of Mississippi, ”B“, 5%, 12/01/2034 | | | 5,000,000 | | | | 6,017,950 | |
| University of Southern Mississippi, Educational Building Corp. Rev. (Facilities Refinancing Project), ”A“, 5%, 3/01/2028 | | | 1,080,000 | | | | 1,259,096 | |
| West Rankin, MS, Utility Authority Rev., AGM, 5%, 1/01/2043 | | | 6,615,000 | | | | 7,814,366 | |
| West Rankin, MS, Utility Authority Rev., AGM, 5%, 1/01/2048 | | | 5,750,000 | | | | 6,739,230 | |
| | | | | | | | |
| | | | | | | $ | 55,999,022 | |
| Missouri - 1.1% | | | | | | |
| Kansas City, MO, Industrial Development Authority, Airport Rev. (Kansas City International Airport Terminal Modernization Project), ”B“, 5%, 3/01/2055 | | $ | 5,675,000 | | | $ | 6,358,157 | |
| Kansas City, MO, Land Clearance for Redevelopment Authority Rev. (Convention Center Hotel Project - TIF Financing), ”B“, 5%, 2/01/2040 | | | 160,000 | | | | 163,314 | |
| Kansas City, MO, Land Clearance for Redevelopment Authority Rev. (Convention Center Hotel Project - TIF Financing), ”B“, 5%, 2/01/2050 | | | 275,000 | | | | 277,109 | |
| Missouri Health & Educational Facilities Authority Rev. (A.T. Still University Health Services), 5%, 10/01/2039 | | | 730,000 | | | | 827,141 | |
| Missouri Health & Educational Facilities Authority Rev. (Mercy Health), ”A“, 5%, 6/01/2030 | | | 5,000,000 | | | | 6,178,900 | |
| Missouri Health & Educational Facilities Authority Rev. (Mercy Health), ”A“, 5%, 6/01/2031 | | | 3,165,000 | | | | 3,884,215 | |
| Missouri Health & Educational Facilities Authority Rev. (Mosaic Health System), ”A“, 4%, 2/15/2044 | | | 2,300,000 | | | | 2,537,245 | |
55
Portfolio of Investments – continued
| | | | | | | | |
| | |
| Issuer | | Shares/Par | | | Value ($) | |
| Municipal Bonds - continued | | | | | | |
| Missouri - continued | | | | | | |
| Missouri Health & Educational Facilities Authority Rev. (Mosaic Health System), ”A“, 4%, 2/15/2049 | | $ | 5,000,000 | | | $ | 5,370,500 | |
| Missouri Health & Educational Facilities Authority Rev. (Mosaic Health System), ”A“, 4%, 2/15/2054 | | | 9,550,000 | | | | 10,021,865 | |
| Missouri Health & Educational Facilities Authority Rev. (SSM Health Care), ”A“, 5%, 6/01/2031 | | | 2,615,000 | | | | 2,959,840 | |
| Missouri Housing Development Commission, Single Family Mortgage Rev. (First Place Homeownership Loan Program), ”A“, 3.75%, 5/01/2038 | | | 730,000 | | | | 757,682 | |
| Missouri Housing Development Commission, Single Family Mortgage Rev. (First Place Homeownership Loan Program), ”A“, FNMA, 4.25%, 5/01/2049 | | | 6,020,000 | | | | 6,509,245 | |
| Missouri Housing Development Commission, Single Family Mortgage Rev. (First Place Homeownership Loan Program), ”B“, FNMA, 4.75%, 5/01/2049 | | | 3,100,000 | | | | 3,419,641 | |
| St. Louis County, MO, Industrial Development Authority Health Facilities Rev. (Nazareth Living Center), ”A“, 5%, 8/15/2030 | | | 140,000 | | | | 140,843 | |
| St. Louis County, MO, Industrial Development Authority Health Facilities Rev. (Nazareth Living Center), ”A“, 5%, 8/15/2035 | | | 95,000 | | | | 94,491 | |
| St. Louis County, MO, Industrial Development Authority Health Facilities Rev. (Nazareth Living Center), ”A“, 5.125%, 8/15/2045 | | | 260,000 | | | | 252,616 | |
| St. Louis, MO, Industrial Development Authority Financing Rev. (Ballpark Village Development Project), ”A“, 3.875%, 11/15/2029 | | | 200,000 | | | | 199,674 | |
| St. Louis, MO, Industrial Development Authority Financing Rev. (Ballpark Village Development Project), ”A“, 4.375%, 11/15/2035 | | | 735,000 | | | | 735,595 | |
| St. Louis, MO, Industrial Development Authority Financing Rev. (Ballpark Village Development Project), ”A“, 4.75%, 11/15/2047 | | | 2,290,000 | | | | 2,302,801 | |
| | | | | | | | |
| | | | | | | $ | 52,990,874 | |
| Montana - 0.0% | | | | | | |
| Montana Board of Housing Single Family Program (Federally Insured or Guaranteed Mortgage Loans), ”A“, 4%, 6/01/2049 | | $ | 1,035,000 | | | $ | 1,103,248 | |
| Montana Board of Housing Single Family Program (Federally Insured or Guaranteed Mortgage Loans),”A-2“, 3%, 12/01/2043 | | | 980,000 | | | | 999,345 | |
| | | | | | | | |
| | | | | | | $ | 2,102,593 | |
| Nebraska - 0.3% | | | | | | |
| Central Plains Energy Project, NE, Gas Project Rev. (Project No. 3), ”A“, 5%, 9/01/2034 | | $ | 850,000 | | | $ | 1,009,562 | |
| Douglas County, NE, Educational Facilities Refunding Rev. (Creighton University), ”A“, 5.875%, 7/01/2040 (Prerefunded 7/01/2020) | | | 6,355,000 | | | | 6,429,099 | |
| Nebraska Investment Finance Authority, Single Family Housing Rev., ”A“, 4%, 9/01/2044 | | | 1,245,000 | | | | 1,303,851 | |
56
Portfolio of Investments – continued
| | | | | | | | |
| | |
| Issuer | | Shares/Par | | | Value ($) | |
| Municipal Bonds - continued | | | | | | |
| Nebraska - continued | | | | | | |
| Nebraska Investment Finance Authority, Single Family Housing Rev., ”C“, 4%, 9/01/2048 (u) | | $ | 4,885,000 | | | $ | 5,243,559 | |
| | | | | | | | |
| | | | | | | $ | 13,986,071 | |
| Nevada - 0.4% | | | | | | |
| Director of the State of Nevada, Department of Business and Industry, Charter School Lease Rev. (Somerset Academy), ”A“, 4.5%, 12/15/2029 | | $ | 150,000 | | | $ | 155,409 | |
| Director of the State of Nevada, Department of Business and Industry, Charter School Lease Rev. (Somerset Academy), ”A“, 5%, 12/15/2035 | | | 630,000 | | | | 661,475 | |
| Director of the State of Nevada, Department of Business and Industry, Charter School Lease Rev. (Somerset Academy), ”A“, 5%, 12/15/2038 | | | 305,000 | | | | 318,341 | |
| Director of the State of Nevada, Department of Business and Industry, Charter School Lease Rev. (Somerset Academy), ”A“, 5.125%, 12/15/2045 | | | 760,000 | | | | 789,898 | |
| Director of the State of Nevada, Department of Business and Industry, Charter School Lease Rev. (Somerset Academy), ”A“, 5%, 12/15/2048 | | | 2,745,000 | | | | 2,831,275 | |
| Director of the State of Nevada, Department of Business and Industry, Solid Waste Disposal Rev. (Republic Services, Inc. Project), 1.47%, 12/01/2026 (Put Date 6/01/2020) | | | 1,800,000 | | | | 1,800,288 | |
| Reno, NV, Sales Tax Rev. (Retrac-Reno Transportation Rail Access Corridor Project), ”B“, AGM, 5%, 6/01/2033 | | | 90,000 | | | | 111,112 | |
| Reno, NV, Sales Tax Rev. (Retrac-Reno Transportation Rail Access Corridor Project), ”B“, AGM, 5%, 6/01/2038 | | | 115,000 | | | | 139,676 | |
| Reno, NV, Sales Tax Rev. (Retrac-Reno Transportation Rail Access Corridor Project), ”B“, AGM, 4%, 6/01/2048 | | | 460,000 | | | | 507,946 | |
| Reno, NV, Sales Tax Rev. (Retrac-Reno Transportation Rail Access Corridor Project), ”B“, AGM, 4.125%, 6/01/2058 | | | 570,000 | | | | 630,865 | |
| Sparks, NV, Tourism Improvement District No. 1 Rev. (Legends at Sparks Marina), ”A“, 2.5%, 6/15/2024 (n) | | | 780,000 | | | | 753,301 | |
| Washoe County, NV, Water Facilities Rev. (Sierra Pacific Power Projects), ”F“, 2.05%, 3/01/2036 (Put Date 4/15/2022) | | | 10,250,000 | | | | 10,284,132 | |
| | | | | | | | |
| | | | | | | $ | 18,983,718 | |
| New Hampshire - 0.6% | | | | | | |
| National Finance Authority, New Hampshire Municipal Certificates, ”A“, 4.125%, 1/20/2034 | | $ | 8,902,316 | | | $ | 9,410,371 | |
| National Finance Authority, New Hampshire Resource Recovery Refunding Rev. (Emerald Renewable Diesel LLC Project), 2%, 6/01/2049 (Put Date 8/31/2020) (n) | | | 9,575,000 | | | | 9,582,468 | |
57
Portfolio of Investments – continued
| | | | | | | | |
| | |
| Issuer | | Shares/Par | | | Value ($) | |
| Municipal Bonds - continued | | | | | | |
| New Hampshire - continued | | | | | | |
| New Hampshire Health & Education Facilities Authority Rev. (Dartmouth-Hitchcock Obligated Group), ”A“, 5%, 8/01/2059 | | $ | 3,460,000 | | | $ | 4,966,311 | |
| New Hampshire Health & Education Facilities Authority Rev. (Memorial Hospital), 5.5%, 6/01/2031 | | | 1,600,000 | | | | 1,905,264 | |
| New Hampshire Health & Education Facilities Authority Rev. (Memorial Hospital), 5.5%, 6/01/2036 | | | 1,595,000 | | | | 1,877,746 | |
| | | | | | | | |
| | | | | | | $ | 27,742,160 | |
| New Jersey - 4.7% | | | | | | |
| Atlantic City, NJ, Tax Appeal Refunding Bonds (Qualified Pursuant to the Provisions of the Municipal Qualified Bond Act), ”A“, BAM, 5%, 3/01/2032 | | $ | 4,925,000 | | | $ | 5,867,103 | |
| Atlantic City, NJ, Tax Appeal Refunding Bonds (Qualified Pursuant to the Provisions of the Municipal Qualified Bond Act), ”A“, BAM, 5%, 3/01/2037 | | | 4,400,000 | | | | 5,171,848 | |
| Atlantic City, NJ, Tax Appeal Refunding Bonds (Qualified Pursuant to the Provisions of the Municipal Qualified Bond Act), ”A“, BAM, 5%, 3/01/2042 | | | 600,000 | | | | 698,676 | |
| Atlantic City, NJ, Tax Appeal Refunding Bonds (Qualified Pursuant to the Provisions of the Municipal Qualified Bond Act), ”B“, AGM, 5%, 3/01/2032 | | | 1,665,000 | | | | 1,983,498 | |
| Atlantic City, NJ, Tax Appeal Refunding Bonds (Qualified Pursuant to the Provisions of the Municipal Qualified Bond Act), ”B“, AGM, 5%, 3/01/2037 | | | 1,670,000 | | | | 1,962,951 | |
| New Jersey Building Authority Rev., Unrefunded Balance, “A”, BAM, 5%, 6/15/2029 | | | 355,000 | | | | 394,252 | |
| New Jersey Casino Reinvestment Development Authority, Luxury Tax Rev., AGM, 5%, 11/01/2029 | | | 555,000 | | | | 615,456 | |
| New Jersey Casino Reinvestment Development Authority, Luxury Tax Rev., AGM, 5%, 11/01/2030 | | | 850,000 | | | | 941,426 | |
| New Jersey Casino Reinvestment Development Authority, Luxury Tax Rev., AGM, 5%, 11/01/2031 | | | 555,000 | | | | 614,191 | |
| New Jersey Casino Reinvestment Development Authority, Luxury Tax Rev., AGM, 5%, 11/01/2032 | | | 555,000 | | | | 613,686 | |
| New Jersey Economic Development Authority Rev. (Goethals Bridge Replacement Project), 5.5%, 1/01/2027 | | | 470,000 | | | | 504,597 | |
| New Jersey Economic Development Authority Rev. (Goethals Bridge Replacement Project), 5%, 1/01/2028 | | | 470,000 | | | | 495,380 | |
| New Jersey Economic Development Authority Rev. (Goethals Bridge Replacement Project), AGM, 5%, 1/01/2031 | | | 1,415,000 | | | | 1,481,265 | |
| New Jersey Economic Development Authority Rev. (Goethals Bridge Replacement Project), AGM, 5.125%, 1/01/2039 | | | 870,000 | | | | 901,546 | |
| New Jersey Economic Development Authority Rev. (Goethals Bridge Replacement Project), AGM, 5.125%, 7/01/2042 | | | 435,000 | | | | 449,246 | |
58
Portfolio of Investments – continued
| | | | | | | | |
| | |
| Issuer | | Shares/Par | | | Value ($) | |
| Municipal Bonds - continued | | | | | | |
| New Jersey - continued | | | | | | |
New Jersey Economic Development Authority Rev. (Provident Group - Montclair Properties LLC - Montclair State University Student Housing Project), ASSD GTY, 5%, 6/01/2037 | | $ | 1,970,000 | | | $ | 2,325,368 | |
| New Jersey Economic Development Authority Rev. (Provident Group - Montclair Properties LLC - Montclair State University Student Housing Project), ASSD GTY, 5%, 6/01/2042 | | | 2,190,000 | | | | 2,559,694 | |
| New Jersey Economic Development Authority Rev. (Provident Group - Rowan Properties LLC - Rowan University Student Housing Project), ”A“, 5%, 1/01/2030 | | | 1,095,000 | | | | 1,149,016 | |
| New Jersey Economic Development Authority Rev. (Provident Group - Rowan Properties LLC - Rowan University Student Housing Project), ”A“, 5%, 1/01/2035 | | | 1,570,000 | | | | 1,630,728 | |
| New Jersey Economic Development Authority Rev., School Facilities Construction, ”DDD“, 5%, 6/15/2034 | | | 610,000 | | | | 646,746 | |
| New Jersey Economic Development Authority Rev., School Facilities Construction, ”DDD“, 5%, 6/15/2035 | | | 510,000 | | | | 539,131 | |
| New Jersey Economic Development Authority Rev., School Facilities Construction, ”DDD“, 5%, 6/15/2042 | | | 2,855,000 | | | | 2,975,767 | |
| New Jersey Economic Development Authority Rev., School Facilities Construction, ”NN“, 5%, 3/01/2027 | | | 4,135,000 | | | | 4,312,598 | |
| New Jersey Economic Development Authority, Special Facilities Rev. (Continental Airlines, Inc.), 5.25%, 9/15/2029 | | | 3,650,000 | | | | 3,618,391 | |
| New Jersey Economic Development Authority, Special Facilities Rev. (Continental Airlines, Inc.), ”A“, 5.625%, 11/15/2030 | | | 4,050,000 | | | | 4,013,874 | |
| New Jersey Economic Development Authority, State Lease Rev. (Juvenile Justice Commission Facilities Project), ”C“, 5%, 6/15/2042 | | | 3,385,000 | | | | 3,536,614 | |
| New Jersey Economic Development Authority, Water Facilities Rev. (Middlesex Water Co.), 5%, 8/01/2059 | | | 1,595,000 | | | | 1,907,062 | |
| New Jersey Economic Development Motor Vehicle Surcharges Subordinate Refunding Rev., ”A“, 3.125%, 7/01/2029 | | | 1,385,000 | | | | 1,330,209 | |
| New Jersey Economic Development Motor Vehicle Surcharges Subordinate Refunding Rev., ”A“, 3.125%, 7/01/2031 (u) | | | 8,400,000 | | | | 8,403,444 | |
| New Jersey Economic Development Motor Vehicle Surcharges Subordinate Refunding Rev., ”A“, 5%, 7/01/2033 | | | 485,000 | | | | 515,652 | |
| New Jersey Economic Development Motor Vehicle Surcharges Subordinate Refunding Rev., ”A“, BAM, 5%, 7/01/2027 | | | 1,105,000 | | | | 1,271,280 | |
| New Jersey Economic Development Motor Vehicle Surcharges Subordinate Refunding Rev., ”A“, BAM, 5%, 7/01/2028 | | | 9,240,000 | | | | 10,539,976 | |
| New Jersey Health Care Facilities, Financing Authority Rev. (University Hospital), ”A“, AGM, 5%, 7/01/2046 | | | 5,485,000 | | | | 5,776,144 | |
| New Jersey Health Care Facilities, Financing Authority, State Contract Refunding Bonds (Hospital Asset Transformation Program), 5%, 10/01/2031 | | | 2,105,000 | | | | 2,273,758 | |
59
Portfolio of Investments – continued
| | | | | | | | |
| | |
| Issuer | | Shares/Par | | | Value ($) | |
| Municipal Bonds - continued | | | | | | |
| New Jersey - continued | | | | | | |
| New Jersey Health Care Facilities, Financing Authority, State Contract Refunding Bonds (Hospital Asset Transformation Program), 5%, 10/01/2032 | | $ | 2,100,000 | | | $ | 2,255,883 | |
| New Jersey Health Care Facilities, Financing Authority, State Contract Refunding Bonds (Hospital Asset Transformation Program), 5%, 10/01/2033 | | | 1,775,000 | | | | 1,895,895 | |
| New Jersey Health Care Facilities, Financing Authority, State Contract Refunding Bonds (Hospital Asset Transformation Program), 5%, 10/01/2034 | | | 1,785,000 | | | | 1,900,936 | |
| New Jersey Health Care Facilities, Financing Authority, State Contract Refunding Bonds (Hospital Asset Transformation Program), 5%, 10/01/2035 | | | 1,575,000 | | | | 1,671,957 | |
| New Jersey Health Care Facilities, Financing Authority, State Contract Refunding Bonds (Hospital Asset Transformation Program), 5%, 10/01/2036 | | | 1,835,000 | | | | 1,942,641 | |
| New Jersey Health Care Facilities, Financing Authority, State Contract Refunding Bonds (Hospital Asset Transformation Program), 5%, 10/01/2037 | | | 3,040,000 | | | | 3,208,750 | |
| New Jersey Higher Education Student Assistance Authority, Senior Student Loan Rev., ”1B“, 2.95%, 12/01/2028 | | | 6,160,000 | | | | 6,100,125 | |
| New Jersey Higher Education Student Assistance Authority, Senior Student Loan Rev., ”B“, 3.25%, 12/01/2039 | | | 5,690,000 | | | | 5,774,155 | |
| New Jersey Housing & Mortgage Finance Agency, Single Family Housing Rev., ”C“, 4.75%, 10/01/2050 (u) | | | 10,220,000 | | | | 11,319,877 | |
| New Jersey Tobacco Settlement Financing Corp., ”A“, 5%, 6/01/2032 | | | 3,000,000 | | | | 3,296,940 | |
| New Jersey Tobacco Settlement Financing Corp., ”A“, 5%, 6/01/2033 | | | 3,000,000 | | | | 3,290,310 | |
| New Jersey Tobacco Settlement Financing Corp., ”A“, 5%, 6/01/2034 | | | 3,000,000 | | | | 3,274,830 | |
| New Jersey Tobacco Settlement Financing Corp., ”A“, 5%, 6/01/2035 | | | 2,950,000 | | | | 3,203,818 | |
| New Jersey Transportation Trust Fund Authority, ”B“, AAC, 5.5%, 9/01/2026 | | | 3,525,000 | | | | 3,944,158 | |
| New Jersey Transportation Trust Fund Authority, Federal Highway Reimbursement Rev., ”A“, 5%, 6/15/2029 | | | 3,420,000 | | | | 3,785,906 | |
| New Jersey Transportation Trust Fund Authority, Federal Highway Reimbursement Rev., ”A“, 5%, 6/15/2031 | | | 2,275,000 | | | | 2,506,754 | |
| New Jersey Transportation Trust Fund Authority, Federal Highway Reimbursement Rev.,”A-1“, 5%, 6/15/2027 | | | 3,985,000 | | | | 4,450,129 | |
| New Jersey Transportation Trust Fund Authority, Transportation System, ”B“, NATL, 5.5%, 12/15/2020 | | | 3,325,000 | | | | 3,390,170 | |
60
Portfolio of Investments – continued
| | | | | | | | |
| | |
| Issuer | | Shares/Par | | | Value ($) | |
| Municipal Bonds - continued | | | | | | |
| New Jersey - continued | | | | | | |
| New Jersey Transportation Trust Fund Authority, Transportation System, ”B“, NATL, 5.5%, 12/15/2021 | | $ | 5,000,000 | | | $ | 5,234,650 | |
| New Jersey Transportation Trust Fund Authority, Transportation System, ”C“, 5%, 6/15/2042 | | | 2,360,000 | | | | 2,470,519 | |
| New Jersey Transportation Trust Fund Authority, Transportation System, Capital Appreciation, ”A“, 0%, 12/15/2037 | | | 25,000,000 | | | | 12,777,750 | |
| New Jersey Transportation Trust Fund Authority, Transportation System, Capital Appreciation, ”C“, AAC, 0%, 12/15/2028 | | | 12,075,000 | | | | 9,367,423 | |
| New Jersey Transportation Trust Fund Authority, Transportation System, Capital Appreciation, ”C“, AAC, 0%, 12/15/2035 | | | 3,725,000 | | | | 2,140,497 | |
| New Jersey Transportation Trust Fund Authority, Transportation System, Capital Appreciation, ”C“, AAC, 0%, 12/15/2036 | | | 9,720,000 | | | | 5,304,787 | |
| New Jersey Transportation Trust Fund Authority, Transportation System, Capital Appreciation, ”C“, AGM, 0%, 12/15/2029 | | | 15,690,000 | | | | 11,979,943 | |
| New Jersey Transportation Trust Fund Authority, Transportation System, Capital Appreciation, ”C“, AGM, 0%, 12/15/2032 | | | 3,345,000 | | | | 2,295,306 | |
| New Jersey Transportation Trust Fund Authority, Transportation System, Capital Appreciation, ”C“, NATL, 0%, 12/15/2027 | | | 6,900,000 | | | | 5,579,961 | |
| New Jersey Transportation Trust Fund Authority, Transportation System, Capital Appreciation, ”C“, NATL, 0%, 12/15/2031 | | | 5,000,000 | | | | 3,482,750 | |
| South Jersey, NJ, Transportation Authority System Rev., ”A“, AGM, 5%, 11/01/2031 | | | 1,290,000 | | | | 1,615,686 | |
| South Jersey, NJ, Transportation Authority System Rev., ”A“, AGM, 5%, 11/01/2032 | | | 2,530,000 | | | | 3,155,517 | |
| South Jersey, NJ, Transportation Authority System Rev., ”A“, AGM, 5%, 11/01/2033 | | | 725,000 | | | | 901,610 | |
| | | | | | | | |
| | | | | | | $ | 215,540,206 | |
| New Mexico - 0.4% | | | | | | |
| Albuquerque, NM, Bernalillo County Water Utility Authority (Joint Water and Sewer System Improvement Rev.), 5%, 7/01/2033 | | $ | 2,300,000 | | | $ | 2,844,341 | |
| Farmington, NM, Pollution Control Rev. (Public Service New Mexico), ”D“, 5.9%, 6/01/2040 | | | 9,975,000 | | | | 9,990,262 | |
| New Mexico Mortgage Finance Authority, Single Family Mortgage Program,”A-1“, FNMA, 4%, 1/01/2049 | | | 1,640,000 | | | | 1,762,475 | |
| New Mexico Mortgage Finance Authority, Single Family Mortgage Program, ”C“, FNMA, 4%, 1/01/2049 | | | 3,310,000 | | | | 3,552,259 | |
| Santa Fe, NM, Retirement Facility Rev. (El Castillo Retirement Residences Project), ”A“, 5%, 5/15/2034 | | | 270,000 | | | | 270,181 | |
| Santa Fe, NM, Retirement Facility Rev. (El Castillo Retirement Residences Project), ”A“, 5%, 5/15/2039 | | | 205,000 | | | | 200,301 | |
| Santa Fe, NM, Retirement Facility Rev. (El Castillo Retirement Residences Project), ”A“, 5%, 5/15/2044 | | | 215,000 | | | | 205,138 | |
61
Portfolio of Investments – continued
| | | | | | | | |
| | |
| Issuer | | Shares/Par | | | Value ($) | |
| Municipal Bonds - continued | | | | | | |
| New Mexico - continued | | | | | | |
| Santa Fe, NM, Retirement Facility Rev. (El Castillo Retirement Residences Project), ”A“, 5%, 5/15/2049 | | $ | 565,000 | | | $ | 531,196 | |
| | | | | | | | |
| | | | | | | $ | 19,356,153 | |
| New York - 3.2% | | | | | | |
| Build NYC Resource Corp. Rev. (Albert Einstein School of Medicine, Inc.), 5.5%, 9/01/2045 | | $ | 5,830,000 | | | $ | 6,245,854 | |
| Glen Cove, NY, Local Economic Assistance Corp. (Garvies Point Public Improvement Project), Convertible Capital Appreciation, ”C“, 0% to 1/01/2024, 5.625% to 1/01/2055 | | | 1,610,000 | | | | 1,384,294 | |
| Hempstead, NY, Local Development Corp. Rev. (Hofstra University Project), 5%, 7/01/2025 | | | 1,450,000 | | | | 1,514,699 | |
| Hempstead, NY, Local Development Corp. Rev. (Hofstra University Project), 5%, 7/01/2026 | | | 1,080,000 | | | | 1,128,190 | |
| Hudson Yards, NY, Infrastructure Corp. Rev., ”A“, 5.75%, 2/15/2047 (Prerefunded 2/15/2021) | | | 2,450,000 | | | | 2,547,608 | |
| Hudson Yards, NY, Infrastructure Corp. Rev., ”A“, Unrefunded Balance, 5.75%, 2/15/2047 | | | 1,500,000 | | | | 1,551,780 | |
| Metropolitan Transportation Authority Rev., NY, Anticipation Note,”B-1B“, 5%, 5/15/2020 | | | 7,670,000 | | | | 7,670,920 | |
| Metropolitan Transportation Authority Rev., NY, Anticipation Note,”B-1C“, 5%, 5/15/2020 | | | 1,835,000 | | | | 1,835,220 | |
| New York Dormitory Authority Rev. (Cornell University), ”D“, 5%, 7/01/2034 | | | 3,000,000 | | | | 4,160,850 | |
| New York Dormitory Authority Rev. (Cornell University), ”D“, 5%, 7/01/2035 | | | 590,000 | | | | 825,593 | |
| New York Dormitory Authority Rev. (Orange Regional Medical Center Obligated Group Rev.), 5%, 12/01/2033 | | | 100,000 | | | | 114,653 | |
| New York Dormitory Authority Rev. (Orange Regional Medical Center Obligated Group Rev.), 5%, 12/01/2035 | | | 200,000 | | | | 226,604 | |
| New York Dormitory Authority Rev. (Rochester Institute of Technology), ”A“, 5%, 7/01/2032 (w) | | | 520,000 | | | | 662,532 | |
| New York Dormitory Authority Rev. (Rochester Institute of Technology), ”A“, 5%, 7/01/2036 (w) | | | 1,115,000 | | | | 1,397,909 | |
| New York Dormitory Authority Rev. (Rochester Institute of Technology), ”A“, 5%, 7/01/2040 (w) | | | 1,265,000 | | | | 1,568,752 | |
| New York Dormitory Authority Rev., State Personal Income Tax, ”A“, 5%, 12/15/2025 | | | 5,000,000 | | | | 5,481,400 | |
| New York Energy Research & Development Authority Pollution Control Rev. (New York Electric & Gas Corp. Project), ”C“, 2%, 6/01/2029 (Put Date 5/01/2020) | | | 3,485,000 | | | | 3,485,941 | |
| New York Environmental Facilities Corp., State Revolving Funds Rev., ”C“, 5%, 5/15/2041 | | | 2,745,000 | | | | 2,851,094 | |
62
Portfolio of Investments – continued
| | | | | | | | |
| | |
| Issuer | | Shares/Par | | | Value ($) | |
| Municipal Bonds - continued | | | | | | |
| New York - continued | | | | | | |
| New York Liberty Development Corp. Rev. (Goldman Sachs Headquarters), 5.25%, 10/01/2035 | | $ | 11,660,000 | | | $ | 14,369,551 | |
| New York Liberty Development Corp., Liberty Rev. (3 World Trade Center Project), ”1“, 5%, 11/15/2044 | | | 16,005,000 | | | | 16,221,388 | |
| New York Liberty Development Corp., Liberty Rev. (3 World Trade Center Project), ”2“, 5.375%, 11/15/2040 | | | 3,190,000 | | | | 3,295,685 | |
| New York Liberty Development Corp., Liberty Rev. (4 World Trade Center Project), 5%, 11/15/2031 | | | 2,300,000 | | | | 2,438,989 | |
| New York Mortgage Agency Rev., ”54“, 4%, 4/01/2047 | | | 3,675,000 | | | | 3,897,411 | |
| New York Mortgage Agency Rev., “208”, 4%, 10/01/2048 | | | 6,855,000 | | | | 7,285,837 | |
| New York Transportation Development Corp., Special Facilities Rev. (American Airlines, Inc. John F. Kennedy International Airport Project), 5%, 8/01/2026 | | | 1,490,000 | | | | 1,482,714 | |
| New York Transportation Development Corp., Special Facilities Rev. (American Airlines, Inc. John F. Kennedy International Airport Project), 5%, 8/01/2031 | | | 765,000 | | | | 759,722 | |
| New York Transportation Development Corp., Special Facilities Rev. (Delta Airlines, Inc. LaGuardia Airport Terminals C&D Redevelopment Project), 5%, 1/01/2031 | | | 8,135,000 | | | | 8,080,984 | |
| New York Transportation Development Corp., Special Facilities Rev. (Delta Airlines, Inc. LaGuardia Airport Terminals C&D Redevelopment Project), 5%, 1/01/2032 | | | 2,330,000 | | | | 2,303,345 | |
| New York Transportation Development Corp., Special Facilities Rev. (Delta Airlines, Inc. LaGuardia Airport Terminals C&D Redevelopment Project), 4%, 1/01/2036 | | | 1,315,000 | | | | 1,242,123 | |
| New York Urban Development Corp., State Personal Income Tax Rev., ”C“, 5%, 3/15/2034 | | | 1,455,000 | | | | 1,774,372 | |
| New York, NY,”B-1“, 5%, 12/01/2041 | | | 3,500,000 | | | | 4,133,220 | |
| New York, NY, City Housing Development Corp., Multi-Family Housing Rev. (8 Spruce Street), ”F“, 4.5%, 2/15/2048 | | | 5,574,420 | | | | 5,968,754 | |
| New York, NY, City Transitional Finance Authority Building Aid Rev.,”S-3“, 5%, 7/15/2043 | | | 1,025,000 | | | | 1,240,086 | |
| New York, NY, Industrial Development Agency, Airport Facilities Rev. (Transportation Infrastructure Properties LLC), 5%, 7/01/2028 | | | 1,570,000 | | | | 1,622,516 | |
| New York, NY, Municipal Water Finance Authority, Water & Sewer System Rev.,”CC-1“, 5%, 6/15/2046 | | | 7,000,000 | | | | 8,142,960 | |
| Port Authority of NY & NJ (214th Series), 4%, 9/01/2037 | | | 1,065,000 | | | | 1,161,638 | |
| Port Authority of NY & NJ (214th Series), 4%, 9/01/2038 | | | 1,065,000 | | | | 1,156,590 | |
| Port Authority of NY & NJ (214th Series), 4%, 9/01/2039 | | | 920,000 | | | | 996,461 | |
| Port Authority of NY & NJ (214th Series), 4%, 9/01/2043 | | | 1,485,000 | | | | 1,596,078 | |
| Port Authority of NY & NJ, Special Obligation Rev. (JFK International Air Terminal LLC), 6%, 12/01/2036 | | | 2,315,000 | | | | 2,378,848 | |
| Poughkeepsie, NY, Anticipation Notes, ”A“, 3%, 5/02/2020 | | | 900,000 | | | | 900,954 | |
63
Portfolio of Investments – continued
| | | | | | | | |
| | |
| Issuer | | Shares/Par | | | Value ($) | |
| Municipal Bonds - continued | | | | | | |
| New York - continued | | | | | | |
| Syracuse, NY, Industrial Development Agency PILOT Rev. (Carousel Center Project), ”A“, 5%, 1/01/2029 | | $ | 870,000 | | | $ | 876,847 | |
| Syracuse, NY, Industrial Development Agency PILOT Rev. (Carousel Center Project), ”A“, 5%, 1/01/2030 | | | 2,330,000 | | | | 2,339,017 | |
| Syracuse, NY, Industrial Development Agency PILOT Rev. (Carousel Center Project), ”A“, 5%, 1/01/2033 | | | 1,255,000 | | | | 1,246,704 | |
| Syracuse, NY, Industrial Development Agency PILOT Rev. (Carousel Center Project), ”A“, 5%, 1/01/2036 | | | 275,000 | | | | 269,404 | |
| Tobacco Settlement Asset Securitization Corp., NY, ”A“, 5%, 6/01/2034 | | | 950,000 | | | | 1,043,052 | |
| Tobacco Settlement Asset Securitization Corp., NY, ”A“, 5%, 6/01/2035 | | | 480,000 | | | | 525,293 | |
| Tobacco Settlement Asset Securitization Corp., NY, ”A“, 5%, 6/01/2041 | | | 2,710,000 | | | | 2,837,776 | |
| | | | | | | | |
| | | | | | | $ | 146,242,212 | |
| North Carolina - 1.0% | | | | | | |
| North Carolina Medical Care Commission, Health Care Facilities Rev. (Novant Health Obligated Group), ”A“, 4%, 11/01/2049 | | $ | 3,790,000 | | | $ | 4,089,031 | |
| North Carolina Medical Care Commission, Health Care Facilities Rev. (Novant Health Obligated Group), ”A“, 4%, 11/01/2052 | | | 9,435,000 | | | | 9,911,751 | |
| North Carolina Medical Care Commission, Health Care Facilities Rev. (Pennybyrn at Maryfield), 5%, 10/01/2025 | | | 205,000 | | | | 211,691 | |
| North Carolina Medical Care Commission, Health Care Facilities Rev. (Pennybyrn at Maryfield), 5%, 10/01/2030 | | | 260,000 | | | | 257,491 | |
| North Carolina Medical Care Commission, Health Care Facilities Rev. (Pennybyrn at Maryfield), 5%, 10/01/2035 | | | 285,000 | | | | 266,318 | |
| North Carolina Medical Care Commission, Retirement Facilities First Mortgage Rev. (United Church Homes and Services), ”A“, 5%, 9/01/2037 | | | 100,000 | | | | 98,624 | |
| North Carolina Medical Care Commission, Retirement Facilities First Mortgage Rev. (United Church Homes and Services), ”C“, 5%, 9/01/2041 | | | 370,000 | | | | 354,956 | |
| North Carolina Medical Care Commission, Retirement Facilities First Mortgage Rev. (United Church Homes and Services), ”C“, 5%, 9/01/2046 | | | 1,350,000 | | | | 1,270,796 | |
| North Carolina Turnpike Authority, Monroe Expressway Toll Rev., ”A“, 5%, 7/01/2042 | | | 610,000 | | | | 652,968 | |
| North Carolina Turnpike Authority, Monroe Expressway Toll Rev., ”A“, 5%, 7/01/2047 | | | 1,195,000 | | | | 1,271,719 | |
| North Carolina Turnpike Authority, Monroe Expressway Toll Rev., ”A“, 5%, 7/01/2051 | | | 2,440,000 | | | | 2,589,621 | |
| North Carolina Turnpike Authority, Monroe Expressway Toll Rev., ”A“, 5%, 7/01/2054 | | | 975,000 | | | | 1,033,110 | |
64
Portfolio of Investments – continued
| | | | | | | | |
| | |
| Issuer | | Shares/Par | | | Value ($) | |
| Municipal Bonds - continued | | | | | | |
| North Carolina - continued | | | | | | |
| North Carolina Turnpike Authority, Triangle Expressway System Rev., AGM, 5%, 1/01/2031 | | $ | 1,600,000 | | | $ | 1,803,712 | |
| North Carolina Turnpike Authority, Triangle Expressway System Senior Lien Refunding Rev., AGM, 4%, 1/01/2055 | | | 1,385,000 | | | | 1,420,996 | |
| North Carolina Turnpike Authority, Triangle Expressway System Senior Lien Rev., AGM, 5%, 1/01/2049 | | | 1,780,000 | | | | 2,003,888 | |
| Northern Hospital District, Surry County, NC, Health Care Facilities Rev., 5%, 10/01/2031 | | | 1,250,000 | | | | 1,350,712 | |
| Northern Hospital District, Surry County, NC, Health Care Facilities Rev., 5%, 10/01/2033 | | | 1,375,000 | | | | 1,479,307 | |
| Raleigh Durham, NC, Airport Authority Rev., ”A“, 5%, 5/01/2027 | | | 625,000 | | | | 743,963 | |
| Raleigh Durham, NC, Airport Authority Rev., ”A“, 5%, 5/01/2028 | | | 835,000 | | | | 1,008,563 | |
| Raleigh Durham, NC, Airport Authority Rev., ”A“, 5%, 5/01/2029 | | | 665,000 | | | | 813,481 | |
| Raleigh Durham, NC, Airport Authority Rev., ”A“, 5%, 5/01/2030 | | | 560,000 | | | | 693,314 | |
| Raleigh Durham, NC, Airport Authority Rev., ”A“, 5%, 5/01/2031 | | | 600,000 | | | | 738,786 | |
| Raleigh Durham, NC, Airport Authority Rev., ”A“, 5%, 5/01/2032 | | | 445,000 | | | | 545,503 | |
| Raleigh Durham, NC, Airport Authority Rev., ”A“, 5%, 5/01/2033 | | | 445,000 | | | | 543,599 | |
| University of North Carolina Board of Governors Rev., 4%, 4/01/2049 | | | 1,000,000 | | | | 1,065,120 | |
| University of North Carolina, Hospitals at Chapel Hill Rev., 5%, 2/01/2045 | | | 900,000 | | | | 1,274,733 | |
| University of North Carolina, Hospitals at Chapel Hill Rev., 5%, 2/01/2046 | | | 5,065,000 | | | | 5,852,506 | |
| University of North Carolina, Hospitals at Chapel Hill Rev., 5%, 2/01/2049 | | | 2,615,000 | | | | 3,768,137 | |
| | | | | | | | |
| | | | | | | $ | 47,114,396 | |
| North Dakota - 0.5% | | | | | | |
| North Dakota Housing Finance Agency Rev. (Home Mortgage Finance Program), ”A“, 4%, 7/01/2034 | | $ | 485,000 | | | $ | 503,110 | |
| North Dakota Housing Finance Agency Rev. (Home Mortgage Finance Program), ”D“, 4.25%, 1/01/2049 (u) | | | 7,140,000 | | | | 7,695,992 | |
| North Dakota State Board of Higher Education, Housing and Auxiliary Facilities Rev. (University of North Dakota), ”A“, AGM, 4%, 4/01/2039 | | | 2,340,000 | | | | 2,670,619 | |
| Ward County, ND, Health Care Facilities Rev. (Trinity Obligated Group), ”C“, 5%, 6/01/2034 | | | 3,105,000 | | | | 3,599,067 | |
| Ward County, ND, Health Care Facilities Rev. (Trinity Obligated Group), ”C“, 5%, 6/01/2038 | | | 3,620,000 | | | | 4,129,732 | |
| Ward County, ND, Health Care Facilities Rev. (Trinity Obligated Group), ”C“, 5%, 6/01/2043 | | | 2,585,000 | | | | 2,915,027 | |
| | | | | | | | |
| | | | | | | $ | 21,513,547 | |
65
Portfolio of Investments – continued
| | | | | | | | |
| | |
| Issuer | | Shares/Par | | | Value ($) | |
| Municipal Bonds - continued | | | | | | |
| Ohio - 3.3% | | | | | | |
| American Municipal Power, Inc. Rev. (AMP Fremont Energy Center Project), ”B“, 5%, 2/15/2024 (Prerefunded 2/15/2022) | | $ | 1,500,000 | | | $ | 1,606,485 | |
| Buckeye, OH, Tobacco Settlement Financing Authority SeniorAsset-Backed Refunding,2020A-2, ”1“, 5%, 6/01/2031 | | | 1,800,000 | | | | 2,247,354 | |
| Buckeye, OH, Tobacco Settlement Financing Authority SeniorAsset-Backed Refunding,2020A-2, ”1“, 5%, 6/01/2032 | | | 290,000 | | | | 360,308 | |
| Buckeye, OH, Tobacco Settlement Financing Authority SeniorAsset-Backed Refunding,2020A-2, ”1“, 5%, 6/01/2033 | | | 210,000 | | | | 259,833 | |
| Buckeye, OH, Tobacco Settlement Financing Authority SeniorAsset-Backed Refunding,2020A-2, ”1“, 5%, 6/01/2034 | | | 900,000 | | | | 1,110,222 | |
| Buckeye, OH, Tobacco Settlement Financing Authority SeniorAsset-Backed Refunding,2020A-2, ”1“, 5%, 6/01/2035 | | | 450,000 | | | | 553,064 | |
| Buckeye, OH, Tobacco Settlement Financing Authority SeniorAsset-Backed Refunding,2020A-2, ”1“, 5%, 6/01/2036 | | | 900,000 | | | | 1,102,329 | |
| Buckeye, OH, Tobacco Settlement Financing Authority SeniorAsset-Backed Refunding,2020A-2, ”1“, 4%, 6/01/2037 | | | 120,000 | | | | 131,891 | |
| Buckeye, OH, Tobacco Settlement Financing Authority SeniorAsset-Backed Refunding,2020A-2, ”1“, 4%, 6/01/2039 | | | 450,000 | | | | 491,441 | |
| Buckeye, OH, Tobacco Settlement Financing Authority SeniorAsset-Backed Refunding,2020A-2, ”1“, 4%, 6/01/2048 | | | 1,005,000 | | | | 1,076,958 | |
| Buckeye, OH, Tobacco Settlement Financing Authority SeniorAsset-Backed Refunding,2020B-2, ”2“, 5%, 6/01/2055 | | | 22,650,000 | | | | 20,068,353 | |
| Buckeye, OH, Tobacco Settlement Financing Authority SeniorAsset-Backed Refunding,2020B-3, Capital Appreciation, ”2“, 0%, 6/01/2057 | | | 62,655,000 | | | | 6,912,726 | |
| Cleveland, OH, Public Power System Refunding Rev., ”A“, AGM, 4%, 11/15/2038 | | | 1,000,000 | | | | 1,129,920 | |
| Cleveland-Cuyahoga County, OH, Port Authority Development Rev. (Flats East Development Project), ”B“, 7%, 5/15/2040 | | | 1,010,000 | | | | 1,023,443 | |
| Cuyahoga County, OH, Hospital Rev. (Metrohealth System), 4.75%, 2/15/2047 | | | 4,065,000 | | | | 4,158,292 | |
| Cuyahoga County, OH, Hospital Rev. (Metrohealth System), 5.5%, 2/15/2052 | | | 890,000 | | | | 951,748 | |
| Cuyahoga County, OH, Hospital Rev. (Metrohealth System), 5.5%, 2/15/2057 | | | 9,355,000 | | | | 9,934,823 | |
| Franklin County, OH, Hospital Facilities Rev. (OhioHealth Corp.), ”A“, 4%, 5/15/2047 | | | 4,140,000 | | | | 4,648,102 | |
| Lancaster, PA, Port Authority Gas Supply Rev., ”A“, 5%, 8/01/2049 (Put Date 2/01/2025) | | | 5,250,000 | | | | 5,699,190 | |
| Miami County, OH, Hospital Facilities Rev. (Kettering Health), ”A“, 5%, 8/01/2049 | | | 9,845,000 | | | | 10,889,259 | |
| Montgomery County, OH, Health Care & Multi-Family Housing Rev. (St. Leonard), 6.375%, 4/01/2030 | | | 1,915,000 | | | | 1,920,209 | |
66
Portfolio of Investments – continued
| | | | | | | | |
| | |
| Issuer | | Shares/Par | | | Value ($) | |
| Municipal Bonds - continued | | | | | | |
| Ohio - continued | | | | | | |
| Montgomery County, OH, Health Care & Multi-Family Housing Rev. (St. Leonard), 6.625%, 4/01/2040 | | $ | 2,770,000 | | | $ | 2,777,894 | |
| Montgomery County, OH, Hospital Facilities Rev. (Premier Health Partners Obligated Group), ”A“, 4%, 11/15/2038 | | | 4,380,000 | | | | 4,610,957 | |
| Northeast Ohio Regional Sewer District, Wastewater Improvement Rev., 4%, 11/15/2036 | | | 1,000,000 | | | | 1,170,800 | |
| Ohio Air Quality Development Authority, Air Quality Rev. (American Electric Power Co.), ”B“, 2.6%, 6/01/2041 (Put Date 10/01/2029) | | | 4,615,000 | | | | 4,341,838 | |
| Ohio Air Quality Development Authority, Air Quality Rev. (American Electric Power Co.), ”C“, 2.1%, 12/01/2027 (Put Date 10/01/2024) | | | 8,400,000 | | | | 8,103,312 | |
| Ohio Air Quality Development Authority, Air Quality Rev. (American Electric Power Co.), ”C“, 2.1%, 4/01/2028 (Put Date 10/01/2024) | | | 3,925,000 | | | | 3,750,808 | |
| Ohio Air Quality Development Authority, Facilities Rev. (Pratt Paper LLC Project), 3.75%, 1/15/2028 | | | 190,000 | | | | 186,966 | |
| Ohio Air Quality Development Authority, Facilities Rev. (Pratt Paper LLC Project), 4.25%, 1/15/2038 | | | 250,000 | | | | 228,890 | |
| Ohio Air Quality Development Authority, Facilities Rev. (Pratt Paper LLC Project), 4.5%, 1/15/2048 | | | 330,000 | | | | 299,825 | |
| Ohio Higher Educational Facility Commission Rev. (Franciscan University of Steubenville), 5%, 11/01/2041 | | | 3,000,000 | | | | 3,453,360 | |
| Ohio Higher Educational Facility Rev. (Kenyon College 2020 Project), 5%, 7/01/2035 (w) | | | 1,130,000 | | | | 1,358,136 | |
| Ohio Higher Educational Facility Rev. (Kenyon College 2020 Project), 5%, 7/01/2038 (w) | | | 1,075,000 | | | | 1,277,874 | |
| Ohio Higher Educational Facility Rev. (Kenyon College 2020 Project), 5%, 7/01/2039 (w) | | | 1,135,000 | | | | 1,346,167 | |
| Ohio Higher Educational Facility Rev. (Kenyon College 2020 Project), 5%, 7/01/2042 (w) | | | 1,950,000 | | | | 2,299,265 | |
| Ohio Housing Finance Agency Residential Mortgage Rev.(Mortgage-Backed Securities Program), ”A“, 4.5%, 9/01/2048 (u) | | | 4,650,000 | | | | 5,081,659 | |
| Ohio Housing Finance Agency Residential Mortgage Rev.(Mortgage-Backed Securities Program), ”A“, 4.5%, 9/01/2049 (u) | | | 8,985,000 | | | | 9,871,909 | |
| Ohio State University, Special Purpose Rev., ”A“, 5%, 6/01/2038 (u) | | | 3,355,000 | | | | 3,695,298 | |
| Ohio State University, Special Purpose Rev., ”A“, 5%, 6/01/2043 (u) | | | 8,150,000 | | | | 8,939,653 | |
| Ohio Tax Exempt Private Activity (Portsmouth Bypass Project), AGM, 5%, 12/31/2035 | | | 7,740,000 | | | | 8,808,352 | |
| Southeastern Ohio Port Authority, Hospital Facilities Improvement Rev. (Memorial Health System Obligated Group Project), 5.5%, 12/01/2029 | | | 130,000 | | | | 147,380 | |
67
Portfolio of Investments – continued
| | | | | | | | |
| | |
| Issuer | | Shares/Par | | | Value ($) | |
| Municipal Bonds - continued | | | | | | |
| Ohio - continued | | | | | | |
| Southeastern Ohio Port Authority, Hospital Facilities Improvement Rev. (Memorial Health System Obligated Group Project), 5%, 12/01/2035 | | $ | 720,000 | | | $ | 787,867 | |
| Southeastern Ohio Port Authority, Hospital Facilities Improvement Rev. (Memorial Health System Obligated Group Project), 5%, 12/01/2043 | | | 925,000 | | | | 987,576 | |
| Southeastern Ohio Port Authority, Hospital Facilities Improvement Rev. (Memorial Health System Obligated Group Project), 5.5%, 12/01/2043 | | | 1,130,000 | | | | 1,235,700 | |
| Summit County, OH, Port Authority Building Rev. (Flats East Development Recovery Zone Facility Bonds), 6.875%, 5/15/2040 | | | 395,000 | | | | 404,034 | |
| | | | | | | | |
| | | | | | | $ | 151,441,470 | |
| Oklahoma - 0.4% | | | | | | |
| Catoosa, OK, Industrial Authority Sales Tax Rev., 4%, 10/01/2028 | | $ | 290,000 | | | $ | 271,078 | |
| Norman, OK, Regional Hospital Authority Rev., 4%, 9/01/2045 | | | 2,195,000 | | | | 2,277,247 | |
| Norman, OK, Regional Hospital Authority Rev., 5%, 9/01/2045 | | | 2,360,000 | | | | 2,834,926 | |
| Oklahoma Development Finance Authority, First Mortgage Rev. (Sommerset Project), 5%, 7/01/2042 | | | 1,495,000 | | | | 1,484,969 | |
| Oklahoma Development Finance Authority, Health System Rev. (OU Medicine Project), ”B“, 5%, 8/15/2029 | | | 150,000 | | | | 181,727 | |
| Oklahoma Development Finance Authority, Health System Rev. (OU Medicine Project), ”B“, 5%, 8/15/2033 | | | 810,000 | | | | 957,258 | |
| Oklahoma Development Finance Authority, Health System Rev. (OU Medicine Project), ”B“, 5%, 8/15/2038 | | | 1,135,000 | | | | 1,306,805 | |
| Oklahoma Development Finance Authority, Health System Rev. (OU Medicine Project), ”B“, 5.25%, 8/15/2043 | | | 395,000 | | | | 453,503 | |
| Oklahoma Development Finance Authority, Health System Rev. (OU Medicine Project), ”B“, 5.25%, 8/15/2048 | | | 1,140,000 | | | | 1,273,106 | |
| Oklahoma Housing Finance Agency, Single Family Mortgage Rev. (Homeownership Loan Project), ”A“, 4.75%, 9/01/2048 | | | 2,750,000 | | | | 3,039,382 | |
| Tulsa, OK, Airport Improvement Trust Rev., ”A“, 5%, 6/01/2045 | | | 755,000 | | | | 830,447 | |
| Tulsa, OK, Municipal Airport Trust Rev. (American Airlines, Inc.), ”B“, 5.5%, 6/01/2035 | | | 3,365,000 | | | | 3,296,993 | |
| Tulsa, OK, Municipal Airport Trust Rev. (American Airlines, Inc.), ”B“, 5.5%, 12/01/2035 | | | 1,440,000 | | | | 1,410,754 | |
| | | | | | | | |
| | | | | | | $ | 19,618,195 | |
| Oregon - 0.9% | | | | | | |
| Gilliam County, OR, Solid Waste Disposal Rev. (Waste Management, Inc. Project), ”A“, 2.4%, 8/01/2025 (Put Date 5/02/2022) | | $ | 1,275,000 | | | $ | 1,262,951 | |
| Gilliam County, OR, Solid Waste Disposal Rev. (Waste Management, Inc. Project), ”A“, 2.4%, 7/01/2038 (Put Date 5/01/2022) | | | 1,730,000 | | | | 1,710,884 | |
68
Portfolio of Investments – continued
| | | | | | | | |
| | |
| Issuer | | Shares/Par | | | Value ($) | |
| Municipal Bonds - continued | | | | | | |
| Oregon - continued | | | | | | |
| Oregon Facilities Authority Rev. (Legacy Health), ”A“, 5%, 6/01/2046 | | $ | 9,000,000 | | | $ | 10,433,610 | |
| Oregon Health & Sciences University Rev., ”B“, 5%, 7/01/2034 | | | 7,500,000 | | | | 8,959,350 | |
| Oregon Housing & Community Services Department Mortgage Rev. (Single-Family Mortgage Program), ”D“, 4.75%, 1/01/2050 (u) | | | 8,175,000 | | | | 8,994,217 | |
| Port of Portland, OR, International Airport Rev., ”24B“, 5%, 7/01/2042 | | | 1,340,000 | | | | 1,520,029 | |
| Washington Clackamas & Yamhill Counties, OR, Sherwood School District No. 88J, General Obligation, ”B“, 5%, 6/15/2030 | | | 4,000,000 | | | | 4,976,600 | |
| Washington Clackamas & Yamhill Counties, OR, Sherwood School District No. 88J, General Obligation, ”B“, 5%, 6/15/2033 | | | 1,750,000 | | | | 2,161,985 | |
| | | | | | | | |
| | | | | | | $ | 40,019,626 | |
| Pennsylvania - 7.1% | | | | | | |
| Allegheny County, PA, Hospital Development Authority Rev. (Allegheny Health Network Obligated Group), ”A“, 4%, 4/01/2044 | | $ | 13,590,000 | | | $ | 14,186,465 | |
| Allentown, PA, City School District Rev., ”C“, BAM, 4%, 2/01/2035 | | | 1,150,000 | | | | 1,301,145 | |
| Allentown, PA, City School District Rev., ”C“, BAM, 4%, 2/01/2036 | | | 1,100,000 | | | | 1,239,898 | |
| Allentown, PA, Neighborhood Improvement Zone Development Authority Tax Rev. (City Center Project), 5%, 5/01/2028 | | | 135,000 | | | | 141,032 | |
| Allentown, PA, Neighborhood Improvement Zone Development Authority Tax Rev. (City Center Project), 5%, 5/01/2033 | | | 135,000 | | | | 138,422 | |
| Allentown, PA, Neighborhood Improvement Zone Development Authority Tax Rev. (City Center Project), 5%, 5/01/2042 | | | 330,000 | | | | 332,386 | |
| Allentown, PA, Neighborhood Improvement Zone Development Authority Tax Rev. (City Center Refunding Project), 5%, 5/01/2027 | | | 2,000,000 | | | | 2,096,120 | |
| Armstrong & Indiana Counties, PA, Armstrong School District, General Obligation, “A”, BAM, 4%, 3/15/2035 | | | 500,000 | | | | 584,995 | |
| Armstrong & Indiana Counties, PA, Armstrong School District, General Obligation, “A”, BAM, 4%, 3/15/2036 | | | 1,075,000 | | | | 1,253,181 | |
| Armstrong & Indiana Counties, PA, Armstrong School District, General Obligation, “A”, BAM, 4%, 3/15/2037 | | | 500,000 | | | | 581,255 | |
| Armstrong & Indiana Counties, PA, Armstrong School District, General Obligation, “A”, BAM, 4%, 3/15/2038 | | | 500,000 | | | | 578,885 | |
| Armstrong & Indiana Counties, PA, Armstrong School District, General Obligation, “A”, BAM, 4%, 3/15/2041 | | | 2,500,000 | | | | 2,877,875 | |
| Berks County, PA, Industrial Development Authority Health System Rev. (Tower Health Project), 5%, 11/01/2029 | | | 2,850,000 | | | | 3,447,445 | |
| Berks County, PA, Industrial Development Authority Health System Rev. (Tower Health Project), 5%, 11/01/2030 | | | 1,025,000 | | | | 1,234,715 | |
69
Portfolio of Investments – continued
| | | | | | | | |
| | |
| Issuer | | Shares/Par | | | Value ($) | |
| Municipal Bonds - continued | | | | | | |
| Pennsylvania - continued | | | | | | |
| Berks County, PA, Industrial Development Authority Health System Rev. (Tower Health Project), 5%, 11/01/2037 | | $ | 900,000 | | | $ | 1,059,867 | |
| Berks County, PA, Industrial Development Authority Health System Rev. (Tower Health Project), 5%, 11/01/2047 | | | 1,460,000 | | | | 1,669,700 | |
| Berks County, PA, Municipal Authority Rev. (Reading Hospital & Medical Center), ”A“, 5%, 11/01/2044 | | | 7,325,000 | | | | 7,661,364 | |
| Berks County, PA, Municipal Authority Rev. (Tower Health Project), ”B“, 5%, 2/01/2040 (Put Date 2/01/2030) | | | 4,200,000 | | | | 4,669,938 | |
| Berks County, PA, Municipal Authority Rev. (Tower Health Project),”B-1“, 5%, 2/01/2040 (Put Date 2/01/2025) | | | 1,205,000 | | | | 1,336,863 | |
| Berks County, PA, Municipal Authority Rev. (Tower Health Project),”B-2“, 5%, 2/01/2040 (Put Date 2/01/2027) | | | 7,015,000 | | | | 7,932,983 | |
| Berks County, PA, Reading School District, AGM, 5%, 3/01/2036 | | | 550,000 | | | | 652,157 | |
| Berks County, PA, Reading School District, BAM, 4%, 4/01/2044 | | | 945,000 | | | | 1,061,679 | |
| Bucks County, PA, Industrial Development Authority, Hospital Rev. (St. Luke’s University Health Network Project), 4%, 8/15/2044 | | | 895,000 | | | | 980,302 | |
| Bucks County, PA, Industrial Development Authority, Hospital Rev. (St. Luke’s University Health Network Project), 4%, 8/15/2050 | | | 4,485,000 | | | | 4,871,428 | |
| Cambria County, PA, General Obligation, ”B“, AGM, 4%, 8/01/2032 | | | 225,000 | | | | 251,390 | |
| Cambria County, PA, General Obligation, ”B“, AGM, 4%, 8/01/2033 | | | 270,000 | | | | 300,607 | |
| Cambria County, PA, General Obligation, ”B“, AGM, 4%, 8/01/2034 | | | 335,000 | | | | 370,982 | |
| Cambria County, PA, General Obligation, ”B“, AGM, 4%, 8/01/2035 | | | 325,000 | | | | 358,105 | |
| Cambria County, PA, General Obligation, ”B“, AGM, 4%, 8/01/2036 | | | 170,000 | | | | 187,036 | |
| Chester County, PA, Industrial Development Authority Educational Facilities Rev. (Avon Grove Charter School), ”A“, 4.75%, 12/15/2037 | | | 1,115,000 | | | | 1,157,348 | |
| Chester County, PA, Industrial Development Authority Educational Facilities Rev. (Avon Grove Charter School), ”A“, 5%, 12/15/2047 | | | 530,000 | | | | 552,711 | |
| Chester County, PA, Industrial Development Authority Educational Facilities Rev. (Avon Grove Charter School), ”A“, 5%, 12/15/2051 | | | 645,000 | | | | 670,897 | |
| Commonwealth of Pennsylvania, Tobacco Master Settlement Financing Authority Rev., 5%, 6/01/2032 | | | 1,475,000 | | | | 1,772,345 | |
| Commonwealth of Pennsylvania, Tobacco Master Settlement Financing Authority Rev., 5%, 6/01/2033 | | | 1,260,000 | | | | 1,507,414 | |
| Commonwealth of Pennsylvania, Tobacco Master Settlement Financing Authority Rev., 5%, 6/01/2034 | | | 630,000 | | | | 752,044 | |
| Cumberland County, PA, Municipal Authority Rev. (Diakon Lutheran Social Ministries Project), 5%, 1/01/2021 | | | 730,000 | | | | 739,592 | |
70
Portfolio of Investments – continued
| | | | | | | | |
| | |
| Issuer | | Shares/Par | | | Value ($) | |
| Municipal Bonds - continued | | | | | | |
| Pennsylvania - continued | | | | | | |
| Cumberland County, PA, Municipal Authority Rev. (Diakon Lutheran Social Ministries Project), 5%, 1/01/2022 | | $ | 1,275,000 | | | $ | 1,311,975 | |
| Cumberland County, PA, Municipal Authority Rev. (Diakon Lutheran Social Ministries Project), 5%, 1/01/2023 | | | 915,000 | | | | 954,455 | |
| Dallas, PA, Municipal Authority, University Rev. (Misericordia University Project), 5%, 5/01/2029 | | | 1,440,000 | | | | 1,517,760 | |
| Dallas, PA, Municipal Authority, University Rev. (Misericordia University Project), 5%, 5/01/2048 | | | 1,730,000 | | | | 1,786,831 | |
| Delaware Valley, PA, Regional Finance Authority, ”C“, FLR, 1.809% (LIBOR - 3mo. + 0.75%), 6/01/2037 | | | 7,315,000 | | | | 6,621,977 | |
| Doylestown, PA, Hospital Rev., ”A“, 4%, 7/01/2045 | | | 585,000 | | | | 613,443 | |
| Doylestown, PA, Hospital Rev., ”A“, 5%, 7/01/2049 | | | 590,000 | | | | 676,559 | |
| East Hempfield Township, PA, Industrial Development Authority Rev. (Student Services, Inc., Student Housing Project at Millersville University of Pennsylvania), 5%, 7/01/2030 | | | 365,000 | | | | 390,773 | |
| East Hempfield Township, PA, Industrial Development Authority Rev. (Student Services, Inc., Student Housing Project at Millersville University of Pennsylvania), 5%, 7/01/2035 | | | 470,000 | | | | 497,312 | |
| East Hempfield Township, PA, Industrial Development Authority Rev. (Student Services, Inc., Student Housing Project at Millersville University of Pennsylvania), 5%, 7/01/2039 | | | 485,000 | | | | 507,043 | |
| East Hempfield Township, PA, Industrial Development Authority Rev. (Student Services, Inc., Student Housing Project at Millersville University of Pennsylvania), 5%, 7/01/2046 | | | 265,000 | | | | 275,123 | |
| Erie, PA, City School District General Obligation, ”A“, AGM, 5%, 4/01/2034 | | | 820,000 | | | | 1,015,783 | |
| Lehigh County, PA, Hospital Authority Rev. (Lehigh Valley Health Network), ”A“, 4%, 7/01/2049 | | | 7,950,000 | | | | 8,411,179 | |
| Lehigh County, PA, Water and Sewer Authority Rev. (Allentown Concession), ”A“, 5%, 12/01/2043 | | | 9,610,000 | | | | 10,623,182 | |
| Lehigh County, PA, Water and Sewer Authority Rev. (Allentown Concession), Capital Appreciation, ”B“, 0%, 12/01/2036 | | | 12,095,000 | | | | 7,650,934 | |
| Luzerne County, PA, ”A“, AGM, 5%, 12/15/2021 | | | 755,000 | | | | 801,085 | |
| Luzerne County, PA, ”A“, AGM, 5%, 12/15/2023 | | | 675,000 | | | | 755,595 | |
| Luzerne County, PA, ”A“, AGM, 5%, 12/15/2024 | | | 690,000 | | | | 792,051 | |
| Luzerne County, PA, ”A“, AGM, 5%, 12/15/2026 | | | 630,000 | | | | 757,638 | |
| Luzerne County, PA, ”A“, AGM, 5%, 11/15/2029 | | | 5,835,000 | | | | 6,811,195 | |
| Luzerne County, PA, ”A“, AGM, 5%, 12/15/2029 | | | 1,570,000 | | | | 1,907,142 | |
| Luzerne County, PA, Wilkes-Barre Area School District, General Obligation, BAM, 5%, 4/15/2059 | | | 940,000 | | | | 1,115,460 | |
| Montgomery County, PA, Higher Education & Health Authority Rev. (Thomas Jefferson University), 5%, 9/01/2031 | | | 680,000 | | | | 823,453 | |
| Montgomery County, PA, Higher Education & Health Authority Rev. (Thomas Jefferson University), 5%, 9/01/2032 | | | 2,625,000 | | | | 3,096,686 | |
71
Portfolio of Investments – continued
| | | | | | | | |
| | |
| Issuer | | Shares/Par | | | Value ($) | |
| Municipal Bonds - continued | | | | | | |
| Pennsylvania - continued | | | | | | |
| Montgomery County, PA, Higher Education & Health Authority Rev. (Thomas Jefferson University), 5%, 9/01/2033 | | $ | 2,000,000 | | | $ | 2,353,480 | |
| Montgomery County, PA, Higher Education & Health Authority Rev. (Thomas Jefferson University), 4%, 9/01/2044 | | | 1,970,000 | | | | 2,077,542 | |
| Montgomery County, PA, Higher Education & Health Authority Rev. (Thomas Jefferson University), 4%, 9/01/2049 | | | 1,880,000 | | | | 1,966,969 | |
| Montgomery County, PA, Higher Education & Health Authority Rev. (Thomas Jefferson University), 4%, 9/01/2051 | | | 2,355,000 | | | | 2,459,020 | |
| Montgomery County, PA, Industrial Development Authority Pollution Control Rev. (Peco Energy Co. Project), ”A“, 2.55%, 6/01/2029 (Put Date 6/01/2020) | | | 1,095,000 | | | | 1,096,183 | |
| Montgomery County, PA, Industrial Development Authority Rev. (Haverford School Project), 4%, 3/01/2049 | | | 8,700,000 | | | | 9,648,996 | |
| Montgomery County, PA, Industrial Development Authority Rev. (Whitemarsh Continuing Care Retirement Community Project), 5.375%, 1/01/2050 | | | 1,015,000 | | | | 967,904 | |
| Northeastern, PA, Hospital & Education Authority College Rev. (King’s College Project), 5%, 5/01/2032 | | | 450,000 | | | | 515,030 | |
| Northeastern, PA, Hospital & Education Authority College Rev. (King’s College Project), 5%, 5/01/2033 | | | 600,000 | | | | 682,506 | |
| Northeastern, PA, Hospital & Education Authority College Rev. (King’s College Project), 5%, 5/01/2044 | | | 1,310,000 | | | | 1,454,008 | |
| Northeastern, PA, Hospital & Education Authority College Rev. (King’s College Project), 5%, 5/01/2049 | | | 800,000 | | | | 883,832 | |
| Northeastern, PA, Hospital & Education Authority Rev. (Wilkes University), ”B“, 5.25%, 3/01/2031 | | | 1,140,000 | | | | 1,261,581 | |
| Northeastern, PA, Hospital & Education Authority Rev. (Wilkes University), ”B“, 5.25%, 3/01/2037 | | | 1,780,000 | | | | 1,940,841 | |
| Pennsylvania Economic Development Financing Authority, Sewer Sludge Disposal Rev. (Philadelphia Biosolids Facility), 6.25%, 1/01/2032 | | | 2,945,000 | | | | 2,998,511 | |
| Pennsylvania Economic Development Financing Authority, Solid Waste Disposal Rev. (Republic Services, Inc. Project), ”A“, 1.2%, 4/01/2034 (Put Date 4/15/2020) | | | 2,945,000 | | | | 2,944,823 | |
| Pennsylvania Economic Development Financing Authority, Solid Waste Disposal Rev. (Republic Services, Inc. Project), ”B“, 1.2%, 4/01/2049 (Put Date 4/15/2020) | | | 1,440,000 | | | | 1,439,914 | |
| Pennsylvania Economic Development Financing Authority, Solid Waste Disposal Rev. (Waste Management Project, Inc.), 2.15%, 7/01/2041 (Put Date 7/01/2024) | | | 8,000,000 | | | | 7,715,040 | |
| Pennsylvania Higher Educational Facilities Authority Rev. (Duquesne University), ”A“, 5%, 3/01/2038 | | | 1,000,000 | | | | 1,168,260 | |
| Pennsylvania Higher Educational Facilities Authority Rev. (Duquesne University), ”A“, 5%, 3/01/2039 | | | 250,000 | | | | 291,328 | |
72
Portfolio of Investments – continued
| | | | | | | | |
| | |
| Issuer | | Shares/Par | | | Value ($) | |
| Municipal Bonds - continued | | | | | | |
| Pennsylvania - continued | | | | | | |
| Pennsylvania Higher Educational Facilities Authority Rev. (Edinboro University Foundation), 5.8%, 7/01/2030 (Prerefunded 7/01/2020) | | $ | 510,000 | | | $ | 515,916 | |
| Pennsylvania Higher Educational Facilities Authority Rev. (Shippensburg University Student Services, Inc. Housing Project), 6.25%, 10/01/2043 (Prerefunded 10/01/2021) | | | 2,305,000 | | | | 2,460,449 | |
| Pennsylvania Higher Educational Facilities Authority Rev. (Shippensburg University Student Services, Inc. Housing Project), 5%, 10/01/2044 (Prerefunded 10/01/2022) | | | 3,915,000 | | | | 4,295,186 | |
| Pennsylvania Housing Finance Agency, Single Family Mortgage Rev., ”128A“, 4.75%, 4/01/2033 (u) | | | 6,825,000 | | | | 7,370,454 | |
| Pennsylvania Public School Building Authority, School Lease Rev. (School District of Philadelphia Project), 5%, 4/01/2028 | | | 1,870,000 | | | | 2,009,820 | |
| Pennsylvania Public School Building Authority, School Lease Rev. (School District of Philadelphia Project), ”A“, AGM, 5%, 6/01/2030 | | | 2,000,000 | | | | 2,381,040 | |
| Pennsylvania Public School Building Authority, School Lease Rev. (School District of Philadelphia Project), ”A“, AGM, 5%, 6/01/2032 | | | 7,820,000 | | | | 9,240,112 | |
| Pennsylvania Public School Building Authority, School Lease Rev. (School District of Philadelphia Project), ”A“, AGM, 5%, 6/01/2033 | | | 22,255,000 | | | | 26,115,130 | |
| Philadelphia, PA, ”B“, 5%, 2/01/2032 | | | 5,250,000 | | | | 6,698,107 | |
| Philadelphia, PA, ”B“, 5%, 2/01/2035 | | | 3,850,000 | | | | 4,855,543 | |
| Philadelphia, PA, Airport Rev., ”B“, 5%, 7/01/2033 | | | 4,215,000 | | | | 4,901,371 | |
| Philadelphia, PA, Airport Rev., ”B“, 5%, 7/01/2034 | | | 250,000 | | | | 289,763 | |
| Philadelphia, PA, Authority for Industrial Development Rev. (MaST Charter School Project), 6%, 8/01/2035 (Prerefunded 8/01/2020) | | | 415,000 | | | | 421,569 | |
| Philadelphia, PA, Authority for Industrial Development Rev. (MaST Charter School Project), ”A“, 5.625%, 8/01/2036 | | | 315,000 | | | | 317,388 | |
| Philadelphia, PA, Authority for Industrial Development Rev. (MaST Charter School Project), ”A“, 5.75%, 8/01/2046 | | | 805,000 | | | | 800,065 | |
| Philadelphia, PA, Authority for Industrial Development Rev. (MaST Charter School Project), ”A“, 5.375%, 8/01/2051 | | | 1,530,000 | | | | 1,573,605 | |
| Philadelphia, PA, Authority for Industrial Development Rev. (MaST Charter School Project), ”B“, 6%, 8/01/2051 | | | 1,180,000 | | | | 1,192,248 | |
| Philadelphia, PA, Authority for Industrial Development Rev. (Philadelphia Performing Arts Charter School Project), 6.5%, 6/15/2033 | | | 2,425,000 | | | | 2,433,584 | |
| Philadelphia, PA, Authority for Industrial Development Rev. (Philadelphia Performing Arts Charter School Project), 6.75%, 6/15/2043 | | | 1,175,000 | | | | 1,178,889 | |
| Philadelphia, PA, Authority for Industrial Development Rev. (Tacony Academy Charter School Project),”A-1“, 6.75%, 6/15/2033 | | | 150,000 | | | | 158,619 | |
| Philadelphia, PA, Authority for Industrial Development Rev. (Tacony Academy Charter School Project),”A-1“, 7%, 6/15/2043 | | | 355,000 | | | | 373,378 | |
73
Portfolio of Investments – continued
| | | | | | | | |
| | |
| Issuer | | Shares/Par | | | Value ($) | |
| Municipal Bonds - continued | | | | | | |
| Pennsylvania - continued | | | | | | |
| Philadelphia, PA, Authority for Industrial Development Rev. (Thomas Jefferson University), ”A“, 5%, 9/01/2035 | | $ | 1,040,000 | | | $ | 1,183,894 | |
| Philadelphia, PA, Authority for Industrial Development Rev. (Thomas Jefferson University), ”A“, 5%, 9/01/2042 | | | 10,810,000 | | | | 12,069,689 | |
| Philadelphia, PA, Authority for Industrial Development,Multi-Family Housing Rev. (University Square ApartmentProject-Section 8), ”I“, 5%, 12/01/2037 | | | 2,080,000 | | | | 2,371,907 | |
| Philadelphia, PA, Authority for Industrial Development,Multi-Family Housing Rev. (University Square ApartmentProject-Section 8), ”I“, 5%, 12/01/2058 | | | 8,300,000 | | | | 9,305,130 | |
| Philadelphia, PA, Authority for Industrial Development,Multi-Family Housing Rev. (University Square ApartmentProject-Section 8), ”III“, 5.25%, 12/01/2047 | | | 350,000 | | | | 345,947 | |
| Philadelphia, PA, Authority for Industrial Development,Multi-Family Housing Rev. (University Square ApartmentProject-Section 8), ”III“, 5.5%, 12/01/2058 | | | 505,000 | | | | 505,510 | |
| Philadelphia, PA, Authority for Industrial Development, Senior Living Facilities Rev. (Wesley Enhanced Living Obligated Group), ”A“, 5%, 7/01/2037 | | | 565,000 | | | | 553,451 | |
| Philadelphia, PA, Authority for Industrial Development, Senior Living Facilities Rev. (Wesley Enhanced Living Obligated Group), ”A“, 5%, 7/01/2042 | | | 1,005,000 | | | | 956,971 | |
| Philadelphia, PA, Authority for Industrial Development, Senior Living Facilities Rev. (Wesley Enhanced Living Obligated Group), ”A“, 5%, 7/01/2049 | | | 1,570,000 | | | | 1,458,483 | |
| Philadelphia, PA, Gas Works Rev. (1998 General Ordinance), ”15“, 5%, 8/01/2042 | | | 9,075,000 | | | | 10,704,416 | |
| Philadelphia, PA, Gas Works Rev., ”14“, AGM, 5%, 10/01/2033 | | | 2,910,000 | | | | 3,442,908 | |
| Philadelphia, PA, Redevelopment Authority Refunding Rev. (Neighborhood Transformation Initiative), BAM, 5%, 4/15/2024 | | | 1,900,000 | | | | 2,035,147 | |
| Philadelphia, PA, School District, ”A“, 5%, 9/01/2033 | | | 310,000 | | | | 378,380 | |
| Philadelphia, PA, School District, ”A“, 5%, 9/01/2035 | | | 1,160,000 | | | | 1,404,679 | |
| Philadelphia, PA, School District, ”A“, 4%, 9/01/2036 | | | 1,565,000 | | | | 1,762,440 | |
| Philadelphia, PA, School District, ”A“, 5%, 9/01/2036 | | | 385,000 | | | | 465,469 | |
| Philadelphia, PA, School District, ”A“, 4%, 9/01/2037 | | | 1,240,000 | | | | 1,391,627 | |
| Philadelphia, PA, School District, ”A“, 5%, 9/01/2037 | | | 385,000 | | | | 465,026 | |
| Philadelphia, PA, School District, ”A“, 4%, 9/01/2038 | | | 1,775,000 | | | | 1,983,332 | |
| Philadelphia, PA, School District, ”A“, 5%, 9/01/2038 | | | 385,000 | | | | 464,198 | |
| Philadelphia, PA, School District, ”A“, 4%, 9/01/2039 | | | 1,000,000 | | | | 1,116,150 | |
| Philadelphia, PA, School District, ”B“, 5%, 9/01/2043 | | | 1,160,000 | | | | 1,386,734 | |
| Philadelphia, PA, School District, ”F“, 5%, 9/01/2037 | | | 1,020,000 | | | | 1,186,036 | |
| Philadelphia, PA, School District, ”F“, 5%, 9/01/2038 | | | 255,000 | | | | 295,848 | |
| Pittsburgh, PA, Water & Sewer Authority Rev., ”A“, AGM, 5%, 9/01/2032 | | | 750,000 | | | | 1,012,193 | |
74
Portfolio of Investments – continued
| | | | | | | | |
| | |
| Issuer | | Shares/Par | | | Value ($) | |
| Municipal Bonds - continued | | | | | | |
| Pennsylvania - continued | | | | | | |
| Pittsburgh, PA, Water & Sewer Authority Rev., ”A“, AGM, 5%, 9/01/2033 | | $ | 565,000 | | | $ | 773,683 | |
| Pittsburgh, PA, Water & Sewer Authority Rev., ”A“, AGM, 4%, 9/01/2035 | | | 285,000 | | | | 327,730 | |
| Pittsburgh, PA, Water & Sewer Authority Rev., ”A“, AGM, 5%, 9/01/2044 | | | 1,875,000 | | | | 2,299,538 | |
| Reading, PA, School District, ”A“, 5%, 4/01/2020 | | | 1,000,000 | | | | 1,000,000 | |
| Washington County, PA, Canon-McMillan School District, BAM, 4%, 6/01/2044 | | | 1,920,000 | | | | 2,100,710 | |
| Washington County, PA, Canon-McMillan School District, BAM, 4%, 6/01/2046 | | | 2,945,000 | | | | 3,212,818 | |
| Washington County, PA, Canon-McMillan School District, BAM, 4%, 6/01/2048 | | | 2,015,000 | | | | 2,193,368 | |
| Washington County, PA, Canon-McMillan School District, BAM, 4%, 6/01/2050 | | | 1,920,000 | | | | 2,083,642 | |
| Washington County, PA, Redevelopment Authority Refunding Rev. (Victory Centre Tax Increment Financing Project), 4%, 7/01/2023 | | | 115,000 | | | | 113,308 | |
| Washington County, PA, Redevelopment Authority Refunding Rev. (Victory Centre Tax Increment Financing Project), 5%, 7/01/2035 | | | 80,000 | | | | 78,488 | |
| West Shore, PA, Area Authority Rev. (Messiah Village Project), ”A“, 5%, 7/01/2030 | | | 445,000 | | | | 455,684 | |
| West Shore, PA, Area Authority Rev. (Messiah Village Project), ”A“, 5%, 7/01/2035 | | | 435,000 | | | | 439,968 | |
| | | | | | | | |
| | | | | | | $ | 326,997,711 | |
| Puerto Rico - 6.5% | | | | | | |
| Commonwealth of Puerto Rico Aqueduct & Sewer Authority Rev., ”A“, ASSD GTY, 5%, 7/01/2028 | | $ | 3,235,000 | | | $ | 3,236,423 | |
| Commonwealth of Puerto Rico Highway & Transportation Authority Rev., ASSD GTY, 5.25%, 7/01/2041 | | | 2,885,000 | | | | 2,983,263 | |
| Commonwealth of Puerto Rico Highway & Transportation Authority Rev., ”A“, NATL, 4.75%, 7/01/2038 | | | 5,860,000 | | | | 5,516,721 | |
| Commonwealth of Puerto Rico Highway & Transportation Authority Rev., ”CC“, AGM, 5.5%, 7/01/2029 | | | 850,000 | | | | 923,126 | |
| Commonwealth of Puerto Rico Highway & Transportation Authority Rev., ”CC“, AGM, 5.25%, 7/01/2036 | | | 2,720,000 | | | | 2,863,616 | |
| Commonwealth of Puerto Rico Highway & Transportation Authority Rev., ”D“, AGM, 5%, 7/01/2032 | | | 5,005,000 | | | | 5,006,351 | |
| Commonwealth of Puerto Rico Highway & Transportation Authority Rev., ”J“, NATL, 5%, 7/01/2029 | | | 365,000 | | | | 365,004 | |
| Commonwealth of Puerto Rico Highway & Transportation Authority Rev., ”L“, AAC, 5.25%, 7/01/2038 | | | 17,370,000 | | | | 17,627,076 | |
| Commonwealth of Puerto Rico Highway & Transportation Authority Rev., ”L“, ASSD GTY, 5.25%, 7/01/2041 | | | 3,255,000 | | | | 3,365,865 | |
75
Portfolio of Investments – continued
| | | | | | | | |
| | |
| Issuer | | Shares/Par | | | Value ($) | |
| Municipal Bonds - continued | | | | | | |
| Puerto Rico - continued | | | | | | |
| Commonwealth of Puerto Rico Highway & Transportation Authority Rev., ”L“, NATL, 5.25%, 7/01/2035 | | $ | 8,390,000 | | | $ | 8,412,569 | |
| Commonwealth of Puerto Rico Highway & Transportation Authority Rev., ”M“, ASSD GTY, 5%, 7/01/2032 | | | 660,000 | | | | 660,244 | |
| Commonwealth of Puerto Rico Highway & Transportation Authority Rev., ”N“, AAC, 5.25%, 7/01/2030 | | | 5,350,000 | | | | 5,613,808 | |
| Commonwealth of Puerto Rico Highway & Transportation Authority Rev., ”N“, AAC, 5.25%, 7/01/2031 | | | 1,980,000 | | | | 2,070,803 | |
| Commonwealth of Puerto Rico Highway & Transportation Authority Rev., ”N“, ASSD GTY, 5.25%, 7/01/2036 | | | 4,910,000 | | | | 5,169,002 | |
| Commonwealth of Puerto Rico Highway & Transportation Authority Rev., ”N“, NATL, 5.25%, 7/01/2032 | | | 1,515,000 | | | | 1,539,210 | |
| Commonwealth of Puerto Rico Highway & Transportation Authority Rev., ”N“, NATL, 5.25%, 7/01/2033 | | | 3,330,000 | | | | 3,370,127 | |
| Commonwealth of Puerto Rico Highway & Transportation Authority Rev., ”Y“, AGM, 6.25%, 7/01/2021 | | | 4,645,000 | | | | 4,742,638 | |
| Commonwealth of Puerto Rico Highway & Transportation Authority Rev., Capital Appreciation, ”N“, AAC, 0%, 7/01/2020 | | | 880,000 | | | | 871,534 | |
| Commonwealth of Puerto Rico Highway & Transportation Authority Rev., Unrefunded Balance, ”A“, NATL, 5%, 7/01/2038 | | | 570,000 | | | | 565,309 | |
| Commonwealth of Puerto Rico, General Obligation, ”A“, 8%, 7/01/2035 (a)(d) | | | 50,110,000 | | | | 30,066,000 | |
| Commonwealth of Puerto Rico, Public Improvement, AAC, 4.5%, 7/01/2023 | | | 290,000 | | | | 290,104 | |
| Commonwealth of Puerto Rico, Public Improvement, ”A“, AGM, 5%, 7/01/2035 | | | 10,035,000 | | | | 10,116,886 | |
| Commonwealth of Puerto Rico, Public Improvement, ”A“, ASSD GTY, 5.5%, 7/01/2029 | | | 3,390,000 | | | | 3,675,472 | |
| Commonwealth of Puerto Rico, Public Improvement, ”A“, NATL, 5.5%, 7/01/2020 | | | 2,890,000 | | | | 2,903,236 | |
| Commonwealth of Puerto Rico, Public Improvement, ”A“, NATL, 5.5%, 7/01/2021 | | | 570,000 | | | | 581,451 | |
| Commonwealth of Puerto Rico, Public Improvement,”A-4“, AGM, 5.25%, 7/01/2030 | | | 785,000 | | | | 789,569 | |
| Commonwealth of Puerto Rico, Public Improvement,”C-7“, NATL, 6%, 7/01/2027 | | | 2,560,000 | | | | 2,605,133 | |
| Puerto Rico Convention Center District Authority, Hotel Occupancy Tax Rev., ”A“, AAC, 5%, 7/01/2020 | | | 510,000 | | | | 510,632 | |
| Puerto Rico Convention Center District Authority, Hotel Occupancy Tax Rev., ”A“, AAC, 5%, 7/01/2031 | | | 7,120,000 | | | | 7,120,926 | |
| Puerto Rico Electric Power Authority Rev., ”A“, 5%, 7/01/2029 (a)(d) | | | 10,160,000 | | | | 7,188,200 | |
| Puerto Rico Electric Power Authority Rev., ”A“, 5%, 7/01/2042 (a)(d) | | | 1,535,000 | | | | 1,086,013 | |
76
Portfolio of Investments – continued
| | | | | | | | |
| | |
| Issuer | | Shares/Par | | | Value ($) | |
| Municipal Bonds - continued | | | | | | |
| Puerto Rico - continued | | | | | | |
| Puerto Rico Electric Power Authority Rev., ”AAA“, 5.25%, 7/01/2021 (a)(d) | | $ | 850,000 | | | $ | 603,500 | |
| Puerto Rico Electric Power Authority Rev., ”AAA“, 5.25%, 7/01/2030 (a)(d) | | | 405,000 | | | | 287,550 | |
| Puerto Rico Electric Power Authority Rev., ”CCC“, 5.25%, 7/01/2027 (a)(d) | | | 3,815,000 | | | | 2,708,650 | |
| Puerto Rico Electric Power Authority Rev., ”DDD“, 5%, 7/01/2020 (a)(d) | | | 425,000 | | | | 300,688 | |
| Puerto Rico Electric Power Authority Rev., ”DDD“, 5%, 7/01/2021 (a)(d) | | | 3,990,000 | | | | 2,822,925 | |
| Puerto Rico Electric Power Authority Rev., ”DDD“, 5%, 7/01/2022 (a)(d) | | | 6,450,000 | | | | 4,563,375 | |
| Puerto Rico Electric Power Authority Rev., ”DDD“, AGM, 3.625%, 7/01/2023 | | | 445,000 | | | | 442,891 | |
| Puerto Rico Electric Power Authority Rev., ”DDD“, AGM, 3.65%, 7/01/2024 | | | 1,915,000 | | | | 1,897,842 | |
| Puerto Rico Electric Power Authority Rev., ”EEE“, 6.05%, 7/01/2032 (a)(d) | | | 2,380,000 | | | | 1,692,775 | |
| Puerto Rico Electric Power Authority Rev., ”MM“, NATL, 5%, 7/01/2020 | | | 50,000 | | | | 50,169 | |
| Puerto Rico Electric Power Authority Rev., ”NN“, NATL, 5.25%, 7/01/2022 | | | 1,505,000 | | | | 1,542,354 | |
| Puerto Rico Electric Power Authority Rev., ”NN“, NATL, 4.75%, 7/01/2033 | | | 225,000 | | | | 222,390 | |
| Puerto Rico Electric Power Authority Rev., ”PP“, NATL, 5%, 7/01/2022 | | | 905,000 | | | | 905,606 | |
| Puerto Rico Electric Power Authority Rev., ”PP“, NATL, 5%, 7/01/2024 | | | 160,000 | | | | 160,059 | |
| Puerto Rico Electric Power Authority Rev., ”PP“, NATL, 5%, 7/01/2025 | | | 210,000 | | | | 210,059 | |
| Puerto Rico Electric Power Authority Rev., ”RR“, ASSD GTY, 5%, 7/01/2028 | | | 110,000 | | | | 110,048 | |
| Puerto Rico Electric Power Authority Rev., ”RR“, NATL, 5%, 7/01/2022 | | | 555,000 | | | | 555,372 | |
| Puerto Rico Electric Power Authority Rev., ”SS“, ASSD GTY, 4.375%, 7/01/2030 | | | 230,000 | | | | 229,128 | |
| Puerto Rico Electric Power Authority Rev., ”SS“, NATL, 5%, 7/01/2020 | | | 560,000 | | | | 560,605 | |
| Puerto Rico Electric Power Authority Rev., ”TT“, 5%, 7/01/2021 (a)(d) | | | 1,955,000 | | | | 1,383,163 | |
| Puerto Rico Electric Power Authority Rev., ”TT“, 5%, 7/01/2023 (a)(d) | | | 1,705,000 | | | | 1,206,288 | |
77
Portfolio of Investments – continued
| | | | | | | | |
| | |
| Issuer | | Shares/Par | | | Value ($) | |
| Municipal Bonds - continued | | | | | | |
| Puerto Rico - continued | | | | | | |
| Puerto Rico Electric Power Authority Rev., ”TT“, 5%, 7/01/2027 (a)(d) | | $ | 345,000 | | | $ | 244,088 | |
| Puerto Rico Electric Power Authority Rev., ”TT“, 5%, 7/01/2037 (a)(d) | | | 5,215,000 | | | | 3,689,613 | |
| Puerto Rico Electric Power Authority Rev., ”TT“, NATL, 5%, 7/01/2024 | | | 970,000 | | | | 970,359 | |
| Puerto Rico Electric Power Authority Rev., ”TT“, NATL, 5%, 7/01/2026 | | | 35,000 | | | | 35,006 | |
| Puerto Rico Electric Power Authority Rev., ”UU“, AGM, 5%, 7/01/2022 | | | 360,000 | | | | 362,678 | |
| Puerto Rico Electric Power Authority Rev., ”UU“, ASSD GTY, 4.25%, 7/01/2027 | | | 1,385,000 | | | | 1,384,986 | |
| Puerto Rico Electric Power Authority Rev., ”VV“, NATL, 5.25%, 7/01/2025 | | | 280,000 | | | | 288,991 | |
| Puerto Rico Electric Power Authority Rev., ”VV“, NATL, 5.25%, 7/01/2026 | | | 840,000 | | | | 867,023 | |
| Puerto Rico Electric Power Authority Rev., ”VV“, NATL, 5.25%, 7/01/2029 | | | 2,295,000 | | | | 2,350,264 | |
| Puerto Rico Electric Power Authority Rev., ”VV“, NATL, 5.25%, 7/01/2030 | | | 3,085,000 | | | | 3,152,777 | |
| Puerto Rico Electric Power Authority Rev., ”VV“, NATL, 5.25%, 7/01/2032 | | | 860,000 | | | | 873,743 | |
| Puerto Rico Electric Power Authority Rev., ”VV“, NATL, 5.25%, 7/01/2034 | | | 465,000 | | | | 468,548 | |
| Puerto Rico Electric Power Authority Rev., ”WW“, 5.375%, 7/01/2022 (a)(d) | | | 360,000 | | | | 256,050 | |
| Puerto Rico Electric Power Authority Rev., ”WW“, 5.25%, 7/01/2025 (a)(d) | | | 815,000 | | | | 578,650 | |
| Puerto Rico Electric Power Authority Rev., ”ZZ“, 5%, 7/01/2018 (a)(d) | | | 2,450,000 | | | | 1,705,813 | |
| Puerto Rico Electric Power Authority Rev., ”ZZ“, 5.25%, 7/01/2023 (a)(d) | | | 2,730,000 | | | | 1,938,300 | |
| Puerto Rico Electric Power Authority Rev., ”ZZ“, 5.25%, 7/01/2024 (a)(d) | | | 955,000 | | | | 678,050 | |
| Puerto Rico Electric Power Authority Rev., ”ZZ“, 5.25%, 7/01/2026 (a)(d) | | | 2,950,000 | | | | 2,094,500 | |
| Puerto Rico Industrial, Tourist, Educational, Medical & Environmental Control Facilities Financing Authority Rev. (Cogeneration Facilities - AES Puerto Rico Project), 9.12%, 6/01/2022 | | | 5,000,000 | | | | 5,125,000 | |
| Puerto Rico Industrial, Tourist, Educational, Medical & Environmental Control Facilities Financing Authority, Educational Facilities Rev. (University Plaza Project), NATL, 5%, 7/01/2033 | | | 2,805,000 | | | | 2,786,235 | |
78
Portfolio of Investments – continued
| | | | | | | | |
| | |
| Issuer | | Shares/Par | | | Value ($) | |
| Municipal Bonds - continued | | | | | | |
| Puerto Rico - continued | | | | | | |
| Puerto Rico Industrial, Tourist, Educational, Medical & Environmental Control Facilities Financing Authority, Higher Education Rev. (Ana G. Mendez University System Project), 4%, 4/01/2020 | | $ | 150,000 | | | $ | 150,000 | |
| Puerto Rico Industrial, Tourist, Educational, Medical & Environmental Control Facilities Financing Authority, Higher Education Rev. (Ana G. Mendez University System Project), 5%, 3/01/2021 | | | 15,000 | | | | 14,969 | |
| Puerto Rico Industrial, Tourist, Educational, Medical & Environmental Control Facilities Financing Authority, Higher Education Rev. (Ana G. Mendez University System Project), 5%, 4/01/2021 | | | 520,000 | | | | 520,967 | |
| Puerto Rico Industrial, Tourist, Educational, Medical & Environmental Control Facilities Financing Authority, Higher Education Rev. (Ana G. Mendez University System Project), 5.375%, 12/01/2021 | | | 250,000 | | | | 247,685 | |
| Puerto Rico Industrial, Tourist, Educational, Medical & Environmental Control Facilities Financing Authority, Higher Education Rev. (Ana G. Mendez University System Project), 5%, 4/01/2022 | | | 600,000 | | | | 589,104 | |
| Puerto Rico Industrial, Tourist, Educational, Medical & Environmental Control Facilities Financing Authority, Higher Education Rev. (Ana G. Mendez University System Project), 5%, 3/01/2026 | | | 155,000 | | | | 145,204 | |
| Puerto Rico Industrial, Tourist, Educational, Medical & Environmental Control Facilities Financing Authority, Higher Education Rev. (Ana G. Mendez University System Project), 5%, 4/01/2027 | | | 2,205,000 | | | | 2,045,071 | |
| Puerto Rico Industrial, Tourist, Educational, Medical & Environmental Control Facilities Financing Authority, Higher Education Rev. (Ana G. Mendez University System Project), 5.5%, 12/01/2031 | | | 690,000 | | | | 637,698 | |
| Puerto Rico Industrial, Tourist, Educational, Medical & Environmental Control Facilities Financing Authority, Higher Education Rev. (Ana G. Mendez University System Project), 5.125%, 4/01/2032 | | | 735,000 | | | | 652,643 | |
| Puerto Rico Industrial, Tourist, Educational, Medical & Environmental Control Facilities Financing Authority, Higher Education Rev. (Ana G. Mendez University System Project), 5%, 3/01/2036 | | | 820,000 | | | | 686,258 | |
| Puerto Rico Industrial, Tourist, Educational, Medical & Environmental Control Facilities Financing Authority, Higher Education Rev. (Ana G. Mendez University System Project), 5.375%, 4/01/2042 | | | 545,000 | | | | 461,135 | |
79
Portfolio of Investments – continued
| | | | | | | | |
| | |
| Issuer | | Shares/Par | | | Value ($) | |
| Municipal Bonds - continued | | | | | | |
| Puerto Rico - continued | | | | | | |
| Puerto Rico Infrastructure Financing Authority Special Tax Rev., ”C“, AAC, 5.5%, 7/01/2023 | | $ | 3,810,000 | | | $ | 3,985,831 | |
| Puerto Rico Infrastructure Financing Authority Special Tax Rev., ”C“, AAC, 5.5%, 7/01/2024 | | | 7,335,000 | | | | 7,733,437 | |
| Puerto Rico Infrastructure Financing Authority Special Tax Rev., ”C“, AAC, 5.5%, 7/01/2025 | | | 705,000 | | | | 748,421 | |
| Puerto Rico Infrastructure Financing Authority Special Tax Rev., ”C“, AAC, 5.5%, 7/01/2027 | | | 5,015,000 | | | | 5,360,483 | |
| Puerto Rico Infrastructure Financing Authority Special Tax Rev., ”C“, AAC, 5.5%, 7/01/2028 | | | 755,000 | | | | 808,137 | |
| Puerto Rico Infrastructure Financing Authority Special Tax Rev., Capital Appreciation, ”A“, AAC, 0%, 7/01/2029 | | | 4,280,000 | | | | 2,841,192 | |
| Puerto Rico Infrastructure Financing Authority Special Tax Rev., Capital Appreciation, ”A“, AAC, 0%, 7/01/2034 | | | 15,570,000 | | | | 7,956,426 | |
| Puerto Rico Infrastructure Financing Authority Special Tax Rev., Capital Appreciation, ”A“, AAC, 0%, 7/01/2035 | | | 2,360,000 | | | | 1,142,948 | |
| Puerto Rico Municipal Finance Agency, ”A“, AGM, 5%, 8/01/2027 | | | 190,000 | | | | 190,112 | |
| Puerto Rico Public Buildings Authority Government Facilities Rev., ”I“, ASSD GTY, 5%, 7/01/2036 | | | 425,000 | | | | 425,034 | |
| Puerto Rico Public Buildings Authority Government Facilities Rev.,”M-3“, NATL, 6%, 7/01/2023 | | | 1,100,000 | | | | 1,155,341 | |
| Puerto Rico Public Buildings Authority Government Facilities Rev.,”M-3“, NATL, 6%, 7/01/2027 | | | 1,600,000 | | | | 1,625,488 | |
| Puerto Rico Public Buildings Authority Government Facilities Rev.,”M-3“, NATL, 6%, 7/01/2028 | | | 435,000 | | | | 442,669 | |
| Puerto Rico Public Buildings Authority Government Facilities Rev., ”N“, ASSD GTY, 5%, 7/01/2032 | | | 400,000 | | | | 400,108 | |
| Puerto Rico Public Buildings Authority Rev.,”M-2“, AAC, 10%, 7/01/2035 | | | 4,660,000 | | | | 5,059,921 | |
| Puerto Rico Sales Tax Financing Corp., Restructured Sales Tax Rev.,”2019A-1“, 4.5%, 7/01/2034 | | | 395,000 | | | | 395,889 | |
| Puerto Rico Sales Tax Financing Corp., Restructured Sales Tax Rev.,”2019A-1“, 4.55%, 7/01/2040 | | | 974,000 | | | | 922,037 | |
| Puerto Rico Sales Tax Financing Corp., Restructured Sales Tax Rev.,”2019A-1“, 5%, 7/01/2058 | | | 28,603,000 | | | | 27,814,987 | |
| Puerto Rico Sales Tax Financing Corp., Restructured Sales Tax Rev.,”2019A-2“, 4.329%, 7/01/2040 | | | 9,821,000 | | | | 9,021,472 | |
| Puerto Rico Sales Tax Financing Corp., Restructured Sales Tax Rev.,”2019A-2“, 4.536%, 7/01/2053 | | | 132,000 | | | | 119,799 | |
| Puerto Rico Sales Tax Financing Corp., Restructured Sales Tax Rev.,”2019A-2“, 4.784%, 7/01/2058 | | | 1,824,000 | | | | 1,708,212 | |
| Puerto Rico Sales Tax Financing Corp., Restructured Sales Tax Rev., Capital Appreciation,”2019A-1“, 0%, 7/01/2024 | | | 157,000 | | | | 134,431 | |
80
Portfolio of Investments – continued
| | | | | | | | |
| | |
| Issuer | | Shares/Par | | | Value ($) | |
| Municipal Bonds - continued | | | | | | |
| Puerto Rico - continued | | | | | | |
| Puerto Rico Sales Tax Financing Corp., Restructured Sales Tax Rev., Capital Appreciation,”2019A-1“, 0%, 7/01/2027 | | $ | 1,554,000 | | | $ | 1,183,247 | |
| Puerto Rico Sales Tax Financing Corp., Restructured Sales Tax Rev., Capital Appreciation,”2019A-1“, 0%, 7/01/2029 | | | 293,000 | | | | 202,756 | |
| Puerto Rico Sales Tax Financing Corp., Restructured Sales Tax Rev., Capital Appreciation,”2019A-1“, 0%, 7/01/2031 | | | 14,021,000 | | | | 8,719,379 | |
| Puerto Rico Sales Tax Financing Corp., Restructured Sales Tax Rev., Capital Appreciation,”2019A-1“, 0%, 7/01/2033 | | | 13,721,000 | | | | 7,592,378 | |
| Puerto Rico Sales Tax Financing Corp., Restructured Sales Tax Rev., Capital Appreciation,”2019A-1“, 0%, 7/01/2046 | | | 9,798,000 | | | | 2,316,443 | |
| University of Puerto Rico Rev., ”P“, NATL, 5%, 6/01/2025 | | | 350,000 | | | | 350,098 | |
| | | | | | | | |
| | | | | | | $ | 300,649,832 | |
| Rhode Island - 0.3% | | | | | | |
| Providence, RI, ”A“, 5%, 1/15/2025 | | $ | 1,345,000 | | | $ | 1,456,259 | |
| Rhode Island Student Loan Authority, Student Loan Rev., ”A“, 3%, 12/01/2021 | | | 4,890,000 | | | | 4,932,054 | |
| Rhode Island Student Loan Authority, Student Loan Rev., ”A“, 5%, 12/01/2021 | | | 1,120,000 | | | | 1,181,678 | |
| Rhode Island Student Loan Authority, Student Loan Rev., ”A“, 3.25%, 12/01/2022 | | | 1,500,000 | | | | 1,514,385 | |
| Rhode Island Student Loan Authority, Student Loan Rev., ”A“, 5%, 12/01/2022 | | | 700,000 | | | | 759,570 | |
| Rhode Island Student Loan Authority, Student Loan Rev., ”A“, 3.8%, 12/01/2031 | | | 1,835,000 | | | | 1,830,688 | |
| Rhode Island Student Loan Authority, Student Loan Rev., ”A“, 3.5%, 12/01/2034 | | | 2,570,000 | | | | 2,662,237 | |
| | | | | | | | |
| | | | | | | $ | 14,336,871 | |
| South Carolina - 2.2% | | | | | | |
| Chesterfield County, SC, School District, 5%, 3/01/2025 | | $ | 2,250,000 | | | $ | 2,412,698 | |
| Lexington County, SC, Health Services District, Inc., Hospital Refunding Rev., 5%, 11/01/2028 | | | 650,000 | | | | 776,269 | |
| North Charleston, SC, Limited Obligation Bond (Hospitality Fee Pledge), ”A“, 5%, 10/01/2040 | | | 3,880,000 | | | | 4,541,462 | |
| Piedmont, SC, Municipal Power Agency, FGIC, 6.25%, 1/01/2021 | | | 4,150,000 | | | | 4,306,621 | |
| Richland County, SC, Environmental Improvement Rev. (International Paper), ”A“, 3.875%, 4/01/2023 | | | 5,750,000 | | | | 6,027,897 | |
| Rock Hill, SC, Combined Utility System Rev., ”A“, 4%, 1/01/2049 | | | 4,350,000 | | | | 4,838,896 | |
| South Carolina Jobs & Economic Development Authority, Hospital Rev. (Conway Hospital, Inc.), 5.25%, 7/01/2047 | | | 8,000,000 | | | | 9,198,240 | |
| South Carolina Jobs & Economic Development Authority, Hospital Rev. (Prisma Health Obligated Group), ”A“, 5%, 5/01/2048 | | | 6,685,000 | | | | 7,776,594 | |
81
Portfolio of Investments – continued
| | | | | | | | |
| | |
| Issuer | | Shares/Par | | | Value ($) | |
| Municipal Bonds - continued | | | | | | |
| South Carolina - continued | | | | | | |
| South Carolina Jobs & Economic Development Authority, Hospital Rev. (St. Joseph’s/Candler Health System, Inc.), ”C“, 5%, 7/01/2032 | | $ | 5,000,000 | | | $ | 6,235,550 | |
| South Carolina Jobs & Economic Development Authority, Residential Care Facilities Rev. (South Carolina Episcopal Home at Still Hopes), 5%, 4/01/2047 | | | 1,580,000 | | | | 1,563,821 | |
| South Carolina Jobs & Economic Development Authority, Residential Care Facilities Rev. (South Carolina Episcopal Home at Still Hopes), 5%, 4/01/2052 | | | 1,210,000 | | | | 1,187,264 | |
| South Carolina Ports Authority Rev., 5.25%, 7/01/2050 | | | 3,075,000 | | | | 3,678,745 | |
| South Carolina Ports Authority Rev.(tax-exempt), ”B“, 5%, 7/01/2044 | | | 8,000,000 | | | | 9,449,360 | |
| South Carolina Ports Authority Rev., ”B“, 4%, 7/01/2035 | | | 3,405,000 | | | | 3,801,070 | |
| South Carolina Ports Authority Rev., ”B“, 4%, 7/01/2037 | | | 5,290,000 | | | | 5,889,251 | |
| South Carolina Ports Authority Rev., ”B“, 4%, 7/01/2039 | | | 5,235,000 | | | | 5,793,470 | |
| South Carolina Public Service Authority Rev., ”A“, 5.125%, 12/01/2043 | | | 2,745,000 | | | | 2,975,882 | |
| South Carolina Public Service Authority Rev., ”B“, 5.125%, 12/01/2043 | | | 6,550,000 | | | | 7,100,920 | |
| South Carolina Public Service Authority Rev., ”C“, 5%, 12/01/2036 | | | 2,920,000 | | | | 3,038,786 | |
| Spartanburg County, SC, Regional Health Services District Hospital Rev., ”A“, 5%, 4/15/2048 | | | 4,620,000 | | | | 5,349,406 | |
| University of South Carolina, Athletic Facilities Rev., ”A“, 5%, 5/01/2034 | | | 1,250,000 | | | | 1,517,463 | |
| University of South Carolina, Athletic Facilities Rev., ”A“, 5%, 5/01/2035 | | | 1,415,000 | | | | 1,712,645 | |
| University of South Carolina, Athletic Facilities Rev., ”A“, 5%, 5/01/2036 | | | 1,045,000 | | | | 1,261,242 | |
| | | | | | | | |
| | | | | | | $ | 100,433,552 | |
| South Dakota - 0.3% | | | | | | |
| South Dakota Educational Enhancement Funding Corp., Tobacco Settlement Rev., ”B“, 5%, 6/01/2024 | | $ | 1,000,000 | | | $ | 1,100,250 | |
| South Dakota Educational Enhancement Funding Corp., Tobacco Settlement Rev., ”B“, 5%, 6/01/2025 | | | 1,000,000 | | | | 1,098,430 | |
| South Dakota Educational Enhancement Funding Corp., Tobacco Settlement Rev., ”B“, 5%, 6/01/2026 | | | 1,400,000 | | | | 1,535,338 | |
| South Dakota Housing Development Authority, Homeownership Mortgage, ”B“, 4.5%, 11/01/2048 (u) | | | 9,460,000 | | | | 10,339,969 | |
| | | | | | | | |
| | | | | | | $ | 14,073,987 | |
| Tennessee - 1.4% | | | | | | |
| Chattanooga, TN, Health, Educational & Housing Facility Board Rev. (Catholic Health Initiatives), ”A“, 5.25%, 1/01/2045 | | $ | 10,310,000 | | | $ | 11,402,344 | |
82
Portfolio of Investments – continued
| | | | | | | | |
| | |
| Issuer | | Shares/Par | | | Value ($) | |
| Municipal Bonds - continued | | | | | | |
| Tennessee - continued | | | | | | |
| Chattanooga, TN, Health, Educational & Housing Facility Board Rev. (CommonSpirit Health),”A-1“, 4%, 8/01/2044 | | $ | 880,000 | | | $ | 877,554 | |
| Chattanooga, TN, Health, Educational & Housing Facility Board Rev. (CommonSpirit Health),”A-2“, 5%, 8/01/2044 | | | 655,000 | | | | 705,147 | |
| Chattanooga, TN, Health, Educational & Housing Facility Board Rev. (CommonSpirit Health),”A-2“, 5%, 8/01/2049 | | | 330,000 | | | | 350,209 | |
| Claiborne County, TN, Industrial Development Board Rev. (Lincoln Memorial University Project), 6.125%, 10/01/2040 | | | 3,000,000 | | | | 3,031,950 | |
| Knox County, TN, Health, Educational & Housing Facility Board Hospital Rev. (Covenant Health), ”A“, 5%, 1/01/2042 | | | 7,000,000 | | | | 8,127,770 | |
| Knox County, TN, Health, Educational & Housing Facility Board Rev. (University Health Systems, Inc.), 5%, 4/01/2030 | | | 790,000 | | | | 920,381 | |
| Knox County, TN, Health, Educational & Housing Facility Board Rev. (University Health Systems, Inc.), 5%, 4/01/2036 | | | 1,980,000 | | | | 2,261,358 | |
| Metropolitan Government of Nashville & Davidson County, TN, Electric Rev., ”A“, 5%, 5/15/2029 (Prerefunded 5/15/2021) | | | 4,765,000 | | | | 4,975,518 | |
| Metropolitan Government of Nashville & Davidson County, TN, Electric Rev., ”A“, 5%, 5/15/2030 (Prerefunded 5/15/2021) | | | 2,500,000 | | | | 2,610,450 | |
| Metropolitan Government of Nashville & Davidson County, TN, Health & Educational Facilities Board Rev. (Vanderbilt University Medical Center), ”A“, 5%, 7/01/2035 | | | 2,685,000 | | | | 3,008,569 | |
| Metropolitan Government of Nashville & Davidson County, TN, Health & Educational Facilities Board Rev., Refunding & Improvement (Trevecca Nazarene University Project), 5%, 10/01/2034 | | | 170,000 | | | | 184,843 | |
| Metropolitan Government of Nashville & Davidson County, TN, Health & Educational Facilities Board Rev., Refunding & Improvement (Trevecca Nazarene University Project), 5%, 10/01/2039 | | | 230,000 | | | | 245,930 | |
| Tennessee Energy Acquisition Corp., Gas Rev., ”A“, 5.25%, 9/01/2022 | | | 1,665,000 | | | | 1,750,881 | |
| Tennessee Energy Acquisition Corp., Gas Rev., ”A“, 5.25%, 9/01/2023 | | | 2,385,000 | | | | 2,550,090 | |
| Tennessee Energy Acquisition Corp., Gas Rev., ”A“, 5.25%, 9/01/2026 | | | 2,805,000 | | | | 3,139,580 | |
| Tennessee Housing Development Agency, Residential Finance | | | | | | | | |
| Program Rev., ”1“, 3.75%, 7/01/2039 | | | 1,500,000 | | | | 1,646,085 | |
| Tennessee Housing Development Agency, Residential Finance Program Rev., ”1“, 4%, 1/01/2043 | | | 2,500,000 | | | | 2,667,600 | |
| Tennessee Housing Development Agency, Residential Finance Program Rev.,”2-C“, 4%, 1/01/2045 | | | 1,030,000 | | | | 1,076,185 | |
| Tennessee Housing Development Agency, Residential Finance Program Rev., ”3“, 4.25%, 7/01/2049 | | | 2,810,000 | | | | 3,035,952 | |
83
Portfolio of Investments – continued
| | | | | | | | |
| | |
| Issuer | | Shares/Par | | | Value ($) | |
| Municipal Bonds - continued | | | | | | |
| Tennessee - continued | | | | | | |
| Tennessee Housing Development Agency, Residential Finance Program Rev., ”4“, 4.5%, 7/01/2049 (u) | | $ | 8,565,000 | | | $ | 9,375,506 | |
| | | | | | | | |
| | | | | | | $ | 63,943,902 | |
| Texas - 4.8% | | | | | | |
| Arlington, TX, Higher Education Finance Corp. Rev. (Riverwalk Education Foundation, Inc.), PSF, 5%, 8/15/2028 | | $ | 650,000 | | | $ | 815,308 | |
| Arlington, TX, Higher Education Finance Corp. Rev. (Riverwalk Education Foundation, Inc.), PSF, 5%, 8/15/2029 | | | 600,000 | | | | 764,442 | |
| Arlington, TX, Higher Education Finance Corp. Rev. (Riverwalk Education Foundation, Inc.), PSF, 5%, 8/15/2030 | | | 850,000 | | | | 1,090,329 | |
| Arlington, TX, Higher Education Finance Corp. Rev. (Riverwalk Education Foundation, Inc.), PSF, 5%, 8/15/2031 | | | 630,000 | | | | 805,436 | |
| Arlington, TX, Higher Education Finance Corp. Rev. (Riverwalk Education Foundation, Inc.), PSF, 5%, 8/15/2032 | | | 625,000 | | | | 796,963 | |
| Arlington, TX, Senior Lien Special Tax Rev., ”A“, AGM, 5%, 2/15/2037 | | | 1,200,000 | | | | 1,445,892 | |
| Arlington, TX, Senior Lien Special Tax Rev., ”A“, AGM, 5%, 2/15/2038 | | | 980,000 | | | | 1,175,167 | |
| Arlington, TX, Senior Lien Special Tax Rev., ”A“, AGM, 5%, 2/15/2043 | | | 5,100,000 | | | | 6,045,132 | |
| Austin, TX, Airport System Rev., ”B“, 5%, 11/15/2041 | | | 1,070,000 | | | | 1,198,582 | |
| Austin, TX, Convention Center (Convention Enterprises, Inc.), ”A“, 5%, 1/01/2029 | | | 715,000 | | | | 715,322 | |
| Austin, TX, Convention Center (Convention Enterprises, Inc.), ”A“, 5%, 1/01/2031 | | | 1,055,000 | | | | 1,039,629 | |
| Austin, TX, Convention Center (Convention Enterprises, Inc.), ”A“, 5%, 1/01/2034 | | | 200,000 | | | | 191,602 | |
| Austin, TX, Convention Center (Convention Enterprises, Inc.), ”B“, 5%, 1/01/2026 | | | 490,000 | | | | 494,214 | |
| Austin, TX, Convention Center (Convention Enterprises, Inc.), ”B“, 5%, 1/01/2028 | | | 315,000 | | | | 315,022 | |
| Austin, TX, Convention Center (Convention Enterprises, Inc.), ”B“, 5%, 1/01/2030 | | | 460,000 | | | | 455,363 | |
| Austin, TX, Water & Wastewater System Rev., 5%, 11/15/2027 | | | 3,000,000 | | | | 3,287,700 | |
| Brazos, TX, Higher Education Authority, Inc., Student Loan Program Rev., ”1A“, 2.35%, 4/01/2040 | | | 1,025,000 | | | | 930,064 | |
| Brazos, TX, Higher Education Authority, Inc., Student Loan Program Rev., ”1A“, 3%, 4/01/2040 | | | 900,000 | | | | 812,790 | |
| Clifton, TX, Higher Education Finance Corp. Rev. (Uplift Education), ”A“, 6.125%, 12/01/2040 (Prerefunded 12/01/2020) | | | 2,355,000 | | | | 2,425,344 | |
| Clifton, TX, Higher Education Finance Corp. Rev. (Uplift Education), ”A“, 6.25%, 12/01/2045 (Prerefunded 12/01/2020) | | | 1,425,000 | | | | 1,468,733 | |
84
Portfolio of Investments – continued
| | | | | | | | |
| | |
| Issuer | | Shares/Par | | | Value ($) | |
| Municipal Bonds - continued | | | | | | |
| Texas - continued | | | | | | |
| College of the Mainland, TX, General Obligation, 4%, 8/15/2044 | | $ | 2,240,000 | | | $ | 2,499,482 | |
| College of the Mainland, TX, General Obligation, 4%, 8/15/2049 | | | 2,240,000 | | | | 2,479,590 | |
| Dallas and Fort Worth, TX, International Airport Rev., ”C“, 5%, 11/01/2045 | | | 1,875,000 | | | | 1,949,606 | |
| Dallas, TX, Waterworks & Sewer System Rev., 5%, 10/01/2039 (Prerefunded 10/01/2020) | | | 1,750,000 | | | | 1,781,290 | |
| Dallas, TX, Waterworks & Sewer System Rev., 5%, 10/01/2039 | | | 8,250,000 | | | | 8,394,952 | |
| Decatur, TX, Hospital Authority Rev. (Wise Regional Health System), ”A“, 5.25%, 9/01/2044 | | | 415,000 | | | | 453,325 | |
| El Paso, TX, Water & Sewer Rev., 5%, 3/01/2028 | | | 455,000 | | | | 486,554 | |
| Harlingen, TX, Economic Development Corp., Sales Tax Refunding Rev. (Cameron County), ”A“, BAM, 4%, 2/15/2030 | | | 1,170,000 | | | | 1,341,709 | |
| Harlingen, TX, Economic Development Corp., Sales Tax Refunding Rev. (Cameron County), ”A“, BAM, 4%, 2/15/2031 | | | 1,525,000 | | | | 1,737,249 | |
| Harris County, TX, Cultural Education Facilities Finance Corp., Hospital Rev. (Texas Children’s Hospital), ”A“, 4%, 10/01/2035 | | | 1,575,000 | | | | 1,832,969 | |
| Harris County, TX, Cultural Education Facilities Finance Corp., Hospital Rev. (Texas Children’s Hospital), ”A“, 4%, 10/01/2036 | | | 2,790,000 | | | | 3,236,149 | |
| Harris County, TX, Cultural Education Facilities Finance Corp., Hospital Rev. (Texas Children’s Hospital), ”A“, 4%, 10/01/2037 | | | 3,775,000 | | | | 4,362,805 | |
| Harris County, TX, Cultural Education Facilities Finance Corp., Hospital Rev. (Texas Children’s Hospital), ”A“, 4%, 10/01/2038 | | | 3,150,000 | | | | 3,627,823 | |
| Harris County-Houston, TX, Sports Authority Rev., ”C“, 5%, 11/15/2032 | | | 225,000 | | | | 251,467 | |
| Harris County-Houston, TX, Sports Authority Rev., ”C“, 5%, 11/15/2033 | | | 545,000 | | | | 608,602 | |
| Harris County-Houston, TX, Sports Authority Rev., Capital Appreciation, ”A“, AGM, 0%, 11/15/2041 | | | 900,000 | | | | 436,554 | |
| Harris County-Houston, TX, Sports Authority Rev., Capital Appreciation, ”A“, AGM, 0%, 11/15/2046 | | | 2,250,000 | | | | 840,870 | |
| Harris, Ft. Bend & Waller Counties, TX, Katy Independent School District, ”C“, FLR, PSF, 0.752% (67% of LIBOR - 1mo. + 0.28%), 8/15/2036 (Put Date 8/16/2021) | | | 10,400,000 | | | | 10,401,872 | |
| Houston, TX, Airport System Rev., Special Facilities Rev. (United Airlines, Inc. Terminal E Project), 4.5%, 7/01/2020 | | | 855,000 | | | | 854,889 | |
| Houston, TX, Airport System Rev., Special Facilities Rev. (United Airlines, Inc. Terminal E Project), 4.75%, 7/01/2024 | | | 2,465,000 | | | | 2,418,436 | |
| Houston, TX, Airport System Rev., Special Facilities Rev. (United Airlines, Inc. Terminal E Project), 5%, 7/01/2029 | | | 100,000 | | | | 99,137 | |
| Houston, TX, Airport System Rev., Special Facilities Rev. (United Airlines, Inc. Terminal Improvement Projects),”B-1“, 5%, 7/15/2030 | | | 2,760,000 | | | | 2,735,298 | |
85
Portfolio of Investments – continued
| | | | | | | | |
| | |
| Issuer | | Shares/Par | | | Value ($) | |
| Municipal Bonds - continued | | | | | | |
| Texas - continued | | | | | | |
| Houston, TX, Airport System Rev., Special Facilities Rev. (United Airlines, Inc. Terminal Improvement Projects),”B-2“, 5%, 7/15/2020 | | $ | 3,215,000 | | | $ | 3,214,518 | |
| Houston, TX, Airport System Rev., Subordinate Lien, ”A“, 5%, 7/01/2031 | | | 2,310,000 | | | | 2,435,317 | |
| Houston, TX, Industrial Development Corp. (United Parcel Service, Inc.), 6%, 3/01/2023 | | | 10,000 | | | | 10,019 | |
| Irving, TX, Hospital Authority Rev. (Baylor Scott & White Medical Center-Irving), ”A“, 5%, 10/15/2044 | | | 1,565,000 | | | | 1,780,829 | |
| Irving, TX, Hotel Occupancy Tax Rev., 5%, 8/15/2035 | | | 150,000 | | | | 152,079 | |
| Irving, TX, Hotel Occupancy Tax Rev., 5%, 8/15/2037 | | | 215,000 | | | | 216,436 | |
| Irving, TX, Hotel Occupancy Tax Rev., 5%, 8/15/2038 | | | 240,000 | | | | 240,778 | |
| Irving, TX, Hotel Occupancy Tax Rev., 5%, 8/15/2043 | | | 435,000 | | | | 430,433 | |
| Mission, TX, Economic Development Corp., Solid Waste Disposal Rev. (Republic Services, Inc. Project), 1.12%, 1/01/2026 (Put Date 5/01/2020) | | | 6,900,000 | | | | 6,898,620 | |
| New Hope, TX, Cultural Education Facilities Finance Corp., Capital Improvement Rev. (CHF - Collegiate Housing Denton LLC - Texas Woman’s University Housing Project),“A-1”, AGM, 5%, 7/01/2038 | | | 490,000 | | | | 567,851 | |
| New Hope, TX, Cultural Education Facilities Finance Corp., Capital Improvement Rev. (CHF - Collegiate Housing Denton LLC - Texas Woman’s University Housing Project),“A-1”, AGM, 5%, 7/01/2048 | | | 1,595,000 | | | | 1,819,480 | |
| New Hope, TX, Cultural Education Facilities Finance Corp., Capital Improvement Rev. (CHF - Collegiate Housing Denton LLC - Texas Woman’s University Housing Project),“A-1”, AGM, 5%, 7/01/2058 | | | 1,780,000 | | | | 2,017,434 | |
| New Hope, TX, Cultural Education Facilities Finance Corp., Retirement Facility Rev. (MRC Senior Living - Langford Project),”B-1“, 3.25%, 11/15/2022 | | | 30,000 | | | | 28,782 | |
| New Hope, TX, Cultural Education Facilities Finance Corp., Senior Living Rev. (Cardinal Bay, Inc. - Village on the Park/Carriage Inn Project),”A-1“, 5%, 7/01/2031 | | | 190,000 | | | | 191,710 | |
| New Hope, TX, Cultural Education Facilities Finance Corp., Senior Living Rev. (Cardinal Bay, Inc. - Village on the Park/Carriage Inn Project),”A-1“, 4%, 7/01/2036 | | | 955,000 | | | | 842,740 | |
| New Hope, TX, Cultural Education Facilities Finance Corp., Senior Living Rev. (Cardinal Bay, Inc. - Village on the Park/Carriage Inn Project),”A-1“, 5%, 7/01/2046 | | | 6,220,000 | | | | 5,965,104 | |
| New Hope, TX, Cultural Education Facilities Finance Corp., Senior Living Rev. (Cardinal Bay, Inc. - Village on the Park/Carriage Inn Project),”A-1“, 5%, 7/01/2051 | | | 2,545,000 | | | | 2,395,583 | |
86
Portfolio of Investments – continued
| | | | | | | | |
| | |
| Issuer | | Shares/Par | | | Value ($) | |
| Municipal Bonds - continued | | | | | | |
| Texas - continued | | | | | | |
| New Hope, TX, Cultural Education Facilities Finance Corp., Student Housing Rev. (CHF - Collegiate Housing Stephenville III LLC - Tarleton State University Project), 5%, 4/01/2030 | | $ | 355,000 | | | $ | 378,522 | |
| New Hope, TX, Cultural Education Facilities Finance Corp., Student Housing Rev. (CHF - Collegiate Housing Stephenville III LLC - Tarleton State University Project), 5%, 4/01/2035 | | | 355,000 | | | | 374,784 | |
| New Hope, TX, Cultural Education Facilities Finance Corp., Student Housing Rev. (CHF - Collegiate Housing Stephenville III LLC - Tarleton State University Project), 5%, 4/01/2047 | | | 895,000 | | | | 930,639 | |
| New Hope, TX, Cultural Education Facilities Finance Corp., Student Housing Rev. (Texas A&M University Project), ”A“, AGM, 5%, 4/01/2046 | | | 1,585,000 | | | | 1,743,215 | |
| Newark, TX, Higher Education Finance Corp. Rev. (Austin Achieve Public Schools, Inc.), 5%, 6/15/2033 | | | 35,000 | | | | 35,405 | |
| Newark, TX, Higher Education Finance Corp. Rev. (Austin Achieve Public Schools, Inc.), 5%, 6/15/2038 | | | 90,000 | | | | 90,478 | |
| Newark, TX, Higher Education Finance Corp. Rev. (Austin Achieve Public Schools, Inc.), 5%, 6/15/2048 | | | 265,000 | | | | 265,090 | |
| Newark, TX, Higher Education Finance Corp. Rev. (Austin Achieve Public Schools, Inc.), ”A“, 5%, 6/15/2032 | | | 110,000 | | | | 111,433 | |
| Newark, TX, Higher Education Finance Corp. Rev. (Austin Achieve Public Schools, Inc.), ”A“, 5%, 6/15/2037 | | | 125,000 | | | | 125,768 | |
| Newark, TX, Higher Education Finance Corp. Rev. (Austin Achieve Public Schools, Inc.), ”A“, 5%, 6/15/2042 | | | 150,000 | | | | 150,383 | |
| Newark, TX, Higher Education Finance Corp. Rev. (Austin Achieve Public Schools, Inc.), ”A“, 5.25%, 6/15/2048 | | | 300,000 | | | | 301,647 | |
| Port Beaumont, TX, Navigation District Facility Rev. (Jefferson Gulf Coast Energy Project), ”A“, 3.625%, 1/01/2035 (n) | | | 2,175,000 | | | | 1,831,089 | |
| Port Beaumont, TX, Navigation District Facility Rev. (Jefferson Gulf Coast Energy Project), ”A“, 4%, 1/01/2050 (n) | | | 7,435,000 | | | | 5,738,779 | |
| Port Beaumont, TX, Navigation District Facility Rev. (Jefferson Gulf Coast Energy Project), ”B“, 6%, 1/01/2025 (n) | | | 4,180,000 | | | | 4,177,367 | |
| Red River, TX, Education Finance Corp., Higher Education Rev. (Houston Baptist University Project), 5.5%, 10/01/2046 | | | 4,380,000 | | | | 4,759,396 | |
| San Antonio, TX, Airport System Rev., ”A“, 5%, 7/01/2029 | | | 420,000 | | | | 504,966 | |
| San Antonio, TX, Airport System Rev., ”A“, 5%, 7/01/2030 | | | 520,000 | | | | 623,225 | |
| San Antonio, TX, Airport System Rev., ”A“, 5%, 7/01/2031 | | | 420,000 | | | | 501,673 | |
| San Antonio, TX, Airport System Rev., ”A“, 5%, 7/01/2032 | | | 420,000 | | | | 500,002 | |
| San Antonio, TX, Electric & Gas Systems Rev., 5%, 2/01/2031 | | | 6,000,000 | | | | 7,146,600 | |
| San Antonio, TX, Passenger Facility Charge and Subordinate Lien Airport System Rev., ”A“, 5%, 7/01/2028 | | | 635,000 | | | | 752,215 | |
| San Antonio, TX, Passenger Facility Charge and Subordinate Lien Airport System Rev., ”A“, 5%, 7/01/2029 | | | 625,000 | | | | 748,588 | |
87
Portfolio of Investments – continued
| | | | | | | | |
| | |
| Issuer | | Shares/Par | | | Value ($) | |
| Municipal Bonds - continued | | | | | | |
| Texas - continued | | | | | | |
| San Antonio, TX, Passenger Facility Charge and Subordinate Lien Airport System Rev., ”A“, 5%, 7/01/2030 | | $ | 520,000 | | | $ | 620,864 | |
| San Antonio, TX, Passenger Facility Charge and Subordinate Lien Airport System Rev., ”A“, 5%, 7/01/2031 | | | 375,000 | | | | 446,224 | |
| San Antonio, TX, Passenger Facility Charge and Subordinate Lien Airport System Rev., ”A“, 5%, 7/01/2032 | | | 465,000 | | | | 551,476 | |
| San Juan, TX, Higher Education Finance Authority Education Rev. (Idea Public Schools), ”A“, 6.7%, 8/15/2040 (Prerefunded 8/15/2020) | | | 2,795,000 | | | | 2,850,481 | |
| Tarrant County, TX, Cultural Education Facilities Finance Corp. Retirement Facility Rev. (Barton Creek Senior Living Center, Inc., Querencia Project), 5%, 11/15/2030 | | | 1,160,000 | | | | 1,182,690 | |
| Tarrant County, TX, Cultural Education Facilities Finance Corp. Retirement Facility Rev. (Barton Creek Senior Living Center, Inc., Querencia Project), 5%, 11/15/2035 | | | 1,385,000 | | | | 1,398,434 | |
| Tarrant County, TX, Cultural Education Facilities Finance Corp. Retirement Facility Rev. (Barton Creek Senior Living Center, Inc., Querencia Project), 5%, 11/15/2040 | | | 1,505,000 | | | | 1,505,647 | |
| Tarrant County, TX, Cultural Education Facilities Finance Corp. Retirement Facility Rev. (Northwest Senior Housing Corp. Edgemere Project), ”B“, 5%, 11/15/2030 | | | 3,200,000 | | | | 2,996,512 | |
| Tarrant County, TX, Cultural Education Facilities Finance Corp. Retirement Facility Rev. (Stayton at Museum Way), 5.75%, 12/01/2054 | | | 8,751,376 | | | | 7,234,587 | |
| Tarrant County, TX, Cultural Education Facilities Finance Corp. Retirement Facility Rev. (Trinity Terrace Project),”A-1“, 5%, 10/01/2044 | | | 785,000 | | | | 807,168 | |
| Texas Department of Housing & Community Affairs Residential Mortgage Rev., ”A“, 4.75%, 1/01/2049 (u) | | | 4,890,000 | | | | 5,408,389 | |
| Texas Department of Housing & Community Affairs Single Family Mortgage Rev., ”A“, 4.75%, 3/01/2049 (u) | | | 3,795,000 | | | | 4,170,743 | |
| Texas Private Activity Surface Transportation Corp., Senior Lien Rev. (NTE Mobility Partners Segments 3 LLC Segment 3C Project), 5%, 6/30/2058 | | | 19,115,000 | | | | 20,426,480 | |
| Texas Private Activity Surface Transportation Corp., Senior Lien Rev. (NTE Mobility Partners Segments 3 LLC Segments 3A & 3B Facility), 7%, 12/31/2038 | | | 1,495,000 | | | | 1,686,584 | |
| Texas Private Activity Surface Transportation Corp., Senior Lien Rev. (NTE Mobility Partners Segments 3 LLC Segments 3A & 3B Facility), 6.75%, 6/30/2043 | | | 1,195,000 | | | | 1,336,464 | |
| Texas Public Finance Authority Rev. (Texas Southern University), BAM, 5%, 5/01/2028 | | | 1,000,000 | | | | 1,170,930 | |
| Texas State University, Financing System Rev., ”A“, 5%, 3/15/2032 | | | 5,000,000 | | | | 6,102,350 | |
88
Portfolio of Investments – continued
| | | | | | | | |
| | |
| Issuer | | Shares/Par | | | Value ($) | |
| Municipal Bonds - continued | | | | | | |
| Texas - continued | | | | | | |
| Texas Transportation Commission, Central Texas Turnpike System First Tier Refunding Rev., ”A“, 5%, 8/15/2039 | | $ | 3,245,000 | | | $ | 4,015,266 | |
| Texas Transportation Commission, State Highway 249 System Rev., ”A“, 5%, 8/01/2057 | | | 4,100,000 | | | | 4,333,003 | |
| Texas Transportation Commission, State Highway 249 System Rev., Capital Appreciation, ”A“, 0%, 8/01/2037 | | | 455,000 | | | | 212,931 | |
| Texas Transportation Commission, State Highway 249 System Rev., Capital Appreciation, ”A“, 0%, 8/01/2038 | | | 335,000 | | | | 148,070 | |
| Texas Transportation Commission, State Highway 249 System Rev., Capital Appreciation, ”A“, 0%, 8/01/2039 | | | 375,000 | | | | 156,941 | |
| Texas Transportation Commission, State Highway 249 System Rev., Capital Appreciation, ”A“, 0%, 8/01/2040 | | | 375,000 | | | | 148,245 | |
| Texas Transportation Commission, State Highway 249 System Rev., Capital Appreciation, ”A“, 0%, 8/01/2041 | | | 745,000 | | | | 278,392 | |
| Texas Transportation Commission, State Highway 249 System Rev., Capital Appreciation, ”A“, 0%, 8/01/2042 | | | 1,025,000 | | | | 362,112 | |
| Texas Transportation Commission, State Highway 249 System Rev., Capital Appreciation, ”A“, 0%, 8/01/2043 | | | 840,000 | | | | 280,888 | |
| Travis County, TX, Health Facilities Development Corp. Rev. (Westminster Manor Health), 7%, 11/01/2030 (Prerefunded 11/01/2020) | | | 590,000 | | | | 609,446 | |
| Travis County, TX, Health Facilities Development Corp. Rev. (Westminster Manor Health), 7.125%, 11/01/2040 (Prerefunded 11/01/2020) | | | 2,575,000 | | | | 2,661,752 | |
| Travis County, TX, Health Facilities Development Corp. Rev. (Westminster Manor Health), Unrefunded Balance, 7%, 11/01/2030 | | | 40,000 | | | | 40,917 | |
| University of Texas, System Rev., ”J“, 5%, 8/15/2028 | | | 5,000,000 | | | | 6,036,400 | |
| | | | | | | | |
| | | | | | | $ | 219,283,025 | |
| Utah - 0.5% | | | | | | |
| Utah Charter School Finance Authority, Charter School Rev. (Spectrum Academy Project), 5%, 4/15/2030 | | $ | 150,000 | | | $ | 150,000 | |
| Utah Charter School Finance Authority, Charter School Rev. (Spectrum Academy Project), 6%, 4/15/2045 | | | 795,000 | | | | 795,119 | |
| Utah Charter School Finance Authority, Charter School Rev. (Summit Academy, Inc.), ”A“, 5%, 4/15/2039 | | | 290,000 | | | | 355,236 | |
| Utah Charter School Finance Authority, Charter School Rev. (Summit Academy, Inc.), ”A“, 5%, 4/15/2044 | | | 260,000 | | | | 315,549 | |
| Utah Charter School Finance Authority, Charter School Rev. (Summit Academy, Inc.), ”A“, 5%, 4/15/2049 | | | 1,840,000 | | | | 2,216,004 | |
| Utah Charter School Finance Authority, Charter School Rev. (Syracuse Arts Academy Project), 5%, 4/15/2037 | | | 1,000,000 | | | | 1,160,180 | |
89
Portfolio of Investments – continued
| | | | | | | | |
| | |
| Issuer | | Shares/Par | | | Value ($) | |
| Municipal Bonds - continued | | | | | | |
| Utah - continued | | | | | | |
| Utah Charter School Finance Authority, Charter School Rev. (Syracuse Arts Academy Project), 5%, 4/15/2042 | | $ | 3,495,000 | | | $ | 4,016,419 | |
| Utah Housing Corp., Tax Exempt Mortgage-Backed Securities, ”H“, GNMA, 4.5%, 8/21/2049 | | | 1,685,173 | | | | 1,796,816 | |
| Utah Housing Corp., Tax Exempt Mortgage-Backed Securities, ”I“, GNMA, 4%, 9/21/2049 | | | 3,338,179 | | | | 3,534,297 | |
| Utah Housing Corp.,Tax-Exempt Mortgage-Backed Securities, ”G“, GNMA, 4.5%, 7/21/2049 | | | 4,118,145 | | | | 4,390,972 | |
| Utah Housing Corp.,Tax-Exempt Mortgage-Backed Securities, ”G“, GNMA, 3.5%, 2/21/2050 | | | 4,023,362 | | | | 4,219,501 | |
| | | | | | | | |
| | | | | | | $ | 22,950,093 | |
| Vermont - 0.5% | | | | | | |
| Burlington, VT, Airport Rev., ”A“, 5%, 7/01/2022 | | $ | 240,000 | | | $ | 247,613 | |
| Burlington, VT, Airport Rev., ”A“, 4%, 7/01/2028 | | | 2,020,000 | | | | 2,074,237 | |
| Vermont Economic Development Authority, Solid Waste Disposal Rev. (Casella Waste Systems, Inc.), 4.625%, 4/01/2036 (Put Date 4/03/2028) | | | 1,035,000 | | | | 1,058,981 | |
| Vermont Housing Finance Agency, Multi-Purpose Rev., ”C“, 4%, 11/01/2043 | | | 455,000 | | | | 474,492 | |
| Vermont Student Assistance Corp., Education Loan Rev., ”A“, 3.625%, 6/15/2029 | | | 575,000 | | | | 603,819 | |
| Vermont Student Assistance Corp., Education Loan Rev., ”A“, 3.75%, 6/15/2030 | | | 635,000 | | | | 669,792 | |
| Vermont Student Assistance Corp., Education Loan Rev., ”A“, 4%, 6/15/2033 | | | 595,000 | | | | 632,425 | |
| Vermont Student Assistance Corp., Education Loan Rev., ”A“, 4%, 6/15/2034 | | | 635,000 | | | | 673,367 | |
| Vermont Student Assistance Corp., Education Loan Rev., ”A“, 3%, 6/15/2035 | | | 13,000,000 | | | | 13,438,100 | |
| Vermont Student Assistance Corp., Education Loan Rev., ”B“, 4.375%, 6/15/2046 | | | 765,000 | | | | 805,025 | |
| Vermont Student Assistance Corp., Education Loan Rev., ”B“, 4%, 6/15/2047 | | | 1,260,000 | | | | 1,304,843 | |
| | | | | | | | |
| | | | | | | $ | 21,982,694 | |
| Virginia - 1.2% | | | | | | |
| Charles City County, VA, Economic Development Authority Solid Waste Disposal Rev. (Waste Management, Inc. Project), ”A“, 2.4%, 8/01/2027 (Put Date 5/01/2022) | | $ | 1,275,000 | | | $ | 1,260,911 | |
| Commonwealth of Virginia, University Health System General Rev., ”A“, 4%, 7/01/2040 | | | 13,150,000 | | | | 14,722,740 | |
| Embrey Mill Community Development Authority, VA, Special Assessment Rev., 7.25%, 3/01/2043 | | | 2,100,000 | | | | 2,172,471 | |
90
Portfolio of Investments – continued
| | | | | | | | |
| | |
| Issuer | | Shares/Par | | | Value ($) | |
| Municipal Bonds - continued | | | | | | |
| Virginia - continued | | | | | | |
| Fairfax County, VA, Redevelopment and Housing Authority Rev. (Wedgewood Affordable Housing Acquisition), 5%, 10/01/2035 | | $ | 3,905,000 | | | $ | 4,822,558 | |
| Fairfax County, VA, Redevelopment and Housing Authority Rev. (Wedgewood Affordable Housing Acquisition), 5%, 10/01/2037 | | | 3,990,000 | | | | 4,894,373 | |
| Gloucester County, VA, Industrial Development Authority Rev. (Waste Management Disposal Services of Virginia, Inc.), ”A“, 2.4%, 9/01/2038 (Put Date 5/02/2022) | | | 1,090,000 | | | | 1,077,955 | |
| Henrico County, VA, Industrial Development Authority Rev. (Bon Secours Health Systems, Inc.), RIBS, AGM, 9.13%, 8/23/2027 (p) | | | 3,400,000 | | | | 4,549,846 | |
| King George County, VA, Industrial Development Authority Solid Waste Disposal Rev. (King George Landfill, Inc. Project), ”A“, 2.5%, 6/01/2023 (Put Date 5/01/2020) | | | 1,455,000 | | | | 1,432,738 | |
| Loudon County, VA, Economic Development Authority Rev. (Howard Hughes Medical Institute), Capital Appreciation, ”A“, 0%, 7/01/2049 | | | 15,000,000 | | | | 6,021,900 | |
| Manassas Park, VA, Economic Development Authority Lease Rev., ”A“, 6%, 7/15/2035 (Prerefunded 7/15/2020) | | | 845,000 | | | | 856,450 | |
| Peninsula Town Center Community Development Authority, VA, Special Obligation Refunding, 4%, 9/01/2023 | | | 110,000 | | | | 110,530 | |
| Peninsula Town Center Community Development Authority, VA, Special Obligation Refunding, 4.5%, 9/01/2028 | | | 145,000 | | | | 148,212 | |
| Peninsula Town Center Community Development Authority, VA, Special Obligation Refunding, 5%, 9/01/2037 | | | 270,000 | | | | 278,586 | |
| Peninsula Town Center Community Development Authority, VA, Special Obligation Refunding, 4.5%, 9/01/2045 | | | 980,000 | | | | 946,190 | |
| Peninsula Town Center Community Development Authority, VA, Special Obligation Refunding, 5%, 9/01/2045 | | | 230,000 | | | | 233,830 | |
| Sussex County, VA, Industrial Development Authority Solid Waste Disposal Rev. (Atlantic Waste Disposal, Inc. Project), ”A“, 2.4%, 6/01/2028 (Put Date 5/01/2022) | | | 1,275,000 | | | | 1,260,911 | |
| Virginia College Building Authority, Educational Facilities Rev. (Marymount University Project), ”B“, 5.25%, 7/01/2030 | | | 800,000 | | | | 815,352 | |
| Virginia College Building Authority, Educational Facilities Rev. (Marymount University Project), ”B“, 5.25%, 7/01/2035 | | | 715,000 | | | | 714,943 | |
| Virginia Small Business Financing Authority Rev. (95 Express Lanes LLC Project), 5%, 7/01/2049 | | | 6,990,000 | | | | 6,969,240 | |
| Virginia Small Business Financing Authority Rev. (Hampton University), 5.25%, 10/01/2029 | | | 625,000 | | | | 721,913 | |
| Virginia Small Business Financing Authority Rev., Solid Waste Disposal (Covanta Project), 5%, 1/01/2048 (Put Date 7/01/2038) | | | 185,000 | | | | 185,205 | |
| West Point, VA, Industrial Development Authority, Solid Waste Disposal Rev. (Chesapeake Corp.), ”A“, 6.375%, 3/01/2019 (a)(d) | | | 529,028 | | | | 53 | |
| | | | | | | | |
| | | | | | | $ | 54,196,907 | |
91
Portfolio of Investments – continued
| | | | | | | | |
| | |
| Issuer | | Shares/Par | | | Value ($) | |
| Municipal Bonds - continued | | | | | | |
| Washington - 1.8% | | | | | | |
| Central Puget Sound, WA, Regional Transit Authority Sales Tax & Motor Vehicle Excise Tax Rev.,”S-1“, 5%, 11/01/2041 | | $ | 13,000,000 | | | $ | 15,468,180 | |
| Grays Harbor County, WA, Public Hospital District No. 2, Limited Tax General Obligation Refunding, 5%, 12/15/2033 | | | 1,885,000 | | | | 2,091,728 | |
| Grays Harbor County, WA, Public Hospital District No. 2, Limited Tax General Obligation Refunding, 5%, 12/15/2038 | | | 2,410,000 | | | | 2,632,443 | |
| Grays Harbor County, WA, Public Hospital District No. 2, Limited Tax General Obligation Refunding, 5%, 12/15/2048 | | | 4,630,000 | | | | 4,975,398 | |
| King Country, WA, Public Hospital District No. 2 (EvergreenHealth), ”A“, 4%, 12/01/2040 | | | 2,000,000 | | | | 2,207,720 | |
| King Country, WA, Public Hospital District No. 2 (EvergreenHealth), ”A“, 4%, 12/01/2041 | | | 1,250,000 | | | | 1,376,587 | |
| King Country, WA, Public Hospital District No. 2 (EvergreenHealth), ”A“, 4%, 12/01/2045 | | | 3,795,000 | | | | 4,142,242 | |
| Seattle, WA, Port Intermediate Lien Rev., 5%, 4/01/2037 | | | 10,000,000 | | | | 11,653,300 | |
| Seattle, WA, Port Rev., 4%, 4/01/2044 | | | 1,600,000 | | | | 1,679,024 | |
| Seattle, WA, Port Rev., ”B“, 5%, 8/01/2024 | | | 3,000,000 | | | | 3,232,800 | |
| Washington Health Care Facilities Authority Rev. (Virginia Mason Medical Center), 5%, 8/15/2027 | | | 500,000 | | | | 601,770 | |
| Washington Health Care Facilities Authority Rev. (Virginia Mason Medical Center), 5%, 8/15/2035 | | | 1,875,000 | | | | 2,196,394 | |
| Washington Health Care Facilities Authority Rev. (Virginia Mason Medical Center), 5%, 8/15/2037 | | | 1,710,000 | | | | 1,994,869 | |
| Washington Motor Vehicle Fuel Tax, ”E“, 5%, 2/01/2037 | | | 12,000,000 | | | | 13,479,840 | |
| Washington Motor Vehicle Fuel Tax, ”E“, 5%, 2/01/2039 | | | 7,985,000 | | | | 8,944,398 | |
| Washington State Convention Center Public Facilities District, Lodging Tax, 5%, 7/01/2058 | | | 3,830,000 | | | | 4,545,061 | |
| | | | | | | | |
| | | | | | | $ | 81,221,754 | |
| West Virginia - 0.6% | | | | | | |
| Harrison County, WV, Community Solid Waste Disposal Rev. (Monongahela Power Co.), 3%, 10/15/2037 | | $ | 10,000,000 | | | $ | 10,198,000 | |
| Monongalia County, WV, Board of Education, 5%, 5/01/2029 | | | 1,445,000 | | | | 1,560,586 | |
| Monongalia County, WV, Building Commission Improvement Rev. (Monongalia Health System Obligated Group), 5%, 7/01/2029 | | | 395,000 | | | | 439,520 | |
| West Virginia Hospital Finance Authority Hospital Improvement Rev. (Charleston Area Medical Center, Inc.), ”A“, 5%, 9/01/2038 | | | 840,000 | | | | 1,025,648 | |
| West Virginia Hospital Finance Authority Hospital Improvement Rev. (Charleston Area Medical Center, Inc.), ”A“, 5%, 9/01/2039 | | | 250,000 | | | | 304,220 | |
| West Virginia Hospital Finance Authority Hospital Improvement Rev. (Thomas Health System), 6.5%, 10/01/2038 (a)(d) | | | 2,110,000 | | | | 1,160,500 | |
| West Virginia Hospital Finance Authority Hospital Improvement Rev. (West Virginia University Health System Obligated Group), ”A“, 4%, 6/01/2051 | | | 10,000,000 | | | | 10,935,900 | |
92
Portfolio of Investments – continued
| | | | | | | | |
| | |
| Issuer | | Shares/Par | | | Value ($) | |
| Municipal Bonds - continued | | | | | | |
| West Virginia - continued | | | | | | |
| West Virginia Housing Development Fund, ”A“, FHA, 3.45%, 11/01/2033 | | $ | 640,000 | | | $ | 692,186 | |
| West Virginia Housing Development Fund, ”A“, FHA, 3.75%, 11/01/2038 | | | 605,000 | | | | 656,963 | |
| West Virginia Housing Development Fund, ”A“, FHA, 3.9%, 11/01/2048 | | | 300,000 | | | | 318,201 | |
| West Virginia Water Development Authority Rev. (Loan Program II),”A-II“, 5%, 11/01/2033 | | | 675,000 | | | | 807,766 | |
| | | | | | | | |
| | | | | | | $ | 28,099,490 | |
| Wisconsin - 1.4% | | | | | | |
| Public Finance Authority Student Housing Rev.(CHF-WilmingtonLLC- University of North Carolina at Wilmington Project), AGM, 5%, 7/01/2048 | | $ | 6,000,000 | | | $ | 6,986,340 | |
| Public Finance Authority Student Housing Rev.(CHF-WilmingtonLLC- University of North Carolina at Wilmington Project), AGM, 5%, 7/01/2053 | | | 3,570,000 | | | | 4,137,630 | |
| Public Finance Authority Student Housing Rev.(CHF-WilmingtonLLC- University of North Carolina at Wilmington Project), AGM, 5%, 7/01/2058 | | | 5,000,000 | | | | 5,776,100 | |
| Wisconsin Health & Educational Facilities Authority Rev. (Aurora Health Care, Inc.), ”A“, 5%, 7/15/2026 (Prerefunded 7/15/2021) | | | 2,215,000 | | | | 2,325,861 | |
| Wisconsin Health & Educational Facilities Authority Rev. (Aurora Health Care, Inc.), ”A“, 5%, 7/15/2028 (Prerefunded 7/15/2021) | | | 665,000 | | | | 698,283 | |
| Wisconsin Health & Educational Facilities Authority Rev. (Bellin Memorial Hospital, Inc.), ”A“, 5%, 12/01/2030 | | | 115,000 | | | | 145,829 | |
| Wisconsin Health & Educational Facilities Authority Rev. (Bellin Memorial Hospital, Inc.), ”A“, 5%, 12/01/2031 | | | 130,000 | | | | 163,818 | |
| Wisconsin Health & Educational Facilities Authority Rev. (Bellin Memorial Hospital, Inc.), ”A“, 5%, 12/01/2032 | | | 150,000 | | | | 188,979 | |
| Wisconsin Health & Educational Facilities Authority Rev. (Bellin Memorial Hospital, Inc.), ”A“, 5%, 12/01/2033 | | | 160,000 | | | | 200,813 | |
| Wisconsin Health & Educational Facilities Authority Rev. (Bellin Memorial Hospital, Inc.), ”A“, 5%, 12/01/2034 | | | 150,000 | | | | 187,571 | |
| Wisconsin Health & Educational Facilities Authority Rev. (Bellin Memorial Hospital, Inc.), ”A“, 5%, 12/01/2035 | | | 190,000 | | | | 236,689 | |
| Wisconsin Health & Educational Facilities Authority Rev. (Marshfield Clinic Health System, Inc.), ”C“, 5%, 2/15/2047 | | | 805,000 | | | | 871,541 | |
| Wisconsin Health & Educational Facilities Authority Rev. (Rogers Memorial Hospital, Inc.), ”A“, 5%, 7/01/2038 | | | 385,000 | | | | 451,971 | |
| Wisconsin Health & Educational Facilities Authority Rev. (Rogers Memorial Hospital, Inc.), ”A“, 5%, 7/01/2044 | | | 450,000 | | | | 524,709 | |
| Wisconsin Health & Educational Facilities Authority Rev. (Rogers Memorial Hospital, Inc.), ”A“, 5%, 7/01/2049 | | | 1,875,000 | | | | 2,178,919 | |
93
Portfolio of Investments – continued
| | | | | | | | |
| | |
| Issuer | | Shares/Par | | | Value ($) | |
| Municipal Bonds - continued | | | | | | |
| Wisconsin - continued | | | | | | |
| Wisconsin Health & Educational Facilities Authority Rev. (St. Camillus Health System, Inc.), ”A“, 5%, 11/01/2039 | | $ | 815,000 | | | $ | 795,090 | |
| Wisconsin Health & Educational Facilities Authority Rev. (St. Camillus Health System, Inc.), ”A“, 5%, 11/01/2046 | | | 875,000 | | | | 827,050 | |
| Wisconsin Health & Educational Facilities Authority Rev. (St. Camillus Health System, Inc.), ”A“, 5%, 11/01/2054 | | | 1,665,000 | | | | 1,543,988 | |
| Wisconsin Health & Educational Facilities Authority Rev. (St. Camillus Health System, Inc.),”B-3“, 2.25%, 11/01/2026 | | | 1,735,000 | | | | 1,628,003 | |
| Wisconsin Health & Educational Facilities Authority Rev. (St. John’s Community, Inc.), ”A“, 5%, 9/15/2040 | | | 465,000 | | | | 462,629 | |
| Wisconsin Health & Educational Facilities Authority Rev. (St. John’s Community, Inc.), ”A“, 5%, 9/15/2045 | | | 630,000 | | | | 614,918 | |
| Wisconsin Health & Educational Facilities Authority Rev. (St. John’s Community, Inc.), ”A“, 5%, 9/15/2050 | | | 2,560,000 | | | | 2,470,707 | |
| Wisconsin Housing & Economic Development Authority, Home Ownership Rev., ”D“, 4%, 3/01/2047 (u) | | | 5,725,000 | | | | 6,147,562 | |
| Wisconsin Public Finance Authority Airport Facilities Rev. (Transportation Infrastructure Properties LLC), ”B“, 5%, 7/01/2022 | | | 685,000 | | | | 695,467 | |
| Wisconsin Public Finance Authority Airport Facilities Rev. (Transportation Infrastructure Properties LLC), ”B“, 5.25%, 7/01/2028 | | | 1,260,000 | | | | 1,295,960 | |
| Wisconsin Public Finance Authority Airport Facilities Rev. (Transportation Infrastructure Properties LLC), ”B“, 5%, 7/01/2042 | | | 1,600,000 | | | | 1,617,136 | |
| Wisconsin Public Finance Authority Airport Facilities Rev. (Transportation Infrastructure Properties LLC), ”C“, 5%, 7/01/2042 | | | 1,630,000 | | | | 1,647,457 | |
| Wisconsin Public Finance Authority Education Facilities Rev. (Piedmont Community Charter School), 5%, 6/15/2039 | | | 200,000 | | | | 223,780 | |
| Wisconsin Public Finance Authority Education Facilities Rev. (Piedmont Community Charter School), 5%, 6/15/2049 | | | 615,000 | | | | 678,019 | |
| Wisconsin Public Finance Authority Education Facilities Rev. (Piedmont Community Charter School), 5%, 6/15/2053 | | | 420,000 | | | | 459,346 | |
| Wisconsin Public Finance Authority Education Rev. (Pine Lake Preparatory), 4.95%, 3/01/2030 | | | 120,000 | | | | 119,995 | |
| Wisconsin Public Finance Authority Education Rev. (Pine Lake Preparatory), 5.25%, 3/01/2035 | | | 120,000 | | | | 120,097 | |
| Wisconsin Public Finance Authority Healthcare Facility Rev. (Church Home of Hartford, Inc. Project), ”A“, 4%, 9/01/2020 | | | 30,000 | | | | 29,984 | |
| Wisconsin Public Finance Authority Healthcare Facility Rev. (Church Home of Hartford, Inc. Project), ”A“, 5%, 9/01/2025 | | | 100,000 | | | | 101,901 | |
| Wisconsin Public Finance Authority Healthcare Facility Rev. (Church Home of Hartford, Inc. Project), ”A“, 5%, 9/01/2030 | | | 165,000 | | | | 166,945 | |
| Wisconsin Public Finance Authority Healthcare Facility Rev. (Church Home of Hartford, Inc. Project), ”A“, 5%, 9/01/2038 | | | 220,000 | | | | 219,465 | |
94
Portfolio of Investments – continued
| | | | | | | | |
| | |
| Issuer | | Shares/Par | | | Value ($) | |
| Municipal Bonds - continued | | | | | | |
| Wisconsin - continued | | | | | | |
| Wisconsin Public Finance Authority Higher Education Facilities Rev. (Gannon University Project), 5%, 5/01/2042 | | $ | 655,000 | | | $ | 699,291 | |
| Wisconsin Public Finance Authority Higher Education Facilities Rev. (Gannon University Project), 5%, 5/01/2047 | | | 605,000 | | | | 643,067 | |
| Wisconsin Public Finance Authority Limited Obligation Grant Rev. (American Dream at Meadowlands Project), ”A“, 6.25%, 8/01/2027 | | | 5,080,000 | | | | 4,894,377 | |
| Wisconsin Public Finance Authority Limited Obligation PILOT Rev. (American Dream at Meadowlands Project), 7%, 12/01/2050 | | | 925,000 | | | | 913,465 | |
| Wisconsin Public Finance Authority Rev. (Celanese Corp.), ”B“, 5%, 12/01/2025 | | | 620,000 | | | | 628,810 | |
| Wisconsin Public Finance Authority Senior Living Refunding Bonds Rev. (Mary’s Woods at Marylhurst Project), ”A“, 5.25%, 5/15/2037 | | | 995,000 | | | | 1,030,780 | |
| Wisconsin Public Finance Authority Senior Living Refunding Bonds Rev. (Mary’s Woods at Marylhurst Project), ”A“, 5.25%, 5/15/2042 | | | 960,000 | | | | 985,738 | |
| Wisconsin Public Finance Authority Senior Living Refunding Bonds Rev. (Mary’s Woods at Marylhurst Project), ”A“, 5.25%, 5/15/2047 | | | 2,320,000 | | | | 2,372,362 | |
| Wisconsin Public Finance Authority Senior Living Refunding Bonds Rev. (Mary’s Woods at Marylhurst Project), ”A“, 5.25%, 5/15/2052 | | | 200,000 | | | | 203,912 | |
| Wisconsin Public Finance Authority Senior Living Rev. (Rose Villa Project), ”A“, 5.125%, 11/15/2029 | | | 490,000 | | | | 492,670 | |
| Wisconsin Public Finance Authority Senior Living Rev. (Rose Villa Project), ”A“, 5.5%, 11/15/2034 | | | 455,000 | | | | 461,256 | |
| Wisconsin Public Finance Authority Senior Living Rev. (Rose Villa Project), ”A“, 5.75%, 11/15/2044 | | | 375,000 | | | | 379,208 | |
| Wisconsin Public Finance Authority Senior Living Rev. (Rose Villa Project), ”A“, 6%, 11/15/2049 | | | 740,000 | | | | 754,252 | |
| Wisconsin Public Finance Authority Student Housing Rev. (Beyond Boone LLC - Appalachian State University Project), ”A“, 5%, 7/01/2036 | | | 500,000 | | | | 598,285 | |
| Wisconsin Public Finance Authority Student Housing Rev. (Beyond Boone LLC - Appalachian State University Project), ”A“, AGM, 5%, 7/01/2044 | | | 375,000 | | | | 443,985 | |
| Wisconsin Public Finance Authority Student Housing Rev. (Beyond Boone LLC - Appalachian State University Project), ”A“, AGM, 4%, 7/01/2045 | | | 805,000 | | | | 879,221 | |
| Wisconsin Public Finance Authority Student Housing Rev. (Beyond Boone LLC - Appalachian State University Project), ”A“, AGM, 4%, 7/01/2050 | | | 695,000 | | | | 754,165 | |
95
Portfolio of Investments – continued
| | | | | | | | |
| | |
| Issuer | | Shares/Par | | | Value ($) | |
| Municipal Bonds - continued | | | | | | |
| Wisconsin - continued | | | | | | |
| Wisconsin Public Finance Authority Student Housing Rev. (Beyond Boone LLC - Appalachian State University Project), ”A“, AGM, 5%, 7/01/2054 | | $ | 485,000 | | | $ | 567,954 | |
| Wisconsin Public Finance Authority Student Housing Rev. (Beyond Boone LLC - Appalachian State University Project), ”A“, AGM, 4%, 7/01/2055 | | | 785,000 | | | | 848,977 | |
| Wisconsin Public Finance Authority Student Housing Rev. (Beyond Boone LLC - Appalachian State University Project), ”A“, AGM, 5%, 7/01/2058 | | | 560,000 | | | | 648,710 | |
| | | | | | | | |
| | | | | | | $ | 66,141,037 | |
| Total Municipal Bonds (Identified Cost, $4,333,596,236) | | | $ | 4,431,329,500 | |
| | |
| Other Municipal Bonds - 0.4% | | | | | | |
| Multi-Family Housing Revenue - 0.4% | | | | | | |
Freddie Mac, VRDN, 2.625%, 6/15/2035
(Identified Cost, $18,291,989) | | $ | 17,780,000 | | | $ | 20,016,902 | |
| | |
| Bonds - 0.4% | | | | | | |
| Consumer Services - 0.4% | | | | | | |
| Toll Road Investors Partnership II LP, Capital Appreciation, NATL, 0%, 2/15/2026 (n) | | $ | 6,065,000 | | | $ | 4,919,578 | |
| Toll Road Investors Partnership II LP, Capital Appreciation, NATL, 0%, 2/15/2027 (n) | | | 851,000 | | | | 666,795 | |
| Toll Road Investors Partnership II LP, Capital Appreciation, NATL, 0%, 2/15/2028 (n) | | | 638,000 | | | | 481,950 | |
| Toll Road Investors Partnership II LP, Capital Appreciation, NATL, 0%, 2/15/2043 (n) | | | 25,900,000 | | | | 9,479,263 | |
| Toll Road Investors Partnership II LP, Capital Appreciation, ”A“, NATL, 0%, 2/15/2045 (n) | | | 484,279 | | | | 155,664 | |
| Toll Road Investors Partnership II LP, Capital Appreciation, ”B“, NATL, 0%, 2/15/2033 (n) | | | 3,715,000 | | | | 2,332,081 | |
| Total Bonds (Identified Cost, $15,565,513) | | | | | | $ | 18,035,331 | |
| | |
| Investment Companies (h) - 3.3% | | | | | | |
| Money Market Funds - 3.3% | | | | | | |
MFS Institutional Money Market Portfolio, 1.28% (v)
(Identified Cost, $149,554,257) | | | 149,529,827 | | | $ | 149,559,733 | |
| | |
| Other Assets, Less Liabilities - (0.3)% | | | | | (12,791,794) | |
| Net Assets - 100.0% | | | | | | $ | 4,606,149,672 | |
| (a) | Non-income producing security. |
96
Portfolio of Investments – continued
| (h) | An affiliated issuer, which may be considered one in which the fund owns 5% or more of the outstanding voting securities, or a company which is under common control. At period end, the aggregate values of the fund’s investments in affiliated issuers and in unaffiliated issuers were $149,559,733 and $4,469,381,733, respectively. |
| (n) | Securities exempt from registration under Rule 144A of the Securities Act of 1933. These securities may be sold in the ordinary course of business in transactions exempt from registration, normally to qualified institutional buyers. At period end, the aggregate value of these securities was $51,214,912, representing 1.1% of net assets. |
| (p) | Primary market inverse floater. |
| (u) | Underlying security deposited into special purpose trust upon creation of self-deposited inverse floaters. |
| (v) | Affiliated issuer that is available only to investment companies managed by MFS. The rate quoted for the MFS Institutional Money Market Portfolio is the annualizedseven-day yield of the fund at period end. |
The following abbreviations are used in this report and are defined:
| AAC | | Ambac Assurance Corp. |
| AGM | | Assured Guaranty Municipal |
| ASSD GTY | | Assured Guaranty Insurance Co. |
| BHAC | | Berkshire Hathaway Assurance Corp. |
| CALHF | | California Health Facility Construction Loan Insurance Program |
| COP | | Certificate of Participation |
| FGIC | | Financial Guaranty Insurance Co. |
| FHA | | Federal Housing Administration |
| FHLMC | | Federal Home Loan Mortgage Corp. |
| FLR | | Floating Rate. Interest rate resets periodically based on the parenthetically disclosed reference rate plus a spread (if any). Theperiod-end rate reported may not be the current rate. All reference rates are USD unless otherwise noted. |
| FNMA | | Federal National Mortgage Assn. |
| GNMA | | Government National Mortgage Assn. |
| LIBOR | | London Interbank Offered Rate |
| NATL | | National Public Finance Guarantee Corp. |
| PSF | | Permanent School Fund |
| RIBS | | Residual Interest Bonds |
| VRDN | | Variable rate demand note that may be puttable to the issuer at the option of the holder. The stated interest rate, which generally resets either daily or weekly, represents the rate in effect at period end and may not be the current rate. |
See Notes to Financial Statements
97
Financial Statements
STATEMENT OF ASSETS AND LIABILITIES
At 3/31/20
This statement represents your fund’s balance sheet, which details the assets and liabilities comprising the total value of the fund.
| | | | |
| Assets | | | | |
Investments in unaffiliated issuers, at value (identified cost, $4,367,453,738) | | | $4,469,381,733 | |
Investments in affiliated issuers, at value (identified cost, $149,554,257) | | | 149,559,733 | |
Receivables for | | | | |
Investments sold | | | 42,065,806 | |
Fund shares sold | | | 34,552,469 | |
Interest | | | 51,628,207 | |
Other assets | | | 11,503 | |
Total assets | | | $4,747,199,451 | |
| |
| Liabilities | | | | |
Payables for | | | | |
Distributions | | | $1,308,888 | |
Investments purchased | | | 15,037,113 | |
Investments purchased on an extended settlement basis | | | 17,087,540 | |
Fund shares reacquired | | | 30,958,902 | |
Interest expense and fees | | | 438,930 | |
Payable to the holders of the floating rate certificates | | | 74,234,700 | |
Payable to affiliates | | | | |
Investment adviser | | | 90,616 | |
Administrative services fee | | | 3,160 | |
Shareholder servicing costs | | | 1,466,857 | |
Distribution and service fees | | | 36,703 | |
Payable for independent Trustees’ compensation | | | 5,704 | |
Accrued expenses and other liabilities | | | 380,666 | |
Total liabilities | | | $141,049,779 | |
Net assets | | | $4,606,149,672 | |
| |
| Net assets consist of | | | | |
Paid-in capital | | | $4,544,789,037 | |
Total distributable earnings (loss) | | | 61,360,635 | |
Net assets | | | $4,606,149,672 | |
Shares of beneficial interest outstanding | | | 530,717,452 | |
98
Statement of Assets and Liabilities – continued
| | | | | | | | | | | | |
| | | |
| | | Net assets | | | Shares
outstanding | | | Net asset value
per share (a) | |
Class A | | | $2,386,528,066 | | | | 274,903,362 | | | | $8.68 | |
Class B | | | 7,843,311 | | | | 902,152 | | | | 8.69 | |
Class C | | | 155,843,182 | | | | 17,889,996 | | | | 8.71 | |
Class I | | | 1,042,591,850 | | | | 120,204,391 | | | | 8.67 | |
Class R6 | | | 591,947,493 | | | | 68,302,479 | | | | 8.67 | |
Class A1 | | | 421,337,974 | | | | 48,508,424 | | | | 8.69 | |
Class B1 | | | 57,796 | | | | 6,648 | | | | 8.69 | |
| (a) | Maximum offering price per share was equal to the net asset value per share for all share classes, except for Classes A and A1, for which the maximum offering prices per share were $9.07 [100 / 95.75 x $8.68] and $9.08 [100 / 95.75 x $8.69], respectively. On sales of $100,000 or more, the maximum offering prices of Class A and Class A1 shares are reduced. A contingent deferred sales charge may be imposed on redemptions of Class A, Class B, Class C, Class A1, and Class B1 shares. Redemption price per share was equal to the net asset value per share for Classes I and R6. |
See Notes to Financial Statements
99
Financial Statements
STATEMENT OF OPERATIONS
Year ended 3/31/20
This statement describes how much your fund earned in investment income and accrued in expenses. It also describes any gains and/or losses generated by fund operations.
| | | | |
| Net investment income (loss) | | | | |
Income | | | | |
Interest | | | $156,263,047 | |
Dividends from affiliated issuers | | | 2,545,856 | |
Other | | | 479 | |
Total investment income | | | $158,809,382 | |
Expenses | | | | |
Management fee | | | $15,980,515 | |
Distribution and service fees | | | 6,929,107 | |
Shareholder servicing costs | | | 2,933,097 | |
Administrative services fee | | | 549,789 | |
Independent Trustees’ compensation | | | 51,005 | |
Custodian fee | | | 283,878 | |
Shareholder communications | | | 153,286 | |
Audit and tax fees | | | 63,487 | |
Legal fees | | | 92,618 | |
Interest expense and fees | | | 1,710,522 | |
Miscellaneous | | | 626,873 | |
Total expenses | | | $29,374,177 | |
Fees paid indirectly | | | (3,206 | ) |
Reduction of expenses by investment adviser and distributor | | | (459,521 | ) |
Net expenses | | | $28,911,450 | |
Net investment income (loss) | | | $129,897,932 | |
| |
| Realized and unrealized gain (loss) | | | | |
Realized gain (loss) (identified cost basis) | | | | |
Unaffiliated issuers | | | $(21,598,665 | ) |
Affiliated issuers | | | 9,613 | |
Net realized gain (loss) | | | $(21,589,052 | ) |
Change in unrealized appreciation or depreciation | | | | |
Unaffiliated issuers | | | $(60,892,280 | ) |
Affiliated issuers | | | (4,587 | ) |
Net unrealized gain (loss) | | | $(60,896,867 | ) |
Net realized and unrealized gain (loss) | | | $(82,485,919 | ) |
Change in net assets from operations | | | $47,412,013 | |
See Notes to Financial Statements
100
Financial Statements
STATEMENTS OF CHANGES IN NET ASSETS
These statements describe the increases and/or decreases in net assets resulting from operations, any distributions, and any shareholder transactions.
| | | | | | | | |
| | | Year ended | |
| | | 3/31/20 | | | 3/31/19 | |
| Change in net assets | | | | | | |
| | |
| From operations | | | | | | | | |
Net investment income (loss) | | | $129,897,932 | | | | $129,156,258 | |
Net realized gain (loss) | | | (21,589,052 | ) | | | (3,621,382 | ) |
Net unrealized gain (loss) | | | (60,896,867 | ) | | | 50,503,636 | |
Change in net assets from operations | | | $47,412,013 | | | | $176,038,512 | |
Total distributions to shareholders | | | $(129,401,588 | ) | | | $(117,871,239 | ) |
Change in net assets from fund share transactions | | | $1,023,405,944 | | | | $345,422,427 | |
Total change in net assets | | | $941,416,369 | | | | $403,589,700 | |
| | |
| Net assets | | | | | | | | |
At beginning of period | | | 3,664,733,303 | | | | 3,261,143,603 | |
At end of period | | | $4,606,149,672 | | | | $3,664,733,303 | |
See Notes to Financial Statements
101
Financial Statements
FINANCIAL HIGHLIGHTS
The financial highlights table is intended to help you understand the fund’s financial performance for the past 5 years (or life of a particular share class, if shorter). Certain information reflects financial results for a single fund share. The total returns in the table represent the rate that an investor would have earned (or lost) on an investment in the fund share class (assuming reinvestment of all distributions) held for the entire period.
| | | | | | | | | | | | | | | | | | | | |
| Class A | | Year ended | |
| | | | | |
| | | 3/31/20 | | | 3/31/19 | | | 3/31/18 | | | 3/31/17 | | | 3/31/16 | |
Net asset value, beginning of period | | | $8.77 | | | | $8.63 | | | | $8.64 | | | | $8.89 | | | | $8.85 | |
| | | | |
| Income (loss) from investment operations | | | | | | | | | | | | | | | | | |
Net investment income (loss) (d) | | | $0.26 | | | | $0.32 | | | | $0.31 | | | | $0.32 | (c) | | | $0.34 | |
Net realized and unrealized gain (loss) | | | (0.09 | ) | | | 0.11 | | | | (0.02 | ) | | | (0.27 | ) | | | 0.01 | |
Total from investment operations | | | $0.17 | | | | $0.43 | | | | $0.29 | | | | $0.05 | | | | $0.35 | |
| | | | |
| Less distributions declared to shareholders | | | | | | | | | | | | | | | | | |
From net investment income | | | $(0.26 | ) | | | $(0.29 | ) | | | $(0.30 | ) | | | $(0.30 | ) | | | $(0.31 | ) |
Net asset value, end of period (x) | | | $8.68 | | | | $8.77 | | | | $8.63 | | | | $8.64 | | | | $8.89 | |
Total return (%) (r)(s)(t)(x) | | | 1.88 | | | | 5.14 | | | | 3.35 | | | | 0.59 | (c) | | | 4.10 | |
| | | | |
Ratios (%) (to average net assets)
and Supplemental data: | | | | | | | | | | | | | | | | | |
Expenses before expense reductions (f) | | | 0.78 | | | | 0.77 | | | | 0.77 | | | | 0.78 | (c) | | | 0.79 | |
Expenses after expense reductions (f) | | | 0.77 | | | | 0.75 | | | | 0.73 | | | | 0.73 | (c) | | | 0.74 | |
Net investment income (loss) | | | 2.89 | | | | 3.74 | | | | 3.49 | | | | 3.67 | (c) | | | 3.88 | |
Portfolio turnover | | | 23 | | | | 19 | | | | 21 | | | | 20 | | | | 22 | |
Net assets at end of period (000 omitted) | | | $2,386,528 | | | | $1,683,822 | | | | $1,418,893 | | | | $1,234,571 | | | | $870,656 | |
| | | | |
| Supplemental Ratios (%): | | | | | | | | | | | | | | | | | |
Ratios of expenses to average net assets
after expense reductions and excluding
interest expense and fees (f)(l) | | | 0.73 | | | | 0.73 | | | | 0.72 | | | | 0.72 | (c) | | | 0.73 | |
See Notes to Financial Statements
102
Financial Highlights – continued
| | | | | | | | | | | | | | | | | | | | |
| Class B | | Year ended | |
| | | | | |
| | | 3/31/20 | | | 3/31/19 | | | 3/31/18 | | | 3/31/17 | | | 3/31/16 | |
Net asset value, beginning of period | | | $8.78 | | | | $8.65 | | | | $8.66 | | | | $8.90 | | | | $8.86 | |
| | | | |
| Income (loss) from investment operations | | | | | | | | | | | | | | | | | |
Net investment income (loss) (d) | | | $0.20 | | | | $0.26 | | | | $0.24 | | | | $0.26 | (c) | | | $0.27 | |
Net realized and unrealized gain (loss) | | | (0.10 | ) | | | 0.10 | | | | (0.02 | ) | | | (0.26 | ) | | | 0.02 | |
Total from investment operations | | | $0.10 | | | | $0.36 | | | | $0.22 | | | | $0.00 | (w) | | | $0.29 | |
| | | | |
| Less distributions declared to shareholders | | | | | | | | | | | | | | | | | |
From net investment income | | | $(0.19 | ) | | | $(0.23 | ) | | | $(0.23 | ) | | | $(0.24 | ) | | | $(0.25 | ) |
Net asset value, end of period (x) | | | $8.69 | | | | $8.78 | | | | $8.65 | | | | $8.66 | | | | $8.90 | |
Total return (%) (r)(s)(t)(x) | | | 1.14 | | | | 4.23 | | | | 2.58 | | | | (0.04 | )(c) | | | 3.32 | |
| | | | |
Ratios (%) (to average net assets)
and Supplemental data: | | | | | | | | | | | | | | | | | |
Expenses before expense reductions (f) | | | 1.53 | | | | 1.52 | | | | 1.52 | | | | 1.53 | (c) | | | 1.54 | |
Expenses after expense reductions (f) | | | 1.52 | | | | 1.50 | | | | 1.48 | | | | 1.49 | (c) | | | 1.49 | |
Net investment income (loss) | | | 2.19 | | | | 2.99 | | | | 2.75 | | | | 2.94 | (c) | | | 3.12 | |
Portfolio turnover | | | 23 | | | | 19 | | | | 21 | | | | 20 | | | | 22 | |
Net assets at end of period (000 omitted) | | | $7,843 | | | | $12,579 | | | | $18,135 | | | | $23,866 | | | | $27,926 | |
| | | | |
| Supplemental Ratios (%): | | | | | | | | | | | | | | | | | |
Ratios of expenses to average net assets
after expense reductions and excluding
interest expense and fees (f)(l) | | | 1.48 | | | | 1.48 | | | | 1.48 | | | | 1.47 | (c) | | | 1.48 | |
See Notes to Financial Statements
103
Financial Highlights – continued
| | | | | | | | | | | | | | | | | | | | |
| Class C | | Year ended | |
| | | | | |
| | | 3/31/20 | | | 3/31/19 | | | 3/31/18 | | | 3/31/17 | | | 3/31/16 | |
Net asset value, beginning of period | | | $8.80 | | | | $8.66 | | | | $8.67 | | | | $8.92 | | | | $8.88 | |
| | | | |
| Income (loss) from investment operations | | | | | | | | | | | | | | | | | |
Net investment income (loss) (d) | | | $0.19 | | | | $0.26 | | | | $0.24 | | | | $0.26 | (c) | | | $0.27 | |
Net realized and unrealized gain (loss) | | | (0.09 | ) | | | 0.11 | | | | (0.02 | ) | | | (0.27 | ) | | | 0.02 | |
Total from investment operations | | | $0.10 | | | | $0.37 | | | | $0.22 | | | | $(0.01 | ) | | | $0.29 | |
| | | | |
| Less distributions declared to shareholders | | | | | | | | | | | | | | | | | |
From net investment income | | | $(0.19 | ) | | | $(0.23 | ) | | | $(0.23 | ) | | | $(0.24 | ) | | | $(0.25 | ) |
Net asset value, end of period (x) | | | $8.71 | | | | $8.80 | | | | $8.66 | | | | $8.67 | | | | $8.92 | |
Total return (%) (r)(s)(t)(x) | | | 1.13 | | | | 4.35 | | | | 2.58 | | | | (0.16 | )(c) | | | 3.31 | |
| | | | |
Ratios (%) (to average net assets)
and Supplemental data: | | | | | | | | | | | | | | | | | |
Expenses before expense reductions (f) | | | 1.53 | | | | 1.52 | | | | 1.52 | | | | 1.53 | (c) | | | 1.54 | |
Expenses after expense reductions (f) | | | 1.52 | | | | 1.50 | | | | 1.49 | | | | 1.49 | (c) | | | 1.49 | |
Net investment income (loss) | | | 2.16 | | | | 2.99 | | | | 2.74 | | | | 2.92 | (c) | | | 3.11 | |
Portfolio turnover | | | 23 | | | | 19 | | | | 21 | | | | 20 | | | | 22 | |
Net assets at end of period (000 omitted) | | | $155,843 | | | | $151,636 | | | | $181,793 | | | | $184,018 | | | | $180,722 | |
| | | | |
| Supplemental Ratios (%): | | | | | | | | | | | | | | | | | |
Ratios of expenses to average net assets
after expense reductions and excluding
interest expense and fees (f)(l) | | | 1.48 | | | | 1.48 | | | | 1.48 | | | | 1.47 | (c) | | | 1.48 | |
See Notes to Financial Statements
104
Financial Highlights – continued
| | | | | | | | | | | | | | | | | | | | |
| Class I | | Year ended | |
| | | | | |
| | | 3/31/20 | | | 3/31/19 | | | 3/31/18 | | | 3/31/17 | | | 3/31/16 | |
Net asset value, beginning of period | | | $8.76 | | | | $8.63 | | | | $8.63 | | | | $8.88 | | | | $8.84 | |
| | | | |
| Income (loss) from investment operations | | | | | | | | | | | | | | | | | |
Net investment income (loss) (d) | | | $0.28 | | | | $0.34 | | | | $0.33 | | | | $0.34 | (c) | | | $0.36 | |
Net realized and unrealized gain (loss) | | | (0.09 | ) | | | 0.10 | | | | (0.01 | ) | | | (0.26 | ) | | | 0.02 | |
Total from investment operations | | | $0.19 | | | | $0.44 | | | | $0.32 | | | | $0.08 | | | | $0.38 | |
| | | | |
| Less distributions declared to shareholders | | | | | | | | | | | | | | | | | |
From net investment income | | | $(0.28 | ) | | | $(0.31 | ) | | | $(0.32 | ) | | | $(0.33 | ) | | | $(0.34 | ) |
Net asset value, end of period (x) | | | $8.67 | | | | $8.76 | | | | $8.63 | | | | $8.63 | | | | $8.88 | |
Total return (%) (r)(s)(t)(x) | | | 2.13 | | | | 5.27 | | | | 3.73 | | | | 0.84 | (c) | | | 4.36 | |
| | | | |
Ratios (%) (to average net assets)
and Supplemental data: | | | | | | | | | | | | | | | | | |
Expenses before expense reductions (f) | | | 0.53 | | | | 0.52 | | | | 0.52 | | | | 0.54 | (c) | | | 0.55 | |
Expenses after expense reductions (f) | | | 0.52 | | | | 0.51 | | | | 0.49 | | | | 0.49 | (c) | | | 0.49 | |
Net investment income (loss) | | | 3.15 | | | | 3.99 | | | | 3.74 | | | | 3.92 | (c) | | | 4.12 | |
Portfolio turnover | | | 23 | | | | 19 | | | | 21 | | | | 20 | | | | 22 | |
Net assets at end of period (000 omitted) | | | $1,042,592 | | | | $870,855 | | | | $672,870 | | | | $974,392 | | | | $474,159 | |
| | | | |
| Supplemental Ratios (%): | | | | | | | | | | | | | | | | | |
Ratios of expenses to average net assets
after expense reductions and excluding
interest expense and fees (f)(l) | | | 0.48 | | | | 0.48 | | | | 0.48 | | | | 0.47 | (c) | | | 0.48 | |
See Notes to Financial Statements
105
Financial Highlights – continued
| | | | | | | | | | | | |
| Class R6 | | Year ended | |
| | | |
| | | 3/31/20 | | | 3/31/19 | | | 3/31/18 (i) | |
Net asset value, beginning of period | | | $8.76 | | | | $8.62 | | | | $8.77 | |
| | |
| Income (loss) from investment operations | | | | | | | | | |
Net investment income (loss) (d) | | | $0.29 | | | | $0.35 | | | | $0.22 | |
Net realized and unrealized gain (loss) | | | (0.09 | ) | | | 0.11 | | | | (0.15 | ) |
Total from investment operations | | | $0.20 | | | | $0.46 | | | | $0.07 | |
| | |
| Less distributions declared to shareholders | | | | | | | | | |
From net investment income | | | $(0.29 | ) | | | $(0.32 | ) | | | $(0.22 | ) |
Net asset value, end of period (x) | | | $8.67 | | | | $8.76 | | | | $8.62 | |
Total return (%) (r)(s)(t)(x) | | | 2.21 | | | | 5.48 | | | | 0.75 | (n) |
| | |
Ratios (%) (to average net assets)
and Supplemental data: | | | | | | | | | |
Expenses before expense reductions (f) | | | 0.46 | | | | 0.45 | | | | 0.42 | (a) |
Expenses after expense reductions (f) | | | 0.45 | | | | 0.43 | | | | 0.41 | (a) |
Net investment income (loss) | | | 3.22 | | | | 4.06 | | | | 3.77 | (a) |
Portfolio turnover | | | 23 | | | | 19 | | | | 21 | |
Net assets at end of period (000 omitted) | | | $591,947 | | | | $491,400 | | | | $492,474 | |
| | |
| Supplemental Ratios (%): | | | | | | | | | |
Ratios of expenses to average net assets after expense reductions and excluding interest expense and fees (f)(l) | | | 0.41 | | | | 0.41 | | | | 0.40 | (a) |
See Notes to Financial Statements
106
Financial Highlights – continued
| | | | | | | | | | | | | | | | | | | | |
| Class A1 | | Year ended | |
| | | | | |
| | | 3/31/20 | | | 3/31/19 | | | 3/31/18 | | | 3/31/17 | | | 3/31/16 | |
Net asset value, beginning of period | | | $8.78 | | | | $8.64 | | | | $8.65 | | | | $8.90 | | | | $8.85 | |
| | | | |
| Income (loss) from investment operations | | | | | | | | | | | | | | | | | |
Net investment income (loss) (d) | | | $0.28 | | | | $0.34 | | | | $0.33 | | | | $0.35 | (c) | | | $0.36 | |
Net realized and unrealized gain (loss) | | | (0.09 | ) | | | 0.12 | | | | (0.02 | ) | | | (0.27 | ) | | | 0.03 | |
Total from investment operations | | | $0.19 | | | | $0.46 | | | | $0.31 | | | | $0.08 | | | | $0.39 | |
| | | | |
| Less distributions declared to shareholders | | | | | | | | | | | | | | | | | |
From net investment income | | | $(0.28 | ) | | | $(0.32 | ) | | | $(0.32 | ) | | | $(0.33 | ) | | | $(0.34 | ) |
Net asset value, end of period (x) | | | $8.69 | | | | $8.78 | | | | $8.64 | | | | $8.65 | | | | $8.90 | |
Total return (%) (r)(s)(t)(x) | | | 2.14 | | | | 5.40 | | | | 3.61 | | | | 0.85 | (c) | | | 4.48 | |
| | | | |
Ratios (%) (to average net assets)
and Supplemental data: | | | | | | | | | | | | | | | | | |
Expenses before expense reductions (f) | | | 0.53 | | | | 0.52 | | | | 0.52 | | | | 0.54 | (c) | | | 0.54 | |
Expenses after expense reductions (f) | | | 0.52 | | | | 0.51 | | | | 0.49 | | | | 0.49 | (c) | | | 0.49 | |
Net investment income (loss) | | | 3.18 | | | | 3.99 | | | | 3.75 | | | | 3.94 | (c) | | | 4.13 | |
Portfolio turnover | | | 23 | | | | 19 | | | | 21 | | | | 20 | | | | 22 | |
Net assets at end of period (000 omitted) | | | $421,338 | | | | $454,350 | | | | $476,864 | | | | $504,886 | | | | $551,970 | |
| | | | |
| Supplemental Ratios (%): | | | | | | | | | | | | | | | | | |
Ratios of expenses to average net assets
after expense reductions and excluding
interest expense and fees (f)(l) | | | 0.48 | | | | 0.48 | | | | 0.48 | | | | 0.48 | (c) | | | 0.48 | |
See Notes to Financial Statements
107
Financial Highlights – continued
| | | | | | | | | | | | | | | | | | | | |
| Class B1 | | Year ended | |
| | | | | |
| | | 3/31/20 | | | 3/31/19 | | | 3/31/18 | | | 3/31/17 | | | 3/31/16 | |
Net asset value, beginning of period | | | $8.78 | | | | $8.65 | | | | $8.66 | | | | $8.90 | | | | $8.86 | |
| | | | |
| Income (loss) from investment operations | | | | | | | | | | | | | | | | | |
Net investment income (loss) (d) | | | $0.22 | | | | $0.28 | | | | $0.26 | | | | $0.28 | (c) | | | $0.29 | |
Net realized and unrealized gain (loss) | | | (0.09 | ) | | | 0.10 | | | | (0.02 | ) | | | (0.26 | ) | | | 0.02 | |
Total from investment operations | | | $0.13 | | | | $0.38 | | | | $0.24 | | | | $0.02 | | | | $0.31 | |
| | | | |
| Less distributions declared to shareholders | | | | | | | | | | | | | | | | | |
From net investment income | | | $(0.22 | ) | | | $(0.25 | ) | | | $(0.25 | ) | | | $(0.26 | ) | | | $(0.27 | ) |
Net asset value, end of period (x) | | | $8.69 | | | | $8.78 | | | | $8.65 | | | | $8.66 | | | | $8.90 | |
Total return (%) (r)(s)(t)(x) | | | 1.38 | | | | 4.49 | | | | 2.83 | | | | 0.19 | (c) | | | 3.55 | |
| | | | |
Ratios (%) (to average net assets)
and Supplemental data: | | | | | | | | | | | | | | | | | |
Expenses before expense reductions (f) | | | 1.53 | | | | 1.52 | | | | 1.52 | | | | 1.53 | (c) | | | 1.54 | |
Expenses after expense reductions (f) | | | 1.27 | | | | 1.25 | | | | 1.24 | | | | 1.26 | (c) | | | 1.27 | |
Net investment income (loss) | | | 2.45 | | | | 3.24 | | | | 2.99 | | | | 3.17 | (c) | | | 3.34 | |
Portfolio turnover | | | 23 | | | | 19 | | | | 21 | | | | 20 | | | | 22 | |
Net assets at end of period (000 omitted) | | | $58 | | | | $91 | | | | $114 | | | | $152 | | | | $257 | |
| | | | |
| Supplemental Ratios (%): | | | | | | | | | | | | | | | | | |
Ratios of expenses to average net assets
after expense reductions and excluding
interest expense and fees (f)(l) | | | 1.23 | | | | 1.23 | | | | 1.23 | | | | 1.25 | (c) | | | 1.25 | |
| (c) | Amount reflects aone-time reimbursement of expenses by the custodian (or former custodian) without which net investment income and performance would be lower and expenses would be higher. |
| (d) | Per share data is based on average shares outstanding. |
| (f) | Ratios do not reflect reductions from fees paid indirectly, if applicable. |
| (i) | For Class R6, the period is from the class inception, August 1, 2017, through the stated period end. |
| (l) | Interest expense and fees include payments made to the holders of the floating rate certificates. |
| (r) | Certain expenses have been reduced without which performance would have been lower. |
| (s) | From time to time the fund may receive proceeds from litigation settlements, without which performance would be lower. |
| (t) | Total returns do not include any applicable sales charges. |
| (w) | Per share amount was less than $0.01. |
| (x) | The net asset values and total returns have been calculated on net assets which include adjustments made in accordance with U.S. generally accepted accounting principles required at period end for financial reporting purposes. |
See Notes to Financial Statements
108
NOTES TO FINANCIAL STATEMENTS
(1) Business and Organization
MFS Municipal Income Fund (the fund) is a diversified series of MFS Municipal Series Trust which is organized as a Massachusetts business trust and is registered under the Investment Company Act of 1940, as amended, as anopen-end management investment company.
The fund is an investment company and accordingly follows the investment company accounting and reporting guidance of the Financial Accounting Standards Board (FASB) Accounting Standards Codification Topic 946 Financial Services – Investment Companies.
(2) Significant Accounting Policies
General– The preparation of financial statements in conformity with U.S. generally accepted accounting principles requires management to make estimates and assumptions that affect the reported amounts of assets and liabilities, and disclosure of contingent assets and liabilities at the date of the financial statements and the reported amounts of increases and decreases in net assets from operations during the reporting period. Actual results could differ from those estimates. In the preparation of these financial statements, management has evaluated subsequent events occurring after the date of the fund’s Statement of Assets and Liabilities through the date that the financial statements were issued. The fund invests primarily in municipal instruments, which generally trade in theover-the-counter market. The value of municipal instruments can be affected by changes in their actual or perceived credit quality. The credit quality of, and the ability to pay principal and interest when due by, an issuer of a municipal instrument depends on the credit quality of the entity supporting the municipal instrument, how essential any services supported by the municipal instrument are, the sufficiency of any revenues or taxes that support the municipal instrument, and/or the willingness or ability of the appropriate government entity to approve any appropriations necessary to support the municipal instrument. Municipal instruments may be supported by insurance which typically guarantees the timely payment of all principal and interest due on the underlying municipal instrument. The value of a municipal instrument can be volatile and significantly affected by adverse tax changes or court rulings, legislative or political changes, changes in specific or general market and economic conditions in the region where the instrument is issued, and the financial condition of municipal issuers and of municipal instrument insurers of which there are a limited number. Also, because many municipal instruments are issued to finance similar projects, conditions in certain industries can significantly affect the fund and the overall municipal market. If the Internal Revenue Service determines an issuer of a municipal instrument has not complied with the applicable tax requirements, interest from the security could become taxable, the security could decline in value, and distributions made by the fund could be taxable to shareholders.
In March 2020, the FASB issued Accounting Standards Update2020-04, Reference Rate Reform (Topic 848) – Facilitation of the Effects of Reference Rate Reform on Financial Reporting (“ASU2020-04”), which provides optional, temporary relief with respect to the financial reporting of contracts subject to certain types of modifications due to the planned discontinuation of the London Interbank Offered Rate (LIBOR) and
109
Notes to Financial Statements – continued
other IBOR-based reference rates as of the end of 2021. The temporary relief provided by ASU2020-04 is effective for certain reference rate-related contract modifications that occur during the period from March 12, 2020 through December 31, 2022. Management is evaluating the impact of ASU2020-04 on the fund’s investments, derivatives, debt and other contracts that will undergo reference rate-related modifications as a result of the reference rate reform.
In March 2017, the FASB issued Accounting Standards Update2017-08, Receivables –Nonrefundable Fees and Other Costs (Subtopic310-20) – Premium Amortization on Purchased Callable Debt Securities (“ASU2017-08”). For callable debt securities purchased at a premium that have explicit,non-contingent call features and that are callable at fixed prices on preset dates, ASU2017-08 requires the premium to be amortized to the earliest call date. The fund adopted ASU2017-08 as of the beginning of the reporting period on a modified retrospective basis. The adoption resulted in a change in accounting principle, since the fund had historically amortized such premiums to maturity for U.S. GAAP. As a result of the adoption, the fund recognized a cumulative effect adjustment that decreased the beginning of period cost of investments and increased the unrealized appreciation on investments by $22,846,599. Adoption had no impact on the fund’s net assets or any prior period information presented in the financial statements. With respect to the fund’s results of operations, amortization of premium to first call date under ASU2017-08 accelerates amortization with the intent of more closely aligning the recognition of income on such bonds with the economics of the instrument.
Balance Sheet Offsetting– The fund’s accounting policy with respect to balance sheet offsetting is that, absent an event of default by the counterparty or a termination of the agreement, the International Swaps and Derivatives Association (ISDA) Master Agreement, or similar agreement, does not result in an offset of reported amounts of financial assets and financial liabilities in the Statement of Assets and Liabilities across transactions between the fund and the applicable counterparty. The fund’s right to setoff may be restricted or prohibited by the bankruptcy or insolvency laws of the particular jurisdiction to which a specific master netting agreement counterparty is subject. Balance sheet offsetting disclosures, to the extent applicable to the fund, have been included in the fund’s Significant Accounting Policies note under the captions for each of the fund’sin-scope financial instruments and transactions.
Investment Valuations– Debt instruments and floating rate loans, including restricted debt instruments, are generally valued at an evaluated or composite bid as provided by a third-party pricing service. Short-term instruments with a maturity at issuance of 60 days or less may be valued at amortized cost, which approximates market value.Open-end investment companies are generally valued at net asset value per share. Securities and other assets generally valued on the basis of information from a third-party pricing service may also be valued at a broker/dealer bid quotation. In determining values, third-party pricing services can utilize both transaction data and market information such as yield, quality, coupon rate, maturity, type of issue, trading characteristics, and other market data.
The Board of Trustees has delegated primary responsibility for determining or causing to be determined the value of the fund’s investments (including any fair valuation) to
110
Notes to Financial Statements – continued
the adviser pursuant to valuation policies and procedures approved by the Board. If the adviser determines that reliable market quotations are not readily available, investments are valued at fair value as determined in good faith by the adviser in accordance with such procedures under the oversight of the Board of Trustees. Under the fund’s valuation policies and procedures, market quotations are not considered to be readily available for most types of debt instruments and floating rate loans and many types of derivatives. These investments are generally valued at fair value based on information from third-party pricing services. In addition, investments may be valued at fair value if the adviser determines that an investment’s value has been materially affected by events occurring after the close of the exchange or market on which the investment is principally traded (such as foreign exchange or market) and prior to the determination of the fund’s net asset value, or after the halt of trading of a specific security where trading does not resume prior to the close of the exchange or market on which the security is principally traded. The adviser generally relies on third-party pricing services or other information (such as the correlation with price movements of similar securities in the same or other markets; the type, cost and investment characteristics of the security; the business and financial condition of the issuer; and trading and other market data) to assist in determining whether to fair value and at what value to fair value an investment. The value of an investment for purposes of calculating the fund’s net asset value can differ depending on the source and method used to determine value. When fair valuation is used, the value of an investment used to determine the fund’s net asset value may differ from quoted or published prices for the same investment. There can be no assurance that the fund could obtain the fair value assigned to an investment if it were to sell the investment at the same time at which the fund determines its net asset value per share.
Various inputs are used in determining the value of the fund’s assets or liabilities. These inputs are categorized into three broad levels. In certain cases, the inputs used to measure fair value may fall into different levels of the fair value hierarchy. In such cases, an investment’s level within the fair value hierarchy is based on the lowest level of input that is significant to the fair value measurement. The fund’s assessment of the significance of a particular input to the fair value measurement in its entirety requires judgment, and considers factors specific to the investment. Level 1 includes unadjusted quoted prices in active markets for identical assets or liabilities. Level 2 includes other significant observable market-based inputs (including quoted prices for similar securities, interest rates, prepayment speed, and credit risk). Level 3 includes unobservable inputs, which may include the adviser’s own assumptions in determining the fair value of investments. The following is a summary of the levels used as of March 31, 2020 in valuing the fund’s assets or liabilities:
| | | | | | | | | | | | | | | | |
| | | | |
| Financial Instruments | | Level 1 | | | Level 2 | | | Level 3 | | | Total | |
| Municipal Bonds | | | $— | | | | $4,451,346,402 | | | | $— | | | | $4,451,346,402 | |
| U.S. Corporate Bonds | | | — | | | | 18,035,331 | | | | — | | | | 18,035,331 | |
| Mutual Funds | | | 149,559,733 | | | | — | | | | — | | | | 149,559,733 | |
| Total | | | $149,559,733 | | | | $4,469,381,733 | | | | $— | | | | $4,618,941,466 | |
For further information regarding security characteristics, see the Portfolio of Investments.
111
Notes to Financial Statements – continued
Inverse Floaters– The fund invests in municipal inverse floating rate securities which are structured by the issuer (known as primary market inverse floating rate securities) or by the fund utilizing the fund’s municipal bonds which have already been issued (known as self-deposited secondary market inverse floating rate securities) to have variable rates of interest which typically move in the opposite direction of short-term interest rates. A self-deposited secondary market inverse floating rate security is created when the fund transfers a fixed rate municipal bond to a special purpose trust (“the trust”), and causes the trust to (a) issue floating rate certificates to third parties, in an amount equal to a fraction of the par amount of the deposited bonds (these certificates usually paytax-exempt interest at short-term interest rates that typically reset weekly; and the certificate holders typically, on seven days notice, have the option to tender their certificates to the trust or another party for redemption at par plus accrued interest), and (b) issue inverse floating rate certificates (sometimes referred to as “inverse floaters”) which are held by the fund. Such self-deposited inverse floaters held by the fund are accounted for as secured borrowings, with the municipal bonds reflected in the investments of the fund and amounts owed to the holders of the floating rate certificates under the provisions of the trust, which amounts are paid solely from the assets of the trust, reflected as liabilities of the fund in the Statement of Assets and Liabilities under the caption, “Payable to the holders of the floating rate certificates”. The carrying value of the fund’s payable to the holders of the floating rate certificates as reported in the fund’s Statement of Assets and Liabilities approximates its fair value. The value of the payable to the holders of the floating rate certificates as of the reporting date is considered level 2 under the fair value hierarchy disclosure. At March 31, 2020, the fund’s payable to the holders of the floating rate certificates was $74,234,700 and the weighted average interest rate on the settled floating rate certificates issued by the trust was 4.83%. For the year ended March 31, 2020, the average payable to the holders of the settled floating rate certificates was $77,131,627 at a weighted average interest rate of 1.75%. Interest expense and fees include interest payments made to the holders of certain floating rate certificates and associated fees, both of which are made from trust assets. Interest expense and fees are recorded as incurred. For the year ended March 31, 2020, interest expense and fees related to self-deposited inverse floaters amounted to $1,683,502 and are included in “Interest expense and fees” in the Statement of Operations. Primary market inverse floaters held by the fund are not accounted for as secured borrowings.
Indemnifications– Under the fund’s organizational documents, its officers and Trustees may be indemnified against certain liabilities and expenses arising out of the performance of their duties to the fund. Additionally, in the normal course of business, the fund enters into agreements with service providers that may contain indemnification clauses. The fund’s maximum exposure under these agreements is unknown as this would involve future claims that may be made against the fund that have not yet occurred.
Investment Transactions and Income– Investment transactions are recorded on the trade date. Interest income is recorded on the accrual basis. All premium and discount is amortized or accreted for financial statement purposes in accordance with U.S. generally accepted accounting principles. Some securities may be purchased or sold on an extended settlement basis which includes “when-issued”, “delayed delivery” or “To Be Announced” (TBA) securities. For extended settlement transactions, the receipt or
112
Notes to Financial Statements – continued
delivery of the securities by the fund and related payments occur at a future date, usually beyond the customary settlement time. Interest payments received in additional securities are recorded on theex-interest date in an amount equal to the value of the security on such date. Debt obligations may be placed onnon-accrual status or set to accrue at a rate of interest less than the contractual coupon when the collection of all or a portion of interest has become doubtful. Interest income for those debt obligations may be further reduced by thewrite-off of the related interest receivables when deemed uncollectible.
The fund may receive proceeds from litigation settlements. Any proceeds received from litigation involving portfolio holdings are reflected in the Statement of Operations in realized gain/loss if the security has been disposed of by the fund or in unrealized gain/loss if the security is still held by the fund. Any other proceeds from litigation not related to portfolio holdings are reflected as other income in the Statement of Operations.
The fund purchased or sold debt securities on a when-issued or delayed delivery basis, or in a “To Be Announced” (TBA) or “forward commitment” transaction with delivery or payment to occur at a later date beyond the normal settlement period. When the fund sells securities on a when-issued, delayed delivery, TBA, or forward commitment basis, the fund typically owns or has the right to acquire securities equivalent in kind and amount to the delivered securities. At the time a fund enters into a commitment to purchase or sell a security, the transaction is recorded and the value of the security acquired or sold is reflected in the fund’s net asset value. The price of such security and the date that the security will be delivered and paid for are fixed at the time the transaction is negotiated. The value of the security may vary with market fluctuations. When-issued investments purchased are held at carrying amount, which approximates fair value and are categorized as level 2 within the fair value hierarchy and included in Investments purchased on an extended settlement basis in the Statement of Assets and Liabilities. No interest accrues to the fund until payment takes place. At the time that a fund enters into this type of transaction, the fund is required to have sufficient cash and/or liquid securities to cover its commitments. Losses may arise due to changes in the value of the underlying securities prior to settlement date or if the counterparty does not perform under the contract’s terms, or if the issuer does not issue the securities due to political, economic or other factors.
Legal fees and other related expenses incurred to preserve and protect the value of a security owned are added to the cost of the security; other legal fees are expensed. Capital infusions made directly to the security issuer, which are generallynon-recurring, incurred to protect or enhance the value of high-yield debt securities, are reported as additions to the cost basis of the security. Costs that are incurred to negotiate the terms or conditions of capital infusions or that are expected to result in a plan of reorganization are reported as realized losses. Ongoing costs incurred to protect or enhance an investment, or costs incurred to pursue other claims or legal actions, are expensed.
Fees Paid Indirectly– The fund’s custody fee may be reduced by a credit earned under an arrangement that measures the value of U.S. dollars deposited with the custodian by the fund. The amount of the credit, for the year ended March 31, 2020, is shown as a reduction of total expenses in the Statement of Operations.
113
Notes to Financial Statements – continued
Tax Matters and Distributions– The fund intends to qualify as a regulated investment company, as defined under Subchapter M of the Internal Revenue Code, and to distribute all of its taxable andtax-exempt income, including realized capital gains. As a result, no provision for federal income tax is required. The fund’s federal tax returns, when filed, will remain subject to examination by the Internal Revenue Service for a three year period. Management has analyzed the fund’s tax positions taken on federal and state tax returns for all open tax years and does not believe that there are any uncertain tax positions that require recognition of a tax liability.
Distributions to shareholders are recorded on theex-dividend date. Income and capital gain distributions are determined in accordance with income tax regulations, which may differ from U.S. generally accepted accounting principles. Certain capital accounts in the financial statements are periodically adjusted for permanent differences in order to reflect their tax character. These adjustments have no impact on net assets or net asset value per share. Temporary differences which arise from recognizing certain items of income, expense, gain or loss in different periods for financial statement and tax purposes will reverse at some time in the future.
Book/tax differences primarily relate to amortization and accretion of debt securities.
The tax character of distributions declared to shareholders for the last two fiscal years is as follows:
| | | | | | | | |
| | |
| | | Year ended
3/31/20 | | | Year ended
3/31/19 | |
Ordinary income (including any
short-term capital gains) | | | $1,893,348 | | | | $1,371,427 | |
| Tax-exempt income | | | 127,508,240 | | | | 116,499,812 | |
| | |
| Total distributions | | | $129,401,588 | | | | $117,871,239 | |
The federal tax cost and the tax basis components of distributable earnings were as follows:
| | | | |
| |
| As of 3/31/20 | | | |
| |
| Cost of investments | | | $4,441,121,658 | |
| Gross appreciation | | | 180,419,985 | |
| |
| Gross depreciation | | | (76,834,877 | ) |
| Net unrealized appreciation (depreciation) | | | $103,585,108 | |
| |
| Undistributed ordinary income | | | 1,504,425 | |
| Undistributedtax-exempt income | | | 14,702,201 | |
| Capital loss carryforwards | | | (46,538,815 | ) |
| Other temporary differences | | | (11,892,284 | ) |
As of March 31, 2020, the fund had capital loss carryforwards available to offset future realized gains. These net capital losses may be carried forward indefinitely and their character is retained as short-term and/or long-term losses. Such losses are characterized as follows:
Multiple Classes of Shares of Beneficial Interest– The fund offers multiple classes of shares, which differ in their respective distribution and service fees. The fund’s
114
Notes to Financial Statements – continued
income and common expenses are allocated to shareholders based on the value of settled shares outstanding of each class. The fund’s realized and unrealized gain (loss) are allocated to shareholders based on the daily net assets of each class. Dividends are declared separately for each class. Differences in per share dividend rates are generally due to differences in separate class expenses. Class B and B1 shares will convert to Class A and A1 shares, respectively, approximately eight years after purchase. Class C shares will convert to Class A shares approximately ten years after purchase. The fund’s distributions declared to shareholders as reported in the Statements of Changes in Net Assets are presented by class as follows:
| | | | | | | | |
| | |
| | | Year
ended
3/31/20 | | | Year
ended
3/31/19 | |
| Class A | | | $60,394,449 | | | | $51,826,775 | |
| Class B | | | 241,460 | | | | 391,018 | |
| Class C | | | 3,367,523 | | | | 4,231,250 | |
| Class I | | | 32,798,905 | | | | 27,023,739 | |
| Class R6 | | | 18,309,232 | | | | 17,557,730 | |
| Class A1 | | | 14,288,175 | | | | 16,837,720 | |
| Class B1 | | | 1,844 | | | | 3,007 | |
| Total | | | $129,401,588 | | | | $117,871,239 | |
(3) Transactions with Affiliates
Investment Adviser– The fund has an investment advisory agreement with MFS to provide overall investment management and related administrative services and facilities to the fund. The management fee is computed daily and paid monthly at the following annual rates based on the fund’s average daily net assets:
| | | | |
| Up to $1.3 billion | | | 0.40 | % |
| In excess of $1.3 billion and up to $2 billion | | | 0.37 | % |
| In excess of $2 billion and up to $5 billion | | | 0.35 | % |
| In excess of $5 billion and up to $10 billion | | | 0.34 | % |
| In excess of $10 billion | | | 0.33 | % |
MFS has agreed in writing to reduce its management fee by a specified amount if certain MFS mutual fund assets exceed thresholds agreed to by MFS and the fund’s Board of Trustees. For the year ended March 31, 2020, this management fee reduction amounted to $428,901, which is included in the reduction of total expenses in the Statement of Operations. The management fee incurred for the year ended March 31, 2020 was equivalent to an annual effective rate of 0.36% of the fund’s average daily net assets.
The investment adviser has agreed in writing to pay a portion of the fund’s total annual operating expenses, excluding interest, taxes, extraordinary expenses, brokerage and transaction costs, and investment-related expenses (including interest expenses and fees associated with investments in inverse floating rate instruments), such that total fund operating expenses do not exceed the following rates annually of each class’s average daily net assets:
| | | | | | | | | | | | | | | | | | | | | | | | | | |
| | | | | | |
| Class A | | | Class B | | | Class C | | | Class I | | | Class R6 | | | Class A1 | | | Class B1 | |
| | 0.73% | | | | 1.48 | % | | | 1.48 | % | | | 0.48 | % | | | 0.42 | % | | | 0.48 | % | | | 1.23 | % |
115
Notes to Financial Statements – continued
This written agreement will continue until modified by the fund’s Board of Trustees, but such agreement will continue at least until July 31, 2020. For the year ended March 31, 2020, the fund’s actual operating expenses did not exceed the limit and therefore, the investment adviser did not pay any portion of the fund’s expenses related to this agreement.
Distributor– MFS Fund Distributors, Inc. (MFD), a wholly-owned subsidiary of MFS, as distributor, received $208,345 and $3,143 for the year ended March 31, 2020, as its portion of the initial sales charge on sales of Class A and Class A1 shares of the fund, respectively.
The Board of Trustees has adopted a distribution plan for certain share classes pursuant to Rule12b-1 of the Investment Company Act of 1940.
The fund’s distribution plan provides that the fund will pay MFD for services provided by MFD and financial intermediaries in connection with the distribution and servicing of certain share classes. One component of the plan is a distribution fee paid to MFD and another component of the plan is a service fee paid to MFD. MFD may subsequently pay all, or a portion, of the distribution and/or service fees to financial intermediaries.
Distribution Plan Fee Table:
| | | | | | | | | | | | | | | | | | | | |
| | | | | |
| | | Distribution
Fee Rate (d) | | | Service
Fee Rate (d) | | | Total
Distribution
Plan (d) | | | Annual
Effective
Rate (e) | | | Distribution
and Service
Fee | |
| Class A | | | — | | | | 0.25% | | | | 0.25% | | | | 0.25% | | | | $5,250,788 | |
| Class B | | | 0.75% | | | | 0.25% | | | | 1.00% | | | | 1.00% | | | | 110,687 | |
| Class C | | | 0.75% | | | | 0.25% | | | | 1.00% | | | | 1.00% | | | | 1,566,875 | |
| Class B1 | | | 0.75% | | | | 0.25% | | | | 1.00% | | | | 0.75% | | | | 757 | |
| Total Distribution and Service Fees | | | | | | | | | | | | $6,929,107 | |
| (d) | In accordance with the distribution plan for certain classes, the fund pays distribution and/or service fees equal to these annual percentage rates of each class’s average daily net assets. The distribution and service fee rates disclosed by class represent the current rates in effect at the end of the reporting period. Any rate changes, if applicable, are detailed below. |
| (e) | The annual effective rates represent actual fees incurred under the distribution plan for the year ended March 31, 2020 based on each class’s average daily net assets. MFD has agreed in writing to reduce the Class B1 service fee rate to 0.00% for all Class B1 shares. This written agreement will continue until modified by the fund’s Board of Trustees, but such agreement will continue at least until July 31, 2020. For the year ended March 31, 2020, this reduction amounted to $189 and is included in the reduction of total expenses in the Statement of Operations. MFD has voluntarily agreed to rebate a portion of each class’s 0.25% service fee attributable to accounts for which there is no financial intermediary specified on the account except for accounts attributable to MFS or its affiliates’ seed money. For the year ended March 31, 2020, this rebate amounted to $29,732, $12, and $687 for Class A, Class B, and Class C, respectively, and is included in the reduction of total expenses in the Statement of Operations. |
Certain Class A and Class A1 shares are subject to a contingent deferred sales charge (CDSC) in the event of a shareholder redemption within 18 months of purchase. Class B and Class B1 shares are subject to a CDSC in the event of a shareholder redemption within six years of purchase. Class C shares are subject to a CDSC in the
116
Notes to Financial Statements – continued
event of a shareholder redemption within 12 months of purchase. All contingent deferred sales charges are paid to MFD and during the year ended March 31, 2020, were as follows:
| | | | |
| |
| | | Amount | |
| Class A | | | $71,243 | |
| Class B | | | 6,537 | |
| Class C | | | 22,498 | |
| Class A1 | | | — | |
| Class B1 | | | 644 | |
Shareholder Servicing Agent– MFS Service Center, Inc. (MFSC), a wholly-owned subsidiary of MFS, receives a fee from the fund for its services as shareholder servicing agent calculated as a percentage of the average daily net assets of the fund as determined periodically under the supervision of the fund’s Board of Trustees. For the year ended March 31, 2020, the fee was $142,684, which equated to 0.0033% annually of the fund’s average daily net assets. MFSC also receives payment from the fund forout-of-pocket expenses,sub-accounting and other shareholder servicing costs which may be paid to affiliated and unaffiliated service providers. Class R6 shares do not incursub-accounting fees. For the year ended March 31, 2020, theseout-of-pocket expenses,sub-accounting and other shareholder servicing costs amounted to $2,790,413.
Administrator– MFS provides certain financial, legal, shareholder communications, compliance, and other administrative services to the fund. Under an administrative services agreement, the fund reimburses MFS the costs incurred to provide these services. The fund is charged an annual fixed amount of $17,500 plus a fee based on average daily net assets. The administrative services fee incurred for the year ended March 31, 2020 was equivalent to an annual effective rate of 0.0127% of the fund’s average daily net assets.
Trustees’ and Officers’ Compensation– The fund pays compensation to independent Trustees in the form of a retainer, attendance fees, and additional compensation to Board and Committee chairpersons. The fund does not pay compensation directly to Trustees or officers of the fund who are also officers of the investment adviser, all of whom receive remuneration from MFS for their services to the fund. Certain officers and Trustees of the fund are officers or directors of MFS, MFD, and MFSC.
Prior to December 31, 2001, the fund had an unfunded defined benefit plan (“DB plan”) for independent Trustees. As of December 31, 2001, the Board took action to terminate the DB plan with respect to then-current and any future independent Trustees, such that the DB plan covers only certain of those former independent Trustees who retired on or before December 31, 2001. The DB plan resulted in a pension expense of $2,646 and is included in “Independent Trustees’ compensation” in the Statement of Operations for the year ended March 31, 2020. The liability for deferred retirement benefits payable to those former independent Trustees under the DB plan amounted to $5,690 at March 31, 2020, and is included in “Payable for independent Trustees’ compensation” in the Statement of Assets and Liabilities.
117
Notes to Financial Statements – continued
Other – This fund and certain other funds managed by MFS (the funds) had entered into a service agreement (the ISO Agreement) which provided for payment of fees solely by the funds to Tarantino LLC in return for the provision of services of an Independent Senior Officer (ISO) for the funds. Frank L. Tarantino served as the ISO and was an officer of the funds and the sole member of Tarantino LLC. Effective June 30, 2019, Mr. Tarantino retired from his position as ISO for the funds, and the ISO Agreement was terminated. For the year ended March 31, 2020, the fee paid by the fund under this agreement was $2,867 and is included in “Miscellaneous” expense in the Statement of Operations. MFS had agreed to bear all expenses associated with office space, other administrative support, and supplies provided to the ISO.
The fund invests in the MFS Institutional Money Market Portfolio which is managed by MFS and seeks current income consistent with preservation of capital and liquidity. This money market fund does not pay a management fee to MFS but does incur investment and operating costs.
(4) Portfolio Securities
For the year ended March 31, 2020, purchases and sales of investments, other than short-term obligations, aggregated $1,978,591,368 and $1,006,609,668, respectively.
(5) Shares of Beneficial Interest
The fund’s Declaration of Trust permits the Trustees to issue an unlimited number of full and fractional shares of beneficial interest. Transactions in fund shares were as follows:
| | | | | | | | | | | | | | | | |
| | | Year ended
3/31/20 | | | Year ended
3/31/19 | |
| | | | |
| | | Shares | | | Amount | | | Shares | | | Amount | |
| Shares sold | | | | | | | | | | | | | | | | |
Class A | | | 129,556,923 | | | | $1,158,166,774 | | | | 72,952,086 | | | | $625,333,183 | |
Class B | | | 34,781 | | | | 309,644 | | | | 90,261 | | | | 779,719 | |
Class C | | | 5,233,994 | | | | 47,220,149 | | | | 2,776,118 | | | | 23,970,837 | |
Class I | | | 62,975,674 | | | | 564,647,920 | | | | 53,211,721 | | | | 457,377,580 | |
Class R6 | | | 23,959,991 | | | | 214,141,467 | | | | 14,470,115 | | | | 124,344,568 | |
Class A1 | | | 442,044 | | | | 3,964,207 | | | | 298,465 | | | | 2,571,077 | |
Class B1 | | | 390 | | | | 3,408 | | | | 1,179 | | | | 10,148 | |
| | | 222,203,797 | | | | $1,988,453,569 | | | | 143,799,945 | | | | $1,234,387,112 | |
| | | |
Shares issued to shareholders in
reinvestment of distributions | | | | | | | | | | | | | |
Class A | | | 6,488,422 | | | | $58,265,262 | | | | 5,758,280 | | | | $49,607,765 | |
Class B | | | 25,602 | | | | 229,891 | | | | 42,683 | | | | 368,312 | |
Class C | | | 330,117 | | | | 2,971,507 | | | | 431,364 | | | | 3,729,001 | |
Class I | | | 2,280,035 | | | | 20,452,915 | | | | 1,886,689 | | | | 16,244,006 | |
Class R6 | | | 2,038,200 | | | | 18,267,314 | | | | 2,034,420 | | | | 17,502,415 | |
Class A1 | | | 1,352,024 | | | | 12,140,041 | | | | 1,656,680 | | | | 14,284,314 | |
Class B1 | | | 204 | | | | 1,844 | | | | 348 | | | | 3,007 | |
| | | 12,514,604 | | | | $112,328,774 | | | | 11,810,464 | | | | $101,738,820 | |
118
Notes to Financial Statements – continued
| | | | | | | | | | | | | | | | |
| | | Year ended
3/31/20 | | | Year ended
3/31/19 | |
| | | | |
| | | Shares | | | Amount | | | Shares | | | Amount | |
| | | | |
| Shares reacquired | | | | | | | | | | | | | | | | |
Class A | | | (53,122,194 | ) | | | $(470,287,658 | ) | | | (51,073,148 | ) | | | $(437,921,258 | ) |
Class B | | | (590,335 | ) | | | (5,266,361 | ) | | | (798,364 | ) | | | (6,877,489 | ) |
Class C | | | (4,903,612 | ) | | | (43,826,403 | ) | | | (6,962,684 | ) | | | (60,104,128 | ) |
Class I | | | (44,432,917 | ) | | | (391,255,575 | ) | | | (33,723,298 | ) | | | (288,787,286 | ) |
Class R6 | | | (13,819,437 | ) | | | (121,383,667 | ) | | | (17,522,238 | ) | | | (150,618,600 | ) |
Class A1 | | | (5,061,459 | ) | | | (45,318,172 | ) | | | (5,385,118 | ) | | | (46,357,354 | ) |
Class B1 | | | (4,319 | ) | | | (38,563 | ) | | | (4,331 | ) | | | (37,390 | ) |
| | | (121,934,273 | ) | | | $(1,077,376,399 | ) | | | (115,469,181 | ) | | | $(990,703,505 | ) |
| | | | |
| Net change | | | | | | | | | | | | | | | | |
Class A | | | 82,923,151 | | | | $746,144,378 | | | | 27,637,218 | | | | $237,019,690 | |
Class B | | | (529,952 | ) | | | (4,726,826 | ) | | | (665,420 | ) | | | (5,729,458 | ) |
Class C | | | 660,499 | | | | 6,365,253 | | | | (3,755,202 | ) | | | (32,404,290 | ) |
Class I | | | 20,822,792 | | | | 193,845,260 | | | | 21,375,112 | | | | 184,834,300 | |
Class R6 | | | 12,178,754 | | | | 111,025,114 | | | | (1,017,703 | ) | | | (8,771,617 | ) |
Class A1 | | | (3,267,391 | ) | | | (29,213,924 | ) | | | (3,429,973 | ) | | | (29,501,963 | ) |
Class B1 | | | (3,725 | ) | | | (33,311 | ) | | | (2,804 | ) | | | (24,235 | ) |
| | | 112,784,128 | | | | $1,023,405,944 | | | | 40,141,228 | | | | $345,422,427 | |
Class T shares were not publicly available for sale during the period. Please see the fund’s prospectus for details.
Effective June 1, 2019, purchases of the fund’s Class B and Class B1 shares are closed to new and existing investors subject to certain exceptions. Please see the fund’s prospectus for details.
(6) Line of Credit
The fund and certain other funds managed by MFS participate in a $1.25 billion unsecured committed line of credit, subject to a $1 billion sublimit, provided by a syndicate of banks under a credit agreement. Borrowings may be made for temporary financing needs. Interest is charged to each fund, based on its borrowings, generally at a rate equal to the highest of one month LIBOR, the Federal Funds Effective Rate and the Overnight Bank Funding Rate, plus an agreed upon spread. A commitment fee, based on the average daily, unused portion of the committed line of credit, is allocated among the participating funds. In addition, the fund and other funds managed by MFS have established unsecured uncommitted borrowing arrangements with certain banks for temporary financing needs. Interest is charged to each fund, based on its borrowings, at rates equal to customary reference rates plus an agreed upon spread. For the year ended March 31, 2020, the fund’s commitment fee and interest expense were $24,970 and $0, respectively, and are included in “Interest expense and fees” in the Statement of Operations.
119
Notes to Financial Statements – continued
(7) Investments in Affiliated Issuers
An affiliated issuer may be considered one in which the fund owns 5% or more of the outstanding voting securities, or a company which is under common control. For the purposes of this report, the following were affiliated issuers:
| | | | | | | | | | | | | | | | | | | | | | | | |
| | | | | | |
| Affiliated Issuers | | Beginning
Value | | | Purchases | | | Sales
Proceeds | | | Realized
Gain
(Loss) | | | Change in
Unrealized
Appreciation or
Depreciation | | | Ending
Value | |
| MFS Institutional Money Market Portfolio | | | $108,660,481 | | | | $1,223,122,876 | | | | $1,182,228,650 | | | | $9,613 | | | | $(4,587 | ) | | | $149,559,733 | |
| | | | | | |
| Affiliated Issuers | | | | | | | | | | | | | | Dividend
Income | | | Capital Gain
Distributions | |
| MFS Institutional Money Market Portfolio | | | | | | | | | | | | | | | | $2,545,856 | | | | $— | |
(8) Impacts ofCOVID-19
The pandemic related to the global spread of novel coronavirus disease(COVID-19), which was first detected in December 2019, has resulted in significant disruptions to global business activity and the global economy, as well as the economies of individual countries, the financial performance of individual companies and sectors, and the securities and commodities markets in general. This pandemic, the full effects of which are still unknown, has resulted in substantial market volatility and may have adversely impacted the prices and liquidity of the fund’s investments and the fund’s performance.
120
REPORT OF INDEPENDENT REGISTERED PUBLIC ACCOUNTING FIRM
To the Board of Trustees of MFS Municipal Series Trust and the Shareholders of MFS Municipal Income Fund:
Opinion on the Financial Statements and Financial Highlights
We have audited the accompanying statement of assets and liabilities of MFS Municipal Income Fund (the “Fund”), including the portfolio of investments, as of March 31, 2020, the related statement of operations for the year then ended, the statements of changes in net assets for each of the two years in the period then ended, the financial highlights for each of the five years in the period then ended, and the related notes. In our opinion, the financial statements and financial highlights present fairly, in all material respects, the financial position of the Fund as of March 31, 2020, and the results of its operations for the year then ended, the changes in its net assets for each of the two years in the period then ended, and the financial highlights for each of the five years in the period then ended, in conformity with accounting principles generally accepted in the United States of America.
Basis for Opinion
These financial statements and financial highlights are the responsibility of the Fund’s management. Our responsibility is to express an opinion on the Fund’s financial statements and financial highlights based on our audits. We are a public accounting firm registered with the Public Company Accounting Oversight Board (United States) (PCAOB) and are required to be independent with respect to the Fund in accordance with the U.S. federal securities laws and the applicable rules and regulations of the Securities and Exchange Commission and the PCAOB.
We conducted our audits in accordance with the standards of the PCAOB. Those standards require that we plan and perform the audit to obtain reasonable assurance about whether the financial statements and financial highlights are free of material misstatement, whether due to error or fraud. The Fund is not required to have, nor were we engaged to perform, an audit of its internal control over financial reporting. As part of our audits we are required to obtain an understanding of internal control over financial reporting but not for the purpose of expressing an opinion on the effectiveness of the Fund’s internal control over financial reporting. Accordingly, we express no such opinion.
Our audits included performing procedures to assess the risks of material misstatement of the financial statements and financial highlights, whether due to error or fraud, and performing procedures that respond to those risks. Such procedures included examining, on a test basis, evidence regarding the amounts and disclosures in the financial statements and financial highlights. Our audits also included evaluating the accounting principles used and significant estimates made by management, as well as evaluating the overall presentation of the financial statements and financial highlights. Our procedures included confirmation of securities owned as of March 31, 2020, by
121
Report of Independent Registered Public Accounting Firm – continued
correspondence with the custodian and brokers; when replies were not received from brokers, we performed other auditing procedures. We believe that our audits provide a reasonable basis for our opinion.
DELOITTE & TOUCHE LLP
Boston, Massachusetts
May 15, 2020
We have served as the auditor of one or more of the MFS investment companies since 1924.
122
TRUSTEES AND OFFICERS — IDENTIFICATION AND BACKGROUND
The Trustees and Officers of the Trust, as of May 1, 2020, are listed below, together with their principal occupations during the past five years. (Their titles may have varied during that period.) The address of each Trustee and Officer is 111 Huntington Avenue, Boston, Massachusetts 02199-7618.
| | | | | | | | | | |
Name, Age | | Position(s)
Held with Fund | | Trustee/Officer Since (h) | | Number of
MFS Funds
overseen
by the
Trustee | | Principal
Occupations During the Past Five Years | | Other Directorships
During the Past
Five Years (j) |
| INTERESTED TRUSTEES |
| Robert J. Manning (k)(age 56) | | Trustee | | February 2004 | | 133 | | Massachusetts Financial Services Company, Executive Chairman (since January 2017); Director; Chairman of the Board; Chief Executive Officer (until 2015);Co-Chief Executive Officer (2015-2016) | | N/A |
| | | | | |
Robin A. Stelmach (k) (age 58) | | Trustee | | January 2014 | | 133 | | Massachusetts Financial Services Company, Vice Chair (since January 2017); Chief Operating Officer and Executive Vice President (until January 2017) | | N/A |
| INDEPENDENT TRUSTEES |
John P. Kavanaugh (age 65) | | Trustee and Chair of Trustees | | January 2009 | | 133 | | Private investor | | N/A |
| | | | | |
Steven E. Buller (age 68) | | Trustee | | February 2014 | | 133 | | Financial Accounting Standards Advisory Council, Chairman (2014-2015); Public Company Accounting Oversight Board, Standing Advisory Group, Member (until 2014); BlackRock, Inc. (investment management), Managing Director (until 2014), BlackRock Finco UK (investment management), Director (until 2014) | | N/A |
123
Trustees and Officers – continued
| | | | | | | | | | |
Name, Age | | Position(s)
Held with Fund | | Trustee/Officer Since (h) | | Number of
MFS Funds
overseen
by the
Trustee | | Principal
Occupations During the Past Five Years | | Other Directorships
During the Past
Five Years (j) |
John A. Caroselli (age 65) | | Trustee | | March 2017 | | 133 | | JC Global Advisors, LLC (management consulting), President (since 2015); First Capital Corporation (commercial finance), Executive Vice President (until 2015) | | N/A |
| | | | | |
Maureen R. Goldfarb (age 65) | | Trustee | | January 2009 | | 133 | | Private investor | | N/A |
| | | | | |
Peter D. Jones
(age 64) | | Trustee | | January 2019 | | 133 | | Franklin Templeton Distributors, Inc. (investment management), President (until 2015); Franklin Templeton Institutional, LLC (investment management), Chairman (until 2015) | | N/A |
| | | | | |
James W. Kilman, Jr. (age 59) | | Trustee | | January 2019 | | 133 | | Burford Capital Limited (finance and investment management), Chief Financial Officer (since 2019); KielStrand Capital LLC (family office), Chief Executive Officer (since 2016); Morgan Stanley & Co. (financial services), Vice Chairman of Investment Banking,Co-Head of Diversified Financials Coverage – Financial Institutions Investment Banking Group (until 2016) | | Alpha-En Corporation, Director(2016-2019) |
124
Trustees and Officers – continued
| | | | | | | | | | |
Name, Age | | Position(s)
Held with Fund | | Trustee/Officer Since (h) | | Number of
MFS Funds
overseen
by the
Trustee | | Principal
Occupations During the Past Five Years | | Other Directorships
During the Past
Five Years (j) |
Clarence Otis, Jr. (age 64) | | Trustee | | March 2017 | | 133 | | Darden Restaurants, Inc., Chief Executive Officer (until 2014) | | VF Corporation, Director; Verizon Communications, Inc., Director; The Travelers Companies, Director; Federal Reserve Bank of Atlanta, Director (until 2015) |
| | | | | |
Maryanne L. Roepke (age 64) | | Trustee | | May 2014 | | 133 | | American Century Investments (investment management), Senior Vice President and Chief Compliance Officer (until 2014) | | N/A |
| | | | | |
Laurie J. Thomsen
(age 62) | | Trustee | | March 2005 | | 133 | | Private investor | | The Travelers Companies, Director; Dycom Industries, Inc., Director (since 2015) |
| | | | | | | | |
Name, Age | | Position(s) Held with Fund | | Trustee/Officer
Since (h) | | Number of MFS Funds for which the Person is an Officer | | Principal
Occupations During the Past Five Years |
| OFFICERS | | | | | | | | |
Christopher R. Bohane (k)
(age 46) | | Assistant Secretary and Assistant Clerk | | July 2005 | | 133 | | Massachusetts Financial Services Company, Senior Vice President and Associate General Counsel |
| | | | |
Kino Clark (k) (age 51) | | Assistant Treasurer | | January 2012 | | 133 | | Massachusetts Financial Services Company, Vice President |
| | | | |
John W. Clark, Jr. (k) (age 53) | | Assistant Treasurer | | April 2017 | | 133 | | Massachusetts Financial Services Company, Vice President (since March 2017); Deutsche Bank (financial services), Department Head – Treasurer’s Office (until February 2017) |
125
Trustees and Officers – continued
| | | | | | | | |
Name, Age | | Position(s) Held with Fund | | Trustee/Officer
Since (h) | | Number of MFS Funds for which the Person is an Officer | | Principal
Occupations During the Past Five Years |
Thomas H. Connors (k) (age 60) | | Assistant Secretary and Assistant Clerk | | September 2012 | | 133 | | Massachusetts Financial Services Company, Vice President and Senior Counsel |
| | | | |
David L. DiLorenzo (k)
(age 51) | | President | | July 2005 | | 133 | | Massachusetts Financial Services Company, Senior Vice President |
| | | | |
Heidi W. Hardin (k) (age 52) | | Secretary and Clerk | | April 2017 | | 133 | | Massachusetts Financial Services Company, Executive Vice President and General Counsel (since March 2017); Harris Associates (investment management), General Counsel (from September 2015 to January 2017); Janus Capital Management LLC (investment management), Senior Vice President and General Counsel (until September 2015) |
| | | | |
Brian E. Langenfeld (k) (age 47) | | Assistant
Secretary and Assistant Clerk | | June 2006 | | 133 | | Massachusetts Financial Services Company, Vice President and Senior Counsel |
| | | | |
Amanda S. Mooradian (k) (age 41) | | Assistant
Secretary and Assistant Clerk | | September 2018 | | 133 | | Massachusetts Financial Services Company, Assistant Vice President and Senior Counsel |
| | | | |
Susan A. Pereira (k)
(age 49) | | Assistant
Secretary and Assistant Clerk | | July 2005 | | 133 | | Massachusetts Financial Services Company, Vice President and Assistant General Counsel |
| | | | |
Kasey L. Phillips (k) (age 49) | | Assistant Treasurer | | September 2012 | | 133 | | Massachusetts Financial Services Company, Vice President |
| | | | |
Matthew A. Stowe (k) (age 45) | | Assistant Secretary and Assistant Clerk | | October 2014 | | 133 | | Massachusetts Financial Services Company, Vice President and Assistant General Counsel |
| | | | |
Martin J. Wolin (k) (age 52) | | Chief Compliance Officer | | July 2015 | | 133 | | Massachusetts Financial Services Company, Senior Vice President and Chief Compliance Officer (since July 2015); Mercer (financial service provider), Chief Risk and Compliance Officer, North America and Latin America (until June 2015) |
126
Trustees and Officers – continued
| | | | | | | | |
Name, Age | | Position(s) Held with Fund | | Trustee/Officer
Since(h) | | Number of MFS Funds for which the Person is an Officer | | Principal
Occupations During the Past Five Years |
James O. Yost (k)
(age 59) | | Treasurer | | September 1990 | | 133 | | Massachusetts Financial Services Company, Senior Vice President |
| (h) | Date first appointed to serve as Trustee/officer of an MFS Fund. Each Trustee has served continuously since appointment unless indicated otherwise. For the period from December 15, 2004 until February 22, 2005, Mr. Manning served as Advisory Trustee. From January 2012 through December 2016, Messrs. DiLorenzo and Yost served as Treasurer and Deputy Treasurer of the Funds, respectively. |
| (j) | Directorships or trusteeships of companies required to report to the Securities and Exchange Commission (i.e., “public companies”). |
| (k) | “Interested person” of the Trust within the meaning of the Investment Company Act of 1940 (referred to as the 1940 Act), which is the principal federal law governing investment companies like the fund, as a result of a position with MFS. The address of MFS is 111 Huntington Avenue, Boston, Massachusetts 02199-7618. |
Each Trustee (other than Messrs. Jones and Kilman) has been elected by shareholders and each Trustee and Officer holds office until his or her successor is chosen and qualified or until his or her earlier death, resignation, retirement or removal. Messrs. Jones and Kilman became Trustees of the Funds on January 1, 2019. The Trust does not hold annual meetings for the purpose of electing Trustees, and Trustees are not elected for fixed terms. Under the terms of the Board’s retirement policy, an Independent Trustee shall retire at the end of the calendar year in which he or she reaches the earlier of 75 years of age or 15 years of service on the Board (or, in the case of any Independent Trustee who joined the Board prior to 2015, 20 years of service on the Board).
Messrs. Buller, Kilman and Otis and Ms. Roepke are members of the Trust’s Audit Committee.
Each of the Interested Trustees and certain Officers hold comparable officer positions with certain affiliates of MFS.
The Statement of Additional Information for a Fund includes further information about the Trustees and is available without charge upon request by calling1-800-225-2606.
| | |
| Investment Adviser | | Custodian |
Massachusetts Financial Services Company
111 Huntington Avenue Boston, MA 02199-7618 | | JPMorgan Chase Bank, NA 4 Metrotech Center New York, NY 11245 |
| Distributor | | Independent Registered Public Accounting Firm |
MFS Fund Distributors, Inc.
111 Huntington Avenue Boston, MA 02199-7618 | | Deloitte & Touche LLP 200 Berkeley Street Boston, MA 02116 |
| Portfolio Manager(s) | | |
Jason Kosty Geoffrey Schechter | | |
127
PROXY VOTING POLICIES AND INFORMATION
MFS votes proxies on behalf of the fund pursuant to proxy voting policies and procedures that are available without charge, upon request, by calling1-800-225-2606, by visitingmfs.com/proxyvoting,or by visiting the SEC’s Web site athttp://www.sec.gov.
Information regarding how the fund voted proxies relating to portfolio securities during the most recent twelve-month period ended June 30 is available by August 31 of each year without charge by visitingmfs.com/proxyvoting,or by visiting the SEC’s Web site athttp://www.sec.gov.
QUARTERLY PORTFOLIO DISCLOSURE
The fund files a complete schedule of portfolio holdings with the SEC for the first and third quarters of each fiscal year as an exhibit to its reports on Form N-PORT. The fund’s Form N-PORT reports are available on the SEC’s website athttp://www.sec.gov. A shareholder can obtain the portfolio holdings report for the first and third quarters of the fund’s fiscal year atmfs.com/openendfunds by choosing the fund’s name and then selecting the “Resources” tab and clicking on “Prospectus and Reports”.
FURTHER INFORMATION
From time to time, MFS may post important information about the fund or the MFS funds on the MFS web site (mfs.com). This information is available athttps://www.mfs.com/en-us/what-we-do/announcements.htmlor atmfs.com/openendfundsby choosing the fund’s name.
INFORMATION ABOUT FUND CONTRACTS AND LEGAL CLAIMS
The fund has entered into contractual arrangements with an investment adviser, administrator, distributor, shareholder servicing agent, 529 program manager (if applicable), and custodian who each provide services to the fund. Unless expressly stated otherwise, shareholders are not parties to, or intended beneficiaries of these contractual arrangements, and these contractual arrangements are not intended to create any shareholder right to enforce them against the service providers or to seek any remedy under them against the service providers, either directly or on behalf of the fund.
Under the Trust’s By-Laws and Declaration of Trust, any claims asserted against or on behalf of the MFS Funds, including claims against Trustees and Officers, must be brought in state and federal courts located within the Commonwealth of Massachusetts.
FEDERAL TAX INFORMATION (unaudited)
The fund will notify shareholders of amounts for use in preparing 2020 income tax forms in January 2021. The following information is provided pursuant to provisions of the Internal Revenue Code.
Of the dividends paid from net investment income during the fiscal year, 98.54% is designated as exempt interest dividends for federal income tax purposes. If the fund has earned income on private activity bonds, a portion of the dividends paid may be considered a tax preference item for purposes of computing a shareholder’s alternative minimum tax.
128
rev. 3/16
| | | | |
| | | |
FACTS | | WHAT DOES MFS DO WITH YOUR PERSONAL INFORMATION? | |  |
| | |
| Why? | | Financial companies choose how they share your personal information. Federal law gives consumers the right to limit some but not all sharing. Federal law also requires us to tell you how we collect, share, and protect your personal information. Please read this notice carefully to understand what we do. |
| | |
| What? | | The types of personal information we collect and share depend on the product or service you have with us. This information can include: • Social Security number and account balances • Account transactions and transaction history • Checking account information and wire transfer instructions When you areno longer our customer, we continue to share your information as described in this notice. |
| | |
| How? | | All financial companies need to share customers’ personal information to run their everyday business. In the section below, we list the reasons financial companies can share their customers’ personal information; the reasons MFS chooses to share; and whether you can limit this sharing. |
| | | | |
Reasons we can share your
personal information | | Does MFS
share? | | Can you limit
this sharing? |
For our everyday business purposes – such as to process your transactions, maintain your account(s), respond to court orders and legal investigations, or report to credit bureaus | | Yes | | No |
For our marketing purposes – to offer our products and services to you | | No | | We don’t share |
For joint marketing with other financial companies | | No | | We don’t share |
For our affiliates’ everyday business purposes – information about your transactions and experiences | | No | | We don’t share |
For our affiliates’ everyday business purposes – information about your creditworthiness | | No | | We don’t share |
| For nonaffiliates to market to you | | No | | We don’t share |
| | |
| | |
| Questions? | | Call800-225-2606 or go tomfs.com. |
129
| | |
| Who we are |
| Who is providing this notice? | | MFS Funds, MFS Investment Management, MFS Institutional Advisors, Inc., and MFS Heritage Trust Company. |
| | |
| What we do |
| How does MFS protect my personal information? | | To protect your personal information from unauthorized access and use, we use security measures that comply with federal law. These measures include procedural, electronic, and physical safeguards for the protection of the personal information we collect about you. |
| How does MFS collect my personal information? | | We collect your personal information, for example, when you • open an account or provide account information • direct us to buy securities or direct us to sell your securities • make a wire transfer We also collect your personal information from others, such as credit bureaus, affiliates, or other companies. |
| Why can’t I limit all sharing? | | Federal law gives you the right to limit only • sharing for affiliates’ everyday business purposes – information about your creditworthiness • affiliates from using your information to market to you • sharing for nonaffiliates to market to you State laws and individual companies may give you additional rights to limit sharing. |
| | |
| Definitions |
| Affiliates | | Companies related by common ownership or control. They can be financial and nonfinancial companies. • MFS does not share personal information with affiliates, except for everyday business purposes as described on page one of this notice. |
| Nonaffiliates | | Companies not related by common ownership or control. They can be financial and nonfinancial companies. • MFS does not share with nonaffiliates so they can market to you. |
| Joint marketing | | A formal agreement between nonaffiliated financial companies that together market financial products or services to you. • MFS doesn’t jointly market. |
| | |
| Other important information |
| If you own an MFS product or receive an MFS service in the name of a third party such as a bank or broker-dealer, their privacy policy may apply to you instead of ours. |
130
Save paper with eDelivery.

| MFS® will send you prospectuses, |
reports, and proxies directly viae-mail so you will get information faster with less mailbox clutter.
To sign up:
1. Go to mfs.com.
2. Log in via MFS® Access.
3. Select eDelivery.
If you own your MFS fund shares through a financial institution or a retirement plan, MFS® TALK, MFS® Access, or eDelivery may not be available to you.
CONTACT
WEB SITE
mfs.com
MFS TALK
1-800-637-8255
24 hours a day
ACCOUNT SERVICE AND LITERATURE
Shareholders
1-800-225-2606
Financial advisors
1-800-343-2829
Retirement plan services
1-800-637-1255
MAILING ADDRESS
MFS Service Center, Inc.
P.O. Box 219341
Kansas City, MO 64121-9341
OVERNIGHT MAIL
MFS Service Center, Inc.
Suite 219341
430 W 7th Street
Kansas City, MO 64105-1407
The Registrant has adopted a Code of Ethics (the “Code”) pursuant to Section 406 of the Sarbanes-Oxley Act and as defined in FormN-CSR that applies to the Registrant’s principal executive officer and principal financial and accounting officer. During the period covered by this report, the Registrant has not amended any provision in the Code that relates to an element of the Code’s definition enumerated in paragraph (b) of Item 2 of this FormN-CSR. During the period covered by this report, the Registrant did not grant a waiver, including an implicit waiver, from any provision of the Code.
A copy of the current Code of Ethics is filed as an exhibit to this FormN-CSR.
| ITEM 3. | AUDIT COMMITTEE FINANCIAL EXPERT. |
Messrs. Steven E. Buller, James Kilman, and Clarence Otis, Jr. and Ms. Maryanne L. Roepke, members of the Audit Committee, have been determined by the Board of Trustees in their reasonable business judgment to meet the definition of “audit committee financial expert” as such term is defined in FormN-CSR. In addition, Messrs. Buller, Kilman, and Otis and Ms. Roepke are “independent” members of the Audit Committee (as such term has been defined by the Securities and Exchange Commission in regulations implementing Section 407 of the Sarbanes-Oxley Act of 2002). The Securities and Exchange Commission has stated that the designation of a person as an audit committee financial expert pursuant to this Item 3 on the FormN-CSR does not impose on such a person any duties, obligations or liability that are greater than the duties, obligations or liability imposed on such person as a member of the Audit Committee and the Board of Trustees in the absence of such designation or identification.
| ITEM 4. | PRINCIPAL ACCOUNTANT FEES AND SERVICES. |
Items 4(a) through 4(d) and 4(g):
The Board of Trustees has appointed Deloitte & Touche LLP (“Deloitte”) to serve as independent accountants to a series of the Registrant (each a “Fund” and collectively the “Funds”). The tables below set forth the audit fees billed to each Fund as well as fees fornon-audit services provided to each Fund and/or to the Fund’s investment adviser, Massachusetts Financial Services Company (“MFS”), and to various entities either controlling, controlled by, or under common control with MFS that provide ongoing services to the Fund (“MFS Related Entities”).
For the fiscal years ended March 31, 2020 and 2019, audit fees billed to each Fund by Deloitte were as follows:
| | | | | | | | |
| | | Audit Fees | |
| | | 2020 | | | 2019 | |
Fees billed by Deloitte: | | | | | | | | |
MFS Alabama Municipal Bond Fund | | | 48,787 | | | | 47,985 | |
MFS Arkansas Municipal Bond Fund | | | 48,787 | | | | 47,985 | |
MFS California Municipal Bond Fund | | | 48,787 | | | | 47,985 | |
MFS Georgia Municipal Bond Fund | | | 48,787 | | | | 47,985 | |
MFS Maryland Municipal Bond Fund | | | 48,787 | | | | 47,985 | |
MFS Massachusetts Municipal Bond Fund | | | 48,787 | | | | 47,985 | |
MFS Mississippi Municipal Bond Fund | | | 48,787 | | | | 47,985 | |
MFS Municipal Income Fund | | | 54,941 | | | | 54,036 | |
MFS New York Municipal Bond Fund | | | 48,787 | | | | 47,985 | |
MFS North Carolina Municipal Bond Fund | | | 48,787 | | | | 47,985 | |
MFS Pennsylvania Municipal Bond Fund | | | 48,787 | | | | 47,985 | |
MFS South Carolina Municipal Bond Fund | | | 48,787 | | | | 47,985 | |
MFS Tennessee Municipal Bond Fund | | | 48,787 | | | | 47,985 | |
MFS Virginia Municipal Bond Fund | | | 48,787 | | | | 47,985 | |
MFS West Virginia Municipal Bond Fund | | | 48,787 | | | | 47,985 | |
| | | | | | | | |
Total | | | 737,959 | | | | 725,826 | |
For the fiscal years ended March 31, 2020 and 2019, fees billed by Deloitte for audit-related, tax and other services provided to each Fund and for audit-related, tax and other services provided to MFS and MFS Related Entities were as follows:
| | | | | | | | | | | | | | | | | | | | | | | | |
| | | Audit-Related Fees1 | | | Tax Fees2 | | | All Other Fees3 | |
| | | 2020 | | | 2019 | | | 2020 | | | 2019 | | | 2020 | | | 2019 | |
Fees billed by Deloitte: | | | | | | | | | | | | | | | | | | | | | | | | |
To MFS Alabama Municipal Bond Fund | | | 0 | | | | 0 | | | | 6,237 | | | | 6,133 | | | | 0 | | | | 0 | |
To MFS Arkansas Municipal Bond Fund | | | 0 | | | | 0 | | | | 6,487 | | | | 6,133 | | | | 0 | | | | 0 | |
To MFS California Municipal Bond Fund | | | 0 | | | | 0 | | | | 6,237 | | | | 6,133 | | | | 0 | | | | 0 | |
To MFS Georgia Municipal Bond Fund | | | 0 | | | | 0 | | | | 6,237 | | | | 6,133 | | | | 0 | | | | 0 | |
To MFS Maryland Municipal Bond Fund | | | 0 | | | | 0 | | | | 6,237 | | | | 6,133 | | | | 0 | | | | 0 | |
To MFS Massachusetts Municipal Bond Fund | | | 0 | | | | 0 | | | | 6,237 | | | | 6,133 | | | | 0 | | | | 0 | |
To MFS Mississippi Municipal Bond Fund | | | 0 | | | | 0 | | | | 6,237 | | | | 6,133 | | | | 0 | | | | 0 | |
To MFS Municipal Income Fund | | | 0 | | | | 0 | | | | 6,552 | | | | 6,197 | | | | 0 | | | | 0 | |
To MFS New York Municipal Bond Fund | | | 0 | | | | 0 | | | | 6,237 | | | | 6,133 | | | | 0 | | | | 0 | |
To MFS North Carolina Municipal Bond Fund | | | 0 | | | | 0 | | | | 6,237 | | | | 6,133 | | | | 0 | | | | 0 | |
To MFS Pennsylvania Municipal Bond Fund | | | 0 | | | | 0 | | | | 6,237 | | | | 6,133 | | | | 0 | | | | 0 | |
To MFS South Carolina Municipal Bond Fund | | | 0 | | | | 0 | | | | 6,237 | | | | 6,133 | | | | 0 | | | | 0 | |
To MFS Tennessee Municipal Bond Fund | | | 0 | | | | 0 | | | | 6,237 | | | | 6,133 | | | | 0 | | | | 0 | |
To MFS Virginia Municipal Bond Fund | | | 0 | | | | 0 | | | | 6,487 | | | | 6,133 | | | | 0 | | | | 0 | |
To MFS West Virginia Municipal Bond Fund | | | 0 | | | | 0 | | | | 6,237 | | | | 6,133 | | | | 0 | | | | 0 | |
Total fees billed by Deloitte to above Funds: | | | 0 | | | | 0 | | | | 94,370 | | | | 92,059 | | | | 0 | | | | 0 | |
| | | |
| | | Audit-Related Fees1 | | | Tax Fees2 | | | All Other Fees3 | |
| | | 2020 | | | 2019 | | | 2020 | | | 2019 | | | 2020 | | | 2019 | |
Fees billed by Deloitte: | | | | | | | | | | | | | | | | | | | | | | | | |
To MFS and MFS Related Entities of MFS Alabama Municipal Bond Fund* | | | 0 | | | | 0 | | | | 0 | | | | 0 | | | | 3,790 | | | | 5,390 | |
To MFS and MFS Related Entities of MFS Arkansas Municipal Bond Fund* | | | 0 | | | | 0 | | | | 0 | | | | 0 | | | | 3,790 | | | | 5,390 | |
To MFS and MFS Related Entities of MFS California Municipal Bond Fund* | | | 0 | | | | 0 | | | | 0 | | | | 0 | | | | 3,790 | | | | 5,390 | |
To MFS and MFS Related Entities of MFS Georgia Municipal Bond Fund* | | | 0 | | | | 0 | | | | 0 | | | | 0 | | | | 3,790 | | | | 5,390 | |
To MFS and MFS Related Entities of MFS Maryland Municipal Bond Fund* | | | 0 | | | | 0 | | | | 0 | | | | 0 | | | | 3,790 | | | | 5,390 | |
To MFS and MFS Related Entities of MFS Massachusetts Municipal Bond Fund* | | | 0 | | | | 0 | | | | 0 | | | | 0 | | | | 3,790 | | | | 5,390 | |
| | | | | | | | | | | | | | | | | | | | | | | | |
To MFS and MFS Related Entities of MFS Mississippi Municipal Bond Fund* | | | 0 | | | | 0 | | | | 0 | | | | 0 | | | | 3,790 | | | | 5,390 | |
To MFS and MFS Related Entities of MFS Municipal Income Fund* | | | 0 | | | | 0 | | | | 0 | | | | 0 | | | | 3,790 | | | | 5,390 | |
To MFS and MFS Related Entities of MFS New York Municipal Bond Fund* | | | 0 | | | | 0 | | | | 0 | | | | 0 | | | | 3,790 | | | | 5,390 | |
To MFS and MFS Related Entities of MFS North Carolina Municipal Bond Fund* | | | 0 | | | | 0 | | | | 0 | | | | 0 | | | | 3,790 | | | | 5,390 | |
To MFS and MFS Related Entities of MFS Pennsylvania Municipal Bond Fund* | | | 0 | | | | 0 | | | | 0 | | | | 0 | | | | 3,790 | | | | 5,390 | |
To MFS and MFS Related Entities of MFS South Carolina Municipal Bond Fund* | | | 0 | | | | 0 | | | | 0 | | | | 0 | | | | 3,790 | | | | 5,390 | |
To MFS and MFS Related Entities of MFS Tennessee Municipal Bond Fund* | | | 0 | | | | 0 | | | | 0 | | | | 0 | | | | 3,790 | | | | 5,390 | |
To MFS and MFS Related Entities of MFS Virginia Municipal Bond Fund* | | | 0 | | | | 0 | | | | 0 | | | | 0 | | | | 3,790 | | | | 5,390 | |
To MFS and MFS Related Entities of MFS West Virginia Municipal Bond Fund* | | | 0 | | | | 0 | | | | 0 | | | | 0 | | | | 3,790 | | | | 5,390 | |
| | | | | | | | |
| | | Aggregate fees for non-audit
services | |
| | | 2020 | | | 2019 | |
Fees billed by Deloitte: | | | | | | | | |
To MFS Alabama Municipal Bond Fund, MFS and MFS Related Entities# | | | 360,027 | | | | 11,523 | |
To MFS Arkansas Municipal Bond Fund, MFS and MFS Related Entities# | | | 360,277 | | | | 11,523 | |
To MFS California Municipal Bond Fund, MFS and MFS Related Entities# | | | 360,027 | | | | 11,523 | |
To MFS Georgia Municipal Bond Fund, MFS and MFS Related Entities# | | | 360,027 | | | | 11,523 | |
To MFS Maryland Municipal Bond Fund, MFS and MFS Related Entities# | | | 360,027 | | | | 11,523 | |
To MFS Massachusetts Municipal Bond Fund, MFS and MFS Related Entities# | | | 360,027 | | | | 11,523 | |
To MFS Mississippi Municipal Bond Fund, MFS and MFS Related Entities# | | | 360,027 | | | | 11,523 | |
To MFS Municipal Income Fund, MFS and MFS Related Entities# | | | 360,342 | | | | 11,587 | |
To MFS New York Municipal Bond Fund, MFS and MFS Related Entities# | | | 360,027 | | | | 11,523 | |
To MFS North Carolina Municipal Bond Fund, MFS and MFS Related Entities# | | | 360,027 | | | | 11,523 | |
To MFS Pennsylvania Municipal Bond Fund, MFS and MFS Related Entities# | | | 360,027 | | | | 11,523 | |
To MFS South Carolina Municipal Bond Fund, MFS and MFS Related Entities# | | | 360,027 | | | | 11,523 | |
To MFS Tennessee Municipal Bond Fund, MFS and MFS Related Entities# | | | 360,027 | | | | 11,523 | |
To MFS Virginia Municipal Bond Fund, MFS and MFS Related Entities# | | | 360,277 | | | | 11,523 | |
To MFS West Virginia Municipal Bond Fund, MFS and MFS Related Entities# | | | 360,027 | | | | 11,523 | |
| * | This amount reflects the fees billed to MFS and MFS Related Entities fornon-audit services relating directly to the operations and financial reporting of the Funds (portions of which services also related to the operations and financial reporting of other funds within the MFS Funds complex). |
| # | This amount reflects the aggregate fees billed by Deloitte, as the case may be, fornon-audit services rendered to the Funds and fornon-audit services rendered to MFS and the MFS Related Entities. |
| 1 | The fees included under “Audit-Related Fees” are fees related to assurance and related services that are reasonably related to the performance of the audit or review of financial statements, but not reported under ‘‘Audit Fees,’’ including accounting consultations, agreed-upon procedure reports, attestation reports, comfort letters and internal control reviews. |
| 2 | The fees included under “Tax Fees” are fees associated with tax compliance, tax advice and tax planning, including services relating to the filing or amendment of federal, state or local income tax returns, regulated investment company qualification reviews and tax distribution and analysis. |
| 3 | The fees included under “All Other Fees” are fees for products and services provided by Deloitte other than those reported under “Audit Fees,” “Audit-Related Fees” and “Tax Fees”. |
Item 4(e)(1):
Set forth below are the policies and procedures established by the Audit Committee of the Board of Trustees relating to thepre-approval of audit andnon-audit related services:
To the extent required by applicable law,pre-approval by the Audit Committee of the Board is needed for all audit and permissiblenon-audit services rendered to the Fund and all permissiblenon-audit services rendered to MFS or MFS Related Entities if the services relate directly to the operations and financial reporting of the Registrant.Pre-approval is currently on anengagement-by-engagement basis. In the eventpre-approval of such services is necessary between regular meetings of the Audit Committee and it is not practical to wait to seekpre-approval at the next regular meeting of the Audit Committee,pre-approval of such services may be referred to the Chair of the Audit Committee for approval; provided that the Chair may notpre-approve any individual engagement for such services exceeding $50,000 or multiple engagements for such services in the aggregate exceeding $100,000 in each period between regular meetings of the Audit Committee. Any engagementpre-approved by the Chair between regular meetings of the Audit Committee shall be presented for ratification by the entire Audit Committee at its next regularly scheduled meeting.
Item 4(e)(2):
None, or 0%, of the services relating to the Audit-Related Fees, Tax Fees and All Other Fees paid by the Fund and MFS and MFS Related Entities relating directly to the operations and financial reporting of the Registrant disclosed above were approved by the audit committee pursuant to paragraphs (c)(7)(i)(C) of Rule2-01 of RegulationS-X (which permits audit committee approval after the start of the engagement with respect to services other than audit, review or attest services, if certain conditions are satisfied).
Item 4(f):
Not applicable.
Item 4(h):
The Registrant’s Audit Committee has considered whether the provision by a Registrant’s independent registered public accounting firm ofnon-audit services to MFS and MFS Related Entities that were notpre-approved by the Committee (because such services did not relate directly to the operations and financial reporting of the Registrant) was compatible with maintaining the independence of the independent registered public accounting firm as the Registrant’s principal auditors.
| ITEM 5. | AUDIT COMMITTEE OF LISTED REGISTRANTS. |
Not applicable to the Registrant.
A schedule of investments of the Registrant is included as part of the report to shareholders of such series under Item 1 of this FormN-CSR.
| ITEM 7. | DISCLOSURE OF PROXY VOTING POLICIES AND PROCEDURES FORCLOSED-END MANAGEMENT INVESTMENT COMPANIES. |
Not applicable to the Registrant.
| ITEM 8. | PORTFOLIO MANAGERS OFCLOSED-END MANAGEMENT INVESTMENT COMPANIES. |
Not applicable to the Registrant.
| ITEM 9. | PURCHASES OF EQUITY SECURITIES BYCLOSED-END MANAGEMENT INVESTMENT COMPANY AND AFFILIATED PURCHASERS. |
Not applicable to the Registrant.
| ITEM 10. | SUBMISSION OF MATTERS TO A VOTE OF SECURITY HOLDERS. |
There were no material changes to the procedures by which shareholders may send recommendations to the Board for nominees to the Registrant’s Board since the Registrant last provided disclosure as to such procedures in response to the requirements of Item 407 (c)(2)(iv) of RegulationS-K or this Item.
| ITEM 11. | CONTROLS AND PROCEDURES. |
| (a) | Based upon their evaluation of the effectiveness of the registrant’s disclosure controls and procedures (as defined in Rule30a-3(c) under the Investment Company Act of 1940 (the “Act”)) as conducted within 90 days of the filing date of this report on FormN-CSR, the registrant’s principal financial officer and principal executive officer have concluded that those disclosure controls and procedures provide reasonable assurance that the material information required to be disclosed by the registrant on this report is recorded, processed, summarized and reported within the time periods specified in the Securities and Exchange Commission’s rules and forms. |
| (b) | There were no changes in the registrant’s internal controls over financial reporting (as defined in Rule30a-3(d) under the Act) that occurred during the period covered by the report that have materially affected, or are reasonably likely to materially affect, the registrant’s internal control over financial reporting. |
| ITEM 12. | DISCLOSURE OF SECURITIES LENDING ACTIVITIES FORCLOSED-END MANAGEMENT INVESTMENT COMPANIES. |
Not applicable to the Registrant.
| (a) | File the exhibits listed below as part of this form. Letter or number the exhibits in the sequence indicated. |
| | (1) | Any code of ethics, or amendment thereto, that is the subject of the disclosure required by Item 2, to the extent that the registrant intends to satisfy the Item 2 requirements through filing of an exhibit: Code of Ethics attached hereto asEX-99.COE. |
| | (2) | A separate certification for each principal executive officer and principal financial officer of the registrant as required by Rule30a-2(a) under the Act (17 CFR270.30a-2): Attached hereto asEX-99.302CERT. |
| | (3) | Any written solicitation to purchase securities under Rule23c-1 under the Act (17 CFR270.23c-1) sent or given during the period covered by the report by or on behalf of the registrant to 10 or more persons. Not applicable. |
| | (4) | Change in the registrant’s independent public accountant. Not applicable. |
| (b) | If the report is filed under Section 13(a) or 15(d) of the Exchange Act, provide the certifications required by Rule30a-2(b) under the Act (17 CFR270.30a-2(b)), Rule13a-14(b) or Rule15d-14(b) under the Exchange Act (17 CFR240.13a-14(b) or240.15d-14(b)) and Section 1350 of Chapter 63 of Title 18 of the United States Code (18 U.S.C. 1350) as an exhibit. A certification furnished pursuant to this paragraph will not be deemed “filed” for the purposes of Section 18 of the Exchange Act (15 U.S.C. 78r), or otherwise subject to the liability of that section. Such certification will not be deemed to be incorporated by reference into any filing under the Securities Act of 1933 or the Exchange Act, except to the extent that the registrant specifically incorporates it by reference: Attached hereto asEX-99.906CERT. |
Notice
A copy of the Amended and Restated Declaration of Trust, as amended, of the Registrant is on file with the Secretary of State of The Commonwealth of Massachusetts and notice is hereby given that this instrument is executed on behalf of the Registrant by an officer of the Registrant as an officer and not individually and the obligations of or arising out of this instrument are not binding upon any of the Trustees or shareholders individually, but are binding only upon the assets and property of the respective constituent series of the Registrant.
SIGNATURES
Pursuant to the requirements of the Securities Exchange Act of 1934 and the Investment Company Act of 1940, the registrant has duly caused this report to be signed on its behalf by the undersigned, thereunto duly authorized.
(Registrant) MFS MUNICIPAL SERIES TRUST
| | |
| By (Signature and Title)* | | DAVID L. DILORENZO |
| | David L. DiLorenzo, President |
Date: May 15, 2020
Pursuant to the requirements of the Securities Exchange Act of 1934 and the Investment Company Act of 1940, this report has been signed below by the following persons on behalf of the registrant and in the capacities and on the dates indicated.
| | |
| By (Signature and Title)* | | DAVID L. DILORENZO |
| | David L. DiLorenzo, President (Principal Executive Officer) |
Date: May 15, 2020
| | |
| By (Signature and Title)* | | JAMES O. YOST |
| | James O. Yost, Treasurer (Principal Financial Officer and Accounting Officer) |
Date: May 15, 2020
| * | Print name and title of each signing officer under his or her signature. |